Investor & analyst presentation June 2016

Welcome message from author
This document is posted to help you gain knowledge. Please leave a comment to let me know what you think about it! Share it to your friends and learn new things together.
Transcript

Investor & analyst presentationJune 2016

Redefine International P.L.C. Investor & analyst presentation
June 2016
Redefine International P.L.C.Who we are and what we do
Redefine International is a FTSE 250 UK Real Estate Investment Trust focused on income driven total returns and committed to delivering superior distributions to its shareholders throughout the property cycle.
Redefine International holds a primary listing on the London Stock Exchange and a secondary listing on the Johannesburg Stock Exchange. The Company is included within the EPRA and FTSE 250 indices.
Introduction
2Redefine International P.L.C.
Investor & analyst presentationJune 2016

Redefine International P.L.C. Investor & analyst presentation
June 2016
09:30 – 10:00 Welcome and registration
10:00 – 10:30 Charing Cross Road, Central London
10:30 – 11:30 Transit; Presentation
11:30 – 12:30 Priory Retail Park, Merton, London
12:30 – 13:30 Transit; Lunch
13:30 – 14:00 Camino Park, Crawley
14:00 Transport to Gatwick Express
15:00 Arrive at London Victoria
3
Itinerary

Redefine International P.L.C. Investor & analyst presentation
June 2016
4
Redefine International P.L.C. Investor & analyst presentation
June 2016

Redefine International P.L.C. Investor & analyst presentation
June 2016
Schloss Strassen Shopping Centre, Berlin
Investment
Proposition

Redefine International P.L.C. Investor & analyst presentation
June 2016
Continued transformation
delivering valueTransformed corporate structure and asset base offer foundation to drive
further value
Market-leading dividends
Proven track record of delivering superior dividends throughout the
property cycle
Secure income stream
Diversified portfolio and tenant base, with WAULT of 8.1 years
complemented by a debt maturity of 7.4 years of which >90% interest cost is
fixed
Lean but intensive management
structureHands on and transparent
management style, allowing for fast and effective reaction to opportunities
Effective, opportunistic capital
allocationInvestment philosophy to efficiently recycle capital to sectors/ locations with strong occupier fundamentals
and assets with realisable upside
Further income and value opportunities
Strategy to continue enhancing the portfolio quality and deliver occupier
led assets management initiatives
6
Focused on income driven total returns in a market where reliable income is increasingly attractive
Income driven total returns are underpinned by a diversified portfolio and efficient capital structure
Redefine International Investment Proposition

Redefine International P.L.C. Investor & analyst presentation
June 2016Delivered value throughout a five year transformation
(1) Market cap of £830m as at 10 June 2016
Committed to delivering superior distributions to shareholders
Annualised total shareholder returns of c.25% since 2012 equity raise
Significant efforts over last 5 years have transformed both the corporate structure and asset base
Reverse takeover of Wichford P.L.C.
Admitted to Premium listing
UK REIT conversion Internalisation of management
JSE secondary listing
Acquisition of Weston Favell Shopping Centre
for £84m
Repayment of over£250m of legacy financing facilities£127m equity raise
German shopping centre acquisition
€189m
Included in the FTSE 250 and EPRA indices£55m equity raise
German Retail Portfolio (“Leopard”) €157m Sold
non-core assets, including Cromwell and
Swiss portfolio
£70m equity raise
£115m equity raise
£490m AUK acquisition
2011 2012 2013 2014 2015 2016
31 August 2011
Market Cap (£m) 227
Portfolio Value (£m) 1,077
Underlying distributable earnings (£m) 20.3
LTV (%) 75.4
29 February 2016 (HY)
Market Cap(1) (£m) 626
Portfolio Value (£m) incl non-core 1,524
Underlying distributable earnings (£m) 25.4
Pro-forma LTV (%) 52.5
7

Redefine International P.L.C. Investor & analyst presentation
June 2016
8
Committed to maintain a superior dividend yield across UK listed real estate sector
Targeting dividend growth of 1-2% over the medium term whilst simultaneously reducing payout ratio to 90%
Market-leading dividends
0%
1%
2%
3%
4%
5%
6%
7%
8%
2016E Dividend yield (%)
Source: Factset as at 17 June 2016
Redefine International (>7%)
London Specialists (1.3%)
Developers (3.0%)
UK Majors (3.9%)
Mid-cap Income Specialists (5.6%)
Redefine International P.L.C. Investor & analyst presentation
June 2016
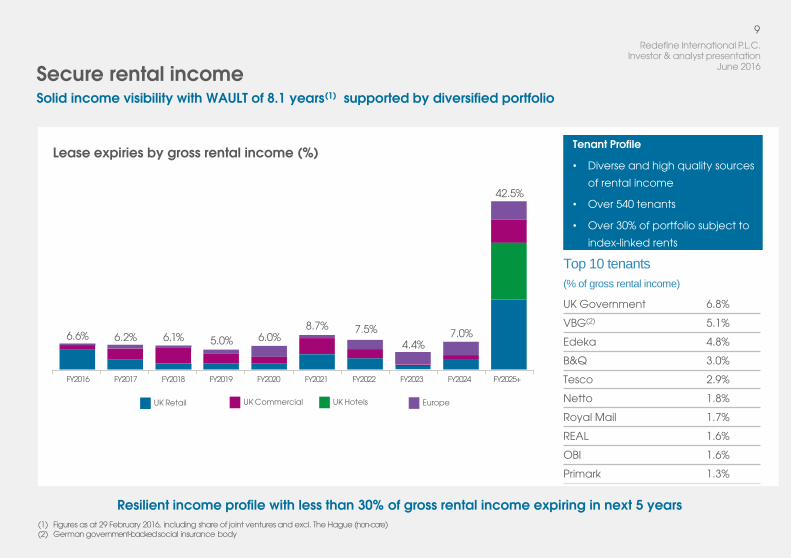
Tenant Profile
• Diverse and high quality sources
of rental income
• Over 540 tenants
• Over 30% of portfolio subject to
index-linked rents
UK Government 6.8%
VBG(2) 5.1%
Edeka 4.8%
B&Q 3.0%
Tesco 2.9%
Netto 1.8%
Royal Mail 1.7%
REAL 1.6%
OBI 1.6%
Primark 1.3%
Top 10 tenants
(% of gross rental income)
9
Solid income visibility with WAULT of 8.1 years(1) supported by diversified portfolio
Resilient income profile with less than 30% of gross rental income expiring in next 5 years
(1) Figures as at 29 February 2016, including share of joint ventures and excl. The Hague (non-core)(2) German government-backed social insurance body
Secure rental income
Lease expiries by gross rental income (%)
UK Retail UK Hotels EuropeUK Commercial
6.6% 6.2% 6.1% 5.0% 6.0%4.4%
42.5%
8.7% 7.5% 7.0%
FY2016 FY2017 FY2018 FY2019 FY2020 FY2021 FY2022 FY2023 FY2024 FY2025+

Redefine International P.L.C. Investor & analyst presentation
June 2016
10
AUK acquisition enhances ability to more actively allocate & recycle capital into new opportunities to deliver the
best risk adjusted returns
Effective, opportunistic capital allocation
Recycled
Streamlined geographical footprint which is nowfocused in Europe’s two largest economies
Realised capital from mature assets which have met their business plan
AUK opportunity
Off-market transaction
Achieved in a highly completive UK property market, owing to flexible
two tranche deal structure
Investment philosophy to invest in assets with resilient income returns and realisable growth opportunities
Clear value-add opportunities
Business plan attached to each asset
Early success
Early progress on income-led asset management initiatives with significant scope to continue
through the cycle

Redefine International P.L.C. Investor & analyst presentation
June 2016
• Enhanced exposure to assets with stronger property
fundamentals providing income-led asset management
opportunities
• More active capital recycling
• Investment market remains strong for secure income
• Disposals to focus on mature and underperforming
assets
11
AUK improves portfolio exposure to sub-sectors with good income and value growth prospects
Outlook supports our targeted sectors with clearly identified opportunities to add value and capitalise on current
occupational market trends
Portfolio repositioned for further income growth
th
c
cc
Market value by geography Market value by sector
Hotels
15%29%
9%
10%12%
18%
22%
12%
11%23%
21%
6%5%5%
2%Retail Parks
Regional Offices
Distribution
London Offices
Industrial & Automotive
Germany
Shopping Centres
Other
Greater London
Big 6 UK cities
Big 5 German cities
UK South
Dominant regional shopping centres
Other

Redefine International P.L.C. Investor & analyst presentation
June 2016
12
Flexible AUK facility presents further capital structure efficiencies and even lower cost of debt opportunities
Capitalising on low interest rate environment and utilising lower leverage on refinancing to attract lower cost of
debt
All figures as at 29 February 2016
Efficient capital structure
Positive direction of travel
52.5%Pro-forma LTV
Target LTV 40% - 50%
3.6%Cost of debt %
Post half year results cost of debt reduced
to 3.4% with opportunities to decrease
further
7.4 yearsDebt maturity
All near term maturities extended or under negotiations with no significant maturities until 2020
>90%Debt at fixed or capped rates
19.5%Principal debt with no LTV
covenants
20bpsFurther reduction in cost of debt %
Recent extensions and AUK Tranche II drawdown reduced
cost of debt to 3.4% (2016HY 3.6%)
Flexible funding£148m revolving credit facility providing opportunity to consolidate
debt and reduce interest costs further
Opportunity to reduce margin on all AUK debt by 15bps if LTV reduced to <50%

Camino Park Distribution Centre, Crawley
Portfolio

Redefine International P.L.C. Investor & analyst presentation
June 2016
14
Geographical focus in Europe’s two largest economies
Balanced exposure to retail, commercial and hotel sectors, supported by
in-house sector specialist asset managers
Secure income returns underpinned by diversified portfolio
UK
London

Redefine International P.L.C. Investor & Analyst Presentation
June 2016
15
All low yielding AUK offices with high vacancies were strategically weighted to Tranche 2
AUK adds high quality offices with immediate upside in filling vacancies which are progressing well
All figures as at 29 February 2016
UK Commercial - Offices
Gross annualised rental income
Latest asset management successes include:
• Charing Cross, London renewals average +29% on passing rent
• Swindon 15 year lease signed with OBU >40% above ERV
94.1%
Occupancy by lettable space:
Majority of vacancies in the high quality AUK regional
offices
4.7 yearsWAULT
Early stage renegotiation of 8 UK government leases totalling gross rent of £3.8m due to expire 31 March 2018
and considering alternate uses
5.2%Net initial yield
5.9% Topped up yield6.9% Reversionary yield
24Total number of UK offices:
4 in Greater London, 8 in Big 6 UK Cities, 3 in UK
South East
94,975Square metres
Average gross rent £17.2 per sqft vs ERV of
£17.4 per sqft
£16.5m

Redefine International P.L.C. Investor & Analyst Presentation
June 2016
16
Progress in filling vacancies, current occupancy at 86% (+590bps since acquisition)
AUK Offices - Income opportunities
Remaining 14% voids in Manchester, Leeds and
Reigate
+£1.2mERV
Vacancies filled to date
+£0.5mGross rent
Market evidence
£80-£100Per sqft
Rental achieved on latest rent reviews +29% on passing
<£40Per sqftCurrent rent for 1st/2nd floor tenant; rent review
Oct 2016
127-133 Charing Cross Road, LondonPositive direction of travel
+9 floors
Immediate neighbours to Charing Cross Road office recently secured planning
permission
£60Per sqft
<£40Per sqft

Redefine International P.L.C. Investor & Analyst Presentation
June 2016
99.2%
9.0 years
6.3%
14
237,621
17
Latest leasing transactions in shopping centres reflect rents at or ahead pre-downturn rental values
All figures as at 29 February 2016
UK Retail
Gross annualised rental income
Opportunity for modest rental growth, reconfiguration of existing space and further development activity
Occupancy by lettable space:
Shopping centres nearlyfully occupied at 98.9%
WAULT
Good quality tenants weighted towards non-discretionary food
retailers, discounters and leisure
Net initial yield
6.6% topped up andreversionary yield
Total number of UK retail assets:
Including 3 in Greater London and 5 regionally
dominant shopping centres
Square metres
Supply demand imbalance combined with long leases
presents opportunity to eliminate Retail Park over- rent
£41.4m

Redefine International P.L.C. Investor & Analyst Presentation
June 2016
18
National retail park vacancy at a 14 year low, reflected in our fully occupied retail parks
Strong tenant demand at retail parks creating opportunities to add additional space and enhance tenant mix to
drive footfall
AUK Retail – Priory Retail Park income opportunities
+17 floors Neighbouring Brown and Root
Tower refurbishment
Significant potential residential development on the Carphone
Warehouse site
Offer received from discount food
retailer will improve tenant mix and
ultimately drive higher footfall
Footfall
Offers received on potential reconfigured
6,000 sqft leisure unit with passing rent of £23 per sqft
Commercialisation
£35-£37.5Per sqft offers
Several initiatives and negotiations underway,
including creating advertising space and
Amazon lockers
Expansion opportunities

Redefine International P.L.C. Investor & Analyst Presentation
June 2016
5.8%
40
121,689
8.2 years
97.9%
19
Distribution sector currently experiencing strong demand and rental growth potential
Consumer shopping patterns with more focus on convenience and online shopping will continue to underpin
strong sector demand
All figures as at 29 February 2016
UK Commercial - Logistics and automotive
Gross annualised rental income
Latest asset management successes include:
• Camino Park, Crawley vacant unit in solicitors’ hands +22% on passing rent. Royal Mail 10 year reversionary lease, with 5 year break, complete
• Express Park, Bridgewater 5 year lease regear in solicitors’ hands at passing and ERV
Occupancy by lettable space:
Demand > Availablespace
WAULT
11.6 years on industrial and automotive sector with long defensive largely indexed income
Distribution asset WAULT +36% in last 6 months
Net initial yield
6.6% Reversionary yieldon distribution assets
Total number of properties:
>50% in Greater London, Big 6 UK cities
and UK South East
Square metres
Distribution asset average gross rent £6.2 per sqft vs
ERV of £6.8 per sqft
£10.5m

Redefine International P.L.C. Investor & Analyst Presentation
June 2016
20
Demand for space exceeding availability
AUK Distribution – Camino Park income opportunities
Royal Mail 10 year reversionary leases concluded with 5 year break option
10 yearsReversionary
lease
Vacant unit in solicitors’ hands at 22% above passing rent
15 yearsNew lease
Recently achieved or targeted at neighbouring estates
£11-£13Per sqft
Achieved on latest agreed lease
<£40Per sqft
As reported at acquisition
Camino Park, CrawleyPositive direction of travel
Online retail
c.15% share of current total retail sales and
gaining share at a rapid
pace
>£10Per sqft
£7.5Per sqft
3.4 years WAULTAs reported 29 February 2016
7.1 years WAULTPost completion of two recent lease activities

Redefine International P.L.C. Investor & analyst presentation
June 2016
Double Tree by Hilton, Edinburgh
Final Thoughts

22
Income focus is in our DNA and defines who we are as a company
Income focused total returns are core to our business
Investment philosophyAcquire secure
income streams, exposed to
strong property fundamentals, with realisable
income and value-add opportunities
Income
Capital structureOptimising debt levels to
capitalise on low interest rate environment and focused on high yielding debt pay down
DevelopmentOptimising existing
space and selective high yielding expansions
DiversifiedIncome security
supported by diversified portfolio
tenant base
Active asset management
Income-led asset management
initiatives informed by occupational market

26Redefine International
P.L.C. Investor & analyst presentation June 2016
Divider page titleDivider page subhead
City Point, Leeds
Appendices

Redefine International P.L.C. Investor & analyst presentation
June 2016Portfolio summary & analysis
Summary (incl. share of joint ventures)
% of portfolio by
market value
Market value 29 February
2016
Properties Area (m2) Annualised gross rental
income
ERV Net initialyield
Reversionaryyield
Weighted average
lease length
Voids (by lettable
area)
%Indexed
Like-for-like retail 22.7% 346.6 6 157,102 27.1 27.4 6.5% 7.0% 8.6 1.1% 20.9%
AUK retail 13.7% 207.8 8 80,519 14.3 13.0 6.0% 5.9% 9.8 0.4% 0.0%
UK Retail 36.4% 554.4 14 237,621 41.4 40.4 6.3% 6.6% 9.0 0.8% 13.7%
Like-for-like commercial 10.4% 157.9 53 79,947 12.7 11.0 7.2% 6.7% 6.8 0.2% 48.0%
AUK commercial 16.9% 257.6 11 136,718 14.3 17.0 4.5% 6.2% 5.3 5.8% —
UK Commercial 27.3% 415.5 64 216,665 27.0 28.0 5.5% 6.4% 6.0 3.8% 22.6%
UK Hotels 15.4% 235.4 9 41,323 15.0 15.0 6.0% 6.0% 10.8 — 5.4%
Total UK 79.1% 1,205.3 87 495,609 83.3 83.4 6.0% 6.4% 8.4 2.0% 15.1%
Europe 20.6% 314.1 87 198,621 20.9 20.8 5.6% 5.6% 6.8 1.8% 97.7%
Total (excl. The Hague) 99.7% 1,519.4 174 694,230 104.2 104.2 5.9% 6.2% 8.1 2.0% 31.7%
The Hague (non-core) 0.3% 5.0 1 12,878 1.9 1.1 33.3% 19.7% 0.3 — 100.0%
Total 100.0% 1,524.4 175 707,108 106.1 105.3 6.0% 6.3% 7.9 1.9% 32.9%
Wholly owned 91.5% 1,395.3 99 598,177 95.9 96.2 5.9% 6.3% 7.8 2.0% 26.7%
Joint ventures (share) 8.5% 129.1 76 108,931 10.2 9.1 6.9% 6.0% 8.6 1.8% 91.2%
Like-for-like portfolio 69.5% 1,059.0 156 489,870 77.6 75.4 6.4% 6.4% 8.1 1.1% 45.0%
AUK portfolio 30.5% 465.4 19 217,238 28.6 29.9 5.0% 6.1% 7.2 3.0% 0.0%

Redefine International P.L.C. Investor & analyst presentation
June 2016
Top 20 assets make up >60% of total portfolio
Top 20 assets
Top 20 assets
% of portfolio by
market value
Market value 29 February
2016
Area (m2) Annualised gross rental
income
Net initialyield
Weighted average
lease length
Voids (by lettable
area)
%Indexed
Grand Arcade, Wigan 6.6% 100.5 43,491 7.9 6.4% 9.5 0.8% 17.0%
Weston Favell, Northampton 5.7% 87.4 28,451 6.5 6.9% 7.8 0.8% 48.7%
St Georges, Harrow 4.8% 73.2 20,202 4.6 5.2% 5.0 0.9% 18.9%
Schloss Centre, Berlin 4.6% 69.6 18,181 4.0 5.0% 5.4 0.9% 98.3%
Bahnhoff Altona, Hamburg 4.0% 60.3 15,074 3.6 5.2% 5.4 0.7% 97.8%
Banbury Cross Retail Park, Banbury 3.3% 50.3 15,845 3.8 7.0% 5.5 — 0.1%
Charing Cross Road, London 3.2% 49.0 3,776 1.8 2.6% 5.7 — —
The Arches Retail Park, Watford 3.1% 48.0 11,443 3.0 6.0% 10.9 — —
Camino Park Distribution Center, Crawley 2.8% 42.0 32,664 2.4 5.3% 3.4 7.8% —
Express Park Distribution Center, Bridgewater 2.7% 41.5 46,961 2.7 6.3% 5.8 — —
Top 10 40.8%
Priory Retail Park, Merton 2.6% 39.0 6,533 2.2 5.2% 9.7 0.0% —
Southwark 2.5% 38.4 3,936 2.4 5.9% 9.8 — —
Birchwood, Warrington 2.3% 35.2 34,583 2.9 7.0% 15.0 2.2% 3.5%
Earl’s Court 2.2% 33.9 2,781 2.2 6.1% 9.8 — —
West Orchards, Coventry 2.0% 30.4 19,656 3.6 8.4% 6.4 0.9% —
Limehouse 2.0% 30.2 5,747 2.1 6.6% 9.8 — —
Edinburgh 1.8% 28.1 7,250 2.0 6.7% 10.0 — 4.4%
Royal Docks 1.7% 26.3 4,561 1.8 6.3% 9.8 — —
Deansgate Office, Manchester 1.7% 26.0 7,775 1.4 3.2% 4.6 24.2% —
Sytner Vehicle Dealership, High Wycombe 1.6% 24.9 6,028 1.4 5.3% 9.1 — —
Top 20 61.3%
Redefine International P.L.C. Investor & analyst presentation
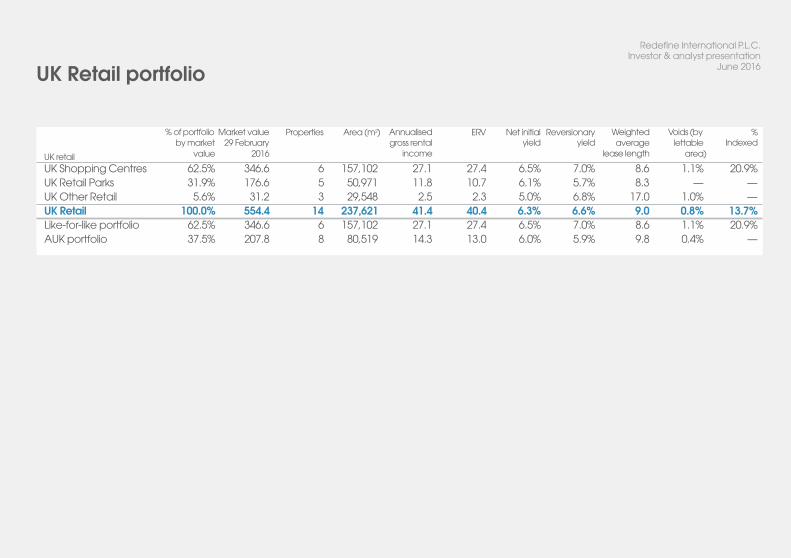
June 2016UK Retail portfolio
UK retail
% of portfolio by market
value
Market value 29 February
2016
Properties Area (m2) Annualised gross rental
income
ERV Net initialyield
Reversionaryyield
Weighted average
lease length
Voids (by lettable
area)
%Indexed
UK Shopping Centres 62.5% 346.6 6 157,102 27.1 27.4 6.5% 7.0% 8.6 1.1% 20.9%
UK Retail Parks 31.9% 176.6 5 50,971 11.8 10.7 6.1% 5.7% 8.3 — —
UK Other Retail 5.6% 31.2 3 29,548 2.5 2.3 5.0% 6.8% 17.0 1.0% —
UK Retail 100.0% 554.4 14 237,621 41.4 40.4 6.3% 6.6% 9.0 0.8% 13.7%
Like-for-like portfolio 62.5% 346.6 6 157,102 27.1 27.4 6.5% 7.0% 8.6 1.1% 20.9%
AUK portfolio 37.5% 207.8 8 80,519 14.3 13.0 6.0% 5.9% 9.8 0.4% —

Redefine International P.L.C. Investor & analyst presentation
June 2016UK Commercial portfolio
UK Commercial (incl. share of joint ventures)
% of portfolio Market value by market 29 February
value 2016
Properties Area (m2) Annualised gross rental
income
ERV Net initial Reversionary yield yield
Weighted average
lease length
Voids (by lettable
area)
%Indexed
UK Offices– GreaterLondon 21.1% 87.7 4 15,706 4.2 4.8 3.9% 5.4% 4.6 — 23.4%
UK Offices – Regions 38.8% 161.1 20 79,269 12.4 13.0 6.0% 7.7% 4.7 7.1% 18.5%
UK Offices 59.9% 248.8 24 94,975 16.5 17.8 5.2% 6.9% 4.7 5.9% 19.7%
UK Distribution 20.1% 83.5 2 79,625 5.2 5.8 5.8% 6.6% 4.7 3.2% —
UK Industrialand Automotive
20.0% 83.2 38 42,065 5.3 4.4 5.9% 4.8% 11.6 — 53.7%
UK Commercial 100.0% 415.5 64 216,665 27.0 28.0 5.5% 6.4% 6.0 3.8% 22.6%
Wholly owned 97.2% 403.7 63 213,912 26.2 27.2 5.4% 6.4% 5.9 3.8% 23.3%
Joint ventures (share) 2.8% 11.8 1 2,753 0.8 0.8 6.7% 6.6% 8.3 — —
Like-for-like portfolio 38.0% 157.9 53 79,946 12.7 11.0 7.2% 6.7% 6.8 0.2% 48.0%
AUK portfolio 62.0% 257.6 11 136,719 14.3 17.0 4.5% 6.2% 5.3 5.8% —

Redefine International P.L.C. Investor & analyst presentation
June 2016UK Hotel portfolio
UK Hotels
% of portfolio by market
value
Market value 29 February
2016
Properties Area (m2) Annualised gross rental
income
ERV Net initialyield
Reversionaryyield
Weighted average
lease length
Voids (by lettable
area)
%Indexed
Greater London &
UK South portfolio
82.2% 193.6 7 29,426 12.3 12.3 6.0% 6.0% 9.8 — —
Edinburgh 12.0% 28.1 1 7,250 2.0 2.0 6.7% 6.7% 10.0 — 4.4%
RBDL Managed Hotels 94.2% 221.7 8 36,676 14.3 14.3 6.1% 6.1% 9.8 — 0.6%
Enfield Travelodge 5.8% 13.7 1 4,647 0.7 0.7 5.0% 5.0% 31.3 — 100.0%
UK Hotels 100.0% 235.4 9 41,323 15.0 15.0 6.0% 6.0% 10.8 — 5.4%

Redefine International P.L.C. Investor & analyst presentation
June 2016European portfolio
Europe (incl. share of joint ventures)
% of portfolio Market value by market 29 February
value 2016
Properties Area (m2) Annualised gross rental
income
ERV Net initial Reversionary yield yield
Weighted average
lease length
Voids (by lettable
area)
%Indexed
German Shopping Centres 46.2% 145.0 3 44,537 7.9 8.8 4.5% 5.2% 5.4 0.8% 98.1%
GermanSupermarkets andRetail Parks
42.4% 133.3 80 131,963 9.9 10.0 6.2% 6.3% 7.9 2.1% 96.9%
German Retail 88.6% 278.3 83 176,500 17.8 18.8 5.3% 5.7% 6.7 1.7% 97.4%
German Offices 11.4% 35.8 4 22,121 3.1 2.0 8.0% 5.0% 7.4 1.9% 99.4%
Europe (excl. non-core) 100.0% 314.1 87 198,621 20.9 20.8 5.6% 5.6% 6.8 1.8% 97.7%
Wholly owned 62.6% 196.9 12 92,442 11.6 12.5 4.8% 5.4% 5.4 1.8% 96.4%
Joint ventures (share) 37.4% 117.2 75 106,179 9.3 8.3 6.9% 6.0% 8.7 1.9% 99.3%

Redefine International P.L.C. Investor & analyst presentation
June 2016Redefine International Team
30
Mike WattersCEOt: +44 (0) 20 7811 0102e: [email protected]
Stephen Oakenfull
Deputy CEO
t: +44 (0) 20 7811 0104
Donald Grant
CFO
t: +44 (0) 20 7811 0106
Adrian Horsburgh
Property Director
t: +44 (0) 20 7808 3992
Janine Ackermann
Head of Investor Relations
t: +44 (0) 20 7808 3998
Redefine International P.L.C.
2nd Floor, 30 Charles II Street
London SW1Y 4AE
Visit us online
www.redefineinternational.com
@RedefinePLC
Redefine International
Related Documents