Investment Strategy Outlook May 2013 EQUITIES & THE T.I.N.A FACTOR – There Is No Alternative Jason DeSena Trennert Managing Partner, Chief Investment Strategist Strategas Research Partners 52 Vanderbilt Ave., 8 th Fl. New York, New York 10017 212-906-0133 [email protected]

Investment Strategy Outlook
Mar 22, 2016
Jason Trennert
Welcome message from author
This document is posted to help you gain knowledge. Please leave a comment to let me know what you think about it! Share it to your friends and learn new things together.
Transcript
Investment Strategy Outlook May 2013
EQUITIES & THE T.I.N.A FACTOR – There Is No Alternative
Jason DeSena Trennert Managing Partner, Chief Investment Strategist
Strategas Research Partners 52 Vanderbilt Ave., 8th Fl.
New York, New York 10017 212-906-0133
Strategas Research Partners – Investment Strategy 2
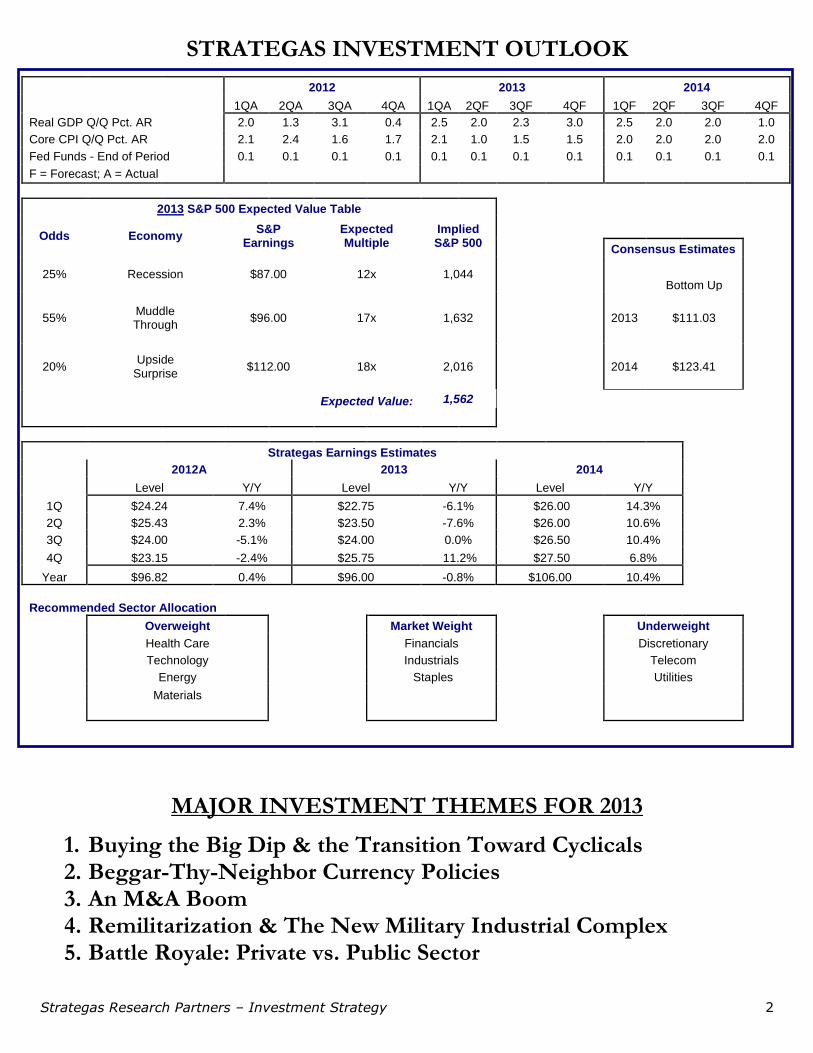
STRATEGAS INVESTMENT OUTLOOK
MAJOR INVESTMENT THEMES FOR 2013
1. Buying the Big Dip & the Transition Toward Cyclicals 2. Beggar-Thy-Neighbor Currency Policies 3. An M&A Boom 4. Remilitarization & The New Military Industrial Complex 5. Battle Royale: Private vs. Public Sector
2012 2013 2014
1QA 2QA 3QA 4QA 1QA 2QF 3QF 4QF 1QF 2QF 3QF 4QF
Real GDP Q/Q Pct. AR 2.0 1.3 3.1 0.4 2.5 2.0 2.3 3.0 2.5 2.0 2.0 1.0
Core CPI Q/Q Pct. AR 2.1 2.4 1.6 1.7 2.1 1.0 1.5 1.5 2.0 2.0 2.0 2.0
Fed Funds - End of Period 0.1 0.1 0.1 0.1 0.1 0.1 0.1 0.1 0.1 0.1 0.1 0.1
F = Forecast; A = Actual
2013 S&P 500 Expected Value Table
Odds Economy S&P
Earnings Expected Multiple
Implied S&P 500
Consensus Estimates
25% Recession $87.00 12x 1,044 Bottom Up
55% Muddle Through
$96.00 17x 1,632
2013 $111.03
20% Upside
Surprise $112.00 18x 2,016
2014 $123.41
Expected Value: 1,562
Strategas Earnings Estimates
2012A 2013 2014
Level Y/Y Level Y/Y Level Y/Y
1Q $24.24 7.4% $22.75 -6.1% $26.00 14.3%
2Q $25.43 2.3% $23.50 -7.6% $26.00 10.6%
3Q $24.00 -5.1% $24.00 0.0% $26.50 10.4%
4Q $23.15 -2.4% $25.75 11.2% $27.50 6.8%
Year $96.82 0.4% $96.00 -0.8% $106.00 10.4%
Recommended Sector Allocation
Overweight Market Weight Underweight
Health Care Financials Discretionary
Technology Industrials Telecom
Energy Staples Utilities
Materials

Strategas Research Partners – Investment Strategy 3
-4
0
4
8
12
16
20
'48 '52 '56 '60 '64 '68 '72 '76 '80 '84 '88 '92 '96 '00 '04 '08 '12
U.S. Nominal GDP Y/Y % Change
PROFITS VULNERABLE BUT IT MIGHT NOT MATTER
Strategas Est. Growth Rate
Bottom-Up Est. (First Call) Growth Rate
2011A 96.44 15.1% 97.82 14.7%
2012A 96.82 0.4% 103.80 6.1%
2013 96.00 -0.8% 111.03 7.0%
2014 106.00 10.4% 123.41 11.2%
As 1Q earnings season kicks off, sales still look much weaker than profits. This is a potential problem given the fact that virtually all of the earnings gains from the market low in 2009 have come from an improvement in operating margins rather than robust top-line growth. There may be some sense in which financial analysts are making the opposite mistake that was made in the 1970s. In those days, high inflation masked weak real growth. Today, subpar but decent real growth may be masking nominal GDP at recession-like levels.
For the past 50
years, 4%
nominal GDP
growth has
been associated
with recession.
1Q 2013 Revenue & Earnings Scorecard (Source: First Call)
% Beating % Missing Surprise Factor
S&P 500 Revenues 43% 57% -1%
S&P 500 Earnings 70% 21% 5%
Revenue vs. Earnings: Market Low March 9, 2009 vs. Today
3/9/09 Today Pct. Chg.
S&P 500 Operating EPS (TTM) 49.51 96.82 95.6%
S&P 500 Sales Per Share (TTM) 1,042.5 1,092.4 4.8%
S&P 500 Ex-Financials EPS (TTM) 64.6 80.3 24.2%
S&P 500 Ex-Financials Sales Per Share (TTM) 896.0 943.7 5.3%
S&P 500 Operating Margin 4.7% 8.9% 86.6%
Grey bars indicate recession

Strategas Research Partners – Investment Strategy 4
12
14
16
18
20
'95 '97 '99 '01 '03 '05 '07 '09 '11 '13
S&P 500 EBITDA Margin (LTM)
0
2
4
6
8
10
'95 '97 '99 '01 '03 '05 '07 '09 '11 '13
S&P 500 Net Income Margin (LTM)
TOUGH TO MAKE THE CASE FOR NET MARGIN EXPANSION FROM HERE
The data below suggest that a substantial portion of the expansion in net margins since 1Q 2009 has been driven by factors other than improved operating efficiency –particularly lower interest cost burdens. Unfortunately, it’s hard to imagine the interest rate environment getting much more favorable for companies from here, and operating margins are already rolling over.
S&P 500 Key Income Statement Items (Per Share)
2008 2009 2010 2011 2012
Chg from 2008
Sales 1042.5 908.4 962.7 1052.8 1092.4 49.9 Cost of Goods Sold 715.2 595.9 615.1 682.9 701.8 -13.5 SG&A 183.7 173.6 181.0 190.8 200.8 17.1 Depreciation & Amort. 49.8 46.4 46.1 48.8 53.1 3.3 Interest Expense 41.7 21.0 19.5 19.4 19.3 -22.4 Income Taxes 23.4 23.0 33.2 36.2 38.6 15.2 Net Income 18.7 56.0 80.2 89.3 88.3 69.6
As Percentage of Sales
2008 2009 2010 2011 2012 Chg from 2008 (bps)
Cost of Goods Sold 68.6% 65.6% 63.9% 64.9% 64.2% -436.8 SG&A 17.6% 19.1% 18.8% 18.1% 18.4% 76.3 Depreciation & Amort. 4.8% 5.1% 4.8% 4.6% 4.9% 8.1 Interest Expense 4.0% 2.3% 2.0% 1.8% 1.8% -223.3 Income Taxes 2.2% 2.5% 3.4% 3.4% 3.5% 128.9 Net Income 1.8% 6.2% 8.3% 8.5% 8.1% 629.1
*above data is index level and comes directly from S&P Compustat. Due to aggregation methodology, not all items sum as with an individual company income statement.

Strategas Research Partners – Investment Strategy 5
WATCHING LABOR’S SHARE OF INCOME FOR AN INDICATION OF PROFIT MARGINS
59.1%
58%
60%
62%
64%
66%
68%
70%
'47 '52 '57 '62 '67 '72 '77 '82 '87 '92 '97 '02 '07 '12
Labor Share of Corporate GDP
12.7%
5%
6%
7%
8%
9%
10%
11%
12%
13%
14%
'47 '52 '57 '62 '67 '72 '77 '82 '87 '92 '97 '02 '07 '12
Corporate Profits as % GDP
Labor down, profits up.
Strategas Research Partners – Investment Strategy 6
0
20
40
60
80
100
120
'90 '92 '94 '96 '98 '00 '02 '04 '06 '08 '10 '12
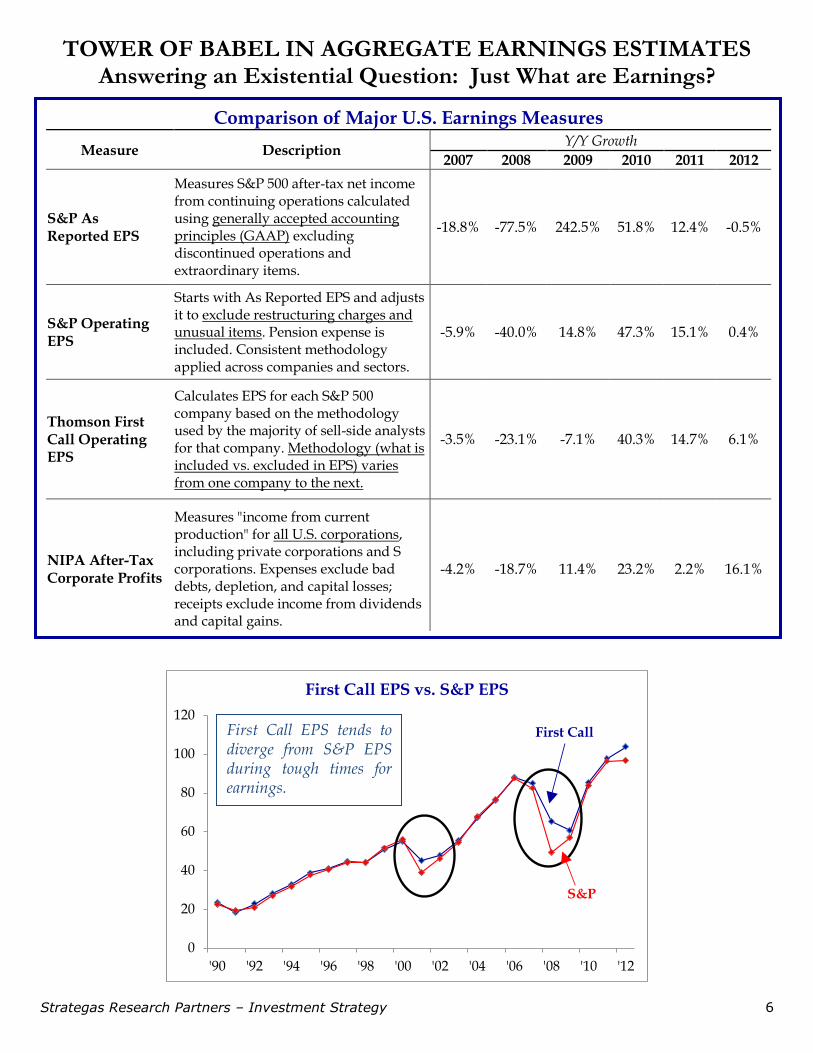
First Call EPS vs. S&P EPS
S&P
First Call
TOWER OF BABEL IN AGGREGATE EARNINGS ESTIMATES Answering an Existential Question: Just What are Earnings?
Comparison of Major U.S. Earnings Measures
Measure Description Y/Y Growth
2007 2008 2009 2010 2011 2012
S&P As Reported EPS
Measures S&P 500 after-tax net income from continuing operations calculated using generally accepted accounting principles (GAAP) excluding discontinued operations and extraordinary items.
-18.8% -77.5% 242.5% 51.8% 12.4% -0.5%
S&P Operating EPS
Starts with As Reported EPS and adjusts it to exclude restructuring charges and unusual items. Pension expense is included. Consistent methodology applied across companies and sectors.
-5.9% -40.0% 14.8% 47.3% 15.1% 0.4%
Thomson First Call Operating EPS
Calculates EPS for each S&P 500 company based on the methodology used by the majority of sell-side analysts for that company. Methodology (what is included vs. excluded in EPS) varies from one company to the next.
-3.5% -23.1% -7.1% 40.3% 14.7% 6.1%
NIPA After-Tax Corporate Profits
Measures "income from current production" for all U.S. corporations, including private corporations and S corporations. Expenses exclude bad debts, depletion, and capital losses; receipts exclude income from dividends and capital gains.
-4.2% -18.7% 11.4% 23.2% 2.2% 16.1%
First Call EPS tends to diverge from S&P EPS during tough times for earnings.

Strategas Research Partners – Investment Strategy 7
0
20
40
60
80
100
120
0
200
400
600
800
1000
1200
1400
1600
'50 '55 '60 '65 '70 '75 '80 '85 '90 '95 '00 '05 '10
S&P 500 Index vs. S&P 500 Operating EPS
Price, left
EPS, right
CAGRS&P Price: 7.1%S&P EPS: 5.9%
-50%
-25%
0%
25%
50%
-50% -25% 0% 25% 50%
Pri
ce R
etu
rn
EPS Growth
S&P 500 Annual Price Return vs. EPS Growth
Correlation: 0.11
EARNINGS & PRICE MOVE TOGETHER OVER THE LONG-TERM, BUT RELATIONSHIP IS WEAK FOR THOSE WITH SHORT HORIZONS
Strategas Research Partners – Investment Strategy 8
361
239
474447
139
50
100
150
200
250
300
350
400
450
500
Jan-07 Jan-08 Jan-09 Jan-10 Jan-11 Jan-12 Jan-13
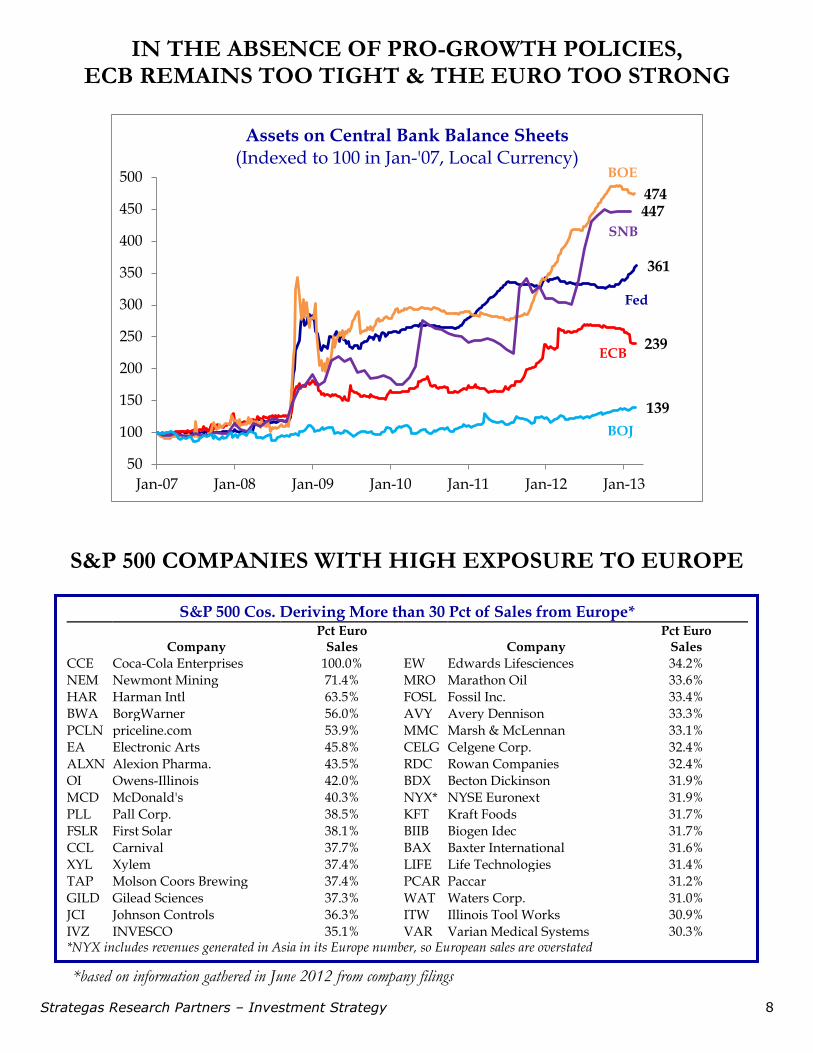
Assets on Central Bank Balance Sheets (Indexed to 100 in Jan-'07, Local Currency)
BOJ
ECB
SNB
Fed
BOE
IN THE ABSENCE OF PRO-GROWTH POLICIES, ECB REMAINS TOO TIGHT & THE EURO TOO STRONG
S&P 500 COMPANIES WITH HIGH EXPOSURE TO EUROPE
S&P 500 Cos. Deriving More than 30 Pct of Sales from Europe*
Company
Pct Euro Sales
Company
Pct Euro Sales
CCE Coca-Cola Enterprises 100.0% EW Edwards Lifesciences 34.2%
NEM Newmont Mining 71.4% MRO Marathon Oil 33.6%
HAR Harman Intl 63.5% FOSL Fossil Inc. 33.4%
BWA BorgWarner 56.0% AVY Avery Dennison 33.3%
PCLN priceline.com 53.9% MMC Marsh & McLennan 33.1%
EA Electronic Arts 45.8% CELG Celgene Corp. 32.4%
ALXN Alexion Pharma. 43.5% RDC Rowan Companies 32.4%
OI Owens-Illinois 42.0% BDX Becton Dickinson 31.9%
MCD McDonald's 40.3% NYX* NYSE Euronext 31.9%
PLL Pall Corp. 38.5% KFT Kraft Foods 31.7%
FSLR First Solar 38.1% BIIB Biogen Idec 31.7%
CCL Carnival 37.7% BAX Baxter International 31.6%
XYL Xylem 37.4% LIFE Life Technologies 31.4%
TAP Molson Coors Brewing 37.4% PCAR Paccar 31.2%
GILD Gilead Sciences 37.3% WAT Waters Corp. 31.0%
JCI Johnson Controls 36.3% ITW Illinois Tool Works 30.9%
IVZ INVESCO 35.1% VAR Varian Medical Systems 30.3% *NYX includes revenues generated in Asia in its Europe number, so European sales are overstated
*based on information gathered in June 2012 from company filings
Strategas Research Partners – Investment Strategy 9
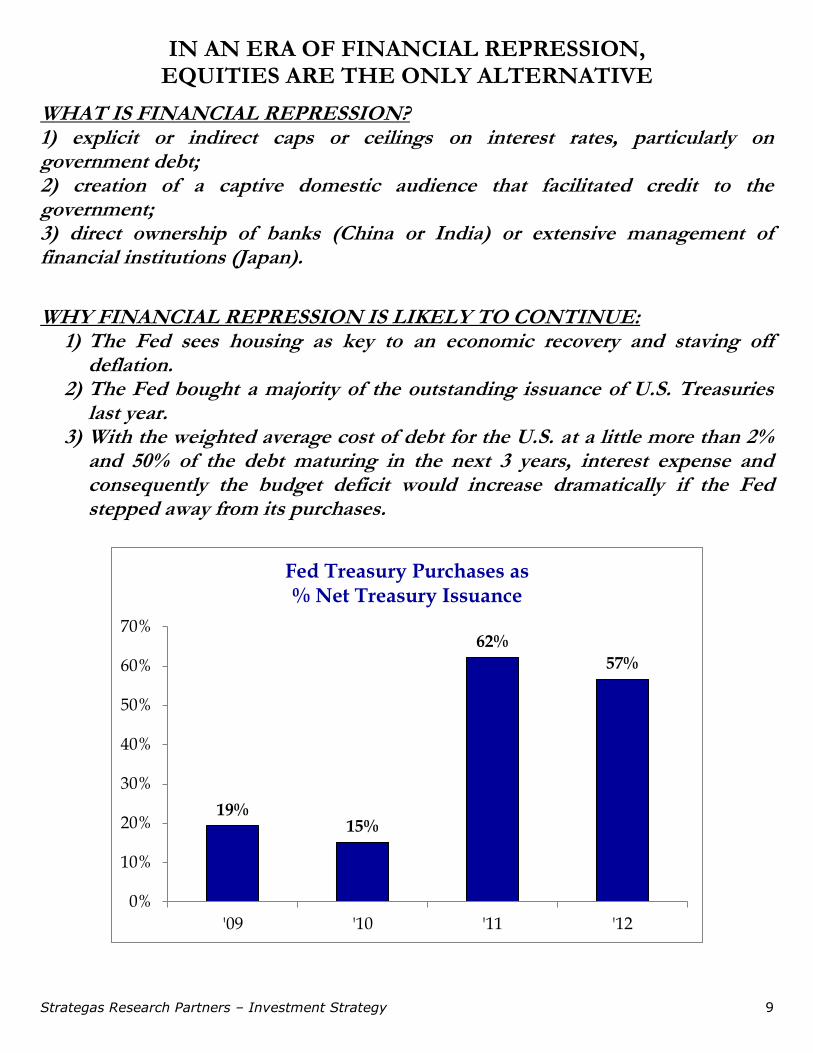
IN AN ERA OF FINANCIAL REPRESSION, EQUITIES ARE THE ONLY ALTERNATIVE
WHAT IS FINANCIAL REPRESSION? 1) explicit or indirect caps or ceilings on interest rates, particularly on government debt; 2) creation of a captive domestic audience that facilitated credit to the government; 3) direct ownership of banks (China or India) or extensive management of financial institutions (Japan).
WHY FINANCIAL REPRESSION IS LIKELY TO CONTINUE:
1) The Fed sees housing as key to an economic recovery and staving off deflation.
2) The Fed bought a majority of the outstanding issuance of U.S. Treasuries last year.
3) With the weighted average cost of debt for the U.S. at a little more than 2% and 50% of the debt maturing in the next 3 years, interest expense and consequently the budget deficit would increase dramatically if the Fed stepped away from its purchases.
19%15%
62%
57%
0%
10%
20%
30%
40%
50%
60%
70%
'09 '10 '11 '12
Fed Treasury Purchases as % Net Treasury Issuance
Strategas Research Partners – Investment Strategy 10
-0.02%
-6%
-4%
-2%
0%
2%
4%
6%
8%
10%
12%
'55 '60 '65 '70 '75 '80 '85 '90 '95 '00 '05 '10
Real Yields: 10-Year U.S. Treasury Yield less CPI Y/Y
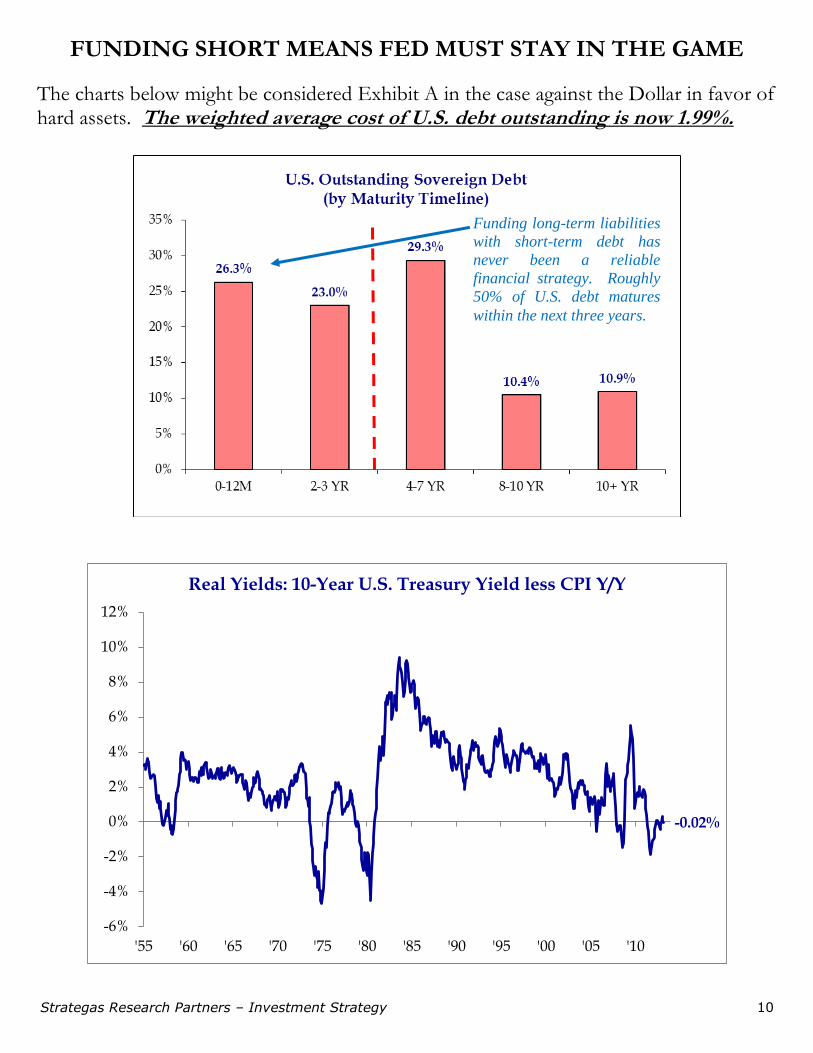
FUNDING SHORT MEANS FED MUST STAY IN THE GAME
The charts below might be considered Exhibit A in the case against the Dollar in favor of hard assets. The weighted average cost of U.S. debt outstanding is now 1.99%.
Funding long-term liabilities
with short-term debt has
never been a reliable
financial strategy. Roughly
50% of U.S. debt matures
within the next three years.
Strategas Research Partners – Investment Strategy 11
8,823
4,916
4,500
5,000
5,500
6,000
6,500
7,000
7,500
8,000
8,500
9,000
9,500
'90 '92 '94 '96 '98 '00 '02 '04 '06 '08 '10 '12
Number of Companies Listed on U.S. Exchanges (Sum of American SE, NASDAQ, NYSE)
1000
1500
2000
2500
3000
3500
4000
4500
5000
5500
'96 '98 '00 '02 '04 '06 '08 '10 '12
Number of Issues in Merrill Lynch AAA-RatedGlobal Fixed Income Markets Index
Down -34% since high in 2007
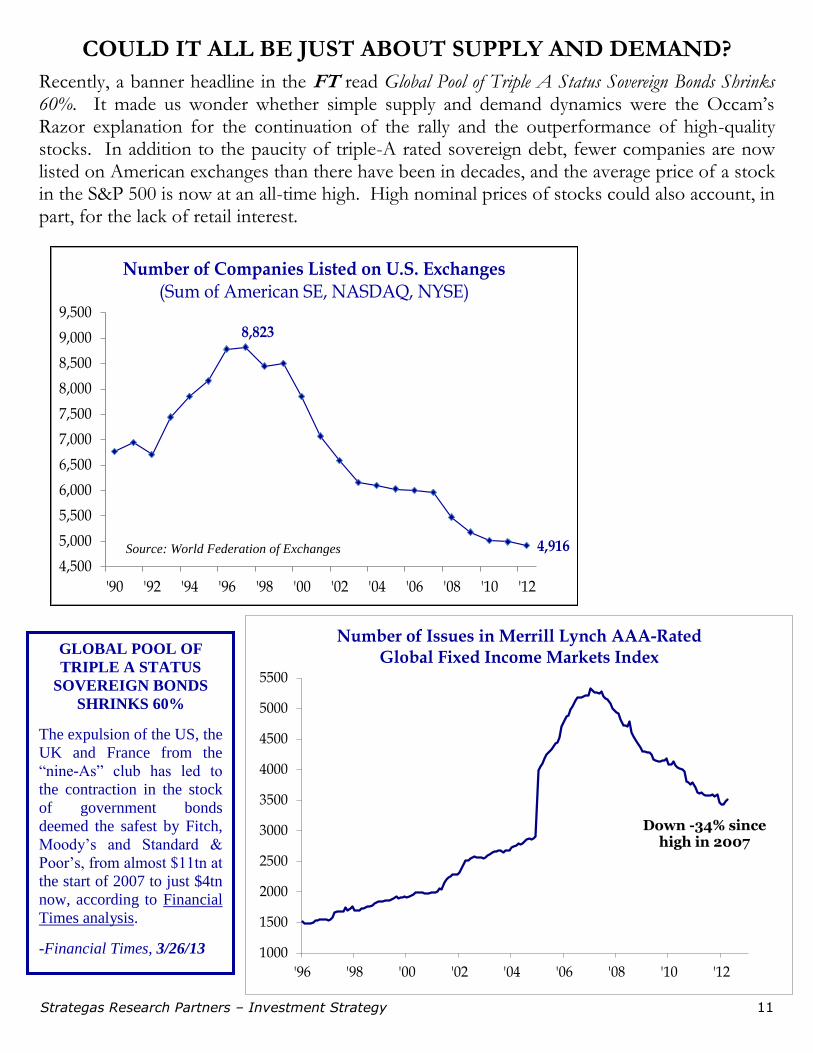
COULD IT ALL BE JUST ABOUT SUPPLY AND DEMAND?
Recently, a banner headline in the FT read Global Pool of Triple A Status Sovereign Bonds Shrinks 60%. It made us wonder whether simple supply and demand dynamics were the Occam’s Razor explanation for the continuation of the rally and the outperformance of high-quality stocks. In addition to the paucity of triple-A rated sovereign debt, fewer companies are now listed on American exchanges than there have been in decades, and the average price of a stock in the S&P 500 is now at an all-time high. High nominal prices of stocks could also account, in part, for the lack of retail interest.
Source: World Federation of Exchanges
GLOBAL POOL OF
TRIPLE A STATUS
SOVEREIGN BONDS
SHRINKS 60%
The expulsion of the US, the
UK and France from the
“nine-As” club has led to
the contraction in the stock
of government bonds
deemed the safest by Fitch,
Moody’s and Standard &
Poor’s, from almost $11tn at
the start of 2007 to just $4tn
now, according to Financial
Times analysis.
-Financial Times, 3/26/13

Strategas Research Partners – Investment Strategy 12
WHAT’S A PROPER MULTIPLE IF THE FED IS FIXING INTEREST RATES?
2013 S&P 500 Expected Value Table
Odds Economy S&P
Earnings Expected Multiple
Implied S&P 500
25% Recession $87.00 12x 1,044
55% Muddle Through
$96.00 17x 1,632
20% Upside
Surprise $112.00 18x 2,016
Expected Value 1,562
P/E Multiples Implied by Various Models
Strategas P/E Model (w/ interest rates & CPI)
19.9x
Strategas P/E Model, Assuming 4% 10Y Treasury
18.8x
Fed Model (bond value for stock) 54.0x
Rule of 20 (20- Inflation Rate) 18.4x
Average 27.8x
Actual TTM P/E 15.7x
Strategas Research Partners – Investment Strategy 13
$64
25
30
35
40
45
50
55
60
65
70
'80 '85 '90 '95 '00 '05 '10
S&P 500 Average Stock Price
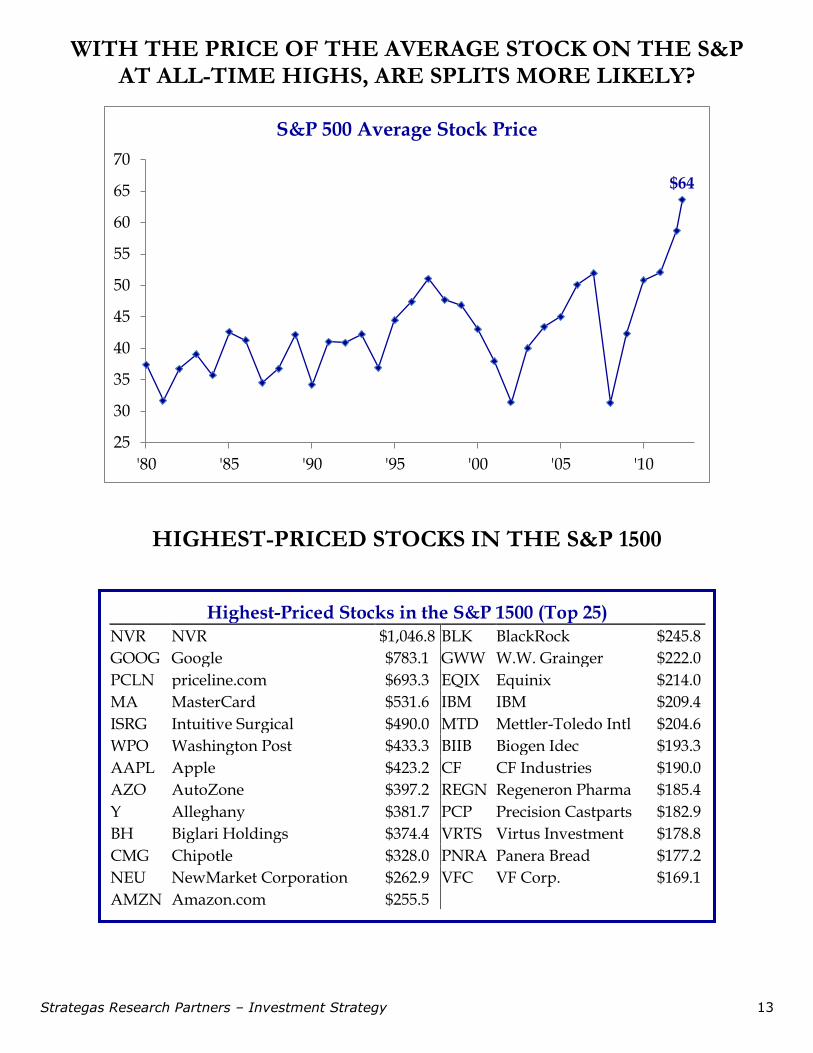
WITH THE PRICE OF THE AVERAGE STOCK ON THE S&P AT ALL-TIME HIGHS, ARE SPLITS MORE LIKELY?
HIGHEST-PRICED STOCKS IN THE S&P 1500
Highest-Priced Stocks in the S&P 1500 (Top 25) NVR NVR $1,046.8 BLK BlackRock $245.8
GOOG Google $783.1 GWW W.W. Grainger $222.0
PCLN priceline.com $693.3 EQIX Equinix $214.0
MA MasterCard $531.6 IBM IBM $209.4
ISRG Intuitive Surgical $490.0 MTD Mettler-Toledo Intl $204.6
WPO Washington Post $433.3 BIIB Biogen Idec $193.3
AAPL Apple $423.2 CF CF Industries $190.0
AZO AutoZone $397.2 REGN Regeneron Pharma $185.4
Y Alleghany $381.7 PCP Precision Castparts $182.9
BH Biglari Holdings $374.4 VRTS Virtus Investment $178.8
CMG Chipotle $328.0 PNRA Panera Bread $177.2
NEU NewMarket Corporation $262.9 VFC VF Corp. $169.1
AMZN Amazon.com $255.5
Strategas Research Partners – Investment Strategy 14
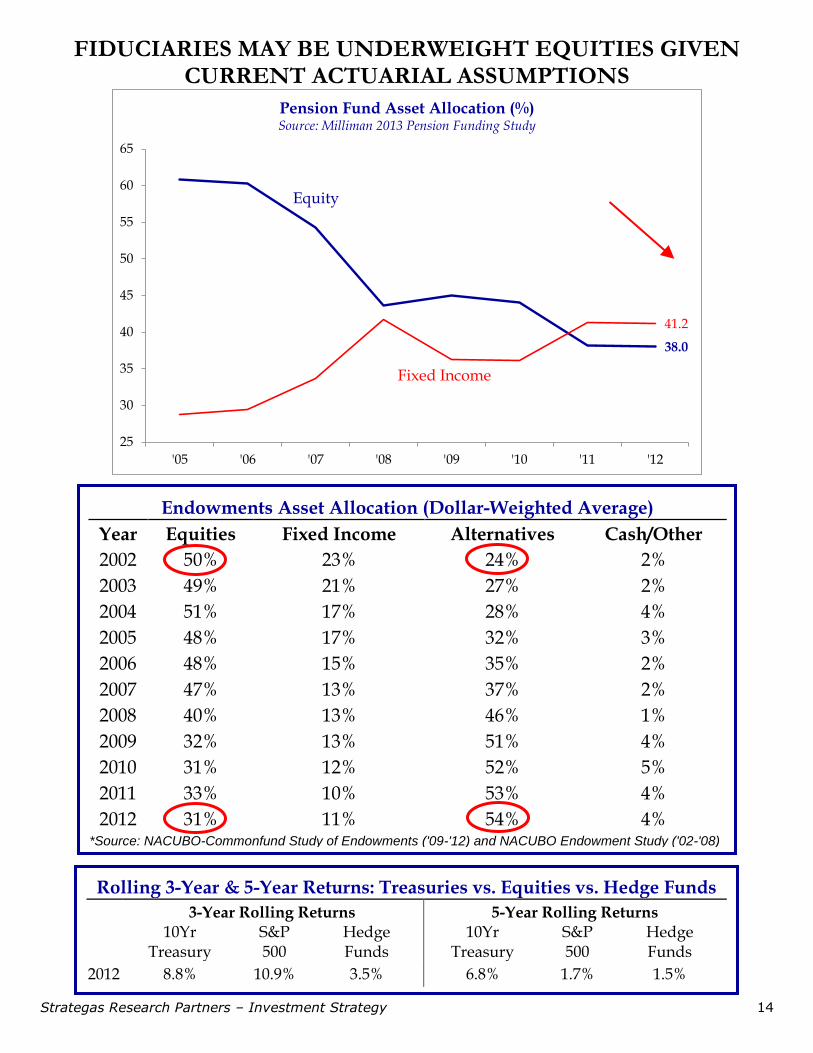
FIDUCIARIES MAY BE UNDERWEIGHT EQUITIES GIVEN CURRENT ACTUARIAL ASSUMPTIONS
38.0
41.2
25
30
35
40
45
50
55
60
65
'05 '06 '07 '08 '09 '10 '11 '12
Pension Fund Asset Allocation (%)Source: Milliman 2013 Pension Funding Study
Equity
Fixed Income
Endowments Asset Allocation (Dollar-Weighted Average)
Year Equities Fixed Income Alternatives Cash/Other
2002 50% 23% 24% 2%
2003 49% 21% 27% 2%
2004 51% 17% 28% 4%
2005 48% 17% 32% 3%
2006 48% 15% 35% 2%
2007 47% 13% 37% 2%
2008 40% 13% 46% 1%
2009 32% 13% 51% 4%
2010 31% 12% 52% 5%
2011 33% 10% 53% 4%
2012 31% 11% 54% 4% *Source: NACUBO-Commonfund Study of Endowments ('09-'12) and NACUBO Endowment Study ('02-'08)
Rolling 3-Year & 5-Year Returns: Treasuries vs. Equities vs. Hedge Funds
3-Year Rolling Returns 5-Year Rolling Returns
10Yr Treasury
S&P 500
Hedge Funds
10Yr Treasury
S&P 500
Hedge Funds
2012 8.8% 10.9% 3.5% 6.8% 1.7% 1.5%
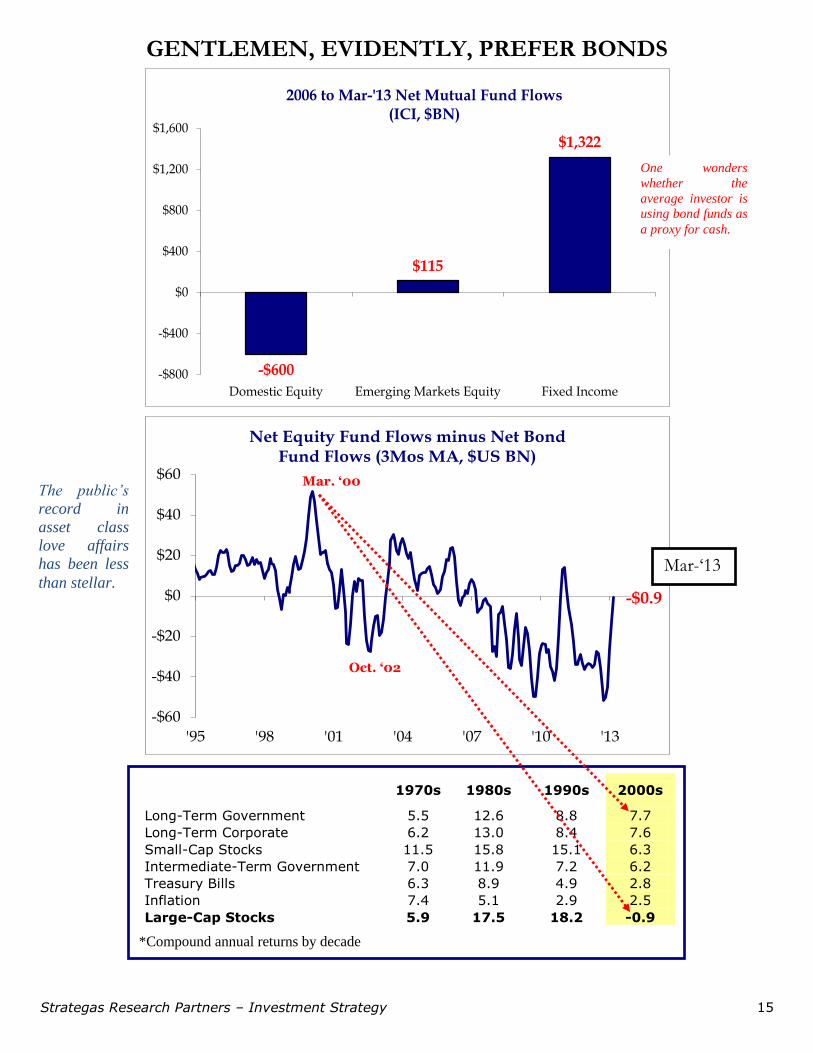
Strategas Research Partners – Investment Strategy 15
-$0.9
-$60
-$40
-$20
$0
$20
$40
$60
'95 '98 '01 '04 '07 '10 '13
Net Equity Fund Flows minus Net Bond Fund Flows (3Mos MA, $US BN)
-$600
$115
$1,322
-$800
-$400
$0
$400
$800
$1,200
$1,600
Domestic Equity Emerging Markets Equity Fixed Income
2006 to Mar-'13 Net Mutual Fund Flows(ICI, $BN)
GENTLEMEN, EVIDENTLY, PREFER BONDS
Mar. ‘00
Oct. ‘02
1970s 1980s 1990s 2000s
Long-Term Government 5.5 12.6 8.8 7.7
Long-Term Corporate 6.2 13.0 8.4 7.6
Small-Cap Stocks 11.5 15.8 15.1 6.3
Intermediate-Term Government 7.0 11.9 7.2 6.2
Treasury Bills 6.3 8.9 4.9 2.8
Inflation 7.4 5.1 2.9 2.5
Large-Cap Stocks 5.9 17.5 18.2 -0.9
*Compound annual returns by decade
One wonders
whether the
average investor is
using bond funds as
a proxy for cash.
Mar-‘13
The public’s
record in
asset class
love affairs
has been less
than stellar.

Strategas Research Partners – Investment Strategy 16
MONEY MARKET ASSETS BACK DOWN TO “NORMAL” LEVELS
16.1%
8%
16%
24%
32%
40%
48%
56%
'85 '87 '89 '91 '93 '95 '97 '99 '01 '03 '05 '07 '09 '11 '13
Money Market Assetsas % of NYSE Market Capitalization
ARE BOND FUNDS BEING USED AS A PROXY FOR CASH?
21.1%
0%
5%
10%
15%
20%
25%
30%
'85 '87 '89 '91 '93 '95 '97 '99 '01 '03 '05 '07 '09 '11 '13
Bond Mutual Fund Assetsas % of NYSE Market Capitalization
The fuel for retail flows into stocks is
much more likely to be from bond funds
rather than money market funds.
Strategas Research Partners – Investment Strategy 17
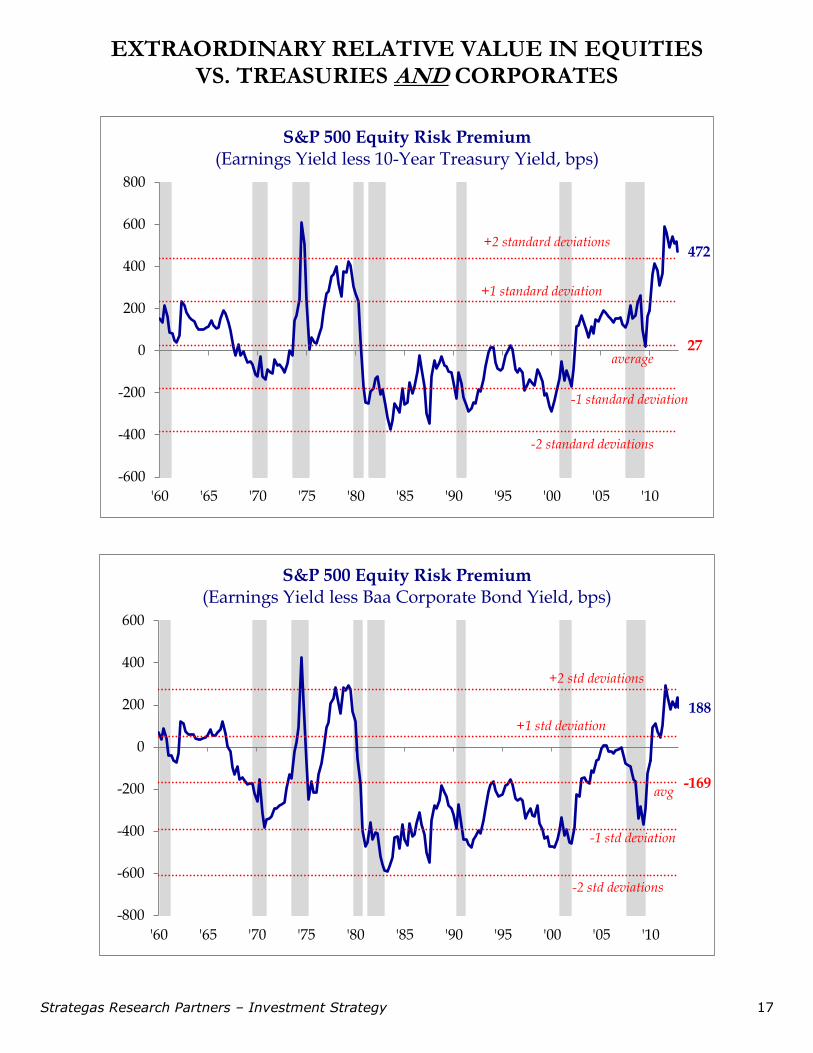
EXTRAORDINARY RELATIVE VALUE IN EQUITIES VS. TREASURIES AND CORPORATES
472
27
-600
-400
-200
0
200
400
600
800
'60 '65 '70 '75 '80 '85 '90 '95 '00 '05 '10
S&P 500 Equity Risk Premium(Earnings Yield less 10-Year Treasury Yield, bps)
+2 standard deviations
-2 standard deviations
average
+1 standard deviation
-1 standard deviation
188
-169
-800
-600
-400
-200
0
200
400
600
'60 '65 '70 '75 '80 '85 '90 '95 '00 '05 '10
S&P 500 Equity Risk Premium(Earnings Yield less Baa Corporate Bond Yield, bps)
+2 std deviations
-2 std deviations
avg
+1 std deviation
-1 std deviation

Strategas Research Partners – Investment Strategy 18
55%
0%
10%
20%
30%
40%
50%
60%
'90 '92 '94 '96 '98 '00 '02 '04 '06 '08 '10 '12
% of S&P 500 Stocks with Dividend Yields Greater than the 10-Year U.S. Treasury Yield
-0.02%
-6%
-4%
-2%
0%
2%
4%
6%
8%
10%
12%
'55 '60 '65 '70 '75 '80 '85 '90 '95 '00 '05 '10
Real Yields: 10-Year U.S. Treasury Yield less CPI Y/Y
FINANCIAL REPRESSION MAKES EQUITIES COMPELLING AS A SOURCE OF YIELD

Strategas Research Partners – Investment Strategy 19
4.9%
0%
2%
4%
6%
8%
10%
12%
14%
'95 '97 '99 '01 '03 '05 '07 '09 '11 '13
S&P 500 Weighted Average Cost of Capital*
7.7%
0%
1%
2%
3%
4%
5%
6%
7%
8%
9%
10%
'95 '97 '99 '01 '03 '05 '07 '09 '11 '13
S&P 500 Return on Average Invested Capital
STILL-LOW COST OF CAPITAL MAKES HURDLE RATE EASIER TO SURPASS
*Strategas approximation
Strategas Research Partners – Investment Strategy 20
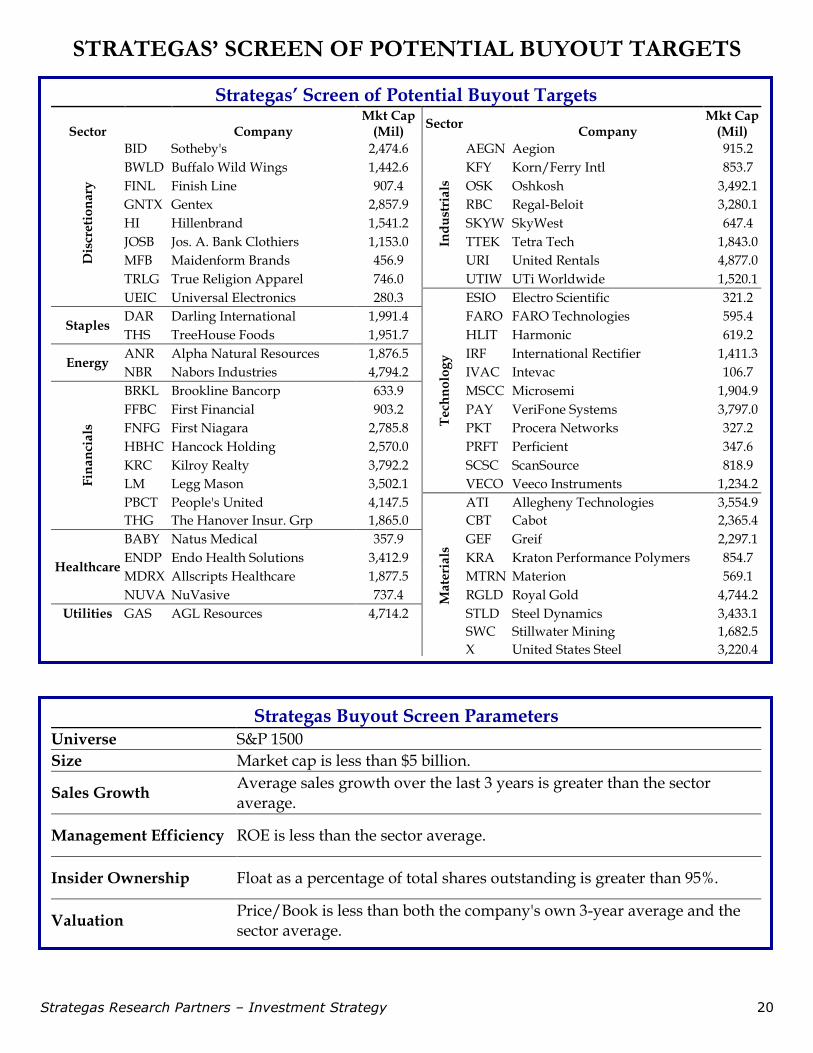
STRATEGAS’ SCREEN OF POTENTIAL BUYOUT TARGETS
Strategas’ Screen of Potential Buyout Targets
Sector
Company
Mkt Cap (Mil)
Sector
Company
Mkt Cap (Mil)
Dis
cre
tio
na
ry
BID Sotheby's 2,474.6
Ind
ust
ria
ls
AEGN Aegion 915.2
BWLD Buffalo Wild Wings 1,442.6
KFY Korn/Ferry Intl 853.7
FINL Finish Line 907.4
OSK Oshkosh 3,492.1
GNTX Gentex 2,857.9
RBC Regal-Beloit 3,280.1
HI Hillenbrand 1,541.2
SKYW SkyWest 647.4
JOSB Jos. A. Bank Clothiers 1,153.0
TTEK Tetra Tech 1,843.0
MFB Maidenform Brands 456.9
URI United Rentals 4,877.0
TRLG True Religion Apparel 746.0
UTIW UTi Worldwide 1,520.1
UEIC Universal Electronics 280.3
Te
chn
olo
gy
ESIO Electro Scientific 321.2
Staples DAR Darling International 1,991.4
FARO FARO Technologies 595.4
THS TreeHouse Foods 1,951.7
HLIT Harmonic 619.2
Energy ANR Alpha Natural Resources 1,876.5
IRF International Rectifier 1,411.3
NBR Nabors Industries 4,794.2
IVAC Intevac 106.7
Fin
an
cia
ls
BRKL Brookline Bancorp 633.9
MSCC Microsemi 1,904.9
FFBC First Financial 903.2
PAY VeriFone Systems 3,797.0
FNFG First Niagara 2,785.8
PKT Procera Networks 327.2
HBHC Hancock Holding 2,570.0
PRFT Perficient 347.6
KRC Kilroy Realty 3,792.2
SCSC ScanSource 818.9
LM Legg Mason 3,502.1
VECO Veeco Instruments 1,234.2
PBCT People's United 4,147.5
Ma
teri
als
ATI Allegheny Technologies 3,554.9
THG The Hanover Insur. Grp 1,865.0
CBT Cabot 2,365.4
Healthcare
BABY Natus Medical 357.9
GEF Greif 2,297.1
ENDP Endo Health Solutions 3,412.9
KRA Kraton Performance Polymers 854.7
MDRX Allscripts Healthcare 1,877.5
MTRN Materion 569.1
NUVA NuVasive 737.4
RGLD Royal Gold 4,744.2
Utilities GAS AGL Resources 4,714.2
STLD Steel Dynamics 3,433.1
SWC Stillwater Mining 1,682.5
X United States Steel 3,220.4
Strategas Buyout Screen Parameters Universe S&P 1500
Size Market cap is less than $5 billion.
Sales Growth Average sales growth over the last 3 years is greater than the sector average.
Management Efficiency ROE is less than the sector average.
Insider Ownership Float as a percentage of total shares outstanding is greater than 95%.
Valuation Price/Book is less than both the company's own 3-year average and the sector average.
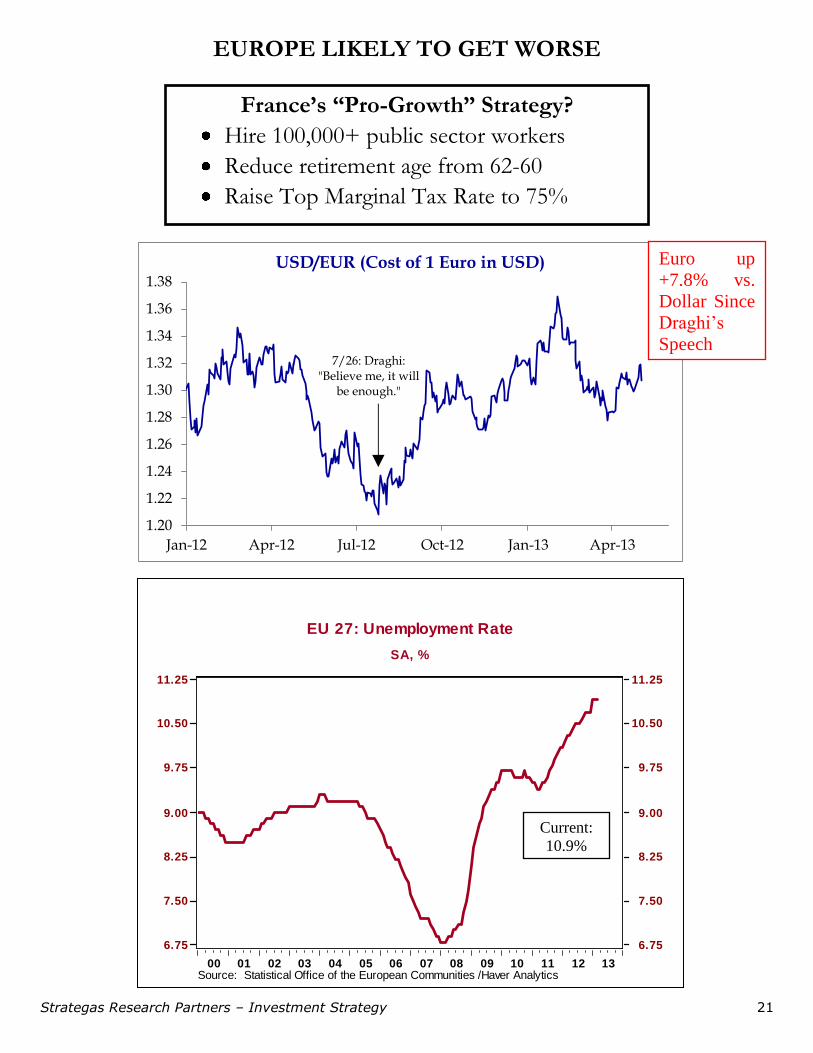
Strategas Research Partners – Investment Strategy 21
EU 27: Unemployment Rate
SA, %
1312111009080706050403020100Source: Statistical Office of the European Communities /Haver Analytics
11.25
10.50
9.75
9.00
8.25
7.50
6.75
11.25
10.50
9.75
9.00
8.25
7.50
6.75
1.20
1.22
1.24
1.26
1.28
1.30
1.32
1.34
1.36
1.38
Jan-12 Apr-12 Jul-12 Oct-12 Jan-13 Apr-13
USD/EUR (Cost of 1 Euro in USD)
7/26: Draghi: "Believe me, it will
be enough."
EUROPE LIKELY TO GET WORSE
France’s “Pro-Growth” Strategy?
Hire 100,000+ public sector workers
Reduce retirement age from 62-60
Raise Top Marginal Tax Rate to 75%
Current:
10.9%
Euro up
+7.8% vs.
Dollar Since
Draghi’s
Speech
Strategas Research Partners – Investment Strategy 22
50
60
70
80
90
100
110
120
130
140
150
160
170
'96 '99 '02 '04 '07 '10 '12
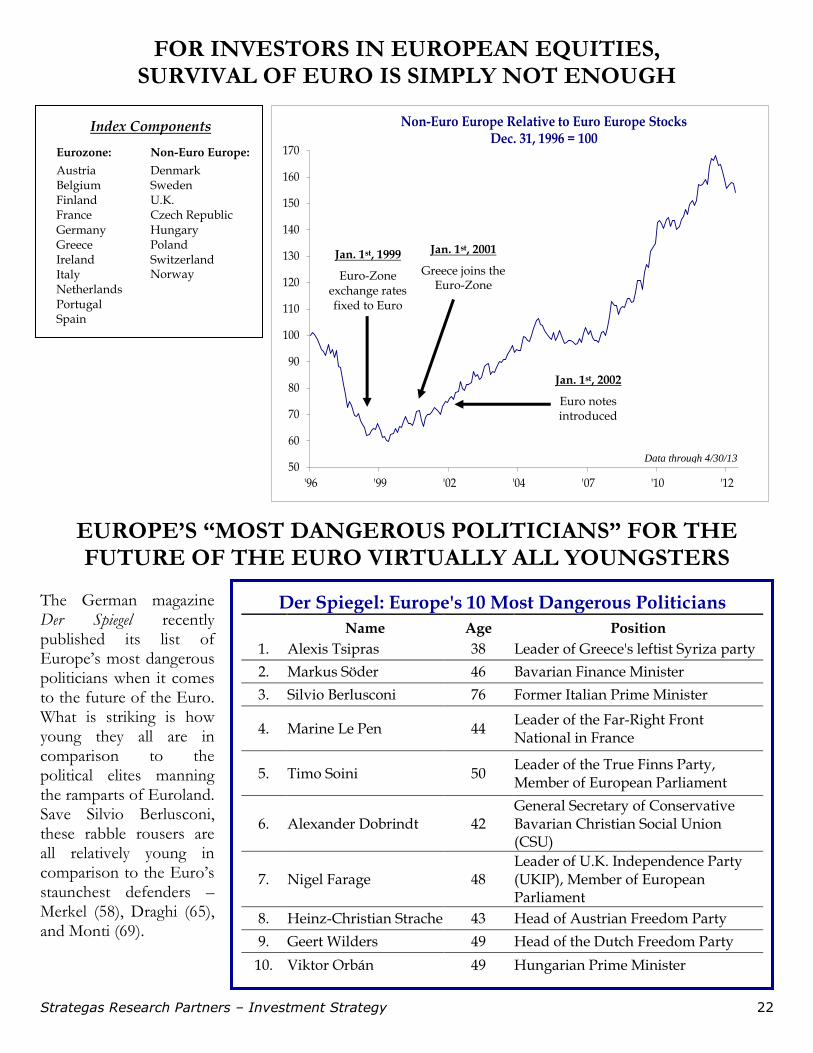
Non-Euro Europe Relative to Euro Europe StocksDec. 31, 1996 = 100
FOR INVESTORS IN EUROPEAN EQUITIES, SURVIVAL OF EURO IS SIMPLY NOT ENOUGH
EUROPE’S “MOST DANGEROUS POLITICIANS” FOR THE FUTURE OF THE EURO VIRTUALLY ALL YOUNGSTERS
Data through 4/30/13
The German magazine Der Spiegel recently published its list of Europe’s most dangerous politicians when it comes to the future of the Euro. What is striking is how young they all are in comparison to the political elites manning the ramparts of Euroland. Save Silvio Berlusconi, these rabble rousers are all relatively young in comparison to the Euro’s staunchest defenders – Merkel (58), Draghi (65), and Monti (69).
Index Components
Eurozone:
Austria Belgium Finland France Germany Greece Ireland Italy Netherlands Portugal Spain
Non-Euro Europe:
Denmark Sweden U.K. Czech Republic Hungary Poland Switzerland Norway
Jan. 1st, 1999
Euro-Zone exchange rates fixed to Euro
Jan. 1st, 2001
Greece joins the Euro-Zone
Jan. 1st, 2002
Euro notes introduced
Der Spiegel: Europe's 10 Most Dangerous Politicians
Name Age Position
1. Alexis Tsipras 38 Leader of Greece's leftist Syriza party
2. Markus Söder 46 Bavarian Finance Minister
3. Silvio Berlusconi 76 Former Italian Prime Minister
4. Marine Le Pen 44 Leader of the Far-Right Front National in France
5. Timo Soini 50 Leader of the True Finns Party, Member of European Parliament
6. Alexander Dobrindt 42 General Secretary of Conservative Bavarian Christian Social Union (CSU)
7. Nigel Farage 48 Leader of U.K. Independence Party (UKIP), Member of European Parliament
8. Heinz-Christian Strache 43 Head of Austrian Freedom Party
9. Geert Wilders 49 Head of the Dutch Freedom Party
10. Viktor Orbán 49 Hungarian Prime Minister
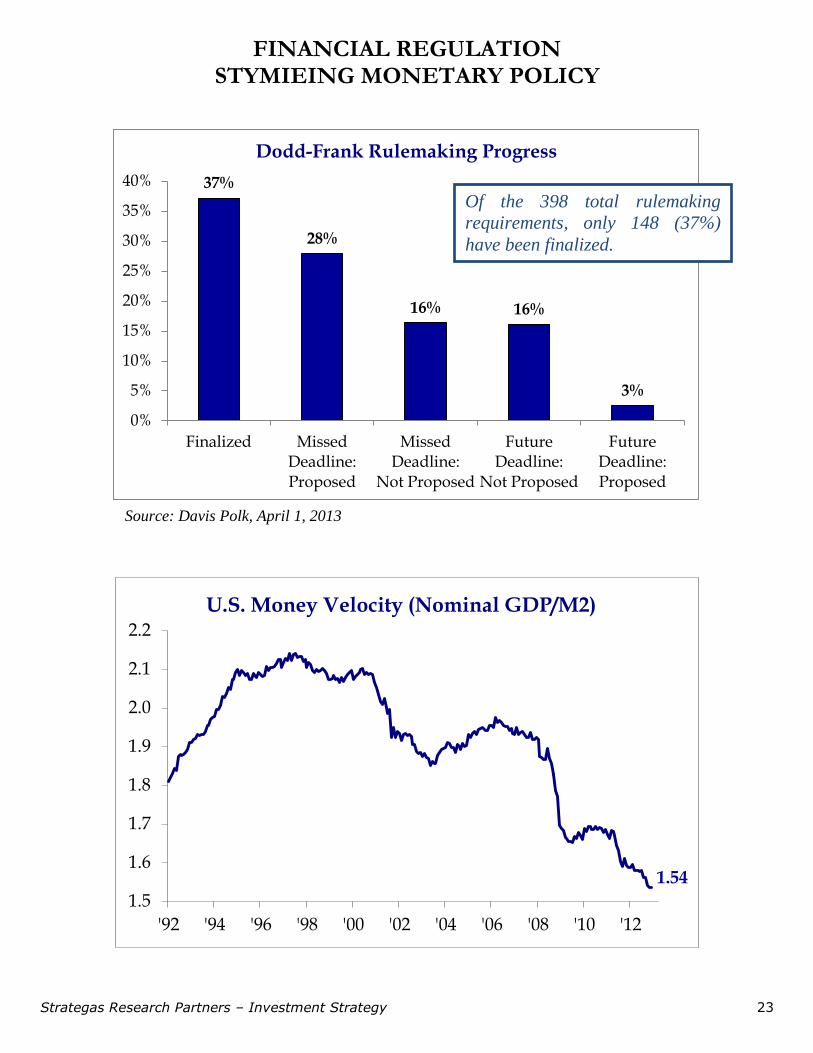
Strategas Research Partners – Investment Strategy 23
37%
28%
16% 16%
3%
0%
5%
10%
15%
20%
25%
30%
35%
40%
Finalized MissedDeadline:Proposed
MissedDeadline:
Not Proposed
FutureDeadline:
Not Proposed
FutureDeadline:Proposed
Dodd-Frank Rulemaking Progress
FINANCIAL REGULATION STYMIEING MONETARY POLICY
1.54
1.5
1.6
1.7
1.8
1.9
2.0
2.1
2.2
'92 '94 '96 '98 '00 '02 '04 '06 '08 '10 '12
U.S. Money Velocity (Nominal GDP/M2)
Source: Davis Polk, April 1, 2013
Of the 398 total rulemaking
requirements, only 148 (37%)
have been finalized.

Strategas Research Partners – Investment Strategy 24
$0.60
$0.65
$0.70
$0.75
$0.80
$0.85
'03 '04 '05 '06 '07 '08 '09 '10 '11 '12
Household Debt: Auto Loans(Trillion $)
$0.8
$0.9
$1.0
$1.1
$1.2
$1.3
$1.4
$1.5
$1.6
'03 '04 '05 '06 '07 '08 '09 '10 '11 '12 '13
C&I Loans (SA, Trillion $)
$0.15
$0.25
$0.35
$0.45
$0.55
$0.65
$0.75
'03 '04 '05 '06 '07 '08 '09 '10 '11 '12
Household Debt: Home-Equity Loans (Trillion $)
$4
$5
$6
$7
$8
$9
$10
'03 '04 '05 '06 '07 '08 '09 '10 '11 '12
Household Debt: Mortgages (Trillion $)
C&I LOANS UP MEANINGFULLY; HOUSEHOLD BORROWING STARTING TO FOLLOW SUIT
+2.0% Q/Q
in 4Q 2012
-1.7% Q/Q
in 4Q 2012
+1.0% M/M
in Jan 2013
+0.1% Q/Q
in 4Q 2012
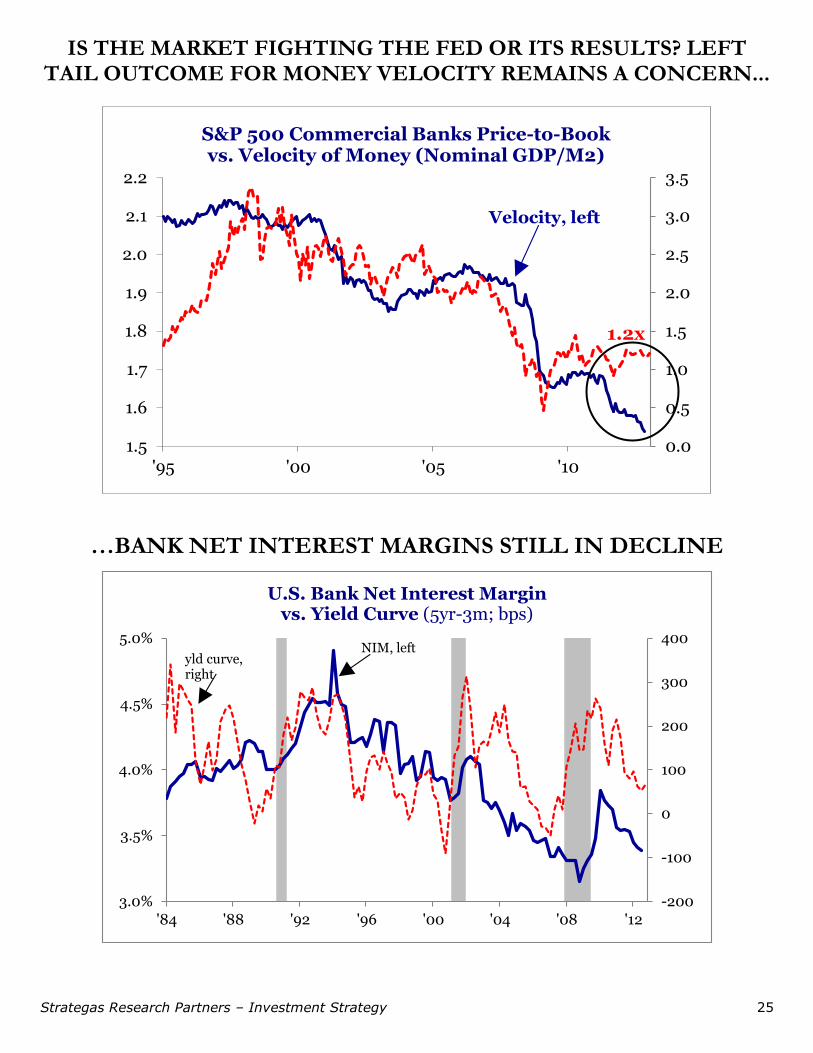
Strategas Research Partners – Investment Strategy 25
1.2x
0.0
0.5
1.0
1.5
2.0
2.5
3.0
3.5
1.5
1.6
1.7
1.8
1.9
2.0
2.1
2.2
'95 '00 '05 '10
S&P 500 Commercial Banks Price-to-Bookvs. Velocity of Money (Nominal GDP/M2)
Velocity, left
IS THE MARKET FIGHTING THE FED OR ITS RESULTS? LEFT TAIL OUTCOME FOR MONEY VELOCITY REMAINS A CONCERN...
…BANK NET INTEREST MARGINS STILL IN DECLINE
-200
-100
0
100
200
300
400
3.0%
3.5%
4.0%
4.5%
5.0%
'84 '88 '92 '96 '00 '04 '08 '12
U.S. Bank Net Interest Margin vs. Yield Curve (5yr-3m; bps)
yld curve, right
NIM, left
Strategas Research Partners – Investment Strategy 26
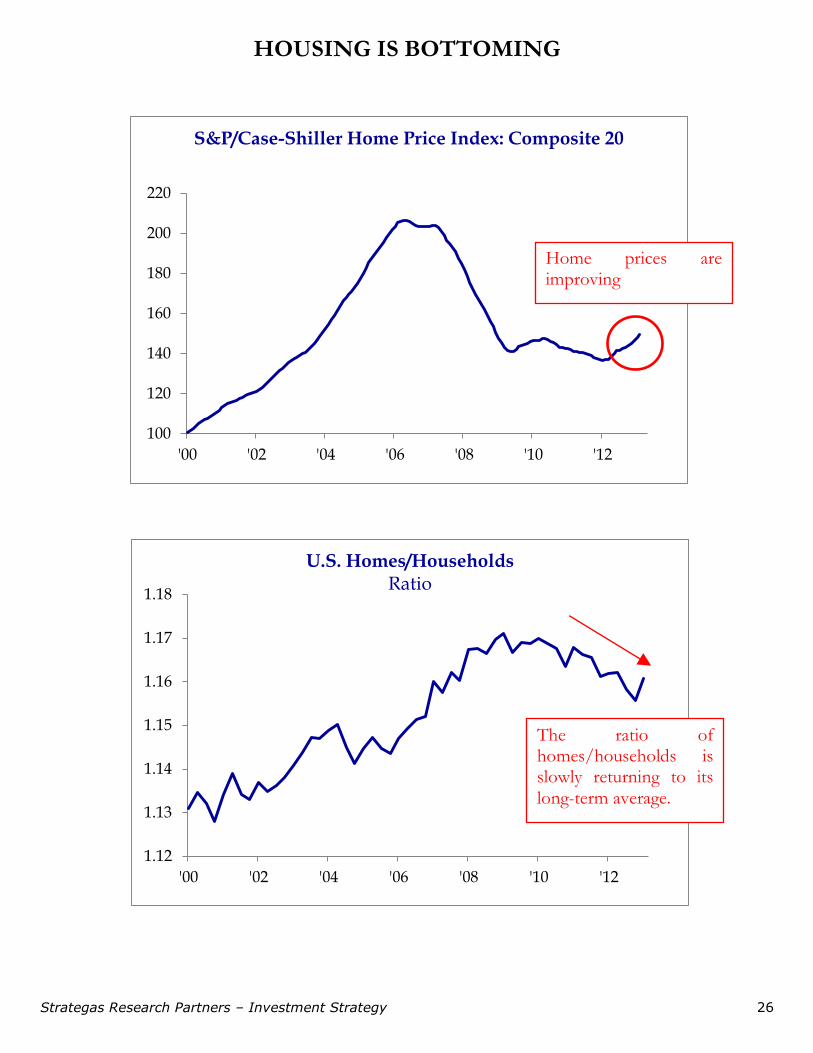
HOUSING IS BOTTOMING
100
120
140
160
180
200
220
'00 '02 '04 '06 '08 '10 '12
S&P/Case-Shiller Home Price Index: Composite 20
1.12
1.13
1.14
1.15
1.16
1.17
1.18
'00 '02 '04 '06 '08 '10 '12
U.S. Homes/HouseholdsRatio
Home prices are improving
The ratio of homes/households is slowly returning to its long-term average.

Strategas Research Partners – Investment Strategy 27
STRATEGAS’ LEADING INDICATOR OF MANUFACTURING (SLIM) SUGGESTS MANUFACTURING IS ON A PLATEAU
48.6%
40%
45%
50%
55%
60%
65%
70%
Jan-12 Mar-12 May-12 Jul-12 Sep-12 Nov-12 Jan-13 Mar-13
SLIM New Orders Diffusion Index (SA)
48.5%
38%
42%
46%
50%
54%
58%
Jan-12 Mar-12 May-12 Jul-12 Sep-12 Nov-12 Jan-13 Mar-13
SLIM Supplier Deliveries Diffusion Index (SA)
New Orders Stall in April
Under the auspices of the former Chairman of the ISM, Strategas’ Director of Proprietary Surveys Norbert Ore has put together a monthly survey of both New Orders and Supplier Deliveries among 60 manufacturing companies in the country. Generally speaking, our SLIM index is designed to be a good leading indicator for the broader ISM.
Deliveries Signal Weakening Demand
Strategas Research Partners – Investment Strategy 28
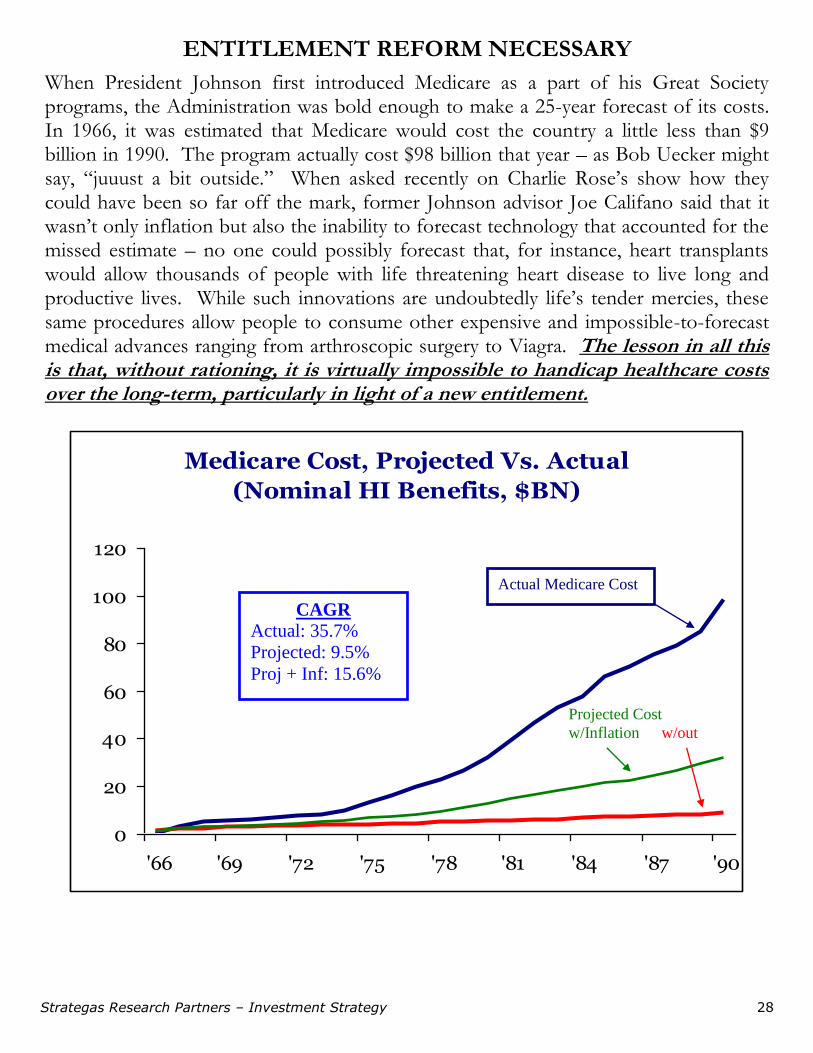
Medicare Cost, Projected Vs. Actual
(Nominal HI Benefits, $BN)
0
20
40
60
80
100
120
'66 '69 '72 '75 '78 '81 '84 '87 '90
ENTITLEMENT REFORM NECESSARY
When President Johnson first introduced Medicare as a part of his Great Society programs, the Administration was bold enough to make a 25-year forecast of its costs. In 1966, it was estimated that Medicare would cost the country a little less than $9 billion in 1990. The program actually cost $98 billion that year – as Bob Uecker might say, “juuust a bit outside.” When asked recently on Charlie Rose’s show how they could have been so far off the mark, former Johnson advisor Joe Califano said that it wasn’t only inflation but also the inability to forecast technology that accounted for the missed estimate – no one could possibly forecast that, for instance, heart transplants would allow thousands of people with life threatening heart disease to live long and productive lives. While such innovations are undoubtedly life’s tender mercies, these same procedures allow people to consume other expensive and impossible-to-forecast medical advances ranging from arthroscopic surgery to Viagra. The lesson in all this is that, without rationing, it is virtually impossible to handicap healthcare costs over the long-term, particularly in light of a new entitlement. We found the Medicare Actuary report from when the program was developed and the cost estimate came nowhere close to the actual cost. Some argue new programs were added later to the program. That is exactly the point. As this program is implemented, new programs will be added, increasing the cost. Even the prescription drug program, which has private competition driving down cost, has exceeded cost estimates. Pharma is vehemently opposed to the Obama proposal to squeeze $75bn from the program given the program’s potential future profits for the industry as the Baby Boomers retire.
Actual Medicare Cost
Projected Cost
w/Inflation w/out
CAGR Actual: 35.7%
Projected: 9.5%
Proj + Inf: 15.6%

Strategas Research Partners – Investment Strategy 29
71%
60%
62%
64%
66%
68%
70%
72%
'47 '54 '61 '68 '75 '82 '89 '96 '03 '10
U.S. Consumption as % of GDP
Long-term Average: 65%
Unemployment Rate: < HS Diploma: 25+ Years (SA, %)Unemployment Rate: HS Diploma, No College: 25+ Years (SA, %)
Unemployment Rate: < Bachelor's Degree: 25+ Years (SA, %)
Unemployment Rate: College Graduates: 25+ Years (SA, %)
1312111009080706050403020100Sources: BLS /Haver
16
12
8
4
0
16
12
8
4
0
U.S. MUST NOW RELY ON CAPEX & EXPORTS FOR GROWTH
It has become part of the standard pabulum of economic commentators to say that consumer spending is 2/3 of the economy. That is indeed the long-term average, but it ignores the fact that consumer spending as a percentage of GDP actually peaked at roughly 71% in early 2011. In a $15 trillion economy, the difference between 71% and 66% is significant and not easily corrected. It appears that growth for the U.S. must now come from capital spending and exports rather than consumer spending and government expenditures.
GDP = C + I + G + X
Hard to rely on C or G now.
Population Breakdown by Education (25 Years & Over, 2011)
Thous % Total
Less than HS Diploma 25,040 12%
HS Grads, No College 61,911 31%
Less than Bach. Degree 53,250 26%
College Graduates 61,343 30%
201,543 100%
< HS Diploma
College Grads
12%
4%
7%
6%
Strategas Research Partners – Investment Strategy 30
0
4
8
12
16
20
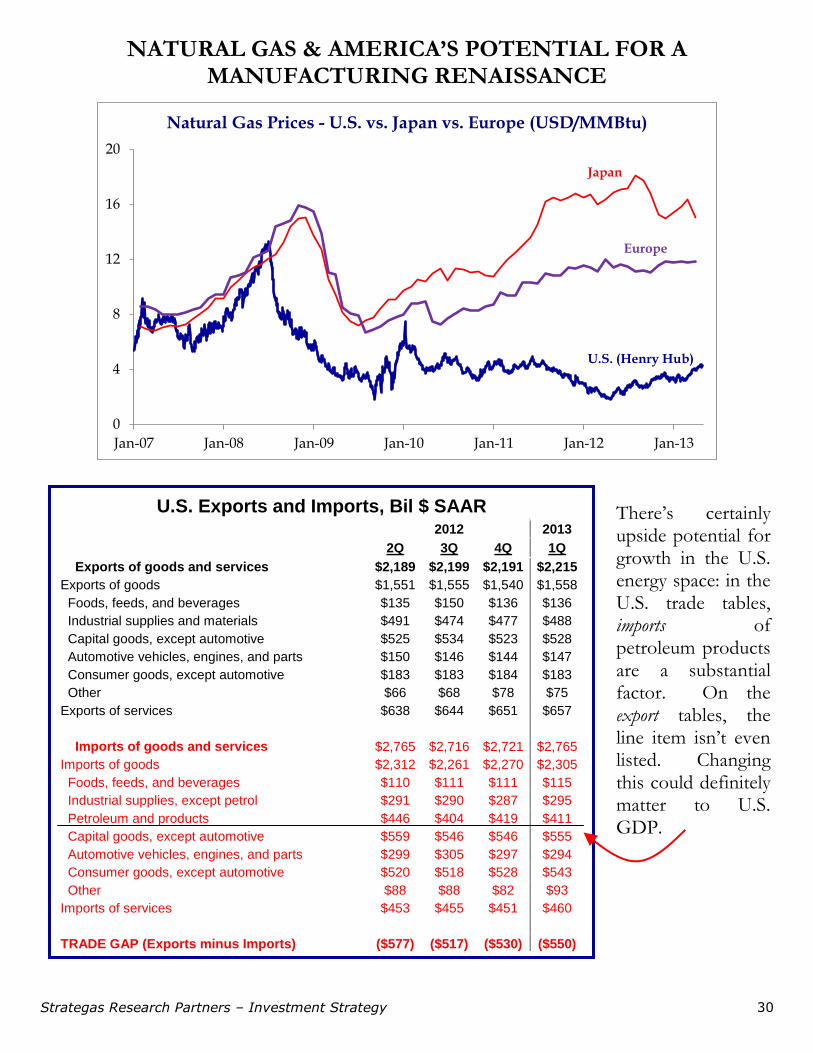
Jan-07 Jan-08 Jan-09 Jan-10 Jan-11 Jan-12 Jan-13
Natural Gas Prices - U.S. vs. Japan vs. Europe (USD/MMBtu)
Japan
U.S. (Henry Hub)
Europe
NATURAL GAS & AMERICA’S POTENTIAL FOR A MANUFACTURING RENAISSANCE
U.S. Exports and Imports, Bil $ SAAR
2012 2013
2Q 3Q 4Q 1Q
Exports of goods and services $2,189 $2,199 $2,191 $2,215
Exports of goods $1,551 $1,555 $1,540 $1,558
Foods, feeds, and beverages $135 $150 $136 $136
Industrial supplies and materials $491 $474 $477 $488
Capital goods, except automotive $525 $534 $523 $528
Automotive vehicles, engines, and parts $150 $146 $144 $147
Consumer goods, except automotive $183 $183 $184 $183
Other $66 $68 $78 $75
Exports of services $638 $644 $651 $657
Imports of goods and services $2,765 $2,716 $2,721 $2,765
Imports of goods $2,312 $2,261 $2,270 $2,305
Foods, feeds, and beverages $110 $111 $111 $115
Industrial supplies, except petrol $291 $290 $287 $295
Petroleum and products $446 $404 $419 $411
Capital goods, except automotive $559 $546 $546 $555
Automotive vehicles, engines, and parts $299 $305 $297 $294
Consumer goods, except automotive $520 $518 $528 $543
Other $88 $88 $82 $93
Imports of services $453 $455 $451 $460
TRADE GAP (Exports minus Imports) ($577) ($517) ($530) ($550)
There’s certainly upside potential for growth in the U.S. energy space: in the U.S. trade tables, imports of petroleum products are a substantial factor. On the export tables, the line item isn’t even listed. Changing this could definitely matter to U.S. GDP.
Strategas Research Partners – Investment Strategy 31
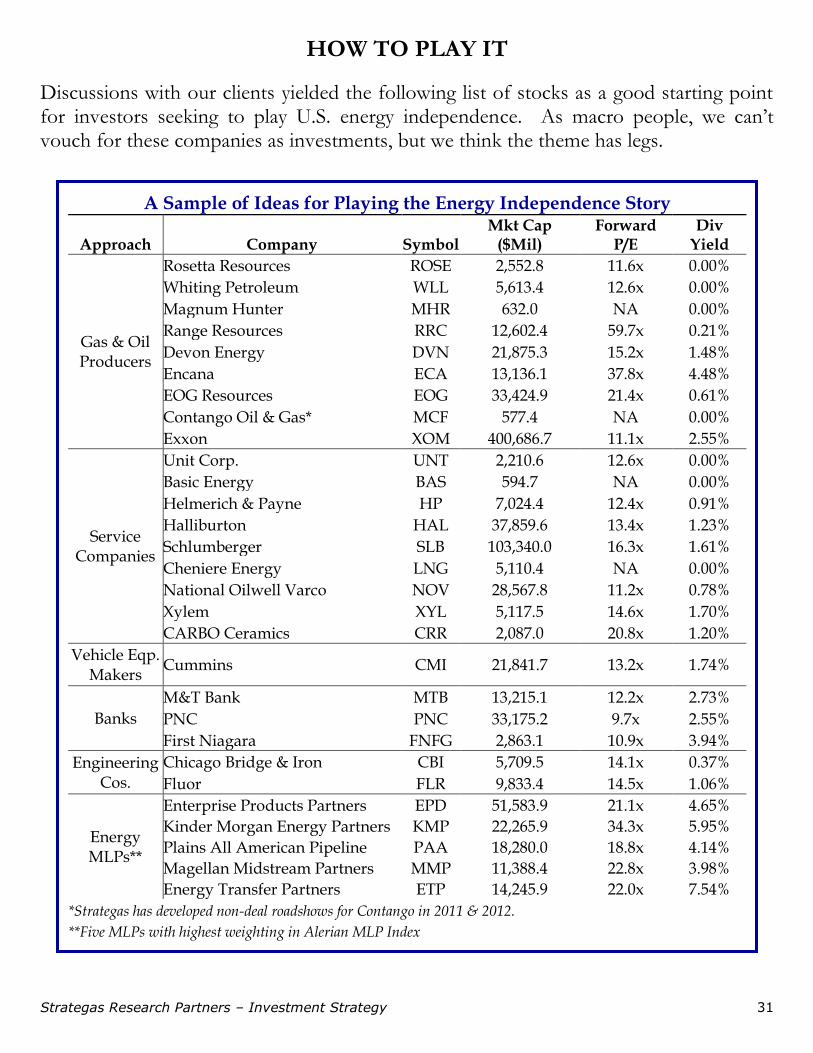
HOW TO PLAY IT
Discussions with our clients yielded the following list of stocks as a good starting point for investors seeking to play U.S. energy independence. As macro people, we can’t vouch for these companies as investments, but we think the theme has legs.
A Sample of Ideas for Playing the Energy Independence Story
Approach Company Symbol Mkt Cap
($Mil) Forward
P/E Div
Yield
Gas & Oil Producers
Rosetta Resources ROSE 2,552.8 11.6x 0.00%
Whiting Petroleum WLL 5,613.4 12.6x 0.00%
Magnum Hunter MHR 632.0 NA 0.00%
Range Resources RRC 12,602.4 59.7x 0.21%
Devon Energy DVN 21,875.3 15.2x 1.48%
Encana ECA 13,136.1 37.8x 4.48%
EOG Resources EOG 33,424.9 21.4x 0.61%
Contango Oil & Gas* MCF 577.4 NA 0.00%
Exxon XOM 400,686.7 11.1x 2.55%
Service Companies
Unit Corp. UNT 2,210.6 12.6x 0.00%
Basic Energy BAS 594.7 NA 0.00%
Helmerich & Payne HP 7,024.4 12.4x 0.91%
Halliburton HAL 37,859.6 13.4x 1.23%
Schlumberger SLB 103,340.0 16.3x 1.61%
Cheniere Energy LNG 5,110.4 NA 0.00%
National Oilwell Varco NOV 28,567.8 11.2x 0.78%
Xylem XYL 5,117.5 14.6x 1.70%
CARBO Ceramics CRR 2,087.0 20.8x 1.20%
Vehicle Eqp. Makers
Cummins CMI 21,841.7 13.2x 1.74%
Banks
M&T Bank MTB 13,215.1 12.2x 2.73%
PNC PNC 33,175.2 9.7x 2.55%
First Niagara FNFG 2,863.1 10.9x 3.94%
Engineering Cos.
Chicago Bridge & Iron CBI 5,709.5 14.1x 0.37%
Fluor FLR 9,833.4 14.5x 1.06%
Energy MLPs**
Enterprise Products Partners EPD 51,583.9 21.1x 4.65%
Kinder Morgan Energy Partners KMP 22,265.9 34.3x 5.95%
Plains All American Pipeline PAA 18,280.0 18.8x 4.14%
Magellan Midstream Partners MMP 11,388.4 22.8x 3.98%
Energy Transfer Partners ETP 14,245.9 22.0x 7.54%
*Strategas has developed non-deal roadshows for Contango in 2011 & 2012.
**Five MLPs with highest weighting in Alerian MLP Index

Strategas Research Partners – Investment Strategy 32
1.00
1.20
1.40
1.60
1.80
2.00
2.20
5x
10x
15x
20x
25x
30x
'50 '60 '70 '80 '90 '00 '10 '20 '30 '40 '50
S&P 500 P/E Ratio & "Middle/Old" Ratio
Ratio: Population aged 40-49 to population aged 60-69 (right)
Trailing P/E, left
Census Projections, 2011-2050
DEMOGRAPHIC TRENDS SUGGEST SECULAR MULTIPLE EXPANSION MAY BE TOUGH TO ACHIEVE
T axes R egulation I nterest rates I nflation
Based on SF Fed calculations
An interesting study from the San Francisco Fed suggests that demographic trends may continue to put pressure on price-earnings multiples. The m/o ratio (middle aged to older aged people) has had a surprisingly tight fit with multiples through the years.
All these factors were big tailwinds for multiple expansions in the ‘80s and ‘90s. It’s difficult to see any of these elements improving much from here.
Strategas Research Partners – Investment Strategy 33
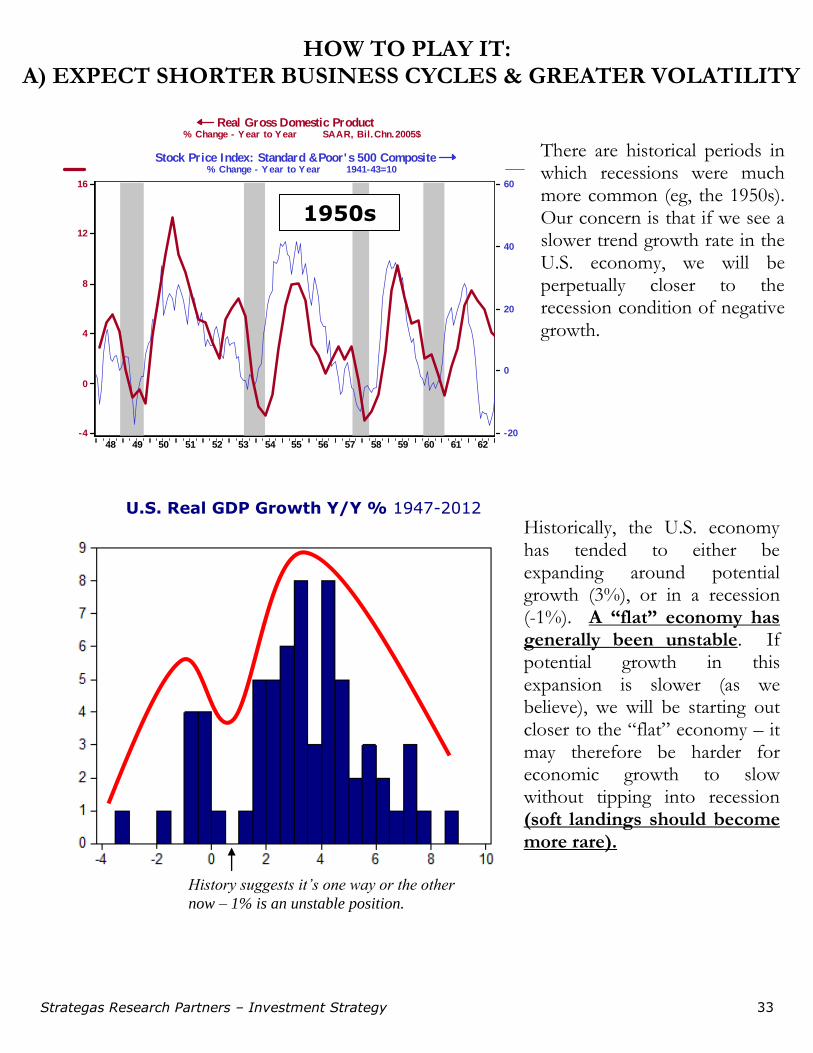
HOW TO PLAY IT: A) EXPECT SHORTER BUSINESS CYCLES & GREATER VOLATILITY
Real Gross Domestic Product % Change - Year to Year SAAR, Bil.Chn.2005$
Stock Price Index: Standard & Poor's 500 Composite % Change - Year to Year 1941-43=10
626160595857565554535251504948
16
12
8
4
0
-4
60
40
20
0
-20
1950s
There are historical periods in which recessions were much more common (eg, the 1950s). Our concern is that if we see a slower trend growth rate in the U.S. economy, we will be perpetually closer to the recession condition of negative growth.
Historically, the U.S. economy has tended to either be expanding around potential growth (3%), or in a recession (-1%). A “flat” economy has generally been unstable. If potential growth in this expansion is slower (as we believe), we will be starting out closer to the “flat” economy – it may therefore be harder for economic growth to slow without tipping into recession (soft landings should become more rare).
U.S. Real GDP Growth Y/Y % 1947-2012
History suggests it’s one way or the other
now – 1% is an unstable position.

Strategas Research Partners – Investment Strategy 34
RELIANCE ON PUBLIC SPENDING LIKELY TO LEAD TO SECULARLY HIGHER VOLATILITY
5,000
10,000
15,000
20,000
25,000
30,000
35,000
40,000
'86 '88 '90 '92 '94 '96 '98 '00 '02 '04 '06 '08 '10
Japan Nikkei 225 Index
While they may be imperfect parallels, we believe the U.S. in the 1930s and Japan in the 1990s underscore a simple point – economies that become dependent upon public spending (as opposed to more traditional drivers of recovery like pent-up demand for consumer durables) tend to spawn greater volatility in their corresponding financial markets. In both cases, attempts to balance the budget via tax increases led to significant dislocations in stock prices as the “bill came due.”
+34%
+48% +34%
+56% +62%
7 Rallies: +62% Average
+140%
+61%
Strategas Research Partners – Investment Strategy 35
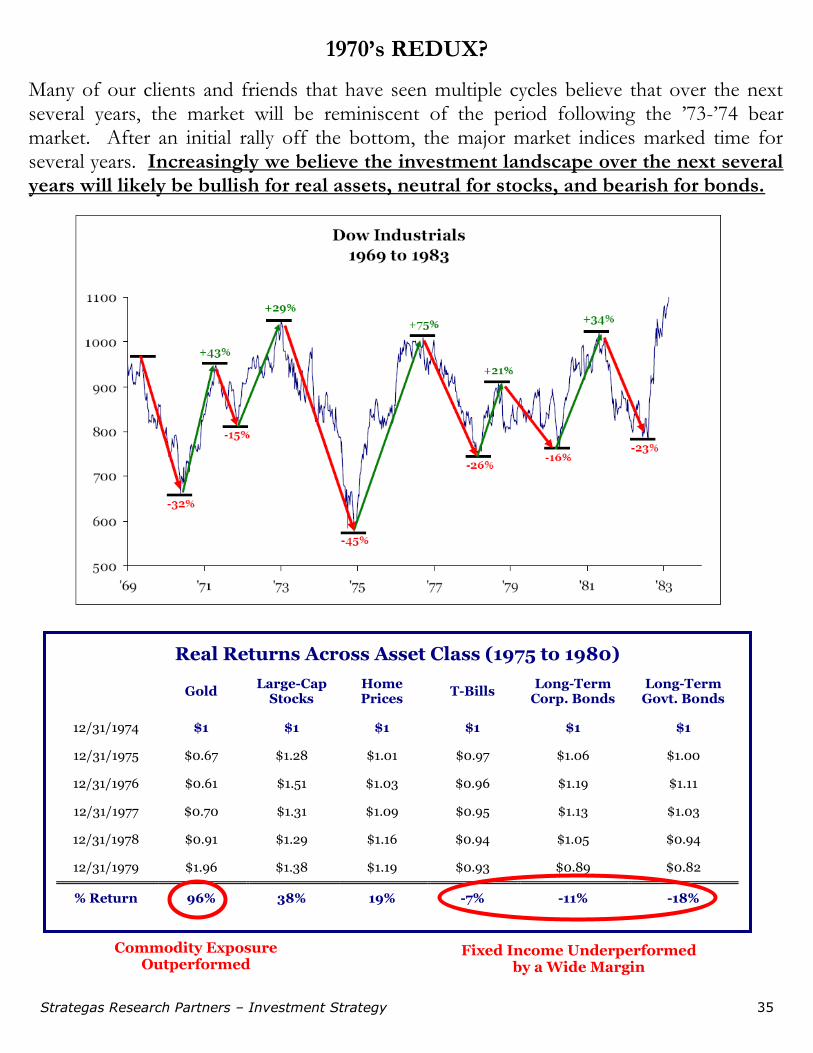
1970’s REDUX?
Real Returns Across Asset Class (1975 to 1980)
Gold Large-Cap
Stocks Home Prices
T-Bills Long-Term
Corp. Bonds Long-Term Govt. Bonds
12/31/1974 $1 $1 $1 $1 $1 $1
12/31/1975 $0.67 $1.28 $1.01 $0.97 $1.06 $1.00
12/31/1976 $0.61 $1.51 $1.03 $0.96 $1.19 $1.11
12/31/1977 $0.70 $1.31 $1.09 $0.95 $1.13 $1.03
12/31/1978 $0.91 $1.29 $1.16 $0.94 $1.05 $0.94
12/31/1979 $1.96 $1.38 $1.19 $0.93 $0.89 $0.82
% Return 96% 38% 19% -7% -11% -18%
Commodity Exposure Outperformed
Fixed Income Underperformed by a Wide Margin
Many of our clients and friends that have seen multiple cycles believe that over the next several years, the market will be reminiscent of the period following the ’73-’74 bear market. After an initial rally off the bottom, the major market indices marked time for several years. Increasingly we believe the investment landscape over the next several years will likely be bullish for real assets, neutral for stocks, and bearish for bonds.

Strategas Research Partners – Investment Strategy 36
(B) VIEW EQUITIES AS AN IMPORTANT PART OF YIELD
The change in the dividend tax rate is likely to have a greater impact on the number of companies paying dividends than on the relative performance of dividend-paying stocks. Arguably the biggest change resulting from the 2003 tax cuts was that it halted the 25-year decline in the number of dividend-paying companies. A return to more discriminatory tax rates on dividends would likely stop cold any nascent move on the part of technology stocks, for instance, to initiate dividends. An important element of the recent tax changes is that rates on dividends and capital gains were equalized. Even if some companies reduce or even stop their dividends as a result, we’d expect still-high demand for a smaller number of payers to fuel a strong bid for dividend stocks.
Total Returns Before & After 1990 Dividend Tax Increase
-3M -1M +1M +3M
Div Aristocrats -4.6% 3.3% 7.1% 15.2%
S&P 500 -7.8% 1.3% 5.3% 12.7%
Aristocrats Rel S&P 3.2% 2.0% 1.8% 2.5%
Total Returns Before & After 1993 Dividend Tax Increase
-3M -1M +1M +3M
Div Aristocrats -1.1% -0.1% 3.2% 4.0%
S&P 500 2.2% 0.5% 3.0% 3.9%
Aristocrats Rel S&P -3.4% -0.6% 0.2% 0.0%
S&P 500 Dividend Aristocrats (25+ Years of Increased Annual Dividends)
MMM 3M Co KO Coca-Cola Co MKC McCormick & Co
ABT Abbott Laboratories CL Colgate-Palmolive MCD McDonald's Corp
ABBV AbbVie Inc. ED Consolidated Edison MHP McGraw-Hill Companies
AFL AFLAC Inc DOV Dover Corp MDT Medtronic, Inc
APD Air Products & Chemicals ECL Ecolab Inc NUE Nucor Corp
ADM Archer-Daniels-Midland EMR Emerson Electric PNR Pentair Ltd.
T AT&T XOM Exxon Mobil PEP PepsiCo Inc
ADP Automatic Data Proc FDO Family Dollar Stores PPG PPG Indus
BCR Bard (C.R.) BEN Franklin Resources PG Procter & Gamble
BDX Becton, Dickinson GPC Genuine Parts SHW Sherwin-Williams
BMS Bemis Co GWW Grainger (W.W.) SIAL Sigma-Aldrich
BF.B Brown-Forman'B' HCP HCP Inc SWK Stanley Black & Decker
CAH Cardinal Health Inc HRL Hormel Foods SYY Sysco Corp
CVX Chevron Corp ITW Illinois Tool Works TROW T.Rowe Price Group
CB Chubb Corp JNJ Johnson & Johnson TGT Target Corp
CINF Cincinnati Financial KMB Kimberly-Clark VFC VF Corp
CTAS Cintas Corp LEG Leggett & Platt WAG Walgreen Co
CLX Clorox Co LOW Lowe's Cos WMT Wal-Mart Stores

Strategas Research Partners – Investment Strategy 37
MUTUAL FUND FLOWS SUGGEST THAT THE DIVIDEND TRADE IS FAR FROM OVER-OWNED
Net Flows Into/Out-of Mutual Funds ($BN, ICI)
Growth & Income Income
Capital Appreciation Total Equity Total Bond
2008 ($31.9) ($14.9) ($105.3) ($233.8) $27.8
2009 ($14.3) ($13.8) ($11.4) ($8.8) $375.9
2010 ($27.2) ($13.5) ($56.4) ($38.7) $241.4
2011 ($32.3) ($1.0) ($105.4) ($137.6) $124.7
2012 ($18.7) ($0.9) ($137.0) ($153.2) $304.8
Sum ($124.5) ($44.0) ($415.6) ($572.2) $1,074.6
Outsized relative valuations for high-yielding sectors like Telecom and Utilities have led many to conclude that the dividend trade is over-owned. But paltry allocations to equities on the part of pensions and endowments, actual redemptions from income-oriented mutual funds over the past four and a half years, and low absolute valuations suggest that there may still be a long way to go as far as the dividend trade is concerned. Like many others, we are more interested in companies and sectors that can grow dividends (e.g., technology) than in those that already sport high yields.
S&P 500 Absolute & Relative Valuations, Dividend Yields (as of 4/18/13)
Sector NTM P/E
Relative P/E
15-Year Avg Rel P/E
Ratio (sorted)
Dividend Yield
Utilities 16.3x 1.209 0.872 1.386 3.89
Telecom 18.9x 1.402 1.079 1.299 4.19
Staples 16.9x 1.251 1.072 1.166 2.72
Financials 12.0x 0.889 0.801 1.109 1.77
Discretionary 16.2x 1.201 1.149 1.045 1.62
Health Care 14.6x 1.082 1.077 1.004 1.96
S&P 500 13.5x 1.000 1.000 1.000 2.19
Industrials 13.4x 0.997 1.020 0.977 2.41
Energy 11.4x 0.845 0.878 0.962 2.27
Materials 12.7x 0.941 0.985 0.956 2.51
Technology 11.7x 0.868 1.342 0.647 1.84
Strategas Research Partners – Investment Strategy 38
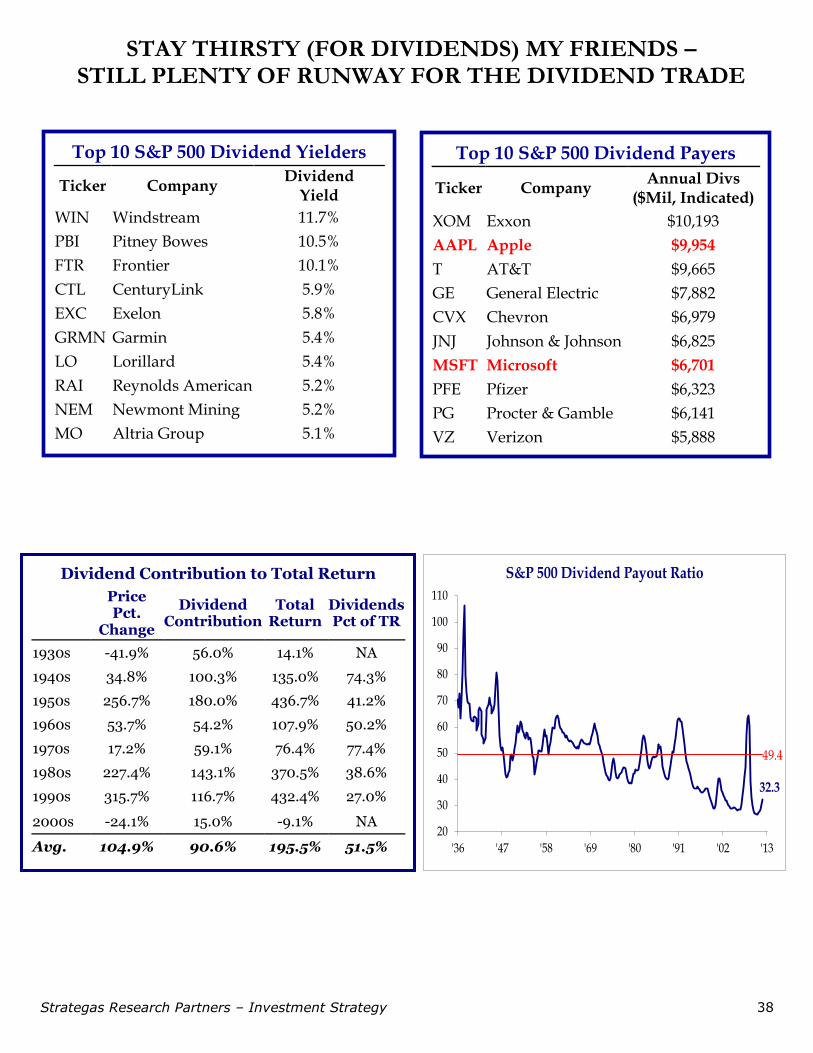
Dividend Contribution to Total Return
Price Pct.
Change
Dividend Contribution
Total Return
Dividends Pct of TR
1930s -41.9% 56.0% 14.1% NA
1940s 34.8% 100.3% 135.0% 74.3%
1950s 256.7% 180.0% 436.7% 41.2%
1960s 53.7% 54.2% 107.9% 50.2%
1970s 17.2% 59.1% 76.4% 77.4%
1980s 227.4% 143.1% 370.5% 38.6%
1990s 315.7% 116.7% 432.4% 27.0%
2000s -24.1% 15.0% -9.1% NA
Avg. 104.9% 90.6% 195.5% 51.5%
32.3
49.4
20
30
40
50
60
70
80
90
100
110
'36 '47 '58 '69 '80 '91 '02 '13
S&P 500 Dividend Payout Ratio
STAY THIRSTY (FOR DIVIDENDS) MY FRIENDS – STILL PLENTY OF RUNWAY FOR THE DIVIDEND TRADE
Top 10 S&P 500 Dividend Yielders
Ticker Company Dividend
Yield
WIN Windstream 11.7%
PBI Pitney Bowes 10.5%
FTR Frontier 10.1%
CTL CenturyLink 5.9%
EXC Exelon 5.8%
GRMN Garmin 5.4%
LO Lorillard 5.4%
RAI Reynolds American 5.2%
NEM Newmont Mining 5.2%
MO Altria Group 5.1%
Top 10 S&P 500 Dividend Payers
Ticker Company Annual Divs
($Mil, Indicated)
XOM Exxon $10,193
AAPL Apple $9,954
T AT&T $9,665
GE General Electric $7,882
CVX Chevron $6,979
JNJ Johnson & Johnson $6,825
MSFT Microsoft $6,701
PFE Pfizer $6,323
PG Procter & Gamble $6,141
VZ Verizon $5,888
Strategas Research Partners – Investment Strategy 39
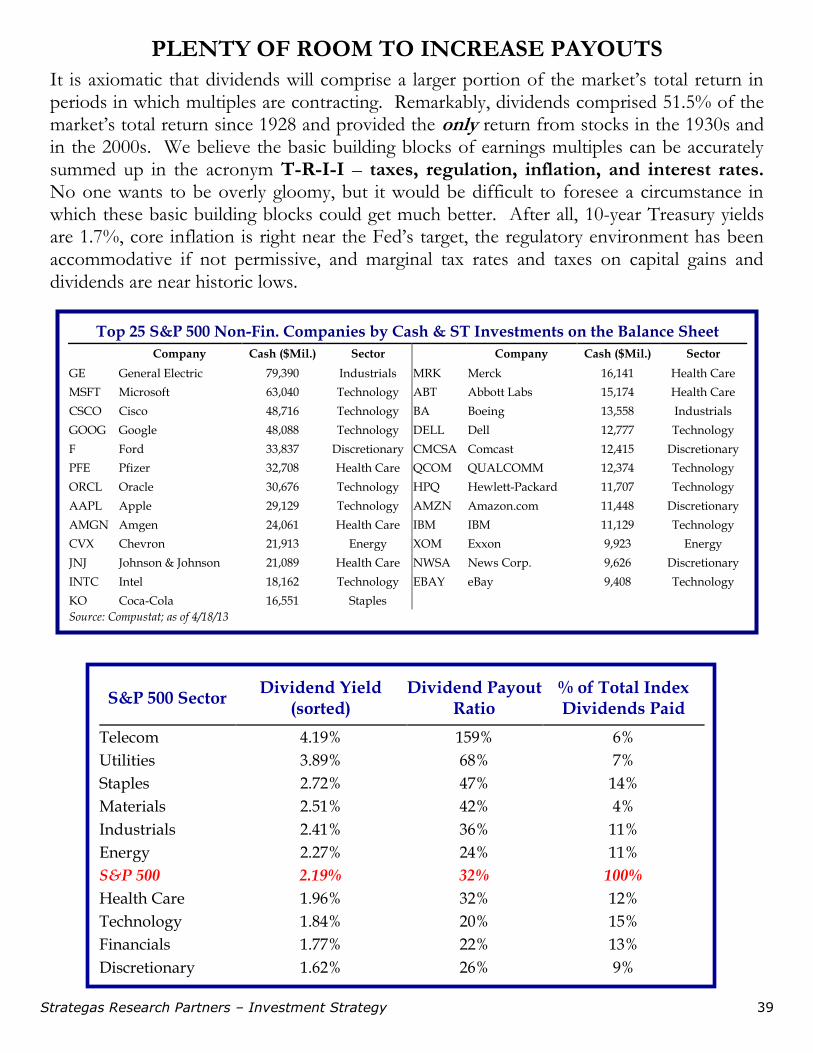
PLENTY OF ROOM TO INCREASE PAYOUTS
It is axiomatic that dividends will comprise a larger portion of the market’s total return in periods in which multiples are contracting. Remarkably, dividends comprised 51.5% of the market’s total return since 1928 and provided the only return from stocks in the 1930s and in the 2000s. We believe the basic building blocks of earnings multiples can be accurately summed up in the acronym T-R-I-I – taxes, regulation, inflation, and interest rates. No one wants to be overly gloomy, but it would be difficult to foresee a circumstance in which these basic building blocks could get much better. After all, 10-year Treasury yields are 1.7%, core inflation is right near the Fed’s target, the regulatory environment has been accommodative if not permissive, and marginal tax rates and taxes on capital gains and dividends are near historic lows.
S&P 500 Sector Dividend Yield
(sorted) Dividend Payout
Ratio % of Total Index Dividends Paid
Telecom 4.19% 159% 6%
Utilities 3.89% 68% 7%
Staples 2.72% 47% 14%
Materials 2.51% 42% 4%
Industrials 2.41% 36% 11%
Energy 2.27% 24% 11%
S&P 500 2.19% 32% 100%
Health Care 1.96% 32% 12%
Technology 1.84% 20% 15%
Financials 1.77% 22% 13%
Discretionary 1.62% 26% 9%
Top 25 S&P 500 Non-Fin. Companies by Cash & ST Investments on the Balance Sheet
Company Cash ($Mil.) Sector
Company Cash ($Mil.) Sector
GE General Electric 79,390 Industrials MRK Merck 16,141 Health Care
MSFT Microsoft 63,040 Technology ABT Abbott Labs 15,174 Health Care
CSCO Cisco 48,716 Technology BA Boeing 13,558 Industrials
GOOG Google 48,088 Technology DELL Dell 12,777 Technology
F Ford 33,837 Discretionary CMCSA Comcast 12,415 Discretionary
PFE Pfizer 32,708 Health Care QCOM QUALCOMM 12,374 Technology
ORCL Oracle 30,676 Technology HPQ Hewlett-Packard 11,707 Technology
AAPL Apple 29,129 Technology AMZN Amazon.com 11,448 Discretionary
AMGN Amgen 24,061 Health Care IBM IBM 11,129 Technology
CVX Chevron 21,913 Energy XOM Exxon 9,923 Energy
JNJ Johnson & Johnson 21,089 Health Care NWSA News Corp. 9,626 Discretionary
INTC Intel 18,162 Technology EBAY eBay 9,408 Technology
KO Coca-Cola 16,551 Staples
Source: Compustat; as of 4/18/13

Strategas Research Partners – Investment Strategy 40
6/11 9/11 12/11 3/12 6/12 9/12 12/12 3/13
100
102
104
106
108
110
112
114
116
Strategas Thrifty Fif ty Rel Equal-Wtd S&P 50025-Apr-2011 to 25-Apr-2013 (Daily)
25-Apr-2011=100; Local
Source: StrategasRP ©FactSet Research Systems 2013
THE SHIELD FOR YIELD: STRATEGAS’ “THRIFTY FIFTY” INDEX
In a world starved for yield, companies with fortress-like balance sheets might be seen as proxies for previously unassailable sovereign debt. In the immediate aftermath of the downgrade last year, 55 companies sported CDS spreads lower than those of Uncle Sam. This was the inspiration for our Thrifty Fifty basket.
U.S. Companies with Lowest 5-Year CDS Spreads (Top 50) – CDS data & screen as of 4/25/13
CDS Div Yld Payout
CDS Div Yld Payout
MRK Merck 14.5 3.76 85.9 CB Chubb 33.5 2.02 26.3
XOM Exxon 15.0 2.84 23.2 HD Home Depot 33.8 2.13 38.3
DIS Walt Disney 16.0 1.17 24.0 PFE Pfizer 33.8 3.28 62.9
MCD McDonald's 18.5 3.02 54.0 ZTS Zoetis 33.8 0.00 NA
CVX Chevron 19.0 3.28 27.0 PG Procter & Gamble 34.5 3.09 54.3
MMM 3M 19.5 2.40 37.5 KMB Kimberly-Clark 34.6 3.10 65.4
HON Honeywell Intl 21.8 2.22 40.0 NWSA News Corp. 34.6 0.53 10.0
GOOG Google 26.4 0.00 NA TGT Target 34.8 2.08 28.9
NSC Norfolk Southern 26.5 2.62 35.1 ED ConEd 35.2 3.87 62.4
UNP Union Pacific 26.5 1.88 30.1 BWP Boardwalk Pipeline 35.5 7.09 156.6
JNJ Johnson & Johnson 26.7 3.10 65.2 CVS CVS 35.5 1.53 21.9
IBM IBM 26.7 1.88 23.2 L Loews 35.5 0.56 22.1
D Dominion Resources 26.9 3.68 383.0 COP ConocoPhillips 36.1 4.33 44.7
BAX Baxter Intl 27.2 2.55 40.3 KRFT Kraft Foods 36.2 3.96 NA
AEP American Electric Power 28.0 3.83 73.7 MDLZ Mondelez Intl 36.2 1.65 114.9
UPS UPS 28.3 2.91 256.0 KO Coca-Cola 36.5 2.67 53.9
MSFT Microsoft 29.4 2.77 43.9 GIS General Mills 36.5 3.01 46.4
BMY Bristol-Myers 29.8 3.50 155.7 COST Costco 36.9 1.14 173.1
MCK McKesson 30.0 0.74 11.9 PX Praxair 38.4 2.12 40.3
DD E.I. DuPont 30.9 3.36 68.0 MON Monsanto 38.5 1.41 28.6
CSX CSX 31.5 2.47 30.9 XEL Xcel Energy 38.9 3.44 54.8
CL Colgate-Palmolive 32.1 2.25 50.2 AMGN Amgen 38.9 1.78 25.8
U.S. Sovereign 32.5
ORCL Oracle 38.9 0.71 16.5
DE Deere 33.0 2.28 22.8 AET Aetna 39.0 1.37 14.8
LLY Eli Lilly 33.5 3.58 46.9 TXN Texas Instruments 39.5 3.05 47.2
WMT Wal-Mart 33.5 2.40 31.5 France Sovereign 75.1
Strategas Research Partners – Investment Strategy 41
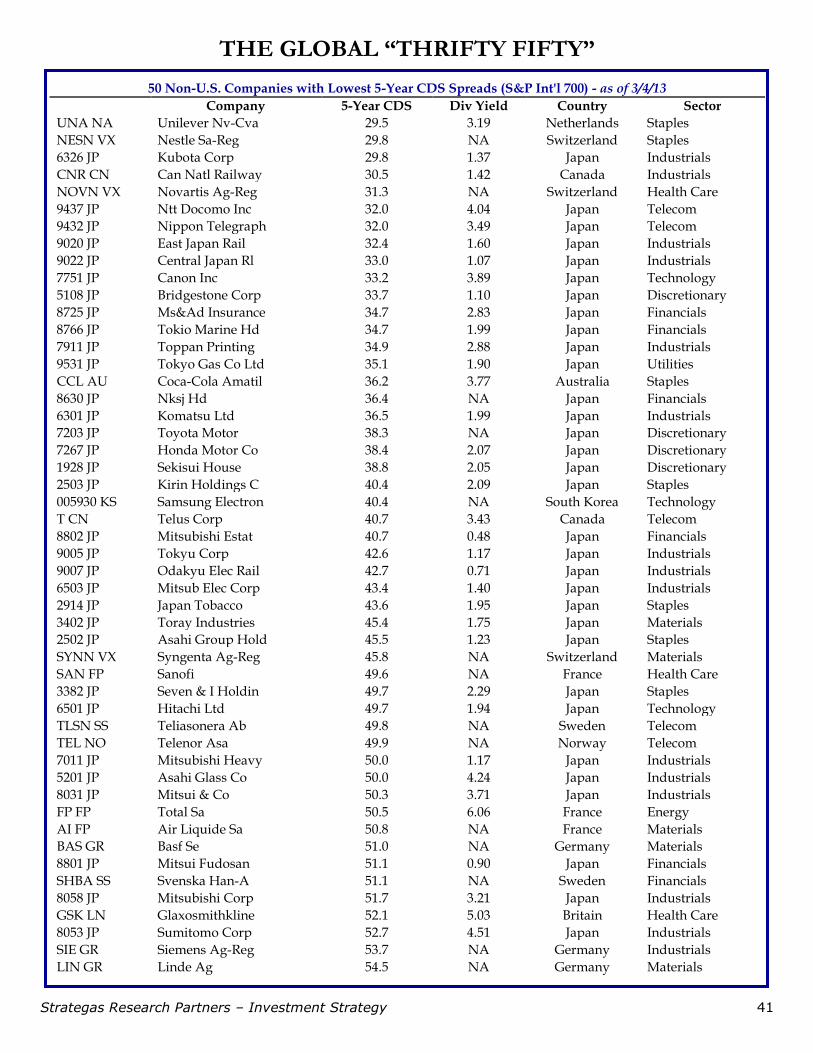
THE GLOBAL “THRIFTY FIFTY”
50 Non-U.S. Companies with Lowest 5-Year CDS Spreads (S&P Int'l 700) - as of 3/4/13
Company 5-Year CDS Div Yield Country Sector
UNA NA Unilever Nv-Cva 29.5 3.19 Netherlands Staples
NESN VX Nestle Sa-Reg 29.8 NA Switzerland Staples
6326 JP Kubota Corp 29.8 1.37 Japan Industrials
CNR CN Can Natl Railway 30.5 1.42 Canada Industrials
NOVN VX Novartis Ag-Reg 31.3 NA Switzerland Health Care
9437 JP Ntt Docomo Inc 32.0 4.04 Japan Telecom
9432 JP Nippon Telegraph 32.0 3.49 Japan Telecom
9020 JP East Japan Rail 32.4 1.60 Japan Industrials
9022 JP Central Japan Rl 33.0 1.07 Japan Industrials
7751 JP Canon Inc 33.2 3.89 Japan Technology
5108 JP Bridgestone Corp 33.7 1.10 Japan Discretionary
8725 JP Ms&Ad Insurance 34.7 2.83 Japan Financials
8766 JP Tokio Marine Hd 34.7 1.99 Japan Financials
7911 JP Toppan Printing 34.9 2.88 Japan Industrials
9531 JP Tokyo Gas Co Ltd 35.1 1.90 Japan Utilities
CCL AU Coca-Cola Amatil 36.2 3.77 Australia Staples
8630 JP Nksj Hd 36.4 NA Japan Financials
6301 JP Komatsu Ltd 36.5 1.99 Japan Industrials
7203 JP Toyota Motor 38.3 NA Japan Discretionary
7267 JP Honda Motor Co 38.4 2.07 Japan Discretionary
1928 JP Sekisui House 38.8 2.05 Japan Discretionary
2503 JP Kirin Holdings C 40.4 2.09 Japan Staples
005930 KS Samsung Electron 40.4 NA South Korea Technology
T CN Telus Corp 40.7 3.43 Canada Telecom
8802 JP Mitsubishi Estat 40.7 0.48 Japan Financials
9005 JP Tokyu Corp 42.6 1.17 Japan Industrials
9007 JP Odakyu Elec Rail 42.7 0.71 Japan Industrials
6503 JP Mitsub Elec Corp 43.4 1.40 Japan Industrials
2914 JP Japan Tobacco 43.6 1.95 Japan Staples
3402 JP Toray Industries 45.4 1.75 Japan Materials
2502 JP Asahi Group Hold 45.5 1.23 Japan Staples
SYNN VX Syngenta Ag-Reg 45.8 NA Switzerland Materials
SAN FP Sanofi 49.6 NA France Health Care
3382 JP Seven & I Holdin 49.7 2.29 Japan Staples
6501 JP Hitachi Ltd 49.7 1.94 Japan Technology
TLSN SS Teliasonera Ab 49.8 NA Sweden Telecom
TEL NO Telenor Asa 49.9 NA Norway Telecom
7011 JP Mitsubishi Heavy 50.0 1.17 Japan Industrials
5201 JP Asahi Glass Co 50.0 4.24 Japan Industrials
8031 JP Mitsui & Co 50.3 3.71 Japan Industrials
FP FP Total Sa 50.5 6.06 France Energy
AI FP Air Liquide Sa 50.8 NA France Materials
BAS GR Basf Se 51.0 NA Germany Materials
8801 JP Mitsui Fudosan 51.1 0.90 Japan Financials
SHBA SS Svenska Han-A 51.1 NA Sweden Financials
8058 JP Mitsubishi Corp 51.7 3.21 Japan Industrials
GSK LN Glaxosmithkline 52.1 5.03 Britain Health Care
8053 JP Sumitomo Corp 52.7 4.51 Japan Industrials
SIE GR Siemens Ag-Reg 53.7 NA Germany Industrials
LIN GR Linde Ag 54.5 NA Germany Materials
Related Documents


