Macroeconomic Outlook for 2015 Samir Rath (CAIA) MBA (Brown[USA] & IE[Spain]) +1 312 985 7570 +65 9750 6842 [email protected] Financial Consultant Global Financial Consultants

Welcome message from author
This document is posted to help you gain knowledge. Please leave a comment to let me know what you think about it! Share it to your friends and learn new things together.
Transcript

Macroeconomic Outlook for 2015
Samir Rath (CAIA)!MBA (Brown[USA] & IE[Spain]) !+1 312 985 7570 +65 9750 6842 [email protected] !Financial Consultant Global Financial Consultants

What has come before in 2014

US equities have been the source of best risk-adjusted returns for the past three years
Risk Adjusted Returns: 2011 - 2014
-0.18
0.00
0.18
0.35
0.53
0.70
iSha
res
Cor
e S&
P 50
0 ET
F
iSha
res
U.S
. Pre
ferre
d St
ock
ETF
iSha
res
MSC
I Den
mar
k C
appe
d ET
F
iSha
res
MSC
I Ire
land
Cap
ped
ETF
iSha
res
MSC
I Bel
gium
Cap
ped
ETF
iSha
res
MSC
I Sw
itzer
land
Cap
ped
ETF
iSha
res
MSC
I New
Zea
land
Cap
ped
ETF
iSha
res
MSC
I Phi
lippi
nes
ETF
iSha
res
Glo
bal H
igh
Yiel
d C
orpo
rate
Bon
d ET
F
iSha
res
Cor
e U
.S. A
ggre
gate
Bon
d ET
F
iSha
res
MSC
I Hon
g Ko
ng E
TF
iSha
res
MSC
I Net
herla
nds
ETF
iSha
res
MSC
I Ger
man
y ET
F
iSha
res
MSC
I Tai
wan
ETF
iSha
res
MSC
I Fin
land
Cap
ped
ETF
iSha
res
MSC
I Jap
an E
TF
iSha
res
Japa
n La
rge-
Cap
ETF
iSha
res
MSC
I Uni
ted
King
dom
ETF
iSha
res
MSC
I Sin
gapo
re E
TF
iSha
res
MSC
I Sw
eden
ETF
iSha
res
MSC
I Chi
na E
TF
iSha
res
MSC
I Fra
nce
ETF
iSha
res
MSC
I Ind
ia E
TF
iSha
res
MSC
I Isr
ael C
appe
d ET
F
iSha
res
MSC
I Tha
iland
Cap
ped
ETF
iSha
res
MSC
I Tur
key
ETF
iSha
res
Emer
ging
Mar
kets
Hig
h Yi
eld
Bond
ETF
iSha
res
MSC
I Spa
in C
appe
d ET
F
iSha
res
MSC
I Can
ada
ETF
iSha
res
7-10
Yea
r Tre
asur
y Bo
nd E
TF
iSha
res
MSC
I Aus
tralia
ETF
iSha
res
MSC
I Pol
and
Cap
ped
ETF
iSha
res
MSC
I Ita
ly C
appe
d ET
F
iSha
res
MSC
I Sou
th A
frica
ETF
iSha
res
MSC
I Aus
tria
Cap
ped
ETF
iSha
res
MSC
I Mex
ico
Cap
ped
ETF
iSha
res
MSC
I Mal
aysi
a ET
F
iSha
res
MSC
I Sou
th K
orea
Cap
ped
ETF
iSha
res
MSC
I Nor
way
Cap
ped
ETF
iSha
res
Emer
ging
Mar
kets
Div
iden
d ET
F
iSha
res
MSC
I Ind
ones
ia E
TF
iSha
res
MSC
I All
Peru
Cap
ped
ETF
iSha
res
MSC
I Bra
zil C
appe
d ET
F
iSha
res
MSC
I Rus
sia
Cap
ped
ETF
iSha
res
MSC
I Chi
le C
appe
d ET
F

Most Assets currently at their Historical High Valuations
Data from 1969 for developed equities to Emerging Debt from 2004

US Dollar Appreciation Cycle has just started
US Dollar Appreciation cycles normally last six to seven years !This means a de-facto tightening of global financial conditions given that about 80% of international trade finance is settled in U.S. dollars. !Emerging markets typically bear the brunt of a stronger dollar as their funding sources dry up.

Greater Growth & Policy Divergence in the years ahead
US: On a strong growth path and will start tightening financial conditions UK: The UK having made some strong reforms has growth back on track and is looking to normalise monetary conditions Japan: Despite the loosest financial conditions, Japan is loosening further to spark growth China and India: To soften their slowing structural growth cycles, they are both loosening financial conditions. Reserve Bank of India tends to be very wary of inflation and despite having the tightest financial conditions it is being quite cautious. Eurozone: Finally, ECB has started appreciating the impact of Quantitative Easing and has jumped into the bandwagon with a Eur 1.2 trillion intervention in 2015. Brazil: Despite a big step towards easing financial conditions, we do not expect growth to pick up
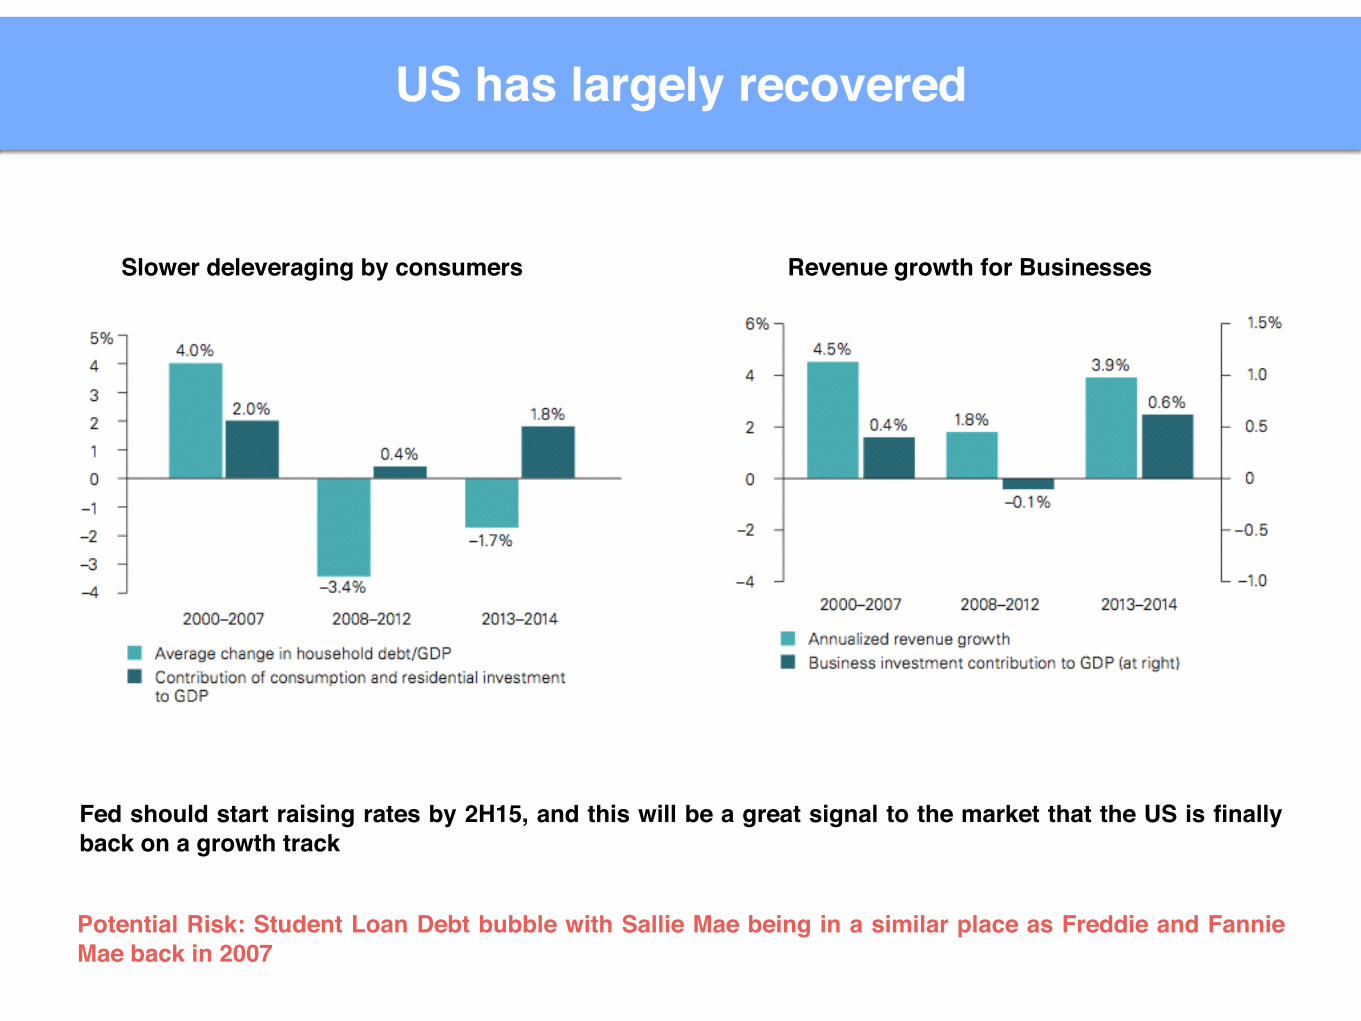
US has largely recovered
Slower deleveraging by consumers Revenue growth for Businesses
Fed should start raising rates by 2H15, and this will be a great signal to the market that the US is finally back on a growth track
Potential Risk: Student Loan Debt bubble with Sallie Mae being in a similar place as Freddie and Fannie Mae back in 2007
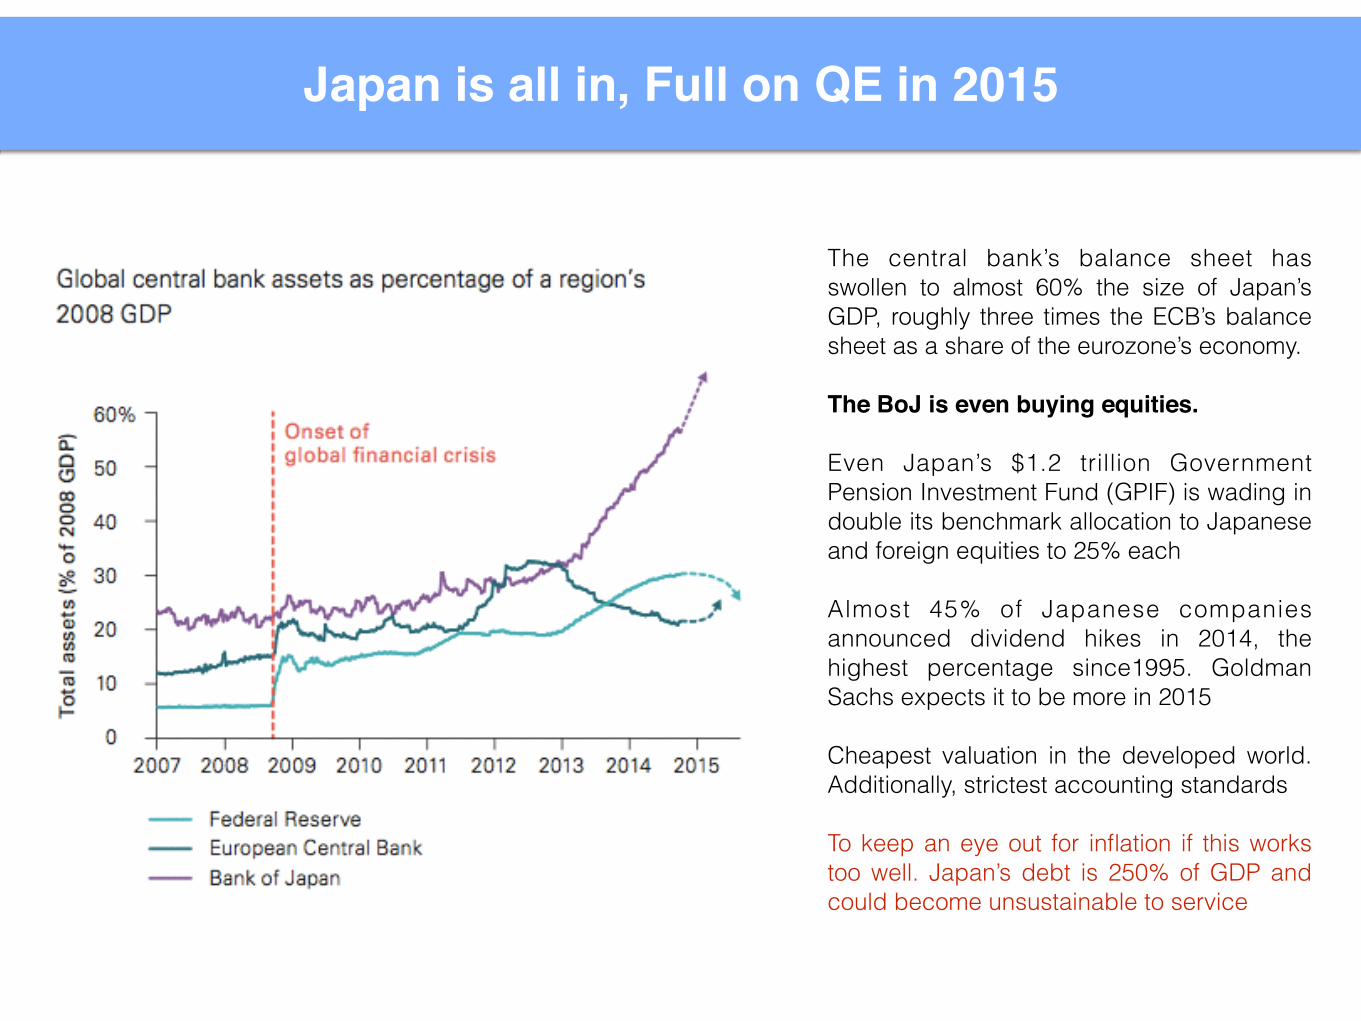
Japan is all in, Full on QE in 2015
The central bank’s balance sheet has swollen to almost 60% the size of Japan’s GDP, roughly three times the ECB’s balance sheet as a share of the eurozone’s economy. !The BoJ is even buying equities. !Even Japan’s $1.2 trillion Government Pension Investment Fund (GPIF) is wading in double its benchmark allocation to Japanese and foreign equities to 25% each !Almost 45% of Japanese companies announced dividend hikes in 2014, the highest percentage since1995. Goldman Sachs expects it to be more in 2015 !Cheapest valuation in the developed world. Additionally, strictest accounting standards !To keep an eye out for inflation if this works too well. Japan’s debt is 250% of GDP and could become unsustainable to service

Europe muddles through & avoids hard questions
QEs knock on wealth effect in Europe will be much lower than in the US given that Europeans have much lower ownership rates of equity and homes. !• For example, only 22% of Germans own equities compared to 47% in the USA!!Imbalances growing with Germany having 2% of Eurozone surplus and 7% of its own GDP. So has a hopelessly underpriced currency.

China’s growth seems to be stabilizing in a new range
China is likely to grow at a 6%–7% pace over the next two to three years. Its maturing as an economy!!- tepid recovery in the global economy, - significant appreciation of the renminbi in REER3 terms - the government’s anticorruption and austerity campaign - regulators’ stricter control on credit growth and curbs on speculative housing demand

India has been re-rated upwards post elections
There is a tendency of markets to be over optimistic right after elections in India, but structurally the current government should be more supportive of growth in the medium term

Commodity super cycle over, depressed prices to continue
Bloomberg Commodity Index has touched 2009 lows!!WTI Crude is at US$ 47.09 !(Shale Oil producers could go virtually bankrupt, Saudi can continue to produce with no issues) !Copper prices just broke below $6000/mt for the first time in 5 years.!!Iron ore, Steel, Aluminum have also hit all time cycle lows.
Bloomberg Commodity Index

Impact of further Oil Price Drop
Countries with exposed trade balances and subsidies will benefit - India - Indonesia - Thailand !Oil will support consumer spending in - USA - UK - Europe !Exporters will be hurt - Nigeria - Russia - Norway
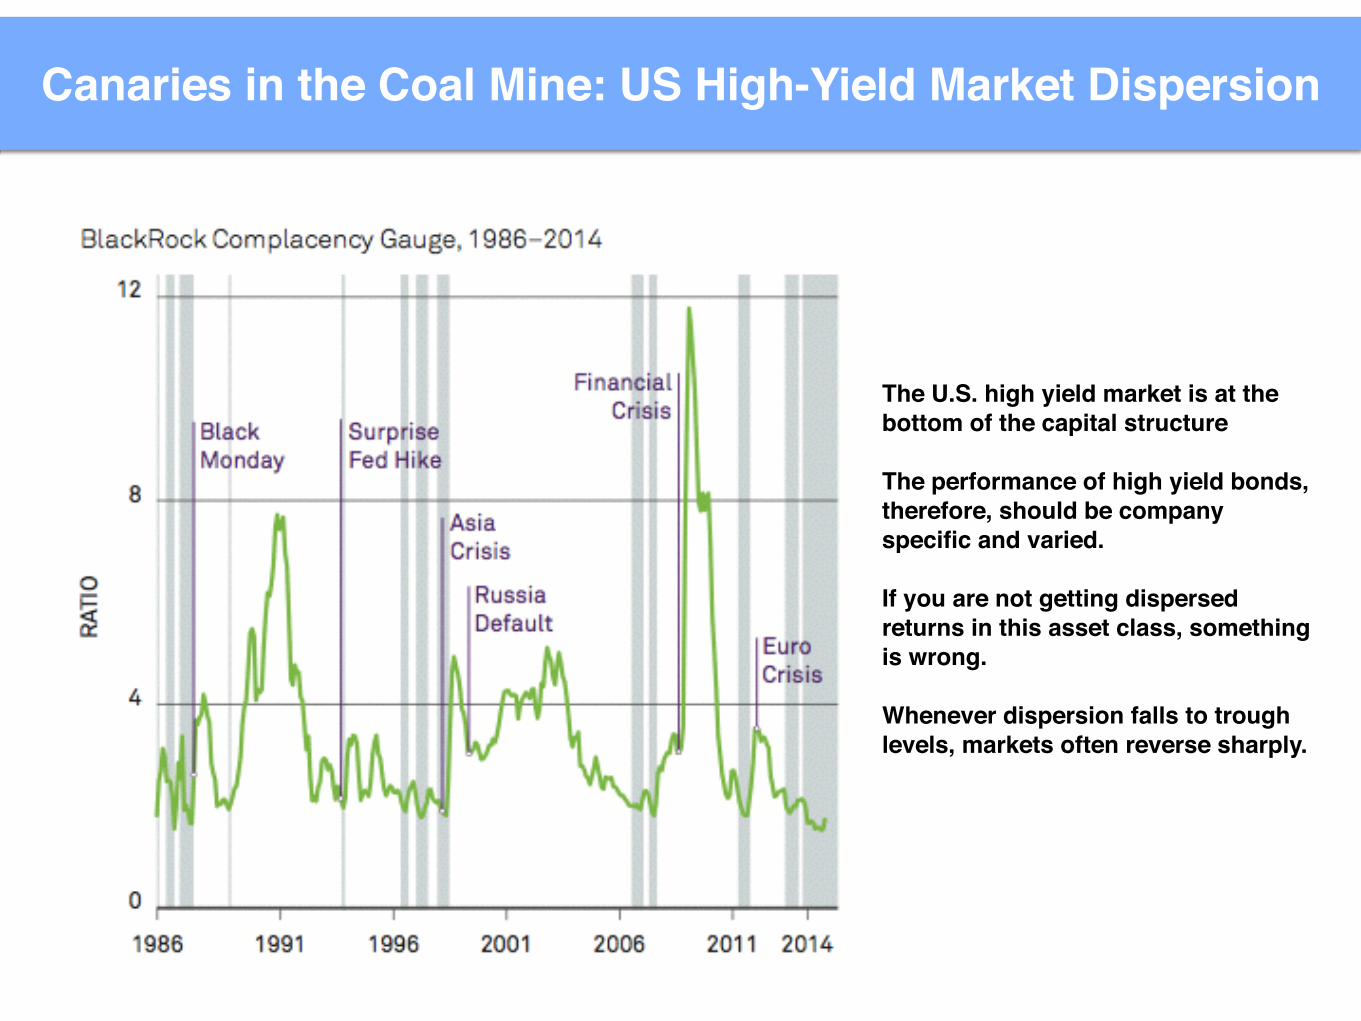
Canaries in the Coal Mine: US High-Yield Market Dispersion
The U.S. high yield market is at the bottom of the capital structure !!The performance of high yield bonds, therefore, should be company specific and varied. !!If you are not getting dispersed returns in this asset class, something is wrong.!!Whenever dispersion falls to trough levels, markets often reverse sharply.

Canaries in the Coal Mine: Lumber is Flashing Red
Lumber is the most economically correlated commodity, even more than WTI Crude and Copper!!Less manipulation and less financialization than crude oil

Political Events to Keep an Eye On
The left-wing party Syriza just won the elections and PM Alexis Tsipras is about to lock horns with the EU on debt repayment and ending austerity
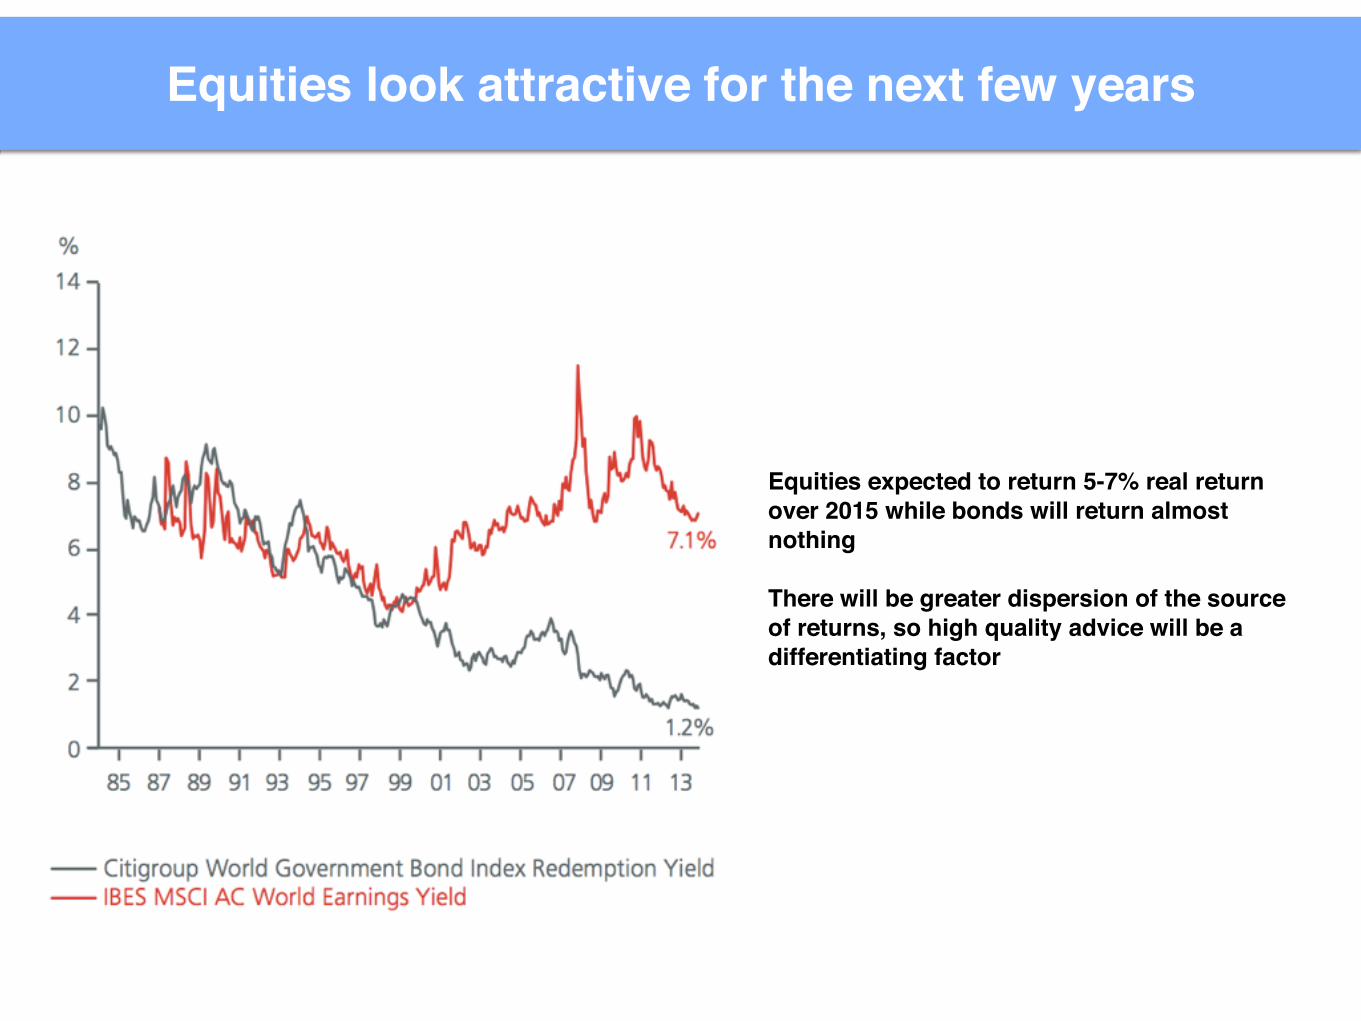
Equities look attractive for the next few years
Equities expected to return 5-7% real return over 2015 while bonds will return almost nothing !There will be greater dispersion of the source of returns, so high quality advice will be a differentiating factor
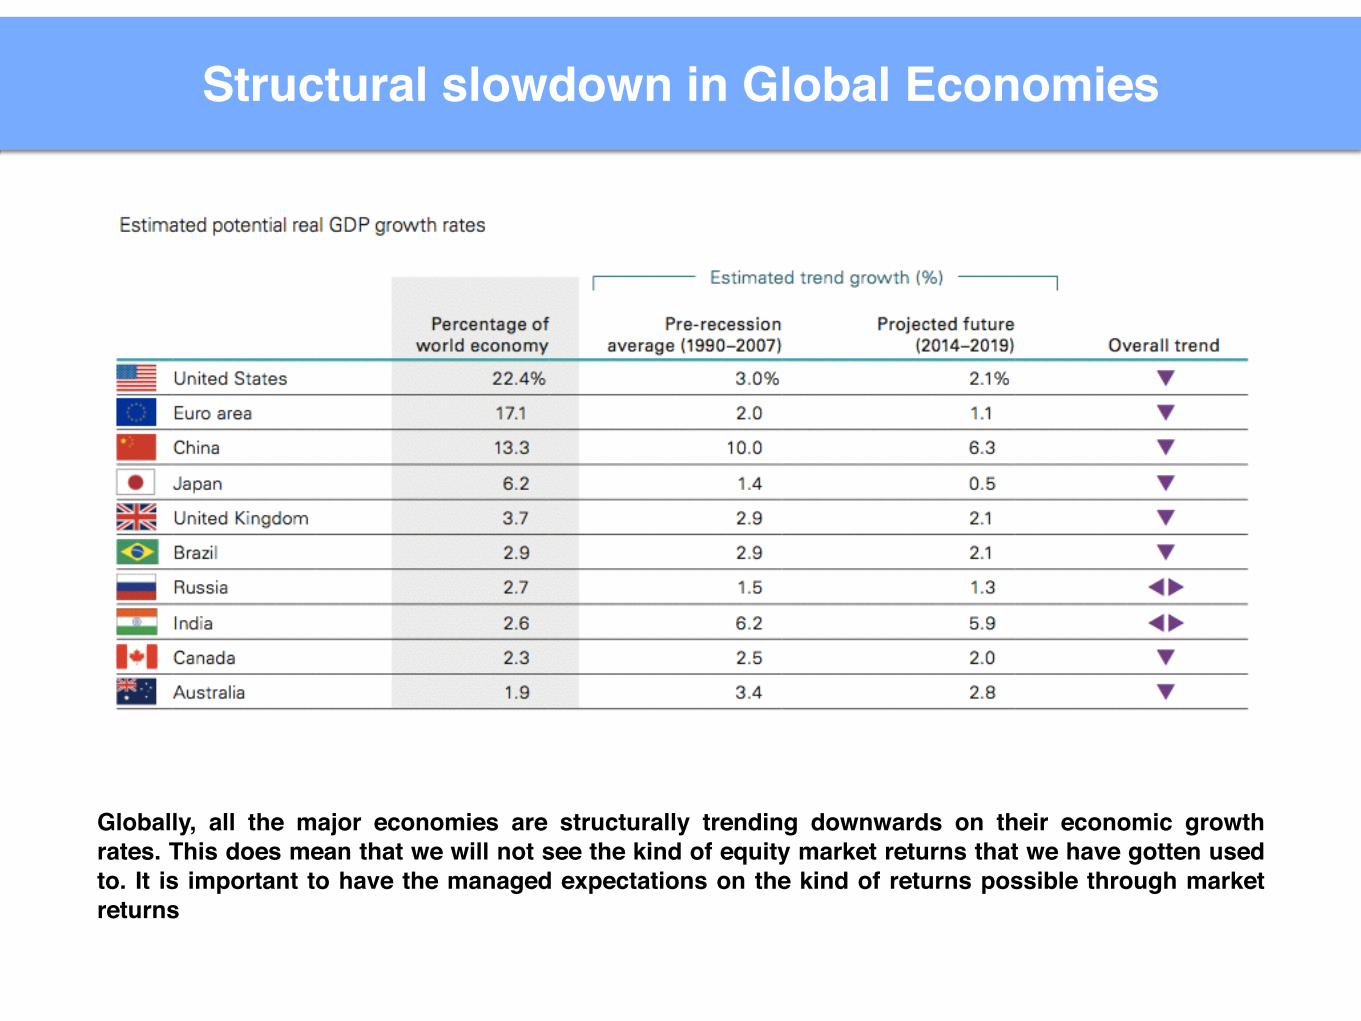
Structural slowdown in Global Economies
Globally, all the major economies are structurally trending downwards on their economic growth rates. This does mean that we will not see the kind of equity market returns that we have gotten used to. It is important to have the managed expectations on the kind of returns possible through market returns
Related Documents


