Investment Management Workshop London, 15 October 2014

Welcome message from author
This document is posted to help you gain knowledge. Please leave a comment to let me know what you think about it! Share it to your friends and learn new things together.
Transcript
Investment Management WorkshopLondon, 15 October 2014
Agenda
2 Talanx Investment Management Workshop, London, 15 October 2014
Organisational set-up and processI Dr. Immo Querner
III
IV
V
VI
Case study II: Direct real estate investments
Case study I: Infrastructure investments
Risk measurement, evaluation and control
Concluding remarks
Investment challenges and responsesII
Dr. Dirk Erdmann
Thomas Fiebig
Dr. Bernhard Graeber
Dr. Immo Querner
Dr. Thomas Mann
Agenda
3 Talanx Investment Management Workshop, London, 15 October 2014
Organisational set-up and processI Dr. Immo Querner
Dr. Dirk Erdmann
Thomas Fiebig
Dr. Bernhard Graeber
Dr. Immo Querner
Case study II: Direct real estate investments
Case study I: Infrastructure investments
Risk measurement, evaluation and control
Concluding remarks
III
IV
V
VI
Investment challenges and responsesII Dr. Thomas Mann
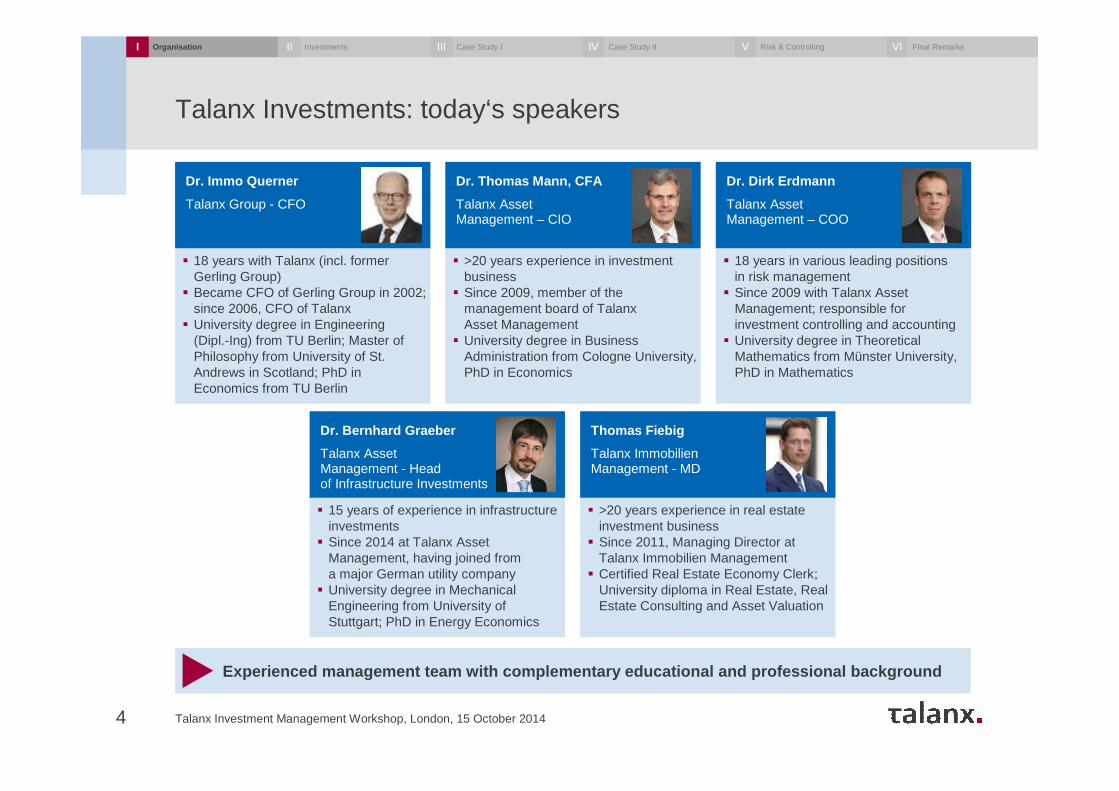
Talanx Investments: today‘s speakers
Talanx Investment Management Workshop, London, 15 October 20144
Experienced management team with complementary educ ational and professional background
Dr. Thomas Mann, CFA
Talanx Asset Management – CIO
� >20 years experience in investment business
� Since 2009, member of the management board of TalanxAsset Management
� University degree in Business Administration from Cologne University, PhD in Economics
Dr. Dirk Erdmann
Talanx Asset Management – COO
� 18 years in various leading positions in risk management
� Since 2009 with Talanx Asset Management; responsible for investment controlling and accounting
� University degree in Theoretical Mathematics from Münster University, PhD in Mathematics
Dr. Immo Querner
Talanx Group - CFO
� 18 years with Talanx (incl. former Gerling Group)
� Became CFO of Gerling Group in 2002; since 2006, CFO of Talanx
� University degree in Engineering (Dipl.-Ing) from TU Berlin; Master of Philosophy from University of St. Andrews in Scotland; PhD in Economics from TU Berlin
Thomas Fiebig
Talanx ImmobilienManagement - MD
� >20 years experience in real estate investment business
� Since 2011, Managing Director at Talanx Immobilien Management
� Certified Real Estate Economy Clerk; University diploma in Real Estate, Real Estate Consulting and Asset Valuation
Dr. Bernhard Graeber
Talanx Asset Management - Head of Infrastructure Investments
� 15 years of experience in infrastructure investments
� Since 2014 at Talanx Asset Management, having joined from a major German utility company
� University degree in Mechanical Engineering from University of Stuttgart; PhD in Energy Economics
I Organisation InvestmentsII Case Study IIII Case Study IIIV Risk & ControllingV Final RemarksVI
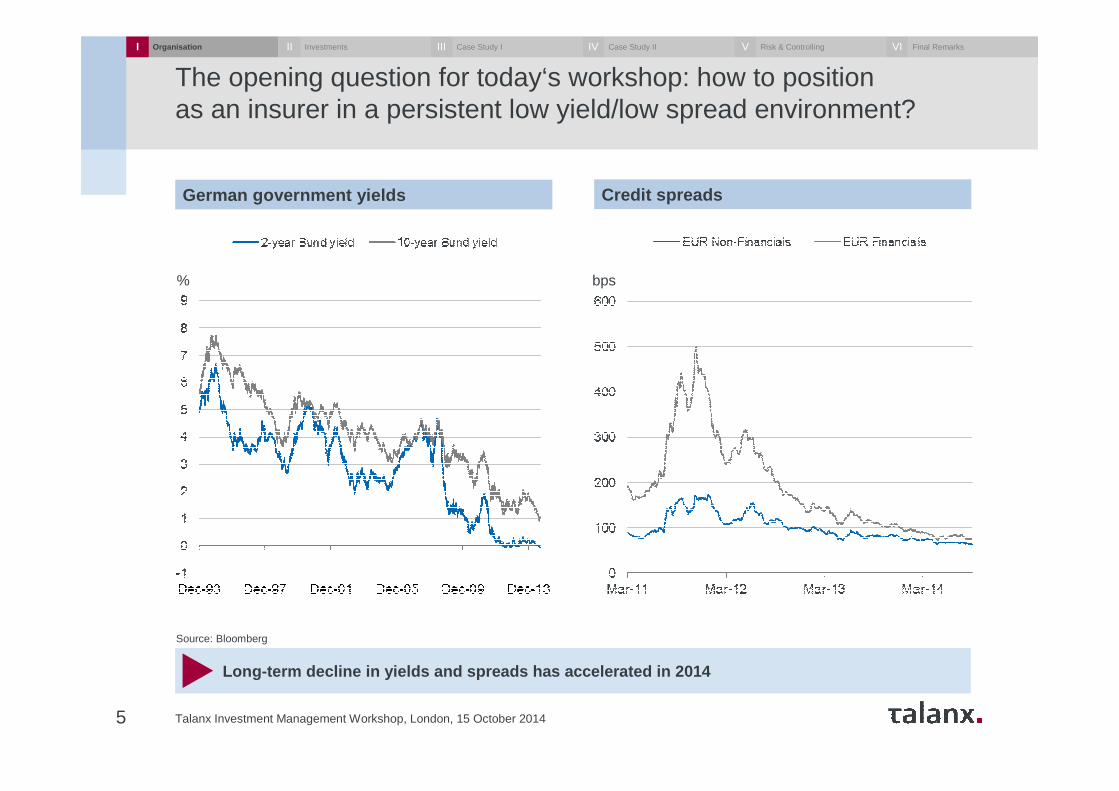
The opening question for today‘s workshop: how to position as an insurer in a persistent low yield/low spread environment?
Talanx Investment Management Workshop, London, 15 October 20145
Long-term decline in yields and spreads has acceler ated in 2014
German government yields Credit spreads
Source: Bloomberg
% bps
I Organisation InvestmentsII Case Study IIII Case Study IIIV Risk & ControllingV Final RemarksVI
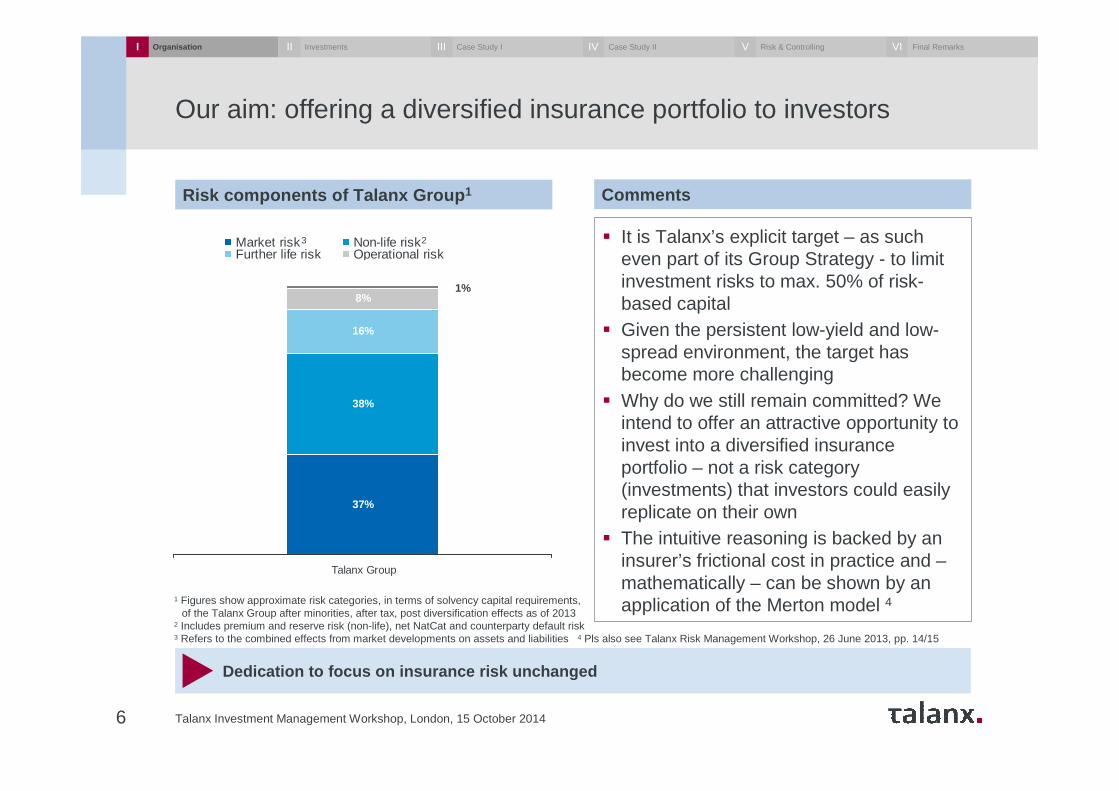
Our aim: offering a diversified insurance portfolio to investors
Talanx Investment Management Workshop, London, 15 October 20146
Dedication to focus on insurance risk unchanged
Risk components of Talanx Group 1
� It is Talanx’s explicit target – as such even part of its Group Strategy - to limit investment risks to max. 50% of risk-based capital
� Given the persistent low-yield and low-spread environment, the target has become more challenging
� Why do we still remain committed? We intend to offer an attractive opportunity to invest into a diversified insurance portfolio – not a risk category (investments) that investors could easily replicate on their own
� The intuitive reasoning is backed by an insurer’s frictional cost in practice and –mathematically – can be shown by an application of the Merton model 4
Comments
1 Figures show approximate risk categories, in terms of solvency capital requirements,of the Talanx Group after minorities, after tax, post diversification effects as of 2013
2 Includes premium and reserve risk (non-life), net NatCat and counterparty default risk3 Refers to the combined effects from market developments on assets and liabilities 4 Pls also see Talanx Risk Management Workshop, 26 June 2013, pp. 14/15
38%
16%
8%
37%
1%
Talanx Group
Market risk Non-life riskFurther life risk Operational riskSäule 5
3 2
I Organisation InvestmentsII Case Study IIII Case Study IIIV Risk & ControllingV Final RemarksVI
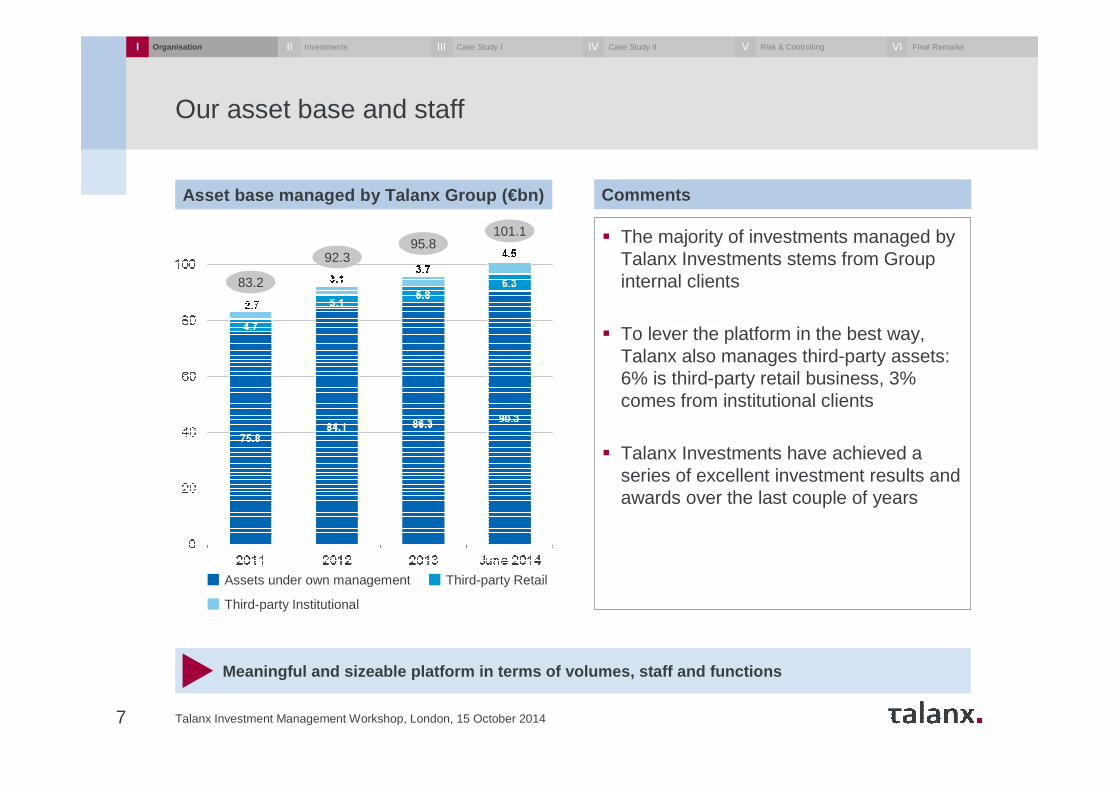
Our asset base and staff
Talanx Investment Management Workshop, London, 15 October 20147
Meaningful and sizeable platform in terms of volumes, s taff and functions
Asset base managed by Talanx Group (€bn)
� The majority of investments managed by Talanx Investments stems from Group internal clients
� To lever the platform in the best way, Talanx also manages third-party assets: 6% is third-party retail business, 3% comes from institutional clients
� Talanx Investments have achieved a series of excellent investment results and awards over the last couple of years
Comments
Assets under own management Third-party Retail
Third-party Institutional
83.2
92.395.8
101.1
I Organisation InvestmentsII Case Study IIII Case Study IIIV Risk & ControllingV Final RemarksVI
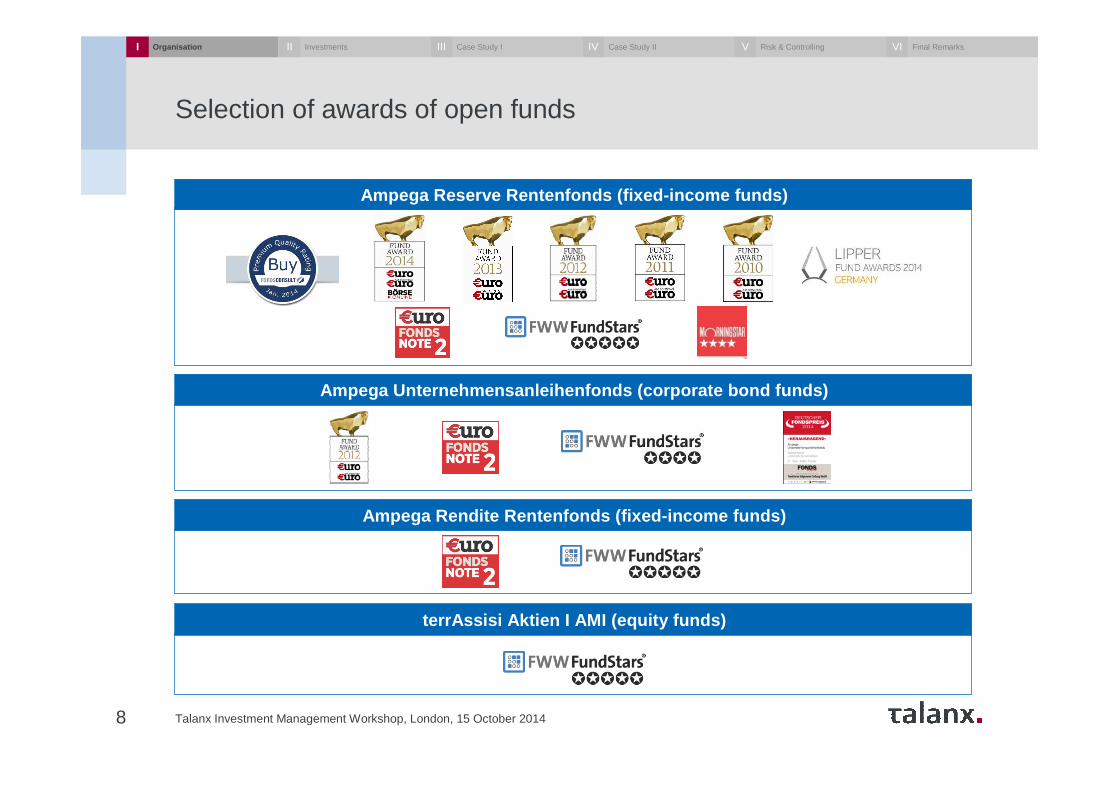
Selection of awards of open funds
Talanx Investment Management Workshop, London, 15 October 20148
Ampega Rendite Rentenfonds (fixed-income funds)
terrAssisi Aktien I AMI (equity funds)
Ampega Unternehmensanleihenfonds (corporate bond fund s)
Ampega Reserve Rentenfonds (fixed-income funds)
I Organisation InvestmentsII Case Study IIII Case Study IIIV Risk & ControllingV Final RemarksVI
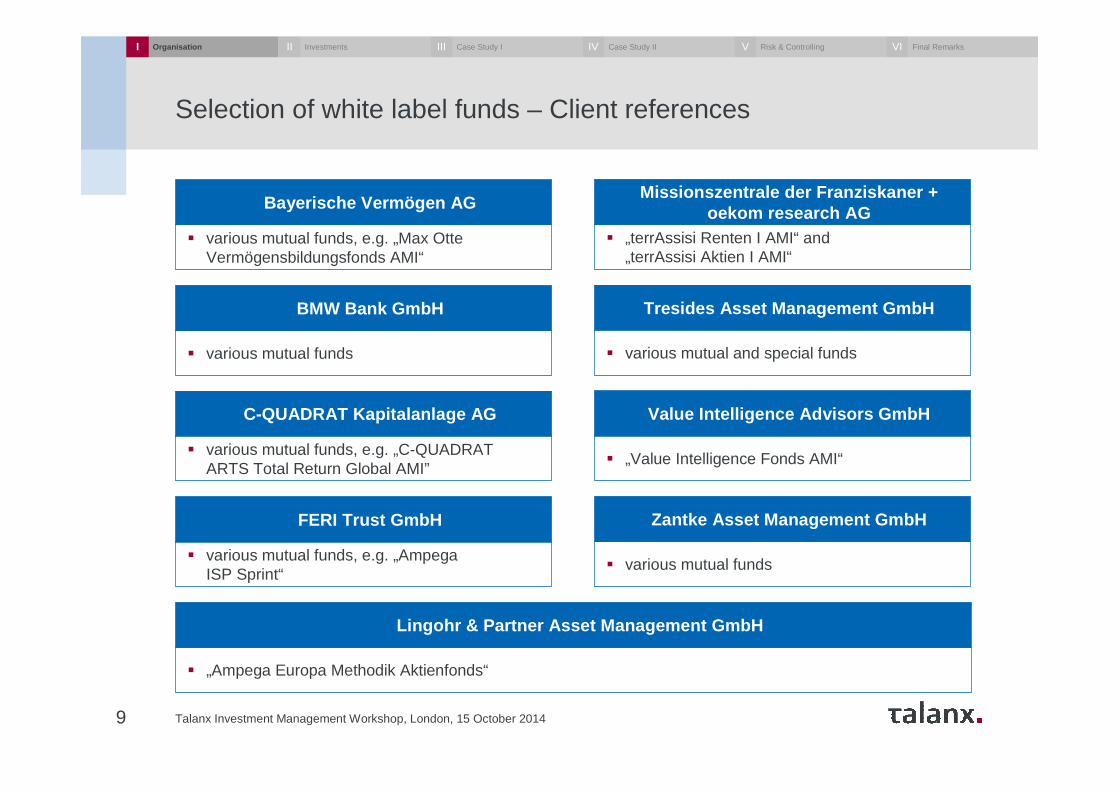
Selection of white label funds – Client references
Talanx Investment Management Workshop, London, 15 October 20149
� various mutual funds, e.g. „Max OtteVermögensbildungsfonds AMI“
Bayerische Vermögen AG
� various mutual funds
BMW Bank GmbH
� various mutual funds, e.g. „C-QUADRAT ARTS Total Return Global AMI”
C-QUADRAT Kapitalanlage AG
� various mutual funds, e.g. „AmpegaISP Sprint“
FERI Trust GmbH
� „Ampega Europa Methodik Aktienfonds“
Lingohr & Partner Asset Management GmbH
� „terrAssisi Renten I AMI“ and „terrAssisi Aktien I AMI“
Missionszentrale der Franziskaner + oekom research AG
� various mutual and special funds
Tresides Asset Management GmbH
� „Value Intelligence Fonds AMI“
Value Intelligence Advisors GmbH
� various mutual funds
Zantke Asset Management GmbH
I Organisation InvestmentsII Case Study IIII Case Study IIIV Risk & ControllingV Final RemarksVI
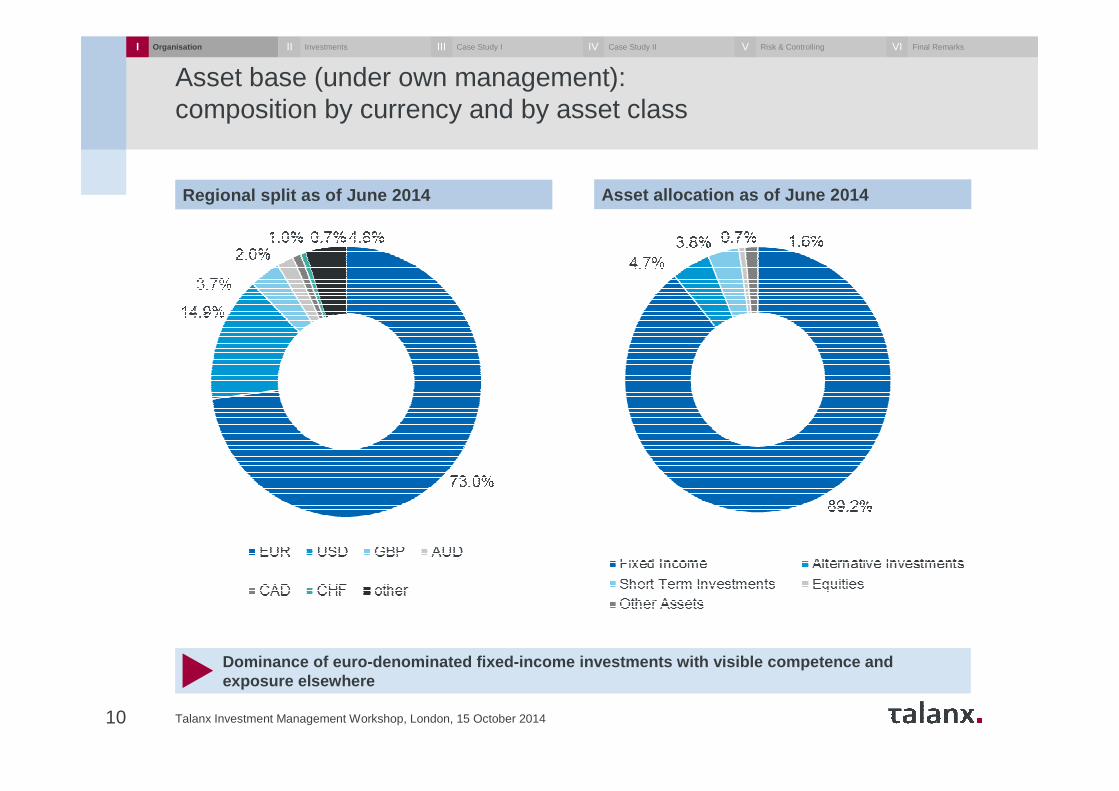
Asset base (under own management): composition by currency and by asset class
Talanx Investment Management Workshop, London, 15 October 201410
Dominance of euro-denominated fixed-income investmen ts with visible competence and exposure elsewhere
Regional split as of June 2014 Asset allocation as of June 2014
I Organisation InvestmentsII Case Study IIII Case Study IIIV Risk & ControllingV Final RemarksVI
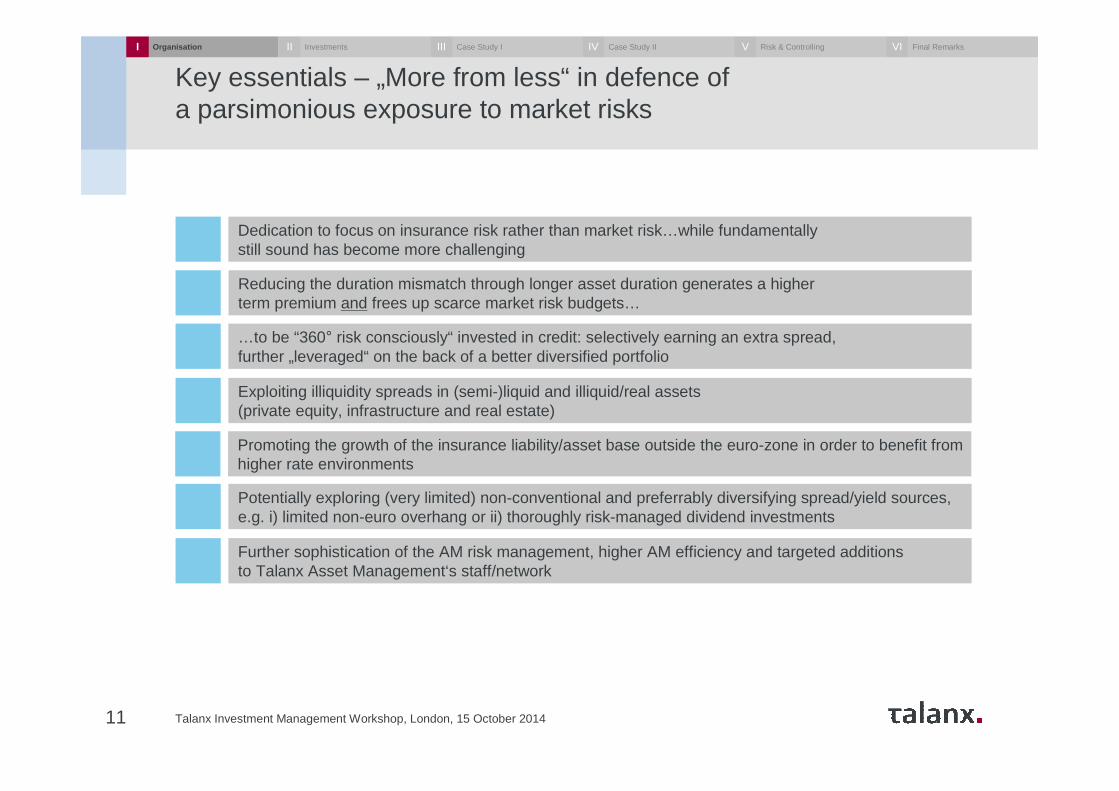
Key essentials – „More from less“ in defence of a parsimonious exposure to market risks
11 Talanx Investment Management Workshop, London, 15 October 2014
Dedication to focus on insurance risk rather than market risk…while fundamentally still sound has become more challenging
Potentially exploring (very limited) non-conventional and preferrably diversifying spread/yield sources, e.g. i) limited non-euro overhang or ii) thoroughly risk-managed dividend investments
…to be “360° risk consciously“ invested in credit: selectively earning an extra spread, further „leveraged“ on the back of a better diversified portfolio
Exploiting illiquidity spreads in (semi-)liquid and illiquid/real assets (private equity, infrastructure and real estate)
Reducing the duration mismatch through longer asset duration generates a higher term premium and frees up scarce market risk budgets…
Further sophistication of the AM risk management, higher AM efficiency and targeted additions to Talanx Asset Management‘s staff/network
Promoting the growth of the insurance liability/asset base outside the euro-zone in order to benefit from higher rate environments
I Organisation InvestmentsII Case Study IIII Case Study IIIV Risk & ControllingV Final RemarksVI
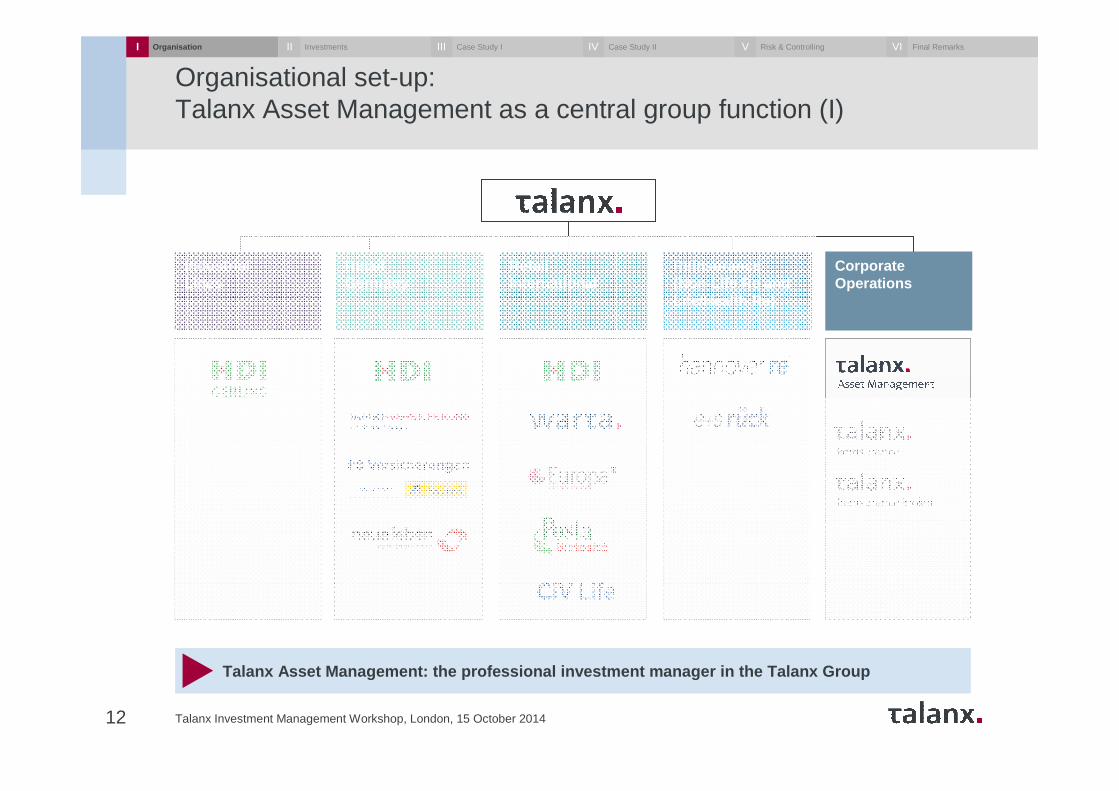
Organisational set-up: Talanx Asset Management as a central group function (I)
Talanx Investment Management Workshop, London, 15 October 201412
Talanx Asset Management: the professional investment manager in the Talanx Group
IndustrialLines
RetailGermany
Reinsurance(Non-Life Re andLife/Health Re)
RetailInternational
Corporate Operations
I Organisation InvestmentsII Case Study IIII Case Study IIIV Risk & ControllingV Final RemarksVI
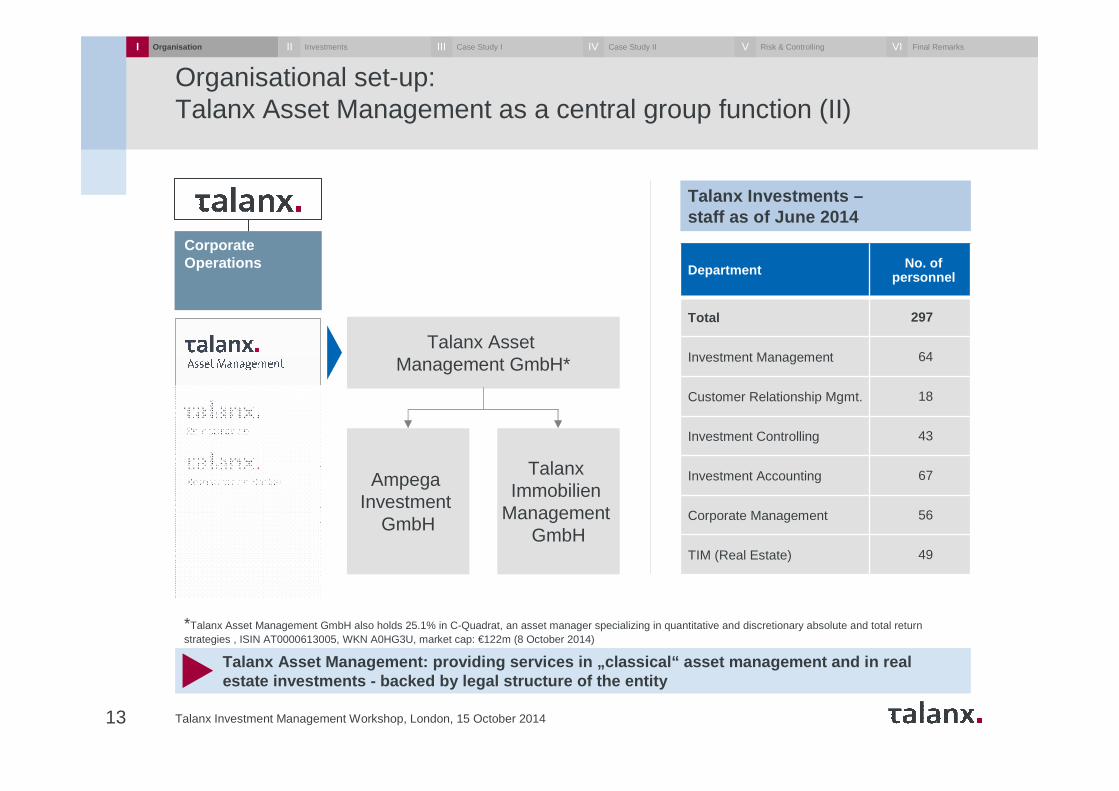
Organisational set-up: Talanx Asset Management as a central group function (II)
Talanx Investment Management Workshop, London, 15 October 201413
Talanx Asset Management: providing services in „classi cal“ asset management and in real estate investments - backed by legal structure of the enti ty
Corporate Operations
Talanx Asset Management GmbH*
AmpegaInvestment
GmbH
TalanxImmobilien
Management GmbH
*Talanx Asset Management GmbH also holds 25.1% in C-Quadrat, an asset manager specializing in quantitative and discretionary absolute and total return strategies , ISIN AT0000613005, WKN A0HG3U, market cap: €122m (8 October 2014)
Talanx Investments –staff as of June 2014
Department No. of personnel
Total 297
Investment Management 64
Customer Relationship Mgmt. 18
Investment Controlling 43
Investment Accounting 67
Corporate Management 56
TIM (Real Estate) 49
I Organisation InvestmentsII Case Study IIII Case Study IIIV Risk & ControllingV Final RemarksVI
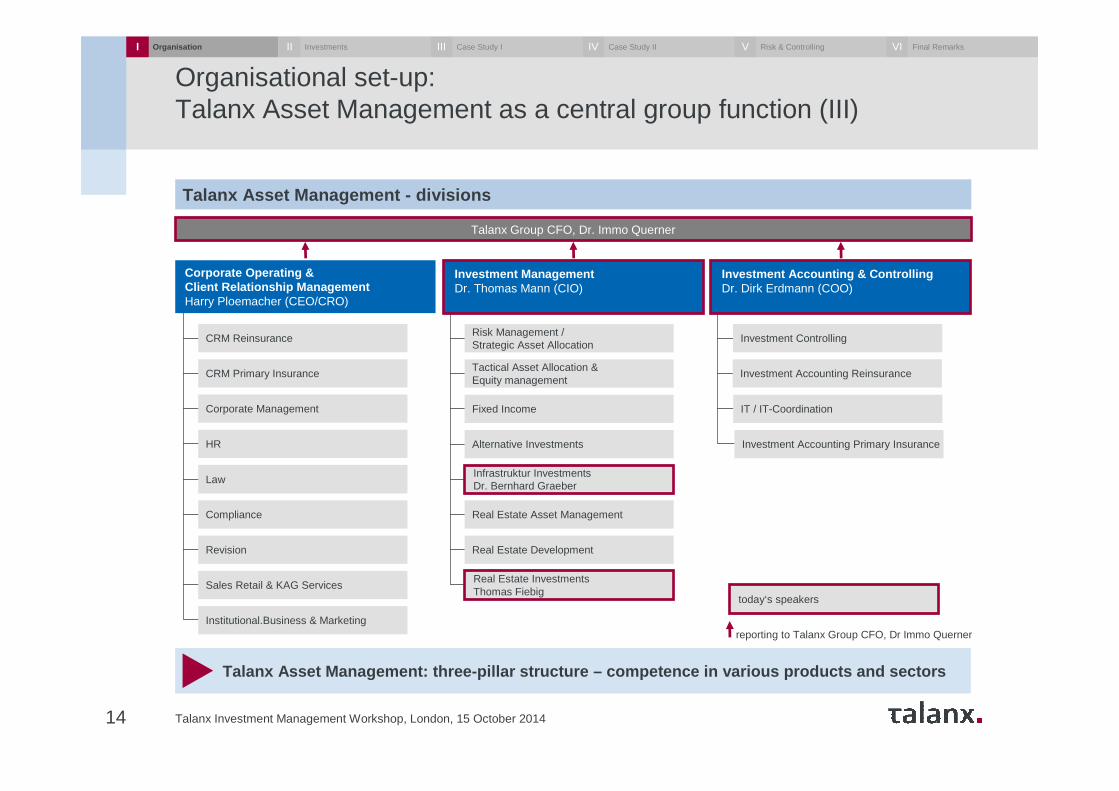
Organisational set-up: Talanx Asset Management as a central group function (III)
Talanx Investment Management Workshop, London, 15 October 201414
Talanx Asset Management: three-pillar structure – compe tence in various products and sectors
Talanx Asset Management - divisions
HR
Corporate Management
CRM Primary Insurance
CRM Reinsurance
Revision
Institutional.Business & Marketing
Sales Retail & KAG Services
Law
Compliance
Tactical Asset Allocation & Equity management
Fixed Income
Alternative Investments
Risk Management / Strategic Asset Allocation
Real Estate Asset Management
Real Estate Development
Investment Controlling
Investment Accounting Primary Insurance
Investment Accounting Reinsurance
IT / IT-Coordination
Talanx Group CFO, Dr. Immo Querner
reporting to Talanx Group CFO, Dr Immo Querner
Corporate Operating & Client Relationship ManagementHarry Ploemacher (CEO/CRO)
Investment ManagementDr. Thomas Mann (CIO)
Investment Accounting & ControllingDr. Dirk Erdmann (COO)
Infrastruktur InvestmentsDr. Bernhard Graeber
Real Estate InvestmentsThomas Fiebig
today‘s speakers
I Organisation InvestmentsII Case Study IIII Case Study IIIV Risk & ControllingV Final RemarksVI
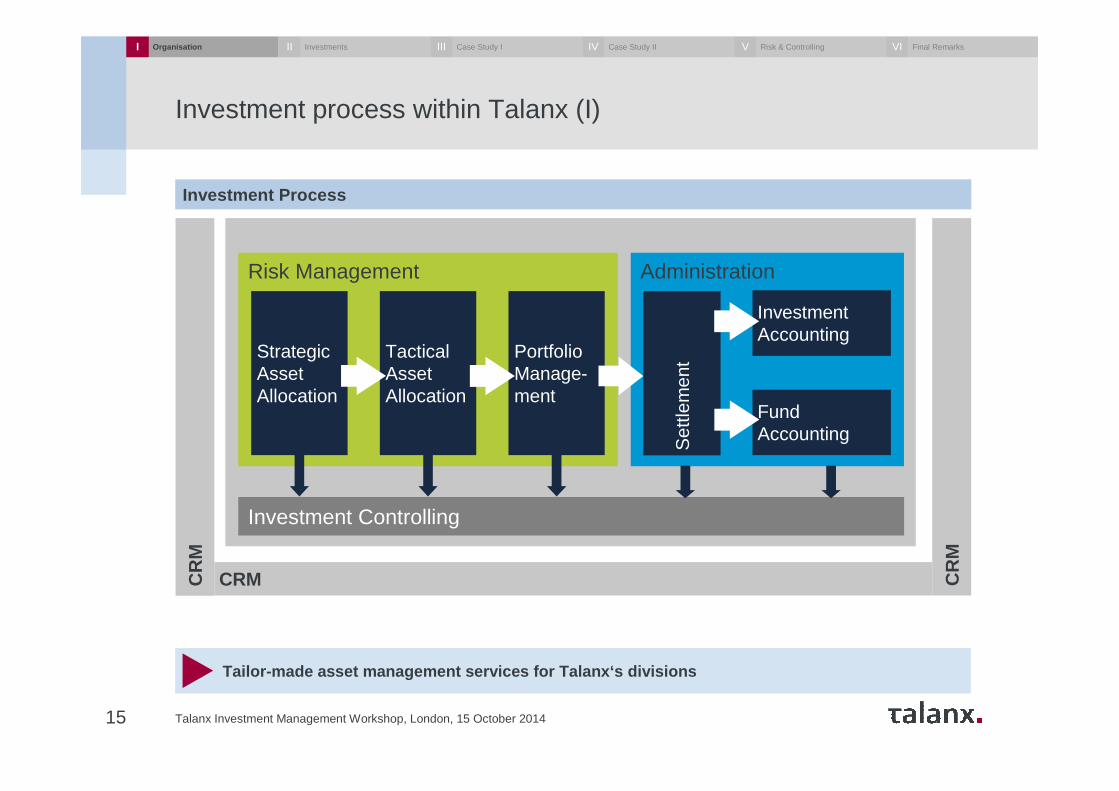
Investment process within Talanx (I)
Talanx Investment Management Workshop, London, 15 October 201415
Tailor-made asset management services for Talanx‘s d ivisions
Investment Process
AdministrationRisk Management
StrategicAssetAllocation
TacticalAssetAllocation
Portfolio Manage-ment
Investment Controlling
FundAccounting
Investment Accounting
Set
tlem
ent
CR
M
CR
M
CRM
I Organisation InvestmentsII Case Study IIII Case Study IIIV Risk & ControllingV Final RemarksVI
Talanx Investment Management Workshop, London, 15 October 201416
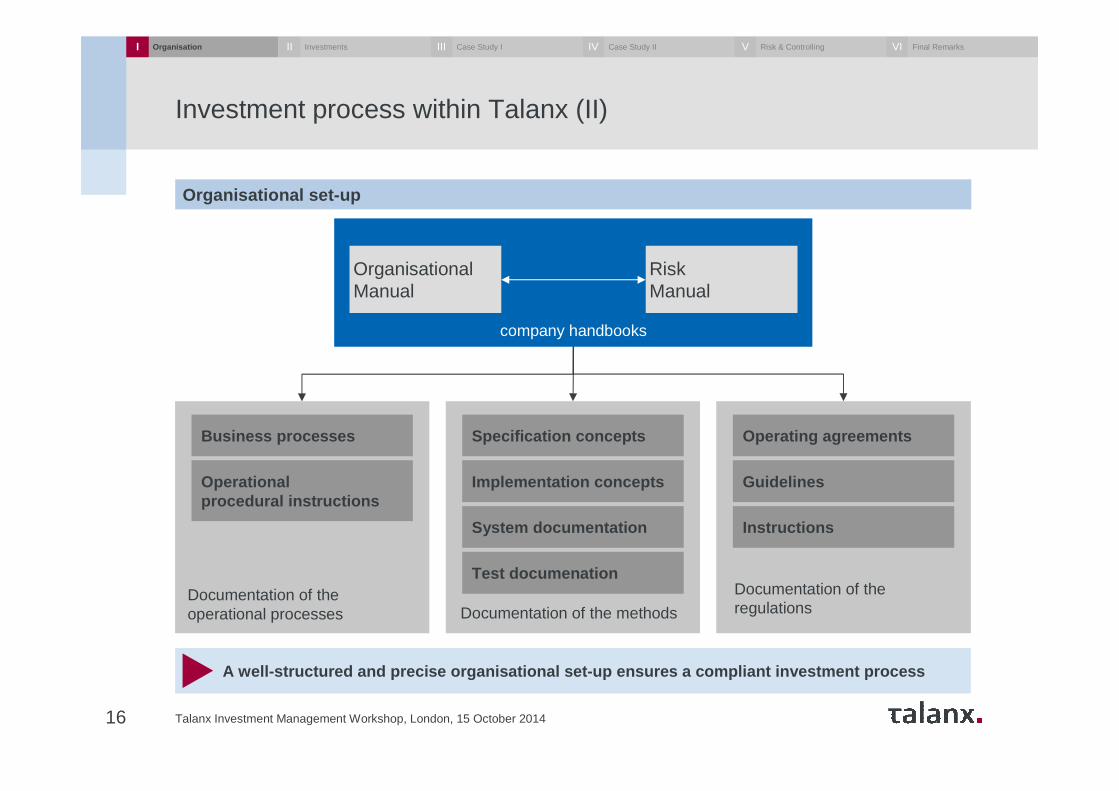
A well-structured and precise organisational set-up e nsures a compliant investment process
Organisational set-up
Operationalprocedural instructions
Business processes
Documentation of theoperational processes
Test documenation
System documentation
Implementation concepts
Specification concepts
Documentation of the methods
Instructions
Guidelines
Operating agreements
Documentation of theregulations
OrganisationalManual
RiskManual
company handbooks
Investment process within Talanx (II)
I Organisation InvestmentsII Case Study IIII Case Study IIIV Risk & ControllingV Final RemarksVI
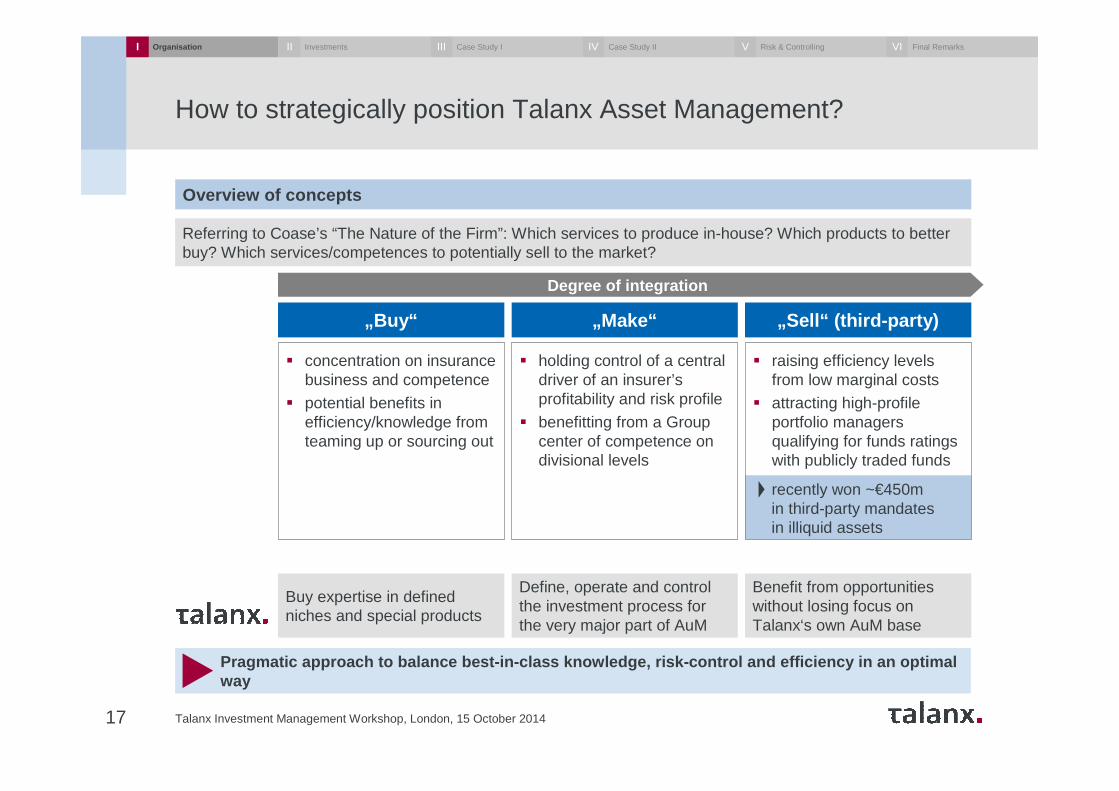
recently won ~€450m in third-party mandates in illiquid assets
How to strategically position Talanx Asset Management?
Talanx Investment Management Workshop, London, 15 October 201417
Pragmatic approach to balance best-in-class knowledge, risk-control and efficiency in an optimal way
Overview of concepts
Degree of integration
„Buy“ „Make“ „Sell“ (third-party)
Referring to Coase’s “The Nature of the Firm”: Which services to produce in-house? Which products to better buy? Which services/competences to potentially sell to the market?
Buy expertise in defined niches and special products
Define, operate and controlthe investment process forthe very major part of AuM
Benefit from opportunitieswithout losing focus on Talanx‘s own AuM base
� concentration on insurance business and competence
� potential benefits in efficiency/knowledge from teaming up or sourcing out
� holding control of a central driver of an insurer’s profitability and risk profile
� benefitting from a Group center of competence on divisional levels
� raising efficiency levels from low marginal costs
� attracting high-profile portfolio managers qualifying for funds ratings with publicly traded funds
I Organisation InvestmentsII Case Study IIII Case Study IIIV Risk & ControllingV Final RemarksVI
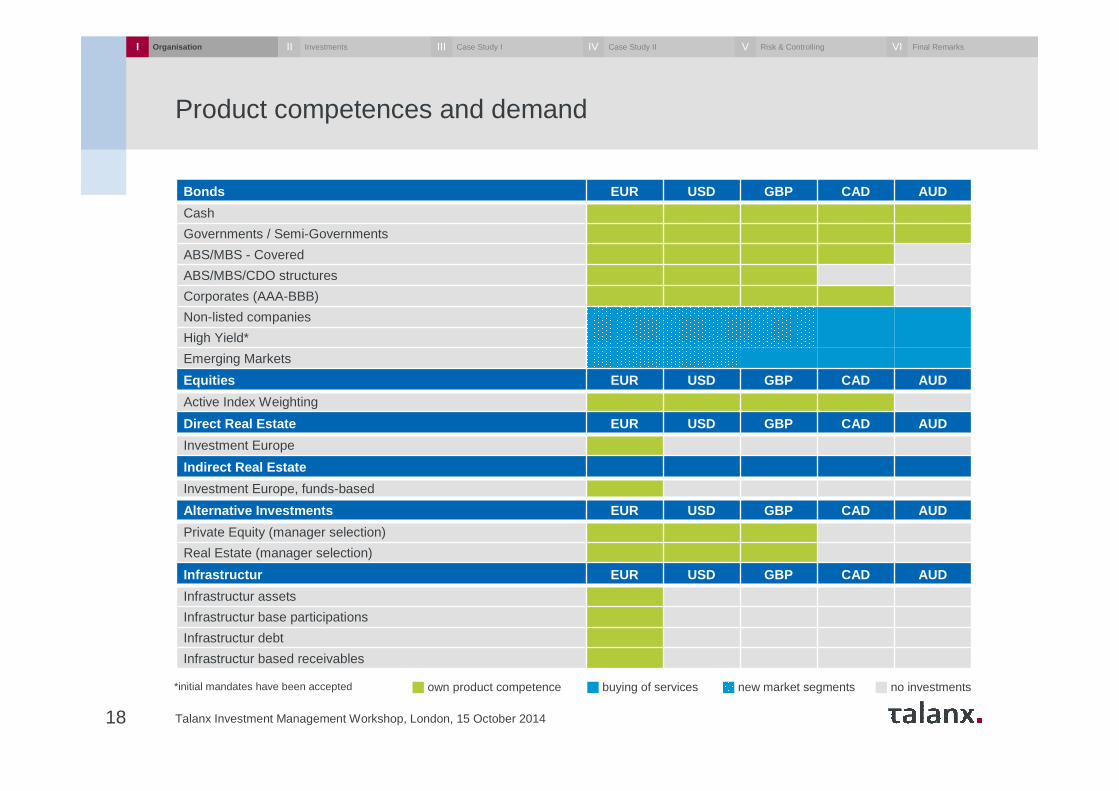
Product competences and demand
Talanx Investment Management Workshop, London, 15 October 201418
Bonds EUR USD GBP CAD AUD
Cash
Governments / Semi-Governments
ABS/MBS - Covered
ABS/MBS/CDO structures
Corporates (AAA-BBB)
Non-listed companies
High Yield*
Emerging Markets
Equities EUR USD GBP CAD AUD
Active Index Weighting
Direct Real Estate EUR USD GBP CAD AUD
Investment Europe
Indirect Real Estate
Investment Europe, funds-based
Alternative Investments EUR USD GBP CAD AUD
Private Equity (manager selection)
Real Estate (manager selection)
Infrastructur EUR USD GBP CAD AUD
Infrastructur assets
Infrastructur base participations
Infrastructur debt
Infrastructur based receivables
*initial mandates have been accepted own product competence buying of services no investments new market segments
I Organisation InvestmentsII Case Study IIII Case Study IIIV Risk & ControllingV Final RemarksVI
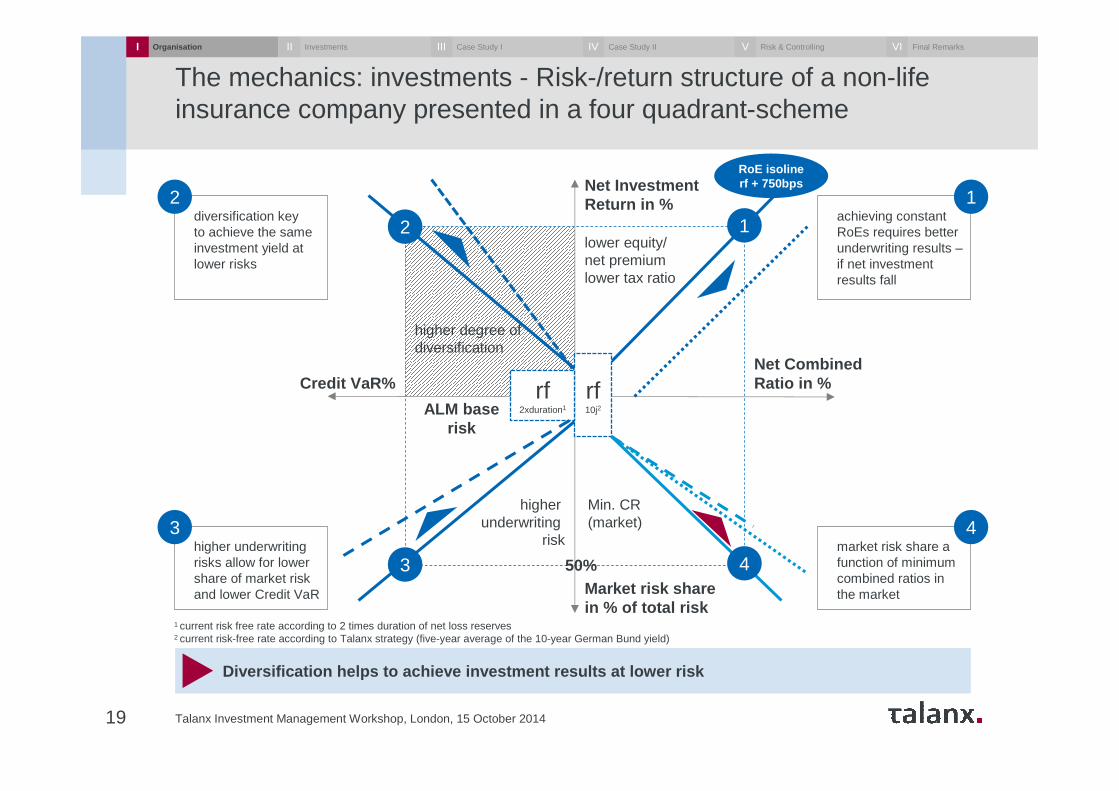
The mechanics: investments - Risk-/return structure of a non-life insurance company presented in a four quadrant-scheme
Talanx Investment Management Workshop, London, 15 October 201419
Diversification helps to achieve investment results at lower risk
1 current risk free rate according to 2 times duration of net loss reserves2 current risk-free rate according to Talanx strategy (five-year average of the 10-year German Bund yield)
diversification key to achieve the same investment yield at lower risks
2achieving constant RoEs requires better underwriting results –if net investment results fall
1
higher underwriting risks allow for lower share of market risk and lower Credit VaR
3market risk share a function of minimum combined ratios in the market
4
Net Investment Return in %
Net CombinedRatio in %Credit VaR%
Market risk sharein % of total risk
rf10j2
rf2xduration1
2 1
4
RoE isolinerf + 750bps
ALM baserisk
lower equity/net premiumlower tax ratio
higher degree ofdiversification
Min. CR (market)
higherunderwriting
risk
50%3
I Organisation InvestmentsII Case Study IIII Case Study IIIV Risk & ControllingV Final RemarksVI
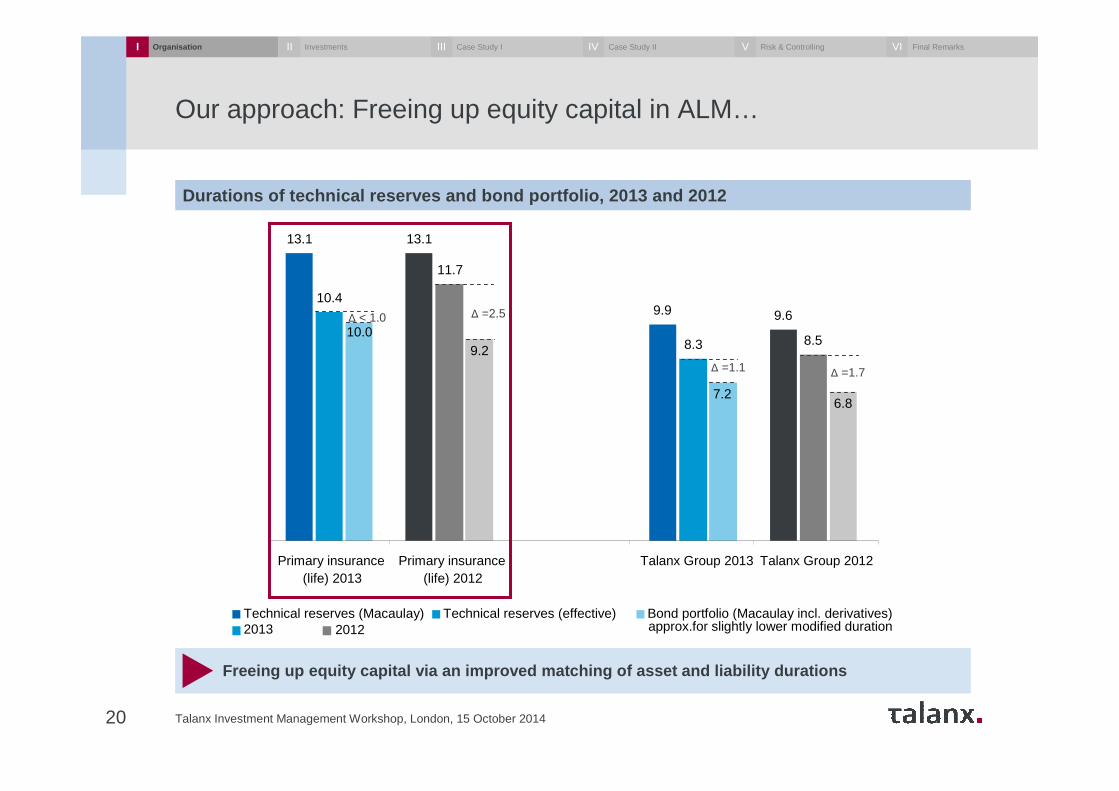
Our approach: Freeing up equity capital in ALM…
Durations of technical reserves and bond portfolio, 2013 and 2012
13.1 13.1
9.9 9.610.4
11.7
8.3 8.5
6.87.2
9.210.0
Primary insurance(life) 2013
Primary insurance(life) 2012
Talanx Group 2013 Talanx Group 2012
Technical reserves (Macaulay) Technical reserves (effective) Bond portfolio (Macaulay incl. derivatives)
∆ < 1.0 ∆ =2.5
∆ =1.1∆ =1.7
20122013 approx.for slightly lower modified duration
Freeing up equity capital via an improved matching of asset and liability durations
20
I Organisation InvestmentsII Case Study IIII Case Study IIIV Risk & ControllingV Final RemarksVI
Talanx Investment Management Workshop, London, 15 October 2014
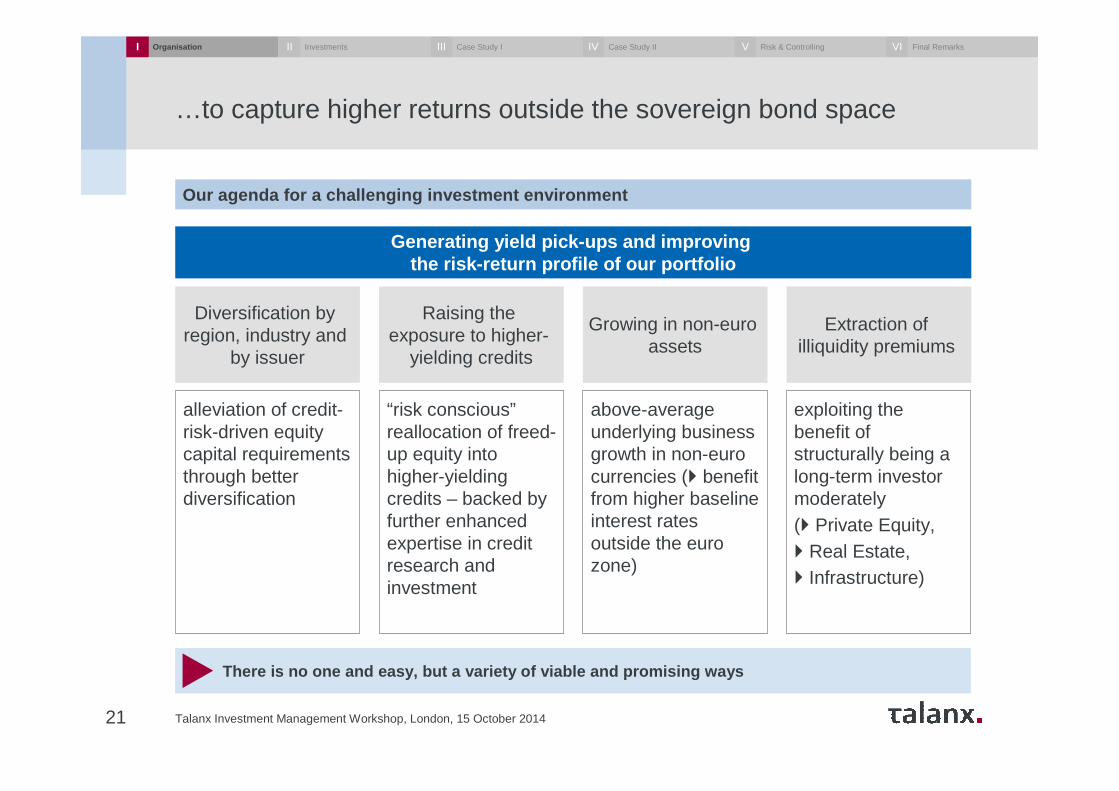
…to capture higher returns outside the sovereign bond space
Talanx Investment Management Workshop, London, 15 October 201421
There is no one and easy, but a variety of viable and pro mising ways
Our agenda for a challenging investment environment
Generating yield pick-ups and improving the risk-return profile of our portfolio
Diversification by region, industry and
by issuer
Raising theexposure to higher-
yielding credits
Extraction of illiquidity premiums
Growing in non-euroassets
alleviation of credit-risk-driven equity capital requirements through better diversification
“risk conscious”reallocation of freed-up equity into higher-yielding credits – backed by further enhanced expertise in credit research and investment
above-average underlying business growth in non-euro currencies (� benefit from higher baseline interest rates outside the euro zone)
exploiting the benefit of structurally being a long-term investor moderately (� Private Equity, � Real Estate, � Infrastructure)
I Organisation InvestmentsII Case Study IIII Case Study IIIV Risk & ControllingV Final RemarksVI
Agenda
22 Talanx Investment Management Workshop, London, 15 October 2014
Organisational set-up and processI Dr. Immo Querner
Dr. Dirk Erdmann
Thomas Fiebig
Dr. Bernhard Graeber
Dr. Immo Querner
Case study II: Direct real estate investments
Case study I: Infrastructure investments
Risk measurement, evaluation and control
Concluding remarks
III
IV
V
VI
Investment challenges and responsesII Dr. Thomas Mann
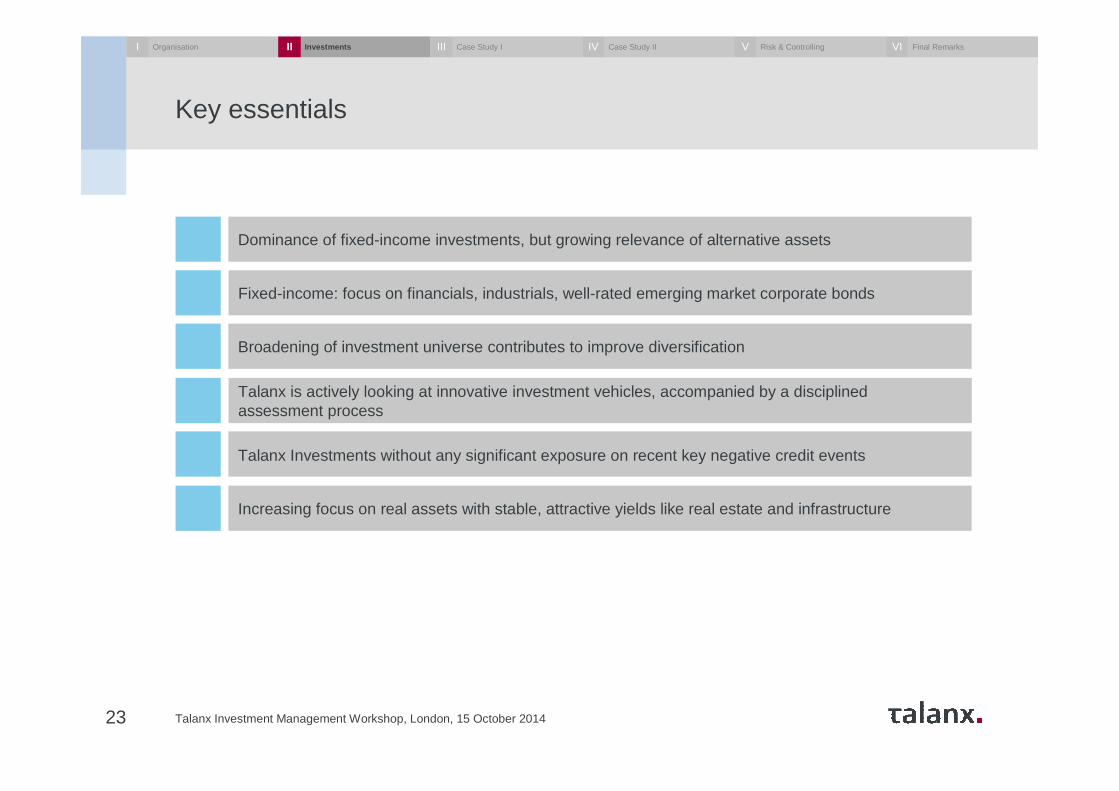
Key essentials
23 Talanx Investment Management Workshop, London, 15 October 2014
Dominance of fixed-income investments, but growing relevance of alternative assets
Broadening of investment universe contributes to improve diversification
Talanx is actively looking at innovative investment vehicles, accompanied by a disciplinedassessment process
Fixed-income: focus on financials, industrials, well-rated emerging market corporate bonds
Talanx Investments without any significant exposure on recent key negative credit events
Increasing focus on real assets with stable, attractive yields like real estate and infrastructure
I Organisation InvestmentsII Case Study IIII Case Study IIIV Risk & ControllingV Final RemarksVI
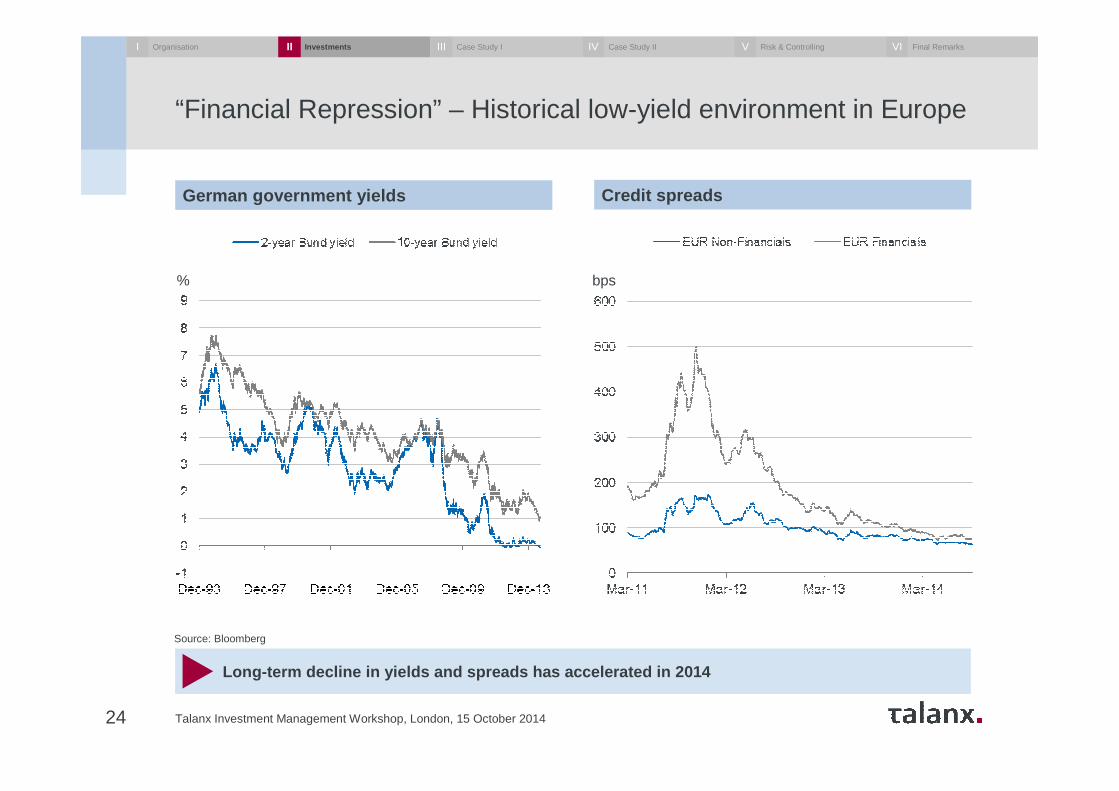
“Financial Repression” – Historical low-yield environment in Europe
Talanx Investment Management Workshop, London, 15 October 201424
Long-term decline in yields and spreads has acceler ated in 2014
Source: Bloomberg
German government yields Credit spreads
% bps
I Organisation InvestmentsII Case Study IIII Case Study IIIV Risk & ControllingV Final RemarksVI
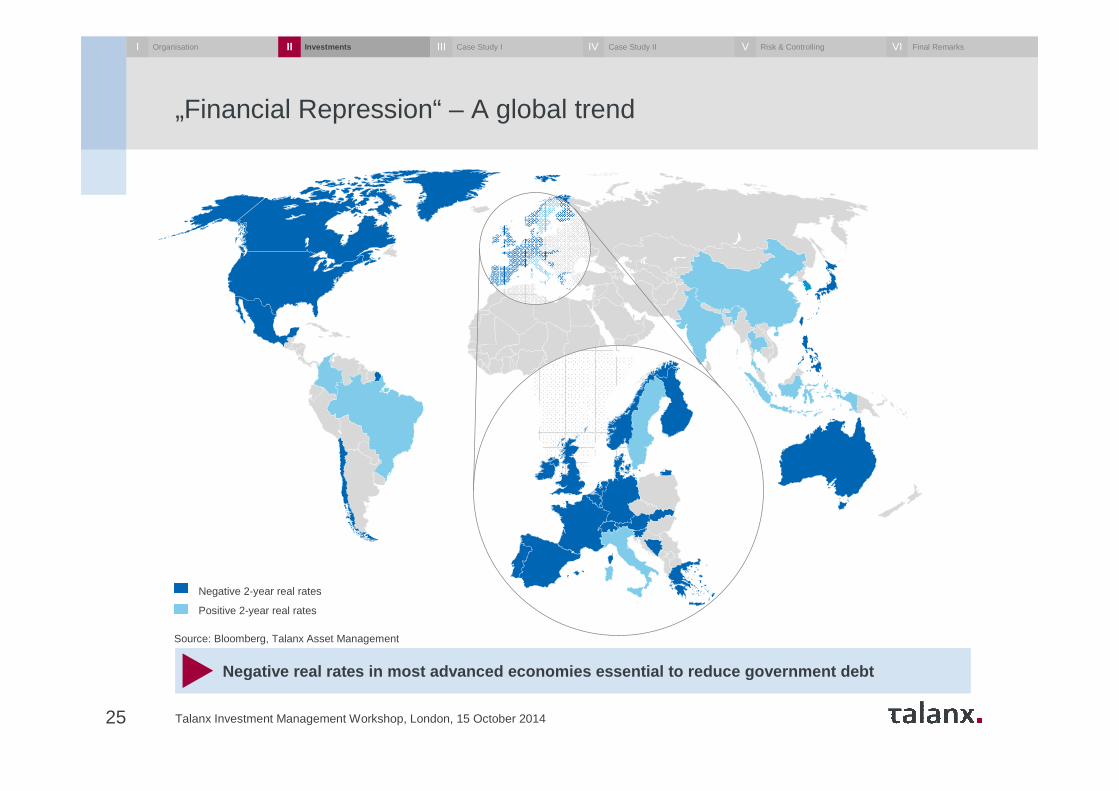
„Financial Repression“ – A global trend
Talanx Investment Management Workshop, London, 15 October 201425
Source: Bloomberg, Talanx Asset Management
Negative real rates in most advanced economies esse ntial to reduce government debt
Negative 2-year real rates
Positive 2-year real rates
I Organisation InvestmentsII Case Study IIII Case Study IIIV Risk & ControllingV Final RemarksVI
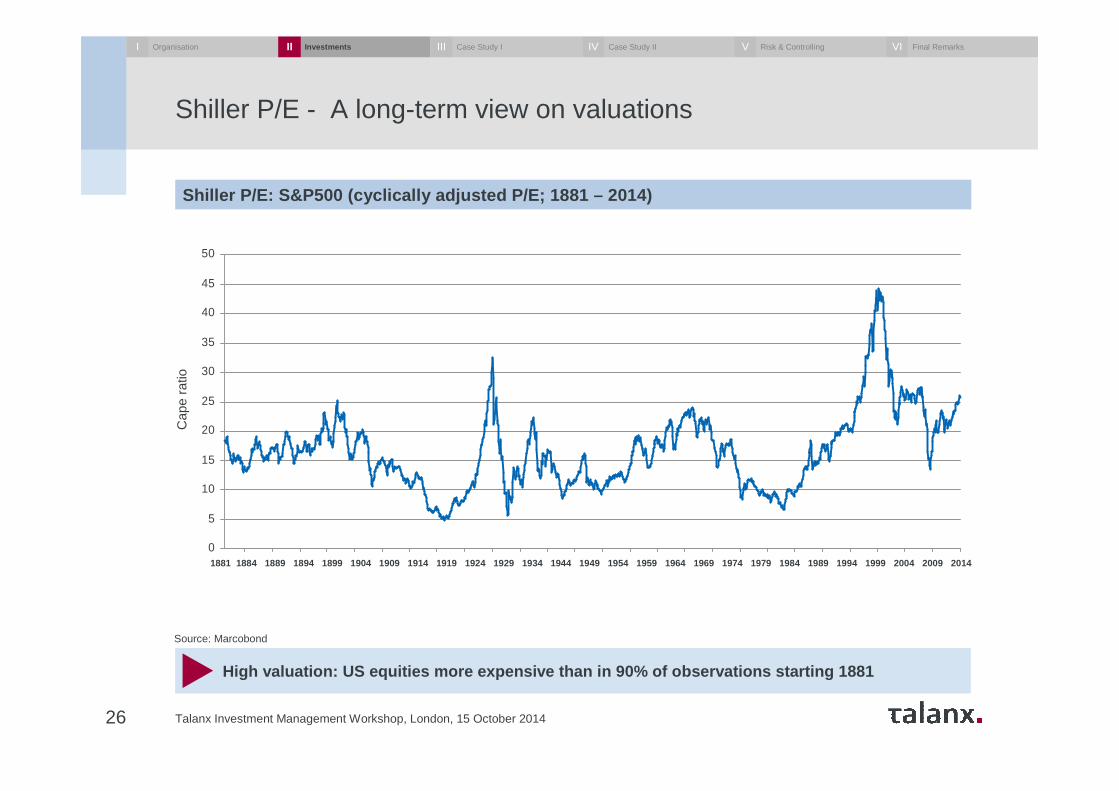
Shiller P/E - A long-term view on valuations
Talanx Investment Management Workshop, London, 15 October 201426
High valuation: US equities more expensive than in 90% of observations starting 1881
Shiller P/E: S&P500 (cyclically adjusted P/E; 1881 – 20 14)
0
5
10
15
20
25
30
35
40
45
50
2014
2009
2004
1999
1994
1989
1984
1979
1974
1969
1964
1959
1954
1949
1944
1939
1934
1929
1924
1919
1914
1909
1904
01.08
.1899
01.08
.1894
01.08
.1889
01.08
.1884
Source: Marcobond
Cap
e ra
tio
1881 1884 1889 1894 1899 1904 1909 1914 1919 1924 1929 1934 1944 1949 1954 1959 1964 1969 1974 1979 1984 1989 1994 1999 2004 2009 2014
I Organisation InvestmentsII Case Study IIII Case Study IIIV Risk & ControllingV Final RemarksVI
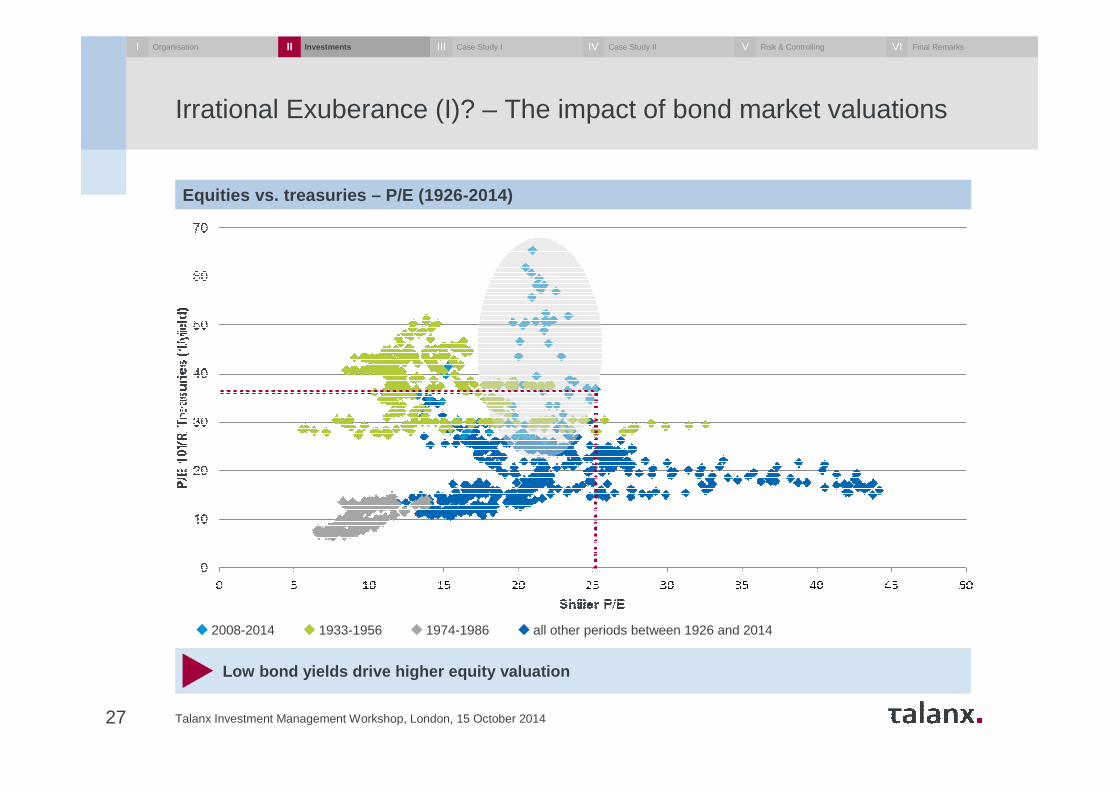
Irrational Exuberance (I)? – The impact of bond market valuations
Equities vs. treasuries – P/E (1926-2014)
Low bond yields drive higher equity valuation
27 Talanx Investment Management Workshop, London, 15 October 2014
all other periods between 1926 and 20142008-2014 1933-1956 1974-1986
I Organisation InvestmentsII Case Study IIII Case Study IIIV Risk & ControllingV Final RemarksVI
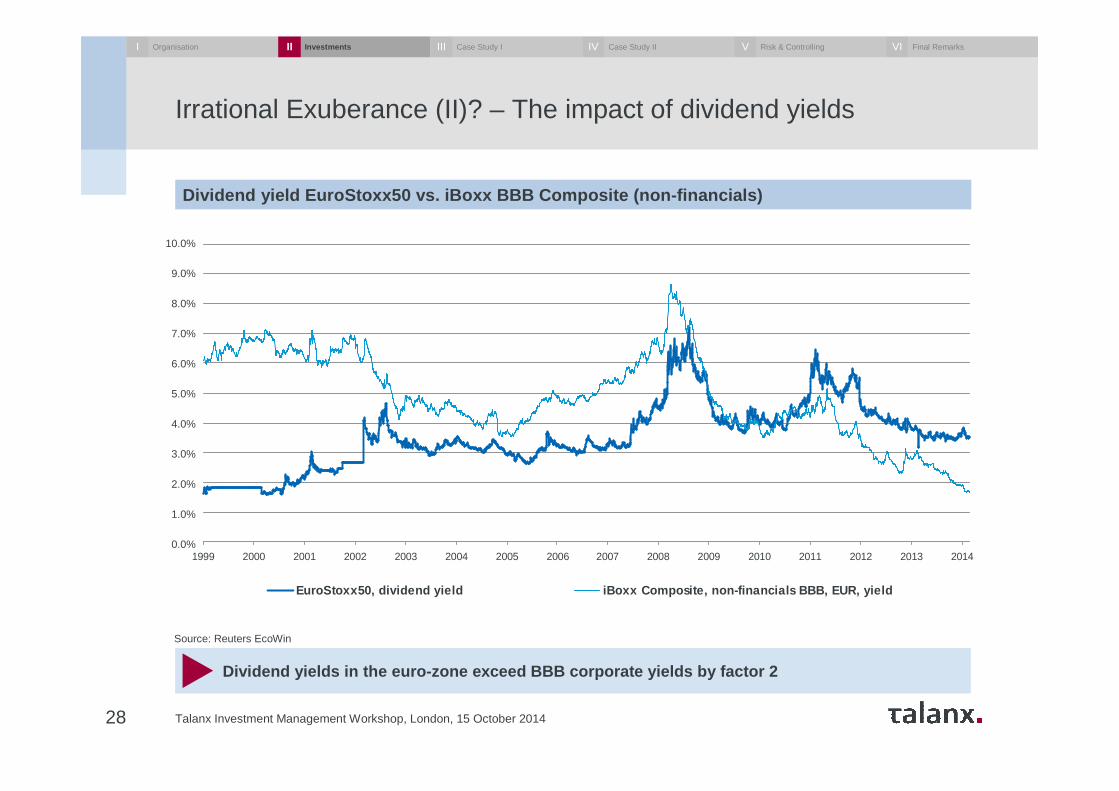
Irrational Exuberance (II)? – The impact of dividend yields
Talanx Investment Management Workshop, London, 15 October 201428
Dividend yields in the euro-zone exceed BBB corporat e yields by factor 2
1999 2000 2001 2002 2003 2004 2005 2006 2007 2008 2009 2010 2011 2012 2013 2014
EuroStoxx50, dividend yield iBoxx Composite, non-financials BBB, EUR, yield
Dividend yield EuroStoxx50 vs. iBoxx BBB Composite (no n-financials)
Source: Reuters EcoWin
10.0%
9.0%
8.0%
7.0%
6.0%
5.0%
4.0%
3.0%
2.0%
1.0%
0.0%
I Organisation InvestmentsII Case Study IIII Case Study IIIV Risk & ControllingV Final RemarksVI
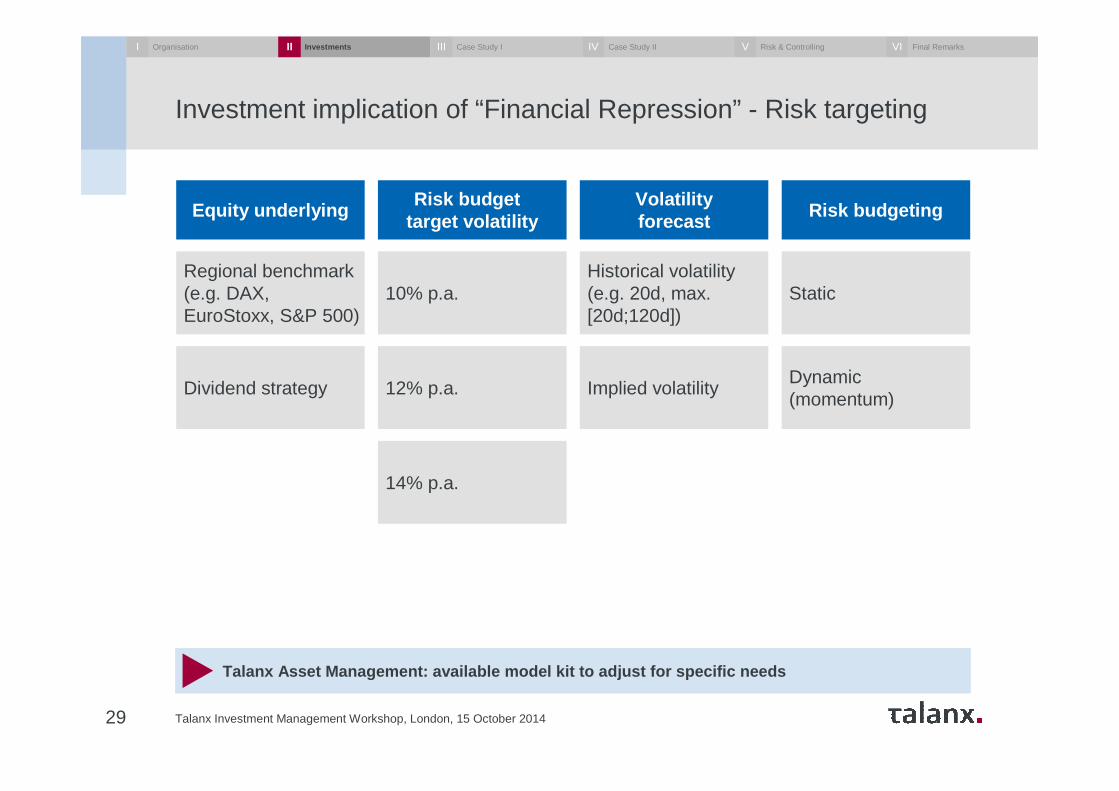
Investment implication of “Financial Repression” - Risk targeting
Talanx Investment Management Workshop, London, 15 October 201429
Talanx Asset Management: available model kit to adjus t for specific needs
Equity underlyingRisk budget
target volatilityRisk budgeting
Volatilityforecast
Regional benchmark(e.g. DAX, EuroStoxx, S&P 500)
10% p.a.Historical volatility(e.g. 20d, max. [20d;120d])
Static
Dividend strategy 12% p.a. Implied volatility
14% p.a.
Dynamic(momentum)
I Organisation InvestmentsII Case Study IIII Case Study IIIV Risk & ControllingV Final RemarksVI
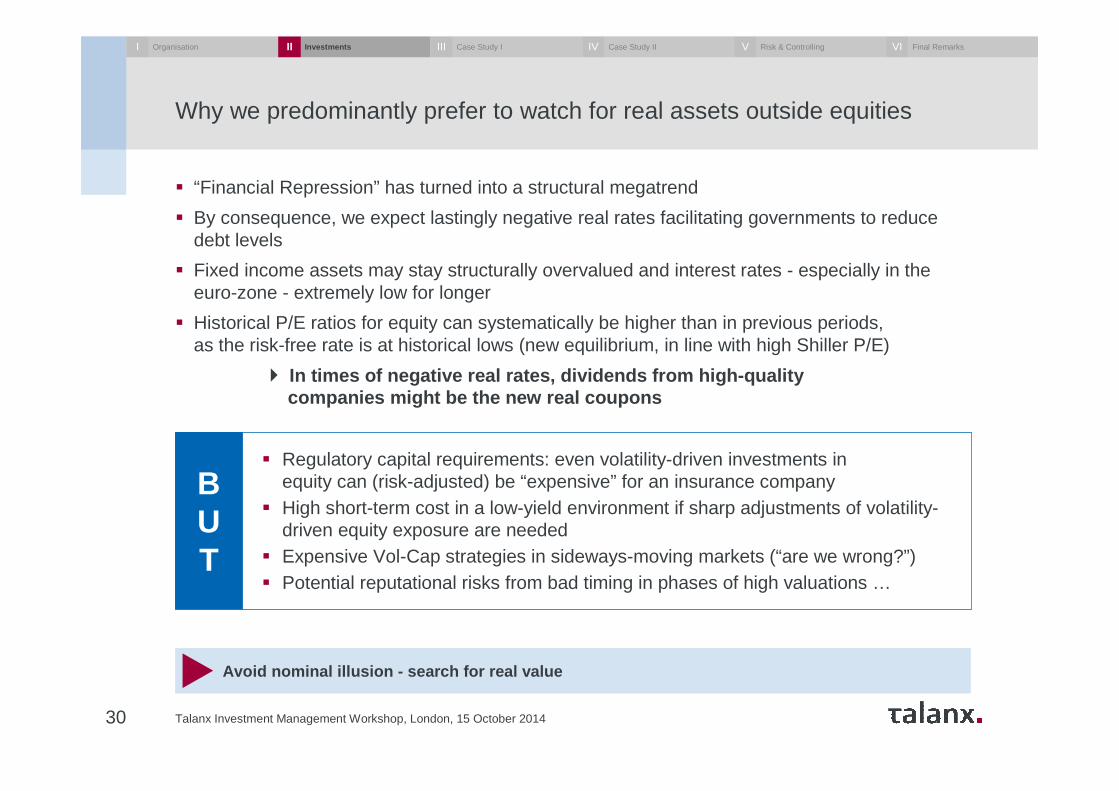
Why we predominantly prefer to watch for real assets outside equities
Talanx Investment Management Workshop, London, 15 October 201430
Avoid nominal illusion - search for real value
BUT
� “Financial Repression” has turned into a structural megatrend
� By consequence, we expect lastingly negative real rates facilitating governments to reduce debt levels
� Fixed income assets may stay structurally overvalued and interest rates - especially in the euro-zone - extremely low for longer
� Historical P/E ratios for equity can systematically be higher than in previous periods, as the risk-free rate is at historical lows (new equilibrium, in line with high Shiller P/E)
� In times of negative real rates, dividends from hig h-qualitycompanies might be the new real coupons
� Regulatory capital requirements: even volatility-driven investments in equity can (risk-adjusted) be “expensive” for an insurance company
� High short-term cost in a low-yield environment if sharp adjustments of volatility-driven equity exposure are needed
� Expensive Vol-Cap strategies in sideways-moving markets (“are we wrong?”)� Potential reputational risks from bad timing in phases of high valuations …
I Organisation InvestmentsII Case Study IIII Case Study IIIV Risk & ControllingV Final RemarksVI
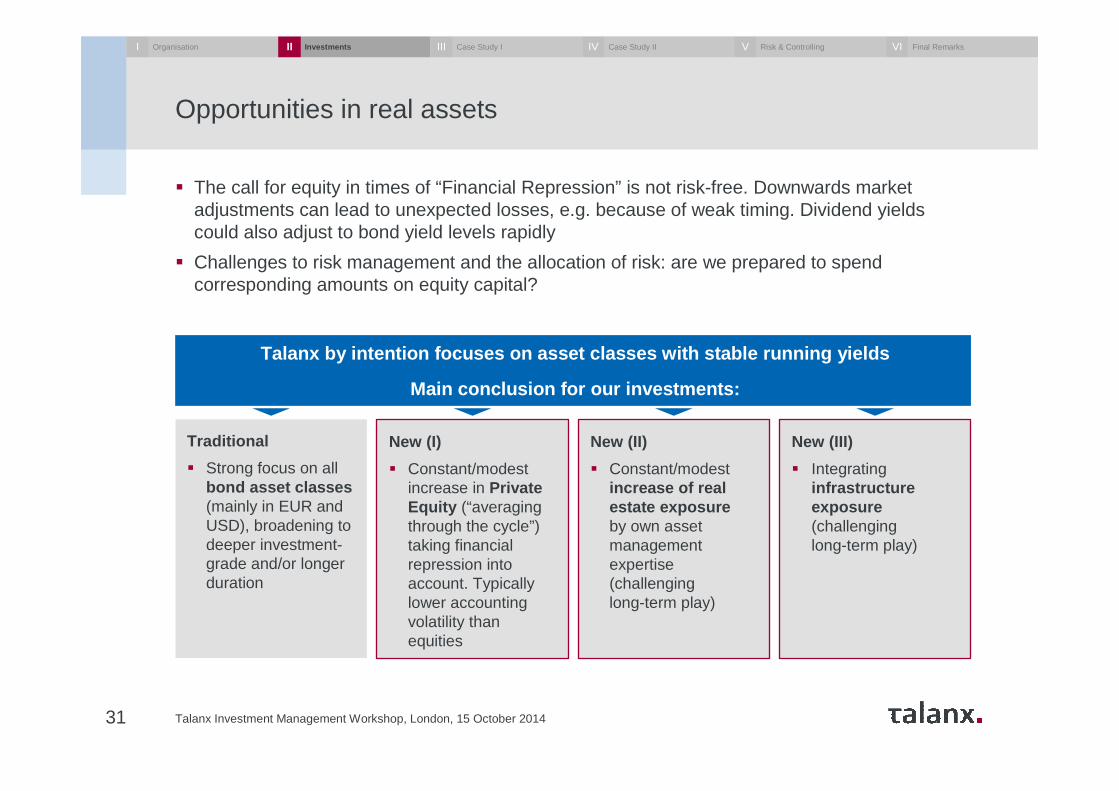
Opportunities in real assets
Talanx Investment Management Workshop, London, 15 October 201431
� The call for equity in times of “Financial Repression” is not risk-free. Downwards market adjustments can lead to unexpected losses, e.g. because of weak timing. Dividend yields could also adjust to bond yield levels rapidly
� Challenges to risk management and the allocation of risk: are we prepared to spend corresponding amounts on equity capital?
Traditional
� Strong focus on all bond asset classes (mainly in EUR and USD), broadening to deeper investment-grade and/or longer duration
Talanx by intention focuses on asset classes with st able running yields
Main conclusion for our investments:
New (I)
� Constant/modest increase in Private Equity (“averaging through the cycle”) taking financial repression into account. Typically lower accounting volatility than equities
New (II)
� Constant/modest increase of real estate exposure by own asset management expertise (challenginglong-term play)
New (III)
� Integrating infrastructure exposure (challenginglong-term play)
I Organisation InvestmentsII Case Study IIII Case Study IIIV Risk & ControllingV Final RemarksVI
Risk management – An integral part of asset management
Talanx Investment Management Workshop, London, 15 October 201432
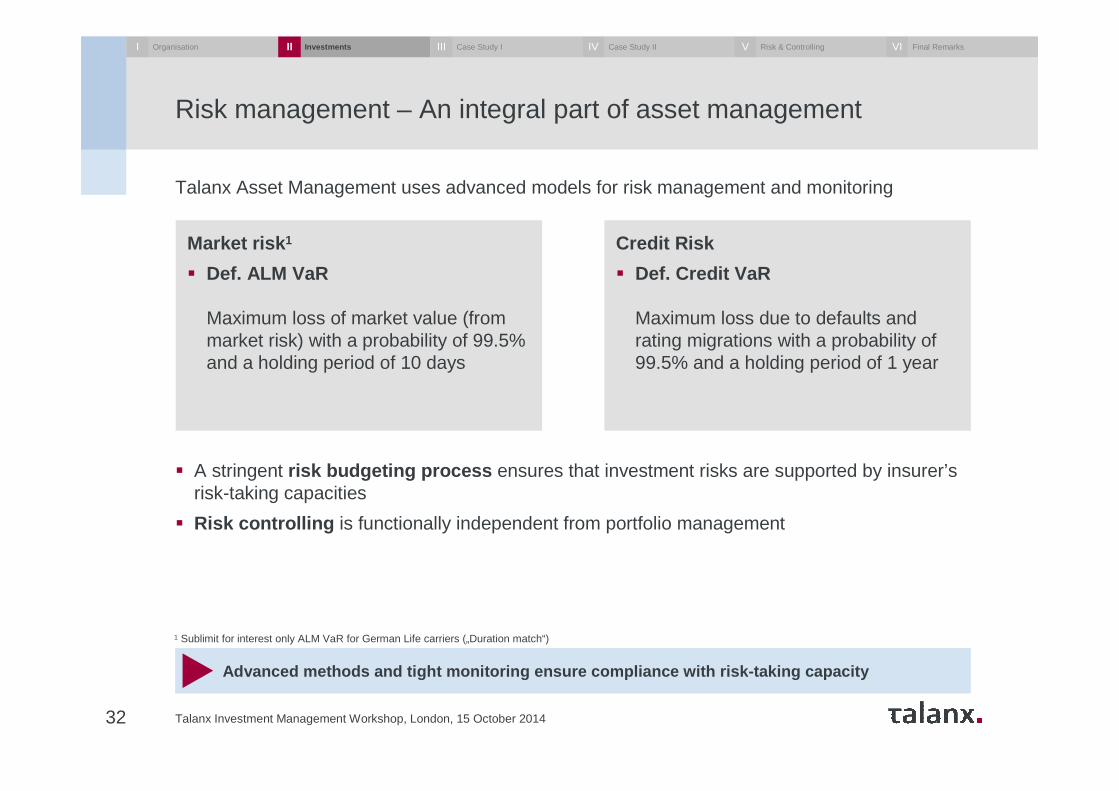
Talanx Asset Management uses advanced models for risk management and monitoring
Market risk 1
� Def. ALM VaR
Maximum loss of market value (from market risk) with a probability of 99.5% and a holding period of 10 days
Credit Risk
� Def. Credit VaR
Maximum loss due to defaults and rating migrations with a probability of 99.5% and a holding period of 1 year
Advanced methods and tight monitoring ensure compli ance with risk-taking capacity
� A stringent risk budgeting process ensures that investment risks are supported by insurer’s risk-taking capacities
� Risk controlling is functionally independent from portfolio management
1 Sublimit for interest only ALM VaR for German Life carriers („Duration match“)
I Organisation InvestmentsII Case Study IIII Case Study IIIV Risk & ControllingV Final RemarksVI
Interest rate risk – A function of duration gap
Talanx Investment Management Workshop, London, 15 October 201433
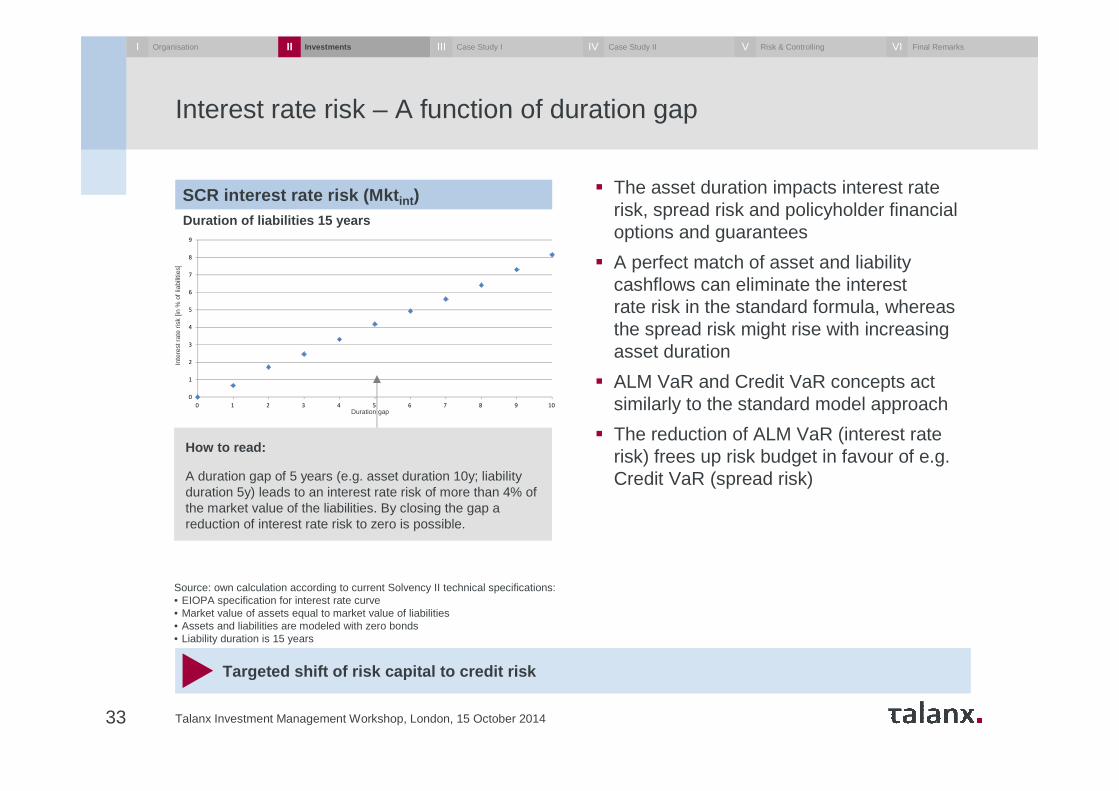
� The asset duration impacts interest rate risk, spread risk and policyholder financial options and guarantees
� A perfect match of asset and liability cashflows can eliminate the interest rate risk in the standard formula, whereas the spread risk might rise with increasing asset duration
� ALM VaR and Credit VaR concepts act similarly to the standard model approach
� The reduction of ALM VaR (interest rate risk) frees up risk budget in favour of e.g.Credit VaR (spread risk)
Targeted shift of risk capital to credit risk
0
1
2
3
4
5
6
7
8
9
0 1 2 3 4 5 6 7 8 9 10
Inte
rest
Rat
e R
isk
[in %
of l
iabi
litie
s]
How to read:
A duration gap of 5 years (e.g. asset duration 10y; liability duration 5y) leads to an interest rate risk of more than 4% of the market value of the liabilities. By closing the gap a reduction of interest rate risk to zero is possible.
Source: own calculation according to current Solvency II technical specifications: • EIOPA specification for interest rate curve • Market value of assets equal to market value of liabilities• Assets and liabilities are modeled with zero bonds• Liability duration is 15 years
SCR interest rate risk (Mkt int )Duration of liabilities 15 years
Duration gap
Inte
rest
rate
ris
k[in
% o
f lia
bilit
ies]
I Organisation InvestmentsII Case Study IIII Case Study IIIV Risk & ControllingV Final RemarksVI
Fixed-income investment universe
Talanx Investment Management Workshop, London, 15 October 201434
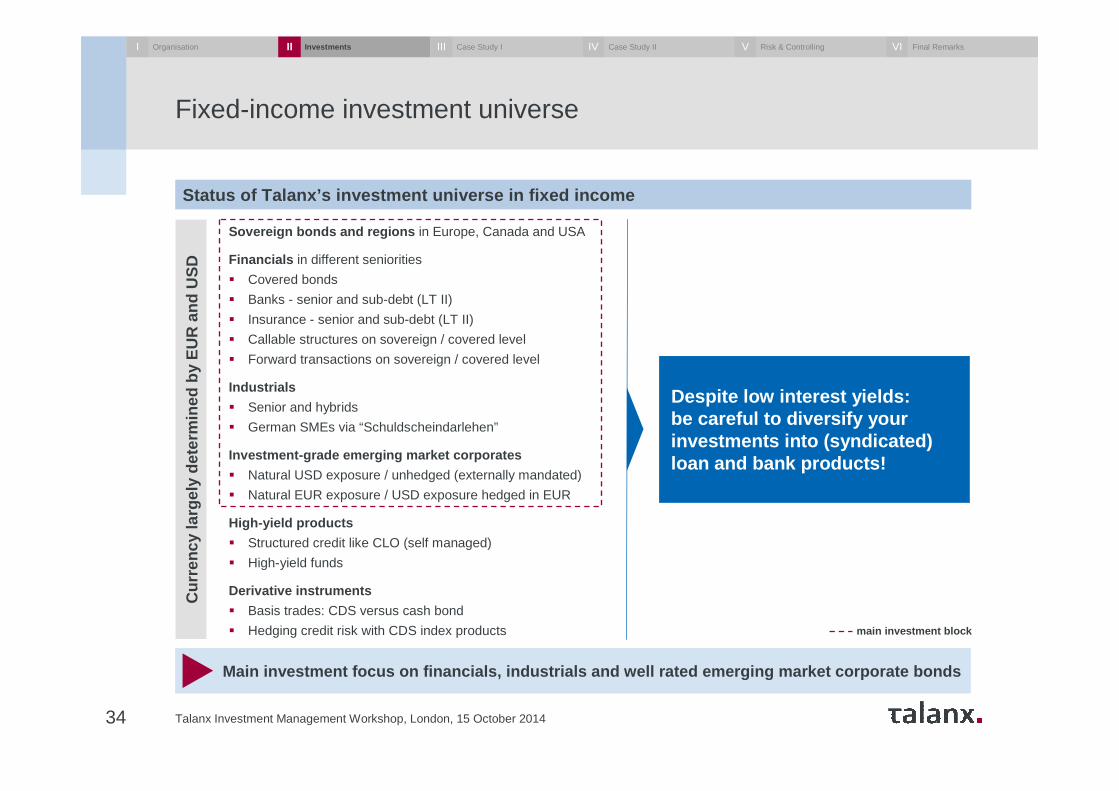
Sovereign bonds and regions in Europe, Canada and USA
Financials in different seniorities
� Covered bonds
� Banks - senior and sub-debt (LT II)
� Insurance - senior and sub-debt (LT II)
� Callable structures on sovereign / covered level
� Forward transactions on sovereign / covered level
Industrials
� Senior and hybrids
� German SMEs via “Schuldscheindarlehen”
Investment-grade emerging market corporates
� Natural USD exposure / unhedged (externally mandated)
� Natural EUR exposure / USD exposure hedged in EUR
High-yield products
� Structured credit like CLO (self managed)
� High-yield funds
Derivative instruments
� Basis trades: CDS versus cash bond
� Hedging credit risk with CDS index products
Cur
renc
y la
rgel
y de
term
ined
by E
UR
and
US
D
Despite low interest yields: be careful to diversify your investments into (syndicated) loan and bank products!
Main investment focus on financials, industrials and w ell rated emerging market corporate bonds
Status of Talanx’s investment universe in fixed inco me
main investment block
I Organisation InvestmentsII Case Study IIII Case Study IIIV Risk & ControllingV Final RemarksVI
Assessment of new investment vehicles – Our experience
Talanx Investment Management Workshop, London, 15 October 201435
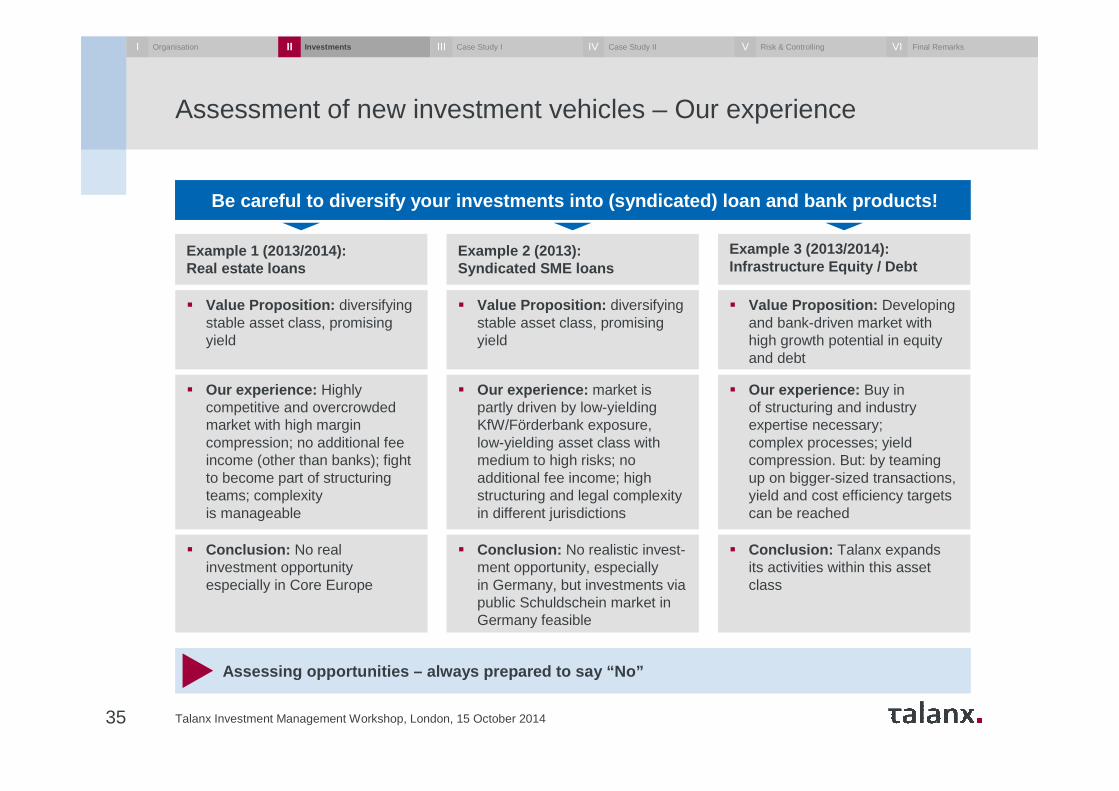
Assessing opportunities – always prepared to say “No ”
Example 1 (2013/2014):Real estate loans
Be careful to diversify your investments into (syndi cated) loan and bank products!
Example 2 (2013):Syndicated SME loans
Example 3 (2013/2014):Infrastructure Equity / Debt
� Value Proposition: Developing and bank-driven market with high growth potential in equity and debt
� Our experience: Buy in of structuring and industry expertise necessary; complex processes; yield compression. But: by teaming up on bigger-sized transactions, yield and cost efficiency targets can be reached
� Conclusion: Talanx expandsits activities within this asset class
� Value Proposition: diversifying stable asset class, promising yield
� Our experience: Highly competitive and overcrowded market with high margin compression; no additional fee income (other than banks); fight to become part of structuring teams; complexity is manageable
� Conclusion: No real investment opportunity especially in Core Europe
� Value Proposition: diversifying stable asset class, promising yield
� Our experience: market is partly driven by low-yielding KfW/Förderbank exposure,low-yielding asset class with medium to high risks; no additional fee income; high structuring and legal complexity in different jurisdictions
� Conclusion: No realistic invest-ment opportunity, especially in Germany, but investments via public Schuldschein market in Germany feasible
I Organisation InvestmentsII Case Study IIII Case Study IIIV Risk & ControllingV Final RemarksVI
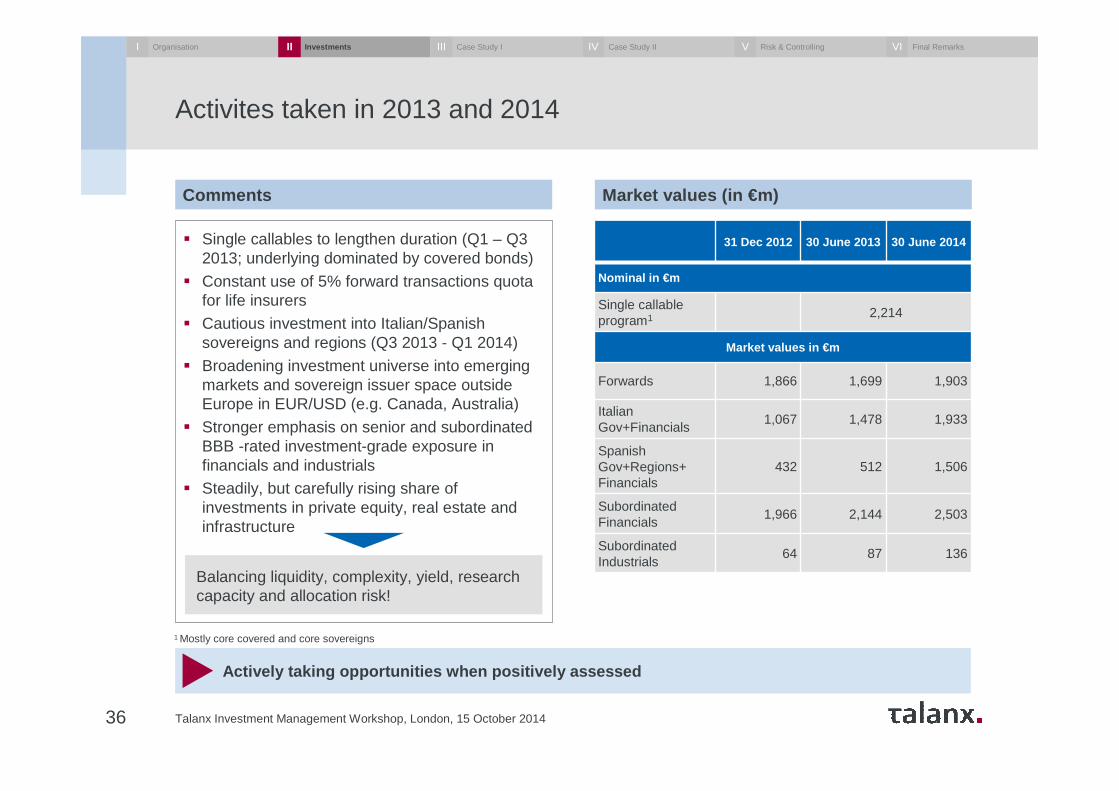
Activites taken in 2013 and 2014
Talanx Investment Management Workshop, London, 15 October 201436
Actively taking opportunities when positively assess ed
� Single callables to lengthen duration (Q1 – Q3 2013; underlying dominated by covered bonds)
� Constant use of 5% forward transactions quota for life insurers
� Cautious investment into Italian/Spanish sovereigns and regions (Q3 2013 - Q1 2014)
� Broadening investment universe into emerging markets and sovereign issuer space outside Europe in EUR/USD (e.g. Canada, Australia)
� Stronger emphasis on senior and subordinated BBB -rated investment-grade exposure in financials and industrials
� Steadily, but carefully rising share of investments in private equity, real estate and infrastructure
Comments
31 Dec 2012 30 June 2013 30 June 2014
Nominal in €m
Single callableprogram1 2,214
Market values in €m
Forwards 1,866 1,699 1,903
ItalianGov+Financials
1,067 1,478 1,933
SpanishGov+Regions+Financials
432 512 1,506
SubordinatedFinancials
1,966 2,144 2,503
SubordinatedIndustrials
64 87 136
Market values (in €m)
Balancing liquidity, complexity, yield, research capacity and allocation risk!
1 Mostly core covered and core sovereigns
I Organisation InvestmentsII Case Study IIII Case Study IIIV Risk & ControllingV Final RemarksVI
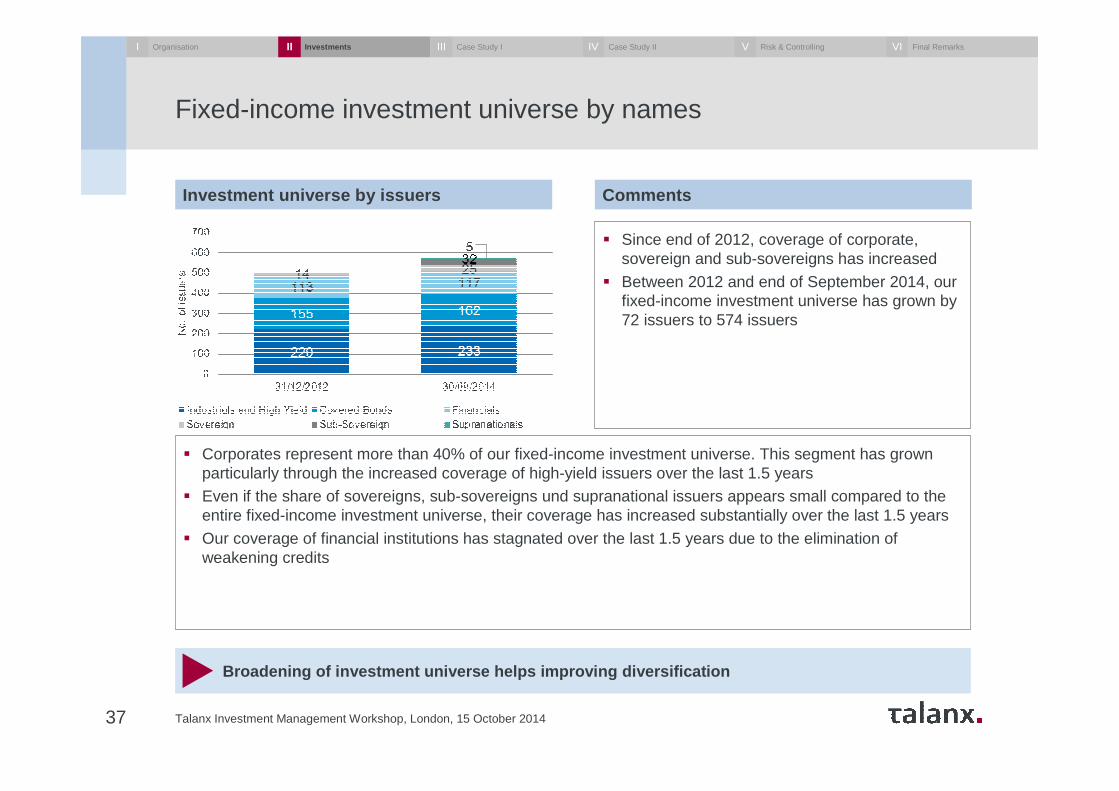
Fixed-income investment universe by names
Talanx Investment Management Workshop, London, 15 October 201437
Broadening of investment universe helps improving d iversification
� Corporates represent more than 40% of our fixed-income investment universe. This segment has grown particularly through the increased coverage of high-yield issuers over the last 1.5 years
� Even if the share of sovereigns, sub-sovereigns und supranational issuers appears small compared to the entire fixed-income investment universe, their coverage has increased substantially over the last 1.5 years
� Our coverage of financial institutions has stagnated over the last 1.5 years due to the elimination of weakening credits
� Since end of 2012, coverage of corporate, sovereign and sub-sovereigns has increased
� Between 2012 and end of September 2014, our fixed-income investment universe has grown by 72 issuers to 574 issuers
Investment universe by issuers Comments
I Organisation InvestmentsII Case Study IIII Case Study IIIV Risk & ControllingV Final RemarksVI
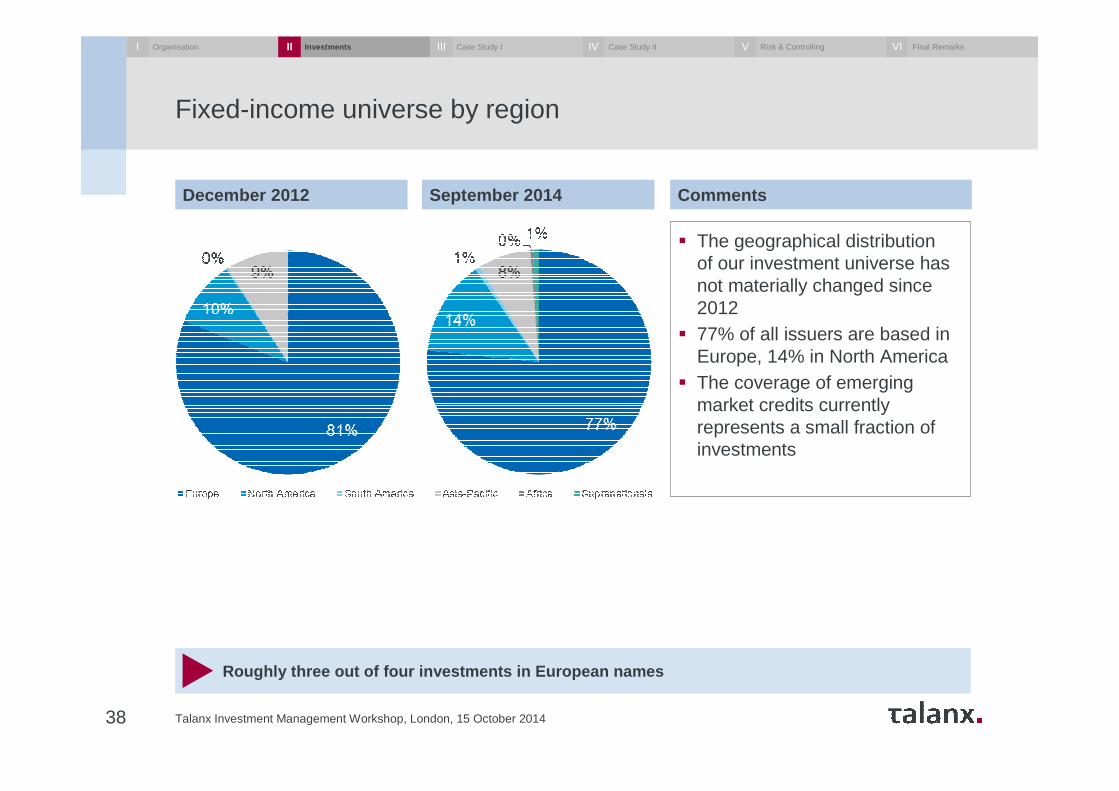
Fixed-income universe by region
Talanx Investment Management Workshop, London, 15 October 201438
Roughly three out of four investments in European name s
� The geographical distribution of our investment universe has not materially changed since 2012
� 77% of all issuers are based in Europe, 14% in North America
� The coverage of emerging market credits currently represents a small fraction of investments
December 2012 September 2014 Comments
I Organisation InvestmentsII Case Study IIII Case Study IIIV Risk & ControllingV Final RemarksVI
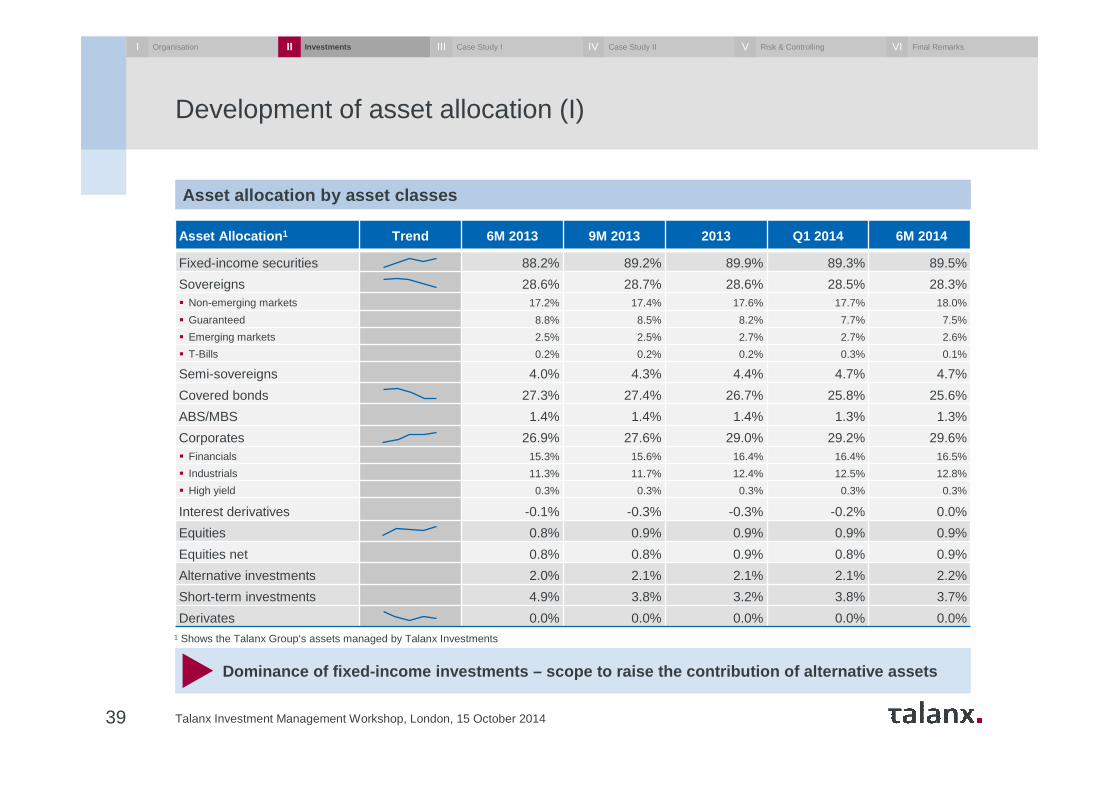
Development of asset allocation (I)
Talanx Investment Management Workshop, London, 15 October 201439
Dominance of fixed-income investments – scope to raise the contribution of alternative assets
Asset allocation by asset classes
Asset Allocation 1 Trend 6M 2013 9M 2013 2013 Q1 2014 6M 2014
Fixed-income securities 88.2% 89.2% 89.9% 89.3% 89.5%
Sovereigns 28.6% 28.7% 28.6% 28.5% 28.3%� Non-emerging markets 17.2% 17.4% 17.6% 17.7% 18.0%
� Guaranteed 8.8% 8.5% 8.2% 7.7% 7.5%
� Emerging markets 2.5% 2.5% 2.7% 2.7% 2.6%
� T-Bills 0.2% 0.2% 0.2% 0.3% 0.1%
Semi-sovereigns 4.0% 4.3% 4.4% 4.7% 4.7%
Covered bonds 27.3% 27.4% 26.7% 25.8% 25.6%
ABS/MBS 1.4% 1.4% 1.4% 1.3% 1.3%
Corporates 26.9% 27.6% 29.0% 29.2% 29.6%� Financials 15.3% 15.6% 16.4% 16.4% 16.5%
� Industrials 11.3% 11.7% 12.4% 12.5% 12.8%
� High yield 0.3% 0.3% 0.3% 0.3% 0.3%
Interest derivatives -0.1% -0.3% -0.3% -0.2% 0.0%
Equities 0.8% 0.9% 0.9% 0.9% 0.9%
Equities net 0.8% 0.8% 0.9% 0.8% 0.9%
Alternative investments 2.0% 2.1% 2.1% 2.1% 2.2%
Short-term investments 4.9% 3.8% 3.2% 3.8% 3.7%
Derivates 0.0% 0.0% 0.0% 0.0% 0.0%1 Shows the Talanx Group‘s assets managed by Talanx Investments
I Organisation InvestmentsII Case Study IIII Case Study IIIV Risk & ControllingV Final RemarksVI
Development of asset allocation (II)
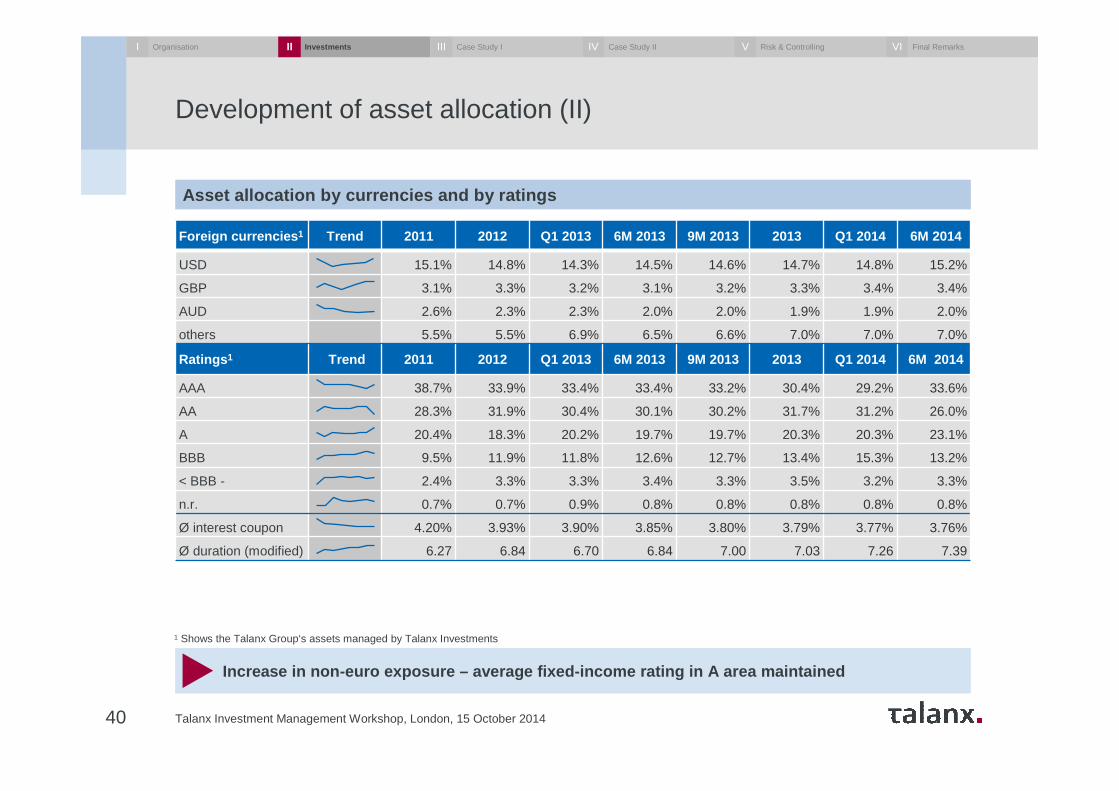
Talanx Investment Management Workshop, London, 15 October 201440
Increase in non-euro exposure – average fixed-income rati ng in A area maintained
Asset allocation by currencies and by ratings
Foreign currencies 1 Trend 2011 2012 Q1 2013 6M 2013 9M 2013 2013 Q1 2014 6M 2014
USD 15.1% 14.8% 14.3% 14.5% 14.6% 14.7% 14.8% 15.2%
GBP 3.1% 3.3% 3.2% 3.1% 3.2% 3.3% 3.4% 3.4%
AUD 2.6% 2.3% 2.3% 2.0% 2.0% 1.9% 1.9% 2.0%
others 5.5% 5.5% 6.9% 6.5% 6.6% 7.0% 7.0% 7.0%
Ratings 1 Trend 2011 2012 Q1 2013 6M 2013 9M 2013 2013 Q1 2014 6M 2014
AAA 38.7% 33.9% 33.4% 33.4% 33.2% 30.4% 29.2% 33.6%
AA 28.3% 31.9% 30.4% 30.1% 30.2% 31.7% 31.2% 26.0%
A 20.4% 18.3% 20.2% 19.7% 19.7% 20.3% 20.3% 23.1%
BBB 9.5% 11.9% 11.8% 12.6% 12.7% 13.4% 15.3% 13.2%
< BBB - 2.4% 3.3% 3.3% 3.4% 3.3% 3.5% 3.2% 3.3%
n.r. 0.7% 0.7% 0.9% 0.8% 0.8% 0.8% 0.8% 0.8%
Ø interest coupon 4.20% 3.93% 3.90% 3.85% 3.80% 3.79% 3.77% 3.76%
Ø duration (modified) 6.27 6.84 6.70 6.84 7.00 7.03 7.26 7.39
1 Shows the Talanx Group‘s assets managed by Talanx Investments
I Organisation InvestmentsII Case Study IIII Case Study IIIV Risk & ControllingV Final RemarksVI
Exposure in GIIPS markets
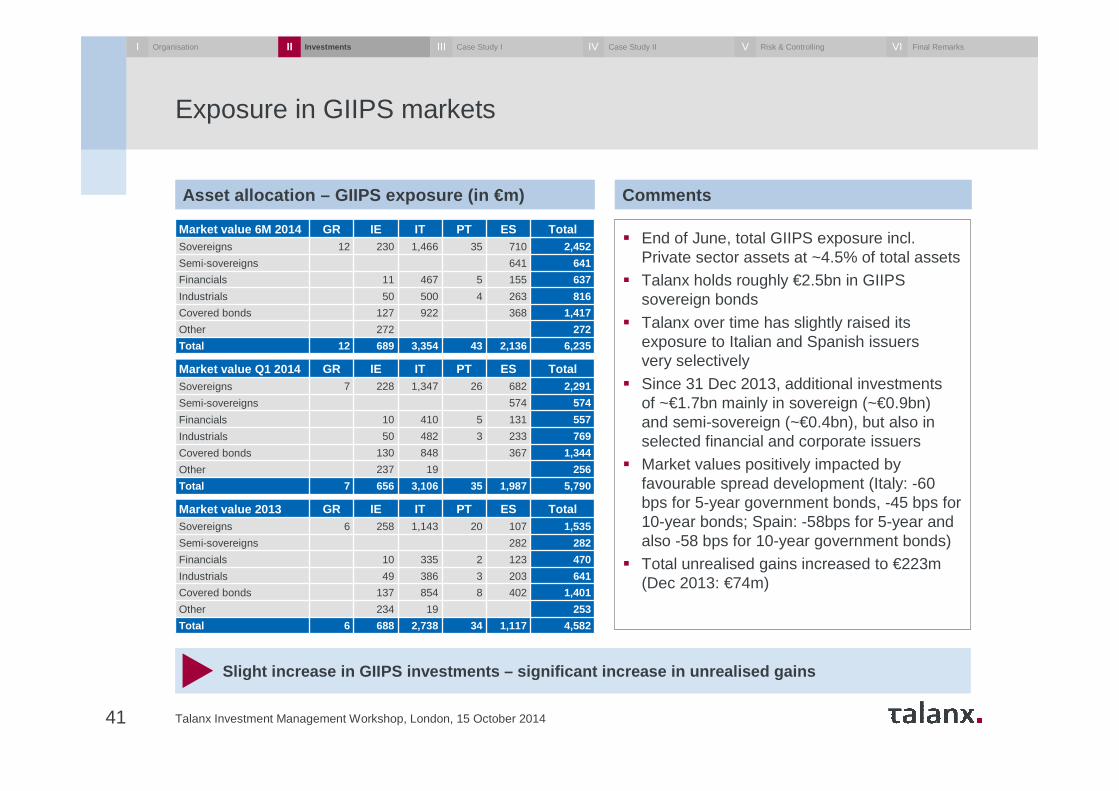
Talanx Investment Management Workshop, London, 15 October 201441
Slight increase in GIIPS investments – significant incre ase in unrealised gains
Asset allocation – GIIPS exposure (in €m)
Market value 6M 2014 GR IE IT PT ES TotalSovereigns 12 230 1,466 35 710 2,452
Semi-sovereigns 641 641
Financials 11 467 5 155 637
Industrials 50 500 4 263 816
Covered bonds 127 922 368 1,417
Other 272 272
Total 12 689 3,354 43 2,136 6,235
Market value Q1 2014 GR IE IT PT ES TotalSovereigns 7 228 1,347 26 682 2,291
Semi-sovereigns 574 574
Financials 10 410 5 131 557
Industrials 50 482 3 233 769
Covered bonds 130 848 367 1,344
Other 237 19 256
Total 7 656 3,106 35 1,987 5,790
Market value 2013 GR IE IT PT ES TotalSovereigns 6 258 1,143 20 107 1,535
Semi-sovereigns 282 282
Financials 10 335 2 123 470
Industrials 49 386 3 203 641
Covered bonds 137 854 8 402 1,401
Other 234 19 253
Total 6 688 2,738 34 1,117 4,582
Comments
� End of June, total GIIPS exposure incl. Private sector assets at ~4.5% of total assets
� Talanx holds roughly €2.5bn in GIIPS sovereign bonds
� Talanx over time has slightly raised its exposure to Italian and Spanish issuers very selectively
� Since 31 Dec 2013, additional investments of ~€1.7bn mainly in sovereign (~€0.9bn) and semi-sovereign (~€0.4bn), but also in selected financial and corporate issuers
� Market values positively impacted by favourable spread development (Italy: -60 bps for 5-year government bonds, -45 bps for 10-year bonds; Spain: -58bps for 5-year and also -58 bps for 10-year government bonds)
� Total unrealised gains increased to €223m (Dec 2013: €74m)
I Organisation InvestmentsII Case Study IIII Case Study IIIV Risk & ControllingV Final RemarksVI
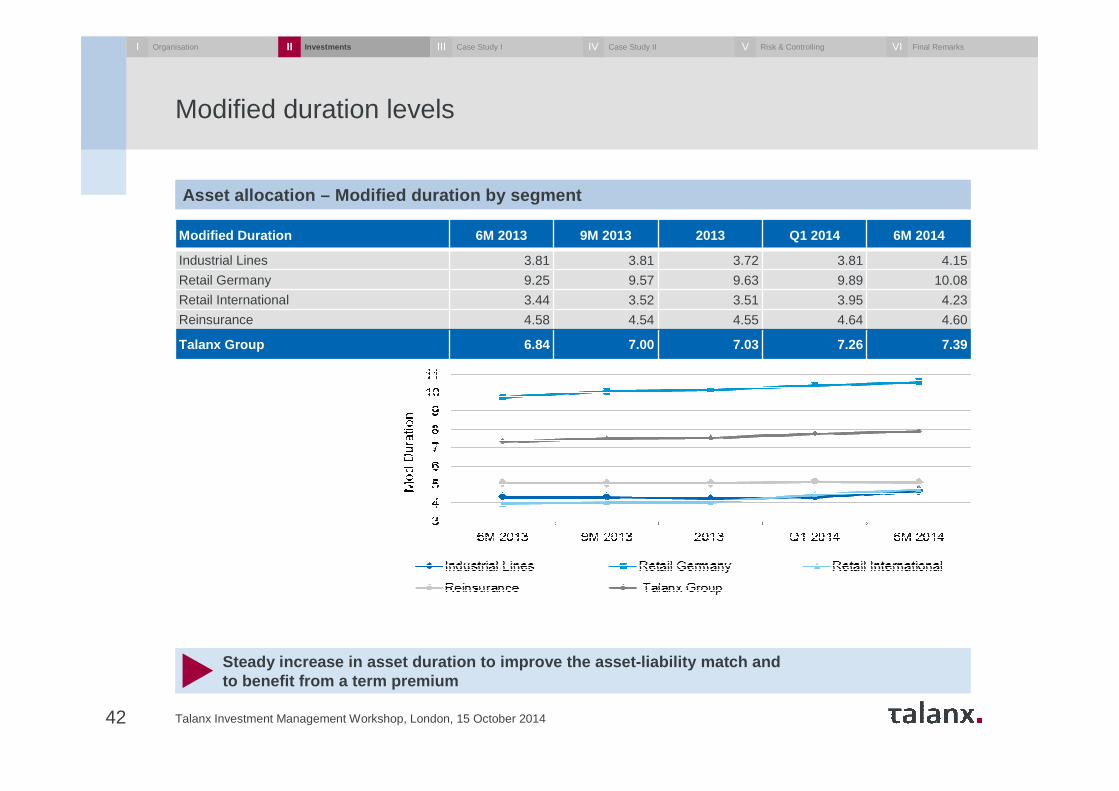
Modified duration levels
Talanx Investment Management Workshop, London, 15 October 201442
Steady increase in asset duration to improve the asset -liability match andto benefit from a term premium
Asset allocation – Modified duration by segment
Modified Duration 6M 2013 9M 2013 2013 Q1 2014 6M 2014
Industrial Lines 3.81 3.81 3.72 3.81 4.15
Retail Germany 9.25 9.57 9.63 9.89 10.08
Retail International 3.44 3.52 3.51 3.95 4.23
Reinsurance 4.58 4.54 4.55 4.64 4.60
Talanx Group 6.84 7.00 7.03 7.26 7.39
I Organisation InvestmentsII Case Study IIII Case Study IIIV Risk & ControllingV Final RemarksVI
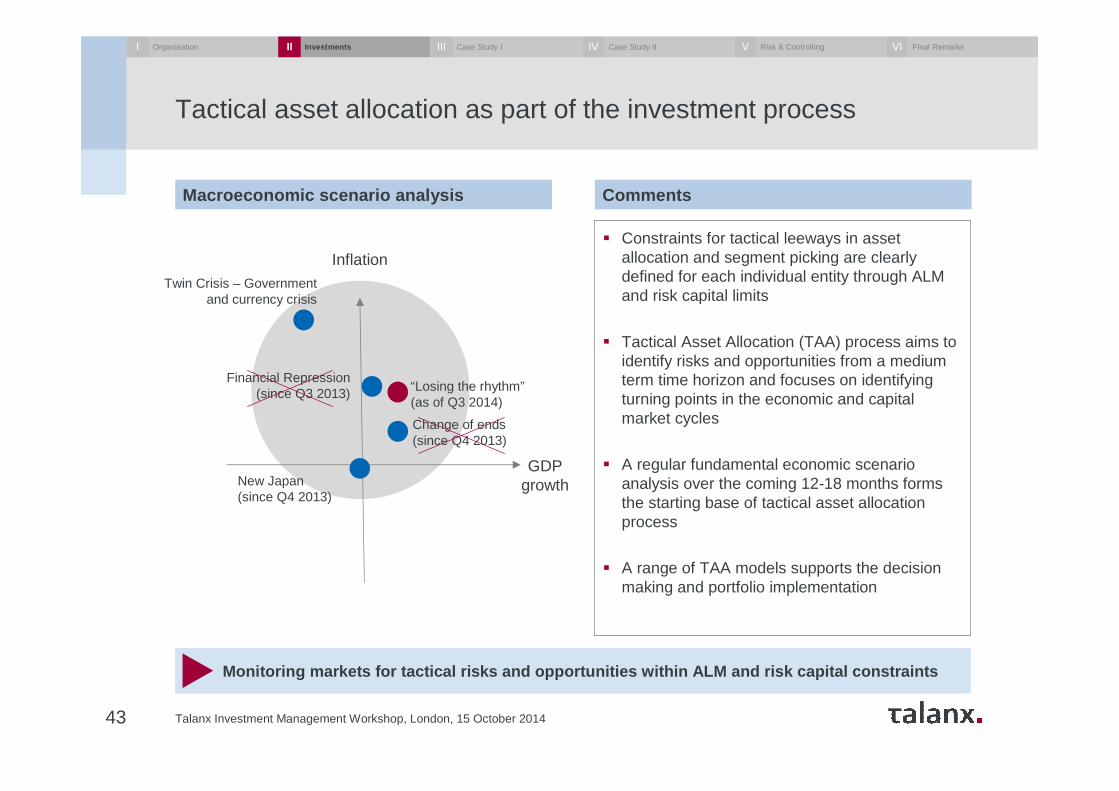
Tactical asset allocation as part of the investment process
Talanx Investment Management Workshop, London, 15 October 201443
Monitoring markets for tactical risks and opportuni ties within ALM and risk capital constraints
Macroeconomic scenario analysis
� Constraints for tactical leeways in asset allocation and segment picking are clearly defined for each individual entity through ALM and risk capital limits
� Tactical Asset Allocation (TAA) process aims to identify risks and opportunities from a medium term time horizon and focuses on identifying turning points in the economic and capital market cycles
� A regular fundamental economic scenario analysis over the coming 12-18 months forms the starting base of tactical asset allocation process
� A range of TAA models supports the decision making and portfolio implementation
Comments
Inflation
GDPgrowthNew Japan
(since Q4 2013)
Twin Crisis – Government and currency crisis
Change of ends(since Q4 2013)
Financial Repression(since Q3 2013) “Losing the rhythm”
(as of Q3 2014)
I Organisation InvestmentsII Case Study IIII Case Study IIIV Risk & ControllingV Final RemarksVI
Talanx Investment Management Workshop, London, 15 October 201444
Focus on a disciplined research and investment process
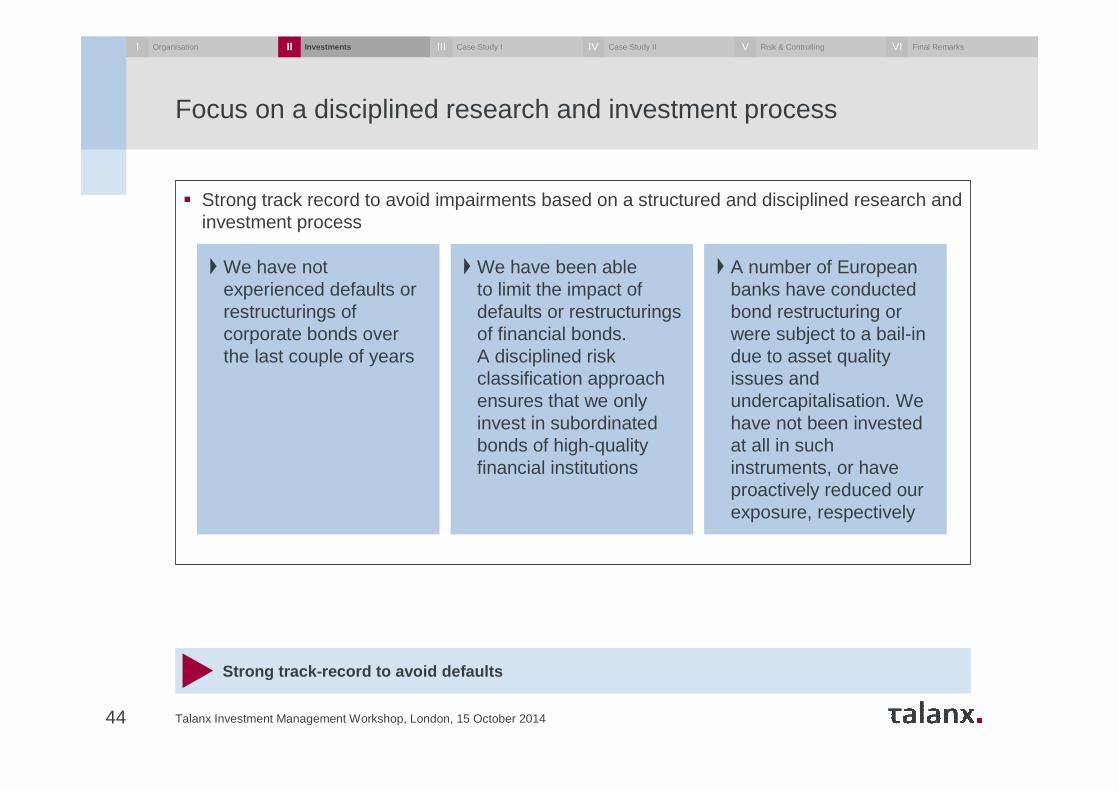
� Strong track record to avoid impairments based on a structured and disciplined research and investment process
We have not experienced defaults or restructurings of corporate bonds over the last couple of years
We have been able to limit the impact of defaults or restructurings of financial bonds.A disciplined risk classification approach ensures that we only invest in subordinated bonds of high-quality financial institutions
A number of European banks have conducted bond restructuring or were subject to a bail-in due to asset quality issues and undercapitalisation. We have not been invested at all in such instruments, or have proactively reduced our exposure, respectively
Strong track-record to avoid defaults
I Organisation InvestmentsII Case Study IIII Case Study IIIV Risk & ControllingV Final RemarksVI
Talanx Investment Management Workshop, London, 15 October 201445
Talanx Investments and key credit events
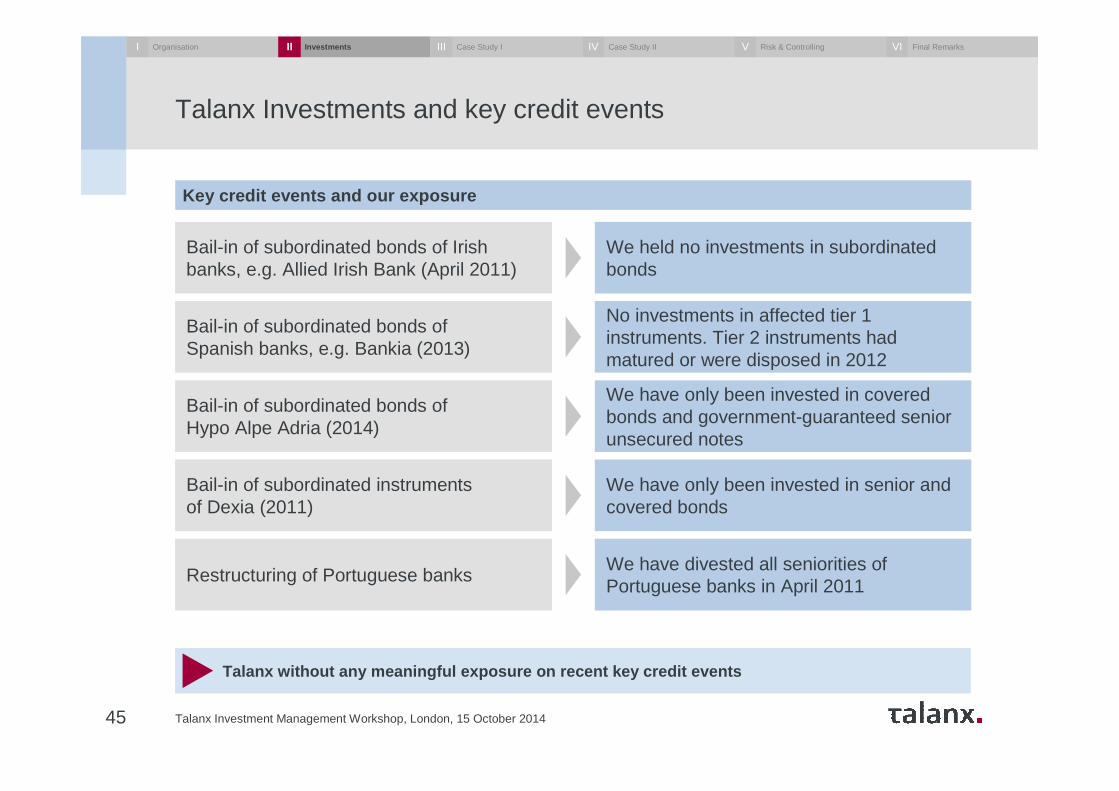
Key credit events and our exposure
Bail-in of subordinated bonds of Irish banks, e.g. Allied Irish Bank (April 2011)
We held no investments in subordinated bonds
Bail-in of subordinated bonds of Spanish banks, e.g. Bankia (2013)
No investments in affected tier 1 instruments. Tier 2 instruments hadmatured or were disposed in 2012
Bail-in of subordinated bonds of Hypo Alpe Adria (2014)
We have only been invested in covered bonds and government-guaranteed senior unsecured notes
Bail-in of subordinated instruments of Dexia (2011)
We have only been invested in senior and covered bonds
Restructuring of Portuguese banksWe have divested all seniorities of Portuguese banks in April 2011
Talanx without any meaningful exposure on recent key credit events
I Organisation InvestmentsII Case Study IIII Case Study IIIV Risk & ControllingV Final RemarksVI
Impairment history
Talanx Investment Management Workshop, London, 15 October 201446
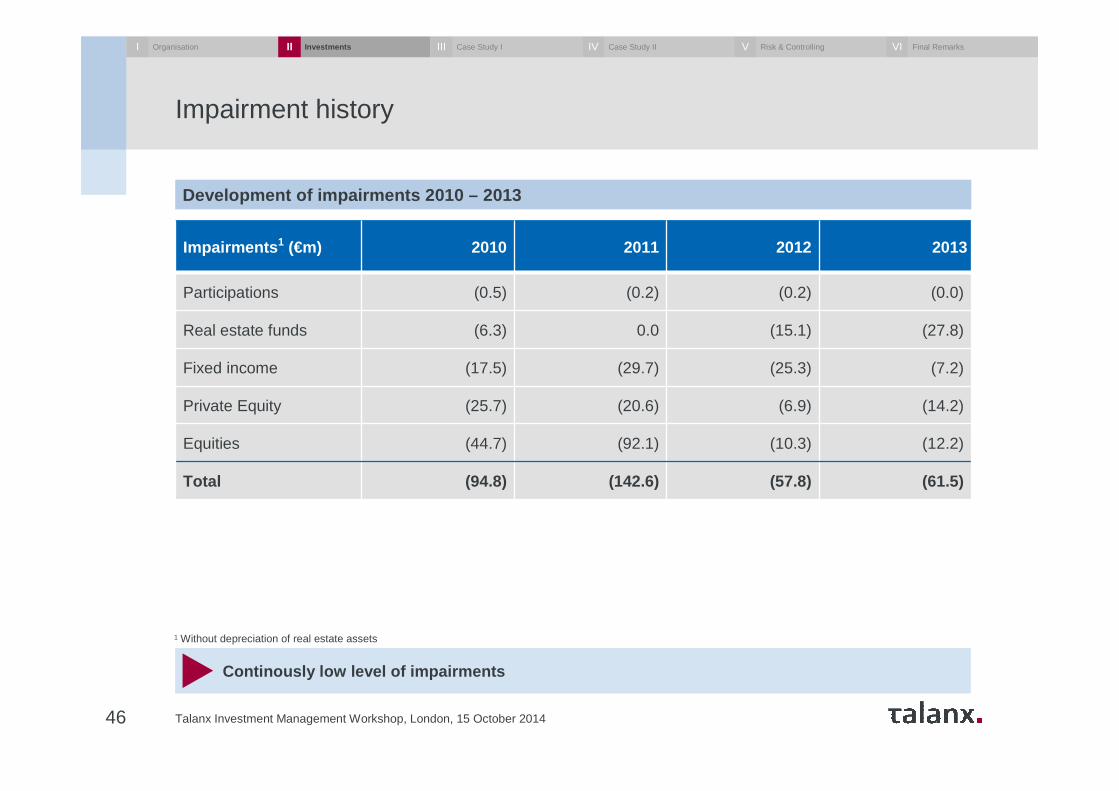
Continously low level of impairments
Development of impairments 2010 – 2013
Impairments 1 (€m) 2010 2011 2012 2013
Participations (0.5) (0.2) (0.2) (0.0)
Real estate funds (6.3) 0.0 (15.1) (27.8)
Fixed income (17.5) (29.7) (25.3) (7.2)
Private Equity (25.7) (20.6) (6.9) (14.2)
Equities (44.7) (92.1) (10.3) (12.2)
Total (94.8) (142.6) (57.8) (61.5)
1 Without depreciation of real estate assets
I Organisation InvestmentsII Case Study IIII Case Study IIIV Risk & ControllingV Final RemarksVI
Development of our exposure in alternative investments
Talanx Investment Management Workshop, London, 15 October 201447
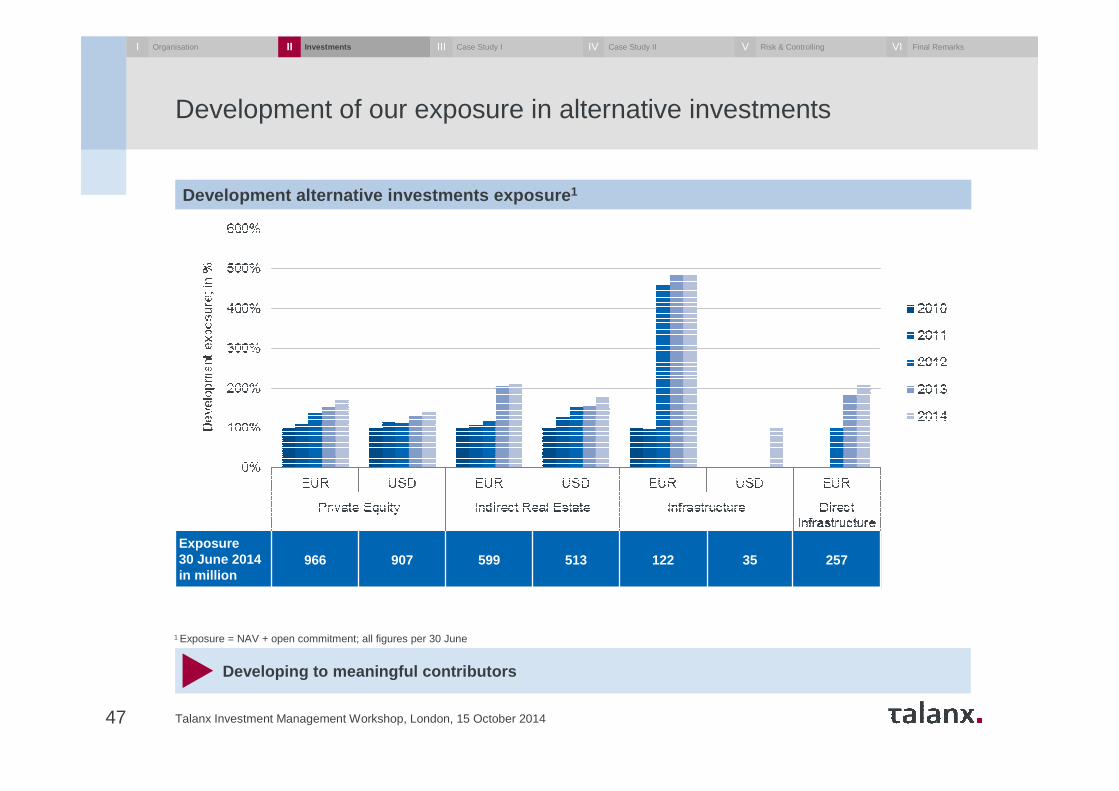
Developing to meaningful contributors
Development alternative investments exposure 1
1 Exposure = NAV + open commitment; all figures per 30 June
Exposure30 June 2014 in million
966 907 599 513 122 35 257
I Organisation InvestmentsII Case Study IIII Case Study IIIV Risk & ControllingV Final RemarksVI
Agenda
48 Talanx Investment Management Workshop, London, 15 October 2014
Organisational set-up and processI Dr. Immo Querner
Dr. Dirk Erdmann
Thomas Fiebig
Dr. Bernhard Graeber
Dr. Immo Querner
Case study I: Infrastructure investments
Concluding remarks
Case study II: Direct real estate investments
Risk measurement, evaluation and control
III
IV
V
VI
Investment challenges and responsesII Dr. Thomas Mann
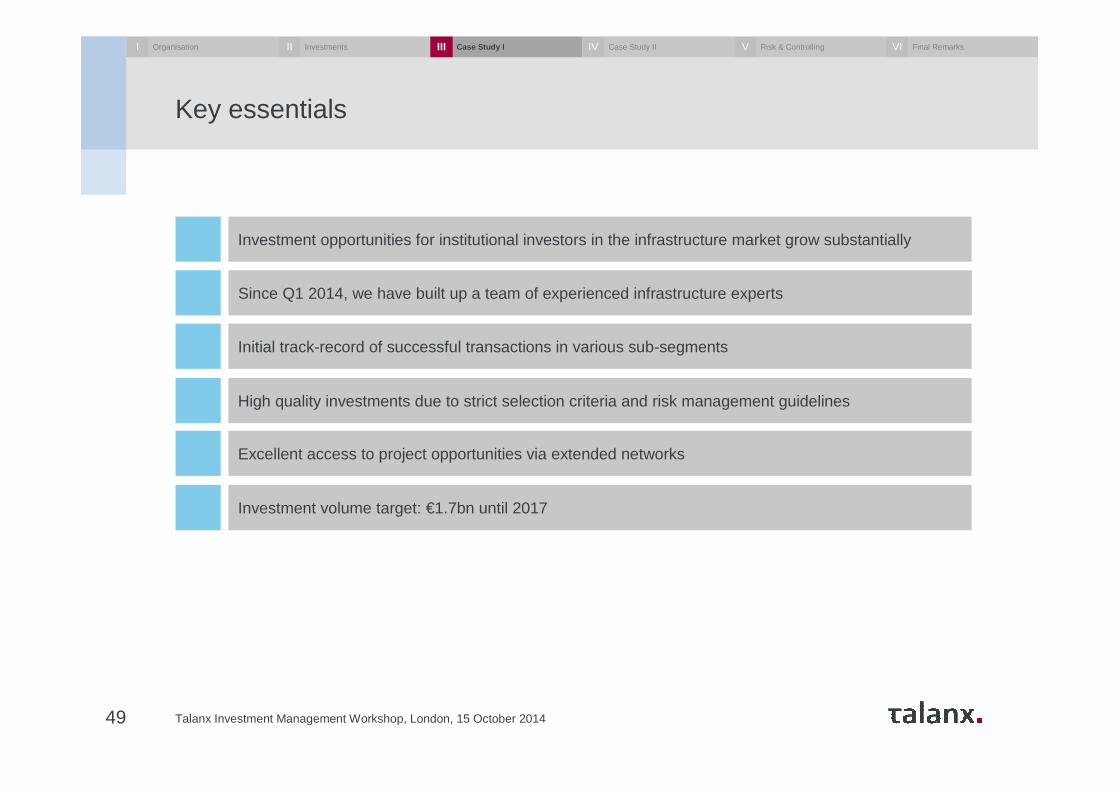
Key essentials
Talanx Investment Management Workshop, London, 15 October 201449
Investment opportunities for institutional investors in the infrastructure market grow substantially
Excellent access to project opportunities via extended networks
Initial track-record of successful transactions in various sub-segments
High quality investments due to strict selection criteria and risk management guidelines
Since Q1 2014, we have built up a team of experienced infrastructure experts
Investment volume target: €1.7bn until 2017
I Organisation InvestmentsII Case Study IIII Case Study IIIV Risk & ControllingV Final RemarksVI
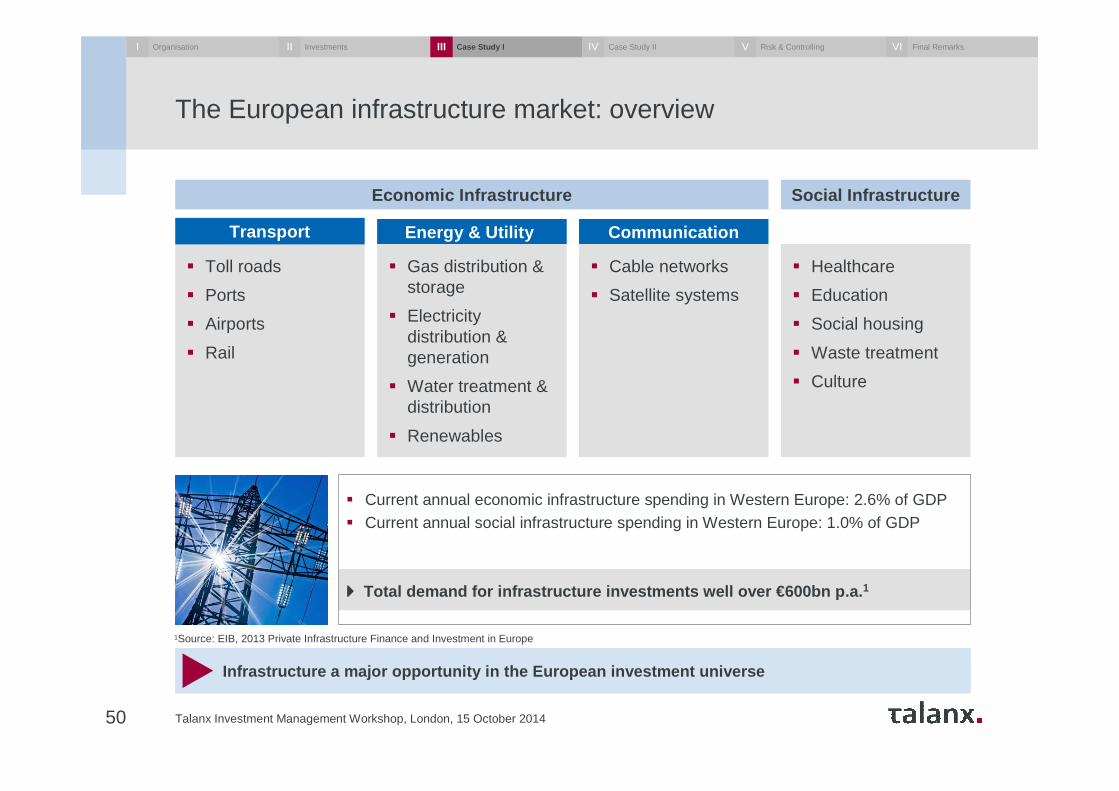
The European infrastructure market: overview
Talanx Investment Management Workshop, London, 15 October 201450
Infrastructure a major opportunity in the European inve stment universe
� Current annual economic infrastructure spending in Western Europe: 2.6% of GDP � Current annual social infrastructure spending in Western Europe: 1.0% of GDP
���� Total demand for infrastructure investments well ov er €600bn p.a. 1
� Toll roads
� Ports
� Airports
� Rail
Transport Energy & Utility Communication
Social Infrastructure Economic Infrastructure
� Gas distribution & storage
� Electricity distribution & generation
� Water treatment & distribution
� Renewables
� Cable networks
� Satellite systems
� Healthcare
� Education
� Social housing
� Waste treatment
� Culture
1Source: EIB, 2013 Private Infrastructure Finance and Investment in Europe
I Organisation InvestmentsII Case Study IIII Case Study IIIV Risk & ControllingV Final RemarksVI
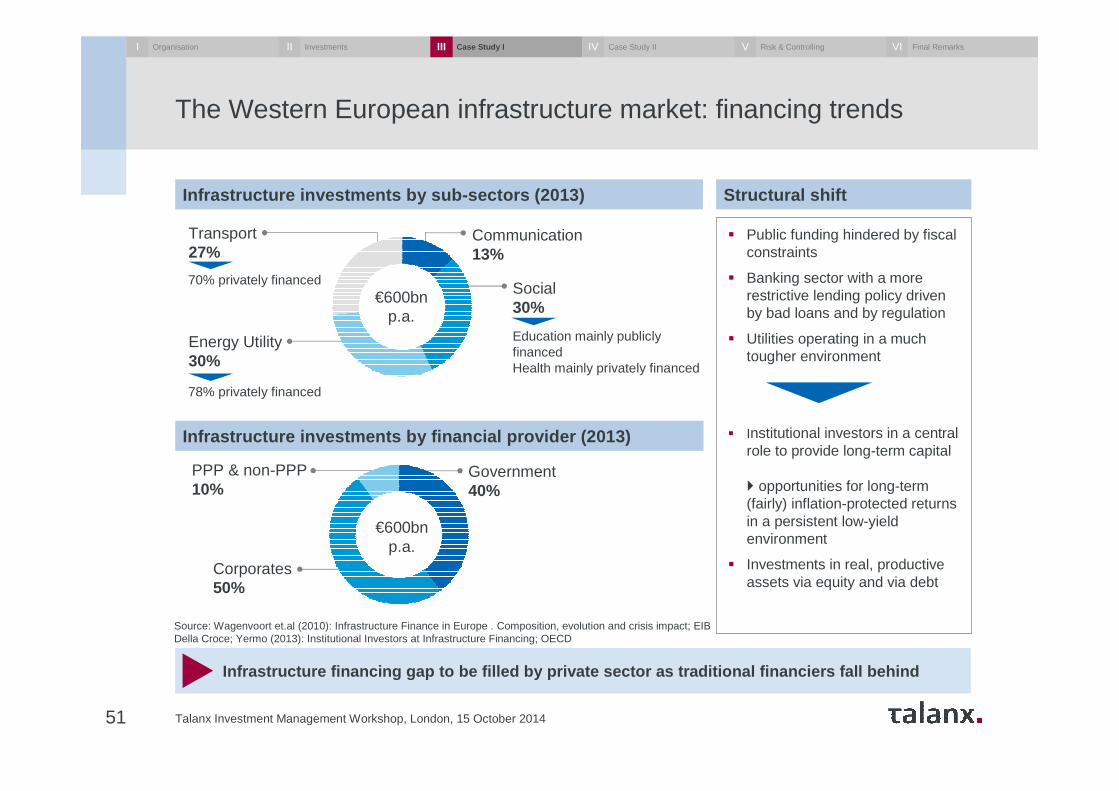
The Western European infrastructure market: financing trends
Talanx Investment Management Workshop, London, 15 October 201451
Infrastructure financing gap to be filled by privat e sector as traditional financiers fall behind
Infrastructure investments by sub-sectors (2013)
Source: Wagenvoort et.al (2010): Infrastructure Finance in Europe . Composition, evolution and crisis impact; EIBDella Croce; Yermo (2013): Institutional Investors at Infrastructure Financing; OECD
� Public funding hindered by fiscal constraints
� Banking sector with a morerestrictive lending policy drivenby bad loans and by regulation
� Utilities operating in a muchtougher environment
� Institutional investors in a central role to provide long-term capital
� opportunities for long-term (fairly) inflation-protected returns in a persistent low-yield environment
� Investments in real, productive assets via equity and via debt
Communication13%
Social30%
Education mainly publicly financedHealth mainly privately financed
Energy Utility30%
78% privately financed
Transport27%
70% privately financed
Government40%
Corporates50%
PPP & non-PPP10%
€600bn p.a.
€600bn p.a.
Structural shift
Infrastructure investments by financial provider (2 013)
I Organisation InvestmentsII Case Study IIII Case Study IIIV Risk & ControllingV Final RemarksVI
Talanx Investment Management Workshop, London, 15 October 201452
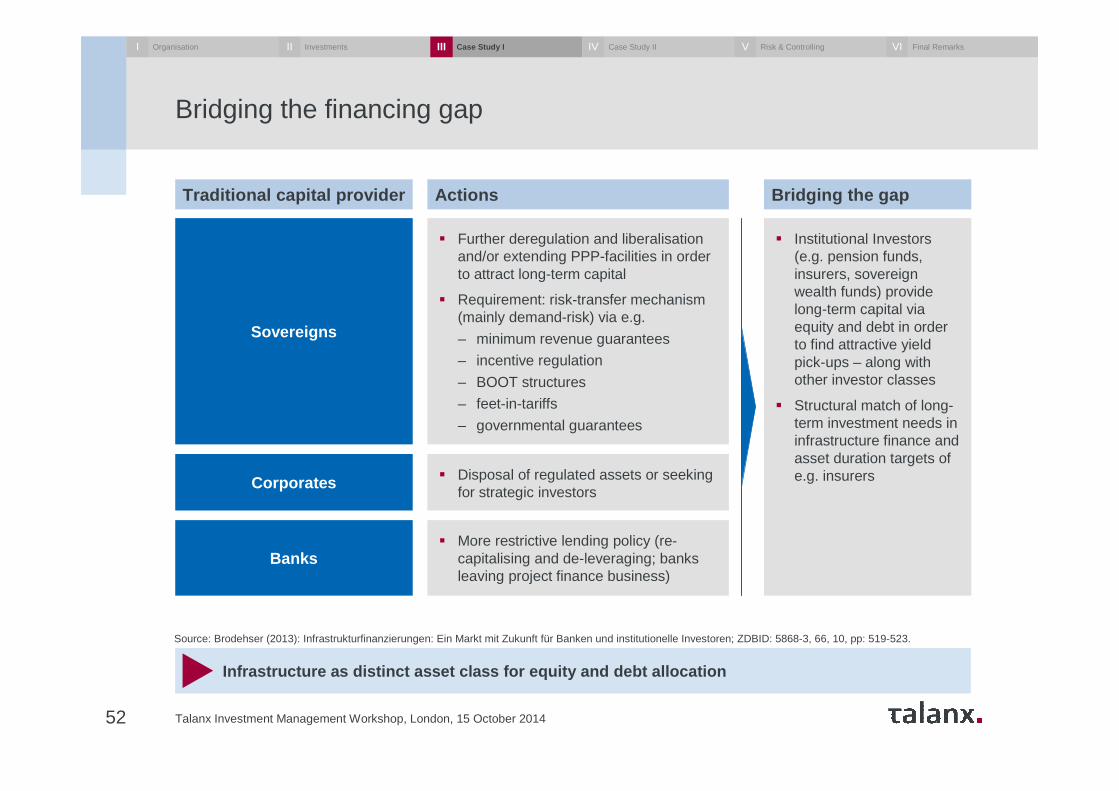
Bridging the financing gap
� Institutional Investors (e.g. pension funds, insurers, sovereign wealth funds) provide long-term capital via equity and debt in orderto find attractive yieldpick-ups – along withother investor classes
� Structural match of long-term investment needs in infrastructure finance and asset duration targets of e.g. insurers
� Further deregulation and liberalisationand/or extending PPP-facilities in order to attract long-term capital
� Requirement: risk-transfer mechanism (mainly demand-risk) via e.g.
– minimum revenue guarantees
– incentive regulation
– BOOT structures
– feet-in-tariffs
– governmental guarantees
Sovereigns
Corporates � Disposal of regulated assets or seeking for strategic investors
Banks� More restrictive lending policy (re-
capitalising and de-leveraging; banks leaving project finance business)
Infrastructure as distinct asset class for equity a nd debt allocation
Traditional capital provider Actions Bridging the gap
Source: Brodehser (2013): Infrastrukturfinanzierungen: Ein Markt mit Zukunft für Banken und institutionelle Investoren; ZDBID: 5868-3, 66, 10, pp: 519-523.
I Organisation InvestmentsII Case Study IIII Case Study IIIV Risk & ControllingV Final RemarksVI
Talanx Investment Management Workshop, London, 15 October 201453
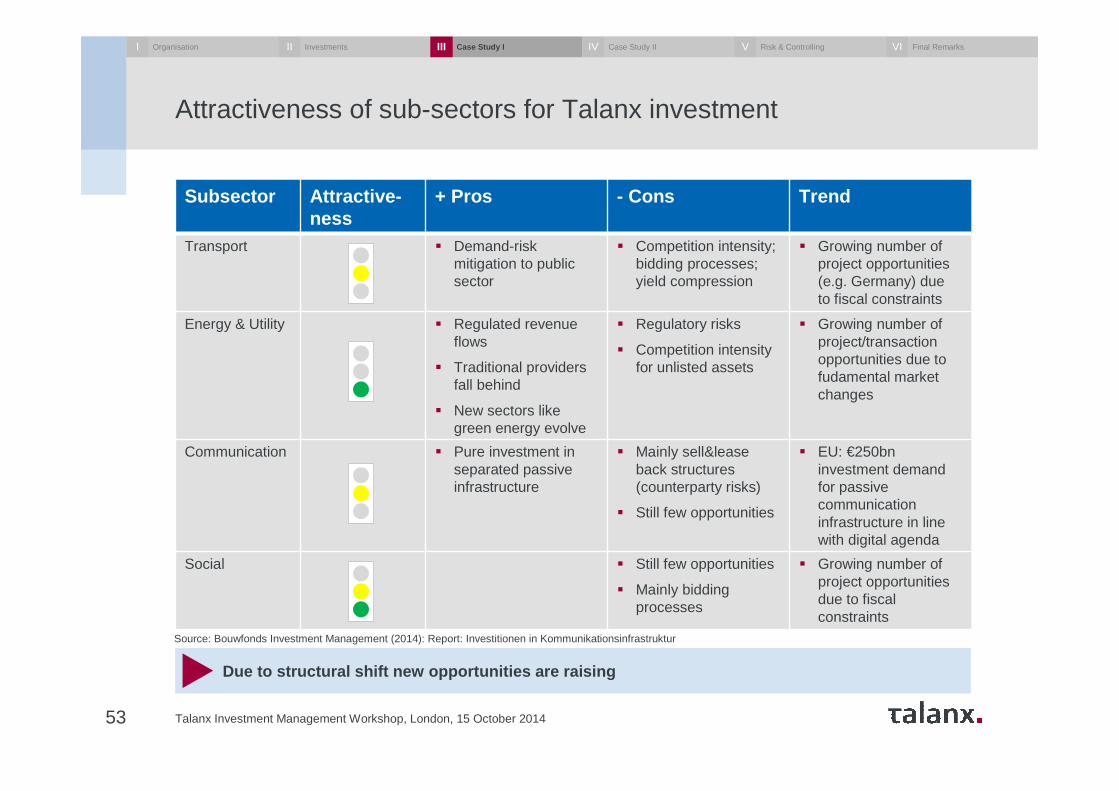
Attractiveness of sub-sectors for Talanx investment
Subsector Attractive-ness
+ Pros - Cons Trend
Transport � Demand-riskmitigation to publicsector
� Competition intensity; bidding processes; yield compression
� Growing number of project opportunities(e.g. Germany) dueto fiscal constraints
Energy & Utility � Regulated revenueflows
� Traditional providersfall behind
� New sectors likegreen energy evolve
� Regulatory risks
� Competition intensityfor unlisted assets
� Growing number of project/transactionopportunities due to fudamental marketchanges
Communication � Pure investment in separated passive infrastructure
� Mainly sell&leaseback structures(counterparty risks)
� Still few opportunities
� EU: €250bninvestment demandfor passive communicationinfrastructure in linewith digital agenda
Social � Still few opportunities
� Mainly biddingprocesses
� Growing number of project opportunitiesdue to fiscalconstraints
Due to structural shift new opportunities are raisi ng
Source: Bouwfonds Investment Management (2014): Report: Investitionen in Kommunikationsinfrastruktur
I Organisation InvestmentsII Case Study IIII Case Study IIIV Risk & ControllingV Final RemarksVI
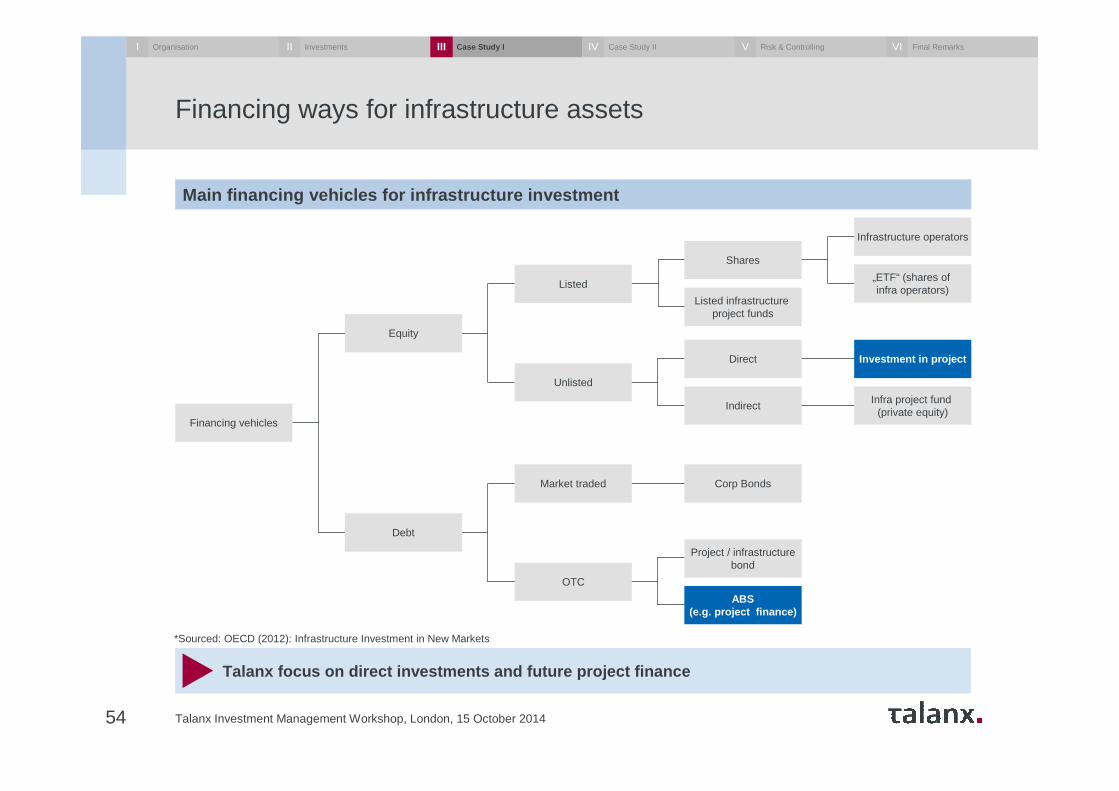
Financing ways for infrastructure assets
Talanx Investment Management Workshop, London, 15 October 201454
Talanx focus on direct investments and future proje ct finance
*Sourced: OECD (2012): Infrastructure Investment in New Markets
Main financing vehicles for infrastructure investme nt
Financing vehicles
Equity
Listed
Unlisted
Shares
Listed infrastructureproject funds
Direct
Indirect
Investment in project
Infra project fund (private equity)
Infrastructure operators
„ETF“ (shares of infra operators)
Market traded
OTC
Corp Bonds
Project / infrastructurebond
ABS(e.g. project finance)
Debt
I Organisation InvestmentsII Case Study IIII Case Study IIIV Risk & ControllingV Final RemarksVI
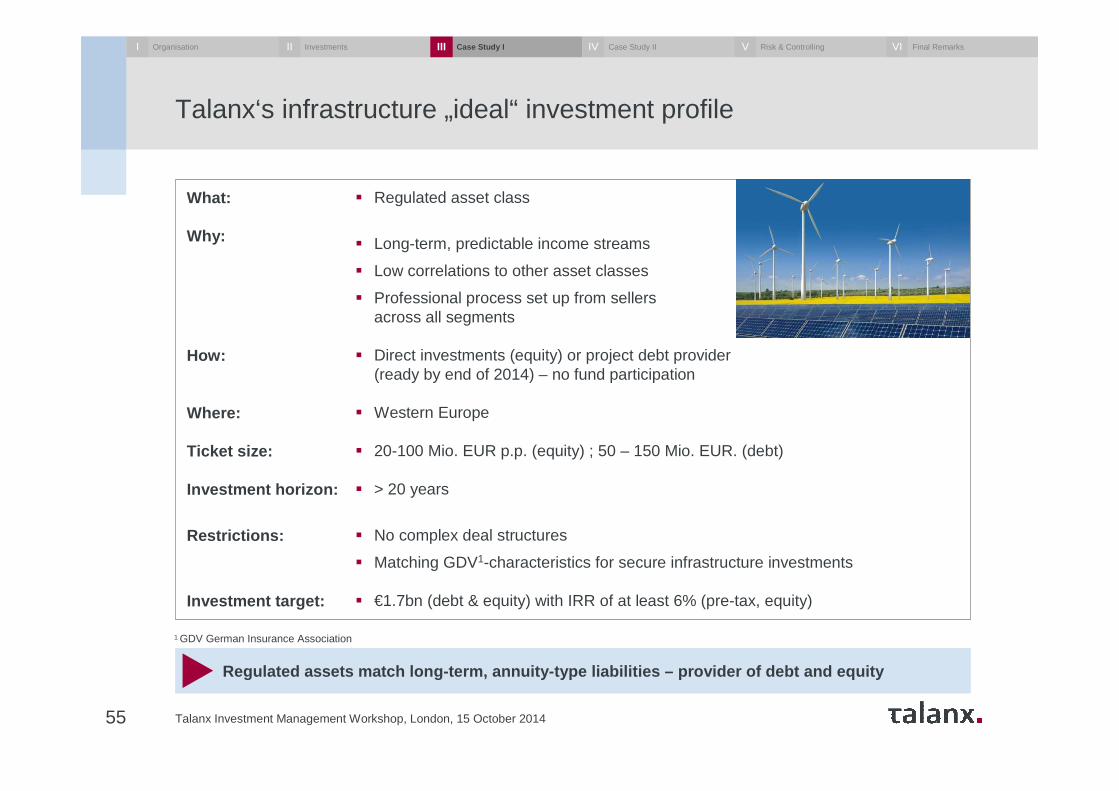
Talanx‘s infrastructure „ideal“ investment profile
Talanx Investment Management Workshop, London, 15 October 201455
Regulated assets match long-term, annuity-type liab ilities – provider of debt and equity
What:
Why:
How:
Where:
Ticket size:
Investment horizon:
Restrictions:
Investment target:
� Regulated asset class
� Long-term, predictable income streams
� Low correlations to other asset classes
� Professional process set up from sellers across all segments
� Direct investments (equity) or project debt provider (ready by end of 2014) – no fund participation
� Western Europe
� 20-100 Mio. EUR p.p. (equity) ; 50 – 150 Mio. EUR. (debt)
� > 20 years
� No complex deal structures
� Matching GDV1-characteristics for secure infrastructure investments
� €1.7bn (debt & equity) with IRR of at least 6% (pre-tax, equity)
1 GDV German Insurance Association
I Organisation InvestmentsII Case Study IIII Case Study IIIV Risk & ControllingV Final RemarksVI
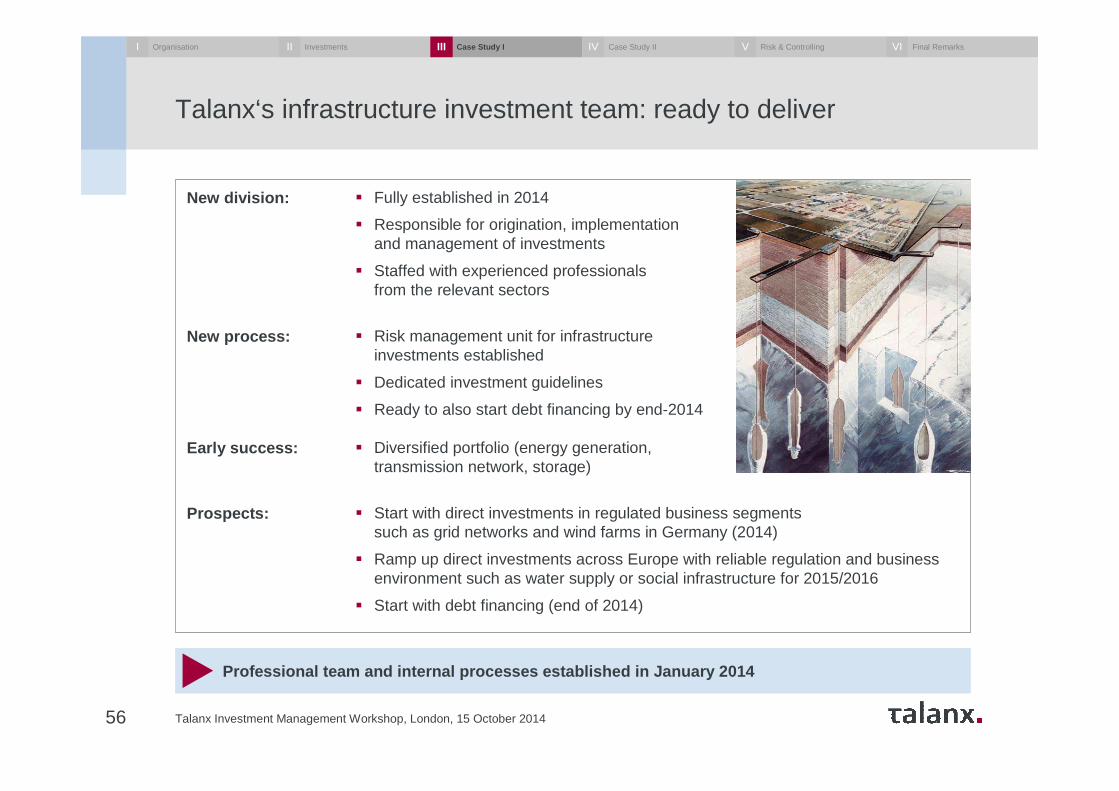
New division:
New process:
Early success:
Prospects:
Talanx‘s infrastructure investment team: ready to deliver
Talanx Investment Management Workshop, London, 15 October 201456
Professional team and internal processes establishe d in January 2014
� Fully established in 2014
� Responsible for origination, implementation and management of investments
� Staffed with experienced professionals from the relevant sectors
� Risk management unit for infrastructure investments established
� Dedicated investment guidelines
� Ready to also start debt financing by end-2014
� Diversified portfolio (energy generation, transmission network, storage)
� Start with direct investments in regulated business segments such as grid networks and wind farms in Germany (2014)
� Ramp up direct investments across Europe with reliable regulation and business environment such as water supply or social infrastructure for 2015/2016
� Start with debt financing (end of 2014)
I Organisation InvestmentsII Case Study IIII Case Study IIIV Risk & ControllingV Final RemarksVI
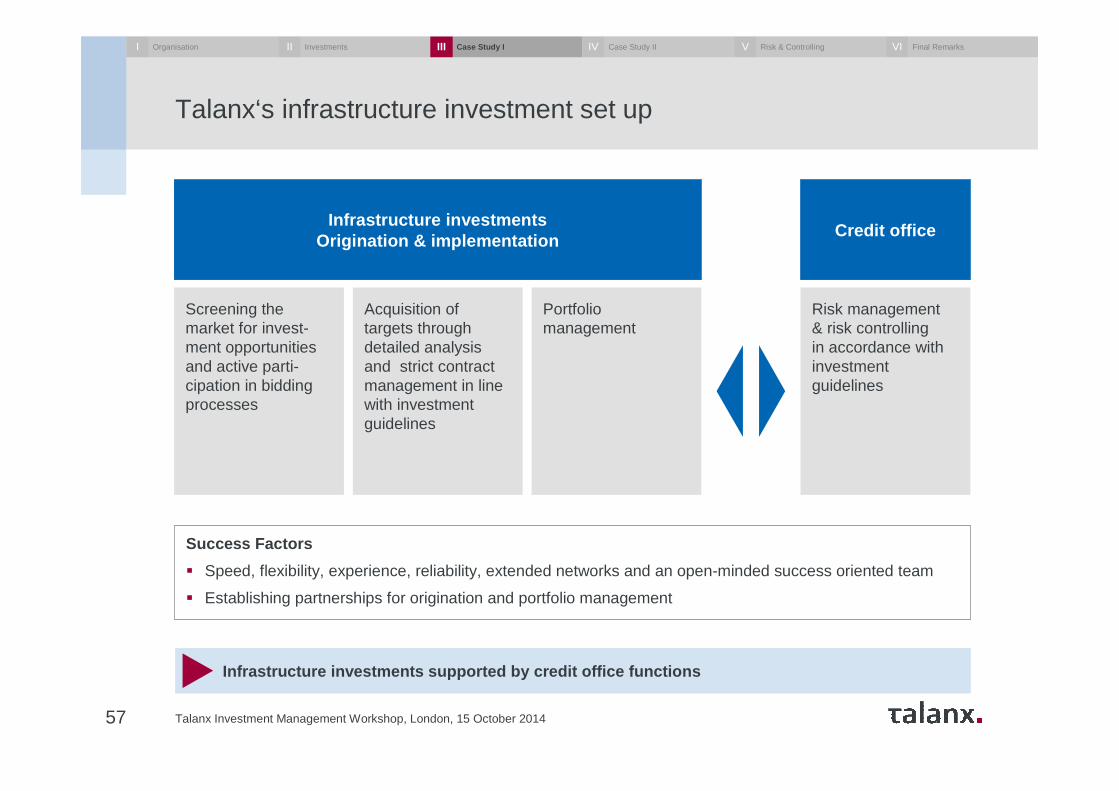
Talanx‘s infrastructure investment set up
Talanx Investment Management Workshop, London, 15 October 201457
Infrastructure investments supported by credit office fu nctions
Success Factors
� Speed, flexibility, experience, reliability, extended networks and an open-minded success oriented team
� Establishing partnerships for origination and portfolio management
Screening the market for invest-ment opportunities and active parti-cipation in bidding processes
Acquisition of targets through detailed analysis and strict contract management in line with investment guidelines
Portfolio management
Risk management& risk controlling in accordance with investment guidelines
Infrastructure investmentsOrigination & implementation
Credit office
I Organisation InvestmentsII Case Study IIII Case Study IIIV Risk & ControllingV Final RemarksVI
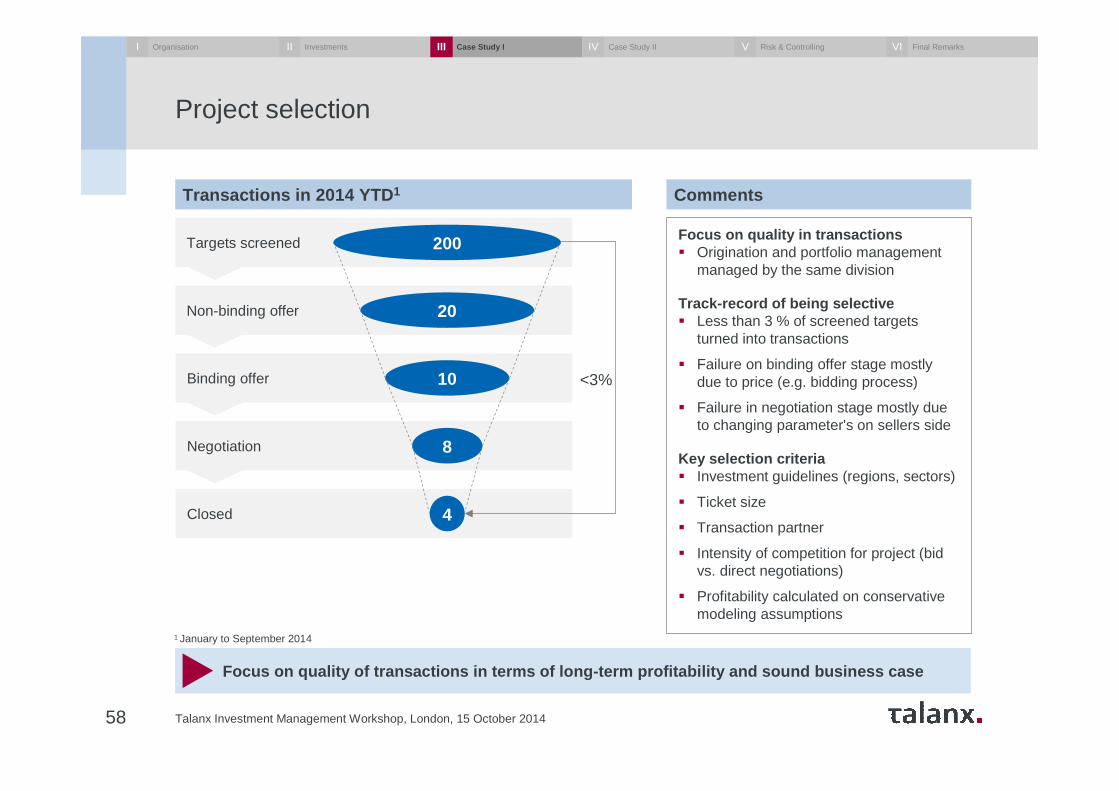
Closed
Binding offer
Negotiation
Targets screened
Non-binding offer
Project selection
20
10
8
4
200
<3%
58
Focus on quality of transactions in terms of long-t erm profitability and sound business case
1 January to September 2014
Transactions in 2014 YTD 1 Comments
Focus on quality in transactions � Origination and portfolio management
managed by the same division
Track-record of being selective� Less than 3 % of screened targets
turned into transactions
� Failure on binding offer stage mostly due to price (e.g. bidding process)
� Failure in negotiation stage mostly due to changing parameter's on sellers side
Key selection criteria� Investment guidelines (regions, sectors)
� Ticket size
� Transaction partner
� Intensity of competition for project (bid vs. direct negotiations)
� Profitability calculated on conservative modeling assumptions
Talanx Investment Management Workshop, London, 15 October 2014
I Organisation InvestmentsII Case Study IIII Case Study IIIV Risk & ControllingV Final RemarksVI
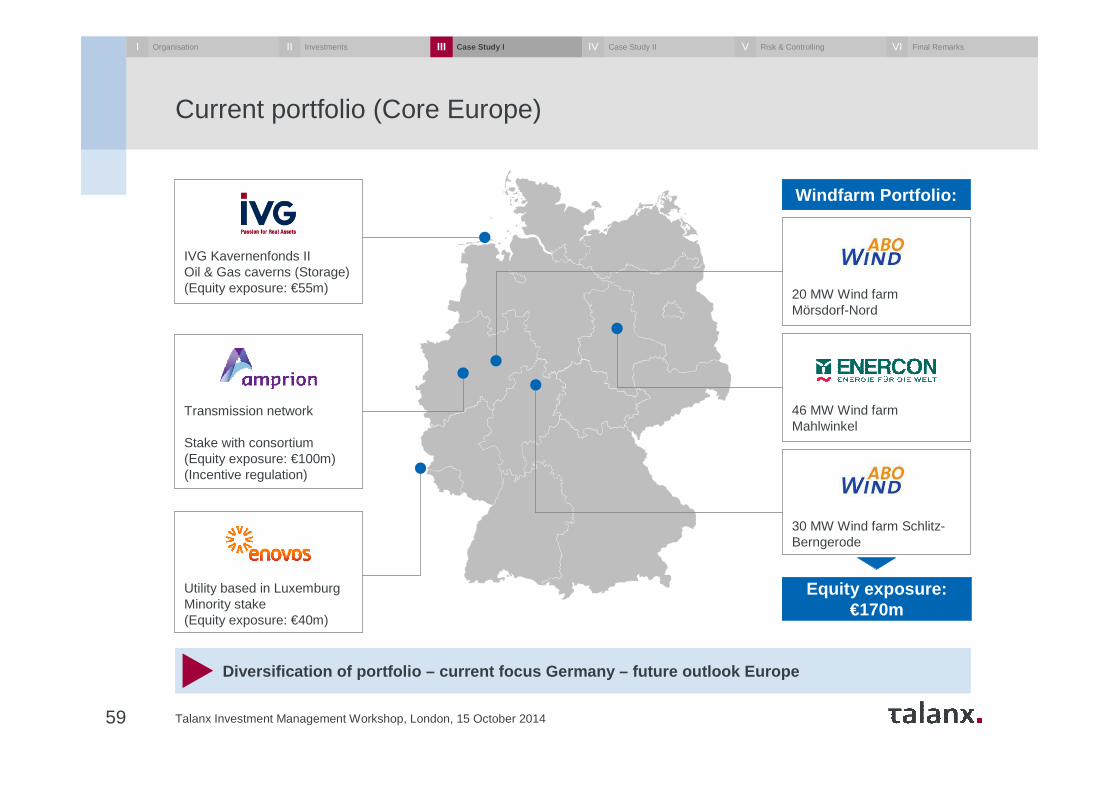
Current portfolio (Core Europe)
Talanx Investment Management Workshop, London, 15 October 201459
Diversification of portfolio – current focus Germany – future outlook Europe
Utility based in LuxemburgMinority stake (Equity exposure: €40m)
Transmission network
Stake with consortium (Equity exposure: €100m) (Incentive regulation)
IVG Kavernenfonds IIOil & Gas caverns (Storage) (Equity exposure: €55m)
Windfarm Portfolio:
20 MW Wind farm Mörsdorf-Nord
46 MW Wind farm Mahlwinkel
30 MW Wind farm Schlitz-Berngerode
Equity exposure: €170m
I Organisation InvestmentsII Case Study IIII Case Study IIIV Risk & ControllingV Final RemarksVI
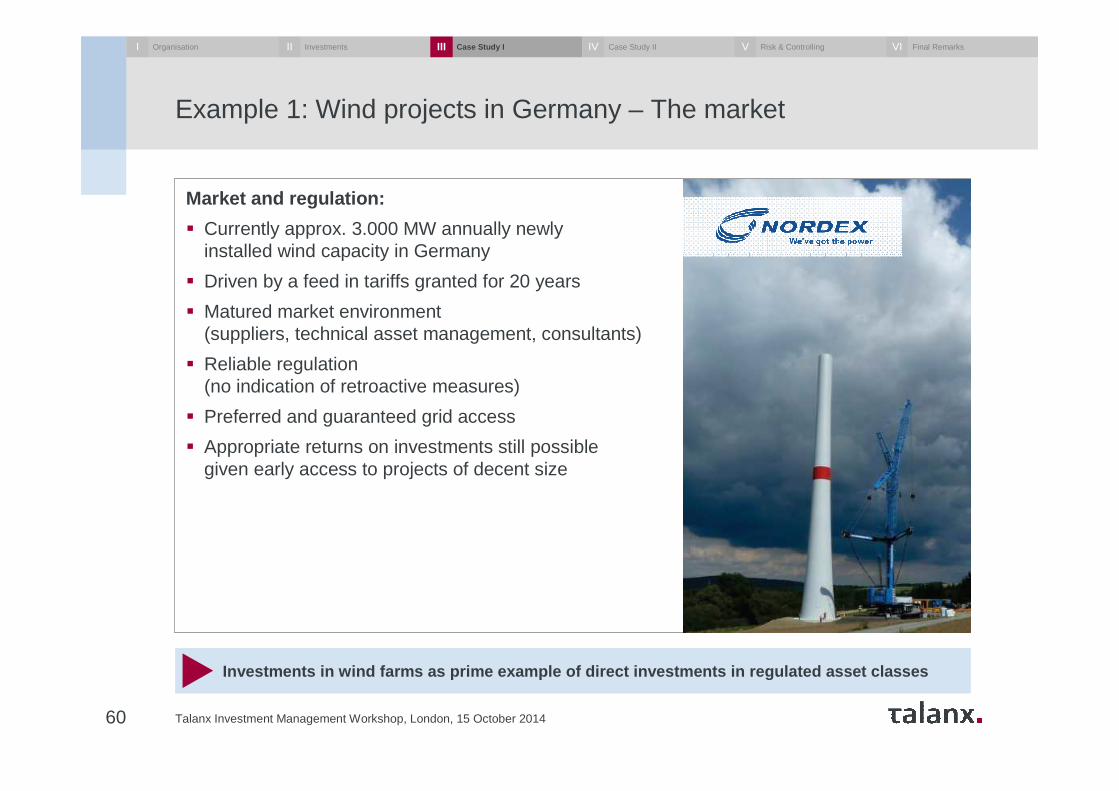
Market and regulation:
� Currently approx. 3.000 MW annually newly installed wind capacity in Germany
� Driven by a feed in tariffs granted for 20 years
� Matured market environment (suppliers, technical asset management, consultants)
� Reliable regulation (no indication of retroactive measures)
� Preferred and guaranteed grid access
� Appropriate returns on investments still possible given early access to projects of decent size
Example 1: Wind projects in Germany – The market
Talanx Investment Management Workshop, London, 15 October 201460
Investments in wind farms as prime example of direc t investments in regulated asset classes
I Organisation InvestmentsII Case Study IIII Case Study IIIV Risk & ControllingV Final RemarksVI
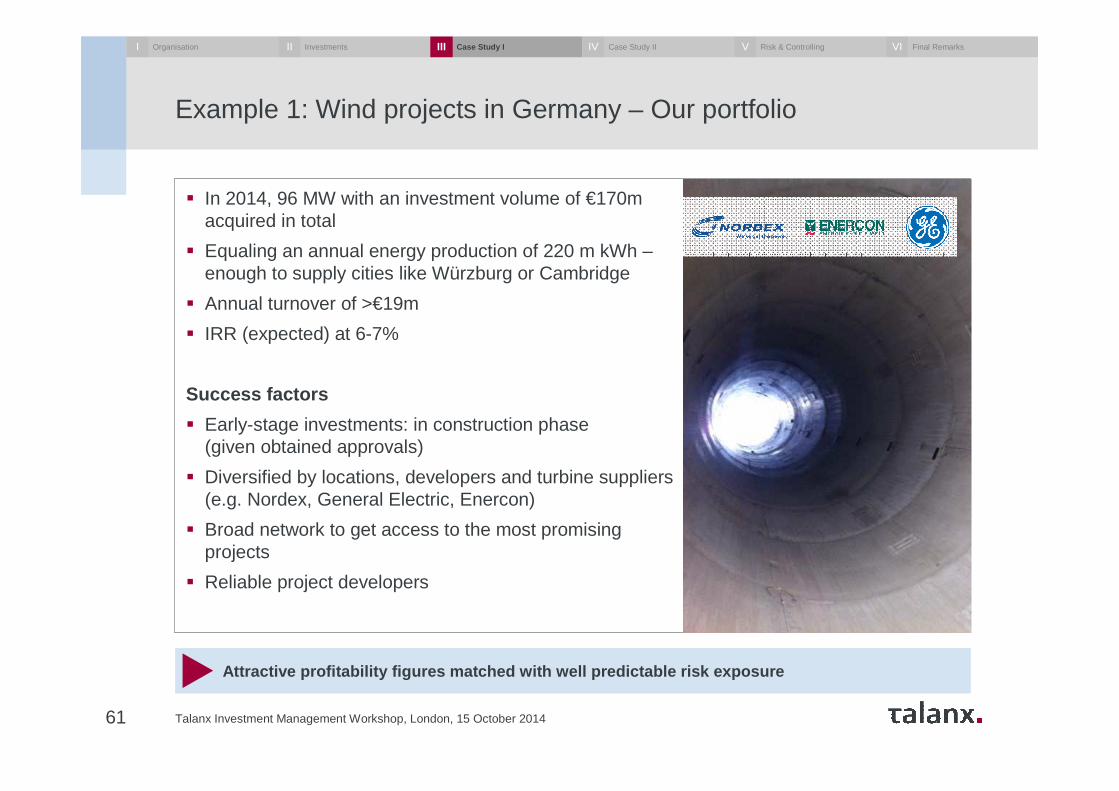
� In 2014, 96 MW with an investment volume of €170m acquired in total
� Equaling an annual energy production of 220 m kWh –enough to supply cities like Würzburg or Cambridge
� Annual turnover of >€19m
� IRR (expected) at 6-7%
Success factors
� Early-stage investments: in construction phase (given obtained approvals)
� Diversified by locations, developers and turbine suppliers(e.g. Nordex, General Electric, Enercon)
� Broad network to get access to the most promisingprojects
� Reliable project developers
Example 1: Wind projects in Germany – Our portfolio
Talanx Investment Management Workshop, London, 15 October 201461
Attractive profitability figures matched with well pre dictable risk exposure
I Organisation InvestmentsII Case Study IIII Case Study IIIV Risk & ControllingV Final RemarksVI
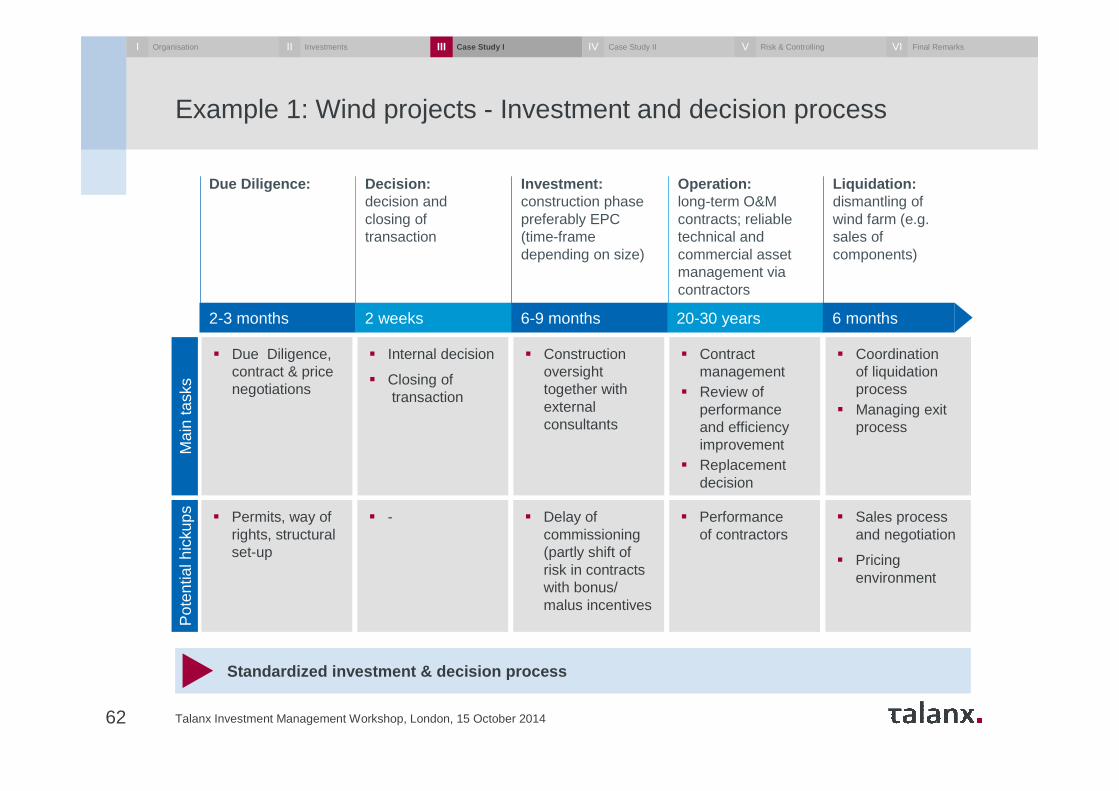
Example 1: Wind projects - Investment and decision process
Talanx Investment Management Workshop, London, 15 October 201462
Standardized investment & decision process
Due Diligence: Decision:decision and closing of transaction
Investment:construction phase preferably EPC (time-frame depending on size)
Operation:long-term O&M contracts; reliable technical and commercial asset management via contractors
Liquidation:dismantling of wind farm (e.g. sales of components)
Mai
n ta
sks
Pot
entia
l hic
kups
20-30 years2-3 months 2 weeks 6 months6-9 months
� Due Diligence, contract & price negotiations
� Internal decision
� Closing oftransaction
� Constructionoversight together with externalconsultants
� Contract management
� Review of performance and efficiency improvement
� Replacementdecision
� Coordination of liquidation process
� Managing exit process
� Permits, way of rights, structural set-up
� - � Delay of commissioning (partly shift of risk in contracts with bonus/ malus incentives
� Performance of contractors
� Sales process and negotiation
� Pricing environment
I Organisation InvestmentsII Case Study IIII Case Study IIIV Risk & ControllingV Final RemarksVI
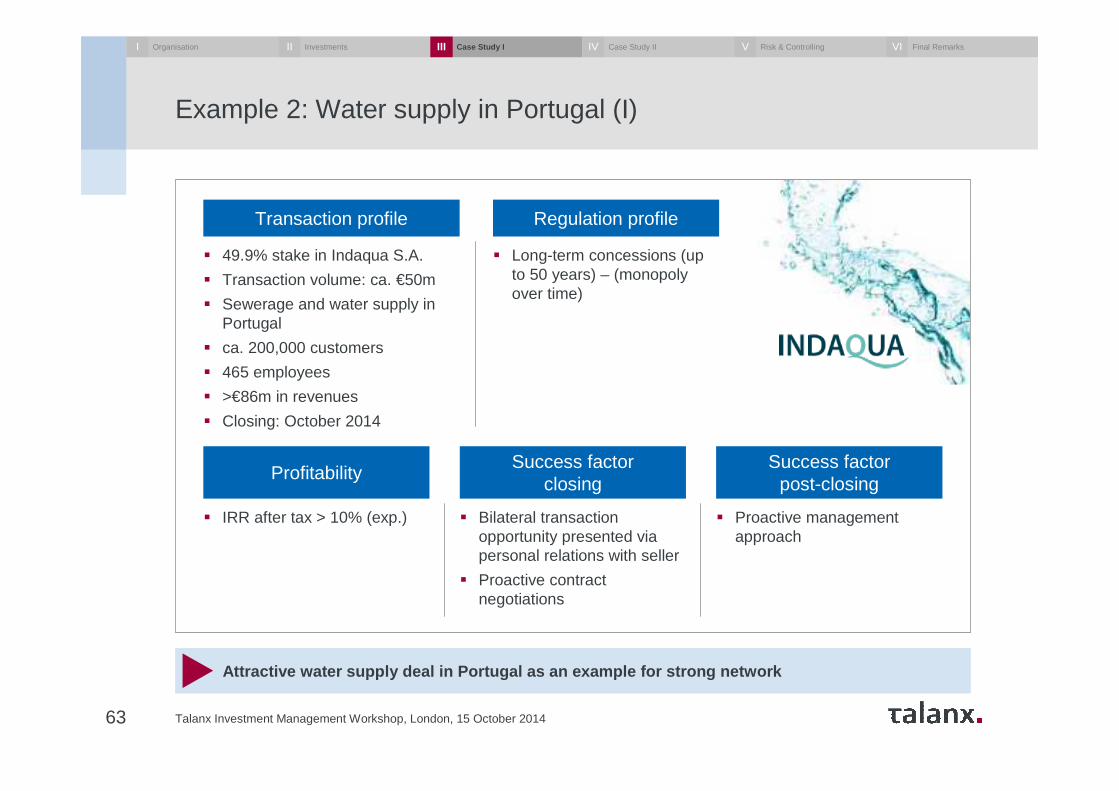
Example 2: Water supply in Portugal (I)
Talanx Investment Management Workshop, London, 15 October 201463
Attractive water supply deal in Portugal as an example for strong network
Transaction profile Regulation profile
� 49.9% stake in Indaqua S.A.
� Transaction volume: ca. €50m
� Sewerage and water supply in Portugal
� ca. 200,000 customers
� 465 employees
� >€86m in revenues
� Closing: October 2014
� Long-term concessions (up to 50 years) – (monopoly over time)
ProfitabilitySuccess factor
closingSuccess factor
post-closing
� IRR after tax > 10% (exp.) � Bilateral transaction opportunity presented via personal relations with seller
� Proactive contract negotiations
� Proactive management approach
I Organisation InvestmentsII Case Study IIII Case Study IIIV Risk & ControllingV Final RemarksVI
Example 2: Water supply in Portugal (II)
Talanx Investment Management Workshop, London, 15 October 201464
Footprint established to get access to further deals from privatisation in Portugal
Objectives Additional chances Risks
� Direct investment in existing company
� Proactive investment management (50% board seats)
� Participation in further privatisation in Portugal
� Beneficiary from the company‘s international expansion
� General regulatory adjustments
� Alignment with company management
I Organisation InvestmentsII Case Study IIII Case Study IIIV Risk & ControllingV Final RemarksVI
What’s next…
Talanx Investment Management Workshop, London, 15 October 201465
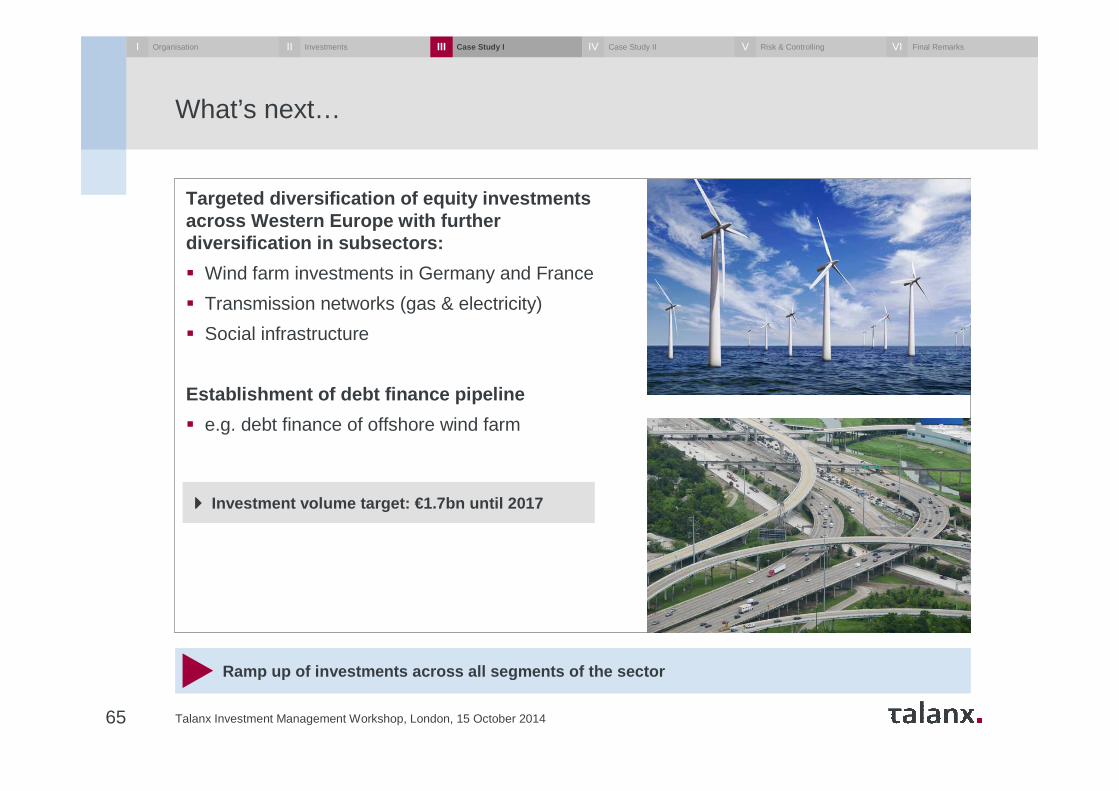
Targeted diversification of equity investments across Western Europe with furtherdiversification in subsectors:
� Wind farm investments in Germany and France
� Transmission networks (gas & electricity)
� Social infrastructure
Establishment of debt finance pipeline
� e.g. debt finance of offshore wind farm
Ramp up of investments across all segments of the s ector
���� Investment volume target: €1.7bn until 2017
I Organisation InvestmentsII Case Study IIII Case Study IIIV Risk & ControllingV Final RemarksVI
Agenda
66 Talanx Investment Management Workshop, London, 15 October 2014
Organisational set-up and processI Dr. Immo Querner
Dr. Dirk Erdmann
Thomas Fiebig
Dr. Bernhard Graeber
Dr. Immo QuernerConcluding remarks
Case Study I: Infrastructure investments
Case study II: Direct real estate investments
Controlling and measuring/evaluating risks
III
IV
V
VI
Investment challenges and responsesII Dr. Thomas Mann
Key essentials
Talanx Investment Management Workshop, London, 15 October 201467
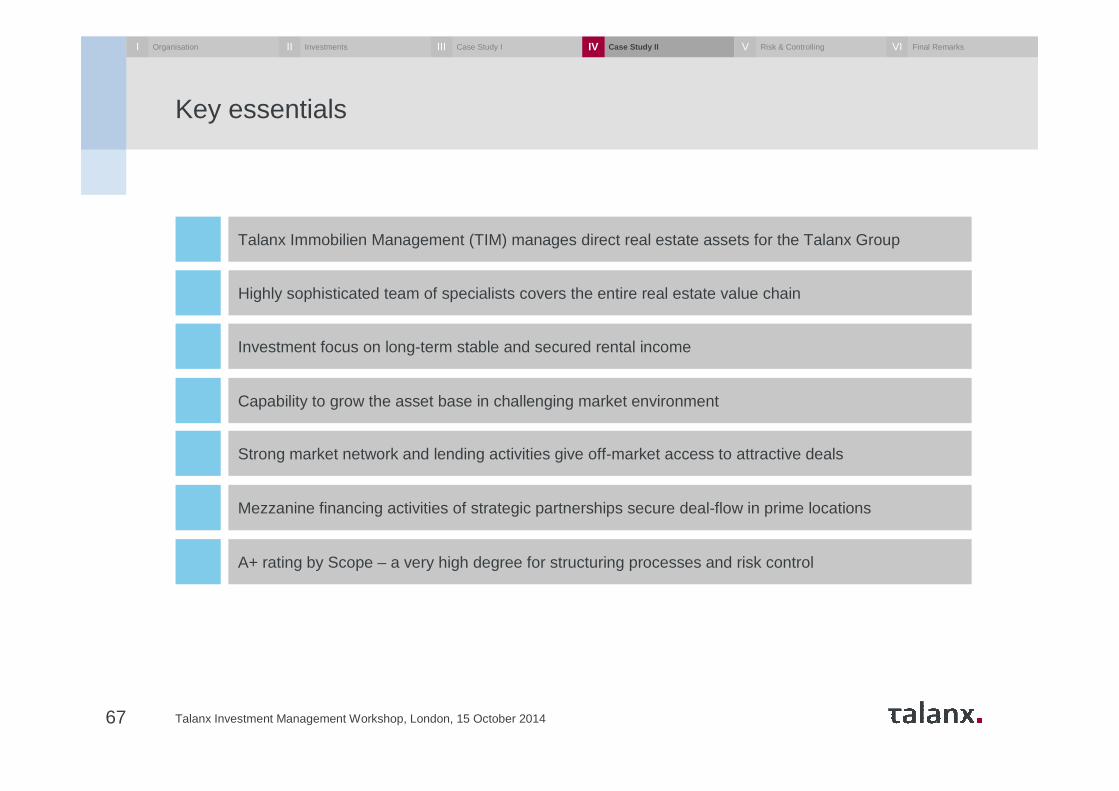
Talanx Immobilien Management (TIM) manages direct real estate assets for the Talanx Group
Strong market network and lending activities give off-market access to attractive deals
Investment focus on long-term stable and secured rental income
Capability to grow the asset base in challenging market environment
Highly sophisticated team of specialists covers the entire real estate value chain
Mezzanine financing activities of strategic partnerships secure deal-flow in prime locations
A+ rating by Scope – a very high degree for structuring processes and risk control
I Organisation InvestmentsII Case Study IIII Case Study IIIV Risk & ControllingV Final RemarksVI
Overview of Talanx‘s real estate management
Talanx Investment Management Workshop, London, 15 October 201468
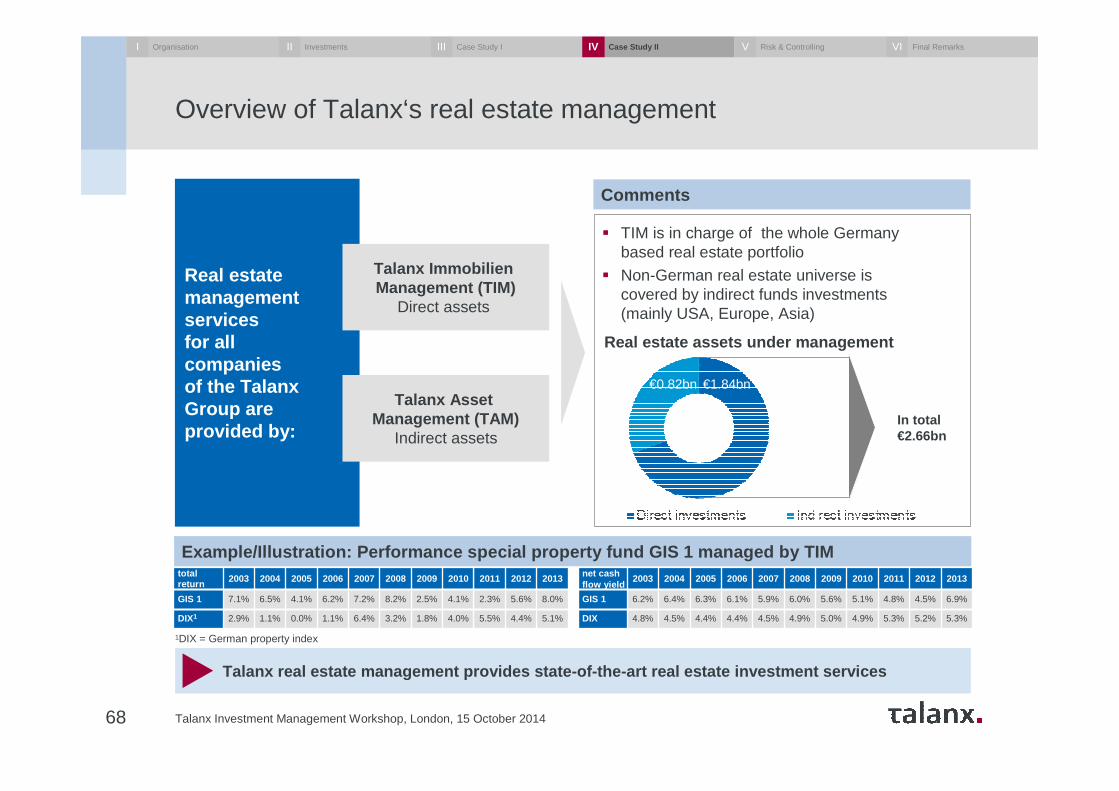
Talanx real estate management provides state-of-the -art real estate investment services
Real estate management services for all companies of the Talanx Group are provided by:
Talanx Asset Management (TAM)
Indirect assets
Talanx ImmobilienManagement (TIM)
Direct assets
� TIM is in charge of the whole Germany based real estate portfolio
� Non-German real estate universe is covered by indirect funds investments (mainly USA, Europe, Asia)
Comments
Real estate assets under management
€0.82bn €1.84bn
In total€2.66bn
total return 2003 2004 2005 2006 2007 2008 2009 2010 2011 2012 2013
GIS 1 7.1% 6.5% 4.1% 6.2% 7.2% 8.2% 2.5% 4.1% 2.3% 5.6% 8.0%
DIX1 2.9% 1.1% 0.0% 1.1% 6.4% 3.2% 1.8% 4.0% 5.5% 4.4% 5.1%
net cash flow yield
2003 2004 2005 2006 2007 2008 2009 2010 2011 2012 2013
GIS 1 6.2% 6.4% 6.3% 6.1% 5.9% 6.0% 5.6% 5.1% 4.8% 4.5% 6.9%
DIX 4.8% 4.5% 4.4% 4.4% 4.5% 4.9% 5.0% 4.9% 5.3% 5.2% 5.3%
1DIX = German property index
Example/Illustration: Performance special property fund GIS 1 managed by TIM
I Organisation InvestmentsII Case Study IIII Case Study IIIV Risk & ControllingV Final RemarksVI
Direct investments in real estate properties
Talanx Investment Management Workshop, London, 15 October 201469
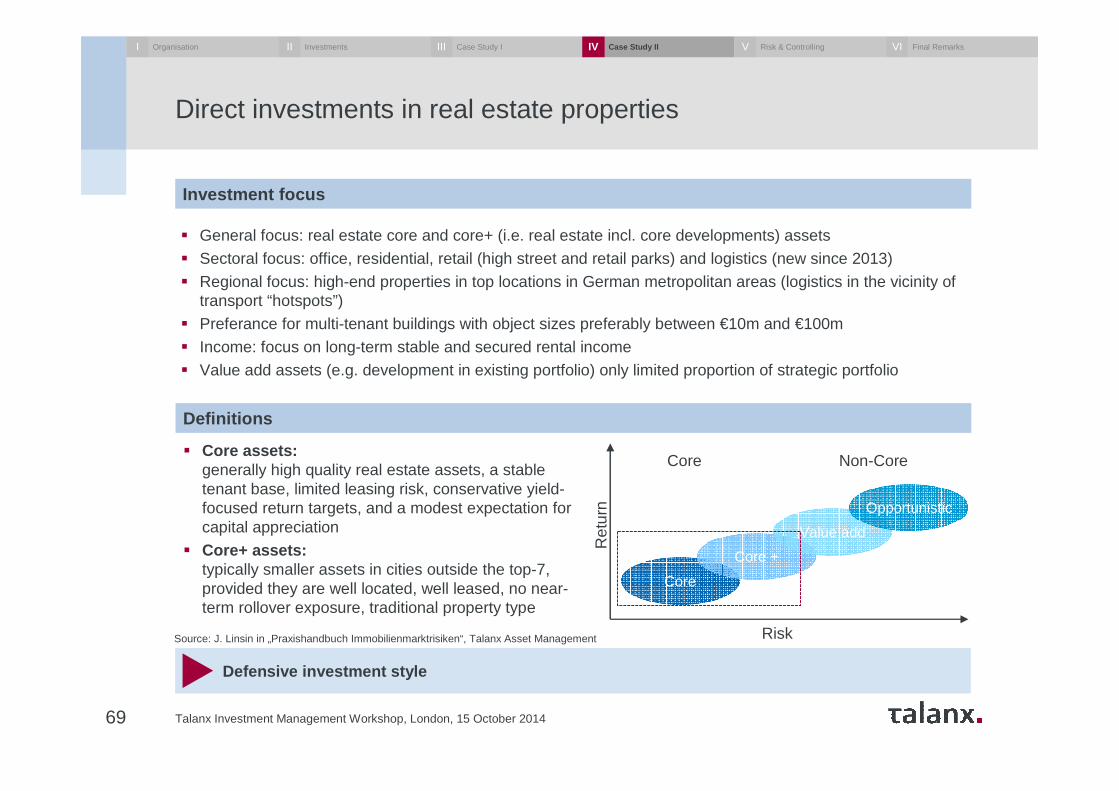
� General focus: real estate core and core+ (i.e. real estate incl. core developments) assets
� Sectoral focus: office, residential, retail (high street and retail parks) and logistics (new since 2013)
� Regional focus: high-end properties in top locations in German metropolitan areas (logistics in the vicinity of transport “hotspots”)
� Preferance for multi-tenant buildings with object sizes preferably between €10m and €100m
� Income: focus on long-term stable and secured rental income
� Value add assets (e.g. development in existing portfolio) only limited proportion of strategic portfolio
Defensive investment style
� Core assets:generally high quality real estate assets, a stable tenant base, limited leasing risk, conservative yield-focused return targets, and a modest expectation for capital appreciation
� Core+ assets:typically smaller assets in cities outside the top-7, provided they are well located, well leased, no near-term rollover exposure, traditional property type
Definitions
Ret
urn
Risk
Core Non-Core
Core
Core +
Value add
Opportunistic
Investment focus
Source: J. Linsin in „Praxishandbuch Immobilienmarktrisiken“, Talanx Asset Management
I Organisation InvestmentsII Case Study IIII Case Study IIIV Risk & ControllingV Final RemarksVI
Specialised teams covering the property value chain
Talanx Investment Management Workshop, London, 15 October 201470
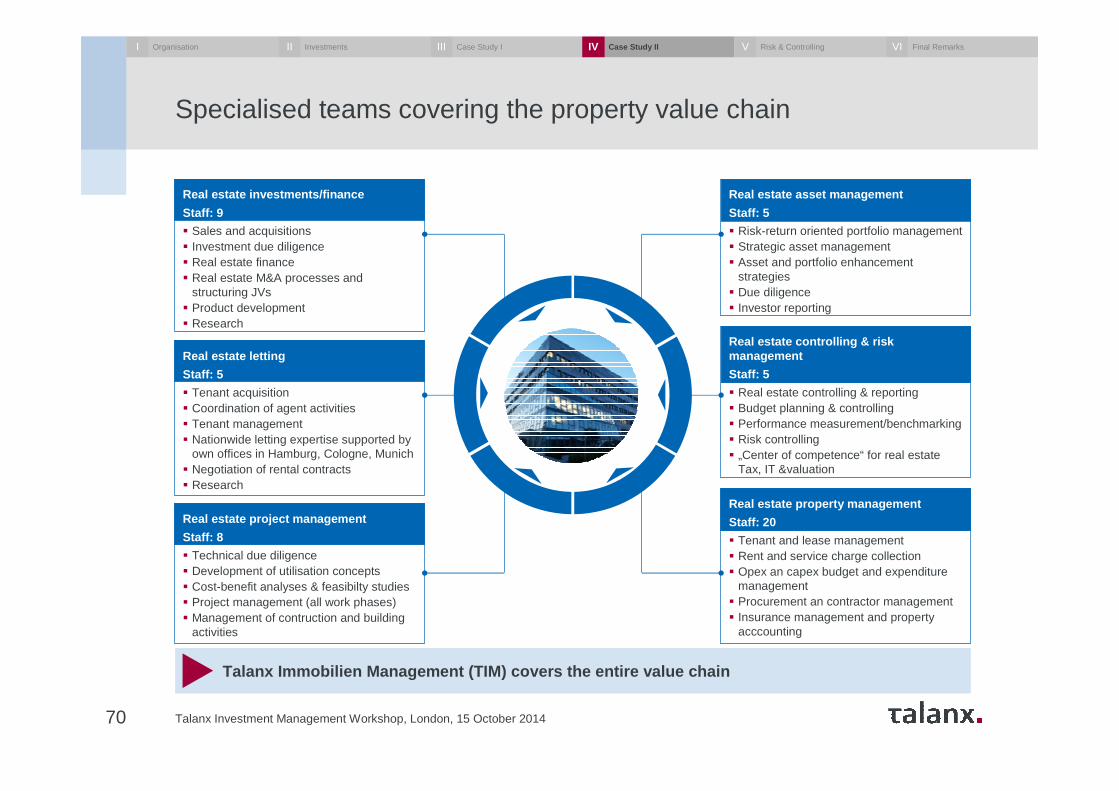
Talanx Immobilien Management (TIM) covers the entir e value chain
Real estate asset management
Staff: 5
� Risk-return oriented portfolio management� Strategic asset management� Asset and portfolio enhancement
strategies� Due diligence� Investor reporting
Real estate controlling & riskmanagement
Staff: 5
� Real estate controlling & reporting� Budget planning & controlling� Performance measurement/benchmarking� Risk controlling� „Center of competence“ for real estate
Tax, IT &valuation
Real estate property management
Staff: 20
� Tenant and lease management� Rent and service charge collection� Opex an capex budget and expenditure
management� Procurement an contractor management� Insurance management and property
acccounting
Real estate investments/finance
Staff: 9
� Sales and acquisitions� Investment due diligence � Real estate finance � Real estate M&A processes and
structuring JVs� Product development� Research
Real estate letting
Staff: 5
� Tenant acquisition� Coordination of agent activities� Tenant management� Nationwide letting expertise supported by
own offices in Hamburg, Cologne, Munich� Negotiation of rental contracts� Research
Real estate project management
Staff: 8
� Technical due diligence� Development of utilisation concepts� Cost-benefit analyses & feasibilty studies� Project management (all work phases)� Management of contruction and building
activities
I Organisation InvestmentsII Case Study IIII Case Study IIIV Risk & ControllingV Final RemarksVI
Direct real estate investments at Talanx Immobilien Management
Talanx Investment Management Workshop, London, 15 October 201471
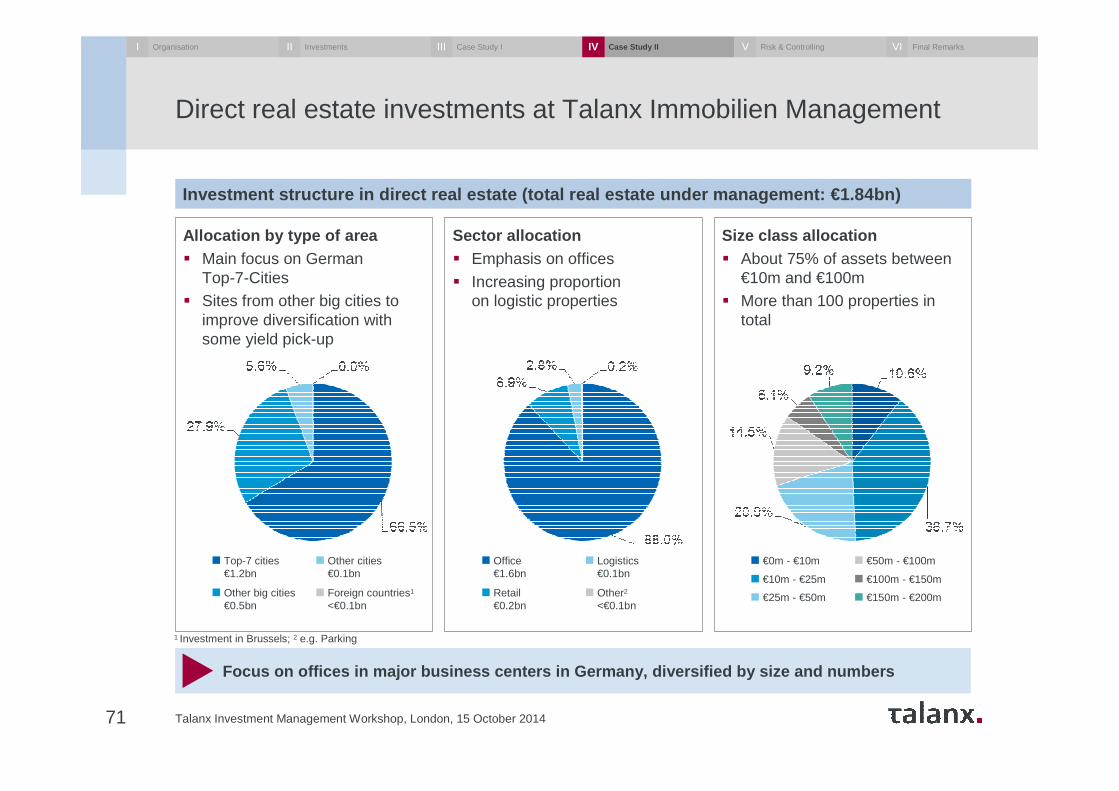
Focus on offices in major business centers in Germany, diversified by size and numbers
Allocation by type of area� Main focus on German
Top-7-Cities� Sites from other big cities to
improve diversification with some yield pick-up
Sector allocation� Emphasis on offices
� Increasing proportion on logistic properties
Size class allocation� About 75% of assets between
€10m and €100m� More than 100 properties in
total
1 Investment in Brussels; 2 e.g. Parking
Top-7 cities€1.2bn
Other big cities€0.5bn
Other cities€0.1bn
Foreign countries1
<€0.1bn
Office€1.6bn
Retail€0.2bn
Logistics€0.1bn
Other2
<€0.1bn
€0m - €10m
€10m - €25m
€25m - €50m €150m - €200m
€50m - €100m
€100m - €150m
Investment structure in direct real estate (total r eal estate under management: €1.84bn)
I Organisation InvestmentsII Case Study IIII Case Study IIIV Risk & ControllingV Final RemarksVI
German real estate investment market
Talanx Investment Management Workshop, London, 15 October 201472
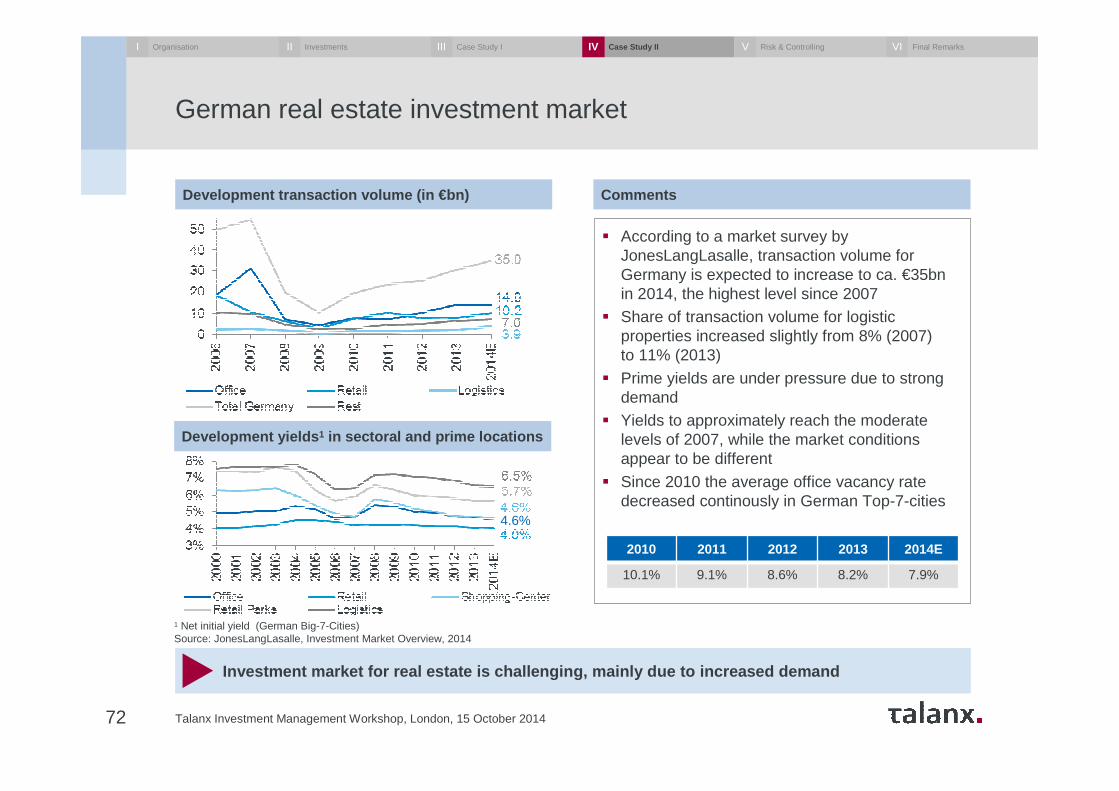
Investment market for real estate is challenging, mainl y due to increased demand
� According to a market survey by JonesLangLasalle, transaction volume for Germany is expected to increase to ca. €35bn in 2014, the highest level since 2007
� Share of transaction volume for logistic properties increased slightly from 8% (2007) to 11% (2013)
� Prime yields are under pressure due to strong demand
� Yields to approximately reach the moderate levels of 2007, while the market conditions appear to be different
� Since 2010 the average office vacancy rate decreased continously in German Top-7-cities
CommentsDevelopment transaction volume (in €bn)
1 Net initial yield (German Big-7-Cities)Source: JonesLangLasalle, Investment Market Overview, 2014
4.6%
Development yields 1 in sectoral and prime locations
2010 2011 2012 2013 2014E
10.1% 9.1% 8.6% 8.2% 7.9%
I Organisation InvestmentsII Case Study IIII Case Study IIIV Risk & ControllingV Final RemarksVI
Challenging environment in Germany for direct real estate investments
Talanx Investment Management Workshop, London, 15 October 201473
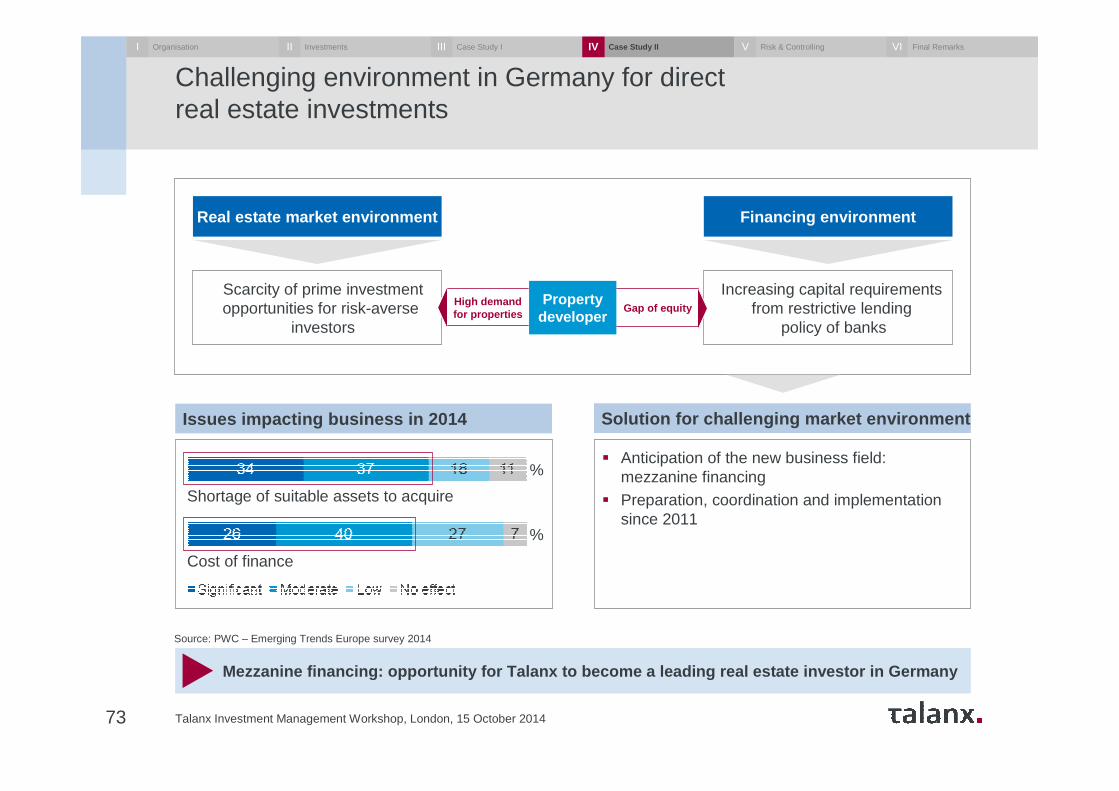
Mezzanine financing: opportunity for Talanx to becom e a leading real estate investor in Germany
Financing environmentReal estate market environment
Scarcity of prime investmentopportunities for risk-averse
investors
Increasing capital requirementsfrom restrictive lending
policy of banks
High demandfor properties Gap of equity
Propertydeveloper
� Anticipation of the new business field: mezzanine financing
� Preparation, coordination and implementation since 2011
Issues impacting business in 2014 Solution for challenging market environment
Source: PWC – Emerging Trends Europe survey 2014
Shortage of suitable assets to acquire
Cost of finance
%
%
I Organisation InvestmentsII Case Study IIII Case Study IIIV Risk & ControllingV Final RemarksVI
Structure of project financing
Talanx Investment Management Workshop, London, 15 October 201474
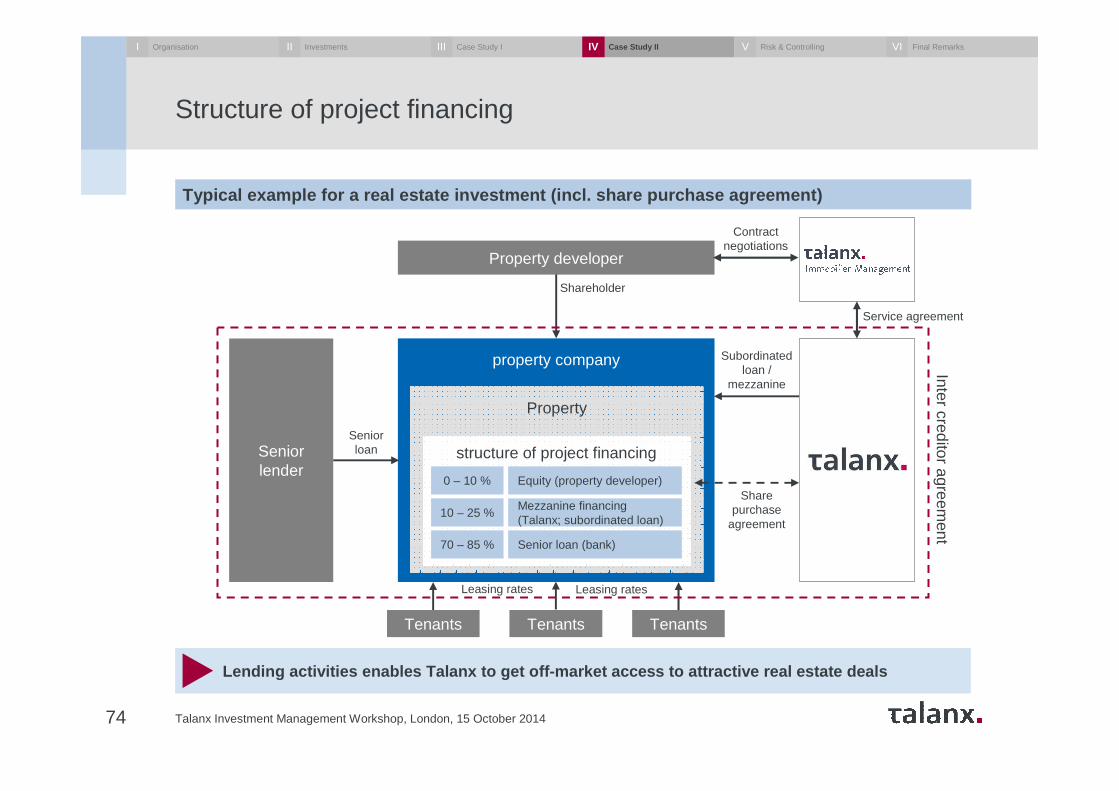
Lending activities enables Talanx to get off-market acce ss to attractive real estate deals
Typical example for a real estate investment (incl. s hare purchase agreement)
Subordinatedloan /
mezzanine
Property developer
Shareholder
Contractnegotiations
Seniorlender
property company
Property
structure of project financing
Equity (property developer)
Mezzanine financing (Talanx; subordinated loan)
Senior loan (bank)
0 – 10 %
10 – 25 %
70 – 85 %
Tenants Tenants Tenants
Leasing rates
Senior loan
Share purchase
agreement
Inter creditoragreem
ent
Service agreement
Leasing rates
I Organisation InvestmentsII Case Study IIII Case Study IIIV Risk & ControllingV Final RemarksVI
Talanx’s direct investments from 2012 until today
Talanx Investment Management Workshop, London, 15 October 201475
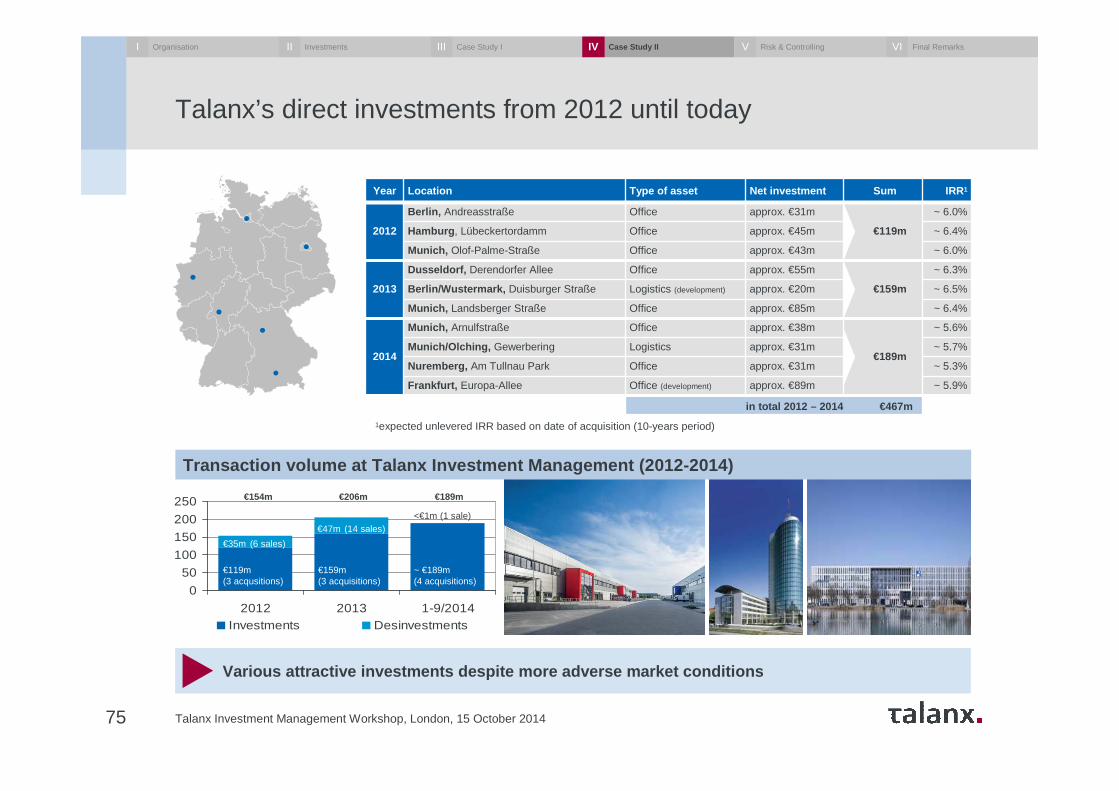
Various attractive investments despite more adverse market conditions
Year Location Type of asset Net investment Sum IRR1
2012
Berlin, Andreasstraße Office approx. €31m
€119m
~ 6.0%
Hamburg , Lübeckertordamm Office approx. €45m ~ 6.4%
Munich, Olof-Palme-Straße Office approx. €43m ~ 6.0%
2013
Dusseldorf, Derendorfer Allee Office approx. €55m
€159m
~ 6.3%
Berlin/Wustermark, Duisburger Straße Logistics (development) approx. €20m ~ 6.5%
Munich, Landsberger Straße Office approx. €85m ~ 6.4%
2014
Munich, Arnulfstraße Office approx. €38m
€189m
~ 5.6%
Munich/Olching, Gewerbering Logistics approx. €31m ~ 5.7%
Nuremberg, Am Tullnau Park Office approx. €31m ~ 5.3%
Frankfurt, Europa-Allee Office (development) approx. €89m ~ 5.9%
in total 2012 – 2014 €467m
1expected unlevered IRR based on date of acquisition (10-years period)
Transaction volume at Talanx Investment Management (2012-2014)
0
50
100
150
200
250
2012 2013 1-9/2014Investments Desinvestments
€119m(3 acqusitions)
€159m(3 acquisitions)
~ €189m(4 acquisitions)
€35m (6 sales)
€47m (14 sales)<€1m (1 sale)
€154m €206m €189m
I Organisation InvestmentsII Case Study IIII Case Study IIIV Risk & ControllingV Final RemarksVI
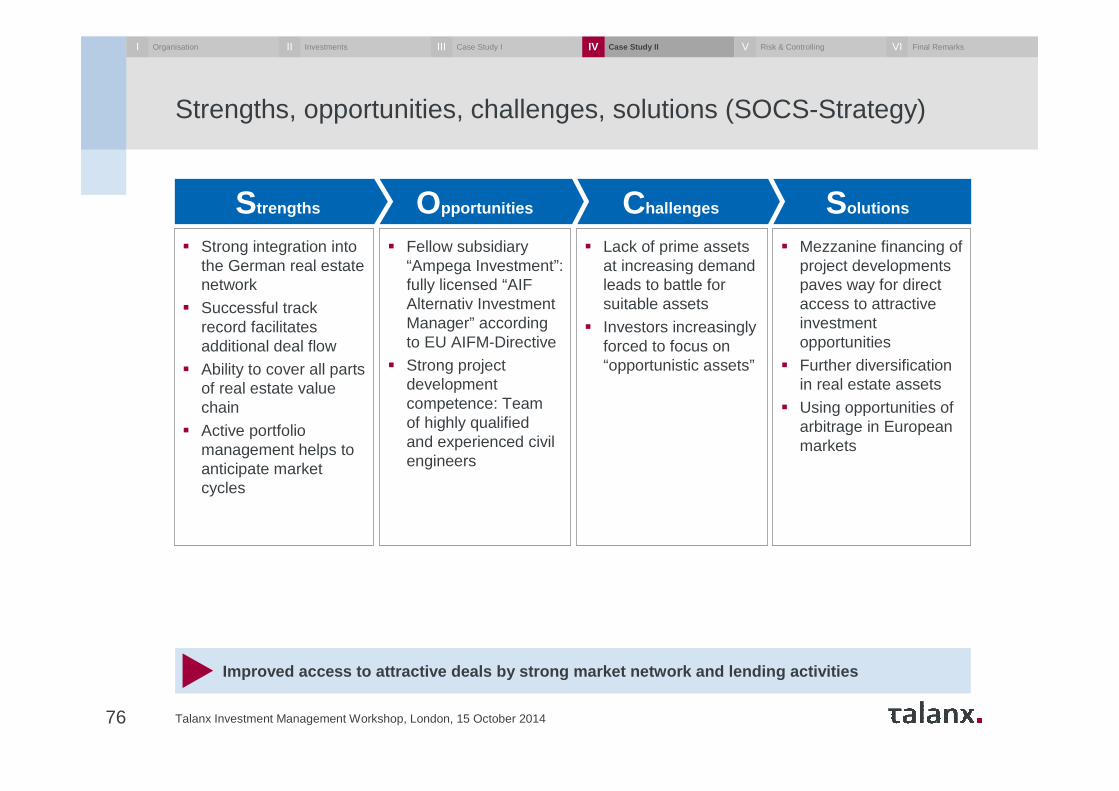
Strengths, opportunities, challenges, solutions (SOCS-Strategy)
Talanx Investment Management Workshop, London, 15 October 201476
Improved access to attractive deals by strong market netw ork and lending activities
SolutionsChallengesOpportunitiesStrengths
� Strong integration into the German real estate network
� Successful track record facilitates additional deal flow
� Ability to cover all parts of real estate value chain
� Active portfolio management helps to anticipate market cycles
� Fellow subsidiary “Ampega Investment”: fully licensed “AIF Alternativ Investment Manager” according to EU AIFM-Directive
� Strong project development competence: Team of highly qualified and experienced civil engineers
� Lack of prime assets at increasing demand leads to battle for suitable assets
� Investors increasingly forced to focus on “opportunistic assets”
� Mezzanine financing of project developments paves way for direct access to attractive investment opportunities
� Further diversification in real estate assets
� Using opportunities of arbitrage in European markets
I Organisation InvestmentsII Case Study IIII Case Study IIIV Risk & ControllingV Final RemarksVI
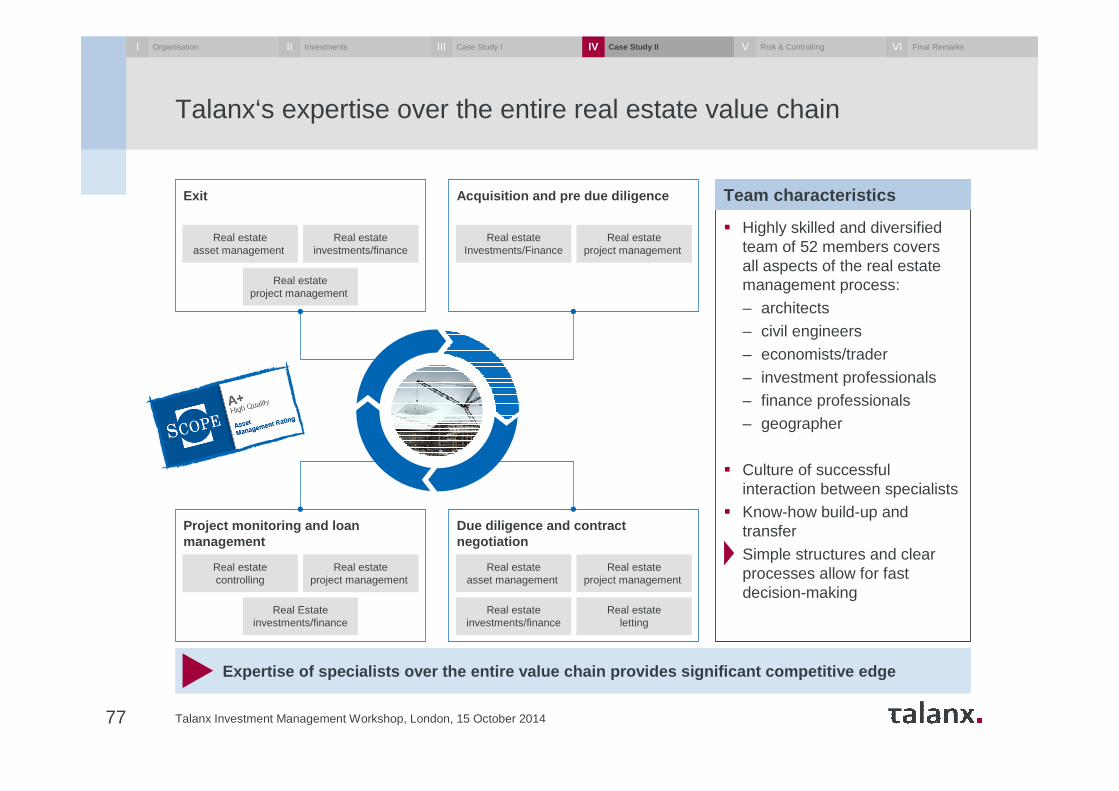
Talanx‘s expertise over the entire real estate value chain
Talanx Investment Management Workshop, London, 15 October 201477
Expertise of specialists over the entire value chain prov ides significant competitive edge
� Highly skilled and diversified team of 52 members covers all aspects of the real estate management process:
– architects
– civil engineers
– economists/trader
– investment professionals– finance professionals
– geographer
� Culture of successful interaction between specialists
� Know-how build-up and transfer
� Simple structures and clear processes allow for fast decision-making
Due diligence and contract negotiation
Real estateasset management
Real estateproject management
Real estateinvestments/finance
Real estateletting
Project monitoring and loan management
Real estatecontrolling
Real estateproject management
Real Estateinvestments/finance
Acquisition and pre due diligence
Real estateInvestments/Finance
Real estateproject management
Exit
Real estateasset management
Real estateinvestments/finance
Real estateproject management
Team characteristics
I Organisation InvestmentsII Case Study IIII Case Study IIIV Risk & ControllingV Final RemarksVI
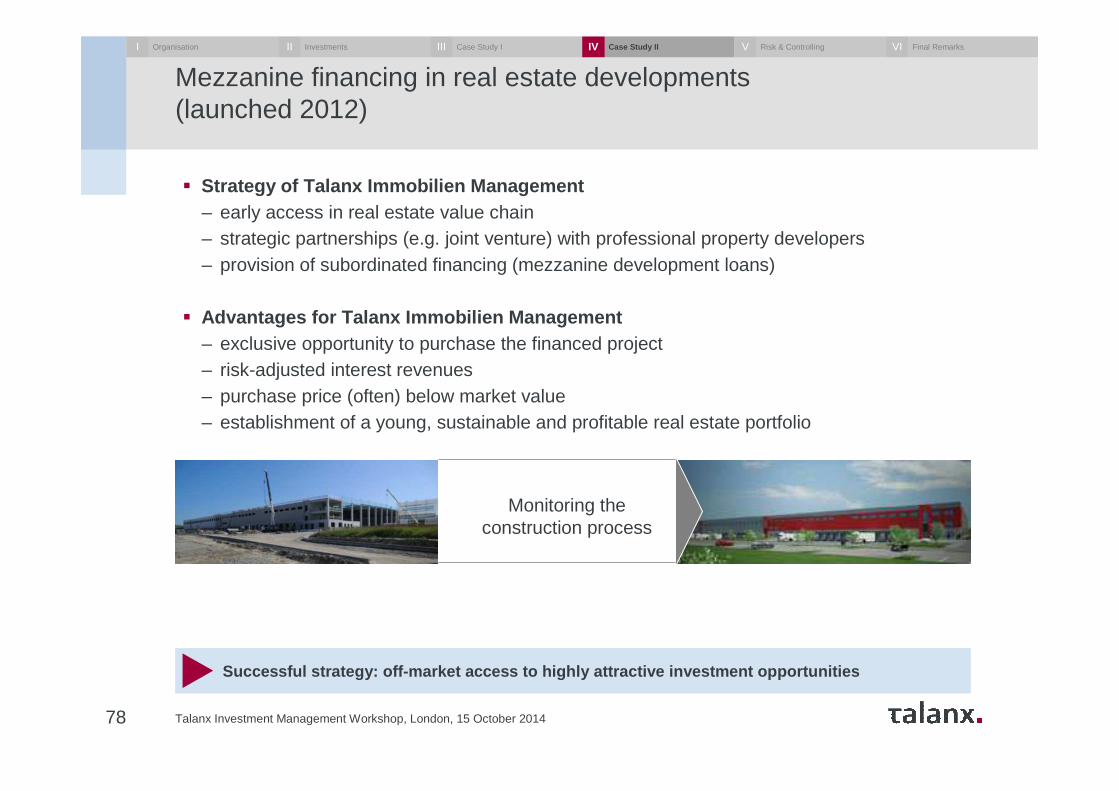
Mezzanine financing in real estate developments (launched 2012)
Talanx Investment Management Workshop, London, 15 October 201478
Successful strategy: off-market access to highly at tractive investment opportunities
� Strategy of Talanx Immobilien Management– early access in real estate value chain – strategic partnerships (e.g. joint venture) with professional property developers– provision of subordinated financing (mezzanine development loans)
� Advantages for Talanx Immobilien Management– exclusive opportunity to purchase the financed project– risk-adjusted interest revenues– purchase price (often) below market value– establishment of a young, sustainable and profitable real estate portfolio
Monitoring the construction process
I Organisation InvestmentsII Case Study IIII Case Study IIIV Risk & ControllingV Final RemarksVI
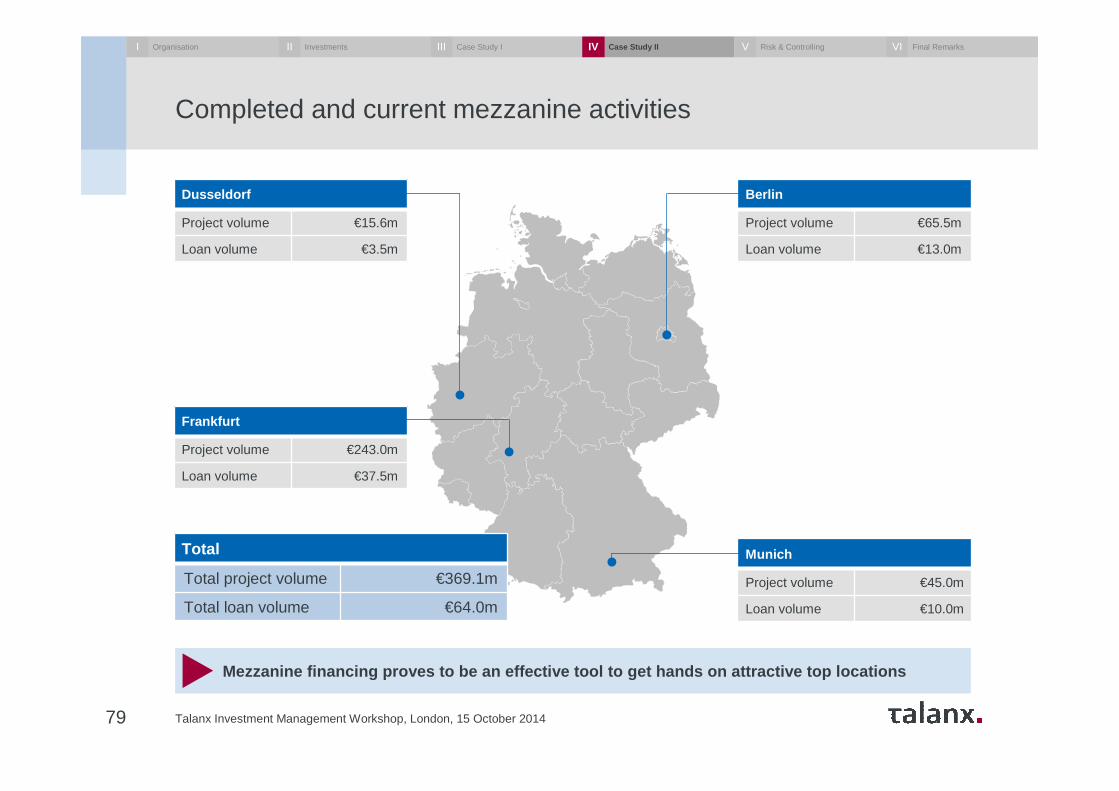
Completed and current mezzanine activities
Talanx Investment Management Workshop, London, 15 October 201479
Mezzanine financing proves to be an effective tool to get hands on attractive top locations
Berlin
Project volume €65.5m
Loan volume €13.0m
Munich
Project volume €45.0m
Loan volume €10.0m
Dusseldorf
Project volume €15.6m
Loan volume €3.5m
Frankfurt
Project volume €243.0m
Loan volume €37.5m
Total
Total project volume €369.1m
Total loan volume €64.0m
I Organisation InvestmentsII Case Study IIII Case Study IIIV Risk & ControllingV Final RemarksVI
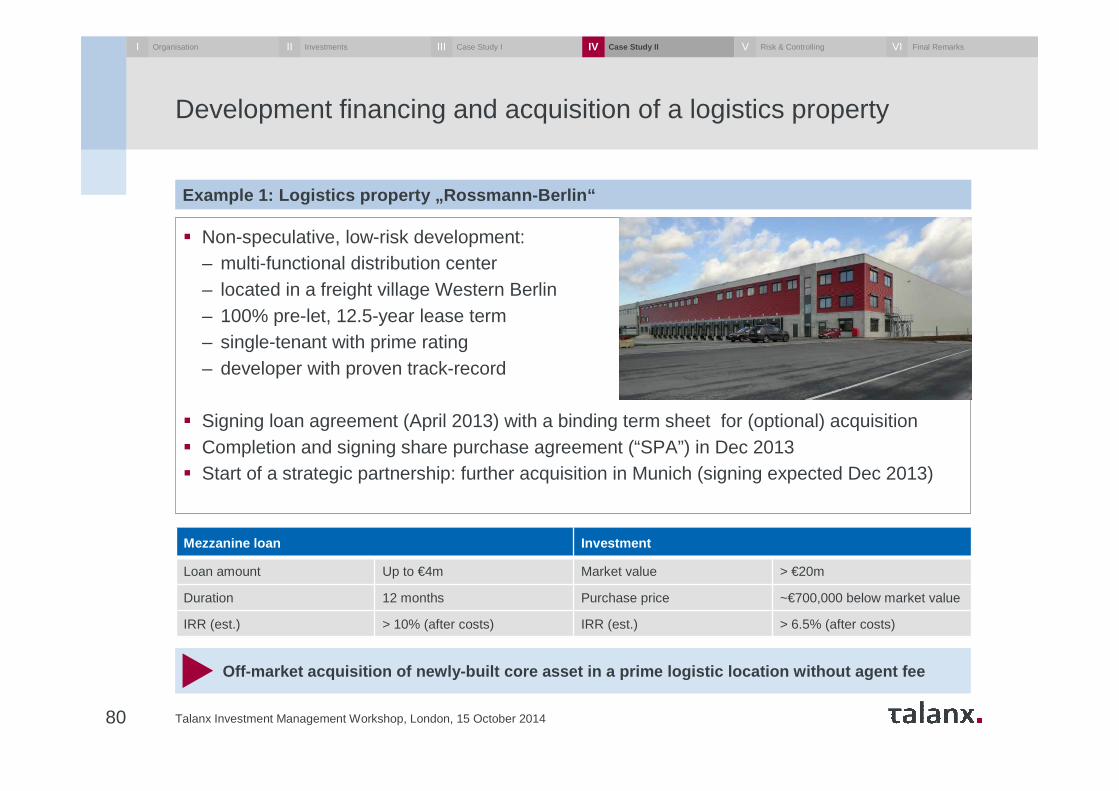
� Non-speculative, low-risk development:– multi-functional distribution center– located in a freight village Western Berlin– 100% pre-let, 12.5-year lease term– single-tenant with prime rating– developer with proven track-record
� Signing loan agreement (April 2013) with a binding term sheet for (optional) acquisition � Completion and signing share purchase agreement (“SPA”) in Dec 2013� Start of a strategic partnership: further acquisition in Munich (signing expected Dec 2013)
Development financing and acquisition of a logistics property
Talanx Investment Management Workshop, London, 15 October 201480
Off-market acquisition of newly-built core asset in a prime logistic location without agent fee
Mezzanine loan Investment
Loan amount Up to €4m Market value > €20m
Duration 12 months Purchase price ~€700,000 below market value
IRR (est.) > 10% (after costs) IRR (est.) > 6.5% (after costs)
Example 1: Logistics property „Rossmann-Berlin“
I Organisation InvestmentsII Case Study IIII Case Study IIIV Risk & ControllingV Final RemarksVI
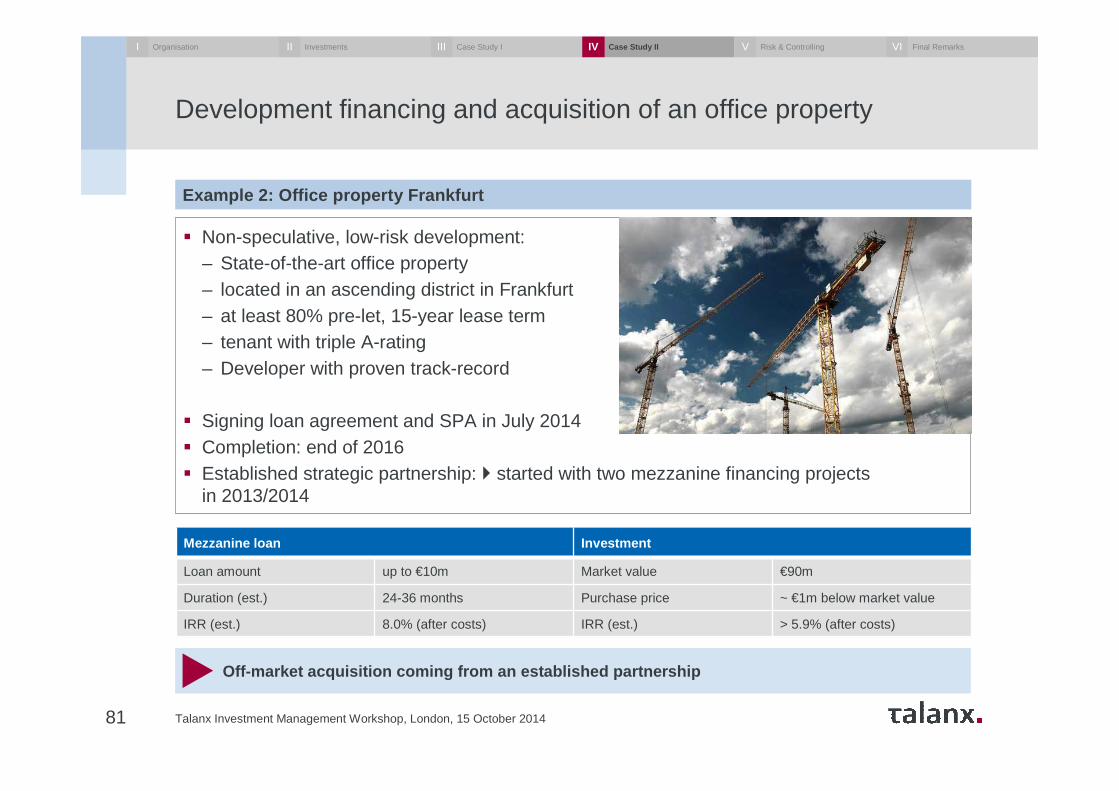
Development financing and acquisition of an office property
Talanx Investment Management Workshop, London, 15 October 201481
Off-market acquisition coming from an established p artnership
� Non-speculative, low-risk development:– State-of-the-art office property– located in an ascending district in Frankfurt– at least 80% pre-let, 15-year lease term– tenant with triple A-rating– Developer with proven track-record
� Signing loan agreement and SPA in July 2014 � Completion: end of 2016� Established strategic partnership: � started with two mezzanine financing projects
in 2013/2014
Mezzanine loan Investment
Loan amount up to €10m Market value €90m
Duration (est.) 24-36 months Purchase price ~ €1m below market value
IRR (est.) 8.0% (after costs) IRR (est.) > 5.9% (after costs)
Example 2: Office property Frankfurt
I Organisation InvestmentsII Case Study IIII Case Study IIIV Risk & ControllingV Final RemarksVI
Agenda
82 Talanx Investment Management Workshop, London, 15 October 2014
Organisational set-up and processI Dr. Immo Querner
Dr. Dirk Erdmann.
Thomas Fiebig
Dr. Bernhard Graeber
Dr. Immo Querner
Case study II: Direct real estate investments
Concluding remarks
Case study I: Infrastructure investments
Risk measurement, evaluation and control
III
IV
V
VI
Investment challenges and responsesII Dr. Thomas Mann
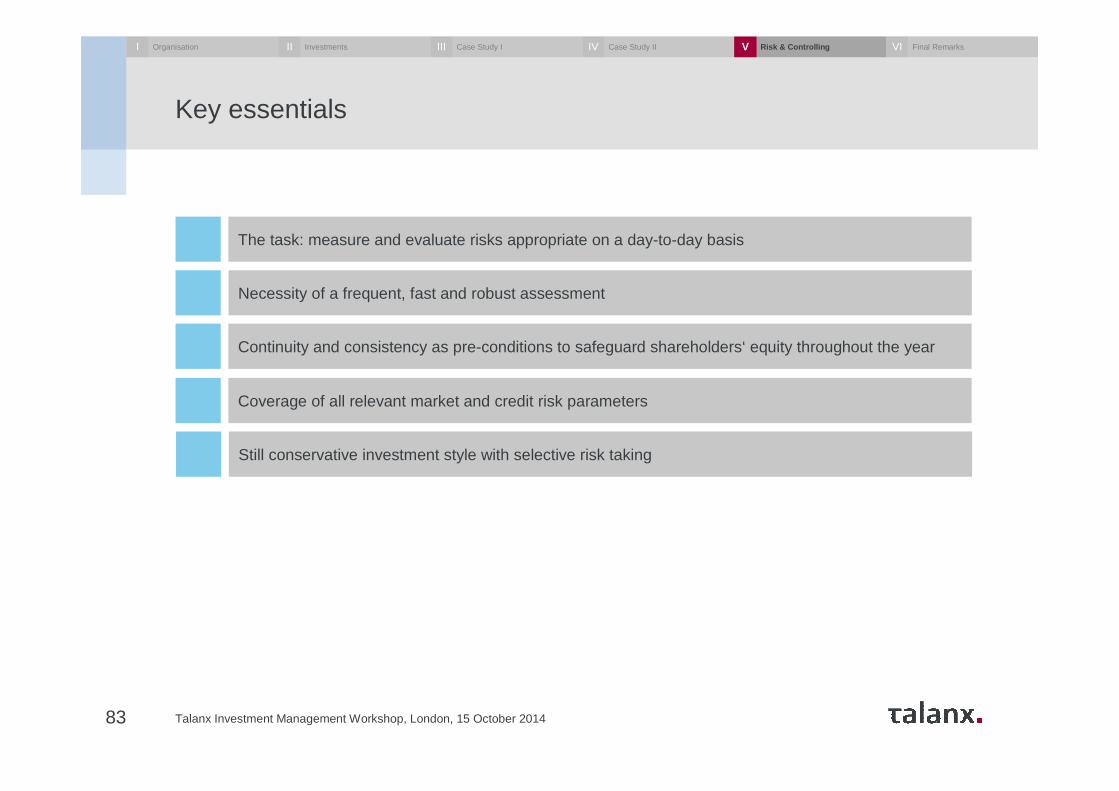
Key essentials
83 Talanx Investment Management Workshop, London, 15 October 2014
The task: measure and evaluate risks appropriate on a day-to-day basis
Continuity and consistency as pre-conditions to safeguard shareholders‘ equity throughout the year
Coverage of all relevant market and credit risk parameters
Necessity of a frequent, fast and robust assessment
Still conservative investment style with selective risk taking
I Organisation InvestmentsII Case Study IIII Case Study IIIV Risk & ControllingV Final RemarksVI
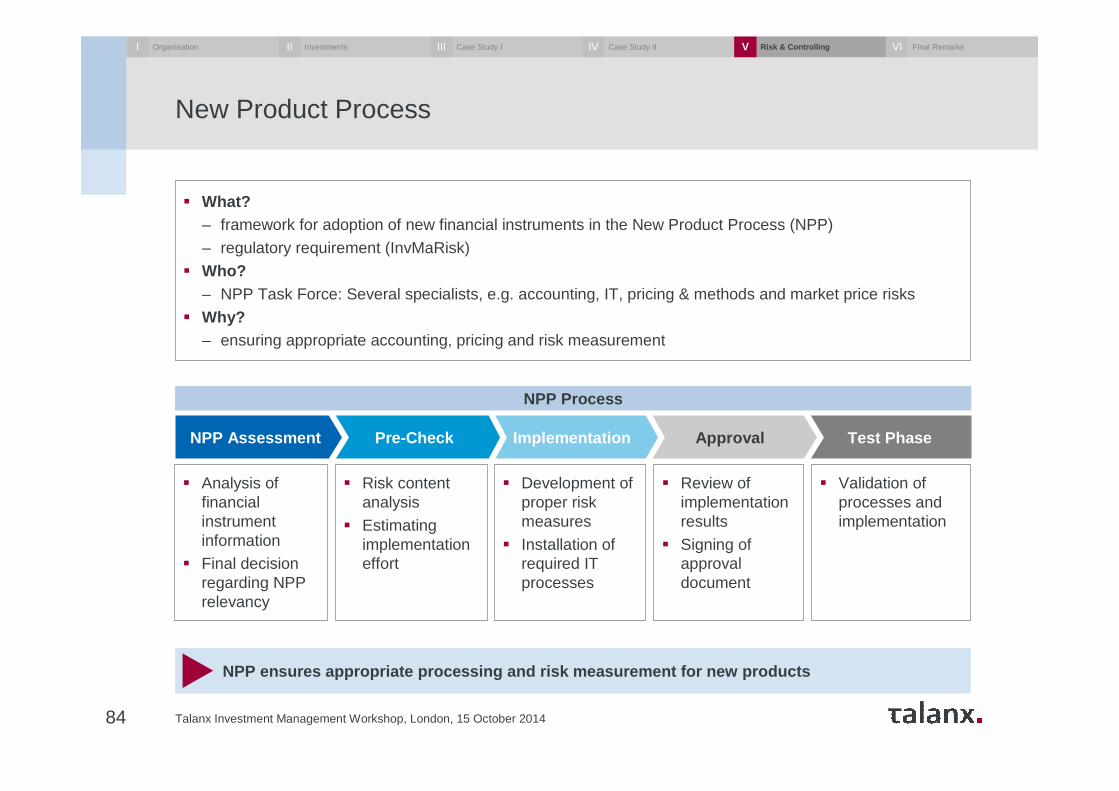
New Product Process
84
� What?– framework for adoption of new financial instruments in the New Product Process (NPP)
– regulatory requirement (InvMaRisk)
� Who? – NPP Task Force: Several specialists, e.g. accounting, IT, pricing & methods and market price risks
� Why?– ensuring appropriate accounting, pricing and risk measurement
NPP ensures appropriate processing and risk measure ment for new products
Test PhaseApprovalImplementationPre-CheckNPP Assessment
NPP Process
Talanx Investment Management Workshop, London, 15 October 2014
� Risk content analysis
� Estimating implementation effort
� Analysis of financial instrument information
� Final decision regarding NPP relevancy
� Review of implementation results
� Signing of approval document
� Development of proper risk measures
� Installation of required IT processes
� Validation of processes and implementation
I Organisation InvestmentsII Case Study IIII Case Study IIIV Risk & ControllingV Final RemarksVI
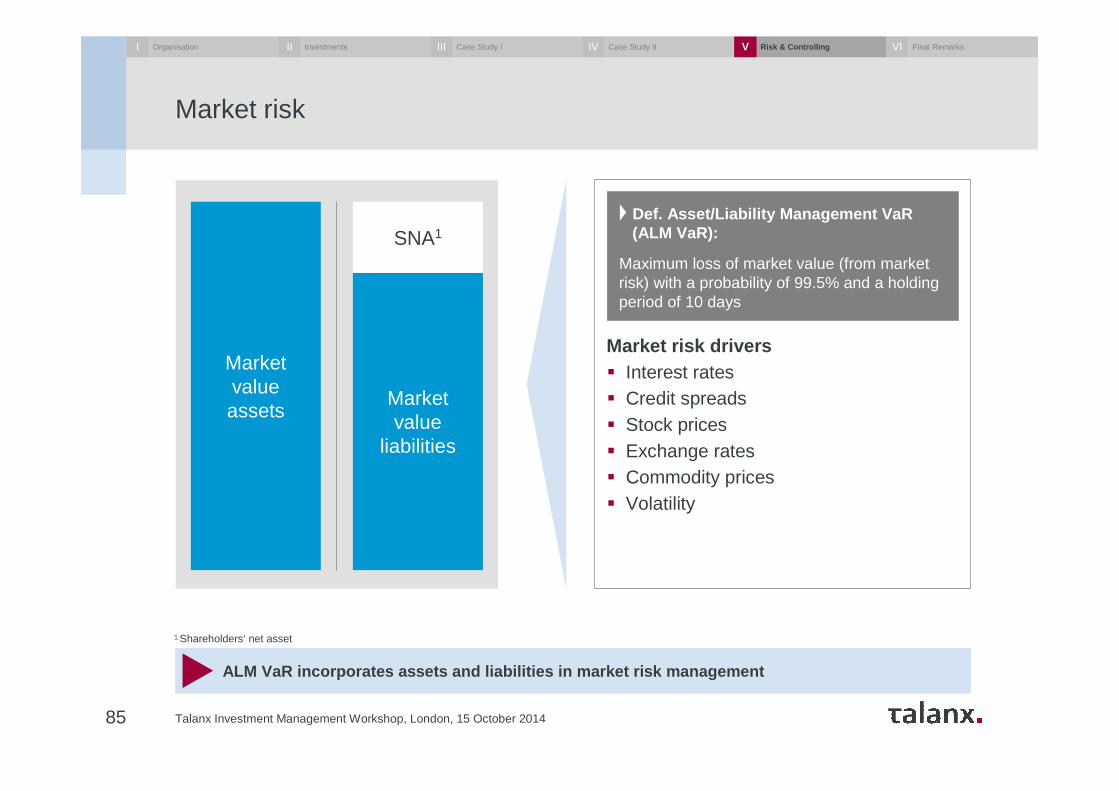
Market risk
Talanx Investment Management Workshop, London, 15 October 201485
ALM VaR incorporates assets and liabilities in marke t risk management
Market valueassets
Market value
liabilities
SNA1
Market risk drivers� Interest rates� Credit spreads� Stock prices� Exchange rates� Commodity prices� Volatility
Def. Asset/Liability Management VaR(ALM VaR):
Maximum loss of market value (from market risk) with a probability of 99.5% and a holding period of 10 days
1 Shareholders‘ net asset
I Organisation InvestmentsII Case Study IIII Case Study IIIV Risk & ControllingV Final RemarksVI
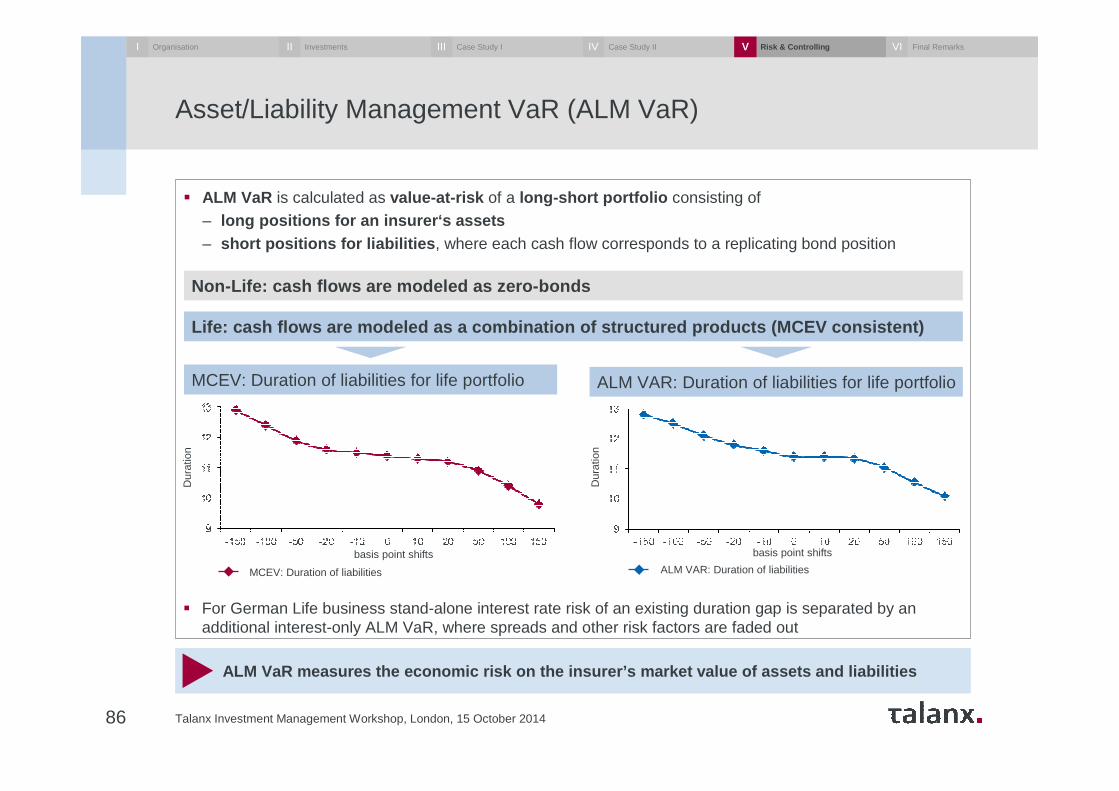
Asset/Liability Management VaR (ALM VaR)
Talanx Investment Management Workshop, London, 15 October 201486
ALM VaR measures the economic risk on the insurer’s mar ket value of assets and liabilities
� ALM VaR is calculated as value-at-risk of a long-short portfolio consisting of– long positions for an insurer‘s assets– short positions for liabilities , where each cash flow corresponds to a replicating bond position
Non-Life: cash flows are modeled as zero-bonds
Life: cash flows are modeled as a combination of st ructured products (MCEV consistent)
MCEV: Duration of liabilities for life portfolio ALM VAR: Duration of liabilities for life portfolio
� For German Life business stand-alone interest rate risk of an existing duration gap is separated by an additional interest-only ALM VaR, where spreads and other risk factors are faded out
basis point shifts
MCEV: Duration of liabilities ALM VAR: Duration of liabilities
basis point shifts
Dur
atio
n
Dur
atio
n
I Organisation InvestmentsII Case Study IIII Case Study IIIV Risk & ControllingV Final RemarksVI
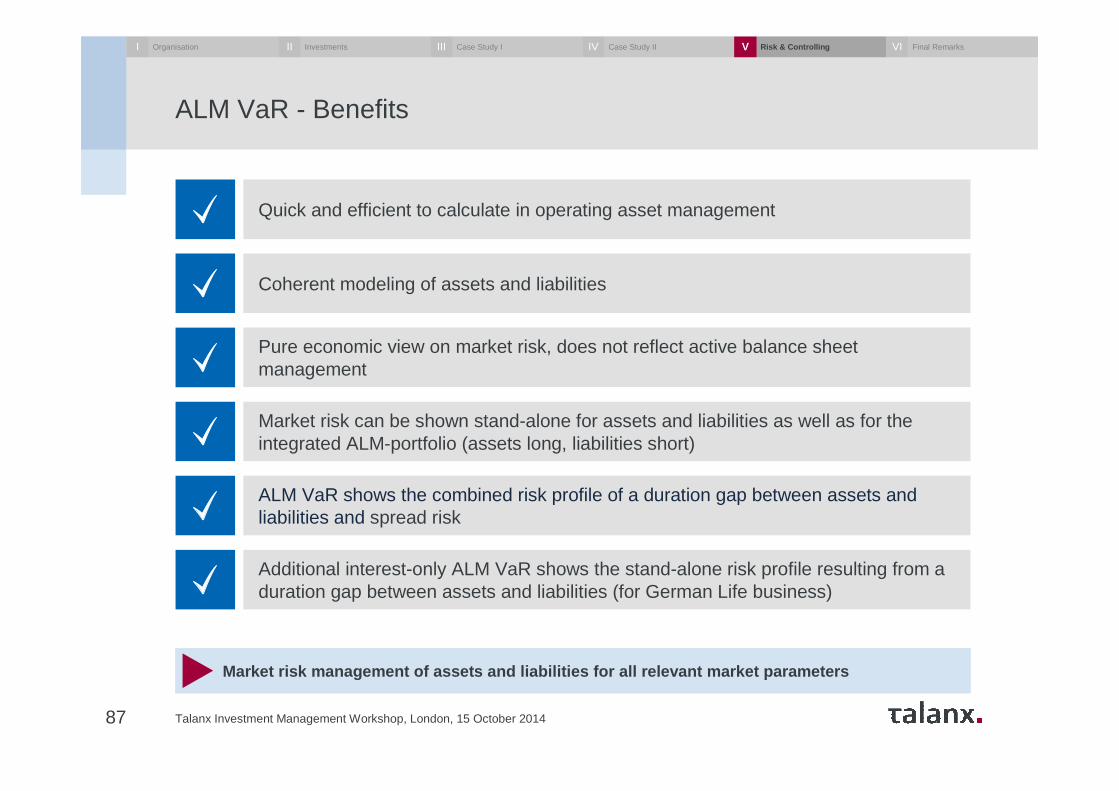
ALM VaR - Benefits
Talanx Investment Management Workshop, London, 15 October 201487
Market risk management of assets and liabilities fo r all relevant market parameters
Quick and efficient to calculate in operating asset management
Coherent modeling of assets and liabilities
Pure economic view on market risk, does not reflect active balance sheet management
Market risk can be shown stand-alone for assets and liabilities as well as for the integrated ALM-portfolio (assets long, liabilities short)
ALM VaR shows the combined risk profile of a duration gap between assets and liabilities and spread risk
Additional interest-only ALM VaR shows the stand-alone risk profile resulting from a duration gap between assets and liabilities (for German Life business)
I Organisation InvestmentsII Case Study IIII Case Study IIIV Risk & ControllingV Final RemarksVI
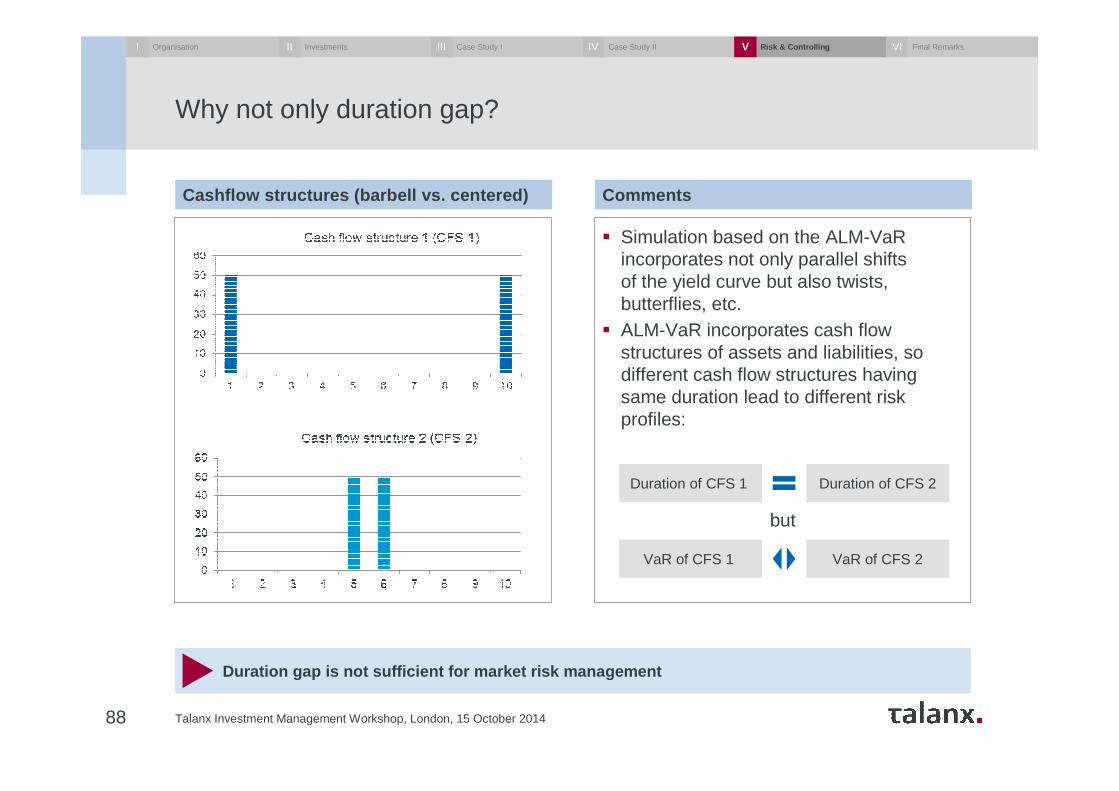
Why not only duration gap?
Talanx Investment Management Workshop, London, 15 October 201488
Cashflow structures (barbell vs. centered) Comments
� Simulation based on the ALM-VaRincorporates not only parallel shifts of the yield curve but also twists, butterflies, etc.
� ALM-VaR incorporates cash flow structures of assets and liabilities, so different cash flow structures having same duration lead to different risk profiles:
but
Duration gap is not sufficient for market risk mana gement
Duration of CFS 1 Duration of CFS 2
VaR of CFS 1 VaR of CFS 2
I Organisation InvestmentsII Case Study IIII Case Study IIIV Risk & ControllingV Final RemarksVI
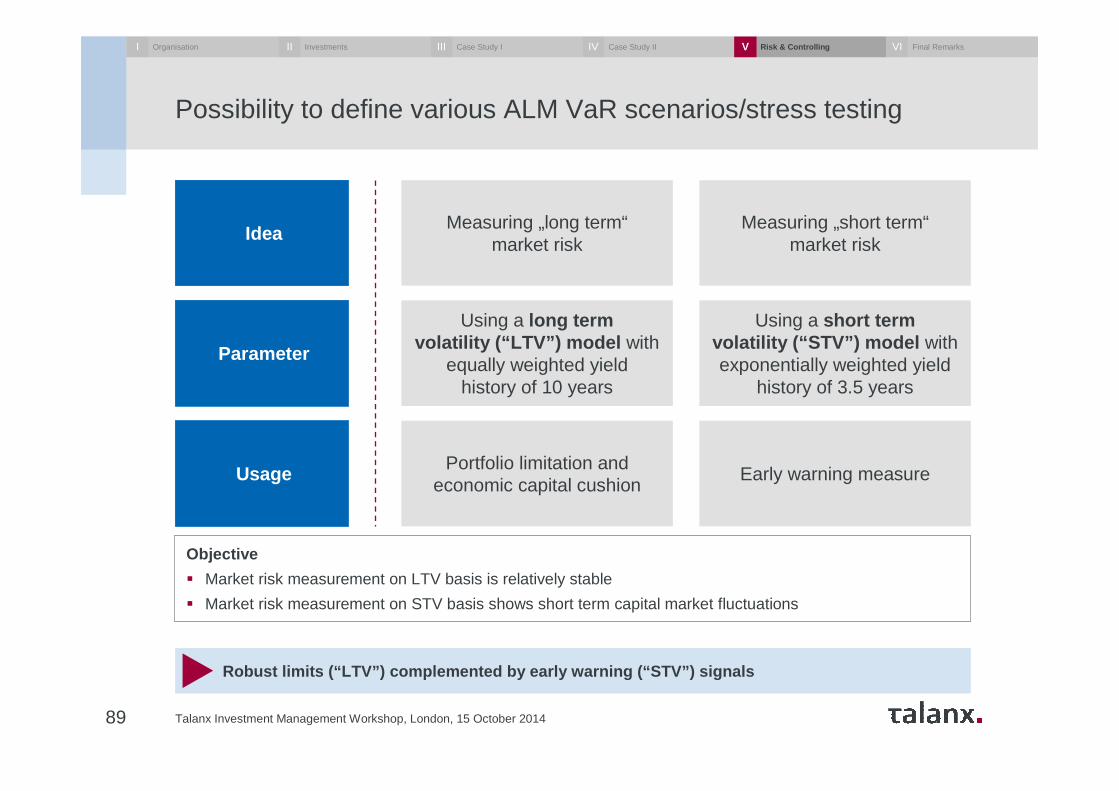
Possibility to define various ALM VaR scenarios/stress testing
Talanx Investment Management Workshop, London, 15 October 201489
Measuring „long term“market risk
Idea
Parameter
Usage
Using a long term volatility (“LTV”) model with
equally weighted yieldhistory of 10 years
Portfolio limitation and economic capital cushion
Early warning measure
Using a short term volatility (“STV”) model with exponentially weighted yield
history of 3.5 years
Measuring „short term“market risk
Robust limits (“LTV”) complemented by early warning (“STV”) signals
Objective
� Market risk measurement on LTV basis is relatively stable
� Market risk measurement on STV basis shows short term capital market fluctuations
I Organisation InvestmentsII Case Study IIII Case Study IIIV Risk & ControllingV Final RemarksVI
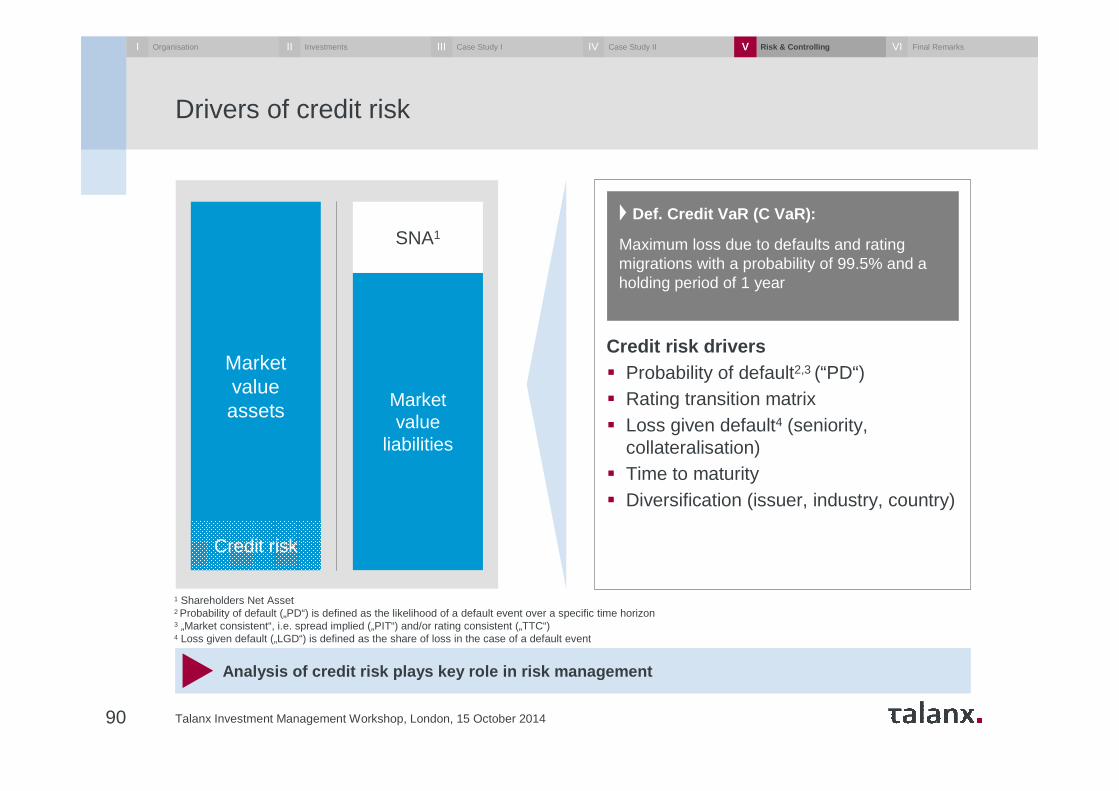
Credit risk drivers� Probability of default2,3 (“PD“)� Rating transition matrix� Loss given default4 (seniority,
collateralisation)� Time to maturity� Diversification (issuer, industry, country)
Drivers of credit risk
Talanx Investment Management Workshop, London, 15 October 201490
Analysis of credit risk plays key role in risk mana gement
Market valueassets Market
value liabilities
SNA1
1 Shareholders Net Asset2 Probability of default („PD“) is defined as the likelihood of a default event over a specific time horizon3 „Market consistent“, i.e. spread implied („PIT“) and/or rating consistent („TTC“)4 Loss given default („LGD“) is defined as the share of loss in the case of a default event
Credit risk
Def. Credit VaR (C VaR):
Maximum loss due to defaults and rating migrations with a probability of 99.5% and a holding period of 1 year
I Organisation InvestmentsII Case Study IIII Case Study IIIV Risk & ControllingV Final RemarksVI
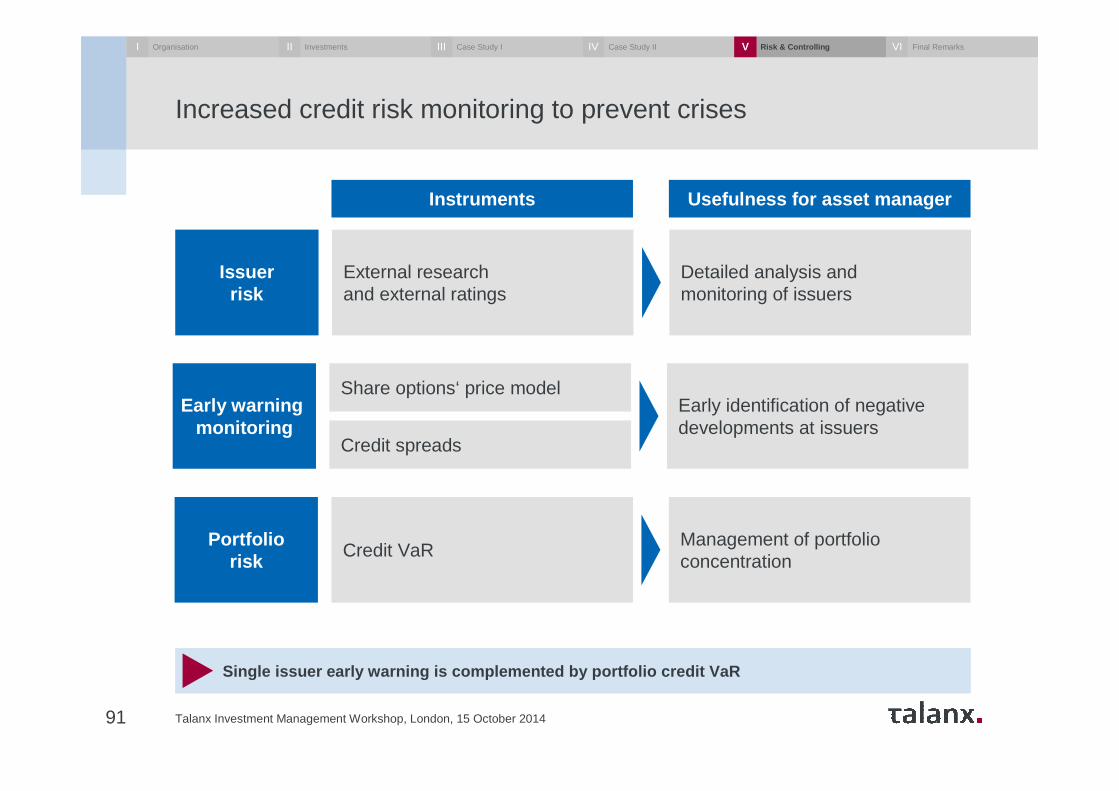
Increased credit risk monitoring to prevent crises
91 Talanx Investment Management Workshop, London, 15 October 2014
Share options‘ price model
Credit spreads
Early identification of negative developments at issuers
External research and external ratings
Detailed analysis and monitoring of issuers
Credit VaRManagement of portfolioconcentration
Usefulness for asset manager
Early warningmonitoring
Issuerrisk
Instruments
Portfoliorisk
Single issuer early warning is complemented by port folio credit VaR
I Organisation InvestmentsII Case Study IIII Case Study IIIV Risk & ControllingV Final RemarksVI
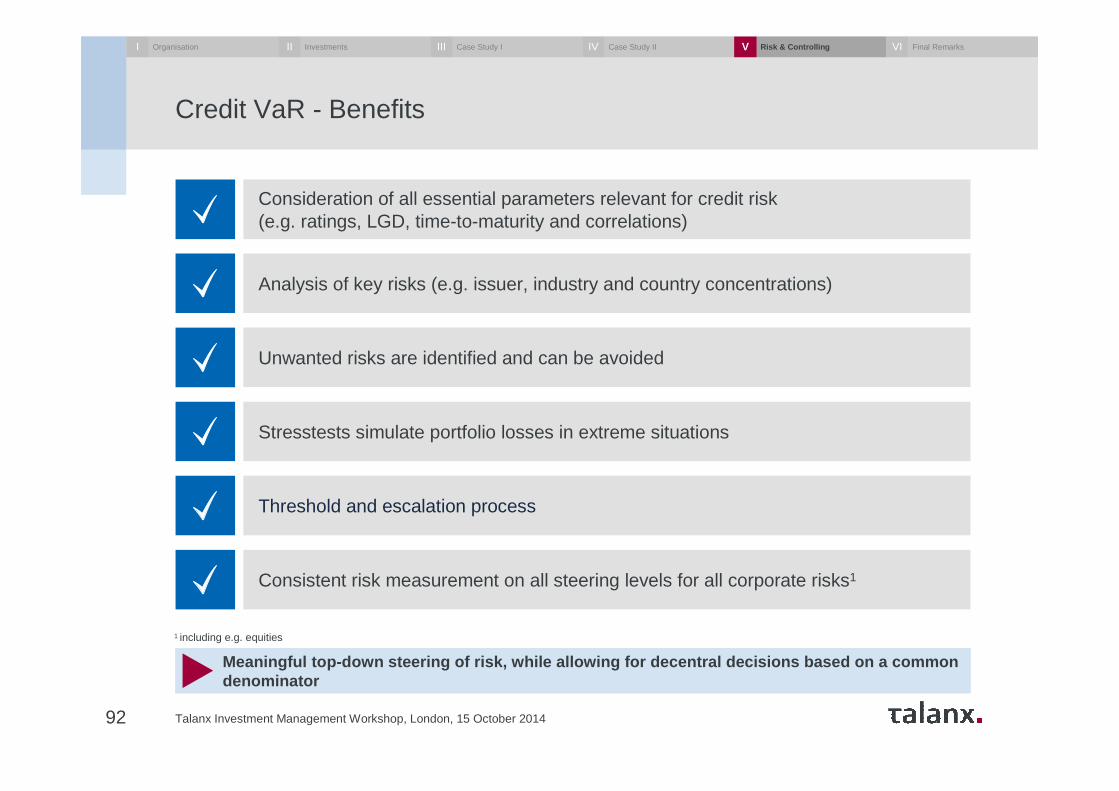
Credit VaR - Benefits
Talanx Investment Management Workshop, London, 15 October 201492
Meaningful top-down steering of risk, while allowing for decentral decisions based on a commondenominator
Consideration of all essential parameters relevant for credit risk(e.g. ratings, LGD, time-to-maturity and correlations)
Analysis of key risks (e.g. issuer, industry and country concentrations)
Unwanted risks are identified and can be avoided
Stresstests simulate portfolio losses in extreme situations
Threshold and escalation process
Consistent risk measurement on all steering levels for all corporate risks1
1 including e.g. equities
I Organisation InvestmentsII Case Study IIII Case Study IIIV Risk & ControllingV Final RemarksVI
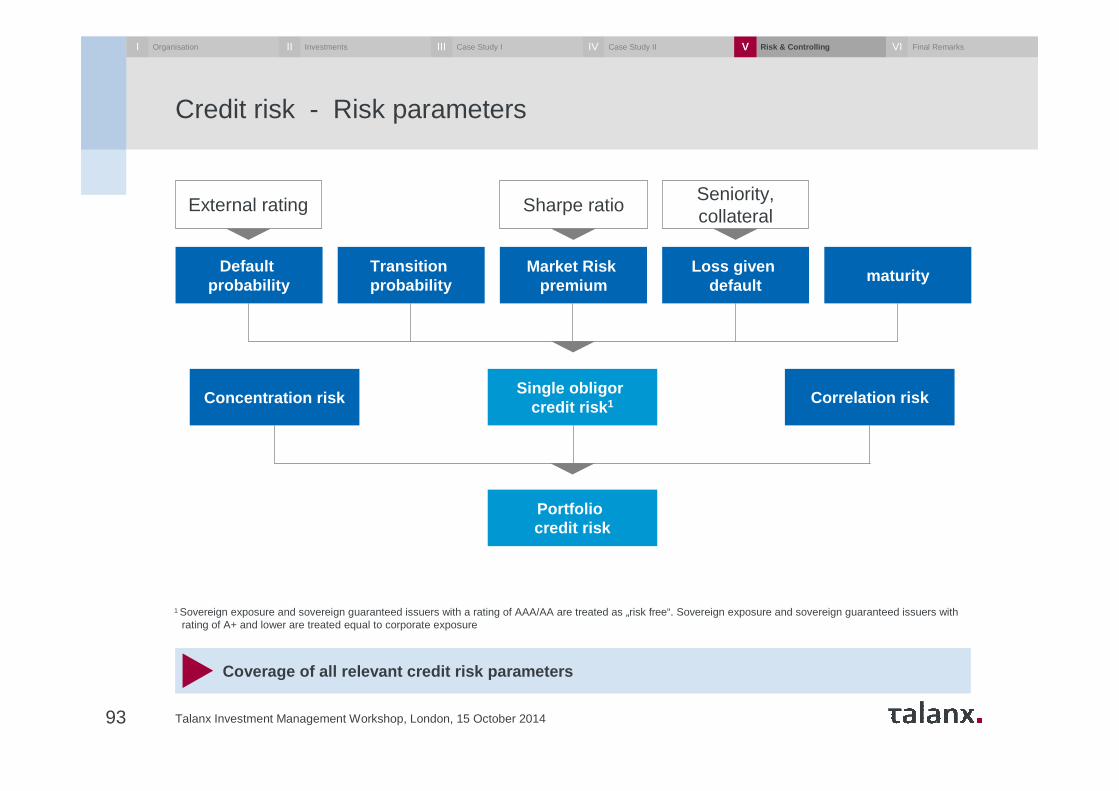
Credit risk - Risk parameters
Talanx Investment Management Workshop, London, 15 October 201493
Coverage of all relevant credit risk parameters
Concentration risk
Portfolio credit risk
Correlation riskSingle obligor
credit risk 1
Loss givendefault
Default probability
maturityTransitionprobability
Market Riskpremium
External rating Sharpe ratioSeniority,collateral
1 Sovereign exposure and sovereign guaranteed issuers with a rating of AAA/AA are treated as „risk free“. Sovereign exposure and sovereign guaranteed issuers withrating of A+ and lower are treated equal to corporate exposure
I Organisation InvestmentsII Case Study IIII Case Study IIIV Risk & ControllingV Final RemarksVI
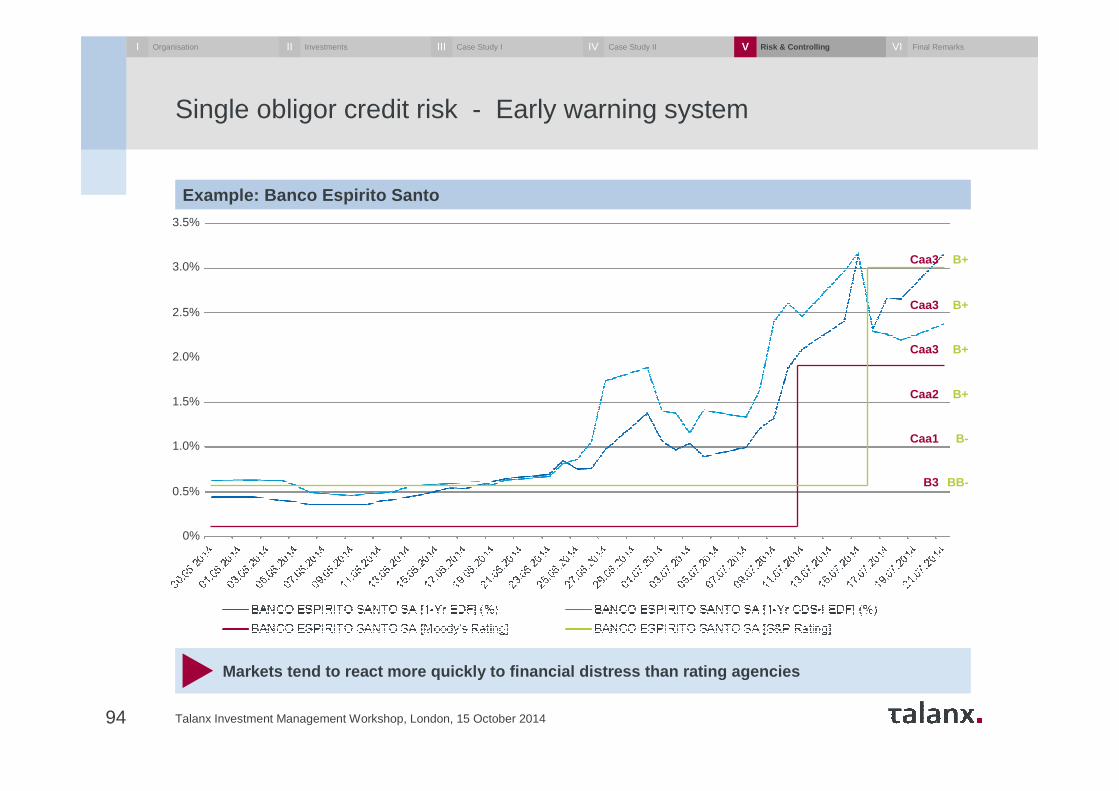
Single obligor credit risk - Early warning system
Talanx Investment Management Workshop, London, 15 October 201494
Markets tend to react more quickly to financial dis tress than rating agencies
Example: Banco Espirito Santo
0%
0.5%
1.0%
1.5%
2.0%
2.5%
3.0%
3.5%
BB-B3
B-Caa1
B+Caa2
B+Caa3
B+Caa3
B+Caa3
I Organisation InvestmentsII Case Study IIII Case Study IIIV Risk & ControllingV Final RemarksVI
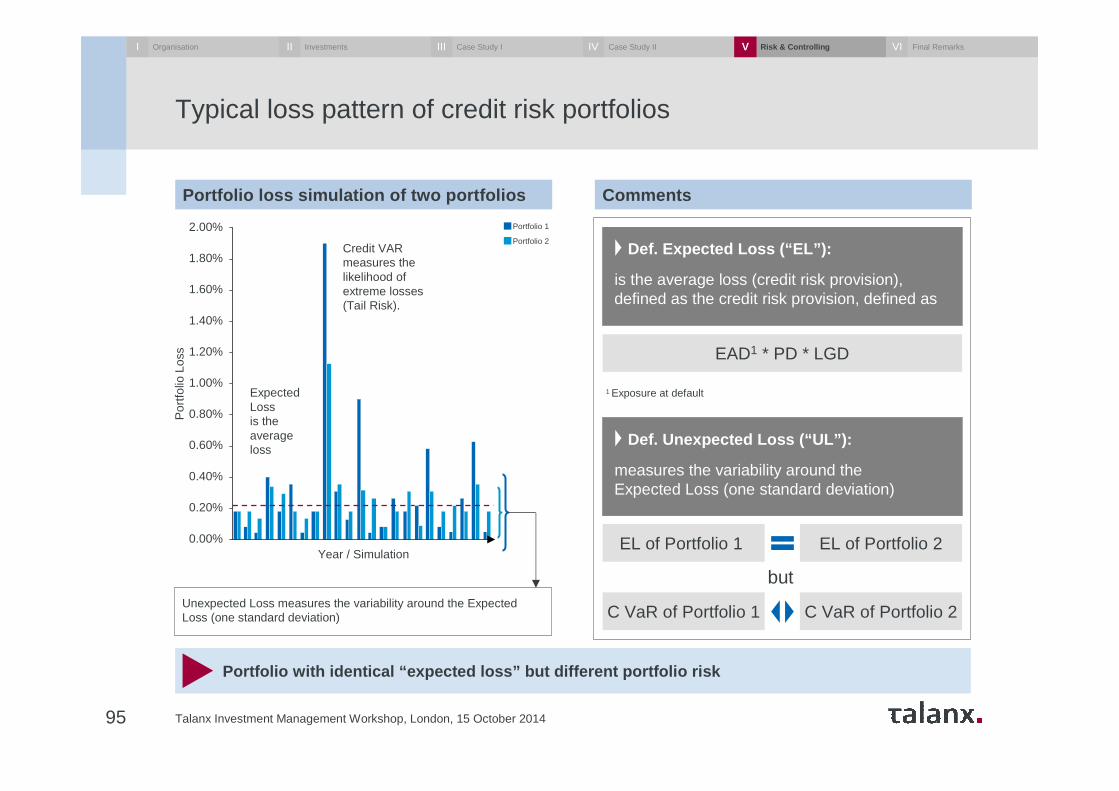
Typical loss pattern of credit risk portfolios
Talanx Investment Management Workshop, London, 15 October 201495
Portfolio with identical “expected loss” but differe nt portfolio risk
CommentsPortfolio loss simulation of two portfolios
0.00%
0.20%
0.40%
0.60%
0.80%
1.00%
1.20%
1.40%
1.60%
1.80%
2.00%
Expected Loss is the average loss
Por
tfolio
Los
s
Year / Simulation
Credit VAR measures the likelihood of extreme losses (Tail Risk).
Portfolio 1
Portfolio 2
Unexpected Loss measures the variability around the Expected Loss (one standard deviation)
EL of Portfolio 1 EL of Portfolio 2
C VaR of Portfolio 1 C VaR of Portfolio 2
EAD1 * PD * LGD
Def. Expected Loss (“EL”):
is the average loss (credit risk provision), defined as the credit risk provision, defined as
but
Def. Unexpected Loss (“UL”):
measures the variability around the Expected Loss (one standard deviation)
1 Exposure at default
I Organisation InvestmentsII Case Study IIII Case Study IIIV Risk & ControllingV Final RemarksVI
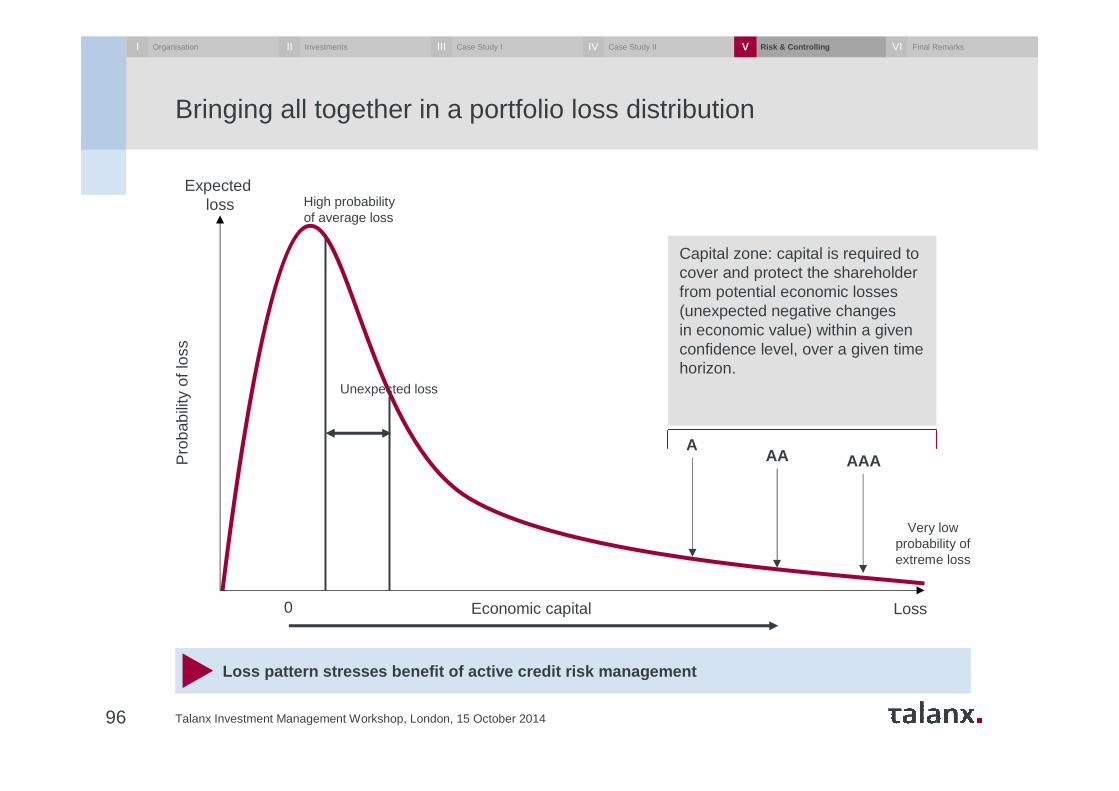
Bringing all together in a portfolio loss distribution
Talanx Investment Management Workshop, London, 15 October 201496
Expected loss
Pro
babi
lity
of lo
ss
Loss
AAA
0
Unexpected loss
Economic capital
Very low probability of extreme loss
High probability of average loss
AAA
Capital zone: capital is required to cover and protect the shareholder from potential economic losses (unexpected negative changes in economic value) within a given confidence level, over a given time horizon.
Loss pattern stresses benefit of active credit risk management
I Organisation InvestmentsII Case Study IIII Case Study IIIV Risk & ControllingV Final RemarksVI
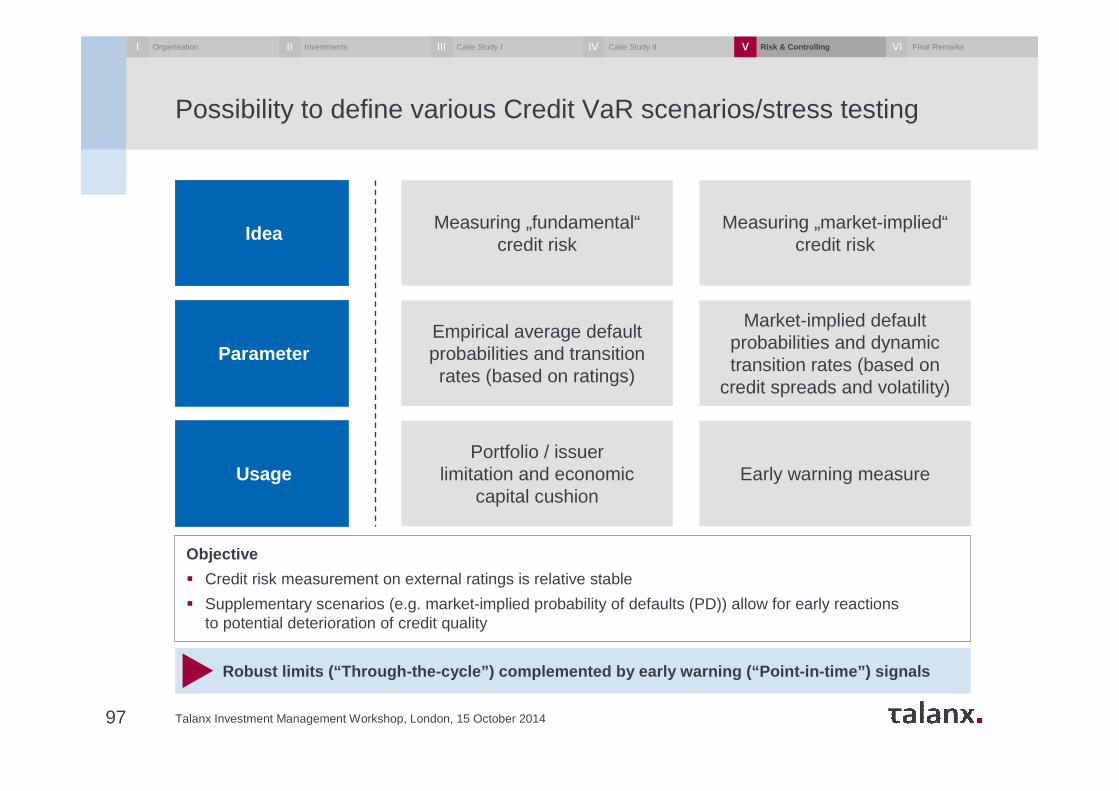
Possibility to define various Credit VaR scenarios/stress testing
Talanx Investment Management Workshop, London, 15 October 201497
Objective
� Credit risk measurement on external ratings is relative stable
� Supplementary scenarios (e.g. market-implied probability of defaults (PD)) allow for early reactions to potential deterioration of credit quality
Measuring „fundamental“credit risk
Idea
Parameter
Usage
Empirical average default probabilities and transition rates (based on ratings)
Portfolio / issuer limitation and economic
capital cushionEarly warning measure
Market-implied default probabilities and dynamic transition rates (based on
credit spreads and volatility)
Measuring „market-implied“credit risk
Robust limits (“Through-the-cycle”) complemented by early warning (“Point-in-time”) signals
I Organisation InvestmentsII Case Study IIII Case Study IIIV Risk & ControllingV Final RemarksVI
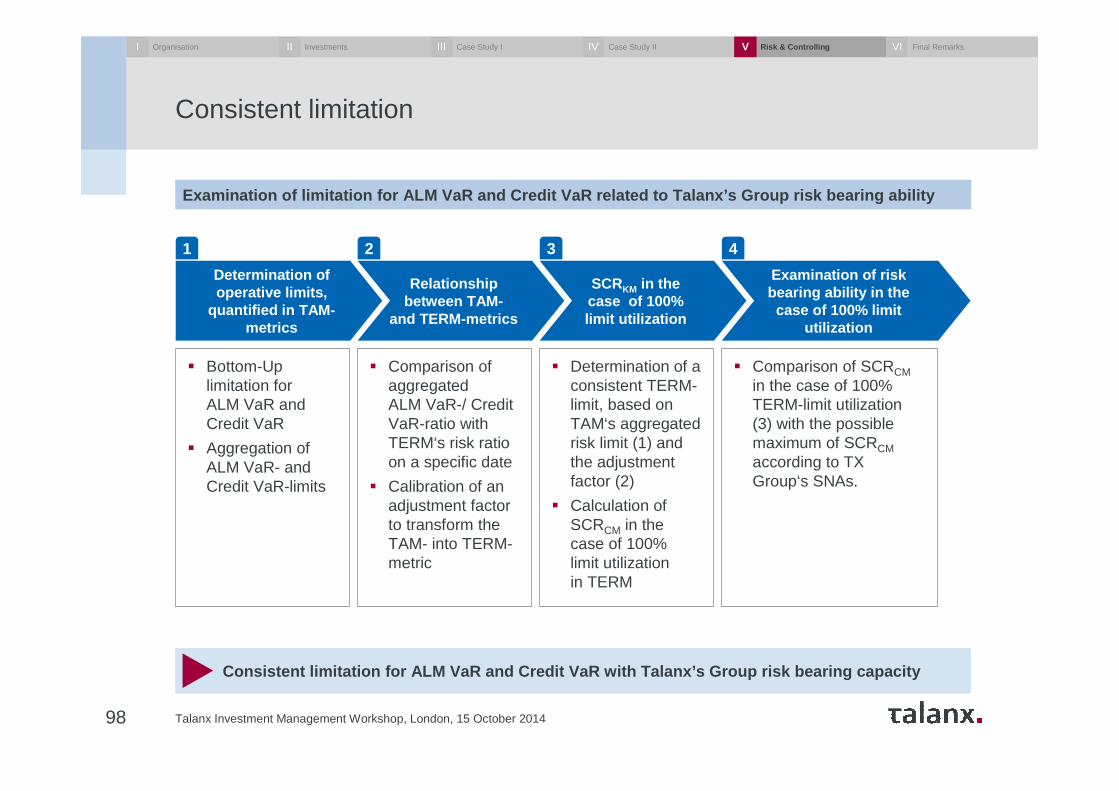
Consistent limitation
Talanx Investment Management Workshop, London, 15 October 201498
Consistent limitation for ALM VaR and Credit VaR with Talanx’s Group risk bearing capacity
Examination of limitation for ALM VaR and Credit VaR related to Talanx’s Group risk bearing ability
Determination of operative limits,
quantified in TAM-metrics
Relationship between TAM-
and TERM-metrics
� Bottom-Up limitation forALM VaR and Credit VaR
� Aggregation of ALM VaR- and Credit VaR-limits
� Comparison of aggregatedALM VaR-/ Credit VaR-ratio with TERM‘s risk ratio on a specific date
� Calibration of an adjustment factor to transform the TAM- into TERM-metric
� Determination of a consistent TERM-limit, based on TAM‘s aggregated risk limit (1) and the adjustment factor (2)
� Calculation of SCRCM in the case of 100% limit utilization in TERM
� Comparison of SCRCMin the case of 100% TERM-limit utilization (3) with the possible maximum of SCRCMaccording to TX Group‘s SNAs.
1 2 3 4
SCRKM in the case of 100% limit utilization
Examination of risk bearing ability in the
case of 100% limit utilization
I Organisation InvestmentsII Case Study IIII Case Study IIIV Risk & ControllingV Final RemarksVI
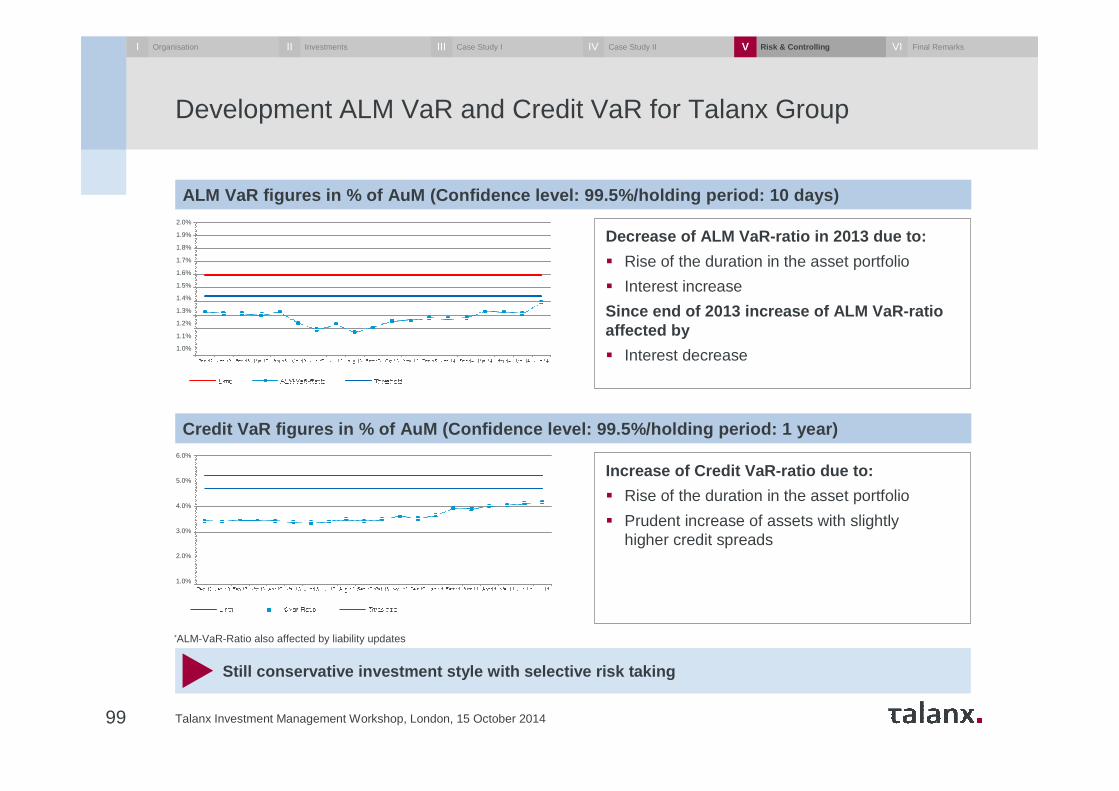
Development ALM VaR and Credit VaR for Talanx Group
99 Talanx Investment Management Workshop, London, 15 October 2014
Still conservative investment style with selective risk taking
ALM VaR figures in % of AuM (Confidence level: 99.5%/ holding period: 10 days)
*ALM-VaR-Ratio also affected by liability updates
Decrease of ALM VaR-ratio in 2013 due to:
� Rise of the duration in the asset portfolio
� Interest increase
Since end of 2013 increase of ALM VaR-ratioaffected by
� Interest decrease
Increase of Credit VaR-ratio due to:
� Rise of the duration in the asset portfolio
� Prudent increase of assets with slightly higher credit spreads
2.0%
1.9%
1.8%
1.7%
1.6%
1.5%
1.4%
1.3%
1.2%
1.1%
1.0%
6.0%
5.0%
4.0%
3.0%
2.0%
1.0%
Credit VaR figures in % of AuM (Confidence level: 99. 5%/holding period: 1 year)
I Organisation InvestmentsII Case Study IIII Case Study IIIV Risk & ControllingV Final RemarksVI
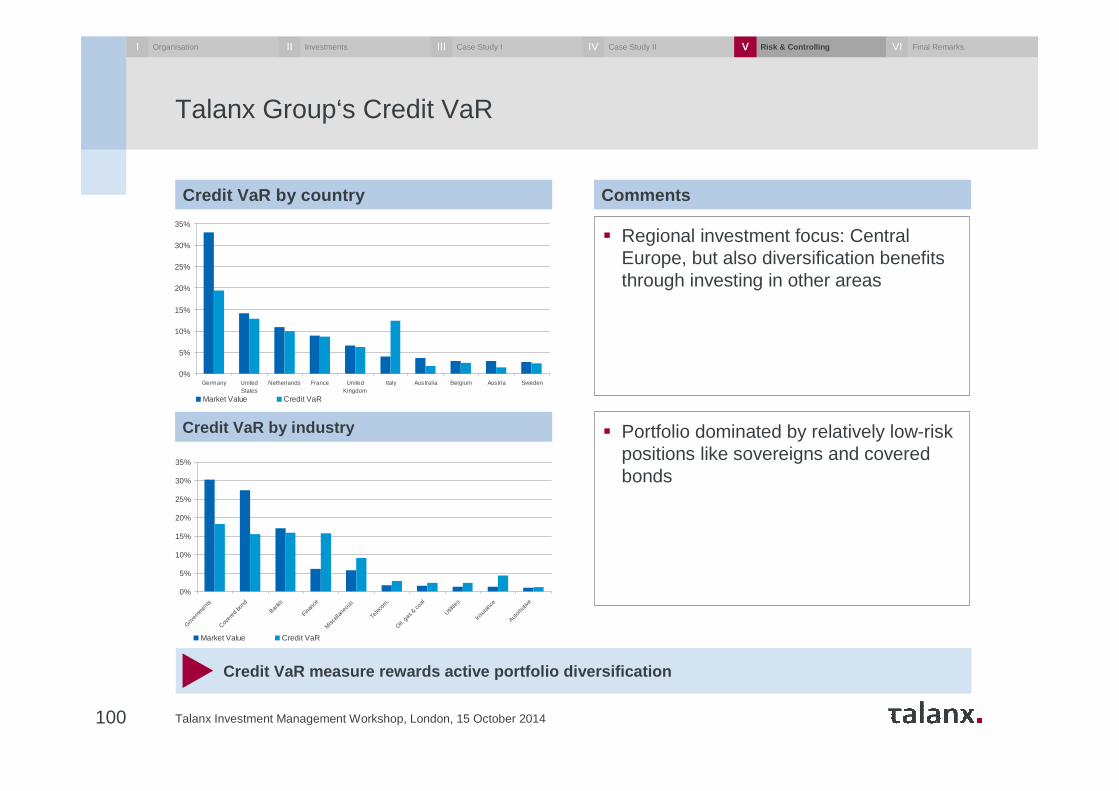
Talanx Group‘s Credit VaR
100 Talanx Investment Management Workshop, London, 15 October 2014
Credit VaR by industry
Credit VaR measure rewards active portfolio diversif ication
Credit VaR by country Comments
� Regional investment focus: Central Europe, but also diversification benefits through investing in other areas
0%
5%
10%
15%
20%
25%
30%
35%
Germany UnitedStates
Netherlands France UnitedKingdom
Italy Australia Belgium Austria Sweden
Market Value Credit VaR
0%
5%
10%
15%
20%
25%
30%
35%
Gover
nmen
ts
Cover
ed b
ond
Banks
Fina
nce
Misc
ellan
eous
Telec
om.
Oil, ga
s & co
al
Utilitie
s
Insu
rance
Autom
otive
Market Value Credit VaR
� Portfolio dominated by relatively low-risk positions like sovereigns and covered bonds
I Organisation InvestmentsII Case Study IIII Case Study IIIV Risk & ControllingV Final RemarksVI
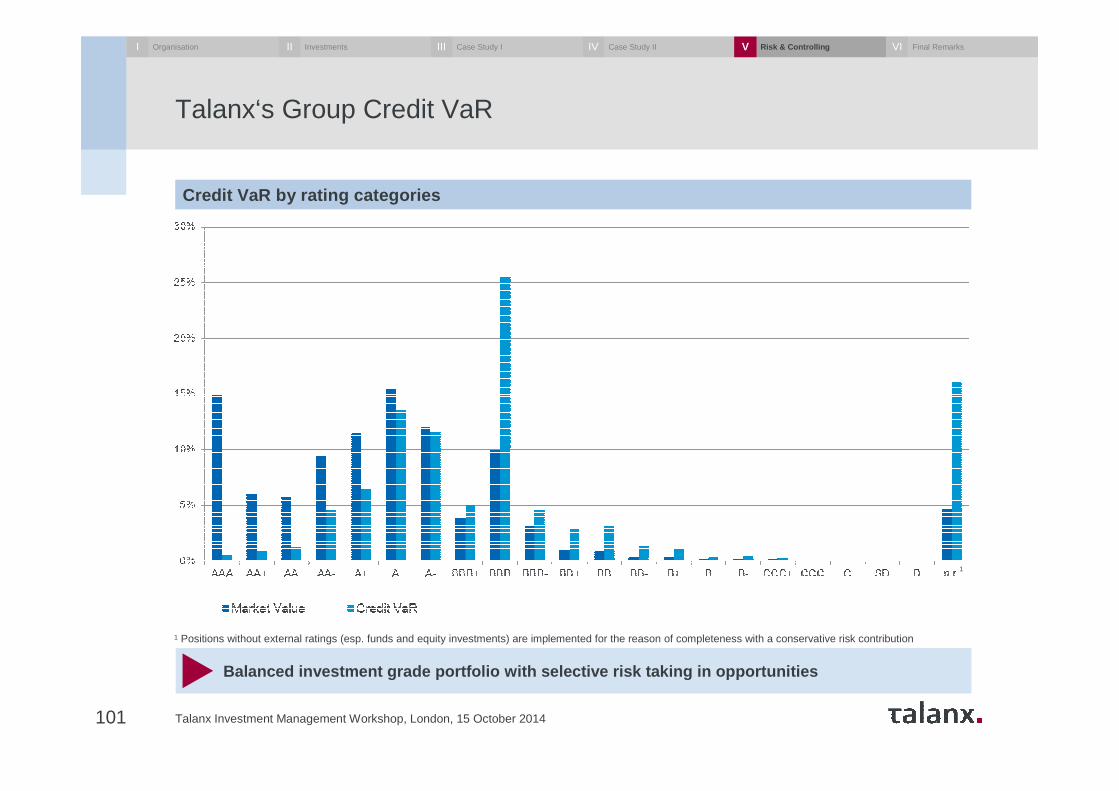
Talanx‘s Group Credit VaR
101 Talanx Investment Management Workshop, London, 15 October 2014
Balanced investment grade portfolio with selective risk taking in opportunities
Credit VaR by rating categories
1 Positions without external ratings (esp. funds and equity investments) are implemented for the reason of completeness with a conservative risk contribution
1
I Organisation InvestmentsII Case Study IIII Case Study IIIV Risk & ControllingV Final RemarksVI
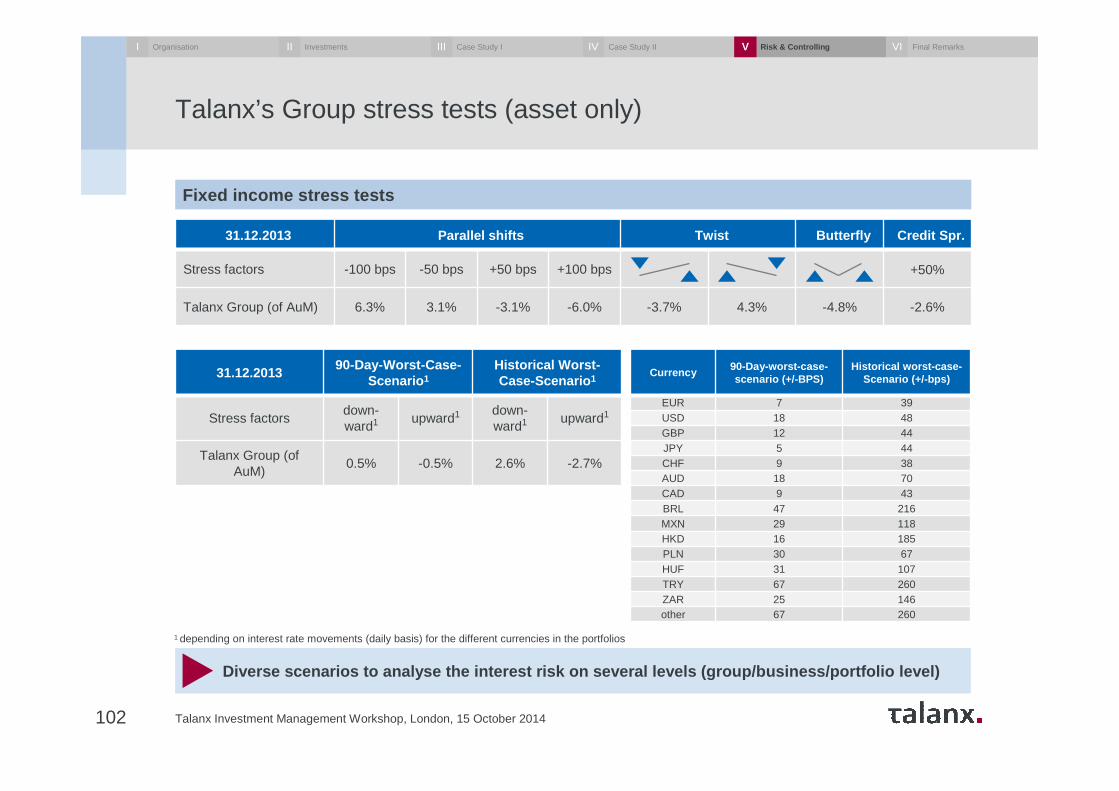
Talanx’s Group stress tests (asset only)
102 Talanx Investment Management Workshop, London, 15 October 2014
Diverse scenarios to analyse the interest risk on se veral levels (group/business/portfolio level)
31.12.2013 Parallel shifts Twist Butterfly Credit Spr.
Stress factors -100 bps -50 bps +50 bps +100 bps +50%
Talanx Group (of AuM) 6.3% 3.1% -3.1% -6.0% -3.7% 4.3% -4.8% -2.6%
Fixed income stress tests
31.12.201390-Day-Worst-Case-
Scenario 1Historical Worst-Case-Scenario 1
Stress factorsdown-ward1 upward1 down-
ward1 upward1
Talanx Group (of AuM)
0.5% -0.5% 2.6% -2.7%
1 depending on interest rate movements (daily basis) for the different currencies in the portfolios
Currency 90-Day-worst-case-scenario (+/-BPS)
Historical worst-case-Scenario (+/-bps)
EUR 7 39USD 18 48GBP 12 44JPY 5 44CHF 9 38AUD 18 70CAD 9 43BRL 47 216MXN 29 118HKD 16 185PLN 30 67HUF 31 107TRY 67 260ZAR 25 146other 67 260
I Organisation InvestmentsII Case Study IIII Case Study IIIV Risk & ControllingV Final RemarksVI
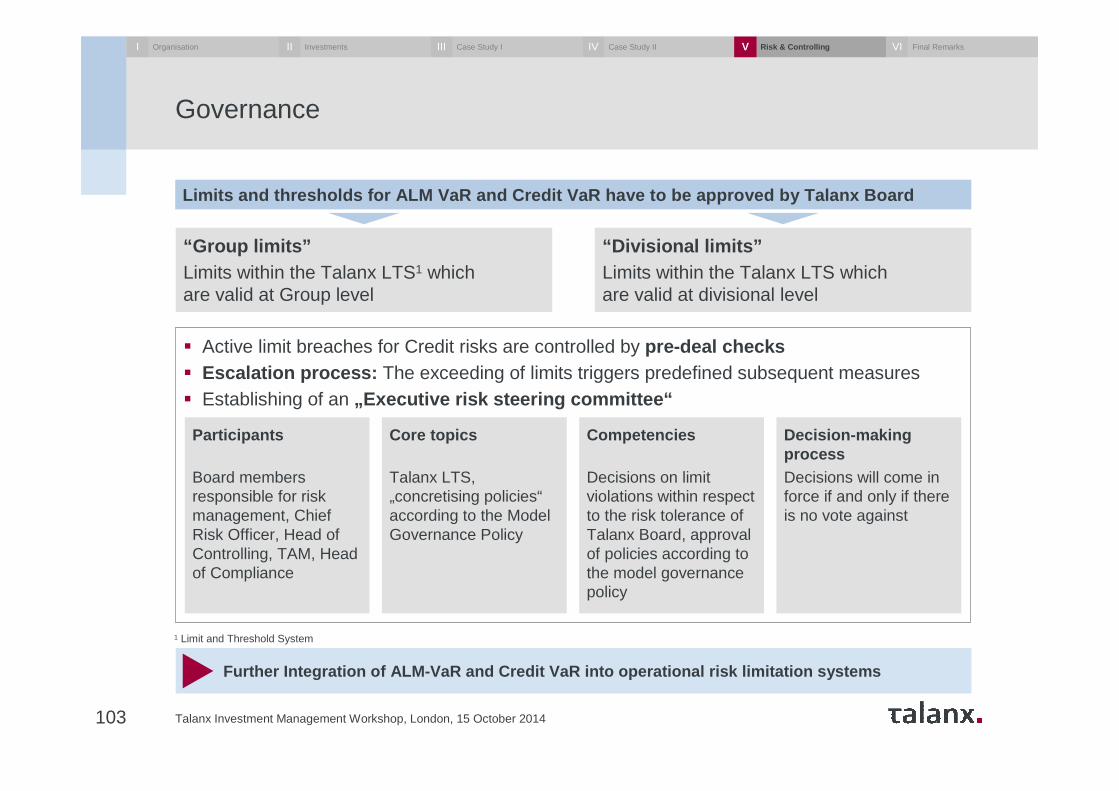
Governance
Talanx Investment Management Workshop, London, 15 October 2014103
� Active limit breaches for Credit risks are controlled by pre-deal checks� Escalation process: The exceeding of limits triggers predefined subsequent measures� Establishing of an „Executive risk steering committee“
Further Integration of ALM-VaR and Credit VaR into op erational risk limitation systems
Limits and thresholds for ALM VaR and Credit VaR have to be approved by Talanx Board
“Group limits”Limits within the Talanx LTS1 which are valid at Group level
“Divisional limits”Limits within the Talanx LTS which are valid at divisional level
Participants
Board members responsible for risk management, Chief Risk Officer, Head of Controlling, TAM, Head of Compliance
Core topics
Talanx LTS, „concretising policies“according to the Model Governance Policy
Competencies
Decisions on limit violations within respect to the risk tolerance of Talanx Board, approval of policies according to the model governance policy
Decision-making processDecisions will come in force if and only if there is no vote against
1 Limit and Threshold System
I Organisation InvestmentsII Case Study IIII Case Study IIIV Risk & ControllingV Final RemarksVI
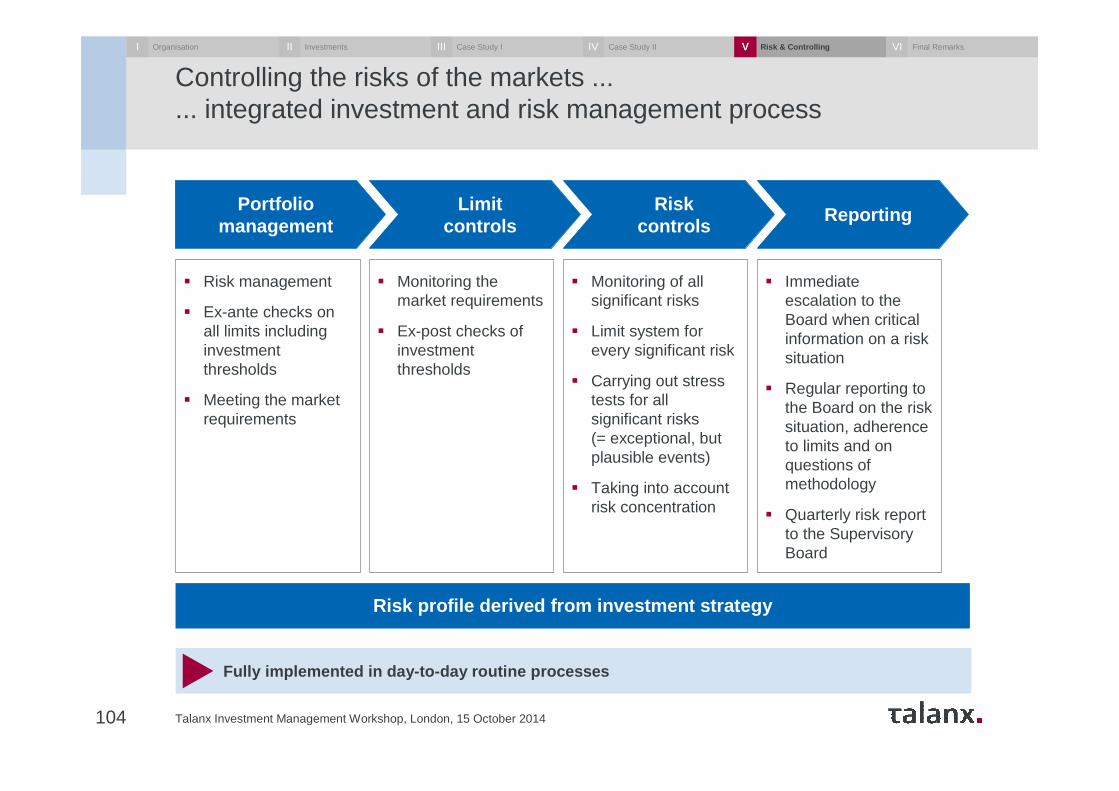
Controlling the risks of the markets ...... integrated investment and risk management process
Talanx Investment Management Workshop, London, 15 October 2014104
Risk profile derived from investment strategy
� Risk management
� Ex-ante checks on all limits including investment thresholds
� Meeting the market requirements
Portfolio management
Limit controls
Riskcontrols
Reporting
� Monitoring the market requirements
� Ex-post checks of investment thresholds
� Monitoring of all significant risks
� Limit system for every significant risk
� Carrying out stress tests for all significant risks (= exceptional, but plausible events)
� Taking into account risk concentration
� Immediate escalation to the Board when critical information on a risk situation
� Regular reporting to the Board on the risk situation, adherence to limits and on questions of methodology
� Quarterly risk report to the Supervisory Board
Fully implemented in day-to-day routine processes
I Organisation InvestmentsII Case Study IIII Case Study IIIV Risk & ControllingV Final RemarksVI
Agenda
105 Talanx Investment Management Workshop, London, 15 October 2014
Organisational set-up and processI Dr. Immo Querner
Dr. Dirk Erdmann.
Thomas Fiebig
Dr. Bernhard Graeber
Dr. Immo Querner
Case study II: Direct real estate investments
Concluding remarks
Case study I: Infrastructure investments
Risk measurement, evaluation and control
III
IV
V
VI
Investment challenges and responsesII Dr. Thomas Mann
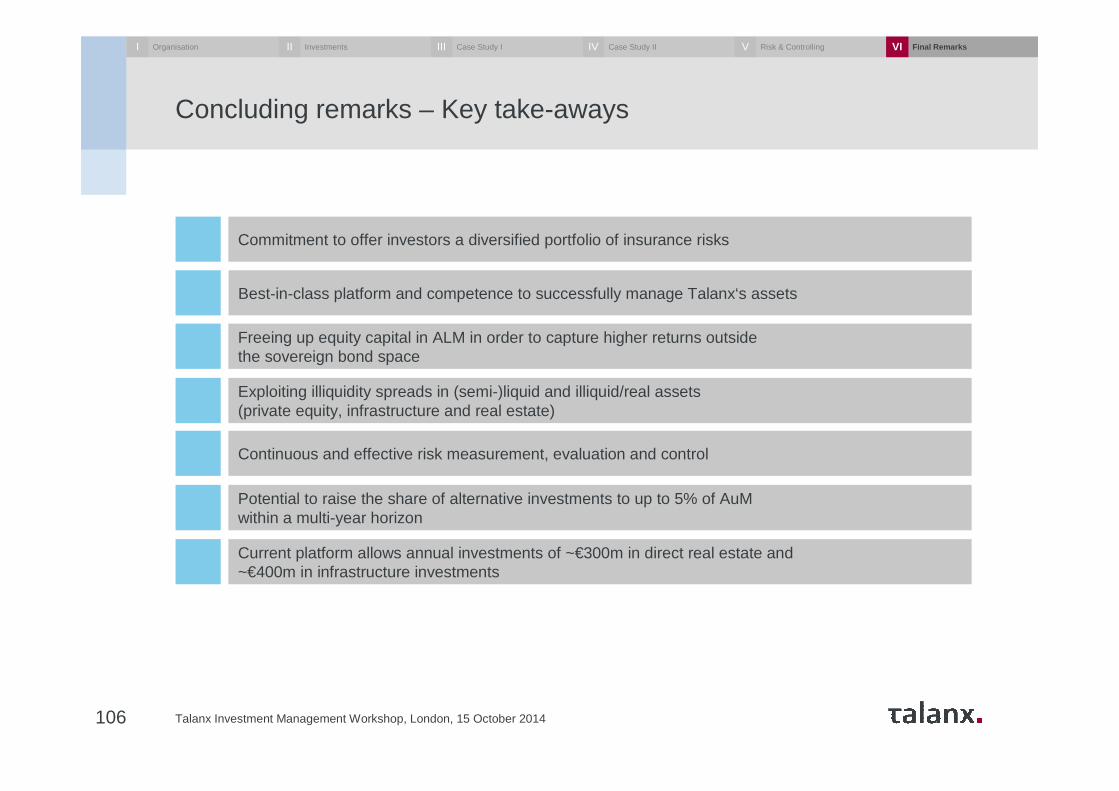
Concluding remarks – Key take-aways
Talanx Investment Management Workshop, London, 15 October 2014106
Commitment to offer investors a diversified portfolio of insurance risks
Continuous and effective risk measurement, evaluation and control
Freeing up equity capital in ALM in order to capture higher returns outside the sovereign bond space
Exploiting illiquidity spreads in (semi-)liquid and illiquid/real assets (private equity, infrastructure and real estate)
Best-in-class platform and competence to successfully manage Talanx‘s assets
Potential to raise the share of alternative investments to up to 5% of AuMwithin a multi-year horizon
Current platform allows annual investments of ~€300m in direct real estate and ~€400m in infrastructure investments
I Organisation InvestmentsII Case Study IIII Case Study IIIV Risk & ControllingV Final RemarksVI
Talanx Investor Relations
Contact
Talanx AGRiethorst 230659 [email protected]
Carsten Werle, CFAPhone: +49 511 3747 [email protected]
Marcus Sander, CFAPhone: +49 511 3747 [email protected]
Wiebke ErlerPhone: +49 511 3747 [email protected]
Christian MarxPhone: +49 511 3747 [email protected]
Financial Calendar
13 November 2014Interim Report 9M 2014
23 March 2015Annual Report 2014
7 May 2015AGM 2015
11 May 2015Interim Report Q1 2015
12 August 2015Interim Report 6M 2015
107 Talanx Investment Management Workshop, London, 15 October 2014
Disclaimer
This presentation contains forward-looking statements which are based on certain assumptions, expectations and opinions of the management of Talanx AG (the "Company") or cited from third-party sources. These statements are, therefore, subject to certain known or unknown risks and uncertainties. A variety of factors, many of which are beyond the Company’s control, affect the Company’s business activities, business strategy, results, performance and achievements. Should one or more of these factors or risks or uncertainties materialize, actual results, performance or achievements of the Company may vary materially from those expressed or implied as being expected, anticipated, intended, planned, believed, sought, estimated or projected.in the relevant forward-looking statement.
The Company does not guarantee that the assumptions underlying such forward-looking statements are free from errors nor does the Company accept any responsibility for the actual occurrence of the forecasted developments. The Company neither intends, nor assumes any obligation, to update or revise these forward-looking statements in light of developments which differ from those anticipated.
Where any information and statistics are quoted from any external source, such information or statistics should not be interpreted as having been adopted or endorsed by the Company as being accurate. Presentations of the company usually contain supplemental financial measures (e.g., return on investment, return on equity, gross/net combined ratios, solvency ratios) which the Company believes to be useful performance measures but which are not recognised as measures under International Financial Reporting Standards, as adopted by the European Union ("IFRS"). Therefore, such measures should be viewed as supplemental to, but not as substitute for, balance sheet, statement of income or cash flow statement data determined in accordance with IFRS. Since not all companies define such measures in the same way, the respective measures may not be comparable to similarly-titled measures used by other companies. This presentation is dated as of 15 October 2014. Neither the delivery of this presentation nor any further discussions of the Company with any of the recipients shall, under any circumstances, create any implication that there has been no change in the affairs of the Company since such date. This material is being delivered in conjunction with an oral presentation by the Company and should not be taken out of context.
108 Talanx Investment Management Workshop, London, 15 October 2014
Related Documents