Hindawi Publishing Corporation Mathematical Problems in Engineering Volume 2012, Article ID 242187, 14 pages doi:10.1155/2012/242187 Research Article Investment Decision Support for Engineering Projects Based on Risk Correlation Analysis Yan Liu, 1 Ting-Hua Yi, 2 and Cui-Qin Wang 1 1 College of Architectural Engineering, Qingdao Agricultural University, Qingdao 266109, China 2 School of Civil Engineering, Dalian University of Technology, Dalian 116023, China Correspondence should be addressed to Ting-Hua Yi, [email protected] Received 2 October 2012; Accepted 31 October 2012 Academic Editor: Fei Kang Copyright q 2012 Yan Liu et al. This is an open access article distributed under the Creative Commons Attribution License, which permits unrestricted use, distribution, and reproduction in any medium, provided the original work is properly cited. Investment decisions are usually made on the basis of the subjective judgments of experts sub- jected to the information gap during the preliminary stages of a project. As a consequence, a series of errors in risk prediction and/or decision-making will be generated leading to out of con- trol investment and project failure. In this paper, the variable fuzzy set theory and intelligent algorithms integrated with case-based reasoning are presented. The proposed algorithm manages the numerous fuzzy concepts and variable factors of a project and also sets up the decision-making process in accordance with past cases and experiences. Furthermore, it decreases the calculation difficulty and reduces the decision-making reaction time. Three types of risk correlations com- bined with different characteristics of engineering projects are summarized, and each of these cor- relations is expounded at the project investment decision-making stage. Quantitative and quali- tative change theories of variable fuzzy sets are also addressed for investment risk warning. The approach presented in this paper enables the risk analysis in a simple and intuitive manner and realizes the integration of objective and subjective risk assessments within the decision-makers’ risk expectation. 1. Introduction The purpose of engineering investment is to obtain satisfactory returns; such decisions however are affected by considerable uncertainties. Expected revenue largely depends on the analysis and control of these incertitudes. These uncertainties have been a constant from the perspective of the entire investment process, and investment decision-making plays a fundamental role because it is the starting point of the entire investment process. According to the expert estimation and case studies of major projects, early decision-making exerts a magnitude of influence of 70% or higher over an entire project. A large number of projects fail due to the errors in initial investment decisions. In the investment decision-making process of large-scale projects, many risk factors can cause decision failure. The most crucial factors

Welcome message from author
This document is posted to help you gain knowledge. Please leave a comment to let me know what you think about it! Share it to your friends and learn new things together.
Transcript
Hindawi Publishing CorporationMathematical Problems in EngineeringVolume 2012, Article ID 242187, 14 pagesdoi:10.1155/2012/242187
Research ArticleInvestment Decision Support for EngineeringProjects Based on Risk Correlation Analysis
Yan Liu,1 Ting-Hua Yi,2 and Cui-Qin Wang1
1 College of Architectural Engineering, Qingdao Agricultural University, Qingdao 266109, China2 School of Civil Engineering, Dalian University of Technology, Dalian 116023, China
Correspondence should be addressed to Ting-Hua Yi, [email protected]
Received 2 October 2012; Accepted 31 October 2012
Academic Editor: Fei Kang
Copyright q 2012 Yan Liu et al. This is an open access article distributed under the CreativeCommons Attribution License, which permits unrestricted use, distribution, and reproduction inany medium, provided the original work is properly cited.
Investment decisions are usually made on the basis of the subjective judgments of experts sub-jected to the information gap during the preliminary stages of a project. As a consequence, aseries of errors in risk prediction and/or decision-making will be generated leading to out of con-trol investment and project failure. In this paper, the variable fuzzy set theory and intelligentalgorithms integrated with case-based reasoning are presented. The proposed algorithm managesthe numerous fuzzy concepts and variable factors of a project and also sets up the decision-makingprocess in accordance with past cases and experiences. Furthermore, it decreases the calculationdifficulty and reduces the decision-making reaction time. Three types of risk correlations com-bined with different characteristics of engineering projects are summarized, and each of these cor-relations is expounded at the project investment decision-making stage. Quantitative and quali-tative change theories of variable fuzzy sets are also addressed for investment risk warning. Theapproach presented in this paper enables the risk analysis in a simple and intuitive manner andrealizes the integration of objective and subjective risk assessments within the decision-makers’risk expectation.
1. Introduction
The purpose of engineering investment is to obtain satisfactory returns; such decisionshowever are affected by considerable uncertainties. Expected revenue largely depends onthe analysis and control of these incertitudes. These uncertainties have been a constant fromthe perspective of the entire investment process, and investment decision-making plays afundamental role because it is the starting point of the entire investment process. Accordingto the expert estimation and case studies of major projects, early decision-making exerts amagnitude of influence of 70% or higher over an entire project. A large number of projects faildue to the errors in initial investment decisions. In the investment decision-making processof large-scale projects, many risk factors can cause decision failure. The most crucial factors

2 Mathematical Problems in Engineering
are the change of expected investment income, the increase of investment opportunity costs,the change of taxes imposed, the variations of market supply and demand relationships,the deficiencies of construction funding, and the backward technology. For the longest time,however, the construction phase has been accorded more attention in comparison with theinvestment decision-making stage despite the latter’s significance in project management.Risk identification, assessment, and management should be initiated early at the projectdecision-making stage to substantially reduce the investment risks and provide the scientificbasis for improvement of the success rate.
Research efforts have been devoted towards risk management; nevertheless, the riskstructure, the risk analysis, and the preventionmethods remain in dispute in academia. A gapstill exists between the actual and expected effects of risk control. Many decisions are basedon the intuition, experiences, and subjective judgments. Project risk factors are complicatedand the clarification of the correlation among these factors is difficult. Implicit assumptionssuggest that risk factors are treated as isolated aspects in the investigation of comprehensiveeffects. Other studies focus only on static links such as qualitative influencing factors,the index weight, and so forth, instead of concentrating on the correlations especially thedynamic correlations among attributes and the dependence between targets and attributes.Risk correlations are found in a large number of projects. Case-based reasoning (CBR) is aneffective data mining application in engineering project studies. It solves new problems byanalyzing similar problems that have been encountered and resolved in the past. When facedwith new problems, the management team can determine suitable solutions by searching forrecorded cases of a similar nature, in effect, reusing past experiences. Should the cases foundbe deemed unsatisfactory, the team canmodify the cases to suit the current situation and thenrecord it in a case database to serve as a future reference; such an approach is a self-learningtechnique. It is a useful tool in handling anticipated complex problems, which are difficult tomodel in theoretical terms.
Marcous et al. [1] investigated the CBR to provide bridge management systems witha deterioration model that eliminates the shortcoming of Markovian model. Chua et al. [2]described a case-based reasoning bidding system that helps contractors with the dynamicinformation varying with the specific features of the job and the new situation. Chua and Goh[3] used the CBR to assist safety-planning teams in developing and improving safety plansfor construction activities through the reuse of safety knowledge during the past time. Chengand Melhem [4] combined the CBR with fuzzy to predict the future health condition of abridge deck and recommended the appropriate maintenance, rehabilitation, and replacementactions. Ozorhon et al. [5] constructed the CBR decision support to demonstrate how theexperiences of competitors can be used by contractors in the international markets, to supportthemarket segment decisions. Ryu et al. [6] presented the CBR as a construction planning toolfor various types of construction projects. Goh and Chua [7] used the CBR approach to utilizepast knowledge in the form of past hazard identification and incident cases to improve theefficiency and quality of new hazard identification.
The diversity of cases can provide high reliability for summarizing correlations, butat the same time may interfere in the decision-making process. Therefore, encapsulating riskcorrelation rules of a certain confidence level using various CBRs and risk management casesis essential. Moreover, understanding risk rules not only reduces risks by shedding light onthe essence of uncertainty, but also plays a key role in investment decision-making and riskprediction. We uncover risk correlations that can provide decision support for investmentdecision-making by combining research trends with the characteristics of engineering pro-jects.

Mathematical Problems in Engineering 3
Input the attribute and data of target case
Case display
Search matching case from the case bank
Transfer case data
Analysis each condition in project
Store the completed project into the case bank
Adjustsearch
condition
N
Data correction
N
Y
Search relevance between factors
Search potential rules based on case data
Case conforms to requirement?
Figure 1: Analysis flow based on CBR technique.
2. Risk Correlation of Project Investment Decision-Making
As a sub-branch of artificial intelligence, the CBR is a mode of reasoning that generates solu-tions to current problems by studying solutions to past problems of a similar nature stored ina knowledge database [8]. The method reuses past cases and experiences to solve new prob-lems, evaluates new problems, explains abnormal conditions, and understands new condi-tions. Figure 1 shows the analysis flow in project investment.
Themore cases stored, themore comprehensive the reference value. The research focusof the CBR is mainly on case storage, case retrieval, and similarity algorithm. However,it takes each case as independent items for research, rather than thoroughly studyingthe correlation between cases and attributes. Not only can it exclude the particularity ofindividual cases, but also reflects the essential characteristics of a wide range of cases toexplore, at a certain confidence level, risk-inherent correlations using a large number ofcases. Currently, the application of CBR in engineering projects is at its initial stage; thus,few studies on risk correlation mining have been conducted. However difficult, the key toexploring risk correlations and the factors relevant to these correlations is to determine theprocess involved in investment decision-making in engineering projects. On the basis of theseinsights, we uncover and compile three kinds of risk correlations (see Table 1) by combiningthe correlation mining methods applied in other domains and the risk factors present inengineering projects. The process is described as follows.
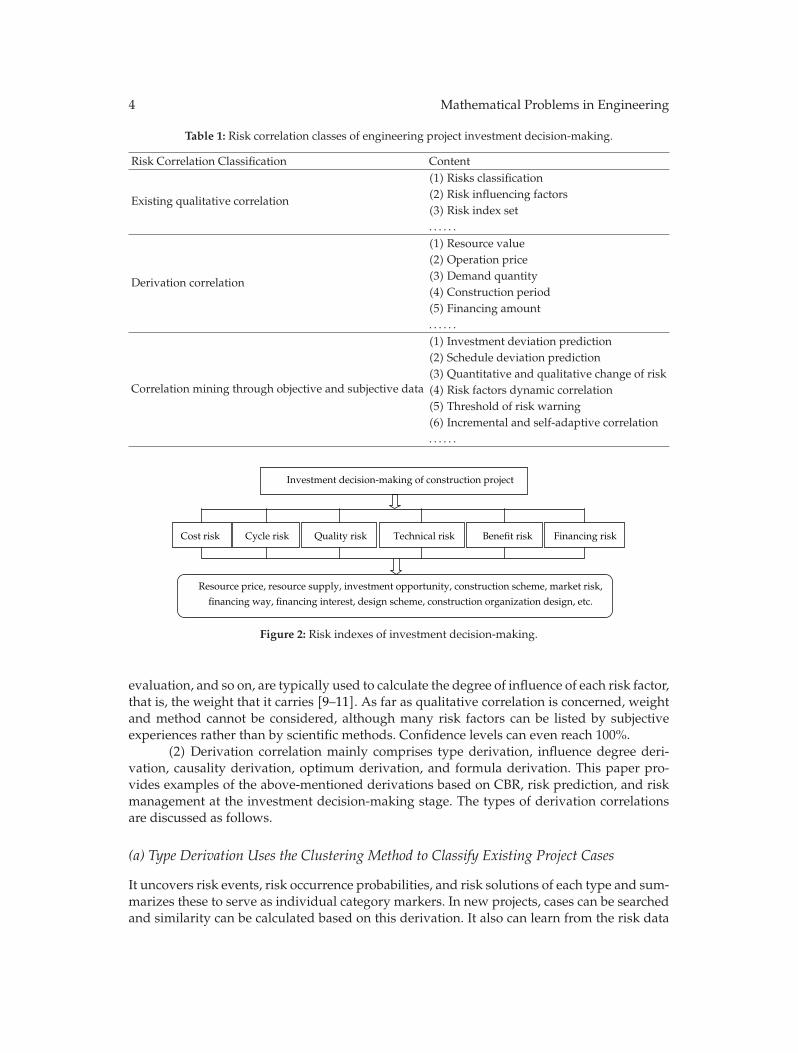
(1) An existing qualitative correlation is always existed as an influencing factor andindex set, and it is also found in risk identification links. It has been accepted knowledge andthis type of correlation is the one most easily identified. For example, as we know, investmentdecision-making composed of a series of first, second, and even multigrade risk indexes (seeFigure 2). In risk prediction, the risk factors affecting target sets are first listed. Subsequently,these factors are divided into two grades or more according to the category they belongto. Subjective scoring methods, such as Analytic Hierarchy Process, fuzzy comprehensive
4 Mathematical Problems in Engineering
Table 1: Risk correlation classes of engineering project investment decision-making.
Risk Correlation Classification Content
Existing qualitative correlation
(1) Risks classification(2) Risk influencing factors(3) Risk index set. . . . . .
Derivation correlation
(1) Resource value(2) Operation price(3) Demand quantity(4) Construction period(5) Financing amount. . . . . .
Correlation mining through objective and subjective data
(1) Investment deviation prediction(2) Schedule deviation prediction(3) Quantitative and qualitative change of risk(4) Risk factors dynamic correlation(5) Threshold of risk warning(6) Incremental and self-adaptive correlation. . . . . .
Investment decision-making of construction project
Cost risk Cycle risk Quality risk Technical risk Financing riskBenefit risk
Resource price, resource supply, investment opportunity, construction scheme, market risk,
financing way, financing interest, design scheme, construction organization design, etc.
Figure 2: Risk indexes of investment decision-making.
evaluation, and so on, are typically used to calculate the degree of influence of each risk factor,that is, the weight that it carries [9–11]. As far as qualitative correlation is concerned, weightand method cannot be considered, although many risk factors can be listed by subjectiveexperiences rather than by scientific methods. Confidence levels can even reach 100%.
(2) Derivation correlation mainly comprises type derivation, influence degree deri-vation, causality derivation, optimum derivation, and formula derivation. This paper pro-vides examples of the above-mentioned derivations based on CBR, risk prediction, and riskmanagement at the investment decision-making stage. The types of derivation correlationsare discussed as follows.
(a) Type Derivation Uses the Clustering Method to Classify Existing Project Cases
It uncovers risk events, risk occurrence probabilities, and risk solutions of each type and sum-marizes these to serve as individual category markers. In new projects, cases can be searchedand similarity can be calculated based on this derivation. It also can learn from the risk data
Mathematical Problems in Engineering 5
and risk measures of its category for decision-making. When a new project is completed, itstores information in a case database for future project risk management. This approach is aprocess of self and incremental learning.
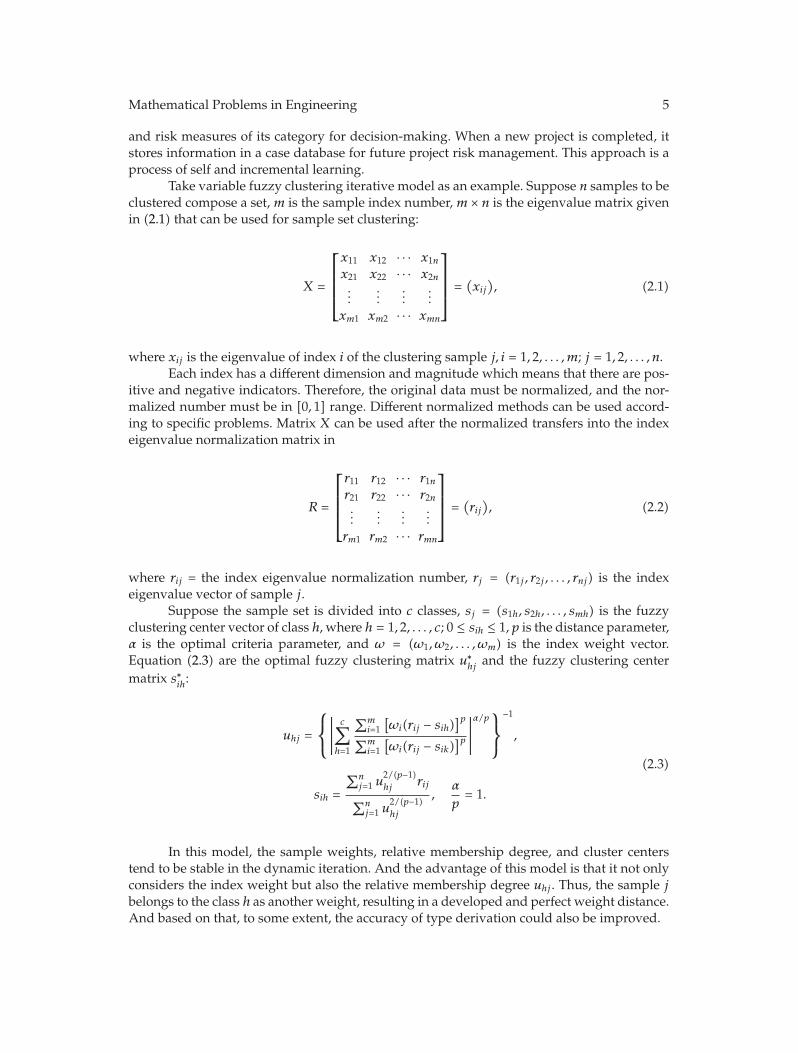
Take variable fuzzy clustering iterative model as an example. Suppose n samples to beclustered compose a set, m is the sample index number, m × n is the eigenvalue matrix givenin (2.1) that can be used for sample set clustering:
X =
⎡⎢⎢⎢⎣
x11 x12 · · · x1n
x21 x22 · · · x2n...
......
...xm1 xm2 · · · xmn
⎤⎥⎥⎥⎦ =
(xij
), (2.1)
where xij is the eigenvalue of index i of the clustering sample j, i = 1, 2, . . . , m; j = 1, 2, . . . , n.Each index has a different dimension and magnitude which means that there are pos-
itive and negative indicators. Therefore, the original data must be normalized, and the nor-malized number must be in [0, 1] range. Different normalized methods can be used accord-ing to specific problems. Matrix X can be used after the normalized transfers into the indexeigenvalue normalization matrix in
R =
⎡⎢⎢⎢⎣
r11 r12 · · · r1nr21 r22 · · · r2n...
......
...rm1 rm2 · · · rmn
⎤⎥⎥⎥⎦ =
(rij), (2.2)
where rij = the index eigenvalue normalization number, rj = (r1j , r2j , . . . , rnj) is the indexeigenvalue vector of sample j.
Suppose the sample set is divided into c classes, sj = (s1h, s2h, . . . , smh) is the fuzzyclustering center vector of class h, where h = 1, 2, . . . , c; 0 ≤ sih ≤ 1, p is the distance parameter,α is the optimal criteria parameter, and ω = (ω1, ω2, . . . , ωm) is the index weight vector.Equation (2.3) are the optimal fuzzy clustering matrix u∗
hj and the fuzzy clustering centermatrix s∗
ih:
uhj =
⎧⎨⎩
∣∣∣∣∣c∑
h=1
∑mi=1
[ωi(rij − sih)
]p∑m
i=1[ωi(rij − sik)
]p∣∣∣∣∣α/p
⎫⎬⎭
−1
,
sih =
∑nj=1 u
2/(p−1)hj
rij∑n
j=1 u2/(p−1)hj
,α
p= 1.
(2.3)
In this model, the sample weights, relative membership degree, and cluster centerstend to be stable in the dynamic iteration. And the advantage of this model is that it not onlyconsiders the index weight but also the relative membership degree uhj . Thus, the sample jbelongs to the class h as another weight, resulting in a developed and perfect weight distance.And based on that, to some extent, the accuracy of type derivation could also be improved.

6 Mathematical Problems in Engineering
(b) Influence Degree Derivation Mainly Aims at Weight and Risk Consequence
Suppose risk event A is more important or has more serious consequences compared withevent B, and B is more important than C. Certainly, A is more important than C. That isA > B and B > C, so A > C. Thus, in the risk prediction and risk control of a new project, Ashould be paid more attention to than B and C to avoid risk losses.
(c) Causality Derivation Is Similar to Influence Degree Derivation
Suppose that in some link, risk event C is directly caused by event B, and B is directly causedbyA. Meanwhile, event C is more serious than B, and B is more serious thanA. Hence, whenevent A occurs, the transformation condition from A to B and B to C should be controlledin a timely manner to prevent a more serious C from occurring. A causal correlation can berevealed from a wide range of existent cases, and this correlation can resolve the risk lossbefore it escalates.
(d) Optimum Derivation Consists of Project Time Optimization, Cost Optimization,Resource Optimization, Bi-Objective Optimization, and Multi-Objective Optimization
Combined with the construction period, cost, and resource allocation of completed projects,optimal project duration, and optimal cost interval can be summarized based on existentcases in each category. The construction period, cost, and resources of a new project can bereasonably controlled, based on category data. It can effectively reduce certain risks.
(e) Formula Derivation Mainly Uses the Western Economic Principles Associated withMathematical Statistics Methods
It can be used as a reference value for improving risk assessment of investment decision-making to reasonably deduce the risk quantitative correlations. Because of the difficultiesinvolved in risk quantitative analysis, there are a few investigations in such type of correlationwhich only limited to macroeconomic and financial risks. At present this type of correlationonly includes the relationship between a single risk factor and the investment target. Weshould study not only on comprehensive effect of risk factors, but also on exploring quanti-tative relationship among risk factors. Because this type involves quantitative analyses, alongwith some potential assumptions in the derivation process, this correlation has inferiorconfidences but with better interestingness than the first type. Moreover it is on the basisof economics rigorous formulas and statistical inference; therefore it provides some scientificreference values. Because of the difficulties involved in risk quantitative analysis, this paperfocuses only on risk measurement derivation. Risk measurement is one of the indicators indetermining risk intensity. Risks are understood differently, bringing forth varied risk mea-surement techniques as well. Equation (2.4) is one representation of this type of derivation.
If the probability distribution of risk eventX is unknown, the empirical distribution ofX can be obtained through statistical analysis. Thus, the risk intensity of event X is
F =σx
E[X]=
√V [X]E[X]
, (2.4)

Mathematical Problems in Engineering 7
where E[X] is the mean value of sample X which is expressed as
E[X] =1n
n∑i=1
Xi, (2.5)
where n is the sample size,Xi is the value of sample ith sample point, and V [X] is the samplevariance.
This derivation correlation process combines basic economics and statistics formulaswith investment risk factors. Fluctuations in the prices of project resources or supply volumeexert some influence on total investment. According to the western economics, a relationshipexists between the resource price and the supply volume, depicted as follows [12]:
ES =ΔQ/Q
ΔP/P, (2.6)
where ES is the elasticity of supply price, P is the resource price, Q represents the supplyvolume, ΔP is the incremental price of resource, and ΔQ denotes the incremental volume ofsupply.
Suppose X = ΔP/P and Y = ΔQ/Q, respectively, represent the rate of change in theresource price and the supply volume. Combined with (2.6), it is expressed as
Y = ES ∗X. (2.7)
SupposeX is a random variable,ES is the constant while themarket condition is stable,and Y is also a random variable with mean and variance as follows:
E[Y ] = ES ∗ E[X], V [Y ] = E2S ∗ V [X]. (2.8)
Calculating the risk degree of Y using (2.4), we obtain
FY =
√V [Y ]E[Y ]
=
√V [X]E[X]
= FX. (2.9)
From (2.9), the risk degree FY of Y is equal to the risk degree FX of X.Because of the market risk, the maximum resource price is as follows:
Pmax = E[P] +√V [P] = E[P](1 + FP ). (2.10)
(i) If FP = 0 does not consider the market risk, the initial value of the resource pricewould be P0 = E[P].
(ii) If FP /= 0 has taken the market risk into account, then the mean of the incrementalresource price would be ΔP = (1/2)(P − P0) = (1/2)P0 • FP .

8 Mathematical Problems in Engineering
(iii) Because of fixed costs, the increment of total investment caused by risks is equalto that of the resource value consumption. Thus, the average increase rate of totalinvestment induced by risks is
ε =∑n
i=1 ΔP∗Qi
B0∗ 100% =
(1/2)∑n
i=1 ΔP ∗Qi ∗ Fpi
B0• 100%, (2.11)
where Qi is the consumption of ith resource, P0i is the initial value of ith resource price, Fpi
represents the risk degree of ith resource price, and B0 denotes the initial estimation of totalinvestment.
Such correlation study based on CBR is still relatively rare. In traditional project man-agement, experiential knowledge is often lost at the end of the project. CBR, therefore, isnot only a repository of existing cases, but also provides a platform for case summaries andknowledge mining. Because the derivation of such correlation assumptions and fault toler-ance is allowed, the subsequent correlation presents lower confidence but is more interesting.Moreover, this correlation is based on CBR and concrete data of completed projects; thus, itis of scientific reference value.
(3) People are often interested in potential correlations hidden under data. Therefore,correlation mining through objective and subjective methods presents the highest interest ofall the three correlations. Currently, research on such correlations is divided into two types:one focuses mainly on algorithm improvement and computer programming for algorithms;this approach has few applications in engineering. The other employs practical analysis,but targets only individuality and not generality. However, theory has to be indispensablefor practical use. We therefore uncover six correlations that can provide decision supportfor investment decision-making in engineering projects. These are investment deviationprediction, schedule deviation prediction, quantitative and qualitative risk change, dynamiccorrelation of risk factors, risk warning threshold, and incremental and self-adaptive correla-tion. According to different sources of data, this type of correlation mining is divided intotwo categories: one is derived from qualitative data, and the other from quantitative data.
(a) Qualitative Data
Qualitative data is obtainedmainly from expert scoring, Boolean values, characteristic values,and so forth. For example, index weight is a form of this correlation. It mainly depends onexpert scoring, indicating that the important relationship among all the risk factors. Manystudies on weight determination and improvement have been carried out. This paper focuseson studying the relationship among risk factors with a certain confidence level based onvariable fuzzy sets, rough sets, Bayesian, decision tree and support vector machines, and soforth A fuzzy set usually has variability of time, space, and conditions, particularly in theengineering project investment. Because of the uncertainties that characterize a given projectand its environment variables in the investment stage, fuzzy theory in engineering projectresearch needs to upgrade mathematical theories, models, and methods. We use variablefuzzy sets for a better fit. To yield sound, adaptive, and heuristic investment decisions, as wellas improve forecast quality and reduce reaction time in actual situations, the decision-makerwould require intelligent algorithms other than CBR, such as rough sets, to mathematicallyaddress fuzziness and uncertainties. The decisions or classification rules can be derivedthrough knowledge reduction based on the premise of invariable classification ability.

Mathematical Problems in Engineering 9
Table 2: Attributes used in CBR prediction model.
InputAttributeNumber
Attribute Class Range
R1 Total area of the building 3[330m2, 1381m2)[1381m2, 2432m2)[2432m2, 3484m2]
R2Ratio of the typical floor area 2 [0.07, 0.16] (0.16, 0.26]to the total area of the building
R3Ratio of the footprint area to 2 [0.07, 0.19] (0.19, 0.30]the total area of the building
R4 Number of floors 2 (4, 5, 6) (7, 8)R5 Type of overhang design 2 No overhang or one wayR6 Foundation system 3 Pier, wall, slabR7 Type of floor structure 2 Cast in situ concrete, precast concreteR8 Location of the core 2 At the sides, in the middle
Output Cost of the structural system per m2 5
($30/m2, $56/m2]($56/m2, $82/m2]($82/m2, $108/m2]($108/m2, $134/m2]($134/m2, $160/m2]
Table 3: Classes specified for output attribute of cost per m2.
Input Casebase
Input Case No. Input Attribute Output Attribute
R1 R2 R3 R4 R5 R6 R7 R8
1 1 2 1 1 One-way Sides Precast Wall 12 3 1 1 2 No cons Middle RC Slab 23 1 2 2 1 No cons Sides RC Wall 14 2 2 2 1 No cons Sides RC Wall 15 1 2 1 1 One-way Middle RC Slab 36 1 1 1 1 No cons Sides RC Wall 17 3 1 1 1 No cons Middle RC Wall 28 1 2 1 1 No cons Sides RC Pier 29 2 2 2 1 No cons Middle RC Slab 310 3 1 1 1 No cons Middle RC Slab 111 2 1 1 2 No cons Sides RC Wall 1
Eleven practical cases of the same category are analyzed, and their unit prices aremainly constrained by eight influencing factors. The eight factors and their grade distribu-tions are enumerated in Table 2. The attribute classifications of each case are shown in Table 3[13]. The rough sets method does not require any prior knowledge other than the dataset thatrequires processing; thus, we adopt this method to reduce the attributes that influence con-struction unit price based on the practical data shown in Table 3.
In rough sets, U/=Ø indicates that the universe is the finite set of objects. SupposeR is an equivalence relationship in U, and U/R represents the set of all equivalence classes

10 Mathematical Problems in Engineering
withoutR. If P ∈ R and P/=Ø, then ∩P denotes the intersection of all equivalence relationshipsin P ·P is also an equivalence relationship. ∩P is the indiscernibility relationship in P, denotedby ind(P). Therefore,U/ind(P) denotes the knowledge related to the equivalence relationshipwith family P; it is usually denoted by U/P.
Suppose U = {R,D}, R = {R1, R2, R3, R4, R5, R6, R7, R8} is the condition attribute set,and D = {Output} is the target set. Their respective equivalence relationships based on attri-bute values are as follows:
U
R1= {(1, 3, 5, 6, 8)(4, 9, 11)(2, 7, 10)};
U
R2= {(2, 6, 7, 10, 11)(1, 3, 4, 5, 8, 9)};
U
R3= {(1, 2, 5, 6, 7, 8, 10, 11)(3, 4, 9)};
U
R4= {(1, 3, 4, 5, 6, 7, 8, 9, 10)(2, 11)};
U
R5= {(1, 5)(2, 3, 4, 6, 7, 8, 9, 10, 11)};
U
R6= {(1, 3, 4, 6, 8, 11)(2, 5, 7, 9, 10)};
U
R7= {(1)(2, 3, 4, 5, 6, 7, 8, 9, 10, 11)};
U
R8= {(1, 3, 4, 6, 7, 11)(2, 5, 9, 10)(8)};
U
D= {(1, 3, 4, 6, 10, 11)(2, 7, 8)(5, 9)}.
(2.12)
Calculatingwhether ind(R) is equal to ind(R-{R}) yields attribute coresR1,R4, andR8.Non-reduction attributes are not unique, and these are {R1, R3, R4, R7, R8}, {R1, R2, R4, R7, R8},{R1, R2, R4, R5, R8}, {R1, R3, R4, R5, R8}, {R1, R3, R4, R6, R8}, and {R1, R2, R4, R6, R8}. The roughsets method decreases the condition attributes to five, which substantially reduces computa-tional complexity and improves decision-making efficiency. In actual forecasts, the morepractical cases there are, the better the scientific decision support for the project. However,as the number of cases increases, the dependence among risk factors may change. It ispractical, therefore, to study incremental correlation, which allows for certain error rates inthe investment decision-making stage.
(b) Quantitative Data
The primary sources of quantitative data are the objective data of each project. There are twoapproaches to process these data. In the first scheme, quantitative data are transformed intoqualitative form by triangular fuzzy or trapezoidal fuzzy method, and then the correlationsare derived from the qualitative data. In the second scheme, objective data are directlyanalyzed to explore correlations [14–16]. In accordance with the second processing method,

Mathematical Problems in Engineering 11
Pm PrP1
0.5µA(u) = 1 µA(u) = 0µAC(u) = 0 µAC(u) = 1
µA(u) > µAC(u) µA(u) < µAC(u)
Figure 3: Schematic diagram of opposite fuzzy sets.
DA(u) = 1 DA(u) = 0 DA(u) = −10 < DA(u) < 1 −1 < DA(u) < 0
Pm PrP1
Figure 4: Schematic diagram of relative difference function.
we analyze the comprehensive effects of risk factors on risk monitoring and risk warning viaquantitative and qualitative change theories of the variable fuzzy sets method.
The fuzzy sets concept was proposed by Zadeh in 1965, which was then developedinto a new mathematical discipline—fuzzy sets theory. However, fuzzy sets are a statictheory that cannot describe the dynamic variability of fuzziness, fuzzy events, or fuzzy con-cepts. Theoretically, using static fuzzy sets theory to study the dynamics of fuzziness is aninsufficient approach. Contradictions exist between theoretical studies and research objec-tives. Chen [17] proposed the relative membership degree and relative membership functionin the 1990s. He established engineering fuzzy sets theory [18]. In the early 21st century,Chen [18–21] created the variable fuzzy sets theory, which was a breakthrough in static con-cepts and theory of fuzzy sets.
Using variable fuzzy sets with the relative membership function to describe inter-mediate transition is a dynamic demonstration of fuzziness by precise mathematical lan-guage. SupposeU is a universe, and u is the element ofU, u ∈ U.A andAc is a pair of oppo-site fuzzy concept in u. At any point in the continuumnumber axis of the relativemembershipfunction, μA(u) is a relative membership degree of u toA, and μc
A(u) is a relative membershipdegree of u to Ac, where Ac is opposite A. μA(u) + μc
A(u) = 1, where 0 ≤ μA(u) ≤ 1 and0 ≤ μc
A(u) ≤ 1. Seen from Figure 3, on left pole Pl: μA(u) = 1, μcA(u) = 0; and on right pole
Pr : μA(u) = 1, μcA(u) = 0; Pm is the gradual qualitative change point whose continuum is [1, 0]
to A and [0, 1] to Ac, and μA(u) + μcA(u) = 0.5.
SupposeDA(u) is the relative difference degree of u toA, andDA(u) = μA(u)−μAc(u).
It is seen from Figure 4 that point Pm is whereDA(u) = 0 denotes the point at which dynamicbalance with gradual qualitative change is reached. Points Pl and Pr are where DA(u) = 1and −1 represent the points at which mutational qualitative change is reached. Thus, the twoforms of qualitative change, that is, gradual change and mutation, can be completely andclearly expressed by the relative difference degree.
Suppose C is one variable factor set of V , and C = {CA,CB, CC, CD,CE, CF}.CA is the variable factor set, CB represents the variable spatial factor set, CC denotes
the variable condition factor set, CD is the variable model set, CE stands for the variableparameter set, and CF is the other variable factor set.
The standard models for evaluating quantitative or qualitative change in a variablefuzzy set are as follows:
(i) The criterion for quantitative change is DA(u) ·DA(C(u)) > 0.
(ii) The criterion for gradual qualitative change is DA(u) ·DA(C(u)) < 0.

12 Mathematical Problems in Engineering
Table 4: Basic data from Feb. 2003 to Sep. 2003 of section F in the contract.
TimeNo. of Monthly Plan Monthly Overall
Completion RateContract Priceafter Change(million Yuan)Month Completion Completion
(million Yuan) (million Yuan) (million Yuan)2003.2 14 880.1126 597.9812 5991.5486 0.6800 8695.20542003.3 15 938.5220 717.9559 6709.5045 0.7650 8555.20542003.4 16 918.4406 530.2455 7239.7500 0.5800 8555.20542003.5 17 959.0213 630.8527 7820.6027 0.6578 8655.20542003.6 18 766.6541 218.3175 8029.8021 0.2848 9021.84952003.7 19 766.6541 259.7389 8219.0000 0.3388 9221.84952003.8 20 68.6561 391.8619 8611.4029 0.5860 9221.84952003.9 21 593.3010 182.7692 8774.9369 0.3080 9141.8495
Table 5: Calculation of investment cost risk of section F in the contract.
TimeVolum Change Cumulative Investment Net Value Offset Ratio Offset RatioThis Month Deviation (million Yuan) from Total Investment from Schedule
(million Yuan) (million Yuan)2003.2 −1614.1201 7605.6690 −0.2122 −0.18562003.3 −140 −1754.1201 8463.6250 −0.2073 −0.20502003.4 0 −1754.1201 8993.8700 −0.1950 −0.20502003.5 100 −1654.1201 9474.7230 −0.1746 −0.19112003.6 366.6441 −1287.4760 9317.2780 −0.1382 −0.14272003.7 200 −1087.4760 9306.4760 −0.1169 −0.11792003.8 0 −1087.4760 9698.8790 −0.1121 −0.11792003.9 −80 −1167.4760 9942.4130 −0.1174 −0.1277
(iii) Two criteria are assigned to mutational qualitative change:
(a) if the change occurs not through the gradual qualitative change point,DA(u) ·DA(C(u)) = |DA(u)|;
(b) if the change occurs through the gradual qualitative change point, DA(u) ·DA(C(u)) = −|DA(u)|.
The data in Tables 4 and 5 were taken from a highway construction project [22]. Weanalyze the quantitative and qualitative changes in risk factors during the construction periodto provide reference for determining the risk threshold value.
DA(u) = ((xi −bi)/(ai −bi)), where xi ∈ [ai, bi] andDA(u) = ((xi −bi)/(di −bi)), wherexi ∈ [bi, di] is the linear equation of relative difference degree [23].
X1 is the deviation rate of the total investment cost, and X2 is the deviation rate of theschedule. This work comprehensively evaluates risks based on these two deviation rates. Therelative difference degree of investment cost and schedule from February 2003 to September2003 is calculated according to eigenvalues of [a, b] and [b, d] (see Table 6), respectively.
Suppose the weight vector of the two indexes is ω = [0.5, 0.5], and the risk relativedifference degree of each month is DA(u) =
∑2i=1 ωiDA(u)i. The relative difference degree of
comprehensive risk of each month is shown in Table 7.

Mathematical Problems in Engineering 13
Table 6: The eigenvalues of [a, b] and [b, d] of the deviation index.
X1 X2
[a1, b1] [b1, d1] [a2, b2] [b2, d2][−0.1,−0.18] [−0.18,−0.25] [−0.1,−0.18] [−0.18,−0.25]
Table 7: Relative difference degrees from Feb. 2003 to Sep. 2003 of section F in the contract.
Time 2003.2 2003.3 2003.4 2003.5 2003.6 2003.7 2003.8 2003.9DA(u) −0.27 −0.37 −0.27 0.26 0.26 0.78 0.80 0.76
The tendency of the value of DA(u) to move closer to −1 indicates high risk. By con-trast, its tendency to move closer to 1 indicates low risk. Table 7 shows that the changes occur-ring from April 2003 to May 2003 are gradual qualitative changes, whereas the other con-tinuous intervals are quantitative changes. The result in Table 7 is simple and intuitionistic.In addition, the decision-maker can combine the results with his own risk tolerance todetermine the risk threshold required to implement appropriate measures. Our proposedmethod combines objective and subjective evaluations.
3. Conclusions
Research on risk correlation remains a bottleneck in current risk management in engineeringproject investment decision-making. We divide risk correlation into three types and elucidatethe third correlation using actual data. The proposed approach combines data mining andvariable fuzzy sets with investment decision-making, yielding simple, intuitionistic, and eas-ily explainable results. Findings generated from this study provide reference value becauseit comprehensively considers risk prediction, risk management, and cost reduction analy-sis. Dynamics correlation and incremental correlation are the directions for further study.
Acknowledgments
This research work was jointly supported by the Science Fund for Creative Research Groupsof the NSFC (Grant no. 51121005), the National Natural Science Foundation of China (Grantno. 51222806), and the Program for New Century Excellent Talents in University (Grant no.NCET-10-0287).
References
[1] G. Morcous, H. Rivard, and A. Hanna, “Case-based reasoning system for bridge management,” Jour-nal of Computing in Engineering, pp. 1363–1370, 2000.
[2] D. K. H. Chua, D. Z. Li, and W. T. Chan, “Case-based reasoning approach in bid decision making,”Journal of Construction Engineering and Management, vol. 127, no. 1, pp. 35–45, 2001.
[3] D. K. H. Chua and Y. M. Goh, “Application of case based reasoning in construction safety planning,”in Proceedings of the International Workshop on Information Technology in Civil Engineering: Computing inCivil Engineering, pp. 298–307, Washington, DC, USA, November 2002.
[4] Y. Cheng andH.Melhem, “Application of fuzzy case-based reasoning to bridgemanagement,” Journalof Construction Engineering and Management, pp. 1–12, 2005.
[5] B. Ozorhon, I. Dikmen, and M. T. Birgonul, “Case-based reasoning model for international marketselection,” Journal of Construction Engineering and Management, vol. 132, no. 9, pp. 940–948, 2006.
14 Mathematical Problems in Engineering
[6] H. G. Ryu, H. S. Lee, and M. Park, “Construction planning method using case-based reasoning(CONPLA-CBR),” Journal of Computing in Civil Engineering, vol. 21, no. 6, pp. 410–422, 2007.
[7] Y. M. Goh and D. K. H. Chua, “Case-based reasoning for construction hazard identification: caserepresentation and retrieval,” Journal of Construction Engineering and Management, vol. 135, no. 11, pp.1181–1189, 2009.
[8] M.Galushka andD. Patterson, “Intelligent index selection for case-based reasoning,” Knowledge-BasedSystems, vol. 19, no. 8, pp. 625–638, 2006.
[9] S. Y. Chen, J. Zhang, H. Zhang, N. M. Kwok, and Y. F. Li, “Intelligent lighting control for vision-basedrobotic manipulation,” IEEE Transactions on Industrial Electronics, vol. 59, no. 8, pp. 3254–3263, 2012.
[10] S. Wen, W. Zheng, J. Zhu, X. Li, and S. Chen, “Elman fuzzy adaptive control for obstacle avoidanceof mobile robots using hybrid force/position incorporation,” IEEE Transactions on Systems, Man andCybernetics Part C, vol. 42, no. 4, pp. 603–608, 2011.
[11] S. Chen, Y. Zheng, C. Cattani, andW.Wang, “Modeling of biological intelligence for SCM system opti-mization,” Computational and Mathematical Methods in Medicine, vol. 2012, Article ID 769702, 10 pages,2012.
[12] W. P. Xiao, W. P. Ou, and Y. G. Ou, “Practical methods of investment risk analysis at constructionproject,” Journal of Chongqing Jianzhu University, vol. 19, no. 6, pp. 7–14, 1997.
[13] S. Z. Dogan, D. Arditi, and H. Murat Gunaydin, “Using decision trees for determining attributeweights in a case-based model of early cost prediction,” Journal of Construction Engineering and Man-agement, vol. 134, no. 2, pp. 146–152, 2008.
[14] S. Chen, W. Huang, C. Cattani, and G. Altieri, “Traffic dynamics on complex networks: a survey,”Mathematical Problems in Engineering, Article ID 732698, 23 pages, 2012.
[15] S. Y. Chen, H. Tong, Z. Wang, S. Liu, M. Li, and B. Zhang, “Improved generalized belief propagationfor vision processing,” Mathematical Problems in Engineering, vol. 2011, Article ID 416963, 12 pages,2011.
[16] S. C. Lim, C. H. Eab, K. H. Mak, M. Li, and S. Y. Chen, “Solving linear coupled fractional differentialequations by direct operational method and some applications,”Mathematical Problems in Engineering,vol. 2012, Article ID 653939, 28 pages, 2012.
[17] S. Y. Chen, “Philosophical basis of systemic dialectical theory of relative subordinate function,” Journalof Systemic Dialectics, vol. 4, no. 2, pp. 26–29, 1996.
[18] S. Y. Chen, “Philosophical foundation of variable fuzzy sets theory,” Journal of Dalian University ofTechnology, vol. 25, no. 1, pp. 53–57, 2005.
[19] S. Y. Chen, “Theory and model of engineering variable fuzzy set—mathematical basis for fuzzyhydrology and water resources,” Journal of Dalian University of Technology, vol. 45, no. 2, pp. 308–312,2005.
[20] S. Y. Chen, “Theory of variable fuzzy sets and variable model sets,”Mathematics in Practice and Theory,vol. 38, no. 18, pp. 146–153, 2008.
[21] S. Y. Chen, “Quantity change and quality change criterion models of variable fuzzy sets theory andtheir application,” Systems Engineering and Electronics, vol. 30, no. 10, pp. 1879–1882, 2008.
[22] G. P. Zhou, “Research on early-warning threshold values for investment risk of infrastructureprojects,” Highway, no. 2, pp. 100–103, 2006.
[23] S. Y. Chen and J. X. Yuan, “Variable fuzzy sets model and demonstration of inaccuracy of extensiblemethods applied in water science,”Water Resources Protection, vol. 23, no. 6, pp. 1–6, 2007.

Submit your manuscripts athttp://www.hindawi.com
Hindawi Publishing Corporationhttp://www.hindawi.com Volume 2014
MathematicsJournal of
Hindawi Publishing Corporationhttp://www.hindawi.com Volume 2014
Mathematical Problems in Engineering
Hindawi Publishing Corporationhttp://www.hindawi.com
Differential EquationsInternational Journal of
Volume 2014
Applied MathematicsJournal of
Hindawi Publishing Corporationhttp://www.hindawi.com Volume 2014
Probability and StatisticsHindawi Publishing Corporationhttp://www.hindawi.com Volume 2014
Journal of
Hindawi Publishing Corporationhttp://www.hindawi.com Volume 2014
Mathematical PhysicsAdvances in
Complex AnalysisJournal of
Hindawi Publishing Corporationhttp://www.hindawi.com Volume 2014
OptimizationJournal of
Hindawi Publishing Corporationhttp://www.hindawi.com Volume 2014
CombinatoricsHindawi Publishing Corporationhttp://www.hindawi.com Volume 2014
International Journal of
Hindawi Publishing Corporationhttp://www.hindawi.com Volume 2014
Operations ResearchAdvances in
Journal of
Hindawi Publishing Corporationhttp://www.hindawi.com Volume 2014
Function Spaces
Abstract and Applied AnalysisHindawi Publishing Corporationhttp://www.hindawi.com Volume 2014
International Journal of Mathematics and Mathematical Sciences
Hindawi Publishing Corporationhttp://www.hindawi.com Volume 2014
The Scientific World JournalHindawi Publishing Corporation http://www.hindawi.com Volume 2014
Hindawi Publishing Corporationhttp://www.hindawi.com Volume 2014
Algebra
Discrete Dynamics in Nature and Society
Hindawi Publishing Corporationhttp://www.hindawi.com Volume 2014
Hindawi Publishing Corporationhttp://www.hindawi.com Volume 2014
Decision SciencesAdvances in
Discrete MathematicsJournal of
Hindawi Publishing Corporationhttp://www.hindawi.com
Volume 2014 Hindawi Publishing Corporationhttp://www.hindawi.com Volume 2014
Stochastic AnalysisInternational Journal of
Related Documents