1 Discussion Pack Investment Conference Philosophy, Performance and Direction Citigroup – London Goldman Sachs JBWere – New York March 2008

Welcome message from author
This document is posted to help you gain knowledge. Please leave a comment to let me know what you think about it! Share it to your friends and learn new things together.
Transcript

1
Discussion Pack
Investment ConferencePhilosophy, Performance and Direction
Citigroup – London
Goldman Sachs JBWere – New York
March 2008

2
Index
12Coles Transaction3
41Operating Divisions6
79Outlook8
77Capital Management7
24Group Overview4
80Investor Relations Contacts and Information9
282008 Half Year Results5
8Sustainability2
3Philosophy, Performance and Direction1

Philosophy, Performance and Direction

4
Long-term, consistent strategies
MANAGING BALANCE SHEET EFFECTIVELY

5
Key Attributes
• Upside potential• Store network;
Strong brand
• Strategic review
• 1H08 Sales comp of 3.1%;
Continuation of strong
performance
• 268 store network;
Strong brand
• Merchandising;
Store roll-out programme
• 5 year turnaround;
Overhead reductions;
Supply Chain investment
• National store networks;
Strong brands
• Network investment
• 1H08 Cash comp of 12.2%;
5 year EBITA CAGR of
12.6% p.a.
• National store networks;
Leading in sectors
• Continued store roll-out;
Range expansionHome Improvement & Office Supplies
Coles
Target
Kmart
Growth Opportunities
QualityAssets
EarningsImprovement
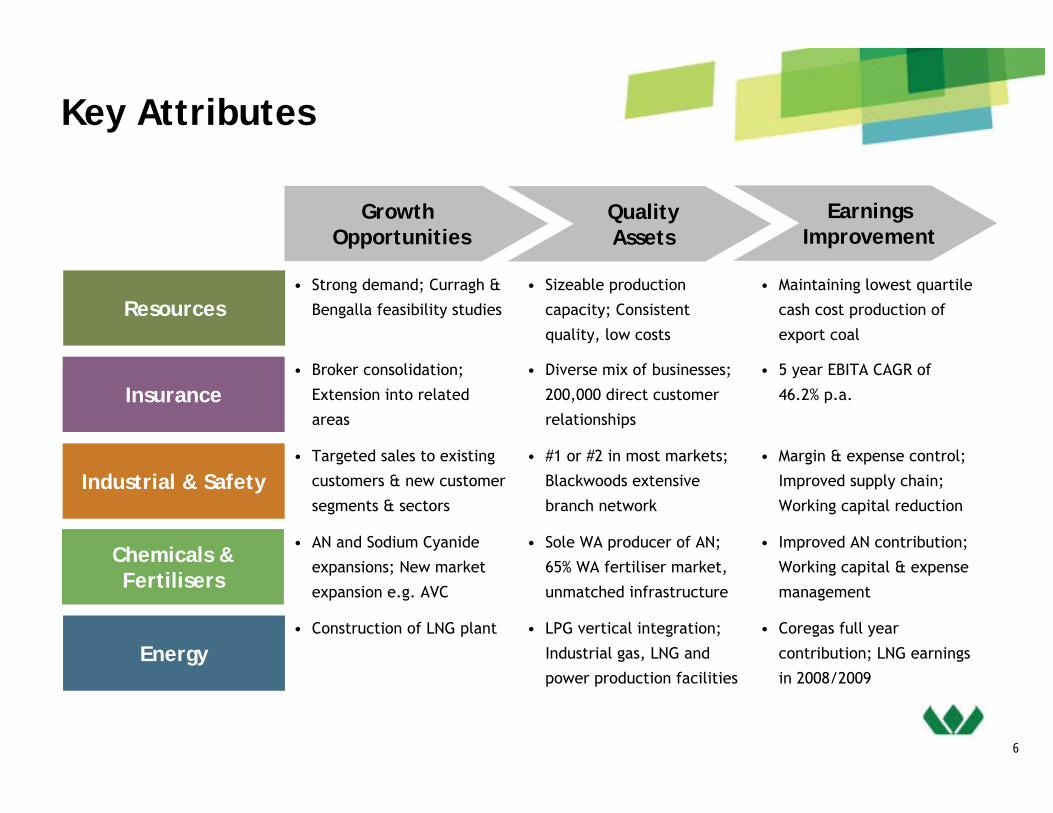
6
Key Attributes
• Coregas full year
contribution; LNG earnings
in 2008/2009
• Improved AN contribution;
Working capital & expense
management
• Margin & expense control;
Improved supply chain;
Working capital reduction
• 5 year EBITA CAGR of
46.2% p.a.
• Maintaining lowest quartile
cash cost production of
export coal
• LPG vertical integration;
Industrial gas, LNG and
power production facilities
• Construction of LNG plant
• Sole WA producer of AN;
65% WA fertiliser market,
unmatched infrastructure
• AN and Sodium Cyanide
expansions; New market
expansion e.g. AVC
• #1 or #2 in most markets;
Blackwoods extensive
branch network
• Targeted sales to existing
customers & new customer
segments & sectors
• Diverse mix of businesses;
200,000 direct customer
relationships
• Broker consolidation;
Extension into related
areas
• Sizeable production
capacity; Consistent
quality, low costs
• Strong demand; Curragh &
Bengalla feasibility studiesResources
Insurance
Industrial & Safety
Chemicals & Fertilisers
Energy
Growth Opportunities
QualityAssets
EarningsImprovement

7
97 98 99 00 01 02 03 04 05 06 07Wesfarmers TSR Index All Ordinaries Accumulation Index
* Adjusted for capital reconstructions
A history of strong returns
0
100
200
300
97 98 99 00 01 02 03 04 05 06 07 1H08
EPS (cents)
0
10
20
30
40
50
Share Price(A$)*
EPS (AGAAP) Girrah EPS Landmark EPS EPS (AIFRS) ARG EPS Wesfarmers Share Price

Sustainability

9
Sustainability
Good value products and services• Central to our business success is to maintain a reputation for quality and value across the range of our diversified suite
of operations. We seek to apply the same principles and standards to delivering export coal as we would to dealing with clients in the insurance businesses and catering to the needs of our now much-expanded retail customer base.
Respect for customers and suppliers• Retention of high levels of satisfaction in both these groups is essential if we are to continue to succeed. Extensive
customer feedback systems are maintained in the retail operations.
Financial performance• All our actions are directed towards satisfying our corporate objective of providing a
satisfactory return to shareholders. To be sustainable, Wesfarmers must continue to achieve high standards of financial performance thereby allowing us to make the most meaningful contribution possible to the community through wealth generation and employment creation
Safe and rewarding workplaces• Attraction and retention of skilled and committed employees is one of our key
priorities. We have an obligation to provide safe workplaces, to treat our people with decency and respect and provide them with opportunities for interesting and rewarding career paths. Each business unit is set a target of reducing its lost time injury frequency rate by 50 per cent a year on the path to zero. Remuneration of some senior staff is linked to achievement of safety targets

10
Sustainability
Environmental responsibility• Our diverse range of businesses expose us to a number of challenging or
potentially challenging environmental issues, including waste disposal, contamination and greenhouse gas emissions. We set legal compliance as a minimum and seek to exceed that wherever possible.
Ethical dealings• Respect for the letter and the spirit of the law is paramount. There are codes
of ethics and conduct in place at both Group and business unit level, as well as for the Board of Directors. Every year hundreds of our employees participate in detailed seminars covering obligations under the Trade Practices Act in Australia and consumer protection legislation in New Zealand.
Community contribution• We believe the company benefits from having a reputation as a good corporate citizen. We have a significant
programme of support for community-focused organisations and causes which the Board contributes up to 0.25 per cent of before tax profits each year. In 2006/2007 this amounted to A$6.6 million with another $5.7 million attributable to fundraising activities of our Bunnings Home Improvement division.
Wesfarmers is a member of the Dow Jones Sustainability World Indexes for 2007, rating it in the top 10 per cent of companies assessed worldwide against economic, environmental and social criteria
11
Sustainability
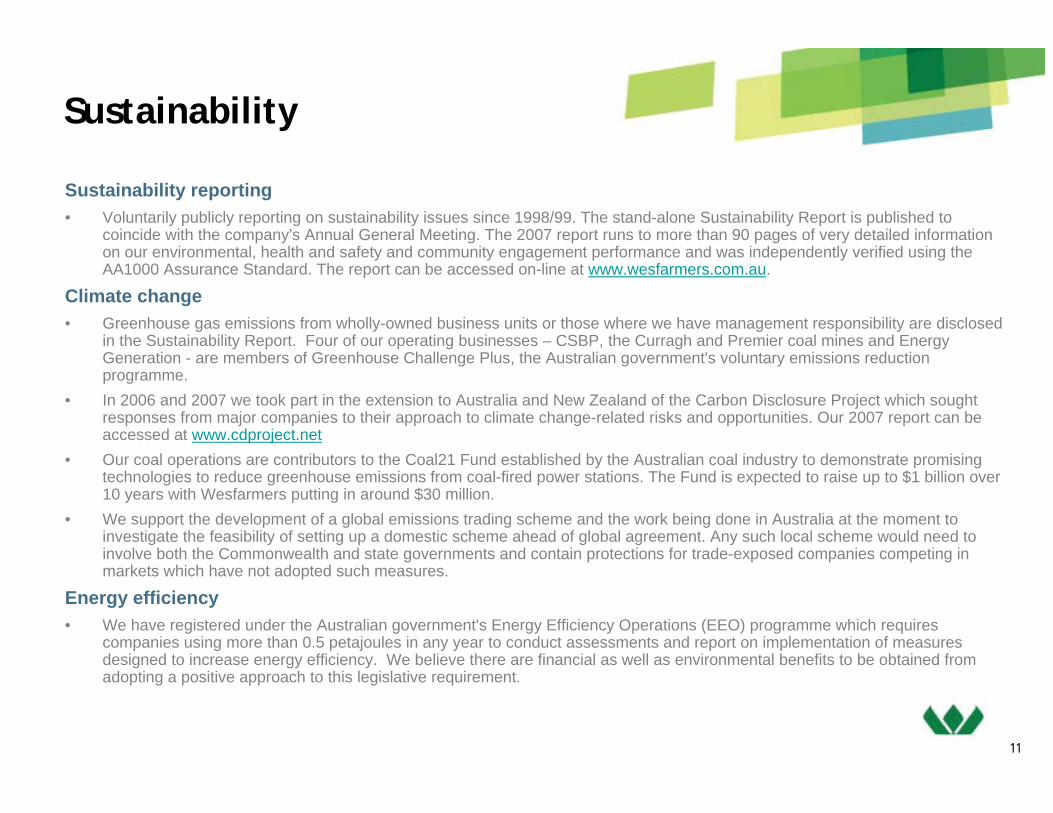
Sustainability reporting• Voluntarily publicly reporting on sustainability issues since 1998/99. The stand-alone Sustainability Report is published to
coincide with the company's Annual General Meeting. The 2007 report runs to more than 90 pages of very detailed information on our environmental, health and safety and community engagement performance and was independently verified using the AA1000 Assurance Standard. The report can be accessed on-line at www.wesfarmers.com.au.
Climate change• Greenhouse gas emissions from wholly-owned business units or those where we have management responsibility are disclosed
in the Sustainability Report. Four of our operating businesses – CSBP, the Curragh and Premier coal mines and Energy Generation - are members of Greenhouse Challenge Plus, the Australian government's voluntary emissions reduction programme.
• In 2006 and 2007 we took part in the extension to Australia and New Zealand of the Carbon Disclosure Project which sought responses from major companies to their approach to climate change-related risks and opportunities. Our 2007 report can be accessed at www.cdproject.net
• Our coal operations are contributors to the Coal21 Fund established by the Australian coal industry to demonstrate promising technologies to reduce greenhouse emissions from coal-fired power stations. The Fund is expected to raise up to $1 billion over 10 years with Wesfarmers putting in around $30 million.
• We support the development of a global emissions trading scheme and the work being done in Australia at the moment to investigate the feasibility of setting up a domestic scheme ahead of global agreement. Any such local scheme would need to involve both the Commonwealth and state governments and contain protections for trade-exposed companies competing in markets which have not adopted such measures.
Energy efficiency• We have registered under the Australian government's Energy Efficiency Operations (EEO) programme which requires
companies using more than 0.5 petajoules in any year to conduct assessments and report on implementation of measures designed to increase energy efficiency. We believe there are financial as well as environmental benefits to be obtained from adopting a positive approach to this legislative requirement.

Coles Transaction
13
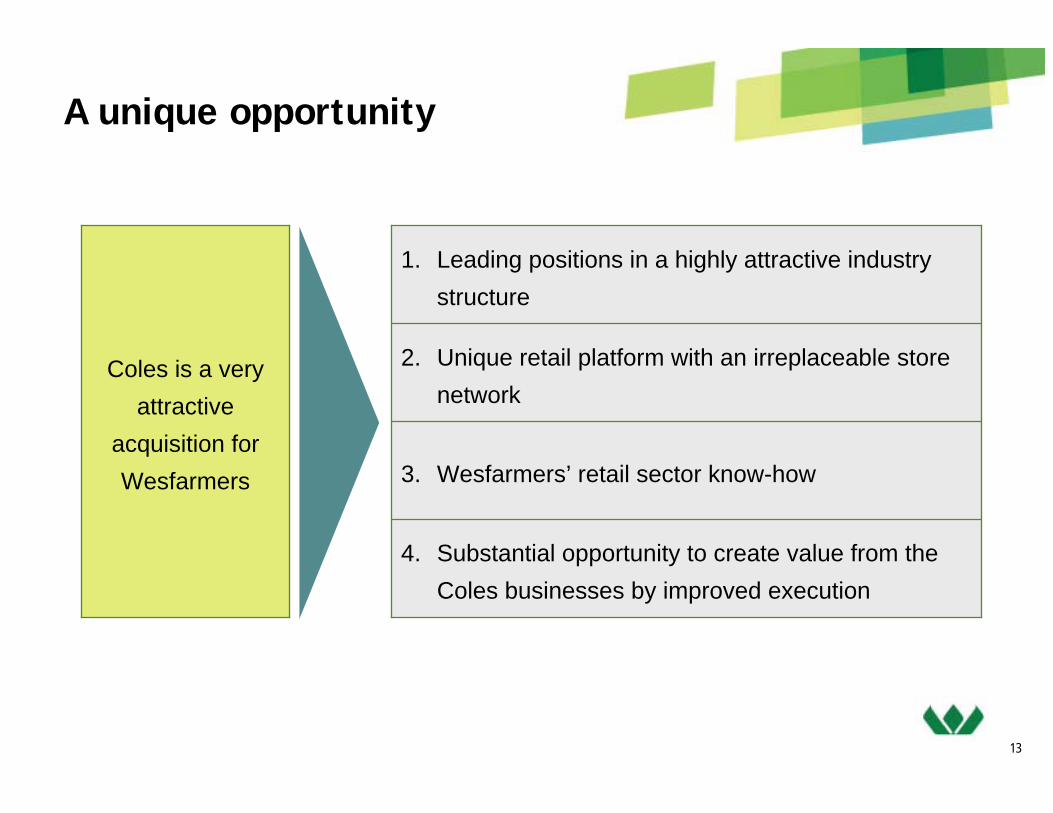
A unique opportunity
4. Substantial opportunity to create value from the Coles businesses by improved execution
3. Wesfarmers’ retail sector know-how
2. Unique retail platform with an irreplaceable store network
1. Leading positions in a highly attractive industry structure
Coles is a very attractive
acquisition for Wesfarmers

14
Coles Packaged Grocery Market Share by State
• Coles is one of two national leaders in supermarkets
Food and Liquor National Market Share
Source: CGJ, WOW FY06 Australian Food & Liquor Sales (excludes fuel)
ABS total food retailing
Woolw orths30%
Coles / Bi-Lo23%
Specialty / Others47%
Source: ACNielsen ScanTrak - Total packaged grocery MAT to 24/04/07
WA: 33.1%
SA: 36.1%
VIC:37.1%
NSW: 32.2%
QLD: 33.1%
National: 34.1%
WA: 33.1%
SA: 36.1%
VIC:37.1%
NSW: 32.2%
QLD: 33.1%
National: 34.1%
Unique Platform and Asset Base

15
Discount DS Market Shares Fuel Market Shares
Office Products Market Shares
Source: Bain & Company Source: CGJ, IBIS World 2005 and 2006
Source: Bis Shrapnel, The Australian Office Products Market 2006 - 2008
Coles24% Caltex
23%
Woolw orths17%
BP15%
Exxon10%
Others11%
Officew orks16%
Corporate Express
12%
Computer / electronic retailers
11%
Other61%
Kmart34%
Target27%
BigW26%
Other13%
Unique Platform and Asset Base

16
> 200,000EMPLOYEES
The Coles Transaction - Outcomes
WES
12 ADDITIONAL BRANDS
> 400,000 SHAREHOLDERS
9 DIVISIONS
545M ORDINARY SHARES
152MWPPS SHARES

17
Pro-forma EBIT Contribution
Coles FY07 EBIT Contribution
Wesfarmers FY07 EBIT Contribution
Wesfarmers FY07 Pro-Forma EBIT Contribution1
1. Excluding corporate overheads, consolidation adjustments and discontinued operations
Insurance4%
Industrial & Safety4%
Resources12%
Kmart4%
Target11%
Home Improvement & Office Supplies
23%
Coles28%
Chemicals & Fertilisers4%
Other7%Energy
3%
Other7%
Kmart7%
Target22%
Officeworks6%
Coles58%
Home Improvement39%
Resources25%
Insurance9%
Industrial & Safety8%
Chemicals & Fertilisers
7%
Other7%Energy
5%
18
Target
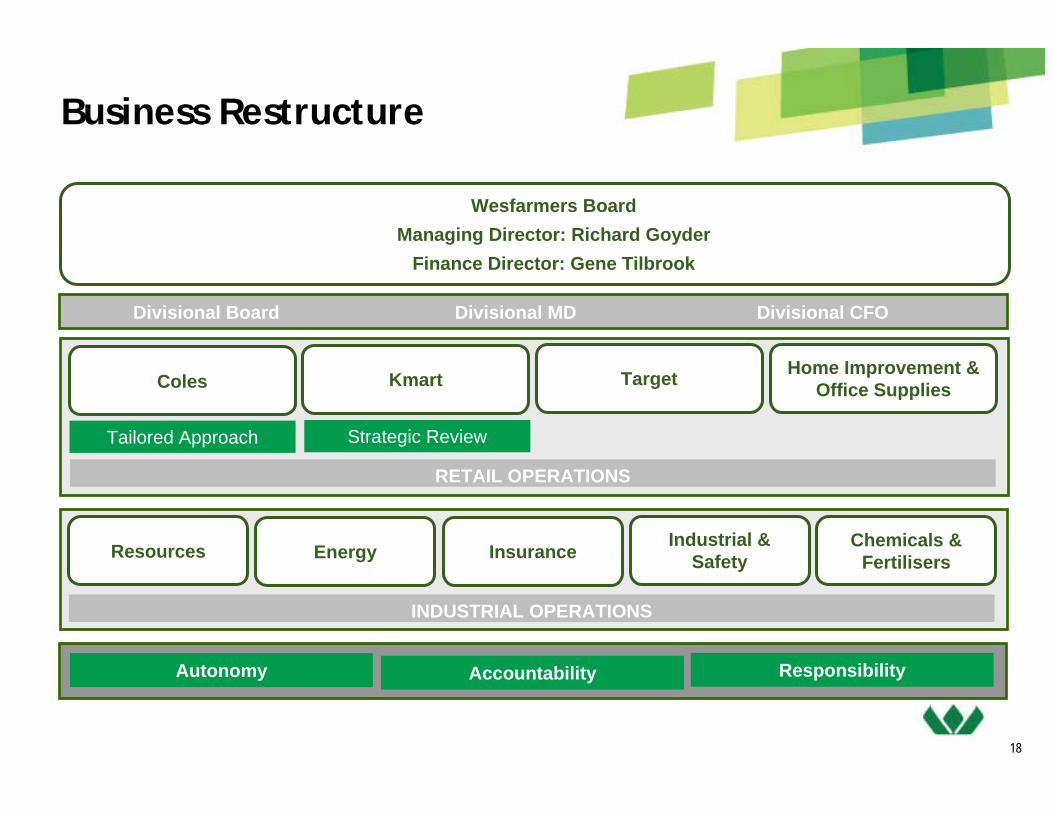
Business Restructure
Wesfarmers BoardManaging Director: Richard Goyder
Finance Director: Gene Tilbrook
Coles
Tailored Approach
Home Improvement & Office Supplies
Resources Energy Insurance Industrial & Safety
Kmart
Strategic Review
RETAIL OPERATIONS
Chemicals & Fertilisers
INDUSTRIAL OPERATIONS
Autonomy Accountability Responsibility
Divisional Board Divisional MD Divisional CFO

19
Implementation of Management Plan
Wesfarmers Managing Director
Coles
Home Improvement & Office Supplies
Target
Kmart
• The Officeworks and Bunnings businesses report as one division under the leadership of John Gillam
• Mark Ward (ex-Bunnings) appointed MD of Officeworks
• Target is performing strongly under the existing management team led by Launa Inman
• New GM Commercial, ex-Bunnings
• Larry Davis will continue as MD• Strategic review due to be completed by March 2008, preferred option is to
retain and strengthen operations
• Ian McLeod appointed MD of Coles; extensive international retailing experience• Terry Bowen appointed as CFO; Mick McMahon continues as COO• Divisional Board will include executives with international retail experience
20
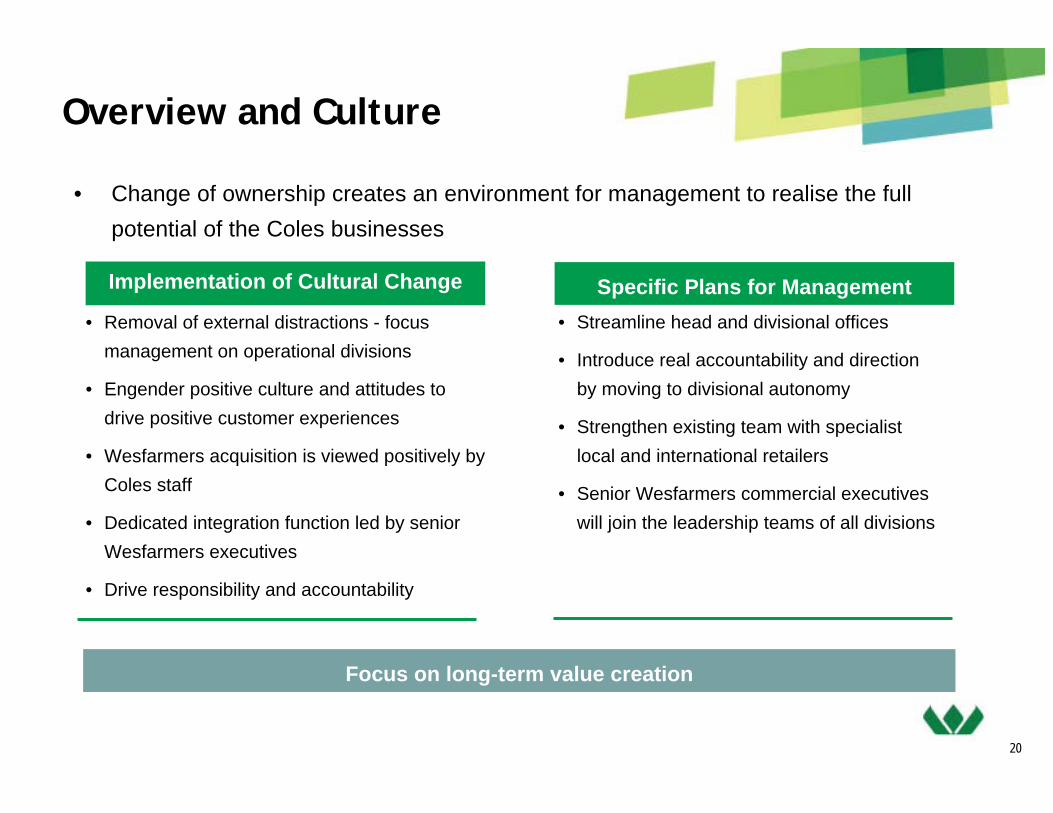
• Change of ownership creates an environment for management to realise the full potential of the Coles businesses
• Removal of external distractions - focus management on operational divisions
• Engender positive culture and attitudes to drive positive customer experiences
• Wesfarmers acquisition is viewed positively by Coles staff
• Dedicated integration function led by senior Wesfarmers executives
• Drive responsibility and accountability
Implementation of Cultural Change
• Streamline head and divisional offices
• Introduce real accountability and direction by moving to divisional autonomy
• Strengthen existing team with specialist local and international retailers
• Senior Wesfarmers commercial executives will join the leadership teams of all divisions
Specific Plans for Management
Focus on long-term value creation
Overview and Culture

21
Value Accretive from Date of AcquisitionMedium Term Value Creation
• Continuation of strong performance
• Support current margin mix initiatives
• Aggressive store roll-out programme
Target• Stabilise the business
• Focus on retail basics
• Deliver supply chain cost savings and overhead reductions
• Restore sales momentum
• Selective network expansions
Coles
• Undertake strategic review
• Wesfarmers’ preference is to retain the Kmart business, however all options to optimise value will be considered
Kmart
• Optimise performance through alignment with Bunnings
• Accelerate store roll-out program to target category leadership
Officeworks
Plans for the Businesses

22
Investing for Growth - Capital Expenditure
• Wesfarmers has a history of ongoing investment in its businesses to deliver shareholder value
• Approximately 70% of capex will be invested in the network (across brands) through new store roll out, increased refurbishments and maintenance
• Approx $5bn to be spent in the Coles businesses over the next 5 years, ramping up to $1.0 - $1.2bn per annum during FY09 and FY10; stabilising between $0.9 - $1.0bn per annum thereafter
Capex Breakdown
~ 80 – 100Kmart
~ 1,000 – 1,200
~ 40 – 60
~ 110 – 120Target
Officeworks
Total
Coles
Capex p.a. FY08/FY09 ($m)
~ 800 – 930
0%
20%
40%
60%
80%
100%
FY08/09 FY10 - FY12
Other
New, Refurbishmentand Maintenance
Supply ChainProgramme
c. 60% of total capex required for the supply chain programme has already been spent.

23
Integration - Progress update
• Completion expected by March 2008• Review is progressing• Anticipated savings remain consistent with pre-acquisition views
• 31 March• (Structural review in progress)• Complete• Complete• Complete
• Complete
Solution design
Commercial reviews
Kmart strategic reviewSupply ChainOverhead reduction
• Scheduled completion by June 2008
• Scheduled completion by April 2008• Scheduled completion by April 2008• Scheduled completion by April 2008
Create
Develop divisional structures
Coles
TargetKmartOfficeworks
• All “integrate” functions reporting to Wesfarmers corporate office
• On schedule for full integration by June 2008
Integrate
Specialist corporate functions
(accounting, tax, treasury, etc)
ImplementationTask
Group Overview

25
Financial Summary
FY06* FY07 1H08
Operating Results
Revenue A$m 8,859 9,754 9,808 107.9
EBITDA A$m 1,650 1,650 1,266 60.1
Earnings before interest and tax A$m 1,366 1,305 1,046 70.6
Net profit after tax A$m 869 786 601 53.3
Financial Position
Total assets A$m 7,430 12,076 37,110 299.0
Net borrowings# A$m 1,460 4,986 11,601 346.2
Shareholders' equity A$m 3,166 3,503 16,552 436.3
Capital expenditure on PPE A$m 615 680 588 85.4
Depreciation and amortisation^ A$m 283 345 220 23.7
Financial Performance
Earnings per share cents 235.6 210.5 134.9 27.5
Dividends per share cents 215 225 65 23.5
Operating Cash flow per share A$ 2.99 3.41 2.75 117.8
Return on average shareholders' equity % 31.1 25.1 18.4 9.3pt
Gearing (net debt to equity) % 46.1 143.6 70.1 14.1pt
Net interest cover (cash basis) times 13.8 8.7 5.0 64.0
* excluding the sale of ARG^ including Stanwell amortisation (1H08 A$33m, FY07 A$119.6m and FY06 A$80.9m)
% Change pcp

26
Divisional Summary – Proforma FY07
Activities Proform FY07 Revenue
Proforma FY07 EBIT
Proforma FY07EBIT
(A$m) (A$m) Contribution
ColesThe division comprises one of Australia's largestsupermarket businesses, liquor retailing outlets, fuel andconvenience outlets and an online pharmacy business.
26,230 773 28%
Home Improvement & Office Supplies
Australasia's leading supplier of home and gardenimprovement products, office products, and a majorsupplier of building materials.
6,201 614 23%
Target Australian department store offering on-trend, fashionableapparel and soft homewares. 3,306 290 11%
Kmart Australian and New Zealand discount department storeretailer offering a wide range of low cost merchandiseranging from apparel to hardware and leisure goods.
3,889 97 4%
27
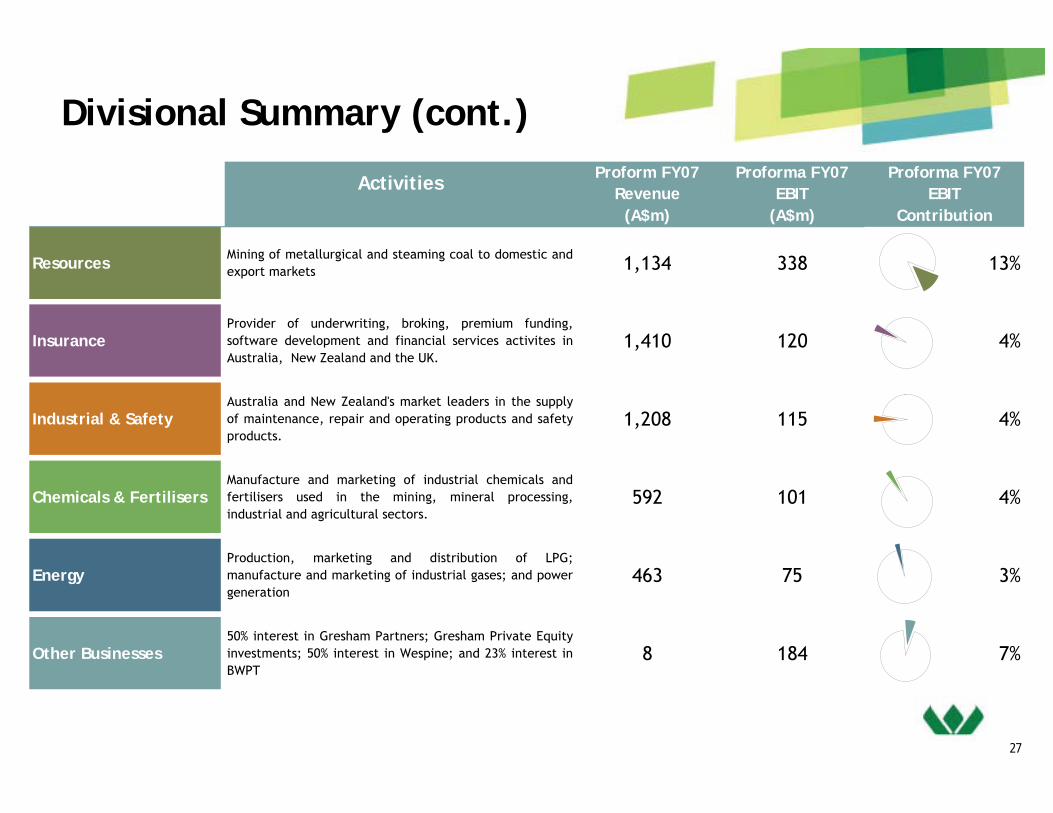
Divisional Summary (cont.)
Activities Proform FY07 Revenue
Proforma FY07 EBIT
Proforma FY07EBIT
(A$m) (A$m) Contribution
Resources Mining of metallurgical and steaming coal to domestic andexport markets 1,134 338 13%
InsuranceProvider of underwriting, broking, premium funding,software development and financial services activites inAustralia, New Zealand and the UK.
1,410 120 4%
Industrial & SafetyAustralia and New Zealand's market leaders in the supplyof maintenance, repair and operating products and safetyproducts.
1,208 115 4%
Chemicals & FertilisersManufacture and marketing of industrial chemicals andfertilisers used in the mining, mineral processing,industrial and agricultural sectors.
592 101 4%
EnergyProduction, marketing and distribution of LPG;manufacture and marketing of industrial gases; and powergeneration
463 75 3%
Other Businesses50% interest in Gresham Partners; Gresham Private Equityinvestments; 50% interest in Wespine; and 23% interest inBWPT
8 184 7%
2008 Half Year Results

29
2008 Half Year Results Performance Highlights
• Completion of Coles transaction on 23 November 2007
– Target and Kmart performing well
– Christmas most profitable period of the year for most businesses
– One-off costs to come through in full year results
• Operating revenue of $9.8 billion, up 108%
• Group profit after tax of $601 million, up 53%
• Earnings per share of 134.9 cents, up 27%
• Operating cash flow of $1.2 billion
• Interim dividend of 65 cents per share
Group Performance Highlights
# EPS and Cash flow exclude sale of Landmark * WANOS includes employee reserved shares^ AGAAP excl. goodwill amortisation (2003), AIFRS excl. employee reserved shares (2004 +)
^ 2006 includes 25 cents per share relating to franking credits from ARG sale
0
40
80
120
160
200
240
280
2003# 2004 2005 2006 2007
cents
EPS^ Operating Cashflow* Dividend
Half Year ended 31 December ($m) 2007 2006 %
Operating revenue 9,808 4,718 107.9
EBITDA 1,266 791 60.1
EBIT 1,046 613 70.6
Net profit after tax 601 392 53.3
Operating cash flow 1,241 477 160.2
Earnings per share (excl. employee res. shares) 134.9 105.8 27.5
Earnings per share (incl. employee res. shares) 133.1 103.6 28.5
Cash flow per share (incl. employee res. shares) 274.9 126.2 117.8
Dividends per share ^ 65 85 (23.5)
30
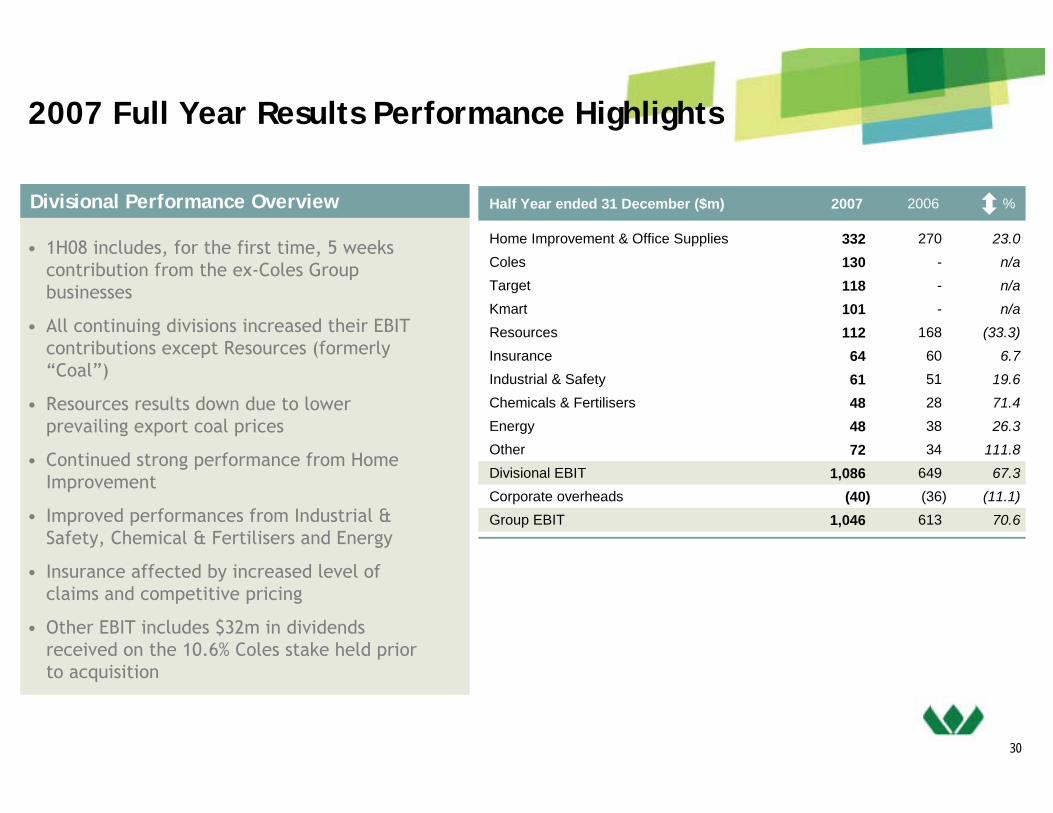
2007 Full Year Results Performance Highlights
Divisional Performance Overview
• 1H08 includes, for the first time, 5 weeks contribution from the ex-Coles Group businesses
• All continuing divisions increased their EBIT contributions except Resources (formerly “Coal”)
• Resources results down due to lower prevailing export coal prices
• Continued strong performance from Home Improvement
• Improved performances from Industrial & Safety, Chemical & Fertilisers and Energy
• Insurance affected by increased level of claims and competitive pricing
• Other EBIT includes $32m in dividends received on the 10.6% Coles stake held prior to acquisition
Half Year ended 31 December ($m) 2007 2006 %
Home Improvement & Office Supplies 332 270 23.0Coles 130 - n/aTarget 118 - n/aKmart 101 - n/aResources 112 168 (33.3)Insurance 64 60 6.7Industrial & Safety 61 51 19.6Chemicals & Fertilisers 48 28 71.4Energy 48 38 26.3Other 72 34 111.8Divisional EBIT 1,086 649 67.3Corporate overheads (40) (36) (11.1)Group EBIT 1,046 613 70.6

31
Home Improvement & Office Supplies2008 Half Year Performance
Highlights
Outlook
Financial Performance
Home Improvement
• Store on store cash sales growth of 12.2%
• 6.1% lift in trade sales
• 6 warehouses and 1 trade centre opened
• Maintaining strong focus on core retail drivers
Officeworks
• Satisfactory Christmas trading
• Integration work proceeding well
Home Improvement
• Continued cash sales growth
– Threats to positive retail trading conditions emerging
• Further gains in trade
• 12 warehouse openings likely for 2007/08
• Strong focus on delivering on strategic agenda
Officeworks
• Full year result to include a number of “one offs”
• Strategy review & re-set work underway
23.0270 332
n/a -7Office Supplies
20.4270 325Home ImprovementEBIT
17.82,471 2,910
n/a -115Office Supplies
13.12,471 2,795Home ImprovementRevenue
20062007Half Year ended 31 December ($m)
23.0270 332
n/a -7Office Supplies
20.4270 325Home ImprovementEBIT
17.82,471 2,910
n/a -115Office Supplies
13.12,471 2,795Home ImprovementRevenue
20062007Half Year ended 31 December ($m)

32
Coles – 2008 Half Year Performance
Highlights
Outlook
• Improving Food & Liquor sales trend
• Christmas trading solid, but later than last year
• Strong increase in Convenience sales
• Continued upgrade of DC Network
• New stores opened (Aug – Dec): 15 supermarkets, 7 1st
Choice, 20 fuel & convenience
• Continuing focus on product availability and cost
management
• Customer focussed strategies
• Restructuring to occur
• New stores planned to open in second half
– 10 supermarkets
– 7 1st Choice
– 10 convenience
Financial Performance
^ Incl. $5m of amortisation of intangibles (provisional)* Incl. $7m of retail support costs not previously on-charged# Incl. $1m of retail support costs not previously on-charged
648RevenueConvenience
6.2Comparative store sales growth %
12Trading EBIT#
118Trading EBIT*
2,271RevenueFood & Liquor
(45)Depreciation & Amortisation^
175EBITDA
2.0
130
2,919
2007
Revenue
Comparative store sales growth %
EBIT
23 November to 31 December ($m)
648RevenueConvenience
6.2Comparative store sales growth %
12Trading EBIT#
118Trading EBIT*
2,271RevenueFood & Liquor
(45)Depreciation & Amortisation^
175EBITDA
2.0
130
2,919
2007
Revenue
Comparative store sales growth %
EBIT
23 November to 31 December ($m)
32
33
Highlights
Outlook
Financial Performance
Target – 2008 Half Year Performance
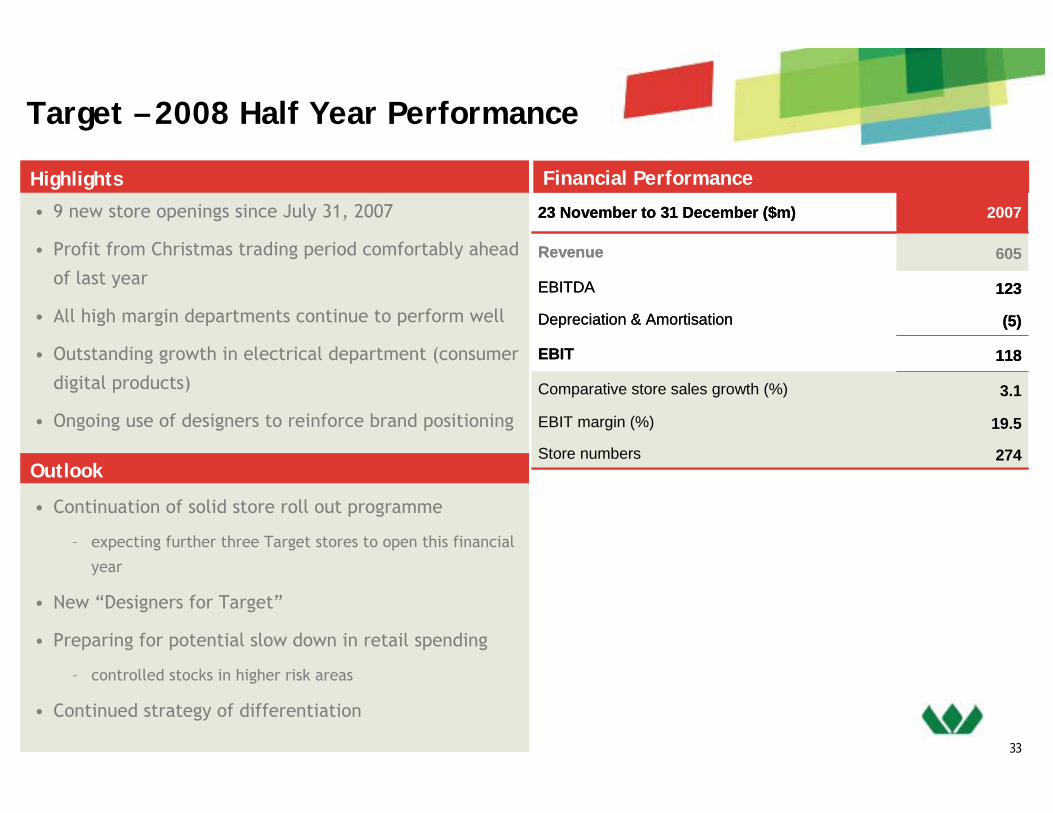
• 9 new store openings since July 31, 2007
• Profit from Christmas trading period comfortably ahead
of last year
• All high margin departments continue to perform well
• Outstanding growth in electrical department (consumer
digital products)
• Ongoing use of designers to reinforce brand positioning
• Continuation of solid store roll out programme
– expecting further three Target stores to open this financial
year
• New “Designers for Target”
• Preparing for potential slow down in retail spending
– controlled stocks in higher risk areas
• Continued strategy of differentiation
274Store numbers
19.5EBIT margin (%)
3.1Comparative store sales growth (%)
118EBIT
(5)Depreciation & Amortisation
123EBITDA
605Revenue
200723 November to 31 December ($m)
274Store numbers
19.5EBIT margin (%)
3.1Comparative store sales growth (%)
118EBIT
(5)Depreciation & Amortisation
123EBITDA
605Revenue
200723 November to 31 December ($m)
33
34
Highlights
Outlook
Financial Performance
Kmart – 2008 Half Year Performance
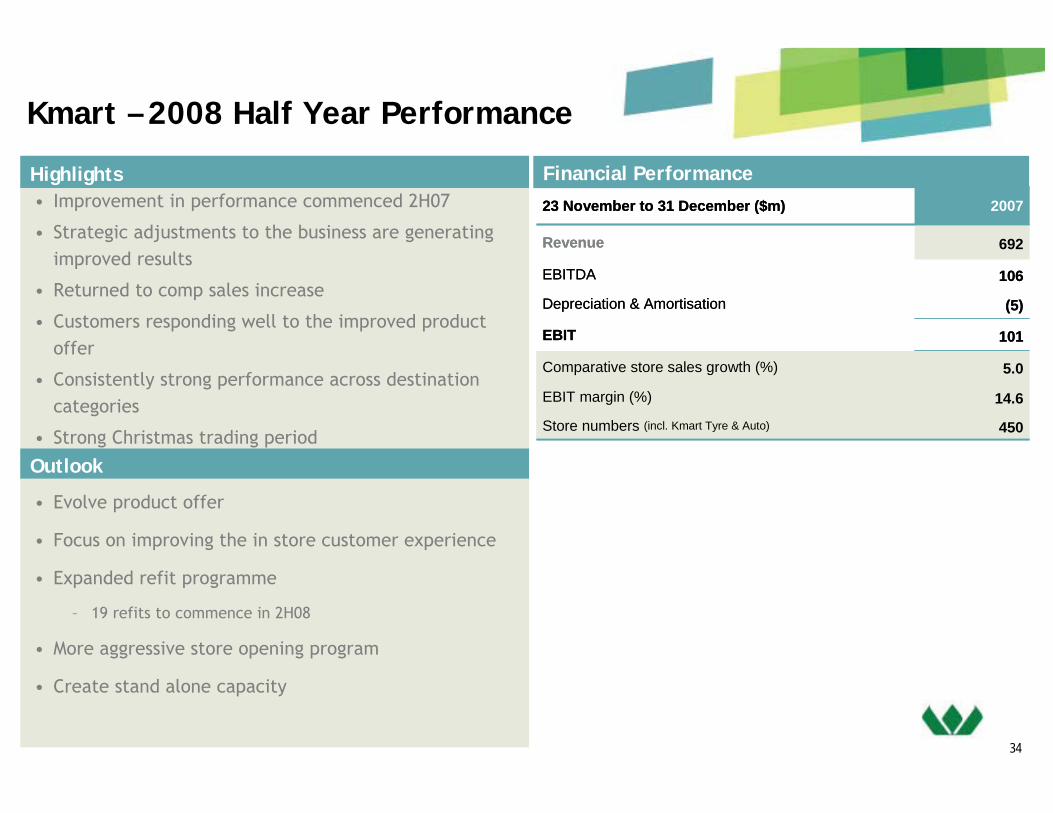
• Improvement in performance commenced 2H07
• Strategic adjustments to the business are generating improved results
• Returned to comp sales increase
• Customers responding well to the improved product offer
• Consistently strong performance across destination categories
• Strong Christmas trading period
• Evolve product offer
• Focus on improving the in store customer experience
• Expanded refit programme
– 19 refits to commence in 2H08
• More aggressive store opening program
• Create stand alone capacity
450Store numbers (incl. Kmart Tyre & Auto)
14.6EBIT margin (%)
5.0Comparative store sales growth (%)
101EBIT
(5)Depreciation & Amortisation
106EBITDA
692Revenue
200723 November to 31 December ($m)
450Store numbers (incl. Kmart Tyre & Auto)
14.6EBIT margin (%)
5.0Comparative store sales growth (%)
101EBIT
(5)Depreciation & Amortisation
106EBITDA
692Revenue
200723 November to 31 December ($m)
34
35
Resources – 2008 Half Year Performance
Highlights
Outlook
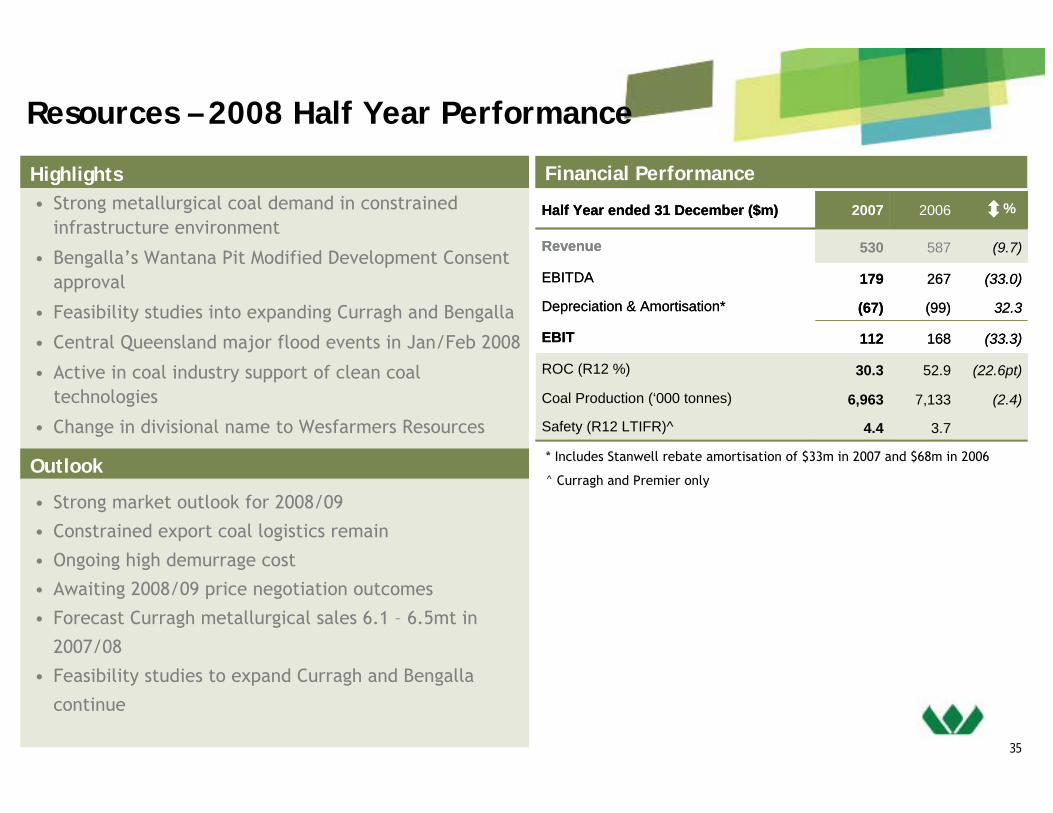
Financial Performance• Strong metallurgical coal demand in constrained
infrastructure environment
• Bengalla’s Wantana Pit Modified Development Consent approval
• Feasibility studies into expanding Curragh and Bengalla
• Central Queensland major flood events in Jan/Feb 2008
• Active in coal industry support of clean coal technologies
• Change in divisional name to Wesfarmers Resources
• Strong market outlook for 2008/09
• Constrained export coal logistics remain
• Ongoing high demurrage cost
• Awaiting 2008/09 price negotiation outcomes
• Forecast Curragh metallurgical sales 6.1 – 6.5mt in
2007/08
• Feasibility studies to expand Curragh and Bengalla
continue
3.74.4Safety (R12 LTIFR)^
(2.4)7,1336,963Coal Production (‘000 tonnes)
(22.6pt)52.930.3ROC (R12 %)
(33.3)168112EBIT
32.3(99)(67)Depreciation & Amortisation*
(33.0)267179EBITDA
(9.7)587530Revenue
20062007Half Year ended 31 December ($m)
3.74.4Safety (R12 LTIFR)^
(2.4)7,1336,963Coal Production (‘000 tonnes)
(22.6pt)52.930.3ROC (R12 %)
(33.3)168112EBIT
32.3(99)(67)Depreciation & Amortisation*
(33.0)267179EBITDA
(9.7)587530Revenue
20062007Half Year ended 31 December ($m) %%
* Includes Stanwell rebate amortisation of $33m in 2007 and $68m in 2006
^ Curragh and Premier only

36
Insurance – 2008 Half Year Performance
Highlights
Outlook
Financial Performance
• Increased frequency of severe weather events
• Continued acquisition of small broking operations in
Australia, NZ and UK
• Completed rollout of OAMPS brand across all Australian
broking operations
• Integration phase completed with portfolio transfer
from AIIL to Lumley
• Record crop season for WFI due to high grain prices
• Broking operations meeting expectations despite the
soft market
• Premium rates in Australia and NZ stabilising
• Restructuring of Lumley NZ operations to improve
underwriting performance
• Continue programme of selective acquisitions that
meet investment criteria
• Difficult claims environment will remain if current La
Niña weather continues
(37.7)6138EBITA Underwriting
n.m.428EBITA Broking
n.m.(2)5EBITA Other
12.2pt15.227.4EBITA Margin (Broking) (%)
(7.6)pt90.598.1Combined Operating Ratio (%)
(7.5)pt59.967.4Net Earned Loss Ratio (%)
6.76064EBIT Insurance Division
12.76371EBITA Insurance Division
13.2546618Gross Written Premium Underwritten
20062007Half Year ended 31 December* ($m)
(37.7)6138EBITA Underwriting
n.m.428EBITA Broking
n.m.(2)5EBITA Other
12.2pt15.227.4EBITA Margin (Broking) (%)
(7.6)pt90.598.1Combined Operating Ratio (%)
(7.5)pt59.967.4Net Earned Loss Ratio (%)
6.76064EBIT Insurance Division
12.76371EBITA Insurance Division
13.2546618Gross Written Premium Underwritten
20062007Half Year ended 31 December* ($m) %%
*2007 incl. 6 mths of OAMPS’ (2006: 2 mths) and 6 mths of Crombie Lockwood (2006: nil)

37
Industrial & Safety – 2008 Half Year Performance
Highlights
Outlook
Financial Performance
• Operating revenue improved by 10.7% to $642m– Growth in all businesses– Inclusion of Bullivants
• Earnings increased by 20% to $61m– Improvement in most businesses including New Zealand– Benefits of global sourcing and business improvement initiatives
• Return on Capital increased to 16.9% (last year 13.7%)– R12 capital employed slightly lower than last year despite the addition of Bullivants
• Market conditions remain mixed−Continued demand from resources and infrastructure in WA
and QLD
– Manufacturing conditions remain subdued in Australia and
New Zealand
• Ongoing strong competition and scarcity of skilled
labour
• However satisfactory growth is expected
* 2007 includes Bullivants for 6 months (2006: 1 month)
20062007Half Year ended 31 December* ($m)
4.14.9Safety (R12 LTIFR)
3.2pt13.716.9ROC (R12 %)
0.7pt8.89.5EBIT margin (%)
19.65161EBIT
28.6(7)(5)Depreciation & Amortisation of PPE
13.85866EBITDA
10.7580642Revenue
20062007Half Year ended 31 December* ($m)
4.14.9Safety (R12 LTIFR)
3.2pt13.716.9ROC (R12 %)
0.7pt8.89.5EBIT margin (%)
19.65161EBIT
28.6(7)(5)Depreciation & Amortisation of PPE
13.85866EBITDA
10.7580642Revenue

38
Chemicals & Fertilisers – 2008 Half Year Performance
Highlights
Outlook
Financial Performance• EBA successfully renegotiated• Ammonia plant production ahead of last year despite
performance problems• Higher production, sales and earnings from AN despite
delay in expansion• Good performance from AVC (acquired Sept ’07)• Improved sodium cyanide earnings; more consistent
plant performance• Higher fertiliser volumes at higher pricing • Sale of chlor alkali business recorded in 1H07 result• AN expansion project
• Demand for mining chemicals remains strong• Demand for PVC strong• Completion of new prill plant in May 08
– Additional prill production – Total cost of AN expansion $400 - $405 million
• Seasonal break critical for fertiliser sales• $15 million investment to debottleneck sodium
cyanide production progressing• QNP debottleneck on track (Sept ’08), finalising
customer contracts
1.3pt14.916.2ROC (R12 %)
Fertilisers
Chemicals
Fertilisers
Chemicals
20062007Half Year ended 31 December ($m)
6.02.9Safety (R12 LTIFR)
33.6289.4386.6
23.6227.6281.4Sales Volume (‘000t):
71.42848EBIT
(16.7)(18)(21)Depreciation & Amortisation of PPE
50.04669EBITDA
69.3231391
63.2106173
74.4125218Revenue
%%
39
Energy – 2008 Half Year Performance
Highlights
Outlook
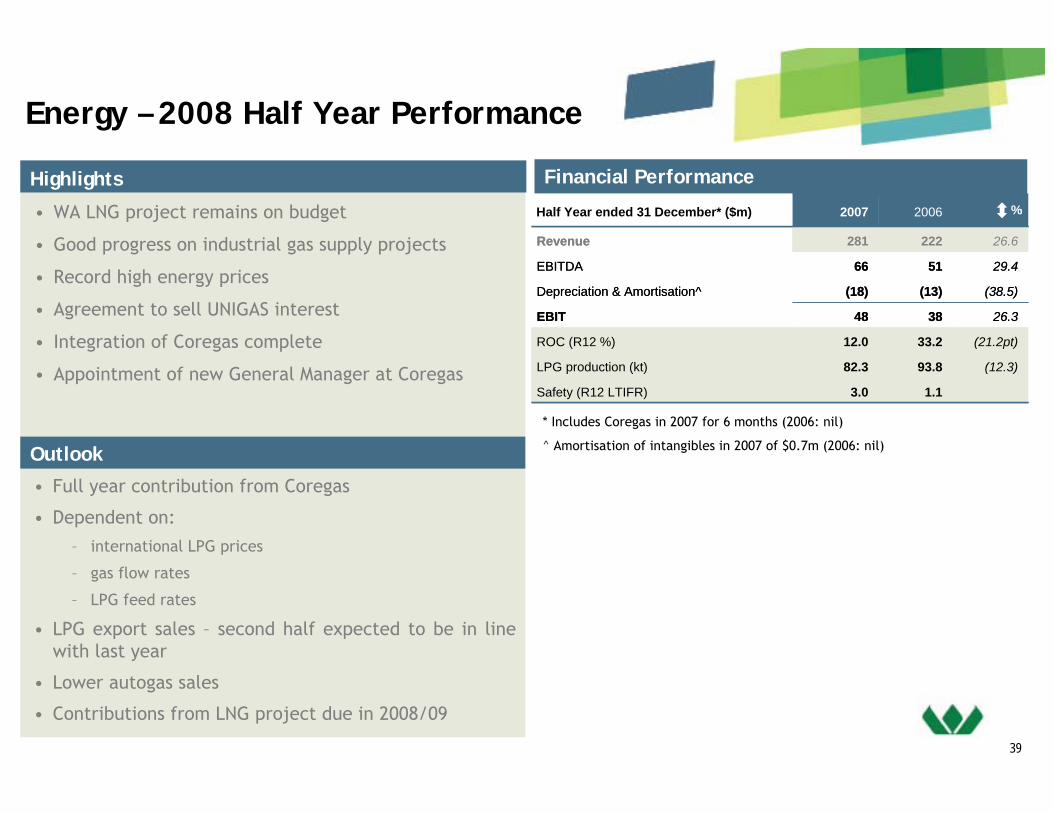
• WA LNG project remains on budget
• Good progress on industrial gas supply projects
• Record high energy prices
• Agreement to sell UNIGAS interest
• Integration of Coregas complete
• Appointment of new General Manager at Coregas
• Full year contribution from Coregas
• Dependent on:
– international LPG prices
– gas flow rates
– LPG feed rates
• LPG export sales – second half expected to be in line with last year
• Lower autogas sales
• Contributions from LNG project due in 2008/09
Financial Performance
26.6222281Revenue
29.45166EBITDA
(38.5)(13)(18)Depreciation & Amortisation^
26.33848EBIT
(21.2pt)33.212.0ROC (R12 %)
(12.3)93.882.3LPG production (kt)
20062007Half Year ended 31 December* ($m)
1.13.0Safety (R12 LTIFR)
26.6222281Revenue
29.45166EBITDA
(38.5)(13)(18)Depreciation & Amortisation^
26.33848EBIT
(21.2pt)33.212.0ROC (R12 %)
(12.3)93.882.3LPG production (kt)
20062007Half Year ended 31 December* ($m)
1.13.0Safety (R12 LTIFR)
%%
* Includes Coregas in 2007 for 6 months (2006: nil)
^ Amortisation of intangibles in 2007 of $0.7m (2006: nil)

40
Other Businesses – 2008 Half Year Performance
Highlights Financial Performance
Gresham Private Equity – Fund 1
Gresham Private Equity – Fund 2
• Norcros divested, with some deferred consideration
• Current investment $31m• Exit of Riviera expected over next
several years• Gross cash realised IRR 30+%
• Wesfarmers’ current commitment $180m;
Capital invested $141m• New Investments in Barminco and
Experiential Group• Revaluations are to Wesfarmers’ earnings
-32Coles dividend (on April 2007 stake)
(4)(4)Tax on relevant associates
3472Total
72Other*
2738Associates Sub-total
26823Bunnings Warehouse Property Trust
4350Wespine
2550Gresham Partners
(1)2367Gresham Private Equity - Fund 2
0350Gresham Private Equity - Fund 1
Associates:
20062007Holding%Half Year ended 31 December ($m)
* Includes corporate interest & investment income, BPML, self insurance

Operating Divisions

42
Home Improvement & Office Supplies
WIDEST RANGELOWEST PRICESBEST SERVICE

43
Store Networkat December 2007
197
28
48
40
2
12
103
5
18
1
1
25
Excludes 12 Trade operational sites and 10 Harris Technology stores
2 160 Bunnings Warehouse Stores63 Small format Bunnings Stores112 Officeworks Stores
810
20
37
35
2
2
44
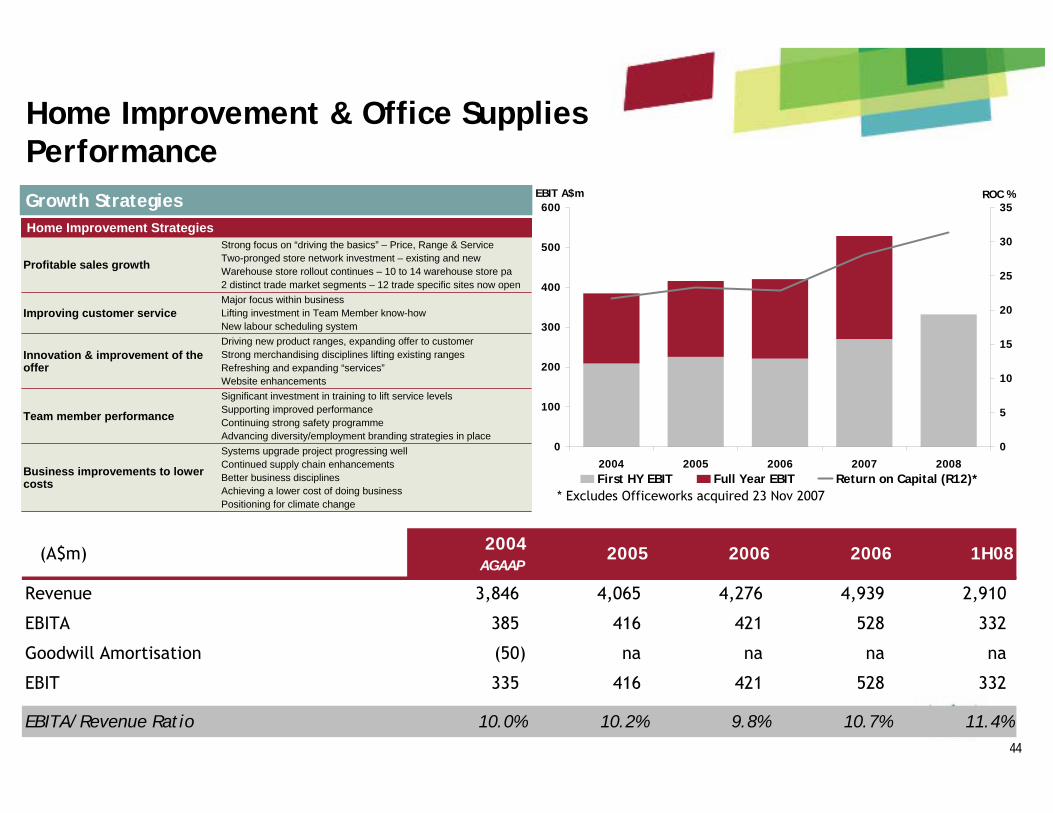
Home Improvement & Office SuppliesPerformanceGrowth Strategies
Significant investment in training to lift service levelsSupporting improved performanceContinuing strong safety programmeAdvancing diversity/employment branding strategies in place
Team member performance
Systems upgrade project progressing wellContinued supply chain enhancementsBetter business disciplinesAchieving a lower cost of doing businessPositioning for climate change
Business improvements to lower costs
Major focus within businessLifting investment in Team Member know-howNew labour scheduling system
Improving customer service
Strong focus on “driving the basics” – Price, Range & ServiceTwo-pronged store network investment – existing and newWarehouse store rollout continues – 10 to 14 warehouse store pa2 distinct trade market segments – 12 trade specific sites now open
Profitable sales growth
Driving new product ranges, expanding offer to customer Strong merchandising disciplines lifting existing rangesRefreshing and expanding “services”Website enhancements
Innovation & improvement of the offer
Home Improvement Strategies
* Excludes Officeworks acquired 23 Nov 2007
0
100
200
300
400
500
600
2004 2005 2006 2007 2008
EBIT A$m
0
5
10
15
20
25
30
35ROC %
First HY EBIT Full Year EBIT Return on Capital (R12)*
(A$m) 2004AGAAP
2005 2006 2006 1H08
Revenue 3,846 4,065 4,276 4,939 2,910
EBITA 385 416 421 528 332
Goodwill Amortisation (50) na na na na
EBIT 335 416 421 528 332
EBITA/Revenue Ratio 10.0% 10.2% 9.8% 10.7% 11.4%

45
Office Supplies
Integration Update
• Now part of expanded “Home
Improvement & Office Supplies” Division
• Integration work proceeding to plan
– 2 businesses, 2 executive teams
• New OW executive team settled
– blend of OW & Bunnings expertise
– Mark Ward appointed Managing Director
• Separation activities well progressed
• Tactical changes to the offer
implemented
– Strategy reset work underway
Focus on business
fundamentals at store and
support office levels
Pursue operational efficiencies
Accelerate store roll-out
programme
Drive category authority
Position for future growth
Re-establish authority across
core categories
Improve in-store execution –
product availability and
service
Enhance competitive position
DetailsStrategies
46
Coles

47
Coles Store Networkat December 2007
2,000+ stores & hotels
110,000+ employees
1.8m+ m2 selling area
748 Supermarkets761 Liquor stores93 Hotels621 Convenience
10 8
236 4248
152 79228
66 53177 591
193 155
14
68 44116
208158
16
11
PRO-FORMA EBIT CONTRIBUTION
(FY07PF)
28%
47
48
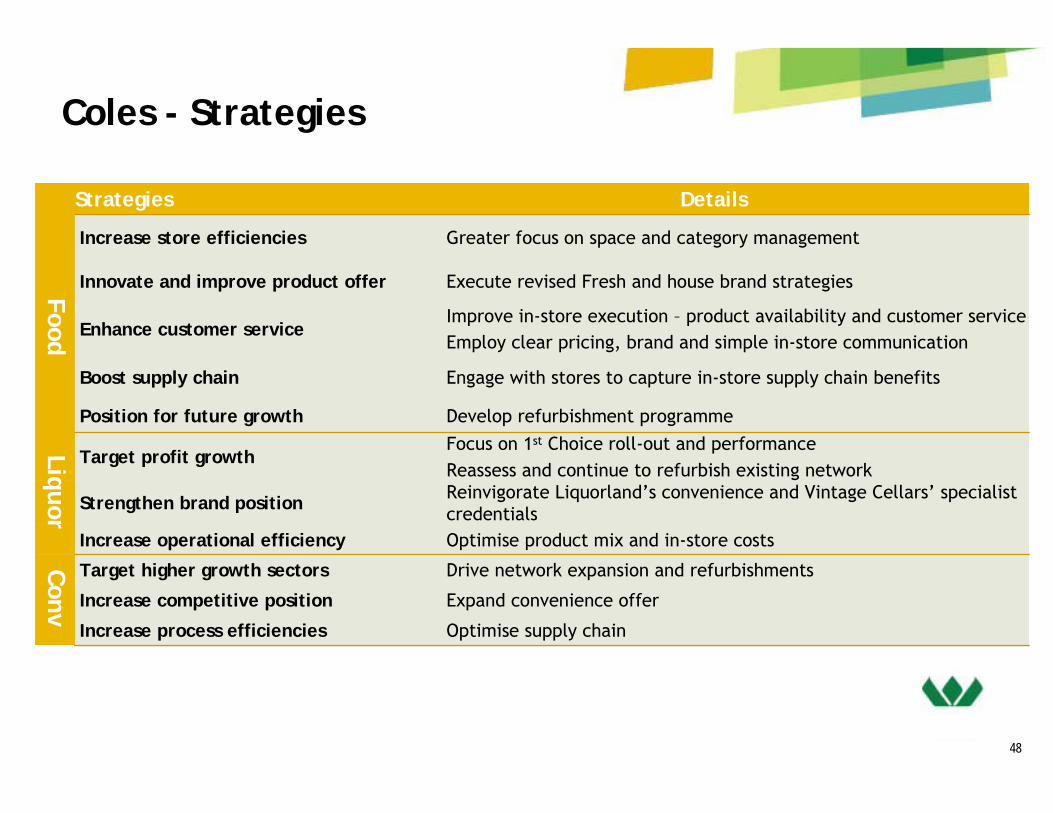
Coles - Strategies
Optimise supply chain
Expand convenience offer
Drive network expansion and refurbishments
Increase process efficiencies
Increase competitive position
Target higher growth sectors
Optimise product mix and in-store costs
Reinvigorate Liquorland’s convenience and Vintage Cellars’ specialist credentials
Focus on 1st Choice roll-out and performanceReassess and continue to refurbish existing network
Increase operational efficiency
Strengthen brand position
Target profit growth
Develop refurbishment programmePosition for future growth
Engage with stores to capture in-store supply chain benefitsBoost supply chain
Improve in-store execution – product availability and customer serviceEmploy clear pricing, brand and simple in-store communication
Enhance customer service
Execute revised Fresh and house brand strategiesInnovate and improve product offer
Greater focus on space and category managementIncrease store efficiencies
DetailsStrategies
FoodLiquor
Conv
49
Target

50
Target Store Networkat December 2007
31
274 Target stores(incl 118 Target Country) 5
64
25
93
54
2
PRO-FORMA EBIT CONTRIBUTION
(FY07PF)
11%
50
51
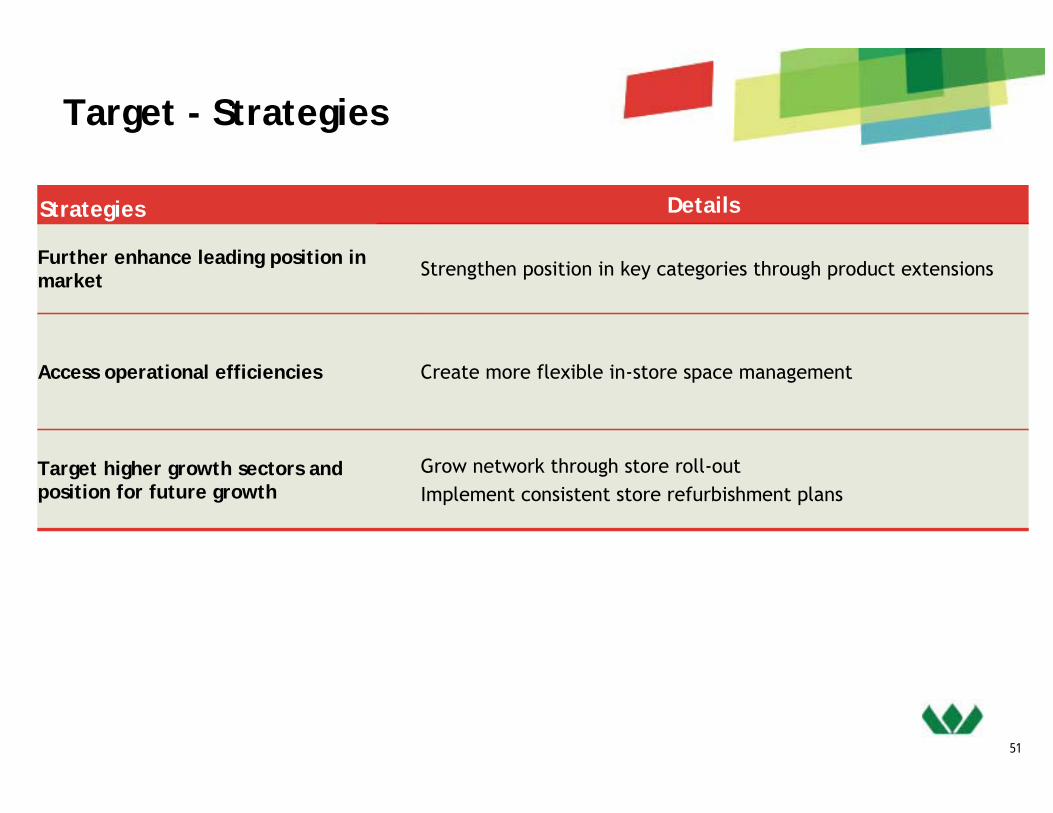
Target - Strategies
Grow network through store roll-outImplement consistent store refurbishment plans
Target higher growth sectors and position for future growth
Create more flexible in-store space managementAccess operational efficiencies
Strengthen position in key categories through product extensionsFurther enhance leading position in market
DetailsStrategies
51

52
Kmart
53
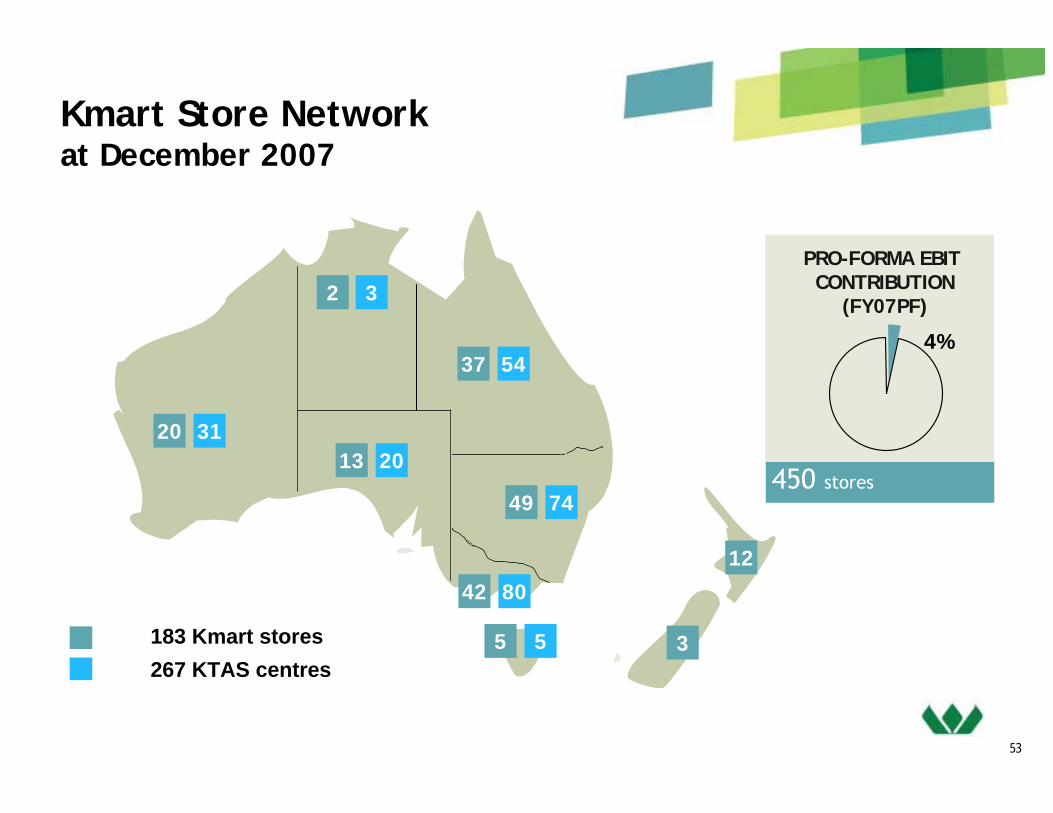
Kmart Store Networkat December 2007
450 stores
20 31
183 Kmart stores267 KTAS centres
2
42 80
37 54
13 20
5 5
49 74
3
3
12
PRO-FORMA EBIT CONTRIBUTION
(FY07PF)
4%
53
54
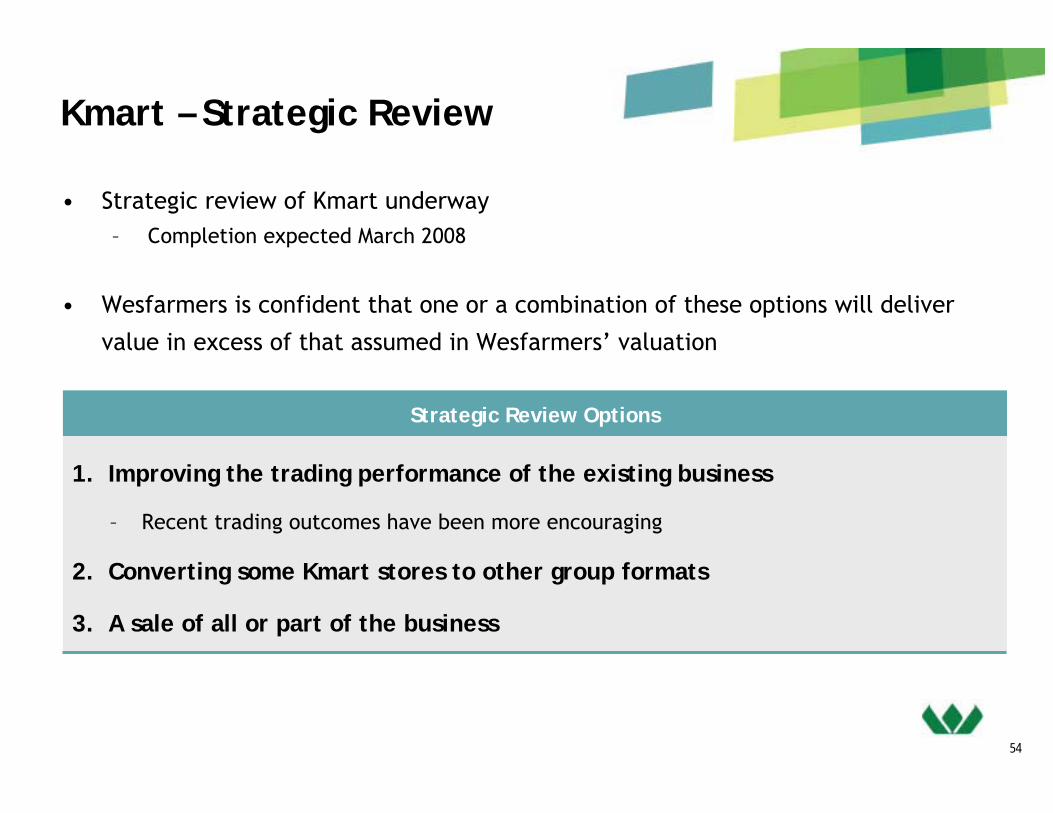
Kmart – Strategic Review
• Strategic review of Kmart underway– Completion expected March 2008
• Wesfarmers is confident that one or a combination of these options will deliver
value in excess of that assumed in Wesfarmers’ valuation
1. Improving the trading performance of the existing business
– Recent trading outcomes have been more encouraging
2. Converting some Kmart stores to other group formats
3. A sale of all or part of the business
Strategic Review Options
54

55
Resources

56
Coal
Bengalla (40%)
Curragh
Premier Coal
Resources - Locations
27%
660 employees
3 coal mines
24 coal customers
PRO-FORMA EBIT CONTRIBUTION
(FY07PF)
13%

Resources - Performance
Growth Strategies
0
100
200
300
400
500
600
700
2004 2005 2006 2007 2008
EBIT A$m
0
10
20
30
40
50
60
70
80
90ROC %
First HY EBIT Full Year EBIT Return on Capital (R12)Coal21Safety and environmental performanceSustainability
Curragh feasibility studyBengalla expansion opportunityIncrease coal production
Closely monitor and capture opportunities to export as soon as capacity becomes availableInfrastructure constraints
Evaluate acquisitions that offer economies of scale or downstream benefitsExtend product and market reach
Maximise export salesLong-term export contracts in placeOptimise sales mixMaintain export price relativity
Strong export customer demand
Curragh North conveyorDragline upgradesBusiness improvement projects
Cost pressures
2007/08 Strategic initiativesOpportunities / Challenges
Coal21Safety and environmental performanceSustainability
Curragh feasibility studyBengalla expansion opportunityIncrease coal production
Closely monitor and capture opportunities to export as soon as capacity becomes availableInfrastructure constraints
Evaluate acquisitions that offer economies of scale or downstream benefitsExtend product and market reach
Maximise export salesLong-term export contracts in placeOptimise sales mixMaintain export price relativity
Strong export customer demand
Curragh North conveyorDragline upgradesBusiness improvement projects
Cost pressures
2007/08 Strategic initiativesOpportunities / Challenges
57
(A$m) 2004AGAAP
2005 2006 2006 1H08
Revenue 628 764 1,304 1,134 530
EBIT 186 251 578 338 112
EBIT/Revenue Ratio 29.6% 32.9% 44.3% 29.8% 21.1%
Stanwell Amortisation - 4 81 120 33
58
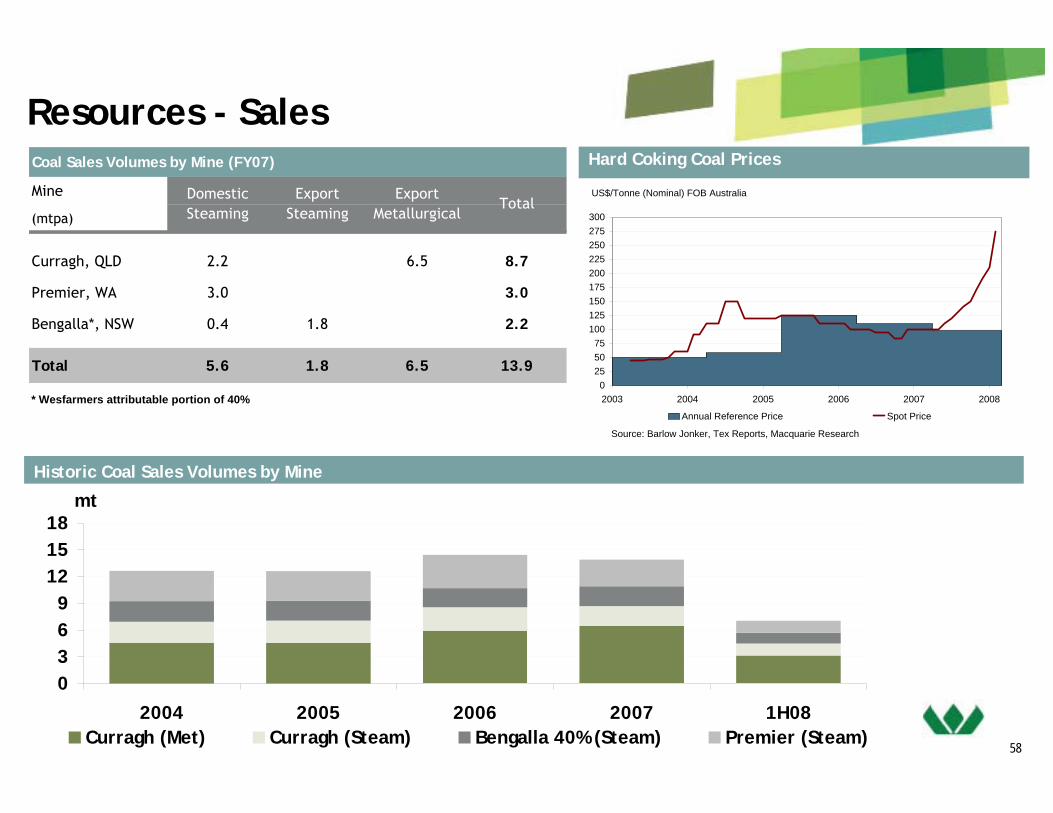
Resources - Sales
Historic Coal Sales Volumes by Mine
Hard Coking Coal Prices
0369
121518
2004 2005 2006 2007 1H08
mt
Curragh (Met) Curragh (Steam) Bengalla 40% (Steam) Premier (Steam)
US$/Tonne (Nominal) FOB Australia
0255075
100125150175200225250275300
2003 2004 2005 2006 2007 2008
Annual Reference Price Spot Price
Source: Barlow Jonker, Tex Reports, Macquarie Research
Coal Sales Volumes by Mine (FY07)
Mine
(mtpa)
Curragh, QLD 2.2 6.5 8.7
Premier, WA 3.0 3.0
Bengalla*, NSW 0.4 1.8 2.2
Total 5.6 1.8 6.5 13.9
* Wesfarmers attributable portion of 40%
Domestic Steaming
Export Steaming
Export Metallurgical
Total

59
ResourcesCurragh and Bengalla Expansion Studies
• Feasibility study to expand exports to 8.0 - 8.5mtpa
• Upgrade of CHPP to 2,200tph
• Additional overburden removal capacity required
– Truck and shovel or in pit conveying options
• Blackwater Creek diversion– Additional coal reserve
• Market development proceeding
• Additional export volume from FY10 dependent on infrastructure constraints
Curragh Expansion Study Bengalla Expansion Study
• Development consent approval granted
• Potential expansion from 8.7mtpa to 10.7mtpa ROM
• Expansion timing dependent on infrastructure constraints

60
Insurance

61
4
20
12
3
18
18
13
2
2
4
8
1
6
2
9
5
5
4
1
1
1
1
1
3
2
Insurance - Locations
10%
3,000 employees
146 locations Lumley General Australia
Lumley General New Zealand
Wesfarmers Federation Insurance
OAMPS
Crombie Lockwood
84
10
2914
9
PRO-FORMA EBIT CONTRIBUTION
(FY07PF)
4%

62
Insurance - PerformanceGrowth Strategies
The above table includes Lumley from Oct 2003, OAMPS from Nov 2006, and Crombie Lockwood from Mar 2007
0
20
40
60
80
100
120
140
160
2004* 2005 2006 2007 2008
EBIT A$m
0
5
10
15
20
25
30
35ROC %
First HY EBIT Full Year EBIT Return on Capital (R12)
(A$m) 2004AGAAP
2005 2006 2006 1H08
Gross Written Premium (underwriting) 787 1,020 1,026 1,191 618 Broking revenue na na na 119 103
EBITA Underwriting 96 133 122 97 38
EBITA Broking na na na 32 28
EBITA Other 0 2 1 1 5
EBITA Insurance Division 96 135 125 130 71 EBIT Insurance Division 88 135 125 120 64
Combined Operating Ratio 86.3% 86.1% 88.1% 94.2% 98.1%
Portfolio transfer by 31/12/07 – integration largely completeIntegration of AIIL with LGA
Expansion of products and servicesStrengthen specialist teamsValue added services (OHES, Safety Assist)
Improve customer service
New management structure – customer focusedPrice increases agreed in Lumley Business SolutionsInitiatives to improve expense ratio
LGNZ Business Improvement
Integration largely completeIntegration of OAMPS and Crombie Lockwood
Broking
Development and CIO rolesNew regional management structure for OAMPSLeadership development programTraining and mentoring
Building the best team
Division
Target Profitable growth
Opportunities / ChallengesMaintain underwriting disciplinesMaintain key alliances and relationshipsLGA online initiativeWFI expansion via “Yourinsurancegroup”Expansion of fee-based and value added services
Underw
riting
Strategies
63
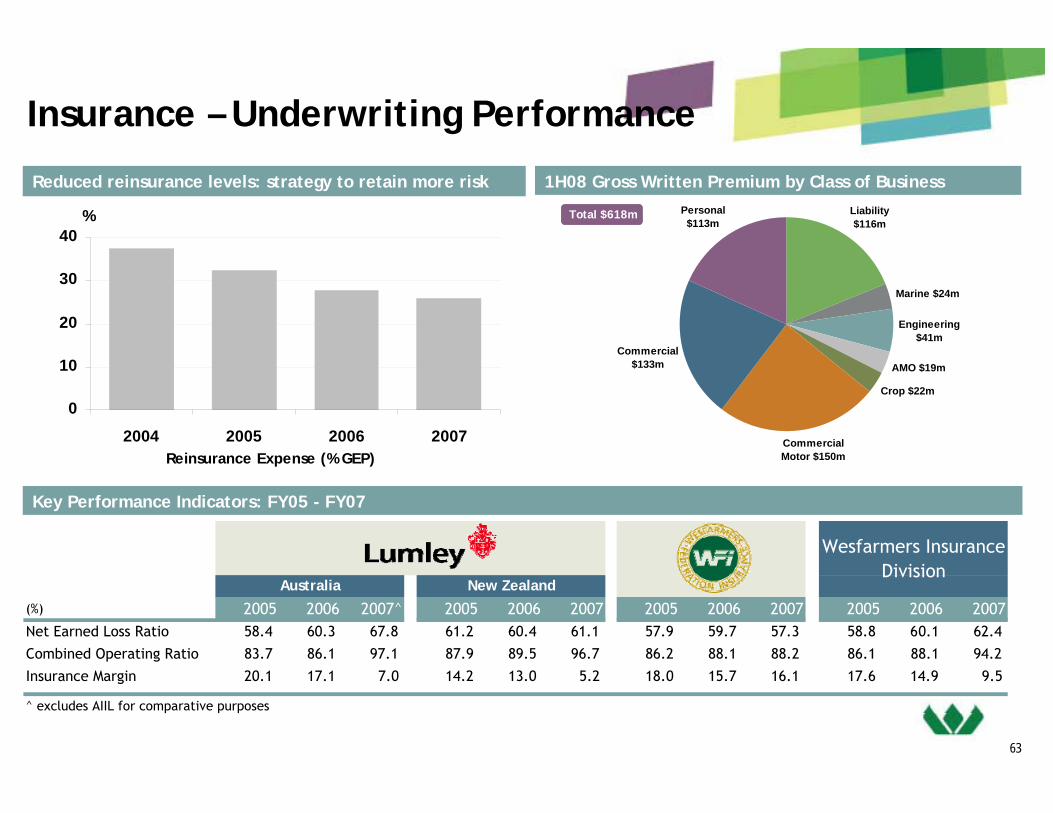
Insurance – Underwriting Performance
1H08 Gross Written Premium by Class of Business
Key Performance Indicators: FY05 - FY07
Reduced reinsurance levels: strategy to retain more risk
(%) 2005 2006 2007^ 2005 2006 2007 2005 2006 2007 2005 2006 2007Net Earned Loss Ratio 58.4 60.3 67.8 61.2 60.4 61.1 57.9 59.7 57.3 58.8 60.1 62.4
Combined Operating Ratio 83.7 86.1 97.1 87.9 89.5 96.7 86.2 88.1 88.2 86.1 88.1 94.2
Insurance Margin 20.1 17.1 7.0 14.2 13.0 5.2 18.0 15.7 16.1 17.6 14.9 9.5
^ excludes AIIL for comparative purposes
Wesfarmers Insurance Division
Australia New Zealand
0
10
20
30
40
2004 2005 2006 2007Reinsurance Expense (% GEP)
% Total $618mTotal $618m Liability $116m
Marine $24m
Engineering $41m
AMO $19m
Crop $22m
Commercial Motor $150m
Commercial $133m
Personal $113m

64
National Specialist BusinessesAustralia New Zealand
Australian market leader in distribution of Maintenance, Repair and Operating supplies (MRO)
Industrial & Safety

65
Industrial & Safety – Distribution Network
8%
3,200 employees
238 locations
100,000+ customers
190,000 product lines
PRO-FORMA EBIT CONTRIBUTION
(FY07PF)
4%
22Protector Safety
24NZ Safety
21Blackwoods Paykels (NZ)10Packaging House
No.NEW ZEALAND BUSINESSES
5 7
17
17
11
5
24
16
2
5
11
7
7
3
21
10
1
10
22
4 4
1 1
4 1
1 1
15
1
1
6
3
1
1
18Bullivants10Mullings
44Protector Alsafe
75
6
Blackwoods
Atkins Electrical
8Motion
No.AUSTRALIAN BUSINESSES
6
66
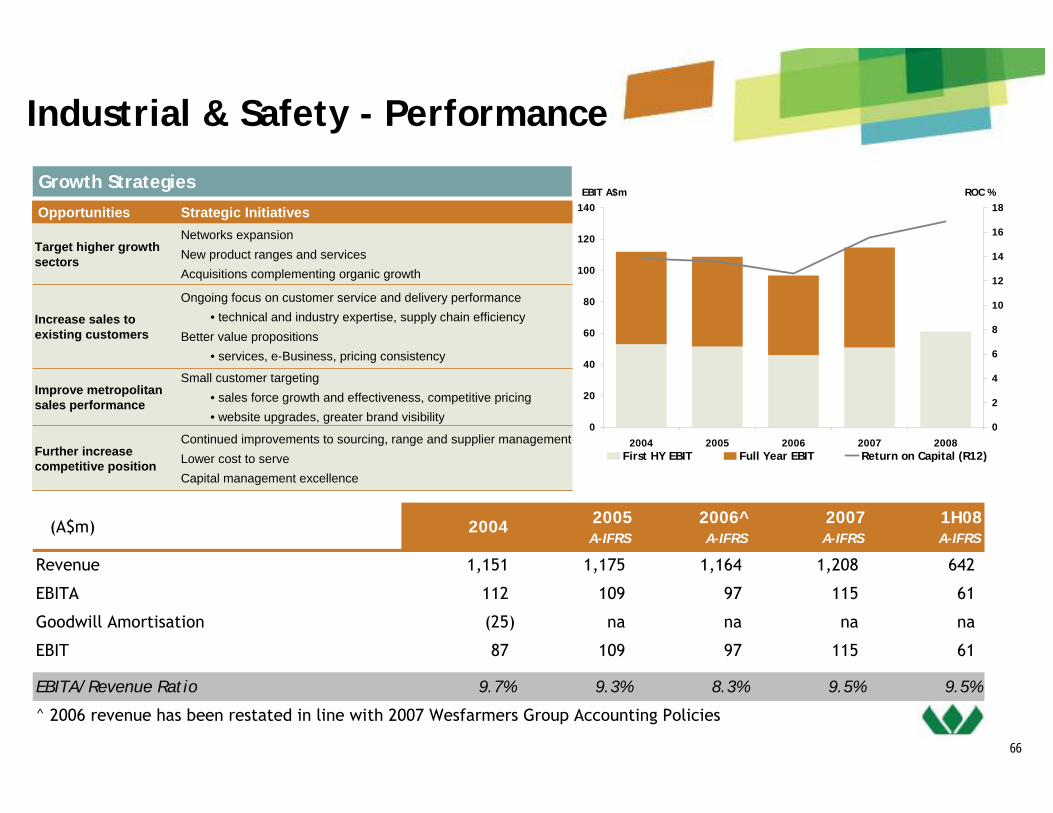
Industrial & Safety - Performance
Growth Strategies
Small customer targeting• sales force growth and effectiveness, competitive pricing• website upgrades, greater brand visibility
Improve metropolitan sales performance
Ongoing focus on customer service and delivery performance• technical and industry expertise, supply chain efficiency
Better value propositions• services, e-Business, pricing consistency
Increase sales to existing customers
Continued improvements to sourcing, range and supplier management Lower cost to serveCapital management excellence
Further increase competitive position
Networks expansionNew product ranges and services Acquisitions complementing organic growth
Target higher growth sectors
Strategic InitiativesOpportunities
(A$m) 2004 2005A-IFRS
2006^A-IFRS
2007A-IFRS
1H08A-IFRS
Revenue 1,151 1,175 1,164 1,208 642
EBITA 112 109 97 115 61
Goodwill Amortisation (25) na na na na
EBIT 87 109 97 115 61
EBITA/Revenue Ratio 9.7% 9.3% 8.3% 9.5% 9.5%
^ 2006 revenue has been restated in line with 2007 Wesfarmers Group Accounting Policies
0
20
40
60
80
100
120
140
2004 2005 2006 2007 2008
EBIT A$m
0
2
4
6
8
10
12
14
16
18ROC %
First HY EBIT Full Year EBIT Return on Capital (R12)

67
Chemicals & Fertilisers

68
474
Chemicals & Fertilisers - Locations
730 employees
300 chemical customers
2 major fertiliserdistributors servicingover 5,000 farmers
17 operationalmanufacturing plants
2
7%
■ CSBP fertilisersManufacturing plant 4Import and distribution centres 5Depots 6Regional Sales Representatives 25Sales agents 151
■ CSBP chemicalsManufacturing plants 7
■ AV Manufacturing plants 2■ QNP (50%)
Manufacturing plants 4
PRO-FORMA EBIT CONTRIBUTION
(FY07PF)
69
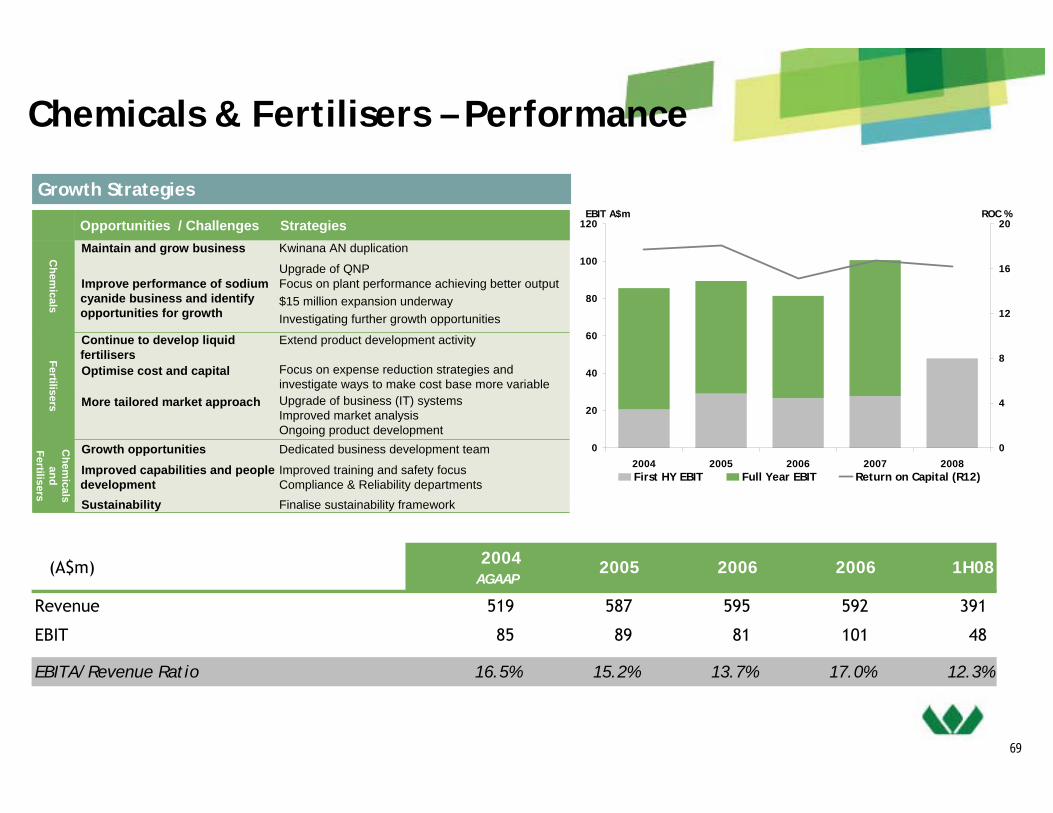
Chemicals & Fertilisers – Performance
Growth Strategies
0
20
40
60
80
100
120
2004 2005 2006 2007 2008
EBIT A$m
0
4
8
12
16
20ROC %
First HY EBIT Full Year EBIT Return on Capital (R12)
(A$m) 2004AGAAP
2005 2006 2006 1H08
Revenue 519 587 595 592 391
EBIT 85 89 81 101 48
EBITA/Revenue Ratio 16.5% 15.2% 13.7% 17.0% 12.3%
Dedicated business development teamGrowth opportunitiesImproved training and safety focusCompliance & Reliability departments
Improved capabilities and people development
Focus on expense reduction strategies and investigate ways to make cost base more variable
Optimise cost and capital
Upgrade of business (IT) systemsImproved market analysisOngoing product development
More tailored market approach
Focus on plant performance achieving better output$15 million expansion underwayInvestigating further growth opportunities
Improve performance of sodium cyanide business and identify opportunities for growth
Extend product development activityContinue to develop liquid fertilisersFertilisers
Finalise sustainability frameworkSustainability
Chem
icals and
Fertilisers
Maintain and grow business
Opportunities / ChallengesKwinana AN duplication
Upgrade of QNP
Chem
icals
Strategies
70
Energy

71
28%
Gas and Power
enGen
Wesfarmers LPG
Kleenheat Gas
Air Liquide WA
Coregas
Energy - Locations
950 employees
279,500 gas customers
23 remote power stations
3 air separation units
1 LPG extraction plant
1 hydrogen plant
PRO-FORMA EBIT CONTRIBUTION
(FY07PF)
3%
72
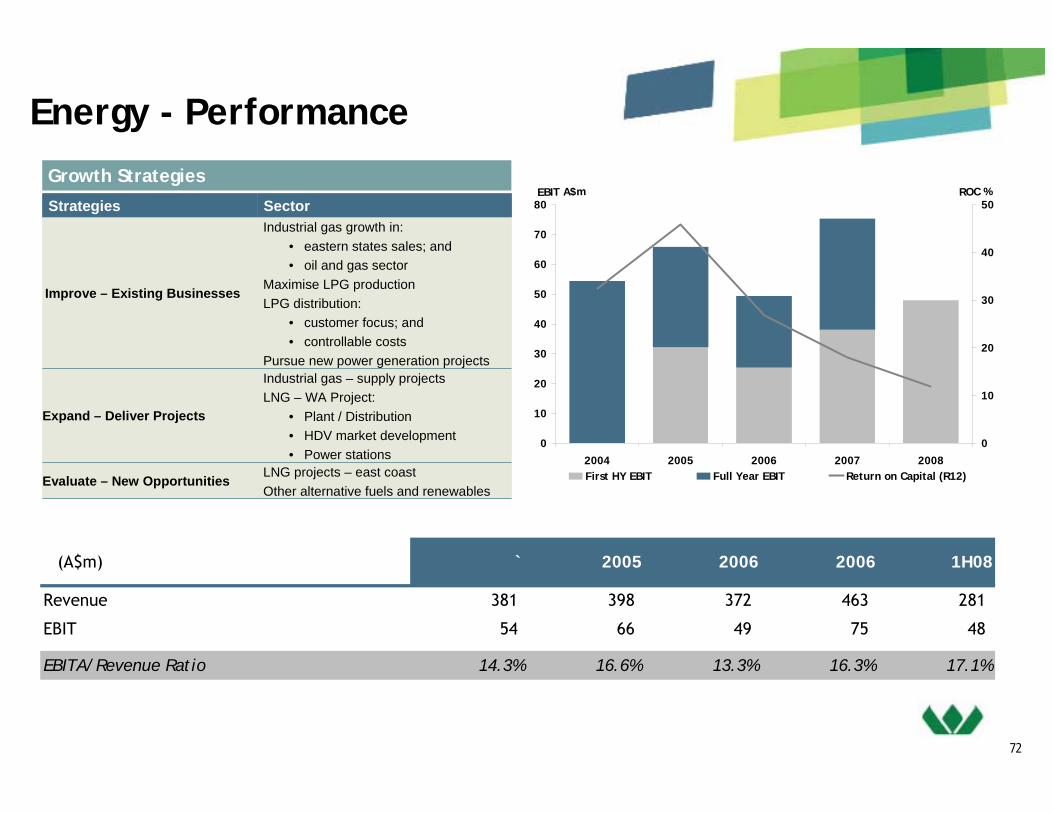
Energy - PerformanceGrowth Strategies
LNG projects – east coastOther alternative fuels and renewables
Industrial gas – supply projectsLNG – WA Project:
• Plant / Distribution• HDV market development• Power stations
Industrial gas growth in:• eastern states sales; and• oil and gas sector
Maximise LPG productionLPG distribution:
• customer focus; and • controllable costs
Pursue new power generation projects
Sector
Evaluate – New Opportunities
Improve – Existing Businesses
Expand – Deliver Projects
Strategies
0
10
20
30
40
50
60
70
80
2004 2005 2006 2007 2008
EBIT A$m
0
10
20
30
40
50ROC %
First HY EBIT Full Year EBIT Return on Capital (R12)
(A$m) ` 2005 2006 2006 1H08
Revenue 381 398 372 463 281
EBIT 54 66 49 75 48
EBITA/Revenue Ratio 14.3% 16.6% 13.3% 16.3% 17.1%

73
Energy - Businesses
2006/07 Actual: 186kT
2006/07 Actual Export: 65kT Domestic: 121kT
Customers 2
Sales Volumes
Activitiesowns and operates a liquified petroleum gas(LPG) extraction facility in WesternAustralia supplying Kleenheat Gasdomestically and export markets
Production Volume
Air Separation Plants: Kwinana: Capacity 285 TPD Oxygen Hismelt: Capacity 880 TPD OxygenCarbon Dioxide Plants: BHP Billiton: Capacity 12 TPD CSBP: Capacity 120 TPDCylinder Filling Operations: 2Branches: 3 in Western Australia
1 in Northern TerritoryAgents: 72Customers: 5,000
Operations
ActivitiesAir Liquide WA is a joint venture betweenWesfarmers (40%) and Air Liquide Australiamanufacturing and supplying a range ofindustrial and medical gases
Cylinder filling operations: 5Specialty gas laboratory Customers: 9,500
ActivitiesProduction, distribution and marketing ofindustrial and medical gases on Australia’seast coast.
OperationsPort Kembla Air Capacity:Separation Unit: 1,350 TPD OxygenHydrogen Plant: 1000 m3/hr
MW installed: 100GWh generated per annum: 390Power stations: 20Customers: circa 10
Operations
design, construction, operatation andmaintenance of both company-owned andcustomer-owned power stations
Activities
2006/07 Actual: 336kT
Depots 36Branches 16Commission agents 30Franchisees 29Dealers 562
Customers 258,000
distributor and marketer of liquefiedpetroleum gas (LPG) and gas appliances to abroad range of domestic, commercial,autogas and industrial customers
Activities
Sales Volumes
Sites

74
Other Businesses
(A$m) 2006 2007
Profit before tax: Gresham Partners 2.7 3.9 Gresham Private Equity 10.1 12.8
(A$m) 2006 2007
Profit before tax 9.8 8.1
(A$m) 2006 2007
Profit before tax 17.0 46.9
Gresham:50% interest in Gresham Partners, an independent investmentbank focused on financial advisory services, private equityinvestment and property investment funds. Wesfarmers alsoholds significant investments in Gresham's Private Equity Funds.
Bunnings Warehouse Property Trust (23%):listed property trust, established in 1998 with a focus on warehouseretailing properties and, in particular, Bunnings Warehousesleased to Bunnings Pty Ltd, a wholly-owned subsidiary ofWesfarmers Limited.
Wespine (50%):50:50 joint venture between Wesfarmers and Fletcher BuildingLimited. Wespine is a softwood sawmiller, specialising in theproduction of premium quality plantation timber for use inhousing construction and furniture manufacturing.

75
• Norcros divested, with some deferred
consideration
• Current investment $31m
• Exit of Riviera expected within several years
• Gross cash realised IRR 30+%
Current Investment Portfolio – Fund 1
Gresham Private Equity – Fund 1
• Wesfarmers’ current commitment $180m; Capital invested $141m
• New Investments:
– Barminco
– Experiential Group
• Revaluations are to Wesfarmers’ earnings
Gresham Private Equity – Fund 2
Investee Companies
Co-investmentFundInvestorsWES
Investment Vehicle
Gresham Private Equity
Riviera ocean cruisers
Gresham Private Equity
76
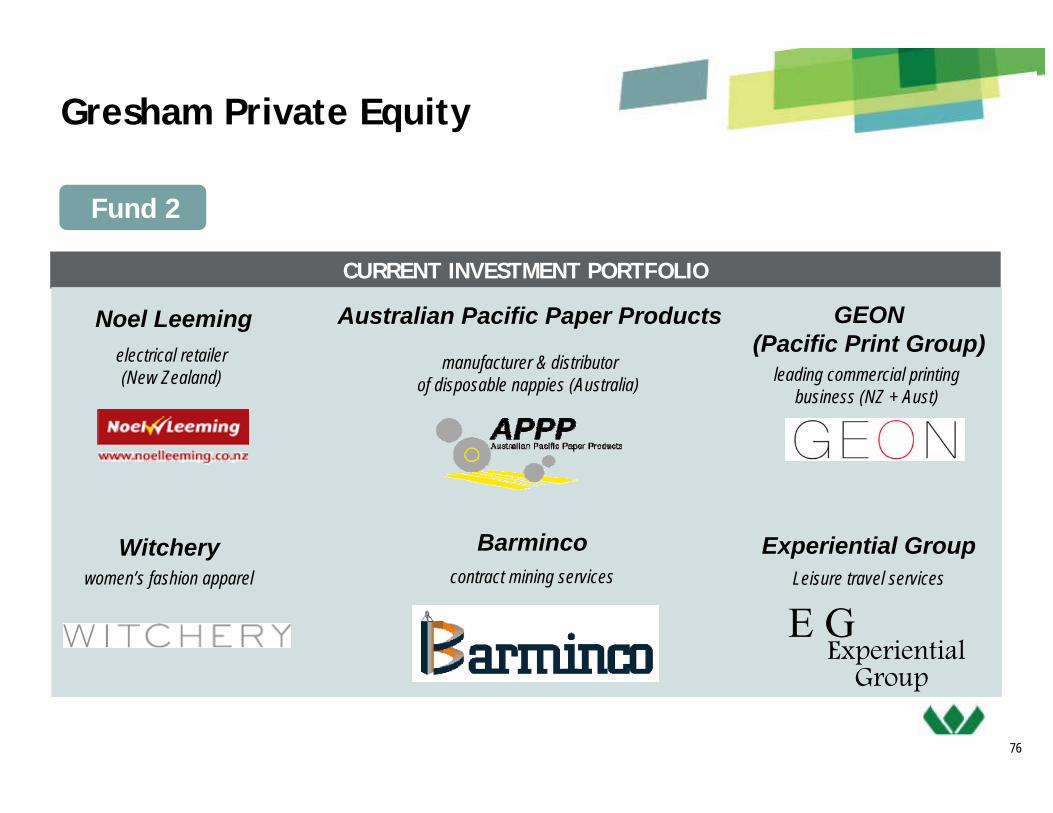
Gresham Private Equity
Fund 2
CURRENT INVESTMENT PORTFOLIO
electrical retailer(New Zealand)
manufacturer & distributorof disposable nappies (Australia) leading commercial printing
business (NZ + Aust)
women’s fashion apparelWitchery
Noel Leeming Australian Pacific Paper Products GEON(Pacific Print Group)
Barmincocontract mining services
Experiential GroupLeisure travel services
ExperientialE G
Group
77
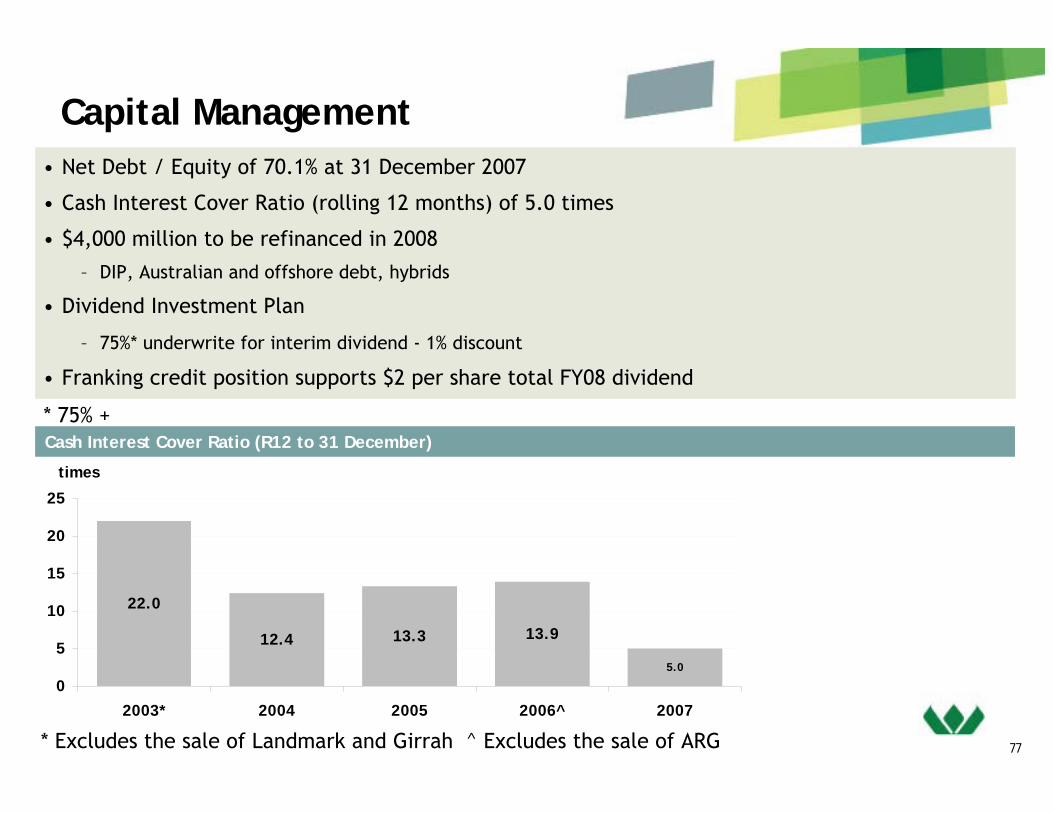
22.0
12.4 13.3 13.9
5.0
0
5
10
15
20
25
2003* 2004 2005 2006^ 2007
times
• Net Debt / Equity of 70.1% at 31 December 2007
• Cash Interest Cover Ratio (rolling 12 months) of 5.0 times
• $4,000 million to be refinanced in 2008
– DIP, Australian and offshore debt, hybrids
• Dividend Investment Plan
– 75%* underwrite for interim dividend - 1% discount
• Franking credit position supports $2 per share total FY08 dividend
Cash Interest Cover Ratio (R12 to 31 December)
* Excludes the sale of Landmark and Girrah ^ Excludes the sale of ARG
Capital Management
* 75% +
78
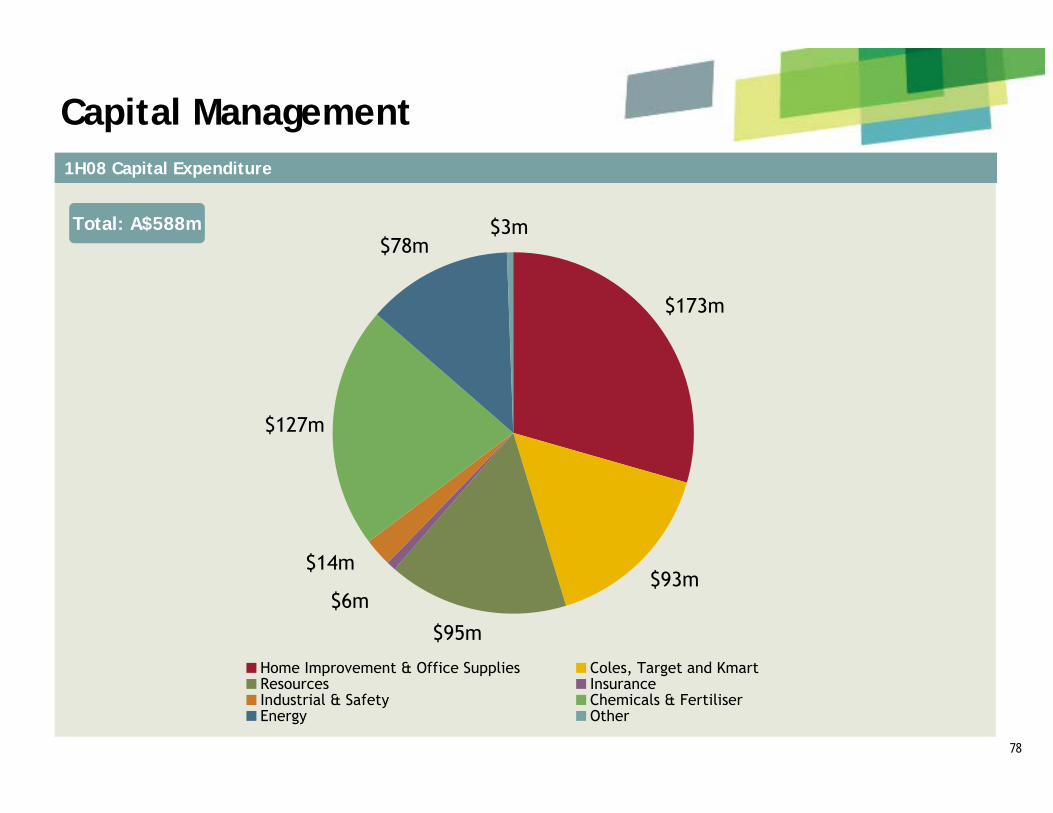
1H08 Capital Expenditure
Total: A$588m
Capital Management
$173m
$93m
$95m
$6m
$14m
$127m
$78m$3m
Home Improvement & Office Supplies Coles, Target and KmartResources InsuranceIndustrial & Safety Chemicals & FertiliserEnergy Other
79
Outlook
• Focus on bringing about substantial change in Coles
• Continuing good results in most businesses
• Impact of higher interest rates and fuel price volatility
• Strengthening coal price outlook
• One-off transaction/restructure costs in 2H08 expected; too early to
quantify
• $4bn to be refinanced

80
Investor Relations ContactWesfarmer’s Public Affairs and Investor Relations
Keith Kessell 61 8 9327 [email protected]
Tanya Rybarczyk 61 8 9327 [email protected]
Address
Wesfarmers House
40 The Esplanade
Perth WA 6000
Fax: 61 8 9327 4320
Important Notice and Disclaimer
• The material contained in this presentation is intended to be general background information on Wesfarmers Limited and its activities
• The information is supplied in summary form and is therefore not necessarily complete. Also, it is not intended that it be relied upon as advice to investors or potential investors, who should consider seeking independent professional advice depending upon their specific investment objectives, financial situation or particular needs
• The financial information contained in this presentation includes non-GAAP financial measures. For a reconciliation of these measures to the most comparable GAAP measure, please refer to half and full year financial statements filed with the Australian Stock Exchange
• Nothing in this release should be construed as either an offer to sell or a solicitation of an offer to buy or sell shares in any jurisdiction
For further information on Wesfarmers including:
Annual reports
Financial results announcements
Presentations and webcasts
Corporate policies
Please visit our website
www.wesfarmers.com.au
Related Documents