Also available via the Internet through BIA’s MEDIA Access Pro™ BIA • 14150 Parkeast Cir., Ste. 110, Chantilly, VA 20151-2296 • Phone: 703-818-2425 • Fax: 703-803-3299 • E-mail: [email protected] • Web: www.bia.com Second Edition Winter 2018 Shares Investing In MARKET REPORT Radio ® 2018

Welcome message from author
This document is posted to help you gain knowledge. Please leave a comment to let me know what you think about it! Share it to your friends and learn new things together.
Transcript

Also available via the Internet through BIA’s MEDIA Access Pro™
BIA • 14150 Parkeast Cir., Ste. 110, Chantilly, VA 20151-2296 • Phone: 703-818-2425 • Fax: 703-803-3299 • E-mail: [email protected] • Web: www.bia.com
Second EditionWinter 2018 Shares
Investing In
MARKET REPORTRadio®
2018
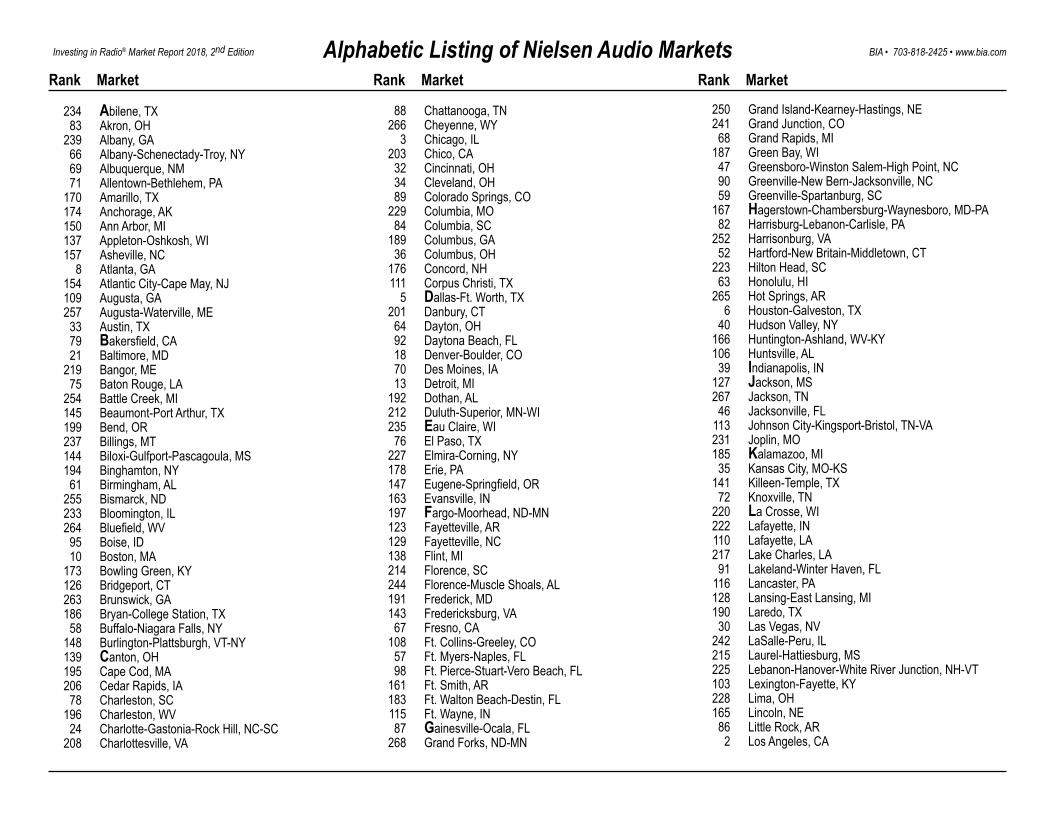
Alphabetic Listing of Nielsen Audio Markets Rank Market Rank Market Rank Market
Investing in Radio® Market Report 2018, 2nd Edition BIA • 703-818-2425 • www.bia.com
234 Abilene, TX 83 Akron, OH 239 Albany, GA 66 Albany-Schenectady-Troy, NY 69 Albuquerque, NM 71 Allentown-Bethlehem, PA 170 Amarillo, TX 174 Anchorage, AK 150 Ann Arbor, MI 137 Appleton-Oshkosh, WI 157 Asheville, NC 8 Atlanta, GA 154 Atlantic City-Cape May, NJ 109 Augusta, GA 257 Augusta-Waterville, ME 33 Austin, TX 79 Bakersfield, CA 21 Baltimore, MD 219 Bangor, ME 75 Baton Rouge, LA 254 Battle Creek, MI 145 Beaumont-Port Arthur, TX 199 Bend, OR 237 Billings, MT 144 Biloxi-Gulfport-Pascagoula, MS 194 Binghamton, NY 61 Birmingham, AL 255 Bismarck, ND 233 Bloomington, IL 264 Bluefield, WV 95 Boise, ID 10 Boston, MA 173 Bowling Green, KY 126 Bridgeport, CT 263 Brunswick, GA 186 Bryan-College Station, TX 58 Buffalo-Niagara Falls, NY 148 Burlington-Plattsburgh, VT-NY 139 Canton, OH 195 Cape Cod, MA 206 Cedar Rapids, IA 78 Charleston, SC 196 Charleston, WV 24 Charlotte-Gastonia-Rock Hill, NC-SC 208 Charlottesville, VA
88 Chattanooga, TN 266 Cheyenne, WY 3 Chicago, IL 203 Chico, CA 32 Cincinnati, OH 34 Cleveland, OH 89 Colorado Springs, CO 229 Columbia, MO 84 Columbia, SC 189 Columbus, GA 36 Columbus, OH 176 Concord, NH 111 Corpus Christi, TX 5 Dallas-Ft. Worth, TX 201 Danbury, CT 64 Dayton, OH 92 Daytona Beach, FL 18 Denver-Boulder, CO 70 Des Moines, IA 13 Detroit, MI 192 Dothan, AL 212 Duluth-Superior, MN-WI 235 Eau Claire, WI 76 El Paso, TX 227 Elmira-Corning, NY 178 Erie, PA 147 Eugene-Springfield, OR 163 Evansville, IN 197 Fargo-Moorhead, ND-MN 123 Fayetteville, AR 129 Fayetteville, NC 138 Flint, MI 214 Florence, SC 244 Florence-Muscle Shoals, AL 191 Frederick, MD 143 Fredericksburg, VA 67 Fresno, CA 108 Ft. Collins-Greeley, CO 57 Ft. Myers-Naples, FL 98 Ft. Pierce-Stuart-Vero Beach, FL 161 Ft. Smith, AR 183 Ft. Walton Beach-Destin, FL 115 Ft. Wayne, IN 87 Gainesville-Ocala, FL 268 Grand Forks, ND-MN
250 Grand Island-Kearney-Hastings, NE 241 Grand Junction, CO 68 Grand Rapids, MI 187 Green Bay, WI 47 Greensboro-Winston Salem-High Point, NC 90 Greenville-New Bern-Jacksonville, NC 59 Greenville-Spartanburg, SC 167 Hagerstown-Chambersburg-Waynesboro, MD-PA 82 Harrisburg-Lebanon-Carlisle, PA 252 Harrisonburg, VA 52 Hartford-New Britain-Middletown, CT 223 Hilton Head, SC 63 Honolulu, HI 265 Hot Springs, AR 6 Houston-Galveston, TX 40 Hudson Valley, NY 166 Huntington-Ashland, WV-KY 106 Huntsville, AL 39 Indianapolis, IN 127 Jackson, MS 267 Jackson, TN 46 Jacksonville, FL 113 Johnson City-Kingsport-Bristol, TN-VA 231 Joplin, MO 185 Kalamazoo, MI 35 Kansas City, MO-KS 141 Killeen-Temple, TX 72 Knoxville, TN 220 La Crosse, WI 222 Lafayette, IN 110 Lafayette, LA 217 Lake Charles, LA 91 Lakeland-Winter Haven, FL 116 Lancaster, PA 128 Lansing-East Lansing, MI 190 Laredo, TX 30 Las Vegas, NV 242 LaSalle-Peru, IL 215 Laurel-Hattiesburg, MS 225 Lebanon-Hanover-White River Junction, NH-VT 103 Lexington-Fayette, KY 228 Lima, OH 165 Lincoln, NE 86 Little Rock, AR 2 Los Angeles, CA

Alphabetic Listing of Nielsen Audio Markets
55 Louisville, KY 168 Lubbock, TX 130 Macon, GA 101 Madison, WI 200 Manchester, NH 56 McAllen-Brownsville-Harlingen, TX 207 Medford-Ashland, OR 102 Melbourne-Titusville-Cocoa, FL 51 Memphis, TN 180 Merced, CA 11 Miami-Ft. Lauderdale-Hollywood, FL 42 Middlesex-Somerset-Union, NJ 41 Milwaukee-Racine, WI 15 Minneapolis-St. Paul, MN 100 Mobile, AL 117 Modesto, CA 54 Monmouth-Ocean, NJ 240 Monroe, LA 85 Monterey-Salinas-Santa Cruz, CA 156 Montgomery, AL 256 Montpelier-Barre-St Johnsbury, VT 175 Morgantown-Clarksburg-Fairmont, WV 121 Morristown, NJ 218 Muncie-Marion, IN 232 Muskegon, MI 136 Myrtle Beach, SC 43 Nashville, TN 20 Nassau-Suffolk, NY 182 New Bedford-Fall River, MA 124 New Haven, CT 181 New London, CT 49 New Orleans, LA 1 New York, NY 153 Newburgh-Middletown, NY 45 Norfolk-Virginia Beach-Newport News, VA 164 Odessa-Midland, TX 50 Oklahoma City, OK 226 Olean, NY 74 Omaha-Council Bluffs, NE-IA 31 Orlando, FL 120 Oxnard-Ventura, CA 132 Palm Springs, CA 224 Panama City, FL 245 Parkersburg-Marietta, WV-OH 125 Pensacola, FL
158 Peoria, IL 9 Philadelphia, PA 14 Phoenix, AZ 28 Pittsburgh, PA 96 Portland, ME 22 Portland, OR 122 Portsmouth-Dover-Rochester, NH 169 Poughkeepsie, NY 44 Providence-Warwick-Pawtucket, RI 236 Pueblo, CO 16 Puerto Rico 155 Quad Cities, IA-IL 38 Raleigh-Durham, NC 253 Rapid City, SD 133 Reading, PA 230 Redding, CA 97 Reno, NV 179 Richland-Kennewick-Pasco, WA 53 Richmond, VA 25 Riverside-San Bernardino, CA 119 Roanoke-Lynchburg, VA 221 Rochester, MN 60 Rochester, NY 160 Rockford, IL 27 Sacramento, CA 149 Saginaw-Bay City-Midland, MI 205 Salina-Manhattan, KS 134 Salisbury-Ocean City, MD 29 Salt Lake City-Ogden-Provo, UT 258 San Angelo, TX 26 San Antonio, TX 17 San Diego, CA 4 San Francisco, CA 37 San Jose, CA 172 San Luis Obispo, CA 209 Santa Barbara, CA 202 Santa Maria-Lompoc, CA 73 Sarasota-Bradenton, FL 146 Savannah, GA 12 Seattle-Tacoma, WA 260 Sheboygan, WI 140 Shreveport, LA 259 Sioux City, IA 188 Sioux Falls, SD
184 South Bend, IN 93 Spokane, WA 99 Springfield, MA 135 Springfield, MO 23 St. Louis, MO 151 Stamford-Norwalk, CT 81 Stockton, CA 216 Sunbury-Selinsgrove-Lewisburg, PA 247 Sussex, NJ 94 Syracuse, NY 162 Tallahassee, FL 19 Tampa-St. Petersburg-Clearwater, FL 213 Terre Haute, IN 243 Texarkana, TX-AR 104 Toledo, OH 204 Topeka, KS 159 Traverse City-Petoskey-Cadillac, MI 152 Trenton, NJ 62 Tucson, AZ 65 Tulsa, OK 211 Tuscaloosa, AL 248 Twin Falls-Sun Valley, ID 142 Tyler-Longview, TX 171 Utica-Rome, NY 249 Valdosta, GA 114 Victor Valley, CA 107 Visalia-Tulare-Hanford, CA 193 Waco, TX 7 Washington, DC 238 Waterloo-Cedar Falls, IA 262 Watertown, NY 177 Wausau-Stevens Point, WI 48 West Palm Beach-Boca Raton, FL 246 Wheeling, WV 251 Wichita Falls, TX 105 Wichita, KS 77 Wilkes Barre-Scranton, PA 261 Williamsport, PA 80 Wilmington, DE 210 Winchester, VA 118 Worcester, MA 198 Yakima, WA 112 York, PA 131 Youngstown-Warren, OH
Investing in Radio® Market Report 2018, 2nd Edition BIA • 703-818-2425 • www.bia.com
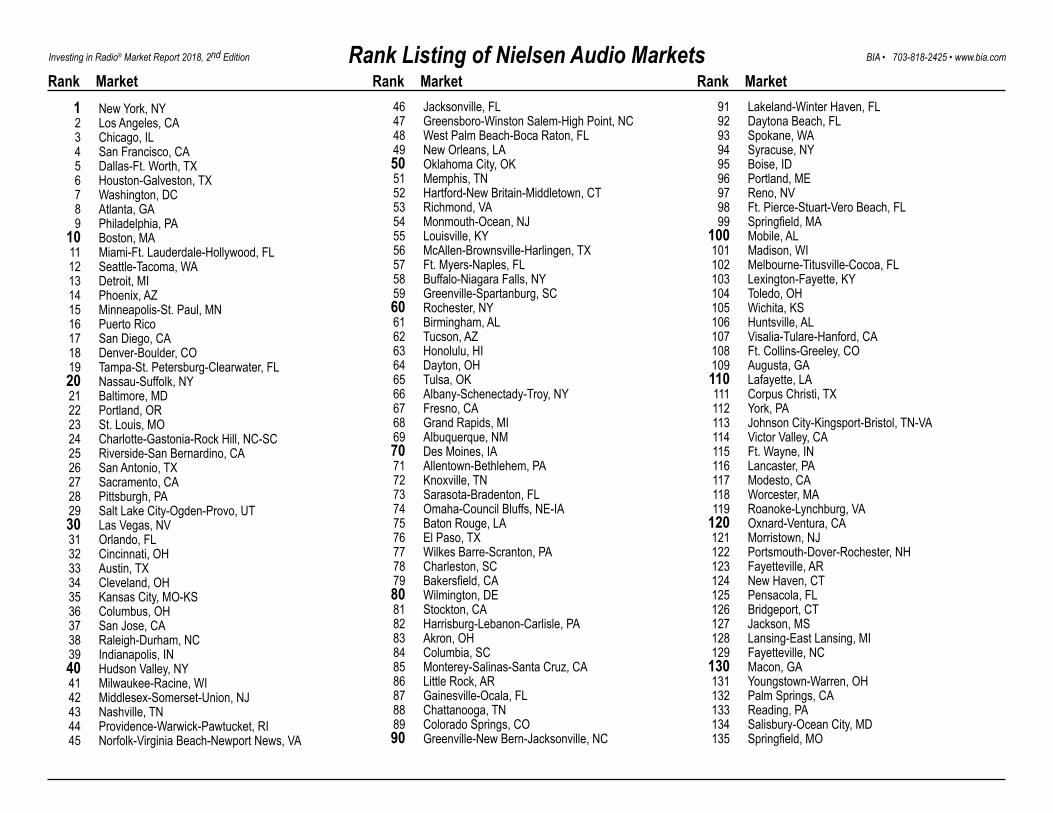
Rank Listing of Nielsen Audio Markets Rank Market Rank Market Rank Market 1 New York, NY 2 Los Angeles, CA 3 Chicago, IL 4 San Francisco, CA 5 Dallas-Ft. Worth, TX 6 Houston-Galveston, TX 7 Washington, DC 8 Atlanta, GA 9 Philadelphia, PA 10 Boston, MA 11 Miami-Ft. Lauderdale-Hollywood, FL 12 Seattle-Tacoma, WA 13 Detroit, MI 14 Phoenix, AZ 15 Minneapolis-St. Paul, MN 16 Puerto Rico 17 San Diego, CA 18 Denver-Boulder, CO 19 Tampa-St. Petersburg-Clearwater, FL 20 Nassau-Suffolk, NY 21 Baltimore, MD 22 Portland, OR 23 St. Louis, MO 24 Charlotte-Gastonia-Rock Hill, NC-SC 25 Riverside-San Bernardino, CA 26 San Antonio, TX 27 Sacramento, CA 28 Pittsburgh, PA 29 Salt Lake City-Ogden-Provo, UT 30 Las Vegas, NV 31 Orlando, FL 32 Cincinnati, OH 33 Austin, TX 34 Cleveland, OH 35 Kansas City, MO-KS 36 Columbus, OH 37 San Jose, CA 38 Raleigh-Durham, NC 39 Indianapolis, IN 40 Hudson Valley, NY 41 Milwaukee-Racine, WI 42 Middlesex-Somerset-Union, NJ 43 Nashville, TN 44 Providence-Warwick-Pawtucket, RI 45 Norfolk-Virginia Beach-Newport News, VA
46 Jacksonville, FL 47 Greensboro-Winston Salem-High Point, NC 48 West Palm Beach-Boca Raton, FL 49 New Orleans, LA 50 Oklahoma City, OK 51 Memphis, TN 52 Hartford-New Britain-Middletown, CT 53 Richmond, VA 54 Monmouth-Ocean, NJ 55 Louisville, KY 56 McAllen-Brownsville-Harlingen, TX 57 Ft. Myers-Naples, FL 58 Buffalo-Niagara Falls, NY 59 Greenville-Spartanburg, SC 60 Rochester, NY 61 Birmingham, AL 62 Tucson, AZ 63 Honolulu, HI 64 Dayton, OH 65 Tulsa, OK 66 Albany-Schenectady-Troy, NY 67 Fresno, CA 68 Grand Rapids, MI 69 Albuquerque, NM 70 Des Moines, IA 71 Allentown-Bethlehem, PA 72 Knoxville, TN 73 Sarasota-Bradenton, FL 74 Omaha-Council Bluffs, NE-IA 75 Baton Rouge, LA 76 El Paso, TX 77 Wilkes Barre-Scranton, PA 78 Charleston, SC 79 Bakersfield, CA 80 Wilmington, DE 81 Stockton, CA 82 Harrisburg-Lebanon-Carlisle, PA 83 Akron, OH 84 Columbia, SC 85 Monterey-Salinas-Santa Cruz, CA 86 Little Rock, AR 87 Gainesville-Ocala, FL 88 Chattanooga, TN 89 Colorado Springs, CO 90 Greenville-New Bern-Jacksonville, NC
91 Lakeland-Winter Haven, FL 92 Daytona Beach, FL 93 Spokane, WA 94 Syracuse, NY 95 Boise, ID 96 Portland, ME 97 Reno, NV 98 Ft. Pierce-Stuart-Vero Beach, FL 99 Springfield, MA 100 Mobile, AL 101 Madison, WI 102 Melbourne-Titusville-Cocoa, FL 103 Lexington-Fayette, KY 104 Toledo, OH 105 Wichita, KS 106 Huntsville, AL 107 Visalia-Tulare-Hanford, CA 108 Ft. Collins-Greeley, CO 109 Augusta, GA 110 Lafayette, LA 111 Corpus Christi, TX 112 York, PA 113 Johnson City-Kingsport-Bristol, TN-VA 114 Victor Valley, CA 115 Ft. Wayne, IN 116 Lancaster, PA 117 Modesto, CA 118 Worcester, MA 119 Roanoke-Lynchburg, VA 120 Oxnard-Ventura, CA 121 Morristown, NJ 122 Portsmouth-Dover-Rochester, NH 123 Fayetteville, AR 124 New Haven, CT 125 Pensacola, FL 126 Bridgeport, CT 127 Jackson, MS 128 Lansing-East Lansing, MI 129 Fayetteville, NC 130 Macon, GA 131 Youngstown-Warren, OH 132 Palm Springs, CA 133 Reading, PA 134 Salisbury-Ocean City, MD 135 Springfield, MO
Investing in Radio® Market Report 2018, 2nd Edition BIA • 703-818-2425 • www.bia.com

Rank Listing of Nielsen Audio Markets
136 Myrtle Beach, SC 137 Appleton-Oshkosh, WI 138 Flint, MI 139 Canton, OH 140 Shreveport, LA 141 Killeen-Temple, TX 142 Tyler-Longview, TX 143 Fredericksburg, VA 144 Biloxi-Gulfport-Pascagoula, MS 145 Beaumont-Port Arthur, TX 146 Savannah, GA 147 Eugene-Springfield, OR 148 Burlington-Plattsburgh, VT-NY 149 Saginaw-Bay City-Midland, MI 150 Ann Arbor, MI 151 Stamford-Norwalk, CT 152 Trenton, NJ 153 Newburgh-Middletown, NY 154 Atlantic City-Cape May, NJ 155 Quad Cities, IA-IL 156 Montgomery, AL 157 Asheville, NC 158 Peoria, IL 159 Traverse City-Petoskey-Cadillac, MI 160 Rockford, IL 161 Ft. Smith, AR 162 Tallahassee, FL 163 Evansville, IN 164 Odessa-Midland, TX 165 Lincoln, NE 166 Huntington-Ashland, WV-KY 167 Hagerstown-Chambersburg-Waynesboro, MD-PA 168 Lubbock, TX 169 Poughkeepsie, NY 170 Amarillo, TX 171 Utica-Rome, NY 172 San Luis Obispo, CA 173 Bowling Green, KY 174 Anchorage, AK 175 Morgantown-Clarksburg-Fairmont, WV 176 Concord, NH 177 Wausau-Stevens Point, WI 178 Erie, PA 179 Richland-Kennewick-Pasco, WA 180 Merced, CA
181 New London, CT 182 New Bedford-Fall River, MA 183 Ft. Walton Beach-Destin, FL 184 South Bend, IN 185 Kalamazoo, MI 186 Bryan-College Station, TX 187 Green Bay, WI 188 Sioux Falls, SD 189 Columbus, GA 190 Laredo, TX 191 Frederick, MD 192 Dothan, AL 193 Waco, TX 194 Binghamton, NY 195 Cape Cod, MA 196 Charleston, WV 197 Fargo-Moorhead, ND-MN 198 Yakima, WA 199 Bend, OR 200 Manchester, NH 201 Danbury, CT 202 Santa Maria-Lompoc, CA 203 Chico, CA 204 Topeka, KS 205 Salina-Manhattan, KS 206 Cedar Rapids, IA 207 Medford-Ashland, OR 208 Charlottesville, VA 209 Santa Barbara, CA 210 Winchester, VA 211 Tuscaloosa, AL 212 Duluth-Superior, MN-WI 213 Terre Haute, IN 214 Florence, SC 215 Laurel-Hattiesburg, MS 216 Sunbury-Selinsgrove-Lewisburg, PA 217 Lake Charles, LA 218 Muncie-Marion, IN 219 Bangor, ME 220 La Crosse, WI 221 Rochester, MN 222 Lafayette, IN 223 Hilton Head, SC 224 Panama City, FL
225 Lebanon-Hanover-White River Junction, NH-VT 226 Olean, NY 227 Elmira-Corning, NY 228 Lima, OH 229 Columbia, MO 230 Redding, CA 231 Joplin, MO 232 Muskegon, MI 233 Bloomington, IL 234 Abilene, TX 235 Eau Claire, WI 236 Pueblo, CO 237 Billings, MT 238 Waterloo-Cedar Falls, IA 239 Albany, GA 240 Monroe, LA 241 Grand Junction, CO 242 LaSalle-Peru, IL 243 Texarkana, TX-AR 244 Florence-Muscle Shoals, AL 245 Parkersburg-Marietta, WV-OH 246 Wheeling, WV 247 Sussex, NJ 248 Twin Falls-Sun Valley, ID 249 Valdosta, GA 250 Grand Island-Kearney-Hastings, NE 251 Wichita Falls, TX 252 Harrisonburg, VA 253 Rapid City, SD 254 Battle Creek, MI 255 Bismarck, ND 256 Montpelier-Barre-St Johnsbury, VT 257 Augusta-Waterville, ME 258 San Angelo, TX 259 Sioux City, IA 260 Sheboygan, WI 261 Williamsport, PA 262 Watertown, NY 263 Brunswick, GA 264 Bluefield, WV 265 Hot Springs, AR 266 Cheyenne, WY 267 Jackson, TN 268 Grand Forks, ND-MN
Investing in Radio® Market Report 2018, 2nd Edition BIA • 703-818-2425 • www.bia.com

1 per Woods & Poole Economics, Inc.
IntroductionWelcome to BIA’s Investing in Radio® 2018 Market Report. Published since 1986, this is the premiere market-by-market investment information guide on the commercial radio industry. Based on an annual cycle, it is published quarterly after each of Nielsen Audio’s ratings periods and profiles all 268 of its rated radio markets. Of the 268 markets profiled in this publication, all including Puerto Rico, have 2017 gross market revenue estimates totaling $9.917 billion. The combined estimated population of all markets (excluding Puerto Rico) is 266.2 million which represents 81.4% of the total U.S. population in 2017. Combined estimated 2017 retail sales for these markets are $4,173.6 billion which is 84.5% of estimated total retail sales for the country. As of the end of December 2017, there were 4,639 AM and 6,744 commercial FM stations licensed to operate in the U.S. About fifty percent of these stations (2,008 AMs and 3,529 FMs) are profiled with revenue estimates in these markets (includes Puerto Rico).
Notes1. We have added market level estimates of total radio online advertising revenues from 2017 through 2022.2. A listing of local FM translators that rebroadcast AM stations or FM digital mul-ticast signals follows the AM stations.3. With the Summer 2011 period, Nielsen Audio began providing audience share data for the multicast signals stations in the Diary markets. The multicast signals had been included in the PPM markets from the beginning.
Market and Competitive Overviews
Each Nielsen Audio-rated Market is presented in two main sections: Market Overview — provides you with the vital statistics about an Nielsen Audio Metro Survey Area’s (MSA) overall financial and demographic health.Competitive Overview — profiles the commercial radio stations in the Nielsen Audio MSA that receive significant ratings in the market. In the case of MSAs which have too many stations to fit on a page, we are forced to go to four pages and split the AMs from the FMs and, in so doing, repeat the Market Overview for your ease of comparison.Why Market Rank Order? Organizing the Market Report in this manner allows the sophisticated financial analyst the ease of performing comparable sales analyses and
2017 NationalEthnic Breakdown
Asian ........................................... 6.2%Black ......................................... 13.0White ........................................ 61.8Hispanic-Origin ........................ 18.1
2017 National IncomePer Capita .............................$45,309Median Household ................$85,332Average Household ............ $116,017
National Totals2017 Population1 .................................... 327,131,0002017 Households1 .................................. 127,757,0002017 Retail Sales1 ..................... $4,937,172,000,0002017 Total Personal Income1 .. $14,821,969,000,0002017 BIA’s Estimated Over-the-Air Gross Radio
Advertising Revenues. .............. $13,870,000,0002017 BIA’s Estimated Online Radio
Advertising Revenues .................... $868,000,000
National Growth Rates ‘12-17 ‘17-22
Population (POP) .......................... 0.8% ...........0.9%Households (HH) .......................... 1.2 ..............1.1Retail Sales (RS) ........................ 2.0 ..............1.6Total Personal Income (TPI) ..........................2.5 ..............2.4 Men Women Total
Under 12 ......7.7% ...7.4% ...15.1%12-17 ............4.7 ......3.7 ........8.418-24 ............4.7 ......4.5 ........9.225-34 ............7.0 ......6.8 ......13.835-44 ............6.2 ......6.2 ......12.445-54 ............6.4 ......6.5 ......12.9Over 55 ......13.0 ....15.2 ......28.2
2017 NationalDemographic Breakdown
National Revenue Ratio Averages 2012 2017 2022Revenue/$1,000 Retail Sales ..............$2.76 .......$2.36 ....... $2.22Revenue/Capita ..........$40.83 .....$36.98 ..... $35.95
National IndicesComparison of various market, owner and station factors with the entire country provides useful indicators of its potential. Below are several nationwide benchmarks:
like-sized market comparisons. Otherwise, significant page flipping would be involved. At the very front of the book, behind the title page, you will find an alphabetical list-ing of the MSAs, followed by a rank listing.
Investing In Radio ® 2018. Copyright © BIA Advisory Services, LLC. Unauthorized distribution prohibited. For permission: 703-818-2425 or [email protected] Page 6
CopyrightsBIA
Copyright © 2018 by BIA Advisory Services, LLC (d/b/a BIA). The contents of this report are the property of BIA and are protected by copyright and other intellectual property laws. No part of this material may be reproduced or transmitted by any means, electronic or mechanical, including photocopying or recording in an information storage and retrieval system, unless there is written permission from BIA or a license agreement with them for such use. All rights reserved.
Information in this publication is solely for the internal use of clients of BIA and may not be distributed to third parties. The information is not for use as the basis for private offering, in a prospectus, in a valuation or appraisal report, or for developing derivative works dis-tributed to third parties without written permission from BIA. Permission is considered upon request and the submittal of an indemnification and release form. Licensing agreements are available for expanded use or external distribution. For further information, please call 703-818-2425 or email [email protected].
BIA ADVISORY SERVICES, BIA FINANCIAL NETWORK, BIAfn, INVESTING IN RA-DIO, INVESTING IN TELEVISION, INVESTING IN NEWSPAPER, RADIO YEARBOOK, TELEVISION YEARBOOK, and MEDIA ACCESS PRO are trademarks of BIA Financial Network, Inc.
Warning: COPYRIGHT VIOLATIONS WILL BE PROSECUTED. BIA shares 10% of the net proceeds of settlements and jury awards with individuals who provide essential evidence of illegal copying or electronic distribution. To report violations, please contact 703-818-2425 or email [email protected].
Nielsen Audio
Copyright © 2018 Nielsen Audio. For use by licensed subscribers only. Reprinted with permission. All audience estimates and/or data contained herein are copyrighted by and proprietary to Nielsen Audio. Nielsen Audio reserves all rights with respect to its data. No such data may be reproduced or transmitted in any form or by any means including but not limited to photocopying or recording on or for any information storage or retrieval system, including the internet, without the prior express written consent of Nielsen Audio. All Nielsen
Audio data are subject to the qualifications and limitations stated in Nielsen Audio’s reports. Due to these qualifications and limitations, the accuracy of Nielsen Audio’s data cannot be determined to any precise mathematical value or definition.
Questions about the Investing in Radio® 2018 Market Report or other BIA publica-tions or services should be directed to:
BIA • 14150 Parkeast Cir, Ste 110, Chantilly, Virginia 20151Phone: (703) 818-2425 • E-mail: [email protected]
Disclaimer NoticeEvery effort has been made to ensure the accuracy of the information in this publica-tion. Any errors detected or called to our attention, which in our opinion are material, will be corrected in future releases. BIA/Kelsey assumes no liability for any errors or omissions in the information, and shall not be liable for any injuries or damages (including consequential) which might result from its use.
Special Notes for Puerto Rico MarketSome demographic information for Puerto Rico is provided by the Puerto Rico Planning Board. BIA/Kelsey has estimated some projected demographic figures using historic growth rates.
Woods & Poole Economics, Inc.
The market demographic and economic data in this publication is based on 2017 copyright data prepared by Woods & Poole Economics, Inc. Any questions or comments regarding these data should be directed to:
Woods & Poole Economics, Inc. 4910 Massachusetts Avenue NW Ste 208 Washington, DC 20016-4368 Tel: 800-786-1915 www.woodsandpoole.com
Investing In Radio ® 2018. Copyright © BIA Advisory Services, LLC. Unauthorized distribution prohibited. For permission: 703-818-2425 or [email protected] Page 7
5.0% 82.8% 2.1% 1.5%
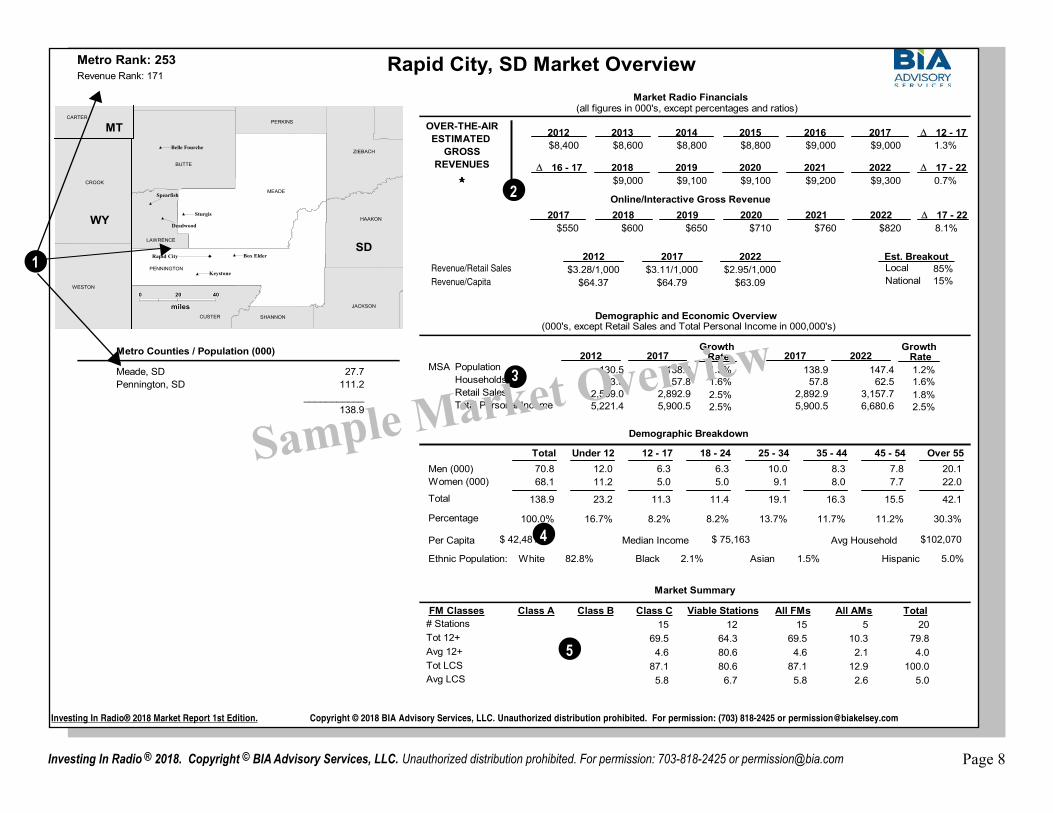
Rapid City, SD Market OverviewMetro Rank: 253Revenue Rank: 171
Market Radio Financials(all figures in 000's, except percentages and ratios)
Demographic Breakdown
Total 70.8 68.1
Under 12 12.0 11.2
12 - 17 6.3 5.0
18 - 24 6.3 5.0
25 - 34 10.0 9.1
35 - 44 8.3 8.0
45 - 54 7.8 7.7
Over 55 20.1 22.0
Men (000)Women (000)
138.9 23.2 11.3 11.4 19.1 16.3 15.5 42.1Total
Percentage 100.0% 16.7% 8.2% 8.2% 13.7% 11.7% 11.2% 30.3%
Per Capita $ 42,481 Median Income $ 75,163 Avg Household $102,070
Ethnic Population: White Black Asian Hispanic
Market Summary
Class A# Stations
Class B Class C Viable Stations All FMs All AMs Total
Tot 12+Avg 12+Tot LCSAvg LCS
Metro Counties / Population (000)
Meade, SD Pennington, SD
27.7111.2
___________138.9
FM Classes15 12 15 5 20
69.5 64.3 69.5 10.3 79.8 4.6 80.6 4.6 4.0 2.187.1 80.6 87.1 100.012.9
6.7 5.8 5.0 2.6 5.8
Revenue/Retail SalesRevenue/Capita
Demographic and Economic Overview
Est. Breakout
130.5 53.3
2,559.0 5,221.4
Rate Growth
Rate Growth
1.3% 138.9 57.8
2,892.9 5,900.5
138.9 57.8
2,892.9 5,900.5
147.4 62.5
3,157.7 6,680.6
1.6% 2.5% 2.5%
1.2% 1.6% 1.8% 2.5%
2012 $8,400
2013 $8,600
2014 $8,800
2015 $8,800
2016 $9,000
2017 $9,000
2018 $9,000
2019 $9,100
2020 $9,100
2021 $9,200
2022 $9,300
16 - 17
LocalNational
85% 15%
2012 2017 2022$3.28/1,000 $3.11/1,000 $2.95/1,000
$64.37 $64.79 $63.09
2012 2017 2017 2022
∆ 17 - 22∆ 0.7%
12 - 17∆ 1.3%
MSA PopulationHouseholdsRetail SalesTotal Personal Income
(000's, except Retail Sales and Total Personal Income in 000,000's)
2017 $550
2019 $650
2020 $710
2021 $760
2022 $820
Online/Interactive Gross Revenue2018
$60017 - 22∆
8.1%
OVER-THE-AIRESTIMATED
GROSSREVENUES
Investing In Radio® 2018 Market Report 1st Edition. Copyright © 2018 BIA Advisory Services, LLC. Unauthorized distribution prohibited. For permission: (703) 818-2425 or [email protected]
000000000 202020202020202020
milesmilesmilesmilesmilesmilesmilesmilesmiles
404040404040404040
CUSTER
CARTER
LAWRENCE
SHANNON
CROOK
BUTTE
MEADE
PENNINGTON
PERKINS
ZIEBACH
Deadwood
Sturgis
Keystone
Belle Fourche
Spearfish
Box ElderRapid City
MT
WY
SD
HAAKON
JACKSON
WESTON
2
3
4
5
1
Sample Market Overview
Investing In Radio ® 2018. Copyright © BIA Advisory Services, LLC. Unauthorized distribution prohibited. For permission: 703-818-2425 or [email protected] Page 8

Market Overview1 Geographic Information
Metro Rank: The ranking of the market by size of 12+ population based on the U.S. census.Revenue Rank: The ranking of the market by BIA’s estimate of 2017 market gross radio advertis-ing revenues.Market Map: A geographic orientation of the region with the actual market highlighted in white. These maps were created using MapInfo®. � = Market City. t = Cities with licensed commercial radio stations. Metro Counties / Population: A listing of the counties that comprise the subject radio market along with its total 2017 population (presented in thousands or 000s), licensed from Woods & Poole Economics, Inc.
2 Market Radio FinancialsEstimated Historic, Present and Projected Revenues: BIA’s estimates of gross advertising revenues ($000s) for this market for the period 2012 to 2022. Revenue estimates represent over-the-air total time sales including local, regional and national spot sales, plus political and program revenues. They do not include trade and barter or production revenues. Historic market revenues have been adjusted to reflect current market composition. Also provided are estimates for total mar-ket revenues from station online activities. Gross revenue estimates are based on several factors including retail sales growth, historical revenues, new station entries and other trends. BIA’s direct consultation with and survey responses from station operators and group owners in most markets yield additional data.Historic and Projected Growth Rates: We have also included the compound average annual rate for the periods indicated: Historically for the last five years ( 12-17); Last year ( 16-17); and projected for the next five years ( 17-22).
Confidence Rating: These stars indicate BIA’s confidence level for the estimated revenues. Three stars are awarded for a high level of confidence (several reliable outside sources); two stars for moderate confidence (limited outside sources); and one star for cautious confidence (estimated with our own resources).Ratios: Radio market revenue to retail sales and revenue per capita are presented for three peri-ods—historic, present and projected.Estimated Revenue Breakout: Percentage of the market’s revenues derived locally and from national billing.
Demographic Breakdown4This breakdown summarizes the population dispersion by age and gender; per capita income, median household and average household incomes for the market in 2017 as well as ethnic populations. For comparison of each market’s growth rates with the entire country, see the tables on page 6.NOTE: Ethnic population is the percentage of each category population in the market. This is defined as: White–Caucasian, Black–African-American, Asian–Asian, Hispanic–persons of Hispanic origin or descent.NOTE: Median Income in markets where the geographic definition differs from that of the Standard Metropolitan Statistical Area (SMSA) is calculated as a weighted average of each county’s median income figure.NOTE: The Demographic Breakdown data and the Demographic and Economic Overview data discussed above are for the Radio Metro as defined by Nielsen Audio for the most recent survey period. Nielsen Audio market ranking is based on the estimated 12+ population (i.e. the number of persons age 12 and older in the metro counties). As the geographic definition of the metro changes, the data are adjusted accordingly. Further, all data from 2010 are readjusted as well so that data from 2012, 2017 and 2022 represent the identical geography.
Demographic and Economic Overview3This overview examines historical and projected growth trends for the following four indicators. The growth rate is the compound average annual rate for the periods indicated. For comparison of each market’s growth rates with the entire country, see the tables on page 6. This information is licensed from Woods & Poole Economics, Inc. and is reprinted herein with their permission.
MSA Population: Presented in thousands (000s) of people. MSA Households: Presented in thousands (000s) of households. MSA Retail Sales: Presented in hundreds of thousands ($000,000s) of dollars.MSA Total Personal Income: Total income available in the market. Presented in hundreds of thousands ($000,000s) of dollars.
Market SummaryThis last section of the Market Overview summarizes the aggregate stations in the market by the following categories by: 1) FCC Class of FM Stations; 2) Viable stations: those stations with significant ratings which we determine are serious competitors in the market; 3) All commercial AMs; 4) All commercial FMs; and 5) Total number of commercial radio stations in the market.Tot 12+: The total Nielsen Audio 12+ Average Quarter Hour (AQH) metro shares.Avg 12+: The average Nielsen Audio 12+ AQH metro shares is calculated by dividing the total shares in each category by the number of stations in that category.Tot LCS: The total Local Commercial Share (LCS) adjusts for lost listening (LL) to non-commercial stations and stations not home to the market. The LCS is calculated by dividing the 12+ share by the sum of the commercial station shares in the market.Avg LCS: The average Local Commercial Share per station = total LCS divided by number of stations in each class.
5
Investing In Radio ® 2018. Copyright © BIA Advisory Services, LLC. Unauthorized distribution prohibited. For permission: 703-818-2425 or [email protected] Page 9

76
109
811
13
13
12
Market: Rapid City, SD Metro Rank: 253Competitive Overview
CallsCity ofLicense
FCCClass Freq C Owner
YearStd
DateAcq'd
SalesPrice(000)
LMA Format
2017 EstRevenue
(000)PowerRatio
Avg '17LocalCommHAAT
Power(kW) 1/
Nielsen Audio 12+ Metro Shares (see rights)
Fall2017
Spring2017
Fall2016
Spring2016
Fall2015
Spring2015
Fall2014
Spring2014
FM Stations
1.12 7.2KQRQ 725Rapid City C1 92.3 100.0 581 New Generation Bcstg 02 Clsc Hits1 5.9 5.8 7.6 6.3 5.4 6.2 7.0 5.4 0.81 7.2KRCS 525Sturgis C0 93.1 100.0 1060 Homeslice Media 72 1602 CHRb d2 6.7 5.8 5.3 5.6 4.6 5.4 5.4 5.4 1.13 6.4KKMK 650Rapid City C1 93.9 100.0 686 Homeslice Media 59 1602 Hot ACb d2 5.2 5.1 4.6 6.3 6.9 4.6 4.7 4.7 0.66 7.2KSQY 425Deadwood C 95.1 100.0 1709 Haugo Bcstg Inc 82 Rockd 4.4 5.8 5.3 4.0 3.1 2.3 3.9 4.7 0.82 2.7KZZI 200Belle Fourche C 95.9 100.0 1788 Western SD Bcstng 95 9904 79 Country1 1.5 2.2 2.3 1.6 2.3 2.3 2.3 3.1
0.9KTPT 100Rapid City C 97.9 100.0 1900 Bethesda Chrstn Bctg 68 9605 350 Chrst/CHRa 1.5 0.7 0.8 1.6 0.8 0.8 1.6 1.6 1.31 7.2KOUT 850Rapid City C1 98.7 100.0 463 Homeslice Media 94 1602 Countryb d2 5.9 5.8 7.6 7.1 6.9 7.7 7.0 7.0 0.39 6.4KRKI 225Keystone C1 99.5 100.0 735 Oregon Trail Bcstg 03 1305 Countrysw 5.2 5.1 3.8 4.0 4.6 3.1 3.9 3.9 1.23 5.4KFXS 600Rapid City C1 100.3 100.0 463 Homeslice Media 77 1602 2,500 Clsc Rockb d2 5.9 4.3 4.6 5.6 4.6 6.2 5.4 4.7 1.23 8.1KDDX 900Spearfish C 101.1 100.0 1788 Duhamel Bcstg Entpr 85 9203 525 Rockc 1 5.9 6.5 5.3 4.0 4.6 6.2 6.2 6.2 1.03 5.4KFMH 500Belle Fourche C 101.9 100.0 1490 Oregon Trail Bcstg 06 1305 Clsc Hitssw 5.9 4.3 4.6 6.3 5.4 4.6 3.9 5.4 0.51 5.4KXMZ 250Box Elder C2 102.7 50.0 449 Haugo Bcstg Inc 08 1708 300 CHR/HotAC 3.7 4.3 3.8 4.0 3.8 3.8 3.9 4.7 0.81 7.2KIQK 525Rapid City C1 104.1 100.0 538 Haugo Bcstg Inc 92 9812 1,970 Countryd c2 5.9 5.8 4.6 4.0 4.6 4.6 4.7 5.4 1.44 2.7KZLK 350Rapid City C1 106.3 100.0 696 Duffy, Steven E. 01 Hot AC1 2.2 2.2 2.3 2.4 3.1 3.1 3.1 3.1 1.05 4.5KSLT 425Spearfish C 107.1 100.0 1900 Bethesda Chrstn Bctg 84 ChrsContempa 3.7 3.6 4.6 4.0 4.6 3.8 3.1 3.1
15# FM Stations - # Combos - FM TOTALS 83.99 69.5 67.3 67.1 66.8 65.3 64.7 66.1 68.4
CallsCity ofLicense
FCCClass Freq C Owner
YearStd
DateAcq'd
SalesPrice(000)
LMA Format
2017 EstRevenue
(000)PowerRatio
Avg '17LocalComm
NightPower
(kW)
DayPower
(kW) 1/
Nielsen Audio 12+ Metro Shares (see rights)
Fall2017
Spring2017
Fall2016
Spring2016
Fall2015
Spring2015
Fall2014
Spring2014
AM Stations
1.16 3.6KBHB 375Sturgis D 810 25.0 0.06 Homeslice Media 62 1406 650 Countryb c1 2.2 2.9 2.3 2.4 3.1 3.1 2.3 2.3 1.31 1.7KKLS 200Rapid City D 920 5.0 0.11 Homeslice Media 59 1406 80s & 90sb c1 1.5 1.4 1.5 0.8 0.8 1.5 1.6 1.63/
0.9KIMM 100Rapid City D 1150 5.0 0.04 Black Hills Bdcstg 62 1712 175 Sports 0.7 0.7 1.5 2.4 1.5 1.5 0.8 0.83/ 3/ 3/ 3/ 3/ 3/ 3/ 3/
1.14 1.7KTOQ 175Rapid City C 1340 1.0 1.00 Haugo Bcstg Inc 53 9812 Sportsd c2 0.7 1.4 0.8 0.8 0.8 0.8 0.8 1.63/
1.17 8.1KOTA 850Rapid City B 1380 5.0 5.00 Duhamel Bcstg Entpr 36 5405 News/Talkc 1 5.2 6.5 7.6 7.1 6.2 6.2 6.2 7.03/ 3/
5# AM Stations - # Combos - AM TOTALS 16.04 10.3 12.9 13.7 13.5 12.4 13.1 11.7 13.3
Total Local Commercial ShareStations Profiled - 20 # Duopolies - 6 79.8 80.2 80.8 80.3 77.7 77.8 77.8 81.7
Calls Freq C OwnerYearStd FormatHAAT
Power(kW)
City ofLicense
Originating Station or Signal
Fall2017
Spring2017
Fall2016
Spring2016
Fall2015
Spring2015
Fall2014
Spring2014
FM Translators Rebroadcasting AM Stations & Multicast Signals
K264CP 100.7 0.3 308 Duhamel Bcstg Entpr 17 News/TalkRapid City KOTA-AM KOTA-AMK289AI 105.7 0.3 387 Haugo Bcstg Inc 86 SportsRapid City KTOQ-AMK294BT 106.7 0.3 397 Black Hills Bdcstg 04 SportsRapid City KIMM-AM KIMM-AM KIMM-AM KIMM-AM KIMM-AM KIMM-AM KIMM-AM KIMM-AM
1/ See introduction section for interpretation of revenue estimates.Investing In Radio® 2018 Market Report 1st Edition. Copyright © 2018 BIA Advisory Services, LLC. Unauthorized distribution prohibited. (703) 818-2425 Metro Rank: 253
3/ TLR share includes listening shares from partner stations Nielsen Audio reports a rolling average of the last two reporting periods for this market.
Sample Competitive Overview
Investing In Radio ® 2018. Copyright © BIA Advisory Services, LLC. Unauthorized distribution prohibited. For permission: 703-818-2425 or [email protected] Page 10

Competitive OverviewTechnical Attributes
Technical information is secured from the FCC through Actions and filings for construction permits.“•”: A bullet to the left of the station’s listing indicates that there has been a change to this station since the last edition was printed. It could be any combination of new call sign, tech-nical upgrade, different format, new LMA or change in ownership.Call Letters: Listed in order of frequency, these are the licensed call letters of the commercial radio stations either licensed to the market or those stations belonging to other markets which receive significant ratings in the market. The multicast signals are listed below the FM stations. FM Translators rebroadcasting AM Stations or Multicast signals are listed below AM station section.City of License: The city from which the radio station is licensed to operate as designated by the FCC.FCC Class: The technical allocation of the facility as defined by the FCC.Frequency: The number of cycles the station’s signal is transmitted per second in MHz for FM and kHz for AM.Power (Day or Night): The power in kilowatts at which the station transmits its signal. A “cp” indicated next to the station’s power signifies that a construction permit has been filed for approval with the FCC to change the station’s technical operations.HAAT: Height above average terrain of the station’s center of radiation (antenna) with respect to its surrounding terrain in feet.C: By matching the letters indicated in this column you will see the stations in the market that operate together as a “combo” (at least two stations with same owner in the market).
Power RatioIn addition to station revenue estimates, we have also calculated power ratios for those sta-tions. This was calculated by determining the estimated revenue share for the station (station revenues divided by market revenues) and dividing this by the local commercial share. See #11 below for explanation on calculation of Local Commercial Share (LCS).
6
10
Nielsen Audio Ratings11
To improve the quality of this publication, we estimate gross revenues for the leading sta-tions in the rated markets. BIA’s revenue estimates do not include trade/barter, or produc-tion revenues. We utilize direct mail surveys, telemarketing, market contacts and computer modeling to generate these estimates. Despite this effort, we must reiterate that these are just estimates. We view these estimates, however, as an important element to the book and encourage station operators and owners to participate in our surveys.
BIA is licensed by Nielsen Audio. to provide its Total Day, Average Quarter Hour (AQH) shares for persons 12 years and older. We profile the last eight ratings periods to enable the reader to analyze trends in a station’s performance. You will notice that Nielsen Audio rates some markets 4 times per year and others only 2 times. Average LCS: The Local Commercial Share is the average share for the prior 12-month period (beginning the previous Fall through the subsequent Summer ratings period) adjusted for lost listening to out-of-market and non-commercial stations. This is calculated by dividing the 12+ share by the total commercial station shares in the market.
Estimated Station Revenues9
OwnershipOwnership changes and information are gleaned from announcements in the trade publica-tions, press releases, market contacts, FCC filings and other sources.Owner: The most recent owner or proposed purchaser of the station. A proposed purchaser is indicated by a “p” next to the Sales Price (see Keys & Codes, Page 13).Year Started: The year the station first went on the air.Date Acq’d: The date (Year Month) the station was acquired by the most recent or proposed purchaser. Sales Price: Presented in thousands, this is the price paid for the station. To the right of the price you may encounter a code that signifies the type of transaction. (See Keys & Codes, Page 13.) NOTE: Because the actual sales price of a station or group may vary from the reported price, caution should be exercised with respect to the use of these data. We have attempted to include the most recent ownership transfer activity from 1981 to the weekday prior to publication. If a sale was proposed but not approved prior to publication, the owner listed is the proposed purchaser. Due to the complexity of the issue, major group purchase prices are not broken out among the stations purchased. LMA: Local Marketing Agreement. The letter indicated in this column coincides with the other stations in the market that operate with this one under such an agreement.
7
FormatThe format is the specific type of programming aired by the station. Format information is based on announcements in trade publications and direct contact with the stations through frequent telephone surveys and annual mail surveys. For a list of formats and the abbrevia-tions used by BIA, see Pages 14 and 15.
8
Other Market Information
12
Top of the page: Under the Metro Rank in the top right corner, we list for your reference, the other markets in which some of the stations of the subject market may also be rated.Bottom of the page: Any new allocations through either Docket 80-90 or other FCC rulemaking are listed at the bottom of the page. Also any footnotes for the market.
NOTE: SEE COPYRIGHTS FOR SPECIAL NOTE ON PUERTO RICO MARKET
13
Total Line ReportingFootnote 2/ lists call letters of parent simulcast station. Footnote 3/ indicates share is for all 100% simulcast stations.
Investing In Radio ® 2018. Copyright © BIA Advisory Services, LLC. Unauthorized distribution prohibited. For permission: 703-818-2425 or [email protected] Page 11

Investing In Radio ® 2018. Copyright © BIA Advisory Services, LLC. Unauthorized distribution prohibited. For permission: 703-818-2425 or [email protected] Page 12
Keys and Codes
General
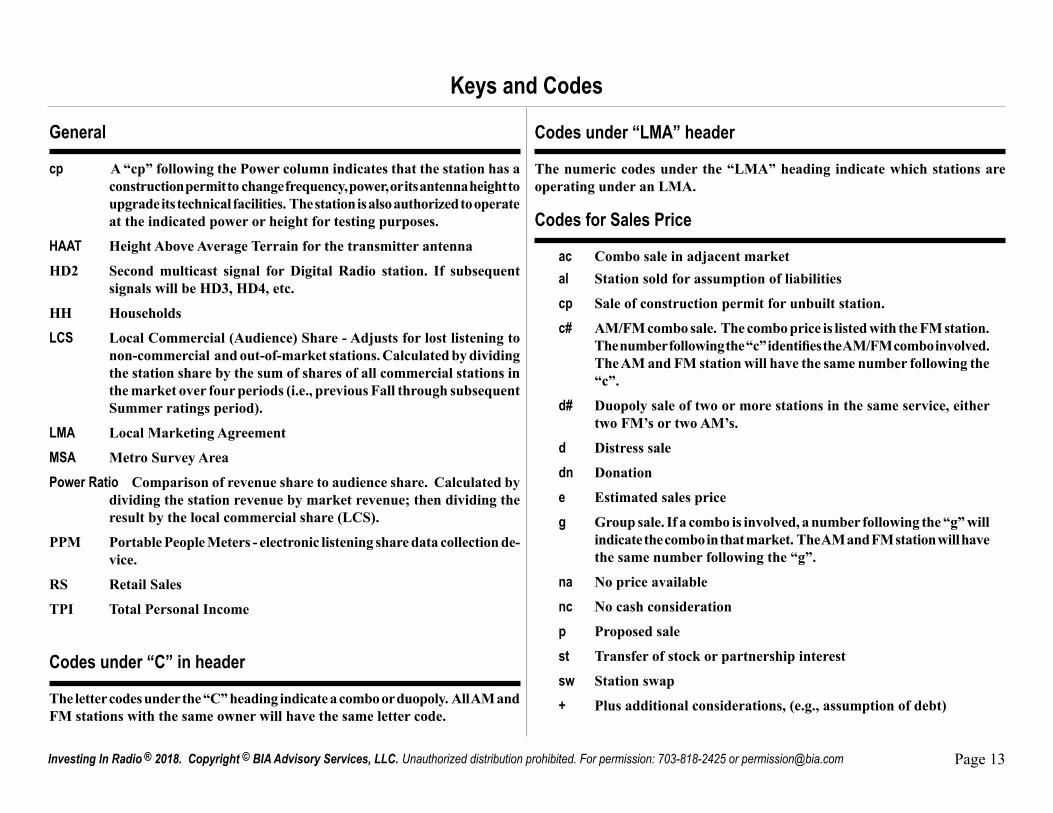
cp A “cp” following the Power column indicates that the station has a construction permit to change frequency, power, or its antenna height to upgrade its technical facilities. The station is also authorized to operate at the indicated power or height for testing purposes.
HAAT Height Above Average Terrain for the transmitter antenna
HD2 Second multicast signal for Digital Radio station. If subsequent signals will be HD3, HD4, etc.
HH Households
LCS Local Commercial (Audience) Share - Adjusts for lost listening to non-commercial and out-of-market stations. Calculated by dividing the station share by the sum of shares of all commercial stations in the market over four periods (i.e., previous Fall through subsequent Summer ratings period).
LMA Local Marketing Agreement
MSA Metro Survey Area
Power Ratio Comparison of revenue share to audience share. Calculated by dividing the station revenue by market revenue; then dividing the result by the local commercial share (LCS).
PPM Portable People Meters - electronic listening share data collection de-vice.
RS Retail Sales
TPI Total Personal Income
Codes under “C” in header
The letter codes under the “C” heading indicate a combo or duopoly. All AM and FM stations with the same owner will have the same letter code.
Codes for Sales Price
ac Combo sale in adjacent marketal Station sold for assumption of liabilities
cp Sale of construction permit for unbuilt station.
c# AM/FM combo sale. The combo price is listed with the FM station. The number following the “c” identifies the AM/FM combo involved. The AM and FM station will have the same number following the “c”.
d# Duopoly sale of two or more stations in the same service, either two FM’s or two AM’s.
d Distress sale
dn Donation
e Estimated sales price
g Group sale. If a combo is involved, a number following the “g” will indicate the combo in that market. The AM and FM station will have the same number following the “g”.
na No price available
nc No cash consideration
p Proposed sale
st Transfer of stock or partnership interest
sw Station swap
+ Plus additional considerations, (e.g., assumption of debt)
Codes under “LMA” header
The numeric codes under the “LMA” heading indicate which stations are operating under an LMA.
Investing In Radio ® 2018. Copyright © BIA Advisory Services, LLC. Unauthorized distribution prohibited. For permission: 703-818-2425 or [email protected] Page 13

Formats for Radio StationsBecause some radio stations air multiple formats, abbreviations are often used for formats in the Competitive Overview section. These abbre-viations may appear by themselves or combined with other format abbreviations. The abbreviations, their expansions, and the major format categories in which BIA/Kelsey classifies these formats are listed in the following table:
70&80 7&8 70s & 80s Oldies 70Hts 7Ht 70s Hits Oldies 70sOd 70s 70s Oldies Oldies 80&90 8&9 80s & 90s Oldies 80Hts 8Ht 80s Hits Oldies 90&20 9&2 90s & 2000s Oldies AAA AAA AAA Rock AC AC AC Adult Contemporary AOR AOR AOR Album Oriented Rock/Classic Rock AdCHR ACH Adult CHR Contemporary Hit Radio/Top 40 AdHts AHt Adult Hits Adult Contemporary AdRck ARk Adult Rock Rock AdStd ASt Adult Standards Nostalgia/Big Band Altve Alt Alternative Rock Amerc Amr Americana Country Asian Asn Asian Ethnic Beach Bch Beach Oldies BtfMs Btf Beautiful Music Easy Listening/Beautiful Music BgBnd BBd Big Band Nostalgia/Big Band Black Blk Black Urban BkGsp BGp Black Gospel Religion Blgrs Bgs Bluegrass Country Blues Blu Blues Urban Bob Bob Bob Adult Contemporary BrtAC BtA Bright AC Adult Contemporary BusNw BNw Business News News CHR CHR CHR Contemporary Hit Radio/Top 40 NOA NOA CP- Not On Air CP - Not On Air Cajun Cjn Cajun Ethnic Chrly Chy Charlie Adult Contemporary
Kids Kds Children Miscellaneous Chrst Cst Christian Religion CCtmp CCt Christian Contemporary Religion Xmas Xms Christmas Seasonal ClHts CHt Classic Hits Oldies CsMOR CMR Classic MOR Middle of the Road ClRck CRk Classic Rock Album Oriented Rock/Classic Rock Clscl Cls Classical Classical Comdy Cdy Comedy Miscellaneous Cntry Cty Country Country Creol Crl Creole Ethnic Cmbia Cmb Cumbia Spanish DARK DRK DARK Dark - Not on air Dance Dnc Dance Contemporary Hit Radio/Top 40 DncOl DnO Dance Oldies Oldies Divrs Dvs Diverse Miscellaneous Easy Esy Easy Easy Listening/Beautiful Music Ecltc Ecl Eclectic Miscellaneous Educa Edu Educational Public/Educational Elect Etr Electronica Rock Ethnc Eth Ethnic Ethnic Famly Fmy Family Hits Miscellaneous Folk Flk Folk Miscellaneous Frnch Fch French French FuSvc FSv Full Service Middle of the Road Gospl Gsp Gospel Religion Greek Grk Greek Ethnic Grupr Grp Grupero Spanish Hwain Hwn Hawaiian Ethnic HpHop HHp Hip Hop Urban
Abbreviation Short Abbrev. Full Format Name Major Format Category Abbreviation Short Abbrev. Full Format Name Major Format Category
Investing In Radio ® 2018. Copyright © BIA Advisory Services, LLC. Unauthorized distribution prohibited. For permission: 703-818-2425 or [email protected] Page 14
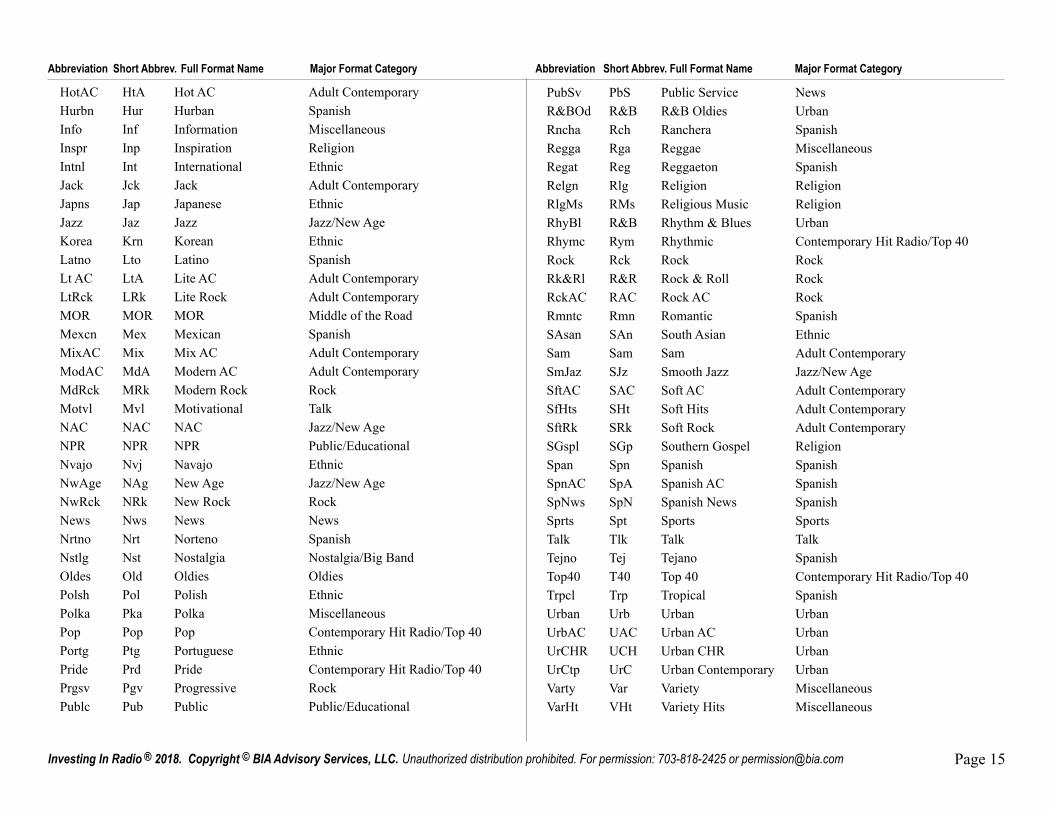
HotAC HtA Hot AC Adult Contemporary Hurbn Hur Hurban Spanish Info Inf Information Miscellaneous Inspr Inp Inspiration Religion Intnl Int International Ethnic Jack Jck Jack Adult Contemporary Japns Jap Japanese Ethnic Jazz Jaz Jazz Jazz/New Age Korea Krn Korean Ethnic Latno Lto Latino Spanish Lt AC LtA Lite AC Adult Contemporary LtRck LRk Lite Rock Adult Contemporary MOR MOR MOR Middle of the Road Mexcn Mex Mexican Spanish MixAC Mix Mix AC Adult Contemporary ModAC MdA Modern AC Adult Contemporary MdRck MRk Modern Rock Rock Motvl Mvl Motivational Talk NAC NAC NAC Jazz/New Age NPR NPR NPR Public/Educational Nvajo Nvj Navajo Ethnic NwAge NAg New Age Jazz/New Age NwRck NRk New Rock Rock News Nws News News Nrtno Nrt Norteno Spanish Nstlg Nst Nostalgia Nostalgia/Big Band Oldes Old Oldies Oldies Polsh Pol Polish Ethnic Polka Pka Polka Miscellaneous Pop Pop Pop Contemporary Hit Radio/Top 40 Portg Ptg Portuguese Ethnic Pride Prd Pride Contemporary Hit Radio/Top 40 Prgsv Pgv Progressive Rock Publc Pub Public Public/Educational
PubSv PbS Public Service News R&BOd R&B R&B Oldies Urban Rncha Rch Ranchera Spanish Regga Rga Reggae Miscellaneous Regat Reg Reggaeton Spanish Relgn Rlg Religion Religion RlgMs RMs Religious Music Religion RhyBl R&B Rhythm & Blues Urban Rhymc Rym Rhythmic Contemporary Hit Radio/Top 40 Rock Rck Rock Rock Rk&Rl R&R Rock & Roll Rock RckAC RAC Rock AC Rock Rmntc Rmn Romantic Spanish SAsan SAn South Asian Ethnic Sam Sam Sam Adult Contemporary SmJaz SJz Smooth Jazz Jazz/New Age SftAC SAC Soft AC Adult Contemporary SfHts SHt Soft Hits Adult Contemporary SftRk SRk Soft Rock Adult Contemporary SGspl SGp Southern Gospel Religion Span Spn Spanish Spanish SpnAC SpA Spanish AC Spanish SpNws SpN Spanish News Spanish Sprts Spt Sports Sports Talk Tlk Talk Talk Tejno Tej Tejano Spanish Top40 T40 Top 40 Contemporary Hit Radio/Top 40 Trpcl Trp Tropical Spanish Urban Urb Urban Urban UrbAC UAC Urban AC Urban UrCHR UCH Urban CHR Urban UrCtp UrC Urban Contemporary Urban Varty Var Variety Miscellaneous VarHt VHt Variety Hits Miscellaneous
Abbreviation Short Abbrev. Full Format Name Major Format Category Abbreviation Short Abbrev. Full Format Name Major Format Category
Investing In Radio ® 2018. Copyright © BIA Advisory Services, LLC. Unauthorized distribution prohibited. For permission: 703-818-2425 or [email protected] Page 15
© 2018 BIA Advisory Services. All Rights Reserved.
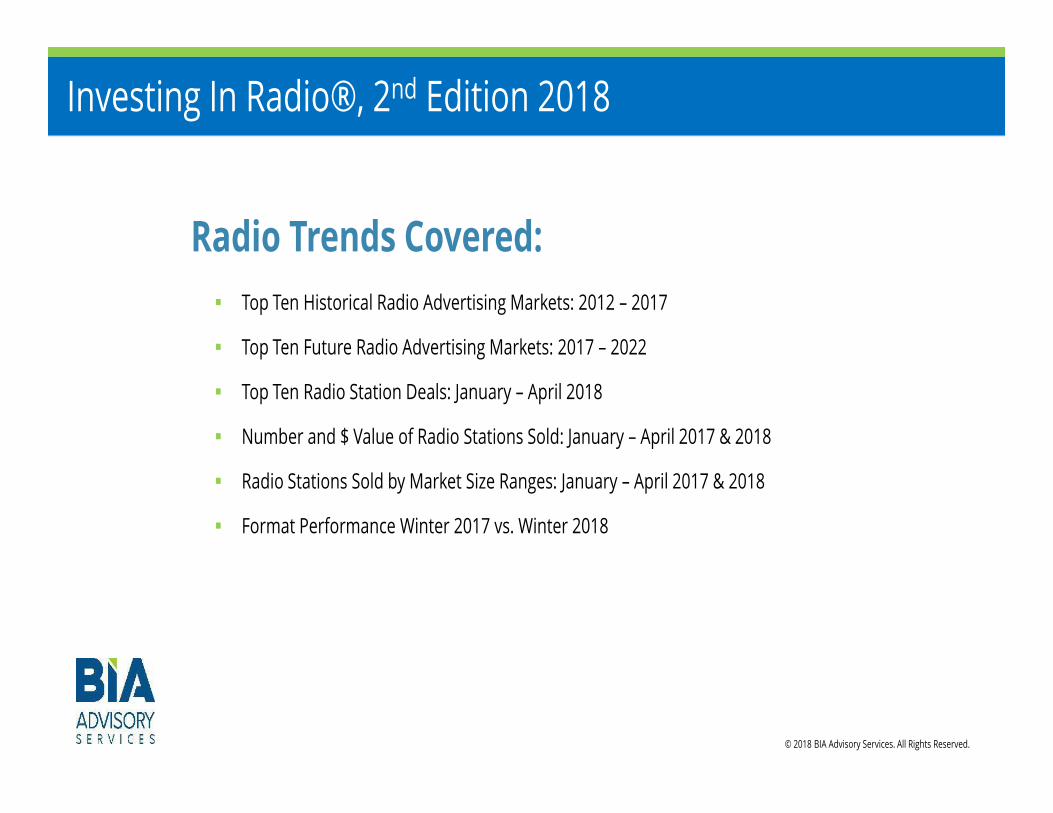
Investing In Radio®, 2nd Edition 2018
Radio Trends Covered: Top Ten Historical Radio Advertising Markets: 2012 – 2017
Top Ten Future Radio Advertising Markets: 2017 – 2022
Top Ten Radio Station Deals: January – April 2018
Number and $ Value of Radio Stations Sold: January – April 2017 & 2018
Radio Stations Sold by Market Size Ranges: January – April 2017 & 2018
Format Performance Winter 2017 vs. Winter 2018

© 2018 BIA Advisory Services. All Rights Reserved.
Lebanon-Hanover-White River Junction, NH-VT and Ft. Collins-Greeley, CO radio markets are the fastest growth markets for 2012 – 2017
2 radio markets in Arkansas included in top ten fastest growth markets for 2017 – 2022
Total Value of Radio Stations Sold: $189 Million
Total Number of Radio Stations Sold: 193
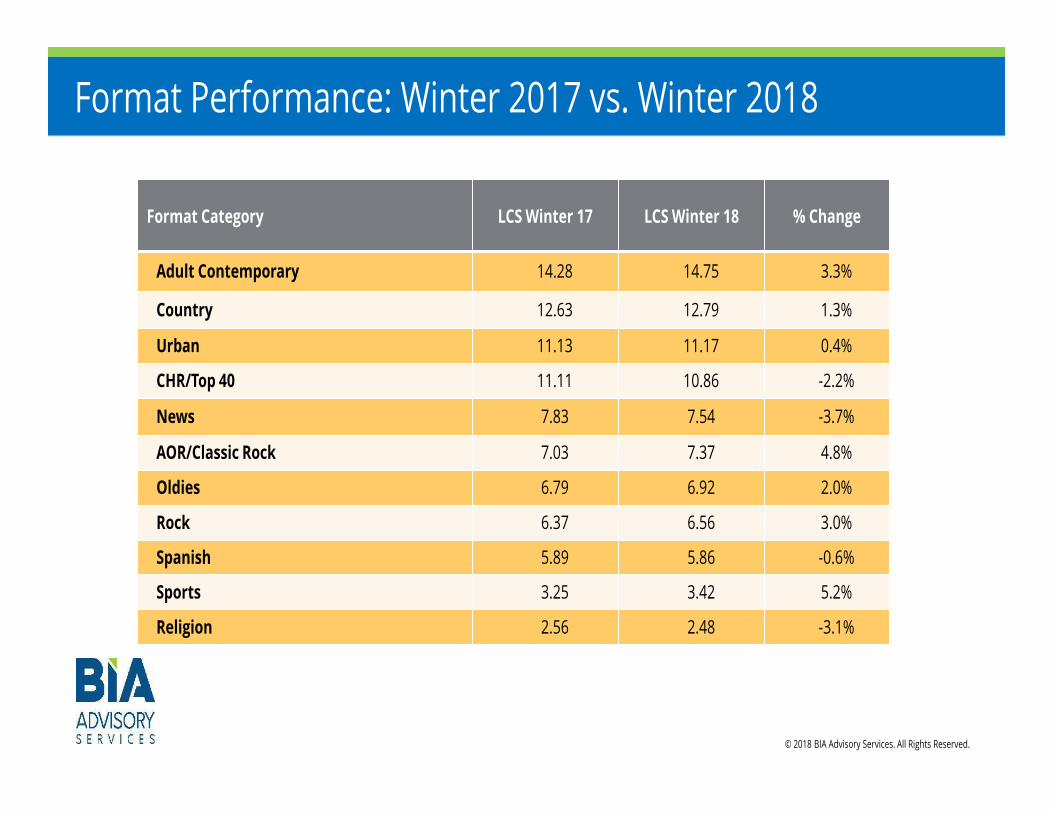
Sports, AOR/Classic Rock and AC, experienced highest percentage growth in Winter 2018 ratings period
January – April 2018 Radio Station Industry Snapshot

© 2018 BIA Advisory Services. All Rights Reserved.
Historical Radio Advertising Growth Markets
Mkt. Rank Market Compounded Annual Growth Rate
225 Lebanon-Hanover-White River Junction, NH-VT 7.5
108 Ft. Collins-Greeley, CO 7.4
197 Fargo-Moorhead, ND-MN 5.4
264 Bluefield, WV 5.1
255 Bismarck, ND 4.2
195 Cape Cod, MA 3.7
126 Bridgeport, CT 3.6
26 San Antonio, TX 3.2
102 Melbourne-Titusville-Cocoa, FL 3.2
219 Bangor, ME 3.1
Top Ten Compounded Annual Growth Rates: 2012 - 2017

© 2018 BIA Advisory Services. All Rights Reserved.
Future Radio Advertising Growth Markets
Mkt. Rank Market Compounded Annual Growth Rate
197 Fargo-Moorhead, ND-MN 1.5
38 Raleigh-Durham, NC 1.4
241 Grand Junction, CO 1.3
33 Austin, TX 1.2
123 Fayetteville, AR 1.2
73 Sarasota-Bradenton, FL 1.1
252 Harrisonburg, VA 1.1
95 Boise, ID 1.1
265 Hot Springs, AR 1.0
62 Tucson, AZ 1.0
Top Ten Compounded Annual Growth Rates: 2017 - 2022
© 2018 BIA Advisory Services. All Rights Reserved.
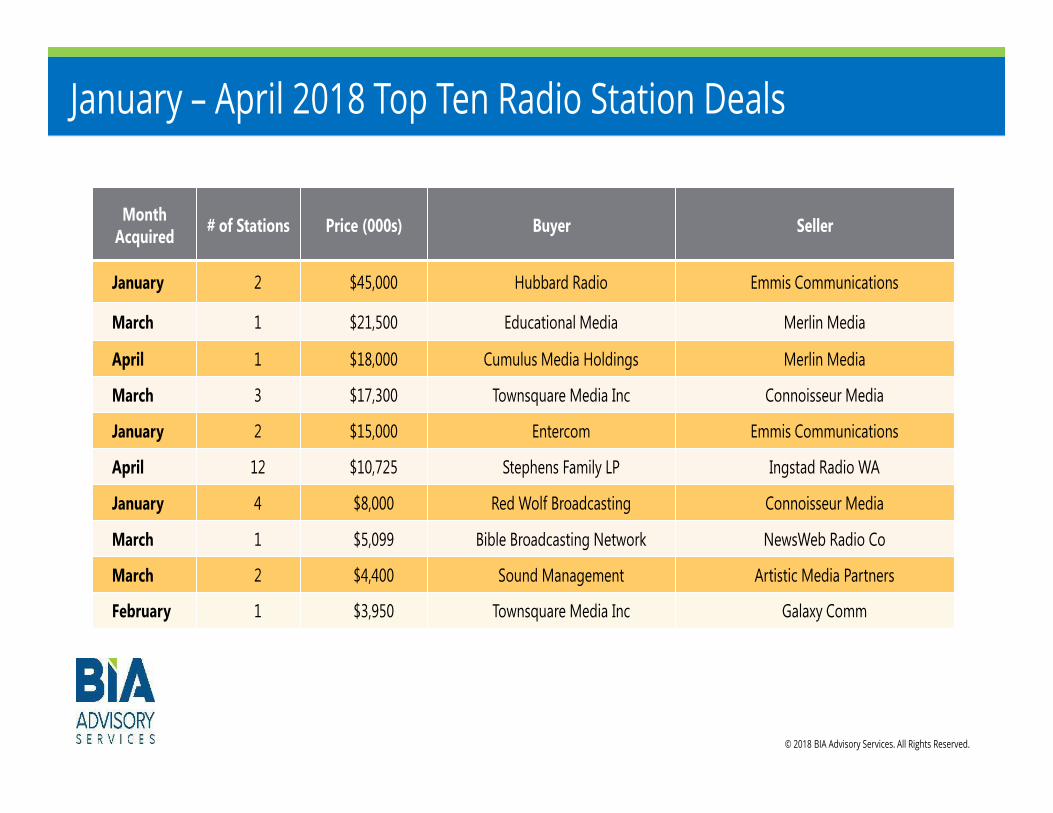
January – April 2018 Top Ten Radio Station Deals
Month Acquired # of Stations Price (000s) Buyer Seller
January 2 $45,000 Hubbard Radio Emmis Communications
March 1 $21,500 Educational Media Merlin Media
April 1 $18,000 Cumulus Media Holdings Merlin Media
March 3 $17,300 Townsquare Media Inc Connoisseur Media
January 2 $15,000 Entercom Emmis Communications
April 12 $10,725 Stephens Family LP Ingstad Radio WA
January 4 $8,000 Red Wolf Broadcasting Connoisseur Media
March 1 $5,099 Bible Broadcasting Network NewsWeb Radio Co
March 2 $4,400 Sound Management Artistic Media Partners
February 1 $3,950 Townsquare Media Inc Galaxy Comm

© 2018 BIA Advisory Services. All Rights Reserved.
# of Radio Stations Sold: January – April, 2017 & 2018
61 49
164
45 51 52 46 44
0
20
40
60
80
100
120
140
160
180
January February March April
2017
2018 2017 – 2018: -39%

© 2018 BIA Advisory Services. All Rights Reserved.
$ Value of Radio Stations Sold: January – April, 2017 & 2018
22 24
2851
16 78 11 63 37 $0
$500
$1,000
$1,500
$2,000
$2,500
$3,000
January February March April
2017
2018 2017 – 2018: -94%
Millio
ns
© 2015 BIA/Kelsey. All Rights Reserved.
Radio Stations Transactions: 2005-2014Metro vs. Non-Metro
2005 2006 2007 2008 2009 2010 2011 2012 2013 2014
Metro 496 1,544 990 383 398 497 682 481 523 539Non 381 562 498 386 284 372 398 424 344 395
496
1,544
990
383 398497
682
481 523 539
381
562498
386284
372 398 424344
395
0
200
400
600
800
1,000
1,200
1,400
1,600
# St
atio
ns S
old
© 2018 BIA Advisory Services. All Rights Reserved.
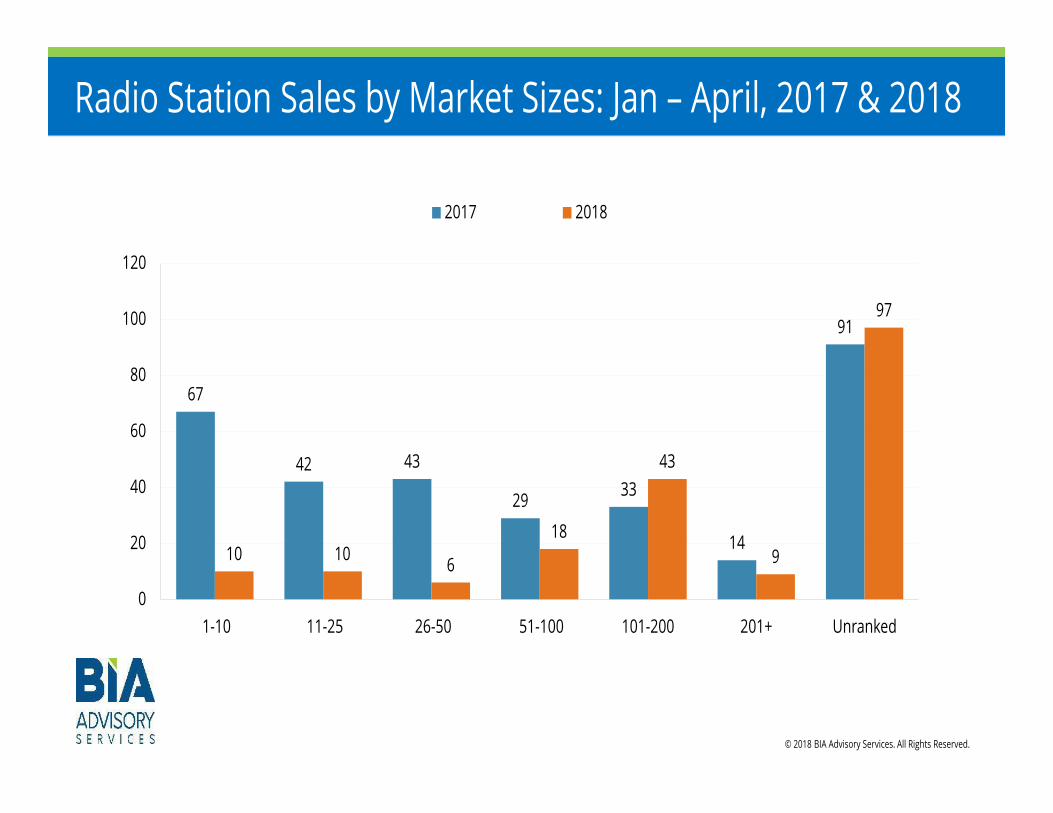
Radio Station Sales by Market Sizes: Jan – April, 2017 & 2018
67
42 43
29 33
14
91
10 10 6
18
43
9
97
0
20
40
60
80
100
120
1-10 11-25 26-50 51-100 101-200 201+ Unranked
2017 2018
© 2018 BIA Advisory Services. All Rights Reserved.
Format Performance: Winter 2017 vs. Winter 2018
Format Category LCS Winter 17 LCS Winter 18 % Change
Adult Contemporary 14.28 14.75 3.3%
Country 12.63 12.79 1.3%
Urban 11.13 11.17 0.4%
CHR/Top 40 11.11 10.86 -2.2%
News 7.83 7.54 -3.7%
AOR/Classic Rock 7.03 7.37 4.8%
Oldies 6.79 6.92 2.0%
Rock 6.37 6.56 3.0%
Spanish 5.89 5.86 -0.6%
Sports 3.25 3.42 5.2%
Religion 2.56 2.48 -3.1%
© 2018 BIA Advisory Services. All Rights Reserved.
Preview of the Next Quarterly Edition
Investing In Radio®, 3rd Edition Radio Industry Trends to be Covered:
Top Ten Markets – Revenues per Retail Expenditures – 2017
Top Ten Markets – Revenues per Population – 2017
Top Ten Markets – Revenues per Station – 2017
Top Ten Radio Station Deals: May – July 2018
Number and Dollar Value of Radio Stations Sold: May – July 2017 & 2018
Radio Stations Sold by Market Size Ranges: May – July 2017 & 2018
Related Documents