Investing in Russian Power Sector Adam Smith International Conference 24 November 2010 Adam Smith International Conference. RUSSIAN POWER: FINANCE AND INVESTMENT 1 22.11.2010 Moscow, Russia

Welcome message from author
This document is posted to help you gain knowledge. Please leave a comment to let me know what you think about it! Share it to your friends and learn new things together.
Transcript
Investing in Russian Power SectorAdam Smith International Conference
24 November 2010
Adam Smith International Conference.
RUSSIAN POWER: FINANCE AND INVESTMENT
122.11.2010
Moscow, Russia
Introduction
Content
Introduction• Investment Opportunity: Russian Electricity DistributionDistribution
• Investment Opportunity: Russian Electricity G tiGeneration
• Appendix
222.11.2010
I t t Th R iInvestment Theme: Russian Electricity DistributionElectricity Distribution
322.11.2010
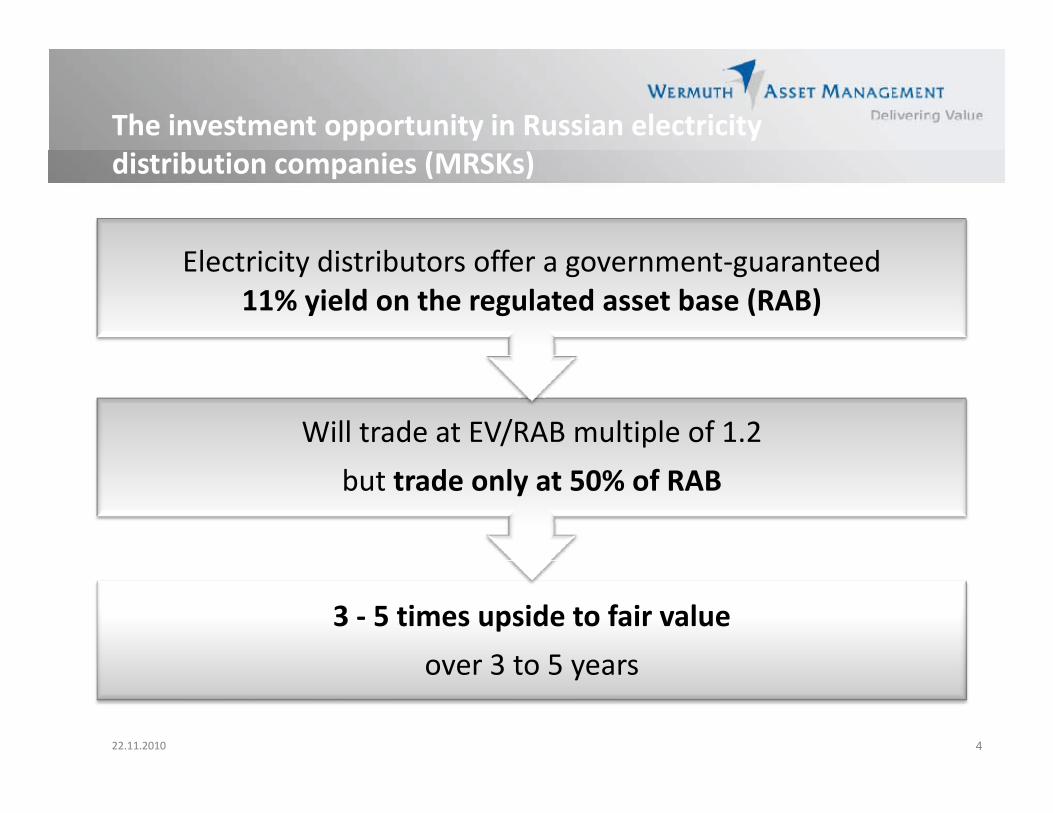
The investment opportunity in Russian electricity
El t i it di t ib t ff t t d
distribution companies (MRSKs)
Electricity distributors offer a government‐guaranteed 11% yield on the regulated asset base (RAB)
Will trade at EV/RAB multiple of 1.2but trade only at 50% of RAB
3 ‐ 5 times upside to fair valueover 3 to 5 years
422.11.2010
over 3 to 5 years
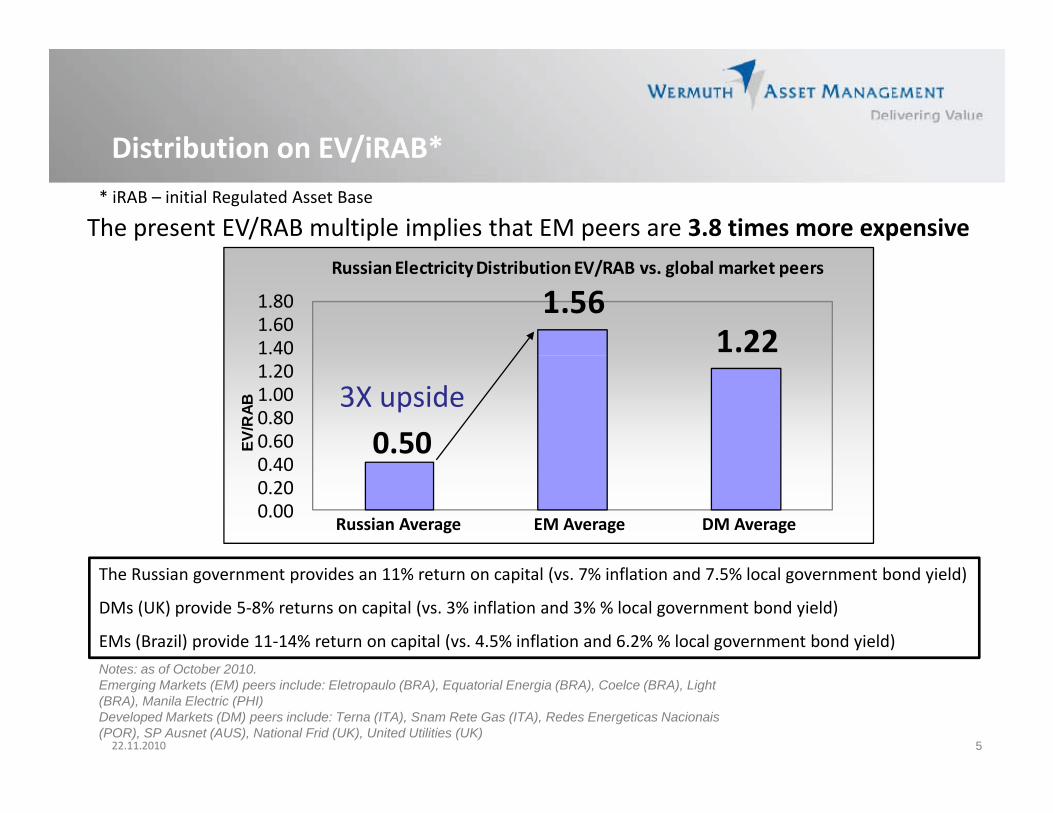
Distribution on EV/iRAB*Distribution on EV/iRAB* iRAB – initial Regulated Asset Base
The present EV/RAB multiple implies that EM peers are 3.8 times more expensive
1.561.221.40
1.601.80
Russian Electricity Distribution EV/RAB vs. global market peers
0 400.600.801.001.20
EV/R
AB 3X upside0.50
0.000.200.40
Russian Average EM Average DM Average
Source: Troika DialogThe Russian government provides an 11% return on capital (vs. 7% inflation and 7.5% local government bond yield)
DMs (UK) provide 5‐8% returns on capital (vs. 3% inflation and 3% % local government bond yield)
EMs (Brazil) provide 11‐14% return on capital (vs. 4.5% inflation and 6.2% % local government bond yield)
522.11.2010
Notes: as of October 2010. Emerging Markets (EM) peers include: Eletropaulo (BRA), Equatorial Energia (BRA), Coelce (BRA), Light (BRA), Manila Electric (PHI)Developed Markets (DM) peers include: Terna (ITA), Snam Rete Gas (ITA), Redes Energeticas Nacionais (POR), SP Ausnet (AUS), National Frid (UK), United Utilities (UK)
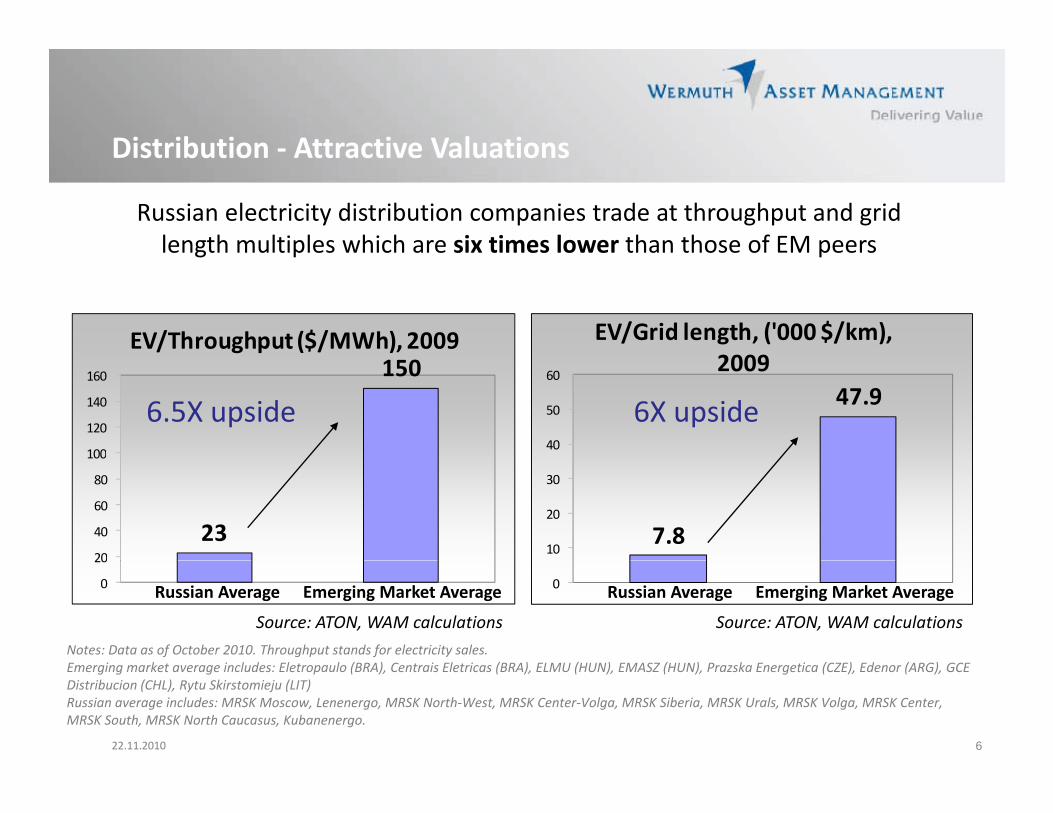
Distribution ‐ Attractive Valuations
Russian electricity distribution companies trade at throughput and grid length multiples which are six times lower than those of EM peers
Distribution ‐ Attractive Valuations
g p p
EV/Throughput ($/MWh), 2009 EV/Grid length, ('000 $/km), 2009150
100
120
140
160
47.9
40
50
60 2009
6.5X upside 6X upside
2320
40
60
80
100
7.810
20
30
Notes: Data as of October 2010. Throughput stands for electricity sales. E i k i l d El l (BRA) C i El i (BRA) ELMU (HUN) EMASZ (HUN) P k E i (CZE) Ed (ARG) GCE
0
20
Russian Average Emerging Market Average 0
Source: ATON, WAM calculations Source: ATON, WAM calculations
Emerging Market AverageRussian Average
622.11.2010
Emerging market average includes: Eletropaulo (BRA), Centrais Eletricas (BRA), ELMU (HUN), EMASZ (HUN), Prazska Energetica (CZE), Edenor (ARG), GCE Distribucion (CHL), Rytu Skirstomieju (LIT) Russian average includes: MRSK Moscow, Lenenergo, MRSK North‐West, MRSK Center‐Volga, MRSK Siberia, MRSK Urals, MRSK Volga, MRSK Center, MRSK South, MRSK North Caucasus, Kubanenergo.
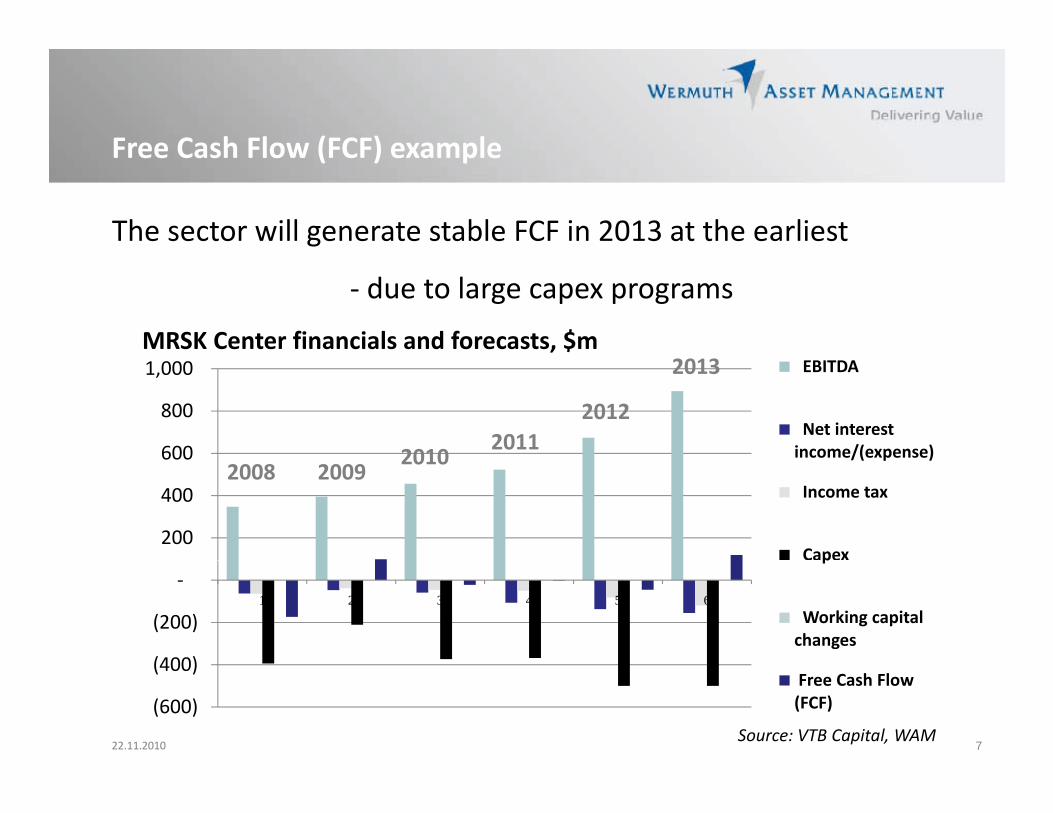
Free Cash Flow (FCF) exampleFree Cash Flow (FCF) example
The sector will generate stable FCF in 2013 at the earliest
MRSK Center financials and forecasts, $m
‐ due to large capex programs
600
800
1,000 EBITDA
Net interest income/(expense) 2010 2011
2012
2013
200
400
600 /( p )
Income tax
Capex
20082010
2009
(400)
(200)
‐1 2 3 4 5 6
p
Working capital changes
722.11.2010
(600)
(400)Free Cash Flow (FCF)
Source: VTB Capital, WAM
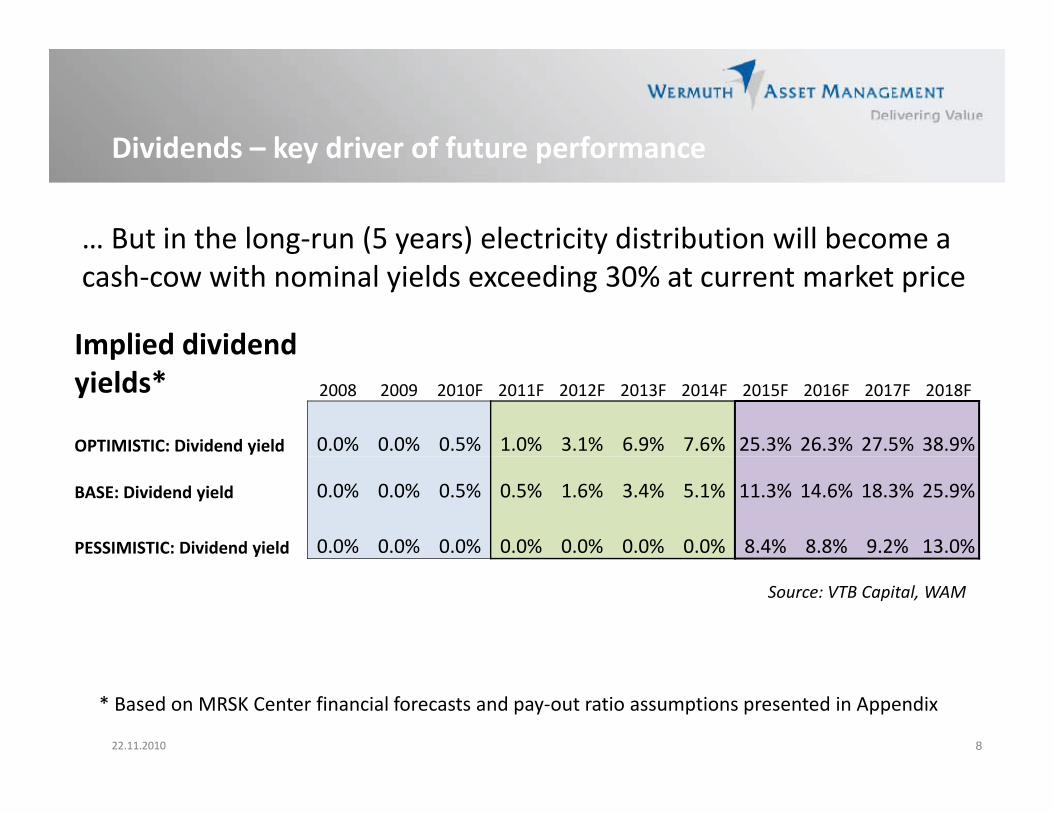
Dividends – key driver of future performanceDividends – key driver of future performance
… But in the long‐run (5 years) electricity distribution will become a g ( y ) ycash‐cow with nominal yields exceeding 30% at current market price
Implied dividend pyields* 2008 2009 2010F 2011F 2012F 2013F 2014F 2015F 2016F 2017F 2018F
OPTIMISTIC: Dividend yield 0.0% 0.0% 0.5% 1.0% 3.1% 6.9% 7.6% 25.3% 26.3% 27.5% 38.9%
BASE: Dividend yield 0.0% 0.0% 0.5% 0.5% 1.6% 3.4% 5.1% 11.3% 14.6% 18.3% 25.9%
PESSIMISTIC: Dividend yield 0.0% 0.0% 0.0% 0.0% 0.0% 0.0% 0.0% 8.4% 8.8% 9.2% 13.0%
Source: VTB Capital, WAM
822.11.2010
* Based on MRSK Center financial forecasts and pay‐out ratio assumptions presented in Appendix
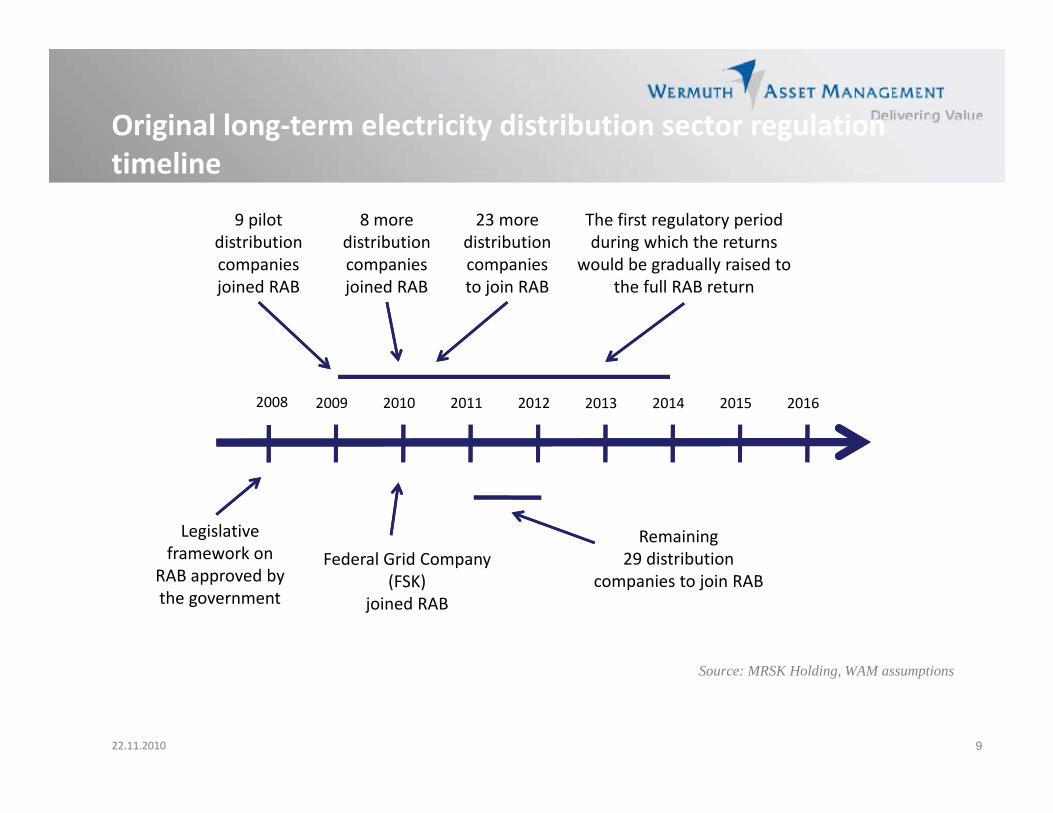
Original long‐term electricity distribution sector regulation
9 pilot distribution
The first regulatory period during which the returns
timeline
8 more distribution
23 more distribution
companies joined RAB
would be gradually raised to the full RAB return
companies joined RAB
companies to join RAB
2008 20132009 2010 2011 2012 2014 2015 2016
Legislative framework on Federal Grid Company
Remaining29 distribution
RAB approved by the government
Federal Grid Company (FSK)
joined RAB
29 distribution companies to join RAB
922.11.2010
Source: MRSK Holding, WAM assumptions
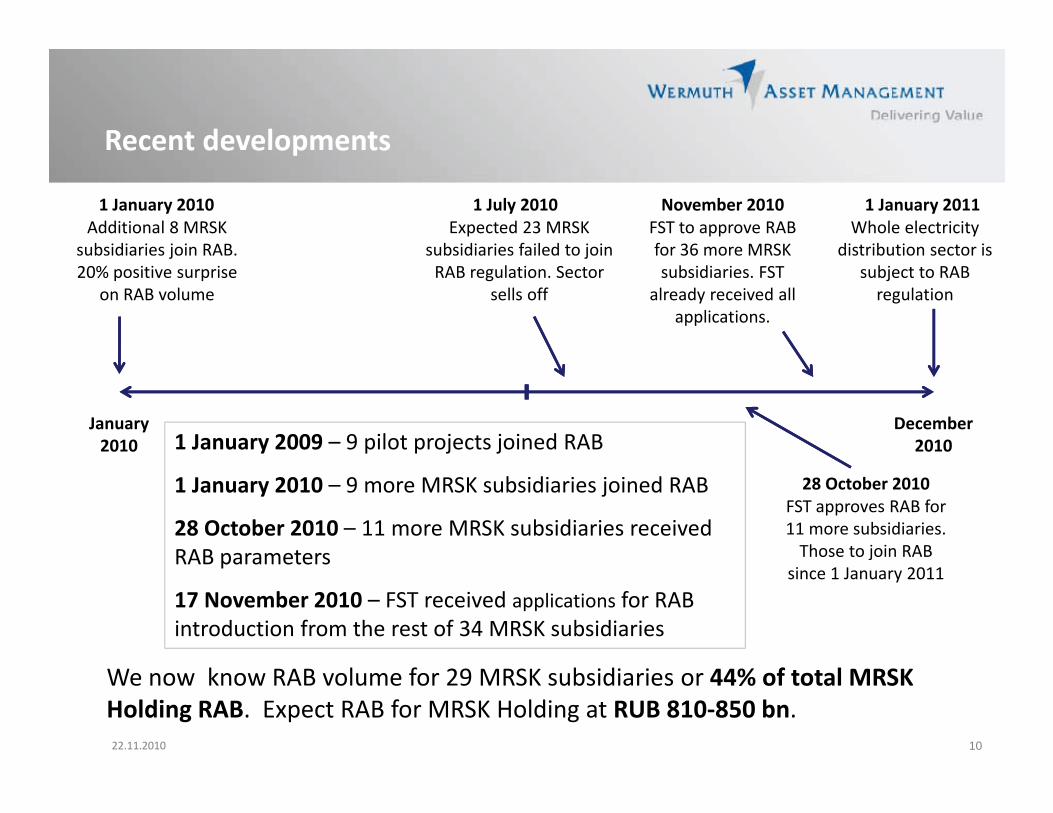
Recent developmentsece t de e op e ts
Expected 23 MRSK subsidiaries failed to join
1 July 2010Whole electricity
distribution sector is
1 January 2011Additional 8 MRSK
subsidiaries join RAB
1 January 2010FST to approve RAB for 36 more MRSK
November 2010
subsidiaries failed to join RAB regulation. Sector
sells off
distribution sector is subject to RAB regulation
subsidiaries join RAB. 20% positive surprise
on RAB volume
for 36 more MRSK subsidiaries. FST
already received all applications.
January 2010
December 20101 January 2009 – 9 pilot projects joined RAB
FST approves RAB for 11 more subsidiaries. Those to join RAB
28 October 20101 January 2010 – 9 more MRSK subsidiaries joined RAB
28 October 2010 – 11 more MRSK subsidiaries received RAB parameters
since 1 January 2011RAB parameters
17 November 2010 – FST received applications for RAB introduction from the rest of 34 MRSK subsidiaries
1022.11.2010
We now know RAB volume for 29 MRSK subsidiaries or 44% of total MRSK Holding RAB. Expect RAB for MRSK Holding at RUB 810‐850 bn.
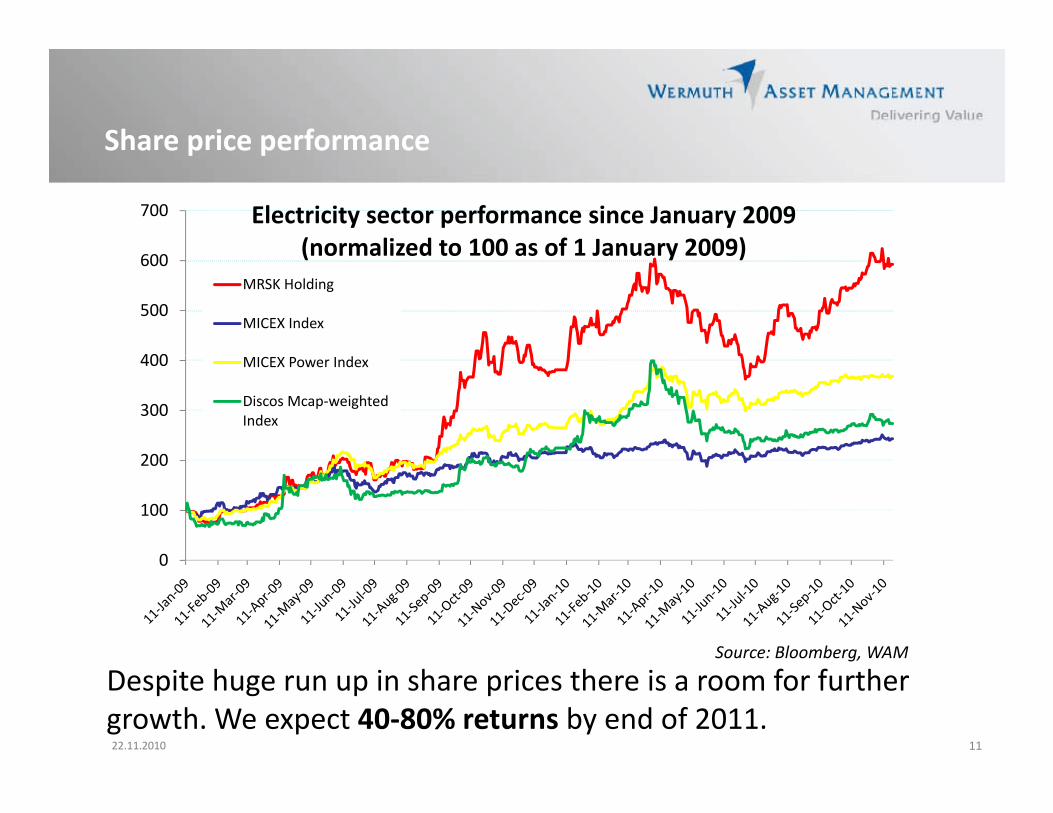
Share price performanceS a e p ce pe o a ce
700 Electricity sector performance since January 2009 (normalized to 100 as of 1 January 2009)
400
500
600 (normalized to 100 as of 1 January 2009)MRSK Holding
MICEX Index
200
300
400 MICEX Power Index
Discos Mcap‐weighted Index
0
100
200
0
Source: Bloomberg, WAM
1122.11.2010
Despite huge run up in share prices there is a room for further growth. We expect 40‐80% returns by end of 2011.
Distribution bottom linest but o botto e
‐ Risk profile of the sector improved much after RAB adoption for 50%f h Wi d f i l i J h 100% fof the sector. Window of opportunity closes in January when 100% of
distribution sector is subject to RAB regulation. MRSKs will followtrading pattern of FSK (which switched to RAB in January 2010 withRAB parameters known back in August 2009),
‐MRSK Holding not necessarily best exposure due to rights issue in 2011‐2013 potential RAB delays/surprises in certain regions 20%2011 2013, potential RAB delays/surprises in certain regions, 20% premium to SOTP.
‐ Next big driver: M&A/consolidation in certain regions. Privatization,
‐ Time to focus on regional MRSKs. We like MRSK Urals, MRSK Volga, MRSK South and Lenenergo.
1222.11.2010

I t t Th R iInvestment Theme: Russian Electricity GenerationElectricity Generation
1322.11.2010
Structural regulatory shift drives earningsSt uctu a egu ato y s t d es ea gs
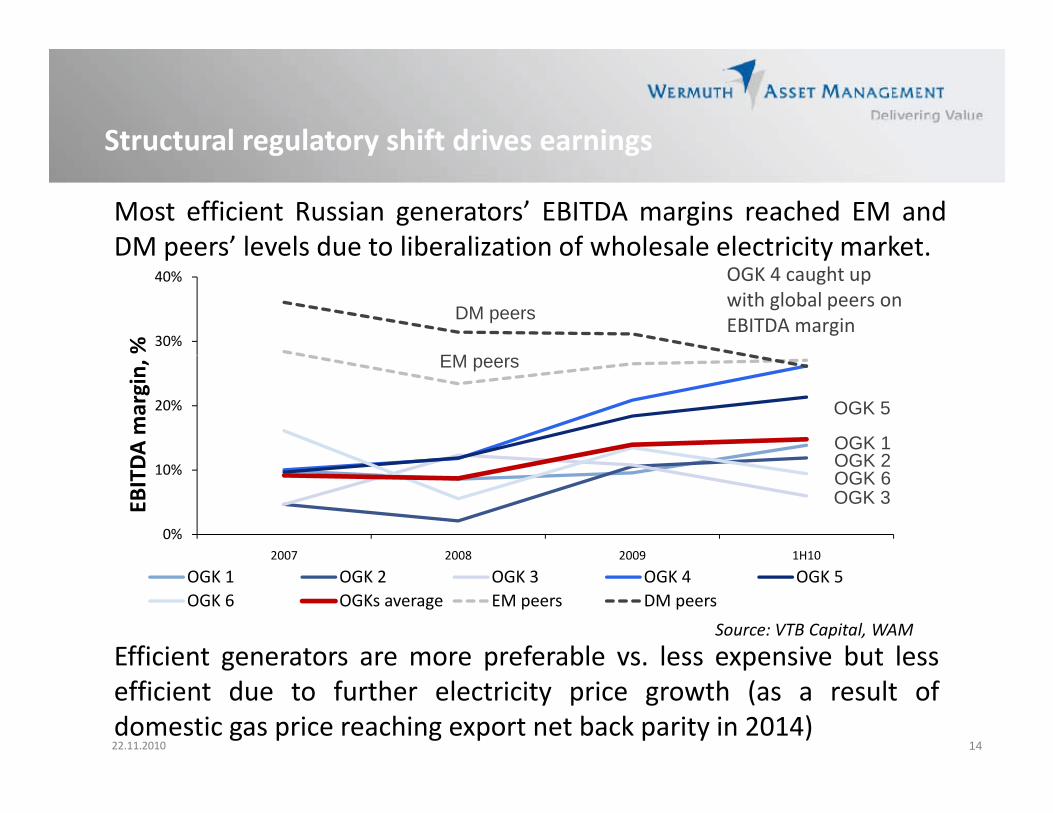
Most efficient Russian generators’ EBITDA margins reached EM andDM peers’ levels due to liberalization of wholesale electricity market.DM peers levels due to liberalization of wholesale electricity market.
30%
40%
%
EM
DM peers
OGK 4 caught up with global peers on EBITDA margin
20%
DA m
argin, EM peers
OGK 5
OGK 1OGK 2
0%
10%
2007 2008 2009 1H10
EBITD OGK 2
OGK 6OGK 3
Efficient generators are more preferable vs. less expensive but less
OGK 1 OGK 2 OGK 3 OGK 4 OGK 5OGK 6 OGKs average EM peers DM peers
Source: VTB Capital, WAM
1422.11.2010
Efficient generators are more preferable vs. less expensive but lessefficient due to further electricity price growth (as a result ofdomestic gas price reaching export net back parity in 2014)
Valuation is still attractivea uat o s st att act e
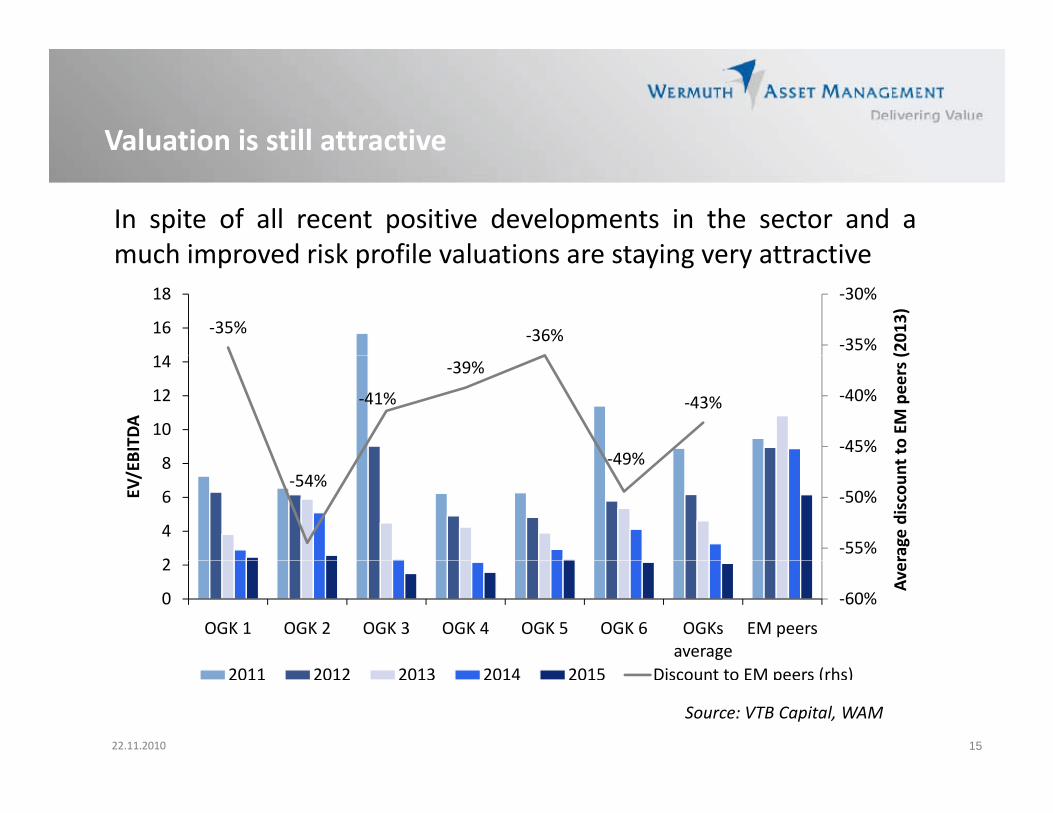
In spite of all recent positive developments in the sector and amuch improved risk profile valuations are staying very attractivemuch improved risk profile valuations are staying very attractive
‐35% ‐36% ‐35%
‐30%
14
16
18
(2013)
‐41%
‐39%
49%
‐43%
‐45%
‐40%
8
10
12
14
to EM peers (
BITD
A
‐54%‐49%
‐55%
‐50%
2
4
6
8
rage discoun
t
EV/EB
‐60%0
2
OGK 1 OGK 2 OGK 3 OGK 4 OGK 5 OGK 6 OGKs average
EM peers
Aver
1522.11.2010
2011 2012 2013 2014 2015 Discount to EM peers (rhs)
Source: VTB Capital, WAM
Next big driver – KOM resultse t b g d e O esu ts
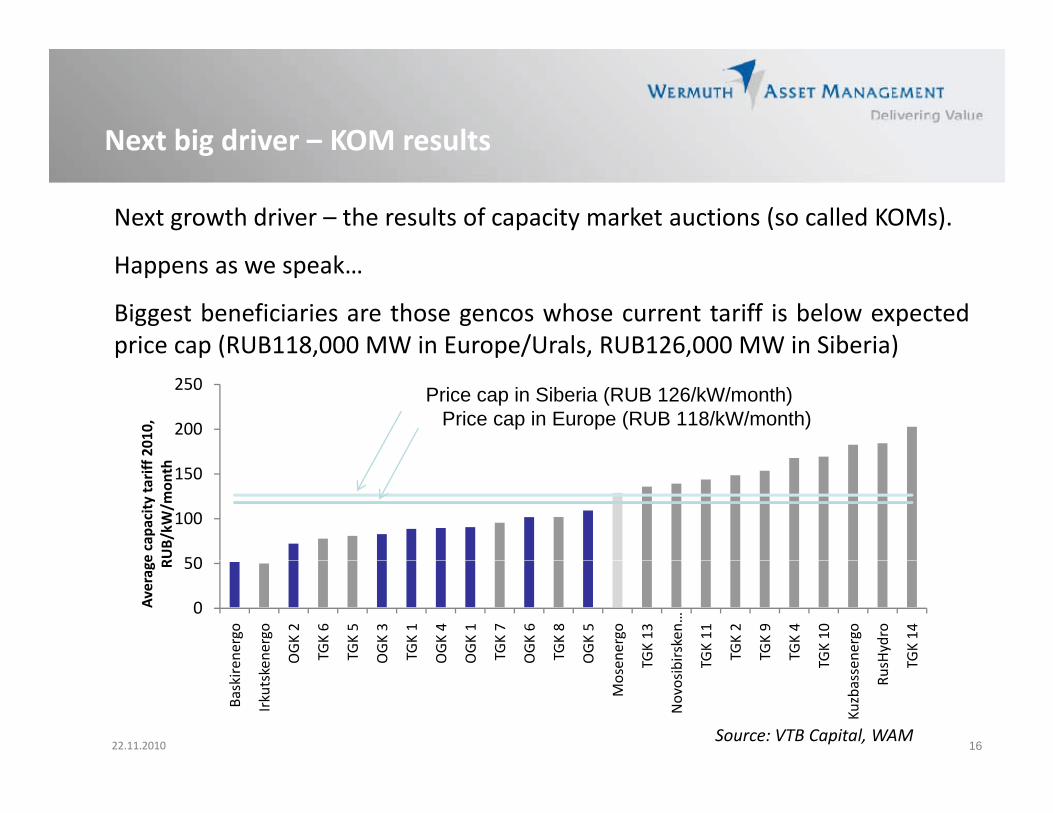
Next growth driver – the results of capacity market auctions (so called KOMs).
Happens as we speak…
Biggest beneficiaries are those gencos whose current tariff is below expectedprice cap (RUB118,000 MW in Europe/Urals, RUB126,000 MW in Siberia)p p ( , p / , , )
200
250
2010,
Price cap in Siberia (RUB 126/kW/month)Price cap in Europe (RUB 118/kW/month)
50
100
150
e capa
city ta
riff
RUB/kW
/mon
th
0
50
energo
energo
OGK 2
TGK 6
TGK 5
OGK 3
TGK 1
OGK 4
OGK 1
TGK 7
OGK 6
TGK 8
OGK 5
energo
TGK 13
birsken…
TGK 11
TGK 2
TGK 9
TGK 4
TGK 10
energo
sHydro
TGK 14
Average R
1622.11.2010
Baskire
Irkutske
Mose T
Novosib T T
Kuzbasse
Rus T
Source: VTB Capital, WAM
Generation bottom lineGe e at o botto e
‐ Risk profile of the sector improved after capacity marketparameters and returns for Capacity commissioningparameters and returns for Capacity commissioningagreements (so called DPM) have been approved by theregulator. New investment is value accretive, no more valuedestructivedestructive,
‐ Russian electricity generation market regulation is mostfavorable among BRIC countries Opposed to commonfavorable among BRIC countries. Opposed to commonperception,
‐ Not only value but also growth story. Russian gencos have ay g y gunique earnings growth profile,
‐ Sector is now cheap not only on EV/capacity multiples but also
1722.11.2010
on financial multiples with earnings profile significantlyimproved. Our top‐picks: OGK‐2, TGK‐1, RusHydro, OGK‐4
Contact detailsCo tact deta s
Sergey EzimovPortfolio AdviserPortfolio [email protected]+7‐495‐580‐7300
1822.11.2010
+7 495 580 7300
APPENDIX
1922.11.2010
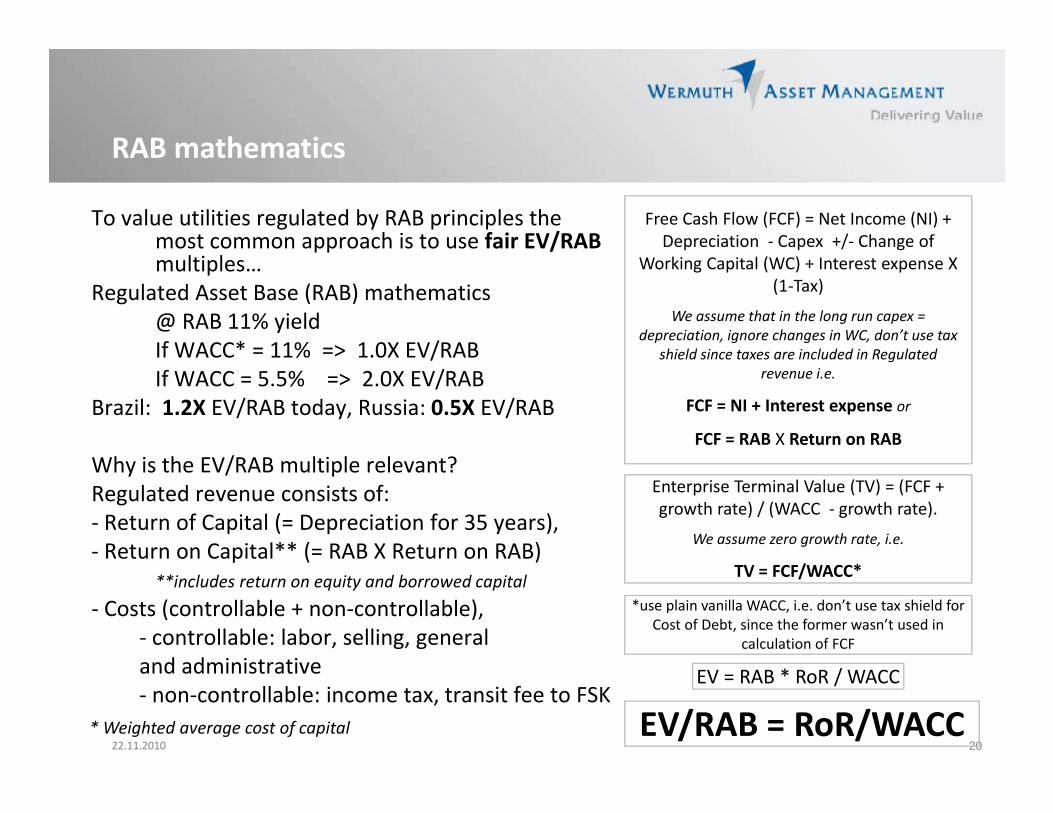
RAB mathematics
To value utilities regulated by RAB principles the most common approach is to use fair EV/RAB
RAB mathematics
Free Cash Flow (FCF) = Net Income (NI) + Depreciation ‐ Capex +/‐ Change of
multiples…Regulated Asset Base (RAB) mathematics
@ RAB 11% yieldIf WACC* = 11% => 1.0X EV/RAB
Working Capital (WC) + Interest expense X (1‐Tax)
We assume that in the long run capex = depreciation, ignore changes in WC, don’t use tax
shield since taxes are included in RegulatedIf WACC 11% > 1.0X EV/RABIf WACC = 5.5% => 2.0X EV/RAB
Brazil: 1.2X EV/RAB today, Russia: 0.5X EV/RAB
Wh i h EV/RAB l i l l ?
shield since taxes are included in Regulated revenue i.e.
FCF = NI + Interest expense or
FCF = RAB X Return on RABWhy is the EV/RAB multiple relevant?Regulated revenue consists of: ‐ Return of Capital (= Depreciation for 35 years),‐ Return on Capital** (= RAB X Return on RAB)
Enterprise Terminal Value (TV) = (FCF + growth rate) / (WACC ‐ growth rate).
We assume zero growth rate, i.e.p ( )**includes return on equity and borrowed capital
‐ Costs (controllable + non‐controllable),‐ controllable: labor, selling, general and administrative
TV = FCF/WACC*
*use plain vanilla WACC, i.e. don’t use tax shield for Cost of Debt, since the former wasn’t used in
calculation of FCF
2022.11.2010
and administrative‐ non‐controllable: income tax, transit fee to FSK
EV = RAB * RoR / WACC
EV/RAB = RoR/WACC* Weighted average cost of capital
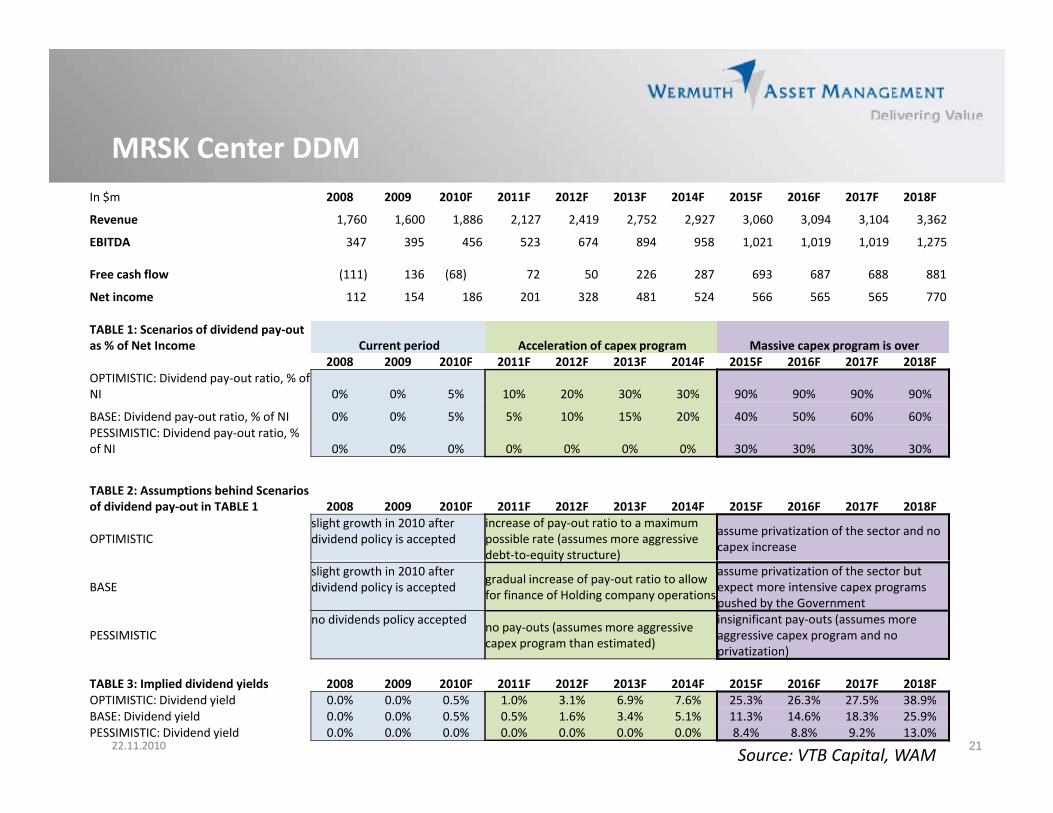
MRSK Center DDMIn $m 2008 2009 2010F 2011F 2012F 2013F 2014F 2015F 2016F 2017F 2018F
Revenue 1,760 1,600 1,886 2,127 2,419 2,752 2,927 3,060 3,094 3,104 3,362
EBITDA 347 395 456 523 674 894 958 1,021 1,019 1,019 1,275
MRSK Center DDM
Free cash flow (111) 136 (68) 72 50 226 287 693 687 688 881
Net income 112 154 186 201 328 481 524 566 565 565 770
TABLE 1: Scenarios of dividend pay‐out as % of Net Income Current period Acceleration of capex program Massive capex program is over
2008 2009 2010F 2011F 2012F 2013F 2014F 2015F 2016F 2017F 2018FOPTIMISTIC: Dividend pay‐out ratio, % of NI 0% 0% 5% 10% 20% 30% 30% 90% 90% 90% 90%
BASE: Dividend pay‐out ratio, % of NI 0% 0% 5% 5% 10% 15% 20% 40% 50% 60% 60%PESSIMISTIC: Dividend pay‐out ratio, % of NI 0% 0% 0% 0% 0% 0% 0% 30% 30% 30% 30%
TABLE 2: Assumptions behind Scenarios of dividend pay‐out in TABLE 1 2008 2009 2010F 2011F 2012F 2013F 2014F 2015F 2016F 2017F 2018F
OPTIMISTICslight growth in 2010 after dividend policy is accepted
increase of pay‐out ratio to a maximum possible rate (assumes more aggressive debt‐to‐equity structure)
assume privatization of the sector and no capex increaseq y )
BASEslight growth in 2010 after dividend policy is accepted gradual increase of pay‐out ratio to allow
for finance of Holding company operations
assume privatization of the sector but expect more intensive capex programs pushed by the Government
PESSIMISTICno dividends policy accepted no pay‐outs (assumes more aggressive
capex program than estimated)
insignificant pay‐outs (assumes more aggressive capex program and no privatization)
2122.11.2010
TABLE 3: Implied dividend yields 2008 2009 2010F 2011F 2012F 2013F 2014F 2015F 2016F 2017F 2018FOPTIMISTIC: Dividend yield 0.0% 0.0% 0.5% 1.0% 3.1% 6.9% 7.6% 25.3% 26.3% 27.5% 38.9%BASE: Dividend yield 0.0% 0.0% 0.5% 0.5% 1.6% 3.4% 5.1% 11.3% 14.6% 18.3% 25.9%PESSIMISTIC: Dividend yield 0.0% 0.0% 0.0% 0.0% 0.0% 0.0% 0.0% 8.4% 8.8% 9.2% 13.0%
Source: VTB Capital, WAM
Related Documents


![[Nahu] - An wa3ul 'Irab (arabic)](https://static.cupdf.com/doc/110x72/549a225eac7959132e8b5af1/nahu-an-wa3ul-irab-arabic.jpg)