Investigations of the warm and cold water route ocean gateways on glacial-interglacial and millennial timescales Conor Purcell Thesis submitted for the degree of Doctor of Philosophy Department of Earth and Ocean Sciences Cardiff University October 2014

Welcome message from author
This document is posted to help you gain knowledge. Please leave a comment to let me know what you think about it! Share it to your friends and learn new things together.
Transcript

Investigations of the warm and cold water route ocean
gateways on glacial-interglacial and millennial timescales
Conor Purcell
Thesis submitted for the degree of Doctor of Philosophy
Department of Earth and Ocean Sciences
Cardiff University
October 2014

ii
DECLARATION
This work has not been submitted in substance for any other degree or award at this or any
other university or place of learning, nor is being submitted concurrently in candidature for
any degree or other award.
Signed………………………………………… (candidate) Date ………………………
STATEMENT 1
This thesis is being submitted in partial fulfilment of the requirements for the degree of
…………… PhD ……………… (insert MCh, MD, MPhil, PhD etc, as appropriate)
Signed………………………………………… (candidate) Date ………………………
STATEMENT 2
This thesis is the result of my own independent work/investigation, except where otherwise
stated.
Other sources are acknowledged by explicit references. The views expressed are my own.
Signed……………………………………… (candidate) Date …………………………
STATEMENT 3
I hereby give consent for my thesis, if accepted, to be available for photocopying and for
inter-library loan, and for the title and summary to be made available to outside
organisations.
Signed……………………………………… (candidate) Date …………………………
STATEMENT 4: PREVIOUSLY APPROVED BAR ON ACCESS
I hereby give consent for my thesis, if accepted, to be available for photocopying and for
inter-library loans after expiry of a bar on access previously approved by the Academic
Standards & Quality Committee.
Signed………………………………………… (candidate) Date …………………….

iii
Summary
The warm and cold water route ocean gateways are important oceanographic locations
with respect to global climate. By the advection of salinity anomalies to the North
Atlantic, changes at these ocean gateways are suggested to affect the strength and
geometry of the Atlantic Meridional Overturning Circulation (AMOC). Adjustments of
the AMOC can play a crucial role in the Earth‘s climate, and are suggested to be related
to climate changes of the Late Pleistocene.
However, little is known about the role of the warm and cold water route gateways on
past glacial-interglacial and millennial time scales. This thesis documents a study which
utilises Earth system modelling, combined with analyses of climate proxy data, to
investigate the behaviour of these ocean gateways during changing climates of the past.
The development of an adapted Earth System Model shows that it is possible to
improve the simulation of climatological mean transport rates through the Indian-
Atlantic Ocean Gateway (I-AOG, warm water route gateway) and Drake Passage (cold
water route gateway). These ocean gateway transports are often overestimated in
contemporary state-of-the-art climate models. The adapted model therefore provides a
solid platform for the application of palaeo boundary conditions and the investigation of
these ocean gateways during the past.
Comparing pre-industrial and Last Glacial Maximum (LGM) climate simulations
reveals that the I-AOG transport was only moderately weaker during the LGM,
contrasting against the general hypothesis inferred from proxy data. A new hypothesis is
developed which can consolidate these results. Supported by proxy data, the modelled
Drake Passage throughflow is substantially weaker during the LGM. This might have
potential implications for the geometry of the relatively shallow glacial AMOC.
In response to freshwater perturbation - mimicking Heinrich events - an increase in
Drake Passage throughflow is simulated, simultaneous with only weak changes of the I-
AOG transport. The response at both locations is supported by proxy data, and suggests
that the Drake Passage might be more important than previously considered with
respect to the mechanisms involved in the abrupt resumption of the AMOC to
interstadial conditions.

iv
Author’s Note
Extracts from Chapters 3 and 5 are under review at the journal Paleoceanography, as:
Purcell, C., Knorr, G., Hall, I.R., Lohmann, G., Stepanek, C., Warm and cold water
route gateway transport changes during abrupt climate shifts.
Extracts from Chapters 3 and 4 of this thesis are in preparation for submission to the
journal Nature Geoscience, as:
Purcell, C., Simon, M., Knorr, G., Ziegler, M., Hall, I.R., Gierz, P., Lohmann G. (in
preparation). Strong Indian-Atlantic Ocean exchange at the Last Glacial Maximum.
Chapter 5 also builds on collaborative work published in the journal Paleoceanography as:
Marino, G., Zahn, R., Ziegler, M., Purcell, C., Knorr, G., Hall, I. R., ... & Elderfield, H.
(2013). Agulhas salt‐leakage oscillations during abrupt climate changes of the Late
Pleistocene. Paleoceanography, 28(3), 599-606.
Extracts from Chapter 5 are also in preparation for submission to the journal Quaternary
Science Reviews as:
Simon, M.H., Purcell, C., Hall, I.R., Ziegler, M., Barker, S., Knorr, G., van der Meer,
M.T.J., Kasper, S., Schouten, S. (in preparation). Land-ocean climate dynamics in
southernmost East Africa: A multi-proxy data and model integration.
Extracts from Chapters 3, 4 and 5 are in preparation for submission to the journal Nature
Geoscience, as:
Lamy, F., Purcell, C., Arz, H.W., Kilian, R., Lembke-Jene, L., Kaiser, J., Baeza Urrea,
O., Knorr, G., Hall, I., Lange, C., Tiedemann, R. (in preparation). Glacial reduction and
millennial-scale variations in Drake Passage throughflow.

v
Preface
―It is not the strongest or the most intelligent who will survive, but those who can best
manage change.‖
― Charles Darwin
In the late 15th
and early 16th
centuries the first European explorers sailed around the
Cape of Good Hope and Cape Horn, leaving the known world of the Atlantic behind
and entering the Indian and Pacific Oceans for the first time since their distant ancestors
many tens of thousands of years before. They left their homelands in search of new
territories, wealth, knowledge, and fame, often mercilessly slaughtering innocent
indigenous peoples along the way. As these voyagers sailed through the ocean gateways,
south of Africa and the Americas, they knew well the reality of their dangerous
undertakings and the storms they faced. Yet little did they know of the precious
sediment and dead organic matter which continued to slowly accumulate on the ocean
floors deep beneath their boots and boats – sedimentary dirt which would four hundred
years later become the investigated matter used to unravel the mysteries of Earth‘s
history. For it is these very ocean sediments, together with other planetary sources,
which today allow breakthroughs in our understanding of the changing climates of the
geological past. Throughout the 20th
century scientific thinkers began to build complex
computational machines which today permit the simulation of past climates, and show
good comparison with the stratigraphic details revealed in the dirt and dead organic
matter at the ocean floors. Today, the investigation of Earth‘s past, which helps us
prepare the planet for all posterity, necessarily includes a host of rigorous disciplines,
and represents yet another spectacular achievement in the sciences, involving
international cooperation, ambition and communal discovery. This PhD thesis
documents a 21st century investigation of the oceanographic and climatological changes
which occurred at the Indian-Atlantic Ocean Gateway south of the Cape of Good Hope,
and the Drake Passage south of Cape Horn, over glacial-interglacial and millennial
timescales of the past - long before Vasco da Gama and Ferdinand Magellan ever sailed
through.

vi
Acknowledgements
Firstly I would like to thank my supervisors Gregor Knorr and Ian Hall for providing me the
opportunity to explore the climates of the past. I am very thankful to Martin Ziegler who
guided me throughout the first years of my PhD and inspired me to think differently -
outside the box. Additionally, Gerrit Lohmann for having me as a long-term guest
researcher at his Paleoclimate Dynamics group at the Alfred Wegener Institute (AWI) in
Bremerhaven, Germany, where I spent over 3 years. My colleagues at Cardiff University for
the warm and friendly working environment created there. Thank you all.
I am grateful to everyone at the Paleoclimate Dynamics group at the AWI, particularly my
office colleagues whom I had the pleasure of knowing over the past few years. Christian,
Xu, Michael, Paul, Xun, Igor - I will never forget the memories shared together in that
cluttered office in that small, industrial, north German city. Christian, Michael, Paul – I owe
you for your patience in my determination to learn the German language. In particular I am
indebted to Christian Stepanek for his professionalism and help with many aspects of this
PhD project, not to mention his great friendship. Dr. Martin Butzin, of the MARUM,
Bremen, is thanked for his technical expertise.
I consider myself to have been extremely privileged to have participated as a researcher on
the Marie Curie funded GATEWAYS project, where I was provided the opportunity to move
abroad, travel the world, and meet some incredible people who shared my enthusiasm for
life. Margit, Kristina, Paolo, Jonathan, Jeroen, Emma, Ben, Juliane, Sebastian, Marlen,
Kerstin, Kristin, Caroline, Martin, Frank, and Lukas (sorry for the snoring). Thank you all
for the fun times and shared memories in Austria, Spain, Germany, Wales, South Africa,
Israel and Palestine.
The achievement of being awarded a doctoral degree is rarely the accomplishment of a
single person, rather reflecting the support of family and friends. My mother and father,
brothers and sister, my nephews and nieces - I could not have done it without your support
and encouragement. In particular I thank my father for fuelling my curiosity and enthusiasm
during my early years. Additionally, my friends who encouraged me through always being
open to stimulating conversation and generating creativity - JP, Niall, Rachel, Rory, Mur,
Cian, amongst many more - you know who you are. Many thanks. JP O‘Malley is thanked
for a final proof read and edit of this thesis.

vii
SYMBOLS AND ABBREVIATIONS
AABW Antarctic Bottom Water
AAIW Antarctic Intermediate Water
ACC Antarctic Circumpolar Current
ALF Agulhas Leakage Fauna
AMOC Atlantic Meridional Overturning Circulation
ARC Agulhas Return Current
BP Before Present
CBR Cape Basin Record
CHC Cape Horn Current
CWR Cold Water Route
D/O Dansgaard-Oeschger Oscillation
DP Drake Passage
EPICA European Project for Ice Coring in Antarctica
ESM Earth System Model
GIN Greenland-Iceland-Norwegian
I-AOG Indian-Atlantic Ocean Gateway
IRD Ice-rafted detritus
ITCZ Intertropical Convergence Zone
ka Thousand years before present , (kilo annum)
kyr Thousand years (duration)
LGM Last Glacial Maximum
MIS Marine Isotope Stage
MOC Meridional Overturning Circulation
NADW North Atlantic Deep Water
NHCS Northern Hemisphere Cold Stadial
PPB Parts Per Billion
PPM Parts Per Million
PF Polar Front
SAF Subantarctic Front
SAFZ Subantarctic Frontal Zone
SCW Southern Component Water
SPC South Pacific Current

viii
SSS Sea Surface Salinity
SST Sea Surface Temperature
STF Subtropical Front
Sverdrup 1 Sv = 1 x 10⁶ m
3/s
THC Thermohaline Circulation
TI, TII, … Termination I, Termination II, etc….
WBC Western Boundary Current
WWR Warm Water Route
δD Stable Hydrogen Isotope

ix
Contents
1. Introduction……………………………………………………………………….1
1.1 The climate system………………………………………………………..1
1.2 The changing climates of the past………………………………………...3
1.2.1 Glacial-interglacial climate change…………………………….4
1.2.2 Millennial scale climate change………………………………..6
1.3 The warm and cold surface water routes of the ocean…………………...8
1.3.1 The warm water route…………………………………………..9
1.3.2 The cold water route………………...………………………...13
1.4 Research scope and outline……...………………………………………16
2. Models, Materials and Methodology…………..……………………………….21
2.1 Models……………………………………………………………………21
2.1.1 The Community Earth System Model (COSMOS)…………...21
2.1.2 The Max Plank Institute Ocean Model (MPIOM)…………….22
2.1.3 The MPIOM-AFRICA configuration……………...………….24
2.1.4 The ECHAM5 Atmospheric model……………...……………25
2.1.5 The JSBACH land surface and vegetation model…………....28
2.1.6 NEC SX8-R supercomputing facilities...…...………………...29
2.2 Materials…………………………………………………………………..30
2.2.1 Proxy data in the region of the Drake Passage………………..30
2.3 Methodology……………………………………………………………...32
2.3.1 Pre-industrial boundary conditions……………………………32
2.3.2 LGM boundary conditions……………………………………..33
2.3.3 Freshwater Perturbation..………………………………………33
2.3.4 Eulerian calculation of ocean water and salt transports…..…..34
2.3.5 Rotation of velocity vectors………………………………..….35
2.3.6 Software……………………………………...…...……………35
3. An adapted Earth System Model for improved simulation of the I-AOG.....36
3.1 Introduction……………………………………………………………….36
3.1.1 Study approach…………………………………………...…….39
3.2 Results and discussion………………………………………………….....40
3.2.1 Pre-industrial simulation……………………………………..…40
3.2.1.1 I-AOG and Drake Passage transports…….…………..43
3.2.1.2 General pre-industrial ocean characteristics……….46
3.2.2 LGM simulation……………………...…………………………57
3.2.2.1 LGM I-AOG and Drake Passage transports……........57
3.2.2.2 General LGM ocean characteristics…………...……..58
3.3 Summary and conclusions………………………………………………..63

x
4. Glacial-interglacial changes at the I-AOG and Drake Passage………….….66
4.1 Introduction………………………………………………………….…….66
4.1.1 Study Approach…………………………………………………68
4.2 Results………………………………………………………………….….71
4.2.1 Modelled sea surface temperatures in the Agulhas region…..…71
4.2.2 Indian-Atlantic Ocean Gateway transport………………….…..73
4.2.3 Southern Hemisphere westerly and trade winds……………….77
4.2.4 Drake Passage transport……………...………...……………....80
4.3 Discussion……………………………………………………………….…82
4.3.1 The Indian-Atlantic Ocean Gateway……………………………82
4.3.2 LGM Drake Passage comparison with proxy data……………..90
4.4 Summary and conclusions…………………………………………………101
5. Millennial scale changes at the I-AOG and Drake Passage……………..….103
5.1 Introduction…………………………………………………………….….103
5.1.1 Study Approach…………………………………………………107
5.2 Results………………………………………………………………….….108
5.2.1 Pre-industrial freshwater perturbation………………………….108
5.2.1.1 Indian-Atlantic Ocean Gateway response……...….…110
5.2.1.2 Drake Passage response………………………..……..113
5.2.2 LGM freshwater perturbation…………………...………….…..113
5.2.2.1 Indian-Atlantic Ocean Gateway response……...…….117
5.2.2.2 Drake Passage response………………………...…….119
5.3 Discussion…………………………………………………………….……121
5.3.1 Global Responses and the Southern Ocean Heat Reservoir...….121
5.3.2 Indian-Atlantic Ocean Gateway………………………………...123
5.3.3 Drake Passage………………...………………………………....126
5.3.4 Consequences for the resumption of the AMOC……………….132
5.4 Summary and conclusions…………………………………………………135
6. Conclusions and Outlook…………………………….……...……..………....137
6.1 An adapted Earth System Model for improved simulation of the I-AOG..137
6.2 Glacial-interglacial changes at the I-AOG and Drake Passage…………..138
6.3 Millennial scale changes at the I-AOG and Drake Passage……….…..…140
6.4 A new hypothesis…………...……………………………...……………..141
6.5 Final words on the warm and cold water route gateways……….…….....146
6.6 Outlook……………………………………………………………………147
Appendix.…………………………………………………………………………149
References…………………………………...………………………………….…159

Chapter 1. Introduction
1
1. Introduction
Interest in palaeoclimate research has accelerated in recent years owing largely to the
requirement for understanding past environmental changes in order to better predict
future climate change under anthropogenic forcing throughout the 21st century and
beyond, in what is termed the Anthropocene. Over the past 20 years governments have
increasingly provided funding for the investigation of past climate changes which are
potentially analogous to those expected in both the near and distant future. The study of
past climates is largely conducted by the analyses of climate proxy data and Earth
system modelling, which are performed with the objective of reconstructing the past and
simulating paleoclimate environments. This chapter provides an introduction to the
climate system and climate changes which are known to have occurred in the past,
leading on to a discussion of the importance of the warm and cold water route gateways
which are suggested to play key roles in global climate change, and constitute the major
component of this PhD thesis.
1.1 The climate system
The Earth‘s climate system includes the ocean, atmosphere, cryosphere and biosphere
components, amongst others. Each of these sub-systems is inextricably linked through
complex arrangements which are yet to be completely understood. The system is
sensitive to both internal and external forcing mechanisms which have governed climate
change in the past, and will do so again in the future. Although the climate is regulated
predominantly by external forcing in the form of variations in orbital forcing
(Milankovitch, 1930; Milankovitch, M., 1941, Hays et al., 1976; Berger, 1978), internal
feedbacks from other system processes such as greenhouse gas concentrations (Luthi et
al., 2008) are known to have modulated the changing climates of the past. Various
feedback mechanisms exist which act to regulate climate by distributing heat both
globally, and on regional scales.

Chapter 1. Introduction
2
One key internal component of the global climate system which acts to regulate our
climate is the global thermohaline circulation (THC), a major driver of change via heat
distribution in the climate system (Figure 1.1). The THC transports huge volumes of
water, salt and heat around the planet (Broecker, 1991). The THC is characterised by
deep water convection (sinking) in the North Atlantic and large scale upwelling in the
equatorial regions and throughout the Southern Hemisphere, resupplying the Atlantic
Basin via the ocean‘s warm and cold water surface return routes (Gordon, 1986).
Specifically, downward processes, such as convection, take place in the Labrador and
Nordic Seas, and upward processes, including mixing (as a result of internal (tide) wave
interactions with topography), allow for waters to rise again across the equatorial
regions. Downward convection also occurs in the Weddel Sea (Southern Ocean),
permitting the formation of Antarctic Bottom Water (AABW). Changes to the Atlantic
component of that circulation, the Atlantic Meridional Overturning Circulation
(AMOC), have been suggested to have been involved in climate changes of the past
(Rahmstorf, 1996; Broecker, 1998), and are a realistic possibility in the future with
respect to anthropogenic climate change (Jungclaus et al., 2006b; Zickfeld et al., 2007;
Stocker et al., 2013). Since the AMOC is also driven by wind at the surface, changes to
the wind field systems are also important for variations in the circulation.
SAP 3.4: Abrupt Climate Change
Figure 4.1. Schematic of the ocean circulation (from Kuhlbrodt et al., 2007) associated
with the global Meridional Overturning Circulation (MOC), with special focus on the
Atlantic section of the flow (AMOC). The red curves in the Atlantic indicate the
northward flow of water in the upper layers. The filled orange circles in the Nordic and
Labrador Seas indicate regions where near-surface water cools and becomes denser,
causing the water to sink to deeper layers of the Atlantic. This process is referred to as
“water mass transformation,” or “deep water formation.” In this process heat is released
to the atmosphere. The light blue curve denotes the southward flow of cold water at
depth. At the southern end of the Atlantic, the AMOC connects with the Antarctic
Circumpolar Current (ACC). Deep water formation sites in the high latitudes of the
Southern Ocean are also indicated with filled orange circles. These contribute to the
production of Antarctic Bottom Water (AABW), which flows northward near the bottom
of the Atlantic (indicated by dark blue lines in the Atlantic). The circles with interior dots
indicate regions where water upwells from deeper layers to the upper ocean (see Section
2 for more discussion on where upwelling occurs as part of the global MOC).
2. What Are the Processes That Control the Overturning Circulation?
We first review our understanding of the fundamental driving processes for the AMOC.
We break this discussion into two parts: the main discussion deals with the factors that
are thought to be important for the equilibrium state of the AMOC, while the last part
(Sec. 2.5) discusses factors of relevance for transient changes in the AMOC.
265

Chapter 1. Introduction
3
Figure 1.1 Strongly simplified sketch of the global overturning circulation system, from Kuhlbrodt et al.
(2007), after Rahmstorf (2002). In the Atlantic, warm and saline waters flow northward all the way from
the Southern Ocean into the Labrador and Nordic Seas. By contrast, there is no deepwater formation in
the North Pacific, and its surface waters are fresher. Deep waters formed in the Southern Ocean become
denser and thus spread in deeper levels than those from the North Atlantic. Note the small, localized
deepwater formation areas in comparison with the widespread zones of mixing-driven upwelling. Wind-
driven upwelling occurs along the Antarctic Circumpolar Current (ACC).
1.2 The changing climates of the past
Early evidence from palaeoclimatic proxies (Emiliani, 1955, Broecker et al., 1968;
Broecker and van Donk, 1970; Johnsen et al., 1972; Shackleton and Opdyke, 1976;
Dansgaard et al., 1993), and various model simulations (Rahmstorf et al., 1996;
Ganopolski and Rahmstorf, 2001; Ganapolski et al., 2010; Knorr and Lohmann, 2014;
Zhang et al., 2014) indicate that the oceans and atmosphere of the past experienced
significant change over both short millennial (103 years) and longer glacial-interglacial
(103 to 10
5 years) to tectonic time-scales (10
6 – 10
9 years). Internal forcing mechanisms
which are suggested to control these climate changes include tectonic shifts (not always
considered an internal forcing) (Keigwin, 1982; Raymo and Ruddiman, 1992; Zachos et
al., 2001; Zhisheng et al., 2001; Lagabrielle et al., 2009) and variability in ocean
circulation (Rahmstorf, 1996; Broecker, 1998) and pCO2 content (Luthi et al., 2008).
External forcing mechanisms involve factors such as solar activity (Barriopedro et al.,
2008; Woollings et al., 2010; Moffa-Sánchez et al., 2014) and the Earth‘s orbital
configuration (Milankovitch, 1941, Hays et al., 1976; Berger, 1978).
Ocean sediment cores have indicated that during the Cenozoic Era (the past 66 million
years) and beyond, the Earth's climate has been in a state of constant change,
characterised by long periods of warming with ice-free polar regions as well as periods
of glaciation with large continental ice sheets forming in the high latitudes (Zachos et
al., 2001). Palaeoclimatic proxy data and modelling simulations are used to investigate
the nature of such climate variability, with great advancements achieved in recent years
(Stocker, 1998; Lynch-Stieglitz et al., 2007; Barker et al., 2011; Knorr and Lohmann,
2014; Zhang et al., 2014). The presence of regular glacial-interglacial climate change
appeared during the past 2 million years of the Quaternary Period.

Chapter 1. Introduction
4
1.2.1 Glacial-interglacial climate change
The existence of glacial-interglacial climate variability (Figure 1.2) during the
Pleistocene geological epoch is known from the analysis of climate proxy data
(Broecker et al., 1968; Broecker and van Donk, 1970; Johnsen et al., 1972; Shackleton
and Opdyke, 1976), which extend back in the record over 22 glacial-interglacial cycles.
The periodicity of these cycles changed approximately 1000 ka, from a 40 kyr to 100
kyr frequency, during the mid-Pleistocene transition (Maasch, 1988; Mudelsee and
Schulz, 1997; Raymo et al., 2006; Hönisch et al., 2009 Elderfield et al., 2012). These
cycles are suggested to be predominantly controlled by variations in orbital forcing
(Milankovitch, 1930; Milankovitch, 1941, Hays et al., 1976; Berger, 1978; Berger and
Loutre, 1991) and are modulated by changing greenhouse gas concentrations (Luthi et
al., 2008). The orbital parameters which govern glacial-interglacial climate variability
are obliquity, eccentricity and precession.
Figure 1.2 Comparison of the dD Dome C record on the EDC3 time scale (with all data points in light
grey and a smoothed curve in black) with the benthic oxygen-18 record (blue) on its own time scale
(Lisiecki and Raymo, 2005), from Jouzel et al., 2007. The 3259.7-m dD record, which includes published
results down to 788m (Jouzel et al., 2001), benefits from an improved accuracy (1s of ± 0.5‰) and a
much more detailed resolution of 55 cm all along the core, whereas the previously published record was
based on 3.85-m samples (EPICA Community Members, 2006). The agreement between the two time

Chapter 1. Introduction
5
series back to ~800 ky B.P. justifies the use of oceanic sediment nomenclature (MIS) for describing the
ice core record.
Obliquity is the parameter which describes the variation of the Earth‘s angle of tilt on its
axis of rotation. The parameter operates on a 41 kyr cycle as the Earth‘s angle of rotation
(tilt) varies between 21.8º and 24.4º (Denton and Hughes, 1983). Obliquity controls the
distribution of heat over the planet, with particularly significant responses at the high
latitudes (Ruddiman and McIntyre, 1981). The effect of variations in the Earth‘s obliquity is
to modulate the strength of seasons (seasonality) at the high latitudes, with only minor
variations in the tropics.
Eccentricity is the parameter which describes the variation in the Earth‘s orbit around
the sun. This variation ranges from elliptic to circular configurations over geological
time, having the effect of modulating the solar insolation received by the Earth (Berger,
1989), dependent on the distance between our planet and the Sun (Denton and Hughes,
1983). Unlike obliquity which controls the distribution of heat on Earth, Eccentricity
uniformly varies the solar insolation received by Earth equally over all latitudes.
Eccentricity operates over a timescale of ~100 kyr (Milankovitch, 1930; Milankovitch,
1941), but is also suggested to act with a period of ~400 kyr (Rial, 1999).
The third parameter, precession, refers to the conical movement of the rotational axis of
the Earth. The Earth‘s precession of the equinoxes controls the position of aphelion and
perihelion - the positions in the Earth‘s orbit furthest and closest to the sun, respectively
(Hays et al., 1976; Berger, 1977). Precession operates over periods of 19 kyr and 23
kyr, and affects the distribution of heat on the planet (Imbrie, 1985; Berger, 1992). The
effect of this is a modulation of the strength of summers in the Northern and Southern
Hemispheres. Precession is also known to be modulated by eccentricity (Milankovitch,
1930).
The overall effect of these phenomena and their interaction is to regulate the magnitude
and distribution of incoming solar irradiation on Earth. This has resulted in the
existence of a wide variation in the range of climate changes of the past, and has
recently (the past two million years) culminated in the appearance of glacial-interglacial

Chapter 1. Introduction
6
cycles in the records. However, climate change also operates on shorter, sub-orbital,
centennial and millennial timescales.
1.2.2 Millennial scale climate change
The Earth‘s climate is known to have shifted abruptly a number of times during glacial
periods of the Late Pleistocene. Details revealed in Greenland ice cores show rapid
temperature shifts in Arctic climate, characterised by abrupt decadal warming events
which are followed by slower centennial scale recoveries towards glacial conditions
(Dansgaard et al., 1993; NGRIP members, 2004) (Figure 1.3). These millennial scale
events have become known as Dansgaard-Oeschger (DO) oscillations, and have since
been observed in numerous proxy data records across the planet (Bond et al., 1997;
Blunier and Brook, 2001; Völker, 2002; Wang et al., 2008; Barker et al., 2009;
Caniupán et al., 2011; Marino et al., 2013; Ziegler et al., 2013).
The abrupt temperature shifts in Greenland, which have a cyclicity of 1470 ± 532 years
(Bond et al., 1997), are out of phase with more gradual changes in Antarctica, that
precede D/O events in Greenland by up to 3 kyr (Blunier and Brook, 2001) (Figure 1.3).
Additionally, it appears that some DO events coincide with anomalously large
abundances of Ice Rafted Detritus (IRD) data in North Atlantic records. These episodes
have come to be known as Heinrich events (Heinrich, 1988). Heinrich events appear to
involve surging of the Laurentide Ice Sheet, possibly through the Hudson Strait,
apparently associated with the DO cooling (Bond et al., 1993).
Many studies have been dedicated to the investigation of the potential causes of DO
events during glacial periods (Ganopolski and Rahmstorf, 2001; Clark et al., 2002;
Rahmstorf, 2002; Wunsch, 2006; Knorr and Lohmann, 2007; Dima and Lohmann,
2008; Barker et al., 2009; Kwasniok and Lohmann, 2009; Arzel et al., 2010; Li et al.,
2010; Banderas et al., 2012; Dokken et al., 2013; Marino et al., 2013; Petersen et al.,
2013). Changes to the AMOC involving the bipolar seesaw process have been suggested
as a link which can potentially explain the anti-phased millennial scale variability
observed in the Northern and Southern Hemispheres (Broecker, 1998). Possible
mechanisms which might force such millennial scale AMOC variability include the

Chapter 1. Introduction
7
introduction of large scale freshwater anomalies in the North Atlantic as a consequence
of massive ice berg rafting (Heinrich, 1988; Bond, 1993; Rahmstorf, 1996; Rahmstorf,
2002), changes in the height of the glacial ice sheets (Wunsch, 2006, Zhang et al.,
2014), or a Southern Hemisphere origin originating in the Agulhas Current, the western
boundary current (WBC) of the African continent (Marino et al., 2013). However, as of
yet, there is no clear consensus as to the root cause of this variability observed in the
records.
Figure 1.3 Millennially resolved proxy data, from Barker and Diz, 2014. Records of %NPS/total N.
pachyderma (B) and warm species (C) from South Atlantic core TNO57-21 compared with Greenland
(NGRIP_members, 2004) (A) and Antarctic (Jouzel et al., 2007) (E) ice core temperature records and the
speleothem growth interval record from Brazil (Wang et al., 2004) (D). The Antarctic record has been
placed on the same timescale following the procedure described by Barker et al. (2011).

Chapter 1. Introduction
8
1.3 The warm and cold surface water routes of the ocean
The Southern Ocean is a key region of the THC, receiving upwelled North Atlantic
sourced deep waters, distributing them around the globe, and eventually resupplying the
Atlantic Basin via the warm and cold water surface return routes (Gordon, 1986;
England and Garcon, 1994) (Figure 1.4). These routes provide water, heat and salt along
the surface branch of the THC, compensating for North Atlantic Deep Water (NADW)
export (Broecker, 1991). The warm water route comprises waters advected through the
Indonesian Throughflow and the Australian-Antarctic gateway, comprising the Tassie
Leakage, which cross the Indian Ocean and eventually resupply the Atlantic Basin via
Agulhas leakage (Speich et al., 2001) (Figure 1.5), a predominantly wind driven
process. On the other hand, the cold water route transports sub-Antarctic waters from
the Pacific to the Atlantic Ocean via the Drake Passage, and has been presumed to be of
secondary importance to the warm water route, contributing just 25% of the latter's
volume flux (Gordon, 1986). Past and future changes to these water routes are
potentially of significance to global climate because of the impact which positive
density anomalies may have on NADW formation and AMOC strength (Weijer et al.,
2002) (Figure 1.6). Such a control on AMOC strength by these remote sources could
ultimately modulate the distribution of heat on the planet via the bi-polar see-saw
process (Broecker, 1998; Stocker and Johnsen, 2003). Effectively, it is the combined
and relative roles of these two water routes supplying the upper branch of the AMOC
which is important. A change in the characteristics of one route could act to enhance or
compensate for changes to the other.

Chapter 1. Introduction
9
Figure 1.4 Global structure of the thermohaline circulation cell associated with NADW production, from
Gordon, (1986). The warm water route, shown by the solid arrows, marks the proposed path for return of
upper layer water to the northern North Atlantic as is required to maintain continuity with the formation
and export of NADW. The circled values are volume flux in Sv which are expected for uniform
upwelling of NADW with a production rate of 20 Sv. These values assume that the return within the cold
water route, via the Drake Passage, is of minor significance.
1.3.1 The warm water route
The ocean‘s warm water surface return route is the flow of warm upwelled thermocline
water masses through the Pacific, Indian and Atlantic oceans, which, along with the
cold water route, act to compensate for global deep water formation (Broecker, 1991).
Specifically, the warm water route includes the Indonesian throughflow transport, Tassie
leakage and Agulhas leakage. The existence of the Indonesian throughflow and Tassie
leakage is a consequence of a separation in the Pacific Ocean subtropical supergyre into
two branches; to the north via Indonesia and south via Tasmania, respectively (Gordon
et al., 2010). After passing through the array of complex passages in the Indonesian
region (Gordon, 2005), these water masses cross the Indian Ocean via the South
Equatorial Current in the 10º – 15º latitude belt (Figure 1.4). As this water is advected
across the Indian Ocean it becomes both more saline due to net evaporation, and more
energetic due to net insolation in these tropical and subtropical regions. At these
latitudes Indian Ocean water is 5ºC warmer than South Atlantic thermocline water at
similar latitudes (Gordon, 1985). After crossing the Indian Ocean, these waters are
transported into the Agulhas Current via southward flows in the Mozambique Channel
and the East Mozambique Current. The Agulhas Current is the strongest western
boundary current in the world, transporting approximately 70-78 Sv of tropical and
subtropical Indian Ocean waters southwards towards the bugle of Africa (Lutjeharms,
2006). South of Africa, the Agulhas Current contributes to a a large scale retroflection
(the Agulhas Retroflection) process whereby a significant majority of its water mass is
transferred back into the Indian Ocean. During the retroflection process an Agulhas
leakage occurs which acts as the warm water route connection between the Indian and
Atlantic oceans. Some of these warm and saline thermocline water travel northwards
within the Atlantic subtropical gyre and are advected to the North Atlantic where
cooling is experienced, and NADW is formed at either of the two convection sites; the
Greenland-Iceland-Norwegian (GIN), and Labrador seas.

Chapter 1. Introduction
10
Agulhas leakage, which passes through the Indian-Atlantic Ocean Gateway (I-AOG) is
by far the most studied and well understood component of the warm water route (De
Ruijter et al., 1999). Due to a wind stress curl of zero to the south of the African
continent, an interocean exchange between the two subtropical gyres of the Indian and
Atlantic oceans is permitted (Biastoch and Böning, 2009). The exchange takes the form
of turbulent filament eddy structures, and is estimated to transfer ~15 Sv of warm, salty
water into the Atlantic Basin (Richardson, 2007). Other studies estimate Agulhas
leakage in the range 12 – 20 Sv (Van Sebille et al, 2010). Modelling studies have
suggested that inter-ocean salt transfer from the Indian to Atlantic Ocean influences the
AMOC (Weijer et al., 2002) (Figure 1.6) and may have significantly affected AMOC
stability in recent decades (Biastoch and Böning, 2013 Srokosz et al., 2012). Knorr and
Lohmann (2003), using a general circulation ocean model to simulate the climate
change of the last deglaciation, demonstrated that a resumption of the AMOC including
an overshoot could be triggered by Southern Hemisphere warming, via increased water
transport through both the I-AOG and Drake Passage. Analysis of proxy data from
marine sediment cores has shown that shifts in Agulhas leakage may have occurred in
the past on glacial-interglacial timescales, with implied increases in Agulhas leakage
during glacial terminations leading to the suggestion that these events importantly acted
as a trigger for the resumption of the AMOC, from a weak glacial to a strong
interglacial mode (Peeters et al., 2004; Martinez-Mendez et al., 2010; Caley et al., 2012)
(Figure 1.7). It has even been suggested that exceptional Agulhas leakage prolonged
interglacial warmth during Marine Isotope Stage (MIS) 11c in Europe (Koutsodendris et
al., 2014). An analogous conceptual framework has been developed for millennial scale
climate change, where it has been suggested that Agulhas leakage may have been
significant in the processes involved in the abrupt resumption of the AMOC to
interstadial conditions (Marino et al., 2013). These increases in Agulhas leakage are
suggested to occur in response to latitudinal shifts of the subtropical front and
associated changes in the position of the zero windstress curl, although this hypothesis
has recently been questioned (De Boer et al., 2013).

Chapter 1. Introduction
11
Figure 1.5 Agulhas leakage affected by westerly winds and position of subtropical front, from Beal et al.
(2011). Schematic of the greater Agulhas system embedded in the Southern Hemisphere supergyre.
Background colours show the mean subtropical gyre circulation, depicted by climatological dynamic
height integrated between the surface and 2,000 dbar, from the CARS database. Black arrows and labels
illustrate significant features of the flow. An outline of the Southern Hemisphere supergyre is given by
the grey dashed line. The plot on the right shows the southward expansion of the Southern Hemisphere
westerlies over a 30-yr period, from the CORE2 wind stress averaged between longitudes 20ºE and 110ºE
(Indian Ocean sector). The expected corresponding southward shift of the subtropical front (STF) is
illustrated by red dashed arrows and would affect Agulhas leakage (shown as eddies) and the pathway
between leakage and the AMOC, which is highlighted with a red box.

Chapter 1. Introduction
12
Figure 1.6. Six snapshots of the annually averaged salinity anomaly (ΔS=Δsource-Δmain in psu) at 250
m depth in a freshwater source experiment, from Weijer et al. (2002).The freshwater source at the Indian-
Atlantic Ocean Gateway, turned on in year 1, creates a negative salinity anomaly that is slowly advected
northward along the east coast of the American continents. It reaches the northern North Atlantic within
30 years.
Figure 1.7. Late Pleistocene proxy records of the Cape Basin record, from Peeters et al. (2004). a, The
oxygen isotope composition of the benthic foraminifer Cibicides wuellerstorfi, largely indicating global
ice volume (V-PDB, Vienna Pee-Dee Belemnite standard). Even numbers at top refer to glacial Marine
Isotopic Stages, T-I to T-VI refer to the major glacial terminations. b, The UK37 SST proxy for the upper
part of the CBR (core GeoB-3603-2). c, The relative abundance of the Agulhas leakage fauna as a
measure of Indian Ocean advection into the Atlantic. d, The relative abundance of Globorotalia
truncatulinoides, indicative of subtropical transitional waters. e, The relative abundance of Globorotalia
inflata and f, Neogloboquadrina pachyderma (dex.) indicative of southern subtropical to Subantarctic
waters. g, The relative abundance of Turborotalita quinqueloba, reflecting Subantarctic waters. h, The
relative abundance of Neogloboquadrina pachyderma (sin.), indicative of Antarctic waters.

Chapter 1. Introduction
13
1.3.2 The Cold Water Route
The predominantly wind driven Antarctic Circumpolar Current (ACC) is the Earth‘s
primary distributor of cold deep waters, having a major impact on global climate. ACC
transport rates have been estimated at 130 Sv (Whitworth and Peterson, 1985) and 134
± 11 Sv (Cunningham et al., 2003) (Figure 1.8), showing good agreement between
observations. These waters are forced by the Southern Hemisphere westerlies and
transported eastwardly around the Antarctic continent in what is the ocean‘s most
voluminous transport regime. Through the Drake Passage, the ACC additionally
constitutes a flow of Antarctic Intermediate Water (AAIW) which enters the Atlantic
Ocean from the Pacific in what is termed the cold water route. Thermocline flow
through the Drake Passage and the Southern Ocean is advected northwards and enters
both the South Atlantic and South Indian Ocean subtropical gyre systems (Speich et al.,
2001) (Figure 1.9). Some of these thermocline water masses are eventually transported
to the North Atlantic, contributing to the formation of NADW. Lagrangian analysis
indicates that, in the modern ocean, ~2.3 Sv of the total flow through the Drake Passage
is advected directly to the North Atlantic (direct cold water route, via subduction in the
Malvinas front, and circulation in the South Atlantic subtropical gyre system), while an
additional ~4.2 Sv is transported through the Indian Ocean subtropical gyre (indirect
cold water route) and, thereafter makes its way to the North Atlantic via the Agulhas
leakage and Benguela Current (Speich et al., 2001) (Figure 1.9). This amounts to a total
of ~6.5 Sv of Drake Passage sourced waters supplying the North Atlantic, comprising
just ~5% of the transport of the ACC through the Drake Passage (134 ± 11 Sv;
(Cunningham et al., 2003)).
The Drake Passage acts as a key choke point for the cold water route, with changes in
the regional hydrography having the potential to adjust the behaviour of the entire
pathway itself. The ACC flow rate and transport through the Drake Passage are strongly
coupled to Southern Hemisphere wind stress forcing across the entire circumpolar belt
(Allison et al., 2010; Meredith et al., 2011). Momentum imparted to the ocean by these
winds is hypothesised to be modulated by sea ice cover (McCave et al., 2013). Due to
relatively low temperature and salinity characteristics of the Drake Passage - the
warmest water in the Drake Passage is approximately 8º C (Gordon and Molinelli,

Chapter 1. Introduction
14
1982) - this interocean exchange is generally accepted to be of secondary importance to
the Agulhas leakage, a key component of the warm water route. Gordon (1986)
suggested that the volumetric capacity of the cold water route is just 25% that of the
warm water route. However, results from Lagrangian analysis suggest that 6.1 Sv of
Agulhas leakage (Rühs et al., 2013), and ~6.5 Sv of Drake Passage throughflow (Speich
et al., 2001) enter the North Atlantic. Although these data are available from two
different ocean models, the results suggest that the cold water route contributes a similar
portion of the water volume to the North Atlantic as the warm water route. This is an
important point, and appears to be absent in the literature, whereas Agulhas leakage and
the warm water route are well highlighted (Beal et al., 2011). These considerations
suggest that volumetric changes at the Drake Passage are likely to be of equal
importance to the Agulhas leakage in contributing to changing global ocean circulation,
and warrant further investigation.
Although the importance of the opening of the Drake Passage is known to have been a
significant driver of past climate change on tectonic timescales (Barker and Burrell,
1977; Sijp and England, 2004; Lagabrielle et al., 2009), little is known about changes at
the Drake Passage on glacial-interglacial and millennial timescales. McCave et al.
(2013) recently documented results from proxy data across a transect of core locations
in the Scotia Sea, downstream of the Drake Passage. This study indicated that the
overall ACC transports during the LGM and the Holocene were similar, with only the
southern component of the transport potentially reduced by modulation of sea-ice
expansion during the glacial period. Furthermore, no millennial scale proxy data exists
at the Drake Passage itself, meaning our past knowledge of this oceanic region is
surprisingly weak for such a prominent ocean gateway.
Chapter 1. Introduction
15
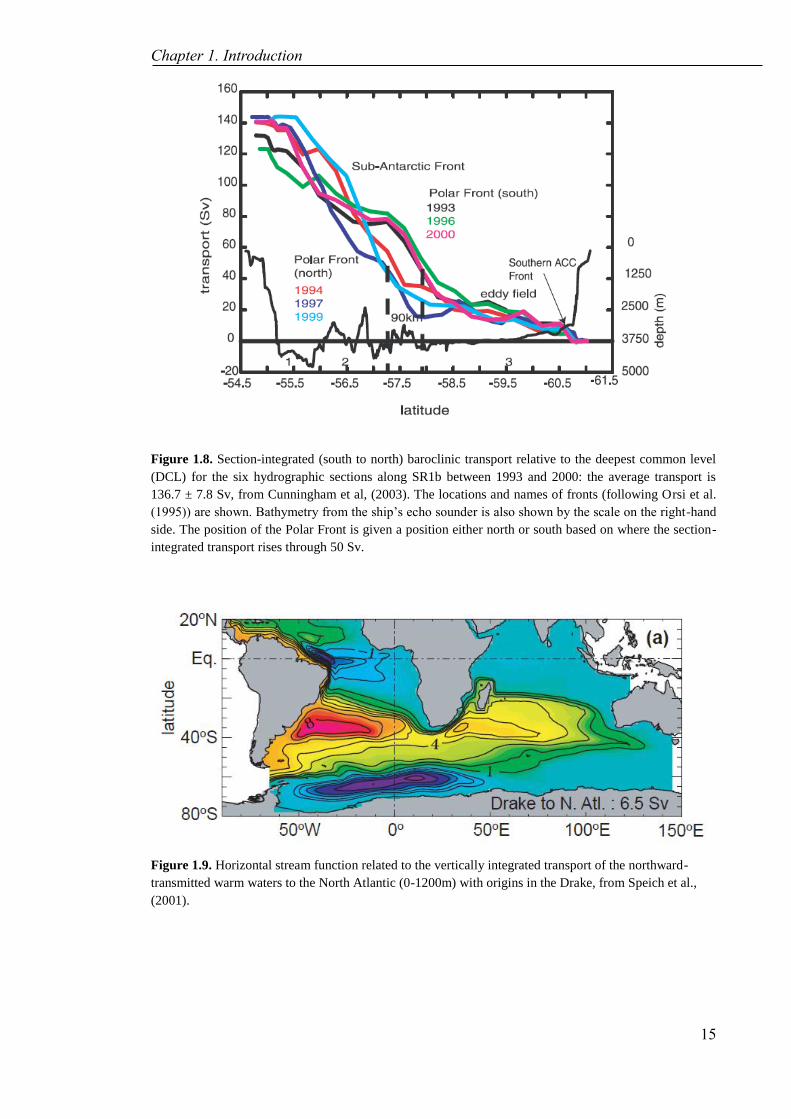
Figure 1.8. Section-integrated (south to north) baroclinic transport relative to the deepest common level
(DCL) for the six hydrographic sections along SR1b between 1993 and 2000: the average transport is
136.7 ± 7.8 Sv, from Cunningham et al, (2003). The locations and names of fronts (following Orsi et al.
(1995)) are shown. Bathymetry from the ship‘s echo sounder is also shown by the scale on the right-hand
side. The position of the Polar Front is given a position either north or south based on where the section-
integrated transport rises through 50 Sv.
Figure 1.9. Horizontal stream function related to the vertically integrated transport of the northward-
transmitted warm waters to the North Atlantic (0-1200m) with origins in the Drake, from Speich et al.,
(2001).

Chapter 1. Introduction
16
1.4 Research scope and outline
The main objective of this thesis is to investigate the palaeoceanography of the warm (I-
AOG) and cold (Drake Passage) water route ocean gateways. Motivation for this goal is
provided by the suggestion inferred from the analysis of proxy data and ocean general
circulation models that the Agulhas leakage may have played a significant role in the
termination of glacial cycles (Knorr and Lohmann, 2003; Peeters et al., 2004; Bard and
Rickaby, 2009), and the resumption of the AMOC to interstadial conditions within the
context of millennial scale climate change (Marino et al., 2013). The thesis is also
motivated by the lack of knowledge about changes to Drake Passage throughflow over
these timescales (McCave et al., 2013). In particular, the hypotheses surrounding the
importance of Agulhas leakage have not yet been tested or confirmed by fully coupled
Earth System Models (ESMs), likely because ESMs tend to highly overestimate the I-
AOG transport of warm Indian Ocean waters into the Atlantic (Beal et al., 2011; Weijer
et al. 2012; Völker and Köhler, 2013; Weijer and van Sebille, 2014). Climate models
also show a wide range of Drake Passage transports - only some comparable with
observational data (Russell et al., 2006) - meaning that knowledge of past climates in
the Drake Passage region is weak both in terms of proxy data and climate modelling. By
documenting the simulation of pre-industrial, LGM and millennial scale climate
changes utilising a state-of-the art ESM (The Community Earth System Model -
COSMOS), this thesis aims to advance our understanding of the I-AOG and the Drake
Passage on those timescales.
In order to do achieve these goals, the thesis will show how it was necessary to generate
a new adapted ocean grid configuration (MPIOM-AFRICA), with the intention of
simulating a reasonable I-AOG transport for the modern ocean, and thereby laying good
foundation for the simulation of past changes at the I-AOG. It becomes apparent that the
adapted model configuration also performs well in terms of simulating an improved
cold water route gateway (Drake Passage) transport, despite coarse model resolution in
that region. This provides the additional advantage of investigating the roles of both the
warm and cold water route gateways during past glacial-interglacial and millennial scale
climate changes. Particular emphasis is placed on the question of the potential active-
passive roles of the I-AOG transport (Agulhas leakage) and Drake Passage throughflow

Chapter 1. Introduction
17
in relation to past climate changes. Might the Agulhas leakage and Drake Passage
transports have been important active players in climate changes of the past? Or did
these oceanic regions simply respond passively through remote Earth system
teleconnections, from the polar regions for example? By modelling glacial-interglacial
and millennial scale changes at the I-AOG and Drake Passage, and comparing results
with proxy data, this thesis provides a new understanding of whether these ocean
gateway transports may have played active or passive roles in the changing climates of
the past.
The specific scientific objectives of this work can be summarised with three key
questions:
1. Can an adapted fully-coupled ESM be used to simulate an improved transfer of
Indian Ocean water into the Atlantic Basin?
A fundamental problem currently underlining state-of-the-art ESMs is their failure to
reproduce a realistic rate of water transport through the I-AOG via Agulhas leakage
(Beal et al., 2011; Weijer et al. 2012; Völker and Köhler, 2013; Weijer and van Sebille,
2014). Not only does the current set of ESMs fail to simulate the turbulent eddy scale
structures that dominate the region, they also overestimate the I-AOG transport
threefold. Additionally, ocean-only models, which successfully simulate the eddy-scale
dynamics of the region do not include the ocean-atmosphere processes that have a large
impact on the evolution of the climate system (Biastoch et al., 2008; Biastoch et al.,
2009; Durgadoo et al., 2013; Rühs et al., 2013). These feedbacks are essential for the
integration of climate models which simulate the climates of the past, without the
requirement of forcing from contemporary wind data. These issues have been pointed
out by a number of studies which illustrate the requirement for improved simulation of
the I-AOG in fully-coupled climate models (Caley et al., 2011, Beal et al., 2011), and
represent a key bottleneck with regards to consolidating the claims made by studies
suggesting the potential importance of Agulhas leakage on glacial-interglacial (Peeters
et al., 2004; Caley et al., 2012) and millennial timescales (Marino et al., 2013).

Chapter 1. Introduction
18
In order to deliver on this shortcoming inherent to contemporary state-of-the-art ESMs,
Chapter 3 describes the development and behaviour of an adapted ESM, where the
ocean model‘s south pole has been located over South Africa, with the intention of
improving the regional dynamics and ultimately the rate of water and salt transport
between the Indian and Atlantic oceans through the I-AOG, in what is termed Agulhas
leakage. The control configuration of the ESM (with the south pole positioned over
Antarctica) is documented in Chapter 2 (Models, materials and methodology), which
also includes a description of the adapted ocean model configuration and setup
(MPIOM-AFRICA). Chapter 3 also includes a description of the performance of the
new model configuration with regards to the simulation of Drake Passage transport, and
shows that the adapted ESM setup can be used to simulate improved I-AOG and Drake
Passage climatological mean transport rates.
2. Did the ocean transport through the warm and cold water route gateways
change on glacial-interglacial timescales, potentially playing active roles in global
climate change?
Agulhas leakage, via its passage through the I-AOG warm water route gateway, is
suggested to have behaved as an important active climate system component with
respect to glacial-interglacial transitions of the Late Pleistocene (Peeters et al., 2004;
Caley et al., 2012). However, recent studies have questioned the validity of the use of
the important planktic foraminifer Globorotalia menardii as a proxy for Agulhas
leakage (Sexton and Norris, 2011; Broecker and Pena, 2014). On the other hand, except
for McCave et al. (2013), who showed little difference between LGM and Holocene
rates of Drake Passage throughflow, little is known about the glacial-interglacial
behaviour of the cold water route gateway. Due to the lack of a sophisticated ESM
capable of simulating the I-AOG (Beal et al., 2011; Weijer et al. 2012; Völker and
Köhler, 2013; Weijer and van Sebille, 2014), and the tendency for climate models to
simulate a wide range of Drake Passage transports (30 – 330 Sv) for the modern ocean
(Russell et al., 2006), these palaeo-hypotheses have yet to be tested by climate
modelling, and remain open for investigation. Furthermore, since both the warm and
cold water routes supply the return branch of the AMOC, a hypothesis involving the

Chapter 1. Introduction
19
combined and relative roles of the I-AOG and Drake Passage ocean gateways on
glacial-interglacial timescales has not yet been proposed.
The above question is addressed in Chapter 4 where the adapted ESM configuration
presented in Chapters 2 and 3 is used to calculate the climatological mean transport
rates through the I-AOG and Drake Passage during modelled pre-industrial and LGM
climate states. The validity of the model results is addressed by performing a
comparison with both kinematic and SST proxy data at both locations. Based on these
model-data comparisons a new hypothesis for the palaeo Agulhas leakage is developed,
with potential implications for scientific leaders and policy makers alike.
3. Could either or both of the transports through the warm and cold water route
ocean gateways have actively contributed to the resumption of the AMOC to
interstadial conditions during millennial scale climate change events of the Late
Pleistocene?
Recent evidence suggests that the Agulhas leakage of warm and saline Indian Ocean
waters may have actively contributed or even controlled the resumption of the AMOC
to interstadial conditions during millennial scale climate change of the Late Pleistocene
(Marino et al., 2013). As of yet no millennial scale oceanographic data at the Drake
Passage exists to form a hypothesis over the role of the cold water route gateway over
these millennial timescales. Since both the warm and cold ocean routes supply the upper
branch of the Atlantic circulation, of particular interest to this study is the combined and
relative changes at these ocean gateways. As is the case for glacial-interglacial climate
change, these concepts have not yet been investigated by state-of-the-art fully-coupled
Earth system modelling.
In answering this question, Chapter 5 addresses the issue of the potential roles of
changing warm and cold water route gateway transports on the resumption of the
AMOC during millennial climate change by using the adapted ESM presented in
Chapter 3. North Atlantic freshwater perturbations, regularly used to mimic DO events
associated with Heinrich stadials (Ganopolski and Rahmstorf, 2001; Knorr and

Chapter 1. Introduction
20
Lohmann, 2007), are performed on both pre-industrial and LGM climate states. It is
considered necessary to conduct the transient freshwater experiments on both climate
states so to assess whether the background climate configuration can modulate the
system response at the I-AOG and Drake Passage. The transient response at the ocean
gateways during the processes of freshwater introduction and removal is investigated
and the results are compared with both existing and new proxy data, with some
surprising conclusions.
A summary of the main results and conclusions of this thesis is provided in Chapter 6,
alongside a new hypothesis for the palaeo Agulhas leakage. Additionally in that chapter
some persisting problems in our understanding of the warm and cold water routes and
the roles which they may have played during past climate changes are discussed in a
section dedicated to future work.

Chapter 2. Models, materials, and methodology
21
2. Models, materials, and methodology
The aim of this chapter is to describe the climate models, sediment core proxy data, and
methodology utilised throughout the PhD project. The Community Earth System Model
(COSMOS), and its ocean (MPIOM), atmosphere (ECHAM5) and land surface
(JSBACH) components are described in detail. An adapted ocean model configuration
(MPIOM-AFRICA), used throughout the PhD project, is also presented. The regional
and sedimentary setting of a marine sediment core used to acquire new palaeo proxy
data at the entrance to the Strait of Magellan, at the Drake Passage, is also described.
Additionally, the chapter provides a general overview of the computer facilities,
software and techniques used throughout the project.
2.1 Models
2.1.1 The Community Earth System Model (COSMOS)
The research conducted and documented in this thesis was largely carried out using the
Community Earth System Model, abbreviated by the acronym COSMOS (Jungclaus et
al., 2006a, Stepanek and Lohmann, 2012). COSMOS was chiefly developed by the Max
Planck Institute for Meteorology (MPI) in Hamburg, Germany. This Earth System
Model (ESM) includes the MPIOM ocean model, the ECHAM5 atmospheric model,
and the JSBACH land surface and vegetation model (Figure 2.1). The atmosphere and
vegetation components are coupled to the ocean model via the OASIS3 model coupler,
which passes information (an exchange of fluxes of energy, momentum and mass)
between the atmosphere and the ocean, once per model day. Details of the coupling are
provided by Jungclaus et al. (2006a). The coupled control model configuration
(MPIOM-ECHAM5-JSBACH) is well established, having previously been utilised to
simulate pre-industrial (Wei et al., 2012), Holocene (Wei and Lohmann, 2012), LGM
(Zhang et al., 2013) and deep-time Palaeo-climate scenarios (Stepanek and Lohmann,
2012; Knorr et al., 2011).

Chapter 2. Models, materials, and methodology
22
Two versions of COSMOS were used to conduct the research presented in this thesis: (i)
the well-established pre-existing version which uses the control configuration of the
ocean component (hereafter MPIOM-CTRL), and (ii) a new version which utilises an
adapted configuration of the MPIOM ocean component (hereafter MPIOM-AFRICA -
see below). MPIOM-AFRICA differs from MPIOM-CTRL in that the model‘s south
pole is located over South Africa, aiming to improve the water transport rate through the
Indian-Atlantic Ocean Gateway (I-AOG) (see Chapter 3 for results).
Figure 2.1 Schematic of COSMOS demonstrating the model‘s fully-coupled capabilities. The MPIOM
(ocean), ECHAM5 (atmosphere), JSBACH (vegetation-weathering above) model components were used
in conjunction with the OASIS coupler in order to conduct the research which is documented in this
thesis. Two versions of the MPIOM ocean model were used: MPIOM-CTRL and MPIOM-AFRICA. Ice-
sheets were prescribed rather than dynamic.
2.1.2 The Max Plank Institute Ocean Model (MPIOM)
The MPIOM is a hydrostatic, free surface, Boussinesq, primitive equation ocean and sea
ice model (Marsland et al., 2003; Jungclaus et al., 2006a; Stepanek and Lohmann,
2012).The control version of MPIOM (MPIOM-CTRL) is structured on a bipolar,
orthogonal, curvilinear grid with poles located over Greenland and Antarctica (Figure
2.2). The advantage of this configuration is to position the locations of maximum model
resolution at the deep water formation sites located in the North Atlantic and around
Antarctica. Locations of higher model resolution typically provide a better simulation of

Chapter 2. Models, materials, and methodology
23
the physical processes which describe ocean dynamics. The model dynamics are solved
on an Arakawa C-grid (Arakawa and Lamb, 1977).
MPIOM has a horizontal resolution of 3.0º×1.8º, with the vertical dimension split into
forty unevenly spaced z-coordinate model levels. The purpose of the unevenly spaced
layers is to ensure that the upper levels are better resolved than lower abyssal levels.
Ocean bathymetry is resolved on partial grid cells (Marsland et al., 2003) and defined
by a global dataset of ocean depth. Flow near the bottom boundary is parameterised by
a bottom boundary layer scheme in a similar way as that described by Beckmann and
Döscher (1997), Lohmann (1998), and Legutke and Maier-Reimer (2002).
Eddy-induced mixing is parameterized in accordance with Gent et al. (1995).
Additionally, an isopycnal diffusion scheme for sub-grid scale mixing is utilised
(Marsland et al., 2003). Ocean convective overturning is implemented by increasing the
rate of vertical diffusion (Jungclaus et al., 2006a). MPIOM also includes a dynamic-
thermodynamic sea ice model, based on the work by Hibler (1979), which simulates the
distribution and thickness of sea ice, responding dynamically to ocean temperature
feedbacks. Ocean and atmosphere are coupled via the Ocean-Atmosphere-Sea Ice-Soil
OASIS3 coupler (Valcke et al., 2003). Once per model day, OASIS3 performs an
exchange of fluxes of energy, momentum and mass between the atmosphere and ocean
model Jungclaus et al. (2006a). The model is run at a time step of 8640 s.

Chapter 2. Models, materials, and methodology
24
Figure 2.2 Land-sea distribution of the ocean model grid for MPIOM-CTRL pre-industrial configuration.
There are two grid poles (white areas) that are located over Greenland and Antarctica. The nominal grid
resolution of 3.0° × 1.8° of the 122 × 101 grid varies - high in polar regions and highest around
Greenland.
2.1.3 The MPIOM-AFRICA configuration
The adapted ocean model configuration which is documented throughout this thesis is
called MPIOM-AFRICA. The model is run with pre-industrial and Last Glacial
Maximum (LGM) boundary conditions. MPIOM-AFRICA is characterised by the same
criteria as MPIOM-CTRL, with the exception of one key difference: MPIOM-
AFRICA‘s poles are positioned over Greenland and South Africa, rather than Greenland
and Antarctica (Figure 2.3). The model is adapted in this way so to increase resolution
in the Agulhas region and the South Atlantic. Grid cell size in this region is reduced
from ~200km in the standard MPIOM-CTRL grid configuration to ~40 km in the
MPIOM-AFRICA grid setup.
The intention of the MPIOM-AFRICA grid configuration is to improve the simulated
transport rate of water from the Indian to Atlantic oceans (through the I-AOG). The
reasoning for this ocean model adaptation is based on the recent realisation that the
current generation of global climate models does not sufficiently resolve the dynamics
of the Agulhas region. These ESMs usually simulate an overly viscous Agulhas Current

Chapter 2. Models, materials, and methodology
25
and viscous boundary layer transport of Agulhas leakage into the Atlantic Ocean
(Dijkstra and de Ruijter, 2001), which can be up to three times overestimated (Weijer et
al. 2011; Völker and Köhler, 2013). Resolution in the region of the Drake Passage using
the MPIOM-AFRICA configuration corresponds to a grid cell size of ~250 km.
MPIOM-AFRICA is utilised within the COSMOS framework, becoming a component
of the fully-coupled ocean-atmosphere-land surface ESM. It should be noted that the
atmospheric ECHAM5 and land-surface JSBACH components associated with coupling
to MPIOM are identical in the model setups MPIOM-CTRL and MPIOM-AFRICA. A
detailed discussion of the performance of MPIOM-AFRICA is included in Chapter 3.
Figure 2.3. Initial land-sea distribution for the ocean model grid for the MPIOM-AFRICA pre-industrial
configuration. There are two grid poles (white areas) which are located over Greenland and Antarctica.
The nominal grid resolution of 3.0° × 1.8° of the 122 × 101 grid varies with highest model resolution
around Greenland and the Agulhas system south of Arica. Based on this initial grid generation continents
were modified to incorporate important features; the Red Sea and the Antarctic Peninsula for example.
2.1.4 The ECHAM5 Atmospheric model
The ECHAM5 atmospheric model has been adapted as a climate model component
from the weather forecasting model of the European Centre for Medium-Range Weather
Forecasts (ECMWF), and is described in detail by Roeckner et al. (2003). The model is
based on a spectral dynamical core and simulates the troposphere and the lower

Chapter 2. Models, materials, and methodology
26
stratosphere up to a pressure level of 102 Pa. The results in this thesis are based on
simulations using ECHAM5 in T31/L19 resolution, meaning there are 19 levels, and
triangular truncation of the series of spherical harmonics operates at wave number 31.
The vertical dimension is organised on a hybrid sigma-pressure-level system. The
horizontal resolution is ~3.75º ×3.75º and the time step of the atmosphere simulation is
2400 s.
ECHAM5 uses a semi-implicit time scheme for solving the equations of surface
pressure, temperature, and divergence. A semi-Lagrangian scheme (Lin and Rood,
1996) is used for passive tracer transport. The model diagnoses Stratiform clouds using
schemes for statistical cloud cover and microphysics. A mass flux scheme is utilised to
simulate cumulus convection. The prognostic equations for water in the fluid, gas and
solid phases are also considered (Roeckner et al., 2003). The lower boundary condition
for the atmosphere is defined by the orography and surface geopotential. Subgrid-scale
orographic effects are included using a parameterisation scheme, described by Lott and
Miller (1997) and Lott (1999). The scheme relies on the orographic elevation, slope,
anisotropy and orientation, as well as the height of orographic peaks and valleys
(Roeckner et al., 2003).
Energy input into the Earth system via insolation at the top of the atmosphere is
calculated taking into account the prescribed orbital parameters of obliquity,
eccentricity, length of the perihelion (equivalent to the precession parameter – or
precession of the equinoxes), and the solar constant (e.g. Berger, 1978). The solar
constant in ECHAM5 is set to the pre-industrial value of 1367Wm−2
. Calculation of
radiative transfer toward the Earth‘s surface is performed using the vertical profiles of
liquid and solid forms of water. The atmospheric model includes variables for cloud
water, ice and water vapour, as well as cloud cover (Roeckner et al., 2003). Adjustable
atmospheric (trace) gases include carbon dioxide, methane, ozone, nitrous dioxide, and
chlorofluorocarbons. Aerosols are prescribed according to the climatology described by
Tanré et al. (1984). In order to calculate the energy budget at the surface, the albedo of
each grid cell is calculated from a combination of prescribed present-day soil, snow and
vegetation albedos.

Chapter 2. Models, materials, and methodology
27
A high-resolution (0.5º×0.5º) hydrological discharge model, documented by Hagemann
and Dümenil (1997) and Hagemann and Gates (2003), is also included in the ECHAM5
model component. This model simulates the movement and retention of water flow over
land. Flow is separated into overland flow, base flow, and river flow. The sum over
these quantities constitutes the continental river runoff at each grid cell, thereby closing
the hydrological cycle (Hagemann and Dümenil, 1998b). The hydrological discharge
model ensures that water flowing into water-sinks over land is redistributed to the
ocean. The continental ice sheets in the COSMOS configuration discussed throughout
this thesis are not dynamic, rather prescribed using ETOPO5 5-minute gridded elevation
data. Precipitation over glacier cells is therefore transferred to adjacent ocean points
rather than being accumulated as ice volume. Data exchange and feedback between the
coarse atmosphere grid and the high resolution hydrological discharge model is
performed via an interpolation scheme. In stand-alone mode, the ECHAM5 atmospheric
model is forced by climatological monthly means of sea surface temperature (SST) and
sea ice concentration. For the experiments documented in this thesis ECHAM5 is run in
coupled mode, as a component of COSMOS.
Figure 2.4 River directions in the hydrological model of ECHAM5 (0.5º ×0.5º) for the pre-industrial
MPIOM-CTRL simulation, from Stepanek and Lohmann, (2012). The colours indicate the flow direction
at each grid point, ocean is indicated by white. In addition to the four main and diagonal directions, dark
blue (O) marks grid cells where the water flow is directly into the ocean (coastal grid points).

Chapter 2. Models, materials, and methodology
28
2.1.5 The JSBACH land surface and vegetation model
The JSBACH land surface and vegetation model is an extension of the ECHAM5
model. A complete description of JSBACH is provided by Raddatz et al. (2007).
JSBACH includes thirteen different plant functional types (PFTs), of which eight have
been in used for the model simulations described in this thesis. These PFTs include
different types of deciduous and evergreen trees, shrubs and grasses (Figure 2.5). A
distinct advantage of the dynamic JSBACH model is that it is capable of simulating
dynamic changes in the vegetation distribution, responding to changing climate
conditions (Brovkin et al., 2009). JSBACH runs at the same horizontal resolution as
ECHAM5 and utilises identical boundary conditions, including a fixed soil-type
distribution and water storage capacity. The coupling between land surface and
atmosphere is performed using an implicit scheme described by Schulz et al. (2001).
Albedo values in the infrared and visible parts of the spectrum are defined separately for
soil and vegetation, which allows JSBACH to adjust the surface albedo in cases where
changes in the vegetation cover are prescribed. The state of the land surface is initialised
with global distributions of leaf area index, snow cover, and soil wetness, as well as a
surface temperature climatology which is also utilised by ECHAM5.

Chapter 2. Models, materials, and methodology
29
Figure 2.5 Grass fraction vegetation forcing for the pre-industrial control simulation, from Stepanek and
Lohmann, (2012). The grass fraction is calculated for each grid cell by summing over the contributing
PFTs in the JSBACH vegetation forcing. The grass fraction includes shrubs, tundra, C3, and C4 grasses,
i.e. JSBACH PFTs 5, 6, 7 and 8.
2.1.6 NEC SX8-R supercomputing facilities
The instance of COSMOS utilised for the work presented in this thesis was developed
by the Palaeoclimate Dynamics working group at the Alfred Wegener Institute,
Helmholtz Centre for Polar and Marine Research (AWI), in Bremerhaven, Germany
(e.g. Stepanek and Lohmann, 2012). COSMOS is run on the NEC SX8-R
supercomputer which is dedicated to climate and ocean research at the AWI. The NEC
SX8-R began operation in 2007 and consists of 14 compute nodes each employing 8
SX-8R processors. The supercomputer contains 112 vector cores and peak-performance
is estimated at 3.94 Teraflops. The batch system NQSII used on this machine is
supported by a graphical monitoring LLview support application. LLview is a client-
server based application which allows the monitoring and utilisation of clusters
controlled by batch systems. Due to the open-source nature of LLview and its modular
Chapter 2. Models, materials, and methodology
30
architecture, adding support for a new batch system is simplified and also welcomed by
the community.
COSMOS is run on the NEC SX8-R via the submission of tasks, specifically by the
execution of project run files. Output files for MPIOM, ECHAM5, and JSBACH, are
generated and post-processed after each model year. A typical fully-coupled model year
takes approximately 30 minutes to simulate and post-process the data. This implies that
an equilibrium simulation of ~4000 years, such as the pre-industrial and LGM climate
states presented in this thesis, takes a theoretical minimum of ~80 real world days.
2.2 Materials
A number of model-data comparisons are conducted throughout this thesis. Proxy data
is either referenced or extracted from pre-existing literature (e.g. the model-data SST
comparisons conducted in Chapter 4). In those cases the text is suitably referenced for
clarity. In addition to the pre-existing data and literature, the thesis also documents new
proxy data from a core site at the entrance to the Drake Passage.
2.2.1 Proxy data in the region of the Drake Passage
Sediment core MD07-3128 has been recovered from the mid-depth continental slope off
the Pacific entrance to the Strait of Magellan, below the Cape Horn Current (CHC)
(52°40‘S, 75°34‘W; 1,032 m water depth) (Figure 2.6) (Lamy et al., in preparation). The
CHC originates in the ACC through Subantarctic surface water, which flows
northeastward across the Southeast Pacific after crossing the East Pacific Rise towards
the Chilean margin at ~40°S (Chaigneau and Pizarro, 2005) (Figure 2.6). At this flow
bifurcation point, a minor fraction joins with the South Pacific Current (SPC) as the
southern limb of the South Pacific Gyre (Chaigneau and Pizarro, 2005) and moves
northward into the Humboldt Current system. The largest component flow is directed
south into the CHC and through the Drake Passage (Strub et al., 1998). The CHC and
the underlying water masses provide a major fraction of the present day Drake Passage

Chapter 2. Models, materials, and methodology
31
transport reaching locally more than 50% of the total 134 ± 11 Sv (Cunningham et al.,
2003) throughflow in its northern sector (Well et al., 2003).
Figure 2.6 Schematic view of the Pacific entrance of the northern Drake Passage including the location of
Chilean margin sites MD07-3128 and ODP 1233, from Lamy et al., (in preparation). ACC=Antarctic
Circumpolar Current; SPC=South Pacific Current; PCC=Peru Chile Current (Humboldt Current);
CHC=Cape Horn Current; AAIW=Antarctic Intermediate Water.
The proxy data presented in this thesis is derived from the ~30 m long MD07-3128
sediment core. The core is well-dated and spans the past ~65 kyr BP (Lamy et al., in
preparation). High sedimentation rates during most of the glacial section provide the
unique opportunity to study climate and ocean changes at millennial-scale timescales in
the Drake Passage region. The data is also useful for comparing glacial and Holocene
oceanographic changes. Previous work on this core revealed substantial SST
fluctuations that largely follow the timing of temperature fluctuations from Antarctic
ice-cores (Caniupan et al, 2011). In order to reconstruct variations in the strength of the
CHC, changes in grain-size properties and major element concentrations were used. The
most direct current strength proxies are fine sand contents and the mean sortable silt
grain-size (SSmean) of the terrigenous fraction (both measured on the opal, organic
carbon, and carbonate-free sediment). SSmean is a commonly used proxy for bottom-

Chapter 2. Models, materials, and methodology
32
current flow speed in deep sea sediments (McCave and Hall, 2006). Results from this
sediment core are presented in chapters 4 and 5 of this thesis.
2.3 Methodology
2.3.1 Pre-industrial boundary conditions
Two fully coupled pre-industrial COSMOS configurations (MPIOM-CTRL and
MPIOM-AFRICA) are described in this thesis. The ocean bathymetry and land-sea
mask have been generated from the Earth Topography Five Minute Grid (ETOPO5,
National Geophysical Data Center 1988; see Jungclaus et al., 2006a). Uniform and
constant atmospheric gas volume mixing ratios of 280 ppm carbon dioxide (CO2), 270
ppb nitrous oxide (N20), and 760 ppb methane (CH4) are applied. Chlorofluorocarbons
are not included. Height-latitude profiles of ozone are prescribed according to a
climatology based on ozone observations (Paul et al., 1998). The Earth‘s orbit is
prescribed by constant values of obliquity (23.446º), eccentricity (0.016724), and length
of the perihelion (282.04º). The vegetation in the pre-industrial control simulation
evolves freely as simulated by the dynamic vegetation JSBACH module.
Initial climatological snow cover in ECHAM5 is taken from an earlier atmosphere
simulation. Soil data flags are prescribed using a data set described by Henderson-
Sellers et al. (1986). A data set of orography-related parameters, used in a
parameterisation scheme for the influence of subgrid-scale orographic effects on the
surface roughness length, is described by Roeckner et al. (2003). The included
parameters, standard deviation of orography, its orientation and slope, have been
derived from topographic gradients relationships (Baines and Palmer, 1990), applied to
a highly-resolved present day orography. Other boundary conditions are taken from a
land surface parameters acquired from a global distribution of major ecosystems
(Hagemann et al., 1999; Hagemann, 2002). This data set includes global distributions of
land ice, vegetation ratio, forest fraction, leaf area index, soil albedo, field capacity of
soil and land-sea-distribution. After ~4000 years of time integration of both model

Chapter 2. Models, materials, and methodology
33
configurations, the last 100 years are taken as pre-industrial climatological mean for
analysis.
2.3.2 LGM boundary conditions
LGM boundary conditions are adopted from the PMIP3 (Palaeo Modelling
Intercomparison Project 3) protocol (available at http://pmip3.lsce.ipsl.fr/). As for the
pre-industrial case both COSMOS configurations (MPIOM-CTRL and MPIOM-
AFRICA) are used. A sea level reduction of 116 m with respect to the pre-industrial
levels and the associated LGM ice sheets (Laurentide, Fennoscandian and Antarctic) are
applied. Greenhouse gas concentrations were set to conditions at the LGM (CO2 = 185
ppm; N2O = 200 ppb; CH4 =350 ppb). Due to the presence of large continental ice
sheets, which reduces the volume of water in the ocean (and therefore sea-level), a
salinity value of 1 psu is added uniformly to the global ocean. LGM river run-off routes
in the hydrological discharge model are adapted to the palaeo-orography. Due to the sea
level drop of 116 m, the Bering Strait is closed. After ~4000 years of time integration of
both model configurations, the last 100 years are taken as LGM climatological mean for
analysis. The LGM simulation employing MPIOM-CTRL is documented by Zhang et
al. (2013).
2.3.3 Freshwater perturbation
Chapter 5 documents the use of freshwater perturbation experiments for the simulation
of weak AMOC states assumed to be associated with Heinrich events of the Late
Pleistocene (Ganopolski and Rahmstorf, 2001; Knorr and Lohmann, 2007). In order to
conduct these experiments, the MPIOM-AFRICA source code (written in Fortran) was
adjusted to introduce an artificial freshwater anomaly. Freshwater perturbations of
magnitude 0.2 Sv were applied across the North Atlantic Ice Rafted Detritus (IRD) belt
around 40ºN-55ºN, 45ºW-20ºW (Hemming, 2004; Gong et al., 2013). The value of 0.2
Sv was selected in order to be consistent with Gong et al., (2013) who also utilised
COSMOS (MPIOM-CTRL). It should be noted that a range of other studies (e.g.
Rahmstorf, 1996) have assessed the ocean response to variable rates of freshwater

Chapter 2. Models, materials, and methodology
34
perturbation, but this was deemed to be beyond the scope of this project.
2.3.4 Eulerian calculation of ocean water and salt transports
In order to estimate the water transport through both the I-AOG and the Drake Passage,
an Eulerian method with the following relationship was employed (adapted from
Lohmann (2003)):
T G=∫−h
0
ῡdz
, where TG is the gateway transport, ῡ denotes meridionally averaged velocity and z,
depth. For the cold water route gateway a Drake Passage section at 77°W between 54°S
and 64°S, encompassing the entire gateway between Chile and the Antarctic Peninsula,
was specified. The integration included the full water column across the section i.e.
from -h to 0. For the warm water route gateway the I-AOG was specified as the
westward zonal velocities above a water depth of 1000 m at 19°E between 34°S and
38°S (directly south of Africa). This criterion ensured that no eastward flowing waters
either beneath the Agulhas leakage (partly comprising the Agulhas Undercurrent), or in
the surface/near-surface, that might be driven by the Southern Hemisphere westerlies,
were included in the estimates. Additionally, since the MPIOM model is non-eddy
resolving (even utilising the AFRICA configuration), the problem of eddy recirculation
back across the measurement section was not incurred. The Agulhas retroflection in this
model configuration is simulated as a direct transport (about 30ºEat the surface) into the
viscous flow regime of the ACC (Figure A.2 in the Appendix).
Salt transports through the I-AOG and the Drake Passage sections were estimated by
multiplying the volume transport by the average salinity across each respective section.
Utilising the approximation that 1 psu is equal to 1 gl-1
, and that 1 m3
contains 1000 l of
water, the salt transport is estimated in kg/s.

Chapter 2. Models, materials, and methodology
35
2.3.5 Rotation of velocity vectors
A problem inherent to the MPIOM ocean model, which is a consequence of the utilised
curvilinear grid, is that the direction of velocity vectors in close proximity to the poles is
falsely rotated by up to 90º. The rate of artificial vector re-direction falls off with
distance from the poles. This implies that any calculation of ocean velocity, or volume
transport (see section 2.3.4), based on the unadjusted ocean velocities will be incorrect.
In order to solve the problem, a Matlab script was written which performs a geometric
adjustment, rotating the modelled velocities and thus allowing accurate calculation of
ocean gateway transports.
2.3.6 Software
A large range of computer software was used throughout this PhD project. Data analysis
was performed using ncview, for viewing netCDF file formats, and the Climate Data
Operators (CDO) command line suite for manipulating and analysing climate data.
Plotting and figure generation was conducted with Matlab, Grads, Panoply, and Python.
Fortran was also required in order to reconfigure and recompile the ocean model, for
example to include a freshwater perturbation in the North Atlantic - Chapter 5. A
combination of Linux, Mac, and Windows operating systems were utilised.

Chapter 3. An adapted Earth System Model for the improved simulation of the I-AOG
36
3. An adapted Earth System Model for the
improved simulation of the I-AOG
3.1. Introduction
The Indian-Atlantic Ocean Gateway (I-AOG) and Drake Passage are considered key
gateways along the ocean's warm and cold water return routes. However, the simulation
of realistic transport rates through these gateways, particularly the I-AOG, using climate
modelling has remained a challenge (Rusell et al., 2006; Weijer and van Sebille, 2014).
Eddy-resolving ocean models which simulate more realistic ocean gateway transports
lack the dynamic atmospheric and land-surface feedbacks which are provided for by
fully-coupled Earth system modelling (Biastoch et al., 2009; Biastoch and Böning,
2013; Durgadoo et al., 2013; Rühs et al., 2013). Additionally, eddy-resolving ocean
models also suffer from an inherent high computational cost, meaning they do not have
the capability to perform the long timescale simulations required for palaeoclimate
modelling (usually a minimum of 4000 model years).
The I-AOG off the southern tip of Africa is regarded as an important location in the
global ocean system, where relatively warm and saline Indian Ocean waters are
transported into the Atlantic Basin via Agulhas leakage (Gordon, 1986; De Ruijter et al.,
1999; Beal et al., 2011). The leakage itself is dominated by non-linear dynamics which
result in a flow of rings, eddies and filaments into the Atlantic Ocean (Figure 3.1). Since
high-resolution models are required in order to resolve relatively small-scale ocean
features, the entire Agulhas system has remained difficult to simulate using the typically
coarse resolution ocean models used for palaeoclimate simulations (Knorr and
Lohmann, 2003). State-of-the-art ESMs tend to simulate an overly viscous Agulhas
Current, restricting the formation of the Agulhas retroflection and the ring shedding
process, resulting in a viscous boundary layer transport of Agulhas leakage into the
Atlantic Ocean (Dijkstra and de Ruijter, 2001). The Indian-Atlantic transport simulated
in these models can be as much as three times overestimated (Weijer et al. 2012; Völker
and Köhler, 2013; Weijer and van Sebille, 2014) (Figure 3.2).

Chapter 3. An adapted Earth System Model for the improved simulation of the I-AOG
37
Initial attempts to model the Agulhas system and associated I-AOG transports were
documented by Dijkstra and de Ruijter (2001) and Weijer et al. (2002). Knorr and
Lohmann, (2003) used an ocean circulation model to simulate the last deglacial period,
showing that an increase in I-AOG transport may have played an integral part of the
glacial termination process. In recent years, high-resolution stand-alone ocean models
have been very successful in simulating the complex dynamics of the Agulhas system
(Biastoch et al., 2008; Biastoch et al., 2009; Biastoch and Böning, 2013; Durgadoo et
al., 2013; Rühs et al., 2013) (Figure 3.1). However, so far, fully coupled ESMs not only
fail to simulate the non-linear turbulent eddy structures associated with the formation of
Agulhas rings, but more importantly, they drastically overestimate the rate of I-AOG
transport (Weijer et al. 2012; Völker and Köhler, 2013; Weijer and van Sebille, 2014).
Figure 3.1 Snapshot of a high-resolution model nested in the global, coarse resolution model, from
Biastoch et al. (2008). Shown are speeds (5-day average around 12 Feb 1969) at 100 m depth (in m s_1).
The geographic locations of the bights of Beira (B), Delagoa (D) and Natal (N) are shown as are the
circulation features Agulhas Current (AC), Agulhas Ring (AR), Agulhas Return Current (ARC), East
Madagascar Current (EMC), eddies of the South Indian Counter Current (SICC), Mozambique Eddy
(ME) and Natal Pulse (NP).

Chapter 3. An adapted Earth System Model for the improved simulation of the I-AOG
38
Figure 3.2 Dependency of Agulhas leakage on the amplitude of the Southern Hemisphere westerly wind
shift, after Völker and Köhler (2013). Agulhas leakage is overestimated in the model, simulated as ~60 Sv
in the climatological mean without artificial wind shifts.
On the other hand much less attention has been focused on the ocean transport through
the Drake Passage, between the southern tip of South America and the Antarctic
Peninsula. Although high-resolution global eddy resolving ocean models are now in
operation (e.g. Deshayes et al., 2013), the Drake Passage ocean gateway has been
considered to be of lesser significance than the I-AOG, possibly relating to the
suggested importance of Agulhas leakage on glacial-interglacial timescales of the Late
Pleistocene (Knorr and Lohmann, 2003; Peeters et al., 2004). State-of-the-art ESMs,
which utilise relatively coarse ocean model components, and do not simulate the small-
scale eddy structures at the I-AOG, also do not reveal similar ocean phenomena at the
Drake Passage (Russell et al., 2006). Rather, a viscous transport associated with the
Antarctic Circumpolar Current (ACC) is simulated (Figures 3.7 and 3.8). A range of
Drake Passage transport estimates are documented by modelling studies (Russell et al.,
2006), including some which show reasonable agreement with observational data
(Völker and Köhler, 2013, Figure 3.3). Other models overestimate the Drake Passage
throughflow. For example, the control configuration of COSMOS (MPIOM-CTRL, see
section 3.1.1), which is adapted in this study, simulates a Drake Passage transport of

Chapter 3. An adapted Earth System Model for the improved simulation of the I-AOG
39
~245.4 ± 4.2 Sv, overestimated by ~100 Sv (Cunningham et al., 2003).
Figure 3.3 Dependency of Drake Passage throughflow on the amplitude of the Southern Hemisphere
westerly wind shift, after Völker and Köhler, (2013).. Throughflow is simulated as ~150 Sv in the
climatological mean without wind shifts. The simulated 150Sv is in reasonable agreement with
observational data which suggests a throughflow of 134 ± 11.2 Sv (Cunningham et al.,, 2003).
3.1.1. Study Approach
Stand-alone ocean models that are designed specifically for the simulation of the
modern ocean can utilise prescribed wind field forcing acquired from data reanalysis
methodologies. However, for palaeoclimate simulations it is typically more essential to
utilise fully-coupled models with interacting ocean and atmosphere components.
Moreover, an improvement of the simulation of present-day I-AOG and Drake Passage
transports in these models is required before the application of boundary conditions
representative of past climates can be conducted. For example, in the context of the
ocean‘s warm and cold water route gateways, little is achieved by applying glacial
boundary conditions to the current state-of-the-art fully-coupled ESMs which, when
integrated using their control configurations, drastically overestimate the I-AOG
transport, and often misrepresent the Drake Passage throughflow (Russell et al., 2006).
Therefore, in order to investigate rates of I-AOG and Drake Passage transports under
past climate conditions it is first important to simulate realistic mean gateway transports

Chapter 3. An adapted Earth System Model for the improved simulation of the I-AOG
40
for the modern ocean.
Here a state-of-the-art fully coupled ESM (COSMOS), including an adapted ocean
model configuration (MPIOM-AFRICA), is employed with the primary intention of
simulating an improved I-AOG transport (see also Chapter 2 for full details on the
model configuration). The I-AOG transport simulated by COSMOS without an adapted
ocean model (MPIOM-CTRL) is misrepresented at 46.1 ± 2.3 Sv. This modelled
transport rate is overestimated compared to ocean observational data which measures
the I-AOG transport (Agulhas leakage) at ~15 Sv (Richardson, 2007). The adapted
model configuration (MPIOM-AFRICA) is therefore intended to provide a useful
platform for the investigation of changes at the I-AOG in palaeoclimate simulations.
Any improvements at the Drake Passage are considered an advantage, which would also
allow an assessment of the palaeo cold water route gateway. The development of the
adapted model aims to represent a significant step forward in the field of palaeoclimate
modelling and our understanding of the past.
3.2. Results and Discussion
3.2.1 Pre-industrial simulation
The MPIOM ocean model‘s Gent-McWilliams diffusion coefficients, which provide an
indication of modelled eddy parameterization, are shown in Figures 3.4 and 3.5 for
MPIOM-AFRICA and MPIOM-CTRL, respectively. The diffusion coefficients are also
indicative of ocean grid resolution, with smallest (largest) values in the most highly
(coarsely) resolved regions. Highest grid resolution exists around the model poles,
approximately 50km in the regions of Greenland and the Agulhas system (MPIOM-
AFRICA). The grid resolution achieved with MPIOM is therefore not sufficient to
resolve small-scale turbulent eddy structures. For example, agrid resolution of ~20km is
required for the simulation of Agulhas rings (Biastoch et al., 2008). However, the
MPIOM resolution is on the boundary of being eddy permitting. At the Drake Passage
MPIOM-AFRICA utilises a grid cell size of ~250km, a factor of five times coarser than
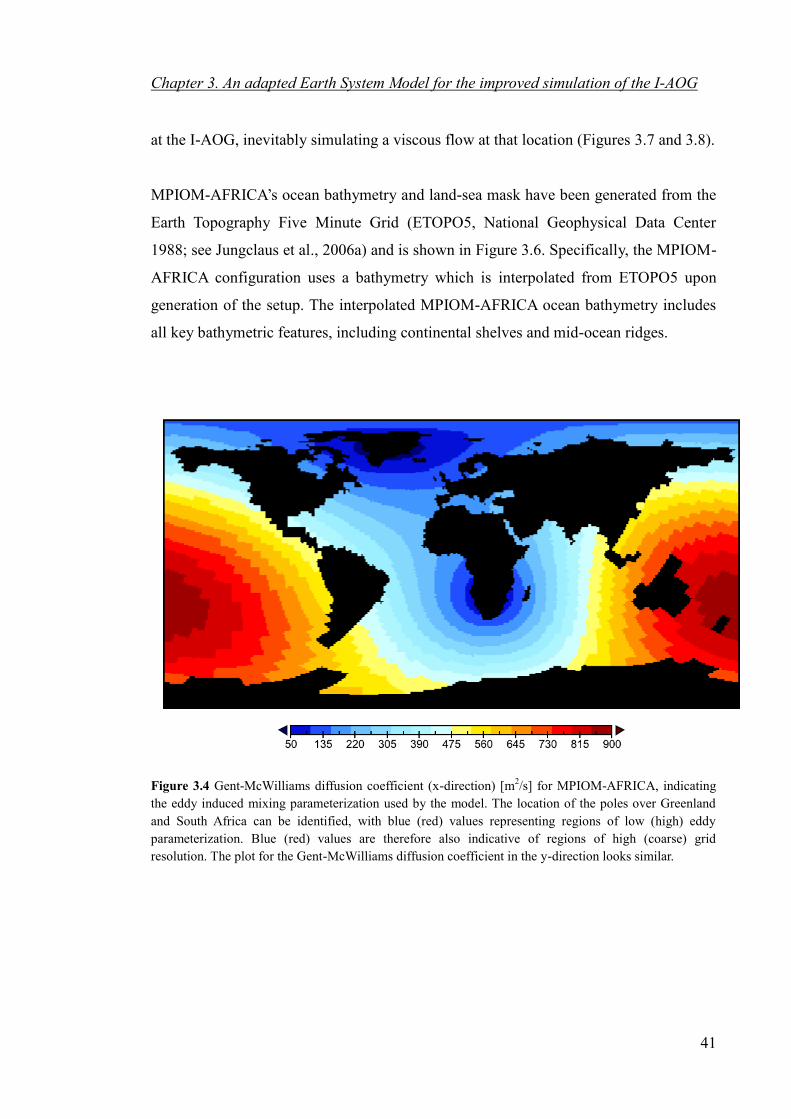
Chapter 3. An adapted Earth System Model for the improved simulation of the I-AOG
41
at the I-AOG, inevitably simulating a viscous flow at that location (Figures 3.7 and 3.8).
MPIOM-AFRICA‘s ocean bathymetry and land-sea mask have been generated from the
Earth Topography Five Minute Grid (ETOPO5, National Geophysical Data Center
1988; see Jungclaus et al., 2006a) and is shown in Figure 3.6. Specifically, the MPIOM-
AFRICA configuration uses a bathymetry which is interpolated from ETOPO5 upon
generation of the setup. The interpolated MPIOM-AFRICA ocean bathymetry includes
all key bathymetric features, including continental shelves and mid-ocean ridges.
Figure 3.4 Gent-McWilliams diffusion coefficient (x-direction) [m2/s] for MPIOM-AFRICA, indicating
the eddy induced mixing parameterization used by the model. The location of the poles over Greenland
and South Africa can be identified, with blue (red) values representing regions of low (high) eddy
parameterization. Blue (red) values are therefore also indicative of regions of high (coarse) grid
resolution. The plot for the Gent-McWilliams diffusion coefficient in the y-direction looks similar.

Chapter 3. An adapted Earth System Model for the improved simulation of the I-AOG
42
Figure 3.5 Gent-McWilliams diffusion coefficient (x-direction) [m
2/s] for MPIOM-CTRL, indicating the
eddy induced mixing parameterization used by the model. The poles are located over Greenland and
Antarctica, with blue (red) values representing regions of low (high) eddy parameterization. Blue (red)
values are therefore also indicative of regions of high (coarse) grid resolution. The plot for the Gent-
McWilliams diffusion coefficient in the y-direction looks similar.
Figure 3.6 Ocean bathymetry (depth in m) for the MPIOM-AFRICA configuration. The bathymetry is
based on an interpolation procedure which takes place during the generation of the model configuration,
using MPIOM-CTRL as a template. The bathymetry is based on the Earth Topography Five Minute Grid
(ETOPO5) (Jungclaus et al, 2006a).

Chapter 3. An adapted Earth System Model for the improved simulation of the I-AOG
43
3.2.1.1 I-AOG and Drake Passage transports and ocean circulation
The MPIOM-AFRICA pre-industrial simulation was integrated for 4000 years and the
final 100 years utilised as a climatological mean (see Chapter 2). After 4000 years of
simulation all model components, including the deep ocean, are in a state of equilibrium
and do not drift. All results onwards in Chapter 3 represent the 100 year climatological
annual mean, unless otherwise stated.
The MPIOM-AFRICA and MPIOM-CTRL gateway water transports across the I-AOG
and the Drake Passage were calculated using an Eulerian method (Chapter 2) and are
presented in Table 3.1. Adopting the MPIOM-AFRICA configuration a climatological
mean I-AOG transport of 18.4 ± 1.6 Sv was simulated. This volumetric flow-rate is an
improvement on the 46.1 ± 2.3 Sv calculated using the MPIOM-CTRL simulation, and
is in reasonable agreement with observations as well as other high-resolution ocean
model results (Richardson, 2007, Biastoch et al., 2008; Biastoch et al., 2009; Durgadoo
et al., 2013; Rühs et al., 2013).
Regarding the Drake Passage throughflow, the MPIOM-AFRICA configuration
simulates a climatological mean transport of 111.4 ± 7.2 Sv (Table 3.1). This calculated
transport is some 17% lower than an observationally estimated throughflow of 134 ±
11.2 Sv (Cunningham et al., 2003), but a much better approximation than the 245.4 ±
4.2 Sv simulated using the MPIOM-CTRL configuration. The improvement of the
Drake Passage transport in MPIOM-AFRICA, despite a lower model grid resolution in
the region, is likely due to the increased model diffusivity in the region (Figures 3.4 and
3.5). The 100 year pre-industrial timeseries for the I-AOG and Drake Passage water
transports in both the MPIOM-CTRL and MPIOM-AFRICA configurations are shown
in Figure 4.6 (Chapter 4).
Upper ocean current systems are revealed by model velocity data and shown in Figure
3.7. Many important ocean features are simulated similarly to other state-of the-art
climate models (e.g. Jungclaus et al., 2006, Stepanek and Lohmann, 2012). The model
successfully simulates the Agulhas Current, the Mozambique Current, the East

Chapter 3. An adapted Earth System Model for the improved simulation of the I-AOG
44
Madagascar Current, the Agulhas Return Current, the Antarctic Circumpolar Current,
and the North Brazil Current, amongst other current systems. Agulhas leakage is
simulated as a viscous boundary flow around the bulge of Southern Africa. Agulhas
rings cannot be observed in such 100 year climatological mean data (Figure 3.7), but
model daily output shows that these relatively small-scale features are absent from the
MPIOM-AFRICA simulation (not shown).
The ocean gyre systems simulated by MPIOM-AFRICA in terms of its barotropic
stream function are illustrated in Figure 3.8. Evident are the South Atlantic and South
Indian Ocean gyre systems, interconnected via the Southern Hemisphere Supergyre
(Speich et al., 2007). The ACC is also discernable, constituting a number of gyre
systems across the Southern Ocean, including the Weddel and Ross Sea gyres. The
oceanic gyre systems are also revealed by the model‘s sea surface height parameter
(Figure 3.9). Gyre systems characterised by a negative mean height are clockwise in the
Southern Hemisphere and anti-clockwise in the Northern Hemisphere, in accordance
with the theories of Ekman transport and Sverdrup balance. Similarly, gyre systems
characterised by a positive mean height are anti-clockwise in the Southern Hemisphere
and clockwise in the Northern Hemisphere. Additional values of barotropic stream
function at specific geographical locations are included in Table A.1 in the Appendix.
Table 3.1 I-AOG and Drake Passage (DP) water transport 100 year climatological mean values and
standard deviations for the LGM and pre-industrial (PI) simulations for both the MPIOM-CTRL and
MPIOM-AFRICA ocean model configurations.
Experiment MPIOM-
CTRL PI
MPIOM-
AFRICA PI
MPIOM-
CTRL LGM
MPIOM-
AFRICA LGM
I-AOG Transport (Sv) 46.1 ± 2.3 18.4 ± 1.6 51.6 ± 2.8 15.1 ± 2.5
DP Transport (Sv) 245.4 ± 4.2 111.4 ± 7.2 225.4 ± 9.9 71.5 ± 10.9

Chapter 3. An adapted Earth System Model for the improved simulation of the I-AOG
45
Figure 3.7 Climatological annual mean surface velocities (m/s) as modelled by the COSMOS model
incorporating the MPIOM-AFRICA configuration. Streamlines indicate vector direction, and colours
show velocity magnitude A similar plot showing velocity arrows can be found in Figure A.1 of the
Appendix.
Figure 3.8 Climatological annual mean barotropic stream function (Sv) as modelled by the COSMOS

Chapter 3. An adapted Earth System Model for the improved simulation of the I-AOG
46
model incorporating the MPIOM-AFRICA configuration. Barotropic stream function is the measure of
ocean water volume transport integrated over all depth levels. Since volume transport below the gyre
depths is generally relatively slow, barotropic stream function can be used as an indicator of ocean gyre
system strength. Evident are the South Atlantic and South Indian Ocean gyre systems, interconnected via
the Southern Hemisphere Supergyre (Speich et al., 2007). The ACC is also discernable, constituting a
number of gyre systems, including the Weddel and Ross Sea gyres, across the Southern Ocean.
Figure 3.9 Climatological annual mean sea surface height (m) as modelled by the COSMOS model
incorporating the MPIOM-AFRICA configuration. Sea surface height can be used as an indicator of
ocean gyre system strength, with some systems characterised by a positive mean height and others by a
negative mean height, depending on the direction of gyre circulation, in accordance with the theories of
Ekman transport and Sverdrup balance (see text).
3.2.1.2 General pre-industrial ocean characteristics
The 100 year climatological mean pre-industrial AMOC (zonal integration) using
MPIOM-AFRICA is shown in Figures 3.10-3.12. The AMOC is presented showing
depth levels as simulated by the model (Figure 3.10), over depth levels in metres
(Figure 3.11), and interpolated spatially (Figure 3.12). The AMOC index, measured at
26ºN, selecting the maximum stream function over the upper 1000 m depth, is ~14 Sv in
the MPIOM-AFRICA setup. Antarctic bottom water (AABW) is simulated over the
depth range ~2500m - 4500m extending into the North Atlantic realm, with a maximum

Chapter 3. An adapted Earth System Model for the improved simulation of the I-AOG
47
magnitude of ~1.5Sv. The simulation compares well with the MPIOM-CTRL simulation
as documented by Wei et al, (2012) for the pre-industrial case, suggesting further
validity of the MPIOM-AFRICA configuration.
Figure 3.10 Zonally integrated AMOC (Sv) for the MPIOM-AFRICA climatological annual mean pre-
industrial simulation, showing depth levels as simulated by the model. Upper levels are more highly
resolved in COSMOS, exemplified by the AMOC upper branch which is simulated over depth levels 0 to
~30. AABW is simulated over depth levels ~30 to 40. Per definition the AMOC is defined north of 30ºS.

Chapter 3. An adapted Earth System Model for the improved simulation of the I-AOG
48
Figure 3.11 Zonally integrated AMOC (Sv) for the MPIOM-AFRICA climatological annual mean pre-
industrial simulation, interpolated (from Figure 3.10) to metric depth coordinates (m). Per definition the
AMOC is defined north of 30ºS.
Figure 3.12 Zonally integrated AMOC (Sv) for the MPIOM-AFRICA climatological annual mean pre-
industrial simulation, spatially interpolated (from Figure 3.11) to smooth the data for visualisation. Per
definition the AMOC is defined north of 30ºS. The simulation is similar to that documented by Wei et al,
(2012) for the MPIOM-CTRL configuration, adding further credence to the validity of the MPIOM-
AFRICA configuration. The general pre-industrial AMOC is rather shallow, which may be related to
relatively shallow North Atlantic mixed layer depths simulated by the model (Figure 3.17).
The MPIOM-AFRICA annual mean sea surface temperatures (SSTs) are shown in
Figures 3.13 and 3.14 (interpolated in Figure 3.14 to exemplify the smoothing of coarse
resolution in the Pacific Ocean). Annual mean SSTs range between ~32ºC in the tropics
and ~0ºC in the polar regions of both hemispheres. Global mean SST is 18.2ºC for the
MPIOM-AFRICA and 17.7ºC for MPIOM-CTRL (Wei et al., 2012) pre-industrial
simulations. The difference between the two configurations may be due to the model
dependent spin-up times required to reach complete equilibrium (Zhang et al., 2013).
A comparison between the modelled ocean SST data (MPIOM-AFRICA and MPIOM-
CTRL) with World Ocean Atlas observational data 2009 (Locarnini et al., 2010) was

Chapter 3. An adapted Earth System Model for the improved simulation of the I-AOG
49
conducted and is presented in Figures 3.15 and 3.16. Generally, the magnitude and
location of the largest anomalies between model and observational data are similar
between MPIOM-ARICA and MPIOM-CTRL. Specifically, a warming bias throughout
the Agulhas region and a cooling bias at the entrance to the Drake Passage are simulated
by both ocean model configurations.
Figure 3.13 Climatological annual mean sea surface temperatures (ºC) as modelled by the COSMOS
model incorporating the MPIOM-AFRICA configuration. A meridional temperature gradient is obvious
across all latitudes, from the polar regions to the tropics.

Chapter 3. An adapted Earth System Model for the improved simulation of the I-AOG
50
Figure 3.14 Interpolated climatological annual mean sea surface temperatures (ºC) as modelled by the
COSMOS model incorporating the MPIOM-AFRICA configuration. The graphic illustrates a
smoothening of the modelled ocean data in order to remove the undesirable coarse grid aesthetics at
certain locations, particularly the Pacific Ocean. A disadvantage to the interpolation procedure is that
regions lacking in data (i.e. the continents) are also interpolated.
Figure 3.15. Upper ocean (100m mean) temperature anomaly (ºC) between the MPIOM-AFRICA pre-
industrial simulation and the WOA09 observational data (Locarnini et al., 2010). The artificial segmented
features are a result of taking an anomaly between two differently gridded datasets. These temperature

Chapter 3. An adapted Earth System Model for the improved simulation of the I-AOG
51
biases compare well with those of Jungclaus et al., (2006).
Figure 3.16 Upper ocean (100m mean) temperature anomaly (ºC) between the MPIOM-CTRL pre-
industrial simulation and the WOA09 observational data (Locarnini et al., 2010). These temperature
biases compare well with those of Jungclaus et al., (2006).
The mixed layer depth simulated by the MPIOM-AFRICA pre-industrial configuration
is shown in Figure 3.17. This output parameter acts as a useful indicator of regions of
large scale convection (sinking) in the ocean. The MPIOM-AFRICA configuration
simulates convection in the North Atlantic at two sites; the Labrador Sea and the GIN
(Greenland-Iceland-Norwegian) seas. The other major location of ocean convection is
in the Southern Ocean, throughout the Weddel Sea, and partly in the Ross Sea. This
simulation compares well with the MPIOM-CTRL simulation which also simulates
open ocean convection at these locations (not shown).

Chapter 3. An adapted Earth System Model for the improved simulation of the I-AOG
52
Figure 3.17 Climatological annual mean mixed layer depth (m) as modelled by the COSMOS model
incorporating the MPIOM-AFRICA configuration. The modelled mixed layer depth is computed based on
the density difference criterion δρ < 0.125 kg/m3 i.e. the depth where the density has increased by 0.125
kg/m3 as compared to the value in the surface box.
The MPIOM-AFRICA annual mean sea surface salinity (SSS) is shown in Figure 3.18.
Annual mean SSS ranges between ≥42 in regions such as the Mediterranean, to ~25 in
Arctic regions where large freshwater input at river mouths is experienced. The Atlantic
Ocean is successfully simulated as the most saline ocean basin, with salinity values of
~39 simulated at locations across the subtropical regions. The high salinity in the
subtropical Atlantic Ocean owes to the existence of the Trade winds which transport
convective precipitation westward across the Americas and into the Pacific Ocean. This
results in the Atlantic Basin having an evaporative regime, ultimately driving the high
levels of salinity.
A comparison between the modelled ocean salinity data (MPIOM-AFRICA and
MPIOM-CTRL) with World Ocean Atlas observational data 2009 (Locarnini et al., 2010)
was conducted and is presented in Figures 3.19 and 3.20. Generally, the magnitude and
location of the largest anomalies between model and observational data are similar

Chapter 3. An adapted Earth System Model for the improved simulation of the I-AOG
53
between MPIOM-ARICA and MPIOM-CTRL. A model freshening bias (salinity ~0.5-
1.0) exists in both configurations throughout the South Atlantic and Indian Oceans
compared with the observational data. At the Drake Passage MPIOM-AFRICA shows a
freshening bias while MPIOM-CTRL is in good agreement with observational data.
Figure 3.18. Climatological annual mean sea surface salinity (psu) as modelled by the COSMOS model
incorporating the MPIOM-AFRICA configuration. As observed (Locarnini et al., 2010), and simulated by
other models, salinity is higher in the Atlantic basin due to the existence of the Trade winds which
transport convective precipitation systems across the Americas and into the Pacific Ocean. This results in
the Atlantic Basin having an evaporative regime, which ultimately drives the high levels of salinity.

Chapter 3. An adapted Earth System Model for the improved simulation of the I-AOG
54
Figure 3.19. Upper ocean (100m mean) salinity anomaly (psu) between the MPIOM-AFRICA pre-
industrial simulation and the WOA09 observational data (Locarnini et al., 2010). The artificial segmented
features are a result of taking an anomaly between two differently gridded datasets.
Figure 3.20 Upper ocean (100m mean) salinity anomaly (psu) between the MPIOM-CTRL pre-industrial
simulation and the WOA09 observational data (Locarnini et al., 2010).

Chapter 3. An adapted Earth System Model for the improved simulation of the I-AOG
55
In order to assess the implications of the model salinity biases at the Drake Passage and
I-AOG, the data is detrended (normalized) by subtracting the area-averaged salinity
from the upper ocean salinity dataset (Figure 3.21). This analysis emphasises the spatial
salinity anomalies of the time-mean state, with the mean value set to zero. The
normalized data reveals the South Atlantic and South Indian Ocean subtropical gyre
systems, characterised by high positive salinity deviation from the mean. However, also
evident is the lack of a large salinity contrast between the South Atlantic and Indian
Ocean, which is usually revealed in ocean observational data as a front in the Agulhas
retroflection region. The front itself is defined by the retroflection (Figure 3.22 a). This
is an important oceanic front with respect to the impact that the Agulhas leakage of high
salinity Indian Ocean waters is suggested to have on AMOC strength. Without
substantially higher salinity in the Indian Ocean compared to the South Atlantic, it
would be unlikely that salt anomalies introduced to the Atlantic Basin could impact
upon the deep convection sites in the North Atlantic, and potentially AMOC strength.
Analyses by Weijer and Van Sebille, (2014) revealed a similar model problem with
regards to the impact of the Agulhas leakage on the AMOC. Specifically, although they
found a dynamical connection between South Atlantic salt anomalies and the North
Atlantic, they found no direct impact of Agulhas leakage on AMOC strength in the
Community Climate System Model, version 4 (CCSM4). The authors demonstrate that,
similar to COSMOS documented here, the salinity biases which leave the Indian Ocean
to enter the Atlantic Ocean in CCSM4 are too homogeneous, acting to erase the
observed salinity front in the Agulhas retroflection region (Figure 3.22 b). As a result
salinity variability in the south-east Atlantic Ocean is found to be much weaker than
observed (Figure 3.22 a). It therefore remains unclear whether salinity biases introduced
to the Atlantic Ocean by the Agulhas leakage impact significantly upon the AMOC.
Due to the South Atlantic and South Indian Ocean freshwater biases existing in
COSMOS, similar to those of CCSM4 documented by Weijer and van Sebille, (2014), it
is unlikely that the modelled I-AOG transport (Agulhas leakage) in MPIOM-AFRICA
can impact upon the strength of the AMOC. It was therefore decided not to use the

Chapter 3. An adapted Earth System Model for the improved simulation of the I-AOG
56
MPIOM-AFRICA model for sensitivity studies linking the I-AOG and Drake Passage
transports with AMOC strength; rather opting to investigate changes at the I-AOG and
Drake Passage in response to variable boundary conditions; specifically boundary
conditions mimicking past millennial scale and glacial-interglacial climate changes. The
absent salinity front in the Agulhas retroflection region remains a significant challenge
for Earth system modellers investigating the potential impact of Agulhas leakage on
AMOC strength.
Figure 3.21 MPIOM-AFRICA upper ocean (500m mean) salinity (psu), where area-averaged salinity
(entire region) is subtracted from the dataset to emphasise spatial anomalies of the time-mean state.

Chapter 3. An adapted Earth System Model for the improved simulation of the I-AOG
57
Figure 3.22 Climatology of S1000, for (a) CARS2009 and (b) CCSM4, from Weijer and van Sebille,
(2014). Area-averaged salinity is subtracted from both datasets to emphasize spatial anomalies of the
time-mean state. The black crosses indicate the location of a reference point at 348S, 108E in the
southeastern South Atlantic, while the boxes represent the area of averaging in the southeastern section of
the southern Indian Ocean.
3.2.2 LGM simulation
Based on the strength of the pre-industrial climate simulation using the adapted
MPIOM-AFRICA ESM, it was decided to perform a glacial simulation via the
application of LGM boundary conditions (see Chapter 2 for full details on the glacial
setup). The motivation for performing an LGM simulation with the adapted model was
to investigate glacial rates of I-AOG (Agulhas leakage) and Drake Passage
throughflows, and to develop a platform where freshwater perturbation experiments
mimicking glacial millennial scale climate change could be carried out.
3.2.2.1 LGM I-AOG and Drake Passage transports
The LGM simulation was integrated for 4000 years and the final 100 years utilised as a

Chapter 3. An adapted Earth System Model for the improved simulation of the I-AOG
58
climatological mean (see Chapter 2). LGM water transport through the I-AOG is
estimated at 15.1 ± 2.5 Sv using the MPIOM-AFRICA configuration, and 51.6 ± 2.8 Sv
using the MPIOM-CTRL configuration (Table 3.1). This compares with a pre-industrial
I-AOG transport of 18.4 ± 1.6 Sv using the MPIOM-AFRICA configuration and 46.1 ±
2.3 Sv using the MPIOM-CTRL configuration, indicating with respect to the pre-
industrial state, a ~17% LGM reduction of I-AOG transport in the MPIOM-AFRICA
configuration, and a ~10% LGM increase of I-AOG transport in the MPIOM-CTRL
configuration.
LGM water transport through the Drake Passage is estimated at 71.5 ± 10.9 Sv using
MPIOM-AFRICA and 225.4 ± 9.9 Sv using the MPIOM-CTRL configuration, over the
100 year climatological mean (Table 3.1). This compares with a pre-industrial Drake
Passage transport of 111.4 ± 7.2 Sv utilising the MPIOM-AFRICA configuration and
245.4 ± 4.2 Sv with MPIOM-CTRL, indicating with respect to the pre-industrial state, a
~36% reduction of Drake Passage transport during the LGM when utilising MPIOM-
AFRICA, and a ~10% reduction of the Drake Passage transport adopting the MPIOM-
CTRL configuration.
Further discussion and a model-data comparison for the I-AOG and Drake Passage
transports are carried out in Chapter 4 (glacial-interglacial) and Chapter 5 (millennial
scale) of this thesis.
3.2.2.2 General LGM ocean characteristics
The 100 year climatological mean LGM AMOC (zonal integration) for MPIOM-
AFRICA is shown in Figures 3.23–3.25. The AMOC is presented showing depth levels
as simulated by the model (Figure 3.23), over depth levels in metres (Figure 3.24), and
interpolated spatially (Figure 3.25). The LGM AMOC is more vigorous than the pre-
industrial case, and is similar to that documented by Zhang et al, (2013) for the
MPIOM-CTRL setup, adding further credence to the validity of the adapted model
configuration.

Chapter 3. An adapted Earth System Model for the improved simulation of the I-AOG
59
AABW is simulated over the depth range ~3000 - 4500 m extending into the North
Atlantic realm, with a maximum magnitude of ~3Sv. The LGM extension of AABW
into the North Atlantic is both stronger and more penetrative than in the pre-industrial
MPIOM-AFRICA simulation (Figure 3.12) (Hall et al., 2011). A vigorous AMOC at the
LGM is also supported by a host of proxy data (Lynch-Stieglitz et al., 2007; Lippold et
al., 2012, Ritz et al., 2013), and is simulated by most state-of-the-art ESMs applying
PMIP3 boundary conditions for the LGM (discussed by Oka et al., 2012). However,
most proxy data suggest a shoaled upper AMOC branch during the LGM compared with
the Holocene or present day (Marchitto and Broecker, 2006; Lynch-Stieglitz et al.,
2007; Oppo and Curry, 2012; Gebbie, 2014). This is not simulated by the MPIOM-
AFRICA configuration (comparing Figures 3.12 and 3.25), nor some other ESMs, and
may be related to the time required for the ocean to reach complete equilibrium. Zhang
et al. (2013) indicated that the time required to reach complete equilibrium may be on
the order of many thousands of years, and is dependent on the model itself. The depth of
the modelled LGM AMOC is also dependent on the southward relocation of the glacial
NADW formation sites and therefore the position of the sea-ice margins, which again
are model dependent.
Figure 3.23 Zonally integrated AMOC (Sv) for the MPIOM-AFRICA climatological annual mean LGM
simulation, showing depth levels as simulated by the model. Upper levels are more highly resolved in

Chapter 3. An adapted Earth System Model for the improved simulation of the I-AOG
60
COSMOS, exemplified by the AMOC upper branch which is simulated over depth levels 0 to ~30.
AABW is simulated over depth levels ~30 to 40. Per definition the AMOC is defined north of 30ºS.
Figure 3.24 Zonally integrated AMOC (Sv) for the MPIOM-AFRICA climatological annual mean LGM
simulation, interpolated (from Figure 3.23) to real depth coordinates. Per definition the AMOC is defined
north of 30ºS.
Figure 3.25 Zonally integrated AMOC (Sv) for the MPIOM-AFRICA climatological annual mean LGM
simulation, spatially interpolated (from Figure 3.24) to smooth the data for visualisation. Per definition

Chapter 3. An adapted Earth System Model for the improved simulation of the I-AOG
61
the AMOC is defined north of 30ºS. The simulation is similar to that documented by Zhang et al. (2013)
for the MPIOM-CTRL setup, adding further credence to the validity of the MPIOM-AFRICA
configuration.
The MPIOM-AFRICA annual mean SST anomaly between the LGM and the pre-
industrial simulations is shown in Figure 3.26. The general simulated temperature
decrease is similar to that of the MPIOM-CTRL LGM simulation (Zhang et al., 2013).
Global mean SST is 15.6ºC for MPIOM-AFRICA and 15.3ºC for MPIOM-CTRL LGM
simulations (Zhang et al., 2013), 2.6ºC and 2.4ºC lower than the corresponding pre-
industrial simulations. The difference between the two configurations may be due to the
differing model spin-up times required to reach complete equilibrium (Zhang et al.,
2013).
In the high latitudes of both hemispheres MPIOM-AFRICA simulates pronounced
annual mean SST cooling (Figure 3.26). The pronounced cooling around Antarctica and
across the Greenland-Iceland-Norwegian (GIN) seas is in line with proxy data
reconstructions of the LGM climate (Gersonde et al., 2005; Kucera et al., 2005; De
Vernal et al., 2006). Global temperature decreases in the range 0ºC to 12ºC, are
generally in agreement with MARGO data reconstructing SSTs at the LGM
(Waelbroeck et al, 2009). However, absent from the MPIOM-AFRICA LGM simulation
are large zonal temperature gradients (including warming in parts of the Pacific Ocean)
revealed by the MARGO project. It appears that fully-coupled ESMs are unable to
reproduce this feature of the LGM surface ocean (Waelbroeck et al, 2009).
Modelled global mean sea surface salinity is generally higher during the LGM
compared to the pre-industrial case, and more pronounced at high latitudes (Figure
3.27). The increased salinity is anticipated due to the addition of 1 psu to the glacial
ocean in accordance with the PMIP3 protocol (see Chapter 2). Adkins et al., (2002)
suggested that the freshwater budget at the poles was quite different during the LGM,
possibly owing to the increased annual formation of sea-ice (Figure 3.28) and resultant
brine rejection. The modelled salinity increase is particularly pronounced (by up to 5
psu) throughout the Arctic Ocean, potentially amplified by the expected decrease in the

Chapter 3. An adapted Earth System Model for the improved simulation of the I-AOG
62
flux of fresh water from frozen boreal rivers during glacial conditions (Cronin et al.,
2012).
Figure 3.26 Global sea surface temperature (SST) anomaly (ºC) between the LGM and pre-industrial
simulations. Positive values have been filtered.

Chapter 3. An adapted Earth System Model for the improved simulation of the I-AOG
63
Figure 3.27 Global sea surface salinity (SSS) anomaly between the LGM and pre-industrial simulations
(psu). Salinity increases are pronounced in the polar regions.
Figure 3.28 Global annual sea-ice fraction (compactness) anomaly between the LGM and pre-industrial
simulations. Increased glacial sea-ice formation and brine rejection may amplify the salinity response at
polar regions (Figure 3.27).
3.3 Summary and Conclusions
Fully coupled ESMs are known to overestimate the transport of warm saline Indian
Ocean waters into the Atlantic Basin (Agulhas leakage) via the I-AOG (Weijer et al.
2012; Völker and Köhler, 2013; Weijer and van Sebille, 2014), and often overestimate
the Drake Passage throughflow (for example the COSMOS MPIOM-CTRL
configuration). In order to accurately simulate rates of I-AOG and Drake Passage
transports under past climate conditions, it is first necessary to get these transport rates
correct for the modern ocean. Therefore, in this chapter an adapted ocean model
configuration (MPIOM-AFRICA) aiming to address the problems associated with
misrepresented ocean gateway transports has been developed and documented.

Chapter 3. An adapted Earth System Model for the improved simulation of the I-AOG
64
The adapted MPIOM-AFRICA ocean model configuration was utilised within the pre-
existing COSMOS ESM (documented by Stepanek and Lohmann, 2012) with the
primary objective of improving the simulation of I-AOG water transport. Although the
model neither permits nor resolves small-scale turbulent eddy structures (Agulhas rings
for example), it does simulate very reasonable climatological mean pre-industrial rates
of I-AOG and Drake Passage transports (18.4 ± 1.6 and 111.4 ± 7.2 respectively). These
transport rates are comparable with ocean observational data (Cunningham et al., 2003;
Richardson, 2007) and other high-resolution ocean models (Biastoch et al., 2008;
Biastoch et al., 2009; Durgadoo et al., 2013; Rühs et al., 2013). The simulation of the
transport through these ocean gateways using MPIOM-AFRICA is therefore an
improvement on the pre-existing MPIOM-CTRL configuration which overestimates
both; 46.1 ± 2.3 and 245.4 ± 4.2 for the I-AOG and Drake Passage, respectively.
Moreover, the MPIOM-AFRICA configuration simulates a global climate comparable
with the MPIOM-CTRL version, with both model configurations generally in
reasonable agreement with World Ocean Atlas observational data 2009 (Locarnini et al.,
2010). MPIOM-AFRICA simulates reasonable global SSTs, SSS, barotropic stream
function (an indicator of oceanic gyre systems), ocean velocities (indicators of ocean
current strength), and mixed layer depth (an indication of ocean convection sites in the
North Atlantic and Southern Ocean). Additionally, the LGM simulation performed using
the MPIOM-AFRICA model configuration is similar to that using the MPIOM-CTRL
version (Zhang et al., 2013), and modelled LGM global SST and SSS data are in good
agreement with a host of proxy data (Adkins et al., 2002; Gersonde et al., 2005; Kucera
et al., 2005; de Vernal et al., 2006; Waelbroeck et al, 2009; Cronin et al., 2012).
However, a major drawback of both the MPIOM-AFRICA and MPIOM-CTRL
configurations is the absence of a significant salinity difference between the South
Indian and South Atlantic oceans, meaning that the modelled I-AOG transport (Agulhas
leakage) is unlikely to impact upon the strength of the AMOC. A similar model issue
has recently been documented by Weijer and van Sebille, (2014) for CCSM4. It is
therefore recommended that these ESMs should not be used for sensitivity studies
testing the impact of Agulhas leakage on AMOC strength and geometry. The models are
nevertheless important tools that can be adopted for the assessment of changes at the I-

Chapter 3. An adapted Earth System Model for the improved simulation of the I-AOG
65
AOG and Drake Passage warm and cold water route gateways in response forcing
scenarios - an idea which comprises a significant component of the rest of this thesis.
In summary, the MPIOM-AFRICA ocean model, used within COSMOS, provides an
excellent platform for the investigation of palaeo-rates of I-AOG transport (Agulhas
leakage) and Drake Passage throughflow, both of which have been suggested to have
been important climate components in the past (Knorr and Lohmann, 2003; Peeters et
al., 2004; McCave et al., 2013). Specifically, the model acts as a sophisticated tool for
determining changes at the I-AOG and Drake Passage in response to the application of
glacial boundary conditions (for glacial-interglacial investigations, discussed in Chapter
4) and abrupt AMOC shifts (millennial scale climate change, discussed in Chapter 5).
Taken together the model represents a step forward in the study of palaeoclimates.

Chapter 4. Glacial-interglacial changes at the I-AOG and Drake Passage
66
4. Glacial-interglacial changes at the I-AOG
and Drake Passage
4.1 Introduction
Glacial-interglacial cycles of the Late Pleistocene are predominantly controlled by
variations in orbital forcing (Milankovic, 1941, Hays et al. 1976) and modulated by
greenhouse gas concentrations (Lüthi et al., 2008). However internal feedbacks from
other system processes can affect and modulate the rates and magnitude of glacial-
interglacial climate change. A significant internal component of the global climate
system is the Atlantic Meridional Overturning Circulation (AMOC), which is
characterised by deep water convection in the North Atlantic and compensated for by
Southern Hemisphere sourced water masses via the ocean‘s warm and cold water return
routes (Gordon, 1986). Therefore, of potential importance to the climate system on
glacial-interglacial timescales are changes to either or both of these surface return water
routes.
Agulhas leakage, which constitutes the water transport of the warm water route as it
enters the Atlantic Ocean, is estimated to transfer ~15 Sv of warm, salty water into the
Atlantic Basin (Richardson, 2007). Modelling studies suggest that this salt input from
the Indian to the Atlantic Ocean influences the AMOC via northward basin scale
advection to the North Atlantic deep-water formation (NADW) sites (Weijer et al.,
2002). Using an ocean general circulation model to simulate the last deglaciation
(Termination I), Knorr and Lohmann, (2003) showed that a resumption of a weakened
glacial AMOC could be initiated by Southern Hemisphere warming through increased
ocean transport at the I-AOG and Drake Passage. This idea has been supported by
inference from proxy data, specifically counts of the planktonic foraminifera
Globorotalia menardii and the Agulhas Leakage Fauna (ALF) planktonic foraminiferal
assemblage, suggesting that the Agulhas leakage volume transport increased, during
glacial terminations, from weak late-glacial to strong interglacial levels, and potentially
triggered the resumption of the AMOC to a more vigorous interglacial level (Peeters et

Chapter 4. Glacial-interglacial changes at the I-AOG and Drake Passage
67
al., 2004; Caley et al., 2012; Bard and Rickaby, 2009). Using an Agulhas leakage
efficiency index, Caley et al. (2014) recently suggested that the persistent peaks in
Agulhas leakage during glacial terminations over the past 640 kyr were on the order of
~10 Sv or more, increasing from late-glacial levels ranging between ~1 Sv and ~7 Sv. In
particular, Agulhas leakage at the LGM has been estimated at ~10 Sv reduced compared
to today (Caley et al., 2014) (Figure 4.1). However this hypothesis has yet to be tested
with a climate model capable of simulating a realistic quantitative rate of I-AOG
transport for the modern ocean.
On glacial-interglacial timescales the rate of Agulhas leakage is believed to be largely
controlled by the position of the subtropical front, which acts as a 'gatekeeper' for water
transport from the Indian to Atlantic Ocean (Bard and Rickaby, 2009). Ocean models
have shown that increases in Agulhas leakage occur in response to poleward shifts of
the subtropical front, and associated changes in the position of the zero wind stress curl
(Biastoch et al., 2009), although this hypothesis has recently been reinterpreted
(Durgadoo et al., 2013; De Boer et al., 2013). Durgadoo et al. (2013) showed that,
although the leakage is driven predominantly by the Southern Hemisphere westerlies, a
southward shift actually results in a decreased Agulhas leakage. These two scenarios
can be reconciled by suggesting that the leakage responds predominantly to the intensity
of the westerlies. Additionally, the position and intensity of the Southern Hemisphere
westerlies during glacials remains ambiguous, with some studies suggesting no
significant change at all (Kohfeld et al., 2013). It is therefore unclear whether shifts of
the wind fields did in fact act to alter glacial-interglacial rates of water transport through
the I-AOG.
On the other hand the Drake Passage acts as a major choke point for the Antarctic
Circumpolar Current (ACC) and the cold water route, transporting 134 ± 11 Sv
(Cunningham et al., 2003), of which ~6.5 Sv has been calculated to reach the North
Atlantic (Speich et al., 2001). Surface and intermediate water masses flowing through
Drake Passage are believed to strongly affect the AMOC strength, in concert with the
warm water route inflow of warm and salty Indian Ocean water masses through Agulhas
Leakage (Gordon, 1986; Beal et al., 2011). The ACC flow rate and Drake Passage
transport have been suggested to be strongly coupled to Southern Hemisphere wind

Chapter 4. Glacial-interglacial changes at the I-AOG and Drake Passage
68
stress forcing across the entire circumpolar belt (Allison et al., 2010; Meredith et al.,
2011; Marshall et al., 2012). More recently it has been proposed that the momentum
imparted to the ocean by winds is modulated by sea ice cover (McCave et al., 2013).
However, on glacial-interglacial timescales, due to a paucity of proxy data, very little is
known about the rate of ACC and Drake Passage transports, and remains a much
debated topic. Only one study has so far conducted a thorough investigation of the
glacial-interglacial rates of ACC and Drake Passage transports (McCave et al., 2013). In
that study the authors documented a series of proxy data for the LGM and Holocene
outlining bottom water speeds in the Drake Passage and Scotia Sea, and concluded that
there was little or no change of the ACC between those time periods (Figure 4.2).
However, the recent development of the notion that the ocean currents at these latitudes
are modulated by the combination of wind strength and sea-ice cover (McCave et al.,
2013) leads to the suggestion that proxy data at other locations across the ACC may
produce different results and conclusions in relation to the nature of the Drake Passage
throughflow on glacial-interglacial timescales.
4.1.1 Study Approach
State-of-the-art fully-coupled Earth System Models are known to misestimate the
modern rate of both Indian-Atlantic Ocean Gateway (I-AOG) and Drake Passage water
transports (Weijer et al., 2014; Weijer and van Sebille, 2014) (see Chapter 3), and the
requirement for investigation of the palaeo Agulhas leakage with improved climate
models has been pointed out (Caley et al., 2011). Investigations of palaeo rates of Drake
Passage throughflow by climate models are also essential for comparison with recent
studies (McCave et al., 2013) and Southern Ocean proxy data which may become
available in the future.
In this chapter the results from the new ocean model configuration documented in
Chapter 3, particularly pre-industrial and Last Glacial Maximum (LGM) transport rates
at the I-AOG and Drake Passage, are investigated and compared with proxy data from
the wider Agulhas and Drake Passage regions. With respect to the Drake Passage our

Chapter 4. Glacial-interglacial changes at the I-AOG and Drake Passage
69
model results are compared with new proxy data from marine sediment core MD07-
3128 at the entrance of the Strait of Magellan in the Cape Horn Current (Lamy et al.,
submitted) (see Chapter 2 for details).
Figure 4.1 Role of Agulhas leakage variability on ocean overturning circulation, from Caley et al. (2014).
(a) Long-term changes over the late Quaternary. (a1) Qualitative index for the Agulhas leakage
(accumulation rate of G. menardii) (Caley et al., 2012). (a2) Agulhas leakage fauna (Peeters et al., 2004)
and Agulhas leakage efficiency indices with associated uncertainties. The star indicates significant
differences between the ALF index and the ALE index during MIS 10. (a3) Changes in Agulhas leakage
(Sv) based on model regression. (a4) Position of the subtropical front, documented by sea surface

Chapter 4. Glacial-interglacial changes at the I-AOG and Drake Passage
70
temperature changes at site MD96-2077 (Bard and Rickaby, 2009). (a5) Benthic !13C at the Cape Basin
record (composed of core GeoB-3603-2 (2840m depth) and core MD96-2081 (3164m depth)) used as a
proxy for the interplay between northern and southern component waters (SCW). The two arrows indicate
the long-term changes in southern hemisphere westerlies imprinted by the subtropical front according to a
400 kyr periodicity and the corresponding changes in the Agulhas leakage. (a6) The !18O of benthic
foraminifera (LR04 stack) as a proxy for ice volume changes (Lisiecki and Raymo, 2005). MIS denotes
marine isotopic stage during glacial periods. Tx denotes Terminations. Gray frames denote periods of
increased Agulhas leakage during Terminations. (b) A focus on termination 1 showing the link between
Agulhas leakage and change in the basin-scale deep Atlantic circulation. Radiogenic isotope pair 231 Pa
and 230Th gradient between northern and southern Atlantic (Negre et al., 2010) as a quantitative proxy of
the abyssal flow rate. During the Holocene, the 231 Pa/230Th gradient redirect a southward flow of
NADW. During the LGM, the situation is different with SCW that leave the southern Ocean to ventilate
the deep Atlantic. The lower bathyal benthic "13C at the Cape Basin record and changes in Agulhas
leakage are also indicated.
Figure 4.2 Average SS particle size, from McCave et al. (2013). SS averaged for the LGM and Holocene.
Error bars are ±2 s.e.m (analytical error of ±0.5 µm is not propagated). Larger core numbers indicate
significant (P<0:01) LGM–Holocene differences. Modern frontal positions (and subsidiaries SSAF and
SSACCF) are indicated (Sokolov et al.,2009). South of 56 ºS, LGM flow was significantly slower than
Holocene flow (cores 6–9), whereas cores 10–12 show no significant change. North of 56ºS (cores 2–5),
flow during the LGM was faster than further south, with a non-significant decrease in the Holocene.

Chapter 4. Glacial-interglacial changes at the I-AOG and Drake Passage
71
4.2 Results
4.2.1 Modelled sea surface temperatures in the Agulhas region
Modelled annual mean SSTs for the LGM and pre-industrial climate states, as well as
their anomaly, are shown in Figures 4.3, 4.4, and 4.5. Pre-industrial annual mean SSTs
show general agreement with modern observations (see Chapter 3). A tongue of warm
water is visible directly south of Africa, which contrasts to lower regional temperatures
at similar latitudes, and owes to the southward flowing Agulhas Current along the
southeast coast of the African continent (Figure 4.9). LGM temperatures show a glacial
cooling in the range of 0.5ºC to 4.5ºC across the region (Figures 4.4 and 4.5), consistent
with glacial cooling experienced in the tropics (Waelbroeck et al, 2009). SSTs do not
increase at any location in the region. Maximum levels of cooling occur across the ACC
and at some locations above the African continental shelf, for example throughout the
Benguela upwelling system (Figure 4.5).
Figure 4.3 Pre-industrial annual mean SSTs as simulated by the MPIOM-AFRICA model configuration.
Apparent is the tongue of warm water directly south of Africa, which contrasts to lower regional
temperatures at similar latitudes because of the southward flowing Agulhas Current along the southeast
coast of the African continent.

Chapter 4. Glacial-interglacial changes at the I-AOG and Drake Passage
72
Figure 4.4 LGM annual mean SSTs as simulated by the MPIOM-AFRICA model configuration.
Apparent is the tongue of warm water directly south of Africa, which contrasts to lower regional
temperatures at similar latitudes because of the southward flowing Agulhas Current along the southeast
coast of the African continent.

Chapter 4. Glacial-interglacial changes at the I-AOG and Drake Passage
73
Figure 4.5 Anomalous annual mean SSTs (LGM – PI) as simulated by the MPIOM-AFRICA model
configuration. A general LGM cooling in the range of 0.5ºC to 4.5ºC is simulated across the region,
consistent with glacial cooling experienced in the tropics (Waelbroeck et al, 2009).
4.2.2 Indian-Atlantic Ocean Gateway transport
Over the 100 year climatological mean, LGM water transport through the I-AOG is
estimated at 15.1 ± 2.5 4 Sv using MPIOM-AFRICA (see Table 3.1). This compares
with a pre-industrial I-AOG transport of 18.4 ± 1.6 Sv. The pre-industrial I-AOG
transport shows good agreement with modern observations (Richardson et al, 2007),
other high resolution non-coupled ocean models (Rühs et al., 2013) and with a
calculation based on the modern Agulhas leakage efficiency index (Caley et al., 2014).
The glacial LGM simulations using both model configurations (MPIOM-AFRICA and
MPIOM-CTRL) demonstrate that the transport of Indian Ocean waters to the south-east
Atlantic was persistent and strong during the LGM (Table 3.1). The 100 year pre-
industrial timeseries for the I-AOG water transport in both the MPIOM-CTRL and
MPIOM-AFRICA configurations are shown in Figure 4.6.

Chapter 4. Glacial-interglacial changes at the I-AOG and Drake Passage
74
Figure 4.6 I-AOG and Drake Passage water transport timeseries for the pre-industrial 100 year
climatology, utilising the MPIOM-AFRICA and MPIOM-CTRL setups: (a) I-AOG transport for the
MPIOM-AFRICA setup (Sv), (b) I-AOG transport for the MPIOM-CTRL setup (Sv), (c) Drake Passage
throughflow for the MPIOM-AFRICA setup (Sv), (d) Drake Passage throughflow for the MPIOM-CTRL
setup (Sv). The blue curves in (a) and (b) and the red curves in (c) and (d) indicate the 10 year moving
mean values. The associated mean values and standard deviations can be found in Table 3.1.
Barotropic stream function in the wider Agulhas region is shown for the pre-industrial
and LGM climate states in Figure 4.7 and Figure 4.8, respectively. This model output
variable is indicative of the strength of gyre systems. The pre-industrial and LGM
simulations both show South Indian Ocean and South Atlantic Ocean sub-tropical gyre
systems which are interconnected, forming part of the Southern Hemisphere supergyre
(Speich et al., 2007). The maximum Barotropic stream function in the South Indian
Ocean sub-tropical gyre is ~110 Sv for the LGM simulation, representing a slight
increase compared to the pre-industrial case (~100 Sv), implying that this gyre system
was more vigorous during the LGM. This result is in agreement with the conclusions of

Chapter 4. Glacial-interglacial changes at the I-AOG and Drake Passage
75
Simon et al. (2013).
Figure 4.7. Barotropic streamfunction (Sv) for the pre-industrial climate state as simulated by the
MPIOM-AFRICA model configuration. The interconnected South Indian Ocean and South Atlantic
Ocean sub-tropical gyre systems are simulated. The maximum stream function in the South Indian Ocean
sub-tropical gyre is ~100 Sv.
Figure 4.8. Barotropic streamfunction (Sv) for the LGM climate state as simulated by the MPIOM-
AFRICA model configuration. The South Indian Ocean and South Atlantic Ocean sub-tropical gyre
systems are simulated and are interconnected, as in the pre-industrial case. The maximum stream function

Chapter 4. Glacial-interglacial changes at the I-AOG and Drake Passage
76
in the South Indian Ocean sub-tropical gyre is ~110 Sv, representing a slight increase compared to the
pre-industrial case.
The surface velocity patterns shown in Figure 4.9 and Figure 4.10 shows a range of
upper ocean features, including the I-AOG transport (Agulhas leakage), the Agulhas
Current, the East Madagascar Current, the South Equatorial Current, the Mozambique
Current, the East African Coastal Current, and the Agulhas Return Current. Comparing
the pre-industrial and LGM simulations it appears that a number of currents in the South
Indian Ocean are more vigorous during the LGM. These more vigorous currents include
the Mozambique Current, the South Equatorial Current, the East Madagascar Current,
and the Agulhas Return Current. This picture is consistent with the overall idea of an
increased Indian Ocean subtropical gyre system during the LGM (Figure 4.7 and Figure
4.8) (Simon et al., 2013). No apparent change in the position of the Agulhas
retroflection is detectable, in agreement with the conclusions of Franseze et al., (2009).
Figure 4.9. Pre-industrial surface velocities as simulated by MPIOM-AFRICA. Maximum surface speeds
of > 0.5 m/s are simulated in the Agulhas Current. The I-AOG transport exists as a viscous flow (non-
eddy resolved) south of Africa. A similar plot showing velocity arrows can be found in Figure A.2 in the
Appendix.

Chapter 4. Glacial-interglacial changes at the I-AOG and Drake Passage
77
Figure 4.10. LGM surface velocities as simulated by MPIOM-AFRICA. Maximum surface speeds of >
0.5 m/s are simulated in the Agulhas Current. The I-AOG transport exists as a viscous flow (non-eddy
resolved) south of Africa. The general pattern supports the idea of a stronger South Indian Ocean sub-
tropical gyre system during the LGM compared to the pre-industrial climate simulation. The I-AOG
transport at the surface is similar to the pre-industrial case. An anomaly plot of LGM-PI is included in the
Appendix (Figure A.3).
4.2.3 Southern Hemisphere westerly and trade winds
The relatively weak change of I-AOG transport between the LGM climate simulation
and the pre-industrial case (15.1 ± 2.5 4 Sv compared to 18.4 ± 1.6 Sv, respectively) is
most likely related to the minimal changes in the Southern Hemisphere westerly and
trade wind systems simulated by the model (Figure 4.11). The Southern Hemisphere
westerlies, which are suggested to predominantly drive Agulhas leakage (Biastoch et al.,
2009; Durgadoo et al., 2013), are relatively insensitive to the application of LGM
boundary conditions, increasing in intensity by just ~5 %. In particular, in this model the
combination of slightly increased westerlies and trades results in a slightly reduced I-

Chapter 4. Glacial-interglacial changes at the I-AOG and Drake Passage
78
AOG transport during the LGM. These results are in line with Kohfeld et al. (2013) who
conducted a synthesis of proxy data and suggested that the glacial Southern Hemisphere
westerlies may not have shifted position nor changed significantly in intensity compared
to their modern analogue. Alternatively, the relatively weak model changes in Southern
Hemisphere westerlies might be related to the lack of a prescribed Ozone concentration
within the PMIP3 protocol for simulation of the LGM, and could be considered for
future updates of the protocol (Shindell and Schmidt, 2004). The modelled wind
systems might also be relatively insensitive to the changes in orbital forcing, and
therefore solar insolation, prescribed by PMIP3.

Chapter 4. Glacial-interglacial changes at the I-AOG and Drake Passage
79
Figure 4.11 Trade (top panel) and westerly (bottom panel) wind stress for the LGM (blue) and pre-
industrial (red) climate states. Westerly wind stress during the LGM increases in intensity by ~5%. Trade
wind stress increases by <5%. No latitudinal shift in the position of the westerlies or the trade wind
systems is simulated. Trade winds are integrated over latitudes 0ºN to 46ºS and longitudes 0ºW to 359ºW.
Westerly wind stress is integrated over latitudes 30ºS to 80ºS and longitudes 0ºW to 359ºW.

Chapter 4. Glacial-interglacial changes at the I-AOG and Drake Passage
80
4.2.4 Drake Passage transport
Over the 100 year climatological mean, LGM water transport through the Drake
Passage is estimated at 71.5 ± 10.9 Sv using MPIOM-AFRICA (Table 3.1). This
compares with a pre-industrial Drake Passage transport of 111.4 ± 7.2 Sv. The 100 year
pre-industrial timeseries for the Drake Passage throughflow in both the MPIOM-CTRL
and MPIOM-AFRICA configurations are shown in Figure 4.6.
In addition to the Drake Passage throughflow reduction in the LGM simulation
compared to the pre-industrial case, a weakened ACC is simulated across most of the
Southern Ocean (Figure 4.12). The strength of the ACC is known to be controlled by the
wind stress exerted by the Southern Hemisphere westerlies (Allison et al., 2010;
Meredith et al., 2011). However, much less documented is the phenomenon of sea-ice
acting as a de-coupler between the ocean surface and the wind forcing (McCave et al.,
2013, Lamy et al., in preparation). Indeed for the LGM climate case modelled here, no
significant change in the position or strength of the Southern Hemisphere westerlies is
simulated (Figure 4.11), suggesting that some other mechanism must be the cause of the
reduced ACC strength.
Figure 4.12 Barotropic streamfunction (Sv) for the pre-industrial (contours) and anomaly between the
LGM and pre-industrial cases (colours), indicating a substantially weakened ACC across the Southern
Ocean in the LGM simulation. Drake Passage throughflow is reduced by ~36%.
Figures 4.13 and Figure 4.14 show the anomalous annual sea-ice thickness and sea-ice
fraction (area) between the LGM and pre-industrial climate states. Annual sea-ice

Chapter 4. Glacial-interglacial changes at the I-AOG and Drake Passage
81
thickness increases across the Southern Ocean during the LGM, with 20-30% increases
in the south-east Pacific Ocean and Drake Passage itself. Annual sea-ice fraction (area)
during the LGM also increases across the entire Southern Ocean, with 20-50% increases
in the south-east Pacific Ocean and Drake Passage. In COSMOS it is the combination of
significantly increased sea-ice thickness and area coverage over the Southern Ocean
during the LGM which acts to de-couple the winds from the ocean surface and results in
a reduced ACC and Drake Passage throughflow(also suggested by McCave et al., 2013).
Figure 4.13 Anomalous annual sea-ice thickness (m) showing the difference between the LGM and pre-
industrial cases, as simulated by the MPIOM-AFRICA model configuration. Evident is the increased sea-
ice thickness during the LGM across the entire Southern Ocean, with 0.2-0.3m increases in the south-east
Pacific Ocean and Drake Passage itself. The enhanced LGM sea-ice thickness acts to de-couple the winds
from the ocean surface (across the Southern Ocean) and results in a reduced ACC and Drake Passage
throughflow.

Chapter 4. Glacial-interglacial changes at the I-AOG and Drake Passage
82
Figure 4.14 Anomalous annual sea-ice fraction (compactness) showing the difference between the LGM
and pre-industrial cases, as simulated by the MPIOM-AFRICA model configuration. Evident is the
increased sea-ice area during the LGM across the entire Southern Ocean, with 20-50% increases in the
south-east Pacific Ocean and Drake Passage itself. The enhanced LGM sea-ice area acts to de-couple the
winds from the ocean surface (across the Southern Ocean) and results in a reduced ACC and Drake
Passage throughflow.
4.3 Discussion
4.3.1 The Indian-Atlantic Ocean Gateway
In order to assess the quality of the pre-industrial and LGM simulations a data-model
SST comparison was performed using a multi-proxy approach for the Agulhas region
(Figure 4.15). The modelled LGM sea-surface temperatures are generally in good
agreement with proxy data (Bard et al., 1997; Peeters et al., 2004; Bard and Rickaby,
2009; Barker et al., 2009; Martínez-Garcia et al., 2010; Caley et al., 2011; Simon et al.,
2013; Kasper et al., 2014; Simon et al., (in preparation); Wang et al., 2013). However it
should be noted that the model data itself show SST biases when compared with World
Ocean Atlas data (see Figures 3.15 and 3.16). In addition to a general reduction of SSTs
in the region during the LGM, an associated equatorward shift of the thermal STF, often
used as a proxy to infer changes in Agulhas leakage (Bard and Rickaby., 2009), is

Chapter 4. Glacial-interglacial changes at the I-AOG and Drake Passage
83
simulated (across most longitudes in the region). Bard and Rickaby, (2009) used their
SST data to suggest that palaeo shifts of the (thermal) STF may have acted to control
Agulhas leakage and therefore global climate changes on glacial-interglacial timescales.
However, shifts in the thermal STF are not related to movements of the dynamical
oceanographic fronts (De Boer et al., 2013), and are therefore unlikely to be indicators
of past changes in Indian-Atlantic Ocean transport. Migrations of the thermal STF are
controlled by the insolation (orbital configuration), CO2 levels, and the bi-polar thermal
see-saw (Barker and Diz. 2014). Oceanographic fronts on the other hand, although lying
north of the position of zero wind stress curl (De Boer et al., 2013), are still likely
controlled by the position and strength of the westerly winds (Durgadoo et al., 2013).
Since both the westerly and trade wind systems respond weakly to the application of
LGM boundary conditions in COSMOS (Figure 4.11), only relatively small changes in
the dynamics of the I-AOG transport are simulated (Table 3.1).

Chapter 4. Glacial-interglacial changes at the I-AOG and Drake Passage
84
Figure 4.15 Proxy data-model SST comparison. (top panel) Pre-industrial (centre panel) LGM, and
(bottom panel) anomalous SST model data (100 year climatological mean), and SSTs at 10 core locations
from the wider Agulhas region, indicated as coloured circles. The 7° and 17° isotherms are shown in
black as indicators of the southern and northern extent of the thermal STF. The thermal STF is identified
by determining the sharpest temperature gradient south of Africa for the pre-industrial case (a gradient of

Chapter 4. Glacial-interglacial changes at the I-AOG and Drake Passage
85
10°C between 7°C to 17°C) occurring over ~5° of latitude between 40°S and 45°S (25°E). The northward
shift of the thermal STF during the LGM could appear to act as a 'gatekeeper' for the Agulhas leakage.
Table 4.1 Summary of core sites from the South-east Atlantic and South-west Indian Ocean used in this
study. SST estimates for Late Holocene and Last Glacial Maximum (LGM) and their difference are
shown in °C. Core top values have been used as closed equivalents to the modelled pre-industrial SST
data. Values at ~20 ka have been used for LGM SST estimates within the data sets. Where available exact
SST values have been used from reference datasets, otherwise values have been estimated from published
graphics.
Core site Latitude/
Longitude
Wate
r
dept
h
(m)
Late
Holocene
SST
LGM
SST
∆SST
Holocene
-LGM
SST proxy Reference
South Atlantic
GeoB-3603-
2
35°S, 17°E 2840 21°C 18°C 3°C UK‘
37 Schneider et al.
(1999); (Caley et al.,
2012); Peeters et al.
(2004)
MD02-2594 34 °S 17°E 2440 18°C 14°C 4°C TEX86 Kasper et al. (2014)
MD02-2594 34 °S 17°E 2440 21°C 19°C 2°C UK‘
37 Kasper et al. (2014)
ODP 1090 42°S 8°E 3702 11°C 8°C 3°C UK‘
37 Martínez-Garcia et
al. (2010)
TNO57-21 41 °S 7°E 4981 14°C 11°C 3°C G..bulloide
s Mg/Ca
Barker et al. (2009)
Southwest Indian Ocean
MD79257 20°S, 36°E 1260 27 °C 24°C 3°C UK‘
37 Bard et al. (1997)
CD154 17-
17K
33°S 29°E 3333 24°C 21°C 3°C G..ruber
Mg/Ca
Simon et al. (2013)
CD154 17-
17K
33°S 29°E 3333 24°C 20°C 4°C SIMMAX
method
(annual
mean)
Simon et al. (2013)

Chapter 4. Glacial-interglacial changes at the I-AOG and Drake Passage
86
CD154 10-
06P
31°S 32°E 3076 22.5°C 20°C 2.5°C G..ruber
Mg/Ca
Simon et al. (in
preparation)
CD154 10-
06P
31°S 32°E 3076 25.5°C 24°C 1.5°C UK‘
37 Simon et al. (in
preparation)
CD154 10-
06P
31°S 32°E 3076 26.5°C 23.5°C
3°C TEX86 Simon et al. (in
preparation)
GIK16160-3 18 °S 37°E 1339 25°C 22.5°C 2.5°C G..ruber
Mg/Ca
Wang et al. (2013)
GIK16160-3 18 °S 37°E 1339 27.5°C 25.5°C 2°C UK‘
37 Wang et al. (2013)
MD96-2048 26°S 34°E 660 24°C 22.°C 2°C G..ruber
Mg/Ca
Caley et al. (2011)
MD96-2048 26°S 34°E 660 27.5°C 25°C 2.5°C UK‘
37 Caley et al. (2011)
MD96-2048 26°S 34°E 660 27°C 24°C 3°C TEX86 Caley et al. (2011)
MD96-2077 33°S 31°E 3781 25°C 21.5°C 3.5°C UK‘
37 Bard and Rickaby
(2009)
The LGM I-AOG transport rate simulated here (15.1 ± 2.5 Sv) suggests that the inter-
ocean exchange around South Africa was persistent at the end of the last glacial period
and of a magnitude similar to today. This contrasts to the common proxy-based
interpretation of a largely reduced Agulhas leakage at that time (Peeters et al, 2004;
Franzese et al., 2006; Caley et al, 2012; Caley et al., 2014). However, the use of the
important (sub)tropical foraminiferal species Globorotalia menardii as an indicator of
Agulhas leakage has recently been invalidated in four different ways by Sexton and
Norris, (2011). This study illustrates how Globorotalia menardii follows poorly
ventilated water masses, and that their absent low-latitude glacial abundance in the
Atlantic is related to the presence of well-ventilated, northern-high-latitude sourced
intermediate water masses. Relatively high present day abundance of the species in the
Atlantic is attributed to the low latitude presence of poorly ventilated Antarctic sourced

Chapter 4. Glacial-interglacial changes at the I-AOG and Drake Passage
87
AAIW. These details suggest that the deglacial reappearance of Globorotalia menardii
in the Atlantic Ocean is unlikely related to changes in volume transport by Agulhas
leakage. Another recent study by Broecker and Pena (2014) showed that the appearance
of Globorotalia menardii in the Atlantic Ocean during the last deglacial preceded the
recovery of NADW formation (AMOC) by 500 - 1000 years. Since connection
timescales between changes of Agulhas leakage and the North Atlantic are on the order
of two decades (Rühs et al., 2013), the delayed AMOC response shown by Broecker
and Pena (2014) suggests that there might be a problem with the current theory.
Motivated by the model results presented here a new hypothesis consistent with the
conceptual picture presented by Sexton and Norris (2011) and Broecker and Pena
(2014) can now be proposed to explain the apparent data-model mismatch – the
mismatch that a largely reduced I-AOG transport is not simulated for the LGM. It will
be proposed that upper ocean temperature changes across the South Atlantic-Southern
Ocean region, resulting from insolation, CO2 and bi-polar thermal see-saw changes
during glacial-interglacial (G-IG) transitions (Barker and Diz, 2014), drove the features
seen in the micropalaeontological proxy records from the I-AOG (Peeters et al, 2004;
Caley et al, 2012), independent of changes in Agulhas leakage itself.
It has been shown that SST records from the South Atlantic-Southern Ocean region
generally reproduce temperature variability observed in Antarctica (Jouzel et al., 2007;
Barker et al., 2009; Martínez-Garcia et al., 2010; Barker and Diz, 2014). This has also
recently been demonstrated for the I-AOG during the penultimate glacial cycle (Figure
4.16 b,d), (Marino et al., 2013). A significant positive correlation between the Antarctic
δDice record of past atmospheric temperature changes (Jouzel et al., 2007) and the ALF
record from the I-AOG (Peeters et al., 2004) over the past 550 kyr was
calculated (Pearson coefficient (Pt)=0.8 with a bootstrap error uncertainty of 0.03; 0.98
(n=354) at >95% Confidence Level). This strong similarity between the two records
leads to the suggestion that ALF variability may have been driven primarily by Southern
Hemisphere temperature changes throughout the Late Pleistocene (Figure 4.16 b,c).
Since species abundance and distribution in the world oceans is strongly related to SST

Chapter 4. Glacial-interglacial changes at the I-AOG and Drake Passage
88
(Kucera, 2007), it can be hypothesised that the proposed maxima in Agulhas leakage at
glacial terminations inferred from the ALF (Peeters et al., 2004) and Globorotalia
menardii records (Caley et al., 2012) (Figure 4.16 c, f) may have rather occurred as a
consequence of increased local planktonic growth rate associated with global deglacial
warming (and associated SST increases) (Figure 4.16 b).
Furthermore, counts of non-ALF planktonic foraminifera in the I-AOG also increase
during deglaciations (e.g. T-II, G. bulloides, Martinez-Mendez et al., 2010. See Figures
4.16 and 4.17) suggesting that the glacial-interglacial pattern is not limited to the ALF
species alone (Figure 4.16 c). Other warm water species behave similarly to the ALF,
increasing in abundance during terminations in the wider South Atlantic-Southern
Ocean region outside the direct influence of the Agulhas leakage pathway (Barker et al.,
2009; Barker and Diz, 2014). This suggests that a variety of species in the region
respond to a general deglacial Southern Hemisphere warming (Jouzel et al., 2007), and
may not be related to Agulhas leakage at all. Moreover, Simon et al., (2013) hinted at
the possibility that the Agulhas leakage signal south of Africa (Peeters et al., 2004;
Caley et al., 2012) may in fact be controlled by upstream dynamics, meaning that a
change in the Agulhas leakage properties at the I-AOG may occur even without a
change in volume transport itself.
The deglacial planktonic foraminiferal abundance peaks at the I-AOG may even have
been enhanced by bi-polar thermal see-saw warming in the South Atlantic-Southern
Ocean region associated with the deglacial Heinrich stadials occurring at each
termination during the late Pleistocene (Barker et al., 2011). The prominent ALF,
G.menardii and δ18OSW increases during Heinrich Stadials at each termination are
synchronous with the millennial-scale IRD pulses in the sub polar North Atlantic
(McManus et al., 1999) (Figure 4.16 a-f), suggesting that SST, ALF abundance and
18OSW (salinity) at the I-AOG increase in response to warming and salinification
associated with the (AMOC forced) bipolar thermal and salt seesaw mechanisms
(Stocker and Johnsen, 2003; Lohmann, 2003).

Chapter 4. Glacial-interglacial changes at the I-AOG and Drake Passage
89
Figure 4.16 (a) Ice-rafted detritus (IRD, grey) from the subpolar North Atlantic, Ocean Drilling Program
(ODP) Site 980 (McManus et al., 1999). (b) Antarctic δDice record of past atmospheric temperature
changes from the European Project for Ice Coring in Antarctica (EPICA) Dome C (Jouzel et al., 2007).
(c) The relative abundance of the Agulhas leakage fauna (ALF) in the Cape Basin record (in red), (Peeters
et al. 2004) as a measure of Indian Ocean advection into the Atlantic; relative abundance of non -ALF
species G. bulloides (in black) over Termination II in core MD96-2080 at the I-AOG (Martínez-Méndez
et al., 2010). (d) G.. ruber Mg/C derived calcification temperatures in MD96-2080, Agulhas Bank, I-
AOG. (e) Agulhas Bank δ18
OSW record as indication for Agulhas salt-leakage variability in the I-AOG. (f)
Accumulation Rate of G. menardii at ODP Site 1087 in the southern Benguela region (Caley et al., 2012).
Glacial-Interglacial terminations are highlighted as cyan bars. The prominent Heinrich event 11, H11,
during Termination II, is also displayed.

Chapter 4. Glacial-interglacial changes at the I-AOG and Drake Passage
90
Figure 4.17 Peeters et al. (2004), supplementary information, illustrating that G. bulloides is not
included in the ALF due to its low count abundance in Agulhas ring Astrid, and should not be used to
infer Palaeo rates of Agulhas leakage. Also important to note are the low abundance counts of G.
Menardii, often used as a proxy for Agulhas leakage. Shown is the integrated standing stock per species
for nine plankton tow stations. The nine panels show the depth integrated (0-800m) relative abundance of
several species of planktic foraminifera (>150μm size fraction). For each station nine plankton tow
samples were analysed. Species related to Agulhas water are indicated with a red colour bar. Station 28 of
the MARE-I expedition indicates the centre of the Agulhas ring studied, while station 1153/1151 of the
MARE-II expedition is related to a second Agulhas ring south of the Astrid ring. Station 09 of the
MARE-IV expedition was located in the centre of ring Astrid one year after the first observations. Station
20 of the MARE-IV expedition was located distal from Agulhas water and retroflection as indicated by
the absence of tropical species. Station locations are given in Figure S4 (Peeters et al., 2004;
supplementary information).
4.3.2 LGM Drake Passage comparison with proxy data
In addition to the investigation of modelled Drake Passage throughflow previously
discussed (section 4.2.4), a comparison with SST and kinematic proxy data was also
carried out. A data-model SST comparison, similar to that performed for the wider

Chapter 4. Glacial-interglacial changes at the I-AOG and Drake Passage
91
Agulhas region (section 4.3.1), but utilizing data from 17 marine cores (Luz, 1977;
Mashiotta et al., 1999; Calvo et al., 2001; Kim et al., 2002; Lea et al., 2006; Romero et
al., 2006; Kaiser et al., 2008; Pena et al., 2008; Kaiser and Lamy, 2010; Rincon-
Martinez et al., 2010; Caniupan et al., 2011; Ho et al., 2012), was conducted and is
shown in Figure 4.18. Model and data are in good agreement at certain locations for the
pre-industrial (top panel) and LGM (centre panel) cases. Although the pronounced (up
to 7°C) LGM SST cooling along the Humboldt Current (see Figure 4.19 for illustration
of the prominent ocean currents in the region) is not clearly depicted in the model,
possibly relating to relatively coarse grid resolution in the region (see Chapter 3), an
enhanced glacial cooling of ~5-6°C is simulated at the entrance of the Drake Passage
(Figure 4.18). SST proxy records upstream of the Drake Passage suggest a stronger
cooling in the Southeast Pacific compared to the central Pacific sector (Figure 4.18
(bottom panel), and Table 4.2) indicating a particularly pronounced northward extension
of the Antarctic cold-water sphere in this region. Accordingly, in the model the thermal
Subantarctic frontal zone (SAFZ), indicated by the 3° and 8° isotherms in Figure 4.18
(top and centre panels), shifts equatorward during the LGM (Ho et al., 2012). This
equatorward shift is also demonstrated by the thermal STF (section 4.3.1) south of
Africa and owes to the insolation (orbital configuration) and CO2 differences between
the pre-industrial and LGM simulations. However, the anomalous SST comparison
(bottom panel) illustrates some serious model-data mismatch. Apart from coarse model
resolution in the region, discrepancies between data and model can potentially be
explained by a combination of seasonal biases in the proxies, and enhanced cooling
captured by proxies along the Chilean coast due to proximity to the Patagonian ice sheet
during the LGM (Caniupan et al., 2011).

Chapter 4. Glacial-interglacial changes at the I-AOG and Drake Passage
92
Figure 4.18. South-east Pacific data-model comparison. (top) Pre-industrial (centre) LGM, and (bottom)

Chapter 4. Glacial-interglacial changes at the I-AOG and Drake Passage
93
anomalous SST model data (100 year annual climatological mean), and SSTs at 17 core locations from
the southeast Pacific region, indicated as coloured circles. The 3° and 8° isotherms are shown in white as
indicators of the southern and northern extent of the thermal Subantarctic frontal zone (SAFZ). The
thermal SAFZ is chosen in accordance with Chaigneu and Pizarro (2005), and is the temperature gradient
spanning the entrance to the Drake Passage for the pre-industrial simulation. Clear is a northward shift of
the thermal SAFZ during the LGM. Coarse coastlines are a result of relatively coarse model resolution in
the region. High resolution coastlines at Cape Horn are due to the superposition of a real world map onto
the model data (available with the Python plotting suite Basemap).
Table 4.2 Table summarizing SST records shown in Figure 4.18.
Core Lat
Long Hol
SST
LGM
SST
(°C)
LGM-
Hol
(°C)
SST Method Reference
East Pacific Rise (central Pacific)
E20-18 -44.55 248.67 9a 9.2
b 0.2 Foraminifera Luz, 1977
DWBG 70 -48.48 246.72 6a 2.6
b -3.4 Foraminifera Luz, 1977
E25-10 -50.10 245.22 6a 1.1
b -4.9 Foraminifera Luz, 1977
E21-15 -52.02 239.98 5a 1.1
b -3.9 Foraminifera Luz, 1977
RC12-225 -53.67 236.90 4a 1.1
b -2.9 Foraminifera Luz, 1977
E11-1 -54.91 245.30 3a 0.7
b -2.3 Foraminifera Luz, 1977
E11-3 -56.90 244.76 2a 0.6
b -1.4 Foraminifera Luz, 1977
E11-2 -56.06 244.94 3a 0.6
b -2.4 Foraminifera Luz, 1977
E11-2 -56.06 244.94 4.7 2.8 -1.9 Mg/Ca Mashiotta et al., 1999
SE Pacific
TG7 -17.20 281.40 20.4 17.3 -3.1 Alkenones Calvo et al., 2001
GeoB7139 -30.20 288.02 18.5 15 -3.5 Alkenones Kaiser et al., 2008
GeoB3302 -33.22 287.91 17.4c 12.7 -4.7 Alkenones Kim et al., 2002
GeoB3359 -35.22 287.20 18 12.4 -5.6 Alkenones Romero et al., 2006
ODP1233 -41.00 285.55 14.9 9.9 -5.0 Alkenones Kaiser and Lamy, 2010
MD07-
3128
-52.66 284.44
12.1 6.5 -5.6
Alkenones Caniupan et al., 2011
PS75/034–
1
-54.65 279.85
8.6 1.5 -7.1
Alkenones Ho et al., 2012
Eastern-tropical Pacific
TR163-22 0.52 267.60 24.4 22.4 -2.0 Mg/Ca Lea et al., 2006
ODP1240 0.02 273.54 25.6 23.1 -2.5 Mg/Ca Pena et al., 2008
ODP1239 -0.67 277.92 24.9 23.4 -1.5 Alkenones Rincon-Martinez et al., 2010 amodern winter SSTs
bLGM winter SSTs
cHolocene values from neighboring core GIK17748

Chapter 4. Glacial-interglacial changes at the I-AOG and Drake Passage
94
Figure 4.19 Frank Lamy (personal correspondence). Prominent ocean currents in the region and glacial
cooling (LGM- Holocene) in the eastern South Pacific based on diatom, alkenone, and Mg/Ca-based SST
reconstructions (Table 4.2). Background shows modern SST during austral winter (Locarnini et al.,2010).
ACC=Antarctic Circumpolar Current, SPC=South Pacific Current; PCC=Peru Chile Current (Humboldt
Current); CHC=Cape Horn Current.
The model results indicating a reduced Drake Passage throughflow of ~36%
simultaneous with a weakened ACC were compared with new proxy data from marine
sediment core MD07-3128 at the entrance of the Strait of Magellan, in the Cape Horn
Current (see Chapter 2 for details). Current strength proxies at this core site are the
weight percent (wt-%) of the 63-125 m fine sands fraction and sortable silt mean
grain-size (SS̅̅ ̅, 10-63 m) of the terrigenous sediment fraction (Lamy et al., submitted,
and Figure 4.20 d,e). The SS̅̅ ̅ proxy is used for estimating relative changes in the near
bottom flow speed in deep sea sediments (McCave and Hall, 2006), although in this
case it cannot be ruled out that the proxy may also reflect latitudinal movements of a jet

Chapter 4. Glacial-interglacial changes at the I-AOG and Drake Passage
95
within the ACC, and not changes in the mean ACC flow itself. The proxy data results
show that the fine sand contents fluctuate between 1 wt-% and 25 wt-% during the last
glacial in contrast to the observed ~50-60 wt-% during the Holocene. Changes in SS̅̅ ̅
follow the fine sand content changes at most times and values range between ~18 and
30 m during the glacial interval (Figure 4.20 d,e). Minimum glacial SS̅̅ ̅ values of ~18
m are recorded at several millennial-scale intervals between ~20-30 kyr BP and ~40-
55 kyr BP.
The high amplitude changes of both grain-size and sediment composition show
significant changes in the strength of the Cape Horn Current and underlying water
masses contributing to Drake Passage throughflow north of the Subantarctic Front (Well
et al., 2003). These results extend the near-bottom current flow speed records from a
meridional transect across the ACC in the Scotia Sea, which do not record substantial
differences in average glacial versus Holocene ACC transport rate (McCave et al.,
2013). However, these records are located more than 1000 km downstream of the Drake
Passage and may not necessarily capture changes in the throughflow itself.
Since all Scotia Sea records of McCave et al., (2013) are located south of the
Subantarctic Front (SAF) and mostly south of the Polar Front, and a major part of the
modern Drake Passage throughflow occurs at or north of the SAF (Meredith et al.,
2011), the combined transect data may indicate a higher meridional heterogeneity in
ACC current dynamics than previously hypothesized. The same applies for the vertical
structure of the ACC as the Scotia Sea cores are located at water depths of >2500 m and
changes in upper Drake Passage throughflow might not have extended to such depths.
However, the slight reduction in glacial ACC flow in the southernmost Scotia Sea
through extension of sea-ice (McCave et al., 2013) might reflect an additional decrease
of the southern Drake Passage throughflow adding to the decrease of total glacial Drake
Passage throughflow as shown by the climate model. Therefore, together with likely
reduced ACC flow in the southern Drake Passage through extension of sea-ice (McCave
et al., 2013), the Cape Horn Current record presented here suggests that the total Drake
Passage throughflow strongly reduced during the last glacial, in agreement with the
results from the COSMOS LGM simulation.

Chapter 4. Glacial-interglacial changes at the I-AOG and Drake Passage
96
The model simulates a throughflow reduction of ~36% from ~110 Sv in the pre-
industrial simulation to ~70 Sv in the LGM case, associated with a general weakening
of the ACC in the Pacific Ocean (Figure 4.12). Although the global model does not
resolve the relatively localized Cape Horn Current, modelled LGM intermediate flow
velocities at the entrance to the Drake Passage (at 1085m, corresponding to the water
depth of sediment core MD07-3128) are also strongly reduced by ~40-50% (Figure
4.21), largely consistent with the decrease in glacial SSmean .

Chapter 4. Glacial-interglacial changes at the I-AOG and Drake Passage
97
Figure 4.20 Reconstructed changes in in CHC strength and DP throughflow compared to temperature
records. (A) Ratio of planktic foraminifera N. pachyderma (sin.) to total N. pachyderma counts indicative
of surface ocean temperature changes in the South Atlantic (Barker et al., 2014). (B) Mg/Ca SST record
from the Galapagos region (Lea et al., 2006) representing eastern tropical Pacific SST changes. (C)
Alkenone SST record from ODP Site 1233 located within the HCS at ~41°S (Kaiser and Lamy, 2010)
(updated age-model). (D, E) Fine sand contents and SS̅̅ ̅ as proxy records for CHC strength and DP
throughflow. (F) Oxygen isotope record of the east Antarctic EDML ice core (EPICA Community
Members, 2006) (AICC12 age scale). Numbers mark Antarctic Isotope Maxima, and largest Antarctic
warmings A1-A4. (G) Oxygen isotope record of the Greenland NGRIP ice-core (EPICA Community
Members, 2006) (GICC05 age scale). H1-H6, Heinrich stadials. Vertical gray bars mark inferred

Chapter 4. Glacial-interglacial changes at the I-AOG and Drake Passage
98
millennial-scale DP throughflow maxima and suggested correlation to other records. (Lamy et al., in
preparation)
Although not simulated by the model, which is extremely coarse in the location of the
Drake Passage and throughout the South Pacific (not correctly resolving relatively
localised ocean features such as the Cape Horn or Humboldt currents), in reality the
reduced Drake Passage throughflow may have acted to deflect ACC water masses into
the Pacific gyre circulation and plausibly explain the strong cooling of eastern Pacific
surface waters up to the equator, as suggested by proxy records (Table 4.2; Figure 4.18;
Figure 4.19). The reduced modelled and inferred (from data) Drake Passage
throughflow also has potential implications for the global distribution of Antarctic
Intermediate Water (AAIW). The major modern formation area of AAIW is the
Southeast Pacific, off the coast of southern Chile (Bostock et al., 2013). The proxy data
results presented here suggest that Drake Passage throughflow of Southeast Pacific
AAIW was strongly reduced or even disrupted, and that Pacific AAIW was largely
exported into the South Pacific gyre, consistent with sediment records showing
enhanced AAIW in the southeast Pacific Ocean (Muratli et al., 2010; Martinez-Mendez
et al, 2013). The glacial reduction of AAIW transport through the Drake Passage is
consistent with proxy data indicating poorly ventilated AAIW in the glacial South
Atlantic (Makou et al., 2010). In order to assess this in the model a salinity transect
across 30ºS in the Atlantic Basin was taken for the PI and LGM simulations (Figures
A.7 and A.8 in the Appendix). However due to the 1psu of salt added to the glacial
ocean it is difficult to elucidate whether increased LGM salinity at 30ºS (across the
AAIW depth range) is due to decreased AAIW penetration at that location (see
Appendix). Future work using Lagrangian tracer methodologies might be able to

Chapter 4. Glacial-interglacial changes at the I-AOG and Drake Passage
99
provide further insights on this issue.
Figure 4.21 Ocean velocity anomaly between the LGM and pre-industrial simulations (m/s), showing a
reduction of the ACC and Drake Passage throughflow during the LGM, from Lamy et al., submitted.
Bathymetry is shown at 1085m, corresponding to the depth of core site MD07-3128. The velocity data is
integrated over depth levels 500m-1500m. Apparent is the anomalous westward velocity field,
corresponding to a decrease in the positive eastward velocity field in the LGM compared to the pre-
industrial case. Maximum LGM velocity reductions over this depth range are up to 50% compared to the
pre-industrial simulation. The coarse bathymetry at depth (1085m) is typical of all state-of-the-art fully-
coupled Earth System Models used for Palaeoclimate modeling.
It has previously been suggested that the ACC and Drake Passage throughflow is
predominantly controlled by the variations in the position and strength of the Southern
Hemisphere westerly wind belt (Allison et al., 2010; Marshall et al., 2012). However,
the model results shown here demonstrate that no significant changes in either the
strength or position of the westerlies are required to permit the development of a
weakened ACC during the LGM (Figure 4.11). It is therefore suggested that the glacial
reduction of the ACC and Drake Passage throughflow in the LGM simulation is caused
by sea-ice modulation of the ocean-atmosphere interaction, specifically due to enhanced
LGM sea-ice (thickness and extent; Figures 4.13 and 4.14) acting to de-couple the
Southern Hemisphere westerlies from the ocean surface (McCave et al. 2013). However
it should be noted that the ACC change might also be controlled or modulated by

Chapter 4. Glacial-interglacial changes at the I-AOG and Drake Passage
100
changes in the meridional salinity and temperature (ultimately density) gradients across
the Southern Ocean (e.g. Lefebvre et al., 2012). (See Appendix, Figures A.4-A.7).
The work presented here shows minimal changes of the I-AOG transport between pre-
industrial and LGM climate states, but a large reduction in Drake Passage throughflow
during the glacial. Additionally, the LGM case simulates a more intense and deeper
AMOC than the pre-industrial state. Such a deeper AMOC is in contrast with most
studies utilising proxy data from the Atlantic Ocean which suggest a shoaled upper
branch circulation during the LGM (Marchitto and Broecker, 2006; Lynch-Stieglitz et
al., 2007; Oppo and Curry, 2012; Gebbie, 2014), and may be related to the spin-up time
required for complete ocean model equilibrium. The increased depth of the modelled
AMOC during the LGM (compared to the PI) is also likely to be controlled by the
southward movement of the NADW convection sites, and the location of the sea-ice
margin , both of which are dependent on the model or model configuration utilised.
Regarding the Drake Passage throughflow, is it possible that through reduced transport
of positive density anomalies along the cold water route, that the weakened Drake
Passage throughflow could have contributed to the shoaled LGM AMOC? This may
have been the case in reality and might provide motivation for future studies, but it not
shown by the model which simulates a more vigorous glacial AMOC characterised by
deep convection in the North Atlantic. Such a link between Drake Passage dynamics
can only be established by the use of Lagrangian tracer methodologies, which are
beyond the scope of this study. For the pre-industrial and LGM simulations presented
here, the modelled AMOC geometry appears to be controlled by a combination of
orbital configuration (Milankovitch, 1930; Milankovitch, , 1941, Hays et al., 1976;
Berger, 1978; Berger and Loutre, 1991), trace gas concentration (Luthi et al., 2008) and
the volume of the Northern Hemisphere ice sheets (Zhang et al., 2014). However a
weaker contribution of the cold water route to a shallower glacial AMOC cannot be

Chapter 4. Glacial-interglacial changes at the I-AOG and Drake Passage
101
ruled out, and warrants further investigation.
4.4. Summary and Conclusions
In this chapter the LGM palaeoceanography of the Agulhas and Drake Passage regions
were investigated. This was conducted with the utilisation of an adapted ocean model
configuration which successfully simulates quantitatively realistic I-AOG and Drake
Passage transports for the pre-industrial climate states. The rate of I-AOG and Drake
Passage transports and modelled SSTs in both pre-industrial (interglacial) and LGM
(glacial) climate states were compared with proxy data from the south-east Atlantic,
Agulhas region, and the south-east Pacific in the vicinity of the Drake Passage.
Agulhas leakage has been suggested as a key process in the modes of Quaternary
climate change, with significantly reduced warm water route gateway (I-AOG) transport
during the LGM (and other previous late-glacial periods of the Late Pleistocene)
compared to the modern climate. While the fully-coupled ESM simulates decreased
LGM SSTs and an equatorward shift of the thermal STF, in agreement with proxy data
throughout the Agulhas region (Bard et al., 1997; Peeters et al., 2004; Bard and
Rickaby, 2009; Barker et al., 2009; Martínez-Garcia et al., 2010; Caley et al., 2011;
Simon et al., 2013; Wang et al., 2013; Kasper et al., 2014; Simon et al., (in
preparation)), a largely suppressed I-AOG water transport is not simulated. The
modelled results show a persistent and strong I-AOG transport at the LGM (15.1 ± 2.5
Sv), suggesting that the Agulhas leakage need not have been weaker than its present
state in order to simulate a glacial climate comparable with SST proxy data.
An alternative hypothesis is provided which can explain the pattern observed in proxy
records from the I-AOG without a necessary change in the glacial-deglacial-interglacial
rate of Agulhas leakage. The hypothesis proposes that the micropalaeontological proxies
used to derive rates of Agulhas leakage (Globorotalia menardii and the ALF) rather
responded to regional upper ocean temperature changes during the glacial-deglacial-
interglacial cycles of the late Pleistocene. However, it still remains challenging to
establish whether SST, salinity and consequent abundance changes in planktonic

Chapter 4. Glacial-interglacial changes at the I-AOG and Drake Passage
102
foraminifera at the I-AOG are a result of 1) global interhemispheric changes impacting
on the wider Agulhas system (suggested by this study) 2) upstream Agulhas Current
variability (Simon et al., 2013) or 3) the status quo - a stronger transfer of Indian Ocean
waters to the Atlantic around South Africa (Peeters et al., 2004). The work here
therefore demands further investigation utilising fully-coupled eddy-resolving ESMs
performing deglacial simulations, and a careful reconsideration of the interpretation of
proxy data from the wider Agulhas region.
At the cold water route gateway COSMOS simulates a reduced Drake Passage
throughflow during the LGM compared to the pre-industrial climate state. The
throughflow is reduced by ~36% from ~110 Sv in the pre-industrial simulation to ~70
Sv in the LGM case, associated with a general weakening of the ACC across the
Southern Ocean. Comparing model results with proxy data for SST in the glacial
southeast Pacific region reveals a number of temperature discrepancies which can be
explained by a combination of coarse model resolution, seasonal biases of proxies, and
and enhanced cooling captured by proxies along the Chilean coast due to proximity to
the Patagonian ice sheet during the LGM (Caniupan et al., 2011). However, the
modelled reduction of Drake Passage throughflow during the LGM is corroborated by
new proxy data from the Cape Horn Current at the entrance to the Strait of Magellan.
Fine sands fraction and sortable silt mean grain-size data at this location suggest a
weakened Drake Passage throughflow during the last glacial. Moreover, the model
results show that the weakened ACC and Drake Passage throughflow during the LGM
are not forced by changes in the position or intensity of the Southern Hemisphere
westerlies, rather to a sea-ice modulation of the ocean-atmosphere interaction,
specifically enhanced LGM sea-ice (thickness and extent) acting to de-couple the
Southern Hemisphere westerlies from the ocean surface (McCave et al. 2013).

Chapter 5. Millennial scale changes at the I-AOG and Drake Passage
103
5. Millennial scale changes at the I-AOG
and Drake Passage
5.1. Introduction
During glacial periods of the Middle to Late Pleistocene, proxy data shows the
existence of large and repeated millennial-scale events known as Dansgaard–Oeschger
(DO) events (Daansgard et al., 1993) (e.g. Figures 1.3 and 5.2b). These events are
characterised by abrupt Northern Hemisphere warmings, often occurring within decades
(to interstadial levels) followed by cooling events, returning to background glacial
levels (stadials). These climate changes are also associated with more moderate bipolar
Southern Hemisphere temperature swings and north-south migrations of the tropical
rain-belts (Broecker, 1998; Stocker and Johnsen, 2003; Völker et al., 2002; Barker et al.,
2009). DO events are a ubiquitous feature of rapid climate change and can be extended
back as far as 800,000 years BP in the ice core record (Barker et al., 2011). The
mechanistic cause of these phenomena is debated but has been attributed to increases
(interstadials) and reductions (stadials) of the Atlantic Meridional Overturning
Circulation (AMOC) (Ganopolski and Rahmstorf, 2001; Clark et al., 2002; Rahmstorf,
2002), likely related to massive ice berg rafting events in the North Atlantic (Heinrich
events) (Heinrich, 1988; Bond et al., 1993) and/or changes in the size of the
intermediate glacial ice sheets (Zhang et al., 2014).
Despite progress being made with respect to the causes of millennial scale climate
changes (e.g. Zhang et al., 2014), little is known about the relative roles of the warm
and cold water route ocean gateways within the mechanisms of DO events, and so a
Southern Hemisphere origin cannot be ruled out (Marino et al., 2013). The warm and
cold water return routes of the thermohaline circulation (THC) supply water, heat and
salt to the upper branch of the AMOC. Since the Indian-Atlantic Ocean Gateway (I-
AOG) and Drake Passage are considered key gateways along the warm and cold routes,
respectively, it has been proposed that changes at either gateway may have implications
for the Atlantic overturning and therefore global climate (Knorr and Lohmann, 2003;
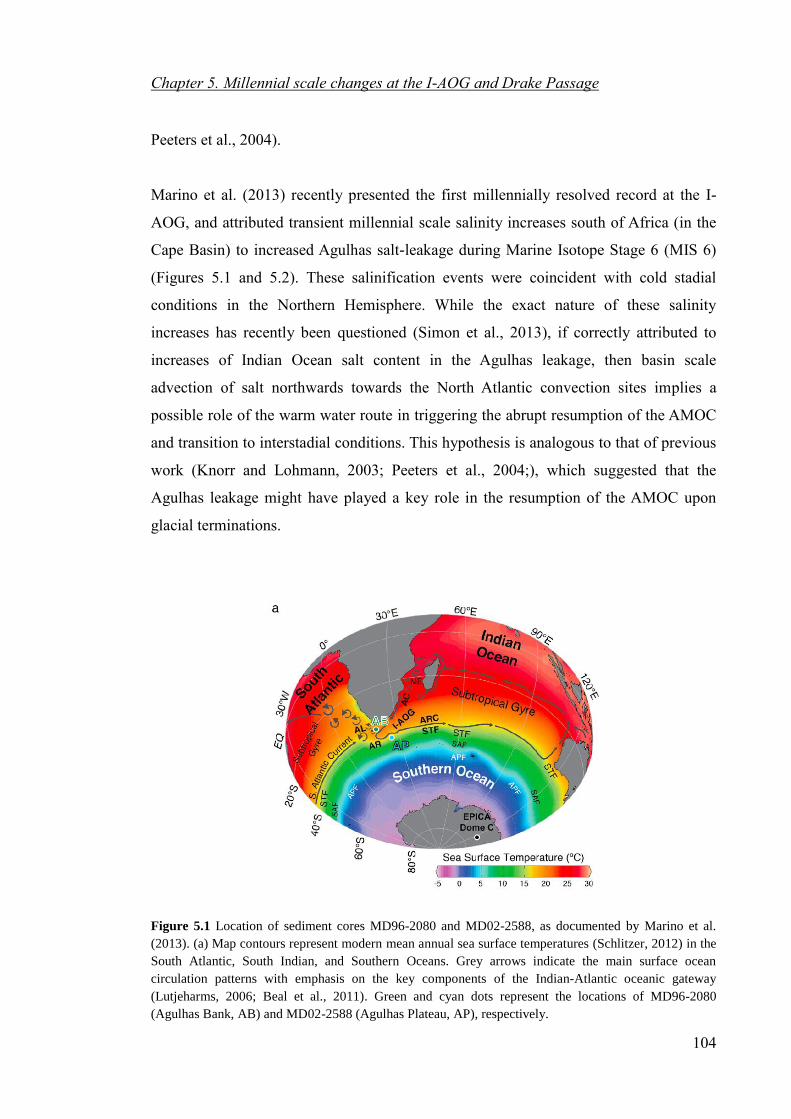
Chapter 5. Millennial scale changes at the I-AOG and Drake Passage
104
Peeters et al., 2004).
Marino et al. (2013) recently presented the first millennially resolved record at the I-
AOG, and attributed transient millennial scale salinity increases south of Africa (in the
Cape Basin) to increased Agulhas salt-leakage during Marine Isotope Stage 6 (MIS 6)
(Figures 5.1 and 5.2). These salinification events were coincident with cold stadial
conditions in the Northern Hemisphere. While the exact nature of these salinity
increases has recently been questioned (Simon et al., 2013), if correctly attributed to
increases of Indian Ocean salt content in the Agulhas leakage, then basin scale
advection of salt northwards towards the North Atlantic convection sites implies a
possible role of the warm water route in triggering the abrupt resumption of the AMOC
and transition to interstadial conditions. This hypothesis is analogous to that of previous
work (Knorr and Lohmann, 2003; Peeters et al., 2004;), which suggested that the
Agulhas leakage might have played a key role in the resumption of the AMOC upon
glacial terminations.
Figure 5.1 Location of sediment cores MD96-2080 and MD02-2588, as documented by Marino et al.
(2013). (a) Map contours represent modern mean annual sea surface temperatures (Schlitzer, 2012) in the
South Atlantic, South Indian, and Southern Oceans. Grey arrows indicate the main surface ocean
circulation patterns with emphasis on the key components of the Indian-Atlantic oceanic gateway
(Lutjeharms, 2006; Beal et al., 2011). Green and cyan dots represent the locations of MD96-2080
(Agulhas Bank, AB) and MD02-2588 (Agulhas Plateau, AP), respectively.

Chapter 5. Millennial scale changes at the I-AOG and Drake Passage
105
Figure 5.2 Linking Agulhas salt oscillations with ocean and climate changes in the North Atlantic, from
Marino et al. (2013). (a) Greenland δ18Oice composite (Capron et al., 2010; Barker et al., 2011; Dahl-
Jensen et al., 2013). (b) Ice-rafted detritus (IRD, grey) from the subpolar North Atlantic, Ocean Drilling
Program (ODP) Site 980 (Oppo et al., 2006). Tetraunsaturated alkenones (C37:4) at the Iberian Margin
(Martrat et al., 2007). (c) Agulhas Bank δ18OSW record. The shaded envelope illustrates the propagated
2σ uncertainty associated with the millennial-scale δ18OSW shifts discussed in the text. (d, e) Mg/Ca-
derived (G. bulloides) SST and IRD from the Agulhas Plateau. (f) Benthic foraminiferal δ13C profile
(Hodell et al., 2008) from the Integrated Ocean Drilling Program Site U1308 (North Atlantic, 3883m
water depth) with a 1 kyr Gaussian low-pass filter. (g) Tie points used to synchronize the MD02-2588
(cyan) and MD96-2080 (green) records to the EDC3/EDML1 chronology and associated 1σ uncertainties.
NAI, North Atlantic Interstadials; ASM, Agulhas Salt-leakage Maximum; H11, Heinrich event 11.

Chapter 5. Millennial scale changes at the I-AOG and Drake Passage
106
On the other hand, proxy based reconstruction of Drake Passage and cold water route
changes on millennial timescales is currently lacking. McCave et al. (2013) recently
documented a series of proxy data for the LGM and Holocene outlining near bottom
water flow speeds, based on the variability of the sortable silt mean grain size (McCave
and Hall, 2006), in the Drake Passage and Scotia Sea, and concluded that there was
little or no change of the ACC between those time periods (Figure 5.3). However this
time-slice approach offers no detail of the deglacial transition itself, which may or may
not have demonstrated millennial scale variability. As a consequence of the scarcity of
data, both reconstructions and modelling studies have yet to fully consider the potential
role of relative, or net, changes of the I-AOG transport and Drake Passage throughflow
on global climate.
Figure 5.3 (Same as Figure 4.2) Average SS particle size, from McCave et al. (2013). SS averaged for the
LGM and Holocene. Error bars are ±2 s.e.m (analytical error of ±0.5 µm is not propagated). Larger core
numbers indicate significant (P<0:01) LGM–Holocene differences. Modern frontal positions (and
subsidiaries SSAF and SSACCF) are indicated (Sokolov et al.,2009). South of 56 ºS, LGM flow was
significantly slower than Holocene flow (cores 6–9), whereas cores 10–12 show no significant change.
North of 56ºS (cores 2–5), flow during the LGM was faster than further south, with a non-significant
decrease in the Holocene.

Chapter 5. Millennial scale changes at the I-AOG and Drake Passage
107
5.1.1 Study approach
Model simulations of North Atlantic freshwater perturbations provide a well-established
testing ground for the diagnosis of weakened AMOC states associated with some
millennial scale Northern Hemisphere cold-stadials (Manabe and Stouffer, 2000;
Stouffer et al., 2006; Lohmann, 2003), particularly those simultaneous with Heinrich
events, as recorded in the geological and ice records (Heinrich, 1988; Dansgaard et al.,
1993). The freshwater input acts as an idealised analogue to iceberg discharge during
Heinrich events. With regards to the analysis of Southern Hemisphere responses, in a
modelling sense it is not critical whether a weakened AMOC be achieved through
freshwater perturbation (the status quo for the past two decades) or via changes in the
size of the Northern Hemisphere ice-sheets, as recently demonstrated by Zhang et al.
(2014).
In order to assess potential hydrographic changes at the warm water route (I-AOG) and
cold water route (Drake Passages) gateways during weakened and recovering AMOC
states associated with millennial scale and abrupt climate change, and also to investigate
the dependence of the response on the background climate, two North Atlantic
freshwater experiments were performed on the pre-industrial and LGM equilibrium
simulations (experiments PI150FW on the pre-industrial background state, and
LGM150FW on the LGM background state). The Agulhas leakage corridor (I-AOG)
was chosen as a key gateway indicative of changes along the warm water route, as used
in previous studies (Peeters et al, 2004; Speich et al., 2001). Since the entire ACC and
associated frontal systems pass through the Drake Passage (McCave et al., 2013), this
choke point was chosen as an appropriate gateway for analysis of the cold water route
(Speich et al., 2001). Flow rate, temperature and salinity were calculated across these
gateways (see also Chapter 2). Freshwater perturbations of magnitude 0.2 Sv were
applied across the North Atlantic Ice Rafted Detritus (IRD) belt around 40ºN-55ºN,
45ºW-20ºW (Hemming, 2004; Gong et al., 2013). In experiments PI150FW and
LGM150FW the forcing was applied over a period of 150 years until a new quasi-
equilibrium state, characterised by a weakened AMOC, had been achieved. This quasi-
equilibrium state differs from the equilibrium achieved via 4000 years of integration in
that the deep water properties do not fully equilibrate. After 150 years of perturbation

Chapter 5. Millennial scale changes at the I-AOG and Drake Passage
108
the system was permitted to recover following the removal of freshwater input - a
recovery which takes ~200 years. Performing the freshwater perturbation experiments
on both PI and LGM background states allowed an investigation of the dependence of
the I-AOG and Drake Passage response on the background climate.
The modelled data was thereafter compared with previously published data (particularly
Marino et al., 2013), and new data from marine sediment core MD07-3128, at the
entrance to the Strait of Magellan (see Chapter 2 for details).
5.2 Results
5.2.1 Pre-industrial freshwater perturbation
In response to the North Atlantic freshwater perturbation, the AMOC is weakened to ~7
Sv after 150 years or forcing, at year 250 (Figure 5.4), resulting in a reduction of the
northward heat transport to the North Atlantic. Following cessation of the perturbation
at year 250 the AMOC recovers and returns to its original quasi-equilibrium state,
characterised by an AMOC index of ~14 Sv, by year 550. Due to the weakened AMOC
and reduced northward heat transport, the global ocean undergoes a bi-polar thermal
adjustment (Stocker et al., 1998; Knutti et al., 2004), with parts of the North Atlantic
Ocean experiencing extreme surface cooling of up to ~7ºC, and large areas of the
Southern Hemisphere oceans warming by a maximum of ~1ºC (Figure 5.5a). The
oceanic response is particularly pronounced in the Atlantic Ocean, indicated by the
relatively large bi-polar thermal gradient experienced there. The most significant global
cooling and warming occur in the Atlantic basin.

Chapter 5. Millennial scale changes at the I-AOG and Drake Passage
109
Figure 5.4 Zonally integrated meridional transport in the Atlantic Ocean (Sv) for the weakened AMOC
state associated with experiment PI150FW. Notable is the intrusion north of the Equator of abyssal waters
below depths of 2500 m .
In addition to the thermal response to freshwater induced AMOC perturbation, the
global ocean undergoes a quasi-inter-hemispheric salt seesaw (Lohmann, 2003),
resulting in a salinification of large parts of the Southern Hemisphere and a freshening
in most of the Northern Hemisphere (Figure 5.5c). The North Atlantic and Arctic oceans
freshen both due to the ad hoc freshwater input itself, as well as the AMOC related
reduction in the salt transport from the South Atlantic. As the AMOC weakens, there is a
reduction in the transport across the equator, thereby limiting the advection of water and
salt to the North Atlantic. This water and salt is rather recirculated around the South
Atlantic subtropical gyre system, and additionally throughout the entire Southern
Hemisphere supergyre (Speich et al., 2007), imprinting the signature of increased
salinity throughout parts of the South Atlantic, Pacific and Indian Oceans, as well as
across upper layers of the I-AOG and Drake Passage (Figure 5.5c and Figure 5.6). The
reduced transport across the equatorial region into the North Atlantic leads to a general
redistribution of salt throughout the Southern Ocean (Figure 5.5c). Additionally, due to
a related weakening of the Gulf Stream and North Atlantic Current, an accumulation of
salt occurs in the Caribbean.

Chapter 5. Millennial scale changes at the I-AOG and Drake Passage
110
Figure 5.5 Sea surface temperature (°C) and salinity (psu) anomaly plots for (a, c) experiment PI150FW
and (b, d) experiment LGM150FW, respectively. Yellow (blue) values indicate increased (decreased) SST
and SSS in response to perturbation. Climatological values for the states in response to perturbation are
averaged over model years 230 – 250, corresponding to the time when the AMOC is at its weakest state.
The red lines in (a) represent the meridional Drake Passage and I-AOG sections used for Figures 5.6 and
5.9.
5.2.1.1 Indian-Atlantic Ocean Gateway response
In order to assess the transient response of the warm and cold water route gateways,
meridional sections at the I-AOG and Drake Passage (see Chapter 2 for details) were
selected, and temporal analyses performed. The I-AOG salinity, temperature and water
transport timeseries for experiment PI150FW are provided in Figure 5.6. As the
freshwater input progresses between years 100 and 250 and the AMOC adjusts, an
upper level (0 - 300 m water depth) salinity increase of ~0.2-0.3 psu develops across the
I-AOG, lagging the North Atlantic forcing by approximately 50 years. Since no major

Chapter 5. Millennial scale changes at the I-AOG and Drake Passage
111
increase of I-AOG water transport is simulated during the experiment (Figure 5.6), the
observed salinity increase is likely related to Atlantic rather than Indian Ocean sourced
salt. The salinity response occurs as a result of the reduced AMOC and associated
reorganisation of the South Atlantic subtropical gyre system, tending to store and
redistribute salt throughout the South Atlantic i.e. the quasi-inter-hemispheric salt
seesaw (Figure 5.5c). The effect of the bi-polar thermal seesaw is detected over depth
levels 600-1100 m, expressed by a 1-2ºC temperature increase, which lags the remote
North Atlantic forcing by ~50 years (Figure 5.6). The signature of eastward transported
NADW exported from the South Atlantic, located beneath the westward flowing I-AOG
transport (above ~1000m), is discernable as a salinity maximum between 1200m and
3000m water depths. The presence of this relatively saline water mass, composed of
water in the salinity range 35.1 - 35.2 psu is reduced beginning around year 150 and
replaced with water in the range 34.9 - 35.0 psu (Figure 5.6). This implies a reduction in
NADW penetration at the location associated with the weak AMOC state (years 150 –
400), lagging the North Atlantic forcing by ~ 50 years.

Chapter 5. Millennial scale changes at the I-AOG and Drake Passage
112

Chapter 5. Millennial scale changes at the I-AOG and Drake Passage
113
Figure 5.6 Drake Passage (left) and I-AOG (right) Hovmoeller diagrams and transport timeseries for
experiment PI150FW. Freshwater perturbation is instantaneously introduced at year 100 and ceases at
year 250 (indicated by black lines). The AMOC timeseries shows a weakening in response to freshwater
perturbation at year 100. After cessation of the forcing at year 250 the AMOC recovers. The red curves
along the AMOC timeseries indicate 30 year moving mean values. Also shown are salinity (psu),
temperature (°C) and water volume transport (Sv) through the respective gateways. 10 year moving
mean values are plotted along the water transport timeseries.
5.2.1.2 Drake Passage response
The Drake Passage and AMOC timeseries for experiment PI150FW are provided in
Figure 5.6. Similar to results from the I-AOG, as the freshwater input progresses
between years 100 and 250, and the AMOC adjusts, an upper level (0-200m water
depth) salinity increase of ~0.2-0.3 psu develops across the Drake Passage section and
lags the North Atlantic forcing by ~100 years, suggesting a bipolar salt seesaw response
time of ~100 years at the Drake Passage (Figure 5.6). Again this salinity response
occurs as a result of the reduced AMOC and subsequent quasi-bipolar salinity seesaw
adjustment process. Coincident with the salinity increase at the Drake Passage is the
development of an upper layer 1-2ºC warming, extending down to a water depth of
700m (Figure 5.6). This thermal response is particularly pronounced between years 250
and 400, lagging the northern forcing by ~150 years, suggesting a bipolar thermal
seesaw response time of ~150 years at the Drake Passage, reflecting the thermal inertia
of the Southern Ocean (Stocker and Johnson, 2003; Knutti et al., 2004).
5.2.2 LGM freshwater perturbation
The LGM equilibrium simulation utilising the MPIOM-AFRICA ocean model
configuration produced 100 year climatological mean I-AOG and Drake Passage
transports of ~15 Sv and ~71 Sv, respectively (Table 3.1). For further details on the
LGM equilibrium state refer to Chapter 3. Performing an identical freshwater
perturbation experiment on the LGM background state (as in PIF150FW), again there is
a reduction in the northward heat and salt transport in the North Atlantic, related to the

Chapter 5. Millennial scale changes at the I-AOG and Drake Passage
114
weakened AMOC state. In this case the AMOC weakens to ~5 Sv after 150 years of
perturbation i.e. at year 250 (Figure 5.7). Thereafter the system re-equilibrates, and by
year 500 the AMOC has returned to its original quasi-equilibrium state characterised by
an AMOC overturning strength of ~21 Sv.
Figure 5.7 Zonally integrated meridional transport in the Atlantic Ocean (AMOC, Sv) for the weakened
state associated with experiment LGM150FW. Notable is the intrusion of abyssal waters north of the
Equator below depths of 2000 m. The AMOC collapse is enhanced in LGM150FW compared to
PI150FW.
The results from LGM150FW show substantial changes in the heat and salt distribution
throughout the entire globe in response to perturbation (Figure 5.5 b,d). These changes
in the distribution of heat and salt are particularly pronounced in the Atlantic and Arctic
oceans, as well as the Atlantic sector of the Southern Ocean (similar to the PI150FW
case). Bi-polar thermal and quasi-bi-polar salt seesaws analogous to those in PI150FW
are simulated (Figure 5.5 b,d). However, despite the qualitative similarities in response
between the two background states, some interesting quantitative differences exist,
relating to the enhanced AMOC weakening in LGM150FW compared to PI150FW. In
terms of thermal response, the North Atlantic surface ocean cools by up to ~12ºC in

Chapter 5. Millennial scale changes at the I-AOG and Drake Passage
115
LGM150FW, 5ºC colder than the maximum cooling experienced in PI150FW (Figure
5.5 a,b). Southern Hemisphere warming in LGM150FW is slightly warmer than in
PI150FW (~ +0.25ºC), especially pronounced in the South Atlantic Ocean. LGM150FW
simulates a slight ~0.25ºC SST increase at the Drake Passage, while PI150FW simulates
almost no change. Freshening of the North Atlantic and Arctic oceans is stronger in
LGM150FW than PI150FW, with maximum freshening of 6 psu and 5 psu in those
basins, respectively (Figure 5.5d). This compares with maximum freshening anomalies
of 4 psu and 2 psu simulated in the North Atlantic and Arctic oceans during experiment
PI150FW (Figure 5.5c). Salt accumulation in the Caribbean, South Atlantic, Indian and
Pacific oceans is also of a higher magnitude and extent in experiment LGM150FW,
reaching maxima of 1.5 - 2.0 psu in some locations e.g. off the west coast of Africa
(Figures 5.5 c,d).
In response to North Atlantic freshwater perturbation, the simulation also shows a
southward shift of the equatorial and near-equatorial precipitation belts associated with
the ITCZ (Figure 5.8a), in agreement with PMIP ensemble-model studies (Stouffer et
al., 2006). For example, precipitation in southeast Africa increases by ~10-15%
compared to the LGM background state (Figure 5.8a). As a result of the precipitation
and river runoff changes, the net freshwater flux in the ocean responds (Figure 5.8b).
Additionally, and associated with the shift of the ITCZ, an anomalously low surface
level pressure (SLP) is simulated over the south-east Atlantic, the entire southern part of
the African continent, and southwest Indian Ocean (Figure 5.8c).

Chapter 5. Millennial scale changes at the I-AOG and Drake Passage
116

Chapter 5. Millennial scale changes at the I-AOG and Drake Passage
117
Figure 5.8 Modelled response to North Atlantic freshwater perturbation on the LGM background
state (a) Annual mean precipitation anomaly (in mm/mon) demonstrating the southward shift of the
equatorial precipitation belts, including increases of precipitation in the range of 5-10 mm over the South-
east African river catchment areas. (b) Net freshwater flux at the ocean surface (in m/s), including the
effects of precipitation, evaporation and river run-off. Evident are the anomalously fresh regions of
increased river run-off along the south-east coast of Africa. (c) Annual mean surface level pressure
anomaly (in Pa) showing anomalously low surface level pressure over the entire southern part of the
African continent, south-east Atlantic, and southwest Indian Ocean. Increased sea-level pressure is
simulated over northern Africa. (d) Sea surface temperature anomaly (in °C) showing anomalously high
temperatures occurring in the Atlantic sector of the Southern Hemisphere. All anomalies are between the
perturbed and background LGM climate states. (Simon et al., in preparation).
5.2.2.1 Indian-Atlantic Ocean Gateway response
As for the PI150FW case, meridional sections at the I-AOG and Drake Passage (see
Chapter 2 for details) were selected, and temporal analyses performed in order to assess
the transient responses. The resulting AMOC and I-AOG salinity, temperature and water
transport timeseries for experiment LGM150FW are provided in Figure 5.9. As the
freshwater input progresses between years 100 and 250, an upper level (0-400m water
depth) salinity increase of ~0.3-0.5 psu develops across the I-AOG section (years 150 to
300), lagging the North Atlantic forcing by approximately 50 years. Similar to
experiment PI150FW, no discernable change of I-AOG water transport is simulated
during the experiment (Figure 5.9). The effect of the bi-polar thermal seesaw is
observable between 700-1200m water depth, expressed by a 2-3ºC temperature increase
(Figure 5.9), lagging the North Atlantic forcing by approximately 50 years. Also similar
to experiment PI150FW, across deeper layers a reduced NADW export from the South
Atlantic, associated with a weakening AMOC, is detectable as a salinity signal with a
lag time of ~ 50 years after the North Atlantic forcing (Figure 5.9). Notable differences
in the temperature and salt responses across the I-AOG section between the two
experiments PI150FW and LGM150FW include the ~3ºC lower SST and ~0.5 psu
higher SSS associated with the LGM background case (Figures 5.6 and 5.9). The ~3ºC
SST cooling at this location between the pre-industrial and LGM simulations reflects
the general sub-tropical temperature response to the application of LGM boundary
conditions, while the ~0.5 psu SSS increase is related to the 1 psu added to the LGM
ocean in order to take the large glacial ice sheets into account (see Chapter 2 for
details).

Chapter 5. Millennial scale changes at the I-AOG and Drake Passage
118

Chapter 5. Millennial scale changes at the I-AOG and Drake Passage
119
Figure 5.9 Drake Passage (left) and I-AOG (right) Hovmoeller diagrams and transport timeseries for
experiment LGM150FW. Freshwater perturbation is instantaneously introduced at year 100 and ceases at
year 250 (indicated by black lines). The AMOC timeseries shows a weakening in response to freshwater
perturbation at year 100. After cessation of the forcing at year 250 the AMOC recovers. The red curves
along the AMOC timeseries indicate 30 year moving mean values. Also shown are salinity (psu),
temperature (°C) and water volume transport (Sv) through the respective gateways. 10 year moving mean
values are plotted along the water transport timeseries. Green lines and associated numbers in red (Sv)
indicate the 100 year climatological mean rate of Drake Passage throughflow. The red arrow indicates the
~26% water transport increase through the Drake Passage.
5.2.2.2 Drake Passage response
The Drake Passage and AMOC timeseries for experiment LGM150FW are provided in
Figure 5.9. Similar to experiment PI150FW on the pre-industrial background state,
upper level salinity and temperature increases are simulated in response to, and lagging,
the northern forcing. As the freshwater input progresses between years 100 and 250, and
the AMOC adjusts, an upper level (0-125m water depth) salinity increase of ~0.1psu
develops across the Drake Passage section and lags the North Atlantic forcing by ~100
years (Figure 5.9). As in the PI150FW case this salinity response occurs as a result of
the reduced AMOC and the subsequent quasi-bipolar salinity seesaw adjustment
process. Coincident with the salinity increase, a warming of 1-2ºC develops and extends
down to a water depth of ~1200m (Figure 5.9). This thermal response is particularly
pronounced between years 250 and 450, beginning ~150 years after the application of
the perturbation. This suggests a bipolar thermal seesaw response time of 150 years at
the Drake Passage, similar to the equivalent response time observed in experiment
PI150FW. These elevated temperatures between years 250 and 450 indicate that the
warming associated with the bi-polar temperature increase persists after cessation of the
North Atlantic forcing, meaning that the Drake Passage remains anomalously warm as
the AMOC recovers, and after it has recovered. The thermal characteristics of the Drake
Passage only appear to return to something resembling their unperturbed state during
years 500 to 550 of the experiment, some 150 years after the AMOC has recovered, and
400 years after removal of the forcing (Figure 5.9).

Chapter 5. Millennial scale changes at the I-AOG and Drake Passage
120
One significant difference between experiments PI150FW and LGM150FW is a 100
year climatological increase in the Drake Passage salt transport of ~35% (compared to
the background LGM climatological mean Drake Passage transport), associated with a
~26% increase in water transport, simulated between years 300 and 400 in experiment
LGM150FW (Figure 5.9, Table 5.1). This increase begins ~50 years after cessation of
the North Atlantic perturbation, coincident with the lagged and persistent temperature
increase at the Drake Passage (Figure 5.9). This phenomenon is further discussed in
Section 5.3.3.
Table 5.1 Water and salt transports and associated standard deviations in Sv and kg/s, respectively,
through the I-AOG (indicated by AL) and Drake Passage (indicated by DP) for experiments PI150FW
and LGM150FW. Of particular interest is the simulated increase of water and salt transport through the
Drake Passage (25.6% and 34.7%, respectively), existing in experiment LGM150FW in response to the
Northern Hemisphere forcing (perturbed state values indicated in red). On the other hand the data reveals
relatively weak changes in salt transport through the Agulhas leakage corridor in both experiments. The
indicated reference, perturbed, and recovered states refer to 100 year climatological mean values over
years 0-100, 300-400, and 450-550, respectively.
Experiment Reference state Perturbed state Recovered state
AL - PI150FW
(water)
18.4 ± 1.6 17.5 ± 1.8 17.6 ± 1.3
AL – PI150FW
(salt)
3.3 ± 0.2 x 10¹⁰
3.2 ± 0.3 x 10¹⁰
3.2 ± 0.2 x 10¹⁰
AL - LGM150FW
(water)
15.1 ± 2.5 15.1 ± 2.6 15.9 ± 3.2
AL - LGM150FW
(salt)
3.9 ± 0.6 x 10¹⁰
3.8 ± 0.6 x 10¹⁰
4.1 ± 0.8 x 10¹⁰
DP – PI150FW
(water)
111.4 ± 7.2 110.6 ± 5.7 106.2 ± 6.6
DP - PI150FW
(salt)
3.7 ± 0.2 x 10¹¹
3.7 ± 0.2 x 10¹¹
3.6 ± 0.2 x 10¹¹
DP - LGM150FW
(water)
71.5 ± 10.9 89.8 ± 12.6 74.9 ± 13.5
DP - LGM150FW
(salt)
2.8 ± 0.9 x 10¹¹
3.7 ± 1.2 x 10¹¹
3.1 ± 1.1 x 10¹¹

Chapter 5. Millennial scale changes at the I-AOG and Drake Passage
121
5.3. Discussion
5.3.1 Global Responses and the Southern Ocean Heat Reservoir
The results here show substantial changes in the heat and salt distribution throughout
the global ocean, especially the Arctic, Atlantic and Southern Oceans (Figure 5.5), in
response to forced AMOC shifts. The North Atlantic freshwater forcing induces a
thermal bi-polar adjustment process in the ocean (Figure 5.5a,b), associated with a
reduction in northward heat transport to the North Atlantic and heat storage in the South
Atlantic (Stocker et al., 1998; Knutti et al., 2004). In addition to this thermal response
to the reduced AMOC strength, a quasi-inter-hemispheric salt seesaw is simulated
(Lohmann, 2003), resulting in a salinification of large parts of the Southern Hemisphere
due to salt advection throughout the supergyre (Speich et al., 2007). This response is
detectable at the Drake Passage and I-AOG in both experiments (Figure 5.5c,d). The
decreased AMOC also causes a freshening throughout most of the North Atlantic and
Arctic Oceans. In the experiments cooling and freshening (warming and salinification)
in the North (South) Atlantic are more pronounced in experiment LGM150FW than in
PI150FW, relating to the degree of AMOC weakening (Figure 5.5).
A thermal response at the Drake Passage (upper ~1000 m, including the surface) is
observed after ~150 years of perturbation in experiments PI150FW and LGM150FW
(Figures 5.6 and 5.9). At the I-AOG, a weaker thermal response occurs more quickly
(over intermediate depths 600-1200 m), detectable ~50 years after the forcing in both
experiments (Figures 5.6 and 5.9). The delayed thermal response at the Drake Passage is
related to the rate of AMOC reduction, the associated decreased northward heat
transport, and the subsequent transmission of the warming signal across the ACC, which
isolates the higher latitudes of the Southern Ocean from the lower latitudes, both
dynamically and thermally (Cox, 1989; Schmittner et al., 2003). As a consequence of
the Southern Ocean acting as a thermal reservoir (Stocker and Johnson, 2003; Knutti et
al., 2004, Barker et al., 2011), the elevated sea-surface temperatures at the Drake
Passage are maintained after the North Atlantic freshwater forcing is eliminated, and the
subsequent cooling and recovery back to pre-industrial and LGM conditions is delayed
by ~150 - 200 years (Figures 5.6 and 5.9).

Chapter 5. Millennial scale changes at the I-AOG and Drake Passage
122
In response to North Atlantic freshwater perturbation, the equatorial and near-equatorial
precipitation belts associated with the ITCZ shift southwards (Figure 5.8a), in
agreement with PMIP ensemble-model studies (Stouffer et al., 2006). For example,
precipitation in southeast Africa increases by ~10-15% compared to the LGM
background state (Figure 5.8a). As a result of the elevated rainfall over the continent,
higher river runoff into the southwest Indian Ocean is simulated and occurs along the
southeast African continental margin with a maximum developing in the vicinity of the
mouth of the Limpopo River (Figure 5.8b). In contrast to southeast Africa, dryer
conditions are simulated further north, at Lake Malawi (Johnson et al., 2002), Lake
Tanganyika (Tierney et al., 2008) and the Sahel zone (Mulitza et al., 2008), reflecting
the southward shift of the ITCZ during Northern Hemisphere cold stadials. While large
parts of sub-Saharan Africa experienced severe dry conditions during the experiment
(Stager et al., 2011), southern Africa experiences more humid conditions (Figure 5.8a).
In particular, the reduction in the Congo and Niger River runoff in western Africa is
evident (Figure 5.8b), and is a well-documented feature in palaeoclimatological studies
from that area (Weijers et al., 2007a; Weldeab et al., 2007; Weldeab, 2012).
An anomalously low SLP is simulated over the entire southern part of the African
continent and the southeast Atlantic (Figure 5.8c). It is known that the ITCZ is sensitive
to shifts in the cross-equatorial SST gradient (Moura and Shukla, 1981) and that
changes in the position of this gradient can influence precipitation patterns in the low
latitudes (Dong and Sutton, 2002). The equatorial and near-equatorial precipitation
changes are mainly determined by a shift in the thermal equator, and the associated sea
level pressure changes. This suggests that a southern shift of the ITCZ occurs in
association with a weakening of the Hadley cell in the southern tropics (Lee et al.,
2011), implying that during Northern Hemisphere cold stadials remote forcing of the
hydrological variability in the region of the I-AOG primarily acts through an
atmospheric adjustment which leads to the development of humid conditions (Simon et
al., in preparation). These patterns are consistent with the interhemispheric
teleconnections associated with the bipolar thermal see-saw (Broecker, 1998; Stocker
and Johnsen, 2003).
Chapter 5. Millennial scale changes at the I-AOG and Drake Passage
123
5.3.2 Indian-Atlantic Ocean Gateway
Changes in salinity and temperature are simulated at the I-AOG in both experiments.
These include a reduced export of deep waters (1000 m – 3000 m water depth) from the
South Atlantic, as well as an upper level salinification (extending to down ~500 m water
depth) and slight intermediate depth (700 m – 1000 m) warming of the region during
weak and recovering AMOC states, independent of the background state. The reduced
deep water export, observable in salinity profiles across the I-AOG (Figures 5.6 and
5.9), can be attributed to the reduction in North Atlantic open-ocean convection and
formation of NADW (McManus et al., 2004; Hall et al., 2006; Thornalley et al., 2011).
Whilst the warming of the intermediate layers of the I-AOG develops due to the bi-
polar thermal seesaw (Stocker, 1998), the salinification of the upper layers is attributed
to the quasi-bi-polar salt seesaw (Lohmann, 2003), an analogue of the thermal seesaw.
Changes in the climatological mean water and salt transports through the I-AOG are
generally weak in the experiments (Figures 5.6 and 5.9, Table 5.1), most likely relating
to negligible changes in the intensity and location of the Southern Hemisphere westerly
winds (Figure 5.12) (Durgadoo et al., 2013). The results are consistent with those of
Marino et al. (2013), in that a salt accumulation is simulated at the I-AOG during the
weakened AMOC state (Northern Hemisphere stadial conditions) in both LGM150FW
and PI150FW. In line with previous studies (for example Peeters et al., 2004, with
regards to glacial-interglacial transitions), Marino et al. (2013) suggested that the
increased salt-leakage might have acted as a source of negative buoyancy for the
perturbed AMOC, possibly promoting its resumption.
Using data from experiment LGM150FW on the LGM background state, virtual core
sites were selected at sites MD02-2588 at the Agulhas plateau and MD96-2080 at the
Agulhas bank (two cores used in the study by Marino et al., 2013). The salinity profiles
from the virtual core sites show that salinity is enhanced in the region, extending to a
depth of ~500m at the Agulhas Bank and ~800m at the Agulhas Plateau during the
freshwater experiment (Figure 5.10). This is in agreement with the data presented by in
Marino et al. (2013). Below these depths salinity begins to decrease with respect to the

Chapter 5. Millennial scale changes at the I-AOG and Drake Passage
124
background LGM state, which is a result of decreased NADW penetration in response
to the weakened AMOC and NADW convection (see Figure 5.9). The temperature
profiles from the virtual core sites demonstrate increased temperature extending down
to ~1500m at the Agulhas Plateau during the freshwater perturbation. At the Agulhas
Bank the temperature increase begins at a depth of ~250m and extends to ~1800m
(Figure 5.11).
The idealised experiments suggest that the salt accumulation at the I-AOG is most likely
Atlantic sourced (Figure 5.12), and occurs via salt advection throughout the Southern
Hemisphere supergyre in response to the bi-polar salt seesaw (Lohmann, 2003). The
rather weak changes in I-AOG transports simulated during the AMOC mode shifts
(Figures 5.6, 5.9, and Table 5.1), suggest that a recirculation of Atlantic sourced salt,
with no net gain or loss of freshwater to the Atlantic Basin, are unlikely to promote
resumption of the AMOC. This is in contrast to the hypothesis developed by Marino et
al., (2013) who proposed that the salinity peaks are Indian Ocean sourced, transported
to the study region by increased Agulhas leakage. If the modelled results are accurate,
the millennial scale salinity peaks documented by Marino et al., (2013) may actually
have occurred as a result of a salinification of the region in response to the bi-polar salt
seesaw (Lohmann 2003) during weakened AMOC states. While these salinity peaks
may well be indicative of increased Agulhas salt-leakage, they may not occur due to
increases of Indian Ocean sourced salt – rather Atlantic Ocean sourced salt.

Chapter 5. Millennial scale changes at the I-AOG and Drake Passage
125
Figure 5.10 Salinity profile for LGM (black line) and LGM150FW (blue line) at core site MD02-2588
(left) at the Agulhas plateau and MD96-2080 (right) at the Agulhas bank (see Figure 5.1).
Figure 5.11 Temperature profile for LGM (black line) and LGM150FW (blue line) at core site MD02-
2588 (left) at the Agulhas Plateau and MD96-2080 (right) at the Agulhas Bank (see Figure 5.1).

Chapter 5. Millennial scale changes at the I-AOG and Drake Passage
126
Figure 5.12 Anomalies of salinity and velocity in the Agulhas region simulated during experiment
LGM150FW. Salinity (colours in psu) and surface velocity (arrows in m/s) anomalies between the
perturbed and background LGM state are averaged over the upper 500m. Velocity anomalies indicate a
reduction in the transport of the Agulhas Current and in the Mozambique Channel, and rather weak
changes at the I-AOG itself. The increased salinity in the region is therefore unlikely to be Indian Ocean
sourced, rather originating in the Atlantic Ocean, in response to the weakened AMOC. Climatological
values for the states in response to perturbation are averaged over model years 230 – 250, corresponding
to the time when the AMOC is at its weakest state.
5.3.3 Drake Passage
As observed in the I-AOG, warming (extending to depths 700 – 1200 m in Figures 5.6
and 5.9) and salinification (Figure 5.5c,d) of the upper/intermediate Drake Passage
layers are also simulated in both perturbation experiments, and can be attributed to the
bi-polar thermal and quasi-bi-polar salt seesaw mechanisms, respectively (Stocker et al.,
1998; Lohmann, 2003). Increases of ~26% and ~35% in the climatological mean water
and salt transports through the Drake Passage are simulated in experiment LGM150FW
(Table 5.1, and years 300 - 400 in Figure 5.9). These increases occur in response to the

Chapter 5. Millennial scale changes at the I-AOG and Drake Passage
127
bi-polar thermal seesaw (Stocker et al., 1998), which gradually warms the oceans and
atmosphere of the Southern Hemisphere in response to the reduced AMOC (Schmittner
et al., 2003), as follows. In the mid to high latitudes of the Southern Hemisphere, the
associated SST increase (which is maintained after cessation of the North Atlantic
perturbation) (Figures 5.6 and 5.9) results in a reduction of Southern Ocean sea ice
cover (Figure 5.14). The reduction of sea ice area cover in LGM150FW is up to 5% at
the Drake Passage and 7% in the Pacific sector (with respect to the sea ice simulated for
the LGM climate state) and occurs as far north as 45ºS across the Southern Ocean,
exposing a large section of the ocean surface (Figure 5.14). The net increase in surface
area of the Southern Ocean which becomes exposed to wind stress due to sea ice retreat
amounts to ~590,000 km2. This area was calculated from the global sea ice coverage,
which was given in a value range between 0 (no sea ice cover) to 1 (full sea ice cover).
Regions south of 45°S (maximum extent of annual LGM sea ice) were selected. For
every selected grid cell, the anomaly in sea ice coverage is multiplied by the total
surface area corresponding to the respective grid cell, and the area contributions by
single grid cells are summed.
This net exposed area of Southern Ocean surface area coincides with the modelled
latitude of maximum zonal wind stress between 30ºS and 56ºS, associated with the
Southern Hemisphere westerlies (Figures 5.13 and 5.14b). As a result of the reduced sea
ice extent, a stronger coupling between the atmosphere and the surface ocean develops,
implying that the atmosphere is capable of exerting wind stress over a larger area of the
exposed Southern Ocean surface and ACC, consistent with a recent observation from
palaeo-reconstructions (McCave et al., 2013). In contrast to the studies of Anderson et
al. (2009) and Toggweiler and Lea (2010), the westerly winds in these experiments
experience only a negligible reduction in strength and displacement of position (Figure
5.13 b,d). Therefore, the simulated increase of Drake Passage transport in LGM150FW
is unlikely to be directly related to changes in wind intensity and location, but rather is
driven by the sea ice modulation of the wind stress forcing at the ocean surface
(McCave et al., 2013). Additionally, it should be noted that changes in the meridional
density gradient across the Southern Ocean may also play a role in determining the
change in Drake Passage throughflow (this was not assessed).

Chapter 5. Millennial scale changes at the I-AOG and Drake Passage
128
A similar reduction in sea ice cover (up to 10%) is simulated in PI150FW (Figure 5.14
c), but rather occurs south of 56ºS, and therefore outside the zone of maximum Southern
Hemisphere westerly wind stress occurring between 30ºS and 56ºS for the pre-industrial
case (Figures 5.13 and 5.14d). As such, and unlike the glacial LGM150FW case, the
wind stress associated with the westerlies is not exerted over a larger exposed area of
the Southern Ocean, and the Drake Passage throughflow does not experience any
significant climatological increase of water or salt transport (Table 5.1).
Figure 5.13 Southern Hemisphere zonal mean wind stress plots for (a) the pre-industrial and (c) the LGM
climate states, and zonal mean wind stress anomaly plots for (b) experiment PI150FW and (d) experiment
LGM150FW. The zonal mean is plotted between 25°S and 65°S across all longitudes. Climatological
anomalies in wind stress are calculated by subtracting years 300 - 400 of experiments PI150FW and
LGM150FW (coincident with the simulated climatological increase in Drake Passage transport in
experiment LGM150FW) from the mean states in the PI and LGM equilibrium simulations, respectively.
Notable are wind stress increases on the order of 10-3
Nm-1
in experiments PI150FW and LGM150FW
occurring in the main Southern Hemisphere westerly latitude belt (30ºS and 50ºS). These increases in
wind stress are however two orders of magnitude smaller than the climatological wind stresses
themselves, and are therefore unlikely to have a significant impact on the imparted momentum to the
ACC.

Chapter 5. Millennial scale changes at the I-AOG and Drake Passage
129
Figure 5.14 Anomaly plots of annual mean sea ice area fraction and SST (°C), and Southern Hemisphere zonal mean wind stress (Nm-2
) for (a, b) experiment LGM150FW,
and (c, d) experiment PI150FW. Red (blue) values in (a) and (c) indicate increased (decreased) SST in response to perturbation. Evident in both experiments is a reduction of
the Southern Hemisphere annual mean sea ice area fraction (indicated by contours), generally coincident with areas of increased SST. Dashed (solid) line contours indicate
regions of decreased (increased) annual sea ice cover, with a contour interval of 0.0125 i.e. 1.25 %. (b, d) Zonal mean wind stress is plotted between 25°S and 65°S (averaged
over all longitudes), demonstrating the latitudinal domain of the Southern Hemisphere westerlies. The unperturbed (perturbed) state is plotted in blue (red), with curves
representing the perturbed and unperturbed states almost coincident, indicating negligible changes in the position and strength of the Southern Hemisphere westerlies in
response to the North Atlantic forcing, in both PI150FW and LGM150FW. Climatological anomalies in wind stress are calculated by subtracting years 300 - 400 of
experiments PI150FW and LGM150FW from the mean states in the PI and LGM equilibrium simulations, respectively. Climatological values in (a, b, c, d) for the states in
response to perturbation are averaged over model years 300 – 400, coincident with the simulated climatological increase in Drake Passage transport in experiment
LGM150FW.

Chapter 5. Millennial scale changes at the I-AOG and Drake Passage
130
The model results from the Drake Passage were additionally compared with new proxy
data from the entrance to the Strait of Magellan, core site MD07-3128 (see Chapter 2
for details). The proxy data show pronounced millennial-scale variability superimposed
on a general glacial reduction of DP throughflow (Figure 5.15d,e). Within age model
uncertainties, the SSmean maxima generally coincide with millennial-scale temperature
maxima in Antarctica (Figure 5.15f). The records depict most of the Antarctic Isotope
Maxima between ~23 and ~60 kyr BP and show pronounced maxima at the beginning
of Termination 1 coeval with Heinrich Event 1 (Figure 2d-g). These data imply that on
millennial time-scales, DP throughflow was enhanced during Northern Hemisphere
stadials including Heinrich events, consistent with the results from experiment
LGM150FW. Taken together, the results suggest that substantial changes in the water
mass flow of the ACC occurred on millennial time-scales, with an increase in Drake
Passage throughflow having potential repercussions for global climate via the cold
water route.
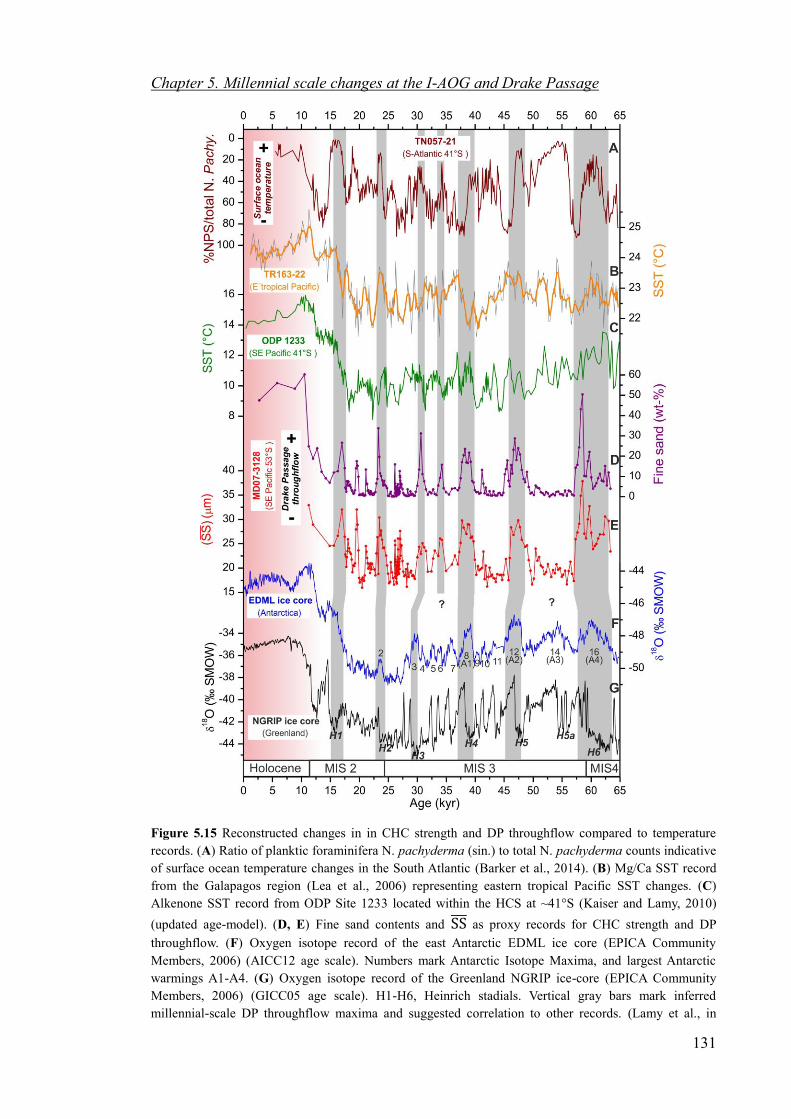
Chapter 5. Millennial scale changes at the I-AOG and Drake Passage
131
Figure 5.15 Reconstructed changes in in CHC strength and DP throughflow compared to temperature
records. (A) Ratio of planktic foraminifera N. pachyderma (sin.) to total N. pachyderma counts indicative
of surface ocean temperature changes in the South Atlantic (Barker et al., 2014). (B) Mg/Ca SST record
from the Galapagos region (Lea et al., 2006) representing eastern tropical Pacific SST changes. (C)
Alkenone SST record from ODP Site 1233 located within the HCS at ~41°S (Kaiser and Lamy, 2010)
(updated age-model). (D, E) Fine sand contents and SS̅̅ ̅ as proxy records for CHC strength and DP
throughflow. (F) Oxygen isotope record of the east Antarctic EDML ice core (EPICA Community
Members, 2006) (AICC12 age scale). Numbers mark Antarctic Isotope Maxima, and largest Antarctic
warmings A1-A4. (G) Oxygen isotope record of the Greenland NGRIP ice-core (EPICA Community
Members, 2006) (GICC05 age scale). H1-H6, Heinrich stadials. Vertical gray bars mark inferred
millennial-scale DP throughflow maxima and suggested correlation to other records. (Lamy et al., in

Chapter 5. Millennial scale changes at the I-AOG and Drake Passage
132
preparation)
5.3.4 Consequences for the resumption of the AMOC
The analysis of changes at the I-AOG and Drake Passage can be used to suggest
potential changes across the warm and cold water routes during weak and recovering
AMOC states. While only minor changes of the I-AOG transport is simulated, the
transport increase through the Drake Passage could affect the stability of the AMOC via
northward salt advection in the Atlantic Ocean, as shown by Weijer et al. (2002) for the
warm water route. Although any change in heat transport through the Drake Passage can
be later reduced by ocean-atmosphere exchange (as shown by Biastoch and Böning,
(2013), for the warm water route), increases in salt transport along the cold water route
are more likely to persist as positive density anomalies advected northwards to the
NADW formation zones (Beal et al., 2011).
A comprehensive Lagrangian analysis would be required in order to fully assess the
contribution of the increased Drake Passage transport to the North Atlantic. However, a
first estimate calculation based on previous studies can be derived. The ~35% salt
transport increase simulated in LGM150FW during years 300 – 400 corresponds to ~0.9
x 1011
kg/s of salt (see Table 5.1). Since ~5% of the Drake Passage throughflow is
estimated to be advected to the North Atlantic (Speich et al., 2001), it is estimated that
the simulated ~35% salt transport increase in LGM150FW corresponds to an increase of
~0.45 x 10¹⁰
kg/s of salt transport advected to the North Atlantic. The ~40 % of Agulhas
leakage reaching the North Atlantic (Rühs et al., 2013) corresponds to ~1.5 x 10¹⁰
of salt
in the LGM simulation (see Table 5.1). Using this as a first approximation, it is implied
that the increased Drake Passage salt transport in LGM150FW is equal to approximately
a third of the Agulhas leakage reaching the North Atlantic i.e. (0.45 x 10¹⁰
) / (1.5 x
1010
).
In order to test whether increased salinity anomalies generated at the Drake Passage
could persist along the cold water route along the pathway towards the NADW
convection sites during the freshwater experiments, the net freshwater flux at the ocean
surface was calculated over a region defined over latitudes 0º to 90ºS and longitudes

Chapter 5. Millennial scale changes at the I-AOG and Drake Passage
133
80ºW to 20ºW, capturing the Atlantic sector of the Southern Ocean (between the Drake
Passage and the I-AOG) and the South Atlantic Ocean (as far north as the equator). The
region is denoted ‗south box‘ (Figures 5.16 and 5.17). The net freshwater flux at the
ocean surface was defined as the integral of precipitation, evaporation and river run-off.
This method provides a useful insight in to how salinity anomalies might be adjusted
along their respective pathways.
As shown in Figures 5.16 and 5.17, no major increase in net freshwater flux at the ocean
surface is simulated during experiments PI150FW and LGM150FW, meaning the
northward propagation of salinity anomalies from the Drake Passage, past the equator
into the North Atlantic, could go unimpeded without additional freshening. A slight
decrease of freshwater flux can actually be detected between years 150 and 300 in
LGM150FW, which would act to enhance salinity anomalies. It is therefore suggested
that the simulated increase of salt transport through the Drake Passage in LGM150FW,
via salt advection throughout the cold water route, including the tropical Atlantic Ocean,
may have played an important role in the mechanisms associated with the resumption of
the AMOC to interstadial conditions.
Figure 5.16 Area averaged net freshwater flux at the ocean surface (in Sv), including the effects of
precipitation, evaporation and river run-off over the ‗south box‘ region defined over latitudes 0º to 90ºS
and longitudes 80ºW to 20ºW, capturing the Atlantic sector of the Southern Ocean (between the Drake

Chapter 5. Millennial scale changes at the I-AOG and Drake Passage
134
Passage and the I-AOG) and the South Atlantic Ocean (as far north as the equator) during experiment
PI150FW. North Atlantic freshwater perturbation occurs between model years 100 and 250. No
significant change in freshwater flux at the ocean surface occurs in response to freshwater perturbation.
Figure 5.17 Area averaged net freshwater flux at the ocean surface (in Sv), including the effects of
precipitation, evaporation and river run-off over the ‗south box‘ region defined over latitudes 0º to 90ºS
and longitudes 80ºW to 20ºW, capturing the Atlantic sector of the Southern Ocean (between the Drake
Passage and the I-AOG) and the South Atlantic Ocean (as far north as the equator) during experiment
LGM150FW. North Atlantic freshwater perturbation occurs between model years 100 and 250. No major
increase in freshwater flux at the ocean surface occurs in response to freshwater perturbation.
An increase in the transport through the Drake Passage was previously suggested by
Knorr and Lohmann (2003) as a potential trigger for AMOC resumption during
deglacial climate transitions. Using a general circulation ocean model, Knorr and
Lohmann (2003) suggested that Southern Hemisphere sea ice and temperature changes
played a more dominant role than wind-forcing with regards to the strength of the
thermohaline circulation. Since the study presented here reveals a simulated increased
Drake Passage transport occurring only during full glacial conditions, it is suggested
that the potential mechanism of this Southern Hemisphere feedback on the abrupt
transition to interstadial conditions can also (in addition to the deglacial) operate during
full glacial climates, when most abrupt millennial climate changes are observed in the
palaeo record (Dansgaard et al., 1993). Due to the lack of a significant increase in Drake

Chapter 5. Millennial scale changes at the I-AOG and Drake Passage
135
Passage transport in experiment PI150FW, no evidence is found to suggest that this
same mechanism could operate during full interglacial climates.
5.4 Summary and Conclusions
This chapter aimed to investigate the palaeoceanography of the I-AOG and Drake
Passage during millennial scale climate changes of the past. North Atlantic freshwater
perturbations, mimicking Heinrich events, which were performed on both the pre-
industrial and LGM climate states, were described in detail. Responding to perturbation,
the ocean experiences a reduced AMOC and the bi-polar thermal and salt seesaw
phenomena, with the magnitude of each dependent on the background state.
Atmospheric circulation changes, involving southward migrations of the equatorial and
near-equatorial precipitation belts associated with the ITCZ and a weakening of the
Hadley cell configuration, are simulated in good agreement with proxy data.
An increased Drake Passage transport which develops only during AMOC perturbation
on the glacial background state is shown. The increased transport is driven by a thermal
bi-polar seesaw induced sea ice modulation of the Southern Ocean wind forcing on the
ocean surface. Contrastingly, at the I-AOG where the Agulhas leakage transports warm,
salty waters from the Indian to the Atlantic Ocean, only minor changes in water
transport are simulated during the freshwater experiments. Although a salinification of
the I-AOG region occurs in response to the bipolar salt seesaw mechanism (Lohmann,
2003), in agreement with Marino et al., (2013), the increased salt content is Atlantic
Ocean sourced. This is in contrast to the claims of Marino et al., (2013) who attributed
millennial scale salinity peaks coeval with Northern Hemisphere cold stadials to
increased transport of Indian Ocean salt through the I-AOG. According to the
freshwater experiments conducted in this study, a recirculation of Atlantic sourced salt,
with no net gain or loss of freshwater to the Atlantic Basin, are unlikely to promote
resumption of the AMOC.
Since this Drake Passage salt transport change is significantly larger than at the I-AOG

Chapter 5. Millennial scale changes at the I-AOG and Drake Passage
136
during the glacial simulation, it can be suggested that the cold water route may play a
more significant role in millennial scale climate change than previously considered. Via
the advection of salt through the tropical Atlantic and further towards the NADW
convection sites, this enhanced Drake Passage transport may potentially play an
important role in the mechanisms associated with the resumption of the AMOC to
interstadial conditions. The freshwater experiment results point towards the importance
of considering net changes in the salt transports at both the Drake Passage and I-AOG in
determining the long term climatological responses in the warm and cold water routes,
and their potential effect on the overturning rate in the North Atlantic. Indeed, in a
warming world where increases in Agulhas Leakage have been suggested to bear a
potential impact on the AMOC (Biastoch et al, 2009), changes at the Drake Passage in
response to sea ice or wind changes due to anthropogenic forcing, may in fact act to
enhance or negate the effect of increased Agulhas leakage on global climate change.

Chapter 6. Conclusions and Outlook
137
6. Conclusions and Outlook
This thesis has aimed to investigate the palaeoceanography of the warm (I-AOG) and cold
(Drake Passage) water route ocean gateways on glacial-interglacial and millennial timescales.
The thesis is predominantly the culmination of efforts from Earth system modelling, but also
presents a number of model-data comparisons with proxy data from the regions in question.
Three key questions were outlined in Chapter 1 and the thesis has been organised towards the
investigation of these questions throughout Chapters 3, 4 and 5, and are now revisited here.
These chapters present a number of findings, which are now summarised here. A new
hypothesis for the palaeo Agulhas leakage is presented, and some final words on the roles of
the warm and cold water gateways on glacial-interglacial and millennial scale timescales are
voiced. The chapter concludes with an outlook, containing a short description of further work
that might help in our understanding of the warm and cold water routes and their gateways
during past and future climate changes.
6.1 Can an adapted fully-coupled ESM be used to simulate an improved transfer of
Indian Ocean water into the Atlantic Basin?
In Chapters 2 and 3, the development and results of a new adapted ESM were described in
detail. Specifically, the adapted model included a reconfigured ocean component (MPIOM-
AFRICA), which relocated the South Pole over South Africa, with the intention of improving
the I-AOG water mass transport (Agulhas leakage) - a key component of the warm water
route. In the model‘s pre-industrial simulation, MPIOM-AFRICA simulates I-AOG and Drake
Passage climatological mean transport rates of 18.4 ± 1.6 Sv and 111.4 ± 7.2 Sv respectively.
These rates are in good agreement with ocean observational data (Cunningham, 2003;
Richardson, 2007) and other high resolution ocean models (Biastoch et al., 2008; Biastoch et
al., 2009; Durgadoo et al., 2013; Rühs et al., 2013). Therefore, with respect to the warm and
cold water route gateways, MPIOM-AFRICA represents an improvement on the pre-existing
MPIOM-CTRL configuration which overestimates these transport rates (46.1 ± 2.3 Sv for the
I-AOG and 245.4 ± 4.2 Sv for the Drake Passage).

Chapter 6. Conclusions and Outlook
138
MPIOM-AFRICA also simulates reasonable global SSTs, SSS, barotropic stream function,
ocean velocities, and mixed layer depth, and AMOC, generally comparable with those
simulated using the well-established MPIOM-CTRL model. Both model configurations are in
reasonable agreement with World Ocean Atlas observational data 2009 (Locarnini et al.,
2010). However, a significant disadvantage of both the MPIOM-AFRICA and MPIOM-CTRL
pre-industrial configurations is the absence of a significant salinity difference between the
South Indian and South Atlantic oceans, meaning that the modelled Agulhas leakage is
unlikely to impact upon the strength of the AMOC (Weijer and van Sebille, 2014). The LGM
simulation performed using MPIOM-AFRICA is similar to that using the MPIOM-CTRL
version (Zhang et al., 2013), and modelled LGM global SST and SSS data are in good
agreement with a host of proxy data (Adkins et al., 2002; Gersonde et al., 2005; Kucera et al.,
2005; de Vernal et al., 2006; Waelbroeck et al, 2009; Cronin et al., 2012), adding further
credence to the adapted setup.
In summary, the adapted ESM represents a step forward in the study of the I-AOG and Drake
Passage ocean gateways and their importance with regards to climate changes of the past. The
model provides a solid platform for the investigation and analyses of palaeo-rates of Agulhas
leakage and Drake Passage throughflow. Specifically, the model can be used as a tool for
determining changes at the Drake Passage and the I-AOG in response to the application of
pre-industrial and glacial boundary conditions for glacial-interglacial investigations (Chapter
4), and freshwater perturbations for the analysis of abrupt AMOC shifts (Chapter 5).
6.2 Did the ocean transport through the warm and cold water route gateways change on
glacial-interglacial timescales, potentially playing active roles in global climate change?
Building on the strength of the MPIOM-AFRICA configuration presented in Chapter 3,
Chapter 4 investigated the changing rates of I-AOG and Drake Passage transport rates on
glacial-interglacial timescales. The rate of I-AOG and Drake Passage transports and modelled
SSTs in both pre-industrial and LGM climate states were compared with proxy data from the
south-east Atlantic, Agulhas region, the south-east Pacific, and the Drake Passage. I-AOG and
Drake Passage transport rates for the LGM simulation were shown to be 15.1 ± 2.5 Sv and
71.5 ± 10.9 Sv, respectively. While the fully coupled ESM simulates decreased LGM SSTs

Chapter 6. Conclusions and Outlook
139
and an equatorward shift of the thermal subtropical front, in agreement with proxy data
throughout the Agulhas region (Bard et al. 1997; Peeters et al. 2004; Bard and Rickaby, 2009;
Barker et al. 2009; Martínez-Garcia et al. 2010; Caley et al., 2011; Simon et al. 2013; Kasper
et al., 2014; Simon et al., (in preparation); Wang et al., 2013), a largely suppressed I-AOG
warm water route water transport is not simulated – at odds with the theory inferred from
proxy data (Peeters et al., 2004; Caley et al., 2014). The modelled results show a persistent I-
AOG transport at the LGM (15.1 ± 2.5 Sv), suggesting that the Agulhas leakage need not have
been weaker than today in order to simulate a glacial climate comparable with SST proxy
data. This chapter provided an alternative hypothesis which can explain the pattern observed
in proxy records from the I-AOG, without a necessary change in the glacial-interglacial rates
of Agulhas leakage. The hypothesis proposes that the micropalaeontological proxies used to
derive rates of Agulhas leakage (Globorotalia menardii and the Agulhas Leakage Fauna
(ALF)) rather responded to regional upper ocean temperature changes during glacial-
interglacial cycles of the late Pleistocene, and may not be related to Agulhas leakage at all
(further expanded on in section 6.4 of this chapter).
At the cold water route gateway a reduced Drake Passage throughflow is simulated during the
LGM compared to the pre-industrial climate state. The throughflow of water is reduced by
~36% from ~110 Sv in the pre-industrial simulation to ~70 Sv in the LGM case. The
modelled reduction of Drake Passage throughflow during the LGM is corroborated by new
proxy data at the entrance to the Drake Passage (Lamy et al., in preparation). In the model, the
reduced throughflow occurs due to enhanced LGM sea-ice (thickness and extent), which acts
to de-couple the Southern Hemisphere westerlies from the ocean surface (McCave et al.
2013).
On glacial-interglacial timescales, this study (both model and proxy data) suggests minimal
changes in the warm water route gateway transport, and a large glacial reduction in transport
at the cold water route gateway. At the same time, the LGM simulation shows a more
vigorous and deeper AMOC than the pre-industrial case. However, most studies of proxy data
in the North Atlantic suggest a shallower (shoaled) AMOC during the LGM (Marchitto and
Broecker, 2006; Lynch-Stieglitz et al., 2007; Oppo and Curry, 2012; Gebbie, 2014). This
poses the question of whether the weakened Drake Passage throughflow might have
contributed to the shallower LGM geometry via reduced transport along the cold water route.

Chapter 6. Conclusions and Outlook
140
The model results presented here suggest not, with neither the slightly reduced I-AOG
transport nor largely reduced Drake Passage transport, nor their combination, reflected in the
geometry of the AMOC in the LGM simulation (which is more vigorous and deeper).
However, this hypothesis can only be tested with Lagrangian tracer methodologies (floats),
not used in this study. In the model, the pre-industrial and LGM AMOC geometries appear to
be predominantly controlled by the combination of orbital configurations (Milankovitch, 1930;
Milankovitch, 1941, Hays et al., 1976; Berger, 1978; Berger and Loutre, 1991), greenhouse
gas concentrations (Luthi et al., 2008) and ice sheet size (Zhang et al., 2014) i.e. the applied
boundary conditions. However a weaker contribution of the cold water route to a shallower
glacial AMOC cannot be ruled out, and warrants further investigation using Lagrangian floats.
6.3 Could either or both of the transports through the warm and cold water route ocean
gateways have actively contributed to the resumption of the AMOC to interstadial
conditions during millennial scale climate change events of the Late Pleistocene?
Chapter 5 aimed to investigate the palaeoceanography of the I-AOG and Drake Passage
during millennial scale climate changes of the past. This chapter described the North Atlantic
freshwater perturbations, mimicking Heinrich events, which were performed on both the pre-
industrial and LGM climate states. A response dependant on the background climate state was
shown. Specifically, while only insignificant changes in water transport through the I-AOG
were simulated in response to the forcing, ~26% and ~35% increases in the climatological
mean water and salt transports, respectively, were simulated through the Drake Passage.
Millennial scale Drake Passage throughflow variability during the last glacial is also
supported by newly available proxy data presented in Chapter 5 (Lamy et al., in preparation).
The increased transport is driven by a thermal bi-polar seesaw induced sea ice modulation of
the Southern Ocean wind forcing on the ocean surface (McCave et al., 2013). This response
occurred only during AMOC perturbation on the glacial background state, where enhanced
equatorward glacial sea-ice is present over the Southern Ocean. Since this Drake Passage salt
transport change is significantly larger than at the I-AOG during the glacial freshwater
perturbation, it can be suggested that the cold water route gateway might have played a more
significant role in millennial scale climate change than previously considered. Via the
advection of salt through the tropical Atlantic and further towards the NADW convection

Chapter 6. Conclusions and Outlook
141
sites, the enhanced Drake Passage transport might potentially play an important role in the
mechanisms associated with the resumption of the AMOC to interstadial conditions. This
hypothesis could be further tested with the utilisation of Lagrangian floats (see ‗Outlook‘).
The results in this chapter point towards the importance of considering net changes in the
water and salt transports at both the Drake Passage and I-AOG in determining the long term
climatological responses in the warm and cold water routes, and their potential effect on the
AMOC on millennial timescales. This has implications for the role of Agulhas leakage under
future anthropogenic climate change (Biastoch et al., 2009; Biastoch et al., 2013). The
modelling results also suggest that salinity peaks observed in proxy data during the
penultimate glacial cycle (Marino et al.,2013) occur in response to the bi-polar salt seesaw
(Lohmann, 2003), rather than to changes in I-AOG volume transport itself. This suggests that,
on millennial timescales, Agulhas leakage responds passively to remote-controlled climate
changes, likely initiated at the high latitudes (Zhang et al., 2014). Through salt advection in
the Atlantic (Gong et al., 2013), Agulhas leakage may have modulated the AMOC upon
resumption to interstadial conditions, but there is no direct evidence to suggest an active role.
According to the freshwater experiments conducted in this study, a recirculation of Atlantic
sourced salt, with no net gain or loss of freshwater to the Atlantic Basin, are unlikely to
promote resumption of the AMOC. Instead, this work suggests that the Drake Passage cold
water route gateway may play a more significant role in the mechanisms associated with the
resumption of the AMOC to interstadial conditions.
6.4 Agulhas leakage as a passive player in Quaternary climate change – a fresh
hypothesis.
In the twelve years since the landmark papers of Weijer et al., (2002), Knorr and Lohmann
(2003) and Peeters et al., (2004), a significant body of research has accumulated towards
further understanding the climate dynamics of the Agulhas region, and the potential
importance of Agulhas leakage on both future and past climate changes (Biastoch and Böning,
2013; Marino et al., 2013). However, during that period a number of studies have showed
problems with the simplistic view put forth a decade ago - a view which potentially fails to
capture the gamut of climate phenomena at work in the region (Sexton and Norris, 2011; De

Chapter 6. Conclusions and Outlook
142
Boer, 2013, Broeker and Pena, 2014). The following is a summarised list of problems
associated with the assumptions and claims made regarding the global significance of Agulhas
leakage on past glacial-interglacial and millennial timescales. The list has been sectioned into
two component parts – models and proxy data.
Models
A positive relationship between Agulhas leakage and AMOC strength in the modern
ocean is beyond the scope of observational data, and has only been demonstrated by
coarse stand-alone ocean circulation models (Weijer et al., 2002). These models lack
the atmospheric feedbacks essential in determining the salinity levels in the Atlantic
basin (precipitation, evaporation, and river runoff – all of which affect NADW
formation and AMOC strength).
High resolution eddy-resolving ocean models, which also lack essential atmospheric
feedbacks, do not show significant increases in AMOC in response to increases in
Agulhas leakage (Biastoch and Böning, 2013). Nevertheless, it must be mentioned that
future high resolution models may successfully capture this connection.
Palaeo changes of Agulhas leakage on glacial-interglacial timescales have only been
shown by coarse stand-alone ocean circulation models, again lacking in essential
atmospheric feedback processes (Knorr and Lohmann, 2003).
State-of-the-art fully-coupled ESMs find no correlation between Agulhas leakage
variability and AMOC strength (Weijer and van Sebille, 2014). The same can be said
regarding the model configuration utilised throughout this PhD project. However,
future versions of these ESMs might demonstrate such a correlation.
Durgadoo et al. (2013) showed that increased Agulhas leakage occurs in response to a
northward shift of the Southern Hemisphere westerlies. This research is consistent
with other studies (Biastoch et al., 2009; Biastoch and Böning, 2013), but alludes to
the question of whether the shift or the intensity of the westerlies is the dominant

Chapter 6. Conclusions and Outlook
143
controlling factor. It is therefore unclear which exact atmosphere-ocean wind
processes control the rate of Agulhas leakage, with implications for palaeo climate
investigations of the region.
The first fully-coupled ESM with the capability of simulating a realistic climatological
mean I-AOG transport (this PhD project) finds little change of Agulhas leakage water
transport between pre-industrial and LGM climate states, and also during millennial
scale climate changes.
Proxy data
Inferred migrations of the subtropical front (STF) south of Africa are often used as a
mechanism for past changes in Agulhas leakage (Bard and Rickaby, 2009; Marino et
al., 2013). However, De Boer et al. (2013) illustrated that the position of the STF lies
up to 10º north of the location of zero wind stress curl, which itself has been shown to
control rates of Agulhas leakage (Biastoch et al., 2009; Durgadoo et al., 2013).
Therefore the SST variations documented by Bard and Rickaby, (2009) and other
studies (Marino et al., 2009) as shifts in the STF, while reflecting changes in the
thermal STF, indicate nothing about wind field changes or past Agulhas leakage
variability. Inferring past changes in Agulhas leakage from SST proxy data is not
robust, because changes in the thermal STF are unrelated to changes in Agulhas
leakage.
It remains unclear whether shifts of the Southern Hemisphere westerly wind fields did
change in the past on glacial-interglacial timescales (Kohfeld et al., 2013). Without a
wind change forcing there is no clear mechanism for changes in Agulhas leakage
(Biastoch et al., 2009; Biastoch and Böning, 2013; Durgadoo et al., 2013).
Sexton and Norris, (2011) disqualified the use of Globorotalia menardii abundance
south of Africa as a proxy for Agulhas leakage. This study shows how Globorotalia
menardii and two other species track poorly ventilated water masses, and that their
low-latitude glacial-interglacial abundance variability is related to alternating high

Chapter 6. Conclusions and Outlook
144
latitude sources of poorly-ventilated (Antarctic sourced - AAIW) and well–ventilated
(northern sourced) intermediate water masses, meaning that that their abundance is
unlikely to be representative of changes in volume transport by Agulhas leakage.
Broecker and Pena (2014), showed that the reappearance of Globorotalia menardii in
the Atlantic Ocean during Termination I preceded the resumption of the AMOC (deep
NADW formation) by up to 1000 years. Since advection timescales of Agulhas
leakage reaching the North Atlantic are on the order of decades (two decades
according to Rühs et al., 2013) this delayed AMOC response poses a problem with the
existing theory.
SST, salinity and abundance changes in planktonic tropical-subtropical foraminiferal
assemblages, used to infer changes in rates of Agulhas leakage at the I-AOG, may be
controlled by upstream Agulhas Current variability, meaning the documented glacial-
interglacial and millennial scale signals south of Africa may not represent rates
(volumes) of Agulhas leakage at all (Simon et al., 2013).
Agulhas Leakage Fauna (ALF) and Globorotalia menardii abundance counts follow
similar regional trends to other foraminiferal species which are not included in the
ALF (Martinez-Mendez et al., 2010) and which lie outside the direct pathway of
Agulhas rings (Barker et al., 2009; Barker and Diz, 2014) (shown in this PhD thesis -
Chapter 4). This suggests that the ALF and Globorotalia menardii records follow a
general regional trend, probably responding with localised abundance changes to the
background glacial-deglacial-interglacial SST variability, and unrelated to fluctuating
rates of Agulhas leakage (passage of Agulhas rings).
The ALF and Globorotalia menardii abundance counts also follow closely the
Antarctic δDice record of past atmospheric temperature changes (EPICA) (Jouzel et
al., 2007). A positive correlation of Pearson coefficient, (Pt)=0.8, is found between the
ALF and δDice record. This close correlation suggests that the ALF records follow a
general Southern Hemisphere temperature signal. Since species abundance and
distribution in the world oceans is strongly correlated to SST (Kucera, 2007), it is

Chapter 6. Conclusions and Outlook
145
possible that the Agulhas leakage signal inferred from the ALF (Peeters et al., 2004)
and Globorotalia menardii records (Caley et al., 2012) may have occurred as a result
of changing local planktonic growth rates associated with local (yet globally driven)
glacial-deglacial-interglacial SST changes – possibly unrelated to changes in Agulhas
leakage.
On millennial timescales, salinification of the Agulhas region can occur in response to
the bipolar salt-seesaw which is known to operate during the weak AMOC states
suggested to exist during DO cold stadials and Heinrich events.(Lohmann, 2003).
According to the modelling studies carried out in this PhD thesis (Chapter 5), the
salinity peaks documented by Marino et al., (2013) across Termination II are more
likely to have occurred due to the salt seesaw mechanism rather than to increases in
Agulhas leakage.
A key question of this thesis was the active-passive role of Agulhas leakage during past
climate changes. Summarising the results presented in this chapter, it appears unclear whether
Agulhas leakage played an active role in either glacial-interglacial climate change or AMOC
recovery during millennial scale climate transitions. According to this modelling study, as
well as the above arguments, changes at the I-AOG may in fact be passive; controlled by
orbital configuration (Milankovitch, 1930; Milankovitch, , 1941, Hays et al., 1976; Berger,
1978; Berger and Loutre, 1991) and greenhouse gas concentrations (Luthi et al., 2008) on
glacial-interglacial timescales; and massive ice rafting events (Heinrich, 1988; Bond et al.,
1993) and ice sheet changes (Zhang et al., 2014), on millennial timescales.
Agulhas leakage may indeed play an important role in future climate change, potentially
counteracting a weakening AMOC forced by North Atlantic freshening (Biastoch et al., 2009;
Biastoch and Böning, 2013). However, during the past, the Indian-Atlantic transfer of warm,
saline water may have played a passive role, merely responding to global or remote climate
changes, at the poles for example (Zhang et al., 2014). Dense salinity anomalies in the South
Atlantic may have been an important component in the changing glacial-interglacial and
millennial scale AMOC geometries (Gong et al., 2013), but this does not imply that changes
in Agulhas leakage must have occurred. Although the conclusions of this PhD thesis are
restricted by the limits of the utilised model (relatively coarse resolution, and ocean
Chapter 6. Conclusions and Outlook
146
freshwater biases), there now appears to be a requirement for more evidence to support the
hypothesis of the palaeo Agulhas leakage. Vast knowledge now exists concerning the
palaeoceanography of the Agulhas region in terms of SST, SSS and other hydrographic
parameters, but without neither a robust kinematic proxy nor overwhelming support from
modelling studies, the hypothesis of the Agulhas leakage as a key player in glacial-interglacial
and millennial scale climate change may now be in question.
6.5 Final words on the warm and cold water route gateways
This thesis points towards the role of the Drake Passage cold water route gateway as a
potentially important climate component during glacial-interglacial and millennial scale
climate changes. According to the work carried out here (both model and proxy based), the
Drake Passage shows substantial transport changes on these timescales – far more significant
than those at the warm water route gateway (I-AOG). On both glacial-interglacial and
millennial timescales, the modelled Drake Passage transport rates show good agreement with
new kinematic proxy data from the region (Lamy et al., in preparation), despite low model
resolution at that location. However this is not the case for the I-AOG transport (Agulhas
leakage), where model simulations at first sight appear to be at odds with the theory inferred
from proxy data. However, once a new hypothesis (section 6.4) had been developed
explaining the documented glacial-interglacial and millennial timescale signals south of
Africa (Peeters et al., 20014; Caley et al., 2014; Marino et al., 2013), the model and proxy
data show good agreement.
The results in this thesis from the warm and cold water route gateways point towards the
importance of considering both the I-AOG and Drake Passage with respect to future and past
climate changes. In particular, it is the combined and relative effect of these ocean gateways
which can impact on the AMOC. Research of past and future climates aiming to assess
AMOC changes should consider changes at both the I-AOG and Drake Passage (Biastoch et
al., 2009; Biastoch et al., 2013). Indeed, in a warming world where increases in Agulhas
Leakage have been suggested to bear a potential impact on the AMOC (Biastoch, 2009),
changes at the Drake Passage in response to sea ice or wind changes due to anthropogenic
forcing, may in fact act to enhance or negate the effect of increased Agulhas leakage on global
climate change.

Chapter 6. Conclusions and Outlook
147
6.6 Outlook
The work presented in this thesis is largely the culmination of efforts using a state-of-
the-art fully-coupled ESM. However, the model does not resolve eddies, which are
considered key components of the oceanic systems at the I-AOG and Drake Passage,
including the formation and advection of large Agulhas rings. Future testing of the
results of this thesis with fully-coupled eddy resolving ESMs is necessary to
consolidate the hypotheses and conclusions developed here. However, these models
are currently computationally very expensive, and it could be some years before they
are available to perform the necessary 4000 year model integrations required for
palaeoclimate simulations.
Our understanding of past changes at the I-AOG and Drake Passage would also
benefit from deglacial transient experiments using fully-coupled eddy resolving ocean
models. The current thesis documents transient freshwater perturbation mimicking
millennial scale climate change, but the simulation of deglacial transitions (LGM-
Holocene for example) is beyond the scope of this work due to the large
computational expense.
The ESM utilised in this PhD project suffers from a salinity bias manifest in an
absence of a significant salinity contrast between the South Indian and South Atlantic
oceans, meaning that the modelled Agulhas leakage is unlikely to impact upon the
strength of the AMOC (Weijer and van Sebille, 2014). Therefore it is not yet possible
to model the impact of warm, saline Agulhas leakage on the AMOC using the current
set of available ESMs. This technical issue needs to be addressed in the future.
In order to test the connections between the warm and cold water route gateways and
the AMOC it would be necessary to adopt a Lagrangian tracer approach. Such a
methodology would allow a calculation of the exact volumetric quantity of water or
salt which is advected from the I-AOG and Drake Passage to the North Atlantic. This
method would be particularly useful in capturing the effect which changes at the warm
and cold water gateways might have on the changing glacial-interglacial and
millennial scale AMOC geometries, and should be adopted in the future.

Chapter 6. Conclusions and Outlook
148
The conclusions of this thesis point towards the requirement for further investigation
(and possibly reconsideration) of the proxy data used to infer past changes in Agulhas
leakage. Strong arguments have been put forth suggesting weaknesses in the use of the
ALF and Globorotalia menardii abundance counts as indicators of palaeo rates of
Agulhas leakage. Therefore, a robust kinematic proxy for Agulhas leakage is required
in order for future work to be carried out.

Appendix
149
Appendix
Supplementary figures and tables
Figure A.1 Climatological annual mean surface velocities (m/s) as modelled by the COSMOS model
incorporating the MPIOM-AFRICA configuration. Streamlines indicate vector direction, and colours
show velocity magnitude.

Appendix
150
Figure A.2 Pre-industrial surface velocities as simulated by MPIOM-AFRICA. Maximum surface speeds
of > 0.5 m/s are simulated in the Agulhas Current. The I-AOG transport exists as a viscous flow (non-
eddy resolved) south of Africa.

Appendix
151
Figure A.3 Anomalous surface velocities between the LGM and PI cases, as simulated by MPIOM-
AFRICA.

Appendix
152
Figure A.4 MPIOM-AFRICA zonal mean salinity (psu) for the pre-industrial simulation.

Appendix
153
Figure A.5 MPIOM-AFRICA zonal mean temperature (ºC) for the pre-industrial simulation.

Appendix
154
Figure A.6 MPIOM-AFRICA zonal mean salinity anomaly (psu) for the LGM-PI case. Evident from the
anomaly is enhanced increased salinity in the formation regions of increased LGM sea-ice (and therefore
brine rejection, at high latitudes) which tracks the increased AABW and is manifest as an increased
salinity signal (pink, may need to tilt screen) into the abyssal layers, providing for an increased
meridional salinity gradient (with highest salinity at high latitudes) across the Southern Ocean. The
meridional density gradient resulting from this salinity gradient (and temperature gradient) could act to
control the strength of the ACC flow (Lefebvre et al., 2012).
.

Appendix
155
Figure A.7 MPIOM-AFRICA zonal mean temperature anomaly (ºC) for the LGM-PI case. Evident from
the anomaly is that the glacial temperature decrease is minimum (blue, may need to tilt screen) at the high
latitudes (66S-70S, 500m-3000m depth), changing the meridional temperature gradient across the
Southern Ocean. The meridional density gradient resulting from this temperature gradient (and salinity
gradient) could act to control the strength of the ACC flow (Lefebvre et al., 2012).

Appendix
156
Figure A.8 MPIOM-AFRICA salinity (psu) across a transect at 30ºS in the Atlantic Basin for the pre-
industrial simulation. According to Makou et al., (2010), glacial AAIW penetrated northwards in the
Atlantic Basin at a depth of ~900-1200m at least as far as 27ºS. This may be represented in the model as
the relatively fresh water component located between 55ºW and 5ºW (over depths 500m-1200m).

Appendix
157
Figure A.9 MPIOM-AFRICA salinity anomaly (psu) across a transect at 30ºS in the Atlantic Basin for the
LGM-PI case. It is difficult to assess whether the salinity increase across 55ºW and 5ºW, over depths
500m-1200m, (see FigureA.8) is a result of decreased AAIW penetration in the model. This is difficult
because the entire global ocean increases in salinity during the glacial (1psu added due to the ice sheets),
and this acts as a background effect which dominates the signal and precludes the assessment of AAIW
penetration.

Appendix
158
Table A.1 Mean barotropic streamfunction at the location of the AC (Agulhas Current), MCT
(Mozambique Channel Throughflow), NBC (North Brazil Current), ITF (Indonesian Throughflow) and
GS (Gulf Stream). Positive (negative) values imply clockwise (anti-clockwise) rotation on the globe.
Units (Sv). Mean barotropic flow in the AC is weaker in the PI-AFRICA compared to PI-CTRL, and is
ultimately manifest in the weakened (more reasonable) I-AOG transport in the MPIOM-AFRICA
configuration. Regarding the PI-CTRL simulation, the higher mean barotropic flow in the AC is also
reflected in the relatively weak MCT streamfunction, implying that the main volumetric water rate in this
region, focussed in the AC, channels water which otherwise, in the PI-AFRICA simulation, would remain
within the MCT. Also of interest is the higher mean barotropic flow in the GS in simulation LGM-
AFRICA (compared to PI-AFRICA), which is related to the vigorous AMOC during the LGM.
PI-AFRICA PI-CTRL LGM-AFRICA
AC -51.61 -79.25 -55.57
MCT -27.85 -8.78 -32.99
NBC 2.48 8.15 4.58
ITF -6.47 -4.13 -9.68
GS 26.67 29.09 39.78

References
159
References
Adkins, J. F., McIntyre, K., & Schrag, D. P. (2002). The salinity, temperature, and
δ18O of the glacial deep ocean. Science, 298(5599), 1769-1773.
Allison, L. C., Johnson, H. L., Marshall, D. P., & Munday, D. R. (2010). Where do
winds drive the Antarctic Circumpolar Current?. Geophysical Research Letters, 37(12).
Anderson, R. F., Ali, S., Bradtmiller, L. I., Nielsen, S. H. H., Fleisher, M. Q., Anderson,
B. E., & Burckle, L. H. (2009). Wind-driven upwelling in the Southern Ocean and the
deglacial rise in atmospheric CO2. Science, 323(5920), 1443-1448.
Arakawa, A., & Lamb, V. R. (1977). Computational design of the basic dynamical
processes of the UCLA general circulation model. Methods in computational physics,
17, 173-265.
Arzel, O., de Verdière, A. C., & England, M. H. (2010, May). The role of oceanic heat
transport in abrupt millennial-scale climate transitions. In EGU General Assembly
Conference Abstracts (Vol. 12, p. 5819).
Baines, P. G. and Palmer, T. N. (1990): Rationale for a new physically based
parameterization of subgrid scale orographic effects, Technical Memorandum 169,
European Centre for Medium-Range Weather Forecasts, Reading, 925.
Banderas, R., Álvarez-Solas, J., & Montoya, M. (2012). Role of CO2 and Southern
Ocean winds in glacial abrupt climate change. Climate of the Past, 8, 1011-1021.
Bard, E., Rostek, F., & Sonzogni, C. (1997). Interhemispheric synchrony of the last
deglaciation inferred from alkenone palaeothermometry. Nature, 385(6618), 707-710.
Bard, E., & Rickaby, R. E. (2009). Migration of the subtropical front as a modulator of
glacial climate. Nature, 460(7253), 380-383.
Barker, P. F., & Burrell, J. (1977). The opening of Drake passage. Marine geology,
25(1), 15-34.
Barker, S., Diz, P., Vautravers, M. J., Pike, J., Knorr, G., Hall, I. R., & Broecker, W. S.
(2009). Interhemispheric Atlantic seesaw response during the last deglaciation. Nature,
457(7233), 1097-1102.
Barker, S., Knorr, G., Edwards, R. L., Parrenin, F., Putnam, A. E., Skinner, L. C., ... &
Ziegler, M. (2011). 800,000 years of abrupt climate variability. Science, 334(6054),
347-351.
Barker, S., & Diz, P. (2014). Timing of the descent into the last ice age determined by
the bipolar seesaw. Paleoceanography.

References
160
Barriopedro, D., García‐Herrera, R., & Huth, R. (2008). Solar modulation of Northern
Hemisphere winter blocking. Journal of Geophysical Research: Atmospheres (1984–
2012), 113(D14).
Beal, L. M., De Ruijter, W. P., Biastoch, A., & Zahn, R. (2011). On the role of the
Agulhas system in ocean circulation and climate. Nature, 472(7344), 429-436.
Beckmann, A., & Döscher, R. (1997). A method for improved representation of dense
water spreading over topography in geopotential-coordinate models. Journal of
Physical Oceanography, 27(4), 581-591.
Berger, A. L. (1977). Support for the astronomical theory of climatic change. Nature,
269(5623), 44-45.
Berger, A. (1978). Long-term variations of daily insolation and Quaternary climatic
changes. Journal of the Atmospheric Sciences, 35(12), 2362-2367.
Berger, A. (1989). Pleistocene climatic variability at astronomical frequencies.
Quaternary International, 2, 1-14.
Berger, A., & Loutre, M. F. (1991). Insolation values for the climate of the last 10
million years. Quaternary Science Reviews, 10(4), 297-317.
Berger, A.L., (1992). Astronomical theory of Paleoclimates and the last glacial-
interglacial cycle. Quaternary Science Reviews 11, 571-581.
Biastoch, A., Lutjeharms, J. R. E., Böning, C. W., & Scheinert, M. (2008). Mesoscale
perturbations control inter‐ocean exchange south of Africa. Geophysical Research
Letters, 35(20).
Biastoch, A., Böning, C. W., Schwarzkopf, F. U., & Lutjeharms, J. R. E. (2009).
Increase in Agulhas leakage due to poleward shift of Southern Hemisphere westerlies.
Nature, 462(7272), 495-498.
Biastoch, A., & Böning, C. W. (2013). Anthropogenic impact on Agulhas leakage.
Geophysical Research Letters, 40(6), 1138-1143.
Blunier, T., & Brook, E. J. (2001). Timing of millennial-scale climate change in
Antarctica and Greenland during the last glacial period. Science, 291(5501), 109-112.
Bond, G., Broecker, W., Johnsen, S., McManus, J., Labeyrie, L., Jouzel, J., & Bonani,
G. (1993). Correlations between climate records from North Atlantic sediments and
Greenland ice. Nature, 365(6442), 143-147.
Bond, G., Showers, W., Cheseby, M., Lotti, R., Almasi, P., Priore, P., ... & Bonani, G.
(1997). A pervasive millennial-scale cycle in North Atlantic Holocene and glacial
climates. Science, 278(5341), 1257-1266.

References
161
Bostock, H. C., Sutton, P. J., Williams, M. J., & Opdyke, B. N. (2013). Reviewing the
circulation and mixing of Antarctic Intermediate Water in the South Pacific using
evidence from geochemical tracers and Argo float trajectories. Deep Sea Research Part
I: Oceanographic Research Papers, 73, 84-98.
Broecker, W. S., Thurber, D. L., Goddard, J., Ku, T. L., Matthews, R. K., & Mesolella,
K. J. (1968). Milankovitch hypothesis supported by precise dating of coral reefs and
deep-sea sediments. Science, 159(3812), 297-300.
Broecker, W. S., & Donk, J. (1970). Insolation changes, ice volumes, and the O18
record in deep‐sea cores. Reviews of Geophysics, 8(1), 169-198.
Broecker, W. S. (1991). The great ocean conveyor. Oceanography, 4(2), 79-89.
Broecker, W. S. (1998). Paleocean circulation during the last deglaciation: a bipolar
seesaw?. Paleoceanography, 13(2), 119-121.
Broecker, W., & Pena, L. D. (2014). Delayed Holocene reappearance of G. menardii.
Paleoceanography, 29(4), 291-295.
Brovkin, V., Raddatz, T., Reick, C. H., Claussen, M., & Gayler, V. (2009). Global
biogeophysical interactions between forest and climate. Geophysical Research Letters,
36(7).
Caley, T., Kim, J. H., Malaizé, B., Giraudeau, J., Laepple, T., Caillon, N., ... &
Sinninghe Damsté, J. S. (2011). High-latitude obliquity as a dominant forcing in the
Agulhas current system. Climate of the Past, 7(4), 1285-1296.
Caley, T., Giraudeau, J., Malaizé, B., Rossignol, L., & Pierre, C. (2012). Agulhas
leakage as a key process in the modes of Quaternary climate changes. Proceedings of
the National Academy of Sciences, 109(18), 6835-6839.
Caley, T., Peeters, F. J., Biastoch, A., Rossignol, L., Sebille, E., Durgadoo, J., ... &
Zahn, R. (2014). Quantitative estimate of the paleo‐Agulhas leakage. Geophysical
Research Letters, 41(4), 1238-1246.
Calvo, E., Pelejero, C., Herguera, J. C., Palanques, A., & Grimalt, J. O. (2001).
Insolation dependence of the southeastern Subtropical Pacific sea surface temperature
over the last 400 kyrs. Geophysical Research Letters, 28(12), 2481-2484.
Caniupán, M., Lamy, F., Lange, C. B., Kaiser, J., Arz, H., Kilian, R., ... & Tiedemann,
R. (2011). Millennial‐scale sea surface temperature and Patagonian Ice Sheet changes
off southernmost Chile (53 S) over the past∼ 60 kyr. Paleoceanography, 26(3).
Chaigneau, A., & Pizarro, O. (2005). Surface circulation and fronts of the South Pacific
Ocean, east of 120 W. Geophysical Research Letters, 32(8).

References
162
Capron, E., Landais, A., Chappellaz, J., Schilt, A., Buiron, D., Dahl-Jensen, D., ... &
Stenni, B. (2010). Millennial and sub-millennial scale climatic variations recorded in
polar ice cores over the last glacial period. Climate of the Past Discussions, 6(1), 135-
183.
Clark, P. U., Pisias, N. G., Stocker, T. F., & Weaver, A. J. (2002). The role of the
thermohaline circulation in abrupt climate change. Nature, 415(6874), 863-869.
Cox, M. D. (1989). An idealized model of the world ocean. Part I: The global-scale
water masses. Journal of Physical Oceanography, 19(11), 1730-1752.
Cunningham, S. A., Alderson, S. G., King, B. A., & Brandon, M. A. (2003). Transport
and variability of the Antarctic circumpolar current in drake passage. Journal of
Geophysical Research: Oceans (1978–2012), 108(C5).
Cronin, T. M., Dwyer, G. S., Farmer, J., Bauch, H. A., Spielhagen, R. F., Jakobsson,
M., ... & Stepanova, A. (2012). Deep Arctic Ocean warming during the last glacial
cycle. Nature Geoscience, 5(9), 631-634.
Dahl-Jensen, D., Albert, M. R., Aldahan, A., Azuma, N., Balslev-Clausen, D.,
Baumgartner, M., ... & Kjær, H. A. (2013). Eemian interglacial reconstructed from a
Greenland folded ice core. Nature, 493(7433), 489-494.
Dansgaard, W., Clausen, H. B., Gundestrup, N., Hammer, C. U., Johnsen, S. F.,
Kristinsdottir, P. M., & Reeh, N. (1982). A new Greenland deep ice core. Science,
218(4579), 1273-1277.
Dansgaard, W., Johnsen, S. J., Clausen, H. B., Dahl-Jensen, D., Gundestrup, N. S.,
Hammer, C. U., ... & Bond, G. (1993). Evidence for general instability of past climate
from a 250-kyr ice-core record. Nature, 364(6434), 218-220.
De Boer, A. M., Graham, R. M., Thomas, M. D., & Kohfeld, K. E. (2013). The control
of the Southern Hemisphere Westerlies on the position of the Subtropical Front. Journal
of Geophysical Research: Oceans, 118(10), 5669-5675.
Denton, G.H., Hughes, T.J., (1983). Milankovitch theory of ice ages: Hypothesis of ice-
sheet linkage between regional insolation and global climate. Quaternary Research 20,
125-144.
De Ruijter, W. D., Biastoch, A., Drijfhout, S. S., Lutjeharms, J. R. E., Matano, R. P.,
Pichevin, T., ... & Weijer, W. (1999). Indian‐Atlantic interocean exchange: Dynamics,
estimation and impact. Journal of Geophysical Research: Oceans (1978–2012),
104(C9), 20885-20910.
Deshayes, J., Tréguier, A. M., Barnier, B., Lecointre, A., Sommer, J. L., Molines, J. M.,
... & Hirschi, J. M. (2013). Oceanic hindcast simulations at high resolution suggest that
the Atlantic MOC is bistable. Geophysical Research Letters, 40(12), 3069-3073.

References
163
De Vernal, A., Rosell-Melé, A., Kucera, M., Hillaire-Marcel, C., Eynaud, F., Weinelt,
M., ... & Kageyama, M. (2006). Comparing proxies for the reconstruction of LGM sea-
surface conditions in the northern North Atlantic. Quaternary Science Reviews, 25(21),
2820-2834.
Dijkstra, H. A., & De Ruijter, W. P. (2001). Barotropic instabilities of the Agulhas
Current system and their relation to ring formation. Journal of marine research, 59(4),
517-533.
Dima, M., & Lohmann, G. (2009). Conceptual model for millennial climate variability:
a possible combined solar-thermohaline circulation origin for the~ 1,500-year cycle.
Climate Dynamics, 32(2-3), 301-311.
Dokken, T. M., Nisancioglu, K. H., Li, C., Battisti, D. S., & Kissel, C. (2013).
Dansgaard‐Oeschger cycles: Interactions between ocean and sea ice intrinsic to the
Nordic seas. Paleoceanography, 28(3), 491-502.
Dong, B. W., & Sutton, R. T. (2002). Adjustment of the coupled ocean–atmosphere
system to a sudden change in the thermohaline circulation. Geophysical Research
Letters, 29(15), 18-1.
Durgadoo, J. V., Loveday, B. R., Reason, C. J., Penven, P., & Biastoch, A. (2013).
Agulhas leakage predominantly responds to the Southern Hemisphere westerlies.
Journal of Physical Oceanography, 43(10), 2113-2131.
Elderfield, H., Ferretti, P., Greaves, M., Crowhurst, S., McCave, I. N., Hodell, D., &
Piotrowski, A. M. (2012). Evolution of ocean temperature and ice volume through the
Mid-Pleistocene climate transition. Science, 337(6095), 704-709.
Emiliani, C. (1955), Pleistocene Temperatures, Journal of Geology, 63, 538-578.
England, M. H., & Garçon, V. C. (1994, September). South Atlantic circulation in a
world ocean model. In Annales geophysicae (Vol. 12, No. 9, pp. 812-825). Springer-
Verlag.
EPICA Community Members, (2006). One-to-one coupling of glacial climate variability
in Greenland and Antarctica. Nature 444, 195.
Franzese, A. M., Hemming, S. R., Goldstein, S. L., & Anderson, R. F. (2006). Reduced
Agulhas Leakage during the Last Glacial Maximum inferred from an integrated
provenance and flux study. Earth and Planetary Science Letters, 250(1), 72-88.
Franzese, A. M., Hemming, S. R., & Goldstein, S. L. (2009). Use of strontium isotopes
in detrital sediments to constrain the glacial position of the Agulhas Retroflection.
Paleoceanography, 24(2).
Ganopolski, A., & Rahmstorf, S. (2001). Rapid changes of glacial climate simulated in
a coupled climate model. Nature, 409(6817), 153-158.

References
164
Ganopolski, A., Calov, R., & Claussen, M. (2010). Simulation of the last glacial cycle
with a coupled climate ice-sheet model of intermediate complexity. Climate of the Past,
6(2), 229-244.
Gebbie, G. (2014). How much did Glacial North Atlantic Water shoal?.
Paleoceanography, 29(3), 190-209.
Gent, P. R., Willebrand, J., McDougall, T. J., & McWilliams, J. C. (1995).
Parameterizing eddy-induced tracer transports in ocean circulation models. Journal of
Physical Oceanography, 25(4), 463-474.
Gersonde, R., Crosta, X., Abelmann, A., & Armand, L. (2005). Sea-surface temperature
and sea ice distribution of the Southern Ocean at the EPILOG Last Glacial Maximum—
a circum-Antarctic view based on siliceous microfossil records. Quaternary Science
Reviews, 24(7), 869-896.
Gong, X., Knorr, G., Lohmann, G., & Zhang, X. (2013). Dependence of abrupt Atlantic
meridional ocean circulation changes on climate background states. Geophysical
Research Letters, 40(14), 3698-3704.
Gordon, A. L., & Molinelli, E. J. (1982). Thermohaline and chemical distributions and
the atlas data set.
Gordon, A. L. (1985). Indian-Atlantic transfer of thermocline water at the Agulhas
Retroflection. Science, 227(4690), 1030-1033.
Gordon, A. L., Weiss, R. F., Smethie, W. M., & Warner, M. J. (1992). Thermocline and
intermediate water communication between the South Atlantic and Indian Oceans.
Journal of Geophysical Research: Oceans (1978–2012), 97(C5), 7223-7240.
Gordon, A. L. (2005). The Indonesian Seas. Oceanography, 18(4), 14.
Gordon, A., Sprintall, J., Wijffels, S., Susanto, D., Molcard, R., Van Aken, H. M., &
Beal, L. (2010). Interocean Exchange of Thermocline Water: Indonesian Throughflow;"
Tassie" Leakage; Agulhas Leakage. Proceedings of OceanObs, 9.
Hagemann, S., & Dümenil, L. (1997). A parametrization of the lateral waterflow for the
global scale. Climate Dynamics, 14(1), 17-31.
Hagemann, S., & Gates, L. D. (1998). Documentation for the hydrological discharge
model. DKRZ.
Hagemann, S., Botzet, M., Dümenil, L., & Machenhauer, B. (1999). Derivation of
global GCM boundary conditions from 1 km land use satellite data. Max-Planck-
Institut für Meteorologie.
Hagemann, S. (2002). An improved land surface parameter dataset for global and
regional climate models. Max-Planck-Institut für Meteorologie.

References
165
Hagemann, S., & Gates, L. D. (2003). Improving a subgrid runoff parameterization
scheme for climate models by the use of high resolution data derived from satellite
observations. Climate Dynamics, 21(3-4), 349-359.
Hall, I. R., Moran, S. B., Zahn, R., Knutz, P. C., Shen, C. C., & Edwards, R. L. (2006).
Accelerated drawdown of meridional overturning in the late‐glacial Atlantic triggered
by transient pre‐H event freshwater perturbation. Geophysical Research Letters, 33(16).
Hall, I. R., Evans, H. K., & Thornalley, D. J. R. (2011). Deep water flow speed and
surface ocean changes in the subtropical North Atlantic during the last deglaciation.
Global and Planetary Change, 79(3), 255-263.
Hays, J. D., Imbrie, J., & Shackleton, N. J. (1976, December). Variations in the Earth's
orbit: Pacemaker of the ice ages. American Association for the Advancement of
Science.
Heinrich, H. (1988). Origin and consequences of cyclic ice rafting in the northeast
Atlantic Ocean during the past 130,000 years. Quaternary research, 29(2), 142-152.
Hemming, S. R. (2004). Heinrich events: Massive late Pleistocene detritus layers of the
North Atlantic and their global climate imprint. Reviews of Geophysics, 42(1).
Henderson-Sellers, A. (1986). Current global land-surface data sets for use in climate-
related studies (No. 272). Atmospheric Analysis and Prediction Division, National
Center for Atmospheric Research.
Hibler III, W. D. (1979). A dynamic thermodynamic sea ice model. Journal of Physical
Oceanography, 9(4), 815-846.
Ho, S. L., Mollenhauer, G., Lamy, F., Martínez‐Garcia, A., Mohtadi, M., Gersonde, R.,
... & Tiedemann, R. (2012). Sea surface temperature variability in the Pacific sector of
the Southern Ocean over the past 700 kyr. Paleoceanography, 27(4).
Hönisch, B., Hemming, N. G., Archer, D., Siddall, M., & McManus, J. F. (2009).
Atmospheric carbon dioxide concentration across the mid-Pleistocene transition.
Science, 324(5934), 1551-1554.
Imbrie, J. (1985). A theoretical framework for the Pleistocene ice ages William Smith
Lecture. Journal of the Geological Society, 142(3), 417-432.
Johnsen, S. J., Dansgaard, W., Clausen, H. B., & Langway, C. C. (1972). Oxygen
isotope profiles through the Antarctic and Greenland ice sheets. Nature, 235(5339),
429-434.
Johnson, T. C., Brown, E. T., McManus, J., Barry, S., Barker, P., & Gasse, F. (2002). A
high-resolution paleoclimate record spanning the past 25,000 years in southern East
Africa. Science, 296(5565), 113-132.

References
166
Jouzel, J., Masson, V., Cattani, O., Falourd, S., Stievenard, M., Stenni, B., & Barkov, N.
I. (2001). A new 27 ky high resolution East Antarctic climate record. Geophysical
Research Letters, 28(16), 3199-3202.
Jouzel, J., Masson-Delmotte, V., Cattani, O., Dreyfus, G., Falourd, S., Hoffmann, G., ...
& Wolff, E. W. (2007). Orbital and millennial Antarctic climate variability over the past
800,000 years. Science, 317(5839), 793-796.
Jungclaus, J. H., Keenlyside, N., Botzet, M., Haak, H., Luo, J. J., Latif, M., ... &
Roeckner, E. (2006a). Ocean circulation and tropical variability in the coupled model
ECHAM5/MPI-OM. Journal of climate, 19(16), 3952-3972.
Jungclaus, J. H., Haak, H., Esch, M., Roeckner, E., & Marotzke, J. (2006b). Will
Greenland melting halt the thermohaline circulation?. Geophysical Research Letters,
33(17).
Kaiser, J., Schefuß, E., Lamy, F., Mohtadi, M., & Hebbeln, D. (2008). Glacial to
Holocene changes in sea surface temperature and coastal vegetation in north central
Chile: high< i> versus</i> low latitude forcing. Quaternary Science Reviews, 27(21),
2064-2075.
Kaiser, J., & Lamy, F. (2010). Links between Patagonian Ice Sheet fluctuations and
Antarctic dust variability during the last glacial period (MIS 4-2). Quaternary Science
Reviews, 29(11), 1464-1471.
Kasper, S., van der Meer, M. T. J., Mets, A., Zahn, R., Sinninghe DamstÃĐ, J. S., &
Schouten, S. (2014). Salinity changes in the Agulhas leakage area recorded by stable
hydrogen isotopes of C 37 alkenones during Termination I and II. Climate of the Past,
10(1), 251-260.
Keigwin, L. (1982), Isotopic Paleoceanography of the Caribbean and East Pacific: Role
of Panama Uplift in Late Neogene Time, Science, 217(4557), 350-353.
Kim, J. H., Schneider, R. R., Hebbeln, D., Müller, P. J., & Wefer, G. (2002). Last
deglacial sea-surface temperature evolution in the Southeast Pacific compared to
climate changes on the South American continent. Quaternary Science Reviews, 21(18),
2085-2097.
Kohfeld, K. E., Graham, R. M., de Boer, A. M., Sime, L. C., Wolff, E. W., Le Quéré,
C., & Bopp, L. (2013). Southern Hemisphere westerly wind changes during the Last
Glacial Maximum: Paleo-data synthesis. Quaternary Science Reviews, 68, 76-95.
Knorr, G. & G. Lohmann, (2003).Southern Ocean origin for the resumption of Atlantic
thermohaline circulation during deglaciation. Nature 424,532–536.
Knorr, G., & Lohmann, G. (2007). Rapid transitions in the Atlantic thermohaline
circulation triggered by global warming and meltwater during the last deglaciation.
Geochemistry, Geophysics, Geosystems, 8(12).

References
167
Knorr, G., Butzin, M., Micheels, A., & Lohmann, G. (2011). A warm Miocene climate
at low atmospheric CO2 levels. Geophysical Research Letters, 38(20).
Knorr, G., & Lohmann, G. (2014). Climate warming during Antarctic ice sheet
expansion at the Middle Miocene transition. Nature Geoscience.
Knutti, R., Flückiger, J., Stocker, T. F., & Timmermann, A. (2004). Strong hemispheric
coupling of glacial climate through freshwater discharge and ocean circulation. Nature,
430(7002), 851-856.
Koutsodendris, A., Pross, J., & Zahn, R. (2014). Exceptional Agulhas leakage
prolonged interglacial warmth during MIS 11c in Europe. Paleoceanography.
Kucera, M., Weinelt, M., Kiefer, T., Pflaumann, U., Hayes, A., Weinelt, M., ... &
Waelbroeck, C. (2005). Reconstruction of sea-surface temperatures from assemblages
of planktonic foraminifera: multi-technique approach based on geographically
constrained calibration data sets and its application to glacial Atlantic and Pacific
Oceans. Quaternary Science Reviews, 24(7), 951-998.
Kucera, M. (2007). Planktonic foraminifera as tracers of past oceanic environments.
Developments in marine geology, 1(6), 213-262.
Kuhlbrodt, T., Griesel, A., Montoya, M., Levermann, A., Hofmann, M., & Rahmstorf,
S. (2007). On the driving processes of the Atlantic meridional overturning circulation.
Reviews of Geophysics, 45(2).
Kwasniok, F., & Lohmann, G. (2009). Deriving dynamical models from paleoclimatic
records: application to glacial millennial-scale climate variability. Physical Review E,
80(6), 066104.
Lagabrielle, Y., Y. Goddéris, Y. Donnadieu, J. Malavieille, and M. Suarez (2009), The
tectonic history of Drake Passage and its possible impacts on global climate, Earth and
Planetary Science Letters, 279(3–4), 197-211.
Lamy, F., Purcell, C., Arz, H.W., Kilian, R., Lembke-Jene, L., Kaiser, J., Baeza Urrea,
O., Knorr, G., Hall, I., Lange, C., Tiedemann, R. (in preparation). Glacial reduction and
millennial-scale variations in Drake Passage throughflow.
Lea, D. W., Pak, D. K., Belanger, C. L., Spero, H. J., Hall, M. A., & Shackleton, N. J.
(2006). Paleoclimate history of Galapagos surface waters over the last 135,000 yr.
Quaternary Science Reviews, 25(11), 1152-1167.
Lee, S. Y., Chiang, J. C., Matsumoto, K., & Tokos, K. S. (2011). Southern Ocean wind
response to North Atlantic cooling and the rise in atmospheric CO2: Modeling
perspective and paleoceanographic implications. Paleoceanography, 26(1).

References
168
Lefebvre, V., Donnadieu, Y., Sepulchre, P., Swingedouw, D., & Zhang, Z. S. (2012).
Deciphering the role of southern gateways and carbon dioxide on the onset of the
Antarctic Circumpolar Current. Paleoceanography, 27(4).
Legutke, S., & Maier-Reimer, E. (2002). The impact of a downslope water-transport
parametrization in a global ocean general circulation model. Climate dynamics, 18(7),
611-623.
Li, C., Battisti, D. S., & Bitz, C. M. (2010). Can North Atlantic Sea Ice Anomalies
Account for Dansgaard-Oeschger Climate Signals?*. Journal of Climate, 23(20), 5457-
5475.
Lin, S. J., & Rood, R. B. (1996). Multidimensional flux-form semi-Lagrangian transport
schemes. Monthly Weather Review, 124(9), 2046-2070.
Lippold, J., Luo, Y., Francois, R., Allen, S. E., Gherardi, J., Pichat, S., ... & Schulz, H.
(2012). Strength and geometry of the glacial Atlantic Meridional Overturning
Circulation. Nature Geoscience, 5(11), 813-816.
Lisiecki, L. E., & Raymo, M. E. (2005). A Pliocene‐Pleistocene stack of 57 globally
distributed benthic δ18O records. Paleoceanography, 20(1).
Locarnini, R.A., Mishonov, A.V., Antonov, J.I., Boyer, T.P., Garcia, H.E., Baranova,
O.K., Zweng, M.M., Johnson, D.R., (2010). World Ocean Atlas 2009 Volume 1:
Temperature In: Levitus, S. (Ed), NOAA Atlas NESDIS 68, U.S. Government Printing
Office, Washington, D.C., 184 pp.
Lohmann, G. (1998). The influence of a near-bottom transport parameterization on the
sensitivity of the thermohaline circulation. Journal of Physical Oceanography, 28(10),
2095-2103.
Lohmann, G. (2003). Atmospheric and oceanic freshwater transport during weak
Atlantic overturning circulation. Tellus A, 55(5), 438-449.
Lott, F. (1999). Alleviation of stationary biases in a GCM through a mountain drag
parameterization scheme and a simple representation of mountain lift forces. Monthly
weather review, 127(5), 788-801.
Lott, F., & Miller, M. J. (1997). A new subgrid‐scale orographic drag parametrization:
Its formulation and testing. Quarterly Journal of the Royal Meteorological Society,
123(537), 101-127.
Lüthi, D., Le Floch, M., Bereiter, B., Blunier, T., Barnola, J. M., Siegenthaler, U., ... &
Stocker, T. F. (2008). High-resolution carbon dioxide concentration record 650,000–
800,000 years before present. Nature, 453(7193), 379-382.
Lutjeharms, J. R. E.,(2006). The Agulhas Current, 329 pp., Springer, Berlin.

References
169
Luz, B. (1977). Late Pleistocene paleoclimates of the South Pacific based on statistical
analysis of planktonic foraminifers. Palaeogeography, Palaeoclimatology,
Palaeoecology, 22(1), 61-78.
Lynch-Stieglitz, J., Adkins, J. F., Curry, W. B., Dokken, T., Hall, I. R., Herguera, J. C.,
... & Zahn, R. (2007). Atlantic meridional overturning circulation during the Last
Glacial Maximum. Science, 316(5821), 66-69.
Lynch-Stieglitz, J., Schmidt, M. W., Henry, L. G., Curry, W. B., Skinner, L. C., Mulitza,
S., ... & Chang, P. (2014). Muted change in Atlantic overturning circulation over some
glacial-aged Heinrich events. Nature Geoscience.
Maasch, K. A. (1988). Statistical detection of the mid-Pleistocene transition. Climate
dynamics, 2(3), 133-143.
Makou, M. C., Oppo, D. W., & Curry, W. B. (2010). South Atlantic intermediate water
mass geometry for the last glacial maximum from foraminiferal Cd/Ca.
Paleoceanography, 25(4).
Manabe, S., & Stouffer, R. J. (2000). Study of abrupt climate change by a coupled
ocean–atmosphere model. Quaternary Science Reviews, 19(1-5), 285-299.
Marchitto, T. M., & Broecker, W. S. (2006). Deep water mass geometry in the glacial
Atlantic Ocean: A review of constraints from the paleonutrient proxy Cd/Ca.
Geochemistry, Geophysics, Geosystems, 7(12).
Marino, G., Zahn, R., Ziegler, M., Purcell, C., Knorr, G., Hall, I. R., ... & Elderfield, H.
(2013). Agulhas salt‐leakage oscillations during abrupt climate changes of the Late
Pleistocene. Paleoceanography, 28(3), 599-606.
Marshall, J., & Speer, K. (2012). Closure of the meridional overturning circulation
through Southern Ocean upwelling. Nature Geoscience, 5(3), 171-180.
Marsland, S. J., Haak, H., Jungclaus, J. H., Latif, M., & Röske, F. (2003). The Max-
Planck-Institute global ocean/sea ice model with orthogonal curvilinear coordinates.
Ocean modelling, 5(2), 91-127.
Martínez-Garcia, A., Rosell-Melé, A., McClymont, E. L., Gersonde, R., & Haug, G. H.
(2010). Subpolar link to the emergence of the modern equatorial Pacific cold tongue.
Science, 328(5985), 1550-1553.
Martínez-Méndez, G., Molyneux, E. G., Hall, I. R., & Zahn, R. (2009). Variable water
column structure of the South Atlantic on glacial–interglacial time scales. Quaternary
Science Reviews, 28(27), 3379-3387.
Martínez‐Méndez, G., Zahn, R., Hall, I. R., Peeters, F. J., Pena, L. D., Cacho, I., &
Negre, C. (2010). Contrasting multiproxy reconstructions of surface ocean hydrography
in the Agulhas Corridor and implications for the Agulhas Leakage during the last
345,000 years. Paleoceanography, 25(4).

References
170
Martínez‐Méndez, G., Hebbeln, D., Mohtadi, M., Lamy, F., Pol‐Holz, D., Reyes‐Macaya, D., & Freudenthal, T. (2013). Changes in the advection of Antarctic
Intermediate Water to the northern Chilean coast during the last 970 kyr.
Paleoceanography, 28(4), 607-618.
Martrat, B., Grimalt, J. O., Shackleton, N. J., de Abreu, L., Hutterli, M. A., & Stocker,
T. F. (2007). Four climate cycles of recurring deep and surface water destabilizations on
the Iberian margin. Science, 317(5837), 502-507.
Mashiotta, T. A., Lea, D. W., & Spero, H. J. (1999). Glacial–interglacial changes in
Subantarctic sea surface temperature and δ18
O-water using foraminiferal Mg. Earth and
Planetary Science Letters, 170(4), 417-432.
McCave, I. N., & Hall, I. R. (2006). Size sorting in marine muds: Processes, pitfalls,
and prospects for paleoflow‐speed proxies. Geochemistry, Geophysics, Geosystems,
7(10).
McCave, I. N., Crowhurst, S. J., Kuhn, G., Hillenbrand, C. D., & Meredith, M. P.
(2013). Minimal change in Antarctic Circumpolar Current flow speed between the last
glacial and Holocene. Nature Geoscience.
McManus, J. F., Oppo, D. W., & Cullen, J. L. (1999). A 0.5-million-year record of
millennial-scale climate variability in the North Atlantic. Science, 283(5404), 971-975.
McManus, J. F., Francois, R., Gherardi, J. M., Keigwin, L. D., & Brown-Leger, S.
(2004). Collapse and rapid resumption of Atlantic meridional circulation linked to
deglacial climate changes. Nature, 428(6985), 834-837.
Meredith, M. P., Woodworth, P. L., Chereskin, T. K., Marshall, D. P., Allison, L. C.,
Bigg, G. R., ... & Sprintall, J. (2011). Sustained monitoring of the Southern Ocean at
Drake Passage: Past achievements and future priorities. Reviews of Geophysics, 49(4).
Milankovitch, M., 1930. Mathematische Klimalehre und Astronomische Theorie der
Klimaschwankungen. Handbuch der Klimalogie, Borntrager Berlin Band 1.
Milankovitch, M., 1941. Kanon der Erdbestrahlung und seine Andwendung auf das
Eiszeitenproblem. Royal Serbian Academy Special Publication, Belgrade, 633.
Moffa-Sánchez, P., Born, A., Hall, I. R., Thornalley, D. J., & Barker, S. (2014). Solar
forcing of North Atlantic surface temperature and salinity over the past millennium.
Nature Geoscience.

References
171
Moura, A. D., & Shukla, J. (1981). On the dynamics of droughts in northeast Brazil:
Observations, theory and numerical experiments with a general circulation model.
Journal of the Atmospheric Sciences, 38(12), 2653-2675.
Mudelsee, M., & Schulz, M. (1997). The Mid-Pleistocene climate transition: onset of
100 ka cycle lags ice volume build-up by 280 ka. Earth and Planetary Science Letters,
151(1), 117-123.
Mulitza, S., Prange, M., Stuut, J. B., Zabel, M., von Dobeneck, T., Itambi, A. C., ... &
Wefer, G. (2008). Sahel megadroughts triggered by glacial slowdowns of Atlantic
meridional overturning. Paleoceanography, 23(4).
Muratli, J. M., Chase, Z., Mix, A. C., & McManus, J. (2009). Increased glacial-age
ventilation of the Chilean margin by Antarctic Intermediate Water. Nature Geoscience,
3(1), 23-26.
Negre, C., R. Zahn, A. L. Thomas, P. Masqué, G. M. Henderson, G. Martínez-Méndez,
I. R. Hall, and J. L. Mas (2010), Reversed flow of Atlantic deep water during the Last
Glacial Maximum, Nature, 468, 84–88.
NGRIP_members (2004), High-resolution record of Northern Hemisphere climate
extending into the last interglacial period, Nature, 431(7005), 147–151.
Oka, A., Hasumi, H., & Abe‐Ouchi, A. (2012). The thermal threshold of the Atlantic
meridional overturning circulation and its control by wind stress forcing during glacial
climate. Geophysical Research Letters, 39(9).
Oppo, D. W., McManus, J. F., & Cullen, J. L. (2006). Evolution and demise of the Last
Interglacial warmth in the subpolar North Atlantic. Quaternary Science Reviews,
25(23), 3268-3277.
Oppo, D. W., & Curry, W. B. (2012). Deep Atlantic circulation during the last glacial
maximum and deglaciation. Nature Education Knowledge, 3(10), 1.
Orsi, A. H., Whitworth III, T., & Nowlin Jr, W. D. (1995). On the meridional extent and
fronts of the Antarctic Circumpolar Current. Deep Sea Research Part I: Oceanographic
Research Papers, 42(5), 641-673.
Parnell, A. C., Haslett, J., Allen, J. R. M., Buck, C. E., & Huntley, B. (2008). A flexible
approach to assessing synchroneity of past events using Bayesian reconstructions of
sedimentation history. Quaternary Science Reviews, 27(19), 1872-1885.
Paul, J., Fortuin, F., & Kelder, H. (1998). An ozone climatology based on ozonesonde
and satellite measurements. Journal of Geophysical Research: Atmospheres (1984–
2012), 103(D24), 31709-31734.
Peeters, F. J., Acheson, R., Brummer, G. J. A., De Ruijter, W. P., Schneider, R. R.,
Ganssen, G. M., ... & Kroon, D. (2004). Vigorous exchange between the Indian and
Atlantic oceans at the end of the past five glacial periods. Nature, 430(7000), 661-665.

References
172
Pena, L. D., Cacho, I., Ferretti, P., & Hall, M. A. (2008). El Niño–Southern Oscillation–
like variability during glacial terminations and interlatitudinal teleconnections.
Paleoceanography, 23(3).
Petersen, S. V., Schrag, D. P., & Clark, P. U. (2013). A new mechanism for Dansgaard‐Oeschger cycles. Paleoceanography, 28(1), 24-30.
Raddatz, T. J., Reick, C. H., Knorr, W., Kattge, J., Roeckner, E., Schnur, R., ... &
Jungclaus, J. (2007). Will the tropical land biosphere dominate the climate–carbon cycle
feedback during the twenty-first century?. Climate Dynamics, 29(6), 565-574.
Rahmstorf, S. (1996). On the freshwater forcing and transport of the Atlantic
thermohaline circulation. Climate Dynamics, 12(12), 799-811.
Rahmstorf, S. (2002). Ocean circulation and climate during the past 120,000 years.
Nature, 419(6903), 207-214.
Raymo, M. E., & Ruddiman, W. F. (1992). Tectonic forcing of late Cenozoic climate.
Nature, 359(6391), 117-122.
Raymo, M. E., Lisiecki, L. E., & Nisancioglu, K. H. (2006). Plio-Pleistocene ice
volume, Antarctic climate, and the global δ18O record. Science, 313(5786), 492-495.
Rial, J.A., (1999). Pacemaking the Ice Ages by Frequency Modulation of Earth's Orbital
Eccentricity. Science 285, 564-568.
Richardson, P. L. (2007). Agulhas leakage into the Atlantic estimated with subsurface
floats and surface drifters. Deep Sea Research Part I: Oceanographic Research Papers,
54(8), 1361-1389.
Rincón‐Martínez, D., Lamy, F., Contreras, S., Leduc, G., Bard, E., Saukel, C., ... &
Tiedemann, R. (2010). More humid interglacials in Ecuador during the past 500 kyr
linked to latitudinal shifts of the equatorial front and the Intertropical Convergence Zone
in the eastern tropical Pacific. Paleoceanography, 25(2).
Ritz, S. P., Stocker, T. F., Grimalt, J. O., Menviel, L., & Timmermann, A. (2013).
Estimated strength of the Atlantic overturning circulation during the last deglaciation.
Nature geoscience, 6(3), 208-212.
Roeckner, E., Bäuml, G., Bonaventura, L., Brokopf, R., Esch, M., Giorgetta, M.,
Hagemann, S., Kirchner, I., Kornblueh, L., Manzini, E., Rhodin, A., Schlese, U.,
Schulzweida, U., and Tompkins, A. (2003): The atmospheric general circulation model
ECHAM5, PART I: Model description, Report 349, Max-Planck-Institut für
Meteorologie, Hamburg. 920, 921, 922, 925
Roeckner, E., Brokopf, R., Esch, M., Giorgetta, M., Hagemann, S., Kornblueh, L., ... &
Schulzweida, U. (2006). Sensitivity of simulated climate to horizontal and vertical
resolution in the ECHAM5 atmosphere model. Journal of Climate, 19(16), 3771-3791.

References
173
Romero, O. E., Kim, J. H., & Hebbeln, D. (2006). Paleoproductivity evolution off
central Chile from the Last Glacial Maximum to the Early Holocene. Quaternary
Research, 65(3), 519-525.
Ruddiman, W.F., McIntyre, A., (1981). Oceanic Mechanisms for Amplification of the
23,000-Year Ice-Volume Cycle. Science 212, 617-627.
Rühs, S., Durgadoo, J. V., Behrens, E., & Biastoch, A. (2013). Advective timescales and
pathways of Agulhas leakage. Geophysical Research Letters, 40(15), 3997-4000.
Russell, J. L., Stouffer, R. J., & Dixon, K. W. (2006). Intercomparison of the Southern
Ocean circulations in IPCC coupled model control simulations. Journal of Climate,
19(18), 4560-4575.
Sexton, P. F., & Norris, R. D. (2011). High latitude regulation of low latitude
thermocline ventilation and planktic foraminifer populations across glacial–interglacial
cycles. Earth and Planetary Science Letters, 311(1), 69-81.
Shackleton, N. J., & Opdyke, N. D. (1976). Oxygen-isotope and paleomagnetic
stratigraphy of Pacific core V28-239 late Pliocene to latest Pleistocene. Geological
Society of America Memoirs, 145, 449-464.
Schefuß, E., Schouten, S., & Schneider, R. R. (2005). Climatic controls on central
African hydrology during the past 20,000 years. Nature, 437(7061), 1003-1006.
Shindell, D. T., & Schmidt, G. A. (2004). Southern Hemisphere climate response to
ozone changes and greenhouse gas increases. Geophysical Research Letters, 31(18).
Schlitzer, R. (2012). Ocean Data View (version 4.5).
Schmittner, A., Saenko, O. A., & Weaver, A. J. (2003). Coupling of the hemispheres in
observations and simulations of glacial climate change. Quaternary Science Reviews,
22(5), 659-671.
Schneider, R. R., Müller, P. J., & Acheson, R. (1999). Atlantic alkenone sea-surface
temperature records. In Reconstructing ocean history (pp. 33-55). Springer US.
Schulz, J. P., Dümenil, L., & Polcher, J. (2001). On the land surface-atmosphere
coupling and its impact in a single-column atmospheric model. Journal of Applied
Meteorology, 40(3), 642-663.
Simon, M. H., Arthur, K. L., Hall, I. R., Peeters, F. J., Loveday, B. R., Barker, S., ... &
Zahn, R. (2013). Millennial-scale Agulhas Current variability and its implications for
salt-leakage through the Indian–Atlantic Ocean Gateway. Earth and Planetary Science
Letters, 383, 101-112.
Simon, M.H., Purcell, C., Hall, I.R., Ziegler, M., Barker, S., Knorr, G., van der Meer,
M.T.J., Kasper, S., Schouten, S. (in preparation). Land-ocean climate dynamics in
southernmost East Africa: A multiproxy data and model integration.

References
174
Sijp, W. P., & England, M. H. (2004). Effect of the Drake Passage throughflow on
global climate. Journal of Physical Oceanography, 34(5), 1254-1266.
Sokolov, S., & Rintoul, S. R. (2009). Circumpolar structure and distribution of the
Antarctic Circumpolar Current fronts: 2. Variability and relationship to sea surface
height. Journal of Geophysical Research: Oceans (1978–2012), 114(C11).
Speich, S., Blanke, B., & Madec, G. (2001). Warm and cold water routes of an OGCM
thermohaline conveyor belt. Geophysical Research Letters, 28(2), 311-314.
Speich, S., Blanke, B., & Cai, W. (2007). Atlantic meridional overturning circulation
and the Southern Hemisphere supergyre. Geophysical Research Letters, 34(23).
Srokosz, M., Baringer, M., Bryden, H., Cunningham, S., Delworth, T., Lozier, S., ... &
Sutton, R. (2012). Past, present, and future changes in the Atlantic meridional
overturning circulation. Bulletin of the American Meteorological Society, 93(11), 1663-
1676.
Stager, J. C., Ryves, D. B., Chase, B. M., & Pausata, F. S. (2011). Catastrophic drought
in the Afro-Asian monsoon region during Heinrich event 1. Science, 331(6022), 1299-
1302.
Stepanek, C., & Lohmann, G. (2012). Modelling mid-Pliocene climate with COSMOS.
Geosci. Model Dev., 5, 1221-1243.
Stocker, T. F. (1998). The seesaw effect. Science, 282(5386), 61-62.
Stocker, T. F., & Johnsen, S. J. (2003). A minimum thermodynamic model for the
bipolar seesaw. Paleoceanography, 18(4).
Stocker, T.F., D. Qin, G.-K. Plattner, M. Tignor, S.K. Allen, J. Boschung, A. Nauels, Y.
Xia, V. Bex and P.M. Midgley (eds.), IPCC, (2013): Climate Change 2013: The Physical
Science Basis. Contribution of Working Group I to the Fifth Assessment Report of the
Intergovernmental Panel on Climate Change. Cambridge University Press, Cambridge,
United Kingdom and New York, NY, USA, 1535 pp.
Stouffer, R. J., Yin, J., Gregory, J. M., Dixon, K. W., Spelman, M. J., Hurlin, W., ... &
Weber, S. L. (2006). Investigating the causes of the response of the thermohaline
circulation to past and future climate changes. Journal of Climate, 19(8), 1365-1387.
Strub, P. T., Mesias, J. M., Montecino, V., Ruttlant, J., Salinas, S., in The global coastal
ocean. Regional studies and syntheses, A. R. Robinson, K. H. Brink, Eds. (Wiley, New
York, 1998), pp. 273-315.
Tanre, D., Geleyn, J. F., & Slingo, J. (1984). First results of the introduction of an
advanced aerosol-radiation interaction in the ECMWF low resolution global model.
Aerosols and their climatic effects, 133-177.
Thornalley, D. J. R., S. Barker, W. S. Broecker, H. Elderfield, and I. N. McCave (2011),

References
175
The deglacial evolution of North Atlantic deep convection, Science, 331, 202–205.
Tierney, J. E., Russell, J. M., Huang, Y., Damsté, J. S. S., Hopmans, E. C., & Cohen, A.
S. (2008). Northern hemisphere controls on tropical southeast African climate during
the past 60,000 years. Science, 322(5899), 252-255.
Toggweiler, J. R., & Lea, D. W. (2010). Temperature differences between the
hemispheres and ice age climate variability. Paleoceanography, 25(2).
Valcke, S., Caubel, A., Declat, D., & Terray, L. (2003). Oasis3 ocean atmosphere sea
ice soil user‘s guide. Prisim project report, 2.
van Sebille, E., Van Leeuwen, P. J., Biastoch, A., & de Ruijter, W. P. (2010). Flux
comparison of Eulerian and Lagrangian estimates of Agulhas leakage: A case study
using a numerical model. Deep Sea Research Part I: Oceanographic Research Papers,
57(3), 319-327.
Völker, A. H. (2002). Global distribution of centennial-scale records for Marine Isotope
Stage (MIS) 3: a database. Quaternary Science Reviews, 21(10), 1185-1212.
Völker, C., and P. Köhler (2013), Responses of ocean circulation and carbon cycle to
changes in the position of the Southern Hemisphere westerlies at Last Glacial
Maximum, Paleoceanography, 28, 726-739.
Waelbroeck, C., Paul, A., Kucera, M., Rosell-Melé, A., Weinelt, M., Schneider, R., ...
& Spero, H. (2009). Constraints on the magnitude and patterns of ocean cooling at the
Last Glacial Maximum. Nature Geoscience, 2(2), 127-132.
Wang, Y., Cheng, H., Edwards, R. L., Kong, X., Shao, X., Chen, S., ... & An, Z. (2008).
Millennial-and orbital-scale changes in the East Asian monsoon over the past 224,000
years. Nature, 451(7182), 1090-1093.
Wang, X. F., A. S. Auler, R. L. Edwards, H. Cheng, P. S. Cristalli, P. L. Smart, D. A.
Richards, and C. C. Shen (2004), Wet periods in northeastern Brazil over the past 210
kyr linked to distant climate anomalies, Nature, 432(7018), 740–743.
Wang, Y. V., Leduc, G., Regenberg, M., Andersen, N., Larsen, T., Blanz, T., &
Schneider, R. R. (2013). Northern and southern hemisphere controls on seasonal sea
surface temperatures in the Indian Ocean during the last deglaciation.
Paleoceanography, 28(4), 619-632.
Wei, W., Lohmann, G., & Dima, M. (2012). Distinct modes of internal variability in the
global meridional overturning circulation associated with the Southern Hemisphere
westerly winds. Journal of Physical Oceanography, 42(5), 785-801.
Wei, W., & Lohmann, G. (2012). Simulated Atlantic multidecadal oscillation during the
Holocene. Journal of Climate, 25(20), 6989-7002.
Weijer, W., De Ruijter, W. P., Sterl, A., & Drijfhout, S. S. (2002). Response of the

References
176
Atlantic overturning circulation to South Atlantic sources of buoyancy. Global and
Planetary Change, 34(3), 293-311.
Weijer, W., Sloyan, B. M., Maltrud, M. E., Jeffery, N., Hecht, M. W., Hartin, C. A., ... &
Landrum, L. (2012). The Southern Ocean and its climate in CCSM4. Journal of
Climate, 25(8), 2652-2675.
Weijer, W., & van Sebille, E. (2014). Impact of Agulhas Leakage on the Atlantic
Overturning Circulation in the CCSM4. Journal of Climate, 27(1), 101-110.
Weijers, J. W., Schefuß, E., Schouten, S., & Damsté, J. S. S. (2007). Coupled thermal
and hydrological evolution of tropical Africa over the last deglaciation. Science,
315(5819), 1701-1704.
Weldeab, S., Lea, D. W., Schneider, R. R., & Andersen, N. (2007). 155,000 years of
West African monsoon and ocean thermal evolution. Science, 316(5829), 1303-1307.
Weldeab, S. (2012). Bipolar modulation of millennial-scale West African monsoon
variability during the last glacial (75,000–25,000 years ago). Quaternary Science
Reviews, 40, 21-29.
Well, R., Roether, W., & Stevens, D. P. (2003). An additional deep-water mass in
Drake Passage as revealed by 3He data. Deep Sea Research Part I: Oceanographic
Research Papers, 50(9), 1079-1098.
Whitworth III, T., & Peterson, R. G. (1985). Volume transport of the Antarctic
Circumpolar Current from bottom pressure measurements. Journal of Physical
Oceanography, 15(6), 810-816.
Woollings, T., Lockwood, M., Masato, G., Bell, C., & Gray, L. (2010). Enhanced
signature of solar variability in Eurasian winter climate. Geophysical Research Letters,
37(20).
Wunsch, C. (2006). Abrupt climate change: An alternative view. Quaternary Research,
65(2), 191-203.
Zachos, J., Pagani, M., Sloan, L., Thomas, E., & Billups, K. (2001). Trends, rhythms,
and aberrations in global climate 65 Ma to present. Science, 292(5517), 686-693.
Zhang, X., Lohmann, G., Knorr, G., & Xu, X. (2013). Different ocean states and
transient characteristics in Last Glacial Maximum simulations and implications for
deglaciation. Climate of the Past, 9, 2319-2333.
Zhang, X., Lohmann, G., Knorr, G., & Purcell, C. (2014). Abrupt glacial climate shifts
controlled by ice sheet changes. Nature.
Zhisheng, A., J. E. Kutzbach, W. L. Prell, and S. C. Porter (2001), Evolution of Asian
monsoons and phased uplift of the Himalaya-Tibetan plateau since Late Miocene times,
Nature, 411(6833), 62-66.

References
177
Zickfeld, K., Levermann, A., Morgan, M. G., Kuhlbrodt, T., Rahmstorf, S., & Keith, D.
W. (2007). Expert judgements on the response of the Atlantic meridional overturning
circulation to climate change. Climatic Change, 82(3-4), 235-265.
Ziegler, M., Simon, M. H., Hall, I. R., Barker, S., Stringer, C., & Zahn, R. (2013).
Development of Middle Stone Age innovation linked to rapid climate change. Nature
communications, 4, 1905.
Related Documents