Investigations of nanometric films of doped polyaniline by using electrochemical surface plasmon resonance and electrochemical quartz crystal microbalance Flavio Santos Damos a , Rita de Ca ´ssia Silva Luz a , Auro Atsushi Tanaka b , Lauro Tatsuo Kubota a, * a Institute of Chemistry, UNICAMP, P.O. Box 6154, 13084-971, Campinas, SP, Brazil b Department of Chemistry, UFMA, Avenida dos Portugueses s/n, 65085-040, Sa ˜o Luı ´s, MA, Brazil Received 22 June 2005; received in revised form 31 August 2005; accepted 12 January 2006 Available online 28 February 2006 Abstract In the present work, the ionic transport in copper tetrasulfonated phthalocyanine doped polyaniline (PANI/CuTsPc) film and its effects on the optical properties of the polymer is presented. The studies were performed in situ and in real time by using electrochemical surface plasmon resonance (ESPR) and electrochemical quartz crystal microbalance (EQCM). The electropolymerization was performed by potentiodynamic method and the EQCM experiments showed that the PANI/CuTsPc films behave rigidly validating the use of the Sauerbray equation. Both protonic and anionic participation in the charge compensation process were calculated and showed that the presence of the CuTsPc in the PANI film suppress the anionic transportation. Finally, the ESPR experiments showed that changes in the optical properties of the PANI/CuTsPc film were more expressive in the same potential range where the protonic transport was dominant. Ó 2006 Elsevier B.V. All rights reserved. Keywords: Aniline; Copper tetrasulfonated phthalocyanine; Electrochemical surface plasmon resonance; Electrochemical quartz crystal microbalance 1. Introduction The electrochemical, optical and structural investiga- tions of conducting polymers (CPs) upon doping/dedoping processes present a high interest to a broad field of applica- tions, including controlled drug release systems [1], battery electrodes [2], sensors [3], electrochromic displays [4], light- emitting devices [5], etc. Among these conducting poly- mers, polyaniline has acquired a special attention due to their high conductivity and its easy preparation from aque- ous solution [6]. Nowadays, the interest on development of polymers films with improved properties have attracted great atten- tion on composite materials based on conducting polymers doped with calixarenes, crown ethers, cyclodextrin, poly- oxometalates, ion exchanger function like alkyl ammo- nium, carboxylate or sulfonate, phthalocyanines and others. Among them, the metal tetrasulfonated phthalocy- anines doped conducting polymers have attracted much attention in many field of applications including electrocat- alytic systems, potentiometric devices and amperometric systems [7,8]. In addition, the anionic nature of these metal tetrasulfonated phthalocyanines can be efficiently used as a counter-anion to neutralize the polymer backbone such as these films become useful for applications in battery cath- odes, as it appears to be preferentially controlled by the transport of cations [9]. As a result, some in situ techniques, such as the optical beam deflection (OBD) [10], scanning tunneling micros- copy (STM) [11], Fourier transform infrared spectroscopy (FT-IR) [12], electron spin resonance (ESR) [13], quartz 0022-0728/$ - see front matter Ó 2006 Elsevier B.V. All rights reserved. doi:10.1016/j.jelechem.2006.01.012 * Corresponding author. Tel.: +55 19 3788 3127; fax: +55 19 3788 3023. E-mail address: [email protected] (L.T. Kubota). www.elsevier.com/locate/jelechem Journal of Electroanalytical Chemistry 589 (2006) 70–81 Journal of Electroanalytical Chemistry

Welcome message from author
This document is posted to help you gain knowledge. Please leave a comment to let me know what you think about it! Share it to your friends and learn new things together.
Transcript

Journal of
www.elsevier.com/locate/jelechem
Journal of Electroanalytical Chemistry 589 (2006) 70–81
ElectroanalyticalChemistry
Investigations of nanometric films of doped polyaniline byusing electrochemical surface plasmon resonance and
electrochemical quartz crystal microbalance
Flavio Santos Damos a, Rita de Cassia Silva Luz a, Auro Atsushi Tanaka b,Lauro Tatsuo Kubota a,*
a Institute of Chemistry, UNICAMP, P.O. Box 6154, 13084-971, Campinas, SP, Brazilb Department of Chemistry, UFMA, Avenida dos Portugueses s/n, 65085-040, Sao Luıs, MA, Brazil
Received 22 June 2005; received in revised form 31 August 2005; accepted 12 January 2006Available online 28 February 2006
Abstract
In the present work, the ionic transport in copper tetrasulfonated phthalocyanine doped polyaniline (PANI/CuTsPc) film and its effectson the optical properties of the polymer is presented. The studies were performed in situ and in real time by using electrochemical surfaceplasmon resonance (ESPR) and electrochemical quartz crystal microbalance (EQCM). The electropolymerization was performed bypotentiodynamic method and the EQCM experiments showed that the PANI/CuTsPc films behave rigidly validating the use of theSauerbray equation. Both protonic and anionic participation in the charge compensation process were calculated and showed that thepresence of the CuTsPc in the PANI film suppress the anionic transportation. Finally, the ESPR experiments showed that changes inthe optical properties of the PANI/CuTsPc film were more expressive in the same potential range where the protonic transport wasdominant.� 2006 Elsevier B.V. All rights reserved.
Keywords: Aniline; Copper tetrasulfonated phthalocyanine; Electrochemical surface plasmon resonance; Electrochemical quartz crystal microbalance
1. Introduction
The electrochemical, optical and structural investiga-tions of conducting polymers (CPs) upon doping/dedopingprocesses present a high interest to a broad field of applica-tions, including controlled drug release systems [1], batteryelectrodes [2], sensors [3], electrochromic displays [4], light-emitting devices [5], etc. Among these conducting poly-mers, polyaniline has acquired a special attention due totheir high conductivity and its easy preparation from aque-ous solution [6].
Nowadays, the interest on development of polymersfilms with improved properties have attracted great atten-tion on composite materials based on conducting polymers
0022-0728/$ - see front matter � 2006 Elsevier B.V. All rights reserved.
doi:10.1016/j.jelechem.2006.01.012
* Corresponding author. Tel.: +55 19 3788 3127; fax: +55 19 3788 3023.E-mail address: [email protected] (L.T. Kubota).
doped with calixarenes, crown ethers, cyclodextrin, poly-oxometalates, ion exchanger function like alkyl ammo-nium, carboxylate or sulfonate, phthalocyanines andothers. Among them, the metal tetrasulfonated phthalocy-anines doped conducting polymers have attracted muchattention in many field of applications including electrocat-alytic systems, potentiometric devices and amperometricsystems [7,8]. In addition, the anionic nature of these metaltetrasulfonated phthalocyanines can be efficiently used as acounter-anion to neutralize the polymer backbone such asthese films become useful for applications in battery cath-odes, as it appears to be preferentially controlled by thetransport of cations [9].
As a result, some in situ techniques, such as the opticalbeam deflection (OBD) [10], scanning tunneling micros-copy (STM) [11], Fourier transform infrared spectroscopy(FT-IR) [12], electron spin resonance (ESR) [13], quartz

F.S. Damos et al. / Journal of Electroanalytical Chemistry 589 (2006) 70–81 71
crystal microbalance (QCM) [14], and more recently sur-face plasmon resonance (SPR) [15] have been used in com-bination with electrochemistry for in situ investigation ofthe polymer formation, surface structure change, andcharge compensation process upon doping/dedoping.Among them, SPR has been shown to be a technique withhigh sensitivity in charactering ultrathin films at nanometerthickness scale [16]. SPR is a surface characterization tech-nique that takes advantage due to the enhanced evanescentfield at the surface of a thin noble metal film for probingthin dielectric film deposited on its surface. Near the reso-nance angle, an extremely strong evanescent field (EF) isgenerated at the metal/dielectric interface by the surfaceplasmon wave (SPW). On the other hand, the propertiesof EF are governed by the experimental parameters suchas dielectric constant of prisms, metal film and dielectricmedium, and the thickness of the metal film. Thus, changesof the dielectric constants and/or thickness of the dielectricmedium at the vicinity of the metal surface shift the reso-nance position of the SPR angle (hSPR) [17].
The SPR technique has been applied in the investigationof electrochemical processes at surfaces since this techniquepresents high sensitivity for in situ and real time character-ization of the solid/liquid interface. As the electrochemicalreactions are inherent surface processes, the SPR techniquehas been employed in the studies of adsorption on an elec-trode surface [18], electrochemical films deposition [19],charge transfer reactions [20], electrochemical induced mol-ecules orientation [21], etc.
Thus, considering the ESPR application in a systemcomposed by three-boundary, i.e., a metal (thickness d2,dielectric constant e2 = e2r + ie2i), which is coated with athin layer on one surface (d3, e3 = e3r + ie3i) and embeddedinto two lossless halfspaces characterized by the dielectricconstants e1 (prism) and e4 (solution), the modulation inthe electrode potential (DE) induces changes in the realand imaginary parts of the dielectric constant (De3r, andDe3i), average thickness of the adsorbed layer (Dd3) andsurface charge density (Dr) as follow [22]:
ðDhSPR=DEÞ � c1ðDe3r=DEÞ þ c2ðDe3i=DEÞþ c3ðDd=DEÞ þ c4ðDr=DEÞ ð1Þ
where c1, c2, c3 and c4 are constants.The first and second terms in the above equation
describes changes in the electronic states of the adsorbedmolecules upon electrode potential changing. The thirdterm describes the change of the average thickness of theadsorbed layer and the fourth is associated with the effectsof the electron density on the surface plasmon resonanceangle.
As a result, the combined use of the SPR technique withelectrochemical approaches have been applied in a varietyof studies, including investigations of changes in the elec-tronic states of the molecules adsorbed on electrode sur-faces [22], monitoring the first and second terms at theright hand of Eq. (1), changes in film thickness [23] upon
modulation of the electrode potential monitoring the thirdterm, and changes in the surface charge [24] monitoring thefourth term.
In this paper, some these abilities of the ESPR techniqueare used in order to investigate the influence of the incorpo-ration of copper tetrasulfonated phthalocyanine upon theredox process in polyaniline electropolymerized films aswell as its effects on the optical properties of these thinfilms. In this sense, the quartz crystal microbalance(QCM) was employed to promote a better correlationbetween the changes of the optical properties of these filmsand the doping/dedoping processes.
2. Experimental
2.1. Reagents and materials
All used chemicals were analytical grade. Aniline (98%)from Aldrich (Milwaukee, USA) was distilled prior to use.The aniline aqueous solution was stored in a dark flask atlow temperature. Sulfuric acid (H2SO4) from Synth (SaoPaulo, Brazil), hydrogen peroxide (H2O2) acquired fromMerck (Darmstadt, Germany) and copper tetrasulfonatedphthalocyanine tetrasodium salt (CuTsPc) from Aldrich(Milwaukee, USA) were used as received. All solutionswere prepared with water purified in a Milli Q systemand the actual pH of the solutions was determined with aCorning pH/ion analyser 350 model.
A gold sensor disk composed of a gold sensing surface(thickness of 50 nm) deposited onto a glass microscopeslide using a titanium adhesion layer (thickness of1.5 nm) was acquired from Xantec Bioanalytics (Muenster,Germany). The sensor disk was optically attached to theprism using an index-matching fluid nd(25�C) = 1.518,Cargille Laboratories (Cedar Grove, NJ, USA). The quartzcrystals, AT-cut with a fundamental frequency of 5 MHzsandwiched between gold electrodes, were acquired fromMaxtek, Inc., CA, USA.
2.2. Electrochemical surface plasmon resonance
measurements
An ESPRIT instrument (Echo Chemie B.V., Ultrech,The Netherlands) was used to perform the optical mea-surements of the SPR angle and cyclic voltammetry wascarried out with a potentiostat (lAUTOLAB) from EchoChemie (Utrecht, Netherlands). The ESPRIT instrumentis based on the Kretschmann configuration [25] with ascanning-angle setup. In this system, the intensity ofreflected light is minimum in the resonance angle. Thisangle can be measured over a range of 4� in this equip-ment by using a photodiode detector. The incidence anglewas varied by using a vibrating mirror (rotating over aangle of 5� at 77 Hz in 13 ms), which directs p-polarizedlaser light onto a 1 mm · 2 mm spot of the sensor diskvia the hemicylindrical prism of BK7 glass. In each cycle,the reflective curves were scanned on both forward and

72 F.S. Damos et al. / Journal of Electroanalytical Chemistry 589 (2006) 70–81
backward movements of the mirror. In this vibrating mir-ror set-up, the resolution was 1 m�. The light source(LASER) of the system is composed of the laser diodewith emission wavelength of 670 nm. In the experiments,a gold sensor disk containing a hemicylinder was mountedinto a precleaned SPR cuvette. In order to obtain highinertless, it was made of Teflon�. The solutions wereinjected into the cuvette using a syringe with a stainlesssteel needle (Fig. 1). In order to avoid contamination ongold surface between the polymerization experimentswas adopted the procedure previously reported [16]. Thedetermination of the optical parameters of the polymerfilm was done by using the fresnel equation for a four-layer system as recently described [16].
2.3. Electrochemical quartz crystal microbalance
measurements
After film formation, the electrodes were placed in aconventional one-compartment cell containing 0.1 mol L�1
H2SO4 aqueous solution. A platinum wire was used ascounter electrode and all potential are referred to Ag|AgClreference electrode. Working electrodes were 5 MHz over-
Fig. 1. Schematic diagram of the surface plasmon resonance spectroscopy usisystem is composed of the laser diode with the emission wavelength of 670 nm.scan of 4000 millidegrees (m�) in approximately 13 ms. A photodiode was usecomponents of the wavevector of the incident light. The prism material was B
tone polished at-cut quartz crystals of 1.37 cm2 area (Max-tek, Inc., CA, USA). Both sides of the quartz crystals werecoated with thin gold films over a titanium adhesion layer,but only one of the faces (working electrode) was exposedto the electrolyte solution. A Maxtek Plating Monitor(Model PM-710, Maxtek, USA), interfaced with a personalcomputed was used in the EQCM measurements. It drivesthe quartz crystal at its resonance frequency while servingto display and record the value of the frequency. Experi-ments were performed by fully immersing the crystal intothe solution. Potentiodynamic, potentiostatic and galvano-static measurements were carried out with a potentiostat(PGSTAT 12) from Echo Chemie.
Before and after using, the quartz wafer was immersedinto the freshly prepared Piranha solution (H2SO4:H2O2,3:1) for 5 min. The crystal was then washed thoroughlywith copious amounts of water purified in a Milli-Q Milli-pore system.
2.4. Preparation of PANI/CuTsPc and PANI films
After mounting the sensor disk in the cell, 100 lL ofdeoxygenated 0.1 mol L�1 aqueous sulfuric acid solution
ng the Kretschmann configuration. The light source (LASER) of the SPRA scanning mirror with a frequency of 76 Hz was used to obtain an angle
d as a detector. h represents the angle of incident light, kx and kz are theK7.

-0.2 0.0 0.2 0.4 0.6 0.8 1.0
-1600
-1200
-800
-400
0
400
a
θ SP
R /
mde
gree
E / (V vs. Ag/AgCl)
10
5
1
-0.2
0.0
0.2
0.4
0.6
0.8
b
j / m
A c
m-2
E / (V vs. Ag/AgCl)
-2000 0 2000
10
20
30
40
50
c
10th, at anodic limit10 th1stAu
Ref
lect
ivity
θ / mdegree
-0.2 0.0 0.2 0.4 0.6 0.8 1.0
Fig. 2. (a) The increase in SPR angle simultaneously recorded to the CVsduring the polymer growth. (b) Cyclic voltammograms (CVs) recordedduring potentiodynamic growth of the PAN/CuTsPc film in a solutioncontaining 0.0125 mol L�1 of aniline, 0.010 mol L�1 of CuTsPc and0.1 mol L�1 H2SO4 at a scan rate of 0.02 V s�1. (c) Reflectivity curvesmeasured at the cathodic limits after each potential cycle. Note that theshowed least (at the right hand) reflectivity curve was updated at theanodic scan. The SPR angle data have 5% of uncertainty.
F.S. Damos et al. / Journal of Electroanalytical Chemistry 589 (2006) 70–81 73
containing 0.0125 mol L�1 aniline was added to the cell orthis solution containing plus 1 mmol L�1 of CuTsPc forconstruction of PANI and PANI/CuTsPc, respectively.The electrochemical synthesis of polyaniline and dopedpolyaniline were performed potentiodynamically in thepotential range of �0.1 and 0.9 V at a scan rate of20 mV/s.
3. Results and discussion
3.1. Electropolymerization of PANI/CuTsPc
Fig. 2a–c shows the SPR angle (top), current density(middle), and the reflectivity curves (bottom) recorded dur-ing the potentiodynamic growth of the PANI/CuTsPc filmon the gold surface. The electropolymerization was carriedout by potential cycling between �0.1 and 0.9 V vs.Ag|AgCl at 0.02 V s�1 and the electrolytic solution consist-ing of 0.0125 mol L�1 aniline and 0.001 mol L�1 CuTsPc in0.1 mol L�1H2SO4. As can be observed, the SPR angleposition shifted toward more positive values during thevoltammetric experiments. The cyclic voltammograms(CVs) obtained during the electropolymerization are shownin Fig. 2b up to tenth cycle. The first and the last cyclic vol-tammograms for the electropolymerization showed distinctbehavior due to the effects of the polymer growth as well asthe doping/dedoping processes, as posteriorly discussed.
The reflectivity curves taken at the anodic limit of eachcycle of potential scan showed a typical broadening foreffects of doping processes [26,27]. Here, a point whichshould be emphasized is the possible interfering effect ofthe applied potential on the profile of the SPR reflectivitycurves due to the changes of the electron density at the goldsurface. In order to exclude this effects, the reflectivitycurves were taken at cathodic (�100 mV) and anodic limitpotential (+900 mV) for bare gold electrode in supportingelectrolyte solution and showed to be similar in terms ofdepth of the minimum resonance, half-width and SPRangle position. In addition, the changes of the reflectivitycurves for the bare electrode were much smaller than thechanges of the reflectivity curves taken for PANI/CuTsPcmodified gold surface. Therefore, the effects of the appliedpotential on the charge electron density at the gold surfacewere considered to be insignificant when compared to thoseobserved for conducting polymer film, such as consideredby Kang et al. [15,26].
As is well known, the change in the shape of the SPRcurve is mainly determined by the variation in the imagi-nary part of the dielectric constant of the film, i.e., theirextinction coefficient (k), which is a measurement of thelight absorption in a medium or due to the surface rough-ness effects [28]. The light scattering at the polymer/electro-lyte interface due to the presence of surface inhomogenities(such as roughness) is well known to promote shift of theSPR angle position as well as increase the half-width ofthe reflectivity curves. However, the effects of the rough-ness on the shift of the SPR angle and changes in the profile
of the reflectivity curves were not significant, since a singlemodel for non-rough surface fitted well the experimentalcurves [29,30]. Thus, the shift of the surface plasmon reso-nance angle (hSPR) toward higher angle with increasing
60 64 68 72 760.0
0.1
0.2
0.3
0.4
0.5
0.6
0.7
0.8 a
Ref
lect
ivity
θ / mdegree
ε3r = 0ε3r = 0.45ε3r = 0.90ε3r = 1.35ε3r = 1.75
60 65 70 75 800.0
0.1
0.2
0.3
0.4
0.5
0.6
0.7
0.8
θ / mdegree
Ref
lect
ivity
b
d3 = 0 nm d3 = 50 nm d3 = 100 nm d3 = 150 nm d3 = 200 nm
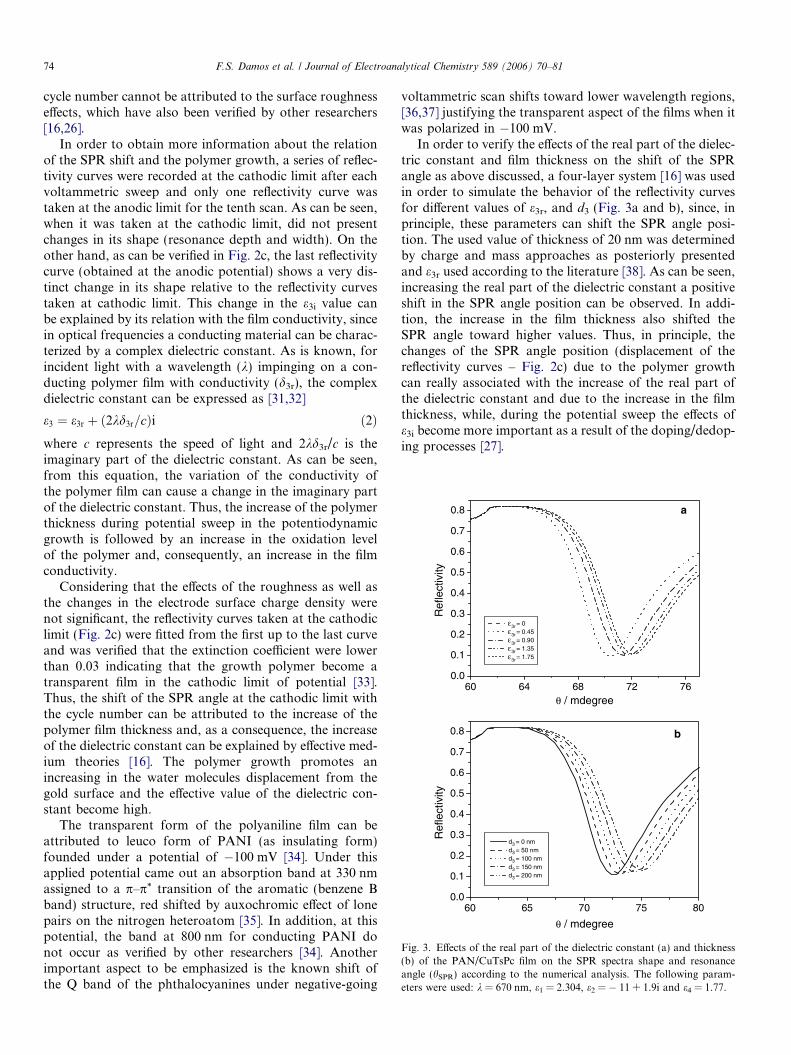
Fig. 3. Effects of the real part of the dielectric constant (a) and thickness(b) of the PAN/CuTsPc film on the SPR spectra shape and resonanceangle (hSPR) according to the numerical analysis. The following param-eters were used: k = 670 nm, e1 = 2.304, e2 = � 11 + 1.9i and e4 = 1.77.
74 F.S. Damos et al. / Journal of Electroanalytical Chemistry 589 (2006) 70–81
cycle number cannot be attributed to the surface roughnesseffects, which have also been verified by other researchers[16,26].
In order to obtain more information about the relationof the SPR shift and the polymer growth, a series of reflec-tivity curves were recorded at the cathodic limit after eachvoltammetric sweep and only one reflectivity curve wastaken at the anodic limit for the tenth scan. As can be seen,when it was taken at the cathodic limit, did not presentchanges in its shape (resonance depth and width). On theother hand, as can be verified in Fig. 2c, the last reflectivitycurve (obtained at the anodic potential) shows a very dis-tinct change in its shape relative to the reflectivity curvestaken at cathodic limit. This change in the e3i value canbe explained by its relation with the film conductivity, sincein optical frequencies a conducting material can be charac-terized by a complex dielectric constant. As is known, forincident light with a wavelength (k) impinging on a con-ducting polymer film with conductivity (d3r), the complexdielectric constant can be expressed as [31,32]
e3 ¼ e3r þ ð2kd3r=cÞi ð2Þwhere c represents the speed of light and 2kd3r/c is theimaginary part of the dielectric constant. As can be seen,from this equation, the variation of the conductivity ofthe polymer film can cause a change in the imaginary partof the dielectric constant. Thus, the increase of the polymerthickness during potential sweep in the potentiodynamicgrowth is followed by an increase in the oxidation levelof the polymer and, consequently, an increase in the filmconductivity.
Considering that the effects of the roughness as well asthe changes in the electrode surface charge density werenot significant, the reflectivity curves taken at the cathodiclimit (Fig. 2c) were fitted from the first up to the last curveand was verified that the extinction coefficient were lowerthan 0.03 indicating that the growth polymer become atransparent film in the cathodic limit of potential [33].Thus, the shift of the SPR angle at the cathodic limit withthe cycle number can be attributed to the increase of thepolymer film thickness and, as a consequence, the increaseof the dielectric constant can be explained by effective med-ium theories [16]. The polymer growth promotes anincreasing in the water molecules displacement from thegold surface and the effective value of the dielectric con-stant become high.
The transparent form of the polyaniline film can beattributed to leuco form of PANI (as insulating form)founded under a potential of �100 mV [34]. Under thisapplied potential came out an absorption band at 330 nmassigned to a p–p* transition of the aromatic (benzene Bband) structure, red shifted by auxochromic effect of lonepairs on the nitrogen heteroatom [35]. In addition, at thispotential, the band at 800 nm for conducting PANI donot occur as verified by other researchers [34]. Anotherimportant aspect to be emphasized is the known shift ofthe Q band of the phthalocyanines under negative-going
voltammetric scan shifts toward lower wavelength regions,[36,37] justifying the transparent aspect of the films when itwas polarized in �100 mV.
In order to verify the effects of the real part of the dielec-tric constant and film thickness on the shift of the SPRangle as above discussed, a four-layer system [16] was usedin order to simulate the behavior of the reflectivity curvesfor different values of e3r, and d3 (Fig. 3a and b), since, inprinciple, these parameters can shift the SPR angle posi-tion. The used value of thickness of 20 nm was determinedby charge and mass approaches as posteriorly presentedand e3r used according to the literature [38]. As can be seen,increasing the real part of the dielectric constant a positiveshift in the SPR angle position can be observed. In addi-tion, the increase in the film thickness also shifted theSPR angle toward higher values. Thus, in principle, thechanges of the SPR angle position (displacement of thereflectivity curves – Fig. 2c) due to the polymer growthcan really associated with the increase of the real part ofthe dielectric constant and due to the increase in the filmthickness, while, during the potential sweep the effects ofe3i become more important as a result of the doping/dedop-ing processes [27].

-0.2 0.0 0.2 0.4 0.6 0.8 1.00.0
0.6
1.3
1.9
2.5
3.1
3.8
4.4
5.0
a
10
5
1
m /
μg c
m-2
E / (V vs. Ag/AgCl)
-0.2 0.0 0.2 0.4 0.6 0.8 1.0
0
4
8
12
16
20
b
10
5
1
E / (V vs. Ag/AgCl)
q / m
C
0 14 18
0.0
0.7
1.5
2.2
2.9
3.7
4.4
c
q / mC cm-2
E = -0.1V (vs.Ag/AgCl)
m /
μg c
m-2
5 9
Fig. 4. (a) Mass/potential and (b) charge/potential curves recorded duringthe potentiodynamic growth of the PAN/CuTsPc film in a solutioncontaining 0.0125 mol L�1 of aniline, 0.010 mol L�1 of CuTsPc and0.1 mol L�1 H2SO4 at a scan rate of 0.02 V s�1. (c) Representation of themass change as a potential function obtained during the potentiodynamicpolymerization of the PAN/CuTsPc. Data calculated from the curves (a)and (b).
F.S. Damos et al. / Journal of Electroanalytical Chemistry 589 (2006) 70–81 75
Therefore, in the first potential scan, the shift of the SPRangle should only be related with the film growth and forfurther cycles the increase in the SPR angle is also relatedto the changes in the imaginary and real parts of the dielec-tric constant which occur due to the doping/dedoping pro-cesses in the polymer film, simultaneously to the polymergrowth. The shift of the SPR angle with the polymer thick-ness due to the polymer growth can be interpreted by con-sidering this system as an heterogeneous dielectric mixtureand, therefore, modeled using a simple effective mediumtheories [39]. Thus, considering the higher value of thedielectric constant of the polymer film than that of thewater molecules at the interface electrode solution, thevalue of the effective dielectric constant should increaseduring the film growth and, therefore, the SPR angle.
In order to obtain more information about the PANI/CuTsPc film formation, it was deposited on a quartz crystalin the same potential range and the same used conditions inthe previous ESPR experiments (Fig. 4). As can be seen,the mass begin to increase at the same region of the largecurrent seen at the end of the positive scan (Figs. 2b and4a) due to the monomer oxidation and subsequently thepolymerization [40]. In order to apply the Sauerbrey equa-tion [41] to the deposition of polyaniline, it was verified ifthe polymer behaves as a rigid layer. It was done plottingthe mass change (m) upon deposition of the film measuredat the cathodic limit vs. the charge consumed in the elec-tropolymerization from �0.1 up to +0.9 V (vs. Ag|AgCl).Assuming that ‘‘m’’ is the mass of deposited polyanilineand the charge measures the total amount of depositedfilm, then this plot should give a straight line with a zerointercept (Fig. 4c) as expected by the Sauerbray equation.Linearity indicated that the mass obtained from the crystalfrequency change is only related with the polymer growthand does not with the viscoelastic properties of thePANI/CuTsPc film as well as roughness contribution[42,43].
Thus, these mass (m) and charge (q) changes during thepolymer growth were considered on the polymer thicknesscontrol and the film thickness was estimated by using theelectrodeposition charge, and the mass of the depositedpolymer were used. The film thickness from electropoly-merization charge was determined according Li [44] andPei [45] by using the following expression: Thick-ness(nm) = q(MAn + cMCounterion)/(2 + c)Fd where, q(Ccm�2) is the polymerization charge density, MAn the molec-ular weight of aniline monomer, c represents the dopingdegree for polyaniline films and MCounterions is the molecu-lar weight of the counterions (CuTsPc), F is the Faraday’sconstant and d represents the PANI density being obtaineda film thickness of 20 nm where the value of the doping wascalculated according with Syritski et al. [46]. In order tocorroborate this value of the film thickness obtained fromthe polymerization charge, the polymer mass depositedon the quartz crystal was also used considering the typicalvalue of the polyaniline film density, which has beenfounded to be 1.5 g cm�2 [44]. As a result, the values of film
thickness founded from charge and mass approaches were20 and 19 nm, respectively. With this mean value of filmthickness obtained from both approaches can expected thata shift of 80 m� should corresponds to a PANI/CuTsPclayer thickness of 1 nm. Considering that the SPR angleand the mass shift obtained at the cathodic limit are relatedwith the film growth a plot of mass change against the SPR

b
c
m /
μg c
m-2
0.5 μg cm-2
1 μg cm-2
0.5 μg cm-2
-0.2 0.0 0.2 0.4 0.6 0.8 1.0
E / (V vs. Ag/AgCL)
200 mdegree
200 mdegree
200 mdegree
θ SP
R / m
degr
ee
a
peak 2peak 10.2 μA cm-2
j / m
A c
m-2
Fig. 5. (a) Cyclic voltammograms (CVs) (b) mass change, and (c) SPRangle curves, recorded during potentiodynamic growth of the PAN/CuTsPc film in a solution containing 0.0125 mol L�1 of aniline,0.010 mol L�1 of CuTsPc and 0.1 mol L�1 H2SO4 at a scan rate of0.02 V s�1. The SPR angle data have 5% of uncertainty.
76 F.S. Damos et al. / Journal of Electroanalytical Chemistry 589 (2006) 70–81
angle at the cathodic limit potential was obtained and indi-cate that the density of the polymer film was constant andindependent of the film thickness (data do not shown) sug-gesting that did not occur morphological changes duringthe growth of this ultrathin films.
In order to obtain a better description of the PANI/CuTsPc film growth, the EQCM and ESPR experimentswere compared for first, fifth and tenth cycles. For the firstcycle, the mass and SPR angle (Fig. 5, full line) increasecorrespond to the start of the PANI/CuTsPc film forma-tion due to the aniline oxidation as seen in the cyclic vol-tammogram (Fig. 5a). This behavior was observedbeyond 0.75 up to 0.9 V as an indicative of the monomeroxidation to form polyaniline [47].
At this potential range, the growing of PANI/CuTsPcfilm promoted an increase in the SPR angle position, sincethe conducting polymers have a higher dielectric constantthan its monomers [48]. In similar way, the mass also pre-sented a pronounced increase from the same applied poten-tial (E = + 0.75 V vs. Ag|AgCl) up to the anodic limit,indicating the polymer growth, since the system behavesas a rigid film as discussed above. As can be seen, in thisfirst potential cycle, the mass and the SPR angle starts toincrease beyond the peak 2 and therefore depends on thedoping/dedoping processes.
For the cathodic scan in the first cycle, the mass (Fig. 5b,full line) continued to increase up to 0.3 V and then,showed a slightly decrease up to the cathodic limit. Themass increase at the cathodic scan (from 0.9 up to 0.3 V)can be associated to the film growing [40,49], since thepotential is still sufficiently high to promote the film growthdue to the existence of oligomers in the solution after theanodic scan which are easier to be oxidized than the mono-mer. On the other hand, the SPR angle continued toincrease only up to 0.75 V in the cathodic scan of the firstcycle (Fig. 5c, full line) and then decreasing until 0.3 V sug-gesting that the region from 0.75 up to 0.3 V at the catho-dic scan the doping/dedoping processes should happenduring the polymer growth.
The decrease of the SPR angle at this potential rangecould also be attributed to a change in the real part ofthe dielectric constant or a change in the film thickness dur-ing the polymer reduction occurring, simultaneously, todoping/dedoping processes [50,51]. As is well known, theionic transport (doping/dedoping processes) in PANI filmsshould promote a structural change of the polymer result-ing in three different polymer forms with different opticalproperties. These are a leuco form absorbing at 330 nm(leucoemeraldine), a radical cation (emeraldine) at 635and a quinoid form absorbing at 540 nm (pernigraniline)[52]. The changes in the conducting polymer form areknown to be accompanied the ionic doping and dedopingof these films. In the anodic scan, the polymer become halfoxidized (emeraldine form) since were not used large over-potentials such as the broad absorption band at 635 nmbecome larger. As a result, the polymer can absorb lightfrom the laser (k = 670 nm) justifying the changes in the
SPR angle in the potential range of the voltammetricpeaks.
As can be verified for the fifth and tenth cycles of poten-tial the mass change was verified to be expressive when thepotential passes by the CV peak 1, which can be attributedto the doping processes by CuTsPc. Thus, the massincrease can be divided into two regions, one from about0.1 up to about 0.55 V associated with the anion uptake

-0.2 0.0 0.2 0.4 0.6 0.8-100
0100200300400500600700
E / (V vs. Ag/AgCl)
c
0.5
0.6
0.7
0.8
0.9
1.0
1.1
b
-0.15-0.11-0.07-0.040.000.040.070.110.15
θ SP
R /
mde
gree
Δm
/μg
cm
-2j /
mA
cm
-2
a
Fig. 6. (a) Cyclic voltammograms (CVs), (b) mass change, and (c) SPRangle curves for a PAN/CuTsPc film in a aqueous solution containing0.1 mol L�1 H2SO4 at a scan rate of 0.02 V s�1. The SPR angle data have5% of uncertainty.
F.S. Damos et al. / Journal of Electroanalytical Chemistry 589 (2006) 70–81 77
and the other from 0.55 up to 0.9 V with the polymergrowth. Moreover, the mass increase in the anodic andcathodic scan for the fifth cycle were more accentuatedthan that observed in the first cycle as a result of the moresignificant effect of the doping processes, since the polymerfilm being more thicker [53]. The SPR angle also increasesin the anodic scan of the fifth cycle and can also be verifiedtwo regions, one attributed to the ionic uptake/release andthe other for the film thickness growing.
In the anodic scan of the tenth cycle (Fig. 5, dotted line),the SPR angle and the mass change presented a greaterslope (from about 0.2 up to 0.5 V) compared with thoseof the first and fifth cycles indicating the more expressiveeffects of the doping/dedoping processes on the opticalproperties of the PANI/CuTsPc film. Thus, the polymerwas investigated in a monomer free solution to obtaininformation about the anionic and protonic uptake/releaseduring the redox processes and were compared to thoseobtained for PANI films. It is, therefore, thought that thechanges of the mass and SPR angle curves in the tworelated regions should correspond to: (1) polymer dopingprocess and (2) oxidation of the monomer and, subse-quently, polymer growth.
3.2. Doping/dedoping properties of ultrathin PANI/CuTsPc
and PANI films
After polymerizing PANI/CuTsPc and PANI, the effectsof the charge compensation processes and its effect on theoptical properties of these films were investigated. Figs. 6and 7 shows the current (a), mass (b) and SPR angle curves(c) for a PANI/CuTsPc and PANI modified electrode,respectively. These data are for steady state scan, i.e., vol-tammetric shape was invariant with respect to the cyclenumber. As can be seen, the mass decrease monotonicallyin the positive scan and increase in the negative scan forPANI/CuTsPc modified electrode (Fig. 6b). On the otherhand, the PANI film acquired mass at the anodic scanand lost mass at the cathodic scan (Fig. 7b). This abruptchange in the behavior of the PANI/CuTsPc in comparisonto the PANI film can be explained by the effects of theCuTsPc dopant in the films. The protonic transport isdominant over the whole scan range for PANI/CuTsPcfilms and the anionic transport is dominant for PANIfilms. As a result, the phthalocyanine doped PANI filmlosses mass in the anodic scan and the PANI film acquiresmass. As a whole, these behavior can be compared withprevious information about the polyaniline films, wherethe initial oxidation process (Fig. 6a, peak 1) is followedby simultaneous proton expulsion and anion insertion,indicating the partial protonation of the polymer (aminenitrogen). Posteriorly, a second peak (Fig. 6a, peak 2) isknowing to lead only to the deprotonation of nearly allof the nitrogen at the polymer backbone [49]. Therefore,the CuTsPc doped PANI film improve the ability of thepolyaniline film to the protonic exchange and suppressthe anionic exchange.
In similarity to the EQCM experiments, the SPR anglewas also dependent of the redox processes for bothCuTsPc/PANI and PANI polymer films. As above dis-cussed, this change in the SPR angle can be attributed tothe changes in the dielectric constant of the polymer filmsdue to changes in the polymer form (leucoemeraldine toemeraldine), which results in changes of the light absorp-tion nature of the film. As can be seen, the increase inthe SPR angle in depends on the kind of ionic process.Thus, in order to obtain a more detailed information aboution flux in these films, the ionic transport in these conduct-ing polymers/copper tetrasulfonated phthalocyanine wereinvestigated.
3.3. Redox processes in PANI/CuTsPc and PANI modified
electrodes
In order to obtain a more detailed information aboution flux in these films a correlation between the masschange provided by the quartz crystal frequency changeand the corresponding charge passed through the corre-sponding cyclic voltammograms were taken. It allowedfinding an apparent molar mass of species involved in theredox reaction under the potential cycling. The plots ofmEQCM vs. qCV during the redox reaction of a PANI/

-0.2 0.0 0.2 0.4 0.6 0.8
-300
-200
-100
0
100
200
300
c
Δm /
μg c
m-2
j / m
A c
m-2
θ SP
R /
mde
gree
0.0
0.2
0.4
0.6
0.8
b
-0.07
-0.04
0.00
0.04
0.07
0.11
a
E / (V vs. Ag/AgCl)
Fig. 7. (a) Cyclic voltammograms (CVs), (b) mass change, and (c) SPRangle curves for a PAN film in an aqueous solution containing 0.1 mol L�1
H2SO4 at a scan rate of 0.02 V s�1. The SPR angle data have 5% ofuncertainty.
-0.5 0.0 0.5 1.0 1.5 2.0 2.5 3.00.3
0.4
0.5
0.6
0.7
0.8
0.9
1.0
1.1
a
m /
μg c
m-2
q / mC cm-2
0.0 0.5 1.0 1.5 2.0 2.5-0.2
0.0
0.2
0.4
0.6
0.8
1.0
1.2
b
m /
μg c
m-2
q / mC cm-2
Fig. 8. Mass change as a function of charge density for a (a) PAN/CuTsPcand (b) PAN films in an aqueous solution containing 0.1 mol L�1 H2SO4.Data calculated from the potentiodynamic profile as shown in Figs. 6 and7.
78 F.S. Damos et al. / Journal of Electroanalytical Chemistry 589 (2006) 70–81
CuTsPc and a PANI film (electropolymerized under thesame condition of PANI/CuTsPc) are shown in Fig. 8a,b.From the slope of these plots, the apparent molar mass(Mapp) of charge compensating species were calculateaccording to a modified Faraday law [47]:
Mapp ¼ �zF ðmEQCM=qCVÞ ð3Þwhere F represents the Faraday constant and z is the elec-tric charge of the compensating species.
The apparent molar mass obtained for the PANI andPANI/CuTsPc were 94 and �25 gmol�1, respectively, con-sidering that the PANI films present only protonicexchange and that the PANI/CuTsPc only shows anionicexchange. The negative sign ‘‘�’’ can represents the posi-tive charge expelling from the film. As can be seen, theMapp obtained for the PANI/CuTsPc was higher than thatexpected for protonic transport. On the other hand, theMapp for PANI film was lower than that expected for pureHSO�4 and/or SO2�
4 in agreement to Lee et al. [47]. Threeexplanations are possible for the difference between Mapp
and the expected real value of the molar mass: (1) the neu-
tral salt transport, (2) solvent transport and/or simulta-neously (3) protonic and anionic transport.
In order to provide a better understanding of the ionictransport in the PANI/CuTsPc and PANI films, plots ofnumber of moles of protons ðgþCÞ and anions ðg�AÞexchanged in these redox processes were obtained as fol-lowing [46]:
gHþ ¼Dm
ðMHA þ bMSÞ� qMA�
F ðMHA þ bMSÞð4Þ
gA� ¼Dm
ðMHA þ bMSÞ� qðMHþ þ bMSÞ
F ðMHA þ bMSÞð5Þ
where, MHA;MA� ;MHþ and MS are molar mass of the elec-trolyte, anion, proton and solvent; gþH and g�A are numberof moles for these cations and anions involved in these re-dox processes; b is the hydration number of the protonswhich was calculated according to the literature [46].
Fig. 9a,b shows the values of gþH and g�A as a potentialfunction for the PANI/CuTsPc and PANI films. As canbe seen, the protonic ejection predominated over the anio-nic exchange for the investigated potential range for PANI/CuTsPc film. Thus, the main characteristic of the PANI/

-0.2 0.0 0.2 0.4 0.6 0.8-35.0
-30.0
-25.0
-20.0
-15.0
-10.0
-5.0
0.0
5.0
a
Mol
ar c
once
ntra
tion
/ nm
olcm
-2
E / (V vs. Ag/AgCl)
-12
-8
-4
0
4
8
12
bMol
ar c
once
ntra
tion
/ nm
olcm
-2
E / (V vs. Ag/AgCl)
-0.2 0.0 0.2 0.4 0.6 0.8
Fig. 9. Moles of protonic (full line) and anionic (dashed line) speciesexchanged as a function of the potential for an aqueous solutioncontaining 0.1 mol L�1 H2SO4: (a) PAN/CuTsPc and (b) PAN films.Data calculated from potentiodynamic profiles as shown in Figs. 6 and 7.
-0.2 0.0 0.2 0.4 0.6 0.8-2.50
-2.00
-1.50
-1.00
-0.50
0.00
0.50
1.00
1.50
2.00
E / (V vs Ag/AgCl)
Mol
ar fl
ux /
nmol
cm
-2s-1
-0.15
-0.11
-0.07
-0.04
0.00
0.04
0.07
0.11
0.15
a
j / mA
cm-2
-0.2 0.0 0.2 0.4 0.6 0.8-1.5
-1.0
-0.5
0.0
0.5
1.0
1.5
E / (V vs. Ag/AgCl)
-0.07
-0.04
-0.02
0.00
0.02
0.04
0.07
0.09
Mol
ar fl
ux /
nmol
cm
-2s-1
b
j / mA
cm-2
Fig. 10. Current (full line), protonic (dashed line) and anionic (dotted line)fluxes as a function of the potential for an aqueous solution containing0.1 mol L�1 H2SO4: (a) PAN/CuTsPc and (b) PAN films. Data calculatesfrom potentiodynamic profiles as shown in Figs. 7 and 8.
F.S. Damos et al. / Journal of Electroanalytical Chemistry 589 (2006) 70–81 79
CuTsPc films is the increase of the protonic transport dur-ing the redox processes when compared with undopedpolyaniline with CuTsPc. On the other hand, as expected[54–56], the PANI films presented both, protonic and anio-nic exchanges during the redox processes.
Although the high coherency between the modelemployed to obtain the values of the number of molesexchanged for PANI and PANI/CuTsPc and the expectedeffects of the anionic dopant, the relevance of these pro-cesses on the redox exchanges is not apparently simple.Thus, the molar fluxes of proton and anions together withthe solvent contribution were taken rearranging and differ-entiating Eqs. (4) and (5) [57,58]. The ionic molar fluxesconsidering the solvent contributions (Fig. 10) wereemployed the following equations [56]:
dðgHþ þ MS
a gSÞdt
¼ 1
adðmÞ
dt
� �� MA�
azA�Fj ð6Þ
dðgA� þzHþMS
zA� a gSÞdt
¼ zHþ
zA�adðmÞ
dt
� �þ 1
zA�F1� zHþMA�
azA�
� �j
ð7Þ
where a ¼ ðz�AMþH þ zþHM�
AÞ=z�A; zþH is the proton charge,
z�AM represents the anion charge and gs is the number ofmoles of solvent molecules involved in these redoxprocesses.
As can be seen, the protonic transport predominatedover all potential range investigated for PANI/CuTsPcmodified electrode and the proton/water molar fluxes weresimilar to the electronic flux (current density). In addition,the protonic and electronic fluxes presented different sign,since both processes are complementary and make partof the whole charge compensation process. On the otherhand, Fig. 10b shows two distinct regions of charge com-pensating, one controlled by the anionic fluxes and theother by the protonic ones.
When compared with the SPR curves the ionic fluxespresented a distinct behavior, since the protonic fluxeswas verified over all investigated potential range and theSPR angle presented a significant change only in the regionof the peak 2. In order to compare the changes in the SPRangle with the electrical processes in this doped polymerfilm, the SPR angle curves obtained for monomer-freesolution (Fig. 6c) was derived and compared with the cyclicvoltammogram obtained simultaneously to the SPR mea-

-0.2 0.0 0.2 0.4 0.6 0.8
-0.20
-0.15
-0.10
-0.05
0.00
0.05
0.10
0.15
0.20
E / (V vs. Ag/AgCl)
j / m
A c
m-2
-80
-60
-40
-20
0
20
40
60
dθS
PR dt -1 / m
degree s-1
Fig. 11. Current (dashed line) and derivative SPR angle (full line) curvesas a function of the potential for an aqueous solution containing0.1 mol L�1 H2SO4. The SPR angle data have 5% of uncertainty.
80 F.S. Damos et al. / Journal of Electroanalytical Chemistry 589 (2006) 70–81
surement (Fig. 11). As can be seen, the first derivative in theSPR angle curves presented two regions, namely onebetween the cathodic limit up to +0.3 V and the other from0.3 V up to the anodic limit, corresponding to the region ofthe peaks 1 and 2, respectively. A explanation for this cor-respondence between the changes of the SPR angle and thecurrent can be supported on the insulator–conductor tran-sition of the polymer, which occur at the potential range ofthe peak 2 [59]. As a result, this transition leds to polymerformation in a high conducting state. Consequently, thistransition promote a significant change in the imaginarypart of the dielectric constant resulting in a pronounciatedchange in the SPR angle which is in accordance to the pre-vious discussion.
4. Conclusion
These results, show that the ultrathin PANI/CuTsPcfilm electrochemically obtained behaves as a rigid layersince the crystal frequency change is only related withthe polymer growth and does not with the viscoelasticproperties of the PANI/CuTsPc film as well as roughnesscontribution. The SPR measurements also indicated thatthe film does not suffer effects of the surface roughnesssince the use of fitting models for rough surfaces werenot necessaries. The use of the EQCM showed that theprotonic transport is dominant over the whole scan rangefor PANI/CuTsPc films and the anionic transport is dom-inant for PANI films. Thus, the main characteristic of thePANI/CuTsPc films is the increase of the protonic trans-port during the redox processes when compared withundoped polyaniline with CuTsPc. Finally, the compari-son of the first derivative in the SPR angle curves withthe protonic fluxes and the changes of the current densityshows that the SPR technique was sensitive to insulator–conductor transition of the polymer, which occur at thepotential range of the peak 2.
Acknowledgements
The authors are grateful for financial support form Fun-dacao de Amparo a Pesquisa do Estado de Sao Paulo (FA-PESP) and Coselho Nacional de DesenvolvimentoCientıfico e Tecnologico (CNPq). F.S.D. and R.C.S.L.are indebted to FAPESP for the fellowships.
References
[1] B. Massoumi, A. Entezami, Eur. Polym. J. 37 (2001) 1015.[2] A.G. MacDiarmid, S.L. Mu, N.L.D. Somasiri, W. Mu, Mol. Cryst.
Liq. Cryst. 121 (1985) 187.[3] S.L. Mu, H.G. Xue, B.D. Qian, J. Electroanal. Chem. 304 (1991) 7.[4] T. Kobayashi, H. Yoneyama, H. Tamura, J. Electroanal. Chem. 161
(1984) 419.[5] H.L. Wang, A.G. MacDiarmid, Y.Z. Wang, D.D. Gebler, A.J.
Epstein, Synth. Met. 78 (1996) 33.[6] D.A. Orata, J. Buttry, Electrochem. Soc. 134 (1987) C466.[7] C. Coutanceau, A.E. Hourch, P. Crouigneau, J.M. Leger, C. Lamy,
Electrochim. Acta 40 (1995) 2739.[8] O.E. Mouahid, C. Coutanceau, E.M. Belgsir, P. Crouigneau, J.M.
Leger, C. Lamy, J. Electroanal. Chem. 426 (1997) 117.[9] E.C. Venancio, A.J. Motheo, F.A. Amaral, N. Bocchi, J. Power
Sources 94 (2001) 36.[10] T. Matencio, M.-A. DePaoli, R.C.D. Peres, R.M. Torresi, S.I.
Cordoba de Torresi, Synth. Met. 72 (1995) 59.[11] R.M. Nyffenegger, R.M. Penner, J. Phys. Chem. 100 (1996) 17041.[12] A. Zimmermann, L. Dunsch, Mol. Struct. 410–411 (1997) 165.[13] K. Kpzoel, M. Lapkowski, E. Genies, Synth. Met. 84 (1997) 105.[14] L.F. Warren, D.P. Anderson, J. Electrochem. Soc. 134 (1987) 101.[15] X. Kang, Y. Jin, G. Cheng, S. Dong, Langmuir 18 (2002) 10305.[16] F.S. Damos, R.C.S. Luz, L.T. Kubota, Langmuir 21 (2005) 602.[17] S. Ekgasit, C. Thammacharoen, W. Knoll, Anal. Chem. 76 (2004)
561.[18] S.J. Tian, J.Y. Liu, T. Zhu, W. Knoll, Chem. Mater. 16 (2004)
4103.[19] T.T. Ehler, J.W. Walker, J. Jurchen, Y. Shen, K. Morris, B.P.
Sullivan, L.J. Noe, J. Electroanal. Chem. 480 (2000) 94.[20] J. Oslonovitch, Y.-J. Li, C. Donner, K. Krischer, J. Electroanal.
Chem. 541 (2003) 163.[21] X. Yao, J. Wang, F. Zhou, J. Wang, N. Tao, J. Phys. Chem. B 108
(2004) 7206.[22] S. Wang, S. Boussaad, S. Wong, N.J. Tao, Anal. Chem. 72 (2000)
4003.[23] S. Boussaad, J. Pean, N.J. Tao, Anal. Chem. 72 (2000) 222.[24] R. Kotz, D.M. Kolb, J.K. Sass, Surf. Sci. 69 (1977) 359.[25] E. Kretschmann, Z. Phys. 241 (1971) 159.[26] X. Kang, Y. Jin, G. Cheng, S. Dong, Langmuir 18 (2002) 1713.[27] I. Pockrand, Surf. Sci. 72 (1978) 577.[28] Z. Salamon, H.A. Macleod, G. Tollm, Biochim. Biophys. Acta 1331
(1997) 117.[29] E. Fontana, R.H. Pantel, Phys. Rev. B 37 (1988) 3164.[30] S.O. Sari, D.K. Cohen, K.D. Scherkoske, Phys. Rev. B 21 (1980)
2162.[31] R. Georgiadis, K.A. Peterlinz, J.R. Rahn, A.W. Peterson, J.H.
Grassi, Langmuir 16 (2000) 6759.[32] C. Li, T. Imae, Macromolecules 37 (2004) 2411.[33] M.J. Giacomini, C.M.M. Souza, E.A. Ticianelli, Surf. Sci. 409 (1998)
465.[34] D.E. Stilwell, S.-M. Park, J. Electrochem. Soc 136 (1989) 427.[35] P. Zach, J. Polym. Sci. 10 (1972) 2379.[36] Z. Jin, K. Nolan, C.R. McArthur, A.B.P. Lever, C.C. Leznoff, J.
Organomet. Chem. 468 (1994) 205.[37] S. Kim, X. Xu, I.T. Bae, Z. Wang, D.A. Scherson, Anal. Chem. 62
(1990) 2647.

F.S. Damos et al. / Journal of Electroanalytical Chemistry 589 (2006) 70–81 81
[38] A. Baba, S. Tian, F. Stefani, C. Xia, Z. Wang, R.C. Advincula, D.Johannsmann, W. Knoll, J. Electroanal. Chem. 562 (2004) 95.
[39] D.E. Aspenes, J.B. Theetem, F. Hottier, Phys. Rev. B 20 (1979) 3292.[40] C. Zhao, Z. Jiang, Appl. Surf. Sci. 229 (2004) 372.[41] G. Sauerbrey, Z. Phys. 155 (1959) 206.[42] H. Varela, R.M. Torresi, D.A. Buttry, J. Electrochem. Soc. 147
(2000) 4217.[43] A. Bund, M. Schneider, J. Electrochem. Soc. 149 (2002) E331.[44] Y. Li, Electrochim. Acta 42 (1997) 203.[45] Q. Pei, R. Qian, Electrochim. Acta 37 (1992) 1075.[46] V. Syritski, A. Opik, O. Forsen, Electrochim. Acta 48 (2003) 1409.[47] C. Lee, J. Kwak, A.J. Bard, J. Electrochem. Soc. 136 (1989) 3720.[48] B.R. Scharifker, E. Garcfa-Pastoriza, W.J. Marino, J. Electroanal.
Chem. 300 (1991) 85.[49] D. Orata, D.A. Buttry, J. Am. Chem. Soc. 109 (1987) 3574.
[50] A. Baba, R.C. Advincula, W. Knoll, J. Phys. Chem. 106 (2002) 1581.[51] C.M.G.S. Cruz, E.A. Ticianelli, J. Electroanal. Chem. 428 (1997)
185.[52] J.E. de Albuquerque, L.H.C. Mattoso, R.M. Faria, J.G. Masters,
A.G. MacDiarmid, Symth. Met. 146 (2004) 1.[53] S.-J. Choi, S.-M. Park, J. Electroanal. Chem. 149 (2002) E26.[54] H. Varela, R.L. Bruno, R.M. Torresi, Polymer 44 (2003) 5369.[55] S.L. De Maranhao Albuquerque, R.M. Torresi, J. Electrochem. Soc.
146 (1999) 4179.[56] M. Hepel, J. Electrochem. Soc. 145 (1998) 124.[57] M. Hepel, J. Electroanal. Chem. 41 (1996) 63.[58] A.R. Hilmann, M.J. Swann, S. Bruckenstein, J. Phys. Chem. 95
(1991) 3271.[59] A.A. Nekrasov, V.F. Ivanov, A.V. Vannikov, J. Electroanal. Chem.
482 (2000) 11.
Related Documents


