Investigation of TQM implementation to the UAE public sector organisations. AL, Awadhi AY. Available from the Sheffield Hallam University Research Archive (SHURA) at: http://shura.shu.ac.uk/19227/ A Sheffield Hallam University thesis This thesis is protected by copyright which belongs to the author. The content must not be changed in any way or sold commercially in any format or medium without the formal permission of the author. When referring to this work, full bibliographic details including the author, title, awarding institution and date of the thesis must be given. Please visit http://shura.shu.ac.uk/19227/ and http://shura.shu.ac.uk/information.html for further details about copyright and re-use permissions.

Welcome message from author
This document is posted to help you gain knowledge. Please leave a comment to let me know what you think about it! Share it to your friends and learn new things together.
Transcript

Investigation of TQM implementation to the UAE public sector organisations.
AL, Awadhi AY.
Available from the Sheffield Hallam University Research Archive (SHURA) at:
http://shura.shu.ac.uk/19227/
A Sheffield Hallam University thesis
This thesis is protected by copyright which belongs to the author.
The content must not be changed in any way or sold commercially in any format or medium without the formal permission of the author.
When referring to this work, full bibliographic details including the author, title, awarding institution and date of the thesis must be given.
Please visit http://shura.shu.ac.uk/19227/ and http://shura.shu.ac.uk/information.html for further details about copyright and re-use permissions.

on S erv ices fly C am pus
S1 1WDSheffield
1 0 2 0 4 4 7 8 1 8
Sheffield Haliam University Learning and Information Services
Adsetts Centre, City Campus Sheffield SI 1WD
2g0"7 i
REFERENCE
ProQuest Number: 10694107
All rights reserved
INFORMATION TO ALL USERS The quality of this reproduction is dependent upon the quality of the copy submitted.
In the unlikely event that the author did not send a com p le te manuscript and there are missing pages, these will be noted. Also, if material had to be removed,
a note will indicate the deletion.
uestProQuest 10694107
Published by ProQuest LLC(2017). Copyright of the Dissertation is held by the Author.
All rights reserved.This work is protected against unauthorized copying under Title 17, United States C ode
Microform Edition © ProQuest LLC.
ProQuest LLC.789 East Eisenhower Parkway
P.O. Box 1346 Ann Arbor, Ml 48106- 1346
Investigation of TQM Implementation to the U.A.E.
Public Sector Organisations
AL AWADHI, A. Y.
A thesis submitted in partial fulfilment of the requirements of Sheffield Hallam University
for the degree of Doctor of Philosophy
November 2010
ABSTRACT
This research explores the possibility of adopting quality approach for the United Arab Emirates Public Sector Institutions (UAEPSI), aiming to improve their performance and enable them to provide quality standard services for customers and other stakeholders.
The research was based on a literature study of the quality advocators for a better understanding in the field of TQM. A triangulation research method of quantitative (survey questionnaires) designed, evaluated the reliability and the concurrent validity of the questions. The gathered data were subjected to a series of correlation and regression analysis.
The results demonstrated a wide gap between TQM principles and the actual practices of the UAEPSI. Certain aspects were found inhibiting proper implementation of TQM. Based on the research theoretical and empirical evidences a Quality Appraisal Model (QAM) emerged as a self assessment instrument against the U.A.E. Government Excellence Program (UAEGEP) criteria’s. The QAM comprises of four core quality critical factors: people, leadership, processes and system, and resources and facilities, in which fragmented to twenty sub-factors. The framework model divides the TQM implementation into five sequential phases namely; identification, appraisal, implementation, monitoring and evaluation. A weighting scoring scale was also formulated as a measurement tool, to facilitate the measurement of quality quotient in the UAEPSI. Furthermore the QAM was benchmarked against widely adopted quality and excellence models and its contribution to the development of TQM knowledge. Two focus groups of top and senior management in the UAEPSI were formulated to validate the QAM viability as a performance assessment vehicle that is in alignment with the UAEGEP quality criteria's. The model provides a model for creating awareness and understanding of TQM concepts and techniques and their impact on developing a quality culture. It is hoped that this in the long run, may encourage the Government of United Arab Emirates to adopt quality strategy in alignment with its corporate strategy.
The thesis reveals that there is a paucity of research in this area and this research study makes a contribution towards filling this gap and for further research in future.
I
ACKNOWLEDGMENTS
IN THE NAME ALLAH THE MOST GRACIOUS THE MOST MERCIFUL.
In the beginning and foremost all extremely grateful to the almighty (Allah), as without
his strength, healthiness, and motive, this work would not come to life.
Then with a sense of deep gratitude, I would like to thank my research director of
studies Prof. Kadim Al-Shaghana for his effort and time, which he devoted throughout
the years of my study and his genuine and valuable guidance during, the preparation of
this thesis. Thanks to the SBS staff in the research office for their kind help and
consideration.
I devote my special thanks to my family (my beloved wife, daughter and son) for their
contiguous support and patient which provided me with the inspiration to preserve
under difficult circumstances.
Also, I would like to extend my appreciation to the H.E. Chairman, H.E.
Undersecretary, the director and the assistant director of the economic section, and to all
colleagues in the Department of Planning, for their support and permitting me to pursue
my career.
II
TABLE OF CONTENTS
Page
ABSTRACT...........................................................................................................................IACKNOWLEDGMENTS................................................................................................... II
TABLE OF CONTENTS....................................................................................................HI
ABBREVIATIONS...........................................................................................................VII
LIST OF TABLES.............................................................................................................. IX
LIST OF FIGURES...........................................................................................................XII
CHAPTER ONE: RESEARCH INTRODUCTION.....................................
1.1 THE RESEARCH RATIONALE...................................................................................1
1.2 RESEARCH AIM AND OBJECTIVES........................................................................ 6
1.3 RESEARCH QUESTIONS.............................................................................................7
1.4 RESEARCH STAGES OUTLINE.................................................................................8
1.5 RESEARCH STRUCTURE...........................................................................................8
CHAPTER TWO: LITERATURE REVIEW...............................................&PREFACE ............................................................................................................................13
2.1 THE QUALITY PHILOSOPHY..................................................................................15
2.1.1 The Quality Concept...................................................................................................15
2.1.2 The Quality Definition............................................................................................... 16
2.2 DEVELOPMENT OF QUALITY THEORY.............................................................. 19
2.2.1 Quality Inspection (QI)..............................................................................................22
2.2.2 Quality Control (QC)................................................................................................. 23
2.2.3 Quality Assurance (QA)............................................................................................. 24
2.2.4 Quality Management (QM)........................................................................................25
2.2.5 Total Quality Management (TQM)........................................................................... 25
2.2.6 Quality Excellence Service (QES)............................................................................ 27
2.3 QUALITY GURU’S .................................................................................................. 33
2.3.1 Deming........................................................................................................................ 33
2.3.2 Juran............................................................................................................................ 36
2.3.3 Crosby......................................................................................................................... 40
2.3.4 Feigenbaum.................................................................................................................43
2.3.5 Shewhart......................................................................................................................45III
2.3.6 Ishikawa......................................................................................................................45
2.3.7 Shingo.........................................................................................................................48
2.3.8 Taguchi........................................................................................................................49
2.4 QUALITY TOOLS.....................................................................................................52
2.4.1 Pareto Chart.................................................................................................................53
2.4.2 Histogram....................................................................................................................54
2.4.3 Statistical Process Control (SPC).............................................................................. 54
2.4.4 Performance Indicators (PI).......................................................................................55
2.4.5 Balance Scorecard (BSC)...........................................................................................56
2.4.6 Benchmarking ........................................................................................................... 57
SUMMARY.........................................................................................................................59
CHAPTER THREE: RESEARCH METHODOLOGY.............................. 62
PREFACE ........................................................................................................................... 62
3.1 RESEARCH METHODS OVERVIEW ..................................................................... 64
3.2 QUANTITATIVE METHOD.......................................................................................65
3.2.1 Survey Questionnaires ..............................................................................................67
3.3 QUALITATIVE METHOD..........................................................................................69
3.3.1 Interviews.................................................................................................................
3.4 RESEARCH METHODS COMPARISON ................................................................73
3.5 RESEARCH METHOD JUSTIFICATION.............................................................. (77)
3.5.1 Why Survey Questionnaires......................................................................................80
3.5.2 Why Interviews .........................................................................................................81
3.6 DATA COLLECTION SOURCES..............................................................................82
3.6.1 Secondary Sources .................................................................................................... 84
3.6.2 Primary Sources .........................................................................................................85
SUMMARY........................................................................................................................ 86
CHAPTER FOUR: FIELDWORK AND DATA COLLECTION..............87PREFACE ........................................................................................................................... 87
4.1 DESIGNING THE QUESTIONNAIRE...................................................................... 89
4.1.1 Questionnaire Development......................................................................................90
4.1.2 Type of Questions.......................................................................................................92
4.1.3 Questionnaire Layout................................................................................................ 96
4.2 PILOTING AND TESTING.....................................................................................100
4.2.1 Piloting....................................................................................................................100
IV
4.2.2 Modifications ...........................................................................................................102
4.2.3 Reliability Testing.................................................................................................... 103
4.3 POPULATION AND SAMPLE................................................................................ I l l
4.3.1 Sampling Criteria .................................................................................................... I l l
4.3.2 Sampling Techniques............................................................................................... 113
4.3.3 Population Size ...................................................................................................... 114
4.4 THE FIELDWORK..................................................................................................116
4.4.1 Questionnaire Distribution and Collection.............................................................116
4.4.2 Conducting Interviews ............................................................................................118
SUMMARY ...................................................................................................................... 120
CHAPTER FIVE: DATA ANALYSIS .....................................................122PREFACE ......................................................................................................................... 122
5.1 GENERAL OVERVIEW........................................................................................... 125
5.2 RESPONDENTS VARIABLES ................................................................................126
5.3 UAEPSI VARIABLES .............................................................................................. 135
5.4 PERCEIVED CRITICAL FACTORS ...................................................................... 144
5.5 PRACTICED CRITICAL FACTORS ...................................................................... 148
5.6 UAEPSI TQM PRACTICES .....................................................................................153
SUMMARY ...................................................................................................................... 180
CHAPTER SIX: QUALITY IN THE U.A.E..............................................181PREFACE ......................................................................................................................... 181
6.1 THE U.A.E. PERSPECTIVE.....................................................................................184
6.2 THE U.A.E. GOVERNMENTS QUALITY INITIATIVES....................................189
6.2.1 The U.A.E. Governments Quality Programs and Awards ....................................191
6.3 QUALITY PRACTICES IN UAEPSI....................................................................... 200
SUMMARY ......................................................................................................................204
CHAPTER SEVEN: THE MODEL DEVELOPMENT...........................205PREFACE ......................................................................................................................... 205
7.1 THEORETICAL DEVELOPMENT.......................................................................... 208
7.1.1 Quality Critical Factors...........................................................................................208
7.1.2 Quality and Excellence Models.............................................................................. 219
7.1.2.1 Deming Model ..................................................................................................... 219
7.1.2.2 Baldrige Model...................................................................................................... 220
7.1.2.3 The EFQM Excellence Model ........................................................................... 222
V
7.1.2.4 Toyota Production System................................................................................... 223
7.1.2.5 Six S igm a............................................................................................................. 224
7.1.2.6 Other Quality Framework Approaches ...............................................................227
7.2 EMPIRICAL DEVELOPMENT..............................................................................234
SUMMARY .....................................................................................................................238
CHAPTER EIGHT: THE MODEL EMERGENCE.................................239
PREFACE .........................................................................................................................239
8.1 THE QUALITY APPRAISAL MODEL (QAM) .................................................... 241
8.2 THE QAM FRAMEWORK ......................................................................................247
8.3 THE QAM MECHANISMS .....................................................................................259
8.4 THE QAM BENCHMARKING .............................................................................. 264
SUMMARY .....................................................................................................................267
CHAPTER NINE: THE QAM VALIDATION........................................ 268PREFACE .........................................................................................................................268
9.1 THE FOCUS GROUP ...............................................................................................270
9.1.1 Groups Formation ................................................................................................. 271
9.2 THE QAM VALIDATION .......................................................................................274
9.3 VALIDATION OUTCOMES....................................................................................277
SUMMARY .....................................................................................................................280
CHAPTER TEN: CONCLUSION ............................................................282PREFACE ......................................................................................................................... 282
10.1 FINDINGS ................................................................................................................285
10.2 RECOMMENDATIONS .........................................................................................290
10.3 LIMITATION ...........................................................................................................294
10.4 CONTRIBUTION.................................................................................................... 295
10.5 FUTURE WORK .................................................................................................... 295
SUMMARY .....................................................................................................................296
REFERENCES .......................................................................................... 298
APPENDIXES ........................................................................................... 326
Appendix (1) Questionnaire Lettres.................................................................................327
Appendix (2) The Questionnaire Leaflet......................................................................... 331
Appendix (3) Respondents Profile....................................................................................343
Appendix (4) The Tables Section Three ........................................................................ 357
VI
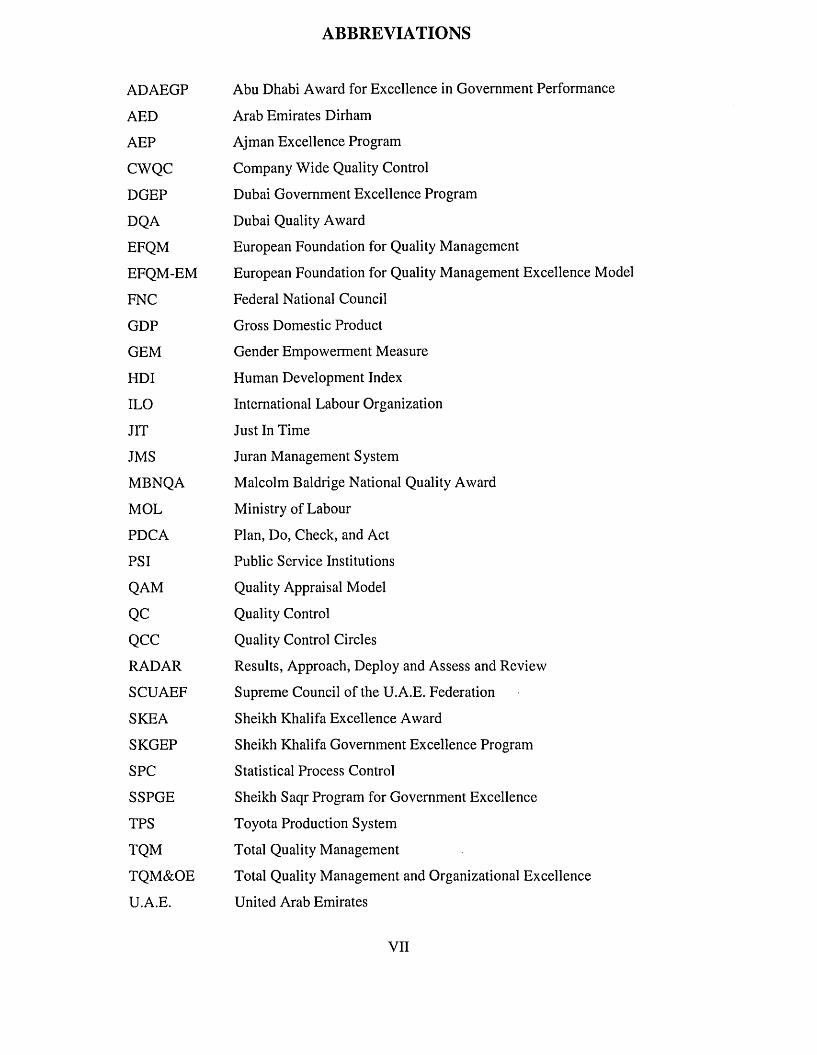
ABBREVIATIONS
ADAEGP Abu Dhabi Award for Excellence in Government Performance
AED Arab Emirates Dirham
AEP Ajman Excellence Program
CWQC Company Wide Quality Control
DGEP Dubai Government Excellence Program
DQA Dubai Quality Award
EFQM European Foundation for Quality Management
EFQM-EM European Foundation for Quality Management Excellence Model
FNC Federal National Council
GDP Gross Domestic Product
GEM Gender Empowerment Measure
HDI Human Development Index
ILO International Labour Organization
JIT Just In Time
JMS Juran Management System
MBNQA Malcolm Baldrige National Quality Award
MOL Ministry of Labour
PDCA Plan, Do, Check, and Act
PSI Public Service Institutions
QAM Quality Appraisal Model
QC Quality Control
QCC Quality Control Circles
RADAR Results, Approach, Deploy and Assess and Review
SCUAEF Supreme Council of the U.A.E. Federation
SKEA Sheikh Khalifa Excellence Award
SKGEP Sheikh Khalifa Government Excellence Program
SPC Statistical Process Control
SSPGE Sheikh Saqr Program for Government Excellence
TPS Toyota Production System
TQM Total Quality Management
TQM&OE Total Quality Management and Organizational Excellence
U.A.E. United Arab Emirates
VII

UAEGEP
UAEPSI
UNESCO
UNDP
United Arab Emirates Government Excellence Program
United Arab Emirates, Public Sector Institutions
United Nations Educational, Scientific and Cultural Organization
United Nations Development Program
VIII
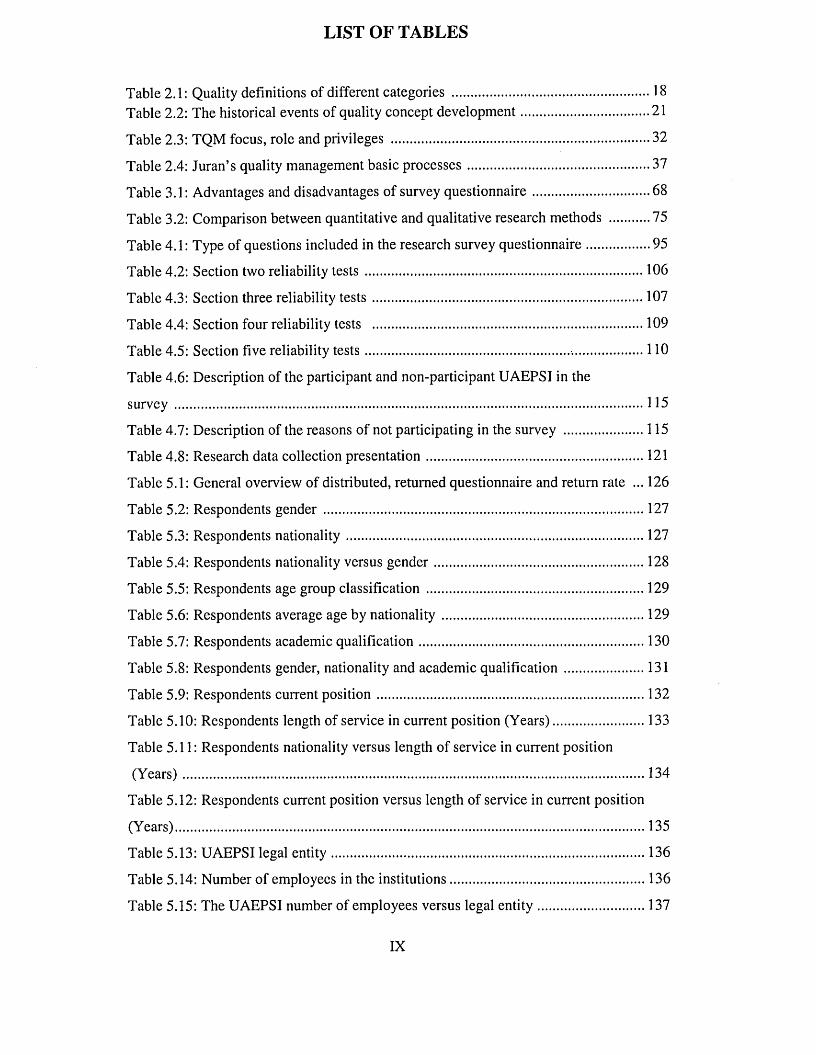
LIST OF TABLES
Table 2.1: Quality definitions of different categories .......................................................18Table 2.2: The historical events of quality concept development................................... 21
Table 2.3: TQM focus, role and privileges ....................................................................... 32
Table 2.4: Juran’s quality management basic processes.................................................. 37
Table 3.1: Advantages and disadvantages of survey questionnaire................................68
Table 3.2: Comparison between quantitative and qualitative research methods ........... 75
Table 4.1: Type of questions included in the research survey questionnaire..................95
Table 4.2: Section two reliability te sts .............................................................................106
Table 4.3: Section three reliability te sts ...........................................................................107
Table 4.4: Section four reliability tests ...........................................................................109
Table 4.5: Section five reliability tests........................................................ 110
Table 4.6: Description of the participant and non-participant UAEPSI in the
survey.................................................................................................................................115
Table 4.7: Description of the reasons of not participating in the survey ...................... 115
Table 4.8: Research data collection presentation............................................................121
Table 5.1: General overview of distributed, returned questionnaire and return rate ... 126
Table 5.2: Respondents gender........................................................................................ 127
Table 5.3: Respondents nationality..................................................................................127
Table 5.4: Respondents nationality versus gender..........................................................128
Table 5.5: Respondents age group classification ............................................................ 129
Table 5.6: Respondents average age by nationality........................................................129
Table 5.7: Respondents academic qualification.............................................................. 130
Table 5.8: Respondents gender, nationality and academic qualification...................... 131
Table 5.9: Respondents current position..........................................................................132
Table 5.10: Respondents length of service in current position (Years)..........................133
Table 5.11: Respondents nationality versus length of service in current position
(Years)...............................................................................................................................134
Table 5.12: Respondents current position versus length of service in current position
(Years).................................................................................................................................135
Table 5.13: UAEPSI legal entity...................................................................................... 136
Table 5.14: Number of employees in the institutions......................................................136
Table 5.15: The UAEPSI number of employees versus legal entity..............................137
IX
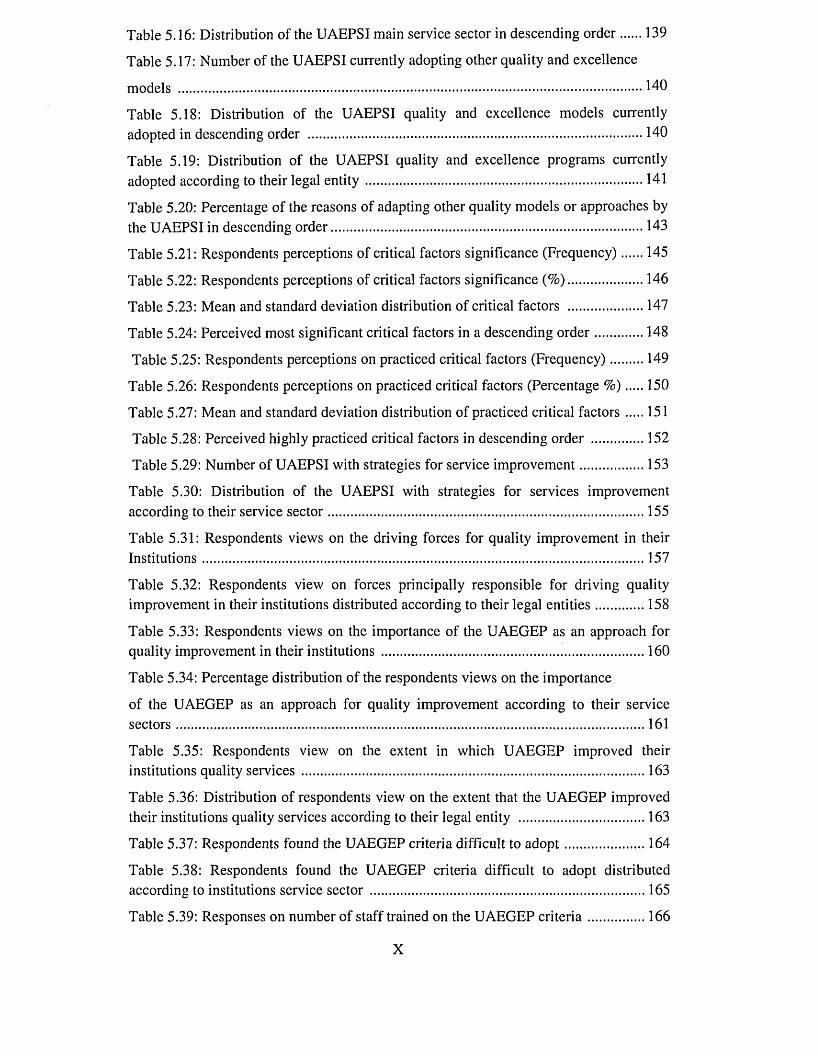
Table 5.16: Distribution of the UAEPSI main service sector in descending order 139
Table 5.17: Number of the UAEPSI currently adopting other quality and excellence
models ............................................................................................................................... 140
Table 5.18: Distribution of the UAEPSI quality and excellence models currently adopted in descending order ............................................................................................ 140
Table 5.19: Distribution of the UAEPSI quality and excellence programs currently adopted according to their legal en tity ............................................................................ 141
Table 5.20: Percentage of the reasons of adapting other quality models or approaches by the UAEPSI in descending order......................................................................................143
Table 5.21: Respondents perceptions of critical factors significance (Frequency) 145
Table 5.22: Respondents perceptions of critical factors significance (% )..................... 146
Table 5.23: Mean and standard deviation distribution of critical factors ..................... 147
Table 5.24: Perceived most significant critical factors in a descending order..............148
Table 5.25: Respondents perceptions on practiced critical factors (Frequency) 149
Table 5.26: Respondents perceptions on practiced critical factors (Percentage % ) ......150
Table 5.27: Mean and standard deviation distribution of practiced critical factors 151
Table 5.28: Perceived highly practiced critical factors in descending order ............... 152
Table 5.29: Number of UAEPSI with strategies for service improvement.................. 153
Table 5.30: Distribution of the UAEPSI with strategies for services improvement according to their service sector.......................................................................................155
Table 5.31: Respondents views on the driving forces for quality improvement in their Institutions......................................................................................................................... 157
Table 5.32: Respondents view on forces principally responsible for driving quality improvement in their institutions distributed according to their legal entities..............158
Table 5.33: Respondents views on the importance of the UAEGEP as an approach for quality improvement in their institutions ........................................................................ 160
Table 5.34: Percentage distribution of the respondents views on the importance
of the UAEGEP as an approach for quality improvement according to their service sectors.................................................................................................................................161
Table 5.35: Respondents view on the extent in which UAEGEP improved their institutions quality services .............................................................................................. 163
Table 5.36: Distribution of respondents view on the extent that the UAEGEP improved their institutions quality services according to their legal entity ..................................163
Table 5.37: Respondents found the UAEGEP criteria difficult to adopt...................... 164
Table 5.38: Respondents found the UAEGEP criteria difficult to adopt distributed according to institutions service sector ............................................................................165
Table 5.39: Responses on number of staff trained on the UAEGEP criteria................ 166
X
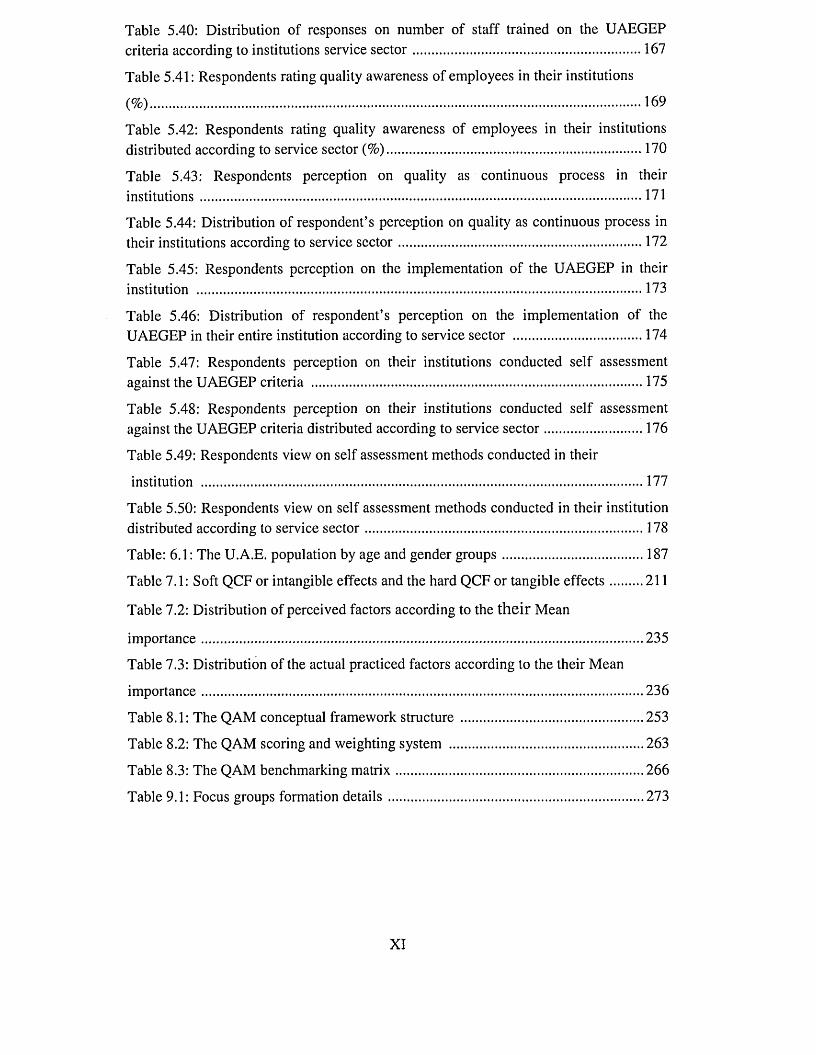
Table 5.40: Distribution of responses on number of staff trained on the UAEGEP criteria according to institutions service sector...............................................................167
Table 5.41: Respondents rating quality awareness of employees in their institutions
(%).......................................................................................................................................169
Table 5.42: Respondents rating quality awareness of employees in their institutions distributed according to service sector (%)...................................................................... 170
Table 5.43: Respondents perception on quality as continuous process in their institutions ......................................................................................................................... 171
Table 5.44: Distribution of respondent’s perception on quality as continuous process in their institutions according to service sector................................................................... 172
Table 5.45: Respondents perception on the implementation of the UAEGEP in their institution .......................................................................................................................... 173
Table 5.46: Distribution of respondent’s perception on the implementation of the UAEGEP in their entire institution according to service sector ....................................174
Table 5.47: Respondents perception on their institutions conducted self assessment against the UAEGEP criteria ........................................................................................... 175
Table 5.48: Respondents perception on their institutions conducted self assessment against the UAEGEP criteria distributed according to service sector........................... 176
Table 5.49: Respondents view on self assessment methods conducted in their
institution ......................................................................................................................... 177
Table 5.50: Respondents view on self assessment methods conducted in their institution distributed according to service sector.............................................................................178
Table: 6.1: The U.A.E. population by age and gender groups....................................... 187
Table 7.1: Soft QCF or intangible effects and the hard QCF or tangible effects......... 211
Table 7.2: Distribution of perceived factors according to the the ir Mean
importance......................................................................................................................... 235
Table 7.3: Distribution of the actual practiced factors according to the their Mean
importance.........................................................................................................................236
Table 8.1: The QAM conceptual framework structure .................................................. 253
Table 8.2: The QAM scoring and weighting system ..................................................... 263
Table 8.3: The QAM benchmarking m atrix.................................................................... 266
Table 9.1: Focus groups formation details...................................................................... 273
XI
LIST OF FIGURES
Figure 1.1: Thesis outline................................................................................................... 12
Figure 2.1: Chapter two outline .........................................................................................14
Figure 2.2: The evolution of quality .............................................................. 27
Figure 2.3: Five key elements of quality management service........................................29
Figure 2.4: The principles and the layout of Deming’s profound knowledge theory 34
Figure 2.5: Deming’s seven deadly diseases ....................................................................34
Figure 2.6: The Deming cycle............................................................................................36
Figure 2.7: Juran’s cost of quality..................................................................................... 38
Figure 2.8: Crosby’s absolutes of quality management................................................... 41
Figure 2.9: Ishikawa fishbone diagram............................................................................. 47
Figure 2.10: Ishikawa control cycle .................................................................................. 48
Figure 2.11: Tagushi’s loss function................................................................................. 50
Figure 2.12: The Pareto chart.............................................................................................53
Figure 2.13: The histogram................................................................................................ 54
Figure 3.1: Chapter three outline .......................................................................................63
Figure 4.1: Chapter four outline.........................................................................................88
Figure 5.0: Chapter five outline ....................................................................................... 124
Figure 5.1: Respondents nationality versus gender........................................................128
Figure 5.2: Respondents academic qualification according to their gender .................. 132
Figure 5.3: Respondents nationality versus length of service in current position
(years).............................................................................................................................. 134
Figure 5.4: Percentages of the UAEPSI employees versus legal entity ........................ 138
Figure 5.5: Percentage of respondents of UAEPSI according to their main service sector ............................................................................................................................................. 139
Figure 5.6: Percentages of respondents of the UAEPSI quality models and approaches adopted according to their legal en tity .............................................................................142
Figure 5.7: Percentage of the UAEPSI with strategies for services delivery
improvement ..................................................................................................................... 154
Figure 5.8: Percentage distribution of the UAEPSI with strategies for services improvement according to their service sector ............................................................... 156
Figure 5.9: Respondents’ views on forces principally responsible for driving quality implementation in their institutions ................................................................................. 157
XII
Figure 5.10: Percentage distribution of respondents view on forces principally responsible for driving quality improvement in their institutions according to their legal entities ............................................................................................................................... 159
Figure 5.11: Percentage distributions of the respondent’s views on the importance of
the UAEGEP as an approach for quality improvement according to their service
sectors................................................................................................................................ 162
Figure 5.12: Respondents view on the extent that the UAEGEP improved their institutions services distributed according to their legal en tity ......................................164
Figure 5.13: Respondents found the UAEGEP criteria difficult to adopt distributed
according to institutions service sector .......................................................................... 166
Figure 5.14: Distribution of responses on number of staff trained on the UAEGEP criteria according to institutions service sector............................................................... 168
Figure 5.15: Respondents rating quality awareness of employees in their institutions distributed according to service sector (%)...................................................................... 170
Figure 5.16: Respondent’s perception on quality as a continuous process in their institutions according to service sector (%) .................................................................... 173
Figure 5.17: Distribution of respondent’s perception on the implementation of the UAEGEP in their entire institution according to service sector (% )..............................175
Figure 5.18: Distribution of respondent’s perception on their institutions conducted self assessment against the UAEGEP criteria according to service sector (%).................... 177
Figure 5.19: Respondents view on self assessment methods conducted in their institution distributed according to service sector (% ) ....................................................179
Figure 6.1: Chapter six outline........................................................................................ 183
Figure 6.2: The U.A.E. government strategies (1971-2009).......................................... 185
Figure 6.3: The U.A.E. Human Development Index (1980 - 2007)...............................189
Figure 7.1: Chapter seven outline....................................................................................207
Figure 7.2: The Truscott's principal of six sigma business initiatives .......................... 225
Figure 8.1: Chapter eight outline .....................................................................................240
Figure 8.2: The conceptual framework of the QAM ...................................................... 250
Figure 9.1: Chapter nine outline ......................................................................................269
Figure 10.1: Chapter ten outline ......................................................................................284
XIII
CHAPTER ONE
RESEARCH INTRODUCTION
1.1 THE RESEARCH RATIONALE
After three decades of prevalent embarkation of the Total Quality Management (TQM)
phenomenon by academics and quality advocators across the globe. It has been realized
that theoretical understanding of quality concepts and approaches, sound undemanding.
On the contrary, when it comes to its practical side, most organizations that experienced
it tend to struggle when it comes to the actual implementation practices processes of
TQM. As they find it not an easy task on how to grasp its benefits in performance
improvement and increasing efficiency. So far, various investigative studies related to
TQM implementations have been carried out in America, Europe and Asia on a wide
range of organizations (large, medium, small, transnational, manufacturing and/or
services private or public) which have implemented TQM criteria and approaches. The
majority of results of such investigations revealed that less than half of the organizations
which launched quality programs neither had any success in achieving their goals, nor
gained any quality benefits. The core reason is that many organizations lacked TQM
knowledge, and did not know how to evaluate their quality implementation success.
(Ahmed, et al. 2008; Psychogios, and Priporas, 2007; Feng, et al 2006; Yasin, et a l
2004; Hides, et a l 2004; Taylor, 1997; and Miller, 1992),
What's more, empirical evidences on the adoption of the TQM as a tool for self-
assessment within the public sector, revels that found public service organizations, had
lagged behind those organizations in the private sector. This lagging was due to
misunderstanding and ambiguity in not knowing when to initiate suitable quality
programmes, and how to properly implement TQM models and approaches. As a result,
this has created a huge gap in terms of improving and delivering services to customers
in the public sector compared with those in private organizations. (Hides, et al)
Alternatively, in contrasting the complexity associated with quality implementation
practices between organizations in western societies such as: U.S.A. and European
Union Nations with those in eastern societies for instance: China and Malaysia, it is
more likely that the eastern organizations share to some extent the same dilemma as
1
those organizations in the western countries. Despite the fact, of current boom in
Chinese exports of products and goods that dominated the world trade. However, in
reality the situation does not necessarily always reflect the facts. This was discovered
with an empirical study carried out by Chin and Pun, which revealed that the majority
of Chinese organizations were not endorsing a sufficient or even essential awareness of
how to implement and measure TQM benefits. In fact, the Chinese organizations
acknowledged that they had a complex and uphill struggle in introducing and
maintaining quality norms (Chin and Pun, 2002).
Quality researchers and practitioners such as Salazar and Tan classified a range of
crucial obstacles that hindering organizations in pursuing successful quality
implementation schemes. They are summarized as follows:
7. Organizations do not understand what quality means and how to measure its
outcomes
2. The resistance to changes in the behaviour of people
3. Habits and relationship between leaders and employees
4. Weak organizational performance and ethics
5. Reward of individuals rather than team
6. Intrinsic preference for individuality over group accountability
7. Size o f organization: the larger is the organization, the harder its TQM
implementation task becomes
8. The diversity and locations o f organizations
(Salazar, 1994 and Tan, 1997)
Djerdjouri and Al Eter (2007) pointed out that in recent years, many quality
management programs have been introduced into the public sector in many countries
around the world. In search of excellence for their organizations, the public sector
managers have gradually adopted quality-based programs and methodologies to
improve service to their customers and stakeholders. This trend has reached the U.A.E.
in the last few years
The situation of quality practices and implementation in the United Arab Emirates
Public Sector Institutions (UAEPSI) does not differ from those organizations in other
countries. Such organizational inexperience in implementing a successful TQM2
program is felt with the same intensity in the U.A.E. as in other developing countries.
According to statement cited by deputy manager of the U.A.E. civil servants department
revealed that, just forty to fifty percent of the UAEPSI capacities output are properly
utilized. As he refers the incapacity of the UAEPSI mainly caused by the intensified
bureaucracy, lack of employee’s capabilities, inefficiency work processes, and
inexistence of adequate use of quality implementation and performance measurements.
(Al Khaleej, 2008 p.25). Furthermore, in the annual report of the U.A.E. Ministry of
Labour, it indicated that only five percent of total UAEPSI employees went through
systematic training schemes. The report claims that, this is due to a lack of inappropriate
quality training programs. As a result, this caused a steady decline of the UAEPSI work
efficiency and in the delivery of its services since 1995 at an annual average rate of
3.8%. (Ministry of Labour, 2008)
The U.A.E. federal as well as local governments have realized that adopting most recent
TQM principles in the UAEPSI is a short cut route to get rid of current drawbacks, and
to enhance productivity and institutional effectiveness. The U.A.E. government believed
that by implementing TQM approaches it should boost institutional productivity, and
overall outputs, which lead to better improved services. By taking this step, it should
also lead to a rise in the level of satisfaction among the employees in the UAEPSI. And
additionally, it enables the U.A.E. government to achieve its short and long term
national development strategy along with gradual economical growth.
In 2006, the government of U.A.E. proclaimed its 2020 strategic development agenda.
One of the agendas prime aims is to become one of the five foremost governments in
the world by the end of 2015. With the intention of achieving this aim, the government
of the U.A.E. commenced momentous organizational reforms and institutional
rehabilitations. Intensive and collective efforts were made to increase the UAEPSI
efficiency, productivity and its services. Hence, a number of quality programs were
launched on a federal as well as on a local government’s level. The objective was to
elevate the knowledge and understanding of quality concepts and ultimately creates a
culture of quality amongst the people in the UAEPSI. (Abdulla, 2008)
In theory, the implementation of TQM sounds simple, but many UAEPSI have
encountered difficulties in implementing the basic principles of TQM when it comes to
the practical side. The researcher perceived that the ad hoc TQM enforcement by the3
U.A.E. government put the UAEPSI management in profound turmoil, with little known
about the nature and extent of quality management and organizational excellence in
relation to service institutions in the U.A.E. The UAEPSI simply wanted to fulfil the
U.A.E. government quality demand. They basically rushed themselves by commencing
a tremendous quality and excellence awareness campaigns in conjunction with intensive
employees training schemes. As majority of the UAEPSI had realized later on that,
these campaigns were to some extent unsuccessful in placing quality criteria into actual
practice. Equally crucial, that due to the absence of current research of its kind in
tackling problems and obstacles of TQM implementation practices had made the effort
of UAEPSI in implementing TQM ineffective and more likely unfruitful. Also, it
created vagueness among the UAEPSI in not knowing what precisely they should need
to do and what they are attempting to change and to achieve by implementing quality
and excellence criterions.
Accordingly, and prior to the research fieldwork the researcher carried out a preliminary
investigation into sample of ten distinctive government institutions. The purpose was to
explore, gauge and to review past experiences and current quality implementation
practices of those institutions. The investigation also engaged in identifying the driving
and inhibiting forces associated with UAEPSI quality initiatives. Those listed below are
the summarized findings of the preliminary investigation:
1. Almost all the UAEPSI management aware about the benefits that could such an
implementation o f quality practices could increase their institutions
performance.
2. Lack o f people and customers involvement in quality process, and employees
rewarding and recognition systems.
3. Some UAEPSI seemed to be reluctant and impatient to recognize the long term
benefits o f TQM. Therefore quality is a non continuous process
4. UAEPSI are committed to TQM, they adopt the widely used and most recent
excellence model, but they find it hard and difficult to use it properly and put its
tenets into practice.
4
5. Inadequate experience in performing self assessment techniques, carrying out
internal and external performance measurements leads to ambiguity and
frustration in not achieving the designated goals o f TQM
6. Lack o f local TQM experts and quality culture
The above facts have shaped in the researcher mind the idea of developing a quality
model that assists UAEPSI on how to initiate successful and effective quality
implementation practices which lead to an increase in efficiency and service
improvement and which meet government quality standards and regulations.
The research emphasis literature related to TQM and particularly to implementation
processes in UAEPSI. By empirically examining the perceptions of the employees in
the UAEPSI it takes into consideration to find out the main factors that have made a
considerable contribution and help UAEPSI to achieve a successful quality
implementation practices.
The basics of the research literatures review were, build up from academic backgrounds
and exploratory analysis, that relevant to the research concept. The academic source
were principally from TQM literatures, the researcher reviewed, extracted and
considered all research methods. Whereas, the exploratory source were obtained from
the preliminary investigation conducted by the researcher to explore the current
UAEPSI quality practices and to evaluate their appreciation to such model. Information
from two sources played a major role in enabling the researcher to evaluate and to
determine the most appropriate research methodology for the research work.
Based on reviewing literatures related to TQM implementation practices specifically
those related to public sector organizations. Besides that, further literatures were revised
about research methodologies, as to allow the researcher to justify and choose a suitable
research method and tool to carry out the empirical stage of the research fieldwork.
Adding to that, by utilizing the findings with the above mentioned outcomes of the
preliminary investigation of TQM implementation practices in the U.A.E. as an
authentic source of information. The researcher has decided to use a mixed research
method to carry out the fieldwork stage, a combination of survey questionnaire
supported by structured interviews were selected. However, due to cultural backgrounds5
of the population sample, it perceived that survey questionnaire is the most appropriate
data collection tool in the UAEPSI. Therefore, significant emphasis was laid on it as a
main research methodology tool. Interviews were also, conducted as a supplementary
tool that supports the results and fill the gaps that it may emerge during the data analysis
stage.
The outcomes of the data analysis identified a number of Quality Critical Factors (QCF)
were found significant to the success of TQM implementation in the UAEPSI. Together
with reviewing the literature, broadly adopted quality models and approaches were
exploited as a basic foundation for the development of the research generic model. This
process eventually emerged the Quality Appraisal Model (QAM). The model outline
contains a set of core factors and sub-factors; supported by systematic sequential phases
of the implementation cycle, and self assessment scoring techniques was evolved. The
purpose is to enable the UAEPSI to appraise their quality status and benchmark their
performance improvements against the United Arab Emirates Government Excellence
Programmes (UAEGEP) criteria and quality standards. In order to examine the QAM
feasibility, a second research method of qualitative focus groups was carried out. Two
focus groups of top management in a designated UAEPSI were formed. The focus
group made considerable statements and observation that it enhanced the model to fit in
accordance to their TQM implementation requirements. This enabled the model the
advantage of flexibility and required adjustments to respond to the individual
institutional needs of such implementation mechanisms by various UAEPSI.
1.2 RESEARCH AIM AND OBJECTIVES
Research Aim
The research aims is “to investigate current TQM practices in the United Arab Emirates
public service institutions, in order to develop a generic quality appraisal model that
assist them in enhancing their quality performance and to betterment o f services”.
6
Research Objectives
In order to achieve the above aim which is pertinent to the current TQM implementation
practices in the UAEPSI, the researcher aspires to acquire the following objectives in
which they facilitates the researcher task in fulfilling the research foremost aim:
1. To investigate current TQM practices in the UAEPSI
2. To identify quality critical factors for successful TQM implementation in the
UAEPSI
3. To determine the appropriateness o f the developed model to the UAEPSI.
1.3 RESEARCH QUESTIONS
The questions below are formulated on the bases the researcher’s knowledge as they
enables him to attain the research aim and objectives relevant to the TQM
implementations practices in the UAEPSI.
1. What are the quality critical factors, and to what extent they are significant for
successful implementation o f TQM in the UAEPSI?
2. What problems and/or obstacles are associated with TQM implementation
practices in the UAEPSI?
3. What are the UAEPSI anticipations o f quality appraisal model?
Obviously, answering such questions keeps the debate open to explain the findings;
whether or not the QAM reflects the UAEPSI cultural values, specifically the traditions
and the management values that can be demonstrated in practice.
7
1.4 RESEARCH STAGES OUTLINE
The researcher reviewed and developed a body of knowledge from the academic
literature related to the research concept. He, then, considered all the research
methodologies in order to determine the most appropriate method relevant to the
research topic. Afterwards, he carried out an empirical fieldwork applying a survey
questionnaire which evaluated and assessed the current quality practices and
implementation processes from the employees perspectives in the UAEPSI.
Subsequently, the researcher compiled the gathered data from the fieldwork survey and
used statistical analysis tools to interpret and analyze the data. The results obtained
identified the key critical factors, problem areas, and gaps between the UAEPSI current
practices and the TQM practices. Based on the results of the previous stage, a
customized Quality Appraisal Model (QAM) was developed for the UAEPSI. Then, the
model was tested to ensure its applicability; a focus group was formed in a designated
government institution. After that the researcher validated and amended the model
based on the above stage outcomes. Finally, the researcher highlights the research
contribution, its limitations and proposes; a set of recommendations is proposed for
future research.
1.5 RESEARCH STRUCTURE
The thesis falls into ten chapters as illustrated in Figure (1.1); though the chapters are
discrete, they complement each other and they are sequenced logically. Chapter one
serves as an introduction.
Chapter Two: Research Literature Review
This chapter sets the theoretical background; information was extracted and reviewed
from the most recent academic publications and sources, such as, books, journals,
articles that relate to the research topic. The chapter is divided into three sections. The
first section explains in detail the quality philosophy and its concept, the quality
definition and the development of the quality theory from its inception to the present
day quality excellence. The second section outlines the quality gurus and their
contribution to the development of the conception of quality. The third section reviews
the most common used and implemented quality approaches.
Chapter Three: Research Methodology
This chapter serves as an overview of the research methodologies, their advantages and
disadvantages; thus, justifying which research design and methodology was used. The
triangulation method of both the quantitative survey questionnaire and the qualitative of
the focus groups were employed. The chapter also discusses what sort of data gathering
instruments and techniques are employed and it accounts for them.
Chapter Four: Fieldwork and Data Collection
This chapter illustrates the development of the research survey questionnaire, how it is
designed, piloted, tested and distributed. It also, discusses in greater detail the sampling
design of the study and the process of getting back the questionnaires.
Chapter Five: Data Analysis
This chapter examines and interprets the data gathered from the research fieldwork
study, from both sources: the questionnaire and interview. The data obtained are then
analyzed in order to identify problem areas and gaps. The results of the data analysis
were used as basic layers for the research model development.
Chapter Six: Quality in the U.A.E.
This chapter demonstrates the quality characteristics of the UAEPSI. The first section
aims to provide a general background to the U.A.E. social and economic perspective.
The second section elaborates the U.A.E. government quality initiative. The third
discusses the current quality practices and implementation in the UAEPSI. The chapter
rounds up by explaining the need for a model to implement the TQM in the UAEPSI.
9
Chapter Seven: The Model Development
This chapter presents the sources of information utilized for the development of the
QAM. The researcher combined theories and empirical evidence to envisage the
development of the model. The chapter is divided into two main sections. Section one,
demonstrates the theoretical development of the QAM. The researcher extensively
reviewed the most recent existing literature, research studies, and universally adopted
quality models and approaches. Section two manipulates the results of the data analysis
which develop the empirical part of the model.
Chapter Eight: The Model Emergence
In this chapter the researcher presents the development stages of the model based on the
outcomes of the previous chapter. Section one expounds the emergence of the quality
appraisal model based on the existing TQM practices in the UAEPSI, the results of data
analysis, and the unique characteristics of the UAEPSI. Section two portrays the model
framework of the core factors and sub-factors. Section three explains the
implementation process and proposes the mechanisms along with systematic scoring
techniques that transform the theoretical principles of the model into practical ones. The
last section benchmarks the development by comparing the matrix with other existing
broadly adopted quality models.
Chapter Nine: The QAM Validation
This chapter displays the practical validation of the emerged QAM. In order to evaluate
the applicability and credibility of the QAM, the researcher addresses a pragmatic
demonstration regarding the viability of the QAM to determine its appropriateness to
the UAEPSI quality needs. Section one explains the process of forming the focus
groups of the top management UAEPSI. Section two discusses the issues and the set of
questions that aimed to acquire the perceptions of the focus groups about the model.
Section three summarizes the observations and feedback received by the focus groups
and the possibilities of the actual implementation of QAM.
10
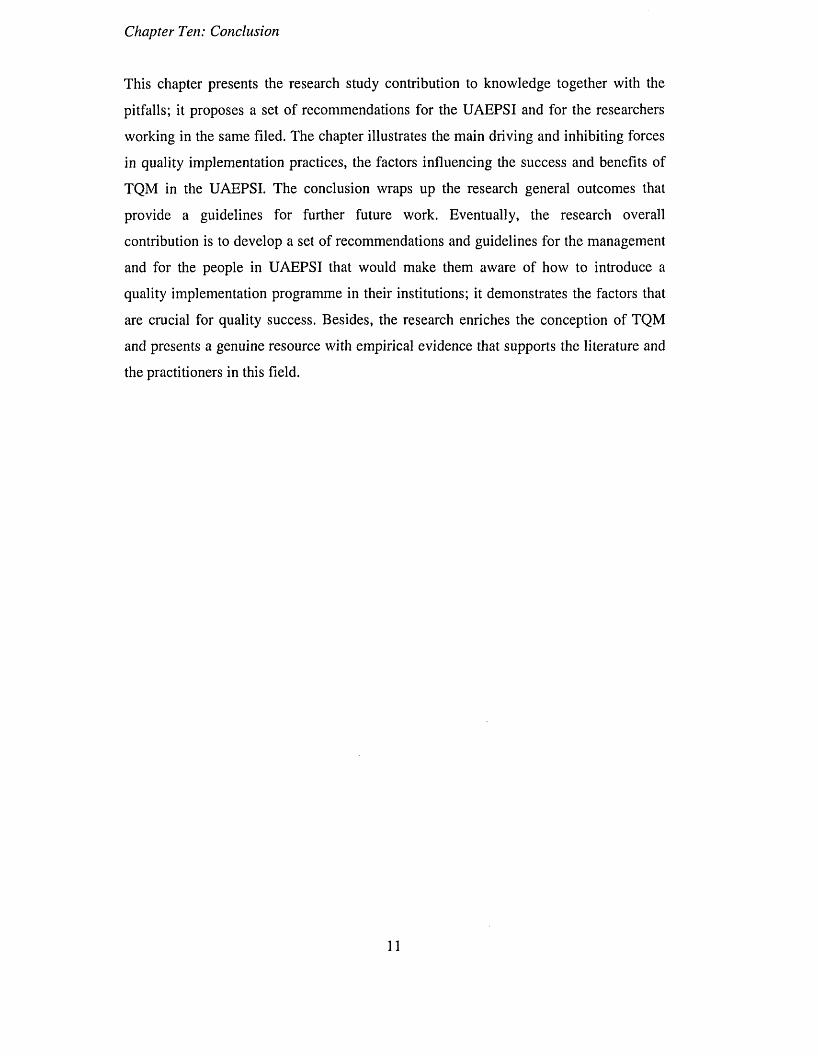
Chapter Ten: Conclusion
This chapter presents the research study contribution to knowledge together with the
pitfalls; it proposes a set of recommendations for the UAEPSI and for the researchers
working in the same filed. The chapter illustrates the main driving and inhibiting forces
in quality implementation practices, the factors influencing the success and benefits of
TQM in the UAEPSI. The conclusion wraps up the research general outcomes that
provide a guidelines for further future work. Eventually, the research overall
contribution is to develop a set of recommendations and guidelines for the management
and for the people in UAEPSI that would make them aware of how to introduce a
quality implementation programme in their institutions; it demonstrates the factors that
are crucial for quality success. Besides, the research enriches the conception of TQM
and presents a genuine resource with empirical evidence that supports the literature and
the practitioners in this field.
11
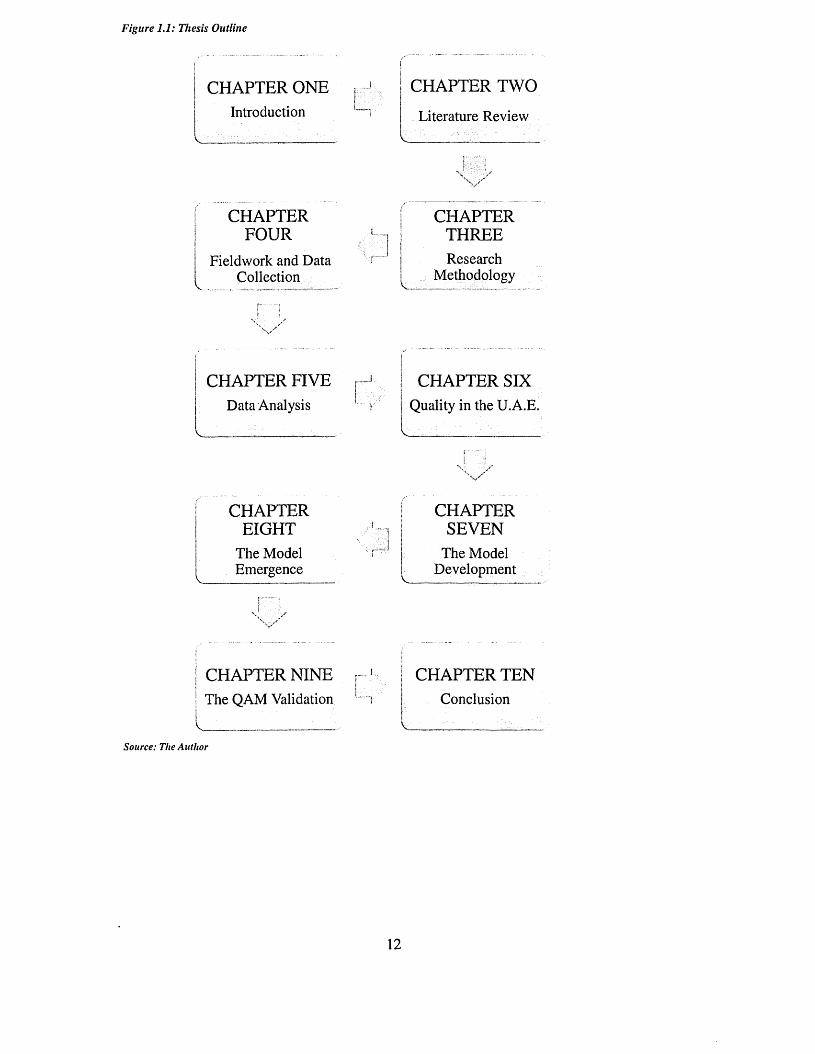
Figure 1.1: Thesis Outline
CHAPTER ONEIntroduction
CHAPTER FOUR
Fieldwork and Data Collection
CHAPTER TWO
Literature Review
v.
CHAPTERTHREEResearch
Methodology
CHAPTER FIVE , ‘ 1 CHAPTER SIXData Analysis r j Quality in the U.A.E
CHAPTEREIGHT
The Model Emergence
CHAPTERSEVEN
The Model Development
CHAPTER NINE The QAM Validation
CHAPTER TEN Conclusion
Source: The Author
12
CHAPTER TWO
LITERATURE REVIEW
PREFACE
This chapter reviews the development of the quality theory from the early days of
quality inspection to the most recent days of organizational excellence. Equal emphasis
was placed on the quality concept and the definition of quality excellence. The
following section highlights the background of the quality gurus, their contribution to
the development of quality concepts and theories and their implementation techniques
and practices. Several recent books, publications, articles, and technical papers were
reviewed. Comments were made regarding the relevance of the theories and their
implications, techniques and practices to the quality concept. A summary of
comprehensive literature on the most common quality tools and quality performance
measurements is presented at the end of the chapter. See Figure 2.1 as it outlines the
chapter.
13
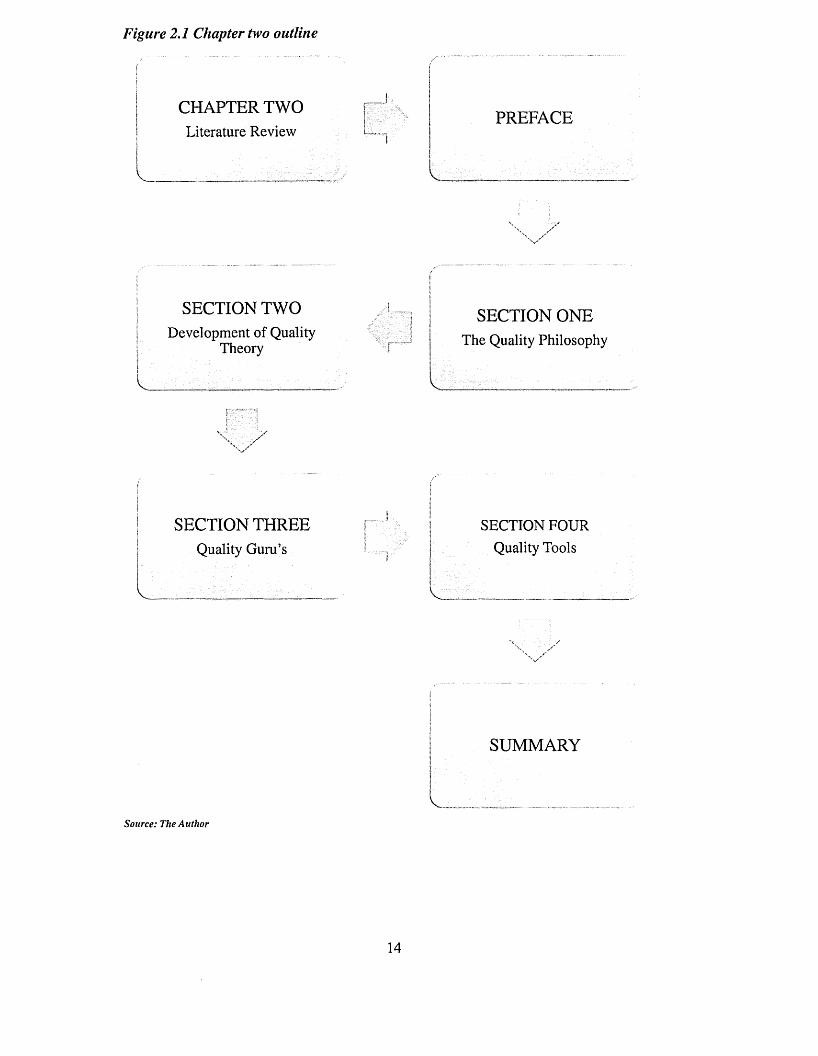
Figure 2.1 Chapter two outline
CHAPTER TWO Literature Review
PREFACE
SECTION TWODevelopment of Quality
Theory
| SECTION THREE j Quality Guru’s
t
SECTION ONEThe Quality Philosophy
v : : 1 : : ........ :...
i SECTION FOUR| Quality Tools
} .!v. , : .
SUMMARY
j
Source: The Author
1 4
2.1 THE QUALITY PHILOSOPHY
Quality concept has its roots in the industrial revolution whereby products were made
by the use of non-standards materials and methods; the results were products of varying
quality. In the turn of the last century, Taylor (2010) developed a system of scientific
management that emphasized productivity and quality control. In reality, it is one of the
few management thoughts that are not developed by researchers and scholars in the
west, and then implemented in industry. Quality is a thought and a cultural practice
developed through implementation; first in Japan and then in the Western firms.
Afterwards, it was moved to the academies for more theoretical research, elaboration
and refinement.
The great shift of the Total Quality Management TQM phenomena took place after the
Second World War when the American manufactures observed a dramatic demand
decline on their products. As a result, quality ideology was advanced and developed by
a number of quality pioneers such as Deming, Juran, Feigenbaum, Crosby, Ishikawa
and Shewhart (Swift et al., 1998). In the 1990s, the TQM progress was accelerated in
order to meet the needs of the organizations; it performed several organizational
functions for the improvement of the total output of the organization as well as the
quality of the output within each function. TQM helps the organizations to focus on
both the external and internal needs of the customers with the objective of achieving top
quality performance in all business areas; thus, enhancing the customer's loyalty and
reducing the costs through getting things done right first time and every time (Long, and
Moullin, 2002; and Stahl, 1999).
2.1.1 The Quality Concept
The concept of quality involves different approaches developed in the last decade by
quality gurus such as Deming, Crosbey, Juran, Feigenbaum, and Ishikawa, in the field
of TQM. Their theories and quality approaches acquired remarkable recognition; they
were adopted as quality management fundamentals by present practitioners and
researches all over the globe. Although they commonly shared thoughts on quality
management and on the significance of quality to the organisation success, they
emphasized one factor and that was the customer satisfactions. Their insights constitute
a good reference for understanding quality philosophy mainly its principles and quality15
implementation techniques and practices for both the organisations that strive for
quality and the researchers as well as the quality experts. However, after careful review
of their exertion, it has been found out that they had quite different perceptions and
contributions to the development of the theory of quality. Gurus disagree with respect to
what each considers as part of quality success. These differences were reflected on the
level of perceiving quality definitions by different TQM gurus, practitioners and
theorists as it is clearly observed in the upcoming sections.
2.1.2 The Quality Definition
The differences in quality understanding and in its adoption by different researchers
have created an unbroken debate and showed a lack precise definition. As a result, there
appears to be no uniform understanding and definition of the meaning of the term
quality (Hackman and Wageman, 1995). However, these divergences had played a vital
role in the evolution and enrichment of quality concepts. The following interpretation of
quality definition is extracted from the different TQM perspectives.
Deming (1986) suggested that the quality of a product must be defined by the ultimate
customer or user of that product and that it must be measured by the interaction between
three components: the product, the user and the method of using it taking into account
how the user exposes/exhibits the product and takes care of it; whether or not he follows
the instructions for use; the customer and the repairman may need some training, some
spare parts and repair services that may or may not be available. Crosby (1984), for
instance, perceived quality in terms of its conformance to the requirements; that is to
say, the products could be of a high quality only if it conforms to all of its requirements.
Feigenbaum (1991) defined quality as the total composite product and service
characteristic of marketing, engineering, manufacturing, and maintenance through
which the product and the service in use will meet the expectations of the customer and
pointed out some individual characteristics associated with the product quality, for
instance, the product must have good reliability; it must perform its intended function
constantly. Moreover, it must have proper serviceability and maintainability during its
life cycle. Juran (2000) defined quality as fitness for use. He described a product that
does not perform as one that definitely dissatisfies the customer.
16
Garvin (1988) observes that researchers cannot agree on a particular definition; he thus
developed a conceptual framework for quality, categorizing divergent approaches and
providing five definitions for quality:
7. Transcendent definition: quality cannot be defined precisely and that it can only
be recognised.
2. Product-Based definition: quality is a precise and measurable variable. This
means that an expensive product is considered a high quality product because
quality reflects the quantity of attributes that a product has; thus, eminent
products will be more expensive than the lower quality ones.
3. User-Based definition: a customer oriented definition; a product with high
quality will definitely meet the customers’ expectations; that will satisfy the
customer's needs
4. Manufacturing-Based definition: the emphasis is placed on the suppliers' needs
together with the engineering and manufacturing practices and cost reduction.
Improvement in quality leads to lower costs since preventing defects in the first
place reduces expense, re-work and repair
5. Value-Based Definition: quality is defined in terms of costs and prices; thus, a
quality product is one that provides conformance at an acceptable price or cost,
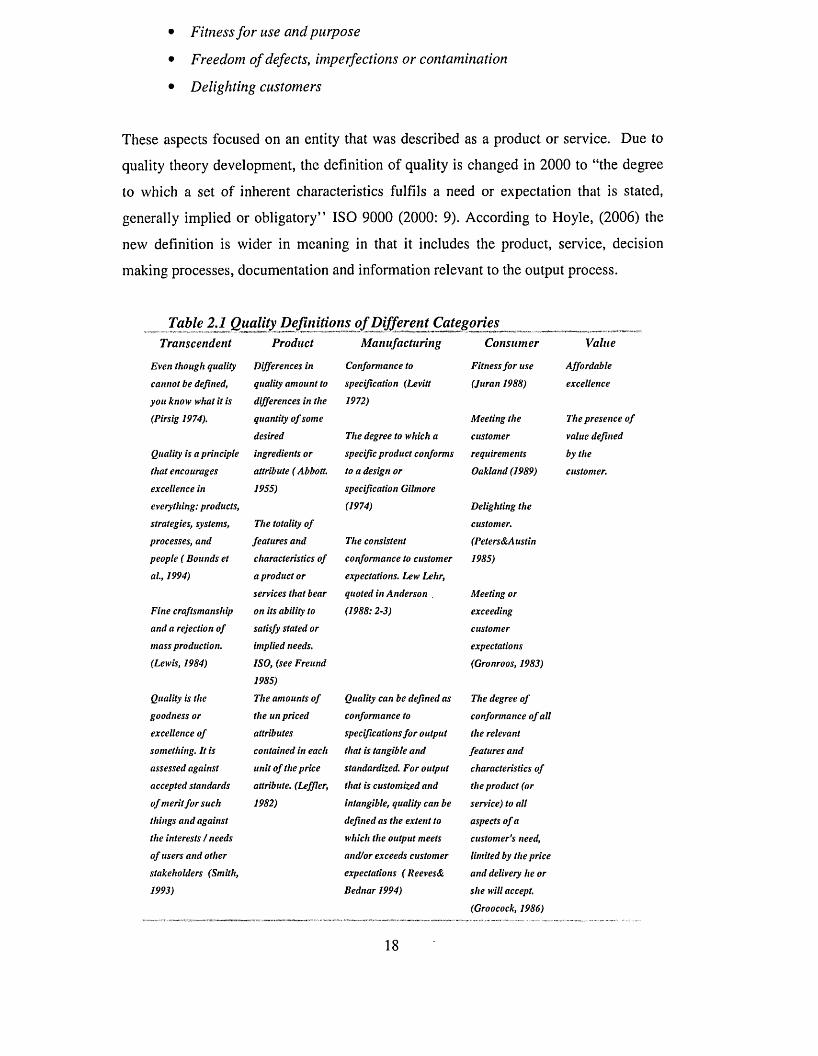
Garvin (1988). See Table (2.1) outlines Garvin’s quality categories definitions.
Flood (1993) defined quality in terms of its compliance to the customer’s agreed
requirements, both formal and informal; the product should not be costly in the first
place
ISO 9000 (2000) also provided different definitions for quality; quality must take
account of:
• The degree o f excellence
• Conformance with requirements
• Its ability to satisfy stated or implied needs17
• Fitness for use and purpose
• Freedom of defects, imperfections or contamination
• Delighting customers
These aspects focused on an entity that was described as a product or service. Due to
quality theory development, the definition of quality is changed in 2000 to “the degree
to which a set of inherent characteristics fulfils a need or expectation that is stated,
generally implied or obligatory” ISO 9000 (2000: 9). According to Hoyle, (2006) the
new definition is wider in meaning in that it includes the product, service, decision
making processes, documentation and information relevant to the output process.
Table 2.1 Quality Definitionsjof Different CategoriesTranscendent Product Manufacturing Consumer Value
Even though quality Differences in Conformance to Fitness fo r use Affordable
cannot be defined, quality amount to specification (Levitt (Juran 1988) excellence
you know what it is differences in the 1972)
(Pirsig 1974). quantity o f some Meeting the The presence o f
desired The degree to which a customer value defined
Quality is a principle ingredients or specific product conforms requirements by the
that encourages attribute ( Abbott. to a design or Oakland (1989) customer.
excellence in 1955) specification Gilmore
everything: products, (1974) Delighting the
strategies, systems, The totality o f customer.
processes, and features and The consistent (Peters&Austin
people ( Bounds et characteristics o f conformance to customer 1985)
al., 1994) a product or expectations. Lew Lehr,
services that bear quoted in Anderson , Meeting or
Fine craftsmanship on its ability to (1988:2-3) exceeding
and a rejection o f satisfy stated or customer
mass production. implied needs. expectations
(Lewis, 1984) ISO, (see Freund
1985)
(Gronroos, 1983)
Quality is the The amounts o f Quality can be defined as The degree o f
goodness or the un priced conformance to conformance o f all
excellence o f attributes specifications fo r output the relevant
something. It is contained in each that is tangible and features and
assessed against unit o f the price standardized. For output characteristics o f
accepted standards attribute. (Leffier, that is customized and the product (or
o f merit fo r such 1982) intangible, quality can be service) to all
things and against defined as the extent to aspects o f a
the interests / needs which the output meets customer's need,
o f users and other and/or exceeds customer limited by the price
stakeholders (Smith, expectations ( Reeves& and delivery he or
1993) Bednar 1994) she will accept.
(Groocock, 1986)
1 8
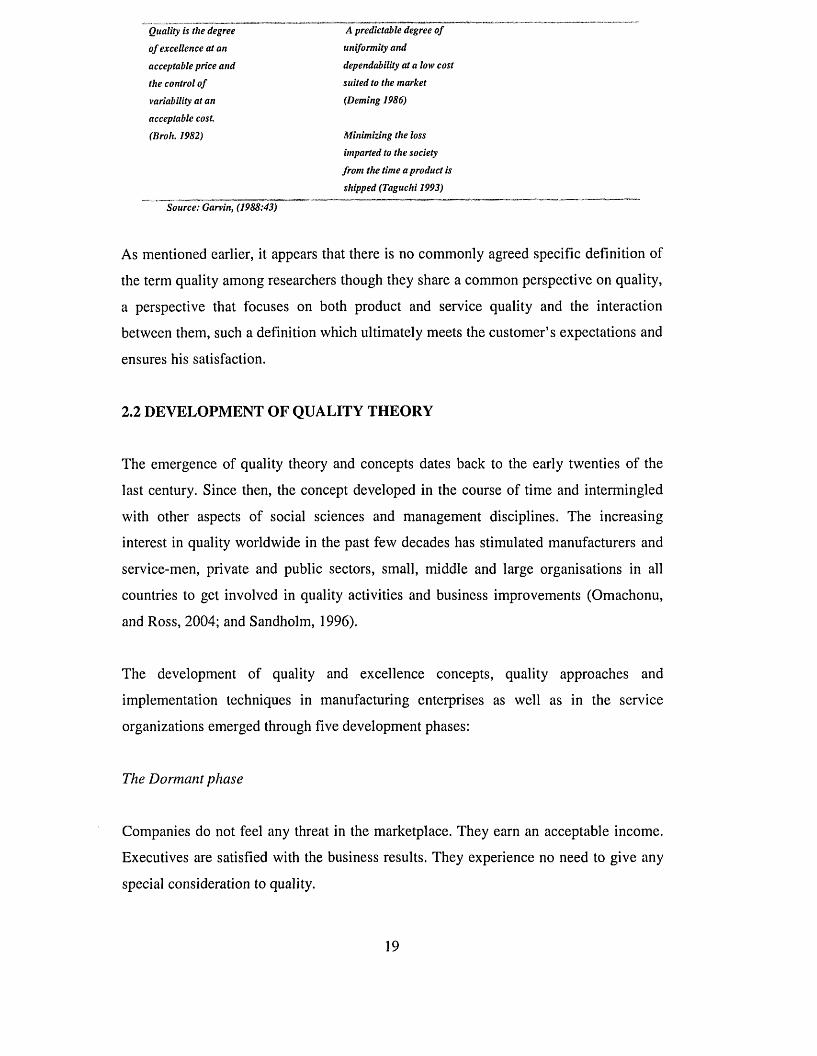
Quality is the degree
o f excellence at an
acceptable price and
the control o f
variability at an
acceptable cost.
(Broh. 1982)
Source: Garvin, (1988:43)
As mentioned earlier, it appears that there is no commonly agreed specific definition of
the term quality among researchers though they share a common perspective on quality,
a perspective that focuses on both product and service quality and the interaction
between them, such a definition which ultimately meets the customer’s expectations and
ensures his satisfaction.
2.2 DEVELOPMENT OF QUALITY THEORY
The emergence of quality theory and concepts dates back to the early twenties of the
last century. Since then, the concept developed in the course of time and intermingled
with other aspects of social sciences and management disciplines. The increasing
interest in quality worldwide in the past few decades has stimulated manufacturers and
service-men, private and public sectors, small, middle and large organisations in all
countries to get involved in quality activities and business improvements (Omachonu,
and Ross, 2004; and Sandholm, 1996).
The development of quality and excellence concepts, quality approaches and
implementation techniques in manufacturing enterprises as well as in the service
organizations emerged through five development phases:
The Dormant phase
Companies do not feel any threat in the marketplace. They earn an acceptable income.
Executives are satisfied with the business results. They experience no need to give any
special consideration to quality.
A predictable degree o f
uniformity and
dependability at a low cost
suited to the market
(Deming 1986)
Minimizing the loss
imparted to the society
from the time a product is
shipped (Taguchi 1993)
19
The Awakening phase
The situation is dramatically changed. Market shares are lost. Income drops. Profit
turns into loss. Executives awake and feel that they are facing a crisis.
The Groping phase
This phase is characterized by trial and error. Upon awakening, executives have
realized that they have to do something in the field of quality, but what they can
specifically do. Fashionable tools and methods are there as a possibility highlighting
aspects in business literature and at management seminars and conferences. Lacking
sound knowledge on managing quality, executives just select whatever presents itself.
The Action phase
Some companies discover that the trendy tools and methods do not lead to excellent
results. They then, embark on carrying out an effective programme for changing the
situation. Such a programme includes a change of the internal culture, as well as
improvements of products and processes.
The Maturity phase
A real sign of maturity is that when quality is no longer discussed in the enterprise. Full
customer satisfaction is realized through integrative processes at all the organizational
levels. The concept of quality applies not only to products, i.e., the goods and services
produced and supplied, but also to all the other supporting activities. A total quality
approach is applied which includes all processes and functions, as well as the
involvement of the organization members, (Sandholm, 1996). Table (2.2) illustrates the
chronological order of quality concept development.
2 0
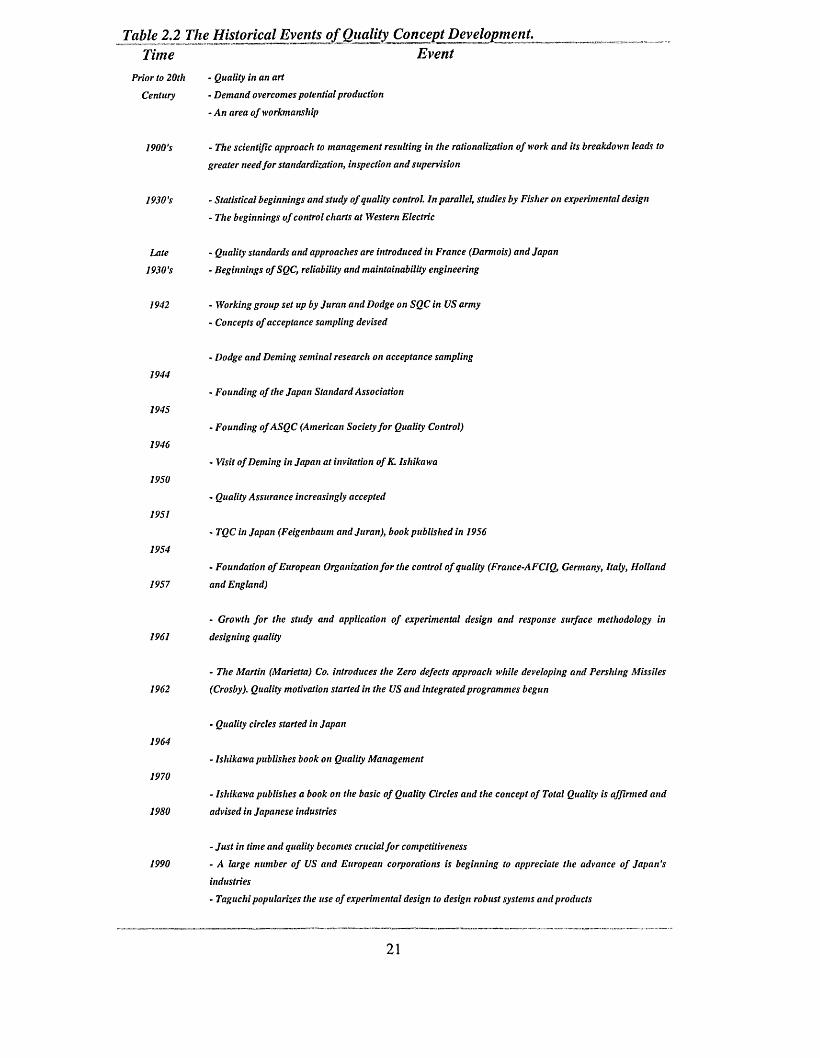
Table 2.2 The Historical Events of Quality Concept Development.Time Event
Prior to 20th - Quality in an art
Century - Demand overcomes potential production
- An area o f workmanship
1900's - The scientific approach to management resulting in the rationalization o f work and its breakdown leads to
greater need fo r standardization, inspection and supervision
1930's - Statistical beginnings and study o f quality control. In parallel, studies by Fisher on experimental design
- The beginnings o f control charts at Western Electric
Late - Quality standards and approaches are introduced in France (Darmois) and Japan
1930's - Beginnings o f SQC, reliability and maintainability engineering
1942 - Working group set up by Juran and Dodge on SQC in US army
- Concepts o f acceptance sampling devised
1944
1945
1946
1950
1951
1954
1964
1970
- Dodge and Deming seminal research on acceptance sampling
- Founding o f the Japan Standard Association
- Founding o f ASQC (American Society fo r Quality Control)
- Visit o f Deming in Japan at invitation o f K. Ishikawa
- Quality Assurance increasingly accepted
• TQC in Japan (Feigenbaum and Juran), book published in 1956
- Foundation o f European Organization fo r the control o f quality (France-AFCIQ, Germany, Italy, Holland
1957 and England)
- Growth fo r the study and application o f experimental design and response surface methodology in
1961 designing quality
- The Martin (Marietta) Co. introduces the Zero defects approach while developing and Pershing Missiles
1962 (Crosby). Quality motivation started in the US and integrated programmes begun
- Quality circles started in Japan
- Ishikawa publishes book on Quality Management
- Ishikawa publishes a book on the basic o f Quality Circles and the concept o f Total Quality is affirmed and
1980 advised in Japanese industries
- Just in time and quality becomes crucial fo r competitiveness
1990 - A large number o f US and European corporations is beginning to appreciate the advance o f Japan's
industries
- Taguchi popularizes the use o f experimental design to design robust systems and products
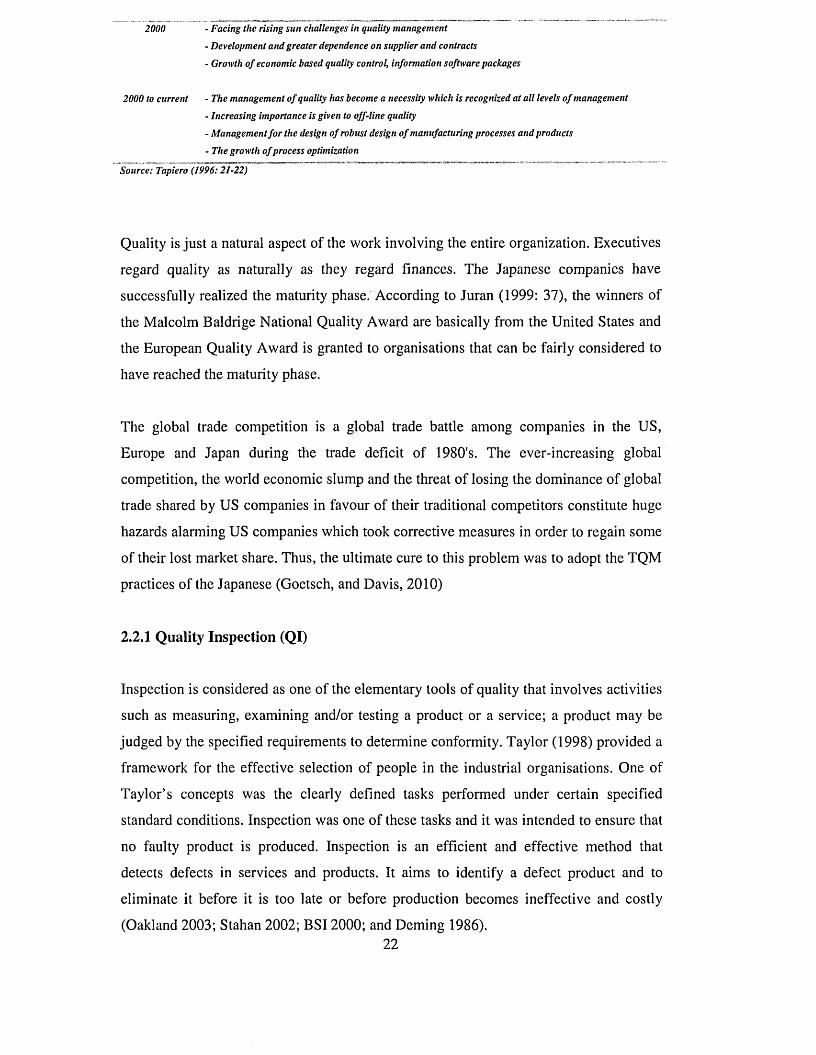
2000 - Facing the rising sun challenges in quality management
- Development and greater dependence on supplier and contracts
- Growth o f economic based quality control, information software packages
2000 to current - The management o f quality has become a necessity which is recognized at all levels o f management
- Increasing importance is given to off-line quality
- Management fo r the design o f robust design o f manufacturing processes and products
- The growth o f process optimization
Source: Tapiero (1996:21-22)
Quality is just a natural aspect of the work involving the entire organization. Executives
regard quality as naturally as they regard finances. The Japanese companies have
successfully realized the maturity phase. According to Juran (1999: 37), the winners of
the Malcolm Baldrige National Quality Award are basically from the United States and
the European Quality Award is granted to organisations that can be fairly considered to
have reached the maturity phase.
The global trade competition is a global trade battle among companies in the US,
Europe and Japan during the trade deficit of 1980's. The ever-increasing global
competition, the world economic slump and the threat of losing the dominance of global
trade shared by US companies in favour of their traditional competitors constitute huge
hazards alarming US companies which took corrective measures in order to regain some
of their lost market share. Thus, the ultimate cure to this problem was to adopt the TQM
practices of the Japanese (Goetsch, and Davis, 2010)
2.2.1 Quality Inspection (QI)
Inspection is considered as one of the elementary tools of quality that involves activities
such as measuring, examining and/or testing a product or a service; a product may be
judged by the specified requirements to determine conformity. Taylor (1998) provided a
framework for the effective selection of people in the industrial organisations. One of
Taylor’s concepts was the clearly defined tasks performed under certain specified
standard conditions. Inspection was one of these tasks and it was intended to ensure that
no faulty product is produced. Inspection is an efficient and effective method that
detects defects in services and products. It aims to identify a defect product and to
eliminate it before it is too late or before production becomes ineffective and costly
(Oakland 2003; Stahan 2002; B SI2000; and Deming 1986).22
However, as industries expanded and the technical problems become frequent, the need
for more effective operations and more skilled workers arose. Inspectors were ordered
to accept defective products to increase output. Skilled workers were promoted to
perform other functions leaving the less skilled workers to carry out the operational jobs
such as manufacturing Boddy (2000) observed that inspection still has an important role
to play in modern quality practices. However, it is no longer seen as the sole answer to
all quality problems. Rather, it is one tool within a wider array. Problems arise
anyway: among them are:
7. Technical problems that require specialised skills often not possessed by
production workers and
2. Inspection problems: inspectors may lack adequate and proper training; they
should also be ordered not to accept defective goods in order to increase output.
(Boddy, 2002)
2.2.2 Quality Control (QC)
Quality control aims at optimizing production; it is based on practices developed in the
Japanese industries. In the beginning, it was part of the concept of quality circles, in
which a team of ten to twenty people were given responsibility for the quality of the
products they produced. It gradually utilized various techniques involving both workers
and managers to maximize productivity and quality. Among these techniques are those
that involve close monitoring of staff and excellent customer service. The concept of
kaizen that considers improvement involves all members of an organisation. Its aim is
to detect and amend problems along the production line to avert the production of
defected products. Quality control is a detective method that organisations have used to
manage quality. Juran (1992) defined quality control as a regulatory process that
measures actual quality performance; he, then contrasted the final products with the
specified standards to determine differences. It is a more sophisticated management tool
that aims at preventing goods and services that do not conform to the basic requirements
from getting to the final consumer. Quality controls are operational techniques and
activities that are used to fulfil quality requirements (ISO, 1994).
23
As a measure of quality, quality control, however, is costly when viewed in terms of
tangible and intangible variable cost. It could also result in the production of
substandard goods and services when applied late in the process of production. Due to
the problems associated with quality control, organisations now focus on other methods
through which quality could be managed effectively (Kelemen, 2003; Evans, and
Lindsay, 2002; and Feigenbaum, 2001).
2.2.3 Quality Assurance (QA)
The principles of Quality assurance (QA) are based on defining the process of
production with a view of a programme for the systematic monitoring and evaluation of
the various aspects of a project, service, or facility to ensure that the standards of quality
are being met. Oakland (2003) defined quality assurance as the broadly prevention of
quality problems through planned and systematic activities.
Dale et al., (2007) affirmed that quality assurance is a prevention based system, which
improves the product and service quality increasing its productivity by placing emphasis
on the product, service and process design. Quality assurance emphasis on defect
prevention is different from quality control that focuses on defect detection once the
item is produced. Preventing the production of a non conforming product is not the
same as the increased emphasis placed on the activities involved in the process of
production. Thus, it is a management technique to control quality at all stages of
production and to avert problems. Quality assurance functions are performed at the
design stage of the products or services.
The concept of quality assurance can be outlined in terms of the following criteria: the
cost effectiveness of a product or service, the enhanced productivity, accuracy and staff
involvement. Effective quality assurance must involve the development of a new
operating philosophy and an approach that seems to be proactive rather than reactive
and that involves motivated and dedicated people in the process across normal
departmental obstacles. (James, 2011; Holmes, 2010; and Sale, 2000)
2 4
2.2.4 Quality Management (QM)
Quality management is the management of the organisation by systematic planning,
measurement and evaluation of performance so that the organization achieves its
objective (Smith et al., 1993, ISO 9000, 2000). Quality management involves the
formulation of strategies, the setting of goals and objectives, the planning and
implementation of plans and the use of control systems for monitoring feedback and
taking corrective actions. The Organisation implements quality management for two
main reasons:
7. To Satisfy the customer's expectation and
2. To improve the overall business efficiency (Dale, et al., 2007)
According to Juran (1992), the basic goal of quality management is the elimination of
failure in the concept, products, services and processes. This does not mean that
products, services, and processes necessarily fail in fulfilling their function but that their
function was not what the customer desires. Failure must be averted in quality
management; to handle this, there should be planning, organization, and control.
2.2.5 Total Quality Management (TQM)
The term ‘total quality’ was used for the first time by Feigenbaum, (1991). It referred to
wider issues within an organisation. Ishikawa, (1991) also discussed ‘total quality
control’ in Japan, which is different from the western idea of total quality. According to
him, total quality control means ‘company-wide quality control’ that involves all
employees in quality control, from top management to the workers. However the term
“TQM” was first introduced by Oakland (2001); he defines it as an approach to improve
the effectiveness and flexibility of business as a whole - quality in all functional area.
The word "total" in “Total Quality Management” means that everyone in the
organization must be involved in the constant improvement effort; "quality" displays the
concern for the customer satisfaction, and "management" refers to the people and
processes needed to achieve that quality.
25
A typical definition of TQM includes phrases such as: the customer focus, the
involvement of all employees, the constant improvement and the integration of quality
management into the total organisation. The definitions given were all similar; thus,
they were confusing. It was not clear what sort of practices, policies, and activities they
involve. (Summers, 2009; Oakland, 2003; Feigenbaum, 2001; Reed, et al, 2000; and
Smith et al, 1993), Figure (2.2) presents the quality evolution from early inspection to
most recent quality excellence.
The core of TQM is the customer-supplier interfaces, both external and internal, and at
each interface, several processes are involved. This must be supported by a commitment
to quality, communication of the quality purposes, and recognition of the need to
change the culture of the organisation to create total quality (Vermeulen, 1997).
Recently, TQM moved from being what some believed to be only a way of competitive
advantage for organisations to survive in the very challenging and changing customer’s
demands, to what others adopt TQM and consider as a fashion and fad. Equally true that
a lot of organisations attribute scepticism about TQM to the length of implementation
procedures. Yet, TQM remains a long and non-stop process, a process and strategy that
in certain situations can improve the organisations effectiveness and efficiency.
TQM places responsibility for quality problems within management rather than on the
employees. A principal concept of TQM is the management process variation, which
seeks to identify special and common needs. The objective of TQM is the continual
improvement of processes, achieved through a shift from outcomes or finished products
to the processes that produce them.
This objective is realized through data collection and analysis, the use of statistical tools
such as: flow charts, histograms, cause and effect diagrams, and other performance
measurements, which are used to interpret and improve processes. These tools are
discussed in further detail in section 2.4.
26
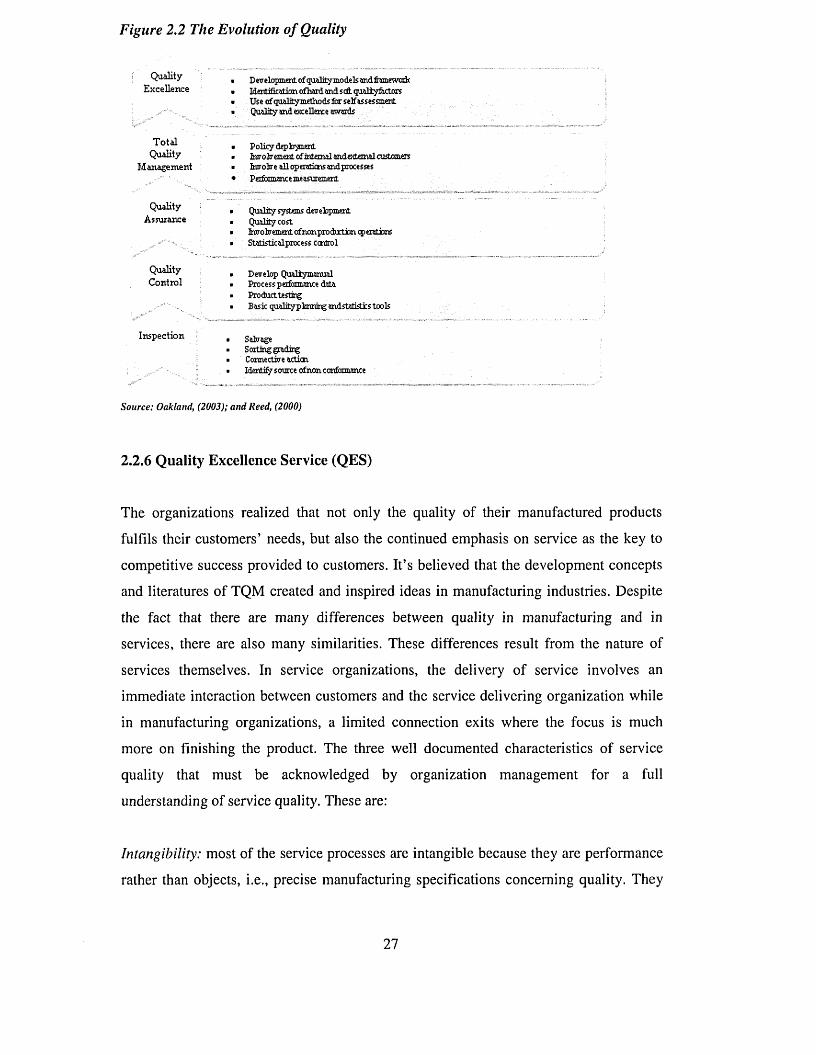
Figure 2.2 The Evolution of Quality
QualityExcellence
Development of quality mode Is andfiamewadt Identification afhard and sdt qualiytactors Use cfqualilymethodsfDirselfessejsment Quality and excellence awards
TotalQuality
Management
Policy deploymentInvolvement of internal and external customers Involve all opeiaticns and processes Performance measurement
QualityAssurance
Quality systems development Quality costInvolvement of non production cperations Statisticalprocess control
QualityControl
Develop Qualiymanual Process performance data Product testingBasic qualitypbnrdrg andstatistics tools
Inspection SalvageSorting gradingConnective actiatIdentify source of non conformance
Source: Oakland, (2003); and Reed, (2000)
2.2.6 Quality Excellence Service (QES)
The organizations realized that not only the quality of their manufactured products
fulfils their customers’ needs, but also the continued emphasis on service as the key to
competitive success provided to customers. It’s believed that the development concepts
and literatures of TQM created and inspired ideas in manufacturing industries. Despite
the fact that there are many differences between quality in manufacturing and in
services, there are also many similarities. These differences result from the nature of
services themselves. In service organizations, the delivery of service involves an
immediate interaction between customers and the service delivering organization while
in manufacturing organizations, a limited connection exits where the focus is much
more on finishing the product. The three well documented characteristics of service
quality that must be acknowledged by organization management for a full
understanding of service quality. These are:
Intangibility: most of the service processes are intangible because they are performance
rather than objects, i.e., precise manufacturing specifications concerning quality. They
27
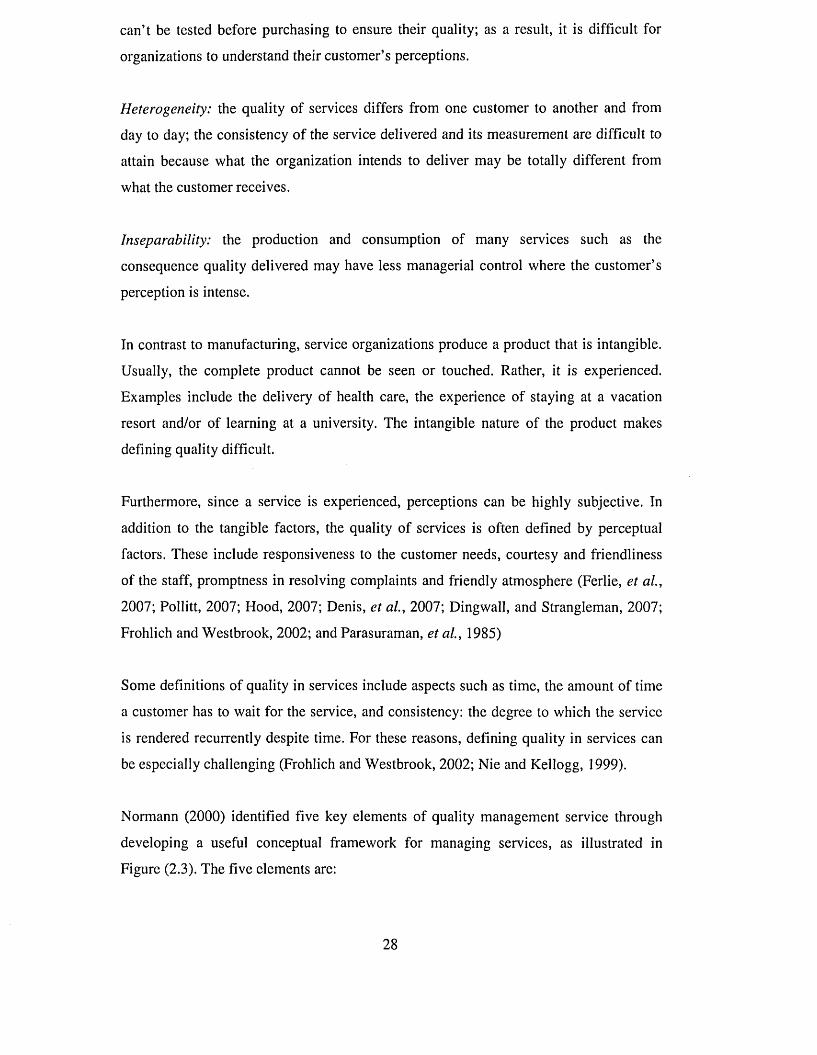
can’t be tested before purchasing to ensure their quality; as a result, it is difficult for
organizations to understand their customer’s perceptions.
Heterogeneity: the quality of services differs from one customer to another and from
day to day; the consistency of the service delivered and its measurement are difficult to
attain because what the organization intends to deliver may be totally different from
what the customer receives.
Inseparability: the production and consumption of many services such as the
consequence quality delivered may have less managerial control where the customer’s
perception is intense.
In contrast to manufacturing, service organizations produce a product that is intangible.
Usually, the complete product cannot be seen or touched. Rather, it is experienced.
Examples include the delivery of health care, the experience of staying at a vacation
resort and/or of learning at a university. The intangible nature of the product makes
defining quality difficult.
Furthermore, since a service is experienced, perceptions can be highly subjective. In
addition to the tangible factors, the quality of services is often defined by perceptual
factors. These include responsiveness to the customer needs, courtesy and friendliness
of the staff, promptness in resolving complaints and friendly atmosphere (Ferlie, et al.,
2007; Pollitt, 2007; Hood, 2007; Denis, et al., 2007; Dingwall, and Strangleman, 2007;
Frohlich and Westbrook, 2002; and Parasuraman, et al., 1985)
Some definitions of quality in services include aspects such as time, the amount of time
a customer has to wait for the service, and consistency: the degree to which the service
is rendered recurrently despite time. For these reasons, defining quality in services can
be especially challenging (Frohlich and Westbrook, 2002; Nie and Kellogg, 1999).
Normann (2000) identified five key elements of quality management service through
developing a useful conceptual framework for managing services, as illustrated in
Figure (2.3). The five elements are:
2 8
1- The market segment that demonstrates the specifically designed service for a
particular customer.
2- The service concept that combines the benefits to be delivered to customers; some of
these benefits are tangible and others are intangible. The concepts are categorised as
core and peripheral; some services are easy to measure and others are quite difficult to
quantify.
3- The service delivery system that describes the systematisation and the different roles
of stakeholders in delivering services. The role of people in the system and the level of
involvement and motivation they perceive. The role of customers' expectations in the
service process along with the other physical elements involved in service delivery.
4- The image o f the service that depends on what the management and the whole
organisation actually do; it is considered as a tool whereby management can influence
the perceptions that people, customers and other stakeholders involved have about the
organisation
5- The culture and philosophy that refer to the method, by means of which the social
process leading to the delivery of services is controlled, maintained and developed.
Figure 2.3 Five Key Elements o f Quality Management Service
TheM arketSegment
TheServiceConcept
The Culture And
Philosophy
TheDeliverySystem
Source: Normann (2000)
29
TQM has proven to be very successful and promising in the manufacturing industry. It
has been said that TQM can be equally applicable with success in the service industry.
But, due to the distinctive nature of service organisations, the application and success of
TQM have been limited to administrative and other supportive functions only in most
service organizations. In fact, the statement made by TQM experts that TQM can be
successfully applied in every organization is based on two implicit but important
assumptions:
• The hierarchical control dominance o f management over the technical processes
and
• The dominance o f rational decision-making processes
Most service organizations head off largely from those two assumptions (Prajogo, and
Sohal, 2006). TQM encompasses a number of strategies designed to improve quality
and reduce costs. These strategies include:
• Identifying and meeting customer needs;
• Reducing the cost o f non-compliance with standards;
• Striving for zero defects;
• Reducing outcome variability;
• Using statistical methods to identify and monitor processes (Terziovski and
Samson 2000)
Williams, et al., (2004) presented three scenarios on why TQM became again a top
management issue; he addressed that in the past couple of years organization and
mainly the CEO’s and top management that shifted their attention in quality approaches
toward Six sigma as a new tool for combining the improvement efforts and defects
reductions with the organizations overall corporate strategies. They argue for the return
of top management to TQM due to three scenarios: first, the growing pressure because
of the use of the Internet to create excellence at the operational level; second, they think
TQM is able to bridge the gap towards increasing demand for improved measures of the
performance of companies; third, increasing the number of networked organizations that
need them to stick together with common shared values.
30
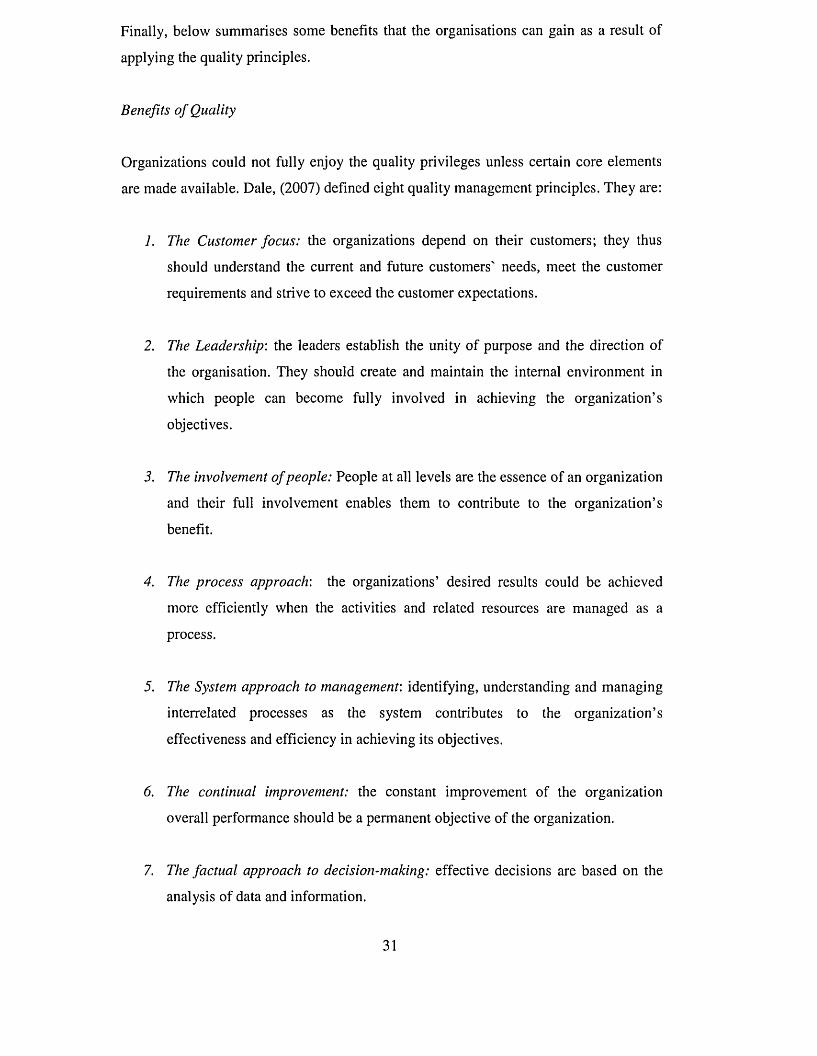
Finally, below summarises some benefits that the organisations can gain as a result of
applying the quality principles.
Benefits o f Quality
Organizations could not fully enjoy the quality privileges unless certain core elements
are made available. Dale, (2007) defined eight quality management principles. They are:
1. The Customer focus: the organizations depend on their customers; they thus
should understand the current and future customers' needs, meet the customer
requirements and strive to exceed the customer expectations.
2. The Leadership: the leaders establish the unity of purpose and the direction of
the organisation. They should create and maintain the internal environment in
which people can become fully involved in achieving the organization’s
objectives.
3. The involvement o f people: People at all levels are the essence of an organization
and their full involvement enables them to contribute to the organization’s
benefit.
4. The process approach’, the organizations’ desired results could be achieved
more efficiently when the activities and related resources are managed as a
process.
5. The System approach to management', identifying, understanding and managing
interrelated processes as the system contributes to the organization’s
effectiveness and efficiency in achieving its objectives.
6. The continual improvement: the constant improvement of the organization
overall performance should be a permanent objective of the organization.
7. The factual approach to decision-making: effective decisions are based on the
analysis of data and information.
3 1
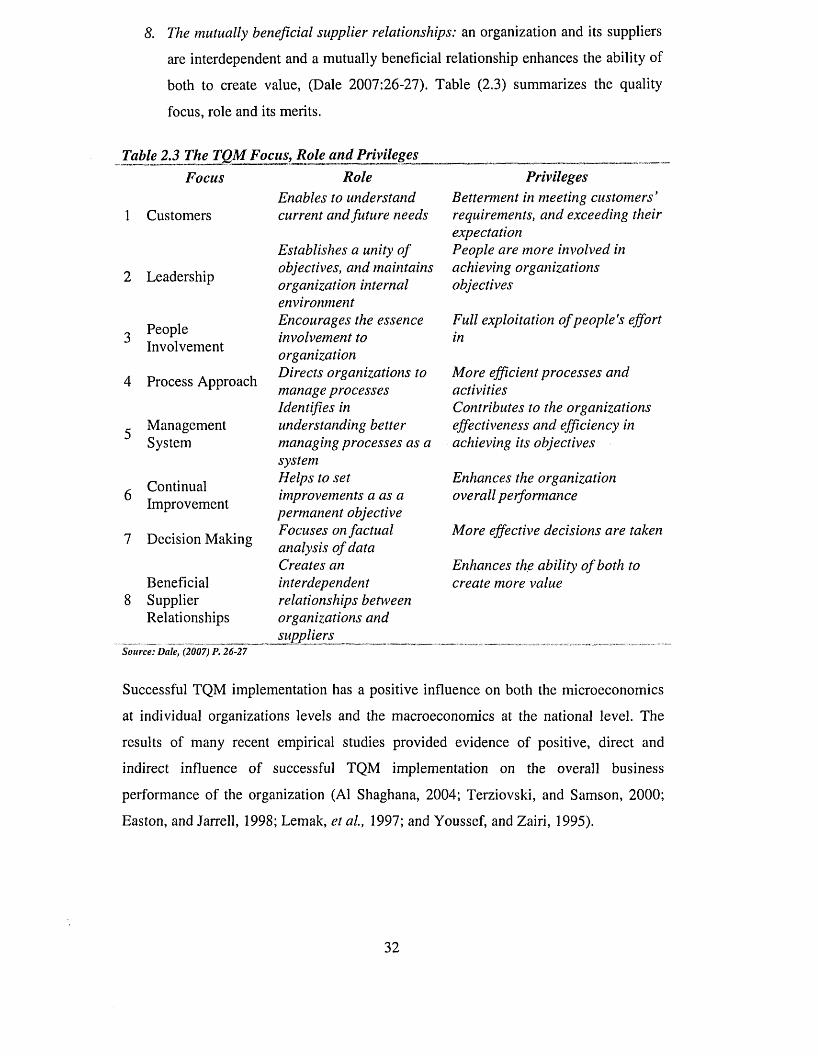
8. The mutually beneficial supplier relationships: an organization and its suppliers
are interdependent and a mutually beneficial relationship enhances the ability of
both to create value, (Dale 2007:26-27). Table (2.3) summarizes the quality
focus, role and its merits.
Table 2.3 The TQM Focus, Role and PrivilegesFocus
1 Customers
2 Leadership
People Involvement
4 Process Approach
ManagementSystem
g Continual Improvement
7 Decision Making
Beneficial8 Supplier
Relationships
Source: Dale, (2007) P.'26-27 "
RoleEnables to understand current and future needs
Establishes a unity of objectives, and maintains organization internal environment Encourages the essence involvement to organization Directs organizations to manage processes Identifies in understanding better managing processes as a system Helps to set improvements a as a permanent objective Focuses on factual analysis o f data Creates an interdependent relationships between organizations and suppliers
PrivilegesBetterment in meeting customers’ requirements, and exceeding their expectationPeople are more involved in achieving organizations objectives
Full exploitation o f people's effort in
More efficient processes and activitiesContributes to the organizations effectiveness and efficiency in achieving its objectives
Enhances the organization overall performance
More effective decisions are taken
Enhances the ability o f both to create more value
Successful TQM implementation has a positive influence on both the microeconomics
at individual organizations levels and the macroeconomics at the national level. The
results of many recent empirical studies provided evidence of positive, direct and
indirect influence of successful TQM implementation on the overall business
performance of the organization (Al Shaghana, 2004; Terziovski, and Samson, 2000;
Easton, and Jarrell, 1998; Lemak, et al, 1997; and Youssef, and Zairi, 1995).
3 2
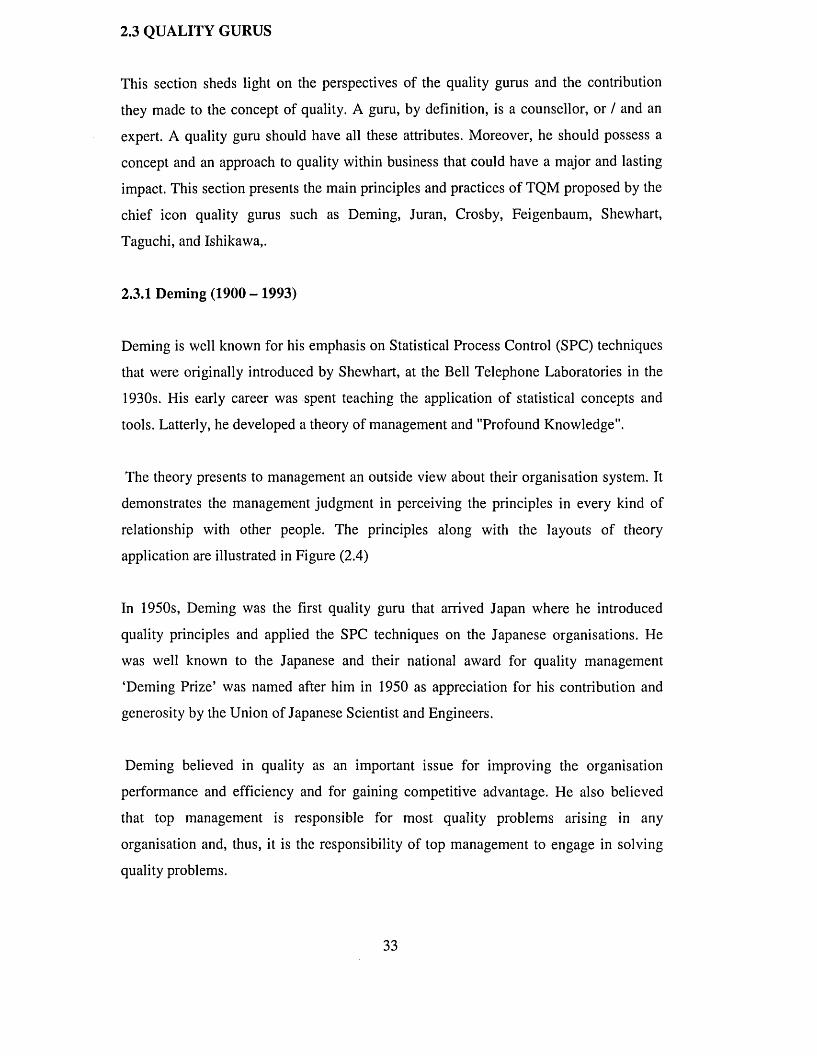
2.3 QUALITY GURUS
This section sheds light on the perspectives of the quality gurus and the contribution
they made to the concept of quality. A guru, by definition, is a counsellor, or / and an
expert. A quality guru should have all these attributes. Moreover, he should possess a
concept and an approach to quality within business that could have a major and lasting
impact. This section presents the main principles and practices of TQM proposed by the
chief icon quality gurus such as Deming, Juran, Crosby, Feigenbaum, Shewhart,
Taguchi, and Ishikawa,.
2.3.1 Deming (1900 -1993)
Deming is well known for his emphasis on Statistical Process Control (SPC) techniques
that were originally introduced by Shewhart, at the Bell Telephone Laboratories in the
1930s. His early career was spent teaching the application of statistical concepts and
tools. Latterly, he developed a theory of management and "Profound Knowledge".
The theory presents to management an outside view about their organisation system. It
demonstrates the management judgment in perceiving the principles in every kind of
relationship with other people. The principles along with the layouts of theory
application are illustrated in Figure (2.4)
In 1950s, Deming was the first quality guru that arrived Japan where he introduced
quality principles and applied the SPC techniques on the Japanese organisations. He
was well known to the Japanese and their national award for quality management
‘Deming Prize’ was named after him in 1950 as appreciation for his contribution and
generosity by the Union of Japanese Scientist and Engineers.
Deming believed in quality as an important issue for improving the organisation
performance and efficiency and for gaining competitive advantage. He also believed
that top management is responsible for most quality problems arising in any
organisation and, thus, it is the responsibility of top management to engage in solving
quality problems.
33
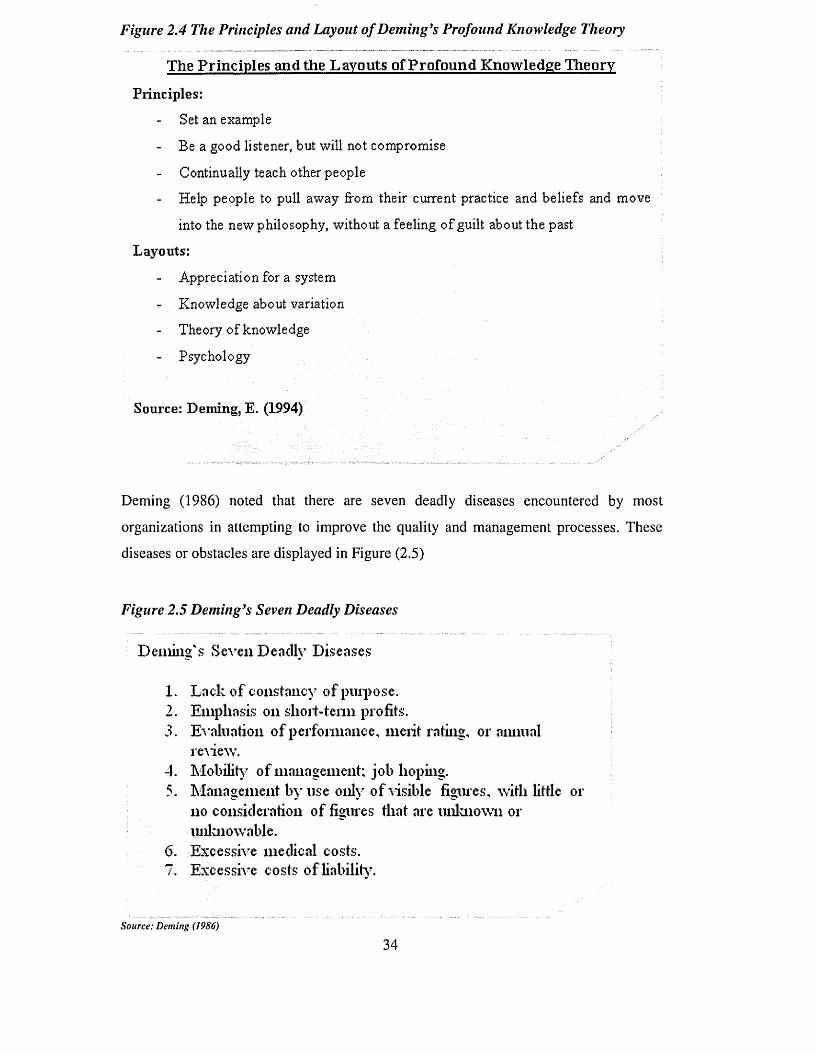
Figure 2.4 The Principles and Layout of Deming’s Profound Knowledge Theory
The Principles and the Layouts of Profound Knowledge Theory
Principles:
Set an example
- Be a good listener, but will not compromise
C ontinu ally te ac h o ther p e op 1 e
- Help people to pull away from their current practice and beliefs and move
into the new philosophy, without a feeling of guilt about the past
Layouts:
- Appreciation for a system
- Knowledge about variation
- Theory of knowledge
- Psychology
Source: Deming, E. (1994)
Deming (1986) noted that there are seven deadly diseases encountered by most
organizations in attempting to improve the quality and management processes. These
diseases or obstacles are displayed in Figure (2.5)
Figure 2.5 Deming’s Seven Deadly Diseases
Dealing's Seven Deadly Diseases
1. Lack of constancy of puipose.2. Emphasis on short-term profits.3. Evaluation of performance, merit rating, or annual
re\ie\v.4. Mobility of management; job hoping.5. Management by use only of visible figures, with little or
no consideration of figures that are unknown or unknowable.
6. Excessive medical costs.7. Excessive costs of liability7.
Source: Deming (1986)
3 4
In 1986, Deming presented in his book ‘Out of Crises’ the fourteen points of
management, which serve as guideline for management if they intend to stay in the
business. He claims that these points are applicable anywhere in manufacturing or in
service industry, to large organisations as well as small ones; these points are:
1. Create constancy o f purpose toward the improvement o f product and service.
2. Adopt the new philosophy.
3. Cease dependence on inspection to achieve quality.
4. End the practice o f awarding business on the basis o f price tag. Instead,
minimise total cost.
5. Improve constantly and forever the system of production and service to advance
quality and productivity, and thus constantly decrease costs.
6. Institute training on the job.
7. Institute leadership.
8. Drive out fear, so that everyone may work effectively for the company.
9. Break down barriers between departments.
10. Eliminate slogans, exhortations, and targets for the workforce asking for zero
defects and new levels o f productivity.
11. Eliminate work standards. Eliminate management by objective. Eliminate
management by numbers or numerical goals. Substitute leadership.
12. Remove barriers that rob people o f their right to pride o f workmanship.
13. Institute a vigorous programme of education and self improvement.
14. Put everybody in the company to work to accomplish the transformation. The
transformation is everybody’s job.
Deming also emphasized the importance of identification and measurement of customer
requirements, the creation of supplier partnership, the use of functional teams to identify
and solve quality problems, the enhancement of employee skills, the participation of
employees, and the pursuit of continuous improvement. As a tool for quality and
management improvement, Deming recommended a systemic approach to problem
solving that is widely known as Plan-Do-Check-Act (PDCA) Cycle or Deming’s Cycle.
The cycle was originally developed by Shewhart and later modified by Deming. See
Figure (2.6).
35
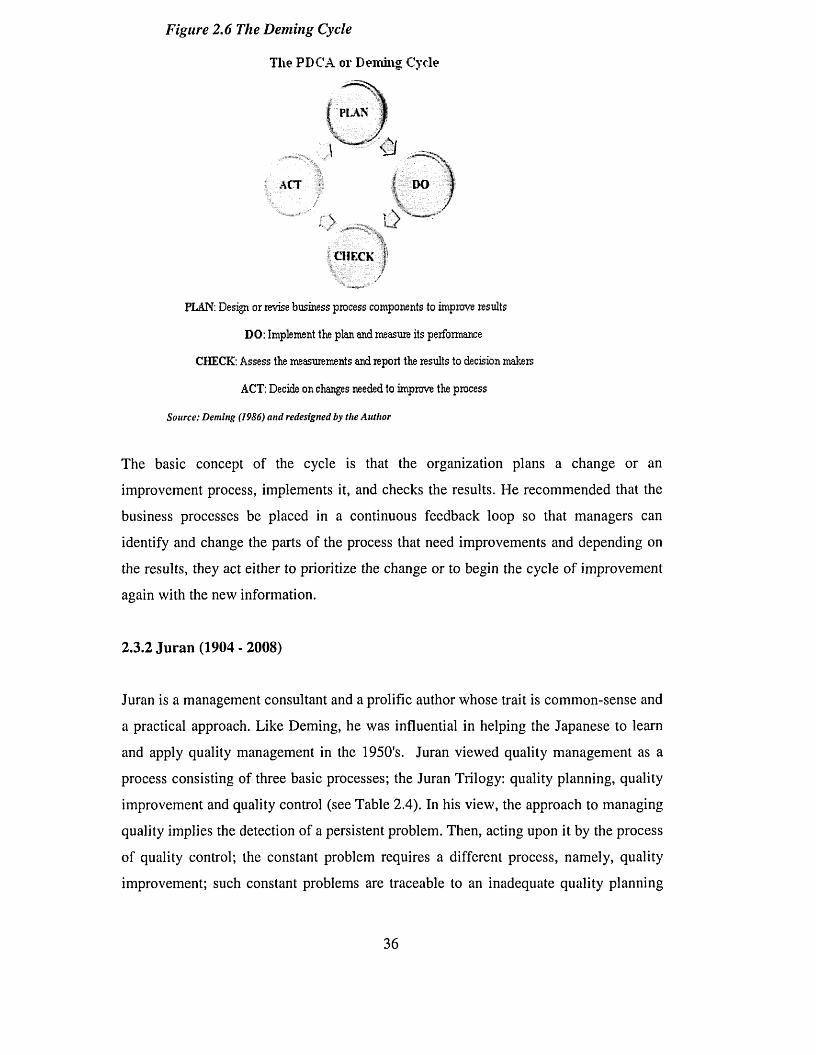
Figure 2.6 The Deming Cycle
The PDCA or Deming Cycle
CHECK |'V.: /'
PLAN: Design or revise business process components to improve results
DO: Implement the plan and measure its performance
CHECK: Assess the measurements and report the results to decision makers
ACT: Decide on changes needed to improve the process
Source: Deming (1986) and redesigned by the Author
The basic concept of the cycle is that the organization plans a change or an
improvement process, implements it, and checks the results. He recommended that the
business processes be placed in a continuous feedback loop so that managers can
identify and change the parts of the process that need improvements and depending on
the results, they act either to prioritize the change or to begin the cycle of improvement
again with the new information.
2.3.2 Juran (1904 - 2008)
Juran is a management consultant and a prolific author whose trait is common-sense and
a practical approach. Like Deming, he was influential in helping the Japanese to learn
and apply quality management in the 1950’s. Juran viewed quality management as a
process consisting of three basic processes; the Juran Trilogy: quality planning, quality
improvement and quality control (see Table 2.4). In his view, the approach to managing
quality implies the detection of a persistent problem. Then, acting upon it by the process
of quality control; the constant problem requires a different process, namely, quality
improvement; such constant problems are traceable to an inadequate quality planning
36
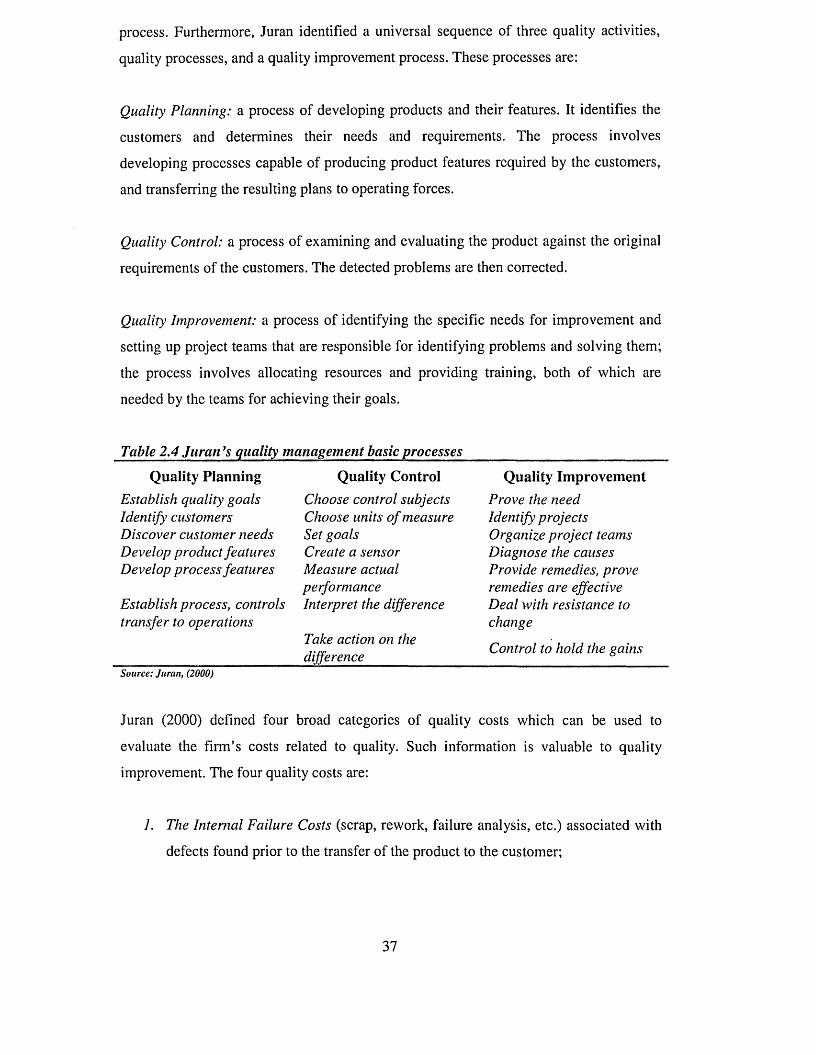
process. Furthermore, Juran identified a universal sequence of three quality activities,
quality processes, and a quality improvement process. These processes are:
Quality Planning: a process of developing products and their features. It identifies the
customers and determines their needs and requirements. The process involves
developing processes capable of producing product features required by the customers,
and transferring the resulting plans to operating forces.
Quality Control: a process of examining and evaluating the product against the original
requirements of the customers. The detected problems are then corrected.
Quality Improvement: a process of identifying the specific needs for improvement and
setting up project teams that are responsible for identifying problems and solving them;
the process involves allocating resources and providing training, both of which are
needed by the teams for achieving their goals.
Table 2.4 Juran’s quality management basic processes
Quality PlanningEstablish quality goals Identify customers Discover customer needs Develop product features Develop process features
Establish process, controls transfer to operations
Quality ControlChoose control subjects Choose units o f measure Set goals Create a sensor Measure actual performance Interpret the difference
Take action on the difference______
Quality ImprovementProve the need Identify projects Organize project teams Diagnose the causes Provide remedies, prove remedies are effective Deal with resistance to change
Control to hold the gainsSource: Juran, (2000)
Juran (2000) defined four broad categories of quality costs which can be used to
evaluate the firm’s costs related to quality. Such information is valuable to quality
improvement. The four quality costs are:
7. The Internal Failure Costs (scrap, rework, failure analysis, etc.) associated with
defects found prior to the transfer of the product to the customer;
37
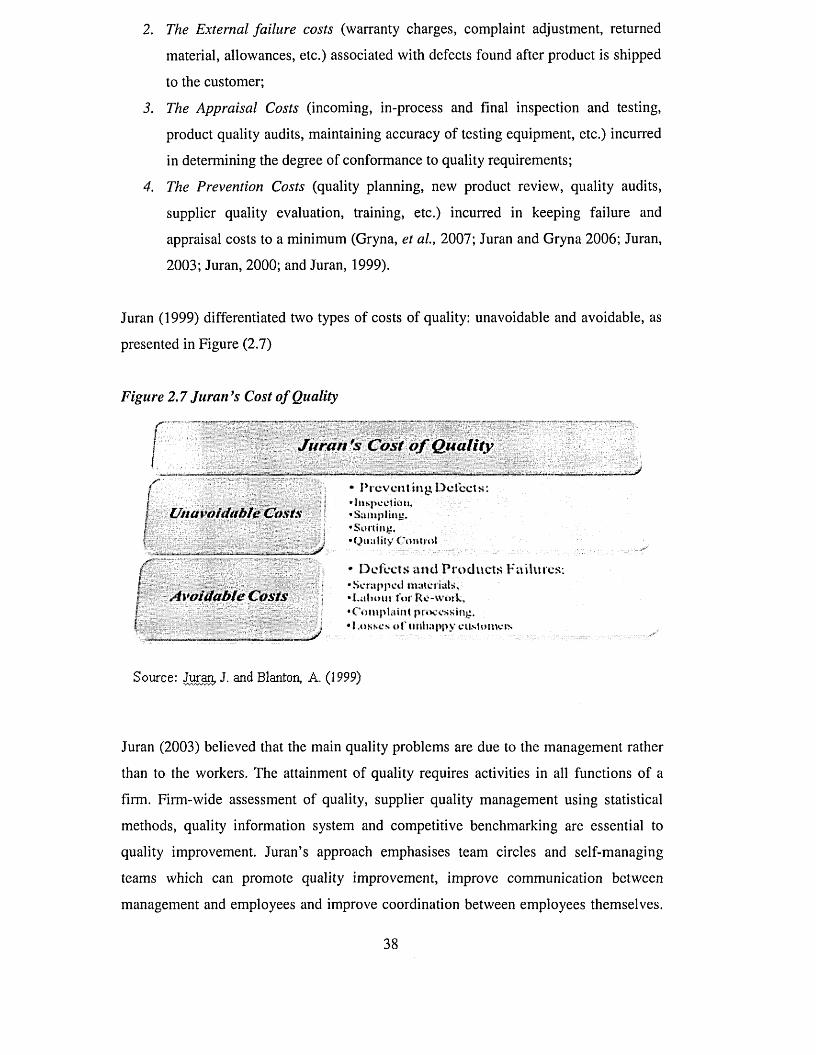
2. The External failure costs (warranty charges, complaint adjustment, returned
material, allowances, etc.) associated with defects found after product is shipped
to the customer;
3. The Appraisal Costs (incoming, in-process and final inspection and testing,
product quality audits, maintaining accuracy of testing equipment, etc.) incurred
in determining the degree of conformance to quality requirements;
4. The Prevention Costs (quality planning, new product review, quality audits,
supplier quality evaluation, training, etc.) incurred in keeping failure and
appraisal costs to a minimum (Gryna, et al., 2007; Juran and Gryna 2006; Juran,
2003; Juran, 2000; and Juran, 1999).
Juran (1999) differentiated two types of costs of quality: unavoidable and avoidable, as
presented in Figure (2.7)
Figure 2.7 Juran’s Cost of Quality
I Juran *s Cost o f Q uality
f • Preventing Detects:| * Jnspcc tum .i Unavoidable Costs \ «s a m p l i n g .| . ’Sorting.i ; • Q u a l i ty C o n tr o l
* Defects and Products Failures.f ; *Scruppcd m a te r ia ls ,| Avoidable Costs •L a b o u r fur R e-vvork ,I •Conipl unt processing,I . *Loss< N il unhappy eu.s1 outers
........
Source: Jurmi, J. and Blanton, A. (1999)
Juran (2003) believed that the main quality problems are due to the management rather
than to the workers. The attainment of quality requires activities in all functions of a
firm. Firm-wide assessment of quality, supplier quality management using statistical
methods, quality information system and competitive benchmarking are essential to
quality improvement. Juran’s approach emphasises team circles and self-managing
teams which can promote quality improvement, improve communication between
management and employees and improve coordination between employees themselves.
3 8
Juran, and Blanton, (2000) proposed ten point plan as an approach to quality and
management process improvement
1. Create awareness o f the quality crisis; the role o f quality planning in that crisis;
and the need to revise the approach to quality planning.
2. Establish a new approach to quality planning.
3. Provide training in how to plan for quality, using the new approach.
4. Assist company personnel to re-plan those existing processes which contain
unacceptable quality deficiencies (March right through the company).
5. Assist company personnel to acquire mastery over the quality planning process,
a mastery derived from re-planning existing processes and from the associated
training.
6. Assist company personnel to use the resulting mastery to plan for quality in
ways that avoid creation o f new chronic problems.
7. Establish specific goals to be reached.
8. Establish plans for reaching the goals.
9. Assign clear responsibility for meeting the goals.
10. Base the rewards on results achieved
The Juran Management System (JMS) is a comprehensive business management system
that incorporates lessons learned from over 50 years of research and study. It is a system
that began in Toyota Company in the 1950s and has continued to evolve over many
decades (Juran 2003). The JMS focuses on changing the culture of an enterprise. It
empowers the employees to:
7. Be proactive in understanding the customer needs and in satisfying them
2. Provide high quality services and products to customer, while improving
efficiency. The JMS enables an organisation to improve quality while
simultaneously reducing costs
3. Become information-driven and solve problems faster with data
4. Stay involved in meeting the customer needs.
5. View management as a quality leader.
6. Reduce the costs o f non-performing processes.
39
Juran has written and edited a number of authoritative books and countless articles. He
is also the founder of the Juran Institute that helps organizations around the world
respond to the emerging needs of businesses and society. The Juran Institute is a
benchmarking, consulting, and training service firm that helps organizations implement
performance excellence programmes. (Gryna, et al., 2007)
2.3.3 Crosby (1926-2001)
Crosby began his career as a quality manager; he is well known by introducing the
concept of "Zero defects", in his best seller book “Quality is Free”. As a result of his
contribution and accumulated experience, he established Crosby’s quality consultancy
and training centre. One of the key features of Crosby's approach is the use of financial
indicators of waste (e.g. the cost of poor quality) to capture management's attention.
Emphasis is placed on prevention rather than on after-the-event inspection doing things
right the first time
Crosby (1979) describes quality as the result of a carefully constructed cultural
environment. It has to be the fabric of the organization, not part of the fabric. He
opposed other quality gurus when he observed that ‘quality has to be caused, not
controlled’; he deems that management should take prime responsibility for quality and
that only workers follow their managers’ example. He defined Four Absolutes of
Quality Management.
The First Absolute: the definition of quality should be in conformance with the
requirements, not with goodness
The Second Absolute: the system for causing quality is preventive not appraisal.
The Third Absolute: the performance standard must be zero defects, not that it is close
enough
The Fourth Absolute: the measurement of quality is the price of non-conformance, not
the indexes as presented in Figure (2.8).
40
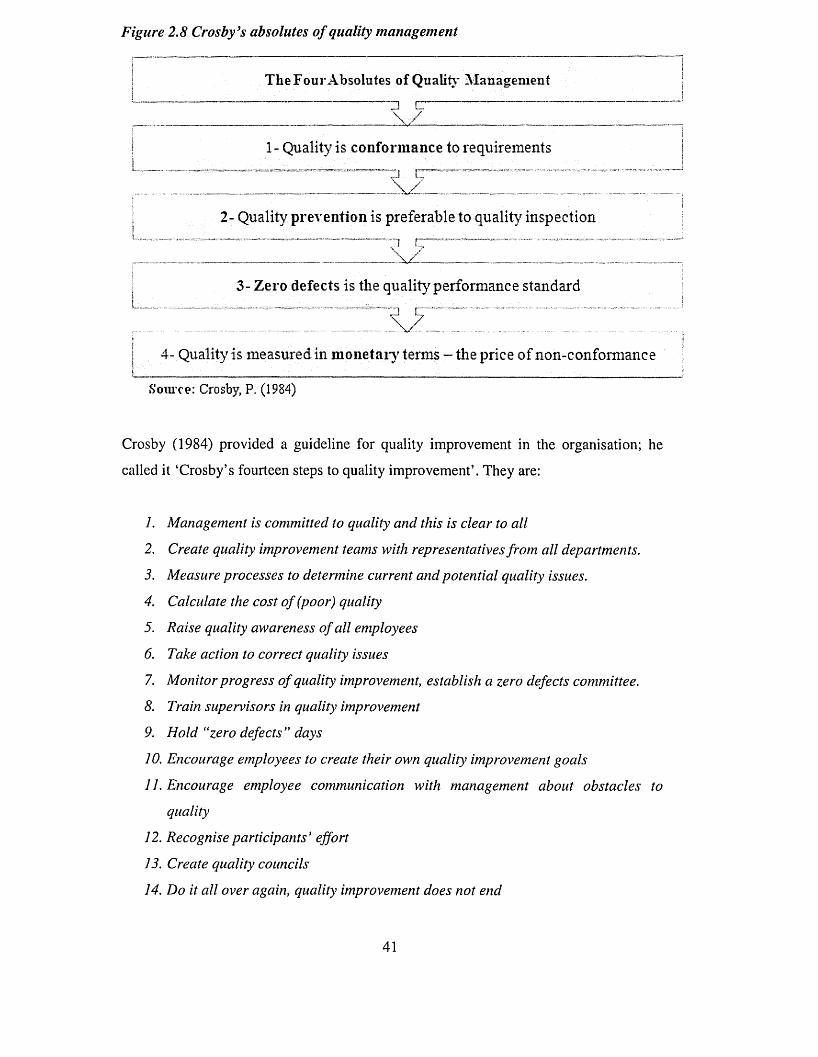
Figure 2.8 Crosby’s absolutes of quality management
! The Four Absolutes of Qualify Managementi' 1 ” ■ ' ' ■ cr ~\ / \ , ,/___________________________
| 1 - Quality is conformance to requirements
i 2- Quality prevention is preferable to quality inspectioni
3- Zero defects is the quality performance standardI"
j 4- Quality is measured in monetary terms - the price of non-conformance
Source: Crosby, P. (1984)
Crosby (1984) provided a guideline for quality improvement in the organisation; he
called it ‘Crosby’s fourteen steps to quality improvement’. They are:
1. Management is committed to quality and this is clear to all
2. Create quality improvement teams with representatives from all departments.
3. Measure processes to determine current and potential quality issues.
4. Calculate the cost o f (poor) quality
5. Raise quality awareness o f all employees
6. Take action to correct quality issues
7. Monitor progress o f quality improvement, establish a zero defects committee.
8. Train supervisors in quality improvement
9. Hold “zero defects ” days
10. Encourage employees to create their own quality improvement goals
11. Encourage employee communication with management about obstacles to
quality
12. Recognise participants’ effort
13. Create quality councils
14. Do it all over again, quality improvement does not end
41
Crosby’s book ‘Quality without Tears’ introduced his famous concept of the
vaccination serum ingredients. The vaccine is explained as a medicine for management
to prevent poor quality. It falls in five sections that cover the requirements of Total
Quality Management.
Section One: Integrity: Treat quality seriously throughout the whole business
organisation from top to bottom; i.e., the organisation’s future will be measured on the
bases of its performance on quality.
Section Two: Systems: Appropriate measures and systems should be put in place for
quality costs, education, quality, performance, review, improvement, and customer
satisfaction.
Section Three: Communication: The communication systems are of paramount
importance since they are utilized to communicate requirements, specifications and
improvement opportunities around the organisation. Customers and operators know
what needs to be put in place in order to improve the business; listening to them will
yield better results.
Section Four: Operations: Working with and developing suppliers; the processes
should be potential and improving culture should be the norm.
Section Five: Policies: the policies must be clear and consistent throughout the
business.
Crosby (1984) also stressed the importance of management style to successful quality
improvement. He broadened his approach to include wider improvement ideals. He
defined them as:
The Five characteristics o f an “Eternally Successful Organisation”
1. People routinely do things right first time
2. Change is anticipated and used to advantage
3. Growth is consistent and profitable
4. New products and services appear when needed
5. Everyone is happy to work there4 2
2.3.4 Feigenbaum (Born in 1922)
Feigenbaum is also considered one of the quality gurus that have made a significant
contribution to the development of the quality management concepts. His contribution
is observable in introducing the concept of Total Quality Control; thus, he published his
book that holds the same title, “The Approach to Quality and Profitability”; it has
profoundly influenced management strategy in the global markets competition.
Feigenbaum (1991:6) defines Total Quality Control as an effective system for
integrating quality development, quality maintenance and quality improvement efforts
of the various groups in an organization so as to enable production and service at the
most economical levels which ensure full customer satisfaction. He considers quality as
a business method and proposed three steps to quality:
• Quality leadership
• Modern quality technology
• Organisational commitment
In his book, Feigenbaum's aim is to integrate the organisation quality development with
the most recent business practices and with the TQM methods in order to improve
productivity and to secure the quantifiable customer’s satisfaction and retention. His
emphasis on generating quality products and service organisations culminates in
building a total quality system, exploring the factors that control the quality by
explaining the functions of quality control. Feigenbaum (2001) notices that in
understanding the mechanisms of total quality control, the organisations ought to
organise themselves utilizing quality management strategies, achieve total commitment
to quality, introduce and practice quality engineering technology and make use of the
statistical technology of quality (Feigenbaum and Feigenbaum, 2003). Feigenbaum
(1986) introduced nine fundamental factors affecting quality in today’s businesses; they
must be met by the corresponding strong programmes for quality control. These are:
1. Markets: Since today’s markets are becoming broader in scope, more
functionally specialised in the goods and services offered and globalised
resulting in competition and a variety of choices for customers, business must be
highly flexible and capable of changing direction rapidly.43
2. Money: Quality costs associated with maintenance rework and quality
improvement resulting in management focus on the quality cost area as one of
the “soft spots” via which operating costs and losses can be decreased to
improve profits.
3. Management: Managing quality becomes an organisation-wide responsibility
which results in an increased load on top management officials, particularly the
increased difficulty of allocating appropriate responsibility for correcting
departures from quality standards
4. Men: The great demand for workers with specialised knowledge results in
breaking the responsibility for quality into a number of pieces
5. Motivation: The human motivational aspects have led to an unparalleled need
for education and training in quality methods, tools, and techniques and
improved communication of quality awareness
6. Materials: The production costs and quality requirements resulted in stricter
material specifications and in the use of highly specialised laboratory machines
as tools for quality measurement
7. Machines and Mechanization: Cost reduction and increased production volumes
have forced companies to use modem and complex manufacturing equipment
8. Modem Information Methods: The information technologies have provided the
means for an unmatched level of control of machines and processes and have
made available to management more helpful, precise, timely, and prognostic
information upon which to base the decisions that guide the future of a business
9. Mounting Product Requirements: Higher performance requirements for products
has emphasised the importance of product safety and reliability; thus constant
attention must be given to ensure that no factors interfere to reduce the reliability
of the components or the systems.
4 4
Feigenbaum is also known for his concept of the “hidden plant“: in every factory, extra
work is performed in correcting defects and mistakes; thus, efforts are wasted through
not getting it right first time; that is there is a hidden plant within any factory
(Feigenbaum and Feigenbaum, 2009). In describing his approach to quality,
Feigenbaum, points out that organization quality is everyone’s job. Thus, quality
improvement leads to improvement throughout the organisation. He claims that today
organisations are having too many isolated quality initiatives and that organisation did
not understand that quality is a management style. The organisations must provide
sufficient quality infrastructure that supports both the work quality of the individual and
the teamwork between organisation departments.
2.3.5 Shewhart (1891-1967)
Shewhart is considered the father of Statistical Process Control (SPC). He worked in
Bell Laboratories and was engaged in a search for the practical methods of quality
control for the emerging telephone industry, which required mass production on a huge
scale. His ideas, published in the 1930's, formed the basis for a process oriented
approach to quality control viewing any recurrent activity as a process and using
statistics to understand and manage the variations that always occur.
2.3.6 Ishikawa (1915-1989)
Ishikawa is one of the famous Japanese quality gurus. The remarkable success of
quality initiatives and quality improvement of the Japanese products are due to him and
in gratitude to his contribution, the Japanese awarded him the nickname of the father of
the Japan quality efforts. In 1952, he introduced the term “Company Wide Quality
Control” (CWQC). His aim was to remove confusion and to make differentiation
between the Japanese style quality control approach and the American one. Ishikawa
(1991) describes his approach as one that relies on management that respects the
humanity aspects of people. Ishikawa believes that the organisation top management
should know that employees play a vital role in contributing to the success of the
organisation by empowering their involvement taking into account their suggestions and
creative ideas.
45
The CWQC involves the participation of the people of an organisation from the top to
the bottom and from the start to the finish of the product life cycle.
Ishikawa (1990) emphasised the need for all employees in any organisation to
understand the concept of the CWQC used to analyse problems and develop
improvements. The organisations should train them in the seven basic tools of quality,
he described:
1. Pareto analysis which concerns the big problems
2. Cause and effect diagram: what causes the problems
3. Stratification: how the data is made up
4. Check sheets: how often it occurs or is done
5. Histograms: what overall variations look like
6. Scatter charts: what the relationships between factors are
7. Process control charts: which variations to control and how
In order to enhance the techniques of CWQC, Ishikawa (1990) introduced the concept
of Quality Circles (QC) as a tool that enables organisation to encourage and motivate
their employee’s involvement and contribution to the problem solving. Later, this
concept was accepted worldwide by western organisations. The quality circle aims to
support employees to form informal meetings discussing what causes problems to occur
and set strategies to solving it.
Furthermore, in order to encourage people to understand this concept and practice,
Ishikawa develops the well known concept of the fishbone shaped diagram; also known
as the Ishikawa or the cause and effect diagram (see Figure 2.9).
The diagram aims to improve the performance of teams in determining the potential
root causes of their quality problems and to work on solving them.
46
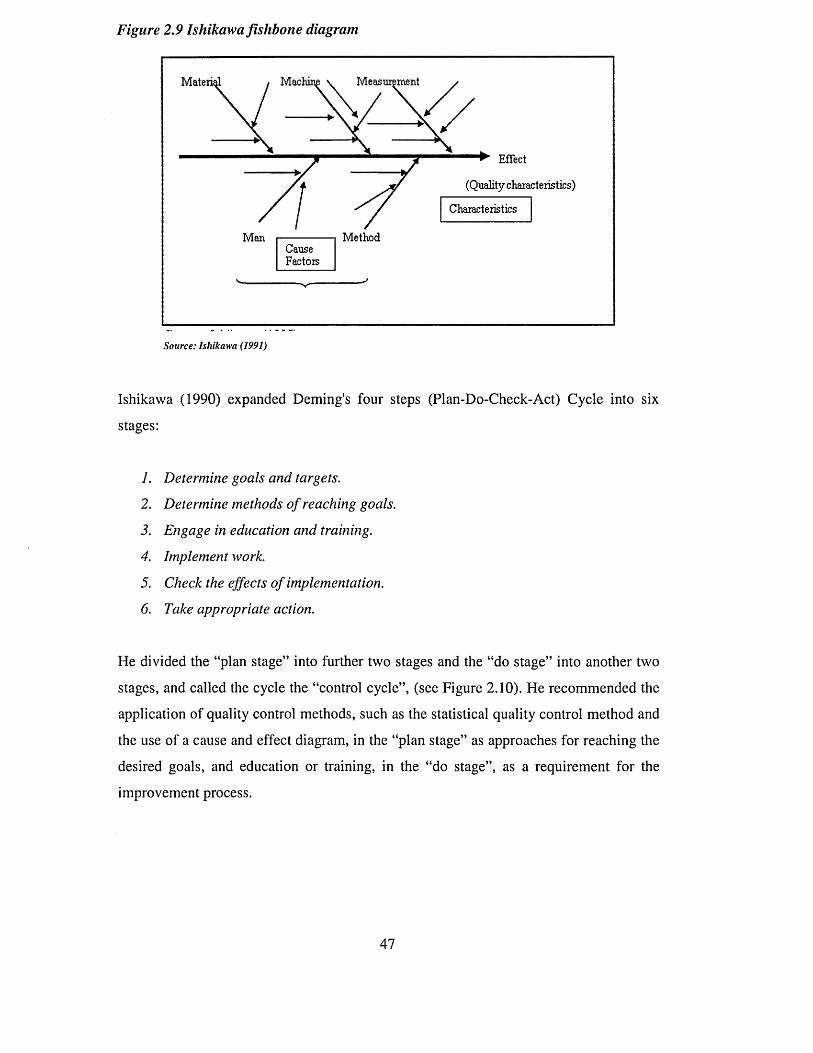
Figure 2.9 Ishikawa fishbone diagram
MeasurementMateri
** Effect
(Quality characteristics)
Characteristics
MethodManCauseFactors
Source: Ishikawa (1991)
Ishikawa (1990) expanded Deming's four steps (Plan-Do-Check-Act) Cycle into six
stages:
1. Determine goals and targets.
2. Determine methods o f reaching goals.
3. Engage in education and training.
4. Implement work.
5. Check the effects o f implementation.
6. Take appropriate action.
He divided the “plan stage” into further two stages and the “do stage” into another two
stages, and called the cycle the “control cycle”, (see Figure 2.10). He recommended the
application of quality control methods, such as the statistical quality control method and
the use of a cause and effect diagram, in the “plan stage” as approaches for reaching the
desired goals, and education or training, in the “do stage”, as a requirement for the
improvement process.
47
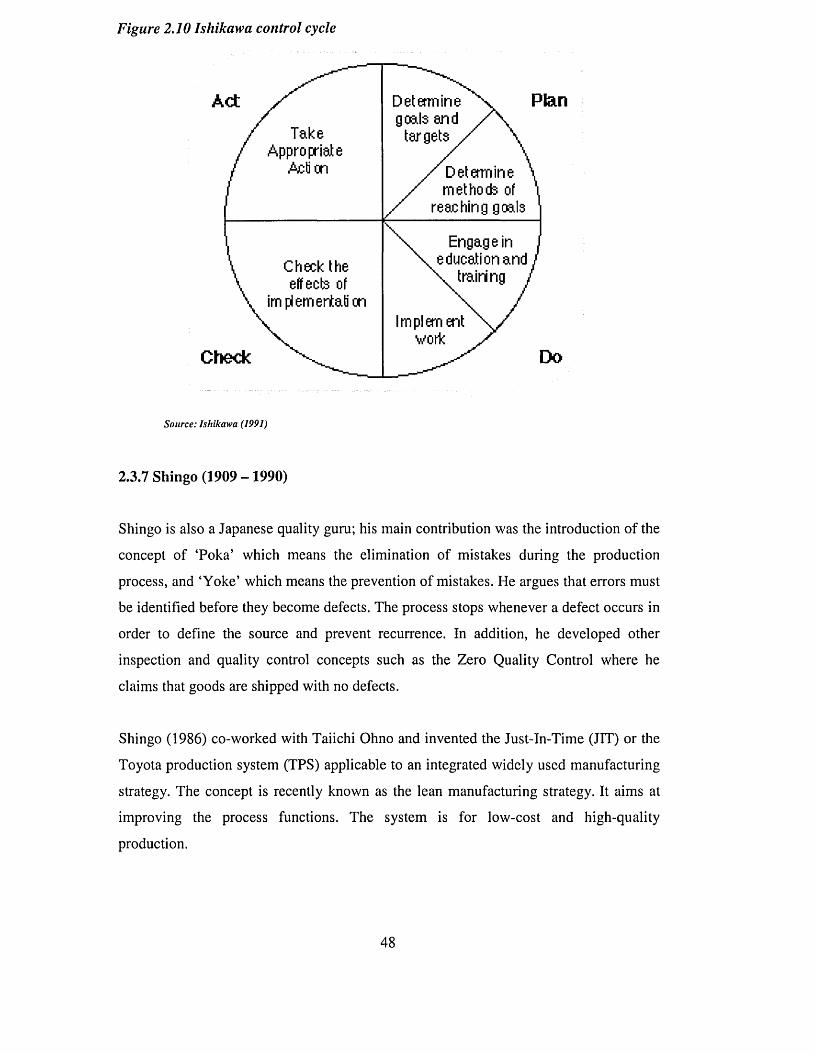
Figure 2.10 Ishikawa control cycle
PlanAct
TakeAppropriate
Action
Check the effects of
implementationImplement
workDoCheck
Determine goals and
targets y
^ Determine methods of
reaching goals
Engage in education and \ training j
Source: Ishikawa (1991)
2.3.7 Shingo (1909 -1990)
Shingo is also a Japanese quality guru; his main contribution was the introduction of the
concept of ‘Poka’ which means the elimination of mistakes during the production
process, and ‘Yoke’ which means the prevention of mistakes. He argues that errors must
be identified before they become defects. The process stops whenever a defect occurs in
order to define the source and prevent recurrence. In addition, he developed other
inspection and quality control concepts such as the Zero Quality Control where he
claims that goods are shipped with no defects.
Shingo (1986) co-worked with Taiichi Ohno and invented the Just-In-Time (JIT) or the
Toyota production system (TPS) applicable to an integrated widely used manufacturing
strategy. The concept is recently known as the lean manufacturing strategy. It aims at
improving the process functions. The system is for low-cost and high-quality
production.
4 8
2.3.8 Taguchi (1924)
Taguchi is another Japanese quality guru who started his career as an engineer and
worked in the area of product design. He has developed an approach called the Taguchi
Method or the Robust Deign. The method primarily focuses on reducing the variations
of the manufactured products by using systematic and planned statistical experiments.
The methods help manufacturers to gain better control over products manufactured and
also to design products under a wide range of environmental and product process
conditions.
Taguchi (1993) divided the product design and the production process stages into three
main phases:
7. System design: choosing the most appropriate system for the production process
and for product development from all possible systems that can perform the
objective functions.
2. Parameter design: deciding the optimal nominal values for the parameters of
the chosen systems.
3. Tolerance design: finding the optimal trade-off between quality loss due to the
variation o f objective functions and the cost o f high-grade components.
Taguchi, et al.,(2005) stresses that manufacturers should focus their quality efforts on
the design stage as it is much cost effective and simpler to make changes during the
product design stage than later during the production process. The emphasis is placed
on products cost reduction and the measurement of the cost of quality and the cost of
conformance and non-conformance. As a result of continuous statistical experiments,
Taguchi developed his “Loss Function” phenomenon, (see Figure 2.11).
The function is basically that of smaller differences in the target result in smaller costs;
this means that the larger the differences, the greater the cost. He thinks that the loss is
the cost of operating, failure to function, maintenance and repair, customer satisfaction
and poor design. The loss function has had a significant impact on changing the view of
quality cost.
49
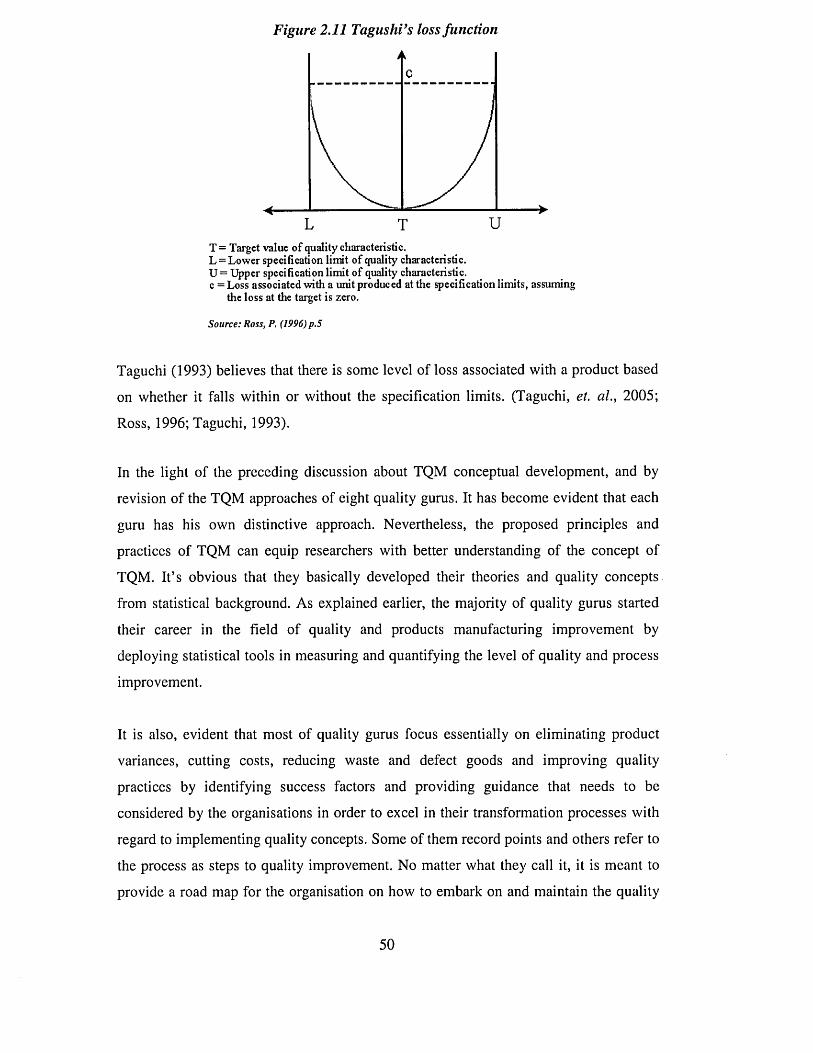
Figure 2.11 Tagushi’s loss function
UL TT = Target value o f quality characteristic.L = Lower specification limit o f quality characteristic.U = Upper specification limit o f quality characteristic, c =Loss associated with a unit produced at the specification limits, assuming
the loss at the target is zero.
Source: Ross, P. (1996) p.5
Taguchi (1993) believes that there is some level of loss associated with a product based
on whether it falls within or without the specification limits. (Taguchi, et. al., 2005;
Ross, 1996; Taguchi, 1993).
In the light of the preceding discussion about TQM conceptual development, and by
revision of the TQM approaches of eight quality gurus. It has become evident that each
guru has his own distinctive approach. Nevertheless, the proposed principles and
practices of TQM can equip researchers with better understanding of the concept of
TQM. It’s obvious that they basically developed their theories and quality concepts
from statistical background. As explained earlier, the majority of quality gurus started
their career in the field of quality and products manufacturing improvement by
deploying statistical tools in measuring and quantifying the level of quality and process
improvement.
It is also, evident that most of quality gurus focus essentially on eliminating product
variances, cutting costs, reducing waste and defect goods and improving quality
practices by identifying success factors and providing guidance that needs to be
considered by the organisations in order to excel in their transformation processes with
regard to implementing quality concepts. Some of them record points and others refer to
the process as steps to quality improvement. No matter what they call it, it is meant to
provide a road map for the organisation on how to embark on and maintain the quality
50
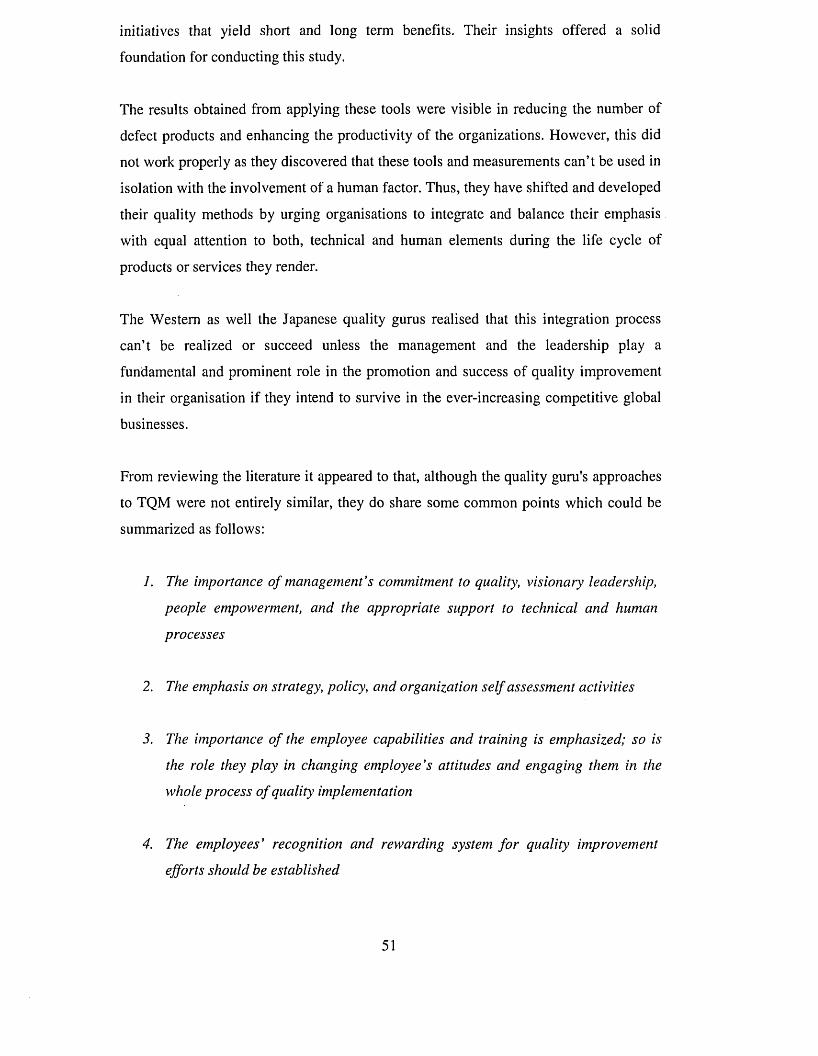
initiatives that yield short and long term benefits. Their insights offered a solid
foundation for conducting this study.
The results obtained from applying these tools were visible in reducing the number of
defect products and enhancing the productivity of the organizations. However, this did
not work properly as they discovered that these tools and measurements can’t be used in
isolation with the involvement of a human factor. Thus, they have shifted and developed
their quality methods by urging organisations to integrate and balance their emphasis
with equal attention to both, technical and human elements during the life cycle of
products or services they render.
The Western as well the Japanese quality gurus realised that this integration process
can’t be realized or succeed unless the management and the leadership play a
fundamental and prominent role in the promotion and success of quality improvement
in their organisation if they intend to survive in the ever-increasing competitive global
businesses.
From reviewing the literature it appeared to that, although the quality guru's approaches
to TQM were not entirely similar, they do share some common points which could be
summarized as follows:
1. The importance o f management's commitment to quality, visionary leadership,
people empowerment, and the appropriate support to technical and human
processes
2. The emphasis on strategy, policy, and organization self assessment activities
3. The importance o f the employee capabilities and training is emphasized; so is
the role they play in changing employee’s attitudes and engaging them in the
whole process o f quality implementation
4. The employees’ recognition and rewarding system for quality improvement
efforts should be established
51
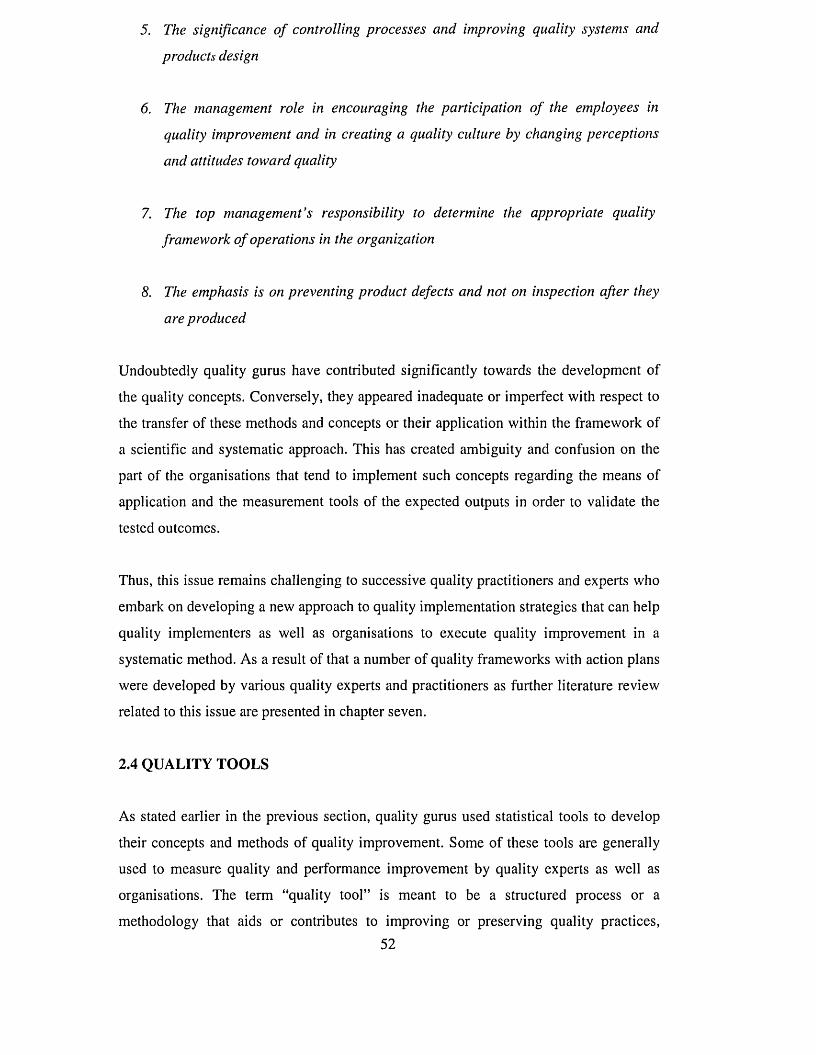
5. The significance o f controlling processes and improving quality systems and
products design
6. The management role in encouraging the participation o f the employees in
quality improvement and in creating a quality culture by changing perceptions
and attitudes toward quality
7. The top management's responsibility to determine the appropriate quality
framework o f operations in the organization
8. The emphasis is on preventing product defects and not on inspection after they
are produced
Undoubtedly quality gurus have contributed significantly towards the development of
the quality concepts. Conversely, they appeared inadequate or imperfect with respect to
the transfer of these methods and concepts or their application within the framework of
a scientific and systematic approach. This has created ambiguity and confusion on the
part of the organisations that tend to implement such concepts regarding the means of
application and the measurement tools of the expected outputs in order to validate the
tested outcomes.
Thus, this issue remains challenging to successive quality practitioners and experts who
embark on developing a new approach to quality implementation strategies that can help
quality implementers as well as organisations to execute quality improvement in a
systematic method. As a result of that a number of quality frameworks with action plans
were developed by various quality experts and practitioners as further literature review
related to this issue are presented in chapter seven.
2.4 QUALITY TOOLS
As stated earlier in the previous section, quality gurus used statistical tools to develop
their concepts and methods of quality improvement. Some of these tools are generally
used to measure quality and performance improvement by quality experts as well as
organisations. The term “quality tool” is meant to be a structured process or a
methodology that aids or contributes to improving or preserving quality practices,52
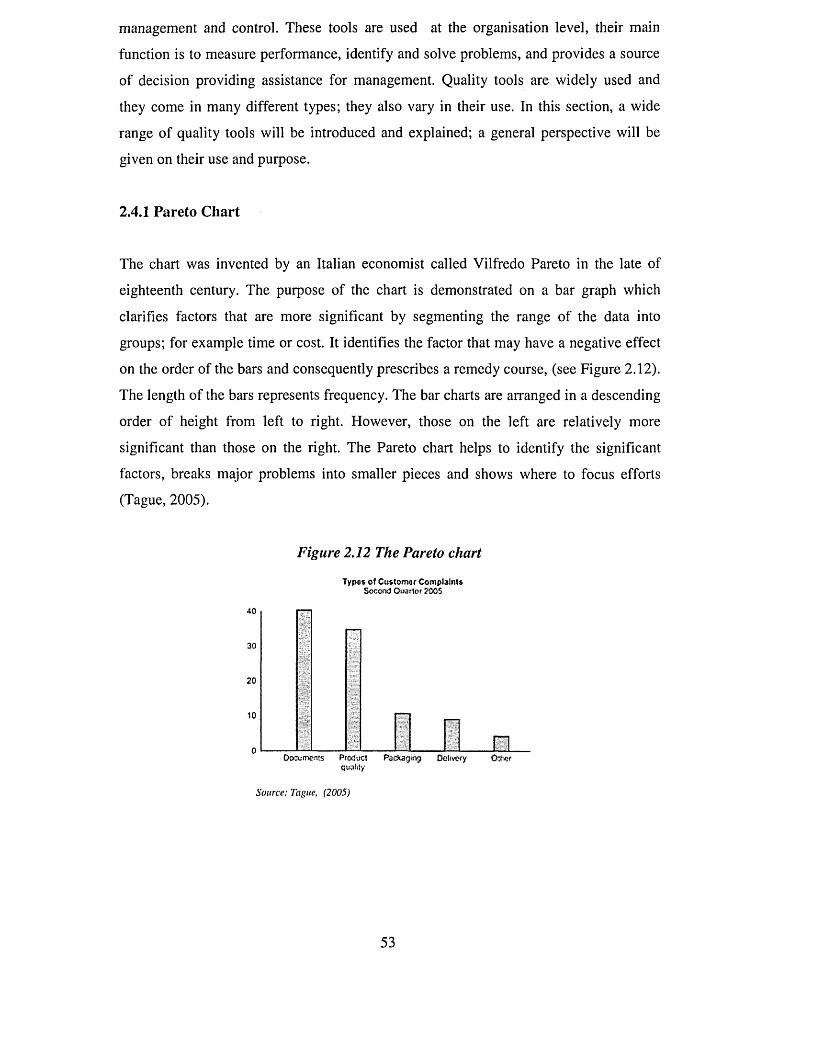
management and control. These tools are used at the organisation level, their main
function is to measure performance, identify and solve problems, and provides a source
of decision providing assistance for management. Quality tools are widely used and
they come in many different types; they also vary in their use. In this section, a wide
range of quality tools will be introduced and explained; a general perspective will be
given on their use and purpose.
2.4.1 Pareto Chart
The chart was invented by an Italian economist called Vilfredo Pareto in the late of
eighteenth century. The purpose of the chart is demonstrated on a bar graph which
clarifies factors that are more significant by segmenting the range of the data into
groups; for example time or cost. It identifies the factor that may have a negative effect
on the order of the bars and consequently prescribes a remedy course, (see Figure 2.12).
The length of the bars represents frequency. The bar charts are arranged in a descending
order of height from left to right. However, those on the left are relatively more
significant than those on the right. The Pareto chart helps to identify the significant
factors, breaks major problems into smaller pieces and shows where to focus efforts
(Tague, 2005).
Figure 2.12 The Pareto chart
Typos of Customer ComplaintsSecond Quarter 2005
40
30
20
10
n0octrfTWft£s Product Packaging Delivery Ocher
quality
Source: Tague, (2005)
53
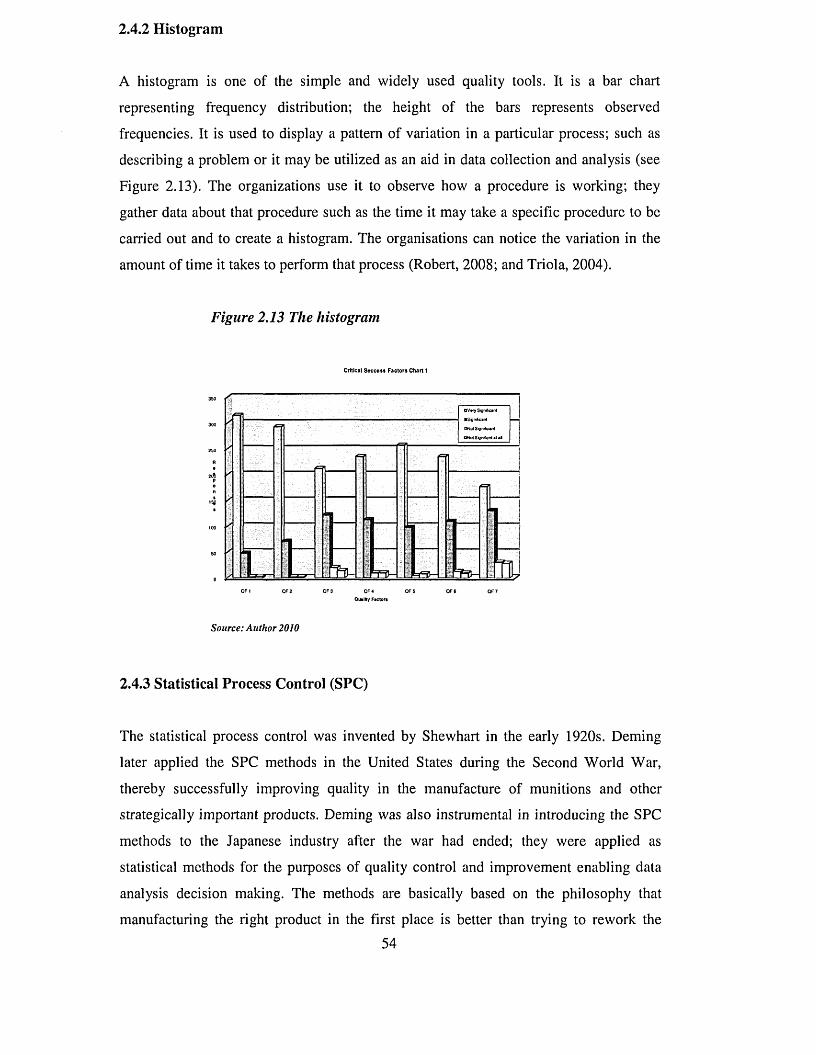
2.4.2 Histogram
A histogram is one of the simple and widely used quality tools. It is a bar chart
representing frequency distribution; the height of the bars represents observed
frequencies. It is used to display a pattern of variation in a particular process; such as
describing a problem or it may be utilized as an aid in data collection and analysis (see
Figure 2.13). The organizations use it to observe how a procedure is working; they
gather data about that procedure such as the time it may take a specific procedure to be
carried out and to create a histogram. The organisations can notice the variation in the
amount of time it takes to perform that process (Robert, 2008; and Triola, 2004).
Figure 2.13 The histogram
Critical S e c e e ss F ac to rs Chart 1
350
300
250
R
2tfcP
100
50
0
QF 1 QF3 OF 6OF 2 OF 5 OF 7
Source: Author 2010
2.4.3 Statistical Process Control (SPC)
The statistical process control was invented by Shewhart in the early 1920s. Deming
later applied the SPC methods in the United States during the Second World War,
thereby successfully improving quality in the manufacture of munitions and other
strategically important products. Deming was also instrumental in introducing the SPC
methods to the Japanese industry after the war had ended; they were applied as
statistical methods for the purposes of quality control and improvement enabling data
analysis decision making. The methods are basically based on the philosophy that
manufacturing the right product in the first place is better than trying to rework the54
defect product. They ensure conformance to the requirements and secure corrective
actions when necessary to remedy problems.
They are used to advance process improvement over time by examining product
variations and eliminating their sources. The techniques of SPC are dependent on
developing control charts that can indicate when the process changes. The control charts
are used to monitor a process and to signal when it goes out of control. The SPC has a
distinct advantage over the other quality methods, such as the inspection in that it
applies resources to detecting and correcting problems after they have occurred.
The SPC helps improve a process to perform consistently and predictably for higher
quality, lower cost, and higher effective capacity; it provides a continuous control of
processes such as:
7. Top management commitment
2. Project champion
3. Initial workable project
4. Employee education and training
5. Accurate measurement system
2.4.4 Performance Indicators (PI)
Performance indicators enable the organizations to understand the needed measures to
evaluate their quality performance and to make comparisons against predetermined
targets. They provide a description of what is measured. The measurement plays a
monitoring or an evaluating role with regard to specific processes, services or systems.
Due to product and service improvement and the ever-increasing pressure for
compaction, the organizations ought to improve their performance. Therefore, mangers
face the complex task of choosing appropriate key performance indicators for their
respective organizations and of implementing them in a systematic way. The data
collected and analyzed in this way are used to measure progress, to demonstrate
accountability, to determine effectiveness and efficiency and to identify problem areas.
The results of the analyzed data are in a quantified outcome or in a qualitative measure
which identify organizations in a particular situation at a specific time and location. In
addition, the data results indicate whether an outcome or objective has been55
accomplished, determine the extent to which objectives and outcomes have been
achieved, indentify targeting data and allow objective assessment of an organization’s
overall performance.
This approach obscures the possibility that any single performance indicator may be a
more important determinant of service quality compared to the rest of the chosen
indicators. One of the major drawbacks of most performance indicators is that they
usually do not measure service quality. (Coffey, 2007; Antony, 2003; and Al-Mashari,
and Zairi, 2000).
2.4.5 Balance Scorecard (BSC)
The balanced scorecard (BSC) is an ever-increasing tool of performance measurement
used by organizations to support the long-term and forward thinking strategic view
across the entire organization and to communicate that strategy down to the individual
performance level. According to Pearce and Robinson (2000), the balance scorecard
enables organization management to balance between short and long term objectives,
between the desired and undesired outcomes and between objective and subjective
performance measures. The balanced scorecard provides a view across a range of
measures that encompass all the key issues for continued quality success (Moullin,
2006; Kanji, and Moura, 2002; Ellis, 2000; and Kanji, and Asher, 1996).
Ellis (2000) remarked that the balance scorecard is currently being applied in major
organisations worldwide to help drive and configure the quality practices around the
organisational performance. He assumes that the benefits of the balance scorecard lies
in compiling a scorecard that not only drives strategic objectives and quality initiatives
through the use of cutting edge technologies and processes but also people performance
to enhance capabilities.
Lawton (2002) describes the balance scorecard as a management decision tool intended
to integrate the organisations strategy with operational performance measures. It often
shows the divers areas of performance an organisation values most. The major
dimensional perspectives of the balance scorecard are: the internal business
perspectives, the learning and growth perspectives, the financial perspectives and the
customer perspectives. The term “balanced” suggests that the organisation objectives56
and measures along different dimensions are accumulated on one sheet, which ensures
multidimensional and qualitative drivers organisational current and future quality
performance success.
Kanji and Moura (2002) perceive that the balance scorecard helps organisations to make
prompt decisions on what to improve or rectify. It also reflects the potential growth of
interest in performance measurement and quality improvements tools. Additionally, the
balance scorecard measures of process performance highlight that an activity is
performed or an orderly work is carried out. They believe that the measures may include
cycle time, productivity and hurdle. (Moullin, et al., 2007). The process measures
usually focus on operations, while the outcome measures focus on the strategic intent.
On the other hand, Kueng (2000) contends that the adoption of the balance scorecard
reflects the balanced priorities of organisations and their customers. He observes that
this requires classification of measures such as processes, products, and results that the
organisations want to achieve and that reflect the values of both the organisations and
customers.
2.4.6 Benchmarking
Benchmarking is one of the most widely adopted tools of quality and performance
measurement used by organisations. Its core theme is to identify the best quality
practice of those organisations that have gained recognition for their excellent
achievements in particular in business processes such as decreased product cycle time,
cost reductions and improved product or service quality. Morling and Tanner (2000)
regarded benchmarking as a continuous process of measuring products, services and
quality practices against the existing competitors or those organisations recognised as
leaders. It provides a systematic technique to discover better products, services, systems
and processes that can be linked and adapted into the organisations current operations. It
is a positive, proactive process to change functions in the organisation in a structured
manner, to gain superior performance and improved product quality aimed at achieving
greater perfection in fulfilling the internal and external customer requirements.
(Matzdorf, 2010)
The benefits of benchmarking are that the organisations are forced to investigate the
external best practices of other organisations and to incorporate those practices into their57
operations. This is a costless method of performance measurement that the
organisations often use for better efficiency that leads to higher responsiveness to the
customers needs. Benchmarking allows organisations to redeploy the most effective
way of supporting customer requirements and obtaining their satisfaction. As a result,
its activity requires a resource increase in both human and capital in order to correctly
determine the true customer satisfaction levels and demands derived from
benchmarking activities, which ultimately reflects the organisation struggle for
excellence in all activities. Benchmarking is thus, a rational approach of ensuring that
the organisation satisfies the customer requirements and continues to consider the
customer requirements changes over time (Dervitsiotis, 2001; and Carpinetti and
Martins, 2001).
Swift et al., (1998) suggest a ten step process for conducting a benchmarking
investigation.
7. Identify the problems. Decide what has to be benchmarked. All functions have
outputs, services or products which could be processes to benchmark to improve
performance.
2. Identify benchmark partners. This is a major step in benchmarking. A successful
approach includes internal, competitive and functional benchmarking.
3. Determine the measurement method. Plan, determine data collection method and
conduct the investigation. Collect data from various sources that can be used,
such as conducting a site visit.
4. Pre-measure the organization own performance. This should be done before
comparing it with the external organization. Examine the best practices from
other organization and measure the performance gap.
5. Determine future performance levels. Comparing the performance levels
objectively can help to determine how to achieve a performance edge. Redefine
goals and incorporate them into the planning process.
58
6. Communicate benchmark findings and gain approval from management. In some
cases, a written report is required with detailed supporting documentation.
7. Revise performance goals after management approves the recommendations.
8. Integrate targets and strategies into action plans and operational reviews and
update them as needed.
9. Implement best practices and monitor the progress made. Periodically readjust
as needed.
10. Recalibrate benchmarks re-evaluate and update the benchmarks to ensure that
they are based on current performance data. (Swift et al., 1998:146)
SUMMARY
This chapter reviewed most recent literatures pertaining to TQM philosophy. It covered
different rationalizations of TQM concepts and approaches. It has also provided an
overview of quality management as a field of study, based on a historical review of its
evolution from quality inspection to quality excellence, alongside with the widely
adopted tools and approaches concerning TQM implementation. Following this, the
principles of TQM provided in literature that are relevant to the research theme were
also discussed in this chapter. Through extensive examination of literature review
carried out to identify the concepts of TQM showed that there is no precise common
definition of the term quality, as it means different things to different people.
The chapter also, presented a broader revision on eight quality gurus, and their
approaches related to the development of the quality management. It has become
evident that each guru had his own distinctive approach. Nevertheless, the proposed
principles and TQM practices conceived by them enabled the researcher to a better
understanding of the concept of TQM. It is believed that their propositions are the
foundation for understanding the conceptual development of TQM. The previous
subsections presented the main principles and practices of TQM proposed by them in
which it inspired the researcher to accumulate a body of knowledge that shaped the
59
theoretical basics of the self assessment framework model and eventually formatting the
reset of consecutive chapters of this research.
It was also explained in this chapter that although quality gurus did not agree on a
particular quality model or a practical approach of quality implementation. This has
resulted difficulties among quality advocators to reach an analytically justifiable about
which quality approach to TQM represents the best. What has become clear is that there
considerable disagreement exists among various quality gurus over the best approach
that any organisation should adopt. However, their remarkable contribution to the
development of the TQM provided the organisations with contemporary managerial
techniques for managing quality and organisational processes and for their performance
improvement. Thus the most important thing is for the organisations to start the quality
journey. Whatever, the adopted approach to TQM the most important factors are the
commitment to work through a continuous quality implementation process.
Furthermore, the chapter reviewed the most unanimously adopted quality models of self
assessment tools, which allow organisations to assess and measure their quality
capabilities and performance improvement. The in depth reading of literatures related to
the quality and excellence models of Deming model, Baldrige model, the EFQM
excellence model, the Toyota production system and Six sigma. Had resulted to clear
understanding of the concept of TQM, forms an essential part of the initial foundation
on which to build a self assessment framework model that responses to the UAEPSI
quality implementation needs.
Further literature discussion on critical success factors and current quality and
excellence models by various researchers and quality practitioners were critically
reviewed. With an attempt is made to construct the core elements of the research self
assessment framework model for the implementation of TQM by considering the unique
characteristics of the UAEPSI. As the situation in the UAEPSI is still lagging behind in
quality management due to limited studies found in the TQM area and in particular to
UAEPSI. Therefore, the model enables them to evaluate their current quality situation
and to be in alignment with the UAEGEP quality and excellence criteria's.
It is aimed that the UAEPSI would benefit from the implementation of the model to
leverage the culture of quality in the U.A.E. The emphasis on a core values of TQM as60
they serve as the basis through which the UAEPSI performance improvements and
service delivery are achieved. It is worthwhile to mention that the detailed literature
explanations of model development were segregated from this chapter and presented in
chapter seven. By doing this it considered to be in consistent with chapter seven themes,
and to flow of thoughts of the conceptual development of the model. The next chapter
presents the research methodological approach in which the researcher applied it in
order to address the research questions.
61
PREFACE
CHAPTER THREE
RESEARCH METHODOLOGY
This chapter outlines the structure of the empirical examination covering the research
question posed in Chapter One. Chapter Two discussed the literature theoretical aspects,
the characteristics, notions, and approaches of TQM conceived by the quality gurus.
This chapter reviews the rationale behind the research methodology and the
justifications underlying the selection of the mixed or triangulation data collection
method. In order to select the most appropriate research methodology for this study. The
first section of this chapter reviews the available research methodologies and outlines
the characteristics, advantages, and drawbacks of each method. The second part of this
chapter identifies the most viable methods that could be adopted in this study and
argues for the appropriateness of the adopted method and possible difficulties that might
be encountered.
Furthermore, it reviews the research methods that are commonly applied in carrying out
the research fieldwork, the stance that the researcher has adopted in approaching the
selection of appropriate research methods. Then, the selection of a particular research
method is discussed and accounted for. A questionnaire survey is also presented and
the reasons for the selection of such research approach were outlined. Figure (3.1)
outlines the content of this chapter.
62
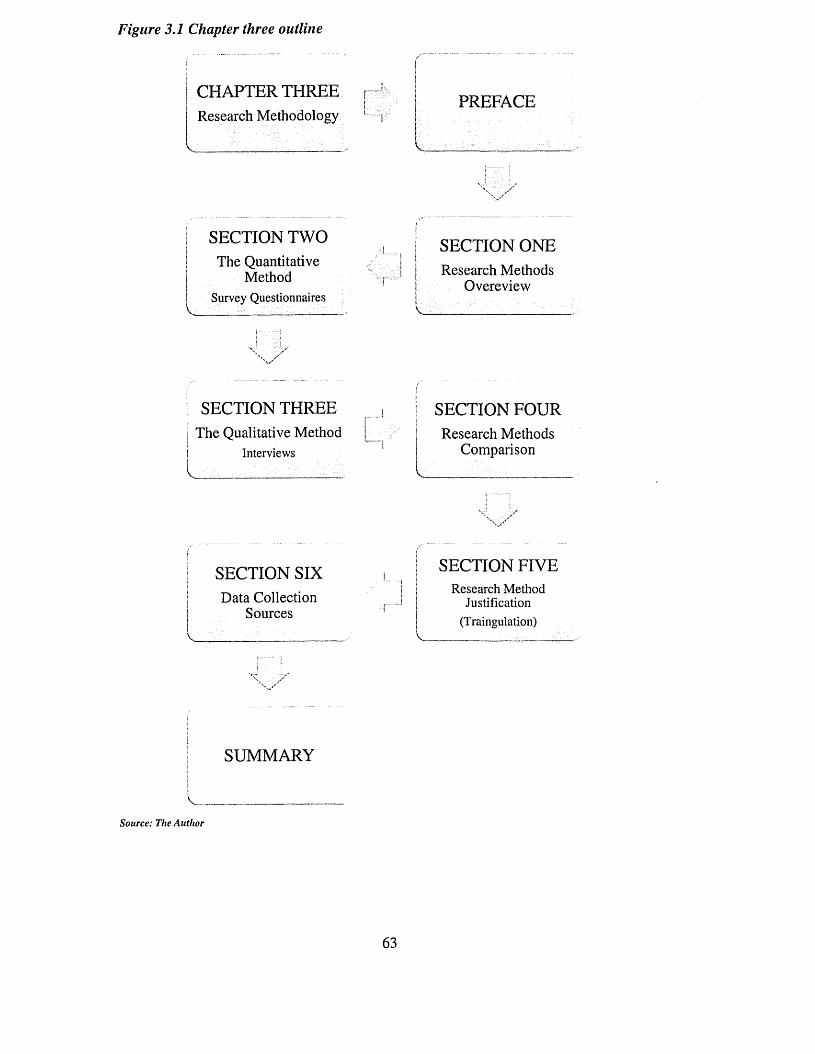
Figure 3.1 Chapter three outline
CHAPTER THREE Research Methodology
SECTION TWOThe Quantitative
MethodSurvey Questionnaires
PREFACE
SECTION ONEResearch Methods
Overeview
SECTION THREE | The Qualitative Method
Interviews
SECTION FOURResearch Methods
Comparison
SECTION SIX i i SECTION FIVEResearch Metho<
Justification(Traingulation)
^ 1 | Research MethodData Collection j j Justification
Sources jI
SUMMARYj|V. _________
Source: The Author
63
3.1 RESEARCH METHODS OVERVIEW
Research is a systematic investigation that aims to find answers to a problem. It can also
be viewed as an act with an objective. It is about anything that has to do with
procedures or techniques of investigation; i.e., the set of techniques used in one piece of
research. It is all about the methods used in the study of the research. It is essential for
gathering relevant information thereby giving effective and reliable representation. It
enables the researcher seeking, enquiring about, investigating, and exploring,
constantly, carefully and closely a specific topic or subject of the study. A research
methodology provides the philosophical ground work for methods implying a
theoretical underpinning to the thesis. Research methods are tools for eliciting data; they
are the guiding principles for choosing and using those tools, in order to come up with
appropriate solution for a problem. Undoubtedly, this particular research also deserves a
carefully selected methodology (Walter 2009; Weerakkody 2008; and Daymon and
Holloway, 2002).
The function of the research methods is to link the questions under investigation to the
alleged data and the information they aim to obtain. The research structure depends on
two main elements: how the research questions are connected to the data and tools and
what approaches are used in responding to them. The established research method
structure should include main ideas, strategies, samples, tools and procedures that
should be used for collecting and analysing empirical data. This is the basic plan for a
successful empirical research (Bryman and Bell, 2007; Rolfe, 2006; Daymon and
Holloway, 2002; Leedy, and Ormrod, 2001; Punch, 2000).).
Neuman, (2006) divides research into three major paradigms or sets of propositions that
explain how the subjects under investigation are perceived; these are: the positive, the
interpretative and the critical. Reality is seen in the interpretative paradigm; the
participants are manipulating physical objects because reality is internally experienced
and socially constructed through interaction; it is interpreted through the actors and it is
based on the definition people attach to it (Neuman, 2006)
Yin (2004) points out that the selection of appropriate research techniques in the social
sciences involves three contextual conditions: the nature of the research question, the
extent to which the researcher can control actual events and the focus of the study-64
whether it is on contemporary or historical events. For the first condition, Yin classified
the nature of questions into widespread Wh/Questions such as “who, where and what”;
these are questions that lead to derivative questions involving “how much or how
many”, These are raised when the intention of the study is to describe the frequency of
the incidence of a particular event or to identify outcomes.
However, the question words “how and why” deal with more than frequencies and
incidences. They suggest explanations and are used for tracing the behaviour of
processes over time. For the second condition, the extent to which the researcher can
control events differentiates the research strategies that are appropriate to answering the
how and why questions. If the researcher has absolutely no access control, as in
focusing on past events when the events are beyond the memory of the people involved,
then the only strategies available are history and archival analysis. When the researcher
gains access to and focuses on contemporary events but has no control over any of the
behavioural events involved, then an appropriate strategy is the case study. When the
researcher can control behavioural events directly and precisely, then the strategy of the
experiment is most appropriate (Yin, 2004).
As a general rule, research methodologies can be broadly classified into two different
approaches: the scientific empirical tradition and the naturalistic phenomenological
modes. These two approaches are also very well known as quantitative and qualitative
research methods (Bryman and Bell. 2007; Collis and Hussey, 2003; Yin, 2004; Kane
and Brun, 2001; Bryman, 2001; Bryman, 1995).
While the social science research literature tends to draw a sharp distinction between
qualitative and quantitative techniques of data collection and analysis, the distinctions
are relatively clear in practice. The distinction between the two types of data can
become conclusive. The next sections 3.2 and 3.3 illustrate in more detail the
characteristics of each method and the tools of data gathering.
3.2 QUANTITATIVE METHOD
Quantitative research is a social research method that relies upon numerical and
statistical methods; it is characterized by surveys and experiments, where the goal is to
produce general statements. The method is more concerned with questions about65
measurements and measuring information, for example: “How much? How many? How
often? To what extent?” From the data presentation perspective, quantitative data
mainly involves counting and measuring numbers; for example, an experiment
conducted to investigate the maximum speed limit and the performance of different
brands of sport cars. “Quantitative research method is often conceptualized by its
practitioners as having a logical structure in which theories determine the problems to
which the researchers address themselves in the form of hypotheses derived from
general theories” (Bryman, 1995:18). According to Yates (2004), quantitative research
methods are methods for analysing numeric information in the form of statistical
methods. Quantitative research methods transform the information into numbers and
amounts.
A quantitative technique is an approach which seeks to inquire into an identified
problem; it is based on testing a theory measured with numbers and on analysing the
data using statistical techniques. The main objective of the quantitative technique is to
find out if a theory can be generalized. The techniques of data gathering are distinct
from the process of data analysis. Data can be gathered by various means. The most
common tools of data collection used by a quantitative method are: questionnaire
surveys, observation schedules, interviews, experiments, psychological tests and
archival records (Sekaran, 2003; Bryman, 1995)
Quantitative research methods usually involve large randomized samples, more
application of statistical inference and few applications of cases demonstrating findings.
The objective of quantitative research is to determine the relationship between one thing
(an independent variable) and another (a dependent or outcome variable) in a
population. Quantitative research designs are either descriptive or experimental. A
descriptive study establishes only associations between variables; an experiment
establishes causality (Robert, et al, 2009; Creswell, 2009; Liamputtong, 2009;
Hutcheson, and Sofroniou, 2009; Bryman, and Bell, 2007; Yates, 2004; and Moore,
2001).
The main advantages of this method lie in precision and control. Precision is reached
through quantitative and reliable measurement and control is achieved by the sampling
and design. Furthermore, hypotheses are tested via a deductive method and the use of
quantitative data to allow for statistical analysis. However, the main disadvantage of the66
quantitative approach is that the results provide less detail on human behaviour,
attitudes, and motivation. Although the response of opinions and perceptions can be
converted into digitised results, it mainly leaves no meaning to the researchers.
Accordingly, many researchers are concerned that the quantitative approach reduces
human individuality and ability to think (Bryman, and Bell, 2007; and Mason, 2002).
3.2.1 Survey Questionnaires
Survey questionnaires represent one of the most common types of quantitative, social
science research method. In survey research, the researcher selects a sample of
respondents from a population and administers a standardised questionnaire to them. A
questionnaire is a series of written questions a researcher supplies to subjects,
requesting their response. Usually the questionnaire is self-administered in that it is
posted to the subjects, asking them to complete it and post it back (Brace, 2008; Fowler,
2008; Bradbum, et al. 2004). The use of survey questionnaire is a valid and useful
approach to data gathering which is not resource intensive; it involves many people of
the organization and can be completed quickly. It is an excellent way of gather
information on the perceptions of the people of the organization quality practices.
The survey questionnaire can be a written document that is completed by the person
being surveyed, an online questionnaire, a face-to-face interview, or a telephone
interview. Using surveys, it is possible to collect data from large or small populations.
Survey research does not belong to any one field and it can be employed in almost any
discipline. Surveys come in a wide range of forms and can be distributed using a variety
of media. In general, there are three categories of survey presentations: written surveys,
oral surveys, and electronic surveys. Furthermore, there are several types for each of
these categories. The subsequent paragraphs give details on these types, and provide the
strengths and weaknesses of each.
Hancock, observes that questionnaires are often used to assess attitudes and that
respondents may be asked to choose a point on a scale, to indicate how they perceive or
feel about a situation. Table (3.1) is adapted from Hancock (1998); it outlines the
advantages and disadvantages of survey questionnaire.
67
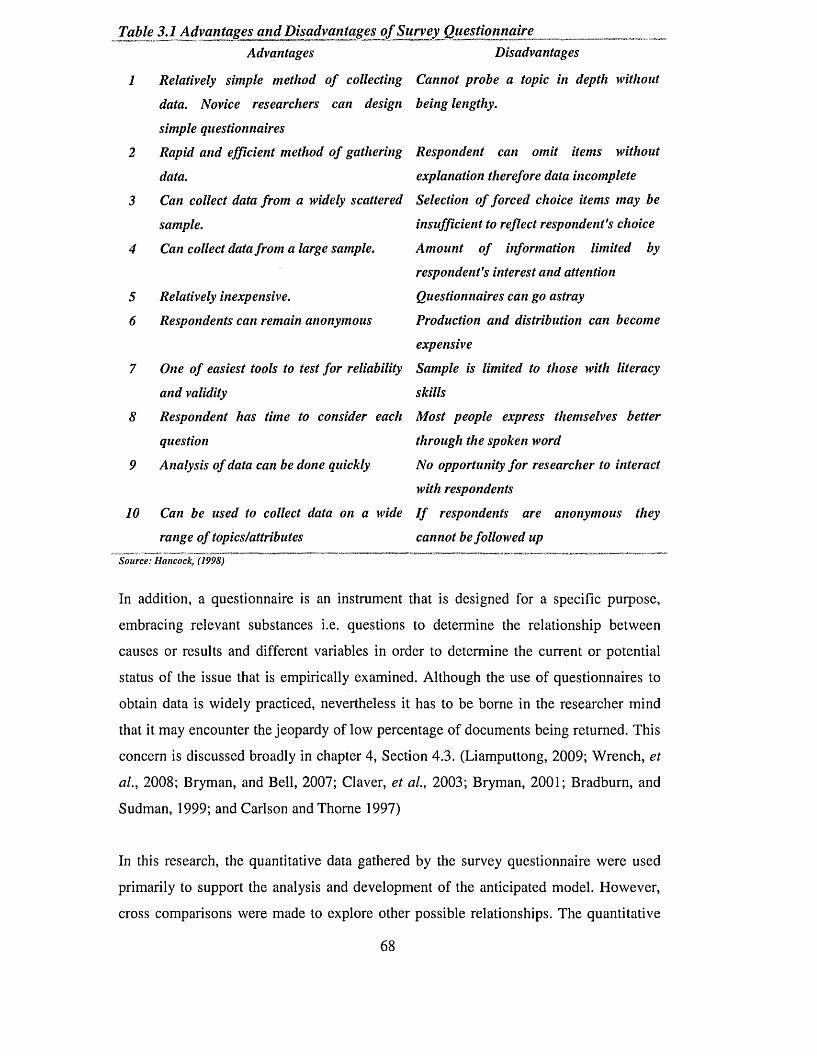
Table 3.1 Advantages and Disadvantages of Survey QuestionnaireAdvantages Disadvantages
1 Relatively simple method of collecting Cannot probe a topic in depth withoutdata. Novice researchers can design being lengthy.
simple questionnaires2 Rapid and efficient method of gathering Respondent can omit items without
data. explanation therefore data incomplete3 Can collect data from a widely scattered Selection of forced choice items may be
sample. insufficient to reflect respondent's choice4 Can collect data from a large sample. Amount of information limited by
respondent's interest and attention
5 Relatively inexpensive. Questionnaires can go astray6 Respondents can remain anonymous Production and distribution can become
expensive7 One of easiest tools to test for reliability Sample is limited to those with literacy
and validity skills8 Respondent has time to consider each Most people express themselves better
question through the spoken word9 Analysis of data can be done quickly No opportunity for researcher to interact
with respondents10 Can be used to collect data on a wide I f respondents are anonymous they
range of topics/attributes cannot be followed upSource: Hancock, (1998)
In addition, a questionnaire is an instrument that is designed for a specific purpose,
embracing relevant substances i.e. questions to determine the relationship between
causes or results and different variables in order to determine the current or potential
status of the issue that is empirically examined. Although the use of questionnaires to
obtain data is widely practiced, nevertheless it has to be borne in the researcher mind
that it may encounter the jeopardy of low percentage of documents being returned. This
concern is discussed broadly in chapter 4, Section 4.3. (Liamputtong, 2009; Wrench, et
al., 2008; Bryman, and Bell, 2007; Claver, et al., 2003; Bryman, 2001; Bradburn, and
Sudman, 1999; and Carlson and Thome 1997)
In this research, the quantitative data gathered by the survey questionnaire were used
primarily to support the analysis and development of the anticipated model. However,
cross comparisons were made to explore other possible relationships. The quantitative
6 8
data were obtained and analyzed by using a statistical software programme of the SSPS
16.0 for windows as well as the Microsoft Office Excel 2007 spreadsheet that provides
a sufficient range of statistical tools to meet the objectives of the study.
3.3 QUALITATIVE METHOD
The qualitative research method is concerned with developing explanations of social
phenomena. That is to say, its aim is to help to understand why things are the way they
are. Qualitative data are mainly words, sounds, or images. The method is concerned
with the social aspects of the life, it focuses on what people say and do. In addition, the
qualitative approach is supported by action research or by a case study method. An
example of a qualitative method is to observe the reasons for buying, or preferring
particular products for instance: mobile phone or a service an airline company. The data
collection instruments of a qualitative method are: Interviews, document analysis, direct
observation, focus groups, participant observation, surveys, open-ended surveys, video
and audio recording, (Flick, 2007; Bryman, and Bell, 2007; Litosseliti, 2005; and
Yates, 2004).
According to Yates (2004), qualitative research methods, are methods used for
analyzing other information, such as interpretations of a text. Qualitative research
methods use the researcher’s interpretation of information which cannot or should not
be translated into numbers or amounts. A qualitative research on the other hand is aimed
at understanding a social or human problem from multiple perspectives and it is mostly
conducted in a natural setting. The qualitative method is concerned with the process
rather than simply the outcomes. The method mainly strives to find an answer for the
meaning certain terms and conditions come to be applied and for the backgrounds of a
precise activity or event under investigation.
Bogdan and Biklen (2006) articulated that qualitative research uses factual
circumstances as the direct source of data and that the researcher is the decisive
instrument. The researcher probes into a particular issue under study because he is
concerned with contextual aspects. He does not merely search data or provide evidence
to prove or disapprove an assumption under study. He feels that an action can be better
understood when it is observed in the setting in which it occurs. In addition, the
researchers replicate that the qualitative method is basically descriptive. The data69
collected are in form of words or pictures rather than numbers. The written results of the
research contain quotations from the data to illustrate and validate the situation
examined. The perceived qualitative method includes a variety of data gathering tools,
for instance: interviews, transcripts, field notes, photographs, videotapes, personal
documents, memos, and other official records. In their search for understanding the
qualitative method, researchers do not reduce the number of page description and other
data to numerical symbol. Rather, they try to analyze the built-in data as the particulars
that have been gathered are grouped together from different sources of collected
evidence. Thus, they emerge as closely as possible in the form in which they were
documented or demonstrated (Bryman and Bell, 2007; and Bogdan and Biklen, 2006)
Qualitative research is generally defined as research that utilizes open-ended
interviewing techniques to explore and understand the attitudes, opinions, feelings and
behaviour of individuals or a group of individuals. It is a research that applies any
method relying upon primary source information, where very often the data are not
numerical. The technique is that the researcher must ensure that the phenomenon is
investigated in terms of the meanings that the participants involved bring to the
situation. It is perceived in terms of providing a lower level of objectivity and scientific
value (Wrench et al., 2008; Yates, 2004; Yin 2004; and Garson, 2002).
Flick, (2007) argue that qualitative research is indicative in the sense that researchers
develop concepts and insights from patterns of data. Researchers use descriptive data, i.
e., and the people’s own writing and observable behaviour in contextual situations.
Qualitative research involves the development of methodological skills, such as
conducting interviews and applying different approaches that involve the participants'
observations. In qualitative research, validity analysis is conducted in order to determine
whether the findings are accurate from the standpoint of the researchers, the
participants, or the readers, i.e. meeting the criteria of trustworthiness, authenticity, and
credibility by using methods such as triangulation, member checking, bias clarification,
external audit, etc. Silverman (2001) observes that the reliability of qualitative research
can be ensured by documenting procedures and demonstrating that the categories are
consistently used, though this aspect plays a minor role (Franzosi, 2010; Creswell,
2009; Alvesson, and Skoldberg, 2009; Wrench, et al., 2008; Bryman, and Bell, 2007;
Huberman, and Miles, 2002; Bryman, 2001; Morse, et al., 2001; Silverman, 2001).
70
(Bryman, 1995) elucidated some of the main characteristics of qualitative research
methods. These are:
Seeing:
The strategy of making connections: the events, actions, norms, values, etc, are being
studied from the perspectives of the people in order to observe how different sensitive
perceptions can determine the feasibility of the issue under investigation.
Description: the researcher needs to provide a detailed description of the issue under
investigation, whereby he advocates that such description is consistent with the
perspectives of people involved.
Contextualism:
Investigating the connection of people’s behaviour in especially the values and practices
for understanding the society in a wider range
Process:
Observing the change in people’s view of the social reality of events in a continuous
change state
Flexibility:
Using an open and unstructured research strategy of people’s perception of issues under
investigations; this may enhance the opportunity of coming across entirely unexpected
outcomes.
Theory and Concepts:
The formulation of fieldwork theories in advance, the qualitative research is frequently
rejected; it is rather sceptical prior to the onset of the research project (Bryman, 1995:
61-69).
71
Qualitative research is best used for the in-depth of information. It is the best research
method for discovering underlying motivations, feelings, values, attitudes, and
perceptions. The main disadvantage is that, unlike quantitative research method, the
findings are not statistically predictable to the population under study. This limitation is
created by two facts: recruiting is rarely completely representative; and, the very nature
of qualitative research necessitates small sample sizes. (Bryman, 1995: 72) outlined
some problems associated with qualitative research:
• Interpretation problems: whereby it is difficult for the researcher to demonstrate
the devotion o f the participant's perspectives
• Methodological problems: involving the relationship between theory and
research in the qualitative tradition
• Overgeneralization problems: the extent to which qualitative research derived
from case studies can be generalized (Bryman, 1995:72).
3.3.1 Interviews
An interview is a series of questions a researcher addresses personally to the
respondents. An interview may be structured: whereby the researcher asks clearly
defined questions or unstructured: the researcher may allow some of the questioning to
be led by the responses of the interviewee. To be specific, structured data are organized
and can be produced by closed questions. Unstructured data are relatively disorganized
and can be produced by open questions. (Bourque, and Fielder, 2002; Punch, 2000; and
Forza, and Filippini, 1998).
Qualitative interviews are semi-structured or unstructured. If the interview schedule is
tightly structured, the researcher may be able to explore the phenomena under
investigation broadly and deeply. Semi-structured interviews tend to work well when
the interviewer has already specified certain aspects he intends to address. The
interviewer can decide in advance what areas to cover; but the responses of the
interviewee are unexpected. This aspect can be principally important if the time
available for each interview is limited and the interviewer wants to be sure that the main
issues are covered72
(Blain, et al., 2004; Gubrium, and Holstein, 2003; Mauthner, and Birch, 2002; Hancock,
2002; Wengraf, 2001; and Lee-Trewick, and Linkogle, 2000).
In this study the method of interviews were chosen as a secondary research instrument
designed to collect the necessary background or contextual information, which
facilitates and supports the analysis questionnaire and thus contributes to the original
credibility of the research as a whole.
3.4 RESEARCH METHODS COMPARISON
One can not draw a demarcation line between qualitative and quantitative research
methods. The differences are subtle; they are mainly concerned with the original
research question of how people or situations are studied and the way the data are
analyzed, interpreted and presented (Wrench, et al., 2008; Bataille, and Phil, 2002; and
Bryman, 2001).
Bryman, and Bell (2007) were against listing the merits of each research method, both
quantitative and qualitative methodologies have their own advantages. The quantitative
method focuses on measurement and independent relationship between the various
variables, whereas the qualitative method lays emphasis on the documentation of
specific description of situations and procedures Bryman, and Bell (2007).
The researcher, in line with Brayman (2000), contend that it would be methodologically
naive to argue that quantitative research methods are more appropriate to organizational
research than qualitative methods but that the distinction between the two approaches
are merely technical.
Quantitative research is often contrasted with qualitative research. The distinct
characteristics of both research approaches support researchers in making appropriate
decisions on designing new research in the initial stage. Based on the discussion above,
Table (3.2) provides comparison between quantitative and qualitative research with
further features of qualitative research and how it differs from quantitative research:
these differences were listed below
73
Qualitative research is concerned with the opinions, experiences and feelings of
individuals producing subjective data.
1. Qualitative research describes social phenomena as they occur naturally. No
attempt is made to manipulate the situation under study as is the case with
experimental quantitative research
2. Understanding o f a situation is gained through a holistic perspective.
Quantitative research depends on the ability to identify a set o f variables
3. Data are used to develop concepts and theories that help us to understand the
social world. This is an inductive approach to the development o f theory
4. Quantitative research is deductive in that it tests theories which have already
been proposed
5. Qualitative data are collected through direct encounters with individuals,
through one to one interviews or group interviews or by observation. Data
collection is time-consuming
6. The intensive and time consuming nature o f data collection necessitates the use
of small samples
7. Different sampling techniques are used. In quantitative research, sampling seeks
to demonstrate representativeness o f findings through random selection o f
subjects
8. Qualitative sampling techniques are concerned with seeking information from
specific groups and subgroups in the population
9. Criteria used to assess reliability and validity differ from those used in
quantitative research
74
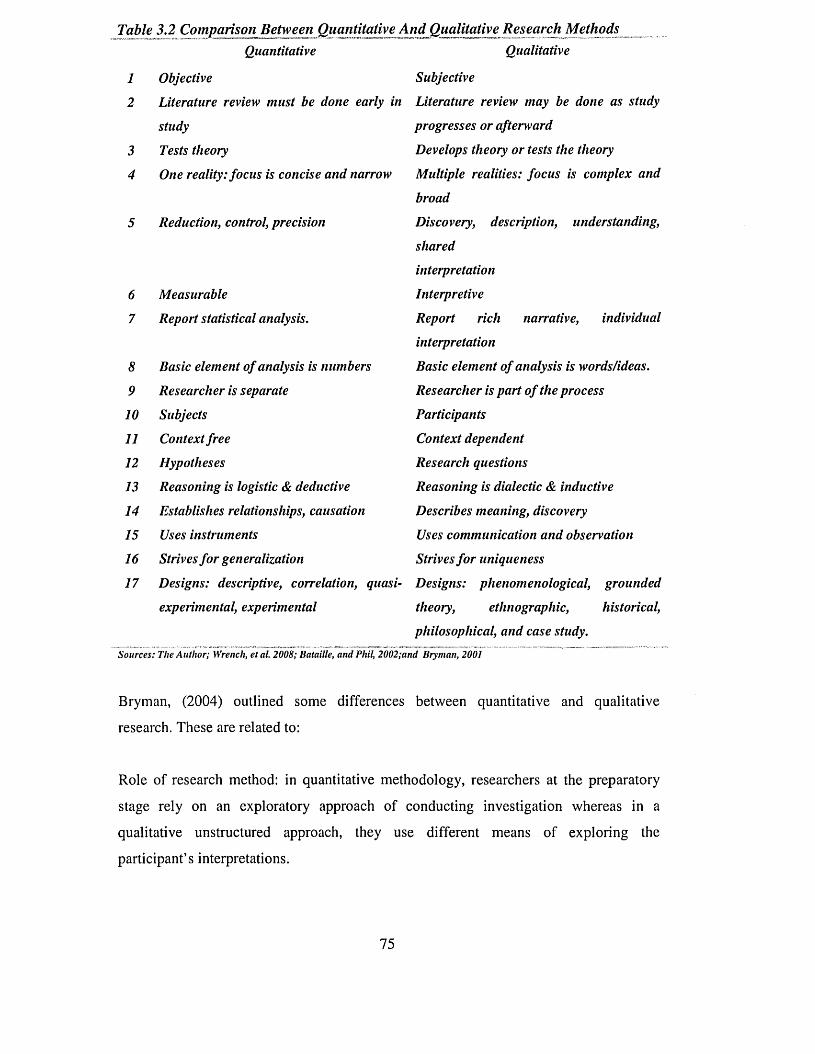
Table 3.2 Comparison Between Quantitative And Qualitative Research Methods Quantitative Qualitative
1 Objective Subjective2 Literature review must be done early in Literature review may be done as study
6
7
8
910
11
12
13141516
17
studyTests theoryOne reality: focus is concise and narrow
Reduction, control, precision
MeasurableReport statistical analysis.
Basic element of analysis is numbersResearcher is separateSubjectsContext freeHypothesesReasoning is logistic & deductive
Establishes relationships, causation Uses instruments
Strives for generalization
progresses or afterward
Develops theory or tests the theory
Multiple realities: focus is complex and
broadDiscovery, description, understanding,
sharedinterpretationInterpretiveReport rich narrative, individual interpretationBasic element of analysis is words/ideas.Researcher is part of the processParticipantsContext dependentResearch questionsReasoning is dialectic & inductiveDescribes meaning, discoveryUses communication and observationStrives for uniqueness
Designs: descriptive, correlation, quasi- Designs: phenomenological, grounded experimental, experimental theory, ethnographic, historical,
philosophical, and case study.Sources: The Author; Wrench, et al. 2008; Bataille, and Phil. 2002;and Bryman, 2001
Bryman, (2004) outlined some differences between quantitative and qualitative
research. These are related to:
Role of research method: in quantitative methodology, researchers at the preparatory
stage rely on an exploratory approach of conducting investigation whereas in a
qualitative unstructured approach, they use different means of exploring the
participant’s interpretations.
75
The relationship between the researcher and the subject: in a quantitative method, the
relationship is distant and contact with the individuals is usually brief whereas the
relationship is much closer between the researcher and the people observed; a constant
contact within the particular study is established.
The researcher’s position in relation to the subject: in a quantitative method, the
researcher adopts the attitude of an outsider to the subject matter, as assumed protocols
were applied. However, in a qualitative method, the researcher is more an insider to his
investigated subject; he interacts regularly with the participants.
The relationship between theory, concepts and research: since the method is
exploratory, the theoretical and conceptual framework is the principal phase for an
investigation, which researchers consider in quantitative studies whereas such
relationship is often redundant in a qualitative method as it emerges throughout the
study phases.
The research strategy: Quantitative researches implement a structured approach, i.e.
sampling and questionnaire are prepared prior to the start of data collection. On the
contrary, quantitative research tends to be more open, flexible and unstructured as it
permits the researcher to observe individuals' behaviour in the data.
The scope of findings: The findings of quantitative research are homothetic, i.e., the
researcher attempts to set up general findings disregarding time and place. However,
qualitative approach tends to be pictorial whereby great emphasis was laid on drawing
its findings in a specific time and place.
The images of social reality: The reality of the social world is stationary; the constant
changes in the behavioural patterns of the participants involved in a quantitative
approach are ignored. But in a qualitative approach, the social reality is more process
oriented and alterations in the interpretation of people’s behaviour are mirrored.
The nature of data (participation, observation, and theory testing): In a quantitative
method, the data are not easily gathered or obtained but the final outcome is more
reliable. Nevertheless, in a qualitative research, the data are richer in generating theories
that can produce insightful findings (Bryman, 2004: 93-123).76
The findings of the research questions and propositions discussed in the preceding
sections need to be matched with the range of available techniques that have been
discussed, in order to determine the appropriate research method to employ in order to
investigate and come up with an answer to the research question.
3.5 RESEARCH METHOD JUSTIFICATION
Different research methods with different characteristics are suitable for different
research purposes; they differ with respect to the kind of data involved and their means
of classification. Both the qualitative and quantitative research methods can often be
combined; each supports the other in research. Attempts are made to combine different
methodological traditions in development research. The combination of different
perspectives necessarily requires recruiting individuals with different skills, which
makes such projects costly in terms of time, talent, and resources. (Breakwell, et al.,
2006; and Brayman, 2000)
There is no rule in research that says that only one method must be exercised in an
empirical investigation. Using more than one method in an empirical investigation can
have substantial privileges. One significant benefit of triangulation methods lies in the
reduction of inappropriate certainty. Exercising a single research method and finding a
straightforward result may deceive researchers into assuming that they have found the
right answer. Whereas, using other or additional approaches, may point to different
answers which eliminate specious certainty (Creswell, 2009; Alvesson, and Skoldberg,
2009; Wrench, et al., 2008; Bryman, and Bell 2007; Silverman, 2004a; Silverman,
2004b; Huberman, and Miles, 2002; Morse, et al., 2001; Bryman, 2001; and Robson,
2002).
The research has a similar apprehension to that stated above since he embarks on
examining the employee’s perceptions of quality implementation practices, with a
specific reference to the UAEPSI. The researcher cautiously considered these
assumptions in order to surmount the constraint of inconsistency in the outcomes
obtained. An alternative strategy was employed to benefit from both qualitative and
quantitative intermarriage in a way that strengthens and supports the research finding.
develop the theoretical structure of the quality implementation model referred to in
Therefore, Ifrtejmalysis outcomes of the quantitative survey questionnaire were used to
77
chapter 4, section 4.1 and chapter 8, section 8.1, where a qualitative method of the focus
group was used to gauge the perceptions of people involved and their anticipations with
regards to accepting the model as an aid tool for better quality implementation practices
in the UAEPSI, (for further details, see chapter 5, section 5.1 and chapter 9, section
As argued in the previous chapter, research evidence on quality implementation
mechanisms involving the participation of people in the government institutions are
relatively new phenomena in the U.A.E.; iLcould be argued, hence, that this study is
mainly exploratory as the notion of quality implementation system is relatively
immature in the UAEPSI context due to the noticeable lack of theory and previous
research on the topic. To the best of the researcher’s knowledge, no sustained academic
study has been conducted on the implementation of TQM in the UAEPSI owing to the
lack of new theoretical and empirical insights into the U.A.E. government institutions.
Therefore, there is a need to investigate, and explore the perceptions of key stakeholders
involved in the implementation of the customized model in the UAEPSI. Perhaps^the
most effective way of doing this is by focusing on a carefully designated PSI. Thus, for
this kind of exploratory study, a mixed method of quantitative and qualitative
approaches is deemed appropriate. This approach investigates the employee’s
perceptions of the quality implementation practices in the UAEPSI, and attempts to
explore the impact of their perceptions: erceptions concerning the significance
perceptions concerning the acceptance of the accustomed quality implementation
model. An exploratory approach to data investigation and analysis extends the findings
to a wide range of alternative explanations since the researcher remains open to
unexpected possibilities.
As pointed out earlier, this research study is a pioneer one in the field of UAEPSI; there
is no specific theoretical model that can be tested and adopted. The research strategy
was based on a combination of qualitative and quantitative approaches. Two reasons led
to the adoption of such methodology: the first is a pragmaticone. It is associated with
the general problems of academic research in the U.A.E. The problem is related to the
access that a researcher can have to people as well as to secondary data. This problem
has two dimensions. The first dimension is that there are no databases in terms of a list78
9.2.)
of the critical success factors as a set for enhancing quality practices and secondly:
of particular public institutions, from which a researcher can obtain a representative
sample of research subject, (see chapter 4, and section 4.1 for further details). The
second dimension is the limited access that a researcher has to the UAEPSI profiles.
The second reason for the adoption of an integrated research methodology is that the
studies that have looked into the perceptions of employees towards quality
implementation practices are essentially quantitative, while very few qualitative
researches looked into government institutions. In addition, a merged methodology
would provide evidence towards a wide range of people and government institutions,
operating in different sectors, without missing the stronger explanatory advantage of the
qualitative survey questionnaire approach.
The quantitative approach aimed to provide a wide range of data concerning TQM
implementation practices in the UAEPSI. This approach is based on a survey
questionnaire theme. This method has three interrelated advantages. The first is that it is
aimed to come up with a conclusion referring to quality implementation practices in the
UAEPSI. At a different level of the institutional hierarchy, there is an interest in two
methodological and one theoretical implication. From the methodological perspective,
this structural level includes a wide range of employees. Thus, the survey obtained a
variety of responses that include different views on TQM implementation practices.
Moreover, it is more feasible to gain access to this occupational level than to try to
reach people at the senior hierarchal level. The theoretical implication is related to the
importance of the employee’s involvement in TQM implementation. As mentioned in
chapter 2, the importance of the employee’s involvement has been underlined by quality
gurus and experts (Oakland, 2003; Juran, 2003; Wilkinson, et al., 1997; Hill 1995;
Feigenbaum, 1991; Deming, 1986; and Crosby, 1984). Therefore, a survey
questionnaire of a wide range of people would offer evidence supporting the TQM
implementation practices in the UAEPSI.
The second advantage of choosing a survey questionnaire method is that through
quantitative data, the researcher can obtain two objectives. Firstly, a comparative
analysis of the various employees’ perceptions on TQM implementation practices in
different government institutional sectors. The comparative quantitative data had shown
great differences between the UAEPSI current quality practices and TQM
implementation practices, which provided credible evidence to the debate on the79
different perceptions of quality implementation practices. Secondly, the quantitative
data facilitate comparison among employees with different age, gender, educational
qualifications and years of job experience (for further details, see Chapter 5, section
5.4.).
Lastly, the third advantage is that a survey questionnaire can explore not only the
responses and processes adopted by specific group of people, but also the new
conditions introduced by the TQM approach. A variety of information items had been
collected and correlated to issues directly or indirectly related to the key factors of TQM
implementation. The former relates to issues such as, top management commitment,
customer satisfactions, employees involvement. The later includes a set of issues related
to the organizational performance, service improvement, employee’s reward and
recognition.
However, a qualitative approach was also required in order to shed light on issues
related to the background and the context of the employee’s responses to TQM
implementation practices. This approach was based on exploratory focus group. The
focus group sessions were held with people who participated in the quantitative stage of
the research and volunteered themselves as potential candidates. The general aim of this
approach was to examine the anticipations of people on the development of the research
implementation model; a list of findings including leadership, process and systems,
customer and employee’s satisfactions was related to the results extracted from the
quantitative approach. These issues cannot simply be explored through a survey
questionnaire. Furthermore, the focus group team responds to the need of the
exploratory mode of the research by giving further explanations on how things
happened. As a final point, the qualitative approach subjects can express several
different opinions regarding their own unique view on the research topic. (Litosseliti,
2005)
3.5.1 Why Survey Questionnaires
A survey questionnaire was selected as one of the two research method tools employed
in this study since ^facilitates the researcher’s task of quantifying information. The
purpose of this instrument was to gather information about the quality implementation
practices in the UAEPSI. One needs to examine the perceived and actual practices of80
quality critical factors from the UAEPSI point of view. In addition, the questions
contained in the questionnaires investigate the most common driving and inhibiting
forces of quality implementation practices in the UAEPSI. McAdam, and Henderson,
(2004)
It is believed that survey questionnaires are a more likely accepted data gathering
instrument due to cultural and customary traditions in the UAEPSI; therefore, the
perceptions of respondents can be obtained in a structured and friendly manner.
From reviewing literature relevant to carrying out research empirical fieldwork in the
government institutions in the U.A.E., it became obvious that survey questionnaires
were the most commonly applied research methods in the UAEPSI. As a result, the
researcher became convinced that in order to attain the thesis objectives, he should
apply the survey questionnaires. Despite the fact that constructing a questionnaire seems
to be quite simple, it in reality is a complex and strenuous process. It must be borne in
mind that information needs to be acknowledged and that survey questions must be
properly formulated and carefully selected. Furthermore, they should be aligned with
the research aims and objectives.
The information gathered from survey questionnaire are then analyzed and used to
formulate and develop the QAM within which the problem is investigated as depicted in
Chapter 8, section 8.2. However, the effective development of a reference model
requires an equally important scientific approach that should preferable be based on
theoretical and empirical research. In integrating both the theoretical conceptions of
quality together with the empirically based information, a solid foundation is provided
for the development of a model, peculiar to the problem being investigated, and the
development of a questionnaire with practical questions fragmented into separate
sections and based on the variables contained in the model.
3.5.2 Why Interviews
Consequently, the researcher has opted to conduct semi-structured interviews with top
management in the UAEPSI; the objective is to enrich the research fieldwork
investigation since interviews:
8 1
1. Support research validity and reliability: avoiding the expected weaknesses of a
questionnaire, interviews enhance the research validity and credibility of the
data gathered
2. Meet Cultural prerequisites: most of top management administrators in the
UAEPSI prefer face to face communication to the written questions because
their cultural behaviour as well as their prestige obliges them to express their
unwillingness to respond to the questionnaire questions as they primarily believe
that they are designed for lower managerial and clerical posts
3. Facilitate the questionnaires distribution: in interviewing UAEPSI top
management executives, the distribution of questionnaires among organisation
employee is facilitated. Managers request them to take it seriously. This support
is a golden opportunity for the researcher; it's like killing two birds in one stone
4. Secure Continuous source o f information: providing an opportunity for building
up a good relation with the management in the UAEPSI since they are
considered a continuous source of information for future studies
5. Enable the researcher to communicate with a large population
6. Prove to be an aid that is inexpensive and easy to administer: one can easily
administer the people involved, which ultimately lead to higher representation,
higher response rate, reliability, credibility and feasibility of interacting with
large population samples.
3.6 DATA COLLECTION SOURCES
This section explains the researcher's endeavour with regard to data collection. The
research design addresses the subjects selected and the data collected or generated. The
researcher made two claims: the first concerns the investigation of quality practices in
the UAEPSI and the second involves scepticism about how quality implementation
processes proceed in the UAEPSI. This might be referred to as the realistic position: the
function of the UAEPSI involves practical aspects that can be identified or modified by82
the view of the employee’s ability or inability to describe them objectively. This
realistic position was extended to the selection of methods of investigation and the
implementation of the research work.
The choice of a survey questionnaire and a semi-structured interview as the primary
method of investigation supported by secondary data collection through the preliminary
survey was made. The selection of focus group was also based on realistic criteria. The
primary consideration was that this theme provided an opportunity to test the research
paradigm. At the same time, it was necessary to have access to the UAEPSI and to
relevant people. A practical way of achieving this was the use of personal relations to
identify the appropriate group team. This approach together with the conditions of
confidentiality and anonymity ensured that potential ethical dilemmas were addressed in
the planning process.
Testing the research paradigm required the broadest view possible about the conduct of
the teamwork. A team selection criterion was that the team members had recognized a
team leader who was willing to report on the details of the event and the behaviour of
people participating in the project. Only the leader is in a position to view the behaviour
of all people involved from a potentially objective standpoint. Observing these
behaviours from a uniform standpoint was considered more important to testing the
research proposal than the possibility of the observer partiality in the overall team
descriptions. Additional participant observers would have enhanced the details of the
focus group, but they would not have the reliability of the observation of behaviours
necessary to testing the research proposal.
With the team leader being the primary source of data, self serving and attribution
biases were expected. Several strategies were adopted to minimize the bias and to
standardize any effect across the focus group. First, objectivity was encouraged.
Interviews were conducted in environments chosen by the researcher and were made
comfortable to the subject, under conditions of cordiality, confidentiality, and
anonymity. Second, the interview questions were set down in a format that emphasized
open questioning and encouraged dialogue, allowing the researcher to evaluate and
answer questions (see chapter 9, section 9.2).
8 3
In keeping with the focus group method, the question orientation was towards the
researcher rather than subject. A taped recording of the dialogue allowed the researcher
to revisit the question and reconsider judgments. Third, the survey questionnaire was
personally administered with the researcher determining the questionnaire response.
Again, this enabled the researcher to review and reconsider the subject’s responses, and
to identify any obvious individual bias. (Silverman, 2004b; and Yin, 2004)
In this study, the researcher is responsible for all recording and transcription, and the
translation of the data. The issues concerning the description of the focus group and the
dialogue between the researcher and the theme concerning the procedure and the survey
questions were observed. Written transcriptions of the interview were not made. The
perceptions and perceptions analysis were written from the researcher’s interpretation of
the interview dialogue. The follow-up question written team reports were provided to
subjects for verification and additional comment.
3.6.1 Secondary Sources
The investigation and gathering of the research secondary data resource was carried out
in the very early stage of the research. The researcher relied heavily on documentary
and archival records of the UAPSI who have been so far the recipients of the local
quality awards. Silverman, (2004b) pointed out the significance of the documentary and
archival records as a source of data gathering. They noted that data could be obtained
from different sources such as: letters, administrative documents, textbooks, journals,
and items from mass media, agendas, policy documents and other similar items. Semi
structured interviews with a number of quality managers and quality advisors in the
UAEPSI were conducted. Besides, the researcher gathered information from a range of
most recent documentary and official records, quite few of the UAEPSI, as they are
very rare and on most occasions, they do not exist.
Further data were obtained from a variety of sources such as: local and international
newspaper, government bulletins, Journals and magazines and last but not least from the
internet. The purpose of the investigation is justified on the basis of the following.
1. Analysis o f the quality initiatives and probing into the organisations records to
determine the most critical success factors that contributed positively to the84
implementation o f TQM practices. The results o f this were experimented with
and applied in designing the questionnaire questions. This drives the researcher
to test and validate his questions, and to determine to what extent it could be
applied to the UAEPSI.
2. The use o f documentation and archival records alongside the semi-structured
interviews as techniques for the researching secondary data; they helped the
researcher to assemble indisputable facts and evidence were used as a
foundation for launching the research fieldwork.
3. Carrying out this investigation was in part fo r fulfilling the second objective o f
the research. Furthermore, the accomplishment o f the above objective,
subsequently paves the road to realize objective three.
The researcher has designed the research fieldwork approaches by applying two
research methods, quantitative and qualitative to UAEPSI. For the quantitative method,
the researcher used a questionnaire as an investigation instrument. It specifically
dispatched to selected employees in different posts and department. Whereas, in
qualitative research method, the researcher formulated two focus groups to carry out
research on the senior management in the UAEPSI exclusively.
3.6.2 Primary Sources
Based on the earlier discussion, the research employed both quantitative and qualitative
data to address different but complementary questions within the study and to develop a
quality implementation model for the UAEPSI. The model focuses on the use of
different research methods for alternative tasks. It predicts what happens when an initial
fieldwork is carried out by means of the descriptive and exploratory survey
questionnaire with the structured interviews. It were used to investigate current quality
practices in the UAEPSI, to identify factors affecting quality implementation from the
employee’s perspective in the UAEPSI, and to determine the suitability of the
developed model to the nature and culture of the UAEPSI, from the employee’s
perspectives. The subsequent focused group work is directed to explore the willingness
to accept and the suitability of the model developed to the nature and needs of the
UAEPSI. The goal was to use the quantitative and qualitative approaches in a
complementary manner to enhance the interpretation of the data gathered.
85
SUMMARY
Identifying the appropriate research methodology is crucial to conducting any research.
Unquestionably, this study requires appropriate research methodologies. First of all, this
chapter begins with reviewing possible research approaches such as qualitative and
quantitative techniques and data collection methods. The strengths and drawbacks of
each research approach and data collection method are investigated and documented.
After the examination of available research methods, the remaining chapter concentrates
on the methods selected for this study. The main research methodology chosen for this
study is the quantitative approach using a survey questionnaire for data collection.
The second research methodology for this study is the qualitative approach of focus
groups, interviewing top management of the UAEPSI. This stage of the research is
discussed in further details in chapter eight.
In addition, the chapter illustrated the research methodology that was employed, the
stages of research and the methods applied to ensure validity and reliability. Measures
taken to preserve the anonymity of the UAEPSI current quality practices in the UAEPSI
were described as well as the temperament of the research. This chapter outlined the
design of the investigation carried out and the expectations of its outcomes. The chapter
reviewed the research methods available and the approaches adopted to select of the
appropriate methods. The reasons for choosing a research strategy based on mixed
(triangulation) aspects of survey questionnaire and focus group were explained and
justified (see also chapter eight). The rationale behind the selection of focus group was
outlined, and the procedures adopted for recruiting participants were explained.
The chapter also displays the design and development of a survey questionnaire, the
approach taken for testing and refining them, the data collection methodology and the
strategy and procedures for analyzing the data obtained. The next chapter discusses the
fieldwork survey carried out, the design of the questionnaire, the preparations for the
interviews and the data gathering instruments employed in the empirical study. The
chapter also discusses the sampling design of the study and the data analysis process.
8 6
CHAPTER FOUR
FIELDWORK AND DATA COLLECTION
PREFACE
In undertaking the empirical stage of the research, the researcher emphasises the careful
selection of appropriate research methodology. The theoretical literature on TQM
implementation practices in UAEPSI was reviewed in depth. Besides the literature
review, the researcher manipulated the feedback obtained from the preliminary
investigation of quality and the implementation practices in a number of public service
institutions in the U.A.E. (see Chapter Three, section 3.6). Furthermore, by integrating
the theories and practices on quality implementation, the researcher got acquainted with
a wider spectrum of different research methods, which helped him to select the most
appropriate research methodology, plan and conduct his empirical research. This is
carried out within the context of the research aim, and objectives and the research
methods discussed in chapter one and chapter three.
The aim of this chapter is to define the method applied for collecting data for the
empirical research. Due attention is accorded to selecting the method appropriate for
processing the data to test the applicability of the proposed quality appraisal model for
the UAEPIS, (see Chapter Three for more details). The research design addresses the
structure of the information produced: what information to be collected or generated,
when and how it will be collected. The data obtained for this study were collected by
means of administered survey questionnaire and semi-structured interviews. The
prerequisites for a successful questionnaire were examined before providing details on
its design and development of the questionnaire, on the content and the process of
distribution methods applied for getting them back. Particular attention was given to the
respondent’s confidentiality as well as to the discussion on the reliability test analysis
and validity.
As explained in chapter three, the research relied on two main sources of information
for data collection. The primary source of information which consists of information
collected from literature, journals and technical papers related to the thesis and the
secondary source which incorporates information gathered by the researchers. They are
87
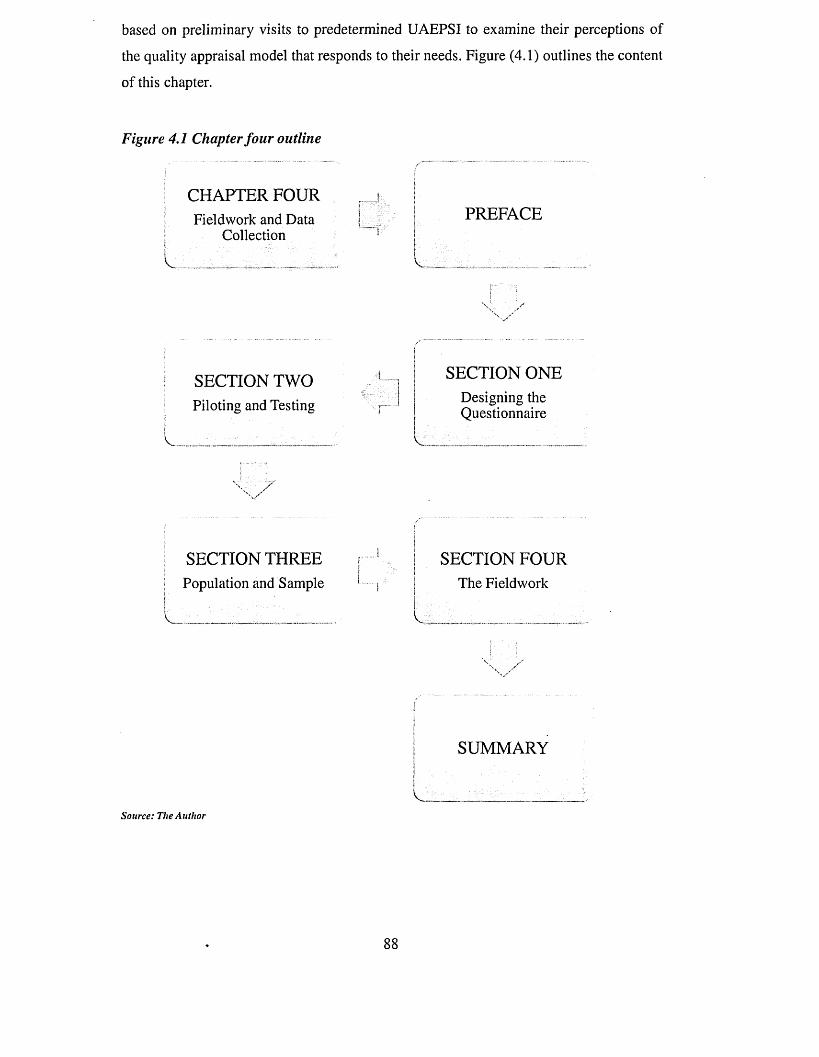
based on preliminary visits to predetermined UAEPSI to examine their perceptions of
the quality appraisal model that responds to their needs. Figure (4.1) outlines the content
of this chapter.
Figure 4.1 Chapter four outline
CHAPTER FOURFieldwork and Data
CollectionPREFACE
SECTION TWOPiloting and Testing
V..
SECTION ONEDesigning the Questionnaire
V ...
SECTION THREE Population and Sample
V ....
SECTION FOUR The Fieldwork
SUMMARY
L -
Source: The Author
4.1 DESIGNING THE QUESTIONNAIRE
In discussing the design and the structure of the research survey questionnaire, it is
necessary to highlight the rationality for using a survey questionnaire as a research tool
for investigation and collecting data. To create a well structured questionnaire, the
researcher considered the following aspects: the variables to be measured, the type and
the size of the population sample, the need for particular control groups if required and
the type of questions together with the appropriate scale, (Domyei, and Taguchi, 2010;
Walter 2009; McColl, 2005; and Oppenheim, 2000).
Although the structured survey questionnaire is used in this research as a prime tool for
collecting data (due to several reasons mentioned in Chapter 3 Section 3.4), the
researcher should bear in mind the scenario of the low percentage of returned and
number of statistically usable or unusable questionnaires. Thus, to alleviate this
problem, two cover letters were enclosed along with every questionnaire sent out. (See
Appendix 1). The first letter was a support letter issued by the researcher's employer; in
which it introduces the researcher as a member of the staff, and as a part of his research,
he needs to conduct a study fieldwork survey. The letter also requested those who are
concerned (the management of the UAEPSI) to provide every assistance should the
researcher need for carrying out the survey successfully.
The second letter was issued by the researcher in coordination with the research director
of studies. The letter clarified the aim of the research, the purpose of the study; it stated
in clear statement that the data and results of the study would be used for academic
purposes and guarantees the confidentiality of the potential respondent’s personnel
details. Both letters were written first in English and then translated, by the researcher to
Arabic language. This is because, it is compulsory by the law that all official
correspondences forwarded to government institutions in the U.A.E. should be written
in Arabic. In addition, the vast majority of respondents were Arabic speakers, therefore
it was sensible to write and interact by Arabic for better communication. The intention
of the two covering letters was to:
Provide support and backup: to give the researcher full support and the necessary
backing required from the researcher employer i.e. government institution to carry out
the fieldwork.89
Ensure Legitimacy and authenticity: to provide a secure sense to the intended PS I
management; that the research is authentic since has been approved by two eminent
references.
Secure confidentiality: to emphasise confidentiality. The researcher assures that no
person or institution name will be mentioned or disclosed under any circumstances.
Serve the academic purpose: the researcher stresses that research is for academic
purposes and information obtained will not commercialized or shared by third party.
It was hoped that these measures would have a positive impact on the response rate by
directing the rate of the returned questionnaires to the presumed target.
4.1.1 Questionnaire Development
The aim of this section is to collect the necessary data for the development of the
research proposed model. To attain such objective, a set of questions for measuring the
variables was well developed. This was carried out through reviewing the TQM
literature and with continuous guidance and assistance from the research director of
studies.
With all the intended questions meeting the criterion of relevance, the content issue
revolves around whether the questions provide sufficient and appropriate coverage of
the research objectives being measured by that question. Excessive questioning may
lead to ambiguity and to the respondent encountering difficulty in interpreting the
question. Otherwise, shortfall question content may cause the respondents to envisage
inappropriate assumptions and misleading responses. Accordingly, the aim of researcher
was to minimize measurement errors by making questions as clear and understandable
as possible.
Distortions were minimized by ensuring that the terminologies used and their meanings
are clear to the native respondents and that technical terms were properly rendered in
Arabic. Special attention was given to the questionnaire sequential layout, to the
impartiality of the questions and to the elimination of ambiguity and to assess no
confusion would be caused with regard to whom the questions were addressed (Walter,90
2009; Weerakkody 2008; Richards, 2005; Marquis, 2005; Bourque, and Fielder, 2002;
Punch, 2000; and Oppenheim, 2000).
Hence, a number of challenges were encountered in this phase; among which was that
of accessing the UAEPSI to collect information. This was not an easy task because all
the UAEPSI participants were very conservative and sensitive with respect to providing
the strangers with any kind of information related to their staff personal details or about
their institution. The second problem was that of language barrier and communication
since the majority of the respondents were Arabic speakers. To overcome this obstacle,
the English version had to be translated into Arabic. This translation might not be
accurate as few quality terms, such as benchmarking, could not be precisely translated
into Arabic (Domyei, and Taguchi, 2010).
The theoretical background and the development of the survey questionnaire were based
on reviewing different sources of literatures and empirical studies related to TQM
implementation in the public sector institutions. However, the researcher did not adopt
or use a specific existing survey questionnaire. Instead, the researcher adopted an
eclectic approach making use of the previous empirical research studies conducted by
other researchers sharing similar concept but, carried out in different countries. Notably,
this study differs from other researches in its kind that it primarily examining public
sector institution in the U.A.E., whereas, previous studies were largely examining
quality practices in private organisations. Briefly, the development questions set of
questionnaire was based on two sources. The first was the adoption of questions from
similar studies. In this respect, the researcher made use of questionnaires developed by
(Walter, 2009; Hafeez, K. et al., 2006; Colinson, et al., Edwards, 1998; Loomba, and
Spencer, 1997; and Dean, and Helms, 1996). Several questions were formulated from
these sources to meet the objectives of the survey.
Second, the set of factors especially those in section three and four were developed from
data analysis obtained from the preliminary research investigation on quality
implementation practices in the UAEPSI. Initially, the components of the quality critical
factors were identified in TQM literature (see Chapters one and six). Then, the
differences among the quality critical factors were identified. Furthermore, some basic
evaluation criteria were obtained from the U.A.E. Government Excellence Programmes
91
(UAEGEP)1. More significantly, the majority of the questions in section five of the
questionnaire (see Appendix 2) were developed as mentioned earlier from different
sources and were further amended to suit the UAEPSI current quality situation. On
these bases, the author constructed the survey questionnaire that hoped to fulfil the aim
and meet the objectives of the research
4.1.2 Type of Questions
The previous section discourses on the design and the structure of the survey
questionnaire. This section deals with the different types of questions incorporated in
the survey questionnaire (see Appendix 2). It is believed that well crafted survey
questionnaires containing a variety of questions more likely increase the likelihood of
the respondents return rate.
Prior to deciding on the type of questions in the questionnaire, the researcher reviewed
the literature as well as the previous researches which conform to the research topic. As
for the selection of the types of questions, Sekaran (2003) observed that the
questionnaires are efficient data collection mechanisms when the researcher knows
exactly what is required and how he can measure the variables of interest. In relation to
this study, the data required from the field survey, the variables to be tested empirically,
and the means by which these variables were to be measured were defined prior to
designing the questionnaire. Consequently, the researcher sought to include commonly
used types of questions usually embraced in survey questionnaires. Below paragraphs
demonstrate the type of questions were enclosed in survey questionnaire.
Closed-Elided Questions
This type of questions contains a predetermined set of answers provided by the
researcher from which the respondents can choose the most appropriate one. This type
of questions is easier than the open-ended questions in terms of response classifications,
and statistical analysis. According to Weisberg et al, (1996:84), the main advantage of
closed-ended questions is that they provide the same frame of reference for all
1 The U.A.E . Government Excellence Programmes (UAEGEP) is an independent local governm ent institution in
individual emirates. Their main function is to enforce and ensure that all UAEPSI are in line with the governm ent
quality initiatives. The UAEGEP, principle criteria are based on the EFQM-EM.
92
respondents to use in determining their answers. It is also easy to work with the
resulting data. Heather and Stone (1984:13) listed the following advantages of closed-
ended questions:
• They are simple to administer.
• Because the categories are determined in advance, it is easy to pre-code the
responses, which facilitates the analysis.
• They have a frame o f reference which guides the respondents’ replies.
• They may clarify the concepts used and make clear the kind o f answers sought.
Despite the advantages of the closed-ended questions, they have some drawbacks. They
may be biased in that they may enforce a statement of opinion on an issue when the
respondents do not have any opinion. They are also hazardous in that they may offer an
easy choice that the respondents might not make if forced to recall, organize, and
evaluate a personal experience, etc. Therefore, a written, closed-ended and self
completion questionnaire was designed. The justification for employing such type of
questionnaire is derived from a consideration of its major advantages, (see Table 4.1).
The Likert-Scale Questions
The most frequently used ordinal scale that is relevant to the research topic is the five-
point Likert-type scale which uses a series of statements or matters, each of which
expresses an opinion that the respondent clearly agrees or disagrees with. The response
is usually expressed in terms of the following five categories: (7 = strongly disagree; 2
= disagree; 3 = neutral; 4 = agree; 5 = strongly agree), (Flynn et al., 1994), The
Likert-Scale is used in this exact from in the survey questionnaire (see Table 4.1 and
Appendix 2). It presumed that including this type of questions in the survey
questionnaire would give an indication about people perceptions on the critical
significance of quality factors and their level of practice in the UAEPSI.
Multiple Choice Questions
This type of questions enables the respondents to choose the most appropriate answer
or sometimes even more than one answer from pre-listed options. This type of questions
is included in sections two and five, (see Table (4.1) and Appendix 2),93
Numerical Questions
This type of questions is basically asked when the answer ought to be a real number
like, age, weight...etc. the study survey questionnaire used this type of questions in
sections one and two, see Table (4.1) and Appendix 2. The following section in this
chapter presents in further detail such questions.
Ordinal Questions
In this type of questions, the respondents in the UAEPSI were asked to rank in a
sequence the possible answers. For instance, the respondents were first asked about
their perception on a particular issue. Then, they were requested to select numbers from
one to five next to each of the five options provided. Number one represents the most
important and number five represents the least important. The researcher omitted this
type of question during the piloting and testing stage of the survey questionnaire
because the majority of those involved remarked that the ordinal questions caused a lot
of confusion to them.
To avoid the risk of havoc and to eliminate any mistake that might occur in the
responses, the researcher changed the ordinal question to Partially Close-Ended
Questions. It is believed that such attempt remedies the drawbacks of the closed-ended
questions, (see Table 4.1 and Appendix 2).
Open-Ended Questions
This type of questions gives the respondents a large amount of freedom and space to
express their point of views, or if they like to add further details. Hence, these types of
questions are quite difficult to classify and to interpret individually. The researcher had
overcome the complexity of embracing all the possible answers in each question by
changing some of the open-ended questions to partially open-ended question and by
attaching to the end of most of the survey question the option (Other).
The researcher was thus, able to extract more information that strengthens the validity
of data analysis. Moreover, this allowed the respondents to write a substitute answer
94
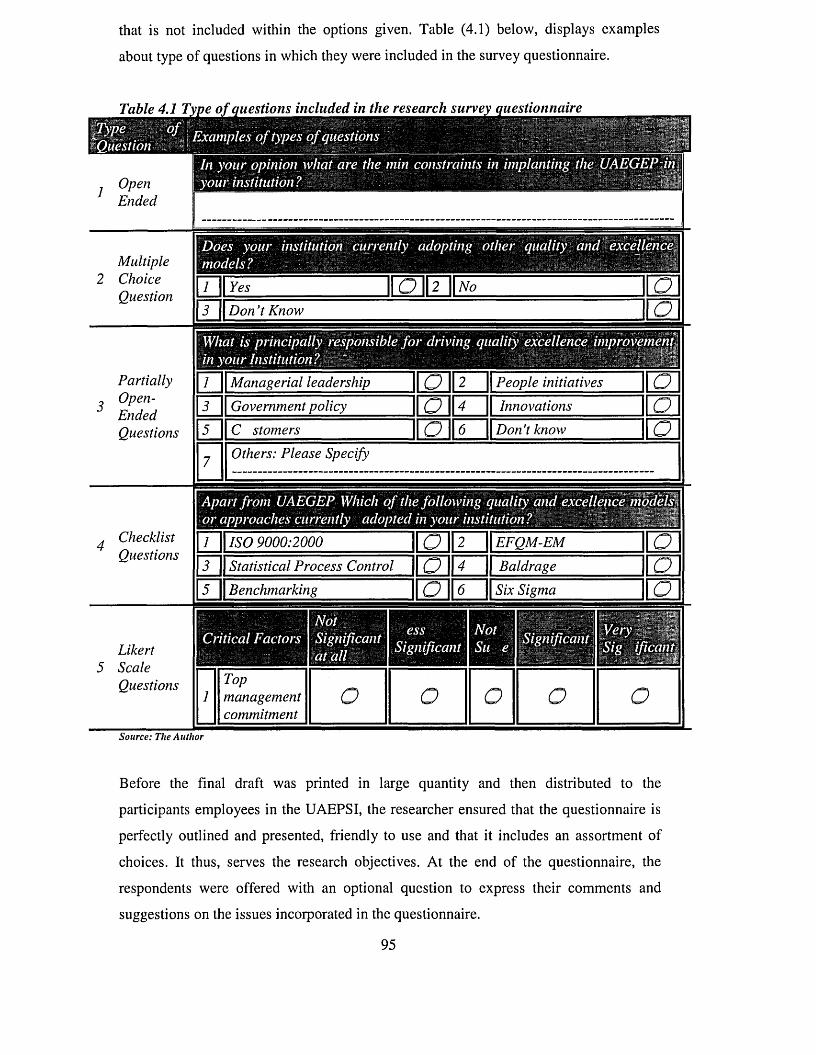
that is not included within the options given. Table (4.1) below, displays examples
about type of questions in which they were included in the survey questionnaire.
Table 4.1 Type o f questions included in the research survey questionnaire
OpenEnded
; Examples o f types o f questions
In your opinion what are the min constraints in implanting the UAEGEP in your institution? : v
Multiple 2 Choice
Question
Does your institution currently adopting other quality and models?TYves 2 NoT~|| Don’t Know
What is principally responsible fo r driving quality excellence improvement tin your Institution?
PartiallyOpen-EndedQuestions
Managerial leadership 2 || People initiativesGovernment policy InnovationsC stomers 11 O P \\ Don't knowOthers: Please Specify
Apart from UAEGEP Which o f the following quality and excellen or approaches currently adopted in your institution?
ChecklistQuestions
1 ISO 9000:2000Statistical Process Control || QBenchmarking
I I e f q m -e m 'II Baldrage
Six Sigma
Likert 5 Scale
Questions
iyI
Topmanagementcommitment
o o o o oSource: The Author
Before the final draft was printed in large quantity and then distributed to the
participants employees in the UAEPSI, the researcher ensured that the questionnaire is
perfectly outlined and presented, friendly to use and that it includes an assortment of
choices. It thus, serves the research objectives. At the end of the questionnaire, the
respondents were offered with an optional question to express their comments and
suggestions on the issues incorporated in the questionnaire.
95
4.1.3 Questionnaire Layout
It is necessary at this stage to describe briefly the main five sections of the
questionnaire, (see Appendix 2).
Section One
The first section covers the personal attributes and the general profile of the
respondents. Thus, the section presented the respondents with the study’s independent
variables that include the following:
• Name
• Nationality
• Gender
• Age group
• Educational qualification
• Current occupation
• Years o f service in the current position
These variables were based on the nominal scale of measurement in which they
qualitatively distinguish the respondents by classifying them into mutually exclusive
categories. The respondents were asked to distinguish themselves by selecting the
appropriate optional variables.
Section Two
The second section establishes a general profile about the UAEPSI in which their
employees were the potential respondents of the research survey questionnaire. Thus,
the section presented the respondents with the study’s independent variables that
include the following:
• The institutions legal entity
• The total Number o f workforce
• The service sector they operate
96
• The type o f quality models or other approaches adopted
• The reasons o f adopting other quality models and approaches in conjunction
with the UAEGEP
The questions in section two of the research survey questionnaire aimed to explore the
institutions size, which service sector they operate, whether their institutions adopt
quality model or approaches other than the UAEGEP, and to what extent these models
or approaches were helpful with respect to improving the quality of their services. The
respondents were provided with twelve optional statements of dependent variables
relating to reasons for adopting the quality model or approaches other than the
UAEGEP. The dependent variables presented in this section were based on an itemized
interval rating scale (see Appendix 2).
Section Three
The third section of the questionnaire refers to the employees perceptions of the
UAEPSI on what quality factors are vital for successful implementation of quality in
their institutions. The major part of this section comprised the quality critical factors
derived from the previous literature; they believed to encompass all the major elements
of the TQM philosophy. The factors were carefully chosen in order to reflect the
UAEPSI quality implementation practices. Thirty seven major factors believed to be
crucial for the UAEPSI were proposed.
For each factor, the respondents were asked to rate the level of significance they place
on each on a five-point Likert scale: 1 = Not significant at all; 2 = Less significant; 3 =
Not Sure; 4 = Significant; 5 = Very significant. The identification of the significance of
these factors was part of answering the first question of the research which is ‘What are
the key critical success factors, and to what extent they are vital for the successful
implementation of TQM from the employee’s perspectives in the UAEPSI? The
identification of these factors laid the foundation of the intended research quality
appraisal model that compatible to the nature of the UAEPSI.
97
Section Four
The fourth section is almost similar to the third section in presenting the set of the
twenty- seven critical factors. It also, seeks the perceptions of the employees regarding
the significance of the critical factors which leads to the successful implementation of
quality in their institutions. The only difference is that the respondents were asked to
rate the extent to which these factors actually been practiced in their institutions. The
Five-point Likert scale rates the extent to which practice was given as 7= very low; 2=
Low; 3= Not sure; 4= High; and 5= Very high\ The middle, 'Not sure’, was provided
to allow for those respondents who did not know or were unsure of the answer
This interval scaling reflects the perceptions of the respondents on how these factors are
actually emphasized, practiced and demonstrated in their institutions. By ranking the
actual level of the practiced factors, this should answer the research second question,
which explores ‘how divergent quality practices are in the UAEPSI and TQM
practices’. The data analysis of this section and section of the survey questionnaire
represents the respondents' view and viewpoint as well as their level of understanding
the most critical quality factors that are significant, well-recognized and practised in the
UAEPSI.
Section Five
The questions in section five investigates into the UAEPSI current and past experience
of quality implementation practices. This is due to the fact that UAEGEP compel all
UAEPSI to adopt the EFQM-EM as a quality tool for their performance assessment and
services improvement measurement. Therefore, the questions of section five were
primarily directed to those institutions experienced in quality implementation practices,
(see Appendix 2). The set of questions were designed to explore and examine the
UAEPSI familiarity with and ability to execute such approach. A question was
presented to the respondents on type of self assessment and improvement measurement
was adopted. Furthermore, they were asked to highlight factors that could facilitate and
enhance quality implementation. In addition, they were asked to identify the driving
forces that could promote the implementation of TQM in the UAEPSI. The factors
included in this section related to the recent U.A.E. public sector reforms in conjunction
with the economic turndown which severely affected the U.A.E. economy. These issues
were presented in the last part of the fifth section as respondents were given a space to98
express their views and perception on whole research issues. The outcomes of these
questions should respond to the third question of the thesis, which is ‘What problems
and/or obstacles are associated with the implementation of TQM tenets in the UAEPSI?.
It’s also, important to mention that this section like other sections was amended and
some repetitive questions were omitted.
The suggestions of the pilot group were to avoid any replication that might disrupt the
respondents' focus away from the main themes of the intended questions. At mentioned
earlier, in order to gain more accurate data and to secure a high response rate from more
than one group of respondents, the questionnaire was designed in two different
languages (Arabic and English) since it was distributed to more than one group within
the total sample population. The group that represented U.A.E. nationals whose mother
language is Arabic, and the expatriates whose language is not Arabic. It has thus, kept
its respondents comfortable using their normal language and made them feel that its use
is not only legitimate but also valued.
Eventually, the questionnaire attempts to expedite the process of gathering information
required for exploring the general view of the collective opinions, views and
perceptions of people directly involved in the quality implementation practices in the
UAEPSI. The researcher estimated that the questionnaire leaflet will probably take
fifteen to twenty minutes to complete.
The ultimate aim of the survey questionnaire should explore employee’s perceptions in
the UAEPSI on:
• The most quality critical factors perceived.
• The actual practices o f critical factors
• The acquaintance o f the UAEGEP
• The quality implementation practices in the UAEPSI.
• The driving forces for quality and service improvements
• The awareness level o f quality and the UAEGEP
• The methods o f self assessment
• The constraints associated with quality implementation in the UAEPSI.
99
4.2 PILOTING AND TESTING
This section describes stages that the survey questionnaire went through subsequent to
its design and development. Consequently the section is divided into three main
subdivisions, the piloting of the survey questionnaire, then making necessary
modifications and amendments, and finally testing the reliability of questions and the
quality critical factor.
4.2.1 Piloting
Piloting gives the researcher an opportunity to identify any problem and to modify the
research method accordingly before carrying out the research survey questionnaire. The
pilot study enabled the researcher to examine the following:
• To acquire external views on the questionnaire contents and consistency
• The accessibility o f the sample group
• The likely response rate
• Whether or not the data collection tool provides the depth, range and quality o f
information required
Having selected the appropriate vocabulary, the wording of the questions needed to be
tested to ensure that the questions were expressed clearly, that no unwarranted
assumptions were made, that the questions were not biased and that there was no
confusion regarding to whom the question was addressed to (Yates, 2004). Piloting also
allows the researcher to detect potential problems that might occur and to take all
possible prevention measures to avoid them. Therefore, the researcher has to make
revisions before undertaking the main study. It is the survey targeted respondent, who
can truly judge whether or not the questions are clear and comprehensive. This ensures
that the data collected in the main study will be usable.
The selection of the questions was based at the outset on a small scale pilot study that
took place almost one month prior to the commencement of the actual fieldwork. The
researcher ensured that questions had to be easily understood by the respondents so as
to avoid confusion. Otherwise, the research findings might have been biased. In this
study, various measures were taken to minimize these potential problems. The English100
version was translated into Arabic by the researcher. A few English terms were
translated into Arabic by providing additional explanations so that the respondents
could understand them better. After translating them, the Arabic version of the
questionnaire was presented to a group of five people who had good experience of
quality and were familiar with interpreting English terms into Arabic. They were asked
whether:
• The questions were stated in a shared vocabulary
• The questions were precise and unambiguous and
• The questions were simple and direct.
The criteria for selecting the test cases were firstly a range of UAEPSI that covered the
potential workspace of the empirical study, and secondly an access to people
experienced in quality implementation and familiar with the quality management idioms
currently used in the UAEPSI. The relationship with the latter people needed to be
consistent in nature, so that the actual research study could be adopted and the
interaction between the subject and the researcher could be made flexible enough to
allow the researcher to try different approaches to questioning.
A pre-test or a pilot study was conducted, before handing the questionnaire to the
potential population to test the validity and reliability of the questions included in the
questionnaire. Fifteen copies of the questionnaire were distributed randomly to a
stratified group of people in different UAEPSI, representing various position levels. The
pilot test included two managers, three officers and three supervisors together with
seven clerics, both males and females. The pilot testing was conducted on two phases.
In the first phase, the pilot group were asked to review the questionnaire handout
without help from the researcher. They were first asked to comment on their
understanding of the questions and second, to comment on the relevance of the
questions to the research paradigm that they brought to the pilot testing. After reviewing
their responses, revision was made to the format of the questionnaire and to the
individual questions.
In the second phase, both the content of the revised draft of the questionnaire and the
procedures of data collection were tested. This phase consisted of full scale practice101
sessions administered verbally. While no concern arose from the data collection
process, further minor revision of the Arabic interpretation of the survey questionnaire
was made. The feedback was really valuable; it contributed positively to the final draft
of the questions and the form of answers.
Although the majority of the questions were of the multiple choice and partially open-
ended type; there was a subsidiary of open-ended questions attached to section five of
the questionnaire, allowing the respondents to make their comments and suggestions.
However, only few of them answered these questions.
4.2.2 Modifications
Some alterations were made according to the piloting group feedback and suggestions.
During the researcher visit to U.A.E., the Arabic version of the questionnaire was
formally pre-tested on different group of people. These people were asked to note their
feedback on: the questionnaire simplicity level and the clarity of specific items; they
were also asked to make suggestions for possible changes or any other general
proposition. Based on their observation and feedback, the Arabic version of the
questionnaire was further modified. They encountered two important issues related to
the critical factors in section three of the questionnaire.
First, they detected some factors which were most likely repetitive. They alleged that
the repetitive factors were written in different words but, they signal the same meaning.
So, they strongly suggested removing the repetitive factors as they might confuse the
respondents.
Second, they felt that the pre-listed factors need to be short- listed; therefore, they
suggested either to reduce the number of factors or to combine them into groups. These
two notes assisted the researcher in changing the critical factors layout. Therefore, the
amended final draft of the questionnaire omitted the repetitive factors which were then
re-classified and categorized into twenty-seven critical ones.
In addition, the task of minimizing distortions was to ensure that the words used
together with their meanings would be perfectly understood by the respondents. The
vocabulary used was intended to bridge the differences in the educational level and the102
experiential background of the respondents and to encompass the Arabic vocabulary of
TQM technical terms that the people in the UAEPSI use in discussing the quality
implementation processes. The final Arabic version of the questionnaire was similar to
the English version in containing of five main sections (see Appendix 2 and Chapter
Four section 4.1.3).
4.2.3 Reliability Testing
The measurement of the survey questionnaire set of questions reliability was the final
stage of the questionnaire design and testing process. Issues covered in question
development were the question content and question wording (Emory, and Cooper,
1991). They were checked for their relevance and for the extent to which the questions
contributed towards answering the research questions. The approach adopted was: if the
research question could be answered without resorting to the anticipated measurement
questions, then the question was redundant and could be removed from the survey
questionnaire without any loss of information.
With all anticipated questions meeting the reliability test measurements, the content
issue revolves around whether the questions provide sufficient coverage of the concept
being measured by the questions. Overloading the question content may result in
ambiguity and, as far as the respondents are concerned, to having difficulty in
expounding the question. Less question content may lead to the respondents making
inappropriate assumptions and misleading responses. The content of the survey
questionnaire was matched to the prior understanding of the potential respondents in the
UAEPSI.
The aim of the reliability test was to measure each question (i.e., item or variable)2 and
its relevance to others and to minimize errors by making the questions as clear and
understandable as possible. The test identifies the correlation of different sections and
question contents in the survey questionnaire: checking whether or not the questions
correspond in a scientifically measurable manner.
2 The term Item in this study represents the question contents in the individual sections of the
questionnaire. However, it is synonymous with the term Variable which is often used in statistical studies.
103
The reliability of the questions also ensures the involvement of the respondents to the
greatest possible extent and ascertains that the findings reflect an authentic
understanding of the people’s perceptions. The fact that someone could make another
interpretation of the material does not necessarily disqualify the first interpretation, as
long as it is based on the material (Silverman, 2004a; Yin, 2004).
The reliability test was executed in order to ensure the internal consistency of a set of
measurements. It refers to the degree to which questions in the set of the questionnaire
are homogeneous. Internal consistency can be estimated using a reliability coefficient
such as Cronbach’s alpha (1951). The coefficient is computed as a scale based on a set
of questions or any subset of questions. It is therefore, possible to identify the subset
that has the highest reliability coefficient.
Moreover, it is worth mentioning that the reliability test can be used to assess the
reliability of the survey questions that represent a construct (a twelve item scale that
measures, for instance, the reasons behind adopting such quality model or approach).
Furthermore, the coefficient alpha was used as a common formula for scale reliability
based on measuring the internal consistency of the responses to questions designed to
represent a construct.
Coefficient alpha measure should always be equal or exceed 0.70, in case it is lower than
0.70 then it indicates poor scale reliability. (Cronbach, 1951) When the coefficient alpha is
high, then the items that constitute the scale are highly correlated with one another. Sekaran
(2003) stated that reliabilities below 0.60 are considered to be poor, those in the 0.70
range are acceptable and those over 0.80 are good (Hays, and Revicki, 2005; and
Munro, 2005)
The reliability test was executed on four sections of the survey questionnaire i.e.,
sections two, three, four, and five. The reason behind getting acceptable alpha
coefficient was that the items were positively correlated whereas the reasons underlying
unacceptable coefficients were:
• Some items are not related to others.
• The Number o f items was not sufficient to run the reliability test; the minimum
requirement is three items.
104
• Questions are not coded numerically (text question).
Cronbach’s Alpha test was used for testing the reliability of questionnaire questions in
sections two, three, four and five as illustrated below:
Section One
No reliability test was run for questions in this section as they were text questions
concerned with the personnel details of the respondent. Therefore, testing section one
questions was unnecessary since it was not coded numerically, and the test did not add
any genuine information; it did not have any positive or negative effect on the research
data analysis outcomes, either.
Section Two
Excluding questions six, seven and eight, the rest of the questions in this section are
similar to the questions in section one. The questions were concerned with collecting
information about the respondent’s institutions they work for. Testing was run on
questions six, seven and eight together. The problem with question eight is that it
doesn’t work with the reliability analysis in harmony with questions six and seven
because it is not coded numerically (being a text question).
Another test was administered to measure reliability between questions six and seven.
The result was unacceptable reliability coefficient, where Alpha equalled 0.5013
because question eight was not related to the rest, (see Table 4.2). An additional test
scenario was executed in attempt to get a positive alpha if question six was eliminated,
but the test results did not make theoretical sense without question six.
105
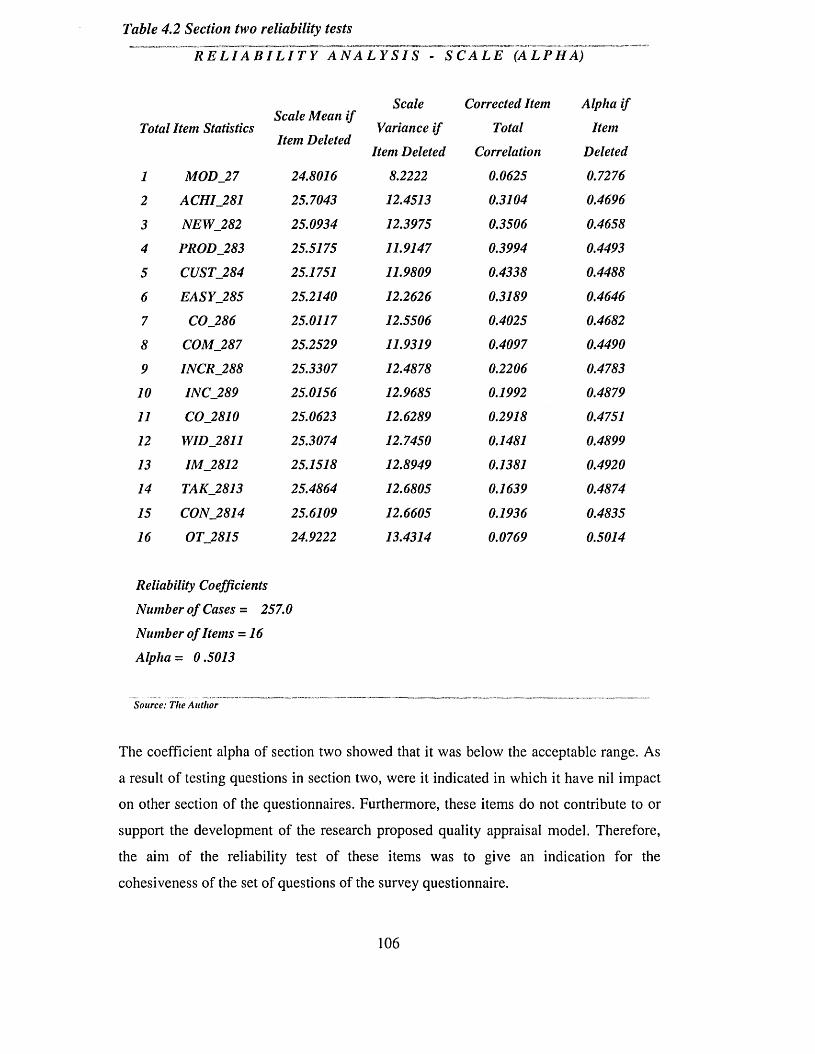
Table 4.2 Section two reliability tests
Total Item StatisticsScale Mean if Item Deleted
Scale Variance if
Item Deleted
Corrected Item Total
Correlation
Alpha if Item
Deleted
1 MODJ27 24.8016 8.2222 0.0625 0.7276
2 ACHIJ281 25.7043 12.4513 0.3104 0.4696
3 NEWJ282 25.0934 12.3975 0.3506 0.4658
4 PRODJ283 25.5175 11.9147 0.3994 0.4493
5 CUSTJ284 25.1751 11.9809 0.4338 0.4488
6 EASY_2 8 5 25.2140 12.2626 0.3189 0.4646
7 COJ286 25.0117 12.5506 0.4025 0.4682
8 COMJ287 25.2529 11.9319 0.4097 0.4490
9 INCR_288 25.3307 12.4878 0.2206 0.4783
10 INC_289 25.0156 12.9685 0.1992 0.4879
11 CO_2810 25.0623 12.6289 0.2918 0.4751
12 WIDJ2811 25.3074 12.7450 0.1481 0.489913 IMJ2812 25.1518 12.8949 0.1381 0.492014 TAKJ2813 25.4864 12.6805 0.1639 0.4874
15 CON_2814 25.6109 12.6605 0.1936 0.483516 OT_2815 24.9222 13.4314 0.0769 0.5014
Reliability Coefficients Number of Cases = 257.0
Number of Items -1 6 Alpha = 0.5013
Source: The Author
The coefficient alpha of section two showed that it was below the acceptable range. As
a result of testing questions in section two, were it indicated in which it have nil impact
on other section of the questionnaires. Furthermore, these items do not contribute to or
support the development of the research proposed quality appraisal model. Therefore,
the aim of the reliability test of these items was to give an indication for the
cohesiveness of the set of questions of the survey questionnaire.
106
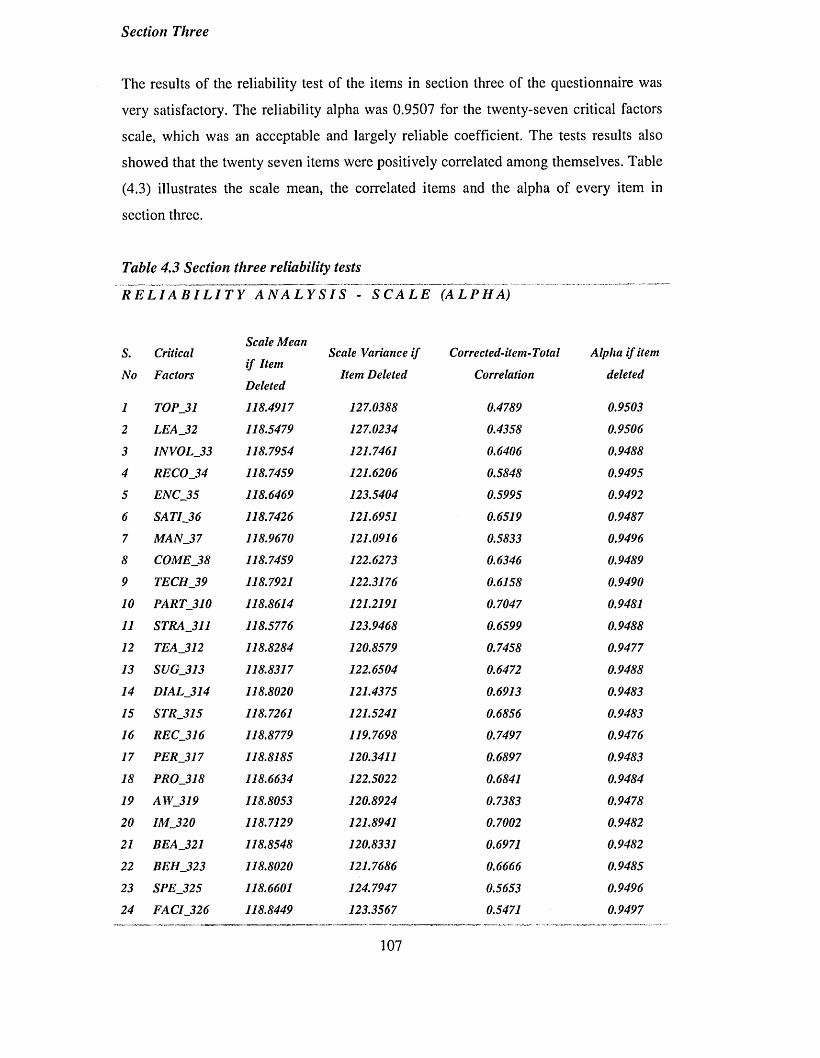
Section Three
The results of the reliability test of the items in section three of the questionnaire was
very satisfactory. The reliability alpha was 0.9507 for the twenty-seven critical factors
scale, which was an acceptable and largely reliable coefficient. The tests results also
showed that the twenty seven items were positively correlated among themselves. Table
(4.3) illustrates the scale mean, the correlated items and the alpha of every item in
section three.
Table 4.3 Section three reliability tests_________
S.
No
Critical
Factors
Scale Mean
i f Item
Deleted
Scale Variance if
Item Deleted
Corrected-item-Total
Correlation
Alpha if item
deleted
1 TOPJ31 118.4917 127.0388 0.4789 0.9503
2 LEA_32 118.5479 127.0234 0.4358 0.9506
3 INVOLJ33 118.7954 121.7461 0.6406 0.9488
4 RECOJ34 118.7459 121.6206 0.5848 0.9495
5 ENCJ35 118.6469 123.5404 0.5995 0.9492
6 SATIJ36 118.7426 121.6951 0.6519 0.9487
7 MANJ37 118.9670 121.0916 0.5833 0.9496
8 COMEJ38 118.7459 122.6273 0.6346 0.9489
9 TECH_39 118.7921 122.3176 0.6158 0.9490
10 PART_310 118.8614 121.2191 0.7047 0.9481
11 STRA_311 118.5776 123.9468 0.6599 0.9488
12 TEA_312 118.8284 120.8579 0.7458 0.9477
13 SUG_313 118.8317 122.6504 0.6472 0.9488
14 DIALJ314 118.8020 121.4375 0.6913 0.9483
15 STR_315 118.7261 121.5241 0.6856 0.9483
16 RECJ316 118.8779 119.7698 0.7497 0.9476
17 PER_317 118.8185 120.3411 0.6897 0.9483
18 PRO_318 118.6634 122.5022 0.6841 0.9484
19 AW_319 118.8053 120.8924 0.7383 0.9478
20 IM_320 118.7129 121.8941 0.7002 0.9482
21 BEAJ321 118.8548 120.8331 0.6971 0.9482
22 BEH_323 118.8020 121.7686 0.6666 0.9485
23 SPEJ325 118.6601 124.7947 0.5653 0.9496
24 FAC1J326 118.8449 123.3567 0.5471 0.9497
107
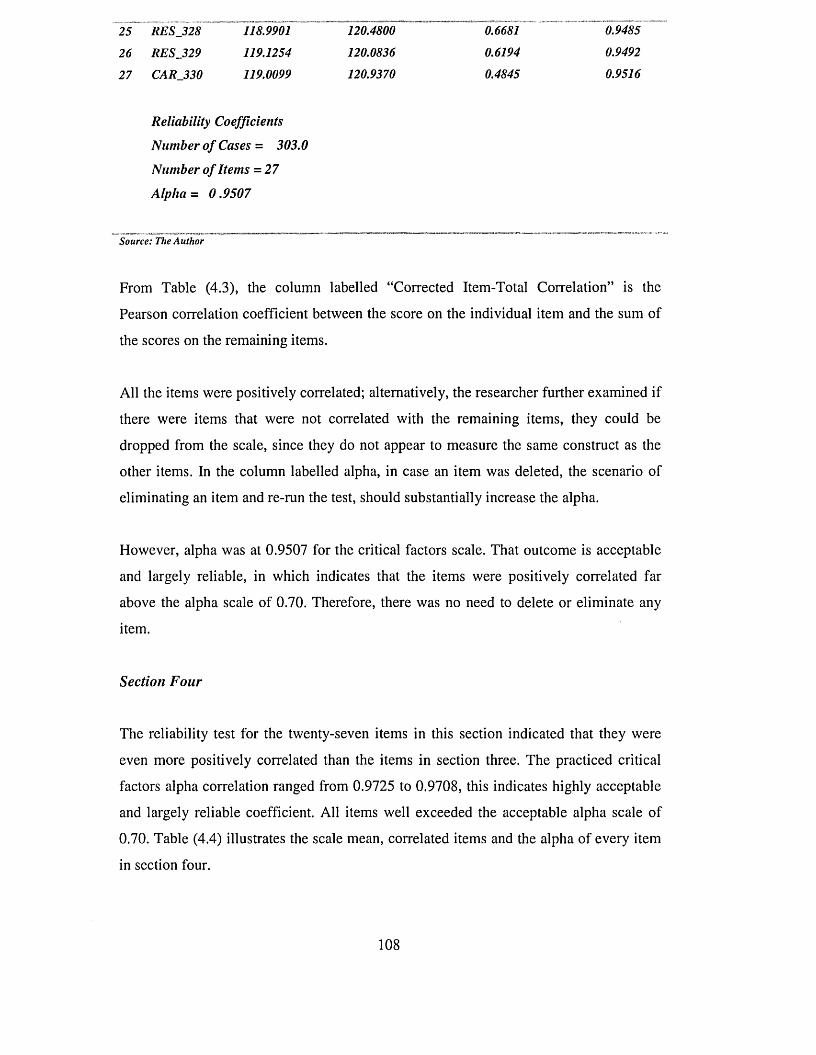
25 RES_328 118.9901 120.4800 0.6681 0.9485
26 RES_329 119.1254 120.0836 0.6194 0.9492
27 CAR_330 119.0099 120.9370 0.4845 0.9516
Reliability Coefficients Number of Cases - 303.0 Number of Items -2 7
Alpha = 0.9507
Source: The Author
From Table (4.3), the column labelled “Corrected Item-Total Correlation” is the
Pearson correlation coefficient between the score on the individual item and the sum of
the scores on the remaining items.
All the items were positively correlated; alternatively, the researcher further examined if
there were items that were not correlated with the remaining items, they could be
dropped from the scale, since they do not appear to measure the same construct as the
other items. In the column labelled alpha, in case an item was deleted, the scenario of
eliminating an item and re-run the test, should substantially increase the alpha.
However, alpha was at 0.9507 for the critical factors scale. That outcome is acceptable
and largely reliable, in which indicates that the items were positively correlated far
above the alpha scale of 0.70. Therefore, there was no need to delete or eliminate any
item.
Section Four
The reliability test for the twenty-seven items in this section indicated that they were
even more positively correlated than the items in section three. The practiced critical
factors alpha correlation ranged from 0.9725 to 0.9708, this indicates highly acceptable
and largely reliable coefficient. All items well exceeded the acceptable alpha scale of
0.70. Table (4.4) illustrates the scale mean, correlated items and the alpha of every item
in section four.
108
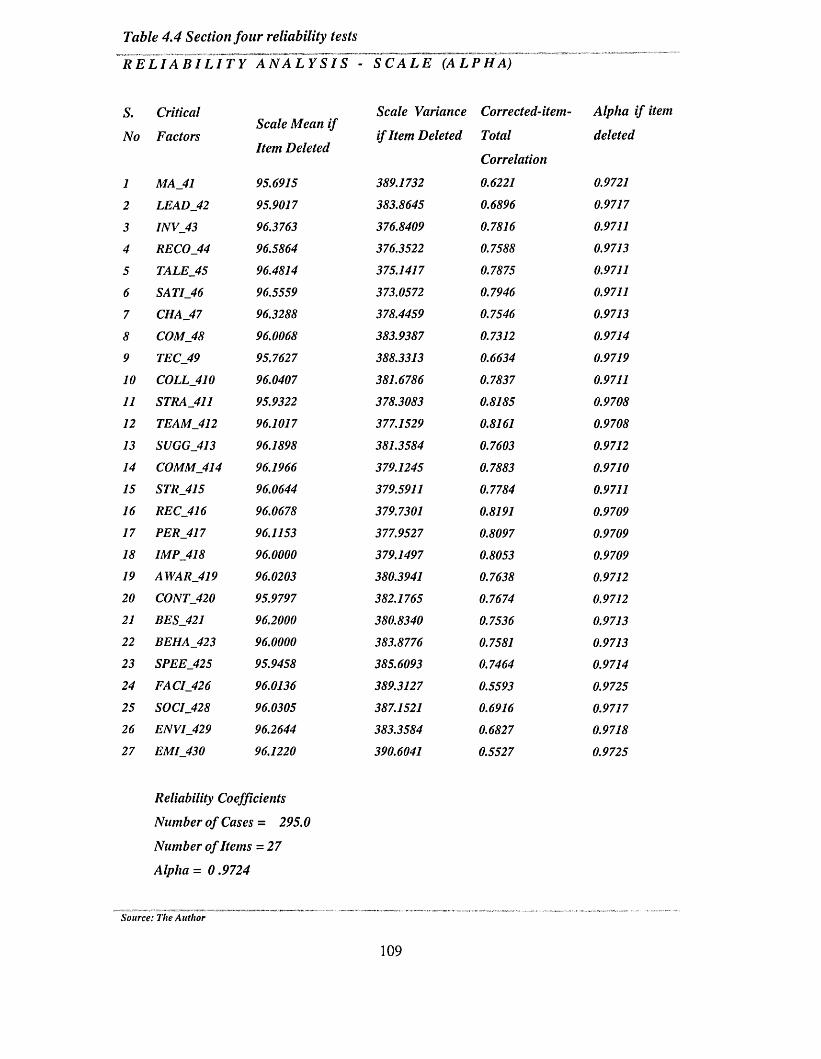
Table 4.4 Section four reliability tests
A N A L Y S I S - S C A L E ( A L P HA )
s.No
CriticalFactors
Scale Mean if Item Deleted
Scale Variance
if Item Deleted
Corrected-item-TotalCorrelation
Alphadeletea
1 MA_41 95.6915 389.1732 0.6221 0.9721
2 L E A D J 2 95.9017 383.8645 0.6896 0.9717
3 1N V J3 96.3763 376.8409 0.7816 0.9711
4 RECO_44 96.5864 376.3522 0.7588 0.9713
5 TALE_45 96.4814 375.1417 0.7875 0.9711
6 SATI_46 96.5559 373.0572 0.7946 0.9711
7 CHA_47 96.3288 378.4459 0.7546 0.9713
8 COM_48 96.0068 383.9387 0.7312 0.9714
9 TEC_49 95.7627 388.3313 0.6634 0.9719
10 COLL_410 96.0407 381.6786 0.7837 0.9711
11 STRA_411 95.9322 378.3083 0.8185 0.9708
12 TEAM_412 96.1017 377.1529 0.8161 0.9708
13 SUGG_413 96.1898 381.3584 0.7603 0.9712
14 COMM_414 96.1966 379.1245 0.7883 0.9710
15 STR_415 96.0644 379.5911 0.7784 0.9711
16 REC_416 96.0678 379.7301 0.8191 0.9709
17 PER_417 96.1153 377.9527 0.8097 0.9709
18 1MP_418 96.0000 379.1497 0.8053 0.9709
19 A W A R J 1 9 96.0203 380.3941 0.7638 0.9712
20 C O N T J20 95.9797 382.1765 0.7674 0.9712
21 BES_421 96.2000 380.8340 0.7536 0.9713
22 BEHA_423 96.0000 383.8776 0.7581 0.9713
23 S P E E J 2 5 95.9458 385.6093 0.7464 0.9714
24 F A C 1J26 96.0136 389.3127 0.5593 0.9725
25 S O C IJ 2 8 96.0305 387.1521 0.6916 0.9717
26 E N V IJ 2 9 96.2644 383.3584 0.6827 0.9718
27 E M IJ 3 0 96.1220 390.6041 0.5527 0.9725
Reliability Coefficients Number of Cases = 295.0
Number o f Items - 27 Alpha = 0.9724
Source: The Author
109
Section Five
A test was executed covering questions one, five, six, eleven, twelve and thirteen which
all shared the same measurement scales. However, the rest of the questions were not
tested because they were under the same conditions mentioned earlier in this section.
The running of the reliability test results in an acceptable reliability coefficient of
correlation alpha of 0.7176 on the scale, in which items are positively correlated. Table
(4.5) illustrates the scale mean, the correlated items and the alpha of every item in
section five, the maximised reliability coefficient ranged from 0.6451 to 0.7119,
indicating that some scales are more reliable than others. In addition, it is clear that
dropping any item from the constructed scales would not improve the reliability of these
scales.
Table 4.5 Section five reliability tests
Scale Mean if Item Deleted
Scale Variance
if Item Deleted
Corrected-item-Total
Correlation
Alpha if item
deleted
/ STRA_51 9.3072 8.7447 0.3856 0.69732 QUA_55 8.6111 8.4811 0.3396 0.71193 BUD_56 8.5850 7.7714 0.4143 0.69294 CON_511 9.1144 7.9574 0.5163 0.66045 EXC_512 8.9085 7.6637 0.5628 0.64516 SELF _513 8.7582 7.5151 0.504 0.6616
Reliability Coefficients Number of Cases = 306.0
Number of Items = 6 Alpha = 0.7176
Source: The Author
The researcher performed separately an internal consistency analysis of the interrelated
questions for sections two and five and a full analysis of the items in sections three and
four of the critical quality factors of TQM in the UAEPSI. Table (4.3) reports the sets of
measurement items associated with the twenty-seven factors in section three and with110
the measurements of items in section four (Table 4.4). The end result of the reliability
test provides strong evidence indicating that the scales developed are arbitrated.
Furthermore, they indicate that some scales are more reliable than others. It is clear that
dropping any lowest correlated factor from the constructed scales would not improve
the reliability of these scales. The reliability coefficients indicating that some scales
were more reliable than others. It was obvious that all items had relatively high
correlations with the scales to which they were originally assigned, compared with all
the other scales. Therefore, it was concluded that all items were appropriately assigned
to scales. Accordingly, the construct development of the proposed QAM to be used as a
self assessment tool for the UAEPSI was judged to be reliable.
Following the extensive process of piloting the set of questions of the research survey
questionnaire, then making essential modifications and amendments, and finally
supporting it by testing its reliability, allowed the researcher to be confident that final
draft of the questionnaire appropriately developed. And therefore, the questionnaire
could be used for the large-scale survey and the full survey to be launched as planned.
4.3 POPULATION AND SAMPLE
This section deals with the research practical fieldwork carried out in which the survey
questionnaires were sent out for gathering information from the potential respondents in
the UAEPSI. Hence it contains three subdivisions, the sampling criteria, the sampling
techniques and the population size. They are discussed in further details as following.
4.3.1 Sampling Criteria
The survey questionnaire sampling criteria involves gathering data about the
employee’s perceptions as related to the TQM implementation practices in the UAEPSI
since they are directly involved in the process and have firsthand knowledge of quality
implementation practices in their institutions. The target respondents for the survey
questionnaire were a comprehensive sample according to the taxonomy of the U.A.E.
civil servants hierarchal structure:
111
Managers: this category comprises all managerial positions such as: middle managers,
assistant managers, and departmental sections managers.
Officers: this category comprises all positions from the low level management to the
high supervisory jobs such as: senior, assistant and trainee officers
Supervisors: this category comprises positions, such as: operators and technicians.
Clerics: this category comprises all types of clerical positions such as: secretaries,
accountants, and book-keepers....etc.
The semi-structured interview sample had also classified, according to the taxonomy of
the U.A.E. civil servants, its hierarchal structure. The interviewees constituted a total of
ten top management officers in different UAEPSI. They were selected on the basis of
their leadership positions, as well as their role in implementing the TQM policies in
their institutions. The selected interviewee’s positions include: one undersecretary, two
assistant undersecretaries, and seven managing directors. The following briefly
describes the interviewee’s role in promoting quality implementation practices in their
institutions:
Undersecretary: the second highest and most senior position in the UAEPSI; he is
responsible for the entire institution. All policies and procedures related to the TQM
initiation and implementation should first be authorized by him.
Assistant Undersecretary: the next most senior position in the UAEPSI. He, by virtue of
his responsibilities, comes directly after the undersecretary; he is ultimately responsible
for putting policies and strategies related to TQM implementation into action. He directs
the senior managers and delegates some of the authorities to them. However, he is fully
accountable to the undersecretary for the progress of the work processes in their
institutions.
Managing Director: the third most top management position in the UAEPSI; he was
chosen to be interviewed in this study mainly because he is in reality responsible person
for running the whole institution including its branches in different locations in the
U.A.E. He is directly engaged with the employees in maintaining and controlling all
aspects and stages of quality implementation.112
4.3.2 Sampling Techniques
In order to achieve a higher response rate from the research respondents’ sample,
explicit techniques were employed:
The first technique was to identify the relevant population of the research subjects. The
term “population” refers to all the employees working in the UAEPSI. A broad
definition is adopted; it covers all civil servants whose occupations are below the top
management and who are currently working in the UAEPSI. The major advantage this
category has is that it does not provoke any problems to the subjects of the research
since almost all its members classify themselves in this broad category of employees.
The second technique was to determine the number of the questionnaires that needs to
be distributed in all government institutions in order to figure out first how many are
willing to participate.
The third technique was to insure that the sample had a broad coverage of five decisive
elements as it is presented in section one of the questionnaire layouts (see Appendix 2):
• Age
• Gender
• Occupation
• Educational qualifications
• Years o f service in the current position
The respondents' profiles are illustrated in further detail in Appendix 2, whereas the
results are analyzed in Chapter 5, section 5.1.
The fourth technique addressed the organization representativeness as it is presented in
section two of the questionnaire layout, four elements were applied:
• The UAEPSI legal entity
• The UAEPSI service sector they operate
• The Number o f employees
• The Current quality model adopted
1 1 3
As evident from the institutional profile illustrated in further detail in Appendix 3, the
researcher managed to select several government institutions, in diverse service sectors
and with different quality implementation backgrounds. The results are discussed in
further detail in Chapter 5, section 5.2.
4.3.3 Population Size
The target population for the survey were chosen from the government institutional
directory, as well as from the U.A.E. government official website. The participants in
the research empirical fieldwork were the employees who were working in the U.A.E.
government institutions, local departments and public sector authorities. Only those
involved in public services were selected since the final objective of this research is to
develop a quality appraisal model and to test its compatibleness for this sector.
The researcher randomly selected one hundred (100) government institutions as
potential participants in the study. Public relations managers, managing directors and
undersecretaries were contacted individually in every single institution requesting their
support and participation. Telephone calls were made to confirm the UAEPSI addresses,
locations, contact details of the key personal and their willingness in taking part in the
research empirical fieldwork.
Consequently some institutions refused straightaway with no reason, and some were
reluctant to participate or were not interested, others did not respond to the researcher
although they initially agreed to participate, still other organizations regretted; they were
mainly federal institutions as they claimed that they had no experience and they had not
yet adopted or applied any quality programme. Few institutions apologised to
participate as they were small branches with limited authorities and resource capacities
to adopt the TQM. Table (4.6) illustrates in details the number of the initial government
institutions that participated and those did not participate. Whereas, table (4.7) clarifies
the reasons, that some UAEPSI point towards, not participating.
This information about the participating institutions had forced the researcher to refine
the initial participating institutions and to develop a schedule of the existing institutions
that already expressed their interest in getting involved in the research fieldwork survey.
After all, a total of sixty (60) institutions agreed to participate in the study. Hence, the114
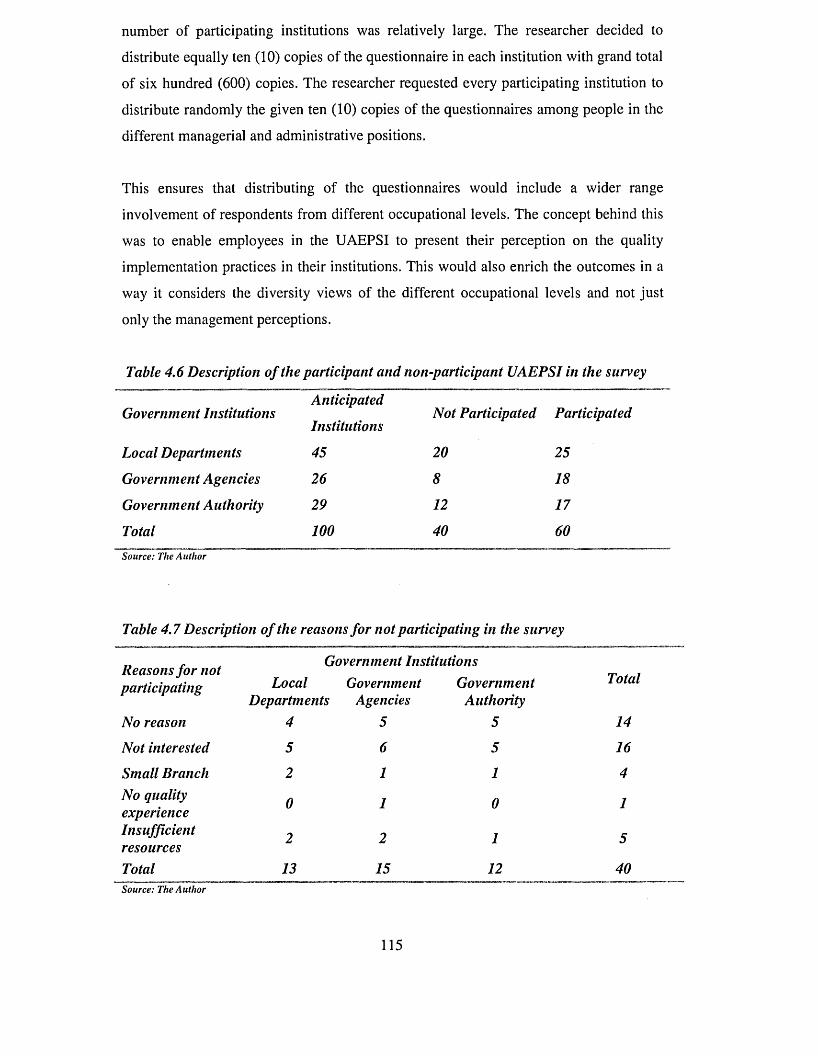
number of participating institutions was relatively large. The researcher decided to
distribute equally ten (10) copies of the questionnaire in each institution with grand total
of six hundred (600) copies. The researcher requested every participating institution to
distribute randomly the given ten (10) copies of the questionnaires among people in the
different managerial and administrative positions.
This ensures that distributing of the questionnaires would include a wider range
involvement of respondents from different occupational levels. The concept behind this
was to enable employees in the UAEPSI to present their perception on the quality
implementation practices in their institutions. This would also enrich the outcomes in a
way it considers the diversity views of the different occupational levels and not just
only the management perceptions.
Table 4.6 Description of the participant and non-participant UAEPSI in the survey
Government InstitutionsAnticipated
InstitutionsNot Participated Participated
Local Departments 45 20 25
Government Agencies 26 8 18
Government Authority 29 12 17
Total 100 40 60Source: The Author
Table 4.7 Description of the reasons for not participating in the survey
Reasons for not participating
Government Institutions Local Government Government Total
No reasonDepartments
4Agencies
5Authority
5 14
Not interested 5 6 5 16
Small Branch 2 1 1 4No quality 0 1 0 1experienceInsufficient 2 2 1 5resourcesTotal 13 15 12 40Source: The Author
115
4.4 THE FIELDWORK
Following the four techniques underlying the distribution of the questionnaires
described in the previous section. As planned the researcher managed to distribute six
hundred (600) copies of the questionnaire among sixty (60) PSI in the U.A.E. on
average of ten (10) copies to be distributed in each participating institutions, (the results
are demonstrated in more detail in Chapter 5, sections 5.2 and Table 5.5) conversely this
section explains the process of distribution and collection of the survey questionnaires
and conducting the interviews.
4.4.1 Questionnaire Distribution and Collection
The fieldwork distribution and collection of the questionnaire was a very complex and
time consuming task. Along with the questionnaire booklet, two official cover letters
were included, (as mentioned earlier in section 4.1) with a prepaid stamped envelope.
The first letter was issued by the researcher’s employer; its content was discussed
earlier.
Whereas the second letter was issued by the researcher and the researcher’s director of
studies; it includes two main paragraphs. Paragraph one explains the purpose of the
survey and assures the confidentiality of respondent’s data. Paragraph two gives
detailed instruction on how to answer the questions and what to do upon completion.
Both letters were written in Arabic. The initial idea was to distribute the questionnaires
personally; this is because the researcher included a clear instruction in the letter
attached with the questionnaires requesting the respondents to forward the completed
questionnaires by despatching them in a prepaid postage envelope provided with every
single questionnaire leaflet, with clearly printed detail of the researcher address in the
U.A.E. on its front face. Unfortunately, from the early days of distribution, this process
did not work as the researcher anticipated. This drawback is caused by two main facts.
First, the management of the UAEPSI do not allow any kind of surveys to be carried out
in their institutions unless its fall through official channels i.e. approaching the public
relations office. The responsible office first task is to ensure the confidentiality of all
data aimed to be collected from their institution. Once the public relations office was
confident the researcher obeys their regulations, then they issue their final authorisation.116

Second, hand to hand distribution to people may cause some of them to be reluctant in
completing the questionnaires.
This was very obvious despite several follow up actions in which the researcher urged
them to accelerate the finishing of their responses. This hesitation alerted the researcher
to find an alternative method of distribution in order to avoid wasting time while getting
low response rate. The people in the UAEPSI are not very familiar with academic
surveys; they presume that they spend unnecessary time in filling in the questionnaires
instead of carrying out their own work duties. Therefore, the alternative decision was
that the actual process of the survey fieldwork will be relying on the researcher’s
personal effort in distributing and collecting the survey questionnaires.
In the light of the above facts, the final decision was to proceed through official
channel and approach the public relation offices in individual institution. Although this
process seemed to be very routine work and time consuming but, it proved to be very
fruitful.
Thus, the whole fieldwork operation was divided to three stages. The first stage was the
distribution of the questionnaires, the second was collecting back the finished
questionnaires and the third stage was the collection follow-up which is the most
difficult and time consuming stage, as the researcher kept chasing every institution
individually.
All possible means of follow-up were used: telephone calls, reminder letters and
personal visits to the lagging institutions urging them to take prompt actions in
completing and returning questionnaires. All these methods of communications were
used in order to leverage the response rate of the returned questionnaires. This strategy
resulted in a good management and control of the fieldwork stage and the data
collection process by keeping notes of the participating institutions as well as making
contacts with those in charge of distributing and collecting the questionnaires in each
organization.
The researcher appointed either directly or indirectly (via the public relations manager)
a voluntary person, most likely the public relations officer who works in the same
institution was appointed to take the responsibility of distributing and collecting back117
the questionnaires. His role was extremely crucial, as he become an intermediary
between the researcher and the respondents. The daily communication with the public
relation offices was the best way that enabled the researcher to keep tracing the
progress of the questionnaires: checking where they have reached, how many have been
returned, how many need further follow-up and when and how they are returned back.
Each public relations officer was informed prior to the distribution of the questionnaires
that he or she has almost two weeks to fill and return back the questionnaires.
However, the levels of responsiveness and commitment of respondents and/or the
institutions varied from high to very poor. In some cases, it took less than two weeks to
return the questionnaires but in most cases, it took a longer time; in certain rare cases, it
took more than three months in order to return few or even no single copy of the
questionnaires, despite several visits and reminders. The number of the returned,
completed, and usable questionnaires together with the return rate is discussed in
chapter 5, section 5.1 and Table (5.1)
4.4.2 Conducting Interviews
In an attempt to utilize time and effort more efficiently during the course of the
questionnaires distribution stage, the researcher successfully arranged to conduct semi
structured interviews with key personal in ten (10) different UAEPSI. As mentioned
earlier in this chapter, the interviews were carried out alongside with the distribution of
the survey questionnaires. The interviewees were chosen from the list of the UAEPSI
that participated in the questionnaire.
The objective was to observe the responses of the interviewees from top management
perspectives in the UAEPSI; this will render the research fairer with respect to the
employees' representatives, in that it does not only include people from middle and
lower managerial and operational positions. It also, considered the views of the top
management officers as they are the key players in the decisions relevant to quality and
in drawing policies and plans for its implementation process.
A representative range of the interviewed participants was obtained by following three
criteria in selecting them. The fist criterion was that researcher was keen that the
interviewees should represent several UAEPSI operating in different governmental118
service sectors. The second criterion was that they entail a wide range of participants:
undersecretary, assistant undersecretary, and managing directors. The third criterion was
that the researcher wanted to ensure that all of interviewees were primarily involved in
the initiation and implementation of the UAEGEP. Almost all interviews were
prearranged: the place and time of the interviews were agreed upon in cooperation with
their office directors3.
The estimated time for each interview was an hour; however, in some cases it last
longer than what proposed. This depends on the individual’s interest in the issues under
discussion in the interview. All interviews were held in the interviewee’s offices. The
reason is that they regard this as part of their responsibility and official duty as senior
managers. They also, feel that it is much more convenient for them since it bestows
more respect upon them in accordance with the U.A.E. traditions when the researcher
approached them seeking their perceptions. These traditions are obliges people to show
respect and reverence to the seniors. The seniors are either elderly people, or people
who occupy high social positions, such as the leaders, most senior government officials
and those who have high educational qualifications.
Although the interviews were semi-structured, the questions for the interviews were the
same as those in the questionnaires, but they were more formally presented. Very often,
the open discussion with the interviewees on issues related quality practices and their
role in deploying the implementation processes, centred on three important aspects.
First, each interviewee got the opportunity to express his opinion in the way he wished.
Second, the researcher better understood the people perceptions and attitudes towards
issues related to regulations and formalities that need to be considered specifically with
those in top managerial positions in the UAEPSI.
Following and fulfilling these regulations make them feel more comfortable and
relaxed. Such atmosphere makes the researcher feel at ease with his interlocutors; he
can easily shift the attention of the interviewees away from formalities and moving it
towards more friendly and intimate discussions. This, in fact, proved to be a positive
3 In the UAEPSI, the protocol is that every top manager has a crew working in his office. The crew
members are in charge of coordinating and arranging the top manger formal events. The researcher
approached most senior members of the crew, briefed them about the purpose of the interview, and were
requested to arrange the interviews at their convenience
119
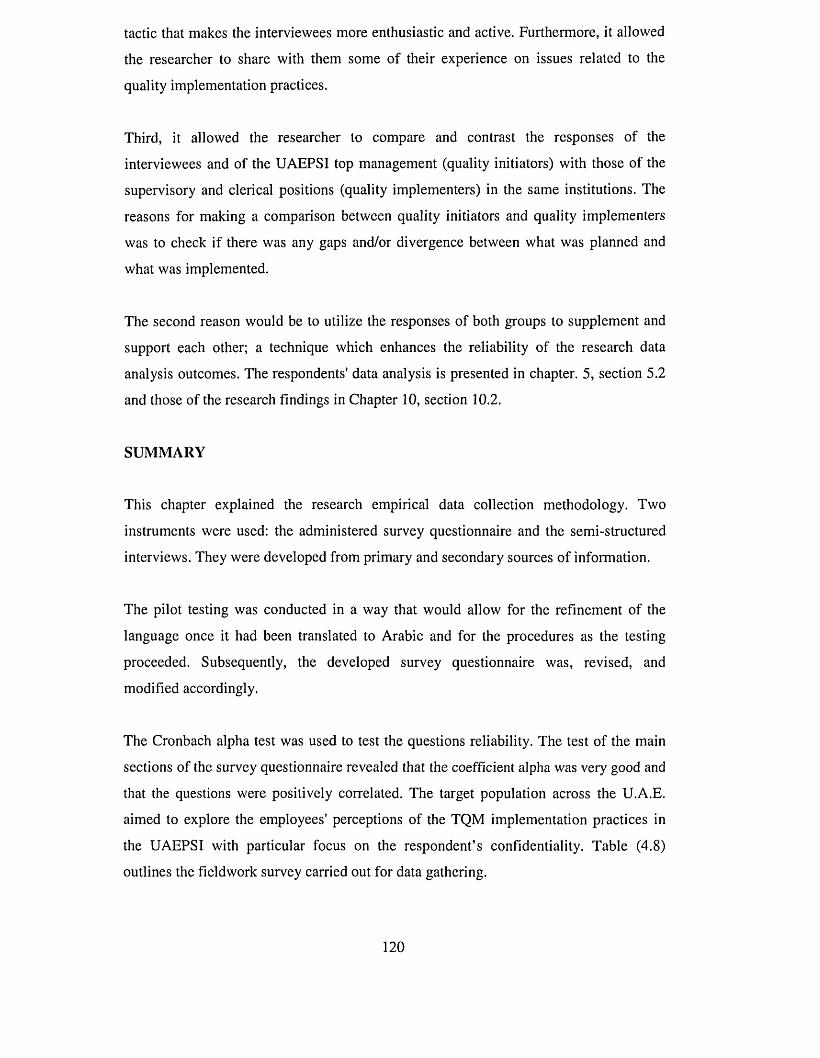
tactic that makes the interviewees more enthusiastic and active. Furthermore, it allowed
the researcher to share with them some of their experience on issues related to the
quality implementation practices.
Third, it allowed the researcher to compare and contrast the responses of the
interviewees and of the UAEPSI top management (quality initiators) with those of the
supervisory and clerical positions (quality implementers) in the same institutions. The
reasons for making a comparison between quality initiators and quality implementers
was to check if there was any gaps and/or divergence between what was planned and
what was implemented.
The second reason would be to utilize the responses of both groups to supplement and
support each other; a technique which enhances the reliability of the research data
analysis outcomes. The respondents' data analysis is presented in chapter. 5, section 5.2
and those of the research findings in Chapter 10, section 10.2.
SUMMARY
This chapter explained the research empirical data collection methodology. Two
instruments were used: the administered survey questionnaire and the semi-structured
interviews. They were developed from primary and secondary sources of information.
The pilot testing was conducted in a way that would allow for the refinement of the
language once it had been translated to Arabic and for the procedures as the testing
proceeded. Subsequently, the developed survey questionnaire was, revised, and
modified accordingly.
The Cronbach alpha test was used to test the questions reliability. The test of the main
sections of the survey questionnaire revealed that the coefficient alpha was very good and
that the questions were positively correlated. The target population across the U.A.E.
aimed to explore the employees' perceptions of the TQM implementation practices in
the UAEPSI with particular focus on the respondent’s confidentiality. Table (4.8)
outlines the fieldwork survey carried out for data gathering.
120
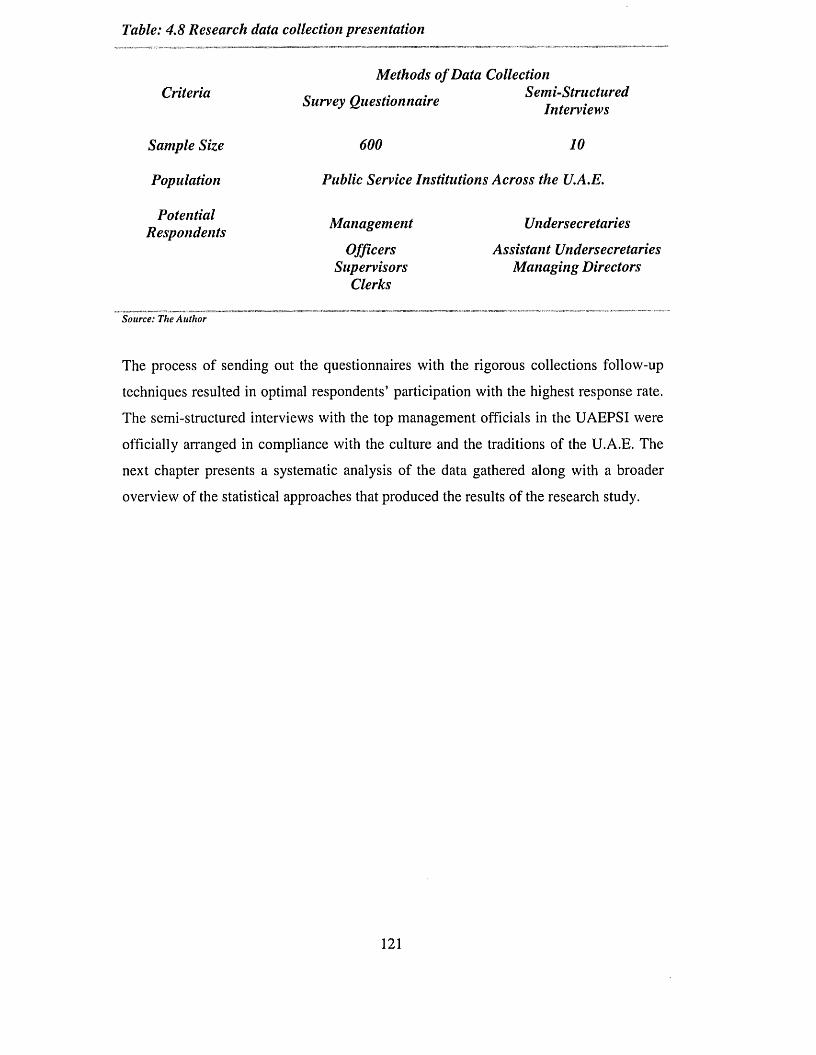
Table: 4.8 Research data collection presentation
Methods of Data CollectionCriteria „ „ . Semi-StructuredSurvey Questionnaire r .J ^ Interviews
Sample Size 600 10
Population Public Service Institutions Across the U.A.E.
Potential . TT , . ._ , , Management UndersecretariesRespondentsOfficers Assistant Undersecretaries
Supervisors Managing DirectorsClerks
Source: The Author
The process of sending out the questionnaires with the rigorous collections follow-up
techniques resulted in optimal respondents’ participation with the highest response rate.
The semi-structured interviews with the top management officials in the UAEPSI were
officially arranged in compliance with the culture and the traditions of the U.A.E. The
next chapter presents a systematic analysis of the data gathered along with a broader
overview of the statistical approaches that produced the results of the research study.
121
CHAPTER FIVE
DATA ANALYSIS
PREFACE
In Chapter 4, the researcher explained the structural development of the research
quantitative approach of the survey questionnaire supported with several semi structures
interviews. Detailed description on how the fieldwork investigation was carried out was
presented: to whom the survey questionnaires was sent out (the population and sample),
what sort of data were gathered, when and how it was distributed and collected. The
difficulties associated with the whole process of survey fieldwork were addressed.
Therefore, it is essential at this stage to present a general view of the most important
elements of the research survey before moving on further in analyzing and manipulating
the data obtained through the research fieldwork. The reader is guided to better
understanding of the research analysis findings. This chapter displays the results of the
empirical study that been carried out in order to explore the current TQM
implementation practices in the UAEPSI. Thus, based on the data analysis, the research
considered the need for developing an accustomed model which assists the UAEPSI in
implementing the TQM practices. This enabled the researcher to attain the research
objective and to answer question one.
The data analyzed in this research are presented in data matrix tables which include
several dependent and independent variables and cases; the aim is to standardize the
data collection techniques so that differences in responses can be documented reliably
as the differences between the different respondents. The analysis of the surveyed data
is presented by applying two broad techniques: descriptive analysis and comparative
analysis.
The descriptive analysis described the range of responses of the individual variables and
how often different values are attained whereas comparative analysis presented an
explanation of the data results which compared the employees responses to their
perceptions of quality implementation practices in the UAEPSI. The researcher
considered the exploratory UNI-Variety data analysis where variables such as gender or
122
the educational qualifications of the respondents were considered in isolation. In BI-
Variety analysis two or more variables were looked at simultaneously, for instance, the
age group, gender and position. The data gathered by means of semi- structured
interviews were clearly decoded so that they could be coded systematically in their
entirety.
Two software packages of data manipulations were employed in the data analysis; the
main tool was the statistical software SPSS and the supplementary tool was the
Microsoft spreadsheet Excel version 2007, (SPSS, 2009; Robert, et al., 2009;
Hutcheson, and Sofroniou, 2009; Robert, 2008; Norusis, 2008; Frankfort-Nachmais,
and Nachmais, 2007; Fielding, and Gilbert, 2006; Vaus, 2002; Kent, 2001; and Field,
2000).
The analysis of the gathered data in this chapter is divided according to the survey
questionnaire classification sections which consist of five main sub-sections. The first
section presents information on the respondent demographic background. The second
section displays information about the institutions which the respondents work in. The
third section addresses the respondent's view on how significant the quality critical
factors are for the successful implementation of TQM. The fourth section presents the
respondent perception on the extent to which these factors are currently practiced in
their institutions. Finally, a general overview on the main driving and inhabiting forces
of the current TQM implementation practices is observed in the UAEPSI. Figure (5.0)
outlines the content of this chapter.
123
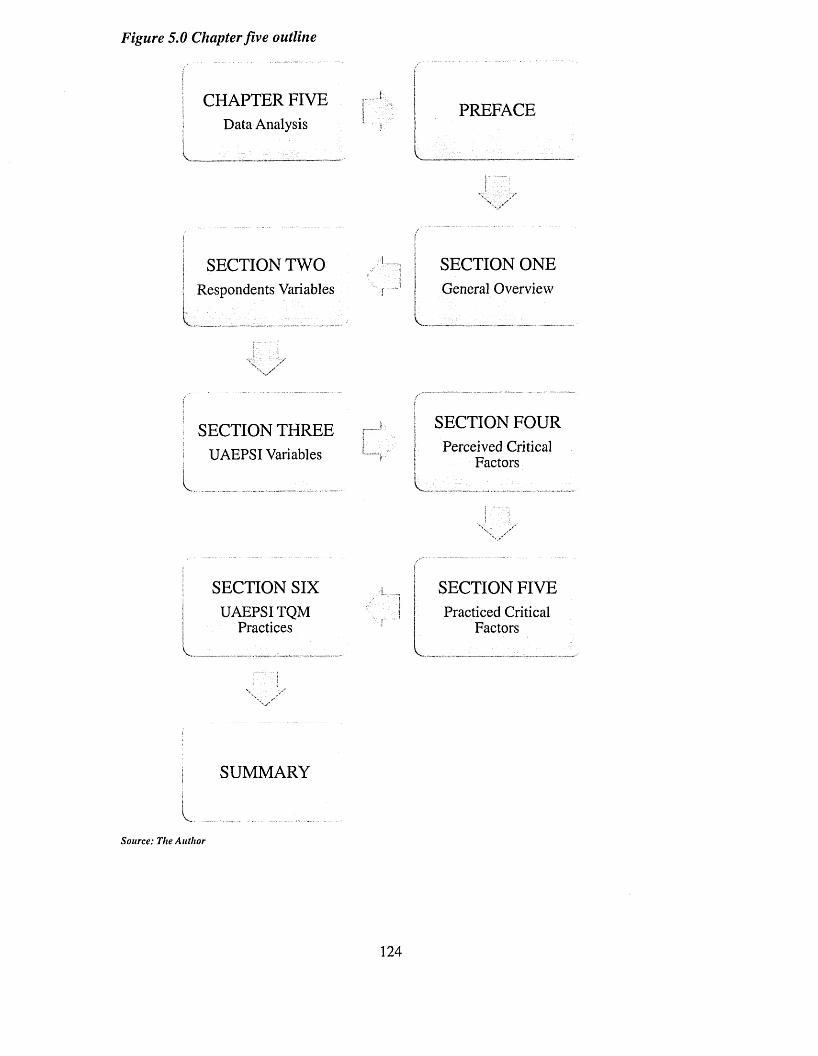
Figure 5.0 Chapter five outline
I CHAPTER FIVEI
f Data AnalysisPREFACE
____
j SECTION TWO! Respondents Variables
I SECTION THREE I UAEPSI Variables
SECTION ONEGeneral Overview
V ............. ...........
SECTION FOURPerceived Critical
Factors
SECTION SIXUAEPSI TQM
Practices
SECTION FIVEPracticed Critical
Factors
j SUMMARY\
i ..................................
Source: The Author
124
Once the filtration process of the statistically valid and invalid questionnaires was
completed, the statistical software of SPSS and Excel spreadsheet schedule preparations
were applied for the response coding entry techniques for data analysis. Two extensive
and delicate steps were followed. First, the response coding step: every question was
coded by numbering it in accordance with the number of items and the independent
variables. Thus, the responses were coded according to the number of items or options
provided. The second step was based on the first one whereby several tables were
created; each table represented the individual question, the response code and its
frequency. Then, the responses were entered in tables for data manipulation and
analysis.
The responses relating to the respondents’ demographic variables (independent
variables) were coded according to the number of items. The variables relating to the
respondents’ gender (male or female) were also coded; for instance (1) indicates (Male),
(2) indicates (Female) and the additional code number (3) indicates (the Missing
Values) respectively. The missing value represents the blank response: in case the
respondent did not answer the question or the item and/or the option given. This ensures
the researcher during the data analysis that the figure summations were correctly
calculated. This coding option also enables the researcher to figure out how many items
were left blank and why. Also, the responses relating to the type of the educational
qualification were given the numbers of 1 to 5 respectively. The responses for the
nationality variables (the U.A.E. citizens), (non U.A.E. citizens) and (the missing
values) were coded as 1, 2 and 3 respectively. The variables relating to the respondents’
age group were also coded as 1 to 5 respectively. Hence, the questions belong to the
same pattern above; their coding techniques follow the same method.
5.1 GENERAL OVERVIEW
As mentioned in Chapter 4, Section 4.4, the participated institutions were sixty (60)
UAEPSI, thus, six hundred copies of the questionnaire were distributed by different
means. The participating institutions consist of local departments, government agencies
and government authorities. When the questionnaires received, more than (30%) items
left blank; they were taken away and not included in the data set for analysis. A number
of questionnaires were excluded due to the fact that the blank items statistically
unusable were seventy three (73) questionnaires out of the three hundred eighty eight125
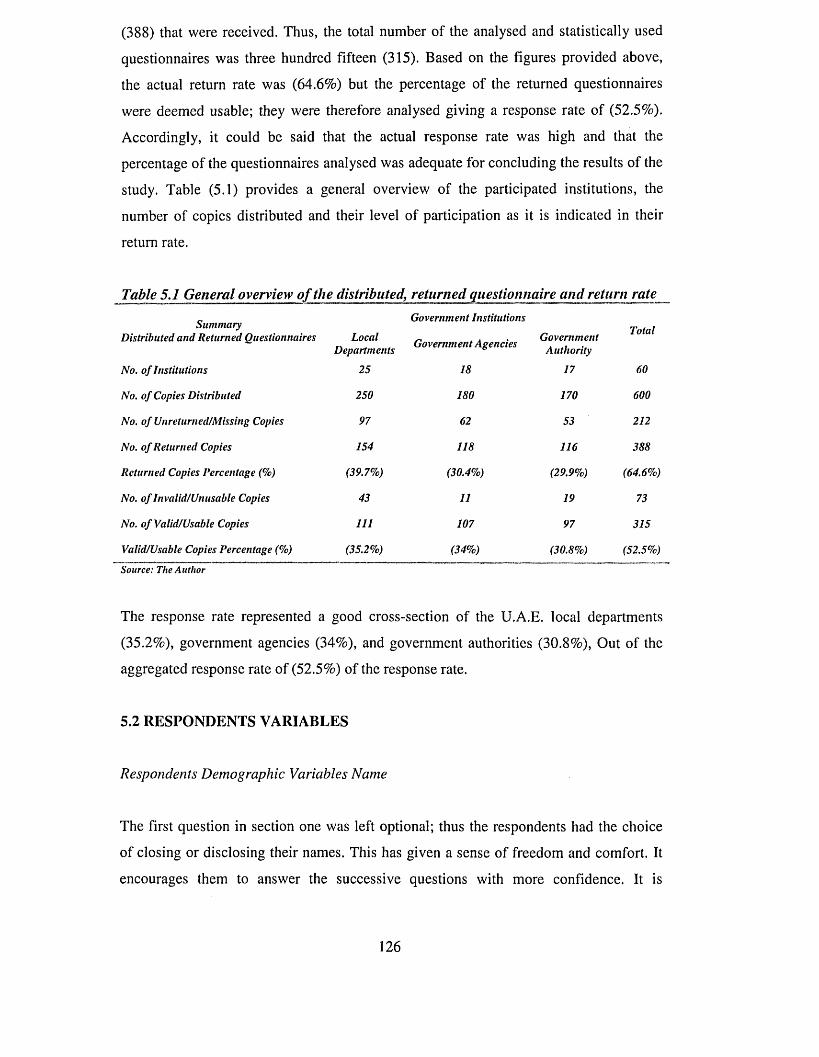
(388) that were received. Thus, the total number of the analysed and statistically used
questionnaires was three hundred fifteen (315). Based on the figures provided above,
the actual return rate was (64.6%) but the percentage of the returned questionnaires
were deemed usable; they were therefore analysed giving a response rate of (52.5%).
Accordingly, it could be said that the actual response rate was high and that the
percentage of the questionnaires analysed was adequate for concluding the results of the
study. Table (5.1) provides a general overview of the participated institutions, the
number of copies distributed and their level of participation as it is indicated in their
return rate.
Table 5.1 General overview o f the distributed, returned questionnaire and return rate
SummaryDistributed and Returned Questionnaires LocalDepartmentsGovernment Institutions Government Agencies GovernmentAuthority Total
No. of Institutions 25 18 17 60No. of Copies Distributed 250 180 170 600No. of Unreturned/Missing Copies 97 62 53 212No. of Returned Copies 154 118 116 388Returned Copies Percentage (%) (39.7%) (30.4%) (29.9%) (64.6%)No. of Invalid/Unusable Copies 43 11 19 73No. of Valid/Usable Copies 111 107 97 315Valid/Usable Copies Percentage (%) (35.2%) (34%) (30.8%) (52.5%)Source: The Author
The response rate represented a good cross-section of the U.A.E. local departments
(35.2%), government agencies (34%), and government authorities (30.8%), Out of the
aggregated response rate of (52.5%) of the response rate.
5.2 RESPONDENTS VARIABLES
Respondents Demographic Variables Name
The first question in section one was left optional; thus the respondents had the choice
of closing or disclosing their names. This has given a sense of freedom and comfort. It
encourages them to answer the successive questions with more confidence. It is
126
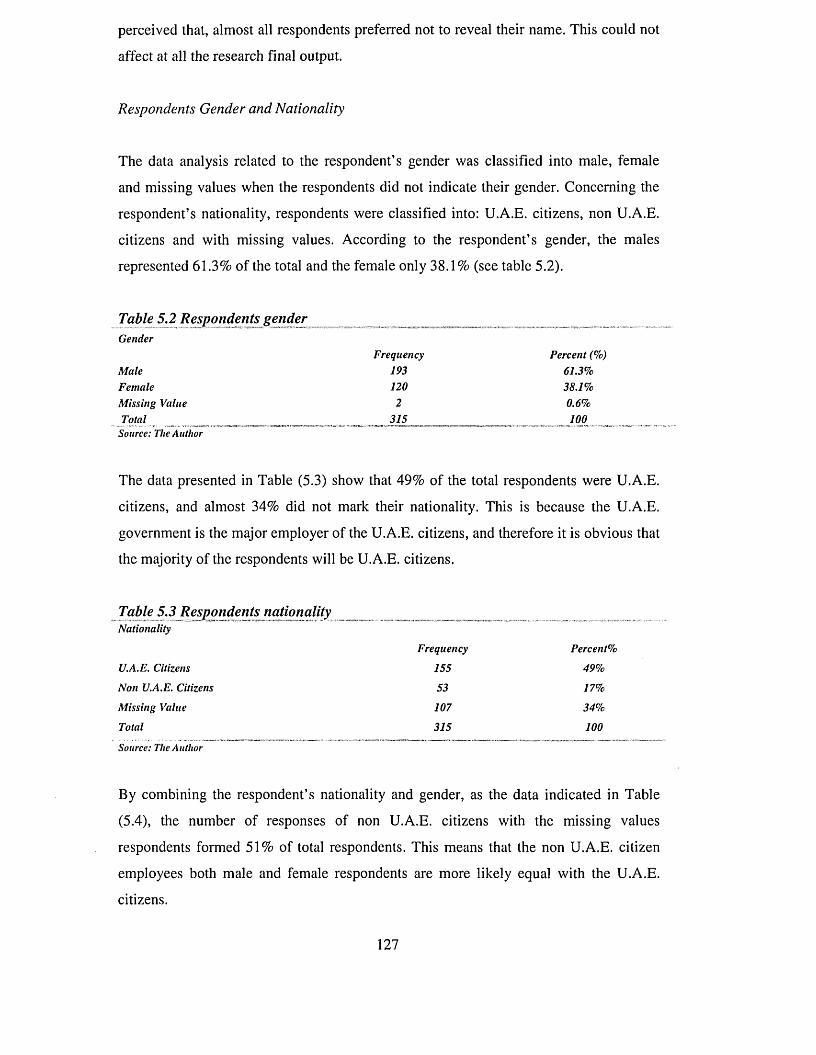
perceived that, almost all respondents preferred not to reveal their name. This could not
affect at all the research final output.
Respondents Gender and Nationality
The data analysis related to the respondent’s gender was classified into male, female
and missing values when the respondents did not indicate their gender. Concerning the
respondent’s nationality, respondents were classified into: U.A.E. citizens, non U.A.E.
citizens and with missing values. According to the respondent’s gender, the males
represented 61.3% of the total and the female only 38.1% (see table 5.2).
Table 5.2 Respondents genderGenderMale Female Missing ValueTotal ..............................Source: The Author
The data presented in Table (5.3) show that 49% of the total respondents were U.A.E.
citizens, and almost 34% did not mark their nationality. This is because the U.A.E.
government is the major employer of the U.A.E. citizens, and therefore it is obvious that
the majority of the respondents will be U.A.E. citizens.
Table 5.3 Respondents nationalityNationality Frequency Percent%U.A.E. Citizens 155 49%Non U.A.E. Citizens 53 17%Missing Value 107 34%Total 315 100Source: The Author
By combining the respondent’s nationality and gender, as the data indicated in Table
(5.4), the number of responses of non U.A.E. citizens with the missing values
respondents formed 51% of total respondents. This means that the non U.A.E. citizen
employees both male and female respondents are more likely equal with the U.A.E.
citizens.
Frequency Percent (%)193 61.3%120 38.1%2 0.6%315 100
127
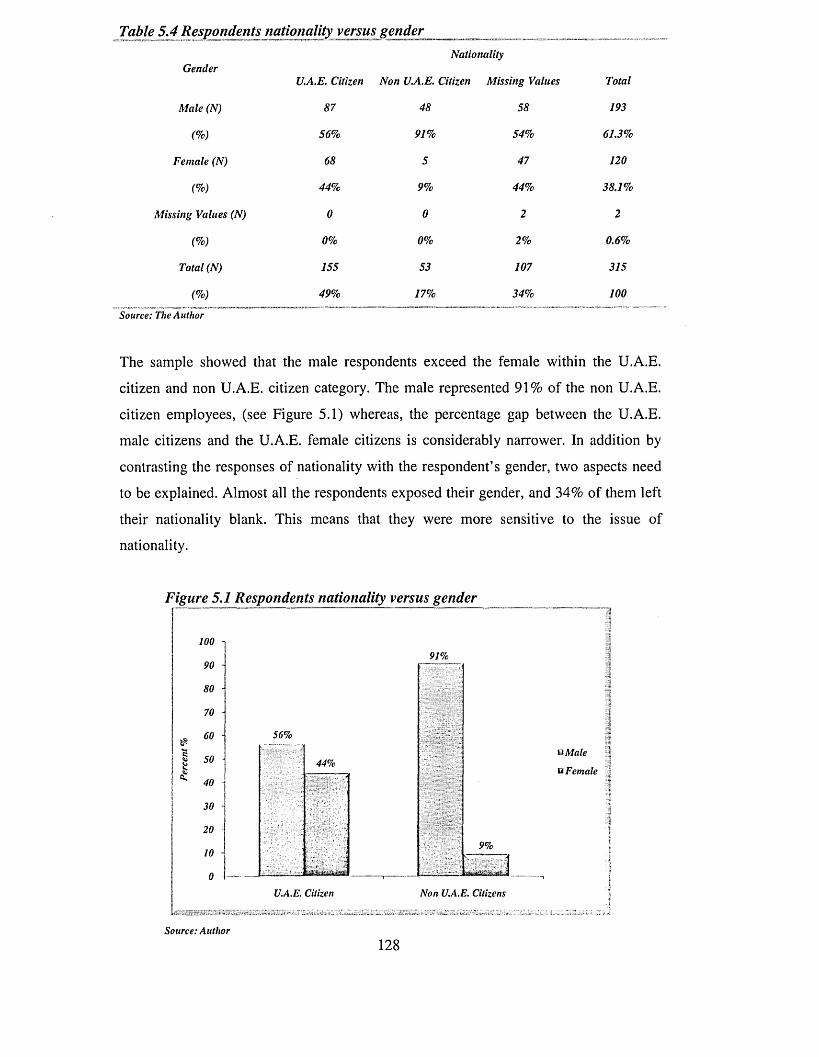
Table 5.4 Respondents nationality versus gender
Gender U.A.E. CitizenMale (N) 87(%) 56%
Female (N) 68(%) 44%
Missing Values (N) 0(%) 0%
Total (N) 155(%) 49%
Source: The Author
NationalityNon U.A.E. Citizen Missing Values Total
48 58 19391% 54% 61.3%5 47 1209% 44% 38.1%0 2 20% 2% 0.6%53 107 31517% 34% 100
The sample showed that the male respondents exceed the female within the U.A.E.
citizen and non U.A.E. citizen category. The male represented 91% of the non U.A.E.
citizen employees, (see Figure 5.1) whereas, the percentage gap between the U.A.E.
male citizens and the U.A.E. female citizens is considerably narrower. In addition by
contrasting the responses of nationality with the respondent’s gender, two aspects need
to be explained. Almost all the respondents exposed their gender, and 34% of them left
their nationality blank. This means that they were more sensitive to the issue of
nationality.
Figure 5.1 Respondents nationality versus gender
100 -|
90 -
80
70 -
60
50
a. 40
30 -
20
10 -
0
56%
44%
91%
9%
U.A.E. Citizen Non U.A.E. Citizens
£3 Male
u Female
Source: Author
128
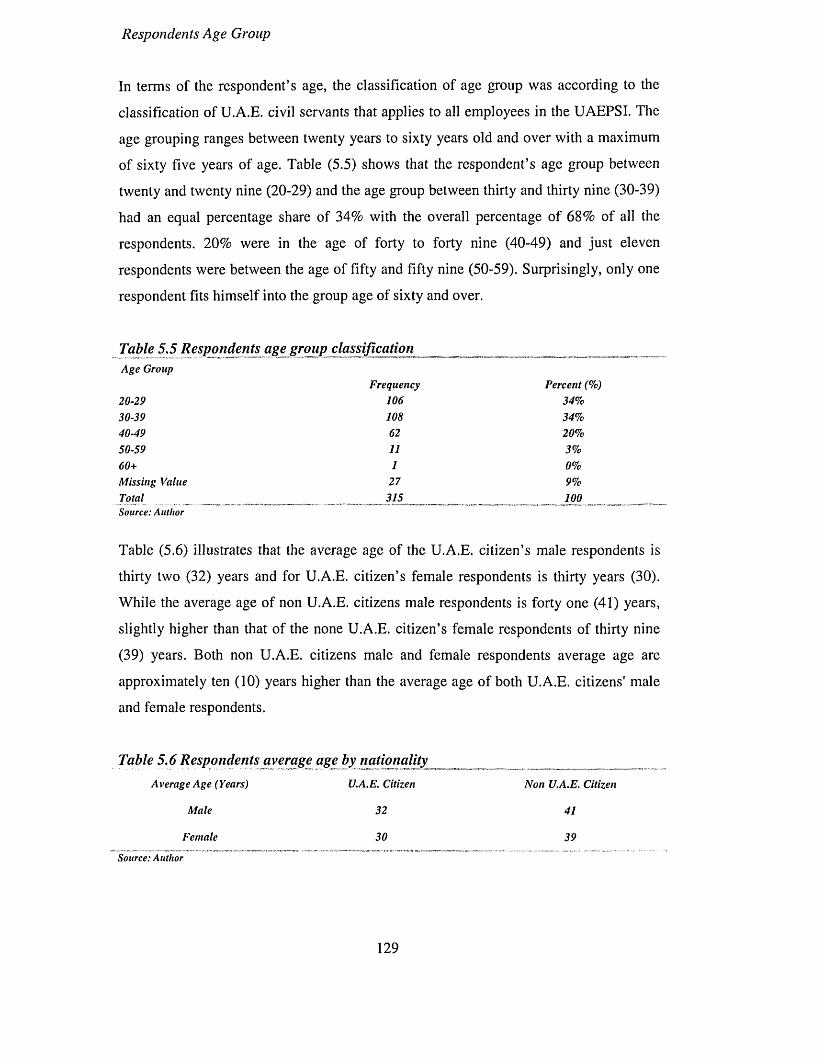
Respondents Age Group
In terms of the respondent’s age, the classification of age group was according to the
classification of U.A.E. civil servants that applies to all employees in the UAEPSI. The
age grouping ranges between twenty years to sixty years old and over with a maximum
of sixty five years of age. Table (5.5) shows that the respondent’s age group between
twenty and twenty nine (20-29) and the age group between thirty and thirty nine (30-39)
had an equal percentage share of 34% with the overall percentage of 68% of all the
respondents. 20% were in the age of forty to forty nine (40-49) and just eleven
respondents were between the age of fifty and fifty nine (50-59). Surprisingly, only one
respondent fits himself into the group age of sixty and over.
Table 5.5 Respondents age group classification _ _Age Group Frequency Percent (%)20-29 106 34%30-39 108 34%40-49 62 20%50-59 11 3%60+ 1 0%Missing Value 27 9%Total ............................. 3 1 5 ....... .................................................................... 100 .................Source: Author
Table (5.6) illustrates that the average age of the U.A.E. citizen’s male respondents is
thirty two (32) years and for U.A.E. citizen’s female respondents is thirty years (30).
While the average age of non U.A.E. citizens male respondents is forty one (41) years,
slightly higher than that of the none U.A.E. citizen’s female respondents of thirty nine
(39) years. Both non U.A.E. citizens male and female respondents average age are
approximately ten (10) years higher than the average age of both U.A.E. citizens' male
and female respondents.
Table 5.6 Respondents average age by nationalityAverage Age (Years) U.A.E. Citizen Non U.A.E. CitizenMale 32 41Female 30 39
Source: Author
129
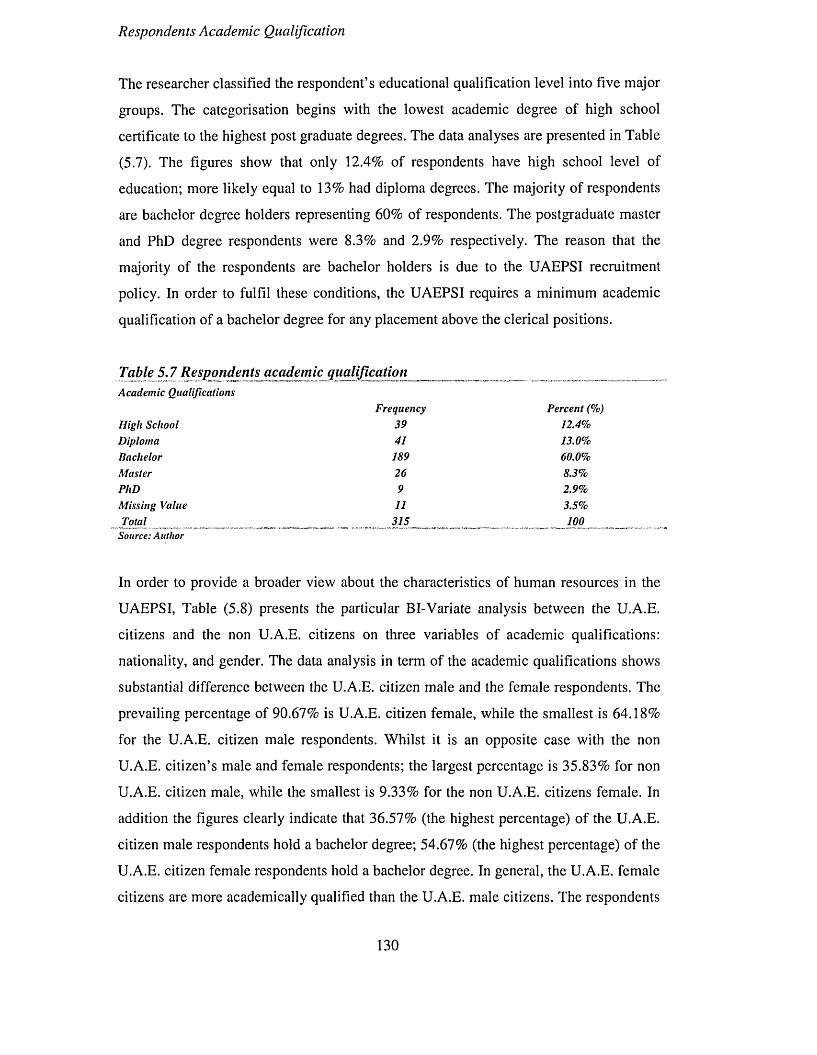
Respondents Academic Qualification
The researcher classified the respondent’s educational qualification level into five major
groups. The categorisation begins with the lowest academic degree of high school
certificate to the highest post graduate degrees. The data analyses are presented in Table
(5.7). The figures show that only 12.4% of respondents have high school level of
education; more likely equal to 13% had diploma degrees. The majority of respondents
are bachelor degree holders representing 60% of respondents. The postgraduate master
and PhD degree respondents were 8.3% and 2.9% respectively. The reason that the
majority of the respondents are bachelor holders is due to the UAEPSI recruitment
policy. In order to fulfil these conditions, the UAEPSI requires a minimum academic
qualification of a bachelor degree for any placement above the clerical positions.
Table 5.7 Respondents academic qualificationAcademic Qualifications Frequency Percent (%)High School 39 12.4%Diploma 41 13.0%Bachelor 189 60.0%Master 26 8.3%PhD 9 2.9%Missing Value 11 3.5%Total _ 315 .. 100Source: Author
In order to provide a broader view about the characteristics of human resources in the
UAEPSI, Table (5.8) presents the particular Bl-Variate analysis between the U.A.E.
citizens and the non U.A.E. citizens on three variables of academic qualifications:
nationality, and gender. The data analysis in term of the academic qualifications shows
substantial difference between the U.A.E. citizen male and the female respondents. The
prevailing percentage of 90.67% is U.A.E. citizen female, while the smallest is 64.18%
for the U.A.E. citizen male respondents. Whilst it is an opposite case with the non
U.A.E. citizen’s male and female respondents; the largest percentage is 35.83% for non
U.A.E. citizen male, while the smallest is 9.33% for the non U.A.E. citizens female. In
addition the figures clearly indicate that 36.57% (the highest percentage) of the U.A.E.
citizen male respondents hold a bachelor degree; 54.67% (the highest percentage) of the
U.A.E. citizen female respondents hold a bachelor degree. In general, the U.A.E. female
citizens are more academically qualified than the U.A.E. male citizens. The respondents
130
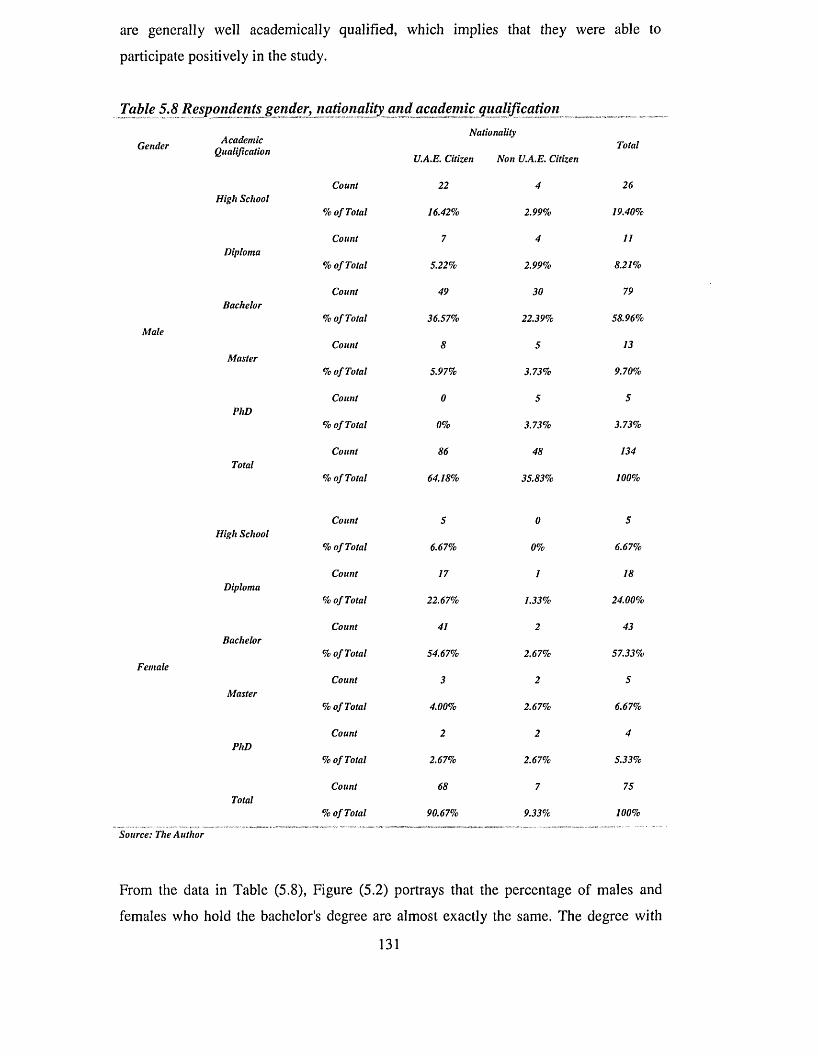
are generally well academically qualified, which implies that they were able to
participate positively in the study.
Table 5.8 Respondents gender, nationality and academic qualification
Gender
Male
AcademicQualification
High School
Diploma
Bachelor
Master
PhD
Total
Count
% o f Total
Count
% o f Total
Count
% o f Total
Count
% o f Total
Count
% o f Total
Count
% o f Total
Nationality
U.A.E. Citizen Non U.A.E. Citizen
422
16.42%
7
5.22%
49
36.57%
8
5.97%
0
0%
86
64.18%
2.99%
4
2.99%
30
22.39%
5
3.73%
5
3.73%
48
35.83%
Total
26
19.40%
11
8.21%
79
58.96%
13
9.70%
5
3.73%
134
100%
Female
High School
Diploma
Bachelor
Master
PhD
Total
Count
% o f Total
Count
% o f Total
Count
% o f Total
Count
% o f Total
Count
% o f Total
Count
% o f Total
5
6.67%
17
22.67%
41
54.67%
3
4.00%
2
2.67%
68
90.67%
0
0%
1
1.33%
2
2.67%
2
2.67%
2
2.67%
7
9.33%
5
6.67%
18
24.00%
43
57.33%
5
6.67%
4
5.33%
75
100%
Source: The Author
From the data in Table (5.8), Figure (5.2) portrays that the percentage of males and
females who hold the bachelor's degree are almost exactly the same. The degree with
131
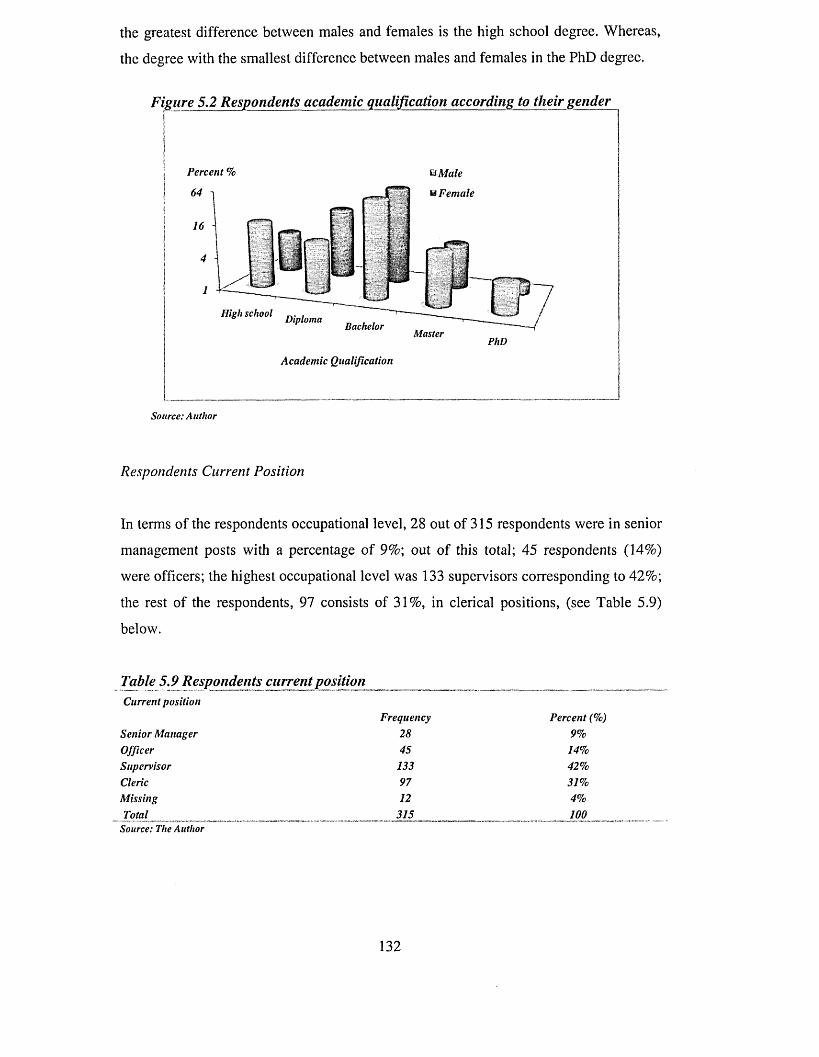
the greatest difference between males and females is the high school degree. Whereas,
the degree with the smallest difference between males and females in the PhD degree.
Figure 5.2 Respondents academic qualification according to their gender
I
Percent % Q Male64 u Female16
41
High school DiplomaBachelor
MasterPhDAcademic Qualification
Source: Author
Respondents Current Position
In terms of the respondents occupational level, 28 out of 315 respondents were in senior
management posts with a percentage of 9%; out of this total; 45 respondents (14%)
were officers; the highest occupational level was 133 supervisors corresponding to 42%;
the rest of the respondents, 97 consists of 31%, in clerical positions, (see Table 5.9)
below.
Table 5.9 Respondents current position _ _Current position Frequency Percent (%)Senior Manager 28 9%Officer 45 14%Supervisor 133 42%Cleric 97 31%Missing 12 4% 315 l oo
Source: The Author
132
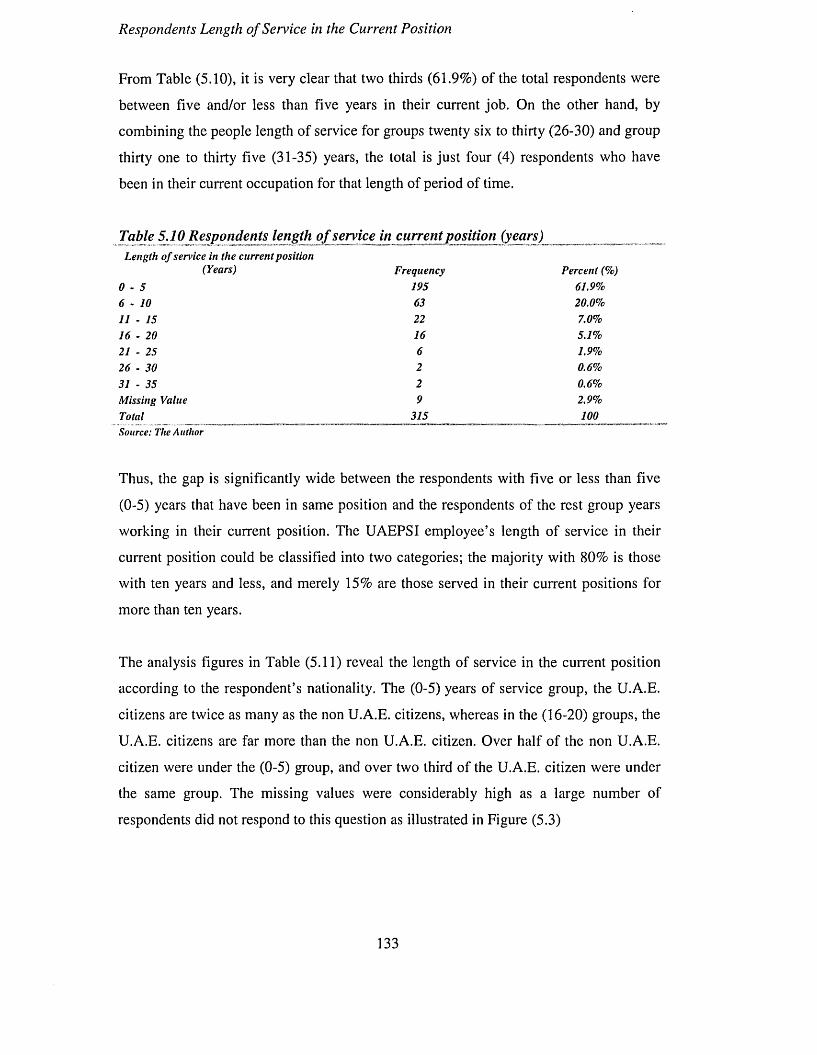
Respondents Length o f Service in the Current Position
From Table (5.10), it is very clear that two thirds (61.9%) of the total respondents were
between five and/or less than five years in their current job. On the other hand, by
combining the people length of service for groups twenty six to thirty (26-30) and group
thirty one to thirty five (31-35) years, the total is just four (4) respondents who have
been in their current occupation for that length of period of time.
Table 5.10 Respondents length of service in current^position (years)Length of service in the current position(Years) Frequency Percent (%)0 - 5 195 61.9%6 - 10 63 20.0%11 - 15 22 7.0%16 - 20 16 5.1%21 - 25 6 1.9%26 - 30 2 0.6%31 - 35 2 0.6%Missing Value 9 2.9%Total 315 100Source: The Author
Thus, the gap is significantly wide between the respondents with five or less than five
(0-5) years that have been in same position and the respondents of the rest group years
working in their current position. The UAEPSI employee’s length of service in their
current position could be classified into two categories; the majority with 80% is those
with ten years and less, and merely 15% are those served in their current positions for
more than ten years.
The analysis figures in Table (5.11) reveal the length of service in the current position
according to the respondent’s nationality. The (0-5) years of service group, the U.A.E.
citizens are twice as many as the non U.A.E. citizens, whereas in the (16-20) groups, the
U.A.E. citizens are far more than the non U.A.E. citizen. Over half of the non U.A.E.
citizen were under the (0-5) group, and over two third of the U.A.E. citizen were under
the same group. The missing values were considerably high as a large number of
respondents did not respond to this question as illustrated in Figure (5.3)
133
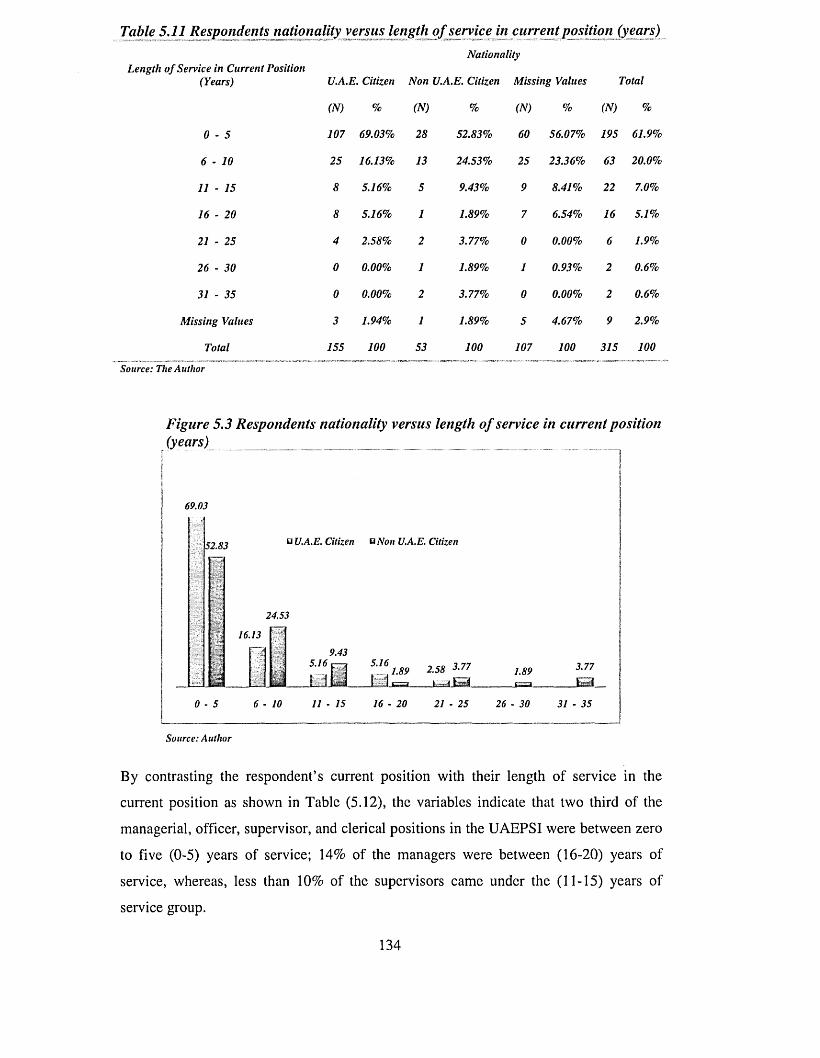
Table 5.11 Respondents nationality versus length o f service in current position (years)NationalityLength of Service in Current Position(Years) U.A.E. CitizenNon U.A.E. CitizenMissing Values Total(N) % (N) % (N) % (N) %
0 - 5 10769.03%28 52.83% 60 56.07%19561.9%6 - 10 25 16.13%13 24.53% 25 23.36%6320.0%11 - 15 8 5.16% 5 9.43% 9 8.41%22 7.0%16 - 20 8 5.16% 1 1.89% 7 6.54%16 5.1%21 - 25 4 2.58% 2 3.77% 0 0.00%6 1.9%26 - 30 0 0.00% 1 1.89% 1 0.93%2 0.6%31 - 35 0 0.00% 2 3.77% 0 0.00%2 0.6%
Missing Values 3 1.94% 1 1.89% 5 4.67%9 2.9%Total 155 100 53 100 107 100 315 100
Source: The Author
Figure 5.3 Respondents nationality versus length of service in current position (years)
69.03
52.83 u U.A.E. Citizen uNon U.A.E. Citizen
24.53
16.13
9.435.16 .16
1.89J jcs= a_
2.58 3.77 S i
1.89 3.77
0 - 5 6 - 10 11 - 15 16 - 20 21 - 25 26 - 30 31 - 35
Source: Author
By contrasting the respondent’s current position with their length of service in the
current position as shown in Table (5.12), the variables indicate that two third of the
managerial, officer, supervisor, and clerical positions in the UAEPSI were between zero
to five (0-5) years of service; 14% of the managers were between (16-20) years of
service, whereas, less than 10% of the supervisors came under the (11-15) years of
service group.
134
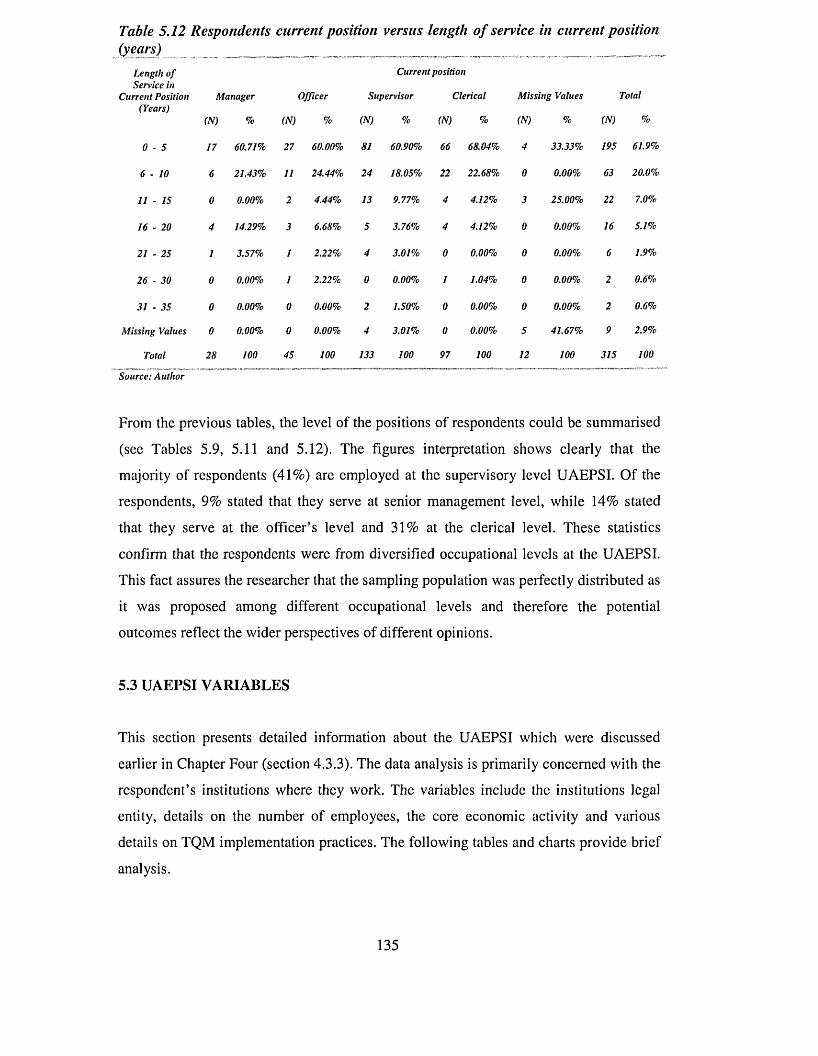
Table 5.12 Respondents current position versus length of service in current position (years) _ _ .............................. ..................................... ______ __..............„_
Length o f Service in
Current Position (Years)
Manager
(N) % (N)
Officer
%
Current position
Supervisor Clerical
(N) % (N) %
Missing Values
(N) % (N)
Total
%
0 - 5 17 60.71% 27 60.00% 81 60.90% 66 68.04% 4 33.33% 195 61.9%
6 - 10 6 21.43% 11 24.44% 24 18.05% 22 22.68% 0 0.00% 63 20.0%
11 - 15 0 0.00% 2 4.44% 13 9.77% 4 4.12% 3 25.00% 22 7.0%
16 - 20 4 14.29% 3 6.68% 5 3.76% 4 4.12% 0 0.00% 16 5.1%
21 - 25 1 3.57% 1 2.22% 4 3.01% 0 0.00% 0 0.00% 6 1.9%
26 - 30 0 0.00% 1 2.22% 0 0.00% 1 1.04% 0 0.00% 2 0.6%
31 - 35 0 0.00% 0 0.00% 2 1.50% 0 0.00% 0 0.00% 2 0.6%
Missing Values 0 0.00% 0 0.00% 4 3.01% 0 0.00% 5 41.67% 9 2.9%
Total 28 100 45 100 133 100 97 100 12 100 315 100
Source: Author
From the previous tables, the level of the positions of respondents could be summarised
(see Tables 5.9, 5.11 and 5.12). The figures interpretation shows clearly that the
majority of respondents (41%) are employed at the supervisory level UAEPSI. Of the
respondents, 9% stated that they serve at senior management level, while 14% stated
that they serve at the officer’s level and 31% at the clerical level. These statistics
confirm that the respondents were from diversified occupational levels at the UAEPSI.
This fact assures the researcher that the sampling population was perfectly distributed as
it was proposed among different occupational levels and therefore the potential
outcomes reflect the wider perspectives of different opinions.
5.3 UAEPSI VARIABLES
This section presents detailed information about the UAEPSI which were discussed
earlier in Chapter Four (section 4.3.3). The data analysis is primarily concerned with the
respondent’s institutions where they work. The variables include the institutions legal
entity, details on the number of employees, the core economic activity and various
details on TQM implementation practices. The following tables and charts provide brief
analysis.
135
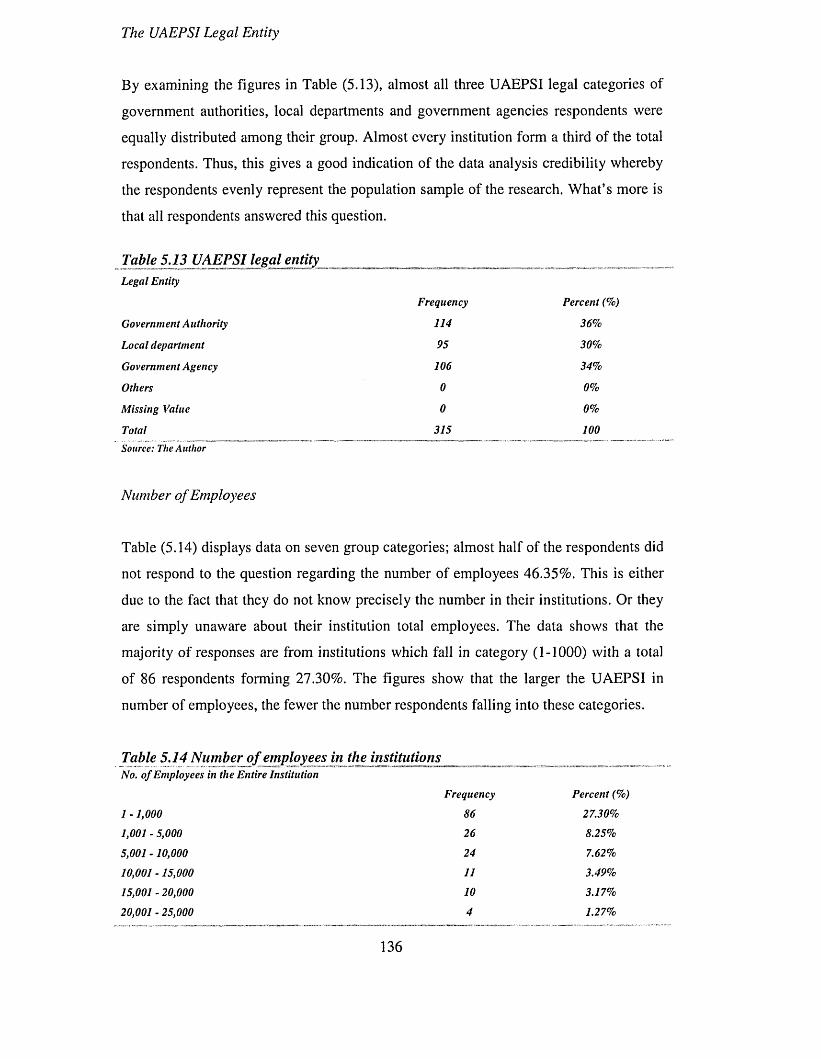
The UAEPSI Legal Entity
By examining the figures in Table (5.13), almost all three UAEPSI legal categories of
government authorities, local departments and government agencies respondents were
equally distributed among their group. Almost every institution form a third of the total
respondents. Thus, this gives a good indication of the data analysis credibility whereby
the respondents evenly represent the population sample of the research. What’s more is
that all respondents answered this question.
Table 5.13 UAEPSI legal entityLegal EntityGovernment Authority Local department Government Agency OthersMissing Value TotalSource: The Author
Frequency1149510600315
Percent (%) 36% 30% 34%0%
0%
100
Number o f Employees
Table (5.14) displays data on seven group categories; almost half of the respondents did
not respond to the question regarding the number of employees 46.35%. This is either
due to the fact that they do not know precisely the number in their institutions. Or they
are simply unaware about their institution total employees. The data shows that the
majority of responses are from institutions which fall in category (1-1000) with a total
of 86 respondents forming 27.30%. The figures show that the larger the UAEPSI in
number of employees, the fewer the number respondents falling into these categories.
Table 5.14 Number of employ ees in the institutions _ _No. of Employees in the Entire Institution Frequency Percent (%)1 -1,000 86 27.30%1.001 - 5,000 26 8.25%5.001 -10,000 24 7.62%10.001 -15,000 11 3.49%15,001-20,000 10 3.17%20.001 - 25,000 4 1.27%136
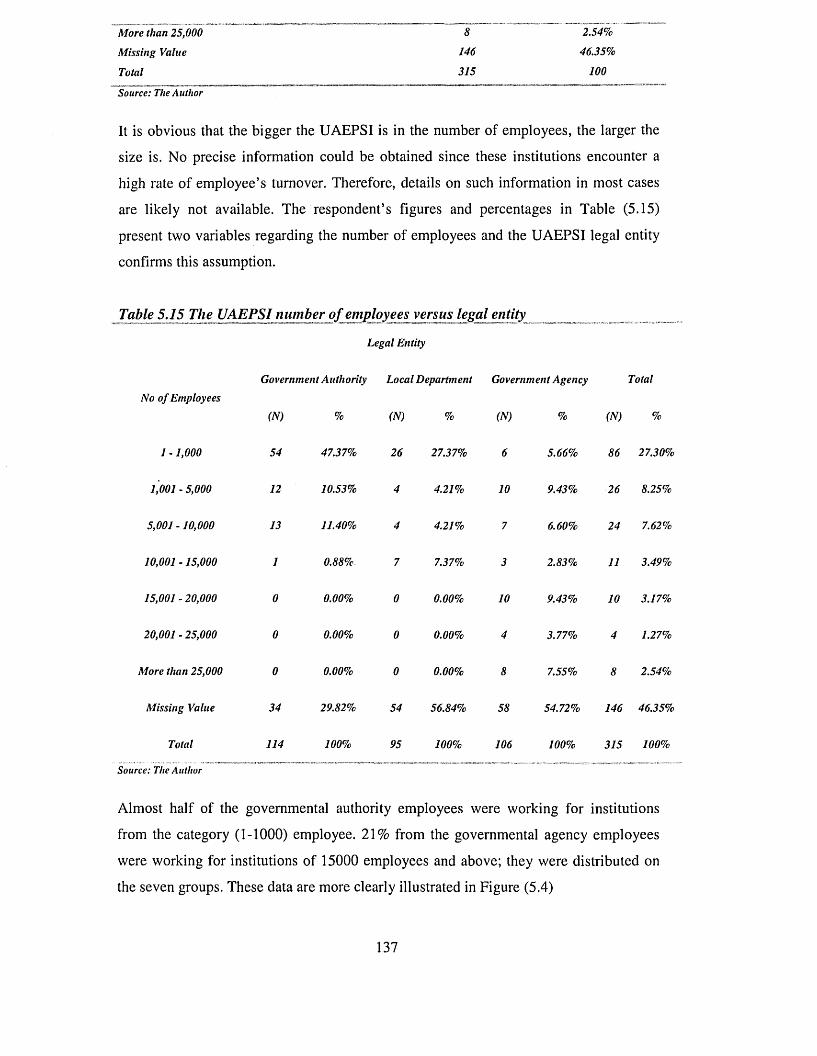
More than 25.000 Missing Value Total8146315
2.54%46.35%100
Source: The Author
It is obvious that the bigger the UAEPSI is in the number of employees, the larger the
size is. No precise information could be obtained since these institutions encounter a
high rate of employee’s turnover. Therefore, details on such information in most cases
are likely not available. The respondent’s figures and percentages in Table (5.15)
present two variables regarding the number of employees and the UAEPSI legal entity
confirms this assumption.
Table 5.15 The UAEPSI number o f employees versus legal entity _ _
Legal EntityGovernment Authority Local Department Government Agency TotalNo of Employees (N) % (N) % (N) % (N) %
1 -1,000 54 47.37% 26 27.37% 6 5.66% 86 27.30%1,001 - 5,000 12 10.53% 4 4.21% 10 9.43% 26 8.25%5,001 -10,000 13 11.40% 4 4.21% 7 6.60% 24 7.62%10,001 -15,000 1 0.88% 7 7.37% 3 2.83% 11 3.49%15,001 - 20,000 0 0.00% 0 0.00% 10 9.43% 10 3.17%20,001 - 25,000 0 0.00% 0 0.00% 4 3.77% 4 1.27%More than 25,000 0 0.00% 0 0.00% 8 7.55% 8 2.54%Missing Value 34 29.82% 54 56.84% 58 54.72%14646.35%
Total 114 100% 95 100% 106 100% 315 100%Source: The Author
Almost half of the governmental authority employees were working for institutions
from the category (1-1000) employee. 21% from the governmental agency employees
were working for institutions of 15000 employees and above; they were distributed on
the seven groups. These data are more clearly illustrated in Figure (5.4)
137
Figure 5.4 Percentages o f the UAEPSI employees versus legal entity
so45
40
35
30
25
20
15
10
5
0 .z: U
B Government authority
c Local Deprtment
k Government Agency
1 -1 ,000 1,001 - 5,000 5,001 -10,000
10,001 -
15,00015,001 - 20,000
20,001 - More than 25,000 25,000
Number o f Employees
Source: The Author
Two third of the governmental authorities and local departments employees were
working for institutions from the category (1-1000) employee. Around half of the
governmental agencies employees were working for institutions of 15001 employees
and above.
UAEPSI Main Service Sector
A total of 315 employee’s in the UAEPSI respondent to the survey, giving a response
rate of 52.5%. The responses represented a good cross-section of the public sector
institutions. Of these, 25.7% were health service institutions respondents, with the next
largest groups being police and security institutions 17.5% and civil services 13.7%.
Table (5.16) presents the main service sector arranged in a descending order
138
Table 5.16 Distribution o f the UAEPSI main servicejector in a descending orderService Sector Frequency Percent (%)1 Health 81 25.7%2 Police and Security 55 17.5%3 Civil Services 43 13.7%4 Economy 31 9.8%5 Transportation 24 7.6%6 Human Resources Development 20 6.3%7 Faith and Religion 18 5.7%8 Tourism 16 5.1%9 Environment 13 4.1%10 Justice 10 3.2%11 Finance 4 1.3%Total 315 100%Source.• The AuthorFrom the cross table above, it is apparent that the 100% of the public service institutions
were from the local departments. Just 1.27% of the 315 respondents were from the
financial services. As shown in Figure (5.5)
Figure 5.5 Percentages of respondents o f the UAEPSI according to their main service sector
Environment4%
Justice3% Transportation
S. 8% jFinance1%
Source: The Author
139
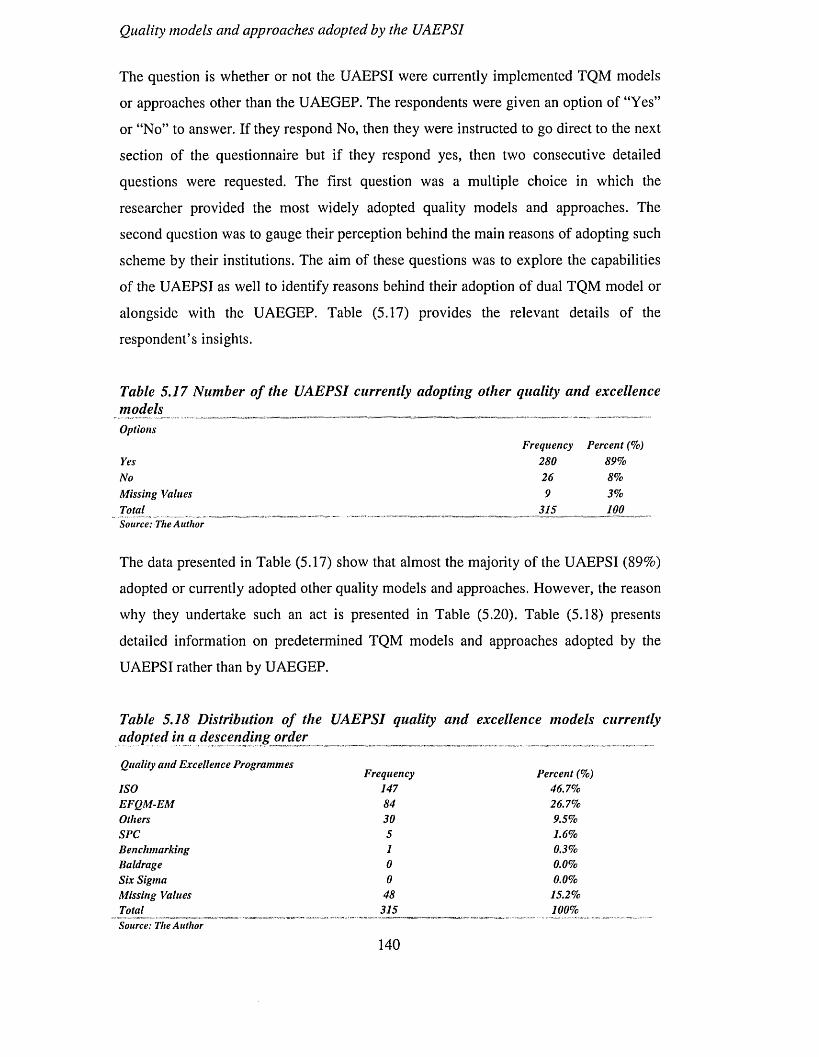
Quality models and approaches adopted by the UAEPSI
The question is whether or not the UAEPSI were currently implemented TQM models
or approaches other than the UAEGEP. The respondents were given an option of “Yes”
or “No” to answer. If they respond No, then they were instructed to go direct to the next
section of the questionnaire but if they respond yes, then two consecutive detailed
questions were requested. The first question was a multiple choice in which the
researcher provided the most widely adopted quality models and approaches. The
second question was to gauge their perception behind the main reasons of adopting such
scheme by their institutions. The aim of these questions was to explore the capabilities
of the UAEPSI as well to identify reasons behind their adoption of dual TQM model or
alongside with the UAEGEP. Table (5.17) provides the relevant details of the
respondent’s insights.
Table 5.17 Number of the UAEPSI currently adopting other quality and excellence models , .........Options Frequency Percent (%)Yes 280 89%No 26 8%Missing Values 9 3%Total 315 100Source: The Author
The data presented in Table (5.17) show that almost the majority of the UAEPSI (89%)
adopted or currently adopted other quality models and approaches. However, the reason
why they undertake such an act is presented in Table (5.20). Table (5.18) presents
detailed information on predetermined TQM models and approaches adopted by the
UAEPSI rather than by UAEGEP.
Table 5.18 Distribution of the UAEPSI quality and excellence models currently adopted in a descending order _
Quality and Excellence Programmes ISOEFQM-EM Others SPCBenchmarking Baldrage Six Sigma Missing Values TotalSource: The Author
Frequency Percent (%)147 46.7%84 26.7%30 9.5%5 1.6%1 0.3%0 0.0%0 0.0%48 15.2%315 100%140
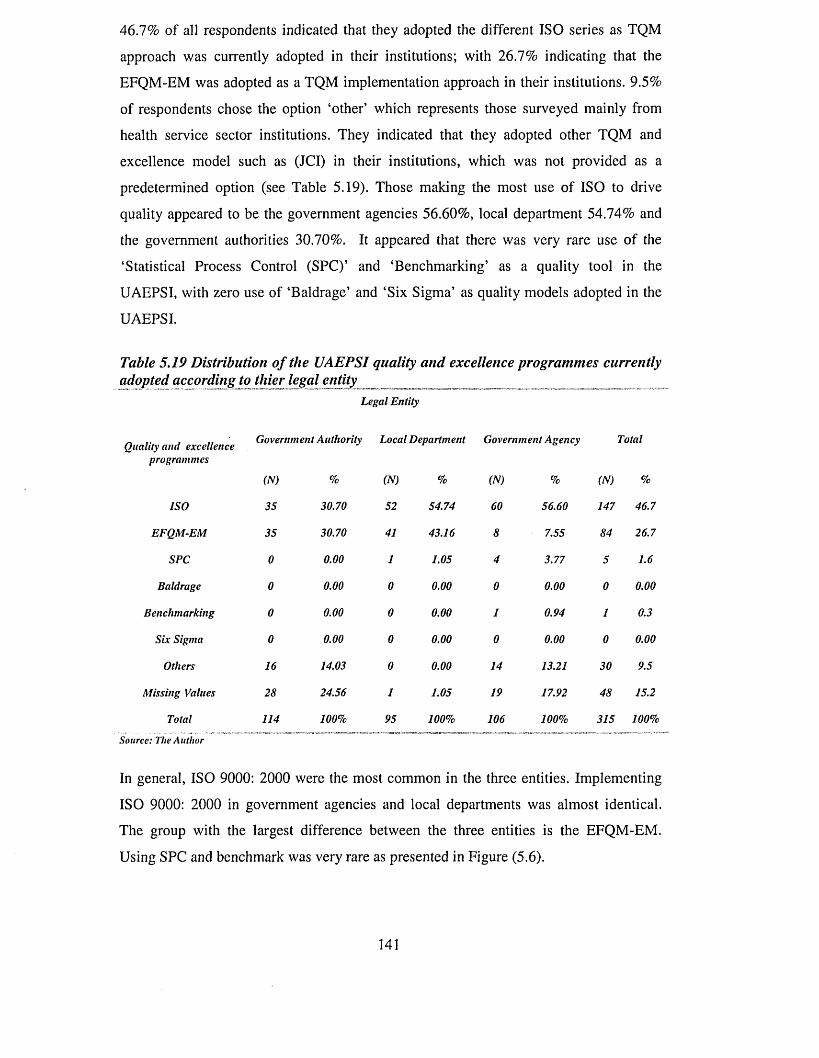
46.7% of all respondents indicated that they adopted the different ISO series as TQM
approach was currently adopted in their institutions; with 26.7% indicating that the
EFQM-EM was adopted as a TQM implementation approach in their institutions. 9.5%
of respondents chose the option ‘other’ which represents those surveyed mainly from
health service sector institutions. They indicated that they adopted other TQM and
excellence model such as (JCI) in their institutions, which was not provided as a
predetermined option (see Table 5.19). Those making the most use of ISO to drive
quality appeared to be the government agencies 56.60%, local department 54.74% and
the government authorities 30.70%. It appeared that there was very rare use of the
‘Statistical Process Control (SPC)’ and ‘Benchmarking’ as a quality tool in the
UAEPSI, with zero use of ‘Baldrage’ and ‘Six Sigma’ as quality models adopted in the
UAEPSI.
Table 5.19 Distribution of the UAEPSI quality and excellence programmes currently adopted according to thier legal entity Legal Entity
_ .. . „ Government Authority Local Department Government Agency TotalQuality and excellenceprogrammes(N) % (N) % (N) % (N) %
ISO 35 30.70 52 54.74 60 56.60 147 46.7EFQM-EM 35 30.70 41 43.16 8 7.55 84 26.7SPC 0 0.00 1 1.05 4 3.77 5 1.6
Baldrage 0 0.00 0 0.00 0 0.00 0 0.00Benchmarking 0 0.00 0 0.00 1 0.94 1 0.3Six Sigma 0 0.00 0 0.00 0 0.00 0 0.00Others 16 14.03 0 0.00 14 13.21 30 9.5
Missing Values 28 24.56 1 1.05 19 17.92 48 15.2Total 114 100% 95 100% 106 100% 315 100%
Source: The Author
In general, ISO 9000: 2000 were the most common in the three entities. Implementing
ISO 9000: 2000 in government agencies and local departments was almost identical.
The group with the largest difference between the three entities is the EFQM-EM.
Using SPC and benchmark was very rare as presented in Figure (5.6).
141
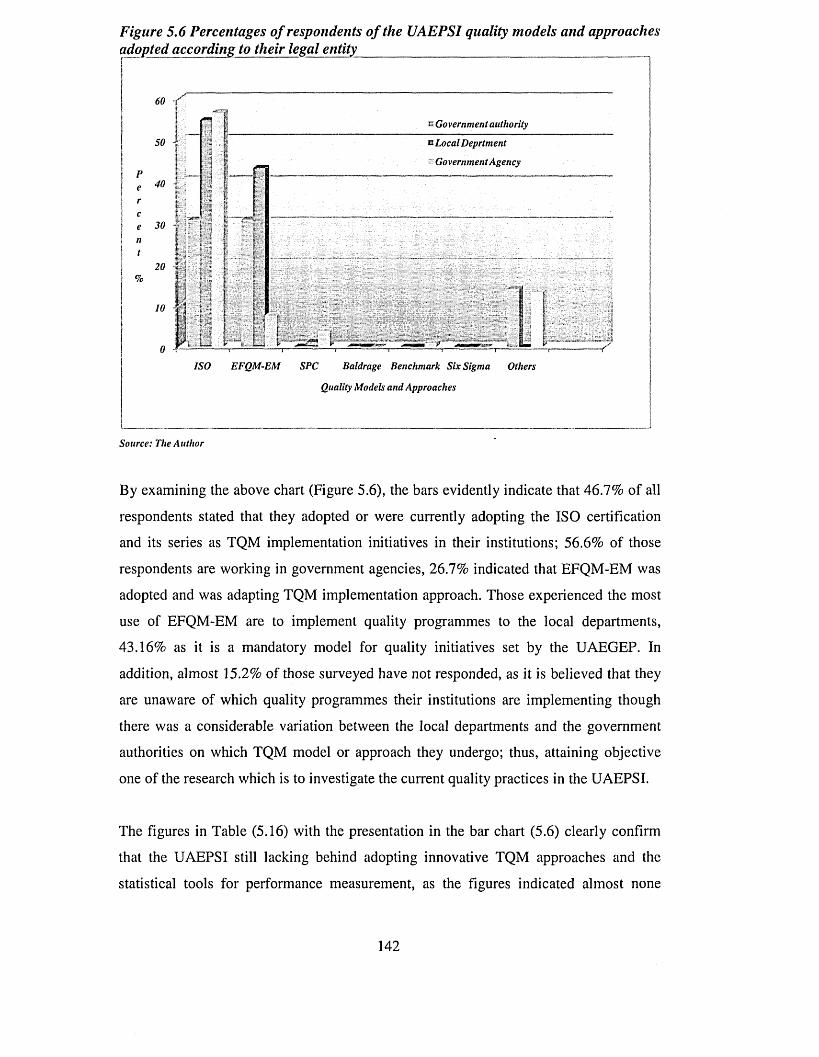
Figure 5.6 Percentages of respondents of the UAEPSI quality models and approaches adopted according to their legal entity
p e r c e n t
%
60
50
40
30
20
10
—,"l
"111
I <;]M
Lid 1 - ^ = ' I
• Government authority
t Local Deprtment
Government Agency
... J
ISO EFQM-EM SPC Baldrage Benchmark Six Sigma Others
Quality Models and Approaches
Source: The Author
By examining the above chart (Figure 5.6), the bars evidently indicate that 46.7% of all
respondents stated that they adopted or were currently adopting the ISO certification
and its series as TQM implementation initiatives in their institutions; 56.6% of those
respondents are working in government agencies, 26.7% indicated that EFQM-EM was
adopted and was adapting TQM implementation approach. Those experienced the most
use of EFQM-EM are to implement quality programmes to the local departments,
43.16% as it is a mandatory model for quality initiatives set by the UAEGEP. In
addition, almost 15.2% of those surveyed have not responded, as it is believed that they
are unaware of which quality programmes their institutions are implementing though
there was a considerable variation between the local departments and the government
authorities on which TQM model or approach they undergo; thus, attaining objective
one of the research which is to investigate the current quality practices in the UAEPSI.
The figures in Table (5.16) with the presentation in the bar chart (5.6) clearly confirm
that the UAEPSI still lacking behind adopting innovative TQM approaches and the
statistical tools for performance measurement, as the figures indicated almost none
142
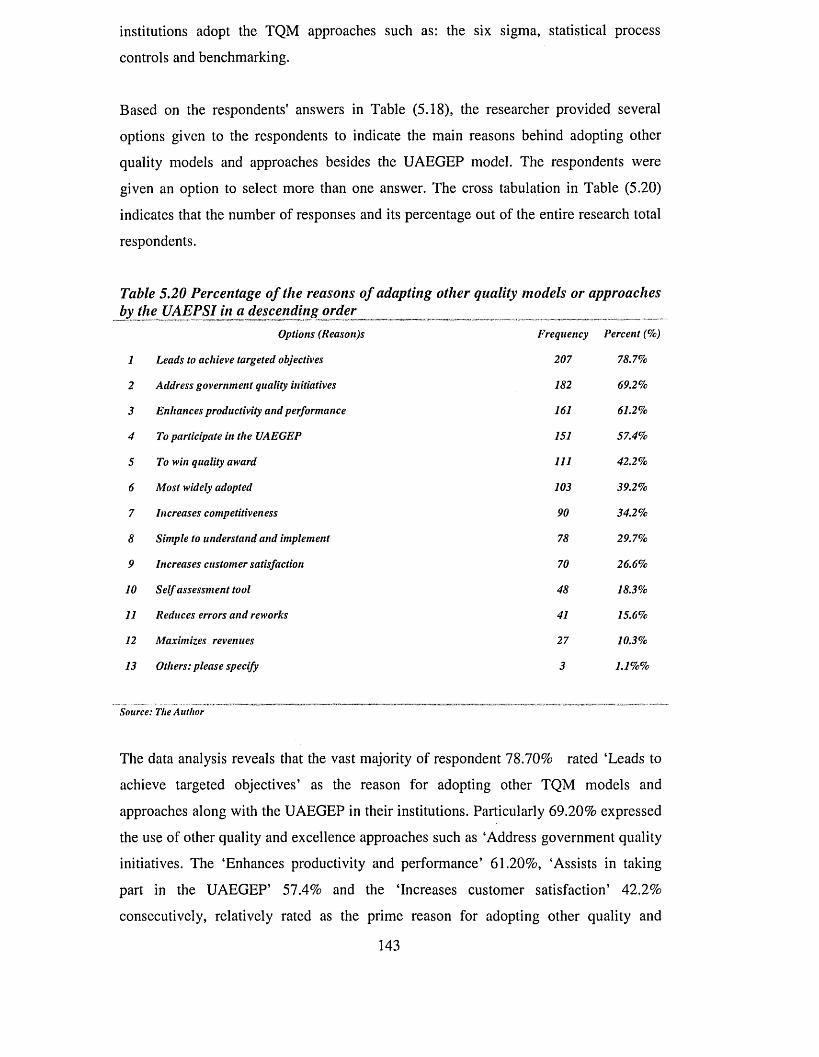
institutions adopt the TQM approaches such as: the six sigma, statistical process
controls and benchmarking.
Based on the respondents' answers in Table (5.18), the researcher provided several
options given to the respondents to indicate the main reasons behind adopting other
quality models and approaches besides the UAEGEP model. The respondents were
given an option to select more than one answer. The cross tabulation in Table (5.20)
indicates that the number of responses and its percentage out of the entire research total
respondents.
Table 5.20 Percentage of the reasons of adapting other quality models or approaches by the UAEPSI in a descending, order _Options (Reason)s Frequency Percent (%)1 Leads to achieve targeted objectives 207 78.7%2 Address government quality initiatives 182 69.2%3 Enhances productivity and performance 161 61.2%4 To participate in the UAEGEP 151 57.4%5 To win quality award 111 42.2%6 Most widely adopted 103 39.2%7 Increases competitiveness 90 34.2%8 Simple to understand and implement 78 29.7%9 Increases customer satisfaction 70 26.6%10 Self assessment tool 48 18.3%11 Reduces errors and reworks 41 15.6%12 Maximizes revenues 27 10.3%13 Others: please specify 3 1.1%%
Source: The Author
The data analysis reveals that the vast majority of respondent 78.70% rated ‘Leads to
achieve targeted objectives’ as the reason for adopting other TQM models and
approaches along with the UAEGEP in their institutions. Particularly 69.20% expressed
the use of other quality and excellence approaches such as ‘Address government quality
initiatives. The ‘Enhances productivity and performance’ 61.20%, ‘Assists in taking
part in the UAEGEP’ 57.4% and the ‘Increases customer satisfaction’ 42.2%
consecutively, relatively rated as the prime reason for adopting other quality and
143
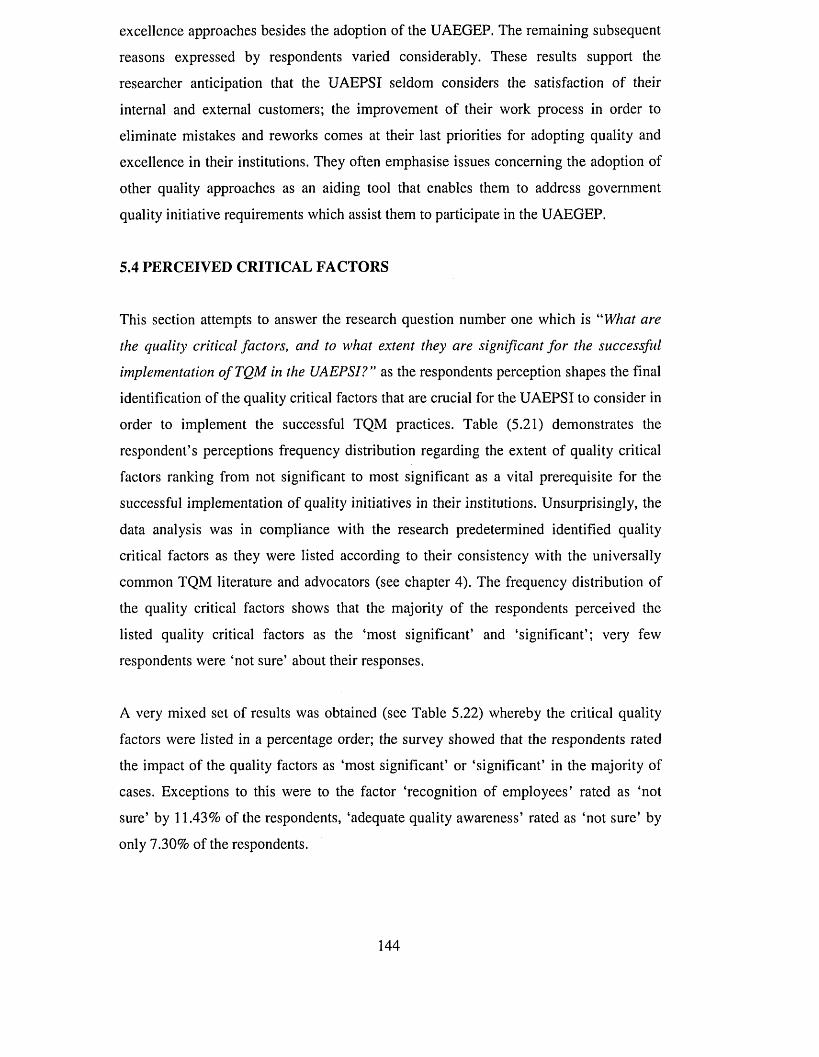
excellence approaches besides the adoption of the UAEGEP. The remaining subsequent
reasons expressed by respondents varied considerably. These results support the
researcher anticipation that the UAEPSI seldom considers the satisfaction of their
internal and external customers; the improvement of their work process in order to
eliminate mistakes and reworks comes at their last priorities for adopting quality and
excellence in their institutions. They often emphasise issues concerning the adoption of
other quality approaches as an aiding tool that enables them to address government
quality initiative requirements which assist them to participate in the UAEGEP.
5.4 PERCEIVED CRITICAL FACTORS
This section attempts to answer the research question number one which is “What are
the quality critical factors, and to what extent they are significant for the successful
implementation o f TQM in the UAEPSI?” as the respondents perception shapes the final
identification of the quality critical factors that are crucial for the UAEPSI to consider in
order to implement the successful TQM practices. Table (5.21) demonstrates the
respondent’s perceptions frequency distribution regarding the extent of quality critical
factors ranking from not significant to most significant as a vital prerequisite for the
successful implementation of quality initiatives in their institutions. Unsurprisingly, the
data analysis was in compliance with the research predetermined identified quality
critical factors as they were listed according to their consistency with the universally
common TQM literature and advocators (see chapter 4). The frequency distribution of
the quality critical factors shows that the majority of the respondents perceived the
listed quality critical factors as the ‘most significant’ and ‘significant’; very few
respondents were ‘not sure’ about their responses.
A very mixed set of results was obtained (see Table 5.22) whereby the critical quality
factors were listed in a percentage order; the survey showed that the respondents rated
the impact of the quality factors as ‘most significant’ or ‘significant’ in the majority of
cases. Exceptions to this were to the factor ‘recognition of employees’ rated as ‘not
sure’ by 11.43% of the respondents, ‘adequate quality awareness’ rated as ‘not sure’ by
only 7.30% of the respondents.
144
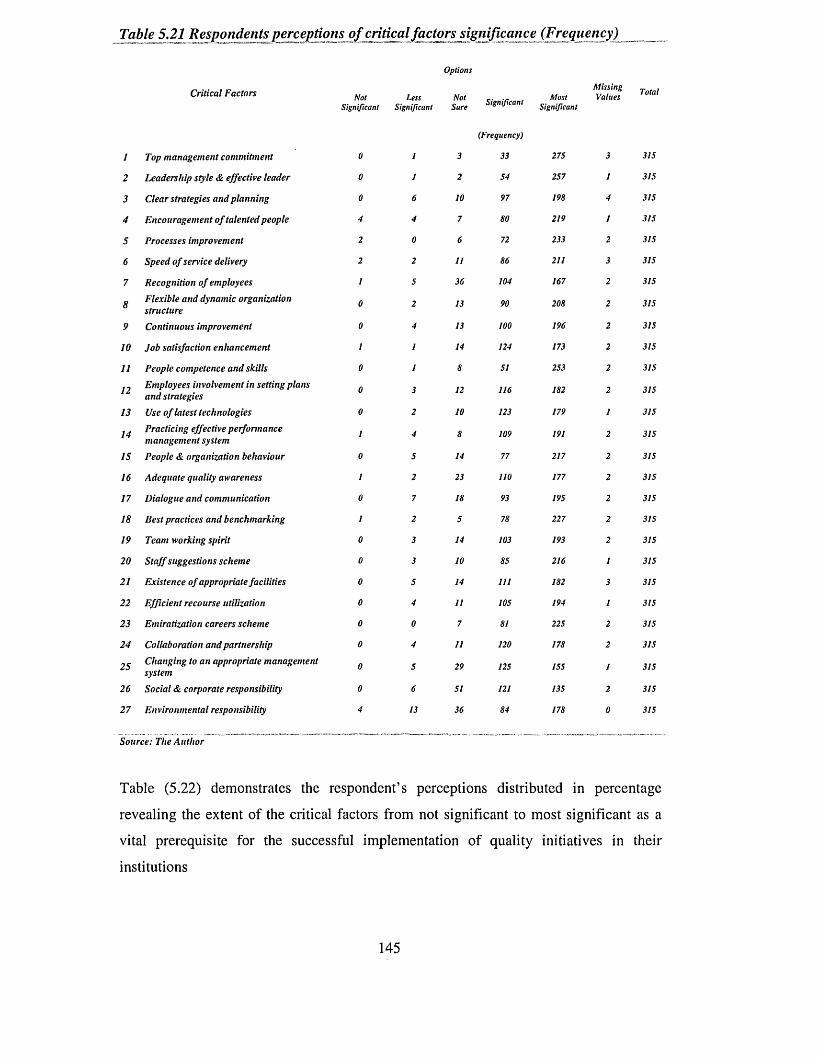
Table 5.21 Respondents perceptions o f critical factors signiJfwance^(Frequency^
Options
Critical Factors NotSignificant
LessSignificant
NotSure Significant
(Frequency)
MostSignificant
MissingValues Total
1 Top management commitment 0 I 3 33 275 3 315
2 Leadership style & effective leader 0 1 2 54 257 1 315
3 Clear strategies and planning 0 6 10 97 198 4 315
4 Encouragement o f talented people 4 4 7 80 219 1 315
5 Processes improvement 2 0 6 72 233 2 315
6 Speed of service delivery 2 2 11 86 211 3 315
7 Recognition o f employees 1 5 36 104 167 2 315
8Flexible and dynamic organization structure
0 2 13 90 208 2 315
9 Continuous improvement 0 4 13 100 196 2 315
10 Job satisfaction enhancement 1 1 14 124 173 2 315
11 People competence and skills 0 1 8 51 253 2 315
12 Employees involvement in setting plans and strategies
0 3 12 116 182 2 315
13 Use o f latest technologies 0 2 10 123 179 1 315
14 Practicing effective performance management system
1 4 8 109 191 2 315
15 People & organization behaviour 0 5 14 77 217 2 315
16 Adequate quality awareness 1 2 23 n o 177 2 315
17 Dialogue and communication 0 7 18 93 195 2 315
18 Best practices and benchmarking 1 2 5 78 227 2 315
19 Team working spirit 0 3 14 103 193 2 315
20 Staff suggestions scheme 0 3 10 85 216 1 315
21 Existence o f appropriate facilities 0 5 14 111 182 3 315
22 Efficient recourse utilization 0 4 11 105 194 1 315
23 Emiratization careers scheme 0 0 7 81 225 2 315
24 Collaboration and partnership 0 4 11 120 178 2 315
25 Changing to an appropriate management system
0 5 29 125 155 1 315
26 Social & corporate responsibility 0 6 51 121 135 2 315
27 En vironmental responsibility 4 13 36 84 178 0 315
Source: The Author
Table (5.22) demonstrates the respondent’s perceptions distributed in percentage
revealing the extent of the critical factors from not significant to most significant as a
vital prerequisite for the successful implementation of quality initiatives in their
institutions
145
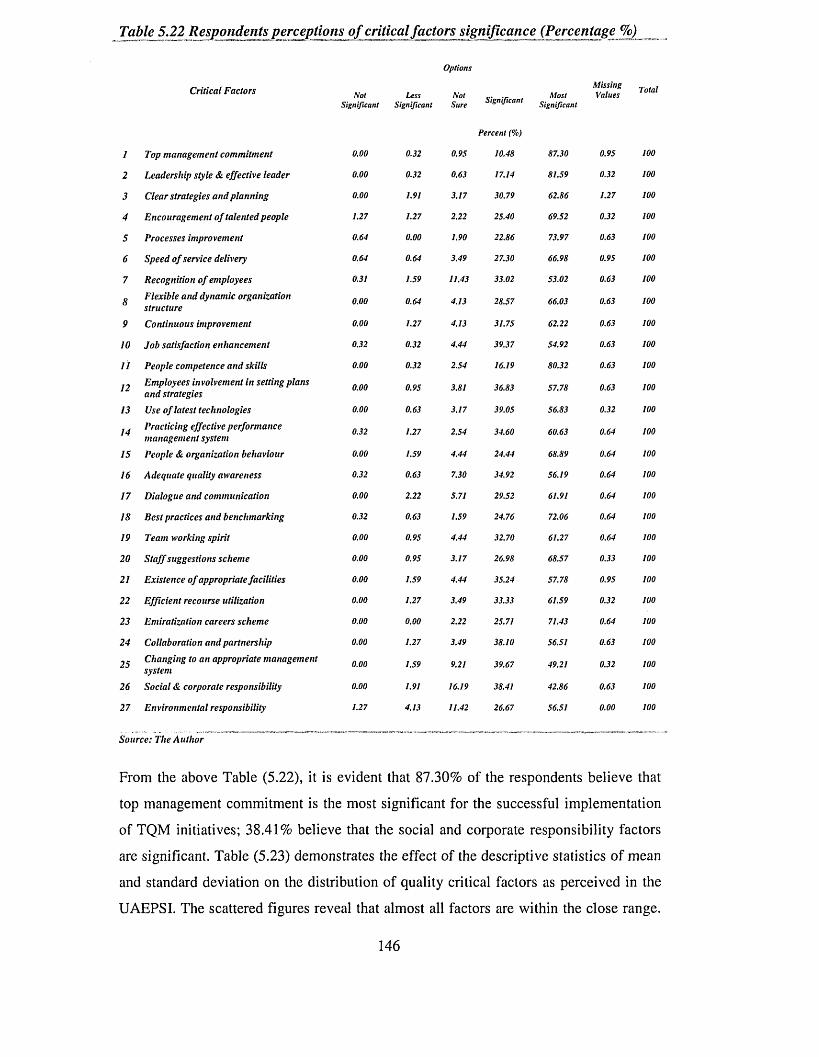
Table 5.22 Respondents perceptions of critical factors significance (Percentage %)
Options
Critical Factors NotSignificant
LessSignificant
NotSure Significant
Percent (%)
MostSignificant
MissingValues Total
1 Top management commitment 0.00 0.32 0.95 10.48 87.30 0.95 100
2 Leadership style & effective leader 0.00 0.32 0.63 17.14 81.59 0.32 100
3 Clear strategies and planning 0.00 1.91 3.17 30.79 62.86 1.27 100
4 Encouragement o f talented people 1.27 1.27 2.22 25.40 69.52 0.32 100
5 Processes improvement 0.64 0.00 1.90 22.86 73.97 0.63 100
6 Speed o f service delivery 0.64 0.64 3.49 27.30 66.98 0.95 100
7 Recognition o f employees 0.31 1.59 11.43 33.02 53.02 0.63 100
8 Flexible and dynamic organization structure
0.00 0.64 4.13 28.57 66.03 0.63 100
9 Continuous improvement 0.00 1.27 4.13 31.75 62.22 0.63 100
10 Job satisfaction enhancement 0.32 0.32 4.44 39.37 54.92 0.63 100
11 People competence and skills 0.00 0.32 2.54 16.19 80.32 0.63 100
12 Employees involvement in setting plans and strategies
0.00 0.95 3.81 36.83 57.78 0.63 100
13 Use o f latest technologies 0.00 0.63 3.17 39.05 56.83 0.32 100
14 Practicing effective performance management system
0.32 1.27 2.54 34.60 60.63 0.64 100
15 People & organization behaviour 0.00 1.59 4.44 24.44 68.89 0.64 100
16 Adequate quality awareness 0.32 0.63 7.30 34.92 56.19 0.64 100
17 Dialogue and communication 0.00 2.22 5.71 29.52 61.91 0.64 100
18 Best practices and benchmarking 0.32 0.63 1.59 24.76 72.06 0.64 100
19 Team working spirit 0.00 0.95 4.44 32.70 61.27 0.64 100
20 Staff suggestions scheme 0.00 0.95 3.17 26.98 68.57 0.33 100
21 Existence o f appropriate facilities 0.00 1.59 4.44 35.24 57.78 0.95 100
22 Efficient recourse utilization 0.00 1.27 3.49 33.33 61.59 0.32 100
23 Emiratization careers scheme 0.00 0.00 2.22 25.71 71.43 0.64 100
24 Collaboration and partnership 0.00 1.27 3.49 38.10 56.51 0.63 100
25 Changing to an appropriate management system
0.00 1.59 9.21 39.67 49.21 0.32 100
26 Social & corporate responsibility 0.00 1.91 16.19 38.41 42.86 0.63 100
27 Environmental responsibility 1.27 4.13 11.42 26.67 56.51 0.00 100
Source: The Author
From the above Table (5.22), it is evident that 87.30% of the respondents believe that
top management commitment is the most significant for the successful implementation
of TQM initiatives; 38.41% believe that the social and corporate responsibility factors
are significant. Table (5.23) demonstrates the effect of the descriptive statistics of mean
and standard deviation on the distribution of quality critical factors as perceived in the
UAEPSI. The scattered figures reveal that almost all factors are within the close range.
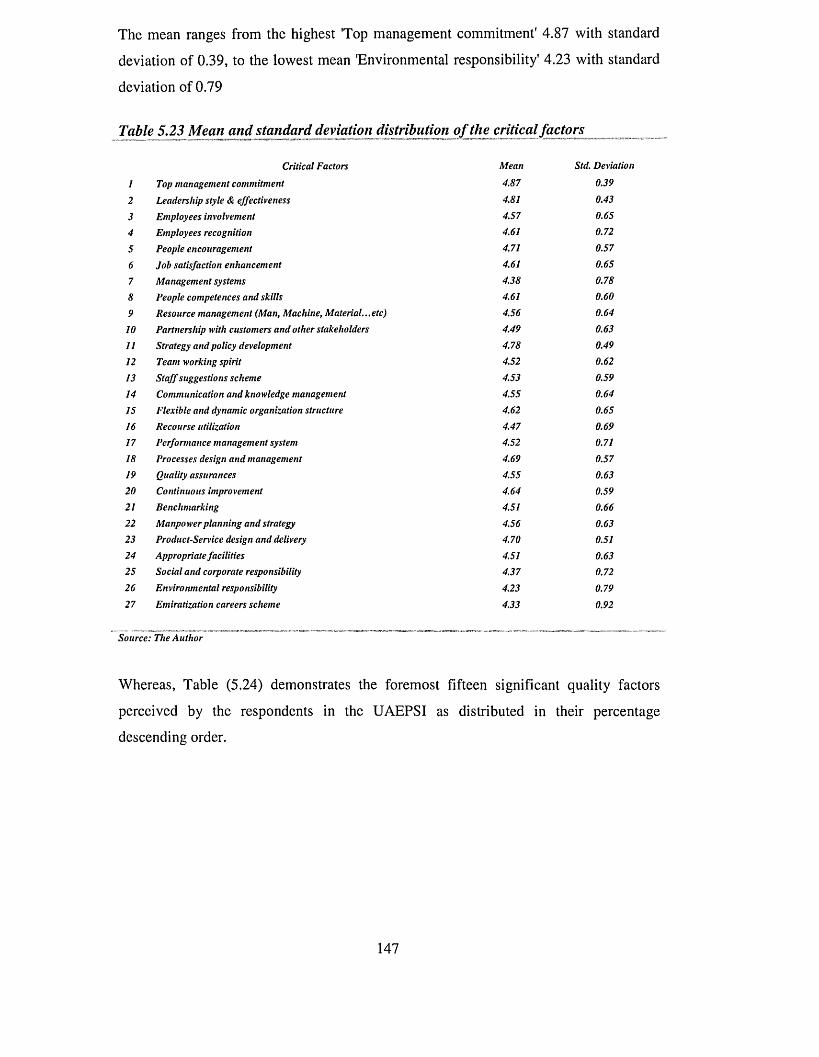
The mean ranges from the highest 'Top management commitment' 4.87 with standard
deviation of 0.39, to the lowest mean 'Environmental responsibility' 4.23 with standard
deviation of 0.79
Table 5.23 Mean and standard deviation distribution o f the critical factors
Critical Factors Mean Std. Deviation
1 Top management commitment 4.87 0.39
2 Leadership style & effectiveness 4.81 0.43
3 Employees involvement 4.57 0.65
4 Employees recognition 4.61 0.72
5 People encouragement 4.71 0.57
6 Job satisfaction enhancement 4.61 0.65
7 Management systems 4.38 0.78
8 People competences and skills 4.61 0.60
9 Resource management (Man, Machine, Material...etc) 4.56 0.64
10 Partnership with customers and other stakeholders 4.49 0.63
11 Strategy and policy development 4.78 0.49
12 Team working spirit 4.52 0.62
13 Staff suggestions scheme 4.53 0.59
14 Communication and knowledge management 4.55 0.64
IS Flexible and dynamic organization structure 4.62 0.65
16 Recourse utilization 4.47 0.69
17 Performance management system 4.52 0.71
18 Processes design and management 4.69 0.57
19 Quality assurances 4.55 0.63
20 Continuous improvement 4.64 0.59
21 Benchmarking 4.51 0.66
22 Manpower planning and strategy 4.56 0.63
23 Product-Service design and delivery 4.70 0.51
24 Appropriate facilities 4.51 0.6325 Social and corporate responsibility 4.37 0.72
26 Environmental responsibility 4.23 0.79
27 Emiratization careers scheme 4.33 0.92
Source: The Author
Whereas, Table (5.24) demonstrates the foremost fifteen significant quality factors
perceived by the respondents in the UAEPSI as distributed in their percentage
descending order.
147
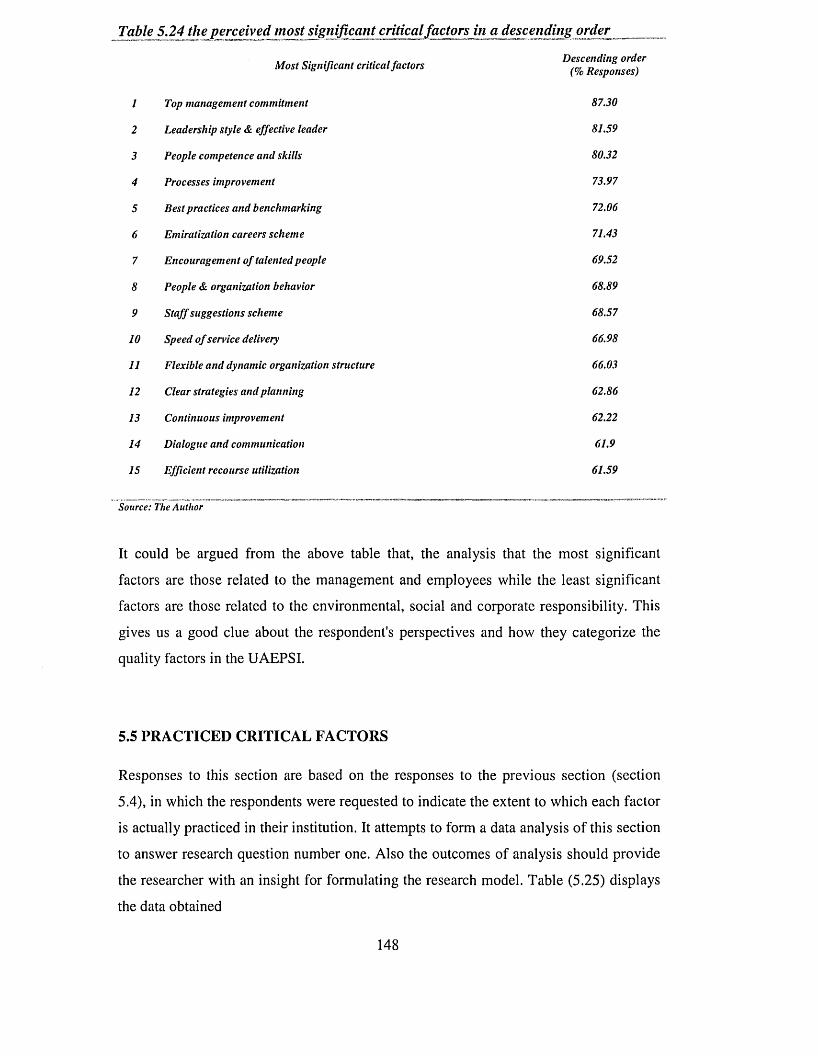
Table 5.24 the perceived most significant critical factors in adescending order
Most Significant critical factors Descending order (% Responses)1 Top management commitment 87.302 Leadership style & effective leader 81.593 People competence and skills 80.324 Processes improvement 73.975 Best practices and benchmarking 72.066 Emiratizjation careers scheme 71.437 Encouragement of talented people 69.528 People & organization behavior 68.899 Staff suggestions scheme 68.5710 Speed of service delivery 66.9811 Flexible and dynamic organization structure 66.0312 Clear strategies and planning 62.8613 Continuous improvement 62.2214 Dialogue and communication 61.915 Efficient recourse utilization 61.59
Source: The Author
It could be argued from the above table that, the analysis that the most significant
factors are those related to the management and employees while the least significant
factors are those related to the environmental, social and corporate responsibility. This
gives us a good clue about the respondent's perspectives and how they categorize the
quality factors in the UAEPSI.
5.5 PRACTICED CRITICAL FACTORS
Responses to this section are based on the responses to the previous section (section
5.4), in which the respondents were requested to indicate the extent to which each factor
is actually practiced in their institution. It attempts to form a data analysis of this section
to answer research question number one. Also the outcomes of analysis should provide
the researcher with an insight for formulating the research model. Table (5.25) displays
the data obtained
148
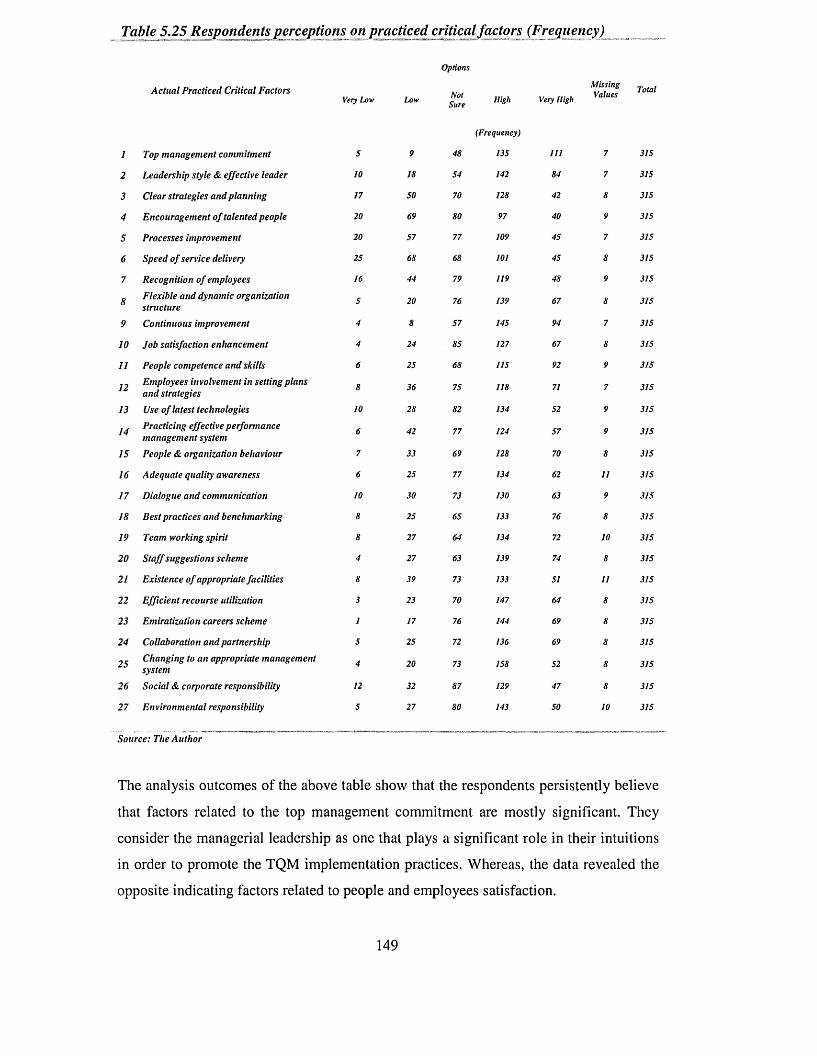
Table 5.25 Respondents perceptions on practiced critical factors (Frequency)
Options
Actual Practiced Critical FactorsVery Low Low Not
Sure High
(Frequency)
Very High
MissingValues Total
1 Top management commitment 5 9 48 135 111 7 315
2 Leadership style & effective leader 10 18 54 142 84 7 315
3 Clear strategies and planning 17 50 70 128 42 8 315
4 Encouragement o f talented people 20 69 80 97 40 9 315
5 Processes improvement 20 57 77 109 45 7 315
6 Speed o f service delivery 25 68 68 101 45 8 315
7 Recognition o f employees 16 44 79 119 48 9 315
8Flexible and dynamic organization structure
5 20 76 139 67 8 315
9 Continuous improvement 4 8 57 145 94 7 315
10 Job satisfaction enhancement 4 24 85 127 67 8 315
11 People competence and skills 6 25 68 U S 92 9 315
12Employees involvement in setting plans and strategies
8 36 75 118 71 7 315
13 Use o f latest technologies 10 28 82 134 52 9 315
14Practicing effective performance management system
6 42 77 124 57 9 315
IS People & organization behaviour 7 33 69 128 70 8 315
16 Adequate quality awareness 6 25 77 134 62 11 315
17 Dialogue and communication 10 30 73 130 63 9 315
18 Best practices and benchmarking 8 25 65 133 76 8 315
19 Team working spirit 8 27 64 134 72 10 315
20 Staff suggestions scheme 4 27 63 139 74 8 315
21 Existence o f appropriate facilities 8 39 73 133 51 11 315
22 Efficient recourse utilization 3 23 70 147 64 8 315
23 Emiratization careers scheme I 17 76 144 69 8 315
24 Collaboration and partnership 5 25 72 136 69 8 315
25 Changing to an appropriate management system
4 20 73 158 52 8 315
26 Social & corporate responsibility 12 32 87 129 47 8 315
27 Environmental responsibility 5 27 80 143 50 10 315
Source: The Author
The analysis outcomes of the above table show that the respondents persistently believe
that factors related to the top management commitment are mostly significant. They
consider the managerial leadership as one that plays a significant role in their intuitions
in order to promote the TQM implementation practices. Whereas, the data revealed the
opposite indicating factors related to people and employees satisfaction.
149
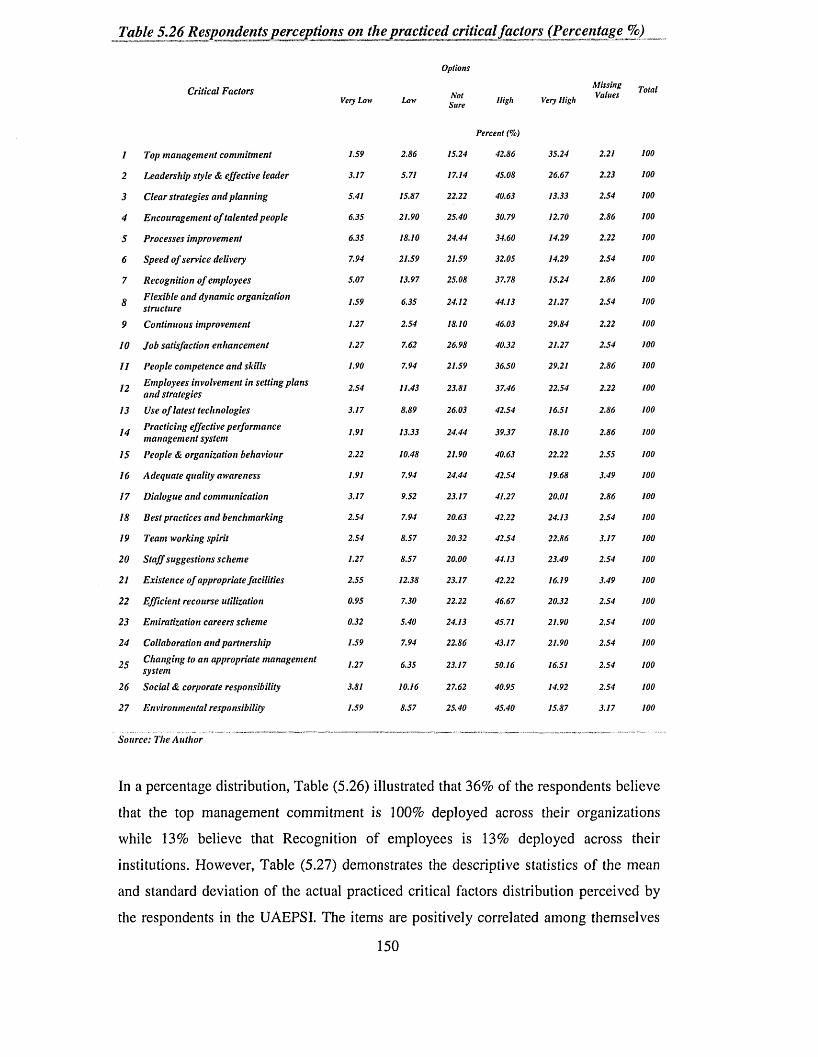
Table 5.26 Respondents perceptions on the p racticed critical factors (Percentage %)
Options
Critical FactorsVery Low Low Not
Sure High
Percent (%)
Very High
MissingValues Total
7 Top m anagem ent com m itm ent 1.59 2.86 15.24 42.86 35.24 2.21 100
2 Leadership style & effective leader 3.17 5.71 17.14 45.08 26.67 2.23 100
3 Clear strategies and p lanning 5.41 15.87 22.22 40.63 13.33 2.54 100
4 Encouragem ent o f talented people 6.35 21.90 25.40 30.79 12.70 2.86 100
5 Processes im provem ent 6.35 18.10 24.44 34.60 14.29 2.22 100
6 Speed o f service delivery 7.94 21.59 21.59 32.05 14.29 2.54 100
7 Recognition o f employees 5.07 13.97 25.08 37.78 15.24 2.86 100
8Flexible and dynam ic organization structure
1.59 6.35 24.12 44.13 21.27 2.54 100
9 Continuous im provem ent 1.27 2.54 18.10 46.03 29.84 2.22 100
10 Job satisfaction enhancem ent 1.27 7.62 26.98 40.32 21.27 2.54 100
11 People com petence and skills 1.90 7.94 21.59 36.50 29.21 2.86 100
12Em ployees involvem ent in setting p lans and strategies
2.54 11.43 23.81 37.46 22.54 2.22 100
13 Use o f latest technologies 3.17 8.89 26.03 42.54 16.51 2.86 100
14Practicing effective perform ance m anagem ent system
1.91 13.33 24.44 39.37 18.10 2.86 100
IS People & organization behaviour 2.22 10.48 21.90 40.63 22.22 2.55 100
16 A dequate quality awareness 1.91 7.94 24.44 42.54 19.68 3.49 100
17 Dialogue and communication 3.17 9.52 23.17 41.27 20.01 2.86 100
18 B est practices and benchm arking 2.54 7.94 20.63 42.22 24.13 2.54 100
19 Team working spirit 2.54 8.57 20.32 42.54 22.86 3.17 100
20 S ta ff suggestions schem e 1.27 8.57 20.00 44.13 23.49 2.54 100
21 Existence o f appropriate facilities 2.55 12.38 23.17 42.22 16.19 3.49 100
22 E fficient recourse utilization 0.95 7.30 22.22 46.67 20.32 2.54 100
23 Em iratization careers schem e 0.32 5.40 24.13 45.71 21.90 2.54 100
24 Collaboration and partnership 1.59 7.94 22.86 43.17 21.90 2.54 100
25 Changing to an appropriate m anagem ent system
1.27 6.35 23.17 50.16 16.51 2.54 100
26 Social & corporate responsibility 3.81 10.16 27.62 40.95 14.92 2.54 100
27 En vironm ental responsibility 1.59 8.57 25.40 45.40 15.87 3.17 100
Source: The Author
In a percentage distribution, Table (5.26) illustrated that 36% of the respondents believe
that the top management commitment is 100% deployed across their organizations
while 13% believe that Recognition of employees is 13% deployed across their
institutions. However, Table (5.27) demonstrates the descriptive statistics of the mean
and standard deviation of the actual practiced critical factors distribution perceived by
the respondents in the UAEPSI. The items are positively correlated among themselves
150
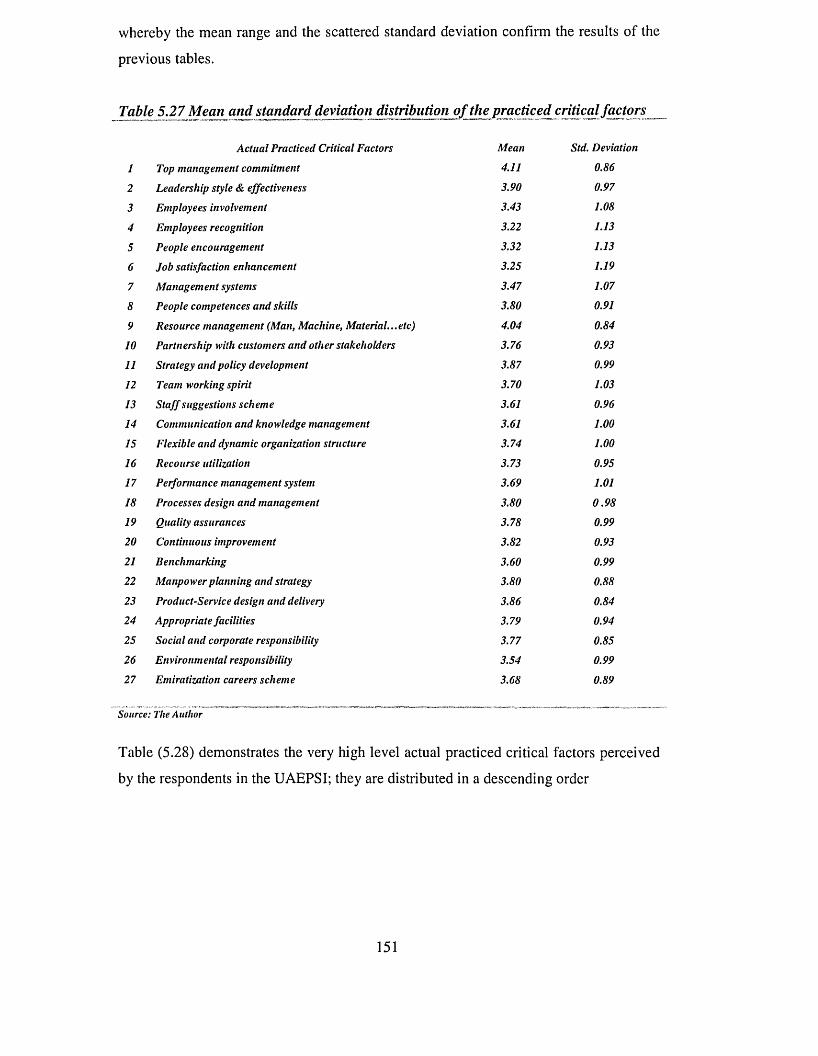
whereby the mean range and the scattered standard deviation confirm the results of the
previous tables.
Table 5.27 Mean and standard deviation distribution of the practiced critical factors
Actual Practiced Critical Factors Mean Std. Deviation1 Top management commitment 4.11 0.862 Leadership style & effectiveness 3.90 0.973 Employees involvement 3.43 1.084 Employees recognition 3.22 1.135 People encouragement 3.32 1.136 Job satisfaction enhancement 3.25 1.197 Management systems 3.47 1.078 People competences and skills 3.80 0.919 Resource management (Man, Machine, Material...etc) 4.04 0.8410 Partnership with customers and other stakeholders 3.76 0.9311 Strategy and policy development 3.87 0.9912 Team working spirit 3.70 1.0313 Staff suggestions scheme 3.61 0.9614 Communication and knowledge management 3.61 1.0015 Flexible and dynamic organization structure 3.74 1.0016 Recourse utilization 3.73 0.9517 Performance management system 3.69 1.0118 Processes design and management 3.80 0.9819 Quality assurances 3.78 0.9920 Continuous improvement 3.82 0.9321 Benchmarking 3.60 0.9922 Manpower planning and strategy 3.80 0.8823 Product-Service design and delivery 3.86 0.8424 Appropriate facilities 3.79 0.9425 Social and corporate responsibility 3.77 0.8526 En vironm ental responsibility 3.54 0.9927 Emiratization careers scheme 3.68 0.89Source: The Author
Table (5.28) demonstrates the very high level actual practiced critical factors perceived
by the respondents in the UAEPSI; they are distributed in a descending order
151
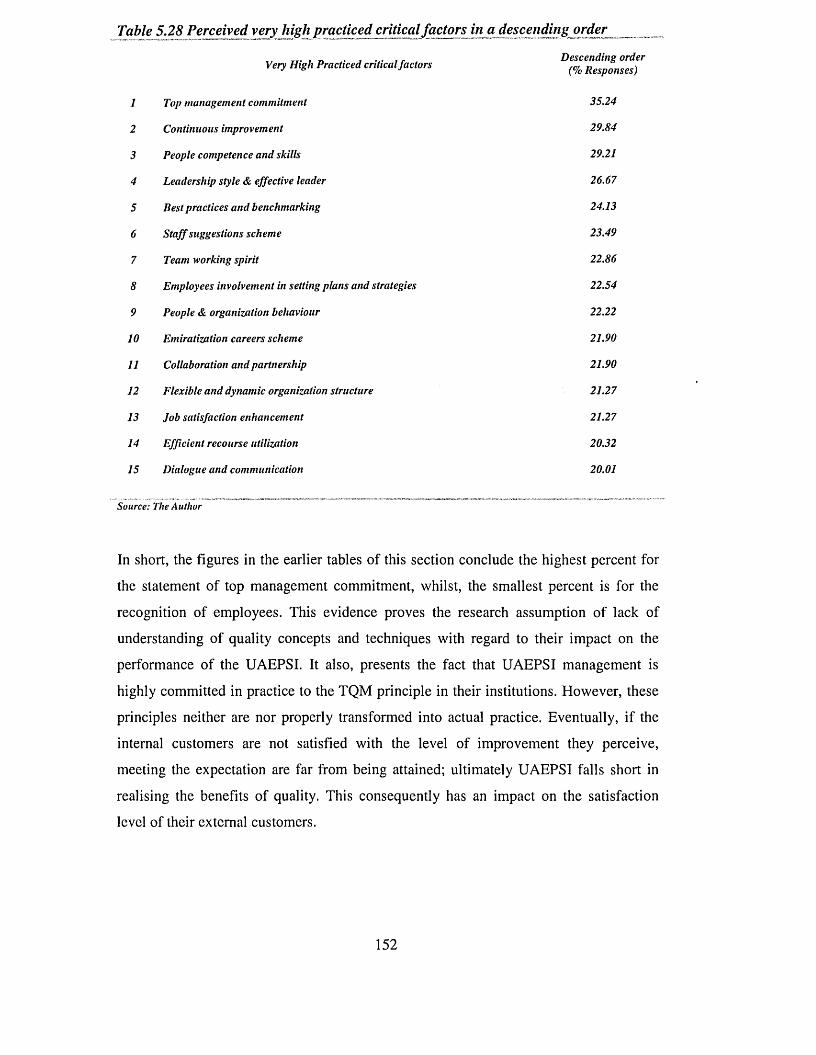
Table 5.28 Perceived very high practiced critical factors m a descending order
Very High Practiced critical factors Descending order (% Responses)I Top management commitment 35.242 Continuous improvement 29.843 People competence and skills 29.214 Leadership style & effective leader 26.675 Best practices and benchmarking 24.136 Staff suggestions scheme 23.497 Team working spirit 22.868 Employees involvement in setting plans and strategies 22.549 People & organization behaviour 22.2210 Emiratization careers scheme 21.9011 Collaboration and partnership 21.9012 Flexible and dynamic organization structure 21.2713 Job satisfaction enhancement 21.2714 Efficient recourse utilization 20.3215 Dialogue and communication 20.01
Source: The Author
In short, the figures in the earlier tables of this section conclude the highest percent for
the statement of top management commitment, whilst, the smallest percent is for the
recognition of employees. This evidence proves the research assumption of lack of
understanding of quality concepts and techniques with regard to their impact on the
performance of the UAEPSI. It also, presents the fact that UAEPSI management is
highly committed in practice to the TQM principle in their institutions. However, these
principles neither are nor properly transformed into actual practice. Eventually, if the
internal customers are not satisfied with the level of improvement they perceive,
meeting the expectation are far from being attained; ultimately UAEPSI falls short in
realising the benefits of quality. This consequently has an impact on the satisfaction
level of their external customers.
152
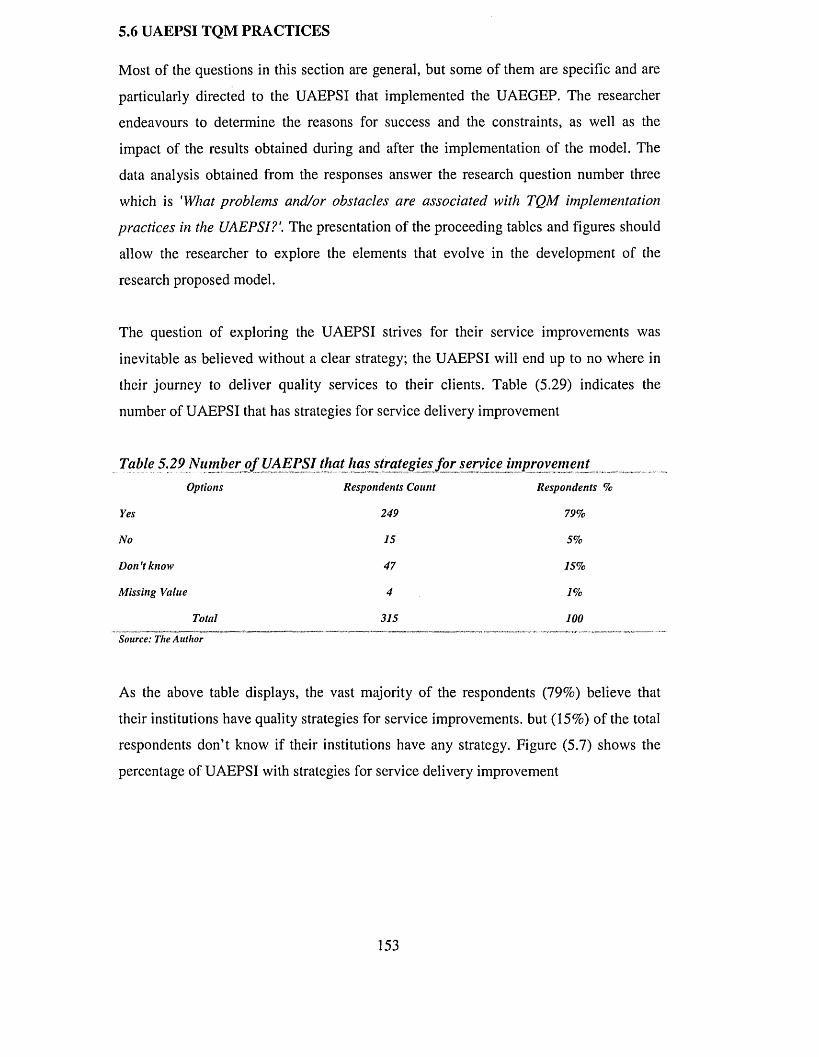
5.6 UAEPSI TQM PRACTICES
Most of the questions in this section are general, but some of them are specific and are
particularly directed to the UAEPSI that implemented the UAEGEP. The researcher
endeavours to determine the reasons for success and the constraints, as well as the
impact of the results obtained during and after the implementation of the model. The
data analysis obtained from the responses answer the research question number three
which is 'What problems and/or obstacles are associated with TQM implementation
practices in the UAEPSI?’. The presentation of the proceeding tables and figures should
allow the researcher to explore the elements that evolve in the development of the
research proposed model.
The question of exploring the UAEPSI strives for their service improvements was
inevitable as believed without a clear strategy; the UAEPSI will end up to no where in
their journey to deliver quality services to their clients. Table (5.29) indicates the
number of UAEPSI that has strategies for service delivery improvement
Table 5.29 Number o f UAEPSI that has strategies fo r service improvementOptions Respondents Count Respondents %Yes 249 79%No 15 5%Don't know 47 15%Missing Value 4 1%
Total 315 100Source: The Author
As the above table displays, the vast majority of the respondents (79%) believe that
their institutions have quality strategies for service improvements, but (15%) of the total
respondents don’t know if their institutions have any strategy. Figure (5.7) shows the
percentage of UAEPSI with strategies for service delivery improvement
153
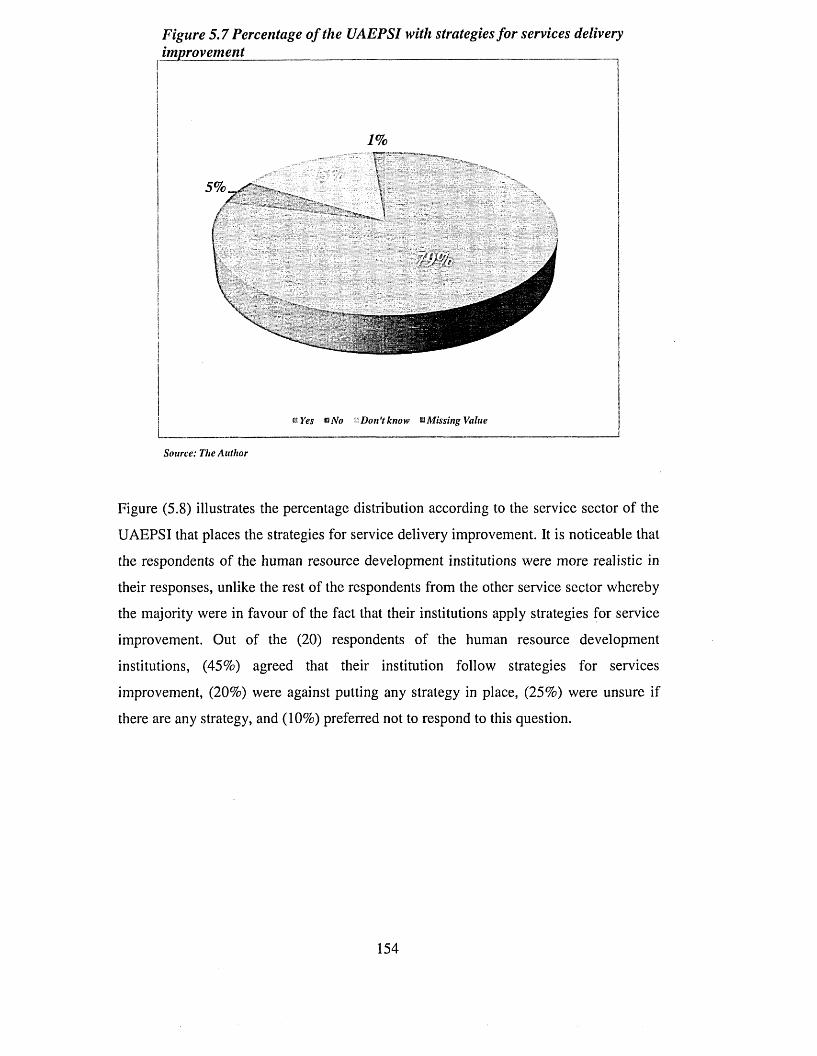
Figure 5.7 Percentage o f the UAEPSI with strategies fo r services deliveryim p ro v e m e n t________________________________________________
1%
5%
® Yes Don't know ® Missing Value__________ ISource: The Author
Figure (5.8) illustrates the percentage distribution according to the service sector of the
UAEPSI that places the strategies for service delivery improvement. It is noticeable that
the respondents of the human resource development institutions were more realistic in
their responses, unlike the rest of the respondents from the other service sector whereby
the majority were in favour of the fact that their institutions apply strategies for service
improvement. Out of the (20) respondents of the human resource development
institutions, (45%) agreed that their institution follow strategies for services
improvement, (20%) were against putting any strategy in place, (25%) were unsure if
there are any strategy, and (10%) preferred not to respond to this question.
154
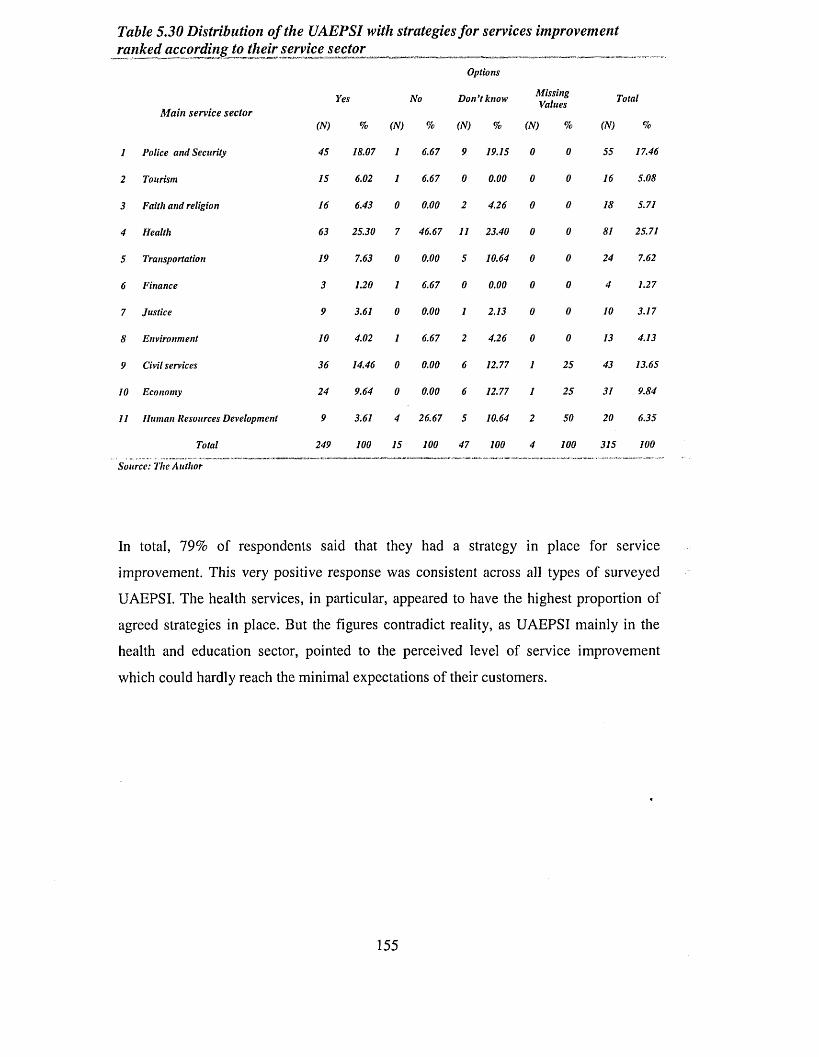
Table 5.30 Distribution o f the UAEPSI with strategies fo r services improvementranked according to their service sector
YesMain service sector(N) %
1 Police and Security 45 18.07
2 Tourism 15 6.02
3 Faith and religion 16 6.43
4 Health 63 25.30
5 Transportation 19 7.63
6 Finance 3 1.20
7 Justice 9 3.61
8 Environment 10 4.02
9 Civil services 36 14.46
10 Economy 24 9.64
11 Human Resources Development 9 3.61
Total 249 100
Source: The Author
Options
No Don ’t know MissingValues
Total
(N) % (N) % (N) % (N) %
1 6.67 9 19.15 0 0 55 17.46
1 6.67 0 0.00 0 0 16 5.08
0 0.00 2 4.26 0 0 18 5.71
7 46.67 11 23.40 0 0 81 25.71
0 0.00 5 10.64 0 0 24 7.62
1 6.67 0 0.00 0 0 4 1.27
0 0.00 1 2.13 0 0 10 3.17
1 6.67 2 4.26 0 0 13 4.13
0 0.00 6 12.77 1 25 43 13.65
0 0.00 6 12.77 1 25 31 9.84
4 26.67 5 10.64 2 50 20 6.35
15 100 47 100 4 100 315 100
In total, 79% of respondents said that they had a strategy in place for service
improvement. This very positive response was consistent across all types of surveyed
UAEPSI. The health services, in particular, appeared to have the highest proportion of
agreed strategies in place. But the figures contradict reality, as UAEPSI mainly in the
health and education sector, pointed to the perceived level of service improvement
which could hardly reach the minimal expectations of their customers.
155
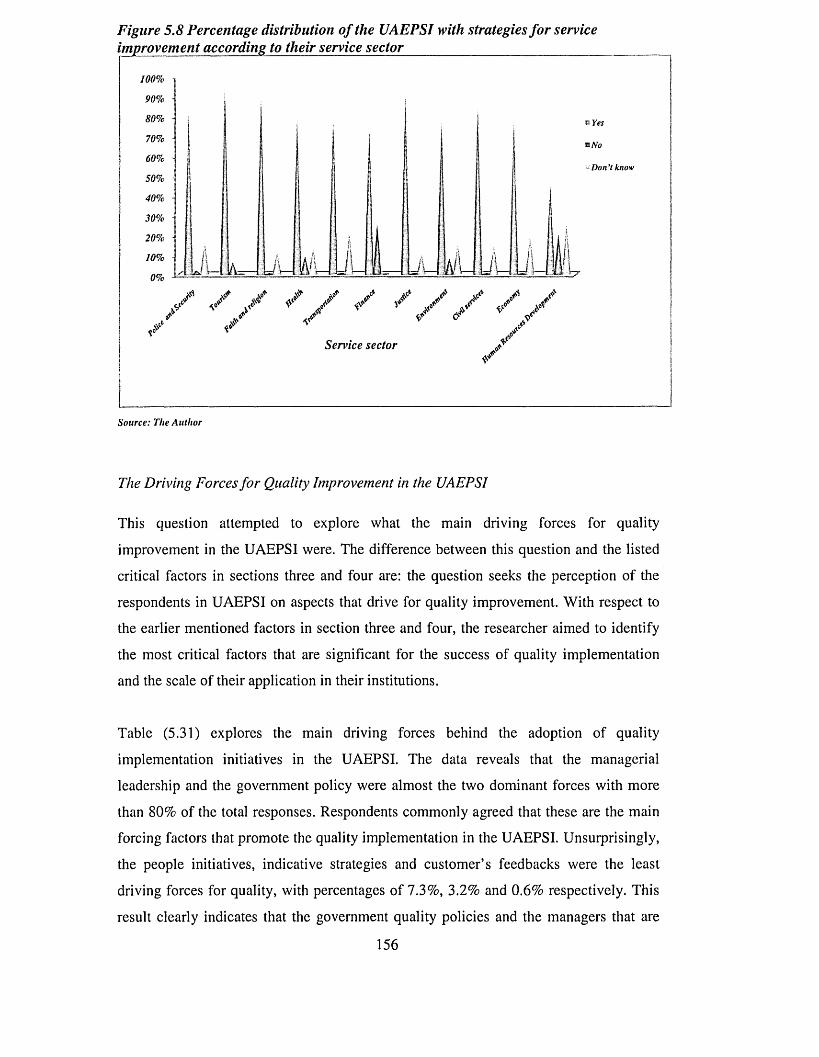
Figure 5.8 Percentage distribution of the UAEPSI with strategies for service improvement according to their service sector
100%
Don t know
y y yService sector
Source: The Author
The Driving Forces fo r Quality Improvement in the UAEPSI
This question attempted to explore what the main driving forces for quality
improvement in the UAEPSI were. The difference between this question and the listed
critical factors in sections three and four are: the question seeks the perception of the
respondents in UAEPSI on aspects that drive for quality improvement. With respect to
the earlier mentioned factors in section three and four, the researcher aimed to identify
the most critical factors that are significant for the success of quality implementation
and the scale of their application in their institutions.
Table (5.31) explores the main driving forces behind the adoption of quality
implementation initiatives in the UAEPSI. The data reveals that the managerial
leadership and the government policy were almost the two dominant forces with more
than 80% of the total responses. Respondents commonly agreed that these are the main
forcing factors that promote the quality implementation in the UAEPSI. Unsurprisingly,
the people initiatives, indicative strategies and customer’s feedbacks were the least
driving forces for quality, with percentages of 7.3%, 3.2% and 0.6% respectively. This
result clearly indicates that the government quality policies and the managers that are
156
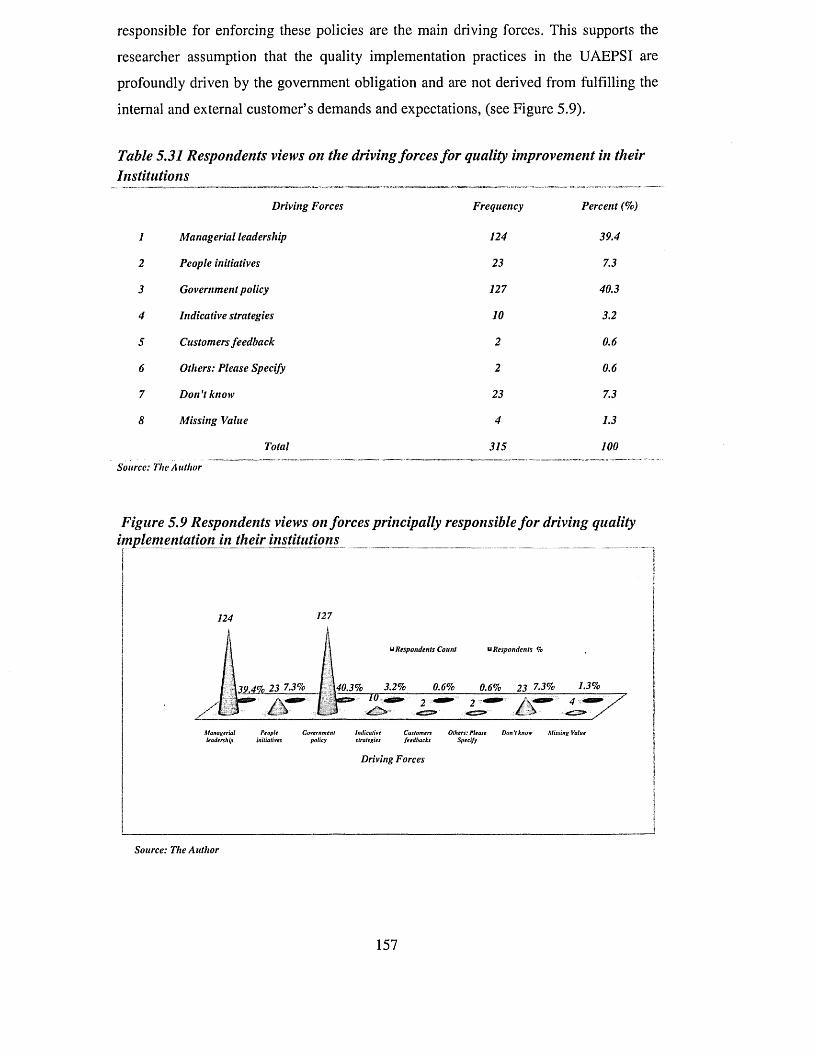
responsible for enforcing these policies are the main driving forces. This supports the
researcher assumption that the quality implementation practices in the UAEPSI are
profoundly driven by the government obligation and are not derived from fulfilling the
internal and external customer’s demands and expectations, (see Figure 5.9).
Table 5.31 Respondents views on the driving forces for quality improvement in theirInstitutions
Driving Forces Frequency Percent (%)1 Managerial leadership 124 39.42 People initiatives 23 7.33 Government policy 127 40.34 Indicative strategies 10 3.25 Customers feedback 2 0.66 Others: Please Specify 2 0.67 Don't know 23 7.38 Missing Value 4 1.3
Total 315 100Source: The Author
Figure 5.9 Respondents views on forces principally responsible for driving quality implementation in their institutions
124 127
u Respondents Count u Respondents %
Managerial People Government Indicative Customers Others: Please b o m know Missing Valueleadership initiatives policy strategies feedbacks Specify
Driving Forces
Source: The Author
157
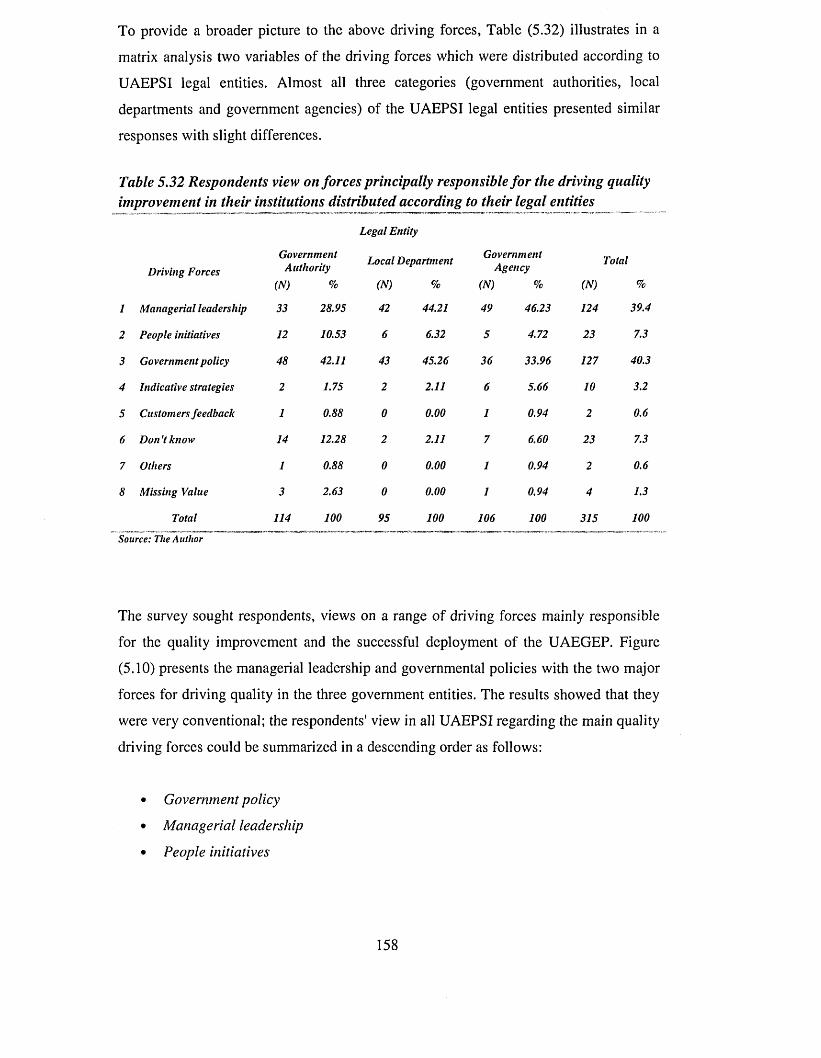
To provide a broader picture to the above driving forces, Table (5.32) illustrates in a
matrix analysis two variables of the driving forces which were distributed according to
UAEPSI legal entities. Almost all three categories (government authorities, local
departments and government agencies) of the UAEPSI legal entities presented similar
responses with slight differences.
Table 5.32 Respondents view on forces principally responsible for the driving quality improvement in their institutions distributed according to their legal entities
Legal EntityDriving Forces GovernmentAuthority(N) %
Local Department (N) %
GovernmentAgency(N) % (N)Total%1Managerial leadership 33 28.95 42 44.21 49 46.23 124 39.42People initiatives 12 10.53 6 6.32 5 4.72 23 7.33Government policy 48 42.11 43 45.26 36 33.96 127 40.34Indicative strategies 2 1.75 2 2.11 6 5.66 10 3.25Customers feedback 1 0.88 0 0.00 1 0.94 2 0.66Don't know 14 12.28 2 2.11 7 6.60 23 7.37Others 1 0.88 0 0.00 1 0.94 2 0.68Missing Value 3 2.63 0 0.00 1 0.94 4 1.3
Total 114 100 95 100 106 100 315 100Source: The Author
The survey sought respondents, views on a range of driving forces mainly responsible
for the quality improvement and the successful deployment of the UAEGEP. Figure
(5.10) presents the managerial leadership and governmental policies with the two major
forces for driving quality in the three government entities. The results showed that they
were very conventional; the respondents' view in all UAEPSI regarding the main quality
driving forces could be summarized in a descending order as follows:
• Government policy
• Managerial leadership
• People initiatives
158
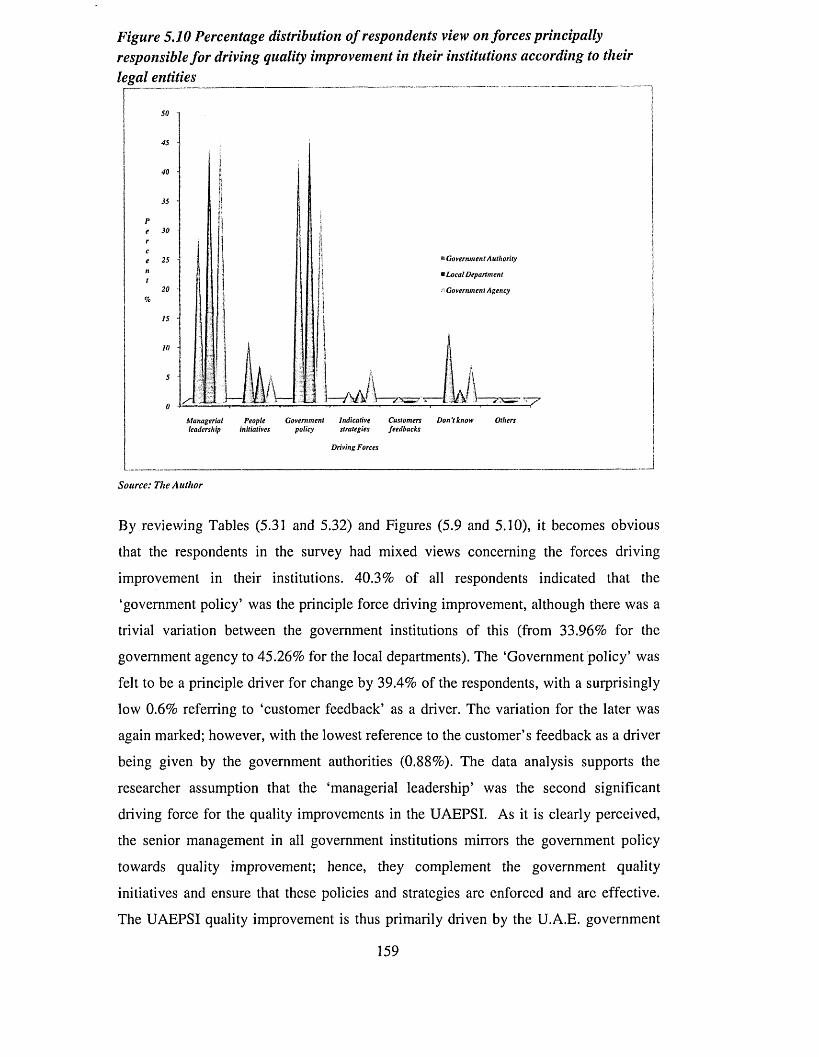
Figure 5.10 Percentage distribution of respondents view on forces principally responsible for driving quality improvement in their institutions according to their legal entities
50 -t
45
40
35
%
P
n
20
25
30
15 -
10
5
* G overnm ent Authority
■ Local D epartm ent
> G overnm ent Agency
M anagerial People G overnm ent Indicative Custom ers D on 't know Othersleadership initiatives policy strategies feedbacks
Driving Forces
Source: The Author
By reviewing Tables (5.31 and 5.32) and Figures (5.9 and 5.10), it becomes obvious
that the respondents in the survey had mixed views concerning the forces driving
improvement in their institutions. 40.3% of all respondents indicated that the
‘government policy’ was the principle force driving improvement, although there was a
trivial variation between the government institutions of this (from 33.96% for the
government agency to 45.26% for the local departments). The ‘Government policy’ was
felt to be a principle driver for change by 39.4% of the respondents, with a surprisingly
low 0.6% referring to ‘customer feedback’ as a driver. The variation for the later was
again marked; however, with the lowest reference to the customer’s feedback as a driver
being given by the government authorities (0.88%). The data analysis supports the
researcher assumption that the ‘managerial leadership’ was the second significant
driving force for the quality improvements in the UAEPSI. As it is clearly perceived,
the senior management in all government institutions mirrors the government policy
towards quality improvement; hence, they complement the government quality
initiatives and ensure that these policies and strategies are enforced and are effective.
The UAEPSI quality improvement is thus primarily driven by the U.A.E. government
159
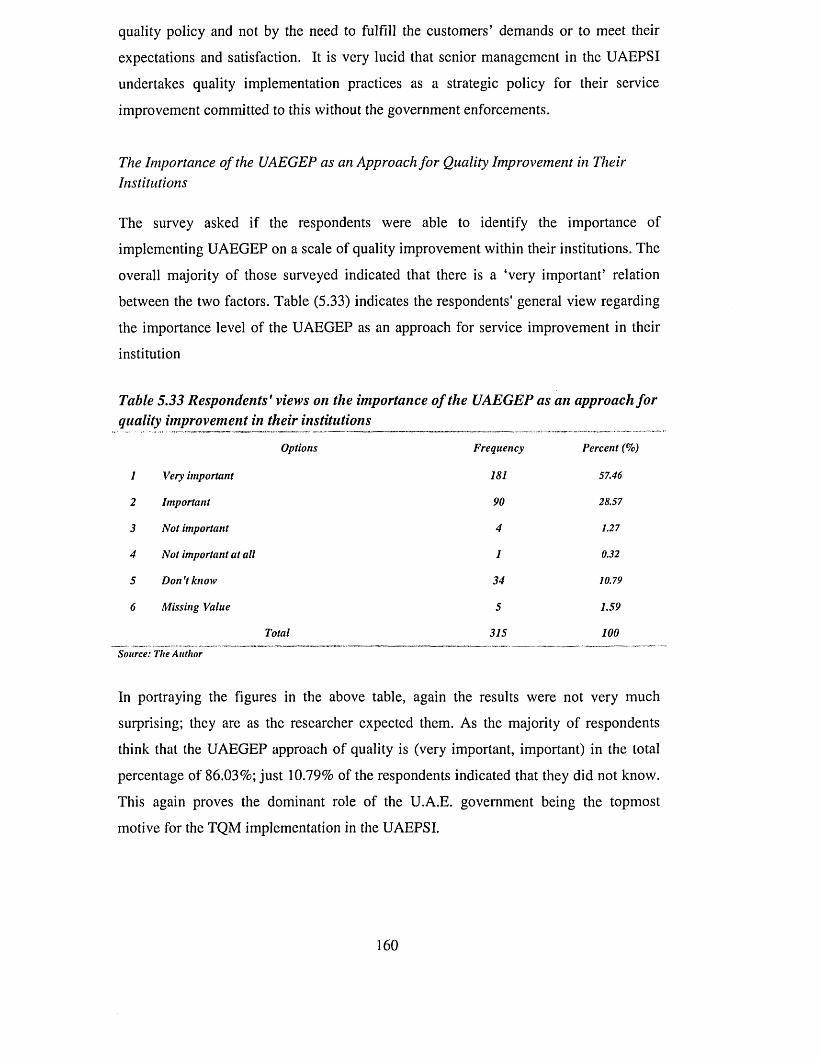
quality policy.and not by the need to fulfill the customers’ demands or to meet their
expectations and satisfaction. It is very lucid that senior management in the UAEPSI
undertakes quality implementation practices as a strategic policy for their service
improvement committed to this without the government enforcements.
The Importance o f the UAEGEP as an Approach for Quality Improvement in Their Institutions
The survey asked if the respondents were able to identify the importance of
implementing UAEGEP on a scale of quality improvement within their institutions. The
overall majority of those surveyed indicated that there is a ‘very important’ relation
between the two factors. Table (5.33) indicates the respondents' general view regarding
the importance level of the UAEGEP as an approach for service improvement in their
institution
Table 5.33 Respondents' views on the importance of the UAEGEP as an approach for quality improvement in their institutions
Options Frequency Percent (%)1 Very important 181 57.462 Important 90 28.573 Not important 4 1.274 Not important at all 1 0.325 Don’t know 34 10.796 Missing Value 5 1.59
Total 315 100Source: The Author
In portraying the figures in the above table, again the results were not very much
surprising; they are as the researcher expected them. As the majority of respondents
think that the UAEGEP approach of quality is (very important, important) in the total
percentage of 86.03%; just 10.79% of the respondents indicated that they did not know.
This again proves the dominant role of the U.A.E. government being the topmost
motive for the TQM implementation in the UAEPSI.
160
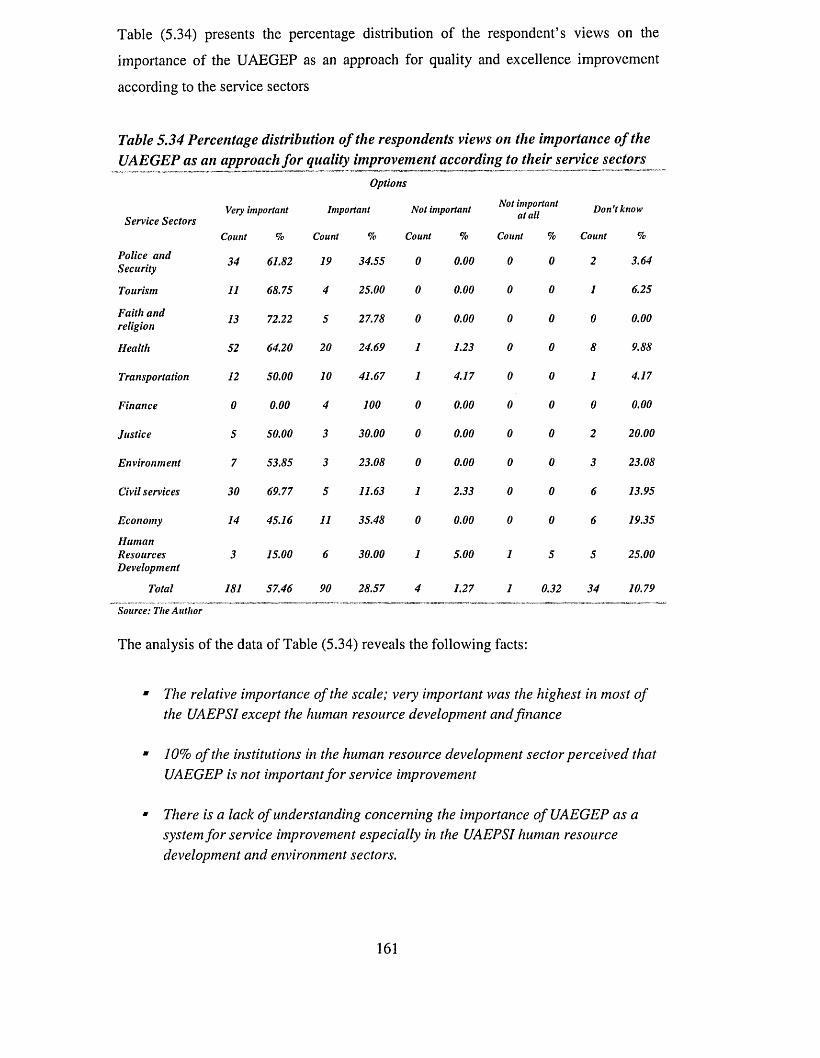
Table (5.34) presents the percentage distribution of the respondent’s views on the
importance of the UAEGEP as an approach for quality and excellence improvement
according to the service sectors
Table 5.34 Percentage distribution of the respondents views on the importance of the UAEGEP as an approach for quality improvement according to their service sectors
Options
Very important Important Not important ^ 0t *mP ° f ant j )on <i knowS erv ice S ectors a aCount % Count % Count % Count %Count %Police and Security 34 61.82 19 34.55 0 0.00 0 0 2 3.64Tourism 11 68.75 4 25.00 0 0.00 0 0 1 6.25Faith and religion 13 72.22 5 27.78 0 0.00 0 0 0 0.00Health 52 64.20 20 24.69 1 1.23 0 0 8 9.88Transportation 12 50.00 10 41.67 1 4.17 0 0 1 4.17Finance 0 0.00 4 100 0 0.00 0 0 0 0.00Justice 5 50.00 3 30.00 0 0.00 0 0 2 20.00Environment 7 53.85 3 23.08 0 0.00 0 0 3 23.08Civil services 30 69.77 5 11.63 1 2.33 0 0 6 13.95Economy 14 45.16 11 35.48 0 0.00 0 0 6 19.35HumanResourcesDevelopment 3 15.00 6 30.00 1 5.00 1 5 5 25.00
Total 181 57.46 90 28.57 4 1.27 1 0.32 34 10.79Source: The Author
The analysis of the data of Table (5.34) reveals the following facts:
* The relative importance o f the scale; very important was the highest in most o f the UAEPSI except the human resource development and finance
" 10% o f the institutions in the human resource development sector perceived thatUAEGEP is not important for service improvement
m There is a lack o f understanding concerning the importance o f UAEGEP as a system for service improvement especially in the UAEPSI human resource development and environment sectors.
161
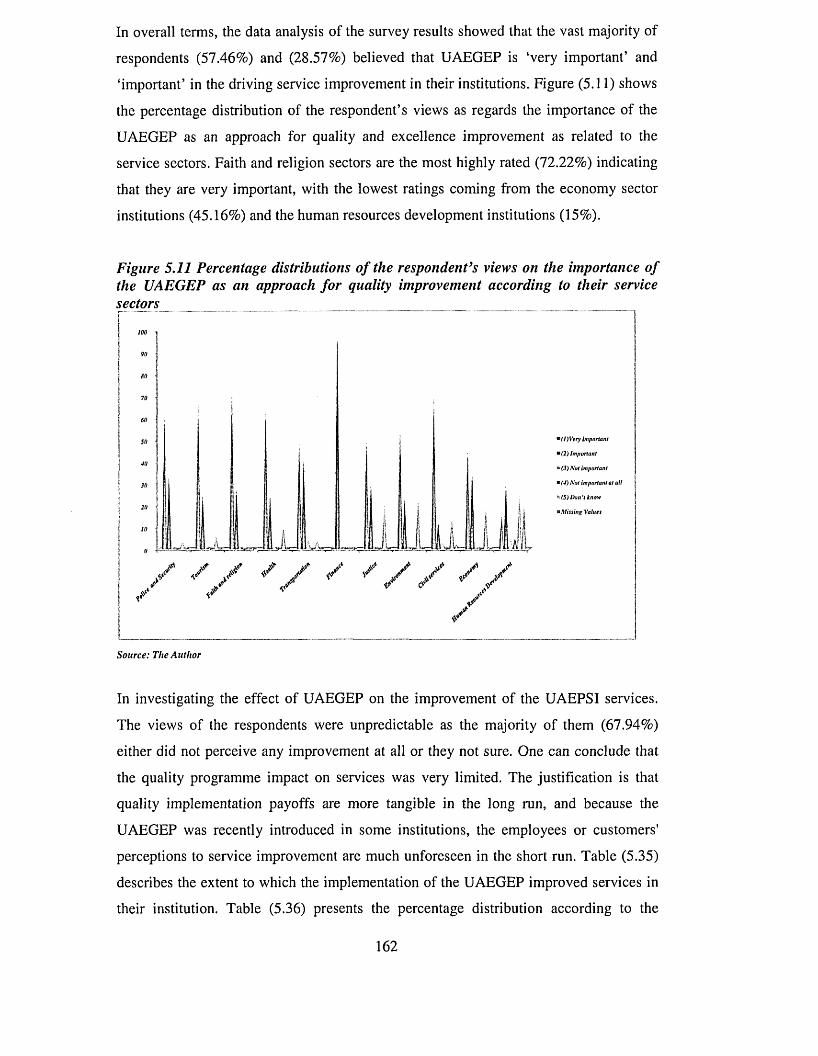
In overall terms, the data analysis of the survey results showed that the vast majority of
respondents (57.46%) and (28.57%) believed that UAEGEP is ‘very important’ and
‘important’ in the driving service improvement in their institutions. Figure (5.11) shows
the percentage distribution of the respondent’s views as regards the importance of the
UAEGEP as an approach for quality and excellence improvement as related to the
service sectors. Faith and religion sectors are the most highly rated (72.22%) indicating
that they are very important, with the lowest ratings coming from the economy sector
institutions (45.16%) and the human resources development institutions (15%).
Figure 5.11 Percentage distributions of the respondent’s views on the importance of the UAEGEP as an approach for quality improvement according to their service sectors
v.
J J l J l i
*(l)V ery important
■ (2) Important
** (3) Not important
* (4) Not important at all
*<(5) Dan't know
* Missing Values
Source: The Author
In investigating the effect of UAEGEP on the improvement of the UAEPSI services.
The views of the respondents were unpredictable as the majority of them (67.94%)
either did not perceive any improvement at all or they not sure. One can conclude that
the quality programme impact on services was very limited. The justification is that
quality implementation payoffs are more tangible in the long run, and because the
UAEGEP was recently introduced in some institutions, the employees or customers'
perceptions to service improvement are much unforeseen in the short run. Table (5.35)
describes the extent to which the implementation of the UAEGEP improved services in
their institution. Table (5.36) presents the percentage distribution according to the
162
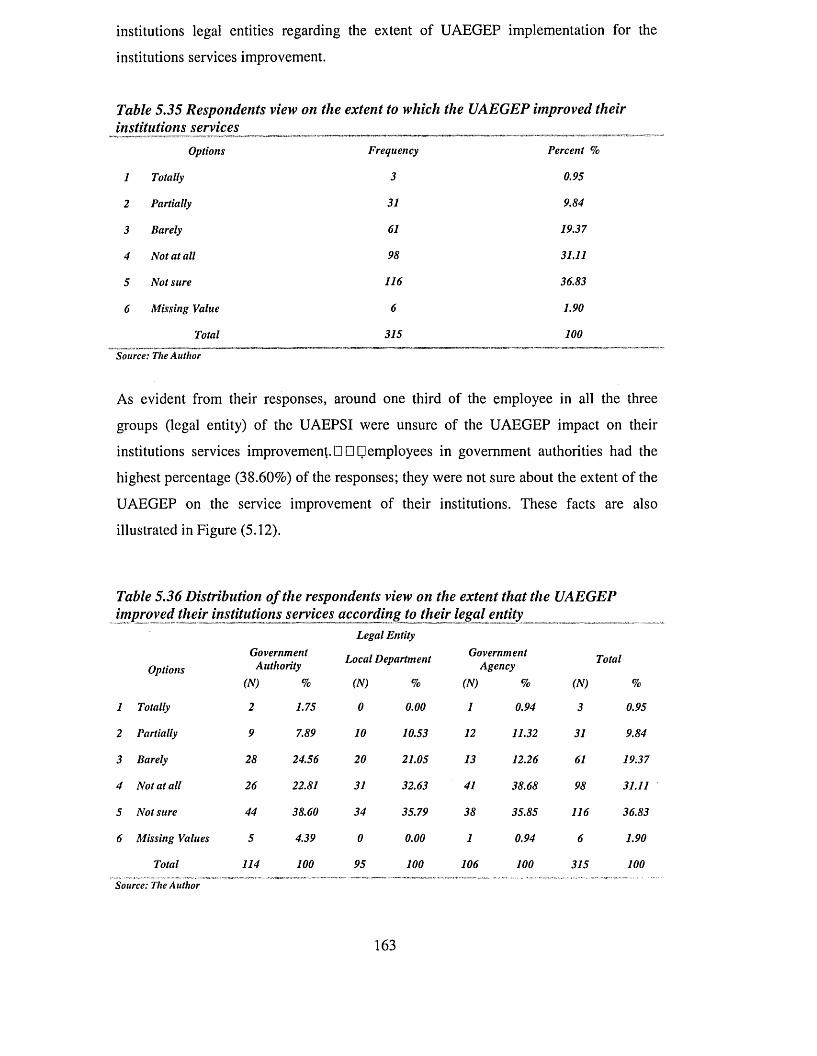
institutions legal entities regarding the extent of UAEGEP implementation for the
institutions services improvement.
Table 5.35 Respondents view on the extent to which the UAEGEP improved their institutions servicesOptions Frequency Percent %1 Totally 3 0.952 Partially 31 9.843 Barely 61 19.374 Not at all 98 31.115 Not sure 116 36.836 Missing Value 6 1.90
Total 315 100Source: The Author
As evident from their responses, around one third of the employee in all the three
groups (legal entity) of the UAEPSI were unsure of the UAEGEP impact on their
institutions services improvement.□□□employees in government authorities had the
highest percentage (38.60%) of the responses; they were not sure about the extent of the
UAEGEP on the service improvement of their institutions. These facts are also
illustrated in Figure (5.12).
Table 5.36 Distribution of the respondents view on the extent that the UAEGEP improved their institutions services according to their legal entityLegal Entityjovernment , , „ . Government. Local DepartmentAuthority r Agency(N) % (N) % (N) % (N) %1Totally 2 1.75 0 0.00 1 0.94 3 0.952Partially 9 7.89 10 10.53 12 11.32 31 9.843Barely 28 24.56 20 21.05 13 12.26 61 19.374Not at all 26 22.81 31 32.63 41 38.68 98 31.115Not sure 44 38.60 34 35.79 38 35.85 116 36.836Missing Values 5 4.39 0 0.00 1 0.94 6 1.90
Total 114 100 95 100 106 100 315 100Source: The Author
1 6 3
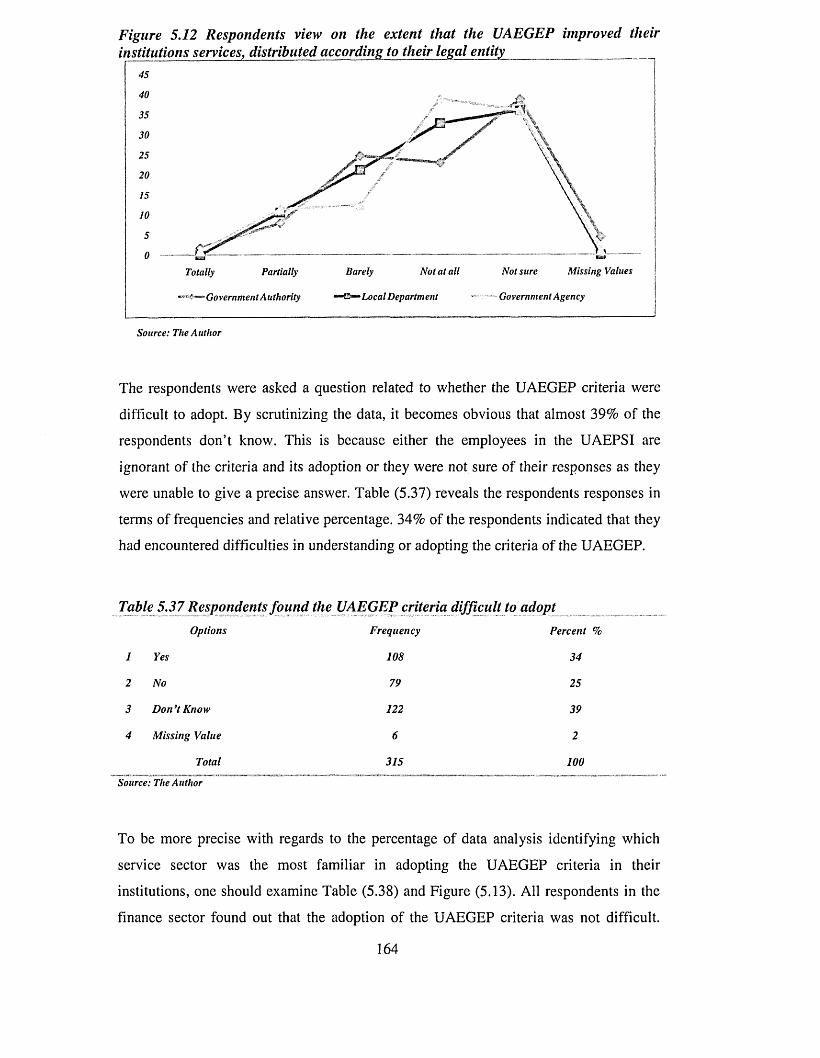
Figure 5.12 Respondents view on the extent that the UAEGEP improved theirinstitutions services, distributed according to their legal entity
25
20
Missing ValuesBarely Not at all Not surePartiallyTotally
—■&«*Local Department Government AgencyGovernment Authority
Source: The Author
The respondents were asked a question related to whether the UAEGEP criteria were
difficult to adopt. By scrutinizing the data, it becomes obvious that almost 39% of the
respondents don’t know. This is because either the employees in the UAEPSI are
ignorant of the criteria and its adoption or they were not sure of their responses as they
were unable to give a precise answer. Table (5.37) reveals the respondents responses in
terms of frequencies and relative percentage. 34% of the respondents indicated that they
had encountered difficulties in understanding or adopting the criteria of the UAEGEP.
Table 5.37 Respondents found the UAEGEP criteria difficult to adoptPercent %34 25 39 2
100
Source: The Author
To be more precise with regards to the percentage of data analysis identifying which
service sector was the most familiar in adopting the UAEGEP criteria in their
institutions, one should examine Table (5.38) and Figure (5.13). All respondents in the
finance sector found out that the adoption of the UAEGEP criteria was not difficult.
Options Frequency1 Yes 1082 No 793 Don’t Know 1224 Missing Value 6
Total 315
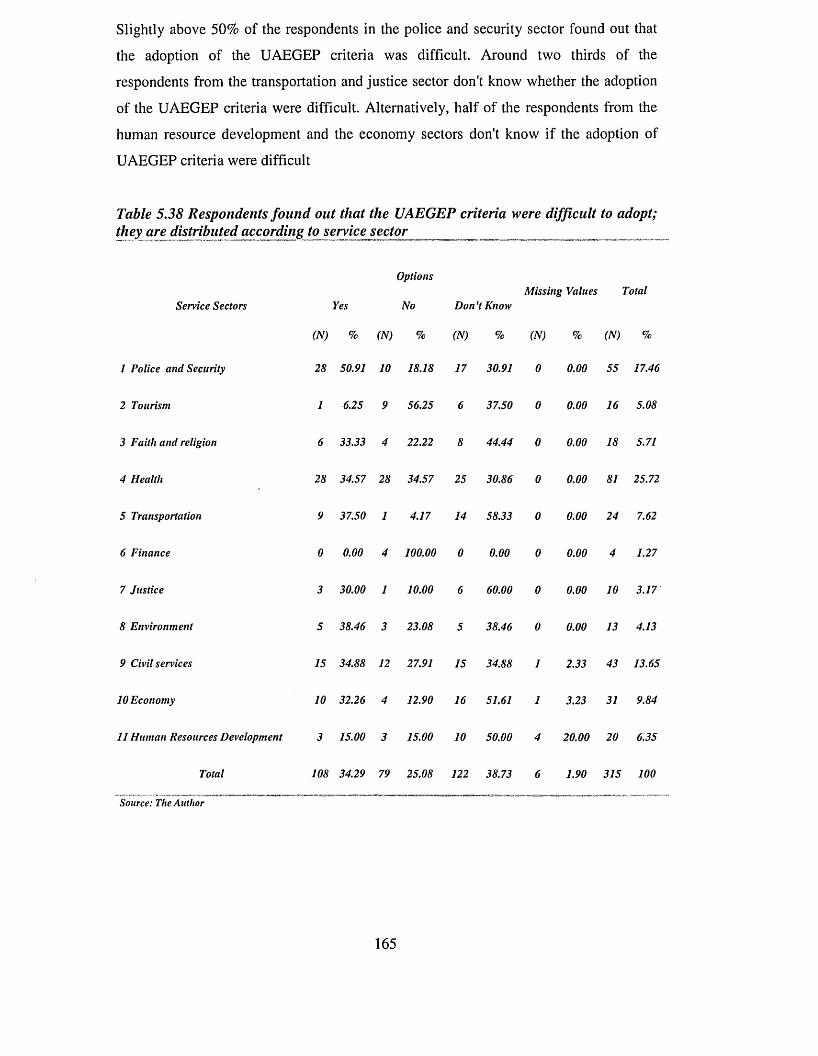
Slightly above 50% of the respondents in the police and security sector found out that
the adoption of the UAEGEP criteria was difficult. Around two thirds of the
respondents from the transportation and justice sector don't know whether the adoption
of the UAEGEP criteria were difficult. Alternatively, half of the respondents from the
human resource development and the economy sectors don't know if the adoption of
UAEGEP criteria were difficult
Table 5.38 Respondents found out that the UAEGEP criteria were difficult to adopt; they are distributed according to service sector _____
Options Missing Values TotalService Sectors Yes No Don't Know(N) %(N) % (N) %(N) %(N) %
1 Police and Security 2850.911018.18 17 30.91 0 0.00 5517.462 Tourism 1 6.25 9 56.25 6 37.50 0 0.00 16 5.083 Faith and religion 633.334 22.22 8 44.44 0 0.00 18 5.714 Health 2834.572834.57 25 30.86 0 0.00 8125.725 Transportation 937.501 4.17 14 58.33 0 0.00 24 7.626 Finance 0 0.00 4100.00 0 0.00 0 0.00 4 1.277 Justice 330.001 10.00 6 60.00 0 0.00 10 3.178 Environment 538.463 23.08 5 38.46 0 0.00 13 4.139 Civil services 1534.881227.91 15 34.88 1 2.33 4313.6510 Economy 1032.264 12.90 16 51.61 1 3.23 31 9.8411 Human Resources Development 315.003 15.00 10 50.00 4 20.0020 6.35
Total 10834.297925.08 122 38.73 6 1.90315100Source: The Author
165
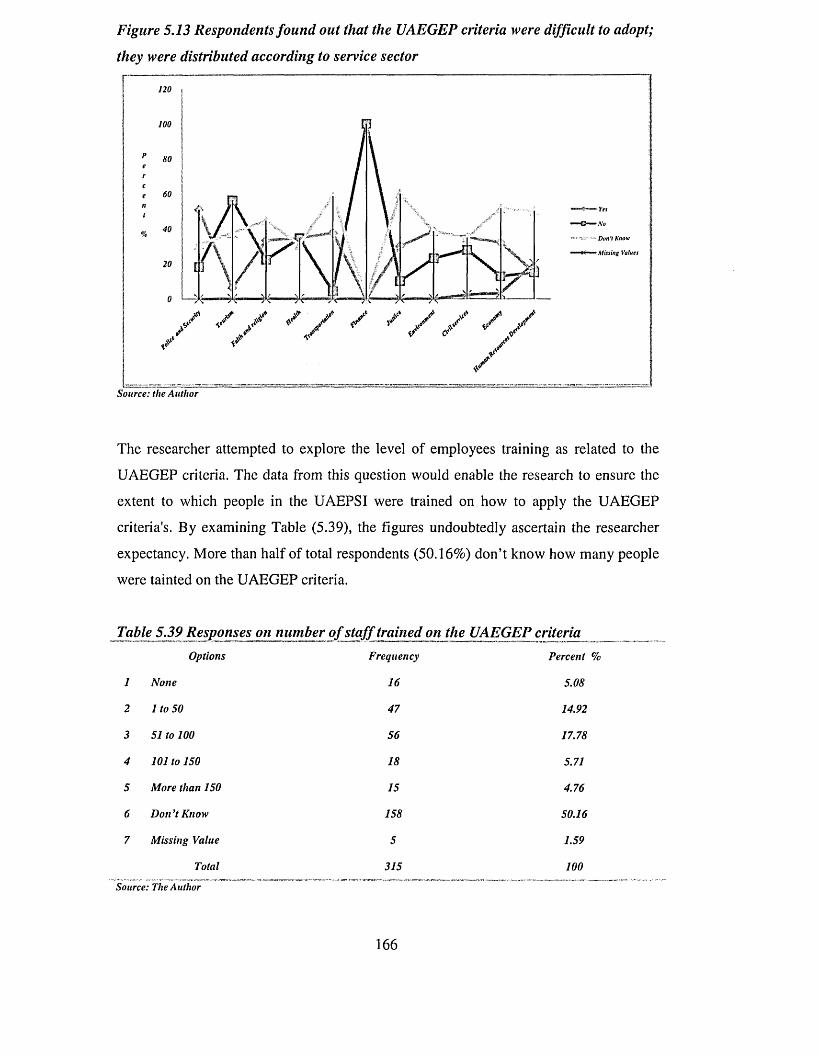
Figure 5.13 Respondents found out that the UAEGEP criteria were difficult to adopt;
they were distributed according to service sector
120
100
80
60
40
20
0,t r i
Don't Know
• Missing Vatues
Source: the Author
The researcher attempted to explore the level of employees training as related to the
UAEGEP criteria. The data from this question would enable the research to ensure the
extent to which people in the UAEPSI were trained on how to apply the UAEGEP
criteria's. By examining Table (5.39), the figures undoubtedly ascertain the researcher
expectancy. More than half of total respondents (50.16%) don’t know how many people
were tainted on the UAEGEP criteria.
Table 5.39 Resp onses on number of staff trained on the UAEGEP criteriaOptions Frequency Percent %1 None 16 5.082 1 to 50 47 14.923 51 to 100 56 17.784 101 to 150 18 5.715 More than 150 15 4.766 Don’t Know 158 50.167 Missing Value 5 1.59
Total 315 100Source: The Author
166
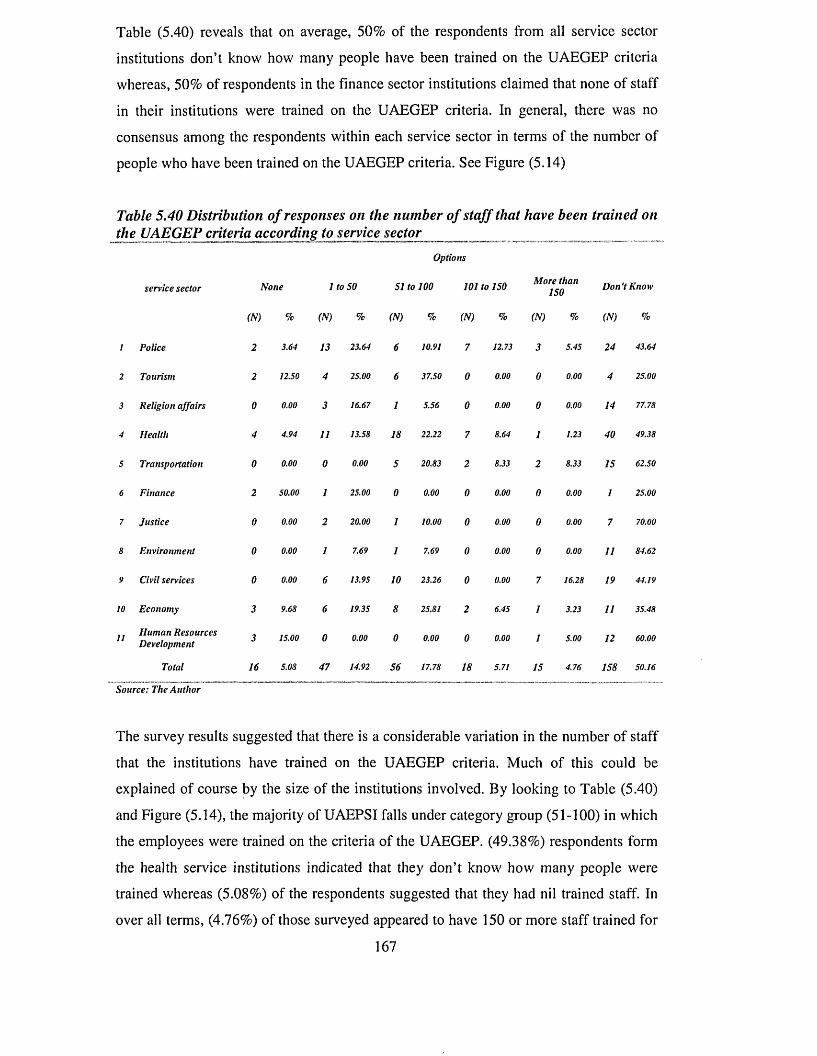
Table (5.40) reveals that on average, 50% of the respondents from all service sector
institutions don’t know how many people have been trained on the UAEGEP criteria
whereas, 50% of respondents in the finance sector institutions claimed that none of staff
in their institutions were trained on the UAEGEP criteria. In general, there was no
consensus among the respondents within each service sector in terms of the number of
people who have been trained on the UAEGEP criteria. See Figure (5.14)
Table 5.40 Distribution of responses on the number of staff that have been trained on the UAEGEP criteria according to service sector
Options
service sector None 1 to SO 51 to 100 101 to 150 More than 150 Don't Know
(N) % (N) % (N) % (N) % (N) % (N) %
1 Police 2 3.64 13 23.64 6 10.91 7 12.73 3 S.4S 24 43.64
2 Tourism 2 12.50 4 25.00 6 37.50 0 0.00 0 0.00 4 25.00
3 Religion affairs 0 0.00 3 16.67 1 5.56 0 0.00 0 0.00 14 77.78
4 Health 4 4.94 11 13.58 18 22.22 7 8.64 1 1.23 40 49.38
5 Transportation 0 0.00 0 0.00 5 20.83 2 8.33 2 8.33 15 62.50
6 Finance 2 50.00 1 25.00 0 0.00 0 0.00 0 0.00 1 25.00
7 Justice 0 0.00 2 20.00 1 10.00 0 0.00 0 0.00 7 70.00
8 Environment 0 0.00 1 7.69 1 7.69 0 0.00 0 0.00 11 84.62
9 Civil services 0 0.00 6 13.95 10 23.26 0 0.00 7 16.28 19 44.19
10 Economy 3 9.68 6 19.35 8 25.81 2 6.45 1 3.23 11 35.48
11 Human Resources Development 3 15.00 0 0.00 0 0.00 0 0.00 1 5.00 12 60.00
Total 16 5.08 47 14.92 56 17.78 18 5.71 15 4.76 158 50.16
Source: The Author
The survey results suggested that there is a considerable variation in the number of staff
that the institutions have trained on the UAEGEP criteria. Much of this could be
explained of course by the size of the institutions involved. By looking to Table (5.40)
and Figure (5.14), the majority of UAEPSI falls under category group (51-100) in which
the employees were trained on the criteria of the UAEGEP. (49.38%) respondents form
the health service institutions indicated that they don’t know how many people were
trained whereas (5.08%) of the respondents suggested that they had nil trained staff. In
over all terms, (4.76%) of those surveyed appeared to have 150 or more staff trained for
167
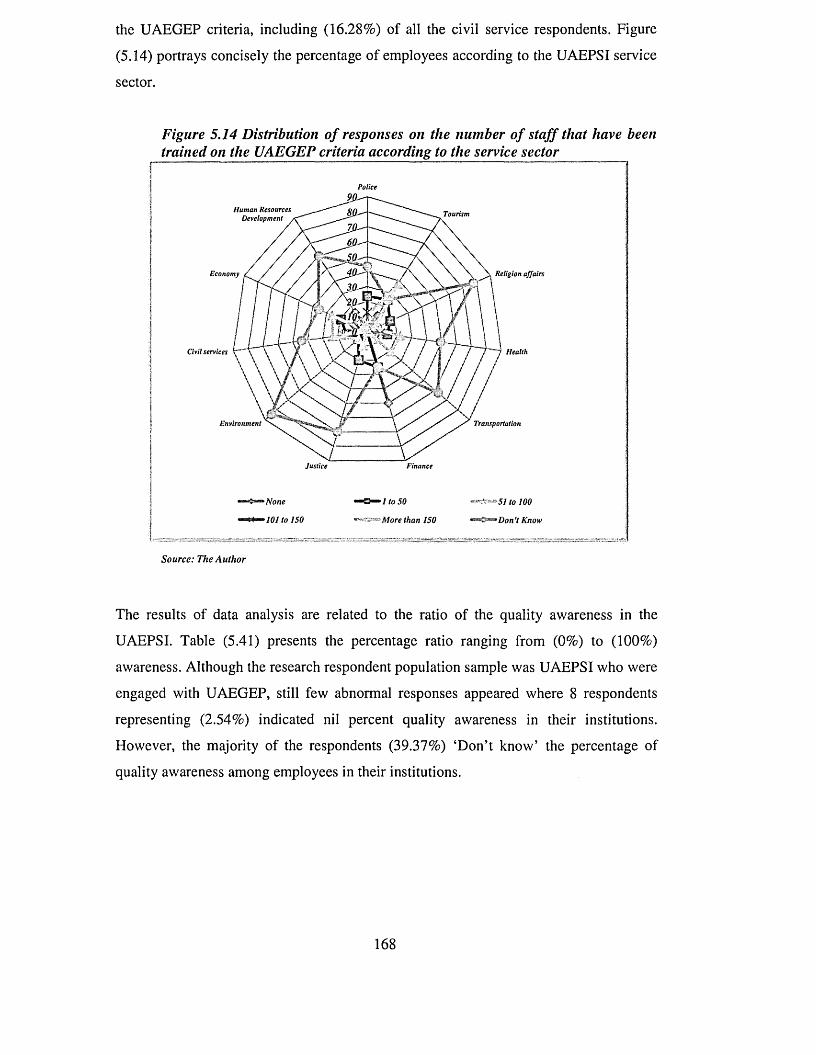
the UAEGEP criteria, including (16.28%) of all the civil service respondents. Figure
(5.14) portrays concisely the percentage of employees according to the UAEPSI service
sector.
Figure 5.14 Distribution of responses on the number of staff that have been trained on the UAEGEP criteria according to the service sector
Police
H um an Resources Development ,
Tourism
Econom y Religion affairs
Civil services H ealth
Environm ent Transportation
Justice Finance
j None ■■(Bum j to SO 51 to 100!I Minimi.™ 7o i to ISO . More than 150 •*<!***Don't KnowI
Source: The Author
The results of data analysis are related to the ratio of the quality awareness in the
UAEPSI. Table (5.41) presents the percentage ratio ranging from (0%) to (100%)
awareness. Although the research respondent population sample was UAEPSI who were
engaged with UAEGEP, still few abnormal responses appeared where 8 respondents
representing (2.54%) indicated nil percent quality awareness in their institutions.
However, the majority of the respondents (39.37%) ‘Don’t know’ the percentage of
quality awareness among employees in their institutions.
168
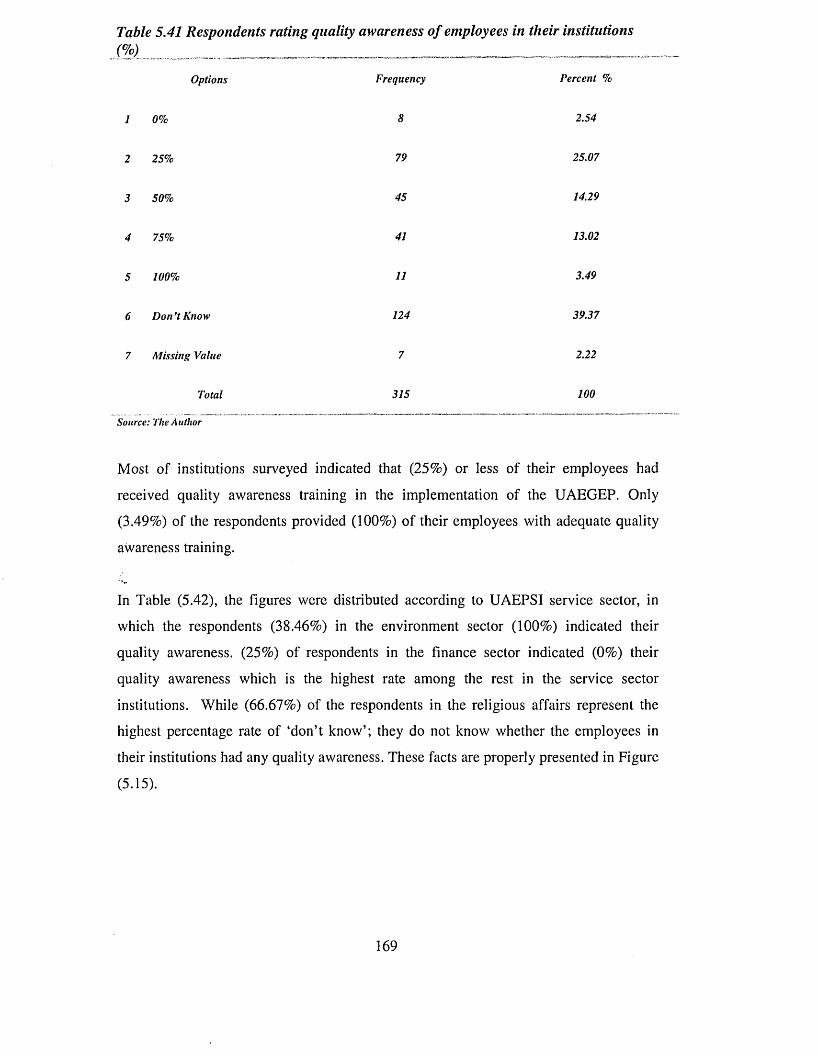
Table 5.41 Respondents rating quality awareness of employees in their institutions(%) .....
Options Frequency Percent %1 0% 8 2.542 25% 79 25.073 50% 45 14.294 75% 41 13.025 100% 11 3.496 Don’t Know 124 39.377 Missing Value 7 2.22
Total 315 100Source: The Author
Most of institutions surveyed indicated that (25%) or less of their employees had
received quality awareness training in the implementation of the UAEGEP. Only
(3.49%) of the respondents provided (100%) of their employees with adequate quality
awareness training.
In Table (5.42), the figures were distributed according to UAEPSI service sector, in
which the respondents (38.46%) in the environment sector (100%) indicated their
quality awareness. (25%) of respondents in the finance sector indicated (0%) their
quality awareness which is the highest rate among the rest in the service sector
institutions. While (66.67%) of the respondents in the religious affairs represent the
highest percentage rate of ‘don’t know’; they do not know whether the employees in
their institutions had any quality awareness. These facts are properly presented in Figure
(5.15).
169
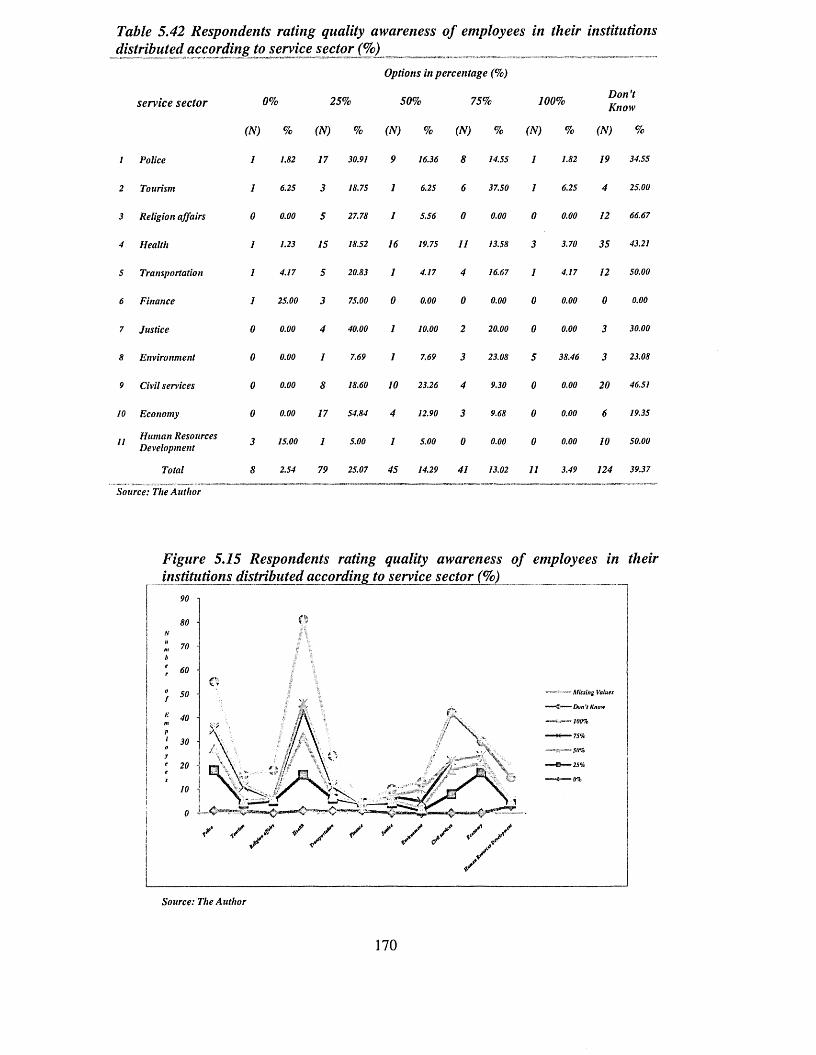
Table 5.42 Respondents rating quality awareness o f employees in their institutionsdistributed according to service sector (%)
service sector 0% 25%
O ptions in p ercen ta g e (% )
5 0% 75% 100% D o n ’tK now
(N) % (N) % (N) % (N) % (N) % (N) %
/ Police 1 1.82 17 30.91 9 16.36 8 14.55 1 1.82 19 34.55
2 Tourism 1 6.25 3 18.75 1 6.25 6 37.50 1 6.25 4 25.00
3 Religion affairs 0 0.00 5 27.78 1 5.56 0 0.00 0 0.00 12 66.67
4 Health 1 1.23 15 18.52 16 19.75 11 13.58 3 3.70 35 43.21
5 Transportation 1 4.17 5 20.83 1 4.17 4 16.67 1 4.17 12 50.00
6 Finance 1 25.00 3 75.00 0 0.00 0 0.00 0 0.00 0 0.00
7 Justice 0 0.00 4 40.00 1 10.00 2 20.00 0 0.00 3 30.00
8 Environment 0 0.00 1 7.69 1 7.69 3 23.08 5 38.46 3 23.08
9 Civil services 0 0.00 8 18.60 10 23.26 4 9.30 0 0.00 20 46.51
10 Economy 0 0.00 17 54.84 4 12.90 3 9.68 0 0.00 6 19.35
11 Human Resources Development 3 15.00 1 5.00 1 5.00 0 0.00 0 0.00 10 50.00
Total 8 2.54 79 25.07 45 14.29 41 13.02 11 3.49 124 39.37
Source: The Author
Figure 5.15 Respondents rating quality awareness of employees in their institutions distributed according to service sector (%)
90
80
70
60
50
40
30
20
10
/ /0
/ /
Missing Values
* Don 7 Know
- 100%
* 75%
Source: The Author
170
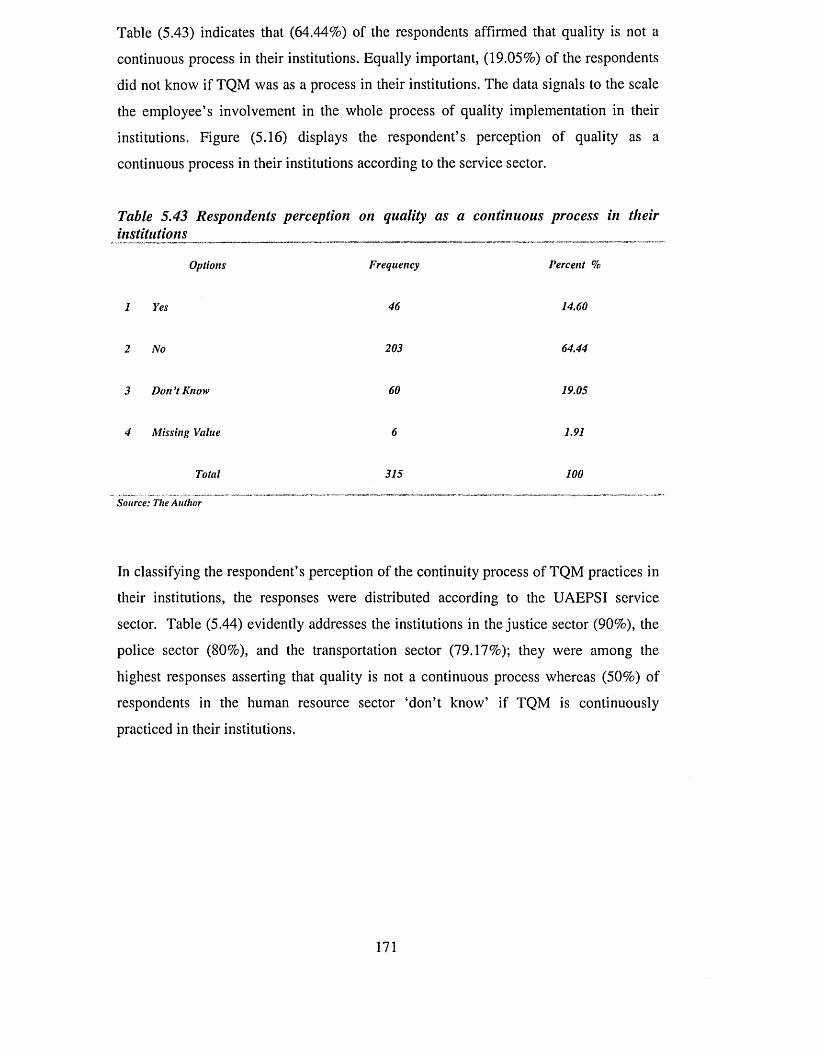
Table (5.43) indicates that (64.44%) of the respondents affirmed that quality is not a
continuous process in their institutions. Equally important, (19.05%) of the respondents
did not know if TQM was as a process in their institutions. The data signals to the scale
the employee’s involvement in the whole process of quality implementation in their
institutions. Figure (5.16) displays the respondent’s perception of quality as a
continuous process in their institutions according to the service sector.
Table 5.43 Respondents perception on quality as a continuous process in their institutions^
Options Frequency Percent %1 Yes 46 14.602 No 203 64.443 Don’t Know 60 19.054 Missing Value 6 1.91
Total 315 100Source: The Author
In classifying the respondent’s perception of the continuity process of TQM practices in
their institutions, the responses were distributed according to the UAEPSI service
sector. Table (5.44) evidently addresses the institutions in the justice sector (90%), the
police sector (80%), and the transportation sector (79.17%); they were among the
highest responses asserting that quality is not a continuous process whereas (50%) of
respondents in the human resource sector ‘don’t know’ if TQM is continuously
practiced in their institutions.
171
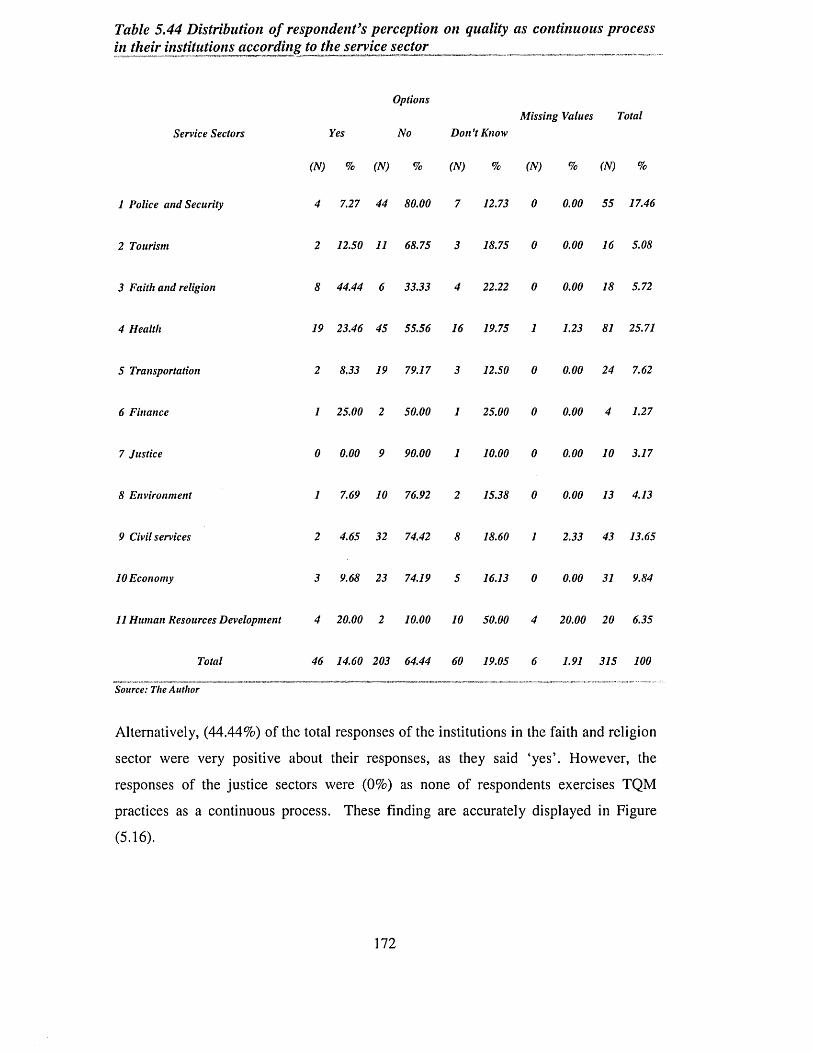
Table 5.44 Distribution of respondent’s perception on quality as continuous process in their institutions according to the service sector
Service Sectors YesOptionsNo Don't KnowMissing Values Total
(N) % (N) % (N) % (N) % (N) %1 Police and Security 4 7.27 44 80.00 7 12.73 0 0.00 55 17.462 Tourism 2 12.50 11 68.75 3 18.75 0 0.00 16 5.083 Faith and religion 8 44.44 6 33.33 4 22.22 0 0.00 18 5.724 Health 19 23.46 45 55.56 16 19.75 1 1.23 81 25.715 Transportation 2 8.33 19 79.17 3 12.50 0 0.00 24 7.626 Finance 1 25.00 2 50.00 1 25.00 0 0.00 4 1.277 Justice 0 0.00 9 90.00 1 10.00 0 0.00 10 3.178 Environment 1 7.69 10 76.92 2 15.38 0 0.00 13 4.139 Civil services 2 4.65 32 74.42 8 18.60 1 2.33 43 13.6510 Economy 3 9.68 23 74.19 5 16.13 0 0.00 31 9.8411 Human Resources Development 4 20.00 2 10.00 10 50.00 4 20.00 20 6.35
TotalSource: The Author
46 14.60 203 64.44 60 19.05 6 1.91 315 100
Alternatively, (44.44%) of the total responses of the institutions in the faith and religion
sector were very positive about their responses, as they said ‘yes’. However, the
responses of the justice sectors were (0%) as none of respondents exercises TQM
practices as a continuous process. These finding are accurately displayed in Figure
(5.16).
172
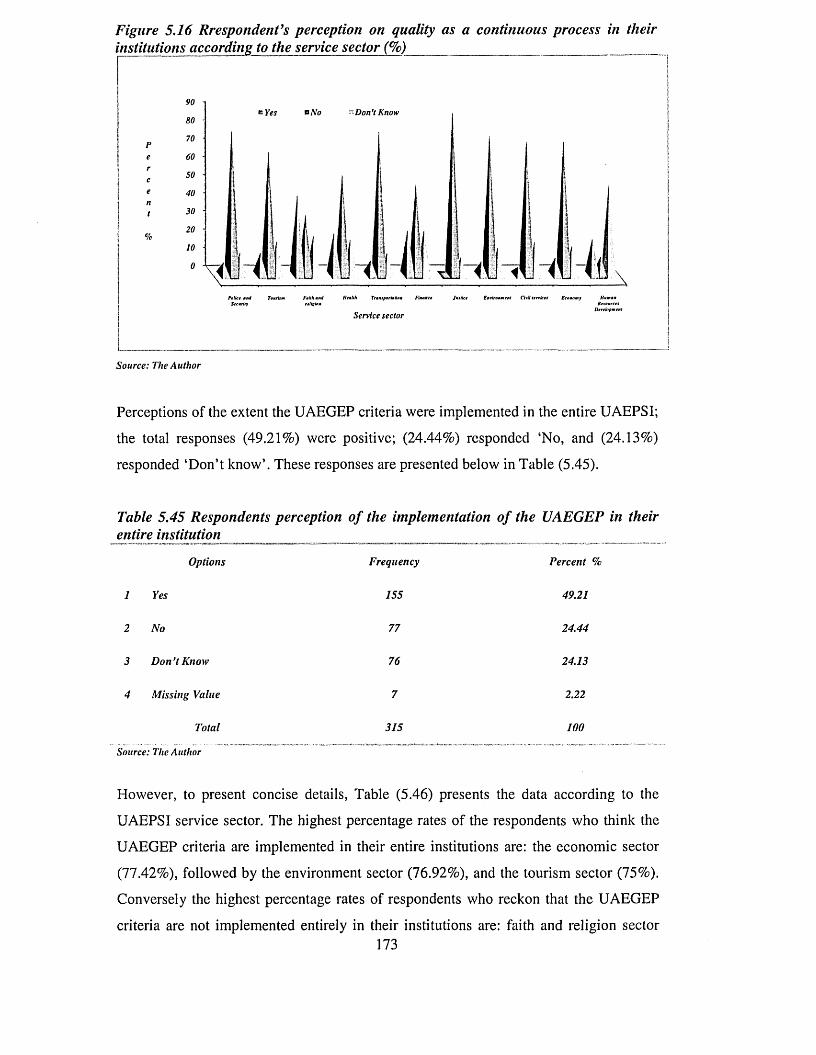
Figure 5.16 Respondent's perception on quality as a continuous process in their institutions according to the service sector (%)______________________________________
k Yes o No s Don't Know
j -Faith and Health Transportation Finance Ju
Service sector
Source: The Author
Perceptions of the extent the UAEGEP criteria were implemented in the entire UAEPSI;
the total responses (49.21%) were positive; (24.44%) responded ‘No, and (24.13%)
responded ‘Don’t know’. These responses are presented below in Table (5.45).
Table 5.45 Respondents perception of the implementation of the UAEGEP in their entire institution
Options1 Yes2 No3 Don’t Know4 Missing Value
Total Source: The Author
Frequency15577767315
Percent % 49.21 24.44 24.13 2.22
100
However, to present concise details, Table (5.46) presents the data according to the
UAEPSI service sector. The highest percentage rates of the respondents who think the
UAEGEP criteria are implemented in their entire institutions are: the economic sector
(77.42%), followed by the environment sector (76.92%), and the tourism sector (75%).
Conversely the highest percentage rates of respondents who reckon that the UAEGEP
criteria are not implemented entirely in their institutions are: faith and religion sector173
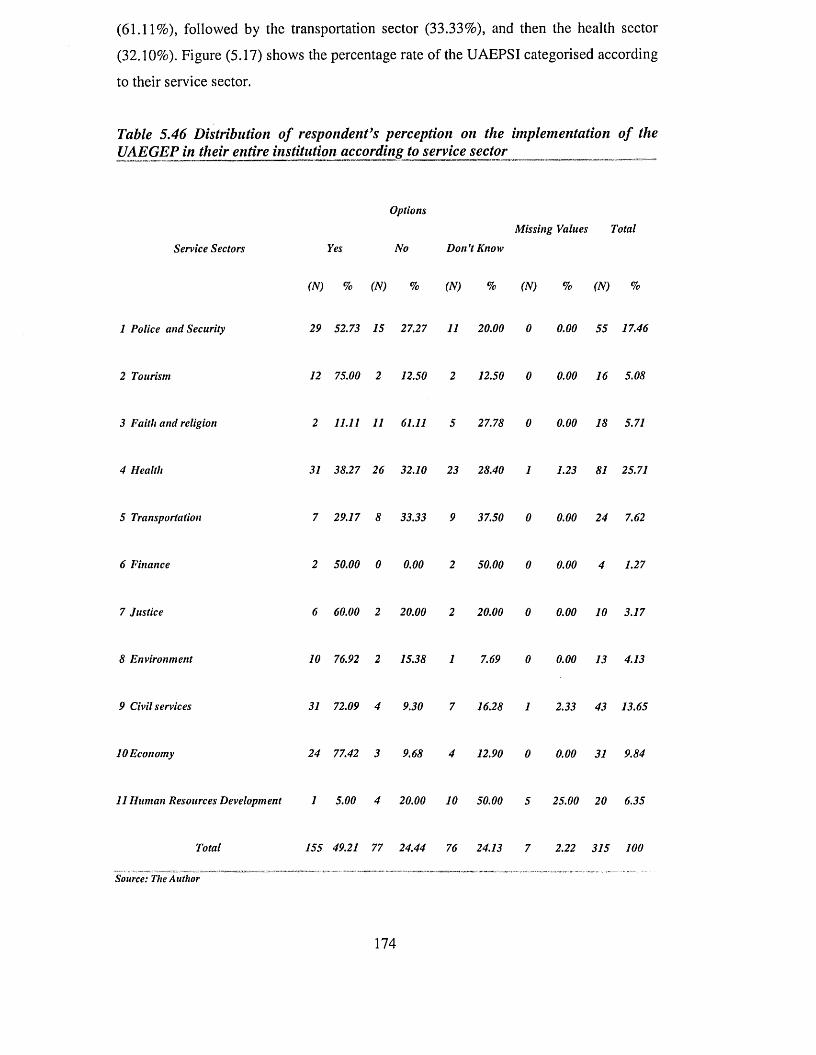
(61.11%), followed by the transportation sector (33.33%), and then the health sector
(32.10%). Figure (5.17) shows the percentage rate of the UAEPSI categorised according
to their service sector.
Table 5.46 Distribution of respondent's perception on the implementation of the UAEGEP in their entire institution according to service sector
Service Sectors YesOptionsNo Don't KnowMissing Values Total
(N) % (N) % (N) % (N) % (N) %1 Police and Security 29 52.73 15 27.27 11 20.00 0 0.00 55 1 7.462 Tourism 12 75.00 2 12.50 2 12.50 0 0.00 16 5.083 Faith and religion 2 11.11 11 61.11 5 27.78 0 0.00 18 5.714 Health 31 38.27 26 32.10 23 28.40 1 1.23 81 25.715 Transportation 7 29.17 8 33.33 9 37.50 0 0.00 24 7.626 Finance 2 50.00 0 0.00 2 50.00 0 0.00 4 1.277 Justice 6 60.00 2 20.00 2 20.00 0 0.00 10 3.178 Environment 10 76.92 2 15.38 1 7.69 0 0.00 13 4.139 Civil services 31 72.09 4 9.30 7 16.28 1 2.33 43 13.6510 Economy 24 77.42 3 9.68 4 12.90 0 0.00 31 9.8411 Human Resources Development 1 5.00 4 20.00 10 50.00 5 25.00 20 6.35
Total Source: The Author
155 49.21 77 24.44 76 24.13 7 2.22 315 100
174
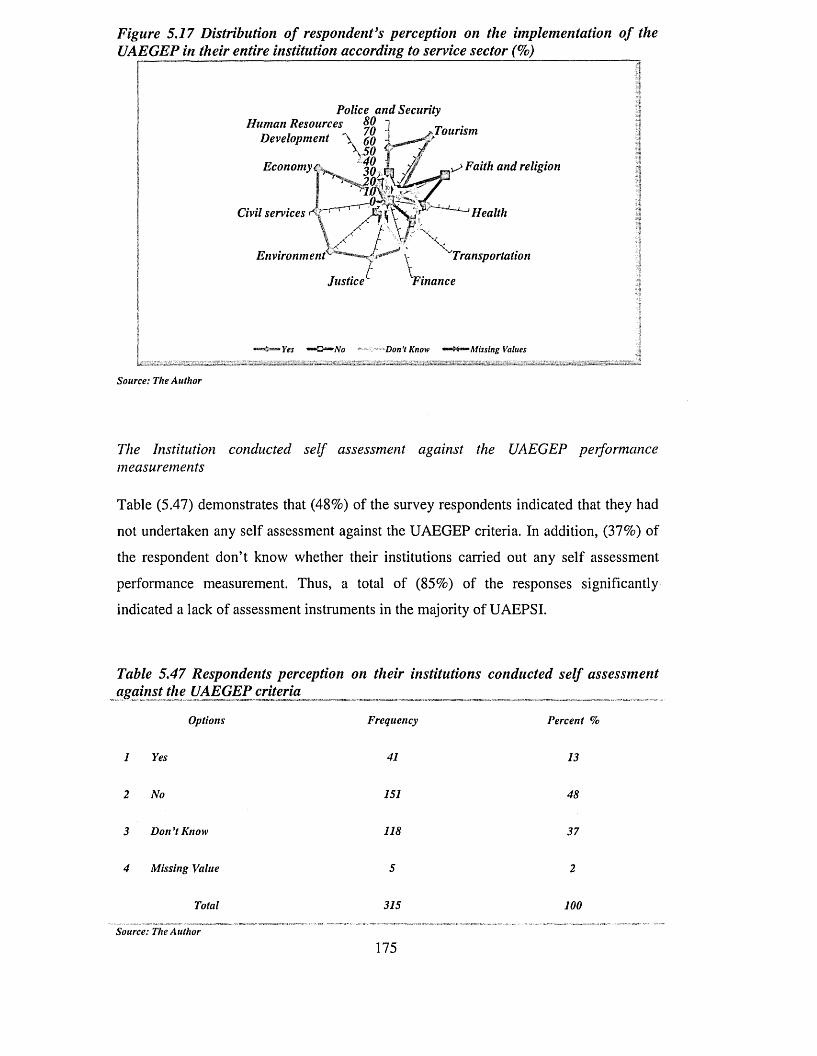
Figure 5.17 Distribution o f respondent’s perception on the implementation o f theUAEGEP in their entire institution according to service sector (%)
Police and SecurityHuman Resources
Development Tourism
Faith and religionEconomy
Civil services Health
Environment Transportation
Justice inance
Yes Don't Know mm**mmMissing Values
Source: The Author
The Institution conducted self assessment against the UAEGEP performance measurements
Table (5.47) demonstrates that (48%) of the survey respondents indicated that they had
not undertaken any self assessment against the UAEGEP criteria. In addition, (37%) of
the respondent don’t know whether their institutions carried out any self assessment
performance measurement. Thus, a total of (85%) of the responses significantly
indicated a lack of assessment instruments in the majority of UAEPSI.
Table 5.47 Respondents perception on their institutions conducted self assessmentagainst the UAEGEP criteria
Options Frequency Percent %1 Yes 41 132 No 151 483 Don’t Know 118 374 Missing Value 5 2
Total 315 100Source: The Author
175
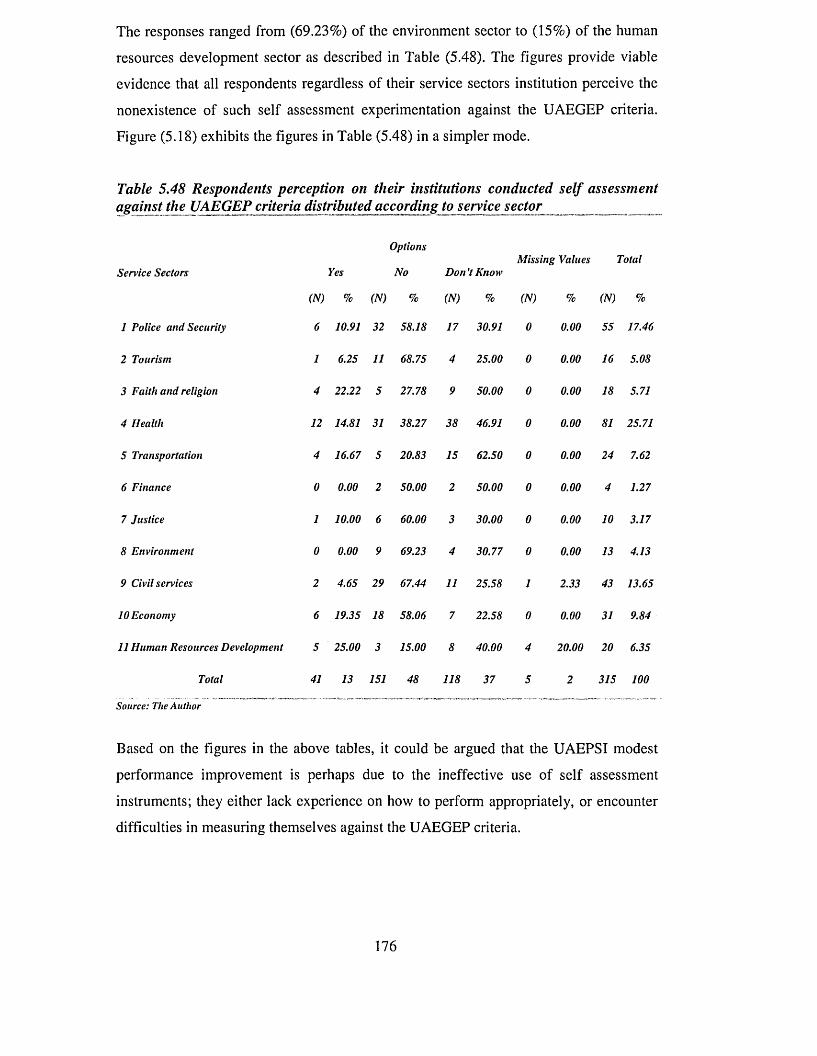
The responses ranged from (69.23%) of the environment sector to (15%) of the human
resources development sector as described in Table (5.48). The figures provide viable
evidence that all respondents regardless of their service sectors institution perceive the
nonexistence of such self assessment experimentation against the UAEGEP criteria.
Figure (5.18) exhibits the figures in Table (5.48) in a simpler mode.
Table 5.48 Respondents perception on their institutions conducted self assessment against the XJAEGEP criteria distributed according to service sector ___
Options Missing Values TotalService Sectors Yes No Don’t Know(N) %(N) %(N) %(N) %(N) %
1 Police and Security 610.913258.18 17 30.91 0 0.00 5517.462 Tourism 1 6.251168.75 4 25.00 0 0.00 165.083 Faith and religion 422.225 27.78 9 50.00 0 0.00 185.714 Health 1214.813138.27 38 46.91 0 0.00 8125.715 Transportation 416.675 20.83 15 62.50 0 0.00 24 7.626 Finance 0 0.00 2 50.00 2 50.00 0 0.00 4 1.277 Justice 110.006 60.00 3 30.00 0 0.00 103.178 Environment 0 0.00 9 69.23 4 30.77 0 0.00 134.139 Civil services 2 4.652967.44 11 25.58 1 2.33 4313.6510 Economy 619.351858.06 7 22.58 0 0.00 31 9.8411 Human Resources Development 525.003 15.00 8 40.00 4 20.00 206.35
Total 41 13151 48 118 37 5 2 315100Source: The Author
Based on the figures in the above tables, it could be argued that the UAEPSI modest
performance improvement is perhaps due to the ineffective use of self assessment
instruments; they either lack experience on how to perform appropriately, or encounter
difficulties in measuring themselves against the UAEGEP criteria.
176
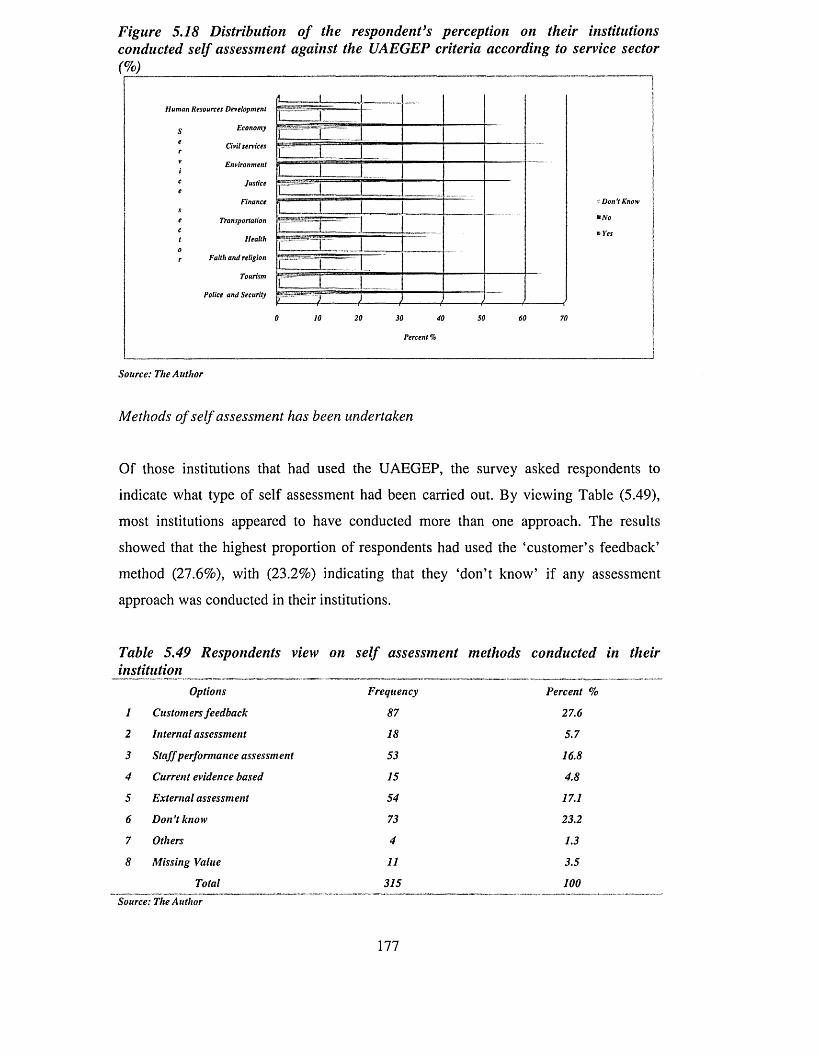
Figure 5.18 Distribution of the respondent’s perception on their institutions conducted self assessment against the UAEGEP criteria according to service sector
i Resources D evelopment
Econom y
Civil services
Environm ent
Justice
F inance
Transportation
Health
Faith a n d religion
Tourism
Police a nd Security
20 SO0 10 30 40 60 70
- D on 't Know
* N o
* Yes
Source: The Author
Methods o f self assessment has been undertaken
Of those institutions that had used the UAEGEP, the survey asked respondents to
indicate what type of self assessment had been carried out. By viewing Table (5.49),
most institutions appeared to have conducted more than one approach. The results
showed that the highest proportion of respondents had used the ‘customer’s feedback’
method (27.6%), with (23.2%) indicating that they ‘don’t know’ if any assessment
approach was conducted in their institutions.
Table 5.49 Respondents view on self assessment methods conducted in their institution Options Frequency Percent %1 Customers feedback 87 27.62 Internal assessment 18 5.73 Staff performance assessment 53 16.84 Current evidence based 15 4.85 External assessment 54 17.16 Don't know 73 23.27 Others 4 1.38 Missing Value 11 3.5Total 315 100Source: The Author
1 1 1
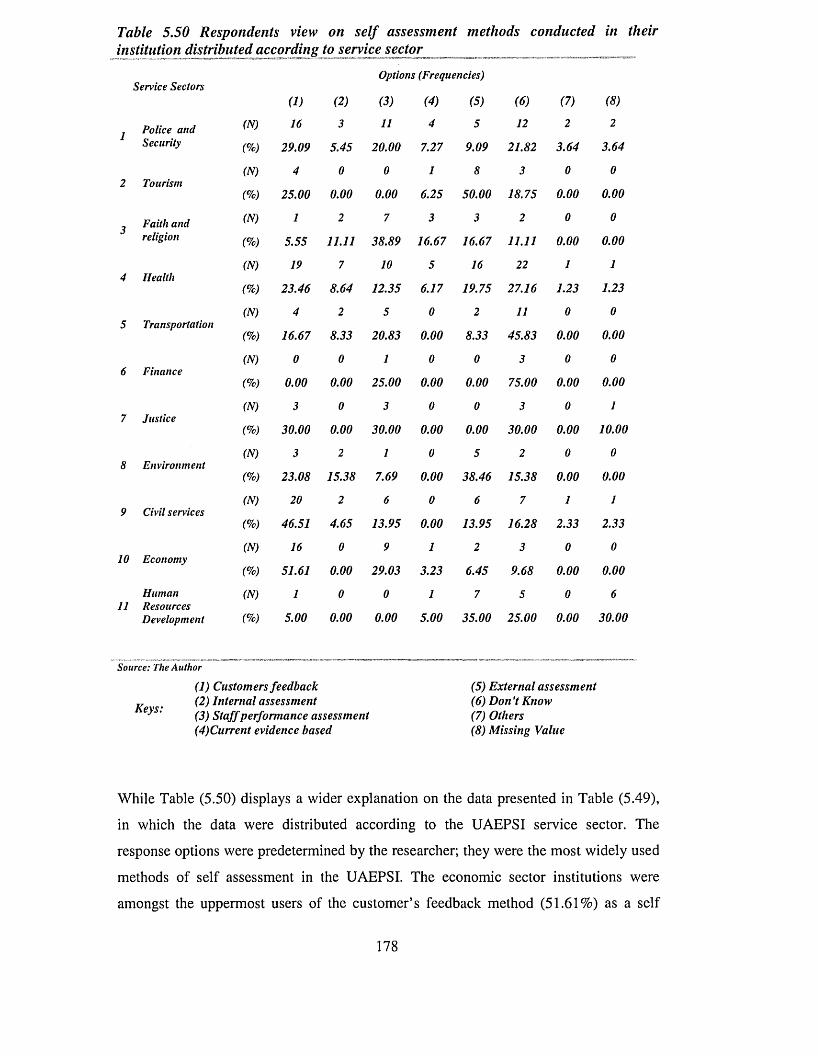
Table 5.50 Respondents viewinstitution distributed according
Service SectorsPolice and Security
2 TourismFaith and religion
4 Health5 Transportation6 Finance7 Justice8 Environment9 Civil services10 Economy
Human11 Resources Development
on self assessment methods conducted in their to service sector _
Options (Frequencies)(1) (2) (3) (4) (5) (6) (7) (8)
(N) 16 3 11 4 5 12 2 2
(%) 29.09 5.45 20.00 7.27 9.09 21.82 3.64 3.64
(N) 4 0 0 1 8 3 0 0
(%) 25.00 0.00 0.00 6.25 50.00 18.75 0.00 0.00
(N) 1 2 7 3 3 2 0 0
(%) 5.55 11.11 38.89 16.67 16.67 11.11 0.00 0.00
(N) 19 7 10 5 16 22 1 1
(%) 23.46 8.64 12.35 6.17 19.75 27.16 1.23 1.23
(N) 4 2 5 0 2 11 0 0
(%) 16.67 8.33 20.83 0.00 8.33 45.83 0.00 0.00
(N) 0 0 1 0 0 3 0 0
(%) 0.00 0.00 25.00 0.00 0.00 75.00 0.00 0.00
(N) 3 0 3 0 0 3 0 1
(%) 30.00 0.00 30.00 0.00 0.00 30.00 0.00 10.00
(N) 3 2 1 0 5 2 0 0
(%) 23.08 15.38 7.69 0.00 38.46 15.38 0.00 0.00
(N) 20 2 6 0 6 7 1 1
(%) 46.51 4.65 13.95 0.00 13.95 16.28 2.33 2.33
(N) 16 0 9 1 2 3 0 0
(%) 51.61 0.00 29.03 3.23 6.45 9.68 0.00 0.00
(N) 1 0 0 1 7 5 0 6
(%) 5.00 0.00 0.00 5.00 35.00 25.00 0.00 30.00
Source: The Author
Keys:
(1) Customers feedback(2) Internal assessment(3) S taff performance assessment(4)Current evidence based
(5) External assessment(6) Don't Know(7) Others(8) Missing Value
While Table (5.50) displays a wider explanation on the data presented in Table (5.49),
in which the data were distributed according to the UAEPSI service sector. The
response options were predetermined by the researcher; they were the most widely used
methods of self assessment in the UAEPSI. The economic sector institutions were
amongst the uppermost users of the customer’s feedback method (51.61%) as a self
178
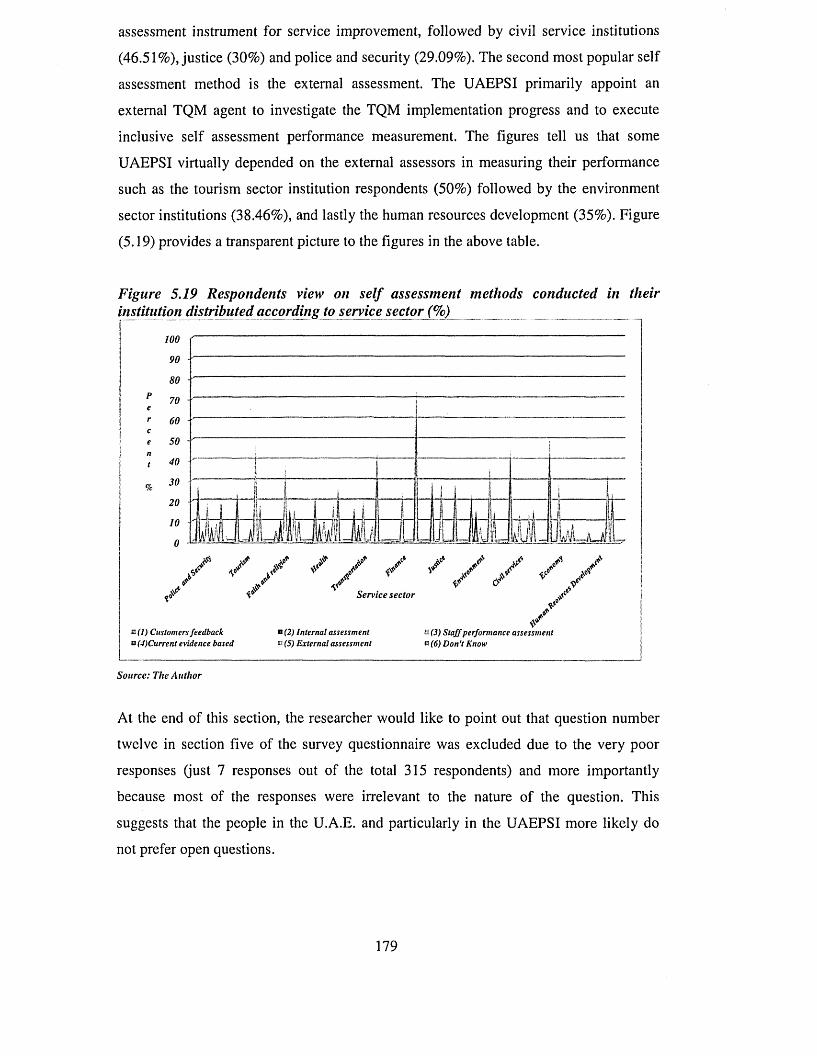
assessment instrument for service improvement, followed by civil service institutions
(46.51%), justice (30%) and police and security (29.09%). The second most popular self
assessment method is the external assessment. The UAEPSI primarily appoint an
external TQM agent to investigate the TQM implementation progress and to execute
inclusive self assessment performance measurement. The figures tell us that some
UAEPSI virtually depended on the external assessors in measuring their performance
such as the tourism sector institution respondents (50%) followed by the environment
sector institutions (38.46%), and lastly the human resources development (35%). Figure
(5.19) provides a transparent picture to the figures in the above table.
Figure 5.19 Respondents view on self assessment methods conducted in their institution distributed according to service sector (%)
100
90
80
70
60
50
40
30
20
10
0
Service sector
* (I) Customers feedback ° (2) Internal assessment ts (3) Sta ff performance assessmentvt(4)Current evidence based ® (5) External assessment n (6) Don't Know
Source: The Author
At the end of this section, the researcher would like to point out that question number
twelve in section five of the survey questionnaire was excluded due to the very poor
responses (just 7 responses out of the total 315 respondents) and more importantly
because most of the responses were irrelevant to the nature of the question. This
suggests that the people in the U.A.E. and particularly in the UAEPSI more likely do
not prefer open questions.
179
SUMMARY
The outcomes of this chapter allowed the researcher to accomplish objective two. Also,
this chapter attempted to answer research questions one and two (see Chapter One,
sections 1.2 and 1.3). In relation to TQM concepts and methods, the data analysis
revealed that there is inadequate awareness of TQM and its concepts amongst the
respondents of the UAEPSI, and that several TQM concepts have never been
implemented in the UAEPSI. Additionally, the data revealed that there are gaps between
the perceived quality critical factors and the extent of their actual practice as significant
to the successful implementation of TQM in the UAEPSI. The data analysis related the
quality critical factors perceived to their actual practice in sections (5.4 and 5.5). Factors
related to employee recognition and reward need to be reconsidered. Teamwork needs
to be used extensively. The employee training and continuous skill development must
be institutionalized in order to address subjects such as the use of TQM approaches and
the acquisition of profound knowledge. Benchmarking also needs to be institutionalised
through a continuous process of measuring performance and service improvement and
practices against the leading institutions in the same business. The self assessment tools
should be used on a regular basis to monitor and measure progress and performance.
Generally, the results obtained together with the empirical evidences support the
researcher proposal on the need for quality model that considers all the TQM
implementation and its practices. This suggests that the data analysis would be
employed to formulate the basic ingredients of the proposed model (Chapter Seven).
Chapter Six aims to present a detailed background on the U.A.E. characteristics. The
chapter conveys quality movement in the U.A.E., draws attention to the U.A.E.
government quality initiatives and various quality practices undertaken by the
individual UAEPSI. Thus, it serves as a workshop where the research proposed model
was validated for its potential implementation in the UAEPSI.
180
CHAPTER SIX
QUALITY IN THE U.A.E.
PREFACE
TQM has been introduced in U.A.E. since 1997. In order to encourage private as well as
public institutions to implement TQM, great efforts have been exerted by the U.A.E.
government. As a result, an increasing number of organizations have implemented
TQM since then. However, current quality practices, pointing to the effectiveness of the
deployment of TQM in the UAEPSI are still vague. How effective the implementation
truly is may be another issue. The researcher perceives from his position as a senior
manager in one of the leading public service institutions in the U.A.E. that effective
TQM systems are still behind; they are not fully applied at all institutional levels. Some
basic quality principles and modem quality management methods are not widely used
by UAEPSI. Based on the results of the researcher preliminary study on the level of
quality practices and the barriers associated with TQM implementation in the UAEPSI,
the researcher concludes that systematic quality implementation procedures in the
UAEPSI as a whole are still at a relatively low level.
An empirical investigation conducted by Djerdjouri and Aleter, (2007) to appraise the
TQM readiness level, as perceived by top management as well as employees in the
federal governments of the three federal ministries in the U.A.E.; namely the Ministry
of Environment and Water, the Ministry of Finance and Industry, and the Ministry of
Public Works. The institutions selection criteria were based on their excellent initiatives
in introducing quality management systems and successfully obtaining ISO 9000
certification. The EFQM-EM criteria were incorporated in a set of questionnaire to test
the TQM readiness level in each ministry. The main findings of their study revealed that
none of the three federal ministries has reached an adequate level of readiness to
implement a TQM system. Additionally, they found out no significant difference
between the perception of TQM readiness of top management and that of the employees
in the three ministries.
What does TQM implementation really mean in The UAEPSI? According to the
researcher’s investigation and based on his knowledge of studies of its kind, none of the
181
empirical research dealing with TQM practices and their effects on the overall business
performance in UAEPSI has been systematically carried out. In order to bridge this gap,
an investigation into TQM implementation practices in the UAEPSI is truly needed.
Such a study can explore the degree of the impact of the principles of TQM
implementation practices on the overall performance improvement in UAEPSI and can
help in identifying problem areas and possible remedies.
The previous chapter delegated the research fieldwork data analysis. An attentive detail
of the outcomes was drawn upon, which contributes to the development of the research
model. However, the purpose of this chapter is to provide a general overview of the
quality practices in the U.A.E. and in the government sector in particular. By writing
this chapter, the researcher intends to provide to the readers a sufficient background
about the U.A.E., as it is considered the arena where the research theoretical elements
(aim and objectives) meet with the practical elements (empirical investigation and the
model validation). The chapter layout is divided into three main sections.
The first section introduces a general perspective on the U.A.E., a historical background
to the development of the U.A.E. government institutions and the economic sectors.
The second section discuses the U.A.E. government’s (federal and local) quality
initiatives, followed by a brief outline of the existing government quality awards and
excellence programmes.
The third section presents quality practices in the public sector, and then investigates the
quality implementation practices of the three different cases in the UAEPSI.
The chapter concludes with a discussion of some emerging trends in the UAEPSI.
Figure (6.1) outlines the content of this chapter.
182
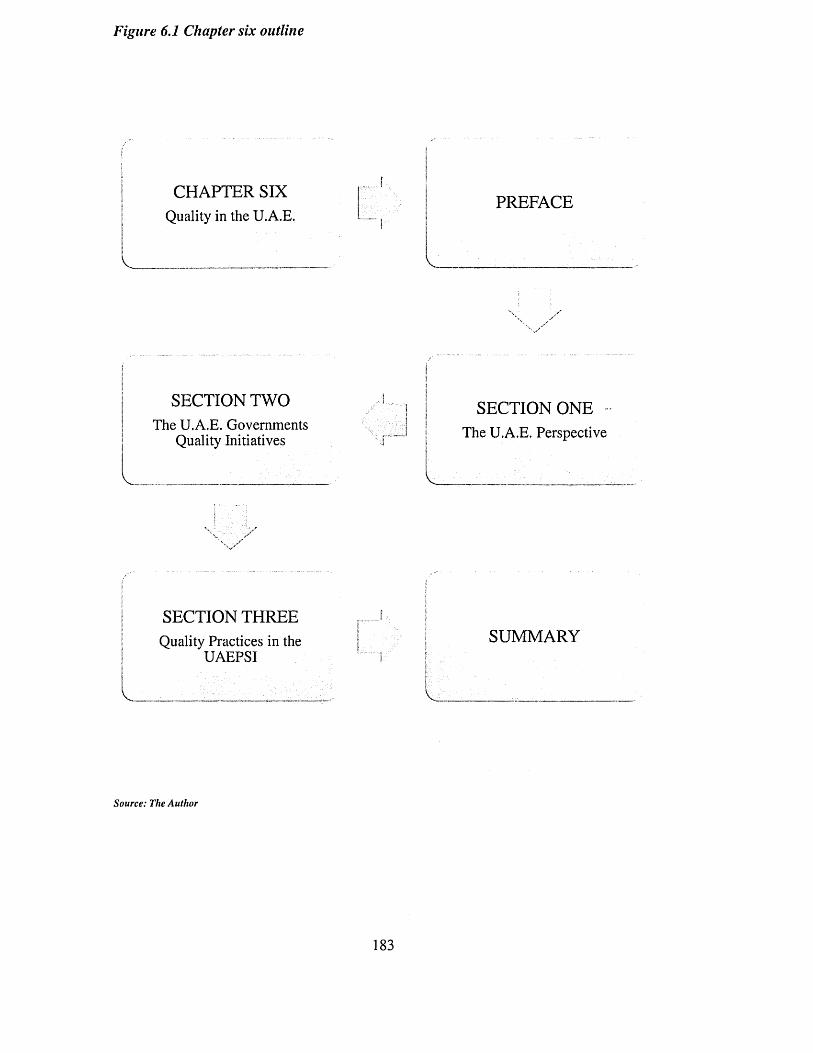
Figure 6.1 Chapter six outline
CHAPTER SIX Quality in the U.A.E.
PREFACE
v
SECTION TWOThe U.A.E. Governments
Quality Initiatives
SECTION ONE The U.A.E. Perspective
SECTION THREEQuality Practices in the
UAEPSI
i ■ ■ !SUMMARY
Source: The Author
183
6.1 THE U.A.E. PERSPECTIVE
The United Arab Emirates (U.A.E.) was formerly known as the Trucial States or Trucial
Coast. From 1820 until 1971, Britain occupied the region signing several treaties
including a maritime truce, which gave the area its name. On December 2nd, 1971 the
flag of the U.A.E. was raised for the first time, marking the beginning of a new era of
prosperity. The first federal government of the U.A.E. was formed and the late Sheikh
Zayed A1 Nahyan, was the Ruler of Abu Dhabi and later the first President of the
U.A.E. The federation consists of seven emirates: Abu Dhabi, Dubai, Sharjah, Ajman,
Umm A1 Qaiwain, Ras A1 Khaimah and Fujairah.
The capital and the largest city of the federation, is Abu Dhabi; it is located in the
emirate and carries its name. The U.A.E. occupies a strategic position along the
southern approaches to the Straits of Hormuz with coastlines of 500 km located in the
south-eastern comer of the Arabian Peninsula. It is bordered by the Sultanate of Oman
and the Gulf of Oman to the east, Saudi Arabia to the south and west, and the Arabian
Gulf to the north; the total land area, including twenty islands, is 83,600 sq km. The
estimated population of the U.A.E. is 5.06 million. Arabic is the official language and
Islam is the state religion. The currency is the Arab Emirates Dirham (AED); the $1
U.S.A. is equivalent to around 3.6 Dirham’s. The U.A.E. has one of the world's highest
standards of living (U.A.E. Interact, 2009a; Ministry of Planning, 2009).
The highest political authority in the federal government is the Supreme Council of the
U.A.E. Federation (SCUAEF), which is made up of the seven rulers of the emirates. In
addition to creating U.A.E. policy, the SCUAEF elects a president, who serves a five-
year term (there is no limit to the number of terms a president may serve). Since 2004,
H.H. Sheikh Khalifa bin Zayed A1 Nahyan has been elected as a second president of the
U.A.E. The prime minister is responsible for selecting the government’s cabinet
ministers. Figure (6.2) displays the successive governments of the U.A.E. cabinet
ministers. Since the first of the two nowadays governments was formed, the strategies
were drawn taking into consideration the impending changes and challenges that ensure
the continuous prosperity of its people.
184
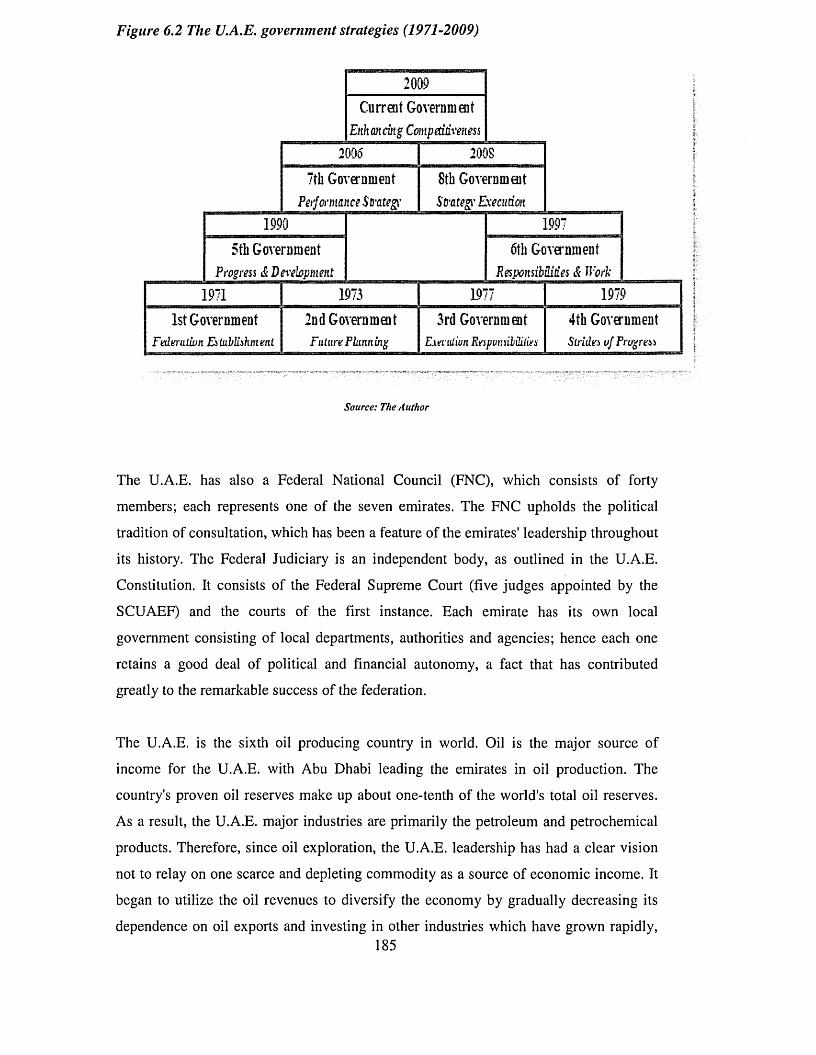
Figure 6.2 The U.A.E. government strategies (1971-2009)
2009Current Government
Enhancing Competitiveness2006 2008
7th Government PeifwinaitceSfrateg}'
8th Government •S’ft'fltegv Execution
1990 19975th Government 6th Government
Progress &Devebpment J?esp0ft5iMti« & Work1971 1973 1977 1979
1st Government 2nd Government 3rd Government 4th GovernmentFederation Establishment Future Fkrtn in# EMttulivn Respvnsibdides Strides v j Prugress
Source: The Author
The U.A.E. has also a Federal National Council (FNC), which consists of forty
members; each represents one of the seven emirates. The FNC upholds the political
tradition of consultation, which has been a feature of the emirates' leadership throughout
its history. The Federal Judiciary is an independent body, as outlined in the U.A.E.
Constitution. It consists of the Federal Supreme Court (five judges appointed by the
SCUAEF) and the courts of the first instance. Each emirate has its own local
government consisting of local departments, authorities and agencies; hence each one
retains a good deal of political and financial autonomy, a fact that has contributed
greatly to the remarkable success of the federation.
The U.A.E. is the sixth oil producing country in world. Oil is the major source of
income for the U.A.E. with Abu Dhabi leading the emirates in oil production. The
country's proven oil reserves make up about one-tenth of the world's total oil reserves.
As a result, the U.A.E. major industries are primarily the petroleum and petrochemical
products. Therefore, since oil exploration, the U.A.E. leadership has had a clear vision
not to relay on one scarce and depleting commodity as a source of economic income. It
began to utilize the oil revenues to diversify the economy by gradually decreasing its
dependence on oil exports and investing in other industries which have grown rapidly,185
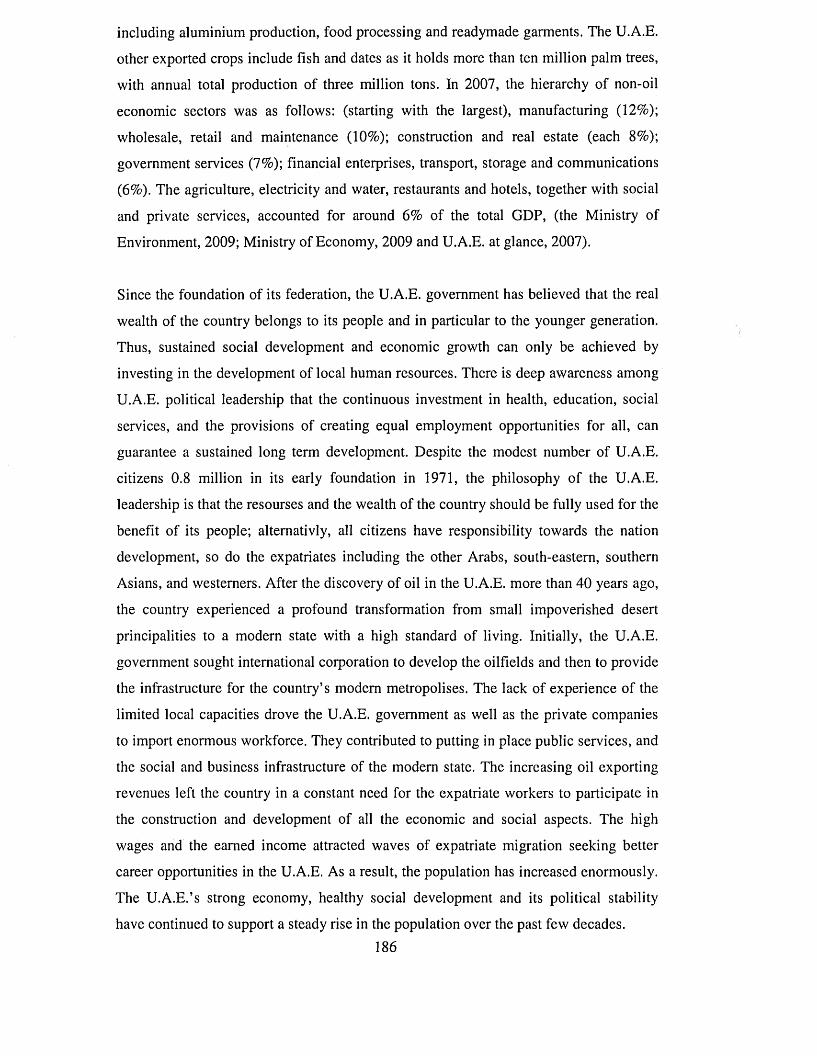
including aluminium production, food processing and readymade garments. The U.A.E.
other exported crops include fish and dates as it holds more than ten million palm trees,
with annual total production of three million tons. In 2007, the hierarchy of non-oil
economic sectors was as follows: (starting with the largest), manufacturing (12%);
wholesale, retail and maintenance (10%); construction and real estate (each 8%);
government services (7%); financial enterprises, transport, storage and communications
(6%). The agriculture, electricity and water, restaurants and hotels, together with social
and private services, accounted for around 6% of the total GDP, (the Ministry of
Environment, 2009; Ministry of Economy, 2009 and U.A.E. at glance, 2007).
Since the foundation of its federation, the U.A.E. government has believed that the real
wealth of the country belongs to its people and in particular to the younger generation.
Thus, sustained social development and economic growth can only be achieved by
investing in the development of local human resources. There is deep awareness among
U.A.E. political leadership that the continuous investment in health, education, social
services, and the provisions of creating equal employment opportunities for all, can
guarantee a sustained long term development. Despite the modest number of U.A.E.
citizens 0.8 million in its early foundation in 1971, the philosophy of the U.A.E.
leadership is that the resourses and the wealth of the country should be fully used for the
benefit of its people; alternativly, all citizens have responsibility towards the nation
development, so do the expatriates including the other Arabs, south-eastern, southern
Asians, and westerners. After the discovery of oil in the U.A.E. more than 40 years ago,
the country experienced a profound transformation from small impoverished desert
principalities to a modern state with a high standard of living. Initially, the U.A.E.
government sought international corporation to develop the oilfields and then to provide
the infrastructure for the country’s modem metropolises. The lack of experience of the
limited local capacities drove the U.A.E. government as well as the private companies
to import enormous workforce. They contributed to putting in place public services, and
the social and business infrastructure of the modem state. The increasing oil exporting
revenues left the country in a constant need for the expatriate workers to participate in
the construction and development of all the economic and social aspects. The high
wages and the earned income attracted waves of expatriate migration seeking better
career opportunities in the U.A.E. As a result, the population has increased enormously.
The U.A.E.’s strong economy, healthy social development and its political stability
have continued to support a steady rise in the population over the past few decades.186
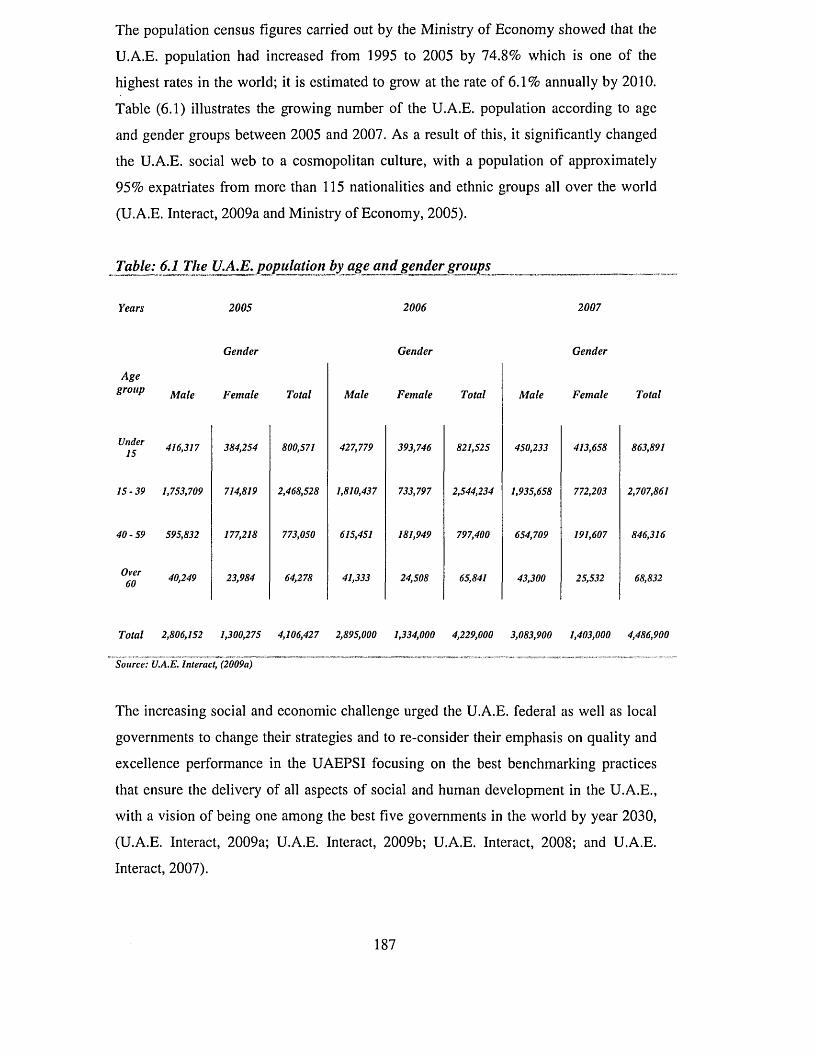
The population census figures carried out by the Ministry of Economy showed that the
U.A.E. population had increased from 1995 to 2005 by 74.8% which is one of the
highest rates in the world; it is estimated to grow at the rate of 6.1% annually by 2010.
Table (6.1) illustrates the growing number of the U.A.E. population according to age
and gender groups between 2005 and 2007. As a result of this, it significantly changed
the U.A.E. social web to a cosmopolitan culture, with a population of approximately
95% expatriates from more than 115 nationalities and ethnic groups all over the world
(U.A.E. Interact, 2009a and Ministry of Economy, 2005).
Table: 6.1 The U.A.E. population by age and gender groups _
Years 2005 2006 2007Gender Gender GenderAgegroup Male Female Total Male Female Total Male Female Total
Under15 416,317 384,254 800,571 427,779 393,746 821,525 450,233 413,658 863,891
1 5 -3 9 1,753,709 714,819 2,468,528 1,810,437 733,797 2,544,234 1,935,658 772,203 2,707,861
4 0 -5 9 595,832 177,218 773,050 615,451 181,949 797,400 654,709 191,607 846,316
Over60 40,249 23,984 64,278 41,333 24,508 65,841 43,300 25,532 68,832
Total 2,806,152 1,300,275 4,106,427 2,895,000 1,334,000 4,229,000 3,083,900 1,403,000 4,486,900
Source: U.A E. Interact, (2009a)
The increasing social and economic challenge urged the U.A.E. federal as well as local
governments to change their strategies and to re-consider their emphasis on quality and
excellence performance in the UAEPSI focusing on the best benchmarking practices
that ensure the delivery of all aspects of social and human development in the U.A.E.,
with a vision of being one among the best five governments in the world by year 2030,
(U.A.E. Interact, 2009a; U.A.E. Interact, 2009b; U.A.E. Interact, 2008; and U.A.E.
Interact, 2007).
187
The U.A.E. government has drawn a policy agenda to attain this vision by widening the
range of human investment and providing a world class services for its people, where
individuals are valued on the bases of their unique skills and the contribution they can
make. The ultimate aim is achiving a better quality life for all in terms of happiness,
health and satisfaction, (U.A.E. Interact, 2009b).
The U.A.E. government is remarkably striving to do better in the area of human
development. The U.A.E. is considered as one of the nations that are marked with high
human development, ranking 35 among 182 countries according to the human
development report of 2009 released by the United Nations Development Programme
(UNDP). The Human Development Index (HDI) measures human development on the
bases of three aspects: “Living a long and healthy life (measured by life expectancy),
being educated (measured by adult literacy and gross enrolment in education) and
having a decent standard of living (measured by the purchasing power parity, PPP,
income),” (United Nations Development Programme, 2009). The report takes into
account statistics figures between 1980 and 2007. The figures indicate that the U.A.E.’s
HDI had increased from 0.743 to 0.903. Life expectancy had significantly improved
from 65 years in 80’s to 77.3 years in 2007, while the adult literacy rate remained at
90%; these figures are clearly illustrated in Figure (6.3).
The Human Development Report also includes the Gender Empowerment Measure
(GEM) which reveals whether women take an active role in the economic and political
life of the country. These measures track the share of seats in parliament held by
women, the number of female legislators, senior officials and managers, the female
professional and the gender disparity in earned income reflecting the financial
independence. The U.A.E. is considered a very conservative country which is
significantly influenced by the tribal traditions and the Islamic customs but in spite of
these influences and social values, it occupies the highest ranks among the countries
within the region with respect to gender equality. The U.A.E., ranks the 25th in a list of
109 countries in the GEM, with a value of 0.691, (United Nations Development
Programme, 2009; and Abdulla, 2008).
188
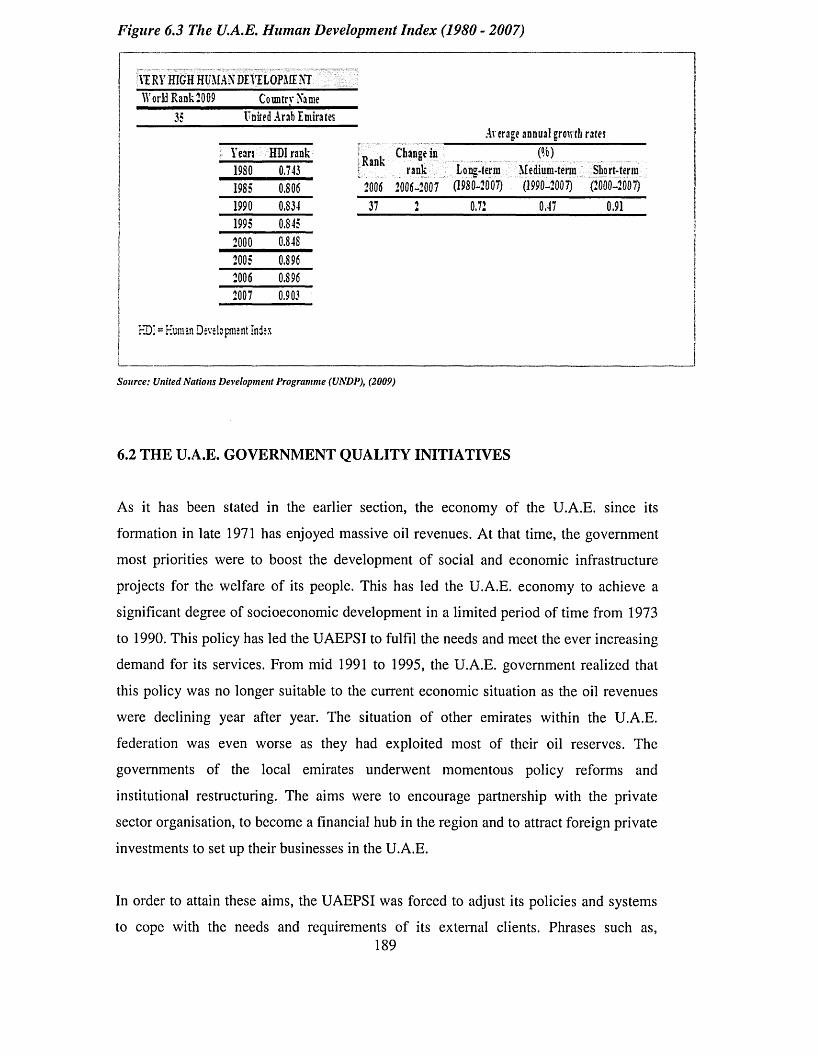
Figure 6.3 The U.A.E. Human Development Index (1980 - 2007)
VERY H IGH H U M A N DEVELOPM ENT.W orld R a n k 2009 C oontrv Name
35 United Arab EmiratesAv erage annual growth rates
f Years HDI rank R ank Change inLong-term1980 0.743 rank M edium-term Short-term
1985 0.806 2006 2006-2007 (1980-2007) (1990-2007) (2000-2007)1990 0.834 37 * 0.72 0.47 0.911995 0.8452000 0.8482005 0.8962006 0.8962007 0.903
H D i = Human Development Index jI jSource: United Nations Development Programme (UNDP), (2009)
6.2 THE U.A.E. GOVERNMENT QUALITY INITIATIVES
As it has been stated in the earlier section, the economy of the U.A.E. since its
formation in late 1971 has enjoyed massive oil revenues. At that time, the government
most priorities were to boost the development of social and economic infrastructure
projects for the welfare of its people. This has led the U.A.E. economy to achieve a
significant degree of socioeconomic development in a limited period of time from 1973
to 1990. This policy has led the UAEPSI to fulfil the needs and meet the ever increasing
demand for its services. From mid 1991 to 1995, the U.A.E. government realized that
this policy was no longer suitable to the current economic situation as the oil revenues
were declining year after year. The situation of other emirates within the U.A.E.
federation was even worse as they had exploited most of their oil reserves. The
governments of the local emirates underwent momentous policy reforms and
institutional restructuring. The aims were to encourage partnership with the private
sector organisation, to become a financial hub in the region and to attract foreign private
investments to set up their businesses in the U.A.E.
In order to attain these aims, the UAEPSI was forced to adjust its policies and systems
to cope with the needs and requirements of its external clients. Phrases such as,189
delivering better services, seeking customer's satisfaction, and improving the quality of
services, were used for the first time by the PSI in the U.A.E. This policy had a positive
impact on the U.A.E. economy; the non-oil sector accounted for % 64 of the U.A.E.
nominal GDP in 2007 when the projects were invested by the private sector. The key
successful economic performance is realized by developing the public joint stock
companies, enlarging the private economic free zones, and launching several mega
development projects (U.A.E. Interact, 2009a; U.A.E. Interact, 2009b; U.A.E. Interact,
2007 and Shihab, 2001).
Hence, this section portrays the recent evidences relevant to the U.A.E. (federal and
local) government initiatives towards establishing and endorsing the TQM in the PSI.
The concept of quality i.e., increasing performance, improving productivity and cost
effectiveness is not a new phenomenon in the UAEPSI, but what is different is the
realization that there is a need for commitment not merely to the quality of services but
also to the systematic management of the UAEPSI. One of the key remedies to the
pitfalls in the U.A.E. government recent restructuring and reforms in the public service
institutions is to create a sense of accountability in the UAEPSI which is aimed to boost
the improvements of services along with the cost saving effectiveness. This is often
attained by furthering the government decentralization and delegating authorities. This
shift encouraged individual institutions to operate as a self managing entity rather than
as institutions controlled by the central government. As a result of this, the UAEPSI
objectives would be to foster the development of quality policies that enable them to
provide the utmost services to the highest standards, and to be prepared for future
challenges and ever increasing competitions. This ultimately plunges the UAEPSI from
being service led to being customer led and from focusing on input to enhancing the
outputs.
Hence, the U.A.E. government has clearly set these objectives that it intends to
accomplish; however, putting them into practice was the real contest. Adopting the
TQM and excellence concepts and approaches was the best available alternative for the
U.A.E. governments to apply as a vehicle that drives UAEPSI towards realizing their
mission successfully. But this vehicle needs to be run and managed by somebody,
which ensures that the government set objectives are heading in the right direction. In
view of that, the U.A.E. federal as well as local governments had established their own
local excellence performance programmes and awards. These quality and excellence190
programmes are independent government institutions, which basically pledge to
perform important roles and functions as they are the solitary government entity within
the local government districts boundary responsible for formulating policies, motivating
and facilitating the TQM and the quality implementation processes in the PSI, and
helping them in initiating their quality schemes. They also monitor, evaluate and
conduct annual inspection visits to the individual institutions. Based on the visit results
and the documentation assessments of the best PSI that maintains the highest scoring,
they announce the awarded institution of the year that wins the excellence award.
6.2.1 The U.A.E. Government Quality Programmes and Awards
In this section, the researcher highlights the list of almost all quality programmes and
excellence awards already existing in the federal as well as the local governments of the
U.A.E. (UAEGEP). The aim of this section is to demonstrate the tendency of quality
and performance enhancement in the U.A.E. as a strategic target for the U.A.E.
governments during the period of three years, between the researcher preliminary
investigations and his visits to the UAEPSI and to several quality and excellence
programmes and awards in which it aimed to explore the quality initiatives and their
implementation practices in the U.A.E. These visits had enabled the researcher to
comprehend the concepts had evolved and then developed (refer to Chapters Three and
Four for further clarification) and to make a contrast with the research fieldwork carried
out in UAEPSI.
Two noteworthy observations need to be addressed. First, without exaggeration as
mentioned in the three year’s time, the number of quality and excellence programmes
and awards launched all over the U.A.E. are indispensable. Some are for the domestic
emirates; others for the federal one and still others for both. Some are regional and
others are international; some are for the private organizations, others for the public and
still others for both. These quality programmes and awards include almost all economic
and social sectors, for instance: economic, industry, environment, education, health,
municipal services, academic researches...etc. Second, due to the difficulties in
mentioning them all, this research focuses on those that are well-established, precisely
those that are pertinent to the public sector institutions and related to the research topic.
The investigation of the quality programmes and awards revealed that almost all of the
seven emirates except one initiated their local quality programme and award that bear191
their name. In addition, the U.A.E. federal government initiated its quality excellence
programme, mainly for the federal ministries, authorities and agencies. It is worthwhile
mentioning that prior to recounting these quality programmes, it is necessary to clarify
that the terms used in this research relate to government institutional system in the
U.A.E.
The government institutions in the federal government are called ministries, whereas, in
the local governments, they are called departments. However both federal and local
governments have their own authorities and agencies which are the institutions of the
federal ministries and local departments. These authorities and agencies are typically
headed by the ministers of the federal ministries and the chairmen of the local
departments, but they are financially and administratively independent. In most
occasions, it is quite hard to distinguish between them as they are seldom mentioned in
the research. To clarify matters to the readers, they are synonymous to the government
institutions and the UAEPSI in this research. These quality and excellence programmes
are listed below in a chronological order.
(1) Dubai Quality Award (DQA)
The award is mainly for the private sector organisations; its aim was to encourage the
private organisations to enhance their contribution to the domestic economy and to
create challenge among them for providing improved quality service to their clients.
Since its inception in 1995, the DQA has contributed to developing the concept of total
quality management and organizational excellence among private institutions in the
U.A.E. The key roles of the DQA are: to raise the awareness of quality as an
increasingly important element in competitiveness, to understand the requirements for
quality excellence in the U.A.E. and to share the best successful quality practices and
the benefits derived from implementing these strategies.
The award has many benefits, one of which is that it offers the private sector
organisations based in the U.A.E. the opportunity to benchmark themselves against the
internationally recognised criteria by the fully trained assessors of the award. The
applicant organisations benefit from the strategy and the teamwork involved in
preparing the submission document. The applicants also receive an independent
feedback report on the strengths and the areas for improvement. The success of DQA192
had encouraged the U.A.E. government to introduce its criteria to be adopted in the
government sector institutions.
The winners of the award prizes are categorised according to their business economic
activity, for instance: Finance, Professional, Services, Tourism, Education,
Manufacturing, Trade and Construction. Then, in 1996, the DQA underwent a slight
adjustment whereby a new category of the award was introduced: the Dubai Quality
Appreciation Programme (DQAP) along with the existing one the DQA. The DQAP
was designed for the organisations that have good quality practices and approaches, for
example, a company which obtained an ISO certificate is eligible to apply for the
DQAP. Yet, again in 1998, the Gold category was added to the awards, targeting
organisations that have been through sustained quality improvement activities
benchmarked on national and international basis.
A remarkable new version of the award wining criteria was introduced in 2000 when the
award was affiliated with the European Foundation for quality Management, the
Excellence Model (EFQM-EM). The DQA awarding criteria is based on the EFQM-
EM. This improvement has given more credibility to the DQA and to its evaluation and
assessment of the award winners than ever. The DQA further pursues its quest towards
quality and excellence progress. It launched the Dubai Human Development Award
(DHDA) in 2002 to recognise and reward individual business organizations towards
providing the work opportunities for the U.A.E. young generation job seekers. The
DHDA also, aims to develop their abilities and emphasize their role in the future of this
country through intensive training and guidance.
Indeed, it provides a quality and excellence framework for the award candidates;
however, the award has become more sophisticated than it used to be. The candidates
mainly for the gold category must fulfil the nine criteria of the EFQM-EM and sustain
constant quality improvements. The advantage of this modification is that it allows the
organisations in the U.A.E. to benchmark their quality quest against those outside the
national boundaries. It also provides them with more confidence in that they implement
a successful internationally recognised excellence model with clear objectives and
guidance (Dubai Quality Award, 2010; Dubai Quality Award, 2009; Department of
Economic Development, 2009 and Dubai Quality Award, 2008).
193
(2) Dubai Government Excellence Programme (DGEP)
On the contrary, the government of Dubai introduced the Dubai Government Excellence
Programme (DGEP) as a government entity in 1998. Its principal function is to
emphasis quality and excellence performance primarily for the public sector institutions
in the emirate of Dubai. The purpose of the programme is to improve the performance
of its local departments so as to empower the entire public service sector institutions.
This should allow local departments to comply with the latest developments in all
fields, and to equip them for impending challenges; furthermore, to enhance their
capacities to implement modern administrative principles which are based on TQM
principles such as, customer satisfaction, resource development, procedure
simplification, processes and systems documentation, creativity, encouragement and
capability building. Since its foundation, the DGEP has continuously played a major
role in the development of Dubai’s local departments, authorities and agencies in order
to excel in government performance and in delivering its services.
The DGEP affiliation with EFQM which is privileged for the adoption of its excellence
model and its approach of RADAR, as a readymade instrument for self-assessment, had
a significant advantage that contributed to the improvement of the programme criteria,
and to the benchmark local departments with their counterparts in developed countries.
The DGEP processes of excellence award starts from evaluating and assessing local
departments to awarding prizes (Dubai Government Excellence Programme Award) and
up to the highest scoring departments; this process is exactly similar to the EFQM
principles. However, the awarding procedures take place every two years. The DGEP
success inspired other local governments in the U.A.E. to follow its path, as it
represents an effective integrated tool for improving PSI performance (Dubai
Government Excellence Programme, 2010; Dubai Government Excellence Programme,
2009 and Dubai Government Excellence Programme, 2007).
(3) Hamdan Bin Rashid Al Maktoum Award for Distinguished Academic
Performance
This annual award was first introduced in 1998 to promote and encourage the quality
and excellence performance of the U.A.E. education sector. Two prominent
characteristics distinguish this award from other quality and excellence programmes in194
the U.A.E. First, the award is granted for the solely independent non government
organization. This means the award does not represent either the U.A.E. federal
government or any other emirates local governments. Second, it is the only quality
award whose criteria and assessment processes are based on the Malcolm Baldrige
National Quality Award (MBNQA).
The jury committees are academic expertise from the U.A.E. University and from the
U.A.E. Ministry of Education. However, the MBNQA criteria have been reviewed and
modified by the jury committees. The result was the development of the customized
criteria that conform to the educational standards of the curriculum and the educational
condition in U.A.E. The ongoing revisions, amendments and frequent rectifications
enabled the award to gain accreditation and creditworthiness in building up a reputation
as every year more and more academic institutions apply for the award even from
neighbouring countries. This recognition encouraged the award board of trustee to
expand participation to set up branches in other countries in the region. Also, the benefit
from revision had led the award to further expand to include an exceptional prize for the
individual households.
In 2009 the award became internationally recognised by being affiliated with the United
Nations Educational, Scientific and Cultural Organization (UNESCO). It jointly
launched the UNESCO-Hamdan bin Rashid Al-Maktoum prize for outstanding practice
and performance. Its objective is to enhance the effectiveness of teachers and to
improve the educational practices around the world, with priority given to developing
countries, as well as to marginalized and disadvantaged communities from the wider
global context (Hamdan Bin Rashid A1 Maktoum Award for Distinguished Academic
Performance, 2009).
(4) Sharjha Government Excellence Award
The government of Sharjah initiated its local excellence award in 2000; its main
purpose is to honour the local government departments in Sharjah. The award aims to
extend distinctive services and to upgrade the public sector performance. Improvements
were undertaken by the award committee in 2002 as to progress the award general and
sub-criteria and to the assessments procedures. The new version of the award went
through minor changes so as to make it different from the EFQM-EM. It is designed to195
echo the government quality strategies and to reflect the national identity of the
UAEPSI. Enormous emphasis was placed by the award on the departments'
commitments to quality achievement a set of targets for the department’s performance
and service improvements as were set for steering their transactions and reinforcing
their relations with their external customers. The award, nowadays, has become a
symbol that embodies the appreciation of Sharjah government quality initiatives and
enhances the creativity of the elite government institutions (General secretariat of
Executive Council, Government of Sharjah, 2009).
(5) Sheikh Saqr Programme for Government Excellence
Likewise, other local governments in the U.A.E., the government of Ras A1 khaimah,
launched its quality programme in 2004. The Sheikh Saqr Programme for Government
Excellence (SSPGE) is identical to the DGEP in that it espouses the EFQM-EM as a
quality model for the local department’s performance assessment. The programme
supports the overall development in the emirate of Ras A1 Khaimah through the
preparation of future leaders and by building of institutional capacity that enables the
government authorities to implement the global standards of excellence. Nonetheless,
the reality contradicts with the SSPGE vision. This was clearly observed during the
research fieldwork stage, while the researcher interviewed the managing director in one
of the leading local departments in the government of Ras A1 Khaimah. He affirmed
that one of the obstacles that inhibit local departments in the emirate of Ras A1 Khaimah
from fully implementing the requirements of the SSPGE is the limited financial
budgets. Therefore, for that reason, he deems that the optimization of quality and
excellence performance of the local departments in the government of Ras A1 Khaimah
to reach the global standards is far to attain in the short term (Sheikh Saqr Programme
for Government Excellence, 2010)
(6) Sheikh Khalifa Government Excellence Programme
On the federal government level, the U.A.E. federal government initiated in 2006 the
Sheikh Khalifa Government Excellence Programme (SKGEP). The programme seeks to
motivate and build the elements of excellence in the federal ministries. Also to ensure
the implementation of innovative TQM concepts that leads to superior performances.
For unknown reasons, the SKGEP was suspended after a very short period of its196
initiation. However, it was re-launched in June, 2009. It appeared to the public in a
modified version under new management. The SKGEP went through critical
reconstruction of its core aims and values. Extreme emphases were put on improving
the performances of the federal government capacities and building their skills. It set a
target to the federal institutions to achieve annually not less seventy percent (70%) of
employee's satisfaction by making the federal ministries more attractive working
environment for their employees. The SKGEP visionary aims and values are following:
1. Awareness o f the principles o f excellence and o f the importance accorded to
modern governments
2. Capacity development needed to advance excellence in all institutions o f the
federal government
3. Contributing to the implementation o f government excellence through the
provision o f information methodologies and expertise required to provide
extension support
4. providing a platform for the development o f the administrative state through
promoting the transfer o f knowledge and applying the best quality practices
5. Installing creative thinking and knowledge in the federal government through
the acquisition o f knowledge and the implementation o f projects and innovative
initiatives
6. Evaluating and following up the evolution o f government excellence through
rigorous methodology, and independent organization to enrich the experience o f
excellence in the federal government
In fact, and according to the data analysis of the research fieldwork showed that, since it
was re-launched the SKGEP has not made any noticeable progress in terms of assessing
performance and services improvement of the federal government institutions.
(7) Abu Dhabi Award for Excellence in Government Performance
Later in 2007, the government of Abu Dhabi launched the Abu Dhabi Award for
Excellence in Government Performance (ADAEGP). The award promotes
understanding of the requirements for excellence in government and the
competitiveness for improvement throughout the government service, sharing of
information and knowledge of successful improvement strategies. The ADAEGP197
seemed have minor impact on the local departments in the emirate of Abu Dhabi, as
these departments to have undergone enormous governmental reforms and managerial
changes. These reforms and changes did not allow the local departments to gain modest
short term tangible benefits of the objectives that the ADAEGP were set to achieve
(Abu Dhabi Award for Excellence in Government Performance, 2010).
(8) Ajman Excellence Programme
The government of Ajman initiated in 2008 Ajman Excellence Programme (AEP). The
programme was established for the sake of promoting competition among all the
government departments and public institutions, and non-profit organizations in order to
improve their performance. The long term objective of AEP leads the local government
institutions to exert the utmost effort to achieve greater efficiency and cost
effectiveness, to exploit their own resources, and to keep up with the highest standards
of quality, culture and excellence. The AEP announced its first award winner on the
same year of its foundation. However, evidences show that the AEP had a minor impact
on promoting the quality and excellence culture in local departments in the emirate of
Ajman. And more importantly in working on services improvements and customers
satisfactions aspects. (Ajman Excellence Programme, 2010)
Review of the Government Excellence Programmes
The above presentation highlights the government of the U.A.E. (federal and local)
efforts to introduce quality and excellence principles in UAEPSI. The researcher would
like to shed light on the following remarks which are addressed in further detail in the
recommendations section of chapter ten.
The government relentlessness to quality and excellence: by looking into the number of
quality and excellence programmes initiated almost in every emirate, it becomes
apparent that the U.A.E. government’s leadership did not spare any effort to promote
and support endeavours to change the prevailing perceptions of the U.A.E. citizens
about the deficiency of UAEPSI in delivering their services.
198
Compulsory participation: It is noticed from reading through the terms and regulations
of all governments’ quality and excellence programmes, that participation in the quality
programmes is mandatory for all UAEPSI without exception.
Adoption o f the sole quality model: it is observed from all of the preceding quality and
excellence programmes that they adopted only one model which is the EFQM-EM
criteria and used its RADAR methodology as an instrument for self assessment to
measure performance improvement against the EFQM-EM criteria. During the research
fieldwork, the researcher interviewed some of the directors of quality and excellence
programmes in different local emirates. At that time, the researcher asked them one
specific question, which was why they adopted only EFQM-EM whilst there are other
quality and excellence models which are widely adopted. Almost all of them gave
similar answers. They stated that the model is the most sophisticated and broadly
adopted by other countries. In addition, they acknowledged that the model is obligatory.
It has been enforced on the UAEPSI as it is aimed to unify the quality practices and
performance measurements among the UAEPSI during the award evaluation process.
Measurement and competitiveness: the research fieldwork scrutinized the ultimate
objective of all quality and excellence programmes that are more or less similar. The
objective is to provide a kind of judgmental instrument that is used by the decision
makers in the U.A.E. to gauge and measure the efficiency level and the services
improvement of the UAEPSI. Besides that, it creates a competitive climate among the
UAEPSI in striving for better performance and ultimately for the quality and excellence
award.
After reviewing almost all the UAEGEP and awards, it becomes evident that the
government’s quality rush, with the aim of adopting sole quality model has created
confusion and sometimes resistance among some of the UAEPSI in understanding the
UAEGEP criteria and its decisive objectives. This had led to creation of a vague
atmosphere in applying the UAEGEP criteria. The obligatory participation in the
UAEGEP award, in addition to the limited time given to the UAEPSI in order to
prepare themselves for submitting the award documentation reports. All these facts had
created an arbitrary and lag of commitment from UAEPSI in adopting the UAEGEP
criteria in a full scale.
199
6.3 QUALITY PRACTICES IN UAEPSI
This section highlights on the previous and existing quality initiatives in which is, based
on the current available studies related to the quality and excellence implementation
practices undertaken by individual efforts of the UAEPSI. Three case studies were
presented. The aim of this section is to demonstrate each case study individually, of
each institution humble quality implementation attempts, their journey for quality,
excellence performance and services improvement.
Institution (A)
Institution (A) is one of the sovereign federal ministries in the U.A.E. Its aim in
implementing quality principles was driven by providing better services and care to its
customers. The challenge for institution (A) was how to put quality principles into
action. The management were convinced that by adopting quality principles, the
institution can effectively manage and regulate the labour market in the U.A.E. As
mentioned earlier in section (6.1), the labour market in the U.A.E. is dominated by
foreign workers whereby they entail more than 95% of the total work force population
in the U.A.E. The top management of institution (A) have realised that managing a
labour market of such nature is not an easy task, particularly when delivering high
quality government services in a complex environment without compromising between
the supply and the demand of the labour force.
The management of institution (A) were very keen to ensure that the implementation of
quality should be also aligned with the U.A.E. federal government efforts to regulate the
labour market in a way it would be beneficiary to all stakeholders, and thus to serve the
national interest in the first place. The difficulties associated with such project were
because institution (A) is the sole authority in the entire U.A.E. controlling the issuing
permits for private businesses to bring into country foreign skilled and non skilled
workers from all comers of the world. This has forced institution (A) to work promptly
to meet its customer’s demands and also to cope with international standards according
to the International Labour Organisation (ILO) conventions. What's more, the issue of
delivering continuously and on a daily basis swift and perfect services to thousands of
its customers at once in its seven branches all over the U.A.E., was persistently
agonizing the management. It’s with new approach to TQM, it means shifting the200
existing routine work process which employees were used to, to almost a new process
and the system of TQM which most of the employees in institution (A) were not quite
familiar with. The new process of work involves a huge amount of legal transactions
and document authentication that make it almost impossible to have an error free and
that possibly jeopardizes the flow of the work process which affects on the speed of
delivering services to customers. The risk of slowing down the services will remain
even with the use of the latest technologies and instruments that would aid the
employees in performing their tasks swiftly and accurately.
The prime reason for implementing quality principle in institution (A) was to improve
its services. One of the service improvement proposals was to deliver most of its
services online. The electronic public services project was aimed in providing 24/7
services. This would enable its customers to do business after the official working
hours, more comfortably and at their convenient time. As it was the case with the mega
project that needed specialized expertise and skilled talents not available in institution
(A).
A partnership with a private organization was sought to provide assistance. For this
partnership, to work effectively and efficiently and to make it successful was not an
easy task. Very carefully planned, managed and executed processes and documentations
are required to be considered, without causing any interruption to the progress service.
Furthermore, the full engagement and high level of commitment from all management,
and the involvement of people in all quality implementation stages were essential. The
change management programme was a key factor for the success of the transformation
process. The successful implementation of the project has an advantage that enabled the
customers to benefit from the effective and efficient online services (Moustafa, 2007).
Institution (B)
Institution (B) is a local government authority; it is considered as one of the foremost
port operation and management authority in the U.A.E. as well as in the region.
Although institution (B) had enjoyed a remarkable success and gained a reputation of
competitive advantage in delivering superior services in the past years, it was not just
enough for its management to unwind. They realised that this success will not last for
long due to the growing competitions from competitors within the U.A.E. and in the201
region. This had forced the management in institution (B) to draw strategies and action
plans to meet the subsequent prospective growth challenges. The inevitability of the
ongoing evaluation of performance measurement needed a higher degree of advance
planning to maintain existing customers and to attract new businesses. To cope with
future challenges, institution (B) began adopting TQM approaches as it was proposed by
appointing external consultant agent. The new quality service strategy basically focused
on three core values:
7. Working to provide world-class services
2. Providing high quality services at an economical cost
3. Dealing efficiently with the intense competition
To overcome challenges and to put these core values into practice, a series of
measurements were taken by the management, such as: giving a great deal of attention
to process flexibility, and focusing on the customers needs, so as to provide them with a
quality range of alternatives and options. The systems and procedures applied for
handling services ought to meet the requirements swiftly and efficiently. Therefore, to
ensure the success of its quality initiative, institution (B) balanced between the quality
of services offered and the associated costs. It constantly reviewed the path of the core
values, in order to make sure that they were aligned with the requirements of quality
implementation approaches. In this regard, institution (B) took many steps; for example,
making detailed analysis of the work process, reconsidering the methods of
technological support for the assignments and duties, identifying service improvement
techniques, document processing, and carrying out self assessment performance tests.
The self assessment tests revealed the need for conducting frequent performance
measurement instruments that involve the entire institution.
As a result, several objectives were achieved through the adoption of the quality
approaches. Institution (B) was the first ISO 9000 certified government authority in the
U.A.E. This resulted in adopting reduction procedures for issuing official consent forms
in general which led to a reduction in the required time and in the documents supplied
by the customer to obtain the necessary service. Moreover, the customer’s satisfaction
surveys confirmed that 98% of the customers expressed their satisfaction with the
services delivered to them. Through accumulated experience with high quality and
202
excellence, institution (B) acquired an invaluable reputation that left its impact on the
global expansion, (Arab Organisation for Administrative Development, 2007).
Institution (C)
Institution (C) is a federal ministry which has two major functions: to allocate annual
spending budgets of other ministries and to be responsible for regulating the U.A.E.
fiscal system. In 2005, it was entitled by the U.A.E. prime minister cabinet, to
implement all-embracing reforms within the federal government institutions. This
project was carried out in coordination with the United Nations Development
Programme (UNDP). The primary aim of the governmental reforms was to prepare the
UAEPSI for the U.A.E. government economic strategy agenda to be the first sought
destination in the region for foreign direct investment to settle in the U.A.E. The
partnership between institution (C) as a client and the UNDP as a consultancy agent was
to work together to facilitate resources and to lay the milestones and mechanisms for the
project execution process that guarantees smooth transformation and implementation of
the U.A.E. government reforms project.
Adopting the TQM principles and introducing its concepts to the federal ministries was
proposed by the UNDP consultants, as the only approach that ensures the success of the
project during its implementation phase, and therefore meets the U.A.E. government
economic agenda. The federal government reforms project focused on three eminent
features which were supposed to be accomplished at the end of the project. First,
services improvements initiatives. Second, these services improvements initiatives must
be in line with the efforts to the ISO 9000 certified. Third, the feature was to improve
the human resource capacity building within the UAEPSI.
The two partners expounded the general mechanism of how the UAEPSI service
improvements re-engineering process would be structured. All individuals within the
UAEPSI were requested to perform their tasks through a well defined process, and by
utilizing the employees' utmost competencies. This was done to ensure a smooth flow
of information and clear outputs.
In order to achieve the project targets, a framework consisting of nine factors was
developed and two implementation stages were proposed: the first stage was203
implemented in institution (C). Based on the implementation outcomes and the success
of the first stage, the second stage would commence and it would be benchmarked by
other UAEPSI. Three years after the first stage commenced, institution (C) was able to
achieve its first aim, which was to obtain the ISO 9000 certification. However, the
second stage did not go well as it was planned. The project encountered many obstacles
such as, lack of cooperation from other ministries and the UAEPSI, particularly lack of
commitment from the top management who simply were not convinced about the
benefits of the project. This lagging, with the passage of time, resulted in a slow down
in the implementation of the following stage and subsequently it led to the termination
of the whole project (Ministry of Cabinet Affairs, 2009 and Ministry of Cabinet Affairs,
2008)
SUMMARY
In the past five years, evidences from the U.A.E. government quality initiatives display
that quality with its practices has become a major strategy for most UAEPSI. This study
aims to highlight the current quality practices in the UAEPSI. There are several quality
and excellence programmes for the UAEPSI, with a considerable number of the quality
excellence awards in the U.A.E. However, the data analysis was presented in Chapter
Five, in which the outcomes led to diverse conclusions mainly when comparing quality
factors and implementation practices; both are vital for the quality and services
improvements in the UAEPSI: actual quality practices were perceived by the
employees.
The chapter demonstrates clearly the role of quality programmes and awards in
enhancing performance and service improvements in the UAEPSI. Because of the
vagueness in implementation, the researcher was inspired to empirically investigate the
gaps between quality concepts and quality practices in the UAEPSI. This has resulted in
developing the research model of quality appraisal to be used by the UAEPSI as a self
assessment tool that assesses them to evaluate their current quality standpoint. The next
chapter revises recent studies and literature that tackled the quality implementation
models and those that contributed to the development of the research model.
204
CHAPTER SEVEN
THE MODEL DEVELOPMENT
PREFACE
The previous chapter provided general background to the empirical research study. It
covered the economic, political and social aspects of the United Arab Emirates. Then,
the chapter examined the U.A.E. government’s quality initiatives reviewing the
UAEGEP roles in advocating the quality practices in the UAEPSI. Afterwards, three
individual cases of diverse UAEPSI together with their quality implementation attempts
were highlighted.
The aim was to acquaint the readers with the development movement of quality and
also with the current quality practices in the U.A.E. and to provide a platform for further
discussion in the succeeding chapters. However, this chapter aims to give further
explanations about the theoretical background for the research-anticipated model. The
theoretical development was basically derived from two distinct sources. The first
source is the literature review and the studies related to the quality critical factors and to
the development of quality implementation framework models. The researcher surveyed
the literature review that spanned over fifteen years from 1993 to 2008. The second
source is the results of the research data analysis outcomes.
Hence, the chapter is split into two main sections. Section one is divided into three
subdivisions that explore the development of the theoretical part of the research model.
The first division scrutinizes the literature related to the most influential and Quality
Critical Factors (QCF) that are vital to the successful implementation of quality.
The researcher judges the common agreed existing QCF in the literature against those
that were identified in this research and that the employees in the UAEPSI basically
perceived as significant. The second division explores and expands the most current and
extensively adopted quality and excellence models. In addition to these models, the
researcher further touches upon the relevant research studies that empirically
investigated and developed the quality implementation models and/or frameworks that
were developed and adopted in general in the governmental and public service
205
institutions in particular. This would enable the researcher to benefit from their
investigation and study experiences; therefore, the researcher exploits it to cement the
academic groundwork for the theoretical and conceptual development of the model. The
model conceptions are discussed in further detail in chapter eight.
Section two is the source of the empirical development of the model. The aim of this
section is to explain in further detail the practical conception of the model that was
gained from the results of the research data analysis. The data analysis was exposed in
Chapter 5, section 5.5. These results actually formed the fundamental structural pillars
of the practical part of the model, and in a way, they assisted the researcher to shape the
core factors and sub-factors of the model. Figure (7.1) outlines the content of this
chapter.
206
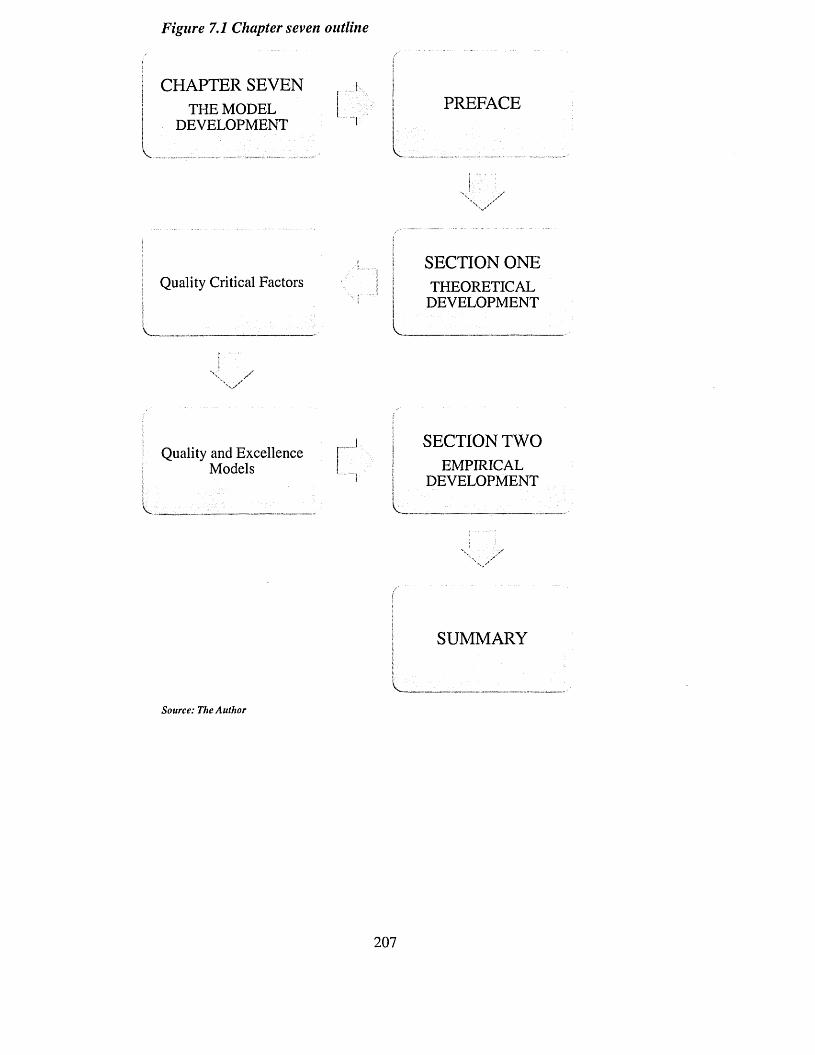
Figure 7.1 Chapter seven outline
CHAPTER SEVENTHE MODEL
DEVELOPMENT
/■ '
PREFACE
v .
Quality Critical Factors
Quality and Excellence Models
| SECTION ONETHEORETICAL
DEVELOPMENT
^ _______
SECTION TWOEMPIRICAL
DEVELOPMENT
_____
i SUMMARYi31
I _________Source: The Author
207
7.1 THE THEORETICAL DEVELOPMENT
As stated above, this section is divided into two eminent divisions; the aim is to
construct the theoretical development of the proposed research model through reviewing
the current literature related to the QCF, the quality models and the frameworks. The
first division reviews the empirical studies and investigates the most influential and
critical factors that the organizations need to attain the successful implementation of
quality. Based on these factors, the researcher contrasted the research-identified factors
with those furnished by the literature to point out any similarities or differences among
them. The second division presents the most apparent and universal quality models
adopted by the organizations. The models which the researcher reviews are the Deming
model, the Baldrige, the EFQM-EM and the Toyota Production System (TPS), Six
Sigma and other quality models and frameworks not often adopted.
The aim of reviewing these models is to analyze their structure, their assessment
methodology and the aspects that are crucial for restraining any of them. Accordingly,
the researcher scans the contribution of these models to the development of the
theoretical part of the research model. At the end of this section, the researcher presents
the general outlook regarding the similarities and differences between the literature
investigation and the extent to which it plays a part in the development of the research
model.
7.1.1 Quality Success Factors
Through interpreting and scrutinizing the literature and the studies of the QCF, the
researcher identified the foremost factors that the literature and TQM gurus' empirically
investigated, and that had a substantial impact on the success of TQM implementation.
Therefore, a considerable attention was paid to them, as these factors were compared for
their significance and consistency with the research identified critical factors; thus, the
core factors of the research model was drafted.
The quality gurus Deming, Juran, Crosby, and Garvin and their perception on the QCF
were illustrated in Chapter One; however, the researcher would like to point out that
they had a common ground with respect to the vital role certain factors play such as: top
management and commitment to quality, employee training and rewarding and
208
customer satisfactions which are the most important factors that enhance quality
management in service organizations.
The following studies are mainly focused on large manufacturing organizations mostly
carried out in developing countries. Authors such as (Das, et al., 2008; Shrivastava, et
al., 2006; Yoo, 2003; Thiagaragan, et al., 2001; Martinez, et a l, 1998; and Mersha,
1997) recounted in their studies that there is a lack of empirical studies concerning the
critical factors affecting the effectiveness of TQM implementation in developed
countries. They concluded that in developing countries, the circumstances of TQM
implementation are far more complex, due to many factors that hinder implementation.
On the other hand, other researchers like Salaheldin, (2003) found out that these factors
could be practical for all developing countries. He argued that the forces that promote or
prohibit TQM implementation in a developing country might be generalized to other
less developed countries.
However, Thiagarajan et al., (2001) claimed that most of these factors have an academic
background; he comprehended the various quality factors identified by the various
writers and experts based on their own experiences in working as consultants, managers
or researches. Sureshchandar, et al., (2001) reviewed over one hundred articles,
perspectives, conceptual frameworks, practitioner and empirical literature on the TQM
and the total quality service. They came up with twelve common critical factors mainly
in the service organizations. Management commitment and human resource
management were among the topmost critical factors.
Oakland, (2001 and 2000) examined the key elements of TQM and the critical factors
that influence the TQM implementation process. The study signalled eight critical
factors, the most important of which is the management behaviour. He concluded that
the eight factors can be arranged in a hierarchy of criticality. He realized the increasing
awareness of the top management who recognized that quality is an important strategic
issue at all levels of the organization. He then, identified the factors responsible for the
success of quality initiatives in the organization. He differentiated the factors in order to
classify the organization maximum output into two categories: soft and hard. The soft
aspects of the management include factors such as top management commitment and
209
involvement, the employee’s empowerment and culture. The hard aspects include
factors like performance measurements, improvement tools, techniques and systems.
Likewise, Lau and Idris, (2001) investigated the Malaysian manufacturing companies
and attempted to specify which of the identified soft elements (culture, trust, teamwork,
employment continuity, education and training, top management leadership for quality
and continuous improvement, employee involvement and customer satisfaction and
involvement) has a significant effect on the TQM tangible effects (growth, profitability,
productivity, quality, finished product inspection, user demerit, user merit, market
competitiveness, cost, production inventory, delivery date, safety, human resource
development, development capability and market strength). They adopted two research
methods for developing a TQM soft model: a postal questionnaire survey and a
structured interview for the practical implementation of the model. With the eight main
soft factors identified, the study outcomes showed a relationship between the identified
soft elements and the TQM tangible effects; they also found out that these factors have
an effect on the tangible effects. They indentified the soft factors.
Table (7.1) illustrates the identified soft and hard elements of TQM. They are arranged
according to their importance: culture, trust, teamwork, employment continuity,
education and training, managerial leadership, employee involvement and customer
satisfaction. Furthermore, they addressed the organizations lack of understanding or
ignorance of the significance of the QCF.
This lack of understanding is considered as an obstacle in implementing quality
effectively and successfully. They affirmed the need for more research studies on the
QCF of TQM implementation, due to the wide variations in TQM as they describe the
results and benefits. Their study investigated the measurement of the relationship
between the soft QCF and the intangible TQM effects on the hard factors and the
tangible effects of TQM on the organization quality implantation quest and service
improvements.
210
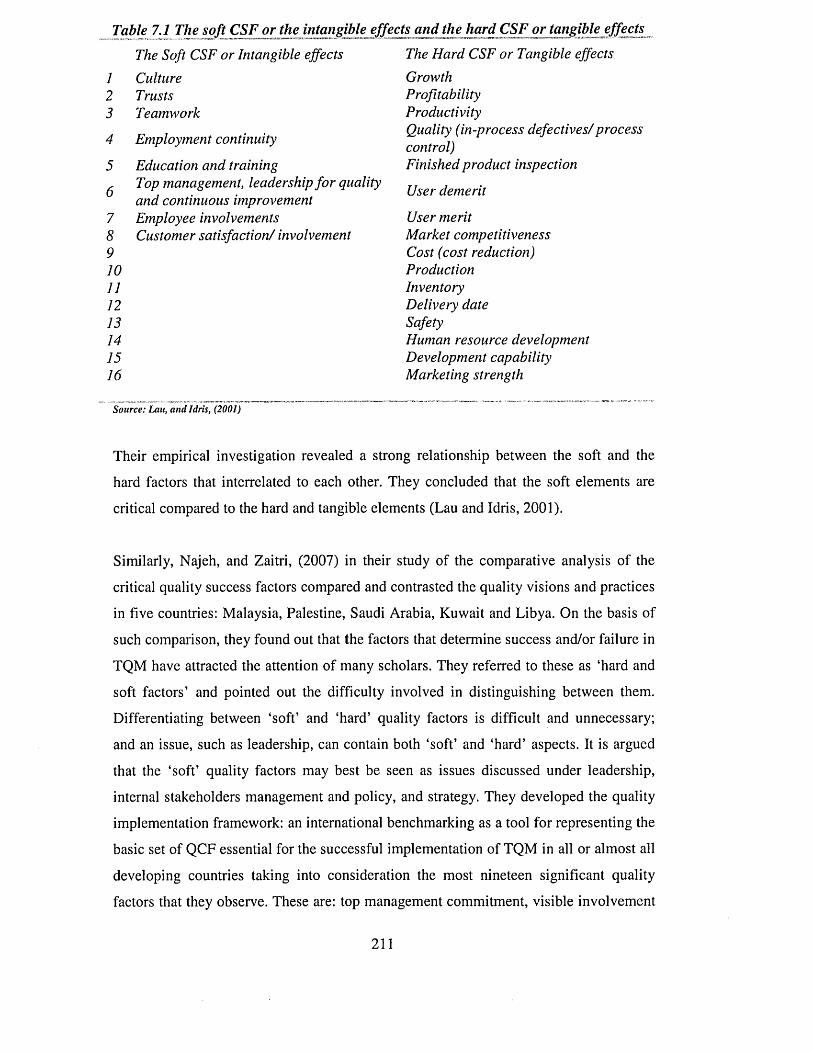
Table 7.1 The soft CSF or the intangible effects and the hard CSF or tangible effe ctsThe Hard CSF or Tangible effectsGrowth Profitability ProductivityQuality (in-process defectives/process control)Finished product inspection
The Soft CSF or Intangible effects1 Culture2 Trusts3 Teamwork
4 Employment continuity
5
678910 11 1213141516
Education and training Top management, leadership for quality and continuous improvement Employee involvements Customer satisfaction/ involvement
User demerit
User meritMarket competitivenessCost (cost reduction)ProductionInventoryDelivery dateSafetyHuman resource development Development capability Marketing strength
Source: Lau, an d Idris, (2001)
Their empirical investigation revealed a strong relationship between the soft and the
hard factors that interrelated to each other. They concluded that the soft elements are
critical compared to the hard and tangible elements (Lau and Idris, 2001).
Similarly, Najeh, and Zaitri, (2007) in their study of the comparative analysis of the
critical quality success factors compared and contrasted the quality visions and practices
in five countries: Malaysia, Palestine, Saudi Arabia, Kuwait and Libya. On the basis of
such comparison, they found out that the factors that determine success and/or failure in
TQM have attracted the attention of many scholars. They referred to these as ‘hard and
soft factors’ and pointed out the difficulty involved in distinguishing between them.
Differentiating between ‘soft’ and ‘hard’ quality factors is difficult and unnecessary;
and an issue, such as leadership, can contain both ‘soft’ and ‘hard’ aspects. It is argued
that the ‘soft’ quality factors may best be seen as issues discussed under leadership,
internal stakeholders management and policy, and strategy. They developed the quality
implementation framework: an international benchmarking as a tool for representing the
basic set of QCF essential for the successful implementation of TQM in all or almost all
developing countries taking into consideration the most nineteen significant quality
factors that they observe. These are: top management commitment, visible involvement
2 1 1
of top management in quality and customer satisfactions, clear mission statement,
quality planning, effective communication between employees and management,
organizing for quality, supplier-customer chain, employee commitment and enthusiasm
and continuous improvement through managers and supervisors.
Quazi, et al., (1998), in his Singapore case study of QCF, examined the level of quality
practices in Singapore and compared them with those of the U.A.E. manufacturing
firms. He found out that they were much higher in Singapore than in the U.A.E. The
reason was primarily due to the fact that the sample firms were selected from among
those which were already firmly well established in the quality management practices.
Quazi, was unrealistic when he compared quality practices among firms in the U.A.E.
with those in Singapore. It is obvious that the quality practices in Singapore are well
ahead and more developed than those in the U.A.E.
However, Badri and Davis, (1996) observed the absence of rationale for selecting
quality factors, and the minimal reliability and validity of instruments and methods
applied by the previous literature in relation to his study topic. Their aim was to
organize and synthesize the various sets of the critical factors identified by the different
authors in more broadly based samples of an international environment. The Saraph's
framework of eight scale factors comprising the sixty six items was used to measure
quality factors and quality performance. A survey questionnaire conducted in the
U.A.E. by manufacturing and services industries, requested participants to assess the
degree or extent of quality management practices use in their business.
The study outcome revealed high reliability coefficient measure offering strong
evidence that the instrument is reliable and that it is a correlated measure of the critical
factors of quality management, consistent with the other literature on quality factors.
Although this study is considered one of the few imperative empirical investigations
aimed to identify the QCF in the U.A.E., the researcher perceives two important
observations related to this study. First, the identified QCF were prolonged; they might
cause a sort of confusion for understanding their significance properly. Second, most of
the survey population sample was sought after the opinion of senior management who
primarily work in the private manufacturing organizations. Indeed, they are the key
players in quality implementation in their organizations; however, their perceptions are
limited to their position and inevitably they do not represent their entire organizations212
even though this study inspires the researcher of the significance of QCF in the U.A.E.
They, on the contrary, are unluckily embodying the distinctive ideology of the UAEPSI.
Baidoun (2003, 2004) and Baidoun, and Zairi, (2003) observed that the top
management, customer satisfaction, and employee involvement were important
variables in terms of their effect on the organizational performance. He also found out
that these factors are consistent with the TQM pioneers literatures. Thirty-one quality
factors were included in his survey questionnaire that was handed to the Palestinian
companies, aiming to identify the quality factors regarding the level of perceived
importance and to stratify the identified factors in a hierarchical structure and in a
descending order of criticality. The result of his study revealed that seventeen factors
out of the nineteen very critical factors share most of the values and aspects covered by
the earlier studies and the literature related to his research topic. However, the study
confirms that there are different degrees of emphasis placed on these factors. Moreover,
Hasan and Kerr, (2003) demonstrated how the critical factors relate to the operational
and financial performance of the companies. They observed that top management,
customer satisfaction and employee involvement were the important variables in terms
of their effect on the organizational performance. They also found out that these factors
are consistent with the TQM pioneers literature. The results of the empirical
examination showed how the organizational performance affected the different quality
factors.
Lakhal, et al, (2006) identified the key quality factors for the successful
implementation of TQM in selected manufacturing industries in Pakistan and
investigated the relationship between the critical quality management implementation
factors and business performance. They concluded that the consideration of a limited set
of critical quality factors can help organizations avoid quality implementation failure;
they further suggest providing a set of factors for the different sectors of the
manufacturing activities. Correspondingly, Seth and Tripathi, (2005) attempted to
extract the significant factors from integrating the principles of TQM and TPM (Total
Productivity Maintenance) in business performance with the empirical investigation of
the Indian manufacturing firms. The research identifies two sets of factors which are
critical for the effectiveness of TQM and TPM: universally significant factors for all the
three approaches: leadership, process management, strategic planning; and approach-
specific factors like equipment management focusing on the customers' satisfaction.213
They recommended that the framework justifies the lack and the well designed
performance indicators at various organizational levels. To support policies and cross
functional processes, TQM and TPM allows organizations to strive towards
accomplishing corporate goals. Zhang, et al., (2000), identified eleven QCF crucial for
quality implementation; an instrument was developed based on the identified factors to
measure the success of quality implementation initiatives in the Chinese manufacturing
organizations. The author tested the reliability and validity of the instrument and
compared it with other three instruments developed by quality experts. The findings
showed that the instrument is viable and applicable to use in different organization
activity.
Nonetheless, Chapman and Al-Khawaldeh, (2002) aimed in their study to measure the
link between TQM and labour productivity in the Jordanian manufacturing industry.
Eight core factors identified in other literatures were used as parameters of the
measurement tool. The empirical investigation showed a positive relationship between
TQM principles and labour productivity, with a major variation in the level of labour
productivity among organizations with ISO certification and organizations without.
Houston, and McKean, (2002), and Venkateswarlu and Nilakant, (2005) identified
factors that assist the organization with means to persist and sustain continuous quality
implementation programmes by conducting five case studies on private manufacturing
firms in New Zealand. The study exposed the five firms; three of them terminated their
quality programmes and two persisted on their quality programmes. The failure was due
to several factors. Their study identified some of these factors: compulsions for change;
core philosophy; commitment of senior management; capability, experience and fit of
the TQM champion; collateral changes; and continuity of leadership. Mann and Kehoe,
(1995) introduced the quality critical organizational characteristics (QCOC) to describe
the characteristics that influence the effectiveness of quality initiatives. They observed
the critical factors which were responsible for the effective and successful
implementation of TQM. Their investigation revealed a complex relationship between
the organizational factors and the quality activities. They concluded that the
organizations must be aware of the importance of these factors that are changing with
time. These factors vary for each quality activity and this variation depends on the TQM
implementation stage.
214
Alternatively, studies focused on the QCF in the service organization, such as those of
Saravanan and Rao, (2006) affirmed that the purpose of their study was to measure the
Total Quality Services (TQS) implementation in service industries rather than in
manufacturing industries and to test them. A survey was conducted in the automotive
service stations to draw the critical dimensions of quality from the management
perspectives. Twelve critical quality factors were identified as crucial dimensions of the
successful implementation of quality in service industries. Based on an extensive
literature survey of quality management, they came up with the following categories of
quality factors; the critical dimensions of TQS can be broadly classified into five groups
as follows:
1. Management oriented dimensions: top management commitment, leadership and
benchmarking.
2. Customer oriented dimensions: customer focus and satisfaction, service
marketing and social responsibility.
3. Employee oriented dimensions: human resource management and employee
satisfaction.
4. Organization oriented dimensions: service culture, services cape, and
continuous improvement.
5. Technology oriented dimensions: technical system and information analysis.
In addition to that, Sirvanci (2004: 5) raised the issue of the increasing costs of higher
education services which are not efficient. The educational authorities lagged behind
other service institutions in adopting and implementing the TQM principles in their
organizations. He focused on several critical factors that are unique for the higher
education institutions such as leadership, cultural and organizational transformation, and
the customer identification and students role. He finally concluded that the
implementation of quality in higher education is different from other service industries
depending on how the customers are identified and how much the performance measure
for the organization and the processes understudy are affected. The critical factors for
the higher education organizations identified by Sirvanci, are leadership, customer
identification, cultural and organizational transformation (such as, teamwork), customer
and market focus, employee involvement and participation, and process management.
215
Tang, and Zairi, (1998a and 1998b) examined the enabler’s criteria of the European
quality award which were used in benchmarking quality implementation in a service in
the context the comparative analysis of the financial services and institutions of higher
education, they observed that there are similarities in the areas of adopting the best
quality practices with considerable emphasis on the quality factors during the
implementation and evaluation of quality in the service organizations. In the first part of
their study on benchmarking quality implementation in a service in the context of the
comparative analysis of the financial services, they pointed out that the key factors are
the indicated drivers of performance: reward, recognition, supervision and training.
Mellahi and Eyuboglu (2001) also identified the key factors that influence the success
of TQM implementation in the Turkish banking sector. In carrying out an extensive
case study, they noted that the QCF was the management’s unwavering commitment to
TQM and enthusiasm. Therefore, they recommended the founding of a formal national
institution responsible for introducing organizations to TQM and for providing
assistance during and after TQM implementation.
Sureshchandar, et a l, (2001) conceived from the previous TQM literature that most of
the researchers focused on the manufacturing organization rather than the service
organization with respect to developing a conceptual model for TQM implementation in
service organizations. They reviewed over 100 articles, perspectives, conceptual
frameworks, practitioner, and empirical literature on TQM and on the total quality
service. They came up with twelve common critical factors for the effective
implementation of quality management in service organizations. Management
commitment and human resources management were the most critical factors.
Other studies focused in identifying QCF in Small and Medium Enterprises (SME’s).
Researchers such as Yusof, and Aspinwall (2000a), stated that the purpose of their study
was to identify the similarities and difference of the CSF between large size
organizations and SME’s. A postal questionnaire was sent to the SME’s in amative
industry in the UK, to test the level of importance and the practices of TQM in
organizations certified with quality standards and in others, not certified. Questionnaires
were distributed. With eleven CSF identified by the survey, the findings showed that
those for SME’s were not the same as those for large companies. Furthermore,
Khamalah and Lingaraj (2007) empirically investigated a survey of managerial216
perceptions for the implementation of TQM in small service businesses in the US. The
study addresses the employment of TQM, the tools used, successes, failures, benefits,
and problems encountered in small firms. The results showed that top management
commitment was the major success factor, but this commitment was not translated into
action whereas the employees' training, recognition and rewarding the employee’s
factors were accorded minor importance with regard to the TQM implementation. The
conclusion seemed to be in the line with the other related literature, that the majority of
SME’s hindered the initiation of such quality project.
Teamwork focusing, lack of long term commitment, and communications gap are also
hindering obstacles. Another study carried out by Wong (2005) reviewed and compared
the different literature related to quality implementation and QCF. He argued that all the
literature derived empirical results from the large organizations. As a result, he tends to
find out a suitable CSF for the SME’s from the empirical and literature investigations.
He suggested a more comprehensive model of eleven factors for implementing KM in
SME’s. The identified factors were consistent with other literature. On the contrary, Eng
and Yusof (2003) argued that most of the quality initiatives of large and SME’s
enterprises pursued the ISO 9000 certification, and very few of them implemented
quality approaches. Therefore, they examined the extent of the practices on TQM
elements and identified the most QCF in SME’s perceived in the Malaysian electrical
manufacturing industries. The survey analysis revealed a significant difference in terms
of quality practices among large and SME’s firms.
Other authors perceived the QCF from different perspectives. Ciptono (2007)
investigated the perception of the managerial level, i.e., top, middle, and low in a large
manufacturing organization, the relationship between the critical factors of quality
management practices and the company financial performance. The research findings
revealed a positive correlation concerning the impact of the critical factors of quality
management practices on the company financial performance; in addition, the empirical
results demonstrated that there is a positive and significant relationship between the
company non-financial performance and the company financial performance. Other
scholars like Denis, et a l, (2007), Gal, (2004), Warwood, and Roberts, (2004), and
Tamimi, (1998) reviewed the different literature related to QCF, by carrying out two
surveys on the winners of quality awards of MBNQA and EQA; one hundred
organizations in the UK revealed the importance of effective leadership, the impact of217
other quality-related programmes, measurement systems, organizational culture,
education and training, the use of teams, efficient communication, active empowerment
of the workforce, a system infrastructure for the business, and the focus on the customer
and processes. Based on the results of the field survey, a self assessment test was
developed to assist the organization to predict their future success or to review the
current quality practices and improve performance.
A comprehensive study carried out by Sila and Ebrahimpour, (2003) empirically
validated the TQM QCF and their impact on the various performance measures across
seventy six countries around the world. The survey-based TQM studies and the
literature review spanned over eleven years from 1989 to 2000. They identified three
factors, most commonly extracted from the MBNQA criterion. They were: top
management commitment and leadership followed by customer focus, information and
analysis; these factors could be considered the most universally applied TQM factors.
Surprisingly, they argued that in some studies across countries the factors and the
results were similar. Similarly, Karuppusami, and Gandhinathan, (2006) acknowledged
a list of QCF for TQM literature. The objective of this literature review is to investigate
and list the QCFs of TQM in a descending order of frequencies of occurrence and to
determine the effects on the performance measurements. The examination of thirty
seven studies on quality QCF resulted in fifty six critical factors identified by using
pareto analysis.
To some extent, the researcher quite agrees with Stupak and Garrity (1993) and
Dingwall, and Strangleman, (2007) who believe that, until recently, there has been
allegation that TQM is not compatible with the public sector and that there is no wide
spread movement to implement the TQM philosophy in the public sector. Much of the
reluctance is due to the belief that the public and the academic cultures are incompatible
with TQM. This may have resulted from misunderstanding the key elements in these
cultures or the more important sub-cultures that prevail in the large, often diverse public
sectors. They have emphasized the key characteristics of TQM in relation to the public
sector as the following factors:
7. Focus on improving the process
2. Quality defined by the customers
3. People empowered to make decisions218
4. Decisions based on facts
5. Long term leadership and commitment to TQM
Form what preceded, it has become obvious that almost all of the QCF which were
identified or explored by gurus and by the literature and empirical studies are identical.
Regardless of the organization type (manufacturing or service; private or public), size
(Large or SME’s) and origin (developed or developing countries), all comply to the
most common factors; for example, leadership and management commitment,
employee’s involvement, reward and their satisfaction, process and work systems
management, customers and suppliers satisfaction, adequate resources and facilities,
continuous goods and services improvement. Since these QCF are alike, the research
identified factors; therefore, the research proposed model considered these factors as the
core factors and the sub-factors that form the model framework. Further details on these
core factors and the structure of the model is presented in Chapter Eight.
7.1.2 Quality and Excellence Models
This section presents the most universal commonly adopted quality framework models.
The purpose is to highlight every model by providing brief explanation on its main
function and how the researcher had extracted the basic conceptions in drafting the
research model.
7.1.2.1 Deming Model
Deming introduced a mechanism model for quality management. He recommended a
systemic procedure known as Plan-Do-Check-Act Cycle. The cycle is the foremost
quality approach that proved to be a successful method for organizational quality
performance improvement. The purpose of the model is to award organizations that
continually apply Company-Wide Quality Control (CWQC) which is basically a
statistical quality control tool. The basic theme of the cycle is that the organization plans
a change or an improvement process, implements it, and checks the results. Depending
on the results, action is taken either to standardize the change or to begin the cycle of
improvement again with new information, (Rungtusanatham, et al., 1998; and Bush and
Dooley, 1989). The Deming Prize for Quality Control was established in Japan
219
(DPQC). Evans and Lindsay (1993) stated that the Deming award criteria consist of ten
major categories:
1- Policy and objectives,
2- Organization and operations
3- Education and dissemination
4- Assembly and disseminating information
5- Analysis
6- Standardization
7- Control
8- Quality assurance
9- Results
10-Future plans
Deming model had inspired other quality and excellence models to develop their
approaches. In the U.A.E., the Deming model and mainly his cycle is used by quite few
UAEPSI as a performance measurement tool. However, the Deming model itself is
rarely adopted.
7.1.2.2 Baldrige Model
In the early and mid-1980s, many industry and government leaders observed that a
renewed emphasis on quality was no longer an option for the American organisations
but a necessity for doing business in an ever expanding, and more demanding,
competitive world market. However, many American businesses either did not believe
that quality mattered for them or did not know where to begin. In 1987, the Malcolm
Baldrige National Quality Award (MBNQA) founded in the United States was launched
as a standard of excellence that would help organizations achieve excellent quality
(Brown, 2008). The Baldrige award criteria are an important tool that defines the
elements of an effective, customer-focused management system based upon the quality
principles. It is widely used for educational and assessment purposes, (Brown, 2006).
The Baldrige performance criteria are a framework that any organization can use to
improve the overall performance. Seven categories make up the award criteria:
2 2 0
1. Leadership: it examines how senior executives guide the organization and how
the organization addresses its responsibilities to the public together with the
practices good citizenship.
2. Strategic planning: it examines how the organization sets strategic directions
and how it determines key action plans.
3. Customer and market focus: it examines how the organization determines the
requirements and expectations of the customers and markets; builds
relationships with customers; and acquires, satisfies, and retains customers.
4. Measurement, analysis, and knowledge management: it examines the
management, effective use, analysis, and improvement of data and information
to support key organization processes and the organization’s performance
management system.
5. Human resource focus: it examines how the organization enables its workforce
to develop its full potential and how the workforce aligns with the organization’s
objectives.
6. Process management: it examines aspects of how key production/delivery and
support processes are designed, managed, and improved.
7. Business results: it examines the organization’s performance and improvement
in its key business areas: customer satisfaction, financial and marketplace
performance, human resources, supplier and partner performance, operational
performance, and governance and social responsibility. The category also
examines how the organization performs relative to the competitors,
(http://www.nist.gov).
As mentioned in Chapter Six, section 6.3, the quality model is not adopted in the
UAEPS, neither by private sector or public organizations. The Baldrige model is
adopted by only one quality award body; it’s primarily established for evaluating the
educational sector in the U.A.E.
2 2 1
7.1.2.3 The EFQM Excellence Model (EFQM-EM)
The European Foundation for Quality Management (EFQM) was founded in 1988. Its
purpose is to assist the development of quality management, an independent body which
implements the basic principles of quality management. The EFQM does offer the
European Quality award which provides quality initiatives and assistance to
organizations within the European Union Nations. In 1992, the EFQM launched its
excellence model, the EFQM-EM. The model is more like a new modified version of
the Deming and Baldrige quality models; it is very similar to them in its form and
structure. It provides the European private and public sector organizations with an
application tool to benchmarking and self-assessment performance. The EFQM-EM
framework consists of nine criteria, equally weighted between Enablers and Results.
The enablers comprise five criteria: leadership, people, policy and society, partnership,
resources and processes. The enablers constitute the organization existing performance.
The results consist of four criteria: people results, customer results, society results, and
key performance results. The results indicate the organization potential achievement.
Each criterion has a number of sub-criteria with different scoring points,
(www.efqm.org).
The basic missions of the EFQM-EM are:
- To stimulate and assist the organizations throughout Europe to participate in
improvement activities leading ultimately to excellence in customer satisfaction, in the
impact on society and in the business results.
- To support the managers of the European organizations in accelerating the process of
making TQM a decisive factor for achieving global competitive advantage,
The EFQM-EM with its self assessment performance measurement method of RADAR
proved to be the most suitable quality approach that responds to the special needs of
organizations in order to pursue their strive to excellence. The model was mainly
developed for private manufacturing organizations; it was later adopted by service
organizations. In the last decade, the EFQM-EM was used by public sector institutions.
This model is officially recognized by all UAEGEP, (Chapter Six explains the reasons
for adopting such model in the UAEPSI).
2 2 2
7.1.2.4 Toyota Production System (Lean Production)
Today, Toyota is the world's largest manufacturer of automobiles. It is by far the largest
Japanese automotive manufacturer, producing nearly ten million vehicles per year; one
every three seconds. This remarkable success is due to the Toyota Production System
(TPS) or the lean production which was initiated in the late 1970s. The TPS is basically
based on the ancient Japanese philosophy of Just in time (JIT). (Toyota Motor
Manufacturing, 2009)
Toyota Corporation built a global trade mark that serves as a model of quality vehicles.
Through TPS, it has managed to cut costs, reduce time to market, and dramatically
improve quality. This has resulted in producing versatile, reliable, efficient vehicles and
affordable spare parts and maintenance services. These key successes have influenced
not just auto making, but the manufacturing standards for many other products all over
the world.
The adaptation of TPS allows Toyota to be one of the few companies that is able to
compete simultaneously as a premium and as a low cost producer. Lean, as a
management philosophy, is also focused on creating a better workplace through the
Toyota principle of respect for humanity. Lean production is a methodology that
focuses on making the product flow through a value-adding process without interruption
(Coffey, 2007; Morgan, 2006; Glauser, 2005; Liker, 2004 and Nave, 2002)
There are several important aspects of TPS. These relate to either cost reduction, or
quality improvement, or both. The underlying philosophy of TPS is a relentless desire
to continually find and remove waste i.e. time, cost, and material. This attitude results
in continual improvement of quality and efficiency. One of the mechanisms for this
improvement is the JIT-TPS. The JIT-TPS main function is to reduce the amount of
inventory in a system to its minimum. The material is only provided when needed.
This is opposed to having large amounts of inventory piled up waiting to be processed.
The JIT-TPS has many advantages over the conventional systems: it eliminates
inventory results and reduces costs. The JIT-TPS also improves quality as it allows for
quick detection of quality problems. Because units are only produced as needed, there
will not be a situation in which large amounts of defects are reworked. The five core
concepts of TPS-JIT are:223
1. Specifying value in the eyes o f the customer
2. Identifying the value stream and eliminate waste
3. Making value flow at the pull o f the customer
4. Involving and empowering employees
5. Continuously improving the pursuit o f perfection
The strategies that underlie the TPS can be summarized into four basic rules. These
rules guide the design, operation and improvement of every process of work; the rules
are as follows: all work should be highly specified as to content, sequence, timing and
outcome. Every customer, supplier connection must be direct. The pathway of every
product and service must be simple and direct. Any improvement must be made in
accordance with a scientific method. The TPS is merely for the mainly public sector
institutions, the manufacturing organizations; it is not properly applicable for service
organizations. However, its core rules and principles are believed to be very useful in
shaping the conceptual part of the research proposed model.
7.1.2.5 Six Sigma
Six Sigma means in business and industry a statistical measure and a management
philosophy. It focuses on eliminating mistakes, waste, and rework. It is defined by
Truscott, as the ' focuses on establishing world-class business-performance benchmarks
and on providing an organizational structure and road-map by which these can be
realized. This is achieved mainly on project by project team basis, using workforce
trained in performance enhancement methodology, within a receptive company culture
and perpetuating infrastructure", (Truscott, 2003: 3). Six sigma works best when
everyone in the organization is involved, and when it combines people power with
process.
It is a programme that establishes a measurable status to achieve and embody a strategic
problem solving methodology that increases the customer satisfaction. It instructs
employees on how to function scientifically in order to augment their new performance
level to the maximum. It is based on statistical measures that provide discipline,
structure, and foundation for a better decision making. It also increases the organization
return with regard to financial and people investment. Chowdhury (2001) presented his
perception of the six sigma goal simply to make the customer happier by considering224
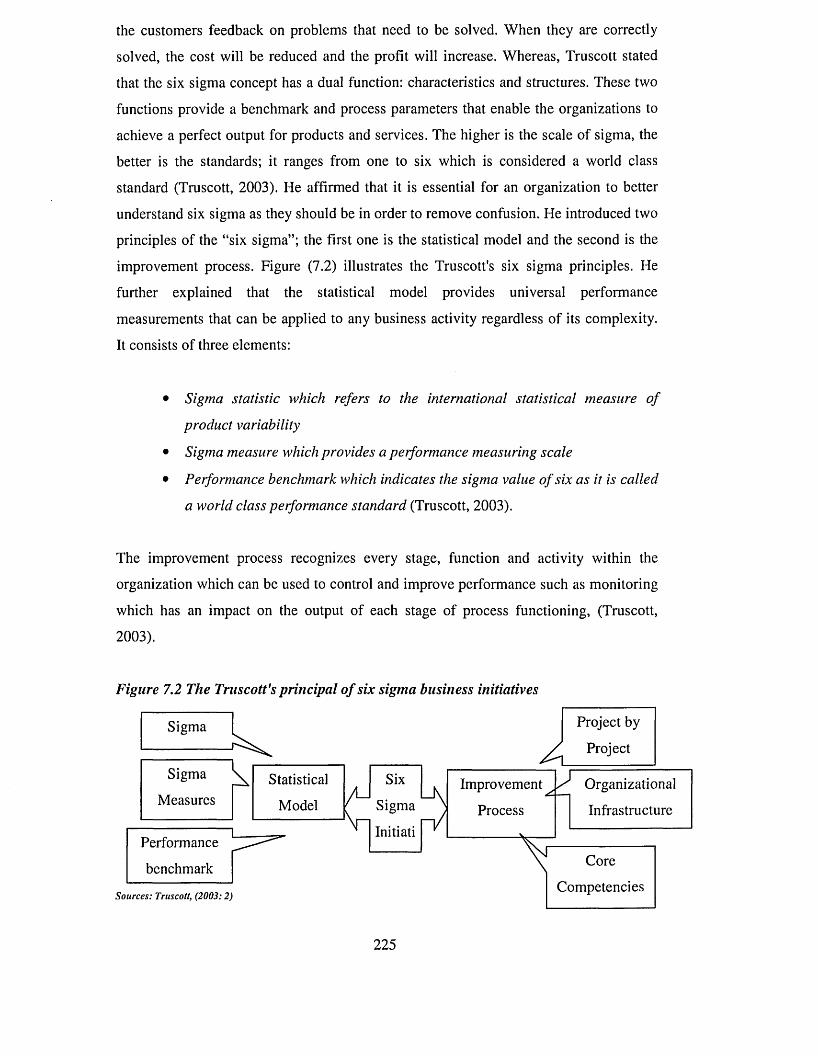
the customers feedback on problems that need to be solved. When they are correctly
solved, the cost will be reduced and the profit will increase. Whereas, Truscott stated
that the six sigma concept has a dual function: characteristics and structures. These two
functions provide a benchmark and process parameters that enable the organizations to
achieve a perfect output for products and services. The higher is the scale of sigma, the
better is the standards; it ranges from one to six which is considered a world class
standard (Truscott, 2003). He affirmed that it is essential for an organization to better
understand six sigma as they should be in order to remove confusion. He introduced two
principles of the “six sigma”; the first one is the statistical model and the second is the
improvement process. Figure (7.2) illustrates the Truscott's six sigma principles. He
further explained that the statistical model provides universal performance
measurements that can be applied to any business activity regardless of its complexity.
It consists of three elements:
• Sigma statistic which refers to the international statistical measure o f
product variability
• Sigma measure which provides a performance measuring scale
• Performance benchmark which indicates the sigma value o f six as it is called
The improvement process recognizes every stage, function and activity within the
organization which can be used to control and improve performance such as monitoring
which has an impact on the output of each stage of process functioning, (Truscott,
2003).
Figure 7.2 The Truscott's principal of six sigma business initiatives
a world class performance standard (Truscott, 2003).
Sigma
Improvement ^
Project by
Project
Sigma
MeasuresStatistical
Sigma
Initiati
OrganizationalModel Process Infrastructure
Performance
Sources: Truscott, (2003:2)
benchmark Core
Competencies
225
The six sigma method is considered as a measurement that it is used to reduce product
and process variations. It indicates how badly or how good the organization
performance of a process is, i.e. how many mistakes or errors are made regardless of the
amount of business conducted. However six sigma is presented in a numeric way to the
organizations; one must know where it stands, what it wants to attain, and how it is
done. One should be aware of the end goal of implementing the six sigma principles,
which is to improve quality so that it goes parallel with the customer satisfaction,
(Chowdhury, 2003).
Truscott (2003: 9) introduced an extended version of the DMAIC (Define-Measure-
Analyse-Implement-Control) approach which he called the six sigma generic approach
and to which he added three further steps: (Identify, Develop, and Communicate) as
illustrated below:
1- Identify the project
2- Define the project
3- Measure the current process performance
4- Analyze the current process
5- Develop the improvements (pilot and verify)
6- Implement the changes (achieve breakthrough in performance)
7- Control at new level (institutionalize to hold the gains)
8- Communicate (the new knowledge gained and transfer the solution to similar areas),
Truscott (2003) justified his approach on the bases of three main reasons. First, the
additional three elements (Identify-Develop-Communicate) which were introduced in
order to differentiate the six sigma approach from the quality circle approach. Second,
the way he has developed; it represents, indeed, the best practices. Third, and most
importantly, its applicability to the project nature, i.e. each project has its own unique
problem solving and process improvement methodology.
This approach is well known and it is adopted by private large size manufacturing
organizations. However, to the best of the researcher’s knowledge, this approach does
not exist in the UAEPSI. Though, it is believed to some extent, that the six sigma
statistical measures are used much frequently as a tool for self assessment and quality
performance improvements in the UAEPSI.226
In the light of the above models and the quality approaches, it is believed that these
models do not focus solely on product, service perfection or traditional quality
management methods, but rather they consider a wide range of management activities,
behaviour and processes. They provide a useful audit framework against which
organizations can evaluate their TQM implementation practices, seek improvement
opportunities, and end results. They remind the researcher that the proposed model
should contain a systematic methodology in translating these theories into practice.
Thus a self assessment measurement tool needs to be developed for this purpose. This
instrument enables the UAEPSI to determine the appreciation level and to initiate
quality programme. More explanations and details related to the model methodology are
presented in Chapter eight.
7.1.2.6 Other Quality Framework Approaches
This section reviews the other quality framework approaches that were developed by
different TQM literature. Their major characteristic is that they are non generic as they
are developed by individual quality practitioners and that they are seldom practically
applied. It is perceived that the majority of them are mainly theories that have never
been broadly experimented with. But, by reviewing them, the researcher would get an
idea about how they were developed.
As the researcher outlines the different quality framework approaches, it becomes
apparent that most of the studies focused on private manufacturing organizations and on
developing frameworks and self assessment instruments to validate their assumptions.
There is also lack of studies in undertaking the issue relevant to the U.A.E. Al-Tamimi,
and Al-Amiri (2003) attempted to measure the level of service quality, to analyze the
service quality of the Islamic banks in the U.A.E. and to compare differences in service
quality provided by two semi-owned state Islamic banks. A survey questionnaire that
aims to examine the level of service in terms of the customers' age, gender, nationality,
education, and the number of years of banking is applied. It also aims to identify the
probability of differences in the service level according to the customers’ expectations
of both banks. By applying the techniques of the SERVQUAL method to analyze the
data gathered, the study results showed that there was no significant difference between
the levels of overall service quality in both banks based on the customer’s genders and
nationality. On the other hand, it indicated significant differences based on the227
customer’s age, education, and number of years of banking. However, what weakens the
study results was the fact that it was carried out in only two organizations, which do not
necessarily reflect the wide Islamic banking industry in the U.A.E. or the private sector
organizations. On the contrary, Leonard, et a l, (2002) carried out an investigation on
the lack of current excellence models to evaluate two critical aspects of organizations;
they examined the self assessment, the performance measurements and the dynamic of
TQM influence on organizations. They reported the results of their fifty two case
studies on the American firms from different economic sectors and sizes applying the
Leonard grounded theory for TQM strategic dynamics. They considered each model
separately as the picture of the TQM dynamics and its relationship with the organization
strategy became clearer. They developed five models of quality: the TQM applications
model, the TQM strategic drivers’ model, the TQM drivers’ model, the TQM
environment model and the TQM lifecycle model. The combination of these models
resulted in the development of a new TQM framework called the strategic dynamics of
TQM. The aim of the framework was to demonstrate both the dynamic and the strategic
perspectives of TQM.
They affirmed that by using this model, the organizations can portray a comprehensive
past, present and future status of TQM. They strongly proposed that the framework used
in their study provides useful and more meaningful insights into the complexity and
dynamics associated with TQM in the organizations. The end result was that TQM is
much more dynamic and it goes beyond the static assessment. Conversely, Radin, and
Coffee (1993) reviewed the experience in the federal government; they proposed a
framework for quality implementation consisting of six elements which should be
considered before a TQM effort is made: 1) the type of organization; 2) the interest
group dominance and policy agreement; 3) the leadership longevity and tenacity; 4) the
crisis or external motivation for change; 5) the size; and 6) the competency of the
organization members. The authors specified the five significant factors that the
government should bear in mind. In order to assess the landscape of TQM and the
management reforms, the government organization should leam (and benchmark to the
private sector, the organization quality initiatives), that quality is a never ending process
and that the top management officials are the main drives for quality; they should
criticise and address the organization problems.
228
Whereas Quazi, at el, (2002) attempted to corroborate the results of their studies with
the previous ones in the same field by applying the Saraph's instrument on thirty three
manufacturing and service firms in Singapore. The aim was to compare the outcomes in
their study with the two other replicating studies covering larger samples in many
countries to establish the robustness of the instrument. A self assessment approach was
suggested to measure the performance and quality practices in the selected
organizations. The end result of the study revealed that the instrument used was reliable
and valid for measuring quality practices in both the service and manufacturing
organizations. It also presented the similarities and difference of quality factors and
implementation practices in comparison with other studies. They recommended that the
instrument could be used as a continuous monitoring quality performance tool serving
as an indicator for the organization decision makers to identify quality gaps and
problems and to solve them. Interestingly, Montes, at el, (2003) conducted a study
which is quite similar to this research, but targeted private manufacturing organization.
They developed a TQM implementation framework that takes into consideration the
content, elements and the needs of the organizations. The framework provides a
guideline for the organization, prior to and after initiating quality approaches regarding
questions such as: what, when, why and how to do it focusing on the characteristics of
the internal and external factors. They argued that in this way they could analyse the
factors regardless of the organizations themselves: whether they are in the
manufacturing or the service sector, and their sizes. However, the framework
development depends on the previous literature which is related to the research issue;
therefore, it couldn’t be viable unless an empirical study supports their assumptions.
Likewise, Alsadhan, et al., (2008) investigated the QCF that affects the success of
Knowledge Management (KM) and identified thirty two factors from various the
literature that contribute to the successful KM project implementation. Survey
questionnaires were sent to the organizations that implement quality across the world;
the respondents came from various countries and industry sectors. An integrated
framework model for the effective implementation of the KM projects based on the best
practiced perspectives was proposed to investigate the organizations that already
implemented quality approaches and to learn from their experiences. The study
findings show that all the factors are interrelated and are strongly dependent on each
other; the framework developed is adaptable and applicable to the different
organizations regardless of the size and nature of business. It provides an insight for the229
organizations that are on their way to commence the quality initiatives considering the
factors identified to achieve better results. Claver, et al., (2003) study based on
reviewing the literature related to QCF, and on the empirical investigation of 106
multiple sector organizations in Spain identified eight critical factors and three results of
TQM. The identified factors were used to develop a scale of TQM measurement, the
critical factors are: leadership, quality planning, training, specialized training, supplier
management, process management, continuous improvement and learning, and the
results factors are: customer satisfaction, social impact, and business results. Based on
the empirical results, a framework was developed. It enables managers understand
better quality practices and TQM, evaluate and measure the factors and results
identified in their organizations. The author recommends the model as a tool for quality
improvement particularly for large size organizations. It allows them to observe the
strength and weakness and to perform the necessary improvements.
Discrete studies underlined the people contribution to private organizations. Pun and
Gill, (2002) examined the prerequisites of the employees' involvement in the process of
TQM implementation that safeguards the organizations efforts in service improvement
processes. They proposed a generic implementation model that was able to integrate the
employee’s involvement, to assist the organization to implement efficient quality
practices and to facilitate their change towards quality. The model also provides the
organization with self assessment criteria for performance improvement. The proposed
framework was initially based on the Baldrige Award criteria. The framework was
tested and it proved to be valid in measuring performance and quality improvements.
More to the point, focusing on three elements of performance management: knowing
the requirements, regular appraisal and review feedback and fair and appropriate
individual performance reward. The aim of the personal performance guide framework
is to get people involved in the TQM process; it helped everyone in the organization to
know what to do and how to do it in order to achieve the overall organizations goals.
The same issue was tackled by Poulymenakou and Tsironis, (2003) who explored the
relationship between electronic commerce and quality management, how to integrate
and use the TQM approach, the tools required to develop the process of the organization
and the service industries. The findings of the study indicated that TQM approach and
its implementation in electronic commerce is significant for their service improvement
and customers’ satisfactions.
230
Several noticeable studies on developing the systematic TQM model were encountered;
for instance, Silvestro, (1997) attempted to develop a generic TQM model that
comprises six precepts to ensure the comprehensive, widespread and balanced
implementation of TQM across service organizations; the idea behind this model is to
facilitate the audit of management practices that measure achievements or results. He
argues that it enables managers to identify areas of TQM; the areas with a partial
implementation level are compared with those, widely and systematically implemented.
The emphasis on two measurements was derived from services and from the literature
on the customer’s satisfaction and the process operation, Silvestro, (1998). Equally
important, Johnson (2004) reviewed the existing quality models developed by other
practitioners and proposed a model based on the previous models that were tailored to
the specific needs of the organizations called the Quality Standard Registration
Performance Outcome Model. The reason for developing such model is that it supports
the relationship between the organizational variables, the organizational change models,
and the quality management system implementation. He focused on expanding the body
of knowledge linking grounded theory associated with the organizational change
models and quality standard registration mandated by the customer. He recommends
that the model could be applied to the implementation of other customer-mandated
initiatives and that it is not strictly limited to quality standard practices.
Several quality frameworks were developed for the SME’s. Yusof and Aspinwall,
(2000b, 2000c, 2000d) examined the various TQM implementation issues particularly
in SME’s. The investigation contended that SME’s are not capable of initiating quality
project in the whole organization at once; instead it needs to focus and implement it
with gradual adoption due to their limited human and financial resources. They
perceived the different TQM practices of the large and SME’s organizations. They
noted that some TQM implementation frameworks were not suitable as they were
developed mainly for large size organization rather than for SME’s ones. They aim to
provide a different perspective and to illustrate the similarities and differences in the
frameworks developed in the literature. They perceive that simple frameworks are
better for SME’s.
Based on their research outcomes, they proposed a TQM conceptual implementation
framework for small businesses that help and guide them on how to initiate a successful
TQM implementation project that enables them to sustain continuous product and231
service improvement. Furthermore, Ghobadian and Gallear, (2000, 1997 and 1996)
explored the difference of quality implementation characteristics between large and
SME’s organizations in order to determine whether size significantly affects the
appropriateness of TQM. They used three factors in the selection of the case study: size,
geographic distribution, and effective use of TQM. The study revealed that the basic
concepts of TQM were equally applicable in the SME’s context. However, the size of
the organization differs between large and small so are the influences in terms of
communication, nature of leadership and the extent of organizational cross functional
integration. Based on the study outcomes, they developed a model for the
implementation of TQM in SME’s and consideration recognition for specific
requirements and needs for the crucial factors for the successful quality implementation
in SME’s.
Whereas Spencer and Loomba, (2001) carried out a fieldwork survey on the TQM
practices employed by the small manufacturing firms in the American industries. Out of
the thirty nine general characteristics of quality in the small firms, they found out that
the small size enterprises could implement TQM as their large counterparts; they then,
proposed a benchmark of TQM practice framework, to be used by other firms in the
same industry.
Hafeez, et al., (2006) conducted a comparative study on ten TQM gurus, on their
quality conceptual development as an instrument for organizational success. They
carried out a survey organization that implemented quality to indentify and authenticate
the theoretical concepts of the practitioners’ points of view. The survey revealed the
theoretical concepts that scored higher than the practitioners’ experience; however,
when it comes to implementation, the results showed that the organizations experience
major difficulties in translating TQM theories into practices.
They suggested that the organizations need to pay due consideration to issues related to
people as well as the TQM traits. They developed a framework (technological and
organizational, involving people and management) by using a balance score card as a
tool for performance measurement that enables organisations to concentrate their efforts
on technology. The organisational and people management instruments provide
indicators for financial and non financial aspects of quality implementation.
232
However, Escrig-Tena (2004) presented a theoretical and empirical analysis
considering TQM as a competitive factor and TQM influence on organizations
performance. The analysis results led to developing a model of relationship between
TQM and the organizations performance improvement. A series of hypotheses were
formulated and tested to support the empirical investigation. The results of the data
analysis revealed that the hypotheses test the relationship of TQM to the organization
performance on the suppliers, customer care, and the relationships with the staff which
were positive and consistent with the preceding literature related to this issue.
Correspondingly, Baxter, and MacLeod (2008); Idris, and Zairi, (2006), Yeh, (2003),
McAuley, (2001), and Selen, and Schepers, (2001) perceived that TQM is simple and
easy to implement once the organizations gave their internal and external customers
their top priority with a proposed framework of steps to TQM journey to recognition
and success in business. They emphasized the short and long term intangible benefits of
TQM, as they explained that the organization should focus on them rather than on using
TQM tools as a future prediction of cash flow and financial profits. They reviewed the
quality frameworks and approaches that provide a universal framework for evaluating
aspects of TQM practices in organizations.
They also provide a framework for identifying a range of intangible and tangible
processes that influence the organizations TQM implementation and the end results.
Although each quality framework and approach has its own unique categories and.
emphasis, there are some common areas. First, each quality framework and approach
has two parts: the first is the TQM implementation and the second is the overall
business results. TQM implementation makes the overall business results happen.
Second, all the models emphasize the importance of leadership, human resource
management, employee participation, employee education and training, process
management, strategy and policy, information, supplier quality management, and
customer focus. In addition, quite few quality frameworks and approaches provide the
organizations with a means to measure their performance improvement against a set of
universal criteria, and to identify their strengths and weaknesses in the areas of quality
management practices and business results.
These models provide insight into the practical way of applying quality, as well as a
solid foundation for this research, and give the researcher a better understanding of the233
concept of quality. Additionally, most of the above mentioned quality frameworks and
approaches are similar in their main concepts. However, in some cases they differ in the
minor details that are related to the sequential priorities of certain criteria or factors.
Some of these frameworks need to gain more credibility, as they are still theoretical
assumptions and have not been empirically tested. Other approaches are based on the
existing models, but they were very rarely applied by the different organizations and
countries. What’s more, it is observed that several framework models do not explain or
do not develop a methodology of self assessment tool.
What is surprising is that according to the researcher’s knowledge and from the revision
of the preceding literature, just one study proposed a framework model for the public
sector organization. These observations enabled the researcher to overcome the
drawbacks noted in the reviewed quality models. Accordingly, it inspires the researcher
to develop a model that is well structured, that has clear mechanisms and that fits the
purpose and responds to the UAEPSI quality requirements. Further details and
clarifications are presented in Chapter Eight as it mainly discusses the development of
the research model.
7.2 EMPIRICAL DEVELOPMENT
This section explains the empirical development part of the research model from the
outcomes of the data analysis already discussed in Chapter Five. The actual data
obtained from the research fieldwork, the literature and the relevant studies were used as
basic sources for the development of the conceptual proposal of the research model.
The outcomes of data analysis as displayed in Table (7.2) weigh against the relative
importance mean of every single factor which the employees in the UAEPSI consider
vital to the success of TQM in their institutions. The factors were ranked in a
descending order according to the relative mean importance. The data revealed that the
factors relevant to the management leadership and people were among the highest
significant factors in all UAEPSI; they, thus, need to be carefully considered.
234
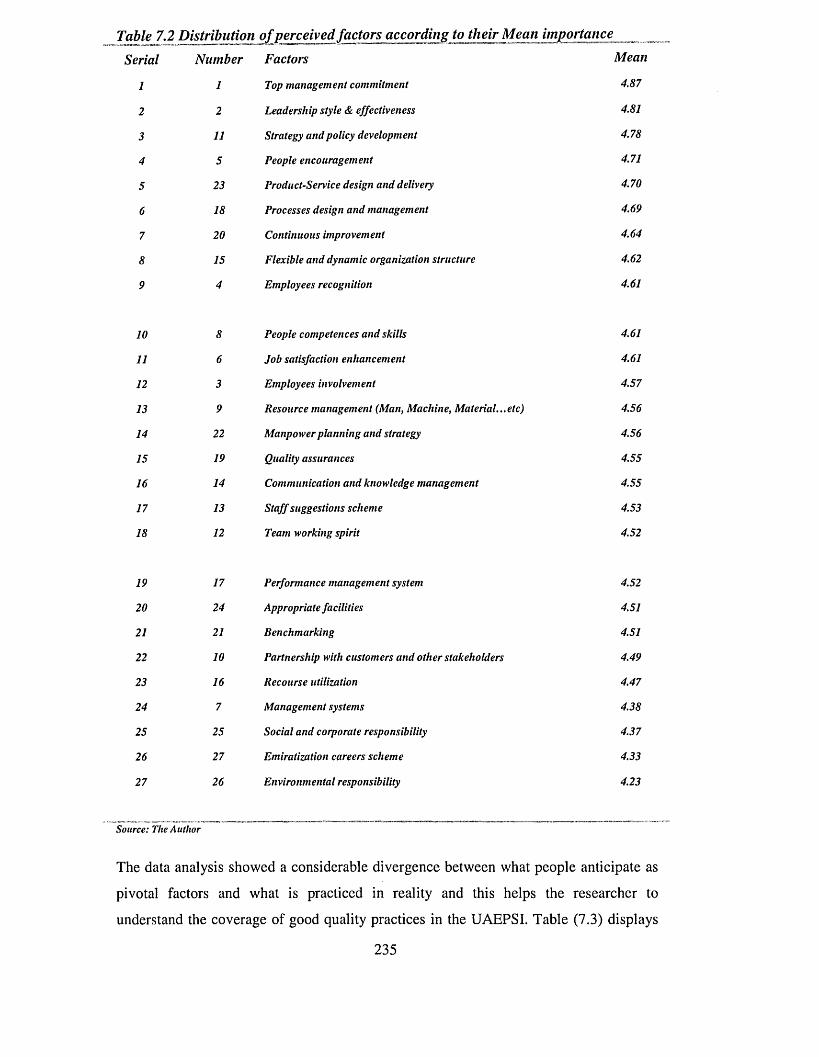
Table 7 .2Distribution o f perceived factors according to their Mean importance
erial Number Factors Mean
1 1 Top management commitment 4.872 2 Leadership style & effectiveness 4.813 11 Strategy and policy development 4.784 5 People encouragement 4.715 23 Product-Service design and delivery 4.706 18 Processes design and management 4.697 20 Continuous improvement 4.648 15 Flexible and dynamic organization structure 4.629 4 Employees recognition 4.6110 8 People competences and skills 4.6111 6 Job satisfaction enhancement 4.6112 3 Employees involvement 4.5713 9 Resource management (Man, Machine, Material...etc) 4.5614 22 Manpower planning and strategy 4.5615 19 Quality assurances 4.5516 14 Communication and knowledge management 4.5517 13 Staff suggestions scheme 4.5318 12 Team working spirit 4.5219 17 Performance management system 4.5220 24 Appropriate facilities 4.5121 21 Benchmarking 4.5122 10 Partnership with customers and other stakeholders 4.4923 16 Recourse utilization 4.4724 7 Management systems 4.3825 25 Social and corporate responsibility 4.3726 27 Emiratization careers scheme 4.3327 26 Environmental responsibility 4.23
Source: The Author
The data analysis showed a considerable divergence between what people anticipate as
pivotal factors and what is practiced in reality and this helps the researcher to
understand the coverage of good quality practices in the UAEPSI. Table (7.3) displays
235
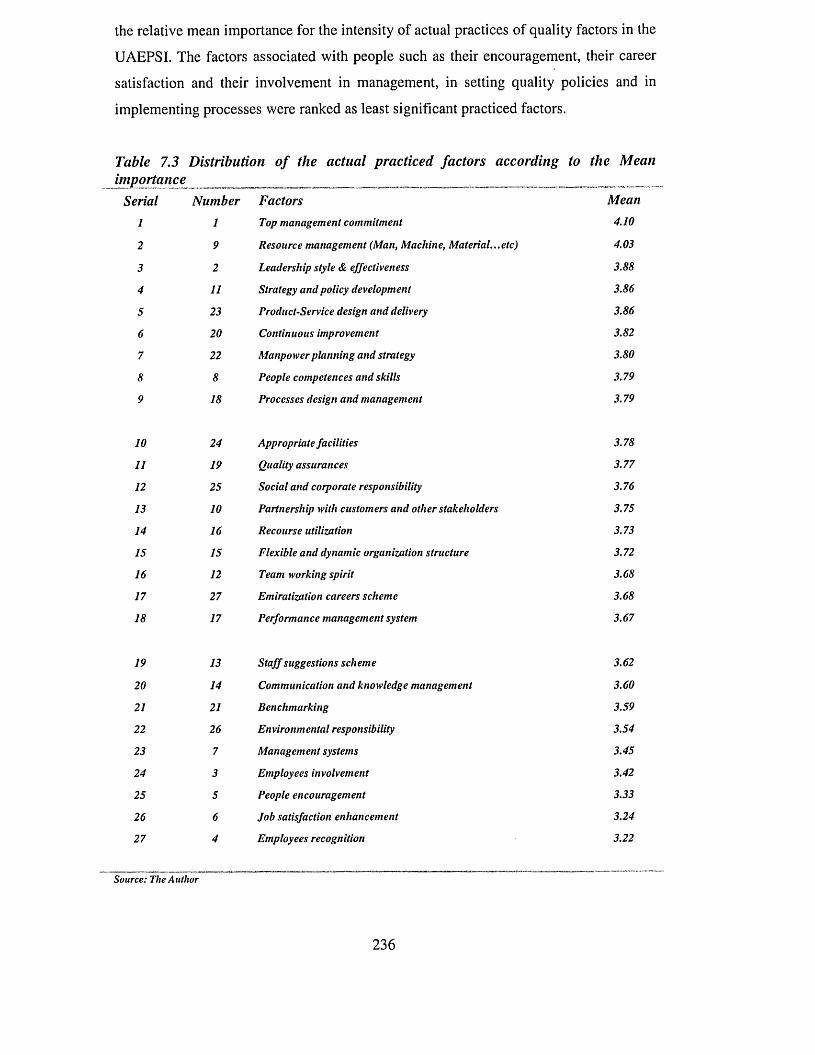
the relative mean importance for the intensity of actual practices of quality factors in the
UAEPSI. The factors associated with people such as their encouragement, their career
implementing processes were ranked as least significant practiced factors.
Table 7.3 Distribution of the actual practiced factors according to the Mean importance _
Serial Number Factors Mean1 1 Top management commitment 4.102 9 Resource management (Man, Machine, Material...etc) 4.033 2 Leadership style & effectiveness 3.884 11 Strategy and policy development 3.865 23 Product-Service design and delivery 3.866 20 Continuous improvement 3.827 22 Manpower planning and strategy 3.808 8 People competences and skills 3.799 18 Processes design and management 3.7910 24 Appropriate facilities 3.7811 19 Quality assurances 3.7712 25 Social and corporate responsibility 3.7613 10 Partnership with customers and other stakeholders 3.7514 16 Recourse utilization 3.7315 15 Flexible and dynamic organization structure 3.7216 12 Team working spirit 3.6817 27 Emiratization careers scheme 3.6818 17 Performance management system 3.6719 13 Staff suggestions scheme 3.6220 14 Communication and knowledge management 3.6021 21 Benchmarking 3.5922 26 Environmental responsibility 3.5423 7 Management systems 3.4524 3 Employees involvement 3.4225 5 People encouragement 3.3326 6 Job satisfaction enhancement 3.2427 4 Employees recognition 3.22
Source: The Author
236
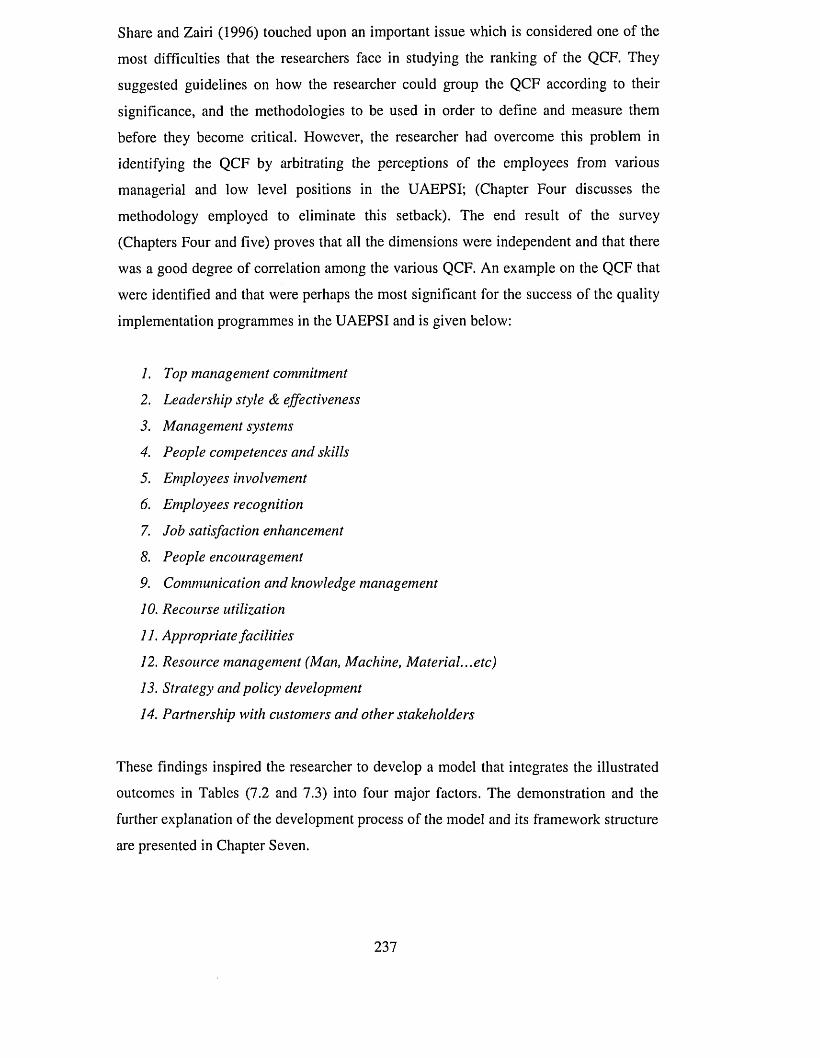
Share and Zairi (1996) touched upon an important issue which is considered one of the
most difficulties that the researchers face in studying the ranking of the QCF. They
suggested guidelines on how the researcher could group the QCF according to their
significance, and the methodologies to be used in order to define and measure them
before they become critical. However, the researcher had overcome this problem in
identifying the QCF by arbitrating the perceptions of the employees from various
managerial and low level positions in the UAEPSI; (Chapter Four discusses the
methodology employed to eliminate this setback). The end result of the survey
(Chapters Four and five) proves that all the dimensions were independent and that there
was a good degree of correlation among the various QCF. An example on the QCF that
were identified and that were perhaps the most significant for the success of the quality
implementation programmes in the UAEPSI and is given below:
1. Top management commitment
2. Leadership style & effectiveness
3. Management systems
4. People competences and skills
5. Employees involvement
6. Employees recognition
7. Job satisfaction enhancement
8. People encouragement
9. Communication and knowledge management
10. Recourse utilization
11. Appropriate facilities
12. Resource management (Man, Machine, Material...etc)
13. Strategy and policy development
14. Partnership with customers and other stakeholders
These findings inspired the researcher to develop a model that integrates the illustrated
outcomes in Tables (7.2 and 7.3) into four major factors. The demonstration and the
further explanation of the development process of the model and its framework structure
are presented in Chapter Seven.
237
SUMMARY
The chapter addressed the theoretical and empirical development of the research model.
Conclusions were drawn from revising studies and literature related to QCF as well as
to the quality implantation framework model. A significant emphasis on certain QCF
(mentioned above) organizations and particularly the UAEPSI need to be placed.
In Addition, the researcher spotted from the outcomes of the previous chapters that the
prime cause that drove him to develop an exclusive self assessment model for the
UAEPSI is to eliminate the complexity of the currently adopted quality programmes
and to simplify the UAEPSI quality implementation processes. The model stresses the
importance of QCF that links quality implementation, people aspects, leadership
management, processes, systems, resources and facilities to each other since these are
the parameters that constitute the core elements of the proposed model.
The basic elements of the model along with the self assessment performance
measurement method function as an aiding tool for the UAEPSI to overcome the
difficulties they encounter along their quality process. The following chapter presents in
more detail the model structure, its measurement method and how it differs from the
other existing quality models.
2 3 8
CHAPTER EIGHT
THE MODEL EMERGENCE
PREFACE
Based on the theoretical and empirical outcomes that shaped the conceptual
development of the research model (see Chapter Seven), this chapter explains how the
research Quality Appraisal Model (QAM) emerges, what it contains, how it works and
its prime purpose. Therefore, this chapter is divided into four sections.
In section one, the researcher enlightens how the outcomes of Chapter Seven were
integrated, utilized, ultimately developed and emerged into the QAM.
Section two provides detailed explanation on the QAM framework structure, what core
factors and sub-factors were considered in order to eliminate the existing gaps between
what is perceived and what is actually practiced in the QCF and in the UAEPSI.
Section three clarifies the QAM mechanisms, how the model functions and how the
method of self assessment instrument operates for evaluating the UAEPSI quality
standpoint.
Section four benchmarks the QAM with other existing universally adopted models,
which they were highlighted in Chapter Seven, section (7.1.2) to point out similarities
and differences.
Finally a brief summary of that chapter is presented. Figure (8.1) outlines the content of
this chapter.
239
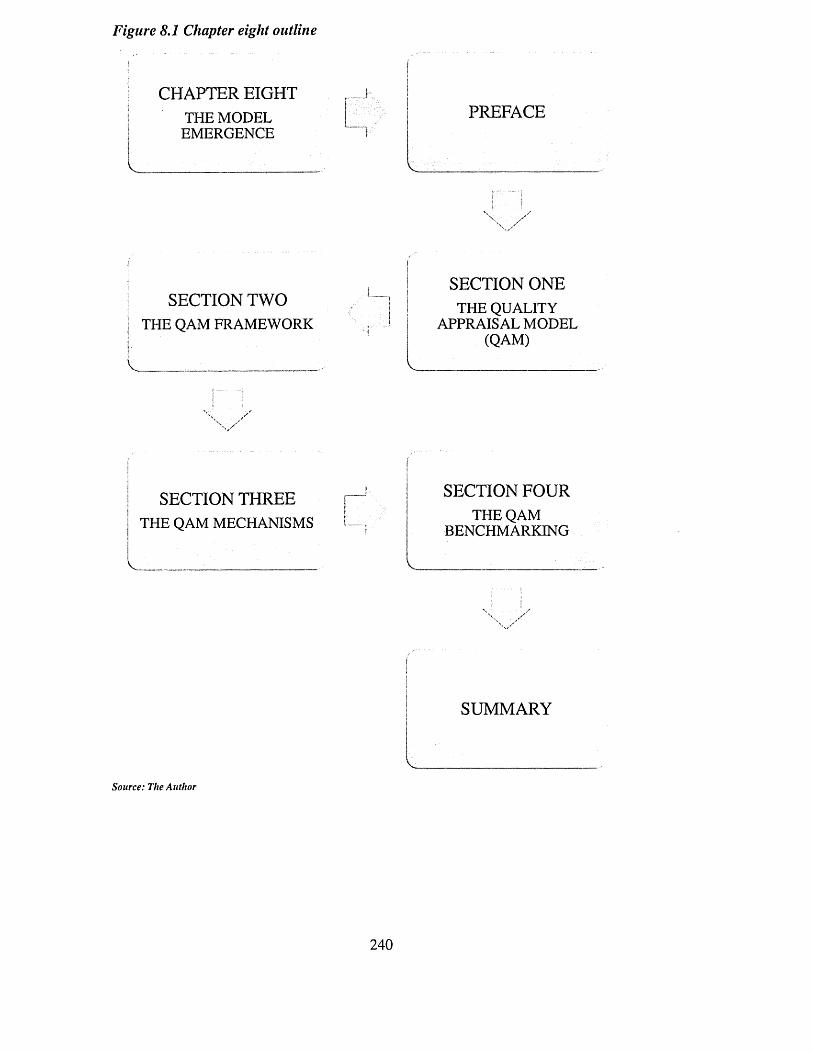
Figure 8.1 Chapter eight outline
CHAPTER EIGHTTHE MODEL EMERGENCE
PREFACE
SECTION TWO THE QAM FRAMEWORK
SECTION ONETHE QUALITY
APPRAISAL MODEL (QAM)
SECTION THREE THE QAM MECHANISMS
SECTION FOURTHE QAM
BENCHMARKING
V .
SUMMARY
Source: The Author
240
8.1 THE QUALITY APPRAISAL MODEL (QAM)
This section aims to ascertain from the reviewed current quality practices in the
UAEPSI (see Chapter Six), that there is a serious need for the development of an
accustomed quality model for the UAEPSI based on a comprehensive QCF. This
prerequisite becomes apparent when the outcomes of Chapters Five and Six revealed
that there is a lack of acknowledged quality factors and measures that assure successful
implementation of quality in the UAEPSI. Furthermore, the outcomes revealed the
struggle in implementing their quality scheme projects professionally. This is because
the majority of the UAEPSI simultaneously adopt a combination of different quality
approaches and assessment tools in conjunction with the UAEGEP criteria and its
assessment method. This veracity is related primarily to the way the UAEPSI
management think and their efforts to win the UAEGEP excellence award. They deny
recognizing the complexity and confusion that have been created among the employees;
yet, the contradicting results of using two or more assessment tools for measurement
were that their institutions performance was improved. Conversely, the main dilemma is
that most of the UAEPSI are not well prepared or capable to adopt or implement
successfully the quality criteria specified by the UAEGEP.
Thus, the primary purpose of developing a QAM is to assist the management in the
UAEPSI to assess their institutions capabilities against the model core factors and sub
factors prior to the initiation of their quality programmes. Sekeran, (2003) clarified that
the conceptual development of a model is based on how the researcher makes logical
sense of the relationship of the several factors that have been identified as important to
the research problem. The researcher had largely reviewed the empirical studies and the
literature relevant to QCF (see Chapter Seven).
The intention was to determine the most common and influential QCF that have attained
and maintained by the UAEPSI. This shall enable them to be appropriately equipped for
embarking on their journey to quality excellence. Additionally, the researcher had also
reviewed a number of the most recent and commonly adopted quality and excellence
framework models (see Chapter Seven). This was done with the intention of developing
the most suitable quality model in term of determining what aspects and components
best fit and exclusively tailored for the UAEPSI. Therefore, developing a model is not
an easy task. Enormous revisions, great effort and carful attentions are required in order241
to mould a presentable, acceptable, and credible model that contributes significantly to
the development of the knowledge. At the same time, it ensures that the model has
avoided the drawbacks of the existing models; the model must be viable, practical and
straightforward.
In the light of the current situation, the researcher came up with the idea of emerging the
theoretical and empirical findings obtained from Chapter Seven. Hence, the
development of a conceptual structure for the QAM emerged from the findings of the
previous literature and from the research data analysis and outcomes, (see Chapter 5,
Sections 5.3 and 5.4 for further details) which were based on the results of the perceived
factors from the employees' perspectives compared with the results of the actual quality
practices. The researcher classified them according to their relative importance and their
contribution to the success of the TQM implementation in the UAEPSI. The model
assists the UAEPSI in evaluating the strengths and weaknesses of their TQM
implementation, targeting their improvement areas and setting up an action plan for
improvement. Moreover, from its prime function in terms of appraisal, it was used
during the stage for selecting a unique name for the model that eventually reflects its
main purpose.
Gatchalian, (1997) examined the literature and the previous surveys of the organizations
that implemented TQM in their organization. The results revealed that twenty to thirty-
five percent of them have had a considerable change in the performance improvement.
The author perceived the TQM practices and the approach that needs to be reviewed and
reconsidered with the investigation of the basis of improvement which are either
identified or redesigned. The research focused on customizing the model that responds
to the needs of the individual UAEPSI. As a result of this, every institution can amend
and alter the model according to their changing requirements, see Table (8.1) which
presents the core factors and sub-factors that consist of the contents of the QAM.
In relation to the quality models adopted broadly in the public sector, the researcher
aims to benefit from their experiences. Kattan, (2005) for instance, applied the TQM
model on the financial institutes in the U.A.E. He divided the main findings of the
research into three main themes: quality initiatives implementation, staff perception and
the implementation pitfalls.
242
Quality initiatives implementations: (Input)
-focusing on concepts, policy and objectives that increase the quality awareness
- Lack o f proper quality future plans and communications
- Lack o f staff involvement and teamwork
The staff quality perceptions: (Process)
- Need to embrace the quality culture
- Negative impact on performance
- Deficient communication system and teamwork spirits
Quality implementation pitfalls: (Output)
- Lack o f proper planning
- Management by objectives
- Lack o f effective communication
- Lack o f resources
- Unprofessional work environment
The investigations outcomes of Syed-Ikhsan, and Rowland (2004a) Syed-Ikhsan, and
Rowland (2004b), and Warwood, and Antony (2003), are more likely similar to the
Kattan’s findings. However, they identified an additional element: the ‘political
directives’. The resource constraints that are politically imposed by the central
government within the public sector have a significant impact on the public sector of the
employee abilities that enable them to transfer knowledge and skills due to the ever-
increasing workloads and time constraints Other key issues, such as the public sector
embodiment of the social processes of institutionalized practices, traditions, attitudes,
behaviour and rewards have not been systematically studied in relation to improving
knowledge transfer within the public.
Other scholars like Clark and Appleby (1997), explored the three different case studies
of the local government councils in their attempt to implement quality programmes in
all areas of the organizations using different quality frameworks. They explored the
similarities and differences in their attempts; they attempted to find out why differences
occurred in each approach. The discussions considered the government entities; the
difficulties involved in transferring quality concepts from the private organizations and
the possibility of adopting these principles in the government service institutions. The243
findings showed that the government agencies are able to deploy different quality
approaches regardless of whether they are designed mainly for the private
manufacturing organizations; however the key points the approach should consider to
implement quality are:
Be sensitive to the culture and values of the authority;
1 Be capable o f being adapted across a range o f different services areas;
2 Be congruent with the current business/policy planning activity;
3 Be supported by mechanisms for effecting change and coordinating activity
Whereas, McAdam and Reid (2000); Weeks and Bruns (2005), and Smith and Gal
(1993), observed that the government institutions are facing the same challenges as
those of the private sector, i.e. cut costs, increased productivity and improved services.
They perceive that the government institutions could use tools similar to those used by
the private organizations to overcome these challenges. The case study of the
government financial organization using these tools revealed that the government
organizations will be able to leverage the process management to create better outcome
at lower public costs (Weeks, and Bruns, 2005; Bollinger and Smith, 2001).
The structure of the model was developed from the research data analysis (see Chapter 5
Section 5.5 for further details), which demonstrates the results of the perceived factors
from the employees' s perspectives. As it has been mentioned in Chapter One, the
objective of the research is to explore the gaps in the perceived and actual quality
practices in the UAEPSI. The outcomes of the empirical investigation revealed that
there are significant gaps between the employee’s expectations and what is actually
practiced on the ground. The researcher identified and classified them and called them
the QCF. They need to be tackled by the UAEPSI in order to fill these gaps.
However, the researcher had observed the source of these gaps. The management of
UAEPSI frankly expressed their concern that there are quality gaps, but they cannot
measure them unless they are based on empirical investigations. They claim that they
exercise the UAEGEP performance measurement method, but the method does not
recognize the details and the specific quality issues of individual institutions. In
244
addition, the UAEGEP declare success in the implementation of quality management in
the public service institutions. The research data analysis results show that there are
distinct divergence between the government announcements and the amount of actual
practices of quality and its success. The employee’s perceptions of the two main areas
were obtained. First, their views on the impact of TQM on their job satisfaction, work
encouragement and recognition, and the level of their involvement in the quality
implementation processes. Second, the research concentrated on the employee’s views
on the capabilities of the existing implemented quality programme to improve the
institutional and employee’s performance.
The research data analysis outcomes revealed the following current quality situation in
the UAEPSI:
1 Management of UAEPSI is fully aware of the TQM principles; however they are
unconfident in determining and then prioritizing the factors that are vital to the
successful implementation. On some occasions, they simply do not pay enough
attention to these factors and specially to those related to the employees satisfactions
2 Although the UAEPSI effortlessly worked to provide the cutting edge technologies
and equipments that accelerate and improve the level and the time needed to deliver
their services, they are still unable to transform the most perquisite factors correctly.
Less emphasis was put on the human side of the quality processes. Factors such as
the employee’s participation, involvement, recognition and their satisfaction were at
their lowest importance
3 TQM benefits are considered intangible; certainly, extra cost and efforts are
required since UAEPSI has limited budgets and human capacities particularly in the
early stages of quality implementation. This causes reluctance and impatient
temperament among the management staff as well as the employees as they consider
the long term benefits of TQM. Therefore, it is very often that some UAEPSI over
time pass their dedication to quality which falls dramatically
4 Very few UAEPSI are committed to TQM, but they lack the adequate experiences
of the methodologies and mechanisms of implementing and the required criteria of
245
the UAEGEP. Also, they lack understanding of how the properly benefits from the
performance measurement tools. As a result of inexperience, shortfalls, mistakes
and errors are very frequent, thus the lessons need to be learned to eliminate
mistakes in later stages of TQM
5 Due to unclear strategies of the related quality implementation processes, the
UAEPSI does not know precisely what criteria are required by the UAEGEP and
how they should put them in action. This ultimately leads to not knowing what
performance measurements need to be tested, which leads to ambiguous situations
and frustration for not achieving the TQM set goals
6 Yet again the obligatory participation in the UAEGEP, had led some UAEPSI to be
not fully convinced and ultimately committed to implement TQM. Therefore, the
management and equally the employees apply the UAEGEP criteria not because
they realize the importance of TQM to their institutions but because they merely
practice quality to fulfill the government duty
7 A small number of the UAEPSI management, still believe that cutting their current
and overhands expenses is an effective method in improving their institutions
performances and services. They assume that this strategy privileges them in getting
higher scores and win the UAEGEP excellence award. By reviewing the UAEGEP
criteria, none of them cited that the UAEPSI were evaluated upon their annual
budgets savings. In fact, this strategy proved to turn against those who applied it; it
resulted in the decline of their service standards and the intensity of their employees
and customers satisfactions.
These current situations added significantly to the development of the research model.
The researcher bears in mind tackling these issues during the course of drafting the final
version of the model. This should strengthen the model propositions so as to make it a
supporting module for the UAEPSI and to enable them to predict their priorities and to
work professionally in alignment with the UAEGEP criteria. Thus, this implies that they
are more likely heading towards achieving their excellence goals and the U.A.E.
government quality strategy.
246
8.2 THE QAM FRAMEWORK
The main idea behind developing the Quality Appraisal Model (QAM) is to enable the
UAEPSI and particularly the top management to prioritize the core factors and sub
factors that contribute positively towards the successful implementation of quality in
their institutions, in other words, the QAM allows them to differentiate the vital factors
from the minor ones as a institutional assessment method to assess their preparedness
prior to embarking their quality scheme project. Therefore, they appraise and reassess
their accessible resources and facilities accordingly. This enables the UAEPSI to
evaluate themselves against the core factors and sub-factors of the QAM; this should
allow them to discover their strengths and weaknesses. It is wise to articulate that the
QAM is developed to be in alignment with the UAEGEP criteria, which the UAEPSI
will adopt as a superlative method that eventually facilitates meeting the U.A.E.
government quality strategy.
This section also describes the mechanisms of integrating the findings of the literature
reviewed in the first section with the results of data analysis presented in the second
section of Chapter Seven; thus, shaping the final version of the accustomed quality
implementation model for the UAEPSI. The purpose of the model was to provide
insight in the management which most fit the quality approaches that were appropriate
mainly for service organization. McAuley, et a l, (2006) and Castka, et al. (2003)
foresee the organizations as social entities designed to achieve economic or other
purposes, while at the same time, fulfil the members’ needs. The effectiveness of the
organizational design must be judged by its fit for the social structure and processes
with the individuals being recruited and the environment being served. The following
four organizational components must be determined:
7 People: what the abilities, needs, values and expectations of the employees are
2 Process: what behavioral patterns, attitudes, and interactions exist within the
organization at the individual, group and intergroup levels?
3 Structure: which formal mechanisms and systems of the organization that are
designed to channel behavior toward the organizational goals and fulfill the
247
members' needs such as organization structure, performance appraisal, policies and
systems exist
4 Environment: what external conditions the organization must deal with, including its
market, customers, stakeholders, government regulations social culture and values
(Beer, 1980: 151).
The researcher has the same conviction; he strongly agrees with Beer the four
components consideration. However, he disagrees with what he perceives as the
components that are interrelated with the people aspects. This means that in order for
the organizations to attain theirs mission and progress, they have to seriously focus on
the humanity dimensions of people. Hence, the organization cannot function without the
systematic work process, the availability of resources and facilities, and the managerial
leadership; all these components do not function unless an employee component exists.
This is the focal point that the QAM stresses on.
A good example of a simple quality model is developed by Tan (1997). In his
perception of the best result of TQM philosophy, he observed that managers need to
market their principles and elements to their customers and employees. They could
strategically implement them through employee training and teamwork concept
schemes to get the best results. He believes that the best results could be achieved if
every organization continuously examines and measures the five strategic building
blocks of TQM for business excellence. With this model, the organizations detect
inefficient operational processes and improve productivity. Product, process,
organization, leadership, and commitment are elements of TQM. In illustrating the
model, an emphasis was placed on the blocks as they are interrelated and dependent on
each other. Teamwork is the best tool for putting the model into practice with
continuous review of the current performance capabilities. Considering the
organizations needs and the obstacles they encounter, they could choose the appropriate
tactics to their current performance, needs, and resources; he concluded that the key
excellence successes are the employees. He further displayed some of these obstacles:
the large size, diversity, the locations of the organizations, the resistance to changes in
behaviour, habits and relationship between leaders and employees, the weak
organizational performance, ethics and challenges. Individuals rather than teams should
be rewarded by the organizations and intrinsic preference for individuality should248
precede group accountability. On top of that, most organizations do not understand what
quality means or how it could be measured.
These factors were integrated into the four inevitable core factors and a total of twenty
sub-factors in which each core factor consists of equally five sub-factors, as they form
the main framework structure of the QAM. The purpose of focusing on just four core
factors is due to the outcomes of Chapter Seven; it aims more importantly to simplify
the model as much as possible. The researcher could profoundly develop a model that is
very sophisticated and that only quality experts could comprehend. But the researcher's
aim is to present a model of self assessment that is versatile and generic and that could
fit the UAEPSI requirements and avoid causing any confusion or mystery in the course
of its practical application. It is all about the simplicity of the QAM, and this simplicity
makes the model distinctively unique in its function; otherwise, it won’t be different in
its purpose from the other currently adapted existing quality models and approaches.
The use of the triangle figure that shaped the QAM indicates the importance of each
core factor, see Figure (8.2). The leadership management factor position indicates that
this factor represents the head as in the human skeleton. The processes, systems,
resources and facilities with their position at the right and at the left side of the model,
are both representing the two arms of the human being. Whereas the most crucial core
factor, is believed the people (employees), as their role and position in the centre of the
model indicates that they the heart of any organization, and ultimately the body
collapses without a healthy heart. The core factors are outlined below:
1 People
2 Leadership management
3 Process and System
4 Resources and facilities
The rational for sequencing the QAM is to provide general guidelines for placing core
factors and sub-factors in a criteria set, for the implementation of the model in the
UAEPSI. However, such a sequence is not a prerequisite for the use of the QAM for the
purpose of performance self assessment of the UAEPSI. The core factors and sub
factors can be assessed in any sequence. However, their relationship must always be
considered. The implementation of factors in a logical sequence is mandatory for the249
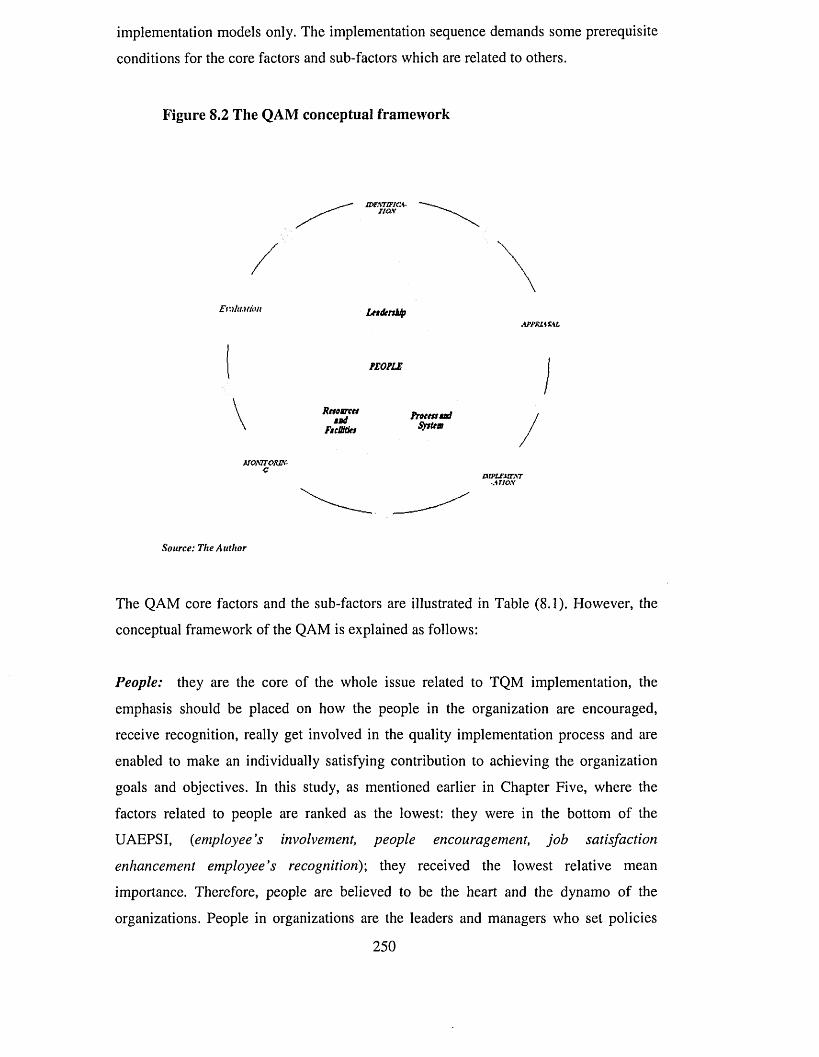
implementation models only. The implementation sequence demands some prerequisite
conditions for the core factors and sub-factors which are related to others.
Figure 8.2 The QAM conceptual framework
Ev.iht.ytion LttdenUp
PEOPLE
Retoarctttad
F tcW kiProcess tad
System
//
MOSTTORIX-C
MPISMFXT■ATIOX
Source: The Author
The QAM core factors and the sub-factors are illustrated in Table (8.1). However, the
conceptual framework of the QAM is explained as follows:
People: they are the core of the whole issue related to TQM implementation, the
emphasis should be placed on how the people in the organization are encouraged,
receive recognition, really get involved in the quality implementation process and are
enabled to make an individually satisfying contribution to achieving the organization
goals and objectives. In this study, as mentioned earlier in Chapter Five, where the
factors related to people are ranked as the lowest: they were in the bottom of the
UAEPSI, (employee's involvement, people encouragement, job satisfaction
enhancement employee’s recognition)', they received the lowest relative mean
importance. Therefore, people are believed to be the heart and the dynamo of the
organizations. People in organizations are the leaders and managers who set policies
250
and plans, who run the organization and draw policies and plans. The processes and
systems of work were created to be performed by people. The organizations are
endowed with adequate facilities and resources to be used by people; without people,
they are simply useless. As a result, the focal factor of the QAM core factors is people
i.e. the employees. Therefore, the QAM addresses the five most crucial sub-factors
which are: encouragement and recognition of employee, employee involvement and
staff suggestion scheme, team working spirit, people competence and skills, and
manpower planning and job satisfaction enhancement strategy.
Abu Naba’a (2008) presents a very clear picture about the Arab management attitudes
with respect to their employees. In his “Arabian Management Theory”, he argues that
the Arab countries must participate in the development of a management theory. They
must think for themselves rather than simply apply the Western theories, which may not
be applicable to their business environment. Abu Naba’a aim was to develop a theory
that is derived from the Arab and Islamic heritage and that conforms to the Arab culture.
Abu Naba’a proposed theory was based on three pillars or concepts. The first is service,
which means that the manager should respect his employees as he respects his guests, in
order to gain their cooperation and increase their productivity. The second is
counselling which means that the manager should consult his employees before taking
decisions. This is necessary in order to direct people successfully and to motivate them
to work. This practice is also important to enable the manager to make the right and
wisest decision. The third pillar is justice which means that the manager should consider
fear of God before taking any decision, thus being fair with all his employees. Finally,
Abu Naba’a hoped that the proposed theory would be implemented in the Arab world,
alongside the other theories, in a way that is commensurate with the Arab mentality and
culture.
Empirical studies carried out by Matzler and Renzl, (2006, 2007) investigated the
employees' satisfaction, particularly the element of trust i.e. trust in management and
peers required in the field of the energy sector to measure their level of satisfaction and
loyalty. They argue that trust motivates employees and encourages them to have a good
moral at work and to perform their tasks more efficiently. The empirical investigation
revealed a strong and significant linkage between trust in management and peers and the
increasing level of satisfaction and loyalty among employees. They further empirically
investigated the impact of the employee satisfaction on the affective commitment to an251
organization. The results showed that people satisfaction has a significant impact on the
effective commitment, performance, and output improvement; they argued that there are
strong links between personality traits and employees satisfaction. They concluded in
their empirical analysis that the level of satisfaction varies from one employee to
another.
On the other hand, Ooi, et al., (2001) contended that management should not ignore the
employee’s attitude and should handle problems properly; some actions need to be
taken at every stage of quality implementation. The aim was to indentify the gaps
perceived by the employees before, during, and after launching a quality programme.
The large gaps should receive the higher priority. In their conclusion, they placed
greater emphasis on human resources as they are by far the most important assets of
most organizations.
Another survey conducted by Kuvaas, (2008) in one of the largest Australia banks, to
examine the relationships between the perceptions of the organizational quality efforts
and the affective reactions of the employees. They assumed that the employees’
perceptions in terms of satisfaction, commitment and turnover intentions are
significantly affected by organizations quality initiatives. The survey results concluded
that supporting the assumptions underlying the employees’ perceptions of quality
efforts was significantly related to each of the affective reactions.
McNary, (2008) and Gatchalian, (1997) believe that people empowerment is the only
way that helps organizations maintain the continuous process of service improvement.
However, McNary, investigation was more detailed regarding the quality management
structure in the government agency through the development and implementation of one
particular project team working on an issue related to work assessment. The purpose
was to analyze the data by using quality improvement tools such as teamwork,
employee training and restructuring the process of work. The results of using the
techniques were shown by leveraging the level of customer’s satisfactions and saving in
resource utilizations.
252
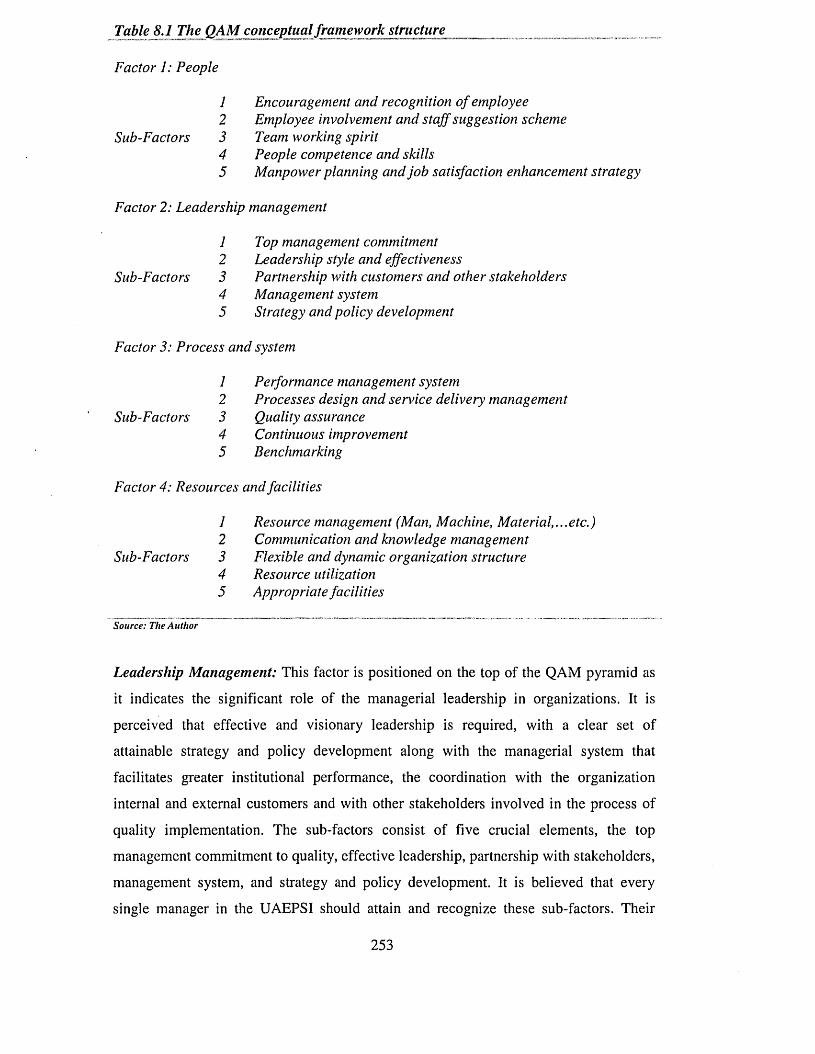
Table 8.1 The QAM conceptual framework structure
Factor 1: People
1 Encouragement and recognition o f employee2 Employee involvement and staff suggestion scheme
Sub-Factors 3 Team working spirit4 People competence and skills5 Manpower planning and job satisfaction enhancement strategy
Factor 2: Leadership management
1 Top management commitment2 Leadership style and effectiveness
Sub-Factors 3 Partnership with customers and other stakeholders4 Management system5 Strategy and policy development
Factor 3: Process and system
1 Performance management system2 Processes design and service delivery management
Sub-Factors 3 Quality assurance4 Continuous improvement5 Benchmarking
Factor 4: Resources and facilities
1 Resource management (Man, Machine, Material,...etc.)2 Communication and knowledge management
Sub-Factors 3 Flexible and dynamic organization structure4 Resource utilization5 Appropriate facilities
Source: The Author
Leadership Management: This factor is positioned on the top of the QAM pyramid as
it indicates the significant role of the managerial leadership in organizations. It is
perceived that effective and visionary leadership is required, with a clear set of
attainable strategy and policy development along with the managerial system that
facilitates greater institutional performance, the coordination with the organization
internal and external customers and with other stakeholders involved in the process of
quality implementation. The sub-factors consist of five crucial elements, the top
management commitment to quality, effective leadership, partnership with stakeholders,
management system, and strategy and policy development. It is believed that every
single manager in the UAEPSI should attain and recognize these sub-factors. Their
253
continuous support to quality as a strategic issue together with their active involvement
in the TQM implementation process plays a noteworthy part in stimulating quality
consciousness in the UAEPSI.
A very recent study conducted by one of the leading research institutes in the U.A.E., on
the impact of the managers’ attitudes in terms of recognition, assessment and motivation
to their employees. The survey results analysis showed that 55% of the employees in the
U.A.E. perceive that their managers are influential and effective. The survey focused
on the staff managers’ personal skills and capabilities, administrative efficiency, and
more interestingly on assessing whether the employees perceived them as leaders. The
results indicate that the employees look to their direct manager who has a major impact
on the level of participation and on their view of the company in general.
Also, the study revealed that people in the U.A.E. perceive their bosses as an effective
manager, a chief who is fair in dealing with the staff and who evaluates their
performance, benefit from the ideas of the staff, and has the ability to solve problems
quickly and to keep the door open for interaction and dialogue. The study also indicates
that good managers have a major impact on the level of the participation of the staff, as
the employees' involvement signals the extent to which they are willing to contribute to
the success of the organization, and the incentive to make an effort to accomplish tasks
to achieve the mission objectives. Also, the involvement of the staff makes them feel
proud of their organization as an ideal location to work and to achieve career
satisfaction. On the contrary, the employees who are dissatisfied with their manager
expressed their intention to quit once they found a better friendly organization, (Al
emrat Al-youm 2010).
Soltani, et al., (2008) criticism is that there are ambiguities in defining TQM in the
different literature and the same thing applies to quality models and implementation
frameworks. They perceived that according to quality experts and studies, the prime
barriers to successful implementation are due to low commitment on the part of senior
management towards quality. Furthermore, Gatchalian, (1997) and Masters, (1996)
associated the lack of understanding of TQM with the lack of leadership commitment.
Thus, this is exactly what Al Zaabi, (2008) emphasizes on with regard to the leadership
role in the U.A.E. in relation to the major important decision needed to undertaken such
as, quality implementation within the organization. Where to begin? This is the first
question that needs to be answered by the leadership.254
Several organizations never get beyond this point. The leadership’s commitment is
evident by answering this question. In other words, the commitment of the leadership is
the vital foundation for the whole programme to be implemented effectively. Service
organization has to demonstrate the quality leadership to be recognized by outstanding
service quality. To keep customers satisfied, employees need to be empowered to
handle any customer complaint. The managerial leadership in service organization has
to set strategies of high levels for employee training and empowerment to make
decisions on the spot to satisfy the customer needs.
Process and system: indicate the design and improvement of the services delivered,
making sure that these services undergone adequate quality awareness and constant
improvement in the work process with appropriate mechanisms. The organization may
measure the improvement of their processes in benchmarking their performance with
the management system that leads to an improved and enhanced service delivery.
Guimaraes, (1996) investigated the impact on employee’s attitudes before and after the
implementation of TQM in terms of job satisfactions and the employee’s retention and
turnover. The first empirical study investigated the employees’ attitude before initiating
the TQM project; the main findings were a high job ambiguity and dissatisfaction, and a
high intention of employee’s turnover. After two years of TQM project implementation,
the second empirical investigation was carried out in the same organization with the
same employees to test their perception of the quality impacts, the results indicated
significant improvement in the role of job ambiguity, job satisfaction, involvement,
management commitment to quality, and reduction in the number of the employee’s
turnover. On the contrary, the study showed no significant impact on changes in role
conflict, task characteristics, and career satisfaction (Guimaraes, 1996). The situation in
the UAEPSI is not far from what Guimaraes found out in his first investigation attempt;
the lack of job descriptions manuals and job specification and duties documentation
creates a sense of frustration and intersection conflicts among employees. As a result,
this situation ends up with uninterested and deprived people joining the organizations.
Therefore, the QAM sub-factors emphasize factors such as; performance management
system, processes design and service delivery management, quality assurance,
continuous improvement, and benchmarking. Although there are other important factors
that need to be addressed, these are presumed to be the most significant to consider
during their quality appraisal.255
Resources and facilities: the services will not get improved unless appropriate
resources and facilities are available alongside the proper management of resource
utilizations. These facilities (tools) and resources (people) include effective
communication with different organization structure, the existence of adequate
capacities, machine and material, etc. The use of the latest technology enhances
productivity and efficiency. The QAM sub-factors comprise five eminent factors that
need to be addressed. They are resource management of man, machine and material
etc., communication and knowledge management, flexible and dynamic organization
structure, resource utilization, and appropriate facilities
The researcher visualized the essence of employing the QAM which is to contribute
significantly to its beneficiaries by placing the QAM core factors and sub-factors in an
execution process. Just a set of identified factors that are believed to be significant to the
success of quality implementation programmes for the UAEPSI is insufficient. There is
a need for a systematic method in putting them into practice. Thus, the researcher
recognized that in order to overcome the typical turmoil that the UAEPSI frequently
faces while applying the UAEGEP criteria in evaluating its tangible benefits. Also, they
need a simplified methodology whereby they can practice those criteria, a methodology
that does not necessitate skillful quality expertise. As a result of this, the researcher
thought of introducing a new method of performance assessment. The new method
integrates the QAM core factors and sub-factors into a simple practical mechanism
process. Hence, any development quality model from its conception to its completion
passes through several stages along with the programme progression and subsequently
turns into the recognition of finding an approach that links all various stages into a
sequential mode. The QAM cycle is designed in a cyclical structure that aims to
integrate the QAM core factors and sub-factors with the development of the QAM
implementation progression stages. The researcher named the mechanisms of QAM
implementation in the UAEPSI, the QAM cycle. The purpose of the cycle is to
demonstrate phase by phase the entire process of quality implementation programme of
the QAM in the UAEPSI; this mechanism is described as a ‘cycle’ because the lessons
learned from past experiences in the UAEPSI are that they lack the provisional
mechanisms of the systematic implementation of their quality schemes project. For this
reason, the QAM cycle was well thought-out to comprise five various sequential phases
as follow:
256
1 Identification: the UAEPSI needs to focus on the viability of the quality scheme
project in undertaking, and on whether the set of the QAM core factors and sub
factor and objectives are attainable.
2 Appraisal: it is based on the feasibility of the identification phase. The UAEPSI
should carry out a fieldwork assessment of the current situation (what QAM core
existing factors and sub-factor are and which one needs to be attained ) that would
enable it to commence its quality scheme project
3 Implementation: to execute the terms of QAM core factors and sub-factor and
objectives that are verified and already set during the first two phases
4 Monitoring: the UAEPSI needs to audit which QAM core factors and sub-factor
and the set of objectives are heading to the right direction, and whether the quality
scheme project may eventually lead to accomplishing its targets
5 Evaluation: it functions the same as other quality models, which reviews and audits
the effect of TQM benefits and pitfalls on the UAEPSI, ensuring that the objectives
are met. If the evaluation outcomes indicated that some QAM core factors and sub
factor or objectives were not met properly, then the whole process of the cycle loops
again
The development the structure of the QAM cycle consists of several sequential phases
from conception to completion. In addition, each phase consists of consequential chains
of stages, activities and procedures that are interrelated and cohesive in a manner that
ultimately aims to converse QAM from an inspiration to existence. As the QAM
proceeds through its life cycle, it passes through an identifiable sequence of phases,
distinguished from each other by the type of tasks characteristic of each phase and
frequently by formal decision points at which it is determined if the adoption of the
QAM has been successful in the earlier phase in order to continue into the next.
Moreover, the researcher considered that each phase involves different management
consideration of individual UAEPSI and presents different tasks to be performed. The
idea of comprising various phases when applying the QAM is to focus on the
significance of the appraisal phase, as this phase distinguishes the QAM cycle from
257
other quality models mostly adopted. Appraisal is generally a procedure for assessment,
and in the field investigation of the current situation. The QAM cycle draws attention to
appraisal within the model as one of the most significant phase which indicates the
decisive current quality standpoint of the individual UAEPSI, and thus pursuing to next
phase is based upon it. The QAM presented appraisal as a connecting link between the
previous phase that is well prepared and identified and the following phases that witness
the existence of adequate preparations and arrangements for quality implementation.
Appraisal is the ultimate sequence of the identification phase. The researcher glimpse
that once the identification of the core QAM factors and sub-factors have been fulfilled,
a significant appraisal of the quality preparation is practical. Therefore, people involved
with quality scheme project are having a better chance to make a correct decision to
determine whether or not the project is fulfilling the criteria of attaining the objectives
they have set. The purpose of this phase is to test the UAEPSI quality capabilities on a
small scale that provides information about the viability of an eventual execution on a
larger scale; this should provide an essential element in appraising the quality schemes
project risks, uncertainties, and its implications on the whole UAEPSI.
The QAM contribution and benefits to the improvement of quality implementation
practices in the UAEPSI are:
1 Allowing the identification o f the critical factors needed to address in the early
stage o f TQM implementation
2 Providing precise guidance on areas o f weaknesses and gaps between perceived
and actual practices o f quality implementation process
3 Having no specific start and end date that this model is an ongoing process along
with the progress o f the quality programme
4 Responding to the individuals and specific UAEPSI quality situation
5 Being flexible and modifiable whereby every single organization can change the
factors and sub-factors according to their current quality practices
258
6 Being basic in its concept, and simple to be adopted even in organization with no
quality experience
7 Could be adopted in any organization regardless o f its size and business nature.
The development of the model also takes into account the flexibility and responsiveness
to the individual needs of the UAEPSI, which allow them to amend and modify the
model accordingly.
8.3 THE QAM MECHANISMS
The definition, application and nature of the model are clarified in order to eliminate
any complexity and confusion when it is applied. By doing this, the necessary pillars of
the model assessment were completed. The following section explains the scoring
scheme.
Statistical quality tools such as: quality inspection, quality control, and descriptive
statistics have been widely used in manufacturing organizations for quite some time (an
extensive detail of these tools is already explained in Chapter Two (Section 2.2).
Unfortunately, service organizations and specifically public service sector have lagged
behind manufacturing firms in their use of statistical quality tools. The primary reason
is that statistical quality tools require measurement, and it is difficult to measure the
quality of a service. Service organizations often provide an intangible product and that
perception of quality is often highly subjective. For example, the quality of a service is
often judged by such factors as friendliness and courtesy of the staff and promptness in
resolving complaints. A way to measure the quality of services is to devise quantifiable
measurements of the important dimensions of a particular service. For example, the
number of complaints received per month, or customer waiting time can be quantified.
Another issue that complicates quality control in service organizations is that the service
is often consumed during the production process. The customer is often present during
service delivery, and there is little time to improve quality. The workforce that
interfaces with the customers is part of the service delivery. The way to manage this
issue is to provide a high level of workforce training and to empower workers to make
decisions that satisfys customer.
259
Sinclair, and Zairi, (2001) conducted a study on the implementation of the total quality
based performance measurement in the context of service organizations. They examined
six service oriented organizations and identified five distinct elements of performance
measurements, strategy development, process management, performance appraisal,
performance assessment and reward and recognition. They concluded that the
successful use of performance measurement organizations should integrate key
elements to the total quality management with the organizations strategic and
operational management. Performance measurement is considered one of the most
powerful tools for public service institutions that allow them to measure their
performance and to compare their current status with their set of aims and objectives.
Nonetheless, very few organizations were able to understand how to use the tool
properly and to measure their performance accordingly, (A1 Khaleej, 2010).
One of the broadly used performance measurement tools is the SERVQUAL which
examines five dimensions that have been consistently ranked by the customers to be
most important for service quality, regardless of the service industry. The five
dimensions of service are:
1 Reliability: the ability to perform the promised service dependably and accurately
2 Tangibles: the appearance o f the physical facilities, equipment, personnel and
communication materials
3 Responsiveness: willingness to help customers and provide prompt services
4 Assurance: knowledge and courtesy o f the employees and their ability to convey
trust and confidence
5 Empathy: the level o f caring and individualized attention the firm provides for its
customers, Saraph's, et al., (1989.)
It is foreseen that the SERVQUAL approach is broadly adopted by quality practitioners
and service organizations as a performance measurement tool. Though this approach
was applied by few UAEPSI, however, this approach is perceived quite complex and
needs professional quality skills in quantifying the improvement results. This makes it260
feasible for the UAEPSI to adopt. For this reason the researcher did consider its five
dimensions but not its use as a measurement tool for the research QAM.
From the researcher experience, he believes that quality has to be implemented
internally within the organization first. Various studies show that if best practices are
implemented within the organization, the results are bound to be good internally as well
as externally. In organizations where results are good, people are highly motivated, as
the achievements of the people are recognized and rewarded. Where the leadership
philosophy is supportive, with clear demonstration of 100% personal involvement,
organizational excellence is bound to be evident in all results.
The absence of documentation and performance measurement in the public service
institutions is the most important obstacle that most public service institutions suffered
from in the past years, and they probably will continue to suffer. It is necessary for
them to realize the importance of these aspects to take a decisive step towards
addressing the current position and proceeding with the project performance
measurement system. It could be argued that a number of UAEPSI today have already
begun to harness human and material resources needed to start the processes of
establishing this system and to design a set of benchmarks and indicators in consultation
and cooperation with the relevant departments and sections.
One should go through a trial period of calibration to ensure the group's ability to
understand the standards and indicators that replicate the real image of comprehensive
improvement of services in the overall work activities and processes. Yet, the majority
of the UAEPSI have vagueness in the concept of performance measurement, its
fundamental objective, its relation to the excellence voyage and its role in improving the
efficiency and effectiveness in their organizations. Public service institutions need to
tackle the causes of confusion between performance measurement and the principles of
the adopted excellence model.
The purpose of the scoring scheme is to provide scores and weighting systems for the
main factors and sub-factors of the model. The assessment of the UAEPSI current
quality implementation practices against the QAM is based on the objective of the
scoring and weighting system. The initial input to the scoring and weighting system is
based on the individual perception of the people in the UAEPSI. The score in261
percentage signifies the factors; it is based on the relative importance of the value of a
particular factor or sub-factors in the QAM. The relative importance of the weights was
allotted through a valuation method which varies from one UAEPSI to another. The
quantitative scoring and the weighting system used in this model is similar to those used
for assessment in the existing quality and excellence model (Abu Dhabi Award for
Excellence in Government Performance, 2010; Ajman Excellence Programme, 2010;
Sheikh Saqr Programme for Government Excellence, 2010; Sheikh Khalifa Government
Excellence Programme, 2010; Hamdan Bin Rashid A1 Maktoum Award for
Distinguished Academic Performance, 2009; EFQM, 2009; Dubai Government
Excellence Programme, 2009).
The model scoring technique devise weights the measurement of the QAM set of core
factors and sub-factors then a framework in a tabulated format is developed to show the
correlation between the core factors and sub-factors and their overall effect. The
assessment of the UAEPSI against the QAM is based on the objective of scoring
techniques. The initial input to the scoring technique is based on the individual
justification of the researcher. The score in percentage, allotted to a core factors and
sub-factors, is based on the relative importance of the value of the concept, indicated by
the QAM. This relative weighting is allotted through a justified means which can vary
from one institution to another. The scoring technique adjusts the individual
justification into quantifiable means. This quantitative scoring technique has also been
adopted for performance assessment in existing quality models, of the UAEGEP and.
EFQM-EM. The researcher has set the relative weight allotted to every core factor and
sub-factor based on his justification and knowledge of the research topic. The core
factors are taken as a reference with a specific score and the remaining of the sub
factors are scored relative to this. The relative importance of each core factor and sub
factor are distributed according to their significance in the overall QAM. For instance:
the process and system core factor reference score took twenty, (weight 20%) and each
sub-factor reference score took different scoring according to their relative significance,
for instance the benchmarking weights took five (weight 5%) of the overall model
weighting. Table (8.2) presents the summarized scoring technique format for the QAM
core factors and sub-factors. In considering very rare and extreme cases of the UAEPSI,
the score in percent is allotted to the core factor because it is possible that either a sub
factor or a core factor may not be broadly applicable to individual UAEPSI.
262
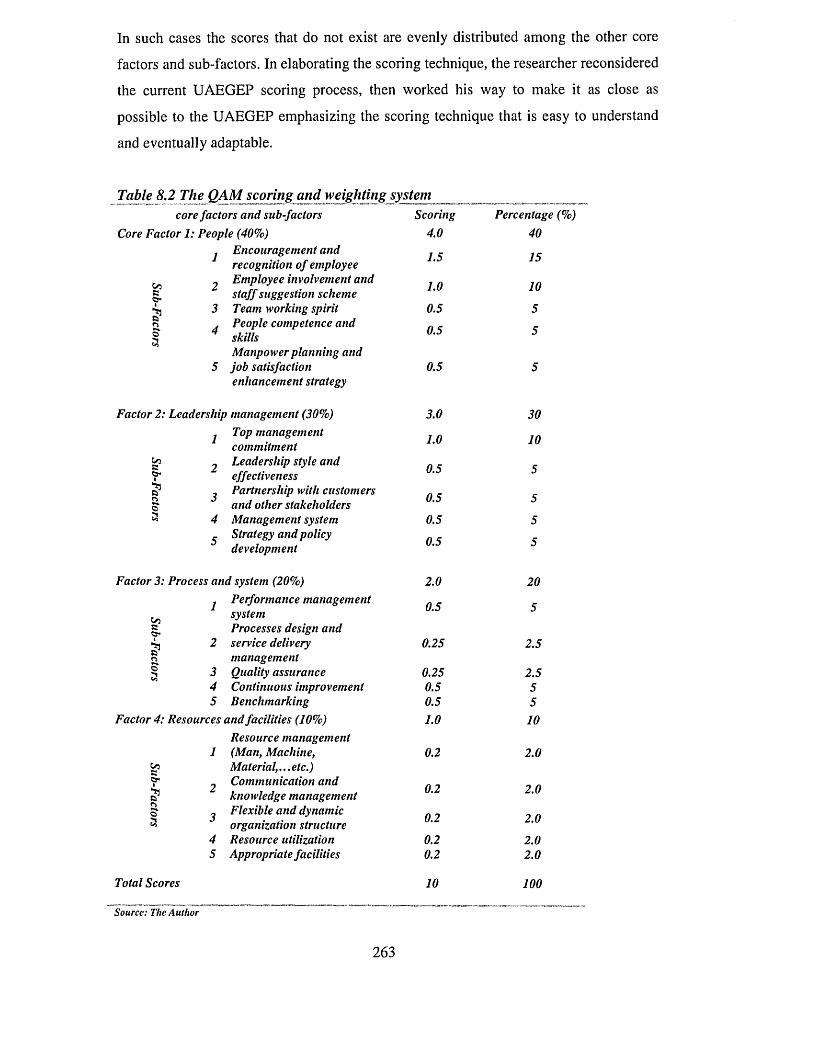
In such cases the scores that do not exist are evenly distributed among the other core
factors and sub-factors. In elaborating the scoring technique, the researcher reconsidered
the current UAEGEP scoring process, then worked his way to make it as close as
possible to the UAEGEP emphasizing the scoring technique that is easy to understand
and eventually adaptable.
Table 8.2 The QAM scoring and weighting systemcore factors and sub-factors Scoring Percentage (%)
Core Factor 1: People (40%) 4.0 40j Encouragement and j ^ ^
recognition o f employee ^ 2 Employee involvement and j ^ ^§ , staff suggestion scheme>53 3 Team working spirit 0.5 5® A People competence and n _I 4 skills U'5 5>5
Manpower planning and 5 jo b satisfaction 0.5 5
enhancement strategy
Factor 2: Leadership management (30%) 3.0 30j Top management
commitment 1.0 10
^ 3 ? Leadership style and _ _effectiveness
a 3 ^ Partnership with customers ^ ^^ and other stakeholders^ 4 Management system 0.5 5
_ Strategy and policy development
Factor 3: Process and system (20%) 2.0 20j Performance management ^ ^
systemProcesses design and
*53 2 service delivery 0.25 2.5H management§ 3 Quality assurance 0.25 2.5
4 Continuous improvement 0.5 55 Benchmarking 0.5 5
Factor 4: Resources and facilities (10%) 1.0 10Resource management
1 (Man, Machine, 0.2 2.0$£ M aterial,...etc.)T 2 Communication and ^ ^ 2 0a 3 knowledge managementg- ^ Flexible and dynamic ^ ^ ^* organization structure
4 Resource utilization 0.2 2.05 Appropriate facilities 0.2 2.0
Total Scores 10 100
Source: The Author
263
The UAEPSI must also use statistical tools to measure their processes and monitor
performance. For example, to regularly collect data in the form of surveys. The
collected data are stored in a large database and are continually examined for patterns,
such as trends and changes in their quality performance preferences. Due to the
simplicity of the scoring techniques of the QAM, the researcher has itemized the most
common statistical techniques used to analyze the data and to provide important
information (see Chapter Two, section 2.4).
Using these tools along with the QAM scoring techniques should facilitate the UAEPSI
to identify areas that have the highest impact on performance, and areas that need
improvement. This information allows UAEPSI to exercise a superior level of quality
practices, anticipate employee's perceptions, and put resources in service features most
important to the success of their quality implementation process. One of the key issues
that the UAEPSI should recognize in order to benefit from the model is that the
UAEPSI should primarily focus on the employee's satisfaction as a priority. Once this is
attained, it is inevitably reflected on their customers' satisfactions.
8.4 THE QAM BENCHMARKING
In this section, the researcher provides concise discussion on the similarities and
differences between the QAM and the list of models reviewed in Chapter Seven. The
researcher aims to discuss the characteristics of the QAM and to point out how they
differ from the Deming Model, Baldrige Model, EFQM Excellence Model, Toyota
Production System Characteristics and six sigma. A summary of the QAM
benchmarking matrix is illustrated in Table (8.3).
The model is based on the number of interrelated variables, with a format formed from
the addressed perception requirements specified by the people in the UAEPSI. It is also,
based on a well established literature and approaches to the quality implementation
criteria which are derived from a number of currently common quality models and
frameworks. Furthermore, the model is much detailed and simplified than the other
common models. The dimensions of the critical factors in this model differ in terms of
their degree of significance, influence and the quality practices and performance in
different UAEPSI.
264
On the other hand, the model as well as other common models had predetermined set of
critical factors and criteria that were necessary for determining the quality
implementation and performance; however, the prime difference between the research
model and the other models is that the core concepts of each individual factor are very
flexible and amendable, which every single institution of the department in the UAEPSI
can observe by measuring the critical factors according to their level of practice and
performance at all stages of the quality implementation process. Whereas in other
common models, the relationship between the critical factors are rigid, and do not
reflect the particular situation of the individual organization quality situation.
The model components indicate that the components synthesize those critical factors for
quality implementation prescribed by eminent quality literature and studies. These
factors in other common models are considered to be indicative, while they are regarded
in the research as an improvement. The purpose of the model is to draw the UAEPSI
decision makers’ attention to the key factors and areas that need to be effectively
managed prior or even during the course of quality deployment. This should provide
them with a self assessment tool that enables them to continuously improve their
performance.
The model allows the UAEPSI to carry out a pre-visibility study on their current
situation, to determine the significance of the core factors and sub-factors, as they were
identified within their institutions. That should provide the essential elements that
contribute successfully toward initiating quality programmes. In addition, the QAM
provides them with a road map of areas they need to focus on. As a result, they have full
understanding of how to start their quality implementation programme right from the
early stages.
In contrast, other common models do not consider the issue of pre-visibility study and
prevention; they simply anticipate that the organization had sufficient quality experience
in order to initiate their quality implementation programme successfully.
265
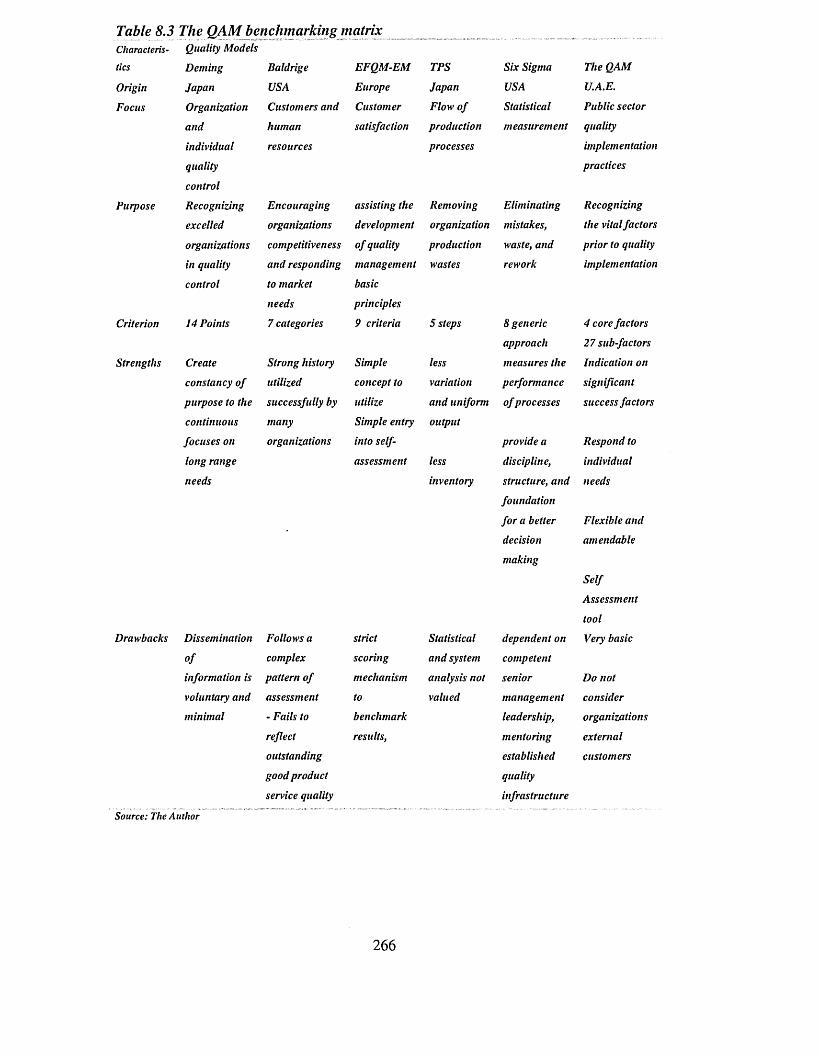
Table 8.3 The QAM benchmarking matrixCharacteris Quality Modelstics Deming Baldrige EFQM-EMTPS Six Sigma The QAMOrigin Japan USA Europe Japan USA U.A.E.Focus Organization Customers andCustomer Flow of Statistical Public sectorand human satisfaction production measurement qualityindividual resources processes implementationquality practicescontrolPurpose Recognizing Encouraging assisting the Removing Eliminating Recognizingexcelled organizations development organizationmistakes, the vital factorsorganizations competitivenessof quality production waste, and prior to qualityin quality and respondingmanagement wastes rework implementationcontrol to market needs basicprinciplesCriterion 14 Points 7 categories 9 criteria 5 steps 8 generic approach 4 core factors 27 sub-factorsStrengths Create Strong history Simple less measures the Indication onconstancy of utilized concept to variation performance significantpurpose to thesuccessfully by utilize and uniformof processes success factorscontinuous many Simple entryoutputfocuses on organizations into self- provide a Respond tolong range assessment less discipline, individualneeds inventory structure, andneeds
Drawbacks
foundation for a better decision making
Disseminationofinformation is voluntary and minimal
Follows a complex pattern of assessment - Fails to reflect outstanding good product service quality
strictscoringmechanismtobenchmarkresults,
Statistical and system analysis not valueddependent oncompetentseniormanagementleadership,mentoringestablishedqualityinfrastructure
Flexible and amendableSelfAssessmenttoolVery basicDo notconsiderorganizationsexternalcustomers
Source: The Author
266
SUMMARY
The UAEGEP criteria are very comprehensive as they are merely based on the EFQM-
EM criteria. Therefore, there is no doubt about the UAEGEP applicability. However,
the associated implementation complexity of the UAEGEP is mainly due to the
inaccurate adoption methods as perceived by the UAEPSI (Chapter Five). As a result,
gaps exist between what is perceived and what is actually on the ground. Thus, the
QAM function is to appraise these gaps and to enable the UAEPSI to determine their
quality status and realize how far they are from the set standards of the UAEGEP.
Accordingly, QAM emerged as an aiding tool for the UAEPSI quality practices. The
model core factors and sub-factors with the sequential appraisal phases illustrate the
mechanism of implementing the model; the scoring techniques that enable the UAEPSI
to appraise their quality quest by benchmarking them against the UAEGEP
requirements. In benchmarking the model with the broad universally quality
approaches, the model conceptually proved to be providing indicative and directive
characteristics that the organization needs to appraise their quality capacities prior to
their initiation of the quality process. The QAM unique characteristic is its simplicity
which facilitates understanding its main function. The UAEPSI can significantly benefit
from this approach, thus, to empirically prove the applicability of the model. The
following chapter validates the QAM by employing a qualitative research method that
focuses on groups whose observations and feedback outcomes are significant for testing
the viability of the model.
267
CHAPTER NINE
THE QAM VALIDATION
PREFACE
The previous chapter (Chapter Eight) confirmed the development process of the QAM.
Accordingly a comprehensive systematic implementation framework with an
assessment instrument was expounded. Subsequently this chapter demonstrates the
practical validation of emerged QAM. In order to evaluate the applicability and
credibility of the QAM, the researcher needs to present pragmatic demonstration on the
viability of the QAM and to determine its appropriateness to the UAEPSI requirements.
The aim is to put the QAM (core factors and sub-factors, the model cycle and the model
assessment tool) under full scale examination. Such aim could be attained by employing
a qualitative research method of the focus groups.
The formation of focus groups comprises a number of key personnel working in a
designated UAEPSI. They critically assess the QAM, as an innovative quality approach
expected to work as an assessment tool which assists the UAEPSI to appraise their
quality conditions. The chapter is divided into two main sections. In section one, the
researcher sets out to provide a framework which enables the management and/or
decision makers in UAEPSI to make an assessment of their quality standpoint prior to
the initiation of the quality implementation programme and its related provisions,
whereby the applicability of such model is examined. Details of the preparation of the
focus groups formation characteristics are verified. The process of meeting
arrangements along with the issues need to be discussed. In section two, the researcher
illustrates the effect of the process of formulating the focus group perceptions and
feedback on the adoption of the QAM in a format which could be practiced in the
UAEPSI. The section also, presents the set of developed questions which the research
study acknowledges; the set of outcomes is based on the perceptions and feedback of
the focus groups. The meeting outcomes shall inspire the researcher to apply the QAM
and to consider the needs for further improvements in response to the UAEPSI specific
needs. A brief summary that rounds up the chapter is presented at the end of this
chapter. Figure (9.1) outlines the content of this chapter.
268

Figure 9.1 Chapter nine outline
CHAPTER NINE THE QAM VALIDATION
PREFACE
\
SECTION TWO THE QAM VALIDATION
SECTION ONE THE FOCUS GROUP
SECTION THREE VALIDATION OUTCOMES
SUMMARY
L _■ ______ L
Source: The Author
269
9.1 THE FOCUS GROUP
The aim of this section is to present the results of the theoretical development of the
QAM, which are broadly explained in Chapter Seven and to verify its applicability to
the quality practices in the UAEPSI. Thus, to attain this aim the researcher formulated a
focus group by interviewing the most influential people such as: Top and Senior
Management in a number of UAEPSI. The top management are those people occupying
the top positions for instance: the chairpersons, the undersecretary and the assistant
undersecretaries.
Whereas, the senior management are those people in the executive position such as: the
general directors, chief executives and advisors responsible for the different divisions of
the institution. It is perceived by the researcher that using a qualitative research method
of focus group is the most suitable research methodology that suits the nature of this
study and precisely this chapter, and also the particular characteristics of the people in
the UAEPSI. The focus group is the most useful means of listening to the perspectives
and experiences of the sampled people (Tremblay, et al, 2010; Halcomb, et al., 2007;
Stewart, et al., 2007; Barbour, 2007; Freeman, 2006; Barbour, 2005; Edmunds, 2000;
Krueger, and Casey, 2000).
The researcher decided to apply the focus group principles and to design and conduct
clustered interviews in order to evaluate and validate the research QAM. Bowling
(2002), defined the focus groups ‘as unstructured interviews with small groups o f
people who interact with each other and with group leader. They have the advantage o f
making use o f group dynamics to stimulate discussion, gain insights and generate ideas
in order to pursue a topic in a grater depth’ (Bowling, 2002: 349). The reasons for
using group interviews as a research method for this part of the research study are
already explained and justified in Chapter Three (sections 3.3.1 and 3.5.2) and Chapter
Four (section 4.4.2).
The process of conducting focus groups interviews comprises two groups. Group one is
the top management of a single UAEPSI. Group two were representatives merely senior
management from various UAEPSI. The purpose was to divide the focus groups into
two different managerial groups as that would be easier for the researcher to administer
the sessions. Also, this segregation allows each group members more freedom to270
discuss the applicability and appropriateness of the developed model to their institution
quality implementation programme. Furthermore, due to the culture and traditions of the
U.A.E. society, it is unpleasant to gather most senior people with their subordinates in
one place. As a result, the researcher has to separate the two groups in order to
overcome this social barrier. This also, allows the researcher to differentiate the
responses of the top management as they are the policy makers and the planners of the
senior management who put policies into practice and make sure that they are on the
right track. The most difficult task was arranging the venues and time that was
convenient for both groups; it actually took a very long time of formal and informal
process arrangements in order to convince them to take part in the focus groups. The
researcher's advantage in a way he was able to share with them their quality
implementation experience and the perceptions that were relevant to the QAM
feasibility.
The involved candidates were assured that the outcomes of these sessions and the
results of this work presented in this study, are confidential and purely for academic
purposes; no individual’s identity or their insinuations entity will be exposed by any
mean to the public. However, the researcher would like to state that the discussions,
outcomes and results reached were obtained from senior officials representing major
and dominant public service institutions un the U.A.E.. The researcher carried out the
work plan of the focus group with manageable limits within the available resources.
This was because this research study was conducted solely by the researcher and it had
to be within his resource limitation and manageable capacity. Aspects such as
confidentiality and convenience were considered, as these were also favoured by the
focus group members and by the previous studies of its kind.
9.1.1 Group Formation
As previously pointed out, the researcher formed two categories of people who were
involved in the focus group. Table (9.1) summarizes the detailed content of each group
together with their occupation. The researcher sought four top and senior management
officials in the UAEPSI who expressed willingness to adopt the new approach that
would enable them to understand their institutions quality prerequisite success factors
prior to commencing their quality and excellence implementation. Additionally, to
inform top and senior management that it is difficult to envisage the sort of proposal271
which directly aims at changing their institution quality practices. In order to stimulate
the validation and the objectivity of the QAM, the researcher decided to choose the
participants of the group sample from different government official perspectives and
backgrounds; two groups were formed. The procedures and the preparation for
conducting both interviews, with the scheduled dates, time and duration of each
interview predetermined in advance and each member of groups was informed in due
time. Therefore, the researcher was prepared for any contingencies or unforeseen
disruptions that may cause delay or postponement of the set interviews.
Group one: it consists of six people in top and senior managerial positions working in
one of the most influential government institutions in the U.A.E., its main activities are
to promote and develop the economic policies and business activities in the U.A.E. The
formation of this group came at a time when a lot of efforts are exerted in order to
persuade the group sample to participate. Another obstacle was gathering the majority
of the senior management of the institution at a certain time. Therefore, setting the
meeting date was not an easy task. The preparation and selection of the people involved
in group one went through a long procedure of formal and informal requests and
personal talks with each member of the group one. However, it is obvious to point out
that the meeting venue took place in the executive board room located within the
premises of the institution. The reasons for holding the meeting venue at group one
institution was that it was easier for the researcher and group one members to be
gathered in a particular well known place. Besides, the meeting time was set during the
office working business hour so as to make it more convenient and accessible for group
one members to be as near to their offices as possible. They may also leave the meeting
board in case of an unprecedented situation.
Group two: it consists of eight members; the formation of the sample group was a very
challenging task that faced the researcher. The members were the same as those of the
first group in that they descended from top and senior managerial positions and worked
in the influential government institutions in the U.A.E., but they were formed from
different service institutions. The sample of this group was gathered when the
researcher attended a training programme for the public service senior officials
organised by the U.A.E. centre of the government leadership in the conference hall of a
leading hotel in the U.A.E. There were twenty five participants in that programme. This
batch represented a good sample of group two because all of them were serving in the272
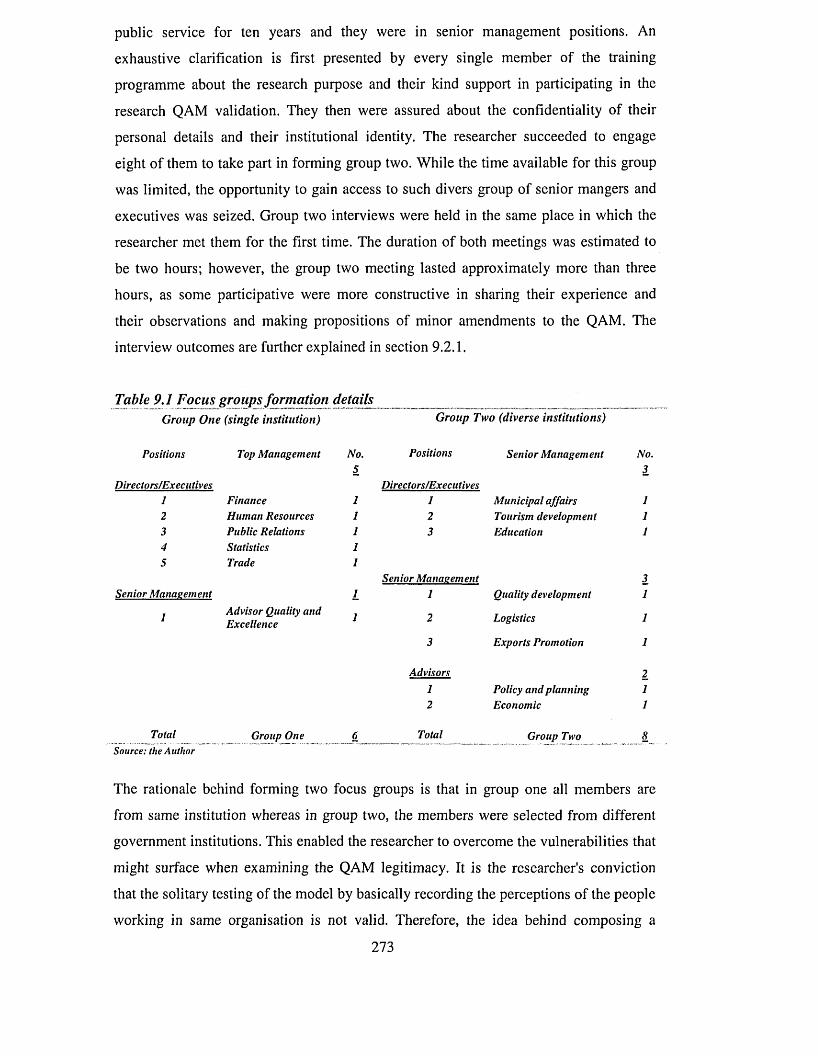
public service for ten years and they were in senior management positions. An
exhaustive clarification is first presented by every single member of the training
programme about the research purpose and their kind support in participating in the
research QAM validation. They then were assured about the confidentiality of their
personal details and their institutional identity. The researcher succeeded to engage
eight of them to take part in forming group two. While the time available for this group
was limited, the opportunity to gain access to such divers group of senior mangers and
executives was seized. Group two interviews were held in the same place in which the
researcher met them for the first time. The duration of both meetings was estimated to
be two hours; however, the group two meeting lasted approximately more than three
hours, as some participative were more constructive in sharing their experience and
their observations and making propositions of minor amendments to the QAM. The
interview outcomes are further explained in section 9.2.1.
Table 9.1 Focus groups formation details ____Group Two (diverse institutions)
Positions Senior Management No.3Directors/Executives1 Municipal affairs 12 Tourism development 13 Education 1Senior Management 31 Quality development 12 Logistics 13 Exports Promotion 1
Advisors 21 Policy and planning 12 Economic 1Total Group Two 8
Source: the A uthor
The rationale behind forming two focus groups is that in group one all members are
from same institution whereas in group two, the members were selected from different
government institutions. This enabled the researcher to overcome the vulnerabilities that
might surface when examining the QAM legitimacy. It is the researcher's conviction
that the solitary testing of the model by basically recording the perceptions of the people
working in same organisation is not valid. Therefore, the idea behind composing a
273
Group One (single institution)
Positions Top Management No.5Directors/Executives1 Finance 12 Human Resources 13 Public Relations 14 Statistics 15 Trade 1
Senior Management 1_Advisor Quality and Excellence
Total Group One 6
second group was to consider diverse collective opinions and to gather feedback from a
mixture of officials in the UAEPSI who were involved in quality policy making and
implementation processes. The diversification of perspectives should enrich the testing
and the validation of the QAM and avert any bias of the private opinions. Furthermore,
it seemed reasonable to assume that the viewpoints of such group would provide good
insights to the QAM potential modification. Hence, these people have sufficient
experience of quality practices and are extensively aware of the UAEGEP criteria: they
are also familiar with the implication of their institutions quality programme.
One of the fundamental issues the researcher attempted to explain to the people
involved in the focus groups is to know how to identify and then change their current
quality implementation practices and align them with the UAEGEP and eventually with
the TQM practices. The researcher's view was to point out the importance of QAM as a
tool to be used before initiating and implementing their quality programmes. The QAM
is more concerned with matching the UAEGEP with TQM principles to their actual
quality condition. If the appraisal analysis is conducted, with a particular emphasis on
the model mechanisms and its core factors and sub-factors, then the management would
be more likely aware of what and how to do it. It is therefore important to understand
before setting out on the TQM implementation programme what the likelihood and the
current state of UAEPSI quality status are.
9.2 THE QAM VALIDATION
The aim of this section is to confirm the validation and to discuss with both groups the
QAM major contribution towards improving the quality practices in their institutions.
Also, to clarify the potential benefits they could gain if they attempt to undertake such
model. Each focus group was briefed about the purpose of the meeting, what the
researcher aims to arrive at, and how they could contribute to the enhancement of the
QAM. Following the briefing, a presentation on QAM was performed and the following
points were discussed during the meeting sessions with the members of the focus group:
1- Theoretical development: the development of the QAM is based on the TQM
criteria set which was developed as a result of the outcomes of the research data
analysis (Chapter Five). The concepts, principles and philosophies (Chapter
Seven), were included in the theoretical development section of the QAM core274
factors and sub-factors set (Chapter Eight). They were favoured or used by a
number of quality researchers, advocates and gurus. Thus, the QAM is based on
empirically investigation identified by the QCF set and perceived by the
employees in the UAEPSI: it also encompasses factors and elements of TQM
tenets. It can be argued that QAM stands valid against the required attributes of
the other quality and excellence models which have an accepted criteria set.
2- Empirical investigation: the QAM has a systematic framework based on the
cyclical sequential phases that should be gone through. This process is discussed
and described to both focus groups to obtain their perceptions, (see Chapter 8,
Section 8.3).
3- Comprehensive validation: the QAM theoretical development is based on
comprehensive literature review and in depth fieldwork analysis. The
comprehensive synthesis confirms the content validity of the model. The core
factors and sub-factors included have been critically reviewed in order to
attribute major quality and TQM models.
4- Performance assessment: The QAM developed scoring technique. The allotted
weighting technique assists its users to benchmark their QCF against the model
factors. It also facilitates to address particular QCF which are significant to their
quality improvements.
5- Simplicity and flexibility: the QAM provides a generic process for the QAM
users. The simplicity of the model concept enables the UAEPSI to amend and
adjust the model according to their changing needs. The model assessment
technique provides for its users, a kind of appraisal study that enables them to
vision their current quality practices and their performance improvement
processes.
6- Benchmark-ability: the QAM enables the top management of the UAEPSI to
evaluate and benchmark their current quality situation against the requirements
of the UAEGEP criteria. As the model unique attribute is that it provides a
prevention mechanism of what QCF needs to obtain, it thus, provides further
275
reconciliation to the management prior to their actual engagement in the process
of quality implementation.
7- Indication conditions: the researcher also explained to the focus group members
that by adopting the QAM in their institution or at a departmental level and by
working forward systematically following the sequential phases of the model
cycle with emphases on the appraisal phase, they would be able to establish a
primary manifestation of their current quality condition. That will also, allow
them to identify their QCF strengths and weaknesses.
8- The Human factor: this significant issue was brought to the attention of the
focus group since it was observed by the researcher, and then supported by the
data analysis results of the research fieldwork empirical investigation.
Concerning the importance of the human factor to the success of their
institutions quality initiatives, the results of data analysis made it clear that they
significantly need to recognise and work for the satisfaction of their employee as
this is the most critical factor for their success in wining the U.A.E. government
excellence award. The employees have to be involved in the quality in all its
process and phases. Furthermore working on the continuous improvement and
career development are the most prior aspects that the management should
reconsider.
However, the key questions that the researcher needs to address and discuss during
the interview sessions are:
1- How the QAM is perceived in terms of its usefulness when compared with other
quality models and self assessment methods they currently adopt?
2- To what extent the adoption of QAM could improve the quality implementation
practices and the performance assessment techniques?
3- Does the application of the QAM approach enable its users to identify their
current quality situation and areas of improvement?
276
9.3 VALIDATION OUTCOMES
This section presents the outcomes of testing and validating the QAM. Basically, the
outcomes are based on the perceptions of both focus groups. The outcomes are a
combination of mixed opinions, suggestions and feedback that were observed, coded
and then analysed accordingly. Additionally, the outcomes analysis implications were
cited in meaningful manner and the information typically is used to evaluate the QAM
for possible modifications.
The members of the focus group initially carried out the review and the validation of the
QAM structure (the core factors and sub-factors). The discussion session was held in
which each participant was asked to present his views on the QAM and to raise any
scepticism. Although the selected sample of the focus groups did not necessarily
represent the entire UAEPSI perceptions, the views and feedback presented provided a
general perspective on the UAEPSI professional experience of the top and senior
management who had gone through the quality planning and execution of the UAEGEP
since its inception. Throughout their discussion of the UAEPSI, one common particular
characteristic was noted. It was that both the focus group members were highly
educated and had a considerable managerial experience in the UAEPSI. Furthermore,
the majority of the focus group members claimed to have been directly or indirectly
involved in the actual implementation of quality in their respective institutions. From
the results of both focus group meeting, a number of conclusions were drawn with
regard to the aims and the key questions posed in the previous section. The following
points summarise the main feedback and the suggestion made:
7. Responses to question one, which was about how the QAM is perceived in terms
of usefulness when compared with other quality self assessment models. The
analysis of the discussion showed a clear preference amongst the group
candidates for applying the QAM in their institutions as an aiding tool that
facilitates the UAEPSI to properly understand their quality strategy and the
sequential steps of their quality implementation processes. They felt that the
QAM principles are coherent with the UAEGEP criteria and improves their
performances and services delivery. Other candidates also considered QAM a
helpful self-assessment tool for steadily measurement of quality performance
improvements. They observed that the simplicity of the model was an overall277

integrative quality implementation approach. They believed that the QAM
provides a practical indication about the institutional standpoint, prior to
commencing their quality process. They also believed that this type of quality
approach (the QAM cycle) is found to be convenient in the UAEPSI context as
it integrates several phases of quality implementation practices. Furthermore,
they perceived that the QAM needs to incorporate a more comprehensive set of
quality factors and measures, such as a scope in service improvements and
customers care schemes.
2. Responses and feedback related to question two on the extent application of the
QAM should lead to improved quality implementation practices. Within the
limitation of the focus group scope, the conclusion arrived at, is that the QAM to
some extent improves the levels of quality practices. They admitted that more
emphasis should be placed on enhancing the role of the employees' involvement
in the all stages of quality implementation according to the sequential phases of
the QAM cycle. In fact, the researcher clearly demonstrated that the general
effects of the QAM application are promptly noticeable. Thus, the mechanisms
of the core factors and the sub-factors of the model as they were recognised in
all phases of the QAM embedded a sustained successful quality implementation
practices in the UAEPSI.
3. Responses and feedback related to question three, which deals with the
application of the QAM approach that enables its users to identify areas of
improvement by analysing their current quality situation. Several respondents
emphasised that the implementation strategy of the QAM must be developed in
collaboration with the UAEGEP requirements and standards. Hence, the optimal
aspect of the model is that it simply enables the UAEPSI, to precisely position
them-selves on where they stand, on their quest to excellence. Therefore, the
respondents were in favour provided that they gain the required benefits from
such model. However, they were uncertain on what mechanisms they need to
apply in order to mutually merge the QAM with the UAEGEP.
4. Due to the unclear focus on the factors influencing the success quality
implementation in the UAEPSI and in particular benefiting the people, the
researcher together with the candidates outlined three aspects which the top and278
senior management should consider on issues relevant to the employees in their
organisations. First, they must accommodate people to plan, handle and
implement improvement by offering them methodology and instructions on how
to implement the necessary actions. Second, they must create a simple but
thorough method of prioritising quality implementation improvement actions
identified by the application of the QAM. Third, they must follow-up the
improvement actions taken, included in the normal review routines monitored by
the top management.
5. A suggestion was made by a number of focus group members to expand the
number of the core factors and sub-factors to include more stakeholders such as
customers and suppliers. That was a valuable point, but the research study did
not include other stakeholder as to simplify the QAM for its users. Additionally,
this suggestion was considered as mentioned in Chapter Ten a proposal for
research studies that consider this aspect.
<5. Redistributing the factors percentage scoring and the weighting system by
increasing or decreasing the allotment of percentages of scoring to a number of
sub-factors. This point is already explained in Chapter Eight, whereby scoring
factors are allotted variable and flexible options to respond to the particular
characteristics of individual UAEPSI needs.
7. Eliminating some of the sub-factors mainly factors one and four
8. Undoubtedly, most of the participants agreed on the important role of the human
factor (the people) to the success of their quality programmes.
9. The issue of the employees' resistance to change has a significant impact on the
attitudes of the people towards accepting new concepts
10. The sub-factor of people involvement in all quality processes went under
extensive debate, as some of the participants responded negatively whereas
others claimed that they faced difficulties in persuading people to take part in
this process as they felt that additional tasks were required to perform.
279
7 7. Almost all the participants acknowledged that they did not attempt to conduct an
appraisal assessment on their current quality practices, prior to their engagement
with the UAEGEP
72. They perceived that the QAM to some extent enables them to identify the
intervals that may arise during the quality implementation process.
13. The concept of practicing quality as a continuous process does not exist in the
UAEPSI.
14. Most of the focus group members admitted that their current quality
implementation practices need to be reviewed and reconsidered in order to fulfil
the quality requirements and to get acquainted with the UAEGEP criteria
15. A comment was made to the senior management who did not eagerly commit
themselves to implementing the anticipated quality proposals after joining the
UAEGEP. Thus, little progress was made. They found out that they had
underestimated the quality implementation difficulties and overestimated the
organisational capabilities and the lack of empowered employees. They failed to
recognise the importance of people involvement and participation in the all
stages of quality implementation; these were the main obstacles facing the
UAEPSI.
SUMMARY
The QAM is mainly developed as an aiding tool for UAEPSI to evaluate the quality
readiness which enables them to comply to the UAEGEP quality criteria standards.
Hence, the model was based on accepted criteria clusters which encompass factors and
sub-factors of the major TQM critical factors. A systematic framework and scoring
mechanisms were also developed as to provide a comprehensive generic model that
could respond to the UAEPSI quality practices demands. Therefore, a qualitative
research method of focus groups was carried out to examine the validity of the model.
The focus group of UAEPSI top management were formed to seek their perceptions and
the possibility of the model adoption in their institutions. The outcomes were very
promising as it can be claimed that QAM proved to be valid against the required traits280

of the TQM implementation of the UAEGEP criteria. The conclusion is that the model
is feasible and applicable and some of the group members showed enthusiasm in
applying the QAM concept in their institutions. However, in order to attain the
maximum advantage of the model, the UAEPSI needs to devote exceptional time and a
lot of managerial and administrative efforts in order to change the quality cultures and
the institutional work environment. This is what the following chapter demonstrates; a
set of findings and general recommendations of the whole research study will be
presented.
281
PREFACE
CHAPTER TEN
CONCLUSION
In the previous chapter, the researcher validated the formulated QAM. The results of the
focus groups analysis revealed that the model is feasible, adoptable and flexible; it
could respond to the individual quality circumstance of the UAEPSI. Thus, this
objective is achieved. This chapter wraps up the whole research study as if realizes the
aim and objectives. Since the aim of this research study was to investigate the quality
implementation practices of the UAEPSI in order to develop a model which assists them
to improve the quality implementation practices. In the course of research study, several
processes were carried out. A review of TQM literature was conducted to manifest the
quality philosophy, the evolution of quality theory and its principles, the approaches of
the quality management gurus and practitioners together with the quality tools (Chapter
Two).
A triangulation research methodology of quantitative and qualitative approaches were
employed (Chapter Three), a fieldwork survey questionnaires was carried out to
investigate the perceived and actual quality practices in order to identify the QCF that
are vital for quality success in the UAEPSI (Chapter Four). The data analysis identified
several quality critical factors that are vital for the betterment of TQM implementation
practices. Also, the data analysis related to TQM practices in the UAEPSI revealed
existing gaps between what is perceived and what is actually practiced (Chapter Five).
A background to the U.A.E. was provided to manifest the escalation of quality
movement the UAEPSI and the initiatives of the UAEGEP to promote the quality
culture (Chapter Six). Further literature revision on quality models and approaches were
broadly implemented and demonstrated the development of the theoretical part of the
research model. The outcomes of the data analysis obtained from Chapter Five are also
employed to formulate the empirical part of the proposed model (Chapter Seven). Thus,
a quality appraisal model has emerged based on the theoretical and empirical outcomes.
The design of the QAM is confined to a set of core factors and sub-factors for building
up its structure framework. Cyclical sequential phases are provided as an application
mechanism which displays the TQM implementation stages. Additionally, a systematic
282
scoring system was evolved as a tool for quality appraisal; it enables the UAEPSI to
assess them recognizing their quality condition and measuring their TQM performance
simultaneously. The QAM elucidates its distinctive benchmarking characteristics
against the broadly adopted quality models (Chapter Eight). The second research
method of the qualitative approach that dealt with the focus groups was employed to
test and validate the QAM. The results indicated that the QAM positively fits the TQM
implementation requirement of the UAEPSI (Chapter Nine).
In this chapter, a number of findings and conclusions were drawn. Firstly, the chapter
presents the findings obtained by means of data analysis, which include the findings
related to the research study aim and objectives that have been accomplished and to the
questions that have been resolved. Secondly, based on these findings, specifically those
relating to the entire research study, a number of recommendations were made. Thirdly,
the chapter highlights the research limitations. Fourthly, it exhibits the research
contribution to the TQM practices in the U.A.E. and generally to knowledge. Finally, it
concludes with a number of suggestions as to the areas requiring further prospective
research work. Figure (10.1) outlines the content of this chapter.
283
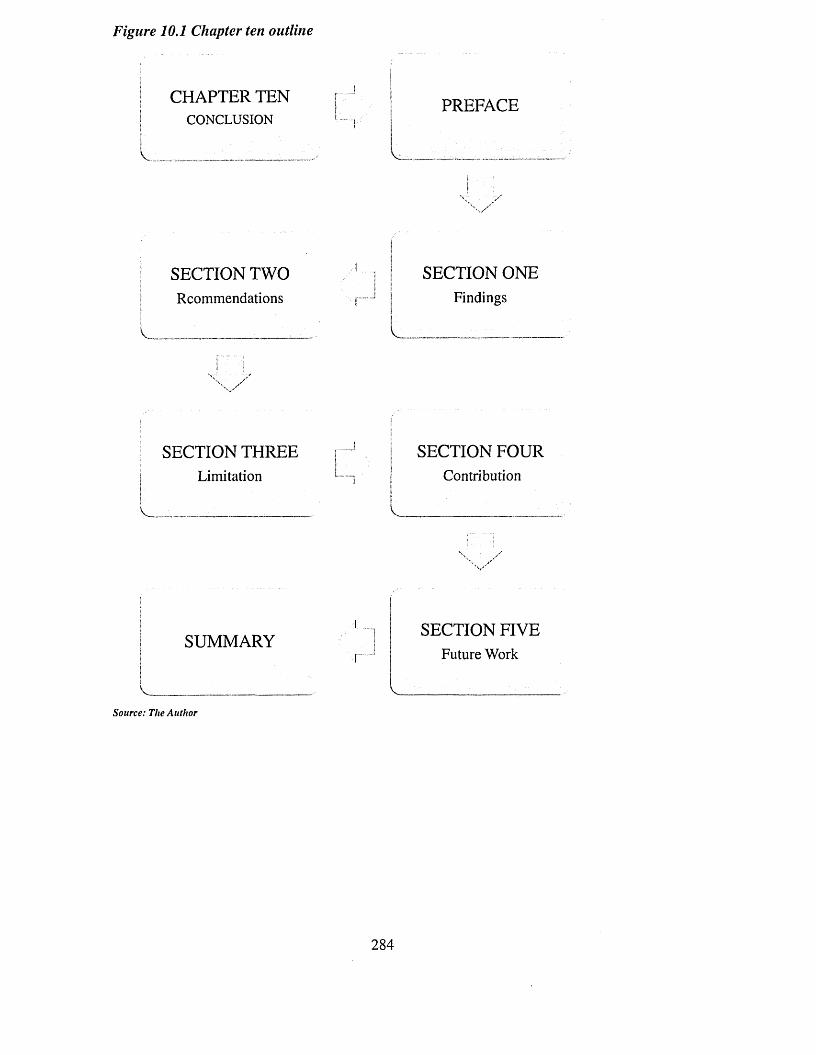
Figure 10.1 Chapter ten outline
CHAPTER TENI CONCLUSION
SECTION TWOI Rcommendations1 _
| SECTION THREE | Limitation
____________
SUMMARY
V ______________Source: The Author
PREFACE
v _ _
SECTION ONE Findings
________
SECTION FOURContribution
v ____________,_____
SECTION FIVE Future Work
v _________ :____
284
10.1 FINDINGS
The lack of sufficient guidance to assist organizations in TQM implementation had led
to a considerable number of unsuccessful TQM implementation practices in the
UAEPSI. This is because the federal and local governments in the U.A.E. have recently
realized the magnitude of TQM in boosting the institutional performance. In view of
that, they began humble initiatives to introduce TQM principles in the UAEPSI. This
lack refers mainly to TQM practices in the UAEPSI that are relatively newly
introduced. Thus, inexperience in benchmarking had eventually resulted in hardly
carrying out any research study related to TQM practices in the UAEPSI. Thus, the
major aim and objectives of the research study are:
Aim
“To investigate current TQM practices in the United Arab Emirates public service
institutions, in order to develop a generic quality appraisal model that assists in
enhancing the quality performance and services ”
Objectives:
1. To investigate the current TQM practices in UAEPSI
2. To identify quality critical factors for the successful TQM implementation o f
UAEPSI
3. To determine the appropriateness o f the developed model to the UAEPSI.
In order to achieve the research aim and objectives, three research questions were
proposed as follows:
7. What are the quality critical factors, and to what extent they are significant for
the successful implementation o f TQM in the UAEPSI?
2. What problems and/or obstacles are associated with TQM implementation
practices in the UAEPSI?285
3. What are the UAEPSI anticipations o f an accustomed quality appraisal model?
This section displays the main findings of the data gained through the empirical
investigation. More specifically, it considers the findings relating to the achievement of
the above research aim, objectives and questions. They are preferentially demonstrated
as they supplement and support each other in leading to the research foremost aim.
Objective one: To investigate current TQM practices in the UAEPSI
In order to attest the researcher proposition related to the ineffective and unsuccessful
TQM implementation practices in the UAEPSI, a groundwork investigation was carried
out to evaluate the current TQM implementation practices and pitfalls in the UAEPSI.
The need for change was felt in the researcher institution as well as in other UAEPSI. A
preliminary investigation in several UAEPSI was conducted in order to confirm the
researcher assumptions, to review the previous experiences related to TQM
implementation practices and to evaluate the likely difficulties that may be encountered.
The major outcomes were realized (see Chapter One, section 1.1) where they are clearly
presented. Thus, it could be regarded that the first objective was successfully attained
with significant outcomes which were utilized for commencing the following research
objectives.
Objective two: to identify quality critical factors for successful TQM implementation in
the UAEPSI,
Question one: What are the quality critical factors, and to what extent they are
significant for the successful implementation o f TQM in the UAEPSI?
In order to attain objective two, it must be supported by a question. Therefore, question
one was formed as an aiding instrument. By answering question one, the outcomes
directly lead to attaining objective two, since they support each other. To achieve the
objective, three research stages were executed. First, the researcher intensively reviewed
the literature related to the QCF, alongside that with the UAEGEP criteria framework.
Second, based on the theoretical revision, twenty seven QCF were identified relevant to286
the UAEPSI (see Appendix 4). Third, an evaluation test was carried out to identify QCF
relevant to the UAEPSI; a measurement instrument was exercised to measure their
validity and reliability. The QCF reliability test revealed the positive correlation and
consistency within the universal common QCF (see Chapter 3 and Chapter 4).
Eventually the QCF constructed section three and four of the research survey
questionnaire. The purpose was to examine their significance to the successful TQM
implementation in the UAEPSI on the one hand. On the other hand, to examine the
extent to which it was actually practiced by the UAEPSI. The aim was to find out if
there are any gaps between the TQM implementation practices and the UAEPSI TQM
implementation practices. The data analysis revealed that almost all QCF such as: top
management commitment, encouragement and recognition of employees, strategy and
policy deployment, and continuous improvements, etc., were significant and vital to the
successful TQM implementation.
However, they were perceived that they were not fully practiced in reality, particularly
the factors that are related to the employees' satisfaction. Therefore, there were
momentous gaps between the theoretical and practical practices in the UAEPSI (see
Chapter Five, sections 5.4 and 5.5). In the light of the earlier discussion, it could be
claimed that both question one and ultimately objective two were certainly attained. The
results prove the need for a quality model that is applicable to the UAEPSI nature (see
Chapter Eight).
Question two: What problems and/or obstacles are associated with TQM
implementation practices in the UAEPSI?
This question is rigorously answered in Chapter Five. The aim was to identify the
reasons behind the unsuccessful quality implementation practices in the UAEPSI. One
of the major obstacles which the UAEPSI experienced in their TQM implementation
practices was the difficulties encountered in applying properly the UAEGEP criteria.
Surprisingly, many institutions were the most vulnerable; they had serious TQM
implementation problems. The data were analyzed, and then the outcomes were
employed in developing the model framework (see Chapter Five, section 5.6).
287
Objective three: to determine the appropriateness o f the developed model to the
UAEPSI
Question three: What are the UAEPSI anticipations o f an accustomed quality appraisal
model?
Both objectives three and question three are interrelated and consistent. The answer to
question three directly leads to attaining objective three. In resolving question three,
extreme literature revision were undertaken related to the most universally adopted
TQM models and approaches (Chapter Seven). Critical analysis to the UAEPSI current
TQM implementation practices were employed and to UAEGEP and were reviewed as
well (see Chapter Six). This was done in order to develop the theoretical part of the
QAM (Chapter Eight).
While the empirical part of the QAM was formulated from the data analysis (Chapter
Five and Chapter Eight), the purpose of the QAM is to assist the UAEPSI to appraise
their TQM status against the UAEGEP criteria. The simplicity and the flexibility of the
model allow every individual UAEPSI to get used to the model according to their
current TQM implementation practices and requirements (Chapter Eight and Nine).
This was done partially to achieve objective three and the overall research aim. Then, to
confirm the appropriateness of the QAM (objective three) and the people anticipations
(question three) related to the QAM, the second research method of qualitative approach
was exercised (Chapter Nine). Two focus groups of top management in the UAEPSI
were formed. The purpose of the focus groups was to test and validate the developed
model. Based on their feedback and outcome analysis, the QAM could be practically
and broadly applied in UAEPSI. As a final point, the research study has accomplished
both objectives and question three effectively by considering all aspects that ensure the
successful implementation of the QAM as an assessment instrument for better TQM
implementation practices in the UAEPSI.
General findings related to research data analysis
In order to achieve the objective of the research, a number of variables were empirically
tested. The first two variables involved the extent to which the quality models in the
288
UAEPSI were adopted and why they were adopted. The results of the research obtained
through the empirical study, provided a number of findings in this regard. In relation to
the extent to which the quality models were adopted, the data analysis revealed that the
majority of respondents, from both the management and the employees’ levels,
exercised quality in their institutions. This finding suggests that the majority of UAEPSI
adopted TQM and its methods simply to comply with the government quality initiatives.
This finding supports the assumption that there is a lack of an appropriate understanding
of TQM principles and implementation practices amongst UAEPSI.
In relation to the complexity of implementing the UAEGEP criteria, the findings of the
research revealed that a significant portion of respondents admitted that they have
encountered various difficulties in practicing these criteria, as both the managers and the
employees were strongly in favour of the fact that they had inadequate awareness of
how to effectively practice the UAEGEP criteria. This suggests that the quality factors
have never concerned the UAEPSI management and that the proposed QAM, if
implemented, would be the first step towards the endorsement of the systematic and
simple method of quality implementation process. The inconclusive findings related to
the impact of the TQM on the UAEPSI performance improvement and institutional
output, demonstrated that there is a pending need to develop other effective
performance measures, such as the customers perceived service quality.
Findings revealed from research methodology
The use of survey questionnaires was the best research method of gathering data and the
most appropriate method of making people interact positively and respond accurately.
Due to the cultural sensitivity of the U.A.E., people are obsessed when they are
observed over a period of time in order to record their impressions or behaviour.
To sum up this section, the researcher is confident that the attainment of the above three
research objectives was achieved and that the three questions were answered. They
ultimately direct to the accomplishment of the overall research aim. In the light of the
earlier discussion, the research study has successfully executed and completed its
mission and therefore the research aim is declared accomplished.
289
10.2 RECOMMENDATIONS
Based on the objectives and outcomes of this research, the researcher recommends a
strategy for quality to be developed and implemented by the UAEPSI to improve the
total institutional performance and meet customer's expectations. This strategy may put
focus on:
Improving quality process
The top management in the UAEPSI should take into the consideration the fact that the
service quality improvement process must be set up in a systematic way that
incorporates all parts of the institution. Every section, unit, and department system
should be aligned in such a way that could lead to improving quality making this goal
the responsibility of every part and everyone in the institution. The service quality
improvement process should be clear as to what it can achieve, how it can achieve it,
and what the responsibilities of each employee in the improvement process are. There
should be an effective upward and downward communication system so that
information related to quality improvement can be transferred effectively and in
coordination between the management and the employees and between the
intersections. The information can then be utilized to reduce conflict and to realize the
ultimate goals of quality improvement.
Effective use o f benchmarking
There is no doubt that the individual institutions in the U.A.E. lack the adoption of
benchmarking as a tool of performance measurement. This is due to the lack of
cooperation and coordination between UAEPSI to improve service quality with those
institutions that have the advantage of experiencing quality. Such kind of inter-
institutional relationships suggest some problems of TQM implementation practices that
can be solved. Effective institutional cooperation between UAEPSI is missing and small
institutions are falling behind large institutions. Small and low income UAEPSI in
particular are weak, partially because they lack the quality expertise, quality training
and proper precision related to TQM implementation obstacles.
290
Effective use o f quality statistical tools
There are new problems facing the UAEPSI in the area of self assessment and
performance measurement which create new challenges. Performance measurement of
quality practice methods to cope with service improvements is one such challenge
which cannot be disregarded. Some difficult quality implementation practice problems
have arisen as a result of the vagueness related to the appropriateness of the statistical
tools in indicating the service improvements, equally true due to shortages of quality
expertise, and to conventional quality measurements methods that need to be replaced
by new tools of performance measurements. Even though there are many certified
quality assessors in the UAEPSI, they are not very active in trying to use some of the
advanced TQM methods such as regression and reliability analysis in order to advance
the current status of TQM implementation practices to a further level.
Developing distinct U.A.E. Quality-Excellence Model
Based on the answers to question one and two, the U.A.E. has its own culture which is
somewhat different from other countries in the region, and is much different from the
rest of the world due to the UAEPSI quality culture uniqueness, and apart from the
research developed model. So far, the UAEGEP did not attempt to develop from its past
experience a quality-excellence model that respects the cultural traditions of the
UAEPSI. This matter should be a critical issue in the UAEGEP since UAEPSI lacks the
statistical tools for measuring performances effectively. Conventional quality practices
may not be sufficient to cope with new trends of institutional challenges. The UAEPSI
needs to be adapted to the QAM proposed in this research, as it is a very simple
assessment method that allows the UAEPSI to understand their current quality situation.
At the present time, employees in the UAEPSI do not seem to be well equipped with the
advanced quality performance measurements and the self assessment methods and they
are not, generally speaking or willing to use them to solve quality implementation
problems. These barriers can be overcome by adopting the principles of QAM,
alongside constant education and training and by the efforts of quality improvement
teams strongly supported by the management.
291
Employee's management relations enhancement
The isolation of employees from the quality planning stages and their involvement only
in the implementation process could not help the UAEPSI to accomplish their quality
targets. The UAEPSI should implement some measures to recognize the human and
social values, to make the working atmospheres attractable and thereby, to increase the
motivation of the employees and that what precisely the QAM main core factor
emphasized on. Management skills such as delegation, empowerment and recognition
schemes need to be really effectible. Career promotion schemes need to be based on the
employee’s actual performance away from the external influences and personnel
interests.
Creating quality culture in the UAEPSI
The UAEPSI, specifically the management, has failed to recognize the importance of
people's attitudes and to encourage change. This is one of the primary reasons for the
failure of the quality transformation and implementation process. The distinctive
multicultural characteristics of the U.A.E. employees is the first factor that needs to be
addressed when establishing a quality practice since it influences the planning stage of
the implementation process. There is a rigid link between people culture particularly
those descending from unlike backgrounds and the success of quality implementation.
For that reason, top management need to pay more attention to problem areas related to
quality cultural improvement issues within their institutions; thus ultimately averting
failure and mismanagement.
Employee’s empowerment
Empowerment of all employees is necessary as a source of improved performance and
participation. The employees form the core of any quality implementation process as
they are involved in managing and improving processes and in serving customers. The
management of UAEPSI demands the recognition of the employee involvement and
motivation; the initiation and implementation of any quality approach would be difficult
to put into practice. Empowerment is a crucial part of the UAEPSI cultural change that
situates the decision-making process regarding solving problems in their work. On top
of that, incentive schemes could reward the employees and result in upsurge in their292
input to their institutional achievements. They must perceive themselves as having
equal opportunities in terms of institutional aspiration.
Effective employee's involvement
This factor has to be thoroughly addressed. As the employees' involvement in their
institutions quality scheme is purely narrowed down to the implementation phase, the
management of the UAEPSI ought to seriously undertake the factor of the employee’s
involvement in the entire institutional quality implementation process. Wider
involvement ought to be exercised, and management needs to transform TQM theories
into practice. It is obvious that the employees who do the work make most of the
decisions about how the work is done. Therefore, the development of appropriate
involvement skills is prerequisite for optimizing the employee contributions to their
institution's quality initiatives success. The management of the UAEPSI should give
their employees the authority, responsibility, knowledge and skills they need to
implement their quality involvement roles. The employees have to realize the
essentiality of their involvement, and the management has to change their traditional
views; they are the planners and the employee’s implementers.
Teamwork enhancement
It is perceived from the research data analysis outcomes that this factor is not often
practiced as a quality implementation practice. Obviously, teamwork is a major factor of
TQM implementation because it enables employees in different parts of the institution
to work together to meet the customer needs in ways that cannot be done through
individual job performance alone. Unfortunately, the philosophy of teamwork in the
UAEPSI is quite unpopular, as infrequently, people work as teams. People in the
UAEPSI tend to work individually and get rewarded according to their particular
performance. Undoubtedly, that collective output is virtually always superior to the
individual output. The teamwork provides an opportunity for employees to work
together in pursuing quality in ways they have not experienced before. The team and the
individual should be recognized and rewarded equally. Through teams, employees are
brought together with a common goal and quality improvement becomes easier to
communicate over departmental or divisional sections. Teamwork is therefore a
behavioural factor that must be made part of the UAEPSI quality culture. It is obvious293
that the only efficient way to tackle process improvement or complex problems is
through teamwork. Therefore, collective efforts are extremely crucial for UAEPSI in
their quality success.
Elective participation in the UAEGEP
Evidences from the research study showed that people particularly in the UAEPSI tend
to be apprehensive when they undertake sudden shift from routine work to adopt TQM
principles. Giving preference to adopting the UAEGEP is the best way to encourage
them to positively contribute without being forced to do it. Actually, the UAEPSI
displays how to initiate quality programmes, and actual involvement; the UAEGEP
needs to change the policing role of the UAEPSI; they should build partnership relation
with the UAEPSI particularly in institutions that lack experience and encounter
difficulties in undertaking such initiatives Particularly when assessed by the UAEGEP,
the assessors considers the size (number of employees, number of branches), the service
sector (health sector, for example, hospitals, clinics, and health service departments), the
educational, background, for example, (schools, universities and education councils)
etc., and the size of the community they serve.
10.3 LIMITATION
Once the research study is completed, it is necessary to evaluate it with respect to its
limitations as shown below.
The research QAM did not include factors related to the customer’s satisfaction. This is
deliberately left as the main concept of the model addressing the internal environment
of UAEPSI quality implementation practices. In addition, the research survey was
carried out to seek the perceptions of the employees in the UAEPSI; therefore, it is not
sensible to ask participants to respond on behalf of their customers.
Also, the researcher did not aim to complicate the application of the QAM, but rather to
keep it simple and straightforward. Therefore, customer related issues were left for
future empirical studied. In addition, this research study involved major UAEPSI who
were experienced in TQM practices in the past few years. This means that the findings
of this study are understood within a certain context, that is, the people (top294
management, senior management, supervisors, officers, and clerical staff) in the
UAEPSI. The state owned organizations 1 were not included; hence, they were
considered more likely private sector operating entities.
10.4 CONTRIBUTION
This research significantly makes constructive contribution to the development of
quality theories and practices specifically to the U.A.E. institutional culture since it is
exclusively focused on TQM implementation practices as related to the public sector
institutions in the U.A.E. The research empirically investigates the critical factors
affecting the success or the closure implementation of TQM. Following are the main
contributions in the research view:
1. Create awareness and understanding o f TQM concepts and implementation
techniques, and their impacts on the performance for the UAEPSI.
2. Encourage the U.A.E. government to set up a strategy for quality in alignment
with the government corporate strategy.
3. Encourage the public sector institutions to develop their quality strategy in
alignment with their corporate strategy.
4. Help employees o f the UAEPSI to adopt a mind set o f improving quality culture
in their way o f thinking and behaviour
10.5 FUTURE WORK
The research topic is a source of literature for other researchers in the same field. Also,
the findings of this study could offer a useful potential orientation to the quality
practices of UAEPSI, being an independent fieldwork study with empirical
investigations. The researcher considers the following topics that need to be addressed
in further research:
1 The state owned organization are merely independent private sector oriented legal entities founded by the U.A.E. local as well federal governments to undertake commercial activities on behalf o f the owner government
295
1. further research and study for the development o f distinct U.A.E. quality-
excellence model
Almost all countries developed their own quality and excellence models that
meet their national criteria and culture. They have accepted the basic principles
of quality and excellence principles originated by the Baldrage system and the
EFQM excellence model and adopted these principles to conform to their
cultural characteristics. The U.A.E. local governments have had experience in
developing their own excellence model; however, no unique U.A.E. quality
model or method has emerged. It may be true that no real effort has been made
and up to now UAEPSI has been content with imitating the ad hoc methods
copied from the advanced nations. As far as TQM and quality culture are
concerned, some questions are often raised by the employees in the UAEPSI
about whether the EFQM-EM is really suitable for the U.A.E. traditions and
culture. This matter deserves to be a vital issue in UAEPSI quality
implementation practices in future research perspectives.
2. Expanding the QAM core factors that include the UAEPSI external customers
3. The effectiveness o f people empowerment and their full involvement in the
success o f quality implementation in the UAEPSI
SUMMARY
In conclusion, the research study investigated the quality implementation practices in
the UAEPSI. This is because most of UAEPSI lack of quality implementation strategy,
thus they encounter difficulties in transforming the TQM concepts into practice.
Therefore they hardly benefit from their quality initiatives in improving their
institutional total business performance and ultimately meet their internal as well as
external customer's expectations as they predict. A fieldwork was carried out in order to
explore the current TQM implementation practice in the UAEPSI.
The data analysis showed that there is a divergent between the TQM principles and the
actual quality implementation practice in the UAEPSI. As to overcome this quality
appraisal model was developed. The main purpose of the model is to enable the296
UAEPSI to assess their quality status and to set quality implementation strategies that
consistent with the U.A.E. government strategy, and also to improve their performance.
In short, the researcher hopes that this study provides insights and contribution to
UAEPSI and TQM practitioners. For UAEPSI, the study provides solid evidence that
certain quality critical factors of the QAM ought to be recognized and considered for the
successful TQM implementation practices in order to yield substantial benefits in
performance improvement.
While for TQM practitioners, the study has moved from theoretical TQM modelling to
empirical testing and validation, integrating the conceptual TQM concepts with the
empirical ones. Researchers as well as UAEPSI management can take advantage of the
QAM for developing new proposals applicable to TQM implementation practices in the
public sector institutions.
297
REFERENCES
Abdulla, A. (2008) The Human Development Between Tow Reports, In Al Khaleej,
September, No. 8820, pp25
Abu Dhabi Award for Excellence in Government Performance (2010) The Abu Dhabi
Award for Excellence in Government Performance Participations and Regulations,
Emirate o f Abu Dhabi, United Arab Emirates
Abu Naba’a, M. (2008) Arabian Management Theory, Al-Sharq Publishing, Amman
Al Shaghana, K. (2004) Integrating Total Quality Management with Excellence,
Conference paper, 2004
Al Zaabi, N. (2008) Internal Organizational Quality, Quality Quill, September, 2008,
United Arab Emirates
Al-Mashari, M. and Zairi, M. (2000) Revisiting BPR: A Holistic Review of Practice
and Development, Business Process Management Journal, Vol. 6, No. 1, pp. 10-42.
Ahmed, A., Abdul Hamid, N., and Takahi, S. (2008) The Impact of ISO Registration
on Total Quality Management (TQM) Practices of the Public Sector in Kota
Kinabalu Sabah, Memories o f the Faculty o f Education and Human Studies, Akita
University, No.63, pp. 7-14.
Al emrat Al-youm, (2010) Vol. 1468, December, United Arab Emirates
Al khaleej, (2009) Vol. 9246, August, United Arab Emirates
Al Khaleej, (2010) Vol. 9629, November, United Arab Emirates
Al-Tamimi, H. and Al-Amiri, A. (2003) Analyzing Service in the U.A.E. Islamic
Banks, Journal o f Financial Services Marketing. Vol. 8, No. 2, pp. 119-132.
298
Alsadhan, A., Zairi, M. and Keoy, K. (2008) From P Economy to K Economy: An
Empirical Study on Knowledge-Based Quality Factors, Total Quality Management.
Vol. 19, No. 7-8, pp. 807-825.
Arab Organization for Administrative Development, (2007) Successful Administrative
Practices, a Series of Successful Management Practices in 2007, U.A.E. Case.
League o f Arab States, Cairo, Arab Republic o f Egypt
Antony, J. (2003) Design Experiment for Engineers and Scientists, Butterworth-
Heinemann Publications, London
Alvesson, M. and Skoldberg, K. (2009) Reflexive Methodology: New Vistas for Qualitative Research, Sage Publications, New York
Ajman Excellence Programme, (2010) The Ajman Excellence Programme: The Award Criteria's, Ajman Excellence Programme, Emirate o f Ajman, United Arab Emirate
Breakwell, G., Fife-Schaw, C., Smith, J., and Hammond, S. (2006) Research Methods
in Psychology, Sage, London
Bollinger, A., and Smith, R. (2001), Managing Organizational Knowledge as a
Strategic Asset, Journal o f Knowledge Management, Vol. 5, No. 1, pp. 8-18
Baxter, L. and MacLeod, A. (2008) Managing Performance Improvement,
Routledge, London
Badri, M. and Davis, D.(1996) A study of Measuring the Critical Factors of Quality
Management, International Journal o f Quality and Reliability Management, Vol. 12,
No. 2, pp. 36-53
Baidoun, S. (2003) An Empirical Study of Critical Factors of TQM in Palestinian
Organizations, Logistics information Management. Vol. 16, No. 2, pp. 156-171.
Baidoun, S. and Zairi, M. (2003) A Proposed Model of TQM Implementation in the
Palestinian Context, TQM and Business Excellence, Vol. 14, No. 10, pp. 1193-1211.
299
Baidoun, S. (2004) The Implementation of TQM Philosophy in Palestinian
Organizations: A Proposed Non-prescriptive Generic Framework, The TQM
Magazine, Vol. 16, No. 3, pp. 174-185.
Bataille, G. and Phil, G. (2002) Research Methods for Managers, 3rd Edition, Sage
Publications, New York.
Boddy, D. (2002) Management: An Introduction, 2nd Edition, Pearson Education,
New York
Bryman, A. and Bell, E. (2007) Business Research Methods, 2nd Edition, Oxford
University Press, London
Bryman, A. (1995) Quantity and Quality in Social Research, Routledge, New York
Bryman, A. (2001) Social Research Methods, Oxford University Press, London.
Brown, M. (2006) Baldrige Award Winning Quality: How To Interpret The Baldrige Criteria For Performance Excellence, 5th Edition, Productivity Press, New York
Blain, J., Ezzy, D. and Harvey, G. (2004) Researching Paganisms, Altamira, New
York.
Bogdan, R., and Biklen, S. (2006) Qualitative Research For Education, An
Introduction To Theories and Methods, 5th Edition, Allyn & Bacon, Boston
Bowling, A. (2002) Research Methods in Health: Investigating Health and Health
Services, 2nd Edition, Open University Press, Buckingham
Bourque, L. and Fielder, E. (2002) How to Conduct Self-Administered and Mail
Surveys - The Survey Kit 3, Sage Publications, New York
Barbour, R. (2005) Making Sense of Focus Groups, Medical Education, Vol. 39, No.
5, pp. 742-750.
300
Barbour, R. (2007) Doing Focus Groups, Qualitative Research kit, Sage
Publications, New York
Brace, I. (2008) Questionnaire Design: How to Plan, Structure, And Write Survey
M aterial for Effective M arket Research, 2nd Edition, Kogan page publisher, India
Bradburn, N., Sudman, S., and Wansink, B. (2004) Asking Questions: The Definitive
Guide to Questionnaire Design - For M arket Research, Political Polls, and Social
and Health Questionnaires, Jossey-Bass, A Wiley Imprint, San Francesco
Bradburn, N., and Sudman, S. (1999) Improving Interview Methods and
Questionnaire Design, Jossey-Bass, A Wiley Imprint, San Francesco
Brown, M. (2008) Baldrige Award Winning Quality: How to Interpret the Baldrige
Criteria for Performance Excellence, 17th Edition, Productivity Press, New York
British Standards Institution (BSI) (2000) Quality Management Systems: Guidelines
for Performance Improvement, BS EN ISO 9004:2000
Castka, P., Bamber, C.J. and Sharp, J.M. (2003) Measuring Teamwork Culture: The
Use of a Modified EFQM Model, Journal o f Management Development, Vol. 22, No.
2, pp. 149-170.
Chowdhury, S., (2001) The Power of Six Sigma, Financial Times, Prentice Hall,
London
Chowdhury, S., (2003) Power of Design for Six Sigma, Dearborn Trade Publishing,
U.S.A.
Carpinetti, L. R. and Martins, R. A. (2001) Continuous Improvement Strategies and
Production Competitive Criteria: some Findings in Brazilian Industries, Total
Quality Management, Vol. 12, No. 3, pp. 281-291.
Chapman, R. and Al-Khawaldeh, K. (2002) TQM and Labour Productivity in
Jordanian Industrial Companies, The TQM Magazine, Vol. 14, No. 4, pp. 248-262.
301
Chin, K. and Pun, K. (2002). A Proposed Framework for Implementing TQM in
Chinese Organizations, International Journal o f Quality & Reliability Management,
Vol. 19, No. 3, pp. 272-294.
Crosby, P. (1979). Quality Is Free: The Art Of Making Quality Certain, Penguin
books, New York
Crosby, P. (1984) Quality Without Tears - The A rt of Hassle-Free Management,
McGraw-Hill, New York
Ciptono, W. (2007) Hierarchical Level of M anagers’ Abilities A M oderator
Between Quality Management Practices and Company Financial Performance,
International Journal o f Business, Vol. 9, No. 3, pp. 295-334.
Claver, E. Jose, T. and Francisco, M. (2003) Critical Factors and Results of Quality
Management: An Empirical Study, Total Quality Management, Vol. 14, No. 1, pp.
91-118
Clark, A. and Appleby, A. (1997) Quality Management in Local Government: Four
Case Studies, Leadership and Organization Development Journal, Vol. 18, No. 2, pp.
74-85
Colin J. and Coulson-Thomas (1998) Managing Innovation in Public Services:
European and International Experience, Total Quality Management, Vol. 9, No.
2&3, pp. 213-222
Creswell, J. (2009) Research Design: Qualitative, Quantitative, and Mixed Methods
Approaches, Sage Publication Ltd., London
Collis, J. and Hussey, R. (2003) Business Research: A Practical Guide for
Undergraduate and Postgraduate Students, 2nd Edition, Palgrave MacMillan,
London
Carlson, W. and Thome, B. (1997) Applied Statistical Methods for Business,
Economics and Social Sciences, Prentice Hall, New Jersey302
Coffey, D. (2007) The Myth of Japanese Efficiency: The World Car Industry in a
Globalizing Age, Edward Elgar, Cheltenham, U.K.
Cronbach, L. J. (1951) Coefficient Alpha and the Internal Structure of Tests,
Psychometrika, Vol. 16 No.3, pp. 297-334.
Dean, M., and Helms, M. (1996) Implementation of Total Quality Management into
Public Sector Agencies: A Case Study of Tennessee Valley Authority,
Benchmarking for Quality Management and Technology, Vol. 3 No. 1, pp. 50-64.
Das, A., Paul, H., and Swierczek, F. (2008) Developing and Validating Total Quality Management (TQM) in the context of Thailand’s M anufacturing Industry,Benchmarking An International Journal, Vol. 15 No. l ,pp. 52-72
Deming, E. (1986) Out of the Crisis, for the Advances Engineering Study,
Cambridge. Massachusetts
Deming, E. (1994) The New Economics: for Industry, Government, Education, 2nd
Edition, First MIT Press Edition, Massachusetts
Denis, J., Langley. A., and Rouleau, L. (2007) Rethinking Leadership in Public
Organizations, in Ferlie, E., Lynn Jr, L. and Pollitt, C. (2007) The Oxford Handbook
of Public Management, Oxford Handbooks in Business and Management, Oxford
University Press, London
Dingwall, R. and Strangleman, T. (2007) Organizational Cultures in the Public
Services, in Ferlie, E., Lynn Jr, L. and Pollitt, C. (2007) The Oxford Handbook of
Public Management, Oxford Handbooks in Business and Management, Oxford
University Press, London
Dervitsiotis, K. N. (2001) Looking at the whole Picture in Performance
Improvement Programmes, Total Quality Management, Vol. 12, No. 6, pp. 687-700.
Dubai Quality Award Secretariat (2010) Dubai Quality Awards, available at:
www.dqg.org/qcentral/q_awards/qualityl.pdf (accessed 21 March 2010)
303
Dubai Quality Award (2009) The Dubai Quality Award Criteria, Dubai Quality
Award Secretariat, Dubai, United Arab Emirates
Dubai Quality Award (2008) The Dubai Quality Award Booklet, Dubai Quality
Award Secretariat, Dubai, United Arab Emirates
Department of Economic Development (2009) The Report: 2009, Dubai, United Arab
Emirates
Dubai Government Excellence Programme (2010) Introduction to the Programme
Criteria, The Dubai Government Excellence Programme General Secretariat, Dubai,
United Arab Emirates
Dubai Government Excellence Programme, (2009) The DGEP Award Assessment
Principles, The Dubai Government Excellence Programme General Secretariat, Dubai,
United Arab Emirates
Dubai Government Excellence Programme, (2007) General C riteria’s, The Dubai
Government Excellence Programme General Secretariat, Dubai, United Arab Emirates
Djerdjouri M. and Aleter, A. (2007) TQM Readiness Assessment in the Public Sector
in the United Arab Emirates: The Case of the Ministry of Environment and
Water, the Ministry of Finance and Industry, and the Ministry of Public Works, E-
-TQM College Working Paper Series. Spring 2007
Dale, B. Wiele, T., and Iwaarden, J. (2007) Managing Quality, 5th edition, Wiley-
Blackwell Publishing Ltd., Oxford
Daymon, C. and Holloway, I. (2002) Qualitative Research Methods in Public
Relations and Marketing Communications, Routledge, New York
Dornyei, Z. and Taguchi, T. (2010) Questionnaires in second Language,tidConstruction, Administration and Processing, 2 Edition, Routledge, London
304
Escrig-Tena, A. (2004) TQM as a Competitive Factor a Theoretical and Empirical
Analysis, International Journal o f Quality & Reliability Management, Vol.21, No. 6,
pp. 612-637.
Ellis, G. (2000) Organisational Performance: Balanced Scorecard and Human
Performance, Management Today, Vol. 16, No. 8, pp. 32-33.
Eng, Q. and Yusof, S. (2003) A Survey of TQM Practices in the Malaysian
Electrical and Electronic Industry, The Total Quality Management, Vol. 14, No. 1,
pp. 63-77
Evans, J. and Lindsay, M. (2002) The Management and Control of Quality, 5th
Edition South-Western, Ohio
Edmunds, H., (2000) The Focus Group Research Handbook, McGraw-Hill
Professional, New York
Easton, G. and Jarrell, S. (1998) The Effects of Total Quality Management on
Corporate Performance: an Empirical Investigation, Journal o f Business, Vol. 71
No. 2, pp.253-307
Freeman, T. (2006) Best Practice’ in Focus Group Research: Making Sense of
Different Views, Journal o f Advanced Nursing, Vol. 56, No. 5, pp. 491-497.
Franzosi, R. (2010) Quantitative Narrative Analysais: Quantitative Applications in
the Social Sciences, Sage Publications, Inc. London
Flick, U. (2007) Managing Quality in Qualitative Research, Sage Publications,
London
Frohlich, M. and Westbrook, R. (2002) Demand Chain Management in
M anufacturing and Services: Web-Based Integration, Drivers and Performance,
Journal o f Operations Management, Vol. 20, No. 6, pp. 729-745
Feigenbaum, A. (2001), How to Manage Quality in Today’s Economy, Journal o f
Quality Progress, Vol. 34, No. 5, pp. 26-27
Feigenbaum, A. and Feigenbaum, D. (2009), The Power of Management Innovation:
24 Keys for Accelerating Profitability and Growth, McGraw-Hill, New York
Feigenbaum, A. and Feigenbaum, D. (2003) The Power Of Management Capital:
Utilizing The New Drivers Of Innovation, Profitability, And Growth In A
Demanding Global Economy, McGraw-Hill, New York
Feigenbaum, A. (1986). Total Quality Control, 2nd Edition, McGraw Hill, New York
Feigenbaum, A. (1991). Total Quality Control, 3rd Edition Revised, McGraw Hill,
New York
Feng, J., Prajogo, D., Tan, K., and Sohal, A. (2006) The Impact of TQM Practices on
Performance: A Comparative Study Between Australian and Singaporean
Organisations. European Journal o f Innovation Management, Vol.9, No. 3, pp. 269-
278.
Flynn, B., Schroeder, R., and Sakakibara, S. (1994) A Framework for Quality
Management Research and an Associated Measurement Instrument, Journal o f
Operations Management, Vol. 11, No. 4, pp. 339-366
Forza, C. and Filippini, R. (1998), TQM Impact On Quality Conformance and
Customer Satisfaction: A Causal Model, International Journal o f Production
Economics, Vol. 55, No. 1, pp. 1-20.
Frankfort-Nachmais, C. and Nachmais, D. (2007) Research Methods in the Social
Sciences, Arnold, New York
Ferlie, E., Lynn Jr, L. and Pollitt, C. (2007) The Oxford Handbook of Public
Management, Oxford Handbooks in Business and Management, Oxford University
Press, London
Field, A. (2000) Discovering Statistics with SPSS for Windows, Sage, London306
Fielding, J. and Gilbert, N. (2006) Understanding Social Statistics, Sage, London
Fowler, F. (2008) Survey Research Methods, 4th Edition, Sage, London
Gallear, D. and Ghobadian, A. (2000) An Examination and Non-Prescriptive Model
of the TQM Implementation Process, MUBS Discussion Paper Series, No.2, pp. 3-33.
Gryna, F., Chua, R., and DeFro, J. (2007) Juran 's quality planning and Analysis for
Enterprise Quality, 5th Edition, McGraw-Hill, London
Garvin, D. (1988). Managing Quality: The Strategic and Competitive Edge, The
Free Press, New York
Jain, A., (2010) Impact of TQM on Employee's Job Satisfaction in Indian Software
Industry, International Conference on e-Education, e-Business, e-Management and e-
Learning, Noida, India
Gatchalian, M. (1997) People Empowerment: The Key to TQM Success, The TQM
Magazine, Vol. 9, No. 6, pp. 429-433
Ghobadian, A. and Gallear, D. (1997) TQM and Organization Size, International
Journal o f Operations & Production Management, Vol. 17, No. 2, pp. 121-163
Gal, Y. (2004). The Reward Effect: A Case Study of Failing to Manage Knowledge,
Journal o f Knowledge Management, Vol. 8, No. 2, pp. 73-83
Ghobadian, A. and Gallear, D. (1996) Total Quality Management in SME’s,
International Journal o f Management Science, Vol. 24, No. 1, pp. 83-106
Guimaraes, T. (1996) TQM ’s Impact on Employee Attitudes, The TQM Magazine,
Vol. 8, No. 1, pp. 20-25
Gubrium, J. F. and Holstein, J. A. (2003) Postmodern Interviewing. Sage
Publications, London
307
General secretariat of Executive Council, Government of Sharjah, (2009) Sharjha
Government Excellence Award, General secretariat o f Executive Council,
Government o f Sharjah, United Arab Emirates
Goetsch, D., and Davis, S., (2010) Quality Management for Organizational
Excellence: Introduction to Total Quality, 6th Edition, Pearson Education
International, New Jersey
Hafeez, K. Malak, N., and Abdelmeguid, H. (2006) A Framework for TQM to
Achieve Business Excellence, The TQM Magazine, Vol. 17, No. 9, pp. 1213-1229
Hasan, M. and Kerr, R. (2003) The Relationship Between Total Quality
Management Practices and Organizational Performance in Service Organizations,
The TQM Magazine, Vol. 15, No. 4, pp. 286-291.
Hides, M., Davies, J. and Jackson, S. (2004). Implementation of EFQM Excellence
Model Self-Assessment In The UK Higher Education Sector - Lessons Learned
From Other Sectors. The TQM Magazine, Vol. 16. No. 3. p p l94-201.
Hays, R. and Revicki, D. (2005) Reliability and Validity, Including Responsiveness
in Fayers, P. and Hays, R. (2005) Assessing Quality of Life in Clinical Trials:
Methods and Practice. 2nd Edition, Oxford University Press, London
Hood, C. (2007) Public Management: The Word, The Movement, The Science, in
Ferlie, E., Lynn Jr, L. and Pollitt, C. (2007) The Oxford Handbook of Public
Management, Oxford Handbooks in Business and Management, Oxford University
Press, London
Huberman, A. M. and Miles, M. (2002) The Qualitative Researcher’s Companion,
Sage Publications, New York
Houston, D. and McKean, J. (2002) Quality Management in New Zealand: A
Critical Review. Total Quality Management, Vol. 13, No. 6, pp. 749-758
308
Hackman, J. and Wageman, R. (1995) Total Quality Management: Empirical,
Conceptual, and Practical Issues, Administrative Science Quarterly, Vol. 40, No. 2,
pp. 309-342
Holmes, C. (2010) The Pursuit of Quality, The IDC
Hutcheson, G. and Sofroniou, N. (2009) The Multivariate Social Scientist, Sage,
London
Hoyle, D. (2006) ISO 9000 Quality Systems Handbook. 5th Edition, Butterworth-
Heinemann Publications, London
Hamdan Bin Rashid Al Maktoum Award for Distinguished Academic Performance
(2009) UNESCO-Hamdan Bin Rashid Al-Maktoum Prize for Outstanding Practice
and Performance in Enhancing the Effectiveness of Teachers. Dubai, United Arab
Emirates
Halcomb, E., Gholizadeh, L., DiGiacomo, M., Phillips, J. and Davidson, P. (2007)
Literature Review: Considerations in Undertaking Focus Group Research with
Culturally and Linguistically Diverse Groups, Journal o f Clinical Nursing, Vol. 16,
No. 5, pp. 1000-1011.
(http://www.nist.gov)
(http://www.efqm.org)
ISO 9004 (2000) Quality Management Systems- Guidelines for Performance
Improvements, International Organization for Standardization, ISO, Geneva
Ishikawa, K. (1991) W hat is Total Quality Control? The Japanese Way, Prentice-
Hall Inc, New Jersey
Ishikawa, K. (1990) Introduction to Total Quality Control, Productivity Press, New
York.
309
Idris, M. and Zairi, M. (2006) Sustaining TQM: A Synthesis of Literature and
Proposed Research Framework, Total Quality Management, Vol. 17, No. 9, 1245-
1260.
Juran, J. and Gryna, F. (2006) Quality Planning and Analysis, McGrow- Hill, New
York
Juran, J. (2000) Quality Control Handbook, McGraw- Hill, New York
Juran, J. (2003) Juran on Leadership for Quality: An Executive Handbook, Free
Press, Collier Macmillan, New York
Juran, J. (1999) Quality in Developing Countries, McGraw-Hill, Professional, New
York
Juran, J. (1992) Juran on Quality by Design: The New Steps for Planning Quality
into Goods and Services, The Free Press, USA
Juran, J. and Blanton, A. (2000) Juran 's Quality Handbook, 5th edition, McGraw-
Hill, New York
Johnson, D. (2004) Adaptation of Organizational Change Models to the
Implementation of Quality Standard Requirements, International Journal o f Quality
& Reliability Management, Vol. 21 No. 2, pp. 154-174
James, R. (2011) Quality Management, Organization and Strategy, 6th Edition,
international Edition, South-Western Cengage learning, Ohio
Khamalah, J. and Lingaraj, B. (2007) TQM in the Service Sector: A Survey of Small
Businesses. Total Quality Management, Vol. 18, No. 9, pp. 973-982
Kuvaas, B., (2008) An Exploration of How the Employee-Organization
Relationship Affects the Linkage Between Perception of Development Human
Resource Practices and Employees Outcomes, Journal o f International Management
Studies. Vol. 45, No.l, pp. 1-25310
Karuppusami, G. and Gandhinathan, R. (2006) Pareto Analysis of Critical Success
Factors of Total Quality Management A Literature Review and Analysis, The TQM
Magazine, Vol. 18, No.4, pp. 372-385
Kanji, G. and Asher, M. (1996) 100 Methods for Total Quality Management, Sage
Publications, India
Kanji, G. and Moura, P. (2002) Business Scorecard, Total Quality Management, Vol.
13, No. 1, pp. 13-27
Kueng, P. (2000) Process Performance Measurement System: A Tool to Support
Process-Based Organisations, Total Quality Management, Vol. 11, No.l, pp. 67-85.
Kattan, K. (2005). TQM Implementation: A Proposed Model for Quality
Management- A Case Study on a Financial Institute in U.A.E., Integrating for
Excellence, 1st International Conference, Sheffield Hallam University, June, 2005
Kelemen, M. (2003) Managing Quality: Managerial and Critical Perspectives, Sage
Publications, London
Kane, E. and Brun, O. (2001) Doing Your Own Research, Marion Boyars Publishing,
London
Krueger, R., and Casey, M., (2000) Focus Groups: A Practical Guide for Applied
Research, Sage, New York
Kent, R. (2001) Data Construction and Data Analysis for Survey Research,
Palgrave, London
Liamputtong, P. (2009) Qualitative Research Methods, 3rd Edition, Oxford University Press, Australia and New Zealand
Lau, H. and Idris, M. (2001) The Soft Foundation of Critical Success Factors on
TQM Implementation in Malaysia, The TQM Magazine, Vol. 13, No.l, pp. 51-60
311
Lakhal, L., Pasin, F., and Liman, M., (2006) Quality Management Practices and their Impact on Performance, International Journal o f Quality and Reliability Management, Vol. 23, No. 6, pp. 625-646
Leonard, D., Reid, R., and McAdam, R. (2002) A Grounded Multi-Model Framework for TQM Dynamics, International Journal o f Quality & Reliability Management, Vol. 19 No. 6, pp. 710-736
Litosseliti, L. (2005) Using Focus Groups in Research, Continuum, New York
Long, P., and Moullin, M. (2002) Process and Service Implementation, Learning
pack, Sheffield Hallam University.
Loomba, A. and Spencer, M. (1997) A model for Institutionalizing TQM in a State
Government Agency, International Journal o f Quality & Reliability Management, Vol.
14, No. 8, pp. 753-767.
Leedy, P. and Ormrod, J. (2001) Practical Research: Planning and Design, 7th
Edition, Merrill Prentice Hall, New Jersey
Lee-Trewick, G. and Linkogle, S. (2000) Danger in the Field: Risk and Ethics in
Social Research, Routledge, London
Lawton, R. (2002) Balance Your Balanced Scorecard, Quality Progress, Vol. 35, No.
3, pp. 66-71.
Liker, J. (2004) The Toyota Way, McGraw-Hill, New York.
Masters, R. (1996) Overcoming the Barriers to TQM ’s Success, Quality Progress, May 1996. pp. 53-55
Munro, B., (2005) Statistical Methods for Health Care Research, 5th Edition, Lippincott Williams and Wilkins, London
Marquis, P. (2005) Translating and Evaluating Questionnaires - Cultural Issues in
Fayers, P. and Hays, R. (2005) Assessing Quality of Life in Clinical Trials: Methods
and Practice, 2nd Edition, Oxford University Press, London
312
McAdam, R. and Henderson, J. (2004) Influencing the Future of TQM: Internal and
External Driving Factors, International Journal o f Quality and Reliability
Management, Vol. 21 No. 1, pp. 51-71.
McAdam, R., and Reid, R. (2000) A Comparison of Public And Private Sector
Perceptions and Use of Knowledge Management. Journal o f European Industrial
Training, Vol. 24 No. 6, pp. 317-329.
McColl, E. (2005) Developing Questionnaires, in Fayers, P. and Hays, R. (2005)
Assessing Quality of Life in Clinical Trials: Methods and Practice. 2nd Edition,
Oxford University Press, London
McNary, L. (2008) Quality Management in the Public Sector: Applying Lean
Concepts to Customer Service in a Consolidated Government Office, Public
Administration Quarterly, Vol. 12, No. 7, pp. 282-301
Mann R. and Kehoe D. (1995) Factors Affecting the Implementation and Success of
TQM, International Journal o f Quality and Reliability Management, Vol. 12, No. 1, pp.
11-23
Matzler, K. and Renzl, B. (2006) The Relationship Between Interpersonal Trust,
Employee Satisfaction, and Employee Loyalty, Total Quality Management, Vol. 17,
No. 10, pp. 1261-1271
Morgan, D. L. (2000) Focus Groups as Qualitative Research, 2nd Edition, Sage
Publications Inc., California, USA
Matzler, K. and Renzl, B. (2007) Personality Traits, Employee Satisfaction and
Affective Commitment, Total Quality Management, Vol. 18, No. 5, pp. 589-598
Ministry of Labour (2008) Training for Increased Productivity and Effectiveness,
The Report, Ministry o f Labour, Abu Dhabi, United Arab Emirates
Ministry of Environment (2009) The Dates in the United Arab Emirates: Annual
Report, Ministry o f Environment, Abu Dhabi, United Arab Emirates313
Ministry of Planning, (2009) The United Arab Emirates Economic and Social
Indicators, Ministry o f Planning, Abu Dhabi, United Arab Emirates
Ministry of Economy (2005) The United Arab Emirates Annual Statistical Year
Book, Ministry of Economy, Abu Dhabi, United Arab Emirates
Ministry of Economy (2009) The United Arab Emirates Annual Statistical Year
Book, 2009, Ministry o f Economy, Abu Dhabi, United Arab Emirates
Ministry of Cabinet Affairs, (2008) The United Arab Emirates Annual Report,
Ministry o f Cabinet Affairs, Abu Dhabi, United Arab Emirates
Ministry of Cabinet Affairs (2009) Highlights of the U.A.E. Government Strategy:
Leadership, Integration and Excellence. Ministry o f Cabinet Affairs, Abu Dhabi,
United Arab Emirates
McAuley, J. (2001) The Relationship Between Quality, Approaches to Management
Control, and the Achievement of Best Value in Public Sector Professionals Service
Organisations, in Johnson, G. and Scholes, K. (2001) Exploring Public Sector
Strategy, Harlow, Pearson Education, London
McAuley, J., Johnson, P. and Duberley, J. (2006) Organisation Theory: Challenges
and Perspectives, Financial Times Press, London
Montes, J., Jover, A., and Fernandez, L. (2003) Factors Affecting the Relationship
Between Total Quality Management and Organizational Performance,
International Journal o f Quality & Reliability Management, Vo. 20, No. 2, pp. 189-209.
Mellahi, K. and Eyuboglu, F. (2001) Critical Factors for Successful Total Quality
Management Implementation in Turkey: Evidence from the Banking Sector, Total
Quality Management, Vol. 12, No. 6, pp. 745-756
Moustafa, E. (2007) Public-Private Partnership in Managing Labour M arket in
U.A.E. - Case Study, Proceedings o f the 1st International Conference on Theory and314
Practice o f Electronic Governance, Macao, China, Workshop Session: Economics for
Electronic Governance, 2007, pp. 165-168
Moullin, M. (2006) The Design of Alternative Balanced Scorecard Framework for
Public and Voluntary Organisation, Perspectives on Performance, Vol. 5, No. 1, pp.
10-12
Moullin, M., Soady, J. Skinner, J., Price, C., Cullen, J., and Gilligan, C. (2007) Using
the Public Sector Scorecard in Public Health, International Journal o f Health Care
Quality and Assurance, Vol. 20, No. 4, pp. 281-289
Matzdorf, F. (2010) Benchmarking The Business Performance of Departmental
Space in Universities, In: European Facility Management Conference, 2010: 9th Euro
FM Symposium, Madrid, 1-2, June 2010
Moore, D. (2001) Statistics: Concepts and Controversies, 5th Edition, Freeman, New
York
Mason, J. (2002) Qualitative Researching, Sage Publications, New York
Morse, J., Swanson, J., and Kuzel, J. (2001) The Nature of Evidence in Qualitative
Inquiry, Sage Publications, New York
Mauthner, M. and Birch, M. (2002) Ethics in Qualitative Research, Sage
Publications, London
Morling, P. and Tanner, S. (2000) Benchmarking a Public Service Business
Management System, Total Quality Management, Vol. 11, No. 5, pp.417-426
Najeh, R. and Zaitri, K. (2007) A Comparative Study of Critical Quality Factors in
Malaysia, Palestine, Saudi Arabia, Kuwait and Libya, Total Quality Management Vol.
18, Nos. 1-2, pp. 189-199
Normann, R. (2000) Service Management: Strategy and Leadership in Service
Business, Wiley Publishing Ltd., New York
315
Nie, W. and Kellogg, D, (1999) How Process Of Operations Management View
Service Operations, Production and Operations Management, Vol. 8, No. 3, pp. 339-
355
Norusis, M. (2008) SPSS 16.0 Guide to Data Analysis, 2nd Edition, Prentice Hall,
London
Neuman, L., (2006) Social Research Methods: Qualitative and Quantitative
Approaches, 6th Edition, Pearson, London
Oakland, J. (2003) Total Quality Management, Text with Cases, 3rd Edition,
Butteworht- Heineman, Oxford
Omachonu, V. and Ross, J., (2004) Principles of Total Quality, 3rd Edition, CRC Pres,
USA
Ooi, K., Abu Baker, N., Arumugam, V., Vellapan, L., and Loke, A., (2007) Does TQM
Influence Employee’s Job Satisfaction? An Empirical Case Analysis, International
Journal o f Quality & Reliability Management, Vol. 24 No. 1, pp. 62-77
Oppenheim, A. (2000) Questionnaire Design, Interviewing Attitude Measurement:
New Edition, Heinemann, London
Oakland, J. (2001) Total Organizational Excellence, Achieving World-Class
Performance, Butterworth Heinemann, New York
Pun, K. and Gill, R. (2002) Integrating EI/TQM Efforts for Performance Improvements: A Model, Integrated Manufacturing Systems, Vol. 13, No. 7, pp. 447- 458
Poulymenakou, A. and Tsironis, L. (2003) Quality and Electronic Commerce: aPartnership for Growth, The TQM Magazine, Vol. 15, No. 3, pp. 137-151
Prajogo, D., and Sohal, A. (2006) The Relationship Between Organisation Strategy,
Total Quality Management (TQM), And Organisation Performance The
Mediating Role of TQM, European Journal o f operational Research, Vol. 168, 2006,
pp. 35-50
316
JParasuraman, A. Zeithaml, V., and Berry, L. (1985) A Conceptual Model of Service
Quality and Its Implications for Future Research, Journal o f Marketing, Vol. 49, fall
1985, pp. 41-50
Punch, K (2000) Developing Effective Research Proposals, Sage Publications,
London
Pollitt, C. (2007) Decentralization: A Central Concept in Contemporary Public
Management, in Ferlie, E., Lynn Jr, L. and Pollitt, C. (2007) The Oxford Handbook
of Public Management, Oxford Handbooks in Business and Management, Oxford
University Press, London
Psychogios, A. and Priporas, C. (2007) Understanding Total Quality Management in
Context: Qualitative Research Managers' Awareness of TQM Aspect in the Greek
Service Industry, The Qualitative Report, Vol. 12, No. 1, pp. 40-66
Pearce, J. A. and Robinson, R. B. (2000) Strategic Management: Formulation,
Implementation, and Control, 7th Edition, McGraw- Hill, New York
Quazi, H., Jemangin, J., Kit, L., and Kian, L. (1998) Critical Factors in Quality
Management and Guidelines for Self-Assessment: The Case of Singapore, Total
Quality Management Vol. 9, No. 1, pp.35-55
Quazi, H, Hong, C. and Meng, C. (2002) Impact of ISO 9000 Certification on
Quality Management Practices: A Comparative Study, Total Quality Management,
Vol. 13, No. 1, pp. 53-67
Robson, C. (2002) Real World Research: A Resource for Social Scientist and
Practitioners Researchers, 2nd Edition, Blackwell Ltd., Oxford
Ross, P. (1996) Taguchi Techniques for Quality Engineering, 2nd Edition, McGraw-
Hill, New York
Radin, B. and Coffee, J. (1993) A Critique of TQM: Problems of Implementation in
the Public Sector, Public Administration Quarterly, Vol. 17, No. 1, pp. 42-54317
Reed, R. Lemak, D., and Mero, N. (2000) Total Quality Management and Sustainable Competitive Advantage, Journal o f Quality Management, Vol. 5, No. 1, pp. 5-26
Rolfe, G. (2006) Validity, Trustworthiness and Rigour: Quality and the Idea of
Qualitative Research, Journal o f Advanced Nursing, Vol. 53, No. 3, pp. 304-310
Robert, R., (2008) Understanding Statistics in Behavioral Sciences, 5th Edition, Pagano, London
Robert, G., Fowler, J., Floyd Jr., Couper, M., Lepkowski, J., Singer, E., and
Tourangeau, R., (2009) Survey Methodology, Wiley, New Jersey
Richards, L. (2005) Handling Qualitative Data: A Practical Guide, Sage
Publications, London
Rungtusanatham, M., Forza, C., Filippini, R. and Anderson, J.C. (1998) A Replication
Study of a Theory of Quality Management Underlying the Deming Management
Method: Insights from an Italian Context, Journal o f Operations Management, Vol.
17No.l, pp. 77-95
Shihab, M., (2001) Economic Development in the U.A.E., in A1 Abed, I. and Hellyer,
P. (2001) United Arab Emirates: A New Perspective, Trident Press Ltd., London
Salaheldin, I. (2003) The Implementation of TQM Strategy in Egypt: A Field-Force
Analysis, The TQM Magazine, Vol. 15, No. 4, pp. 266-274
Salazar, R., (1994). Why TQM Fails, World Executive Digest, July, 1994, pp. 3-20
Seth, D. and Tripathi, D. (2005) Relationship Between TQM and TPM
Implementation Factors and Business Performance of Manufacturing Industry in
Indian Context, International Journal o f Quality & Reliability Management, Vol. 22,
No. 3, pp. 256-277
Silvestro, R., (1997) Measuring the M aturity of TQM Implementation in Services,
Logistics Information Management, Vol. 10, No. 6, pp. 259-263
318
Silvestro, R., (1998) The Manufacturing TQM and Service Quality Literatures:
Synergistic or Conflicting Paradigms, International Journal o f Quality and Reliability
Management, Vol. 15, No. 3, pp. 303-328.
Stewart, D., Shamdasani, P. and Rook, D. (2007) Focus Group Theory and Practice,
2nd Edition, Sage Publications Inc., California, USA
Spencer, M. and Loomba, A. (2001) Total Quality Management Programmes at
Smaller M anufacturers: Benchmarking Techniques and Results, Total Quality
Management, Vol. 12, No.5, pp. 689-695
Stahl, M. (1999) Perspectives in Total Quality, Blackwell publishers, Oxford
Swift, J. Ross, J., and Omachonu, V. (1998) Principles of Total Quality, 2nd Edition.
St. Lucie Press, Florida
Sureshchandar, G., Rajendran, C., and Anantharaman, R. (2001) A Conceptual Model
for Total Quality Management in Service Organizations, Total Quality
Management, Vol. 12, No. 3, pp. 343-363
Sinclair, D. and Zairi, M. (2001) An Empirical Study of Key Elements of Total Quality Based Performance Measurement Systems: A Case Study Approach in Service Industry Sector. Total Quality Management Magazine, Vol. 12, No. 4, pp. 535-550.
Saraph,V., Benson, G., and Schroeder, R., (1989) An Instrum ent For M easuring The
Critical Factors Of Quality Management, Decision Sciences, Vol. 20 No. 4, pp. 810-
829
Stupak, R. and Garrity, R. (1993) Change, Challenge, and the Responsibility of
Public Administrators for Total Quality Management in the 1990s: A Symposium,
Part l.PAQ, winter, 1993
Sirvanci, M. (2004) TQM Implementation: Critical Issues for TQMImplementation in Higher Education, The TQM Magazine, Vol. 16, No. 6, pp. 382-386
319
Selen, W. and Schepers, J. (2001) Design of Quality Service Systems in the Public Sector: Use of Quality Function Deployment in Police Services, Total Quality Management Magazine, Vol. 12, No. 5, pp. 677-687
Saravanan, R. and Rao, K. (2006) Development and Validation of an Instrument for Measuring Total Quality Service, Total Quality Management Magazine, Vol. 17, No. 6, pp. 733-749
Sila, I. and Ebrahimpour, M. (2003) Examination and Comparison of the Critical
Factors of Total Quality Management (TQM) Across Countries, International
Journal o f Production Research, Vol. 41, No. 2, pp. 235-268
Soltani, E., Lai, P., Sayed, J., and Hassan, G. (2008) A Review of the Theory and Practice of Managing TQM: An Integrative Framework, Total Quality Management Magazine, Vol. 19, No. 5, pp. 461-479
Smith, H., Discenza, R., Piland, N., (1993) Reflections on Total Quality Managementand Health Care Supervisors. Health Care Supervisor, Vol. 12, No. 2, pp. 32-45
Stahan, J. (2002) Transition ISO 9000:2000, Quality Progress, Vol. 35, No. 3, pp. 27- 30
Sale, D. (2000) Quality Assurance: A Pathway to Excellence, MacMillan, London
Syed-Ikhsan, S., and Rowland, F. (2004a) Benchmarking Knowledge Management in
A Public Organisation in Malaysia. Benchmarking, An International Journal, Vol.
11, No. 3, pp. 238-266
Syed-Ikhsan, S., and Rowland, F. (2004b) Knowledge Management in a Public
Organization: A Study on the Relationship Between Organizational Elements and
The Performance of Knowledge Transfer. Journal o f Knowledge Management,
Vol. 8, No. 2, pp. 95-111
Shrivastava, R., Mohanty, R., and Lakhe, R. (2006) Linkages Between Total Quality
Management And Organisational Performance: An Empirical Study for Indian
Industry, Production Planning and Control, Vol. 17, No. 1, pp 13-30
320
Shingo, S. (1986) Zero Quality Control: Source Inspection and the Poka-Yoke
System, Productivity Press, New York
Silverman, D. (2004a) Doing Qualitative Research: A Practical Handbook,
Sage Publications, New York
Silverman, D. (2001) Interpreting Qualitative Data, Sage Publications, New York
Silverman, D. (2004b) Qualitative Research: Theory, Method and Practice, 2nd
Edition, Sage Publications, New York
Summers, D. (2009) Quality Management: Creating and Sustaining Organizational
Development, Pearson Prentice Hall, New Jersey
Sekaran, U. (2003) Research Methods for Business: A Skill Building Approach, 4th
Edition, John Wiley and Sons Inc, New York
SPSS (2009) SPSS Base 11.5 Users Guide, SPSS
Sheikh Saqr Programme for Government Excellence (2010) Government Quality
Award Booklet, Government ofRas Al Khaimah, United Arab Emirates.
Tremblay, M., Hevner, A., and Bemdt, D., (2010) The Use of Focus Groups in Design
Science Research, Integrated Research in Information Systems, Vol. 22, No. 3, pp. 121-
143
Tan, P.K. (1997) An Evaluation of TQM and the Techniques for Successful
Implementation, Training for quality. Vol. 5, No. 4, pp. 150-159
Thiagarajan, T., Zairi, M. and Dale, B. (2001). A Proposed Model of TQM
Implementation Based On an Empirical Study of Malaysian Industry, International
Journal o f Quality and Reliability Management, Vol. 18, No. 3, pp. 289-306
Tang, K. and Zairi, M. (1998a) Benchmarking Quality Implementation in a Service
Context: A Comparative Analysis of Financial Services and Institutions of Higher321
Education Part I: Financial Services Sector, Total Quality Management, Vol. 9 No. 6,
pp. 407-420
Tang, K. and Zairi, M. (1998b) Benchmarking Quality Implementation in a Service
Context: A Comparative Analysis of Financial Services and Institutions of Higher
Education Part III, Total Quality Management, Vol. 9, No. 8, pp. 669-679
Tamimi, N. (1998) A Second-Order Factor Analysis of Critical TQM Factors,
International Journal o f Quality Science, Vol. 3 No. 1, pp. 71-79
Taylor, F. (2010) The Principles of Scientific Management, EZ Readers, New York.
Terziovski, M. and Samson, D. (2000) The Effect of Company Size on the
Relationship Between TQM Strategy and Organisational Performance, The TQM
Magazine, Vol. 12 No. 2, pp. 144-149
Tapiero, C. (1996) The Management of Quality and its Control, Chapman& Hall,
London
Tague, N. (2005) The Quality Toolbox, 2nd Edition, American Society for Quality,
Quality Press, Milwaukee, USA
Taguchi, G. (1993) Taguchi on Robust Technology Development: Bringing Quality
Engineering Upstream, American Society o f Mechanical Engineers ASME, Press, New
York
Taguchi G., Chowdhury S. and Wu, Y. (2005) Taguchi's Quality Engineering
Handbook, John Wiley and Sons, New Jersey
Taylor, A. (1998) TQM Implementation: Organisation Practices and Information
Infrastructures, The International Journal o f Management Science, Vol. 26 No. 6, pp.
715-727
322
Taylor, W. (1997) Leadership Challenges For Smaller Organisations: Self-
Perceptions of TQM Implementation, International Journal o f Management Science
Vol. 25 No. 5, pp. 567-579
Triola, M. (2004) Elementary Statistics, 9th Edition, Pearson Education, New York
Truscott, W., (2003) Six Sigma: Continual Improvement for Business: A Practical
Guide, Butterworth-Heinemann, Amsterdam
United Nations Development Programme, (2009) Human Development Report 2009,
Oxford University Press, London
U.A.E. Interact, (2007) The U.A.E. Year Book 2007, Trident Press, London
U.A.E. Interact, (2008) The U.A.E. Year Book 2008, Trident Press, London
U.A.E. Interact, (2009a) The U.A.E. Year Book 2009, Trident Press, London
U.A.E. Interact, (2009b) U.A.E. at Glance 2009, Trident Press, London
Vermeulen, W. (1997) Cultural Change: Crucial for the Implementation of TQM
Journal o f Training for Quality Vol. 5, No. 1, pp. 40-45
Venkateswarlu, P. and Nilakant, V. (2005) Adoption and Persistence of TQM
Programmes - Case Studies of Five New Zealand Organizations, Total Quality
Management, Vol. 16, No. 7, pp. 807-825
Vaus, D., (2002) Surveys in Social Research, 5th Edition, Routledge, London
Warwood, S. and Roberts, P. (2004) A Survey of TQM Success Factors in the UK,
Total Quality Management, Vol. 15, No. 8, pp. 1109-1117
Warwood, S. and Antony J. (2003) Simple, Semi-Prescriptive Self-Assessment Model
for TQM, Quality Assurance, Vol. 10, No. 2, pp. 67-81
323
Wilkinson, A., Godfrey, G. and Marchington, M. (1997) Bouquets, Brickbats and
Blinkers: TQM and Employee Involvement in Practice, Organization Studies, Vol.
18 No. 5, pp. 799-819
Williams, R., Wiele, T., Lwaarden, J., and Visser, R., (2004) TQM: Why It Will
Again Become a Top Management Issue, International Journal o f Quality and
Reliability Management, Vol. 21, No. 6, pp. 603-611
Wong, K. (2005) Critical Success Factors for Implementing Knowledge
Management in Small and Medium Enterprises, Industrial Management & Data
Systems, Vol. 105 No. 3, pp. 261-279
Weeks, D. and Bruns, D. (2005) Private-Sector Tools for the Public Sector: Business
Process management Scores big at a Florida State Agency, Journal o f
Organizational Excellence, Vol. 24, No. 3, pp. 31-41
Wrench, J., Maddox, C., Richmond, V., and McCroskey, J., (2008) Quantitative
Research Methods for Communication: A Hands-on Approach, Oxford University
Press, London
Weerakkody, N. (2008) Research Methods for Media and Communications, Oxford University Press, Australia and New Zealand
Walter, M. (2009) Social Research Methods, 2nd Edition, Oxford University Press, Australia and New Zealand
Wengraf, T. (2001) Qualitative Research Interviewing, Sage Publications, London
Yeh, Y. (2003) Implementing a Sustainable TQM System: Employee Focus, TheTQM Magazine, Vol. 15, No. 4, pp. 257-265.
Yusof, S. and Aspinwall E. (2000) Critical Success Factors in Small and Medium
Enterprises: Survey Results, Total Quality Management, Vol. 11 No. 4Z5&6, pp. 448-
462
3 2 4
Yusof, S. and Aspinwall, E. (2000) TQM Implementation Issues: Review and Case
Study, International Journal o f Operations &Production Management, Vol. 20 No. 6,
pp. 634-655
Yusof, S. and Aspinwall, E. (2000a) TQM Implementation Frameworks:
Comparison and Review, Total Quality Management, Vol. 11 No. 3, pp. 281-294.
Yusof, S. and Aspinwall, E. (2000b) A Conceptual Framework for TQM
Implementation for SME’s, The TQM Magazine, Vol. 12 No. 1, pp. 6-31
Yoo, H. (2003) A Study on the Efficiency Evaluation of Total Quality Management
Activities in Korean Companies, Total Quality Management, Vol. 14 No. 1, pp. 119-
128
Yates, S. (2004) Doing Social Science Research, Sage Publications, New York
Yin, R. (2004) Case Study research, Design and Methods, 3rd Edition, Sage
Publications, New York
Yasin, M., Alavi, J., kunt, M. and Zimmerer, T. (2004) TQM Practices in Service
Organisations: An Exploratory Study into the Implementation, Outcomes and
Effectiveness, Managing Service Quality, Vol. 14 No. 5, pp. 377-389
Zhang, Z., Waszink, A., and Wijingaard, J., (2000) An Instrument for Measuring
TQM Implementation for Chinese M anufacturing Companies, International
Journal o f Quality & Reliability Management, Vol. 17, No. 7, pp. 730-755
325
APPENDIXES
APPENDIX (1) QUESTIONNAIRE LETTRES
APPENDIX (2) THE SURVEY QUESTIONNAIRE LEAFLET ✓
APPENDIX (3) RESPONDENTS PROFILE ^
APPENDIX (4) THE TABLES SECTION THREE
326

APPENDIX (1) QUESTIONNAIRE LETTRES
LETTER (1) QUESTIONNAIRE COVER LETTER (The Researcher/Arabic)
£ 3Jb*>j OL~U«>t j ll
OUlJl u*?- «*JLoJl dJLa Up tjpj» J>A\ <jj£~Z> JLdl
. C - 3 V 01 c<bjJUail
jULami SjwI^- y» S jb l <J oljjsS 'jJl 2 ^ -ji J-jJ Lbdl SJL^U; LJb- ^j§l
^ y f ija (J J j^ xd lj J-«LiJl ^1<A-Il d -? tJ b LjIjJJI O L lia ia (y^P ,y >j SJbcdl S ^ U ib
J -a J Ij SJUUJl o ij^ -l (JjJaJ fcUP Sjusll O b N l j i j k j ) J j? - jjpx^sJ ^ J l j «UL»»
. ( oJbcd l O O l j U ^ I i l j i (J J JU <Uj j£ - <Lolji :^ ^ w j j i l
j*£jbbf1 tj-£> J d U i j d-?xJi « b - j S j ib x J l (Jl <0 < ^ x J l
C*£ IAa ja jp ydl 01 £ j US*j .jjfJdl OL-x Vl J <Lwaiil aJLl^ I Js-
J ^ j £ J ~ \ «.bV' j> Sjb^fl j»Js- <J d^?sJl s-lj \ (Jl <blgjl <J «-3kigj
. Oljb*iJl 5jji (J ~&*j* 2^~\ <LadjM OLmijil
J-abu c3j-j SijljJl ObLJl 01 OLo-o i jt -bJl 3 JS'ly iJlij
( 1 j j j l l (-3JcAI (j <ula Jbu 0L*u*» l J b -ij l SiU-lj A£ij 2jUI «bb»-*i[l <ulpj <Ub
.<■3jlaJl ^rull 01 ji*Jl
^-iJl Jijsr >^J tJ i4 ^Liacujl jf jL«ia-ol |^ jJJ OlS* lil
. jjJLcaJlj
tjA b 'x il
j*Jl cJ j j I
A y o o b .A l-A w a d i@ stu d e n t.sh u .a c .u k H 327

APPENDIX (1) QUESTIONNAIRE LETTRES
LETTER (2) QUESTIONNAIRE COVER LETTER (The Researcher
Employer/ Arabic)
SIj j o SJ AILujj QUfUdl f ; p
LIU. (jp (— AjjuJI (ji -J Ag .Lj
j oA_js»Jl SjL I t^ysu-aaj ol^jjSiAll A ^jA (Jjj-faaii y * J l AJju)I )A
.SA^aa]! A ^IaaIL ^JIa A j ia U £ya
a JLui ) (JjaxI aIIj (JaL aII CLlaujU AjuoIj AII eAA iAjL I L I a
S_j IaI £_£ALa (^ n la j Ale. AjuI aII ^ J a lilj d lU lV I (J^2k. j j ^ aTi SI^)j j £ a1I
aJj A ^ 3 A_iA^^aJ! Aj a As JI (AjLulluJ a I] A-UJ^aJj AjuoI^jA • ^ juuaJjaII ^ L oiillj a I aLuoII oA_yaJl
^SAaJLall Ajj^>*JI Cj Ij Ia VI
^ jjIaLJI (Jj3 <ja Aii.hi j (jLuluiVI £ jjjJ ^ LlaLlI Aa a (JxAailll
diaoll A Sk Aj Aj^juj <-J) juo lIAa IxaJI (jlj LLe co 3 aJI £AjolujJa
.JbS3 -ajaISVI
jjAiil! j j l ^ l £ A
328

APPENDIX (1) QUESTIONNAIRE LETTRES
LETTER (3) INTERVIEWS COVER LETTER (The Researcher
Employer/Arabic)
/ fiJiU-ui
JUI f i l l f l j » t ; p j J sjaSI
<Ujill (IjLuwju j-a i iVfba £jojj IgJjj (Ij| jJaJI J ib j j £)jbHl| jj-uia* X a tj £ > (---- ) q h ja> (jjilaia q a
f^us,j * j | c _ ijj! JlluiII L u i l u f t la jA ll l ) A a j j ^ Ju iljL u i £ja 5j i l i l l u n ^ j ,£ > ^ ,5 ^ 4 " i lu a ,a 4a2 L a j j
iiuaj j4 £_rIll| 51 jjaSill AJLujj ^ 1 s > |»lxll uijduoll 4J»3|j a j tllljj <_ uai»ui fill
^Ualll diLuMij^ l& jjlSUij AjulaJl S ijaJlj j -alill <LaIall <Lai La )fr p.Hill jjx a u j .L lLaSI
doall (jlajil Ajj-ui f Hill JM i lui l La l ! j *a < j1| ilAfrj*2ajAll c k Ulfr j(aUll
.< 1x11
jHua ( j k 51 jjlS ill ^ j i J j^a^il Ulxll AIujIjJ <Llua|j aI UL3 q a d <»'“» »■* Lll^ cjjjI JU-uJIj
j»IU iLLi A*-abb SjbVISheffield Hallam U n iv ers ity iiUilala <y*j .Siv u l l 4 1aa3U
Jj^ jjvaTt 51 jjISill AlLutj £jJajA ^ jaxIaIIj J luill ^IJjaII diaalU LH1| jA <Lwi|jill
4ujjjaJj <Luj|jJ ^^^uiujjaII J^alllj LLaLill SijaJI £$Jlj-a (JjjJaj * c’ ^*^*11 ^alllj iLilVi )
LLujIj Ak C- fjlA ^uali du^ .( SiaJLall AjjjjlII ililjLaV! -IjJ <Jk AjajSaJl 4_u>AaJl (JjLuujjjAil.5jSjaII j l j j (Ja & £ a diaall £ j*2aj-a
illlij H&V SiJiaj p -u lj! 11 HuAia A jjjj (^ill i£ ja1| JbiAJ ^jibcuj & a ( )J*aijj
t^£jiljLuj uuLaj Ljjji iAuill £-a (jxumlb
^jUlaVlj jSA!l J jja . (k lj
329
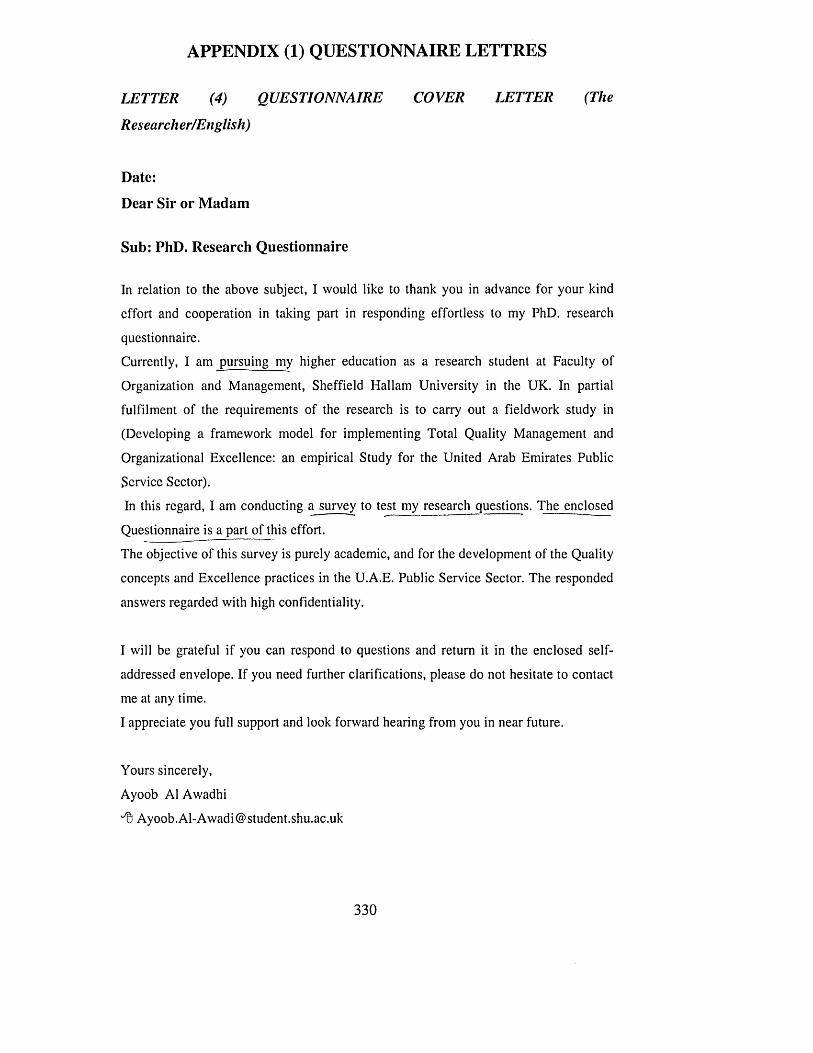
APPENDIX (1) QUESTIONNAIRE LETTRES
LETTER (4) QUESTIONNAIRE COVER LETTER (The
Research erf English )
Date:
Dear Sir or Madam
Sub: PhD. Research Questionnaire
In relation to the above subject, I would like to thank you in advance for your kind effort and cooperation in taking part in responding effortless to my PhD. research
questionnaire.Currently, I am pursuing my higher education as a research student at Faculty of
Organization and Management, Sheffield Hallam University in the UK. In partial fulfilment of the requirements of the research is to carry out a fieldwork study in (Developing a framework model for implementing Total Quality Management and
Organizational Excellence: an empirical Study for the United Arab Emirates Public
Service Sector).In this regard, I am conducting a survey to test my research questions. The enclosed
Questionnaire is a part of this effort.The objective of this survey is purely academic, and for the development of the Quality concepts and Excellence practices in the U.A.E. Public Service Sector. The responded
answers regarded with high confidentiality.
I will be grateful if you can respond to questions and return it in the enclosed self-
addressed envelope. If you need further clarifications, please do not hesitate to contact me at any time.
I appreciate you full support and look forward hearing from you in near future.
Yours sincerely,Ayoob A1 Awadhi^ [email protected]
330
APPENDIX (2) THE SURVEY QUESTIONNAIRE LEAFLET
Research Survey Questionnaire
Investigation of TQM Implementation to U.A.E. Public Sector
Organisations
331
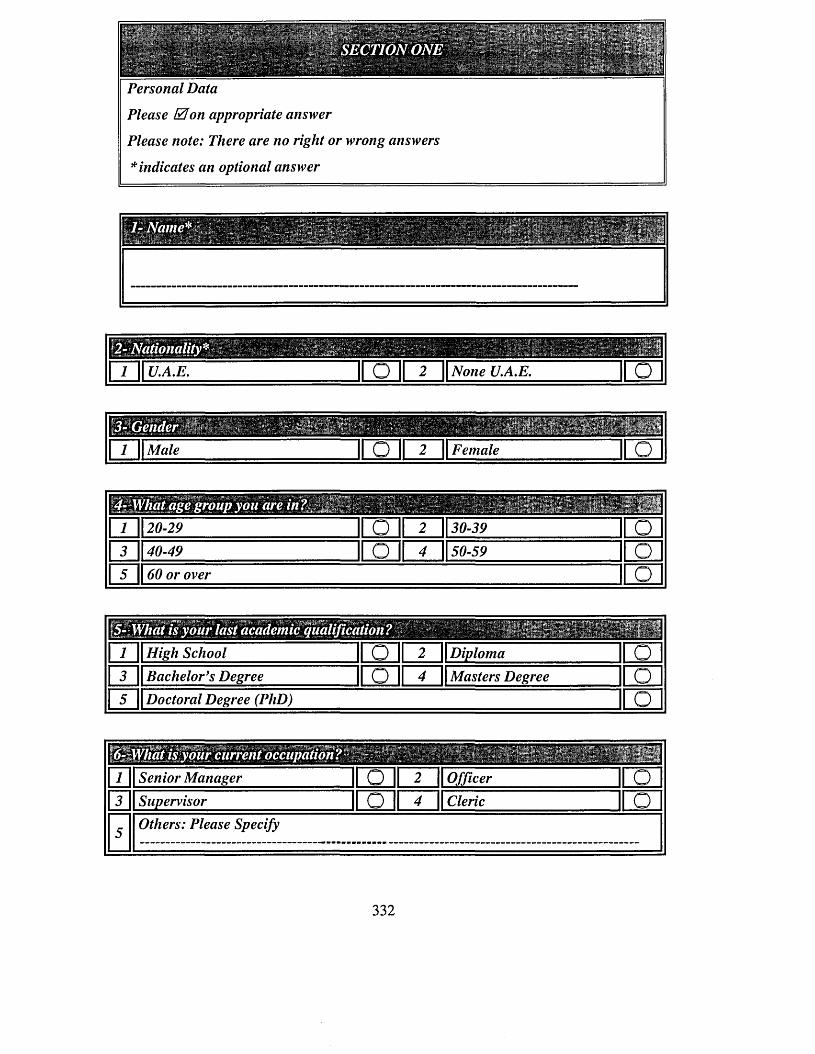
r . . **-. - •., .. .V; >'■■ ■ ■ . ■-'■rV'Tr'-T' ' TKT-."V- T-T—w—*, y/4S5fi > ? - " r ri *_** ~-i !'*'•' * * V** * * * ^ST/SS^siSi^Sffik^^t ££/-•£.*»“/ *« i:; .
Personal Data
Please Efon appropriate answer
Please note: There are no right or wrong answers
* indicates an optional answer
H111111111111111111111111111111111111111111111aiaiiiiiiaaaaiiiiiiiiiiiiiiiiiaiiiii
—| 1 II U.A.E. j! O II 2 | |NoneUA.E. II 0.1
1 SEUSjgm m m WM| 1 || Male o 1 | Female o
w — s s s a r a i a s i i t e w| 1 II20-29 o 2 30-39 o| 3 || 40-49 o 4 50-59 o| 5 || 60 or over o
Mm| 1 ll High School O 2 Diploma o| 3 || Bachelor’s Degree O 4 Masters Degree o| 5 || Doctoral Degree (PhD) o
I f B i P j i p a - ...."][T Senior Manager | 0 | | 2 ll Officer O[T Supervisor loll < || Cleric O5 Others: Please Specify
L—.
332

, J1 1 ||<W O 2 6-10 o| 3 II11-15 O 4 16-20 o| 5 || 21-25 O 6 26-30 o
|| 7 || 31 and over o
333
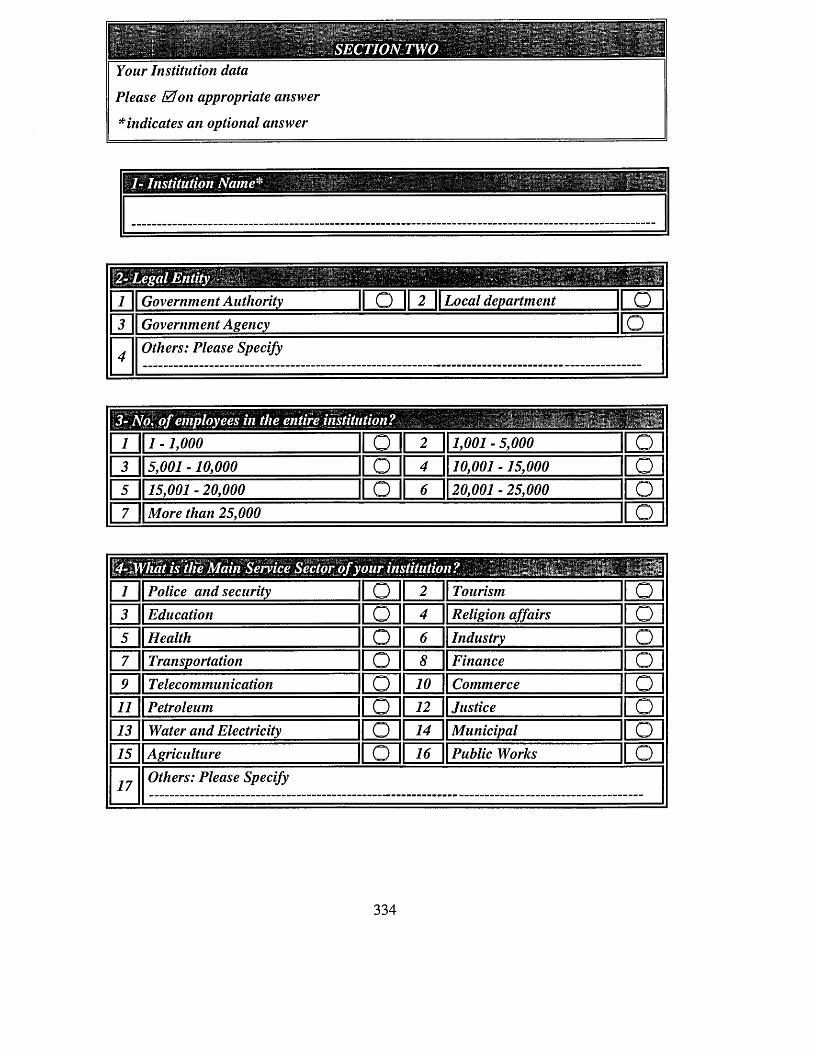
p i ............. 11 " ~ v v ‘I. ......4 uy. a - ■■ -- P P ^ f L * . '■ l l ” - * * \ J y ]-. J\ t -jj ^ * » * . i j * ^ ^ V . ' i j
^ & .. t : : - ' V y - * J
Your Institution data
Please 0 o n appropriate answer
*indicates an optional answer
\T Government Authority II O II 2 || Local department Ou Government Agency o
4 Others: Please Specifyi .
■ B1 / II i-iooo O 2 ]| 2,002 - 5,000 o| 3 II 5,001-10,000 O 4 J| 20,002 - 25,000 oI 5 II 15,001 - 20,000 O (J \\ 20,001 - 25,000 o| 7 || M ore than 25,000 o
Rlli]1 Police and security o 2 1Tourism o3 Education o 4 1Religion affairs o5 Health o 6 IIndustry o7 Transportation o # 1Finance o9 Telecommunication o 20 | Commerce o11 Petroleum o 22 Justice o13 Water and Electricity o l« IIMunicipal o15 Agriculture o l« IIPublic Works o17 Others: Please Specify
334
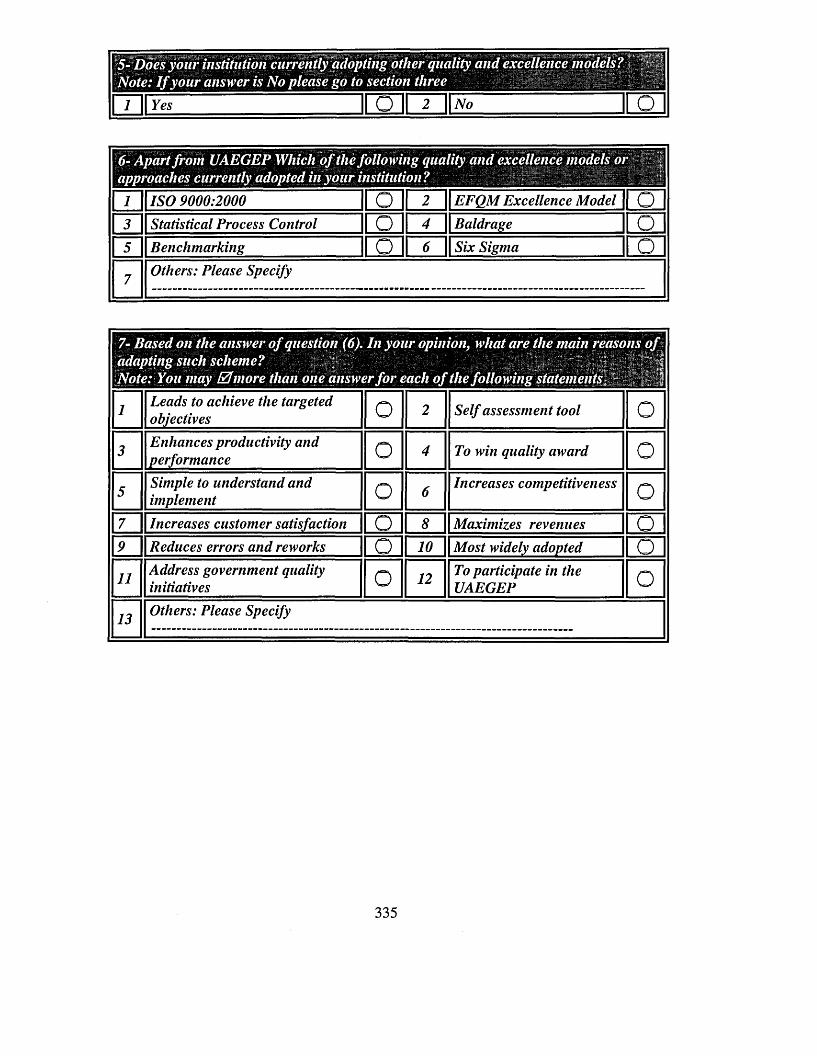
Id|| 1 || Yes O 2 No O
i ISO 9000:2000 || O II 2 \\EFQMExcellence Model J[O3 Statistical Process Control HD If 4 || Baldrage f or~5~Benchmarking IPO If 6 || Six Sigma |fo7 Others: Please Specify
___
1 Leads to achieve the targeted objectives o 2 Self assessment tool o
3 Enhances productivity and performance o 4 To win quality award o
5 Simple to understand and implement o 6 Increases competitiveness o
H Z Increases customer satisfaction o 8 Maximizes revenues opr~ Reduces errors and reworks o 10 Most widely adopted oa Address government quality
initiatives o 12 To participate in the UAEGEP o
13 Others: Please Specify—
335
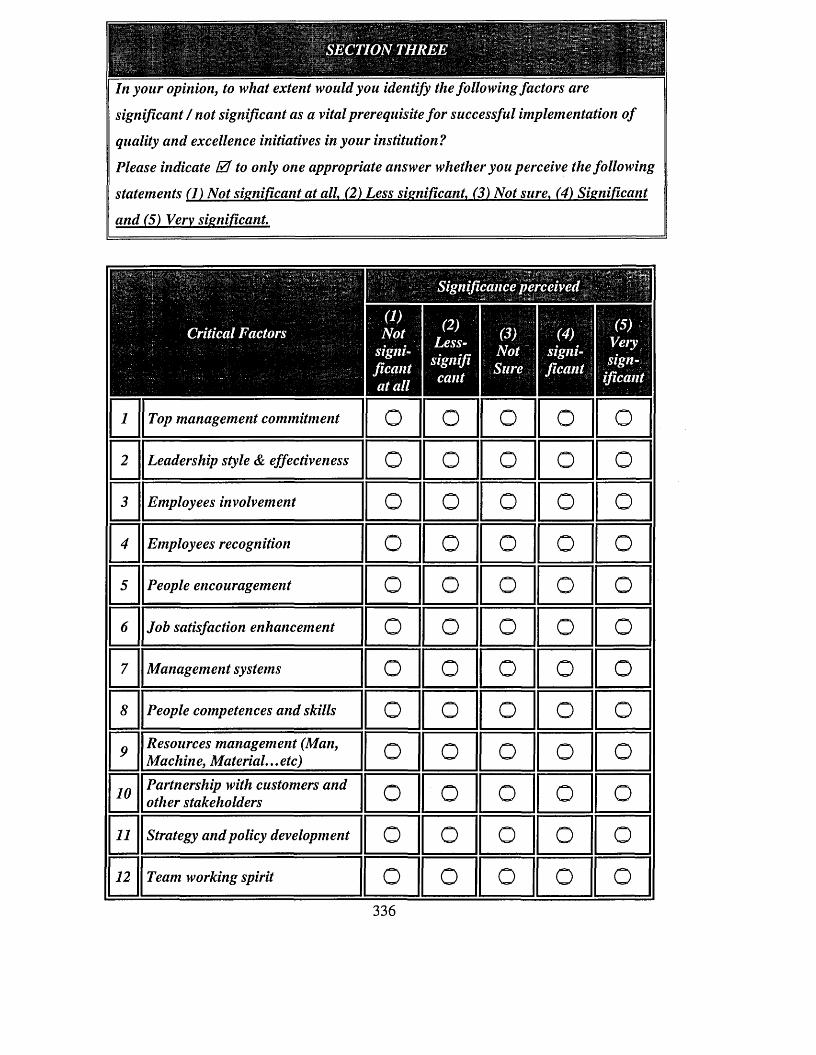
" M MSECTION THREE
Mt a r »
In your opinion, to what extent would you identify the following factors are
significant / not significant as a vital prerequisite for successful implementation of
quality and excellence initiatives in your institution?
Please indicate 0 to only one appropriate answer whether you perceive the following
statements (1) Not sisnificant at a ll (2) Less significant, (3) Not sure. (4) Sienificant
and (5) Very sienificant.
H i
i
i Top management commitment o o o o o2 Leadership style & effectiveness o o o o o3 Employees involvement o o o o o4 Employees recognition o o o o o5 People encouragement o o o o o6 Job satisfaction enhancement o o o o o7 Management systems o o o o o8 People competences and skills o o o o o9 Resources management (Man,
Machine, Material...etc) o o o o o10 Partnership with customers and
other stakeholders o o o o o11 Strategy and policy development o o o o o12 Team working spirit o o o o o
336
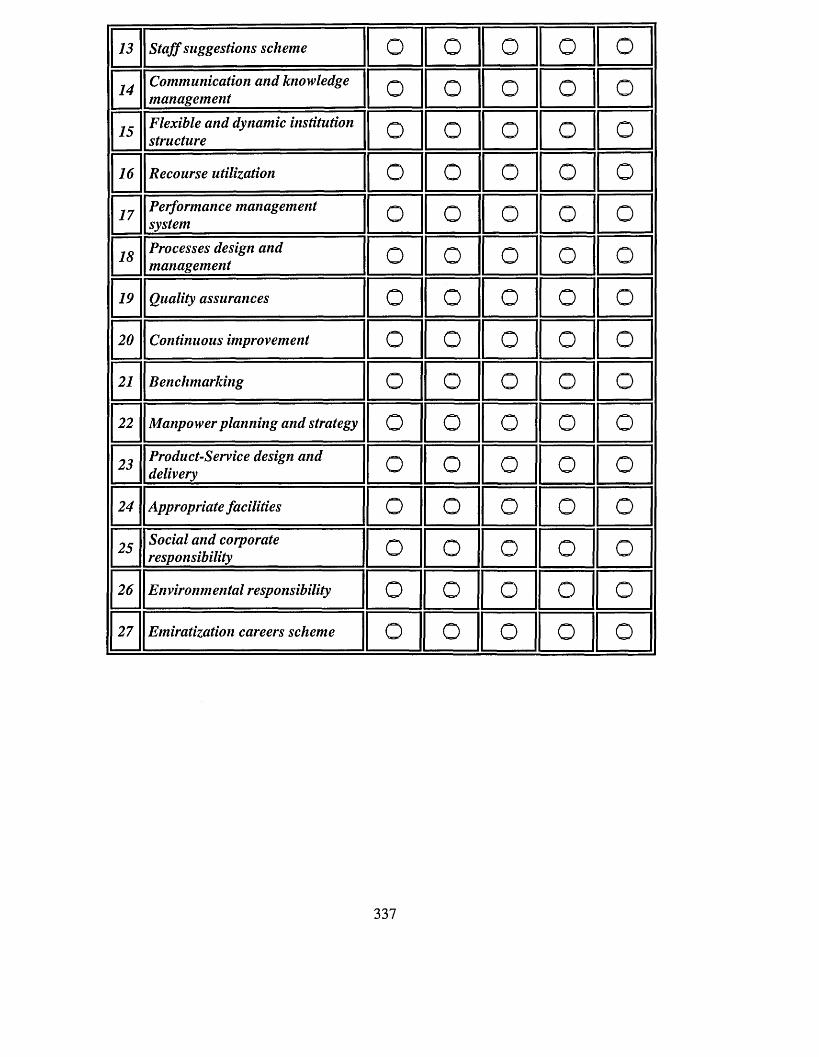
13 Staff suggestions scheme o o o o o14 Communication and knowledge
management o o o o o15 Flexible and dynamic institution
structure o o o o o16 Recourse utilization o o o o o17 Performance management
system o o o o o18 Processes design and
management o o o o o19 Quality assurances o o o o o20 Continuous improvement o o o o o21 Benchmarking o o o o o22 Manpower planning and strategy o o o o o23 Product-Service design and
delivery o o o o o24 Appropriate facilities o o o o o25 Social and corporate
responsibility o o o o o26 Environmental responsibility o o o o o27 Emiratization careers scheme o o o o o
337
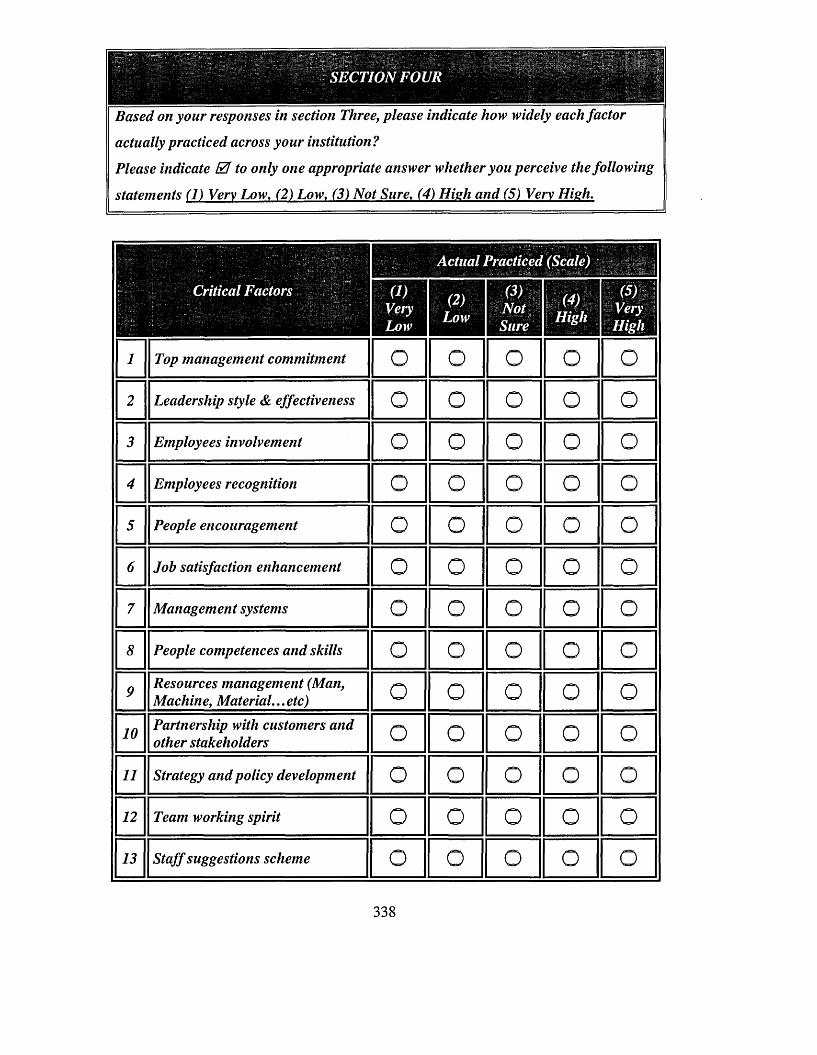
SECTION FOUR
Based on your responses in section Three, please indicate how widely each factor
actually practiced across your institution ?
Please indicate 0 to only one appropriate answer whether you perceive the following
statements (1) Very Low. (2) Low. (3) Not Sure. (4) Hieh and (5) Very Hieh.
■ m1
n1 Top management commitment o o o o o2 Leadership style & effectiveness o o o o o3 Employees involvement o o o o o4 Employees recognition o o o o o5 People encouragement o o o o o6 Job satisfaction enhancement o o o o o7 Management systems o o o o o8 People competences and skills o o o o o9 Resources management (Man,
Machine, Material...etc) o o o o o10 Partnership with customers and
other stakeholders o o o o o11 Strategy and policy development o o o o o12 Team working spirit o o o o o13 Staff suggestions scheme o o o o o
338
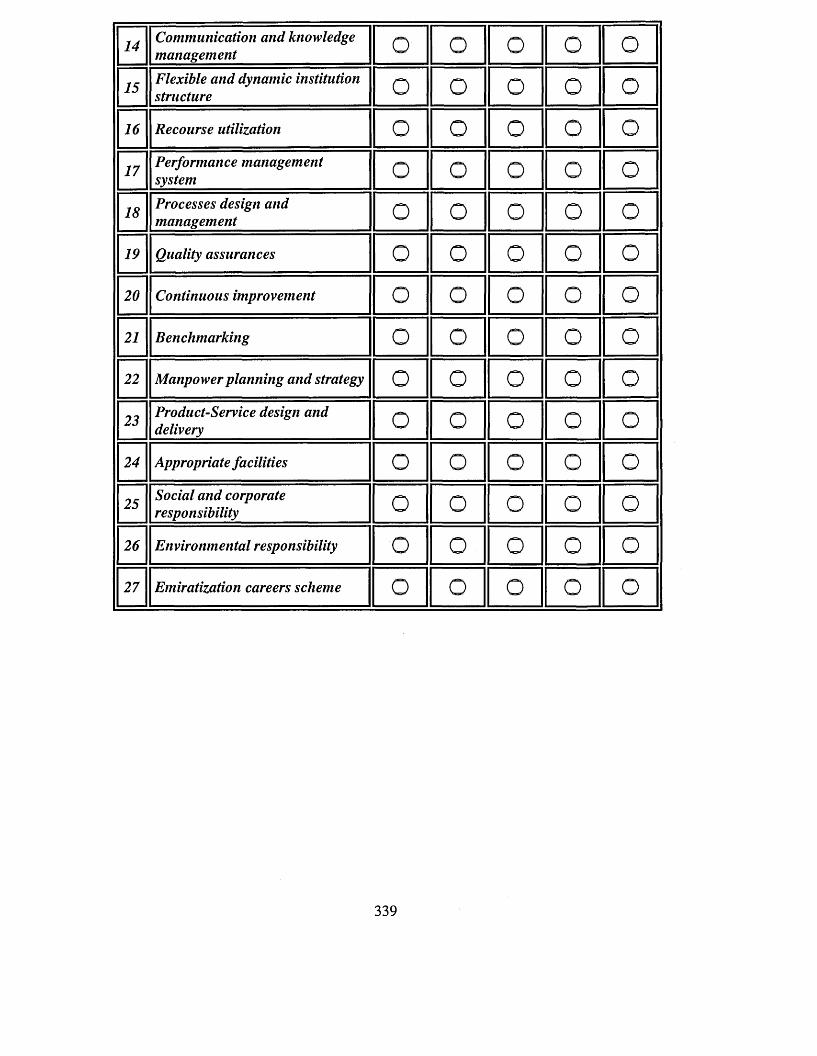
14 Communication and knowledge management o o o o o
15 Flexible and dynamic institution structure o o o o o
16 Recourse utilization o o o o o17 Performance management
system o o o o o18 Processes design and
management o o o o o19 Quality assurances o o o o o20 Continuous improvement o o o o o21 Benchmarking o o o o o22 Manpower planning and strategy o o o o o23 Product-Service design and
delivery o o o o o24 Appropriate facilities o o o o o25 Social and corporate
responsibility o o o o o26 Environmental responsibility o o o o o27 Emiratization careers scheme o o o o o
339
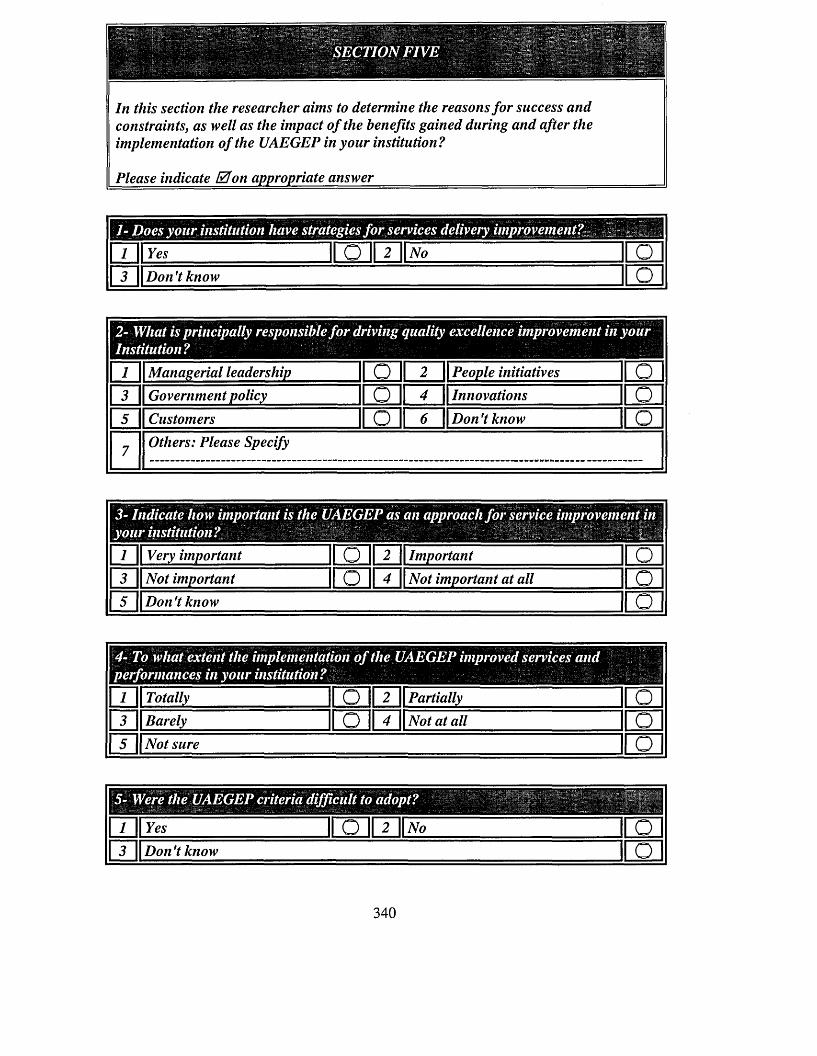
In this section the researcher aims to determine the reasons for success and constraints, as well as the impact of the benefits gained during and after the implementation of the UAEGEP in your institution?
Please indicate E l on appropriate answer___________________________
.... mill1 1 II Yes n r o i 2 Ik * II o || 3 \\Don't know II o |
1 Managerial leadership □ E m People initiatives o|~7~ Government policy □ c a m Innovations o[~~5~ Customers □ E m Don't know o
7 Others: Please Specify____
| / || Very important JO II2 ||Important O| 3 || Not important II O l! 4 ^Not important at all o| 5 | |Don't know o
m iM m
| 1 || Totally |[ OJI 2 || Partially o| 3 || Barely II O II ^ \\Not at all o| 5 || Not sure o
| 1 II Yes 0 to ? O|^3 \\Don't know o
340
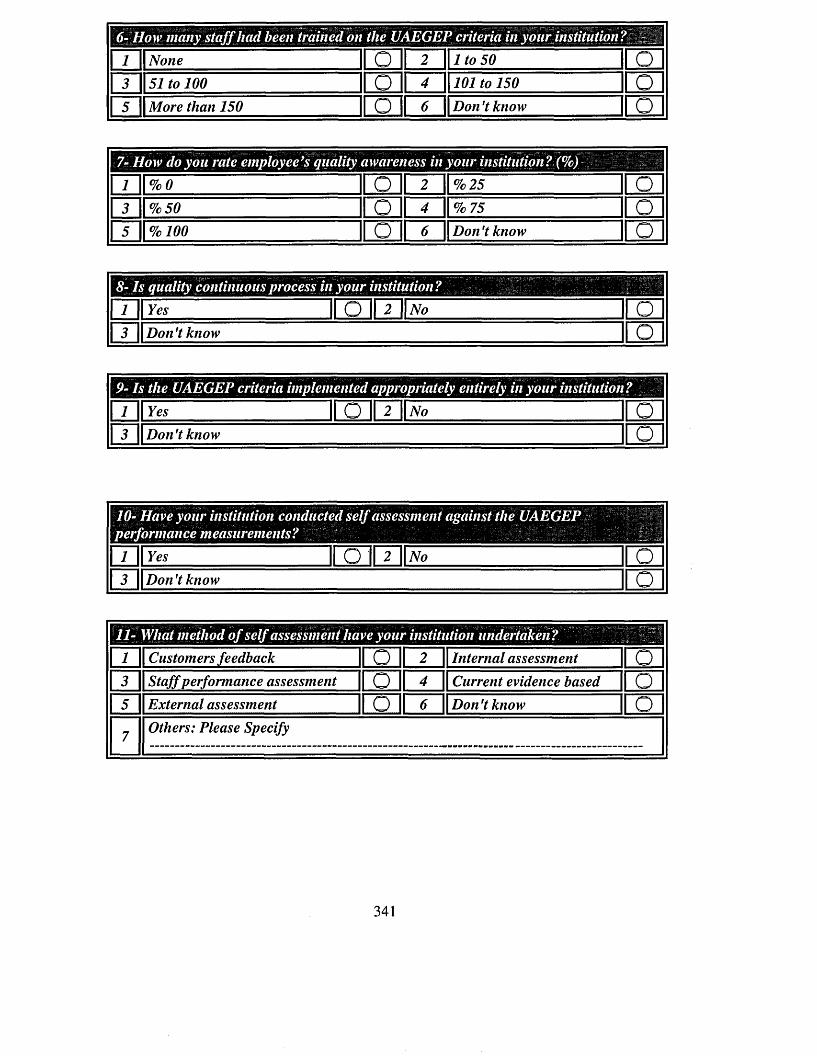
L i || None o 2 || 1 to 50 |[ o 1[ J j l 51 to 100 o 4 || 101 to 150 |[ oI 5 || More than 150 o | 6 \\ Don’t know |f O 1
| 1 II % 0 o [ 2 II% 25 I I O I| 3 ll % 50 o | 4 j |% 75 II O l| 5 || % 100 o | 6 || Don't know I I O |
1 1 II yes Ifo I U Ifiv. o| 3 || Don't know o
1 1 II Yes II O II 2 ||iVo o| 3 \\ Don't know o
10- Have your institution conducted self assessment against the UAEGEP performance measurements?1 || Yes 2 iVo3 \\Don't know
H—1 Customers feedback o 2 Internal assessment n a3 Staff performance assessment o 4 Current evidence based ircn5 External assessment o 6 Don't know o7 Others: Please Specify
341
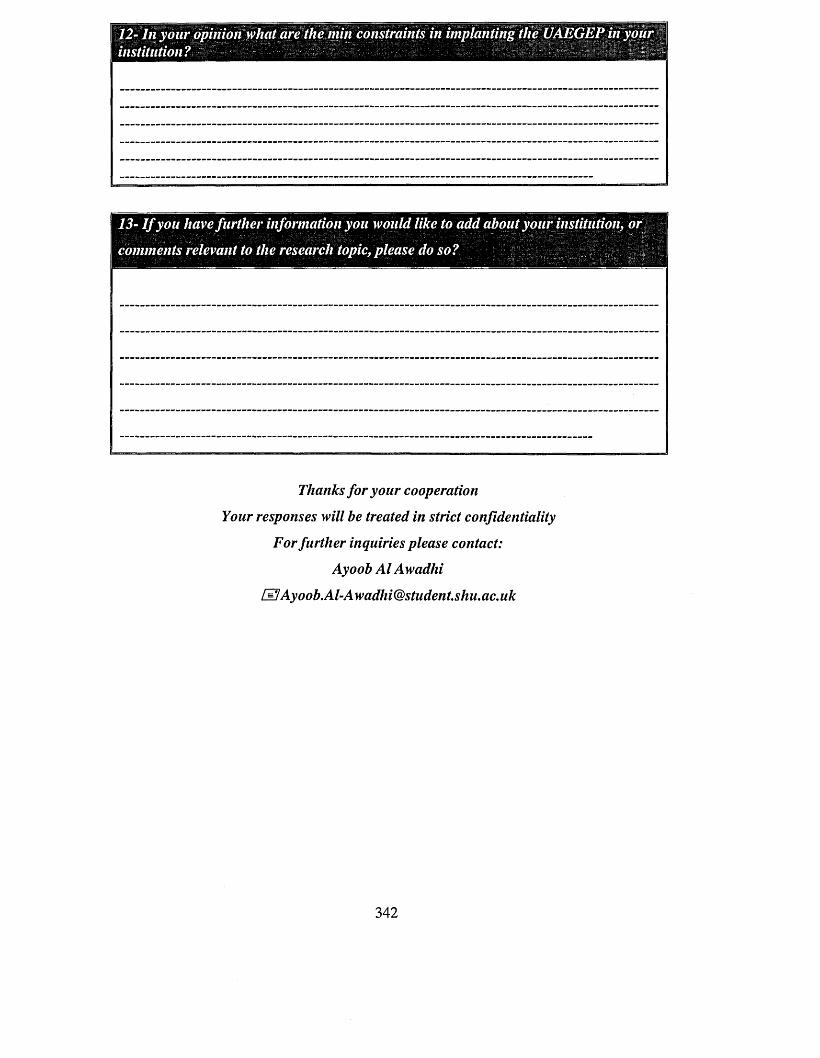
12- In your opinion what are the min constraints in implanting the UAEGEP in your institution?
13- I f you have further information you would like to add about your institution, or
comments relevant to the research topic, please do so?
Thanks for your cooperation
Your responses will be treated in strict confidentiality
For further inquiries please contact:
Ayoob A l Awadhi
342
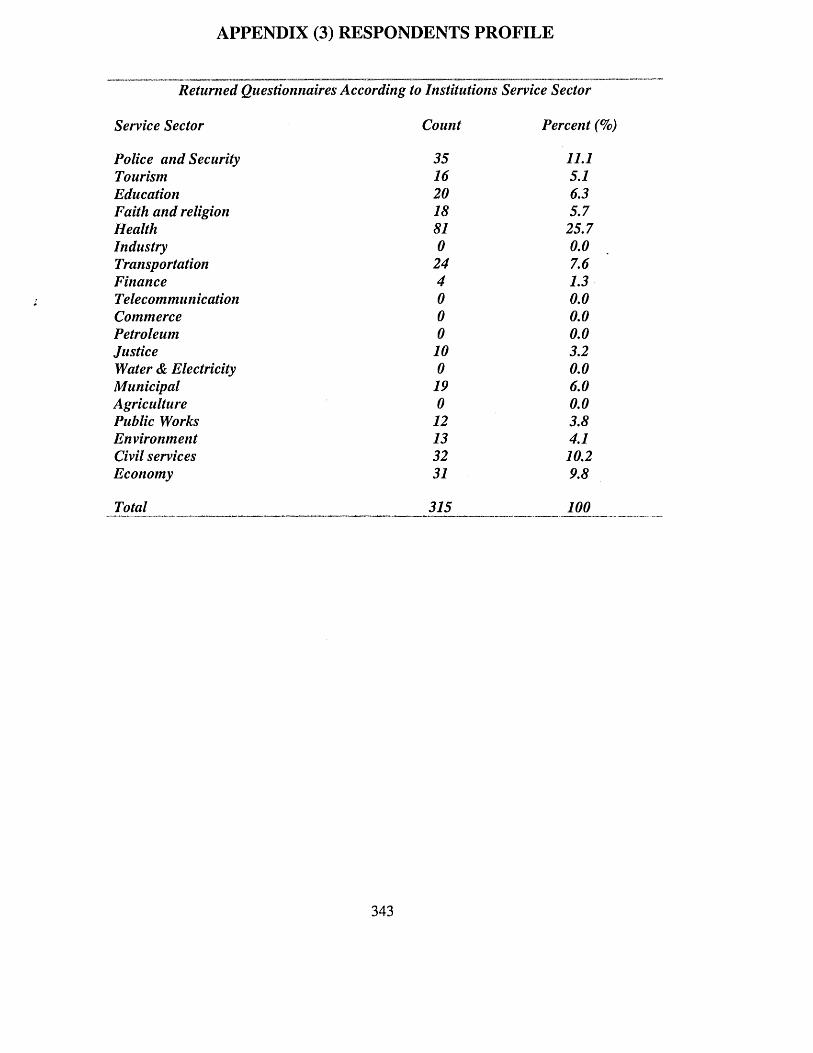
APPENDIX (3) RESPONDENTS PROFILE
Returned Questionnaires According to Institutions Service Sector
Service Sector Count Percent (%)
Police and Security 35 11.1Tourism 16 5.1Education 20 6.3Faith and religion 18 5.7Health 81 25.7Industry 0 0.0Transportation 24 7.6Finance 4 1.3Telecommunication 0 0.0Commerce 0 0.0Petroleum 0 0.0Justice 10 3.2Water & Electricity 0 0.0Municipal 19 6.0Agriculture 0 0.0Public Works 12 3.8Environment 13 4.1Civil services 32 10.2Economy 31 9.8
Total 315 100
343
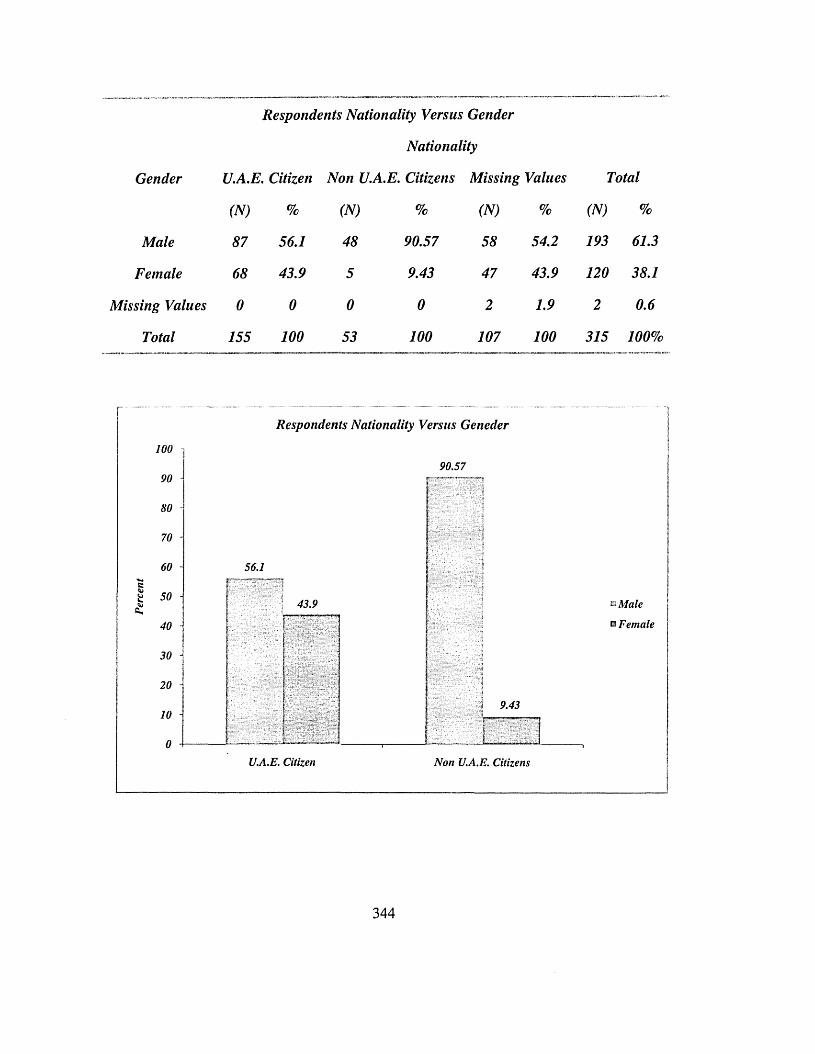
Respondents Nationality Versus Gender
Nationality
Gender U.A.E. Citizen Non U.A.E. Citizens Missing Values Total
(N) % (N) % (N) % (N) %
Male 87 56.1 48 90.57 58 54.2 193 61.3
Female 68 43.9 5 9.43 47 43.9 120 38.1
Missing Values 0 0 0 0 2 1.9 2 0.6
Total 155 100 53 100 107 100 315 100%
R esponden ts N ation ality Versus G en eder
100 90.57
56.1
9.43U.A.E. Citizen Non U.A.E. Citizens
e Male o Female
344
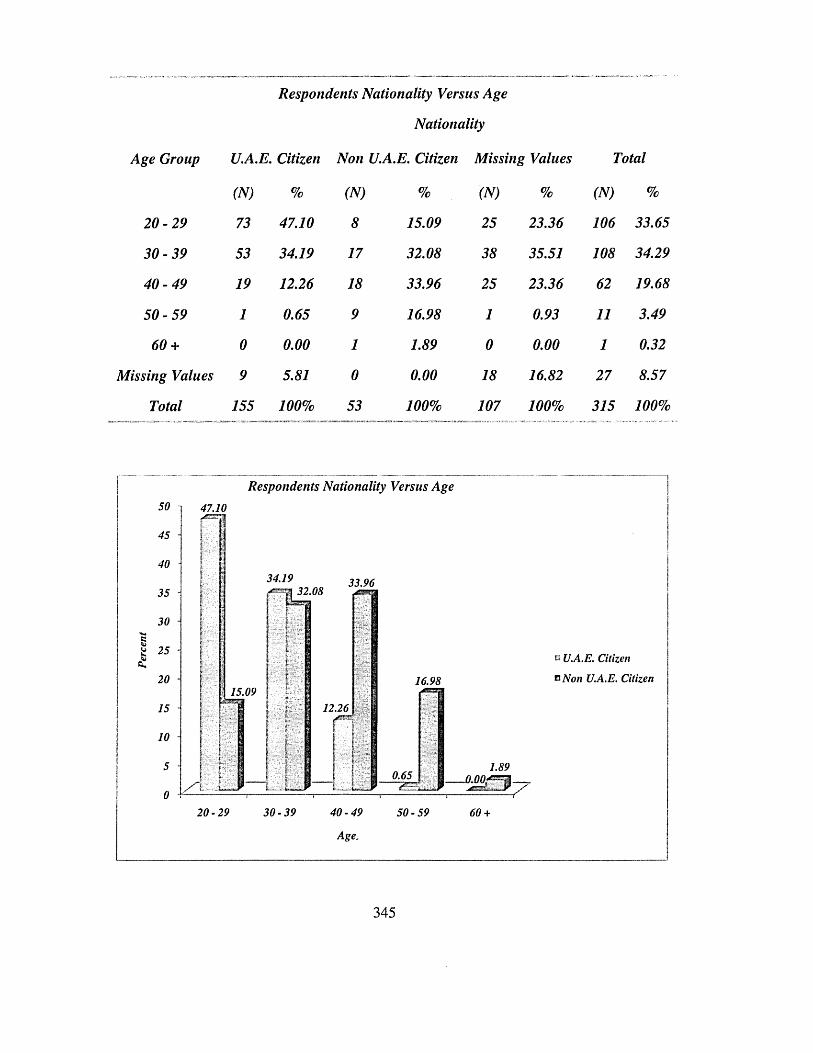
Respondents Nationality Versus Age
Nationality
Age Group U.A.E. Citizen Non U.A.E. Citizen Missing Values Total
( N ) % ( N ) % ( N ) % ( N ) %
2 0 -2 9 73 47.10 8 15.09 25 23.36 106 33.65
3 0 -3 9 53 34.19 17 32.08 38 35.51 108 34.29
4 0 -4 9 19 12.26 18 33.96 25 23.36 62 19.68
5 0 -59 1 0.65 9 16.98 1 0.93 11 3.49
60 + 0 0.00 1 1.89 0 0.00 1 0.32
Missing Values 9 5.81 0 0.00 18 16.82 27 8.57
Total 155 100% 53 100% 107 100% 315 100%
Respondents Nationality Versus Age50 47.104540 34.19 33.9635302520 16.9815.09 12.26JB!S1510
5 0.650 30-39 40-4920-29 50-59 60 +
U.A.E. Citizen
®Non U.A.E. Citizen
Age.
345
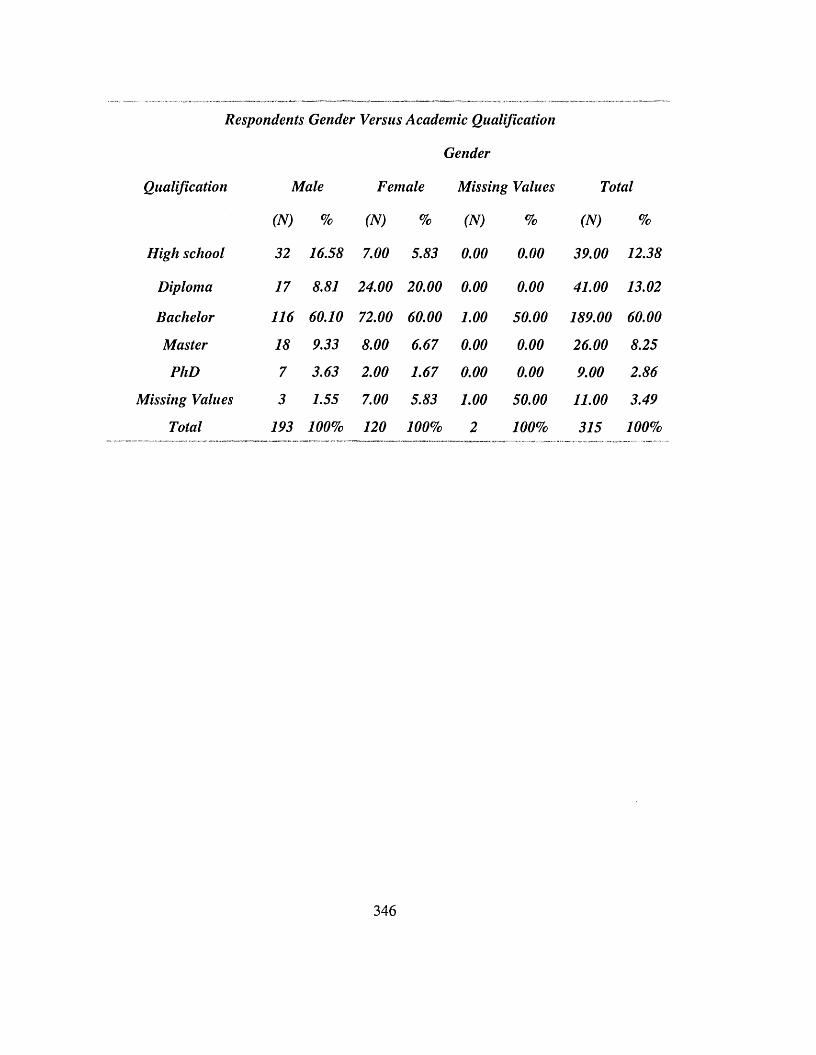
Respondents Gender Versus Academic Qualification
Gender
Qualification Male Female Missing Values Total
(N) % (N) % (N) % (N) %
High school 32 16.58 7.00 5.83 0.00 0.00 39.00 12.38
Diploma 17 8.81 24.00 20.00 0.00 0.00 41.00 13.02
Bachelor 116 60.10 72.00 60.00 1.00 50.00 189.00 60.00
Master 18 9.33 8.00 6.67 0.00 0.00 26.00 8.25
PhD 7 3.63 2.00 1.67 0.00 0.00 9.00 2.86
Missing Values 3 1.55 7.00 5.83 1.00 50.00 11.00 3.49
Total 193 100% 120 100% 2 100% 315 100%
346
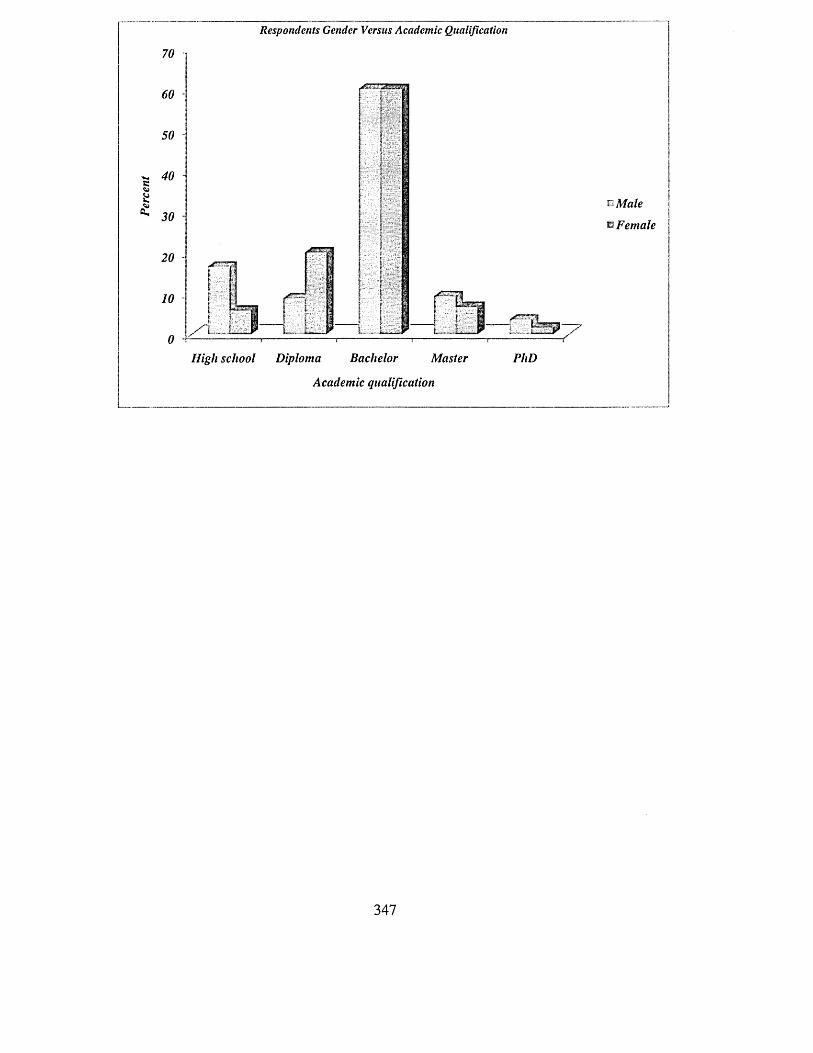
R espon den ts G ender Versus A c a d em ic Q ualification
20
"SET
BachelorHigh school Diploma PhDMaster
b Male
b Female
Academic qualification
347
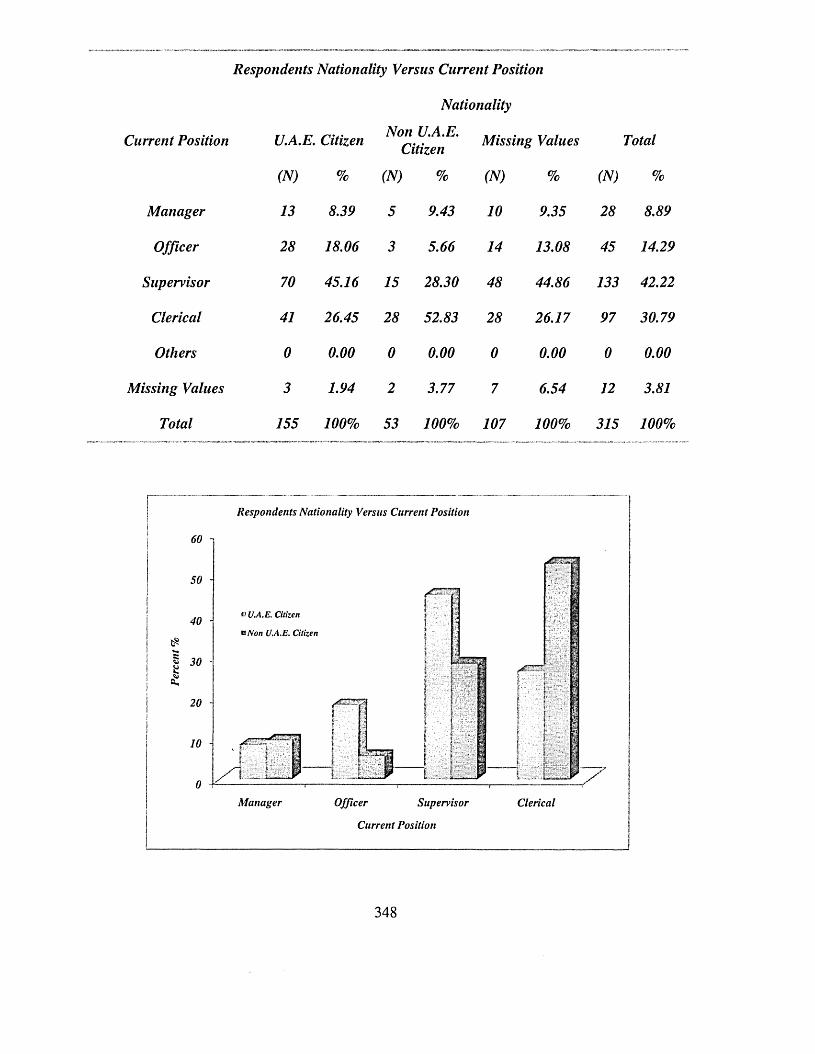
Respondents Nationality Versus Current Position
Nationality
Current Position U.A.E. Citizen Non U.A.E. Citizen Missing Values Total
(N) % (N) % (N) % (N) %
Manager 13 8.39 5 9.43 10 9.35 28 8.89
Officer 28 18.06 3 5.66 14 13.08 45 14.29
Supervisor 70 45.16 15 28.30 48 44.86 133 42.22
Clerical 41 26.45 28 52.83 28 26.17 97 30.79
Others 0 0.00 0 0.00 0 0.00 0 0.00
Missing Values 3 1.94 2 3.77 7 6.54 12 3.81
Total 155 100% 53 100% 107 100% 315 100%
Respondents Nationality Versus Current Position6050
» U.A.E. Citizen40BNon U.A.E. Citizen
3020
10
0 OfficerManager Supervisor ClericalCurrent Position
348
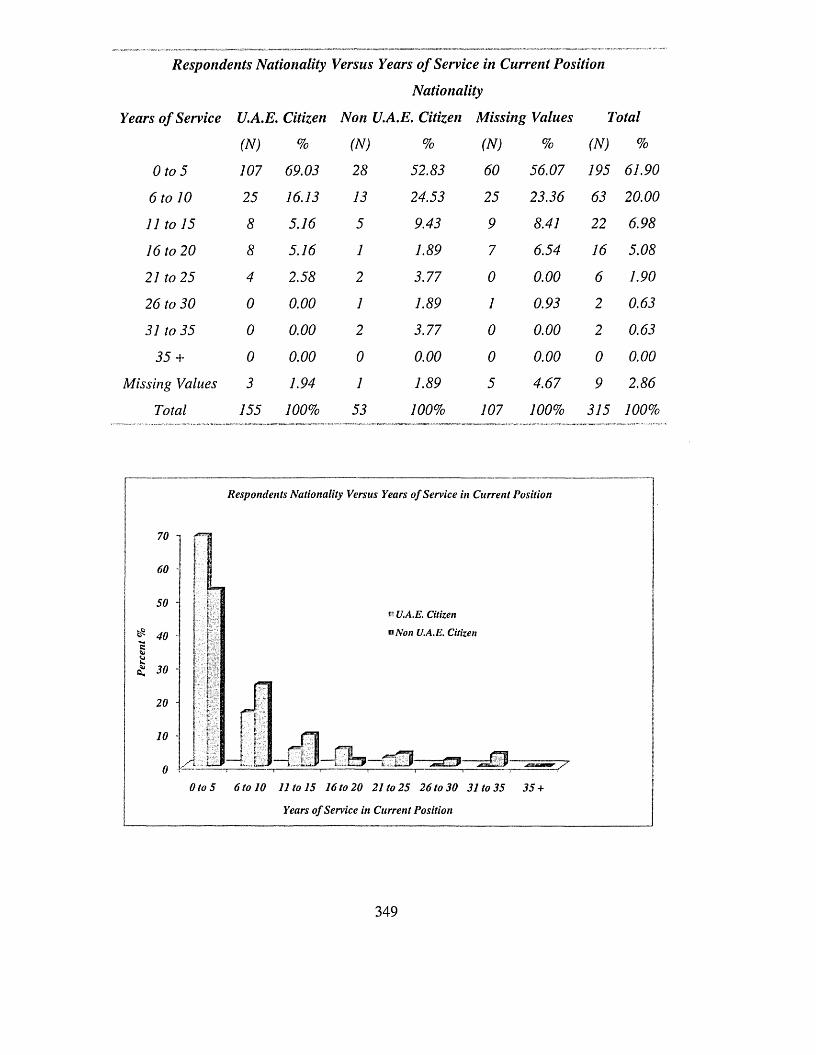
Respondents Nationality Versus Years of Service in Current Position
Nationality
Years o f Service U.A.E. Citizen Non U.A.E. Citizen Missing Values Total
(N) % (N) % (N) % (N) %
0 to 5 107 69.03 28 52.83 60 56.07 195 61.90
6 to 10 25 16.13 13 24.53 25 23.36 63 20.00
11 to 15 8 5.16 5 9.43 9 8.41 22 6.98
16 to 20 8 5.16 1 1.89 7 6.54 16 5.08
21 to 25 4 2.58 2 3.77 0 0.00 6 1.90
26 to 30 0 0.00 1 1.89 1 0.93 2 0.63
31 to 35 0 0.00 2 3.77 0 0.00 2 0.63
35 + 0 0.00 0 0.00 0 0.00 0 0.00
Missing Values 3 1.94 1 1.89 5 4.67 9 2.86
Total 155 100% 53 100% 107 100% 315 100%
Respondents Nationality Versus Years of Service in Current Position706050
** U.A.E. Citizen
uNon U.A.E. Citizen403020
10
0 0to5 6 to 10 11 to 15 16 to 20 21 to 25 26 to 30 31 to 35Years of Service in Current Position
349
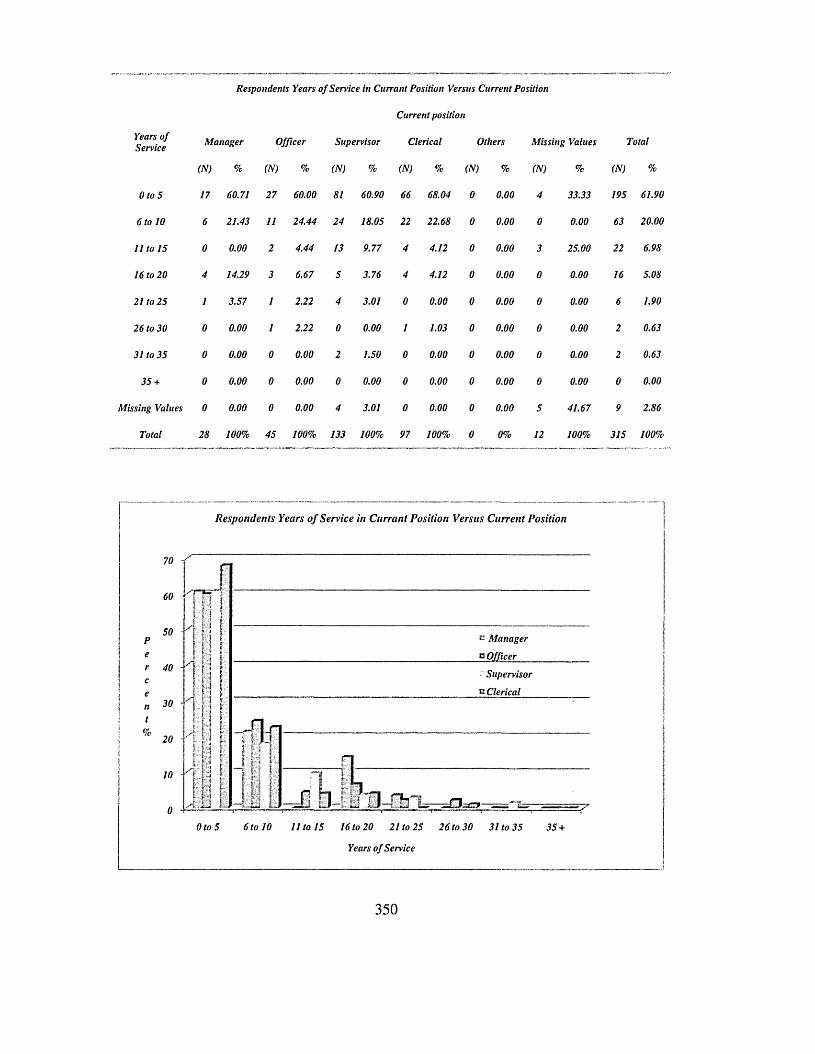
Respondents Years o f Service in Currant Position Versus Current Position
Current position
Years o f Service Manager Officer Supervisor Clerical Others Missing Values Total
m % m % (N) % (N) % (N) % (N) % (N) %
Oto 5 17 60.71 27 60.00 81 60.90 66 68.04 0 0.00 4 33.33 195 61.90
6 to 10 6 21.43 11 24.44 24 18.05 22 22.68 0 0.00 0 0.00 63 20.00
11 to 15 0 0.00 2 4.44 13 9.77 4 4.12 0 0.00 3 25.00 22 6.98
16 to 20 4 14.29 3 6.67 5 3.76 4 4.12 0 0.00 0 0.00 16 5.08
21 to 25 1 3.57 1 2.22 4 3.01 0 0.00 0 0.00 0 0.00 6 1.90
26 to 30 0 0.00 1 2.22 0 0.00 1 1.03 0 0.00 0 0.00 2 0.63
31 to 35 0 0.00 0 0.00 2 1.50 0 0.00 0 0.00 0 0.00 2 0.63
35 + 0 0.00 0 0.00 0 0.00 0 0.00 0 0.00 0 0.00 0 0.00
Missing Values 0 0.00 0 0.00 4 3.01 0 0.00 0 0.00 5 41.67 9 2.86
Total 28 100% 45 100% 133 100% 97 100% 0 0% 12 100% 315 100%
Respondents Years of Service in Currant Position Versus Current Position70
60
50 *2 Manager
p Officer40
Supervisor
p Clerical30
20
10
06 to 10 11 to 15 16 to 20 21 to 25 26 to 30 31 to 35Oto 5 35 +
Years o f Service
350
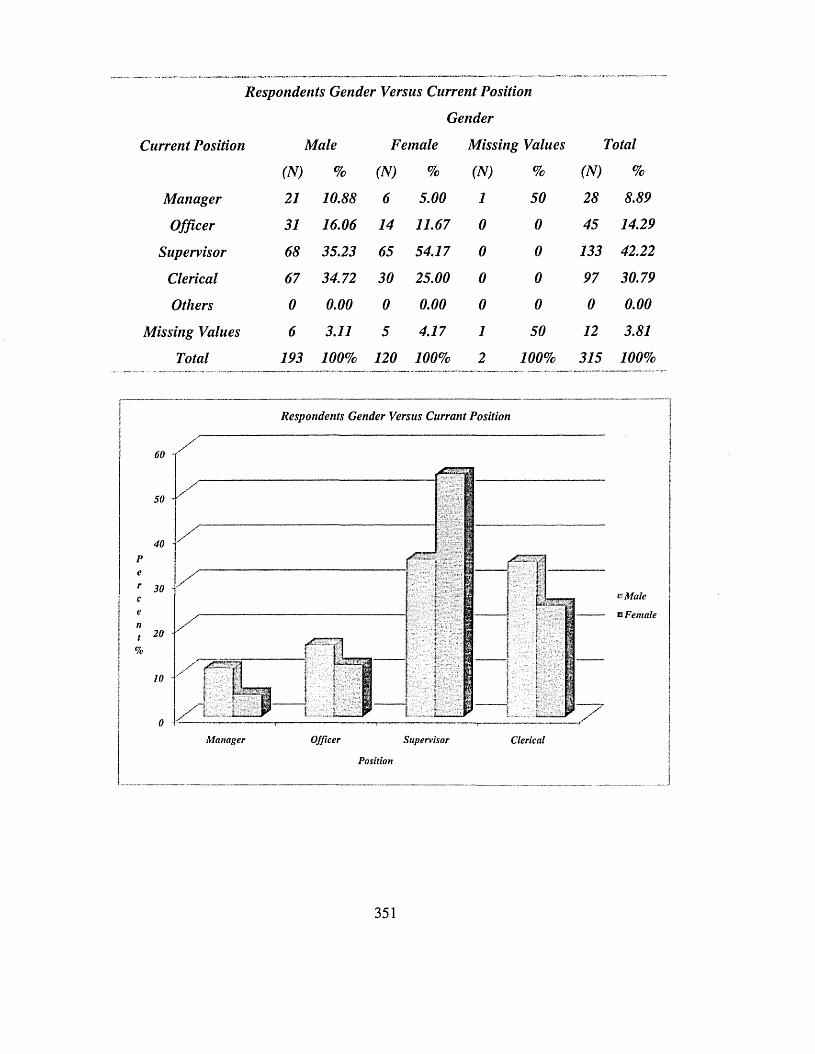
Respondents Gender Versus Current Position
Gender
Current Position Male Female Missing Values Total
(N) % (N) % (N) % (N) %
Manager 21 10.88 6 5.00 1 50 28 8.89
Officer 31 16.06 14 11.67 0 0 45 14.29
Supervisor 68 35.23 65 54.17 0 0 133 42.22
Clerical 67 34.72 30 25.00 0 0 97 30.79
Others 0 0.00 0 0.00 0 0 0 0.00
Missing Values 6 3.11 5 4.17 1 50 12 3.81
Total 193 100% 120 100% 2 100% 315 100%
Respondents Gender Versus Currant Position60 f
Percent
%
Officer SupervisorM anager C lerical
Position
351
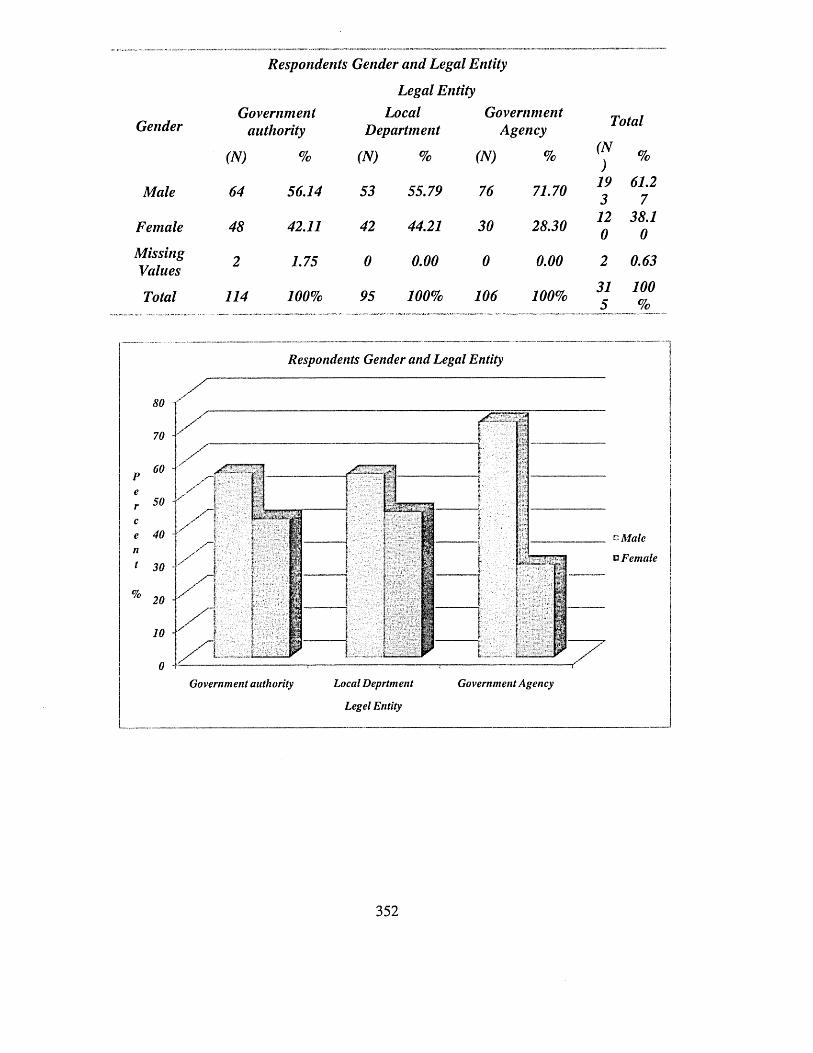
Gender
Respondents Gender and Legal Entity
Legal EntityGovernment
authorityLocal
DepartmentGovernment
Agency
(N) % (N) % (N) %
Male 64 56.14 53 55.79 76 71.70
Female 48 42.11 42 44.21 30 28.30
MissingValues 2 1.75 0 0.00 0 0.00
Total 114 100% 95 100% 106 100%
Total
(N)
%
19 61.23 712 38.10 0
2 0.63
31 1005 %
Respondents Gender and Legal Entity
P e r ce 40 n( 30
Government authority Local Deprtment Legel Entity Government Agency
cMale b Female
352
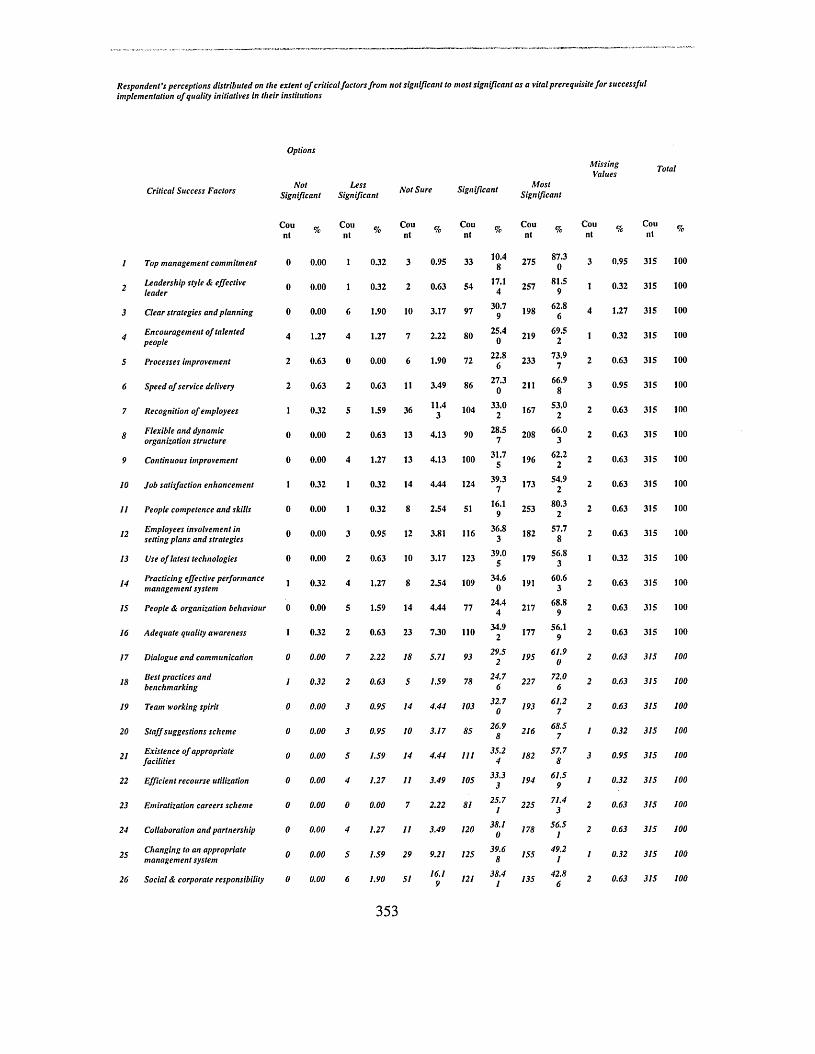
Respondent’s perceptions distributed on the extent o f critical factors from not significant to most significant as a vital prerequisite fo r successful implementation o f quality initiatives in their institutions
Options
Critical Success Factors significant Significant NotSure Significant signiJicant
C o un t % C o u
n t % C o un t % C o u
n t % C o un t % C o u
n t % C o un t %
/ Top management commitment 0 0.00 1 0 .3 2 3 0 .9 5 3 3 1 0 .48 2 7 5 8 7 .3
0 3 0 .9 5 3 1 5 100
2 Leadership style <& effective leader
0 0.00 1 0 .3 2 2 0 .6 3 5 4 17 .14 2 5 7 8 1 .5
9 1 0 .3 2 3 1 5 100
3 Clear strategies and planning 0 0.00 6 1 .9 0 10 3 .1 7 9 7 3 0 .79 1 9 8 6 2 .8
6 4 1 .2 7 3 1 5 100
4 Encouragement o f talented people 4 1 .2 7 4 1 .2 7 7 2.22 8 0 2 5 .4
0 2 1 9 6 9 .52 1 0 .3 2 3 1 5 100
5 Processes improvement 2 0 .6 3 0 0.00 6 1 .9 0 7 2 22.86 2 3 3 7 3 .9
7 2 0 .6 3 3 1 5 100
6 Speed o f service delivery 2 0 .6 3 2 0 .6 3 11 3 .4 9 86 2 7 .30 211 6 6 .9
8 3 0 .9 5 3 1 5 100
7 Recognition o f employees 1 0 .3 2 5 1 .5 9 3 6 1 1 .43 1 0 4 3 3 .0
2 1 6 7 5 3 .02 2 0 .6 3 3 1 5 100
8 Flexible and dynamic organization structure 0 0.00 2 0 .6 3 13 4 .1 3 9 0 2 8 .5
7 2 0 8 66.03 2 0 .6 3 3 1 5 100
9 Continuous improvement 0 0.00 4 1 .2 7 13 4 .1 3 100 3 1 .75 1 9 6 6 2 .2
2 2 0 .6 3 3 1 5 100
10 Job satisfaction enhancement 1 0 .3 2 1 0 .3 2 14 4 .4 4 1 2 4 3 9 .37 1 7 3 5 4 .9
2 2 0 .6 3 3 1 5 100
11 People competence and skills 0 0.00 1 0 .3 2 8 2 .5 4 51 16.19 2 5 3 8 0 .3
2 2 0 .6 3 3 1 5 100
12 Employees involvement in setting plans and strategies 0 0.00 3 0 .9 5 12 3 .8 1 1 16 3 6 .8
3 1 8 2 5 7 .78 2 0 .6 3 3 1 5 100
13 Use o f latest technologies 0 0.00 2 0 .6 3 10 3 .1 7 123 3 9 .05 1 7 9 5 6 .8
3 1 0 .3 2 3 1 5 100
14 Practicing effective performance management system 1 0 .3 2 4 1 .2 7 8 2 .5 4 109 3 4 .6
0 191 6 0 .63 2 0 .6 3 3 1 5 100
15 People & organization behaviour 0 0.00 5 1 .5 9 14 4 .4 4 7 7 2 4 .44 2 1 7 68.8
9 2 0 .6 3 3 1 5 100
16 Adequate quality awareness 1 0 .3 2 2 0 .6 3 2 3 7 .3 0 110 3 4 .92 1 7 7 56 .1
9 2 0 .6 3 3 1 5 100
17 Dialogue and communication 0 0.00 7 2.22 18 5.71 93 29.52 195 61.9
0 2 0.63 315 100
18 Best practices and benchmarking 1 0.32 2 0.63 5 1.59 78 24.7
6 227 72.06 2 0.63 315 100
19 Team working spirit 0 0.00 3 0.95 14 4.44 103 32.70 193 61.2
7 2 0.63 315 100
20 Staff suggestions scheme 0 0.00 3 0.95 10 3.17 85 26.98 216 68.5
7 1 0.32 315 100
21 Existence o f appropriate facilities 0 0.00 5 1.59 14 4.44 111 35.2
4 182 57.78 3 0.95 315 100
22 Efficient recourse utilization 0 0.00 4 1.27 11 3.49 105 33.33 194 61.5
9 1 0.32 315 100
23 Emiratization careers scheme 0 0.00 0 0.00 7 2.22 81 25.71 225 71.4
3 2 0.63 315 100
24 Collaboration and partnership 0 0.00 4 1.27 11 3.49 120 38.10 178 56.5
1 2 0.63 315 100
25 Changing to an appropriate management system 0 0.00 5 1.59 29 9.21 125 39.6
8 155 49.21 1 0.32 315 100
26 Social & corporate responsibility 0 0.00 6 1.90 51 16.19 121 38.4
1 135 42.86 2 0.63 315 100
353
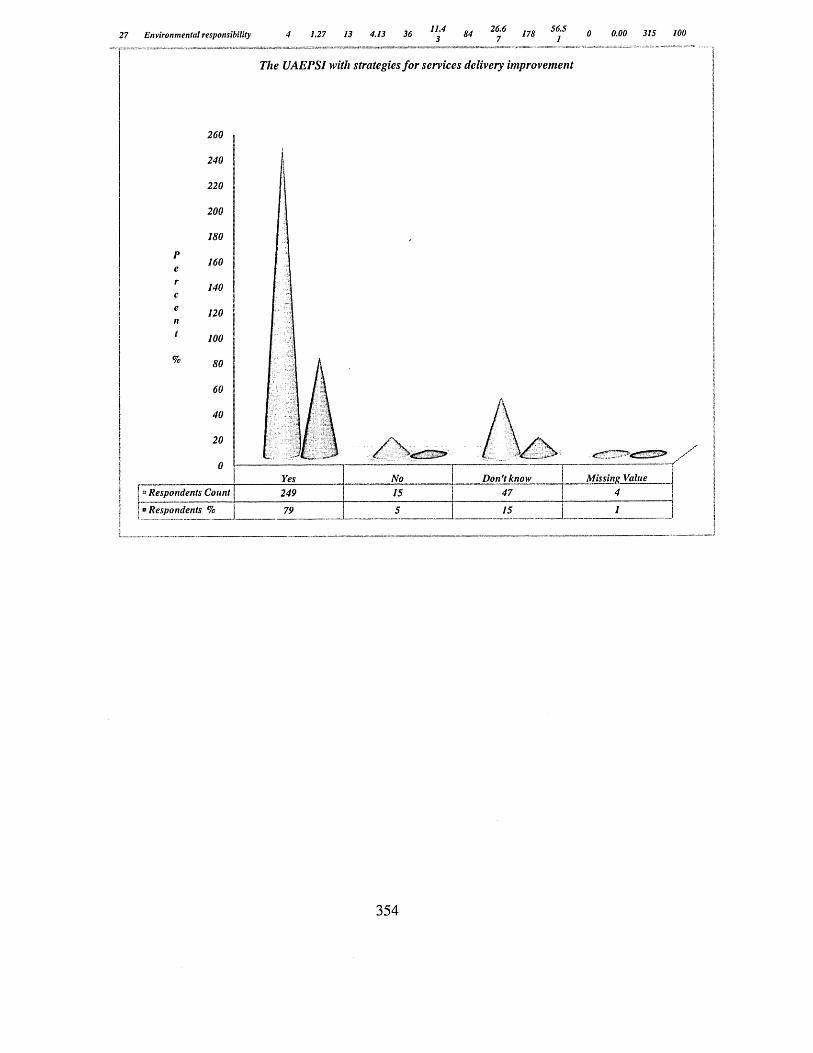
Environmental responsibility 4 1.27 13 4.13 36 84 178 0 0.00 315 100
The UAEPSI with strategies for services delivery improvement
260
240
220
200
180
160
140
120
100
I Missing ValueDon't knowNoYes“ Respondents Count 249
Respondents %
354
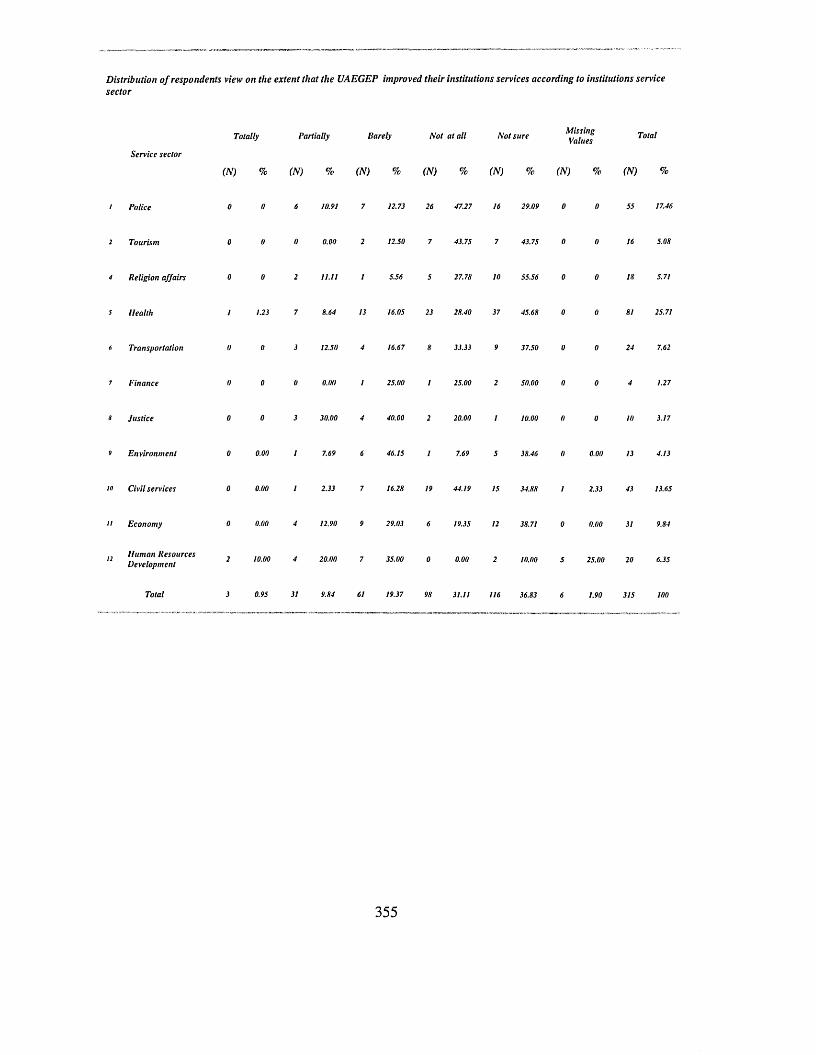
Distribution o f respondents view on the extent that the UAEGEP improved their institutions services according to institutions service sector
Service sector
Human Resources Development
Totally Partially Barely Not at all Not sure ^Values Total
(N) % (N) % (N) % (N) % (N) % (TV) % (N) %
1 Police 0 0 6 10.9} 7 12.73 26 47.27 16 29.09 0 0 55 17.46
2 T ourism 0 0 0 0.00 2 12.50 7 43.75 7 43.75 0 0 16 5.08
4 R elig ion a ffa irs 0 0 2 11.11 1 5.56 5 27.78 10 55.56 0 0 18 5.71
5 H ealth 1 1.23 7 8.64 13 16.05 23 28.40 37 45.68 0 0 81 25.71
6 Transporta tion 0 0 3 12.50 4 16.67 8 33.33 9 37.50 0 0 24 7.62
7 F in a n ce 0 0 0 0.00 1 25.00 1 25.00 2 50.00 0 0 4 1.27
8 J u s tice 0 0 3 30.00 4 40.00 2 20.00 I 10.00 0 0 10 3.17
» E n v iro n m e n t 0 0.00 I 7.69 6 46.15 1 7.69 5 38.46 0 0.00 13 4.13
to C ivil services 0 0.00 1 2.33 7 16.28 19 44.19 15 34.88 1 2.33 43 13.65
i t E co n o m y 0 0.00 4 12.90 9 29.03 6 19.35 12 38.71 0 0.00 31 9.84
2 10.00 4 20.00 7 35.00 0 0.00 2 10.00 5 25.00 20 6.35
Tota l 3 0.95 31 9.84 61 19.37 98 31.11 116 36.83 6 1.90 315 100
355
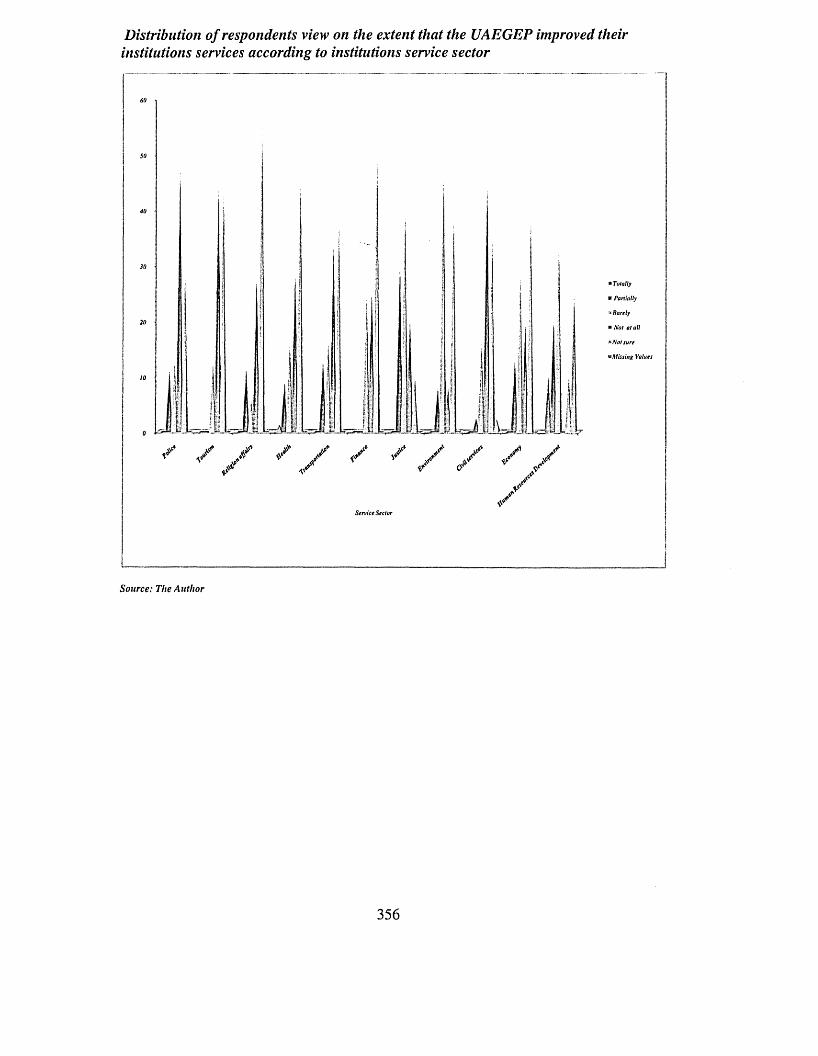
Distribution o f respondents view on the extent that the UAEGEP improved theirinstitutions services according to institutions service sector
60
50
40
30
20
iO
0
* Totally
■ Partially
* Barely
* Nat at all
» Nat sure
* Missing Values
Source: The Author
356
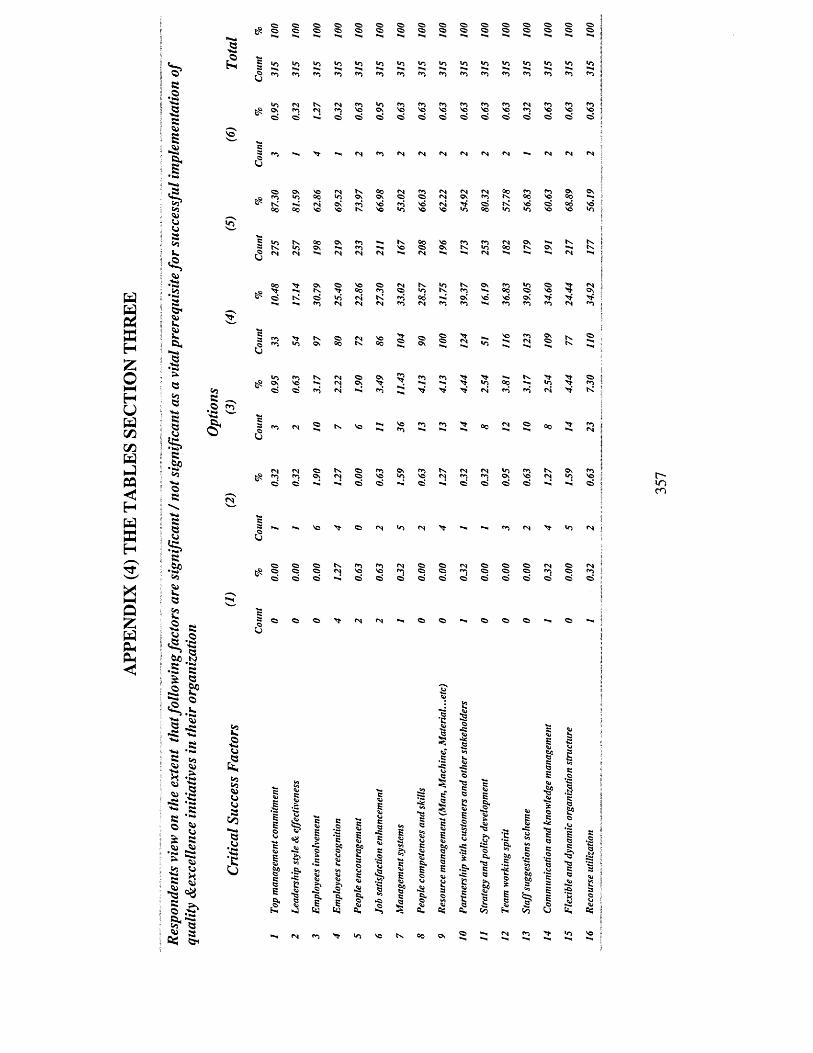
k>
88•e
sk
a -
*n i£ I
6*?&5kV)k8V)ik
<£>k*•»;sss8-<kk8<
JO
PS 9© pn pn Os Ospn Is. oo no Oo »•«*C5 K NO c> Oo NO©0 *n ‘n NO >o in
oo > Os 'o PS K jn ts Os pn *n>* *•* Is > Oo pn C> in ts pn oo<d ts o> »n PS is pn Oo s Os 'd o*S pn PS PS <N pn <N *n pn pn pn
HUWc/3CZ3W►JPQ<H
Wf f lH
XHHQXHPU&<
«0553-t«*88k
s&8•Sf>05
8<3k
s sk
.£f>0 5
Si53e5 8
« K 8too .k?
I I **** 8^ . 2 ^ » *>Ni2 -8 »8 ^3
8 0 5
S *81 .§ I8 ^ ir <■> £ 8•Si *Si
v •«»*^ k i? k>« 3
*3
§&1 *8
£ 8 fi£ 8<
s tv00 »«.r r j P-S
^ 505 ><N >t
8 rn « ^
§
JN
e5k
£0 50 5kkk8
50»••»8k
•■e
5
cv •N
I£COE
£
a*«8
•S<-ae|3
tv f*5 r<5<N 'O VOk C5 55
^ «N «N
I !•ak
$
5=c
I1S%>£P ■a
•tj
•&<e«5
1
<a> <a>a> <a a> a>
k■eaaCV
•cI6«
a sjbI IIf |c ^§ «5 o* s“§r .y•Si c
s&
r->ir>CO
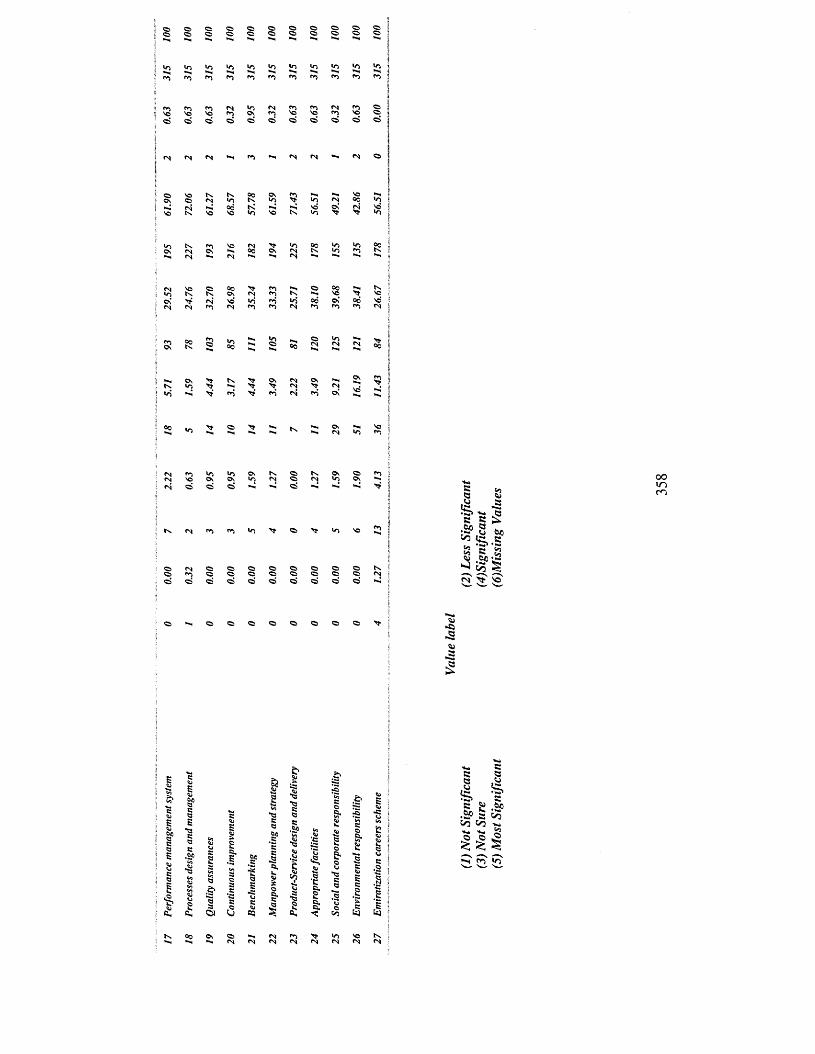
I 10I s
<**■5 <N *0 <NVO 'O vo O n *n<55 55 c> <55 <55 5>
I <N
^0 On **> *■* 'O *■*tv *o *o <N 00 loK *-1 vo CN vo»o 'O K lo >1* >* lo
lo 10 Os K 05 h s O n <55vo on OS *o <N <N *0 O n
55 <55 55 N N <55 N *-S
<*) >0 >»• ©
C *5 Q& -5•t5» •*- fcis s ^*> S*
OOmm
•s ' 2 &o 1/3t, •?* r? tn3 .1*1^
><5•3%>•35
** Q
C•SP
?
a
£aa
O )
.1 £S 1§ g
-So .
•aMaa
•I5
■S
■§
I&
"5 £ b3
e
§ c £> •£P s03 Kn
c«
.§ >00
© e £ ^ ^ f? rrj
Leadership style & effectiveness Employees involvement Employees recognition People encouragement Job satisfaction enhancement Management systems People competences and skillsResource management (Man, Machine, Material...etc)Partnership with customers and other stakeholdersStrategy and policy developmentTeam working spiritStaff suggestions schemeCommunication and knowledge managementFlexible and dynamic organization structureRecourse utilizationPerformance management systemProcesses design and managementQuality assurancesContinuous improvementBenchmarkingManpower planning and strategy Product-Service design and delivery Appropriate facilities Social and corporate responsibility En vironmental responsibility Emiratization careers scheme
359
Related Documents