Investigation of Thermal Biomass Gasification for Sustainable Small Scale Rural Electricity Generation in Uganda Joseph Olwa Licentiate Thesis 2011 Division of Energy and Climate Studies Department of Energy Technology KTH School of Industrial Engineering and Management STOCKHOLM, SWEDEN

Welcome message from author
This document is posted to help you gain knowledge. Please leave a comment to let me know what you think about it! Share it to your friends and learn new things together.
Transcript

Investigation of Thermal Biomass Gasification for Sustainable
Small Scale Rural Electricity Generation in Uganda
Joseph Olwa
Licentiate Thesis 2011
Division of Energy and Climate Studies
Department of Energy Technology
KTH School of Industrial Engineering and Management
STOCKHOLM, SWEDEN

ii
ISBN 978-91-7501-045-8 ISRN KTH/KRV/11/06-SE ISSN 1100-7990 TRITA KRV Report 11/06 © Joseph Olwa
Licentiate Thesis/Joseph Olwa
iii
Abstract
With the increasing need for renewable energy technologies in the world, biomass fuel
transformation technology is growing towards meeting that need, among others. Challenges
remain certain and new innovations are being tested in bid to overcome them with the
application of biomass as energy source. This report presents some studies carried out into
understanding the potential and challenges associated with utilization of biomass fuel, especially
for technologies that are appropriate for rural applications. Utilization of biomass gasification
technologies is in the focus of this study.
The great potential biomass fuel provide to Uganda for possible energy production in small scale
application is presented. This study was carried out to understand the possibility of using
biomass as fuel in electricity power generation in Uganda. It takes into consideration the use of
biomass gasification technology in energy production. Challenges related to the application of
biomass fuels are discussed, mostly with tar and alkali metal compounds in the gas stream.
Suggested methods to combat some of the challenges with biomass fuels are pointed out in this
study. Application of externally fired gas turbine (EFGT) system is a particular approach
discussed and its technical performance analyzed. The analysis revealed that efficiency of the
EFGT system is greatly dependent on the heat exchanger effectiveness and on turbine inlet
temperature. Optimum performance can be realized with air compression ratio of 3.4. It is also
noted that fouling and deposition in the heat exchanger can affect its performance.
A related study carried out was on the retention of alkali metals in an updraft gasifier. The
gasifier was chosen for possible integration with the EFGT system. Finding was that about 99%
of the alkali metals are retained in the gasifier. It is anticipated that this would reduce on the
deposition in the heat exchanger, reducing on maintenance time. A need is identified to
determine the level of deposition mentioned. A simple thermodynamic modeling of the alkali
metals condensation reaction on a high temperature heat exchanger surface was conducted. The
results showed that with appropriate quantity of S in the raw fuel, alkali metals bounding with Cl
are greatly reduced. Cl is passed out as gaseous HCl, leaving deposition of none corrosive
sulphates. Recommendation is made to study this phenomenon in an experimental setting.
Biomass gasification technology integration with an internal combustion (IC) engine is also
studied. Here requirements for the producer gas quality have been discussed. Some tests carried
out with wood pellets and wood cylinders compared the yield of tar from the two physically
different fuels. Wood pellets were found to yield more tar than wood cylinders.
Economic analysis of biomass gasifier integrated with an IC engine running a generator of 100
kWe was carried out. Comparison with a diesel electricity generator of similar capacity was made
for a scenario in Uganda over a project life of 20 years. Different Plant Capacity Factors (PCF)
and fuel costs including subsidies were considered. The analysis showed that over long period of
time biomass power plant was more beneficial than the diesel power plant at PCF over 40%.
This is more pronounced with unsubsidized diesel fuel.
Licentiate Thesis/Joseph Olwa
iv
Acknowledgement
I thank God for His awesome grace in letting me see this work to its completion.
The research was sponsored by the Swedish International Development Agency, SIDA, through
its capacity building program for Makerere University, Kampala. I am very grateful for the
funding without which it would have been very difficult.
I would like to express my deepest gratitude to the Head of Energy Department at KTH, Prof.
Torsten Fransson, for the supervision and support he provided during my efforts to accomplish
this work. Many thanks also go to staffs and colleagues of the Energy Department of KTH who
worked with me in the various aspects of this study. I am also indebted to Prof. em Bjorn
Kjellstrom from Lulea Technical University and Prof. Mackay Okure from the College of
Engineering Design and Art of Makerere University for their supervision and moral support
which they provided during the course of this study.
My sincerely appreciation also is extended to Prof. Marcus Öhman of the Energy Department of
Lulea Technical University through whom some of the experiments were made possible.
I would also like to thank my dear wife and daughter, Susan and Hebron, for their patience and
encouragement which created a beautiful atmosphere for my work.
Joseph Olwa Stockholm 2011
Licentiate Thesis/Joseph Olwa
v
Abbreviations
µg
micrograms
ASME
American Society of Mechanical Engineers
ASTM
American Society of Testing and Materials
CHP
Combine heat and power
EFGT
externally fired gas turbine
FAO
Food Agricultural Organization
GDP
Gross Domestic Product
GJ
giga-joule
GT
gas turbine
GW
giga-watt
GWh
giga-watt-hour
hp-h
horse power-hour
IC
internal combustion
ICP-AES
Inductively coupled plasma atomic emission spectroscopy
IRR
internal rate of return
KCC
Kampala City Council
kg
kilogram
kJ
kilo-joule
kW
kilo-watt
kWe
kilo-watt-electric
kWh
kilo-watt-hour
kWt
kilo-watt-thermal
L
liters
Max. maximum
Min. minimum
MJ
mega-joule
MS
Mass Spectroscopy
MSW
municipal solid waste
MWe
mega-watt-electric
MWh
mega-watt-hour
MWt
mega-watt-thermal
Nm3
normal cubic meter
NPV
net present value
O&M
Operation and Maintenance
OLGA
Dutch acronym for oil-based gas washers
OPEC
Organization of Petroleum Exporting Countries
PBP
payback period
ppbw
part per billion weight
PPP
purchase power parity
Licentiate Thesis/Joseph Olwa
vi
SPA
solid phase absorption
TARWATC
tar-water treatment and condensation
TEMA
Tubular Exchangers and Manufacturers Association
TIT
turbine inlet temperature
TWh tera-watt-hour
UNS
Universal Number System
WBG
Wood Based Gasifier
wt
weight
VTT
Finnish acronym for governmental technical research center
XRD
X-ray diffraction
Nomenclature
The symbols used in equations in the text are explained immediately below the equation where
the symbols appear.
Licentiate Thesis/Joseph Olwa
vii
TABLE OF CONTENT
ABSTRACT ............................................................................................................................................................. III
ACKNOWLEDGEMENT ............................................................................................................................................. IV
ABBREVIATIONS ..................................................................................................................................................... V
NOMENCLATURE ................................................................................................................................................... VI
INDEX OF TABLES ................................................................................................................................................... XII
1. INTRODUCTION.............................................................................................................................. 13
1.1 BACKGROUND ............................................................................................................................................ 13
1.2 OBJECTIVE OF THE STUDY .............................................................................................................................. 15
1.2.1 General objective ................................................................................................................................ 15
1.2.2 Specific objectives ................................................................................................................................ 16
1.3 CONCEPTUAL FRAMEWORK ........................................................................................................................... 16
1.4 OVERVIEW OF THE CONTENTS OF THE THESIS .................................................................................................... 18
2. DEVELOPMENTS IN BIOMASS GASIFICATION TECHNOLOGY ........................................... 19
2.1 A BRIEF BACKGROUND ................................................................................................................................. 19
2.2 THERMAL GASIFICATION OF BIOMASS ............................................................................................................. 19
2.2.1 Gasification process .................................................................................................................................. 20
2.3 GASIFIER TYPES ........................................................................................................................................... 21
2.3.1 Downdraft gasifiers............................................................................................................................. 21
2.3.2 Updraft gasifiers ................................................................................................................................ 23
2.3.3 Fluidized bed gasifiers ......................................................................................................................... 23
2.3.4 Entrained flow gasifier ........................................................................................................................ 24
2.3.5 Some Aspects on Applications of Gasifiers .............................................................................................. 25
2.4 CONTAMINANTS IN THE PRODUCER GAS .......................................................................................................... 26
2.4.1 Tar in producer gas ............................................................................................................................ 26
2.4.2 Tar treatment methods in selected biomass gasification technologies ................................................................ 28
2.4.3 Alkali metals in producer gas ............................................................................................................... 32
2.4.4 Particles in producer gas ...................................................................................................................... 33
2.5 PRODUCER GAS APPLICATIONS ...................................................................................................................... 33
2.5.1 Gas quality requirements ..................................................................................................................... 33
2.5.2 Cooled gas for IC engines applications .................................................................................................... 35
2.5.3 Hot gas for turbine application .............................................................................................................. 37
2.6 CONCLUSIONS AND RECOMMENDATIONS ......................................................................................................... 39
3. DESIGN CONSIDERATIONS FOR AN EXTERNALLY FIRED MICRO GAS TURBINE
(EFGT) HEAT EXCHANGER USING BIOMASS AS FUEL .................................................................... 41
3.1 INTRODUCTION ........................................................................................................................................... 41
Licentiate Thesis/Joseph Olwa
viii
3.2 EFGT SYSTEM MODELING AND SIMULATION .................................................................................................... 41
3.2.1 Method and assumptions ..................................................................................................................... 41
3.3 RESULTS AND DISCUSSION ON EFGT TECHNICAL PERFORMANCE .......................................................................... 42
3.4 HEAT EXCHANGER DESIGN CONSIDERATIONS .................................................................................................... 43
3.5 CONSIDERATION OF UNCERTAINTY IN THE HEAT EXCHANGER DESIGN .................................................................... 44
3.6 SIMULATION TO DETERMINE HEAT EXCHANGER DESIGN UNCERTAINTIES ............................................................... 46
3.6.1 Monte Carlo simulation ...................................................................................................................... 46
3.6.2 Application of Monte Carlo ................................................................................................................. 47
3.6.3 Determination of number of iterations ..................................................................................................... 48
3.7 DISCUSSION ON UNCERTAINTY ANALYSIS RESULTS ............................................................................................. 48
3.8 CONCLUSIONS AND RECOMMENDATION .......................................................................................................... 50
4. ALKALI METAL COMPOUNDS RETENTION IN AN UPDRAFT GASIFIER ........................... 51
4.1 INTRODUCTION ........................................................................................................................................... 51
4.2 EXPERIMENTS ............................................................................................................................................. 52
4.2.1 Equipment description ........................................................................................................................ 52
4.2.2 Experimental method ......................................................................................................................... 53
4.2.3 Measurement technique and sampling methods .......................................................................................... 54
4.3 RESULTS AND DISCUSSION ............................................................................................................................. 55
4.3.1 Ultimate analysis ............................................................................................................................... 55
4.3.2 Temperature profiles ........................................................................................................................... 55
4.3.3 Gas composition................................................................................................................................. 59
4.3.4 Particulates analysis ........................................................................................................................... 60
4.3.5 Alkali metals distributions .................................................................................................................. 63
4.4 THERMO-CHEMICAL MODELING OF ALKALI METAL COMPOUNDS CONDENSATION REACTION IN HIGHER TEMPERATURE
HEAT EXCHANGER ................................................................................................................................................. 67
4.4.1 Alkali compounds condensation reactions ................................................................................................ 67
4.5 CONCLUSIONS AND RECOMMENDATION .......................................................................................................... 69
5. DOWNDRAFT GASIFIER PRODUCT GAS TAR CONTENT FROM WOOD PELLETS AND
WOOD CYLINDERS FUELS ..................................................................................................................... 71
5.1 INTRODUCTION ........................................................................................................................................... 71
5.2 EXPERIMENT............................................................................................................................................... 72
5.2.1 Fuel ................................................................................................................................................ 72
5.2.2 Experimental setup ............................................................................................................................ 72
5.2.3 Procedure.......................................................................................................................................... 74
5.3 RESULTS .................................................................................................................................................... 75
5.4 DISCUSSION ............................................................................................................................................... 76
5.5 CONCLUSIONS ............................................................................................................................................ 78
Licentiate Thesis/Joseph Olwa
ix
6. EFFECTS OF TAR SAMPLE STORAGE ON ANALYSIS RESULTS ............................................. 79
6.1 INTRODUCTION ........................................................................................................................................... 79
6.2 EXPERIMENTAL SETUP AND PROCEDURE ........................................................................................................... 80
6.3 ANALYSIS RESULTS AND DISCUSSION ............................................................................................................... 80
6.4 STATISTICAL TREATMENT OF RESULTS .............................................................................................................. 82
6.5 CONCLUSION AND RECOMMENDATIONS .......................................................................................................... 83
7. FIELD STUDY OF A BIOMASS GASIFIER IC ENGINE SYSTEM ............................................... 84
7.1 INTRODUCTION ........................................................................................................................................... 84
7.2 DESCRIPTION OF THE INSTALLATION ................................................................................................................ 84
7.3 OPERATIONAL EXPERIENCES .......................................................................................................................... 86
7.4 POSSIBLE REASONS FOR THE DEGRADATION OF THE OUTPUT ............................................................................... 87
7.4.1 Low density of the fuel-air mixture entering the cylinder .............................................................................. 87
7.4.2 Poor heating value of the fuel-air mixture ................................................................................................ 87
7.4.3 Low conversion efficiency of the engine ..................................................................................................... 87
7.5 EVALUATION OF THE FUEL GAS PREPARATION PROCESS ........................................................................................ 88
7.5.1 Wood moisture content ........................................................................................................................ 88
7.5.2 Wood consumption ............................................................................................................................. 88
7.5.3 Gasifier performance ........................................................................................................................... 89
7.5.4 Pressure drop across the gas filters .......................................................................................................... 92
7.5.5 Conversion efficiencies .......................................................................................................................... 93
7.6 TESTS ON THE GAS ENGINE ............................................................................................................................ 94
7.6.1 Check on compression ratio for the IC engine ........................................................................................... 94
7.6.2 Exhaust gas analysis .......................................................................................................................... 96
7.7 DISCUSSION ............................................................................................................................................... 97
7.8 CONCLUSIONS AND RECOMMENDATIONS ......................................................................................................... 98
8. BIOMASS GASIFICATION INVESTMENT OPPORTUNITY FOR SMALL SCALE
APPLICATIONS IN UGANDA ................................................................................................................... 99
8.1 INTRODUCTION ........................................................................................................................................... 99
8.2 BIOMASS FUELS - AVAILABILITY ISSUES .......................................................................................................... 100
8.3 BIOMASS GASIFIER AND DIESEL SYSTEMS ....................................................................................................... 101
8.4 ECONOMICS OF BIOMASS AND DIESEL SYSTEMS .............................................................................................. 102
8.5 ISSUES WITH BIOMASS GASIFICATION TECHNOLOGY SYSTEMS IN UGANDA ............................................................ 105
8.6 CONCLUSIONS .......................................................................................................................................... 106
9. FUTURE WORK ............................................................................................................................... 107
REFERENCES .......................................................................................................................................... 109
Licentiate Thesis/Joseph Olwa
x
Index of Figures
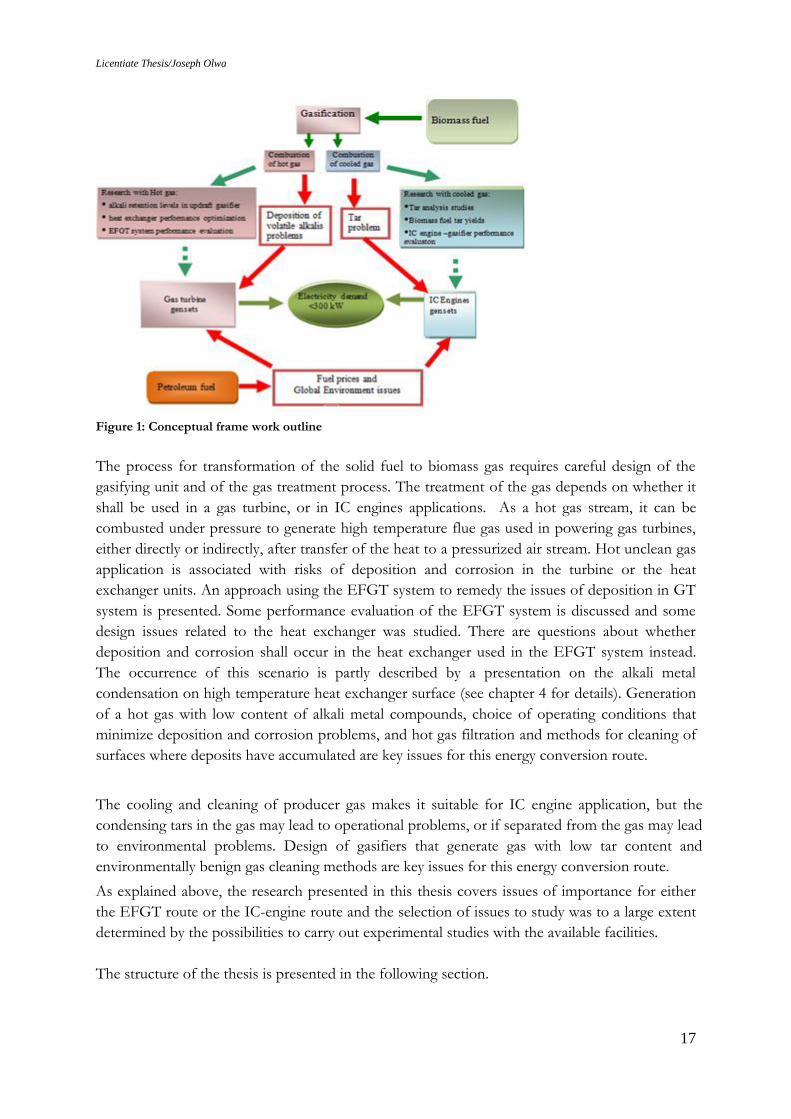
Figure 1: Conceptual frame work outline ............................................................................................................. 17
Figure 2: Conversion of biomass into producer gas. Source:
http://www.members.tripod.com/~cturare/pro.htm ........................................................................ 20
Figure 3: Downdraft gasifier ................................................................................................................................. 22
Figure 4: Updraft gasifier. Source: http://www.knowledgepublications.com ..................................................... 23
Figure 5: Fluidized bed gasifier. Source: FAO [18]
................................................................................................... 24
Figure 6: Entrained bed gasifier. Source: www.netl.doe.gov/.../gasification/basics/4.html ................................ 24
Figure 7: Two stage gasification process [32]
......................................................................................................... 28
Figure 8: OLGA gas cleaning process [34],
............................................................................................................. 29
Figure 9: Carbona Gasifier and gas cleaning technology [36]
. ............................................................................... 30
Figure 10: Process for purification of tar condensate under Babcock & Wilcox Volund [37]
.................................. 31
Figure 11: Dual power gasifier for the production of low tar and high tar content producer gas installed at
Entimos Oy, Finland [38]
....................................................................................................................... 32
Figure 12: Biomass-gasifier IC engine system ....................................................................................................... 36
Figure 13: Directly fired GT scheme ...................................................................................................................... 38
Figure 14: EFGT system Scheme ........................................................................................................................... 38
Figure 15: (a) Variation of system efficiency with pressure ratios at different TIT and (b) Vartiation of Net power
output with presure ratio for different TIT .......................................................................................... 43
Figure 16: Normal distribution curve .................................................................................................................... 49
Figure 17: Monte Carlo Simulation used to determine design factor for the heat exchanger surface area ......... 49
Figure 18: Photograph of grate viewed from underside with the ash pot removed after first wood pellets
gasification ......................................................................................................................................... 52
Figure 19: Gasifier details: (a) construction dimensions in mm, (b) Connections of components, and (c)
motorized half-closed ball valve model .............................................................................................. 53
Figure 20: Temperature time plot at different heights (z) along the gasifier central axis for first wood pellets
experiment 1 ....................................................................................................................................... 56
Figure 21: Temperature time plot at different heights (z) near the gasifier wall for first wood pellets experiment
1 .......................................................................................................................................................... 57
Figure 22: Time temperature profile at different heights (z) along gasifier central axis for wood pellets
experiment 2 ....................................................................................................................................... 57
Figure 23: Temperature -time plot at different heights (z) along the gasifier central axis for first reed canary
grass experiment ................................................................................................................................ 58
Figure 24: Temperature -time plot at different heights (z) near the wall in the fuel bed for first reed canary grass
experiment .......................................................................................................................................... 58
Figure 25: Gas composition from wood pellets experiment ................................................................................. 59
Figure 26: Gas composition from wood pellets experiment 2 .............................................................................. 59
Figure 27: Gas composition from reed canary grass gasification experiment 1 ................................................... 60
Licentiate Thesis/Joseph Olwa
xi
Figure 28: Photograph of thermocouple tubes showing parts of the normal and the melted tubes including
thermocouple wires during the reed canary grass pellets gasification. ............................................. 61
Figure 29: Condensed tar after the filter in half of the filter housing (b) Filter holder simplified drawing ........... 62
Figure 30: Distribution of ingoing K (a) and Na (b) in the producer gas and the different solid residues fractions
during the second experiment with wood pellets ............................................................................... 65
Figure 31: Distribution of ingoing K (a) and Na (b) in the producer gas and the different solid residues fractions
during the second experiment with wood pellets ............................................................................... 65
Figure 32:Chemical equilibrium diagram for cooling of the flue gases(produced by combustion of the wood
pellet based producer gas in air to fuel ratio of 1.1) from 1100-400oC for the K-system. .................. 68
Figure 33: Chemical equilibrium diagram for cooling of the flue gases (produced by combustion of the wood
pellets based producer gas in an air fuel ratio of 1.1) from 1100-400oC for the S system .................. 68
Figure 34: Chemical equilibrium diagram for cooling of the flue gases (produced by combustion of the wood
pellet based producer gas in an air to fuel ration of 1.1) from 1100-400oC for the Cl- system ........... 69
Figure 35: Gasifier system setup ........................................................................................................................... 73
Figure 36 : Diagram Showing a Cut Section through the down draft and Section B-B showing the combustion
zone details ......................................................................................................................................... 73
Figure 37: Sampling unit [76]
.................................................................................................................................. 74
Figure 38: Combustion zone temperature with wood pellets and wood cylinders ............................................... 75
Figure 39: Reduction zone temperature with wood pellets and wood cylinders .................................................. 75
Figure 40: Plot of ultimate analysis tests on wood char from wood cylinders and pellets ................................... 76
Figure 41: Tar group sample quantities ................................................................................................................ 80
Figure 42: Flow scheme for the Muzizi power plant ............................................................................................. 85
Figure 43: Specific fuel consumption determined from logbook data and measured on two site visits. .............. 89
Figure 44: Power output and specific wood consumption in the Muzizi power plant in year 2009 and 2010 ..... 89
Figure 45: Three photographs showing combustion process as viewed through the nozzle hole ........................ 91
Figure 46: Char samples from Muzizi power plant ............................................................................................... 91
Figure 47: Compression machine operation ......................................................................................................... 94
Figure 48: Compression Test Results .................................................................................................................... 95
Figure 49: Turbo charger unit scheme and gas flow ............................................................................................. 96
Figure 50: Muzizi exhaust emission 1900-2000hrs ............................................................................................... 97
Figure 51: Electricity costs estimates at different PCF with biomass and subsidized diesel prize 0.203 $/kWh . 103
Figure 52: Electricity Costs Estimates at different PCF with biomass and unsubsidized diesel price of 0.28 $/kWh
.......................................................................................................................................................... 103
Figure 53: Electricity costs estimates at different PCF with biomass and a subsidized diesel price US$
0.1015/kWh ...................................................................................................................................... 104
Figure 54: Costs percentage contribution for (a) diesel system with fuel cost at US$0.280/kWh and (b) biomass
system with fuel cost at US$0.03/kWh. ............................................................................................ 104
Licentiate Thesis/Joseph Olwa
xii
Index of Tables
Table 1 : Fuel potential of some agricultural residues in Uganda ........................................................................ 14
Table 2 : Producer gas composition from Wood and Charcoal gasification in downdraft gasifier ...................... 22
Table 3 : Characteristics of different gasification configurations (source. www.bgtworld.com) ......................... 25
Table 4 : Advantages and challenges of gasifying agents, gasifier design and gasifier operations [22]
................ 26
Table 5: VTT Demonstration plant ........................................................................................................................ 30
Table 6: Gas quality requirements for gas turbines and IC engines [27] [47]
............................................................ 35
Table 7: Different gasifier Tar and particulates loads [47]
..................................................................................... 35
Table 8 : Heat Exchanger Specification Sheet ....................................................................................................... 45
Table 9: Some of the maximum and minimum values of parameters used in Monte Carlo Simulation ............... 47
Table 10: Raw fuel composition including main ash-forming elements of the used pellet fuels .......................... 55
Table 11: K and Cl-content (re-calculated to concentrations in producer gas) in solid material trapped in the
total particle filter ash during the initial experiments with wood and reed canary grass pellets,
respectively. .......................................................................................................................................... 62
Table 12: K, Na, Pb, V, S, Cl, Ca and Mg content (re-calculated to concentrations in producer gas) in solid
material trapped in the total particle filter ash and in the gas wash bottles during the second
experiment with wood pellets. ............................................................................................................. 63
Table 13: Acceptable contaminant concentration in fuel for LM2500 gas turbine. Source : Nelson [65]
.............. 63
Table 14: Elemental composition (main ash forming elements and some interesting trace elements) of the
different solid residue samples produced in the second experiment with wood pellets....................... 64
Table 15: Phase identified (wt% of crystalline phase)* in the different solid residue samples produced in the
second experiment with wood pellets. ................................................................................................. 64
Table 16: Fuel consumption and residues obtained from the experiments ......................................................... 66
Table 17: Elements and solution models used in the chemical equilibrium model calculations [73]
. ................... 67
Table 18: Wood fuels analysis results ................................................................................................................... 72
Table 19: Average tar composition in g/Nm3 of gas ............................................................................................. 77
Table 20 : Quantities of Tar constituents in x10-2
g/Nm3 of Producer gas an updraft gasifier .............................. 81
Table 21: Group statistics with quantities in mg/Nm3 .......................................................................................... 82
Table 22: Testing differences between sample means ......................................................................................... 82
Table 23 : Correction Factors for Tar Storage ....................................................................................................... 83
Table 24: Results of moisture content for Muzizi Plant ........................................................................................ 88
Table 25: Gasifier mass balance at 46 kWe ........................................................................................................... 92
Table 26: Pressure drop across the gas filters ...................................................................................................... 93
Table 27: Gasifier energy balance at 46kWe ......................................................................................................... 93
Table 28: Pressure readings from Muzizi power plant gas engine. ...................................................................... 96
Table 29 : Uganda electricity tariff by consumer category ................................................................................. 100
Table 30: The variation of heating value with different oxidizers for biomass fuel ............................................ 101
Licentiate Thesis/Joseph Olwa
13
1. Introduction
1.1 Background
Uganda‟s energy consumption per capita is very low at only 3923 kWh (337kg oil Equivalent)
[1]compared to United States of America at 91702 kWh (7886kg oil Equivalent) [2]recorded in
2007. The main energy supply, in Uganda, is derived from biomass sources at 92.1%, followed
by petroleum products 6.9%, leaving electricity at only 1%. The recorded national electricity
access in 2007 was about 9% and is a very low figure when compared to a developed country like
Singapore 100% and to a developing country like Egypt with 80% [3].
Most urban areas of Uganda where extension of power grids cannot be economically viable are
utilizing diesel powered electricity generators. Most of these generators are state owned while
others are owned by private entrepreneurs. Such installations are meeting domestic and small
commercial electricity needs in grid isolated areas. Some of these areas have resources, which
encouraged small scale industrial growth. The high cost on imported fossil fuels in Uganda has
repressed its application in power generation for addressing the electricity need, yet electricity is
considered one of the vital components in enhancing economic and social development. Thus,
the unmet electricity demand has belated developments in most rural areas of Uganda.
There are other renewable energy options to consider when it comes to electricity power
generation in Uganda with the choices limited by; lack of investment capital, unsecured
investment environment and lack of technical knowhow, among others. These options are;
geothermal, Wind, Solar and Hydro power resources. When biomass is compared to
aforementioned resources, it still offers an affordable alternative in the generation of electricity
power, especially in small scale applications for rural and isolated settlements. The availability of
biomass resources and its wide spread consumption in Uganda; present a potential platform to
transform it in to a sustainable, efficient, and effective energy source.
The possible energy sources for electricity generation from biomass in Uganda are; wood and its
products/residues, agricultural/farmland residues and MSW. MSW generation is attractive with
the increasing population in urban areas generating more wastes. According to Kampala City
Council (KCC), 1500 tons/day of wastes are generated in the city of Kampala, Uganda [4]. The
waste collection rate is about 45% which leaves 55% unaccounted for due to lack of equipment
and personnel to manage the collection. Similar trends can be speculated for the other bigger
towns in Uganda like Mbale and Mbarara. MSW can be a sturdy source for electricity power
production through gasification, especially with its 80% organic matter content which is
combustible [5].
Estimation of the wood biomass potential stands at about 27.7 million tons of accessible and
sustainable supply, which is equivalent to 140TWh of energy. The accessibility refers to ease of
harvesting and transportation to consumption points, which in most cases come at considerable
costs. Planned energy plantations are one possibility for making these resources more
Licentiate Thesis/Joseph Olwa
14
economically viable and sustainable. It is sometimes argued that electrification opens possibilities
for reduced use of wood fuel for domestic use and commercial activities such as in ceramic
industries. A study done in Uganda concluded, however, that this is not realistic within the
forecasting horizon due to the high electricity tariff [6]. Unless new ways are identified and
explored to allow sustainable utilization of wood fuel, their consumption as the main energy
resource put a very unsustainable demand on the forest wood. This if not controlled will cause
adverse environmental degradations in a few years to come [7]. Through proper planning and
implementation of policies on sustainable utilization of woody biomass, and with supplement
from agricultural residues and MSW, it is possible to avert detrimental effects to the environment
that can occur through traditional methods of wood fuel consumption.
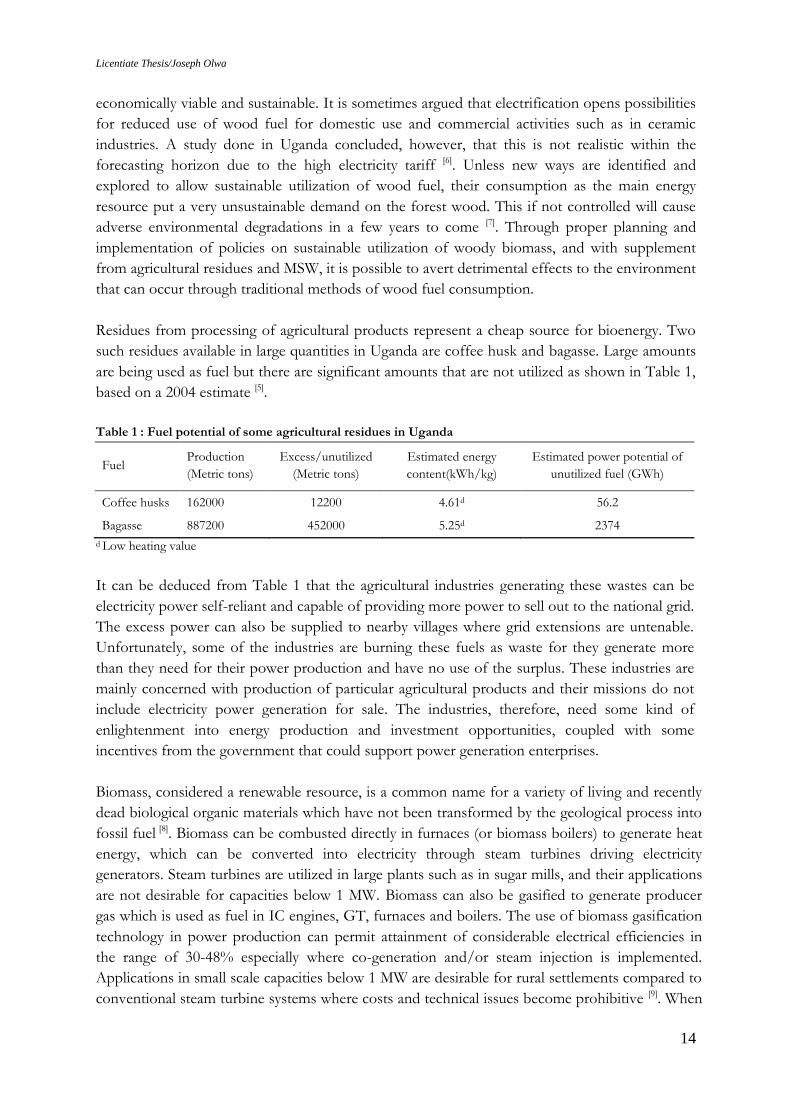
Residues from processing of agricultural products represent a cheap source for bioenergy. Two
such residues available in large quantities in Uganda are coffee husk and bagasse. Large amounts
are being used as fuel but there are significant amounts that are not utilized as shown in Table 1,
based on a 2004 estimate [5].
Table 1 : Fuel potential of some agricultural residues in Uganda
Fuel Production
(Metric tons)
Excess/unutilized
(Metric tons)
Estimated energy
content(kWh/kg)
Estimated power potential of
unutilized fuel (GWh)
Coffee husks 162000 12200 4.61d 56.2
Bagasse 887200 452000 5.25d 2374
d Low heating value
It can be deduced from Table 1 that the agricultural industries generating these wastes can be
electricity power self-reliant and capable of providing more power to sell out to the national grid.
The excess power can also be supplied to nearby villages where grid extensions are untenable.
Unfortunately, some of the industries are burning these fuels as waste for they generate more
than they need for their power production and have no use of the surplus. These industries are
mainly concerned with production of particular agricultural products and their missions do not
include electricity power generation for sale. The industries, therefore, need some kind of
enlightenment into energy production and investment opportunities, coupled with some
incentives from the government that could support power generation enterprises.
Biomass, considered a renewable resource, is a common name for a variety of living and recently
dead biological organic materials which have not been transformed by the geological process into
fossil fuel [8]. Biomass can be combusted directly in furnaces (or biomass boilers) to generate heat
energy, which can be converted into electricity through steam turbines driving electricity
generators. Steam turbines are utilized in large plants such as in sugar mills, and their applications
are not desirable for capacities below 1 MW. Biomass can also be gasified to generate producer
gas which is used as fuel in IC engines, GT, furnaces and boilers. The use of biomass gasification
technology in power production can permit attainment of considerable electrical efficiencies in
the range of 30-48% especially where co-generation and/or steam injection is implemented.
Applications in small scale capacities below 1 MW are desirable for rural settlements compared to
conventional steam turbine systems where costs and technical issues become prohibitive [9]. When
Licentiate Thesis/Joseph Olwa
15
gasification technology is implemented without co-generation, the efficiency of the power plant
can drop to below 25%. However the drop can be offset by the low cost fuels, which can enhance
the plant economic viability.
The sighted levels of efficiencies and the known low prices of biomass fuels, mostly from
agricultural, municipal and timber mill waste streams, are some of the reasons that have
stimulated interests into biomass gasification technology. This technology can be developed for
electricity power generation in the urban and rural settlements and for small scale industries
where biomass fuel availability can permit. Investments in biomass gasification technology find
support through donations, tax waivers and subsidies. Such projects are also deemed
environmentally friendly (clean technology) and industries seeking more carbon credits through
the Kyoto Mechanisms can support, economically, biomass power plant projects in the
developing countries.
Utilization of locally available biomass residues as primary energy source for village power plants
in Uganda would be attractive for many reasons. It would reduce the need for importation of
fossil fuels for electricity generators, and also improve on local self-reliance. It can also facilitate
donor financing. The choice of the technology is not obvious however; for larger biomass power
plants above a few Mega-Watts, steam turbine power plant is the obvious solution, but for
smaller capacities this is not economically favorable as mentioned earlier. In Uganda, use of
gasifiers to generate a combustible gas that can power IC engines driving electricity generators
are being discussed for capacities in range of 25 –250 kWe. Pilot projects have so far seen some
units installed in that capacity category, but the system is experiencing operational and technical
challenges.
This study focused on the utilization of biomass for substitution of fossil fuels in the electricity
power generation for isolated rural settlements and small scale industries in Uganda. The main
emphasis is on the gasification of wood and agricultural residues, which besides it availability,
affords a net zero carbon input to the environment when utilized in a sustainable manner [10].
Therefore, measures to improve on consumption efficiency and operating characteristics of
equipment utilizing woody and non-woody biomass products for energy production is
inevitable.
1.2 Objective of the study
1.2.1 General objective
The major research goal was to investigate the problems of biomass gasification technology
applications with IC engines and GT. Emphasis was made on evaluating the product gas quality
with the view of understanding their contribution to gasifier-engine performances in small scale
isolated electricity power generation. This was to contribute new knowledge on issues where the
knowledge available in the open literature about the performance and design constraints for
small biomass fuelled power plants using externally fired gas turbines (EFGT) or IC engines was
considered insufficient for decisions about the direction of further research on these
Licentiate Thesis/Joseph Olwa
16
technologies in Uganda. The researched aimed at the development of indigenous capacity for
designing and manufacturing of the gasification/combustion/gas-treatment equipment for small
scale biomass fuelled power plants.
1.2.2 Specific objectives
The scope of the studies carried out in this first part of the research work was to a large extent
determined by the availability of facilities for experimental research in Uganda and Sweden. In
Uganda, the existing power plant with a gasifier and an IC engine delivered by an Indian
company to a remote tea estate in western Uganda appeared to offer possibilities for studies of
the field performance of such power plants. In Sweden, at KTH, the only operational facility that
was considered useful for studies leading to the general goal was a very small downdraft gasifier
with flaring of the gas. Opportunities for studies of updraft gasification in applications for
externally fired gas turbines were offered by Luleå University of Technology.
The objectives of the studies focused on EFGT were to:
Evaluate the technical performance characteristics of the externally fired gas turbine
integrated with a biomass gasifier system.
Identify design constraints for the high temperature heat exchanger required for the
externally fired gas turbine
Investigate the levels of alkali metal salts retention in an updraft gasifier and their carry
over into the generated product gas stream.
The objectives of the studies focused on internal combustion engines with gasifiers were to:
Determine if pelletized biomass can be expected to perform differently from wood
pieces of the same size with respect to tar formation in a downdraft gasifier.
Identify criteria for handling product gas samples drawn for tar analysis when using Solid
Phase Adsorption (SPA) technique for sampling.
Identify and propose solutions to current technical and operational problems being
experienced by a 250kWe biomass power plant in Uganda,
Evaluate the economic potential of the gasifier-IC engine and compare it to a diesel
powered system
1.3 Conceptual Framework
Figure 1, shows an attempt to illustrate two energy conversion chains covered by this research,
the fundamental problems associated with each technology and the research issues related to
these. The two biomass fuelled technologies for electricity generation at a capacity below about
300 kW are competing with conventional diesel generators. In order to realize the biomass
technologies either the tar problem for the IC-engine option or the alkali deposition problem for
the gas turbine option must be resolved. Whether any of these two options will be competitive
with the conventional option based on petroleum fuel depends on fuel prices, the investments
required and the importance given to the efforts to reduce CO2-emissions from use of fossil fuels.
Licentiate Thesis/Joseph Olwa
17
Figure 1: Conceptual frame work outline
The process for transformation of the solid fuel to biomass gas requires careful design of the
gasifying unit and of the gas treatment process. The treatment of the gas depends on whether it
shall be used in a gas turbine, or in IC engines applications. As a hot gas stream, it can be
combusted under pressure to generate high temperature flue gas used in powering gas turbines,
either directly or indirectly, after transfer of the heat to a pressurized air stream. Hot unclean gas
application is associated with risks of deposition and corrosion in the turbine or the heat
exchanger units. An approach using the EFGT system to remedy the issues of deposition in GT
system is presented. Some performance evaluation of the EFGT system is discussed and some
design issues related to the heat exchanger was studied. There are questions about whether
deposition and corrosion shall occur in the heat exchanger used in the EFGT system instead.
The occurrence of this scenario is partly described by a presentation on the alkali metal
condensation on high temperature heat exchanger surface (see chapter 4 for details). Generation
of a hot gas with low content of alkali metal compounds, choice of operating conditions that
minimize deposition and corrosion problems, and hot gas filtration and methods for cleaning of
surfaces where deposits have accumulated are key issues for this energy conversion route.
The cooling and cleaning of producer gas makes it suitable for IC engine application, but the
condensing tars in the gas may lead to operational problems, or if separated from the gas may lead
to environmental problems. Design of gasifiers that generate gas with low tar content and
environmentally benign gas cleaning methods are key issues for this energy conversion route.
As explained above, the research presented in this thesis covers issues of importance for either
the EFGT route or the IC-engine route and the selection of issues to study was to a large extent
determined by the possibilities to carry out experimental studies with the available facilities.
The structure of the thesis is presented in the following section.
Licentiate Thesis/Joseph Olwa
18
1.4 Overview of the Contents of the Thesis
In chapter 2, the state-of-the-art for the two biomass based energy conversion routes illustrated
in Figure 1 is presented. The selection of research issues to be studied is discussed.
Chapter 3 discusses the design requirement for a heat exchanger for application in an EFGT
system. The thermal model of the EFGT system and the heat exchanger design are discussed
and the level of uncertainty in the design is pointed out. A unique feature to this chapter is the
use of Monte Carlo simulation to provide possible design solutions to the heat exchanger design
problem.
Unique results for alkali metal retention in an updraft gasifier are presented in chapter 4. Tests
with wood pellets revealed that about 99% retention of the alkali species is possible. A
thermodynamic modeling of product gas cooling in high temperature heat exchanger is carried
out and the results of simulation of condensation reactions of K, Cl and S compounds are
presented and discussed.
A study carried out to determine levels of tar yield from the gasification of wood cylinders and
wood pellets is presented in chapter 5. The finding was that wood pellets generate more tar than
wood cylinders of similar physical dimension; the reasons for this difference are discussed.
Chapter 6 presents another study carried out on tar samples taken from product gas in an
updraft gasification process. The goal was to determine the level of deterioration of samples
taken using solid phase absorption technique and stored for a particular period of time under
different environmental conditions. The outcome suggests a need for inclusion of correction
factors in samples analysis results when samples are stored in particular environmental
conditions.
A case study conducted in a commercial biomass power plant is presented in chapter 7. The
plant had experienced a 50% drop in power output, therefore was not delivering any substantial
financial gain to the owners. This chapter presents the work carried to identify reasons for the
drop in power output and the recommendations provided in order to get it up again.
Chapter 8 discusses the investment potential of biomass power plants in Uganda. The economics
of installing and operating a 100kWe biomass and diesel power plants are compared. Results are
presented which show biomass as a more profitable investment option in Uganda than a diesel
system.
Chapter 9 offers a summary of the findings and suggests directions for further research aiming at
development of indigenous capacity in Uganda for design and construction of the gasifier and
gas treatment equipment for small scale biomass fuelled power plants.
References are listed in Chapter 10.
Licentiate Thesis/Joseph Olwa
19
2. Developments in Biomass Gasification Technology
2.1 A Brief Background
The first appearance of gasification technology found its way in the industries in the early 1920s‟ [11]. The technology gained prominence during World War II when petroleum fuel supplies were
cut off to oil importing nations. At that time many gasifying units were built for automobiles and
power production applications in industries. There is silence on the state of the technology after
the war until the 1970s‟ when OPEC and other oil exporters increased oil prices [12]. The increase
in oil prices rekindled interest in the technology development and application. Energy
conservation approaches were implemented in most countries, which reduced the consumption
of petroleum products between 1973 and 1980. Gasification technology was one alternative
under development in some developing countries for power production and application in
automobiles.
In 1981, oil prices went down when a decrease in demand and overproduction created surplus in
the world oil market. After that year, the gasification technology development came to almost a
halt until later, in the 1990s‟, when climate change related issues became a serious concern world
over. Generally, commercialization of biomass gasification technology failed during the past
decades for reasons of poor mechanical design, high gas tar content, improper tar cleaning
methods, lack of training and unmet expectations and low oil prices, among others [12].
In some developing countries like China and India, developments in the biomass gasification
technology started around the 1980s‟ with the focus of building up indigenous expertise in this
field. To date, there are some commercial activities in this field, but the technology used is around
the mid-1940s‟ level of automation in operation and performance. This means that plants cannot
operate without a more or less continuous surveillance, and tar condensate resulting from gas
scrubbing and cooling is not destroyed in the facility creating environmental hazard. The
adaptation of gasifiers for different types of agricultural wastes, and the construction of
equipment locally without careful design improvement considerations meant that the equipment
do not meet the service requirements for smaller power plants in some parts of the world, such as
in Western Europe, or North America.
2.2 Thermal Gasification of Biomass
In the developing countries, the traditional methods for charcoal production through pyrolysis
process realize yields of charcoal of about 20% or less of the loaded raw biomass material, and
modern industrial technology offers yields of only 25-37%. [13]. Wood fuels, depending on their
chemical compositions, have heating values in the ranges of 18.5-21MJ/kg. When compared to
charcoal yield of 25%, with HHV at 30MJ/kg, the energy lost in the charcoal making through
pyrolysis is in the range of 58-63% of the total raw wood energy. Therefore, solid biomass fuel
transformed into gaseous fuel through a thermo-chemical process offers some advantages
among others: higher burning efficiency, easily controllable and adjustable energy output,
simpler burner construction, reduced levels of particulates emissions, direct application in IC
engines, less fouling in heat exchanger equipment, possible gas storage and distribution within
Licentiate Thesis/Joseph Olwa
20
short distances with less loss of energy in the process, good control of process temperature and
better efficiencies can be realized from its utilization [14] [15] [16].
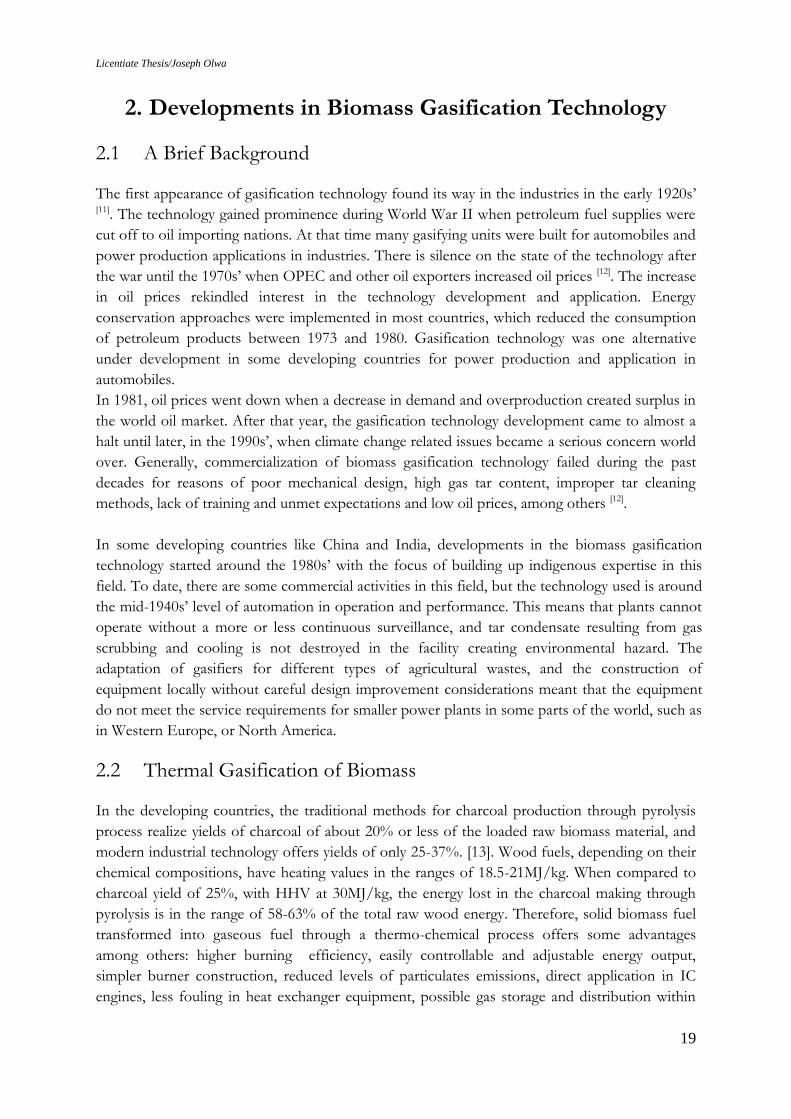
Gasification of biomass is a thermal decomposition in limited supply of the oxidizing agent (in
this case air and/or steam) such that complete combustion does not occur. The process of
biomass gasification can be described by Figure 2 and it is explained in the following sections.
The stratification of the process is a better way of conceptualizing gasification process; otherwise
the reaction process occurs almost everywhere within the fuel bed in the gasifier where
temperatures are suitable.
Figure 2: Conversion of biomass into producer gas. Source: http://www.members.tripod.com/~cturare/pro.htm
2.2.1 Gasification process
Gasification of the fuel usually is initiated by introduction of a burning medium or flame into the
gasifier to start the biomass fuel combustion process at the oxidation zone (explained later in this
section). The heat generated in the combustion process is used in the gasification. The
mechanism occurs through the following processes of; drying, pyrolysis, oxidation and
reduction.
Drying of the fuel occurs by heat generated in the exothermic reactions taking place in the
gasifier. The fuel, depending on the gasifier type employed, have varying moisture content
between 5-35% and these moisture is released as steam in the drying process. Drying occurs in
the temperature range of about 100-150oC.
Pyrolysis is an endothermic reaction process occurring in limited supply of the oxidizing agent
where volatiles from the raw biomass fuels are released. The process starts at low temperature
from about 150oC and continues up to about 700oC where organic volatiles from the solid fuels
are released leaving char/charcoal with other trace elements in solid form [17]. Thus, three
products are usually generated in the process; pyrolysis oil (tar) mixed with condensed water,
char and gas, with all having relative proportions depending greatly on the pyrolysis method,
biomass fuel composition and on the reaction parameters which relate to the reactor design.
Some of the gas and char realized in the pyrolysis process are partly consumed in the oxidation
stage of the gasification process to generate more heat to sustain the endothermic processes.

Licentiate Thesis/Joseph Olwa
21
Oxidation is the exothermic reaction between the biomass fuel and air (or air and steam) which
gives more heat to sustain the gasification process. Part of the volatiles and char realized from
the pyrolysis process are also combusted to generate the required heat for the gasification
process. The reaction usually takes place between 700oC to 1300oC, depending on the gasifier
type and the operating performance required.
In the reduction process which occurs at temperatures between 800-1100oC CO2 and H20 are
partly reduced into CO, H2 and CH4. Other volatiles from the pyrolysis process are also reduced
to increase on the content of the gases with some escaping and condensing as tar in the gas
treatment units. The hot char bed created act as a catalyst in breaking down the heavy
hydrocarbons into CO and H2 molecules. The process efficiency in tar cracking depends on the
gasifier design and reaction temperatures. Tar is the result of un-cracked (unreduced) hydro-
carbons which proves very troublesome in some downstream equipment in the biomass
gasification technology application for power production.
Solid biomass fuel contains C, O, H, S, N, and traces of other elements in different proportions
depending on the biomass source. Its gasification carried out in limited supply of an oxidizing
agent (in this case air in sub stoichiometric ratio of 1.5:1-1.8:1) generates gaseous mixture
(producer gas) and ash residues. Producer gas is constituted of H2, CO, CH4 and traces of other
hydrocarbons, which form the combustible entity; CO2, H2O(g) and nitrogen N2 forming the
incombustible part. Producer gas contains these compounds in proportions depending on the
gasification conditions and the raw biomass fuel chemical composition.
2.3 Gasifier types
There are many different types of gasifiers that are used in the gasification of biomass for heating
applications and powering of mechanical prime movers. Depending on the gas application
requirement, raw fuel characteristics, and available funds: it is possible to obtain the best
gasification technology available. Normally, options are limited by the financial implication of the
required investment. The general types of gasifiers include; fixed bed (downdraft, updraft),
fluidized bed and entrained bed. Downdraft and updraft gasifiers are studied in this work due to
the relatively low costs in their construction and in operations.
2.3.1 Downdraft gasifiers
Downdraft (co-current) gasifiers get the name from the producer gas flow which moves
downward in the direction of flow of the solid fuel. The raw fuel is usually fed from the upper
part of the gasifier and air is delivered at the combustion zone where combustion is first initiated-
shown in Figure 3. The gasification process in downdraft gasifiers starts with the drying of fuel by
heat of combustion sustained in limited supply of air passing through the system. Closure to the
combustion zone the pyrolysis process is very effective in releasing combustible volatiles from the
solid fuel to support the combustion process whose products (CO2, H20 and other volatile
organic compounds) are reduced in the reduction zone into CO, H2 and CH4 and tar.
Licentiate Thesis/Joseph Olwa
22
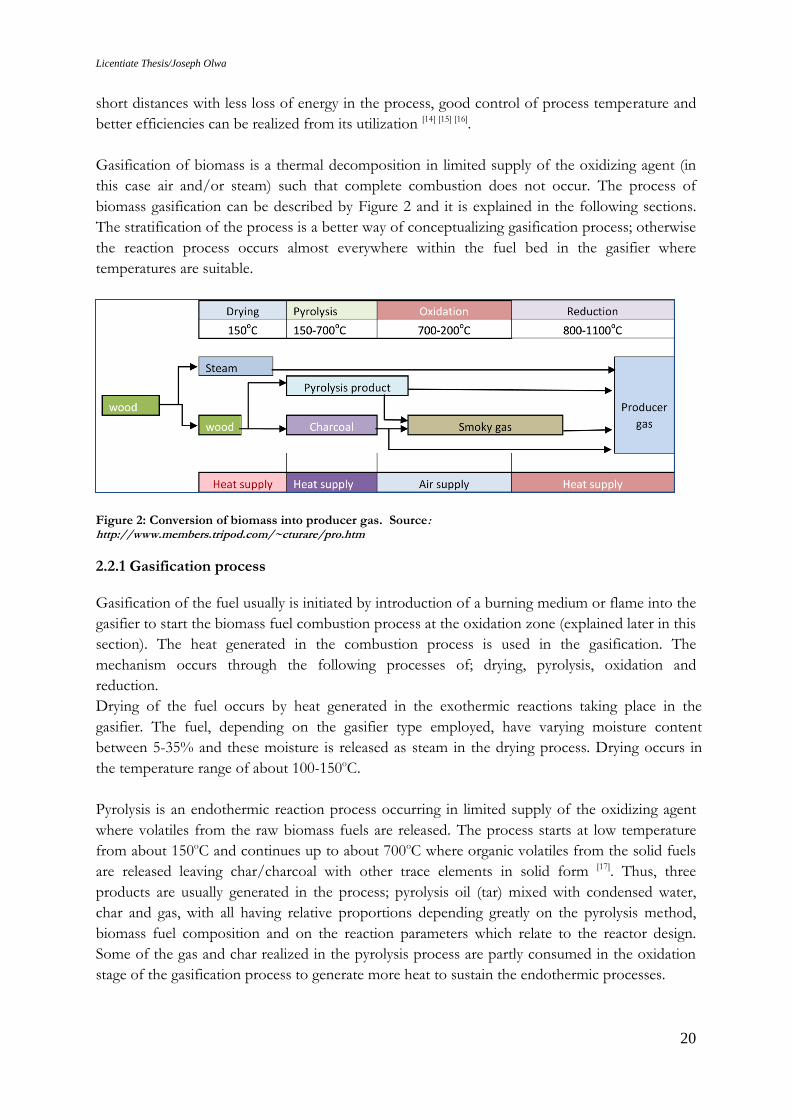
The producer gas realized contains less of the volatiles generated in the pyrolysis process since a
considerable amount of the volatiles are oxidized while passing through the combustion zone and
are subsequently reduced to producer gas with some escaping as tar vapor.
Typical producer gas compositions obtained from wood and charcoal with 20% and 7% moisture
content, respectively from a downdraft gasifier are shown in Table 2 in the next page.
Table 2 : Producer gas composition from Wood and Charcoal gasification in downdraft gasifier
Component Wood Gas (vol. %) Charcoal Gas (vol. %)
Nitrogen 50 - 54 55 - 65
Carbon monoxide 17 - 22 28 - 32
Carbon dioxide 9 – 15 1 - 3
Hydrogen 12 - 20 4 - 10
Methane 2 – 3 0 - 2
Source: FAO Forestry Paper-72, T0512/E 1986 (http://www.fao.org/docrep/t0512e/t0512e09.htm)
From Table 2 above, it can be seen that a large proportion of producer gas is constituted of N2
from the air used in the gasification. This is because when using air as the oxidizing agent, every 1
part of oxygen in the air consumed by the fuel, 3.76 parts of N2 accompanies it. N2, being
incombustible, dilutes the producer gas lowering its energy per unit volume with the resultant low
LHV. This value is in the range of 4 – 6 MJ/Nm3 depending on the process being used with air.
When steam or oxygen is used as the oxidizing agent, the LHV can be improved to over 10
MJ/Nm3. The LHV of producer gas when compared to those of other fuels such as natural gas
and gasoline with values of 31.6 MJ/Nm3 and 34.8 MJ/Nm3, respectively is found to be very low.
A book by FAO on producer gas application with IC engine using a down draft gasifier
mentioned that the gas-air mixture has heating value of about 2500 kJ/m3 while the
stoichiometric gasoline-air mixture has about 3800kJ/m3 [18]. Though the conditions under which
this values were determined is not mentioned, the implication could be that an IC engine powered
by gasoline when converted to run on producer gas is likely down-rated to 65 % of its original
power output.
Combustion
zone
Pyrolysis
zone
Figure 3: Downdraft gasifier
Licentiate Thesis/Joseph Olwa
23
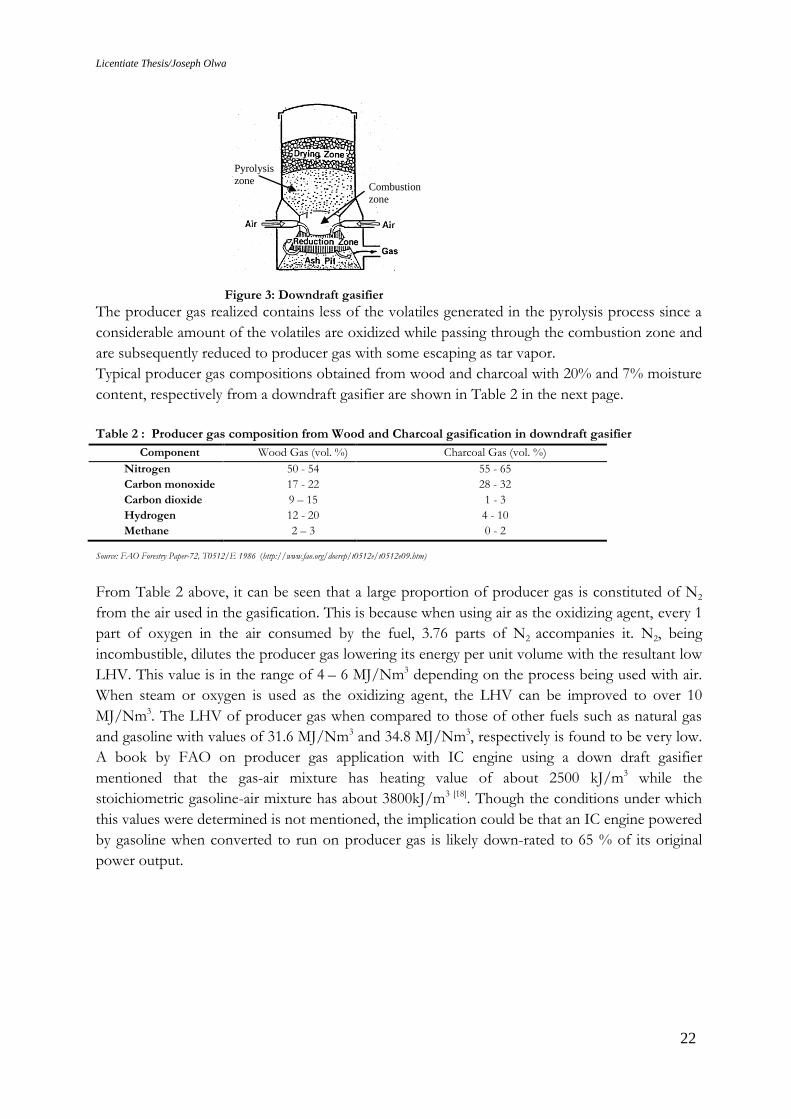
2.3.2 Updraft gasifiers
In updraft gasifier, shown in Figure 4, the generated producer gas flows in the opposite direction
to the solid fuel flow (a reason it is sometimes referred to as a countercurrent gasifier).
The combustion process with limited supply of air creates a reduction zone (zone with hot
pyrolyzed char) just above the combustion front which reduces the generated CO2 and H20 into
mainly the CO, H2 and CH4. The high temperature gas moving through the fuel bed pyrolyzes the
fuel just above the reduction zone and entrains the pyrolysis volatiles with it to the gas outlet. The
resulting producer gas stream contains higher percentages of other low molecular mass
hydrocarbons than realized in downdraft gasification process. The result is that the producer gas
is exited at a lower temperature than in downdraft process, but with the updraft process having
the advantage of a better thermal efficiency.
The main drawback of updraft gasification is the high tar content in the producer gas generated.
This render it not suitable for applications with IC engines where low costs investments are
concerned such as in rural villages of Africa. The higher heating value of the gas realized from
the updraft gasifier makes it suitable for thermal applications such as in firing kilns and for
applications with EFGT system. The heating value is a result of entrainment of the volatiles
generated by the pyrolysis process, which enhance the producer gas LHV.
2.3.3 Fluidized bed gasifiers
Fluidized bed gasifier shown in Figure 5, has the bed consisting of inert entities such as sand and
sometimes a catalyst which is heated up externally to about 700oC. Biomass fuel is added into the
heated bed, and the oxidizing agent is passed through the distributor plate. The bed temperature
is usually maintained between 700-900oC in order to avoid slagging in the bed. The oxidizing
agent, commonly oxygen, air and/or steam, is blown upward through the fuel bed at sufficient
velocity to permit particles elutriation.
Combustion zone
Reduction
zone
Pyrolysis
zone
Drying zone
Gas outlet
Air inlet Ash
Grate
Figure 4: Updraft gasifier. Source: http://www.knowledgepublications.com
Licentiate Thesis/Joseph Olwa
24
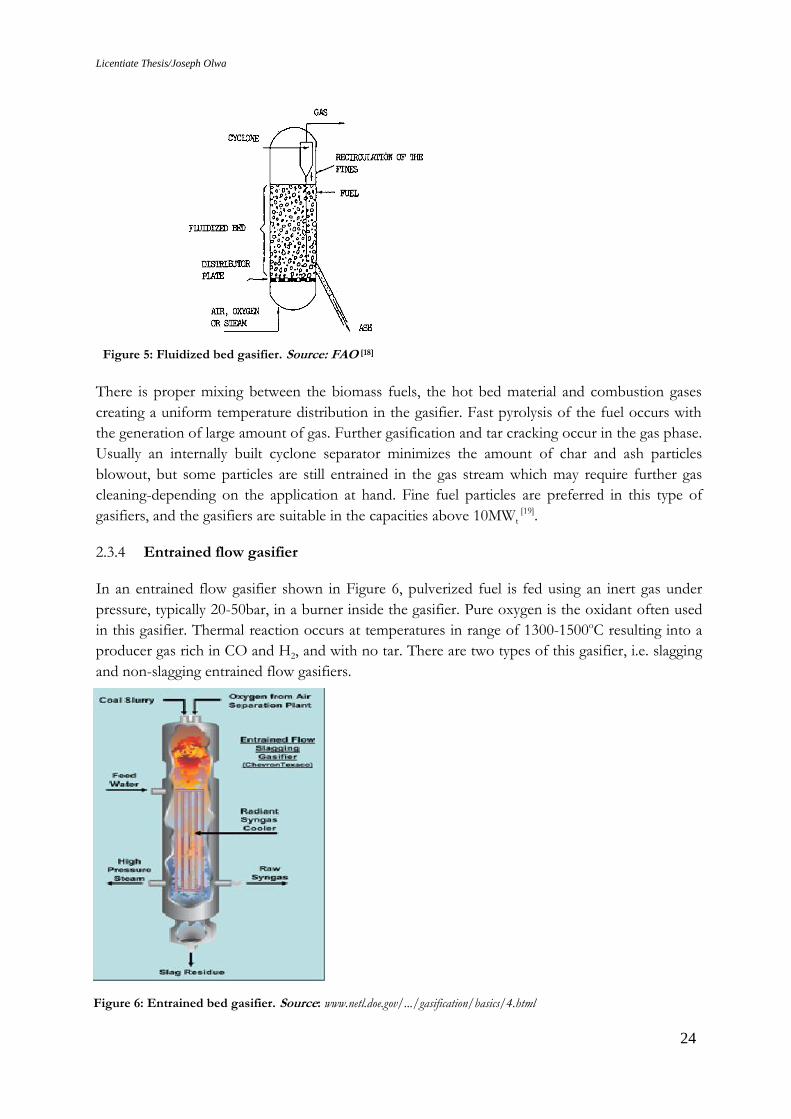
There is proper mixing between the biomass fuels, the hot bed material and combustion gases
creating a uniform temperature distribution in the gasifier. Fast pyrolysis of the fuel occurs with
the generation of large amount of gas. Further gasification and tar cracking occur in the gas phase.
Usually an internally built cyclone separator minimizes the amount of char and ash particles
blowout, but some particles are still entrained in the gas stream which may require further gas
cleaning-depending on the application at hand. Fine fuel particles are preferred in this type of
gasifiers, and the gasifiers are suitable in the capacities above 10MWt [19].
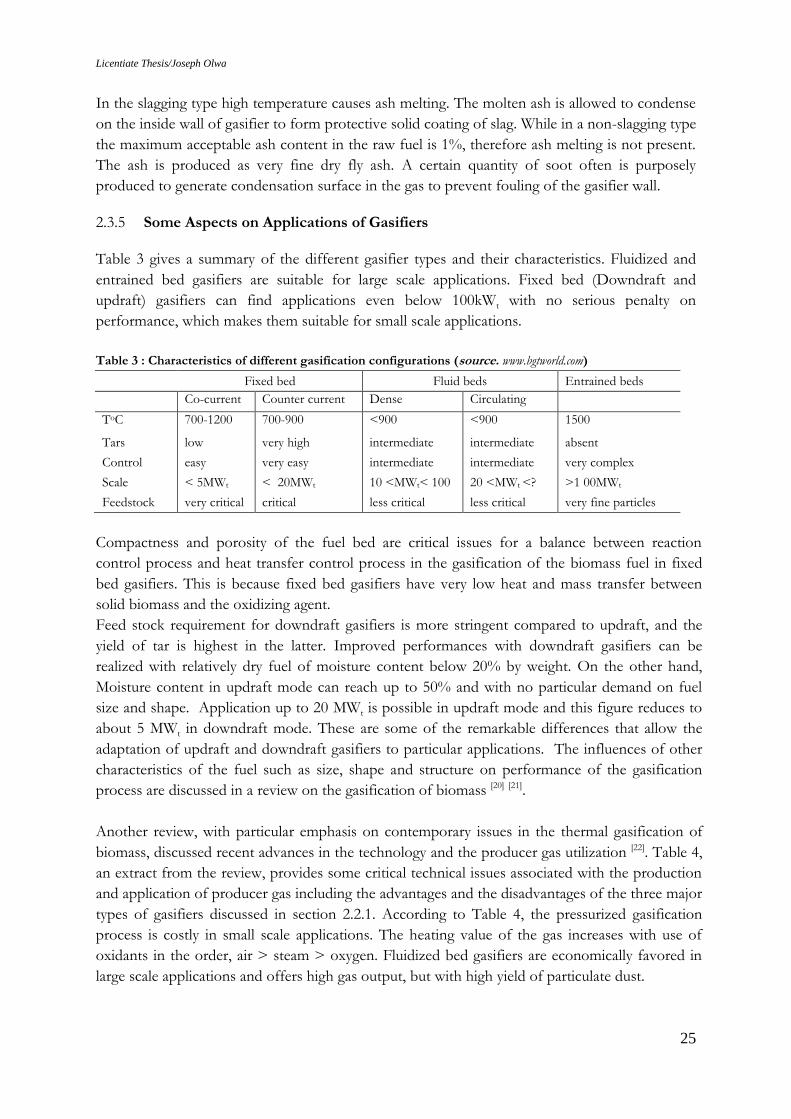
2.3.4 Entrained flow gasifier
In an entrained flow gasifier shown in Figure 6, pulverized fuel is fed using an inert gas under
pressure, typically 20-50bar, in a burner inside the gasifier. Pure oxygen is the oxidant often used
in this gasifier. Thermal reaction occurs at temperatures in range of 1300-1500oC resulting into a
producer gas rich in CO and H2, and with no tar. There are two types of this gasifier, i.e. slagging
and non-slagging entrained flow gasifiers.
Figure 5: Fluidized bed gasifier. Source: FAO [18]
Figure 6: Entrained bed gasifier. Source: www.netl.doe.gov/.../gasification/basics/4.html
Licentiate Thesis/Joseph Olwa
25
In the slagging type high temperature causes ash melting. The molten ash is allowed to condense
on the inside wall of gasifier to form protective solid coating of slag. While in a non-slagging type
the maximum acceptable ash content in the raw fuel is 1%, therefore ash melting is not present.
The ash is produced as very fine dry fly ash. A certain quantity of soot often is purposely
produced to generate condensation surface in the gas to prevent fouling of the gasifier wall.
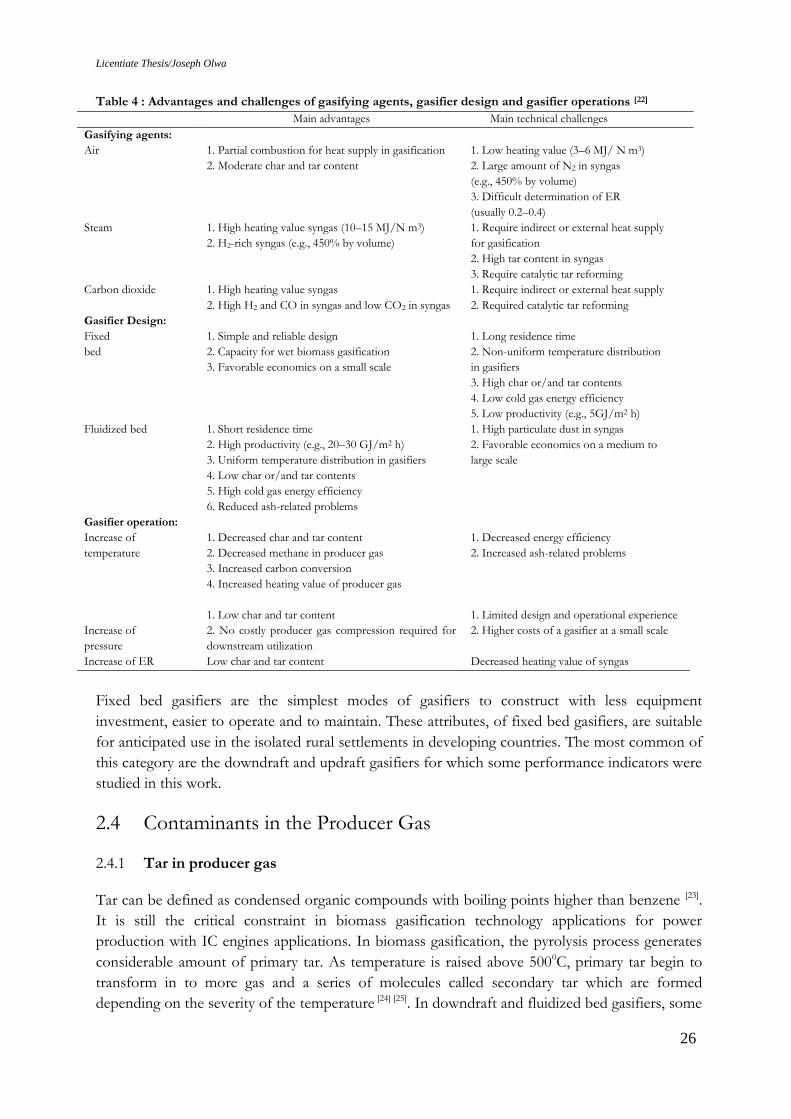
2.3.5 Some Aspects on Applications of Gasifiers
Table 3 gives a summary of the different gasifier types and their characteristics. Fluidized and
entrained bed gasifiers are suitable for large scale applications. Fixed bed (Downdraft and
updraft) gasifiers can find applications even below 100kWt with no serious penalty on
performance, which makes them suitable for small scale applications.
Table 3 : Characteristics of different gasification configurations (source. www.bgtworld.com)
Fixed bed Fluid beds Entrained beds
Co-current Counter current Dense Circulating
ToC 700-1200 700-900 <900 <900 1500
Tars low very high intermediate intermediate absent
Control easy very easy intermediate intermediate very complex
Scale < 5MWt < 20MWt 10 <MWt< 100 20 <MWt <? >1 00MWt
Feedstock very critical critical less critical less critical very fine particles
Compactness and porosity of the fuel bed are critical issues for a balance between reaction
control process and heat transfer control process in the gasification of the biomass fuel in fixed
bed gasifiers. This is because fixed bed gasifiers have very low heat and mass transfer between
solid biomass and the oxidizing agent.
Feed stock requirement for downdraft gasifiers is more stringent compared to updraft, and the
yield of tar is highest in the latter. Improved performances with downdraft gasifiers can be
realized with relatively dry fuel of moisture content below 20% by weight. On the other hand,
Moisture content in updraft mode can reach up to 50% and with no particular demand on fuel
size and shape. Application up to 20 MWt is possible in updraft mode and this figure reduces to
about 5 MWt in downdraft mode. These are some of the remarkable differences that allow the
adaptation of updraft and downdraft gasifiers to particular applications. The influences of other
characteristics of the fuel such as size, shape and structure on performance of the gasification
process are discussed in a review on the gasification of biomass [20] [21].
Another review, with particular emphasis on contemporary issues in the thermal gasification of
biomass, discussed recent advances in the technology and the producer gas utilization [22]. Table 4,
an extract from the review, provides some critical technical issues associated with the production
and application of producer gas including the advantages and the disadvantages of the three major
types of gasifiers discussed in section 2.2.1. According to Table 4, the pressurized gasification
process is costly in small scale applications. The heating value of the gas increases with use of
oxidants in the order, air > steam > oxygen. Fluidized bed gasifiers are economically favored in
large scale applications and offers high gas output, but with high yield of particulate dust.
Licentiate Thesis/Joseph Olwa
26
Table 4 : Advantages and challenges of gasifying agents, gasifier design and gasifier operations [22]
Main advantages Main technical challenges
Gasifying agents:
Air 1. Partial combustion for heat supply in gasification 1. Low heating value (3–6 MJ/ N m3)
2. Moderate char and tar content 2. Large amount of N2 in syngas
(e.g., 450% by volume)
3. Difficult determination of ER
(usually 0.2–0.4)
Steam 1. High heating value syngas (10–15 MJ/N m3) 1. Require indirect or external heat supply
2. H2-rich syngas (e.g., 450% by volume) for gasification
2. High tar content in syngas
3. Require catalytic tar reforming
Carbon dioxide 1. High heating value syngas 1. Require indirect or external heat supply
2. High H2 and CO in syngas and low CO2 in syngas 2. Required catalytic tar reforming
Gasifier Design:
Fixed 1. Simple and reliable design 1. Long residence time
bed 2. Capacity for wet biomass gasification 2. Non-uniform temperature distribution
3. Favorable economics on a small scale in gasifiers
3. High char or/and tar contents
4. Low cold gas energy efficiency
5. Low productivity (e.g., 5GJ/m2 h)
Fluidized bed 1. Short residence time 1. High particulate dust in syngas
2. High productivity (e.g., 20–30 GJ/m2 h) 2. Favorable economics on a medium to
3. Uniform temperature distribution in gasifiers large scale
4. Low char or/and tar contents
5. High cold gas energy efficiency
6. Reduced ash-related problems
Gasifier operation:
Increase of
temperature
1. Decreased char and tar content 1. Decreased energy efficiency [21,56]
2. Decreased methane in producer gas 2. Increased ash-related problems
3. Increased carbon conversion
4. Increased heating value of producer gas
Increase of
pressure
1. Low char and tar content
2. No costly producer gas compression required for
downstream utilization
1. Limited design and operational experience
2. Higher costs of a gasifier at a small scale
Increase of ER Low char and tar content Decreased heating value of syngas
Fixed bed gasifiers are the simplest modes of gasifiers to construct with less equipment
investment, easier to operate and to maintain. These attributes, of fixed bed gasifiers, are suitable
for anticipated use in the isolated rural settlements in developing countries. The most common of
this category are the downdraft and updraft gasifiers for which some performance indicators were
studied in this work.
2.4 Contaminants in the Producer Gas
2.4.1 Tar in producer gas
Tar can be defined as condensed organic compounds with boiling points higher than benzene [23].
It is still the critical constraint in biomass gasification technology applications for power
production with IC engines applications. In biomass gasification, the pyrolysis process generates
considerable amount of primary tar. As temperature is raised above 5000C, primary tar begin to
transform in to more gas and a series of molecules called secondary tar which are formed
depending on the severity of the temperature [24] [25]. In downdraft and fluidized bed gasifiers, some
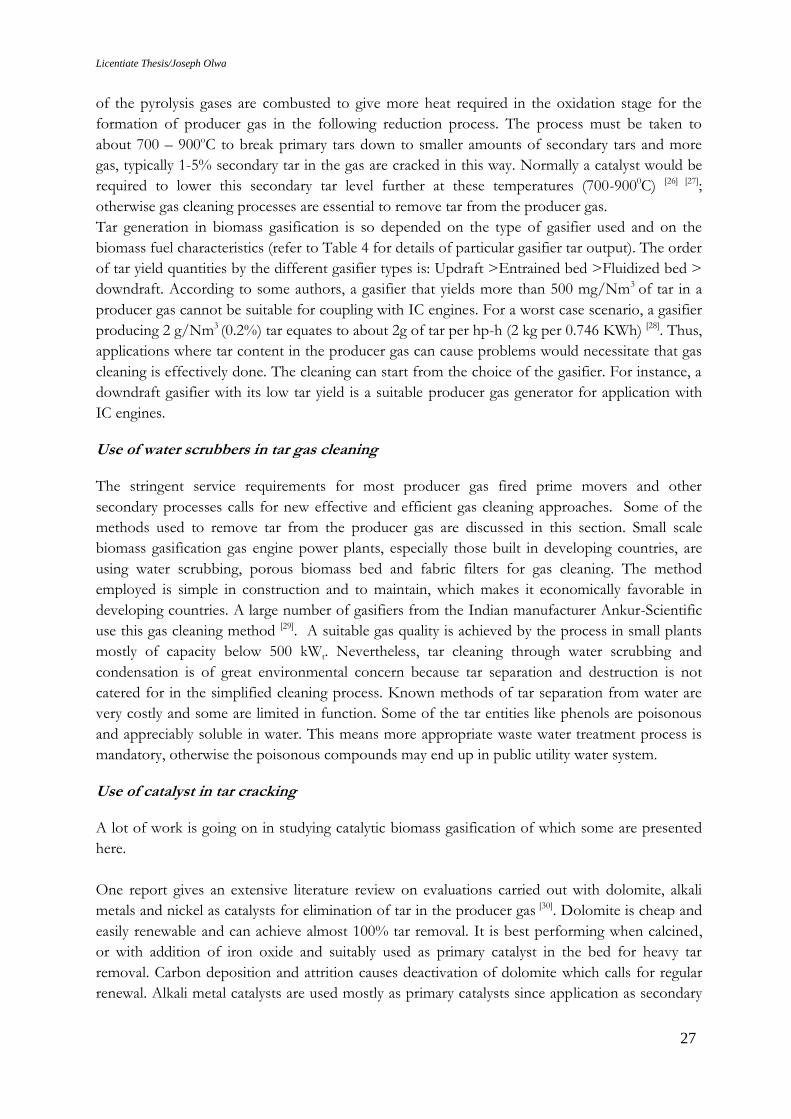
Licentiate Thesis/Joseph Olwa
27
of the pyrolysis gases are combusted to give more heat required in the oxidation stage for the
formation of producer gas in the following reduction process. The process must be taken to
about 700 – 900oC to break primary tars down to smaller amounts of secondary tars and more
gas, typically 1-5% secondary tar in the gas are cracked in this way. Normally a catalyst would be
required to lower this secondary tar level further at these temperatures (700-9000C) [26] [27];
otherwise gas cleaning processes are essential to remove tar from the producer gas.
Tar generation in biomass gasification is so depended on the type of gasifier used and on the
biomass fuel characteristics (refer to Table 4 for details of particular gasifier tar output). The order
of tar yield quantities by the different gasifier types is: Updraft >Entrained bed >Fluidized bed >
downdraft. According to some authors, a gasifier that yields more than 500 mg/Nm3 of tar in a
producer gas cannot be suitable for coupling with IC engines. For a worst case scenario, a gasifier
producing 2 g/Nm3 (0.2%) tar equates to about 2g of tar per hp-h (2 kg per 0.746 KWh) [28]. Thus,
applications where tar content in the producer gas can cause problems would necessitate that gas
cleaning is effectively done. The cleaning can start from the choice of the gasifier. For instance, a
downdraft gasifier with its low tar yield is a suitable producer gas generator for application with
IC engines.
Use of water scrubbers in tar gas cleaning
The stringent service requirements for most producer gas fired prime movers and other
secondary processes calls for new effective and efficient gas cleaning approaches. Some of the
methods used to remove tar from the producer gas are discussed in this section. Small scale
biomass gasification gas engine power plants, especially those built in developing countries, are
using water scrubbing, porous biomass bed and fabric filters for gas cleaning. The method
employed is simple in construction and to maintain, which makes it economically favorable in
developing countries. A large number of gasifiers from the Indian manufacturer Ankur-Scientific
use this gas cleaning method [29]. A suitable gas quality is achieved by the process in small plants
mostly of capacity below 500 kWt. Nevertheless, tar cleaning through water scrubbing and
condensation is of great environmental concern because tar separation and destruction is not
catered for in the simplified cleaning process. Known methods of tar separation from water are
very costly and some are limited in function. Some of the tar entities like phenols are poisonous
and appreciably soluble in water. This means more appropriate waste water treatment process is
mandatory, otherwise the poisonous compounds may end up in public utility water system.
Use of catalyst in tar cracking
A lot of work is going on in studying catalytic biomass gasification of which some are presented
here.
One report gives an extensive literature review on evaluations carried out with dolomite, alkali
metals and nickel as catalysts for elimination of tar in the producer gas [30]. Dolomite is cheap and
easily renewable and can achieve almost 100% tar removal. It is best performing when calcined,
or with addition of iron oxide and suitably used as primary catalyst in the bed for heavy tar
removal. Carbon deposition and attrition causes deactivation of dolomite which calls for regular
renewal. Alkali metal catalysts are used mostly as primary catalysts since application as secondary
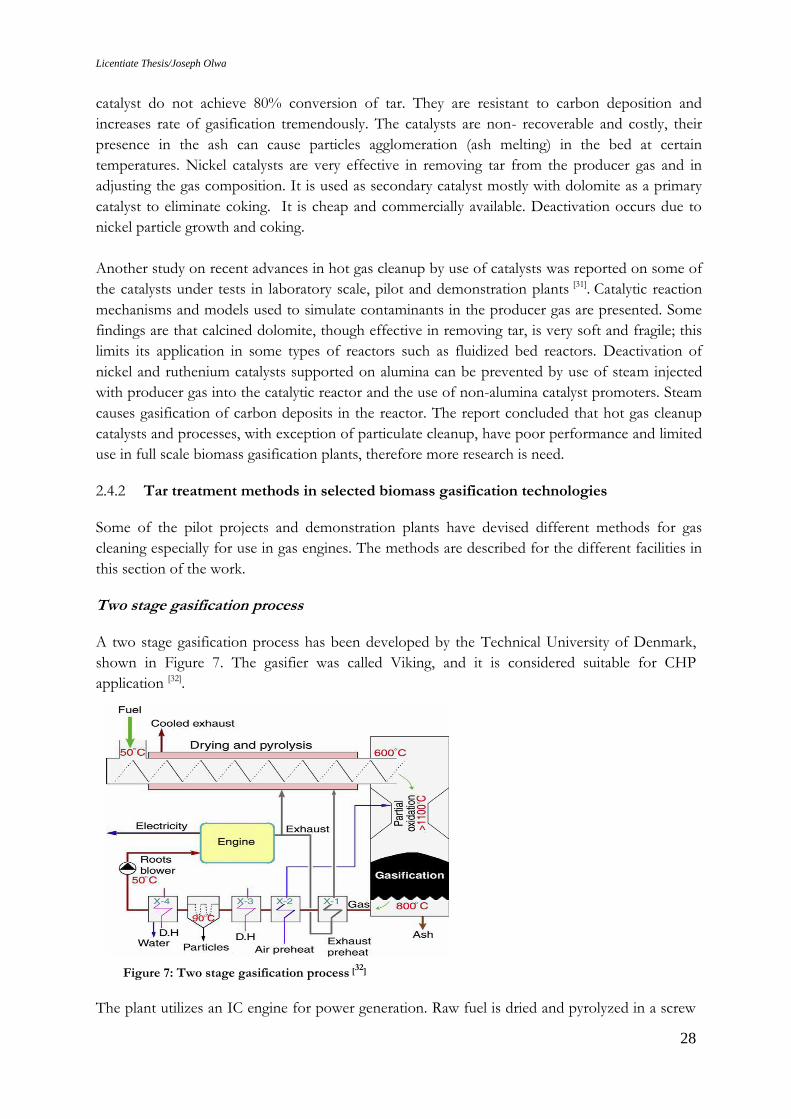
Licentiate Thesis/Joseph Olwa
28
catalyst do not achieve 80% conversion of tar. They are resistant to carbon deposition and
increases rate of gasification tremendously. The catalysts are non- recoverable and costly, their
presence in the ash can cause particles agglomeration (ash melting) in the bed at certain
temperatures. Nickel catalysts are very effective in removing tar from the producer gas and in
adjusting the gas composition. It is used as secondary catalyst mostly with dolomite as a primary
catalyst to eliminate coking. It is cheap and commercially available. Deactivation occurs due to
nickel particle growth and coking.
Another study on recent advances in hot gas cleanup by use of catalysts was reported on some of
the catalysts under tests in laboratory scale, pilot and demonstration plants [31]. Catalytic reaction
mechanisms and models used to simulate contaminants in the producer gas are presented. Some
findings are that calcined dolomite, though effective in removing tar, is very soft and fragile; this
limits its application in some types of reactors such as fluidized bed reactors. Deactivation of
nickel and ruthenium catalysts supported on alumina can be prevented by use of steam injected
with producer gas into the catalytic reactor and the use of non-alumina catalyst promoters. Steam
causes gasification of carbon deposits in the reactor. The report concluded that hot gas cleanup
catalysts and processes, with exception of particulate cleanup, have poor performance and limited
use in full scale biomass gasification plants, therefore more research is need.
2.4.2 Tar treatment methods in selected biomass gasification technologies
Some of the pilot projects and demonstration plants have devised different methods for gas
cleaning especially for use in gas engines. The methods are described for the different facilities in
this section of the work.
Two stage gasification process
A two stage gasification process has been developed by the Technical University of Denmark,
shown in Figure 7. The gasifier was called Viking, and it is considered suitable for CHP
application [32].
The plant utilizes an IC engine for power generation. Raw fuel is dried and pyrolyzed in a screw
Figure 7: Two stage gasification process [32]
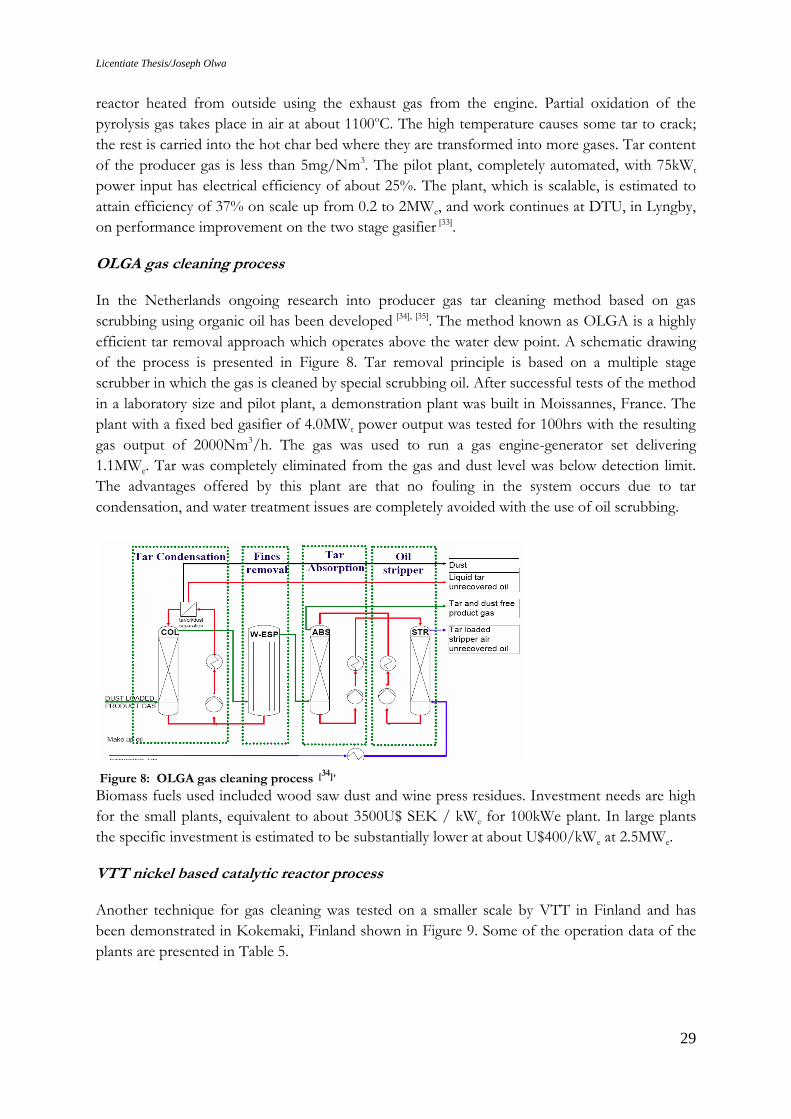
Licentiate Thesis/Joseph Olwa
29
reactor heated from outside using the exhaust gas from the engine. Partial oxidation of the
pyrolysis gas takes place in air at about 1100oC. The high temperature causes some tar to crack;
the rest is carried into the hot char bed where they are transformed into more gases. Tar content
of the producer gas is less than 5mg/Nm3. The pilot plant, completely automated, with 75kWt
power input has electrical efficiency of about 25%. The plant, which is scalable, is estimated to
attain efficiency of 37% on scale up from 0.2 to 2MWe, and work continues at DTU, in Lyngby,
on performance improvement on the two stage gasifier [33].
OLGA gas cleaning process
In the Netherlands ongoing research into producer gas tar cleaning method based on gas
scrubbing using organic oil has been developed [34], [35]. The method known as OLGA is a highly
efficient tar removal approach which operates above the water dew point. A schematic drawing
of the process is presented in Figure 8. Tar removal principle is based on a multiple stage
scrubber in which the gas is cleaned by special scrubbing oil. After successful tests of the method
in a laboratory size and pilot plant, a demonstration plant was built in Moissannes, France. The
plant with a fixed bed gasifier of 4.0MWt power output was tested for 100hrs with the resulting
gas output of 2000Nm3/h. The gas was used to run a gas engine-generator set delivering
1.1MWe. Tar was completely eliminated from the gas and dust level was below detection limit.
The advantages offered by this plant are that no fouling in the system occurs due to tar
condensation, and water treatment issues are completely avoided with the use of oil scrubbing.
Biomass fuels used included wood saw dust and wine press residues. Investment needs are high
for the small plants, equivalent to about 3500U$ SEK / kWe for 100kWe plant. In large plants
the specific investment is estimated to be substantially lower at about U$400/kWe at 2.5MWe.
VTT nickel based catalytic reactor process
Another technique for gas cleaning was tested on a smaller scale by VTT in Finland and has
been demonstrated in Kokemaki, Finland shown in Figure 9. Some of the operation data of the
plants are presented in Table 5.
Figure 8: OLGA gas cleaning process [34],
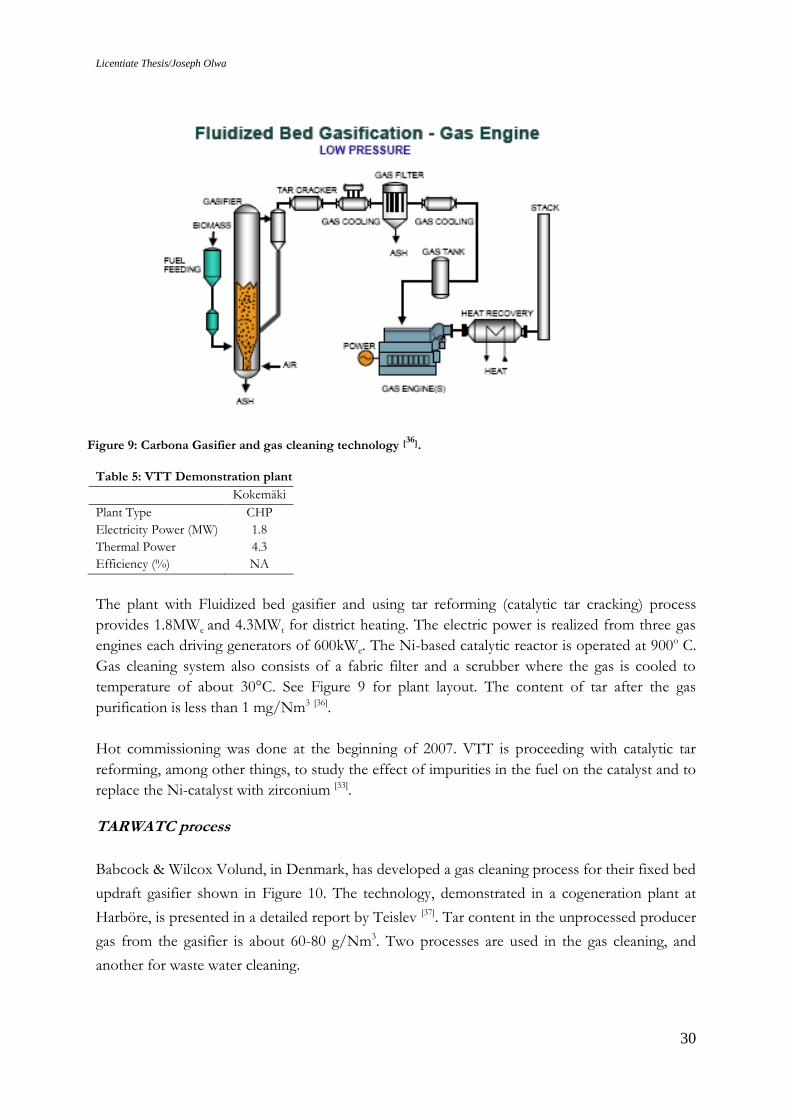
Licentiate Thesis/Joseph Olwa
30
Table 5: VTT Demonstration plant
Kokemäki
Plant Type CHP
Electricity Power (MW) 1.8
Thermal Power 4.3
Efficiency (%) NA
The plant with Fluidized bed gasifier and using tar reforming (catalytic tar cracking) process
provides 1.8MWe and 4.3MWt for district heating. The electric power is realized from three gas
engines each driving generators of 600kWe. The Ni-based catalytic reactor is operated at 900o C.
Gas cleaning system also consists of a fabric filter and a scrubber where the gas is cooled to
temperature of about 30°C. See Figure 9 for plant layout. The content of tar after the gas
purification is less than 1 mg/Nm3 [36].
Hot commissioning was done at the beginning of 2007. VTT is proceeding with catalytic tar
reforming, among other things, to study the effect of impurities in the fuel on the catalyst and to
replace the Ni-catalyst with zirconium [33].
TARWATC process
Babcock & Wilcox Volund, in Denmark, has developed a gas cleaning process for their fixed bed
updraft gasifier shown in Figure 10. The technology, demonstrated in a cogeneration plant at
Harböre, is presented in a detailed report by Teislev [37]. Tar content in the unprocessed producer
gas from the gasifier is about 60-80 g/Nm3. Two processes are used in the gas cleaning, and
another for waste water cleaning.
Figure 9: Carbona Gasifier and gas cleaning technology [
36].
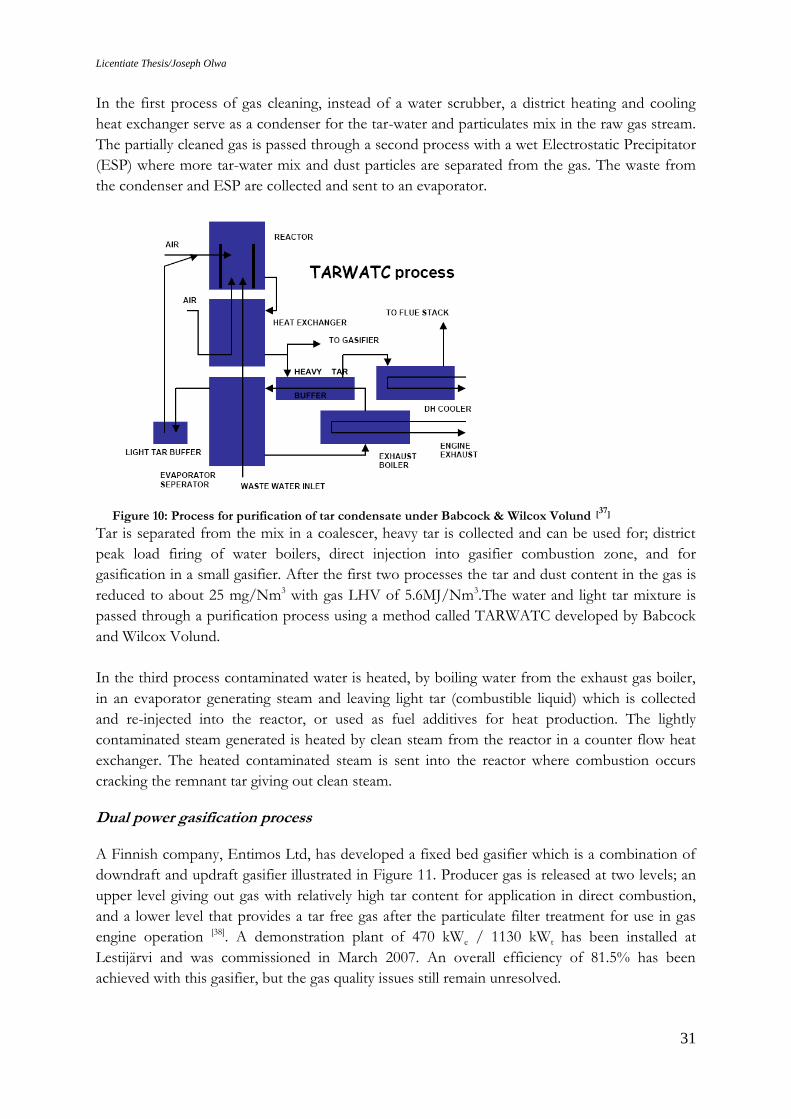
Licentiate Thesis/Joseph Olwa
31
In the first process of gas cleaning, instead of a water scrubber, a district heating and cooling
heat exchanger serve as a condenser for the tar-water and particulates mix in the raw gas stream.
The partially cleaned gas is passed through a second process with a wet Electrostatic Precipitator
(ESP) where more tar-water mix and dust particles are separated from the gas. The waste from
the condenser and ESP are collected and sent to an evaporator.
Tar is separated from the mix in a coalescer, heavy tar is collected and can be used for; district
peak load firing of water boilers, direct injection into gasifier combustion zone, and for
gasification in a small gasifier. After the first two processes the tar and dust content in the gas is
reduced to about 25 mg/Nm3 with gas LHV of 5.6MJ/Nm3.The water and light tar mixture is
passed through a purification process using a method called TARWATC developed by Babcock
and Wilcox Volund.
In the third process contaminated water is heated, by boiling water from the exhaust gas boiler,
in an evaporator generating steam and leaving light tar (combustible liquid) which is collected
and re-injected into the reactor, or used as fuel additives for heat production. The lightly
contaminated steam generated is heated by clean steam from the reactor in a counter flow heat
exchanger. The heated contaminated steam is sent into the reactor where combustion occurs
cracking the remnant tar giving out clean steam.
Dual power gasification process
A Finnish company, Entimos Ltd, has developed a fixed bed gasifier which is a combination of
downdraft and updraft gasifier illustrated in Figure 11. Producer gas is released at two levels; an
upper level giving out gas with relatively high tar content for application in direct combustion,
and a lower level that provides a tar free gas after the particulate filter treatment for use in gas
engine operation [38]. A demonstration plant of 470 kWe / 1130 kWt has been installed at
Lestijärvi and was commissioned in March 2007. An overall efficiency of 81.5% has been
achieved with this gasifier, but the gas quality issues still remain unresolved.
HEAVY TAR
BUFFER
Figure 10: Process for purification of tar condensate under Babcock & Wilcox Volund [37]
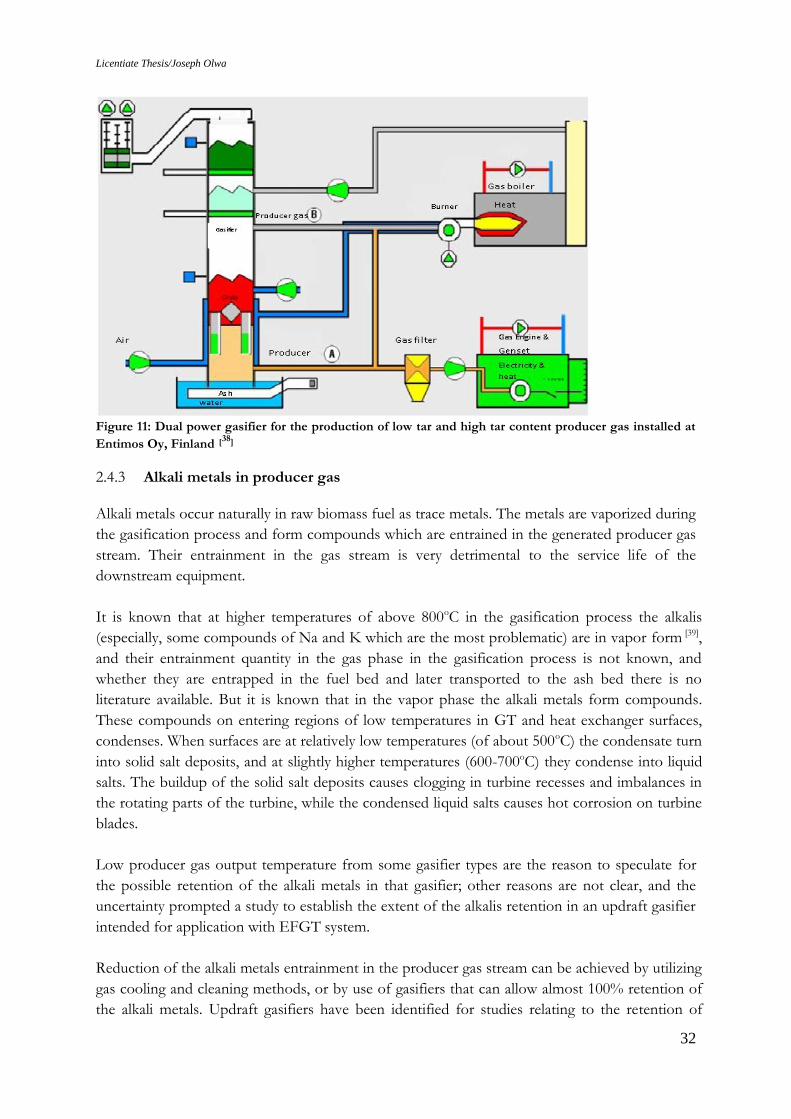
Licentiate Thesis/Joseph Olwa
32
Figure 11: Dual power gasifier for the production of low tar and high tar content producer gas installed at
Entimos Oy, Finland [38]
2.4.3 Alkali metals in producer gas
Alkali metals occur naturally in raw biomass fuel as trace metals. The metals are vaporized during
the gasification process and form compounds which are entrained in the generated producer gas
stream. Their entrainment in the gas stream is very detrimental to the service life of the
downstream equipment.
It is known that at higher temperatures of above 800oC in the gasification process the alkalis
(especially, some compounds of Na and K which are the most problematic) are in vapor form [39],
and their entrainment quantity in the gas phase in the gasification process is not known, and
whether they are entrapped in the fuel bed and later transported to the ash bed there is no
literature available. But it is known that in the vapor phase the alkali metals form compounds.
These compounds on entering regions of low temperatures in GT and heat exchanger surfaces,
condenses. When surfaces are at relatively low temperatures (of about 500oC) the condensate turn
into solid salt deposits, and at slightly higher temperatures (600-700oC) they condense into liquid
salts. The buildup of the solid salt deposits causes clogging in turbine recesses and imbalances in
the rotating parts of the turbine, while the condensed liquid salts causes hot corrosion on turbine
blades.
Low producer gas output temperature from some gasifier types are the reason to speculate for
the possible retention of the alkali metals in that gasifier; other reasons are not clear, and the
uncertainty prompted a study to establish the extent of the alkalis retention in an updraft gasifier
intended for application with EFGT system.
Reduction of the alkali metals entrainment in the producer gas stream can be achieved by utilizing
gas cooling and cleaning methods, or by use of gasifiers that can allow almost 100% retention of
the alkali metals. Updraft gasifiers have been identified for studies relating to the retention of
Licentiate Thesis/Joseph Olwa
33
alkali metals in them; see Chapter 4 for details on retention of the alkali metals in updraft
gasification process.
2.4.4 Particles in producer gas
A lot of particles is generated and are entrained in the producer gas during biomass gasification
process. The constituents include among others, ash, char and soot to a limited extent. Ash is
mainly consisted of inorganic compounds of the alkali metals, sand and unburnt carbon. Ash
melting in the gasifier interrupts the gasification reaction process with the result of yielding poor
quality (less energy content per unit volume than normal) producer gas, and possible burn-out of
some auxiliary units in the gasifier can result. Normally, gasification must be carried out below ash
melting points to avoid ash bed slagging.
The entrainment of ash particles in the producer gas stream can lead to erosion in down steam
equipment, and this is attributed to the abrasive nature of the ash particles constituents which to
some extent is linked to the fuel contamination with soil. Hot gas filtration can be utilized in the
gas cleaning process, but the process costs have caused many gasification projects to be
decommissioned shortly after takeoff [26]. Normally, in a GT system the combustion chamber is
integrated within the turbine housing. There are no problems associated with alkali metals
compounds when running on natural gas and producer gas from coal gasification. But when
operating on producer gas from biomass gasification, the alkali metal compounds deposition and
the ash particles in the producer gas stream necessitate that rigorous cleaning is effected before
utilization in GT.
Char particles are formed from un-burnt char from the pyrolysis process of the gasification and
can be filtered from the gas stream by use of cyclone, water scrubbers, electrostatic and fabric
filters. Soot is formed during the gasification process. It is constituted by agglomerates with a
diameter of up to several hundred nanometers. These have a fine structure of spherical primary
particles. Soot formation is initiated by the pyrolysis of fuel particles and the formation of
polycyclic aromatic hydrocarbons (PAH). The most important precursor of the formation of
higher hydrocarbons is acetylene (C2H2). 2-dimensional condensation processes follow, and finally
a rearrangement produces spherical primary particles which continue growing at their surface [40].
The most concern is that that fine particles created in the process remain a serious toxicological
problem.
2.5 Producer Gas Applications
2.5.1 Gas quality requirements
Producer gas can be utilized either as a hot or cooled gas stream depending on the intended
application. Hot gas applications from updraft gasification process find use in GT and other
thermal systems. The high tar content in an updraft gasifier process necessitates a significant
investment in gas cleanup equipment, which renders it economically unfavorable for investments
in gas cleaning to meet IC engine application in developing countries.
Licentiate Thesis/Joseph Olwa
34
Tar and particulate loads from the different gasifier types are presented in Table 6. The figures
presented are conservative and were determined based on different fuel and gasifier
characteristics, and on particular gasifier operating parameters. As such different authors reported
varying ranges for a particular gasifier, as quoted by Milnes et al [41]. As shown in Table 6, it cannot
be overemphasized that downdraft gasifiers yield less tar compared to other types of gasifiers with
estimated average of about 0.275g/Nm3 compared to about 55g/Nm3, 6g/Nm3, 19g/Nm3 in
updraft, fluidized bed and entrained bed gasifiers, respectively. Thus, in downdraft gasification
process less cleaning is involved for applications with IC engines compared to the other gasifying
processes.
Hot producer gas has low density such that when used in IC engines the power output is
significantly lowered due to the decrease in energy content per unit volume. Thus, downdraft
gasification with low tar yield, provided with gas cooling and cleaning, is suitable for application
with IC engines. There is obvious sacrifice of efficiency in form of heat loss in the gas cooling
process.
Gas cleaning is expensive if done at high temperatures and leads to reduced efficiency if the hot
gas is cooled before cleaning. An alternative approach is the use of external firing in GT system,
which was introduced earlier as EFGT system. In this case, the turbine is driven by expansion of
heated compressed air. The system is a favorable technology because its design reduces fouling
load in the GT unit. The design simplicity makes it suitable in small scale application for power
plants in rural and isolated settlements. The evasion of fouling in the GT unit is achieved by the
relocation of the combustion chamber outside the turbine unit and the inclusion of a heat
exchanger to handle the unfiltered gas stream.
There are two possible ways to using the EFGT system. One method involves biomass
combustion directly in a chamber integrated to a heat exchanger, and the other constitutes
biomass gasification and the subsequent combustion of the generated producer gas in a detached
combustor. In both cases the heat of combustion is transferred to compressed air through a heat
exchanger and the heated air is then expanded in the turbine unit. A report on experiments
carried out by Talbott‟s Heating Ltd. in England presented the use of direct biomass combustion
integrated with a heat exchanger for powering a micro-gas turbine [42]. Though the system
showed good performance with electrical efficiency of about 17%, there is no mention about
clogging and fouling of the heat exchanger in the system.
The EFGT system affords some advantages over the directly fired system including; clean
working fluid (air) in the turbine, better temperature control with producer gas and inclusion of
an external combustor allowing for low pressure operations with increased efficiency [43].
The main reason alkali metal salts end up in the gas phase when biomass is gasified is that many
compounds of K and Na are transformed into vapor phase at temperatures in the range of 700-
8000C and above [44]. This volatized compounds ends up in the producer gas stream.
Up-draft gasifiers have producer gas temperatures in the range of 150 – 2500C and it can be
expected that the producer gas generated may have very low alkali metals content [45]. This is
anticipated to reduce on deposition and corrosion problems in a high temperature heat
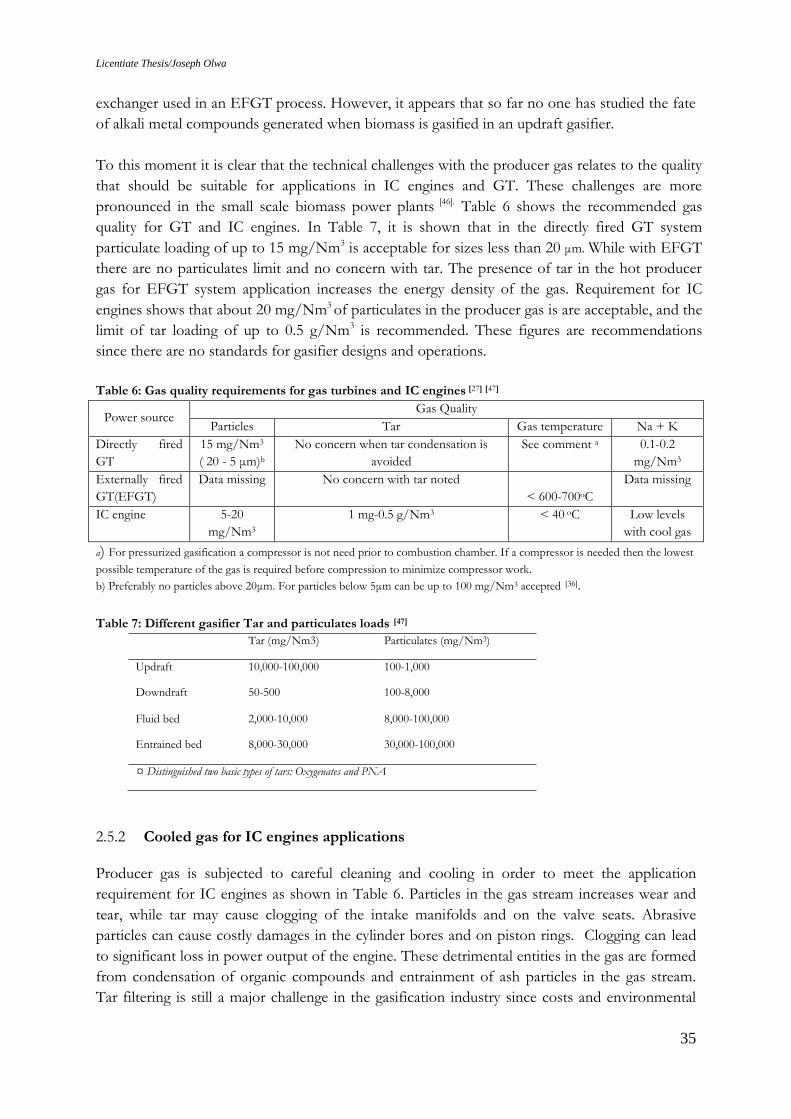
Licentiate Thesis/Joseph Olwa
35
exchanger used in an EFGT process. However, it appears that so far no one has studied the fate
of alkali metal compounds generated when biomass is gasified in an updraft gasifier.
To this moment it is clear that the technical challenges with the producer gas relates to the quality
that should be suitable for applications in IC engines and GT. These challenges are more
pronounced in the small scale biomass power plants [46]. Table 6 shows the recommended gas
quality for GT and IC engines. In Table 7, it is shown that in the directly fired GT system
particulate loading of up to 15 mg/Nm3 is acceptable for sizes less than 20 μm. While with EFGT
there are no particulates limit and no concern with tar. The presence of tar in the hot producer
gas for EFGT system application increases the energy density of the gas. Requirement for IC
engines shows that about 20 mg/Nm3 of particulates in the producer gas is are acceptable, and the
limit of tar loading of up to 0.5 g/Nm3 is recommended. These figures are recommendations
since there are no standards for gasifier designs and operations.
Table 6: Gas quality requirements for gas turbines and IC engines [27] [47]
Power source Gas Quality
Particles Tar Gas temperature Na + K
Directly fired
GT
15 mg/Nm3
( 20 - 5 μm)b
No concern when tar condensation is
avoided
See comment a 0.1-0.2
mg/Nm3
Externally fired
GT(EFGT)
Data missing No concern with tar noted
< 600-700oC
Data missing
IC engine
5-20
mg/Nm3
1 mg-0.5 g/Nm3
< 40 oC Low levels
with cool gas
a) For pressurized gasification a compressor is not need prior to combustion chamber. If a compressor is needed then the lowest
possible temperature of the gas is required before compression to minimize compressor work.
b) Preferably no particles above 20μm. For particles below 5μm can be up to 100 mg/Nm3 accepted [36].
Table 7: Different gasifier Tar and particulates loads [47]
Tar (mg/Nm3) Particulates (mg/Nm3)
Updraft 10,000-100,000 100-1,000
Downdraft 50-500 100-8,000
Fluid bed 2,000-10,000 8,000-100,000
Entrained bed 8,000-30,000 30,000-100,000
¤ Distinguished two basic types of tars: Oxygenates and PNA
2.5.2 Cooled gas for IC engines applications
Producer gas is subjected to careful cleaning and cooling in order to meet the application
requirement for IC engines as shown in Table 6. Particles in the gas stream increases wear and
tear, while tar may cause clogging of the intake manifolds and on the valve seats. Abrasive
particles can cause costly damages in the cylinder bores and on piston rings. Clogging can lead
to significant loss in power output of the engine. These detrimental entities in the gas are formed
from condensation of organic compounds and entrainment of ash particles in the gas stream.
Tar filtering is still a major challenge in the gasification industry since costs and environmental
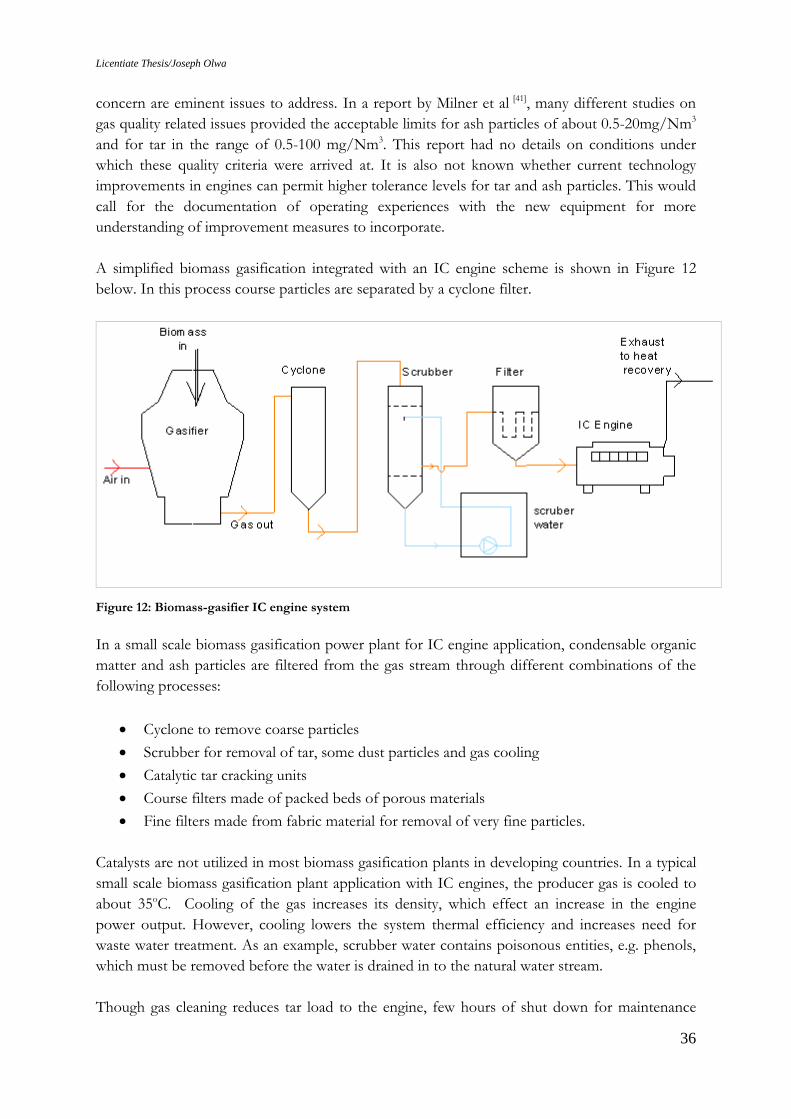
Licentiate Thesis/Joseph Olwa
36
concern are eminent issues to address. In a report by Milner et al [41], many different studies on
gas quality related issues provided the acceptable limits for ash particles of about 0.5-20mg/Nm3
and for tar in the range of 0.5-100 mg/Nm3. This report had no details on conditions under
which these quality criteria were arrived at. It is also not known whether current technology
improvements in engines can permit higher tolerance levels for tar and ash particles. This would
call for the documentation of operating experiences with the new equipment for more
understanding of improvement measures to incorporate.
A simplified biomass gasification integrated with an IC engine scheme is shown in Figure 12
below. In this process course particles are separated by a cyclone filter.
Figure 12: Biomass-gasifier IC engine system
In a small scale biomass gasification power plant for IC engine application, condensable organic
matter and ash particles are filtered from the gas stream through different combinations of the
following processes:
Cyclone to remove coarse particles
Scrubber for removal of tar, some dust particles and gas cooling
Catalytic tar cracking units
Course filters made of packed beds of porous materials
Fine filters made from fabric material for removal of very fine particles.
Catalysts are not utilized in most biomass gasification plants in developing countries. In a typical
small scale biomass gasification plant application with IC engines, the producer gas is cooled to
about 35oC. Cooling of the gas increases its density, which effect an increase in the engine
power output. However, cooling lowers the system thermal efficiency and increases need for
waste water treatment. As an example, scrubber water contains poisonous entities, e.g. phenols,
which must be removed before the water is drained in to the natural water stream.
Though gas cleaning reduces tar load to the engine, few hours of shut down for maintenance
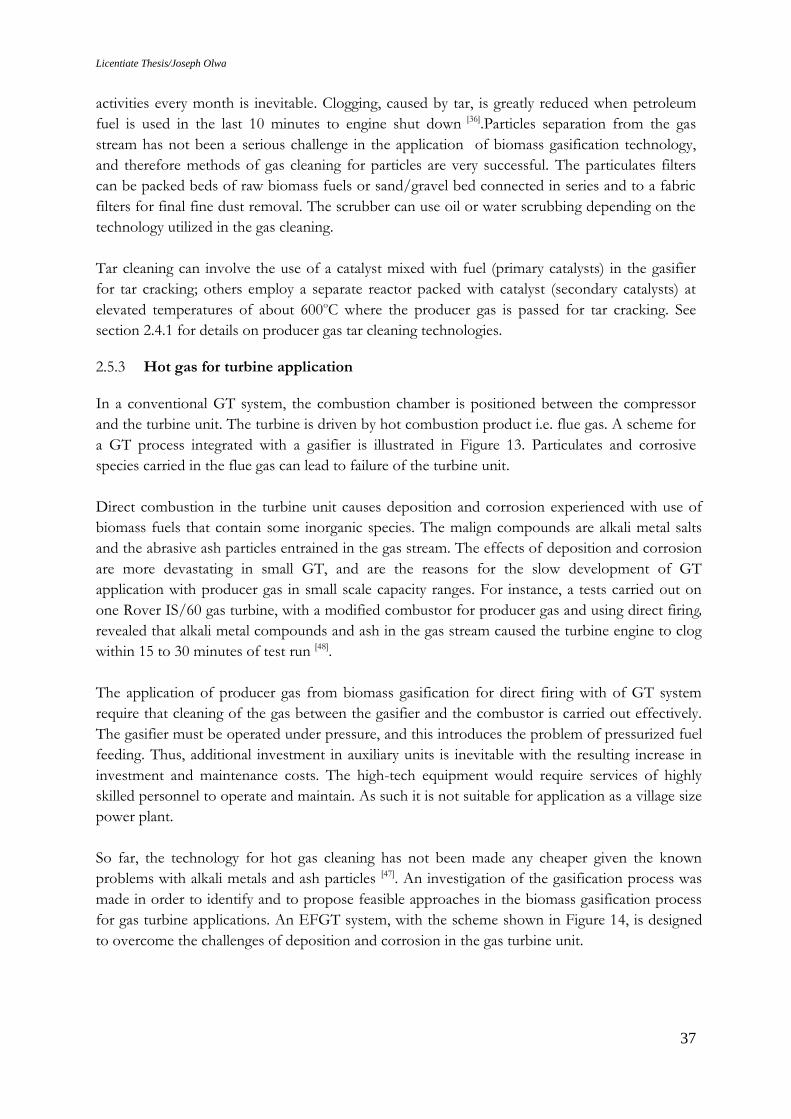
Licentiate Thesis/Joseph Olwa
37
activities every month is inevitable. Clogging, caused by tar, is greatly reduced when petroleum
fuel is used in the last 10 minutes to engine shut down [36].Particles separation from the gas
stream has not been a serious challenge in the application of biomass gasification technology,
and therefore methods of gas cleaning for particles are very successful. The particulates filters
can be packed beds of raw biomass fuels or sand/gravel bed connected in series and to a fabric
filters for final fine dust removal. The scrubber can use oil or water scrubbing depending on the
technology utilized in the gas cleaning.
Tar cleaning can involve the use of a catalyst mixed with fuel (primary catalysts) in the gasifier
for tar cracking; others employ a separate reactor packed with catalyst (secondary catalysts) at
elevated temperatures of about 600oC where the producer gas is passed for tar cracking. See
section 2.4.1 for details on producer gas tar cleaning technologies.
2.5.3 Hot gas for turbine application
In a conventional GT system, the combustion chamber is positioned between the compressor
and the turbine unit. The turbine is driven by hot combustion product i.e. flue gas. A scheme for
a GT process integrated with a gasifier is illustrated in Figure 13. Particulates and corrosive
species carried in the flue gas can lead to failure of the turbine unit.
Direct combustion in the turbine unit causes deposition and corrosion experienced with use of
biomass fuels that contain some inorganic species. The malign compounds are alkali metal salts
and the abrasive ash particles entrained in the gas stream. The effects of deposition and corrosion
are more devastating in small GT, and are the reasons for the slow development of GT
application with producer gas in small scale capacity ranges. For instance, a tests carried out on
one Rover IS/60 gas turbine, with a modified combustor for producer gas and using direct firing,
revealed that alkali metal compounds and ash in the gas stream caused the turbine engine to clog
within 15 to 30 minutes of test run [48].
The application of producer gas from biomass gasification for direct firing with of GT system
require that cleaning of the gas between the gasifier and the combustor is carried out effectively.
The gasifier must be operated under pressure, and this introduces the problem of pressurized fuel
feeding. Thus, additional investment in auxiliary units is inevitable with the resulting increase in
investment and maintenance costs. The high-tech equipment would require services of highly
skilled personnel to operate and maintain. As such it is not suitable for application as a village size
power plant.
So far, the technology for hot gas cleaning has not been made any cheaper given the known
problems with alkali metals and ash particles [47]. An investigation of the gasification process was
made in order to identify and to propose feasible approaches in the biomass gasification process
for gas turbine applications. An EFGT system, with the scheme shown in Figure 14, is designed
to overcome the challenges of deposition and corrosion in the gas turbine unit.
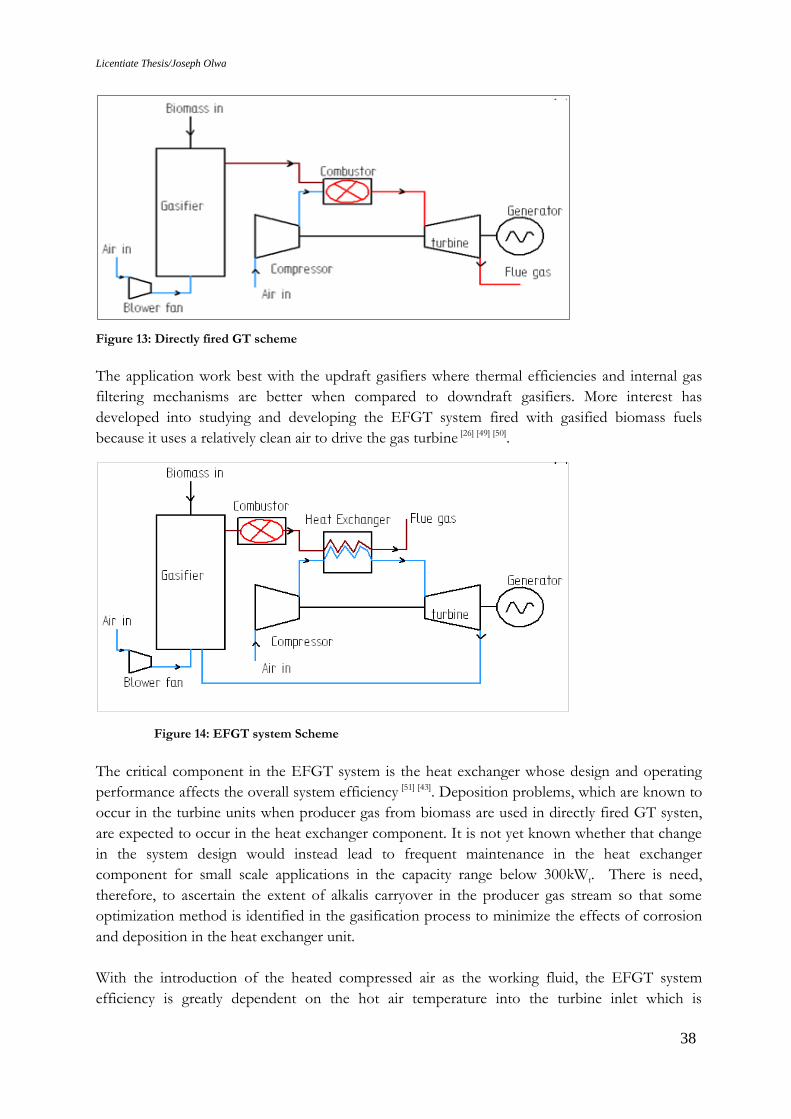
Licentiate Thesis/Joseph Olwa
38
Figure 13: Directly fired GT scheme
The application work best with the updraft gasifiers where thermal efficiencies and internal gas
filtering mechanisms are better when compared to downdraft gasifiers. More interest has
developed into studying and developing the EFGT system fired with gasified biomass fuels
because it uses a relatively clean air to drive the gas turbine [26] [49] [50].
The critical component in the EFGT system is the heat exchanger whose design and operating
performance affects the overall system efficiency [51] [43]. Deposition problems, which are known to
occur in the turbine units when producer gas from biomass are used in directly fired GT systen,
are expected to occur in the heat exchanger component. It is not yet known whether that change
in the system design would instead lead to frequent maintenance in the heat exchanger
component for small scale applications in the capacity range below 300kWt. There is need,
therefore, to ascertain the extent of alkalis carryover in the producer gas stream so that some
optimization method is identified in the gasification process to minimize the effects of corrosion
and deposition in the heat exchanger unit.
With the introduction of the heated compressed air as the working fluid, the EFGT system
efficiency is greatly dependent on the hot air temperature into the turbine inlet which is
Figure 14: EFGT system Scheme
Licentiate Thesis/Joseph Olwa
39
dependent on the heat exchanger material operating temperature [26]. The producer gas
combustion temperature is about 1200oC while an alloyed steel (such as Allegheny Ludlum A286
Iron-Base Super alloy - UNS S66286) material has continuous maximum operating temperature of
about 850oC. At about 1200oC this material cannot support the operation due to large thermal
stresses which would develop, therefore some form of cooling of the combustion gases before
transmission through the heat exchanger is inevitable. The cooling is achieved by dilution of the
combustion products with air from the compressor like always used in gas turbines. This leads to
exergy losses but not any energy losses. The cooling subsequently reduces the overall system
efficiency since the efficiency depends also on the turbine inlet temperature.
2.6 Conclusions and Recommendations
Biomass gasification technology has been successfully demonstrated in large scale power
generation and heating plants [19], but they are still considered expensive in comparison to fossil
fuel based systems and therefore face economical, technical and other non-technical barriers while
trying to penetrate the energy markets. This impediment can be overridden by carefully
considering the gasification technology improvement strategies and recommending designs that
are easier to construct, operate and maintain, suitable for rural Africa. Careful consideration need
to be taken when venturing into commercialization of biomass gasification technology due to the
many factors that influence its performances.
The challenges experienced with biomass fuel gasification necessitated an investigation into
analyzing the technical problems associated with the application with IC engines. Experiments
were carried out with biomass fuels in downdraft and updraft gasifiers to determine their
technical performances. This report present some of the findings presented in line with the
aforementioned objectives. And the following outline concludes the introductory part of this
work.
There is availability of un tapped biomass resources in Uganda which can be used for
energy production
Biomass gasification technology integration with IC engines and gas GT systems can
provide an alternative for power generation in rural villages of Uganda. But there are
concerns that need to be addressed among which are: gas cleaning methods, competition
from fossil fuel systems, convenience of operation, decreased reliability of the equipment
after extended operation.
Application of producer gas from biomass gasification processes in IC engines is a viable
approach, but gas cleaning for abrasive particles and tar create some challenges.
Tar cleaning techniques being tested in demonstrations plants in Europe are very costly to
be employed in biomass gasification plants in rural villages of Africa.
Producer gas tar cleaning methods employed in developing countries raises some concern
on the adequacy of the treatment methods used on the tar contaminated water.
Hot producer gas from biomass gasification process applications with GT systems
experiences problem of hot corrosion, erosion and clogging. These detrimental effects can
be avoided by use of EFGT system.

Licentiate Thesis/Joseph Olwa
40
Details about EFGT system heat exchanger performance when used as air heating
medium with hot combustion products of producer gas combustion is not known and
require some studies.
Some of these issues will be covered by the present study.
Licentiate Thesis/Joseph Olwa
41
3. Design Considerations for an Externally Fired Micro
Gas Turbine (EFGT) Heat Exchanger Using Biomass as
Fuel
3.1 Introduction
The use of biomass as a primary energy source for electricity generation in small scale (below 1
MW electric) includes many challenges as noted earlier. Gasifying the biomass and using the
producer gas as fuel in an internal IC engine driving an electric generator is one possible process,
but experience has shown that operational problems caused by tar in the gas increase with the
increase in system size. It was therefore interesting to explore another biomass fuel conversion
process for applications with energy production systems.
The EFGT system is one alternative to IC engines for integration with biomass gasifiers,
mentioned earlier. And for better performance realization, the heat exchanger surfaces used in
the EFGT system must be able to operate at temperatures of about 30-50oC above the turbine
inlet temperature (TIT) [52] . By the nature of the gas stream involved, deterioration in
performance is a common occurrence when biomass fuels are utilized. The diminution in the
heat transfer effectiveness and the corrosion of the material may be caused by ash, soot and alkali
metal compounds carried in the hot gas stream generated from the gasified biomass. Alkali
metals raise a serious concern, because they are the precursor to high temperature material
deposition and clogging problems experienced with use of biomass fuels.
It is known that the product gas temperature from an updraft gasification process is lower than
that of a down draft one [53]. Thus, it is anticipated that the carry-over of alkali metal compounds
in the gas stream is low with the updraft gasification mode (see chapter 4 for a discussion on
alkali metals). This was the motivation for the study of the updraft gasification process for
integration with an EFGT system.
This chapter aims to present the relevant issues involved in designing one of the heat exchanger
type for EFGT system application. A shell and tube heat exchanger was designed for an EFGT
system consisting of a Rover IS/60 gas turbine. The uncertainty in determining the heat
exchanger surface area as a result of variations in the input parameters was studied. Tests with a
heat exchanger utilizing hot gas generated by combustion of producer gas from an up-draft
gasifier shall be needed for assessment of operating potential at targeted TIT of about 1000 K.
3.2 EFGT System Modeling and Simulation
3.2.1 Method and assumptions
The first step in analyzing the EFGT was to study the thermodynamics of the system illustrated
in Figure 14, section 2.5.3. Known correlations and derived thermodynamic relations were
compiled into a program on a computer to determine mass and energy balances for each of the
Licentiate Thesis/Joseph Olwa
42
components of the system. Temperatures, pressures and mass flow rates of the gas stream were
determined at every mass entry and exit points for each component. Key assumptions included
the following:
1. Ambient conditions assumed for the model runs were 25oC (298K) and 101.3 kPa
2. Thermodynamic properties taken from the air and gas property tables at the relevant
temperatures and pressures.
3. Heat transfer coefficient determined as average for gas and air stream at inlet and outlet
conditions.
4. An average moisture content of 20% for the raw biomass fuel was used, which provided
a fuel with a heating value of 17 MJ/kg.
5. Heat exchanger effectiveness was assumed to be 0.85
6. Ideal gas behavior was assumed for the gas streams.
7. Total Pressure loss allowable in the system was 4% of the compressor output pressure.
Mass and energy balance for the gasifier and combustor units modeled were determined by taking
a control volume approach, whereby the first law of thermodynamics and the law of conservation
of mass and energy were applied to arrive at the final gas properties. Air mass flow rate of 0.612
kg/s for the Rover IS/60 GT was used as input data for air flow quantity in the program. The
airflow and the specified compressor isentropic efficiency of 78% were used as input into the
program to determine the unknown compressor outlet temperature. The parameters that could
be varied were turbine inlet and outlet temperatures, air mass flow rate, fuel consumption and
pressure ratio.
Relations were then developed to depict the power output of the turbine over a range of
conditions, which depended on the amount of biomass energy available and on the maximum
TIT that could be achieved. These relations, together with the heat exchanger and turbine model
were used to determine the pressure, temperature and mass flow rate at major locations in the
modeled EFGT system.
3.3 Results and Discussion on EFGT Technical Performance
Figures 15a shows the variation of total system efficiency with pressure ratio at different values of
TIT. Looking at the system performance, system efficiency depended on TIT. Lower values of
pressure ratio at moderate TIT gave better efficiency. At 900 K the overall system efficiency was
determined to be about 9%, and at 1000 K, about the maximum temperature for a low alloy steel
heat exchanger, efficiency was about 13%. At 1300 K it was almost 21%, but at that temperature
the system would require special alloy steel or ceramic heat exchangers. Optimum pressure ratio
over the compressor was determined to be about 3.4. All these values are obtained without
recuperation.
The variation of net power with pressure ratio for different values of TIT is shown in Figure 15b
where net power was found to be depended on both pressure ratio and TIT. Lower temperature
resulted into low power output just like in a conventional GT. In this case the maximum net
power output for a given TIT was represented by pressure in the range of 3.0- 4.5 bar. Therefore,
the EFGT system would be operated at low pressure ratio for a desired TIT in order to realize
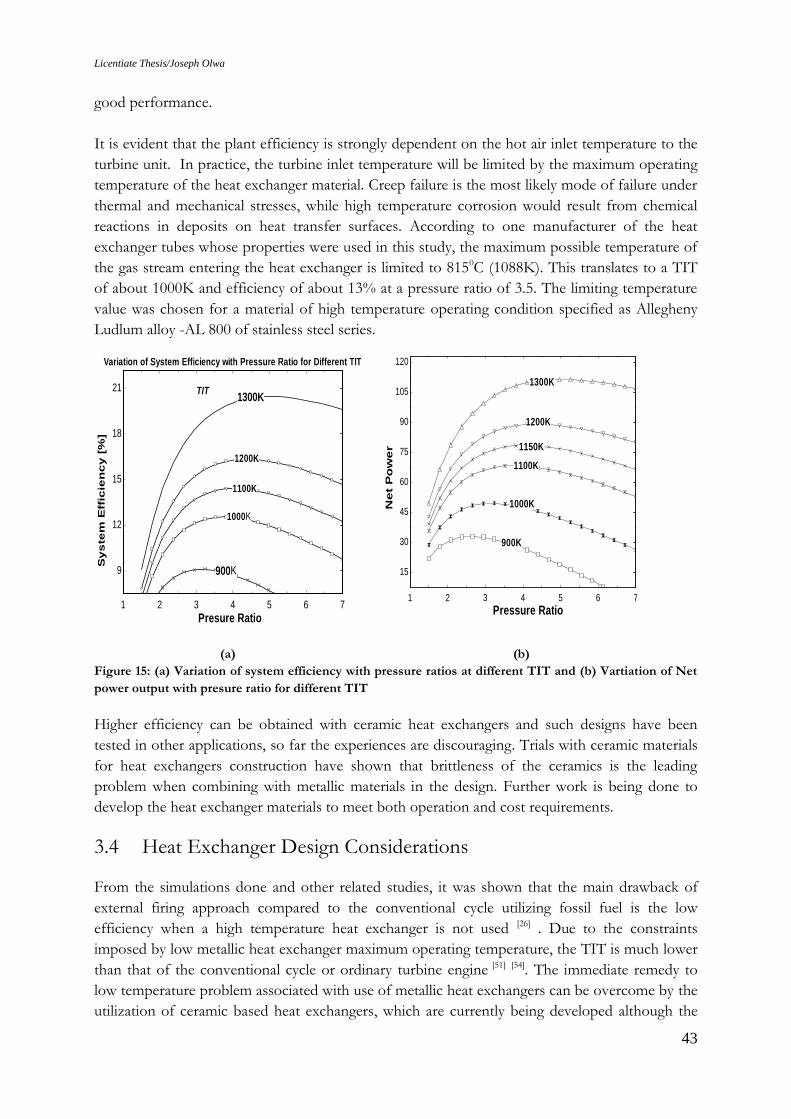
Licentiate Thesis/Joseph Olwa
43
good performance.
It is evident that the plant efficiency is strongly dependent on the hot air inlet temperature to the
turbine unit. In practice, the turbine inlet temperature will be limited by the maximum operating
temperature of the heat exchanger material. Creep failure is the most likely mode of failure under
thermal and mechanical stresses, while high temperature corrosion would result from chemical
reactions in deposits on heat transfer surfaces. According to one manufacturer of the heat
exchanger tubes whose properties were used in this study, the maximum possible temperature of
the gas stream entering the heat exchanger is limited to 8150C (1088K). This translates to a TIT
of about 1000K and efficiency of about 13% at a pressure ratio of 3.5. The limiting temperature
value was chosen for a material of high temperature operating condition specified as Allegheny
Ludlum alloy -AL 800 of stainless steel series.
(a) (b)
Figure 15: (a) Variation of system efficiency with pressure ratios at different TIT and (b) Vartiation of Net
power output with presure ratio for different TIT
Higher efficiency can be obtained with ceramic heat exchangers and such designs have been
tested in other applications, so far the experiences are discouraging. Trials with ceramic materials
for heat exchangers construction have shown that brittleness of the ceramics is the leading
problem when combining with metallic materials in the design. Further work is being done to
develop the heat exchanger materials to meet both operation and cost requirements.
3.4 Heat Exchanger Design Considerations
From the simulations done and other related studies, it was shown that the main drawback of
external firing approach compared to the conventional cycle utilizing fossil fuel is the low
efficiency when a high temperature heat exchanger is not used [26] . Due to the constraints
imposed by low metallic heat exchanger maximum operating temperature, the TIT is much lower
than that of the conventional cycle or ordinary turbine engine [51] [54]. The immediate remedy to
low temperature problem associated with use of metallic heat exchangers can be overcome by the
utilization of ceramic based heat exchangers, which are currently being developed although the
1 2 3 4 5 6 7
9
12
15
18
21
Presure Ratio
Sy
ste
m E
ffic
ien
cy
[%
]
1300K
1200K
900K
1000K
1100K
TIT
Variation of System Efficiency with Pressure Ratio for Different TIT
1 2 3 4 5 6 7
15
30
45
60
75
90
105
120
Pressure Ratio
Ne
t P
ow
er
1100K
1300K
900K
1200K
1000K
1150K
Licentiate Thesis/Joseph Olwa
44
cost involved is quite unfavorable at the moment. The heat exchanger design, therefore, involve
challenges related to; the high operating temperatures, pressure losses and fouling on the heat
transfer surfaces. Currently, there are no off-the-shelves heat exchangers designed for service
conditions that can be adopted in the EFGT system, especially for application with biomass fuels
through a gasification process. The operating condition requires a high temperature material,
which can withstand continuous operation above 850oC and easy to service. In light of the
maintenance concern, the shell and tube heat exchanger was found suitable for this application.
The tubes can be designed with single passes that can allow for easy cleaning by mechanical
means (manually).
According to Mueller [55], the gas stream in the tube of a shell-and-tube heat exchanger should be
selected, in this case, as one having more fouling tendency, which was the criteria utilized in this
work. Single tube pass design was considered for passage of hot gas stream for the purpose of
easy cleaning, and TEMA type E shell was selected with baffles to approximate a counter flow
pattern. The design was carried out using ASME Boiler and Pressure Vessel Code, Section VIII
and TEMA codes, which are accepted codes used in the USA and many other developed nations.
Thermal design analysis resulted into a surface area with a safety factor of 1.1, and the result of
thermal design calculations is shown in Table 8.
3.5 Consideration of Uncertainty in the Heat Exchanger Design
In the thermal design of a heat exchanger, parameters used to arrive at a required size of the
exchanger are derived from physical properties such as; thermal conductivity, density of fluid
stream, viscosity and specific heat.
These parameters are not exactly known; therefore, they are taken at their mean values for the
calculations involved. It is apparent that the choices of mean values for properties and
dimensions carry with it the inherent uncertainties in the quantities which they represent, as
functions. Some of the examples include pipe dimensions not being uniform, fouling factors of
the fluid stream cannot be measured exactly, and values for heat transfer coefficient are spread
about the mean. It was noted that the important unknowns in the design of a single phase gas
heat exchanger are:
The nature and degree of fouling
Local heat transfer variations in the heat exchanger
The exact fluid stream flow and velocities on the shell side
Most design methods available in literature have assumptions such as constant parameter values
for shell-side and tube-side, taking shell-side cross flow area at the center, and properties of fluid
taken at the average temperatures. More of this is discussed by Frank [56]. Considerations of these
assumptions paved way for safety factor inclusion to allow for uncertainties in the heat transfer
equations that are normally up to 20-30 % in the best of the design methods as mentioned by
Gupta [57].
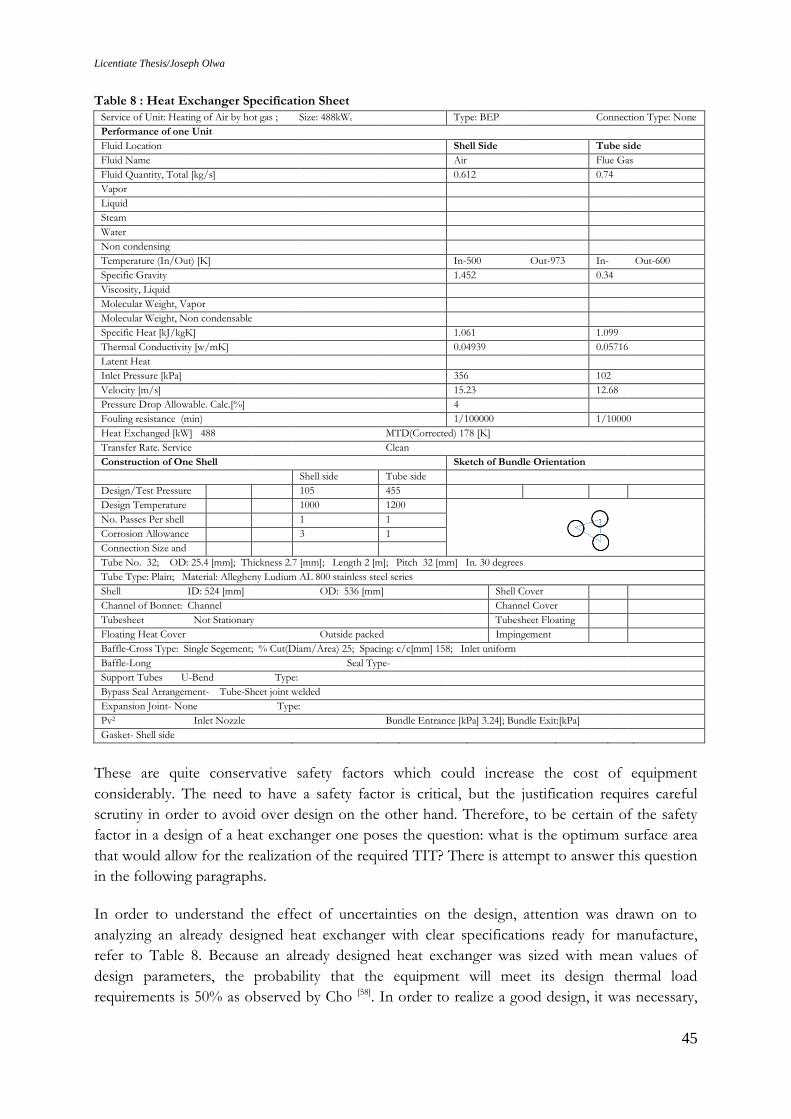
Licentiate Thesis/Joseph Olwa
45
Table 8 : Heat Exchanger Specification Sheet
Service of Unit: Heating of Air by hot gas ; Size: 488kWt Type: BEP Connection Type: None
Performance of one Unit
Fluid Location Shell Side Tube side
Fluid Name Air Flue Gas
Fluid Quantity, Total [kg/s] 0.612 0.74
Vapor
Liquid
Steam
Water
Non condensing
Temperature (In/Out) [K] In-500 Out-973 In-
1088
Out-600
Specific Gravity 1.452 0.34
Viscosity, Liquid
Molecular Weight, Vapor
Molecular Weight, Non condensable
Specific Heat [kJ/kgK] 1.061 1.099
Thermal Conductivity [w/mK] 0.04939 0.05716
Latent Heat
Inlet Pressure [kPa] 356 102
Velocity [m/s] 15.23 12.68
Pressure Drop Allowable. Calc.[%] 4
Fouling resistance (min) 1/100000 1/10000
Heat Exchanged [kW] 488 MTD(Corrected) 178 [K]
Transfer Rate. Service Clean
Construction of One Shell Sketch of Bundle Orientation
Shell side Tube side
Design/Test Pressure
[kPa]
105 455
Design Temperature
[K]
1000 1200
No. Passes Per shell 1 1
Corrosion Allowance
[mm]
3 1
Connection Size and
Rating
Tube No. 32; OD: 25.4 [mm]; Thickness 2.7 [mm]; Length 2 [m]; Pitch 32 [mm] In. 30 degrees
Tube Type: Plain; Material: Allegheny Ludium AL 800 stainless steel series
Shell ID: 524 [mm] OD: 536 [mm] Shell Cover
Removable
Channel of Bonnet: Channel Channel Cover
Removable
Tubesheet Not Stationary Tubesheet Floating
Floating Heat Cover Outside packed Impingement
Protection -None
Baffle-Cross Type: Single Segement; % Cut(Diam/Area) 25; Spacing: c/c[mm] 158; Inlet uniform
Baffle-Long Seal Type-
Support Tubes U-Bend Type:
Bypass Seal Arrangement- Tube-Sheet joint welded
Expansion Joint- None Type:
Pv2 Inlet Nozzle Bundle Entrance [kPa] 3.24]; Bundle Exit:[kPa]
Gasket- Shell side
These are quite conservative safety factors which could increase the cost of equipment
considerably. The need to have a safety factor is critical, but the justification requires careful
scrutiny in order to avoid over design on the other hand. Therefore, to be certain of the safety
factor in a design of a heat exchanger one poses the question: what is the optimum surface area
that would allow for the realization of the required TIT? There is attempt to answer this question
in the following paragraphs.
In order to understand the effect of uncertainties on the design, attention was drawn on to
analyzing an already designed heat exchanger with clear specifications ready for manufacture,
refer to Table 8. Because an already designed heat exchanger was sized with mean values of
design parameters, the probability that the equipment will meet its design thermal load
requirements is 50% as observed by Cho [58]. In order to realize a good design, it was necessary,
Licentiate Thesis/Joseph Olwa
46
therefore to consider uncertainty analysis for all major design parameters. The most
representative of these parameters in the determination of the exchanger surface area are the heat
transfer coefficient values and the fouling factors of fluid streams involved. Assuming that all
parameters fall within error limits following a normal distribution, sometimes referred to as
Gaussian distribution, the degree of data spread around the mean value can be quantified using
the concept of standard deviation. To obtain a normal distribution a recorded occurrence of an
event many times is required, but in this case there was no such data to begin with. Therefore, a
basis to build on was necessary so that a normal distribution could be realized from the available
data. This then prompted the idea of Monte Carlo simulation method discussed in the next
section.
3.6 Simulation to Determine Heat Exchanger Design Uncertainties
3.6.1 Monte Carlo simulation
A Monte Carlo method was used to carry out this simulation. The name Monte Carlo was coined
by S. Ulam and Nicholas Metropolis in reference to the games of Chance, a popular attraction in
Monte Carlo, Monaco [59]. One of the advantages of the method in simulating real systems is the
ability to take into account randomness, by investigating hundreds of thousands of different
scenarios. The results are then compiled and used to make decisions.
A Monte Carlo method is a technique that involves using random numbers and probability to
solve problems. In this simulation method, the random selection process is repeated many times
to create multiple scenarios. Each time a value is randomly selected, it forms one possible
scenario and solution to the problem. Together, these scenarios give a range of possible
solutions, some are more probable, others less. These values are taken from within a fixed range
and selected to fit a probability distribution like the Gauss distribution curve, commonly referred
to as the bell shape curve. The outcome is always within a specified range and there is an equal
opportunity for any number to be the outcome within the specified range. The maximum and
minimum values are obtained from known real occurrences of deviations of parameters within a
certain limit. The accuracy of this method can be improved by simulating more scenarios. In fact,
the accuracy of a Monte Carlo simulation is proportional to the square root of the number of
scenarios used. This method is advantageous because it is a direct application approach that is
able to solve a problem for which no other solution methods exist.
Computer simulation was carried out with a model to imitate a real life scenario and to make
predictions on anticipated events. The model was created in Microsoft Excel windows
application, and a certain number of input variables i.e. heat transfer coefficient, fouling factor
and tube thickness values were employed in the model which gave a set of outputs. This model
was deterministic. The program could iteratively evaluate the deterministic model using sets of
random numbers as inputs which resulted into a creation of a stochastic model.
Licentiate Thesis/Joseph Olwa
47
3.6.2 Application of Monte Carlo
Multiple trials were implemented by propagating a basic formula as many times as the number of
iterations required for better approximation of the real situation could be used. Consider the
parameters expressed in Equation 1; each parameter had a value contained between the
maximum and minimum values as specified by their individual error limits. In other words, the
fluid stream properties were defined at inlet and outlet temperatures within their error limits.
Each of those parameters had a unique distribution and it was assume acceptable to have a
uniform distribution without compromising the results. The imperative assumption was that
parameters were mutually exclusive, which implied that variations in one did not influence
another.
))/(/1(()/)(/()/1((
1
ioifmowfoo
cofAAhiRAAkwRh
[Equation 1]
[Equation 1]
Where:
µcof, heat transfer coefficient
foR , fouling resistance on the outside of the tube surface
oh , heat transfer coefficient on the outside of the tube surface
ih , heat transfer coefficient on the inside of the tube surface
w, tube wall thickness
Ao , tube outside surface area
Am, arithmetic mean of surface area defined as 2
)( io DDL with Do and Di being the tube
outside and inside diameters respectively
kw , thermal conductivity of the wall material
Rfi, fouling resistance on the inside of the tube surface
Therefore, the total surface area was a random variable determined within the minimum and
maximum values of the solutions generated. Since the exchanger surface area calculated formed a
variable of random numbers, it was expected to be a normal distribution, which was the reason
why individual distributions of each variable were not important. The input parameters were
then; heat transfer coefficient of the fluid streams, fouling factors and the tube thickness. Table 9
gives the ranges for the parameters employed in the calculations.
Table 9: Some of the maximum and minimum values of parameters used in Monte Carlo Simulation
Max. value Min. Value
Heat transfer coefficient gas [W/m2K] 28.76 19.17
Heat transfer coefficient air [W/m2K] 58.28 38.85
Tube thickness (t) [mm] 2.64 3.45
Fouling 1/10000 1/100000
Heat transfer coefficient is dependent on the Reynolds number, Prandtl number and the thermal
conductivity of the fluid stream involved. It varies with the given parameters according to the
Licentiate Thesis/Joseph Olwa
48
flow geometry and the temperature of the fluid stream. Therefore in determining its values there
are uncertainties incurred inherited from the input parameters causing its value to vary over some
average. Also the empirical correlations as such are associated with uncertainties. Here an error
limit of 20% is used. The tube thickness limits were determined using the specified ASTM
standard for tubes with thickness, t, expressed as 0.2tn < t < 0.125tn, where tn is the mean
thickness. Fouling resistances were read from fouling resistance tables for air and flue gases.
At first the random values for each input were generated from the bounded values, and later the
area required was calculated using the generated results. The resulting area was then the mean
value of those area values for all the runs. As mentioned above, the task commenced by
generating random values for each of the parameters within their error bounds, and assuming a
uniform distribution, the RAN ( ) function was used to generate random numbers in the interval
(0, 1) and multiplied these by the range of each variable as presented in Equation 2. The range
was defined as the difference between the maximum and minimum values. This is expressed
below and it generates random numbers in between maximum and minimum values of the
specified range. RAN ( ) x (Maximum - Minimum) + Minimum [Equation 2]
3.6.3 Determination of number of iterations
The Monte Carlo method provides an estimate of the expected value of a random variable and
predicts the estimation error, which is inversely proportional to the square root of the number of
iterations. The total error ε is defined by using three standard deviations (3σ) expressed in the
Equation 3.
N
3 [Equation 3]
Where, σ is the standard deviation of the random variable estimated with upper bound and N as
the number of iterations. This calculation of the standard deviation is carried out of the
maximum, the minimum and average values of the random variables as expected value from the
Microsoft Excel windows application spread sheet function STDEVP( ).
The expected surface area was calculated as the random variable average for the surface using the
function AVERAGE ( ) in excel spreadsheet. The 3σ accounts for the 99.7% of the sample
population being studied in this case for a normal distribution.
The limits for the physical parameters such as tubes internal diameters were taken from the
ASTM specified variations, temperature variations where determined through calculations using
Logarithm Mean temperature. The mean and standard deviations for the surface area were
determined for 10000 runs.
3.7 Discussion on Uncertainty Analysis Results
Turbine inlet temperature, TIT, depends on the amount of heat transferred to the compressed air
flowing to the turbine. This is dependent on the heat exchanger tubes total surface area , which is
first determined using the sizing method. The expression for relation between TIT and total
exchanger surface area is shown in Equation 4 below.
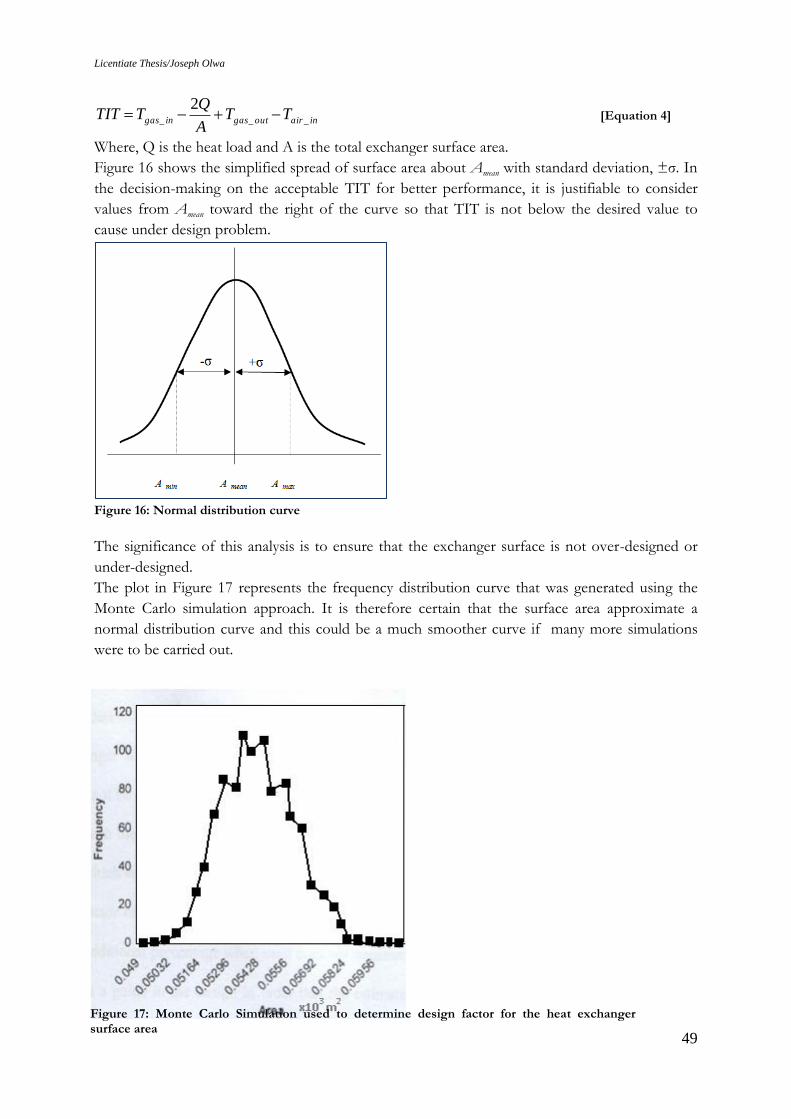
Licentiate Thesis/Joseph Olwa
49
inairoutgasingas TTA
QTTIT ___
2 [Equation 4]
Where, Q is the heat load and A is the total exchanger surface area.
Figure 16 shows the simplified spread of surface area about Amean with standard deviation, ±σ. In
the decision-making on the acceptable TIT for better performance, it is justifiable to consider
values from Amean toward the right of the curve so that TIT is not below the desired value to
cause under design problem.
Figure 16: Normal distribution curve
The significance of this analysis is to ensure that the exchanger surface is not over-designed or
under-designed.
The plot in Figure 17 represents the frequency distribution curve that was generated using the
Monte Carlo simulation approach. It is therefore certain that the surface area approximate a
normal distribution curve and this could be a much smoother curve if many more simulations
were to be carried out.
Figure 17: Monte Carlo Simulation used to determine design factor for the heat exchanger surface area

Licentiate Thesis/Joseph Olwa
50
The mean of surface area gave an error limit of 15.51%, which can be interpreted as the safety
factor equivalent to 1.155. The surface area determined by analytical method was 49m2 and that
obtained by using simulation method gave approximately 54 m2. These two values had a
difference of about 5m2 which is 9.3% variation. The difference between analytical and simulated
results can be attributed to the use of average values of parameters at inlet and outlet conditions.
It is most likely that the average values of heat transfer coefficient were overestimated in the
analytical method, which resulted into a small exchanger surface area. Simulation offered a better
result considering the common practice where safety is a major indicator in determining a heat
exchanger surface area.
Therefore, the 15.5% error on the surface area seem to indicate that the 20-30% factors
commonly employed in practice, which looks very conservative, can be acceptable to cover up
for the uncertainties of the fluid streams properties. It is desirable to maintain the exchanger
surface area to about and above the mean values determined so that the TIT is maintained at the
desired level for better performance of the turbine system.
3.8 Conclusions and Recommendation
In the EFGT system, the heat exchanger is the critical component whose
performance affects the whole system efficiency.
Optimal performance of the EFGT system can be achieved at low air pressure ratio
of about 3.4 and at moderate TIT of about 1000K.
TIT depends on the heat exchanger effectiveness, which also depends on the
maximum allowable heat exchanger material operating temperature in the EFGT
system. TIT determines the EFGT system efficiency.
In the design of shell and tube heat exchanger for EFGT system, design factor of
over 1.2 is sufficient to employ.
There is need for further studies on the fouling levels in the EFGT system heat
exchanger unit, especially due to alkali metal compound deposition.
Licentiate Thesis/Joseph Olwa
51
4. Alkali Metal Compounds Retention in an Updraft
Gasifier
4.1 Introduction
There is a growing interest in biomass gasification application with gas turbine (GT) mostly for
small scale power plants. GT systems present great potential in the biomass gasification industry
where small scale applications with steam turbines are not economically viable [60]. However, there
are challenges met when operating GT with product gas from biomass gasification. One major
challenge in the application of biomass fuel relates to the product gas quality. The generated gas
requires proper treatment to avoid deleterious effects it can cause in ferrous materials for high
temperature applications. With careful consideration, the GT industry developed criteria for
product gas quality for applications with GT. The meeting of the criteria is significant to
achieving effective operations with biomass fuels in GT.
The goal of biomass gasification is to obtain a combustible product gas, but many undesirable
constituents are formed in the process. Of particular interest in this study are the alkali metals,
which occur naturally in raw biomass fuel as free elements and as complex compounds. These
alkalis in their various forms are vaporized during a thermal gasification process and their vapors
react to form inorganic compounds of salts and oxides. The alkali may bind with one or more of
the following elements: calcium, chlorine and sulfur (Ca, Cl and S). Entrainment of some of the
new compounds formed in the generated product gas stream is very detrimental to the service
life of the downstream equipment. Studies have shown that the alkalis are in vapor state at
temperatures above 800oC in the biomass gasification process [61], [39]. The most problematic are K
and Na salts. Their quantity in the gas phase in an updraft gasifier is not known, and whether
some proportion are entrapped in the fuel bed and later transported to the ash bed there is no
literature available.
The objective of this study was to establish the extent of the alkalis retention in an updraft
gasifier intended for application with the EFGT system. In the EFGT system a heat exchanger
medium is integrated to obviate the direct use of adulterated producer gas in the GT, see section
2.5.3 for details and the work of Kautz and Hansen [62] for further discussions on EFGT system.
An updraft gasifier was chosen for this study because of the relatively high calorific value gas it
produce, better thermal efficiency, and for the alkali metals retention potential anticipated, among
others. Experiments were carried out to generate product gas with the fuel feed and airflow rates
chosen to resemble those used in an experiment by Di Blasi et al [63] to allow some comparisons
with a bench scale gasification experiment. The gases realized were analyzed for contents of alkali
metals and gas composition.
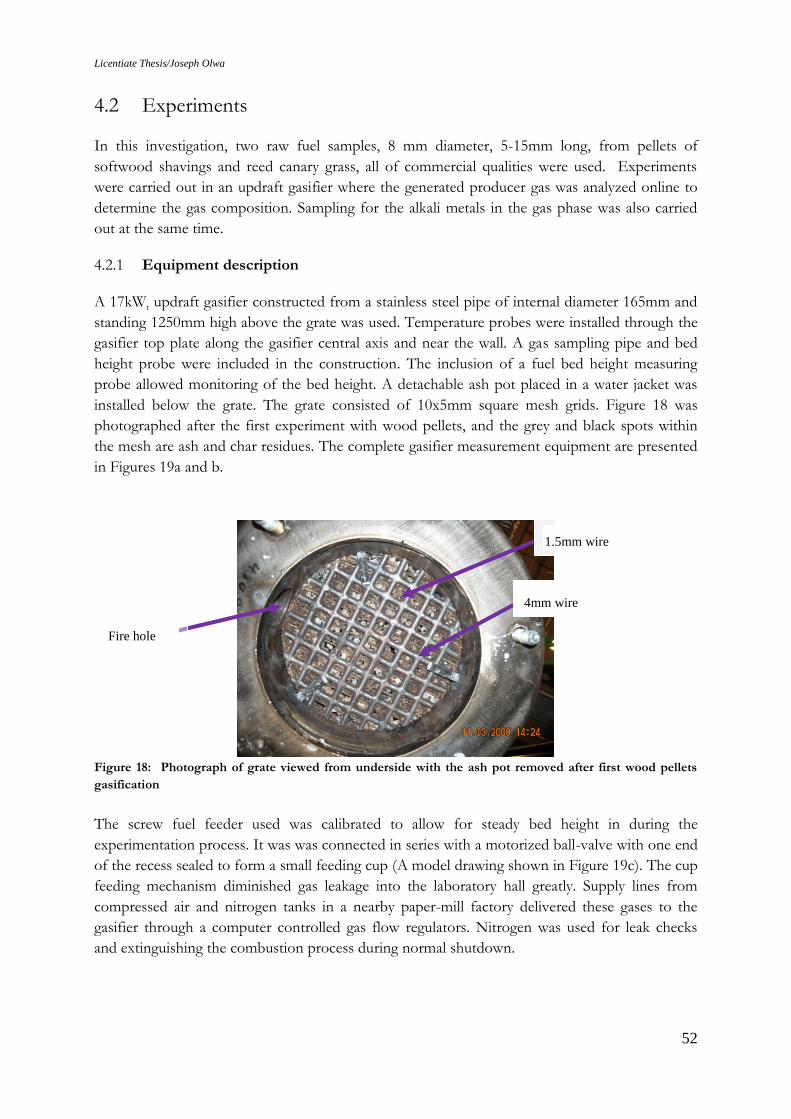
Licentiate Thesis/Joseph Olwa
52
4.2 Experiments
In this investigation, two raw fuel samples, 8 mm diameter, 5-15mm long, from pellets of
softwood shavings and reed canary grass, all of commercial qualities were used. Experiments
were carried out in an updraft gasifier where the generated producer gas was analyzed online to
determine the gas composition. Sampling for the alkali metals in the gas phase was also carried
out at the same time.
4.2.1 Equipment description
A 17kWt updraft gasifier constructed from a stainless steel pipe of internal diameter 165mm and
standing 1250mm high above the grate was used. Temperature probes were installed through the
gasifier top plate along the gasifier central axis and near the wall. A gas sampling pipe and bed
height probe were included in the construction. The inclusion of a fuel bed height measuring
probe allowed monitoring of the bed height. A detachable ash pot placed in a water jacket was
installed below the grate. The grate consisted of 10x5mm square mesh grids. Figure 18 was
photographed after the first experiment with wood pellets, and the grey and black spots within
the mesh are ash and char residues. The complete gasifier measurement equipment are presented
in Figures 19a and b.
Figure 18: Photograph of grate viewed from underside with the ash pot removed after first wood pellets
gasification
The screw fuel feeder used was calibrated to allow for steady bed height in during the
experimentation process. It was was connected in series with a motorized ball-valve with one end
of the recess sealed to form a small feeding cup (A model drawing shown in Figure 19c). The cup
feeding mechanism diminished gas leakage into the laboratory hall greatly. Supply lines from
compressed air and nitrogen tanks in a nearby paper-mill factory delivered these gases to the
gasifier through a computer controlled gas flow regulators. Nitrogen was used for leak checks
and extinguishing the combustion process during normal shutdown.
1.5mm wire
4mm wire
Fire hole
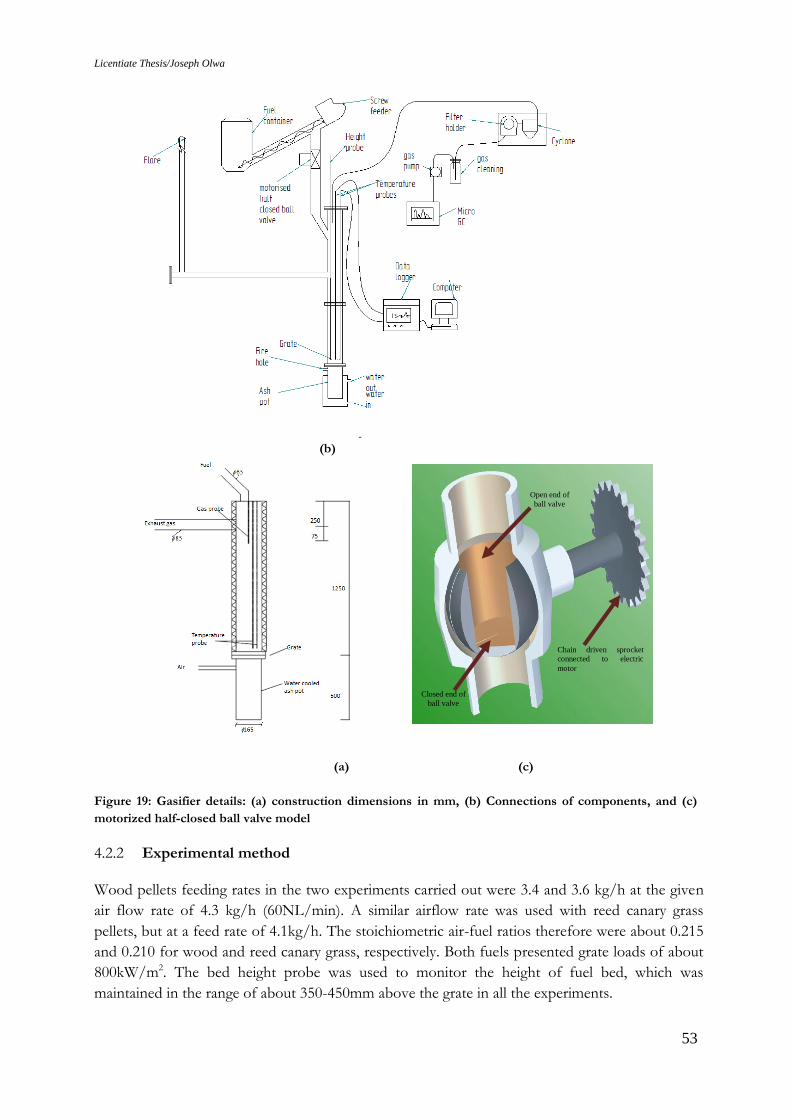
Licentiate Thesis/Joseph Olwa
53
(b)
(a) (c)
Figure 19: Gasifier details: (a) construction dimensions in mm, (b) Connections of components, and (c)
motorized half-closed ball valve model
4.2.2 Experimental method
Wood pellets feeding rates in the two experiments carried out were 3.4 and 3.6 kg/h at the given
air flow rate of 4.3 kg/h (60NL/min). A similar airflow rate was used with reed canary grass
pellets, but at a feed rate of 4.1kg/h. The stoichiometric air-fuel ratios therefore were about 0.215
and 0.210 for wood and reed canary grass, respectively. Both fuels presented grate loads of about
800kW/m2. The bed height probe was used to monitor the height of fuel bed, which was
maintained in the range of about 350-450mm above the grate in all the experiments.
Closed end of
ball valve
Open end of
ball valve
Chain driven sprocket
connected to electric
motor
Licentiate Thesis/Joseph Olwa
54
Product gas mixed with methane was ignited in a simple gas combustor connected to the gasifier
outlet. A self-sustaining flame from the product gas combustion was realized after the first 10
minutes of run. Steady conditions were determined by the stabilization of the temperature values
being read from all thermocouples installed in the gasifier. Temperature values were recorded and
stored on a computer, and product gas composition was analyzed every 5 minutes and values were
recorded on a separate computer throughout the experiment.
4.2.3 Measurement technique and sampling methods
In order to understand the condition and behavior of our equipment, preliminary test runs were
conducted. This was to determine the necessary time needed to achieve stable temperature
conditions within the gasifier before sampling for the alkali metals could commence. Checks for
leakages in the system were done using an online Micro GC connected after the filters. Zero
sample analysis for the test Teflon filters was carried out using Inductively Coupled Plasma
Atomic Emission Spectroscopy/ Mass Spectroscopy (ICP-AES/MS). This was to determine the
inorganic element content and to identify the measurement method to employ. The analysis
results turned out that less than 1% of the filter content consisted of inorganic elements of interest
to this study. Therefore the content was within the recommended limit for applications with
filtration methods used in sampling of the alkali metals.
The Micro-GC was used online for gas analysis of samples drawn through the filters for quantities
of CO, CO2, H2, CH4, C2H2, C2H4, C2H6, N2 and O2. The constituent quantities were compared to
that obtained with the gas drawn without passing through the filters in order to identify any
leakage that may arise in the system. Temperature measurements were made at 9 points along the
central axis and near the wall inside the gasifier.
Temperature values read through an analogue digital converter were recorded on a computer.
After two hours of run, the filter holders with Teflon filters inside were first heated to about
220oC and at that temperature the producer gas was drawn using suction pump through the filters
to collect samples for about 50 minutes during sampling. This time allowed for isokinetic total
dust sampling in 1nm3 of gas drawn as required by the Standard BS EN13284-1 with the
exception, in this case that a 10 micron particles size limiting cyclone was connected upstream the
filter holder.
In the second experiment with wood pellets the producer gas drawn through the filters was
bubbled in distilled water as sorbent for alkali metal compounds in a gas wash bottle. The alkali
metal compounds that might have passed through the filters were finally retained in the water.
Earlier a zero analysis was carried out on the distilled water to ensure no appreciable amount of
the alkalis were present to interfere with sample integrity. The total concentration of K, Na, Ca,
Cl, S, Pb and V were determined from samples collected by total dust sampling and absorption in
gas wash bottles. The analyses of the dissolved elements were determined using X-ray Diffraction
(XRD) and Inductively Coupled Plasma Atomic Emission Spectroscopy/ Mass Spectroscopy
ICP-AES/MS methods. At the close of each experiment the gasification reaction was
extinguished using nitrogen gas. The retained char in the bed, un-burnt wall residues and ash on
grate and in the ash pot were analyzed. Quantitative analyses of the ash content for the
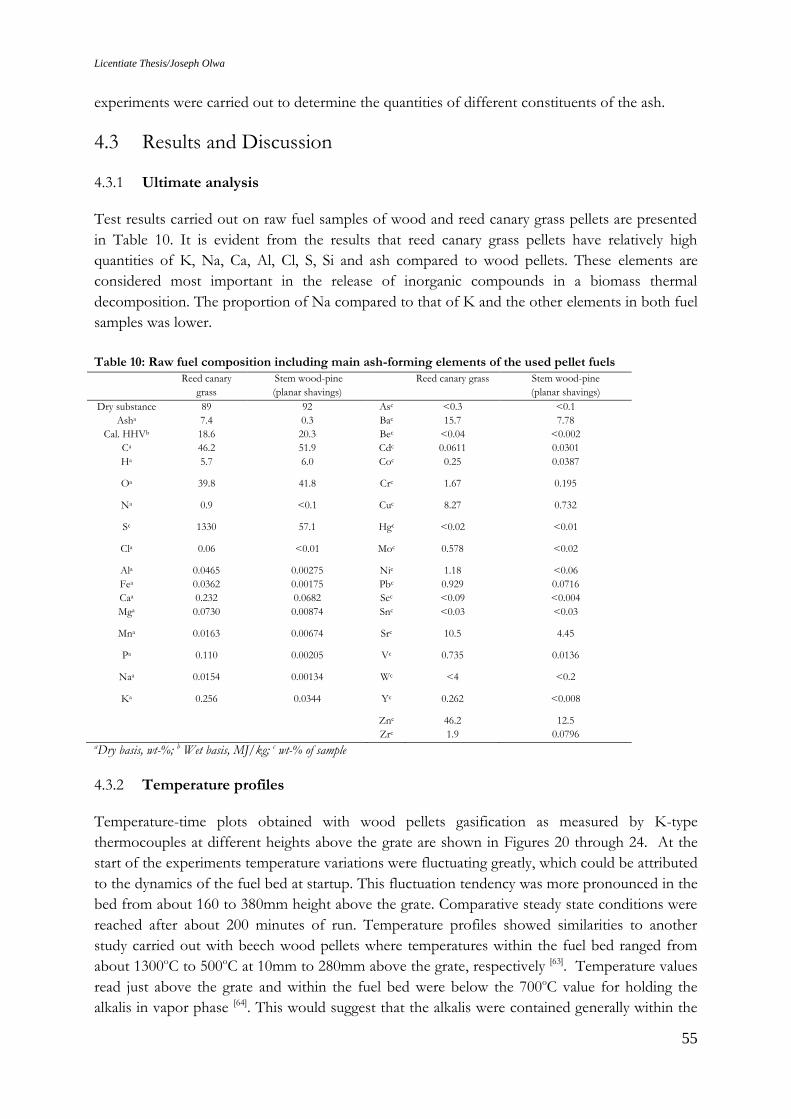
Licentiate Thesis/Joseph Olwa
55
experiments were carried out to determine the quantities of different constituents of the ash.
4.3 Results and Discussion
4.3.1 Ultimate analysis
Test results carried out on raw fuel samples of wood and reed canary grass pellets are presented
in Table 10. It is evident from the results that reed canary grass pellets have relatively high
quantities of K, Na, Ca, Al, Cl, S, Si and ash compared to wood pellets. These elements are
considered most important in the release of inorganic compounds in a biomass thermal
decomposition. The proportion of Na compared to that of K and the other elements in both fuel
samples was lower.
Table 10: Raw fuel composition including main ash-forming elements of the used pellet fuels
Reed canary
grass
Stem wood-pine
(planar shavings)
Reed canary grass
Stem wood-pine
(planar shavings)
Dry substance 89 92 Asc <0.3 <0.1
Asha 7.4 0.3 Bac 15.7 7.78
Cal. HHVb 18.6 20.3 Bec <0.04 <0.002
Ca 46.2 51.9 Cdc 0.0611 0.0301
Ha 5.7 6.0 Coc 0.25 0.0387
Oa 39.8 41.8 Crc 1.67 0.195
Na 0.9 <0.1 Cuc 8.27 0.732
Sc 1330 57.1 Hgc <0.02 <0.01
Cla 0.06 <0.01 Moc 0.578 <0.02
Ala 0.0465 0.00275 Nic 1.18 <0.06
Fea 0.0362 0.00175 Pbc 0.929 0.0716
Caa 0.232 0.0682 Scc <0.09 <0.004
Mga 0.0730 0.00874 Snc <0.03 <0.03
Mna 0.0163 0.00674 Src 10.5 4.45
Pa 0.110 0.00205 Vc 0.735 0.0136
Naa 0.0154 0.00134 Wc <4 <0.2
Ka 0.256 0.0344 Yc 0.262 <0.008
Znc 46.2 12.5
Zrc 1.9 0.0796 aDry basis, wt-%; b Wet basis, MJ/kg; c wt-% of sample
4.3.2 Temperature profiles
Temperature-time plots obtained with wood pellets gasification as measured by K-type
thermocouples at different heights above the grate are shown in Figures 20 through 24. At the
start of the experiments temperature variations were fluctuating greatly, which could be attributed
to the dynamics of the fuel bed at startup. This fluctuation tendency was more pronounced in the
bed from about 160 to 380mm height above the grate. Comparative steady state conditions were
reached after about 200 minutes of run. Temperature profiles showed similarities to another
study carried out with beech wood pellets where temperatures within the fuel bed ranged from
about 1300oC to 500oC at 10mm to 280mm above the grate, respectively [63]. Temperature values
read just above the grate and within the fuel bed were below the 700oC value for holding the
alkalis in vapor phase [64]. This would suggest that the alkalis were contained generally within the
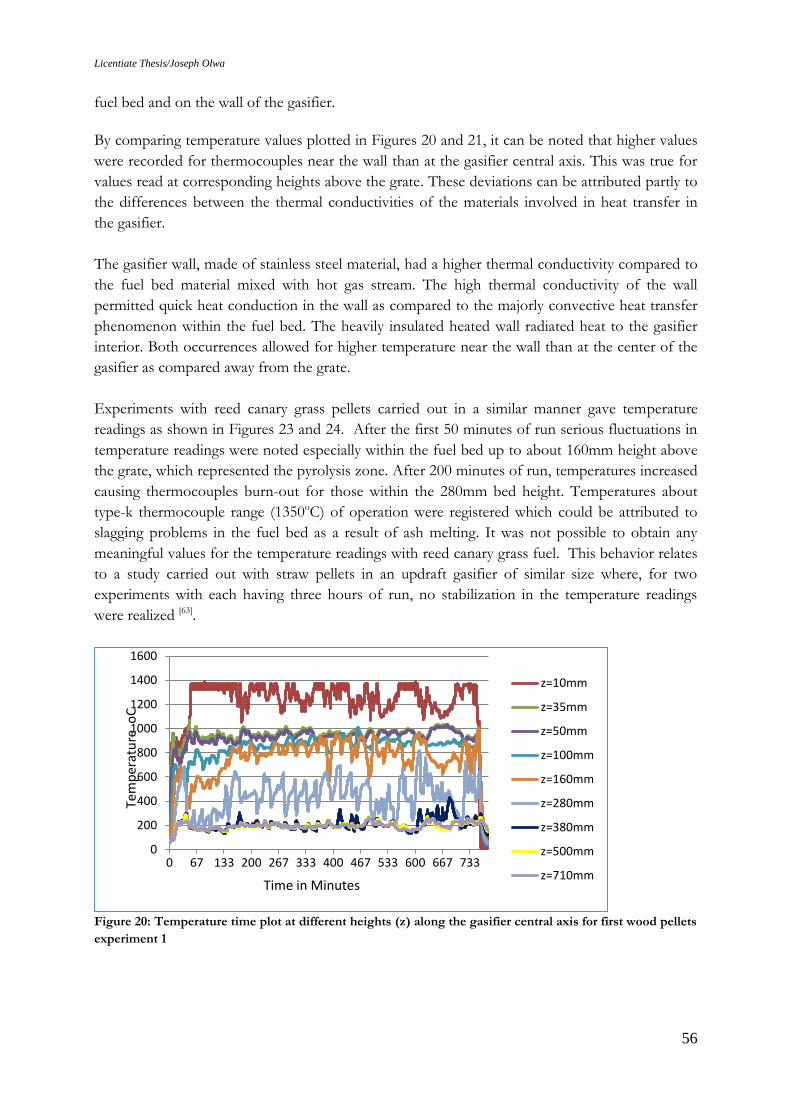
Licentiate Thesis/Joseph Olwa
56
fuel bed and on the wall of the gasifier.
By comparing temperature values plotted in Figures 20 and 21, it can be noted that higher values
were recorded for thermocouples near the wall than at the gasifier central axis. This was true for
values read at corresponding heights above the grate. These deviations can be attributed partly to
the differences between the thermal conductivities of the materials involved in heat transfer in
the gasifier.
The gasifier wall, made of stainless steel material, had a higher thermal conductivity compared to
the fuel bed material mixed with hot gas stream. The high thermal conductivity of the wall
permitted quick heat conduction in the wall as compared to the majorly convective heat transfer
phenomenon within the fuel bed. The heavily insulated heated wall radiated heat to the gasifier
interior. Both occurrences allowed for higher temperature near the wall than at the center of the
gasifier as compared away from the grate.
Experiments with reed canary grass pellets carried out in a similar manner gave temperature
readings as shown in Figures 23 and 24. After the first 50 minutes of run serious fluctuations in
temperature readings were noted especially within the fuel bed up to about 160mm height above
the grate, which represented the pyrolysis zone. After 200 minutes of run, temperatures increased
causing thermocouples burn-out for those within the 280mm bed height. Temperatures about
type-k thermocouple range (1350oC) of operation were registered which could be attributed to
slagging problems in the fuel bed as a result of ash melting. It was not possible to obtain any
meaningful values for the temperature readings with reed canary grass fuel. This behavior relates
to a study carried out with straw pellets in an updraft gasifier of similar size where, for two
experiments with each having three hours of run, no stabilization in the temperature readings
were realized [63].
Figure 20: Temperature time plot at different heights (z) along the gasifier central axis for first wood pellets
experiment 1
0
200
400
600
800
1000
1200
1400
1600
0 67 133 200 267 333 400 467 533 600 667 733
z=10mm
z=35mm
z=50mm
z=100mm
z=160mm
z=280mm
z=380mm
z=500mm
z=710mmTime in Minutes
Tem
per
atu
re o
C
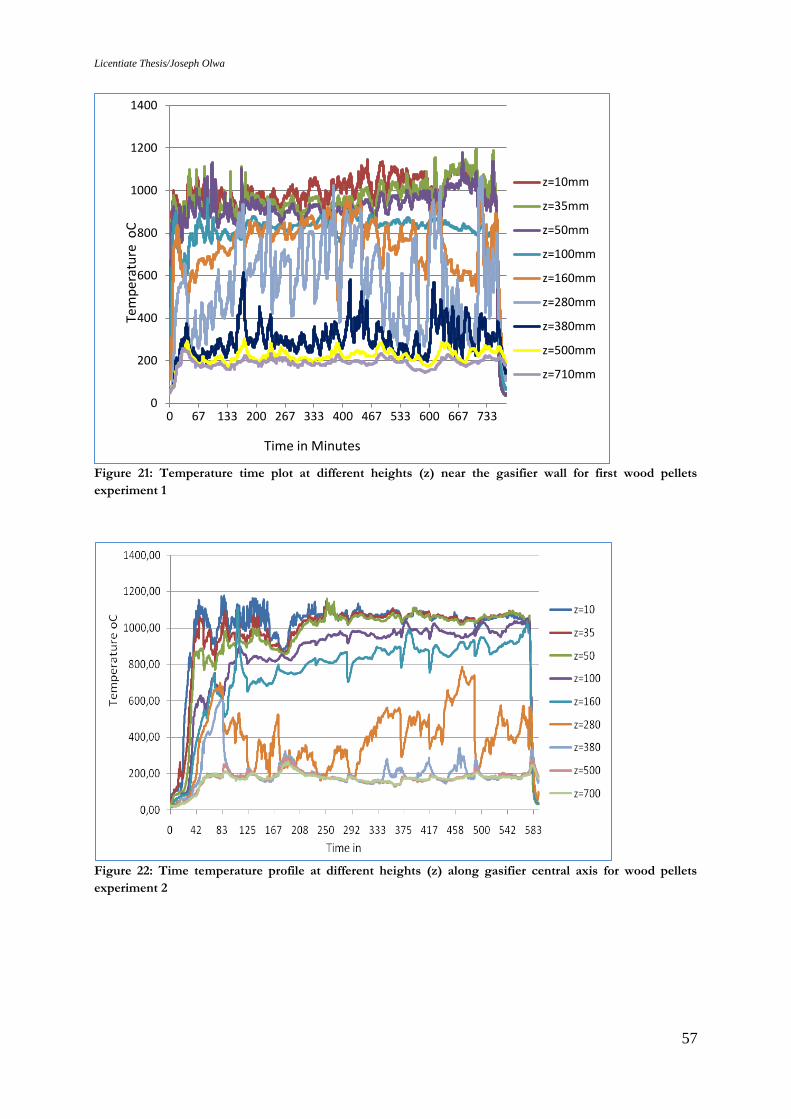
Licentiate Thesis/Joseph Olwa
57
Figure 21: Temperature time plot at different heights (z) near the gasifier wall for first wood pellets
experiment 1
Figure 22: Time temperature profile at different heights (z) along gasifier central axis for wood pellets
experiment 2
0
200
400
600
800
1000
1200
1400
0 67 133 200 267 333 400 467 533 600 667 733
z=10mm
z=35mm
z=50mm
z=100mm
z=160mm
z=280mm
z=380mm
z=500mm
z=710mm
Time in Minutes
Tem
per
atu
re o
C
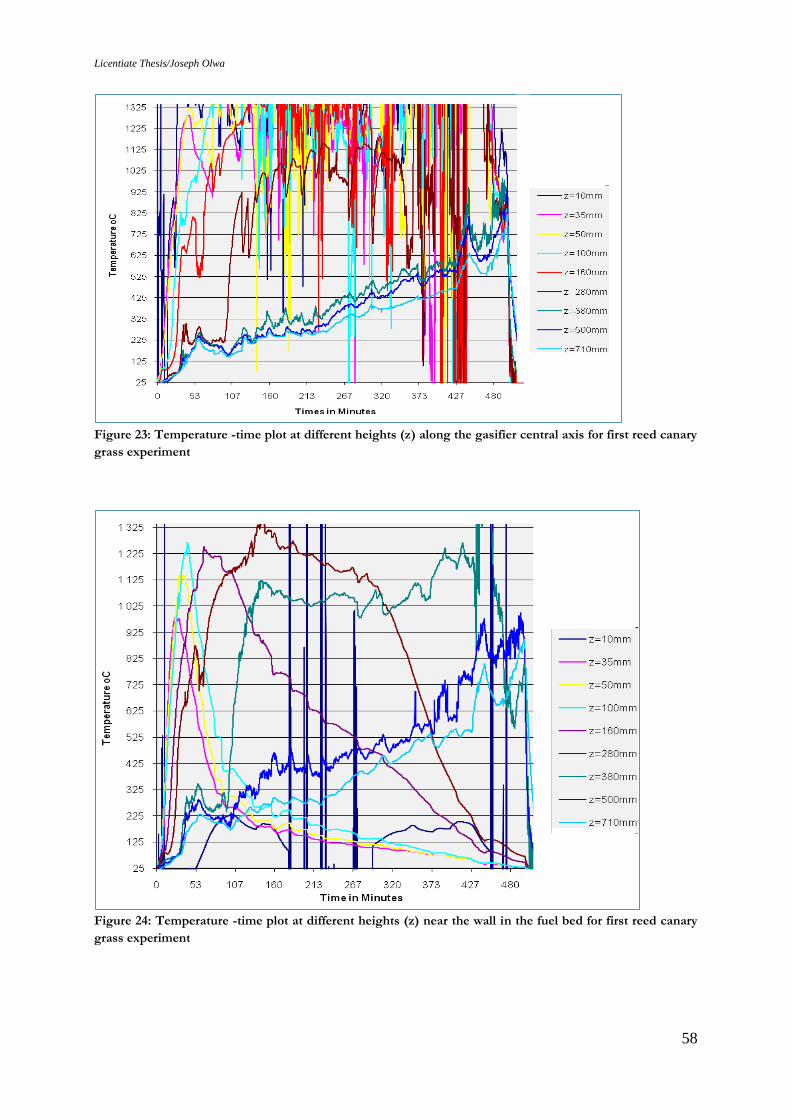
Licentiate Thesis/Joseph Olwa
58
Figure 23: Temperature -time plot at different heights (z) along the gasifier central axis for first reed canary
grass experiment
Figure 24: Temperature -time plot at different heights (z) near the wall in the fuel bed for first reed canary
grass experiment
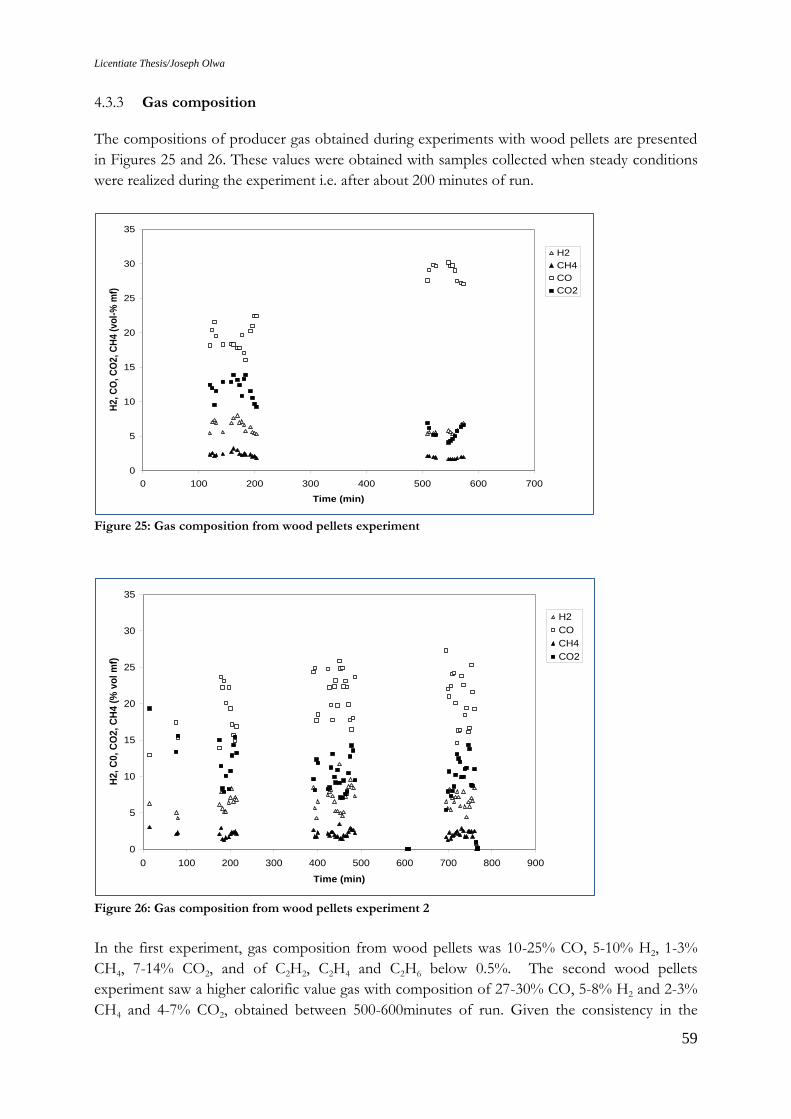
Licentiate Thesis/Joseph Olwa
59
4.3.3 Gas composition
The compositions of producer gas obtained during experiments with wood pellets are presented
in Figures 25 and 26. These values were obtained with samples collected when steady conditions
were realized during the experiment i.e. after about 200 minutes of run.
Figure 25: Gas composition from wood pellets experiment
Figure 26: Gas composition from wood pellets experiment 2
In the first experiment, gas composition from wood pellets was 10-25% CO, 5-10% H2, 1-3%
CH4, 7-14% CO2, and of C2H2, C2H4 and C2H6 below 0.5%. The second wood pellets
experiment saw a higher calorific value gas with composition of 27-30% CO, 5-8% H2 and 2-3%
CH4 and 4-7% CO2, obtained between 500-600minutes of run. Given the consistency in the
0
5
10
15
20
25
30
35
0 100 200 300 400 500 600 700
Time (min)
H2,
CO
, C
O2,
CH
4 (
vo
l-%
mf)
H2
CH4
CO
CO2
0
5
10
15
20
25
30
35
0 100 200 300 400 500 600 700 800 900
Time (min)
H2,
C0,
CO
2,
CH
4 (
% v
ol
mf)
H2
CO
CH4
CO2
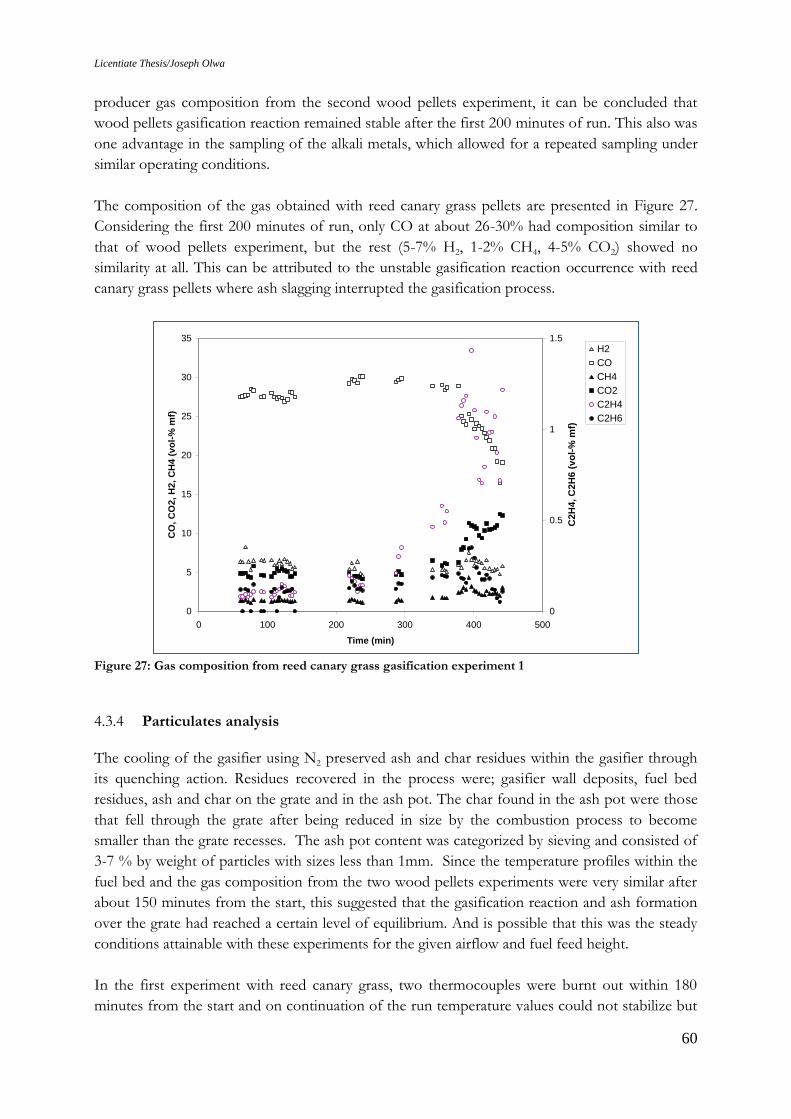
Licentiate Thesis/Joseph Olwa
60
producer gas composition from the second wood pellets experiment, it can be concluded that
wood pellets gasification reaction remained stable after the first 200 minutes of run. This also was
one advantage in the sampling of the alkali metals, which allowed for a repeated sampling under
similar operating conditions.
The composition of the gas obtained with reed canary grass pellets are presented in Figure 27.
Considering the first 200 minutes of run, only CO at about 26-30% had composition similar to
that of wood pellets experiment, but the rest (5-7% H2, 1-2% CH4, 4-5% CO2) showed no
similarity at all. This can be attributed to the unstable gasification reaction occurrence with reed
canary grass pellets where ash slagging interrupted the gasification process.
Figure 27: Gas composition from reed canary grass gasification experiment 1
4.3.4 Particulates analysis
The cooling of the gasifier using N2 preserved ash and char residues within the gasifier through
its quenching action. Residues recovered in the process were; gasifier wall deposits, fuel bed
residues, ash and char on the grate and in the ash pot. The char found in the ash pot were those
that fell through the grate after being reduced in size by the combustion process to become
smaller than the grate recesses. The ash pot content was categorized by sieving and consisted of
3-7 % by weight of particles with sizes less than 1mm. Since the temperature profiles within the
fuel bed and the gas composition from the two wood pellets experiments were very similar after
about 150 minutes from the start, this suggested that the gasification reaction and ash formation
over the grate had reached a certain level of equilibrium. And is possible that this was the steady
conditions attainable with these experiments for the given airflow and fuel feed height.
In the first experiment with reed canary grass, two thermocouples were burnt out within 180
minutes from the start and on continuation of the run temperature values could not stabilize but
0
5
10
15
20
25
30
35
0 100 200 300 400 500
Time (min)
CO
, C
O2,
H2,
CH
4 (
vo
l-%
mf)
0
0.5
1
1.5
C2H
4, C
2H
6 (
vo
l-%
mf)
H2
CO
CH4
CO2
C2H4
C2H6
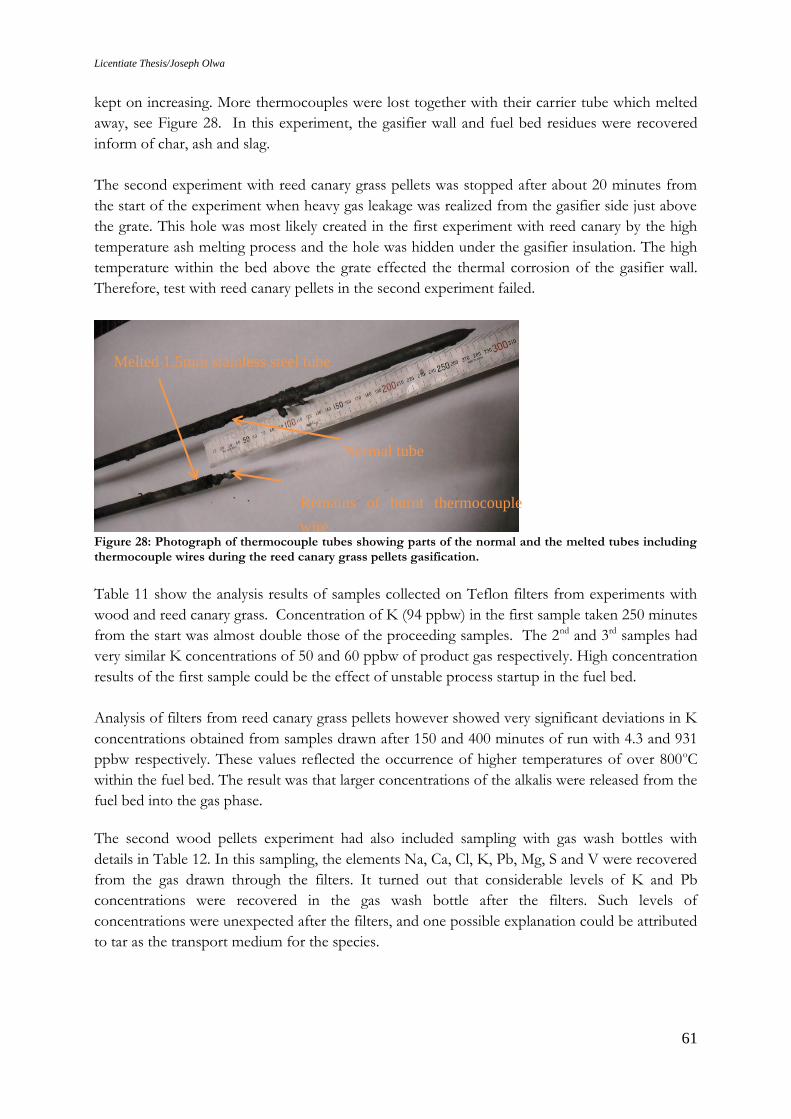
Licentiate Thesis/Joseph Olwa
61
kept on increasing. More thermocouples were lost together with their carrier tube which melted
away, see Figure 28. In this experiment, the gasifier wall and fuel bed residues were recovered
inform of char, ash and slag.
The second experiment with reed canary grass pellets was stopped after about 20 minutes from
the start of the experiment when heavy gas leakage was realized from the gasifier side just above
the grate. This hole was most likely created in the first experiment with reed canary by the high
temperature ash melting process and the hole was hidden under the gasifier insulation. The high
temperature within the bed above the grate effected the thermal corrosion of the gasifier wall.
Therefore, test with reed canary pellets in the second experiment failed.
Figure 28: Photograph of thermocouple tubes showing parts of the normal and the melted tubes including thermocouple wires during the reed canary grass pellets gasification.
Table 11 show the analysis results of samples collected on Teflon filters from experiments with
wood and reed canary grass. Concentration of K (94 ppbw) in the first sample taken 250 minutes
from the start was almost double those of the proceeding samples. The 2nd and 3rd samples had
very similar K concentrations of 50 and 60 ppbw of product gas respectively. High concentration
results of the first sample could be the effect of unstable process startup in the fuel bed.
Analysis of filters from reed canary grass pellets however showed very significant deviations in K
concentrations obtained from samples drawn after 150 and 400 minutes of run with 4.3 and 931
ppbw respectively. These values reflected the occurrence of higher temperatures of over 800oC
within the fuel bed. The result was that larger concentrations of the alkalis were released from the
fuel bed into the gas phase.
The second wood pellets experiment had also included sampling with gas wash bottles with
details in Table 12. In this sampling, the elements Na, Ca, Cl, K, Pb, Mg, S and V were recovered
from the gas drawn through the filters. It turned out that considerable levels of K and Pb
concentrations were recovered in the gas wash bottle after the filters. Such levels of
concentrations were unexpected after the filters, and one possible explanation could be attributed
to tar as the transport medium for the species.
Melted 1.5mm stainless steel tube
Remains of burnt thermocouple
wire
Normal tube
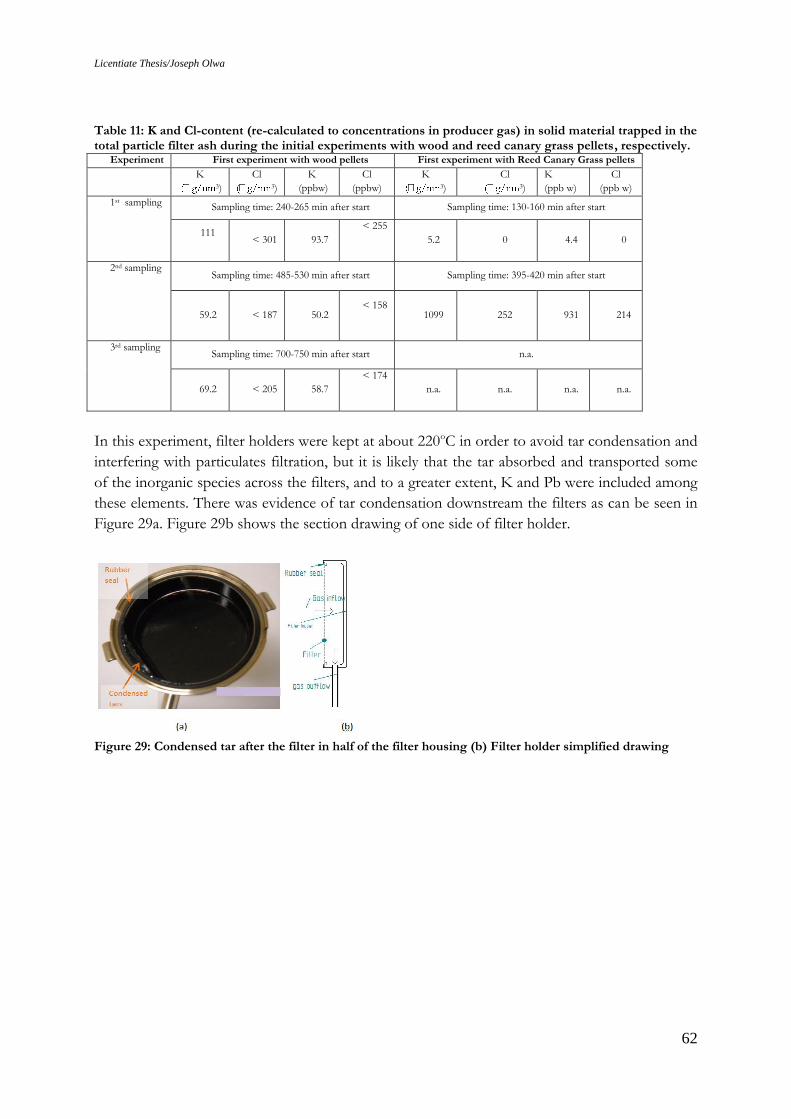
Licentiate Thesis/Joseph Olwa
62
Table 11: K and Cl-content (re-calculated to concentrations in producer gas) in solid material trapped in the total particle filter ash during the initial experiments with wood and reed canary grass pellets, respectively.
Experiment First experiment with wood pellets First experiment with Reed Canary Grass pellets
K
3)
Cl 3)
K
(ppbw)
Cl
(ppbw)
K 3)
Cl 3)
K
(ppb w)
Cl
(ppb w)
1st sampling Sampling time: 240-265 min after start Sampling time: 130-160 min after start
111
< 301 93.7
< 255
5.2 0 4.4 0
2nd sampling Sampling time: 485-530 min after start Sampling time: 395-420 min after start
59.2 < 187 50.2 < 158
1099 252 931 214
3rd sampling Sampling time: 700-750 min after start n.a.
69.2 < 205 58.7
< 174
n.a. n.a. n.a. n.a.
In this experiment, filter holders were kept at about 220oC in order to avoid tar condensation and
interfering with particulates filtration, but it is likely that the tar absorbed and transported some
of the inorganic species across the filters, and to a greater extent, K and Pb were included among
these elements. There was evidence of tar condensation downstream the filters as can be seen in
Figure 29a. Figure 29b shows the section drawing of one side of filter holder.
Figure 29: Condensed tar after the filter in half of the filter housing (b) Filter holder simplified drawing
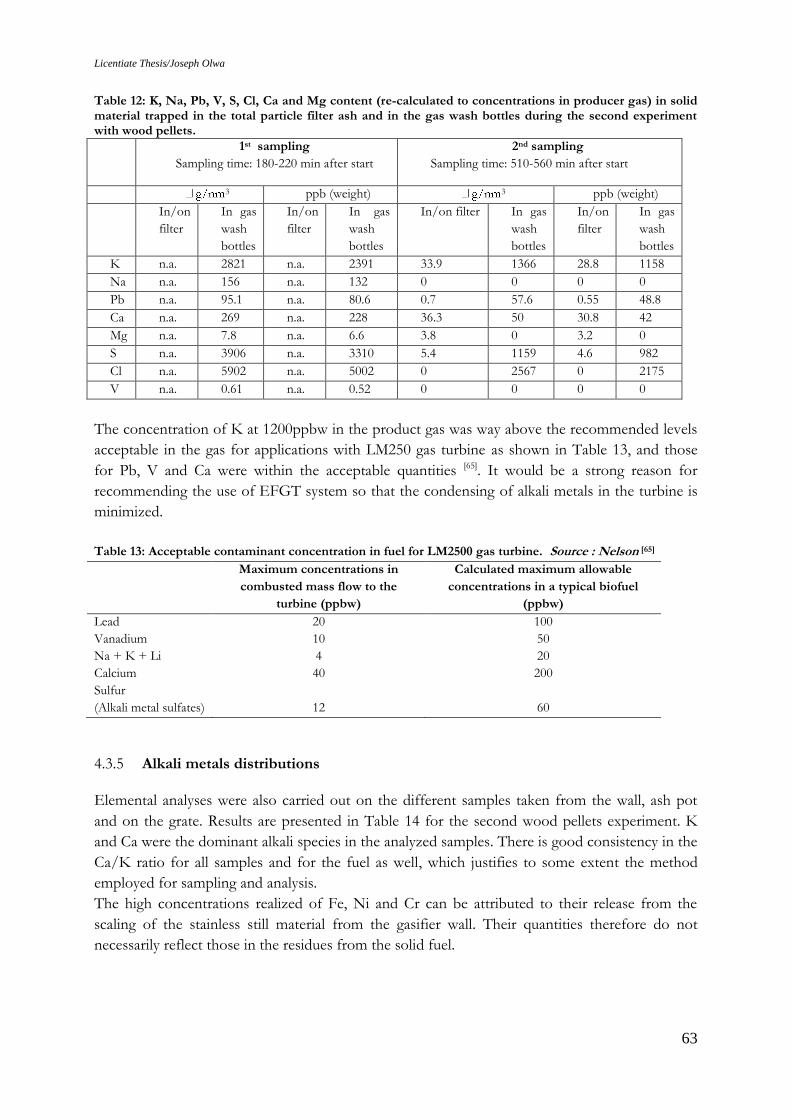
Licentiate Thesis/Joseph Olwa
63
Table 12: K, Na, Pb, V, S, Cl, Ca and Mg content (re-calculated to concentrations in producer gas) in solid material trapped in the total particle filter ash and in the gas wash bottles during the second experiment with wood pellets.
1st sampling
Sampling time: 180-220 min after start
2nd sampling
Sampling time: 510-560 min after start
3 ppb (weight) 3 ppb (weight)
In/on
filter
In gas
wash
bottles
In/on
filter
In gas
wash
bottles
In/on filter In gas
wash
bottles
In/on
filter
In gas
wash
bottles
K n.a. 2821 n.a. 2391 33.9 1366 28.8 1158
Na n.a. 156 n.a. 132 0 0 0 0
Pb n.a. 95.1 n.a. 80.6 0.7 57.6 0.55 48.8
Ca n.a. 269 n.a. 228 36.3 50 30.8 42
Mg n.a. 7.8 n.a. 6.6 3.8 0 3.2 0
S n.a. 3906 n.a. 3310 5.4 1159 4.6 982
Cl n.a. 5902 n.a. 5002 0 2567 0 2175
V n.a. 0.61 n.a. 0.52 0 0 0 0
The concentration of K at 1200ppbw in the product gas was way above the recommended levels
acceptable in the gas for applications with LM250 gas turbine as shown in Table 13, and those
for Pb, V and Ca were within the acceptable quantities [65]. It would be a strong reason for
recommending the use of EFGT system so that the condensing of alkali metals in the turbine is
minimized.
Table 13: Acceptable contaminant concentration in fuel for LM2500 gas turbine. Source : Nelson [65]
Maximum concentrations in
combusted mass flow to the
turbine (ppbw)
Calculated maximum allowable
concentrations in a typical biofuel
(ppbw)
Lead 20 100
Vanadium 10 50
Na + K + Li 4 20
Calcium 40 200
Sulfur
(Alkali metal sulfates)
12
60
4.3.5 Alkali metals distributions
Elemental analyses were also carried out on the different samples taken from the wall, ash pot
and on the grate. Results are presented in Table 14 for the second wood pellets experiment. K
and Ca were the dominant alkali species in the analyzed samples. There is good consistency in the
Ca/K ratio for all samples and for the fuel as well, which justifies to some extent the method
employed for sampling and analysis.
The high concentrations realized of Fe, Ni and Cr can be attributed to their release from the
scaling of the stainless still material from the gasifier wall. Their quantities therefore do not
necessarily reflect those in the residues from the solid fuel.
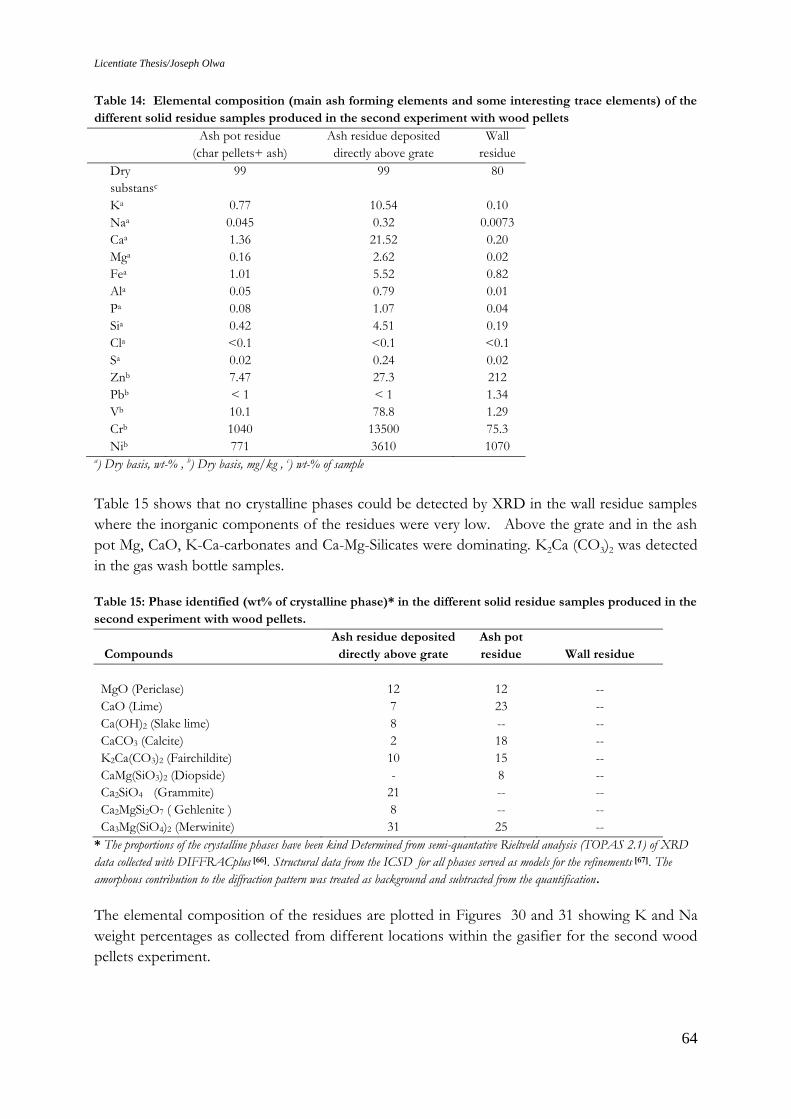
Licentiate Thesis/Joseph Olwa
64
Table 14: Elemental composition (main ash forming elements and some interesting trace elements) of the
different solid residue samples produced in the second experiment with wood pellets
Ash pot residue
(char pellets+ ash)
Ash residue deposited
directly above grate
Wall
residue
Dry
substansc
99 99 80
Ka 0.77 10.54 0.10
Naa 0.045 0.32 0.0073
Caa 1.36 21.52 0.20
Mga 0.16 2.62 0.02
Fea 1.01 5.52 0.82
Ala 0.05 0.79 0.01
Pa 0.08 1.07 0.04
Sia 0.42 4.51 0.19
Cla <0.1 <0.1 <0.1
Sa 0.02 0.24 0.02
Znb 7.47 27.3 212
Pbb < 1 < 1 1.34
Vb 10.1 78.8 1.29
Crb 1040 13500 75.3
Nib 771 3610 1070 a) Dry basis, wt-% , b) Dry basis, mg/kg , c) wt-% of sample
Table 15 shows that no crystalline phases could be detected by XRD in the wall residue samples
where the inorganic components of the residues were very low. Above the grate and in the ash
pot Mg, CaO, K-Ca-carbonates and Ca-Mg-Silicates were dominating. K2Ca (CO3)2 was detected
in the gas wash bottle samples.
Table 15: Phase identified (wt% of crystalline phase)* in the different solid residue samples produced in the
second experiment with wood pellets.
Compounds
Ash residue deposited
directly above grate
Ash pot
residue Wall residue
MgO (Periclase) 12 12 --
CaO (Lime) 7 23 --
Ca(OH)2 (Slake lime) 8 -- --
CaCO3 (Calcite) 2 18 --
K2Ca(CO3)2 (Fairchildite) 10 15 --
CaMg(SiO3)2 (Diopside) - 8 --
Ca2SiO4 (Grammite) 21 -- --
Ca2MgSi2O7 ( Gehlenite ) 8 -- --
Ca3Mg(SiO4)2 (Merwinite) 31 25 --
* The proportions of the crystalline phases have been kind Determined from semi-quantative Rieltveld analysis (TOPAS 2.1) of XRD
data collected with DIFFRACplus [66]. Structural data from the ICSD for all phases served as models for the refinements [67]. The
amorphous contribution to the diffraction pattern was treated as background and subtracted from the quantification.
The elemental composition of the residues are plotted in Figures 30 and 31 showing K and Na
weight percentages as collected from different locations within the gasifier for the second wood
pellets experiment.
Licentiate Thesis/Joseph Olwa
65
0
5
10
15
20
25
30
35
40
45
50
K in producer gas K in ash residue
on grate
K in ash pot K in wall residue K in other
fractions (e.g. char
bed above grate)
Wt-
% o
f in
go
ing
K w
ith
fu
el
Figure 30: Distribution of ingoing K (a) and Na (b) in the producer gas and the different solid residues
fractions during the second experiment with wood pellets
Figure 31: Distribution of ingoing K (a) and Na (b) in the producer gas and the different solid residues
fractions during the second experiment with wood pellets
Table 16 presents quantities of the fuel consumed and the residues in the three tests carried out.
The quantities were used in determining the alkali retained in the gasifier. The analysis from wall,
ash pot and grate residues yielded, 3%, 32% and 42% respectively, implying a total of 77% of the
K was retained in the ash. Similarly, Na content in the aforementioned sample order was 5%,
47% and 33% respectively, giving a total of 85% retention in the ash. The fraction distribution of
sodium in the raw fuel samples are well below those of potassium as reflected in Table 14. The
contribution of Na in the (K + Na) for wood fuel was about 4%.Thus the Na percentage in the
raw fuel was very low, thus presents a very small fraction in the sampled residues rendering
detection very difficult.
0
5
10
15
20
25
30
35
40
45
50
Na in producer
gas
Na in ash residue
on grate
Na in ash pot Na in wall residue Na in other
fractions (e.g. char
bed above grate)
Wt-
% o
f in
go
ing
Na
wit
h f
ue
l
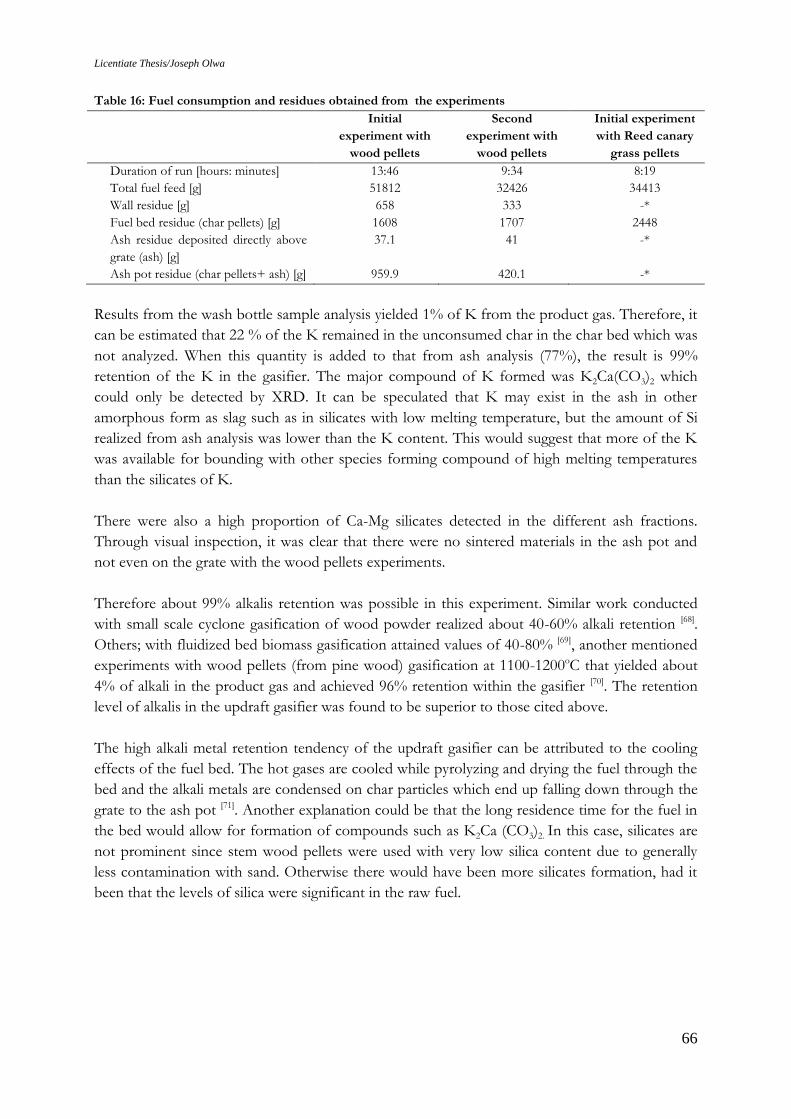
Licentiate Thesis/Joseph Olwa
66
Table 16: Fuel consumption and residues obtained from the experiments
Initial
experiment with
wood pellets
Second
experiment with
wood pellets
Initial experiment
with Reed canary
grass pellets
Duration of run [hours: minutes] 13:46 9:34 8:19
Total fuel feed [g] 51812 32426 34413
Wall residue [g] 658 333 -*
Fuel bed residue (char pellets) [g] 1608 1707 2448
Ash residue deposited directly above
grate (ash) [g]
37.1 41 -*
Ash pot residue (char pellets+ ash) [g] 959.9 420.1 -*
Results from the wash bottle sample analysis yielded 1% of K from the product gas. Therefore, it
can be estimated that 22 % of the K remained in the unconsumed char in the char bed which was
not analyzed. When this quantity is added to that from ash analysis (77%), the result is 99%
retention of the K in the gasifier. The major compound of K formed was K2Ca(CO3)2 which
could only be detected by XRD. It can be speculated that K may exist in the ash in other
amorphous form as slag such as in silicates with low melting temperature, but the amount of Si
realized from ash analysis was lower than the K content. This would suggest that more of the K
was available for bounding with other species forming compound of high melting temperatures
than the silicates of K.
There were also a high proportion of Ca-Mg silicates detected in the different ash fractions.
Through visual inspection, it was clear that there were no sintered materials in the ash pot and
not even on the grate with the wood pellets experiments.
Therefore about 99% alkalis retention was possible in this experiment. Similar work conducted
with small scale cyclone gasification of wood powder realized about 40-60% alkali retention [68].
Others; with fluidized bed biomass gasification attained values of 40-80% [69], another mentioned
experiments with wood pellets (from pine wood) gasification at 1100-1200oC that yielded about
4% of alkali in the product gas and achieved 96% retention within the gasifier [70]. The retention
level of alkalis in the updraft gasifier was found to be superior to those cited above.
The high alkali metal retention tendency of the updraft gasifier can be attributed to the cooling
effects of the fuel bed. The hot gases are cooled while pyrolyzing and drying the fuel through the
bed and the alkali metals are condensed on char particles which end up falling down through the
grate to the ash pot [71]. Another explanation could be that the long residence time for the fuel in
the bed would allow for formation of compounds such as K2Ca (CO3)2. In this case, silicates are
not prominent since stem wood pellets were used with very low silica content due to generally
less contamination with sand. Otherwise there would have been more silicates formation, had it
been that the levels of silica were significant in the raw fuel.

Licentiate Thesis/Joseph Olwa
67
4.4 Thermo-Chemical Modeling of Alkali Metal Compounds
Condensation Reaction in Higher Temperature Heat Exchanger
In order to understand the alkali metal compounds condensation reaction in a high temperature
heat exchanger after product gas combustion, a computer based thermo-chemical model was
used to simulate the situation. The condensation reaction was modeled with 2% excess air and
this was used in the calculation and simulation of the condensation reaction phase status of the
inorganic elements in the fine particles entrained in the product gas especially the K, Cl and S.
Simulation was carried out for temperatures in the range of 400-1100oC at normal atmospheric
pressure of 1bar in which the different phases of compounds formed from the three elements
were studied. The temperature values represent the inlet and outlet temperatures in a high heat
exchanger.
The computer program FACTSage 5.4 [72] was used to model the condensation reactions and the
calculations were based on the minimization of the Gibbs free energy for the components. The
program retrieved data from its data bank built-in with thermodynamic data for a single gas
including stoichiometric condensed phases, 2 non-ideal solutions of salt and oxide or slag, and 7
non-ideal solid solutions. The program then uses this information to determine the status of the
different components as shown in Table 17. The input to the program was the concentrations of
K, Cl, S and Ca obtained from the gasification experiment with wood pellets.
Table 17: Elements and solution models used in the chemical equilibrium model calculations 1 [73] .
Elements C, H, O, N, S, Cl, K, Ca
Solution models Slag: SLAGA (liquid)
Salt: SALTA (liquid)
Chloride: ACL (solid solution)
CO3SO4: CSOB (solid solution)
liq-K,Ca/CO3,SO4 (LCSO)
s-K,Ca/CO3,SO4 (SCSO)
liq-Ca,Mg,Na/(SO4) (LSUL)
s-Ca,Mg,Na/(SO4) (SSUL)
4.4.1 Alkali compounds condensation reactions
The thermo-chemical reaction simulation results for the alkali metal compounds considered the
four species i.e. K, Ca, Cl and S in the product gas after combustion. The results plotted in
Figures 32 to 34 present prediction of what happens when temperatures in the range of 400-
1100oC, as expected in high temperature heat exchangers, is modeled
In Figure 32, analysis of K-species revealed that the species inform of K2SO4 condensate
dominated after about 900oC and no chlorides of the alkali metal was formed after about 680oC
since the preferential reaction yielded the sulfate component as long as the S-species was available
to take up the K-species. Na was not included in the model because its concentration in the gas
1 The designations of the solution models are the ones used in FACTSage 5.4.1.
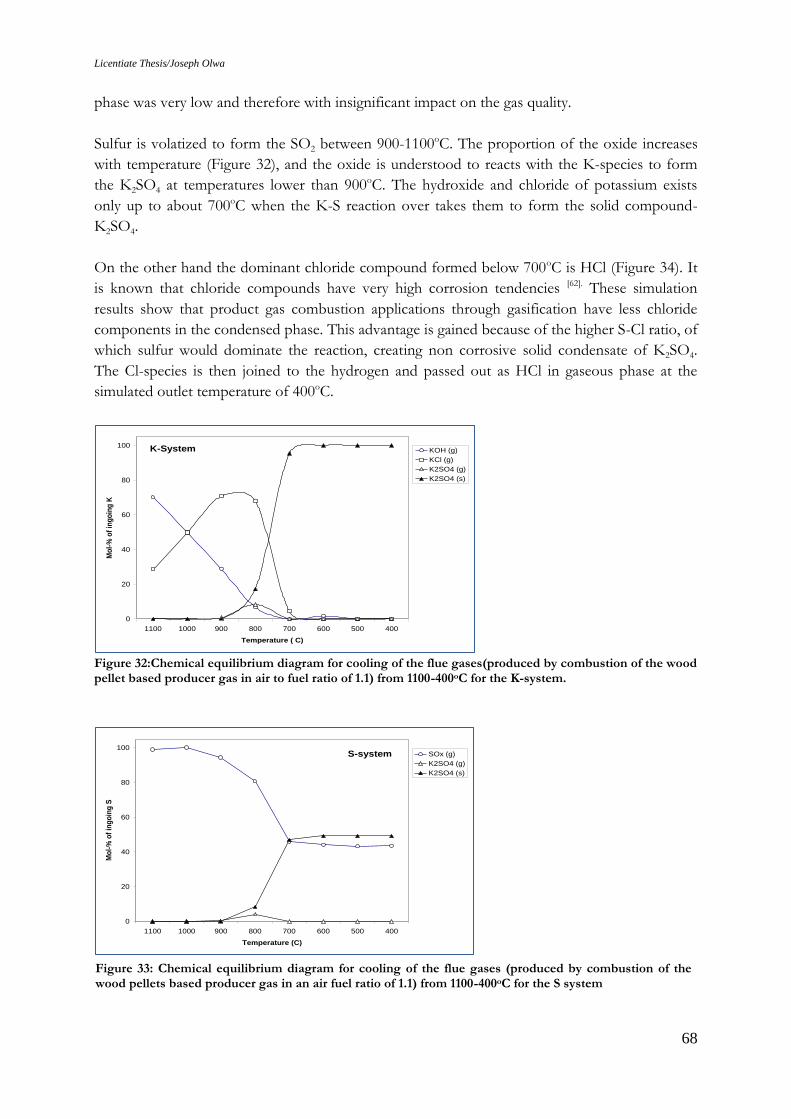
Licentiate Thesis/Joseph Olwa
68
phase was very low and therefore with insignificant impact on the gas quality.
Sulfur is volatized to form the SO2 between 900-1100oC. The proportion of the oxide increases
with temperature (Figure 32), and the oxide is understood to reacts with the K-species to form
the K2SO4 at temperatures lower than 900oC. The hydroxide and chloride of potassium exists
only up to about 700oC when the K-S reaction over takes them to form the solid compound-
K2SO4.
On the other hand the dominant chloride compound formed below 700oC is HCl (Figure 34). It
is known that chloride compounds have very high corrosion tendencies [62]. These simulation
results show that product gas combustion applications through gasification have less chloride
components in the condensed phase. This advantage is gained because of the higher S-Cl ratio, of
which sulfur would dominate the reaction, creating non corrosive solid condensate of K2SO4.
The Cl-species is then joined to the hydrogen and passed out as HCl in gaseous phase at the
simulated outlet temperature of 400oC.
Figure 32:Chemical equilibrium diagram for cooling of the flue gases(produced by combustion of the wood pellet based producer gas in air to fuel ratio of 1.1) from 1100-400oC for the K-system.
0
20
40
60
80
100
1100 1000 900 800 700 600 500 400
Temperature ( C)
Mo
l-%
of
ing
oin
g K
KOH (g)
KCl (g)
K2SO4 (g)
K2SO4 (s)
K-System
0
20
40
60
80
100
1100 1000 900 800 700 600 500 400
Temperature (C)
Mo
l-%
of
ing
oin
g S
SOx (g)
K2SO4 (g)
K2SO4 (s)
S-system
Figure 33: Chemical equilibrium diagram for cooling of the flue gases (produced by combustion of the wood pellets based producer gas in an air fuel ratio of 1.1) from 1100-400oC for the S system
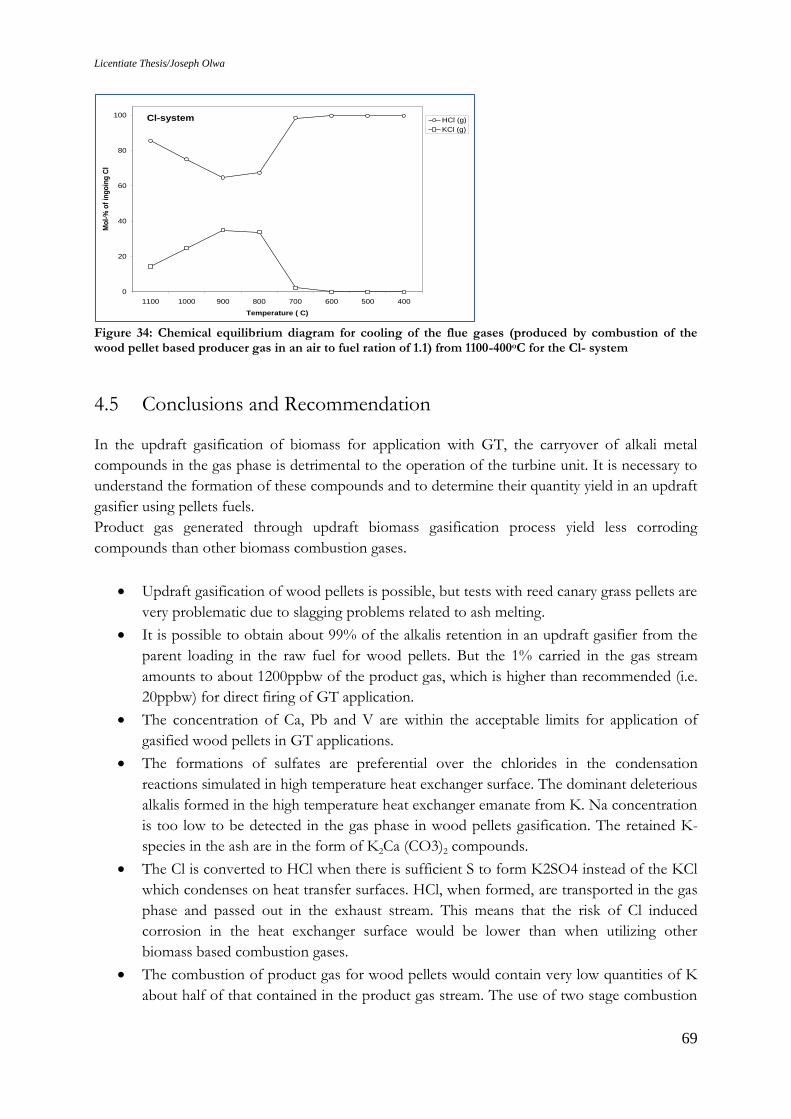
Licentiate Thesis/Joseph Olwa
69
Figure 34: Chemical equilibrium diagram for cooling of the flue gases (produced by combustion of the wood pellet based producer gas in an air to fuel ration of 1.1) from 1100-400oC for the Cl- system
4.5 Conclusions and Recommendation
In the updraft gasification of biomass for application with GT, the carryover of alkali metal
compounds in the gas phase is detrimental to the operation of the turbine unit. It is necessary to
understand the formation of these compounds and to determine their quantity yield in an updraft
gasifier using pellets fuels.
Product gas generated through updraft biomass gasification process yield less corroding
compounds than other biomass combustion gases.
Updraft gasification of wood pellets is possible, but tests with reed canary grass pellets are
very problematic due to slagging problems related to ash melting.
It is possible to obtain about 99% of the alkalis retention in an updraft gasifier from the
parent loading in the raw fuel for wood pellets. But the 1% carried in the gas stream
amounts to about 1200ppbw of the product gas, which is higher than recommended (i.e.
20ppbw) for direct firing of GT application.
The concentration of Ca, Pb and V are within the acceptable limits for application of
gasified wood pellets in GT applications.
The formations of sulfates are preferential over the chlorides in the condensation
reactions simulated in high temperature heat exchanger surface. The dominant deleterious
alkalis formed in the high temperature heat exchanger emanate from K. Na concentration
is too low to be detected in the gas phase in wood pellets gasification. The retained K-
species in the ash are in the form of K2Ca (CO3)2 compounds.
The Cl is converted to HCl when there is sufficient S to form K2SO4 instead of the KCl
which condenses on heat transfer surfaces. HCl, when formed, are transported in the gas
phase and passed out in the exhaust stream. This means that the risk of Cl induced
corrosion in the heat exchanger surface would be lower than when utilizing other
biomass based combustion gases.
The combustion of product gas for wood pellets would contain very low quantities of K
about half of that contained in the product gas stream. The use of two stage combustion
0
20
40
60
80
100
1100 1000 900 800 700 600 500 400
Temperature ( C)
Mo
l-%
of
ing
oin
g C
l
HCl (g)
KCl (g)
Cl-system

Licentiate Thesis/Joseph Olwa
70
process for external gas turbine application would alleviate the problems of alkali metals
compounds condensation and corrosion of turbine blades.
The study on alkali metal compounds condensation reactions of the process of product
gas combustion serve as a qualitative indicator which requires verification through long
term test with a high temperature heat exchanger; to study the corrosion and fouling with
intention to obtain quantifiable performance data.
Licentiate Thesis/Joseph Olwa
71
5. Downdraft Gasifier Product Gas Tar Content from Wood
Pellets and Wood Cylinders fuels
5.1 Introduction
Biomass fuels come in different sizes, shapes and densities, and the gasification technology is
very fuel specific [74]. Normally wood residues are either available in a form that requires some
method for size reduction or they are in the form requiring some process for densification.
There is great need to balance fuel sizes to the gasifier design because with fine fuel there is risk
of clogging the gasifier throat leading to shut down, and with larger fuel than required there is
risk of having combustion reaction dominating the gasification process resulting into poor gas
quality. Most biomass fuels used in the gasification technology from wood are in form of pellets,
chips, cylinders and briquettes though some now use black liquor as well. Wood saw dusts can
be turned into briquettes or pellets thereby increasing their densities and ease of handling. This
would mean more energy per unit volume of the refined fuel and better operation of the gasifier.
In wood gasification tar is one ingredient in the producer gas whose generation depends on the
fuel characteristics. Tar carryover in the gas stream and its subsequent condensation in gas
handling units have undesirable consequences in IC engine applications and heat exchangers.
The challenges of efficient tar separation from the producer gas have slowed the development of
biomass gasification technology applications integration with IC engines. This is evident from
the fact that different fuels have varying physical and chemical characteristics, which determine
their tar yield quantities during the gasification process. The more tar yield the more cleaning is
required and with it comes the economic penalties. Refer to section 2.4.1in chapter 1 for a detail
discussion on tar issues in producer gas.
A study done on biomass gasification revealed there exist a conceptual relationship between the
yield of tar and the reaction temperature [25], while others cited levels of tar yields for various
reactors with updraft gasifiers at about 12 wt % of wood fuel and downdraft less than 1wt % of
wood. These reports show that down draft gasifiers generate less tar than updraft gasifiers with a
given biomass fuel. It is also known that downdraft gasifiers operated under atmospheric
pressure are attractive for small scale applications (<1.5MWt) with IC engines and that there are
potential markets for them in developing economies [75]. These advantages make them suitable
for IC engine application compared to updraft or fluidized bed gasifiers.
A 20kWt atmospheric downdraft gasifier was chosen for studying the quantities of tar yield from
wood cylinders and wood pellets gasification. The fuels are considered for possible application
in biomass power plants in rural areas of Uganda. In this work wood pellets and wood cylinders
were studied to determine their tar yield quantities when used as fuel in a down draft gasifier.
The interest was to compare tar yields from wood pellets and wood cylinders with the intention
of determining the differences, if any, in their tar yield when used as gasifier fuel anticipated for
applications with IC engines. The goal of this study was to investigate the yields and to further
determine the tar content and tar composition in the producer gas generated from the two fuels.
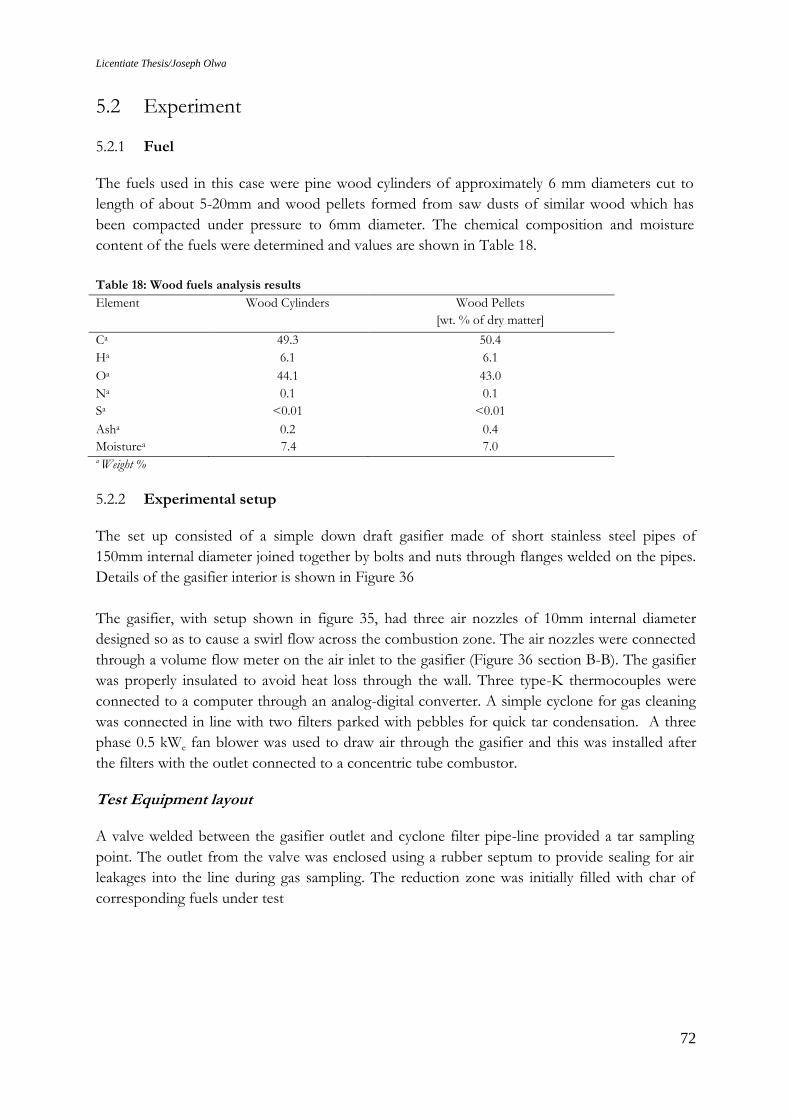
Licentiate Thesis/Joseph Olwa
72
5.2 Experiment
5.2.1 Fuel
The fuels used in this case were pine wood cylinders of approximately 6 mm diameters cut to
length of about 5-20mm and wood pellets formed from saw dusts of similar wood which has
been compacted under pressure to 6mm diameter. The chemical composition and moisture
content of the fuels were determined and values are shown in Table 18.
Table 18: Wood fuels analysis results
Element Wood Cylinders
Wood Pellets
[wt. % of dry matter]
Ca 49.3 50.4
Ha 6.1 6.1
Oa 44.1 43.0
Na 0.1 0.1
Sa <0.01 <0.01
Asha
Moisturea
0.2
7.4
0.4
7.0 a Weight %
5.2.2 Experimental setup
The set up consisted of a simple down draft gasifier made of short stainless steel pipes of
150mm internal diameter joined together by bolts and nuts through flanges welded on the pipes.
Details of the gasifier interior is shown in Figure 36
The gasifier, with setup shown in figure 35, had three air nozzles of 10mm internal diameter
designed so as to cause a swirl flow across the combustion zone. The air nozzles were connected
through a volume flow meter on the air inlet to the gasifier (Figure 36 section B-B). The gasifier
was properly insulated to avoid heat loss through the wall. Three type-K thermocouples were
connected to a computer through an analog-digital converter. A simple cyclone for gas cleaning
was connected in line with two filters parked with pebbles for quick tar condensation. A three
phase 0.5 kWe fan blower was used to draw air through the gasifier and this was installed after
the filters with the outlet connected to a concentric tube combustor.
Test Equipment layout
A valve welded between the gasifier outlet and cyclone filter pipe-line provided a tar sampling
point. The outlet from the valve was enclosed using a rubber septum to provide sealing for air
leakages into the line during gas sampling. The reduction zone was initially filled with char of
corresponding fuels under test
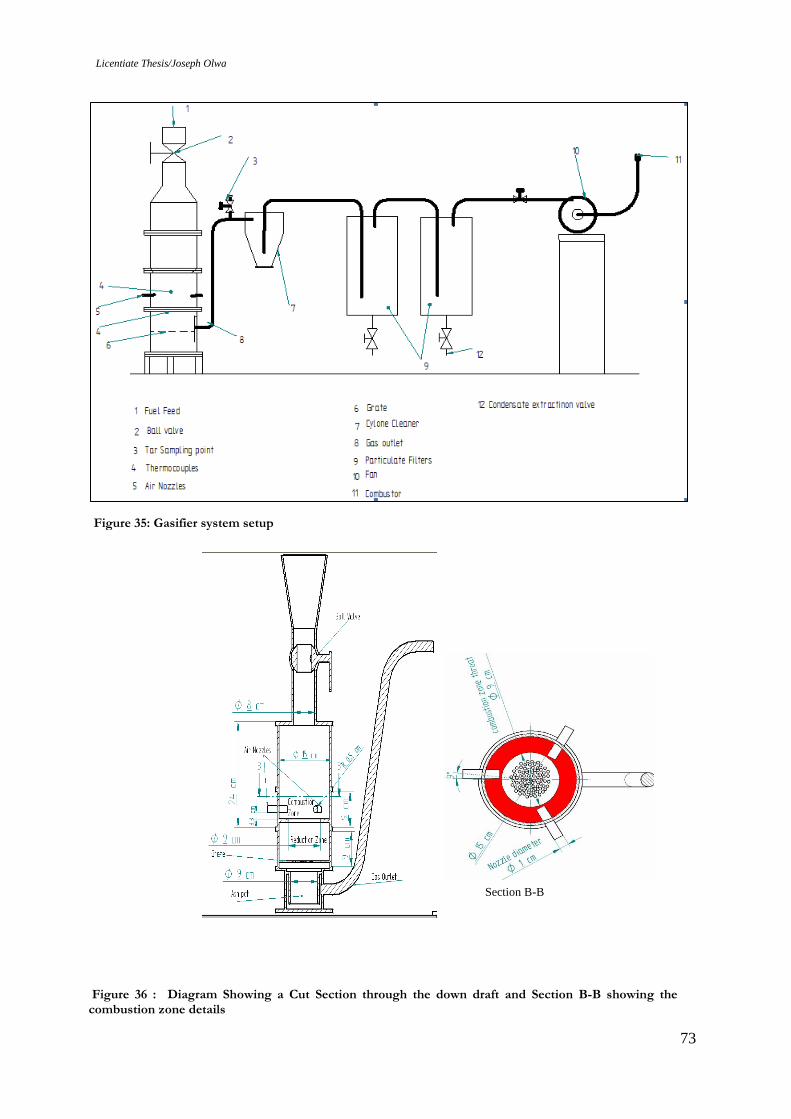
Licentiate Thesis/Joseph Olwa
73
.
Figure 36 : Diagram Showing a Cut Section through the down draft and Section B-B showing the combustion zone details
Section B-B
Figure 35: Gasifier system setup
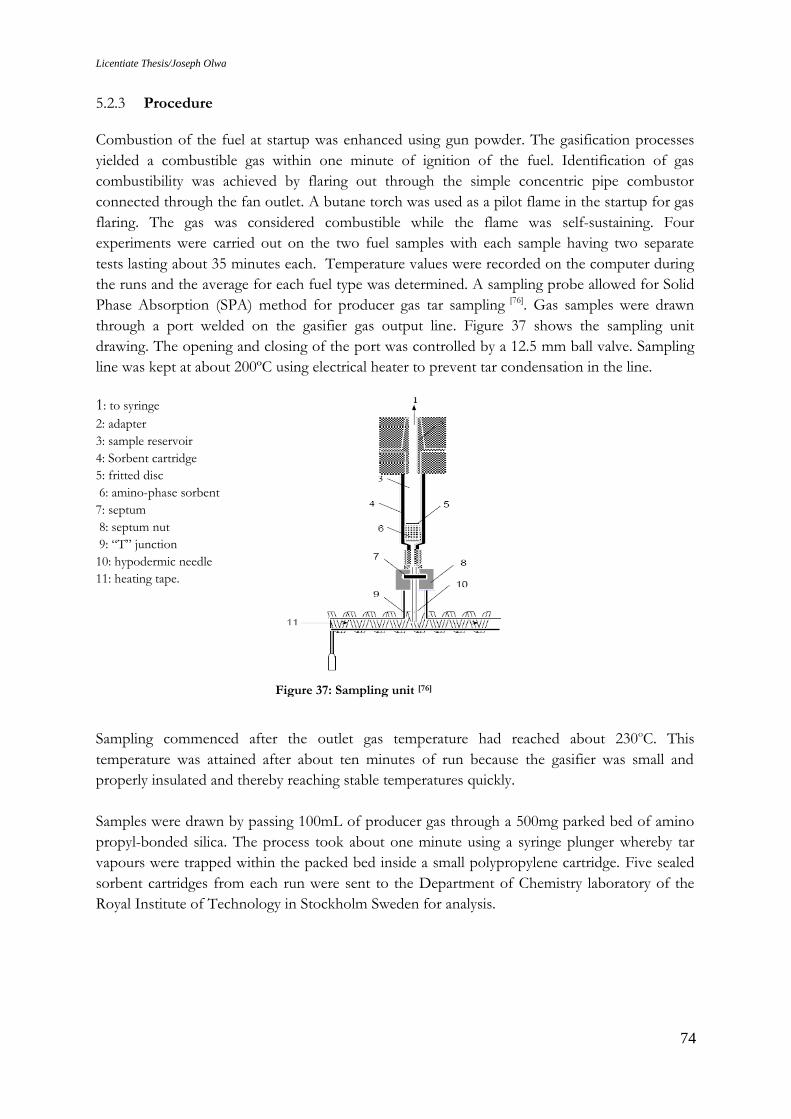
Licentiate Thesis/Joseph Olwa
74
5.2.3 Procedure
Combustion of the fuel at startup was enhanced using gun powder. The gasification processes
yielded a combustible gas within one minute of ignition of the fuel. Identification of gas
combustibility was achieved by flaring out through the simple concentric pipe combustor
connected through the fan outlet. A butane torch was used as a pilot flame in the startup for gas
flaring. The gas was considered combustible while the flame was self-sustaining. Four
experiments were carried out on the two fuel samples with each sample having two separate
tests lasting about 35 minutes each. Temperature values were recorded on the computer during
the runs and the average for each fuel type was determined. A sampling probe allowed for Solid
Phase Absorption (SPA) method for producer gas tar sampling [76]. Gas samples were drawn
through a port welded on the gasifier gas output line. Figure 37 shows the sampling unit
drawing. The opening and closing of the port was controlled by a 12.5 mm ball valve. Sampling
line was kept at about 200ºC using electrical heater to prevent tar condensation in the line.
1: to syringe 2: adapter
3: sample reservoir
4: Sorbent cartridge
5: fritted disc
6: amino-phase sorbent
7: septum
8: septum nut
9: “T” junction
10: hypodermic needle
11: heating tape.
Sampling commenced after the outlet gas temperature had reached about 230oC. This
temperature was attained after about ten minutes of run because the gasifier was small and
properly insulated and thereby reaching stable temperatures quickly.
Samples were drawn by passing 100mL of producer gas through a 500mg parked bed of amino
propyl-bonded silica. The process took about one minute using a syringe plunger whereby tar
vapours were trapped within the packed bed inside a small polypropylene cartridge. Five sealed
sorbent cartridges from each run were sent to the Department of Chemistry laboratory of the
Royal Institute of Technology in Stockholm Sweden for analysis.
Figure 37: Sampling unit [76]
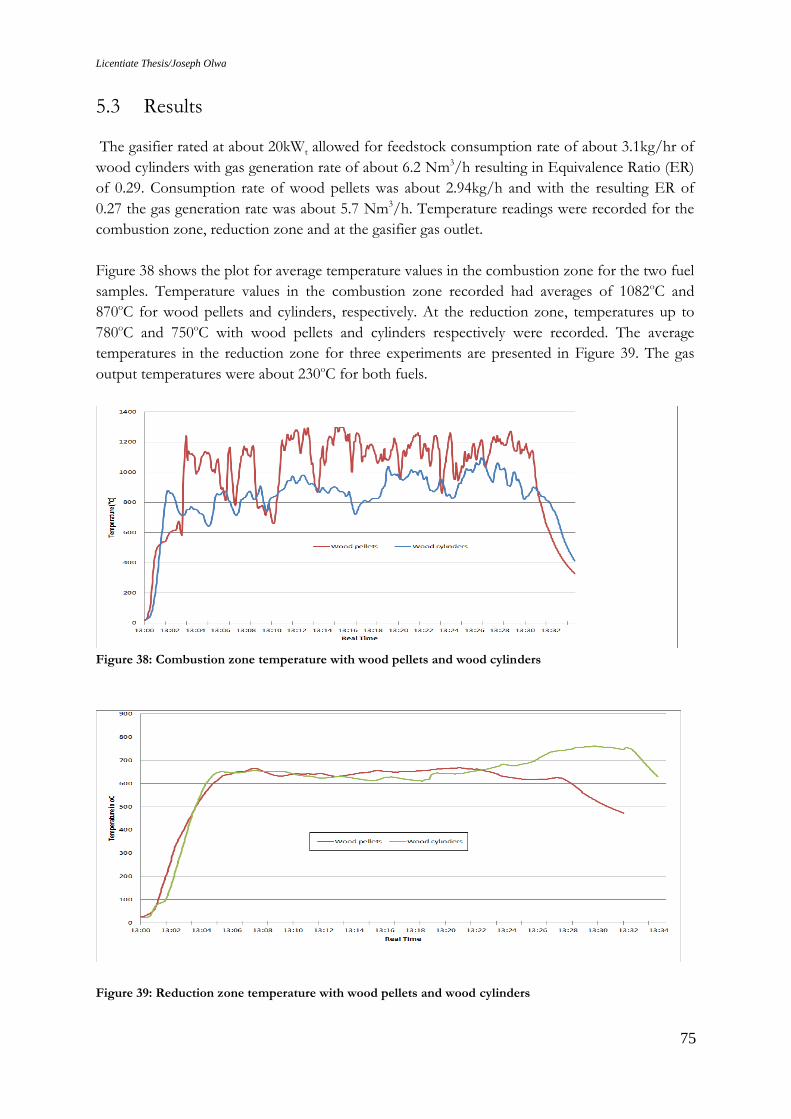
Licentiate Thesis/Joseph Olwa
75
5.3 Results
The gasifier rated at about 20kWt allowed for feedstock consumption rate of about 3.1kg/hr of
wood cylinders with gas generation rate of about 6.2 Nm3/h resulting in Equivalence Ratio (ER)
of 0.29. Consumption rate of wood pellets was about 2.94kg/h and with the resulting ER of
0.27 the gas generation rate was about 5.7 Nm3/h. Temperature readings were recorded for the
combustion zone, reduction zone and at the gasifier gas outlet.
Figure 38 shows the plot for average temperature values in the combustion zone for the two fuel
samples. Temperature values in the combustion zone recorded had averages of 1082oC and
870oC for wood pellets and cylinders, respectively. At the reduction zone, temperatures up to
780oC and 750oC with wood pellets and cylinders respectively were recorded. The average
temperatures in the reduction zone for three experiments are presented in Figure 39. The gas
output temperatures were about 230oC for both fuels.
Figure 38: Combustion zone temperature with wood pellets and wood cylinders
Figure 39: Reduction zone temperature with wood pellets and wood cylinders
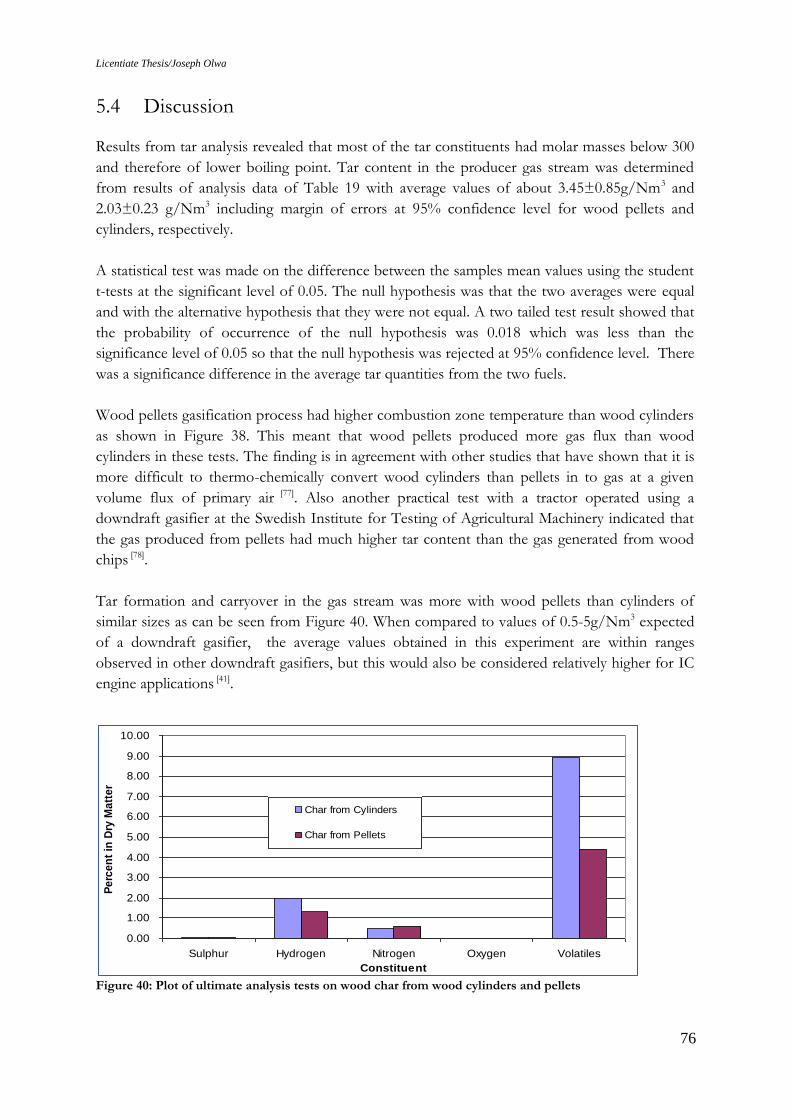
Licentiate Thesis/Joseph Olwa
76
5.4 Discussion
Results from tar analysis revealed that most of the tar constituents had molar masses below 300
and therefore of lower boiling point. Tar content in the producer gas stream was determined
from results of analysis data of Table 19 with average values of about 3.45±0.85g/Nm3 and
2.03±0.23 g/Nm3 including margin of errors at 95% confidence level for wood pellets and
cylinders, respectively.
A statistical test was made on the difference between the samples mean values using the student
t-tests at the significant level of 0.05. The null hypothesis was that the two averages were equal
and with the alternative hypothesis that they were not equal. A two tailed test result showed that
the probability of occurrence of the null hypothesis was 0.018 which was less than the
significance level of 0.05 so that the null hypothesis was rejected at 95% confidence level. There
was a significance difference in the average tar quantities from the two fuels.
Wood pellets gasification process had higher combustion zone temperature than wood cylinders
as shown in Figure 38. This meant that wood pellets produced more gas flux than wood
cylinders in these tests. The finding is in agreement with other studies that have shown that it is
more difficult to thermo-chemically convert wood cylinders than pellets in to gas at a given
volume flux of primary air [77]. Also another practical test with a tractor operated using a
downdraft gasifier at the Swedish Institute for Testing of Agricultural Machinery indicated that
the gas produced from pellets had much higher tar content than the gas generated from wood
chips [78].
Tar formation and carryover in the gas stream was more with wood pellets than cylinders of
similar sizes as can be seen from Figure 40. When compared to values of 0.5-5g/Nm3 expected
of a downdraft gasifier, the average values obtained in this experiment are within ranges
observed in other downdraft gasifiers, but this would also be considered relatively higher for IC
engine applications [41].
Figure 40: Plot of ultimate analysis tests on wood char from wood cylinders and pellets
0.00
1.00
2.00
3.00
4.00
5.00
6.00
7.00
8.00
9.00
10.00
Sulphur Hydrogen Nitrogen Oxygen Volatiles
Constituent
Pe
rce
nt
in D
ry M
att
er
Char from Cylinders
Char from Pellets
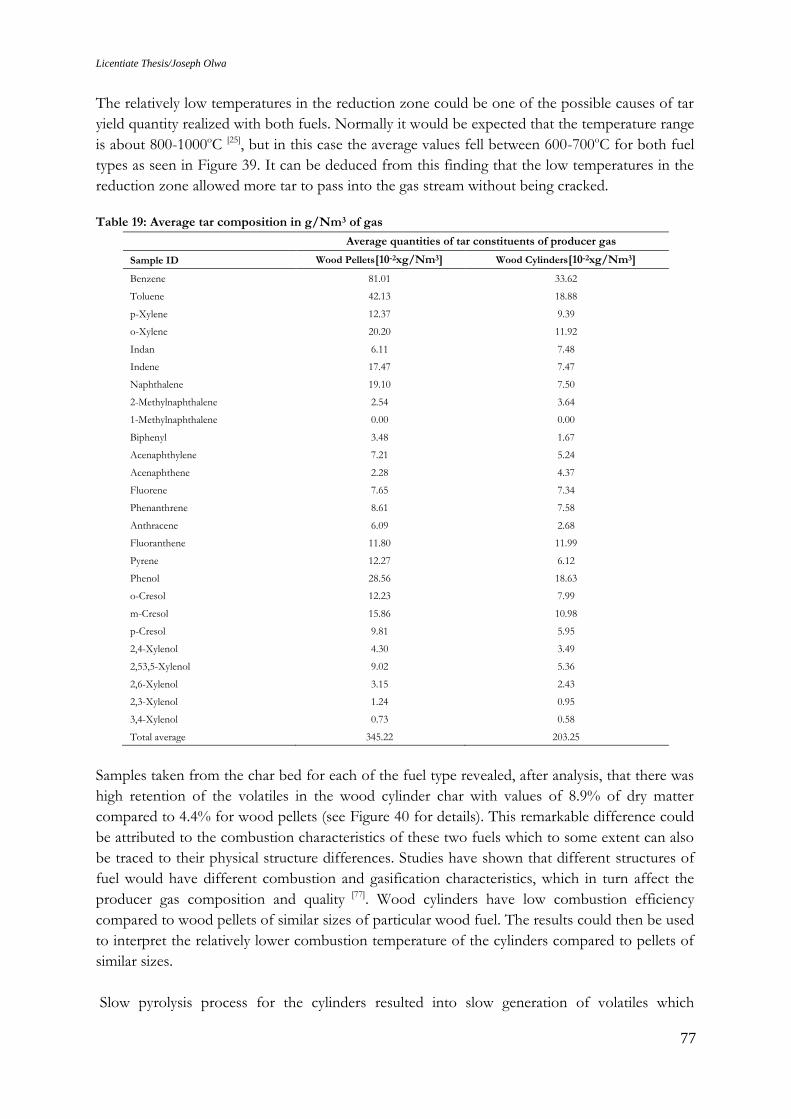
Licentiate Thesis/Joseph Olwa
77
The relatively low temperatures in the reduction zone could be one of the possible causes of tar
yield quantity realized with both fuels. Normally it would be expected that the temperature range
is about 800-1000oC [25], but in this case the average values fell between 600-700oC for both fuel
types as seen in Figure 39. It can be deduced from this finding that the low temperatures in the
reduction zone allowed more tar to pass into the gas stream without being cracked.
Table 19: Average tar composition in g/Nm3 of gas
Average quantities of tar constituents of producer gas
Sample ID Wood Pellets[10-2xg/Nm3] Wood Cylinders[10-2xg/Nm3]
Benzene 81.01 33.62
Toluene 42.13 18.88
p-Xylene 12.37 9.39
o-Xylene 20.20 11.92
Indan 6.11 7.48
Indene 17.47 7.47
Naphthalene 19.10 7.50
2-Methylnaphthalene 2.54 3.64
1-Methylnaphthalene 0.00 0.00
Biphenyl 3.48 1.67
Acenaphthylene 7.21 5.24
Acenaphthene 2.28 4.37
Fluorene 7.65 7.34
Phenanthrene 8.61 7.58
Anthracene 6.09 2.68
Fluoranthene 11.80 11.99
Pyrene 12.27 6.12
Phenol 28.56 18.63
o-Cresol 12.23 7.99
m-Cresol 15.86 10.98
p-Cresol 9.81 5.95
2,4-Xylenol 4.30 3.49
2,53,5-Xylenol 9.02 5.36
2,6-Xylenol 3.15 2.43
2,3-Xylenol 1.24 0.95
3,4-Xylenol 0.73 0.58
Total average 345.22 203.25
Samples taken from the char bed for each of the fuel type revealed, after analysis, that there was
high retention of the volatiles in the wood cylinder char with values of 8.9% of dry matter
compared to 4.4% for wood pellets (see Figure 40 for details). This remarkable difference could
be attributed to the combustion characteristics of these two fuels which to some extent can also
be traced to their physical structure differences. Studies have shown that different structures of
fuel would have different combustion and gasification characteristics, which in turn affect the
producer gas composition and quality [77]. Wood cylinders have low combustion efficiency
compared to wood pellets of similar sizes of particular wood fuel. The results could then be used
to interpret the relatively lower combustion temperature of the cylinders compared to pellets of
similar sizes.
Slow pyrolysis process for the cylinders resulted into slow generation of volatiles which
Licentiate Thesis/Joseph Olwa
78
constituted mainly the producer gas, tar and water vapor. The retention of the volatiles with
wood cylinders was higher in this case and therefore less volatiles in terms of tar and water
vapor was realized out of wood cylinder gasification as compared to the pellets. And because
nitrogen was used to extinguish the combustion process, its percentage in the dry matter
increased by about 0.3 percent. Gasification process for pellets achieved more yields of volatiles
due to the loose structure that allowed for easy heat transfer and volatiles vapor transfer within
the body of the pellets. And the high porosity of the char created in the high temperature zone
could not retain volatiles as would be possible with char from wood cylinders.
The quantities of tar from both fuel was significant, which can be attributed to low reduction
zone temperature as noted earlier. Since this was a comparative study between the two fuel types
subjected to similar treatment, the unfavorable gasifier behavior which is a function of its design
and size was overlooked. The result of this study indicated, that it is possible to conclude that
wood cylinders give less tar than pellets of similar sizes for a given biomass fuel.
5.5 Conclusions
The use of biomass from wood and agricultural residues is increasing with applications in
thermal engines. Biomass fuel suitability for these applications depends on matching them to
particular gasifier design for the desired application. The following conclusion can be drawn
from this study:
Tar realized from wood pellets and wood cylinders gasification process were constituted
mainly of low molecular mass hydro-carbons of molecular mass less than 300.
Wood pellets generate more tar than wood cylinders of similar physical dimensions. This
is resulting from the combustion and reduction zone temperatures which are higher with
wood pellets than with wood cylinders.
Wood pellets provide good fuel for gasification processes suitable with thermal
applications
Wood cylinders, even chips, with obvious gas cleaning, are suitable for gasifier -IC
engines applications.
Licentiate Thesis/Joseph Olwa
79
6. Effects of Tar Sample Storage on Analysis Results
6.1 Introduction
The advantages of biomass as a sustainable fuel are almost being equaled by the challenges of
transforming it into a competitive fuel for any purpose. The challenges are even deep routed in
the stringent qualities that the consuming mediums require for effective and reliable operations
and productivity. In the gasification of biomass for IC engines applications, gas quality
consideration is paramount with respect to the energy content. The consideration is generic from
the gasification process, which relates to ash-particulates, tar and alkali metal compounds. Down
draft gasifiers are preferred to remedy tar problems in IC engines. These gasifiers are known to
generate less tar, which is the most undesired and difficult constituent to eliminate in the gas
stream intended for powering IC engines. Ash particles are eliminated by low cost filtration
methods for producer gas cleaning (refer to section 2.5 for details).
Tar yields from biomass gasification process can be quantified and its constituents analyzed. This
is done to understand their formation and to identify how to influence their formation. The
process of tar sampling from producer gas has gone through some changes from the tedious „Tar
Protocol‟ method to the simplified online tar sampling and analytical techniques. One method
under consideration now is the use of Solid Phase Absorption (SPA) technique with amino
propyl-silane base as the absorbent medium [76], [25].
The simplification of tar analysis with SPA technique is suitable for samples that are not more
than five hours away from the laboratory. Samples obtained from processes in remote locations
which are many hours of drive from the laboratory may require some criterion for handling
because of the expected degeneration of the samples. The level of deterioration that results from
the samples delay (of over five hours) before analysis is not known and therefore the treatment to
be accorded the results from delayed samples is also not known since there is no available
literature on it.
In field work related activities, samples delay of up to five days are anticipated especially for those
to be transported from Africa to Europe. This work assessed the level of deterioration that
accrued from effects of tar samples stored for five days. Three groups of samples were each
accorded different treatment; the first group was kept under room temperature of 20oC, the
second group stored at -19oC and the third group analyzed within five hours from sampling as
recommended for SPA method. The differences between the analysis results of the samples were
determined.
The study was carried out to understand the level of deterioration so as to find ways of
compensating for errors in results when delays are inevitable in analyzing samples. It was
anticipated that some sort of relationship(s) could be developed to show the level of
deteriorations and that possible correction factors could be arrived at which would allow for
correction of analysis results of the delayed samples.
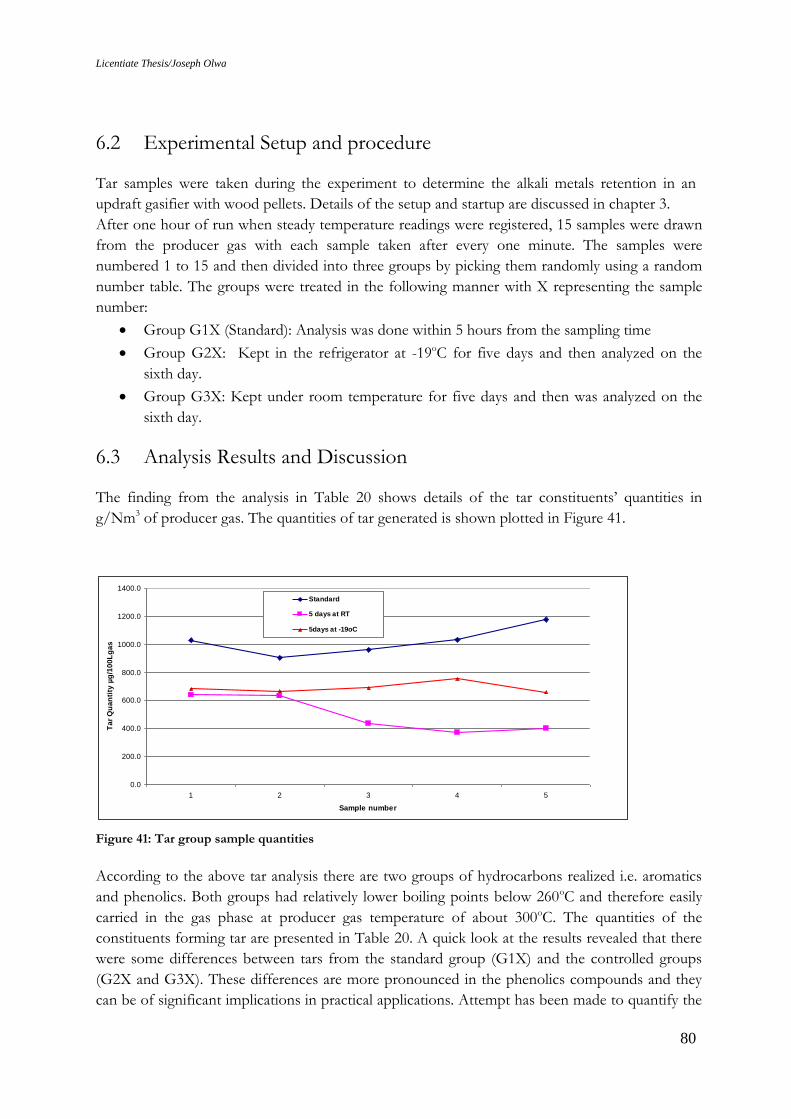
Licentiate Thesis/Joseph Olwa
80
6.2 Experimental Setup and procedure
Tar samples were taken during the experiment to determine the alkali metals retention in an
updraft gasifier with wood pellets. Details of the setup and startup are discussed in chapter 3.
After one hour of run when steady temperature readings were registered, 15 samples were drawn
from the producer gas with each sample taken after every one minute. The samples were
numbered 1 to 15 and then divided into three groups by picking them randomly using a random
number table. The groups were treated in the following manner with X representing the sample
number:
Group G1X (Standard): Analysis was done within 5 hours from the sampling time
Group G2X: Kept in the refrigerator at -19oC for five days and then analyzed on the
sixth day.
Group G3X: Kept under room temperature for five days and then was analyzed on the
sixth day.
6.3 Analysis Results and Discussion
The finding from the analysis in Table 20 shows details of the tar constituents‟ quantities in
g/Nm3 of producer gas. The quantities of tar generated is shown plotted in Figure 41.
According to the above tar analysis there are two groups of hydrocarbons realized i.e. aromatics
and phenolics. Both groups had relatively lower boiling points below 260oC and therefore easily
carried in the gas phase at producer gas temperature of about 300oC. The quantities of the
constituents forming tar are presented in Table 20. A quick look at the results revealed that there
were some differences between tars from the standard group (G1X) and the controlled groups
(G2X and G3X). These differences are more pronounced in the phenolics compounds and they
can be of significant implications in practical applications. Attempt has been made to quantify the
0.0
200.0
400.0
600.0
800.0
1000.0
1200.0
1400.0
1 2 3 4 5
Sample number
Ta
r Q
ua
nti
ty µ
g/1
00
Lg
as
Standard
5 days at RT
5days at -19oC
Figure 41: Tar group sample quantities
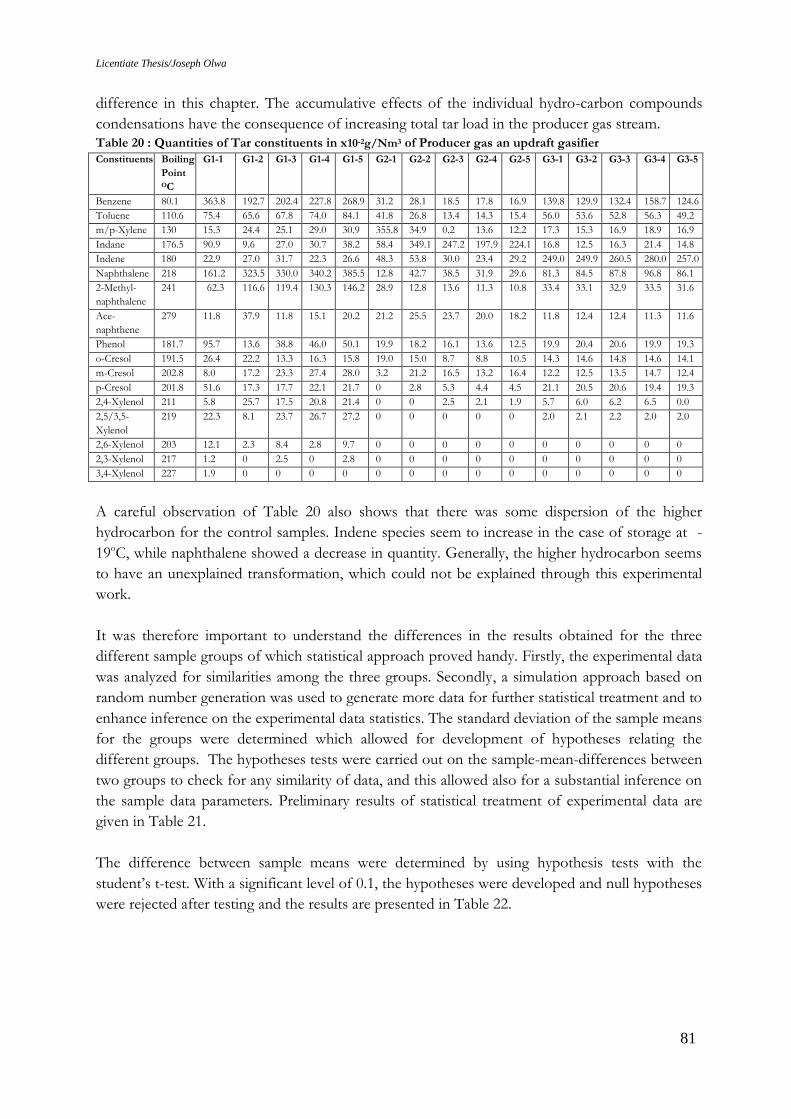
Licentiate Thesis/Joseph Olwa
81
difference in this chapter. The accumulative effects of the individual hydro-carbon compounds
condensations have the consequence of increasing total tar load in the producer gas stream.
Table 20 : Quantities of Tar constituents in x10-2g/Nm3 of Producer gas an updraft gasifier
Constituents Boiling
Point OC
G1-1 G1-2 G1-3 G1-4 G1-5 G2-1 G2-2 G2-3 G2-4 G2-5 G3-1 G3-2 G3-3 G3-4 G3-5
Benzene 80.1 363.8 192.7 202.4 227.8 268.9 31.2 28.1 18.5 17.8 16.9 139.8 129.9 132.4 158.7 124.6
Toluene 110.6 75.4 65.6 67.8 74.0 84.1 41.8 26.8 13.4 14.3 15.4 56.0 53.6 52.8 56.3 49.2
m/p-Xylene 130 15.3 24.4 25.1 29.0 30.9 355.8 34.9 0.2 13.6 12.2 17.3 15.3 16.9 18.9 16.9
Indane 176.5 90.9 9.6 27.0 30.7 38.2 58.4 349.1 247.2 197.9 224.1 16.8 12.5 16.3 21.4 14.8
Indene 180 22.9 27.0 31.7 22.3 26.6 48.3 53.8 30.0 23.4 29.2 249.0 249.9 260.5 280.0 257.0
Naphthalene 218 161.2 323.5 330.0 340.2 385.5 12.8 42.7 38.5 31.9 29.6 81.3 84.5 87.8 96.8 86.1
2-Methyl-
naphthalene
241 62.3 116.6 119.4 130.3 146.2 28.9 12.8 13.6 11.3 10.8 33.4 33.1 32.9 33.5 31.6
Ace-
naphthene
279 11.8 37.9 11.8 15.1 20.2 21.2 25.5 23.7 20.0 18.2 11.8 12.4 12.4 11.3 11.6
Phenol 181.7 95.7 13.6 38.8 46.0 50.1 19.9 18.2 16.1 13.6 12.5 19.9 20.4 20.6 19.9 19.3
o-Cresol 191.5 26.4 22.2 13.3 16.3 15.8 19.0 15.0 8.7 8.8 10.5 14.3 14.6 14.8 14.6 14.1
m-Cresol 202.8 8.0 17.2 23.3 27.4 28.0 3.2 21.2 16.5 13.2 16.4 12.2 12.5 13.5 14.7 12.4
p-Cresol 201.8 51.6 17.3 17.7 22.1 21.7 0 2.8 5.3 4.4 4.5 21.1 20.5 20.6 19.4 19.3
2,4-Xylenol 211 5.8 25.7 17.5 20.8 21.4 0 0 2.5 2.1 1.9 5.7 6.0 6.2 6.5 0.0
2,5/3,5-
Xylenol
219 22.3 8.1 23.7 26.7 27.2 0 0 0 0 0 2.0 2.1 2.2 2.0 2.0
2,6-Xylenol 203 12.1 2.3 8.4 2.8 9.7 0 0 0 0 0 0 0 0 0 0
2,3-Xylenol 217 1.2 0 2.5 0 2.8 0 0 0 0 0 0 0 0 0 0
3,4-Xylenol 227 1.9 0 0 0 0 0 0 0 0 0 0 0 0 0 0
A careful observation of Table 20 also shows that there was some dispersion of the higher
hydrocarbon for the control samples. Indene species seem to increase in the case of storage at -
19oC, while naphthalene showed a decrease in quantity. Generally, the higher hydrocarbon seems
to have an unexplained transformation, which could not be explained through this experimental
work.
It was therefore important to understand the differences in the results obtained for the three
different sample groups of which statistical approach proved handy. Firstly, the experimental data
was analyzed for similarities among the three groups. Secondly, a simulation approach based on
random number generation was used to generate more data for further statistical treatment and to
enhance inference on the experimental data statistics. The standard deviation of the sample means
for the groups were determined which allowed for development of hypotheses relating the
different groups. The hypotheses tests were carried out on the sample-mean-differences between
two groups to check for any similarity of data, and this allowed also for a substantial inference on
the sample data parameters. Preliminary results of statistical treatment of experimental data are
given in Table 21.
The difference between sample means were determined by using hypothesis tests with the
student‟s t-test. With a significant level of 0.1, the hypotheses were developed and null hypotheses
were rejected after testing and the results are presented in Table 22.
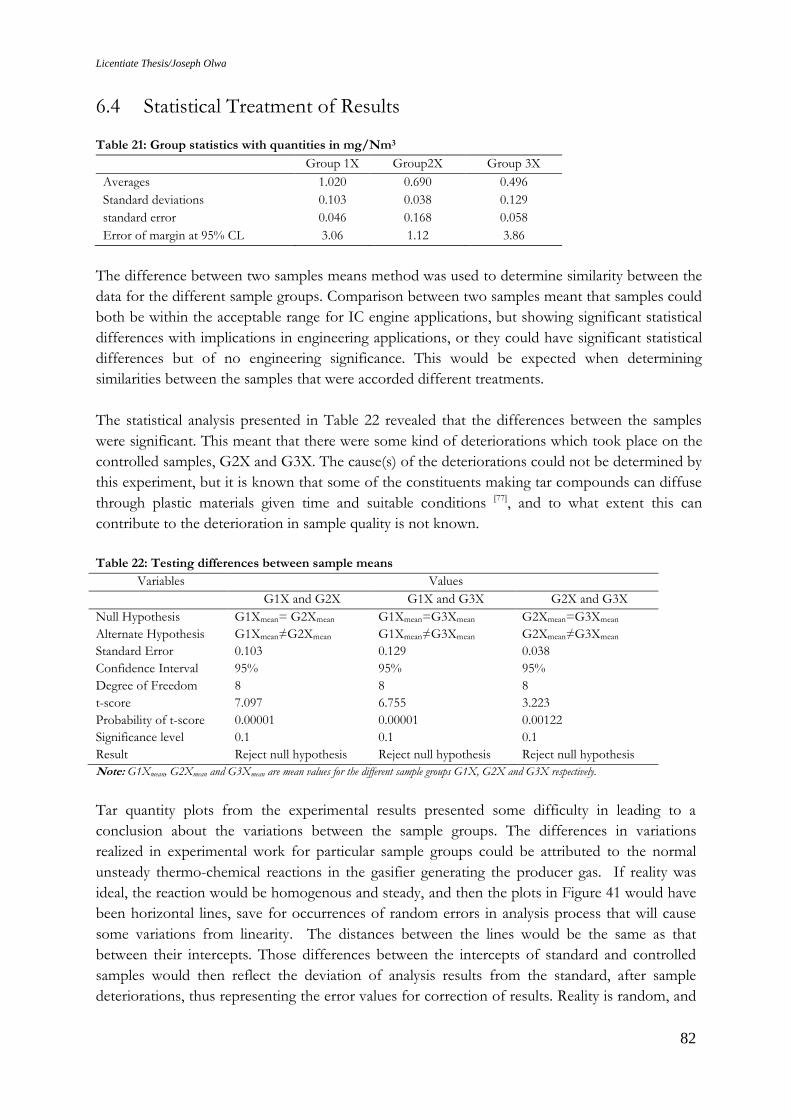
Licentiate Thesis/Joseph Olwa
82
6.4 Statistical Treatment of Results
Table 21: Group statistics with quantities in mg/Nm3
Group 1X Group2X Group 3X
Averages 1.020 0.690 0.496
Standard deviations 0.103 0.038 0.129
standard error 0.046 0.168 0.058
Error of margin at 95% CL 3.06 1.12 3.86
The difference between two samples means method was used to determine similarity between the
data for the different sample groups. Comparison between two samples meant that samples could
both be within the acceptable range for IC engine applications, but showing significant statistical
differences with implications in engineering applications, or they could have significant statistical
differences but of no engineering significance. This would be expected when determining
similarities between the samples that were accorded different treatments.
The statistical analysis presented in Table 22 revealed that the differences between the samples
were significant. This meant that there were some kind of deteriorations which took place on the
controlled samples, G2X and G3X. The cause(s) of the deteriorations could not be determined by
this experiment, but it is known that some of the constituents making tar compounds can diffuse
through plastic materials given time and suitable conditions [77], and to what extent this can
contribute to the deterioration in sample quality is not known.
Table 22: Testing differences between sample means
Variables Values
G1X and G2X G1X and G3X G2X and G3X
Null Hypothesis G1Xmean= G2Xmean G1Xmean=G3Xmean G2Xmean=G3Xmean
Alternate Hypothesis G1Xmean≠G2Xmean G1Xmean≠G3Xmean G2Xmean≠G3Xmean
Standard Error 0.103 0.129 0.038
Confidence Interval 95% 95% 95%
Degree of Freedom 8 8 8
t-score 7.097 6.755 3.223
Probability of t-score 0.00001 0.00001 0.00122
Significance level 0.1 0.1 0.1
Result Reject null hypothesis Reject null hypothesis Reject null hypothesis
Note: G1Xmean, G2Xmean and G3Xmean are mean values for the different sample groups G1X, G2X and G3X respectively.
Tar quantity plots from the experimental results presented some difficulty in leading to a
conclusion about the variations between the sample groups. The differences in variations
realized in experimental work for particular sample groups could be attributed to the normal
unsteady thermo-chemical reactions in the gasifier generating the producer gas. If reality was
ideal, the reaction would be homogenous and steady, and then the plots in Figure 41 would have
been horizontal lines, save for occurrences of random errors in analysis process that will cause
some variations from linearity. The distances between the lines would be the same as that
between their intercepts. Those differences between the intercepts of standard and controlled
samples would then reflect the deviation of analysis results from the standard, after sample
deteriorations, thus representing the error values for correction of results. Reality is random, and
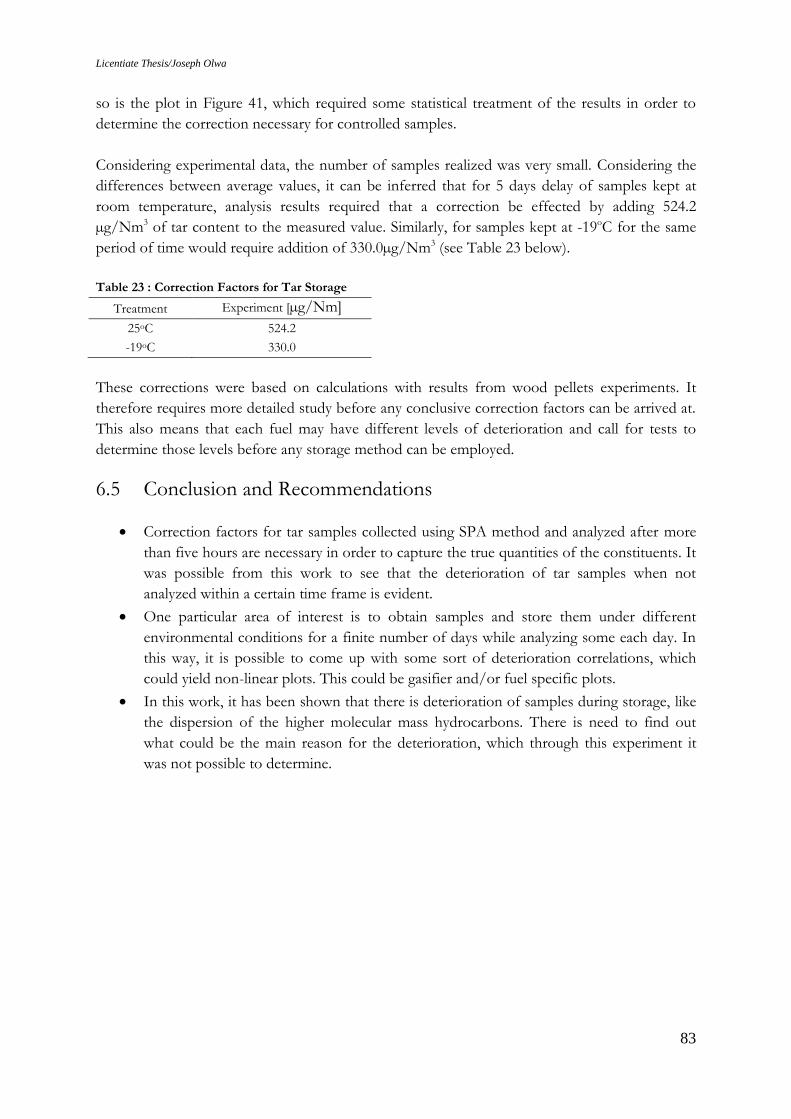
Licentiate Thesis/Joseph Olwa
83
so is the plot in Figure 41, which required some statistical treatment of the results in order to
determine the correction necessary for controlled samples.
Considering experimental data, the number of samples realized was very small. Considering the
differences between average values, it can be inferred that for 5 days delay of samples kept at
room temperature, analysis results required that a correction be effected by adding 524.2
µg/Nm3 of tar content to the measured value. Similarly, for samples kept at -19oC for the same
period of time would require addition of 330.0µg/Nm3 (see Table 23 below).
Table 23 : Correction Factors for Tar Storage
Treatment Experiment [µg/Nm]
25oC 524.2
-19oC 330.0
These corrections were based on calculations with results from wood pellets experiments. It
therefore requires more detailed study before any conclusive correction factors can be arrived at.
This also means that each fuel may have different levels of deterioration and call for tests to
determine those levels before any storage method can be employed.
6.5 Conclusion and Recommendations
Correction factors for tar samples collected using SPA method and analyzed after more
than five hours are necessary in order to capture the true quantities of the constituents. It
was possible from this work to see that the deterioration of tar samples when not
analyzed within a certain time frame is evident.
One particular area of interest is to obtain samples and store them under different
environmental conditions for a finite number of days while analyzing some each day. In
this way, it is possible to come up with some sort of deterioration correlations, which
could yield non-linear plots. This could be gasifier and/or fuel specific plots.
In this work, it has been shown that there is deterioration of samples during storage, like
the dispersion of the higher molecular mass hydrocarbons. There is need to find out
what could be the main reason for the deterioration, which through this experiment it
was not possible to determine.
Licentiate Thesis/Joseph Olwa
84
7. Field Study of a Biomass Gasifier IC Engine System
7.1 Introduction
In order to understand challenges related to biomass gasifier IC engine systems, a study was
conducted to determine causes of a reported deterioration in performance of an installed
biomass power plant in Uganda. This unit was supplied by the Indian company Ankur Scientific
Ltd. The plant is installed at a tea factory in Muzizi, in Kibaale district of Western Uganda, about
300km from Kampala, the capital city of Uganda. The plant was commissioned in the end of the
year 2005. The commissioning was done in a period of about four weeks. Training of the staff in
operating and servicing the plant was carried out during the commissioning period and this took
ten days. The expected performance of 205 kWe gross power output (a 180kWe net output after
deduction of auxiliary power) was not achieved during commissioning. The plant could generate
about 180kWe gross without auxiliary loads.
Since commissioning, the performance of the power plant has deteriorated. The objective of this
study was to identify possible reasons for this and suggest measures that would make it possible
to reach the output originally achieved. At Makerere university there was an ongoing research in
application of biomass for electricity power generation, in particular studies in improvement
methods for biomass gasification power plants, in Uganda. With this research program there was
a focus on capacity building in gasification technology expertise and the development of
knowledge base and dissemination center for Uganda. The information about the reported
deterioration in performance of the Muzizi biomass power plant provided an avenue for
collaboration with the industry.
A study was carried out on the performance characteristics of the power plant, and an inquiry
was made on operating experiences gained so far on the plant that had been installed at the
factory. This information was vital in finding a solution to the deterioration in performance of
the system as reported by the proprietors. It was also significant for the understanding of
challenges related to the biomass gasification technology application for small scale electricity
generation in Uganda in general. This chapter therefore describes the plant at Muzizi tea factory,
its performance details, challenges and recommendations regarding ways to reinstate the plant to
delivery its designed power output.
7.2 Description of the installation
The power plant consists of a machine hall with the gasifier, gas treatment system, engine
generator set and control panels, an adjacent building for fuel preparation and fuel storage and a
combined spray pond and sludge pond where the scrubber water is cooled and contaminants in
the water are allowed to settle at the bottom.
A flow scheme showing the main features of the installation in the machine hall is shown in
Figure 42 below.
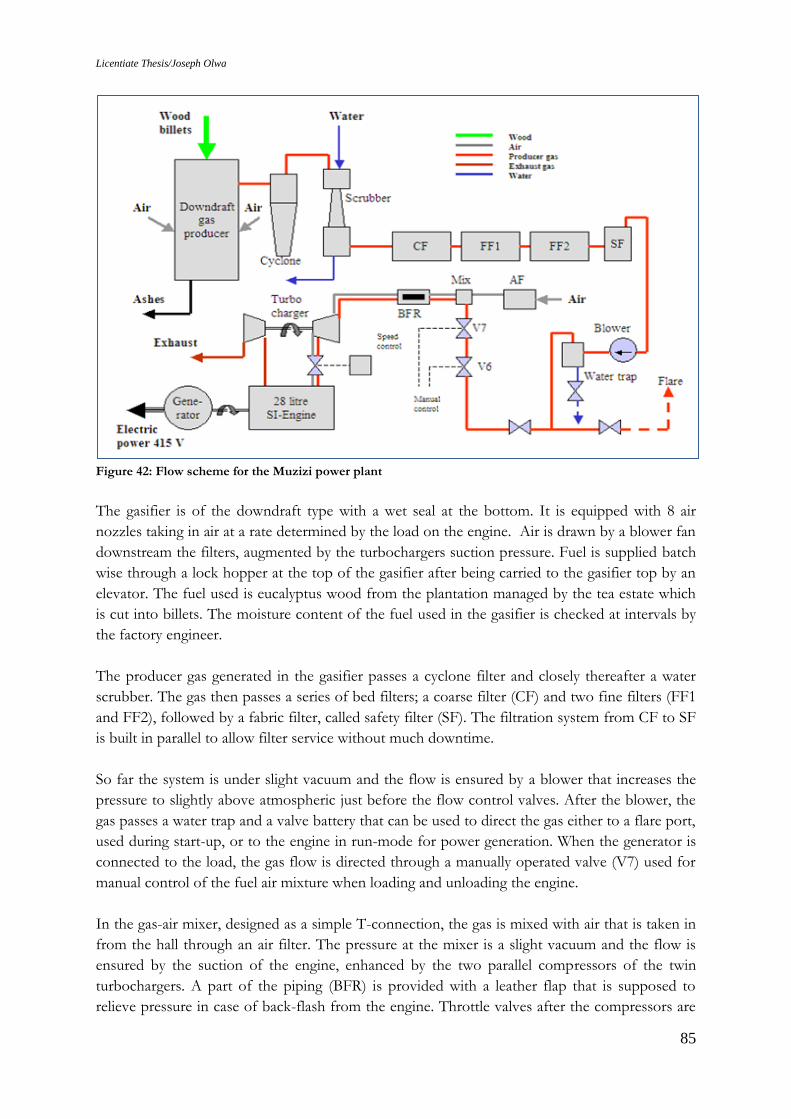
Licentiate Thesis/Joseph Olwa
85
Figure 42: Flow scheme for the Muzizi power plant
The gasifier is of the downdraft type with a wet seal at the bottom. It is equipped with 8 air
nozzles taking in air at a rate determined by the load on the engine. Air is drawn by a blower fan
downstream the filters, augmented by the turbochargers suction pressure. Fuel is supplied batch
wise through a lock hopper at the top of the gasifier after being carried to the gasifier top by an
elevator. The fuel used is eucalyptus wood from the plantation managed by the tea estate which
is cut into billets. The moisture content of the fuel used in the gasifier is checked at intervals by
the factory engineer.
The producer gas generated in the gasifier passes a cyclone filter and closely thereafter a water
scrubber. The gas then passes a series of bed filters; a coarse filter (CF) and two fine filters (FF1
and FF2), followed by a fabric filter, called safety filter (SF). The filtration system from CF to SF
is built in parallel to allow filter service without much downtime.
So far the system is under slight vacuum and the flow is ensured by a blower that increases the
pressure to slightly above atmospheric just before the flow control valves. After the blower, the
gas passes a water trap and a valve battery that can be used to direct the gas either to a flare port,
used during start-up, or to the engine in run-mode for power generation. When the generator is
connected to the load, the gas flow is directed through a manually operated valve (V7) used for
manual control of the fuel air mixture when loading and unloading the engine.
In the gas-air mixer, designed as a simple T-connection, the gas is mixed with air that is taken in
from the hall through an air filter. The pressure at the mixer is a slight vacuum and the flow is
ensured by the suction of the engine, enhanced by the two parallel compressors of the twin
turbochargers. A part of the piping (BFR) is provided with a leather flap that is supposed to
relieve pressure in case of back-flash from the engine. Throttle valves after the compressors are
Licentiate Thesis/Joseph Olwa
86
connected to a speed governor for automatic speed control during load variations.
The gas engine is a 12 cylinder spark ignition engine in V-arrangement, from Cummins India,
with a displacement volume 28 liters and a compression pressure ratio at cranking of about 14.5.
It is equipped with two Holset turbochargers, one for each side of the V block. The operating
speed is 1500 rpm. The generator is from Newage Electrical India and is rated for 440 kVA at
415 V. The exhaust gas is brought to a recovery boiler for generation of steam to be used in the
processing of the tea, but this is not being used.
A weighing scale is used for determination of the mass of fuel wood charged into the gasifier.
Simple U-tube manometers are used to monitor the pressure differences over gasifier nozzles,
across gasifier fuel bed and the different filters. A manometer is also used to measure the
pressure after the blower. Pressure readings taken during this study were made using electronic
pressure measuring equipment (Testo 512 with ranges of 0-200hPa and 0-2000 hPa).
Temperatures of engine coolant and of the gas after the compressor are measured by
temperature gauges installed on the engine. Engine operating hours and electrical power output
are also measured. Sampling ports for gas analysis are available at the cyclone, the safety filter
(SF) and on the engine intake manifolds.
Clear step-wise instructions are shown on large panels attached to the walls of the machine hall.
All operating parameters are recorded each 30 minutes on standardized log-book sheets.
No heat recovery is being used at the moment. The equipment appears to be in good working
condition. By opening the flap of the back-fire relief section of the pipe leading to the
turbocharger compressor inlet it was possible to inspect the inside of this pipe. No signs of tar or
ash deposits were found.
7.3 Operational Experiences
The failure to reach the original target output of 205kWe has already been mentioned. It is not
clear what the reasons are, but they are probably to be sought in the selection of the
turbochargers or that compensation for the altitude was neglected. The accumulated operation
time of the engine was 7435 hours at the time of this study. The plant was saving significant
amounts of money by replacing power from the diesel electricity generators, when it was
operated at loads over 150kWe.
It was noted that the power output of the plant dropped with time, originally from 180kWe to
about 100kWe. When this level was reached, experts from the supplier were called in and found
that the reason was poor gas heating value, caused by air leakage into the gasifier bottom. It
turned out that the bottom had corroded as a result of high water level in the water seals, an
effect of ash/char deposits in water lock space that had not been removed as part of the service
routine. After repairs, the power output was brought up to about 150kWe, but again after a few
weeks it dropped down to about 100kWe. New visits of experts from the supplier resulted in
adjustment of the spark timing and in June 2007 again an improved output, this time, of 185kWe
was achieved. After some months a gradual drop of the output was observed. In April 2008 the
output had dropped to about 110kWe and operation was stopped since the engineer feared that
Licentiate Thesis/Joseph Olwa
87
continued operation, at that capacity, might lead to deposits in the engine. The operation was
resumed in 2009 to date at loads not reaching 110kWe. Details of the earlier repair work by the
suppliers were not divulged to the owners.
The experience from the operation of the scrubber system where scrubber water is brought to a
spray pond for cooling and sedimentation of contaminants appears to be favorable in this plant.
No liquid bleed-off is necessary since more water is evaporated by the sprays than condensed
from the raw gas in the scrubber. The sludge collected in the pond is removed from time to
time. How the sludge was handled thereafter is not discussed in this study and remains an
important issue, since the sludge can be an environmental hazard.
7.4 Possible Reasons for the Degradation of the Output
7.4.1 Low density of the fuel-air mixture entering the cylinder
Possible causes:
Impaired turbocharger function (wear, deposits)
Reduced pressure before turbo-charger (increased pressure loss in air filter)
Stuck speed control valve
Increased pressure loss over inlet valves (deposits)
7.4.2 Poor heating value of the fuel-air mixture
Possible causes:
Reduced heating value of the producer gas (air leakage into hot part of system, increased
fuel moisture, bridging in the fuel bed)
Deviation of air-fuel ratio obtained in the producer gas and air mixer from optimum
(wrong valve settings on gas side, increased pressure loss across air filter, air leakage into
cold parts of the system)
7.4.3 Low conversion efficiency of the engine
Possible causes:
Reduced compression ratio (valve leakage, leakage past piston rings)
Failure to ignite in some cylinders (faulty spark plugs, faulty ignition system)
Ignition timing deviates from maximum brake torque (MBT) position
Increased back-pressure in exhaust pipe (deposition)
Improper producer gas- air mixture ratio
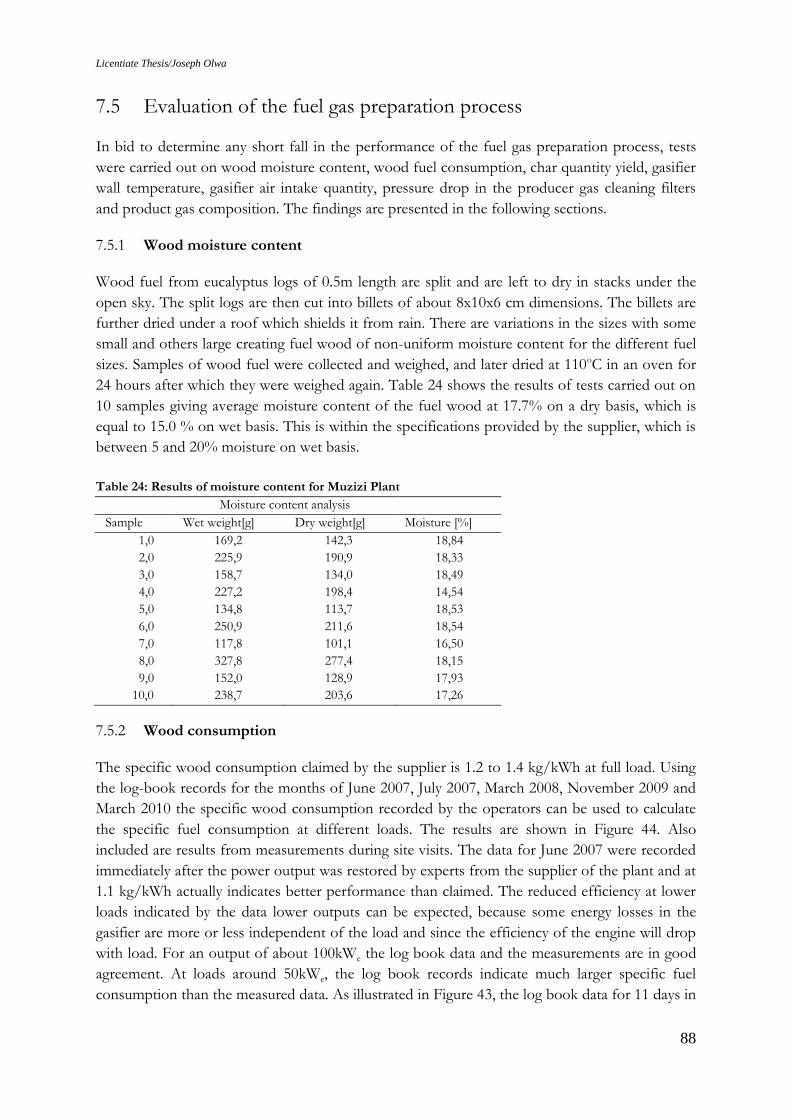
Licentiate Thesis/Joseph Olwa
88
7.5 Evaluation of the fuel gas preparation process
In bid to determine any short fall in the performance of the fuel gas preparation process, tests
were carried out on wood moisture content, wood fuel consumption, char quantity yield, gasifier
wall temperature, gasifier air intake quantity, pressure drop in the producer gas cleaning filters
and product gas composition. The findings are presented in the following sections.
7.5.1 Wood moisture content
Wood fuel from eucalyptus logs of 0.5m length are split and are left to dry in stacks under the
open sky. The split logs are then cut into billets of about 8x10x6 cm dimensions. The billets are
further dried under a roof which shields it from rain. There are variations in the sizes with some
small and others large creating fuel wood of non-uniform moisture content for the different fuel
sizes. Samples of wood fuel were collected and weighed, and later dried at 110oC in an oven for
24 hours after which they were weighed again. Table 24 shows the results of tests carried out on
10 samples giving average moisture content of the fuel wood at 17.7% on a dry basis, which is
equal to 15.0 % on wet basis. This is within the specifications provided by the supplier, which is
between 5 and 20% moisture on wet basis.
Table 24: Results of moisture content for Muzizi Plant
Moisture content analysis
Sample Wet weight[g] Dry weight[g] Moisture [%]
1,0 169,2 142,3 18,84
2,0 225,9 190,9 18,33
3,0 158,7 134,0 18,49
4,0 227,2 198,4 14,54
5,0 134,8 113,7 18,53
6,0 250,9 211,6 18,54
7,0 117,8 101,1 16,50
8,0 327,8 277,4 18,15
9,0 152,0 128,9 17,93
10,0 238,7 203,6 17,26
7.5.2 Wood consumption
The specific wood consumption claimed by the supplier is 1.2 to 1.4 kg/kWh at full load. Using
the log-book records for the months of June 2007, July 2007, March 2008, November 2009 and
March 2010 the specific wood consumption recorded by the operators can be used to calculate
the specific fuel consumption at different loads. The results are shown in Figure 44. Also
included are results from measurements during site visits. The data for June 2007 were recorded
immediately after the power output was restored by experts from the supplier of the plant and at
1.1 kg/kWh actually indicates better performance than claimed. The reduced efficiency at lower
loads indicated by the data lower outputs can be expected, because some energy losses in the
gasifier are more or less independent of the load and since the efficiency of the engine will drop
with load. For an output of about 100kWe the log book data and the measurements are in good
agreement. At loads around 50kWe, the log book records indicate much larger specific fuel
consumption than the measured data. As illustrated in Figure 43, the log book data for 11 days in
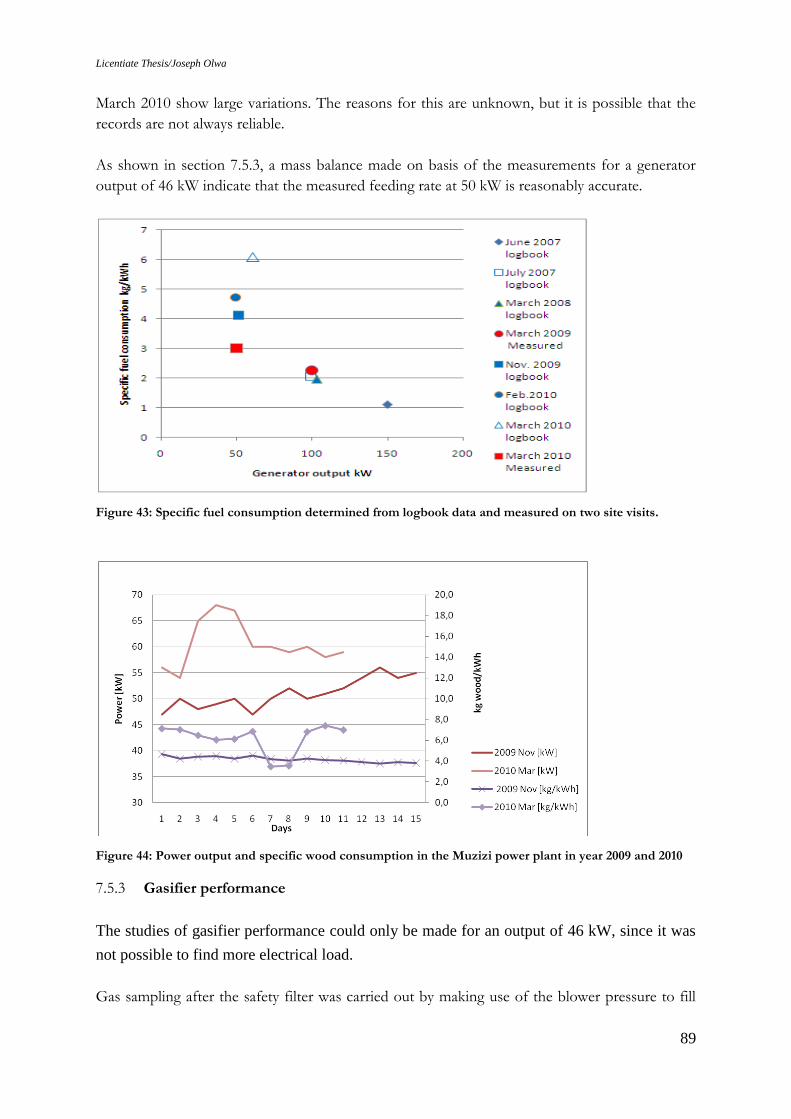
Licentiate Thesis/Joseph Olwa
89
March 2010 show large variations. The reasons for this are unknown, but it is possible that the
records are not always reliable.
As shown in section 7.5.3, a mass balance made on basis of the measurements for a generator
output of 46 kW indicate that the measured feeding rate at 50 kW is reasonably accurate.
Figure 43: Specific fuel consumption determined from logbook data and measured on two site visits.
Figure 44: Power output and specific wood consumption in the Muzizi power plant in year 2009 and 2010
7.5.3 Gasifier performance
The studies of gasifier performance could only be made for an output of 46 kW, since it was
not possible to find more electrical load.
Gas sampling after the safety filter was carried out by making use of the blower pressure to fill
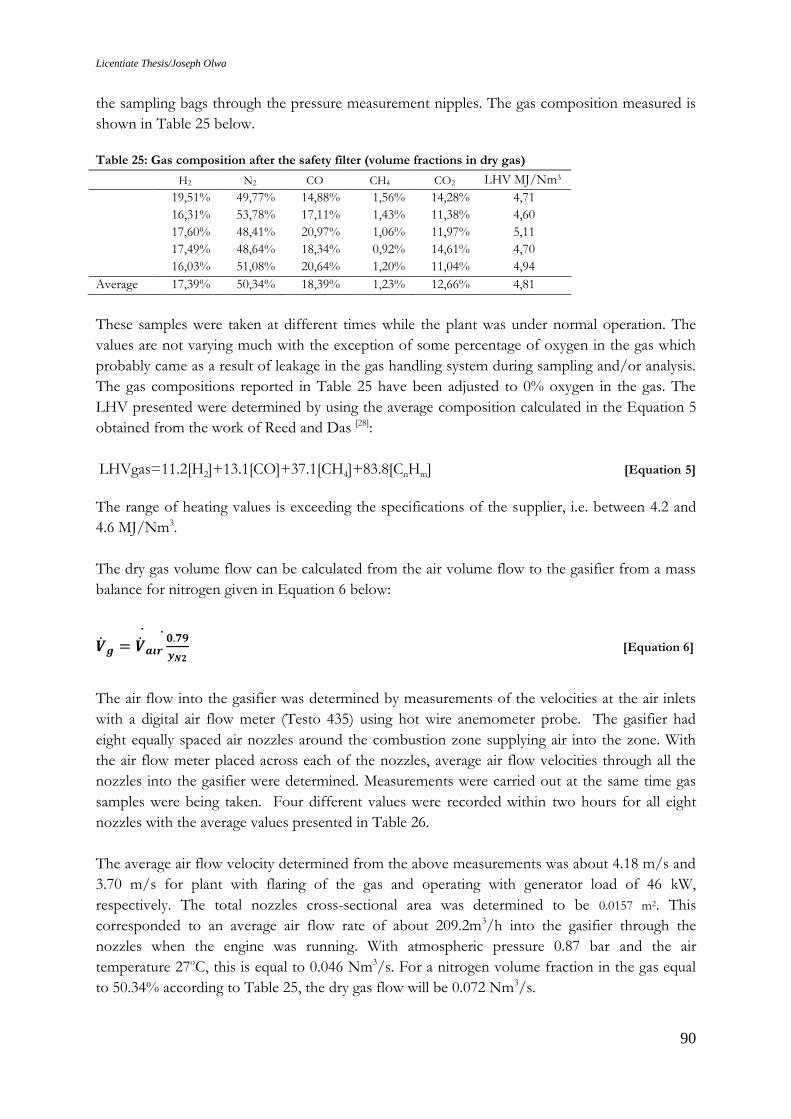
Licentiate Thesis/Joseph Olwa
90
the sampling bags through the pressure measurement nipples. The gas composition measured is
shown in Table 25 below.
Table 25: Gas composition after the safety filter (volume fractions in dry gas)
H2 N2 CO CH4 CO2 LHV MJ/Nm3
19,51% 49,77% 14,88% 1,56% 14,28% 4,71
16,31% 53,78% 17,11% 1,43% 11,38% 4,60
17,60% 48,41% 20,97% 1,06% 11,97% 5,11
17,49% 48,64% 18,34% 0,92% 14,61% 4,70
16,03% 51,08% 20,64% 1,20% 11,04% 4,94
Average 17,39% 50,34% 18,39% 1,23% 12,66% 4,81
These samples were taken at different times while the plant was under normal operation. The
values are not varying much with the exception of some percentage of oxygen in the gas which
probably came as a result of leakage in the gas handling system during sampling and/or analysis.
The gas compositions reported in Table 25 have been adjusted to 0% oxygen in the gas. The
LHV presented were determined by using the average composition calculated in the Equation 5
obtained from the work of Reed and Das [28]:
LHVgas=11.2[H2]+13.1[CO]+37.1[CH4]+83.8[CnHm] [Equation 5]
The range of heating values is exceeding the specifications of the supplier, i.e. between 4.2 and
4.6 MJ/Nm3.
The dry gas volume flow can be calculated from the air volume flow to the gasifier from a mass
balance for nitrogen given in Equation 6 below:
[Equation 6]
The air flow into the gasifier was determined by measurements of the velocities at the air inlets
with a digital air flow meter (Testo 435) using hot wire anemometer probe. The gasifier had
eight equally spaced air nozzles around the combustion zone supplying air into the zone. With
the air flow meter placed across each of the nozzles, average air flow velocities through all the
nozzles into the gasifier were determined. Measurements were carried out at the same time gas
samples were being taken. Four different values were recorded within two hours for all eight
nozzles with the average values presented in Table 26.
The average air flow velocity determined from the above measurements was about 4.18 m/s and
3.70 m/s for plant with flaring of the gas and operating with generator load of 46 kW,
respectively. The total nozzles cross-sectional area was determined to be 0.0157 m2. This
corresponded to an average air flow rate of about 209.2m3/h into the gasifier through the
nozzles when the engine was running. With atmospheric pressure 0.87 bar and the air
temperature 27oC, this is equal to 0.046 Nm3/s. For a nitrogen volume fraction in the gas equal
to 50.34% according to Table 25, the dry gas flow will be 0.072 Nm3/s.
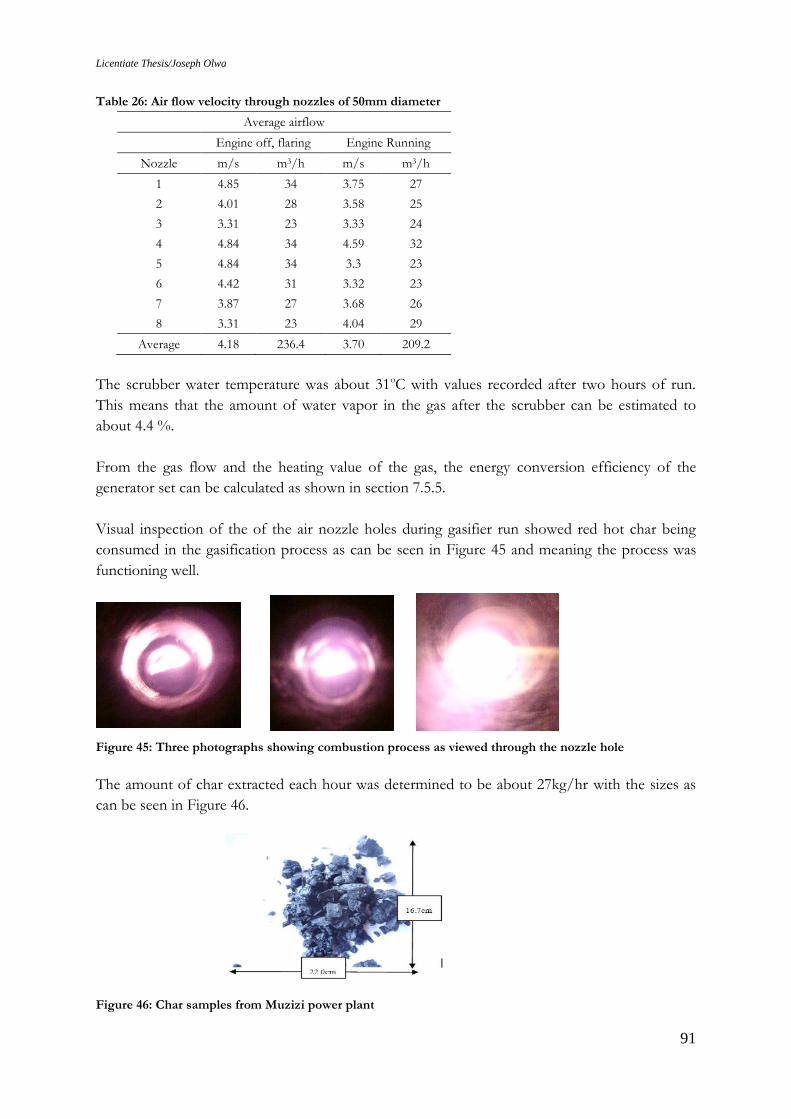
Licentiate Thesis/Joseph Olwa
91
Table 26: Air flow velocity through nozzles of 50mm diameter
Average airflow
Engine off, flaring Engine Running
Nozzle m/s m3/h m/s m3/h
1 4.85 34 3.75 27
2 4.01 28 3.58 25
3 3.31 23 3.33 24
4 4.84 34 4.59 32
5 4.84 34 3.3 23
6 4.42 31 3.32 23
7 3.87 27 3.68 26
8 3.31 23 4.04 29
Average 4.18 236.4 3.70 209.2
The scrubber water temperature was about 31oC with values recorded after two hours of run.
This means that the amount of water vapor in the gas after the scrubber can be estimated to
about 4.4 %.
From the gas flow and the heating value of the gas, the energy conversion efficiency of the
generator set can be calculated as shown in section 7.5.5.
Visual inspection of the of the air nozzle holes during gasifier run showed red hot char being
consumed in the gasification process as can be seen in Figure 45 and meaning the process was
functioning well.
Figure 45: Three photographs showing combustion process as viewed through the nozzle hole
The amount of char extracted each hour was determined to be about 27kg/hr with the sizes as
can be seen in Figure 46.
Figure 46: Char samples from Muzizi power plant
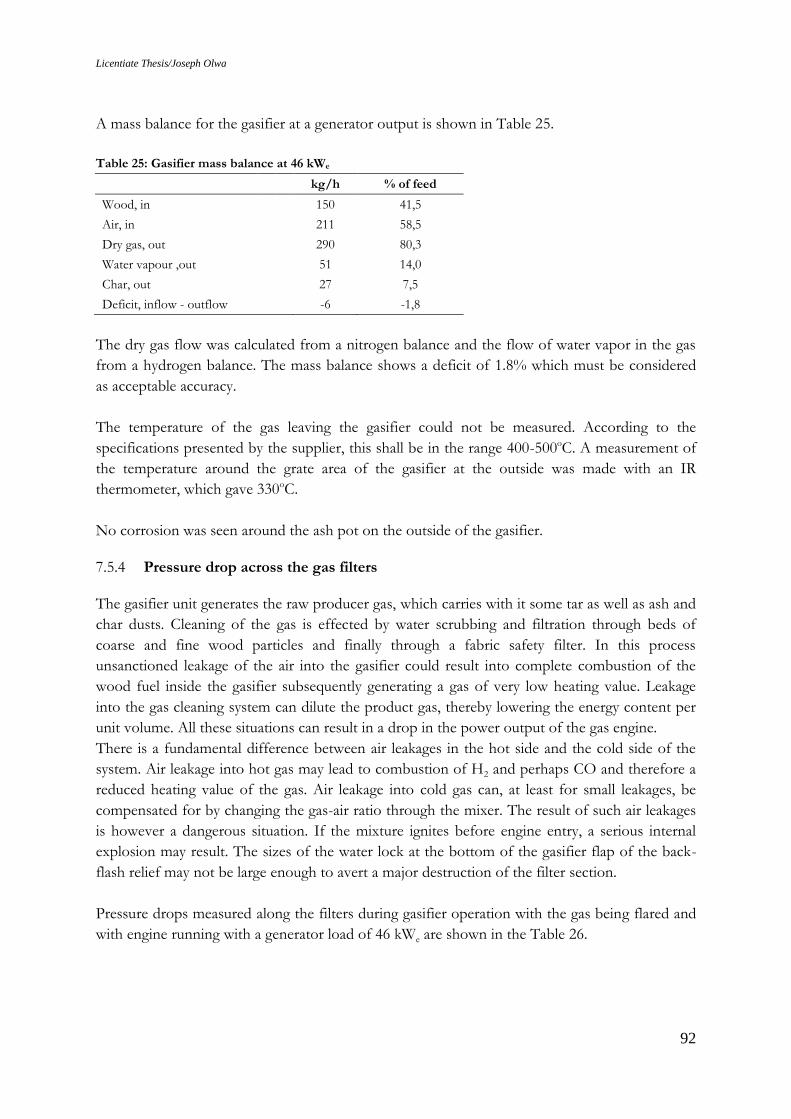
Licentiate Thesis/Joseph Olwa
92
A mass balance for the gasifier at a generator output is shown in Table 25.
Table 25: Gasifier mass balance at 46 kWe
kg/h % of feed
Wood, in 150 41,5
Air, in 211 58,5
Dry gas, out 290 80,3
Water vapour ,out 51 14,0
Char, out 27 7,5
Deficit, inflow - outflow -6 -1,8
The dry gas flow was calculated from a nitrogen balance and the flow of water vapor in the gas
from a hydrogen balance. The mass balance shows a deficit of 1.8% which must be considered
as acceptable accuracy.
The temperature of the gas leaving the gasifier could not be measured. According to the
specifications presented by the supplier, this shall be in the range 400-500oC. A measurement of
the temperature around the grate area of the gasifier at the outside was made with an IR
thermometer, which gave 330oC.
No corrosion was seen around the ash pot on the outside of the gasifier.
7.5.4 Pressure drop across the gas filters
The gasifier unit generates the raw producer gas, which carries with it some tar as well as ash and
char dusts. Cleaning of the gas is effected by water scrubbing and filtration through beds of
coarse and fine wood particles and finally through a fabric safety filter. In this process
unsanctioned leakage of the air into the gasifier could result into complete combustion of the
wood fuel inside the gasifier subsequently generating a gas of very low heating value. Leakage
into the gas cleaning system can dilute the product gas, thereby lowering the energy content per
unit volume. All these situations can result in a drop in the power output of the gas engine.
There is a fundamental difference between air leakages in the hot side and the cold side of the
system. Air leakage into hot gas may lead to combustion of H2 and perhaps CO and therefore a
reduced heating value of the gas. Air leakage into cold gas can, at least for small leakages, be
compensated for by changing the gas-air ratio through the mixer. The result of such air leakages
is however a dangerous situation. If the mixture ignites before engine entry, a serious internal
explosion may result. The sizes of the water lock at the bottom of the gasifier flap of the back-
flash relief may not be large enough to avert a major destruction of the filter section.
Pressure drops measured along the filters during gasifier operation with the gas being flared and
with engine running with a generator load of 46 kWe are shown in the Table 26.
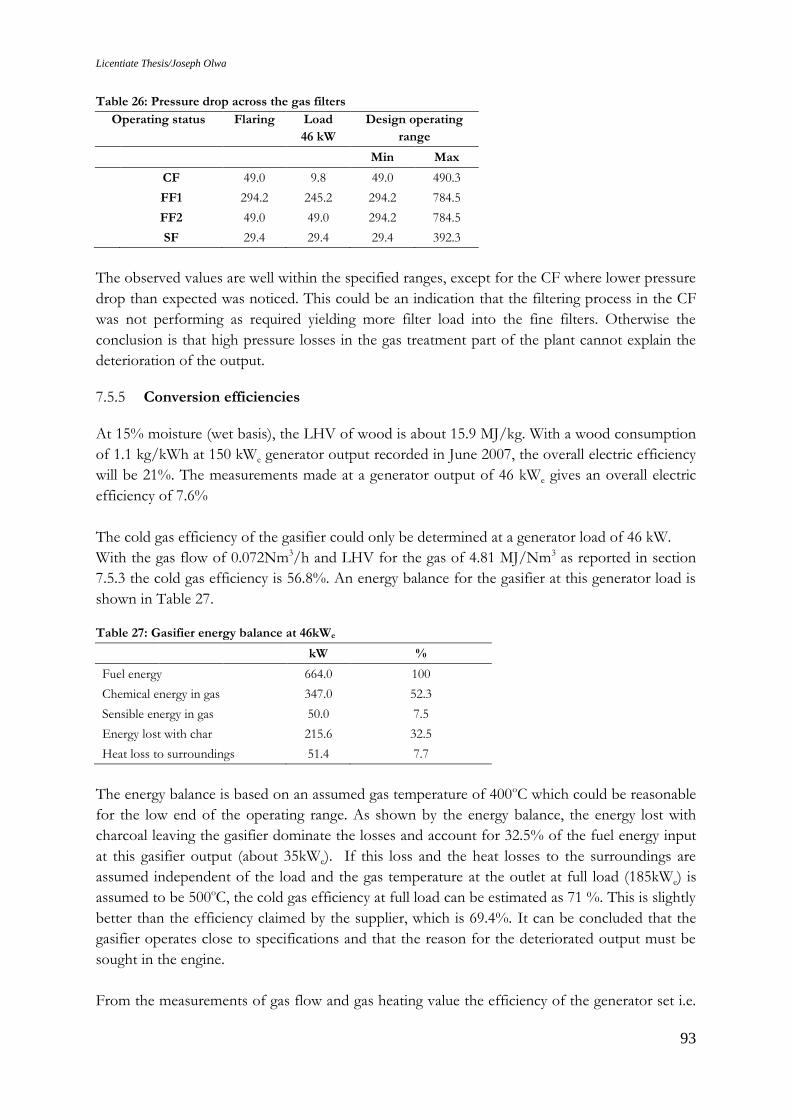
Licentiate Thesis/Joseph Olwa
93
Table 26: Pressure drop across the gas filters
Operating status
Flaring
Load
46 kW
Design operating
range
Min Max
CF 49.0 9.8 49.0 490.3
FF1 294.2 245.2 294.2 784.5
FF2 49.0 49.0 294.2 784.5
SF 29.4 29.4 29.4 392.3
The observed values are well within the specified ranges, except for the CF where lower pressure
drop than expected was noticed. This could be an indication that the filtering process in the CF
was not performing as required yielding more filter load into the fine filters. Otherwise the
conclusion is that high pressure losses in the gas treatment part of the plant cannot explain the
deterioration of the output.
7.5.5 Conversion efficiencies
At 15% moisture (wet basis), the LHV of wood is about 15.9 MJ/kg. With a wood consumption
of 1.1 kg/kWh at 150 kWe generator output recorded in June 2007, the overall electric efficiency
will be 21%. The measurements made at a generator output of 46 kWe gives an overall electric
efficiency of 7.6%
The cold gas efficiency of the gasifier could only be determined at a generator load of 46 kW.
With the gas flow of 0.072Nm3/h and LHV for the gas of 4.81 MJ/Nm3 as reported in section
7.5.3 the cold gas efficiency is 56.8%. An energy balance for the gasifier at this generator load is
shown in Table 27. Table 27: Gasifier energy balance at 46kWe
kW %
Fuel energy 664.0 100
Chemical energy in gas 347.0 52.3
Sensible energy in gas 50.0 7.5
Energy lost with char 215.6 32.5
Heat loss to surroundings 51.4 7.7
The energy balance is based on an assumed gas temperature of 400oC which could be reasonable
for the low end of the operating range. As shown by the energy balance, the energy lost with
charcoal leaving the gasifier dominate the losses and account for 32.5% of the fuel energy input
at this gasifier output (about 35kWe). If this loss and the heat losses to the surroundings are
assumed independent of the load and the gas temperature at the outlet at full load (185kWe) is
assumed to be 500oC, the cold gas efficiency at full load can be estimated as 71 %. This is slightly
better than the efficiency claimed by the supplier, which is 69.4%. It can be concluded that the
gasifier operates close to specifications and that the reason for the deteriorated output must be
sought in the engine.
From the measurements of gas flow and gas heating value the efficiency of the generator set i.e.
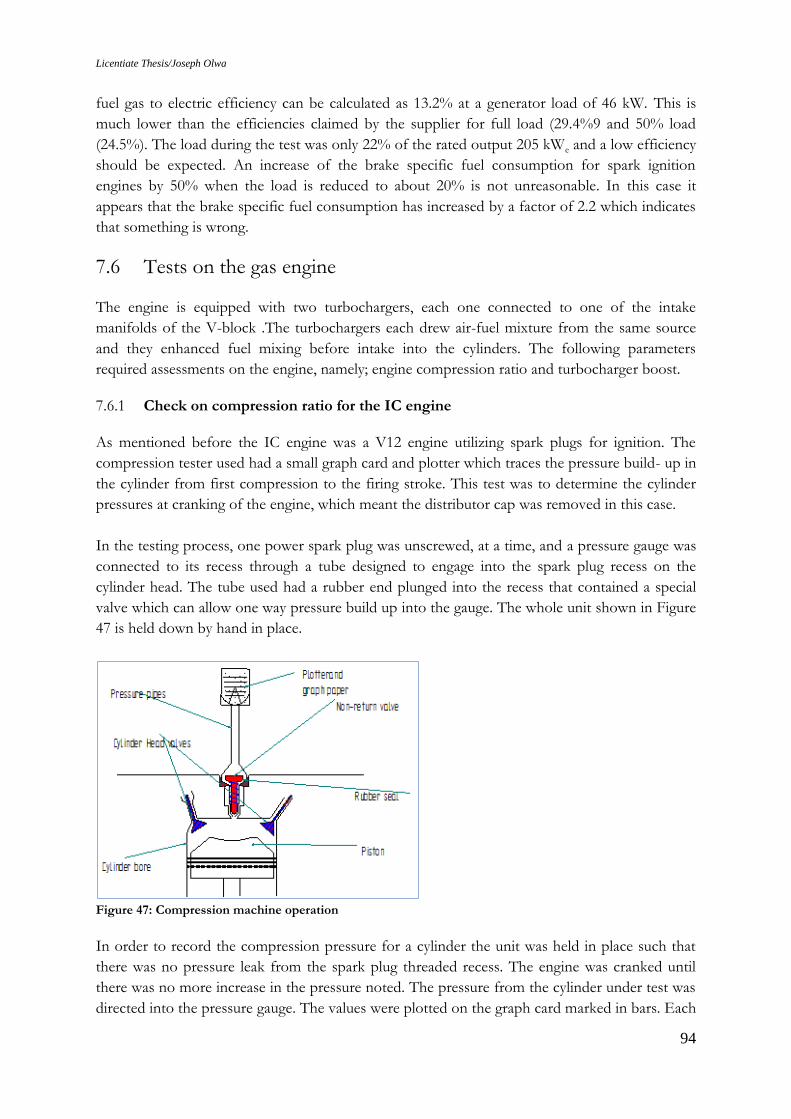
Licentiate Thesis/Joseph Olwa
94
fuel gas to electric efficiency can be calculated as 13.2% at a generator load of 46 kW. This is
much lower than the efficiencies claimed by the supplier for full load (29.4%9 and 50% load
(24.5%). The load during the test was only 22% of the rated output 205 kWe and a low efficiency
should be expected. An increase of the brake specific fuel consumption for spark ignition
engines by 50% when the load is reduced to about 20% is not unreasonable. In this case it
appears that the brake specific fuel consumption has increased by a factor of 2.2 which indicates
that something is wrong.
7.6 Tests on the gas engine
The engine is equipped with two turbochargers, each one connected to one of the intake
manifolds of the V-block .The turbochargers each drew air-fuel mixture from the same source
and they enhanced fuel mixing before intake into the cylinders. The following parameters
required assessments on the engine, namely; engine compression ratio and turbocharger boost.
7.6.1 Check on compression ratio for the IC engine
As mentioned before the IC engine was a V12 engine utilizing spark plugs for ignition. The
compression tester used had a small graph card and plotter which traces the pressure build- up in
the cylinder from first compression to the firing stroke. This test was to determine the cylinder
pressures at cranking of the engine, which meant the distributor cap was removed in this case.
In the testing process, one power spark plug was unscrewed, at a time, and a pressure gauge was
connected to its recess through a tube designed to engage into the spark plug recess on the
cylinder head. The tube used had a rubber end plunged into the recess that contained a special
valve which can allow one way pressure build up into the gauge. The whole unit shown in Figure
47 is held down by hand in place.
Figure 47: Compression machine operation
In order to record the compression pressure for a cylinder the unit was held in place such that
there was no pressure leak from the spark plug threaded recess. The engine was cranked until
there was no more increase in the pressure noted. The pressure from the cylinder under test was
directed into the pressure gauge. The values were plotted on the graph card marked in bars. Each
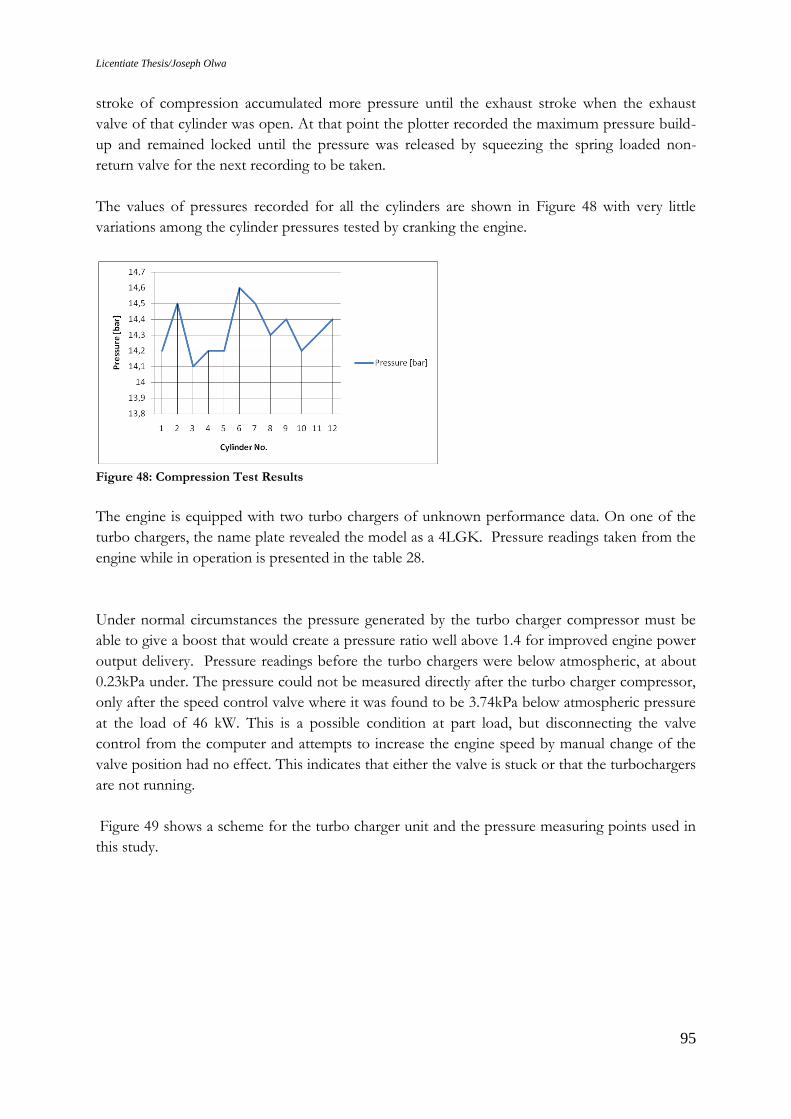
Licentiate Thesis/Joseph Olwa
95
stroke of compression accumulated more pressure until the exhaust stroke when the exhaust
valve of that cylinder was open. At that point the plotter recorded the maximum pressure build-
up and remained locked until the pressure was released by squeezing the spring loaded non-
return valve for the next recording to be taken.
The values of pressures recorded for all the cylinders are shown in Figure 48 with very little
variations among the cylinder pressures tested by cranking the engine.
Figure 48: Compression Test Results
The engine is equipped with two turbo chargers of unknown performance data. On one of the
turbo chargers, the name plate revealed the model as a 4LGK. Pressure readings taken from the
engine while in operation is presented in the table 28.
Under normal circumstances the pressure generated by the turbo charger compressor must be
able to give a boost that would create a pressure ratio well above 1.4 for improved engine power
output delivery. Pressure readings before the turbo chargers were below atmospheric, at about
0.23kPa under. The pressure could not be measured directly after the turbo charger compressor,
only after the speed control valve where it was found to be 3.74kPa below atmospheric pressure
at the load of 46 kW. This is a possible condition at part load, but disconnecting the valve
control from the computer and attempts to increase the engine speed by manual change of the
valve position had no effect. This indicates that either the valve is stuck or that the turbochargers
are not running.
Figure 49 shows a scheme for the turbo charger unit and the pressure measuring points used in
this study.
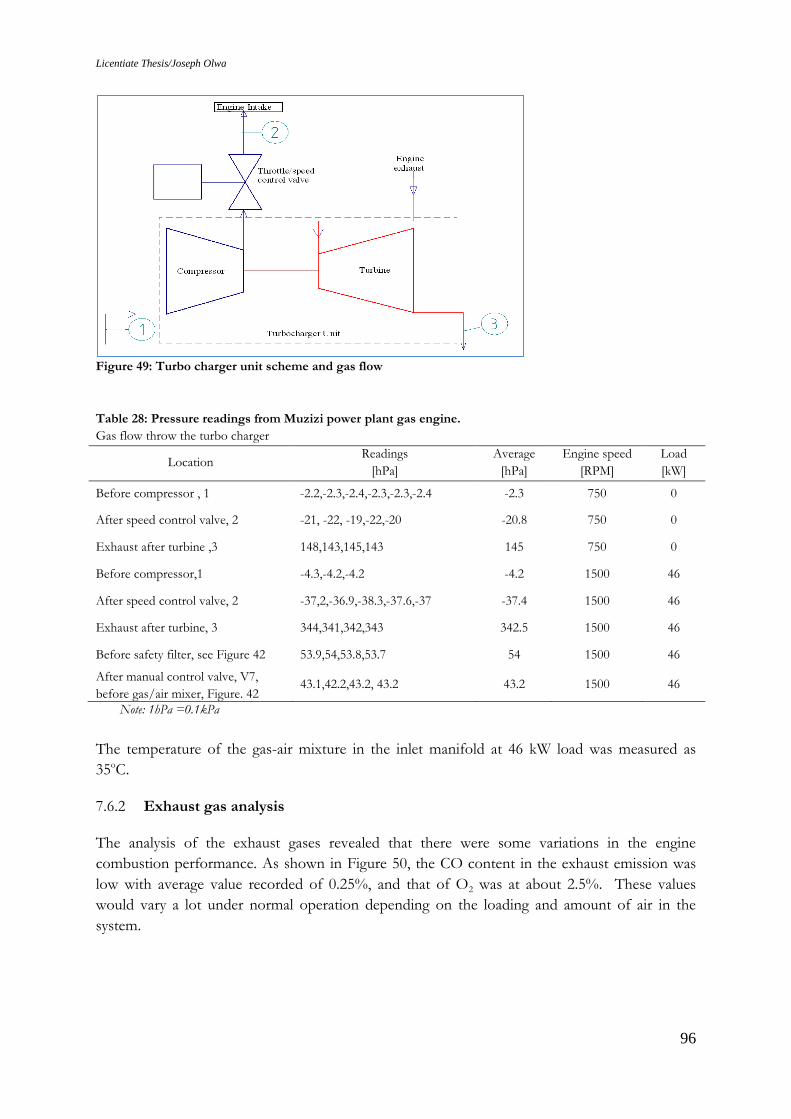
Licentiate Thesis/Joseph Olwa
96
Figure 49: Turbo charger unit scheme and gas flow
Table 28: Pressure readings from Muzizi power plant gas engine.
Gas flow throw the turbo charger
Location Readings
[hPa]
Average
[hPa]
Engine speed
[RPM]
Load
[kW]
Before compressor , 1 -2.2,-2.3,-2.4,-2.3,-2.3,-2.4 -2.3 750 0
After speed control valve, 2 -21, -22, -19,-22,-20 -20.8 750 0
Exhaust after turbine ,3 148,143,145,143 145 750 0
Before compressor,1 -4.3,-4.2,-4.2 -4.2 1500 46
After speed control valve, 2 -37,2,-36.9,-38.3,-37.6,-37 -37.4 1500 46
Exhaust after turbine, 3 344,341,342,343 342.5 1500 46
Before safety filter, see Figure 42 53.9,54,53.8,53.7 54 1500 46
After manual control valve, V7,
before gas/air mixer, Figure. 42 43.1,42.2,43.2, 43.2 43.2 1500 46
Note: 1hPa =0.1kPa
The temperature of the gas-air mixture in the inlet manifold at 46 kW load was measured as
35oC.
7.6.2 Exhaust gas analysis
The analysis of the exhaust gases revealed that there were some variations in the engine
combustion performance. As shown in Figure 50, the CO content in the exhaust emission was
low with average value recorded of 0.25%, and that of O2 was at about 2.5%. These values
would vary a lot under normal operation depending on the loading and amount of air in the
system.
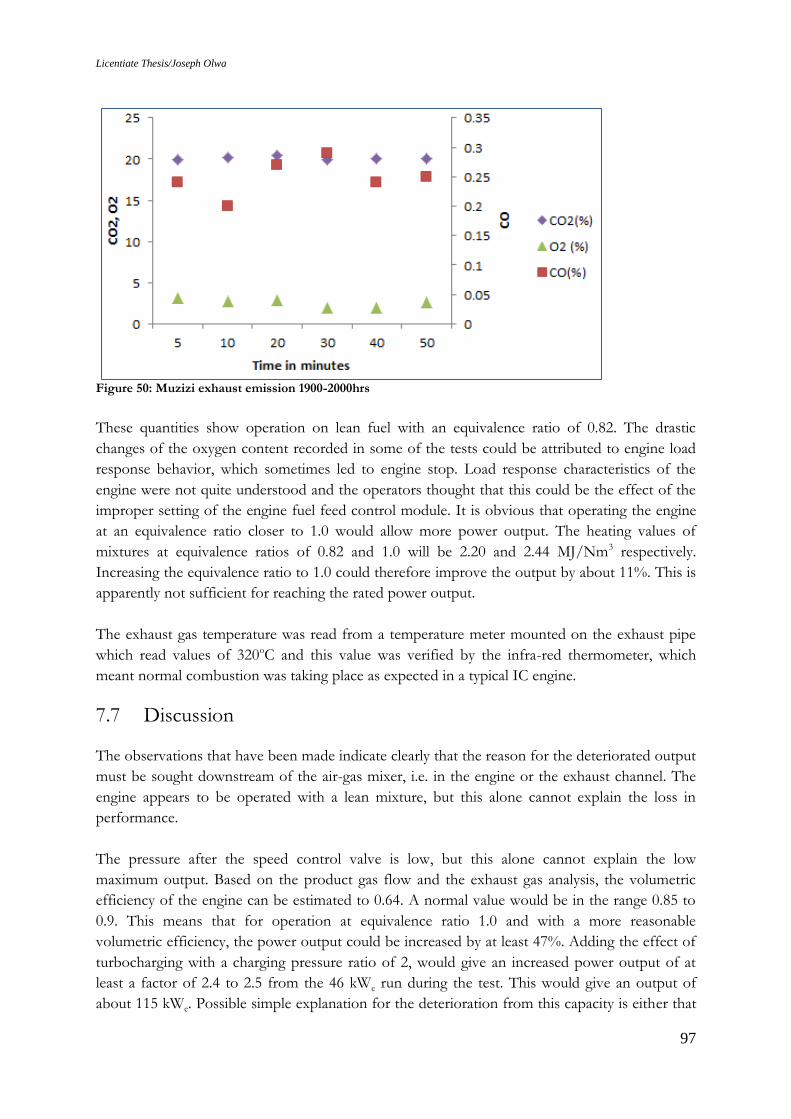
Licentiate Thesis/Joseph Olwa
97
Figure 50: Muzizi exhaust emission 1900-2000hrs
These quantities show operation on lean fuel with an equivalence ratio of 0.82. The drastic
changes of the oxygen content recorded in some of the tests could be attributed to engine load
response behavior, which sometimes led to engine stop. Load response characteristics of the
engine were not quite understood and the operators thought that this could be the effect of the
improper setting of the engine fuel feed control module. It is obvious that operating the engine
at an equivalence ratio closer to 1.0 would allow more power output. The heating values of
mixtures at equivalence ratios of 0.82 and 1.0 will be 2.20 and 2.44 MJ/Nm3 respectively.
Increasing the equivalence ratio to 1.0 could therefore improve the output by about 11%. This is
apparently not sufficient for reaching the rated power output.
The exhaust gas temperature was read from a temperature meter mounted on the exhaust pipe
which read values of 320oC and this value was verified by the infra-red thermometer, which
meant normal combustion was taking place as expected in a typical IC engine.
7.7 Discussion
The observations that have been made indicate clearly that the reason for the deteriorated output
must be sought downstream of the air-gas mixer, i.e. in the engine or the exhaust channel. The
engine appears to be operated with a lean mixture, but this alone cannot explain the loss in
performance.
The pressure after the speed control valve is low, but this alone cannot explain the low
maximum output. Based on the product gas flow and the exhaust gas analysis, the volumetric
efficiency of the engine can be estimated to 0.64. A normal value would be in the range 0.85 to
0.9. This means that for operation at equivalence ratio 1.0 and with a more reasonable
volumetric efficiency, the power output could be increased by at least 47%. Adding the effect of
turbocharging with a charging pressure ratio of 2, would give an increased power output of at
least a factor of 2.4 to 2.5 from the 46 kWe run during the test. This would give an output of
about 115 kWe. Possible simple explanation for the deterioration from this capacity is either that
Licentiate Thesis/Joseph Olwa
98
the speed control valve are stuck (which is indicated by the experiences reported in section 7.6.1)
or that the turbochargers have failed. The lack of charging pressure at the low load is however to
be expected and this explanation is therefore less credible.
A further improvement of the output would be possible if the pressure losses in the exhaust
channel could be reduced. The pumping power required at the tested load of 46 kW for an inlet
pressure of -3,7 kPa (gauge) and a pressure in the exhaust pipe of +34.3 kPa (gauge) will be
about 13 kW. The pressure losses in the exhaust system will increase roughly proportionally to
the square of the exhaust flow and this pressure loss will certainly be limiting the output. Records
for the development of the pressure in the exhaust pipe are not available, but it is possible that
soot accumulation in the recovery boiler have caused an increasing pressure in the exhaust
system. The low volumetric efficiency can partly be caused by a high pressure in the exhaust pipe
leading to more residual gas in the cylinder.
7.8 Conclusions and Recommendations
The power plant made it possible to save significantly on fuel costs when it performed as
in the early period of operation. The deterioration of the performance after a relatively
short time will however discourage others from switching from diesel generator sets to
wood gasifiers and IC-engines. For promotion of biomass based, small scale power
generation in Uganda, it is important that the reasons for the loss of capacity are clarified,
so that measure to maintain the rated output can be taken.
The reasons for the loss in capacity must be sought in the engine or the exhaust system
downstream. The gas quality is within specifications or better and the pressure losses in
the gas treatment system is within specifications.
The engine appears to be operated with a lean fuel mixture, but adjusting that alone will
not improve the power output significantly.
It seems that the main reasons for the impaired output are low pressure in the inlet
manifold, low volumetric efficiency and high pressure losses in the exhaust pipe.
It is recommended that the speed control valves, the turbo chargers are dismantled for
inspection and if necessary renovated and also that the recovery boiler is inspected and if
necessary cleaned. Also the timing of the firing must be checked and adjusted if
necessary. New tests where the plant can be loaded to its maximum capacity shall then be
carried out, with measurements similar to those reported here.
It is important that the experiences from the power plant are documented and
disseminated to other interested parties. When operation of the Muzizi plant has been
resumed careful monitoring of the operating experiences and operational parameters are
to be made.
Finally it is recommended that tar samples from the gas at the cyclone and at the safety
filter (at least three samples at each position), a sample of the liquid in the cooling pond
and a sample of the sludge found in the bottom of the pond be taken for analysis.
Analysis of these samples will indicate if additional steps, in treatment process, should be
taken in order to avoid negative environmental impacts.
Licentiate Thesis/Joseph Olwa
99
8. Biomass Gasification Investment Opportunity for Small
Scale Applications in Uganda
8.1 Introduction
Most developing countries are putting a lot of funds to importation of petroleum fuels to meet
their energy demand, which electricity power generation and transport sectors are the major
consumers. In Uganda an estimated US$500 million (UGsh820 billion) worth of petroleum was
imported in 2004, which represented about 23.5% of the national budget in the financial year
(2004/2005) [79]. The increasing numbers of automobiles, population and industrial growth rates
of 30%, 3.8 and 5.8% per annum, respectively (2008 estimate) [2] [80], suggests a comparative
increase in consumption of petroleum products. Both production and transportation are greatly
dependent on imported fuel whose base price is controlled by foreign countries and the
implication is that changes in world oil prices have direct impact on the local market prices of
goods and services. One author noted that one reason most countries end up in debts is when
their petroleum fuels import grows to 10% of the total national import [80], which can be the case
for Uganda.
It is possible that domestic prices for petroleum products may drop in the future when Ugandan
oil is introduced into the market. Unfortunately this speculation is difficult to ascertain due to
inadequate information on Uganda oil production projections. Diesel fuel greatly used by
industries in their standalone electricity power generation units and in heavy trucks currently
costs about US$ 1.0/L (An exchange rate of Uganda shillings to United States Dollars (US$)
giving US$1.0 equivalent to 2000Ugsh has been used in this paper), but carries a subsidy to allow
US$ 0.725/L for electricity power generation plants with capacity above 200 kWe. With the
expected increase in World market prices for petroleum products, it is unforeseeable that the
diesel price per liter can be halved by introduction of Uganda fuel into the local market.
In Table 29, the current electricity tariff in Uganda is presented and compared to that from
United States of America [81] (USA). The pinch of the electricity price in Uganda can be
understood by the great disparity between Gross Domestic Product (GDP) at Purchasing Power
Parity (PPP) per capita of the two countries where US $ 1300 and US $ 47900 are reported for
Uganda and USA respectively: The figures attest the fact that a unit price of electricity in Uganda
is more expensive than in USA. The situation in Uganda is that electricity coverage is only about
5% [82]of the total population compared to 100%, 100% and 98% for USA, Sweden and Egypt,
respectively [3] as an example.
Initially electricity power came mainly from one hydro-power station of about 380 MW which
was not producing enough power to meet the demand due to its limited capacity. Thermal
electricity power generating units were installed to abate the electricity power deficit that
climaxed in 2006 due to prolonged drought that caused a tremendous drop in water levels of
Lake Victoria [83] and to meet the increasing demand. The thermal units come with inherent costs
from imported petroleum fuels of which costs are transferred to the consumers inform of high
tariffs.
Licentiate Thesis/Joseph Olwa
100
Table 29 : Uganda electricity tariff by consumer category
Uganda USA
Consumer Type Tariff Particulars
( kWh)
Cost US$/(kWh) Cost (US$/kWh)
Domestic <15 0.031
0.1155 >15 0.214
Small and Medium Scale Industry Average 0.200 0.1025
Large Scale Average 0.094 0.0696
Currently construction of a new hydro power generation station (Bujjagali on River Nile) is
ongoing and it is expected to produce about 280 MWe when commissioned in 2012. There is
anticipation that it will present some opportunity for a reduction in electricity power tariff to the
consumers and provide also reliable supply as well. It is also known that electricity power
connections is not about to reach the vast rural settlements in Uganda and some of the isolated
production industries in remote areas. Areas which are still deemed uneconomical to connect to
the national electricity grid lines would be forced to use thermal power plants in form of
petroleum fuel guzzlers or renewable energy resources powered systems.
This study compared the investment options between biomass gasification-gas engine and a
diesel engine generator sets in Uganda. Particular interest was directed in determine the initial
investments and rates of return on investments for the two systems.
8.2 Biomass Fuels - Availability Issues
There are lucrative business opportunities in meeting the energy deficit in some areas through
exploitation of the locally available biomass resources in Uganda. Gasification is one of the
biomass fuel transformation technologies for applications in conventional IC engines and GT
applications. IC engines are more attractive than gas turbines in rural areas due to the simplicity
of equipment and availability of local knowledge for service and maintenance requirements.
Biomass gasification integrated with IC engines for 100kWe generations is economically
favorable than steam turbine based systems with boilers [60].
Introduction of new methods and technologies is always met with suspicion and rejection at the
extreme and at times this occurs for justifiable reasons [84]. In this particular situation there are
challenges related to biomass fuel utilization for electricity power generation which amount from
economic, social, political and environmental spectrum, and that gasification technology is not
yet fully developed, adds to the odd. These challenges present the uncertainty of the anticipated
benefits when such projects are undertaken. However such concerns can be addressed through
information seeking and in consultations with recognized promoting institutions and other
projects using similar technology.
Investment into biomass gasifier-engine system would require some sensitization and training for
the entrepreneurs into understanding logistics planning and operational issues requirement
related to the success of such undertaking. It is known that biomass gasification technology
integrated with IC engines are economically viable, but like any other investment project, prior
establishment of the biomass resources sustainability anticipated for application is obligatory for
Licentiate Thesis/Joseph Olwa
101
future prosperity.
Due to the largely available biomass resources around the country such as in the urban areas, at
the sugar mills and other sources like coffee industries. This study offers a quick insight into
economic potential of biomass gasification technology integration with IC engines in Uganda. A
study model of 100kWe generator is chosen in this case. The comparison between these systems
based on wood fuel and a diesel generator set of similar output was carried out and discussed in
this chapter. Biomass gasification process was presented in section 2.2 of this work. Table 30
shows the heating values of the fuel gas that can be realized when gasification is carried out with
the oxidizing agent as either air, or with air and steam mixture. A rich fuel can be obtained by
using the air-steam mixture with LHV of up to 11MJ/kg, but the costs in equipment investment
and operation can be heavy for small units. It is also noteworthy that the LHV of 4.5MJ/kg is
sufficient for IC engine application. It can be boosted by installation of a turbo charger on the
engine for more power delivery from the engine. Therefore, air is the predominantly used
oxidizer in the gasification process because it is availability at no cost.
Table 30: The variation of heating value with different oxidizers for biomass fuel
` Producer gas
Oxidizer Lower Heating Value ( MJ/kg)
Air 4.5-5.0
Air/steam 11.0
The power output from a modified 444kWt diesel rated engine (model: TB232, make Greaves)
tested with producer gas from biomass gasification process gave a power output of 203 kW [85].
This can allow comparison on size difference between biomass and diesel system, for instance,
the LHV for diesel fuel is about 43.4 MJ/kg and for air gasification process producer gas from
biomass fuel is 4.5M J/kg, which explains the difference in sizes between biomass and the diesel
powered systems. This difference in producer gas and diesel fuel energy contents is the main
reason diesel systems are smaller than producer gas driven engine of comparable power output
and is reflected in the price per unit power output for each one of them.
8.3 Biomass Gasifier and Diesel systems
Biomass gasification system integrated with an internal combustion engine is comprised of five
units. These are the; gasifier gas cleaning units, internal combustion engine, generator set, and
fuel preparation units. Depending on the gasifier size, it is important that suitable fuel sizes be
used to allow a matching of the fuel physical characteristics to the gasifier for better
performance. In that way bridging and holing can be avoided. Holing is the occurrence of a
burnt-out of fuel in the middle of the gasifier creating a hole with more air intake through the
gasifier than required for gasification process. Fine particles biomass fuels also develop high
pressure drops in gasifier unit. All these phenomena affect the performance of the gasifier
adversely with the consequence of poor gas quality. The result is that total system efficiency is
reduced tremendously which is not desirable for any investment projects.
The gasifier type chosen for this study was a co-current (downdraft) gasifier. A wood gasifier
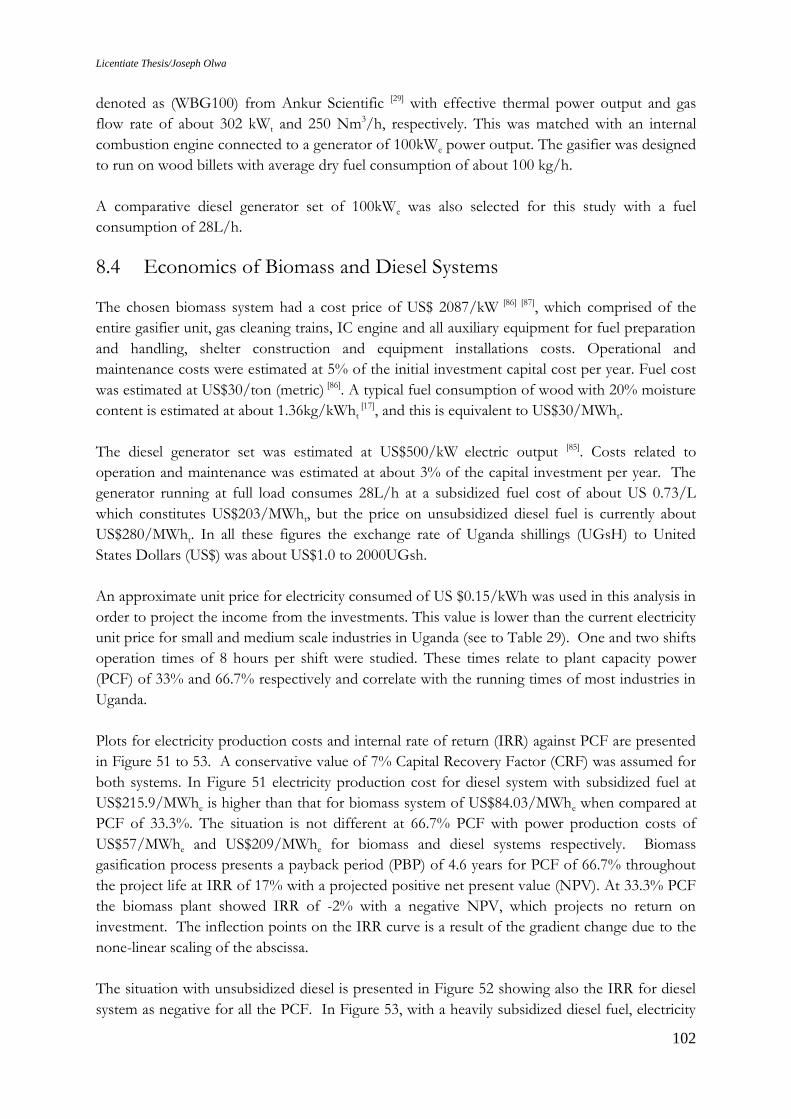
Licentiate Thesis/Joseph Olwa
102
denoted as (WBG100) from Ankur Scientific [29] with effective thermal power output and gas
flow rate of about 302 kWt and 250 Nm3/h, respectively. This was matched with an internal
combustion engine connected to a generator of 100kWe power output. The gasifier was designed
to run on wood billets with average dry fuel consumption of about 100 kg/h.
A comparative diesel generator set of 100kWe was also selected for this study with a fuel
consumption of 28L/h.
8.4 Economics of Biomass and Diesel Systems
The chosen biomass system had a cost price of US$ 2087/kW [86] [87], which comprised of the
entire gasifier unit, gas cleaning trains, IC engine and all auxiliary equipment for fuel preparation
and handling, shelter construction and equipment installations costs. Operational and
maintenance costs were estimated at 5% of the initial investment capital cost per year. Fuel cost
was estimated at US$30/ton (metric) [86]. A typical fuel consumption of wood with 20% moisture
content is estimated at about 1.36kg/kWht [17], and this is equivalent to US$30/MWht.
The diesel generator set was estimated at US$500/kW electric output [85]. Costs related to
operation and maintenance was estimated at about 3% of the capital investment per year. The
generator running at full load consumes 28L/h at a subsidized fuel cost of about US 0.73/L
which constitutes US$203/MWht, but the price on unsubsidized diesel fuel is currently about
US$280/MWht. In all these figures the exchange rate of Uganda shillings (UGsH) to United
States Dollars (US$) was about US$1.0 to 2000UGsh.
An approximate unit price for electricity consumed of US $0.15/kWh was used in this analysis in
order to project the income from the investments. This value is lower than the current electricity
unit price for small and medium scale industries in Uganda (see to Table 29). One and two shifts
operation times of 8 hours per shift were studied. These times relate to plant capacity power
(PCF) of 33% and 66.7% respectively and correlate with the running times of most industries in
Uganda.
Plots for electricity production costs and internal rate of return (IRR) against PCF are presented
in Figure 51 to 53. A conservative value of 7% Capital Recovery Factor (CRF) was assumed for
both systems. In Figure 51 electricity production cost for diesel system with subsidized fuel at
US$215.9/MWhe is higher than that for biomass system of US$84.03/MWhe when compared at
PCF of 33.3%. The situation is not different at 66.7% PCF with power production costs of
US$57/MWhe and US$209/MWhe for biomass and diesel systems respectively. Biomass
gasification process presents a payback period (PBP) of 4.6 years for PCF of 66.7% throughout
the project life at IRR of 17% with a projected positive net present value (NPV). At 33.3% PCF
the biomass plant showed IRR of -2% with a negative NPV, which projects no return on
investment. The inflection points on the IRR curve is a result of the gradient change due to the
none-linear scaling of the abscissa.
The situation with unsubsidized diesel is presented in Figure 52 showing also the IRR for diesel
system as negative for all the PCF. In Figure 53, with a heavily subsidized diesel fuel, electricity
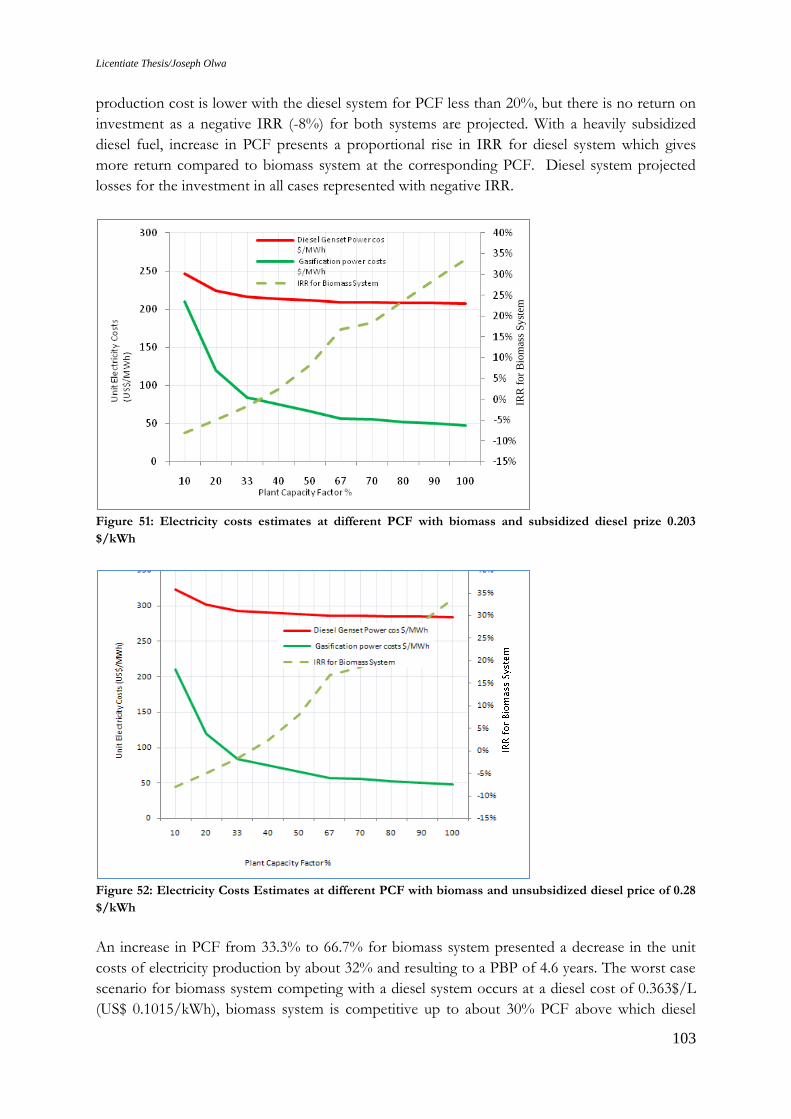
Licentiate Thesis/Joseph Olwa
103
production cost is lower with the diesel system for PCF less than 20%, but there is no return on
investment as a negative IRR (-8%) for both systems are projected. With a heavily subsidized
diesel fuel, increase in PCF presents a proportional rise in IRR for diesel system which gives
more return compared to biomass system at the corresponding PCF. Diesel system projected
losses for the investment in all cases represented with negative IRR.
Figure 51: Electricity costs estimates at different PCF with biomass and subsidized diesel prize 0.203
$/kWh
Figure 52: Electricity Costs Estimates at different PCF with biomass and unsubsidized diesel price of 0.28
$/kWh
An increase in PCF from 33.3% to 66.7% for biomass system presented a decrease in the unit
costs of electricity production by about 32% and resulting to a PBP of 4.6 years. The worst case
scenario for biomass system competing with a diesel system occurs at a diesel cost of 0.363$/L
(US$ 0.1015/kWh), biomass system is competitive up to about 30% PCF above which diesel
IRR
fo
r B
iom
ass
Sy
stem
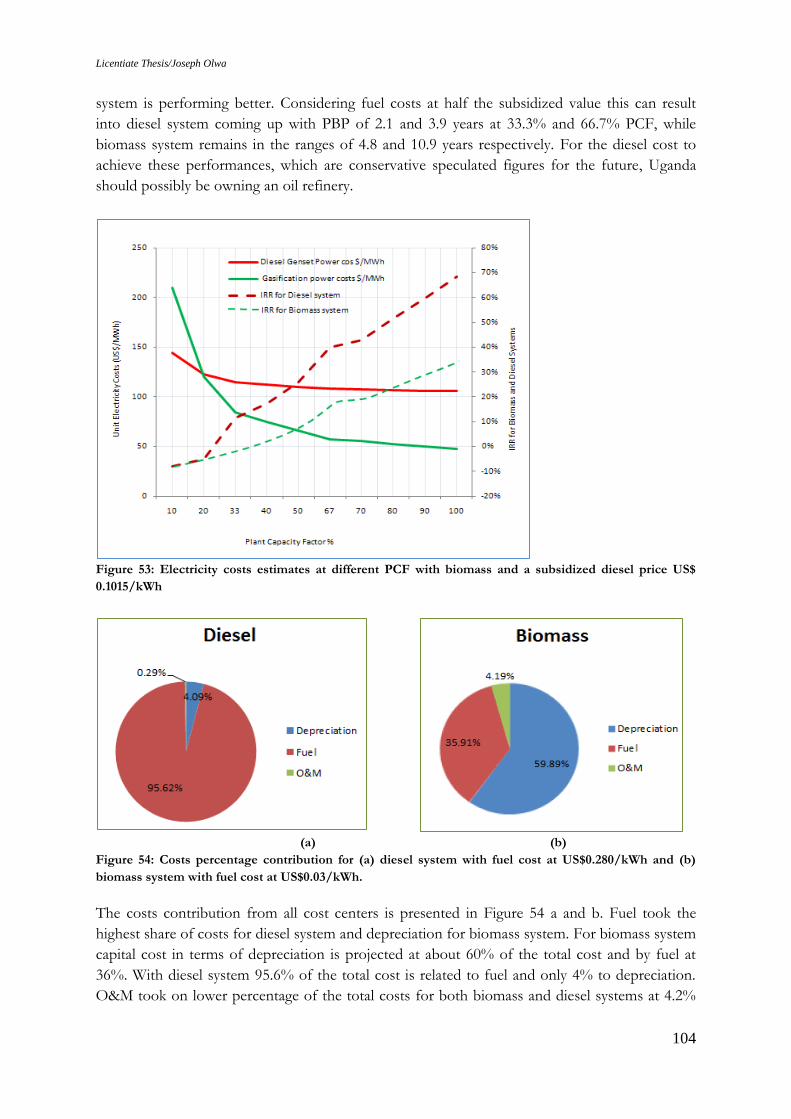
Licentiate Thesis/Joseph Olwa
104
system is performing better. Considering fuel costs at half the subsidized value this can result
into diesel system coming up with PBP of 2.1 and 3.9 years at 33.3% and 66.7% PCF, while
biomass system remains in the ranges of 4.8 and 10.9 years respectively. For the diesel cost to
achieve these performances, which are conservative speculated figures for the future, Uganda
should possibly be owning an oil refinery.
Figure 53: Electricity costs estimates at different PCF with biomass and a subsidized diesel price US$
0.1015/kWh
(a) (b)
Figure 54: Costs percentage contribution for (a) diesel system with fuel cost at US$0.280/kWh and (b)
biomass system with fuel cost at US$0.03/kWh.
The costs contribution from all cost centers is presented in Figure 54 a and b. Fuel took the
highest share of costs for diesel system and depreciation for biomass system. For biomass system
capital cost in terms of depreciation is projected at about 60% of the total cost and by fuel at
36%. With diesel system 95.6% of the total cost is related to fuel and only 4% to depreciation.
O&M took on lower percentage of the total costs for both biomass and diesel systems at 4.2%
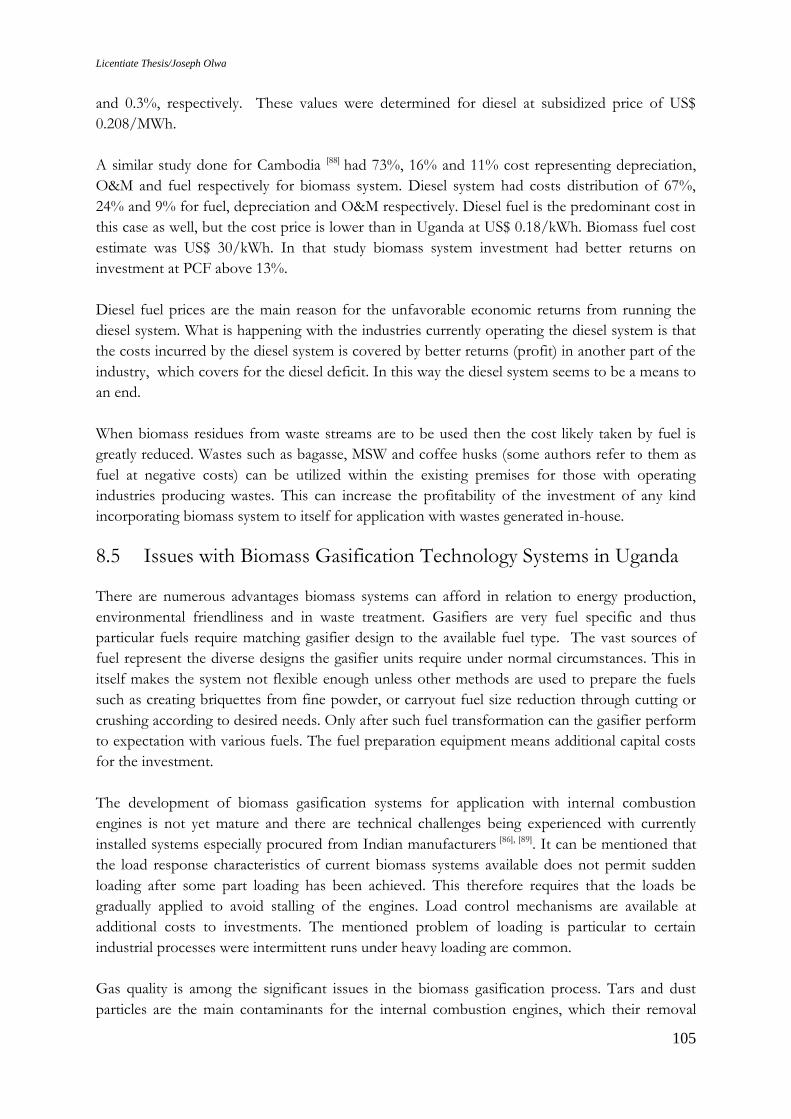
Licentiate Thesis/Joseph Olwa
105
and 0.3%, respectively. These values were determined for diesel at subsidized price of US$
0.208/MWh.
A similar study done for Cambodia [88] had 73%, 16% and 11% cost representing depreciation,
O&M and fuel respectively for biomass system. Diesel system had costs distribution of 67%,
24% and 9% for fuel, depreciation and O&M respectively. Diesel fuel is the predominant cost in
this case as well, but the cost price is lower than in Uganda at US$ 0.18/kWh. Biomass fuel cost
estimate was US$ 30/kWh. In that study biomass system investment had better returns on
investment at PCF above 13%.
Diesel fuel prices are the main reason for the unfavorable economic returns from running the
diesel system. What is happening with the industries currently operating the diesel system is that
the costs incurred by the diesel system is covered by better returns (profit) in another part of the
industry, which covers for the diesel deficit. In this way the diesel system seems to be a means to
an end.
When biomass residues from waste streams are to be used then the cost likely taken by fuel is
greatly reduced. Wastes such as bagasse, MSW and coffee husks (some authors refer to them as
fuel at negative costs) can be utilized within the existing premises for those with operating
industries producing wastes. This can increase the profitability of the investment of any kind
incorporating biomass system to itself for application with wastes generated in-house.
8.5 Issues with Biomass Gasification Technology Systems in Uganda
There are numerous advantages biomass systems can afford in relation to energy production,
environmental friendliness and in waste treatment. Gasifiers are very fuel specific and thus
particular fuels require matching gasifier design to the available fuel type. The vast sources of
fuel represent the diverse designs the gasifier units require under normal circumstances. This in
itself makes the system not flexible enough unless other methods are used to prepare the fuels
such as creating briquettes from fine powder, or carryout fuel size reduction through cutting or
crushing according to desired needs. Only after such fuel transformation can the gasifier perform
to expectation with various fuels. The fuel preparation equipment means additional capital costs
for the investment.
The development of biomass gasification systems for application with internal combustion
engines is not yet mature and there are technical challenges being experienced with currently
installed systems especially procured from Indian manufacturers [86], [89]. It can be mentioned that
the load response characteristics of current biomass systems available does not permit sudden
loading after some part loading has been achieved. This therefore requires that the loads be
gradually applied to avoid stalling of the engines. Load control mechanisms are available at
additional costs to investments. The mentioned problem of loading is particular to certain
industrial processes were intermittent runs under heavy loading are common.
Gas quality is among the significant issues in the biomass gasification process. Tars and dust
particles are the main contaminants for the internal combustion engines, which their removal
Licentiate Thesis/Joseph Olwa
106
from the producer gas is vital. The filters usually get clogged in many circumstances resulting
into less gas flow into the engine and subsequent output power reduction. Another related
problem can arise from high moisture content fuels which also affect adversely the biomass
system performance, and recommendations is that moisture content of raw biomass fuels be
kept below 18% for better power output from the biomass system.
Resistance to change and acceptance of new technology by the operators are some other
problems as well. Possible reasons arise when biomass systems are run in parallel and/or with
diesel system as emergency plant unit. Issues related to the convenience of running diesel engine
and to some extend theft of diesel fuel may cause some operators to sabotage the biomass
system. Some of these issues were noted during field visits by the authors of this report and as
long as there is diesel nobody would like to run the biomass system.
There is still great dependence on the suppliers for maintenance related issues. It can be partly
that the suppliers create the void to allow some kind of market control with the equipment by
offering inadequate training and information related to their equipment. At times it is just the
owners who are sometimes concerned that their technicians cannot handle the maintenance
work, especially when there is some serious breakdown. This has caused some gasifier systems to
be shut down.
8.6 Conclusions
Great potential avail itself for biomass gasification systems application with internal
combustion engines in Uganda. This is achievable through the utilization of available
biomass resources generated from agro-based industries by-products and planned
plantations and MSW. Biomass systems stand competitive with diesel systems for
electricity power generation with biomass systems presenting better investment returns.
Fuel prices contribute greatly to the production costs of power from thermal electricity
generator plants and in this particular study biomass have strong prospects for
investment returns than diesel system due to greatly the cheaper fuel (US$0.03/MW)
compared to (US$0.28/MWh). The competitiveness of biomass is even emphasized
when biomass from waste streams are considered, and at relatively higher Plant Capacity
Factor improved return on investment is realized within 4 years. This also leaves the
equipment with a lot of life for more returns.
Biomass gasification equipment can be locally made and it would greatly reduce on the
costs of equipment. Additionally there are subsidies that can be accorded through
government intervention as part payment on the capital equipment investment costs or
tax waiver. Other supporting institutional bodies advocating for clean energy can offer
similar support as government would which are directed towards encouraging renewable
energy system application for better environment. Any subsidy to biomass system lower
power production cost per unit with the consequence of better returns and
competitiveness against other power sources.
Licentiate Thesis/Joseph Olwa
107
9. Future work
Biomass gasification is a feasible approach in meeting some of the energy needs in developing
countries. Uganda has a great opportunity in embracing this technology to its prosperity. There
are challenges as noted in this study and with these some recommendations have been made in
every chapter. It would be good practice to close this report with emphasis on those
recommendations which are to guide future work.
It was noted that EFGT system offers great advantage over directly fired GT systems. Its
limitation comes in the form of low maximum operating temperature that the heat exchanger
material can permit, which is something that require more research into materials engineering to
solve thus out of scope of this work. Nevertheless, the current materials that would take a
maximum operating temperature of 850oC would be sufficient and the major concern is the
fouling, and possible deposition and corrosion in the heat exchanger unit. That part of the study
should follow this work, to devise ways of averting deposition of corrosive entities in the heat
exchanger units. Therefore a study in deposition o high temperature heat exchanger surfaces
should be carried out.
There is need to determine the economic analysis of the EFGT system for application in
Uganda. This would be compared to performance of a gas engine and diesel engine of similar
capacity. Such determination of economic performances may reveal some unknown potentials
and offer credible platform for decision making on the biomass gasification technology method
to employ.
In this report also tar related challenges stands out strongly, and there are some simple methods
that can be used to effect acceptable gas quality for application in IC engines as pointed out in
this study. These methods fit the operating requirements in developing countries when less
automation is favorable and equipment maintenance personnel technical knowledge is not very
demanding. The use of biomass bed filters and fabric filters remains a feasible approach but
require some standardization in design and cleaning medium to employ for the Uganda scenario.
There are various fuels from the agricultural residues and MSW whose tar content require
determination. Knowledge of possible tar yield from these anticipated fuels for gasification
would permit better decision on how to handle the gas cleaning process for the possible different
capacities of the plants anticipated. This study should carry forward similar tests made in chapter
5 of this report on agricultural residues and MSW.
The inclusion of water scrubbers in gas cleaning would necessitate determining the content of
the waste stream from a pilot project and to suggest ways on how the extracted waste can be
treated.
There are problems experienced with imported technologies when proper training in operation
and maintenance are not carried out. Through this study it has been identified as one problem
affecting installed power plants in Uganda and in India as well from where some of these
gasification equipment are imported. The construction of the equipment for biomass gasification

Licentiate Thesis/Joseph Olwa
108
is not a complex task especially where designs have been determined for a particular need. It is
therefore interesting to study the requirement for such a venture of designing and fabricating
gasifier units and auxiliary equipment locally. With this there would be a survey on potential
market for such equipment through some kind of interviews with identified organizations. This
should be able to present a definitive view of what level of contribution in the energy sector
gasification technology can attain given introduction and time in Uganda.
Biomass can be a grand substitute to fossil fuel, especially in small capacity power plants in the
rural villages of Uganda, but there is great need for a functional demonstration plant and
establishment of a knowledge dissemination center.
Licentiate Thesis/Joseph Olwa
109
References
[1] Uganda Government, Annual Report. Kampala: Ministry of Energy and Mineral
Development, 2007.
[2] US Energy Agency. (2008, March) Photius.com. [Online].
htt://www.probonostats.wordpress.com
[3] United Nations Development Program. (2009, March) Geographic website. [Online].
http://www.photius.com/rankings/electrification_by_country_2007_2008.html
[4] City Council of Kampala. (2001) City Council of Kampala Website. [Online].
http://www.kcc.og.ug
[5] Bingh L P, "Opportunities for utilizing waste biomass for energy in Uganda," Oslo,
2004.
[6] Turyahikayo G R, Hatanga E S, Otti T, and Kegirungi P, "Renewable energy
technologies dissemination in Uganda- The case of small hydro power plants," Kampala,
1996.
[7] Krani P K, Sustainable management of tropical rain forests in Uganda. Ontario:
Common Wealth Secretariat, 1994.
[8] Forestry Research. (2008) Biomass Energy Centre Website. [Online].
http://www.biomassenergycentre.org.uk
[9] United States Department of Energy, "Opportunities for small biomass power systems,"
2000.
[10] Yan J, "Externally fired gas turbien - Technical report," Stockholm, 1998.
[11] Rambush N E, Modern Gasifiers. London: Benn, 1923.
[12] Wikipedia. (2010, April) Wikipedia Encyclopedia. [Online].
http://en.wikipedia.org/wiki/1980s_oil_glut
[13] Michael A l J Jr. et al., "High yield biomass charcoal," Energy and Fuels, vol. 10, no. 3,
1996.
[14] Loewe O Jr, Black J R, Ross I J, and Payne F, "Economic potential for on farm biomass
gasification for corn drying," 80-3508, 1980.
[15] Cruz I E, "Producer gas from agricultural waste," Resource Recovery and Conservation,
vol. 2, no. 3, 1977.
[16] Peiy J, "The application of paddy husk gas in rice mill - In proceedings of the FAO/FHI
Regional technical consultation on Agricultura waste fro farm energy needs," Suzhou,
China, XF8333069, 1983.
[17] Maschio G, Koufopanos C, and Lucchesi A, "Pyrolysis a promising route for biomass
utilization," Bioresource Technology, vol. 42, no. 3, 1992.
Licentiate Thesis/Joseph Olwa
110
[18] Food and Agricultural organization of the United Nations, Wood gas as engine fuel.:
FAO, 1986.
[19] Mckendry P, "Energy production from biomass (part 3): gasification technologies,"
Bioresource Technology, vol. 83, no. 1, 2003.
[20] Kirubakaran V et al., "Review on gasification of biomass," Renewable and Sustainable
Energy Reviews, vol. 13, 2009.
[21] Elvin L Ip H, Scott J, Foster P, Mark Vickers, and Baxter Larry L, "Effects of schape
and size on devolatization of biomass particles," Fuels, vol. 89, 2010.
[22] Lijun W, Weller Curtis L, David D Jonnes, and Milford A. Hanna, "Contemporary
issues in thermal gasfication of biomass and its application to electricity and fuel
productuion," Biomass and Bioenergy, vol. 32, no. 7, 2008.
[23] Thermal Gasification of Biomass Task. , "EC and USDOE Meeting on Tar Measurement
Protocol," Brussels, 1988.
[24] Elliott D C, "Relation of reaction time and temperatue to chmical comosition of
pyrolysis oils," Denver, CO, 13:9780841215368, 1988.
[25] Baker E.G, Brown M.D, Elliott D.C, and Mudge L.K, "Characterization and treatment of
tars from biomass gasifiers," Denver, CO, 1988.
[26] LaHaye P G and Zabolotny E, "Externally fired combine cycle of (EFCC).," Chicago,
IL, 1989.
[27] Milne T.A, Evans R.J, and Abatzoglou N, "Biomass gasifier tars: Their nature,
formation, destruction, and tolerance limits in energy conversion devices," Canada,
1997b.
[28] Reed T A and Das A, Handbook of biomass downdraft gasfier engine system. Golden,
Colorado: Solar Energy Research Institute, 1988.
[29] Ankur Scientific Energy Technologies Pvt Ltd. (2008) Ankur Scientific Energy
Technologies. [Online]. http://ankurscientific.com
[30] Sutton D, Kelleher B, and J R.H.Ross, "Review of literature on catalysts for biomass
gasification," Fuel Processing Technology, vol. 73, no. 3, 2001.
[31] Xu C C, Donald J, Byambajav E, and Ohtsuka Y, "Recent advances in catalysts for hot-
gas removal of tar and ammonia from biomass gasification fuel," Fuel, vol. 89, no. 8,
2010.
[32] Henriksen U et al., "The design, construction adn operation of a 75 kW two-stage
gasifier," Energy, vol. 31, no. 10-11, 2006.
[33] Babu S P, "Thermal gasification of biomass- Workshop No.1: Perspectives on biomass
gasification, Task 33," Chicago, 2006.
Licentiate Thesis/Joseph Olwa
111
[34] Boerrigter H, Snader V.P, Patrick Bergman, and Rob Emmen Jan-Villem K, "Tar
removal from biomass product gas, develpment and optimization of the OLGA tar
removal technology," Paris, 2005.
[35] Zwart R W et al., "Oil-based gas washing - Flexible tar removal for high efficient
production of clean heat and power as well as sustainalbe fuels and chemicals,"
Environmental Progress and Sustainalbe Energy, vol. 28, no. 3, 2009.
[36] Patel J, "Skive BGGE/CHP-IEA Task 33 Meeting," Chicago, 2006.
[37] Teislev B, "Haboore-wood chips gasifier and 1500 kW gas engines operating at 32%
power efficiency in CHP configuration," Amsterdan, The Netherlands, 2002.
[38] Kirjavainen M, Siplia K, T Savola, Salomon M, and K Alakangas. (2003) Aboutus
Organization Website. [Online]. www.http://habmigern2003.info/PDF/Pyrolysis.pdf
[39] Nielsen P H, Frandsen F J, Dam-Johansen K, and Baxter L L, "Implications of chlorine
associated corrosion on the operation of biomss fired boilers.," Progress in Energy and
Combustion Science, vol. 26, 2000.
[40] Keller A, Kovacs R, and Homann K H, "Large molecules, radicals, ions, and small soot
particles in fuel rich hydrocarbons: Part IV, Large polycyclic aromatic hydrocarbons and
their radicals in a fuel rich benzene-oxygen flame," Phys Chem, Chem Phys, vol. 2, no.
8, 2000.
[41] Milne T.A, Evans R.J, and Abotzoglou N, "Biomass gasfiers "tars": Their nature,
formation and conversion," Springfield, VA, NREL/TP-570 25357, 1998.
[42] Pritchad D, "Biomass combustion gas turbine," London, 2003.
[43] Traverso A, Magistri L, Scarpellini R, and Massardo A, "Demonstration of an
exteranally fired micro gas turbine," Energy Resource Technology, vol. 12, 2003.
[44] Blander M, "TThe inorganic chemistry of the combustion of aspen wood with added
sulfur," Biomass and Bioenergy, vol. 12, no. 4, 1997.
[45] Quaak P, Knoef H, and Hubert S, Energy fom biomass- a review of combustion and
gasification technologies. Washington D.C.: World Bank, 1999.
[46] Hasler P and Nussbaumer Th, "Gas Cleaning for IC engine applications from fixed bed
biomass gasification," Journal of Biomass and Bioenergy, vol. 16, 1999.
[47] Nelson C E, "LM2500 gas turbine modification for biomass fuel opoeration," Biomass
and Bioenergy, vol. 15, 1998.
[48] Brown M D, Baker E G, and Mudge L K, "Environmental design considerations for
thermochemical biomass energy," Biomass, vol. 11, 1986.
[49] Salman H, "Evaluation of a cyclone gasifier design to be used for biomass fuelled gas
turbine - Doctoral Thesis," Lulea, 2001.
Licentiate Thesis/Joseph Olwa
112
[50] Traverso A, Massadro A, Aristide F, and Scarpellini R, "Externally fied micro gas
turbine: Modelling and experimental performance," 2006.
[51] Graham R.G and Bain R, "Biomass gasification: Hot-gas cleanup. International Energy
Agency, Biomass gasification working group," 1993.
[52] Ferrira S.B and Pilidis P, "Comparison of externally fired and internal combustion gas
turbine using biomass fuel," Energy Resource Technology, vol. 123, no. 4, 2001.
[53] Taborek J, Heat exchanger handbook. London: Hemisphere Publishing Corporation,
1986.
[54] Duwig C, "Numerical and experimental validation of a gas turbine combustor design for
gasified biomass combustion," Stockholm, 2000.
[55] Larson E.D and Williams R. H., "Biomass fired steam injected gas turbine cogeneration
for sugar can industry. Proceedings of Research in Thermochemical Boimass
Conversion," London, 1988.
[56] Mueller A C, Heat exchangers. Handbook of heat transfer. New York: McGraw-Hill,
1973.
[57] Frank O, "Simplified design procedures for tubular exchangers I. Practical aspects of
heat transfer," Chem. Eng. Prog. Tech. Manual ( Am. Inst. Chem.Eng.), 1978.
[58] Gupta J P, Fundamentals of heat exchanger and pressure vessel technology. New York:
Hemisphere Publishing Corp, 1986.
[59] Cho S M, "Uncertainty analysis of heat exchanger hydraulic designs," Heat Transfer
Engineering, vol. 8, 1987.
[60] Metropli N and Ulam S, "The Monte Carlo Method," Journal of American Statistical
Association, vol. 44, no. 247, 1949.
[61] Kjellstrom B, "Research and development in application for micro-CHP from biofuels -
Summary of activities in some European countries," Stockholm, 2007.
[62] Knudsen J N, Jensen P A, and Dam-Johansen K., "Transformation and release to the gas
phase of Cl, K and S during combustion of annual biomass," Energy Fuels, vol. 18, no.
5, 2004.
[63] Kautz M and Hansen U, "The externally fired gas turbine (EFGT-Cycle) for
decentralized use of biomass," Applied Energy, vol. 84, 2007.
[64] Di Blasi C, Signorelli G, and Protoricco G, "Counter-current fixed bed gasification of
biomass at laboratory scale," Ind. Eng. Chem. Res., vol. 38, 1999.
[65] Gabra Muhammed, Arms Nordin, Marcus Ohman, and Bjorn Kjellstrom, "Alkali
retention/separation during bagasse gasifcation: A comparison between fluidized bed
and a cyclone gasifier," Biomass and Bioenergy, vol. 15, 2001.
Licentiate Thesis/Joseph Olwa
113
[66] DIFRACplus, "TOPAS 2.1," Karlsruhe, 2003.
[67] Fredriksson C, "Exploratory experimenttal and theoretical study of cyclone gasification
of wood - PhD Thesis," Lulea, 1999.
[68] Turns S, Kinoshita C, Ishmera D, and Zhou J, "The fate of inorganic constituents of
biomass in fluid bed gasification," Fuel, vol. 77, 1988.
[69] Gilbe C et al., "Slagging characteristics during residential combustion of biomass
pellets," Energy and Fuels., vol. 22, 2008.
[70] Kurkela E, Stahlberg P, Simell P, and Leppalathi J, "Updraft gasification of peat and
biomass," Biomass, vol. 19, 1989.
[71] Zevenhoven-onderwater M, R Backman, Skrifvars B J, and Hup M, "The ash chemistry
in fluidised bed gasification of biomass fuels. Part I: Predicting the chemistry of meltin g
of ash and ash bed material interaction," Fuel., vol. 26, 2001.
[72] Bale C W and Pelton A D, "FACT-Win Version 3.05," Montreal, 1999.
[73] Bale C W et al., "Factsage thermochemical software and database," Calpha, vol. 26.,
2002.
[74] Rajvanshi A.K, "Biomass gasification," in Alternative energy in agriculture, Yogi
Goswani, Ed. India: CRC Press, 1986.
[75] Knoef H A M T, "Status and development of fixed bed gasification," Utrecht, Report
EWAB 9929, 2000.
[76] Brage C, Yu Q, Chen G, and Sjostrom K, "Use of amino based absorbent for biomass tar
sampling and separation," Fuel, vol. 17, 1997.
[77] R.C.E Friberg, "A new method to analyze the thermochemical conversion of solid
fuels," Stockholm, 2000.
[78] Nordstrom O, "Account of research and testing activities in the producer gas field,"
Uppsala, 1963.
[79] Uganda Government, "The Uganda Budget 2004/2005 Citizen Guide," Kampala, 2005.
[80] Miguel Barrientos. (2008, January) Index Mundi. [Online]. http:www.indexmundi.com
[81] AMulya K N R, Williams H R, and Johansson B. T, "Energy After Rio: Prospects and
Challenges," New York, 10 9211267013, 1997.
[82] Energy Information Administration. (2011, April) U.S Energy Information
Administration. [Online]. http://www.eia.gov/
[83] Uganda Government, "Electrification rate," Kampala, 2005.
[84] Reibeeki H. (2006, March) Earth Observatory. [Online]. http://earthobervatory.nasa.gov
[85] Dana M, "Technology and market information for the next millennium.," Cashiers,
North Carolina, 1998.
Licentiate Thesis/Joseph Olwa
114
[86] Dasappa S. (2006, February) Combustion Gasification and Propulsion Laboratory
Website. [Online]. http://www.cgpl.iisc.ernet.in
[87] Buchholz T and Volk T, "Designing short rotational coppices based bio-energy system
for rural communities in E. Africa," Kampala., 2007.
[88] World Bank, "Technical assessment of off-grid, mini-grid and grid electrification
technologies," ESMAP Technical Papers 121/07, 2007.
[89] Hitofumi A et al., "Potential for rural electrification based on biomass gasfication in
Cambodia," Biomass and Energy, vol. 31, 2007.
[90] National Informatics Centre, Bangalore. Biomass Energy for Rural India. [Online].
http://bioenergyindia.kar.nic.in
[91] FAO, "Quarterly Bulletin of Statistics," FAO, United Nations, vol. 5, no. 4, 1992.
[92] Brage C, Yu Q, Chen G, and Sjorstrom K, "Tar evolution profiles obtained from
gasification of biomass and coal," Biomass and Bioenergy, vol. 18, 2000.
[93] Bridgewater A V, "The technical and economic feasibility of biomass gasfication for
power generation," Fuels, vol. 7, 1995.
Related Documents