Avid Boustani Lewis Girod Dietmar Offenhuber Rex Britter Malima Wolf David Lee Stephen Miles Assaf Biderman Carlo Ratti Investigation of the waste-removal chain through pervasive computing This paper might be a pre-copy-editing or a post-print author-produced .pdf of an article accepted for publication. For the definitive publisher-authenticated version, please refer directly to publishing house’s archive system.

Welcome message from author
This document is posted to help you gain knowledge. Please leave a comment to let me know what you think about it! Share it to your friends and learn new things together.
Transcript
Avid Boustani Lewis Girod Dietmar Offenhuber Rex Britter Malima Wolf David Lee Stephen Miles Assaf Biderman Carlo Ratti
Investigation of the
waste-removal chain through
pervasive computing
This paper might be a pre-copy-editing or a post-print author-produced .pdf of an article accepted for publication. For the
definitive publisher-authenticated version, please refer directly to publishing house’s archive system.
IEEE
Proof
1 Investigation of the2 waste-removal3 chain through4 pervasive computing
A. BoustaniL. Girod
D. OffenhuberR. BritterM. I. Wolf
D. LeeS. Miles
A. BidermanC. Ratti5 Environmental sustainability and energy management are
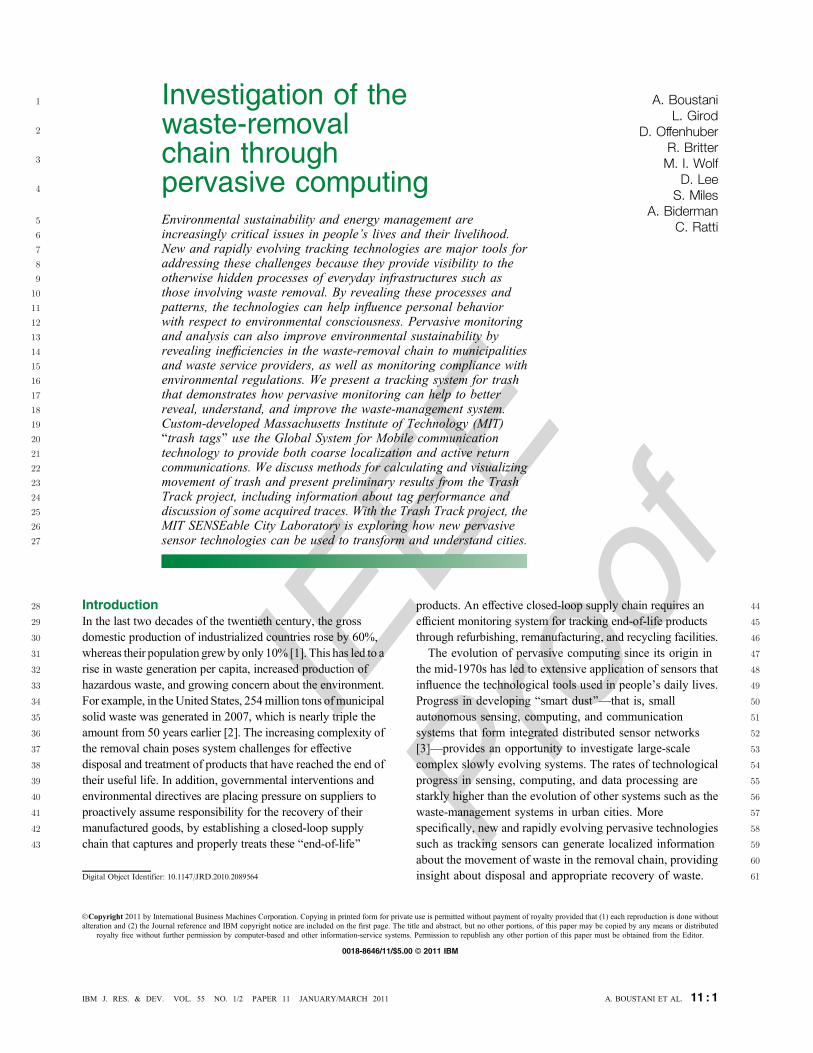
6 increasingly critical issues in people’s lives and their livelihood.7 New and rapidly evolving tracking technologies are major tools for8 addressing these challenges because they provide visibility to the9 otherwise hidden processes of everyday infrastructures such as10 those involving waste removal. By revealing these processes and11 patterns, the technologies can help influence personal behavior12 with respect to environmental consciousness. Pervasive monitoring13 and analysis can also improve environmental sustainability by14 revealing inefficiencies in the waste-removal chain to municipalities15 and waste service providers, as well as monitoring compliance with16 environmental regulations. We present a tracking system for trash17 that demonstrates how pervasive monitoring can help to better18 reveal, understand, and improve the waste-management system.19 Custom-developed Massachusetts Institute of Technology (MIT)20 Btrash tags[ use the Global System for Mobile communication21 technology to provide both coarse localization and active return22 communications. We discuss methods for calculating and visualizing23 movement of trash and present preliminary results from the Trash24 Track project, including information about tag performance and25 discussion of some acquired traces. With the Trash Track project, the26 MIT SENSEable City Laboratory is exploring how new pervasive27 sensor technologies can be used to transform and understand cities.
28 Introduction29 In the last two decades of the twentieth century, the gross30 domestic production of industrialized countries rose by 60%,31 whereas their population grew by only 10% [1]. This has led to a32 rise in waste generation per capita, increased production of33 hazardous waste, and growing concern about the environment.34 For example, in theUnited States, 254million tons ofmunicipal35 solid waste was generated in 2007, which is nearly triple the36 amount from 50 years earlier [2]. The increasing complexity of37 the removal chain poses system challenges for effective38 disposal and treatment of products that have reached the end of39 their useful life. In addition, governmental interventions and40 environmental directives are placing pressure on suppliers to41 proactively assume responsibility for the recovery of their42 manufactured goods, by establishing a closed-loop supply43 chain that captures and properly treats these Bend-of-life[
44products. An effective closed-loop supply chain requires an45efficient monitoring system for tracking end-of-life products46through refurbishing, remanufacturing, and recycling facilities.47The evolution of pervasive computing since its origin in48the mid-1970s has led to extensive application of sensors that49influence the technological tools used in people’s daily lives.50Progress in developing Bsmart dust[Vthat is, small51autonomous sensing, computing, and communication52systems that form integrated distributed sensor networks53[3]Vprovides an opportunity to investigate large-scale54complex slowly evolving systems. The rates of technological55progress in sensing, computing, and data processing are56starkly higher than the evolution of other systems such as the57waste-management systems in urban cities. More58specifically, new and rapidly evolving pervasive technologies59such as tracking sensors can generate localized information60about the movement of waste in the removal chain, providing61insight about disposal and appropriate recovery of waste.
!Copyright 2011 by International Business Machines Corporation. Copying in printed form for private use is permitted without payment of royalty provided that (1) each reproduction is done withoutalteration and (2) the Journal reference and IBM copyright notice are included on the first page. The title and abstract, but no other portions, of this paper may be copied by any means or distributed
royalty free without further permission by computer-based and other information-service systems. Permission to republish any other portion of this paper must be obtained from the Editor.
Digital Object Identifier: 10.1147/JRD.2010.2089564
A. BOUSTANI ET AL. 11 : 1IBM J. RES. & DEV. VOL. 55 NO. 1/2 PAPER 11 JANUARY/MARCH 2011
0018-8646/11/$5.00 B 2011 IBM
IEEE
Proof
62 The extensive literature with regard to pervasive computing63 and its impact on urban infrastructure can provide guidance64 for tracking trash. The waste system is challenging to profile65 because of the unpredictable paths that trash can follow.66 Pervasive computing can enable an unconstrained and detailed67 view of the city and its flows of people and goods [4], as well68 as the flow of end-of-life products. Previous applications of69 pervasive computing to unconstrained urban systems include70 applications that involve traffic systems, wastewater flow,71 and energy management. Roozemond discusses the72 application of pervasive computing in producing autonomous73 intelligent agents as observed in urban real-time traffic74 signal-control systems [5]. Schutze et al. discuss the impact75 of computing technology in optimizing the control strategies76 for the urban wastewater system [6]. Tompros et al. propose77 a solution for making use of pervasive network architectures78 to benefit energy management services for the residential79 sector and power distribution network operators [7].80 Other projects have specifically focused on the application81 of pervasive sensing to trash, albeit in restricted fashions.82 In particular, radio frequency identification (RFID)83 technology has frequently been proposed as a solution for84 identifying trash products during end-of-life processing.85 Thomas explores the application of RFID technology for86 improving waste management by labeling the goods to be87 recycled [8]. Binder et al. suggest using RFID tags for the88 automatic separation of recyclable materials [9]. On the other89 hand, other scholars such as Wager et al. argue that the90 material composition of RFID tags will contaminate the91 quality of recyclable materials [10]. While RFID technology92 has several advantages, as discussed in a later section, RFID93 tags are not able to transmit data over long distances. This94 severely limits their utility in unconstrained systems, and thus,95 many projects with a global scale have made use of different96 technologies.97 In a project conducted by Greenpeace that involves98 following the trail of electronic waste (e-waste), the99 organization employed Global Positioning System (GPS)
100 tracking devices and attached them to broken television sets.101 The project uncovered illicit practices of U.K. recycling102 companies that resold the defunct appliances as second-hand103 goods to developing countries, thus violating European104 Union regulations [11]. Other projects involve less105 technologically advanced, more labor-intensive tracking106 approaches. Ebbesmeyer et al. have been following107 thousands of drifting objects on the Pacific Ocean,108 including 29,000 rubber ducks that fell from a container ship109 in 1992. Based on the observed positions, the researchers110 formulated models of oceanic currents [12]. While taking111 advantage of escaped objects to track ocean currents has a112 low environmental impact, releasing sensors into the113 environment may have adverse consequences. Koehler and114 Som question the impact of ubiquitous computing on the115 environment [13].
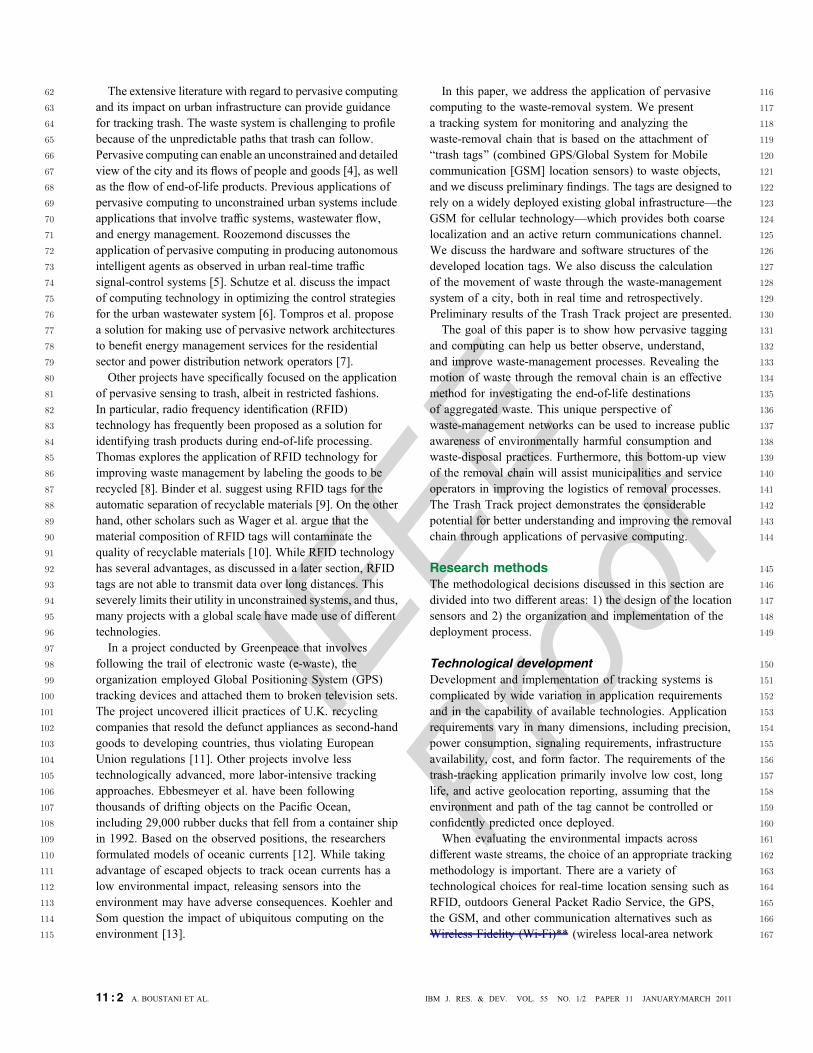
116In this paper, we address the application of pervasive117computing to the waste-removal system. We present118a tracking system for monitoring and analyzing the119waste-removal chain that is based on the attachment of120Btrash tags[ (combined GPS/Global System for Mobile121communication [GSM] location sensors) to waste objects,122and we discuss preliminary findings. The tags are designed to123rely on a widely deployed existing global infrastructureVthe124GSM for cellular technologyVwhich provides both coarse125localization and an active return communications channel.126We discuss the hardware and software structures of the127developed location tags. We also discuss the calculation128of the movement of waste through the waste-management129system of a city, both in real time and retrospectively.130Preliminary results of the Trash Track project are presented.131The goal of this paper is to show how pervasive tagging132and computing can help us better observe, understand,133and improve waste-management processes. Revealing the134motion of waste through the removal chain is an effective135method for investigating the end-of-life destinations136of aggregated waste. This unique perspective of137waste-management networks can be used to increase public138awareness of environmentally harmful consumption and139waste-disposal practices. Furthermore, this bottom-up view140of the removal chain will assist municipalities and service141operators in improving the logistics of removal processes.142The Trash Track project demonstrates the considerable143potential for better understanding and improving the removal144chain through applications of pervasive computing.
145Research methods146The methodological decisions discussed in this section are147divided into two different areas: 1) the design of the location148sensors and 2) the organization and implementation of the149deployment process.
150Technological development151Development and implementation of tracking systems is152complicated by wide variation in application requirements153and in the capability of available technologies. Application154requirements vary in many dimensions, including precision,155power consumption, signaling requirements, infrastructure156availability, cost, and form factor. The requirements of the157trash-tracking application primarily involve low cost, long158life, and active geolocation reporting, assuming that the159environment and path of the tag cannot be controlled or160confidently predicted once deployed.161When evaluating the environmental impacts across162different waste streams, the choice of an appropriate tracking163methodology is important. There are a variety of164technological choices for real-time location sensing such as165RFID, outdoors General Packet Radio Service, the GPS,166the GSM, and other communication alternatives such as167Wireless Fidelity (Wi-Fi)** (wireless local-area network
11 : 2 A. BOUSTANI ET AL. IBM J. RES. & DEV. VOL. 55 NO. 1/2 PAPER 11 JANUARY/MARCH 2011
rdannuc
IEEE
Proof
168 systems based on the IEEE 802.11 standards) and Worldwide169 Interoperability for Microwave Access (WiMAX**).170 Passive RFID tags are an attractive solution that is already171 commonly used to track items in retail supply chains; the low172 price of these tags makes them cost effective to deploy in173 large quantities. However, in the trash-tracking scenario,174 the path of the tags cannot be predicted a priori, which175 makes it difficult to know where to deploy the required RFID176 reader infrastructure. While an RFID solution could177 conceivably identify which trash reached a set of178 predetermined locations, it would not be able to track the179 most interesting cases of trash, those that went astray from180 expected paths. Information privacy and security is also a181 major concern to officials when the deployment of RFID is182 discussed [14].183 AlthoughGPS is an attractive choice because of its precision184 and the steadily declining cost of GPS chipsets, the use of GPS185 tracking systems may lead to discontinuity in signal186 transmissions, since it is difficult to guarantee that tags will187 be in locations that can receive GPS signals. Augmented188 GPS based on pseudolite transmitters (i.e., high-power189 nonspace-based GPS transmitters called pseudosatellites,190 or pseudolites) might address some of these problems, but191 the infrastructure required for this is generally unavailable in192 rural areas.193 There are other low-cost communication infrastructures194 with varying breadths of deployment. Urban areas typically195 have extensive wireless coverage from multiple technologies,196 including Wi-Fi and WiMAX; a variety of cellular197 technologies are prevalent in the United States, including198 code-division multiple access, GSM, and Universal Mobile199 Telecommunications System. Of these, the most globally200 ubiquitous infrastructure is GSM cellular technology.201 Because GSM technology is mature, the cost of GSM202 chipsets has been also steadily declining.203 Active reporting infrastructure is critical to tracking object204 movement in an unconstrained system such as the205 waste-removal chain. The biggest advantage of GSM location206 technology is that it provides a solution for location sensing207 and, at the same time, a communications backchannel.208 GSM provides a coarse-grained localization capability based209 on the set of reachable cell sites and an active return210 communications channel through those cell sites. The primary211 disadvantages of GSM are its high cost relative to RFID and212 the low positioning accuracy relative to GPS or Wi-Fi cell213 positioning; however, the requirements for global reach and214 unsupervised deployment exclude those alternatives.
215 Design process216 The tracking system for monitoring and analyzing the217 waste-removal chain is based on active location-reporting tags218 attached to individual waste items. These trash tags were219 developed at the Massachusetts Institute of Technology (MIT)220 by utilizing an off-the-shelf GSM data modem chipset,
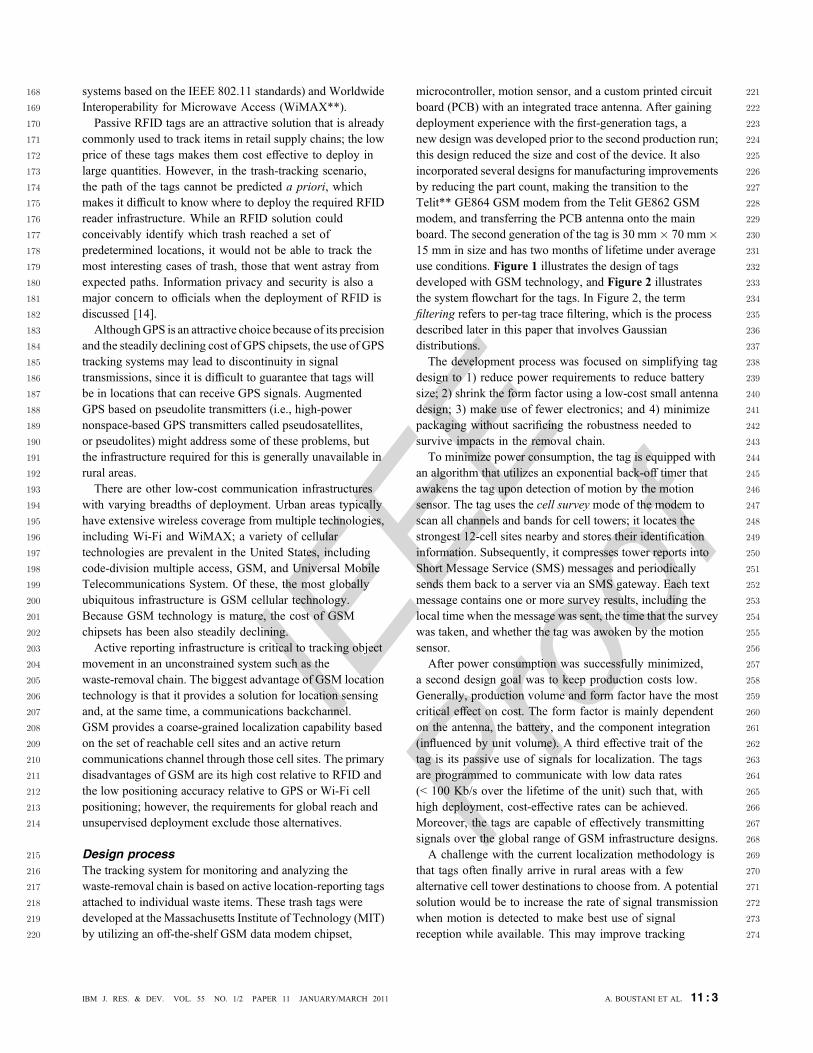
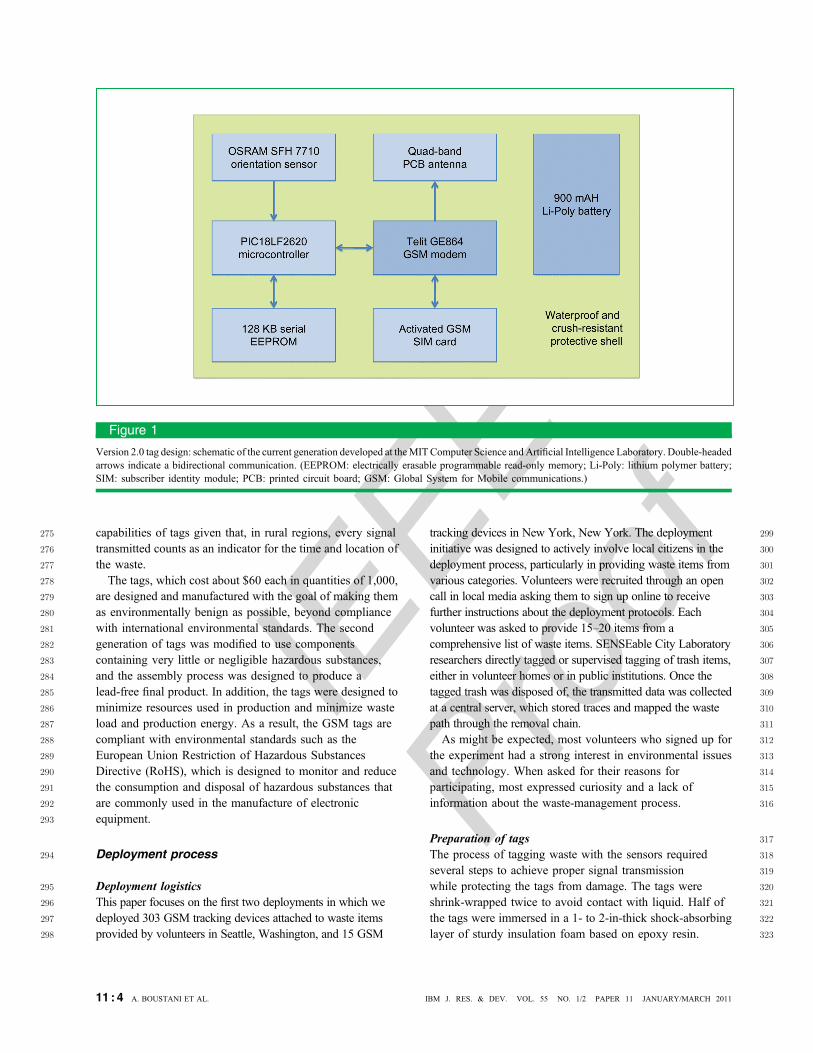
221microcontroller, motion sensor, and a custom printed circuit222board (PCB) with an integrated trace antenna. After gaining223deployment experience with the first-generation tags, a224new design was developed prior to the second production run;225this design reduced the size and cost of the device. It also226incorporated several designs for manufacturing improvements227by reducing the part count, making the transition to the228Telit** GE864 GSM modem from the Telit GE862 GSM229modem, and transferring the PCB antenna onto the main230board. The second generation of the tag is 30 mm! 70 mm!23115 mm in size and has two months of lifetime under average232use conditions. Figure 1 illustrates the design of tags233developed with GSM technology, and Figure 2 illustrates234the system flowchart for the tags. In Figure 2, the term235filtering refers to per-tag trace filtering, which is the process236described later in this paper that involves Gaussian237distributions.238The development process was focused on simplifying tag239design to 1) reduce power requirements to reduce battery240size; 2) shrink the form factor using a low-cost small antenna241design; 3) make use of fewer electronics; and 4) minimize242packaging without sacrificing the robustness needed to243survive impacts in the removal chain.244To minimize power consumption, the tag is equipped with245an algorithm that utilizes an exponential back-off timer that246awakens the tag upon detection of motion by the motion247sensor. The tag uses the cell survey mode of the modem to248scan all channels and bands for cell towers; it locates the249strongest 12-cell sites nearby and stores their identification250information. Subsequently, it compresses tower reports into251Short Message Service (SMS) messages and periodically252sends them back to a server via an SMS gateway. Each text253message contains one or more survey results, including the254local time when the message was sent, the time that the survey255was taken, and whether the tag was awoken by the motion256sensor.257After power consumption was successfully minimized,258a second design goal was to keep production costs low.259Generally, production volume and form factor have the most260critical effect on cost. The form factor is mainly dependent261on the antenna, the battery, and the component integration262(influenced by unit volume). A third effective trait of the263tag is its passive use of signals for localization. The tags264are programmed to communicate with low data rates265(G 100 Kb/s over the lifetime of the unit) such that, with266high deployment, cost-effective rates can be achieved.267Moreover, the tags are capable of effectively transmitting268signals over the global range of GSM infrastructure designs.269A challenge with the current localization methodology is270that tags often finally arrive in rural areas with a few271alternative cell tower destinations to choose from. A potential272solution would be to increase the rate of signal transmission273when motion is detected to make best use of signal274reception while available. This may improve tracking
A. BOUSTANI ET AL. 11 : 3IBM J. RES. & DEV. VOL. 55 NO. 1/2 PAPER 11 JANUARY/MARCH 2011
IEEE
Proof275 capabilities of tags given that, in rural regions, every signal
276 transmitted counts as an indicator for the time and location of277 the waste.278 The tags, which cost about $60 each in quantities of 1,000,279 are designed and manufactured with the goal of making them280 as environmentally benign as possible, beyond compliance281 with international environmental standards. The second282 generation of tags was modified to use components283 containing very little or negligible hazardous substances,284 and the assembly process was designed to produce a285 lead-free final product. In addition, the tags were designed to286 minimize resources used in production and minimize waste287 load and production energy. As a result, the GSM tags are288 compliant with environmental standards such as the289 European Union Restriction of Hazardous Substances290 Directive (RoHS), which is designed to monitor and reduce291 the consumption and disposal of hazardous substances that292 are commonly used in the manufacture of electronic293 equipment.
294 Deployment process
295 Deployment logistics296 This paper focuses on the first two deployments in which we297 deployed 303 GSM tracking devices attached to waste items298 provided by volunteers in Seattle, Washington, and 15 GSM
299tracking devices in New York, New York. The deployment300initiative was designed to actively involve local citizens in the301deployment process, particularly in providing waste items from302various categories. Volunteers were recruited through an open303call in local media asking them to sign up online to receive304further instructions about the deployment protocols. Each305volunteer was asked to provide 15–20 items from a306comprehensive list of waste items. SENSEable City Laboratory307researchers directly tagged or supervised tagging of trash items,308either in volunteer homes or in public institutions. Once the309tagged trash was disposed of, the transmitted data was collected310at a central server, which stored traces and mapped the waste311path through the removal chain.312As might be expected, most volunteers who signed up for313the experiment had a strong interest in environmental issues314and technology. When asked for their reasons for315participating, most expressed curiosity and a lack of316information about the waste-management process.
317Preparation of tags318The process of tagging waste with the sensors required319several steps to achieve proper signal transmission320while protecting the tags from damage. The tags were321shrink-wrapped twice to avoid contact with liquid. Half of322the tags were immersed in a 1- to 2-in-thick shock-absorbing323layer of sturdy insulation foam based on epoxy resin.
Figure 1
Version 2.0 tag design: schematic of the current generation developed at theMITComputer Science andArtificial Intelligence Laboratory. Double-headedarrows indicate a bidirectional communication. (EEPROM: electrically erasable programmable read-only memory; Li-Poly: lithium polymer battery;SIM: subscriber identity module; PCB: printed circuit board; GSM: Global System for Mobile communications.)
11 : 4 A. BOUSTANI ET AL. IBM J. RES. & DEV. VOL. 55 NO. 1/2 PAPER 11 JANUARY/MARCH 2011
IEEE
Proof
324 The remaining tags were protected using a latex mold rubber.325 The tagging process was found to be a very delicate task326 given that a few main objectives had to be met: protection327 of tags from physical damage, proper signal transmission,328 and concealing the presence of tags to prevent manual329 removal.
330 Selection of municipal solid waste331 Waste items for Trash Track deployments were carefully332 chosen by considering the following: 1) a wide range of333 waste, which is categorized into municipal solid waste334 definitions by the U.S. Environmental Protection Agency;335 2) environmental impacts of each waste category (including336 such considerations as hazardous elements in e-waste, the337 energy that can be saved by remanufacturing tires, and338 material recovery potential of appliances); 3) waste production339 levels and significance; and 4) alternative routes for removal340 of waste (e.g., recycling, remanufacturing, reuse, and341 landfilling). The waste items were carefully chosen to
342represent the diverse origins of municipal waste from343residential, commercial, and industrial sources. As a result,34449 product types were organized into 15 waste categories,345with higher priority for tagging given to the specific group346of products listed in Table 1.
347Data acquisition348The GSM sensors send an SMS text with the identification349information of the 12 closest cell phone towers in the350vicinity. We then determine the location of each observed351cell tower by querying an online triangulation service352provided by Navizon, Inc. We note that access to the mobile353triangulation application programming interface (API) of354Navizon was provided free of charge for the duration of355the experiment. In many cases, different cell ID numbers356report similar physical coordinates. Therefore, to avoid357overweighting those points, the duplicate coordinates from358the computation are discarded, and the algorithm retains only359one of the colocated sites.
Figure 2
System flowchart 2.0 of the trash tag tracking application and its external interactions. Double-headed arrows indicate a bidirectional flow of information.Google Earth is a virtual map and geographic information program. (SMS: Short Message Service; API: application programming interface; IP: InternetProtocol.)
A. BOUSTANI ET AL. 11 : 5IBM J. RES. & DEV. VOL. 55 NO. 1/2 PAPER 11 JANUARY/MARCH 2011
IEEE
Proof
360 For each survey point, the distribution of site locations is361 recorded. Moreover, the minimum intersite distance is362 computed and used as the scale for a Gaussian probability363 distribution centered at each observed site. This logic364 ensures that the probability distributions centered at each site365 location become more diffuse as the overall distribution of366 locations becomes more diffuse, ensuring that the tightest367 cluster of points registers as the most heavily weighted368 cluster in each new survey point.369 This probability distribution is also localized in time from370 the observation of the survey through the time of the next371 survey. After a site is no longer observed, the weight of its372 probability density function (pdf) is reduced by a weight373 based on a logistic function Bs-curve[ with 50% decay374 after 15 minutes. These pdf’s are then superimposed in space375 and time to compute an overall pdf for any given point in
376space and time. This results in the most general377representation of the location of tags, as it captures the378relative likelihoods of different locations. This methodology379can be particularly useful for observing correlated motion380of multiple sensors such as tags that travel in the same381vehicle.382The pdf is used to identify a single location that represents383the maximum-likelihood position for each point in time.384The programmers search for the space by testing only the385points at actual observed cell locations to determine the386highest likelihood among those points. Then, the weighted387average of all points within a 1-km radius of that maximum388is computed; this is considered the most likely estimate at389that point in time. The maximum-likelihood points are390utilized for display and visualization purposes.
391Preliminary results392While a larger analysis of the acquired data is still underway,393we discuss preliminary results of the experiment through a394technical analysis of the sensor performance and a discussion395of some of the traces acquired through the experiment.
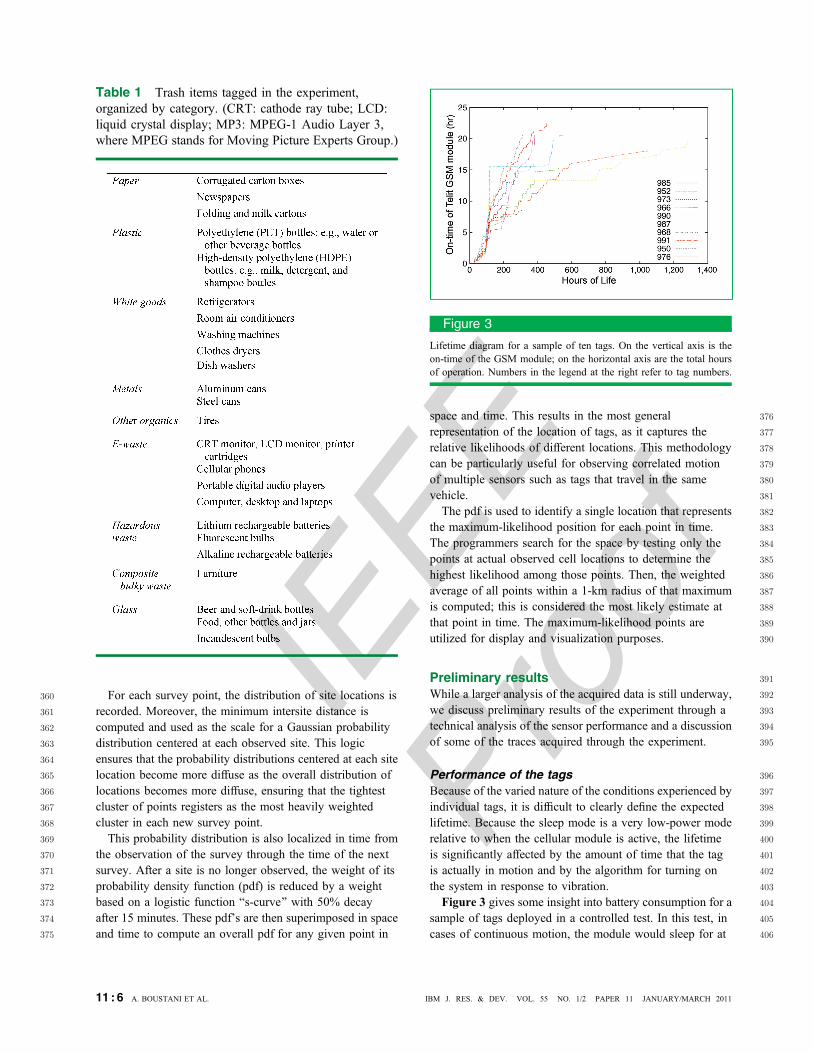
396Performance of the tags397Because of the varied nature of the conditions experienced by398individual tags, it is difficult to clearly define the expected399lifetime. Because the sleep mode is a very low-power mode400relative to when the cellular module is active, the lifetime401is significantly affected by the amount of time that the tag402is actually in motion and by the algorithm for turning on403the system in response to vibration.404Figure 3 gives some insight into battery consumption for a405sample of tags deployed in a controlled test. In this test, in406cases of continuous motion, the module would sleep for at
Table 1 Trash items tagged in the experiment,organized by category. (CRT: cathode ray tube; LCD:liquid crystal display; MP3: MPEG-1 Audio Layer 3,where MPEG stands for Moving Picture Experts Group.)
Figure 3
Lifetime diagram for a sample of ten tags. On the vertical axis is theon-time of the GSM module; on the horizontal axis are the total hoursof operation. Numbers in the legend at the right refer to tag numbers.
11 : 6 A. BOUSTANI ET AL. IBM J. RES. & DEV. VOL. 55 NO. 1/2 PAPER 11 JANUARY/MARCH 2011
IEEE
Proof
407 least 5 minutes after taking a measurement, and that sleep408 duration would be linearly increased up to 1 hour. The same409 figure shows the distribution of Bactive time[ over the410 lifetime of ten sample tags. The data was collected by411 reporting the total uptime and total active time in each412 message. These numbers can then be plotted to show the413 evolution of the Bburn rate[ (i.e., battery dissipation rate)414 over time. Each curve in the figure represents the415 performance history of an individual tag, comparing the416 number of hours the cellular module of a tag has been active417 with the number of hours that the tag has been running.418 The slope of the curve represents the effective duty cycle419 over that time period. Note that the scales on the axes are in420 a ratio 1 : 40, meaning that a 45" line would represent an421 effective duty cycle of 1 : 40. The timing of the reports is not422 uniform because the reporting intervals are determined by423 when the tag reports data.424 The deployment proceeded in three phases, which can be425 observed in the plot. In the first 100 hours, the tags were active426 but were being prepared for deployment. Since they were427 being handled by the deployment staff, motion was observed428 to varying degrees for different tags. After being prepared,429 the tags were mailed to several volunteers who would430 apply them to pieces of trash. This is observable in the431 steep segment in the 24–48 hours following the preparation432 phase. Because the tags were moving quickly, observations433 of new cell sites would trigger the back-off timers to reset434 frequently, with the result that the tags were active nearly435 continuously. Once they reached the volunteers, the tags were436 applied to trash items and disposed of. In this phase, different437 pieces of trash fared differently until the end of the traces.438 The data is characterized by brief periods of activity in which439 the burn rate is high and long lulls during which the tag is440 primarily asleep. The burn rate in this period varies between441 1 : 20 and 1 : 40.442 In some instances, the tags experienced very long lags.443 For example, tag 987 was deployed to a volunteer in a remote444 part of Scotland, whose trash was only collected once per445 month. Since the tag arrived too late for the monthly446 collection, it lay dormant for 600 hours before reactivating.447 Nearly vertical lines indicate periods of significant448 motion.449 The traces did not end at a uniform time, either because450 the tags were destroyed or their batteries expired. We estimate451 that this version of the tags had sufficient energy to operate452 between 20 and 30 hours in active mode and between three453 and six months in sleep mode. Because the tags consumed454 approximately 50% of their available energy during455 shipment, the tags in this particular experiment had a456 reduced lifetime.457 Lifetime can also be extended by tuning (i.e., adjusting)458 the algorithm to minimize wasted energy when in motion.459 The trash-tracking application is unusual among tracking460 applications, in that the tags may be destroyed at their
461destination. It is critical to get the Blast message[ out before462they are destroyed; however, it is also critical to avoid463unnecessary operation when in motion for long times.464Thus, simply decreasing the duty cycle may lead to much465worse application performance.
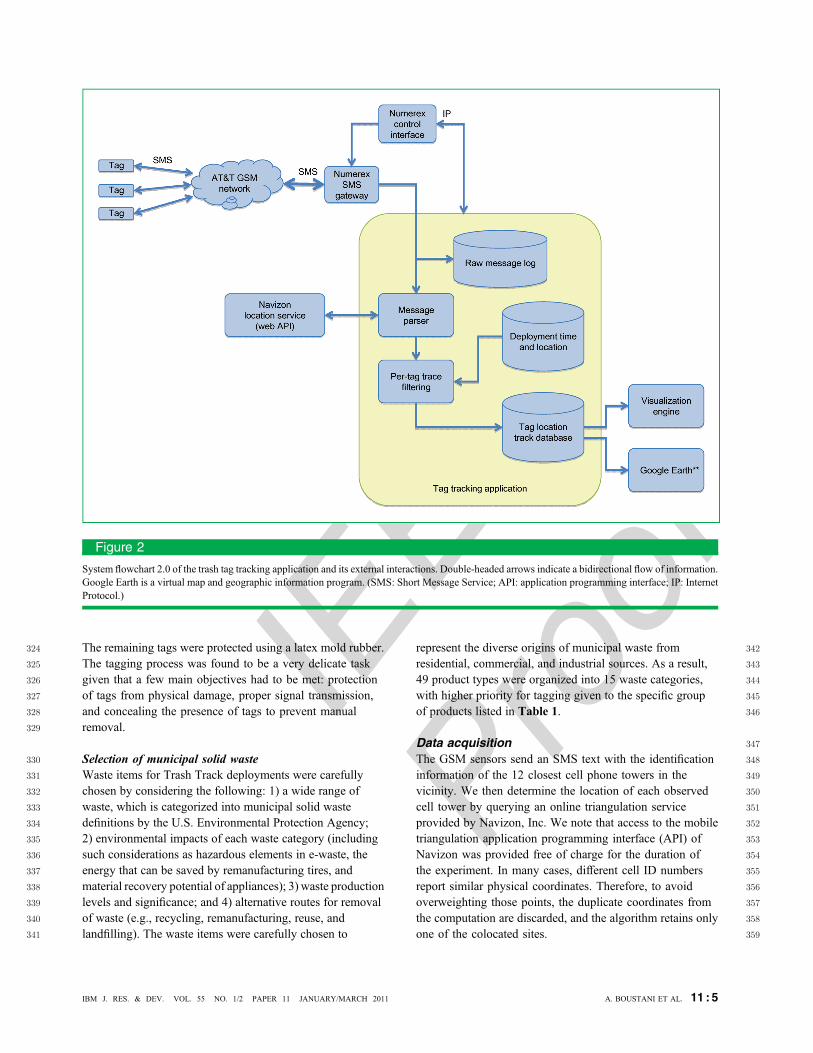
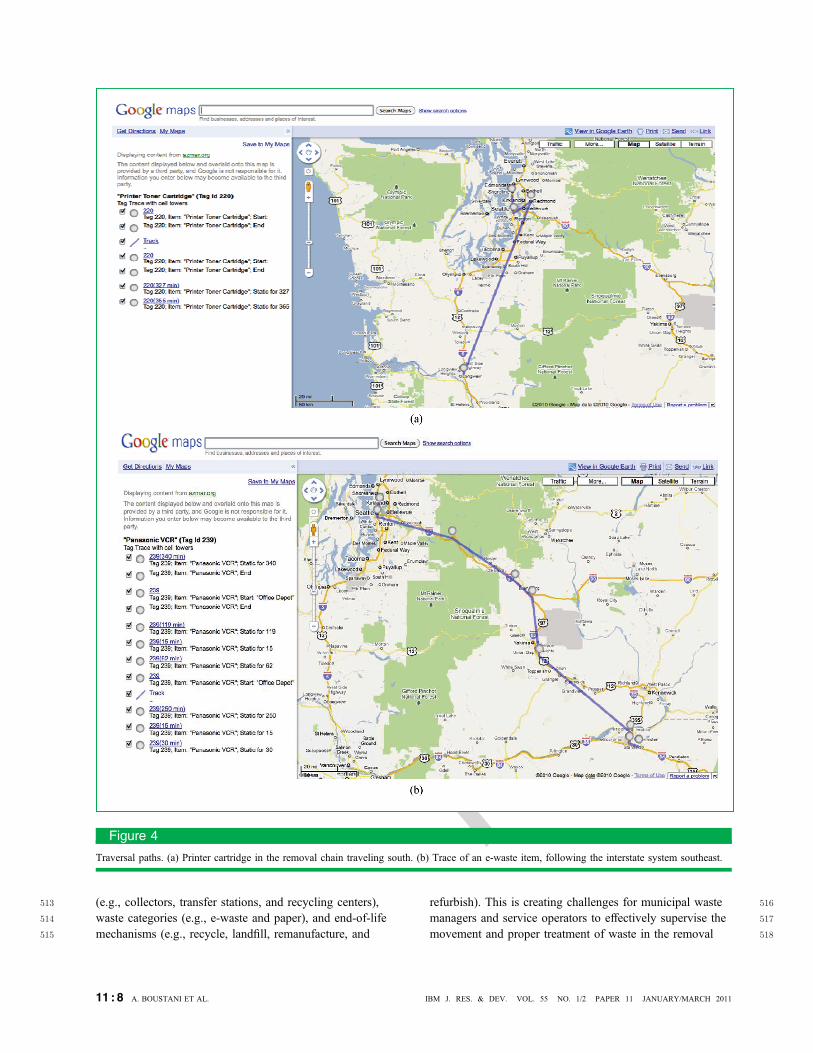
466Acquired traces467Using the setup described earlier, we were able to acquire468a set of traces for the two cities of New York and Seattle.469As illustrated in Figures (4a) and (4b), the location470reports we received have a low resolution, due to the471power-conserving measures explained earlier. However,472the resolution is sufficiently high for inferences about the473route and the mode of transportation. As an example,474Figure (4a) shows a traversal path for a printer cartridge,475and Figure (4b) provides the trace associated with the476removal of a Panasonic videocassette recorder from477a disposal site in Seattle, Washington, to a landfill478located in north Oregon along the Interstate highways47990 and 82.480Given the harsh environment in the waste-disposal system,481electromechanical failure of tags was a major challenge.482Tags failed for any number of reasons: They could be483destroyed during the waste-removal process before sending484a location report, or they could arrive in an environment485where the transmission signal was blocked. Other possible486reasons include hardware malfunctions of the tracking487device or human errors resulting from volunteers not488disposing of the tagged item. We found that the failure rates489heavily depended on the packaging strategy. Among the490described packaging methods, the rubber packaging gave491the lowest failure ratesV46% for rubber versus 72% for492foam packaging. However, rubber packaging also involved493the most time-consuming method. Overall, we observed494that electronic waste items were less prone to failure than495regular household trash, which is understandable given the496more severe physical forces involved in regular garbage497collection. For most of the traces, battery failure was498determined to be less of a problem compared to physical499destruction.500Investigating the valid traces, it quickly became obvious501that electronic waste and hazardous waste tend to travel502the longest distances. Furthermore, the acquired traces reflect503the structure of the removal system in general; from tags504dispersed throughout the city, we eventually received a505large number of reports from a large recycling facility in506Seattle.
507Conclusion508Population growth, accelerating waste generation, and509growing concerns about the environment have made the510removal chain increasingly critical. End-of-life procedures511have evolved into complex distributive networks involving512growing numbers of municipalities and service operators
A. BOUSTANI ET AL. 11 : 7IBM J. RES. & DEV. VOL. 55 NO. 1/2 PAPER 11 JANUARY/MARCH 2011
rdannuc
IEEE
Proof
513 (e.g., collectors, transfer stations, and recycling centers),514 waste categories (e.g., e-waste and paper), and end-of-life515 mechanisms (e.g., recycle, landfill, remanufacture, and
516refurbish). This is creating challenges for municipal waste517managers and service operators to effectively supervise the518movement and proper treatment of waste in the removal
Figure 4
Traversal paths. (a) Printer cartridge in the removal chain traveling south. (b) Trace of an e-waste item, following the interstate system southeast.
11 : 8 A. BOUSTANI ET AL. IBM J. RES. & DEV. VOL. 55 NO. 1/2 PAPER 11 JANUARY/MARCH 2011
IEEE
Proof
519 chain. More specifically, increasing complexities in520 communication networks among stakeholders make it521 difficult for municipalities and service operators to evaluate522 the end-of-life destinations of aggregate waste. Pervasive523 computing is opening a new frontier for studying urban524 environmental systems such as waste management.525 In this paper, we have addressed the application of526 pervasive computing to the waste-removal system. We527 have presented a tracking system for monitoring and528 analyzing the waste-removal chain by attaching real-time529 location-sensing tags to the waste, utilizing GSM cellular530 technology for coarse localization and active return531 communications. We have discussed the hardware and532 software structures of the tracking sensors and the533 methodologies for computing the movement of waste534 through the removal chain.535 The data acquired from the deployment of GSM tracking536 sensors in Seattle and New York also provided insights537 with regard to shortcomings of the Trash Track system.538 Trash tags could fail because of physical damage in the539 removal chain, enclosure in an environment where540 transmission signal was blocked, improper tagging, and541 device malfunctions. The type of waste object also had an542 influence on the ability of a tag to report; for example,543 sensors attached to or embedded within electronic544 waste had higher chances of success than household545 items.546 Preliminary results of the Trash Track project reveal the547 motion of waste through municipalities and multiple service548 providers along the removal chain. Analysis of each trace549 provides a complete narrative of the journey of that item550 through the waste-management process, including the551 disposal location, final destination, transportation distance552 and time, number of transfers, and other useful information.553 Comparing the observed waste-removal process with the554 expected case can help service providers understand how555 well the system performs and whether it can be improved556 to be more energy efficient or ecologically responsible.557 Additionally, making these traces viewable will enhance558 public environmental awareness about the removal chain559 and promote responsible consumption and disposal560 practices.561 Future directions for the Trash Track project will further562 investigate the impact of pervasive computing on the removal563 chain. More specifically, the Trash Track researchers will564 map out all the acquired traces and determine the links565 (i.e., transfer stations and recycling facilities) that waste566 passes through in the waste-management networks. This will567 enable a comparison between the monitored end-of-life568 processes and the optimal end-of-life treatments for waste.569 Regarding product development, the Trash Track project will570 continue improving the GSM tags while investigating tag571 designs that can provide higher accuracy, smaller size, and572 better cost effectiveness.
573This paper builds on previous work at the MIT SENSEable574City Laboratory in its exploration of how the increasing575deployment of sensors and mobile technologies radically576transforms how we understand and describe cities. The577understanding of the cities, their real and virtual processes,578and the behavior of their citizens opens many opportunities579for intervention and feedback to produce change.
580Acknowledgments581The authors would like to thank Seattle Waste Management,582Qualcomm, and Sprint for sponsoring this research; their583contributions have enabled the success of the Trash Track584project. In addition, the achievements of this project involved585many talented individuals who greatly contributed to the586progress of Trash Track, particularly Musstanser Tinauli,587Kristian Kloeckl, E. Roon Kang, and Jennifer Dunnam.588The authors would like to thank Prof. Steve Graves and589Timothy Gutowski for their advisory roles. Rex Britter590acknowledges support in part from the National Research591Foundation of Singapore under the SMART CENSAM592project.
593**Trademark, service mark, or registered trademark of Wireless594Ethernet Compatibility Alliance, Inc., WiMAX Forum Corporation, or595Telit Communications Corporation in the United States, other countries,596or both.
597References5981. E. Baker, E. Bournay, A. Harayama, P. Rekacewicz, M. Catelin,599N. Dawe, and O. Simonett, BVital waste graphics,[ in Proc. Conf.600Parties Basel Conv. (COP7), Oct. 2004. [Online]. Available:601http://www.grida.no/_res/site/file/publications/vital-waste/602wastereport-full.pdf.6032. Environmental Protection Agency, Municipal Solid Waste in604the United Stated 2007 Facts and Figures. [Online]. Available:605http://www.epa.gov/epawaste/nonhaz/municipal/pubs/606msw07-rpt.pdf6073. B. Warneke, M. Last, B. Liebowitz, and K. S. J. Pister,608BSmart dust: Communicating with a cubic-millimeter computer,[609Computer, vol. 34, no. 1, pp. 44–51, Jan. 2001.6104. T. Ojala and H. Kukka, A Digital City Needs Open Pervasive611Computing Infrastructure, MediaTeam, Univ. Oulu, Oulu,612Finland. [Online]. Available: http://www.mediateam.oulu.fi/613publications/pdf/1220.pdf6145. D. A. Roozemond, BUsing intelligent agents for urban traffic615control systems,[ in Proc. Int. Conf. Artif. Intell. Transp. Syst. Sci.,6161999, pp. 69–79.6176. M. Schutze, D. Butler, and M. B. Beck, BOptimisation of control618strategies for the urban wastewater systemVAn integrated619approach,[ J. Water Sci. Technol., vol. 39, no. 9, pp. 209–216,6201999, PII:S0273-1223 (99) 00235-8.6217. S. Tompros, N. Mouratidis, M. Caragiozidis, H. Hrasnica, and622A. Gavras, BA pervasive network architecture featuring intelligent623energy management of households,[ in Proc. 1st Int. Conf.624Pervasive Technol. Related Assistive Environ., Athens, Greece,6252008, vol. 282, p. 75.6268. V. M. Thomas, BProduct self-management: Evolution in627recycling and reuse,[ Environ. Sci. Technol., vol. 37, no. 23,628pp. 5297–5302, Oct. 2003.6299. C. R. Binder, R. Quirici, S. Domnitcheva, and B. Staubi,630BSmart labels for waste and resource management: An631integrated assessment,[ J. Ind. Ecol., vol. 12, no. 2, pp. 207–228,632Apr. 2008.
A. BOUSTANI ET AL. 11 : 9IBM J. RES. & DEV. VOL. 55 NO. 1/2 PAPER 11 JANUARY/MARCH 2011
rdannuc
IEEE
Proof
633 10. P. A. Wager, M. Eugster, L. M. Hilty, and C. Som, BSmart634 labels in municipal solid wasteVA case for the precautionary635 principle?[ Environ. Impact Assess. Rev., vol. 25, no. 5,636 pp. 567–586, Jul. 2005.637 11. Greenpeace International, Following the e-Waste TrailVUK638 to Nigeria. [Online]. Available: http://www.greenpeace.org/639 international/photosvideos/greenpeace-photo-essays/640 following-the-e-waste-trail641 12. C. C. Ebbesmeyer, W. J. Ingraham, T. C. Royer, and642 C. E. Grosch, BTub toys orbit the Pacific subarctic gyre,[643 EOS, Trans. Amer. Geophys. Union, vol. 88, no. 1, pp. 1–12,644 Jan. 2007.645 13. A. Koehler and C. Som, BEffects of pervasive computing on646 sustainable development,[ IEEE Technol. Soc. Mag., vol. 24,647 no. 1, pp. 15–23, 2005AQ1 .648 14. T. Dobson and E. Todd, BRadio frequency identification649 technology,[ Comput. Law Secur. Rep., vol. 22, no. 4,650 pp. 313–315, Jul. 2006.
651
652 Received March 1, 2010; accepted for publication653 April 2, 2010
654 Avid Boustani SENSEable City Lab, Massachusetts Institute655 of Technology, Cambridge, MA 02139 USA ([email protected]).656 Mr. Boustani graduated with a B.S. degree in mechanical engineering657 with High Honors distinction from the University of California,658 Berkeley. He is a graduate student in mechanical engineering at MIT659 and a research fellow at the SENSEable City Lab. Prior to his time660 at the SENSEable City Lab, he was a graduate researcher for MIT661 Energy Initiative. Mr. Boustani has more than five years of research662 experience, analyzing complex theoretical and computational issues663 in addressing feasible solutions regarding energy management and664 environmental sustainability. He has extensive knowledge in addressing665 the life-cycle energy and economic impacts of products and systems.666 His research background is predominantly focused on analyzing667 challenges in energy and their respective impacts on the performance668 of systems and the environment. He has successfully launched two669 Internet startup ventures and is the 2009 MIT $100K Business Plan670 Competition Life-Science track winner.
671 Lewis Girod MIT Computer Science and Artificial Intelligence672 Lab, Massachusetts Institute of Technology, Cambridge, MA 02139673 USA ([email protected]). Dr. Girod holds a B.S. degree in674 mathematics and an M.Eng. degree in electrical engineering and675 computer science from MIT. He received a Ph.D. degree in 2006676 from University of California, Los Angeles (UCLA). That same year,677 he joined the Computer Science and Artificial Intelligence Lab (CSAIL)678 in the Center for Embedded Networked Sensing. He is currently679 a Research Scientist CSAIL. He has been working in the area of680 wireless and embedded networked sensing since 1998. Dr. Girod has681 numerous academic publications in wireless sensor networks and broad682 experience implementing vertical networked sensing applications in683 academia and industry.
684 Dietmar Offenhuber SENSEable City Lab, Massachusetts685 Institute of Technology, Cambridge, MA 02139 USA686 ([email protected]). Mr. Offenhuber holds degrees from UT Vienna687 (Vienna University of Technology) and the MIT Media Lab, and he is688 Ph.D. candidate in Urban Studies at the Massachusetts Institute of689 Technology. He has a background in architecture, urban studies, and690 digital media art and is interested in the spatial aspects of cognition,691 interaction, and behavior. Before joining the SENSEable City Lab,692 he worked as key researcher at the Ars Electronica Futurelab and the693 Ludwig Boltzmann Institute for Media Art Research and as professor at694 the Art University Linz. His research interests include visualization,695 temporal analysis, and social media for low-threshold interaction/696 cooperation in public space.
697Rex Britter SENSEable City Lab, Massachusetts Institute of698Technology, Cambridge, MA 02139 USA ([email protected]).699Dr. Britter is the Emeritus Professor of Environmental Fluid Dynamics700in the Department of Engineering at the University of Cambridge,701UK and a Visiting Scientist at the SENSEable City Laboratory,702Department of Urban Studies and Planning, MIT, in Boston. His703research interests include fundamental studies into turbulent fluid704dynamics, particularly those involving buoyancy. This is paralleled705with operational interests in the flow and dispersion of hazardous706materials, conventional pollutant dispersion problems in complex707geometries such as cities, formalized model evaluation procedures,708urban air quality, sustainable energy use in cities, and security issues.709He has published five books and some 300 articles in journals and710conference proceedings.
711Malima I. Wolf Massachusetts Institute of Technology,712Cambridge, MA 02139 USA ([email protected]). A Ph.D. candidate713with the MIT Department of Mechanical Engineering, Ms. Wolf714works as a research assistant with the Environmentally Benign715Manufacturing Laboratory, led by Professor Tim Gutowski. Her main716research pursuits include exploring the energy and environmental717impacts of end-of-life systems, with an emphasis on the performance of718recycling systems. Her work in this field has earned her fellowships719with the Xerox MIT Fellowship program and the Martin Family Society720of Fellows for Sustainability. In addition to serving as a Btrash expert[721for Trash Track, she helped tag trash during the Seattle deployment.
722David Lee SENSEable City Lab, Massachusetts Institute of723Technology, Cambridge, MA 02139 USA ([email protected]).724Mr. Lee has completed his master’s degree in city planning and a725bachelor’s degrees in physics and urban planning at MIT. He is a726Ph.D. student in urban studies and planning at MIT, concentrating in727urban information systems. As a researcher at the SENSEable City Lab,728he is interested in human behavioral response to real-time information729feedback systems, and how digital technology can transform public730discourse on critical urban issues. As a Fulbright Scholar, he conducted731research in Seoul, Korea, and instructed courses in urban design at732the University of Seoul.
733Stephen Miles SENSEable City Lab, Massachusetts Institute of734Technology, Cambridge, MA 02139 USA ([email protected]).735A Research Affiliate at the MIT Auto-ID Labs and Advisor to the736SENSEable City Laboratory Trash Track project, Mr. Miles’ research737interests involve leveraging of Automated Information Data Capture738(AIDC) and advanced wireless tracking technologies to communicate739more effectively about shared business processes in the physical world.740As a Research Engineer and RFID Evangelist for the Auto-ID Labs,741he organized the RFID Academic Convocations, the results of which742are published in RFID Technology and Applications (Cambridge743University Press, 2008), for which Mr. Miles served as coeditor.744Prior to enrolling in the MIT Sloan Management of Technology745Program in 2003, he was a founder of several startup companies in746the computer services and network infrastructure business.
747Assaf Biderman SENSEable City Lab, Massachusetts Institute748of Technology, Cambridge, MA 02139 USA ([email protected]).749Mr. Biderman teaches at the Massachusetts Institute of Technology,750where he is the Associate Director of the SENSEable City Lab, an MIT751research group that explores the Breal-time city[ by studying the752increasing deployment of sensors and networked hand-held electronics,753and their relationship to the built environment. Mr. Biderman has754backgrounds in physics and human-computer interaction. He focuses755on working in partnership with city administrations and industry756members worldwide to explore how distributed technologies can be757used to improve our understanding of cities and create a more758sustainable future.
11 : 10 A. BOUSTANI ET AL. IBM J. RES. & DEV. VOL. 55 NO. 1/2 PAPER 11 JANUARY/MARCH 2011
rdannuc

IEEE
Proof
759 Carlo Ratti SENSEable City Lab, Massachusetts Institute of760 Technology, Cambridge, MA 02139 USA ([email protected]). An architect761 and engineer, Dr. Ratti graduated with an M.Sc. degree in civil762 structural engineering from both the Politecnico di Torino, Italy, and763 the ecole Nationale des Ponts et ChaussOes in Paris, France. He later764 received an M.Phil. and a Ph.D. degree in architecture from the765 University of Cambridge, United Kingdom. He practices architecture766 in Turin and teaches at MIT, where he directs the SENSEable City Lab,767 a new research initiative within the Department of Urban Studies768 and Planning. His work has been exhibited in leading museums769 worldwide, including the Kunsthaus Graz (2005), Venice Biennale770 (2004, 2006 and 2008), the Museum of Modern Art (MoMA) (2008),771 and Design Museum Barcelona (2009). Dr. Ratti has coauthored772 more than 100 scientific publications and holds several patents.773 His Digital Water Pavilion at the World Expo 2008 was hailed by774 TIME magazine as one of the BBest Inventions of the Year.[775 In December 2008, he was included in Esquire magazine’s776 BBest & Brightest[ list.
A. BOUSTANI ET AL. 11 : 11IBM J. RES. & DEV. VOL. 55 NO. 1/2 PAPER 11 JANUARY/MARCH 2011

IEEE
Proof
AUTHOR QUERY
AUTHOR PLEASE ANSWER QUERY
AQ1 = Please provide month of publication in Ref. [13].
END OF AUTHOR QUERY
Related Documents