Investigation of the Machinability Characteristics of GFRP/ Epoxy Composites using Taguchi Methodology Hari Vasudevan 1, a , Naresh Deshpande 2, b and Ramesh Rajguru 3,c 1, 2, 3 D.J. Sanghvi College of Engineering, Mumbai, India a [email protected], b [email protected], c [email protected] Keywords: Machinability, CNC Turning, Epoxy, Polycrystalline Diamond Tool, Taguchi Methodology, Woven Fabric Abstract. Many glass fiber reinforced plastic (GFRP) composite components made from primary melt processes require additional machining to meet the requirements of assembly and accurate dimensional tolerances. Importance of woven fabric based glass fibre reinforced composites is widely known in many industrial applications. However, very little is known about machinability of these composites. Cutting force is treated as one of the primary measures for determining the machinability of any material.This paper presents an investigation into the longitudinal turning of woven fabric and epoxy based GFRP composites, using polycrystalline diamond tool, so as to analyze the effect of cutting parameters and insert radius on the cutting force. The force was measured through longitudinal turning, according to the experimental plan, as developed on the basis of Taguchi methodology. The signal to noise ratio and analysis of variance were applied to the experimental data, in order to determine the effect of the process variables on tangential cutting force. Statistical results indicated that the cutting force is significantly influenced (at a 95% confidence level) by feed rate, followed by depth of cut, whereas, cutting speed and insert radius have a smaller influence. The cutting force also increases with the increase in feed rate and depth of cut. Introduction During the last decade, machining of components made of polymer matrix composites has been developed as an alternative to the processes of injection molding, extrusion and sintering. Many components made from primary melt processes also require additional machining to meet the requirements of assembly and accurate dimensional tolerances. Machining of fibre reinforced composites differs from that of metal alloys due to their anisotropy, low thermal conductivity and difference between coefficient of linear expansion of the matrix and the fibre. The quality of the machined surface depends upon the type of fibres and matrix materials, type of weave of the fabric etc. Some of the typical problems faced during the machining of fiber reinforced plastics (FRPs) are fibers getting pulled out, separation of the bond between matrix and fibres, burning out of material, short tool life, powder type chips, high cutting forces and poor surface finish. Moreover, cutting forces have a direct effect on power consumption and tool wear. They are oscillating and periodic in nature. The oscillations are generated due to repeated running of cutting tool into fibres and matrix phases. This often results in strong variations of magnitudes of cutting forces. In order to achieve good machinability, it is desirable to have minimum values of cutting force. Since, machining involves large number of process variables, the optimization of cutting force is time consuming and costly. Instead of, one factor at a time experimental approach, in the present study, the machining data is analyzed using Taguchi design of experiments (DOE) and analysis of variance (ANOVA). Palanikumar et.al [1] carried out optimization of turning process parameters of filament wound GFRP/Epoxy composites. They used polycrystalline diamond (PCD) tool for turning and Taguchi’s method with Pareto ANOVA for optimization of surface roughness. Davim and Mata [2] suggested a new machinability index, using specific cutting pressure and roughness average, while turning GFRP/Polyester composites. The pipes were manufactured using filament winding and hand lay-up Applied Mechanics and Materials Vol. 612 (2014) pp 123-129 © (2014) Trans Tech Publications, Switzerland doi:10.4028/www.scientific.net/AMM.612.123 All rights reserved. No part of contents of this paper may be reproduced or transmitted in any form or by any means without the written permission of TTP, www.ttp.net. (ID: 122.170.126.130-05/08/14,08:55:58)

Welcome message from author
This document is posted to help you gain knowledge. Please leave a comment to let me know what you think about it! Share it to your friends and learn new things together.
Transcript
Investigation of the Machinability Characteristics of GFRP/ Epoxy Composites using Taguchi Methodology
Hari Vasudevan1, a, Naresh Deshpande2, b and Ramesh Rajguru3,c 1, 2, 3 D.J. Sanghvi College of Engineering, Mumbai, India
[email protected], [email protected], [email protected]
Keywords: Machinability, CNC Turning, Epoxy, Polycrystalline Diamond Tool, Taguchi Methodology, Woven Fabric
Abstract. Many glass fiber reinforced plastic (GFRP) composite components made from primary
melt processes require additional machining to meet the requirements of assembly and accurate
dimensional tolerances. Importance of woven fabric based glass fibre reinforced composites is
widely known in many industrial applications. However, very little is known about machinability of
these composites. Cutting force is treated as one of the primary measures for determining the
machinability of any material.This paper presents an investigation into the longitudinal turning of
woven fabric and epoxy based GFRP composites, using polycrystalline diamond tool, so as to
analyze the effect of cutting parameters and insert radius on the cutting force. The force was
measured through longitudinal turning, according to the experimental plan, as developed on the
basis of Taguchi methodology. The signal to noise ratio and analysis of variance were applied to the
experimental data, in order to determine the effect of the process variables on tangential cutting
force. Statistical results indicated that the cutting force is significantly influenced (at a 95%
confidence level) by feed rate, followed by depth of cut, whereas, cutting speed and insert radius
have a smaller influence. The cutting force also increases with the increase in feed rate and depth of
cut.
Introduction
During the last decade, machining of components made of polymer matrix composites has been
developed as an alternative to the processes of injection molding, extrusion and sintering. Many
components made from primary melt processes also require additional machining to meet the
requirements of assembly and accurate dimensional tolerances.
Machining of fibre reinforced composites differs from that of metal alloys due to their
anisotropy, low thermal conductivity and difference between coefficient of linear expansion of the
matrix and the fibre. The quality of the machined surface depends upon the type of fibres and
matrix materials, type of weave of the fabric etc. Some of the typical problems faced during the
machining of fiber reinforced plastics (FRPs) are fibers getting pulled out, separation of the bond
between matrix and fibres, burning out of material, short tool life, powder type chips, high cutting
forces and poor surface finish. Moreover, cutting forces have a direct effect on power consumption
and tool wear. They are oscillating and periodic in nature. The oscillations are generated due to
repeated running of cutting tool into fibres and matrix phases. This often results in strong variations
of magnitudes of cutting forces. In order to achieve good machinability, it is desirable to have
minimum values of cutting force. Since, machining involves large number of process variables, the
optimization of cutting force is time consuming and costly. Instead of, one factor at a time
experimental approach, in the present study, the machining data is analyzed using Taguchi design of
experiments (DOE) and analysis of variance (ANOVA).
Palanikumar et.al [1] carried out optimization of turning process parameters of filament wound
GFRP/Epoxy composites. They used polycrystalline diamond (PCD) tool for turning and Taguchi’s
method with Pareto ANOVA for optimization of surface roughness. Davim and Mata [2] suggested
a new machinability index, using specific cutting pressure and roughness average, while turning
GFRP/Polyester composites. The pipes were manufactured using filament winding and hand lay-up
Applied Mechanics and Materials Vol. 612 (2014) pp 123-129© (2014) Trans Tech Publications, Switzerlanddoi:10.4028/www.scientific.net/AMM.612.123
All rights reserved. No part of contents of this paper may be reproduced or transmitted in any form or by any means without the written permission of TTP,www.ttp.net. (ID: 122.170.126.130-05/08/14,08:55:58)
processes. PCD tool was used for turning and Taguchi’s method with ANOVA was used for
studying the influence of the machining parameters on specific cutting pressure and roughness
average. Palanikumar and Davim [3] assessed the influence of cutting parameters on tool wear,
while turning filament wound GFRP/Epoxy composites. They used coated cemented carbide tool
for turning and Taguchi’s method for optimization. Davim et.al [4] conducted a machinability
study, during precision turning of PA66 Polyamide with and without glass fibre reinforcement.
They used four different types of tool materials. The PCD tool gave the lowest force values
associated with best surface finish, followed by the ISO grade K15 uncoated carbide tool with chip
breaker, when machining reinforced polyamide. Khan and Kumar [5] conducted machining studies
on GFRP/Polyester composites, produced by filament winding process. Two different alumina
cutting tools were used namely a Ti (C, N) mixed alumina cutting tool and a Sic whisker reinforced
cutting tool. The machining process was performed at different cutting speeds, constant feed rate
and depth of cut. The performance of the tool was evaluated by measuring the flank wear and
surface roughness of the machined GFRP composite.
The machinability of composite materials is highly influenced by the type of fibre, type of resin,
fibre orientation and method of manufacturing. The extant literature survey reveals that PCD cutting
tool is more appropriate for cutting a hard material like GFRP. Also woven glass fibre reinforced
epoxy composites manufactured by hand lay-up process have not been widely explored for their
machining characteristics, despite their wide applications in electrical components, aerospace and
automotive structural parts. In this context, the present study is an attempt to find the effect of
cutting parameters and insert radius on the tangential cutting force during turning of Epoxy and
woven fabric based GFRP composites, manufactured by hand lay-up process.
Experimental Details
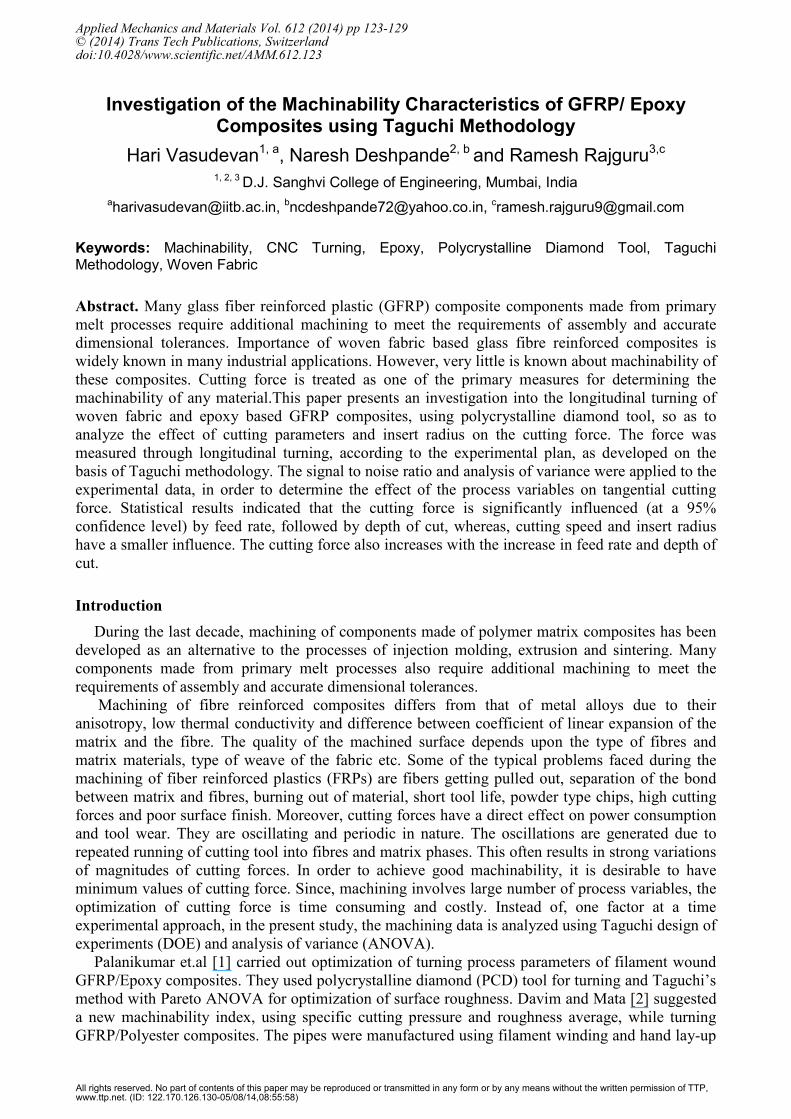
Work Material The work material selected for the study is glass fibre reinforced epoxy
composite. The E-glass reinforcement is of woven fabric form having following specifications.
Type of weave: plain, weight: 180±5 gm/m2 and 0.18mm thickness, manufactured using Hybon
multi-end roving. Epoxy resin manufactured by Huntsman; product Araldite LY3297; hardener
Aradur 3298 is used as polymer matrix material. The work specimens are tubular in shape 50 mm
long, with inner diameter of 20 mm and outer diameter of 55 mm. They are manufactured using
hand lay-up process and cured at room temperature. The volume fraction of the reinforcement is
70%. The work specimens before & after machining are as shown in Fig. 1 (a & b).
Cutting Tool The cutting tool selected for machining GFRP composites is PCD insert of the fine
grade. Three different types of inserts are used. They are ISO coded with CNMA 120404, CNMA
120408 & CNMA 120412 and are produced by Varun Tools Pvt. Ltd. The tool holder is of
WIDEX-ID1G with ISO coding PCLNL 25X25 M12.
Fig. 1. (a) Work specimens before machining ; (b) Work specimen after machining.
124 Advanced Research in Design, Manufacturing and Materials
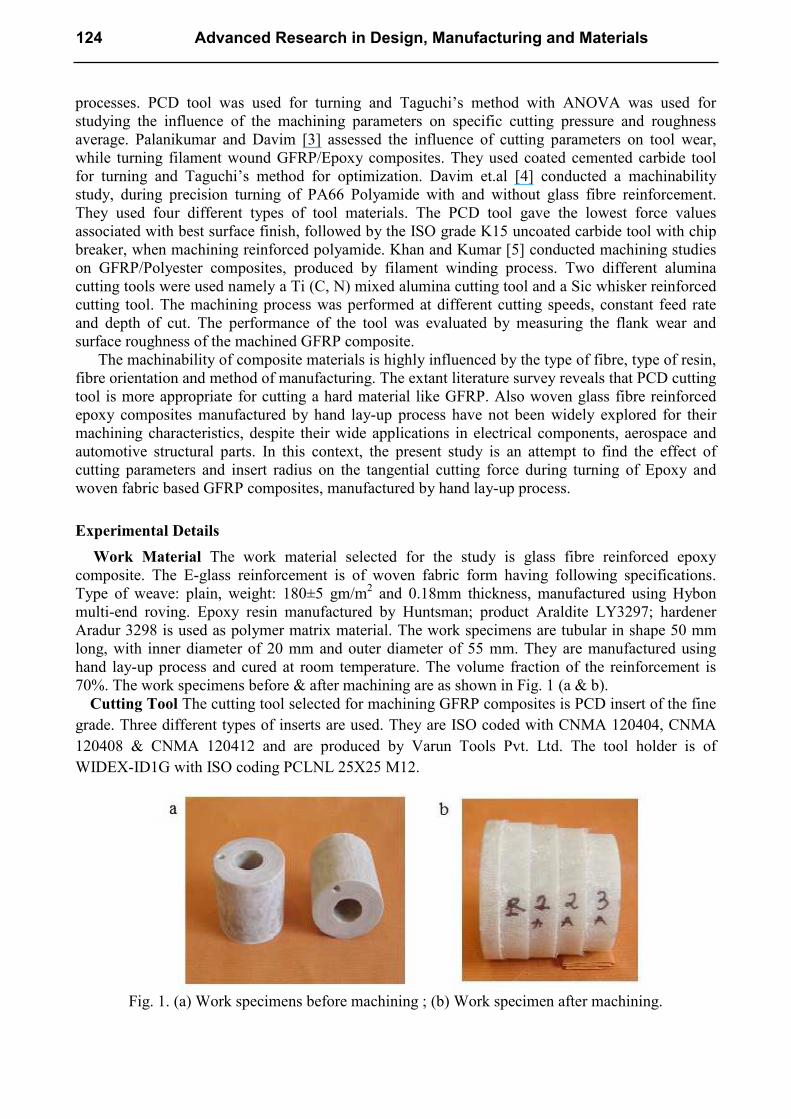
Experimental set-up and plan The experiment for this work was planned using Taguchi’s DOE
as per the flow chart given in Fig. 2. Taguchi’s approach to parameter design provides the design
engineer with a systematic and efficient method for determining near optimum design parameters
for performance and cost. This method can reduce the number of experiments required to collect
necessary data. Four control factors, which could probably affect the cutting force, were selected for
the study, viz. insert nose radius, cutting speed, feed and depth of cut. Each factor was studied at
three levels. The most appropriate orthogonal array in this case is L27 OA. The factors are assigned
to column no. 1, 2, 5 and 8 respectively. The unassigned columns are treated as error. The output
response used to measure machinability is the tangential cutting force. Each trial was repeated once.
Also the trials were carried out in random order. The work piece was mounted on specially designed
mandrel, which was subsequently clamped by the lathe chuck. These experiments were conducted
on an Ace Jobber XL CNC lathe machine with the following specifications, swing over bed: 500
mm, swing over carriage: 260 mm, max. turning dia.: 270 mm, max. turning length: 400 mm, max.
spindle speed: 4000 rpm, spindle motor power: 7.5 KW and Fanuc series Oi-TD Mate CNC
controller. The machining tests were carried out without any coolant. The tangential cutting force
was measured with Kistler Piezo electric dynamometer of type-5233A, with built in charge
amplifier up to 10 KN. Data acquisition was accomplished by connecting this dynamometer to a
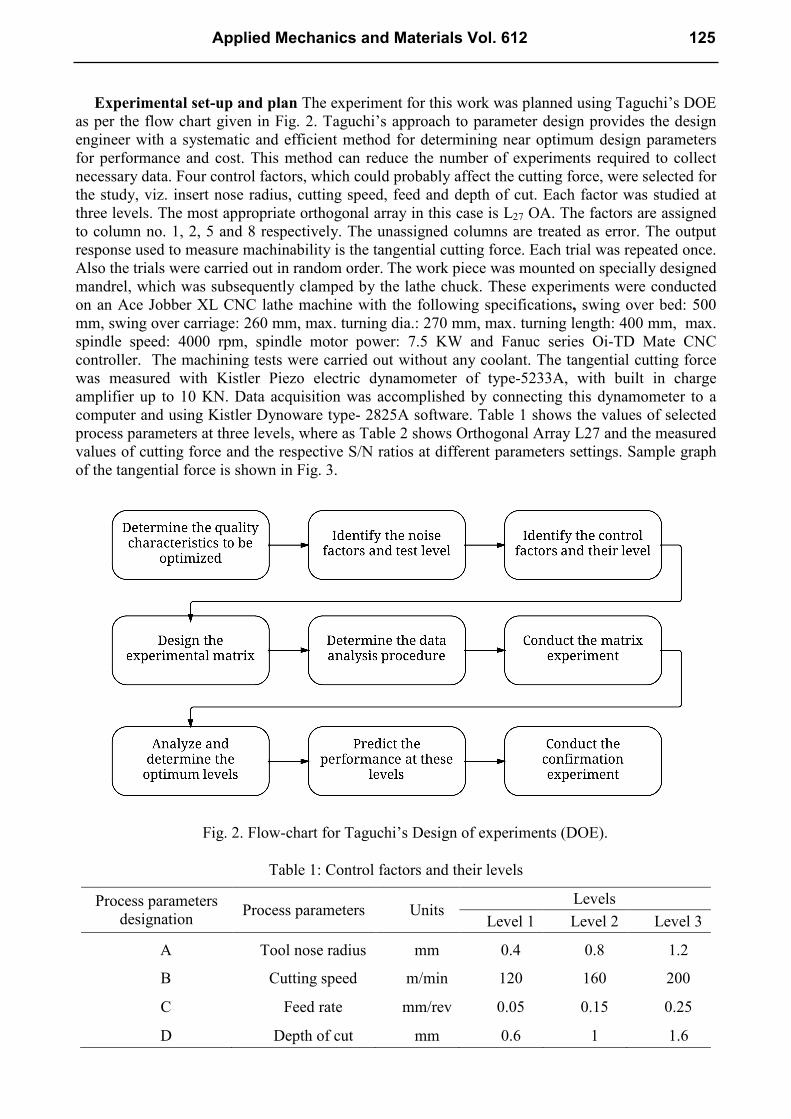
computer and using Kistler Dynoware type- 2825A software. Table 1 shows the values of selected
process parameters at three levels, where as Table 2 shows Orthogonal Array L27 and the measured
values of cutting force and the respective S/N ratios at different parameters settings. Sample graph
of the tangential force is shown in Fig. 3.
Table 1: Control factors and their levels
Process parameters
designation Process parameters Units
Levels
Level 1 Level 2 Level 3
A Tool nose radius mm 0.4 0.8 1.2
B Cutting speed m/min 120 160 200
C Feed rate mm/rev 0.05 0.15 0.25
D Depth of cut mm 0.6 1 1.6
Fig. 2. Flow-chart for Taguchi’s Design of experiments (DOE).
Applied Mechanics and Materials Vol. 612 125
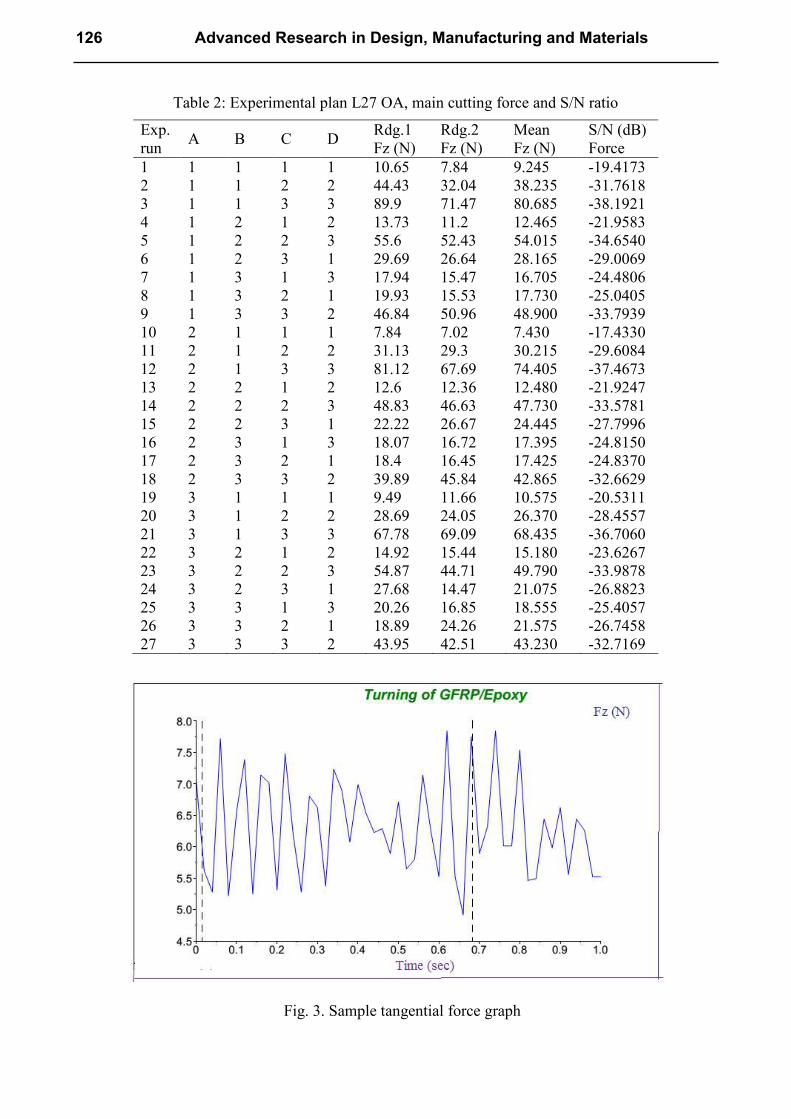
Table 2: Experimental plan L27 OA, main cutting force and S/N ratio
Exp.
run A B C D
Rdg.1
Fz (N)
Rdg.2
Fz (N)
Mean
Fz (N)
S/N (dB)
Force
1 1 1 1 1 10.65 7.84 9.245 -19.4173
2 1 1 2 2 44.43 32.04 38.235 -31.7618
3 1 1 3 3 89.9 71.47 80.685 -38.1921
4 1 2 1 2 13.73 11.2 12.465 -21.9583
5 1 2 2 3 55.6 52.43 54.015 -34.6540
6 1 2 3 1 29.69 26.64 28.165 -29.0069
7 1 3 1 3 17.94 15.47 16.705 -24.4806
8 1 3 2 1 19.93 15.53 17.730 -25.0405
9 1 3 3 2 46.84 50.96 48.900 -33.7939
10 2 1 1 1 7.84 7.02 7.430 -17.4330
11 2 1 2 2 31.13 29.3 30.215 -29.6084
12 2 1 3 3 81.12 67.69 74.405 -37.4673
13 2 2 1 2 12.6 12.36 12.480 -21.9247
14 2 2 2 3 48.83 46.63 47.730 -33.5781
15 2 2 3 1 22.22 26.67 24.445 -27.7996
16 2 3 1 3 18.07 16.72 17.395 -24.8150
17 2 3 2 1 18.4 16.45 17.425 -24.8370
18 2 3 3 2 39.89 45.84 42.865 -32.6629
19 3 1 1 1 9.49 11.66 10.575 -20.5311
20 3 1 2 2 28.69 24.05 26.370 -28.4557
21 3 1 3 3 67.78 69.09 68.435 -36.7060
22 3 2 1 2 14.92 15.44 15.180 -23.6267
23 3 2 2 3 54.87 44.71 49.790 -33.9878
24 3 2 3 1 27.68 14.47 21.075 -26.8823
25 3 3 1 3 20.26 16.85 18.555 -25.4057
26 3 3 2 1 18.89 24.26 21.575 -26.7458
27 3 3 3 2 43.95 42.51 43.230 -32.7169
Fig. 3. Sample tangential force graph
126 Advanced Research in Design, Manufacturing and Materials
Results and Discussion
The analysis was made using the popular software, specially used for design of experiment
applications, known as MINITAB 16. Response Table 3 shows the response for S/N ratio values of
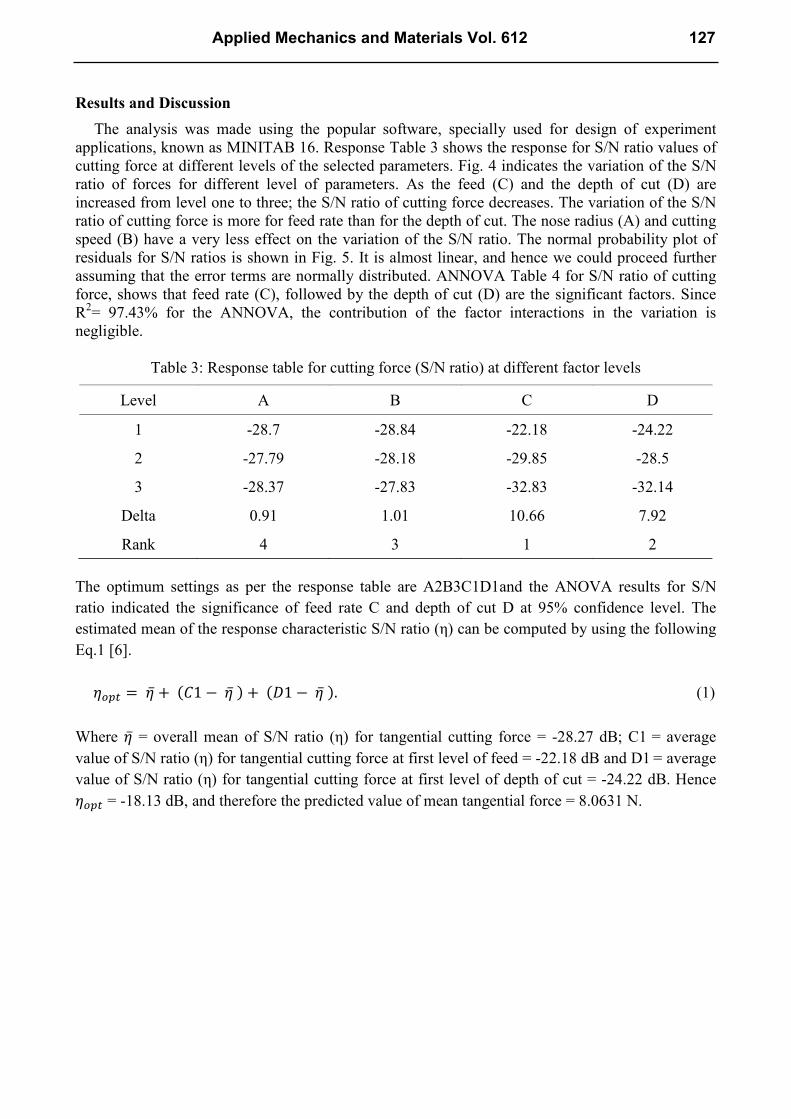
cutting force at different levels of the selected parameters. Fig. 4 indicates the variation of the S/N
ratio of forces for different level of parameters. As the feed (C) and the depth of cut (D) are
increased from level one to three; the S/N ratio of cutting force decreases. The variation of the S/N
ratio of cutting force is more for feed rate than for the depth of cut. The nose radius (A) and cutting
speed (B) have a very less effect on the variation of the S/N ratio. The normal probability plot of
residuals for S/N ratios is shown in Fig. 5. It is almost linear, and hence we could proceed further
assuming that the error terms are normally distributed. ANNOVA Table 4 for S/N ratio of cutting
force, shows that feed rate (C), followed by the depth of cut (D) are the significant factors. Since
R2= 97.43% for the ANNOVA, the contribution of the factor interactions in the variation is
negligible.
Table 3: Response table for cutting force (S/N ratio) at different factor levels
The optimum settings as per the response table are A2B3C1D1and the ANOVA results for S/N
ratio indicated the significance of feed rate C and depth of cut D at 95% confidence level. The
estimated mean of the response characteristic S/N ratio (η) can be computed by using the following
Eq.1 [6].
= ̅ + 1 − ̅ + 1 − ̅ . (1)
Where ̅ = overall mean of S/N ratio (η) for tangential cutting force = -28.27 dB; C1 = average
value of S/N ratio (η) for tangential cutting force at first level of feed = -22.18 dB and D1 = average
value of S/N ratio (η) for tangential cutting force at first level of depth of cut = -24.22 dB. Hence
= -18.13 dB, and therefore the predicted value of mean tangential force = 8.0631 N.
Level A B C D
1 -28.7 -28.84 -22.18 -24.22
2 -27.79 -28.18 -29.85 -28.5
3 -28.37 -27.83 -32.83 -32.14
Delta 0.91 1.01 10.66 7.92
Rank 4 3 1 2
Applied Mechanics and Materials Vol. 612 127
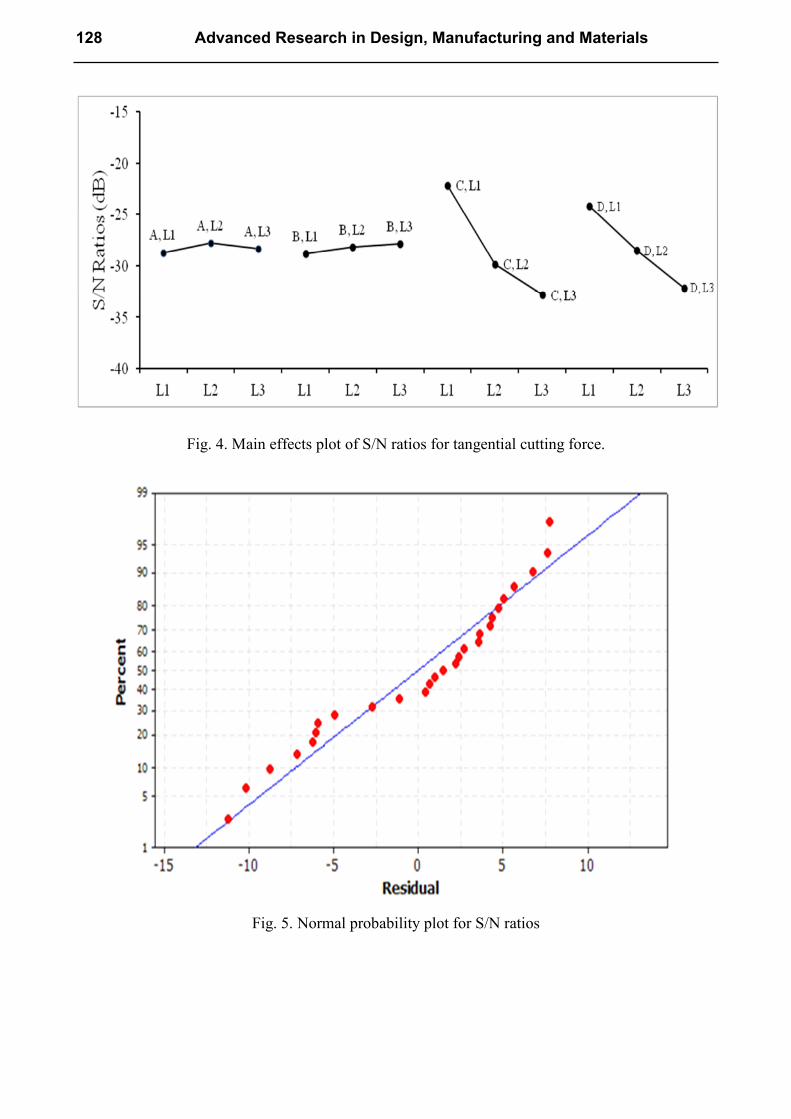
Fig. 4. Main effects plot of S/N ratios for tangential cutting force.
Fig. 5. Normal probability plot for S/N ratios
128 Advanced Research in Design, Manufacturing and Materials
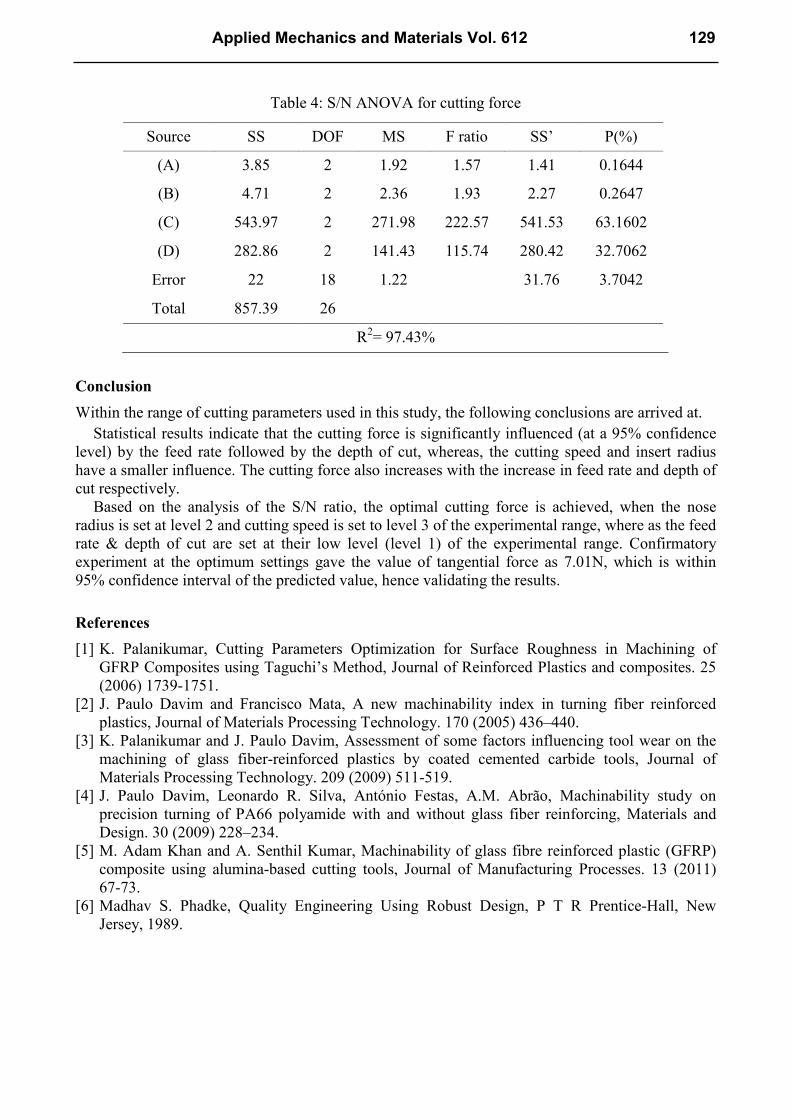
Table 4: S/N ANOVA for cutting force
Source SS DOF MS F ratio SS’ P(%)
(A) 3.85 2 1.92 1.57 1.41 0.1644
(B) 4.71 2 2.36 1.93 2.27 0.2647
(C) 543.97 2 271.98 222.57 541.53 63.1602
(D) 282.86 2 141.43 115.74 280.42 32.7062
Error 22 18 1.22
31.76 3.7042
Total 857.39 26
R2= 97.43%
Conclusion
Within the range of cutting parameters used in this study, the following conclusions are arrived at.
Statistical results indicate that the cutting force is significantly influenced (at a 95% confidence
level) by the feed rate followed by the depth of cut, whereas, the cutting speed and insert radius
have a smaller influence. The cutting force also increases with the increase in feed rate and depth of
cut respectively.
Based on the analysis of the S/N ratio, the optimal cutting force is achieved, when the nose
radius is set at level 2 and cutting speed is set to level 3 of the experimental range, where as the feed
rate & depth of cut are set at their low level (level 1) of the experimental range. Confirmatory
experiment at the optimum settings gave the value of tangential force as 7.01N, which is within
95% confidence interval of the predicted value, hence validating the results.
References
[1] K. Palanikumar, Cutting Parameters Optimization for Surface Roughness in Machining of
GFRP Composites using Taguchi’s Method, Journal of Reinforced Plastics and composites. 25
(2006) 1739-1751.
[2] J. Paulo Davim and Francisco Mata, A new machinability index in turning fiber reinforced
plastics, Journal of Materials Processing Technology. 170 (2005) 436–440.
[3] K. Palanikumar and J. Paulo Davim, Assessment of some factors influencing tool wear on the
machining of glass fiber-reinforced plastics by coated cemented carbide tools, Journal of
Materials Processing Technology. 209 (2009) 511-519.
[4] J. Paulo Davim, Leonardo R. Silva, António Festas, A.M. Abrão, Machinability study on
precision turning of PA66 polyamide with and without glass fiber reinforcing, Materials and
Design. 30 (2009) 228–234.
[5] M. Adam Khan and A. Senthil Kumar, Machinability of glass fibre reinforced plastic (GFRP)
composite using alumina-based cutting tools, Journal of Manufacturing Processes. 13 (2011)
67-73.
[6] Madhav S. Phadke, Quality Engineering Using Robust Design, P T R Prentice-Hall, New
Jersey, 1989.
Applied Mechanics and Materials Vol. 612 129
Related Documents