Investigation of the Elemental Profiles of Hypericum perforatum as used in herbal remedies Jade Denise Owen Submitted to the University of Hertfordshire in fulfillment of the requirements of the degree of Doctor of Philosophy March 2013

Welcome message from author
This document is posted to help you gain knowledge. Please leave a comment to let me know what you think about it! Share it to your friends and learn new things together.
Transcript

Investigation of the
Elemental Profiles of
Hypericum perforatum
as used in herbal
remedies
Jade Denise Owen
Submitted to the University of Hertfordshire in fulfillment of the requirements of the degree of Doctor of Philosophy March 2013
i
Acknowledgements
A special thanks to my supervisory team; Dr Jacqueline Stair and Dr Sara Evans for their
roles throughout the project and the opportunities achieved. I would also like to thank Dr
Stuart Kirton and the technicians in Pharmacy for their guidance as well as those involved
with sample collection abroad.
To my family and friends, thank you for your continued support throughout my research.
Elemental Profiling of St John’s Wort By J. D. Owen
ii
Abstract
The work presented in this thesis has demonstrated that the use of elemental profiles for
the quality control of herbal medicines can be applied to multiple stages of processing. A
single method was developed for the elemental analysis of a variety of St John’s Wort
(Hypericum perforatum) preparations using Inductively Coupled Plasma – Optical Emission
Spectroscopy (ICP-OES). The optimised method consisted of using 5 ml of nitric acid and
microwave digestion reaching temperatures of 185⁰C. Using NIST Polish tea (NIST INCT-TL-
1) the method was found to be accurate and the matrix effect from selected St John’s Wort
(SJW) preparations was found to be ≤22%. The optimised method was then used to
determine the elemental profiles for a larger number of SJW preparations (raw herbs=22,
tablets=20 and capsules=12). Specifically, the method was used to determine the typical
concentrations of 25 elements (Al, As, B, Ba, Be, Ca, Cd, Co, Cr, Cu, Fe, Hg, In, Mg, Mn, Mo,
Ni, Pb, Pt, Sb, Se, Sr, V, Y and Zn) for each form of SJW which ranged from not detected to
200 mg/g. To further interpret the element profiles, Principal Component Analysis (PCA) was
carried out. This showed that different forms of SJW could be differentiated based on their
elemental profile and the SJW ingredient used (i.e. extract or raw herb) identified. The
differences in the profiles were likely due to two factors: (1) the addition of bulking agents
and (2) solvent extraction. In order to further understand how the elemental profile changes
when producing the extract from the raw plant, eight SJW herb samples were extracted
with four solvents (100% water, 60% ethanol, 80% ethanol and 100% ethanol) and analysed
for their element content. The results showed that the transfer of elements from the raw
herb to an extract was solvent and metal dependent. Generally the highest concentrations
of an element were extracted with 100% water, which decreased as the concentration of
ethanol increased. However, the transfer efficiency for the element Cu was highest with
60% ethanol. The solvents utilised in industry (60% and 80% ethanol) were found to
preconcentrate some elements; Cu (+119%), Mg (+93%), Ni (+183%) and Zn (+12%) were
found to preconcentrate in 60 %v/v ethanol extracts and Cu (+5%) and Ni (+30%). PCA of the
elemental profiles of the four types of extract showed that differentiation was observed
between the different solvents and as the ethanol concentration increased, the extracts
became more standardised. Analysis of the bioactive compounds rutin, hyperoside,
quercetin, hyperforin and adhyperforin followed by subsequent Correlation Analysis (CA)

iii
displayed relationships between the elemental profiles and the molecular profiles. For
example strong correlations were seen between hyperoside and Cr as well as Quercetin and
Fe. This shows potential for tuning elemental extractions for metal-bioactive compounds for
increased bioactivity and bioavailability; however further work in needed in this area.
iv
Contents
1 Introduction ......................................................................................................................... 1
1.1 Brief History of Herbal Medicines .......................................................................................... 1
1.2 Herbal Medicines Today ........................................................................................................ 2
1.3 Safety of Herbal Medicines .................................................................................................... 3
1.4 Regulation of Herbal Medicines............................................................................................. 5
1.5 Chemical Characterisation of Herbal Medicines ................................................................... 6
1.6 Elements in Herbal Medicines ............................................................................................... 7
1.6.1 Toxic and Non-essential Elements ................................................................................... 7
1.6.2 Essential Elements ......................................................................................................... 10
1.6.3 Hyper-accumulators ....................................................................................................... 11
1.6.4 Links between Elemental and Bioactive Components .................................................. 13
1.6.5 Medication Interactions with Elements ......................................................................... 14
1.6.6 Chemical Characterisation of Elements ......................................................................... 15
1.6.7 Statistical Approaches .................................................................................................... 17
1.7 St John’s Wort (Hypericum perforatum) .............................................................................. 19
1.7.1 Use of St John’s Wort ..................................................................................................... 19
1.7.2 Molecular Analysis of St John’s Wort ............................................................................ 20
1.7.2.1 Common Molecular Constituents .......................................................................... 20
1.7.2.2 Quality Control ....................................................................................................... 24
1.7.3 Elemental Analysis of St John’s Wort ............................................................................ 25
1.7.3.1 Known Elemental Constituents .............................................................................. 25
1.7.3.2 Quality Control ....................................................................................................... 25
1.7.4 Links between Elements and Bioactive Compounds ..................................................... 25
1.7.5 Statistical Approaches .................................................................................................... 26
v
1.8 Aim of Study ......................................................................................................................... 27
2 Method Development for the Elemental Analysis of Hypericum perforatum (St John’s
Wort) Preparations .................................................................................................................... 28
2.1 Introduction ......................................................................................................................... 28
2.2 Method ................................................................................................................................ 30
2.2.1 Materials ........................................................................................................................ 30
2.2.1.1 Reagents, Standards and Samples .......................................................................... 30
2.2.1.2 Instrumentation ...................................................................................................... 30
2.2.1.3 Labware Pretreatment ........................................................................................... 31
2.2.2 ICP-OES Parameter Optimisation ................................................................................... 31
2.2.3 Quantification - Non-weighted Regression vs. Weighted ............................................. 31
2.2.4 Initial Validation Studies ................................................................................................ 32
2.2.4.1 Studies using different acid mixtures ..................................................................... 32
2.2.4.2 Elemental Transfer Loss .......................................................................................... 32
2.2.4.3 Analysis of CRM NIST Polish Tea ............................................................................. 33
2.2.4.4 Analysis of St John’s Wort Sample .......................................................................... 33
2.2.4.5 Confirmation of Glass Leaching .............................................................................. 33
2.2.4.6 Microwave Power Setting ...................................................................................... 33
2.2.5 Validation-Accuracy ....................................................................................................... 34
2.2.5.1 NIST CRM and Spiked Recovery .............................................................................. 34
2.2.5.2 Standard Addition ................................................................................................... 34
2.3 Results and Discussion ......................................................................................................... 34
2.3.1 ICP-OES Parameter Optimisation ................................................................................... 34
2.3.2 Quantification - Non-weighted Regression vs. Weighted ............................................. 36
2.3.3 Microwave Digestion ..................................................................................................... 38
2.3.3.1 Selection of Acid Mixture ....................................................................................... 38
vi
2.3.3.1.1 Elemental Transfer Loss ..................................................................................... 38
2.3.3.1.2 Analysis of CRM NIST Polish Tea ........................................................................ 40
2.3.3.1.3 Analysis of St John’s Wort samples .................................................................... 42
2.3.3.1.4 Confirmation of Glass Leaching ......................................................................... 44
2.3.4 Method Validation ......................................................................................................... 46
2.3.4.1 NIST CRM and Spiked Recovery .............................................................................. 46
2.3.4.2 Standard Addition ................................................................................................... 47
2.4 Conclusions .......................................................................................................................... 48
3 Elemental Analysis of St John’s Wort Preparations .............................................................. 49
3.1 Introduction ......................................................................................................................... 49
3.2 Method ................................................................................................................................ 51
3.2.1 Materials ........................................................................................................................ 51
3.2.2 Inductively Coupled Plasma – Optical Emission Spectroscopy Analysis ........................ 51
3.2.3 Sample Preparation ....................................................................................................... 52
3.2.4 Statistical Analysis .......................................................................................................... 55
3.3 Results and Discussion ......................................................................................................... 56
3.3.1 Elemental Analysis of SJW Samples ............................................................................... 56
3.3.2 Application of Statistics to SJW Elemental Profiles ....................................................... 59
3.3.2.1 Investigation of the Robustness of the PCA Classification ..................................... 67
3.3.2.2 Investigations of SJW Origin and Identity............................................................... 67
3.3.2.3 Preliminary Investigation with Different Plant Species .......................................... 69
3.4 Conclusions .......................................................................................................................... 71
4 Elemental Analysis of St John’s Wort Extracts ..................................................................... 72
4.1 Introduction ......................................................................................................................... 72
4.2 Method ................................................................................................................................ 74
4.2.1 Materials ........................................................................................................................ 74
vii
4.2.2 Inductively Coupled Plasma-Optical Emission Spectroscopy (ICP-OES) ........................ 75
4.2.3 Method Development .................................................................................................... 76
4.2.3.1 Filter Paper Comparison ......................................................................................... 76
4.2.3.2 Extraction Time ....................................................................................................... 76
4.2.3.3 Validation ................................................................................................................ 76
4.2.4 SJW Sample Preparation ................................................................................................ 77
4.2.5 Statistical Analysis .......................................................................................................... 77
4.3 Results and discussion ......................................................................................................... 77
4.3.1 Method Development .................................................................................................... 77
4.3.1.1 Filter Paper Comparison ......................................................................................... 77
4.3.1.2 Extraction Time ....................................................................................................... 79
4.3.1.3 Validation ................................................................................................................ 80
4.3.2 Elemental Analysis of St John’s Wort Extracts ............................................................... 82
4.3.2.1 Aluminium .............................................................................................................. 84
4.3.2.2 Barium .................................................................................................................... 86
4.3.2.3 Calcium ................................................................................................................... 88
4.3.2.4 Cadmium ................................................................................................................. 90
4.3.2.5 Cobalt ...................................................................................................................... 93
4.3.2.6 Chromium ............................................................................................................... 95
4.3.2.7 Copper .................................................................................................................... 96
4.3.2.8 Iron .......................................................................................................................... 99
4.3.2.9 Magnesium ........................................................................................................... 101
4.3.2.10 Manganese ........................................................................................................... 103
4.3.2.11 Molybdenum ........................................................................................................ 105
4.3.2.12 Nickel .................................................................................................................... 106
4.3.2.13 Strontium .............................................................................................................. 109
viii
4.3.2.14 Zinc ........................................................................................................................ 110
4.3.2.15 Comparison of All Extraction Results for All Solvents .......................................... 112
4.3.3 Statistical Analysis of Different Solvents ..................................................................... 113
4.3.3.1 Correlation Analysis .............................................................................................. 113
4.3.3.2 Principal Component Analysis .............................................................................. 117
4.4 Conclusions ........................................................................................................................ 119
5 Investigations of Bioactive Compounds in St John’s Wort .................................................. 120
5.1 Introduction ....................................................................................................................... 120
5.2 Method .............................................................................................................................. 123
5.2.1 Materials ...................................................................................................................... 123
5.2.2 Instruments .................................................................................................................. 123
5.2.3 Rutin – Copper Complex Study .................................................................................... 124
5.2.3.1 Rutin - Copper Complex Formation ...................................................................... 124
5.2.3.2 Investigating a Chromatographic Method for the Monitoring of Rutin-Cu
Complex 124
5.2.4 Method Development for the Analysis of SJW Extracts .............................................. 124
5.2.4.1 Preliminary Analysis of SJW and Column Comparison ......................................... 124
5.2.4.2 Improving Retention Time Consistency with Temperature Control .................... 125
5.2.4.3 Reducing Run time ................................................................................................ 125
5.2.5 Method Validation ....................................................................................................... 125
5.2.5.1 UHPLC; Consistency Between Injections .............................................................. 125
5.2.5.2 UHPLC; Characterisation and Calibration of Reference Standards ...................... 125
5.2.6 Transferability to Other LC Systems ............................................................................ 126
5.2.7 Analysis of SJW Extracts ............................................................................................... 127
5.2.7.1 Analysis of SJW Extracts ....................................................................................... 127
5.3 Results and Discussion ....................................................................................................... 127
ix
5.3.1 Rutin – Copper Complex Study .................................................................................... 127
5.3.1.1 Rutin – Copper Complex Formation ..................................................................... 127
5.3.1.2 Investigating a Chromatographic Method for the Monitoring of Rutin-Cu
Complex 130
5.3.2 Method Development for the analysis of SJW extracts .............................................. 133
5.3.2.1 Preliminary Analysis and Column Comparison ..................................................... 133
5.3.2.2 Reducing Run Time ............................................................................................... 140
5.3.3 Validation ..................................................................................................................... 142
5.3.3.1 UHPLC Consistency ............................................................................................... 142
5.3.3.2 Characterisation and Calibration of Reference Standards ................................... 142
5.3.4 Transferability to Other LC Systems ............................................................................ 148
5.3.4.1 Varian ProStar 500 ................................................................................................ 148
5.3.4.2 Perkin Elmer Flexar ............................................................................................... 151
5.3.5 Analysis of SJW extracts ............................................................................................... 152
5.3.5.1 Rutin ...................................................................................................................... 153
5.3.5.2 Hyperoside ............................................................................................................ 154
5.3.5.3 Quercetin .............................................................................................................. 154
5.3.5.4 Hyperforin ............................................................................................................. 155
5.3.5.5 Adhyperforin ......................................................................................................... 156
5.4 Conclusions ........................................................................................................................ 158
6 Analysis of Combined Elemental and Chemical Profiles ..................................................... 159
6.1 Introduction ....................................................................................................................... 159
6.2 Method .............................................................................................................................. 160
6.2.1 Materials ...................................................................................................................... 160
6.2.2 Elemental Analysis ....................................................................................................... 160
6.2.3 Chemical Analysis ......................................................................................................... 160
x
6.2.4 Statistical Analysis ........................................................................................................ 160
6.3 Results and Discussion ....................................................................................................... 160
6.3.1 Elemental Analysis Summary ....................................................................................... 160
6.3.2 Chemical Analysis Summary ........................................................................................ 162
6.3.3 Correlation Analysis ..................................................................................................... 163
6.3.3.1 Correlation of Original Herb Elements with Bioactive Compounds ..................... 163
6.3.3.2 Herb Dried Extracts with Bioactive Compounds .................................................. 166
6.4 Conclusions ........................................................................................................................ 167
7 Conclusions ...................................................................................................................... 169
8 Future Work ..................................................................................................................... 173
9 Bibliography ..................................................................................................................... 176
10 Appendix .......................................................................................................................... 190
10.1 Element Limits from different Agencies ............................................................................ 191
10.2 Element Concentrations Found in Other Studies .............................................................. 192
10.3 Elemental Concentrations in SJW Preparations ................................................................ 196
10.4 Liquid chromatography Methods ...................................................................................... 201
10.5 The periodic table of elements .......................................................................................... 203
10.6 List of Publications ............................................................................................................. 204
10.6.1 Papers Undergoing Finalisation for Submission for Publication ................................. 204
10.6.2 Published abstracts and documents ............................................................................ 204
10.6.3 Oral Presentations ....................................................................................................... 204
10.6.4 Poster Presentations .................................................................................................... 205
10.6.5 Book Sections ............................................................................................................... 205
xi
Figures
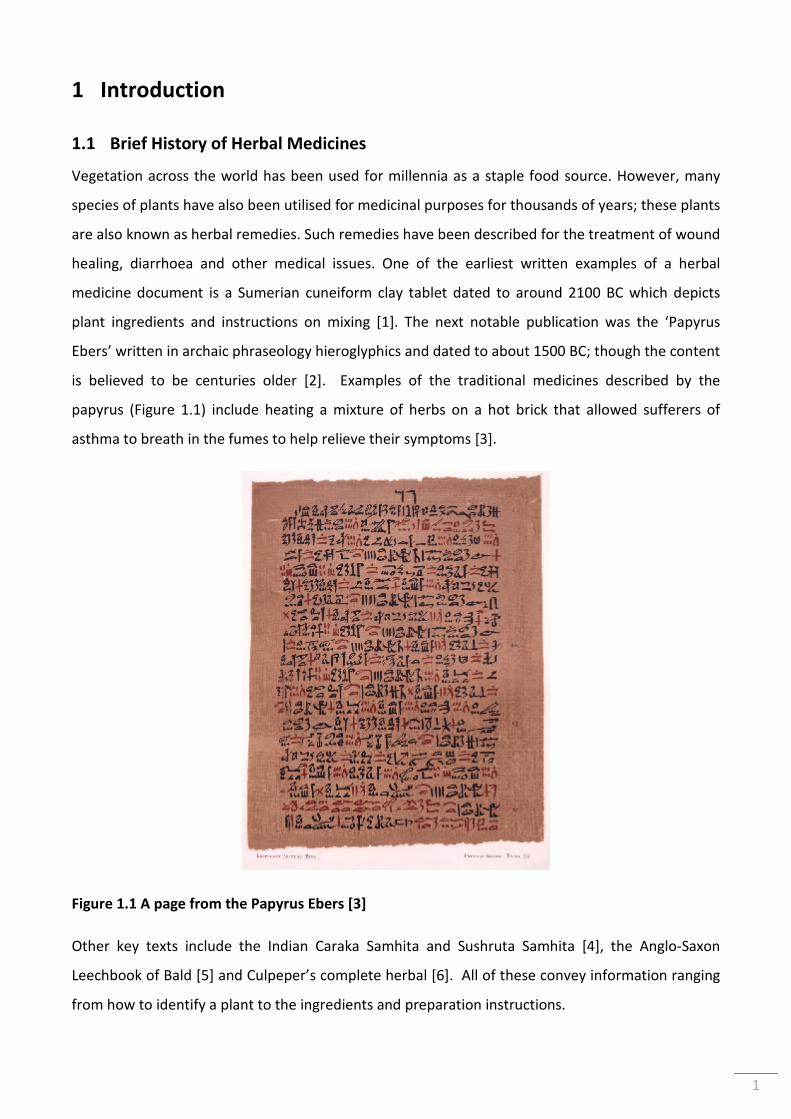
Figure 1.1 A page from the Papyrus Ebers [3] ....................................................................................... 1
Figure 1.2 Protocyanin molecule; blue = anthocyanin, yellow = flavone glycoside, spheres:
red= Fe3+, green =Mg2+; black= Ca2+ .................................................................................................... 14
Figure 1.3 Example of tetracycline complexed with Ca, adapted from [73] ....................................... 15
Figure 1.4 Dynamic range of some elemental analysis techniques ..................................................... 16
Figure 1.5 Method A for heavy metals from European Pharmacopoeia............................................. 16
Figure 1.6 Data reduction using PCA ................................................................................................... 18
Figure 1.8 Hypericum perforatum flower by J. D. Owen ..................................................................... 19
Figure 2.1 Recovery of elements of NIST tea with each acid mixture (error bars ±1SD) .................... 42
Figure 2.2. (A) Comparison of acid mixture 1 and acid mixture 3 with the digestion of a SJW
herb on full y-axis (B) y-axis limited to 400 µg/g (error bars ±1SD). ................................................... 43
Figure 2.3. (A) Comparison of elements (mg/kg) between glass and plastic volumetric
container (B) comparison of elements (% weight) between glass and plastic volumetric
container (±1SD). ................................................................................................................................. 45
Figure 3.1 Two-dimensional PCA plot (PC1 vs. PC2) using 16 elements found in 54 SJW
samples with a 95% confidence ellipse applied. The samples H15, T5, T19, C1 and C2 were
outside the 95% confidence ellipse and considered outliers in comparison to the rest of the
dataset. ................................................................................................................................................ 61
Figure 3.2. (A) 2D loading plot of PC1 & PC2 and (B) 3D plot of PC1, PC2 & PC3 using 16
elements from 49 SJW samples (squares = herbs, circles = tablets and triangles = capsules) ........... 63
Figure 3.3. 2D PCA of 49 SJW samples with 14 elements. Squares = herbs, circles = tablets
and triangles = capsules. Three PCs with 65% total variance. ............................................................. 65
Figure 3.4. (A) 2D loading plot of PC1 & PC2 and (B) 3D plot of PC1, PC2 & PC3 using 7
elements from 50 SJW samples (squares = herbs, circles = tablets and triangles = capsules). .......... 66
Figure 3.5. 3D PCA of 48 SJW samples with 10 elements. Squares = herbs, circles = tablets
and triangles = Capsules. Three PCs with 77% total variance. ............................................................ 67
Figure 3.7. PCA of (A) all 22 SJW raw herb samples with 16 elements with 95% confidence
ellipse and (B) SJW raw herbs without H13 and H15 .......................................................................... 69
Figure 3.8 PCA of SJW capsules with Ginger, Ginseng and Milk thistle capsules ................................ 70
xii
Figure 4.1 The element concentration of unfiltered, cellulose filtered and glass fibre filtered
60 %v/v ethanol solution. Uncertainty is ±1SD ................................................................................... 78
Figure 4.2 Comparison of unfiltered (blank) and filtered (cellulose or glass fibre) element
enriched 60 %v/v ethanol solution. Uncertainty is ±1SD. ................................................................... 79
Figure 4.3 (A) Extraction of Al from SJW powdered herbs in different solvents and (B)
percent of Alextracted from original raw herb. Uncertainty is ±1SD. ................................................. 85
Figure 4.4 (A) Concentration of Al in dried extracts (B) Comparison of Al concentration in dry
extract to dry herb. Uncertainty is ±1SD. ........................................................................................... 86
Figure 4.5 (A) Extraction of Ba from SJW powdered herbs in different solvents and (B)
Percent of Ba extracted from original raw herb. Uncertainty is ±1SD. ............................................... 87
Figure 4.6 (A) Amount of Ba in dried extracts (B) Comparison of Ba extract concentration to
original herb concentration. Uncertainty is ±1SD. .............................................................................. 88
Figure 4.7 (A) Extraction of Ca from SJW powdered herbs in different solvents and (B)
Percent of Ca extracted from original raw herb. Uncertainty is ±1SD. ............................................... 89
Figure 4.8 (A) Amount of Ca in dried extracts (B) Comparison of Ca extract concentration to
original herb concentration. Uncertainty is ±1SD. .............................................................................. 90
Figure 4.9 Percent of Cd extracted from original raw herb. Uncertainty is ±1SD. .............................. 91
Figure 4.10 Comparison of Cd extract concentration to original herb concentration.
Uncertainty is ±1SD. ............................................................................................................................. 93
Figure 4.11 (A) Extraction of Cu from SJW powdered herbs in different solvents and (B)
Percent of Cu extracted from original raw herb. Uncertainty is represented by ±1SD. ..................... 98
Figure 4.12 (A) Amount of Cu in dried extracts (B) Comparison of Cu extract concentration to
original herb concentration. Uncertainty is represented by ±1SD. ..................................................... 99
Figure 4.13 (A) Extraction of Fe from SJW powdered herbs in different solvents and (B)
Percent of Fe extracted from original raw herb. Uncertainty is represented by ±1SD. .................... 100
Figure 4.14 (A) Amount of Fe in dried extracts (B) Comparison of Fe extract concentration to
original herb concentration. Uncertainty is represented by ±1SD. ................................................... 101
Figure 4.15 (A) Extraction of Mg from SJW powdered herbs in different solvents and (B)
Percent of Mg extracted from original raw herb. Uncertainty is represented by ±1SD. .................. 102
Figure 4.16 (A) Amount of Mg in dried extracts (B) Comparison of Mg extract concentration
to original herb concentration. Uncertainty is represented by ±1SD. .............................................. 103
xiii
Figure 4.17 (A) Extraction of Mn from SJW powdered herbs in different solvents and (B)
Percent of Mn extracted from original raw herb. Uncertainty is represented by ±1SD. .................. 104
Figure 4.18 (A) Amount of Mn in dried extracts (B) Comparison of Mn extract concentration
to original herb concentration. Uncertainty is represented by ±1SD. .............................................. 105
Figure 4.19 (A) Extraction of Ni from SJW powdered herbs in different solvents and (B)
Percent of Ni extracted from original raw herb. Uncertainty is represented by ±1SD. .................... 107
Figure 4.20 (A) Amount of Ni in dried extracts (B) Comparison of Ni extract concentration to
original herb concentration. Uncertainty is represented by ±1SD. ................................................... 108
Figure 4.21 (A) Extraction of Sr from SJW powdered herbs in different solvents and (B)
Percent of Sr extracted from original raw herb. Uncertainty is represented by ±1SD. .................... 109
Figure 4.22 (A) Amount of Sr in dried extracts (B) Comparison of Sr extract concentration to
original herb concentration. Uncertainty is represented by ±1SD. ................................................... 110
Figure 4.23 (A) Extraction of zinc from SJW powdered herbs in different solvents and (B)
Percent of zinc extracted from original raw herb. Uncertainty is represented by ±1SD. ................. 111
Figure 4.24 (A) Amount of zinc in dried extracts (B) Comparison of zinc extract concentration
to original herb concentration. Uncertainty is represented by ±1SD. .............................................. 112
Figure 4.25 (A) PCA of eight herbs with 14 elements. Square = original Herb, circle = 100%
water extraction, triangle = 60 %v/v ethanol extraction, diamond = 80 %v/v ethanol
extraction and star = 100% ethanol extraction. (B) 2D loadings for PCA. ......................................... 118
Figure 5.1 UV-Vis spectra of rutin (blue), CuCl2 (red) and Rutin-Cu (green) in methanol. ................ 128
Figure 5.2 (A) Cu complexed at catechol group on rutin and (B) Cu complexed at 4-oxo-5-
hydroxyl group on rutin. R = Rutinose moiety. .................................................................................. 128
Figure 5.3 UV-Vis spectra of a mixture of rutin and CuCl2 refluxed for different times. RT =
Room temperature. ........................................................................................................................... 129
Figure 5.4 Mass spectra collected by direct injection of a Rutin-Cu complex solution at (A)
room temperature-0 min (B) 30 min (C) 180 min and (D) 210 min of reflux. ................................... 130
Figure 5.5. Rutin standard (blue) and methanol (red) run using UHPLC and method 001,
appendix 10.4, (λ = 280 nm) .............................................................................................................. 131
Figure 5.6. UHPLC chromatograms of methanol (red), CuCl2 (green), rutin (purple) and Rutin-
Cu (blue) complex using method 002, appendix 10.4 (λ = 280 nm) .................................................. 131
Figure 5.7 Mass Spectra collected by the direct injection of (A) rutin-Cu in methanol and (B)
rutin-Cu in UHPLC mobile phase with no formic acid ....................................................................... 132
xiv
Figure 5.8. A chromatogram of SJW methanol extract (λ = 280 nm) using method 003
(appendix 10.4), Kinetix C18 column. ................................................................................................ 133
Figure 5.9. Chromatogram (λ = 280 nm) of SJW methanol extract using Method 004
(appendix 10.4) Kinetix C18 column. Shows increase of aqueous mobile phase increases the
Rt of some compounds and removes some from solvent front. ....................................................... 134
Figure 5.10 A chromatogram of SJW extract in methanol with additional gradient step.
(Method 005, appendix 10.4, λ = 280 nm) Kinetix C18 column. ....................................................... 134
Figure 5.11. Chromatograms of (A) Quercetin, (B) Rutin and (C) SJW extract using
Phenomenex Kinetix Column (method 006, appendix 10.4, λ = 280 nm) ......................................... 136
Figure 5.12. Analysis of samples using Phenomenex Luna Column (A) Quercetin, (B) Rutin
and (C) SJW extract (method 007, appendix 10.4, λ = 280 nm) ........................................................ 137
Figure 5.13 Separation of SJW peaks in 60 %v/v ethanol. (A) Full chromatogram and (B)
Expanded view of chromatogram. (method 008, appendix 10.4). .................................................... 139
Figure 5.14 Subsequent injections of rutin standard (A) showing retention time drift before
column oven is fitted (B) no retention time drift with column oven (λ = 280 nm) ........................... 140
Figure 5.15 SJW 60 %v/v ethanol liquid extract (A) Full chromatogram and (B) an expanded
view (25-70 mins) of the region of interest (method 010, appendix 10.4, λ = 280 nm) ................... 141
Figure 5.16 Overlay of 10 chromatograms of same SJW sample. Method 009, appendix 10.4 ....... 142
Figure 5.17 Calibration curve of rutin on UHPLC (280nm) ................................................................ 143
Figure 5.18 Chromatogram Overlay of rutin (red), hyperoside (green), quercetin (purple) and
hyperforin/adhyperforin (blue) standards (ʎ=280nm). ..................................................................... 143
Figure 5.19 LC-MS chromatogram of multi-standard 1 ..................................................................... 144
Figure 5.20 Mass spectrum of LC peak associated with (A) rutin, (B)quercetin (C) hyperoside
(D) hyperforin (E) Adhyperforin ......................................................................................................... 145
Figure 5.21 Comparison of original rutin calibration and new calibration ........................................ 147
Figure 5.22 Calibration graphs for (A) hyperoside, (B) quercetin, (C) hyperforin and (D)
adhyperforin. ..................................................................................................................................... 148
Figure 5.23. Expanded view of SJW extract run on Varian ProStar 500 (ʎ=280nm). Method
008, appendix 10.4 ............................................................................................................................. 149
Figure 5.24. Analysis of SJW extract on Varian ProStar 500 HPLC (A) first injection, (B) fifth
injection and (C) eighth injection. Arrows shows Rt drift of 15 minutes over the injections
and an increase in compounds eluting with solvent front. Method 008, appendix 10.4 ................. 150
xv
Figure 5.25 Overlay of 10 injections of SJW 60 %v/v ethanol extract on Perkin Elmer Flexar
HPLC ................................................................................................................................................... 151
Figure 5.26 (A) Full chromatogram of SJW 60 %v/v ethanol on Perkin Elmer Flexar (method
008) and (B) expanded view of flavonoid region ............................................................................... 152
Figure 5.27 (A) Amount of rutin extracted per original herb (B) Amount of rutin per dried
extract. Uncertainty is reported as ±1SD ........................................................................................... 153
Figure 5.28 (A) Amount of hyperoside extracted from original herb (B) Amount of
hyperoside in dried extract. Uncertainty is reported as ±1SD .......................................................... 154
Figure 5.29 (A) Amount of quercetin extracted from original herb (B) Amount of quercetin in
dried extract. Uncertainty is reported as ±1SD ................................................................................. 155
Figure 5.30 (A) Amount of hyperforin extracted from original herb (B) Amount of hyperforin
in dried extract. Uncertainty is reported as ±1SD ............................................................................. 156
Figure 5.31 (A) Amount of adhyperforin extracted from original herb (B) Amount of
adhyperforin in dried extract. Uncertainty is reported as ±1SD ....................................................... 157
Figure 6.1 Biosynthesis of rutin production from quercetin. F3GT = flavonol 3-O-
glucosyltransferase, A3RT = UDP-Rha:anthocyanidin 3-O-glucoside rhamnosyltransferase.
Adapted from [256] ........................................................................................................................... 164
Figure 6.2 Biosynthesis of quercetin production from dihydroquercetin. Adapted from [256] ....... 164
Figure 6.3 Proposed hyperforin biosynthetic pathway (reproduced with permission from
[87]). DMAPP - dimethylallyl diphosphate, GPP - geranyl diphosphate and PP - diphosphate. ....... 165
Figure 10.1 The periodic table of elements ....................................................................................... 203
xvi
Tables
Table 1.1 Examples of herb-drug interactions ....................................................................................... 5
Table 1.2 Default elemental limits in oral drugs from US Pharmacopoeia ........................................... 9
Table 1.3 British Pharmacopoeia [53] concentration limits for Cd, Hg and Pb ..................................... 9
Table 1.4 Examples of essential element use by plants ...................................................................... 11
Table 1.5 Examples of hyper-accumulation concentrations for some elements (adapted from
Krämer 2010 [58]) ................................................................................................................................ 12
Table 1.6 Examples of plants that accumulate elements .................................................................... 12
Table 1.7 Common constituents found in St John’s Wort ................................................................... 21
Table 2.1. Summary of acid mixtures .................................................................................................. 32
Table 2.2 MarsXpress microwave settings .......................................................................................... 32
Table 2.3. SN values from optimisation of Varian ICP-OES ................................................................. 35
Table 2.4. Optimised parameters for Varian 710 ICP-OES .................................................................. 35
Table 2.5 Limits of detection (LOD) of two different nebulisers ......................................................... 36
Table 2.6. Comparison of calibration error between weighted and non-weighted regression
lines ...................................................................................................................................................... 38
Table 2.7. Summary of elemental loss due to sample transference ................................................... 40
Table 2.8. Recovery of elements of NIST tea with each acid mixture ................................................. 41
Table 2.9. Comparison of microwave power settings with NIST tea ................................................... 46
Table 2.10. Recovery of elements with NIST tea and spiked recovery ............................................... 47
Table 2.11. SJW metal concentrations obtained using standard addition vs. weighted
calibration ............................................................................................................................................ 48
Table 3.1. Summary of SJW samples ................................................................................................... 53
Table 3.2 Summary of Concentrations found in SJW preparations1 ................................................... 57
Table 3.3 Correlation matrix of elements monitored in SJW dry herbs 1, 2 ......................................... 60
Table 3.4. Difference in loading values between elements correlated on PC1 ................................... 66
Table 4.1. Summary of SJW powdered samples obtained ................................................................. 75
Table 4.2. Concentration of elements in SJW transferred during extraction for 1, 2, 4, 8 and
24 hrs ................................................................................................................................................... 80
Table 4.3. Recovery of elements from hotplate digestion of NIST tea ................................................ 81
xvii
Table 4.4 Summary of concentrations of elements within different extracts of eight SJW
herbs .................................................................................................................................................... 83
Table 4.5 Comparison of dried extract weights from different solvents ............................................ 84
Table 4.6 Cadmium transferred from SJW raw herbs in water1 .......................................................... 91
Table 4.7 Amount of Cd in dried water extracts .................................................................................. 92
Table 4.8 Cobalt transferred from SJW raw herbs in different solvents from original herb ............... 94
Table 4.9 Concentration of Co in dried extract and the comparison to total Co in original
herb ...................................................................................................................................................... 95
Table 4.10 Chromium transferred from SJW raw herbs in different solvents from original
herb ...................................................................................................................................................... 95
Table 4.11 Concentration of Cr in dried extract and the comparison to total Cr in original
herb ...................................................................................................................................................... 96
Table 4.12 Molybdenum transferred from SJW raw herbs in 100% water ....................................... 106
Table 4.13 Concentration of Mo in dried extract and the comparison to total Mo in original
herb .................................................................................................................................................... 106
Table 4.14 Correlation term definitions ............................................................................................ 114
Table 4.15 Correlation analysis of elements in eight herbs extracted with 100% water1 ................ 114
Table 4.16 Correlation analysis of elements in eight herbs extracted with 60 %v/v ethanol1 ......... 115
Table 4.17 Correlation analysis of elements in eight herbs extracted with 80 %v/v ethanol1 ......... 116
Table 4.18 Correlation analysis of elements in eight herbs extracted with 100 % ethanol1 ............ 117
Table 5.1 Literature findings of secondary metabolites complexed with metal ions ....................... 122
Table 5.2 Concentrations of rutin, hyperoside, quercetin, hyperforin and adhyperforin in
multi-component standards .............................................................................................................. 126
Table 5.3 Comparison of UHPLC and LC-MS retention times ............................................................ 146
Table 6.1 Summary of element content in eight SJW raw herbs ...................................................... 161
Table 6.2 Summary of element content in eight SJW ethanolic extracts .......................................... 162
Table 6.3 Summary of Bioactive Content in Eight SJW Ethanolic Extracts ........................................ 162
Table 6.4 Correlation analysis of total element concentrations in original herb to bioactive
compounds1 ....................................................................................................................................... 163
Table 6.5 Correlation Analysis of Extracted Elements to Bioactive Compounds ............................. 167
Table 10.1 Exposure Limits of Different Elements from the European Union Scientific
Committee on Food (SCF), US Institute of Medicine(IOM), World Health Organisation
xviii
(WHO), US Environmental Protection Agency (EPA), US Agency for Toxic Substances and
Disease Registry (ATSDR) and European Food Safety Authority (ESFA)1 .......................................... 191
Table 10.2 Summary of Element Concentrations (µg/g unless otherwise stated) Found in
Hypericum perforatum Products ....................................................................................................... 192
Table 10.3 Summary of Element Concentrations (µg/g unless otherwise stated) Found in
Hypericum perforatum Products Continued...................................................................................... 193
Table 10.4 Summary of Element Concentrations (µg/g unless otherwise stated) Found in
Hypericum perforatum Products Continued...................................................................................... 194
Table 10.5 Summary of Element Concentrations (µg/g unless otherwise stated) Found in
Hypericum perforatum Products Continued...................................................................................... 195
Table 10.6 Concentrations of Elements in SJW raw Herbs (H1 – H11).............................................. 196
Table 10.7. Concentrations of Elements in SJW raw Herbs (H12 – H22)........................................... 197
Table 10.8. Concentrations of Elements in SJW Capsules ................................................................. 198
Table 10.9. Concentrations of Elements in SJW raw Tablets (T1 – T10) ........................................... 199
Table 10.10. Concentrations of Elements in SJW raw Tablets (T11 – T20) ....................................... 200
Table 10.11 Details of all the methods and parameters used on the Perkin Elmer UHPLC. ............. 201
xix
Abbreviations
A3RT - UDP-Rha:anthocyanidin 3-O-glucoside rhamnosyltransferase AAS - Atomic Absorption Spectroscopy AD - Anno Domini AES - Atomic Emission Spectroscopy BC - Before Christ BPC - Bioactive Plant Compound CA - Cluster Analysis CAM - Complementary and Alternative Medicine CRM - Certified Reference Material CYP - Cytochrome P450 enzyme family DMA - Direct Mercury Analyser DMAPP - Dimethylallyl diphosphate EU - European Union F3GT - Flavonol 3-O-glucosyltransferase (EC 2.4.1.91) FDA - Food and Drug Administration FLS - Flavonol synthase (EC 1.14.11.23) GLP - Good Laboratory Practice GMP - Good Manufacturing Practice GPP - Geranyl diphosphate HF - Hydrogen fluoride HMDE - Hanging Mercury Drop Electrode HPLC - High Performance Liquid Chromatography ICP-MS - Inductively Coupled Plasma-Mass Spectrometry ICP-OES - Inductively Coupled Plasma-Optical Emission spectroscopy KNN - K Nearest-Neighbour Analysis LA-ICP-MS - Laser Ablation ICP-MS LC-ICP-MS - Liquid Chromatography ICP-MS LC-ICP-OES - Liquid Chromatography ICP-OES LDA - Linear Discriminate Analysis LOD - Limit of Detection LOQ - Limit of Quantification MA - Marketing Authorisation MAO - Monoamine oxidase MHRA - Medicines and Healthcare products Regulatory Agency ND - Not Detected PC - Principal Component PCA - Principal Component Analysis ppb - Parts per billion ppm - Parts per million ppt - Parts per trillion RF - Radio Frequency
xx
SEM - Standard Error of the Mean (95% confidence interval) SD - Standard Deviation SIMCA - Soft Independent Modelling of Class Analogies SJW - St John’s Wort SN - Signal to Noise THR - Traditional Herbal Medicines Registration TLC - Thin Layer Chromatography TMFE - Thin Mercury Film Electrode UHPLC - Ultra High Performance Liquid Chromatography UK - United Kingdom USA/US - United States of America UV - Ultraviolet spectroscopy WHO - World Health Organisation Al - Aluminium As - Arsenic B - Boron Ba - Barium Be - Beryllium Ca - Calcium Cd - Cadmium Co - Cobalt Cr - Chromium Cu - Copper Fe - Iron Hg - Mercury In - Indium Mg - Magnesium Mn - Manganese Mo - Molybdenum Ni - Nickel Pb - Lead Pt - Platinum Sb - Antimony Se - Selenium Sr - Strontium V - Vanadium Y - Yttrium Zn - Zinc
1
1 Introduction
1.1 Brief History of Herbal Medicines
Vegetation across the world has been used for millennia as a staple food source. However, many
species of plants have also been utilised for medicinal purposes for thousands of years; these plants
are also known as herbal remedies. Such remedies have been described for the treatment of wound
healing, diarrhoea and other medical issues. One of the earliest written examples of a herbal
medicine document is a Sumerian cuneiform clay tablet dated to around 2100 BC which depicts
plant ingredients and instructions on mixing [1]. The next notable publication was the ‘Papyrus
Ebers’ written in archaic phraseology hieroglyphics and dated to about 1500 BC; though the content
is believed to be centuries older [2]. Examples of the traditional medicines described by the
papyrus (Figure 1.1) include heating a mixture of herbs on a hot brick that allowed sufferers of
asthma to breath in the fumes to help relieve their symptoms [3].
Figure 1.1 A page from the Papyrus Ebers [3]
Other key texts include the Indian Caraka Samhita and Sushruta Samhita [4], the Anglo-Saxon
Leechbook of Bald [5] and Culpeper’s complete herbal [6]. All of these convey information ranging
from how to identify a plant to the ingredients and preparation instructions.
2
The information and knowledge of herbal remedies has increased from these early texts; however
many are still not fully understood. Firstly, the cleanliness of such preparations has improved
greatly and many traditional mixtures are no longer utilised due to the discovery of
microorganisms. For example, the Papyrus Ebers describes a traditional medicine for wound healing
after minor surgery that contains ‘Elderberries, uah-corn and cat dung’ [2]. Secondly, the use of
analytical chemistry has allowed the identification of some of the bioactive constituents in plants
that gave a therapeutic effect. From this, manufacturers have been able to separate and purify, or
synthesise the compound. Examples include Aspirin originally from willow trees and Digoxin from
Foxgloves (Digitalis purpurea). Thirdly, herbal remedies are being tested for their effectiveness
against their indented use as well as other disorders and the safety of their use. However, herbal
remedies are still not fully understood due to their complexity and those which contain more than
one herb also need further investigation to understand the synergy between them.
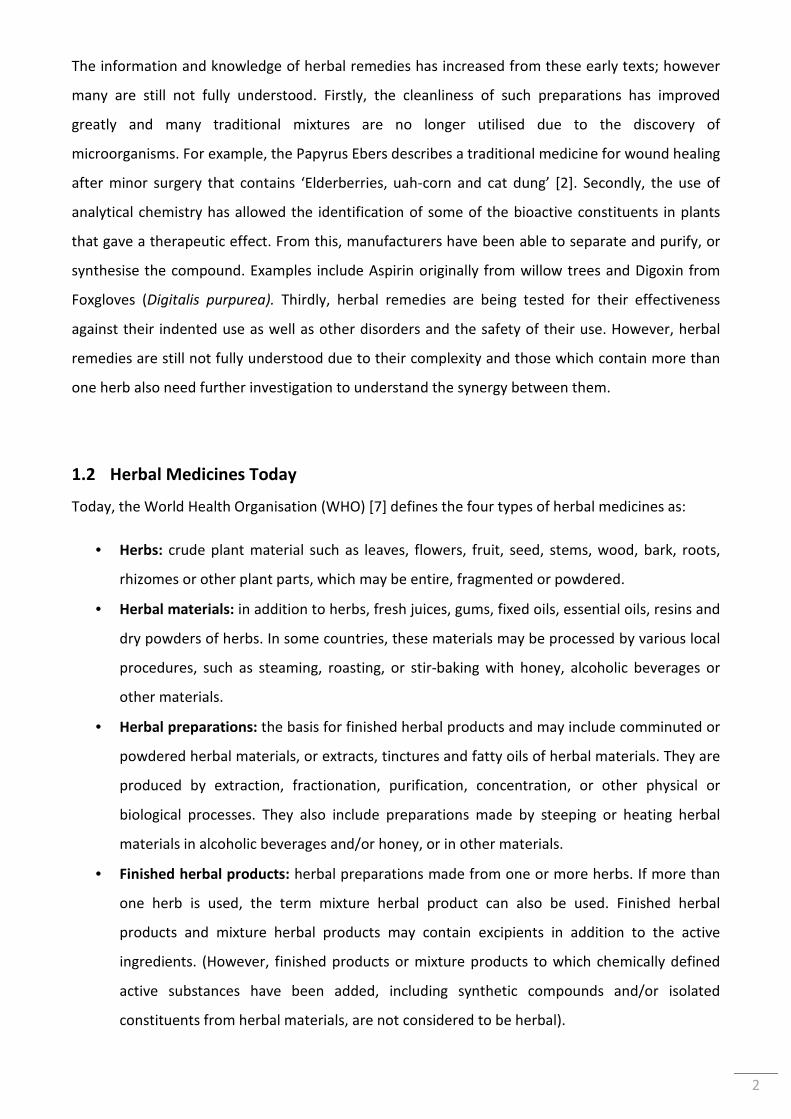
1.2 Herbal Medicines Today
Today, the World Health Organisation (WHO) [7] defines the four types of herbal medicines as:
• Herbs: crude plant material such as leaves, flowers, fruit, seed, stems, wood, bark, roots,
rhizomes or other plant parts, which may be entire, fragmented or powdered.
• Herbal materials: in addition to herbs, fresh juices, gums, fixed oils, essential oils, resins and
dry powders of herbs. In some countries, these materials may be processed by various local
procedures, such as steaming, roasting, or stir-baking with honey, alcoholic beverages or
other materials.
• Herbal preparations: the basis for finished herbal products and may include comminuted or
powdered herbal materials, or extracts, tinctures and fatty oils of herbal materials. They are
produced by extraction, fractionation, purification, concentration, or other physical or
biological processes. They also include preparations made by steeping or heating herbal
materials in alcoholic beverages and/or honey, or in other materials.
• Finished herbal products: herbal preparations made from one or more herbs. If more than
one herb is used, the term mixture herbal product can also be used. Finished herbal
products and mixture herbal products may contain excipients in addition to the active
ingredients. (However, finished products or mixture products to which chemically defined
active substances have been added, including synthetic compounds and/or isolated
constituents from herbal materials, are not considered to be herbal).
3
Within Asian and African countries, 80% of their population depend on complementary and
alternative medicines (CAM) as their primary form of healthcare [7]. Within developed countries
70-80% of people have used some form of CAM. Herbal remedies are a popular and wide spread
form of CAM. In the UK during 2008, the Medicines and Healthcare products Regulatory Agency
(MHRA) carried out a survey about herbal medicines use and perception [8]. The report found that
35% of adults had used herbal medicines and of those (who had used herbal medicines in the
previous two years), 89% felt most herbal medicines were safe to take. Due, in part, to these views
on herbal remedies the UK spent £136 million on herbal medicines in 2009 [9]. The global herbal
supplements and remedy market is forecast to reach US$ 107 billion by the year 2017 [10].
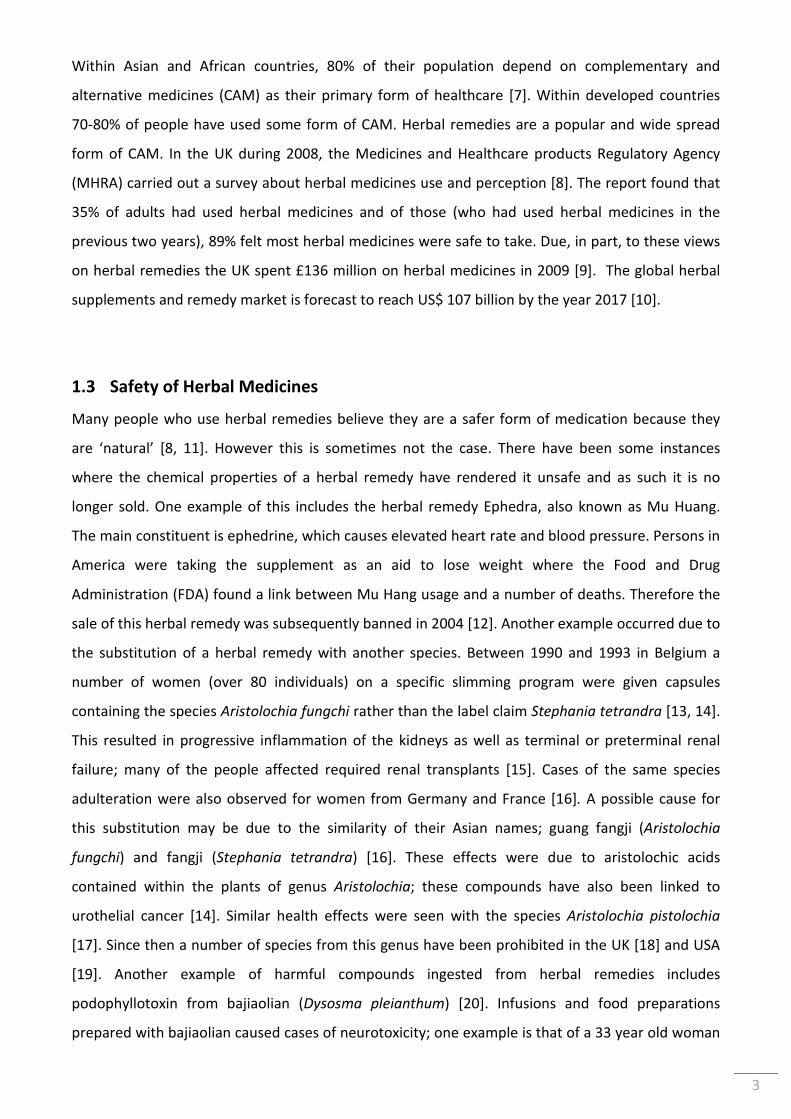
1.3 Safety of Herbal Medicines
Many people who use herbal remedies believe they are a safer form of medication because they
are ‘natural’ [8, 11]. However this is sometimes not the case. There have been some instances
where the chemical properties of a herbal remedy have rendered it unsafe and as such it is no
longer sold. One example of this includes the herbal remedy Ephedra, also known as Mu Huang.
The main constituent is ephedrine, which causes elevated heart rate and blood pressure. Persons in
America were taking the supplement as an aid to lose weight where the Food and Drug
Administration (FDA) found a link between Mu Hang usage and a number of deaths. Therefore the
sale of this herbal remedy was subsequently banned in 2004 [12]. Another example occurred due to
the substitution of a herbal remedy with another species. Between 1990 and 1993 in Belgium a
number of women (over 80 individuals) on a specific slimming program were given capsules
containing the species Aristolochia fungchi rather than the label claim Stephania tetrandra [13, 14].
This resulted in progressive inflammation of the kidneys as well as terminal or preterminal renal
failure; many of the people affected required renal transplants [15]. Cases of the same species
adulteration were also observed for women from Germany and France [16]. A possible cause for
this substitution may be due to the similarity of their Asian names; guang fangji (Aristolochia
fungchi) and fangji (Stephania tetrandra) [16]. These effects were due to aristolochic acids
contained within the plants of genus Aristolochia; these compounds have also been linked to
urothelial cancer [14]. Similar health effects were seen with the species Aristolochia pistolochia
[17]. Since then a number of species from this genus have been prohibited in the UK [18] and USA
[19]. Another example of harmful compounds ingested from herbal remedies includes
podophyllotoxin from bajiaolian (Dysosma pleianthum) [20]. Infusions and food preparations
prepared with bajiaolian caused cases of neurotoxicity; one example is that of a 33 year old woman
4
who lost sensitivity to touch and deep tendon reflexes as well as abnormal liver function and
gastrointestinal upset through ingestion of bajiaolian made with chicken soup. Full recovery took 8
months after two days ingestion of the soup [20, 21]. Other examples of herb safety arise from
contamination with microorganisms [22], allergic reactions [16], interactions with other medicines
[23], adulteration [24, 25] and metal contamination [26]. For example, an allergic reaction was
observed with a 42 year old man who developed progressive renal failure and lupus-like syndrome
after the ingestion of Yohimbine (from the yohimbe tree) [27]. Cases of metal contamination
include a 5 year old boy from Italy who was given traditional Indian medicine (unknown pill and
powder ingredients to prevent removal of his second eye) and suffered from arsenic poisoning [26].
A similar example of a 5 year old boy from China was observed whereby the child suffered from
mercury poisoning from traditional Chinese medicine for treatment of mouth ulcers [26]. A 4 month
old boy from China (fed numerous herbs from birth for minor aliments) developed cough, fever and
vomiting which was due to Pb poisoning from herbal pills ‘Po Ying Tan’ [21]. As well as adulteration
of herbal remedies with different or lower quality herbs (for example, ginseng (Pananx ginseng) has
been adultered with cheaper and lower quality species [28]); synthetic compounds such as caffeine,
aspirin, diazepam and paracetamol have been used [16]. A case study of a 51 year old woman who
had been taking Tung Shueh pills (traditional Chinese medicine) for abdominal pain developed renal
problems due to inflamed kidneys [21]. Examination of the pills found that they had been adultered
with diazepam and mefenamic acid. Another example of synthetic compounds being used in herbal
medicines includes traditional medicines enriched with aminopyrine and phenylbutazone [29].
These caused the suppression of white blood cells which in turn caused severe bacterial sepsis and
in one case death [29].
In addition to these safety issues, some herbal medicines have been able to interact with synthetic
mainstream medicines. Numerous drug-herb interactions have been reported [30] with some
examples displayed in Table 1.1. One infamous interaction is between the herbal remedy St John’s
Wort (Hypericum perforatum) and some oral contraception medication which has resulted in
unwanted pregnancy [31] due to the interaction of its bioactive compounds with cytochrome P450
(CYP) 3A4 enzymes [32].
5
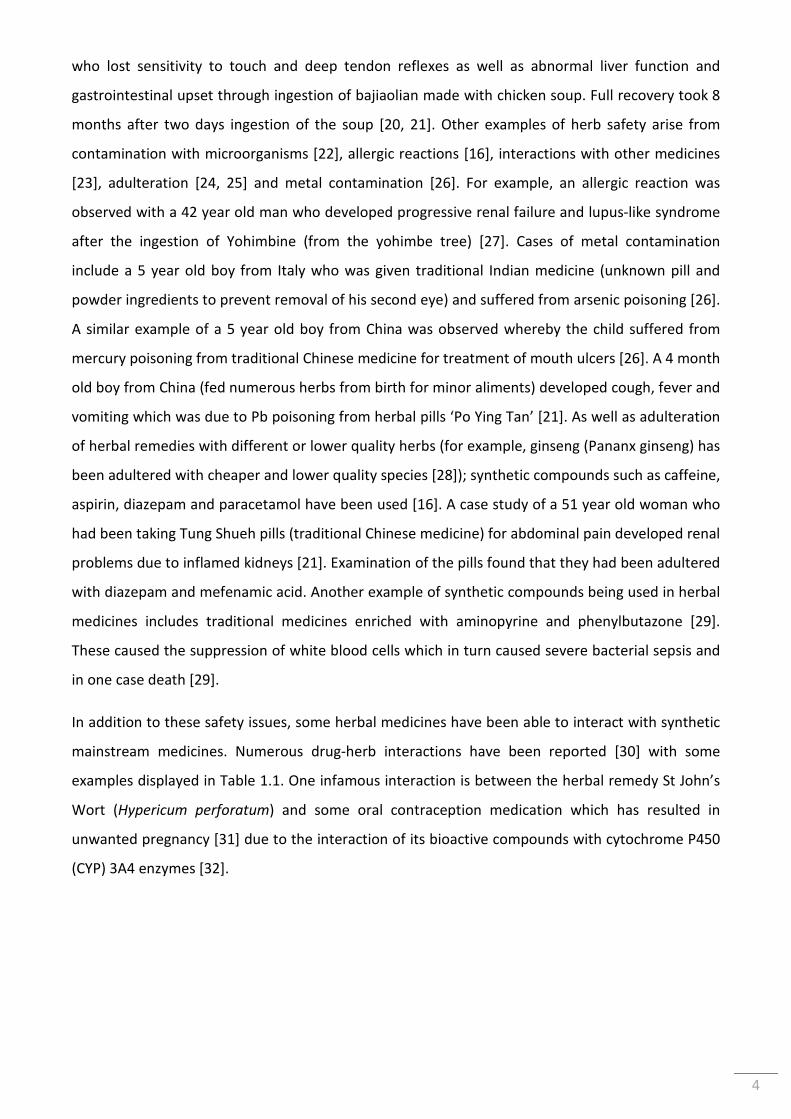
Table 1.1 Examples of herb-drug interactions
Herb Drug Adverse Reaction of Taking both
St John's Wort (Hypericum perforatum) Digoxin Lowers blood concentration of digoxin
Ginkgo (Ginkgo biloba) Warfarin Bleeding
Garlic (Allium sativum) Chlorpropamide Hypoglycaemia
Kava (Piper methysticum) Alprazolam Sedation
1.4 Regulation of Herbal Medicines
The regulation associated with herbal medicines has increased over the last 25 years. For example,
the World Health Organization (WHO) conducted a survey on member states and found that in
1991 only 27 member states had some form of regulation on herbal medicines whilst in 2003 this
had increased to 83 member states [33]. This is due to safety issues, as explained in the previous
section, highlighting the need for quality control of such substances. Such regulations are also being
consistently updated with the development of instrumentation. The introduction of regulations and
organisations to report adverse effects (e.g. to the Food and Drug Administration (FDA), World
Health Organisation (WHO) or the Medicines and Healthcare products Regulatory Agency (MHRA))
has facilitated quality monitoring and if needed, for herbs to be banned if severe health hazards are
noted.
The first type of quality control a herbal medicine must adhere to is its herbal remedy monograph.
This can be found in their countries Pharmacopoeia (e.g., US Pharmacopoeia, European
Pharmacopoeia and British Pharmacopoeia) or the WHO monographs [34]. From this, numerous
consumed herb species have a monograph that states basic quality limits including but not limited
to foreign organic matter, total ash, microbiological contamination, pesticide residues and heavy
metals before human consumption. In 2005, the WHO found that 24% of the member states had
national Pharmacopoeias which included herbal medicines or 58% of member states used another
Pharmacopoeia in the absence of their own [33]. For those who do not have a national
Pharmacopoeia, the three most popular are the European, British and US Pharmacopoeias [33].
However, in some cases, the Pharmacopoeias can differ between countries allowing for confusion.
For example with Valerian (Valeriana officinalis) extracts the European Pharmacopoeia [35]
recommends a minimum of 0.25% valerenic acid whilst the US Pharmacopoeia [36] requires a
minimum of 0.3% valerenic acid. Therefore Valerian extracts produced outside of the US may not
meet the requirements needed for sale in the US. In some cases, monographs are missing in certain
6
Pharmacopoeias. For example, the monograph for Passion flower (Passiflora incarnata) is available
in the European Pharmacopoeia [35], but is not present in the US Pharmacopoeia [36].
During the manufacture of herbal remedies the Pharmacopoeia guidelines, as well as other
practices are followed. These include Good Laboratory Practice (GLP) and/ or Good Manufacturing
Practice (GMP) which involves providing a paper trail throughout the production of the herbal
medicine [33, 37] to ensure quality procedures are implemented and all analyses/ manufacture or
other aspect of production can be accounted for. Following on from a herbs monograph or
manufacturing processes, the commercial sale of the remedy must also follow other regulations
which are country specific.
To be able to sell a herbal product in the UK one of three criteria must be fulfilled. The first is that a
herbal remedy can be sold through a licensed herbalist in which the product is prescribed following
a consultation. The second is through a marketing authorisation (MA) which is obtained by
providing full clinical trial evidence of safety. The third option is a traditional herbal medicines
registration (THR). The THR scheme was brought into effect in 2005 whereby herbal medicines
could obtain a THR if they could prove safe use for 30 years with at least 15 years usage within the
EU. This allowed the sale of such herbs without the extensive clinical trial data needed for a MA.
A common theme amongst the sales regulations in the UK and US are factors such as correct
labelling of the herbal remedies and the types of ‘claims’ they are allowed to use (e.g. medical,
health, nutrient) [37, 38]. Such regulations and guidelines described are being utilised by many
countries, but there are some countries, mostly undeveloped, which do not have such systems in
place [33].
1.5 Chemical Characterisation of Herbal Medicines
The compounds utilised for medicinal purposes in herbal remedies are produced by the plants for a
variety of functions. Some compounds are essential to a plant’s metabolism whilst others are
produced as by-products of metabolism (known as secondary metabolites). The functions of
secondary metabolites vary greatly and can often contribute to the colour and fragrance of flowers
or involved in defence against herbivores. Usually the compounds selected for characterisation of
the plant are done so as they are either specific to that species or genus of plants. Examples of
compounds monitored for quality stated by monographs include: silymarin content in Milk Thistle
(Silybum marianum) seeds [34], different ginsenosides in Radix Ginseng (Panax ginseng) [34]
7
whereas Passion flower (Passiflora incarnata) is assessed by its vitexin content [34]. Such analyses
are usually carried out firstly using Thin Layer Chromatography (TLC) to assess and identify the
herb. Following this, the standardised extract is analysed by liquid chromatography to quantify the
compounds and ensure the concentrations agree with the monograph. In some cases, due to
harvest variation, a batch may be too high or too low in concentration for the selected compounds.
In industry this is overcome by mixing different batches together to correct the selected compound
levels. Elemental constituents are also found in herbs and some are monitored which will be
discussed in the next section.
1.6 Elements in Herbal Medicines
In addition to molecular constituents, a diverse range of elements are also found in herbal
medicines. The concentrations of elements within plants are highly influenced by the medium in
which the plant is grown. Factors such as soil type, temperature, aeration, elemental content, pH
and water content can affect the available nutrients for the plant [39, 40]. There is also a large
difference between plant species due to genotype and the biochemical processes different plants
utilise in relation to elements [39]. This can include factors such as selectivity for certain ions, stage
of development, root properties and the release of organic compounds by the plant or
microorganisms to free elements (e.g. chemicals secreted by plants/microorganisms to allow easier
uptake of nutrients) [39, 40].
1.6.1 Toxic and Non-essential Elements
The monitoring of toxic metals by regulators is of great interest in order to prevent the harmful
effects associated with their ingestion. In some cases, the presence of metals in herbal remedies
has resulted in As, Hg or Pb poisoning [21, 26]. At present, manufacturers for the UK market test for
selected metals ensuring they are not over the recommended limit [41]. This however usually only
considers the more toxic elements Cd, Hg or Pb unless a monograph specifically indicates the
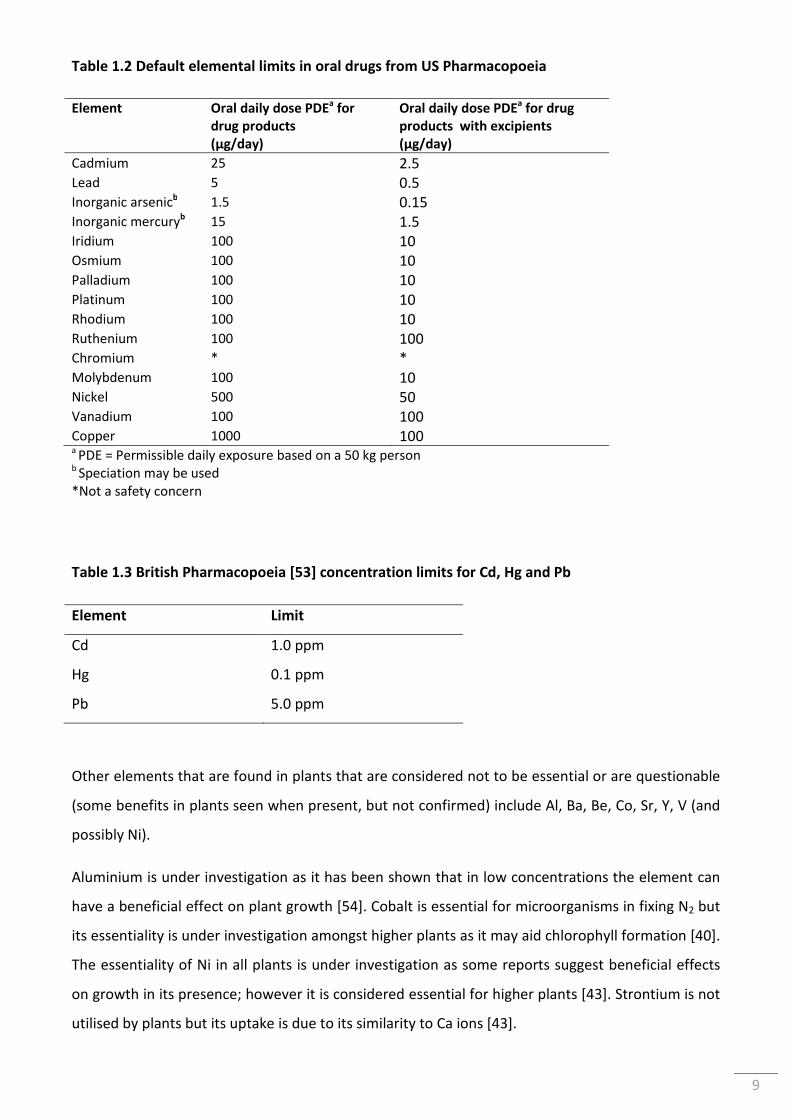
analysis for particular elements. However, new regulations introduced by the US Pharmacopoeia
[42] will increase the number of elements to include limits for As, Ir, Os, Pd, Pt, Rh, Cr, Mo, Ni, V and
Cu (Table 1.2) in medications. The majority of these elements are being monitored due to their use
as catalysts in the synthesis of medical compounds whilst others are absorbed into plant tissue via
the plants root or leaf system.
8
The toxic element As has been found in many different herbs but little is known about its
biochemical function [40, 43]. However, there is evidence that this element might be essential in
very small amounts for animals [44] but is mostly known for its toxic effects [45, 46]. The speciation
of As should also be noted as As (V) is less toxic in comparison to As (III) [47]. Cadmium is not
required biologically for plants but is readily introduced via the root and leaf systems [40, 43]. In
high concentrations, Cd can cause stunting of growth and chlorosis in plants [43]. There is no clear
evidence for the essentiality of Cr in plants but Cr added to Cr-deficient soils has shown to increase
the growth and yields of plants such as maize, wheat, rye and potatoes [39]. The speciation of Cr is
also noted as Cr (III) is less toxic in comparison to Cr (VI). Mercury is not an essential element to
plants; however, it can be absorbed and stored in plant tissues [39, 43]. The toxicity of Hg
compounds increases from elemental Hg < ionic Hg < organic-Hg compounds [48]. Lead uptake
within plants can originate from the atmosphere or soil. Before Pb was removed from petrol, large
amounts of Pb particulates would be in the air and as such could become deposited onto plant
surfaces [49]. Atmospheric deposition has been shown to be a major contributor for some
elements, including Pb, in certain species [49, 50] or within urban areas [49]. For example,
Dalenberg and Driel [50] found that 73-95% of the Pb concentration found in the leafy material of L.
multiflorum, carrots, spinach, wheat grain and wheat straw was attributed to atmospheric
deposition. Although the concentrations of Pb can vary between plants, the element has not been
shown to be essential [43].
In addition to these elements entering a plant via the root or leaf system, other routes of toxic
element contamination can occur from human interaction. For example, such elements may be
incorporated accidentally during the manufacturing process via machinery, or the addition of
bulking agents as well as improper storage. Contamination could also occur from known
adulteration. Toxic elements such as As, Hg and Pb have caused poisonings in the past from the
ingestion of herbal remedies [21, 26]. For example, in many Asian herbal medicines it has been
common to add cinnabar (mercury (II) sulphide) [51] or realgar (arsenic sulphide) [52]. The limits by
which the toxic elements discussed in herbal medicines must be below can be found in Table 1.2
and Table 1.3.
9
Table 1.2 Default elemental limits in oral drugs from US Pharmacopoeia
Element Oral daily dose PDEa for
drug products
(µg/day)
Oral daily dose PDEa for drug
products with excipients
(µg/day)
Cadmium 25 2.5 Lead 5 0.5 Inorganic arsenicb 1.5 0.15 Inorganic mercuryb 15 1.5 Iridium 100 10 Osmium 100 10 Palladium 100 10 Platinum 100 10 Rhodium 100 10 Ruthenium 100 100 Chromium * * Molybdenum 100 10 Nickel 500 50 Vanadium 100 100 Copper 1000 100 a PDE = Permissible daily exposure based on a 50 kg person b Speciation may be used *Not a safety concern
Table 1.3 British Pharmacopoeia [53] concentration limits for Cd, Hg and Pb
Element Limit
Cd 1.0 ppm
Hg 0.1 ppm
Pb 5.0 ppm
Other elements that are found in plants that are considered not to be essential or are questionable
(some benefits in plants seen when present, but not confirmed) include Al, Ba, Be, Co, Sr, Y, V (and
possibly Ni).
Aluminium is under investigation as it has been shown that in low concentrations the element can
have a beneficial effect on plant growth [54]. Cobalt is essential for microorganisms in fixing N2 but
its essentiality is under investigation amongst higher plants as it may aid chlorophyll formation [40].
The essentiality of Ni in all plants is under investigation as some reports suggest beneficial effects
on growth in its presence; however it is considered essential for higher plants [43]. Strontium is not
utilised by plants but its uptake is due to its similarity to Ca ions [43].
10
1.6.2 Essential Elements
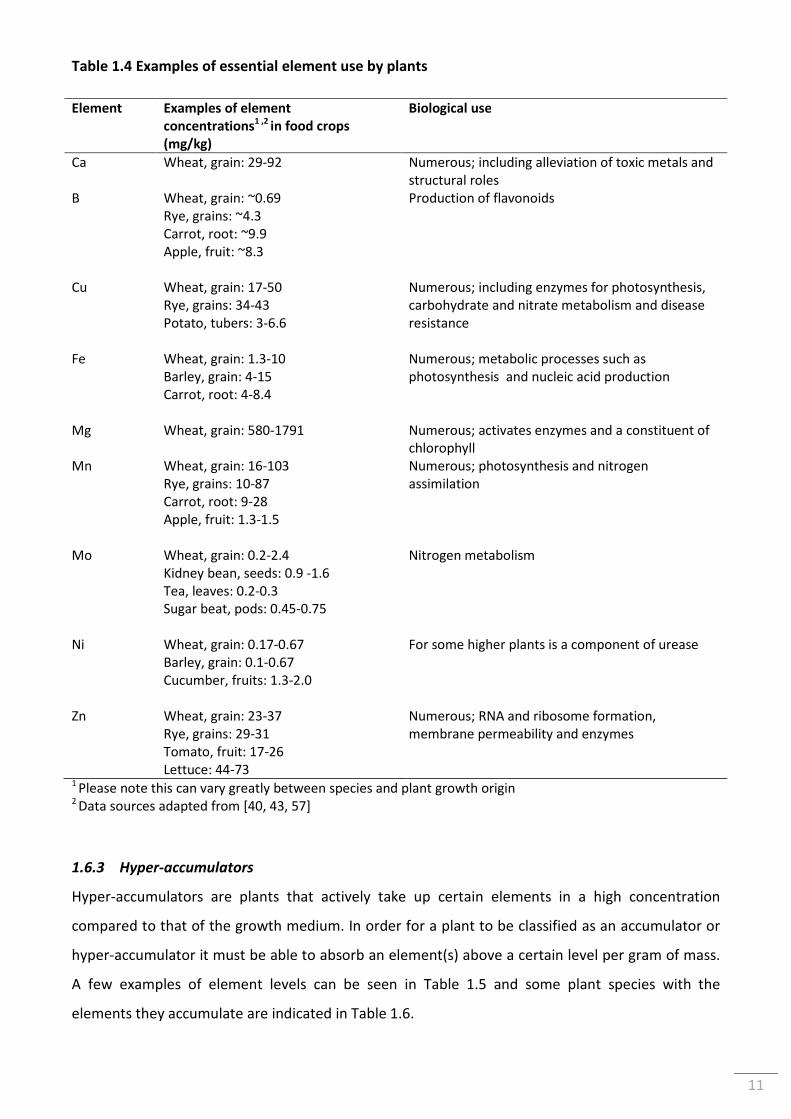
Many elements are essential to plants (Table 1.4); however, within herbal medicines these
elements are not monitored (with the recent exception of Ni and Cu with the US Pharmacopoeia,
Table 1.2). Calcium is present in large concentrations in plant cells [39] as it is used in numerous
plant functions including alleviation of toxic metal effects [55, 56]. Copper is involved with enzymes
for processes such as photosynthesis, carbohydrate and nitrate metabolism as well as disease
resistance [43]. Iron is involved in many metabolic processes such as photosynthesis (very
concentrated in the chloroplasts) and metabolism of nucleic acids [43]. Magnesium activates many
enzymes and is a constituent of chlorophyll [39]. Manganese is utilised in functions such as
photosynthesis and nitrogen assimilation [43] and Mo is applied within nitrogen metabolism [43].
Zinc is involved in several functions such as RNA and ribosome formation, membrane permeability
and is essential for the catalytic activity of various enzymes [43].
11
Table 1.4 Examples of essential element use by plants
Element Examples of element
concentrations1 ,2
in food crops
(mg/kg)
Biological use
Ca Wheat, grain: 29-92 Numerous; including alleviation of toxic metals and structural roles
B Wheat, grain: ~0.69 Rye, grains: ~4.3 Carrot, root: ~9.9 Apple, fruit: ~8.3
Production of flavonoids
Cu Wheat, grain: 17-50 Rye, grains: 34-43 Potato, tubers: 3-6.6
Numerous; including enzymes for photosynthesis, carbohydrate and nitrate metabolism and disease resistance
Fe Wheat, grain: 1.3-10 Barley, grain: 4-15 Carrot, root: 4-8.4
Numerous; metabolic processes such as photosynthesis and nucleic acid production
Mg Wheat, grain: 580-1791 Numerous; activates enzymes and a constituent of chlorophyll
Mn Wheat, grain: 16-103 Rye, grains: 10-87 Carrot, root: 9-28 Apple, fruit: 1.3-1.5
Numerous; photosynthesis and nitrogen assimilation
Mo Wheat, grain: 0.2-2.4 Kidney bean, seeds: 0.9 -1.6 Tea, leaves: 0.2-0.3 Sugar beat, pods: 0.45-0.75
Nitrogen metabolism
Ni Wheat, grain: 0.17-0.67 Barley, grain: 0.1-0.67 Cucumber, fruits: 1.3-2.0
For some higher plants is a component of urease
Zn Wheat, grain: 23-37 Rye, grains: 29-31 Tomato, fruit: 17-26 Lettuce: 44-73
Numerous; RNA and ribosome formation, membrane permeability and enzymes
1 Please note this can vary greatly between species and plant growth origin 2 Data sources adapted from [40, 43, 57]
1.6.3 Hyper-accumulators
Hyper-accumulators are plants that actively take up certain elements in a high concentration
compared to that of the growth medium. In order for a plant to be classified as an accumulator or
hyper-accumulator it must be able to absorb an element(s) above a certain level per gram of mass.
A few examples of element levels can be seen in Table 1.5 and some plant species with the
elements they accumulate are indicated in Table 1.6.
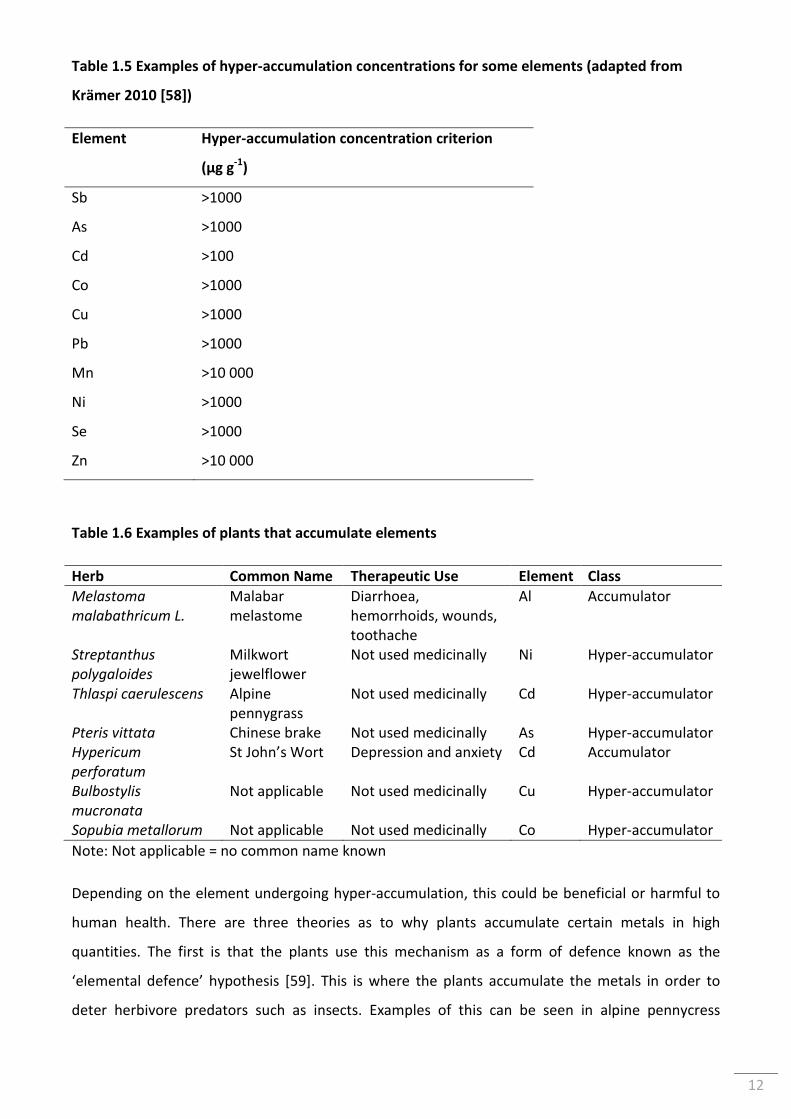
12
Table 1.5 Examples of hyper-accumulation concentrations for some elements (adapted from
Krämer 2010 [58])
Element Hyper-accumulation concentration criterion
(µg g-1
)
Sb >1000
As >1000
Cd >100
Co >1000
Cu >1000
Pb >1000
Mn >10 000
Ni >1000
Se >1000
Zn >10 000
Table 1.6 Examples of plants that accumulate elements
Herb Common Name Therapeutic Use Element Class
Melastoma malabathricum L.
Malabar melastome
Diarrhoea, hemorrhoids, wounds, toothache
Al Accumulator
Streptanthus polygaloides
Milkwort jewelflower
Not used medicinally Ni Hyper-accumulator
Thlaspi caerulescens Alpine pennygrass
Not used medicinally Cd Hyper-accumulator
Pteris vittata Chinese brake Not used medicinally As Hyper-accumulator Hypericum perforatum
St John’s Wort Depression and anxiety Cd Accumulator
Bulbostylis mucronata
Not applicable Not used medicinally Cu Hyper-accumulator
Sopubia metallorum Not applicable Not used medicinally Co Hyper-accumulator
Note: Not applicable = no common name known
Depending on the element undergoing hyper-accumulation, this could be beneficial or harmful to
human health. There are three theories as to why plants accumulate certain metals in high
quantities. The first is that the plants use this mechanism as a form of defence known as the
‘elemental defence’ hypothesis [59]. This is where the plants accumulate the metals in order to
deter herbivore predators such as insects. Examples of this can be seen in alpine pennycress
13
(Thlaspi caerulescens) with Cd [60], milkwort jewelflower (Streptanthus polygaloides) with Ni [61]
and Chinese brake fern (Pteris vittata) with As [62]. The ‘trade off’ hypothesis explains that some
plants utilise such elements as a defence mechanism and in doing so reduces the production of
organic defences as a way to save energy. Examples of this have been seen with alpine pennycress
(Thlaspi caerulescens) and Zn [63] and milkwort jewelflower (Streptanthus polygaloides) with Ni
[64]. Another reason for the accumulation of certain elements is known as the ‘joint effects’
hypothesis. This is where the elements in conjunction with the organic defences work together in
order to enhance the overall protection of the plant. An example of this has been shown in
experiments on larvae of Plutella xylostella [65]. The combination of organic defence molecules
such as either tannic acid, atropine or nicotine with Ni at certain concentrations statistically
decreased the number of larvae reaching the pupal stage compared to either bioactive or Ni alone
for the majority of concentrations used.
There is considerable interest in hyper-accumulators due to the potential benefits they could bring.
For example, such plants could be used to ‘clean up’ contaminated land in a more environmentally
friendly process [66, 67]. Another interesting avenue using phytoextraction is using plants to
specifically ‘mine’ rare elements for commercial purposes [68].
1.6.4 Links between Elemental and Bioactive Components
As mentioned previously, bioactive compounds can work synergistically to improve a plant’s
defence system against herbivores [65]. In addition to this, many metals are constituents of
enzymes or organelles of the plant [39, 40, 43]. For example, Mn2+ is a main component of enzymes
arginase (part of the urea cycle) and phosphotransferase (phosphorylation) [43] whereas Zn is part
of many enzymes (proteinases, peptidases and phosphohyrolases) [40].
Other aspects of metals and bioactive molecules interacting include the colour of flowers [69, 70].
For example, the vivid blue of a cornflower is from a ‘superpigment’ known as protocyanin (Figure
1.2) [70]. This pigment consists of four metal ions (Fe3+, Mg2+, and two Ca2+) which are complexed
with six anthocyanin molecules and six flavone (apigenin 7-O-glucuronide-4'-O-(6-O-malonyl-
glucoside)) molecules.
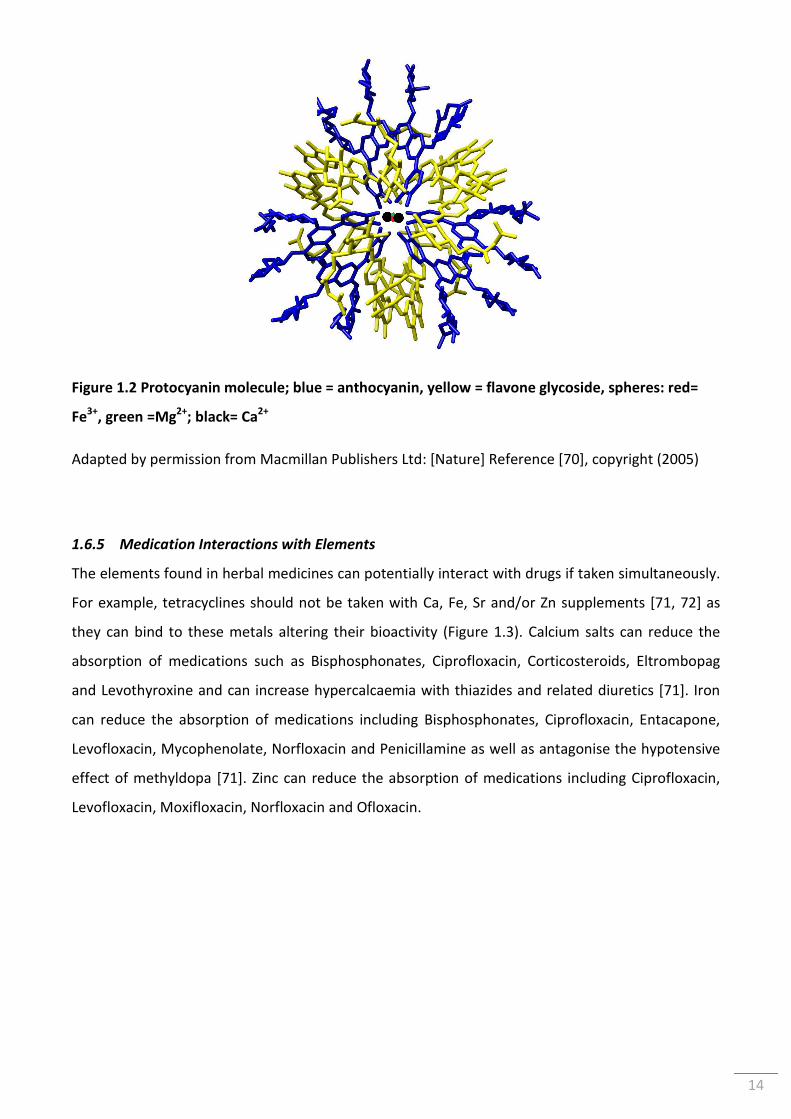
14
Figure 1.2 Protocyanin molecule; blue = anthocyanin, yellow = flavone glycoside, spheres: red=
Fe3+
, green =Mg2+
; black= Ca2+
Adapted by permission from Macmillan Publishers Ltd: [Nature] Reference [70], copyright (2005)
1.6.5 Medication Interactions with Elements
The elements found in herbal medicines can potentially interact with drugs if taken simultaneously.
For example, tetracyclines should not be taken with Ca, Fe, Sr and/or Zn supplements [71, 72] as
they can bind to these metals altering their bioactivity (Figure 1.3). Calcium salts can reduce the
absorption of medications such as Bisphosphonates, Ciprofloxacin, Corticosteroids, Eltrombopag
and Levothyroxine and can increase hypercalcaemia with thiazides and related diuretics [71]. Iron
can reduce the absorption of medications including Bisphosphonates, Ciprofloxacin, Entacapone,
Levofloxacin, Mycophenolate, Norfloxacin and Penicillamine as well as antagonise the hypotensive
effect of methyldopa [71]. Zinc can reduce the absorption of medications including Ciprofloxacin,
Levofloxacin, Moxifloxacin, Norfloxacin and Ofloxacin.
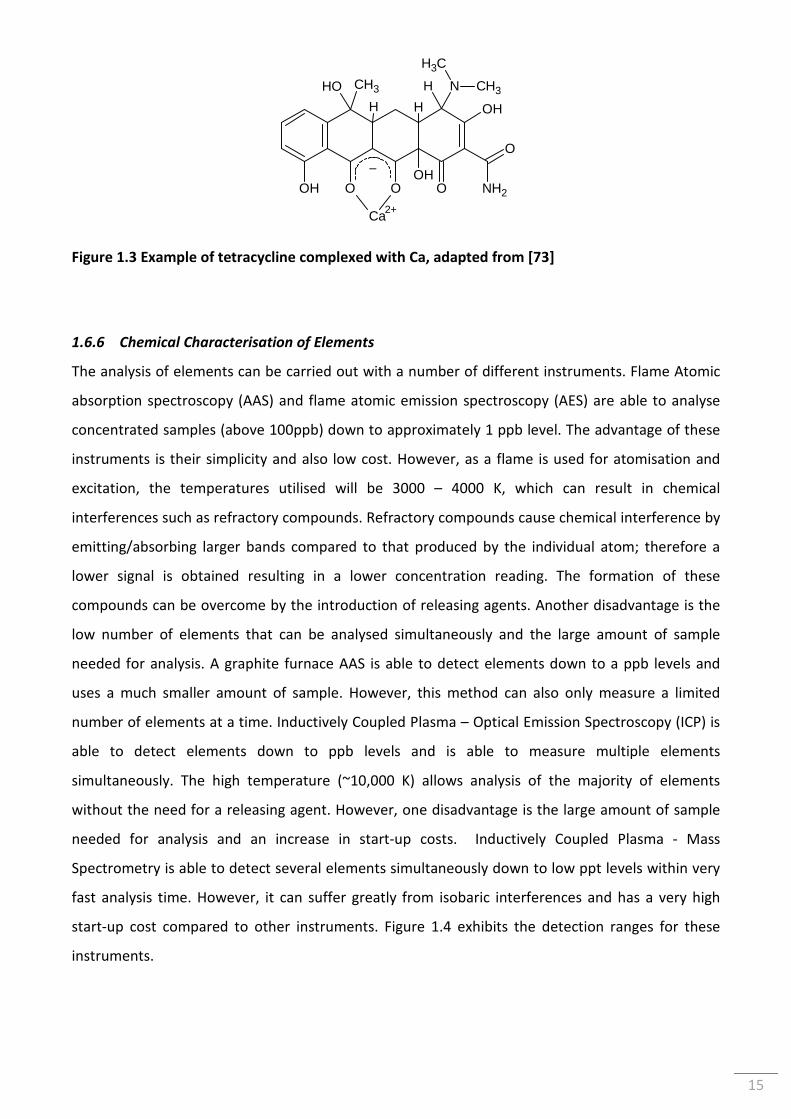
15
NH2
CH3
CH3
CH3N
OH O
OH
O O
O
OH
OH
H H
H
2+Ca
Figure 1.3 Example of tetracycline complexed with Ca, adapted from [73]
1.6.6 Chemical Characterisation of Elements
The analysis of elements can be carried out with a number of different instruments. Flame Atomic
absorption spectroscopy (AAS) and flame atomic emission spectroscopy (AES) are able to analyse
concentrated samples (above 100ppb) down to approximately 1 ppb level. The advantage of these
instruments is their simplicity and also low cost. However, as a flame is used for atomisation and
excitation, the temperatures utilised will be 3000 – 4000 K, which can result in chemical
interferences such as refractory compounds. Refractory compounds cause chemical interference by
emitting/absorbing larger bands compared to that produced by the individual atom; therefore a
lower signal is obtained resulting in a lower concentration reading. The formation of these
compounds can be overcome by the introduction of releasing agents. Another disadvantage is the
low number of elements that can be analysed simultaneously and the large amount of sample
needed for analysis. A graphite furnace AAS is able to detect elements down to a ppb levels and
uses a much smaller amount of sample. However, this method can also only measure a limited
number of elements at a time. Inductively Coupled Plasma – Optical Emission Spectroscopy (ICP) is
able to detect elements down to ppb levels and is able to measure multiple elements
simultaneously. The high temperature (~10,000 K) allows analysis of the majority of elements
without the need for a releasing agent. However, one disadvantage is the large amount of sample
needed for analysis and an increase in start-up costs. Inductively Coupled Plasma - Mass
Spectrometry is able to detect several elements simultaneously down to low ppt levels within very
fast analysis time. However, it can suffer greatly from isobaric interferences and has a very high
start-up cost compared to other instruments. Figure 1.4 exhibits the detection ranges for these
instruments.
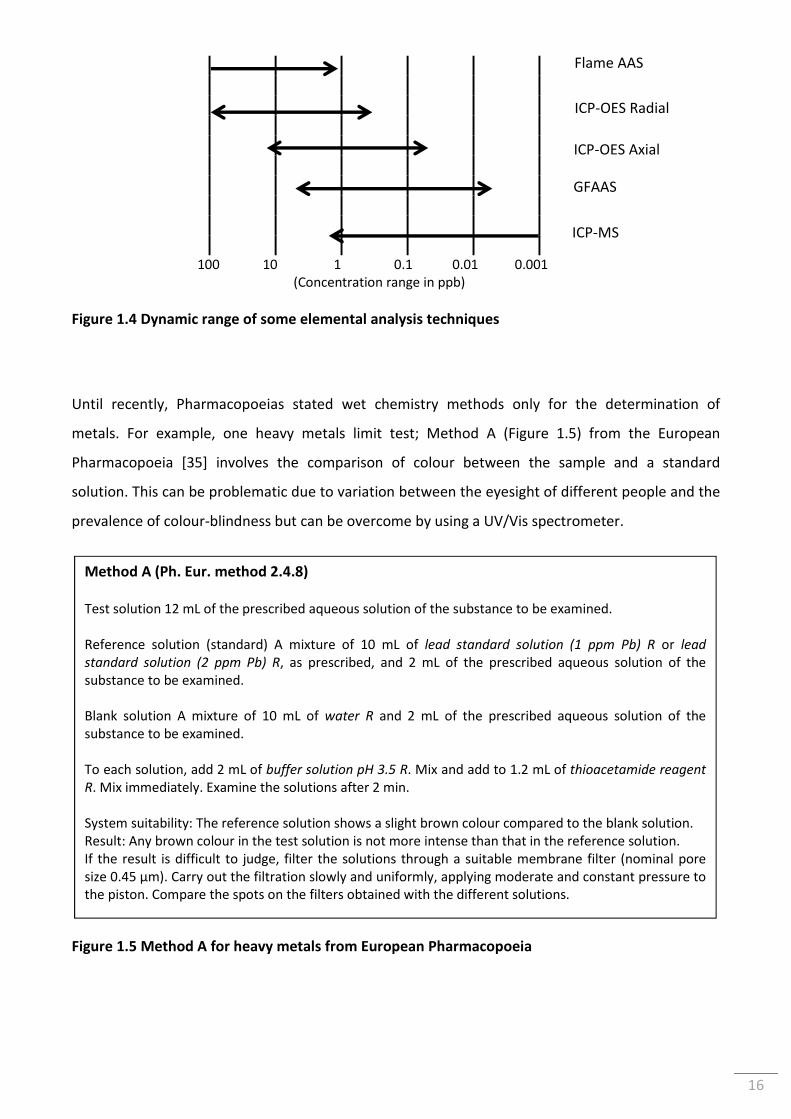
16
100 10 1 0.1 0.01 0.001 (Concentration range in ppb)
Figure 1.4 Dynamic range of some elemental analysis techniques
Until recently, Pharmacopoeias stated wet chemistry methods only for the determination of
metals. For example, one heavy metals limit test; Method A (Figure 1.5) from the European
Pharmacopoeia [35] involves the comparison of colour between the sample and a standard
solution. This can be problematic due to variation between the eyesight of different people and the
prevalence of colour-blindness but can be overcome by using a UV/Vis spectrometer.
Figure 1.5 Method A for heavy metals from European Pharmacopoeia
Method A (Ph. Eur. method 2.4.8)
Test solution 12 mL of the prescribed aqueous solution of the substance to be examined. Reference solution (standard) A mixture of 10 mL of lead standard solution (1 ppm Pb) R or lead standard solution (2 ppm Pb) R, as prescribed, and 2 mL of the prescribed aqueous solution of the substance to be examined. Blank solution A mixture of 10 mL of water R and 2 mL of the prescribed aqueous solution of the substance to be examined. To each solution, add 2 mL of buffer solution pH 3.5 R. Mix and add to 1.2 mL of thioacetamide reagent R. Mix immediately. Examine the solutions after 2 min. System suitability: The reference solution shows a slight brown colour compared to the blank solution. Result: Any brown colour in the test solution is not more intense than that in the reference solution. If the result is difficult to judge, filter the solutions through a suitable membrane filter (nominal pore size 0.45 µm). Carry out the filtration slowly and uniformly, applying moderate and constant pressure to the piston. Compare the spots on the filters obtained with the different solutions.
ICP-OES Radial
Flame AAS
ICP-OES Axial
GFAAS
ICP-MS
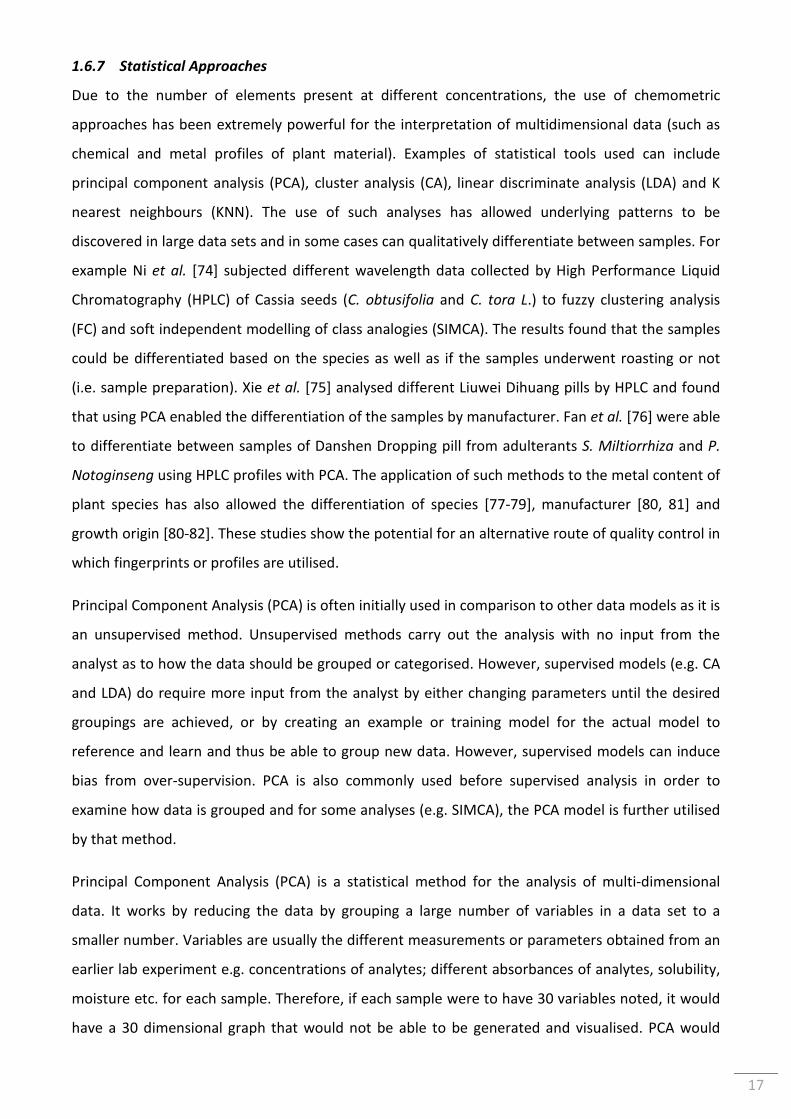
17
1.6.7 Statistical Approaches
Due to the number of elements present at different concentrations, the use of chemometric
approaches has been extremely powerful for the interpretation of multidimensional data (such as
chemical and metal profiles of plant material). Examples of statistical tools used can include
principal component analysis (PCA), cluster analysis (CA), linear discriminate analysis (LDA) and K
nearest neighbours (KNN). The use of such analyses has allowed underlying patterns to be
discovered in large data sets and in some cases can qualitatively differentiate between samples. For
example Ni et al. [74] subjected different wavelength data collected by High Performance Liquid
Chromatography (HPLC) of Cassia seeds (C. obtusifolia and C. tora L.) to fuzzy clustering analysis
(FC) and soft independent modelling of class analogies (SIMCA). The results found that the samples
could be differentiated based on the species as well as if the samples underwent roasting or not
(i.e. sample preparation). Xie et al. [75] analysed different Liuwei Dihuang pills by HPLC and found
that using PCA enabled the differentiation of the samples by manufacturer. Fan et al. [76] were able
to differentiate between samples of Danshen Dropping pill from adulterants S. Miltiorrhiza and P.
Notoginseng using HPLC profiles with PCA. The application of such methods to the metal content of
plant species has also allowed the differentiation of species [77-79], manufacturer [80, 81] and
growth origin [80-82]. These studies show the potential for an alternative route of quality control in
which fingerprints or profiles are utilised.
Principal Component Analysis (PCA) is often initially used in comparison to other data models as it is
an unsupervised method. Unsupervised methods carry out the analysis with no input from the
analyst as to how the data should be grouped or categorised. However, supervised models (e.g. CA
and LDA) do require more input from the analyst by either changing parameters until the desired
groupings are achieved, or by creating an example or training model for the actual model to
reference and learn and thus be able to group new data. However, supervised models can induce
bias from over-supervision. PCA is also commonly used before supervised analysis in order to
examine how data is grouped and for some analyses (e.g. SIMCA), the PCA model is further utilised
by that method.
Principal Component Analysis (PCA) is a statistical method for the analysis of multi-dimensional
data. It works by reducing the data by grouping a large number of variables in a data set to a
smaller number. Variables are usually the different measurements or parameters obtained from an
earlier lab experiment e.g. concentrations of analytes; different absorbances of analytes, solubility,
moisture etc. for each sample. Therefore, if each sample were to have 30 variables noted, it would
have a 30 dimensional graph that would not be able to be generated and visualised. PCA would
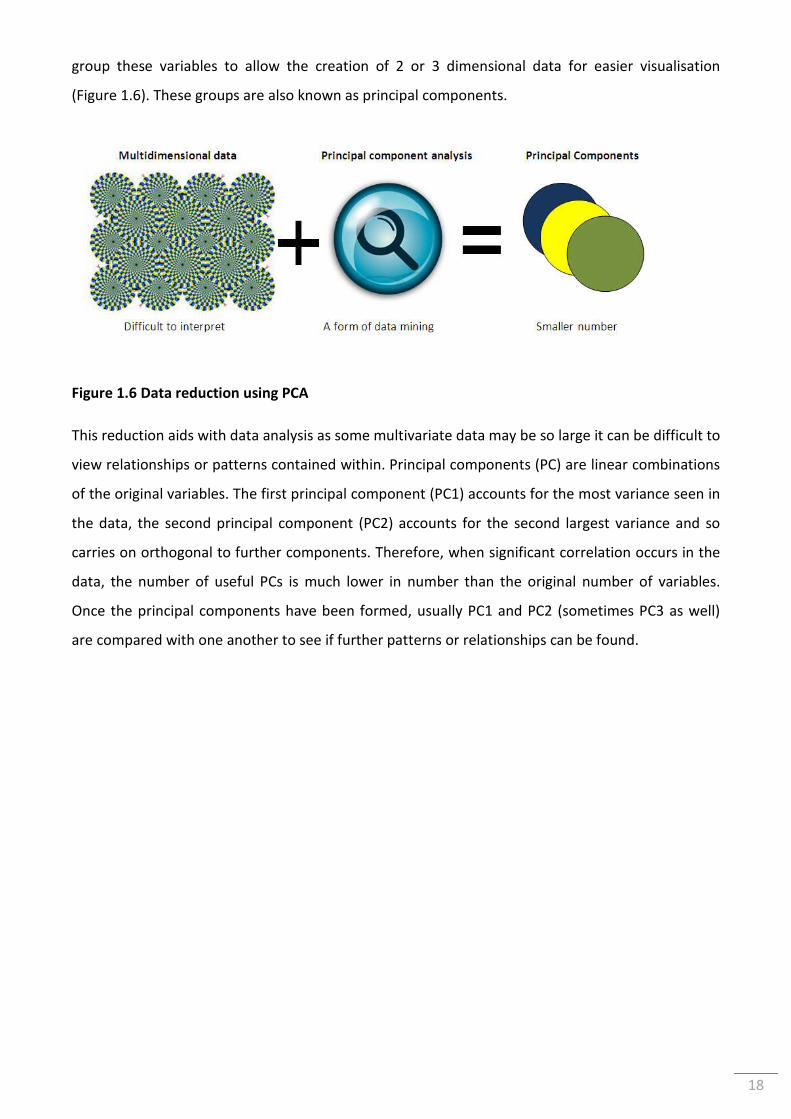
18
group these variables to allow the creation of 2 or 3 dimensional data for easier visualisation
(Figure 1.6). These groups are also known as principal components.
Figure 1.6 Data reduction using PCA
This reduction aids with data analysis as some multivariate data may be so large it can be difficult to
view relationships or patterns contained within. Principal components (PC) are linear combinations
of the original variables. The first principal component (PC1) accounts for the most variance seen in
the data, the second principal component (PC2) accounts for the second largest variance and so
carries on orthogonal to further components. Therefore, when significant correlation occurs in the
data, the number of useful PCs is much lower in number than the original number of variables.
Once the principal components have been formed, usually PC1 and PC2 (sometimes PC3 as well)
are compared with one another to see if further patterns or relationships can be found.
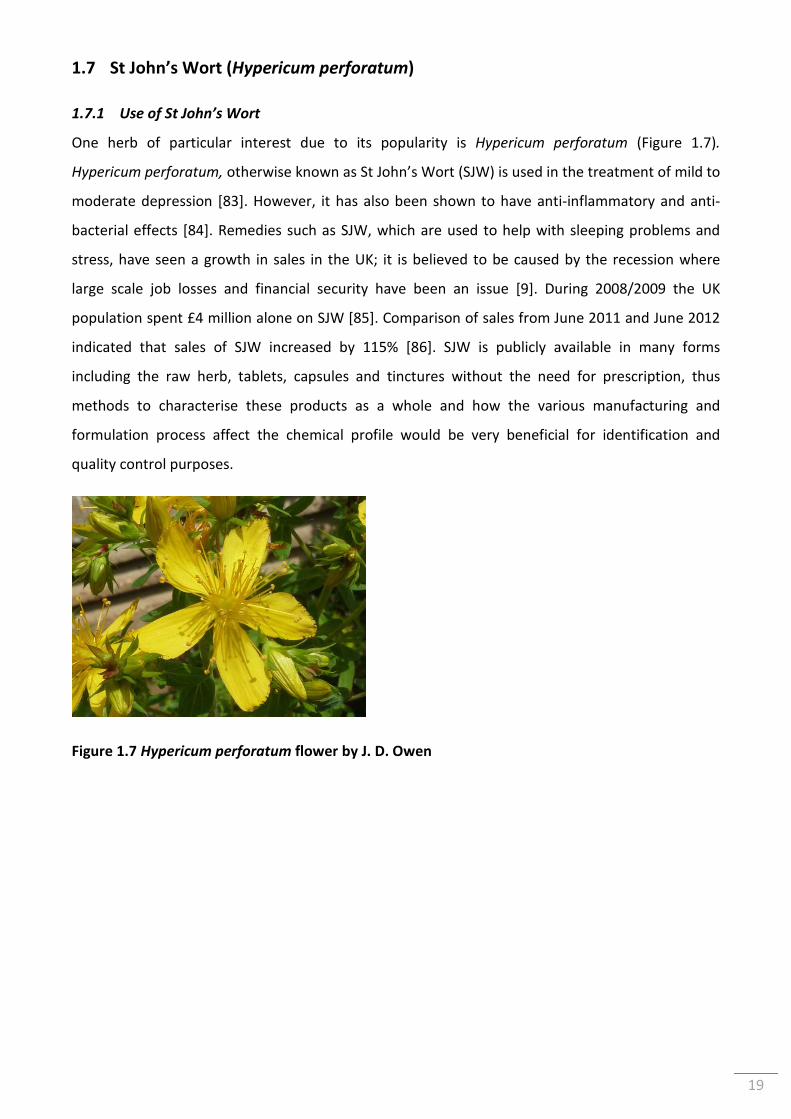
19
1.7 St John’s Wort (Hypericum perforatum)
1.7.1 Use of St John’s Wort
One herb of particular interest due to its popularity is Hypericum perforatum (Figure 1.7).
Hypericum perforatum, otherwise known as St John’s Wort (SJW) is used in the treatment of mild to
moderate depression [83]. However, it has also been shown to have anti-inflammatory and anti-
bacterial effects [84]. Remedies such as SJW, which are used to help with sleeping problems and
stress, have seen a growth in sales in the UK; it is believed to be caused by the recession where
large scale job losses and financial security have been an issue [9]. During 2008/2009 the UK
population spent £4 million alone on SJW [85]. Comparison of sales from June 2011 and June 2012
indicated that sales of SJW increased by 115% [86]. SJW is publicly available in many forms
including the raw herb, tablets, capsules and tinctures without the need for prescription, thus
methods to characterise these products as a whole and how the various manufacturing and
formulation process affect the chemical profile would be very beneficial for identification and
quality control purposes.
Figure 1.7 Hypericum perforatum flower by J. D. Owen
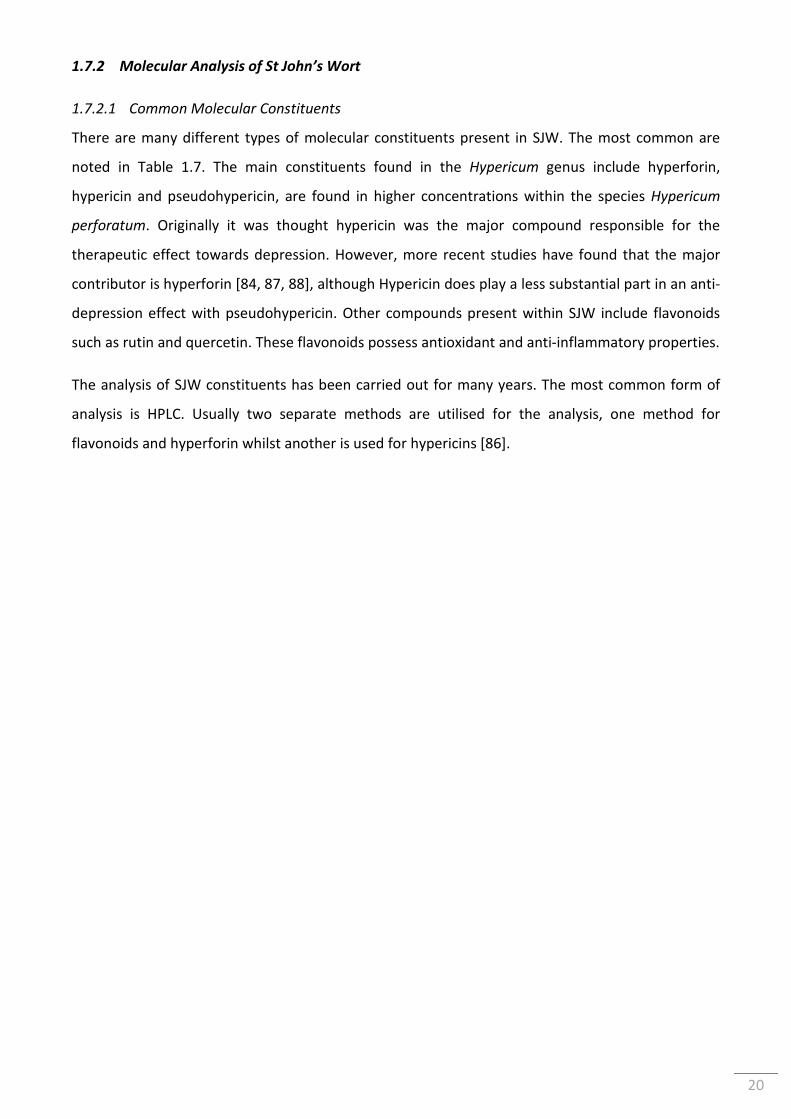
20
1.7.2 Molecular Analysis of St John’s Wort
1.7.2.1 Common Molecular Constituents
There are many different types of molecular constituents present in SJW. The most common are
noted in Table 1.7. The main constituents found in the Hypericum genus include hyperforin,
hypericin and pseudohypericin, are found in higher concentrations within the species Hypericum
perforatum. Originally it was thought hypericin was the major compound responsible for the
therapeutic effect towards depression. However, more recent studies have found that the major
contributor is hyperforin [84, 87, 88], although Hypericin does play a less substantial part in an anti-
depression effect with pseudohypericin. Other compounds present within SJW include flavonoids
such as rutin and quercetin. These flavonoids possess antioxidant and anti-inflammatory properties.
The analysis of SJW constituents has been carried out for many years. The most common form of
analysis is HPLC. Usually two separate methods are utilised for the analysis, one method for
flavonoids and hyperforin whilst another is used for hypericins [86].
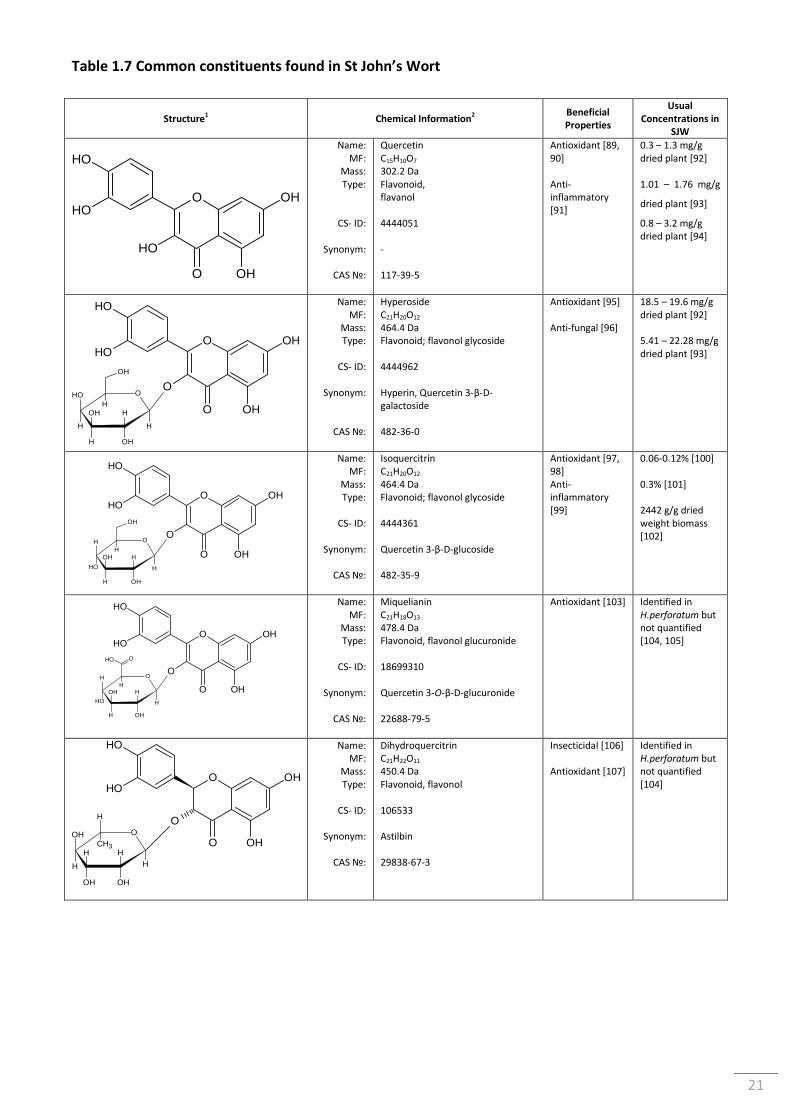
21
Table 1.7 Common constituents found in St John’s Wort
Structure1
Chemical Information2 Beneficial
Properties
Usual
Concentrations in
SJW
OH
OH
OH
OHO
OH
O
Name: MF:
Mass: Type:
CS- ID:
Synonym:
CAS №:
Quercetin C15H10O7
302.2 Da Flavonoid, flavanol 4444051 - 117-39-5
Antioxidant [89, 90] Anti-inflammatory [91]
0.3 – 1.3 mg/g dried plant [92] 1.01 – 1.76 mg/g
dried plant [93]
0.8 – 3.2 mg/g dried plant [94]
O
HH
OH
H
OH
H OH
H
OH
OH
OH
OH
OHO
O
O
Name: MF:
Mass: Type:
CS- ID:
Synonym:
CAS №:
Hyperoside C21H20O12
464.4 Da Flavonoid; flavonol glycoside 4444962 Hyperin, Quercetin 3-β-D-galactoside 482-36-0
Antioxidant [95] Anti-fungal [96]
18.5 – 19.6 mg/g dried plant [92] 5.41 – 22.28 mg/g dried plant [93]
O
HH
OH
H
OH
H OH
H
OH
OH
OH
OH
OHO
O
O
Name: MF:
Mass: Type:
CS- ID:
Synonym:
CAS №:
Isoquercitrin C21H20O12 464.4 Da Flavonoid; flavonol glycoside 4444361 Quercetin 3-β-D-glucoside 482-35-9
Antioxidant [97, 98] Anti-inflammatory [99]
0.06-0.12% [100] 0.3% [101] 2442 g/g dried weight biomass [102]
OH
O
HH
OH
H
OH
H OH
H
O
OH
OH
OH
OHO
O
O
Name: MF:
Mass: Type:
CS- ID:
Synonym:
CAS №:
Miquelianin C21H18O13 478.4 Da Flavonoid, flavonol glucuronide 18699310 Quercetin 3-O-β-D-glucuronide 22688-79-5
Antioxidant [103] Identified in H.perforatum but not quantified [104, 105]
OH
OH
OH
OHO
O
O
O
HCH3
OH
H
H
OH OH
H
H
Name: MF:
Mass: Type:
CS- ID:
Synonym:
CAS №:
Dihydroquercitrin C21H22O11 450.4 Da Flavonoid, flavonol 106533 Astilbin 29838-67-3
Insecticidal [106] Antioxidant [107]
Identified in H.perforatum but not quantified [104]
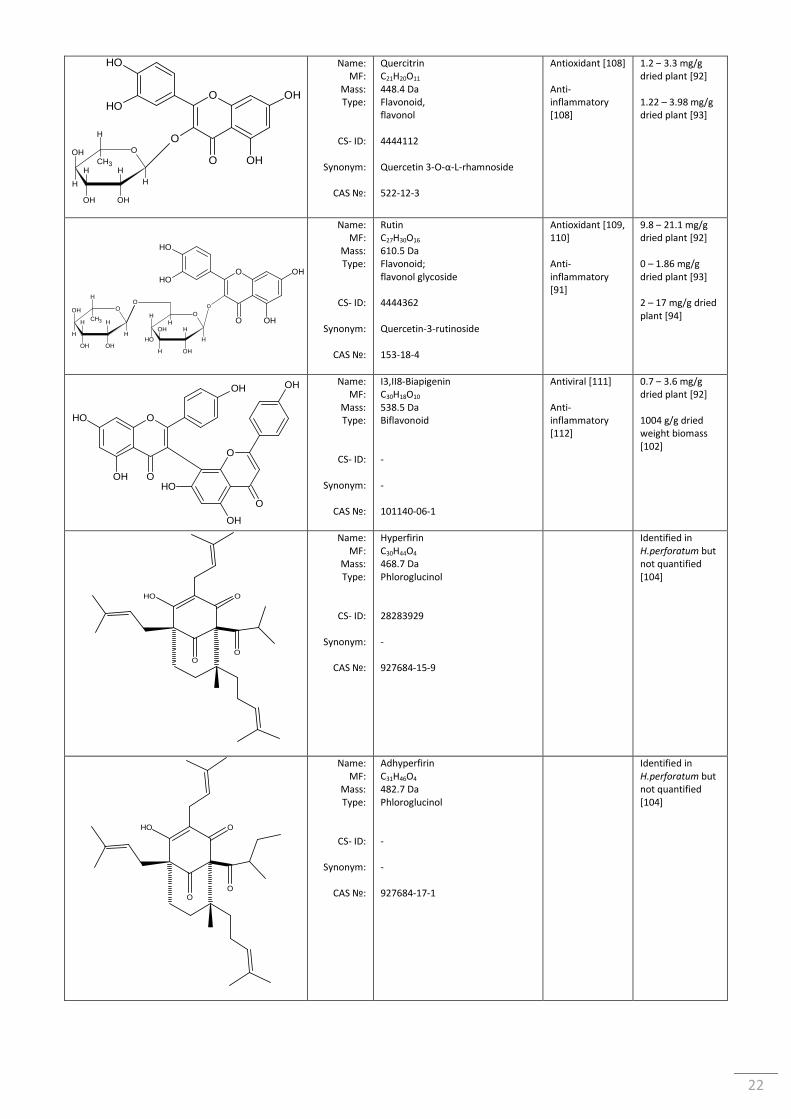
22
OH
OH
OH
OHO
O
O
O
HCH3
OH
H
H
OH OH
H
H
Name: MF:
Mass: Type:
CS- ID:
Synonym:
CAS №:
Quercitrin C21H20O11
448.4 Da Flavonoid, flavonol 4444112 Quercetin 3-O-α-L-rhamnoside 522-12-3
Antioxidant [108] Anti-inflammatory [108]
1.2 – 3.3 mg/g dried plant [92] 1.22 – 3.98 mg/g dried plant [93]
O
H
HCH3
OH
H
H
OH OH
HO
O
H
HH
H
OH
OH
H OH
OH
OH
OH
OHO
O
O
Name: MF:
Mass: Type:
CS- ID:
Synonym:
CAS №:
Rutin C27H30O16
610.5 Da Flavonoid; flavonol glycoside 4444362 Quercetin-3-rutinoside 153-18-4
Antioxidant [109, 110] Anti-inflammatory [91]
9.8 – 21.1 mg/g dried plant [92] 0 – 1.86 mg/g dried plant [93] 2 – 17 mg/g dried plant [94]
OH
OH
OH O
O
OH
OH
OH
O
O
Name: MF:
Mass: Type:
CS- ID:
Synonym:
CAS №:
I3,II8-Biapigenin C30H18O10
538.5 Da Biflavonoid - - 101140-06-1
Antiviral [111] Anti-inflammatory [112]
0.7 – 3.6 mg/g dried plant [92] 1004 g/g dried weight biomass [102]
O
OHO
O
Name: MF:
Mass: Type:
CS- ID:
Synonym:
CAS №:
Hyperfirin C30H44O4
468.7 Da Phloroglucinol 28283929 - 927684-15-9
Identified in H.perforatum but not quantified [104]
O
OHO
O
Name: MF:
Mass: Type:
CS- ID:
Synonym:
CAS №:
Adhyperfirin C31H46O4
482.7 Da Phloroglucinol - - 927684-17-1
Identified in H.perforatum but not quantified [104]
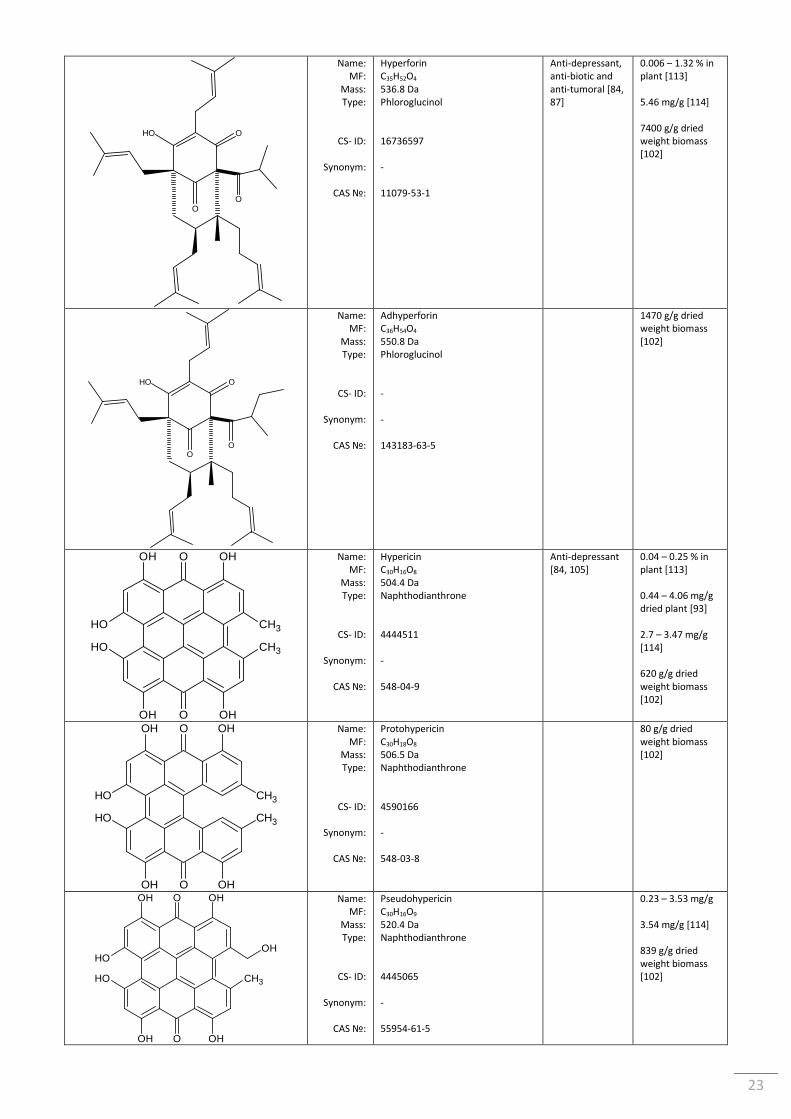
23
O
OHO
O
Name: MF:
Mass: Type:
CS- ID:
Synonym:
CAS №:
Hyperforin C35H52O4
536.8 Da Phloroglucinol 16736597 - 11079-53-1
Anti-depressant, anti-biotic and anti-tumoral [84, 87]
0.006 – 1.32 % in plant [113] 5.46 mg/g [114] 7400 g/g dried weight biomass [102]
O
OHO
O
Name: MF:
Mass: Type:
CS- ID:
Synonym:
CAS №:
Adhyperforin C36H54O4
550.8 Da Phloroglucinol - - 143183-63-5
1470 g/g dried weight biomass [102]
CH3
CH3
OH
OH
OH
OH
OH
OH
O
O
Name: MF:
Mass: Type:
CS- ID:
Synonym:
CAS №:
Hypericin C30H16O8
504.4 Da Naphthodianthrone 4444511 - 548-04-9
Anti-depressant [84, 105]
0.04 – 0.25 % in plant [113] 0.44 – 4.06 mg/g dried plant [93] 2.7 – 3.47 mg/g [114] 620 g/g dried weight biomass [102]
CH3
CH3
OH
OH
OH
OH
OH
OH
O
O
Name: MF:
Mass: Type:
CS- ID:
Synonym:
CAS №:
Protohypericin C30H18O8
506.5 Da Naphthodianthrone 4590166 - 548-03-8
80 g/g dried weight biomass [102]
CH3
OH
OH
OH
OH
OH
OH
OH
O
O
Name: MF:
Mass: Type:
CS- ID:
Synonym:
CAS №:
Pseudohypericin C30H16O9
520.4 Da Naphthodianthrone 4445065 - 55954-61-5
0.23 – 3.53 mg/g 3.54 mg/g [114] 839 g/g dried weight biomass [102]
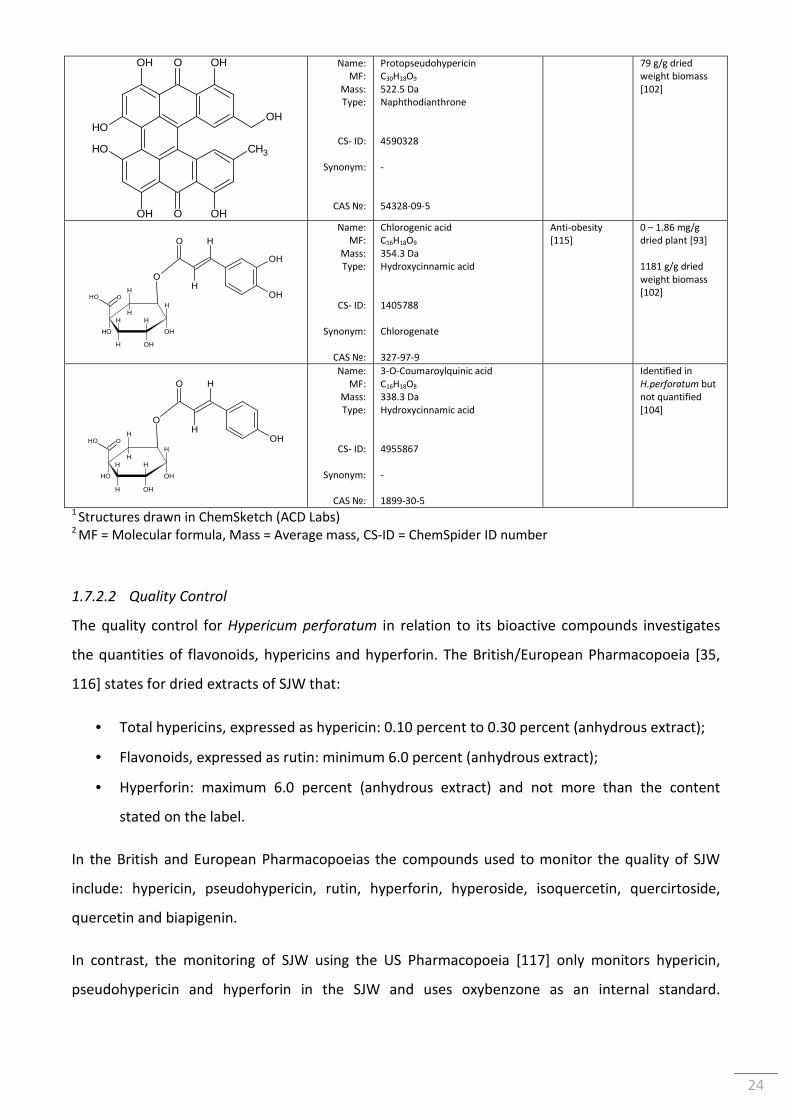
24
CH3
OH
OH
OH
OH
OH
OH
OH
O
O
Name: MF:
Mass: Type:
CS- ID:
Synonym:
CAS №:
Protopseudohypericin C30H18O9
522.5 Da Naphthodianthrone 4590328 - 54328-09-5
79 g/g dried weight biomass [102]
OH
OH
O
O
H
HOH O
OH
HH
OH
H
H OH
H
H
Name: MF:
Mass: Type:
CS- ID:
Synonym:
CAS №:
Chlorogenic acid C16H18O9
354.3 Da Hydroxycinnamic acid 1405788 Chlorogenate 327-97-9
Anti-obesity [115]
0 – 1.86 mg/g dried plant [93] 1181 g/g dried weight biomass [102]
OH
O
O
H
HOH O
OH
HH
OH
H
H OH
H
H
Name: MF:
Mass: Type:
CS- ID:
Synonym:
CAS №:
3-O-Coumaroylquinic acid C16H18O8 338.3 Da Hydroxycinnamic acid 4955867 - 1899-30-5
Identified in H.perforatum but not quantified [104]
1 Structures drawn in ChemSketch (ACD Labs) 2 MF = Molecular formula, Mass = Average mass, CS-ID = ChemSpider ID number
1.7.2.2 Quality Control
The quality control for Hypericum perforatum in relation to its bioactive compounds investigates
the quantities of flavonoids, hypericins and hyperforin. The British/European Pharmacopoeia [35,
116] states for dried extracts of SJW that:
• Total hypericins, expressed as hypericin: 0.10 percent to 0.30 percent (anhydrous extract);
• Flavonoids, expressed as rutin: minimum 6.0 percent (anhydrous extract);
• Hyperforin: maximum 6.0 percent (anhydrous extract) and not more than the content
stated on the label.
In the British and European Pharmacopoeias the compounds used to monitor the quality of SJW
include: hypericin, pseudohypericin, rutin, hyperforin, hyperoside, isoquercetin, quercirtoside,
quercetin and biapigenin.
In contrast, the monitoring of SJW using the US Pharmacopoeia [117] only monitors hypericin,
pseudohypericin and hyperforin in the SJW and uses oxybenzone as an internal standard.
25
Concentrations of all three compounds must fall between 90.0%–110.0% relative to the
oxybenzone; the flavonoids rutin and hyperoside are used in the identification process only.
1.7.3 Elemental Analysis of St John’s Wort
1.7.3.1 Known Elemental Constituents
Previous studies [118-145] investigating the elemental content of SJW raw plant and preparations
demonstrate the varied elemental profile of SJW where the elements Cd, Cu, Fe, Mn, Pb and Zn
were found in concentrations in the range of 0.04-20 μg/g, 4-200 μg/g, 6-1300 μg/g, 8-450 μg/g,
≤0.1-20 μg/g and 10-200 μg/g, respectively. The concentration of other elements in SJW samples
such as Al, As, B, Ba, Ca, Co, Cr, Hg, Mg, Mo, Ni, Sb, Sn, Sr and V has also been reported in the
literature [119, 125, 126, 129, 131, 142, 145] with techniques such as ICP-OES, ICP-MS, FAAS, FAES,
GFAAS and anodic stripping voltammetry. SJW is also known to be an accumulator of the element
Cd [66, 120] which is known to be toxic in high concentrations [146].
The elements present in SJW raw herbs mostly enter the plant tissue via the presence of the
elements in the growth medium. However, during processing elemental contamination can occur in
a number of ways from the mechanical processing, incorrect storage and the addition of bulking
agents.
1.7.3.2 Quality Control
Elemental quality control of SJW is still rather limited. The British and European Pharmacopoeias
[35, 53] specify the analysis of all herbal remedies to be tested for a minimum of Cd, Hg and Pb
(Table 1.3). Whereas the US Pharmacopoeia states that no more than 50 µg/g of heavy metals
should be present using Method II regarding heavy metals [147] which is a colour-comparison wet
chemistry method despite the new guidelines brought in for oral drugs which is based on atomic
spectroscopy (Table 1.2). This method does not include the quantification of Hg.
1.7.4 Links between Elements and Bioactive Compounds
The binding of metal ions with bioactive compounds has been shown to modify the biological
effects compared to the organic constituents alone. One such effect is the production of the
bioactive compounds. In regards to SJW, the presence of Cr (0.01mM) resulted in an increase in the
production of protopseudohypericin (+135%), hypericin (+38%) and pseudohypericin (+5%). Higher
concentrations of Cr (0.1 mM) resulted in a further increase of protopseudohypericin (+167%), but
26
the amounts were similar for hypericin (+25%) and pseudohypericin (+5%) [148] when compared to
using 0.01mM Cr. However, in the presence of Ni, an opposite relationship was observed. A
concentration of 25 mM or 50 mM Ni caused the levels of hypericin and pseudohypericin to
significantly decrease by 21- and 15-fold, respectively, whilst hyperforin production fell below limits
of detection [149]. A second relationship noted between elements and bioactive compounds is an
alteration to bioactivity. For example, flavonoids such as rutin and quercetin have been shown to
bind to metal ions (see Chapter 5, Table 5.1) and as a result the functions such as antioxidant [109,
150] and anti-inflammatory [109] properties increased compared to the flavonoid alone or in some
cases became pro-oxidant [109]. A third relationship between elements and bioactive compounds is
bioavailability. It was found that chickens fed an element rich diet in the presence of herbal
remedies were able to uptake more elements into their tissues [151]. Interestingly, the type of
herbal medicine influenced the concentrations of different metals to different tissues. For example,
Sage significantly increased levels of Cu, Fe, Mn, and Zn in chicken liver whereas St. John’s Wort and
Small-flowered Willowherb did not. On the other hand, the presence of SJW significantly increased
the concentrations of Zn in chicken legs [151]. These studies suggest metal-bioactive compound
complexes may be more bioavailable, but more research is needed.
1.7.5 Statistical Approaches
A few studies have used chemometrics to investigate the elemental content of SJW, but these
studies are more focused on other plant species or plants found in polluted areas. In a study by
Ražić and co-workers [142] the elements Cu, Zn, Mn, Fe, K, Ca, Mg, Al, Ba and B were examined in
twenty-six medicinal herbs of which one was SJW. Positive correlations between metal
concentrations were found using PCA (e.g. Al and Fe correlated at the 0.01 significance level).
Moreno-Jiménez and co-workers [136], monitored the elements Cd, Cu, Fe, Mn and Zn in 25
different plant species grown in a polluted mining area which included Hypericum perforatum (n ≤
12) as well as other plants from different families such as Digitalis thapsi, Salix atrocinerea and
Cytisus scoparius. The multivariate data was analysed using correlation analysis as well as PCA and
showed that Cd and Zn uptake was the greatest variant between species, Cu and Fe uptake was
more homogeneous and Mn uptake was independent of pollution. This suggests that the uptake of
certain elements is controlled by the plant whereas others are not and is species dependant.
27
1.8 Aim of Study
The aim of this study is to assess if the elemental profile of SJW could be used as a quality indicator.
In order to use elemental profiling as a quality indicator several aspects need to be investigated;
therefore the specific objectives of this study are to:
• Develop an accurate method for the elemental profiling of various SJW preparations;
• Analyse a large number of SJW preparations to determine the underlying elemental
patterns;
• Evaluate the metal transfer properties of SJW when preparing formulated products from the
herb;
• Develop a method to identity and quantify SJW bioactive constituents;
• Compare the elemental profile with the molecular profile to assess correlation and possible
biomarker identification.
28
2 Method Development for the Elemental Analysis of
Hypericum perforatum (St John’s Wort) Preparations
2.1 Introduction
The analysis of herbal remedies for elemental purposes is generally done so in order to determine if
the concentrations of such elements are harmful to health. This is especially true for toxic elements
such as As, Cd, Hg and Pb [35, 53, 117]. Several incidents have been reported whereby persons
have come to harm through metal poisoning via the ingestion of herbal medicines [21, 26, 152,
153]. For example, two 5 year old boys (one from Italy, the other from China) were poisoned by As
and Hg respectively [26] due to the ingestion of herbal medicines. These as well as other elements
can enter the plant via a number of instances; the element could be present in the growth medium
and taken-up through natural growing purposes via the roots or introduced via air pollution in
addition to manufacturing/processing. During manufacturing, the addition of toxic elements may
be accidental or on purpose. Accidental contamination could occur from poor storage or improper
following of Good Manufacturing Practices (GMP) whereas known addition of elements could be
through bulking agents or as an active ingredient. For example, in many Asian herbal medicines it
has been common to add cinnabar (mercury (II) sulphide) [51] or realgar (arsenic sulphide) [52].
Recent studies show the examination of elements with plants could be used in other fields of
research in addition to monitoring levels of toxic elements in items for food consumption. This
includes the exploitation of a plants elemental up-take to increase nutritional enrichment [154], for
cleaning contaminated land [155], to increase the production of secondary metabolites or
Bioactive Plant Compounds (BPCs) of interest [148, 149, 156] or possibly improve bioactivity or
absorption of elements and BPCs into the body via complexing [151]. However, there are several
challenges when analysing plant material for elemental content. The most profound being the lack
of certified reference material (CRMs) for trace elements in herbal remedies. The majority of CRMs
for trace analysis that are available are either not used for general food consumption (e.g., peach,
apple or tomato leaves), are used as bases for foods (e.g., oats, wheat, barley), or are popular fruit,
vegetables or salads (e.g., potato, cucumber, lettuce, sprouts). Trace element CRMs for true herbal
medicines are very limited (e.g., dandelion, clover, pansy, ginkgo biloba). Elements are often
present at trace levels in herbal medicines and due to this great care must be taken in order to
analyse these reproducibly and without introducing contamination. The herbal remedy, St John’s
Wort (SJW) is of interest as it is a known metal accumulator [118-145] and is known to contain
numerous bioactive compounds [98, 104, 127]. This herb is also popular within Europe and the USA
29
[9, 85] as it is utilised for its anti-depressant therapeutic effect [83, 101]. A number of studies [118-
145] have investigated the elemental content of SJW plant and/or preparations in which
concentrations of Cd, Cu, Fe, Mn, Pb and Zn have been found in the range of 0.04-20 μg/g, 4-200
μg/g, 6-1300 μg/g, 8-450 μg/g, ≤0.1-20 μg/g and 10-200 μg/g, respectively. Other studies have
monitored the concentrations of Al, As, B, Ba, Ca, Co, Cr, Hg, Mg, Mo, Ni, Sb, Sn, Sr and V [119, 125,
126, 129, 131, 142, 145]. For a full summary of such studies, please see
Table 10.5, Appendix 10.2.
The techniques employed by these studies vary greatly. For example, there were 16 studies that
utilised AAS [118, 120-122, 125, 127, 128, 130, 132, 133, 136, 137, 140, 142, 143, 157], 4 that
applied GFAAS [120, 125, 126, 131], 6 that used ICP-OES [126, 129, 138, 139, 142, 145] with an
equal number using ICP-MS [119, 123, 124, 131, 141, 144] in addition to 3 studies that applied AES
[125, 128, 142] for the determination of elemental content in SJW. A smaller number of studies
employed Hanging Mercury Drop Electrode (HMDE) [135], Thin Mercury Film Electrode (TMFE)
[139], Direct Mercury Analyser (DMA) [134] or LA-ICP-MS [119] analysis for the elemental
determination. Thus, with different instruments of analysis being utilised it is also inherent that
many different sample preparation techniques have also been exploited. This includes the acid used
to digest the SJW material; varying in aspects of volume and composition (e.g., a single acid such as
HNO3 to a mixture of several acids) as well as the technique of the digestion; varying in length of
time, temperature and equipment (e.g., hotplate or microwave). In addition to this, several of the
studies [118, 120, 122, 123, 132, 133, 138, 143, 157] examined 5 elements or less in the SJW
samples. Also noted is that some of the observed studies [122, 126, 130, 136, 158, 159] contribute
data based on SJW grown in a single country or region which, on their own, do not allow full
interpretation of these elemental concentrations due to soil and climate constrictions in addition to
the majority of the studies examining only the raw herb.
As discussed earlier, the lack of a SJW reference material is an issue for its elemental validation. As
such, where these studies have used reference materials to aid validation the material used differs
greatly. Some studies have opted for plant based CRMs such as tomato leaves [119, 134, 142],
peach leaves [119], spinach leaves [119] hay powder [121] tea leaves [144, 160] mixed polish herbs
[160] grass [135] and Rosa plant [135] whereas other studies have utilised reference materials
which are not plant-based including soil [134], dogfish muscle tissue [134] and lobster
hepatopancreas tissue [134]. Therefore, although the studies above have investigated element
30
concentrations in SJW, they are often limited by the number of elements, number of samples and
geographic location. There are also extremely large discrepancies in the consistency of analysis
between these studies, which make it difficult to correlate the information gathered for further
interpretation.
In this study, a single method was developed using ICP-OES in order to obtain the concentrations of
25 elements (i.e., Al, As, B, Ba, Be, Ca, Cd, Co, Cr, Cu, Fe, Hg, In, Mg, Mn, Mo, Ni, Pb, Pt, Sb, Se, Sr, V,
Y and Zn) in a range of SJW preparations including raw herb, tablet and capsule form.
2.2 Method
2.2.1 Materials
2.2.1.1 Reagents, Standards and Samples
High-purity (99.99% trace metal basis) nitric acid 70% (Sigma-Aldrich, Gillingham, UK), high purity
37% trace metal grade hydrochloric acid (Sigma-Aldrich, Gillingham, UK), high purity 35%, trace
metal grade hydrogen peroxide (Sigma-Aldrich, Gillingham, UK) and high purity ammonium fluoride
(Sigma-Aldrich, Gillingham, UK) was used for determining the optimum acid mixture for the
digestion of samples and the recovery of trace metals. Elemental stock solutions, 1000 ppm of Al,
As, B, Ba, Cd, Co, Pb, Mg, Mn, Mo, Ni, In and Hg (Fisher, Loughborough, UK), Be and Pt (VWR,
Lutterworth, UK), Ca, Cr, Cu, Fe, Sb, Se, Sr and Zn (Merck, Feltham, UK), V (Sigma-Aldrich,
Gillingham, UK) and Y (Acros organics, Geel, Belgium) were used to prepare calibration standards
and ICP-OES optimisation solution. Certified reference material NIST Polish tea (NIST INCT-TL-1) for
trace metals was used within method development and validation. Samples of St John’s wort
(Hypericum perforatum) including raw herbs, tablets and capsules were sourced from retail and
internet suppliers (Table 3.1).
2.2.1.2 Instrumentation
Acid digestion was carried out using a Mars Xpress microwave (CEM Corporation, Middle Slade, UK)
with Teflon digestion vessels. Elemental analysis was carried out using a Varian 710-ES ICP-OES with
SPS3 autosampler.
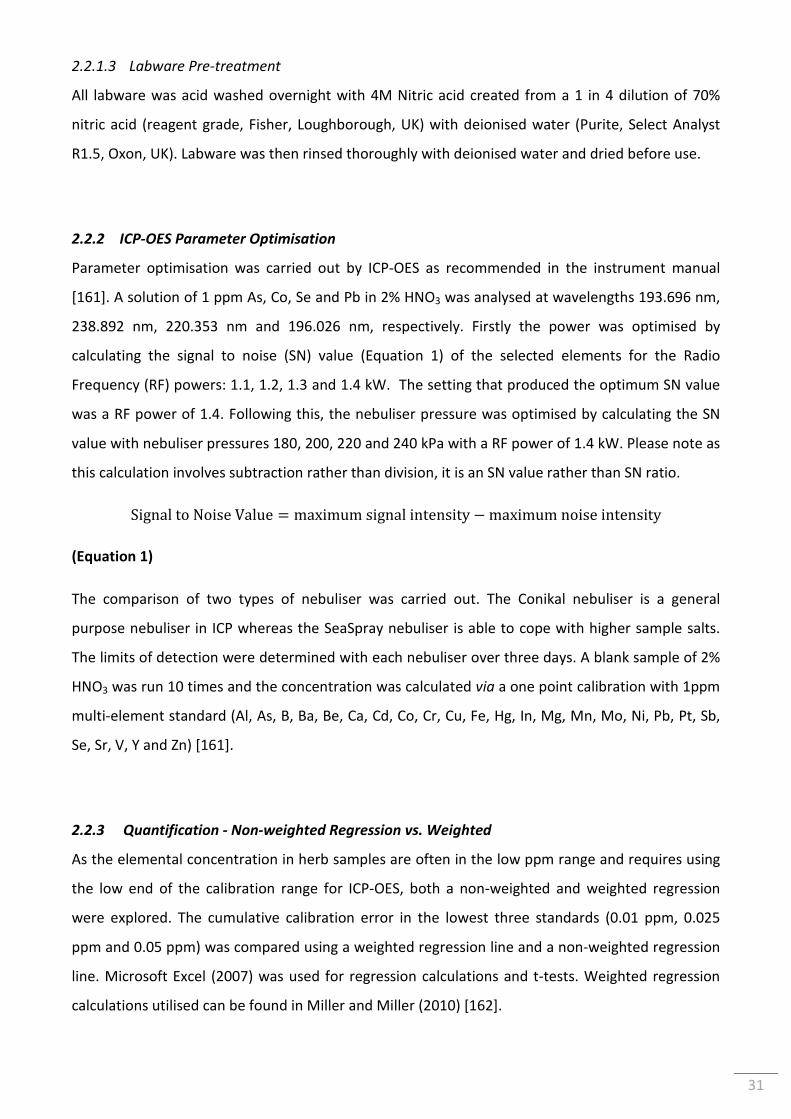
31
2.2.1.3 Labware Pre-treatment
All labware was acid washed overnight with 4M Nitric acid created from a 1 in 4 dilution of 70%
nitric acid (reagent grade, Fisher, Loughborough, UK) with deionised water (Purite, Select Analyst
R1.5, Oxon, UK). Labware was then rinsed thoroughly with deionised water and dried before use.
2.2.2 ICP-OES Parameter Optimisation
Parameter optimisation was carried out by ICP-OES as recommended in the instrument manual
[161]. A solution of 1 ppm As, Co, Se and Pb in 2% HNO3 was analysed at wavelengths 193.696 nm,
238.892 nm, 220.353 nm and 196.026 nm, respectively. Firstly the power was optimised by
calculating the signal to noise (SN) value (Equation 1) of the selected elements for the Radio
Frequency (RF) powers: 1.1, 1.2, 1.3 and 1.4 kW. The setting that produced the optimum SN value
was a RF power of 1.4. Following this, the nebuliser pressure was optimised by calculating the SN
value with nebuliser pressures 180, 200, 220 and 240 kPa with a RF power of 1.4 kW. Please note as
this calculation involves subtraction rather than division, it is an SN value rather than SN ratio.
SignaltoNoiseValue = maximumsignalintensity −maximumnoiseintensity
(Equation 1)
The comparison of two types of nebuliser was carried out. The Conikal nebuliser is a general
purpose nebuliser in ICP whereas the SeaSpray nebuliser is able to cope with higher sample salts.
The limits of detection were determined with each nebuliser over three days. A blank sample of 2%
HNO3 was run 10 times and the concentration was calculated via a one point calibration with 1ppm
multi-element standard (Al, As, B, Ba, Be, Ca, Cd, Co, Cr, Cu, Fe, Hg, In, Mg, Mn, Mo, Ni, Pb, Pt, Sb,
Se, Sr, V, Y and Zn) [161].
2.2.3 Quantification - Non-weighted Regression vs. Weighted
As the elemental concentration in herb samples are often in the low ppm range and requires using
the low end of the calibration range for ICP-OES, both a non-weighted and weighted regression
were explored. The cumulative calibration error in the lowest three standards (0.01 ppm, 0.025
ppm and 0.05 ppm) was compared using a weighted regression line and a non-weighted regression
line. Microsoft Excel (2007) was used for regression calculations and t-tests. Weighted regression
calculations utilised can be found in Miller and Miller (2010) [162].
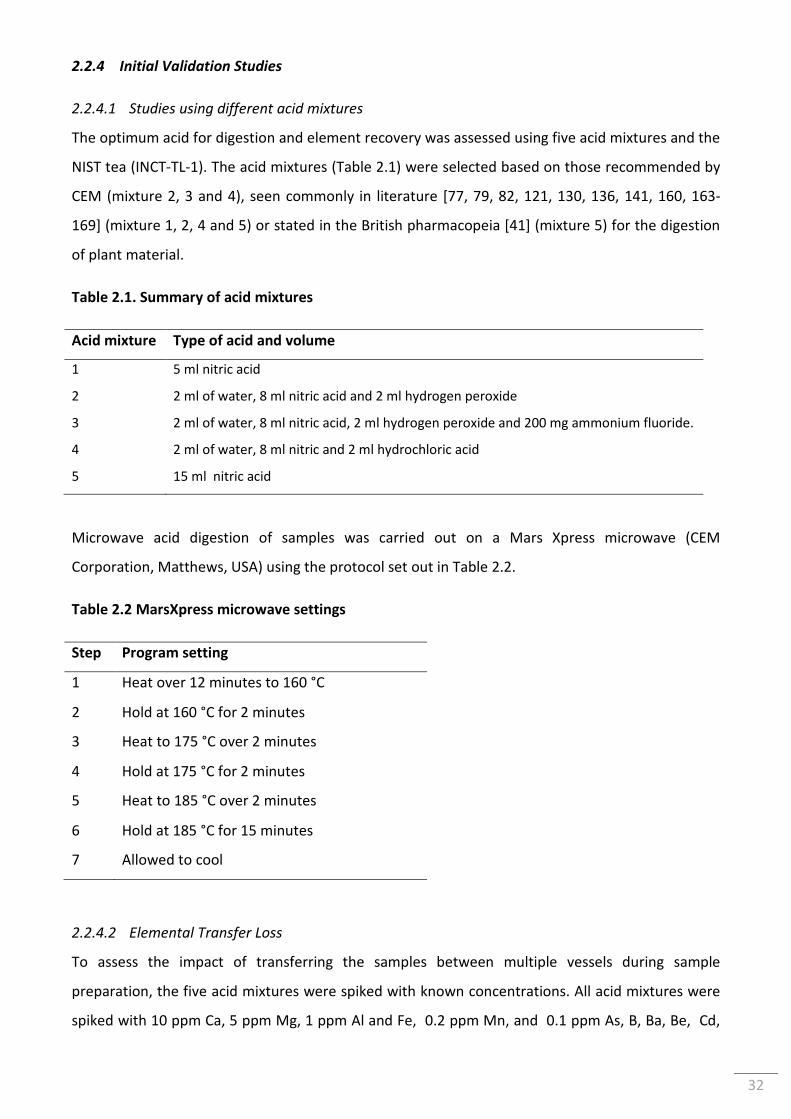
32
2.2.4 Initial Validation Studies
2.2.4.1 Studies using different acid mixtures
The optimum acid for digestion and element recovery was assessed using five acid mixtures and the
NIST tea (INCT-TL-1). The acid mixtures (Table 2.1) were selected based on those recommended by
CEM (mixture 2, 3 and 4), seen commonly in literature [77, 79, 82, 121, 130, 136, 141, 160, 163-
169] (mixture 1, 2, 4 and 5) or stated in the British pharmacopeia [41] (mixture 5) for the digestion
of plant material.
Table 2.1. Summary of acid mixtures
Acid mixture Type of acid and volume
1 5 ml nitric acid 2 2 ml of water, 8 ml nitric acid and 2 ml hydrogen peroxide 3 2 ml of water, 8 ml nitric acid, 2 ml hydrogen peroxide and 200 mg ammonium fluoride. 4 2 ml of water, 8 ml nitric and 2 ml hydrochloric acid 5 15 ml nitric acid
Microwave acid digestion of samples was carried out on a Mars Xpress microwave (CEM
Corporation, Matthews, USA) using the protocol set out in Table 2.2.
Table 2.2 MarsXpress microwave settings
Step Program setting
1 Heat over 12 minutes to 160 °C
2 Hold at 160 °C for 2 minutes
3 Heat to 175 °C over 2 minutes
4 Hold at 175 °C for 2 minutes
5 Heat to 185 °C over 2 minutes
6 Hold at 185 °C for 15 minutes
7 Allowed to cool
2.2.4.2 Elemental Transfer Loss
To assess the impact of transferring the samples between multiple vessels during sample
preparation, the five acid mixtures were spiked with known concentrations. All acid mixtures were
spiked with 10 ppm Ca, 5 ppm Mg, 1 ppm Al and Fe, 0.2 ppm Mn, and 0.1 ppm As, B, Ba, Be, Cd,
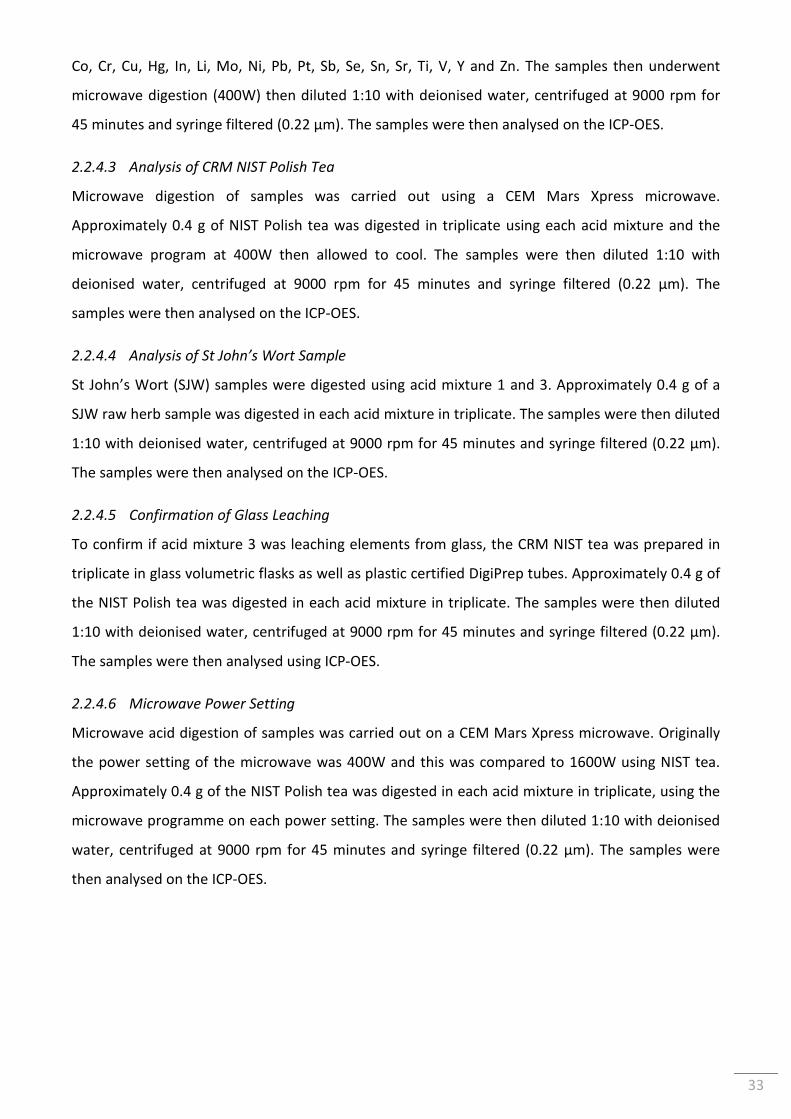
33
Co, Cr, Cu, Hg, In, Li, Mo, Ni, Pb, Pt, Sb, Se, Sn, Sr, Ti, V, Y and Zn. The samples then underwent
microwave digestion (400W) then diluted 1:10 with deionised water, centrifuged at 9000 rpm for
45 minutes and syringe filtered (0.22 µm). The samples were then analysed on the ICP-OES.
2.2.4.3 Analysis of CRM NIST Polish Tea
Microwave digestion of samples was carried out using a CEM Mars Xpress microwave.
Approximately 0.4 g of NIST Polish tea was digested in triplicate using each acid mixture and the
microwave program at 400W then allowed to cool. The samples were then diluted 1:10 with
deionised water, centrifuged at 9000 rpm for 45 minutes and syringe filtered (0.22 µm). The
samples were then analysed on the ICP-OES.
2.2.4.4 Analysis of St John’s Wort Sample
St John’s Wort (SJW) samples were digested using acid mixture 1 and 3. Approximately 0.4 g of a
SJW raw herb sample was digested in each acid mixture in triplicate. The samples were then diluted
1:10 with deionised water, centrifuged at 9000 rpm for 45 minutes and syringe filtered (0.22 µm).
The samples were then analysed on the ICP-OES.
2.2.4.5 Confirmation of Glass Leaching
To confirm if acid mixture 3 was leaching elements from glass, the CRM NIST tea was prepared in
triplicate in glass volumetric flasks as well as plastic certified DigiPrep tubes. Approximately 0.4 g of
the NIST Polish tea was digested in each acid mixture in triplicate. The samples were then diluted
1:10 with deionised water, centrifuged at 9000 rpm for 45 minutes and syringe filtered (0.22 µm).
The samples were then analysed using ICP-OES.
2.2.4.6 Microwave Power Setting
Microwave acid digestion of samples was carried out on a CEM Mars Xpress microwave. Originally
the power setting of the microwave was 400W and this was compared to 1600W using NIST tea.
Approximately 0.4 g of the NIST Polish tea was digested in each acid mixture in triplicate, using the
microwave programme on each power setting. The samples were then diluted 1:10 with deionised
water, centrifuged at 9000 rpm for 45 minutes and syringe filtered (0.22 µm). The samples were
then analysed on the ICP-OES.
34
2.2.5 Validation-Accuracy
2.2.5.1 NIST CRM and Spiked Recovery
Validation of the method was carried out using NIST certified reference material (CRM) Polish tea
(INCT-TL-1) and spike recovery methods. The NIST reference was certified for Al, B, Ba, Ca, Cu, Fe,
Mg, Mn, Ni, Sr and Zn. To validate the remaining metals or those below detection limits, the NIST
reference was artificially enriched with 0.5 ppm As, Be, Cd, Co, Cr, Hg, In, Mo, Pb, Pt, Sb, Se, V and Y
prior to acid digestion. Approximately 0.4 g of the NIST Polish tea was microwave digested (1600W)
in acid mixture 1 in triplicate. The samples were then diluted 1:10 with deionised water, centrifuged
at 9000 rpm for 45 minutes and syringe filtered (0.22 µm). The samples were then analysed using
ICP-OES.
2.2.5.2 Standard Addition
Each type of SJW sample (i.e., dry herb, capsule, and tablet) was evaluated using the standard
addition method. The samples were digested using acid mixture 1 at 1600W. A single point
standard addition method was used to evaluate the matrix effects of the different preparations. In
this case, the samples were artificially enriched with elements at concentrations equal or greater
than five times the expected elemental concentration [170]. The standards added were 2.5 ppm of
As, B, Ba, Be, Ca, Cd, Co, Cr, Cu, Hg, In, Pb, Pt, Mg, Mo, Ni, Sb, Se, Sr, V, Y and Zn; 5 ppm of Fe and
Mn; 25 ppm for Al; 60 ppm of Mg and 225 ppm Ca.
2.3 Results and Discussion
2.3.1 ICP-OES Parameter Optimisation
Optimization was carried out on the Varian 710-ES ICP-OES using a solution of 1 ppm As, Co, Pb and
Se. The RF power controls the magnetic field around the plasma helping to contain its shape while
the nebuliser pressure aids the flow of sample through the nebuliser. The background intensities of
the selected elements were subtracted from the signal intensity (Equation 1) to give a SN value. The
power setting that produced the optimum SN value (Table 2.3) for all elements was an RF power of
1.4 kW. Elements As and Co obtained their optimum at 1.3 kW however there was no decrease in
SN value for these at a setting of 1.4 kW; therefore, 1.4 kW was applied for the following nebuliser
pressure optimisation. Higher RF powers were not investigated as this was the limitation of the
instrument. For elements As and Pb the optimum nebuliser pressure was 180 kPa whereas for Co
and Se it was 220 kPa and 200 kPa respectively. As the majority of elements had a higher SN value
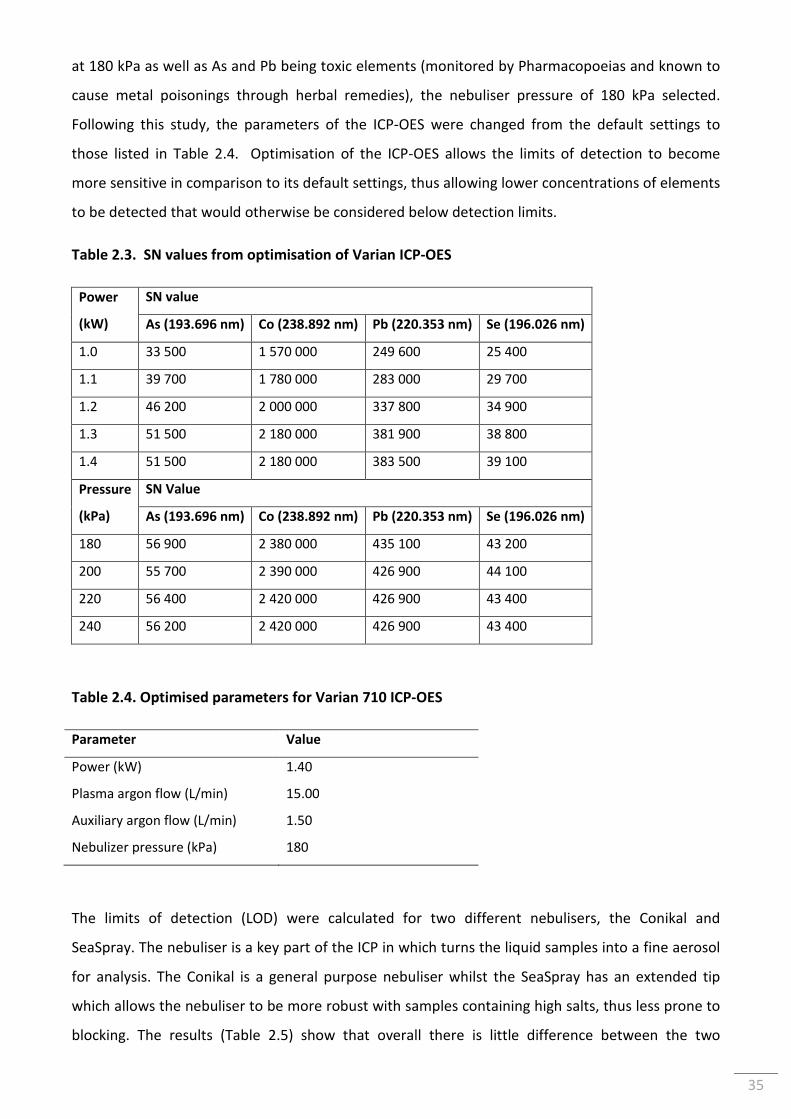
35
at 180 kPa as well as As and Pb being toxic elements (monitored by Pharmacopoeias and known to
cause metal poisonings through herbal remedies), the nebuliser pressure of 180 kPa selected.
Following this study, the parameters of the ICP-OES were changed from the default settings to
those listed in Table 2.4. Optimisation of the ICP-OES allows the limits of detection to become
more sensitive in comparison to its default settings, thus allowing lower concentrations of elements
to be detected that would otherwise be considered below detection limits.
Table 2.3. SN values from optimisation of Varian ICP-OES
Power (kW)
SN value
As (193.696 nm) Co (238.892 nm) Pb (220.353 nm) Se (196.026 nm)
1.0 33 500 1 570 000 249 600 25 400
1.1 39 700 1 780 000 283 000 29 700
1.2 46 200 2 000 000 337 800 34 900
1.3 51 500 2 180 000 381 900 38 800
1.4 51 500 2 180 000 383 500 39 100
Pressure
(kPa)
SN Value
As (193.696 nm) Co (238.892 nm) Pb (220.353 nm) Se (196.026 nm)
180 56 900 2 380 000 435 100 43 200
200 55 700 2 390 000 426 900 44 100
220 56 400 2 420 000 426 900 43 400
240 56 200 2 420 000 426 900 43 400
Table 2.4. Optimised parameters for Varian 710 ICP-OES
Parameter Value
Power (kW) 1.40 Plasma argon flow (L/min) 15.00 Auxiliary argon flow (L/min) 1.50 Nebulizer pressure (kPa) 180
The limits of detection (LOD) were calculated for two different nebulisers, the Conikal and
SeaSpray. The nebuliser is a key part of the ICP in which turns the liquid samples into a fine aerosol
for analysis. The Conikal is a general purpose nebuliser whilst the SeaSpray has an extended tip
which allows the nebuliser to be more robust with samples containing high salts, thus less prone to
blocking. The results (Table 2.5) show that overall there is little difference between the two
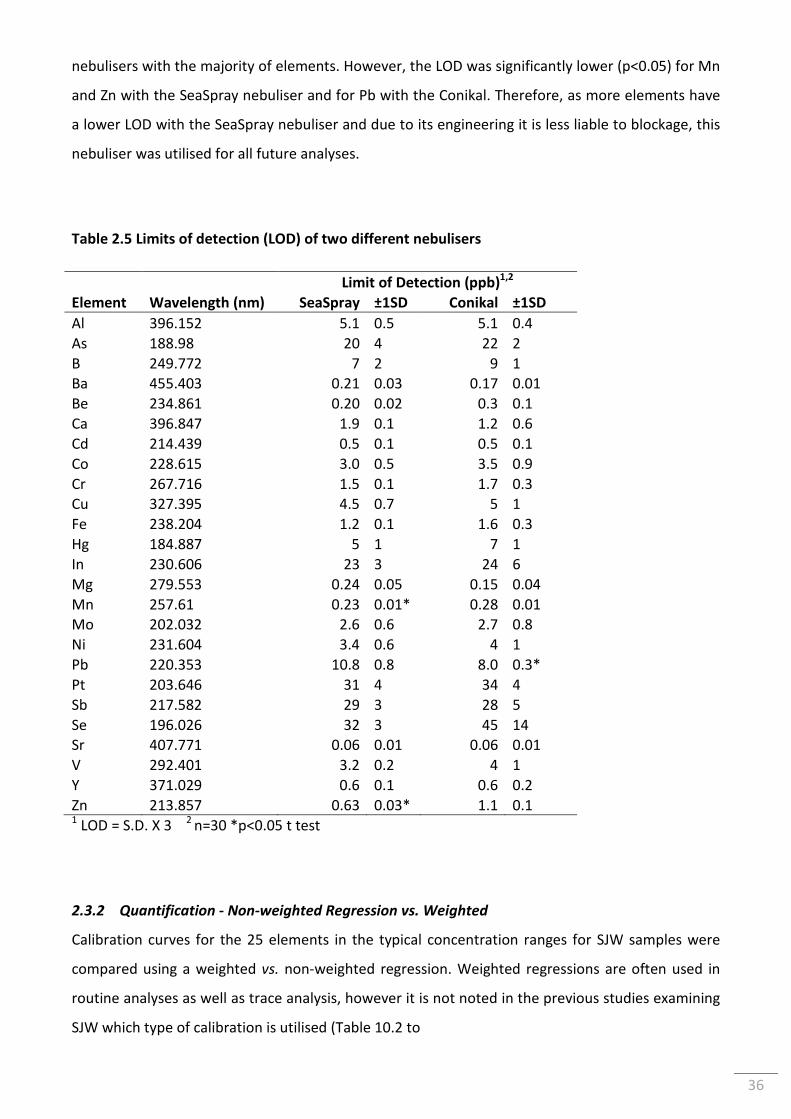
36
nebulisers with the majority of elements. However, the LOD was significantly lower (p<0.05) for Mn
and Zn with the SeaSpray nebuliser and for Pb with the Conikal. Therefore, as more elements have
a lower LOD with the SeaSpray nebuliser and due to its engineering it is less liable to blockage, this
nebuliser was utilised for all future analyses.
Table 2.5 Limits of detection (LOD) of two different nebulisers
Limit of Detection (ppb)1,2
Element Wavelength (nm) SeaSpray ±1SD Conikal ±1SD
Al 396.152 5.1 0.5 5.1 0.4 As 188.98 20 4 22 2 B 249.772 7 2 9 1 Ba 455.403 0.21 0.03 0.17 0.01 Be 234.861 0.20 0.02 0.3 0.1 Ca 396.847 1.9 0.1 1.2 0.6 Cd 214.439 0.5 0.1 0.5 0.1 Co 228.615 3.0 0.5 3.5 0.9 Cr 267.716 1.5 0.1 1.7 0.3 Cu 327.395 4.5 0.7 5 1 Fe 238.204 1.2 0.1 1.6 0.3 Hg 184.887 5 1 7 1 In 230.606 23 3 24 6 Mg 279.553 0.24 0.05 0.15 0.04 Mn 257.61 0.23 0.01* 0.28 0.01 Mo 202.032 2.6 0.6 2.7 0.8 Ni 231.604 3.4 0.6 4 1 Pb 220.353 10.8 0.8 8.0 0.3* Pt 203.646 31 4 34 4 Sb 217.582 29 3 28 5 Se 196.026 32 3 45 14 Sr 407.771 0.06 0.01 0.06 0.01 V 292.401 3.2 0.2 4 1 Y 371.029 0.6 0.1 0.6 0.2 Zn 213.857 0.63 0.03* 1.1 0.1 1 LOD = S.D. X 3 2 n=30 *p<0.05 t test
2.3.2 Quantification - Non-weighted Regression vs. Weighted
Calibration curves for the 25 elements in the typical concentration ranges for SJW samples were
compared using a weighted vs. non-weighted regression. Weighted regressions are often used in
routine analyses as well as trace analysis, however it is not noted in the previous studies examining
SJW which type of calibration is utilised (Table 10.2 to
37
Table 10.5, Appendix 10.2). As the concentration of many elements would fall in this range for ICP-
OES, the calibration errors associated with the lowest concentration standards above the LOQ were
compared (0.01 ppm, 0.025 ppm and 0.05ppm for the majority of elements however: 0.025 ppm,
0.05 ppm and 0.1ppm for elements Cr and In, 0.05 ppm, 0.1 ppm and 0.5ppm for elements B, Cu,
Hg, Mo, Ni and Y followed by 0.5 ppm and 1ppm for Pt, As, Sb and Se). The results (Table 2.6) show
that for the majority of elements, the weighted regression line has less error in the calculation of
concentrations at these low concentrations in comparison to a non-weighted regression line. For
example, with a weighted regression Al has 10% uncertainty whereas Be has 3%, Cd has 4% and Sr
has 10% whereas with a non-weighted graph these values are 36%, 27%, 16%, and 46%
respectively. This is because in weighted regression lines the line passes more closely to the data
points of lower concentration with less associated error which in turn gives more realistic
confidence limits for sample concentrations. In contrast non-weighted lines assume all data points
have equal error [162]. Some elements however (B, Fe, Se and Zn) have a lower uncertainty with a
non-weighted calibration.
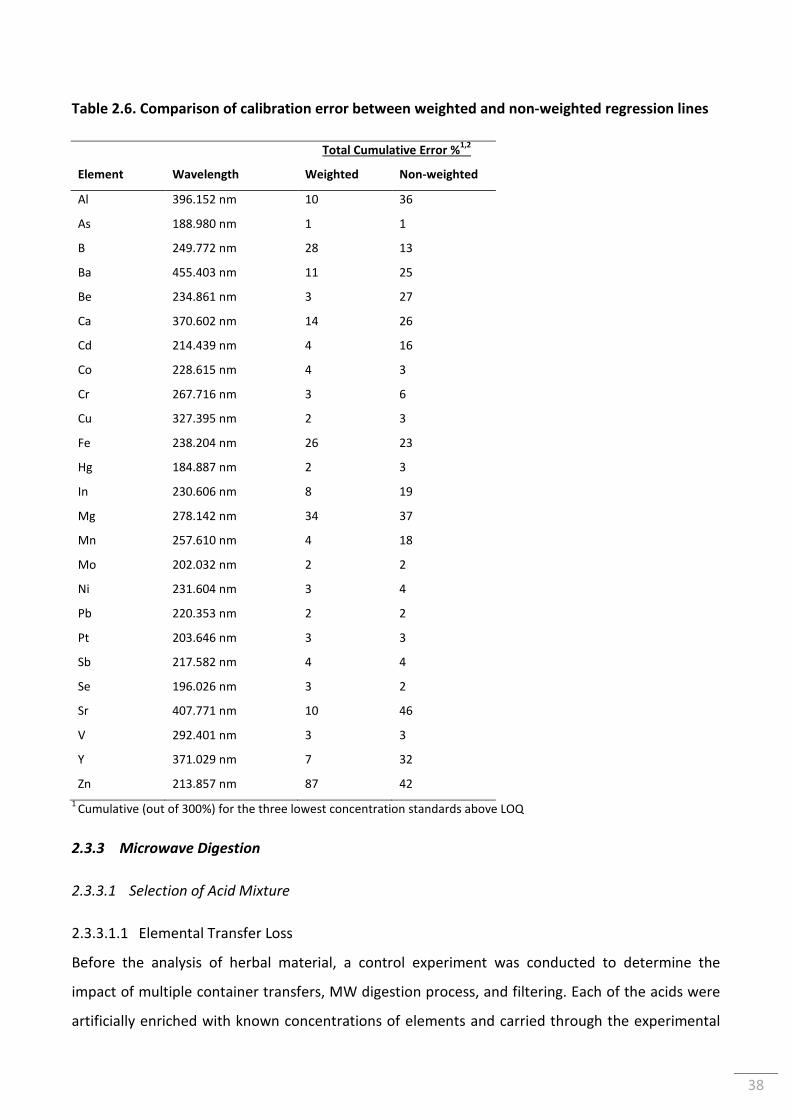
38
Table 2.6. Comparison of calibration error between weighted and non-weighted regression lines
Total Cumulative Error %1,2
Element Wavelength Weighted Non-weighted
Al 396.152 nm 10 36
As 188.980 nm 1 1
B 249.772 nm 28 13
Ba 455.403 nm 11 25
Be 234.861 nm 3 27
Ca 370.602 nm 14 26
Cd 214.439 nm 4 16
Co 228.615 nm 4 3
Cr 267.716 nm 3 6
Cu 327.395 nm 2 3
Fe 238.204 nm 26 23
Hg 184.887 nm 2 3
In 230.606 nm 8 19
Mg 278.142 nm 34 37
Mn 257.610 nm 4 18
Mo 202.032 nm 2 2
Ni 231.604 nm 3 4
Pb 220.353 nm 2 2
Pt 203.646 nm 3 3
Sb 217.582 nm 4 4
Se 196.026 nm 3 2
Sr 407.771 nm 10 46
V 292.401 nm 3 3
Y 371.029 nm 7 32
Zn 213.857 nm 87 42
1 Cumulative (out of 300%) for the three lowest concentration standards above LOQ
2.3.3 Microwave Digestion
2.3.3.1 Selection of Acid Mixture
2.3.3.1.1 Elemental Transfer Loss
Before the analysis of herbal material, a control experiment was conducted to determine the
impact of multiple container transfers, MW digestion process, and filtering. Each of the acids were
artificially enriched with known concentrations of elements and carried through the experimental
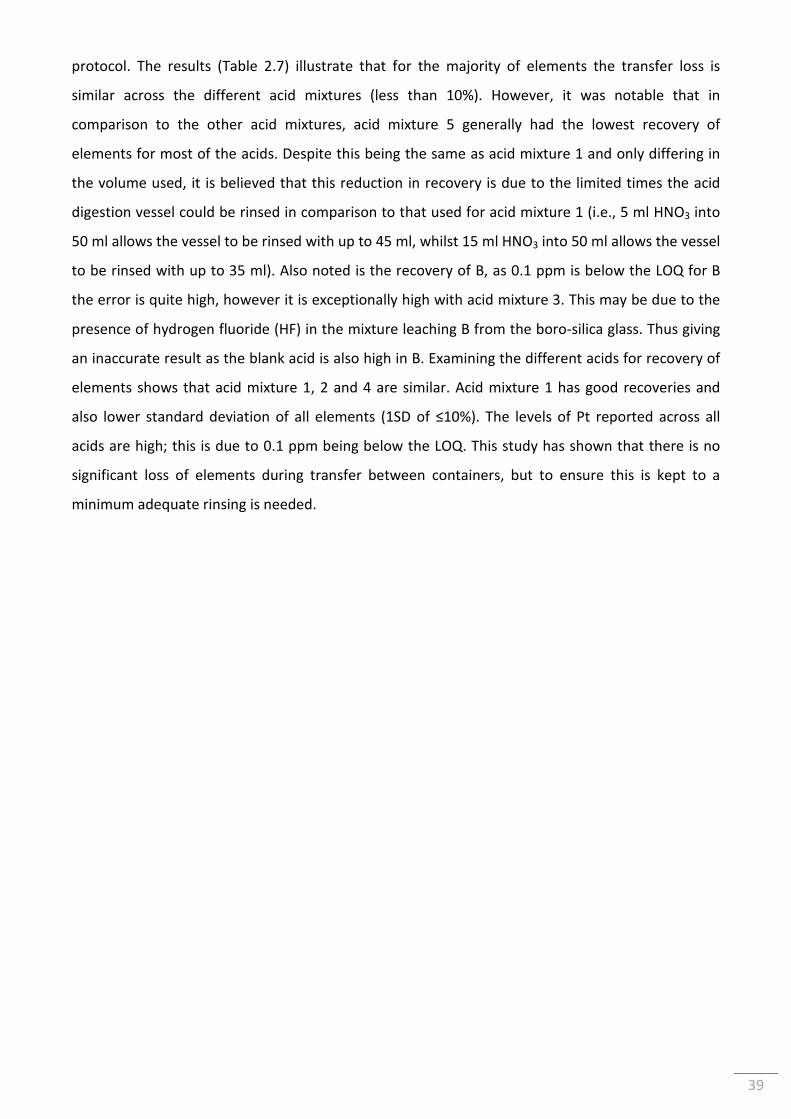
39
protocol. The results (Table 2.7) illustrate that for the majority of elements the transfer loss is
similar across the different acid mixtures (less than 10%). However, it was notable that in
comparison to the other acid mixtures, acid mixture 5 generally had the lowest recovery of
elements for most of the acids. Despite this being the same as acid mixture 1 and only differing in
the volume used, it is believed that this reduction in recovery is due to the limited times the acid
digestion vessel could be rinsed in comparison to that used for acid mixture 1 (i.e., 5 ml HNO3 into
50 ml allows the vessel to be rinsed with up to 45 ml, whilst 15 ml HNO3 into 50 ml allows the vessel
to be rinsed with up to 35 ml). Also noted is the recovery of B, as 0.1 ppm is below the LOQ for B
the error is quite high, however it is exceptionally high with acid mixture 3. This may be due to the
presence of hydrogen fluoride (HF) in the mixture leaching B from the boro-silica glass. Thus giving
an inaccurate result as the blank acid is also high in B. Examining the different acids for recovery of
elements shows that acid mixture 1, 2 and 4 are similar. Acid mixture 1 has good recoveries and
also lower standard deviation of all elements (1SD of ≤10%). The levels of Pt reported across all
acids are high; this is due to 0.1 ppm being below the LOQ. This study has shown that there is no
significant loss of elements during transfer between containers, but to ensure this is kept to a
minimum adequate rinsing is needed.
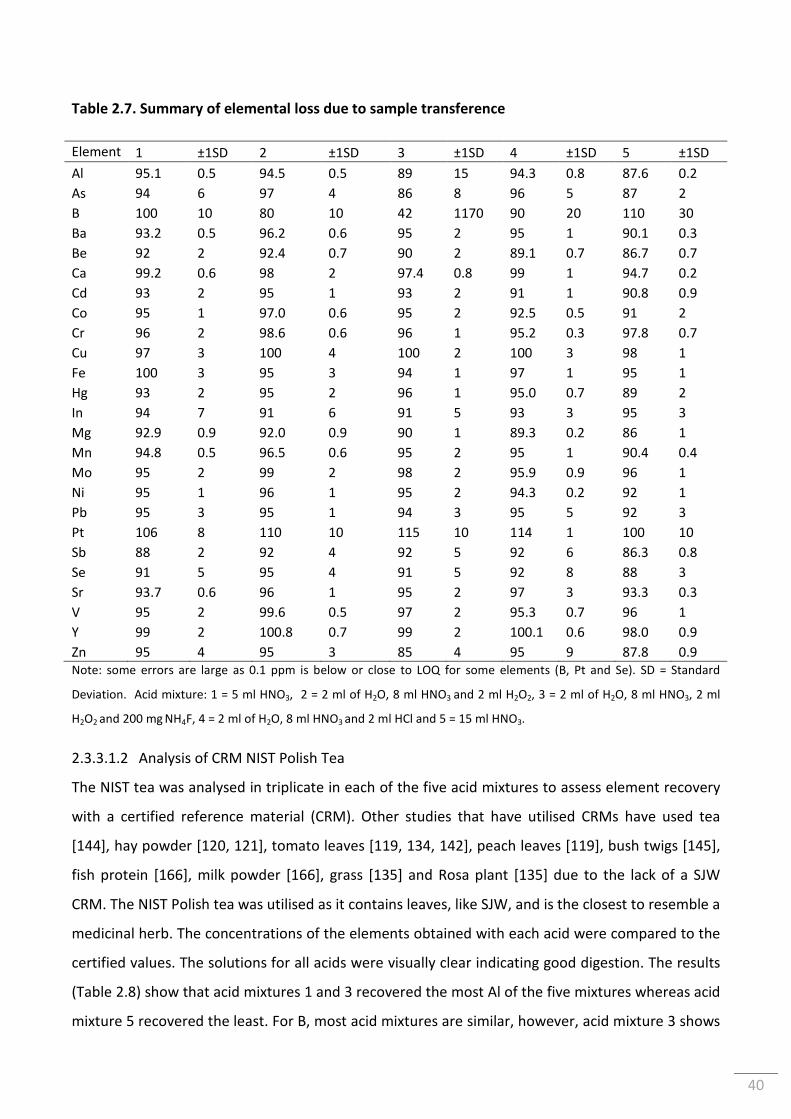
40
Table 2.7. Summary of elemental loss due to sample transference
Element 1 ±1SD 2 ±1SD 3 ±1SD 4 ±1SD 5 ±1SD
Al 95.1 0.5 94.5 0.5 89 15 94.3 0.8 87.6 0.2
As 94 6 97 4 86 8 96 5 87 2
B 100 10 80 10 42 1170 90 20 110 30
Ba 93.2 0.5 96.2 0.6 95 2 95 1 90.1 0.3
Be 92 2 92.4 0.7 90 2 89.1 0.7 86.7 0.7
Ca 99.2 0.6 98 2 97.4 0.8 99 1 94.7 0.2
Cd 93 2 95 1 93 2 91 1 90.8 0.9
Co 95 1 97.0 0.6 95 2 92.5 0.5 91 2
Cr 96 2 98.6 0.6 96 1 95.2 0.3 97.8 0.7
Cu 97 3 100 4 100 2 100 3 98 1
Fe 100 3 95 3 94 1 97 1 95 1
Hg 93 2 95 2 96 1 95.0 0.7 89 2
In 94 7 91 6 91 5 93 3 95 3
Mg 92.9 0.9 92.0 0.9 90 1 89.3 0.2 86 1
Mn 94.8 0.5 96.5 0.6 95 2 95 1 90.4 0.4
Mo 95 2 99 2 98 2 95.9 0.9 96 1
Ni 95 1 96 1 95 2 94.3 0.2 92 1
Pb 95 3 95 1 94 3 95 5 92 3
Pt 106 8 110 10 115 10 114 1 100 10
Sb 88 2 92 4 92 5 92 6 86.3 0.8
Se 91 5 95 4 91 5 92 8 88 3
Sr 93.7 0.6 96 1 95 2 97 3 93.3 0.3
V 95 2 99.6 0.5 97 2 95.3 0.7 96 1
Y 99 2 100.8 0.7 99 2 100.1 0.6 98.0 0.9
Zn 95 4 95 3 85 4 95 9 87.8 0.9 Note: some errors are large as 0.1 ppm is below or close to LOQ for some elements (B, Pt and Se). SD = Standard
Deviation. Acid mixture: 1 = 5 ml HNO3, 2 = 2 ml of H2O, 8 ml HNO3 and 2 ml H2O2, 3 = 2 ml of H2O, 8 ml HNO3, 2 ml
H2O2 and 200 mg NH4F, 4 = 2 ml of H2O, 8 ml HNO3 and 2 ml HCl and 5 = 15 ml HNO3.
2.3.3.1.2 Analysis of CRM NIST Polish Tea
The NIST tea was analysed in triplicate in each of the five acid mixtures to assess element recovery
with a certified reference material (CRM). Other studies that have utilised CRMs have used tea
[144], hay powder [120, 121], tomato leaves [119, 134, 142], peach leaves [119], bush twigs [145],
fish protein [166], milk powder [166], grass [135] and Rosa plant [135] due to the lack of a SJW
CRM. The NIST Polish tea was utilised as it contains leaves, like SJW, and is the closest to resemble a
medicinal herb. The concentrations of the elements obtained with each acid were compared to the
certified values. The solutions for all acids were visually clear indicating good digestion. The results
(Table 2.8) show that acid mixtures 1 and 3 recovered the most Al of the five mixtures whereas acid
mixture 5 recovered the least. For B, most acid mixtures are similar, however, acid mixture 3 shows
41
to have greatly elevated concentrations of B (Figure 2.1); this is likely to be due to the HF produced
in the acid mixture causing leaching of B from the glassware. For Ba recovery, all acid mixtures are
similar (36 – 39 mg/kg). Acid mixture 1 had the highest recoveries for elements Mg, Mn and Ni with
similar recoveries for elements Ca, Cu, Sr and Zn compared to other acids. Acid mixture 3 had the
highest recoveries for B and Fe, acid mixture 4 had highest recovery for Ca. Overall, of the acid
mixtures tested, acid mixture 1 was chosen for further investigations as it had the highest recovery
for the majority of elements and no recovery values below 80%.
Table 2.8. Recovery of elements of NIST tea with each acid mixture
Concentration obtained with acid mixtures1
Element Certified value 1 ±1SD 2 ± 1SD 3 ± 1SD 4 ± 1SD 5 ± 1SD
Al 0.229 ± 0.028 wt% 0.193 0.009 0.2 0.2 0.183 0.006 0.17 0.02 0.163 0.005
B 26 mg/kg 21 1 25 1 80 50 29 1 30 1
Ba 43.2 ± 3.9 mg/kg 37.6 0.3 36.7 0.2 39 3 37 4 36.2 0.2
Ca 0.582 ± 0.052 wt% 0.538 0.002 0.519 0.003 0.520 0.003 0.539 0.004 0.52 0.06
Cu 20.4 ± 1.5 mg/kg 20 1 18.98 0.09 18.8 0.4 20 2 19.9 0.8
Fe 432 mg/kg 380 10 370 20 470 20 430 50 360 30
Mg 0.224 ± 0.017 wt% 0.203 0.000 0.193 0.001 0.193 0.001 0.19 0.02 0.187 0.001
Mn 0.157 ± 0.011 wt% 0.145 0.002 0.141 0.001 0.140 0.001 0.15 0.02 0.142 0.001
Ni 6.12 ± 0.52 mg/kg 5.40 0.05 4.97 0.06 5.10 0.07 5.1 0.6 5.03 0.05
Sr 20.8 ± 1.7 mg/kg 18.7 0.1 18.158 0.008 19.6 0.1 19 2 18.1 0.1
Zn 34.7 ± 2.7 mg/kg 32.4 0.3 30.7 0.6 29.6 0.5 32 3 30 2
1 units same as those for certified values. SD = Standard Deviation. Acid mixture: 1 = 5 ml HNO3, 2 = 2 ml of H2O, 8 ml
HNO3 and 2 ml H2O2, 3 = 2 ml of H2O, 8 ml HNO3, 2 ml H2O2 and 200 mg NH4F, 4 = 2 ml of H2O, 8 ml HNO3 and 2 ml HCl
and 5 = 15 ml HNO3
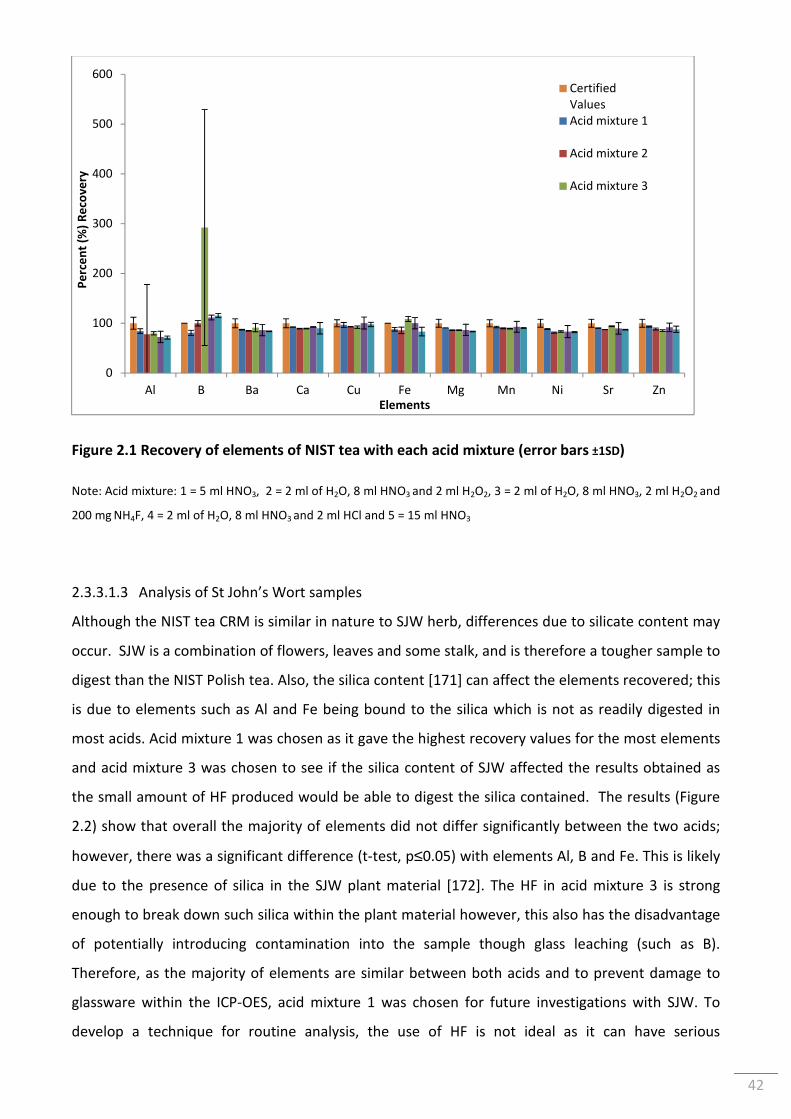
42
Figure 2.1 Recovery of elements of NIST tea with each acid mixture (error bars ±1SD)
Note: Acid mixture: 1 = 5 ml HNO3, 2 = 2 ml of H2O, 8 ml HNO3 and 2 ml H2O2, 3 = 2 ml of H2O, 8 ml HNO3, 2 ml H2O2 and
200 mg NH4F, 4 = 2 ml of H2O, 8 ml HNO3 and 2 ml HCl and 5 = 15 ml HNO3
2.3.3.1.3 Analysis of St John’s Wort samples
Although the NIST tea CRM is similar in nature to SJW herb, differences due to silicate content may
occur. SJW is a combination of flowers, leaves and some stalk, and is therefore a tougher sample to
digest than the NIST Polish tea. Also, the silica content [171] can affect the elements recovered; this
is due to elements such as Al and Fe being bound to the silica which is not as readily digested in
most acids. Acid mixture 1 was chosen as it gave the highest recovery values for the most elements
and acid mixture 3 was chosen to see if the silica content of SJW affected the results obtained as
the small amount of HF produced would be able to digest the silica contained. The results (Figure
2.2) show that overall the majority of elements did not differ significantly between the two acids;
however, there was a significant difference (t-test, p≤0.05) with elements Al, B and Fe. This is likely
due to the presence of silica in the SJW plant material [172]. The HF in acid mixture 3 is strong
enough to break down such silica within the plant material however, this also has the disadvantage
of potentially introducing contamination into the sample though glass leaching (such as B).
Therefore, as the majority of elements are similar between both acids and to prevent damage to
glassware within the ICP-OES, acid mixture 1 was chosen for future investigations with SJW. To
develop a technique for routine analysis, the use of HF is not ideal as it can have serious
0
100
200
300
400
500
600
Al B Ba Ca Cu Fe Mg Mn Ni Sr Zn
Pe
rce
nt
(%)
Re
cov
ery
Elements
CertifiedValuesAcid mixture 1
Acid mixture 2
Acid mixture 3
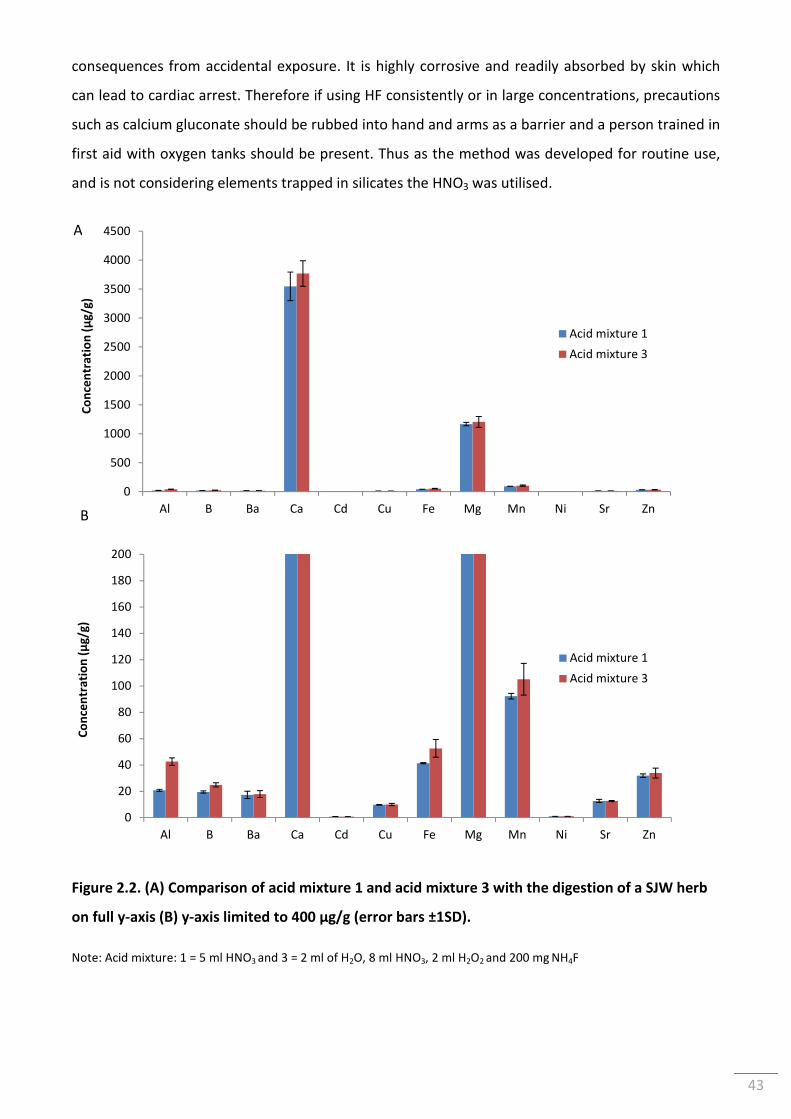
43
consequences from accidental exposure. It is highly corrosive and readily absorbed by skin which
can lead to cardiac arrest. Therefore if using HF consistently or in large concentrations, precautions
such as calcium gluconate should be rubbed into hand and arms as a barrier and a person trained in
first aid with oxygen tanks should be present. Thus as the method was developed for routine use,
and is not considering elements trapped in silicates the HNO3 was utilised.
Figure 2.2. (A) Comparison of acid mixture 1 and acid mixture 3 with the digestion of a SJW herb
on full y-axis (B) y-axis limited to 400 µg/g (error bars ±1SD).
Note: Acid mixture: 1 = 5 ml HNO3 and 3 = 2 ml of H2O, 8 ml HNO3, 2 ml H2O2 and 200 mg NH4F
0
500
1000
1500
2000
2500
3000
3500
4000
4500
Al B Ba Ca Cd Cu Fe Mg Mn Ni Sr Zn
Co
nce
ntr
ati
on
(µ
g/g
)
Acid mixture 1
Acid mixture 3
0
20
40
60
80
100
120
140
160
180
200
Al B Ba Ca Cd Cu Fe Mg Mn Ni Sr Zn
Co
nce
ntr
ati
on
(µ
g/g
)
Acid mixture 1
Acid mixture 3
A
B
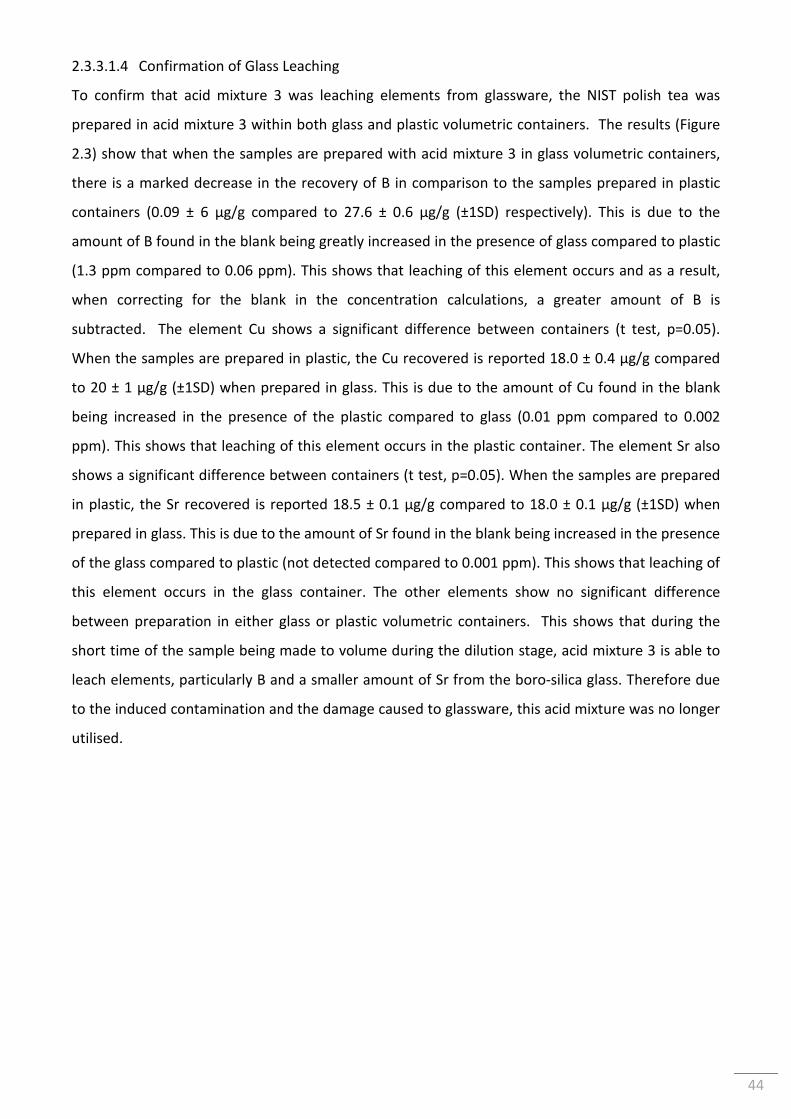
44
2.3.3.1.4 Confirmation of Glass Leaching
To confirm that acid mixture 3 was leaching elements from glassware, the NIST polish tea was
prepared in acid mixture 3 within both glass and plastic volumetric containers. The results (Figure
2.3) show that when the samples are prepared with acid mixture 3 in glass volumetric containers,
there is a marked decrease in the recovery of B in comparison to the samples prepared in plastic
containers (0.09 ± 6 µg/g compared to 27.6 ± 0.6 µg/g (±1SD) respectively). This is due to the
amount of B found in the blank being greatly increased in the presence of glass compared to plastic
(1.3 ppm compared to 0.06 ppm). This shows that leaching of this element occurs and as a result,
when correcting for the blank in the concentration calculations, a greater amount of B is
subtracted. The element Cu shows a significant difference between containers (t test, p=0.05).
When the samples are prepared in plastic, the Cu recovered is reported 18.0 ± 0.4 µg/g compared
to 20 ± 1 µg/g (±1SD) when prepared in glass. This is due to the amount of Cu found in the blank
being increased in the presence of the plastic compared to glass (0.01 ppm compared to 0.002
ppm). This shows that leaching of this element occurs in the plastic container. The element Sr also
shows a significant difference between containers (t test, p=0.05). When the samples are prepared
in plastic, the Sr recovered is reported 18.5 ± 0.1 µg/g compared to 18.0 ± 0.1 µg/g (±1SD) when
prepared in glass. This is due to the amount of Sr found in the blank being increased in the presence
of the glass compared to plastic (not detected compared to 0.001 ppm). This shows that leaching of
this element occurs in the glass container. The other elements show no significant difference
between preparation in either glass or plastic volumetric containers. This shows that during the
short time of the sample being made to volume during the dilution stage, acid mixture 3 is able to
leach elements, particularly B and a smaller amount of Sr from the boro-silica glass. Therefore due
to the induced contamination and the damage caused to glassware, this acid mixture was no longer
utilised.
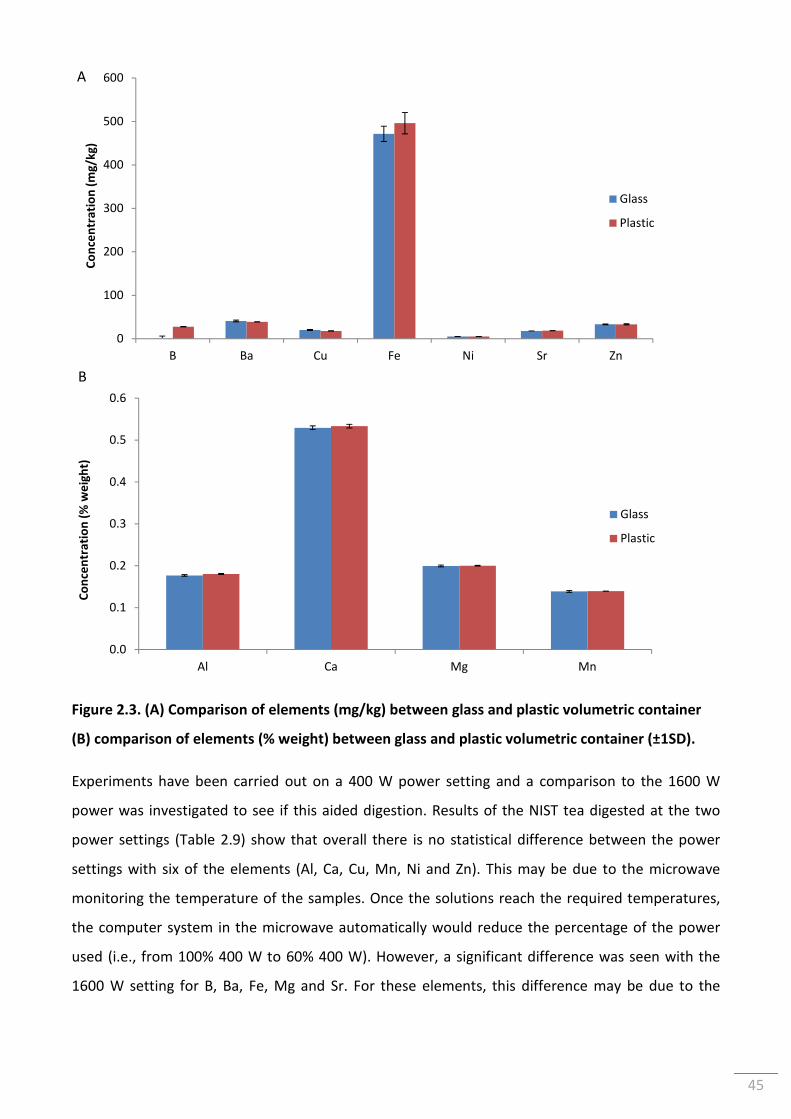
45
Figure 2.3. (A) Comparison of elements (mg/kg) between glass and plastic volumetric container
(B) comparison of elements (% weight) between glass and plastic volumetric container (±1SD).
Experiments have been carried out on a 400 W power setting and a comparison to the 1600 W
power was investigated to see if this aided digestion. Results of the NIST tea digested at the two
power settings (Table 2.9) show that overall there is no statistical difference between the power
settings with six of the elements (Al, Ca, Cu, Mn, Ni and Zn). This may be due to the microwave
monitoring the temperature of the samples. Once the solutions reach the required temperatures,
the computer system in the microwave automatically would reduce the percentage of the power
used (i.e., from 100% 400 W to 60% 400 W). However, a significant difference was seen with the
1600 W setting for B, Ba, Fe, Mg and Sr. For these elements, this difference may be due to the
0
100
200
300
400
500
600
B Ba Cu Fe Ni Sr Zn
Co
nce
ntr
ati
on
(m
g/k
g)
Glass
Plastic
0.0
0.1
0.2
0.3
0.4
0.5
0.6
Al Ca Mg Mn
Co
nce
ntr
ati
on
(%
we
igh
t)
Glass
Plastic
A
B
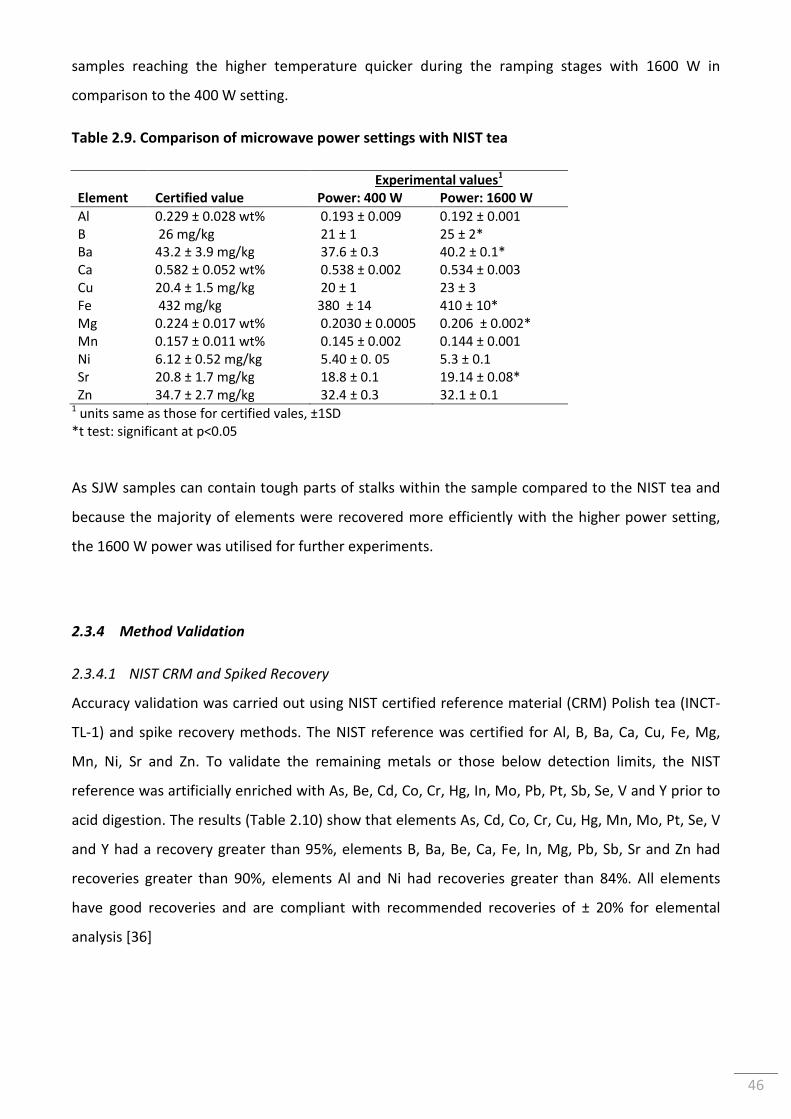
46
samples reaching the higher temperature quicker during the ramping stages with 1600 W in
comparison to the 400 W setting.
Table 2.9. Comparison of microwave power settings with NIST tea
Experimental values1
Element Certified value Power: 400 W Power: 1600 W
Al 0.229 ± 0.028 wt% 0.193 ± 0.009 0.192 ± 0.001 B 26 mg/kg 21 ± 1 25 ± 2* Ba 43.2 ± 3.9 mg/kg 37.6 ± 0.3 40.2 ± 0.1* Ca 0.582 ± 0.052 wt% 0.538 ± 0.002 0.534 ± 0.003 Cu 20.4 ± 1.5 mg/kg 20 ± 1 23 ± 3 Fe 432 mg/kg 380 ± 14 410 ± 10* Mg 0.224 ± 0.017 wt% 0.2030 ± 0.0005 0.206 ± 0.002* Mn 0.157 ± 0.011 wt% 0.145 ± 0.002 0.144 ± 0.001 Ni 6.12 ± 0.52 mg/kg 5.40 ± 0. 05 5.3 ± 0.1 Sr 20.8 ± 1.7 mg/kg 18.8 ± 0.1 19.14 ± 0.08* Zn 34.7 ± 2.7 mg/kg 32.4 ± 0.3 32.1 ± 0.1
1 units same as those for certified vales, ±1SD *t test: significant at p<0.05
As SJW samples can contain tough parts of stalks within the sample compared to the NIST tea and
because the majority of elements were recovered more efficiently with the higher power setting,
the 1600 W power was utilised for further experiments.
2.3.4 Method Validation
2.3.4.1 NIST CRM and Spiked Recovery
Accuracy validation was carried out using NIST certified reference material (CRM) Polish tea (INCT-
TL-1) and spike recovery methods. The NIST reference was certified for Al, B, Ba, Ca, Cu, Fe, Mg,
Mn, Ni, Sr and Zn. To validate the remaining metals or those below detection limits, the NIST
reference was artificially enriched with As, Be, Cd, Co, Cr, Hg, In, Mo, Pb, Pt, Sb, Se, V and Y prior to
acid digestion. The results (Table 2.10) show that elements As, Cd, Co, Cr, Cu, Hg, Mn, Mo, Pt, Se, V
and Y had a recovery greater than 95%, elements B, Ba, Be, Ca, Fe, In, Mg, Pb, Sb, Sr and Zn had
recoveries greater than 90%, elements Al and Ni had recoveries greater than 84%. All elements
have good recoveries and are compliant with recommended recoveries of ± 20% for elemental
analysis [36]
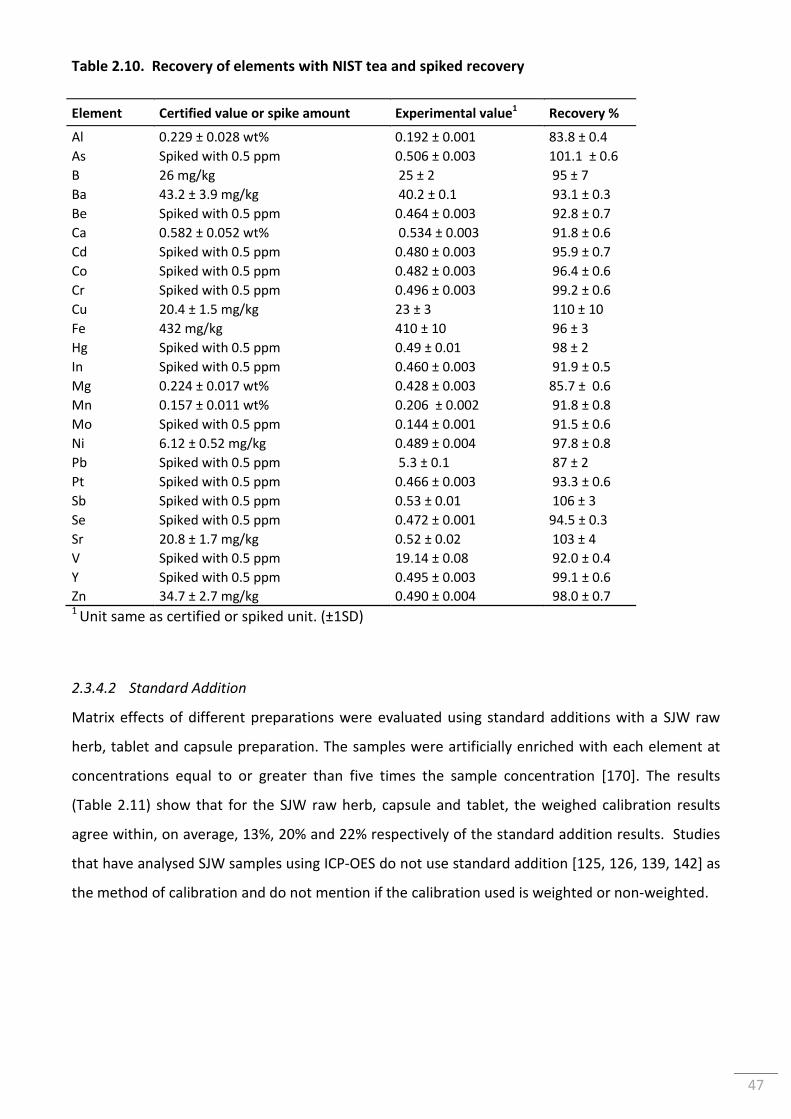
47
Table 2.10. Recovery of elements with NIST tea and spiked recovery
Element Certified value or spike amount Experimental value1
Recovery %
Al 0.229 ± 0.028 wt% 0.192 ± 0.001 83.8 ± 0.4
As Spiked with 0.5 ppm 0.506 ± 0.003 101.1 ± 0.6
B 26 mg/kg 25 ± 2 95 ± 7
Ba 43.2 ± 3.9 mg/kg 40.2 ± 0.1 93.1 ± 0.3
Be Spiked with 0.5 ppm 0.464 ± 0.003 92.8 ± 0.7
Ca 0.582 ± 0.052 wt% 0.534 ± 0.003 91.8 ± 0.6
Cd Spiked with 0.5 ppm 0.480 ± 0.003 95.9 ± 0.7
Co Spiked with 0.5 ppm 0.482 ± 0.003 96.4 ± 0.6
Cr Spiked with 0.5 ppm 0.496 ± 0.003 99.2 ± 0.6
Cu 20.4 ± 1.5 mg/kg 23 ± 3 110 ± 10
Fe 432 mg/kg 410 ± 10 96 ± 3
Hg Spiked with 0.5 ppm 0.49 ± 0.01 98 ± 2
In Spiked with 0.5 ppm 0.460 ± 0.003 91.9 ± 0.5
Mg 0.224 ± 0.017 wt% 0.428 ± 0.003 85.7 ± 0.6
Mn 0.157 ± 0.011 wt% 0.206 ± 0.002 91.8 ± 0.8
Mo Spiked with 0.5 ppm 0.144 ± 0.001 91.5 ± 0.6
Ni 6.12 ± 0.52 mg/kg 0.489 ± 0.004 97.8 ± 0.8
Pb Spiked with 0.5 ppm 5.3 ± 0.1 87 ± 2
Pt Spiked with 0.5 ppm 0.466 ± 0.003 93.3 ± 0.6
Sb Spiked with 0.5 ppm 0.53 ± 0.01 106 ± 3
Se Spiked with 0.5 ppm 0.472 ± 0.001 94.5 ± 0.3
Sr 20.8 ± 1.7 mg/kg 0.52 ± 0.02 103 ± 4
V Spiked with 0.5 ppm 19.14 ± 0.08 92.0 ± 0.4
Y Spiked with 0.5 ppm 0.495 ± 0.003 99.1 ± 0.6
Zn 34.7 ± 2.7 mg/kg 0.490 ± 0.004 98.0 ± 0.7 1 Unit same as certified or spiked unit. (±1SD)
2.3.4.2 Standard Addition
Matrix effects of different preparations were evaluated using standard additions with a SJW raw
herb, tablet and capsule preparation. The samples were artificially enriched with each element at
concentrations equal to or greater than five times the sample concentration [170]. The results
(Table 2.11) show that for the SJW raw herb, capsule and tablet, the weighed calibration results
agree within, on average, 13%, 20% and 22% respectively of the standard addition results. Studies
that have analysed SJW samples using ICP-OES do not use standard addition [125, 126, 139, 142] as
the method of calibration and do not mention if the calibration used is weighted or non-weighted.
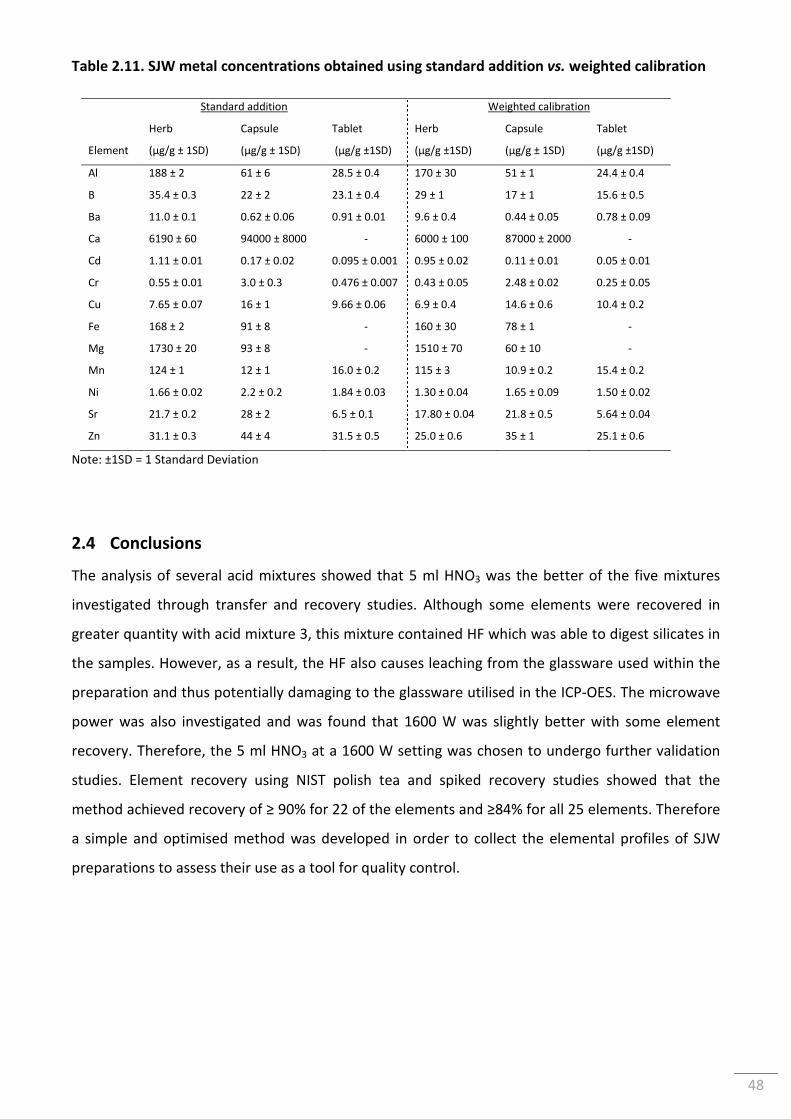
48
Table 2.11. SJW metal concentrations obtained using standard addition vs. weighted calibration
Standard addition Weighted calibration
Element
Herb
(μg/g ± 1SD)
Capsule
(μg/g ± 1SD)
Tablet
(μg/g ±1SD)
Herb
(μg/g ±1SD)
Capsule
(μg/g ± 1SD)
Tablet
(μg/g ±1SD)
Al 188 ± 2 61 ± 6 28.5 ± 0.4 170 ± 30 51 ± 1 24.4 ± 0.4
B 35.4 ± 0.3 22 ± 2 23.1 ± 0.4 29 ± 1 17 ± 1 15.6 ± 0.5
Ba 11.0 ± 0.1 0.62 ± 0.06 0.91 ± 0.01 9.6 ± 0.4 0.44 ± 0.05 0.78 ± 0.09
Ca 6190 ± 60 94000 ± 8000 - 6000 ± 100 87000 ± 2000 -
Cd 1.11 ± 0.01 0.17 ± 0.02 0.095 ± 0.001 0.95 ± 0.02 0.11 ± 0.01 0.05 ± 0.01
Cr 0.55 ± 0.01 3.0 ± 0.3 0.476 ± 0.007 0.43 ± 0.05 2.48 ± 0.02 0.25 ± 0.05
Cu 7.65 ± 0.07 16 ± 1 9.66 ± 0.06 6.9 ± 0.4 14.6 ± 0.6 10.4 ± 0.2
Fe 168 ± 2 91 ± 8 - 160 ± 30 78 ± 1 -
Mg 1730 ± 20 93 ± 8 - 1510 ± 70 60 ± 10 -
Mn 124 ± 1 12 ± 1 16.0 ± 0.2 115 ± 3 10.9 ± 0.2 15.4 ± 0.2
Ni 1.66 ± 0.02 2.2 ± 0.2 1.84 ± 0.03 1.30 ± 0.04 1.65 ± 0.09 1.50 ± 0.02
Sr 21.7 ± 0.2 28 ± 2 6.5 ± 0.1 17.80 ± 0.04 21.8 ± 0.5 5.64 ± 0.04
Zn 31.1 ± 0.3 44 ± 4 31.5 ± 0.5 25.0 ± 0.6 35 ± 1 25.1 ± 0.6
Note: ±1SD = 1 Standard Deviation
2.4 Conclusions
The analysis of several acid mixtures showed that 5 ml HNO3 was the better of the five mixtures
investigated through transfer and recovery studies. Although some elements were recovered in
greater quantity with acid mixture 3, this mixture contained HF which was able to digest silicates in
the samples. However, as a result, the HF also causes leaching from the glassware used within the
preparation and thus potentially damaging to the glassware utilised in the ICP-OES. The microwave
power was also investigated and was found that 1600 W was slightly better with some element
recovery. Therefore, the 5 ml HNO3 at a 1600 W setting was chosen to undergo further validation
studies. Element recovery using NIST polish tea and spiked recovery studies showed that the
method achieved recovery of ≥ 90% for 22 of the elements and ≥84% for all 25 elements. Therefore
a simple and optimised method was developed in order to collect the elemental profiles of SJW
preparations to assess their use as a tool for quality control.
49
3 Elemental Analysis of St John’s Wort Preparations
3.1 Introduction
Herbal medicines are chemically complex and in many cases the pharmacological effect is a result
of interactions between multiple chemical constituents. In the last decade herbal medicine
regulation has changed dramatically [42, 173, 174] improving many aspects of quality control; yet
challenges still remain to reduce differences between products sold of the same medicinal herb
ensuring similar therapeutic effects.
One area that has received limited attention is the monitoring of elemental species for the quality
control of herbal products. These products are often standardised according to key molecular
constituents, yet herbs also contain a diverse range of essential and non-essential elements. Many
herbal plants of medicinal interest are known accumulators or hyper-accumulators of metals [59,
66, 155, 175-177], meaning they actively uptake and accumulate certain metals in high
concentrations in comparison to the concentration in the surrounding growth medium. Elements
can also be added or removed via processing and formulating the raw herb into commercial
products. In recent years, much attention has been paid to the presence of toxic elements such as
As, Cd, Hg and Pb in herbal products due to the adverse effects they can cause [21, 26].
Consequently, manufacturers are recommended to ensure “heavy metals” fall within
recommended limits [41, 178]. The remaining elemental composition, however, is potentially
overlooked and underutilised. Firstly, the essential element composition has inherent nutritional
value. The form of the metal found in herbs is often more bioavailable than metal salts used in
supplements; thus, the accumulation properties of herbs could be exploited to provide key sources
of elements. For example, herbs that accumulate Se or Mn could improve deficiencies in these
elements. Deficiencies in these elements have been linked to cardiovascular disease [179, 180].
Secondly, elements play a key role in the expression of secondary metabolites, or bioactive plant
compounds (BPC), such as polyphenols and flavonoids. Studies have shown that production of
secondary metabolites could be tuned by elemental exposure [148, 149, 156]. Thirdly, many BPCs
are natural metal chelators where these complexes have been shown to improve metal absorption
[151] and alter BPC pharmacological activity [109, 150]. Lastly, the elements found in herbal
medicines can potentially interact with drugs if taken simultaneously, altering their bioactivity. In
summary, the metal accumulation properties of plants and the addition of elements during
processing and formulation have a number of implications for health and product quality, which
should be investigated.
50
One medicinal herb that is of particular interest due to its popularity and metal accumulation
properties is Hypericum perforatum, otherwise known as St John’s Wort (SJW). It is used in the
treatment of mild to moderate depression [83] and is also noted for its anti-inflammatory and anti-
bacterial effects [84]. The SJW constituents have shown a number of biological interactions in
relation to depression. For example, MAO-inhibition (Monoamine oxidase) has been demonstrated
for the flavonoids quercetin and luteolin, whereas amentoflavone have affinity for the δ-opioid
receptor, hypericin has affinity for the δ-receptor and the reuptake of serotonin can be inhibited by
hyperforin [105]. In 2008/2009, the UK spent £4 million on SJW products [85]. Currently, SJW is
standardised in Europe according to three groups of pharmacologically active ingredients
hypericins, hyperforin and flavonoids (e.g. rutin) [116]. An advantage to using elemental
fingerprints for quality control is the greater stability of metals in comparison to molecular
constituents, which are subject to oxidation and photo-degradation over time. A number of studies
[118-145] have investigated the elemental content of SJW raw plant and preparations in which
concentrations of Cd, Cu, Fe, Mn, Pb and Zn are usually found in ranges of 0.04-20 μg/g, 4-200 μg/g,
6-1300 μg/g, 8-450 μg/g, ≤0.1-20 μg/g and 10-200 μg/g, respectively. Other studies have looked at
elements such as Al, As, B, Ba, Ca, Co, Cr, Hg, Mg, Mo, Ni, Sb, Sn, Sr and V [119, 125, 126, 129, 131,
142, 145]. Also, the addition of Ni and Cr in the growth medium has been shown to affect the
production of BPCs in SJW. For example, a 15-20 fold decrease in the production of hypericin and
pseudohypericin was observed when SJW was exposed to 50 mM Ni [149]. On the other hand, SJW
exposed to 0.1 mM Cr showed increased production of protopseudohypericin (+167%), hypericin
(+25%) and pseudohypericin (+5%) compared to untreated SJW [148]. A number of BPCs found in
SJW, such as rutin, quercetin, and hypericin, have also been shown to complex metals ex-situ and in
some cases affecting the bioactivity [109, 150, 151, 181, 182]. The extent to which this happens in
SJW is largely unknown. Although some studies have investigated the elemental content of SJW,
they are often limited by the number of elements and/or breadth of samples investigated. A gap
remains on how the elemental profiles can be fully utilized, therefore, before the elemental profile
of SJW can be exploited further, ‘normal’ concentration ranges for a selection of elements needs to
be determined for both the herb and preparations and this information further interpreted.
Chemometric approaches have been extremely powerful for the interpretation of multidimensional
data, as metal profiles of plant material has allowed the differentiation of species [77-79],
manufacturer [80, 81] and origin [80-82]. Two studies [150, 155] were outlined in section 1.7.5
regarding SJW and multivariate analysis. In order to determine the feasibility of using elemental
profiles for SJW as a mean for quality control, a large number of elements and samples from a large
51
geographic area must be investigated to establish a typical range and potential variability for the
elements monitored.
In this study, the elemental profile was obtained for 54 SJW products including dry herb (n=22),
tablets (n=20) and capsules (n=12). Twenty-five elements (i.e., Al, As, B, Ba, Be, Ca, Cd, Co, Cr, Cu,
Fe, Hg, In, Mg, Mn, Mo, Ni, Pb, Pt, Sb, Se, Sr, V, Y and Zn) were monitored using ICP-OES. The
elemental profiles were also subjected to PCA to identify underlying patterns from the multivariate
data. Following this the PCA model was optimised and examined for robustness.
3.2 Method
3.2.1 Materials
A variety of SJW dry herbs, tablets and capsules were purchased through high street retailers and
Internet sources. A summary of all samples is shown in (Table 3.1). All labware was acid washed
overnight with 4M Nitric acid and rinsed thoroughly with deionised water before use. High-purity
HNO3 70% (99.99% trace metal basis) (Sigma-Aldrich, Gillingham, UK) was used for microwave
digestion and preparation of 2% HNO3 solutions. Elemental stock solutions (1000 ppm) of Al, As, B,
Ba, Cd, Co, Pb, Mg, Mn, Mo, Ni, In and Hg (Fisher, Loughborough, UK); Be and Pt (VWR,
Lutterworth, UK); Ca, Cr, Cu, Fe, Sb, Se, Sr and Zn (Merck, Feltham, UK); V (Sigma-Aldrich,
Gillingham, UK); and Y (Acros organics, Geel, Belgium) were used to prepare calibration standards.
3.2.2 Inductively Coupled Plasma – Optical Emission Spectroscopy Analysis
Elemental analysis was carried out using a 710 ICP-OES (Varian, Mulgrave, Australia) axial
spectrometer fitted with a SeaSpray nebuliser and SPS3 autosampler. The wavelengths for each
element as well as the instrument parameters used are summarized in Chapter 2. Limits of
quantification were calculated (LOQ = standard deviation of the blank x 10) for each wavelength by
analysis of a 2% HNO3 blank (n=40) on three separate days [161] (please see Chapter 2). The
calibration standards for the majority of elements were 1, 0.5, 0.1, 0.05, 0.025 and 0.01 ppm with
the exception of Al (20, 10, 5, 1, 0.5, 0.25 and 0.1 ppm), Ca (50, 20, 10, 2, 1, 0.5 and 0.2 ppm), Fe (5,
2, 1, 0.2, 0.1, 0.05 and 0.02 ppm) Mg (15, 10, 5, 1, 0.5, 0.25 and 0.1 ppm) and Mn (2, 1, 0.2, 0.1,
0.05 and 0.02 ppm). Concentrations were calculated using a weighted regression.
52
3.2.3 Sample Preparation
Dry herb samples were ground using a Precelly’s homogeniser (Bertin Technologies, Aix-en-
Provence, France). The contents of capsule samples were removed from the capsule case; tablet
samples were ground using an agate pestle and mortar then sieved (1 mm mesh) to remove any
outer coating. The samples were dried (40⁰C) overnight in an oven (8000 psi) and then stored in
desiccators at room temperature before analysis. The sample (0.4 g) was weighed by difference and
digested with 5 ml high purity nitric acid via a CEM MARS Xpress microwave at 1600W. The samples
were then diluted 10:1 with deionised water, centrifuged for 45 minutes at 9000 RPM and filtered
using 0.22 µm syringe filter (Millipore, Watford, UK) prior to analysis. All samples were prepared in
triplicate.
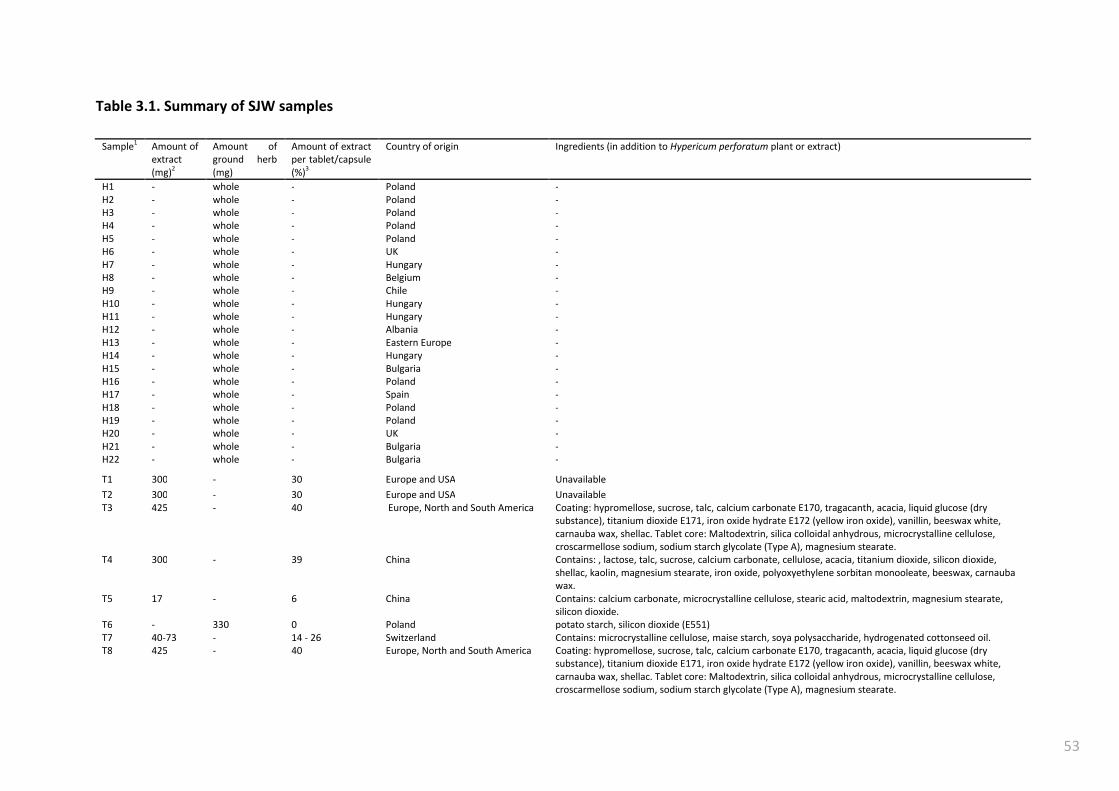
53
Table 3.1. Summary of SJW samples
Sample1 Amount of extract (mg)2
Amount of ground herb (mg)
Amount of extract per tablet/capsule (%)3
Country of origin Ingredients (in addition to Hypericum perforatum plant or extract)
H1 - whole - Poland - H2 - whole - Poland - H3 - whole - Poland - H4 - whole - Poland - H5 - whole - Poland - H6 - whole - UK - H7 - whole - Hungary - H8 - whole - Belgium - H9 - whole - Chile - H10 - whole - Hungary - H11 - whole - Hungary - H12 - whole - Albania - H13 - whole - Eastern Europe - H14 - whole - Hungary - H15 - whole - Bulgaria - H16 - whole - Poland - H17 - whole - Spain - H18 - whole - Poland - H19 - whole - Poland - H20 - whole - UK - H21 - whole - Bulgaria - H22 - whole - Bulgaria -
T1 300 - 30 Europe and USA Unavailable
T2 300 - 30 Europe and USA Unavailable T3 425 - 40 Europe, North and South America Coating: hypromellose, sucrose, talc, calcium carbonate E170, tragacanth, acacia, liquid glucose (dry
substance), titanium dioxide E171, iron oxide hydrate E172 (yellow iron oxide), vanillin, beeswax white, carnauba wax, shellac. Tablet core: Maltodextrin, silica colloidal anhydrous, microcrystalline cellulose, croscarmellose sodium, sodium starch glycolate (Type A), magnesium stearate.
T4 300 - 39 China Contains: , lactose, talc, sucrose, calcium carbonate, cellulose, acacia, titanium dioxide, silicon dioxide, shellac, kaolin, magnesium stearate, iron oxide, polyoxyethylene sorbitan monooleate, beeswax, carnauba wax.
T5 17 - 6 China Contains: calcium carbonate, microcrystalline cellulose, stearic acid, maltodextrin, magnesium stearate, silicon dioxide.
T6 - 330 0 Poland potato starch, silicon dioxide (E551) T7 40-73 - 14 - 26 Switzerland Contains: microcrystalline cellulose, maise starch, soya polysaccharide, hydrogenated cottonseed oil. T8 425 - 40 Europe, North and South America Coating: hypromellose, sucrose, talc, calcium carbonate E170, tragacanth, acacia, liquid glucose (dry
substance), titanium dioxide E171, iron oxide hydrate E172 (yellow iron oxide), vanillin, beeswax white, carnauba wax, shellac. Tablet core: Maltodextrin, silica colloidal anhydrous, microcrystalline cellulose, croscarmellose sodium, sodium starch glycolate (Type A), magnesium stearate.
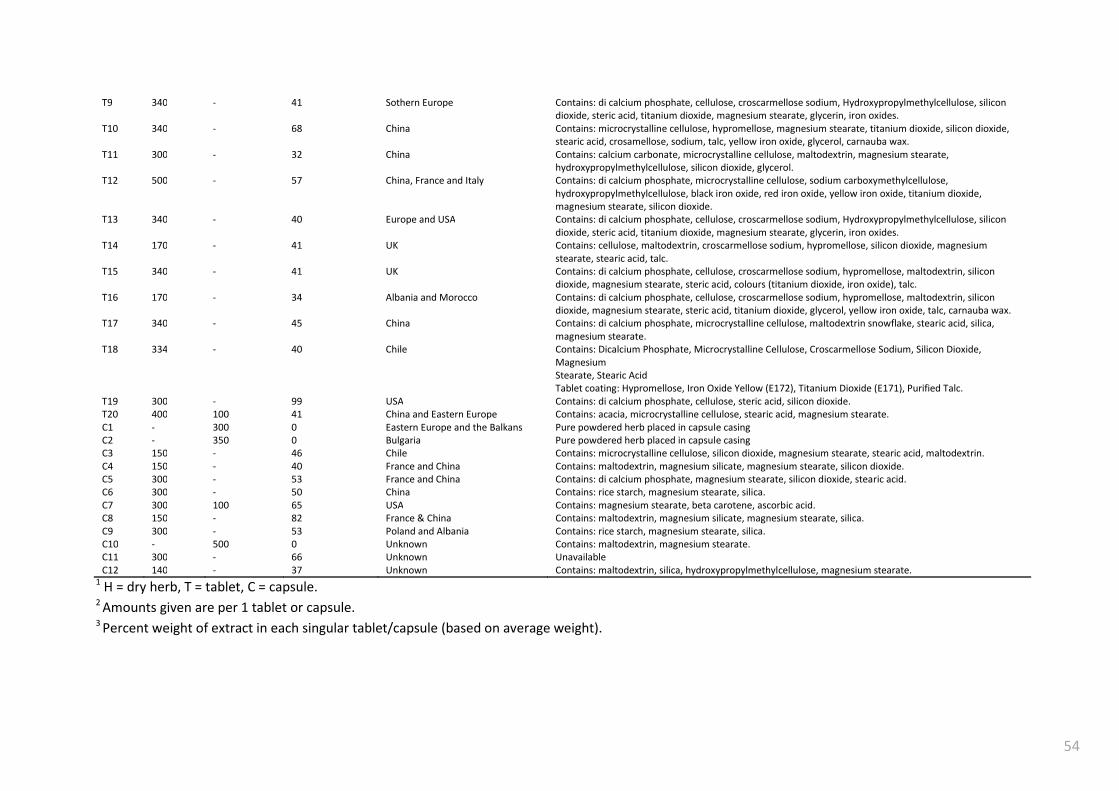
54
T9 340 - 41 Sothern Europe Contains: di calcium phosphate, cellulose, croscarmellose sodium, Hydroxypropylmethylcellulose, silicon dioxide, steric acid, titanium dioxide, magnesium stearate, glycerin, iron oxides.
T10 340 - 68 China Contains: microcrystalline cellulose, hypromellose, magnesium stearate, titanium dioxide, silicon dioxide, stearic acid, crosamellose, sodium, talc, yellow iron oxide, glycerol, carnauba wax.
T11 300 - 32 China Contains: calcium carbonate, microcrystalline cellulose, maltodextrin, magnesium stearate, hydroxypropylmethylcellulose, silicon dioxide, glycerol.
T12 500 - 57 China, France and Italy Contains: di calcium phosphate, microcrystalline cellulose, sodium carboxymethylcellulose, hydroxypropylmethylcellulose, black iron oxide, red iron oxide, yellow iron oxide, titanium dioxide, magnesium stearate, silicon dioxide.
T13 340 - 40 Europe and USA Contains: di calcium phosphate, cellulose, croscarmellose sodium, Hydroxypropylmethylcellulose, silicon dioxide, steric acid, titanium dioxide, magnesium stearate, glycerin, iron oxides.
T14 170 - 41 UK Contains: cellulose, maltodextrin, croscarmellose sodium, hypromellose, silicon dioxide, magnesium stearate, stearic acid, talc.
T15 340 - 41 UK Contains: di calcium phosphate, cellulose, croscarmellose sodium, hypromellose, maltodextrin, silicon dioxide, magnesium stearate, steric acid, colours (titanium dioxide, iron oxide), talc.
T16 170 - 34 Albania and Morocco Contains: di calcium phosphate, cellulose, croscarmellose sodium, hypromellose, maltodextrin, silicon dioxide, magnesium stearate, steric acid, titanium dioxide, glycerol, yellow iron oxide, talc, carnauba wax.
T17 340 - 45 China Contains: di calcium phosphate, microcrystalline cellulose, maltodextrin snowflake, stearic acid, silica, magnesium stearate.
T18 334 - 40 Chile Contains: Dicalcium Phosphate, Microcrystalline Cellulose, Croscarmellose Sodium, Silicon Dioxide, Magnesium Stearate, Stearic Acid Tablet coating: Hypromellose, Iron Oxide Yellow (E172), Titanium Dioxide (E171), Purified Talc.
T19 300 - 99 USA Contains: di calcium phosphate, cellulose, steric acid, silicon dioxide. T20 400 100 41 China and Eastern Europe Contains: acacia, microcrystalline cellulose, stearic acid, magnesium stearate. C1 - 300 0 Eastern Europe and the Balkans Pure powdered herb placed in capsule casing C2 - 350 0 Bulgaria Pure powdered herb placed in capsule casing C3 150 - 46 Chile Contains: microcrystalline cellulose, silicon dioxide, magnesium stearate, stearic acid, maltodextrin. C4 150 - 40 France and China Contains: maltodextrin, magnesium silicate, magnesium stearate, silicon dioxide. C5 300 - 53 France and China Contains: di calcium phosphate, magnesium stearate, silicon dioxide, stearic acid. C6 300 - 50 China Contains: rice starch, magnesium stearate, silica. C7 300 100 65 USA Contains: magnesium stearate, beta carotene, ascorbic acid. C8 150 - 82 France & China Contains: maltodextrin, magnesium silicate, magnesium stearate, silica. C9 300 - 53 Poland and Albania Contains: rice starch, magnesium stearate, silica. C10 - 500 0 Unknown Contains: maltodextrin, magnesium stearate. C11 300 - 66 Unknown Unavailable C12 140 - 37 Unknown Contains: maltodextrin, silica, hydroxypropylmethylcellulose, magnesium stearate.
1 H = dry herb, T = tablet, C = capsule. 2 Amounts given are per 1 tablet or capsule.
3 Percent weight of extract in each singular tablet/capsule (based on average weight).
55
3.2.4 Statistical Analysis
Correlation analysis was carried out on the elemental profile of dry SJW using Excel 2007
(Microsoft) to see if relationships exist between the elements. Principal component analysis
(PCA) was carried out using the Unscrambler X (CAMO) software. Elements with
concentration values below the LOQ were removed from the dataset and remaining values
were ratio normalised prior to analysis. All of the data associated with a given element
across all samples was concatenated to give a single point on the loadings plot. This gave 16
descriptors in total. The relative position (x-coordinate) of each descriptor on the first
principal component was established. Points with similar values on PC1 are indicative of two
elements explaining the total variance of the dataset in the same manner, the inference
being that this is an over-representation of information in the dataset. Having identified the
two descriptors with the most similar values on PC1, an analysis of the magnitude of their y-
coordinate values on the loadings plot i.e. their contribution to explaining the variance in
the dataset according to the PC2 vector was carried out. The individual descriptor in the pair
which had the y-coordinate value closest to zero was removed from the dataset. The PCA
analysis was then regenerated using the reduced dataset. This process was repeated until
the percentage variance being explained by the first two components remained constant
(i.e. the maximum amount of noise had been removed from the dataset). A qualitative
appraisal of the scores plot associated with the PCA was also carried out after each
reiteration to ensure that removal of elemental data did not have a deleterious effect on
the separation of dry herbs vs. formulated products on the scores plot.
56
3.3 Results and Discussion
3.3.1 Elemental Analysis of SJW Samples
The concentrations of 25 elements were determined for 54 SJW samples including dry
herbs, tablets and capsules (Table 3.2). For all three types of SJW, sixteen elements (i.e. Al,
B, Ba, Ca, Cd, Cr, Cu, Fe, Mg, Mn, Mo, Ni, Pt, Sr, Y and Zn) had concentrations above the
calculated Limits of Quantification (LOQ), whereas four elements were below the LOQs (i.e.
Be, Co, Pb and V) and five elements below Limits of Detection (LOD, i.e. As, Hg, In, Sb and
Se). The levels of Cd, Cr and Pb were below recommended daily intake values [71, 146, 183].
The elements found in highest concentrations (38 – 4870 μg/g) for the dry herbs (Table 10.6
and Table 10.7, Appendix 10.3) were in the order Ca>Mg>Fe>Mn>Al>Zn. For Ca, obtained
results (2611-9533 μg/g) are higher in concentration (up to 10 times) in comparison to
previous SJW studies of dry herb [125, 128, 145]. Calcium is present in large concentrations
in plant cells [39] and Ca ions are used in numerous plant functions including alleviation of
toxic metal effects [55, 56]. The results for Mg (789-1869 μg/g), Fe (38-756 μg/g), Mn (59-
261 μg/g), Al (20-373 μg/g), and Zn (23-64 μg/g) agreed with previous studies [118, 120,
121, 125-127, 129, 130, 136, 142, 145]. Magnesium is also an essential element for plants as
it activates many enzymes and is also a constituent of chlorophyll [39]. Iron is used in the
production of chlorophyll and aids enzyme systems in plants [39]. Aluminium function in
plants is unclear [39], although it was shown that low concentrations can have a beneficial
effect on growth [54]. Aluminium is usually noted for its toxicity to plants with the most
recognized effect being the reduction of root growth [39, 55, 184]. Zinc is an essential
component of many proteins in plants [185]. Elements found in concentrations between 13
and 28 μg/g were in the order B>Sr>Cu>Ba. Strontium uptake in plants is influenced by the
Ca content of the soil [186] and is an essential element for higher plants [47]. Levels of Sr in
dry herbs found, agree with other studies [129, 144]. Copper is utilised for plant processes
such as photosynthesis, protein metabolism, and respiration [39]. Elements found in the
lowest concentrations (0.01 – 2 μg/g) were in the order Y<Mo<Cr<Cd<Pt<Ni. Chromium may
be an essential element in plant growth [39] and has been shown to increase production of
bioactive constituents in SJW [148]. Cadmium is not essential for plants [39, 187] and
usually low levels are integrated into plant material from water uptake and growth medium.
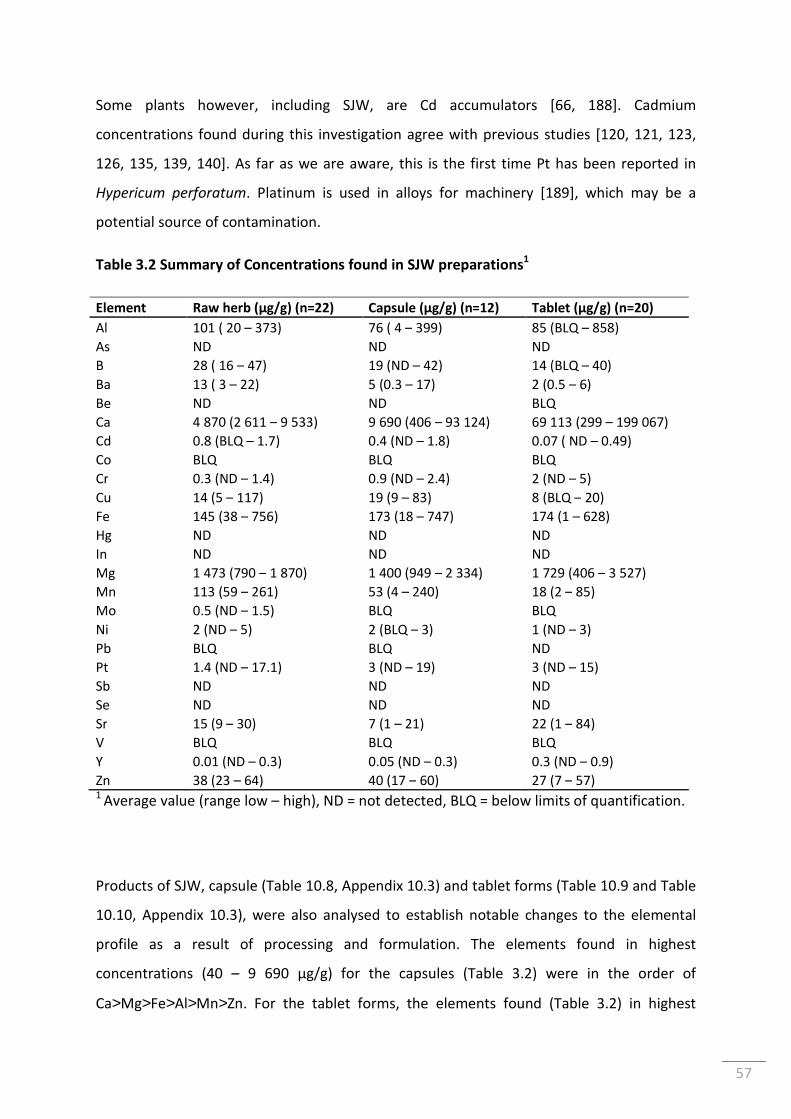
57
Some plants however, including SJW, are Cd accumulators [66, 188]. Cadmium
concentrations found during this investigation agree with previous studies [120, 121, 123,
126, 135, 139, 140]. As far as we are aware, this is the first time Pt has been reported in
Hypericum perforatum. Platinum is used in alloys for machinery [189], which may be a
potential source of contamination.
Table 3.2 Summary of Concentrations found in SJW preparations1
Element Raw herb (μg/g) (n=22) Capsule (μg/g) (n=12) Tablet (μg/g) (n=20)
Al 101 ( 20 – 373) 76 ( 4 – 399) 85 (BLQ – 858)
As ND ND ND
B 28 ( 16 – 47) 19 (ND – 42) 14 (BLQ – 40)
Ba 13 ( 3 – 22) 5 (0.3 – 17) 2 (0.5 – 6)
Be ND ND BLQ
Ca 4 870 (2 611 – 9 533) 9 690 (406 – 93 124) 69 113 (299 – 199 067)
Cd 0.8 (BLQ – 1.7) 0.4 (ND – 1.8) 0.07 ( ND – 0.49)
Co BLQ BLQ BLQ
Cr 0.3 (ND – 1.4) 0.9 (ND – 2.4) 2 (ND – 5)
Cu 14 (5 – 117) 19 (9 – 83) 8 (BLQ – 20)
Fe 145 (38 – 756) 173 (18 – 747) 174 (1 – 628)
Hg ND ND ND
In ND ND ND
Mg 1 473 (790 – 1 870) 1 400 (949 – 2 334) 1 729 (406 – 3 527)
Mn 113 (59 – 261) 53 (4 – 240) 18 (2 – 85)
Mo 0.5 (ND – 1.5) BLQ BLQ
Ni 2 (ND – 5) 2 (BLQ – 3) 1 (ND – 3)
Pb BLQ BLQ ND
Pt 1.4 (ND – 17.1) 3 (ND – 19) 3 (ND – 15)
Sb ND ND ND
Se ND ND ND
Sr 15 (9 – 30) 7 (1 – 21) 22 (1 – 84)
V BLQ BLQ BLQ
Y 0.01 (ND – 0.3) 0.05 (ND – 0.3) 0.3 (ND – 0.9)
Zn 38 (23 – 64) 40 (17 – 60) 27 (7 – 57) 1 Average value (range low – high), ND = not detected, BLQ = below limits of quantification.
Products of SJW, capsule (Table 10.8, Appendix 10.3) and tablet forms (Table 10.9 and Table
10.10, Appendix 10.3), were also analysed to establish notable changes to the elemental
profile as a result of processing and formulation. The elements found in highest
concentrations (40 – 9 690 μg/g) for the capsules (Table 3.2) were in the order of
Ca>Mg>Fe>Al>Mn>Zn. For the tablet forms, the elements found (Table 3.2) in highest
58
concentrations (22 – 69 113 μg/g) were in the order of Ca>Mg>Fe>Al>Zn>Sr. A steady
increase in Ca was observed when comparing the dry herb (4 870 μg/g), capsule (9 690
μg/g) and tablet form (69 113 μg/g). The increase in Ca content for the capsules and tablets
is likely due to the addition of excipients such as calcium carbonate and di-calcium
phosphate as stated on their label claim, which are used as bulking agents. Values obtained
for Ca are higher than those seen in previous studies for tablets/capsules [119, 125]. A
small increase was observed for Mg when comparing the dry herb (1473 μg/g) and capsule
(1400 μg/g) content to the tablet forms (1729 μg/g). The increase in Mg content for the
tablets is likely to be due to excipient addition of magnesium stearate and magnesium
silicate. The results agree with those found by Bu et al (2012) [119] for Mg in capsules. An
increase in the average Fe concentration was also observed when comparing the dry herb
(145 μg/g) to the formulated products (173 & 174 μg/g). Iron oxides are used as a colouring
for tablet coatings, however in this study much care was taken to remove these. An increase
of Fe could also be due to contamination through processing whereby Fe is a major
component of stainless steel [190]. The levels of Fe in tablets agree with the range reported
by Kalny et al. (2012) [131]. The elements found in midrange average concentrations were
B, Cu, Sr, and Ba for capsules (5-19 μg/g); and Ba, Cu, B, and Mn for tablets (2 and 18 μg/g).
The levels of Ba and Cu in the capsules and tablets agree with previous studies [119, 125,
131]. Elements found in the lowest average concentrations were Y, Cd, Cr, Ni, and Pt for
capsules (0.05 – 3 μg/g); and Cd, Y, Pt, Ni, and Cr for tablets (0.05 – 2 μg/g). Levels of Cd, Cr
and Ni in the capsules and tablets agree with previous studies [119, 126, 131]. Although the
concentration of Ca and Mg increased in the formulated products, a number of elements
(i.e. Al, B, Ba, Cd, and Mn) decreased in concentration from 25-75% of that found in the dry
herb samples. For example, a steady decrease was observed for Mn when comparing the
raw herb (113 μg/g), capsule (53 μg/g) and tablet forms (18 μg/g). Also, Ba decreased from
an average concentration of 13 μg/g to 2-5 μg/g in the SJW formulated products. One
element, Mo, was found in the dry herb samples above the LOQ but not in the capsules and
tablets analysed in this study. These decreases could be due to a combination of two main
factors. Firstly, a majority of the formulated products in this study contained the dry
alcoholic extract of SJW and not the dry herb (Table 1) [113, 191]. The extraction process
would only transfer those elements that are released from the bulk plant material and in a
soluble form. The element concentration in the extract (μg/g) could potentially increase or
59
decrease depending on the extraction efficiency and the amount of extract recovered.
Secondly, the addition of excipients when formulating would act as a diluent and further
decrease the elemental concentration. Thus, an element could be concentrated via the
extraction process, but then diluted by the addition of excipient and have similar
concentrations in herb and tablet form.
3.3.2 Application of Statistics to SJW Elemental Profiles
Correlation between the 16 elements (i.e. those above calculated LOQs) in SJW dry herbs
was investigated to determine the relationship between elements. The correlation matrix
(Pearson’s) between the elements (Table 3.3) shows that there are several positive
correlations between elements. A correlation between Ca and Sr was observed with a value
of 0.6458 and this relationship is well documented [39] as Sr ions often replace some Ca
ions. Therefore as the concentration of Ca increases, Sr will increase as well. Other
correlations found (such as Al with Ca, Al with Fe, B with Mn as well as Ca with Cr) may be
due to soil conditions. As soil becomes more acidic, more elements are taken up by a plant
and other factors such as soil type, moisture content and the plants root surface properties
can result in synergic (or antagonistic) relationships [40].
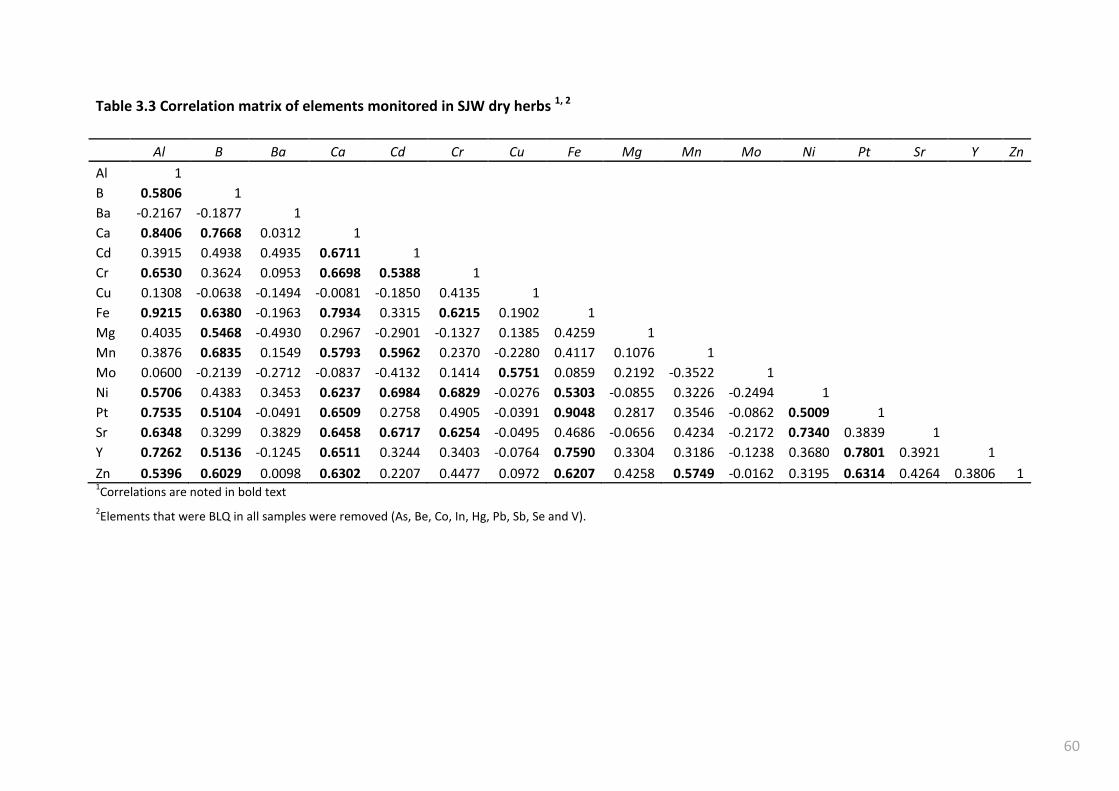
60
Table 3.3 Correlation matrix of elements monitored in SJW dry herbs 1, 2
Al B Ba Ca Cd Cr Cu Fe Mg Mn Mo Ni Pt Sr Y Zn
Al 1 B 0.5806 1
Ba -0.2167 -0.1877 1 Ca 0.8406 0.7668 0.0312 1
Cd 0.3915 0.4938 0.4935 0.6711 1 Cr 0.6530 0.3624 0.0953 0.6698 0.5388 1
Cu 0.1308 -0.0638 -0.1494 -0.0081 -0.1850 0.4135 1 Fe 0.9215 0.6380 -0.1963 0.7934 0.3315 0.6215 0.1902 1
Mg 0.4035 0.5468 -0.4930 0.2967 -0.2901 -0.1327 0.1385 0.4259 1 Mn 0.3876 0.6835 0.1549 0.5793 0.5962 0.2370 -0.2280 0.4117 0.1076 1
Mo 0.0600 -0.2139 -0.2712 -0.0837 -0.4132 0.1414 0.5751 0.0859 0.2192 -0.3522 1 Ni 0.5706 0.4383 0.3453 0.6237 0.6984 0.6829 -0.0276 0.5303 -0.0855 0.3226 -0.2494 1
Pt 0.7535 0.5104 -0.0491 0.6509 0.2758 0.4905 -0.0391 0.9048 0.2817 0.3546 -0.0862 0.5009 1 Sr 0.6348 0.3299 0.3829 0.6458 0.6717 0.6254 -0.0495 0.4686 -0.0656 0.4234 -0.2172 0.7340 0.3839 1
Y 0.7262 0.5136 -0.1245 0.6511 0.3244 0.3403 -0.0764 0.7590 0.3304 0.3186 -0.1238 0.3680 0.7801 0.3921 1 Zn 0.5396 0.6029 0.0098 0.6302 0.2207 0.4477 0.0972 0.6207 0.4258 0.5749 -0.0162 0.3195 0.6314 0.4264 0.3806 1
1Correlations are noted in bold text
2Elements that were BLQ in all samples were removed (As, Be, Co, In, Hg, Pb, Sb, Se and V).
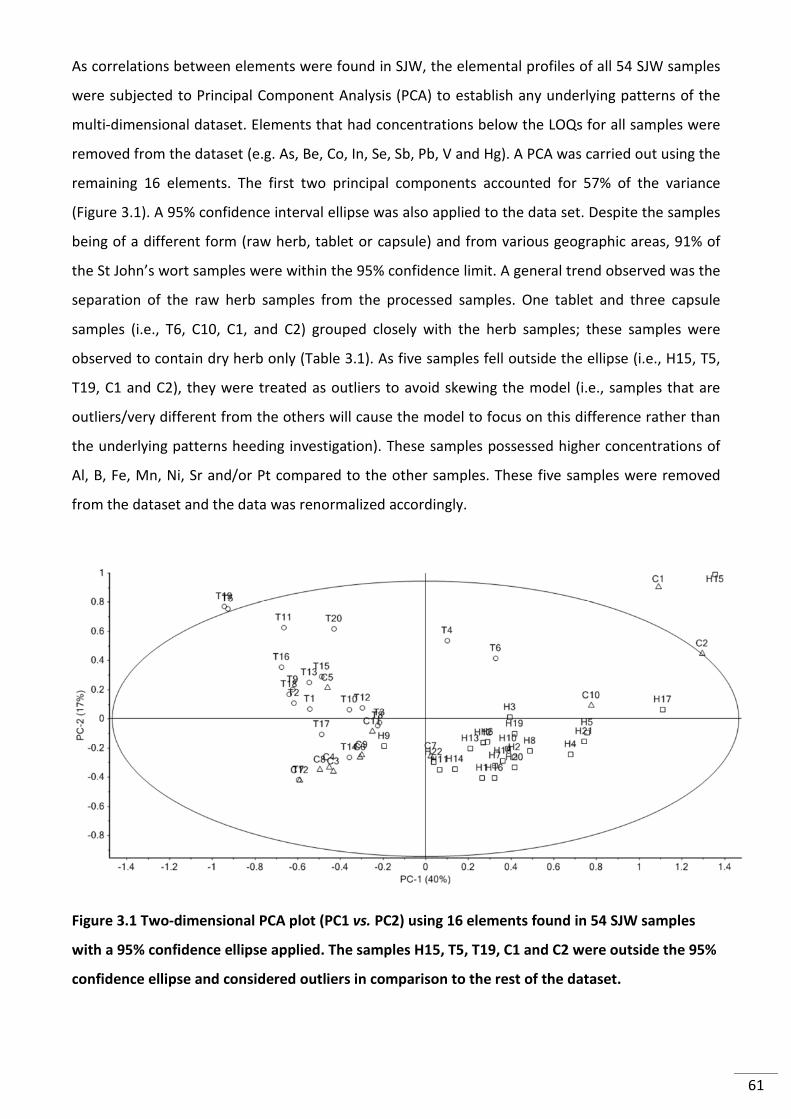
61
As correlations between elements were found in SJW, the elemental profiles of all 54 SJW samples
were subjected to Principal Component Analysis (PCA) to establish any underlying patterns of the
multi-dimensional dataset. Elements that had concentrations below the LOQs for all samples were
removed from the dataset (e.g. As, Be, Co, In, Se, Sb, Pb, V and Hg). A PCA was carried out using the
remaining 16 elements. The first two principal components accounted for 57% of the variance
(Figure 3.1). A 95% confidence interval ellipse was also applied to the data set. Despite the samples
being of a different form (raw herb, tablet or capsule) and from various geographic areas, 91% of
the St John’s wort samples were within the 95% confidence limit. A general trend observed was the
separation of the raw herb samples from the processed samples. One tablet and three capsule
samples (i.e., T6, C10, C1, and C2) grouped closely with the herb samples; these samples were
observed to contain dry herb only (Table 3.1). As five samples fell outside the ellipse (i.e., H15, T5,
T19, C1 and C2), they were treated as outliers to avoid skewing the model (i.e., samples that are
outliers/very different from the others will cause the model to focus on this difference rather than
the underlying patterns heeding investigation). These samples possessed higher concentrations of
Al, B, Fe, Mn, Ni, Sr and/or Pt compared to the other samples. These five samples were removed
from the dataset and the data was renormalized accordingly.
Figure 3.1 Two-dimensional PCA plot (PC1 vs. PC2) using 16 elements found in 54 SJW samples
with a 95% confidence ellipse applied. The samples H15, T5, T19, C1 and C2 were outside the 95%
confidence ellipse and considered outliers in comparison to the rest of the dataset.

62
A PCA was carried out on the remaining 49 SJW samples and the results are shown in Figure 3.2. A
3D plot using the first three principal components (Figure 3.2 B), which represented 65% total
variance, shows delineation between the raw herb and formulated products and some general
delineation between tablets and capsules with a small amount of overlap. The separation is
primarily along principal component 1 (PC1) which has high positive loadings for B, Ba, Cd, Mn, Ni
and Zn as well as high negative loadings for Ca, Cr and Y (Figure 3.2 A). This shows that the herb
samples have higher values for B, Ba, Cd, Ni, Zn and Mn and lower values for Ca, Cr and Y in
comparison to the processed samples. As mentioned previously, formulated products often contain
excipients containing calcium such as calcium carbonate (or talc) and di-calcium phosphate, which
may contribute to these differences. On principal component 2 (PC2) there is a positive loading for
Al, Cu, Fe, Ni and Mo and a high negative loading for Ca, Cr, Y and Sr. The loadings on principal
component three (PC3) included a high positive loading for Al, Fe, Mg, Ni and Pt. Those samples
that were not clearly separated were investigated in more detail to determine the cause, if any, for
their miss-grouping. Again, C10 and T6, which grouped closely to the raw herb samples, are
composed of ground herb only and contained no extract or added excipients according to their
label claim. Also, C7 was found to contain a mixture of ground herb and alcoholic extract, therefore
explaining why this sample is positioned between the capsule and dry herb clusters. The capsule C5
is clustered closely with the tablets and its label claim indicates the presence of bulking agents
more closely linked to those used for tablets as compared to the other capsules. Moreover, the
levels of Ca, Mg and Sr are more comparable to those of the tablets than the other capsules.
A B
63
Figure 3.2. (A) 2D loading plot of PC1 & PC2 and (B) 3D plot of PC1, PC2 & PC3 using 16 elements
from 49 SJW samples (squares = herbs, circles = tablets and triangles = capsules)
As there is clear delineation between the raw herb and formulated products, it was of interest to
assess if excipients containing Ca and Mg were the main cause of delineation or if other factors
influenced the separation. The elements Ca and Mg were removed from the dataset and using the
remaining 14 elements (i.e. Al, B, Ba, Cd, Cr, Cu, Fe, Mn, Mo, Ni, Pt, Sr, Y and Zn) and 49 samples, a
new PCA was constructed (Figure 3.3). The results show delineation is clear between the herb
samples and the processed SJW but less delineation is seen between the tablets and capsules. Thus
it appears the differentiation of the raw herbs from the processed samples can occur based on the
other elements. The removal of Ca and Mg also indicated that these elements can vary between the
tablet samples as without Ca and Mg the tablet samples are grouped closer together. From Table
3.1, the tablets have both Mg and Ca containing excipients, while the capsules have primarily Mg
excipients. This is echoed in the loadings (
Figure 3.2 A), which show greater Ca loading for the tablets than for the capsules. The delineation
that remains between the herb and formulated products may be influenced by other factors than
elements introduced via excipients and that an underlying fingerprint from SJW can be monitored
even when mixed with excipients to form a formulated product. It is also important to note, that
C5
C7 T6
C10
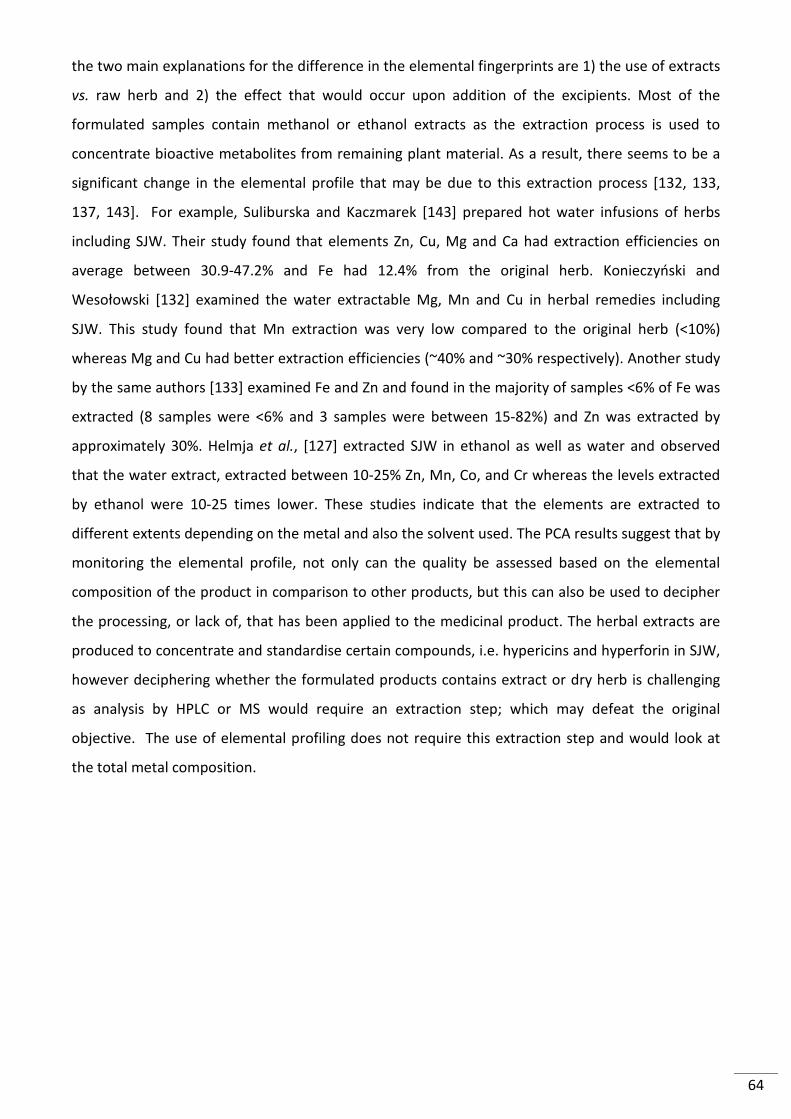
64
the two main explanations for the difference in the elemental fingerprints are 1) the use of extracts
vs. raw herb and 2) the effect that would occur upon addition of the excipients. Most of the
formulated samples contain methanol or ethanol extracts as the extraction process is used to
concentrate bioactive metabolites from remaining plant material. As a result, there seems to be a
significant change in the elemental profile that may be due to this extraction process [132, 133,
137, 143]. For example, Suliburska and Kaczmarek [143] prepared hot water infusions of herbs
including SJW. Their study found that elements Zn, Cu, Mg and Ca had extraction efficiencies on
average between 30.9-47.2% and Fe had 12.4% from the original herb. Konieczyński and
Wesołowski [132] examined the water extractable Mg, Mn and Cu in herbal remedies including
SJW. This study found that Mn extraction was very low compared to the original herb (<10%)
whereas Mg and Cu had better extraction efficiencies (~40% and ~30% respectively). Another study
by the same authors [133] examined Fe and Zn and found in the majority of samples <6% of Fe was
extracted (8 samples were <6% and 3 samples were between 15-82%) and Zn was extracted by
approximately 30%. Helmja et al., [127] extracted SJW in ethanol as well as water and observed
that the water extract, extracted between 10-25% Zn, Mn, Co, and Cr whereas the levels extracted
by ethanol were 10-25 times lower. These studies indicate that the elements are extracted to
different extents depending on the metal and also the solvent used. The PCA results suggest that by
monitoring the elemental profile, not only can the quality be assessed based on the elemental
composition of the product in comparison to other products, but this can also be used to decipher
the processing, or lack of, that has been applied to the medicinal product. The herbal extracts are
produced to concentrate and standardise certain compounds, i.e. hypericins and hyperforin in SJW,
however deciphering whether the formulated products contains extract or dry herb is challenging
as analysis by HPLC or MS would require an extraction step; which may defeat the original
objective. The use of elemental profiling does not require this extraction step and would look at
the total metal composition.
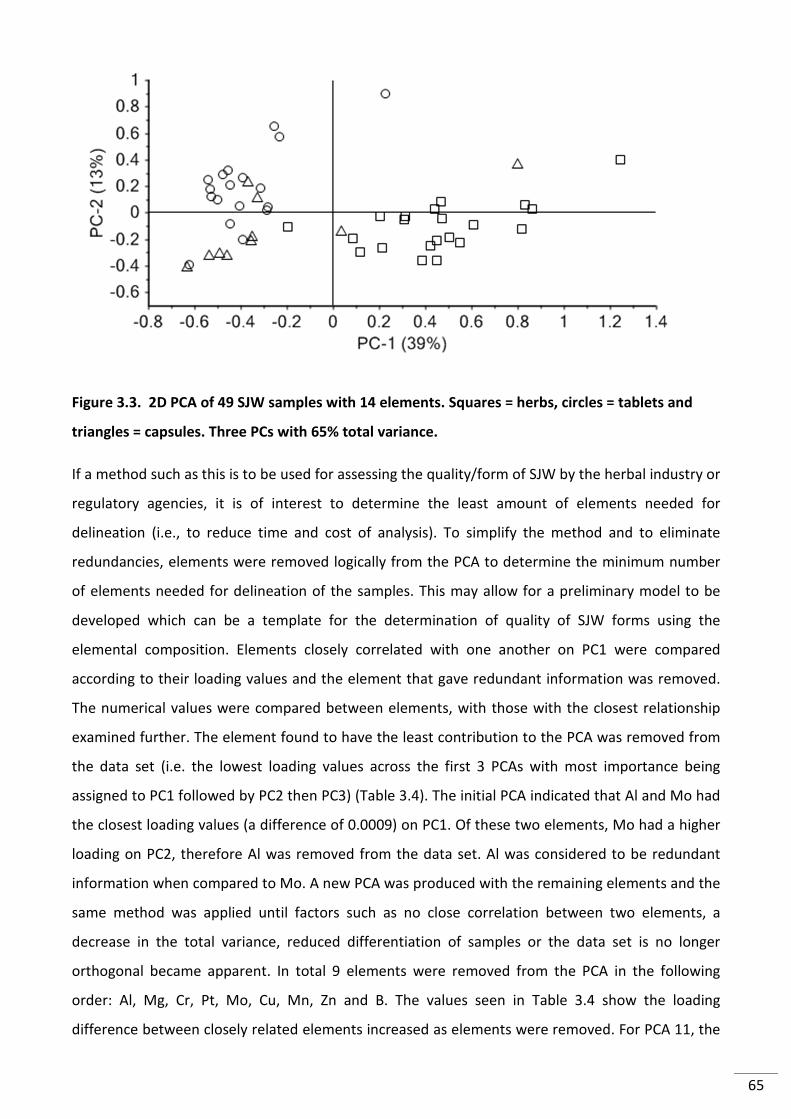
65
Figure 3.3. 2D PCA of 49 SJW samples with 14 elements. Squares = herbs, circles = tablets and
triangles = capsules. Three PCs with 65% total variance.
If a method such as this is to be used for assessing the quality/form of SJW by the herbal industry or
regulatory agencies, it is of interest to determine the least amount of elements needed for
delineation (i.e., to reduce time and cost of analysis). To simplify the method and to eliminate
redundancies, elements were removed logically from the PCA to determine the minimum number
of elements needed for delineation of the samples. This may allow for a preliminary model to be
developed which can be a template for the determination of quality of SJW forms using the
elemental composition. Elements closely correlated with one another on PC1 were compared
according to their loading values and the element that gave redundant information was removed.
The numerical values were compared between elements, with those with the closest relationship
examined further. The element found to have the least contribution to the PCA was removed from
the data set (i.e. the lowest loading values across the first 3 PCAs with most importance being
assigned to PC1 followed by PC2 then PC3) (Table 3.4). The initial PCA indicated that Al and Mo had
the closest loading values (a difference of 0.0009) on PC1. Of these two elements, Mo had a higher
loading on PC2, therefore Al was removed from the data set. Al was considered to be redundant
information when compared to Mo. A new PCA was produced with the remaining elements and the
same method was applied until factors such as no close correlation between two elements, a
decrease in the total variance, reduced differentiation of samples or the data set is no longer
orthogonal became apparent. In total 9 elements were removed from the PCA in the following
order: Al, Mg, Cr, Pt, Mo, Cu, Mn, Zn and B. The values seen in Table 3.4 show the loading
difference between closely related elements increased as elements were removed. For PCA 11, the
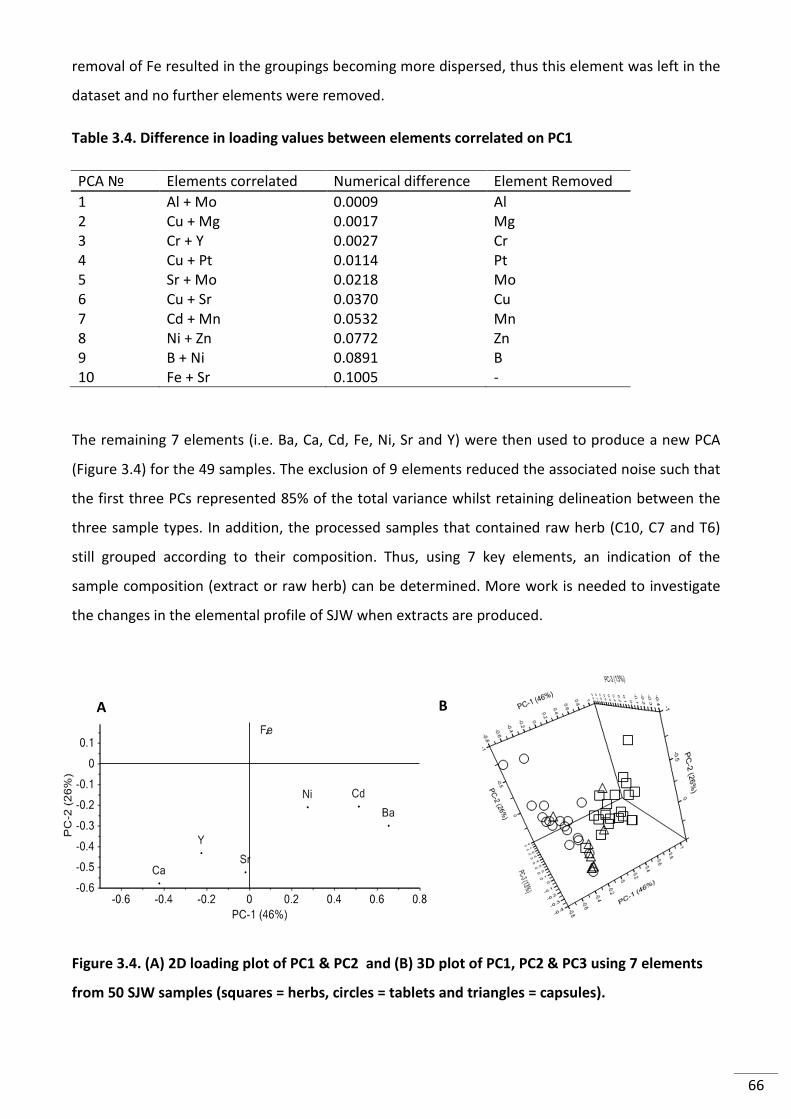
66
removal of Fe resulted in the groupings becoming more dispersed, thus this element was left in the
dataset and no further elements were removed.
Table 3.4. Difference in loading values between elements correlated on PC1
PCA № Elements correlated Numerical difference Element Removed
1 Al + Mo 0.0009 Al 2 Cu + Mg 0.0017 Mg 3 Cr + Y 0.0027 Cr 4 Cu + Pt 0.0114 Pt 5 Sr + Mo 0.0218 Mo 6 Cu + Sr 0.0370 Cu 7 Cd + Mn 0.0532 Mn 8 Ni + Zn 0.0772 Zn 9 B + Ni 0.0891 B 10 Fe + Sr 0.1005 -
The remaining 7 elements (i.e. Ba, Ca, Cd, Fe, Ni, Sr and Y) were then used to produce a new PCA
(Figure 3.4) for the 49 samples. The exclusion of 9 elements reduced the associated noise such that
the first three PCs represented 85% of the total variance whilst retaining delineation between the
three sample types. In addition, the processed samples that contained raw herb (C10, C7 and T6)
still grouped according to their composition. Thus, using 7 key elements, an indication of the
sample composition (extract or raw herb) can be determined. More work is needed to investigate
the changes in the elemental profile of SJW when extracts are produced.
Figure 3.4. (A) 2D loading plot of PC1 & PC2 and (B) 3D plot of PC1, PC2 & PC3 using 7 elements
from 50 SJW samples (squares = herbs, circles = tablets and triangles = capsules).
A B
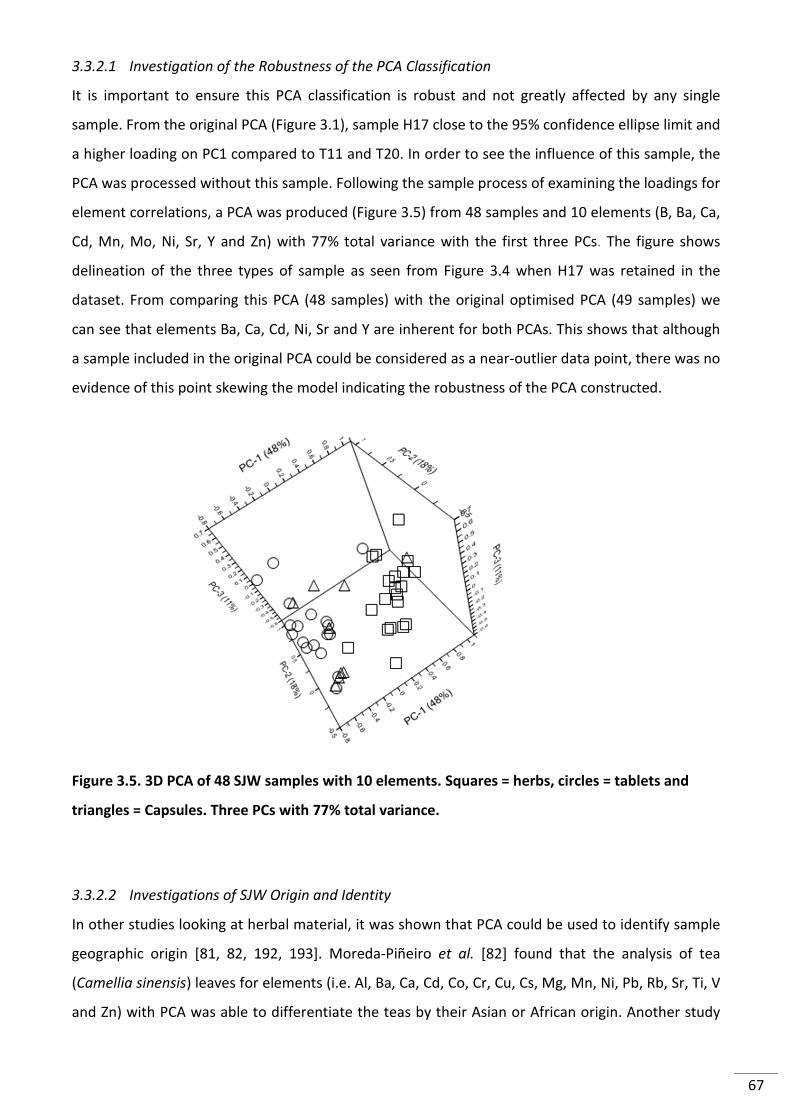
67
3.3.2.1 Investigation of the Robustness of the PCA Classification
It is important to ensure this PCA classification is robust and not greatly affected by any single
sample. From the original PCA (Figure 3.1), sample H17 close to the 95% confidence ellipse limit and
a higher loading on PC1 compared to T11 and T20. In order to see the influence of this sample, the
PCA was processed without this sample. Following the sample process of examining the loadings for
element correlations, a PCA was produced (Figure 3.5) from 48 samples and 10 elements (B, Ba, Ca,
Cd, Mn, Mo, Ni, Sr, Y and Zn) with 77% total variance with the first three PCs. The figure shows
delineation of the three types of sample as seen from Figure 3.4 when H17 was retained in the
dataset. From comparing this PCA (48 samples) with the original optimised PCA (49 samples) we
can see that elements Ba, Ca, Cd, Ni, Sr and Y are inherent for both PCAs. This shows that although
a sample included in the original PCA could be considered as a near-outlier data point, there was no
evidence of this point skewing the model indicating the robustness of the PCA constructed.
Figure 3.5. 3D PCA of 48 SJW samples with 10 elements. Squares = herbs, circles = tablets and
triangles = Capsules. Three PCs with 77% total variance.
3.3.2.2 Investigations of SJW Origin and Identity
In other studies looking at herbal material, it was shown that PCA could be used to identify sample
geographic origin [81, 82, 192, 193]. Moreda-Piñeiro et al. [82] found that the analysis of tea
(Camellia sinensis) leaves for elements (i.e. Al, Ba, Ca, Cd, Co, Cr, Cu, Cs, Mg, Mn, Ni, Pb, Rb, Sr, Ti, V
and Zn) with PCA was able to differentiate the teas by their Asian or African origin. Another study
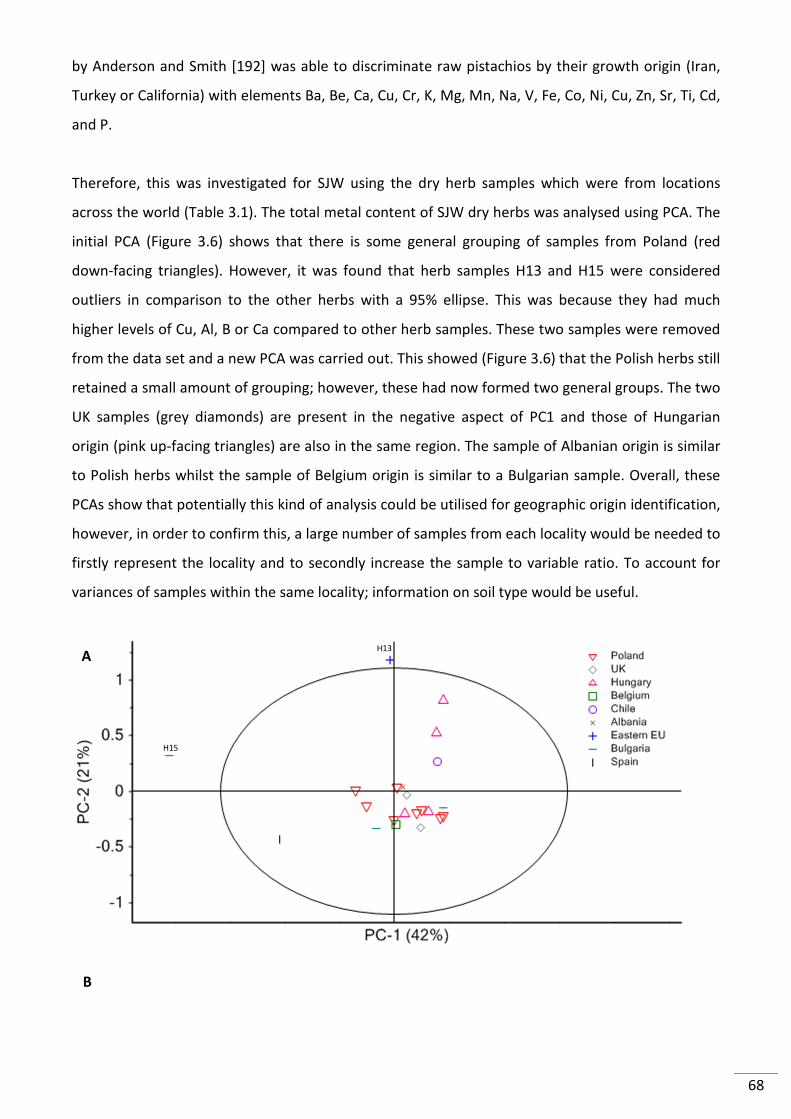
68
by Anderson and Smith [192] was able to discriminate raw pistachios by their growth origin (Iran,
Turkey or California) with elements Ba, Be, Ca, Cu, Cr, K, Mg, Mn, Na, V, Fe, Co, Ni, Cu, Zn, Sr, Ti, Cd,
and P.
Therefore, this was investigated for SJW using the dry herb samples which were from locations
across the world (Table 3.1). The total metal content of SJW dry herbs was analysed using PCA. The
initial PCA (Figure 3.6) shows that there is some general grouping of samples from Poland (red
down-facing triangles). However, it was found that herb samples H13 and H15 were considered
outliers in comparison to the other herbs with a 95% ellipse. This was because they had much
higher levels of Cu, Al, B or Ca compared to other herb samples. These two samples were removed
from the data set and a new PCA was carried out. This showed (Figure 3.6) that the Polish herbs still
retained a small amount of grouping; however, these had now formed two general groups. The two
UK samples (grey diamonds) are present in the negative aspect of PC1 and those of Hungarian
origin (pink up-facing triangles) are also in the same region. The sample of Albanian origin is similar
to Polish herbs whilst the sample of Belgium origin is similar to a Bulgarian sample. Overall, these
PCAs show that potentially this kind of analysis could be utilised for geographic origin identification,
however, in order to confirm this, a large number of samples from each locality would be needed to
firstly represent the locality and to secondly increase the sample to variable ratio. To account for
variances of samples within the same locality; information on soil type would be useful.
A
B
H13
H15
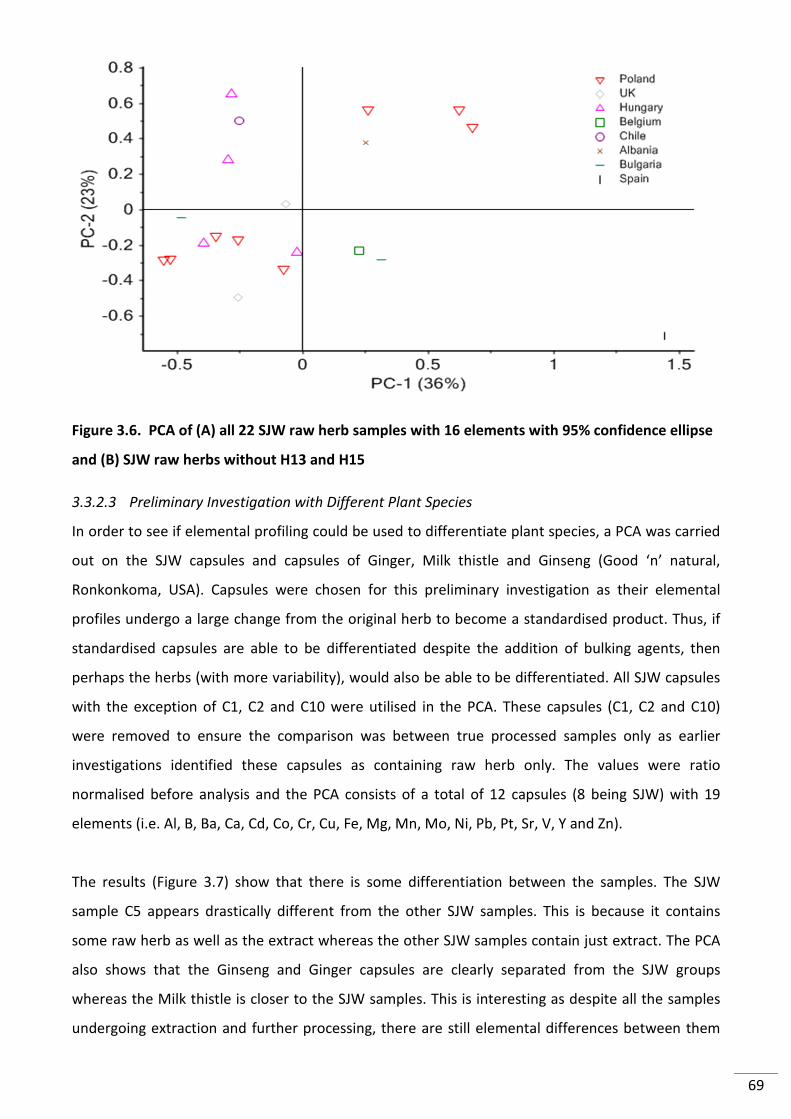
69
Figure 3.6. PCA of (A) all 22 SJW raw herb samples with 16 elements with 95% confidence ellipse
and (B) SJW raw herbs without H13 and H15
3.3.2.3 Preliminary Investigation with Different Plant Species
In order to see if elemental profiling could be used to differentiate plant species, a PCA was carried
out on the SJW capsules and capsules of Ginger, Milk thistle and Ginseng (Good ‘n’ natural,
Ronkonkoma, USA). Capsules were chosen for this preliminary investigation as their elemental
profiles undergo a large change from the original herb to become a standardised product. Thus, if
standardised capsules are able to be differentiated despite the addition of bulking agents, then
perhaps the herbs (with more variability), would also be able to be differentiated. All SJW capsules
with the exception of C1, C2 and C10 were utilised in the PCA. These capsules (C1, C2 and C10)
were removed to ensure the comparison was between true processed samples only as earlier
investigations identified these capsules as containing raw herb only. The values were ratio
normalised before analysis and the PCA consists of a total of 12 capsules (8 being SJW) with 19
elements (i.e. Al, B, Ba, Ca, Cd, Co, Cr, Cu, Fe, Mg, Mn, Mo, Ni, Pb, Pt, Sr, V, Y and Zn).
The results (Figure 3.7) show that there is some differentiation between the samples. The SJW
sample C5 appears drastically different from the other SJW samples. This is because it contains
some raw herb as well as the extract whereas the other SJW samples contain just extract. The PCA
also shows that the Ginseng and Ginger capsules are clearly separated from the SJW groups
whereas the Milk thistle is closer to the SJW samples. This is interesting as despite all the samples
undergoing extraction and further processing, there are still elemental differences between them
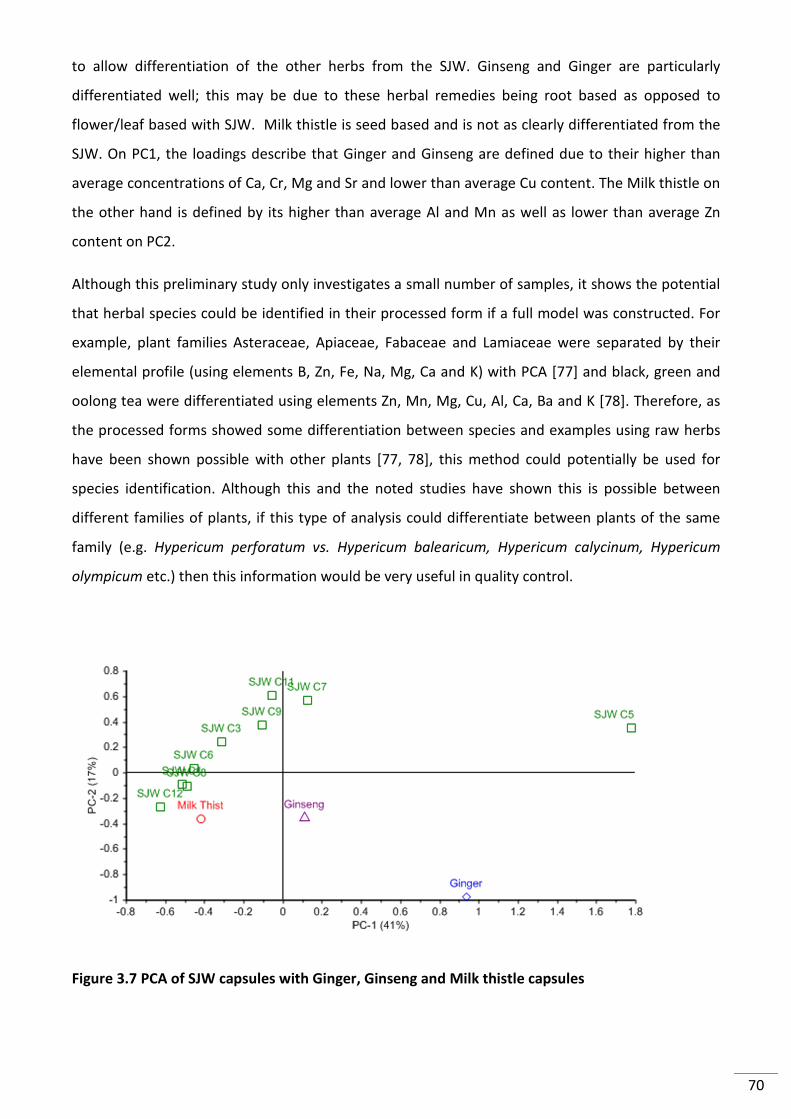
70
to allow differentiation of the other herbs from the SJW. Ginseng and Ginger are particularly
differentiated well; this may be due to these herbal remedies being root based as opposed to
flower/leaf based with SJW. Milk thistle is seed based and is not as clearly differentiated from the
SJW. On PC1, the loadings describe that Ginger and Ginseng are defined due to their higher than
average concentrations of Ca, Cr, Mg and Sr and lower than average Cu content. The Milk thistle on
the other hand is defined by its higher than average Al and Mn as well as lower than average Zn
content on PC2.
Although this preliminary study only investigates a small number of samples, it shows the potential
that herbal species could be identified in their processed form if a full model was constructed. For
example, plant families Asteraceae, Apiaceae, Fabaceae and Lamiaceae were separated by their
elemental profile (using elements B, Zn, Fe, Na, Mg, Ca and K) with PCA [77] and black, green and
oolong tea were differentiated using elements Zn, Mn, Mg, Cu, Al, Ca, Ba and K [78]. Therefore, as
the processed forms showed some differentiation between species and examples using raw herbs
have been shown possible with other plants [77, 78], this method could potentially be used for
species identification. Although this and the noted studies have shown this is possible between
different families of plants, if this type of analysis could differentiate between plants of the same
family (e.g. Hypericum perforatum vs. Hypericum balearicum, Hypericum calycinum, Hypericum
olympicum etc.) then this information would be very useful in quality control.
Figure 3.7 PCA of SJW capsules with Ginger, Ginseng and Milk thistle capsules
71
3.4 Conclusions
This study has determined the ‘normal’ range of 16 elements (i.e. Al, B, Ba, Ca, Cd, Cr, Cu, Fe, Mg,
Mn, Mo, Ni, Pt, Sr, Y and Zn) in St John’s wort raw herb and processed preparations. Nine elements
were either below LOQ or LOD. For the toxic elements As, Pb, Hg and Cd, all samples were within
recommended daily allowances (if the products were taken within the dosage recommendations on
the label claim). The application of PCA to the elemental profiles for the SJW samples clearly
differentiated the raw herb samples from the processed samples with some general differentiation
between tablets and capsules. A reduction in essential elements B, Ba, and Mn seems to occur after
formulation either due to factors such as the extraction process or powder dilution. A reduction in
Cd and Ni was also observed. Higher levels of Ca and Mg found in processed forms were expected,
but higher levels of Cr, Y, and Sr were also found. The PCA model was able to be optimised and
reduced the 16 quantified elements to a minimum of 7 (Ba, Ca, Cd, Fe, Ni, Sr and Y) that still
facilitated differentiation between SJW samples. Removal of a near-outlier data point showed that
the PCA method is robust. Results indicated sample forms (herb, tablet and capsule) were
differentiated by a change in the elemental profile due to excipient addition, dilution, and/or the
extraction process. This initial study indicated that SJW samples can be classified by formulation
using the elemental fingerprint. There is also evidence to suggest that this fingerprint may also
classify based on a change due to the extraction process, yet, even with this processing, the identity
of the herb may be feasible. Further investigations should focus on the extraction process as well
as obtaining other similar herbal samples to confirm classifications of identity.
72
In addition to this, the preliminary investigation that compared SJW capsules to capsules containing
milk thistle, ginseng and ginger indicated that this type of analysis with PCA could potentially be
used for species identification. However, the results obtained in this study were inconclusive due to
number of samples analysed. Therefore, to assess the use of this method for species identification,
future investigations need to increase the number of samples and also investigate with the raw
herbs.
4 Elemental Analysis of St John’s Wort Extracts
4.1 Introduction
St John’s Wort is commonly available in many forms of preparation. The raw herb is often utilised
to make teas and tinctures that can be homemade or bought commercially. These, in addition to
the majority of tablets and capsules available on the market, utilise St John’s Wort (SJW) in an
extracted form. In teas, the SJW constituents are extracted in water, for tinctures the plant is
extracted in ethanol, and the dried extract (i.e., used in tablet and capsule formulations) is obtained
by extraction in ethanol or methanol. Therefore the majority of SJW products that are used by
consumers are of an extracted form. SJW extracts, as opposed to the raw herb, are utilised more
frequently because during the extraction process the bioactive constituents responsible for the
therapeutic effect become concentrated and can be isolated. This process also aids with
standardising the formulated products [191, 194, 195]. Although it has been reported that the
elemental form can influence the bioactivity of these constituents [109, 150, 196], little is
understood regarding the extraction process for elements present in the raw herb. In addition,
initial studies (Chapter 3) indicate that the extraction process may have a large, yet predictable
impact on the elemental fingerprint of SJW products. Understanding the changes in element
composition after extraction may further assist with the quality control of these products. The
extraction of elements is of interest as some elements have been shown to form complexes with
73
bioactive compounds such as flavonoids [90, 109, 150, 181, 196, 197] and hypericins [198, 199]
which are found in SJW. The complexation of metal ions to these bioactive compounds in vitro has
shown to affect their bioactivity properties [109, 196] as well as their bioavailability [151]. To date,
such complexes have not been identified in herbal remedy extracts. However, if such complexes
occur naturally (i.e., in the herb and extract), it could lead to herbal medicines being artificially
enriched with certain elements to aid disease treatment (e.g., Se and heart disease [180]). Also, the
amount of herb extract used in manufacturing could be reduced while maintaining the same level
of bioactivity and new options for quality control could be utilised. However, before these further
avenues can be examined, the relationship between the elements transferred and extraction
solvent used needs to be understood.
Although elements have been analysed in the infusions [125, 126, 131-133, 143, 157, 200], herbs
[125-129, 133, 135, 136] or manufactured versions of SJW [119, 125, 126], little has been explored
on the effect of the type of extraction solvent on the elemental content in extracts of SJW. More
emphasis has been placed on the extraction of the bioactive molecules; however, it is known that
elements are also transferred in the extraction process [127, 137]. In addition to the formation of
complexes, a particular concern is the speciation of the elements extracted. It has been shown that
for elements such as As and Cr certain forms of these elements are safer than others (e.g., Cr (VI) is
more toxic than Cr (III) [45]). The speciation of elements could aid pharmaceutical companies that
have to comply with the new USP elemental limits [36] within their products. For example, if a
product has just surpassed a limit it could be proven through speciation that the element is of the
safer form (e.g., Cr (VI) rather than Cr (III)).
The limited studies that investigate the elemental content of SJW extracts are primarily water
extracts of SJW [125, 126, 131-133, 143, 157, 200] with fewer studies investigating alcoholic
extracts [127, 137]. Gomez et al. [125, 126] , Oledzka and Szyszkowska [157], Kalny et al. [131] as
well as Suliburska and Kaczmarek [143] examined hot water extractions of SJW herb for elements
including Al, Ba, Ca, Cd, Co, Cu, Cr, Fe, Pb, Mg, Mn, Ni, V and Zn. Gomez et al. [125, 126] prepared
two teas of SJW using boiling water and found that of the elements analysed (Cd, Co, Pb, Al, Cr, Fe,
V, Ca, Cu, Mg, Mn, Zn and Ni), all concentrations were below that of the original herb. These studies
found that, compared to the original herb, Ca, Cu, Ba, Zn, Mg, Mn and Ni had extraction efficiencies
between 17-74%, whereas elements Cd and Fe had extraction efficiencies between 7.8-8.4% and 8-
23% respectively. Elements Cr and Pb were not detected in infusions. Konieczyński and Wesołowski
[132] examined the water extractable Mg, Mn and Cu in herbal remedies including SJW. This study
found that Mn extraction was very low compared to the original herb (<10%) whereas Mg and Cu
74
had higher extraction efficiencies (~40% and ~30% respectively). A similar study by the same
authors [133] examined elements Fe and Zn which found on average <6% Fe was extracted (with 3
high samples 15-82% compared to other 8 samples) and Zn was extracted on average by 30%.
Two studies investigated the elemental content of alcoholic extracts. Naeem et al. [137] prepared
methanol extracts of various Hypericum species including Hypericum perforatum. The extracts
were then analysed for elements Ni, Cr, Cu, Pb, Cd, Co and Fe whereby 0.069 ± 0.007 mg/g, 0.054 ±
0.004 mg/g, 0.210 ± 0.004 mg/g, 0.0460 ± 0.0001 mg/g, 0.005 ± 0.001 mg/g, 0.054 ± 0.009 mg/g
and 0.318 ± 0.009 mg/g was found respectively. Helmja et al. [127] extracted SJW in ethanol as well
as water and observed that the water extract, extracted between 10-25% Zn, Mn, Co, and Cr
whereas the ethanol extracted levels 10-25 times lower.
The majority of these studies are limited as they examine three or fewer SJW samples with the
exception of Koineczynski et al. [133], whom investigated eight. All samples within these studies
use SJW from only one country of origin, thus consistency between herbal samples still needs
investigating. Another limitation of the previous studies mentioned is that only concentrations of
100% water, ethanol or methanol are investigated as extraction solvents. For commercial
formulations, these solvents are used in concentrations of 60% and 80% ethanol or methanol as
they have been shown to extract more bioactive constituents at these percentages [191, 194, 195].
To be able to understand the mechanism of metal transfer, systematic studies are needed using
different solvent conditions.
In this study, fourteen elements from those identified as being present in SJW from Chapter 3 (Al, B,
Ba, Ca, Cd, Cr, Cu, Fe, Mg, Mn, Mo, Ni, Sr and Zn) were monitored in different SJW extracts. A total
of eight SJW raw herbs from different localities (Table 4.1) were used to prepare extracts using
100% water, 60 %v/v ethanol, 80 %v/v ethanol and 100% ethanol to identify transfer relationships
in a systematic way.
4.2 Method
4.2.1 Materials
Eight SJW dry powdered herbs were purchased through high street retailers and internet sources. A
summary of all samples is shown in Table 4.1. Due to the large amount of sample needed for this
study, new SJW samples were purchased in addition to those stated in Chapter 3. All labware was
acid washed overnight with 4M nitric acid and rinsed thoroughly with deionised water before use.
75
High-purity nitric acid 70% (99.99% trace metal basis, Sigma-Aldrich, Gillingham, UK) was used for
hotplate digestion and preparation of 2% HNO3 solutions. Elemental stock solutions (1000 ppm) of
Al, As, B, Ba, Cd, Co, Pb, Mg, Mn, Mo, Ni, In and Hg (Fisher, Loughborough, UK); Be and Pt(VWR,
Lutterworth, UK); Ca, Cr, Cu, Fe, Sb, Se, Sr and Zn(Merck, Feltham, UK); V(Sigma-Aldrich, Gillingham,
UK); and Y (Acros organics, Geel, Belgium) were used to prepare calibration standards. Extractions
of samples were carried out using mixtures of HPLC grade water (Fisher, Loughborough, UK) and
absolute ethanol (Fisher, Loughborough, UK) in %v/v. Whatman cellulose filter paper (grade 1) and
Whatman glass microfiber filter paper (GF/A) were used in the filtering stage of sample
preparation.
Table 4.1. Summary of SJW powdered samples obtained
Sample Name Sample Number Species Country of Origin
Herb 1 H101 Hypericum perforatum Hungary
Herb 2 H171 Hypericum perforatum Spain
Herb 3 H23 Hypericum perforatum Hungary
Herb 4 H24 Hypericum perforatum Hungary
Herb 5 H25 Hypericum perforatum Poland
Herb 6 H26 Hypericum perforatum Hungary
Herb 7 H27 Hypericum perforatum Czech Republic
Herb 8 H29 Hypericum perforatum USA
1SJW dry herb used in the initial investigation (Chapter 3)
4.2.2 Inductively Coupled Plasma-Optical Emission Spectroscopy (ICP-OES)
Elemental analysis was carried out using a 710 ICP-OES (Varian) axial spectrometer fitted with a
Seaspray nebuliser and SPS3 auto sampler. Please see Chapter 3 for full ICP-OES parameters and
wavelengths used.
76
4.2.3 Method Development
4.2.3.1 Filter Paper Comparison
In order to determine the effect of filtering on the elemental profile, the element leaching and
retention was examined during the filtering process. A volume of 20 ml 60 %v/v ethanol was
filtered through two types of filter paper (Whatman cellulose and Whatman glass microfiber) in
triplicate and compared to a non-filtered solution. A volume of 20 ml 60 %v/v ethanol spiked with
known quantities of elements (0.8 ppm for elements As, B, Ba, Be, Ca, Cd, Co, Cr, Cu, Fe, Pb, Mg,
Mo, Ni, In, Hg, Pt Sb, Se, Sr, Y and Zn, 8 ppm for Al and 1.6 ppm for Mn) was also filtered through
the two types of paper (Whatman cellulose and Whatman glass microfiber) in triplicate and
compared to non-filtered solution. The resulting solutions were dried down on a hotplate followed
by acid digestion with 5 ml HNO3. The sample was then diluted 1:10 with deionised water,
centrifuged at 9000 rpm for 15 minutes and filtered (0.2 µm) before ICP-OES analysis.
4.2.3.2 Extraction Time
Approximately 1 g of sample (herb 2) was weighed by difference into an amber jar (50mm x 100
mm). To the jar was added 20 ml of 60 %v/v ethanol. The samples were then stirred for 1, 2, 4, 8 or
24 hrs with an x-bar magnetic stirrer at 450 rpm. Following this the samples were filtered
(Whatman grade 1 cellulose filter paper). Following filtration, 4 ml was transferred from the
Buchner flask into an amber vial. The remaining sample solution was transferred to a tall beaker
with watch glass and rinsed with an additional 5 ml 60 %v/v ethanol. The solution was evaporated
to dryness on a hotplate. Following this, 5 ml high purity HNO3 was added to the beaker and acid
digestion was carried out until no NO2 fumes were visible. The samples were then diluted 1:10 with
deionised water, centrifuged at 9000 rpm for 15 minutes and filtered (0.2 µm). Samples were then
analysed via ICP-OES.
4.2.3.3 Validation
Validation of the hotplate digestion was carried out using the certified reference material NIST
Polish tea (NIST INCT-TL-1). Approximately 0.2 g was weighed by difference and digested with 5 ml
high purity HNO3 via hotplate digestion in triplicate. The NIST tea was also spiked with known
quantities of elements to assess those elements not certified or below limits of detection (As, Be,
Cd, Co, Hg, In, Mo, Pb, Pt, Sb, Se, V and Y). The sample was then diluted 1:10 with deionised water,
centrifuged at 9000 rpm for 15 min and filtered (0.2 µm) before ICP-OES analysis.
77
4.2.4 SJW Sample Preparation
Approximately 2 g of sample was weighed by difference into an amber jar (50 mm x 100 mm) with
20 ml of the selected extraction solvent (100 % water, 60 %v/v ethanol, 80 %v/v ethanol or 100
%v/v ethanol). The samples were stirred for 1 hour with an x-bar magnetic stirrer at 450 rpm, and
filtered (Whatman grade 1 cellulose filter paper). Once filtered, 4 ml was transferred from the
Buchner flask into an amber vial for future liquid chromatography (LC) analysis (see Chapter 5). The
remaining sample solution was transferred to a tall beaker with watch glass and rinsed with an
additional 5 ml of solvent. The solution was evaporated to dryness on a hotplate. Following this, 5
ml high purity HNO3 was added to the beaker and acid digestion was carried out until no NO2 fumes
were visible. The samples were then diluted 1:10 with deionised water, centrifuged at 9000 rpm for
15 minutes and filtered (0.2 µm). Samples were then analysed via ICP-OES. Samples were prepared
in triplicate unless further repeats were needed (n = 4-5) to improve precision.
4.2.5 Statistical Analysis
The solvent extraction data of the dried extracts were subjected to correlation analysis (CA) using
Microsoft Excel (2007) to see if relationships exist between the elements in each extraction solvent.
Principal component analysis (PCA) was utilised on the elemental profiles produced by the four
types of extraction solvent as well as the concentrations elements found in the original herb. Data
was normalised using ratio normalisation before undergoing PCA and was carried out using the
Unscrambler X (CAMO) software.
4.3 Results and discussion
4.3.1 Method Development
4.3.1.1 Filter Paper Comparison
Cellulose and glass microfiber filter paper was compared in order to determine the optimum filter
paper that would not introduce elemental contamination to samples as well as not retain elements
on the paper. Firstly, 20 ml of 60 %v/v ethanol was filtered through each type of filter paper in
triplicate and compared to unfiltered solution. A 60 %v/v ethanol solution was chosen for this study
as it is the most popular ethanol concentration used by extract manufacturers of SJW [201]. The
results (Figure 4.1) show that five of the elements of interest (Al, Ca, Fe, Mg, and Zn) were detected
in the control experiment of unfiltered 60 %v/v ethanol solution. These elements may come from
the solvents used as they are not of high purity grade. When the solution was filtered through
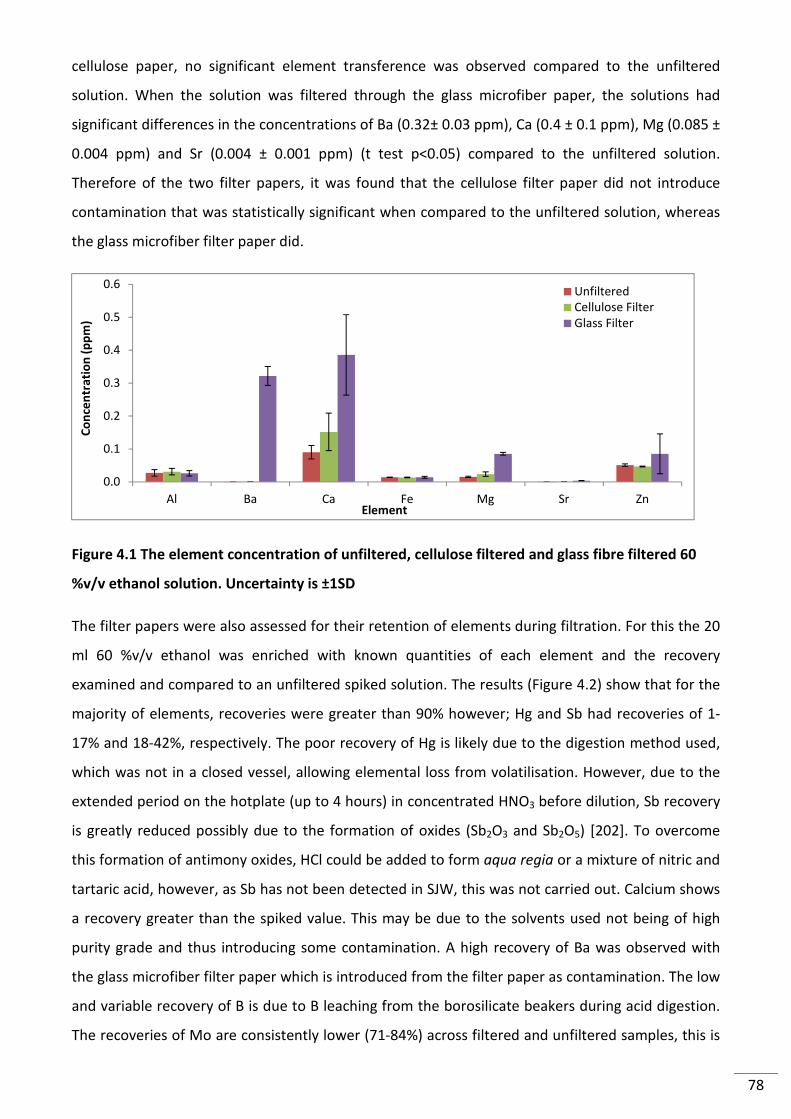
78
cellulose paper, no significant element transference was observed compared to the unfiltered
solution. When the solution was filtered through the glass microfiber paper, the solutions had
significant differences in the concentrations of Ba (0.32± 0.03 ppm), Ca (0.4 ± 0.1 ppm), Mg (0.085 ±
0.004 ppm) and Sr (0.004 ± 0.001 ppm) (t test p<0.05) compared to the unfiltered solution.
Therefore of the two filter papers, it was found that the cellulose filter paper did not introduce
contamination that was statistically significant when compared to the unfiltered solution, whereas
the glass microfiber filter paper did.
Figure 4.1 The element concentration of unfiltered, cellulose filtered and glass fibre filtered 60
%v/v ethanol solution. Uncertainty is ±1SD
The filter papers were also assessed for their retention of elements during filtration. For this the 20
ml 60 %v/v ethanol was enriched with known quantities of each element and the recovery
examined and compared to an unfiltered spiked solution. The results (Figure 4.2) show that for the
majority of elements, recoveries were greater than 90% however; Hg and Sb had recoveries of 1-
17% and 18-42%, respectively. The poor recovery of Hg is likely due to the digestion method used,
which was not in a closed vessel, allowing elemental loss from volatilisation. However, due to the
extended period on the hotplate (up to 4 hours) in concentrated HNO3 before dilution, Sb recovery
is greatly reduced possibly due to the formation of oxides (Sb2O3 and Sb2O5) [202]. To overcome
this formation of antimony oxides, HCl could be added to form aqua regia or a mixture of nitric and
tartaric acid, however, as Sb has not been detected in SJW, this was not carried out. Calcium shows
a recovery greater than the spiked value. This may be due to the solvents used not being of high
purity grade and thus introducing some contamination. A high recovery of Ba was observed with
the glass microfiber filter paper which is introduced from the filter paper as contamination. The low
and variable recovery of B is due to B leaching from the borosilicate beakers during acid digestion.
The recoveries of Mo are consistently lower (71-84%) across filtered and unfiltered samples, this is
0.0
0.1
0.2
0.3
0.4
0.5
0.6
Al Ba Ca Fe Mg Sr Zn
Co
nce
ntr
ati
on
(p
pm
)
Element
UnfilteredCellulose FilterGlass Filter
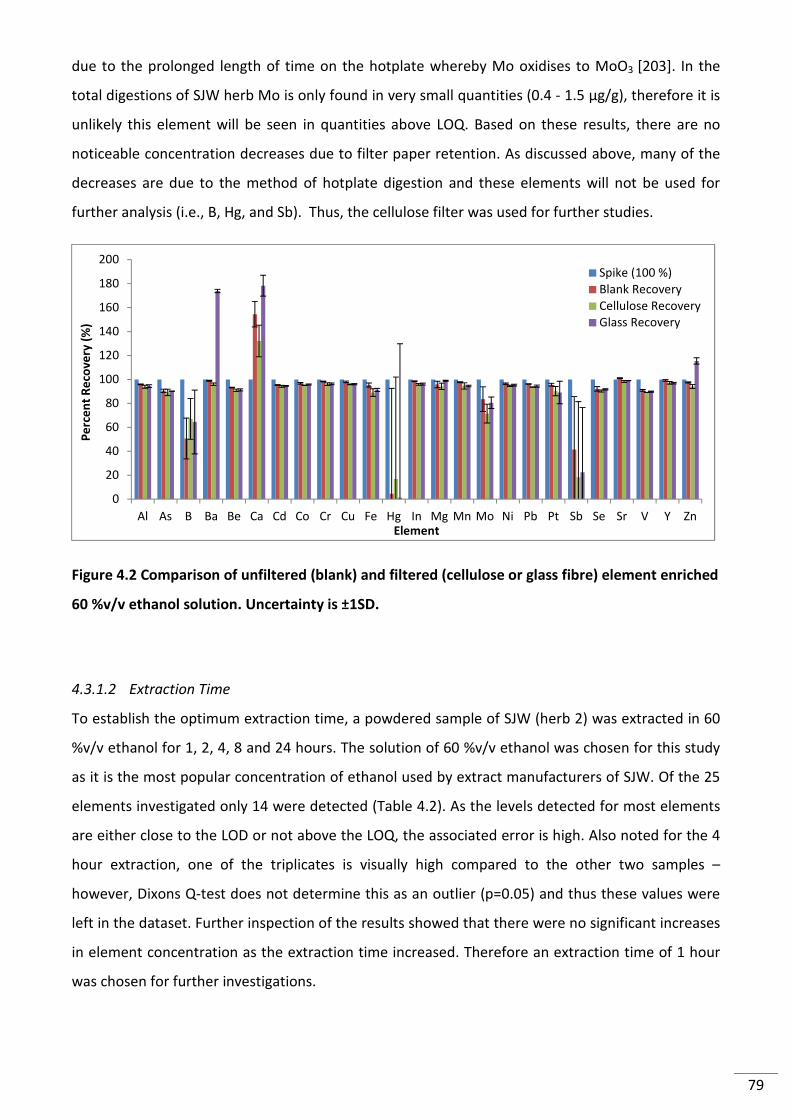
79
due to the prolonged length of time on the hotplate whereby Mo oxidises to MoO3 [203]. In the
total digestions of SJW herb Mo is only found in very small quantities (0.4 - 1.5 µg/g), therefore it is
unlikely this element will be seen in quantities above LOQ. Based on these results, there are no
noticeable concentration decreases due to filter paper retention. As discussed above, many of the
decreases are due to the method of hotplate digestion and these elements will not be used for
further analysis (i.e., B, Hg, and Sb). Thus, the cellulose filter was used for further studies.
Figure 4.2 Comparison of unfiltered (blank) and filtered (cellulose or glass fibre) element enriched
60 %v/v ethanol solution. Uncertainty is ±1SD.
4.3.1.2 Extraction Time
To establish the optimum extraction time, a powdered sample of SJW (herb 2) was extracted in 60
%v/v ethanol for 1, 2, 4, 8 and 24 hours. The solution of 60 %v/v ethanol was chosen for this study
as it is the most popular concentration of ethanol used by extract manufacturers of SJW. Of the 25
elements investigated only 14 were detected (Table 4.2). As the levels detected for most elements
are either close to the LOD or not above the LOQ, the associated error is high. Also noted for the 4
hour extraction, one of the triplicates is visually high compared to the other two samples –
however, Dixons Q-test does not determine this as an outlier (p=0.05) and thus these values were
left in the dataset. Further inspection of the results showed that there were no significant increases
in element concentration as the extraction time increased. Therefore an extraction time of 1 hour
was chosen for further investigations.
0
20
40
60
80
100
120
140
160
180
200
Al As B Ba Be Ca Cd Co Cr Cu Fe Hg In Mg Mn Mo Ni Pb Pt Sb Se Sr V Y Zn
Pe
rce
nt
Re
cov
ery
(%
)
Element
Spike (100 %)Blank RecoveryCellulose RecoveryGlass Recovery
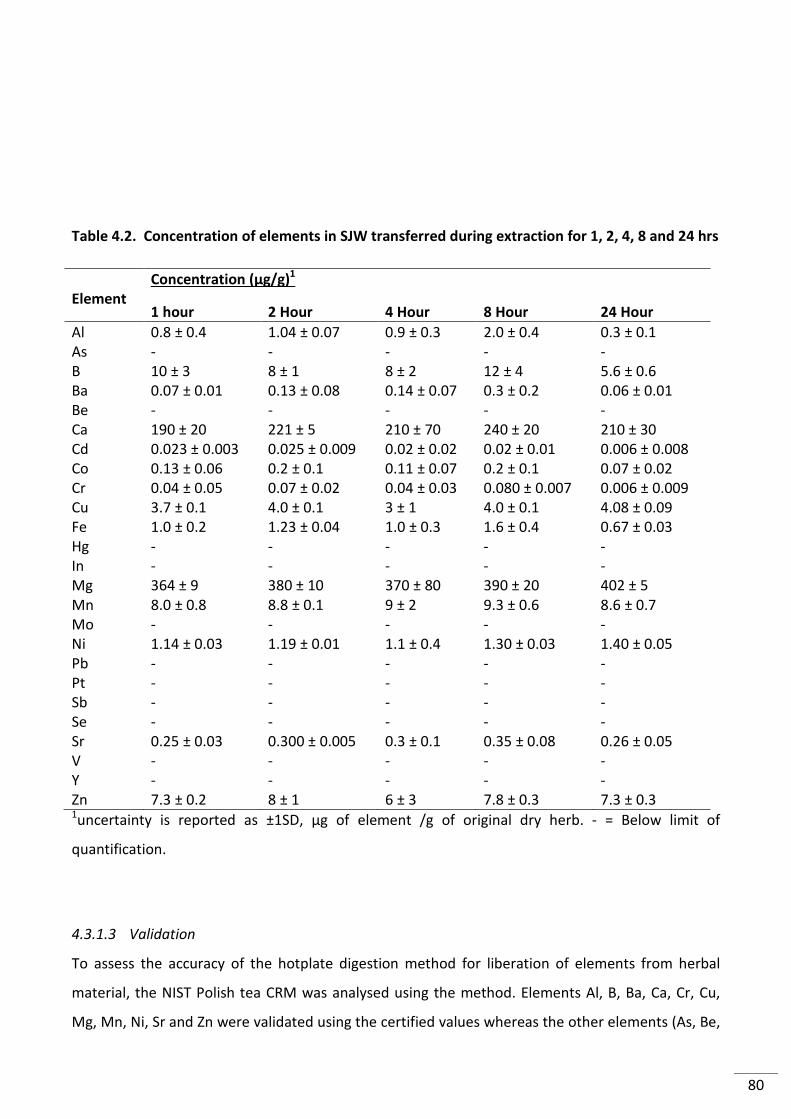
80
Table 4.2. Concentration of elements in SJW transferred during extraction for 1, 2, 4, 8 and 24 hrs
Element
Concentration (μg/g)1
1 hour 2 Hour 4 Hour 8 Hour 24 Hour Al 0.8 ± 0.4 1.04 ± 0.07 0.9 ± 0.3 2.0 ± 0.4 0.3 ± 0.1 As - - - - - B 10 ± 3 8 ± 1 8 ± 2 12 ± 4 5.6 ± 0.6 Ba 0.07 ± 0.01 0.13 ± 0.08 0.14 ± 0.07 0.3 ± 0.2 0.06 ± 0.01 Be - - - - - Ca 190 ± 20 221 ± 5 210 ± 70 240 ± 20 210 ± 30 Cd 0.023 ± 0.003 0.025 ± 0.009 0.02 ± 0.02 0.02 ± 0.01 0.006 ± 0.008 Co 0.13 ± 0.06 0.2 ± 0.1 0.11 ± 0.07 0.2 ± 0.1 0.07 ± 0.02 Cr 0.04 ± 0.05 0.07 ± 0.02 0.04 ± 0.03 0.080 ± 0.007 0.006 ± 0.009 Cu 3.7 ± 0.1 4.0 ± 0.1 3 ± 1 4.0 ± 0.1 4.08 ± 0.09 Fe 1.0 ± 0.2 1.23 ± 0.04 1.0 ± 0.3 1.6 ± 0.4 0.67 ± 0.03 Hg - - - - - In - - - - - Mg 364 ± 9 380 ± 10 370 ± 80 390 ± 20 402 ± 5 Mn 8.0 ± 0.8 8.8 ± 0.1 9 ± 2 9.3 ± 0.6 8.6 ± 0.7 Mo - - - - - Ni 1.14 ± 0.03 1.19 ± 0.01 1.1 ± 0.4 1.30 ± 0.03 1.40 ± 0.05 Pb - - - - - Pt - - - - - Sb - - - - - Se - - - - - Sr 0.25 ± 0.03 0.300 ± 0.005 0.3 ± 0.1 0.35 ± 0.08 0.26 ± 0.05 V - - - - - Y - - - - - Zn 7.3 ± 0.2 8 ± 1 6 ± 3 7.8 ± 0.3 7.3 ± 0.3 1uncertainty is reported as ±1SD, μg of element /g of original dry herb. - = Below limit of
quantification.
4.3.1.3 Validation
To assess the accuracy of the hotplate digestion method for liberation of elements from herbal
material, the NIST Polish tea CRM was analysed using the method. Elements Al, B, Ba, Ca, Cr, Cu,
Mg, Mn, Ni, Sr and Zn were validated using the certified values whereas the other elements (As, Be,
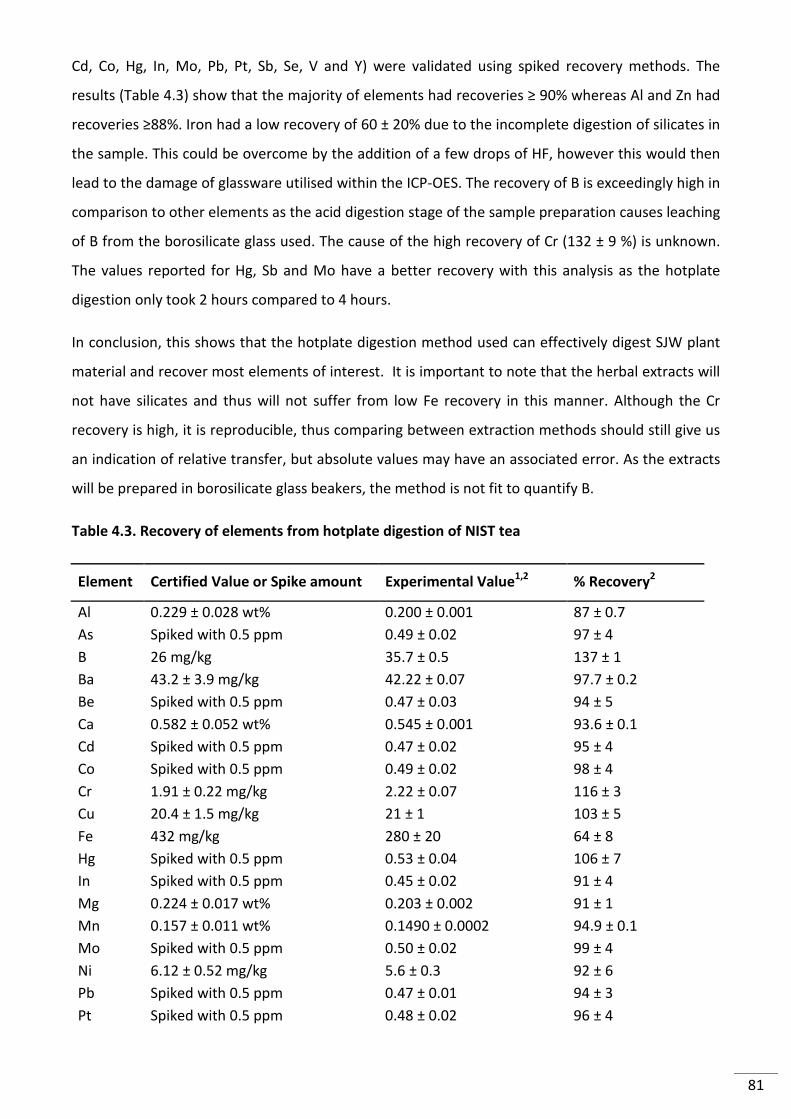
81
Cd, Co, Hg, In, Mo, Pb, Pt, Sb, Se, V and Y) were validated using spiked recovery methods. The
results (Table 4.3) show that the majority of elements had recoveries ≥ 90% whereas Al and Zn had
recoveries ≥88%. Iron had a low recovery of 60 ± 20% due to the incomplete digestion of silicates in
the sample. This could be overcome by the addition of a few drops of HF, however this would then
lead to the damage of glassware utilised within the ICP-OES. The recovery of B is exceedingly high in
comparison to other elements as the acid digestion stage of the sample preparation causes leaching
of B from the borosilicate glass used. The cause of the high recovery of Cr (132 ± 9 %) is unknown.
The values reported for Hg, Sb and Mo have a better recovery with this analysis as the hotplate
digestion only took 2 hours compared to 4 hours.
In conclusion, this shows that the hotplate digestion method used can effectively digest SJW plant
material and recover most elements of interest. It is important to note that the herbal extracts will
not have silicates and thus will not suffer from low Fe recovery in this manner. Although the Cr
recovery is high, it is reproducible, thus comparing between extraction methods should still give us
an indication of relative transfer, but absolute values may have an associated error. As the extracts
will be prepared in borosilicate glass beakers, the method is not fit to quantify B.
Table 4.3. Recovery of elements from hotplate digestion of NIST tea
Element Certified Value or Spike amount Experimental Value1,2
% Recovery2
Al 0.229 ± 0.028 wt% 0.200 ± 0.001 87 ± 0.7
As Spiked with 0.5 ppm 0.49 ± 0.02 97 ± 4
B 26 mg/kg 35.7 ± 0.5 137 ± 1
Ba 43.2 ± 3.9 mg/kg 42.22 ± 0.07 97.7 ± 0.2
Be Spiked with 0.5 ppm 0.47 ± 0.03 94 ± 5
Ca 0.582 ± 0.052 wt% 0.545 ± 0.001 93.6 ± 0.1
Cd Spiked with 0.5 ppm 0.47 ± 0.02 95 ± 4
Co Spiked with 0.5 ppm 0.49 ± 0.02 98 ± 4
Cr 1.91 ± 0.22 mg/kg 2.22 ± 0.07 116 ± 3
Cu 20.4 ± 1.5 mg/kg 21 ± 1 103 ± 5
Fe 432 mg/kg 280 ± 20 64 ± 8
Hg Spiked with 0.5 ppm 0.53 ± 0.04 106 ± 7
In Spiked with 0.5 ppm 0.45 ± 0.02 91 ± 4
Mg 0.224 ± 0.017 wt% 0.203 ± 0.002 91 ± 1
Mn 0.157 ± 0.011 wt% 0.1490 ± 0.0002 94.9 ± 0.1
Mo Spiked with 0.5 ppm 0.50 ± 0.02 99 ± 4
Ni 6.12 ± 0.52 mg/kg 5.6 ± 0.3 92 ± 6
Pb Spiked with 0.5 ppm 0.47 ± 0.01 94 ± 3
Pt Spiked with 0.5 ppm 0.48 ± 0.02 96 ± 4
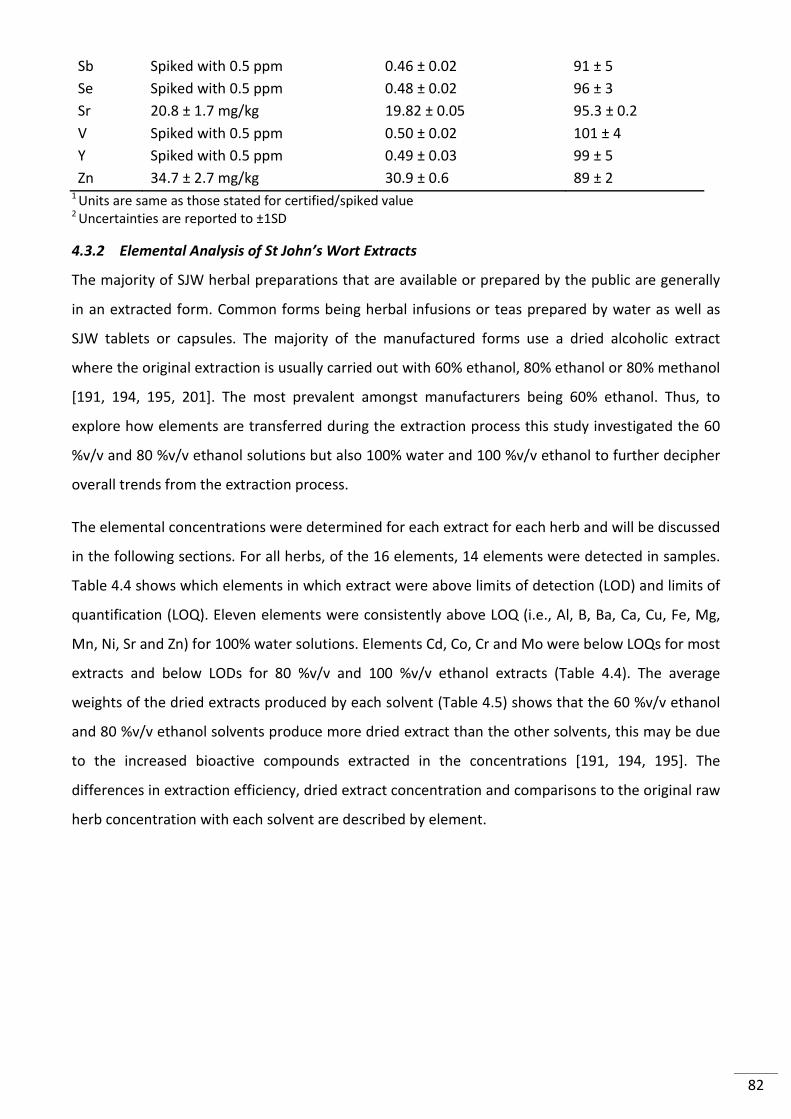
82
Sb Spiked with 0.5 ppm 0.46 ± 0.02 91 ± 5
Se Spiked with 0.5 ppm 0.48 ± 0.02 96 ± 3
Sr 20.8 ± 1.7 mg/kg 19.82 ± 0.05 95.3 ± 0.2
V Spiked with 0.5 ppm 0.50 ± 0.02 101 ± 4
Y Spiked with 0.5 ppm 0.49 ± 0.03 99 ± 5
Zn 34.7 ± 2.7 mg/kg 30.9 ± 0.6 89 ± 2 1 Units are same as those stated for certified/spiked value 2 Uncertainties are reported to ±1SD
4.3.2 Elemental Analysis of St John’s Wort Extracts
The majority of SJW herbal preparations that are available or prepared by the public are generally
in an extracted form. Common forms being herbal infusions or teas prepared by water as well as
SJW tablets or capsules. The majority of the manufactured forms use a dried alcoholic extract
where the original extraction is usually carried out with 60% ethanol, 80% ethanol or 80% methanol
[191, 194, 195, 201]. The most prevalent amongst manufacturers being 60% ethanol. Thus, to
explore how elements are transferred during the extraction process this study investigated the 60
%v/v and 80 %v/v ethanol solutions but also 100% water and 100 %v/v ethanol to further decipher
overall trends from the extraction process.
The elemental concentrations were determined for each extract for each herb and will be discussed
in the following sections. For all herbs, of the 16 elements, 14 elements were detected in samples.
Table 4.4 shows which elements in which extract were above limits of detection (LOD) and limits of
quantification (LOQ). Eleven elements were consistently above LOQ (i.e., Al, B, Ba, Ca, Cu, Fe, Mg,
Mn, Ni, Sr and Zn) for 100% water solutions. Elements Cd, Co, Cr and Mo were below LOQs for most
extracts and below LODs for 80 %v/v and 100 %v/v ethanol extracts (Table 4.4). The average
weights of the dried extracts produced by each solvent (Table 4.5) shows that the 60 %v/v ethanol
and 80 %v/v ethanol solvents produce more dried extract than the other solvents, this may be due
to the increased bioactive compounds extracted in the concentrations [191, 194, 195]. The
differences in extraction efficiency, dried extract concentration and comparisons to the original raw
herb concentration with each solvent are described by element.
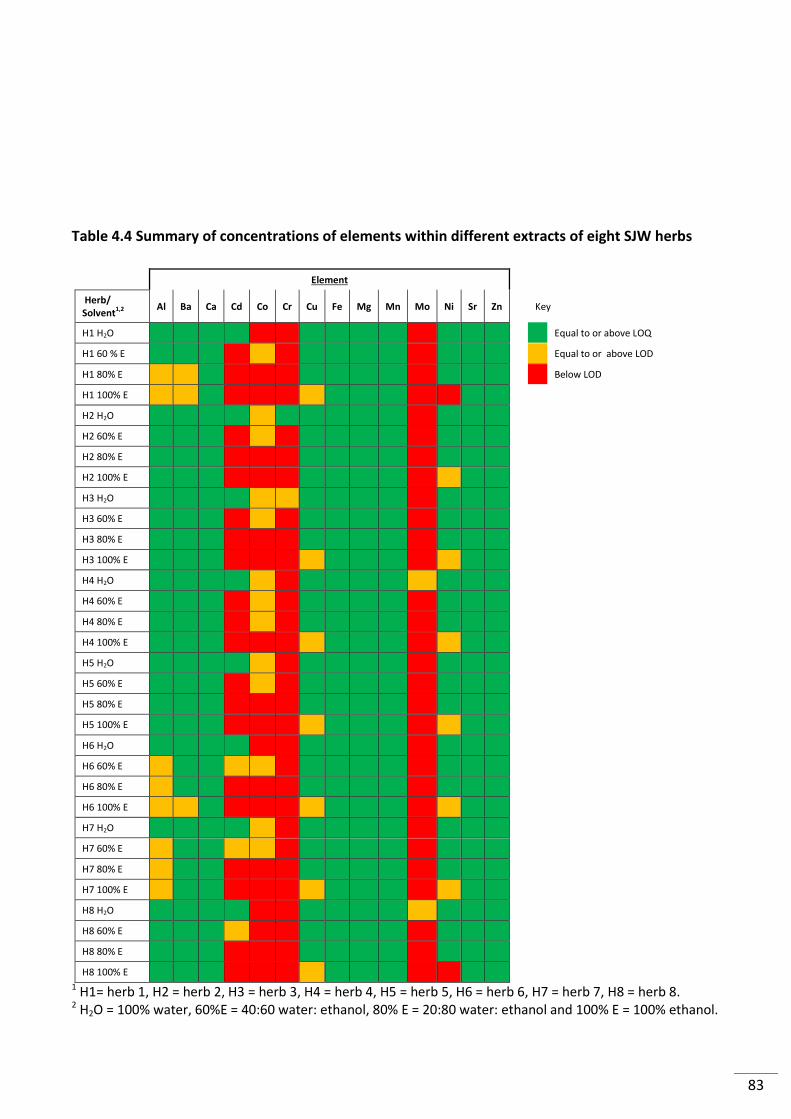
83
Table 4.4 Summary of concentrations of elements within different extracts of eight SJW herbs
Element
Herb/
Solvent1,2
Al Ba Ca Cd Co Cr Cu Fe Mg Mn Mo Ni Sr Zn
Key
H1 H2O
Equal to or above LOQ
H1 60 % E
Equal to or above LOD
H1 80% E
Below LOD
H1 100% E
H2 H2O
H2 60% E
H2 80% E
H2 100% E
H3 H2O
H3 60% E
H3 80% E
H3 100% E
H4 H2O
H4 60% E
H4 80% E
H4 100% E
H5 H2O
H5 60% E
H5 80% E
H5 100% E
H6 H2O
H6 60% E
H6 80% E
H6 100% E
H7 H2O
H7 60% E
H7 80% E
H7 100% E
H8 H2O
H8 60% E
H8 80% E
H8 100% E
1 H1= herb 1, H2 = herb 2, H3 = herb 3, H4 = herb 4, H5 = herb 5, H6 = herb 6, H7 = herb 7, H8 = herb 8. 2 H2O = 100% water, 60%E = 40:60 water: ethanol, 80% E = 20:80 water: ethanol and 100% E = 100% ethanol.
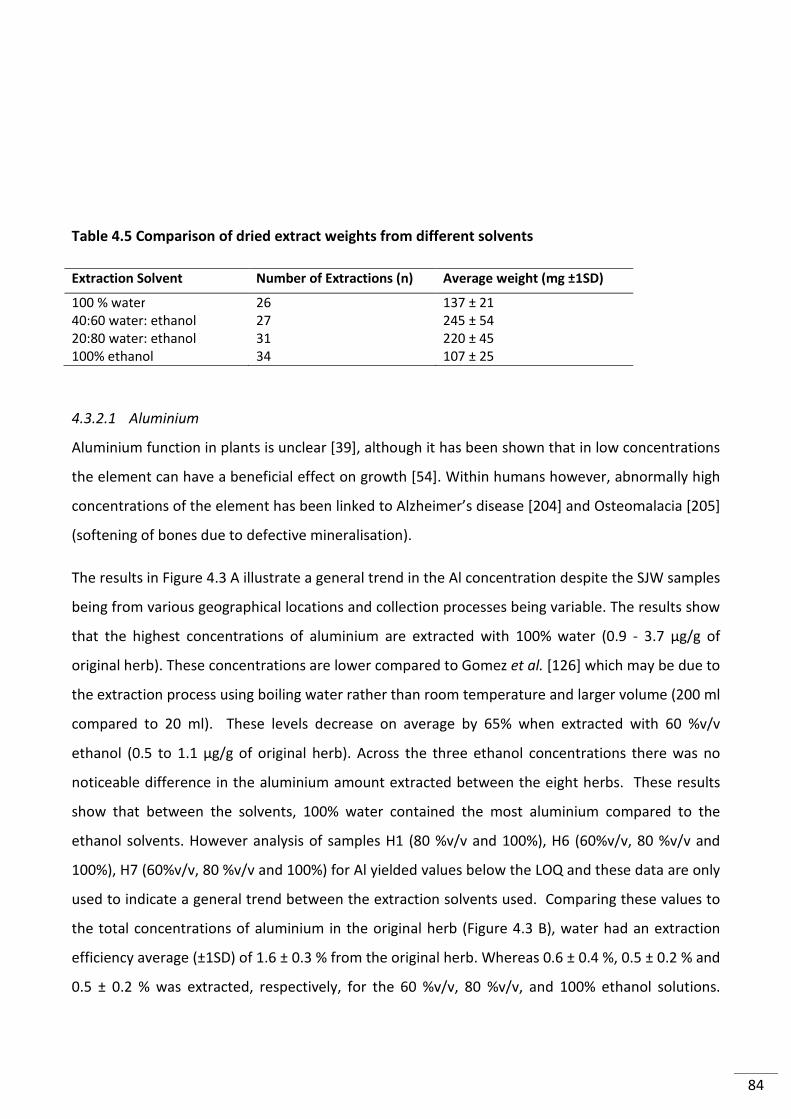
84
Table 4.5 Comparison of dried extract weights from different solvents
Extraction Solvent Number of Extractions (n) Average weight (mg ±1SD)
100 % water 26 137 ± 21 40:60 water: ethanol 27 245 ± 54 20:80 water: ethanol 31 220 ± 45 100% ethanol 34 107 ± 25
4.3.2.1 Aluminium
Aluminium function in plants is unclear [39], although it has been shown that in low concentrations
the element can have a beneficial effect on growth [54]. Within humans however, abnormally high
concentrations of the element has been linked to Alzheimer’s disease [204] and Osteomalacia [205]
(softening of bones due to defective mineralisation).
The results in Figure 4.3 A illustrate a general trend in the Al concentration despite the SJW samples
being from various geographical locations and collection processes being variable. The results show
that the highest concentrations of aluminium are extracted with 100% water (0.9 - 3.7 µg/g of
original herb). These concentrations are lower compared to Gomez et al. [126] which may be due to
the extraction process using boiling water rather than room temperature and larger volume (200 ml
compared to 20 ml). These levels decrease on average by 65% when extracted with 60 %v/v
ethanol (0.5 to 1.1 µg/g of original herb). Across the three ethanol concentrations there was no
noticeable difference in the aluminium amount extracted between the eight herbs. These results
show that between the solvents, 100% water contained the most aluminium compared to the
ethanol solvents. However analysis of samples H1 (80 %v/v and 100%), H6 (60%v/v, 80 %v/v and
100%), H7 (60%v/v, 80 %v/v and 100%) for Al yielded values below the LOQ and these data are only
used to indicate a general trend between the extraction solvents used. Comparing these values to
the total concentrations of aluminium in the original herb (Figure 4.3 B), water had an extraction
efficiency average (±1SD) of 1.6 ± 0.3 % from the original herb. Whereas 0.6 ± 0.4 %, 0.5 ± 0.2 % and
0.5 ± 0.2 % was extracted, respectively, for the 60 %v/v, 80 %v/v, and 100% ethanol solutions.
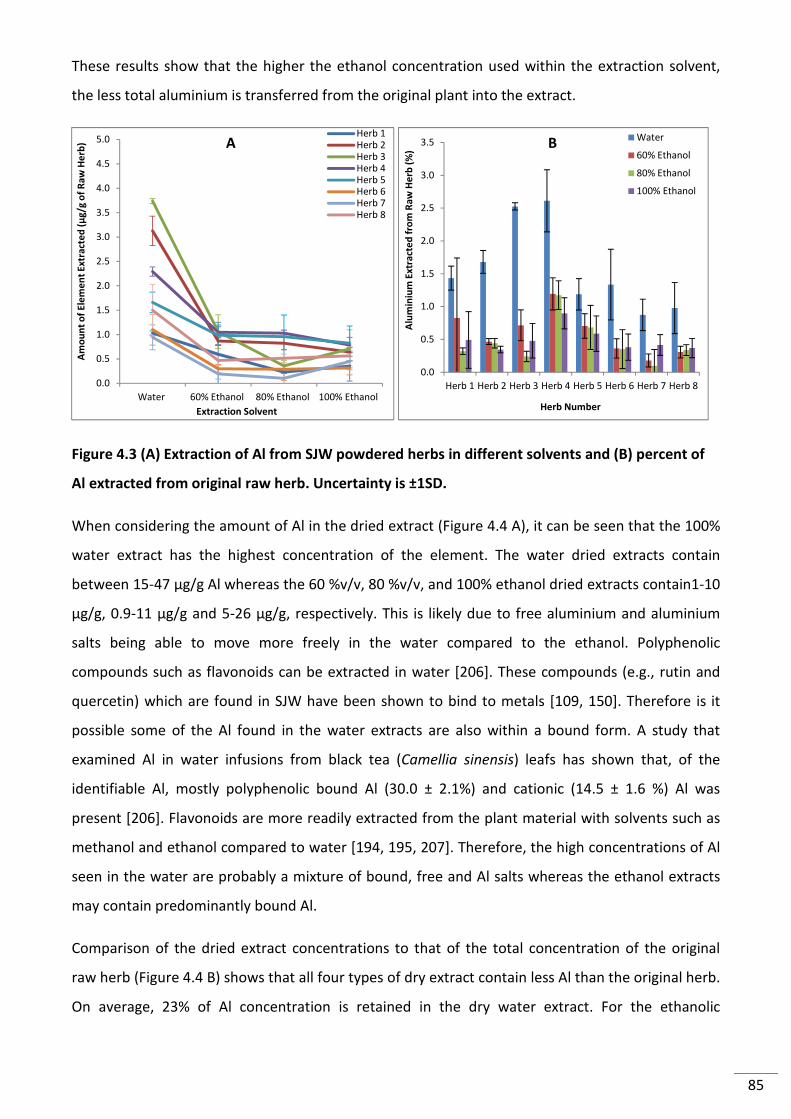
85
These results show that the higher the ethanol concentration used within the extraction solvent,
the less total aluminium is transferred from the original plant into the extract.
Figure 4.3 (A) Extraction of Al from SJW powdered herbs in different solvents and (B) percent of
Al extracted from original raw herb. Uncertainty is ±1SD.
When considering the amount of Al in the dried extract (Figure 4.4 A), it can be seen that the 100%
water extract has the highest concentration of the element. The water dried extracts contain
between 15-47 µg/g Al whereas the 60 %v/v, 80 %v/v, and 100% ethanol dried extracts contain1-10
µg/g, 0.9-11 µg/g and 5-26 µg/g, respectively. This is likely due to free aluminium and aluminium
salts being able to move more freely in the water compared to the ethanol. Polyphenolic
compounds such as flavonoids can be extracted in water [206]. These compounds (e.g., rutin and
quercetin) which are found in SJW have been shown to bind to metals [109, 150]. Therefore is it
possible some of the Al found in the water extracts are also within a bound form. A study that
examined Al in water infusions from black tea (Camellia sinensis) leafs has shown that, of the
identifiable Al, mostly polyphenolic bound Al (30.0 ± 2.1%) and cationic (14.5 ± 1.6 %) Al was
present [206]. Flavonoids are more readily extracted from the plant material with solvents such as
methanol and ethanol compared to water [194, 195, 207]. Therefore, the high concentrations of Al
seen in the water are probably a mixture of bound, free and Al salts whereas the ethanol extracts
may contain predominantly bound Al.
Comparison of the dried extract concentrations to that of the total concentration of the original
raw herb (Figure 4.4 B) shows that all four types of dry extract contain less Al than the original herb.
On average, 23% of Al concentration is retained in the dry water extract. For the ethanolic
0.0
0.5
1.0
1.5
2.0
2.5
3.0
3.5
4.0
4.5
5.0
Water 60% Ethanol 80% Ethanol 100% Ethanol
Am
ou
nt
of
Ele
me
nt
Ex
tra
cte
d (
μg
/g o
f R
aw
He
rb)
Extraction Solvent
Herb 1Herb 2Herb 3Herb 4Herb 5Herb 6Herb 7Herb 8
0.0
0.5
1.0
1.5
2.0
2.5
3.0
3.5
Herb 1 Herb 2 Herb 3 Herb 4 Herb 5 Herb 6 Herb 7 Herb 8
Alu
min
ium
Ex
tra
cte
d f
rom
Ra
w H
erb
(%
)Herb Number
Water
60% Ethanol
80% Ethanol
100% Ethanol
A B
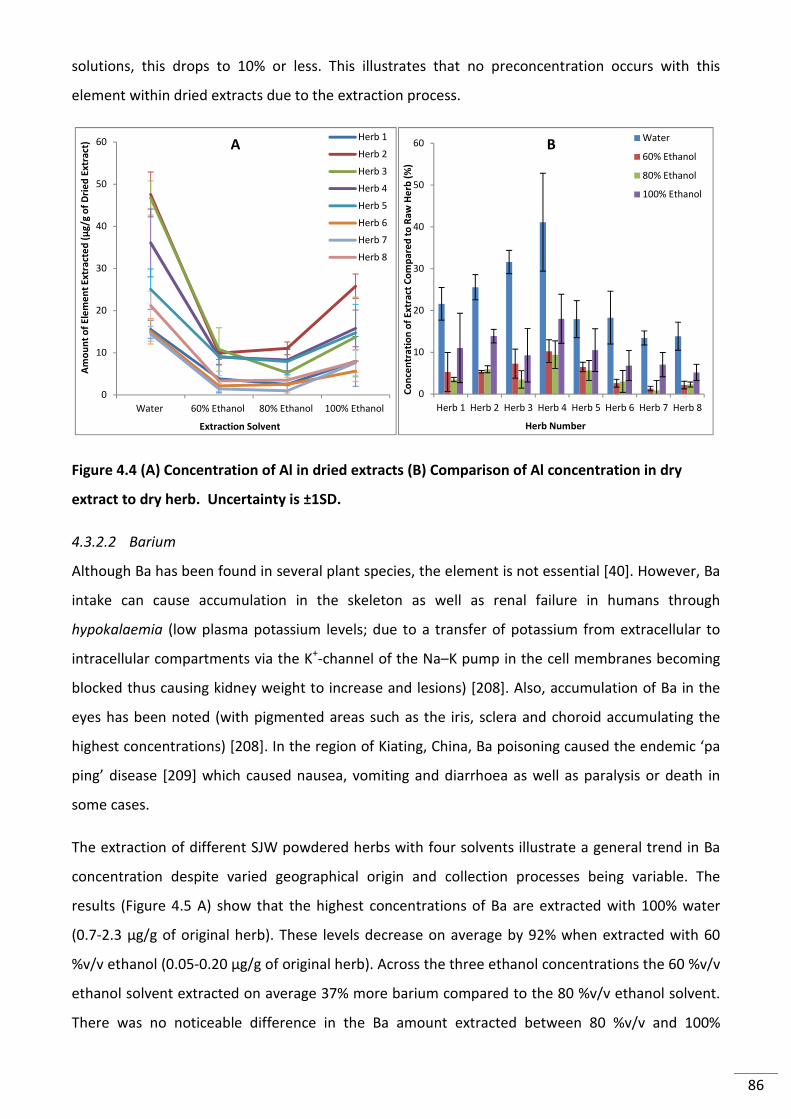
86
solutions, this drops to 10% or less. This illustrates that no preconcentration occurs with this
element within dried extracts due to the extraction process.
Figure 4.4 (A) Concentration of Al in dried extracts (B) Comparison of Al concentration in dry
extract to dry herb. Uncertainty is ±1SD.
4.3.2.2 Barium
Although Ba has been found in several plant species, the element is not essential [40]. However, Ba
intake can cause accumulation in the skeleton as well as renal failure in humans through
hypokalaemia (low plasma potassium levels; due to a transfer of potassium from extracellular to
intracellular compartments via the K+-channel of the Na–K pump in the cell membranes becoming
blocked thus causing kidney weight to increase and lesions) [208]. Also, accumulation of Ba in the
eyes has been noted (with pigmented areas such as the iris, sclera and choroid accumulating the
highest concentrations) [208]. In the region of Kiating, China, Ba poisoning caused the endemic ‘pa
ping’ disease [209] which caused nausea, vomiting and diarrhoea as well as paralysis or death in
some cases.
The extraction of different SJW powdered herbs with four solvents illustrate a general trend in Ba
concentration despite varied geographical origin and collection processes being variable. The
results (Figure 4.5 A) show that the highest concentrations of Ba are extracted with 100% water
(0.7-2.3 µg/g of original herb). These levels decrease on average by 92% when extracted with 60
%v/v ethanol (0.05-0.20 µg/g of original herb). Across the three ethanol concentrations the 60 %v/v
ethanol solvent extracted on average 37% more barium compared to the 80 %v/v ethanol solvent.
There was no noticeable difference in the Ba amount extracted between 80 %v/v and 100%
0
10
20
30
40
50
60
Water 60% Ethanol 80% Ethanol 100% Ethanol
Am
ou
nt
of
Ele
me
nt
Ex
tra
cte
d (
μg
/g o
f D
rie
d E
xtr
act
)
Extraction Solvent
Herb 1
Herb 2
Herb 3
Herb 4
Herb 5
Herb 6
Herb 7
Herb 8
0
10
20
30
40
50
60
Herb 1 Herb 2 Herb 3 Herb 4 Herb 5 Herb 6 Herb 7 Herb 8C
on
cen
tra
tio
n o
f E
xtr
act
Co
mp
are
d t
o R
aw
He
rb (
%)
Herb Number
Water
60% Ethanol
80% Ethanol
100% Ethanol
A B
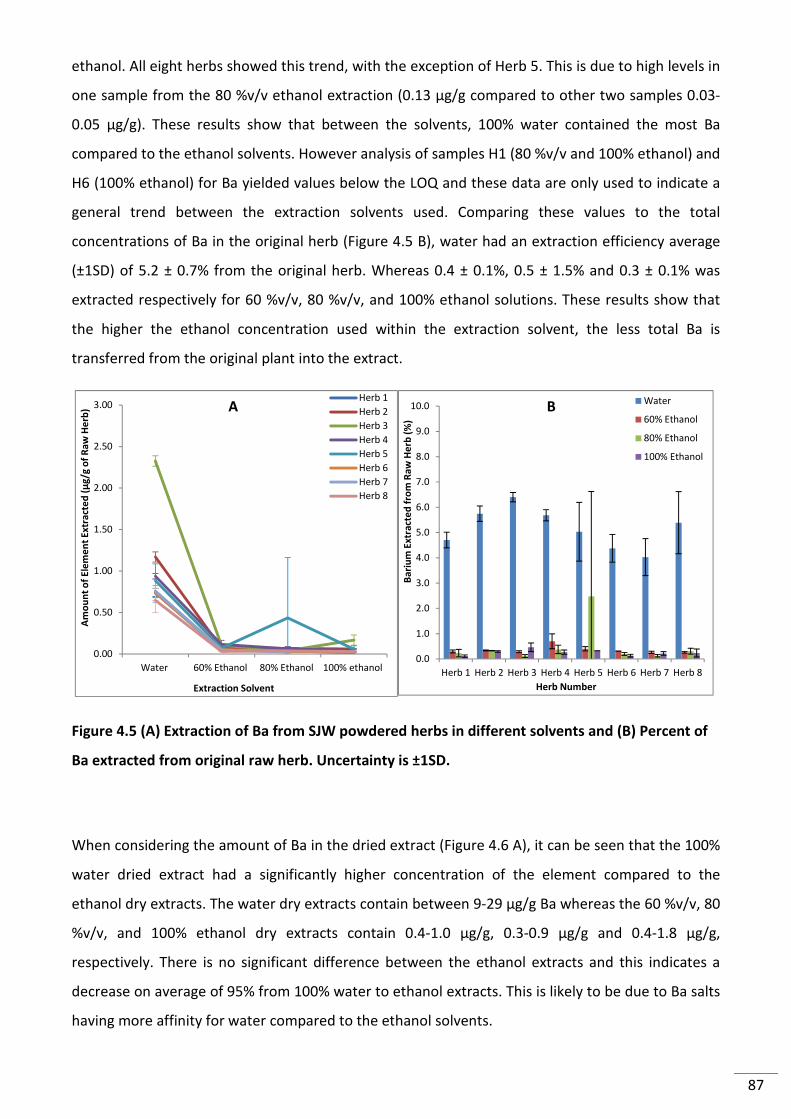
87
ethanol. All eight herbs showed this trend, with the exception of Herb 5. This is due to high levels in
one sample from the 80 %v/v ethanol extraction (0.13 µg/g compared to other two samples 0.03-
0.05 µg/g). These results show that between the solvents, 100% water contained the most Ba
compared to the ethanol solvents. However analysis of samples H1 (80 %v/v and 100% ethanol) and
H6 (100% ethanol) for Ba yielded values below the LOQ and these data are only used to indicate a
general trend between the extraction solvents used. Comparing these values to the total
concentrations of Ba in the original herb (Figure 4.5 B), water had an extraction efficiency average
(±1SD) of 5.2 ± 0.7% from the original herb. Whereas 0.4 ± 0.1%, 0.5 ± 1.5% and 0.3 ± 0.1% was
extracted respectively for 60 %v/v, 80 %v/v, and 100% ethanol solutions. These results show that
the higher the ethanol concentration used within the extraction solvent, the less total Ba is
transferred from the original plant into the extract.
Figure 4.5 (A) Extraction of Ba from SJW powdered herbs in different solvents and (B) Percent of
Ba extracted from original raw herb. Uncertainty is ±1SD.
When considering the amount of Ba in the dried extract (Figure 4.6 A), it can be seen that the 100%
water dried extract had a significantly higher concentration of the element compared to the
ethanol dry extracts. The water dry extracts contain between 9-29 µg/g Ba whereas the 60 %v/v, 80
%v/v, and 100% ethanol dry extracts contain 0.4-1.0 µg/g, 0.3-0.9 µg/g and 0.4-1.8 µg/g,
respectively. There is no significant difference between the ethanol extracts and this indicates a
decrease on average of 95% from 100% water to ethanol extracts. This is likely to be due to Ba salts
having more affinity for water compared to the ethanol solvents.
0.00
0.50
1.00
1.50
2.00
2.50
3.00
Water 60% Ethanol 80% Ethanol 100% ethanol
Am
ou
nt
of
Ele
me
nt
Ex
tra
cte
d (
μg
/g o
f R
aw
He
rb)
Extraction Solvent
Herb 1
Herb 2
Herb 3
Herb 4
Herb 5
Herb 6
Herb 7
Herb 8
0.0
1.0
2.0
3.0
4.0
5.0
6.0
7.0
8.0
9.0
10.0
Herb 1 Herb 2 Herb 3 Herb 4 Herb 5 Herb 6 Herb 7 Herb 8
Ba
riu
m E
xtr
act
ed
fro
m R
aw
He
rb (
%)
Herb Number
Water
60% Ethanol
80% Ethanol
100% Ethanol
A B
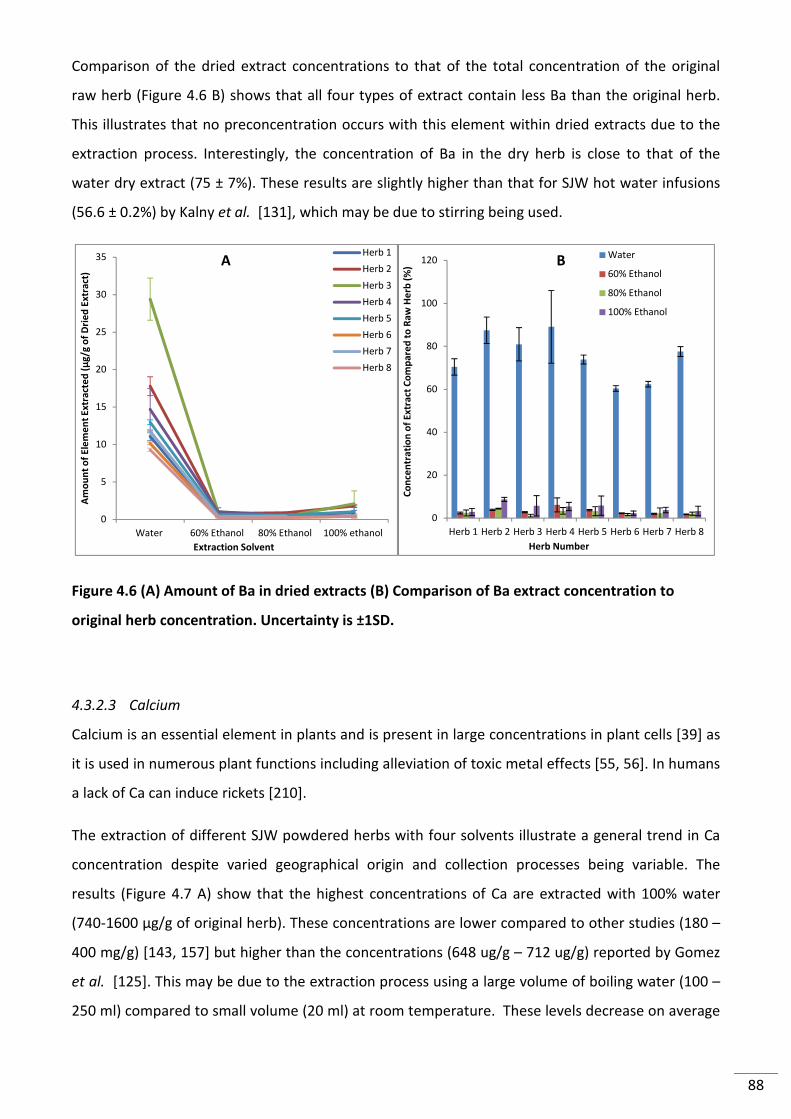
88
Comparison of the dried extract concentrations to that of the total concentration of the original
raw herb (Figure 4.6 B) shows that all four types of extract contain less Ba than the original herb.
This illustrates that no preconcentration occurs with this element within dried extracts due to the
extraction process. Interestingly, the concentration of Ba in the dry herb is close to that of the
water dry extract (75 ± 7%). These results are slightly higher than that for SJW hot water infusions
(56.6 ± 0.2%) by Kalny et al. [131], which may be due to stirring being used.
Figure 4.6 (A) Amount of Ba in dried extracts (B) Comparison of Ba extract concentration to
original herb concentration. Uncertainty is ±1SD.
4.3.2.3 Calcium
Calcium is an essential element in plants and is present in large concentrations in plant cells [39] as
it is used in numerous plant functions including alleviation of toxic metal effects [55, 56]. In humans
a lack of Ca can induce rickets [210].
The extraction of different SJW powdered herbs with four solvents illustrate a general trend in Ca
concentration despite varied geographical origin and collection processes being variable. The
results (Figure 4.7 A) show that the highest concentrations of Ca are extracted with 100% water
(740-1600 µg/g of original herb). These concentrations are lower compared to other studies (180 –
400 mg/g) [143, 157] but higher than the concentrations (648 ug/g – 712 ug/g) reported by Gomez
et al. [125]. This may be due to the extraction process using a large volume of boiling water (100 –
250 ml) compared to small volume (20 ml) at room temperature. These levels decrease on average
0
5
10
15
20
25
30
35
Water 60% Ethanol 80% Ethanol 100% ethanol
Am
ou
nt
of
Ele
me
nt
Ex
tra
cte
d (
μg
/g o
f D
rie
d E
xtr
act
)
Extraction Solvent
Herb 1
Herb 2
Herb 3
Herb 4
Herb 5
Herb 6
Herb 7
Herb 8
0
20
40
60
80
100
120
Herb 1 Herb 2 Herb 3 Herb 4 Herb 5 Herb 6 Herb 7 Herb 8
Co
nce
ntr
ati
on
of
Ex
tra
ct C
om
pa
red
to
Ra
w H
erb
(%
)
Herb Number
Water
60% Ethanol
80% Ethanol
100% Ethanol
A B
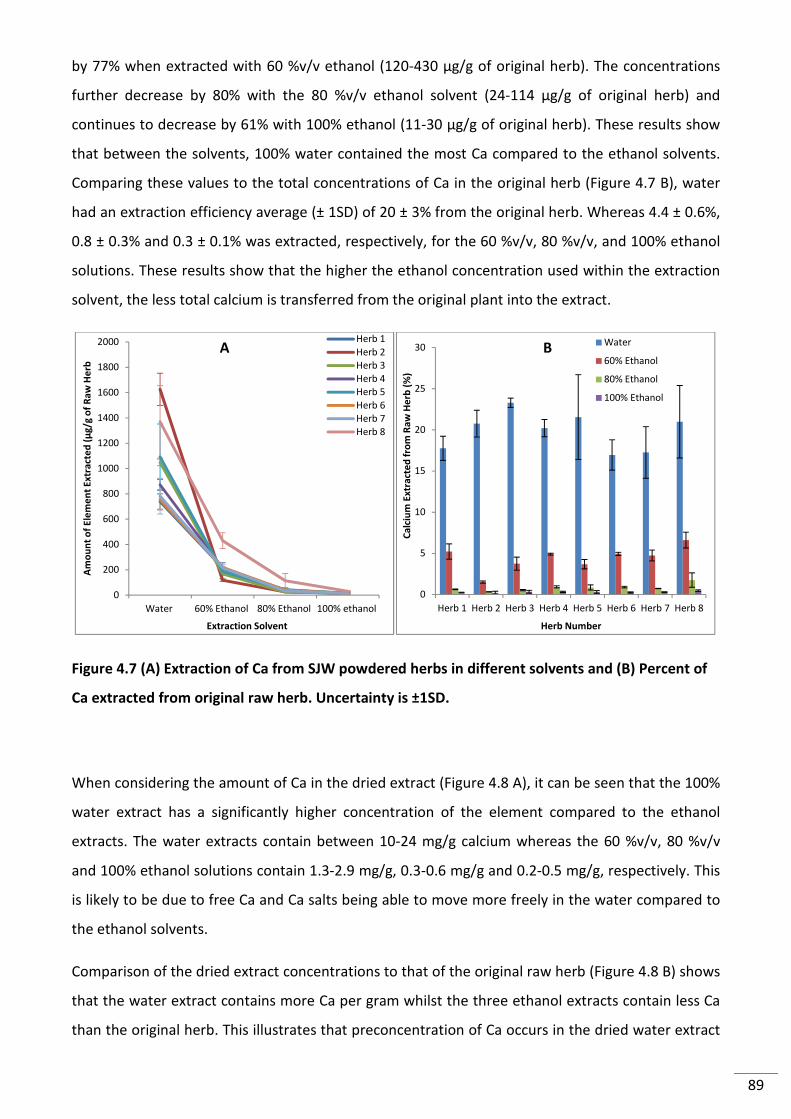
89
by 77% when extracted with 60 %v/v ethanol (120-430 µg/g of original herb). The concentrations
further decrease by 80% with the 80 %v/v ethanol solvent (24-114 µg/g of original herb) and
continues to decrease by 61% with 100% ethanol (11-30 µg/g of original herb). These results show
that between the solvents, 100% water contained the most Ca compared to the ethanol solvents.
Comparing these values to the total concentrations of Ca in the original herb (Figure 4.7 B), water
had an extraction efficiency average (± 1SD) of 20 ± 3% from the original herb. Whereas 4.4 ± 0.6%,
0.8 ± 0.3% and 0.3 ± 0.1% was extracted, respectively, for the 60 %v/v, 80 %v/v, and 100% ethanol
solutions. These results show that the higher the ethanol concentration used within the extraction
solvent, the less total calcium is transferred from the original plant into the extract.
Figure 4.7 (A) Extraction of Ca from SJW powdered herbs in different solvents and (B) Percent of
Ca extracted from original raw herb. Uncertainty is ±1SD.
When considering the amount of Ca in the dried extract (Figure 4.8 A), it can be seen that the 100%
water extract has a significantly higher concentration of the element compared to the ethanol
extracts. The water extracts contain between 10-24 mg/g calcium whereas the 60 %v/v, 80 %v/v
and 100% ethanol solutions contain 1.3-2.9 mg/g, 0.3-0.6 mg/g and 0.2-0.5 mg/g, respectively. This
is likely to be due to free Ca and Ca salts being able to move more freely in the water compared to
the ethanol solvents.
Comparison of the dried extract concentrations to that of the original raw herb (Figure 4.8 B) shows
that the water extract contains more Ca per gram whilst the three ethanol extracts contain less Ca
than the original herb. This illustrates that preconcentration of Ca occurs in the dried water extract
0
200
400
600
800
1000
1200
1400
1600
1800
2000
Water 60% Ethanol 80% Ethanol 100% ethanol
Am
ou
nt
of
Ele
me
nt
Ex
tra
cte
d (
μg
/g o
f R
aw
He
rb
Extraction Solvent
Herb 1Herb 2Herb 3Herb 4Herb 5Herb 6Herb 7Herb 8
0
5
10
15
20
25
30
Herb 1 Herb 2 Herb 3 Herb 4 Herb 5 Herb 6 Herb 7 Herb 8
Ca
lciu
m E
xtr
act
ed
fro
m R
aw
He
rb (
%)
Herb Number
Water
60% Ethanol
80% Ethanol
100% Ethanol
A B
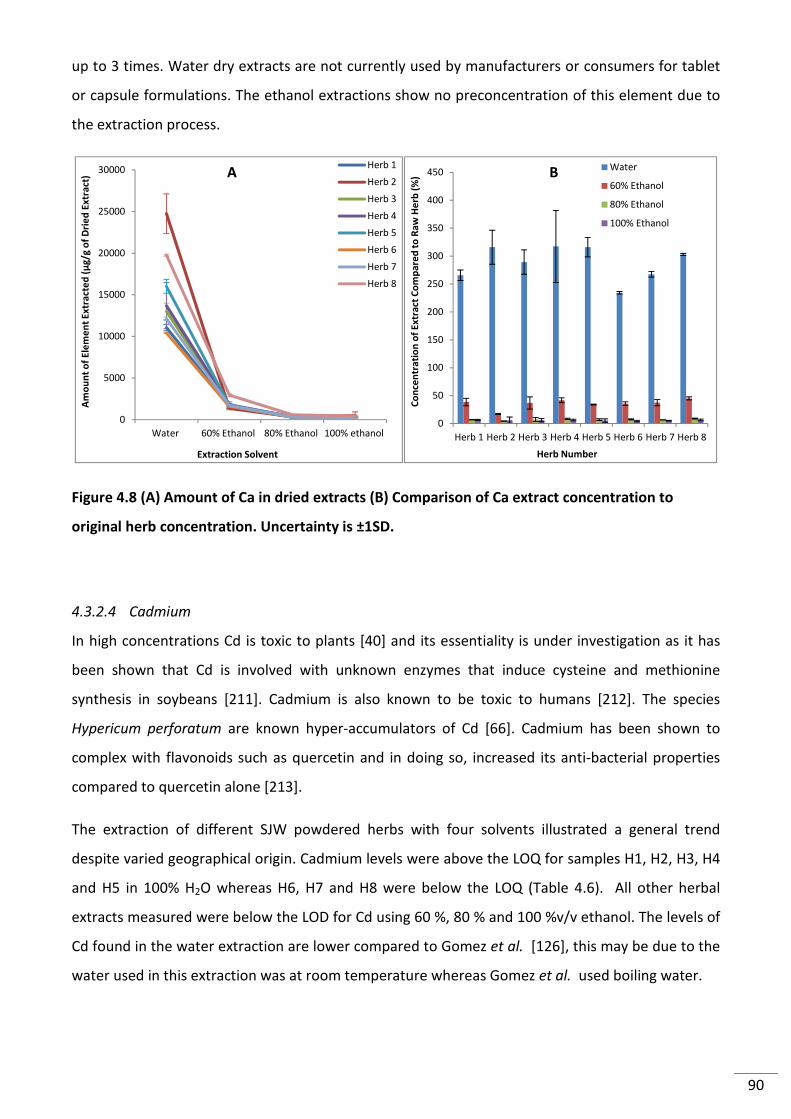
90
up to 3 times. Water dry extracts are not currently used by manufacturers or consumers for tablet
or capsule formulations. The ethanol extractions show no preconcentration of this element due to
the extraction process.
Figure 4.8 (A) Amount of Ca in dried extracts (B) Comparison of Ca extract concentration to
original herb concentration. Uncertainty is ±1SD.
4.3.2.4 Cadmium
In high concentrations Cd is toxic to plants [40] and its essentiality is under investigation as it has
been shown that Cd is involved with unknown enzymes that induce cysteine and methionine
synthesis in soybeans [211]. Cadmium is also known to be toxic to humans [212]. The species
Hypericum perforatum are known hyper-accumulators of Cd [66]. Cadmium has been shown to
complex with flavonoids such as quercetin and in doing so, increased its anti-bacterial properties
compared to quercetin alone [213].
The extraction of different SJW powdered herbs with four solvents illustrated a general trend
despite varied geographical origin. Cadmium levels were above the LOQ for samples H1, H2, H3, H4
and H5 in 100% H2O whereas H6, H7 and H8 were below the LOQ (Table 4.6). All other herbal
extracts measured were below the LOD for Cd using 60 %, 80 % and 100 %v/v ethanol. The levels of
Cd found in the water extraction are lower compared to Gomez et al. [126], this may be due to the
water used in this extraction was at room temperature whereas Gomez et al. used boiling water.
0
5000
10000
15000
20000
25000
30000
Water 60% Ethanol 80% Ethanol 100% ethanol
Am
ou
nt
of
Ele
me
nt
Ex
tra
cte
d (
μg
/g o
f D
rie
d E
xtr
act
)
Extraction Solvent
Herb 1
Herb 2
Herb 3
Herb 4
Herb 5
Herb 6
Herb 7
Herb 8
0
50
100
150
200
250
300
350
400
450
Herb 1 Herb 2 Herb 3 Herb 4 Herb 5 Herb 6 Herb 7 Herb 8
Co
nce
ntr
ati
on
of
Ex
tra
ct C
om
pa
red
to
Ra
w H
erb
(%
)
Herb Number
Water
60% Ethanol
80% Ethanol
100% Ethanol
A B
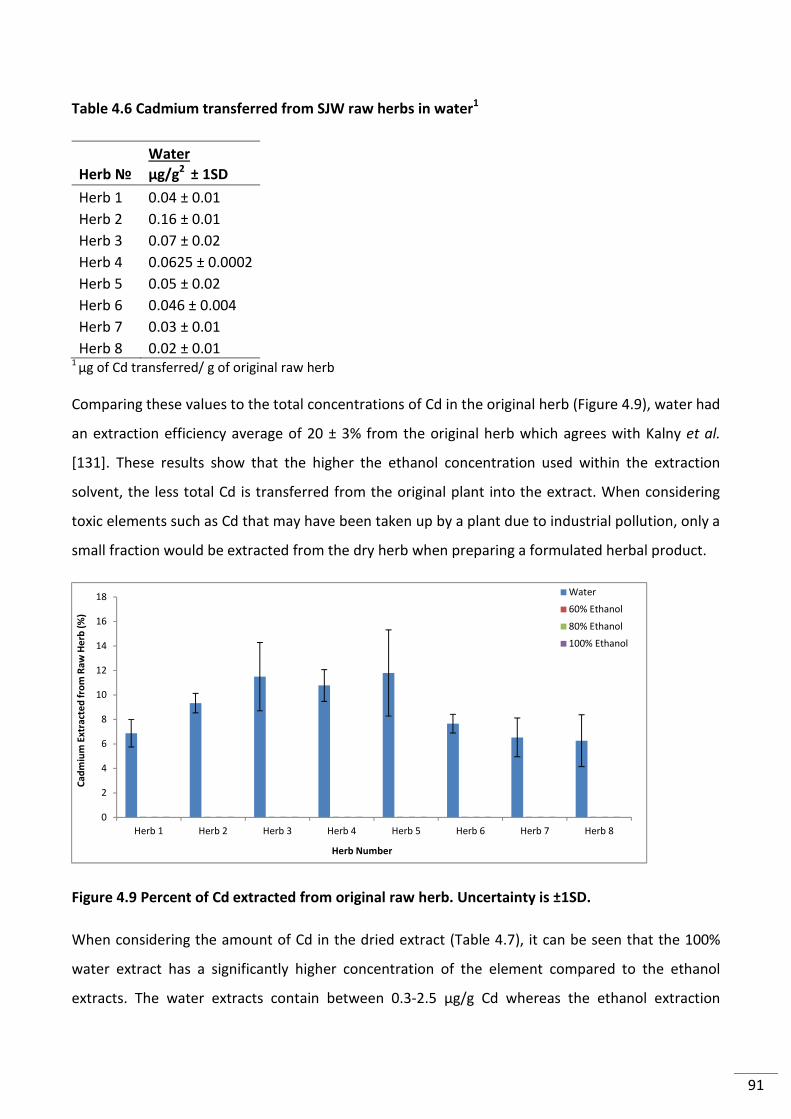
91
Table 4.6 Cadmium transferred from SJW raw herbs in water1
Water
Herb № μg/g2
± 1SD
Herb 1 0.04 ± 0.01
Herb 2 0.16 ± 0.01
Herb 3 0.07 ± 0.02
Herb 4 0.0625 ± 0.0002
Herb 5 0.05 ± 0.02
Herb 6 0.046 ± 0.004
Herb 7 0.03 ± 0.01
Herb 8 0.02 ± 0.01 1 μg of Cd transferred/ g of original raw herb
Comparing these values to the total concentrations of Cd in the original herb (Figure 4.9), water had
an extraction efficiency average of 20 ± 3% from the original herb which agrees with Kalny et al.
[131]. These results show that the higher the ethanol concentration used within the extraction
solvent, the less total Cd is transferred from the original plant into the extract. When considering
toxic elements such as Cd that may have been taken up by a plant due to industrial pollution, only a
small fraction would be extracted from the dry herb when preparing a formulated herbal product.
Figure 4.9 Percent of Cd extracted from original raw herb. Uncertainty is ±1SD.
When considering the amount of Cd in the dried extract (Table 4.7), it can be seen that the 100%
water extract has a significantly higher concentration of the element compared to the ethanol
extracts. The water extracts contain between 0.3-2.5 µg/g Cd whereas the ethanol extraction
0
2
4
6
8
10
12
14
16
18
Herb 1 Herb 2 Herb 3 Herb 4 Herb 5 Herb 6 Herb 7 Herb 8
Ca
dm
ium
Ex
tra
cte
d f
rom
Ra
w H
erb
(%
)
Herb Number
Water
60% Ethanol
80% Ethanol
100% Ethanol
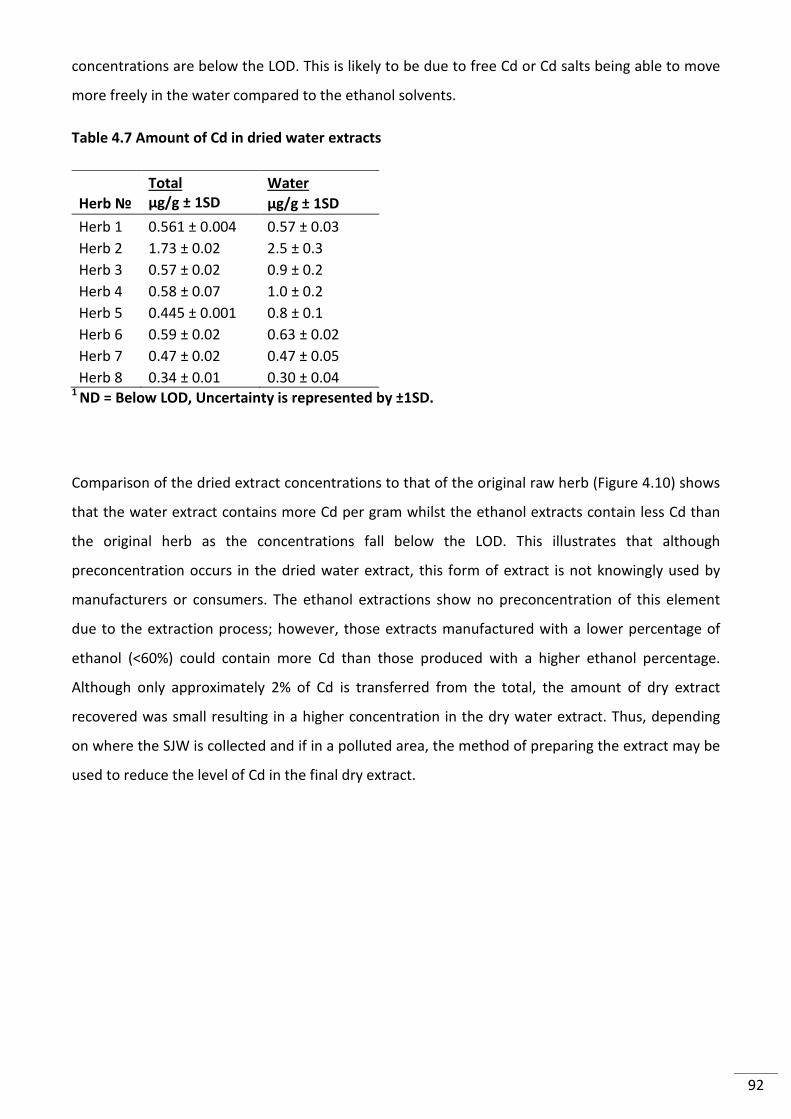
92
concentrations are below the LOD. This is likely to be due to free Cd or Cd salts being able to move
more freely in the water compared to the ethanol solvents.
Table 4.7 Amount of Cd in dried water extracts
Total Water
Herb № μg/g ± 1SD μg/g ± 1SD
Herb 1 0.561 ± 0.004 0.57 ± 0.03
Herb 2 1.73 ± 0.02 2.5 ± 0.3
Herb 3 0.57 ± 0.02 0.9 ± 0.2
Herb 4 0.58 ± 0.07 1.0 ± 0.2
Herb 5 0.445 ± 0.001 0.8 ± 0.1
Herb 6 0.59 ± 0.02 0.63 ± 0.02
Herb 7 0.47 ± 0.02 0.47 ± 0.05
Herb 8 0.34 ± 0.01 0.30 ± 0.04 1
ND = Below LOD, Uncertainty is represented by ±1SD.
Comparison of the dried extract concentrations to that of the original raw herb (Figure 4.10) shows
that the water extract contains more Cd per gram whilst the ethanol extracts contain less Cd than
the original herb as the concentrations fall below the LOD. This illustrates that although
preconcentration occurs in the dried water extract, this form of extract is not knowingly used by
manufacturers or consumers. The ethanol extractions show no preconcentration of this element
due to the extraction process; however, those extracts manufactured with a lower percentage of
ethanol (<60%) could contain more Cd than those produced with a higher ethanol percentage.
Although only approximately 2% of Cd is transferred from the total, the amount of dry extract
recovered was small resulting in a higher concentration in the dry water extract. Thus, depending
on where the SJW is collected and if in a polluted area, the method of preparing the extract may be
used to reduce the level of Cd in the final dry extract.
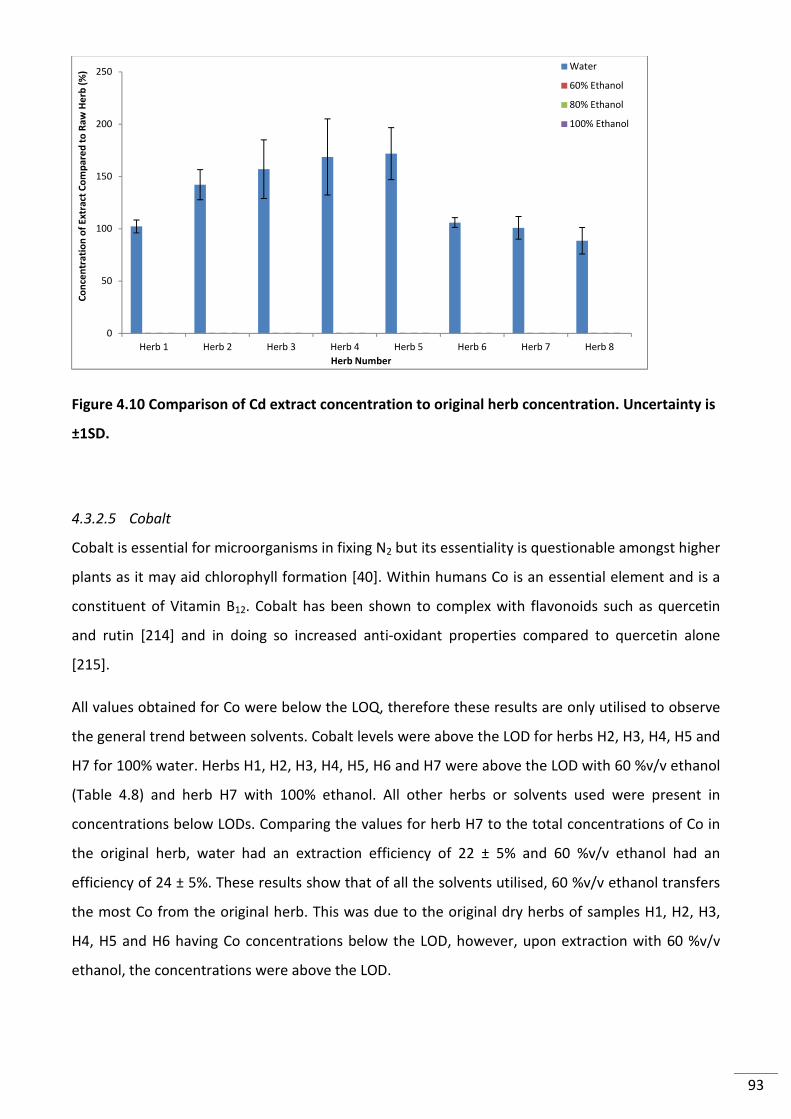
93
Figure 4.10 Comparison of Cd extract concentration to original herb concentration. Uncertainty is
±1SD.
4.3.2.5 Cobalt
Cobalt is essential for microorganisms in fixing N2 but its essentiality is questionable amongst higher
plants as it may aid chlorophyll formation [40]. Within humans Co is an essential element and is a
constituent of Vitamin B12. Cobalt has been shown to complex with flavonoids such as quercetin
and rutin [214] and in doing so increased anti-oxidant properties compared to quercetin alone
[215].
All values obtained for Co were below the LOQ, therefore these results are only utilised to observe
the general trend between solvents. Cobalt levels were above the LOD for herbs H2, H3, H4, H5 and
H7 for 100% water. Herbs H1, H2, H3, H4, H5, H6 and H7 were above the LOD with 60 %v/v ethanol
(Table 4.8) and herb H7 with 100% ethanol. All other herbs or solvents used were present in
concentrations below LODs. Comparing the values for herb H7 to the total concentrations of Co in
the original herb, water had an extraction efficiency of 22 ± 5% and 60 %v/v ethanol had an
efficiency of 24 ± 5%. These results show that of all the solvents utilised, 60 %v/v ethanol transfers
the most Co from the original herb. This was due to the original dry herbs of samples H1, H2, H3,
H4, H5 and H6 having Co concentrations below the LOD, however, upon extraction with 60 %v/v
ethanol, the concentrations were above the LOD.
0
50
100
150
200
250
Herb 1 Herb 2 Herb 3 Herb 4 Herb 5 Herb 6 Herb 7 Herb 8
Co
nce
ntr
ati
on
of
Ex
tra
ct C
om
pa
red
to
Ra
w H
erb
(%
)
Herb Number
Water
60% Ethanol
80% Ethanol
100% Ethanol
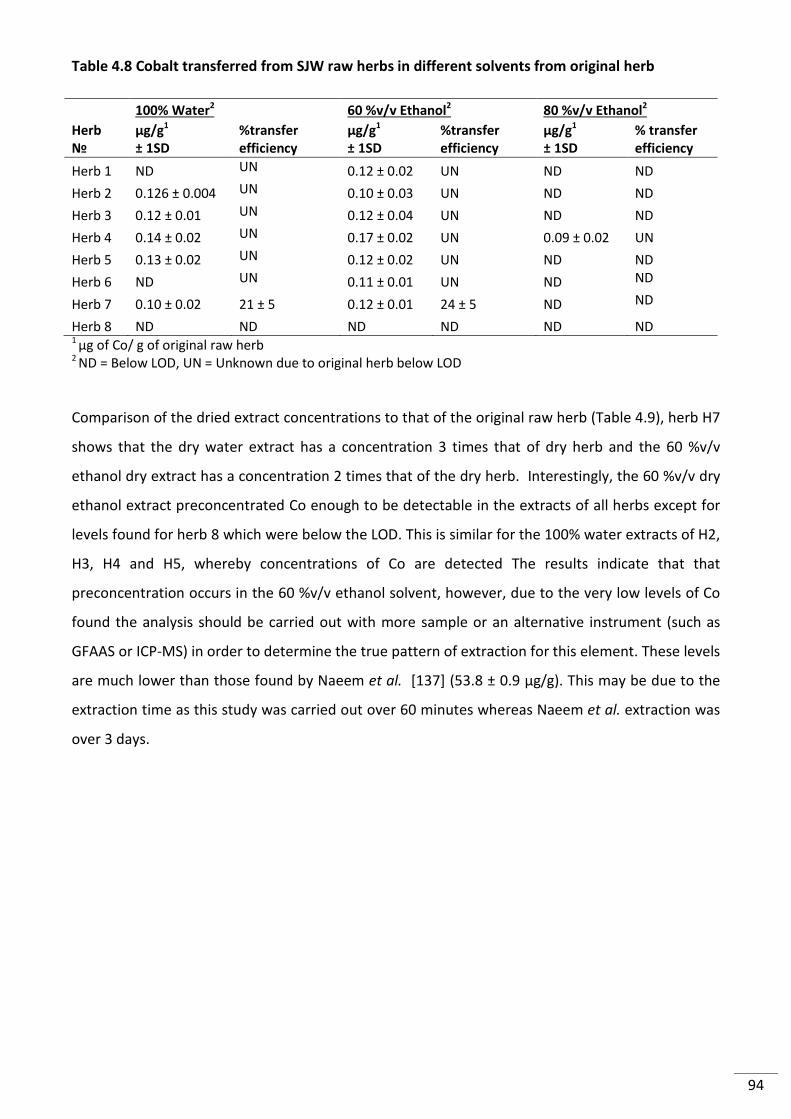
94
Table 4.8 Cobalt transferred from SJW raw herbs in different solvents from original herb
100% Water2 60 %v/v Ethanol
2 80 %v/v Ethanol
2
Herb
№
μg/g1
± 1SD
%transfer
efficiency
μg/g1
± 1SD
%transfer
efficiency
μg/g1
± 1SD
% transfer
efficiency
Herb 1 ND UN 0.12 ± 0.02 UN ND ND
Herb 2 0.126 ± 0.004 UN 0.10 ± 0.03 UN ND ND
Herb 3 0.12 ± 0.01 UN 0.12 ± 0.04 UN ND ND
Herb 4 0.14 ± 0.02 UN 0.17 ± 0.02 UN 0.09 ± 0.02 UN
Herb 5 0.13 ± 0.02 UN 0.12 ± 0.02 UN ND ND
Herb 6 ND UN 0.11 ± 0.01 UN ND ND
Herb 7 0.10 ± 0.02 21 ± 5 0.12 ± 0.01 24 ± 5 ND ND
Herb 8 ND ND ND ND ND ND 1 μg of Co/ g of original raw herb 2 ND = Below LOD, UN = Unknown due to original herb below LOD
Comparison of the dried extract concentrations to that of the original raw herb (Table 4.9), herb H7
shows that the dry water extract has a concentration 3 times that of dry herb and the 60 %v/v
ethanol dry extract has a concentration 2 times that of the dry herb. Interestingly, the 60 %v/v dry
ethanol extract preconcentrated Co enough to be detectable in the extracts of all herbs except for
levels found for herb 8 which were below the LOD. This is similar for the 100% water extracts of H2,
H3, H4 and H5, whereby concentrations of Co are detected The results indicate that that
preconcentration occurs in the 60 %v/v ethanol solvent, however, due to the very low levels of Co
found the analysis should be carried out with more sample or an alternative instrument (such as
GFAAS or ICP-MS) in order to determine the true pattern of extraction for this element. These levels
are much lower than those found by Naeem et al. [137] (53.8 ± 0.9 µg/g). This may be due to the
extraction time as this study was carried out over 60 minutes whereas Naeem et al. extraction was
over 3 days.
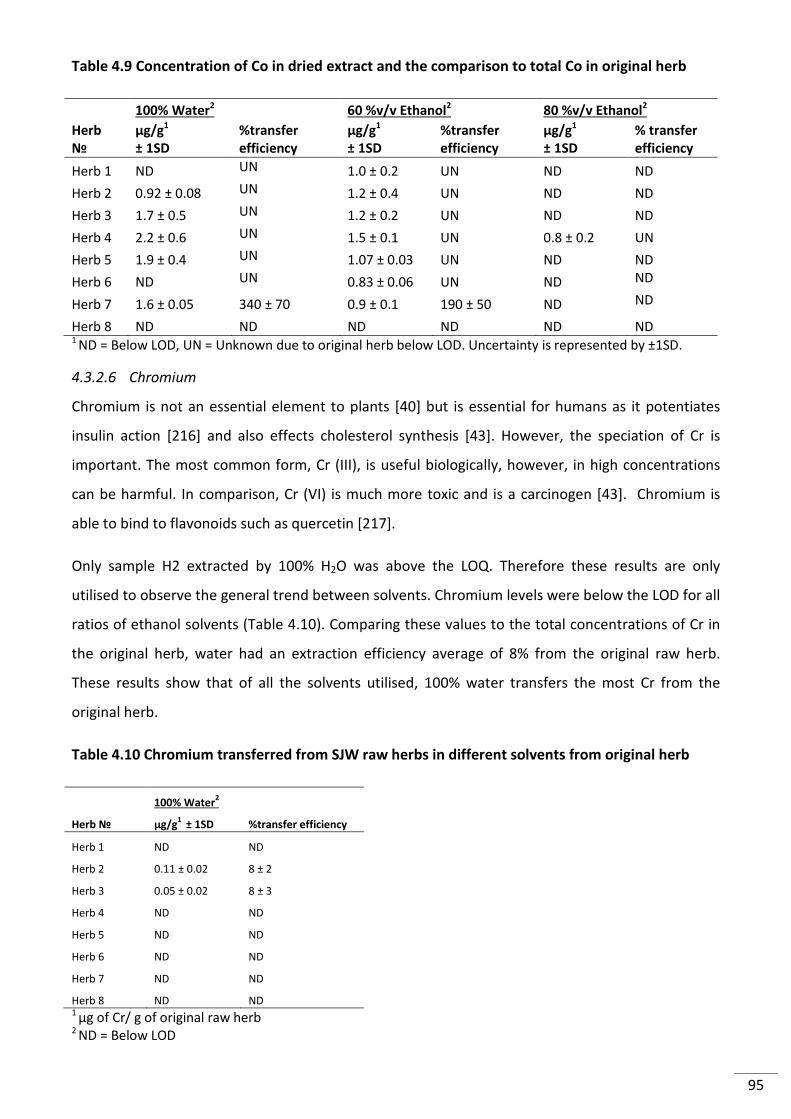
95
Table 4.9 Concentration of Co in dried extract and the comparison to total Co in original herb
100% Water2 60 %v/v Ethanol
2 80 %v/v Ethanol
2
Herb
№
μg/g1
± 1SD
%transfer
efficiency
μg/g1
± 1SD
%transfer
efficiency
μg/g1
± 1SD
% transfer
efficiency
Herb 1 ND UN 1.0 ± 0.2 UN ND ND
Herb 2 0.92 ± 0.08 UN 1.2 ± 0.4 UN ND ND
Herb 3 1.7 ± 0.5 UN 1.2 ± 0.2 UN ND ND
Herb 4 2.2 ± 0.6 UN 1.5 ± 0.1 UN 0.8 ± 0.2 UN
Herb 5 1.9 ± 0.4 UN 1.07 ± 0.03 UN ND ND
Herb 6 ND UN 0.83 ± 0.06 UN ND ND
Herb 7 1.6 ± 0.05 340 ± 70 0.9 ± 0.1 190 ± 50 ND ND
Herb 8 ND ND ND ND ND ND 1 ND = Below LOD, UN = Unknown due to original herb below LOD. Uncertainty is represented by ±1SD.
4.3.2.6 Chromium
Chromium is not an essential element to plants [40] but is essential for humans as it potentiates
insulin action [216] and also effects cholesterol synthesis [43]. However, the speciation of Cr is
important. The most common form, Cr (III), is useful biologically, however, in high concentrations
can be harmful. In comparison, Cr (VI) is much more toxic and is a carcinogen [43]. Chromium is
able to bind to flavonoids such as quercetin [217].
Only sample H2 extracted by 100% H2O was above the LOQ. Therefore these results are only
utilised to observe the general trend between solvents. Chromium levels were below the LOD for all
ratios of ethanol solvents (Table 4.10). Comparing these values to the total concentrations of Cr in
the original herb, water had an extraction efficiency average of 8% from the original raw herb.
These results show that of all the solvents utilised, 100% water transfers the most Cr from the
original herb.
Table 4.10 Chromium transferred from SJW raw herbs in different solvents from original herb
100% Water2
Herb № μg/g1
± 1SD %transfer efficiency
Herb 1 ND ND
Herb 2 0.11 ± 0.02 8 ± 2
Herb 3 0.05 ± 0.02 8 ± 3
Herb 4 ND ND
Herb 5 ND ND
Herb 6 ND ND
Herb 7 ND ND
Herb 8 ND ND 1 μg of Cr/ g of original raw herb 2 ND = Below LOD
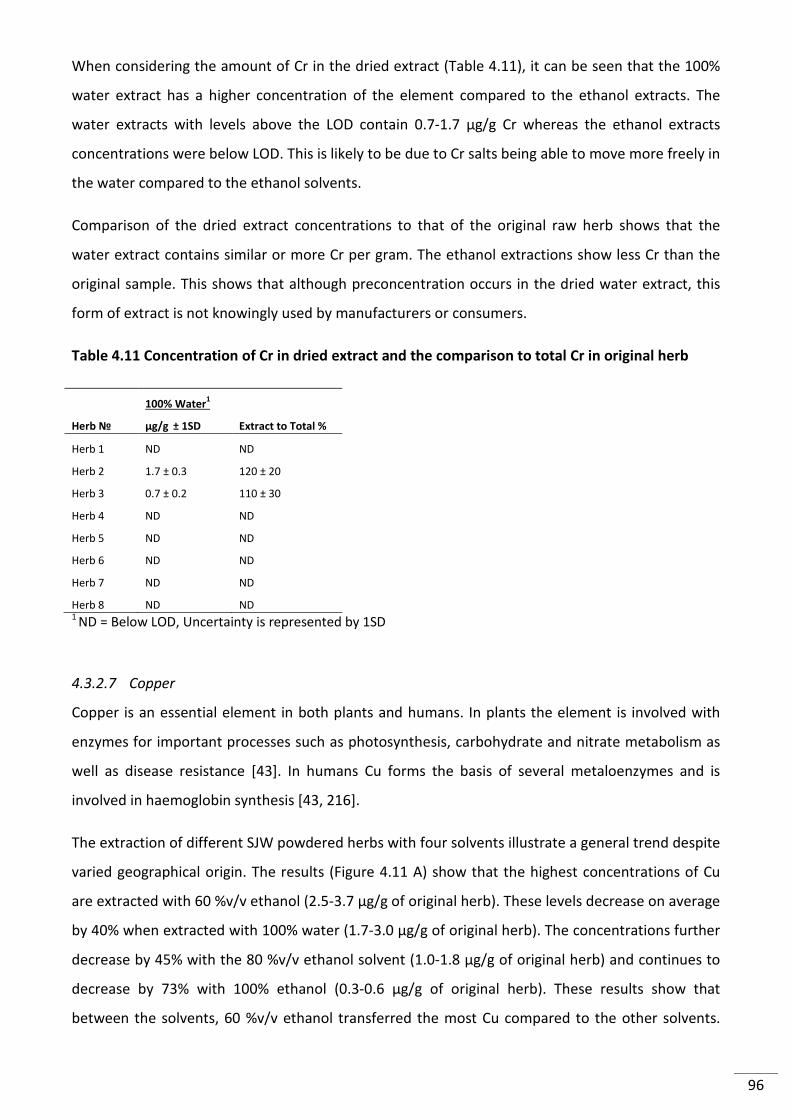
96
When considering the amount of Cr in the dried extract (Table 4.11), it can be seen that the 100%
water extract has a higher concentration of the element compared to the ethanol extracts. The
water extracts with levels above the LOD contain 0.7-1.7 µg/g Cr whereas the ethanol extracts
concentrations were below LOD. This is likely to be due to Cr salts being able to move more freely in
the water compared to the ethanol solvents.
Comparison of the dried extract concentrations to that of the original raw herb shows that the
water extract contains similar or more Cr per gram. The ethanol extractions show less Cr than the
original sample. This shows that although preconcentration occurs in the dried water extract, this
form of extract is not knowingly used by manufacturers or consumers.
Table 4.11 Concentration of Cr in dried extract and the comparison to total Cr in original herb
100% Water1
Herb № μg/g ± 1SD Extract to Total %
Herb 1 ND ND
Herb 2 1.7 ± 0.3 120 ± 20
Herb 3 0.7 ± 0.2 110 ± 30
Herb 4 ND ND
Herb 5 ND ND
Herb 6 ND ND
Herb 7 ND ND
Herb 8 ND ND 1 ND = Below LOD, Uncertainty is represented by 1SD
4.3.2.7 Copper
Copper is an essential element in both plants and humans. In plants the element is involved with
enzymes for important processes such as photosynthesis, carbohydrate and nitrate metabolism as
well as disease resistance [43]. In humans Cu forms the basis of several metaloenzymes and is
involved in haemoglobin synthesis [43, 216].
The extraction of different SJW powdered herbs with four solvents illustrate a general trend despite
varied geographical origin. The results (Figure 4.11 A) show that the highest concentrations of Cu
are extracted with 60 %v/v ethanol (2.5-3.7 µg/g of original herb). These levels decrease on average
by 40% when extracted with 100% water (1.7-3.0 µg/g of original herb). The concentrations further
decrease by 45% with the 80 %v/v ethanol solvent (1.0-1.8 µg/g of original herb) and continues to
decrease by 73% with 100% ethanol (0.3-0.6 µg/g of original herb). These results show that
between the solvents, 60 %v/v ethanol transferred the most Cu compared to the other solvents.
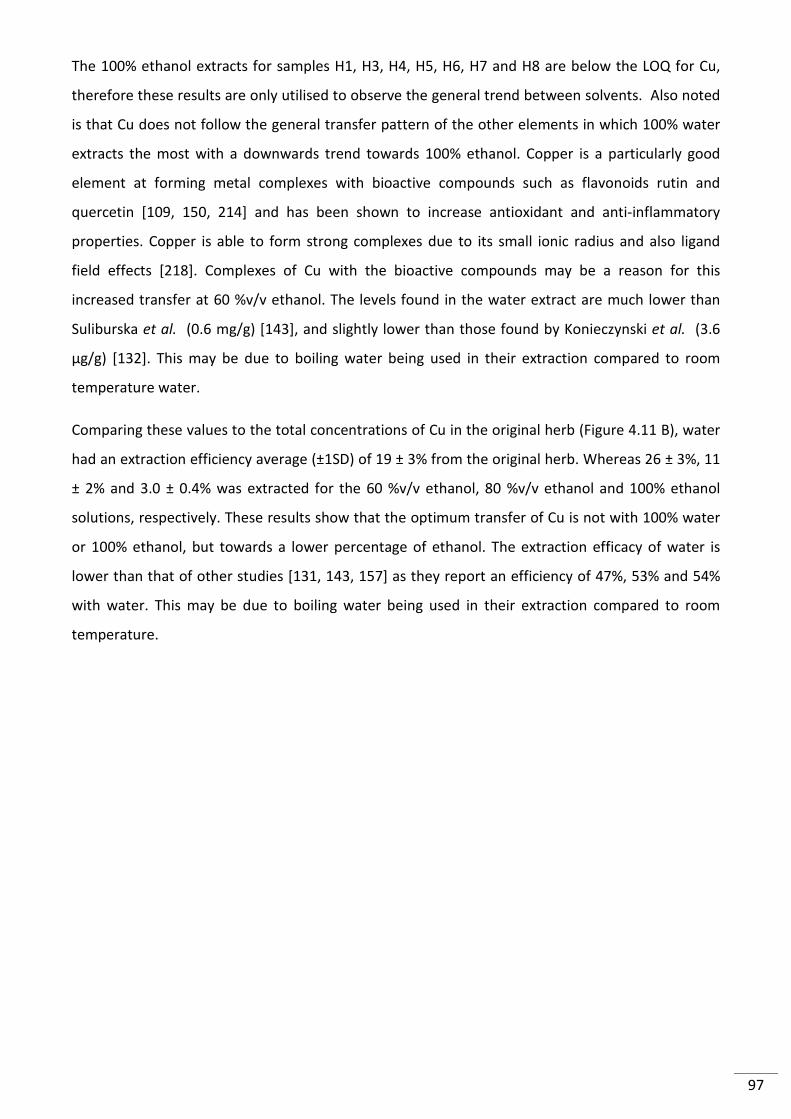
97
The 100% ethanol extracts for samples H1, H3, H4, H5, H6, H7 and H8 are below the LOQ for Cu,
therefore these results are only utilised to observe the general trend between solvents. Also noted
is that Cu does not follow the general transfer pattern of the other elements in which 100% water
extracts the most with a downwards trend towards 100% ethanol. Copper is a particularly good
element at forming metal complexes with bioactive compounds such as flavonoids rutin and
quercetin [109, 150, 214] and has been shown to increase antioxidant and anti-inflammatory
properties. Copper is able to form strong complexes due to its small ionic radius and also ligand
field effects [218]. Complexes of Cu with the bioactive compounds may be a reason for this
increased transfer at 60 %v/v ethanol. The levels found in the water extract are much lower than
Suliburska et al. (0.6 mg/g) [143], and slightly lower than those found by Konieczynski et al. (3.6
µg/g) [132]. This may be due to boiling water being used in their extraction compared to room
temperature water.
Comparing these values to the total concentrations of Cu in the original herb (Figure 4.11 B), water
had an extraction efficiency average (±1SD) of 19 ± 3% from the original herb. Whereas 26 ± 3%, 11
± 2% and 3.0 ± 0.4% was extracted for the 60 %v/v ethanol, 80 %v/v ethanol and 100% ethanol
solutions, respectively. These results show that the optimum transfer of Cu is not with 100% water
or 100% ethanol, but towards a lower percentage of ethanol. The extraction efficacy of water is
lower than that of other studies [131, 143, 157] as they report an efficiency of 47%, 53% and 54%
with water. This may be due to boiling water being used in their extraction compared to room
temperature.
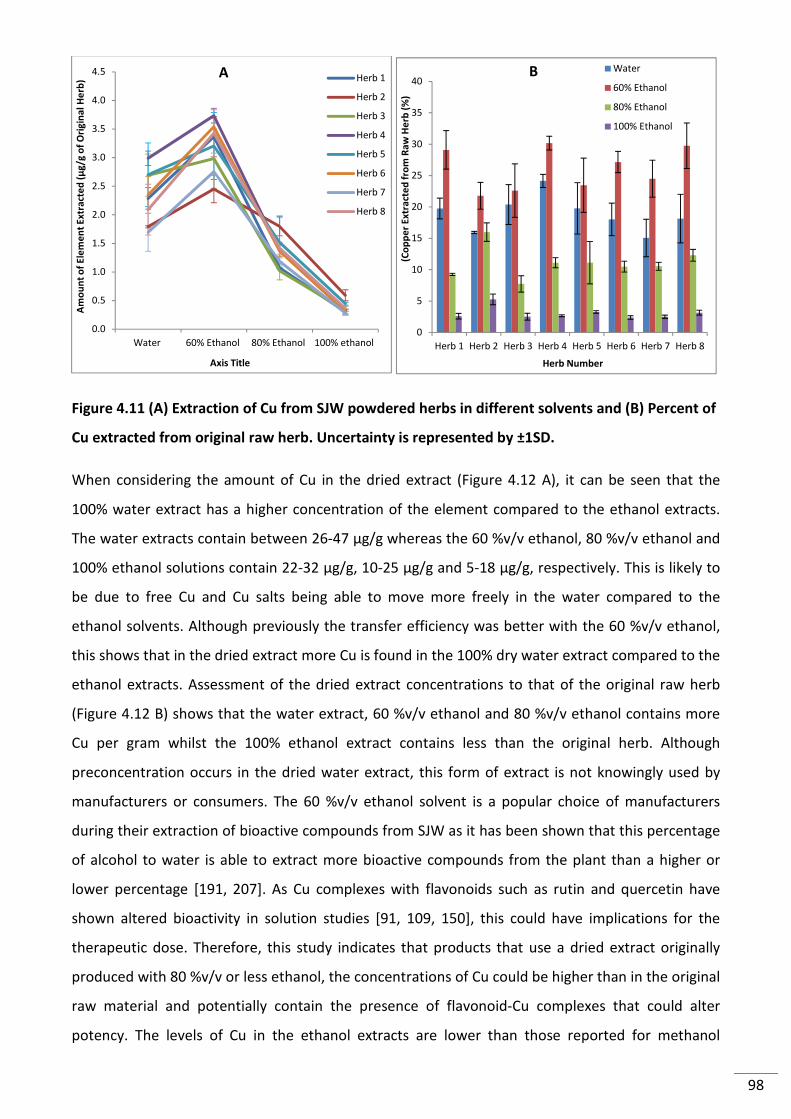
98
Figure 4.11 (A) Extraction of Cu from SJW powdered herbs in different solvents and (B) Percent of
Cu extracted from original raw herb. Uncertainty is represented by ±1SD.
When considering the amount of Cu in the dried extract (Figure 4.12 A), it can be seen that the
100% water extract has a higher concentration of the element compared to the ethanol extracts.
The water extracts contain between 26-47 µg/g whereas the 60 %v/v ethanol, 80 %v/v ethanol and
100% ethanol solutions contain 22-32 µg/g, 10-25 µg/g and 5-18 µg/g, respectively. This is likely to
be due to free Cu and Cu salts being able to move more freely in the water compared to the
ethanol solvents. Although previously the transfer efficiency was better with the 60 %v/v ethanol,
this shows that in the dried extract more Cu is found in the 100% dry water extract compared to the
ethanol extracts. Assessment of the dried extract concentrations to that of the original raw herb
(Figure 4.12 B) shows that the water extract, 60 %v/v ethanol and 80 %v/v ethanol contains more
Cu per gram whilst the 100% ethanol extract contains less than the original herb. Although
preconcentration occurs in the dried water extract, this form of extract is not knowingly used by
manufacturers or consumers. The 60 %v/v ethanol solvent is a popular choice of manufacturers
during their extraction of bioactive compounds from SJW as it has been shown that this percentage
of alcohol to water is able to extract more bioactive compounds from the plant than a higher or
lower percentage [191, 207]. As Cu complexes with flavonoids such as rutin and quercetin have
shown altered bioactivity in solution studies [91, 109, 150], this could have implications for the
therapeutic dose. Therefore, this study indicates that products that use a dried extract originally
produced with 80 %v/v or less ethanol, the concentrations of Cu could be higher than in the original
raw material and potentially contain the presence of flavonoid-Cu complexes that could alter
potency. The levels of Cu in the ethanol extracts are lower than those reported for methanol
0.0
0.5
1.0
1.5
2.0
2.5
3.0
3.5
4.0
4.5
Water 60% Ethanol 80% Ethanol 100% ethanol
Am
ou
nt
of
Ele
me
nt
Ex
tra
cte
d (
μg
/g o
f O
rig
ina
l H
erb
)
Axis Title
Herb 1
Herb 2
Herb 3
Herb 4
Herb 5
Herb 6
Herb 7
Herb 8
0
5
10
15
20
25
30
35
40
Herb 1 Herb 2 Herb 3 Herb 4 Herb 5 Herb 6 Herb 7 Herb 8
(Co
pp
er
Ex
tra
cte
d f
rom
Ra
w H
erb
(%
)
Herb Number
Water
60% Ethanol
80% Ethanol
100% Ethanol
A B
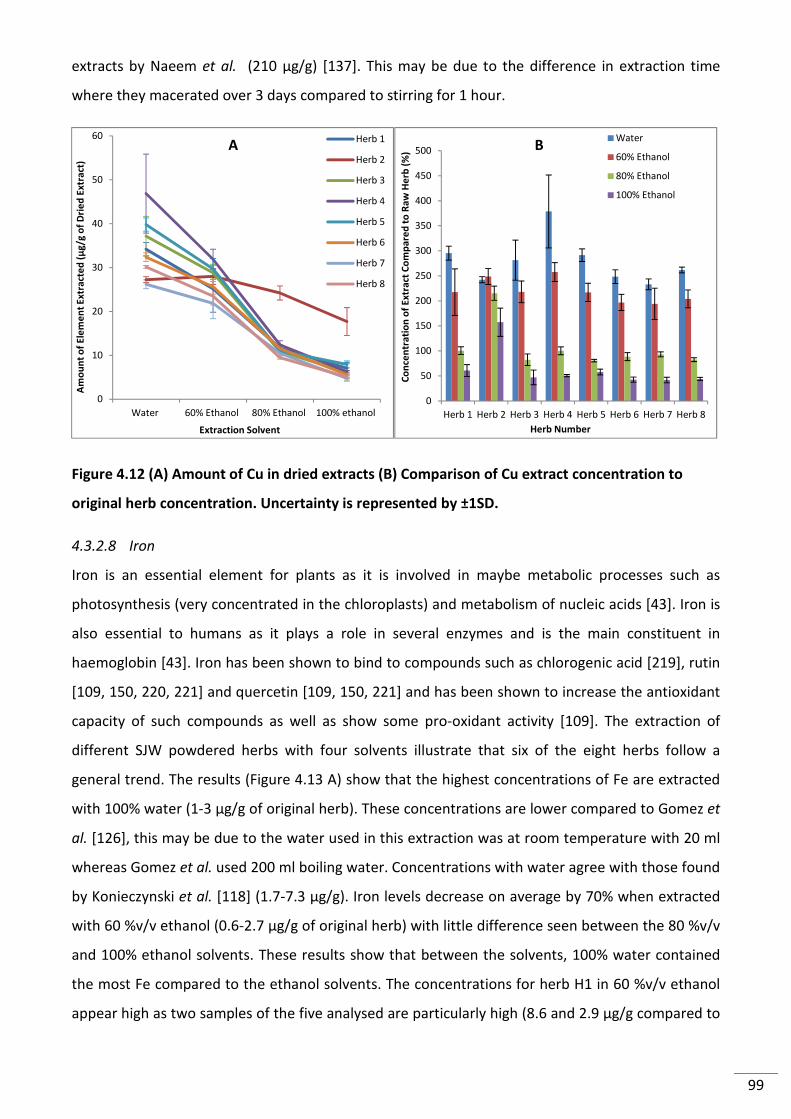
99
extracts by Naeem et al. (210 µg/g) [137]. This may be due to the difference in extraction time
where they macerated over 3 days compared to stirring for 1 hour.
Figure 4.12 (A) Amount of Cu in dried extracts (B) Comparison of Cu extract concentration to
original herb concentration. Uncertainty is represented by ±1SD.
4.3.2.8 Iron
Iron is an essential element for plants as it is involved in maybe metabolic processes such as
photosynthesis (very concentrated in the chloroplasts) and metabolism of nucleic acids [43]. Iron is
also essential to humans as it plays a role in several enzymes and is the main constituent in
haemoglobin [43]. Iron has been shown to bind to compounds such as chlorogenic acid [219], rutin
[109, 150, 220, 221] and quercetin [109, 150, 221] and has been shown to increase the antioxidant
capacity of such compounds as well as show some pro-oxidant activity [109]. The extraction of
different SJW powdered herbs with four solvents illustrate that six of the eight herbs follow a
general trend. The results (Figure 4.13 A) show that the highest concentrations of Fe are extracted
with 100% water (1-3 µg/g of original herb). These concentrations are lower compared to Gomez et
al. [126], this may be due to the water used in this extraction was at room temperature with 20 ml
whereas Gomez et al. used 200 ml boiling water. Concentrations with water agree with those found
by Konieczynski et al. [118] (1.7-7.3 µg/g). Iron levels decrease on average by 70% when extracted
with 60 %v/v ethanol (0.6-2.7 µg/g of original herb) with little difference seen between the 80 %v/v
and 100% ethanol solvents. These results show that between the solvents, 100% water contained
the most Fe compared to the ethanol solvents. The concentrations for herb H1 in 60 %v/v ethanol
appear high as two samples of the five analysed are particularly high (8.6 and 2.9 µg/g compared to
0
10
20
30
40
50
60
Water 60% Ethanol 80% Ethanol 100% ethanol
Am
ou
nt
of
Ele
me
nt
Ex
tra
cte
d (
μg
/g o
f D
rie
d E
xtr
act
)
Extraction Solvent
Herb 1
Herb 2
Herb 3
Herb 4
Herb 5
Herb 6
Herb 7
Herb 8
0
50
100
150
200
250
300
350
400
450
500
Herb 1 Herb 2 Herb 3 Herb 4 Herb 5 Herb 6 Herb 7 Herb 8C
on
cen
tra
tio
n o
f E
xtr
act
Co
mp
are
d t
o R
aw
He
rb (
%)
Herb Number
Water
60% Ethanol
80% Ethanol
100% Ethanol
A B
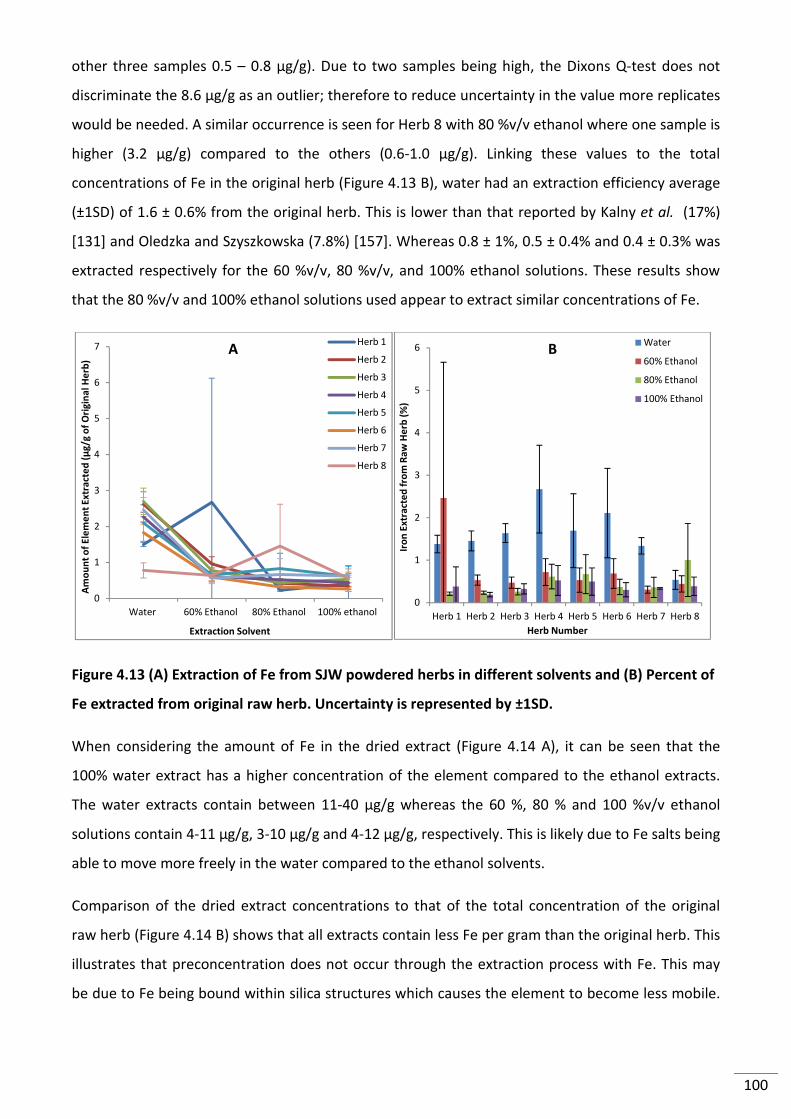
100
other three samples 0.5 – 0.8 µg/g). Due to two samples being high, the Dixons Q-test does not
discriminate the 8.6 µg/g as an outlier; therefore to reduce uncertainty in the value more replicates
would be needed. A similar occurrence is seen for Herb 8 with 80 %v/v ethanol where one sample is
higher (3.2 µg/g) compared to the others (0.6-1.0 µg/g). Linking these values to the total
concentrations of Fe in the original herb (Figure 4.13 B), water had an extraction efficiency average
(±1SD) of 1.6 ± 0.6% from the original herb. This is lower than that reported by Kalny et al. (17%)
[131] and Oledzka and Szyszkowska (7.8%) [157]. Whereas 0.8 ± 1%, 0.5 ± 0.4% and 0.4 ± 0.3% was
extracted respectively for the 60 %v/v, 80 %v/v, and 100% ethanol solutions. These results show
that the 80 %v/v and 100% ethanol solutions used appear to extract similar concentrations of Fe.
Figure 4.13 (A) Extraction of Fe from SJW powdered herbs in different solvents and (B) Percent of
Fe extracted from original raw herb. Uncertainty is represented by ±1SD.
When considering the amount of Fe in the dried extract (Figure 4.14 A), it can be seen that the
100% water extract has a higher concentration of the element compared to the ethanol extracts.
The water extracts contain between 11-40 µg/g whereas the 60 %, 80 % and 100 %v/v ethanol
solutions contain 4-11 µg/g, 3-10 µg/g and 4-12 µg/g, respectively. This is likely due to Fe salts being
able to move more freely in the water compared to the ethanol solvents.
Comparison of the dried extract concentrations to that of the total concentration of the original
raw herb (Figure 4.14 B) shows that all extracts contain less Fe per gram than the original herb. This
illustrates that preconcentration does not occur through the extraction process with Fe. This may
be due to Fe being bound within silica structures which causes the element to become less mobile.
0
1
2
3
4
5
6
7
Water 60% Ethanol 80% Ethanol 100% ethanol
Am
ou
nt
of
Ele
me
nt
Ex
tra
cte
d (
μg
/g o
f O
rig
ina
l H
erb
)
Extraction Solvent
Herb 1
Herb 2
Herb 3
Herb 4
Herb 5
Herb 6
Herb 7
Herb 8
0
1
2
3
4
5
6
Herb 1 Herb 2 Herb 3 Herb 4 Herb 5 Herb 6 Herb 7 Herb 8
Iro
n E
xtr
act
ed
fro
m R
aw
He
rb (
%)
Herb Number
Water
60% Ethanol
80% Ethanol
100% Ethanol
A B
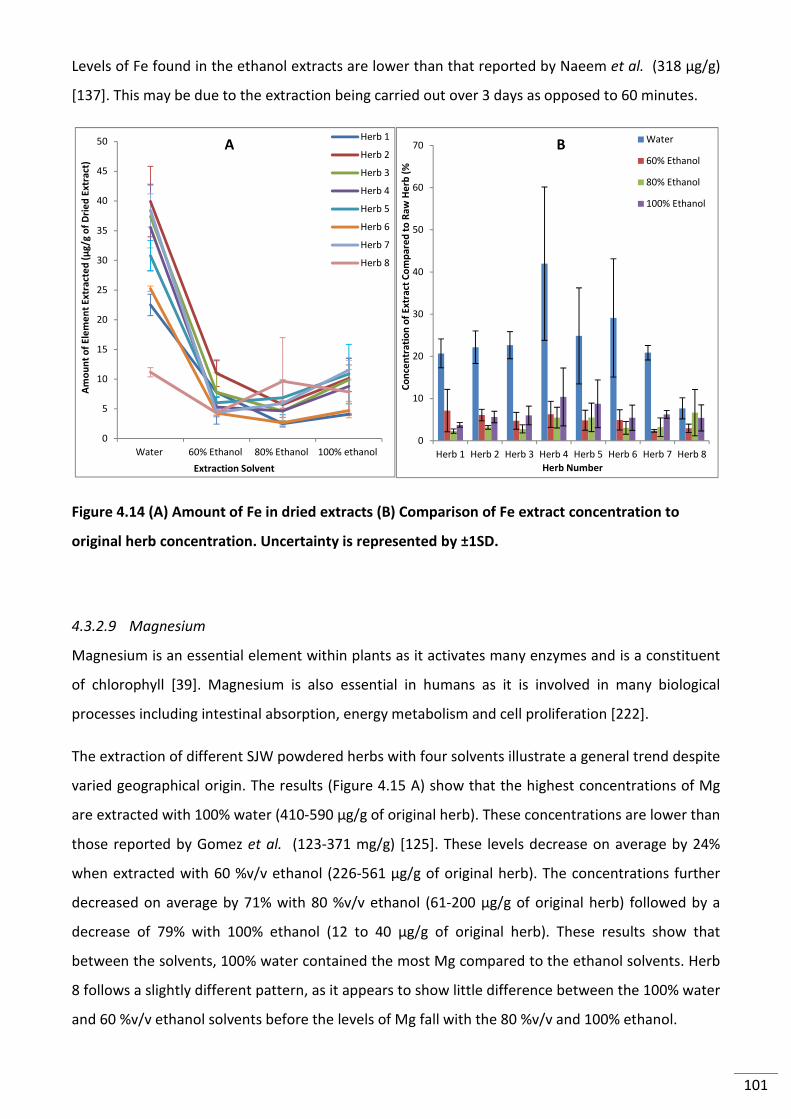
101
Levels of Fe found in the ethanol extracts are lower than that reported by Naeem et al. (318 µg/g)
[137]. This may be due to the extraction being carried out over 3 days as opposed to 60 minutes.
Figure 4.14 (A) Amount of Fe in dried extracts (B) Comparison of Fe extract concentration to
original herb concentration. Uncertainty is represented by ±1SD.
4.3.2.9 Magnesium
Magnesium is an essential element within plants as it activates many enzymes and is a constituent
of chlorophyll [39]. Magnesium is also essential in humans as it is involved in many biological
processes including intestinal absorption, energy metabolism and cell proliferation [222].
The extraction of different SJW powdered herbs with four solvents illustrate a general trend despite
varied geographical origin. The results (Figure 4.15 A) show that the highest concentrations of Mg
are extracted with 100% water (410-590 µg/g of original herb). These concentrations are lower than
those reported by Gomez et al. (123-371 mg/g) [125]. These levels decrease on average by 24%
when extracted with 60 %v/v ethanol (226-561 µg/g of original herb). The concentrations further
decreased on average by 71% with 80 %v/v ethanol (61-200 µg/g of original herb) followed by a
decrease of 79% with 100% ethanol (12 to 40 µg/g of original herb). These results show that
between the solvents, 100% water contained the most Mg compared to the ethanol solvents. Herb
8 follows a slightly different pattern, as it appears to show little difference between the 100% water
and 60 %v/v ethanol solvents before the levels of Mg fall with the 80 %v/v and 100% ethanol.
0
5
10
15
20
25
30
35
40
45
50
Water 60% Ethanol 80% Ethanol 100% ethanol
Am
ou
nt
of
Ele
me
nt
Ex
tra
cte
d (
μg
/g o
f D
rie
d E
xtr
act
)
Extraction Solvent
Herb 1
Herb 2
Herb 3
Herb 4
Herb 5
Herb 6
Herb 7
Herb 8
0
10
20
30
40
50
60
70
Herb 1 Herb 2 Herb 3 Herb 4 Herb 5 Herb 6 Herb 7 Herb 8
Co
nce
ntr
ati
on
of
Ex
tra
ct C
om
pa
red
to
Ra
w H
erb
(%
Herb Number
Water
60% Ethanol
80% Ethanol
100% Ethanol
A B
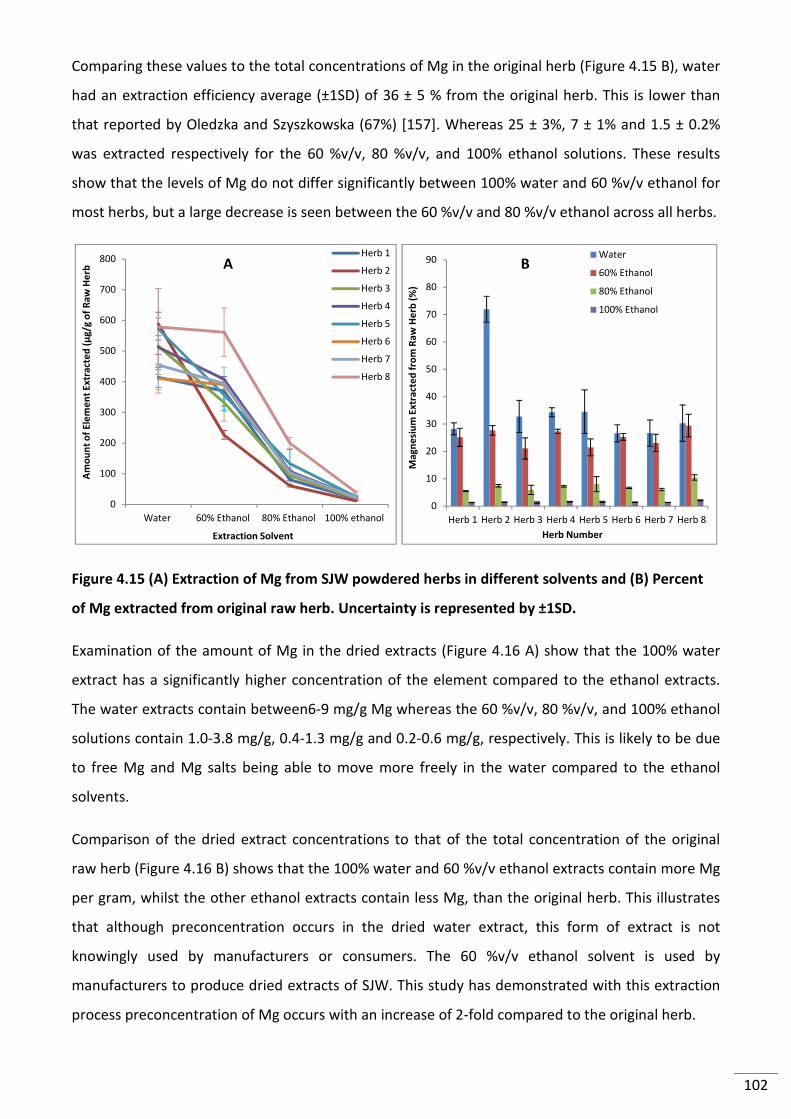
102
Comparing these values to the total concentrations of Mg in the original herb (Figure 4.15 B), water
had an extraction efficiency average (±1SD) of 36 ± 5 % from the original herb. This is lower than
that reported by Oledzka and Szyszkowska (67%) [157]. Whereas 25 ± 3%, 7 ± 1% and 1.5 ± 0.2%
was extracted respectively for the 60 %v/v, 80 %v/v, and 100% ethanol solutions. These results
show that the levels of Mg do not differ significantly between 100% water and 60 %v/v ethanol for
most herbs, but a large decrease is seen between the 60 %v/v and 80 %v/v ethanol across all herbs.
Figure 4.15 (A) Extraction of Mg from SJW powdered herbs in different solvents and (B) Percent
of Mg extracted from original raw herb. Uncertainty is represented by ±1SD.
Examination of the amount of Mg in the dried extracts (Figure 4.16 A) show that the 100% water
extract has a significantly higher concentration of the element compared to the ethanol extracts.
The water extracts contain between6-9 mg/g Mg whereas the 60 %v/v, 80 %v/v, and 100% ethanol
solutions contain 1.0-3.8 mg/g, 0.4-1.3 mg/g and 0.2-0.6 mg/g, respectively. This is likely to be due
to free Mg and Mg salts being able to move more freely in the water compared to the ethanol
solvents.
Comparison of the dried extract concentrations to that of the total concentration of the original
raw herb (Figure 4.16 B) shows that the 100% water and 60 %v/v ethanol extracts contain more Mg
per gram, whilst the other ethanol extracts contain less Mg, than the original herb. This illustrates
that although preconcentration occurs in the dried water extract, this form of extract is not
knowingly used by manufacturers or consumers. The 60 %v/v ethanol solvent is used by
manufacturers to produce dried extracts of SJW. This study has demonstrated with this extraction
process preconcentration of Mg occurs with an increase of 2-fold compared to the original herb.
0
100
200
300
400
500
600
700
800
Water 60% Ethanol 80% Ethanol 100% ethanol
Am
ou
nt
of
Ele
me
nt
Ex
tra
cte
d (
μg
/g o
f R
aw
He
rb
Extraction Solvent
Herb 1
Herb 2
Herb 3
Herb 4
Herb 5
Herb 6
Herb 7
Herb 8
0
10
20
30
40
50
60
70
80
90
Herb 1 Herb 2 Herb 3 Herb 4 Herb 5 Herb 6 Herb 7 Herb 8
Ma
gn
esi
um
Ex
tra
cte
d f
rom
Ra
w H
erb
(%
)
Herb Number
Water
60% Ethanol
80% Ethanol
100% Ethanol
A B
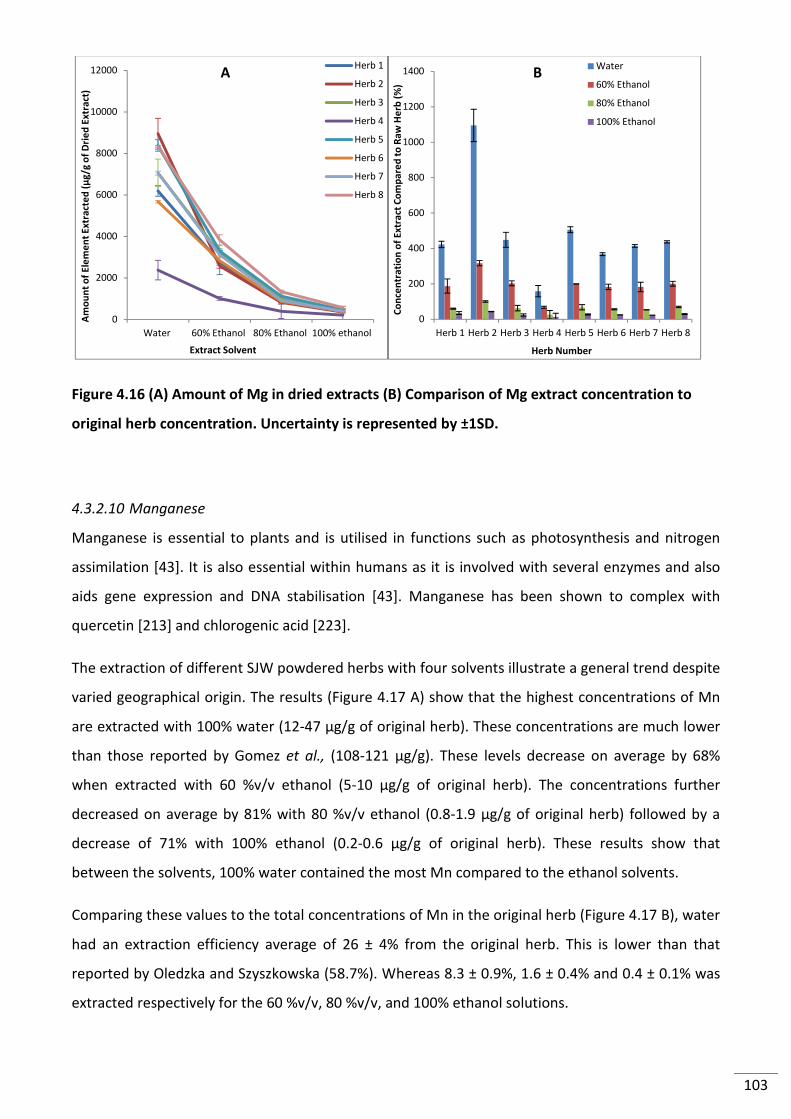
103
Figure 4.16 (A) Amount of Mg in dried extracts (B) Comparison of Mg extract concentration to
original herb concentration. Uncertainty is represented by ±1SD.
4.3.2.10 Manganese
Manganese is essential to plants and is utilised in functions such as photosynthesis and nitrogen
assimilation [43]. It is also essential within humans as it is involved with several enzymes and also
aids gene expression and DNA stabilisation [43]. Manganese has been shown to complex with
quercetin [213] and chlorogenic acid [223].
The extraction of different SJW powdered herbs with four solvents illustrate a general trend despite
varied geographical origin. The results (Figure 4.17 A) show that the highest concentrations of Mn
are extracted with 100% water (12-47 µg/g of original herb). These concentrations are much lower
than those reported by Gomez et al., (108-121 µg/g). These levels decrease on average by 68%
when extracted with 60 %v/v ethanol (5-10 µg/g of original herb). The concentrations further
decreased on average by 81% with 80 %v/v ethanol (0.8-1.9 µg/g of original herb) followed by a
decrease of 71% with 100% ethanol (0.2-0.6 µg/g of original herb). These results show that
between the solvents, 100% water contained the most Mn compared to the ethanol solvents.
Comparing these values to the total concentrations of Mn in the original herb (Figure 4.17 B), water
had an extraction efficiency average of 26 ± 4% from the original herb. This is lower than that
reported by Oledzka and Szyszkowska (58.7%). Whereas 8.3 ± 0.9%, 1.6 ± 0.4% and 0.4 ± 0.1% was
extracted respectively for the 60 %v/v, 80 %v/v, and 100% ethanol solutions.
0
2000
4000
6000
8000
10000
12000
Water 60% Ethanol 80% Ethanol 100% ethanol
Am
ou
nt
of
Ele
me
nt
Ex
tra
cte
d (
μg
/g o
f D
rie
d E
xtr
act
)
Extract Solvent
Herb 1
Herb 2
Herb 3
Herb 4
Herb 5
Herb 6
Herb 7
Herb 8
0
200
400
600
800
1000
1200
1400
Herb 1 Herb 2 Herb 3 Herb 4 Herb 5 Herb 6 Herb 7 Herb 8
Co
nce
ntr
ati
on
of
Ex
tra
ct C
om
pa
red
to
Ra
w H
erb
(%
)
Herb Number
Water
60% Ethanol
80% Ethanol
100% Ethanol
A B
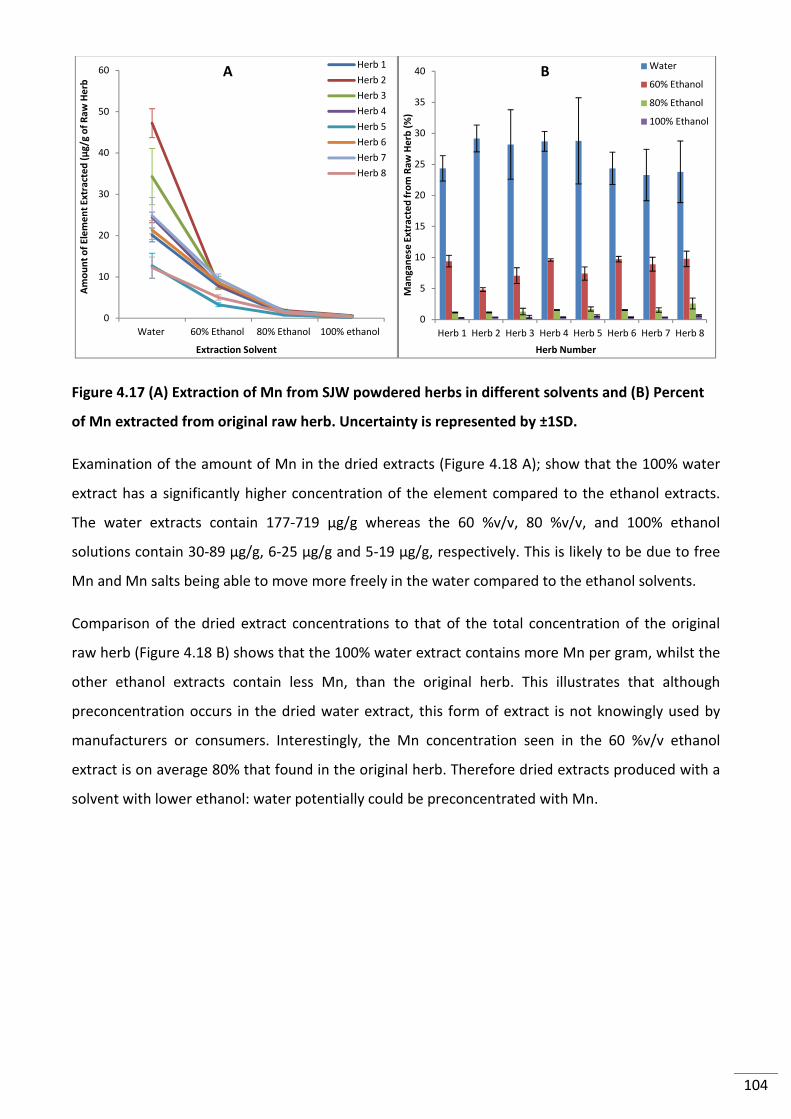
104
Figure 4.17 (A) Extraction of Mn from SJW powdered herbs in different solvents and (B) Percent
of Mn extracted from original raw herb. Uncertainty is represented by ±1SD.
Examination of the amount of Mn in the dried extracts (Figure 4.18 A); show that the 100% water
extract has a significantly higher concentration of the element compared to the ethanol extracts.
The water extracts contain 177-719 µg/g whereas the 60 %v/v, 80 %v/v, and 100% ethanol
solutions contain 30-89 µg/g, 6-25 µg/g and 5-19 µg/g, respectively. This is likely to be due to free
Mn and Mn salts being able to move more freely in the water compared to the ethanol solvents.
Comparison of the dried extract concentrations to that of the total concentration of the original
raw herb (Figure 4.18 B) shows that the 100% water extract contains more Mn per gram, whilst the
other ethanol extracts contain less Mn, than the original herb. This illustrates that although
preconcentration occurs in the dried water extract, this form of extract is not knowingly used by
manufacturers or consumers. Interestingly, the Mn concentration seen in the 60 %v/v ethanol
extract is on average 80% that found in the original herb. Therefore dried extracts produced with a
solvent with lower ethanol: water potentially could be preconcentrated with Mn.
0
10
20
30
40
50
60
Water 60% Ethanol 80% Ethanol 100% ethanol
Am
ou
nt
of
Ele
me
nt
Ex
tra
cte
d (
μg
/g o
f R
aw
He
rb
Extraction Solvent
Herb 1
Herb 2
Herb 3
Herb 4
Herb 5
Herb 6
Herb 7
Herb 8
0
5
10
15
20
25
30
35
40
Herb 1 Herb 2 Herb 3 Herb 4 Herb 5 Herb 6 Herb 7 Herb 8
Ma
ng
an
ese
Ex
tra
cte
d f
rom
Ra
w H
erb
(%
)
Herb Number
Water
60% Ethanol
80% Ethanol
100% Ethanol
A B
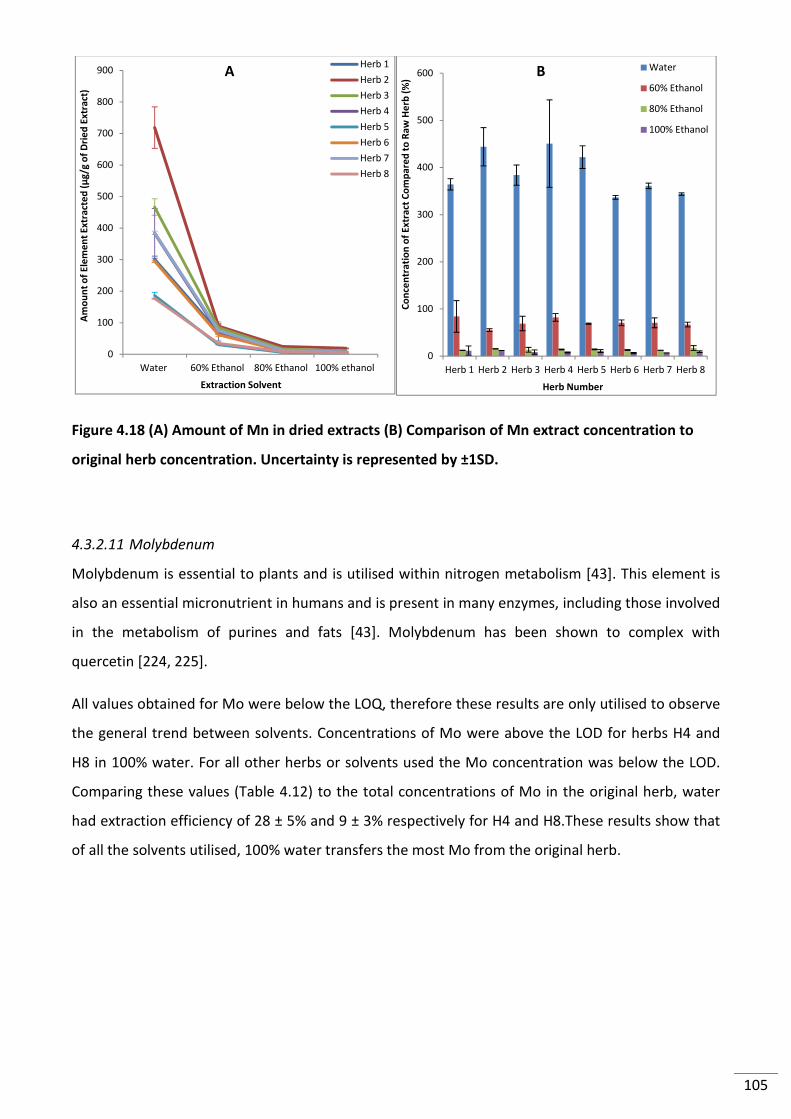
105
Figure 4.18 (A) Amount of Mn in dried extracts (B) Comparison of Mn extract concentration to
original herb concentration. Uncertainty is represented by ±1SD.
4.3.2.11 Molybdenum
Molybdenum is essential to plants and is utilised within nitrogen metabolism [43]. This element is
also an essential micronutrient in humans and is present in many enzymes, including those involved
in the metabolism of purines and fats [43]. Molybdenum has been shown to complex with
quercetin [224, 225].
All values obtained for Mo were below the LOQ, therefore these results are only utilised to observe
the general trend between solvents. Concentrations of Mo were above the LOD for herbs H4 and
H8 in 100% water. For all other herbs or solvents used the Mo concentration was below the LOD.
Comparing these values (Table 4.12) to the total concentrations of Mo in the original herb, water
had extraction efficiency of 28 ± 5% and 9 ± 3% respectively for H4 and H8.These results show that
of all the solvents utilised, 100% water transfers the most Mo from the original herb.
0
100
200
300
400
500
600
700
800
900
Water 60% Ethanol 80% Ethanol 100% ethanol
Am
ou
nt
of
Ele
me
nt
Ex
tra
cte
d (
μg
/g o
f D
rie
d E
xtr
act
)
Extraction Solvent
Herb 1
Herb 2
Herb 3
Herb 4
Herb 5
Herb 6
Herb 7
Herb 8
0
100
200
300
400
500
600
Herb 1 Herb 2 Herb 3 Herb 4 Herb 5 Herb 6 Herb 7 Herb 8
Co
nce
ntr
ati
on
of
Ex
tra
ct C
om
pa
red
to
Ra
w H
erb
(%
)
Herb Number
Water
60% Ethanol
80% Ethanol
100% Ethanol
A B
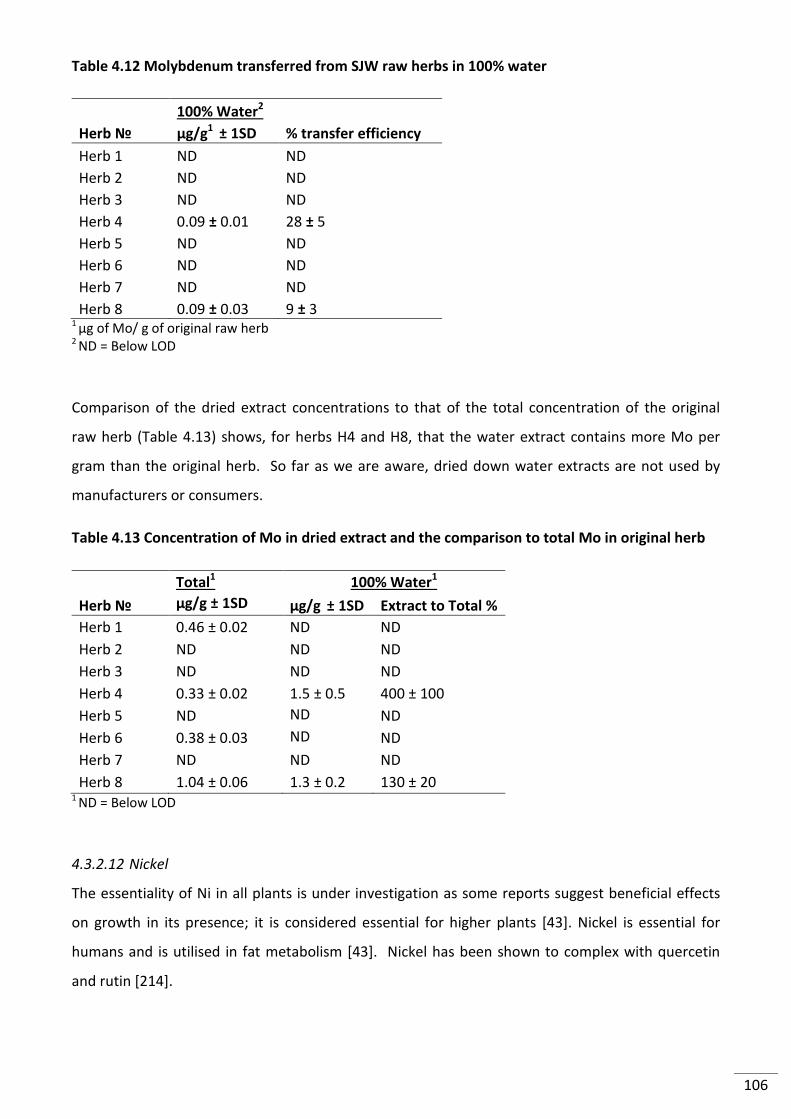
106
Table 4.12 Molybdenum transferred from SJW raw herbs in 100% water
100% Water2
Herb № μg/g1
± 1SD % transfer efficiency
Herb 1 ND ND
Herb 2 ND ND
Herb 3 ND ND
Herb 4 0.09 ± 0.01 28 ± 5
Herb 5 ND ND
Herb 6 ND ND
Herb 7 ND ND
Herb 8 0.09 ± 0.03 9 ± 3 1 μg of Mo/ g of original raw herb 2 ND = Below LOD
Comparison of the dried extract concentrations to that of the total concentration of the original
raw herb (Table 4.13) shows, for herbs H4 and H8, that the water extract contains more Mo per
gram than the original herb. So far as we are aware, dried down water extracts are not used by
manufacturers or consumers.
Table 4.13 Concentration of Mo in dried extract and the comparison to total Mo in original herb
Total1
100% Water1
Herb № μg/g ± 1SD μg/g ± 1SD Extract to Total %
Herb 1 0.46 ± 0.02 ND ND
Herb 2 ND ND ND
Herb 3 ND ND ND
Herb 4 0.33 ± 0.02 1.5 ± 0.5 400 ± 100
Herb 5 ND ND ND
Herb 6 0.38 ± 0.03 ND ND
Herb 7 ND ND ND
Herb 8 1.04 ± 0.06 1.3 ± 0.2 130 ± 20 1 ND = Below LOD
4.3.2.12 Nickel
The essentiality of Ni in all plants is under investigation as some reports suggest beneficial effects
on growth in its presence; it is considered essential for higher plants [43]. Nickel is essential for
humans and is utilised in fat metabolism [43]. Nickel has been shown to complex with quercetin
and rutin [214].
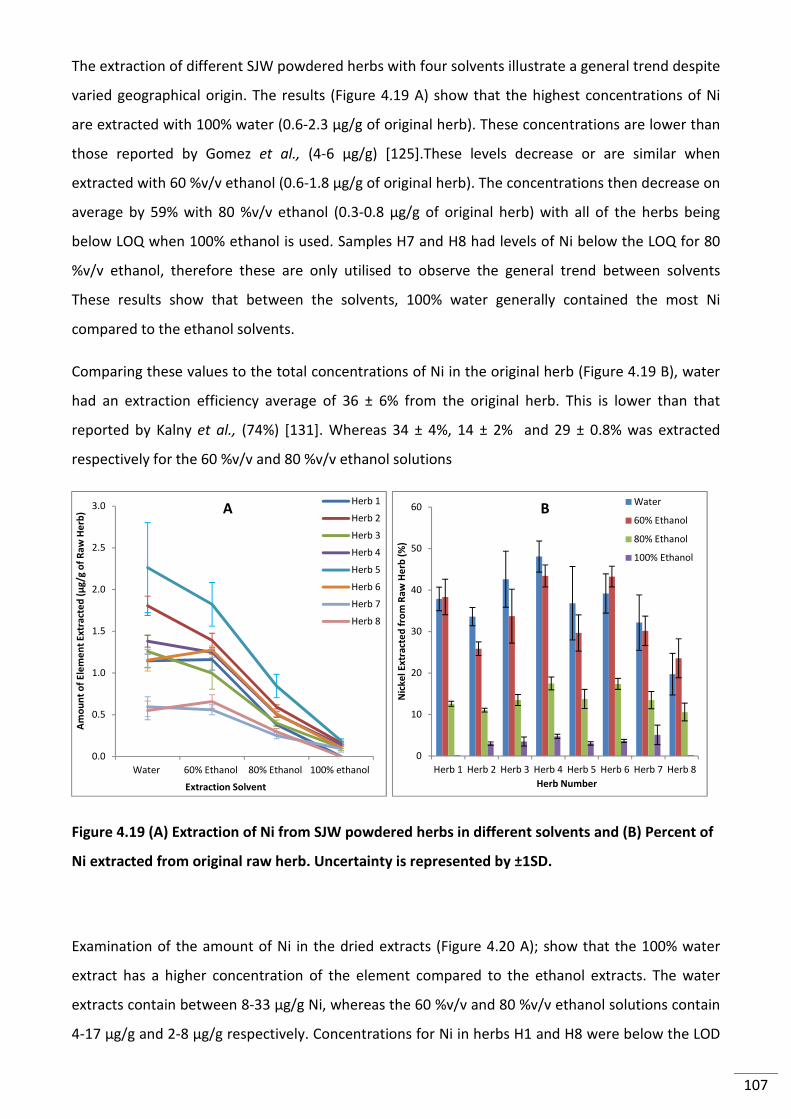
107
The extraction of different SJW powdered herbs with four solvents illustrate a general trend despite
varied geographical origin. The results (Figure 4.19 A) show that the highest concentrations of Ni
are extracted with 100% water (0.6-2.3 µg/g of original herb). These concentrations are lower than
those reported by Gomez et al., (4-6 µg/g) [125].These levels decrease or are similar when
extracted with 60 %v/v ethanol (0.6-1.8 µg/g of original herb). The concentrations then decrease on
average by 59% with 80 %v/v ethanol (0.3-0.8 µg/g of original herb) with all of the herbs being
below LOQ when 100% ethanol is used. Samples H7 and H8 had levels of Ni below the LOQ for 80
%v/v ethanol, therefore these are only utilised to observe the general trend between solvents
These results show that between the solvents, 100% water generally contained the most Ni
compared to the ethanol solvents.
Comparing these values to the total concentrations of Ni in the original herb (Figure 4.19 B), water
had an extraction efficiency average of 36 ± 6% from the original herb. This is lower than that
reported by Kalny et al., (74%) [131]. Whereas 34 ± 4%, 14 ± 2% and 29 ± 0.8% was extracted
respectively for the 60 %v/v and 80 %v/v ethanol solutions
Figure 4.19 (A) Extraction of Ni from SJW powdered herbs in different solvents and (B) Percent of
Ni extracted from original raw herb. Uncertainty is represented by ±1SD.
Examination of the amount of Ni in the dried extracts (Figure 4.20 A); show that the 100% water
extract has a higher concentration of the element compared to the ethanol extracts. The water
extracts contain between 8-33 µg/g Ni, whereas the 60 %v/v and 80 %v/v ethanol solutions contain
4-17 µg/g and 2-8 µg/g respectively. Concentrations for Ni in herbs H1 and H8 were below the LOD
0.0
0.5
1.0
1.5
2.0
2.5
3.0
Water 60% Ethanol 80% Ethanol 100% ethanol
Am
ou
nt
of
Ele
me
nt
Ex
tra
cte
d (
μg
/g o
f R
aw
He
rb)
Extraction Solvent
Herb 1
Herb 2
Herb 3
Herb 4
Herb 5
Herb 6
Herb 7
Herb 8
0
10
20
30
40
50
60
Herb 1 Herb 2 Herb 3 Herb 4 Herb 5 Herb 6 Herb 7 Herb 8
Nic
ke
l E
xtr
act
ed
fro
m R
aw
He
rb (
%)
Herb Number
Water
60% Ethanol
80% Ethanol
100% Ethanol
A B
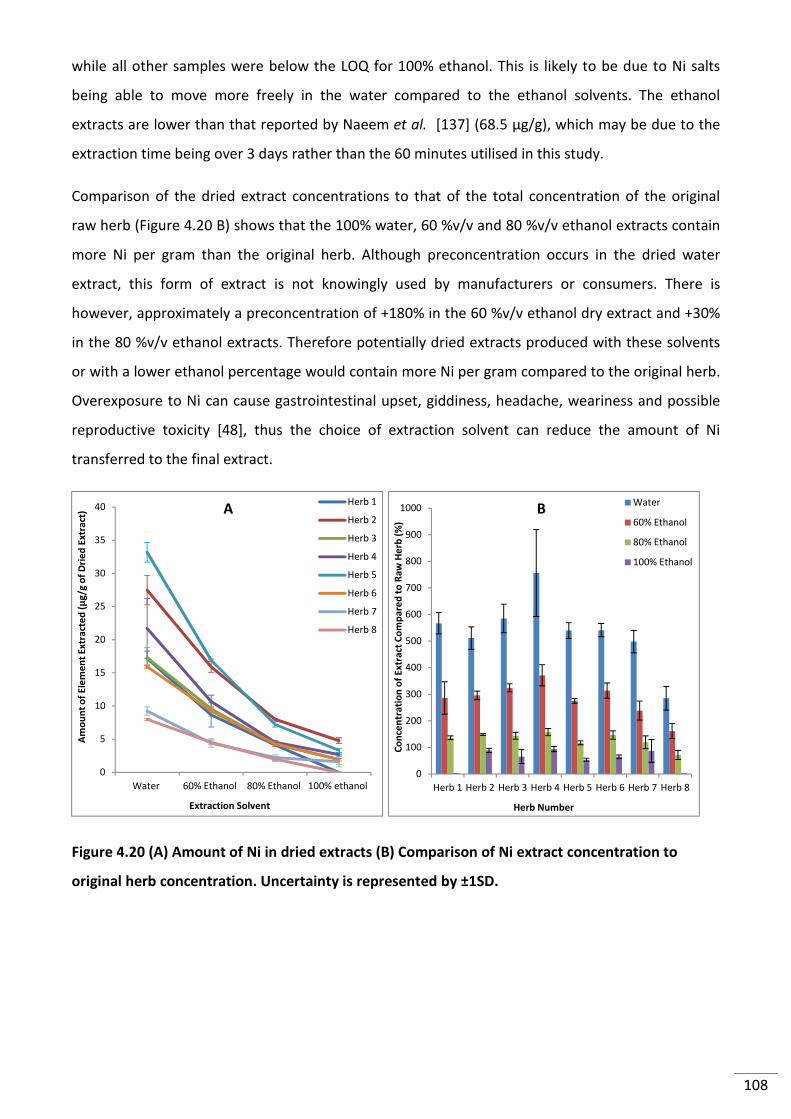
108
while all other samples were below the LOQ for 100% ethanol. This is likely to be due to Ni salts
being able to move more freely in the water compared to the ethanol solvents. The ethanol
extracts are lower than that reported by Naeem et al. [137] (68.5 µg/g), which may be due to the
extraction time being over 3 days rather than the 60 minutes utilised in this study.
Comparison of the dried extract concentrations to that of the total concentration of the original
raw herb (Figure 4.20 B) shows that the 100% water, 60 %v/v and 80 %v/v ethanol extracts contain
more Ni per gram than the original herb. Although preconcentration occurs in the dried water
extract, this form of extract is not knowingly used by manufacturers or consumers. There is
however, approximately a preconcentration of +180% in the 60 %v/v ethanol dry extract and +30%
in the 80 %v/v ethanol extracts. Therefore potentially dried extracts produced with these solvents
or with a lower ethanol percentage would contain more Ni per gram compared to the original herb.
Overexposure to Ni can cause gastrointestinal upset, giddiness, headache, weariness and possible
reproductive toxicity [48], thus the choice of extraction solvent can reduce the amount of Ni
transferred to the final extract.
Figure 4.20 (A) Amount of Ni in dried extracts (B) Comparison of Ni extract concentration to
original herb concentration. Uncertainty is represented by ±1SD.
0
5
10
15
20
25
30
35
40
Water 60% Ethanol 80% Ethanol 100% ethanol
Am
ou
nt
of
Ele
me
nt
Ex
tra
cte
d (
μg
/g o
f D
rie
d E
xtr
act
)
Extraction Solvent
Herb 1
Herb 2
Herb 3
Herb 4
Herb 5
Herb 6
Herb 7
Herb 8
0
100
200
300
400
500
600
700
800
900
1000
Herb 1 Herb 2 Herb 3 Herb 4 Herb 5 Herb 6 Herb 7 Herb 8
Co
nce
ntr
ati
on
of
Ex
tra
ct C
om
pa
red
to
Ra
w H
erb
(%
)
Herb Number
Water
60% Ethanol
80% Ethanol
100% Ethanol
A B
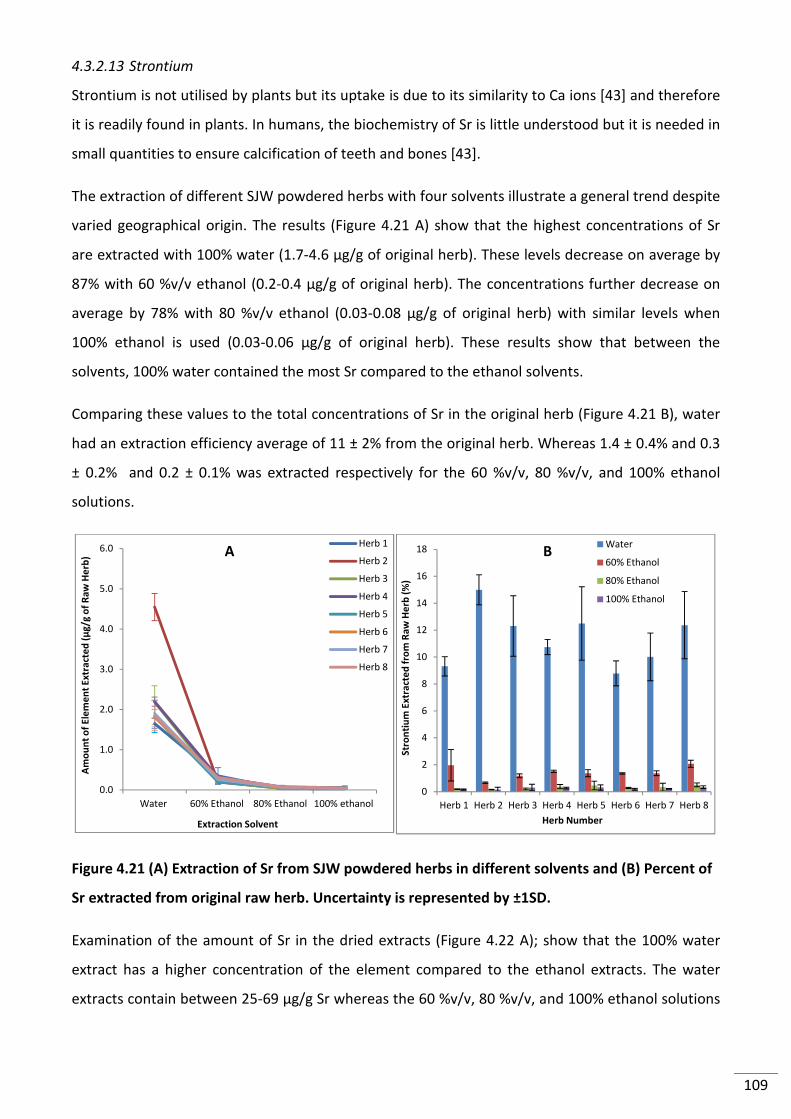
109
4.3.2.13 Strontium
Strontium is not utilised by plants but its uptake is due to its similarity to Ca ions [43] and therefore
it is readily found in plants. In humans, the biochemistry of Sr is little understood but it is needed in
small quantities to ensure calcification of teeth and bones [43].
The extraction of different SJW powdered herbs with four solvents illustrate a general trend despite
varied geographical origin. The results (Figure 4.21 A) show that the highest concentrations of Sr
are extracted with 100% water (1.7-4.6 µg/g of original herb). These levels decrease on average by
87% with 60 %v/v ethanol (0.2-0.4 µg/g of original herb). The concentrations further decrease on
average by 78% with 80 %v/v ethanol (0.03-0.08 µg/g of original herb) with similar levels when
100% ethanol is used (0.03-0.06 µg/g of original herb). These results show that between the
solvents, 100% water contained the most Sr compared to the ethanol solvents.
Comparing these values to the total concentrations of Sr in the original herb (Figure 4.21 B), water
had an extraction efficiency average of 11 ± 2% from the original herb. Whereas 1.4 ± 0.4% and 0.3
± 0.2% and 0.2 ± 0.1% was extracted respectively for the 60 %v/v, 80 %v/v, and 100% ethanol
solutions.
Figure 4.21 (A) Extraction of Sr from SJW powdered herbs in different solvents and (B) Percent of
Sr extracted from original raw herb. Uncertainty is represented by ±1SD.
Examination of the amount of Sr in the dried extracts (Figure 4.22 A); show that the 100% water
extract has a higher concentration of the element compared to the ethanol extracts. The water
extracts contain between 25-69 µg/g Sr whereas the 60 %v/v, 80 %v/v, and 100% ethanol solutions
0.0
1.0
2.0
3.0
4.0
5.0
6.0
Water 60% Ethanol 80% Ethanol 100% ethanol
Am
ou
nt
of
Ele
me
nt
Ex
tra
cte
d (
μg
/g o
f R
aw
He
rb)
Extraction Solvent
Herb 1
Herb 2
Herb 3
Herb 4
Herb 5
Herb 6
Herb 7
Herb 8
0
2
4
6
8
10
12
14
16
18
Herb 1 Herb 2 Herb 3 Herb 4 Herb 5 Herb 6 Herb 7 Herb 8
Str
on
tiu
m E
xtr
act
ed
fro
m R
aw
He
rb (
%)
Herb Number
Water
60% Ethanol
80% Ethanol
100% Ethanol
A B
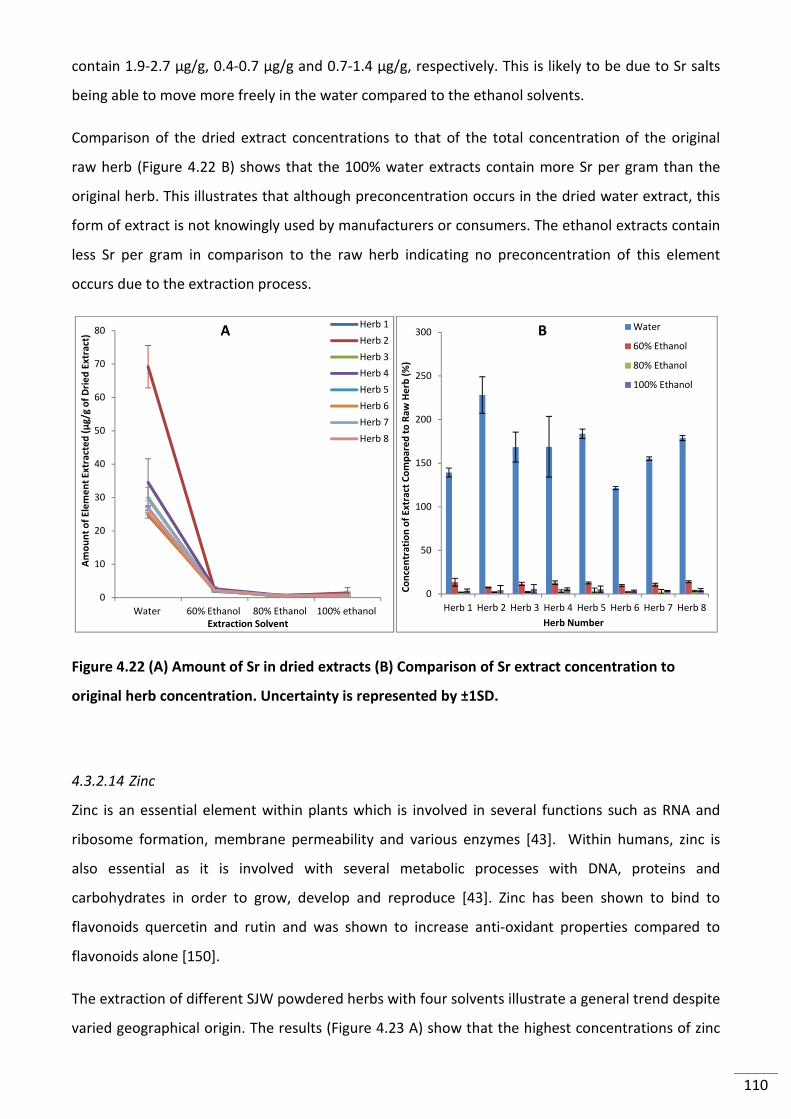
110
contain 1.9-2.7 µg/g, 0.4-0.7 µg/g and 0.7-1.4 µg/g, respectively. This is likely to be due to Sr salts
being able to move more freely in the water compared to the ethanol solvents.
Comparison of the dried extract concentrations to that of the total concentration of the original
raw herb (Figure 4.22 B) shows that the 100% water extracts contain more Sr per gram than the
original herb. This illustrates that although preconcentration occurs in the dried water extract, this
form of extract is not knowingly used by manufacturers or consumers. The ethanol extracts contain
less Sr per gram in comparison to the raw herb indicating no preconcentration of this element
occurs due to the extraction process.
Figure 4.22 (A) Amount of Sr in dried extracts (B) Comparison of Sr extract concentration to
original herb concentration. Uncertainty is represented by ±1SD.
4.3.2.14 Zinc
Zinc is an essential element within plants which is involved in several functions such as RNA and
ribosome formation, membrane permeability and various enzymes [43]. Within humans, zinc is
also essential as it is involved with several metabolic processes with DNA, proteins and
carbohydrates in order to grow, develop and reproduce [43]. Zinc has been shown to bind to
flavonoids quercetin and rutin and was shown to increase anti-oxidant properties compared to
flavonoids alone [150].
The extraction of different SJW powdered herbs with four solvents illustrate a general trend despite
varied geographical origin. The results (Figure 4.23 A) show that the highest concentrations of zinc
0
10
20
30
40
50
60
70
80
Water 60% Ethanol 80% Ethanol 100% ethanol
Am
ou
nt
of
Ele
me
nt
Ex
tra
cte
d (
μg
/g o
f D
rie
d E
xtr
act
)
Extraction Solvent
Herb 1
Herb 2
Herb 3
Herb 4
Herb 5
Herb 6
Herb 7
Herb 8
0
50
100
150
200
250
300
Herb 1 Herb 2 Herb 3 Herb 4 Herb 5 Herb 6 Herb 7 Herb 8
Co
nce
ntr
ati
on
of
Ex
tra
ct C
om
pa
red
to
Ra
w H
erb
(%
)
Herb Number
Water
60% Ethanol
80% Ethanol
100% Ethanol
A B
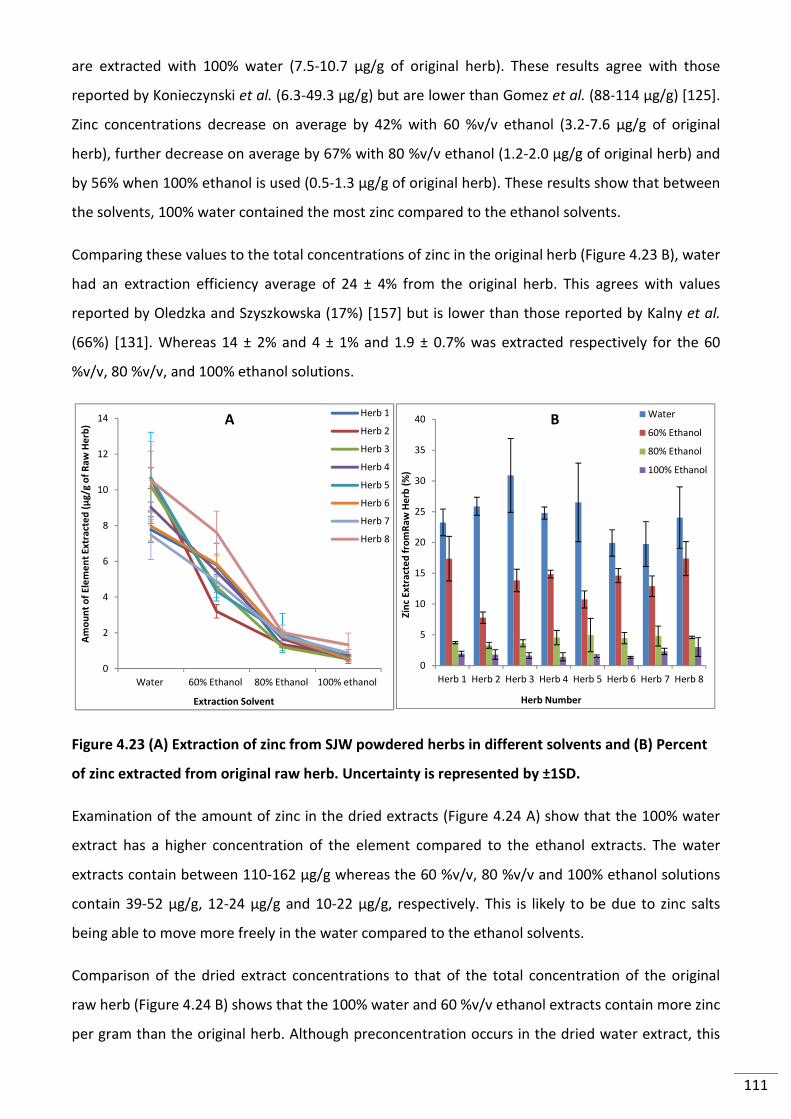
111
are extracted with 100% water (7.5-10.7 µg/g of original herb). These results agree with those
reported by Konieczynski et al. (6.3-49.3 µg/g) but are lower than Gomez et al. (88-114 µg/g) [125].
Zinc concentrations decrease on average by 42% with 60 %v/v ethanol (3.2-7.6 µg/g of original
herb), further decrease on average by 67% with 80 %v/v ethanol (1.2-2.0 µg/g of original herb) and
by 56% when 100% ethanol is used (0.5-1.3 µg/g of original herb). These results show that between
the solvents, 100% water contained the most zinc compared to the ethanol solvents.
Comparing these values to the total concentrations of zinc in the original herb (Figure 4.23 B), water
had an extraction efficiency average of 24 ± 4% from the original herb. This agrees with values
reported by Oledzka and Szyszkowska (17%) [157] but is lower than those reported by Kalny et al.
(66%) [131]. Whereas 14 ± 2% and 4 ± 1% and 1.9 ± 0.7% was extracted respectively for the 60
%v/v, 80 %v/v, and 100% ethanol solutions.
Figure 4.23 (A) Extraction of zinc from SJW powdered herbs in different solvents and (B) Percent
of zinc extracted from original raw herb. Uncertainty is represented by ±1SD.
Examination of the amount of zinc in the dried extracts (Figure 4.24 A) show that the 100% water
extract has a higher concentration of the element compared to the ethanol extracts. The water
extracts contain between 110-162 µg/g whereas the 60 %v/v, 80 %v/v and 100% ethanol solutions
contain 39-52 µg/g, 12-24 µg/g and 10-22 µg/g, respectively. This is likely to be due to zinc salts
being able to move more freely in the water compared to the ethanol solvents.
Comparison of the dried extract concentrations to that of the total concentration of the original
raw herb (Figure 4.24 B) shows that the 100% water and 60 %v/v ethanol extracts contain more zinc
per gram than the original herb. Although preconcentration occurs in the dried water extract, this
0
2
4
6
8
10
12
14
Water 60% Ethanol 80% Ethanol 100% ethanol
Am
ou
nt
of
Ele
me
nt
Ex
tra
cte
d (
μg
/g o
f R
aw
He
rb)
Extraction Solvent
Herb 1
Herb 2
Herb 3
Herb 4
Herb 5
Herb 6
Herb 7
Herb 8
0
5
10
15
20
25
30
35
40
Herb 1 Herb 2 Herb 3 Herb 4 Herb 5 Herb 6 Herb 7 Herb 8
Zin
c E
xtr
act
ed
fro
mR
aw
He
rb (
%)
Herb Number
Water
60% Ethanol
80% Ethanol
100% Ethanol
A B
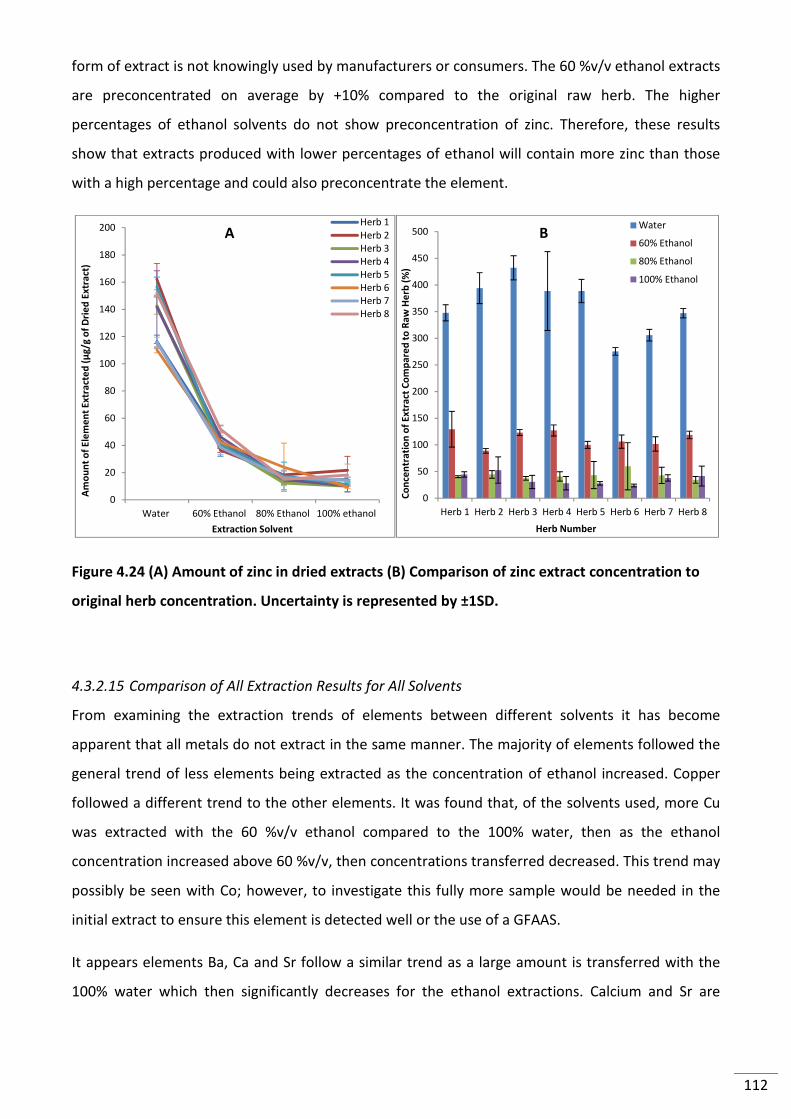
112
form of extract is not knowingly used by manufacturers or consumers. The 60 %v/v ethanol extracts
are preconcentrated on average by +10% compared to the original raw herb. The higher
percentages of ethanol solvents do not show preconcentration of zinc. Therefore, these results
show that extracts produced with lower percentages of ethanol will contain more zinc than those
with a high percentage and could also preconcentrate the element.
Figure 4.24 (A) Amount of zinc in dried extracts (B) Comparison of zinc extract concentration to
original herb concentration. Uncertainty is represented by ±1SD.
4.3.2.15 Comparison of All Extraction Results for All Solvents
From examining the extraction trends of elements between different solvents it has become
apparent that all metals do not extract in the same manner. The majority of elements followed the
general trend of less elements being extracted as the concentration of ethanol increased. Copper
followed a different trend to the other elements. It was found that, of the solvents used, more Cu
was extracted with the 60 %v/v ethanol compared to the 100% water, then as the ethanol
concentration increased above 60 %v/v, then concentrations transferred decreased. This trend may
possibly be seen with Co; however, to investigate this fully more sample would be needed in the
initial extract to ensure this element is detected well or the use of a GFAAS.
It appears elements Ba, Ca and Sr follow a similar trend as a large amount is transferred with the
100% water which then significantly decreases for the ethanol extractions. Calcium and Sr are
0
20
40
60
80
100
120
140
160
180
200
Water 60% Ethanol 80% Ethanol 100% ethanol
Am
ou
nt
of
Ele
me
nt
Ex
tra
cte
d (
μg
/g o
f D
rie
d E
xtr
act
)
Extraction Solvent
Herb 1Herb 2Herb 3Herb 4Herb 5Herb 6Herb 7Herb 8
0
50
100
150
200
250
300
350
400
450
500
Herb 1 Herb 2 Herb 3 Herb 4 Herb 5 Herb 6 Herb 7 Herb 8
Co
nce
ntr
ati
on
of
Ex
tra
ct C
om
pa
red
to
Ra
w H
erb
(%
)
Herb Number
Water
60% Ethanol
80% Ethanol
100% Ethanol
A B
113
known to be closely correlated due to their similar ionic radius [39]. The other elements Al, Fe, Mg,
Mn and Zn follow a more gradual decline in element transfer as ethanol concentration increases.
The majority of elements were found to preconcentrate in the dried water extract with the
exception of Al, Ba and Fe. The lack of preconcentration for Al and Fe may be due to these elements
being bound to silica thus affecting their mobility. Fe is usually extracted in a lower percentage than
other major elements in SJW (such as Mg and Cu), with the exception of that found by Naeem et al
[137]. This may be due to the extraction technique which involved maceration over three days. The
other studies [125, 126, 131-133, 143, 157, 200] extraction methods took 60 minutes or less and
usually did so without agitation to the solution. The extended length of time and maceration may
be able to release Fe from plant structures that a hot water infusion cannot. Elements Cu (+118%),
Mg (+94%), Mo (+121%), Ni (+173%) and Zn (+21%) (and possibly Co) were found to preconcentrate
in 60 %v/v ethanol extracts. Elements Cu (+9%) and Ni (+21%) also preconcentated in 80 %v/v
extracts with no elements preconcentrating in 100% ethanol extractions. The elements that
preconcentrate in the 60 %v/v and 80 %v/v ethanol are of interest as this shows that by carefully
selecting the extraction solvent, the quantity of elements that are transferred can be influenced.
This could aid enrichment of herbal extracts for nutritional value as well as prevent the
preconcentration of elements that may cause harm. This also suggests that extracts prepared with
these solvents could potentially be identified based on their elemental profile before further
dilution/preconcentration from further processing (e.g. addition of bulking agents). In order to see
if this was possible, the results underwent further statistical analysis.
4.3.3 Statistical Analysis of Different Solvents
4.3.3.1 Correlation Analysis
Correlation Analysis (CA) was carried out to determine if there were any relationships between
elements in each solvent solution. In Chapter 3 it was hypothesised that the main differences in the
elemental fingerprint between products and dry herbs was as a result of solvent extraction and not
due to excipient addition. Please see Table 4.14 for clarification of correlation terms.
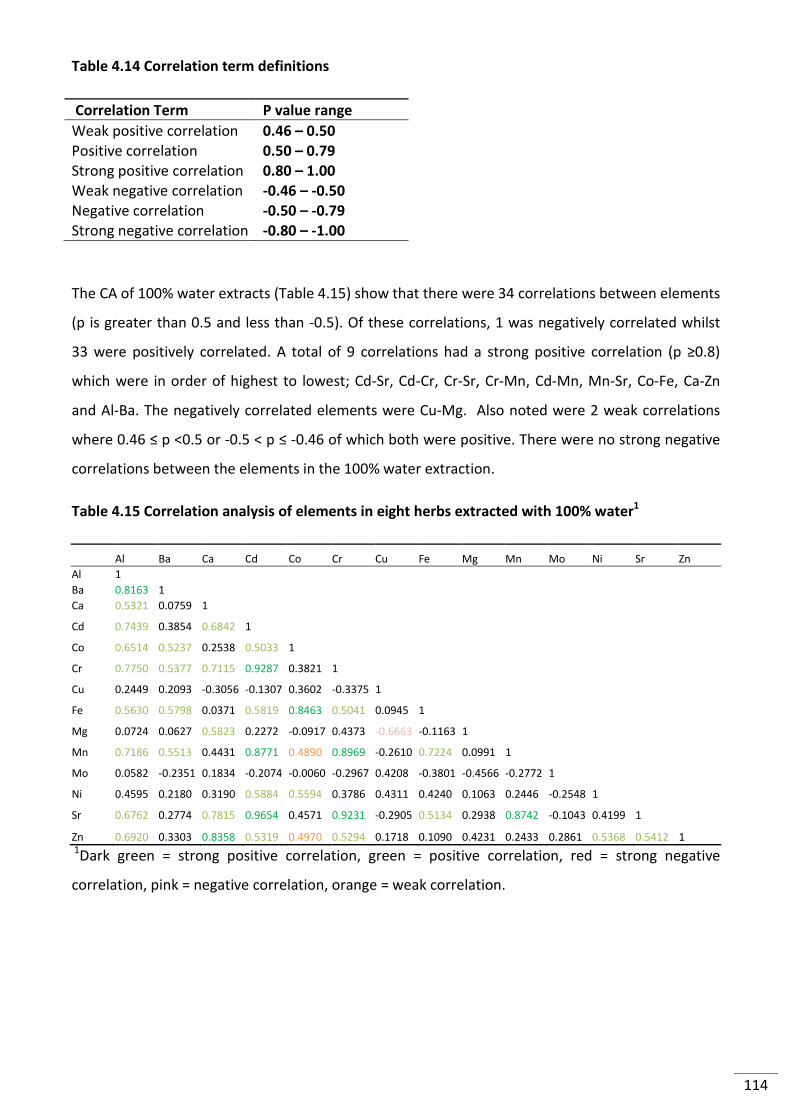
114
Table 4.14 Correlation term definitions
Correlation Term P value range
Weak positive correlation 0.46 – 0.50
Positive correlation 0.50 – 0.79
Strong positive correlation 0.80 – 1.00
Weak negative correlation -0.46 – -0.50
Negative correlation -0.50 – -0.79
Strong negative correlation -0.80 – -1.00
The CA of 100% water extracts (Table 4.15) show that there were 34 correlations between elements
(p is greater than 0.5 and less than -0.5). Of these correlations, 1 was negatively correlated whilst
33 were positively correlated. A total of 9 correlations had a strong positive correlation (p ≥0.8)
which were in order of highest to lowest; Cd-Sr, Cd-Cr, Cr-Sr, Cr-Mn, Cd-Mn, Mn-Sr, Co-Fe, Ca-Zn
and Al-Ba. The negatively correlated elements were Cu-Mg. Also noted were 2 weak correlations
where 0.46 ≤ p <0.5 or -0.5 < p ≤ -0.46 of which both were positive. There were no strong negative
correlations between the elements in the 100% water extraction.
Table 4.15 Correlation analysis of elements in eight herbs extracted with 100% water1
Al Ba Ca Cd Co Cr Cu Fe Mg Mn Mo Ni Sr Zn
Al 1
Ba 0.8163 1
Ca 0.5321 0.0759 1
Cd 0.7439 0.3854 0.6842 1
Co 0.6514 0.5237 0.2538 0.5033 1
Cr 0.7750 0.5377 0.7115 0.9287 0.3821 1
Cu 0.2449 0.2093 -0.3056 -0.1307 0.3602 -0.3375 1
Fe 0.5630 0.5798 0.0371 0.5819 0.8463 0.5041 0.0945 1
Mg 0.0724 0.0627 0.5823 0.2272 -0.0917 0.4373 -0.6663 -0.1163 1
Mn 0.7186 0.5513 0.4431 0.8771 0.4890 0.8969 -0.2610 0.7224 0.0991 1
Mo 0.0582 -0.2351 0.1834 -0.2074 -0.0060 -0.2967 0.4208 -0.3801 -0.4566 -0.2772 1
Ni 0.4595 0.2180 0.3190 0.5884 0.5594 0.3786 0.4311 0.4240 0.1063 0.2446 -0.2548 1
Sr 0.6762 0.2774 0.7815 0.9654 0.4571 0.9231 -0.2905 0.5134 0.2938 0.8742 -0.1043 0.4199 1
Zn 0.6920 0.3303 0.8358 0.5319 0.4970 0.5294 0.1718 0.1090 0.4231 0.2433 0.2861 0.5368 0.5412 1 1Dark green = strong positive correlation, green = positive correlation, red = strong negative
correlation, pink = negative correlation, orange = weak correlation.
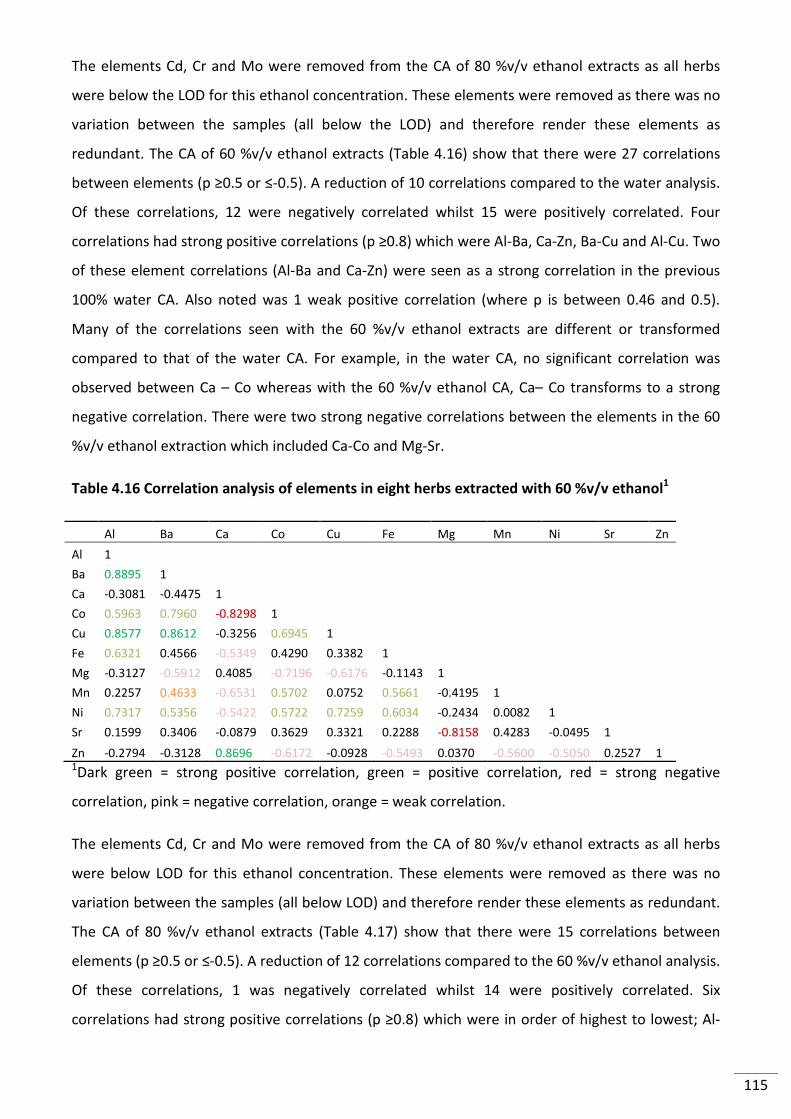
115
The elements Cd, Cr and Mo were removed from the CA of 80 %v/v ethanol extracts as all herbs
were below the LOD for this ethanol concentration. These elements were removed as there was no
variation between the samples (all below the LOD) and therefore render these elements as
redundant. The CA of 60 %v/v ethanol extracts (Table 4.16) show that there were 27 correlations
between elements (p ≥0.5 or ≤-0.5). A reduction of 10 correlations compared to the water analysis.
Of these correlations, 12 were negatively correlated whilst 15 were positively correlated. Four
correlations had strong positive correlations (p ≥0.8) which were Al-Ba, Ca-Zn, Ba-Cu and Al-Cu. Two
of these element correlations (Al-Ba and Ca-Zn) were seen as a strong correlation in the previous
100% water CA. Also noted was 1 weak positive correlation (where p is between 0.46 and 0.5).
Many of the correlations seen with the 60 %v/v ethanol extracts are different or transformed
compared to that of the water CA. For example, in the water CA, no significant correlation was
observed between Ca – Co whereas with the 60 %v/v ethanol CA, Ca– Co transforms to a strong
negative correlation. There were two strong negative correlations between the elements in the 60
%v/v ethanol extraction which included Ca-Co and Mg-Sr.
Table 4.16 Correlation analysis of elements in eight herbs extracted with 60 %v/v ethanol1
Al Ba Ca Co Cu Fe Mg Mn Ni Sr Zn
Al 1
Ba 0.8895 1
Ca -0.3081 -0.4475 1
Co 0.5963 0.7960 -0.8298 1
Cu 0.8577 0.8612 -0.3256 0.6945 1
Fe 0.6321 0.4566 -0.5349 0.4290 0.3382 1
Mg -0.3127 -0.5912 0.4085 -0.7196 -0.6176 -0.1143 1
Mn 0.2257 0.4633 -0.6531 0.5702 0.0752 0.5661 -0.4195 1
Ni 0.7317 0.5356 -0.5422 0.5722 0.7259 0.6034 -0.2434 0.0082 1
Sr 0.1599 0.3406 -0.0879 0.3629 0.3321 0.2288 -0.8158 0.4283 -0.0495 1
Zn -0.2794 -0.3128 0.8696 -0.6172 -0.0928 -0.5493 0.0370 -0.5600 -0.5050 0.2527 1 1Dark green = strong positive correlation, green = positive correlation, red = strong negative
correlation, pink = negative correlation, orange = weak correlation.
The elements Cd, Cr and Mo were removed from the CA of 80 %v/v ethanol extracts as all herbs
were below LOD for this ethanol concentration. These elements were removed as there was no
variation between the samples (all below LOD) and therefore render these elements as redundant.
The CA of 80 %v/v ethanol extracts (Table 4.17) show that there were 15 correlations between
elements (p ≥0.5 or ≤-0.5). A reduction of 12 correlations compared to the 60 %v/v ethanol analysis.
Of these correlations, 1 was negatively correlated whilst 14 were positively correlated. Six
correlations had strong positive correlations (p ≥0.8) which were in order of highest to lowest; Al-
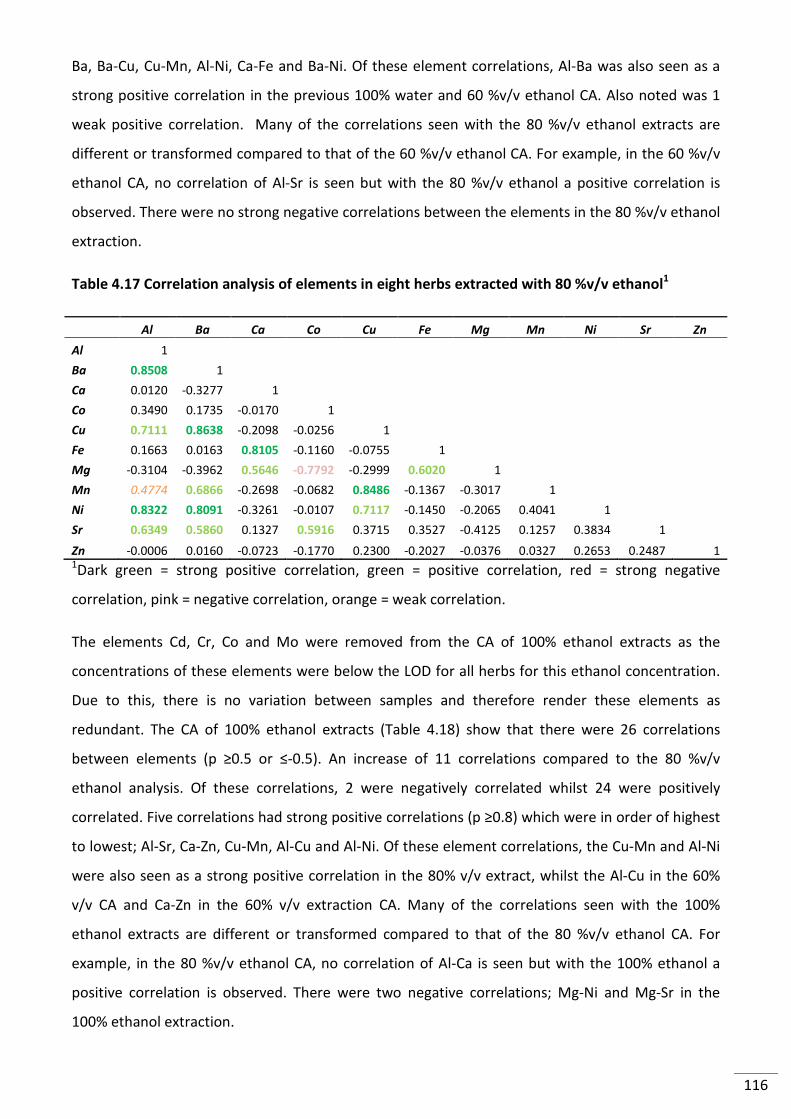
116
Ba, Ba-Cu, Cu-Mn, Al-Ni, Ca-Fe and Ba-Ni. Of these element correlations, Al-Ba was also seen as a
strong positive correlation in the previous 100% water and 60 %v/v ethanol CA. Also noted was 1
weak positive correlation. Many of the correlations seen with the 80 %v/v ethanol extracts are
different or transformed compared to that of the 60 %v/v ethanol CA. For example, in the 60 %v/v
ethanol CA, no correlation of Al-Sr is seen but with the 80 %v/v ethanol a positive correlation is
observed. There were no strong negative correlations between the elements in the 80 %v/v ethanol
extraction.
Table 4.17 Correlation analysis of elements in eight herbs extracted with 80 %v/v ethanol1
Al Ba Ca Co Cu Fe Mg Mn Ni Sr Zn
Al 1
Ba 0.8508 1
Ca 0.0120 -0.3277 1
Co 0.3490 0.1735 -0.0170 1
Cu 0.7111 0.8638 -0.2098 -0.0256 1
Fe 0.1663 0.0163 0.8105 -0.1160 -0.0755 1
Mg -0.3104 -0.3962 0.5646 -0.7792 -0.2999 0.6020 1
Mn 0.4774 0.6866 -0.2698 -0.0682 0.8486 -0.1367 -0.3017 1
Ni 0.8322 0.8091 -0.3261 -0.0107 0.7117 -0.1450 -0.2065 0.4041 1
Sr 0.6349 0.5860 0.1327 0.5916 0.3715 0.3527 -0.4125 0.1257 0.3834 1
Zn -0.0006 0.0160 -0.0723 -0.1770 0.2300 -0.2027 -0.0376 0.0327 0.2653 0.2487 1 1Dark green = strong positive correlation, green = positive correlation, red = strong negative
correlation, pink = negative correlation, orange = weak correlation.
The elements Cd, Cr, Co and Mo were removed from the CA of 100% ethanol extracts as the
concentrations of these elements were below the LOD for all herbs for this ethanol concentration.
Due to this, there is no variation between samples and therefore render these elements as
redundant. The CA of 100% ethanol extracts (Table 4.18) show that there were 26 correlations
between elements (p ≥0.5 or ≤-0.5). An increase of 11 correlations compared to the 80 %v/v
ethanol analysis. Of these correlations, 2 were negatively correlated whilst 24 were positively
correlated. Five correlations had strong positive correlations (p ≥0.8) which were in order of highest
to lowest; Al-Sr, Ca-Zn, Cu-Mn, Al-Cu and Al-Ni. Of these element correlations, the Cu-Mn and Al-Ni
were also seen as a strong positive correlation in the 80% v/v extract, whilst the Al-Cu in the 60%
v/v CA and Ca-Zn in the 60% v/v extraction CA. Many of the correlations seen with the 100%
ethanol extracts are different or transformed compared to that of the 80 %v/v ethanol CA. For
example, in the 80 %v/v ethanol CA, no correlation of Al-Ca is seen but with the 100% ethanol a
positive correlation is observed. There were two negative correlations; Mg-Ni and Mg-Sr in the
100% ethanol extraction.
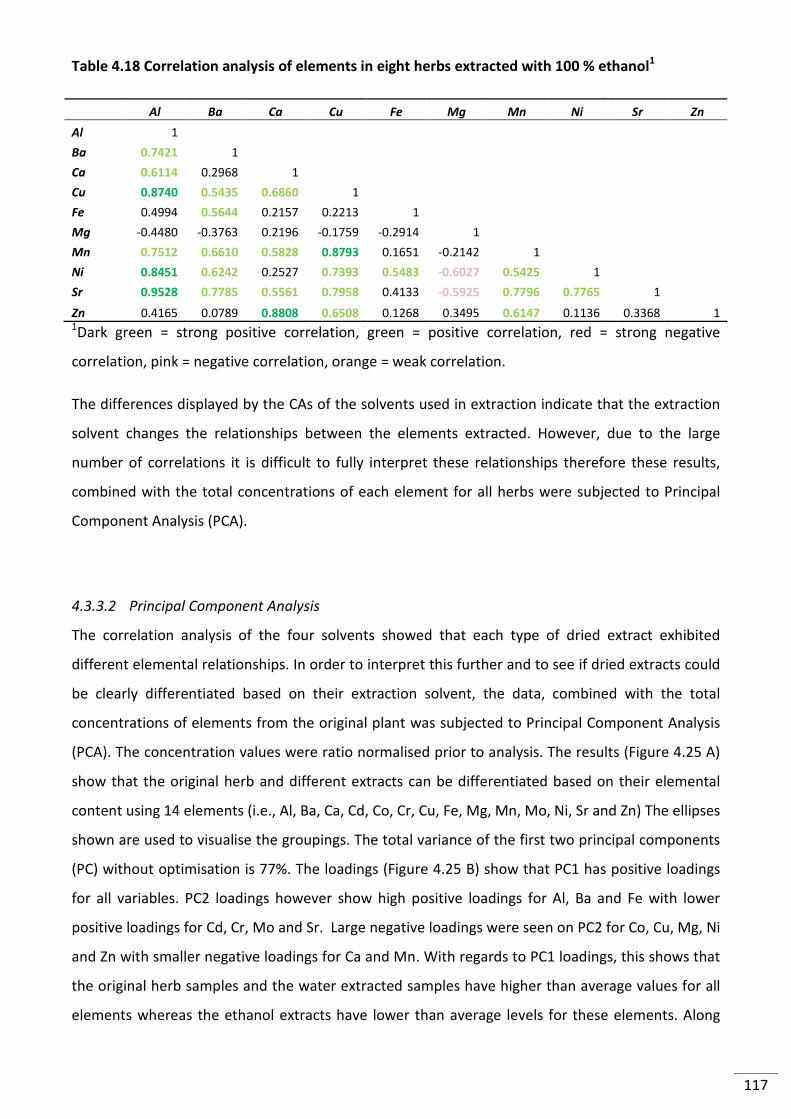
117
Table 4.18 Correlation analysis of elements in eight herbs extracted with 100 % ethanol1
Al Ba Ca Cu Fe Mg Mn Ni Sr Zn
Al 1
Ba 0.7421 1
Ca 0.6114 0.2968 1
Cu 0.8740 0.5435 0.6860 1
Fe 0.4994 0.5644 0.2157 0.2213 1
Mg -0.4480 -0.3763 0.2196 -0.1759 -0.2914 1
Mn 0.7512 0.6610 0.5828 0.8793 0.1651 -0.2142 1
Ni 0.8451 0.6242 0.2527 0.7393 0.5483 -0.6027 0.5425 1
Sr 0.9528 0.7785 0.5561 0.7958 0.4133 -0.5925 0.7796 0.7765 1
Zn 0.4165 0.0789 0.8808 0.6508 0.1268 0.3495 0.6147 0.1136 0.3368 1 1Dark green = strong positive correlation, green = positive correlation, red = strong negative
correlation, pink = negative correlation, orange = weak correlation.
The differences displayed by the CAs of the solvents used in extraction indicate that the extraction
solvent changes the relationships between the elements extracted. However, due to the large
number of correlations it is difficult to fully interpret these relationships therefore these results,
combined with the total concentrations of each element for all herbs were subjected to Principal
Component Analysis (PCA).
4.3.3.2 Principal Component Analysis
The correlation analysis of the four solvents showed that each type of dried extract exhibited
different elemental relationships. In order to interpret this further and to see if dried extracts could
be clearly differentiated based on their extraction solvent, the data, combined with the total
concentrations of elements from the original plant was subjected to Principal Component Analysis
(PCA). The concentration values were ratio normalised prior to analysis. The results (Figure 4.25 A)
show that the original herb and different extracts can be differentiated based on their elemental
content using 14 elements (i.e., Al, Ba, Ca, Cd, Co, Cr, Cu, Fe, Mg, Mn, Mo, Ni, Sr and Zn) The ellipses
shown are used to visualise the groupings. The total variance of the first two principal components
(PC) without optimisation is 77%. The loadings (Figure 4.25 B) show that PC1 has positive loadings
for all variables. PC2 loadings however show high positive loadings for Al, Ba and Fe with lower
positive loadings for Cd, Cr, Mo and Sr. Large negative loadings were seen on PC2 for Co, Cu, Mg, Ni
and Zn with smaller negative loadings for Ca and Mn. With regards to PC1 loadings, this shows that
the original herb samples and the water extracted samples have higher than average values for all
elements whereas the ethanol extracts have lower than average levels for these elements. Along
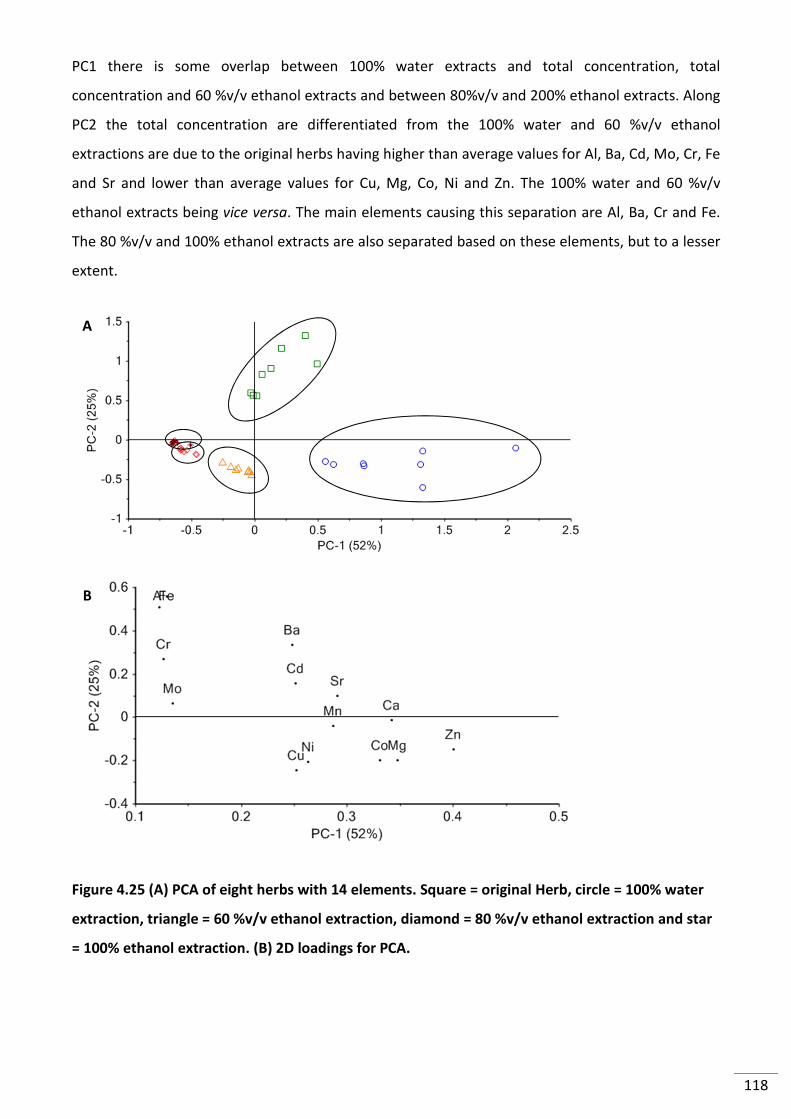
118
PC1 there is some overlap between 100% water extracts and total concentration, total
concentration and 60 %v/v ethanol extracts and between 80%v/v and 200% ethanol extracts. Along
PC2 the total concentration are differentiated from the 100% water and 60 %v/v ethanol
extractions are due to the original herbs having higher than average values for Al, Ba, Cd, Mo, Cr, Fe
and Sr and lower than average values for Cu, Mg, Co, Ni and Zn. The 100% water and 60 %v/v
ethanol extracts being vice versa. The main elements causing this separation are Al, Ba, Cr and Fe.
The 80 %v/v and 100% ethanol extracts are also separated based on these elements, but to a lesser
extent.
Figure 4.25 (A) PCA of eight herbs with 14 elements. Square = original Herb, circle = 100% water
extraction, triangle = 60 %v/v ethanol extraction, diamond = 80 %v/v ethanol extraction and star
= 100% ethanol extraction. (B) 2D loadings for PCA.
A
B
119
4.4 Conclusions
The elemental fingerprint of SJW was shown to alter when extracted depending on the solvent
used. With this extraction process, all elements (with the exception of Cu), were transferred in
higher concentrations when extracted with 100% water. This indicates that SJW taken as a tea
infusion would contain the most variety of elements before further processing is introduced (e.g.,
addition of excipient via the production of tablets/capsules). However, Cu was found to be
transferred in higher concentrations with 60 %v/v ethanol. Further interpretation found that all
elements examined, with the exception of Al, Ba and Fe, became preconcentrated in dried water
extracts. This type of extract is not knowingly used by consumers or manufacturers; however, this
study suggests the possibility of tuning the metal content for future applications. The 60 %v/v
ethanol solvent however, is used extensively by manufacturers in the production of dried extracts
of SJW as it is shown to be the optimum percentage of alcohol for the extraction of hypericins. With
this extraction solvent, the elements Cu, Mg, Ni and Zn preconcentrate in the extract compared to
the original herb. The 80 %v/v ethanol solvent is also utilised by industry and from this study has
shown to preconcentrate Cu and Ni. The preconcentration of elements observed in this study could
be of benefit to nutritional disorders caused by a deficiency of these elements. For example, a
deficiency in zinc with humans can cause retardation of growth, diarrhoea, failure of appetite and
behavioural changes. A deficiency in Cu can cause hypopigmentation of hair and skin, osteoporosis
and vascular abnormalities. Severe Ni deficiency can cause depressed growth and haematopoiesis.
Therefore by controlling the percentage of ethanol in the extraction process it is possible to modify
the extraction to also extract and concentrate these elements. Thus allowing added nutritional
value but also reducing the amount of toxic elements (Cd, Cr etc.) available for consumption.
The principal component analysis demonstrated that the elemental fingerprint changes in a
predictable manner with the solvents used regardless of where the sample was obtained from or
cultivated. This study shows the extraction solvent plays a key role in the concentrations of
elements contained in a dried extract. However, only one kind of extraction method was utilised.
Other methods such as Soxhlet and sonication should be utilised for further studies to understand
their impact on the elemental profile. In addition to this, other solvents such as methanol or
chloroform should also be investigated. Ultimately, this process could be used to determine
whether dry herb or type of dry extract has been used in a product. Other considerations would be
to use other extraction solvents, such as methanol which is also used in industry, to see in different
solvent extractions can also be identified.
120
5 Investigations of Bioactive Compounds in St John’s Wort
5.1 Introduction
Quality control of St John’s Wort (Hypericum perforatum) in relation to its bioactive properties is
normally monitored by assessing the compounds rutin, hypericin, pseudohypericin and hyperforin
[36, 116]. Rutin is a natural antioxidant found in many species of plant [93, 110, 226, 227]. It has
been shown to be an effective anti-inflammatory [91] and is also an antioxidant [228]. Rutin has
been shown to increase the antioxidant activity of ascorbic acid as synergism was found when the
two compounds were present together in radical scavenging experiments (in homogeneous
aqueous solutions, ufasome and erythrocyte ghost preparations) [229] and is also a metal chelator
[109, 150, 220, 230-232]. The antioxidant properties of rutin can be increased eight fold by the
complexation with Cu [109]. Hypericin, pseudohypericin and hyperforin are compounds produced
by the Hypericum genus of plants, of which, Hypericum perforatum contains the highest
concentrations (There are over 400 species within the genus Hypericum, of which only a small
number have been studied. Of those studied, Hypericum perforatum has the highest concentration
of these compounds). These compounds are only readily found in this family of plants, however,
hypericin has now been shown to exist in a species of fungus [233] and has been detected in
fossilised crinoids [234]. Originally it was thought hypericin was the major bioactive component to
cause the therapeutic effect against depression. Further research has shown that although it does
play a part in the treatment of depression, the compound hyperforin actually produced the largest
therapeutic effect [88]. The compounds adhyperforin [235] and pseudohypericin also contribute to
the therapeutic effect. Hyperforin has also been shown to be antibacterial, an anti-proliferate
(stops growth) and pro-apoptotic (induces cell death) towards some cancer cells as well as other
possible beneficial properties [84]. Hyperoside is also a flavonoid that possesses antifungal [96] and
antioxidant properties [95]. It differs from the structure of rutin by the substitution of the sugar
group as galatose rather than rutinose. The most common molecular constituents in SJW and their
relative amounts can be seen in Table 1.7, Chapter 1.
The analysis of the bioactive compounds within SJW is generally completed using HPLC or UHPLC
[92, 93, 159, 236-240]. In order to analyse these compounds they firstly have to be extracted from
the SJW sample. The extraction of bioactive compounds from SJW has been investigated in other
studies with a number of different extraction solvents [113, 191, 207, 241-243]. Generally these
studies found that of the solvents tested, ethanol and methanol were able to extract a higher
concentration of hypericins and flavonoids. Also noted was that these solvents in either 60% v/v or
121
80% v/v with water were the optimum ratios which are reflected by the products of SJW produced
commercially. The concentrations of the bioactive compounds within SJW can vary significantly
depending on soil type and water content, growth climate and genetics [92, 93, 127, 237, 244, 245].
The variation has also been shown to be different between seasons for the same crop as well as the
time of harvest [237, 245]. The storage post-harvest of the herb is also of importance as inadequate
storage can greatly reduce the concentrations of these bioactive constituents as many are sensitive
to light, pH and temperature [244, 246, 247]. Examples of the concentration ranges these bioactive
compounds have been quantified can be seen in Table 1.7, Chapter 1. The HPLC methods utilised
generally use C18 columns [92, 93, 207, 236, 237] but differ in their mobile phase preparation and
type of analysis. For example Ari et al. employ a gradient method using aqueous 5 mM ammonium
acetate (Mobile phase A) and acetonitrile (Mobile phase B), Çirak et al. utilise a gradient method
with 0.1% trifluoroacetic acid in water (Mobile phase A) and 95:5 of acetonitrile to 0.1%
trifluoroacetic acid in water (Mobile phase B) whereas Couceiro et al. uses an isocratic method with
0.1 mol triethyl ammonium acetate( Mobile phase A) and acetonitrile (33:67, v/v) (Mobile phase B).
However, many studies that examine the bioactive content of SJW use buffers as part of their
mobile phase composition. Therefore, in order to identify and characterise the peaks from UHPLC
analysis on an LC-MS, a method would need to be developed that did not utilised buffers as these
can cause serious blockages to the electrospray sample induction system and high background
noise on the LC-MS.
Some studies have shown that there is a link between the expression of secondary metabolites in
SJW and the elements in the growth medium. For example, a 15-20 fold decrease in the production
of hypericin and pseudohypericin was observed when SJW was exposed to 50 mM Ni [149]. On the
other hand, SJW exposed to 0.1 mM Cr showed increased production of protopseudohypericin
(+167%), hypericin (+25%) and pseudohypericin (+5%) compared to untreated SJW [148]. As well as
elements influencing the production of secondary metabolites, metals ions can form complexes
with them and alter their bioactivity (Table 5.1).
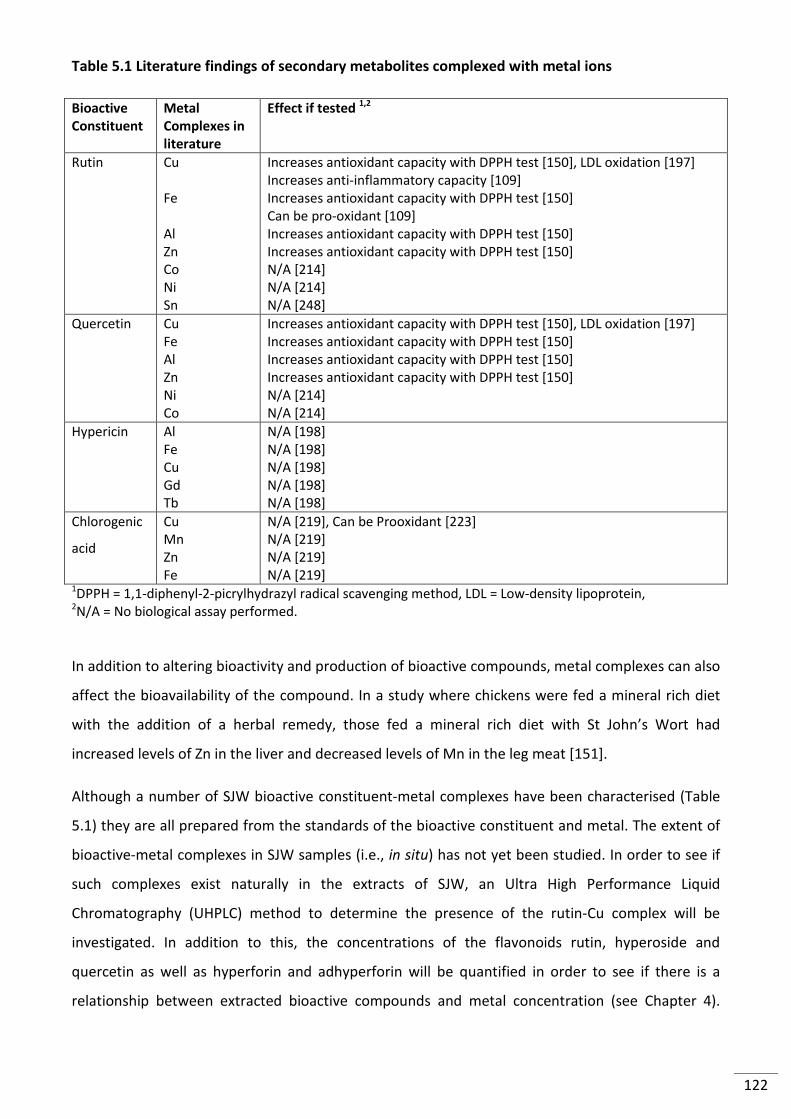
122
Table 5.1 Literature findings of secondary metabolites complexed with metal ions
Bioactive
Constituent
Metal
Complexes in
literature
Effect if tested 1,2
Rutin Cu Fe Al Zn Co Ni Sn
Increases antioxidant capacity with DPPH test [150], LDL oxidation [197] Increases anti-inflammatory capacity [109] Increases antioxidant capacity with DPPH test [150] Can be pro-oxidant [109] Increases antioxidant capacity with DPPH test [150] Increases antioxidant capacity with DPPH test [150] N/A [214] N/A [214] N/A [248]
Quercetin Cu Fe Al Zn Ni Co
Increases antioxidant capacity with DPPH test [150], LDL oxidation [197] Increases antioxidant capacity with DPPH test [150] Increases antioxidant capacity with DPPH test [150] Increases antioxidant capacity with DPPH test [150] N/A [214] N/A [214]
Hypericin Al Fe Cu Gd Tb
N/A [198] N/A [198] N/A [198] N/A [198] N/A [198]
Chlorogenic
acid
Cu Mn Zn Fe
N/A [219], Can be Prooxidant [223] N/A [219] N/A [219] N/A [219]
1DPPH = 1,1-diphenyl-2-picrylhydrazyl radical scavenging method, LDL = Low-density lipoprotein, 2N/A = No biological assay performed.
In addition to altering bioactivity and production of bioactive compounds, metal complexes can also
affect the bioavailability of the compound. In a study where chickens were fed a mineral rich diet
with the addition of a herbal remedy, those fed a mineral rich diet with St John’s Wort had
increased levels of Zn in the liver and decreased levels of Mn in the leg meat [151].
Although a number of SJW bioactive constituent-metal complexes have been characterised (Table
5.1) they are all prepared from the standards of the bioactive constituent and metal. The extent of
bioactive-metal complexes in SJW samples (i.e., in situ) has not yet been studied. In order to see if
such complexes exist naturally in the extracts of SJW, an Ultra High Performance Liquid
Chromatography (UHPLC) method to determine the presence of the rutin-Cu complex will be
investigated. In addition to this, the concentrations of the flavonoids rutin, hyperoside and
quercetin as well as hyperforin and adhyperforin will be quantified in order to see if there is a
relationship between extracted bioactive compounds and metal concentration (see Chapter 4).
123
Therefore, in this thesis, a method was developed that was able to be utilised on LC-MS as well as
UHPLC in order to allow quantification and characterisation of these compounds.
5.2 Method
5.2.1 Materials
Eight SJW dry powdered herbs were purchased through high street retailers and internet sources. A
summary of all samples is shown in Table 4.1, Chapter 4. All labware was acid washed overnight
with 4M nitric acid and rinsed thoroughly with deionised water before use. Extractions of samples
were carried out using mixtures of HPLC grade water (Fisher, Loughborough, UK), HPLC grade
methanol (Fisher, Loughborough, UK) and absolute ethanol (Fisher, Loughborough, UK). Whatman
cellulose filter paper (grade 1) was used in the filtering stage of sample preparation whereas 0.2 µm
syringe filters (Sigma-Aldrich, Gillingham, UK) were used before UHPLC/HPLC analysis.
Standards of rutin (Fisher, Loughborough, UK), quercetin (Sigma-Aldrich, Gillingham, UK),
hyperforin/adhyperforin (Schwabe Pharma, Karlsruhe, Germany) and hyperoside (Schwabe Pharma,
Karlsruhe, Germany) were utilised for method development and identification or quantification.
The mobile phase for LC analysis used HPLC grade water (Fisher, Loughborough, UK), HPLC grade
acetonitrile (Fisher, Loughborough, UK) and formic acid (Fisher, Loughborough, UK).
5.2.2 Instruments
Several instruments were utilised during these studies. A Varian Cary 1G UV/Vis spectrometer was
used to monitor the formation of rutin-Cu complexes. A Perkin Elmer 200 EP DAD UHPLC with
autosampler was used for the method development and analysis of rutin-Cu complexes as well as
liquid extracts of SJW. The Perkin Elmer Flexar UV/Vis HPLC with autosampler and Varian ProStar
500 DAD HPLC with ProStar 410 autosampler were used to assess method transferability. A Varian
ProStar 210 LC- Varian 1200L quadrupole MS/MS with ProStar 410 autosampler was utilised for
confirmation of a rutin-Cu complex formation as well as characterisation of SJW peaks. A Perkin
Elmer LC oven 101 was used for temperature control. The columns utilised were either a
Phenomenex Kinetex™ (2.6 µm C18 100 Å, 100 x 4.6 mm) LC column or a Phenomenex Luna® (3 µm
C18 100 Å, 150 x 4.6 mm) LC column.
124
5.2.3 Rutin – Copper Complex Study
5.2.3.1 Rutin - Copper Complex Formation
In order to assess the optimum reflux time needed to form a rutin-Cu complex, approximately 0.1 g
of rutin was dissolved in 100 ml methanol to prepare the rutin sample. A CuCl2 solution was
prepared by 0.1 g in 100 ml methanol. These were then mixed in a 1:1 molar ratio. The 1:1 mixture
was then refluxed over a period of 4 hours whereby a 1 ml aliquot was removed every 30 minutes
to determine optimum reflux time for complex formation. The complex formation was monitored
using UV-Vis and Mass Spectrometry. The sample was scanned between wavelengths 200-800 nm.
Mass spectrometry was carried out using direct injection of 20 µl/second, in positive mode with
mass scan between 50-1500 m/z single quadrapole.
5.2.3.2 Investigating a Chromatographic Method for the Monitoring of Rutin-Cu Complex
Development of an LC method for the rutin Cu complex was investigated using a gradient method
where mobile phase A was 0.1 %v/v formic acid in water and mobile phase B was 0.1 %v/v formic
acid in acetonitrile unless otherwise stated. Mobile phases were sonicated for 30 minutes prior to
use. For a full list of methods with mobile phase composition and gradient parameters used during
method development please see Appendix 10.4. Approximately 66mg of rutin was dissolved in 100
ml methanol, filtered using a 0.2µm syringe filter and run on UHPLC (Perkin Elmer). Methods 001 to
002, Appendix 10.4.
5.2.4 Method Development for the Analysis of SJW Extracts
The mobile phases used were; mobile phase A: HPLC grade water with 0.1 %v/v formic acid, mobile
phase B: HPLC grade acetonitrile with 0.1 %v/v formic acid unless otherwise stated. Mobile phases
were sonicated for 30 minutes prior to use. A Phenomenex Kinetex™ (2.6 µm C18 100 Å, 100 x 4.6
mm) LC Column or Phenomenex Luna® (3 µm C18 100 Å, 150 x 4.6 mm) LC Column was used. For
full list of gradient methods with mobile phase ratios, flow rates and ramp times please see
appendix 10.4.
5.2.4.1 Preliminary Analysis of SJW and Column Comparison
Approximately 1 g of SJW herb (H10) was sonicated with 10 ml of 60 %v/v ethanol. The samples
were centrifuged at 8000 rpm for 20 minutes, and then syringe filtered (0.22 µm) before LC analysis
(methods 003 to 005, appendix 10.4). Two types of column were compared by analysing the SJW
extract, as well as rutin and quercetin standards. The Phenomenex Kinetex™ column was compared
125
to that of a Phenomenex Luna® column. The same basic method (methods 006 and 007, appendix
10.4) was used across both columns with the flow rate being adjusted using a Luna column to
compensate for particle size. Following this, optimisation was carried out to allow the separation of
the flavonoids, rutin and hyperoside.
5.2.4.2 Improving Retention Time Consistency with Temperature Control
During large sequences the retention time (Rt) of peaks increased by up to 15 minutes then
returned to normal as the sequence progressed. In order to see if this was due to a drop in
temperature as the sequence was running over night, the same sequence (method 008, Appendix
10.4) was analysed in the presence of an external column oven (Perkin Elmer 101); at a
temperature of 30 ± 3°C.
5.2.4.3 Reducing Run time
Previous adjustments to the method to allow separation of flavonoids resulted in the run time
being 145 minutes per sample (method 008). In order to save time and mobile phase, the method
was examined closely to reduce the run time to less than 100 minutes by increasing the initial
aqueous mobile phase to 92% and editing the gradient step to reach 79:21 A:B compared to 73:27
A:B (method 009 and 010, appendix 10.4).
5.2.5 Method Validation
For method validation experiments, the mobile phase A was HPLC grade water with 0.1 %v/v formic
acid and mobile phase B was HPLC grade acetonitrile with 0.1 %v/v formic acid. The full list of
gradient methods with mobile phase volume ratios and ramp times are shown in appendix 10.4.
Mobile phases were sonicated for 30 minutes prior to use. A Phenomenex Luna® (3 µm C18 100 Å,
150 x 4.6 mm) LC Column was used at a flow rate of 1 ml/min.
5.2.5.1 UHPLC; Consistency Between Injections
An extraction took place with 1 g SJW H10 in 10 ml 60 %v/v ethanol which was sonicated for 30
minutes. The sample was centrifuged at 8000 rpm for 20 minutes then syringe filtered. The sample
was run by UHPLC for ten times using method 009, appendix 10.4 to determine the consistency of
the method.
5.2.5.2 UHPLC; Characterisation and Calibration of Reference Standards
Rutin standards of concentration 0.016 mg/ml, 0.033 mg/ml, 0.066 mg/ml, 0.099 mg/ml, 0.148
mg/ml, 0.222 mg/ml, 0.248 mg/ml, 0.371 mg/ml, 0.495 mg/ml and 0.99 mg/ml were prepared in 60
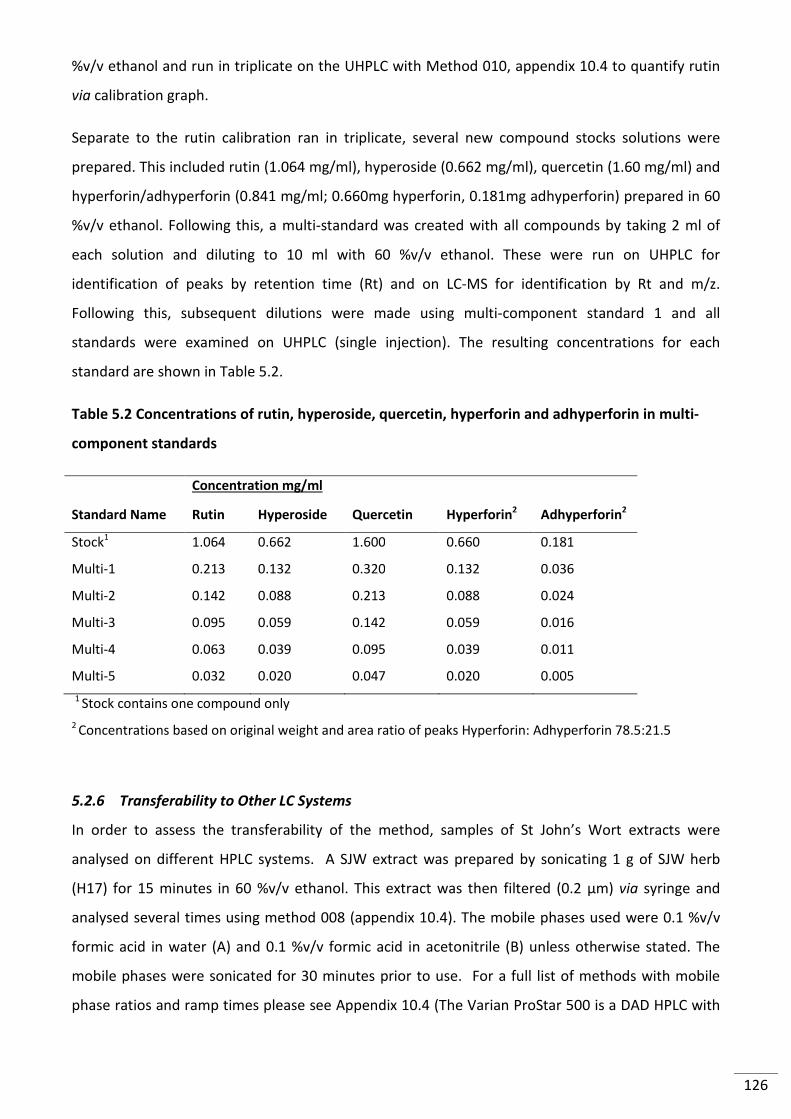
126
%v/v ethanol and run in triplicate on the UHPLC with Method 010, appendix 10.4 to quantify rutin
via calibration graph.
Separate to the rutin calibration ran in triplicate, several new compound stocks solutions were
prepared. This included rutin (1.064 mg/ml), hyperoside (0.662 mg/ml), quercetin (1.60 mg/ml) and
hyperforin/adhyperforin (0.841 mg/ml; 0.660mg hyperforin, 0.181mg adhyperforin) prepared in 60
%v/v ethanol. Following this, a multi-standard was created with all compounds by taking 2 ml of
each solution and diluting to 10 ml with 60 %v/v ethanol. These were run on UHPLC for
identification of peaks by retention time (Rt) and on LC-MS for identification by Rt and m/z.
Following this, subsequent dilutions were made using multi-component standard 1 and all
standards were examined on UHPLC (single injection). The resulting concentrations for each
standard are shown in Table 5.2.
Table 5.2 Concentrations of rutin, hyperoside, quercetin, hyperforin and adhyperforin in multi-
component standards
Concentration mg/ml
Standard Name Rutin Hyperoside Quercetin Hyperforin2
Adhyperforin2
Stock1 1.064 0.662 1.600 0.660 0.181
Multi-1 0.213 0.132 0.320 0.132 0.036
Multi-2 0.142 0.088 0.213 0.088 0.024
Multi-3 0.095 0.059 0.142 0.059 0.016
Multi-4 0.063 0.039 0.095 0.039 0.011
Multi-5 0.032 0.020 0.047 0.020 0.005
1 Stock contains one compound only
2 Concentrations based on original weight and area ratio of peaks Hyperforin: Adhyperforin 78.5:21.5
5.2.6 Transferability to Other LC Systems
In order to assess the transferability of the method, samples of St John’s Wort extracts were
analysed on different HPLC systems. A SJW extract was prepared by sonicating 1 g of SJW herb
(H17) for 15 minutes in 60 %v/v ethanol. This extract was then filtered (0.2 µm) via syringe and
analysed several times using method 008 (appendix 10.4). The mobile phases used were 0.1 %v/v
formic acid in water (A) and 0.1 %v/v formic acid in acetonitrile (B) unless otherwise stated. The
mobile phases were sonicated for 30 minutes prior to use. For a full list of methods with mobile
phase ratios and ramp times please see Appendix 10.4 (The Varian ProStar 500 is a DAD HPLC with
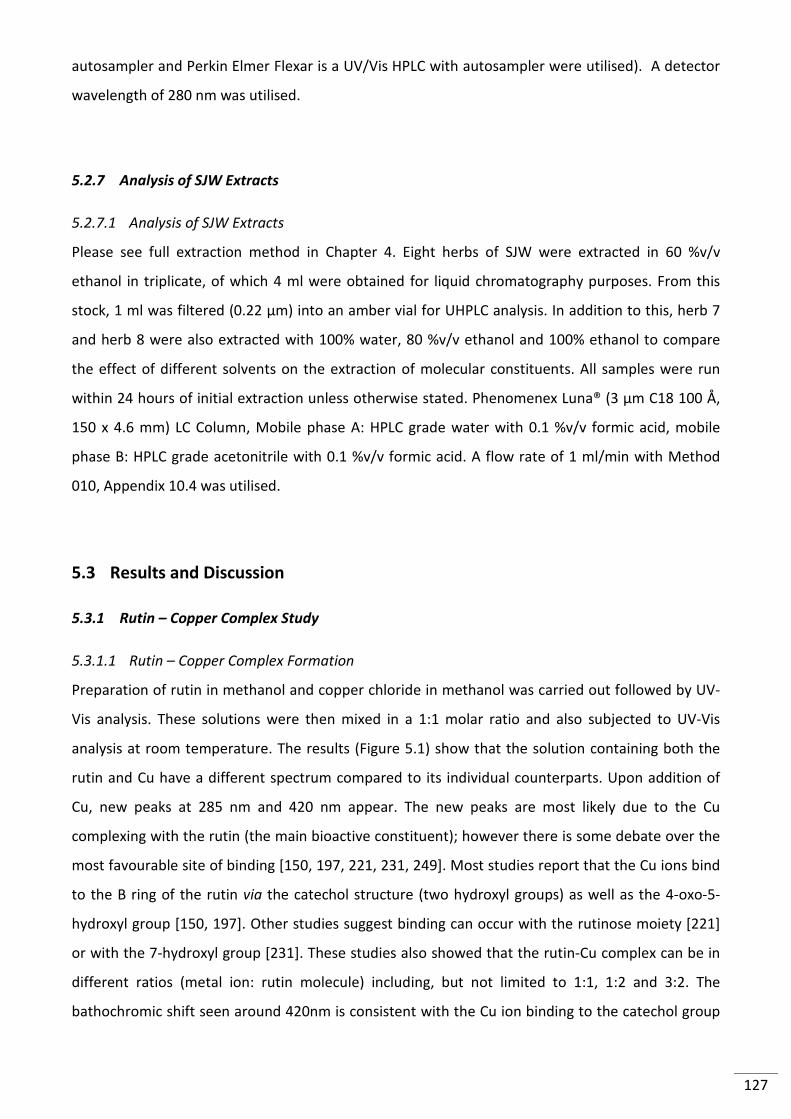
127
autosampler and Perkin Elmer Flexar is a UV/Vis HPLC with autosampler were utilised). A detector
wavelength of 280 nm was utilised.
5.2.7 Analysis of SJW Extracts
5.2.7.1 Analysis of SJW Extracts
Please see full extraction method in Chapter 4. Eight herbs of SJW were extracted in 60 %v/v
ethanol in triplicate, of which 4 ml were obtained for liquid chromatography purposes. From this
stock, 1 ml was filtered (0.22 µm) into an amber vial for UHPLC analysis. In addition to this, herb 7
and herb 8 were also extracted with 100% water, 80 %v/v ethanol and 100% ethanol to compare
the effect of different solvents on the extraction of molecular constituents. All samples were run
within 24 hours of initial extraction unless otherwise stated. Phenomenex Luna® (3 µm C18 100 Å,
150 x 4.6 mm) LC Column, Mobile phase A: HPLC grade water with 0.1 %v/v formic acid, mobile
phase B: HPLC grade acetonitrile with 0.1 %v/v formic acid. A flow rate of 1 ml/min with Method
010, Appendix 10.4 was utilised.
5.3 Results and Discussion
5.3.1 Rutin – Copper Complex Study
5.3.1.1 Rutin – Copper Complex Formation
Preparation of rutin in methanol and copper chloride in methanol was carried out followed by UV-
Vis analysis. These solutions were then mixed in a 1:1 molar ratio and also subjected to UV-Vis
analysis at room temperature. The results (Figure 5.1) show that the solution containing both the
rutin and Cu have a different spectrum compared to its individual counterparts. Upon addition of
Cu, new peaks at 285 nm and 420 nm appear. The new peaks are most likely due to the Cu
complexing with the rutin (the main bioactive constituent); however there is some debate over the
most favourable site of binding [150, 197, 221, 231, 249]. Most studies report that the Cu ions bind
to the B ring of the rutin via the catechol structure (two hydroxyl groups) as well as the 4-oxo-5-
hydroxyl group [150, 197]. Other studies suggest binding can occur with the rutinose moiety [221]
or with the 7-hydroxyl group [231]. These studies also showed that the rutin-Cu complex can be in
different ratios (metal ion: rutin molecule) including, but not limited to 1:1, 1:2 and 3:2. The
bathochromic shift seen around 420nm is consistent with the Cu ion binding to the catechol group
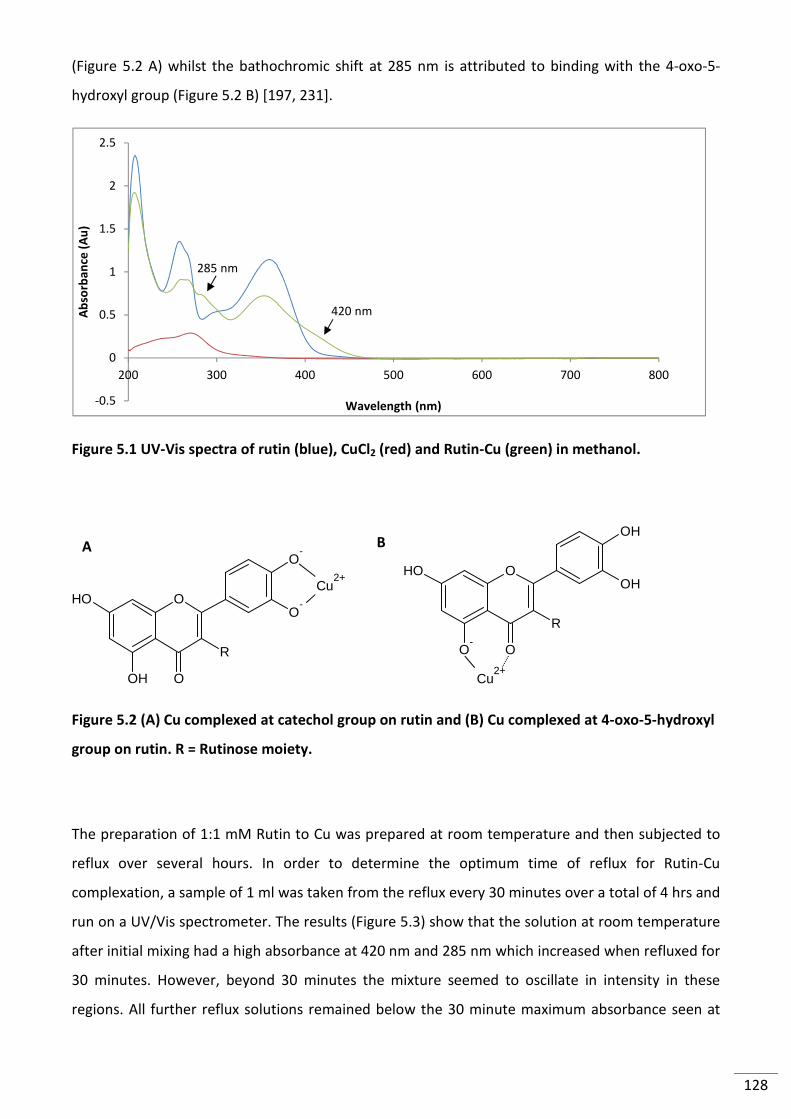
128
(Figure 5.2 A) whilst the bathochromic shift at 285 nm is attributed to binding with the 4-oxo-5-
hydroxyl group (Figure 5.2 B) [197, 231].
Figure 5.1 UV-Vis spectra of rutin (blue), CuCl2 (red) and Rutin-Cu (green) in methanol.
Cu2+
R
OH O
OH
O-
O-O
Cu2+
R
O-
O
OH
OH
OHO
Figure 5.2 (A) Cu complexed at catechol group on rutin and (B) Cu complexed at 4-oxo-5-hydroxyl
group on rutin. R = Rutinose moiety.
The preparation of 1:1 mM Rutin to Cu was prepared at room temperature and then subjected to
reflux over several hours. In order to determine the optimum time of reflux for Rutin-Cu
complexation, a sample of 1 ml was taken from the reflux every 30 minutes over a total of 4 hrs and
run on a UV/Vis spectrometer. The results (Figure 5.3) show that the solution at room temperature
after initial mixing had a high absorbance at 420 nm and 285 nm which increased when refluxed for
30 minutes. However, beyond 30 minutes the mixture seemed to oscillate in intensity in these
regions. All further reflux solutions remained below the 30 minute maximum absorbance seen at
420 nm
285 nm
-0.5
0
0.5
1
1.5
2
2.5
200 300 400 500 600 700 800
Ab
sorb
an
ce (
Au
)
Wavelength (nm)
A B
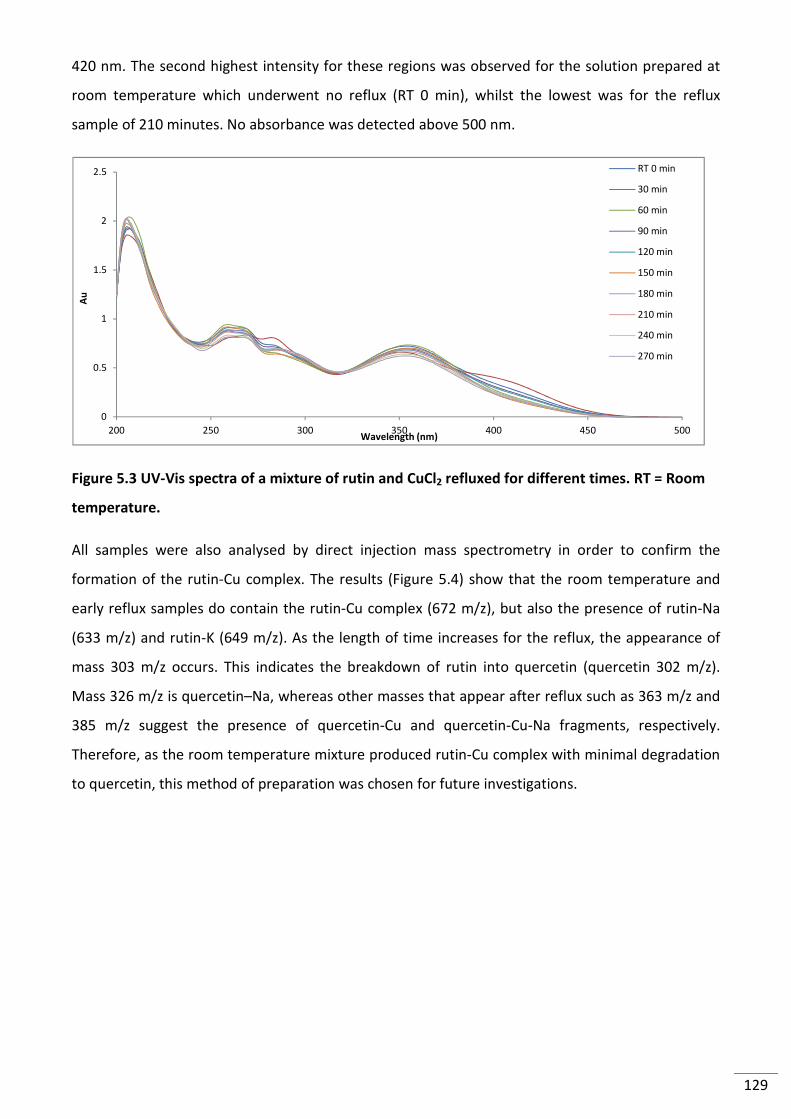
129
420 nm. The second highest intensity for these regions was observed for the solution prepared at
room temperature which underwent no reflux (RT 0 min), whilst the lowest was for the reflux
sample of 210 minutes. No absorbance was detected above 500 nm.
Figure 5.3 UV-Vis spectra of a mixture of rutin and CuCl2 refluxed for different times. RT = Room
temperature.
All samples were also analysed by direct injection mass spectrometry in order to confirm the
formation of the rutin-Cu complex. The results (Figure 5.4) show that the room temperature and
early reflux samples do contain the rutin-Cu complex (672 m/z), but also the presence of rutin-Na
(633 m/z) and rutin-K (649 m/z). As the length of time increases for the reflux, the appearance of
mass 303 m/z occurs. This indicates the breakdown of rutin into quercetin (quercetin 302 m/z).
Mass 326 m/z is quercetin–Na, whereas other masses that appear after reflux such as 363 m/z and
385 m/z suggest the presence of quercetin-Cu and quercetin-Cu-Na fragments, respectively.
Therefore, as the room temperature mixture produced rutin-Cu complex with minimal degradation
to quercetin, this method of preparation was chosen for future investigations.
0
0.5
1
1.5
2
2.5
200 250 300 350 400 450 500
Au
Wavelength (nm)
RT 0 min
30 min
60 min
90 min
120 min
150 min
180 min
210 min
240 min
270 min
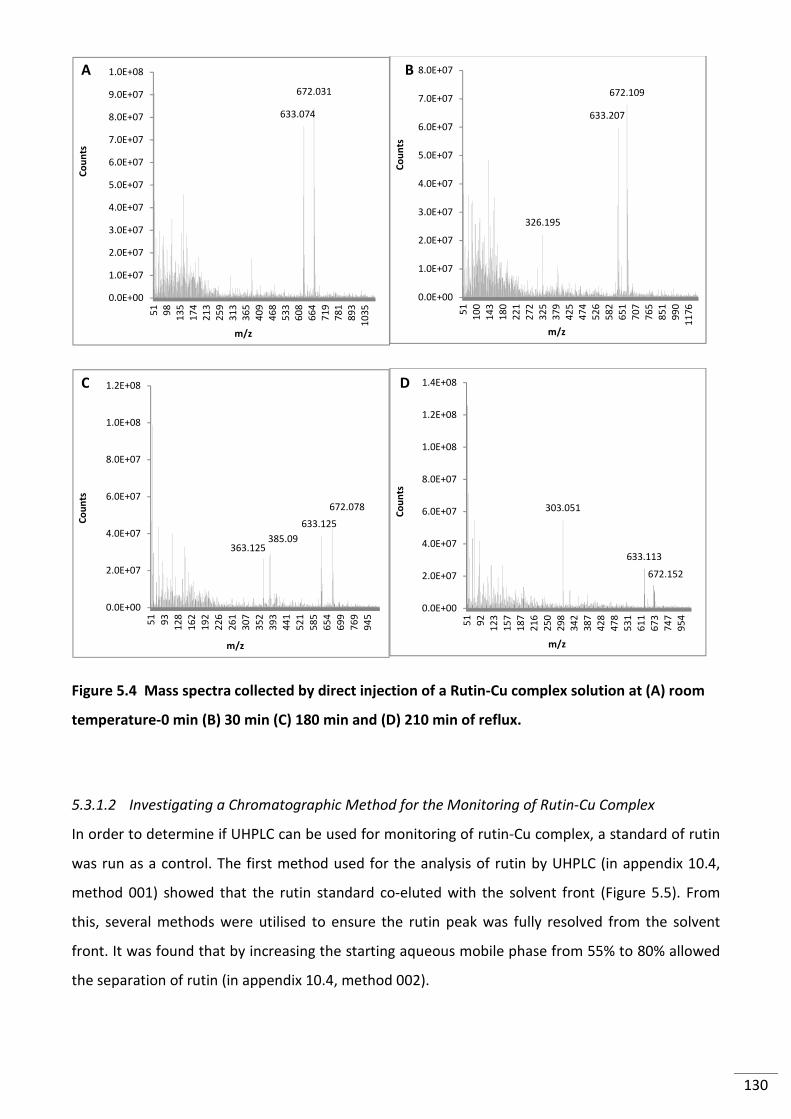
130
Figure 5.4 Mass spectra collected by direct injection of a Rutin-Cu complex solution at (A) room
temperature-0 min (B) 30 min (C) 180 min and (D) 210 min of reflux.
5.3.1.2 Investigating a Chromatographic Method for the Monitoring of Rutin-Cu Complex
In order to determine if UHPLC can be used for monitoring of rutin-Cu complex, a standard of rutin
was run as a control. The first method used for the analysis of rutin by UHPLC (in appendix 10.4,
method 001) showed that the rutin standard co-eluted with the solvent front (Figure 5.5). From
this, several methods were utilised to ensure the rutin peak was fully resolved from the solvent
front. It was found that by increasing the starting aqueous mobile phase from 55% to 80% allowed
the separation of rutin (in appendix 10.4, method 002).
633.074
672.031
0.0E+00
1.0E+07
2.0E+07
3.0E+07
4.0E+07
5.0E+07
6.0E+07
7.0E+07
8.0E+07
9.0E+07
1.0E+08
51 98 135
174
213
259
313
365
409
468
533
608
664
719
781
893
1035
Co
un
ts
m/z
326.195
633.207
672.109
0.0E+00
1.0E+07
2.0E+07
3.0E+07
4.0E+07
5.0E+07
6.0E+07
7.0E+07
8.0E+07
51 100
143
180
221
272
325
379
425
474
526
582
651
707
765
851
990
1176
Co
un
ts
m/z
363.125385.09
633.125
672.078
0.0E+00
2.0E+07
4.0E+07
6.0E+07
8.0E+07
1.0E+08
1.2E+08
51 93 128
162
192
226
261
307
352
393
441
521
585
654
699
769
945
Co
un
ts
m/z
303.051
633.113
672.152
0.0E+00
2.0E+07
4.0E+07
6.0E+07
8.0E+07
1.0E+08
1.2E+08
1.4E+08
51 92 123
157
187
216
250
298
342
387
428
478
531
611
673
747
954
Co
un
ts
m/z
A B
C D
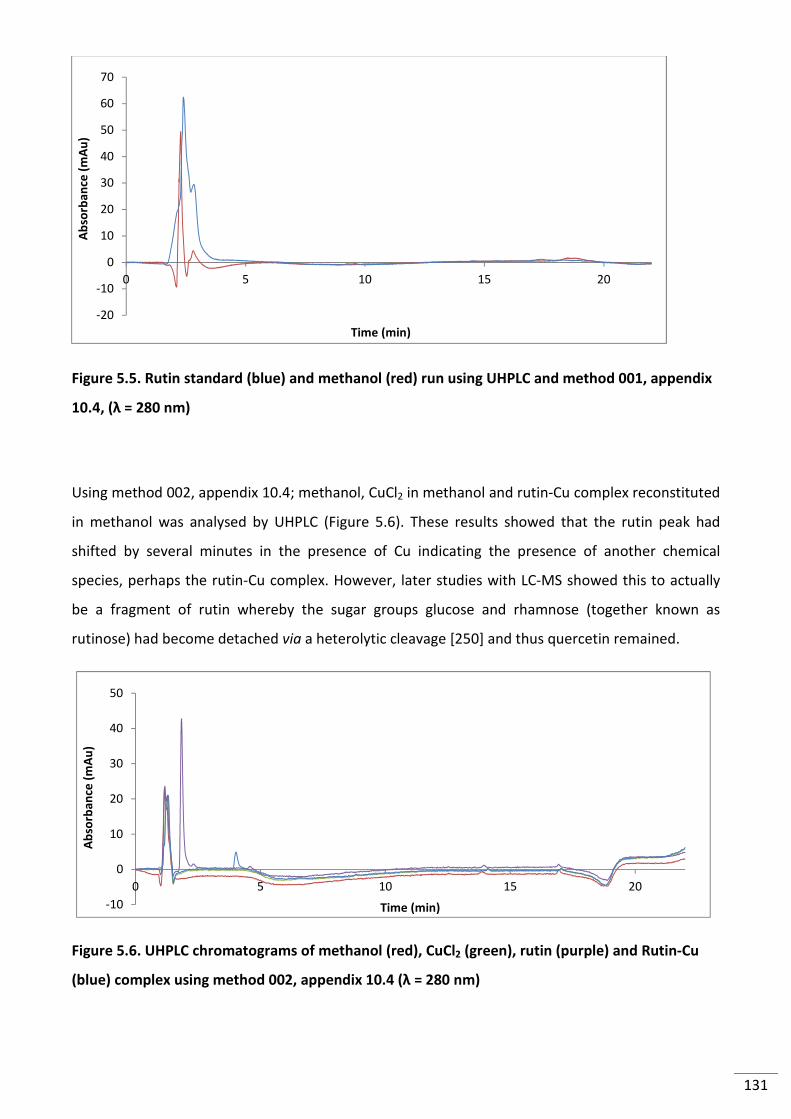
131
Figure 5.5. Rutin standard (blue) and methanol (red) run using UHPLC and method 001, appendix
10.4, (λ = 280 nm)
Using method 002, appendix 10.4; methanol, CuCl2 in methanol and rutin-Cu complex reconstituted
in methanol was analysed by UHPLC (Figure 5.6). These results showed that the rutin peak had
shifted by several minutes in the presence of Cu indicating the presence of another chemical
species, perhaps the rutin-Cu complex. However, later studies with LC-MS showed this to actually
be a fragment of rutin whereby the sugar groups glucose and rhamnose (together known as
rutinose) had become detached via a heterolytic cleavage [250] and thus quercetin remained.
Figure 5.6. UHPLC chromatograms of methanol (red), CuCl2 (green), rutin (purple) and Rutin-Cu
(blue) complex using method 002, appendix 10.4 (λ = 280 nm)
-20
-10
0
10
20
30
40
50
60
70
0 5 10 15 20
Ab
sorb
an
ce (
mA
u)
Time (min)
-10
0
10
20
30
40
50
0 5 10 15 20
Ab
sorb
an
ce (
mA
u)
Time (min)
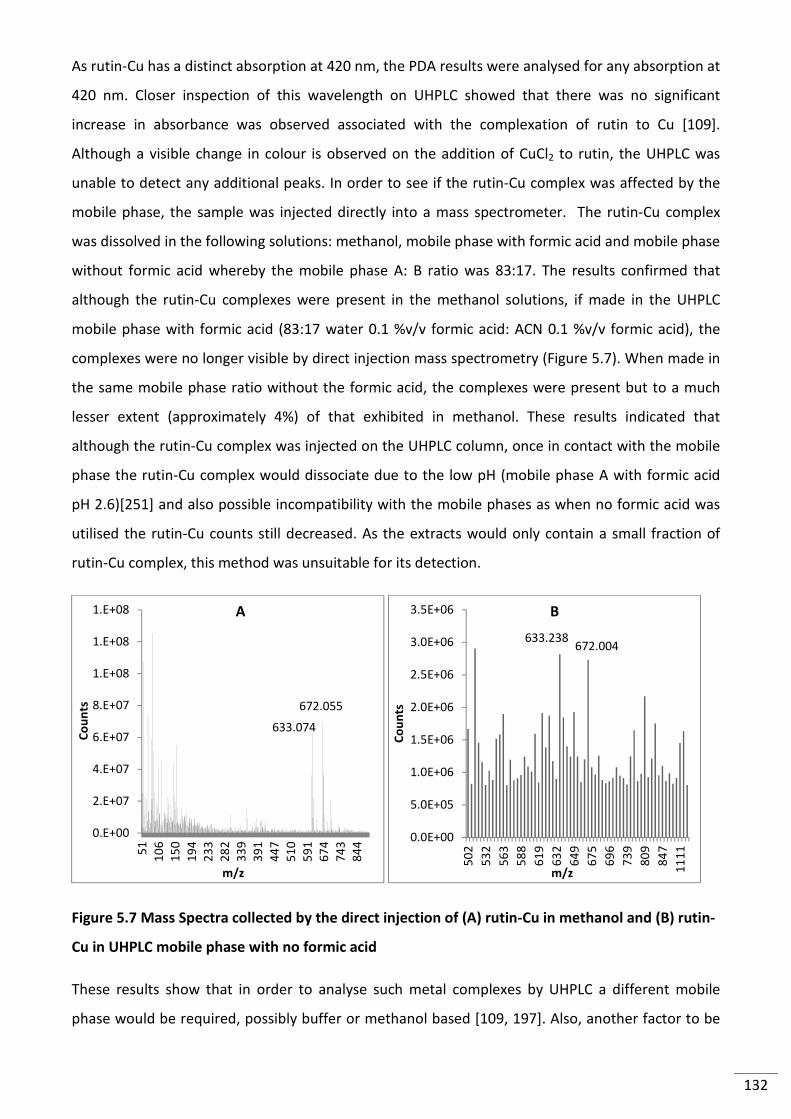
132
As rutin-Cu has a distinct absorption at 420 nm, the PDA results were analysed for any absorption at
420 nm. Closer inspection of this wavelength on UHPLC showed that there was no significant
increase in absorbance was observed associated with the complexation of rutin to Cu [109].
Although a visible change in colour is observed on the addition of CuCl2 to rutin, the UHPLC was
unable to detect any additional peaks. In order to see if the rutin-Cu complex was affected by the
mobile phase, the sample was injected directly into a mass spectrometer. The rutin-Cu complex
was dissolved in the following solutions: methanol, mobile phase with formic acid and mobile phase
without formic acid whereby the mobile phase A: B ratio was 83:17. The results confirmed that
although the rutin-Cu complexes were present in the methanol solutions, if made in the UHPLC
mobile phase with formic acid (83:17 water 0.1 %v/v formic acid: ACN 0.1 %v/v formic acid), the
complexes were no longer visible by direct injection mass spectrometry (Figure 5.7). When made in
the same mobile phase ratio without the formic acid, the complexes were present but to a much
lesser extent (approximately 4%) of that exhibited in methanol. These results indicated that
although the rutin-Cu complex was injected on the UHPLC column, once in contact with the mobile
phase the rutin-Cu complex would dissociate due to the low pH (mobile phase A with formic acid
pH 2.6)[251] and also possible incompatibility with the mobile phases as when no formic acid was
utilised the rutin-Cu counts still decreased. As the extracts would only contain a small fraction of
rutin-Cu complex, this method was unsuitable for its detection.
Figure 5.7 Mass Spectra collected by the direct injection of (A) rutin-Cu in methanol and (B) rutin-
Cu in UHPLC mobile phase with no formic acid
These results show that in order to analyse such metal complexes by UHPLC a different mobile
phase would be required, possibly buffer or methanol based [109, 197]. Also, another factor to be
633.074
672.055
0.E+00
2.E+07
4.E+07
6.E+07
8.E+07
1.E+08
1.E+08
1.E+08
5110
615
019
423
328
233
939
144
751
059
167
474
384
4
Co
un
ts
m/z
633.238672.004
0.0E+00
5.0E+05
1.0E+06
1.5E+06
2.0E+06
2.5E+06
3.0E+06
3.5E+06
502
532
563
588
619
632
649
675
696
739
809
847
1111
Co
un
ts
m/z
A B
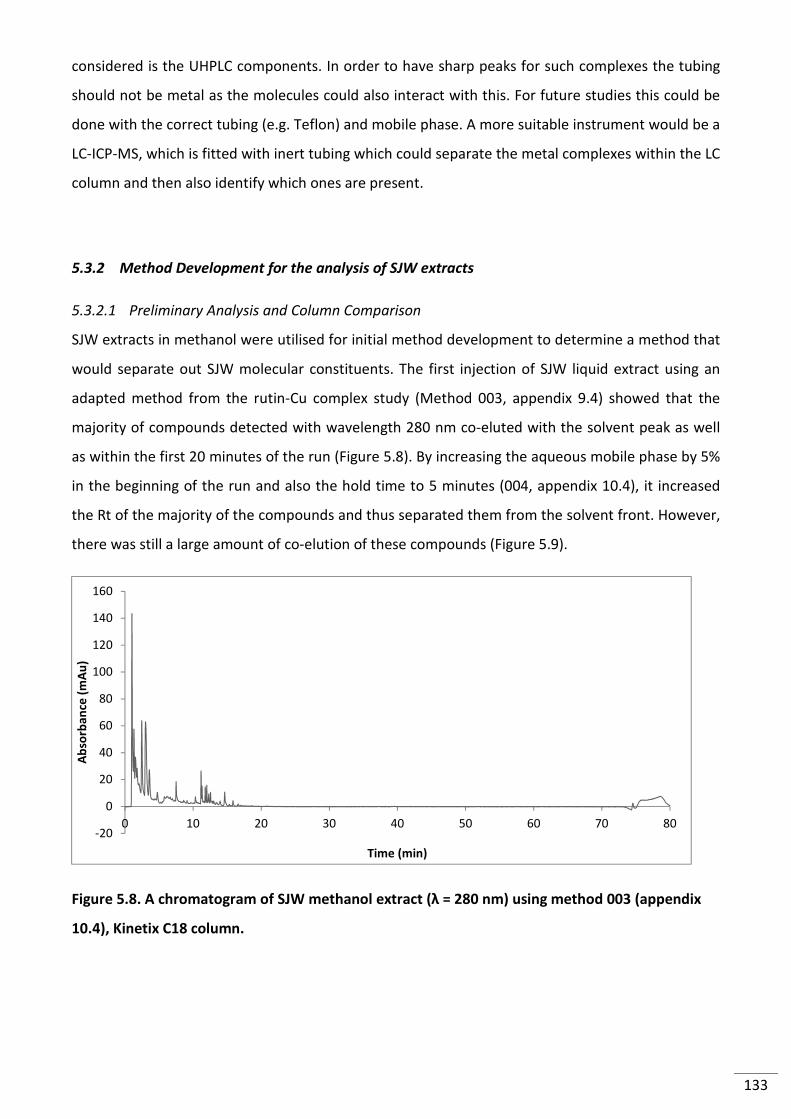
133
considered is the UHPLC components. In order to have sharp peaks for such complexes the tubing
should not be metal as the molecules could also interact with this. For future studies this could be
done with the correct tubing (e.g. Teflon) and mobile phase. A more suitable instrument would be a
LC-ICP-MS, which is fitted with inert tubing which could separate the metal complexes within the LC
column and then also identify which ones are present.
5.3.2 Method Development for the analysis of SJW extracts
5.3.2.1 Preliminary Analysis and Column Comparison
SJW extracts in methanol were utilised for initial method development to determine a method that
would separate out SJW molecular constituents. The first injection of SJW liquid extract using an
adapted method from the rutin-Cu complex study (Method 003, appendix 9.4) showed that the
majority of compounds detected with wavelength 280 nm co-eluted with the solvent peak as well
as within the first 20 minutes of the run (Figure 5.8). By increasing the aqueous mobile phase by 5%
in the beginning of the run and also the hold time to 5 minutes (004, appendix 10.4), it increased
the Rt of the majority of the compounds and thus separated them from the solvent front. However,
there was still a large amount of co-elution of these compounds (Figure 5.9).
Figure 5.8. A chromatogram of SJW methanol extract (λ = 280 nm) using method 003 (appendix
10.4), Kinetix C18 column.
-20
0
20
40
60
80
100
120
140
160
0 10 20 30 40 50 60 70 80
Ab
sorb
an
ce (
mA
u)
Time (min)
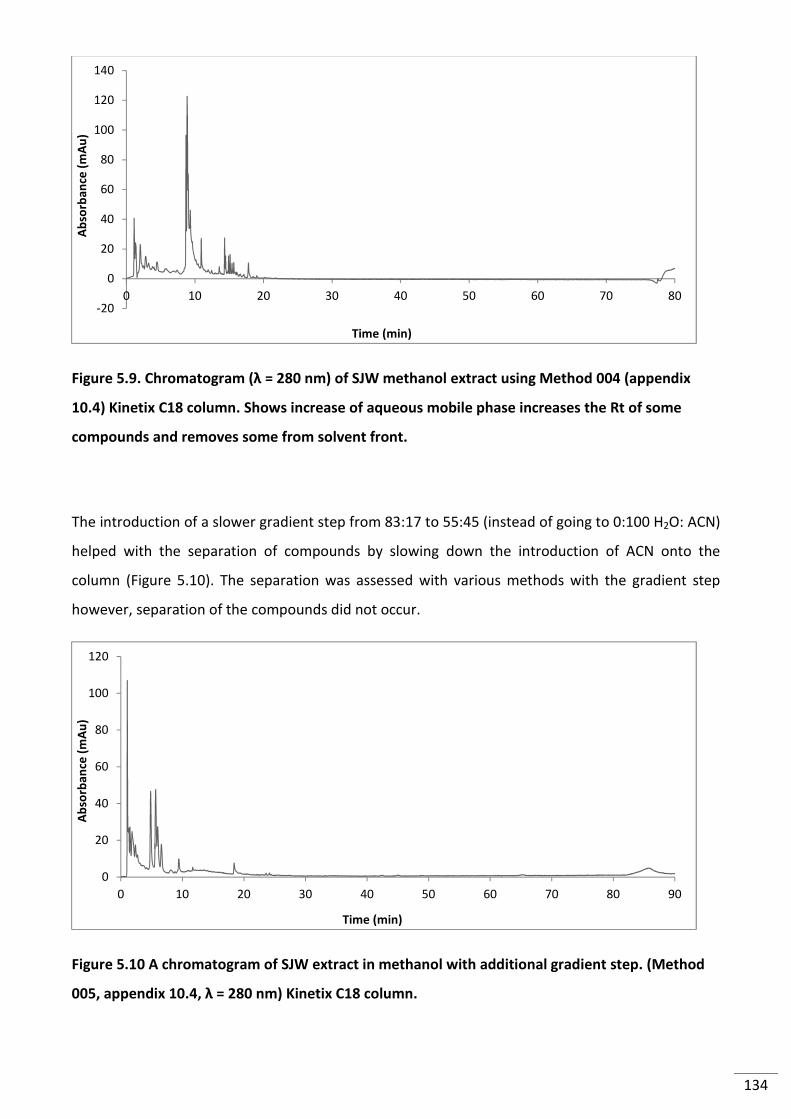
134
Figure 5.9. Chromatogram (λ = 280 nm) of SJW methanol extract using Method 004 (appendix
10.4) Kinetix C18 column. Shows increase of aqueous mobile phase increases the Rt of some
compounds and removes some from solvent front.
The introduction of a slower gradient step from 83:17 to 55:45 (instead of going to 0:100 H2O: ACN)
helped with the separation of compounds by slowing down the introduction of ACN onto the
column (Figure 5.10). The separation was assessed with various methods with the gradient step
however, separation of the compounds did not occur.
Figure 5.10 A chromatogram of SJW extract in methanol with additional gradient step. (Method
005, appendix 10.4, λ = 280 nm) Kinetix C18 column.
-20
0
20
40
60
80
100
120
140
0 10 20 30 40 50 60 70 80
Ab
sorb
an
ce (
mA
u)
Time (min)
0
20
40
60
80
100
120
0 10 20 30 40 50 60 70 80 90
Ab
sorb
an
ce (
mA
u)
Time (min)
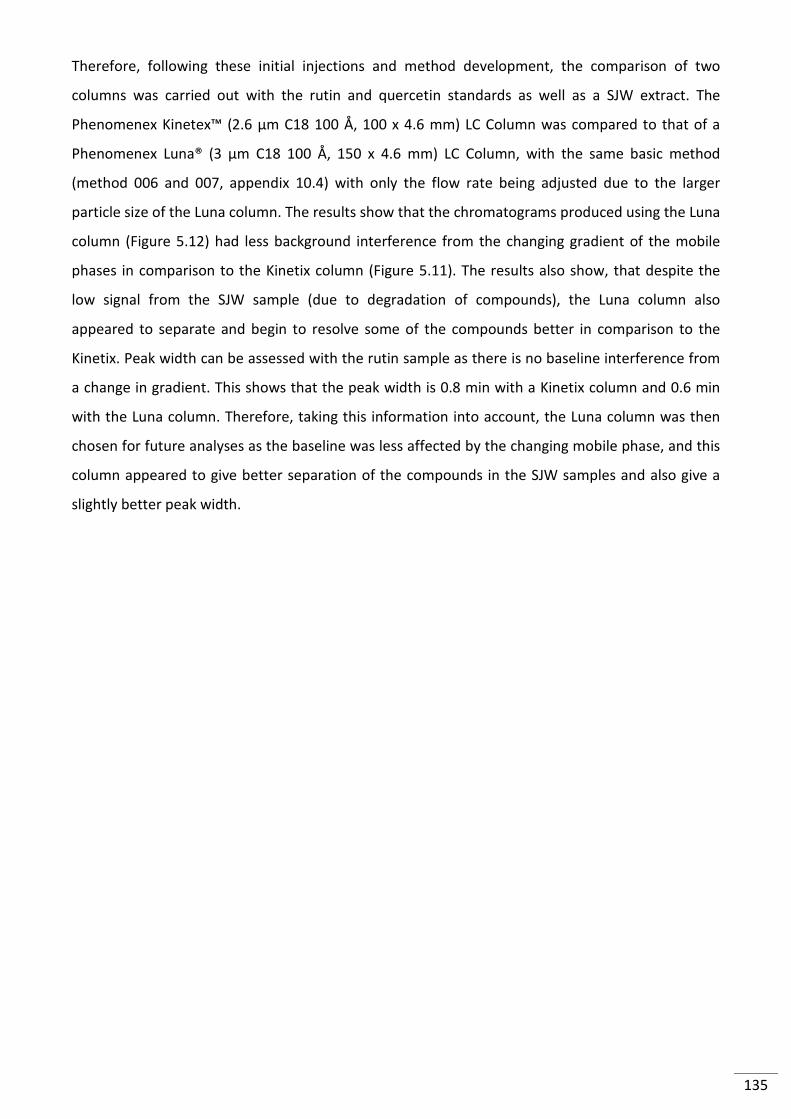
135
Therefore, following these initial injections and method development, the comparison of two
columns was carried out with the rutin and quercetin standards as well as a SJW extract. The
Phenomenex Kinetex™ (2.6 µm C18 100 Å, 100 x 4.6 mm) LC Column was compared to that of a
Phenomenex Luna® (3 µm C18 100 Å, 150 x 4.6 mm) LC Column, with the same basic method
(method 006 and 007, appendix 10.4) with only the flow rate being adjusted due to the larger
particle size of the Luna column. The results show that the chromatograms produced using the Luna
column (Figure 5.12) had less background interference from the changing gradient of the mobile
phases in comparison to the Kinetix column (Figure 5.11). The results also show, that despite the
low signal from the SJW sample (due to degradation of compounds), the Luna column also
appeared to separate and begin to resolve some of the compounds better in comparison to the
Kinetix. Peak width can be assessed with the rutin sample as there is no baseline interference from
a change in gradient. This shows that the peak width is 0.8 min with a Kinetix column and 0.6 min
with the Luna column. Therefore, taking this information into account, the Luna column was then
chosen for future analyses as the baseline was less affected by the changing mobile phase, and this
column appeared to give better separation of the compounds in the SJW samples and also give a
slightly better peak width.
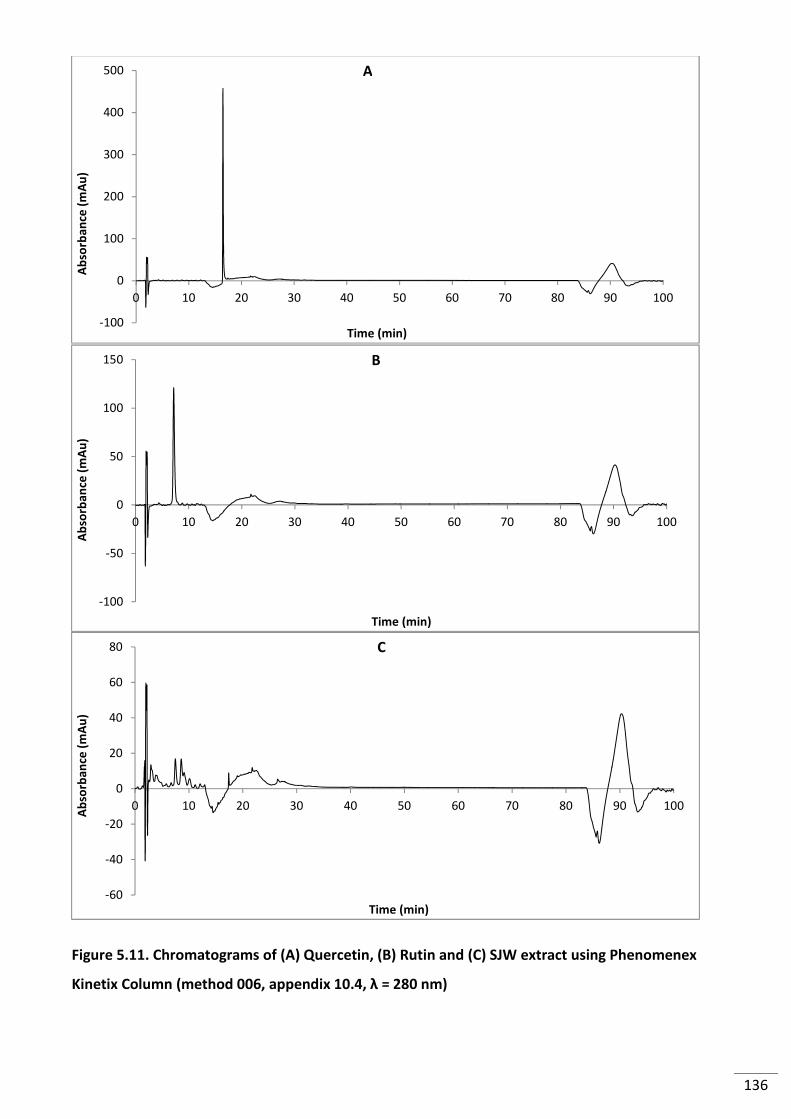
136
Figure 5.11. Chromatograms of (A) Quercetin, (B) Rutin and (C) SJW extract using Phenomenex
Kinetix Column (method 006, appendix 10.4, λ = 280 nm)
-100
0
100
200
300
400
500
0 10 20 30 40 50 60 70 80 90 100
Ab
sorb
an
ce (
mA
u)
Time (min)
-100
-50
0
50
100
150
0 10 20 30 40 50 60 70 80 90 100
Ab
sorb
an
ce (
mA
u)
Time (min)
-60
-40
-20
0
20
40
60
80
0 10 20 30 40 50 60 70 80 90 100
Ab
sorb
an
ce (
mA
u)
Time (min)
A
B
C
137
Figure 5.12. Analysis of samples using Phenomenex Luna Column (A) Quercetin, (B) Rutin and (C)
SJW extract (method 007, appendix 10.4, λ = 280 nm)
-150
50
250
450
650
850
1050
0 10 20 30 40 50 60 70 80 90 100
Ab
sorb
an
ce (
mA
u)
Time (min)
-150
-100
-50
0
50
100
150
0 10 20 30 40 50 60 70 80 90 100
Ab
sorb
an
ce (
mA
u)
Time (min)
-80
-60
-40
-20
0
20
40
0 10 20 30 40 50 60 70 80 90 100
Ab
sorb
an
ce (
mA
u)
Time (min)
A
B
C
138
It is worth noting that if the future method was not being utilised on LC-MS for compound
identification, the Kinetix column may be able to give the same if not better resolution. The reason
for its poor performance here is the low flow rate to ensure the pressure doesn’t exceed 3000 psi in
order to not exceed pressure limits on the LC-MS. If using for UHPLC analysis only, this column
could be used for better separation of SJW extracts by increasing the flow rate and thus using it as a
true UHPLC system.
Following this, method development was carried out on the Luna column at a flow rate of 1 ml/min
and 60 %v/v ethanol extracts of SJW. The 60 %v/v ethanol was utilised as the extraction solvent as
it is the most common extraction solvent used by industry [201]. Several methods were utilised in
the method development stage which focused on the separation of the flavonoids. It was noted
that the hypericins present in SJW (hypericin and pseudohypericin) absorb at 590 nm. However,
throughout the analyses no peaks were observed at 590nm. As hypericin standards are very
expensive for a small amount (£145 for 1 mg, Sigma Aldrich), the decision was made to focus on the
flavonoids within SJW that could be quantified (rutin, hyperoside and quercetin). Through various
methods, adjusting the ratios of the 3-step gradient and increasing the initial aqueous mobile
phase, a SJW method was developed that allowed the separation of the flavonoid peaks (Figure
5.13).
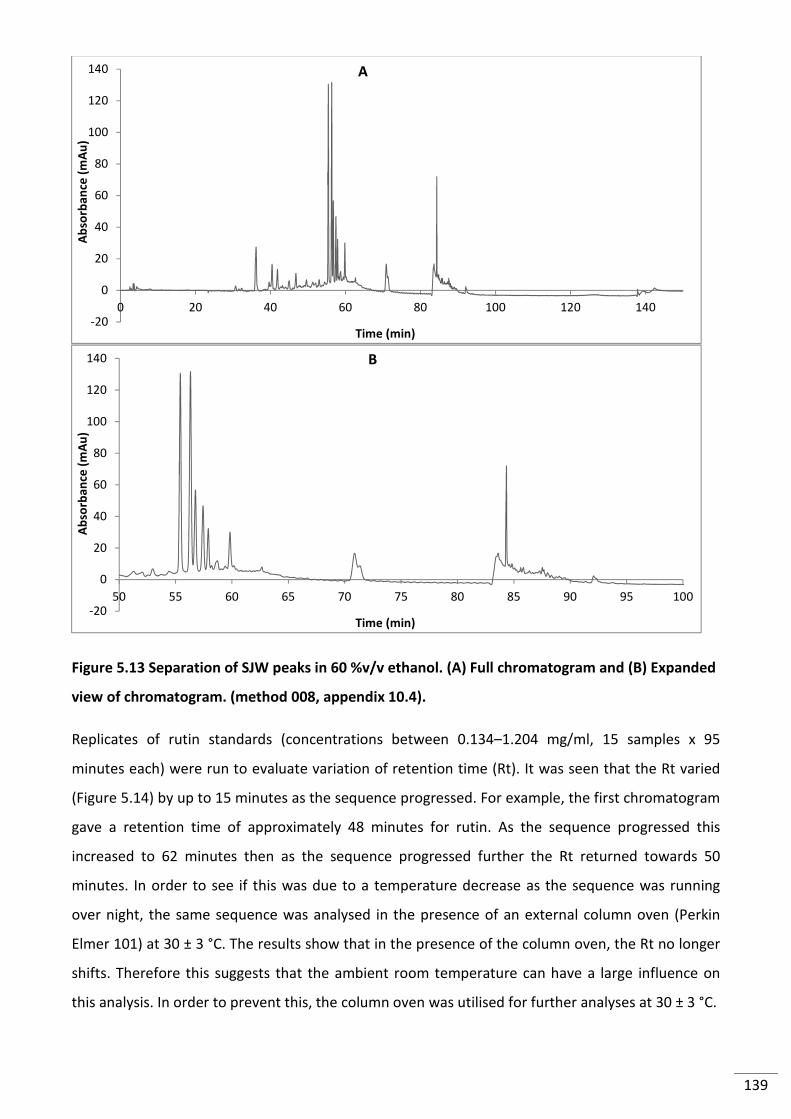
139
Figure 5.13 Separation of SJW peaks in 60 %v/v ethanol. (A) Full chromatogram and (B) Expanded
view of chromatogram. (method 008, appendix 10.4).
Replicates of rutin standards (concentrations between 0.134–1.204 mg/ml, 15 samples x 95
minutes each) were run to evaluate variation of retention time (Rt). It was seen that the Rt varied
(Figure 5.14) by up to 15 minutes as the sequence progressed. For example, the first chromatogram
gave a retention time of approximately 48 minutes for rutin. As the sequence progressed this
increased to 62 minutes then as the sequence progressed further the Rt returned towards 50
minutes. In order to see if this was due to a temperature decrease as the sequence was running
over night, the same sequence was analysed in the presence of an external column oven (Perkin
Elmer 101) at 30 ± 3 °C. The results show that in the presence of the column oven, the Rt no longer
shifts. Therefore this suggests that the ambient room temperature can have a large influence on
this analysis. In order to prevent this, the column oven was utilised for further analyses at 30 ± 3 °C.
-20
0
20
40
60
80
100
120
140
0 20 40 60 80 100 120 140
Ab
sorb
an
ce (
mA
u)
Time (min)
-20
0
20
40
60
80
100
120
140
50 55 60 65 70 75 80 85 90 95 100
Ab
sorb
an
ce (
mA
u)
Time (min)
A
B
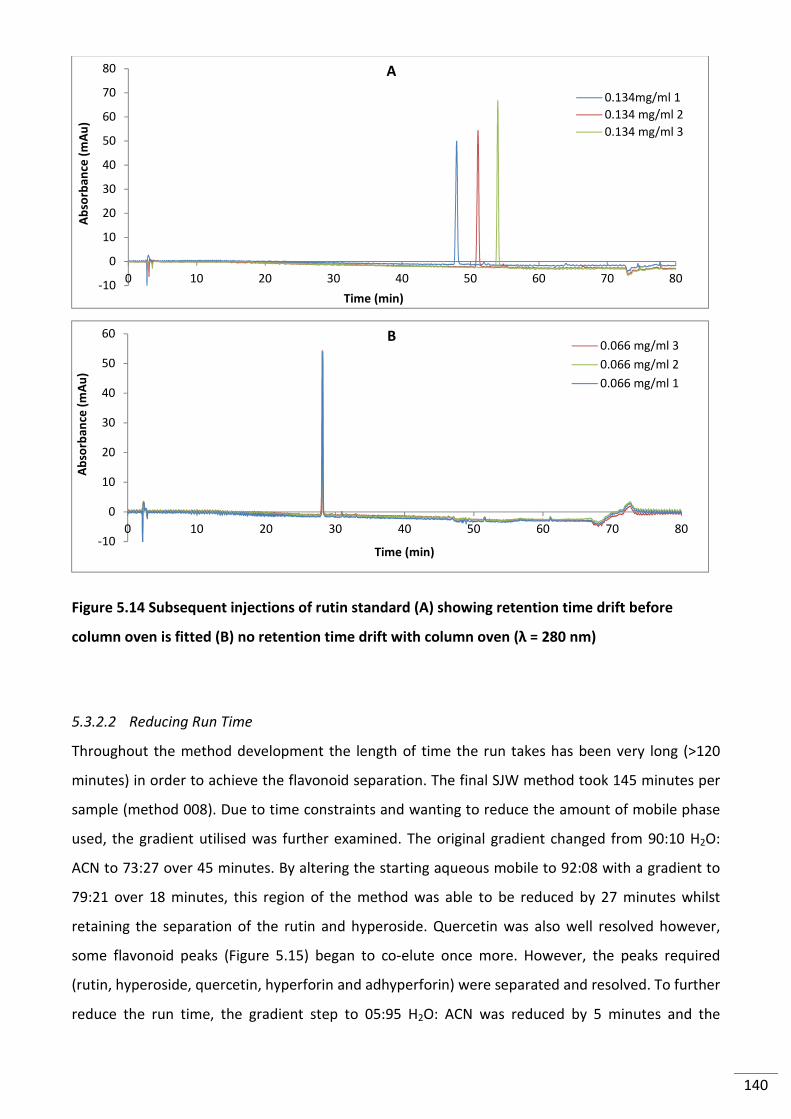
140
Figure 5.14 Subsequent injections of rutin standard (A) showing retention time drift before
column oven is fitted (B) no retention time drift with column oven (λ = 280 nm)
5.3.2.2 Reducing Run Time
Throughout the method development the length of time the run takes has been very long (>120
minutes) in order to achieve the flavonoid separation. The final SJW method took 145 minutes per
sample (method 008). Due to time constraints and wanting to reduce the amount of mobile phase
used, the gradient utilised was further examined. The original gradient changed from 90:10 H2O:
ACN to 73:27 over 45 minutes. By altering the starting aqueous mobile to 92:08 with a gradient to
79:21 over 18 minutes, this region of the method was able to be reduced by 27 minutes whilst
retaining the separation of the rutin and hyperoside. Quercetin was also well resolved however,
some flavonoid peaks (Figure 5.15) began to co-elute once more. However, the peaks required
(rutin, hyperoside, quercetin, hyperforin and adhyperforin) were separated and resolved. To further
reduce the run time, the gradient step to 05:95 H2O: ACN was reduced by 5 minutes and the
-10
0
10
20
30
40
50
60
70
80
0 10 20 30 40 50 60 70 80
Ab
sorb
an
ce (
mA
u)
Time (min)
0.134mg/ml 1
0.134 mg/ml 2
0.134 mg/ml 3
-10
0
10
20
30
40
50
60
0 10 20 30 40 50 60 70 80
Ab
sorb
an
ce (
mA
u)
Time (min)
0.066 mg/ml 3
0.066 mg/ml 2
0.066 mg/ml 1
A
B
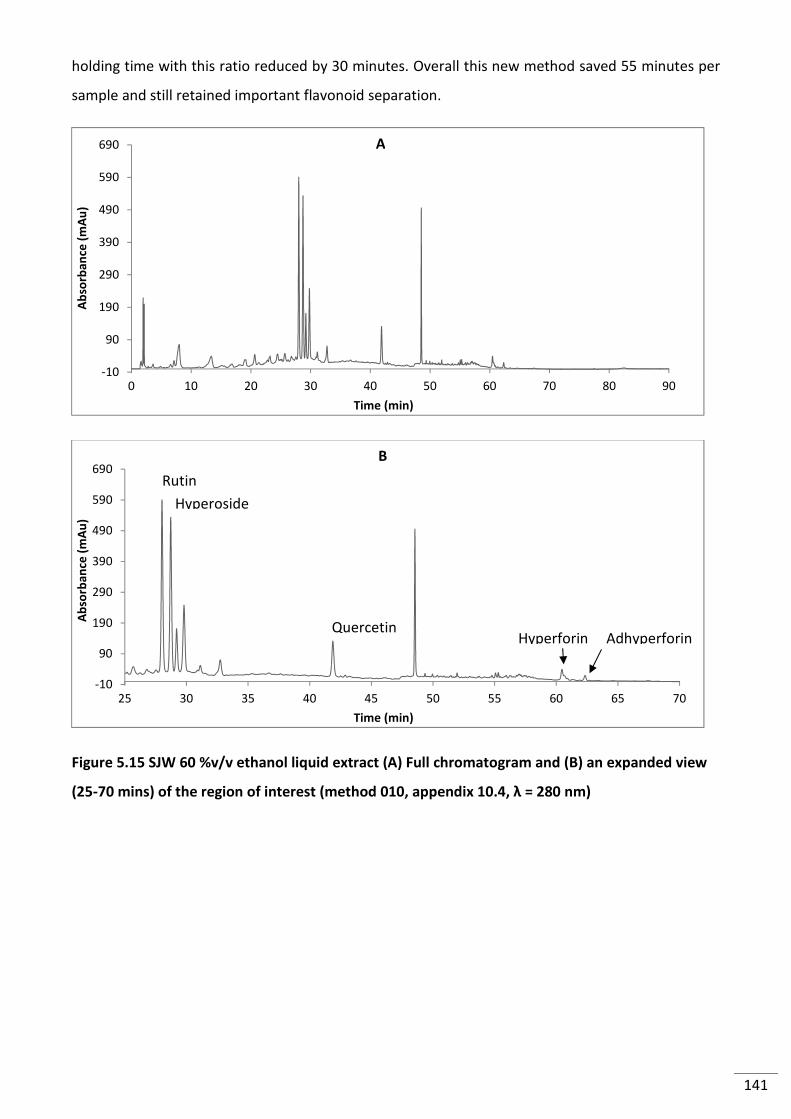
141
holding time with this ratio reduced by 30 minutes. Overall this new method saved 55 minutes per
sample and still retained important flavonoid separation.
Figure 5.15 SJW 60 %v/v ethanol liquid extract (A) Full chromatogram and (B) an expanded view
(25-70 mins) of the region of interest (method 010, appendix 10.4, λ = 280 nm)
-10
90
190
290
390
490
590
690
0 10 20 30 40 50 60 70 80 90
Ab
sorb
an
ce (
mA
u)
Time (min)
-10
90
190
290
390
490
590
690
25 30 35 40 45 50 55 60 65 70
Ab
sorb
an
ce (
mA
u)
Time (min)
Rutin
Hyperoside
Quercetin Hyperforin Adhyperforin
B
A
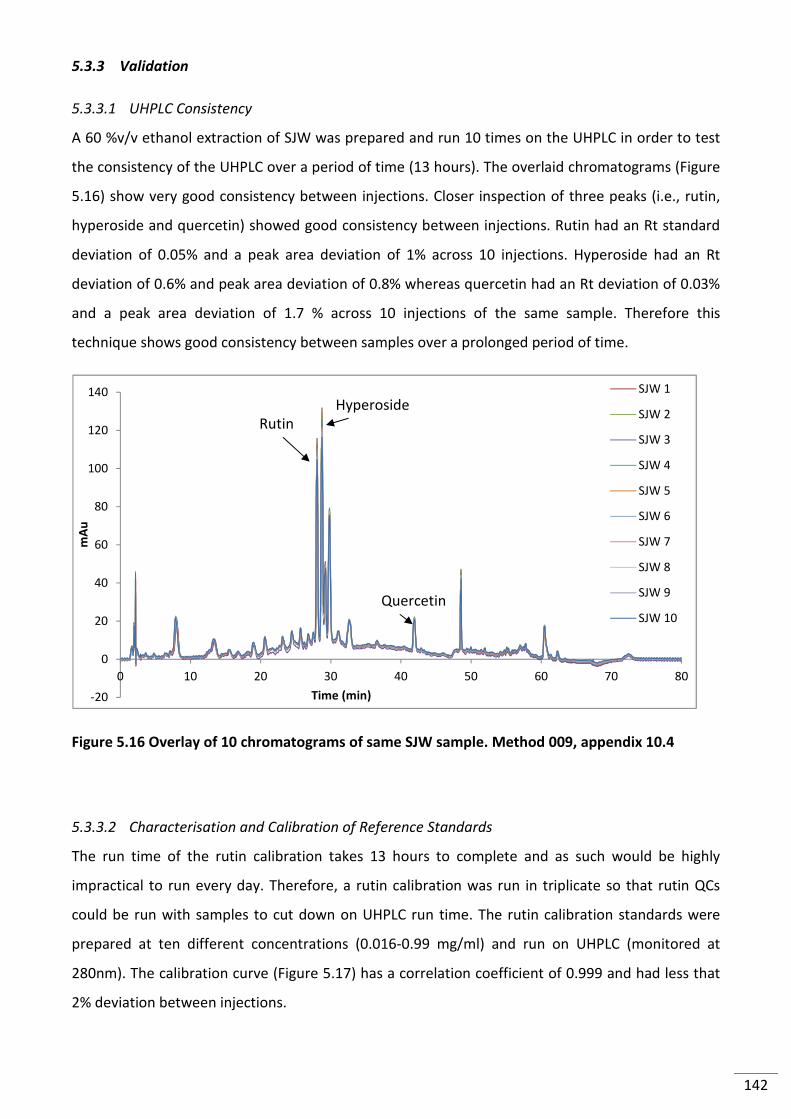
142
5.3.3 Validation
5.3.3.1 UHPLC Consistency
A 60 %v/v ethanol extraction of SJW was prepared and run 10 times on the UHPLC in order to test
the consistency of the UHPLC over a period of time (13 hours). The overlaid chromatograms (Figure
5.16) show very good consistency between injections. Closer inspection of three peaks (i.e., rutin,
hyperoside and quercetin) showed good consistency between injections. Rutin had an Rt standard
deviation of 0.05% and a peak area deviation of 1% across 10 injections. Hyperoside had an Rt
deviation of 0.6% and peak area deviation of 0.8% whereas quercetin had an Rt deviation of 0.03%
and a peak area deviation of 1.7 % across 10 injections of the same sample. Therefore this
technique shows good consistency between samples over a prolonged period of time.
Figure 5.16 Overlay of 10 chromatograms of same SJW sample. Method 009, appendix 10.4
5.3.3.2 Characterisation and Calibration of Reference Standards
The run time of the rutin calibration takes 13 hours to complete and as such would be highly
impractical to run every day. Therefore, a rutin calibration was run in triplicate so that rutin QCs
could be run with samples to cut down on UHPLC run time. The rutin calibration standards were
prepared at ten different concentrations (0.016-0.99 mg/ml) and run on UHPLC (monitored at
280nm). The calibration curve (Figure 5.17) has a correlation coefficient of 0.999 and had less that
2% deviation between injections.
-20
0
20
40
60
80
100
120
140
0 10 20 30 40 50 60 70 80
mA
u
Time (min)
SJW 1
SJW 2
SJW 3
SJW 4
SJW 5
SJW 6
SJW 7
SJW 8
SJW 9
SJW 10
Rutin
Quercetin
Hyperoside
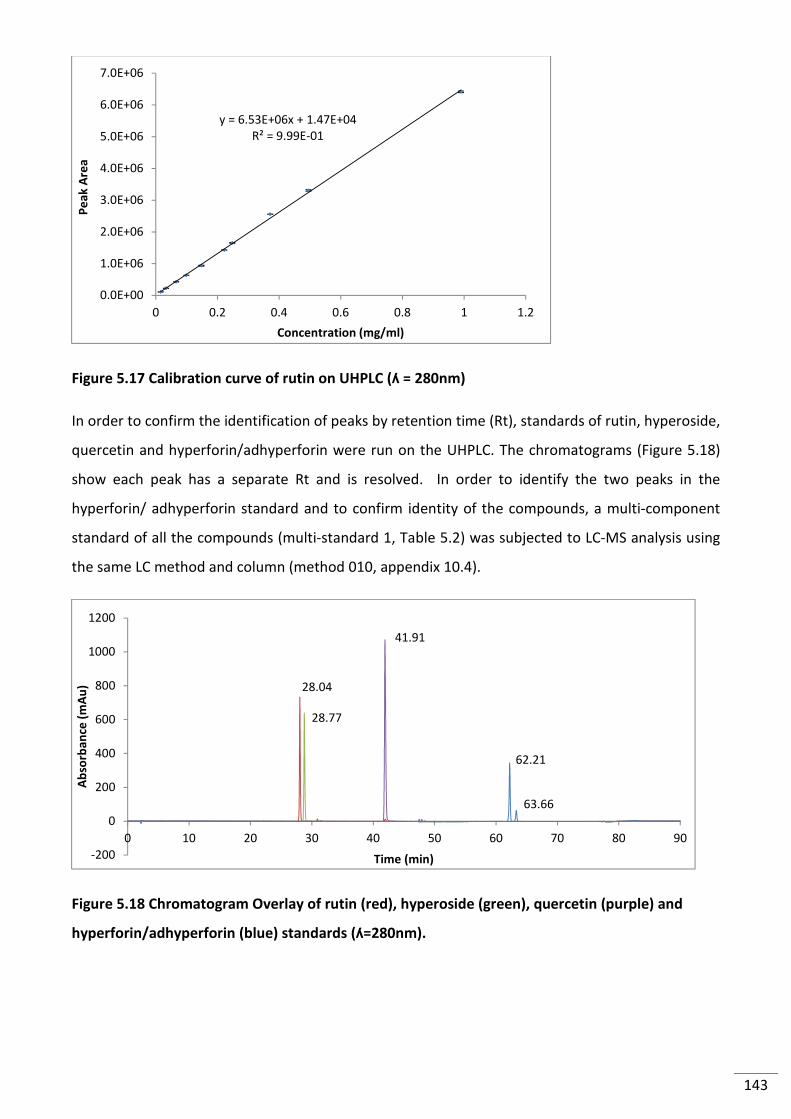
143
Figure 5.17 Calibration curve of rutin on UHPLC (ʎ = 280nm)
In order to confirm the identification of peaks by retention time (Rt), standards of rutin, hyperoside,
quercetin and hyperforin/adhyperforin were run on the UHPLC. The chromatograms (Figure 5.18)
show each peak has a separate Rt and is resolved. In order to identify the two peaks in the
hyperforin/ adhyperforin standard and to confirm identity of the compounds, a multi-component
standard of all the compounds (multi-standard 1, Table 5.2) was subjected to LC-MS analysis using
the same LC method and column (method 010, appendix 10.4).
Figure 5.18 Chromatogram Overlay of rutin (red), hyperoside (green), quercetin (purple) and
hyperforin/adhyperforin (blue) standards (ʎ=280nm).
y = 6.53E+06x + 1.47E+04R² = 9.99E-01
0.0E+00
1.0E+06
2.0E+06
3.0E+06
4.0E+06
5.0E+06
6.0E+06
7.0E+06
0 0.2 0.4 0.6 0.8 1 1.2
Pe
ak
Are
a
Concentration (mg/ml)
28.04
28.77
41.91
62.21
63.66
-200
0
200
400
600
800
1000
1200
0 10 20 30 40 50 60 70 80 90
Ab
sorb
an
ce (
mA
u)
Time (min)
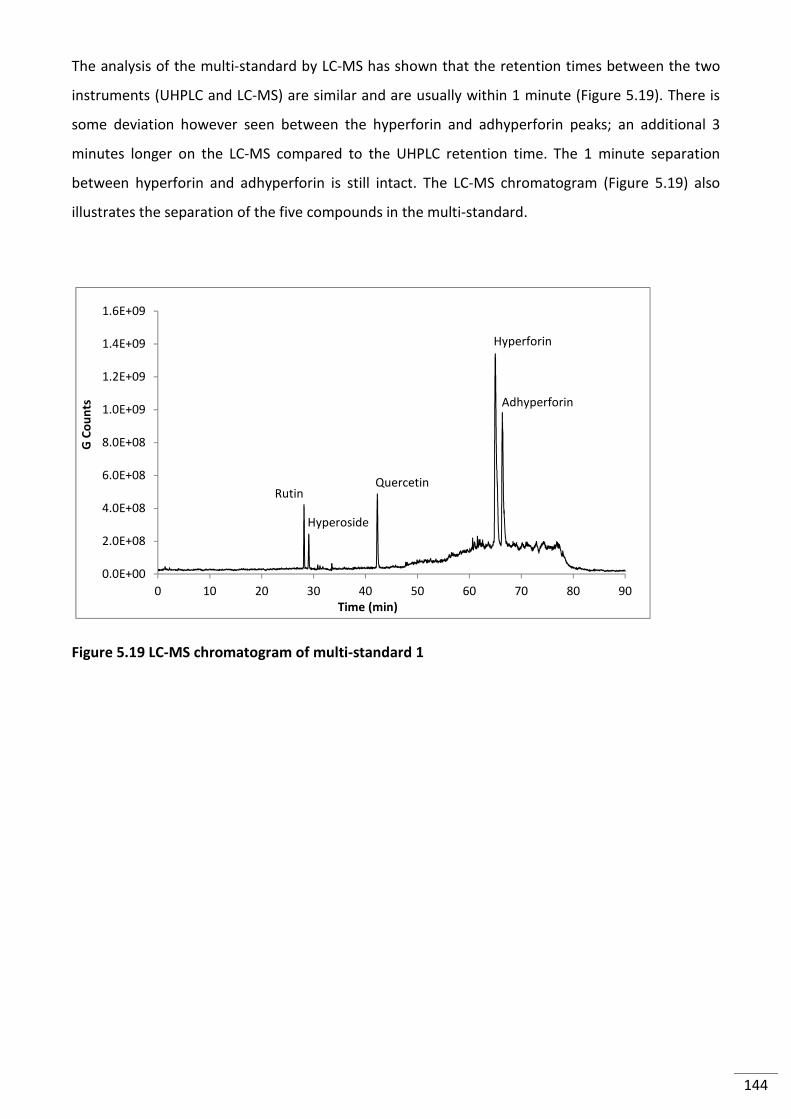
144
The analysis of the multi-standard by LC-MS has shown that the retention times between the two
instruments (UHPLC and LC-MS) are similar and are usually within 1 minute (Figure 5.19). There is
some deviation however seen between the hyperforin and adhyperforin peaks; an additional 3
minutes longer on the LC-MS compared to the UHPLC retention time. The 1 minute separation
between hyperforin and adhyperforin is still intact. The LC-MS chromatogram (Figure 5.19) also
illustrates the separation of the five compounds in the multi-standard.
Figure 5.19 LC-MS chromatogram of multi-standard 1
0.0E+00
2.0E+08
4.0E+08
6.0E+08
8.0E+08
1.0E+09
1.2E+09
1.4E+09
1.6E+09
0 10 20 30 40 50 60 70 80 90
G C
ou
nts
Time (min)
Rutin
Hyperoside
Quercetin
Hyperforin
Adhyperforin
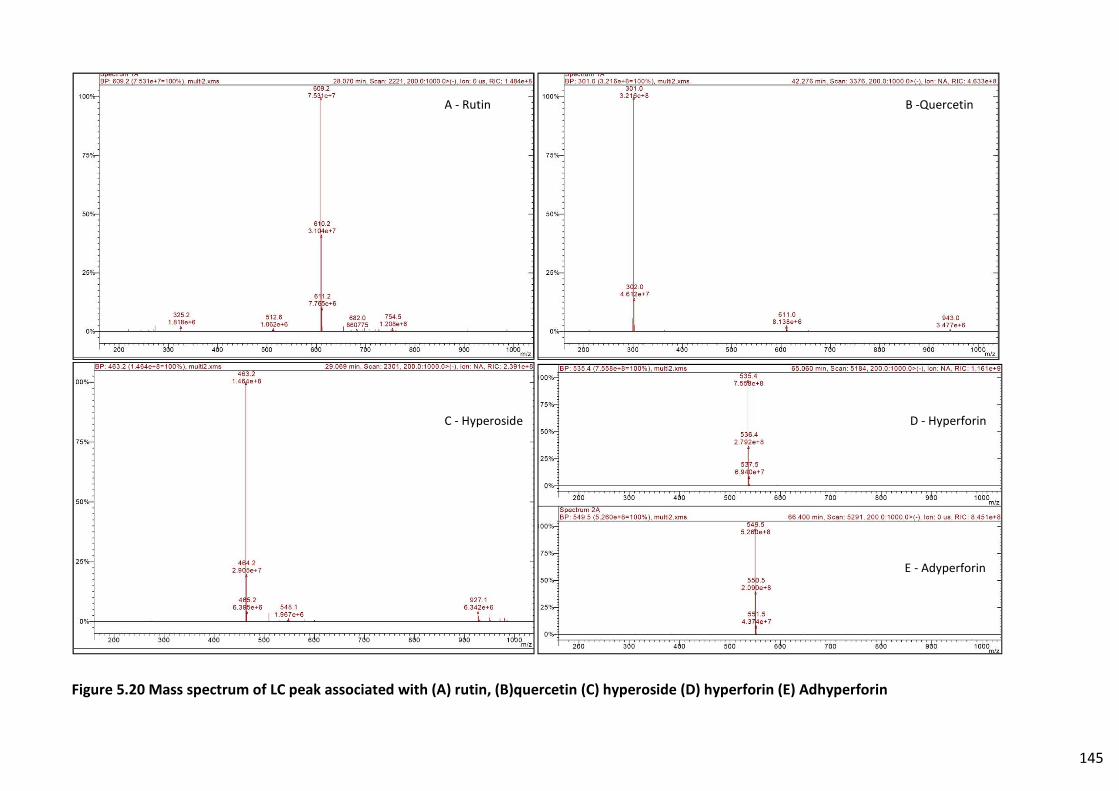
145
Figure 5.20 Mass spectrum of LC peak associated with (A) rutin, (B)quercetin (C) hyperoside (D) hyperforin (E) Adhyperforin
A - Rutin B -Quercetin
C - Hyperoside D - Hyperforin
E - Adyperforin
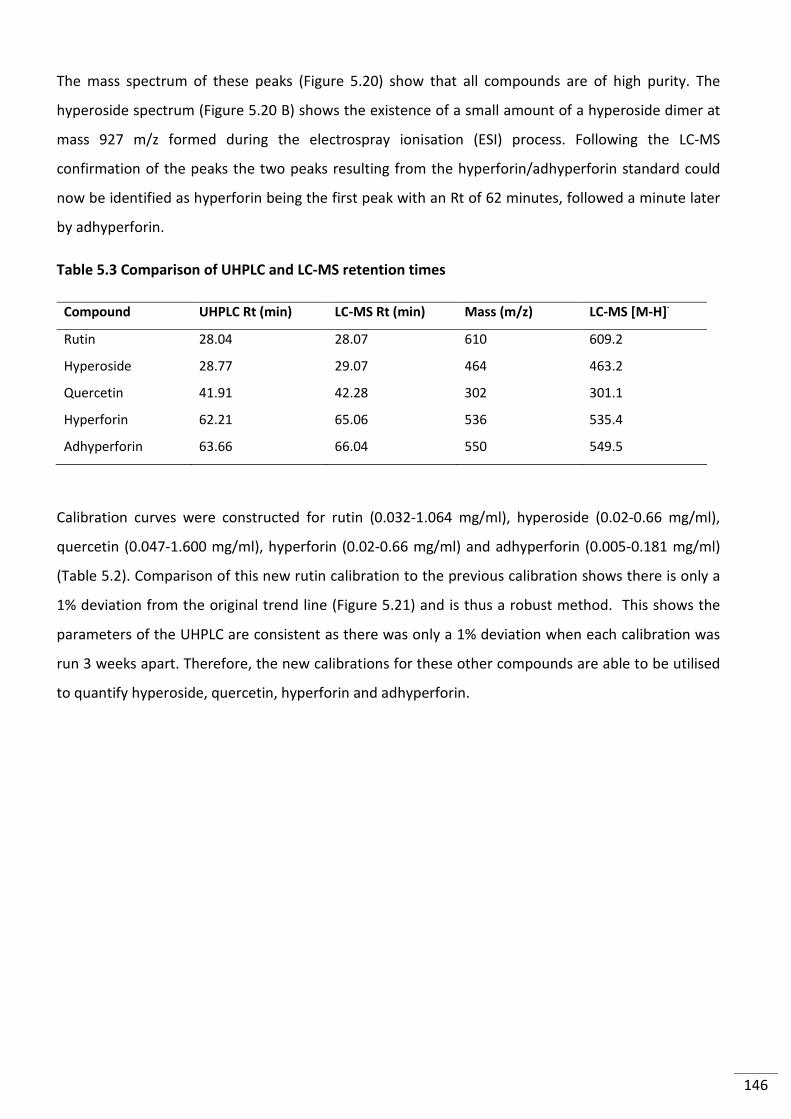
146
The mass spectrum of these peaks (Figure 5.20) show that all compounds are of high purity. The
hyperoside spectrum (Figure 5.20 B) shows the existence of a small amount of a hyperoside dimer at
mass 927 m/z formed during the electrospray ionisation (ESI) process. Following the LC-MS
confirmation of the peaks the two peaks resulting from the hyperforin/adhyperforin standard could
now be identified as hyperforin being the first peak with an Rt of 62 minutes, followed a minute later
by adhyperforin.
Table 5.3 Comparison of UHPLC and LC-MS retention times
Compound UHPLC Rt (min) LC-MS Rt (min) Mass (m/z) LC-MS [M-H]-
Rutin 28.04 28.07 610 609.2
Hyperoside 28.77 29.07 464 463.2
Quercetin 41.91 42.28 302 301.1
Hyperforin 62.21 65.06 536 535.4
Adhyperforin 63.66 66.04 550 549.5
Calibration curves were constructed for rutin (0.032-1.064 mg/ml), hyperoside (0.02-0.66 mg/ml),
quercetin (0.047-1.600 mg/ml), hyperforin (0.02-0.66 mg/ml) and adhyperforin (0.005-0.181 mg/ml)
(Table 5.2). Comparison of this new rutin calibration to the previous calibration shows there is only a
1% deviation from the original trend line (Figure 5.21) and is thus a robust method. This shows the
parameters of the UHPLC are consistent as there was only a 1% deviation when each calibration was
run 3 weeks apart. Therefore, the new calibrations for these other compounds are able to be utilised
to quantify hyperoside, quercetin, hyperforin and adhyperforin.
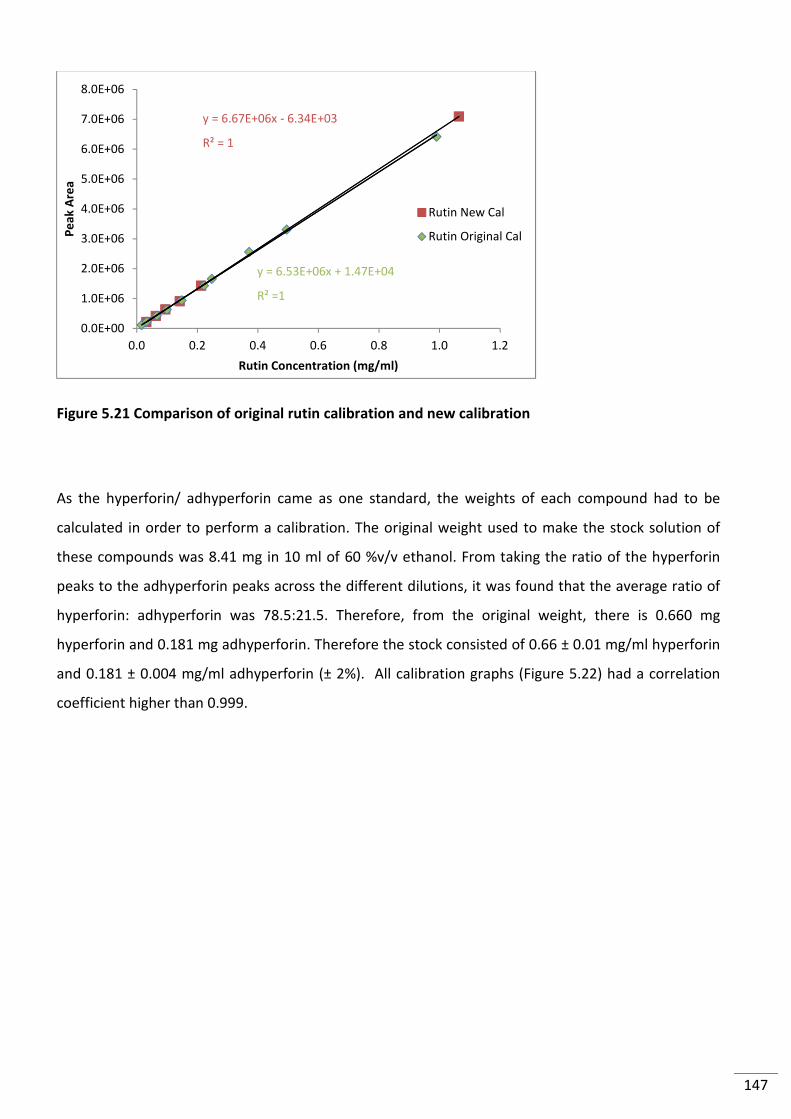
147
Figure 5.21 Comparison of original rutin calibration and new calibration
As the hyperforin/ adhyperforin came as one standard, the weights of each compound had to be
calculated in order to perform a calibration. The original weight used to make the stock solution of
these compounds was 8.41 mg in 10 ml of 60 %v/v ethanol. From taking the ratio of the hyperforin
peaks to the adhyperforin peaks across the different dilutions, it was found that the average ratio of
hyperforin: adhyperforin was 78.5:21.5. Therefore, from the original weight, there is 0.660 mg
hyperforin and 0.181 mg adhyperforin. Therefore the stock consisted of 0.66 ± 0.01 mg/ml hyperforin
and 0.181 ± 0.004 mg/ml adhyperforin (± 2%). All calibration graphs (Figure 5.22) had a correlation
coefficient higher than 0.999.
0.0E+00
1.0E+06
2.0E+06
3.0E+06
4.0E+06
5.0E+06
6.0E+06
7.0E+06
8.0E+06
0.0 0.2 0.4 0.6 0.8 1.0 1.2
Pe
ak
Are
a
Rutin Concentration (mg/ml)
Rutin New Cal
Rutin Original Cal
y = 6.67E+06x - 6.34E+03
R² = 1
y = 6.53E+06x + 1.47E+04
R² =1
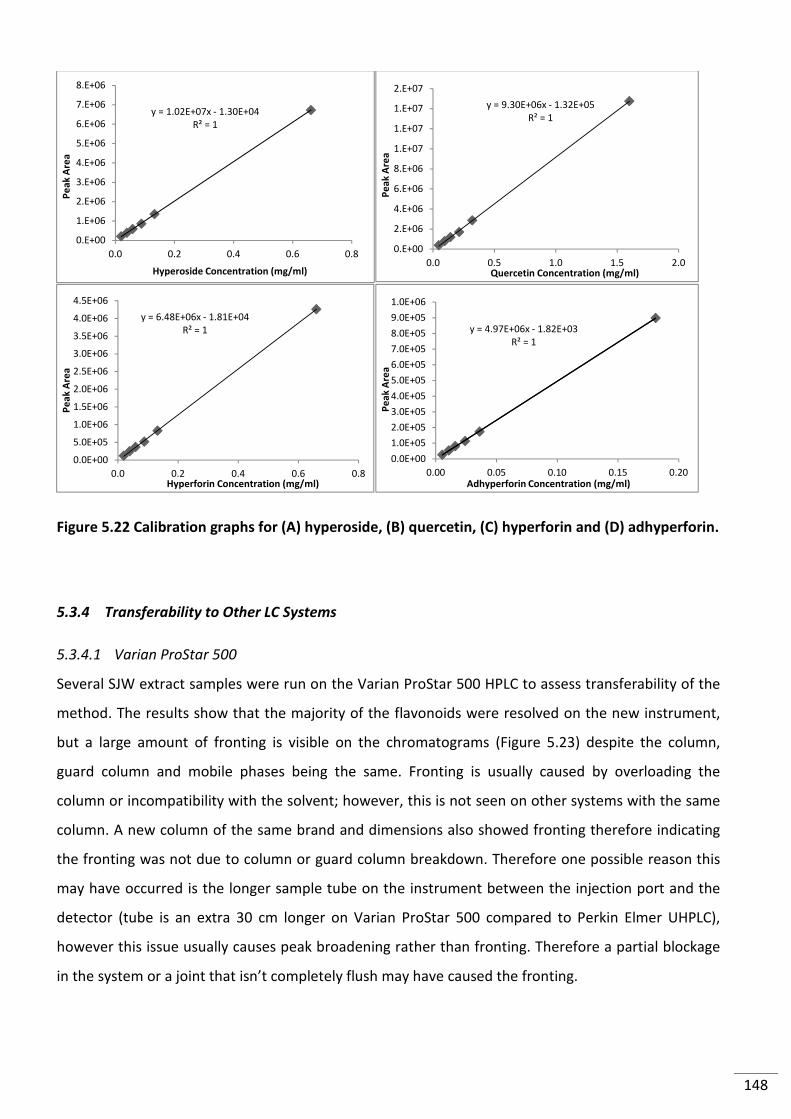
148
Figure 5.22 Calibration graphs for (A) hyperoside, (B) quercetin, (C) hyperforin and (D) adhyperforin.
5.3.4 Transferability to Other LC Systems
5.3.4.1 Varian ProStar 500
Several SJW extract samples were run on the Varian ProStar 500 HPLC to assess transferability of the
method. The results show that the majority of the flavonoids were resolved on the new instrument,
but a large amount of fronting is visible on the chromatograms (Figure 5.23) despite the column,
guard column and mobile phases being the same. Fronting is usually caused by overloading the
column or incompatibility with the solvent; however, this is not seen on other systems with the same
column. A new column of the same brand and dimensions also showed fronting therefore indicating
the fronting was not due to column or guard column breakdown. Therefore one possible reason this
may have occurred is the longer sample tube on the instrument between the injection port and the
detector (tube is an extra 30 cm longer on Varian ProStar 500 compared to Perkin Elmer UHPLC),
however this issue usually causes peak broadening rather than fronting. Therefore a partial blockage
in the system or a joint that isn’t completely flush may have caused the fronting.
y = 1.02E+07x - 1.30E+04R² = 1
0.E+00
1.E+06
2.E+06
3.E+06
4.E+06
5.E+06
6.E+06
7.E+06
8.E+06
0.0 0.2 0.4 0.6 0.8
Pe
ak
Are
a
Hyperoside Concentration (mg/ml)
y = 9.30E+06x - 1.32E+05R² = 1
0.E+00
2.E+06
4.E+06
6.E+06
8.E+06
1.E+07
1.E+07
1.E+07
2.E+07
0.0 0.5 1.0 1.5 2.0
Pe
ak
Are
a
Quercetin Concentration (mg/ml)
y = 6.48E+06x - 1.81E+04R² = 1
0.0E+00
5.0E+05
1.0E+06
1.5E+06
2.0E+06
2.5E+06
3.0E+06
3.5E+06
4.0E+06
4.5E+06
0.0 0.2 0.4 0.6 0.8
Pe
ak
Are
a
Hyperforin Concentration (mg/ml)
y = 4.97E+06x - 1.82E+03R² = 1
0.0E+00
1.0E+05
2.0E+05
3.0E+05
4.0E+05
5.0E+05
6.0E+05
7.0E+05
8.0E+05
9.0E+05
1.0E+06
0.00 0.05 0.10 0.15 0.20
Pe
ak
Are
a
Adhyperforin Concentration (mg/ml)
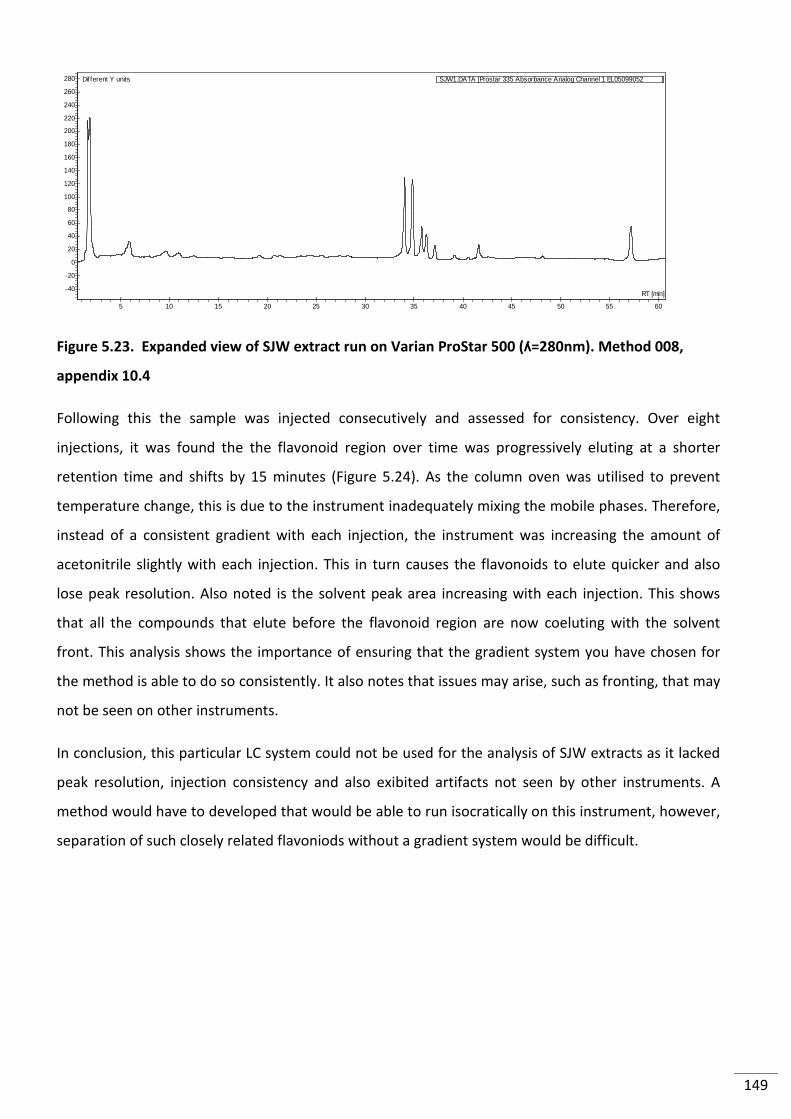
149
Figure 5.23. Expanded view of SJW extract run on Varian ProStar 500 (ʎ=280nm). Method 008,
appendix 10.4
Following this the sample was injected consecutively and assessed for consistency. Over eight
injections, it was found the the flavonoid region over time was progressively eluting at a shorter
retention time and shifts by 15 minutes (Figure 5.24). As the column oven was utilised to prevent
temperature change, this is due to the instrument inadequately mixing the mobile phases. Therefore,
instead of a consistent gradient with each injection, the instrument was increasing the amount of
acetonitrile slightly with each injection. This in turn causes the flavonoids to elute quicker and also
lose peak resolution. Also noted is the solvent peak area increasing with each injection. This shows
that all the compounds that elute before the flavonoid region are now coeluting with the solvent
front. This analysis shows the importance of ensuring that the gradient system you have chosen for
the method is able to do so consistently. It also notes that issues may arise, such as fronting, that may
not be seen on other instruments.
In conclusion, this particular LC system could not be used for the analysis of SJW extracts as it lacked
peak resolution, injection consistency and also exibited artifacts not seen by other instruments. A
method would have to developed that would be able to run isocratically on this instrument, however,
separation of such closely related flavoniods without a gradient system would be difficult.
60555045403530252015105
280
260
240
220
200
180
160
140
120
100
80
60
40
20
0
-20
-40RT [min]
SJW1.DATA [Prostar 335 Absorbance Analog Channel 1 EL05099052 ]Different Y units
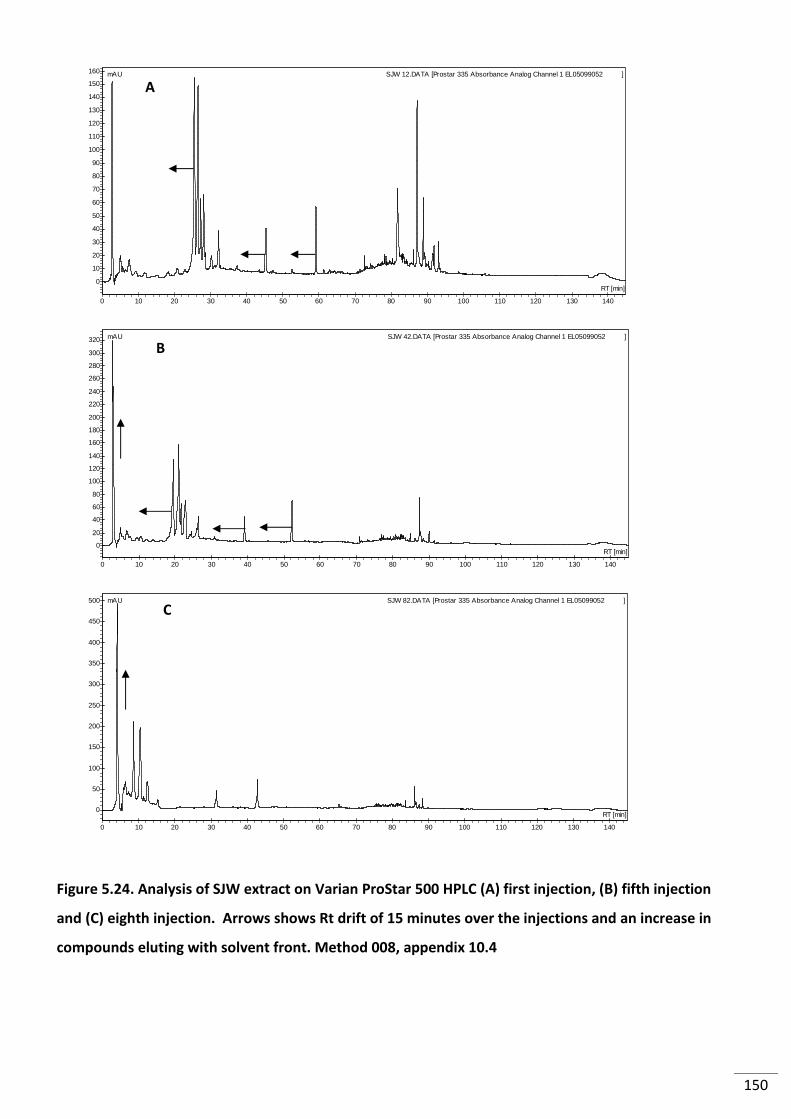
150
1401301201101009080706050403020100
160
150
140
130
120
110
100
90
80
70
60
50
40
30
20
10
0RT [min]
mAU SJW 12.DATA [Prostar 335 Absorbance Analog Channel 1 EL05099052 ]
1401301201101009080706050403020100
500
450
400
350
300
250
200
150
100
50
0RT [min]
mAU SJW 82.DATA [Prostar 335 Absorbance Analog Channel 1 EL05099052 ]
1401301201101009080706050403020100
320
300
280
260
240
220
200
180
160
140
120
100
80
60
40
20
0RT [min]
mAU SJW 42.DATA [Prostar 335 Absorbance Analog Channel 1 EL05099052 ]
Figure 5.24. Analysis of SJW extract on Varian ProStar 500 HPLC (A) first injection, (B) fifth injection
and (C) eighth injection. Arrows shows Rt drift of 15 minutes over the injections and an increase in
compounds eluting with solvent front. Method 008, appendix 10.4
C
B
A
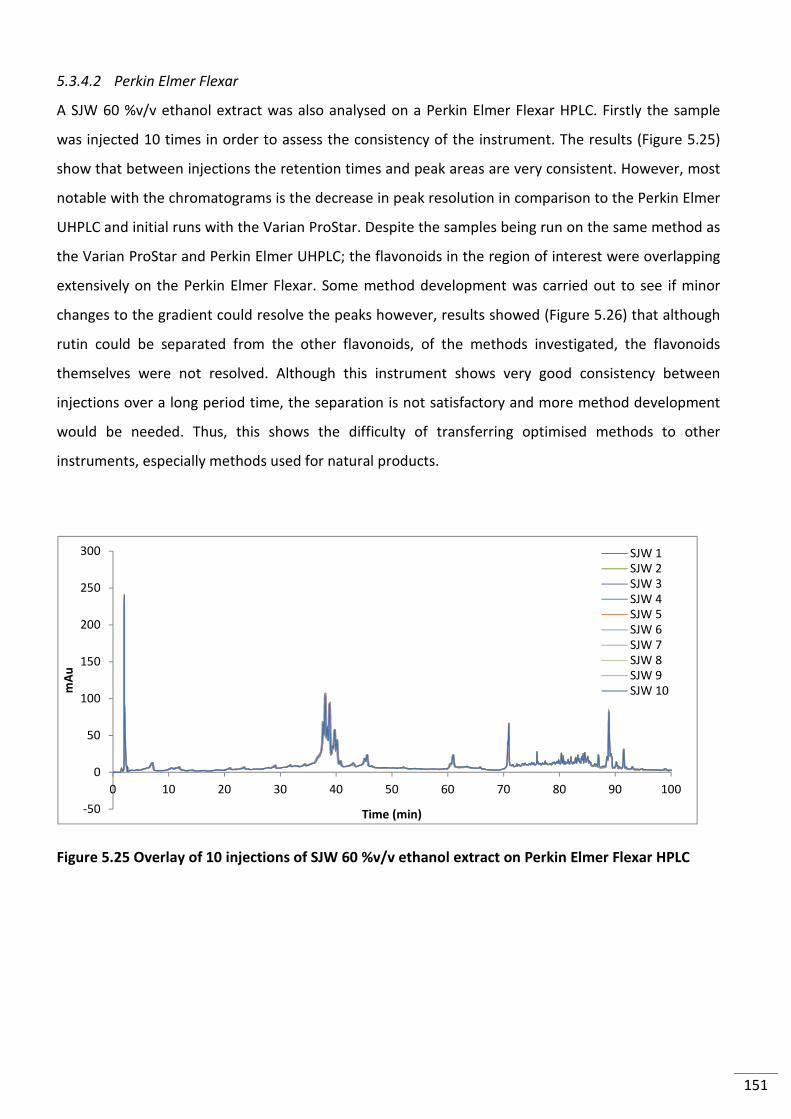
151
5.3.4.2 Perkin Elmer Flexar
A SJW 60 %v/v ethanol extract was also analysed on a Perkin Elmer Flexar HPLC. Firstly the sample
was injected 10 times in order to assess the consistency of the instrument. The results (Figure 5.25)
show that between injections the retention times and peak areas are very consistent. However, most
notable with the chromatograms is the decrease in peak resolution in comparison to the Perkin Elmer
UHPLC and initial runs with the Varian ProStar. Despite the samples being run on the same method as
the Varian ProStar and Perkin Elmer UHPLC; the flavonoids in the region of interest were overlapping
extensively on the Perkin Elmer Flexar. Some method development was carried out to see if minor
changes to the gradient could resolve the peaks however, results showed (Figure 5.26) that although
rutin could be separated from the other flavonoids, of the methods investigated, the flavonoids
themselves were not resolved. Although this instrument shows very good consistency between
injections over a long period time, the separation is not satisfactory and more method development
would be needed. Thus, this shows the difficulty of transferring optimised methods to other
instruments, especially methods used for natural products.
Figure 5.25 Overlay of 10 injections of SJW 60 %v/v ethanol extract on Perkin Elmer Flexar HPLC
-50
0
50
100
150
200
250
300
0 10 20 30 40 50 60 70 80 90 100
mA
u
Time (min)
SJW 1SJW 2SJW 3SJW 4SJW 5SJW 6SJW 7SJW 8SJW 9SJW 10
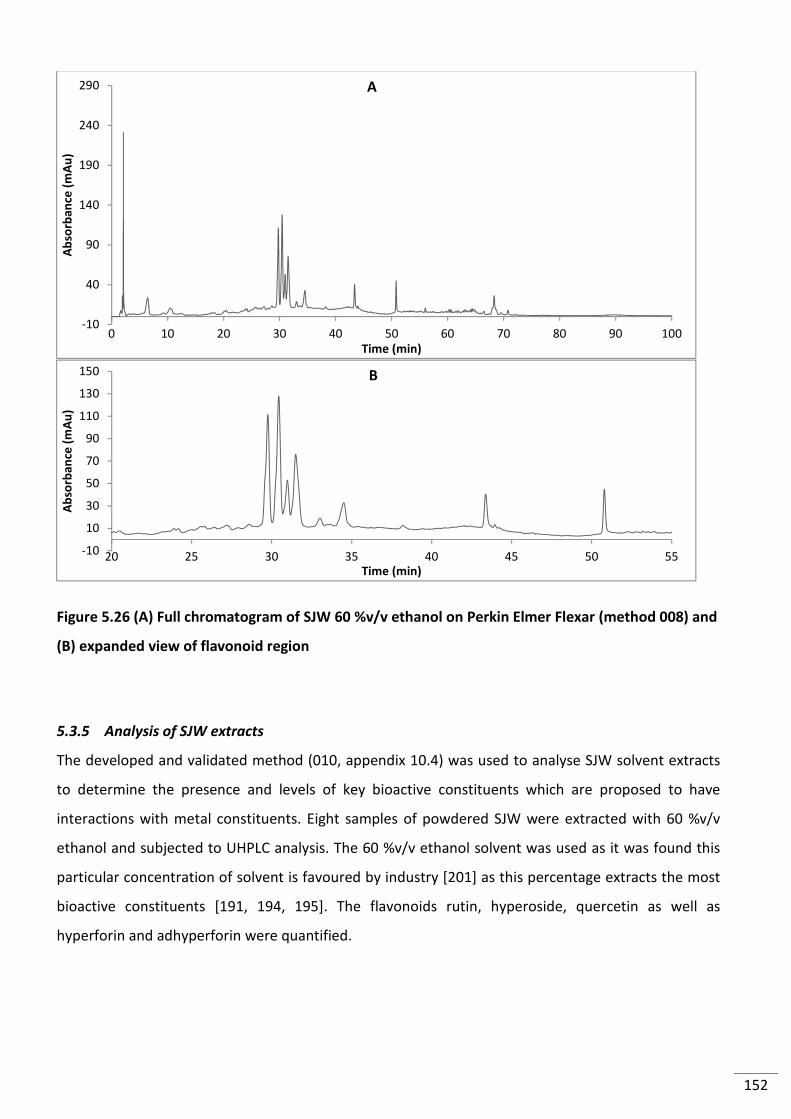
152
Figure 5.26 (A) Full chromatogram of SJW 60 %v/v ethanol on Perkin Elmer Flexar (method 008) and
(B) expanded view of flavonoid region
5.3.5 Analysis of SJW extracts
The developed and validated method (010, appendix 10.4) was used to analyse SJW solvent extracts
to determine the presence and levels of key bioactive constituents which are proposed to have
interactions with metal constituents. Eight samples of powdered SJW were extracted with 60 %v/v
ethanol and subjected to UHPLC analysis. The 60 %v/v ethanol solvent was used as it was found this
particular concentration of solvent is favoured by industry [201] as this percentage extracts the most
bioactive constituents [191, 194, 195]. The flavonoids rutin, hyperoside, quercetin as well as
hyperforin and adhyperforin were quantified.
-10
40
90
140
190
240
290
0 10 20 30 40 50 60 70 80 90 100
Ab
sorb
an
ce (
mA
u)
Time (min)
-10
10
30
50
70
90
110
130
150
20 25 30 35 40 45 50 55
Ab
sorb
an
ce (
mA
u)
Time (min)
A
B
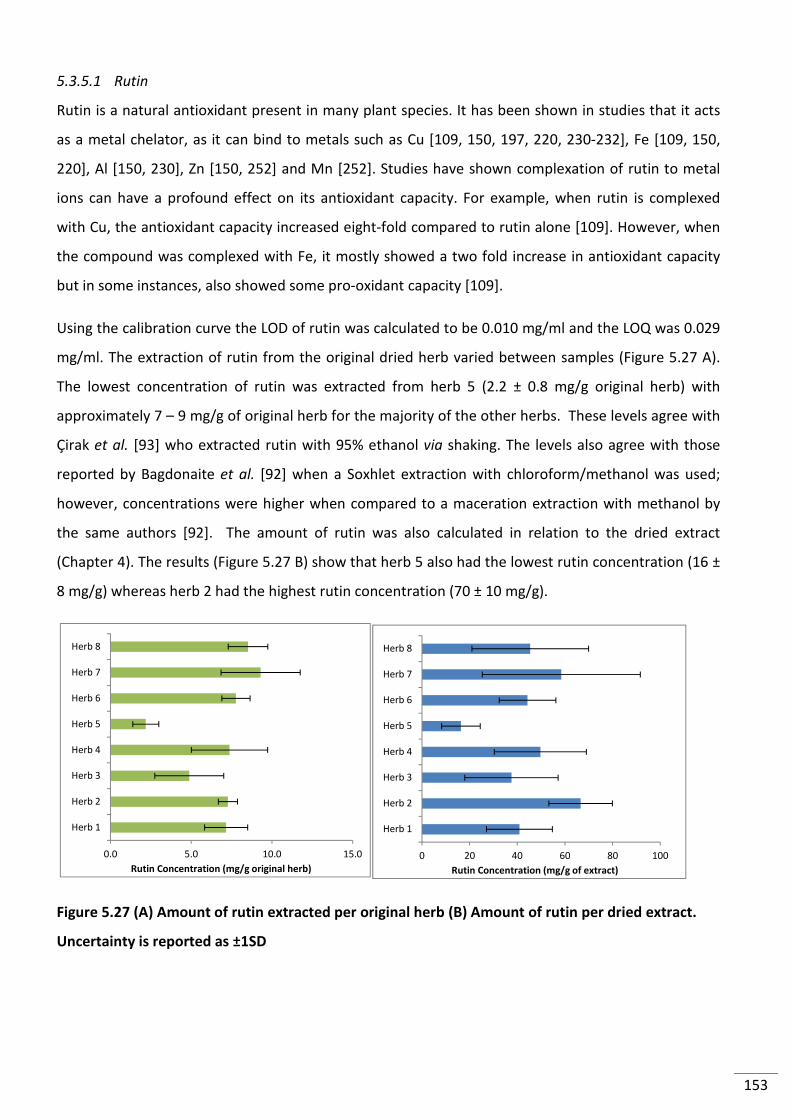
153
5.3.5.1 Rutin
Rutin is a natural antioxidant present in many plant species. It has been shown in studies that it acts
as a metal chelator, as it can bind to metals such as Cu [109, 150, 197, 220, 230-232], Fe [109, 150,
220], Al [150, 230], Zn [150, 252] and Mn [252]. Studies have shown complexation of rutin to metal
ions can have a profound effect on its antioxidant capacity. For example, when rutin is complexed
with Cu, the antioxidant capacity increased eight-fold compared to rutin alone [109]. However, when
the compound was complexed with Fe, it mostly showed a two fold increase in antioxidant capacity
but in some instances, also showed some pro-oxidant capacity [109].
Using the calibration curve the LOD of rutin was calculated to be 0.010 mg/ml and the LOQ was 0.029
mg/ml. The extraction of rutin from the original dried herb varied between samples (Figure 5.27 A).
The lowest concentration of rutin was extracted from herb 5 (2.2 ± 0.8 mg/g original herb) with
approximately 7 – 9 mg/g of original herb for the majority of the other herbs. These levels agree with
Çirak et al. [93] who extracted rutin with 95% ethanol via shaking. The levels also agree with those
reported by Bagdonaite et al. [92] when a Soxhlet extraction with chloroform/methanol was used;
however, concentrations were higher when compared to a maceration extraction with methanol by
the same authors [92]. The amount of rutin was also calculated in relation to the dried extract
(Chapter 4). The results (Figure 5.27 B) show that herb 5 also had the lowest rutin concentration (16 ±
8 mg/g) whereas herb 2 had the highest rutin concentration (70 ± 10 mg/g).
Figure 5.27 (A) Amount of rutin extracted per original herb (B) Amount of rutin per dried extract.
Uncertainty is reported as ±1SD
0.0 5.0 10.0 15.0
Herb 1
Herb 2
Herb 3
Herb 4
Herb 5
Herb 6
Herb 7
Herb 8
Rutin Concentration (mg/g original herb)
0 20 40 60 80 100
Herb 1
Herb 2
Herb 3
Herb 4
Herb 5
Herb 6
Herb 7
Herb 8
Rutin Concentration (mg/g of extract)
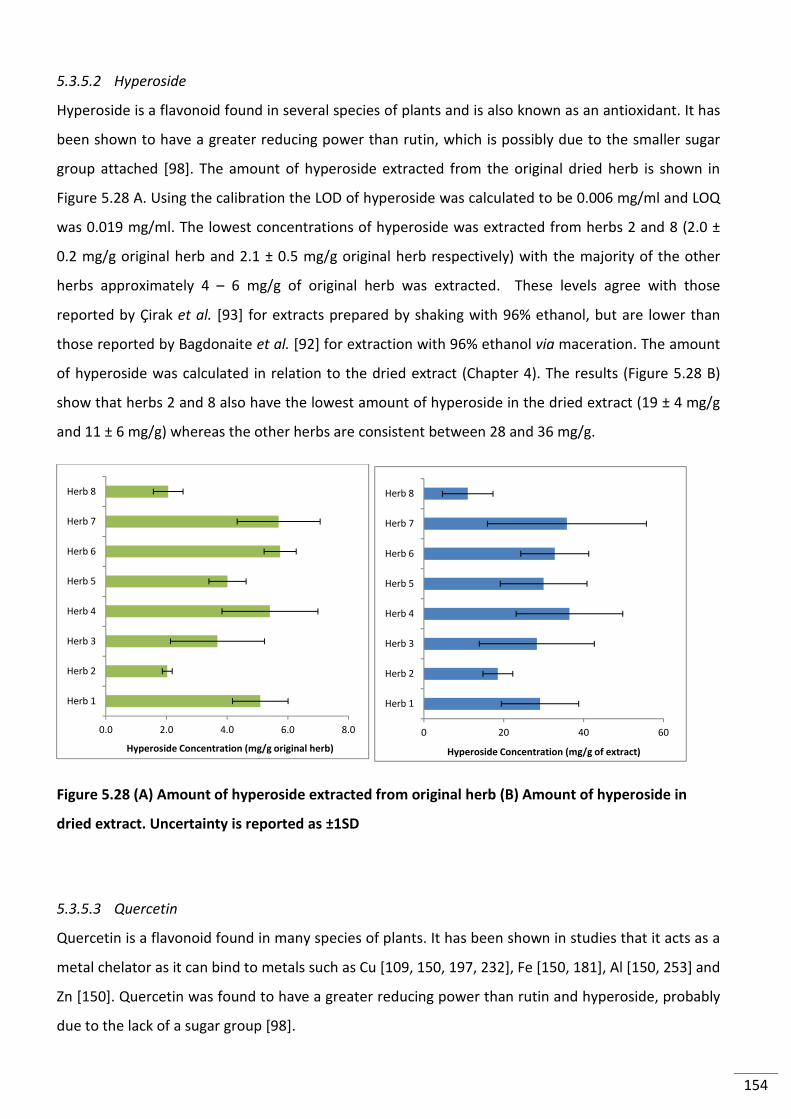
154
5.3.5.2 Hyperoside
Hyperoside is a flavonoid found in several species of plants and is also known as an antioxidant. It has
been shown to have a greater reducing power than rutin, which is possibly due to the smaller sugar
group attached [98]. The amount of hyperoside extracted from the original dried herb is shown in
Figure 5.28 A. Using the calibration the LOD of hyperoside was calculated to be 0.006 mg/ml and LOQ
was 0.019 mg/ml. The lowest concentrations of hyperoside was extracted from herbs 2 and 8 (2.0 ±
0.2 mg/g original herb and 2.1 ± 0.5 mg/g original herb respectively) with the majority of the other
herbs approximately 4 – 6 mg/g of original herb was extracted. These levels agree with those
reported by Çirak et al. [93] for extracts prepared by shaking with 96% ethanol, but are lower than
those reported by Bagdonaite et al. [92] for extraction with 96% ethanol via maceration. The amount
of hyperoside was calculated in relation to the dried extract (Chapter 4). The results (Figure 5.28 B)
show that herbs 2 and 8 also have the lowest amount of hyperoside in the dried extract (19 ± 4 mg/g
and 11 ± 6 mg/g) whereas the other herbs are consistent between 28 and 36 mg/g.
Figure 5.28 (A) Amount of hyperoside extracted from original herb (B) Amount of hyperoside in
dried extract. Uncertainty is reported as ±1SD
5.3.5.3 Quercetin
Quercetin is a flavonoid found in many species of plants. It has been shown in studies that it acts as a
metal chelator as it can bind to metals such as Cu [109, 150, 197, 232], Fe [150, 181], Al [150, 253] and
Zn [150]. Quercetin was found to have a greater reducing power than rutin and hyperoside, probably
due to the lack of a sugar group [98].
0.0 2.0 4.0 6.0 8.0
Herb 1
Herb 2
Herb 3
Herb 4
Herb 5
Herb 6
Herb 7
Herb 8
Hyperoside Concentration (mg/g original herb)
0 20 40 60
Herb 1
Herb 2
Herb 3
Herb 4
Herb 5
Herb 6
Herb 7
Herb 8
Hyperoside Concentration (mg/g of extract)
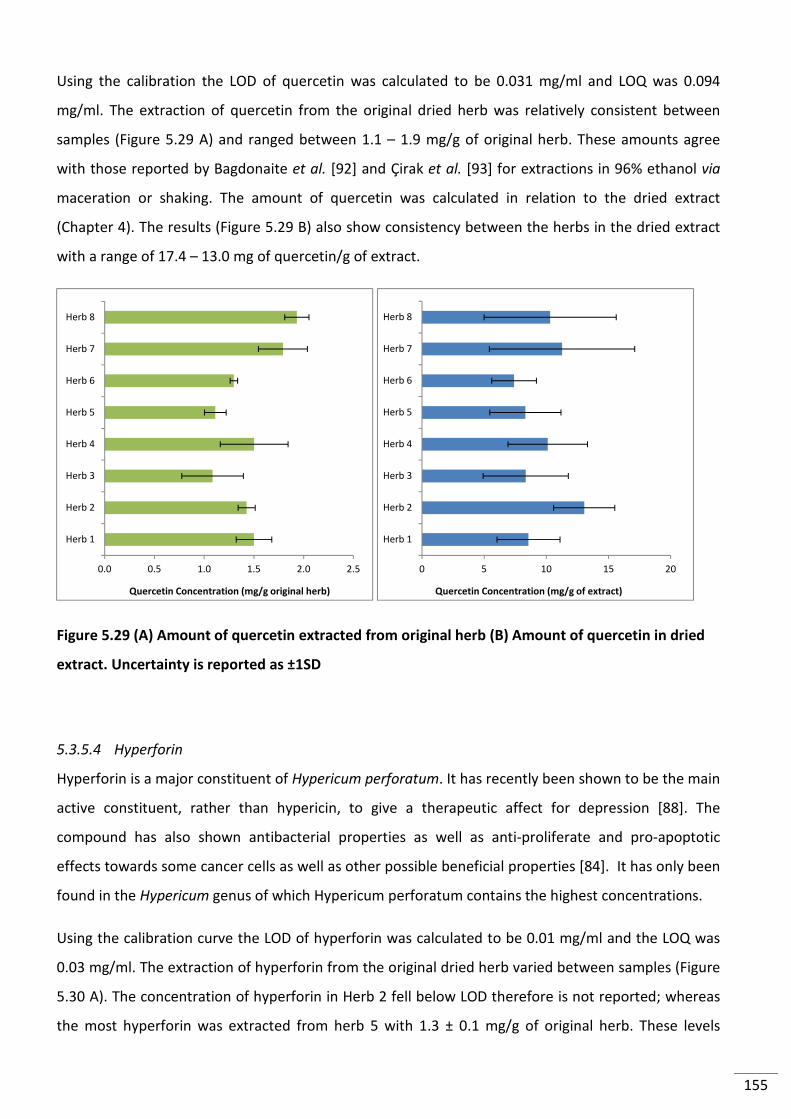
155
Using the calibration the LOD of quercetin was calculated to be 0.031 mg/ml and LOQ was 0.094
mg/ml. The extraction of quercetin from the original dried herb was relatively consistent between
samples (Figure 5.29 A) and ranged between 1.1 – 1.9 mg/g of original herb. These amounts agree
with those reported by Bagdonaite et al. [92] and Çirak et al. [93] for extractions in 96% ethanol via
maceration or shaking. The amount of quercetin was calculated in relation to the dried extract
(Chapter 4). The results (Figure 5.29 B) also show consistency between the herbs in the dried extract
with a range of 17.4 – 13.0 mg of quercetin/g of extract.
Figure 5.29 (A) Amount of quercetin extracted from original herb (B) Amount of quercetin in dried
extract. Uncertainty is reported as ±1SD
5.3.5.4 Hyperforin
Hyperforin is a major constituent of Hypericum perforatum. It has recently been shown to be the main
active constituent, rather than hypericin, to give a therapeutic affect for depression [88]. The
compound has also shown antibacterial properties as well as anti-proliferate and pro-apoptotic
effects towards some cancer cells as well as other possible beneficial properties [84]. It has only been
found in the Hypericum genus of which Hypericum perforatum contains the highest concentrations.
Using the calibration curve the LOD of hyperforin was calculated to be 0.01 mg/ml and the LOQ was
0.03 mg/ml. The extraction of hyperforin from the original dried herb varied between samples (Figure
5.30 A). The concentration of hyperforin in Herb 2 fell below LOD therefore is not reported; whereas
the most hyperforin was extracted from herb 5 with 1.3 ± 0.1 mg/g of original herb. These levels
0.0 0.5 1.0 1.5 2.0 2.5
Herb 1
Herb 2
Herb 3
Herb 4
Herb 5
Herb 6
Herb 7
Herb 8
Quercetin Concentration (mg/g original herb)
0 5 10 15 20
Herb 1
Herb 2
Herb 3
Herb 4
Herb 5
Herb 6
Herb 7
Herb 8
Quercetin Concentration (mg/g of extract)
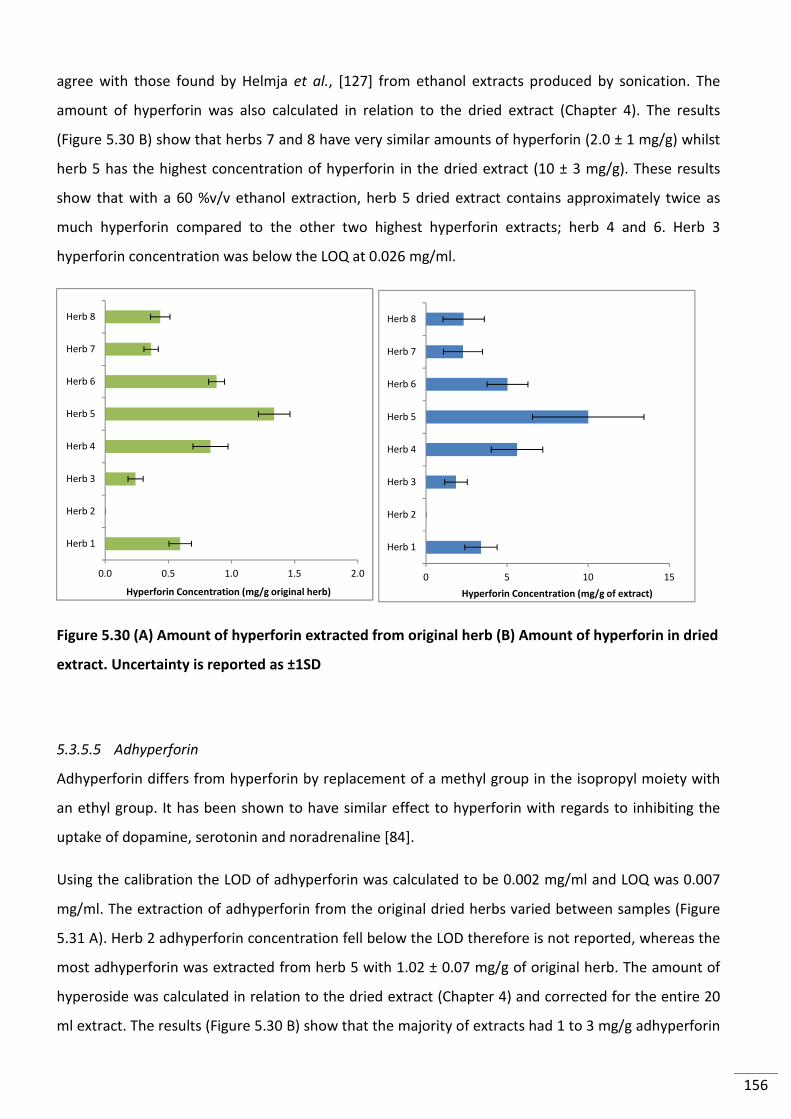
156
agree with those found by Helmja et al., [127] from ethanol extracts produced by sonication. The
amount of hyperforin was also calculated in relation to the dried extract (Chapter 4). The results
(Figure 5.30 B) show that herbs 7 and 8 have very similar amounts of hyperforin (2.0 ± 1 mg/g) whilst
herb 5 has the highest concentration of hyperforin in the dried extract (10 ± 3 mg/g). These results
show that with a 60 %v/v ethanol extraction, herb 5 dried extract contains approximately twice as
much hyperforin compared to the other two highest hyperforin extracts; herb 4 and 6. Herb 3
hyperforin concentration was below the LOQ at 0.026 mg/ml.
Figure 5.30 (A) Amount of hyperforin extracted from original herb (B) Amount of hyperforin in dried
extract. Uncertainty is reported as ±1SD
5.3.5.5 Adhyperforin
Adhyperforin differs from hyperforin by replacement of a methyl group in the isopropyl moiety with
an ethyl group. It has been shown to have similar effect to hyperforin with regards to inhibiting the
uptake of dopamine, serotonin and noradrenaline [84].
Using the calibration the LOD of adhyperforin was calculated to be 0.002 mg/ml and LOQ was 0.007
mg/ml. The extraction of adhyperforin from the original dried herbs varied between samples (Figure
5.31 A). Herb 2 adhyperforin concentration fell below the LOD therefore is not reported, whereas the
most adhyperforin was extracted from herb 5 with 1.02 ± 0.07 mg/g of original herb. The amount of
hyperoside was calculated in relation to the dried extract (Chapter 4) and corrected for the entire 20
ml extract. The results (Figure 5.30 B) show that the majority of extracts had 1 to 3 mg/g adhyperforin
0.0 0.5 1.0 1.5 2.0
Herb 1
Herb 2
Herb 3
Herb 4
Herb 5
Herb 6
Herb 7
Herb 8
Hyperforin Concentration (mg/g original herb)
0 5 10 15
Herb 1
Herb 2
Herb 3
Herb 4
Herb 5
Herb 6
Herb 7
Herb 8
Hyperforin Concentration (mg/g of extract)
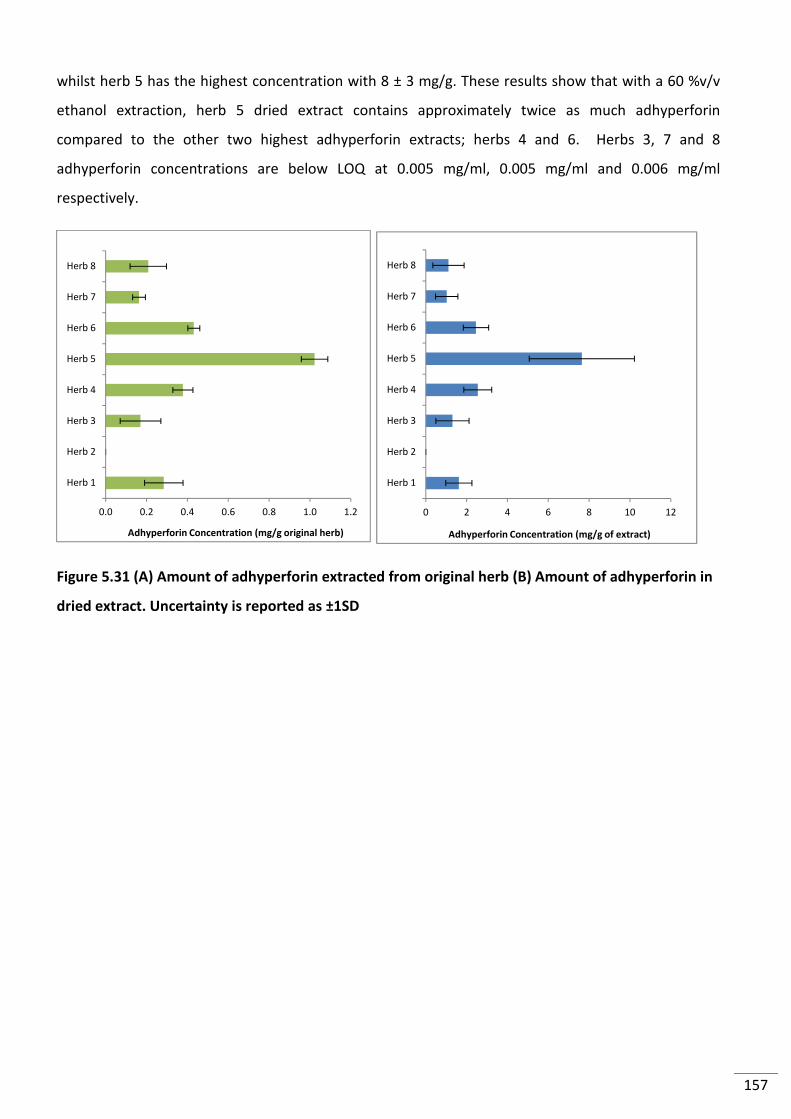
157
whilst herb 5 has the highest concentration with 8 ± 3 mg/g. These results show that with a 60 %v/v
ethanol extraction, herb 5 dried extract contains approximately twice as much adhyperforin
compared to the other two highest adhyperforin extracts; herbs 4 and 6. Herbs 3, 7 and 8
adhyperforin concentrations are below LOQ at 0.005 mg/ml, 0.005 mg/ml and 0.006 mg/ml
respectively.
Figure 5.31 (A) Amount of adhyperforin extracted from original herb (B) Amount of adhyperforin in
dried extract. Uncertainty is reported as ±1SD
0.0 0.2 0.4 0.6 0.8 1.0 1.2
Herb 1
Herb 2
Herb 3
Herb 4
Herb 5
Herb 6
Herb 7
Herb 8
Adhyperforin Concentration (mg/g original herb)
0 2 4 6 8 10 12
Herb 1
Herb 2
Herb 3
Herb 4
Herb 5
Herb 6
Herb 7
Herb 8
Adhyperforin Concentration (mg/g of extract)
158
5.4 Conclusions
The study of rutin and Cu complexes showed that this combination of flavonoid and metal easily
forms and can do so at room temperature. However, although complexation can occur in methanol, it
was found that on introduction of a 0.1 %v/v formic acid mobile phase (either 0.1 %v/v formic acid in
water or acetonitrile), the majority of complex present dissociates due to the low pH. Without the
presence of formic acid, it was found a small amount of complex still remained; therefore the mobile
phase is unsuitable for analysis of the rutin-Cu complex. In order to thoroughly investigate these
complexes, a method would need to be developed in which the mobile phases are as neutral as
possible, buffer based or methanol based. Another consideration is the tubing in the instrument. The
UHPLC used in this analysis has metal tubing, and thus the complexes could interact with it and form
much broader peaks. To overcome this, an inert system fitted with Teflon tubing is recommended. An
LC-ICP-MS would be the most suitable instrument for the analysis of metal complexes as it could
potentially separate the uncomplexed and complexed rutin and also provide estimates for the
concentrations complexed. As the complexation occurred in methanol at room temperature, this
leads to the conclusion that in methanol extracts of SJW in industry, such flavonoid-metals complexes
may occur in the extracts. Previous work (chapter 4) had shown that the similar solvent ethanol was
able to extract and pre-concentrate Cu when 60 %v/v ethanol is used. Therefore, although this
avenue of research could not be fully investigated, it does show there is a possibility of these
complexes being present in SJW extracts. This gives for the future an exciting opportunity to identify
which are present and in what quantities.
The analysis of the flavonoid content in eight herbs of SJW showed that they are readily transferred
from the plant in 60 %v/v ethanol. The results also showed that generally, there is little variation in
quercetin concentration between SJW samples and that rutin and hyperoside concentrations are also
similar. On the other hand, the concentrations of hyperforin and adhyperforin varied, sometimes by
twice as much, between the herbs and in some cases the observed concentrations were below LOQ
(therefore only general trends could be illustrated for these). Comparison of these values to other
studies is difficult as the bioactive constituents can vary drastically depending on factors such as
geographical origin [92, 93], harvesting time [92, 237, 245] and the extraction process used [113, 191,
241].
159
6 Analysis of Combined Elemental and Chemical Profiles
6.1 Introduction
The interaction of bioactive compounds and metal ions has been discussed in previous sections. Such
complexes have been shown to have three main relationships with bioactive compounds. The first is
the production of such bioactive compounds. Studies with the plant Hypericum perforatum have
shown that, the presence of Cr in the growth medium exhibited an increase of the production of some
hypericins [148], however, in the presence of Ni, an opposite relationship was observed [149]. A
second relationship noted between elements and bioactive compounds is an alteration in bioactivity.
For example, flavonoids such as rutin and quercetin have been shown to bind to metal ions (see
Chapter 5, Table 5.1) and as a result the functions such as antioxidant [109, 150] and anti-
inflammatory [109] properties increased compared to the flavonoid alone or in some causes became
pro-oxidant [109]. A third relationship between elements and bioactive compounds is bioavailability.
It was found that chickens fed an element rich diet in the presence of herbal remedies were able to
uptake more elements into their tissue [151]. Interestingly, the type of herbal medicine depicted the
concentrations of different metals to different tissues. For example, Sage significantly increased levels
of Cu, Fe, Mn, and Zn in chicken liver whereas St. John’s Wort and Small-flowered Willow herb did
not. On the other hand, the presence of SJW significantly increased the concentrations of Zn in
chicken legs and Mn in chicken liver [151].
The relationships with elements and bioactive compound production could be utilised to optimise the
production of hyperforin and other hypericins to increase the production yield each year. Such
elemental relationships with bioavailability and bioactivity could be utilised in order to make herbal
medicines more potent, thus allowing for less product being contained in a dosage. However, in order
to do this more information is needed on these interactions between elemental content and the
bioactive compound content in addition to the normal concentrations of such elements within the
herbal remedies.
In this thesis, Chapter 3 acquired the concentrations of 25 elements in raw herb, tablet and capsule
formulations of SJW (n=54). From this, the elemental profiles of some water and ethanolic extracts
were examined to see how the elements change from raw herb to extracted form. This illustrated that
extraction solvent can greatly influence the elements extracted and could therefore be used for the
preconcentration of certain elements. Chapter 5 then utilised UHPLC in order to quantify some
bioactive compounds contained within some SJW samples. This chapter will focus on correlation
160
analysis in order to indicate if there are any relationships between the bioactive compounds studied
and the elements investigated. The bioactive compounds rutin, hyperoside, quercetin, hyperforin and
adhyperforin were compared to the elements in the original herb as well as those in the dried extract.
However, it is noted that the information generated will be strictly for qualitative purposes. This is
due to the low number of samples (8 herbs), therefore data that fell below LOQ was also utilised.
6.2 Method
6.2.1 Materials
For all materials utilised please see materials sections in Chapter 3, Chapter 4 and Chapter 5.
6.2.2 Elemental Analysis
The elemental profile of eight SJW herbs was collected for total and extracted SJW using Inductively
Coupled Plasma – Optical Emission Spectroscopy (ICP-OES), please see Chapter 3 and Chapter 4 for
full experimental details.
6.2.3 Chemical Analysis
The content of flavonoids rutin, hyperoside and quercetin as well as hyperforin and adhyperforin
were determined using UHPLC for eight herb samples of SJW. Please see Chapter 5 for full
experimental details.
6.2.4 Statistical Analysis
Correlation analyses (CA, Pearson’s) were carried out on the combined data of total metals, extracted
metals and bioactive values for eight SJW herbs, using Excel 2007 (Microsoft).
6.3 Results and Discussion
6.3.1 Elemental Analysis Summary
The elemental concentrations were determined for eight SJW in both the raw herb (please see
Chapter 3) as well as an ethanolic extract (please see Chapter 4). An overview of the elements in the
raw herbs is presented in Table 6.1. All eight herbs had concentrations of the elements As, Be, Hg, In,
Sb and Se below the LOD. Herbs 7 and 8 were the only samples to have concentrations of Co above
LOD whereas herb 2 was the only sample to have detectable levels of Pb and V. Yttrium was detected
in herb samples 2, 5 and 7 and was above LOQ for herb 8.
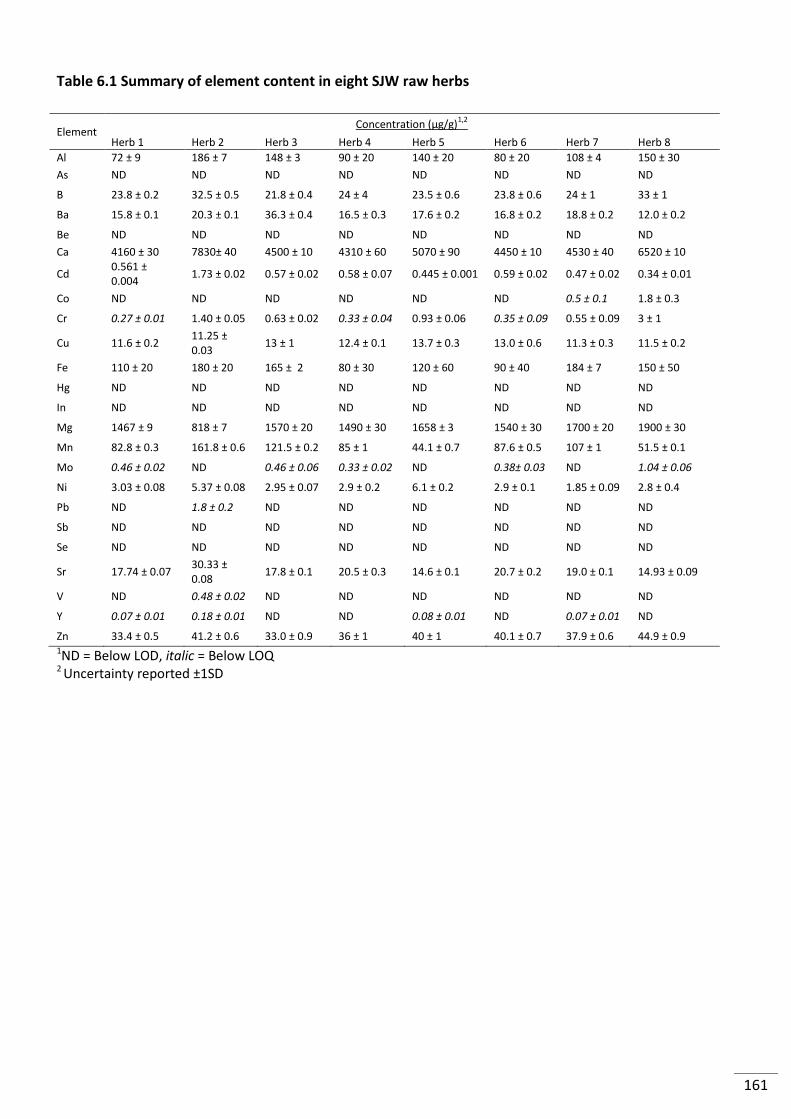
161
Table 6.1 Summary of element content in eight SJW raw herbs
Element Concentration (µg/g)1,2
Herb 1 Herb 2 Herb 3 Herb 4 Herb 5 Herb 6 Herb 7 Herb 8
Al 72 ± 9 186 ± 7 148 ± 3 90 ± 20 140 ± 20 80 ± 20 108 ± 4 150 ± 30
As ND ND ND ND ND ND ND ND
B 23.8 ± 0.2 32.5 ± 0.5 21.8 ± 0.4 24 ± 4 23.5 ± 0.6 23.8 ± 0.6 24 ± 1 33 ± 1
Ba 15.8 ± 0.1 20.3 ± 0.1 36.3 ± 0.4 16.5 ± 0.3 17.6 ± 0.2 16.8 ± 0.2 18.8 ± 0.2 12.0 ± 0.2
Be ND ND ND ND ND ND ND ND
Ca 4160 ± 30 7830± 40 4500 ± 10 4310 ± 60 5070 ± 90 4450 ± 10 4530 ± 40 6520 ± 10
Cd 0.561 ± 0.004
1.73 ± 0.02 0.57 ± 0.02 0.58 ± 0.07 0.445 ± 0.001 0.59 ± 0.02 0.47 ± 0.02 0.34 ± 0.01
Co ND ND ND ND ND ND 0.5 ± 0.1 1.8 ± 0.3
Cr 0.27 ± 0.01 1.40 ± 0.05 0.63 ± 0.02 0.33 ± 0.04 0.93 ± 0.06 0.35 ± 0.09 0.55 ± 0.09 3 ± 1
Cu 11.6 ± 0.2 11.25 ± 0.03
13 ± 1 12.4 ± 0.1 13.7 ± 0.3 13.0 ± 0.6 11.3 ± 0.3 11.5 ± 0.2
Fe 110 ± 20 180 ± 20 165 ± 2 80 ± 30 120 ± 60 90 ± 40 184 ± 7 150 ± 50
Hg ND ND ND ND ND ND ND ND
In ND ND ND ND ND ND ND ND
Mg 1467 ± 9 818 ± 7 1570 ± 20 1490 ± 30 1658 ± 3 1540 ± 30 1700 ± 20 1900 ± 30
Mn 82.8 ± 0.3 161.8 ± 0.6 121.5 ± 0.2 85 ± 1 44.1 ± 0.7 87.6 ± 0.5 107 ± 1 51.5 ± 0.1
Mo 0.46 ± 0.02 ND 0.46 ± 0.06 0.33 ± 0.02 ND 0.38± 0.03 ND 1.04 ± 0.06
Ni 3.03 ± 0.08 5.37 ± 0.08 2.95 ± 0.07 2.9 ± 0.2 6.1 ± 0.2 2.9 ± 0.1 1.85 ± 0.09 2.8 ± 0.4
Pb ND 1.8 ± 0.2 ND ND ND ND ND ND
Sb ND ND ND ND ND ND ND ND
Se ND ND ND ND ND ND ND ND
Sr 17.74 ± 0.07 30.33 ± 0.08
17.8 ± 0.1 20.5 ± 0.3 14.6 ± 0.1 20.7 ± 0.2 19.0 ± 0.1 14.93 ± 0.09
V ND 0.48 ± 0.02 ND ND ND ND ND ND
Y 0.07 ± 0.01 0.18 ± 0.01 ND ND 0.08 ± 0.01 ND 0.07 ± 0.01 ND
Zn 33.4 ± 0.5 41.2 ± 0.6 33.0 ± 0.9 36 ± 1 40 ± 1 40.1 ± 0.7 37.9 ± 0.6 44.9 ± 0.9 1ND = Below LOD, italic = Below LOQ 2 Uncertainty reported ±1SD
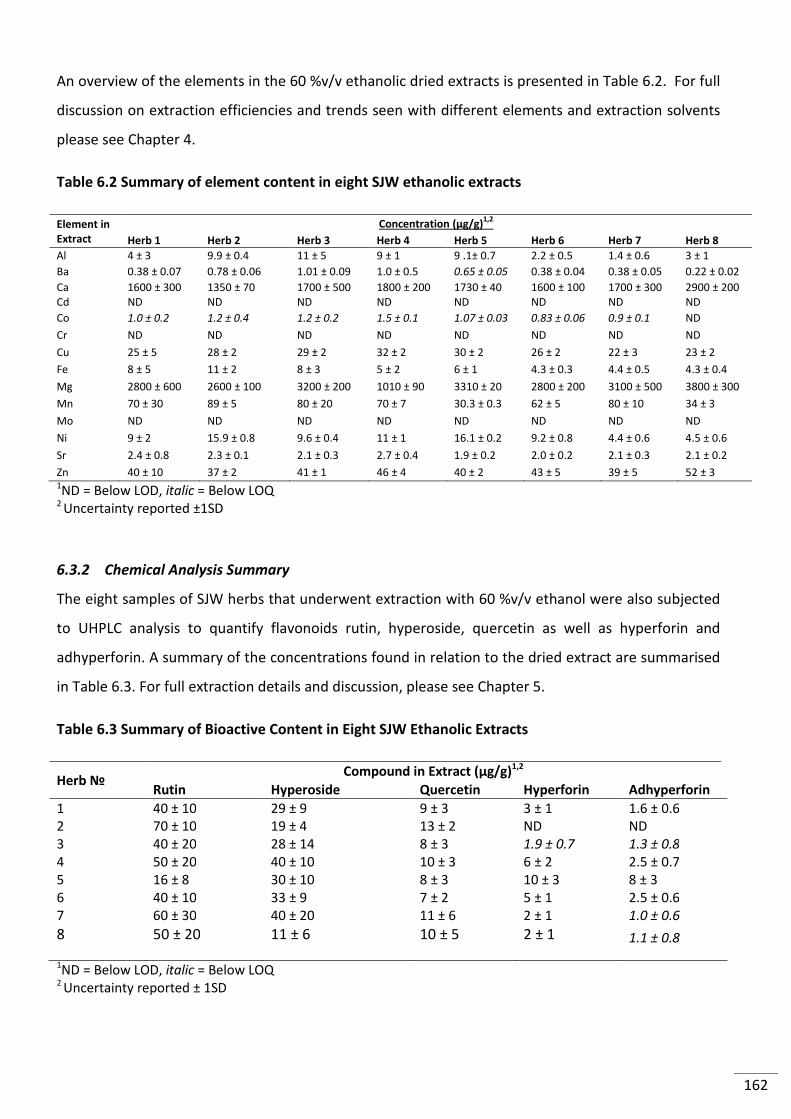
162
An overview of the elements in the 60 %v/v ethanolic dried extracts is presented in Table 6.2. For full
discussion on extraction efficiencies and trends seen with different elements and extraction solvents
please see Chapter 4.
Table 6.2 Summary of element content in eight SJW ethanolic extracts
Element in
Extract
Concentration (µg/g)1,2
Herb 1 Herb 2 Herb 3 Herb 4 Herb 5 Herb 6 Herb 7 Herb 8
Al 4 ± 3 9.9 ± 0.4 11 ± 5 9 ± 1 9 .1± 0.7 2.2 ± 0.5 1.4 ± 0.6 3 ± 1
Ba 0.38 ± 0.07 0.78 ± 0.06 1.01 ± 0.09 1.0 ± 0.5 0.65 ± 0.05 0.38 ± 0.04 0.38 ± 0.05 0.22 ± 0.02
Ca 1600 ± 300 1350 ± 70 1700 ± 500 1800 ± 200 1730 ± 40 1600 ± 100 1700 ± 300 2900 ± 200 Cd ND ND ND ND ND ND ND ND
Co 1.0 ± 0.2 1.2 ± 0.4 1.2 ± 0.2 1.5 ± 0.1 1.07 ± 0.03 0.83 ± 0.06 0.9 ± 0.1 ND
Cr ND ND ND ND ND ND ND ND
Cu 25 ± 5 28 ± 2 29 ± 2 32 ± 2 30 ± 2 26 ± 2 22 ± 3 23 ± 2
Fe 8 ± 5 11 ± 2 8 ± 3 5 ± 2 6 ± 1 4.3 ± 0.3 4.4 ± 0.5 4.3 ± 0.4
Mg 2800 ± 600 2600 ± 100 3200 ± 200 1010 ± 90 3310 ± 20 2800 ± 200 3100 ± 500 3800 ± 300
Mn 70 ± 30 89 ± 5 80 ± 20 70 ± 7 30.3 ± 0.3 62 ± 5 80 ± 10 34 ± 3
Mo ND ND ND ND ND ND ND ND
Ni 9 ± 2 15.9 ± 0.8 9.6 ± 0.4 11 ± 1 16.1 ± 0.2 9.2 ± 0.8 4.4 ± 0.6 4.5 ± 0.6
Sr 2.4 ± 0.8 2.3 ± 0.1 2.1 ± 0.3 2.7 ± 0.4 1.9 ± 0.2 2.0 ± 0.2 2.1 ± 0.3 2.1 ± 0.2
Zn 40 ± 10 37 ± 2 41 ± 1 46 ± 4 40 ± 2 43 ± 5 39 ± 5 52 ± 3 1ND = Below LOD, italic = Below LOQ 2 Uncertainty reported ±1SD
6.3.2 Chemical Analysis Summary
The eight samples of SJW herbs that underwent extraction with 60 %v/v ethanol were also subjected
to UHPLC analysis to quantify flavonoids rutin, hyperoside, quercetin as well as hyperforin and
adhyperforin. A summary of the concentrations found in relation to the dried extract are summarised
in Table 6.3. For full extraction details and discussion, please see Chapter 5.
Table 6.3 Summary of Bioactive Content in Eight SJW Ethanolic Extracts
Herb № Compound in Extract (µg/g)
1,2
Rutin Hyperoside Quercetin Hyperforin Adhyperforin
1 40 ± 10 29 ± 9 9 ± 3 3 ± 1 1.6 ± 0.6 2 70 ± 10 19 ± 4 13 ± 2 ND ND 3 40 ± 20 28 ± 14 8 ± 3 1.9 ± 0.7 1.3 ± 0.8 4 50 ± 20 40 ± 10 10 ± 3 6 ± 2 2.5 ± 0.7 5 16 ± 8 30 ± 10 8 ± 3 10 ± 3 8 ± 3 6 40 ± 10 33 ± 9 7 ± 2 5 ± 1 2.5 ± 0.6 7 60 ± 30 40 ± 20 11 ± 6 2 ± 1 1.0 ± 0.6
8 50 ± 20 11 ± 6 10 ± 5 2 ± 1 1.1 ± 0.8
1ND = Below LOD, italic = Below LOQ 2 Uncertainty reported ± 1SD
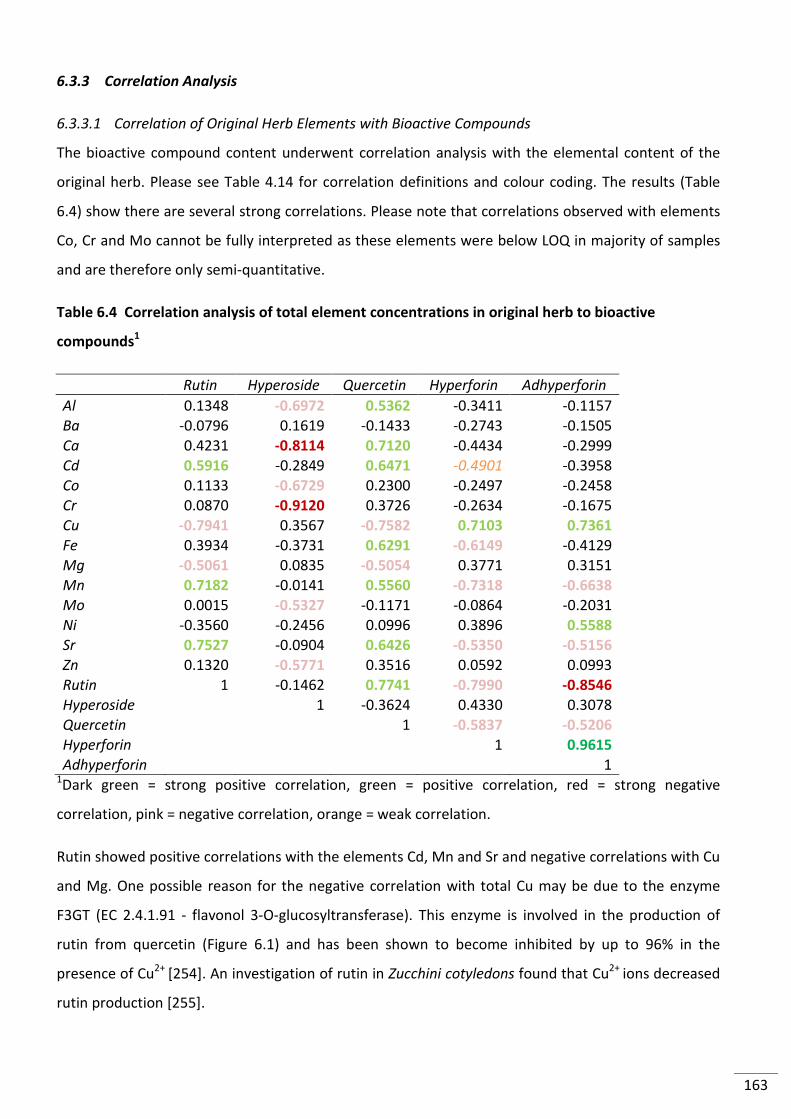
163
6.3.3 Correlation Analysis
6.3.3.1 Correlation of Original Herb Elements with Bioactive Compounds
The bioactive compound content underwent correlation analysis with the elemental content of the
original herb. Please see Table 4.14 for correlation definitions and colour coding. The results (Table
6.4) show there are several strong correlations. Please note that correlations observed with elements
Co, Cr and Mo cannot be fully interpreted as these elements were below LOQ in majority of samples
and are therefore only semi-quantitative.
Table 6.4 Correlation analysis of total element concentrations in original herb to bioactive
compounds1
Rutin Hyperoside Quercetin Hyperforin Adhyperforin
Al 0.1348 -0.6972 0.5362 -0.3411 -0.1157 Ba -0.0796 0.1619 -0.1433 -0.2743 -0.1505 Ca 0.4231 -0.8114 0.7120 -0.4434 -0.2999 Cd 0.5916 -0.2849 0.6471 -0.4901 -0.3958 Co 0.1133 -0.6729 0.2300 -0.2497 -0.2458 Cr 0.0870 -0.9120 0.3726 -0.2634 -0.1675 Cu -0.7941 0.3567 -0.7582 0.7103 0.7361
Fe 0.3934 -0.3731 0.6291 -0.6149 -0.4129 Mg -0.5061 0.0835 -0.5054 0.3771 0.3151 Mn 0.7182 -0.0141 0.5560 -0.7318 -0.6638
Mo 0.0015 -0.5327 -0.1171 -0.0864 -0.2031 Ni -0.3560 -0.2456 0.0996 0.3896 0.5588
Sr 0.7527 -0.0904 0.6426 -0.5350 -0.5156
Zn 0.1320 -0.5771 0.3516 0.0592 0.0993 Rutin 1 -0.1462 0.7741 -0.7990 -0.8546
Hyperoside 1 -0.3624 0.4330 0.3078 Quercetin 1 -0.5837 -0.5206
Hyperforin 1 0.9615
Adhyperforin 1 1Dark green = strong positive correlation, green = positive correlation, red = strong negative
correlation, pink = negative correlation, orange = weak correlation.
Rutin showed positive correlations with the elements Cd, Mn and Sr and negative correlations with Cu
and Mg. One possible reason for the negative correlation with total Cu may be due to the enzyme
F3GT (EC 2.4.1.91 - flavonol 3-O-glucosyltransferase). This enzyme is involved in the production of
rutin from quercetin (Figure 6.1) and has been shown to become inhibited by up to 96% in the
presence of Cu2+ [254]. An investigation of rutin in Zucchini cotyledons found that Cu2+ ions decreased
rutin production [255].
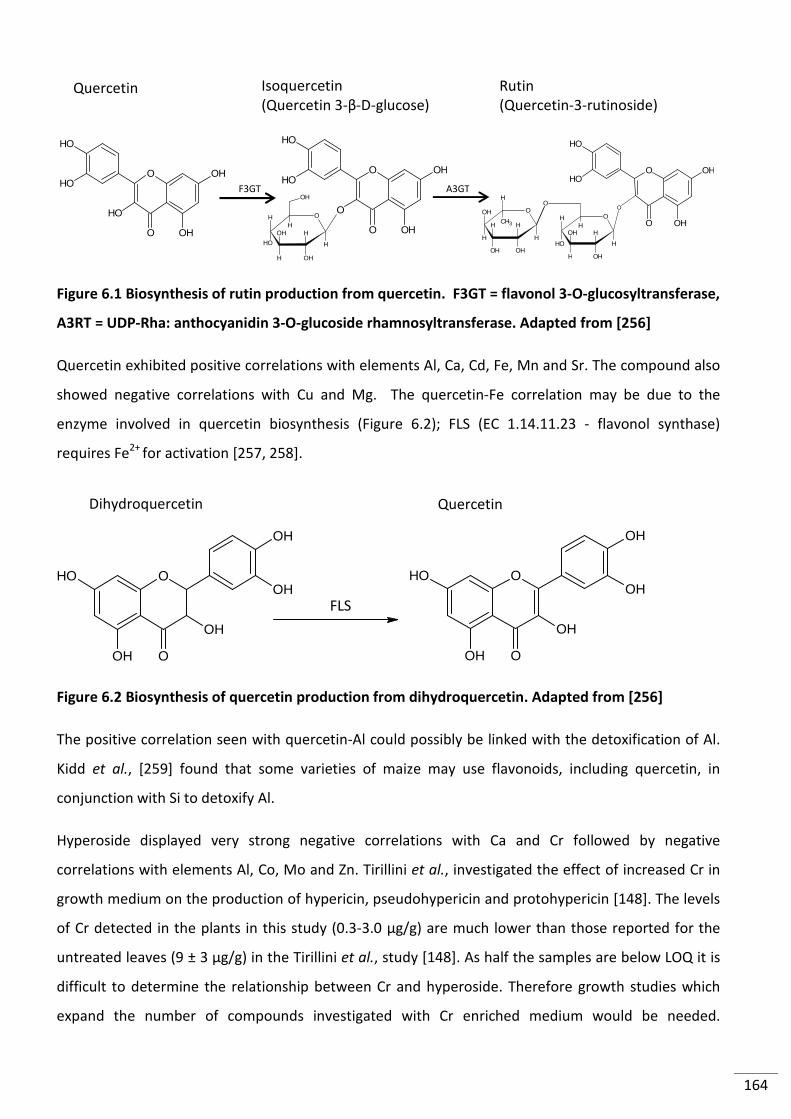
164
Figure 6.1 Biosynthesis of rutin production from quercetin. F3GT = flavonol 3-O-glucosyltransferase,
A3RT = UDP-Rha: anthocyanidin 3-O-glucoside rhamnosyltransferase. Adapted from [256]
Quercetin exhibited positive correlations with elements Al, Ca, Cd, Fe, Mn and Sr. The compound also
showed negative correlations with Cu and Mg. The quercetin-Fe correlation may be due to the
enzyme involved in quercetin biosynthesis (Figure 6.2); FLS (EC 1.14.11.23 - flavonol synthase)
requires Fe2+ for activation [257, 258].
OH
OH
OH
OH O
OH
O OH
OH
OH
OH O
OH
O
Figure 6.2 Biosynthesis of quercetin production from dihydroquercetin. Adapted from [256]
The positive correlation seen with quercetin-Al could possibly be linked with the detoxification of Al.
Kidd et al., [259] found that some varieties of maize may use flavonoids, including quercetin, in
conjunction with Si to detoxify Al.
Hyperoside displayed very strong negative correlations with Ca and Cr followed by negative
correlations with elements Al, Co, Mo and Zn. Tirillini et al., investigated the effect of increased Cr in
growth medium on the production of hypericin, pseudohypericin and protohypericin [148]. The levels
of Cr detected in the plants in this study (0.3-3.0 µg/g) are much lower than those reported for the
untreated leaves (9 ± 3 µg/g) in the Tirillini et al., study [148]. As half the samples are below LOQ it is
difficult to determine the relationship between Cr and hyperoside. Therefore growth studies which
expand the number of compounds investigated with Cr enriched medium would be needed.
FLS
Quercetin Dihydroquercetin
OH
OH
OH
OHO
OH
O
O
HH
OH
H
OH
H OH
H
OH
OH
OH
OH
OHO
O
O
O
H
HCH3
OH
H
H
OH OH
HO
O
H
HH
H
OH
OH
H OH
OH
OH
OH
OHO
O
O
F3GT A3GT
Quercetin Isoquercetin (Quercetin 3-β-D-glucose)
Rutin (Quercetin-3-rutinoside)
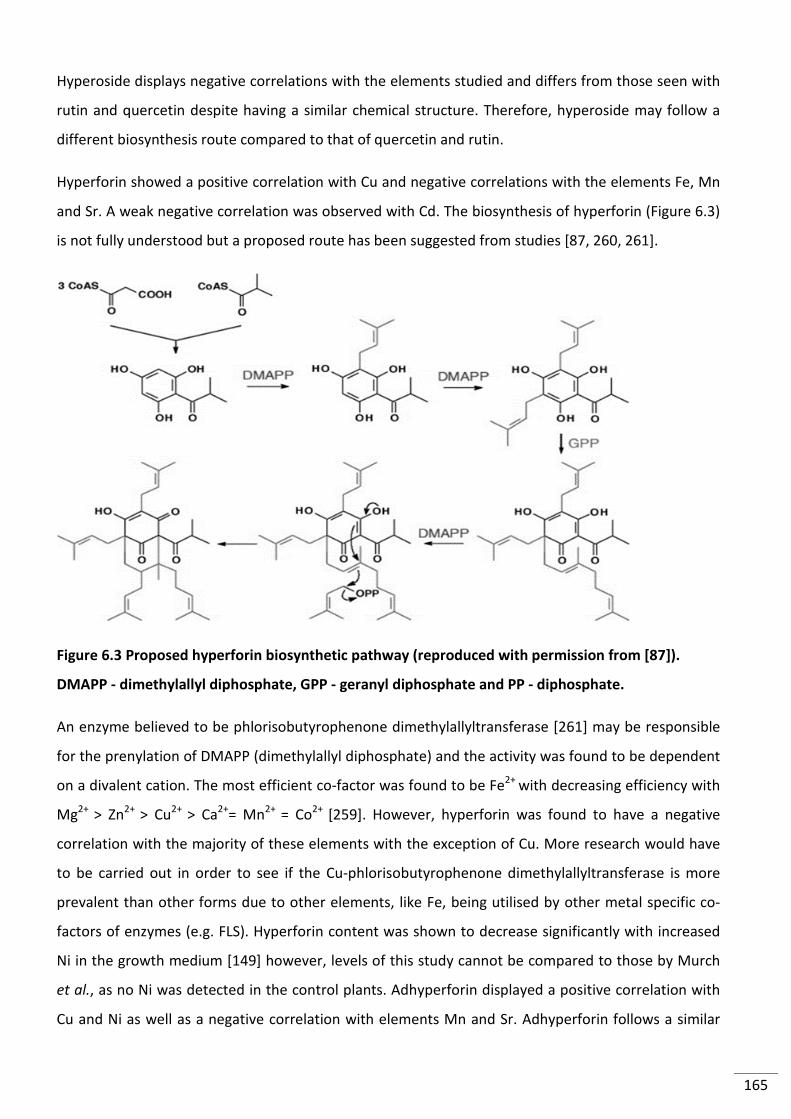
165
Hyperoside displays negative correlations with the elements studied and differs from those seen with
rutin and quercetin despite having a similar chemical structure. Therefore, hyperoside may follow a
different biosynthesis route compared to that of quercetin and rutin.
Hyperforin showed a positive correlation with Cu and negative correlations with the elements Fe, Mn
and Sr. A weak negative correlation was observed with Cd. The biosynthesis of hyperforin (Figure 6.3)
is not fully understood but a proposed route has been suggested from studies [87, 260, 261].
Figure 6.3 Proposed hyperforin biosynthetic pathway (reproduced with permission from [87]).
DMAPP - dimethylallyl diphosphate, GPP - geranyl diphosphate and PP - diphosphate.
An enzyme believed to be phlorisobutyrophenone dimethylallyltransferase [261] may be responsible
for the prenylation of DMAPP (dimethylallyl diphosphate) and the activity was found to be dependent
on a divalent cation. The most efficient co-factor was found to be Fe2+ with decreasing efficiency with
Mg2+ > Zn2+ > Cu2+ > Ca2+= Mn2+ = Co2+ [259]. However, hyperforin was found to have a negative
correlation with the majority of these elements with the exception of Cu. More research would have
to be carried out in order to see if the Cu-phlorisobutyrophenone dimethylallyltransferase is more
prevalent than other forms due to other elements, like Fe, being utilised by other metal specific co-
factors of enzymes (e.g. FLS). Hyperforin content was shown to decrease significantly with increased
Ni in the growth medium [149] however, levels of this study cannot be compared to those by Murch
et al., as no Ni was detected in the control plants. Adhyperforin displayed a positive correlation with
Cu and Ni as well as a negative correlation with elements Mn and Sr. Adhyperforin follows a similar
166
biosynthesis route to hyperforin and differs from hyperforin by one of the methyl groups in the
isopropyl moiety being replaced by an ethyl group. However, it appears to have a positive relationship
with Ni concentration compared to that reported of hyperforin [149].
Also noted from the analysis are correlations between the flavonoids themselves. For example a
positive correlation is exhibited between rutin and quercetin. This is because quercetin is an aglycone
of rutin (Figure 6.1), therefore the more quercetin that is available in a plant, the more rutin could be
produced. Hyperoside on the other hand, shows no strong correlations with any of the other
compounds monitored. Hyperforin and adhyperforin are very strongly correlated which may be due
to their structural similarity with only a –CH3 group difference between them. Strong negative
correlations were observed between flavonoids (rutin and quercetin) and the phloroglucinols
(hyperforin and adhyperforin).
6.3.3.2 Herb Dried Extracts with Bioactive Compounds
The bioactive compound content underwent correlation analysis with the elemental content of the
dried 60 %v/v ethanolic extract. Elements Cd, Mo and Cr were removed from the dataset as all values
were below the LOD. Please note that correlations with Co cannot be fully interpreted as these
elements were below LOQ and are therefore are for qualitative purposes only. Please see Table 4.14
for correlation definitions and colour coding. The results (Table 6.5) show several strong correlations.
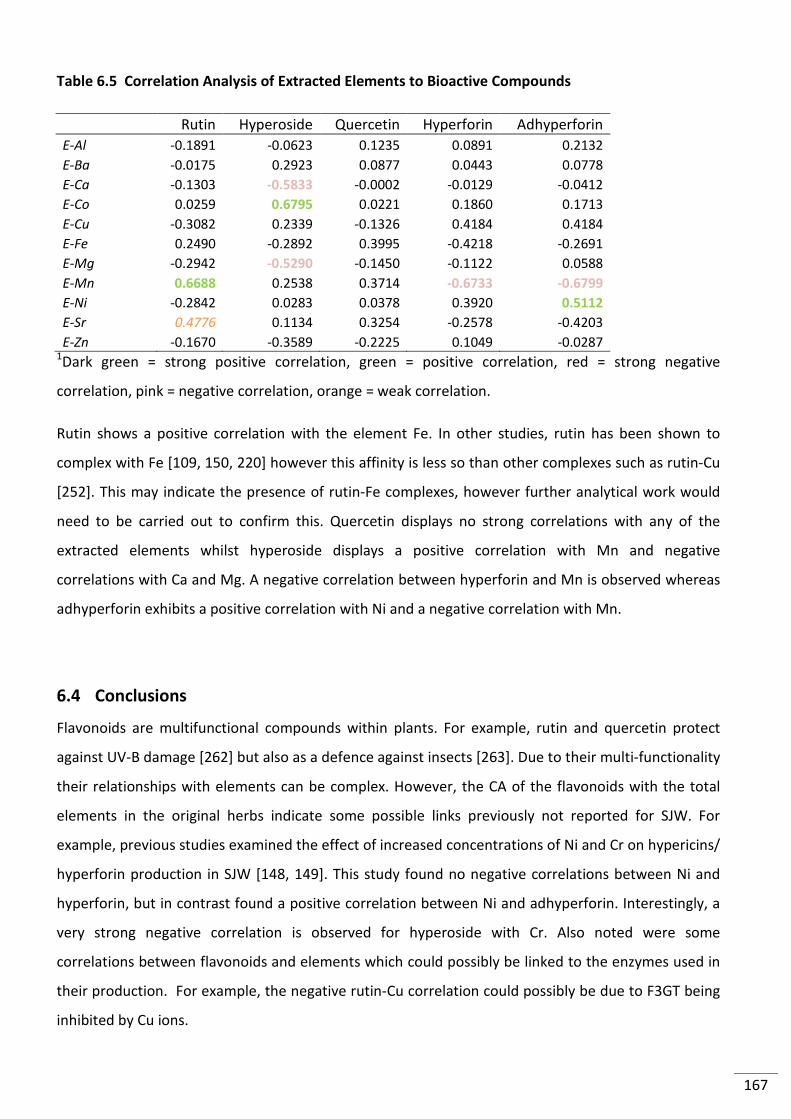
167
Table 6.5 Correlation Analysis of Extracted Elements to Bioactive Compounds
Rutin Hyperoside Quercetin Hyperforin Adhyperforin
E-Al -0.1891 -0.0623 0.1235 0.0891 0.2132 E-Ba -0.0175 0.2923 0.0877 0.0443 0.0778 E-Ca -0.1303 -0.5833 -0.0002 -0.0129 -0.0412 E-Co 0.0259 0.6795 0.0221 0.1860 0.1713 E-Cu -0.3082 0.2339 -0.1326 0.4184 0.4184 E-Fe 0.2490 -0.2892 0.3995 -0.4218 -0.2691 E-Mg -0.2942 -0.5290 -0.1450 -0.1122 0.0588 E-Mn 0.6688 0.2538 0.3714 -0.6733 -0.6799 E-Ni -0.2842 0.0283 0.0378 0.3920 0.5112 E-Sr 0.4776 0.1134 0.3254 -0.2578 -0.4203
E-Zn -0.1670 -0.3589 -0.2225 0.1049 -0.0287 1Dark green = strong positive correlation, green = positive correlation, red = strong negative
correlation, pink = negative correlation, orange = weak correlation.
Rutin shows a positive correlation with the element Fe. In other studies, rutin has been shown to
complex with Fe [109, 150, 220] however this affinity is less so than other complexes such as rutin-Cu
[252]. This may indicate the presence of rutin-Fe complexes, however further analytical work would
need to be carried out to confirm this. Quercetin displays no strong correlations with any of the
extracted elements whilst hyperoside displays a positive correlation with Mn and negative
correlations with Ca and Mg. A negative correlation between hyperforin and Mn is observed whereas
adhyperforin exhibits a positive correlation with Ni and a negative correlation with Mn.
6.4 Conclusions
Flavonoids are multifunctional compounds within plants. For example, rutin and quercetin protect
against UV-B damage [262] but also as a defence against insects [263]. Due to their multi-functionality
their relationships with elements can be complex. However, the CA of the flavonoids with the total
elements in the original herbs indicate some possible links previously not reported for SJW. For
example, previous studies examined the effect of increased concentrations of Ni and Cr on hypericins/
hyperforin production in SJW [148, 149]. This study found no negative correlations between Ni and
hyperforin, but in contrast found a positive correlation between Ni and adhyperforin. Interestingly, a
very strong negative correlation is observed for hyperoside with Cr. Also noted were some
correlations between flavonoids and elements which could possibly be linked to the enzymes used in
their production. For example, the negative rutin-Cu correlation could possibly be due to F3GT being
inhibited by Cu ions.
168
The CA analysis of flavonoids to the metals obtained during the extracts show some correlations.
However, as some of the data utilised in these investigations were below the analytes LOQ values, the
results obtained are to be used for indicative qualitative purposes. The positive correlations could
possibly indicate some complexing between the constituents; however, many of the combinations
could form stronger complexes with other elements. In order to access if these elements (e.g. Mn and
Sr with rutin) are in a complexed form, mass spectrometry analysis would need to be carried out,
using direct injection and SIM.
Overall this study has shown some interesting interactions between elements and flavonoids as well
as flavonoids with other flavonoids. However, to ensure the correlations are completely robust the
number of SJW samples needs to be increased from eight, and also the concentrations of the extract
increased to ensure more data falls above LOQ or another analytical instrument with increased
sensitivity utilised (e.g. a UHPLC with a single UV wavelength detector). In order to compare with the
other limited studies on elemental influence on bioactive production, the hypericin compounds
should also be investigated.
169
7 Conclusions
The work presented in this thesis has demonstrated that the use of metal fingerprints for the quality
control of herbal medicines can be applied to multiple stages of processing. This study suggests that
the processing steps, such as extraction and addition of excipients, has a less random and more
predictable effect on the elemental profile of SJW. Thus, these trends can be exploited for further
assessment of SJW quality. This work has produced a validated and simple method for the analysis of
trace metals in SJW, and demonstrated the differences in the metal fingerprint of SJW upon
formulation and the consistency between products, determined the elemental transfer trends in
solvents of increasing alcohol content (i.e., each element has a different extraction profile, yet the
extraction profile is consistent between SJW samples), as well as demonstrating correlations between
the elemental and molecular (i.e., flavonoids and phloroglucinol) constituents present in SJW. The
major conclusions from the work are highlighted below.
The lack of a certified reference material for trace elements in SJW presented a challenge when an
accurate metal profile is desired. Thus, a method for the analysis of trace elements was determined
involving validation using NIST polish tea, spiked recovery methods and standard addition. These
experiments illustrated good recovery of elements with the NIST tea, however validation with SJW
samples showed the presence of silicates when HF was applied. Thus, current certified reference
materials may not be similar in the silicate content as SJW samples. However, methods used without
HF will need to state the metal content is not from the silicates present. The standard addition also
highlights matrix effects with SJW samples as well. In addition, there were significant improvements in
the error of the measurement when using a weighted calibration curve to that of a non-weighted
curve. All previous studies in the literature investigating elemental content of SJW have used external
calibrations for element quantification therefore not considering the matrix effects present. Thus, the
validation study highlighted current limitations to using available standard reference materials for
SJW, but also the consideration that should be made when making this comparison.
As mentioned, there are several studies that have investigated the elemental content of SJW;
however, they were limited by the number of samples, number of elements analysed, geographical
origin as well as little continuity between studies. This project was able to investigate a large number
of SJW samples in both its raw and processed forms to give a normal range for the concentrations of
25 elements. The samples were also sourced worldwide to avoid localisation of one growth
area/country. The results showed that 93% of the SJW samples fell within a 95% confidence interval.
This implies that despite the SJW samples being in different forms and from worldwide growth
170
locations, underlying elemental patterns were still able to define the majority of sample forms. Thus,
SJW samples were differentiated based on their elemental profiles. Those samples that overlapped in
different groups could be justified. For example, a capsule that grouped with the raw herbs was in fact
just raw herb with no added excipients. This could allow manufacturers to confirm their claim for
products that are ‘organic’ rather than using an extract. This analysis can also show if the products are
wholly extract, raw herb or a mixture of both. The PCA model used was robust as despite including a
sample considered a near- outlier; it was still able to produce the differentiation between SJW raw
herbs, tablets and capsules. A PCA constructed without the elements Ca and Mg (common
constituents of bulking agents) was created and showed that differentiation between the SJW forms
still existed; but less separation was observed between the tablets and capsules. The results from this
project suggest that the elemental differences observed between the different SJW forms are due to
two main factors. The first being the extraction process of the bioactive compounds from the raw
herb and the second being the addition of excipients such as bulking agents. The PCA analysis was
also utilised to assess the potential for geographic origin and species identification. These studies
were inconclusive and thus studies investigating more samples of SJW raw herb from different growth
localities and of different species may be considered. Literatures from other studies (with different
plant families) have shown that such identifications could be obtained with PCA, thus this analysis in
the future may have potential.
The work investigating SJW elemental profiles indicated that the extraction process played a key role
in shaping the elemental profiles of the processed forms. Therefore to understand the effect to the
elemental profile, eight SJW herbs were extracted in four different solvents (100% water, 60 %v/v
ethanol, 80 %v/v ethanol and 100% ethanol). These solvents were utilised as the 60 %v/v and 80 %v/v
ethanol concentrations are used routinely in industry to manufacture extracts whilst the two 100%
solutions were utilised to understand the transfer trends. The results of these studies showed that the
elemental transfer from the original herb for the majority of elements was small (≤35% of original
herb concentration). More interestingly, the results displayed that transfer was solvent and metal
dependent. Generally the highest concentrations of an element were extracted with 100% water,
which decreased as the concentration of ethanol increased. However, the transfer efficiency for the
element Cu was highest with 60 %v/v ethanol. The concentrations in the dried extract was compared
to that of the original herb and results showed that preconcentration occurs with all elements with
the exception of Al, Ba and Fe. The majority of preconcentration occurred in the dry 100% water
extract; however this form is not knowingly used therefore does not cause concern. The solvents
utilised in industry however was found to preconcentrate some elements; Cu (+119%), Mg (+93%), Ni
171
(+183%) and Zn (+12%) were found to preconcentrate in 60 %v/v ethanol extracts and Cu (+5%) and
Ni (+30%) preconcentated in 80 %v/v extracts. These results indicate that the selection of solvent
plays an important role in elemental extraction as well as bioactive extraction. It also shows the
potential that the extraction of elements contained in raw herbs could be tuned for purpose. For
example, there are several nutritional disorders due to deficiencies of nutrients (e.g. deficiencies in Se
and Mn linked to cardiovascular disease), therefore by selecting an appropriate solvent the elemental
concentration could be increased for nutritional purposes and to assist with the formation of metal-
bioactive complexes which could increase bioavailability and/or bioactivity. The tuning of elemental
extract via solvent to decrease the elemental content could lower the transfer of toxic elements as
well as decrease drug interactions. Other possibilities for tuning the elemental extraction include the
use of plants for ‘mining’ rare earth metals or cleansing contaminated land in order to retrieve a
larger yield.
The elemental profiles produced from the extraction processes underwent PCA with the total
concentrations found from the original herbs. The PCA results showed that the extracts produced by
each solvent are well differentiated indicating that each solvent type provides a specific and
predictable elemental profile. The results also show that as the ethanol content increases, the extract
samples become more standardised (i.e., elemental profile has less variation). Therefore these results
with the extracted samples show again the potential for tuning the elemental profile of SJW products.
As noted, the elemental concentrations can interact with the bioactive compounds of a plant in
numerous ways. Therefore, the elemental and molecular profiles were compared to see if synergy
between them could potentially be exploited in using the metal content to predict the bioactive
content. The results from correlation analyses suggest that this may only be possible with the total
concentrations from the original raw herb as few strong correlations were apparent with the extract
values. The results also suggest more biochemical roles of elements within the original plant as
correlations found are not consistent with reported metal-flavonoid complexes. The correlation
analysis with the extract data were investigated to see if such complexes could be investigated
indirectly; however, correlations obtained were of elements that formed weaker complexes (e.g., Mn
and Sr with rutin) compared to those reported as strong complexes (e.g., Cu and Fe with rutin).
Overall the investigation of the elemental profiles of SJW raw herbs, tablets, capsules and extracts has
shown that the profiles differ greatly between each form, but follow specific trends. The analysis of
these profiles by PCA shows the potential for this method to be used for quality control. It can be
utilised to assess batch to batch consistency, confirm if the SJW is the raw herb or an extract and if it
172
is an extract potentially identify the extraction solvent/process that produced it. On the other hand, it
also showed that the elemental profile can be tuned for exploitation of metal bioactive complexes,
however, further work is needed in this area.
173
8 Future Work
This project has highlighted a number of routes this research could follow in the future.
The results achieved from the geographical origin experiments were inconclusive; however some
grouping was observed (Poland and UK samples). This could be to a number of factors such as the
part of the plant utilised, growth year variation and limited number of samples for some localities
(e.g. Spain and Chile). To further investigate if this method could be used for the identification of
growth origin; a large number of samples with proper paperwork would be required. To do this, a
pilot study would be carried out using different regions of a country as a basis. Poland would be a
strong candidate as all manufacturers or producers of herbal remedies state the growth region on the
label. Therefore a large number of samples could be purchased from different regions of Poland to
see if elemental profiling could differentiate between them. This pilot study would allow the
investigation of growth origin before going to the expense of different countries around the world.
This could be used as a tool to follow Good Manufacturing Practice (GMP) where necessary
paperwork is needed to follow a paper trail should any discrepancies occur.
In addition to this, the preliminary experiments with different species showed that despite being in a
processed form, the different species of plant-based capsules did not overlap with those of SJW.
Therefore there is the potential for the developed method to be utilised in species identification. To
confirm this, several different species of medicinal herbs could be purchased and their elemental
profiles collected, then included in the PCA model. This could then potentially be utilised to
differentiate families of plants (as seen in literature). A true test of compatibility could be carried out
between different species of Hypericum to see if more closely related plants can be differentiated. It
could also be used to check the quality of raw herbs before a manufacturer continues with
production. If different forms (tablets and capsules) of these other species are also purchased,
investigations could be carried out to see if differentiation between these forms is possible in other
plant species. This would confirm or invalidate an ‘organic’ claim by manufacturers.
The elemental profiles collected from the extracted SJW showed that the extracts could be
differentiated by the solvent used. By further investigating different extraction techniques and
solvents; the elemental profiles could be assessed to see if extraction solvent, technique and
manufacturer can be differentiated. This could be used as a method to check and ensure batch to
batch consistency of a product. This could also be useful in cases where a product is of low quality and
thus trace back to manufacture source.
174
The correlation analyses of the elemental and molecular profiles showed there were relationships
between the two. Due to this, the analysis of the elements can give a clearer picture to the overall
herb than just the concentration of a few bioactive species. To date, only Cr and Ni in growth medium
has been assessed in relation to the production of hypericins. These growth studies could be
expanded upon to aid the understanding of such relationships. A number of other elements could be
investigated, starting with those found from this study (e.g. Al, Ba, Co, Cu, Fe, Mn, Ni) to see if they
effect the production of the hypericins and hyperforin production. In addition to the elements, the
bioactive compounds could be expanded to include flavonoids such as rutin and quercetin as well as
other common constituents. The Results from this project show that the different bioactive
compounds have different relationships with the same element. These studies could be carried out on
a smaller scale within a green house or much larger using fields. The optimum method for assessing
elemental nutrition on the production of bioactive compounds would be to use a hydroponic farming
system in which the elements introduced to the plants could be uniquely controlled and also removes
considerations such as soil interactions. This information could then be utilised in industry to improve
yields of these compounds. From the previous in-depth growth studies or from extensive analysis of
many SJW herbs for elemental and chemical profiles; if strong relationships are identified between
certain elements and bioactive compounds, those elements could be utilised as an indicator for the
concentration of the compound. This would be beneficial to laboratories that do not have extensive
equipment. Also, if one particular metal was found to have a very strong relationship, a quick and
simple wet chemistry test could be developed to aid those in developing countries who do not have
access to laboratories. If proven with SJW, such biomarkers could then be investigated in other herbal
remedies.
The analysis of the extracts of SJW has shown that elementals are present in addition to the bioactive
constituents. External experiments with standards of rutin and copper chloride also displayed that
metal-bioactive compounds are able to form readily at room temperature. Therefore, it is highly likely
that such complexes may exist within the herbal extract. However, to be able to detect these in depth
method development would be needed on HPLC to ensure the complexes remain stable for the shift
in wavelength to be detected. A better instrument to utilise with the investigation of metal-bioactive
complexes would be a LC-ICP-MS. This would separate the bioactive compounds from one another
and transfer each one separately to the MS system. This would then give information as to which
metal ions are complexed to that molecule and the approximate ratios between them. This could
firstly identify, through standards, which bioactive complexes could form from mixing singular
compounds with various metal ions. Continuing this, multiple bioactive compounds with multiple
175
metal ions could be mixed to see how they interact (i.e. is there competition for certain metal ions,
will some compounds form stable complexes or do they disassociate due to the presence of other
bioactive compounds, do complexes form with multiple ions and compounds?). Such experiments
could help identify the kinetics of the complexes and also the metal species involved. Following such
experiments, a method could be optimised to detect and quantify complexes in true samples by the
analysis of herbal extracts or infusions. The speciation is of interest as this would identify if the more
toxic or safer forms of an element are present. The MS would also be able to record the element
isotopes and thus provide additional variables for the differentiation of samples through isotope
ratios. In addition to the physical properties and identification of metal-bioactive complexes in herbal
extracts, these could then be isolated and tested for various biological activities such as antioxidant,
anti-inflammatory, anti-bacterial and anti-cancer properties. From this, bioavailability could also be
assessed by examining these complexes in biological matrixes. These experiments would show which
are stable and would survive gut conditions or more likely which reform within the duodenum. If
proven to exist in such conditions this could be taken further with cell cultures to assess their
bioavailability then ultimately their therapeutic effect. In addition to this, the effect of other herbs or
main stream synthetic medications being present could be explored.
These are a few examples and routes the research from this project could progress to now that the
normal range of elements in SJW has been identified in addition to the presence of relationships
between the bioactive and elemental constituents and how they change with processing.
176
9 Bibliography
1. Janick, J., Herbals: the connection between horticulture and medicine. HortTechnology 2003, 13, (2), 229-238.
2. Bryan, C. P., The Papyrus Ebers. The Garden City Press Ltd: 1930. 3. National Library of Medicine Papyros Ebers (06/07/2013), 4. Van Alpen, J.; Aris, A., Oriental Medicine: An Illustrated Guide to the Asian Arts of Healing.
Serindia Publ.: 1995. 5. Cameron, M. L., Bald's Leechbook: its sources and their use in its compilation. AngloSaxon
England 1983, 12, 153-182. 6. Culpeper, N. Culpeper's complete herbal.
http://archive.org/stream/culpeperscomplet00culpuoft#page/n3/mode/2up (15/03/13), 7. World Health Organisation Fact sheet N°134, Traditional medicine.
http://www.who.int/mediacentre/factsheets/fs134/en/print.html (15/04/2010), 8. MHRA; Iposos Mori, Public Perceptions of Herbal Medicines In General Public Qualitative &
Quantitative Research, Ed. 2008. 9. Mintel oxygen Complementary Medicines -UK- 2009; 2009. 10. Global Industry Analysts Inc. Herbal Supplements and Remedies: A Global Strategic Business
Report; 2013. 11. Lynch, N.; Berry, D., Differences in perceived risks and benefits of herbal, over-the-counter
conventional, and prescribed conventional, medicines, and the implications of this for the safe and effective use of herbal products. Complementary Therapies in Medicine 2007, 15, (2), 84-91.
12. US Food and Drug Administration FDA Acts to Remove Ephedra-Containing Dietary Supplements From Market. http://www.fda.gov/NewsEvents/Newsroom/PressAnnouncements/2004/ucm108379.htm (05/03/13),
13. Vanherweghem, J.-L.; Tielemans, C.; Abramowicz, D.; Depierreux, M.; Vanhaelen-Fastre, R.; Vanhaelen, M.; Dratwa, M.; Richard, C.; Vandervelde, D.; Verbeelen, D., Rapidly progressive interstitial renal fibrosis in young women: association with slimming regimen including Chinese herbs. The Lancet 1993, 341, (8842), 387-391.
14. Nortier, J. l. L.; Martinez, M.-C. M.; Schmeiser, H. H.; Arlt, V. M.; Bieler, C. A.; Petein, M.; Depierreux, M. F.; De Pauw, L.; Abramowicz, D.; Vereerstraeten, P.; Vanherweghem, J.-L., Urothelial Carcinoma Associated with the Use of a Chinese Herb (Aristolochia fangchi). New England Journal of Medicine 2000, 342, (23), 1686-1692.
15. Ernst, E., Harmless Herbs? A Review of the Recent Literature. The American Journal of Medicine 1998, 104, (2), 170-178.
16. Ernst Md, E., Harmless Herbs? A Review of the Recent Literature. The American Journal of Medicine 1998, 104, (2), 170-178.
17. Peña, J. M.; Borras, M.; Ramos, J.; Montoliu, J., Rapidly progressive interstitial renal fibrosis due to a chronic intake of a herb (Aristolochia pistolochia) infusion. Nephrology Dialysis Transplantation 1996, 11, (7), 1359-1360.
18. MHRA Prohibited or restricted herbal ingredients. http://www.mhra.gov.uk/Howweregulate/Medicines/Herbalmedicinesregulation/Prohibitedorrestrictedherbalingredients/index.htm (07/03/13),
19. US Food and Drug Administration Detention Without Physical Examination of Bulk/Finished Dietary Supplements Products Containing Aristolochic Acid. http://www.accessdata.fda.gov/cms_ia/importalert_141.html (07/03/13),
177
20. Kao, W. F.; Hung, D. Z.; Tsai, W. J.; Lin, K. P.; Deng, J. F., Podophyllotoxin intoxication: toxic effect of Bajiaolian in herbal therapeutics. Hum Exp Toxicol 1992, 11, (6), 480-7.
21. Deng, J.-F., Clinical and laboratory investigations in herbal poisonings. Toxicology 2002, 181-182, 571-576.
22. Mazzanti, G.; Battinelli, L.; Daniele, C.; Costantini, S.; Ciaralli, L.; Evandri, M. G., Purity control of some Chinese crude herbal drugs marketed in Italy. Food and Chemical Toxicology 2008, 46, (9), 3043-3047.
23. Mason, P., Important drug-nutrient interactions. Proceedings of the Nutrition Society 2010, 69, (4), 551-557.
24. Bogusz, M. J.; Hassan, H.; Al-Enazi, E.; Ibrahim, Z.; Al-Tufail, M., Application of LC-ESI-MS-MS for detection of synthetic adulterants in herbal remedies. Journal of Pharmaceutical and Biomedical Analysis 2006, 41, (2), 554-564.
25. Ku, Y.-R.; Chang, Y.-S.; Wen, K.-C.; Ho, L.-K., Analysis and confirmation of synthetic anorexics in adulterated traditional Chinese medicines by high-performance capillary electrophoresis. Journal of Chromatography A 1999, 848, (1-2), 537-543.
26. Ernst, E., Toxic heavy metals and undeclared drugs in Asian herbal medicines. Trends in Pharmacological Sciences 2002, 23, (3), 136-139.
27. Sandler, B.; Aronson, P., Yohimbine-induced cutaneous drug eruption, progressive renal failure, and lupus-like syndrome. Urology 1993, 41, (4), 343-345.
28. Yap, K. Y. L.; Chan, S. Y.; Chan, Y. W.; Lim, C. S., Overview on the analytical tools for quality control of natural product-based supplements: A case study of ginseng. Assay and Drug Development Technologies 2005, 3, (6), 683-699.
29. Ries, C. A.; Sahud, M. A., Agranulocytosis caused by Chinese herbal medicines. Dangers of medications containing aminopyrine and phenylbutazone. JAMA 1975, 231, (4), 352-5.
30. Izzo, A. A.; Ernst, E., Interactions between herbal medicines and prescribed drugs: a systematic review. Drugs 2001, 61, (15), 2163-75.
31. Schwarz, U. I.; Buschel, B.; Kirch, W., Unwanted pregnancy on self-medication with St John's wort despite hormonal contraception. Br J Clin Pharmacol 2003, 55, (1), 112-3.
32. Hall, S. D.; Wang, Z.; Huang, S.-M.; Hamman, M. A.; Vasavada, N.; Adigun, A. Q.; Hilligoss, J. K.; Miller, M.; Gorski, J. C., The interaction between St John's wort and an oral contraceptive&ast. Clinical Pharmacology & Therapeutics 2003, 74, (6), 525-535.
33. World Health Organization, National policy on traditional medicine and regulation of herbal medicines. Report of a WHO global survey 2005.
34. Solimene, U., WHO monograph on selected medicinal plants. Volume 2. 2002. 35. EDQM, European Pharmacopoeia. Council of Europe: 2013. 36. US Pharmacopoeia, General Chapter on Inorganic Impurities: Heavy Metals. In USP Ad Hoc
Advisory Panel, Ed. US Pharmacopoeia: 2008. 37. MHRA Good Manufacturing Practice: Background.
http://www.mhra.gov.uk/Howweregulate/Medicines/Inspectionandstandards/GoodManufacturingPractice/Background/index.htm (07/03/13),
38. US Food and Drug Administration Food. http://www.fda.gov/Food/default.htm (08/03/13), 39. Farago, M. E., Plants and the chemical elements: biochemistry, uptake, tolerance and toxicity.
VCH Publishers: 1994. 40. Kabata-Pendias, K., Trace elements in soils and plants. 4th edition ed.; CRC Press: 2010. 41. MHRA British Pharmacopoeia online.
http://www.pharmacopoeia.co.uk/bp2011/ixbin/bp.cgi?id=1003&a=display&a=display#WIXLINKp2p04216 (01/03/2011),
42. US Pharmacopeia, <232> Elemental Impurities - Limits. In US Pharmacopeia, The United States Pharmacopeial Convention, Ed. 2013; pp 151-153.
43. Kabata-Pendias, A.; Mukherjee, A. B., Trace Elements from Soil to Human. Springer: 2007.
178
44. Uthus, E. O., Evidence for arsenic essentiality. Environmental Geochemistry and Health 1992, 14, (2), 55-58.
45. Caussy, D.; Gochfeld, M.; Gurzau, E.; Neagu, C.; Ruedel, H., Lessons from case studies of metals: investigating exposure, bioavailability, and risk. Ecotoxicology and Environmental Safety 2003, 56, (1), 45-51.
46. Abernathy, C. O.; Liu, Y.-P.; Longfellow, D.; Aposhian, H. V.; Beck, B.; Fowler, B.; Goyer, R.; Menzer, R.; Rossman, T.; Thompson, C., Arsenic: health effects, mechanisms of actions, and research issues. Environmental health perspectives 1999, 107, (7), 593.
47. Markert, B., Instrumental Element and Multi-Element Analysis of Plant Samples: Methods and Applications. John Wiley & Sons: 1996.
48. Agency for Toxic Substances and Disease Registry (ATSDR) Minimal Risk Levels (MRLs) for Hazardous Substances. http://www.atsdr.cdc.gov/mrls/mrllist.asp#34tag
49. Sharma, R. K.; Agrawal, M.; Marshall, F. M., Heavy metal (Cu, Zn, Cd and Pb) contamination of vegetables in urban India: A case study in Varanasi. Environmental Pollution 2008, 154, (2), 254-263.
50. Dalenberg, J. W.; Driel, W. v., Contribution of atmospheric deposition to heavy-metal concentrations in field crops. Netherlands Journal of Agricultural Science 1990, 38, (3A), 369-379.
51. Liu, J.; Shi, J.-Z.; Yu, L.-M.; Goyer, R. A.; Waalkes, M. P., Mercury in Traditional Medicines: Is Cinnabar Toxicologically Similar to Common Mercurials? Experimental Biology and Medicine 2008, 233, (7), 810-817.
52. Liu, J.; Lu, Y.; Wu, Q.; Goyer, R. A.; Waalkes, M. P., Mineral arsenicals in traditional medicines: orpiment, realgar, and arsenolite. Journal of pharmacology and experimental therapeutics 2008, 326, (2), 363-368.
53. MHRA, British Pharmacopoeia 2013. 2013. 54. Clark, R. B., Effect of aluminium on growth and mineral elements of al-tolerant and Al-
intolerant corn. Plant and Soil 1977, 47, (3), 653-662. 55. Brady, D. J.; Edwards, D. G.; Asher, C. J.; Blamey, F. P. C., Calcium amelioration of aluminium
toxicity effects on root hair development in soybean [Glycine max (L.) Merr.]. New Phytologist 1993, 123, (3), 531-538.
56. Baker, A. J. M.; Proctor, J., The influence of cadmium, copper, lead, and zinc on the distribution and evolution of metallophytes in the British Isles. Plant Systematics and Evolution 1990, 173, (1-2), 91-108.
57. Nahapetian, A.; Bassiri, A., Changes in concentrations and interrelations of phytate, phosphorus, magnesium, calcium, and zinc in wheat during maturation. Journal of Agricultural and Food Chemistry 1975, 23, (6), 1179-1182.
58. Krämer, U., Metal Hyperaccumulation in Plants. Annual Review of Plant Biology 2000, 61, (1), 517-534.
59. Rascio, N.; Navari-Izzo, F., Heavy metal hyperaccumulating plants: How and why do they do it? And what makes them so interesting? Plant Science 2011, 180, (2), 169-181.
60. Jiang, R. F.; Ma, D. Y.; Zhao, F. J.; McGrath, S. P., Cadmium hyperaccumulation protects Thlaspi caerulescens from leaf feeding damage by thrips (Frankliniella occidentalis). New Phytologist 2005, 167, (3), 805-814.
61. Jhee, E. M.; Boyd, R. S.; Eubanks, M. D.; Davis, M. A., Nickel hyperaccumulation by Streptanthus polygaloides protects against the folivore Plutella xylostella (Lepidoptera: Plutellidae). Plant Ecology 2006, 183, (1), 91-104.
62. Rathinasabapathi, B.; Rangasamy, M.; Froeba, J.; Cherry, R. H.; McAuslane, H. J.; Capinera, J. L.; Srivastava, M.; Ma, L. Q., Arsenic hyperaccumulation in the Chinese brake fern (Pteris vittata) deters grasshopper (Schistocerca americana) herbivory. New Phytologist 2007, 175, (2), 363-369.
179
63. Tolrà, R. P.; Poschenrieder, C.; Alonso, R.; Barceló, D.; Barceló, J., Influence of zinc hyperaccumulation on glucosinolates in Thlaspi caerulescens. New Phytologist 2001, 151, (3), 621-626.
64. Davis, M. A.; Boyd, R. S., Dynamics of Ni-based defence and organic defences in the Ni hyperaccumulator, Streptanthus polygaloides (Brassicaceae). New Phytologist 2000, 146, (2), 211-217.
65. Jhee, E.; Boyd, R.; Eubanks, M., Effectiveness of Metal-Metal and Metal-Organic Compound Combinations Against Plutella xylostella: Implications for Plant Elemental Defense. Journal of Chemical Ecology 2006, 32, (2), 239-259.
66. Baker, A. J. M.; McGrath, S. P.; Reeves, R. D.; Smith, J. A. C., Metal Hyperaccumulator Plants: a Review of the Ecology and Physiology of a Biological Resource For Phytoremediation Of Metal-Polluted Soils. In Phytoremediation of Contaminated Soil and Water
Terry, N.; Banuelos, G. S., Eds. CRC Press,: 2000. 67. Raskin, I.; Ensley, B. D., Phytoremediation of toxic metals. John Wiley and Sons: 2000. 68. Ernst, W., Phytoextraction of mine wastes-options and impossibilities. Chemie Der Erde-
Geochemistry 2005, 65, 29-42. 69. Akbari, R.; Hatamzadeh, A.; Sariri, R.; Bakhshi, D., Relationship of Flower Colour Parameters
and Metal Ions of Petal Tissue in Fully Opened Flowers of Gerbera. Journal of Plant Studies 2012, 2, (1), p89.
70. Shiono, M.; Matsugaki, N.; Takeda, K., Phytochemistry: Structure of the blue cornflower pigment. Nature 2005, 436, (7052), 791-791.
71. British National Formulary BNF. http://www.medicinescomplete.com/mc/bnf/current/203947.htm (26 March),
72. Novak-Pekli, M.; El-Hadi Mesbah, M.; Petho, G., Equilibrium studies on tetracycline-metal ion systems. Journal of Pharmaceutical and Biomedical Analysis 1996, 14, (8-10), 1025-1029.
73. Palm, G.; Lederer, T.; Orth, P.; Saenger, W.; Takahashi, M.; Hillen, W.; Hinrichs, W., Specific binding of divalent metal ions to tetracycline and to the Tet repressor/tetracycline complex. Journal of Biological Inorganic Chemistry 2008, 13, (7), 1097-1110.
74. Ni, Y.; Lai, Y.; Brandes, S.; Kokot, S., Multi-wavelength HPLC fingerprints from complex substances: An exploratory chemometrics study of the Cassia seed example. Analytica Chimica Acta 2009, 647, (2), 149-158.
75. Xie, B.; Gong, T.; Tang, M.; Mi, D.; Zhang, X.; Liu, J.; Zhang, Z., An approach based on HPLC-fingerprint and chemometrics to quality consistency evaluation of Liuwei Dihuang Pills produced by different manufacturers. Journal of Pharmaceutical and Biomedical Analysis 2008, 48, (4), 1261-1266.
76. Fan, X. H.; Cheng, Y. Y.; Ye, Z. L.; Lin, R. C.; Qian, Z. Z., Multiple chromatographic fingerprinting and its application to the quality control of herbal medicines. Analytica Chimica Acta 2006, 555, (2), 217-224.
77. Arceusz, A.; Radecka, I.; Wesolowski, M., Identification of diversity in elements content in medicinal plants belonging to different plant families. Food Chemistry 2010, 120, (1), 52-58.
78. Herrador, M. Á.; González, A. G., Pattern recognition procedures for differentiation of Green, Black and Oolong teas according to their metal content from inductively coupled plasma atomic emission spectrometry. Talanta 2001, 53, (6), 1249-1257.
79. Kara, D., Evaluation of trace metal concentrations in some herbs and herbal teas by principal component analysis. Food Chemistry 2009, 114, (1), 347-354.
80. Fernandes, A. P.; Santos, M. C.; Lemos, S. G.; Ferreira, M. M. C.; Nogueira, A. R. A.; Nóbrega, J. A., Pattern recognition applied to mineral characterization of Brazilian coffees and sugar-cane spirits. Spectrochimica Acta Part B: Atomic Spectroscopy 2005, 60, (5), 717-724.
180
81. Ni, Y.; Peng, Y.; Kokot, S., Fingerprinting of complex mixtures with the use of high performance liquid chromatography, inductively coupled plasma atomic emission spectroscopy and chemometrics. Analytica Chimica Acta 2008, 616, (1), 19-27.
82. Moreda-Piñeiro, A.; Fisher, A.; Hill, S. J., The classification of tea according to region of origin using pattern recognition techniques and trace metal data. Journal of Food Composition and Analysis 2003, 16, (2), 195-211.
83. Brattström, A., Long-term effects of St. John's wort (Hypericum perforatum) treatment: A 1-year safety study in mild to moderate depression. Phytomedicine 2009, 16, (4), 277-283.
84. Medina, M. A.; Martínez-Poveda, B.; Amores-Sánchez, M. I.; Quesada, A. R., Hyperforin: More than an antidepressant bioactive compound? Life Sciences 2006, 79, (2), 105-111.
85. Manley, J., Top Markets: Lifestyle, Health & Retailing. Key Note Ltd 2010, (Fifth Edition). 86. Bates, C. Wet British weather triggers spike in sales of 'mood-boosting' supplements.
http://www.dailymail.co.uk/health/article-2170808/Wet-British-weather-causes-spike-sales-mood-boosting-supplements.html (17/03/13),
87. Beerhues, L., Hyperforin. Phytochemistry 2006, 67, (20), 2201-2207. 88. Chatterjee, S. S., Antidepressant activity of hypericum perforatum and hyperforin: The
neglected possibility. Pharmacopsychiatry 1998, 31, (SUPPL. 1), 7-15. 89. Bu, T. L.; Mi, Y. L.; Zeng, W. D.; Zhang, C. Q., Protective Effect of Quercetin on Cadmium-
Induced Oxidative Toxicity on Germ Cells in Male Mice. Anatomical Record-Advances in Integrative Anatomy and Evolutionary Biology 2011, 294, (3), 520-526.
90. Pekal, A.; Biesaga, M.; Pyrzynska, K., Interaction of quercetin with copper ions: Complexation, oxidation and reactivity towards radicals. BioMetals 2011, 24, (1), 41-49.
91. Guardia, T.; Rotelli, A. E.; Juarez, A. r. O.; Pelzer, L. E., Anti-inflammatory properties of plant flavonoids. Effects of rutin, quercetin and hesperidin on adjuvant arthritis in rat. Il Farmaco 2001, 56, (9), 683-687.
92. Bagdonaite, E.; Ma¡rtonfi, P.; Repcak, M.; Labokas, J., Variation in concentrations of major bioactive compounds in Hypericum perforatum L. from Lithuania. Industrial Crops and Products 2012, 35, (1), 302-308.
93. Çirak, C.; Radusiene, J.; Karabük, B.; Janulis, V., Variation of bioactive substances and morphological traits in Hypericum perforatum populations from Northern Turkey. Biochemical Systematics and Ecology 2007, 35, (7), 403-409.
94. Wach, A.; Pyrzyaska, K.; Biesaga, M., Quercetin content in some food and herbal samples. Food Chemistry 2007, 100, (2), 699-704.
95. Piao, M. J.; Kang, K. A.; Zhang, R.; Ko, D. O.; Wang, Z. H.; You, H. J.; Kim, H. S.; Kim, J. S.; Kang, S. S.; Hyun, J. W., Hyperoside prevents oxidative damage induced by hydrogen peroxide in lung fibroblast cells via an antioxidant effect. Biochimica et Biophysica Acta (BBA) - General Subjects 2008, 1780, (12), 1448-1457.
96. Li, S.; Zhang, Z.; Cain, A.; Wang, B.; Long, M.; Taylor, J., Antifungal Activity of Camptothecin, Trifolin, and Hyperoside Isolated from Camptotheca acuminata. Journal of Agricultural and Food Chemistry 2004, 53, (1), 32-37.
97. Silva, C. G.; Raulino, R. J.; Cerqueira, D. M.; Mannarino, S. C.; Pereira, M. D.; Panek, A. D.; Silva, J. F. M.; Menezes, F. S.; Eleutherio, E. C. A., In vitro and in vivo determination of antioxidant activity and mode of action of isoquercitrin and Hyptis fasciculata. Phytomedicine 2009, 16, (8), 761-767.
98. Zou, Y. P.; Lu, Y. H.; Wei, D. Z., Antioxidant activity of a flavonoid-rich extract of Hypericum perforatum L. in vitro. Journal of Agricultural and Food Chemistry 2004, 52, (16), 5032-5039.
99. Rogerio, A.; Kanashiro, A.; Fontanari, C.; da Silva, E.; Lucisano-Valim, Y.; Soares, E.; Faccioli, L., Anti-inflammatory activity of quercetin and isoquercitrin in experimental murine allergic asthma. Inflammation Research 2007, 56, (10), 402-408.
181
100. Hamoudova, R.; Pospisilova, M.; Spilkova, J., Analysis of selected constituents in methanolic extracts of Hypericum perforatum collected in different localitites by capillary ITP-CZE. Electrophoresis 2006, 27, (23), 4820-4826.
101. Barnes, J.; Anderson, L. A.; Phillipson, J. D., St John's wort (Hypericum perforatum L.): a review of its chemistry, pharmacology and clinical properties. Journal of Pharmacy and Pharmacology 2001, 53, (5), 583-600.
102. Silva, B. A.; Ferreres, F.; Malva, J. o. O.; Dias, A. C. P., Phytochemical and antioxidant characterization of Hypericum perforatum alcoholic extracts. Food Chemistry 2005, 90, (1-2), 157-167.
103. Plumb, G. W.; Price, K. R.; Williamson, G., Antioxidant properties of flavonol glycosides from green beans. Redox Report 1999, 4, (3), 123-127.
104. Tatsis, E. C.; Boeren, S.; Exarchou, V.; Troganis, A. N.; Vervoort, J.; Gerothanassis, I. P., Identification of the major constituents of Hypericum perforatum by LC/SPE/NMR and/or LC/MS. Phytochemistry 2007, 68, (3), 383-393.
105. Butterweck, V.; Schmidt, M., St. John's wort: Role of active compounds for its mechanism of action and efficacy. WMW Wiener Medizinische Wochenschrift 2007, 157, (13), 356-361.
106. Batista Pereira, L. G.; Petacci, F.; Fernandes, J. B.; Corrca, A. G.; Vieira, P. C.; Da Silva, M. F. G. F.; Malaspina, O., Biological activity of astilbin from Dimorphandra mollis against Anticarsia gemmatalis and Spodoptera frugiperda. Pest Management Science 2002, 58, (5), 503-507.
107. Haraguchi, H.; Mochida, Y.; Sakai, S.; Masuda, H.; Tamura, Y.; Mizutani, K.; Tanaka, O.; Chou, W. H., Protection against oxidative damage by dihydroflavonols in Engelhardtia chrysolepis. Bioscience, Biotechnology and Biochemistry 1996, 60, (6), 945-948.
108. Camuesco, D.; Comalada, M.; Rodríguez-Cabezas, M. E.; Nieto, A.; Lorente, M. D.; Concha, A.; Zarzuelo, A.; Gálvez, J., The intestinal anti-inflammatory effect of quercitrin is associated with an inhibition in iNOS expression. British Journal of Pharmacology 2004, 143, (7), 908-918.
109. Afanas'eva, I. B.; Ostrakhovitch, E. A.; Mikhal'chik, E. V.; Ibragimova, G. A.; Korkina, L. G., Enhancement of antioxidant and anti-inflammatory activities of bioflavonoid rutin by complexation with transition metals. Biochemical Pharmacology 2001, 61, (6), 677-684.
110. Karimi, E.; Jaafar, H. Z. E.; Ahmad, S., Phenolics and flavonoids profiling and antioxidant activity of three varieties of Malaysian indigenous medicinal herb Labisia pumila benth. Journal of Medicinal Plants Research 2011, 5, (7), 1200-1206.
111. Ma, S. C.; But, P. P. H.; Ooi, V. E. C.; He, Y. H.; Lee, S. H. S.; Lee, S. F.; Lin, R. C., Antiviral amentoflavone from Selaginella sinensis. Biological and Pharmaceutical Bulletin 2001, 24, (3), 311-312.
112. Kim, H.; Son, K.; Chang, H.; Kang, S.; Kim, H., Amentoflavone, a plant biflavone: A new potential anti-inflammatory agent. Archives of Pharmacal Research 1998, 21, (4), 406-410.
113. Anand, R.; Verma, N.; Gupta, D. K.; Puri, S. C.; Handa, G.; Sharma, V. K.; Qazi, G. N., Comparison of extraction techniques for extraction of bioactive molecules from Hypericum perforatum L. plant. Journal of Chromatographic Science 2005, 43, (10), 530-531.
114. Ozkan, E. E.; Mat, A., An overview on Hypericum species of Turkey. Journal of Pharmacognosy and Phytotherapy 2013, 5, (3), 38-46.
115. Cho, A.-S.; Jeon, S.-M.; Kim, M.-J.; Yeo, J.; Seo, K.-I.; Choi, M.-S.; Lee, M.-K., Chlorogenic acid exhibits anti-obesity property and improves lipid metabolism in high-fat diet-induced-obese mice. Food and Chemical Toxicology 2010, 48, (3), 937-943.
116. British Pharmacopoeia St. John's Wort Quantified Dry Extract. http://www.pharmacopoeia.co.uk/bp2013/ixbin/bp.cgi?a=display&r=lWZTJfJyVv4&n=1&id=4892&tab=search (08/10/12),
117. United States Pharmacopoeia and The National Formulary, USP-NF. 2013.
182
118. Konieczyński P.; Wesołowski M., Determination of Zinc, Iron, Nitrogen and Phosphorus in Several Botanical Species of Medicinal Plants. Polish Journal of Environmental Studies 2007, 16, (5), 785-790.
119. Bu, K.; Cizdziel, J. V.; Reidy, L., Analysis of herbal supplements for selected dietary minerals and trace elements by laser ablation- and solution-based ICPMS. Microchemical Journal 2012, (0).
120. Chizzola, R.; Lukas, B., Variability Of The Cadmium Content In HypericumSpecies Collected In Eastern Austria. Water, Air, & Soil Pollution 2005, 170, (1), 331-343.
121. Chizzola, R.; Michitsch, H.; Franz, C., Monitoring of metallic micronutrients and heavy metals in herbs, spices and medicinal plants from Austria. European Food Research and Technology 2003, 216, (5), 407-411.
122. Djukić-Ćosić, D.; Stanojević, A.; Djekić-Ivanković, M.; Ćurčić, M.; Plamenac-Bulat, Z.; Antonijević, B.; Matović, V., Cadmium content in Hypericum perforatum L. and thymus serpyllum L. from localities of the mountains Rtanj and Ozren. Sadržaj kadmijuma u Hypericum perforatum L. i thymus serpyllum L. sa lokaliteta planina Rtnja i Ozrena 2011, 68, (11), 930-934.
123. Falco, G.; Gomez-Catalan, J.; Llobet, J. M.; Domingo, J. L., Contribution of medicinal plants to the daily intake of various toxic elements in Catalonia, Spain. Trace Elements and Electrolytes 2003, 20, (2), 120-124.
124. Falco, G.; Llobet, J. M.; Zareba, S.; Krzysiak, K.; Domingo, J. L., Risk assessment of trace elements intake through natural remedies in Poland. Trace Elements and Electrolytes 2005, 22, (3), 222-226.
125. Gomez, M. R.; Cerutti, S.; Olsina, R. A.; Silva, M. F.; Martínez, L. D., Metal content monitoring in Hypericum perforatum pharmaceutical derivatives by atomic absorption and emission spectrometry. Journal of Pharmaceutical and Biomedical Analysis 2004, 34, (3), 569-576.
126. Gomez, M. R.; Cerutti, S.; Sombra, L. L.; Silva, M. F.; Martínez, L. D., Determination of heavy metals for the quality control in argentinian herbal medicines by ETAAS and ICP-OES. Food and Chemical Toxicology 2007, 45, (6), 1060-1064.
127. Helmja, K.; Vaher, M.; Puessa, T.; Orav, A.; Viitak, A.; Levandi, T.; Kaljurand, M., Variation in the composition of the essential oils, phenolic compounds and mineral elements of Hypericum perforatum L. growing in Estonia. Natural Product Research 2011, 25, (5), 496-510.
128. Hussain, J.; Bahader, A.; Ullah, F.; Rehman, N. U.; Khan, A. L.; Ullah, W.; Shinwari, Z. K., Proximate and Nutrient Analysis of the Locally Manufactured Herbal Medicines and its Raw Material. Journal of American Science 2010, 6, (5), 91-96.
129. Jurca, T.; Marian, E.; Vicas, L.; Gatea, D., Simultaneous determination of metals in hypericum perforatum L. by ICP-OES. Revista de Chimie 2011, 62, (12), 1154-1156.
130. Kadioglu, I.; Mendil, D.; Sari, H.; Hasdemir, E., Determination of heavy metal levels in some weeds collected from Tokat, Turkey. Asian Journal of Chemistry 2005, 17, (1), 564-568.
131. Kalny, P.; Wyderska, S.; Fijałek, Z.; Wroczyński, P., Determination of selected elements in different pharmaceutical forms of some polish herbal medicinal products. Acta Poloniae Pharmaceutica - Drug Research 2012, 69, (2), 279-283.
132. Konieczynski, P.; Wesolowski, M., Water-extractable magnesium, manganese and copper in leaves and herbs of medicinal plants. Acta Poloniae Pharmaceutica - Drug Research 2012, 69, (1), 33-39.
133. Konieczyński, P.; Wesolowski, M.; Radecka, I.; Rafalski, P., Bioavailable inorganic forms of essential elements in medicinal plants from Northern Poland. Chemical Speciation and Bioavailability 2011, 23, (2), 61-70.
134. Levine, K. E.; Levine, M. A.; Weber, F. X.; Hu, Y.; Perlmutter, J.; Grohse, P. M., Determination of mercury in an assortment of dietary supplements using an inexpensive combustion atomic absorption spectrometry technique. Journal of Automated Methods & Management in Chemistry 2005, (4), 211-216.
183
135. Mamani, M. C. V.; Aleixo, L. M.; Abreu, M. F. d.; Rath, S., Simultaneous determination of cadmium and lead in medicinal plants by anodic stripping voltammetry. Journal of Pharmaceutical and Biomedical Analysis 2005, 37, (4), 709-713.
136. Moreno-Jiménez, E.; Peñalosa, J. M.; Manzano, R.; Carpena-Ruiz, R. O.; Gamarra, R.; Esteban, E., Heavy metals distribution in soils surrounding an abandoned mine in NW Madrid (Spain) and their transference to wild flora. Journal of Hazardous Materials 2009, 162, (2-3), 854-859.
137. Naeem, S.; Mubeen, H.; Saddiqe, Z., Characterization of Heavy Metals in Extracts of Hypericum Medicinal Plant by Flame Atomic Absorption Spectrometry. Asian Journal of Chemistry 2010, 22, (6), 4387-4392.
138. Ozkutlu, F.; Sekeroglu, N.; Koca, U.; Yazici, G., Selenium concentrations of selected medicinal and aromatic plants in Turkey. Natural Product Communications 2011, 6, (10), 1469-1472.
139. Palchetti, I.; Mascini, M.; Minunni, M.; Bilia, A. R.; Vincieri, F. F., Disposable electrochemical sensor for rapid determination of heavy metals in herbal drugs. Journal of Pharmaceutical and Biomedical Analysis 2003, 32, (2), 251-256.
140. Radanovic, D.; Antic-Mladenovic, S.; Jakovljevic, M., Influence of some soil characteristics on heavy metal content in Hypericum perforatum L. and Achillea millefolium L. In Proceedings of the International Conference on Medicinal and Aromatic Plants Possibilities and Limitations of Medicinal and Aromatic Plant Production in the 21st Century, International Society Horticultural Science: Leuven 1, 2002; pp 295-301.
141. Raman, P.; Patino, L. C.; Nair, M. G., Evaluation of Metal and Microbial Contamination in Botanical Supplements. Journal of Agricultural and Food Chemistry 2004, 52, (26), 7822-7827.
142. Razic, S.; Onjia, A.; Ðogo, S.; Slavkovic, L.; Popovic, A., Determination of metal content in some herbal drugs--Empirical and chemometric approach. Talanta 2005, 67, (1), 233-239.
143. Suliburska, J.; Kaczmarek, K., Herbal infusions as a source of calcium, magnesium, iron, zinc and copper in human nutrition. International Journal of Food Sciences and Nutrition 2012, 63, (2), 194-198.
144. Tokalioglu, S., Determination of trace elements in commonly consumed medicinal herbs by ICP-MS and multivariate analysis. Food Chemistry 2012, 134, (4), 2504-2508.
145. Yi, X. P.; Liu, J. P.; Li, G., [Determination of elements of hypericum perforatum L. in Xinjiang by microwave digestion-ICP-AES]. Guang Pu Xue Yu Guang Pu Fen Xi 2004, 24, (7), 890-2.
146. U.S. Environmental Protection Agency Cadmium. http://www.epa.gov/iris/subst/0141.htm (26 March),
147. US Pharmacopiea, <231> Heavy Metals. In US Pharmacopiea, The United States Pharmacopeial Convention, Ed. 2013; pp 150-151.
148. Tirillini, B.; Ricci, A.; Pintore, G.; Chessa, M.; Sighinolfi, S., Induction of hypericins in Hypericum perforatum in response to chromium. Fitoterapia 2006, 77, (3), 164-170.
149. Murch, S. J.; Haq, K.; Rupasinghe, H. P. V.; Saxena, P. K., Nickel contamination affects growth and secondary metabolite composition of St. John's wort (Hypericum perforatum L.). Environmental and Experimental Botany 2003, 49, (3), 251-257.
150. de Souza, R. F. V.; De Giovani, W. F., Antioxidant properties of complexes of flavonoids with metal ions. Redox Report 2004, 9, (2), 97-104.
151. Stef, D. S.; Gergen, I., Effect of mineral-enriched diet and medicinal herbs on Fe, Mn, Zn, and Cu uptake in chicken. Chem Cent J 2012, 6, (1), 19.
152. Kew, J.; Morris, C.; Aihie, A.; Fysh, R.; Jones, S.; Brooks, D., Arsenic and mercury intoxication due to Indian ethnic remedies. BMJ: British Medical Journal 1993, 306, (6876), 506.
153. Deng, J. F.; Wu, M. L.; Tsai, W. J.; Ger, J.; Yang, C. C., P1F148 - Acute realgar herbal poisoning: Two cases report. Toxicology Letters 1998, 95, Supplement 1, (0), 73.
154. Finley, J. W.; Sigrid-Keck, A.; Robbins, R. J.; Hintze, K. J., Selenium Enrichment of Broccoli: Interactions between Selenium and Secondary Plant Compounds. The Journal of Nutrition 2005, 135, (5), 1236-1238.
184
155. McCutcheon, S. C.; Schnoor, J. L., Phytoremediation : Transformation and Control of Contaminants. John Wiley & Sons, Inc.: 2003.
156. Lovkova, M. Y.; Buzuk, G. N.; Sokolova, S. M.; Kliment'eva, N. I., Chemical Features of Medicinal Plants (Review). Applied Biochemistry and Microbiology 2001, 37, (3), 229-237.
157. Oledzka, R.; Szyszkowska, E., Determination of the content of some elements in selected species of herbs and herb infusions. BROMATOLOGIA I CHEMIA TOKSYKOLOGICZNA 2000, 33, (4), 311-316.
158. Erken, S.; Malyer, H.; Demirci, F.; Demirci, B.; Baser, K. H. C., CHEMICAL INVESTIGATIONS ON SOME HYPERICUM SPECIES GROWING IN TURKEY-I. Chemistry of Natural Compounds 2001, 37, (5), 434-438.
159. Tawaha, K.; Gharaibeh, M.; El-Elimat, T.; Alali, F. Q., Determination of hypericin and hyperforin content in selected Jordanian Hypericum species. Industrial Crops and Products 2010, 32, (3), 241-245.
160. Kalny, P.; Fijalek, Z.; Daszczuk, A.; Ostapczuk, P., Determination of selected microelements in polish herbs and their infusions. Science of The Total Environment 2007, 381, (1-3), 99-104.
161. Greenberg, H.; Varian inc, Varian ICP-OES Training Course Manual. In 1999. 162. Miller, J. N.; Miller, J. C., Statistics and Chemometrics for Analytical Chemistry. 6th Edition ed.;
Pearson/Prentice Hall: 2010. 163. Sucharova¡, J.; Suchara, I., Determination of 36 elements in plant reference materials with
different Si contents by inductively coupled plasma mass spectrometry: Comparison of microwave digestions assisted by three types of digestion mixtures. Analytica Chimica Acta 2006, 576, (2), 163-176.
164. Cao, H.; Jiang, Y.; Chen, J.; Zhang, H.; Huang, W.; Li, L.; Zhang, W., Arsenic accumulation in Scutellaria baicalensis Georgi and its effects on plant growth and pharmaceutical components. Journal of Hazardous Materials 2009, 171, (1-3), 508-513.
165. Lesniewicz, A.; Jaworska, K.; Zyrnicki, W., Macro- and micro-nutrients and their bioavailability in polish herbal medicaments. Food Chemistry 2006, 99, (4), 670-679.
166. Tumir, H.; Bosnir, J.; Vedrina-Dragojevic, I.; Dragun, Z.; Tomic, S.; Puntaric, D.; Jurak, G., Monitoring of metal and metalloid content in dietary supplements on the Croatian market. Food Control 2010, 21, (6), 885-889.
167. Ang, H. H., Lead contamination in Eugenia dyeriana herbal preparations from different commercial sources in Malaysia. Food and Chemical Toxicology 2008, 46, (6), 1969-1975.
168. Ang, H. H.; Lee, K. L., Contamination of mercury in tongkat Ali hitam herbal preparations. Food and Chemical Toxicology 2006, 44, (8), 1245-1250.
169. Caldas, E. D.; Machado, L. L., Cadmium, mercury and lead in medicinal herbs in Brazil. Food and Chemical Toxicology 2004, 42, (4), 599-603.
170. Thompson, M., Standard additions: myth and reality. In 37 ed.; Analytical Methods Committee, Ed. RSC: 2009.
171. Sucharová, J.; Suchara, I., Determination of 36 elements in plant reference materials with different Si contents by inductively coupled plasma mass spectrometry: Comparison of microwave digestions assisted by three types of digestion mixtures. Analytica Chimica Acta 2006, 576, (2), 163-176.
172. Cooke, J.; Leishman, M. R., Is plant ecology more siliceous than we realise? Trends in Plant Science 2011, 16, (2), 61-68.
173. The European Parliament and the Council of the European Union, Directive 2004/24/ec of the European Parliament and of the Council. Official Journal of the European Union 2004.
174. US Pharmacopiea, <233> Elemental Impurities - Procedures. In US Pharmacopiea, Convention, T. U. S. P., Ed. 2013; pp 153-156.
175. Rai, V.; Kakkar, P.; Khatoon, S.; Rawat, A. K. S.; Mehrotra, S., Heavy Metal Accumulation in Some Herbal Drugs. Pharmaceutical Biology 2001, 39, (5), 384-387.
185
176. Watanabe, T.; Osaki, M.; Yoshihara, T.; Tadano, T., Distribution and chemical speciation of aluminum in the Al accumulator plant, Melastoma malabathricum L. Plant and Soil 1998, 201, (2), 165-173.
177. Masarovičová, E.; Kráľová, K.; Kummerová, M., Principles of classification of medicinal plants as hyperaccumulators or excluders. Acta Physiologiae Plantarum 2010, 32, (5), 823-829.
178. U.S. Department of Health and Human Services, Guidance for Industry; Botanical Drug Products. In Food and Drug Administration, Ed. Center for Drug Evaluation and Research (CDER): 2004.
179. Passwater, R. A.; Cranton, E. M., Trace Elements, Hair Analysis, and Nutrition. Keats Pub.: 1983. 180. Chan, Y.; Siu, C.; Yiu, K.; Chan, H.; Li, S.; Tam, S.; Cheung, B.; Lau, C.; Lam, T.; Tse, H.-F., Adverse
systemic arterial function in patients with selenium deficiency. The Journal of Nutrition, Health & Aging 2012, 16, (1), 85-88.
181. Malesev, D.; Kuntic, V., Investigation of metal-flavonoid chelates and the determination of flavonoids via metal-flavonoid complexing reactions. Journal of the Serbian Chemical Society 2007, 72, (10), 921-939.
182. Baugh, S.; Ignelzi, S., Hydorlysis and Redox Factors Affecting Analysis of Commond Phenolic Marker Compounds in Botanical Extracts and Finished Products. Journal of AOAC International 2000, 83, (5), 1135-1140.
183. U.S. Environmental Protection Agency Chromium. http://www.epa.gov/iris/subst/0144.htm (26 March),
184. Silva, S.; Santos, C.; Matos, M.; Pinto-Carnide, O., Al toxicity mechanism in tolerant and sensitive rye genotypes. Environmental and Experimental Botany 75, (6), 89-97.
185. Broadley, M. R.; White, P. J.; Hammond, J. P.; Zelko, I.; Lux, A., Zinc in plants. New Phytologist 2007, 173, (4), 677-702.
186. Lembrechts, J. F.; van Ginkel, J. H.; Desmet, G. M., Comparative study on the uptake of strontium-85 from nutrient solutions and potted soils by lettuce. Plant and Soil 1990, 125, (1), 63-69.
187. Gallego, S. M.; Pena, L. B.; Barcia, R. A.; Azpilicueta, C. E.; Iannone, M. F.; Rosales, E. P.; Zawoznik, M. S.; Groppa, M. D.; Benavides, M. P., Unravelling cadmium toxicity and tolerance in plants: Insight into regulatory mechanisms. Environmental and Experimental Botany 2012, 83, (0), 33-46.
188. Gardea-Torresdey, J. L.; Peralta-Videa, J. R.; de la Rosa, G.; Parsons, J. G., Phytoremediation of heavy metals and study of the metal coordination by X-ray absorption spectroscopy. Coordination Chemistry Reviews 2005, 249, (17-18), 1797-1810.
189. Johnson Matthey Platinum Manual - Alloys. http://www.johnsonmattheyny.com/public/miniHome_technical/platinumTechManual/1_Alloys.pdf (08/10/2012),
190. Harvey, P. W. J.; Dexter, P. B.; Darnton-Hill, I., The impact of consuming iron from non-food sources on iron status in developing countries. Public Health Nutrition 2000, 3, (4), 375-383.
191. Wagner, H.; Bladt, S., Pharmaceutical quality of hypericum extracts. Journal of Geriatric Psychiatry and Neurology 1994, 7, (SUPPL. 1), S65-S68.
192. Anderson, K. A.; Smith, B. W., Use of Chemical Profiling to Differentiate Geographic Growing Origin of Raw Pistachios. Journal of Agricultural and Food Chemistry 2004, 53, (2), 410-418.
193. Kelly, S.; Heaton, K.; Hoogewerff, J., Tracing the geographical origin of food: The application of multi-element and multi-isotope analysis. Trends in Food Science & Technology 2005, 16, (12), 555-567.
194. Weidong, H.; Xiaojuan, B.; Yuqi, Y.; Tao, Z.; Xianli, L.; Shengfang, L.; Yuandong, L., Study on the Ultrasound-assisted Extraction of Flavonoids Components from Hypericum Perforatum. Guangdong Chemical Industry 2012, 39, (4), 272-273.
186
195. Kulevanova, S.; Stefova, M.; Stafilov, T., Determination of total flavonoids and quercetin in Hyperici herba and its aqueous, aqueous-ethanolic and oil extracts. Acta pharmaceutica 2000, 50, (1), 29-37.
196. Dehghan, G.; Khoshkam, Z., Tin(II)-quercetin complex: Synthesis, spectral characterisation and antioxidant activity. Food Chemistry 2012, 131, (2), 422-426.
197. Brown, J. E.; Khodr, H.; Hider, R. C.; Rice-Evans, C. A., Structural dependence of flavonoid interactions with Cu2+ ions: implications for their antioxidant properties. Biochemical Journal 1998, 330, (3), 1173.
198. Nafis, M.; Jardon, P., Propriétés spectroscopiques et photophysiques de complexes métalliques de l'hypericine en relation avec leur activité photodynamique. Journal de chimie physique 1994, 91, (1), 99-112.
199. Masarovičová, E.; Kráľová, K. In Medicinal plants-past, nowadays, future, International Symposium on Chamomile Research, Development and Production 749, 2006; pp 19-27.
200. Raczuk, J.; Biardzka, E.; Daruk, J., The content of Ca, Mg, Fe and Cu in selected species of herbs and herb infusions. Rocz Panstw Zakl Hig 2008, 59, (1), 33-40.
201. Middleton, D., Email enquiry from the Schwabe Pharma UK Web Site. In Owen, J., Ed. 2012. 202. Gaines, P. Antimony. http://inorganicventures.com/tech/periodic-table/ (15/03/13), 203. Gaines, P. Samples Containing Molybdenum. http://inorganicventures.com/tech/sample-
preparation/molybdenum/the-metal-and-alloys (15/03/13), 204. De Sole, P.; Rossi, C.; Chiarpotto, M.; Ciasca, G.; Bocca, B.; Alimonti, A.; Bizzarro, A.; Masullo,
C., Possible relationship between Al/ferritin complex and Alzheimer's disease. Clinical Biochemistry 2013, 46, (1-2), 89-93.
205. Boyce, B. F.; Elder, H. Y.; Elliot, H. L.; Fogelman, I.; Fell, G. S.; Junor, B. J.; Beastall, G.; Boyle, I. T., HYPERCALCAEMIC OSTEOMALACIA DUE TO ALUMINIUM TOXICITY. The Lancet 1982, 320, (8306), 1009-1013.
206. Erdemoǧlu, S. B.; Pyrzyniska, K.; Güçercer, Å., Speciation of aluminum in tea infusion by ion-exchange resins and flame AAS detection. Analytica Chimica Acta 2000, 411, (1-2), 81-89.
207. Biesaga, M.; Stafiej, A.; Pyrzynska, K., Extraction and Hydrolysis Parameters for Determination of Quercetin in Hypericum perforatum. Chromatographia 2007, 65, (11), 701-706.
208. Fowler, B. A.; Nordberg, G. F.; Nordberg, M.; Friberg, L., Handbook on the Toxicology of Metals. Elsevier Science: 2011.
209. Roza, O.; Berman, L. B., The pathophysiology of barium: hypokalemic and cardiovascular effects. Journal of pharmacology and experimental therapeutics 1971, 177, (2), 433-439.
210. Davidovits, M.; Levy, Y.; Avramovitz, T.; Eisenstein, B., Calcium-deficiency rickets in a four-year-old boywith milk allergy. The Journal of Pediatrics 1993, 122, (2), 249-251.
211. Roucoux, P.; Dabin, P. In The effect of cadmium on the nitrogen fixation and amino acids content of soybean plants, Carbohydrate and protein synthesis, Giessen (Germany, FR), 7 Sep 1977, 1978; Office for Official Publications of the European Communities: 1978.
212. Nordberg, G., Excursions of intake above ADI: Case study on cadmium. Regulatory Toxicology and Pharmacology 1999, 30, (2 II), S57-S62.
213. Bravo, A.; Anacona, J. R., Metal complexes of the flavonoid quercetin: antibacterial properties. Transition Metal Chemistry 2001, 26, (1), 20-23.
214. Escandar, G. M.; Sala, L. F., Complexing behavior of rutin and quercetin. Canadian journal of chemistry 1991, 69, (12), 1994-2001.
215. Birjees Bukhari, S.; Memon, S.; Mahroof Tahir, M.; Bhanger, M. I., Synthesis, characterization and investigation of antioxidant activity of cobalt-quercetin complex. Journal of Molecular Structure 2008, 892, (1-3), 39-46.
216. World Health Organization, Trace elements in human nutrition and health. In 1996.
187
217. Alvarez, M. J.; Garcia, M. E.; Sanz-Medel, A., The complexation of Cr (III) and Cr (VI) with flavones in micellar media and its use for the spectrophotometric determination of chromium. Talanta 1989, 36, (9), 919-923.
218. Irving, H.; Williams, R. J. P., 637. The stability of transition-metal complexes. Journal of the Chemical Society (Resumed) 1953, 3192-3210.
219. Ameziane, J.; Aplincourt, M.; Dupont, L.; Heirman, F.; Pierrard, J. C., Thermodynamic stability of copper (II), manganese (II), zinc (II) and iron (III) complexes with chlorogenic acid. Bulletin de la Sociatae chimique de France 1996, 133, (3), 243-249.
220. Nowak, D.; Kuzniar, A.; Kopacz, M., Solid complexes of iron(II) and iron(III) with rutin. Structural Chemistry 2010, 21, (2), 323-330.
221. Esparza, I.; Salinas, I.; Santamaria, C.; Garcia-Mina, J. M.; Fernandez, J. M., Electrochemical and theoretical complexation studies for Zn and Cu with individual polyphenols. Analytica Chimica Acta 2005, 543, (1), 267-274.
222. Saris, N. E.; Mervaala, E.; Karppanen, H.; Khawaja, J. A.; Lewenstam, A., Magnesium. An update on physiological, clinical and analytical aspects. Clin Chim Acta 2000, 294, (1-2), 1-26.
223. Fan, G. J.; Jin, X. L.; Qian, Y. P.; Wang, Q.; Yang, R. T.; Dai, F.; Tang, J. J.; Shang, Y. J.; Cheng, L. X.; Yang, J., Hydroxycinnamic Acids as DNA-Cleaving Agents in the Presence of CuII Ions: Mechanism, Structure-Activity Relationship, and Biological Implications. Chemistry-A European Journal 2009, 15, (46), 12889-12899.
224. Ahmadi, S. M.; Dehghan, G.; Hosseinpourfeizi, M. A.; Dolatabadi, J. E. N.; Kashanian, S., Preparation, Characterization, and DNA Binding Studies of Water-Soluble Quercetin-Molybdenum (VI) Complex. DNA and cell biology 2011, 30, (7), 517-523.
225. Viswanathan, P.; Sriram, V.; Yogeeswaran, G., Sensitive Spectrophotometric Assay for 3-Hydroxy-Substituted Flavonoids, Based on Their Binding with Molybdenum, Antimony, or Bismuth. Journal of Agricultural and Food Chemistry 2000, 48, (7), 2802-2806.
226. Ghasemzadeh, A.; Jaafar, H. Z. E.; Rahmat, A., Effects of solvent type on phenolics and flavonoids content and antioxidant activities in two varieties of young ginger (Zingiber officinale Roscoe) extracts. Journal of Medicinal Plants Research 2011, 5, (7), 1147-1154.
227. Uddin, M. R.; Li, X.; Park, W. T.; Kim, Y. B.; Kim, S. J.; Kim, Y. S.; Lee, M. Y.; Park, C. H.; Park, S. U., Phenolic compound content in different organs of Korean common buckwheat cultivars. Asian Journal of Chemistry 2013, 25, (1), 424-426.
228. Masuoka, N.; Matsuda, M.; Kubo, I., Characterisation of the antioxidant activity of flavonoids. Food Chemistry 2012, 131, (2), 541-545.
229. Nègre-Salvayre, A.; Affany, A.; Hariton, C.; Salvayre, R., Additional Antilipoperoxidant Activities of Alpha-Tocopherol and Ascorbic Acid on Membrane-Like Systems Are Potentiated by Rutin. Pharmacology 1991, 42, (5), 262-272.
230. Kuntic, V.; Filipovic, I.; Vujic, Z., Effects of Rutin and Hesperidin and their Al(III) and Cu(II) Complexes on in Vitro Plasma Coagulation Assays. Molecules 2011, 16, (2), 1378-1388.
231. Medvidovic-Kosanovic, M.; Samardzic, M.; Malatesti, N.; Sak-Bosnar, M., Electroanalytical Characterization of a Copper(II)-Rutin Complex. International Journal of Electrochemical Science 2011, 6, (4), 1075-1084.
232. Torres, S.; Ferraudi, G.; Aguirre, M. J.; Isaacs, M.; Matsuhiro, B.; Chandia, N. P.; Mendoza, L., On the Ligand-to-Metal Charge-Transfer Photochemistry of the Copper(II) Complexes of Quercetin and Rutin. Helvetica Chimica Acta 2011, 94, (2), 293-300.
233. Kusari, S.; Lamshöft, M.; Zühlke, S.; Spiteller, M., An endophytic fungus from Hypericum perforatum that produces hypericin. Journal of Natural Products 2008, 71, (2), 159-162.
234. Wolkenstein, K.; Gross, J. r. H.; Falk, H.; Schaler, H. F., Preservation of Hypericin and Related Polycyclic Quinone Pigments in Fossil Crinoids. Proceedings: Biological Sciences 2006, 273, (1585), 451-456.
188
235. Jensen, A. G.; Hansen, S. H.; Nielsen, E. Ã., Adhyperforin as a contributor to the effect of Hypericum perforatum L. in biochemical models of antidepressant activity. Life Sciences 2001, 68, (14), 1593-1605.
236. Ari, T.; Anja, H.; Jorma, J., Fast high-performance liquid chromatographic analysis of naphthodianthrones and phloroglucinols from <I>Hypericum perforatum</I> extracts. Phytochemical Analysis 2003, 14, (5), 306-309.
237. Couceiro, M. A.; Afreen, F.; Zobayed, S. M. A.; Kozai, T., Variation in concentrations of major bioactive compounds of St. John's wort: Effects of harvesting time, temperature and germplasm. Plant Science 2006, 170, (1), 128-134.
238. Fourneron, J.-D.; Naït-Si, Y., Effect of eluent pH on the HPLC-UV analysis of hyperforin from St. John's Wort (Hypericum perforatum L.). Phytochemical Analysis 2006, 17, (2), 71-77.
239. Mauri, P.; Pietta, P., High performance liquid chromatography/electrospray mass spectrometry of Hypericum perforatum extracts. Rapid Communications in Mass Spectrometry 2000, 14, (2), 95-99.
240. Ruckert, U.; Likussar, W.; Michelitsch, A., Simultaneous determination of total hypericin and hyperforin in St. John's wort extracts by HPLC with electrochemical detection. Phytochemical Analysis 2007, 18, (3), 204-208.
241. Smelcerovic, A.; Spiteller, M.; Zuehlke, S., Comparison of methods for the exhaustive extraction of hypericins, flavonoids, and hyperforin from Hypericum perforatum L. Journal of Agricultural and Food Chemistry 2006, 54, (7), 2750-2753.
242. Williams, F. B.; Sander, L. C.; Wise, S. A.; Girard, J., Development and evaluation of methods for determination of naphthodianthrones and flavonoids in St. John's wort. Journal of Chromatography A 2006, 1115, (1-2), 93-102.
243. Stalikas, C. D., Extraction, separation, and detection methods for phenolic acids and flavonoids. Journal of Separation Science 2007, 30, (18), 3268-3295.
244. Bruni, R.; Sacchetti, G., Factors Affecting Polyphenol Biosynthesis in Wild and Field Grown St. John's Wort (Hypericum perforatum L. Hypericaceae/Guttiferae). Molecules 2009, 14, (2), 682-725.
245. Southwell, I. A.; Bourke, C. A., Seasonal variation in hypericin content of Hypericum perforatum L. (St. John's Wort). Phytochemistry 2001, 56, (5), 437-441.
246. Bilia, A. R.; Bergonzi, M. C.; Morgenni, F.; Mazzi, G.; Vincieri, F. F., Evaluation of chemical stability of St. John's wort commercial extract and some preparations. International Journal of Pharmaceutics 2001, 213, (1-2), 199-208.
247. Odabas, M. S.; Raduǧienë, J.; Camas, N.; Janulis, V.; Ivanauskas, L.; Çirak, C., The quantitative effects of temperature and light intensity on hyperforin and hypericins accumulation in Hypericum perforatum L. Journal of Medicinal Plant Research 2009, 3, (7), 519-525.
248. Weber, G. n., Selective detection of metal species in HPLC and FIA by means of pulsed amperometric detection (PAD). Fresenius' journal of analytical chemistry 1996, 356, (3), 242-246.
249. Tripathy, D. R.; Singha Roy, A.; Dasgupta, S., Complex formation of rutin and quercetin with copper alters the mode of inhibition of Ribonuclease A. FEBS letters 2011, 585, (20), 3270-3276.
250. Hvattum, E.; Ekeberg, D., Study of the collision-induced radical cleavage of flavonoid glycosides using negative electrospray ionization tandem quadrupole mass spectrometry. Journal of Mass Spectrometry 2003, 38, (1), 43-49.
251. Hajji, H. E.; Nkhili, E.; Tomao, V.; Dangles, O., Interactions of quercetin with iron and copper ions: Complexation and autoxidation. Free Radical Research 2006, 40, (3), 303-320.
189
252. Bai, Y.; Song, F.; Chen, M.; Xing, J.; Liu, Z.; Liu, S., Characterization of the rutin-metal complex by electrospray ionization tandem mass spectrometry. Analytical sciences 2004, 20, (8), 1147-1151.
253. Deng, H.; Van Berkel, G. J., Electrospray mass spectrometry and UV/visible spectrophotometry studies of aluminum(III)–flavonoid complexes. Journal of Mass Spectrometry 1998, 33, (11), 1080-1087.
254. Ishikura, N.; Mato, M., Partial Purification and Some Properties of Flavonol 3-O-Glycosyltransferases from Seedlings of Vigna mungo, with Special Reference to the Formation of Kaempferol 3-O-Galactoside and 3-O-Glucoside. Plant and Cell Physiology 1993, 34, (2), 329-335.
255. Stoynova-Bakalova, E.; Nikolova, M.; Maksymiec, W., Effects of Cu2+, cytokinins and jasmonate on content of two flavonols identified in Zucchini cotyledons. Acta Biologica Cracoviensia. Series Botanica 2009, 51, (2), 77-83.
256. Ververidis, F.; Trantas, E.; Douglas, C.; Vollmer, G.; Kretzschmar, G.; Panopoulos, N., Biotechnology of flavonoids and other phenylpropanoid-derived natural products. Part I: Chemical diversity, impacts on plant biology and human health. Biotechnology journal 2007, 2, (10), 1214-1234.
257. Halbwirth, H.; Fischer, T. C.; Schlangen, K.; Rademacher, W.; Schleifer, K.-J. r.; Forkmann, G.; Stich, K., Screening for inhibitors of 2-oxoglutarate-dependent dioxygenases: Flavanone 3β-hydroxylase and flavonol synthase. Plant Science 2006, 171, (2), 194-205.
258. Wellmann, F.; Lukacin, R.; Moriguchi, T.; Britsch, L.; Schiltz, E.; Matern, U., Functional expression and mutational analysis of flavonol synthase from Citrus unshiu. European Journal of Biochemistry 2002, 269, (16), 4134-4142.
259. Kidd, P. S.; Llugany, M.; Poschenrieder, C.; Gunse, B.; Barcelo, J., The role of root exudates in aluminium resistance and silicon-induced amelioration of aluminium toxicity in three varieties of maize (Zea mays L.). Journal of Experimental Botany 2001, 52, (359), 1339-1352.
260. Adam, P.; Arigoni, D.; Bacher, A.; Eisenreich, W., Biosynthesis of hyperforin in Hypericum perforatum. Journal of Medicinal Chemistry 2002, 45, (21), 4786-4793.
261. Boubakir, Z.; Beuerle, T.; Liu, B.; Beerhues, L., The first prenylation step in hyperforin biosynthesis. Phytochemistry 2005, 66, (1), 51-57.
262. Kreft, I.; Fabjan, N.; Germ, M., Rutin in buckwheat protection of plants and its importance for the production of functional food. Fagopyrum 2003, 20, 7-11.
263. Mallikarjuna, N.; Kranthi, K. R.; Jadhav, D. R.; Kranthi, S.; Chandra, S., Influence of foliar chemical compounds on the development of Spodoptera litura (Fab.) in interspecific derivatives of groundnut. Journal of Applied Entomology 2004, 128, (5), 321-328.

190
10 Appendix
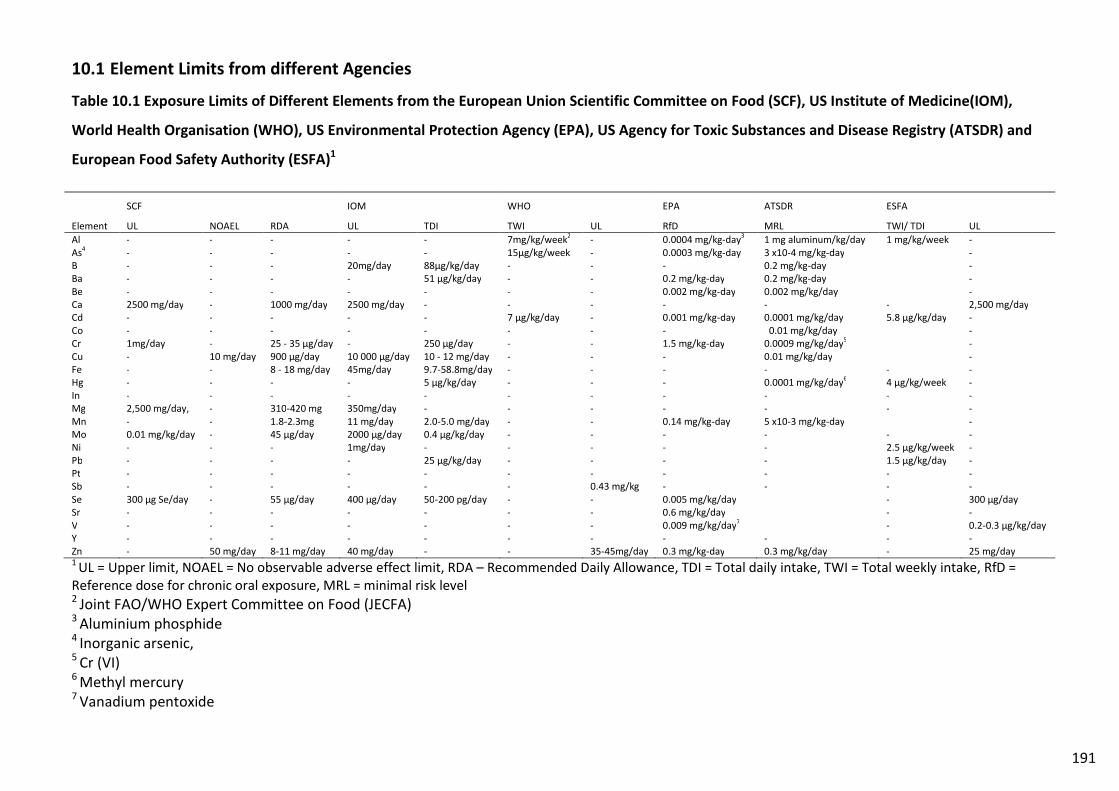
191
10.1 Element Limits from different Agencies
Table 10.1 Exposure Limits of Different Elements from the European Union Scientific Committee on Food (SCF), US Institute of Medicine(IOM),
World Health Organisation (WHO), US Environmental Protection Agency (EPA), US Agency for Toxic Substances and Disease Registry (ATSDR) and
European Food Safety Authority (ESFA)1
SCF IOM WHO EPA ATSDR ESFA
Element UL NOAEL RDA UL TDI TWI UL RfD MRL TWI/ TDI UL Al - - - - - 7mg/kg/week2 - 0.0004 mg/kg-day3 1 mg aluminum/kg/day 1 mg/kg/week - As4 - - - - - 15µg/kg/week - 0.0003 mg/kg-day 3 x10⁻⁴ mg/kg-day - B - - - 20mg/day 88µg/kg/day - - - 0.2 mg/kg-day - Ba - - - - 51 μg/kg/day - - 0.2 mg/kg-day 0.2 mg/kg-day - Be - - - - - - - 0.002 mg/kg-day 0.002 mg/kg/day - Ca 2500 mg/day - 1000 mg/day 2500 mg/day - - - - - - 2,500 mg/day Cd - - - - - 7 μg/kg/day - 0.001 mg/kg-day 0.0001 mg/kg/day 5.8 μg/kg/day - Co - - - - - - - - 0.01 mg/kg/day - Cr 1mg/day - 25 - 35 μg/day - 250 μg/day - - 1.5 mg/kg-day 0.0009 mg/kg/day5 - Cu - 10 mg/day 900 μg/day 10 000 μg/day 10 - 12 mg/day - - - 0.01 mg/kg/day - Fe - - 8 - 18 mg/day 45mg/day 9.7-58.8mg/day - - - - - - Hg - - - - 5 μg/kg/day - - - 0.0001 mg/kg/day6 4 µg/kg/week - In - - - - - - - - - - - Mg 2,500 mg/day, - 310-420 mg 350mg/day - - - - - - - Mn - - 1.8-2.3mg 11 mg/day 2.0-5.0 mg/day - - 0.14 mg/kg-day 5 x10⁻³ mg/kg-day - Mo 0.01 mg/kg/day - 45 μg/day 2000 μg/day 0.4 μg/kg/day - - - - - - Ni - - - 1mg/day - - - - - 2.5 µg/kg/week - Pb - - - - 25 μg/kg/day - - - - 1.5 μg/kg/day - Pt - - - - - - - - - - - Sb - - - - - - 0.43 mg/kg - - - - Se 300 μg Se/day - 55 μg/day 400 μg/day 50-200 pg/day - - 0.005 mg/kg/day - 300 μg/day Sr - - - - - - - 0.6 mg/kg/day - - V - - - - - - - 0.009 mg/kg/day7 - 0.2-0.3 μg/kg/day Y - - - - - - - - - - - Zn - 50 mg/day 8-11 mg/day 40 mg/day - - 35-45mg/day 0.3 mg/kg-day 0.3 mg/kg/day - 25 mg/day 1 UL = Upper limit, NOAEL = No observable adverse effect limit, RDA – Recommended Daily Allowance, TDI = Total daily intake, TWI = Total weekly intake, RfD = Reference dose for chronic oral exposure, MRL = minimal risk level 2 Joint FAO/WHO Expert Committee on Food (JECFA) 3 Aluminium phosphide 4 Inorganic arsenic, 5 Cr (VI) 6 Methyl mercury 7 Vanadium pentoxide
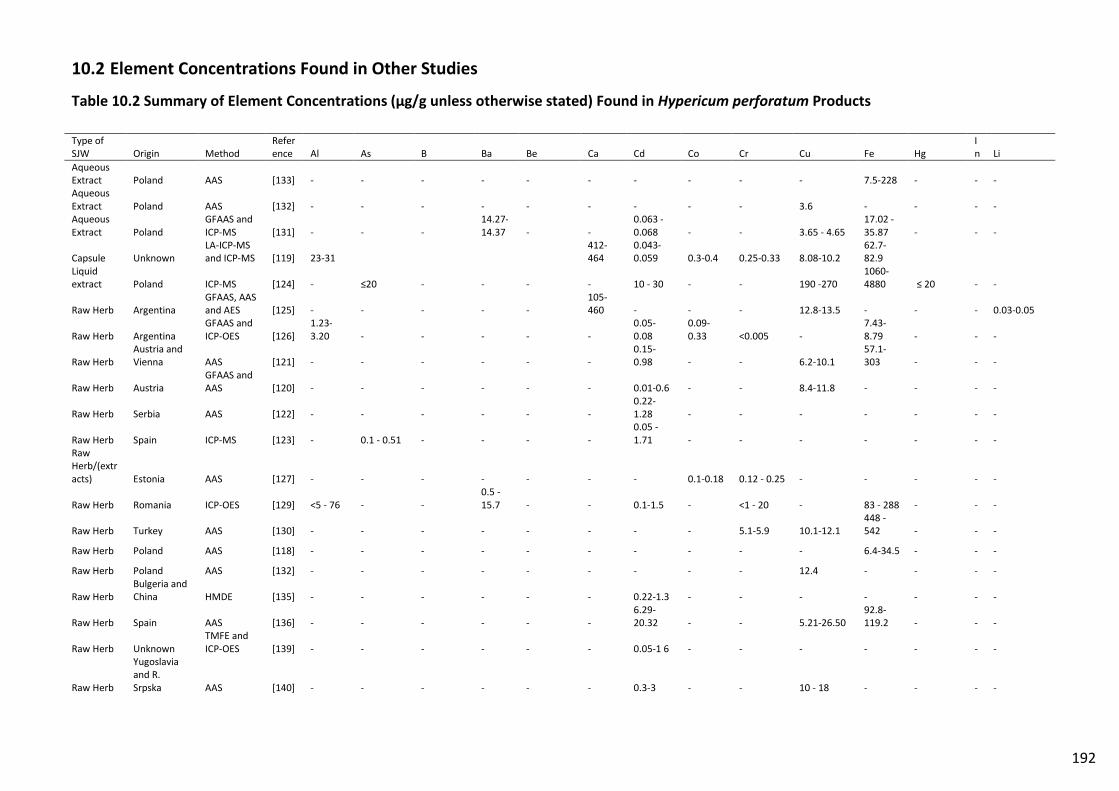
192
10.2 Element Concentrations Found in Other Studies
Table 10.2 Summary of Element Concentrations (µg/g unless otherwise stated) Found in Hypericum perforatum Products
Type of SJW Origin Method
Reference Al As B Ba Be Ca Cd Co Cr Cu Fe Hg
In Li
Aqueous Extract Poland AAS [133] - - - - - - - - - - 7.5-228 - - - Aqueous Extract Poland AAS [132] - - - - - - - - - 3.6 - - - - Aqueous Extract Poland
GFAAS and ICP-MS
[131] - - -
14.27-14.37 - -
0.063 - 0.068 - - 3.65 - 4.65
17.02 - 35.87 - - -
Capsule Unknown LA-ICP-MS and ICP-MS [119] 23-31
412-464
0.043-0.059 0.3-0.4 0.25-0.33 8.08-10.2
62.7-82.9
Liquid extract Poland ICP-MS [124] - ≤20 - - - - 10 - 30 - - 190 -270
1060-4880 ≤ 20 - -
Raw Herb Argentina GFAAS, AAS and AES [125] - - - - -
105-460 - - - 12.8-13.5 - - - 0.03-0.05
Raw Herb Argentina GFAAS and ICP-OES [126]
1.23-3.20 - - - - -
0.05-0.08
0.09-0.33 <0.005 -
7.43-8.79 - - -
Raw Herb Austria and Vienna AAS [121] - - - - - -
0.15-0.98 - - 6.2-10.1
57.1-303 - - -
Raw Herb Austria GFAAS and AAS [120] - - - - - - 0.01-0.6 - - 8.4-11.8 - - - -
Raw Herb Serbia AAS [122] - - - - - - 0.22-1.28 - - - - - - -
Raw Herb Spain ICP-MS [123] - 0.1 - 0.51 - - - - 0.05 - 1.71 - - - - - - -
Raw Herb/(extracts) Estonia AAS [127] - - - - - - - 0.1-0.18 0.12 - 0.25 - - - - -
Raw Herb Romania ICP-OES [129] <5 - 76 - -
0.5 -15.7 - - 0.1-1.5 - <1 - 20 - 83 - 288 - - -
Raw Herb Turkey AAS [130] - - - - - - - - 5.1-5.9 10.1-12.1 448 - 542 - - -
Raw Herb Poland AAS [118] - - - - - - - - - - 6.4-34.5 - - -
Raw Herb Poland AAS [132] - - - - - - - - - 12.4 - - - -
Raw Herb Bulgeria and China HMDE [135] - - - - - - 0.22-1.3 - - - - - - -
Raw Herb Spain AAS [136] - - - - - - 6.29-20.32 - - 5.21-26.50
92.8-119.2 - - -
Raw Herb Unknown TMFE and ICP-OES [139] - - - - - - 0.05-1 6 - - - - - - -
Raw Herb
Yugoslavia and R. Srpska AAS [140] - - - - - - 0.3-3 - - 10 - 18 - - - -
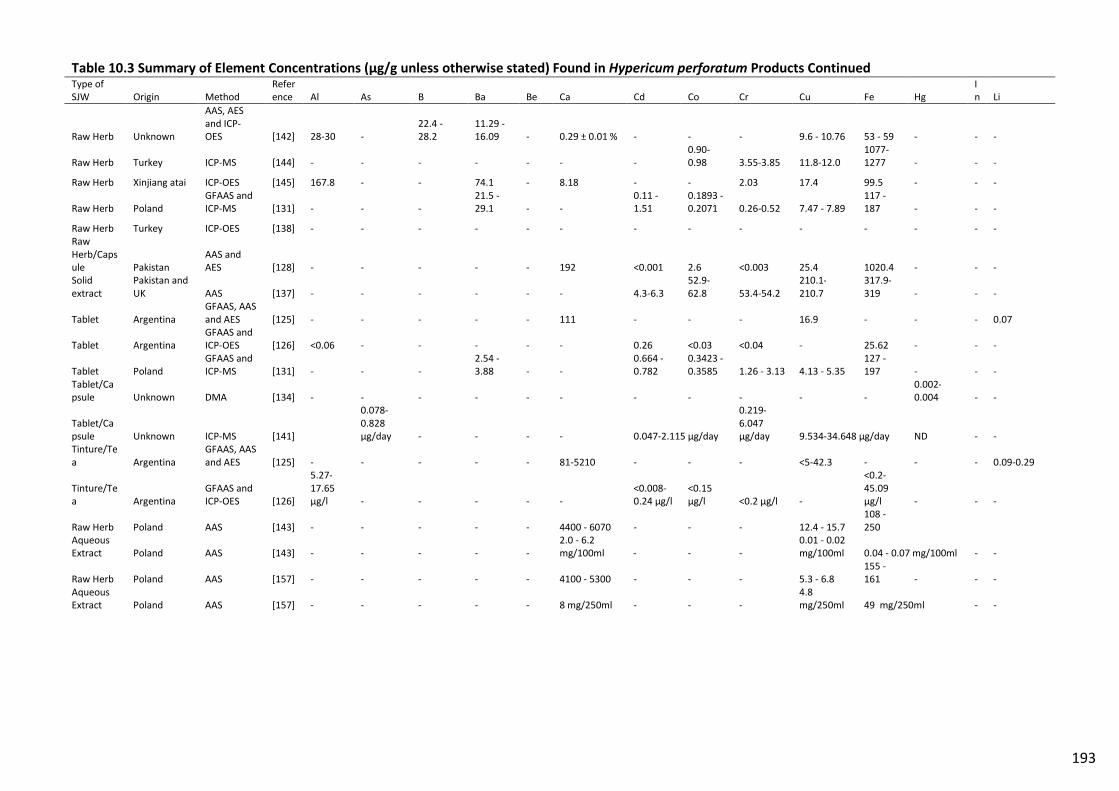
193
Table 10.3 Summary of Element Concentrations (µg/g unless otherwise stated) Found in Hypericum perforatum Products Continued
Type of SJW Origin Method
Reference Al As B Ba Be Ca Cd Co Cr Cu Fe Hg
In Li
Raw Herb Unknown
AAS, AES and ICP-OES [142] 28-30 -
22.4 - 28.2
11.29 - 16.09 - 0.29 ± 0.01 % - - - 9.6 - 10.76 53 - 59 - - -
Raw Herb Turkey ICP-MS [144] - - - - - - - 0.90-0.98 3.55-3.85 11.8-12.0
1077-1277 - - -
Raw Herb Xinjiang atai ICP-OES [145] 167.8 - - 74.1 - 8.18 - - 2.03 17.4 99.5 - - -
Raw Herb Poland GFAAS and ICP-MS [131] - - -
21.5 - 29.1 - -
0.11 - 1.51
0.1893 - 0.2071 0.26-0.52 7.47 - 7.89
117 - 187 - - -
Raw Herb Turkey ICP-OES [138] - - - - - - - - - - - - - - Raw Herb/Capsule Pakistan
AAS and AES [128] - - - - - 192 <0.001 2.6 <0.003 25.4 1020.4 - - -
Solid extract
Pakistan and UK AAS [137] - - - - - - 4.3-6.3
52.9-62.8 53.4-54.2
210.1-210.7
317.9-319 - - -
Tablet Argentina GFAAS, AAS and AES [125] - - - - - 111 - - - 16.9 - - - 0.07
Tablet Argentina GFAAS and ICP-OES [126] <0.06 - - - - - 0.26 <0.03 <0.04 - 25.62 - - -
Tablet Poland GFAAS and ICP-MS [131] - - -
2.54 - 3.88 - -
0.664 - 0.782
0.3423 - 0.3585 1.26 - 3.13 4.13 - 5.35
127 - 197 - - -
Tablet/Capsule Unknown DMA
[134] - - - - - - - - - - -
0.002-0.004 - -
Tablet/Capsule Unknown ICP-MS [141]
0.078-0.828 μg/day - - - - 0.047-2.115 μg/day
0.219-6.047 μg/day 9.534-34.648 μg/day ND - -
Tinture/Tea Argentina
GFAAS, AAS and AES [125] - - - - - 81-5210 - - - <5-42.3 - - - 0.09-0.29
Tinture/Tea Argentina
GFAAS and ICP-OES [126]
5.27-17.65 μg/l - - - - -
<0.008-0.24 μg/l
<0.15 μg/l <0.2 μg/l -
<0.2-45.09 μg/l - - -
Raw Herb Poland AAS [143] - - - - - 4400 - 6070 - - - 12.4 - 15.7 108 - 250
Aqueous Extract Poland AAS [143] - - - - -
2.0 - 6.2 mg/100ml - - -
0.01 - 0.02 mg/100ml 0.04 - 0.07 mg/100ml - -
Raw Herb Poland AAS [157] - - - - - 4100 - 5300 - - - 5.3 - 6.8 155 - 161 - - -
Aqueous Extract Poland AAS [157] - - - - - 8 mg/250ml - - -
4.8 mg/250ml 49 mg/250ml - -
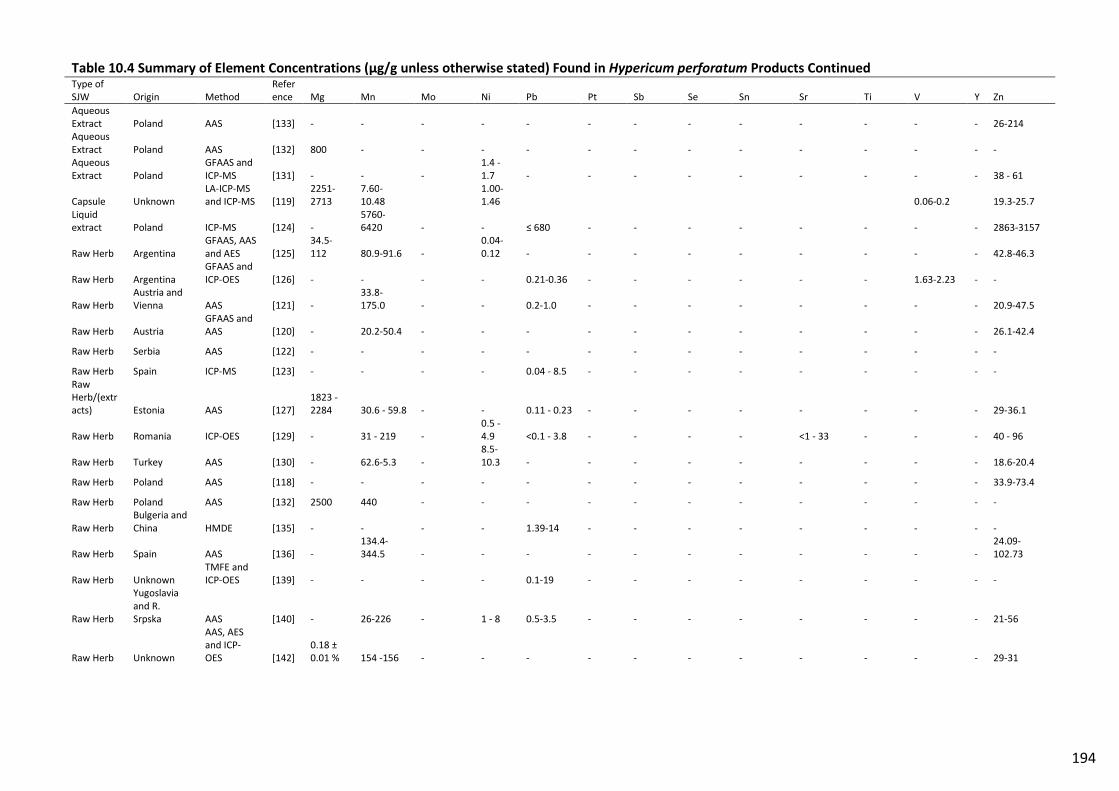
194
Table 10.4 Summary of Element Concentrations (µg/g unless otherwise stated) Found in Hypericum perforatum Products Continued
Type of SJW Origin Method
Reference Mg Mn Mo Ni Pb Pt Sb Se Sn Sr Ti V Y Zn
Aqueous Extract Poland AAS [133] - - - - - - - - - - - - - 26-214 Aqueous Extract Poland AAS [132] 800 - - - - - - - - - - - - - Aqueous Extract Poland
GFAAS and ICP-MS [131] - - -
1.4 - 1.7 - - - - - - - - - 38 - 61
Capsule Unknown LA-ICP-MS and ICP-MS [119]
2251-2713
7.60-10.48
1.00-1.46
0.06-0.2
19.3-25.7
Liquid extract Poland ICP-MS [124] -
5760-6420 - - ≤ 680 - - - - - - - - 2863-3157
Raw Herb Argentina GFAAS, AAS and AES [125]
34.5-112 80.9-91.6 -
0.04-0.12 - - - - - - - - - 42.8-46.3
Raw Herb Argentina GFAAS and ICP-OES [126] - - - - 0.21-0.36 - - - - - - 1.63-2.23 - -
Raw Herb Austria and Vienna AAS [121] -
33.8-175.0 - - 0.2-1.0 - - - - - - - - 20.9-47.5
Raw Herb Austria GFAAS and AAS [120] - 20.2-50.4 - - - - - - - - - - - 26.1-42.4
Raw Herb Serbia AAS [122] - - - - - - - - - - - - - -
Raw Herb Spain ICP-MS [123] - - - - 0.04 - 8.5 - - - - - - - - - Raw Herb/(extracts) Estonia AAS [127]
1823 - 2284 30.6 - 59.8 - - 0.11 - 0.23 - - - - - - - - 29-36.1
Raw Herb Romania ICP-OES [129] - 31 - 219 - 0.5 - 4.9 <0.1 - 3.8 - - - - <1 - 33 - - - 40 - 96
Raw Herb Turkey AAS [130] - 62.6-5.3 - 8.5-10.3 - - - - - - - - - 18.6-20.4
Raw Herb Poland AAS [118] - - - - - - - - - - - - - 33.9-73.4
Raw Herb Poland AAS [132] 2500 440 - - - - - - - - - - - -
Raw Herb Bulgeria and China HMDE [135] - - - - 1.39-14 - - - - - - - - -
Raw Herb Spain AAS [136] - 134.4-344.5 - - - - - - - - - - -
24.09-102.73
Raw Herb Unknown TMFE and ICP-OES [139] - - - - 0.1-19 - - - - - - - - -
Raw Herb
Yugoslavia and R. Srpska AAS [140] - 26-226 - 1 - 8 0.5-3.5 - - - - - - - - 21-56
Raw Herb Unknown
AAS, AES and ICP-OES [142]
0.18 ± 0.01 % 154 -156 - - - - - - - - - - - 29-31
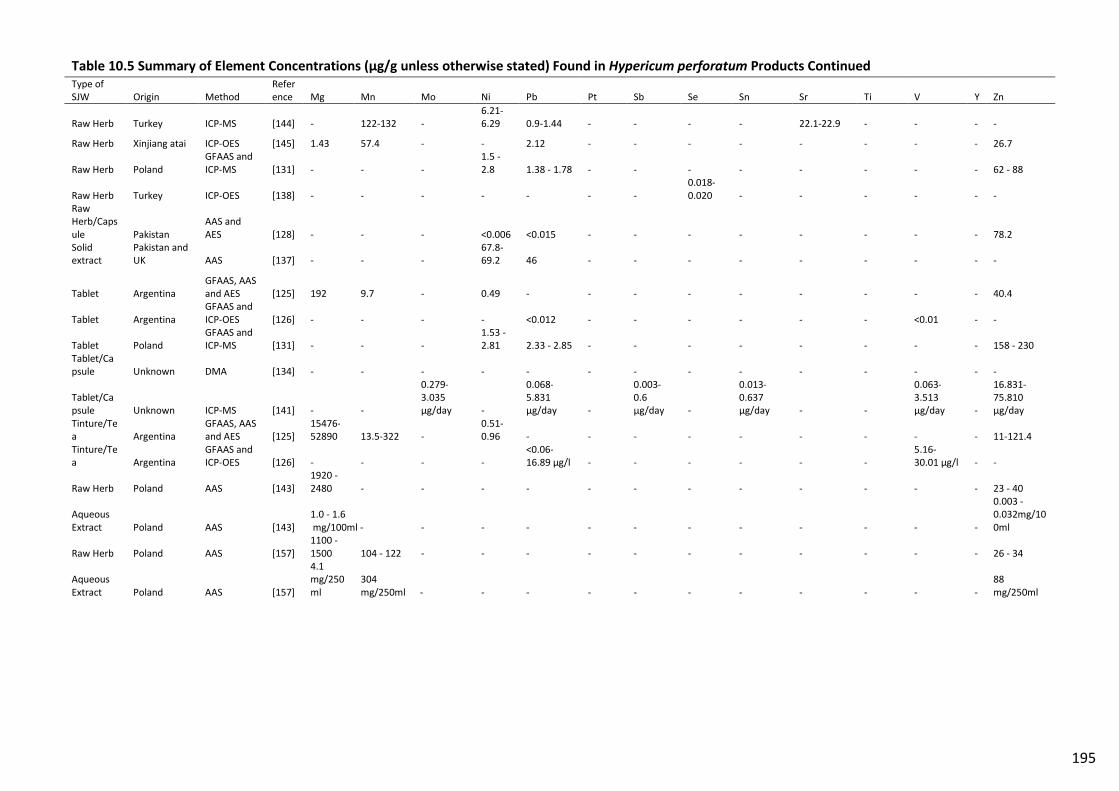
195
Table 10.5 Summary of Element Concentrations (µg/g unless otherwise stated) Found in Hypericum perforatum Products Continued
Type of SJW Origin Method
Reference Mg Mn Mo Ni Pb Pt Sb Se Sn Sr Ti V Y Zn
Raw Herb Turkey ICP-MS [144] - 122-132 - 6.21-6.29 0.9-1.44 - - - - 22.1-22.9 - - - -
Raw Herb Xinjiang atai ICP-OES [145] 1.43 57.4 - - 2.12 - - - - - - - - 26.7
Raw Herb Poland GFAAS and ICP-MS [131] - - -
1.5 - 2.8 1.38 - 1.78 - - - - - - - - 62 - 88
Raw Herb Turkey ICP-OES [138] - - - - - - - 0.018-0.020 - - - - - -
Raw Herb/Capsule Pakistan
AAS and AES [128] - - - <0.006 <0.015 - - - - - - - - 78.2
Solid extract
Pakistan and UK AAS [137] - - -
67.8-69.2 46 - - - - - - - - -
Tablet Argentina GFAAS, AAS and AES [125] 192 9.7 - 0.49 - - - - - - - - - 40.4
Tablet Argentina GFAAS and ICP-OES [126] - - - - <0.012 - - - - - - <0.01 - -
Tablet Poland GFAAS and ICP-MS [131] - - -
1.53 - 2.81 2.33 - 2.85 - - - - - - - - 158 - 230
Tablet/Capsule Unknown DMA [134] - - - - - - - - - - - - - -
Tablet/Capsule Unknown ICP-MS [141] - -
0.279-3.035 μg/day -
0.068-5.831 μg/day -
0.003-0.6 μg/day -
0.013-0.637 μg/day - -
0.063-3.513 μg/day -
16.831-75.810 μg/day
Tinture/Tea Argentina
GFAAS, AAS and AES [125]
15476-52890 13.5-322 -
0.51-0.96 - - - - - - - - - 11-121.4
Tinture/Tea Argentina
GFAAS and ICP-OES [126] - - - -
<0.06-16.89 μg/l - - - - - -
5.16-30.01 μg/l - -
Raw Herb Poland AAS [143] 1920 - 2480 - - - - - - - - - - - - 23 - 40
Aqueous Extract Poland AAS [143]
1.0 - 1.6 mg/100ml - - - - - - - - - - - -
0.003 - 0.032mg/100ml
Raw Herb Poland AAS [157] 1100 - 1500 104 - 122 - - - - - - - - - - - 26 - 34
Aqueous Extract Poland AAS [157]
4.1 mg/250ml
304 mg/250ml - - - - - - - - - - -
88 mg/250ml
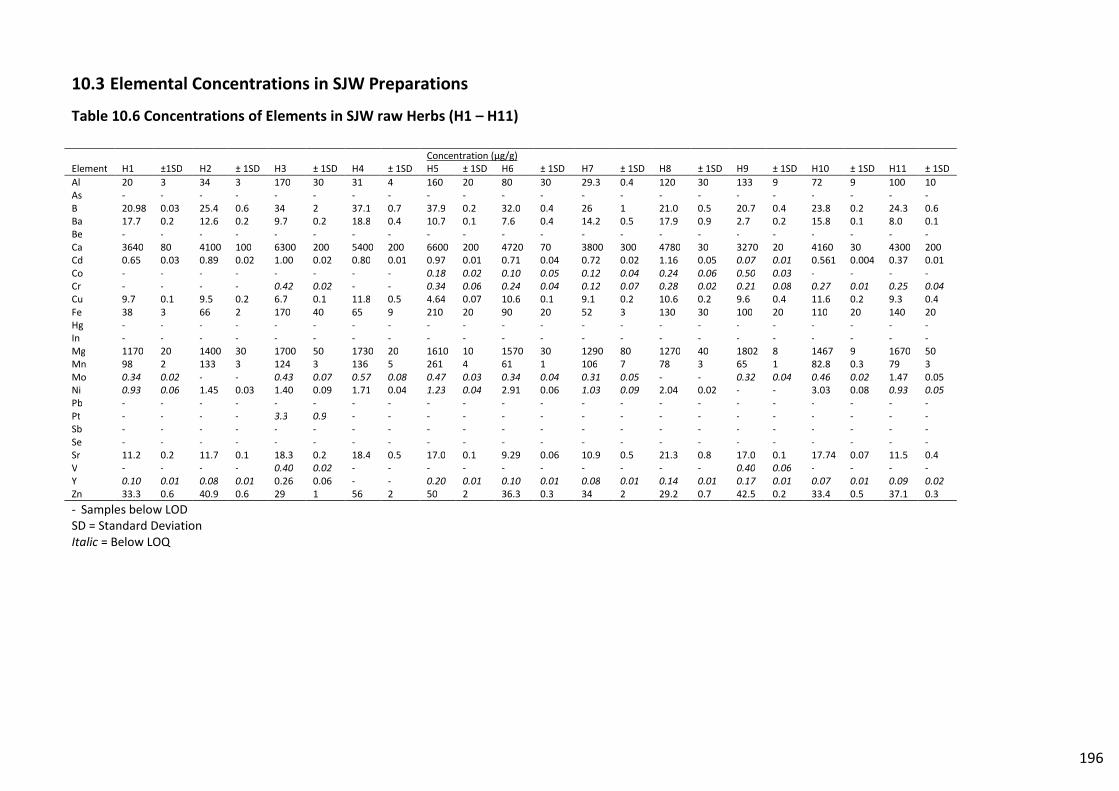
196
10.3 Elemental Concentrations in SJW Preparations
Table 10.6 Concentrations of Elements in SJW raw Herbs (H1 – H11)
Concentration (μg/g) Element H1 ±1SD H2 ± 1SD H3 ± 1SD H4 ± 1SD H5 ± 1SD H6 ± 1SD H7 ± 1SD H8 ± 1SD H9 ± 1SD H10 ± 1SD H11 ± 1SD
Al 20 3 34 3 170 30 31 4 160 20 80 30 29.3 0.4 120 30 133 9 72 9 100 10 As - - - - - - - - - - - - - - - - - - - - - - B 20.98 0.03 25.4 0.6 34 2 37.1 0.7 37.9 0.2 32.0 0.4 26 1 21.0 0.5 20.7 0.4 23.8 0.2 24.3 0.6 Ba 17.7 0.2 12.6 0.2 9.7 0.2 18.8 0.4 10.7 0.1 7.6 0.4 14.2 0.5 17.9 0.9 2.7 0.2 15.8 0.1 8.0 0.1 Be - - - - - - - - - - - - - - - - - - - - - - Ca 3640 80 4100 100 6300 200 5400 200 6600 200 4720 70 3800 300 4780 30 3270 20 4160 30 4300 200 Cd 0.65 0.03 0.89 0.02 1.00 0.02 0.80 0.01 0.97 0.01 0.71 0.04 0.72 0.02 1.16 0.05 0.07 0.01 0.561 0.004 0.37 0.01 Co - - - - - - - - 0.18 0.02 0.10 0.05 0.12 0.04 0.24 0.06 0.50 0.03 - - - - Cr - - - - 0.42 0.02 - - 0.34 0.06 0.24 0.04 0.12 0.07 0.28 0.02 0.21 0.08 0.27 0.01 0.25 0.04 Cu 9.7 0.1 9.5 0.2 6.7 0.1 11.8 0.5 4.64 0.07 10.6 0.1 9.1 0.2 10.6 0.2 9.6 0.4 11.6 0.2 9.3 0.4 Fe 38 3 66 2 170 40 65 9 210 20 90 20 52 3 130 30 100 20 110 20 140 20 Hg - - - - - - - - - - - - - - - - - - - - - - In - - - - - - - - - - - - - - - - - - - - - - Mg 1170 20 1400 30 1700 50 1730 20 1610 10 1570 30 1290 80 1270 40 1802 8 1467 9 1670 50 Mn 98 2 133 3 124 3 136 5 261 4 61 1 106 7 78 3 65 1 82.8 0.3 79 3 Mo 0.34 0.02 - - 0.43 0.07 0.57 0.08 0.47 0.03 0.34 0.04 0.31 0.05 - - 0.32 0.04 0.46 0.02 1.47 0.05 Ni 0.93 0.06 1.45 0.03 1.40 0.09 1.71 0.04 1.23 0.04 2.91 0.06 1.03 0.09 2.04 0.02 - - 3.03 0.08 0.93 0.05 Pb - - - - - - - - - - - - - - - - - - - - - - Pt - - - - 3.3 0.9 - - - - - - - - - - - - - - - - Sb - - - - - - - - - - - - - - - - - - - - - - Se - - - - - - - - - - - - - - - - - - - - - - Sr 11.2 0.2 11.7 0.1 18.3 0.2 18.4 0.5 17.0 0.1 9.29 0.06 10.9 0.5 21.3 0.8 17.0 0.1 17.74 0.07 11.5 0.4 V - - - - 0.40 0.02 - - - - - - - - - - 0.40 0.06 - - - - Y 0.10 0.01 0.08 0.01 0.26 0.06 - - 0.20 0.01 0.10 0.01 0.08 0.01 0.14 0.01 0.17 0.01 0.07 0.01 0.09 0.02 Zn 33.3 0.6 40.9 0.6 29 1 56 2 50 2 36.3 0.3 34 2 29.2 0.7 42.5 0.2 33.4 0.5 37.1 0.3
- Samples below LOD SD = Standard Deviation Italic = Below LOQ
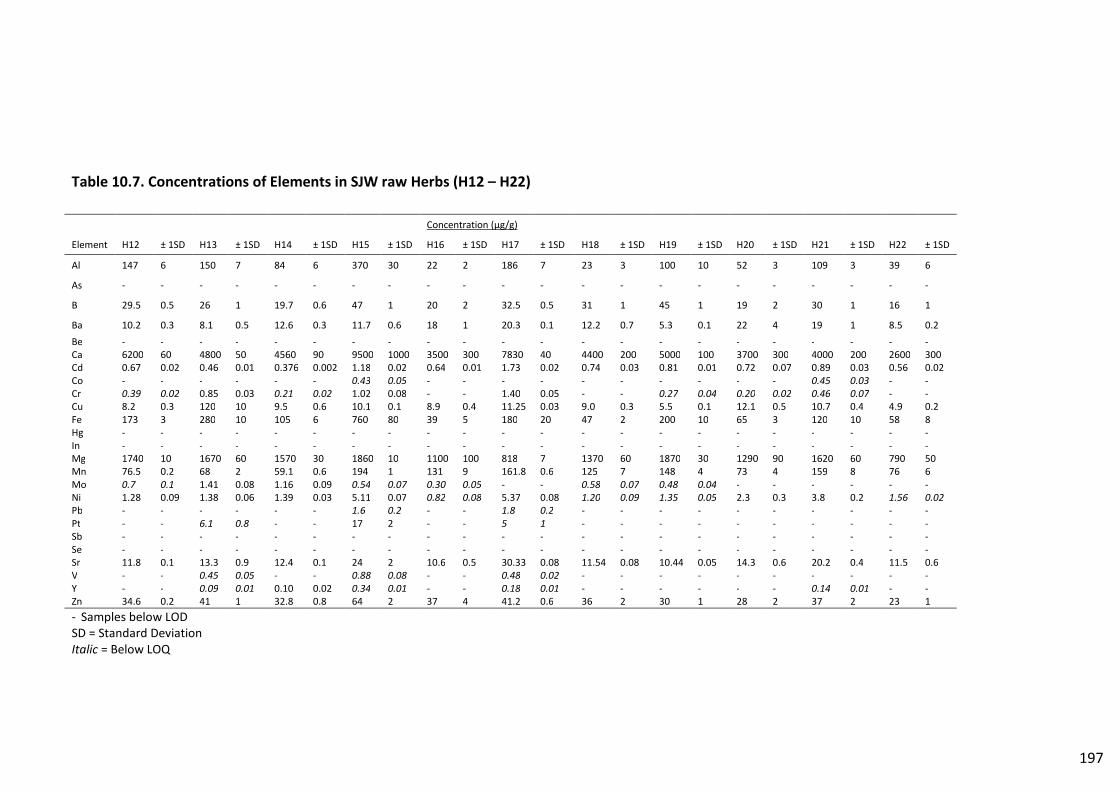
197
Table 10.7. Concentrations of Elements in SJW raw Herbs (H12 – H22)
Concentration (μg/g)
Element H12 ± 1SD H13 ± 1SD H14 ± 1SD H15 ± 1SD H16 ± 1SD H17 ± 1SD H18 ± 1SD H19 ± 1SD H20 ± 1SD H21 ± 1SD H22 ± 1SD
Al 147 6 150 7 84 6 370 30 22 2 186 7 23 3 100 10 52 3 109 3 39 6
As - - - - - - - - - - - - - - - - - - - - - -
B 29.5 0.5 26 1 19.7 0.6 47 1 20 2 32.5 0.5 31 1 45 1 19 2 30 1 16 1
Ba 10.2 0.3 8.1 0.5 12.6 0.3 11.7 0.6 18 1 20.3 0.1 12.2 0.7 5.3 0.1 22 4 19 1 8.5 0.2
Be - - - - - - - - - - - - - - - - - - - - - - Ca 6200 60 4800 50 4560 90 9500 1000 3500 300 7830 40 4400 200 5000 100 3700 300 4000 200 2600 300 Cd 0.67 0.02 0.46 0.01 0.376 0.002 1.18 0.02 0.64 0.01 1.73 0.02 0.74 0.03 0.81 0.01 0.72 0.07 0.89 0.03 0.56 0.02 Co - - - - - - 0.43 0.05 - - - - - - - - - - 0.45 0.03 - - Cr 0.39 0.02 0.85 0.03 0.21 0.02 1.02 0.08 - - 1.40 0.05 - - 0.27 0.04 0.20 0.02 0.46 0.07 - - Cu 8.2 0.3 120 10 9.5 0.6 10.1 0.1 8.9 0.4 11.25 0.03 9.0 0.3 5.5 0.1 12.1 0.5 10.7 0.4 4.9 0.2 Fe 173 3 280 10 105 6 760 80 39 5 180 20 47 2 200 10 65 3 120 10 58 8 Hg - - - - - - - - - - - - - - - - - - - - - - In - - - - - - - - - - - - - - - - - - - - - - Mg 1740 10 1670 60 1570 30 1860 10 1100 100 818 7 1370 60 1870 30 1290 90 1620 60 790 50 Mn 76.5 0.2 68 2 59.1 0.6 194 1 131 9 161.8 0.6 125 7 148 4 73 4 159 8 76 6 Mo 0.7 0.1 1.41 0.08 1.16 0.09 0.54 0.07 0.30 0.05 - - 0.58 0.07 0.48 0.04 - - - - - - Ni 1.28 0.09 1.38 0.06 1.39 0.03 5.11 0.07 0.82 0.08 5.37 0.08 1.20 0.09 1.35 0.05 2.3 0.3 3.8 0.2 1.56 0.02 Pb - - - - - - 1.6 0.2 - - 1.8 0.2 - - - - - - - - - - Pt - - 6.1 0.8 - - 17 2 - - 5 1 - - - - - - - - - - Sb - - - - - - - - - - - - - - - - - - - - - - Se - - - - - - - - - - - - - - - - - - - - - - Sr 11.8 0.1 13.3 0.9 12.4 0.1 24 2 10.6 0.5 30.33 0.08 11.54 0.08 10.44 0.05 14.3 0.6 20.2 0.4 11.5 0.6 V - - 0.45 0.05 - - 0.88 0.08 - - 0.48 0.02 - - - - - - - - - - Y - - 0.09 0.01 0.10 0.02 0.34 0.01 - - 0.18 0.01 - - - - - - 0.14 0.01 - - Zn 34.6 0.2 41 1 32.8 0.8 64 2 37 4 41.2 0.6 36 2 30 1 28 2 37 2 23 1
- Samples below LOD SD = Standard Deviation Italic = Below LOQ
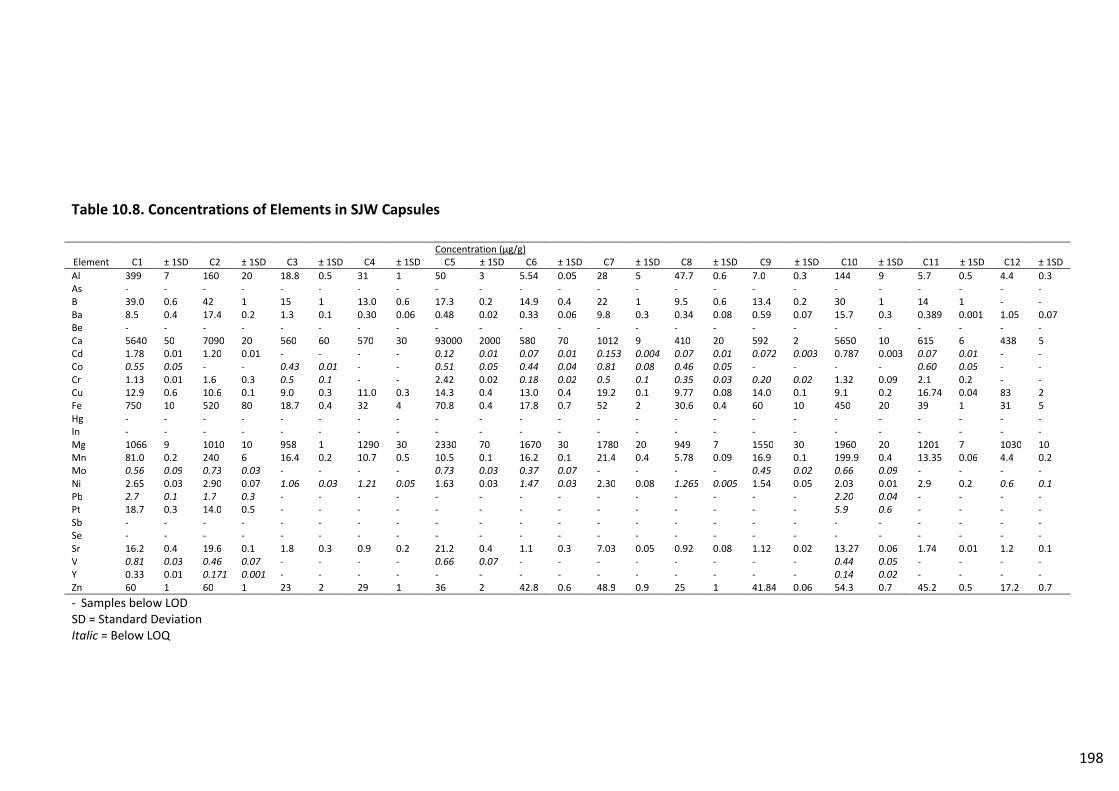
198
Table 10.8. Concentrations of Elements in SJW Capsules
Concentration (μg/g) Element C1 ± 1SD C2 ± 1SD C3 ± 1SD C4 ± 1SD C5 ± 1SD C6 ± 1SD C7 ± 1SD C8 ± 1SD C9 ± 1SD C10 ± 1SD C11 ± 1SD C12 ± 1SD
Al 399 7 160 20 18.8 0.5 31 1 50 3 5.54 0.05 28 5 47.7 0.6 7.0 0.3 144 9 5.7 0.5 4.4 0.3 As - - - - - - - - - - - - - - - - - - - - - - - - B 39.0 0.6 42 1 15 1 13.0 0.6 17.3 0.2 14.9 0.4 22 1 9.5 0.6 13.4 0.2 30 1 14 1 - - Ba 8.5 0.4 17.4 0.2 1.3 0.1 0.30 0.06 0.48 0.02 0.33 0.06 9.8 0.3 0.34 0.08 0.59 0.07 15.7 0.3 0.389 0.001 1.05 0.07 Be - - - - - - - - - - - - - - - - - - - - - - - - Ca 5640 50 7090 20 560 60 570 30 93000 2000 580 70 1012 9 410 20 592 2 5650 10 615 6 438 5 Cd 1.78 0.01 1.20 0.01 - - - - 0.12 0.01 0.07 0.01 0.153 0.004 0.07 0.01 0.072 0.003 0.787 0.003 0.07 0.01 - - Co 0.55 0.05 - - 0.43 0.01 - - 0.51 0.05 0.44 0.04 0.81 0.08 0.46 0.05 - - - - 0.60 0.05 - - Cr 1.13 0.01 1.6 0.3 0.5 0.1 - - 2.42 0.02 0.18 0.02 0.5 0.1 0.35 0.03 0.20 0.02 1.32 0.09 2.1 0.2 - - Cu 12.9 0.6 10.6 0.1 9.0 0.3 11.0 0.3 14.3 0.4 13.0 0.4 19.2 0.1 9.77 0.08 14.0 0.1 9.1 0.2 16.74 0.04 83 2 Fe 750 10 520 80 18.7 0.4 32 4 70.8 0.4 17.8 0.7 52 2 30.6 0.4 60 10 450 20 39 1 31 5 Hg - - - - - - - - - - - - - - - - - - - - - - - - In - - - - - - - - - - - - - - - - - - - - - - - - Mg 1066 9 1010 10 958 1 1290 30 2330 70 1670 30 1780 20 949 7 1550 30 1960 20 1201 7 1030 10 Mn 81.0 0.2 240 6 16.4 0.2 10.7 0.5 10.5 0.1 16.2 0.1 21.4 0.4 5.78 0.09 16.9 0.1 199.9 0.4 13.35 0.06 4.4 0.2 Mo 0.56 0.09 0.73 0.03 - - - - 0.73 0.03 0.37 0.07 - - - - 0.45 0.02 0.66 0.09 - - - - Ni 2.65 0.03 2.90 0.07 1.06 0.03 1.21 0.05 1.63 0.03 1.47 0.03 2.30 0.08 1.265 0.005 1.54 0.05 2.03 0.01 2.9 0.2 0.6 0.1 Pb 2.7 0.1 1.7 0.3 - - - - - - - - - - - - - - 2.20 0.04 - - - - Pt 18.7 0.3 14.0 0.5 - - - - - - - - - - - - - - 5.9 0.6 - - - - Sb - - - - - - - - - - - - - - - - - - - - - - - - Se - - - - - - - - - - - - - - - - - - - - - - - - Sr 16.2 0.4 19.6 0.1 1.8 0.3 0.9 0.2 21.2 0.4 1.1 0.3 7.03 0.05 0.92 0.08 1.12 0.02 13.27 0.06 1.74 0.01 1.2 0.1 V 0.81 0.03 0.46 0.07 - - - - 0.66 0.07 - - - - - - - - 0.44 0.05 - - - - Y 0.33 0.01 0.171 0.001 - - - - - - - - - - - - - - 0.14 0.02 - - - - Zn 60 1 60 1 23 2 29 1 36 2 42.8 0.6 48.9 0.9 25 1 41.84 0.06 54.3 0.7 45.2 0.5 17.2 0.7
- Samples below LOD SD = Standard Deviation Italic = Below LOQ
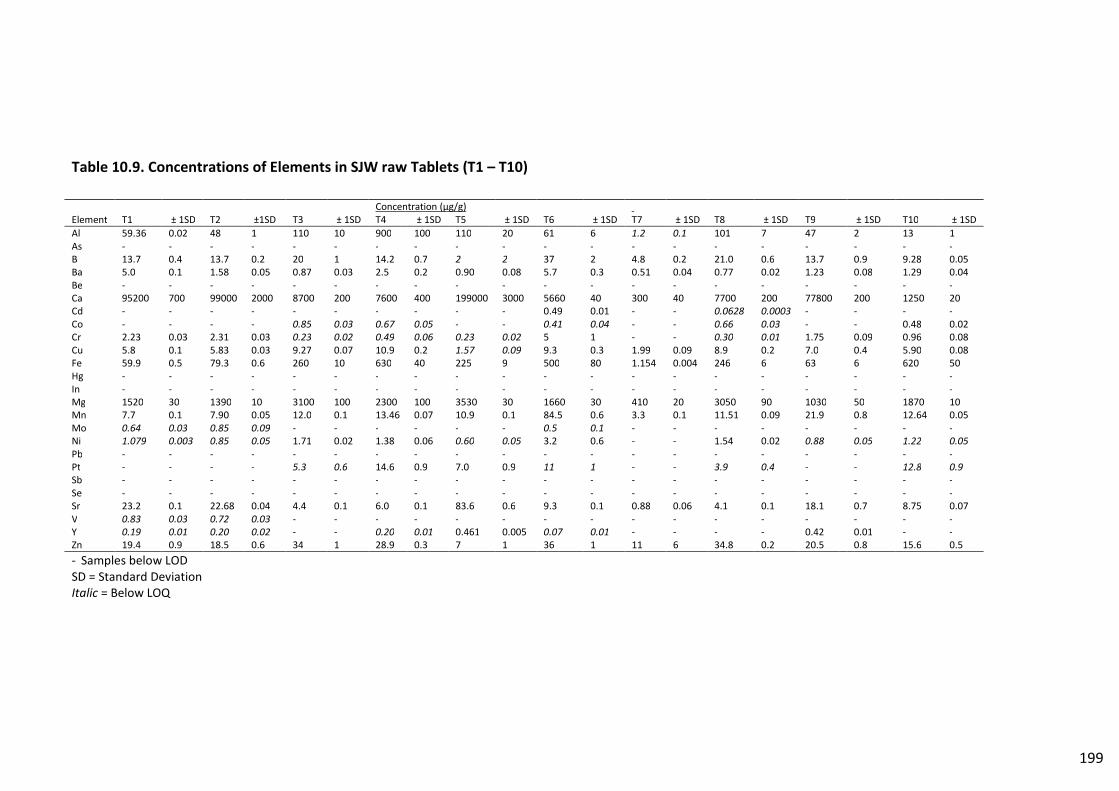
199
Table 10.9. Concentrations of Elements in SJW raw Tablets (T1 – T10)
Concentration (μg/g) Element T1 ± 1SD T2 ±1SD T3 ± 1SD T4 ± 1SD T5 ± 1SD T6 ± 1SD T7 ± 1SD T8 ± 1SD T9 ± 1SD T10 ± 1SD Al 59.36 0.02 48 1 110 10 900 100 110 20 61 6 1.2 0.1 101 7 47 2 13 1 As - - - - - - - - - - - - - - - - - - - - B 13.7 0.4 13.7 0.2 20 1 14.2 0.7 2 2 37 2 4.8 0.2 21.0 0.6 13.7 0.9 9.28 0.05 Ba 5.0 0.1 1.58 0.05 0.87 0.03 2.5 0.2 0.90 0.08 5.7 0.3 0.51 0.04 0.77 0.02 1.23 0.08 1.29 0.04 Be - - - - - - - - - - - - - - - - - - - - Ca 95200 700 99000 2000 8700 200 7600 400 199000 3000 5660 40 300 40 7700 200 77800 200 1250 20 Cd - - - - - - - - - - 0.49 0.01 - - 0.0628 0.0003 - - - - Co - - - - 0.85 0.03 0.67 0.05 - - 0.41 0.04 - - 0.66 0.03 - - 0.48 0.02 Cr 2.23 0.03 2.31 0.03 0.23 0.02 0.49 0.06 0.23 0.02 5 1 - - 0.30 0.01 1.75 0.09 0.96 0.08 Cu 5.8 0.1 5.83 0.03 9.27 0.07 10.9 0.2 1.57 0.09 9.3 0.3 1.99 0.09 8.9 0.2 7.0 0.4 5.90 0.08 Fe 59.9 0.5 79.3 0.6 260 10 630 40 225 9 500 80 1.154 0.004 246 6 63 6 620 50 Hg - - - - - - - - - - - - - - - - - - - - In - - - - - - - - - - - - - - - - - - - - Mg 1520 30 1390 10 3100 100 2300 100 3530 30 1660 30 410 20 3050 90 1030 50 1870 10 Mn 7.7 0.1 7.90 0.05 12.0 0.1 13.46 0.07 10.9 0.1 84.5 0.6 3.3 0.1 11.51 0.09 21.9 0.8 12.64 0.05 Mo 0.64 0.03 0.85 0.09 - - - - - - 0.5 0.1 - - - - - - - - Ni 1.079 0.003 0.85 0.05 1.71 0.02 1.38 0.06 0.60 0.05 3.2 0.6 - - 1.54 0.02 0.88 0.05 1.22 0.05 Pb - - - - - - - - - - - - - - - - - - - - Pt - - - - 5.3 0.6 14.6 0.9 7.0 0.9 11 1 - - 3.9 0.4 - - 12.8 0.9 Sb - - - - - - - - - - - - - - - - - - - - Se - - - - - - - - - - - - - - - - - - - - Sr 23.2 0.1 22.68 0.04 4.4 0.1 6.0 0.1 83.6 0.6 9.3 0.1 0.88 0.06 4.1 0.1 18.1 0.7 8.75 0.07 V 0.83 0.03 0.72 0.03 - - - - - - - - - - - - - - - - Y 0.19 0.01 0.20 0.02 - - 0.20 0.01 0.461 0.005 0.07 0.01 - - - - 0.42 0.01 - - Zn 19.4 0.9 18.5 0.6 34 1 28.9 0.3 7 1 36 1 11 6 34.8 0.2 20.5 0.8 15.6 0.5
- Samples below LOD SD = Standard Deviation Italic = Below LOQ
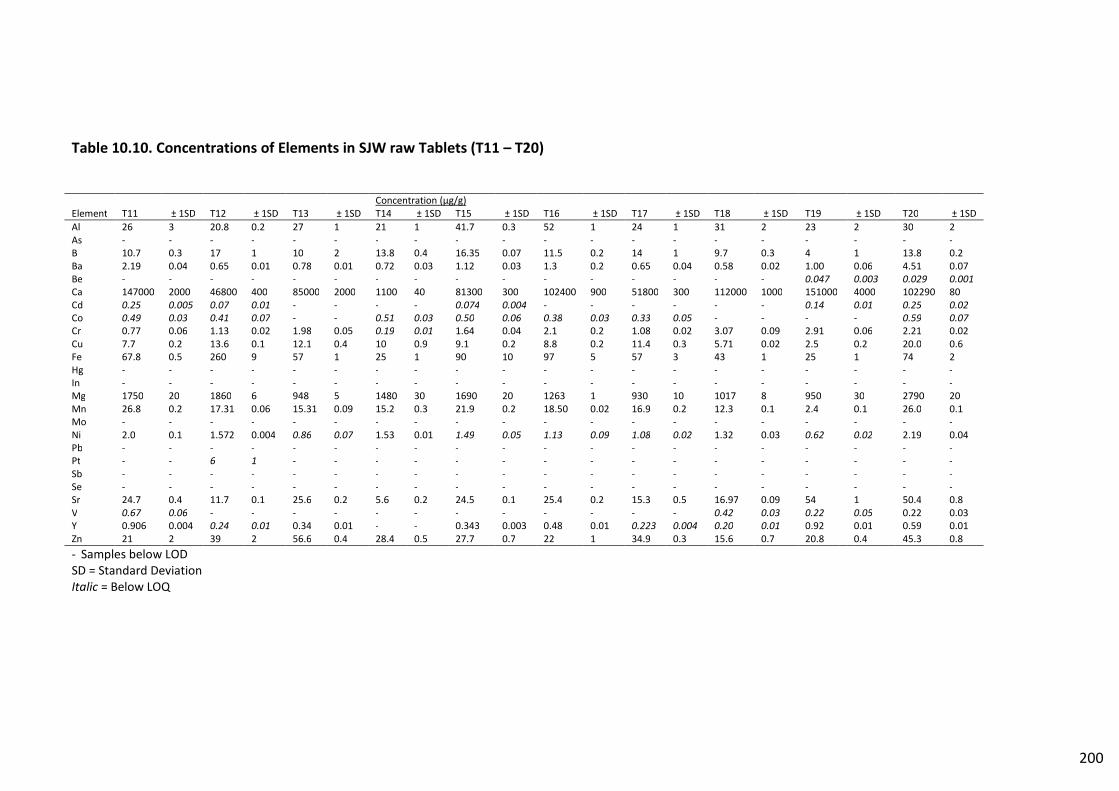
200
Table 10.10. Concentrations of Elements in SJW raw Tablets (T11 – T20)
Concentration (μg/g) Element T11 ± 1SD T12 ± 1SD T13 ± 1SD T14 ± 1SD T15 ± 1SD T16 ± 1SD T17 ± 1SD T18 ± 1SD T19 ± 1SD T20 ± 1SD Al 26 3 20.8 0.2 27 1 21 1 41.7 0.3 52 1 24 1 31 2 23 2 30 2 As - - - - - - - - - - - - - - - - - - - - B 10.7 0.3 17 1 10 2 13.8 0.4 16.35 0.07 11.5 0.2 14 1 9.7 0.3 4 1 13.8 0.2 Ba 2.19 0.04 0.65 0.01 0.78 0.01 0.72 0.03 1.12 0.03 1.3 0.2 0.65 0.04 0.58 0.02 1.00 0.06 4.51 0.07 Be - - - - - - - - - - - - - - - - 0.047 0.003 0.029 0.001 Ca 147000 2000 46800 400 85000 2000 1100 40 81300 300 102400 900 51800 300 112000 1000 151000 4000 102290 80 Cd 0.25 0.005 0.07 0.01 - - - - 0.074 0.004 - - - - - - 0.14 0.01 0.25 0.02 Co 0.49 0.03 0.41 0.07 - - 0.51 0.03 0.50 0.06 0.38 0.03 0.33 0.05 - - - - 0.59 0.07 Cr 0.77 0.06 1.13 0.02 1.98 0.05 0.19 0.01 1.64 0.04 2.1 0.2 1.08 0.02 3.07 0.09 2.91 0.06 2.21 0.02 Cu 7.7 0.2 13.6 0.1 12.1 0.4 10 0.9 9.1 0.2 8.8 0.2 11.4 0.3 5.71 0.02 2.5 0.2 20.0 0.6 Fe 67.8 0.5 260 9 57 1 25 1 90 10 97 5 57 3 43 1 25 1 74 2 Hg - - - - - - - - - - - - - - - - - - - - In - - - - - - - - - - - - - - - - - - - - Mg 1750 20 1860 6 948 5 1480 30 1690 20 1263 1 930 10 1017 8 950 30 2790 20 Mn 26.8 0.2 17.31 0.06 15.31 0.09 15.2 0.3 21.9 0.2 18.50 0.02 16.9 0.2 12.3 0.1 2.4 0.1 26.0 0.1 Mo - - - - - - - - - - - - - - - - - - - - Ni 2.0 0.1 1.572 0.004 0.86 0.07 1.53 0.01 1.49 0.05 1.13 0.09 1.08 0.02 1.32 0.03 0.62 0.02 2.19 0.04 Pb - - - - - - - - - - - - - - - - - - - - Pt - - 6 1 - - - - - - - - - - - - - - - - Sb - - - - - - - - - - - - - - - - - - - - Se - - - - - - - - - - - - - - - - - - - - Sr 24.7 0.4 11.7 0.1 25.6 0.2 5.6 0.2 24.5 0.1 25.4 0.2 15.3 0.5 16.97 0.09 54 1 50.4 0.8 V 0.67 0.06 - - - - - - - - - - - - 0.42 0.03 0.22 0.05 0.22 0.03 Y 0.906 0.004 0.24 0.01 0.34 0.01 - - 0.343 0.003 0.48 0.01 0.223 0.004 0.20 0.01 0.92 0.01 0.59 0.01 Zn 21 2 39 2 56.6 0.4 28.4 0.5 27.7 0.7 22 1 34.9 0.3 15.6 0.7 20.8 0.4 45.3 0.8
- Samples below LOD SD = Standard Deviation Italic = Below LOQ
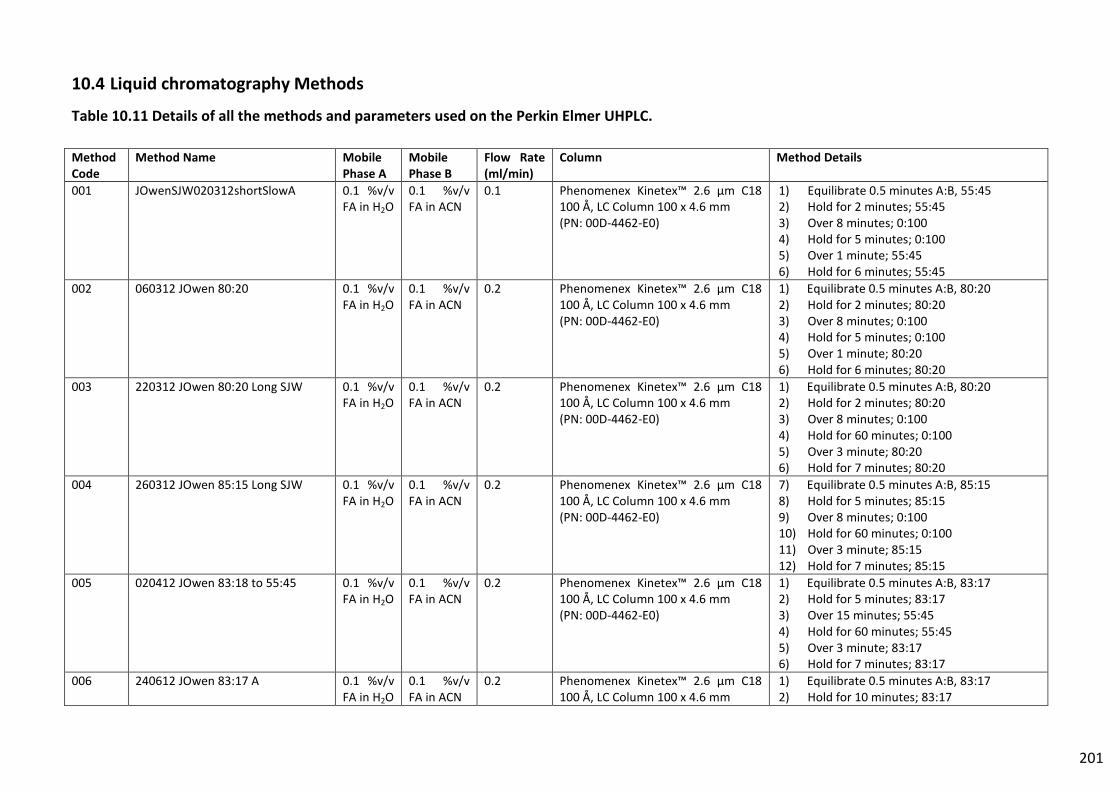
201
10.4 Liquid chromatography Methods
Table 10.11 Details of all the methods and parameters used on the Perkin Elmer UHPLC.
Method
Code
Method Name Mobile
Phase A
Mobile
Phase B
Flow Rate
(ml/min)
Column Method Details
001 JOwenSJW020312shortSlowA 0.1 %v/v FA in H2O
0.1 %v/v FA in ACN
0.1 Phenomenex Kinetex™ 2.6 µm C18 100 Å, LC Column 100 x 4.6 mm (PN: 00D-4462-E0)
1) Equilibrate 0.5 minutes A:B, 55:45 2) Hold for 2 minutes; 55:45 3) Over 8 minutes; 0:100 4) Hold for 5 minutes; 0:100 5) Over 1 minute; 55:45 6) Hold for 6 minutes; 55:45
002 060312 JOwen 80:20 0.1 %v/v FA in H2O
0.1 %v/v FA in ACN
0.2 Phenomenex Kinetex™ 2.6 µm C18 100 Å, LC Column 100 x 4.6 mm (PN: 00D-4462-E0)
1) Equilibrate 0.5 minutes A:B, 80:20 2) Hold for 2 minutes; 80:20 3) Over 8 minutes; 0:100 4) Hold for 5 minutes; 0:100 5) Over 1 minute; 80:20 6) Hold for 6 minutes; 80:20
003 220312 JOwen 80:20 Long SJW 0.1 %v/v FA in H2O
0.1 %v/v FA in ACN
0.2 Phenomenex Kinetex™ 2.6 µm C18 100 Å, LC Column 100 x 4.6 mm (PN: 00D-4462-E0)
1) Equilibrate 0.5 minutes A:B, 80:20 2) Hold for 2 minutes; 80:20 3) Over 8 minutes; 0:100 4) Hold for 60 minutes; 0:100 5) Over 3 minute; 80:20 6) Hold for 7 minutes; 80:20
004 260312 JOwen 85:15 Long SJW 0.1 %v/v FA in H2O
0.1 %v/v FA in ACN
0.2 Phenomenex Kinetex™ 2.6 µm C18 100 Å, LC Column 100 x 4.6 mm (PN: 00D-4462-E0)
7) Equilibrate 0.5 minutes A:B, 85:15 8) Hold for 5 minutes; 85:15 9) Over 8 minutes; 0:100 10) Hold for 60 minutes; 0:100 11) Over 3 minute; 85:15 12) Hold for 7 minutes; 85:15
005
020412 JOwen 83:18 to 55:45 0.1 %v/v FA in H2O
0.1 %v/v FA in ACN
0.2 Phenomenex Kinetex™ 2.6 µm C18 100 Å, LC Column 100 x 4.6 mm (PN: 00D-4462-E0)
1) Equilibrate 0.5 minutes A:B, 83:17 2) Hold for 5 minutes; 83:17 3) Over 15 minutes; 55:45 4) Hold for 60 minutes; 55:45 5) Over 3 minute; 83:17 6) Hold for 7 minutes; 83:17
006
240612 JOwen 83:17 A 0.1 %v/v FA in H2O
0.1 %v/v FA in ACN
0.2 Phenomenex Kinetex™ 2.6 µm C18 100 Å, LC Column 100 x 4.6 mm
1) Equilibrate 0.5 minutes A:B, 83:17 2) Hold for 10 minutes; 83:17
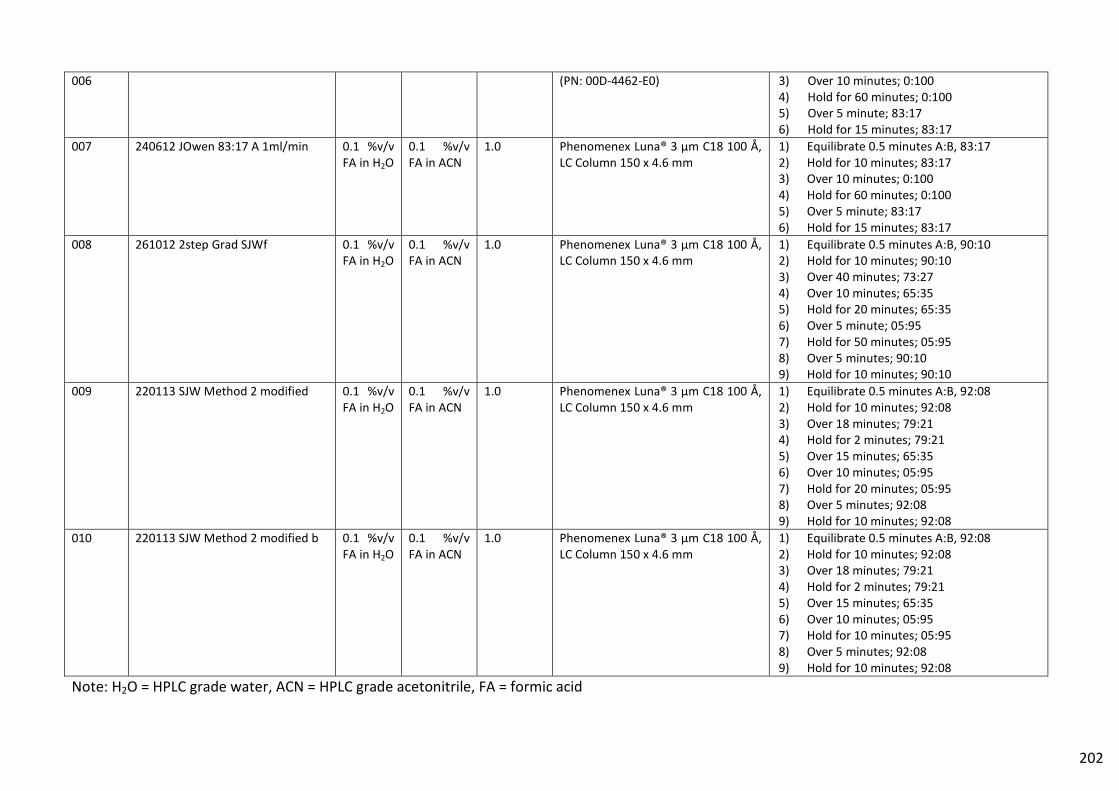
202
006 (PN: 00D-4462-E0) 3) Over 10 minutes; 0:100 4) Hold for 60 minutes; 0:100 5) Over 5 minute; 83:17 6) Hold for 15 minutes; 83:17
007 240612 JOwen 83:17 A 1ml/min 0.1 %v/v FA in H2O
0.1 %v/v FA in ACN
1.0 Phenomenex Luna® 3 µm C18 100 Å, LC Column 150 x 4.6 mm
1) Equilibrate 0.5 minutes A:B, 83:17 2) Hold for 10 minutes; 83:17 3) Over 10 minutes; 0:100 4) Hold for 60 minutes; 0:100 5) Over 5 minute; 83:17 6) Hold for 15 minutes; 83:17
008 261012 2step Grad SJWf 0.1 %v/v FA in H2O
0.1 %v/v FA in ACN
1.0 Phenomenex Luna® 3 µm C18 100 Å, LC Column 150 x 4.6 mm
1) Equilibrate 0.5 minutes A:B, 90:10 2) Hold for 10 minutes; 90:10 3) Over 40 minutes; 73:27 4) Over 10 minutes; 65:35 5) Hold for 20 minutes; 65:35 6) Over 5 minute; 05:95 7) Hold for 50 minutes; 05:95 8) Over 5 minutes; 90:10 9) Hold for 10 minutes; 90:10
009 220113 SJW Method 2 modified 0.1 %v/v FA in H2O
0.1 %v/v FA in ACN
1.0 Phenomenex Luna® 3 µm C18 100 Å, LC Column 150 x 4.6 mm
1) Equilibrate 0.5 minutes A:B, 92:08 2) Hold for 10 minutes; 92:08 3) Over 18 minutes; 79:21 4) Hold for 2 minutes; 79:21 5) Over 15 minutes; 65:35 6) Over 10 minutes; 05:95 7) Hold for 20 minutes; 05:95 8) Over 5 minutes; 92:08 9) Hold for 10 minutes; 92:08
010 220113 SJW Method 2 modified b 0.1 %v/v FA in H2O
0.1 %v/v FA in ACN
1.0 Phenomenex Luna® 3 µm C18 100 Å, LC Column 150 x 4.6 mm
1) Equilibrate 0.5 minutes A:B, 92:08 2) Hold for 10 minutes; 92:08 3) Over 18 minutes; 79:21 4) Hold for 2 minutes; 79:21 5) Over 15 minutes; 65:35 6) Over 10 minutes; 05:95 7) Hold for 10 minutes; 05:95 8) Over 5 minutes; 92:08 9) Hold for 10 minutes; 92:08
Note: H2O = HPLC grade water, ACN = HPLC grade acetonitrile, FA = formic acid
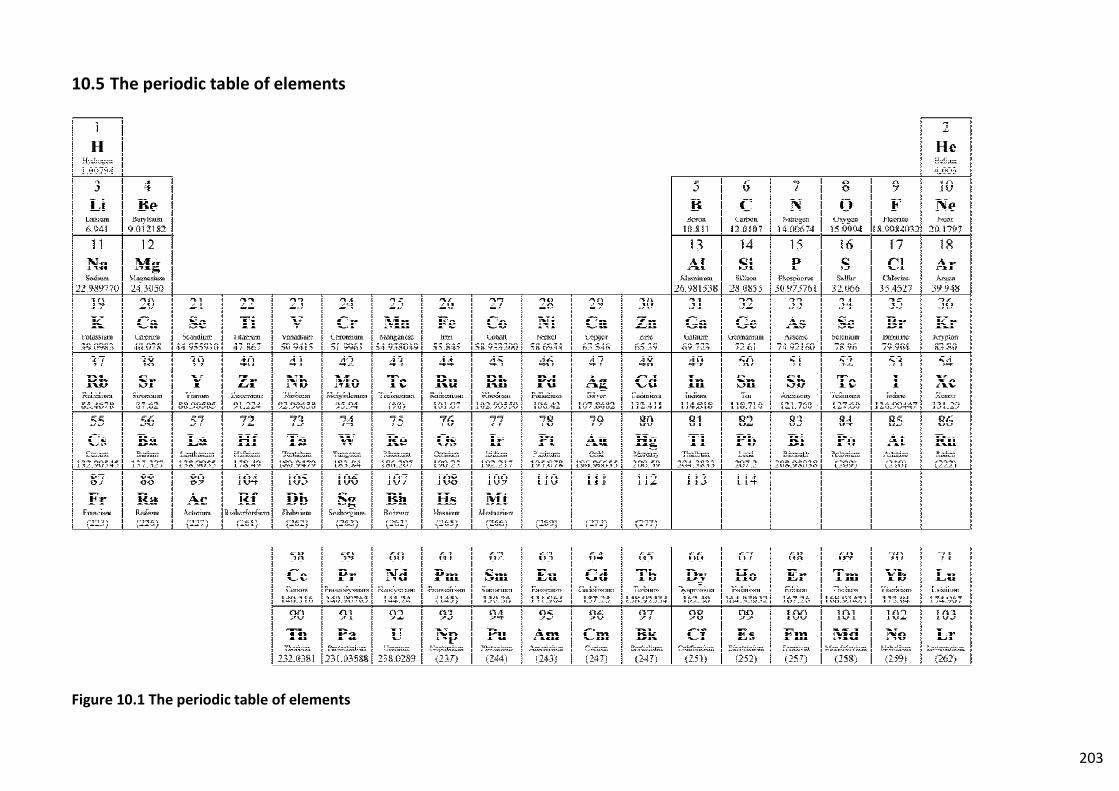
203
10.5 The periodic table of elements
Figure 10.1 The periodic table of elements
204
10.6 List of Publications
10.6.1 Papers Undergoing Finalisation for Submission for Publication
Owen J.D.; Kirton, S. B.; Evans, S. E.; Assi, S.; and Stair, J. L., ‘Elemental fingerprinting of Hypericum
perforatum (St John’s Wort) herb and preparations using ICP-OES and chemometrics’.
Owen J.D.; Evans, S. E.; and Stair, J. L., Method Development for the Elemental Analysis of
Hypericum perforatum (St John’s Wort) Products using ICP-OES and Microwave Digestion
10.6.2 Published abstracts and documents
Owen, J. D.; Evans, S. J.; Stair, J. L., Elemental Profile of Hypericum perforatum (St John's Wort)
Preparations Using ICP-OES. Journal of Pharmacy and Pharmacology 2010, 62, (10), 1206-1207.
Guirguis, A.; Owen, J. D.; Stair, J. L., Presence of metals in herbal extracts. Pharmaceutical Journal
2012, 289, (7731), 536.
Anjum, K.; Staff, K.; Mistry, T.; Owen, J.; Stair, J. L.; Moss, G. P., The effect of depilation on the
percutaneous absorption of aluminium from antiperspirant products. Journal of Pharmacy and
Pharmacology 2010, 62, (6), 800-800.
Mistry, T.; Staff, K.; Anjum, K.; Owen, J.; Stair, J. L.; Moss, G. P., The effect of occlusion on the
percutaneous absorption of aluminium from antiperspirant products. Journal of Pharmacy and
Pharmacology 2010, 62, (6), 799-799.
10.6.3 Oral Presentations
Owen J.D.; Kirton, S. B.; Evans, S. E.; Assi, S.; and Stair, J. L., ‘Elemental profiling as a tool for quality
control of Hypericum Perforatum (St John’s Wort)’. American Chemical Society, 244th national
meeting, Philadelphia, 19th- 24th August 2012.
Owen J.D.; Kirton, S. B.; Evans, S. E.; Assi, S.; and Stair, J. L., ‘Elemental profiling as a tool for quality
control of St John’s Wort (Hypericum Perforatum)’. Young Researchers BioResources, Reading, 3rd
July 2012.
205
10.6.4 Poster Presentations
Owen, J. D.; Evans, S. J.; Assi, S.; Stair, J. L., Elemental Fingerprinting of Hypericum perforatum (St
John’s Wort) with Inductively Coupled Plasma - Optical Emission Spectroscopy (ICP-OES) and
Chemometrics. In RSC Analytical Research Forum Nottingham, 2011.
Owen, J. D.; Evans, S. J.; Stair, J. L., Elemental Fingerprinting of Hypericum perforatum (St John’s
Wort) using ICP-OES. In RSC Analytical Research Forum, Loughborough University, 2010.
Owen, J. D.; Evans, S. J.; Stair, J. L., Trace Metal Analysis of Hypericum perforatum (St John’s Wort)
Using ICP-OES. In Student Forensic Science Conference, Westminster University, 2010.
Guirguis, A.; Owen, J. D.; Stair, J. L., The effect of extraction conditions on the elemental profile of
Hypericum Perforatum L. (St John’s Wort). In PharmSci, Nottingham, 2012.
Mistry, T.; Staff, K.; Anjum, K.; Owen, J. D.; Stair, J. L.; Moss, G., The effect of occlusion on the
percutaneous absorption of aluminium from antiperspirant products. In Perspectives in
Percutaneous Penetration, La Grande Motte, France, 2010.
Mistry, T.; Staff, K.; Anjum, K.; Owen, J. D.; Stair, J. L.; Moss, G., The effect of occlusion on
transdermal aluminium absorption after the application of antiperspirant products. . In UKICRS,
Hertfordshire, UK 2010.
Anjum, K.; Staff, K.; Mistry, T.; Owen, J. D.; Stair, J. L.; Moss, G., The effect of depilation on the
percutaneous absorption of aluminium from antiperspirant products. In Perspectives in
Percutaneous Penetration, La Grande Motte, France, 2010.
Anjum, K.; Staff, K.; Mistry, T.; Owen, J. D.; Stair, J. L.; Moss, G., The effect of depilation on
transdermal aluminium absorption after the application of antiperspirant products. . In UKICRS,
Hertfordshire, UK 2010.
10.6.5 Book Sections
Mistry, T.; Ajum, K.; Owen, J.D.; Stair, J.L.; Wilkinson, S.C.; Staff, K.; Moss, G.P., The percutaneous
absorption of aluminium from antiperspirant products. In: Brain, K.R., Chilcott, R. (eds) Advances in
the Dermatological Sciences, Royal Society of Chemistry, Cambridge, UK., December 2013.
Related Documents


