Nat. Hazards Earth Syst. Sci., 13, 2579–2598, 2013 www.nat-hazards-earth-syst-sci.net/13/2579/2013/ doi:10.5194/nhess-13-2579-2013 © Author(s) 2013. CC Attribution 3.0 License. Natural Hazards and Earth System Sciences Open Access Investigation of superstorm Sandy 2012 in a multi-disciplinary approach M. Kunz 1,2 , B. Mühr 1,2 , T. Kunz-Plapp 1,3 , J. E. Daniell 1,3 , B. Khazai 1,3 , F. Wenzel 1,3 , M. Vannieuwenhuyse 1,4 , T. Comes 1,4 , F. Elmer 1,5 , K. Schröter 1,6 , J. Fohringer 1,7 , T. Münzberg 1,8 , C. Lucas 1,9 , and J. Zschau 1,10 1 Center for Disaster Management and Risk Reduction Technology (CEDIM), Potsdam and Karlsruhe, Germany 2 Institute for Meteorology and Climate Research (IMK-TRO), Karlsruhe Institute of Technology (KIT), Karlsruhe, Germany 3 Geophysical Institute (GPI), Karlsruhe Institute of Technology (KIT), Karlsruhe, Germany 4 Institute for Industrial Production (IIP), Karlsruhe Institute of Technology (KIT), Karlsruhe, Germany 5 Scientific Infrastructure and Platforms, GFZ German Research Centre for Geosciences, Potsdam, Germany 6 Section Hydrology, GFZ German Research Centre for Geosciences, Potsdam, Germany 7 Section Geoinformatics, GFZ German Research Centre for Geosciences, Potsdam, Germany 8 Institute for Nuclear and Energy Technologies (IKET), Karlsruhe Institute of Technology (KIT), Karlsruhe, Germany 9 Institute of Photogrammetry and Remote Sensing (IPF), Karlsruhe Institute of Technology (KIT), Karlsruhe, Germany 10 Section Earthquake Risk and Early Warning, GFZ German Research Centre for Geosciences, Potsdam, Germany Correspondence to: M. Kunz ([email protected]) Received: 8 January 2013 – Published in Nat. Hazards Earth Syst. Sci. Discuss.: 25 March 2013 Revised: 3 July 2013 – Accepted: 6 September 2013 – Published: 18 October 2013 Abstract. At the end of October 2012, Hurricane Sandy moved from the Caribbean Sea into the Atlantic Ocean and entered the United States not far from New York. Along its track, Sandy caused more than 200 fatalities and severe losses in Jamaica, The Bahamas, Haiti, Cuba, and the US. This paper demonstrates the capability and potential for near- real-time analysis of catastrophes. It is shown that the impact of Sandy was driven by the su- perposition of different extremes (high wind speeds, storm surge, heavy precipitation) and by cascading effects. In par- ticular the interaction between Sandy and an extra-tropical weather system created a huge storm that affected large ar- eas in the US. It is examined how Sandy compares to historic hurricane events, both from a hydro-meteorological and im- pact perspective. The distribution of losses to different sectors of the econ- omy is calculated with simple input-output models as well as government estimates. Direct economic losses are estimated about USD 4.2 billion in the Caribbean and between USD 78 and 97 billion in the US. Indirect economic losses from power outages is estimated in the order of USD 16.3 billion. Modelling sector-specific dependencies quantifies total busi- ness interruption losses between USD 10.8 and 15.5 billion. Thus, seven years after the record impact of Hurricane Kat- rina in 2005, Hurricane Sandy is the second costliest hurri- cane in the history of the United States. 1 Introduction Hurricane Sandy was the last tropical cyclone (TC) of the 2012 Northern Atlantic Hurricane season. From 24 to 30 Oc- tober, Sandy moved on an unusual track from the Caribbean to the East Coast of the United States, where it made land- fall in New Jersey in the early hours of 30 October. Along its path, the severe storm caused more than 200 fatalities and widespread damage to one the poorest (Haiti) and one of the richest countries (US) in the world with different patterns of impact and loss. Sandy was an extraordinary event due to its multihazard nature and the cascades of adverse events in the aftermath that aggravated the direct impacts significantly. From a hydro-meteorological perspective, the most un- usual aspect was the very large spatial extent of up to 1700 km, primarily a result of the interaction of the TC with an upper-tropospheric trough. This interaction led to a rapid extra-tropical transition (e.g., Jones et al., 2003) Published by Copernicus Publications on behalf of the European Geosciences Union.

Welcome message from author
This document is posted to help you gain knowledge. Please leave a comment to let me know what you think about it! Share it to your friends and learn new things together.
Transcript

Nat. Hazards Earth Syst. Sci., 13, 2579–2598, 2013www.nat-hazards-earth-syst-sci.net/13/2579/2013/doi:10.5194/nhess-13-2579-2013© Author(s) 2013. CC Attribution 3.0 License.
Natural Hazards and Earth System
SciencesO
pen Access
Investigation of superstorm Sandy 2012 in a multi-disciplinaryapproach
M. Kunz 1,2, B. Mühr 1,2, T. Kunz-Plapp1,3, J. E. Daniell1,3, B. Khazai1,3, F. Wenzel1,3, M. Vannieuwenhuyse1,4,T. Comes1,4, F. Elmer1,5, K. Schröter1,6, J. Fohringer1,7, T. Münzberg1,8, C. Lucas1,9, and J. Zschau1,10
1Center for Disaster Management and Risk Reduction Technology (CEDIM), Potsdam and Karlsruhe, Germany2Institute for Meteorology and Climate Research (IMK-TRO), Karlsruhe Institute of Technology (KIT), Karlsruhe, Germany3Geophysical Institute (GPI), Karlsruhe Institute of Technology (KIT), Karlsruhe, Germany4Institute for Industrial Production (IIP), Karlsruhe Institute of Technology (KIT), Karlsruhe, Germany5Scientific Infrastructure and Platforms, GFZ German Research Centre for Geosciences, Potsdam, Germany6Section Hydrology, GFZ German Research Centre for Geosciences, Potsdam, Germany7Section Geoinformatics, GFZ German Research Centre for Geosciences, Potsdam, Germany8Institute for Nuclear and Energy Technologies (IKET), Karlsruhe Institute of Technology (KIT), Karlsruhe, Germany9Institute of Photogrammetry and Remote Sensing (IPF), Karlsruhe Institute of Technology (KIT), Karlsruhe, Germany10Section Earthquake Risk and Early Warning, GFZ German Research Centre for Geosciences, Potsdam, Germany
Correspondence to:M. Kunz ([email protected])
Received: 8 January 2013 – Published in Nat. Hazards Earth Syst. Sci. Discuss.: 25 March 2013Revised: 3 July 2013 – Accepted: 6 September 2013 – Published: 18 October 2013
Abstract. At the end of October 2012, Hurricane Sandymoved from the Caribbean Sea into the Atlantic Ocean andentered the United States not far from New York. Alongits track, Sandy caused more than 200 fatalities and severelosses in Jamaica, The Bahamas, Haiti, Cuba, and the US.This paper demonstrates the capability and potential for near-real-time analysis of catastrophes.
It is shown that the impact of Sandy was driven by the su-perposition of different extremes (high wind speeds, stormsurge, heavy precipitation) and by cascading effects. In par-ticular the interaction between Sandy and an extra-tropicalweather system created a huge storm that affected large ar-eas in the US. It is examined how Sandy compares to historichurricane events, both from a hydro-meteorological and im-pact perspective.
The distribution of losses to different sectors of the econ-omy is calculated with simple input-output models as well asgovernment estimates. Direct economic losses are estimatedabout USD 4.2 billion in the Caribbean and between USD 78and 97 billion in the US. Indirect economic losses frompower outages is estimated in the order of USD 16.3 billion.Modelling sector-specific dependencies quantifies total busi-ness interruption losses between USD 10.8 and 15.5 billion.
Thus, seven years after the record impact of Hurricane Kat-rina in 2005, Hurricane Sandy is the second costliest hurri-cane in the history of the United States.
1 Introduction
Hurricane Sandy was the last tropical cyclone (TC) of the2012 Northern Atlantic Hurricane season. From 24 to 30 Oc-tober, Sandy moved on an unusual track from the Caribbeanto the East Coast of the United States, where it made land-fall in New Jersey in the early hours of 30 October. Alongits path, the severe storm caused more than 200 fatalities andwidespread damage to one the poorest (Haiti) and one of therichest countries (US) in the world with different patterns ofimpact and loss. Sandy was an extraordinary event due to itsmultihazard nature and the cascades of adverse events in theaftermath that aggravated the direct impacts significantly.
From a hydro-meteorological perspective, the most un-usual aspect was the very large spatial extent of up to1700 km, primarily a result of the interaction of the TCwith an upper-tropospheric trough. This interaction led toa rapid extra-tropical transition (e.g.,Jones et al., 2003)
Published by Copernicus Publications on behalf of the European Geosciences Union.

2580 M. Kunz et al.: Hurricane Sandy 2012
shortly before landfall that further increased the strength ofthe storm. High wind speeds were associated with record-breaking storm surges on the US. Mid-Atlantic and NewEngland Coast during high (astronomical) tide, leading towidespread flooding. Very unusual was also the storm’s trackfrom the south to the north, which was mainly due to block-ing by an extended high pressure system. Thus, Sandy hit aregion that has rarely been affected by hurricanes in the pastbut is densely populated and very vulnerable to such an un-expected event. Since recording, Sandy was only the thirdhurricane that made landfall in New Jersey.
Though Sandy was not the most severe storm event interms of wind speed and precipitation, the impact, particu-larly in the US, was enormous. More than 20 million peo-ple on the East Coast were affected by power outages thatlasted a few days to weeks in some regions. Furthermore,many places on the East Coast suffered several days fromshortages in fuel supply. This situation was aggravated bya cold air outbreak in the days following the event, causingtemperatures to drop down to almost 0◦C. Total damage willbe in excess of USD 100 billion, with our estimates rangingbetween USD 78 and 97 billion for direct damage and overUSD 10 to 16 billion for indirect damage due to business in-terruption. Seven years after the record impact of HurricaneKatrina in 2005 (e.g.,Daniels et al., 2006) with total eco-nomic losses in the order of USD 160 (inflation-adjusted to2012;Swiss Re, 2006), Sandy was the second most costliestTC in the history of the United States.
The new Forensic Disaster Analysis (FDA) Task Forceof the Center for Disaster Management and Risk ReductionTechnology (CEDIM) intends to improve our understandingof the temporal evolution and the impact of natural disas-ters. The main research strategy is to consider not only thenatural hazard components, but also the related complex in-teractions and cascading effects in and between the natural,social, economic and infrastructure system. This is imple-mented in an interdisciplinary way by collecting and com-piling scattered and distributed information from availabledatabases and sources via the Internet, by application of ourown methodologies and models for near-real-time analysesdeveloped in recent years, and by expert knowledge. Al-though much better data emerge weeks and months after suchan event, the CEDIM FDA concept attempts to obtain andprovide information within the first few hours to days after adisaster. Time critically is considered important as potentialuser interest (e.g., relief organizations, insurance industry,tourist agencies) peaks in the initial stage of a disaster. Also,many pieces of information emerge within the first days thatmay later be obscured by a flood of information. Initial hy-potheses on loss evolution and its implications can be testedin the following days and, thus, may enhance our understand-ing of the impact and evolution of natural disasters withintheir respective socio-economic context.
This paper draws on two reports that are availableon CEDIM’s webpage (www.cedim.de), the first one of
30 October 2012, 20 h after Sandy had crossed the US EastCoast, and the second one 10 days later. The paper de-scribes the multihazard situation that led to the extraordinaryevent, highlights the interaction of the TC with other hydro-meteorological events, and examines impacts such as socialand economic losses including cascading effects, for exam-ple, due to power outages. It is examined how Sandy com-pares to historic hurricane events in the US, both from thehydro-meteorological and impact perspective. Direct and in-direct losses are estimated by comparison with past eventsand by application of an economic loss model that describesthe dependencies between the various economic sectors.
The paper is structured as follows. Section2 describesbackground, procedure, and strategy of CEDIM’s near-real-time FDA. Section3 gives an overview of the hazard situa-tion and discusses what made Sandy an extraordinary event.While Sect.4 examines the impact of Sandy during the earlystages in the Caribbean, Sect.5 discusses the impact specifi-cally for the US, with a focus on power outages, their conse-quences and associated indirect losses. Finally, Sect.6 brieflysummarizes the various findings, lists some conclusions, anddiscusses future perspectives and requirements that are nec-essary for implementing near-real-time FDA.
2 CEDIM forensic disaster analysis
Modern technologies, accessible databases and informationservices open unprecedented opportunities for natural disas-ter loss assessment and analysis in near-real time. The Inter-net, for instance, provides information from various sources,including the new technique of crowd sourcing, in min-utes to hours after an extreme event anywhere on the globe.Databases have been developed for storms, floods, or earth-quakes, which allow the rapid estimation of the potentialdamage once the triggering parameters, such as gust windspeed, precipitation totals, or ground motion are roughlyknown. Moreover, several services are accessible with highlyrelevant disaster information; among these are the Joint Re-search Center (JRC) with its GDACS service (www.gdacs.org), as well as the CatWatch (www.eqecat.com) informationservice from the private sector.
Forensic disaster investigation (Burton, 2011) has beenimplemented as a research target by the Integrated Re-search on Disaster Risk (IRDR,www.irdrinternational.org),an ICSU (International Council for Science,www.icsu.org)initiative located in Beijing. The Forensic Investigations ofDisasters (FORIN) programme (IRDR, 2011) aims at uncov-ering the root causes of natural disasters through in-depthinvestigations that go beyond the typical sectoral case stud-ies. For disaster analysis in near-real time, which is notthe pretension in the FORIN concept, CEDIM is develop-ing the strategy of Forensic Disaster Analysis (FDA;Wenzelet al., 2012). The word “forensic” is applied in the sense ofscrutinising disasters closely and with a multi-disciplinary
Nat. Hazards Earth Syst. Sci., 13, 2579–2598, 2013 www.nat-hazards-earth-syst-sci.net/13/2579/2013/

M. Kunz et al.: Hurricane Sandy 2012 2581
approach by making use of the high potential of modernobservational and analytical methodologies available in sci-ence, engineering, remote sensing and information technol-ogy. Results from these heterogeneous sources are the start-ing point for comprehensive science-based assessments innear-real time, i.e. less than 24 h after a catastrophic eventoccurred. This information are complemented by our ownmodels for near-real time-loss estimates that are currentlybeing developed. The forensic approach incorporates event-triggered task force activities, as well as specific research to-wards new methodologies that can support the near-real-timeapproach.
The objective of CEDIM’s FDA approach are to build upthe capability to rapidly:
– generate a portrait of the disaster with the aims of re-vealing its main characteristics and tracking its evolu-tion;
– reveal the short- and long-term impacts on regional andnational scale;
– estimate potential losses and analyze the critical causesof loss and risk;
– contribute to the development of a framework for fu-ture loss and risk reduction.
An important component in the CEDIM FDA is the near-real-time approach as: (i) many pieces of information emergewithin the first days of disasters; (ii) interest of and interac-tion with potential users (e.g., emergency services, tourismindustry, insurance industry, relief agencies) is particularhigh during the initial stage of a disaster; (iii) methodolo-gies and models of CEDIM for near-real-time loss evolutionand implications can be tested and calibrated and can thus(iv) contribute to significantly speed up our understanding ofdisasters within their respective socio-economic contexts.
3 Hazard description
3.1 Overview of Sandy
From 22–29 October 2012, Hurricane Sandy made its wayfrom the Caribbean Sea into the Atlantic Ocean and finallyentered the United States near Atlantic City (NJ) on the earlymorning of 30 October. According to the Saffir–SimpsonHurricane Scale ranging from 1 to 5, Sandy was a category 2Hurricane (154–177 kmh−1). The very unusual coincidenceof reinforcing conditions over the US, e.g. the interaction be-tween Sandy and an extra-tropical weather system, created ahuge storm that made landfall in the US and affected large ar-eas. The storm was associated with high impact weather thatstretched up to the Great Lakes and even beyond in southernand southeastern Canada. Due to the huge spatial extensionand high intensity, Sandy caused massive damage and losses
in several of the densely populated New England and Mid-Atlantic states.
A coastline of more than 1000 km in length was hit bya significant storm surge with the highest and often record-breaking water levels occurring north of the landfall locationin New Jersey and New York. In contrast, fluvial floodingin the Mid-Atlantic region in response to heavy precipitationturned out to be a minor hazardous effect.
In the next subsections, the storm track, the spatial-temporal evolution of Sandy and its hazardous effects, heavyprecipitation, storm surge, and river floods are presented.
3.2 Storm track of Sandy
Sandy was added to the list of 2012 tropical storm systemson 22 October, 15:00 UTC. So far that year, it was tropicalstorm system #18 in the North Atlantic region. At the ini-tial stage, huge convective cloud structures begun to organize250 km north of Panama and 515 km south of Kingston, Ja-maica. With further strengthening, Sandy was classified as acategory 1 hurricane according to the Saffir–Simpson Hur-ricane Scale on 24 October, just before crossing the islandof Jamaica. Heading further north, the hurricane approachedCuba, where the storm center arrived 24 h later. Associatedwith heavy rainfall, Sandy crossed the eastern parts of Cuba,where it reached its maximum intensity. At 06:00 UTC on25 October, the TC had 1 min sustained winds of 95 kts(176 kmh−1) and gusts around 110 kts (204 kmh−1) makingSandy a category 2 hurricane.
Constant in intensity, Sandy passed The Bahamas on26 October. The following day the hurricane made a rightturn towards the northeast and started to lose strength. Moreand more weather forecast models began to predict a scenariowhere Sandy was expected to make landfall after a leftwardmovement on the East Coast of the US. The TC was expectedto arrive in the night 29/30 October somewhere along theDelaware/New Jersey Atlantic coast.
Some hours before entering the US mainland, the hur-ricane intensified again and showed mean wind speeds of80 kts (148 kmh−1). Shortly before and while making land-fall, the center pressure of Sandy was 940 hPa, which was anew low pressure record for hurricanes making landfall northof Cape Hatteras (Hurricane Gladys in 1977 showed a mini-mum pressure of 939 hPa, however, kept its center away fromthe coast). Even the well-known “Long Island Express” in1938 only had a minimum pressure of 947 hPa. The stormcenter of Sandy crossed the coastline around 00:00 UTC on30 October. From 30 to 31 October, Sandy moved furthernorthwards and finally dissipated near Lake Erie.
www.nat-hazards-earth-syst-sci.net/13/2579/2013/ Nat. Hazards Earth Syst. Sci., 13, 2579–2598, 2013
2582 M. Kunz et al.: Hurricane Sandy 2012
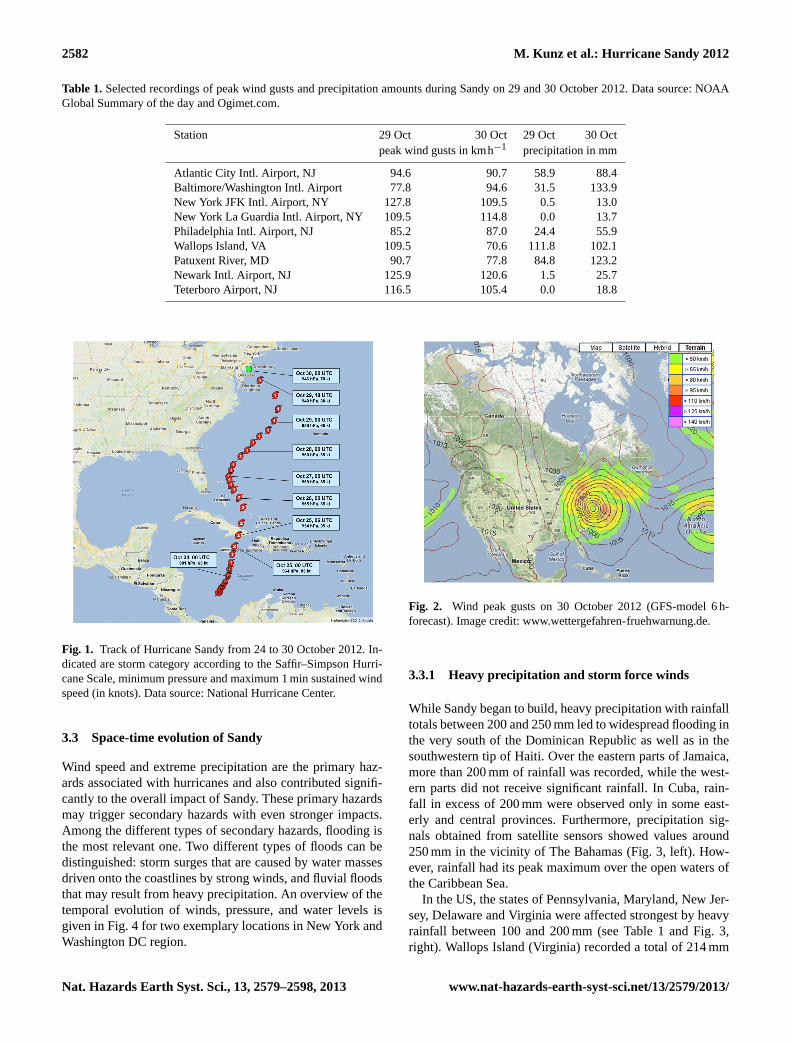
Table 1. Selected recordings of peak wind gusts and precipitation amounts during Sandy on 29 and 30 October 2012. Data source: NOAAGlobal Summary of the day andOgimet.com.
Station 29 Oct 30 Oct 29 Oct 30 Octpeak wind gusts in kmh−1 precipitation in mm
Atlantic City Intl. Airport, NJ 94.6 90.7 58.9 88.4Baltimore/Washington Intl. Airport 77.8 94.6 31.5 133.9New York JFK Intl. Airport, NY 127.8 109.5 0.5 13.0New York La Guardia Intl. Airport, NY 109.5 114.8 0.0 13.7Philadelphia Intl. Airport, NJ 85.2 87.0 24.4 55.9Wallops Island, VA 109.5 70.6 111.8 102.1Patuxent River, MD 90.7 77.8 84.8 123.2Newark Intl. Airport, NJ 125.9 120.6 1.5 25.7Teterboro Airport, NJ 116.5 105.4 0.0 18.8
Figures
Fig. 1. Track of Hurricane Sandy from 24 to 30 Oct. 2012. Indicated are storm category according to the
Saffir-Simpson Hurricane Scale, minimum pressure and maximum 1-minute sustained wind speed (in knots).
Data source: National Hurricane Center
Fig. 2. Wind peak gusts on 30 October 2012 (GFS-model 6h-forecast). Image credit: www.wettergefahren-
fruehwarnung.de.
29
Fig. 1. Track of Hurricane Sandy from 24 to 30 October 2012. In-dicated are storm category according to the Saffir–Simpson Hurri-cane Scale, minimum pressure and maximum 1 min sustained windspeed (in knots). Data source: National Hurricane Center.
3.3 Space-time evolution of Sandy
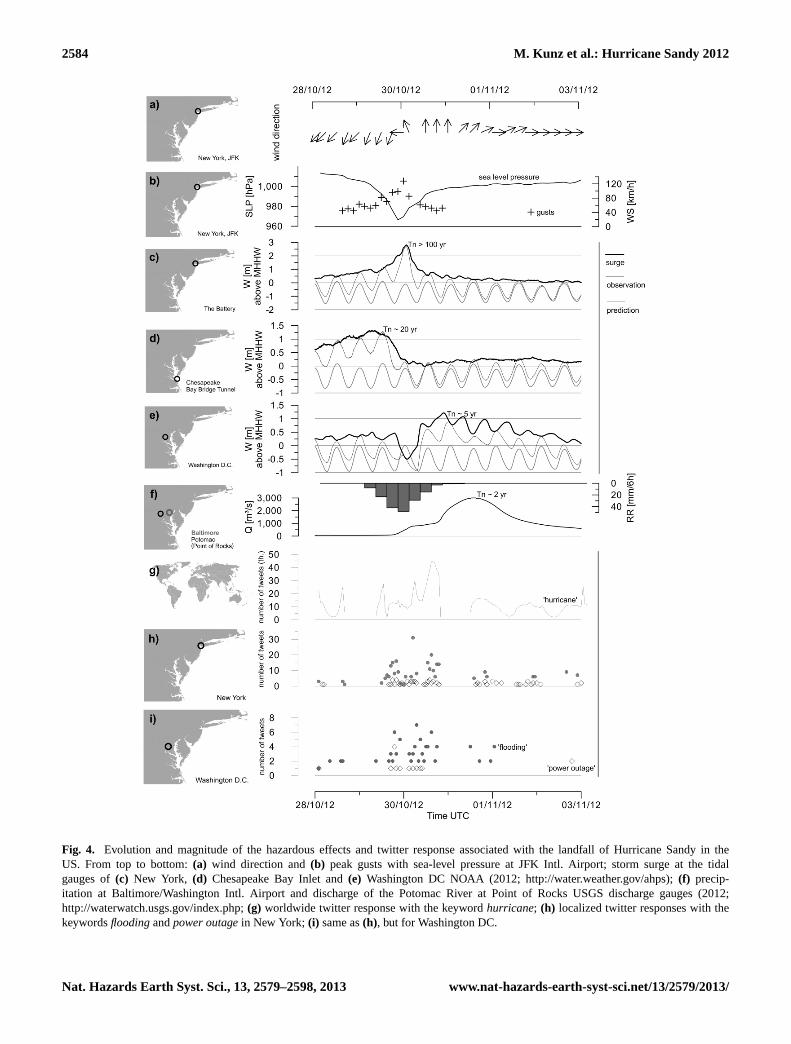
Wind speed and extreme precipitation are the primary haz-ards associated with hurricanes and also contributed signifi-cantly to the overall impact of Sandy. These primary hazardsmay trigger secondary hazards with even stronger impacts.Among the different types of secondary hazards, flooding isthe most relevant one. Two different types of floods can bedistinguished: storm surges that are caused by water massesdriven onto the coastlines by strong winds, and fluvial floodsthat may result from heavy precipitation. An overview of thetemporal evolution of winds, pressure, and water levels isgiven in Fig.4 for two exemplary locations in New York andWashington DC region.
Figures
Fig. 1. Track of Hurricane Sandy from 24 to 30 Oct. 2012. Indicated are storm category according to the
Saffir-Simpson Hurricane Scale, minimum pressure and maximum 1-minute sustained wind speed (in knots).
Data source: National Hurricane Center
Fig. 2. Wind peak gusts on 30 October 2012 (GFS-model 6h-forecast). Image credit: www.wettergefahren-
fruehwarnung.de.
29
Fig. 2. Wind peak gusts on 30 October 2012 (GFS-model 6 h-forecast). Image credit:www.wettergefahren-fruehwarnung.de.
3.3.1 Heavy precipitation and storm force winds
While Sandy began to build, heavy precipitation with rainfalltotals between 200 and 250 mm led to widespread flooding inthe very south of the Dominican Republic as well as in thesouthwestern tip of Haiti. Over the eastern parts of Jamaica,more than 200 mm of rainfall was recorded, while the west-ern parts did not receive significant rainfall. In Cuba, rain-fall in excess of 200 mm were observed only in some east-erly and central provinces. Furthermore, precipitation sig-nals obtained from satellite sensors showed values around250 mm in the vicinity of The Bahamas (Fig.3, left). How-ever, rainfall had its peak maximum over the open waters ofthe Caribbean Sea.
In the US, the states of Pennsylvania, Maryland, New Jer-sey, Delaware and Virginia were affected strongest by heavyrainfall between 100 and 200 mm (see Table1 and Fig.3,right). Wallops Island (Virginia) recorded a total of 214 mm
Nat. Hazards Earth Syst. Sci., 13, 2579–2598, 2013 www.nat-hazards-earth-syst-sci.net/13/2579/2013/

M. Kunz et al.: Hurricane Sandy 2012 2583
Fig. 3. Rainfall totals (in mm) from 18-25 Oct. 2012 (left) over the Caribbean and 24-31 October (right) over
the U.S. East Coast. Image credit: TRMM Tropical Rainfall Measuring Mission.
30
Fig. 3. Rainfall totals (in mm) from 18–25 October 2012 (left) over the Caribbean and 24–31 October (right) over the US East Coast. Imagecredit: TRMM Tropical Rainfall Measuring Mission.
within 48 h, while at Baltimore/Washington Intl. Airport itwas 165 mm (Fig.4f). The most intense rainfall occurred inthe vicinity of the Chesapeake Bay (Easton, MD, 319 mm).Sandy was responsible for the wettest days that have everbeen recorded in October at Baltimore/Washington Intl. Air-port as well as at Dulles Intl. Airport.
The intrusion of cold air near the surface from the north-west led to heavy snowfall, especially in the southern andcentral Appalachian Mountains. In mountainous areas ofTennessee, Kentucky, North Carolina, West Virginia and Vir-ginia people experienced blizzard-like conditions and snowamounts of up to 1 m.
Many parts between the Atlantic coast and the Great Lakesexperienced wind gusts in excess of 85 kmh−1. Selectedrecordings of peak wind gusts on 29 and 30 October areshown in Table1. The strongest winds occurred along andnear the coastlines of Virginia, Delaware, New Jersey andparts of New York. At JFK Intl. airport in NYC, the highestgust recording was 128 kmh−1 (see time series of Fig.4b).
3.3.2 Storm surge and river floods
In the Caribbean, Haiti, Jamaica and the eastern part of Cubawere affected by flooding and debris flow caused by heavyprecipitation. For example, the Croix de Mission River flow-ing through Port au Prince in Haiti rose to threatening levelsfor the adjacent housings.
On the US East Coast, the huge extent of the hurricaneled to storm surges caused by storm winds that advancedfrom south to north along the affected coastlines of Virginia,Delaware, New Jersey, New York, Connecticut, Rhode Islandand Massachusetts. As shown in Fig.4d, the storm surge atthe Chesapeake Bay Bridge Tunnel Gauge occurred twelve
hours (equivalent to one astronomical tide) before the highestwater levels in New York (Battery gauge, Fig.4c). North ofthe storm center, hurricane-force winds had an east to west(landward) direction (wind gusts of up to 130 kmh−1) andcaused the extreme water levels seen along the coastlinesfrom New Jersey to Massachusetts. The impact and magni-tude of the storm surge in the affected area differed due to thebathymetric and geographical characteristics and a complexinterplay of spatio-temporal factors. In New York City andon Long Island, the storm surge was most extreme: measure-ments from New York City show that the shift in the winddirection, minimum sea level pressure accompanied by max-imum gusts, and the full moon high (astronomical) tide oc-curred at the same time: around 01:00 UTC on 30 October(Fig. 4a–c). This superposition of effects did not happen tothe full extent at other locations of the affected coastal areas.
Fluvial river flooding due to high precipitation amountswas recorded at several gauges that are spatially clustered inthe Potomac and upper Susquehanna river basins as well asthe tributaries of the Delaware River in the area of Philadel-phia. These river basins cover large parts of the federalstates of Pennsylvania, Maryland and Delaware. Further, twogauges at the Hudson River reported flooding. The runoff re-sponse is determined by the interplay of diverse hydrologicalprocesses depending on geomorphological catchment char-acteristics and conditions. In this specific event, the occur-rence of snowfall in the Appalachian Mountains resulted ina temporary storage of water in the headwater regions ofthe river systems and thus attenuated the runoff response.Furthermore, the initial flow conditions had been much be-low normal flow. For instance, in the Potomac River at thegauge Point of Rocks (Fig.4f), the flood wave started from
www.nat-hazards-earth-syst-sci.net/13/2579/2013/ Nat. Hazards Earth Syst. Sci., 13, 2579–2598, 2013
2584 M. Kunz et al.: Hurricane Sandy 2012
Fig. 4. Evolution and magnitude of the hazardous effects and twitter response associated with the landfall of
hurricane Sandy in the U.S. From top to bottom: (a) Wind direction and (b) peak gusts with sea-level pressure at
JFK Intl. Airport; storm surge at the tidal gauges of (c) New York, (d) Chesapeake Bay Inlet and (e) Washington
D.C. NOAA (2012; http://water.weather.gov/ahps); (f) precipitation at Baltimore/Washington Intl. Airport and
discharge of the Potomac River at Point of Rocks USGS discharge gauges (2012; http://waterwatch.usgs.gov/
index.php; (g) worldwide twitter response with the keyword hurricane; (h) localized twitter responses with the
keywords flooding and power outage in New York; (i) same as (h), but for Washington D.C.
31
Fig. 4. Evolution and magnitude of the hazardous effects and twitter response associated with the landfall of Hurricane Sandy in theUS. From top to bottom:(a) wind direction and(b) peak gusts with sea-level pressure at JFK Intl. Airport; storm surge at the tidalgauges of(c) New York, (d) Chesapeake Bay Inlet and(e) Washington DC NOAA (2012;http://water.weather.gov/ahps); (f) precip-itation at Baltimore/Washington Intl. Airport and discharge of the Potomac River at Point of Rocks USGS discharge gauges (2012;http://waterwatch.usgs.gov/index.php; (g) worldwide twitter response with the keywordhurricane; (h) localized twitter responses with thekeywordsfloodingandpower outagein New York; (i) same as(h), but for Washington DC.
Nat. Hazards Earth Syst. Sci., 13, 2579–2598, 2013 www.nat-hazards-earth-syst-sci.net/13/2579/2013/
M. Kunz et al.: Hurricane Sandy 2012 2585
a discharge of around 60 m3s, which was very close to theflow value that exceeded 90 % of the time (USGS, 2012).
At lower reaches of the rivers or in estuaries near the At-lantic, high water levels cannot be attributed to single triggermechanisms. Rather they were caused by the superpositionof tidal currents, storm surges and fluvial flooding associ-ated with heavy rainfall. For the tide gauge of WashingtonDC, for example, the influence of tidal dynamics and stormsurge is obvious in the time series shown in Fig.4e. Thisgauge is situated remote from the coast at the mouthing ofthe Potomac River. The maximum water levels during thisevent were reached a full 36 h after the high tide at the Chesa-peake Bay Bridge Tunnel (Fig.4d). This is due to the propa-gation of the surge along the Chesapeake Bay. Further, thewater levels remained at a high level during the 31 Octo-ber and 1 November. The superposition with the inland floodwave flowing off from the Potomac River basin (Fig.4f) con-tributed to this effect.
In order to assess how the peak coastal water levels andriver discharges recorded during Sandy compare to the past,their recurrence intervals (Tn) using extreme value statis-tics were quantified. For this purpose, annual maximum se-ries (AMS) for the different USGS (2012) discharge gauges(http://waterwatch.usgs.gov/index.phpand NOAA (2012)tidal gauges (http://water.weather.gov/ahps) were obtainedand analyzed statistically. As several probability distributionfunctions may satisfactorily describe the AMS data variabil-ity, our assessment was based on a composite distributionfunction approach (Apel et al., 2006; Wood and Rodriguez-Iturbe, 1975). The composite function resulted from weight-ing the distribution functions based on likelihood weights.Note that at the given point of time all observations consid-ered in this paper are provisional data and subject to revision.
Observed water levels at the tidal gauges from northernVirginia to Rhode Island exceeded recurrence intervals (Tn)of 10 yr. The highest levels, corresponding to a Tn> 100 yrevent, occurred at the tidal gauge at Battery on the south-ern tip of Manhattan, where water levels unprecedented inthe record occurred due to the concurrence of the aforemen-tioned reinforcing effects. Specific flow characteristics at thisgauge, namely the confluence of Hudson and East rivers atthe northern end of Upper Bay may also have contributedto the record water level. At Kings Point in the Long Is-land Sound and at the Chesapeake Bay Bridge Tunnel gauge(Fig. 4d), for example, the effects of the storm tide maximawere pronouncedly lowered by the low (astronomical) tide,but still reached levels of Tn= 20 yr and more.
By contrast, recurrence intervals of peak discharges at lo-cations off the coast were substantially lower. For example atthe streamflow gauge Point of Rocks at the Potomac River(Fig. 4f), Tn= 2 yr was quantified. Other gauges showedslightly higher levels, for example, Tn of 4 yr has been es-timated for the peak discharge at the gauge East BranchBrandy Wine Creek below Downington and a Tn of 6 yr forthe Monocacy River at Jug Bridge near Frederick. In general,
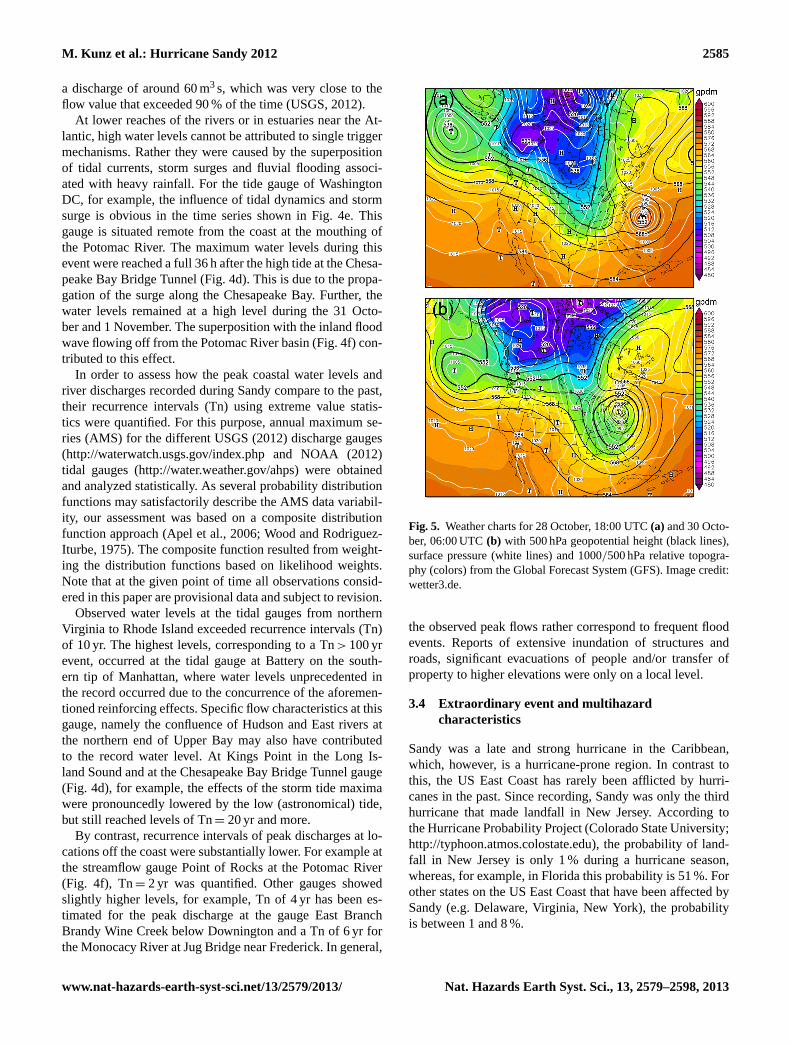
Fig. 5. Weather charts for 28 Oct., 18:00 UTC (a) and 30 Oct., 06:00 UTC (b) with 500 hPa Geopotential
height (black lines), surface pressure (white lines) and 1000/500 hPa relative topography (colors) from the
Global Forecast System (GFS). Image credit: wetter3.de.
32
Fig. 5. Weather charts for 28 October, 18:00 UTC(a) and 30 Octo-ber, 06:00 UTC(b) with 500 hPa geopotential height (black lines),surface pressure (white lines) and 1000/500 hPa relative topogra-phy (colors) from the Global Forecast System (GFS). Image credit:wetter3.de.
the observed peak flows rather correspond to frequent floodevents. Reports of extensive inundation of structures androads, significant evacuations of people and/or transfer ofproperty to higher elevations were only on a local level.
3.4 Extraordinary event and multihazardcharacteristics
Sandy was a late and strong hurricane in the Caribbean,which, however, is a hurricane-prone region. In contrast tothis, the US East Coast has rarely been afflicted by hurri-canes in the past. Since recording, Sandy was only the thirdhurricane that made landfall in New Jersey. According tothe Hurricane Probability Project (Colorado State University;http://typhoon.atmos.colostate.edu), the probability of land-fall in New Jersey is only 1 % during a hurricane season,whereas, for example, in Florida this probability is 51 %. Forother states on the US East Coast that have been affected bySandy (e.g. Delaware, Virginia, New York), the probabilityis between 1 and 8 %.
www.nat-hazards-earth-syst-sci.net/13/2579/2013/ Nat. Hazards Earth Syst. Sci., 13, 2579–2598, 2013
2586 M. Kunz et al.: Hurricane Sandy 2012
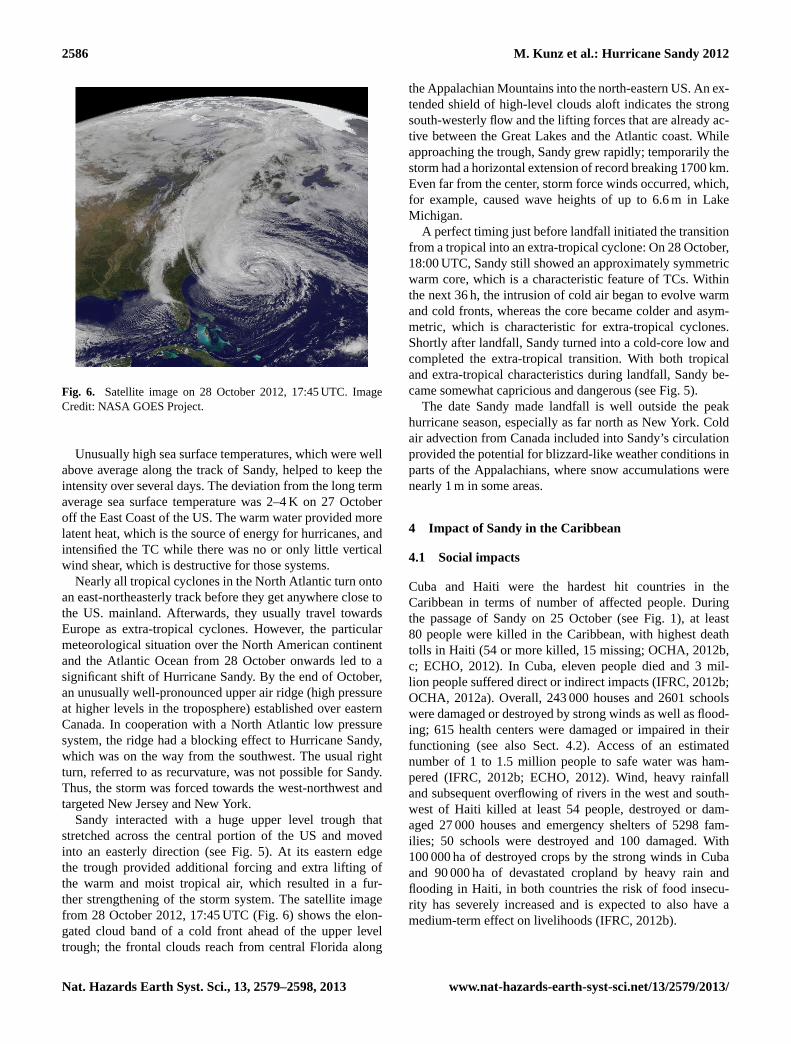
Fig. 6. Satellite image on 28 October 2012, 17:45 UTC Image Credit: NASA GOES Project.
33
Fig. 6. Satellite image on 28 October 2012, 17:45 UTC. ImageCredit: NASA GOES Project.
Unusually high sea surface temperatures, which were wellabove average along the track of Sandy, helped to keep theintensity over several days. The deviation from the long termaverage sea surface temperature was 2–4 K on 27 Octoberoff the East Coast of the US. The warm water provided morelatent heat, which is the source of energy for hurricanes, andintensified the TC while there was no or only little verticalwind shear, which is destructive for those systems.
Nearly all tropical cyclones in the North Atlantic turn ontoan east-northeasterly track before they get anywhere close tothe US. mainland. Afterwards, they usually travel towardsEurope as extra-tropical cyclones. However, the particularmeteorological situation over the North American continentand the Atlantic Ocean from 28 October onwards led to asignificant shift of Hurricane Sandy. By the end of October,an unusually well-pronounced upper air ridge (high pressureat higher levels in the troposphere) established over easternCanada. In cooperation with a North Atlantic low pressuresystem, the ridge had a blocking effect to Hurricane Sandy,which was on the way from the southwest. The usual rightturn, referred to as recurvature, was not possible for Sandy.Thus, the storm was forced towards the west-northwest andtargeted New Jersey and New York.
Sandy interacted with a huge upper level trough thatstretched across the central portion of the US and movedinto an easterly direction (see Fig.5). At its eastern edgethe trough provided additional forcing and extra lifting ofthe warm and moist tropical air, which resulted in a fur-ther strengthening of the storm system. The satellite imagefrom 28 October 2012, 17:45 UTC (Fig.6) shows the elon-gated cloud band of a cold front ahead of the upper leveltrough; the frontal clouds reach from central Florida along
the Appalachian Mountains into the north-eastern US. An ex-tended shield of high-level clouds aloft indicates the strongsouth-westerly flow and the lifting forces that are already ac-tive between the Great Lakes and the Atlantic coast. Whileapproaching the trough, Sandy grew rapidly; temporarily thestorm had a horizontal extension of record breaking 1700 km.Even far from the center, storm force winds occurred, which,for example, caused wave heights of up to 6.6 m in LakeMichigan.
A perfect timing just before landfall initiated the transitionfrom a tropical into an extra-tropical cyclone: On 28 October,18:00 UTC, Sandy still showed an approximately symmetricwarm core, which is a characteristic feature of TCs. Withinthe next 36 h, the intrusion of cold air began to evolve warmand cold fronts, whereas the core became colder and asym-metric, which is characteristic for extra-tropical cyclones.Shortly after landfall, Sandy turned into a cold-core low andcompleted the extra-tropical transition. With both tropicaland extra-tropical characteristics during landfall, Sandy be-came somewhat capricious and dangerous (see Fig.5).
The date Sandy made landfall is well outside the peakhurricane season, especially as far north as New York. Coldair advection from Canada included into Sandy’s circulationprovided the potential for blizzard-like weather conditions inparts of the Appalachians, where snow accumulations werenearly 1 m in some areas.
4 Impact of Sandy in the Caribbean
4.1 Social impacts
Cuba and Haiti were the hardest hit countries in theCaribbean in terms of number of affected people. Duringthe passage of Sandy on 25 October (see Fig.1), at least80 people were killed in the Caribbean, with highest deathtolls in Haiti (54 or more killed, 15 missing;OCHA, 2012b,c; ECHO, 2012). In Cuba, eleven people died and 3 mil-lion people suffered direct or indirect impacts (IFRC, 2012b;OCHA, 2012a). Overall, 243 000 houses and 2601 schoolswere damaged or destroyed by strong winds as well as flood-ing; 615 health centers were damaged or impaired in theirfunctioning (see also Sect. 4.2). Access of an estimatednumber of 1 to 1.5 million people to safe water was ham-pered (IFRC, 2012b; ECHO, 2012). Wind, heavy rainfalland subsequent overflowing of rivers in the west and south-west of Haiti killed at least 54 people, destroyed or dam-aged 27 000 houses and emergency shelters of 5298 fam-ilies; 50 schools were destroyed and 100 damaged. With100 000 ha of destroyed crops by the strong winds in Cubaand 90 000 ha of devastated cropland by heavy rain andflooding in Haiti, in both countries the risk of food insecu-rity has severely increased and is expected to also have amedium-term effect on livelihoods (IFRC, 2012b).
Nat. Hazards Earth Syst. Sci., 13, 2579–2598, 2013 www.nat-hazards-earth-syst-sci.net/13/2579/2013/

M. Kunz et al.: Hurricane Sandy 2012 2587
Fig. 7. Number of cumulated Cholera deaths per week and percentage of cholera as death cause out of all
deaths per week in Haiti (a) during the four months before and the seven weeks after Hurricane Sandy, and (b)
from 17 Oct. 2010 to 12 Dec.. 2012. Data: Ministere de la Sante Publique, Republique d’Haiti and CATDAT
Database
34
Fig. 7. Number of cumulated cholera deaths per week and percent-age of cholera as death cause out of all deaths per week in Haiti(a)during the four months before and the seven weeks after HurricaneSandy, and(b) from 17 October 2010 to 12 December 2012. Data:Ministère de la Santé Publique, Republique d’Haiti and CATDATDatabase
Even if Sandy historically was not the deadliest hurricaneaffecting Haiti (seeMühr et al., 2012), there are some fac-tors that aggravate Sandy’s impact in Haiti. Firstly, Hurri-cane Sandy struck a country that is still recovering fromthe devastating earthquake in 2010 with 350 000 people stillliving in camps for internally displaced persons (OCHA,2012c). Secondly, after the passage of Hurricane Isaac in Au-gust 2012 and Hurricane Sandy in October 2012 resulting indestruction of agricultural crops in at least 60 communities,450 000 to 1.5 million people are at an increased risk of mal-nutrition (OCHA, 2012c, d; CDEMA, 2012; ECHO, 2012).Thirdly, damage to medical facilities (including 22 choleratreatment centers), problems in restocking because of inter-rupted transportation, and poor sanitary conditions have in-creased the risk of waterborne diseases such as cholera. Af-ter the cholera outbreak in October 2010 in the aftermath ofthe major earthquake in January 2010, cholera is still preva-lent in Haiti, yet was declining in terms of new cases anddeaths in the months before Hurricane Sandy. Figure7 showsthe cumulated absolute number of cholera deaths over time
Fig. 8. Residential damage in Cuba as a percentage of housing stock using data from (Daniell, 2012; IFRC,
2012a).
Fig. 9. Timeline of restoration of power outage from Hurricane Sandy between 29 and 30 Oct. and the
Nor’easter on 7 Nov. for affected customers in the U.S. (Customer outages are compiled from specific situation
reports obtained from the U.S. Department of Energy, Office of Electricity Delivery and Energy Reliability
from 29 Oct. to 19 Nov.).
35
Fig. 8. Residential damage in Cuba as a percentage of housingstock using data from (Daniell, 2012; IFRC, 2012a).
and the percentage of weekly cholera deaths since the epi-demic outbreak in October 2010. In the first seven weeks af-ter Sandy, approximately 22 000 new cases and 209 deathswere reported (Ministère de la Santé Publique, Republiqued’Haiti), which represents a slight increase in disease spread,compared to the weeks before, both for cholera deaths andnew cases. Comparing the current increase in cholera deathsafter Hurricane Sandy with the progression of the epidemicsince its outbreak, it can be seen that the current increaseis still rather small compared to the peaks during the initialoutbreak phase and also smaller than the peak in June 2012when cholera had already started to decline.
4.2 Economic impacts
Direct losses in the Caribbean have been extensive on aGDP comparison for nations (see Table2). The estimationof losses listed in Table2 was undertaken using analysis ofdestroyed and damaged buildings in addition to other sec-toral losses such as agriculture, infrastructure, education andhealth as a proportion of capital stock and GDP as reportedfrom Daniell et al. (2011) and in the CATDAT database(Daniell, 2012). Loss functions were developed based onprevious damage seen in previous impacts of hurricanes inCuba, Haiti and the rest of the Caribbean as a function ofwind speed, storm intensity and flooding as well as the cur-rent damage reported from the International Federation ofRed Cross and Red Crescent Societies (IFRC) and nationalagencies.
According to this analysis, losses were greatest in Cubawith around 5.5 % of GDP where over 226 000 houses weredamaged and 17 000 destroyed (Fig.8). The damage fol-lowed the storm track closely, with over 20 % of houses los-ing roofs due to the high wind speeds. Flooding was alsowidespread. In some sections of the Holguin and Santiago
www.nat-hazards-earth-syst-sci.net/13/2579/2013/ Nat. Hazards Earth Syst. Sci., 13, 2579–2598, 2013
2588 M. Kunz et al.: Hurricane Sandy 2012
Table 2. Direct economic loss estimates for the Caribbean and theUS.
Country Estimates loss(million US$) % of GDP
Source
Cuba 3380 5.5 CEDIMHaiti >280 3.8 CEDIMTheBahamas
300–400 3.7–4.9 CCRIF
USA 78 000–97 000 0.5 CEDIMJamaica 66 0.4 Jamaican
GovtDominicanRepublic
85 0.14 CEDIM
Canada >100 0.0057 JamaicanGovt
Bermuda minor
de Cuba provinces, the percentage of damaged buildingsreached over 80 % as compared to the total building stockestimated from the changes from last census. Some of thiswas related to the vulnerability of building stock, yet someto variable wind speeds and flooding from storm surge (asseen in Guama) and rainfall (seen in Songo-La Maya).
In addition, much damage to schools, agriculture (sugarcane, bananas) and the power systems occurred. However,this has not been the largest economic loss due to hurricanesin Cuba, as over USD 8 billion damage occurred throughHurricane Ike in 2008.
Haiti has also seen major damage through the combina-tion of river flooding and pluvial flash flooding with over6000 buildings destroyed and 21 000 buildings damaged, andThe Bahamas also saw major damage with both countrieshaving losses equivalent to around 4 % of GDP.
5 Impacts of Sandy in the US
5.1 Impacts on life
In the eastern US, 142 people died because of Sandy, mostof them in New York, New Jersey and Pennsylvania. Of the64 fatalities in the state of New York, 43 occurred in NewYork City (NYC) 22 of which were on Staten Island (Reuters,16 November 2012, and Keller in NY Times, 17 Novem-ber 2012). Comparing the hurricane fatalities in the statesNew York, New Jersey and Pennsylvania with historic events(see Table3), it can be seen that Sandy is among the threemost fatal events of recorded history of hurricane deaths. ForNew Jersey, it is the deadliest single TC event ever.
5.2 Impacts on infrastructure: cascading effects
Energy systems are amongst the most important criti-cal infrastructure due to their essential role in sustaining
Fig. 8. Residential damage in Cuba as a percentage of housing stock using data from (Daniell, 2012; IFRC,
2012a).
Fig. 9. Timeline of restoration of power outage from Hurricane Sandy between 29 and 30 Oct. and the
Nor’easter on 7 Nov. for affected customers in the U.S. (Customer outages are compiled from specific situation
reports obtained from the U.S. Department of Energy, Office of Electricity Delivery and Energy Reliability
from 29 Oct. to 19 Nov.).
35
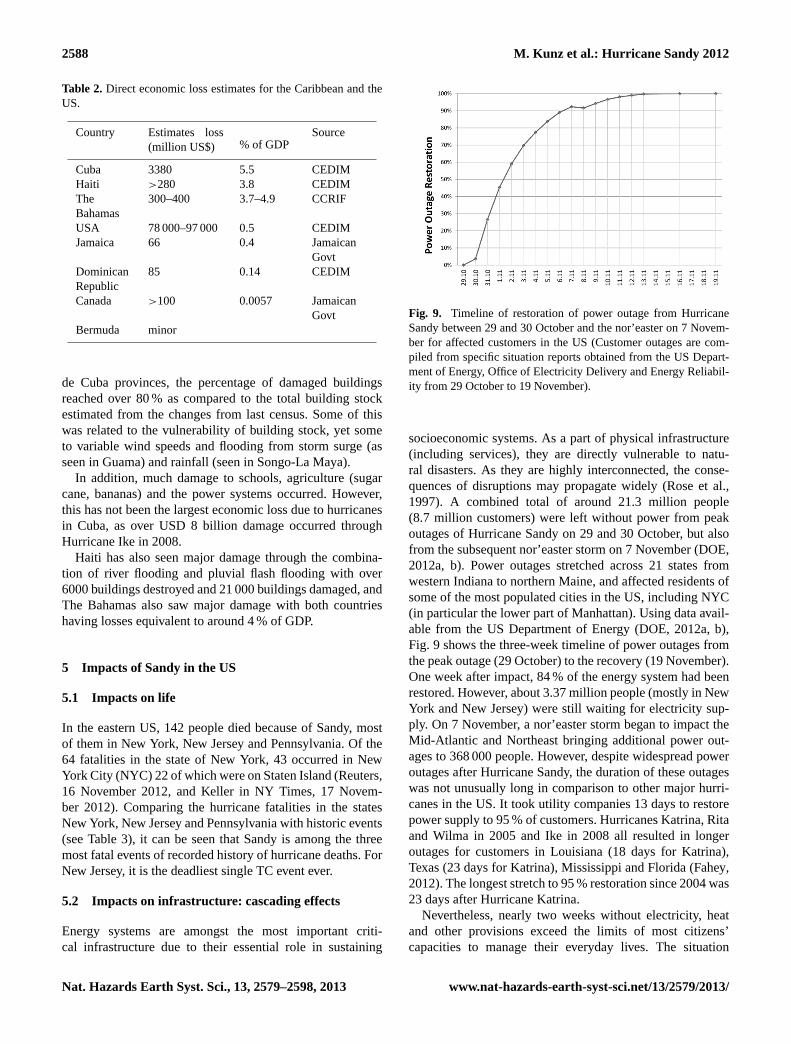
Fig. 9. Timeline of restoration of power outage from HurricaneSandy between 29 and 30 October and the nor’easter on 7 Novem-ber for affected customers in the US (Customer outages are com-piled from specific situation reports obtained from the US Depart-ment of Energy, Office of Electricity Delivery and Energy Reliabil-ity from 29 October to 19 November).
socioeconomic systems. As a part of physical infrastructure(including services), they are directly vulnerable to natu-ral disasters. As they are highly interconnected, the conse-quences of disruptions may propagate widely (Rose et al.,1997). A combined total of around 21.3 million people(8.7 million customers) were left without power from peakoutages of Hurricane Sandy on 29 and 30 October, but alsofrom the subsequent nor’easter storm on 7 November (DOE,2012a, b). Power outages stretched across 21 states fromwestern Indiana to northern Maine, and affected residents ofsome of the most populated cities in the US, including NYC(in particular the lower part of Manhattan). Using data avail-able from the US Department of Energy (DOE, 2012a, b),Fig. 9 shows the three-week timeline of power outages fromthe peak outage (29 October) to the recovery (19 November).One week after impact, 84 % of the energy system had beenrestored. However, about 3.37 million people (mostly in NewYork and New Jersey) were still waiting for electricity sup-ply. On 7 November, a nor’easter storm began to impact theMid-Atlantic and Northeast bringing additional power out-ages to 368 000 people. However, despite widespread poweroutages after Hurricane Sandy, the duration of these outageswas not unusually long in comparison to other major hurri-canes in the US. It took utility companies 13 days to restorepower supply to 95 % of customers. Hurricanes Katrina, Ritaand Wilma in 2005 and Ike in 2008 all resulted in longeroutages for customers in Louisiana (18 days for Katrina),Texas (23 days for Katrina), Mississippi and Florida (Fahey,2012). The longest stretch to 95 % restoration since 2004 was23 days after Hurricane Katrina.
Nevertheless, nearly two weeks without electricity, heatand other provisions exceed the limits of most citizens’capacities to manage their everyday lives. The situation
Nat. Hazards Earth Syst. Sci., 13, 2579–2598, 2013 www.nat-hazards-earth-syst-sci.net/13/2579/2013/

M. Kunz et al.: Hurricane Sandy 2012 2589
Table 3. Number of storm fatalities in the states New York, New Jersey and Pennsylvania from historic hurricane/storm events. Sources:Reuters, 16 November 2012, Keller in NY Times, 17 November 2012, andDaniell (2012).
New York New Jersey PennsylvaniaRank Storm Name, Year Deaths Storm Name, Year Deaths Storm Name, Year Deaths
1* Sandy, 2012 64 Sandy, 2012 37 Diane/Connie, 1955 75–901 New England, 1938 60 Unnamed, 1806 21 Agnes, 1972 503 Edna, 1954 29 Irene, 2011 10 Sandy, 2012 134 Norfolk/Long Is., 1821 17 Unnamed, 1944 9 Floyd, 1999 6–135 Hurricane Five, 1894 10 Unnamed, 1878 8 Gale of 1878 106 Agnes, 1972 6 Floyd, 1999 6 TC Allison, 2001 7
* The New England Storm 1938 and Sandy 2012 are deemed to be equally ranked as the fatality numbers for the New England Storm 1938 did notinclude indirect deaths whereas the numbers for Hurricane Sandy include indirect deaths via carbon monoxide poisoning, debris removal, etc.
Fig. 10. A breakdown of direct losses in New York State (in million US$ and %) reported by (Cuomo, 2012).
Fig. 11. Direct Economic Losses (in billion US$ and %) by U.S. State from Hurricane Sandy.
36
Fig. 10. A breakdown of direct losses in New York State (in millionUS$ and %) reported by (Cuomo, 2012).
imposed a particularly severe hardship on the sick, elderly,handicapped and poor. Since there is only limited data avail-able on the consequences of power outages caused by TCs,an empirical comparison is difficult. The affected people relyon electricity and are heightened exposed to risks from fireand carbon monoxide poisoning as people use generators, orother gasoline-, propane-, or charcoal burning devices insidetheir homes for heating, and observed in former comparableincidents (Platz et al., 2007).
The main reason for fires following hurricane is usuallyelectrical system failures and wiring issues caused simply bythe wind speed being too high for the intended safety factorassociated with this infrastructure. In a fire in Breezy Point,Queens, in New York during Hurricane Sandy, 111 houseswere destroyed and 20 damaged (Trapasso, 2012). Numer-ous other dwelling fires occurred in other states. In total, overUSD 60 million damage can be attributed to fire in New Yorkalone. Historically, Hurricane Katrina showed the large im-pact of fires following hurricane, where due to evacuations,fires were able to spread uncontrolled through poorer parts ofthe city. Hurricane Irene in 2011 also caused many electricalfires (Daniell, 2012). Models for fire following hurricane arecurrently limited to poorly validated probabilistic relationsbetween number of outbreaks, TC wind loads damage before
Fig. 10. A breakdown of direct losses in New York State (in million US$ and %) reported by (Cuomo, 2012).
Fig. 11. Direct Economic Losses (in billion US$ and %) by U.S. State from Hurricane Sandy.
36
Fig. 11. Direct economic losses (in billion US$ and %) by US statesfrom Hurricane Sandy.
fire, wind speeds, and the level of preventive fire protectionstandards.
In tall apartment buildings and commercial skyscrapers,lack of elevator service poses a serious problem for the dis-abled or elderly who cannot navigate stairs. The combinedpower outage and severe weather conditions due to winterstorms, further stresses the affected population. Threats fromwater and food shortages, food poisoning from refrigerationnot working, disease outbreaks from malfunctioning sewagesystems/drinking water supply and deficits in health care canbecome serious issues (Bayleyegn et al., 2006). Althoughthere was no gas shortage through resource depletion, thelack of electricity prevented filling stations from dispensingfuel, resulting in long queues and rationing.
5.3 Estimation of direct losses
Early estimates of direct economic losses from risk mod-elling firms such as EQECAT and AIR were in the order ofUSD 20–50 billion but turned out to be lower than the finaltotal.
New York direct losses have totalled around USD 32.8 bil-lion for repairs and restoration (Fig.10; Governor Andrew
www.nat-hazards-earth-syst-sci.net/13/2579/2013/ Nat. Hazards Earth Syst. Sci., 13, 2579–2598, 2013

2590 M. Kunz et al.: Hurricane Sandy 2012
Table 4. Direct economic losses by historic hurricanes that haveaffected the US.
Hurricane (Year) Direct Economic Losses in the US(in billion US$ 2012)
Katrina (2005) 127.8Sandy (2012) 78–97*Andrew (1992) 42.7Ike (2008) 31.3Wilma (2005) 23.9
* refers to the loss estimation by CEDIM (CATDAT DatabaseDaniell,2012).
Cuomo). An estimated 305 000 houses were damaged or de-stroyed in New York state as of 26 November 2012, causingaround USD 9.7 billion in damage. The other relative com-ponents of the loss estimate by the government are shownin Fig. 10 (Cuomo, 2012). This is related to the massive ex-posure located in this region of the US with New York andNew Jersey combining to have over USD 5 trillion capitalstock. In addition, over 265 000 businesses were affected.New York City has stated that the economic losses due todirect causes have totalled USD 13.3 billion, and indirectcauses from USD 5.7 billion (DeStefano, 2012). The lossesprovided byCuomo (2012) were slightly higher totallingover USD 15 billion for New York City (about 2 % of thegross city proper product).
New Jersey has released losses to housing, transit sys-tems, infrastructure, tourism and coastlines at USD 29.4 bil-lion (Fig. 11). Damage before this was quoted as being 34 %from New York, 30 % from New Jersey, 20 % from Pennsyl-vania and 16 % from remaining states using the EQECAT es-timate. Using this total system, losses in Pennsylvania wouldhit around USD 19 billion, with an additional USD 15 billionfrom other states, leaving a total of USD 97 billion damagefrom this event, given the fact that New York and New Jerseyloss estimates have fitted this model well.
In addition, indirect losses (see Sect.5.4) could contributeto additional losses on top of the USD 97 billion estimateddamage, and indirect losses may already be included to someextent in the business impact in New York and tourism es-timate in New Jersey, thus a reduction of 20 % and a rangeof losses is proposed from USD 78–97 billion for the directloss estimate (see Table4). This would make Sandy the sec-ond highest economic loss from a US hurricane in historyand the highest worldwide loss from a natural disaster eventsince the Tohoku earthquake in March 2011 (Daniell et al.,2011).
Indirect losses are generally high in productive locationssuch as New York City. They are scrutinized in the followingSect.5.4.
Fig. 12. Economic loss from power outages.
Fig. 13. Share of sectors’ value added in affected States compared to the US economy.
37
Fig. 12. Economic loss from power outages.
5.4 Estimation of indirect losses
Besides direct costs due to damage of physical infrastructure,natural disasters often result in importantindirect losses thathave grown considerably due to the increasing interrelated-ness of globalized supply networks and the growing depen-dence of modern societies on critical infrastructure (Klein-dorfer and Saad, 2005; Comes and Schultmann, 2012; Per-row, 1984). Indirect economic losses are caused by the dis-ruption or failure of physical or economic linkages (Penning-Rowsell et al., 2003; Messner et al., 2007). Particularly theinterruption of the most essential infrastructure such as elec-tric power (cf. Sect. 5.2) or transportation can cause cascad-ing effects throughout further infrastructure systems (Rinaldiet al., 2001). In the aftermath of a natural hazard, the great-est share of indirect losses results from business interruption(Tierney, 1994), especially due to the decline of productionresulting from destroyed infrastructure and associated supplychain disruptions (Zimmerman and Restrepo, 2006).
To estimate the indirect losses, two approaches were used:an estimation of the costs of the power outages based on acomparison with previous events and an estimation of the in-direct based on a sector-specific model that takes into accountthe indirect vulnerability of industrial sectors due to busi-ness interruption using an input-output model (I-O model)approach.
5.4.1 Estimation based on past events
The total costs (direct and indirect) of blackouts can beroughly estimated based on a comparison with similar pastevents. The losses of previous power blackouts have beencompared, including events that were not caused by disas-ters. For instance, the costs of the 2003 Northeast black-out, which affected 55 million people, particularly through-out the northeastern states of the US, were estimated to beabout USD 6.3 billion. With close estimates of USD 5.6 bil-lion for one day,Zimmermann et al.(2005) demonstrated the
Nat. Hazards Earth Syst. Sci., 13, 2579–2598, 2013 www.nat-hazards-earth-syst-sci.net/13/2579/2013/
M. Kunz et al.: Hurricane Sandy 2012 2591
possibility to estimate costs based on GDP per capita and thenumber of people affected.
A similar approach is used to assess the costs for the poweroutages that occurred in the aftermath of Sandy. The GDP percapita per day averaged from Pennsylvania, New York andNew Jersey is USD 160.89. Using a linear recovery func-tion from 20 million people affected on Monday, 29 Oc-tober, to 2 million on Wednesday, 7 November, losses areabout USD 3.22 billion for the first day, and USD 17.7 bil-lion for the first ten days of power outages. Using the currentstatistics of power outages as portrayed in Fig.12 and dis-cussed in Sect.5.2, the value of power outage disruption isUSD 16.3 billion.
5.4.2 Estimation of economic losses due to businessinterruption (I-O modeling)
The rapid assessment of indirect losses requires robust meth-ods that work with limited and incomplete data. At the sametime the methods must allow for comparisons with previ-ous disastrous events, occurring in countries of differentsizes, development levels and economic power. Given thoserequirements, a methodology was chosen based on input-output data available from the national statistical offices ofeach state. Indirect economic losses are usually quantified interms of production losses in the affected region with the helpof input-output models (Okuyama, 2007). Such an approachis based on a national account’s input-output matrix whichrepresents monetary transaction flows between the variousindustry sectors. Based on an inverse matrix according toLeontief (1986), the output loss resulting from the interrup-tion of a specific sector as well as its indirect effects is quan-tified by considering the inter-industrial linkages and depen-dencies.
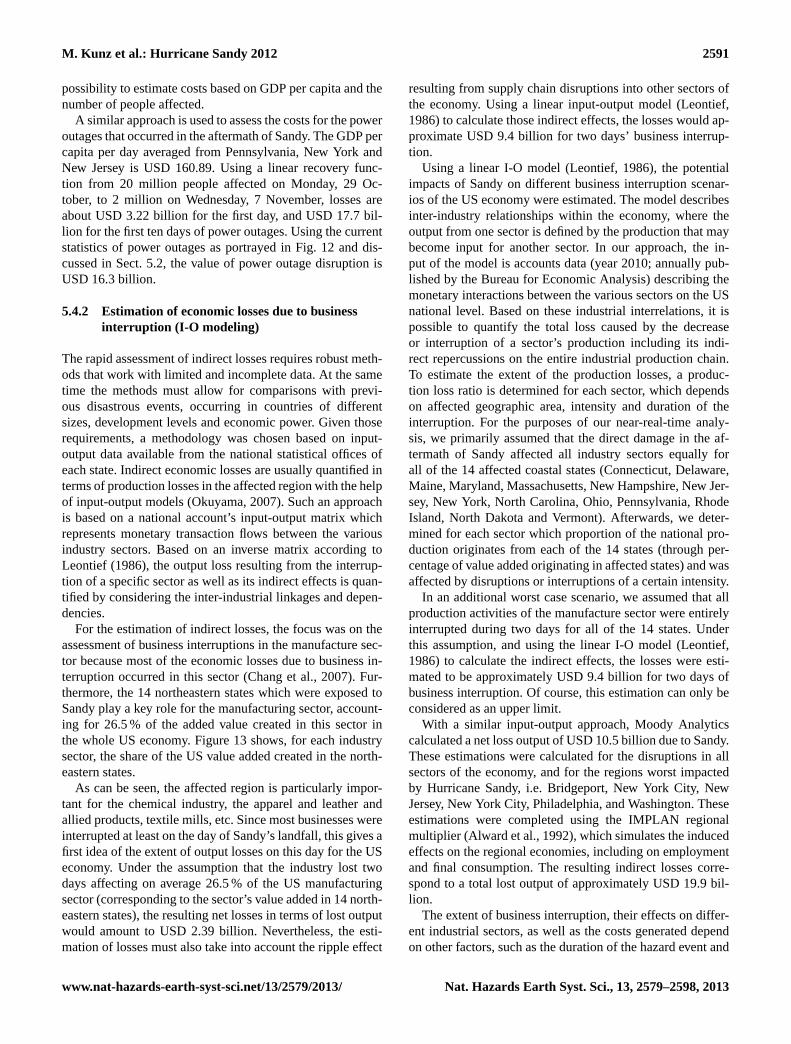
For the estimation of indirect losses, the focus was on theassessment of business interruptions in the manufacture sec-tor because most of the economic losses due to business in-terruption occurred in this sector (Chang et al., 2007). Fur-thermore, the 14 northeastern states which were exposed toSandy play a key role for the manufacturing sector, account-ing for 26.5 % of the added value created in this sector inthe whole US economy. Figure13 shows, for each industrysector, the share of the US value added created in the north-eastern states.
As can be seen, the affected region is particularly impor-tant for the chemical industry, the apparel and leather andallied products, textile mills, etc. Since most businesses wereinterrupted at least on the day of Sandy’s landfall, this gives afirst idea of the extent of output losses on this day for the USeconomy. Under the assumption that the industry lost twodays affecting on average 26.5 % of the US manufacturingsector (corresponding to the sector’s value added in 14 north-eastern states), the resulting net losses in terms of lost outputwould amount to USD 2.39 billion. Nevertheless, the esti-mation of losses must also take into account the ripple effect
resulting from supply chain disruptions into other sectors ofthe economy. Using a linear input-output model (Leontief,1986) to calculate those indirect effects, the losses would ap-proximate USD 9.4 billion for two days’ business interrup-tion.
Using a linear I-O model (Leontief, 1986), the potentialimpacts of Sandy on different business interruption scenar-ios of the US economy were estimated. The model describesinter-industry relationships within the economy, where theoutput from one sector is defined by the production that maybecome input for another sector. In our approach, the in-put of the model is accounts data (year 2010; annually pub-lished by the Bureau for Economic Analysis) describing themonetary interactions between the various sectors on the USnational level. Based on these industrial interrelations, it ispossible to quantify the total loss caused by the decreaseor interruption of a sector’s production including its indi-rect repercussions on the entire industrial production chain.To estimate the extent of the production losses, a produc-tion loss ratio is determined for each sector, which dependson affected geographic area, intensity and duration of theinterruption. For the purposes of our near-real-time analy-sis, we primarily assumed that the direct damage in the af-termath of Sandy affected all industry sectors equally forall of the 14 affected coastal states (Connecticut, Delaware,Maine, Maryland, Massachusetts, New Hampshire, New Jer-sey, New York, North Carolina, Ohio, Pennsylvania, RhodeIsland, North Dakota and Vermont). Afterwards, we deter-mined for each sector which proportion of the national pro-duction originates from each of the 14 states (through per-centage of value added originating in affected states) and wasaffected by disruptions or interruptions of a certain intensity.
In an additional worst case scenario, we assumed that allproduction activities of the manufacture sector were entirelyinterrupted during two days for all of the 14 states. Underthis assumption, and using the linear I-O model (Leontief,1986) to calculate the indirect effects, the losses were esti-mated to be approximately USD 9.4 billion for two days ofbusiness interruption. Of course, this estimation can only beconsidered as an upper limit.
With a similar input-output approach, Moody Analyticscalculated a net loss output of USD 10.5 billion due to Sandy.These estimations were calculated for the disruptions in allsectors of the economy, and for the regions worst impactedby Hurricane Sandy, i.e. Bridgeport, New York City, NewJersey, New York City, Philadelphia, and Washington. Theseestimations were completed using the IMPLAN regionalmultiplier (Alward et al., 1992), which simulates the inducedeffects on the regional economies, including on employmentand final consumption. The resulting indirect losses corre-spond to a total lost output of approximately USD 19.9 bil-lion.
The extent of business interruption, their effects on differ-ent industrial sectors, as well as the costs generated dependon other factors, such as the duration of the hazard event and
www.nat-hazards-earth-syst-sci.net/13/2579/2013/ Nat. Hazards Earth Syst. Sci., 13, 2579–2598, 2013
2592 M. Kunz et al.: Hurricane Sandy 2012
Fig. 12. Economic loss from power outages.
Fig. 13. Share of sectors’ value added in affected States compared to the US economy.
37
Fig. 13. Share of sectors’ value added in affected states compared to the US economy.
the recovery time (Webb et al., 2002), as well as the vul-nerability of the industry sector. In order to take these fac-tors into account, a simple input-output analysis coupled withan assessment of the industrial vulnerability was used whichtested different scenarios of recovery and business interrup-tion duration. The vulnerability of the affected industry de-termines the capacity of businesses to cope with the impactsof disasters and interruption and to restart their businessesafter a disaster, and therefore influences indirect losses. Asdifferent industrial sectors vary greatly with respect to theircharacteristics (such as dependence on critical infrastructureor further industrial sectors, labor dependence etc.), the vul-nerability of industrial production systems strongly dependson the type of industry affected.
In order to assess the sector-specific vulnerability, anindicator-based approach was used for its transparency andoperational representation of vulnerability (Cutter et al.,2003). Additionally, due to their hierarchical structure, in-dicator approaches are suitable for (near) real-time disasterassessments as they enable the efficient update of informa-tion as revisions of information only in the affected branchesare required (as opposed to a complete update). Moreover,newly available information can be added in terms of furtherbranching (e.g., higher level of detail by the integration of in-formation about specific production sights). For the generic
assessments in the early phases after the incident, consider-ations remained on the sectoral level. Production downtimemainly occurs due to the damage of production equipment,the obstruction of workers, the interruption of critical infras-tructure or the disturbance of supply chain processes (e.g.,delivery or distribution processes). Therefore each sector’sspecific vulnerability against indirect disaster effects can bedetermined with the help of vulnerability indicators describ-ing its degree of dependency on capital, on labor, critical in-frastructure systems and its connectedness in supply chains(Merz, 2011). The sector specific vulnerability was calcu-lated based on 17 indicators. These were based on national-level data from 2011, including input-output tables and otherdata obtained from the US Bureau of Economic Analysis.
Figure14 shows the industrial vulnerability against indi-rect disaster effects at the state level. It can be seen on themap that from the northeastern states, the most vulnerablestates are Maine, Virginia and North Carolina. It can there-fore be assumed that these states are the most vulnerableagainst business interruption. However, the extent of lossesalso depends on the direct damages caused by the storm inaffected states. (Note that vulnerability is not the only di-mension of risk; further components determining the actuallosses refer to the extent and severity of the hazard itself.)
Nat. Hazards Earth Syst. Sci., 13, 2579–2598, 2013 www.nat-hazards-earth-syst-sci.net/13/2579/2013/

M. Kunz et al.: Hurricane Sandy 2012 2593
Fig. 14. Industrial vulnerability of Eastern U.S. against indirect disaster impacts (To obtain those results, the
sector specific vulnerability was regionalised by considering the industrial density of regions of the different
sectors (obtained through the value added). The relative vulnerability index scaled from 0 to 1, 0 and 1 being
respectively the least vulnerable and most vulnerable state against indirect effects of disasters on the industry).
38
Fig. 14. Industrial vulnerability of the eastern US against indirectdisaster impacts (to obtain those results, the sector specific vulner-ability was regionalized by considering the industrial density of re-gions of the different sectors (obtained through the value added).The relative vulnerability index scaled from 0 to 1, 0 and 1 beingrespectively the least vulnerable and most vulnerable state againstindirect effects of disasters on the industry).
Vulnerabilities are a starting point to assess the indi-rect economic losses, particularly the longer term aspects.Here an approach quantifying production losses is combinedwith input-output approaches (Okuyama, 2007) with recov-ery functions that have been determined according to a sec-tor’s vulnerability. Using a linear input-output model (Leon-tief, 1986), the potential impacts of Sandy were estimated ondifferent business interruption scenarios of the US economy.As the uncertainties, particularly in the immediate aftermathof the event, are fundamental (i.e., hard to quantify), scenar-ios were used, which have been proven useful as a meansto account for the severe uncertainties (Comes et al., 2011).To construct the scenarios in a systematic way, the indirectcosts were split up into several sub-scenarios considering theoverall disruptiondue to the event (across all sectors), theimpact of power blackoutsand the impact of disruptions ofthe transportation system.The overall impact depends to alarge degree on the assumptions about the disaster recov-ery. As mentioned in the preceding chapter, assuming thatthe disruptions of the overall manufacturing sector lasted fortwo days in the 14 states affected by Sandy, the costs wouldapproximate USD 9.4 billion for the two days of the storm.However, the time needed for the industrial sector to recovermust be considered, which extends the time for utilities to
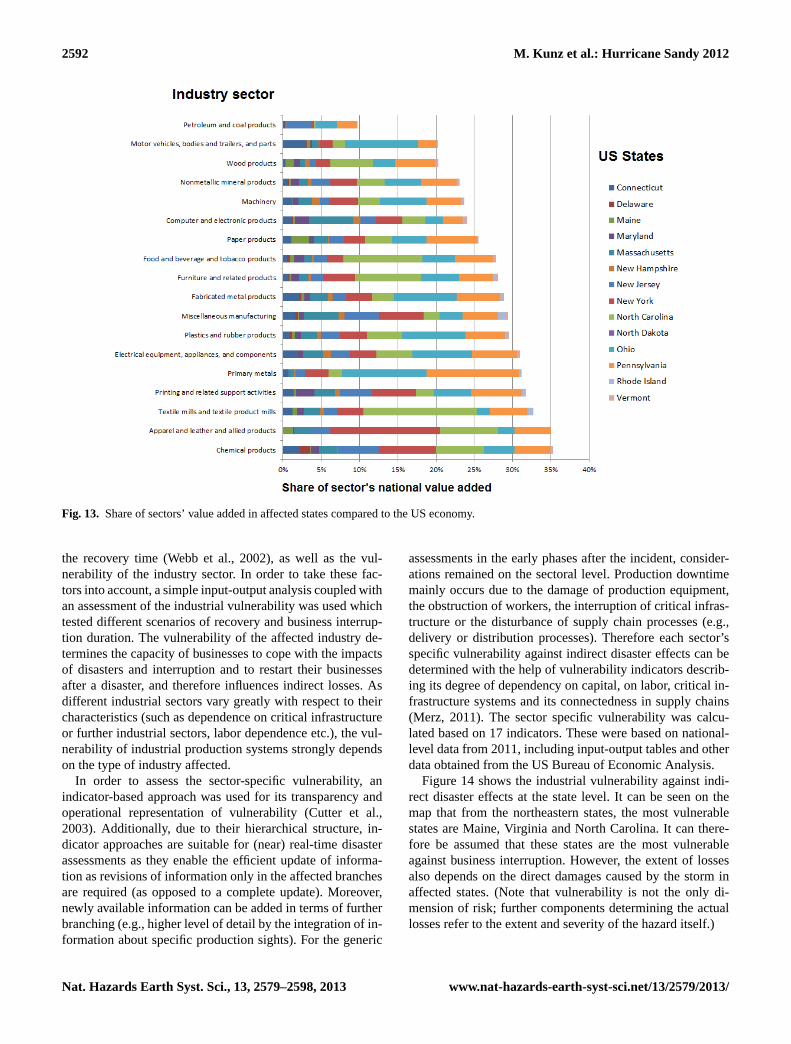
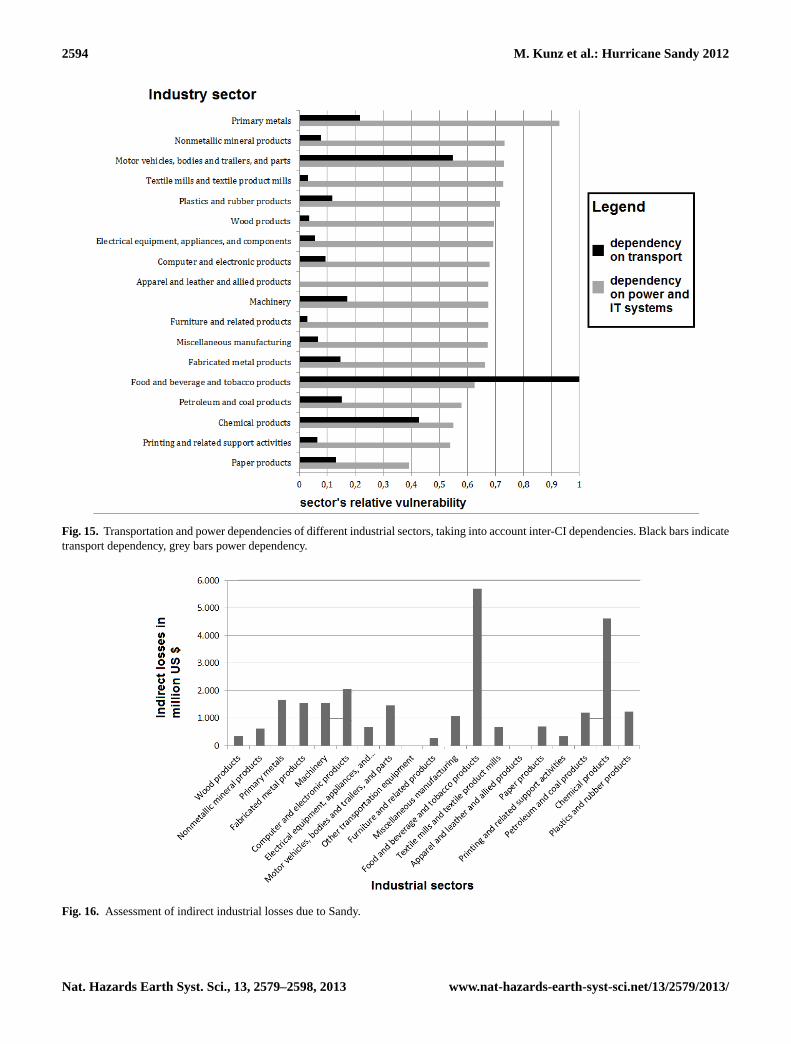
recover. The capacity of businesses to restart their activityduring this recovery period highly depends on the vulnera-bility of the sectors. Following this rationale, an ensembleof recovery scenarios (comparable to meteorological ensem-bles) were calculated by using exponential potential recoveryfunctions with different curvatures (Cimellaro et al., 2010).Depending on the recovery scenario, the indirect costs es-timated by the model for 10 days following the storm rangefrom USD 1.4 to 5.6 billion. Assuming that the closure of thestock exchanges and offices affected 30 % of the finance sec-tor US-wide on the two days of the storm, the indirect costson the economy would approximate USD 9.8 billion. Addingthe estimated partial disruption losses during the recovery pe-riod to the losses of the two days of total shutdown for allmanufacturing sectors, the total business interruption lossesare estimated between USD 10.8 and 15.5 billion. Figure16illustrates the differences in expected losses for varying in-dustrial sectors (again, differences may arise due to varyingvulnerabilities and exposure levels).
5.5 Observing impacts using social media
Using data from social media provided by eyewitnessesseems promising; in combination with data from conven-tional sensors, it provides a more comprehensive picture ofthe local situation only seconds after an event occurs. Thismay be an important source of information especially for re-gions with low infrastructure, where other information of theimpact of a catastrophe are scarce. For Hurricane Sandy, wetested the applicability and the potential use of social media.
To get up-to-date information on the characteristics andthe impact of the hurricane, data was collected from thetweets of the micro-blogging service Twitter (see Fig.17).During Hurricane Sandy, 5 328 029 tweets were collectedand stored in near-real time from 29 October to 2 Novem-ber in our database. These messages were filtered by key-words likehurricane, flood, damage, victimsor power out-age. About 3 % of the tweets (154 890) can be localized bygeo-coordinates and be used for further information extrac-tion.
The tweets provide detailed and very local informationabout Sandy’s impact such as “sandy floods #fdr 63rd street”,“Flooding on Pitney Rd is just from a storm drain”, or “Somemay not have power but we all have phones” (see examples inTable5). Besides announcements of general damage, the ex-amples give information about flooding (see Sect. 3.3.2) andpower outages (Sect. 5.2) at particular locations of the Twit-ter users. Reports of flooding from eyewitnesses are often theonly information source, since data acquisition of floodingin urban areas is difficult as usually no appropriate sensorsare installed outside of traditional river channels and watersources.
Furthermore, the spatial and temporal distribution oftweets reporting on power outages may indicate areas andtime periods with impaired or unimpaired power supply.
www.nat-hazards-earth-syst-sci.net/13/2579/2013/ Nat. Hazards Earth Syst. Sci., 13, 2579–2598, 2013
2594 M. Kunz et al.: Hurricane Sandy 2012
Fig. 15. Transportation and power dependencies of different industrial sectors, taking into account inter-CI
dependencies. Black bars indicate transport dependency, grey bars power dependency.
Fig. 16. Assessment of indirect industrial losses due to Sandy.
39
Fig. 15. Transportation and power dependencies of different industrial sectors, taking into account inter-CI dependencies. Black bars indicatetransport dependency, grey bars power dependency.
Fig. 15. Transportation and power dependencies of different industrial sectors, taking into account inter-CI
dependencies. Black bars indicate transport dependency, grey bars power dependency.
Fig. 16. Assessment of indirect industrial losses due to Sandy.
39
Fig. 16. Assessment of indirect industrial losses due to Sandy.
Nat. Hazards Earth Syst. Sci., 13, 2579–2598, 2013 www.nat-hazards-earth-syst-sci.net/13/2579/2013/

M. Kunz et al.: Hurricane Sandy 2012 2595
Fig. 17. Density map of the located tweets with the keywordhurricane for a timeline of six days, from 28 October to 2 November 2012(dates indicated in the figures). The density refers to the number of tweets per 0.05◦ grid cell (approximately 5× 5 km2).
Table 5. Examples of tweets sent during Hurricane Sandy on 30 Oct. 2012; time is in UTC.
Topic User Time Message
Damage Lamar Liffridge 09:19:52 Wakes up, sees power and can still on, and no damage, yes #sandyKirk Moore 13:50:28 Severe damage on South Green Street Tuckerton Beach area, boats jumbled
in marinashttp://t.co/jhLGBp2mFlood ELCIRCUITOTV 03:34:20 #sandy floods #fdr 63rd streethttp://t.co/10K0clpi
Bill Speakman 09:26:27 Flooding on Pitney Rd is just from a storm drain. The Conestoga River stillhas a couple of feet before reaching the bank.
Power outage/ John Powell 00:02:46 I have officially lost power at my home in Glenolden, PAinfrastructure Preston Kilgore 06:20:27 Some may not have power but we all have phones #connected
Lis Kalogris 13:02:38 Here in the EOB Garden we have lost power but so far no visible majordamage. Worried about our many tulip poplars. All of you, be safe. XO
Absence of any tweets or a significant decrease of tweets,respectively, may indicate presumably breakdown or impair-ment of supply networks. Additionally, the spatial and tem-poral distribution of tweets allow for inferring intensity andimpact of the event in a larger area. An example of the largepotential of tweets for spatio-temporal investigations of tech-nical or natural hazards is given by Fig.17 that shows allgeolocated tweets during Hurricane Sandy with the keywordhurricane. The time series in Fig.4 show that the numberof tweets corresponds well with maximum wind speeds andstorm surges.
6 Conclusions
In this paper, we presented a multidisciplinary analysis of thecauses, hazardous effects, and consequences associated withHurricane Sandy. This examination was done in an interdis-ciplinary approach by collecting and compiling scattered anddistributed information from available databases and sourcesvia the Internet, by application of own methodologies andsimple input-output models, and by expert knowledge.
Hurricane Sandy was an extraordinary event for the US inparticular due the simultaneous occurrence of specific mete-orological features leading to an unusual storm’s track, themultihazard nature that further amplified intensities, and thecascades of adverse events in the aftermath that aggravatedthe direct impacts significantly. The track more or less fromthe south to the north was mainly the result of a block-ing by an extended high pressure system. Thus, Sandy hit
www.nat-hazards-earth-syst-sci.net/13/2579/2013/ Nat. Hazards Earth Syst. Sci., 13, 2579–2598, 2013

2596 M. Kunz et al.: Hurricane Sandy 2012
a region in the US that has rarely been affected by hurri-canes in the past but is densely populated and very vulner-able to such an unexpected event. Since recording, Sandywas only the third hurricane to have made landfall in NewJersey. Most unusual was the very large spatial extent of upto 1700 km, primarily a result of the interaction of the hur-ricane with an upper-tropospheric trough. This interactionled to a rapid extra-tropical transition shortly before landfalland further increased the strength of the storm in terms ofwind speed and precipitation. Significant storm surges due tohigh wind speeds towards the eastern US coast occurred si-multaneously with high astronomical tides. This caused totalrecord-breaking storm surges along the US Mid-Atlantic andNew England coastlines.
Along the track from the Caribbean up to the eastern US,one of the poorest (Haiti) and one of the richest countries(US) were devastated with different – though characteristic –patterns of impact and loss. Apart from fatalities (about 80 inHaiti and Cuba; 142 in the US) and direct economic losses(about USD 4.2 billion in the Caribbean; 78 to 97 billion inthe US), the rich and poor were struck by cascades of adverseevents that aggravated the direct impacts significantly.
Haiti, only slowly recovering from the 12 January 2010earthquake that destroyed 121 % of Haiti’s (nominal) GDPand killed more than 100 000 people, lost another 4.5 %GDP. Crop destruction triggered danger of malnutrition for450 000 to 1 500 000 people. Many of the 350 000 peoplestill living in temporary shelters and camps suffered fromdestruction of those shelters. In addition, many cholera treat-ment centers, other medical facilities and schools were de-stroyed or hampered in functioning. An increase in cholerainfected persons is observed although current numbers seemto indicate that no major cholera outbreak increase will fol-low.
The US suffered from the high direct losses to residentialand industrial buildings but also from power outages rangingbetween several days and two weeks for individual house-holds, subsequent supply problems with gas, and business in-terruption (particularly in transport-dependent industry sec-tors). Cold weather imposing harsh conditions on people whodepend on electric heating and the uncontrolled electric firesfed by heavy storms were additional aggravating factors. Therole of the proximity of Sandy to the US presidential elec-tions remains a speculative issue until researched in detail.
The key scientific question addressed in this paper is towhat extent, with which databases and which models can thelosses and impacts of a catastrophic event like Sandy be ex-tracted and predicted several hours after the event. Our work-ing hypothesis is that the potential for near-real-time analysishas changed significantly with the Internet and the social me-dia that generate huge amounts of information from the veryonset of a disaster. Utilizing these resources in combinationwith analytic tools developed by CEDIM and historic lossand event databases provides a framework for near-real-timeanalysis and predictions.
Whereas the first CEDIM report was published only sev-eral hours after Sandy made landfall on the US east coast,the second report with a focus on damage estimates for theaffected states of Pennsylvania, New Jersey and New Yorkand comparisons to past events was published by 7 Novem-ber 2012. Risk modelers such as EQECAT and other pub-lished earlier estimates, but they underestimated the lossesby a factor of 2 to 3. There is obviously a trade off betweenthe value of loss information and uncertainty, which is hard toquantify. Early information is in high demand but also highlyuncertain. The determination of the trade-off points is obvi-ously user-dependent and quantification of uncertainties innear-real-time loss estimation a high-profile topic. Overall,our work on Sandy shows that the forensic disaster analysisis possible and useful directly after the event occurred. Withour new approach of FDA we fill the gap between the firstand rough damage estimations and events descriptions per-formed by insurance companies and the FORIN concept ofIRDR.
Tracking power outages and estimating downtimes re-quires a combination of simple models and crowd-sourcingtools, which should be brought closer together than was man-aged during Sandy. The distribution of losses to different sec-tors of the economy is done with a simple input-output modeland, given the data sparseness at an early stage of the analy-sis, is a valid methodology. In this manner, fast assessment ofindirect losses due to business disruptions could be achieved.First estimates were already released prior to Sandy’s land-fall. Due to the ease of adaptation of all models, the anal-yses were refined in the aftermath of the event as more in-formation was published (e.g., about the most severely af-fected areas and the extent and duration of power blackouts).An equally simple model allows defining an industrial vul-nerability parameter for states (and potentially other admin-istrative units) that immediately indicates where aggravat-ing impacts are to be expected even if the state is less af-fected in terms of hazard and current loss numbers. The es-timates provided here do, however, not consider all indirectcosts: beyond output losses all indirect losses across global-ized supply networks should be considered. Additionally, thedynamic evolution of the losses (including, e.g., price effects)will be subject of our future investigations.
Although our working hypothesis was essentially con-firmed, it has been learnt that linking methods and modelshas more potential than are currently exploited, and in ad-dition, that more systematic utilization of historic databasesmight hold the key for uncertainty estimation in direct andindirect loss predictions.
Acknowledgements.The Center for Disaster Management and RiskReduction Technology (CEDIM) is an interdisciplinary researchcenter in the field of disaster management funded by HelmholtzCentre Potsdam – German Research Centre for Geoscience (GFZ),and Karlsruhe Institute of Technology (KIT). We acknowledgesupport by Deutsche Forschungsgemeinschaft and Open Access
Nat. Hazards Earth Syst. Sci., 13, 2579–2598, 2013 www.nat-hazards-earth-syst-sci.net/13/2579/2013/
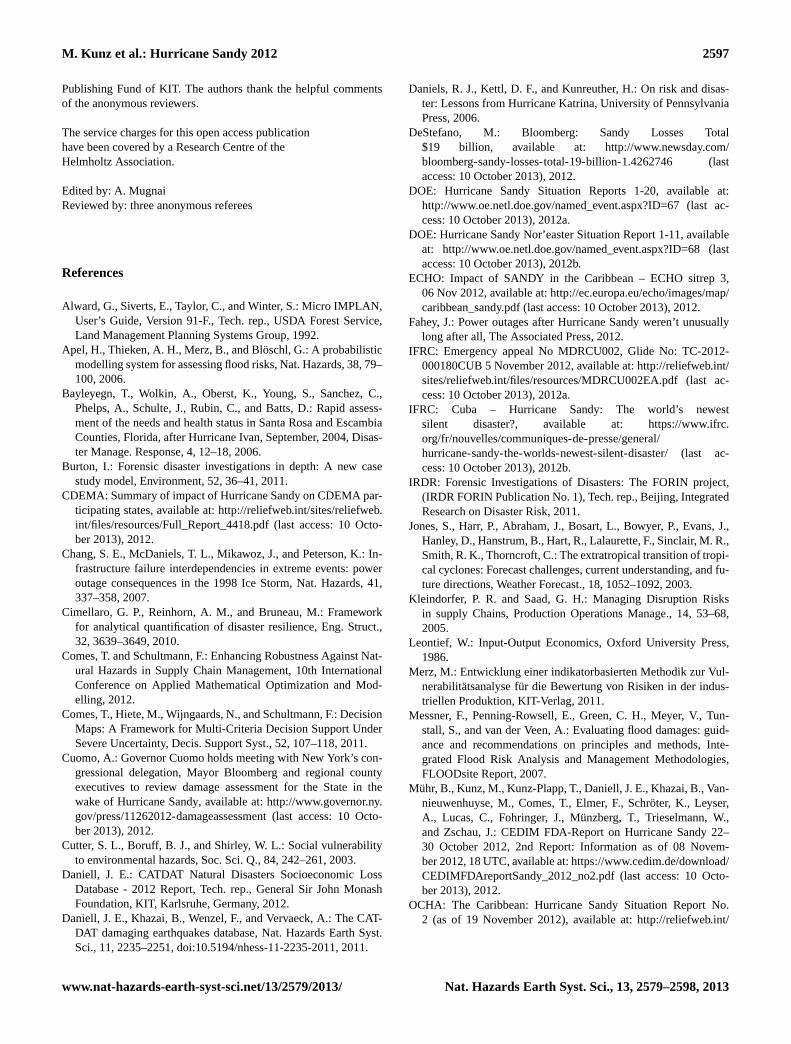
M. Kunz et al.: Hurricane Sandy 2012 2597
Publishing Fund of KIT. The authors thank the helpful commentsof the anonymous reviewers.
The service charges for this open access publicationhave been covered by a Research Centre of theHelmholtz Association.
Edited by: A. MugnaiReviewed by: three anonymous referees
References
Alward, G., Siverts, E., Taylor, C., and Winter, S.: Micro IMPLAN,User’s Guide, Version 91-F., Tech. rep., USDA Forest Service,Land Management Planning Systems Group, 1992.
Apel, H., Thieken, A. H., Merz, B., and Blöschl, G.: A probabilisticmodelling system for assessing flood risks, Nat. Hazards, 38, 79–100, 2006.
Bayleyegn, T., Wolkin, A., Oberst, K., Young, S., Sanchez, C.,Phelps, A., Schulte, J., Rubin, C., and Batts, D.: Rapid assess-ment of the needs and health status in Santa Rosa and EscambiaCounties, Florida, after Hurricane Ivan, September, 2004, Disas-ter Manage. Response, 4, 12–18, 2006.
Burton, I.: Forensic disaster investigations in depth: A new casestudy model, Environment, 52, 36–41, 2011.
CDEMA: Summary of impact of Hurricane Sandy on CDEMA par-ticipating states, available at:http://reliefweb.int/sites/reliefweb.int/files/resources/Full_Report_4418.pdf(last access: 10 Octo-ber 2013), 2012.
Chang, S. E., McDaniels, T. L., Mikawoz, J., and Peterson, K.: In-frastructure failure interdependencies in extreme events: poweroutage consequences in the 1998 Ice Storm, Nat. Hazards, 41,337–358, 2007.
Cimellaro, G. P., Reinhorn, A. M., and Bruneau, M.: Frameworkfor analytical quantification of disaster resilience, Eng. Struct.,32, 3639–3649, 2010.
Comes, T. and Schultmann, F.: Enhancing Robustness Against Nat-ural Hazards in Supply Chain Management, 10th InternationalConference on Applied Mathematical Optimization and Mod-elling, 2012.
Comes, T., Hiete, M., Wijngaards, N., and Schultmann, F.: DecisionMaps: A Framework for Multi-Criteria Decision Support UnderSevere Uncertainty, Decis. Support Syst., 52, 107–118, 2011.
Cuomo, A.: Governor Cuomo holds meeting with New York’s con-gressional delegation, Mayor Bloomberg and regional countyexecutives to review damage assessment for the State in thewake of Hurricane Sandy, available at:http://www.governor.ny.gov/press/11262012-damageassessment(last access: 10 Octo-ber 2013), 2012.
Cutter, S. L., Boruff, B. J., and Shirley, W. L.: Social vulnerabilityto environmental hazards, Soc. Sci. Q., 84, 242–261, 2003.
Daniell, J. E.: CATDAT Natural Disasters Socioeconomic LossDatabase - 2012 Report, Tech. rep., General Sir John MonashFoundation, KIT, Karlsruhe, Germany, 2012.
Daniell, J. E., Khazai, B., Wenzel, F., and Vervaeck, A.: The CAT-DAT damaging earthquakes database, Nat. Hazards Earth Syst.Sci., 11, 2235–2251, doi:10.5194/nhess-11-2235-2011, 2011.
Daniels, R. J., Kettl, D. F., and Kunreuther, H.: On risk and disas-ter: Lessons from Hurricane Katrina, University of PennsylvaniaPress, 2006.
DeStefano, M.: Bloomberg: Sandy Losses Total$19 billion, available at: http://www.newsday.com/bloomberg-sandy-losses-total-19-billion-1.4262746 (lastaccess: 10 October 2013), 2012.
DOE: Hurricane Sandy Situation Reports 1-20, available at:http://www.oe.netl.doe.gov/named_event.aspx?ID=67(last ac-cess: 10 October 2013), 2012a.
DOE: Hurricane Sandy Nor’easter Situation Report 1-11, availableat: http://www.oe.netl.doe.gov/named_event.aspx?ID=68(lastaccess: 10 October 2013), 2012b.
ECHO: Impact of SANDY in the Caribbean – ECHO sitrep 3,06 Nov 2012, available at:http://ec.europa.eu/echo/images/map/caribbean_sandy.pdf(last access: 10 October 2013), 2012.
Fahey, J.: Power outages after Hurricane Sandy weren’t unusuallylong after all, The Associated Press, 2012.
IFRC: Emergency appeal No MDRCU002, Glide No: TC-2012-000180CUB 5 November 2012, available at:http://reliefweb.int/sites/reliefweb.int/files/resources/MDRCU002EA.pdf(last ac-cess: 10 October 2013), 2012a.
IFRC: Cuba – Hurricane Sandy: The world’s newestsilent disaster?, available at: https://www.ifrc.org/fr/nouvelles/communiques-de-presse/general/hurricane-sandy-the-worlds-newest-silent-disaster/(last ac-cess: 10 October 2013), 2012b.
IRDR: Forensic Investigations of Disasters: The FORIN project,(IRDR FORIN Publication No. 1), Tech. rep., Beijing, IntegratedResearch on Disaster Risk, 2011.
Jones, S., Harr, P., Abraham, J., Bosart, L., Bowyer, P., Evans, J.,Hanley, D., Hanstrum, B., Hart, R., Lalaurette, F., Sinclair, M. R.,Smith, R. K., Thorncroft, C.: The extratropical transition of tropi-cal cyclones: Forecast challenges, current understanding, and fu-ture directions, Weather Forecast., 18, 1052–1092, 2003.
Kleindorfer, P. R. and Saad, G. H.: Managing Disruption Risksin supply Chains, Production Operations Manage., 14, 53–68,2005.
Leontief, W.: Input-Output Economics, Oxford University Press,1986.
Merz, M.: Entwicklung einer indikatorbasierten Methodik zur Vul-nerabilitätsanalyse für die Bewertung von Risiken in der indus-triellen Produktion, KIT-Verlag, 2011.
Messner, F., Penning-Rowsell, E., Green, C. H., Meyer, V., Tun-stall, S., and van der Veen, A.: Evaluating flood damages: guid-ance and recommendations on principles and methods, Inte-grated Flood Risk Analysis and Management Methodologies,FLOODsite Report, 2007.
Mühr, B., Kunz, M., Kunz-Plapp, T., Daniell, J. E., Khazai, B., Van-nieuwenhuyse, M., Comes, T., Elmer, F., Schröter, K., Leyser,A., Lucas, C., Fohringer, J., Münzberg, T., Trieselmann, W.,and Zschau, J.: CEDIM FDA-Report on Hurricane Sandy 22–30 October 2012, 2nd Report: Information as of 08 Novem-ber 2012, 18 UTC, available at:https://www.cedim.de/download/CEDIMFDAreportSandy_2012_no2.pdf(last access: 10 Octo-ber 2013), 2012.
OCHA: The Caribbean: Hurricane Sandy Situation Report No.2 (as of 19 November 2012), available at:http://reliefweb.int/
www.nat-hazards-earth-syst-sci.net/13/2579/2013/ Nat. Hazards Earth Syst. Sci., 13, 2579–2598, 2013

2598 M. Kunz et al.: Hurricane Sandy 2012
sites/reliefweb.int/files/resources/Situation_Report_351.pdf(lastaccess: 10 October 2013), 2012a.
OCHA: Overview Map 31 Oct 2012: Impact of Tropical StormSandy, available at:http://reliefweb.int/sites/reliefweb.int/files/resources/Sandymap.pdf(last access: 10 October 2013), 2012b.
OCHA: UN Relief Agency Estimates 1.8 Million HaveBeen Affected by Hurricane Sandy, available at:http://reliefweb.int/report/haiti/un-relief-agency-estimates(last access: 10 October 2013) 2012c.
OCHA: Haiti: Hurricane Sandy Situation Report No. 04 (asof 9/11/2012), available at:http://reliefweb.int/report/haiti/haiti-hurricane-sandy-situation-report-no-04-09112012(lastaccess: 10 October 2013), 2012d.
Okuyama, Y.: Economic Modeling for Disaster Impact Analysis:Past, Present and Future, Economic Syst. Res., 19, 115–124,2007.
Penning-Rowsell, E., Johnson, C., Tunstall, S., Tapsell, S., Morris,J., Chatterton, J., Coker, A., and Green, C.: The Benefits of floodand coastal defence: techniques and data for 2003, Flood Haz-ard Research Center, Middlesex University, Middlesex Univer-sity Press, 2003.
Platz, E., Cooper, H. P., Silvestri, S., and Siebert, C. F.: The impactof a Series of Hurricanes on the Visits to Two Central FloridaEmergency Departments, J. Emerg. Med., 33, 39–46, 2007.
Rinaldi, S. M., Peerenboom, J. P., and Kelly, T. K.: Identifying, un-derstanding, and analysing critical infrastructure interdependen-cies, Control Systems, IEEE, 21, 11–25, 2001.
Rose, A., Benavides, J., Chang, S. E., Szczesniak, P., and Lim, D.:The Regional Economic Impact of an Earthquake: Direct and In-direct Effects of Electricity Lifeline Disruptions, J. Reg. Sci., 37,437–458, 1997.
Swiss Re: Sigma Report No 2/2006: Natural catastrophes and man-made disasters in 2006, Tech. rep., Swiss Reinsurance Company,2006.
Tierney, K. J.: Business Vulnerability and Disruption: Data from the1993 Midwest Floods (Draft), Paper presented at the 41st NorthAmerican Meetings of the Regional Science Association Inter-national, Niagara Falls, Ontario, available at:http://dspace.udel.edu:8080/dspace/bitstream/19716/596/1/PP213.pdf(last access:10 October 2013), 1994.
Trapasso, C.: Families return to Breezy Point after devas-tating fire during Hurricane Sandy destroys 111 houses,NY Daily News article, 1st November 2012, availableat: http://www.nydailynews.com/new-york/queens/(last access:10 October 2013), 2012.
USGS: Water-resources data for the United States, Water Year2011: U.S. Geological Survey Water-Data Report WDR-US-2011, available at:http://wdr.water.usgs.gov/wy2011/pdfs/01638500.2011.pdf(last access: 1 March 2013), 2012.
Webb, G. R., Tierney, K. J., and Dalhamer, J. M.: Predicting long-term business recoverey from disaster: a comparison of the LomaPrieta earthquake and Hurricane Andrew, Environ. Hazards, 4,45–58, 2002.
Wenzel, F., Daniell, J. E., Khazai, B., Mühr, B., Kunz-Plapp, T.,Markus, M., and Vervaeck, A.: Real-time forensic disaster anal-ysis, Geophys. Res. Abstr., Vol. 14, EGU2012-1328, EGU Gen-eral Assembly 2012, 22–27 April, Vienna, Austria, 2012.
Wood, E. F. and Rodriguez-Iturbe, I.: A Baysian approach to ana-lyzing uncertainty among flood frequency models, Water Resour.Res., 11, 839–843, 1975.
Zimmerman, R. and Restrepo, C. E.: The next step: quantifying in-frastructure interdependencies to improve security, Int. J Crit. In-frastruct., 2, 215–230, 2006.
Zimmermann, R., Lave, L., Restrepo, C., Dooskin, N., Hartwell, R.,Miller, J., Remington, W., Simonoff, J., and Schuler, R.: Elec-tricity Case: Economic Cost Estimation Factors for EconomicAssessment of Terrorist Attacks, New York University, WagnerGraduate School, Institute of Civil Infrastructure Systems, 2005.
Nat. Hazards Earth Syst. Sci., 13, 2579–2598, 2013 www.nat-hazards-earth-syst-sci.net/13/2579/2013/
Related Documents