Investigation of shroud tension on sailing yacht aerodynamics using full-scale real-time pressure and sail shape measurements F Bergsma, University of Twente, Netherlands D Motta, University of Auckland, New Zealand D J Le Pelley, University of Auckland, New Zealand P J Richards, University of Auckland, New Zealand R G J Flay, University of Auckland, New Zealand ABSTRACT The steady and unsteady aerodynamic behaviour of a sailing yacht is investigated in this research by carrying outfull-scale tests on a Stewart 34 class yacht. The aerodynamic forces developed by the yacht in real-time are derived from knowledge of the differential pressures acting across the sails, and the sail shape. Experimental results are compared with the numerical results obtained from a dynamic velocity prediction program and good agreement was found. 1. INTRODUCTION Sail aerodynamics is an active field of research in the scientific community. In the past century several methods were developed for a better understanding of the behaviour of sails. Some of the topics of current interest are knowledge of the flying sail shape, determination of the pressure distribution across the sails, and determination of the aerodynamic forces developed by sails. These studies can be carried out by different methods, the most common being numerical methods, wind tunnel testing and full scale testing. The first pressure measurements are dated around the beginning of 1900. More recent important benchmarks in this field were obtained by Gentry (1971) and Wilkinson (1989). In the last 10 years pressure measurements have become a common field of research. Puddu et al.(2006) investigated the full-scale static pressureson the mainsail of a Tornado class catamaran by using hard-wired small data loggers connected to regularly spaced pressure taps along the sail. Flay & Millar (2006) considered important experimental considerations concerning pressure measurements on sails. Viola & Flay (2009) describe results from testing a range of asymmetric spinnakers at 1/15 th scale using a multi-channel pressure system built in-house. They also used a slightly modified “field” version of the same pressure system for a full-scale on-the-water sail pressure investigation (Viola and Flay 2010) with considerable success. Recording the flying sail shape has always been a rather difficult task to accomplish, although it has been done by well funded America‟s Cup syndicates, for example. Several different sail shape recording systems (e.g. cameras at the mast top, cameras on the deck, laser scanning systems)have been developed over the years (Freides 1991; Graves et al. 2008; Le Pelley and Modral 2008) and are now relatively common on high performance racing yachts. Aerodynamic force determination is an important task for the yacht and sail designer, as well as the researcher, as it allows one to predict the performance of a yacht in order to improve the design or to make it more competitive through optimum trimming. Nowadays force predictionsare commonly made through velocity prediction programs. In the wind tunnel, forces are obtained by mounting the models on a force balance (Flay 1996; Fossati et al. 2006). In addition, research effort in recent years has been aimed at deducing the aerodynamic forces in full-scale and in real-time, both in the wind tunnel and on the water. The use of dynamometers and load cells for determining forces has been explored in full scale by Masuyama (2009). In 2011 Augier et al. (2011) conducted a full-scale validation experiment for their “fluid-structure-interaction” numerical model in which loads on the rig were computed. A successful method for determining sail forceshas been implemented at the Yacht Research Unit by Le Pelley et al. (2012).Pressures and sail shapes are recorded at several sail sections and are then interpolated and integrated across the entire sail to get the aerodynamic forces. Lozej (2012)describes a similar system which uses different pressure and sail shape recognition systems. Both systems are aimed at determining the forces with the minimum degree of approximation. The current research, being carried out at the Yacht Research Unit of the University of Auckland, is aimed at improving the equipment and post-processing techniques of the full-scale measurements of sail pressures and shapes for sailing yacht testing, in order to allow a wider range of application and testing, and to provide researchers with a better understanding of the aerodynamicof sails in actual sailing conditions. The current paper presents an investigation of the effects of rig tension (in particular the shroud tension) on yacht performance. Results are presented and discussed for steady (obtained through the average of pressures and sail shape over a pre-established run time) and unsteady conditions. Particular emphasis has beenpaidto the relationship between the

Welcome message from author
This document is posted to help you gain knowledge. Please leave a comment to let me know what you think about it! Share it to your friends and learn new things together.
Transcript
Investigation of shroud tension on sailing yacht aerodynamics using full-scale real-time pressure
and sail shape measurements
F Bergsma, University of Twente, Netherlands
D Motta, University of Auckland, New Zealand
D J Le Pelley, University of Auckland, New Zealand
P J Richards, University of Auckland, New Zealand
R G J Flay, University of Auckland, New Zealand
ABSTRACT
The steady and unsteady aerodynamic behaviour of a sailing yacht is investigated in this research by carrying outfull-scale
tests on a Stewart 34 class yacht. The aerodynamic forces developed by the yacht in real-time are derived from knowledge
of the differential pressures acting across the sails, and the sail shape. Experimental results are compared with the numerical
results obtained from a dynamic velocity prediction program and good agreement was found.
1. INTRODUCTION
Sail aerodynamics is an active field of research in the scientific community. In the past century several methods were
developed for a better understanding of the behaviour of sails. Some of the topics of current interest are knowledge of the
flying sail shape, determination of the pressure distribution across the sails, and determination of the aerodynamic forces
developed by sails. These studies can be carried out by different methods, the most common being numerical methods, wind
tunnel testing and full scale testing.
The first pressure measurements are dated around the beginning of 1900. More recent important benchmarks in this field
were obtained by Gentry (1971) and Wilkinson (1989). In the last 10 years pressure measurements have become a common
field of research. Puddu et al.(2006) investigated the full-scale static pressureson the mainsail of a Tornado class catamaran
by using hard-wired small data loggers connected to regularly spaced pressure taps along the sail. Flay & Millar (2006)
considered important experimental considerations concerning pressure measurements on sails. Viola & Flay (2009) describe
results from testing a range of asymmetric spinnakers at 1/15th
scale using a multi-channel pressure system built in-house.
They also used a slightly modified “field” version of the same pressure system for a full-scale on-the-water sail pressure
investigation (Viola and Flay 2010) with considerable success.
Recording the flying sail shape has always been a rather difficult task to accomplish, although it has been done by well
funded America‟s Cup syndicates, for example. Several different sail shape recording systems (e.g. cameras at the mast top,
cameras on the deck, laser scanning systems)have been developed over the years (Freides 1991; Graves et al. 2008; Le
Pelley and Modral 2008) and are now relatively common on high performance racing yachts.
Aerodynamic force determination is an important task for the yacht and sail designer, as well as the researcher, as it allows
one to predict the performance of a yacht in order to improve the design or to make it more competitive through optimum
trimming. Nowadays force predictionsare commonly made through velocity prediction programs. In the wind tunnel, forces
are obtained by mounting the models on a force balance (Flay 1996; Fossati et al. 2006). In addition, research effort in
recent years has been aimed at deducing the aerodynamic forces in full-scale and in real-time, both in the wind tunnel and
on the water. The use of dynamometers and load cells for determining forces has been explored in full scale by Masuyama
(2009). In 2011 Augier et al. (2011) conducted a full-scale validation experiment for their “fluid-structure-interaction”
numerical model in which loads on the rig were computed. A successful method for determining sail forceshas been
implemented at the Yacht Research Unit by Le Pelley et al. (2012).Pressures and sail shapes are recorded at several sail
sections and are then interpolated and integrated across the entire sail to get the aerodynamic forces. Lozej (2012)describes
a similar system which uses different pressure and sail shape recognition systems. Both systems are aimed at determining
the forces with the minimum degree of approximation.
The current research, being carried out at the Yacht Research Unit of the University of Auckland, is aimed at improving the
equipment and post-processing techniques of the full-scale measurements of sail pressures and shapes for sailing yacht
testing, in order to allow a wider range of application and testing, and to provide researchers with a better understanding of
the aerodynamicof sails in actual sailing conditions.
The current paper presents an investigation of the effects of rig tension (in particular the shroud tension) on yacht
performance. Results are presented and discussed for steady (obtained through the average of pressures and sail shape over
a pre-established run time) and unsteady conditions. Particular emphasis has beenpaidto the relationship between the

aerodynamic forces, the apparent wind angle, and the pitching motion of the boat in upwind sailing. A dynamic velocity
prediction program developed at the University of Auckland (Bordogna 2012) has been tested by comparing its predictions
with some of the measured experimental results.
2. FORCE EVALUATION VIA PRESSURES AND VSPARS (FEPV)
Determining the sail forces by measuring their shapes and pressures simultaneously has been given the acronym FEPV,
which stands for Force Evaluation via Pressures and VSPARS, where VSPARS stands for Visual Sail Position and Rig
Shape, and is the name of a commercially available sail shape recording system that has been developed in the Yacht
Research Unit at The University of Auckland. VSPARS and the sail pressure system are described in detail in the following
two sections.
2.1 VSPARS For Sail Shape Measurement
Visual Sail Position and Rig Shape (VSPARS) is a system that was developed at the YRU by Le Pelley and Modral (2008);
it is designed to measure the sail shapeand can handle large perspective effects and sails with large curvatures using very
small off-the-shelf cameras. The shape is recorded using severalcoloured stripes on the sails. A discretized sail section
shape, together with several section characteristics (such as camber, draft, twist angle, entry and exit angles, bend, sag, etc.)
are outputted by the system. This is shown in figure 1. All these outputs are then imported into the FEPV system and
appropriately post-processed.The number of coloured stripes that can be used is arbitrary, but it is common practice at the
YRU and elsewhereto use 3-4 stripes per sail. In this study 3 stripes were used in order to keep the system “light” and have
an accurate reproduction of the entire sail shape.
1 a) 1 b)
Figure 1 a) VSPARS stripes recognition and b) pdf output file
Determining the forces requires the recreation of the entire sail geometry based on the stripes; this is done in the FEPV
code, which is coupled with the pressure measurements. Particular attention has been paid to the re-creation of head and
foot shapes of the sails. The position of the head can be extrapolated from the known luff position of the stripes, while the
head section shape can reasonably be considered to be short and straight for these pin-headed sails. The foot section can be
reproduced by extrapolating the tack and clew positions (differently for mainsail and headsail), and the measured
camber/draft characteristics from further up the sail. An initial foot shape is calculated from knowledge of these
characteristics, and is adjusted to a more refined shape by comparing it with the known (input) foot length. The sail shapes
so defined are quite accurate enough for the results required from a full-scale test, where the aim is often to compare
different sail trims qualitatively.
2.2 Pressure Measurement System
When measuring pressures across a sail, several decisions have to be made concerning the experimental setup, such as: the
type of recording (single side measurement or differential measurement), the number of taps, the tap locations, tap size,
recording frequency, etc. In the present study, itwas decided to measure the differential pressures across the sailsdirectly by
using differential pressure transducers, which avoided the important issue of recording a reference free-steam static
pressure, which is known to be difficult(Flay and Millar 2006). Therefore pressure taps with in-loco transducers are used,
and differential pressures were recorded by connecting one side of the transducers to the suction side and the other to the
pressure side of the sail. A customised housing for the pressure taps was designed, together with appropriate sail-cloth

patches covering the taps,in order to minimize their interference with the flow. This geometry was the result of previous
studies carried out by Flay & Millar (2006).
The number of pressure taps used in this studywas restricted to 24 per sail, arranged in 3 rows of 8 taps placed close to the
VSPARS stripes. This is a low number of taps compared to previous studies (Puddu et al. 2006; Viola and Flay 2010; Lozej
et al. 2012) but was consistent with the aim of the authors to have a lightweight system that could be applied easily to all the
sails. Based on previous experience (Le Pelley et al. 2012), it was felt that appropriate interpolation of the pressures across
the sail (as is done in the FEPV software) would lead to a reasonably accurate prediction of the real span-wise pressure
distributions along the sail.The chord-wise location of the taps was chosen in order to capture the main features of the
pressure distribution, such as the leading edge suction peak, and so they were concentrated near the leading edge.
2.3 FEPV Data Analysis
The FEPV data analysis system uses Matlab code to handle the output data from the pressure and sail shape measurement
systems. The main objective of this software is to accurately interpolate the sail shape and the pressures across the sail and
to combine them to obtain the aerodynamic forces developed by the sails, as described below.
Firstly, starting from the VSPARS sail shape output, the digitised sail sections are reproduced numerically in an appropriate
format.Secondly, the head and foot positions are determined, and finally, a user-defined high resolution sail shape (50 x 100
cells) is obtained.Once the sail geometry has been defined, the discrete pressure measurements are taken as input and
interpolated to estimate a complete pressure distribution over the sails. The correct choice of interpolation to use (linear,
spline, cubic) is very important. Indeed, wrong interpolations can lead to wrong chord-wise pressure distributions, not
catching some features such as the leading edge suction, or altering the trailing edge pressure value. Spline interpolations
are used to get both the chord-wise and span-wise sail shape at the desired resolution; this scheme should be able to fit a fair
curve for most sail shapes either with a 2nd
or 3rd
degree function.The chord-wise pressure distributions vary quite
significantly and are seldom regular, and thus cannot be easily fitted with a spline curve, which would easily lead to
incorrect reproductions of the leading edge or trailing edge distribution. Therefore a linear interpolation is used.After this is
done, a complete sail pressure map is defined as shown in figure 2.
Figure 2Pressure distribution across headsail and mainsail (Pressures in Pa)
Some interesting conclusions can be drawn from the analysis of Figure2, even without knowledge of the forces. For instance
it can be seen thatin the example shown, the headsail is contributing the most to the driving force, as the differential
pressure coefficient is higher all over itcompared to the mainsail. It is also possible to seethat the headsail is not perfectly
trimmed, as the sail appears to be luffing in the lower sections (the differential pressure coefficient is close to zero), while a
leading edge suction peak seems to be present in the higher sections. Also, the backwinding at the mainsail can be seen
(zero pressure close to the luff for all sections). Figure 2also shows the VSPARS stripes and the pressure tap locations are
indicated as well by the dots.
The forces and moments developed by the sails in each direction are determined using the Cross-Product Theorem. This
theorem proves that the magnitude of the normal calculated using the cross product of two diagonals of a quadrilateral is

equal to twice the projected area in each direction. Therefore the forcesfrom each panelin the directions of interest are
simply given by the product of the pressure by the normal vector to the panel obtained as above (Equation 1).
⁄
⁄ (1)
⁄
The moment contribution from each panel is then obtained fromthe knowledge of the panel distance from the yacht‟s
moment reference centre in the x, y and z directions.Force and moment coefficients, as well as lift and drag coefficients, can
be obtained and plotted in a “force versusrun number” plot, in order to directly compare the effect of different trimswhile
testing, as is shown in the results section 4 below.
Other features can be investigated, and other outputs can be plotted by the user when running the code. The processing time
varies between 2 and 6 seconds for each run, depending on the processor capability and the number of outputs displayed.
Keeping in mind that pressures and sail shape are typically averaged over a 30s to 60s run, 6s seems to be a reasonablysmall
time lag for this kind of real-time testing.
The FEPV system is fully automatic (in steady investigations). The only input to be prompted before running the software is
the number of the runs (each run corresponds to a particular trim) to be considered and the outputs desired. Good planning
of the sail testing then allows FEPV to be a very useful real-time tool for force computations.
A Graphical User Interface has been developed for the visualization of the pressures across the sail sections from different
runs (e.g. see Figs.4 and 6).This tool allows the user to rapidly check if the trim chosen is near optimal or not.
Figure 4Pressure distributions across sail sections for different runs
For instance, figure 4 shows the pressures for main and headsail for four settings, corresponding to “tight”, “medium”,
”slack” and “fully slack” shroud tensionsettings. From figure 4 one can see which of the settings leads to the highest
differential pressure coefficient.

The FEPV system is also a useful tool for the investigation of unsteady aerodynamics. At the end of the run it is possible to
investigate the relationship between variables, such as pressures and/or forces with the pitch angle, both in the time domain
and the frequency domain.
The accuracy of the FEPV system has been validated previously through wind tunnel testing at the Yacht Research Unit (Le
Pelley et al. 2012). Thus in the current work the full-scale sail shape and pressure measurements, and the resulting force and
moment predictions have not been compared with wind tunnel measurements. Nevertheless,the results have been used to
compare with predictions from a Dynamic Velocity Prediction Program, and this comparison is discussedin the result
section 4.2 below.
3. FULL SCALE TESTING
3.1 Equipment Setup
The physical setup and the equipment used in the current research are the same as described in Le Pelly et al. (2012). In this
section an application of the FEPV system is described. The sails for a Stewart 34 yacht have been equipped with VSPARS
stripes and pressure taps. The system also includes GPS, sonic anemometer and an Inertial Measurement Unit located at the
top of the mast and boat instruments. The test was performed in good weather with steady winds on the Hauraki Gulf,
Auckland, with a breeze between 10 and 18 knots.
Figure 5 Stewart 34 boat equipment
3.2 Tests on the Water
In this particular set of experiments, the effects of the shroud tension on the yacht performance are investigated. In order to
have valid and reliable results in full scale, it is important to minimize the number of variables allowed to change during the
test. Therefore, only the cap shroud tension was changed during the tests.Four different settings were used and compared:
“tight”, “medium”, “slack” and “fully slack” settings. As far as possible, all the other variables, such as sheet trim,
backstay, vang and outhaul tension, etc. were kept constant during the tests. They were changed only for the last runs as the
wind conditions were considerably different from the beginning of the tests, and the authors wished to re-trim the sails in
order to have asconsistentperformance as possible.Three different headings of the yacht were tested, namely: optimal
heading (called VMG for simplicity), pinching (a few degrees higherthan VMG) and footing (a few degrees lowerthan
VMG). Therefore it was possible to compare the different shroud settings for all yacht heading cases, although the VMG
heading is the most representative as it is the fastest.
A total of 24 runs were performed. The first 12 runs were on port tack (all the configurations), and after a break (downwind
sailing to avoid high tidal stream areas) another 12 runs on starboard tack were carried out.
With full scale testing it is impossible to control all factors and inevitably some of these can affect the results. These
include: tidal stream, waves, variation in wind speed, alignment of the instruments with the boat centreline, calibration and
Sonic Anemometer
IMU
Pressure Taps VSPARS stripes
Shrouds

zero recording of the pressure taps. These had to be taken into account during the post-processing, and can possibly explain
some unexpected results as outlined below.
4. RESULTS
4.1. Steady Results
As stated above, in this test the effects of the shroud tension on a Stewart 34 yacht performance are investigated.In
particular, it is a common belief among Stewart 34 sailors that the yachts sail faster with really slack shroud tensions.
Indeed, slack shroud tension theoretically increase the velocity made good (VMG) by allowing the masthead genoa to be
trimmed tighter and the yacht to point higher. The authors wanted to investigate this belief by using the FEPV system.
In this section the results obtained from the FEPV system from the full-scale tests are presented and discussed. The driving
force coefficients (CFx) and heeling moment coefficients (CMx), as directly outputted from the FEPV system and, together
with the complete pressure distribution over the sails (figure 1), give immediate feedback on the yacht performance.
It should be noted that these results were obtained from full-scale tests with particular sail trims, natural fluctuations in
heading, wind speed and direction during each run. Thus sometimes it is difficult to discriminate clear trends in the results.
In figure 6 the velocity made good is plotted for all the shroud settings for VMG and pinching headings on both port and
starboard tack.For the runs on the port tack a minimum boat speed is achieved for the medium to slack shroud setting. On
the starboard tack however, a maximum boat speed is achieved for the medium to slack shroud setting. The difference
between the trends on the two tacks could be caused by effects that are not corrected for when determining boat speed, such
as different wind speed or sea state. That the headings show similar trends can be explained by the order of the experiments.
First the experiments for all three runs on a certain shroud setting were done. After that the shroud setting was adjusted.
That means that experiments with similar shroud settings were performed with little time in between, sometimes less than a
minute. The conditions under which these experiments were performed are thus similar. This causes similar trends over the
shroud settings.
Figure 6 Velocity made good for different shroud settings for: a) starboard tack and b) port tack
2,50
2,60
2,70
2,80
2,90
3,00
200 210 220 230 240 250 260
Ve
loci
ty m
ade
go
od
[m
/s]
Shroud position [mm]
VMG runs -
starboard
Pinching
runs -
starboard
2,30
2,40
2,50
2,60
2,70
2,80
200 210 220 230 240 250 260
Ve
loci
ty m
ade
go
od
[m
/s]
Shroud position [mm]
VMG runs -
port
Pinching runs
- port
tight medium slack fully slack
tight medium slack fully slack
6 a)
6 b)

In order to investigate the effect of the shroud tension on the yacht performance,results in terms of driving force and heeling
moment are presented herewith. Similar to what is done for the boat speed, the component of the driving force coefficient
(CFx) and heeling moment coefficient (CMx) in the direction of the wind is considered. A further correction of CFx and CMx
with an average apparent wind angle of 33 degrees is performed in order to take into account the differences in AWA
between each run. The variation of CFx with the shroud position is shown in figure 7.
Figure 7Driving force coefficient variation with shroud tension
Figure 7 doesnot show a clear trend of CFx with the shroud position. This lack of a clear trendmight be due to the fact that
an increased force coefficient does not necessarily imply increased performance. If the heeling moment increases with the
force coefficient, the heel angle increases and the hydrodynamic drag increases. It is thus better to analyze the variation of
the ration of the driving force coefficient on heeling moment coefficient CFx/CMx with the shroud tension, as shown in
figure 8. The ratio CFx/CMx should be a good indicator of the yacht performance. In most of the cases the measured
CFx/CMx is higher when sailing with medium to slack shrouds for all headings (footing results are not included).
0,32
0,33
0,34
0,35
0,36
0,37
0,38
0,39
0,40
200 210 220 230 240 250 260
CFx
@ 3
3 d
eg
shroud position [mm]
VMG port runs
VMG stbd runs
0,55
0,60
0,65
0,70
0,75
0,80
200 220 240 260
CFx
/ C
Mx
@ 3
3 d
eg
shroud position [mm]
VMG portruns
VMGstarboardruns
8 a)

Figure 8Drivingforce on heeling moment coefficient ratio variation with shroud tension, for:
a) VMG runs and b) pinching runs
Changing the shroud tension is expected to affect the mast sag, and the mainsail luff curve, with consequences on the yacht
performance. In the current test, in order to improve the recordedmast shape (bend and sag) extra points were added in close
to the mast-head for the VSPARS post-processing. This allowed 5 points to be recorded in order to define the mast shape for
each image.
In figure 9 the sag of the mast to leeward is shown for different shroud settings for the VMG yacht heading. The vertical
axis shows the height above the datum, and the horizontal axisshows the deflection of the mast from the neutral position.
For all three headings and both tacks the sideways mast deflection increases with increased slackness of the cap shroud
tension, as expected. It is worth noting that the deflection at an approximate height of 6700 mm does not change, as this is
the height at which the spreaders are placed. Indeed the diagonal shrouds prevent the mast at this position from deflecting.
Figure 9 Mast sag for different shroud settings: a) port and b) starboard
4.2. Unsteady Results
The results presented so far deal with steady aerodynamics, i.e. they are obtained by averaging the pressures and sail shape
over a run-time of about 60 seconds. Full-scale testing and the FEPV recording system also allow unsteady phenomena to
be recorded. Interesting results on sailing aerodynamics in unsteady conditions have been obtained by Lozej (2012) in full
scale and Fossati & Muggiasca in model scale (2012).The FEPV code was used for similar analysis. Taking these works as
references, particular attention has been paid to the relationship between the driving force and the pitching motion of the
boat when sailing upwind. All the boat motions were recorded with the equipment mounted on board.
Results of a specific unsteady run are presented and discussed below, namely a VMG run on starboard tack with slack
shroud tension (run 21). Other runs show consistent results to those presented herewith. The boat was sailing into head-on
waves on starboard tack (the wave heights are not known precisely, but they were approximately 0.5m in height). Several
analyses and comparisons have been performed, and are presented in the following sections
4.2.1 Comparison of pressures and pitch angles
Firstly, a relationship between pressures on the sails and pitching motion of the boat was found. Spectral analysis of
pressures and pitching motion lead to the conclusion that pressures in particular locations of the sails have a high correlation
0,50
0,55
0,60
0,65
0,70
200 220 240 260
CFx
/ C
Mx
@ 3
3 d
eg
shroud position [mm]
pinching portruns
pinchingstarboard runs
8 b)
9 a) 9 b)
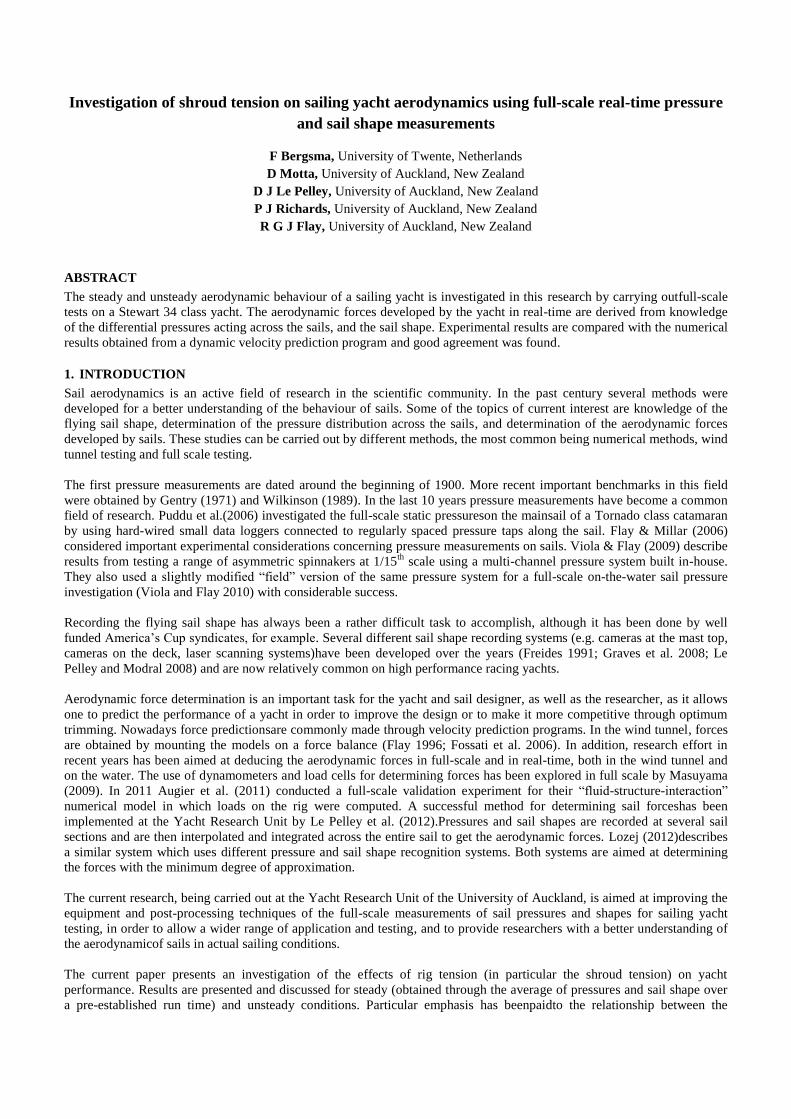
with the pitching motion of the yacht. Pressures and pitching motion were recorded at sampling rates of 4Hz and 30Hz
respectively. For instance figure 10 showstwo pressure spectra (which refer to the 1st tap close to the luff in the top stripe,
respectively for mainsail and headsail) and the pitching motion spectrafrom a VMG runon starboard tack.
Figure 10Series spectra: a) main sail pressure, b) jib pressure, c) pitch angle
As one case see from figure 10 pressures on the headsail seem to be much more influenced by the pitching than the ones on
the mainsail. This is consistent with the yacht geometry, which has a big overlapping genoa that contributes the most to
developing the driving force.
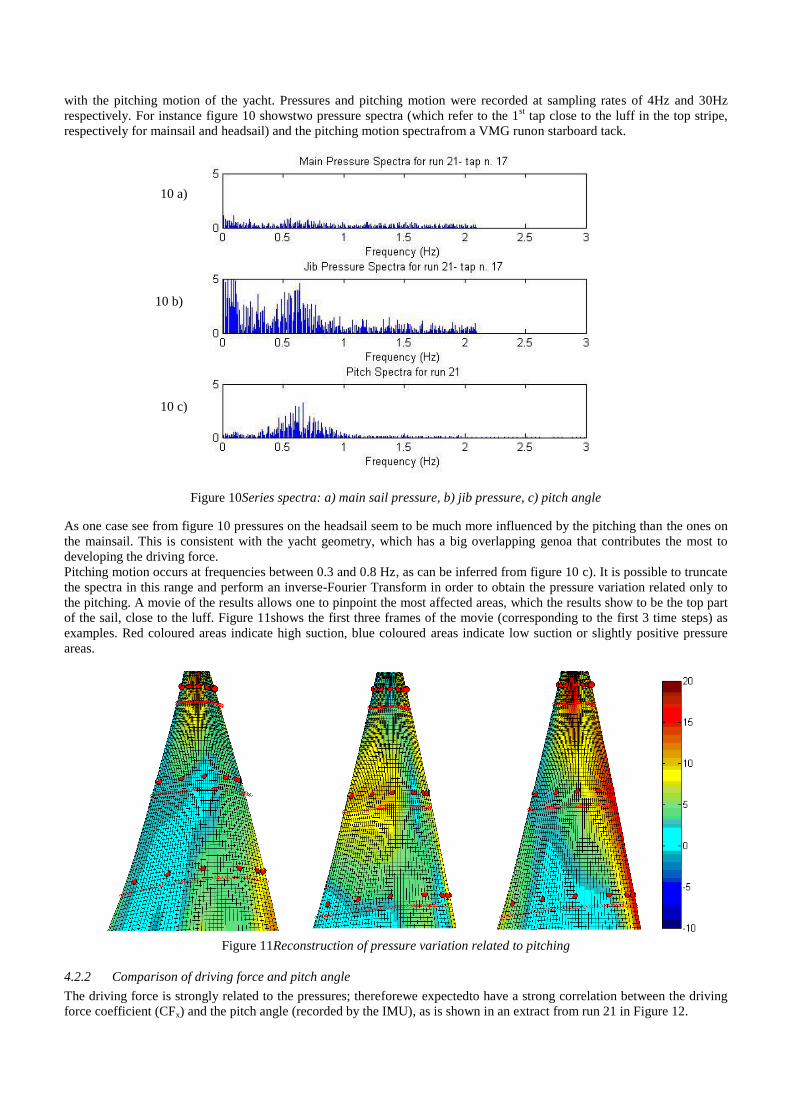
Pitching motion occurs at frequencies between 0.3 and 0.8 Hz, as can be inferred from figure 10 c). It is possible to truncate
the spectra in this range and perform an inverse-Fourier Transform in order to obtain the pressure variation related only to
the pitching. A movie of the results allows one to pinpoint the most affected areas, which the results show to be the top part
of the sail, close to the luff. Figure 11shows the first three frames of the movie (corresponding to the first 3 time steps) as
examples. Red coloured areas indicate high suction, blue coloured areas indicate low suction or slightly positive pressure
areas.
Figure 11Reconstruction of pressure variation related to pitching
4.2.2 Comparison of driving force and pitch angle
The driving force is strongly related to the pressures; thereforewe expectedto have a strong correlation between the driving
force coefficient (CFx) and the pitch angle (recorded by the IMU), as is shown in an extract from run 21 in Figure 12.
10 a)
10 b)
10 c)

Figure 12 CFx and pitch angle time series
From figure 12it can be inferred that CFx increases when the bow rises (pitch angle increases), while CFx decreases when
the bow dips.Moreover, a phase shift may be expected between them, with a delay of pitch angle respect to CFx. This is
confirmed byan analysis of the cross-correlation between the variables. Indeed, CFx and pitching have a reasonably high
cross-correlation coefficient of 0.3 at -2 lags, i.e. the pitch angle is delayed of two time lags (0.5s) respect to the force
coefficient.
Figure 13CFx and pitch angle spectra
Spectral analysis illustrates these considerations (figure 13). The driving force coefficient shows a high peak at similar
frequenciesas the pitch angle, as expected. Note thatthe test was not prepared in order to perform a spectral analysis. The
recording time of about 90s is not enough to get really accurate results; indeed it allows only one block of data to be
transformed into the frequency domain. This can explain the presence another peak at lower frequencies for CFx, and the
non-zero values at different frequencies which are probably due to noise in the signal.
-20,00
-15,00
-10,00
-5,00
0,00
5,00
10,00
15,00
0,00
0,10
0,20
0,30
0,40
0,50
0,60
0,00 5,00 10,00 15,00 20,00 25,00
Pit
ch [
de
g]
CFx
time [s]
CFx vs Pitch Angle
CFx
Pitch Angle

4.2.3 Comparison of pitch angle, AWA and AWS
According to Fossati (2012), pitch angle, AWA and AWS are correlated when sailing upwind. Results from the full scale
test (figure 14 and 15 show a 25s recording time) confirm that AWA and pitch angle are in phase, whereas AWA and AWS
are out of phase.
Figure 14AWA and Pitch angle time series
Figure 15 AWS and Pitch angle time series
4.2.4 Variation of driving force coefficient with AWA
Of particular interest is the relationship between CFx with AWA. According to the previous resultswe expected an increase
in CFx with AWA. In figure 16 a) four full cycles (named “set” in the graph) of pitching motion of the boat are considered,
each starting from the instant in which the bow dips. To each pitch angle there is a corresponding value of AWA and CFx.
Therefore four full cycles of CFx variation with AWA can be identified and shown. As expected, CFx increases with
increasing AWA. Moreover, it is evident that there is a hysteresis loop in the graph, which indicates a shift in phase between
CFx and AWA. This is again coherent with the time history plots. If the drive force and the apparent wind angle were
exactly in phase, the loop would collapse into a single line. The analysis of the cross-correlation between the two variables
confirms the trends. Indeed, CFx and AWA have a cross-correlation coefficient of 0.6 at 1 time interval lag (0.25s).
-20,00
-15,00
-10,00
-5,00
0,00
5,00
10,00
15,00
7,00
7,50
8,00
8,50
9,00
9,50
10,00
10,50
11,00
0,00 5,00 10,00 15,00 20,00 25,00 30,00
Pit
ch A
ngl
e [
de
g]
AW
S [d
eg]
time [s]
AWS vs Pitch Angle
AWS
Pitch
20,00
25,00
30,00
35,00
40,00
45,00
8,00
8,50
9,00
9,50
10,00
10,50
11,00
11,50
12,00
0,00 5,00 10,00 15,00 20,00 25,00 30,00
AW
A [
de
g]
AW
S [m
/s]
time [s]
AWA vs AWS
AWS
AWA

CMx and AWA show a similar trend, as shown in figure 16 b). Note that for a simpler presentation, the heeling moment
coefficient is assumed to be positive everywhere. Results are in accord with Fossati‟s results which were obtained in the
wind tunnel (Fossati and Muggiasca 2012).
Fig 16 (a)
Figure 16 (b)
Figure 16a) CFx and b) CMx variation with AWA
For completeness, similar investigations have been carried out on other runs, both on starboard and port tacks. It is
interesting to note that the results obtained so far are not exactly repeated on the port tack runs. Indeed, a much weaker
relationship between drive force and pitching motion is present. This may be due to the direction of the approaching waves,
which were closer tothe beam (nearer to sideways to the boat centreline). A periodic pitching motion is still present, but is
not as strong as on starboard tack (as confirmed by graphs of spectra). As a consequence, also the relationship between
AWA and pitch angle is not so clear and nor is the relationship between CFx and AWA.
4.3 Dynamic Velocity Prediction Program Predictions
The results obtained so far have been compared to publishedresearch results in order to verify their validity. In addition,a
Dynamic Velocity Prediction Program (DVPP) developed at the Yacht Research Unit was used to simulate the variation in
the aerodynamic forces basing on the recorded experimental motions of the boat. This DVPP, developed by Bordogna
(2012) and based on an “unsteady thin aerofoil theory” developed by Gerhardt (2010) is aimed at predicting the velocity of
a yacht sailing upwind which is subjected to a periodic pitching motion.
The DVPP takes as input a specified periodic pitching motion, thus the average values of maximum pitch angle, wave
frequency, wave height, wind speed and wind direction were entered into the program. Moreover, in order to develop the
analytical theory, the flow around the sails is assumed to be two-dimensional, inviscid and incompressible; therefore „sail
slices” of the mainsail and headsail are considered. The middle sections of both sails were chosen as representative of the
entire sails. Given all these inputs, the DVPP produces sets of results, such as the boat speed and acceleration, heel angle
and sail coefficients.

In figure 17 the driving force and side force coefficient as measured on board the Stewart 34 yacht and calculated by the
DVPP are compared for a recording time of 80 seconds within run 21 (VMG runs in starboard tack). For a complete set of
results refer to (Bordogna 2012). The boat was sailing upwind inhead waves with a significant pitching motion. Measured
and calculated sail force coefficients agree well in magnitude. It can be seen that the full-scale results have a higher
frequency motion superimposed on a lower frequency motion. This may be due to the oscillations at the natural frequency
of the yacht in the experimental test. In the DVPP results, there are no oscillation terms apart from the forcing of the waves.
Figure 17Aerodynamic Forces Coefficients: DVPP and full-scale testing results
Although some discrepanciesin the results arepresent (these are discussed in (Bordogna 2012)) the results agree quite well,
particularly the aerodynamic force coefficients.
5 CONCLUSIONS
A system for the investigation of sailing yacht aerodynamics using real time pressure and sail shape measurements at full
scale has been developed. Aerodynamic forces and yacht performance can be recorded and evaluated in real time.
An application of the system, called FEPV, for the investigation of the effects of rig tension on the yacht performance is
shown and the results are in good agreement with the performance based on sailing experience. The system proved to be an
effective tool to obtain fast and accurate feedback of the yacht performance.
The system can be used for the investigation of unsteady sail aerodynamics. The relationship between pressure/aerodynamic
forces and pitching motion when sailing upwind has been investigated and the experimental results have been compared to a
dynamic velocity prediction program, which showed good agreement.
REFERENCES
Augier, B., P. Bot, F. Hauville (2011). Experimental full scale study on yacht sails and rig under unsteady sailing conditions
and comparison to fluid structure interaction unsteady models. The 20th Chesapeake Sailing Yacht Symposium.
Annapolis, Maryland.
Bordogna, G. (2012). Development of a generic Dynamic VPP based on an Unsteady Thin Aerfoil Theory for two
interacting sails in two-dimensional potential flow, University of Auckland.
Flay, R. G. J. (1996). "A twisted flow wind tunnel for testing yacht sails." Journal of Wind Engineering and Industrial
Aerodynamics 63(1–3): 171-182.
Flay, R. G. J. and S. Millar (2006). Experimental Considerations Concerning Pressure Measurements on Sails: Wind Tunnel
and Full-Scale. 2nd High Performance Yacht Design Conference. Auckland, New Zealand.
Fossati, F. and S. Muggiasca (2012). Sailing Yacht Aerodynamics in Dynamics Conditions. 4th High Performance Yacht
Design Conference. Auckland, New Zealand.
Fossati, F., S. Muggiasca, I.M. Viola, A. Zasso (2006). Wind tunnel techniques for investigation and optimization of sailing
yachts aerodynamics. 2nd High Performance yacht design Conference. Auckland.

Freides, D. S. (1991). An Image Processing Based System For Three Dimensional Sail Shape Analysis. Master in Naval
Architecture and Marine Engineering, Massachussets Institute of Technology.
Gentry, A. (1971). The Aerodynamics of Sail Interaction. Third AIAA Symposium on the Aero/Hydronautics of Sailing,
Redondo Beach, California.
Gerhardt, F. C., R. G. J. Flay, P.J. Richards (2010). "Unsteady Aerodynamics of two interacting yacht sails in two-
dimensional potential flow." Journal of Fluid Mechanics 668: 551-581.
Graves, W., T. Barbera, J.B. Braun, L. Imas (2008). Measurement and Simulation of Pressure Distribution on Full Size
Sails. 3rd High Performance Yacht Design Conference. Auckland, New Zealand.
Le Pelley, D. J. and O. Modral (2008). VSPARS: A combined sail and rig shape recognition system using imaging
techniques. 3rd High performance Yacht Design Conference. Auckland.
Le Pelley, D. J., D. Morris, P.J. Richards (2012). Aerodynamic force deduction on yacht sails using pressure and shape
measurement in real time. 4th High Performance Yacht Design Conference. Auckland, New Zealand.
Lozej, M., D. Golob, B. Vrtic, D. Bokal (2012). Pressure Distribution on Sail Surfaces In Real Sailing Conditions. 4th High
Performance Yacht Design Conference. Auckland, New Zealand.
Masuyama, Y. and T. Fukasawa (2009). "Database of sail shapes versus sail performance and validation of numerical
calculations for the upwind condition." Journal of Marine technologies.
Puddu, P., N. Erriu, F. Nurzia, A. Pistidda, A. Mura (2006). Full Scale Investigation of One-Design Class Catamaran Sails.
2nd High Performance Yacht Design Conference. Auckland, New Zealand.
Viola, I. M. and R. G. J. Flay (2009). "Force and Pressure Investigation of modern asymmetric spinnakers." Transaction of
RINA151.
Viola, I. M. and R. G. J. Flay (2010). "Full-scale pressure measurements on a Sparkman and Stephens 24-foot sailing
yacht." Journal of Wind Engineering and Industrial Aerodynamics98(12): 800-807.
Wilkinson, S. (1989). "Static pressure distribution over 2D mast/sail geometries." Journal of Marine Technology 26: 5.
Related Documents