Investigation of Selected Molecular and Crystalline Systems using Ultrafast Time-Resolved Infrared Spectroscopy Dissertation Presented in Partial Fulfillment of the Requirements for the Degree Doctor of Philosophy in the Graduate School of The Ohio State University By Lisa Nguyen Graduate Program in Chemistry The Ohio State University 2019 Dissertation Committee Terry L. Gustafson, Advisor Claudia Turro Patrick M. Woodward Thomas Kerler

Welcome message from author
This document is posted to help you gain knowledge. Please leave a comment to let me know what you think about it! Share it to your friends and learn new things together.
Transcript

Investigation of Selected Molecular and Crystalline Systems using Ultrafast
Time-Resolved Infrared Spectroscopy
Dissertation
Presented in Partial Fulfillment of the Requirements for the Degree Doctor of Philosophy
in the Graduate School of The Ohio State University
By
Lisa Nguyen
Graduate Program in Chemistry
The Ohio State University
2019
Dissertation Committee
Terry L. Gustafson, Advisor
Claudia Turro
Patrick M. Woodward
Thomas Kerler

Copyrighted by
Lisa Nguyen
2019

i
Abstract
The world’s increasing energy consumption puts an enormous demand on
non-renewable energy sources such as oil and coal. Solar energy is an attractive
alternative energy source due to its abundance and small carbon footprint. Unfortunately,
current solar harvesting systems are not efficient or cheap enough to completely replace
conventional technologies. The search for efficient and affordable solar cells is necessary
as world-wide energy consumption increases. Time-resolved infrared (TRIR)
spectroscopy is used in this work to investigate the fundamental photophysics of the
photoexcited state of multiple molecular and crystalline systems that have potential to
contribute to the world’s growing demand in alternative solar harvesting materials.
In Chapter 3, dimolybdenum (Mo2) paddlewheel complexes are studied as a
highly adaptable class of dyes and potential component in dye sensitized solar cells. Mo2
complexes exhibit unique long-lived charge separated metal-to-ligand charge transfer
singlet excited states (1MLCT) which can be monitored with ultrafast resolution with the
aid of infrared reporting ligands such as C=O, C=N and N+O-. When adsorbed onto
TiO2, the dye absorbs visible light and fast charge injection occurs from the 1MLCT of
the dye to the conduction band of TiO2. Free carrier absorption and transient vibrational
bands can be monitored simultaneously using TRIR.

ii
In Chapter 4, the charge carrier state of hybrid perovskites, APbBr3 and MAPbX3
(where A = methylammonium, formamidinium or Cs+ and X = Cl-, Br- or I-) are
investigated by utilizing different cations as a mid-IR excited state probe. Photoexcitation
with an energy that exceeds the optical bandgap of these materials produces a broad
transient absorption across the mid-IR due to free carrier absorption. Positive vibrational
absorption features, blue shifted from the ground state are also observed. Free carrier
absorption decays faster for hybrid perovskites that possess high energy phonon modes in
comparison to an all inorganic perovskite with no accessible high energy phonon modes.
This chapter also discusses Maximum Entropy Method, a different approach to analyze
kinetic data that can provide an explanation for heterogeneous domains inherent to
microcrystalline materials.
The solvent stabilization upon photoexcitation of a series of mononuclear
tripyrazolylborate iron (III) building block complexes with ancillary TpR ligand is
explored in Chapter 5. A relationship is drawn from the electronic structure of the
complex to the extent of C≡N stretch weakening in the excited state using TRIR.
Solvation, stabilization of the LMCT and sterics of the ancillary ligands all play
important roles in the lifetime of each complex.
Lastly in Chapter 6, the vibrational spectrum of a donor-acceptor columnar liquid
crystal in its frozen state is discussed. This work combines both the vibrational specificity
provided by molecular systems as well as long range order and high electron transport
properties typically seen in crystalline systems. The components of the liquid crystal

iii
under study include a donor, a diaminonapthalene derivative and an acceptor, a
naphthalene diimide derivative. The C=O and aromatic ring stretches on both
components prove to be useful infrared probes that give insight into the change of charge
density upon excitation into the charge transfer state of the material. The columnar long
range order is corroborated by broad mid-IR absorption that can be attributed to electron
transfer occurring between the rings.
TRIR provides simultaneous insight regarding the vibrational response and free
carrier absorption. This dissertation will explore several systems that highlight the
versatility of ultrafast spectroscopy. TRIR proves to be a powerful tool in understanding
fundamental structure-function behaviors in solution phase and crystalline samples.

iv
Dedication
To my parents and brothers

v
Acknowledgments
“Knowledge is like a group of islands.” Malcolm Chisholm told me this during
my first year as a graduate student. He went on to say that every time I would learn a new
skill, it would represent an island. As I progressed through my graduate work and classes,
I would gain more and more islands and eventually the islands would connect and
hopefully grow to one big island. I like to think Malcolm’s analogy came from his
Scottish roots and the hundreds of islands off of Scotland. I have him to thank for
bringing me to Ohio, a place I now call home. I have had so many opportunities here at
OSU and met so many wonderful people who have helped me grow and gain more
islands. I find mentors anywhere I can. So in this space, I will acknowledge all the
mentors who have helped me during my graduate work. First and foremost, I must thank
Malcolm for setting me up with the map to build up my knowledge and experiences.
It was actually both Malcolm and Terry Gustafson who convinced me to come to
OSU and become a buckeye. Terry: my boss, my advisor, my most important mentor and
my strongest supporter. You gave me that first island and introduced me to the beauty of
spectroscopy. You gave me the freedom to study whatever I wanted and develop my own
projects driven by my interests. You were a guiding light during the darkest time. You
never stopped believing in me and always tried your best to bring me out of my own

vi
imposter syndrome feelings. I’m working on it. You’ve shown me what it takes to be a
strong mentor and teacher who can be a positive and motivating influence on everyone.
Most importantly, you taught me that any meeting can be discussed over a tasty beverage.
Thank you for bringing me here. I’m glad I got lost at visitation weekend and returned to
your office that second time.
I have had the pleasure of working with numerous colleagues, all of whom have
been mentors to me academically and personally. I would like to thank my committee
members, Claudia Turro and Patrick Woodward. Your guidance and encouragement has
helped me see the end of this PhD tunnel. I also need to thank all of my collaborators,
Eric McClure, Steve Holmes and Joe Rezcek. Thank you all for making and remaking the
materials I needed to complete the projects and listening to my spectroscopy talk.
I must recognize the Chisholm group: Savithra, Chris Z, Trevor, Phil, CC. Thank
you, Chris Durr for taking me under your wing and Will Kender for teaching me how to
do everything the right way. Next, I need to thank the Gustafson group: Sam-wise, Weny,
Barbara, Erin, Romulo and Nathalia. You all were my cheering squad and favorite trivia
teammates. Thank you Barbara for keeping the laser systems in tip-top shape. Thank you
Erin for letting me attempt to mentor you. Thank you Kohler group and Coe group for
your company in the office. I can’t believe they put the most fun research groups in one
room. Keep up all our traditions. I must thank two of the three members of Charlie’s
Angels, Lauren and Shelby, my best friends and loudest supporters. Your company
showed me that any bad feeling can be smothered away by food, drinks or shopping.

vii
To my parents, my brothers, my nieces and nephews, I must thank my family,
whom this dissertation is dedicated to. I may not be the medical doctor you wanted, but I
will technically have that Dr. title and a lot less debt. My family shaped me into the
chemist I am today. Thank you all for encouraging me through all of my graduate work.
And finally, I must thank Kevin Click for cleaning up my messes and keeping balance in
my life.
Thank you everyone for helping me build my big island.

viii
Vita
2010 – 2014 ………………….……………B.S. Chemistry, Millersville University
Millersville, PA
2014 – 2016 ………………….……………Graduate Teaching Associate,
Department of Chemistry and Biochemistry,
The Ohio State University
2016 – 2018 ………………….……………Metro Early College High School Fellow,
College of Arts and Sciences,
The Ohio State University
2018 – present ………………….…………Graduate Teaching Associate,
Department of Chemistry and Biochemistry,
The Ohio State University
Publications
1. Ando, R. A.; Brown-Xu, S. E.; Nguyen, L. N. Q.; Gustafson, T. L. Probing the
Solvation Structure and Dynamics in Ionic Liquids by Time-Resolved Infrared
Spectroscopy of 4-(Dimethylamino)benzonitrile. Phys. Chem. Chem. Phys. 2017,
19 (36), 25151–25157 DOI: 10.1039/C7CP04961G.

ix
2. Collado, C. M.; Horner, I. J.; Empey, J. M.; Nguyen, L. N. Q.; Bright, F. V.
Gallium Indium Eutectic Masking prior to Porous Silicon Formation Creates
Unique Spatially-Dependent Chemistries. Analytica Chimica Acta 2018, 1032,
147–153.
3. Nguyen, L. N. Q.; McClure, E.T.; Woodward, P.M.; Gustafson, T.L. Ultrafast
Time-Resolved Infrared Spectroscopy for Direct Analysis of Charge Carrier
Dynamics in Methylammonium Lead Halide Perovskites. J. Phys. Chem. A. 2019,
(in progress).
Fields of Study
Major Field: Chemistry

x
Table of Contents
Abstract ................................................................................................................................ i
Dedication .......................................................................................................................... iv
Acknowledgments............................................................................................................... v
Vita ................................................................................................................................... viii
Table of Contents ................................................................................................................ x
List of Tables .................................................................................................................... xv
List of Figures ................................................................................................................. xvii
List of Abbreviations ...................................................................................................... xxv
Chapter 1: Introduction ....................................................................................................... 1
1.1 Photophysical processes ....................................................................................... 1
1.1.1 Molecular photophysical processes ................................................................... 2
1.1.2 Bulk photophysical processes ............................................................................ 4
1.2 Ultrafast pump-probe spectroscopy .......................................................................... 7
1.3 Molecular systems .................................................................................................. 14
1.3.1 Quadruply bonded Mo2 complexes .................................................................. 14
1.3.2 Mononuclear tripyrazyol borate iron (III) cyanide complexes ........................ 20

xi
1.4 Crystalline systems ................................................................................................. 22
1.4.1 Hybrid perovskites ........................................................................................... 22
1.4.2 Donor-Acceptor columnar liquid crystals ........................................................ 26
1.5 Summary of chapters .............................................................................................. 28
Chapter 2: Methods and Materials .................................................................................... 30
2.1 General Experimental ............................................................................................. 30
2.2 Compound purity analysis ...................................................................................... 30
2.3 Film preparation ...................................................................................................... 31
2.4 Computational Methods .......................................................................................... 32
2.3 Electrochemistry ..................................................................................................... 32
2.4 Steady State Instrumentation .................................................................................. 33
2.4.1 Electronic Absorption ...................................................................................... 33
2.4.2 Electronic Emission ......................................................................................... 34
2.4.3 FT-IR................................................................................................................ 34
2.5 Ultrafast Instrumentation ........................................................................................ 34
2.5.1 Transient Absorption ....................................................................................... 34
2.5.2 Time-Resolved Infrared Spectroscopy ............................................................ 36
2.6 Kinetic decay analysis............................................................................................. 39

xii
2.6.1 Conventional single kinetic analysis ................................................................ 40
2.6.2 Maximum Entropy Method.............................................................................. 40
Chapter 3: Mo2 paddlewheel complexes and their application to dye sensitized solar cells
........................................................................................................................................... 42
3.1 Introduction ............................................................................................................. 42
3.2 Results and Discussion ........................................................................................... 48
3.2.1 Synthesis .......................................................................................................... 48
3.2.2 Electronic Structure Calculations .................................................................... 51
3.2.3 Electronic Absorption and Emission ............................................................... 54
3.2.4 Vibrational Spectroscopy and Characterization............................................... 58
3.2.5 Electrochemical studies ................................................................................... 61
3.2.6 Ultrafast UV-Vis Transient Absorption Spectroscopy .................................... 64
3.2.7 Ultrafast Time-Resolved Infrared Spectroscopy ............................................. 66
3.3 Concluding Remarks .......................................................................................... 72
Chapter 4: Ultrafast infrared analysis of hybrid perovskites ............................................ 74
4.1 Introduction ............................................................................................................. 74
4.2 Results and Discussion ........................................................................................... 76
4.2.1 Synthesis .......................................................................................................... 76

xiii
4.2.2 Exploration of perovskite powders, pellets and films ...................................... 79
4.2.3 Steady state absorption .................................................................................... 85
4.2.4 Vibrational spectroscopy ................................................................................. 91
4.2.5 Time resolved infrared spectroscopy ............................................................... 94
4.2.6 Maximum Entropy Method for kinetic analysis of heterogeneity of pellets and
films ........................................................................................................................ 120
4.3 Concluding Remarks ............................................................................................. 125
Chapter 5. Solvent stabilization of tripyrazolylborate iron (III) complexes upon LMCT
absorption ........................................................................................................................ 127
5.1 Introduction ........................................................................................................... 127
5.2 Results and Discussion ......................................................................................... 129
5.2.1 Synthesis ........................................................................................................ 129
5.2.2 Spectroscopic trends in A-E .......................................................................... 130
5.2.3 Time-resolved Infrared Spectroscopy ............................................................ 134
5.2.4 Ultrafast UV-Vis Transient Absorption Spectroscopy .................................. 140
5.3 Concluding Remarks ............................................................................................. 145
Chapter 6. Ultrafast dynamics of aromatic donor-acceptor liquid crystals .................... 147
6.1 Introduction ........................................................................................................... 147
xiv
6.2 Results and Discussion ......................................................................................... 150
6.2.1 Synthesis ........................................................................................................ 150
6.2.2 Ground State Vibrational Spectroscopy......................................................... 151
6.2.3 Time-resolved Infrared Spectroscopy ............................................................ 153
6.3 Concluding Remarks ............................................................................................. 156
Chapter 7. Perspective .................................................................................................... 158
Appendix A: Supplementary Information for Chapter 2 ................................................ 163
Appendix B: Supplementary Information for Chapter 3 ................................................ 168
Appendix C: Supplementary Information for Chapter 4 ................................................ 175
References ....................................................................................................................... 184
xv
List of Tables
Table 1 - Summary of electronic and electrochemical data for trans-(I) and cis-(II) Mo2
para-isonicotinate N-oxide complexes. ............................................................................. 58
Table 2 - Comparison of select vibrational modes of ground state 1’ and 2’ from DFT
calculations and experimental GS-IR of complexes 1 and 2 ............................................ 59
Table 3 - Summary of electronic and electrochemical data for trans-(1) and cis-(2) Mo2
para-isonicotinate N-oxide complexes .............................................................................. 63
Table 4 – Summary of band gap energies for MAPbX3 series and APbBr3 series (where X
= I, Br and I and A = Cs, MA and FA) ............................................................................. 88
Table 5 - Summary of optical bandgaps, experimental pump wavelengths and calculated
carrier injection levels for MAPbX3 where X = I-, Br- or Cl-............................................ 90
Table 6 – Summary of optical bandgaps, experimental pump wavelengths and calculated
carrier injection levels for APbBr3 where A = Cs+, MA+ or FA+ ..................................... 90
Table 7 - Measured vibrational modes (in cm−1) and peak assignments for MAPbBr3 and
FAPbBr3 ............................................................................................................................ 92
Table 8 - Measured vibrational modes (in cm−1) and assignments for the MAPbX3 series
........................................................................................................................................... 94

xvi
Table 9 - Time constant components and contribution (%) to the TRIR signal decay taken
at 1600 cm−1 for the APbBr3 series ................................................................................. 101
Table 10 - Time constant components and contribution (%) to the TRIR signal decay
taken at 1250 cm−1 of MAPbX3 series ............................................................................ 113
Table 11 - Observed shifts (cm−1) of vibrations in excited state vs. ground state in TRIR
......................................................................................................................................... 118
Table 12 - FWHM of –NH3+ bend transient with respect to pump energy ..................... 119
Table 13 – Summary of TRIR data of A-E taken in MeCN and DMSO........................ 137
Table 14 - Summary of TA data of A-E taken in MeCN ............................................... 142
Table 15 – Summary of TA kinetics of B and solvent properties .................................. 145

xvii
List of Figures
Figure 1 – Basic Jablonski diagram for monophotonic unimolecular photophysical
processes where a solid arrow indicates radiative absorption or emission, while dotted
arrows indicate non-radiative processes2,6,8 ........................................................................ 4
Figure 2 – Comparison between photophysical processes in molecular systems vs. bulk
semiconductor systems ....................................................................................................... 6
Figure 3 – Mode locked pulse by Kerr lens effect .............................................................. 8
Figure 4 – Block diagram of TRIR system ....................................................................... 11
Figure 5 – Block diagram of TA system ........................................................................... 12
Figure 6 - Diagram of signals that arise from pump probe spectroscopy ......................... 14
Figure 7 - Frontier molecular orbital diagram for a Mo2 quadruply bonded complex
embraced by (left) four carboxylates (right) four amidinates, Adapted from reference22 15
Figure 8 – Cooperative orbital interactions in a metal carbonyl ....................................... 17
Figure 9 – CO2 orbital symmetries and frontier MO diagram of a trans Mo2 complex
highlighting the back-bonding interaction between Mo2 δ and carboxylate π*, adapted
from reference23,31,33.......................................................................................................... 19
Figure 10 – Representation of the 3D structure and charge transfer process of Co-Fe
Prussian Blue analogs. Adapted from reference41 ............................................................ 21

xviii
Figure 11 - APbX3 perovskite structure where the inorganic framework is comprised of
an infinite network of corner connected PbX6 octahedra. The A-site cation occupies the
center of the cage surrounded by 12 halide ions60 ............................................................ 24
Figure 12 - Energy level diagram of a tandem dye-sensitized photoelectrochemical cell
system. The photoanode is connected to the photocathode by an external circuit96......... 44
Figure 13 - Comparison of trans vs. cis geometries in Mo2 complexes. 1 adopts a trans
geometry, where the ancillary ligands are TiPB = triisoproylbenzoate. 2 adopts a cis
geometry, where the ancillary ligands are DAniF = dianisoleformamidinate. ................. 46
Figure 14 – Frontier molecular orbital diagram of 1’ (left) and 2’ (right) together with the
GaussView 5.0.8 isosurface (isovalue = 0.02) electron density contour plots of selected
frontier orbitals. Energy vs. vacuum ................................................................................. 53
Figure 15 – Electronic absorption spectra of 1 and 2 collected in THF at room
temperature where MLCT peak normalized to 1 .............................................................. 55
Figure 16 – Emission spectra of 1 (top) and 2 (bottom) at room temperature and 77 K. λex
= 480 nm (1) and 500 nm (2) ............................................................................................ 57
Figure 17 - From left to right: Absorption, steady-state singlet and triplet emission spectra
of compounds 1 (blue) and 2 (red). Emission spectra were measured at 77 K in
2-methyltetrahydrofuran. λex = 500 nm (1), 480 nm (2) ................................................... 57
Figure 18 - Ground state IR of 1 (in THF) and 2 (in CDCl3) ........................................... 59
Figure 19 – Ground state IR of 2 and 2@TiO2 in CDCl3 ................................................. 61

xix
Figure 20 - Energy level diagram comparing the oxidation potentials of the ground state
(black), singlet state (red) and triplet (blue) state of 2 and the Ru(II) N719103 dye
referenced to NHE. Redox potential of I-/I3- couple is included. ...................................... 64
Figure 21 – TA spectrum of 1 in THF, λex = 565 nm ....................................................... 65
Figure 22 - TA spectrum of 2 in DCM, λex = 515 nm ...................................................... 65
Figure 23 – TRIR spectrum of 1in THF, λex = 515 nm .................................................... 68
Figure 24 – TRIR spectrum of 2 in CDCl3, λex = 515 nm ................................................ 69
Figure 25 – TRIR spectrum of TiO2 nanoparticles (p25) suspended in CDCl3, λex = 515
nm ..................................................................................................................................... 70
Figure 26- TRIR spectrum of 2 adsorbed onto TiO2 (2@TiO2) nanoparticles suspended in
CDCl3, λex = 515 nm ......................................................................................................... 71
Figure 27 – TRIR spectrum for MAPbI3 KBr pellet (2 mm thick), λex = 515 nm ............ 82
Figure 28 – TRIR spectrum for MAPbI3 KBr pellet (<1 mm thick), λex = 750 nm.......... 83
Figure 29 - Ground state UV-Vis of MAPbI3, MAPbBr3 and MAPbCl3 ......................... 86
Figure 30 - Ground state UV-Vis of CsPbBr3, MAPbBr3 and FAPbBr3 films ................. 87
Figure 31 – Ground state IR spectra of MAPbBr3 and FAPbBr3 (left) stretching modes,
(right) rocking and bending modes ................................................................................... 92
Figure 32 - Relative transmittance spectra of MAPbI3 (black), MAPbBr3 (orange), and
MAPbCl3 (blue) films (left) stretching modes, (right) rocking and bending modes. ........ 93
Figure 33 - Full TRIR spectrum of MAPbBr3 with excitation energy (top) above band gap
(λex = 500 nm) and (bottom) near the bandgap onset (λex = 535 nm). The black dotted line

xx
denotes ground state absorption, while solid lines represent the transient spectrum at
different time delays between −100 ps and 2.7 ns. ........................................................... 95
Figure 34 - Full TRIR spectrum of FAPbBr3 with excitation energy (top) above band gap
(λex = 500 nm) and (bottom) near the bandgap onset (λex = 530 nm). The black dotted line
denotes ground state absorption, while solid lines represent the transient spectrum at
different time delays between −100 ps and 2.5 ns. ........................................................... 96
Figure 35 - Full TRIR spectrum of CsPbBr3 with excitation energy above band gap (500
nm. Colored solid lines represent the transient spectrum at different time delays between
−100 ps and 2.7 ns. ........................................................................................................... 98
Figure 36 - Full TRIR spectrum of CsPbBr3 with excitation energy near band gap (530
nm. Colored solid lines represent the transient spectrum at different time delays between
−100 ps and 2.5 ns ............................................................................................................ 99
Figure 37 – FAPbBr3 peak position and FWHM of transient/bleach C=N feature with
time (top: 500 nm pump, bottom: 530 nm pump) ........................................................... 105
Figure 38 - FAPbBr3 peak position and FWHM of transient N-H stretch feature with time
(left: 500 nm pump, right: 530 nm pump) ...................................................................... 106
Figure 39 - MAPbBr3 peak position and FWHM of transient –NH3+ bend feature with
time (left: 500 nm pump, right: 535 nm pump) .............................................................. 107
Figure 40 - MAPbBr3 peak position and FWHM of dual transient feature with time,
assigned to asymmetric and symmetric –NH3+ stretches (top: 500 nm pump, bottom: 535
nm pump) ........................................................................................................................ 109

xxi
Figure 41 - Full TRIR spectra of MAPbX3 series – (top to bottom) MAPbI3, MAPbBr3,
and MAPbCl3 with excitation energy above band gap (750 nm, 500 nm, and 377 nm
respectively) and near band gap excitation (780 nm, 532 nm, and 407 nm respectively).
......................................................................................................................................... 111
Figure 42 - Early time kinetics (taken at 1250 cm-1) of MAPBX3 series pumped at
different energies ............................................................................................................ 114
Figure 43 - TRIR spectra of MAPbX3 series at low probe energy – (top to bottom)
MAPbI3, MAPbBr3, and MAPbCl3 with excitation energy above band gap (750 nm, 500
nm, and 377 nm respectively) and near band gap excitation (780 nm, 532 nm, and 407
nm respectively) .............................................................................................................. 116
Figure 44 – Conventional kinetic analysis of MAPbBr3 in KBr pellet, λex = 515 nm .... 121
Figure 45 – MEM analysis of MAPbBr3 in KBr pellet, λex = 515 nm ............................ 122
Figure 46 - MEM analysis of MAPbBr3 thin film, one-step method, λex = 500 nm ....... 124
Figure 47 - MEM analysis of MAPbBr3 thin film, two-step method, λex = 500 nm ...... 124
Figure 48 - Representative TpRFeIII(CN)3- complex in the fac geometry and series of
poly(pyrazol-1-yl)borate ligands investigated in this study154,155 ................................... 128
Figure 49 – Spectroscopic trends of the TpRFeIII(CN)3- series with different TpR ligands,
Adapted from reference154 .............................................................................................. 131
Figure 50 – Frontier molecular orbital diagram for high spin Fe3+ and ferricyanide
[Fe(CN)6]3-
, Adapted from reference158........................................................................... 133
Figure 51 - Representation of [TpRFe(CN)3]- frontier orbitals from DFT calculations27 134

xxii
Figure 52 – TRIR spectrum of A in MeCN, λex = 440 nm ............................................. 136
Figure 53 - TRIR spectrum of B in MeCN, λex = 440 nm .............................................. 136
Figure 54 – TRIR spectrum of A in DMSO, λex = 440 nm ............................................. 138
Figure 55 - TRIR spectrum of B in DMSO, λex = 440 nm ............................................. 139
Figure 56 – TA spectrum of A in MeCN, λex = 400 nm ................................................. 141
Figure 57 - TA spectrum of B in MeCN, λex = 400 nm .................................................. 141
Figure 58 - TA spectrum of B in MeCN, λex = 480 nm .................................................. 142
Figure 59 - TA spectrum of B in DMSO, λex = 480 nm .................................................. 143
Figure 60 – Schematic of HOMO-LUMO alignment of donor/acceptor system for charge
transfer band.................................................................................................................... 148
Figure 61 – DACLC, electron rich donor D1 and electron deficient acceptor A1 used in
this study ......................................................................................................................... 149
Figure 62 – HOMO and LUMO orbitals for D1 and A1. Adapted from reference168 .... 150
Figure 63 – Ground state IR spectrum of D1-A1 in the CH stretch region .................... 152
Figure 64 - Ground state IR spectrum of D1-A1 in the C=O and conjugated CC stretch
region .............................................................................................................................. 152
Figure 65 – TRIR spectrum of D1-A1, λex = 450 nm ..................................................... 153
Figure 66 - TRIR spectrum of D1-A1, λex = 700 nm ...................................................... 155
Figure 67 - 1H NMR (400 MHz, d8 – THF) and MALDI-TOF of (1) ............................ 163
Figure 68 - 1H NMR (400 MHz, CDCl3) and MALDI-TOF of (2) ................................ 164

xxiii
Figure 69 – 1H NMR (250 MHz, CDCl3) of tetrabutylammonium isonicotinate N-oxide
......................................................................................................................................... 165
Figure 70 - 1H NMR (250 MHz, CDCl3) of Mo2(DAnif)4 homoleptic ........................... 166
Figure 71 - 1H NMR (250 MHz, CD3CN) of [Mo2(DAnif)2(CH3CN)6][BF4]2 .............. 167
Figure 72 - X-Ray diffraction pattern and fit for CsPbBr3 film ...................................... 168
Figure 73 - X-Ray diffraction pattern and fit for MAPbBr3 film ................................... 169
Figure 74 - X-Ray diffraction pattern and fit for FAPbBr3 film ..................................... 169
Figure 75 –Ground state IR spectra of MAPbX3 series (where X = I, Br or Cl) as KBr
pellet ................................................................................................................................ 170
Figure 76 - TRIR spectrum for MAPbI3 KBr pellet (<1 mm thick), λex = 780 nm ........ 170
Figure 77 - TRIR spectrum for MAPbBr3 KBr pellet (<1 mm thick), λex = 537 nm...... 171
Figure 78 - MEM kinetic fit of CsPbBr3 pumped (left) above the band with 500 nm and
(right) at the band gap with 530 nm ................................................................................ 171
Figure 79 - MEM kinetic fit of MAPbBr3 pumped (left) above the band with 500 nm and
(right) at the band gap with 535 nm ................................................................................ 172
Figure 80 - MEM kinetic fit of FAPbBr3 pumped (left) above the band with 500 nm and
(right) at the band gap with 530 nm ................................................................................ 172
Figure 81 - MEM kinetic fit of FAPbBr3 pumped (left) above the band with 750 nm and
(right) at the band gap with 780 nm ................................................................................ 173
Figure 82 - MEM kinetic fit of MAPbBr3 pumped (left) above the band with 500 nm and
(right) at the band gap with 532 nm ................................................................................ 173

xxiv
Figure 83 - MEM kinetic fit of FAPbBr3 pumped (left) above the band with 377 nm and
(right) at the band gap with 407 nm ................................................................................ 174
Figure 84 - TRIR spectrum of C in MeCN, λex = 440 nm .............................................. 175
Figure 85 - TRIR spectrum of D in MeCN, λex = 440 nm .............................................. 175
Figure 86 - TRIR spectrum of E in MeCN, λex = 440 nm .............................................. 176
Figure 87 - TRIR spectrum of C in DMSO, λex = 440 nm ............................................. 176
Figure 88 - TRIR spectrum of D in DMSO, λex = 440 nm ............................................. 177
Figure 89 - TRIR spectrum of E in DMSO, λex = 440 nm ............................................. 177
Figure 90 – TA spectra of A in MeCN, λex = (top) 400 nm ; (bottom) 480 nm ............. 178
Figure 91 - TA spectra of C in MeCN, λex = (top) 400 nm ; (bottom) 480 nm .............. 179
Figure 92 - TA spectra of D in MeCN, λex = (top) 400 nm ; (bottom) 480 nm .............. 180
Figure 93 - TA spectra of E in MeCN, λex = (top) 400 nm ; (bottom) 480 nm .............. 181
Figure 94 - TA spectra of B in methanol, λex = 480 nm ................................................. 182
Figure 95 - TA spectra of B in acetone, λex = 480 nm .................................................... 182
Figure 96 - TA spectra of B in chloroform, λex = 480 nm .............................................. 183

xxv
List of Abbreviations
CLC Columnar liquid crystal
CT Charge transfer
CV Cyclic voltammetry
DACLC Donor-acceptor columnar liquid crystal
DAniF Dianisoleformamidinate
DCM Dichloromethane
DFG Difference frequency generation
DFT Density functional theory
DMF Dimethylformamide
DMSO Dimethyl sulfoxide
DPV Differential pulse voltammetry
DSSC Dye sensitized solar cell
ES Excited state
FA Formamidinium
FCA Free carrier absorption
fs femtosecond
FWHM Full width at half maximum
GS Ground state
HOMO Highest occupied molecular orbital

xxvi
IR Infrared
LC Liquid crystal
LIESST Light induced excited spin-state trapping
LMCT Ligand to metal charge transfer
LUMO Lowest unoccupied molecular orbital
MA Methylammonium
MALDI-TOF Matrix-assisted laser desorption/ionization – time of flight mass
spectrometry
MEM Maximum entropy method
MLCT Metal to ligand charge transfer
NDI Naphthalenediimide
NHE Normal hydrogen electrode
NMR Nuclear magnetic resonance
ns nanosecond
OPA Optical parametric amplifier
ppm parts per million
ps picosecond
SCO Spin crossover
SFG Sum frequency generation
SHE Standard hydrogen electrode
TA Transient absorption spectroscopy

xxvii
TD-DFT Time-dependent density functional theory
THF Tetrahydrofuran
TiPB triisoproylbenzoate
TRIR Time-resolved infrared spectroscopy
TRPL Time-resolved photoluminescence
VC Vibrational cooling
XRD X-ray diffraction

1
Chapter 1: Introduction
Spectroscopy is a powerful tool that utilizes light to interrogate the inner-most
properties of molecules and materials. The first instance of light and matter interaction
must have involved sunlight as the light source and our eyes as the detector. Beyond this
observable absorption of visible light, we can use other energies of light to extend our
ability to measure other innate behaviors that may define a material. At the intersection
between chemistry and physics lies spectroscopy and photophysics. Spectroscopy
involves the measurement of absorption or emission of light from a molecule or material,
while photophysics describes the physical reasoning behind the process. Light interaction
processes may differ between discrete molecules and bulk crystalline materials. This
work explores both realms by observing the electron dynamics that occur within
hundreds of femtoseconds after light absorption.
1.1 Photophysical processes
The description of condensed-phase molecular system used in this work defines
the system as a collection of discrete molecules that exist in identical environments. This
is typically carried out by dissolving a substance in a solvent so each molecule may

2
undergo its processes independently of one another, with only molecular and/or solvent
interactions to consider. With removal of solvent, aggregation of molecules or
microcrystallinity will produce heterogeneous domains. Spectroscopic observations of
solid materials will be a result of the average of the material.1 Line broadening of the
electronic and vibrational energy levels will occur leading to a continuum of states.2 The
next sections will discuss the key factors that describe photophysics of molecules in
solution and crystalline materials in the solid phase separately.
1.1.1 Molecular photophysical processes
Molecular photophysical processes can be described by use of a Jablonski
diagram depicted in Figure 1. The thick horizontal lines represent electronic states (Sn)
with higher energy vibrational levels (thinner lines) associated with each electronic state.
Electronic and vibrational states are unique to the molecule under study. There is a
distinction between the absorption of light and emission of light. Excitation between
energy states, electronic or vibrational, require the absorption of a photon (1 on Figure 1).
A direct transition between electronic states typically requires light with energy in the
ultraviolet-visible region and is termed radiative excitation. Transitions between
vibrational states can be achieved by excess electronic state absorption or by light with
energy in the infrared region, also a type of radiative excitation (red 1 on Figure 1). Once
at an elevated state, a molecule can return to its ground state by the photophysical
processes of luminescence (2) or non-radiative relaxation (7 and 8).

3
The process of radiative excitation occurs by the transition of promoting an
electron from one orbital to another. The probability of a particular process to occur is
defined by the nature of the transition. The likelihood of transitions between electronic
states is defined by spin selection rules and by symmetry. Spin selection rules forbid
transitions between Sn and Tn while allowing transitions between Sn and Sn+1 or Tn and
Tn-1. Transitions between S and T states may only occur by the non-radiative process
intersystem crossing (ISC, 6) where an electron changes its spin during the ST or TS
transition. Symmetry selection rules allow transitions to occur when the transition
involves a change in angular momentum. These rules dictate that d-d transitions are
forbidden while transitions involving ug or gu symmetry of orbitals are allowed.3
Radiative luminescent deactivation involves the emission of light. This type of
transition typically occurs from the lowest lying S1 or T1 state to the ground state. This is
due to Kasha’s rule, which states that the process of relaxing to the lowest lying excited
state is faster than relaxing to the ground state.4 A S1 S0 transition, or fluorescence (2),
is observed to be more intense than T1 S0, phosphorescence (3) due to the selection
rules outlined above.
Transitions between vibrational states can be achieved through non-radiative
processes, which is referred to as vibrational cooling (9). 5–7 An additional non-radiative
process that occurs between higher lying electronic states of the same spin is referred to
as internal conversion (5). Non-radiative transitions between higher lying states and the
ground state, S0, are sometimes observed when the lowest lying S1 or T1 is vibronically

4
coupled to the ground state (7 and 8). In this case, vibrational coupling provides a
non-radiative energetic route for a molecule to relax to the ground state. Coupling of
vibrational states are typically seen when there is a small energy difference between the
lowest lying Sn or Tn and the ground state.8,9
Figure 1 – Basic Jablonski diagram for monophotonic unimolecular photophysical
processes where a solid arrow indicates radiative absorption or emission, while dotted
arrows indicate non-radiative processes2,6,8
1.1.2 Bulk photophysical processes
Ultrafast spectroscopies utilizing visible and infrared probes have been used to
examine electronic behaviors of materials. Transient absorption experiments have
revealed the processes in formation of photoexcited excitons and polarons specifically,

5
while infrared probes can directly examine electronic structure and trap state
distribution.10 The materials describe in this work have molecular domains and
oftentimes we can pull from molecular processes to describe bulk materials. In general,
electronic transitions in materials are more broad and inhomogeneous due to their
disorder, therefore structural information is more difficult to interpret. This is where
ultrafast vibrational spectroscopy can complete the picture and provide both electronic
information and structural specificity to the local environment. Materials with low charge
trap depths (<0.1 eV) are electrically active and their behaviors can be monitored directly
with mid-IR probes. Though, local heating is also a valid concern when using
pump-probe experiments to examine vibrational response in bulk materials.
Photoexcited or electrically excited electrons in semiconducting materials absorb
strongly in the IR region by free carrier absorption as seen in Figure 2. Free carrier
absorption, which is electronic in nature, increases as wavelength of the probe increases
by λ3. Intensity of the absorption also depends on the presence and types of phonons
present in the material. Disorder and surface defects introduce trap states that can limit
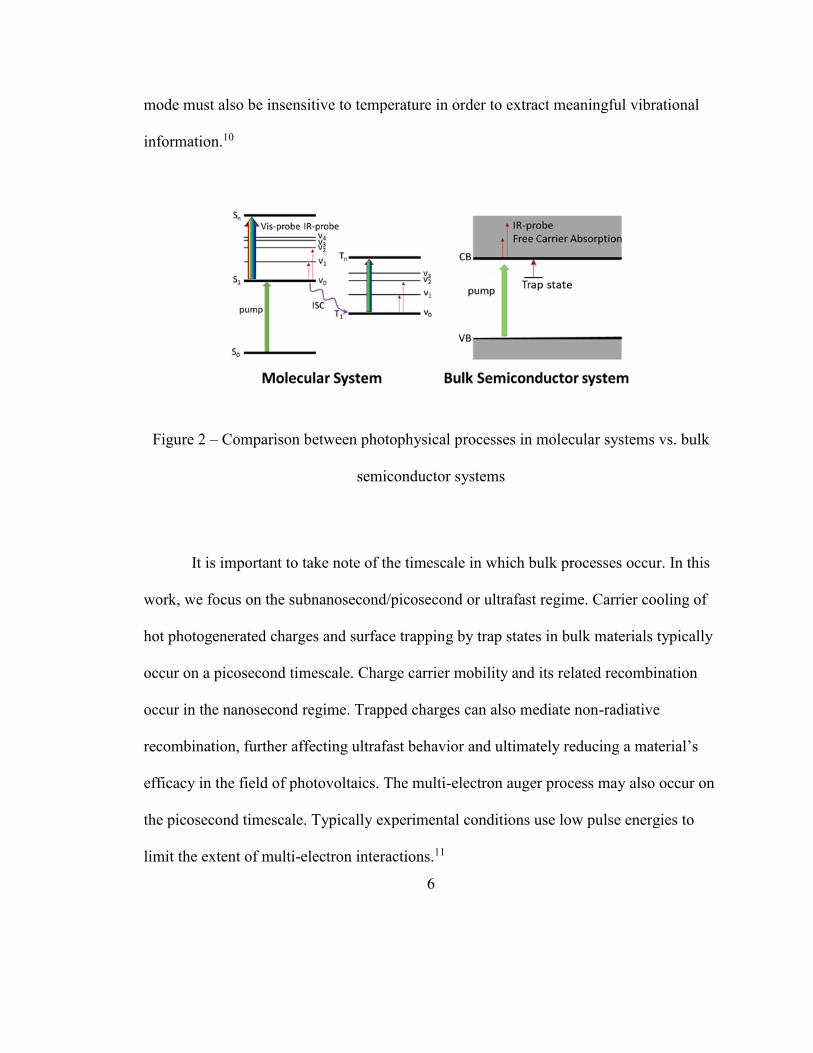
the degree of free carrier absorption. A high density of trapped carriers can be observed
as a broad absorption in the near-IR, where the trapped electron is promoted back to the
conduction band by near-IR absorption. In order to observe vibrational specificity of a
bulk material, the oscillator strength of the vibrational modes under study must be strong
enough to see transient signal on top of intense free carrier absorption. The vibrational
6
mode must also be insensitive to temperature in order to extract meaningful vibrational
information.10
Figure 2 – Comparison between photophysical processes in molecular systems vs. bulk
semiconductor systems
It is important to take note of the timescale in which bulk processes occur. In this
work, we focus on the subnanosecond/picosecond or ultrafast regime. Carrier cooling of
hot photogenerated charges and surface trapping by trap states in bulk materials typically
occur on a picosecond timescale. Charge carrier mobility and its related recombination
occur in the nanosecond regime. Trapped charges can also mediate non-radiative
recombination, further affecting ultrafast behavior and ultimately reducing a material’s
efficacy in the field of photovoltaics. The multi-electron auger process may also occur on
the picosecond timescale. Typically experimental conditions use low pulse energies to
limit the extent of multi-electron interactions.11

7
1.2 Ultrafast pump-probe spectroscopy
Ultrafast pump probe spectroscopy was utilized in this work to explore the
behaviors of molecules and materials in their excited state manifold. The photoexcited
state is short lived and produced by a pump pulse. An additional absorption pulse can be
delivered to the sample to measure or probe excited state properties. The discovery of
femtosecond pulsed lasers has opened up the time resolution necessary for observing the
transient photoexcited species.12 A broadband probe in the UV-visible energy region will
interrogate higher lying Sn states, while mid-IR probe energy will measure the vibrational
energy levels associated with that excited state. The basic operating principles of
pump-probe experiments involve the alignment of the pump and probe pulses in time and
space.
In order to produce femtosecond time resolution necessary for investigation of
transient species, we must generate fs laser pulses and introduce time delays between
pump and probe pulses. To do this, a mode-locked diode-pumped Ti:sapphire oscillator is
placed at the beginning of the ultrafast laser system that can produce ~10 fs pulses. In a
mode-locked laser, all resonant frequencies within the cavity oscillate with the same
initial phase, but constructive and destructive interference of these modes will form wave
packets. Shorter widths of these wave packets require more contributing modes. The
Ti:Sapphire lasing medium possesses nonlinear behaviors, and this material is a popular
medium because these properties amplify the peak pulse and attenuate less intense

8
portions (tail ends) of the pulse and essentially shortens the pulse duration. This process
occurs through the Kerr lens effect.13 In the optical Kerr effect, the refractive index
experienced by light in a medium is dependent on its field strength. So in a Kerr lens,
light at the center of the beam (along the beam axis) experiences a larger refractive index
than the edges of the beam, thus focusing the beam. This “self-focusing” effect is
stronger for high intensity portions of the pulse and will lead to amplification of the
center peak pulse while attenuating the pulse tails, as well as shortening the pulse
duration.
Figure 3 – Mode locked pulse by Kerr lens effect
The resultant pulse travels to a regenerative amplifier (Labeled Legend in Figure
4 and Figure 5) to amplify the fs pulse. The pulse is first stretched from a width of 30 fs
to 500 ps, then is sent to a Q-switched Nd:YLF (Neodynium-doped yittrium lithium
fluoride) laser in a Ti:Sapphire rod. After several passes through the gain medium and
after the maximum energy is achieved inside the Q-switch laser cavity, voltage is applied

9
to a Pockels cell that initiates a cavity dump from the laser to produce a pulse with an
increased intensity by several orders of magnitude.14,15 The pulse is then recompressed to
a width of 40 fs at a central wavelength of 800 nm.
From the regenerative amplifier, the fundamental output is split 50/50 to produce
the pump and mid-IR probe beams for the time-resolved infrared system (TRIR). For the
UV-Visible probe system (TA), only 10% of the fundamental is used to produce the
probe beam. For both systems, in order to produce the pump, part of the fundamental is
sent to an Optical Parametric Amplifier16 (OPA) which produces two pulse beams, a
signal and idler that can be tuned to energies between 1150 – 1600 nm and 1600 – 2630
nm respectively. To produce pump energies in the visible region, a Sum Frequency
Generator (SFG) attachment or a UV/VIS attachment are utilized in conjunction with the
signal/idler output of the OPA. In the SFG attachment, a photon from the residual 800 nm
fundamental is combined with a photon from either the signal or idler from the OPA in an
SFG crystal. The energy of the resulting photon satisfies energy conservation, as seen in
Equation 1. In the UV/VIS attachment, the signal or idler output of the OPA is sent
through a doubling crystal that doubles the frequency/energy of that photon (ω1 = ω2).17
ω1 + ω2 = ω3 [Eq. 1]
ω1 – ω2 = ω3 [Eq. 2]
The OPA and attachments described above are capable of tuning the wavelength of the
fundamental (800 nm) to any wavelength between 245 – 1150 nm. For the TA system,

10
90% of the fundamental is sent through a specialty OPA with motorized controls that
contains SFG and doubling crystals within the amplifier.
For the TRIR system, the other 50% portion of the fundamental output is used to
produce the mid-IR probe beam. This is accomplished by combining a signal and an idler
output from an OPA in a Difference Frequency Generation (DFG) crystal. The crystal
angle, signal and idler energies determine the IR wavelength produced, through energy
conservation (Equation 2). By changing the DFG crystal angle, the probe region can be
tuned to different mid-IR ranges. This crystal can produce wavelengths from 900 – 4000
cm-1 with a bandwidth of 80 – 200 cm-1. From the DFG, the probe beam travels through a
Germanium beam splitter to produce the probe beam and a reference beam that are
separated by 5 mm at the sample. At the sample, the probe beam and pump beam overlap,
where the pump excites the sample to some excited state, and at some time delay the
probe interrogates the excited state. The time delay is introduced by sending the pump
beam through a delay stage, so a pump pulse can arrive at the sample earlier with respect
to a probe pulse. The probe then travels to the detector which consists of a grating and
HgCdTe (MCT) array detector that consists of 32 x 2 pixel array. The detector is cooled
to liquid N2 temperature to prevent thermal noise. The pump and probe beams cross at
30° to reduce pump scattering from entering the detector.
Generation of the probe beam in the TA system is carried out by focusing 10% of
the fundamental to a CaF2 white light continuum crystal where a supercontinuum of
while light is produced. The continuum is split into a probe and reference beam by using
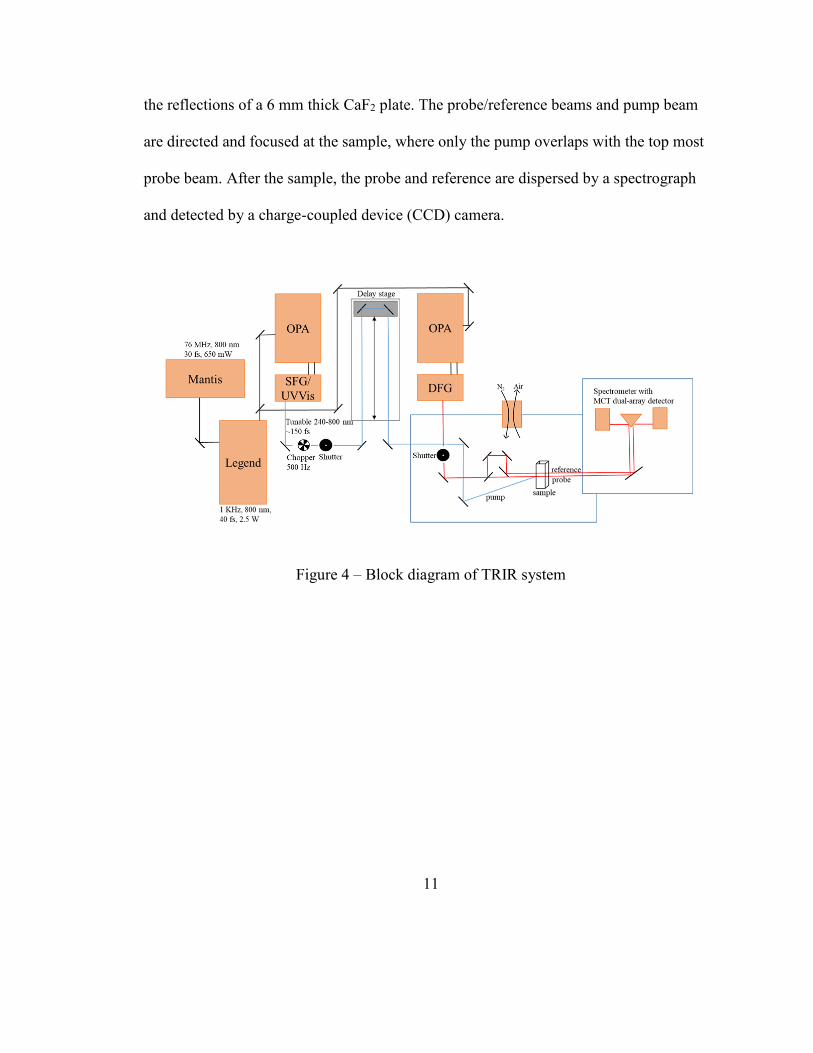
11
the reflections of a 6 mm thick CaF2 plate. The probe/reference beams and pump beam
are directed and focused at the sample, where only the pump overlaps with the top most
probe beam. After the sample, the probe and reference are dispersed by a spectrograph
and detected by a charge-coupled device (CCD) camera.
Figure 4 – Block diagram of TRIR system

12
Figure 5 – Block diagram of TA system
The spectrum produced by TRIR or TA is a result of a ground state subtraction of
the unpumped reference signal from the probe signal. A spectrum is graphed as ΔOD
(optical density) (Equation 3) vs. wavelength (cm-1).
[Eq. 3]

13
In Equation 3, Iprobe and Iref refer to the intensity of the signal collected from the
probe or reference beam. The second portion of the subscript refers to whether
pump/probe is on. In the case for the first intensity ratio, both the pump and probe are on
and for the second intensity ratio, the pump is off, while the probe is on. The second
intensity ratio, with the pump off, can correct for shot-to-shot noise. This process is
important because the change in optical density that is being studied is quite small.
The pump and probe are able to be turned on and off (as seen in Equation 3) by
the use of shutters and choppers as seen in the block diagrams, Figure 4 and Figure 5. An
unchopped probe pulse is sent to the sample about once every millisecond. Every other
millisecond the chopped pump beam is sent to the sample. This way every other probe
pulse interrogates the excited sample, while all other probe pulses interrogate the ground
state.
There are two types of signals to interpret from a spectrum: a ground state (GS)
bleach or excited state (ES) transient as seen in Figure 6. Conceptually, a ground state
bleach is a negative ΔOD value, which means the pump has excited some amount of the
ground state electrons to some higher energy excited state. Less of the probe will be
absorbed by the ground state because it is not as populated due to the pump, and this
results in a negative change in optical density. Conversely, an excited state transient
results in a positive ΔOD feature. This is produced by the pump exciting some electron to
a new electronic excited state which will give rise to a new absorptions within the excited
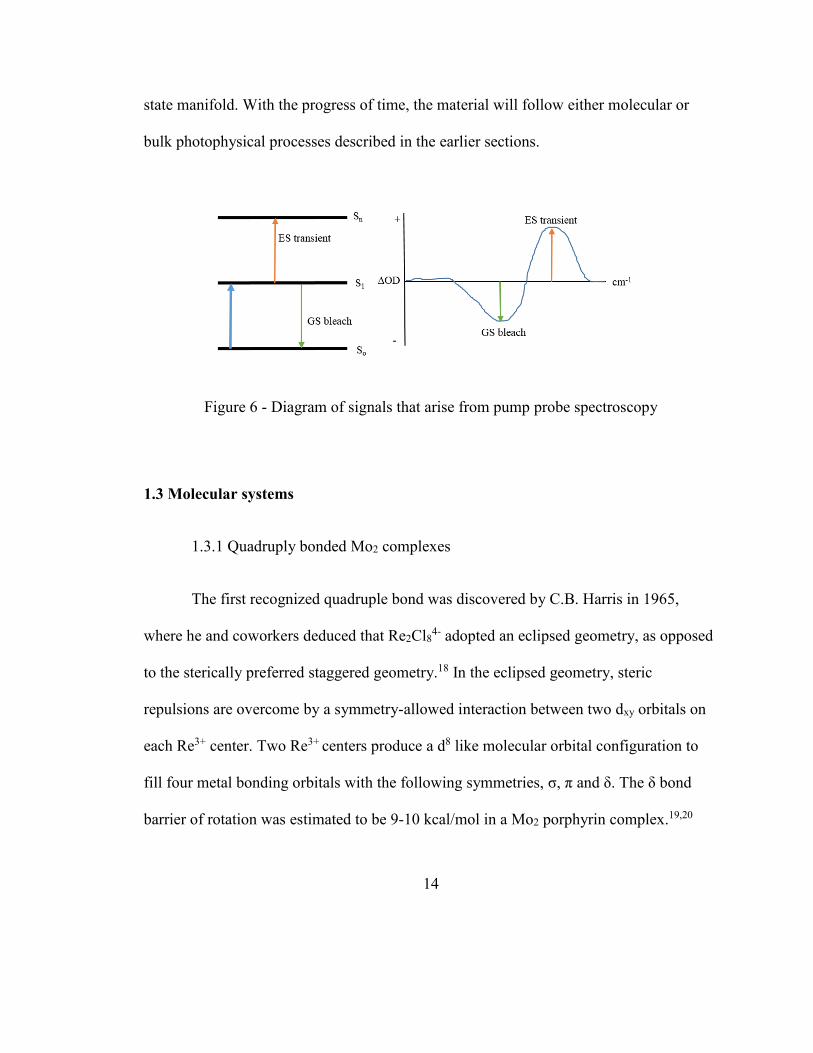
14
state manifold. With the progress of time, the material will follow either molecular or
bulk photophysical processes described in the earlier sections.
Figure 6 - Diagram of signals that arise from pump probe spectroscopy
1.3 Molecular systems
1.3.1 Quadruply bonded Mo2 complexes
The first recognized quadruple bond was discovered by C.B. Harris in 1965,
where he and coworkers deduced that Re2Cl84- adopted an eclipsed geometry, as opposed
to the sterically preferred staggered geometry.18 In the eclipsed geometry, steric
repulsions are overcome by a symmetry-allowed interaction between two dxy orbitals on
each Re3+ center. Two Re3+ centers produce a d8 like molecular orbital configuration to
fill four metal bonding orbitals with the following symmetries, σ, π and δ. The δ bond
barrier of rotation was estimated to be 9-10 kcal/mol in a Mo2 porphyrin complex.19,20

15
Generalized molecular orbital diagrams for a Mo2 tetracarboxylate and Mo2
tetraamidinate are presented in Figure 7. The bonding orbitals involve two Mo2+, d4 metal
centers and leads to the filling of a σ2π4δ2 which come from the interactions of dz2, dxy,yz
and dxy atomic orbitals respectively. The lowered electronegativity in the amidinate type
ligand splits the δδ* combination more compared to the tetracarboxylate due to increased
metal ligand mixing.21
Figure 7 - Frontier molecular orbital diagram for a Mo2 quadruply bonded complex
embraced by (left) four carboxylates (right) four amidinates, Adapted from reference22

16
The lowest lying electronic transition in the original Re2Cl82- complex involved
promoting an electron from a δ orbital to a δ* orbital to form a metal centered 1δδ* state.
The absorptivity of this transition is low in the range 10-100 M-1cm-1. The addition of
carboxylate or amidinate ligands to the complex, introduces low lying π* orbitals. These
types of complexes exhibit intense MLCT transition involving the Mo2 δ bond and ligand
π* orbitals. The absorptivity increases to 10,000 – 50,000 M-1cm-1. The MLCT typically
occurs in the visible region and can be tuned anywhere from 400-1000 nm depending on
the extent of conjugation on the ligand and identity of the metal (Mo or W).23
The presence of carboxylate or amidinate ligands embracing a Mo2 core brings up
the concept of metal ligand π-backbonding. Typically, metal carbonyls (M(CO)x) are
used as the case study where the ligand, CO, has poor ligand basicity, yet behaves as a
strong field ligand. This phenomena is due to the synergistic σ-donation, π-backbonding
capabilities of CO.24 Cyanide, CN-, can also exhibit π-backbonding because it is
isoelectronic to CO and has identical orbital symmetries.25 These ligands have two
bonding interactions with metals (1) ligand-to-metal (lone pair on CO donation to metal d
with σ symmetry) and (2) metal to ligand (filled metal d to ligand π* with π symmetry).
The two bonding interactions are presented in Figure 8.

17
Figure 8 – Cooperative orbital interactions in a metal carbonyl
The π-backbonding interaction involves a filled metal d orbital (from t2g set) to a
π* of CO. This interaction places electron density from the metal back on to the ligand
and weakens the C≡O bond due to population of the L π*. Conceptually, the more
electrons on the metal should increase the π-backbonding interaction. If the σ-donation of
the carbonyl carbon is strong, the metal has more electron density to π-backbond to the
ligand. This is the reason this phenomena is considered synergistic or cooperative. The
weakening of the CO triple bond can be monitored experimentally using infrared
spectroscopy. Free carbon monoxide has a ν(CO) frequency at 2143 cm-1. When
complexed to a metal, the ν(CO) lowers in energy due to π-backbonding and weakening
of the C≡O triple bond. The extent of backbonding depends on the electronegativity of
the metal and energy matching of the d-orbitals and L π*. In a heteroleptic complex,
backbonding in CO also depends on the other ligands associated with the metal center. If

18
other ligands with strong σ-donation behavior are present in a complex, ν(CO) will
weaken due to the increased electron density on the metal to participate in π-back
donation. If the other ligand is a more effective π-backbonding ligand, it will compete
with CO and ν(CO) will strengthen.26
Many research groups utilize the π-acceptor, CO, and its ligand analogs such as
CN-, NO and pyridyl derivatives, in organometallic chemistry studies as early as the
1970’s.27–29 The concept of π-backbonding can also be applied to Mo2 paddlewheel
complexes, where instead of interacting with metal d orbitals, this interaction involves the
in- and out-of-phase combinations of the Mo2 δ molecular orbital that is a symmetry
match with the carboxylate (or amidinate) L π*. In a homoleptic carboxylate,
Mo2(O2C-L)4 with D4h symmetry, the Mo2 δ and δ* orbitals transform as b2g and b1u
respectively.30 The symmetries of relevant carboxylate π-orbitals involved in bonding are
also depicted in Figure 9. The π orbitals on carboxylate transform as a2g, eu and b2g. The
carboxylate π* orbitals also transform as a2g, eu and b2g.31,32
Important interactions
according to symmetry, orbital energies and overlap involve b2g filled Mo2 δ and the CO2
π and π* combinations of b2g symmetry. These interactions results in in-phase and
out-of-phase combinations of metal – ligand mixing, as seen in Figure 9. The more
relevant interaction is the L π* combination due to its orbital energy near the LUMO and
intimate involvement with photoexcitation, while the L π combination is deeply
stabilized. The extent of backbonding and orbital mixing influences the degree of
electronic coupling that the Mo2 center can mediate. If the oxygen atoms of the

19
carboxylate are replaced by NR groups (as in amidinate ligands), the π bonding and
non-bonding p orbitals will occur at higher energy due to the decreased electronegativity
of N vs. O. This raised energy is a better match to interact and mix with the Mo2 δ and δ*
resulting in a larger splitting between these two orbitals. This phenomena is observed in
Figure 7 and Figure 14.
Figure 9 – CO2 orbital symmetries and frontier MO diagram of a trans Mo2 complex
highlighting the back-bonding interaction between Mo2 δ and carboxylate π*, adapted
from reference23,31,33
The π-backbonding phenomena and electron density sensitivity of Mo2
carboxylate and amidinate complexes can be exploited by using -CO2 and –CN2
embracing groups as an infrared probe in ultrafast vibrational spectroscopy experiments.
Upon photoexitation into the 1MLCT or intersystem crossing to a 3δδ* state, electron

20
density will affect the π-backbonding interaction. Using TRIR we can monitor the
changes in symmetric and asymmetric ν(CO) or ν(CN) frequencies and draw conclusions
of electron delocalization in the excited state.31,34 Mo2 paddlewheel complexes embraced
by carboxylate or amidinate ligands are model tunable systems for exploration of
photophysical behaviors on the ultrafast timescale.
1.3.2 Mononuclear tripyrazyol borate iron (III) cyanide complexes
Photomagnetism in iron-cobalt clusters and its family of small molecule magnets
has been fascinating area of research for years. These coordination compounds have been
studied for their metal centered electron transfer and spin-crossover (SCO) dynamics.
Photoswitchable molecules are attractive to spectroscopists particularly with the
discovery of the light-induced excited spin-state-trapping phenomena (LIESST).35,36
Prussian blue is composed of a Fe/Co network, bridged by cyanide anions, and exhibits
thermally induced metal-to-metal electron transfer and switchable magnetic properties.
At high temperatures, the system exists as a paramagnetic species FeIIILS – CN – CoII
HS
and at low temperatures, an electron is transferred from cobalt to iron to produce a
diamagnetic species FeIILS – CN – CoIII
LS (where LS is low spin and HS is high spin).
A simplified frontier orbital representation of the d-electrons of a Fe/Co network
is presented in Figure 10. Cyanide is an ambidentate bridging ligand. The C end of
cyanide is an efficient σ-base and π-acid. It has been shown through single crystal X-ray
diffraction that iron preferentially binds to the cyanide carbon and less so to the cyanide

21
nitrogen.37 Shorter bond lengths between Fe2+ – C vs. Fe2+ – N were observed, indicating
stronger synergistic ligand binding by the cyanide carbon to iron. CN- is also a strong
field ligand due to the presence of σ and π interactions as described in previous
sections.25,38The strong field environment around iron keeps the electron configuration in
a low spin state whether iron is in a +2 or +3 oxidation state.35 The cyanide nitrogen side
of the bridging ligand is a less effective σ-base and π-acid than the carbon side, therefore
the ligand field around cobalt is weaker. The smaller octahedral d-splitting, ∆o, competes
energetically with spin pairing, so conversion between high spin and low spin electron
configurations are possible.39,40
Figure 10 – Representation of the 3D structure and charge transfer process of Co-Fe
Prussian Blue analogs. Adapted from reference41
The process of thermally converting between high spin and low spin complexes is
referred to as spin crossover (SCO) and was first observed in 1931.39 This discovery led

22
to the extensive studies of Prussian blue analogs and their SCO and magnetic
susceptibility properties. In 1984, a d6 iron (II) complex was observed to undergo spin
crossover without thermal heating. This was the first instance of light-induced excited
spin state trapping.42,42 The process involves two intersystem crossing events from the
excited state (1T1 3T1 ; 3T1 5T1).
43–45 although intersystem crossing and subsequent
triplet relaxation occurs on a slower timescale, femtosecond spectroscopies can still
reveal details about the transient excited state and determine what characteristics might
produce efficient LIESST.
SCO has been studied using some ultrafast techniques such as TA,46 IR and
Raman,47 X-ray diffraction,48 and X-ray absorption near edge structure.41 A Fe/Co
Prussian blue complex was investigated by ground state infrared spectroscopy, using the
bridging CN- as an IR reporter. The ν(CN) occurs at a higher energy as the paramagnetic
species and shifts to lower energy in the diamagnetic species.35,41 The cyanide ligands
present in the building block of small molecular magnets allow for a vibrationally active
window for spectroscopists to use to gain insight into the photoexcited state.
1.4 Crystalline systems
1.4.1 Hybrid perovskites
Hybrid organic-inorganic perovskites have emerged as an attractive class of
materials for photovoltaic devices due to their ease of production, high absorption

23
coefficients, tunable band gaps, broad absorption, long charge carrier diffusion lengths,
and high power conversion efficiencies that are comparable to conventional
polycrystalline silicon solar cells.49,50 Perovskite based solar cells were first reported with
3.8% efficiency in 2009, but within a decade this has been improved to its latest record of
23.7%.51–55 With this fast progress, a great opportunity arises to fully understand
perovskite structure-property relationships that are critical in determining photovoltaic
performance and reproducibility. Time-resolved optical spectroscopic techniques can be
used to understand carrier and lattice dynamics on an ultrafast timescale. Photophysical
processes such as bulk, trap-state assisted recombination, Auger recombination, and
phonon coupling are being studied in order to better understand the nature of the charge
carrier state of devices and how these characteristics relate to their quality and
performance.53,56–58
The perovskite family of materials all form the same type of crystal structure to
calcium titinate, CaTiO3, which is a naturally occurring perovskite structure. Perovskites
currently being studied by chemists are diverse in their compositions. The common
perovskite architecture is of a formula ABX3 where the A-site is a cation, organic or
inorganic, B is typically Pb2+ and X is a halide anion.59 Depicted in Figure 11, the APbX3
general perovskite structure consists of a Pb-X network of corner sharing octahedra with
A-site cations situated in the cavities of the framework. Hybrid organic-inorganic
perovskites consist of an organic moiety for the A-site cation or X-site anion. In this

24
work, we compare behaviors of hybrid perovskites with organic A-site cation exchange
to the all inorganic perovskite.
Figure 11 - APbX3 perovskite structure where the inorganic framework is comprised of
an infinite network of corner connected PbX6 octahedra. The A-site cation occupies the
center of the cage surrounded by 12 halide ions60
The perovskites under study in this work are direct-bandgap semiconductors.
Their bandgaps are determined by the halide, X, identity due to the strong contribution of
X p to the valence band. The projected density of states61 predicts the valence band is
mainly X p in character with some Pb 6s mixing and the conduction band consists of a

25
mixture of Pb 6p and other orbitals (hybridized with small degree of 5p of X). In general,
the A-site species contribute weakly to the bandgap energy. Distortions of the framework
by hydrogen bonding or van der Waals interactions can influence the crystal packing and
thus influence the bandgap weakly.59,61
Crystal structure directly influences electronic properties, specifically
carrier-phonon scattering and transport. It has been reported that free carriers are strongly
coupled to the phonons of the crystal lattice.62–64 It has been hypothesized that polarons
have an important role in the photoexcited state of these materials where electrons and
hole separate after excitation forming localized carriers. Since free carrier absorption is
intense in the mid-IR region, we propose to use TRIR to investigate these materials.
The advantage of infrared vs. visible probes in pump probe experiments is that
changes in infrared absorption can give us insight into what specific bonds and chemical
moieties involved in an excited state process. TRIR has been utilized in numerous
molecular applications such as reactive organic species,65 organometallic light
absorbers,34 and biological catalytic metal centered enzymes.66 The technique TRIR can
monitor of the bond vibrations of the organic A-site cation in a hybrid perovskite system
as well as interrogate free carrier absorption often observed in the mid-IR region
simultaneously.

26
1.4.2 Donor-Acceptor columnar liquid crystals
Simply, a liquid crystal (LC) is a mesophase or state of matter that has properties
between both a liquid and solid crystal. At a certain temperature range, a liquid crystal
material may flow similarly to a liquid, but also have long range order or orientation
similar to a crystal. Driven by intermolecular forces, LC self-assembly is attractive to
material chemists as a new class of anisotropic materials.67 Above the LC temperature,
thermal energy overcomes the intermolecular forces that dictate long range order, thus
the material will be isotropic. Like any state of matter, the transitions between liquid and
mesophase, solid and mesophase or even mesophase and mesophase have corresponding
phase transition temperatures and enthalpies of transitions.68,69
Columnar liquid crystals (CLC) are a class of LC that contain rigid, disk-shaped
molecular components that self-assemble under the influence of intermolecular
interactions such as π- π stacking of ring cores. The ring stacking is counterbalanced by
thermal motions of added long alkyl chains, which will result in a stacked long range
structure, giving to its name columnar liquid crystal (previously referred to as a discotic
phase).70,71 The alignment of ring faces in CLC results in an overlap of p-orbitals of the
aromatic carbon atoms, generating delocalized π states. Transport of electrons can take
place along over lapping LUMO orbitals of neighboring molecules, similar to that of a
conduction band-like structure, while transport of holes occur along overlapping HOMO
orbitals, similar to the analogous valence band. The long range order in CLCs enable the
HOMO-LUMO combinations of the molecular unit to produce the valence and

27
conduction band semiconductor-like structure of a liquid crystal. The reported ranges of
electron mobility of organic crystal semiconductor systems are as high as 60 cm2V-1s-1
(compared to 1400 cm2V-1s-1 for single crystal silicon).71
The anisotropy of electron transport has been measured in triphenylene
derivatives where electrical conductivity was 1000x more intense parallel to the columnar
stacking vs. perpendicular to the stacking.72 Unique to columnar LCs, electron transport
can only occur along the axis of π- π stacking and not neighboring columns. In the liquid
crystal state, overlap of p-orbitals is weak, so electron transport can be better described as
exchange of charge carriers between localized states and single molecular components of
the column.
The hopping method can be described by Marcus theory.73,74 Typical outer-sphere
electron transfer explained by Marcus theory applies solvent response to stabilize the
negative charge on an acceptor group in a solution phase system. Here, in a mesophase
material, solvent is not available for reorganization. Instead distortions of the lattice or
creation of small polarons can shield the new charge thus stabilizing the electron transfer
product. The electron transfer process between two neighboring molecules is facilitated
by the coupling of molecular vibrations of the two molecules. The energy barrier between
molecules, preventing the charge transfer process is directly related to the reorganization
energy relating to the deformation response of the lattice or creation of a small polaron to
shield the new charge. The quality of crystallization of a frozen liquid crystal or

28
disordered liquid crystal affects the concentration of trap states or domain boundaries that
will prevent efficient electron transfer.75
Donor-acceptor systems have been extensively used in molecular-scaffolds where
π-rich (donor) and π-deficient (acceptor) aromatic molecules interact and stack by π- π
interactions.76 With alignment of HOMO-LUMO levels of the donor and acceptor, a
non-covalent electron transfer can occur between the molecules sometimes referred to
charge transfer or electron transfer. The orbitals involved in a CT transition involve the
HOMO of the donor and LUMO of the acceptor. This is not to be confused with energy
transfer, where the emission energy of the donor typically overlaps with the absorption
energy of the acceptor. The emergence of a lower energy charge transfer band in the
visible region observed in donor-acceptor systems is attractive to the photovoltaic
community as a photosynthesis mimic.77–79
1.5 Summary of chapters
The introduction of this dissertation gave a brief explanation of the motivation of
the document and how we propose to use TRIR and ultrafast spectroscopy to learn more
about photophysical processes involved with several molecular and semiconductor
systems. Chapter 2 explores the different methods and experimental details utilized in the
studies set forth in this dissertation. The purpose of Chapter 3 is to explore the
photophysical properties of Mo2 quadruply bonded complexes in the context of solar
energy conversion using ultrafast spectroscopies. Chapter 4 explores two series of

29
perovskites: MAPbX3 (where X = Cl-, Br- or I-), APbBr3 (where A = MA+, FA+ or Cs+)
and discusses perovskite photophysical behaviors in the form of pellets and thin films
using time resolved infrared spectroscopy. Chapter 5 will discuss the photophysical
behaviors of a series of cyanide bound iron (III) complexes with varying degree of
ancillary ligand donor strengths while utilizing cyanide as a sensitive IR probe. Chapter 6
will investigate the CT state of a frozen state DACLC system using TRIR. The presence
of two unique CT absorption bands lends itself to exploration into the differences that
may arise from absorption into to either of these two state. And finally, chapter 7 will
serve as a perspective of the entirety of this work and discuss future project directions.

30
Chapter 2: Methods and Materials
2.1 General Experimental
Reactions were performed either using standard Schlenk line or glove box
techniques. Air-free sample and reaction manipulations were performed under ultra-high
purity argon gas on a Schlenk line or under nitrogen inside a glovebox. Chemicals,
reagents and solvents were purchased from Sigma Aldrich Co. Solvents were dried by
solvent purification system or solvent still. Solvents were stored in large flasks with
Kontes tops with 4 Å molecular sieves. Before use, solvents were degassed using vacuum
techniques prior to introduction to the Schlenk line or glove box.
2.2 Compound purity analysis
Nuclear Magnetic Resonance (NMR) analysis was performed on either a 250
MHz or 400 MHz Bruker DPX spectrometer to evaluate compound purity. NMR samples
were prepared in DMSO-d6 , THF-d8, chloroform-d or d3-acetonitrile depending on
compound solubility. Reusable J-Young NMR tubes were utilized for air-sensitive
samples. Proton NMR spectra were recorded in parts per million (ppm) relative to the
protio impurity of the solvent.
31
Maldi-assisted laser desorption ionization time-of-flight (MALDI-TOF)
spectroscopy was also utilized to evaluate sample purity. Mass spectra were collected on
a Bruker Microflex in positive ion mode. Samples were prepared in a glove box where a
matrix consisting of dithranol was co-dissolved with the sample of interest. A drop of the
mixture was placed onto a target plate. Then the solvent was allowed to dry before
analysis. To limit the sample’s exposure to air, the plate was transported to the instrument
via screw top container. During transfer from the container to the MALDI plate chamber,
a steady stream of nitrogen was applied to the target plate surface via Tygon tubing.
2.3 Film preparation
Substrates consisted of 1mm x 25.4 mm Ø UV grade CaF2 windows. Prior to use,
substrates were roughened with a fine polishing sandpaper (1500 grit). A Ni-Lo Scientific
spin coater was implemented for deposition of prepared solutions, using 2500 rpm, a 250
rpm/s acceleration, and a total spin time of 40 seconds. Substrates were preheated to 75
°C on a hotplate. Once the substrate reached top speed, approximately 8 drops of
solution was deposited. The substrates were returned to the hot plate to be annealed for
30 minutes. The samples were then washed with fresh isopropanol, dried with a light
stream of nitrogen, and then annealed for 30 minutes at 100 °C in an oven.
X-ray diffraction (XRD) was used to confirm crystallization of the desired crystal
phases. XRD patterns were collected by a Bruker D8 Advance X-ray Powder

32
Diffractometer (40 kV, 40mA, sealed Cu X-ray tube) equipped with a custom sample
holder. Rietveld refinements were completed using TOPAS-Academic software package.
Film preparation and analysis was expertly performed by Dr. Eric T. McClure.
2.4 Computational Methods
Energy optimizations on model complexes in the gas phase were conducted using
density functional theory (DFT) with the Gaussian09 suite of programs.80,81 Calculations
for molybdenum containing compounds utilized the B3LYP functional with 6-31G* basis
set for lighter atoms such as C, H, N, and O. For heavy atoms such as Mo, the
Stuttgart/Dresden (SDD) energy-consistent pseudopotential and SDD basis set was
applied to model the core electrons.82,83
Vibrational frequency analysis was performed to aid in the interpretation of
ground state IR spectra. Time dependent DFT (TD-DFT) calculations were performed to
predict the extent of orbitals involved in electronic transitions. Isosurfaces of molecular
orbitals were produced using GaussView84 with an isovalue of 0.02.
2.3 Electrochemistry
Electrochemical experiments, such as cyclic voltammetry (CV), were performed
with a Pine Research Instruments Wavenow potentiostat-galvanostat inside of a glovebox
under positive pressure of nitrogen gas. The electrode, obtained by Pine research,

33
consisted of a platinum working and counter electrode imbedded on a ceramic plate. A
silver wire functioned as a pseudo-reference electrode. Measurements were performed in
a 0.01 M solution of tetra-n-butylammonium hexafluorophosphate in THF as a
supporting electrolyte. CV experiments were scanned at a rate of 100 mV/s where the
oxidative and reductive waves were measure individually. Scans were repeated
consecutively to assess the reversibility of each couple. All potentials are referenced to
the FeCp2+/0 couple as an internal standard.
2.4 Steady State Instrumentation
2.4.1 Electronic Absorption
Ground state UV-Vis absorption spectra of compounds dissolved in solvent were
collect on a Perkin-Elmer Lambda 900 or Lambda 20 spectrophotometer. Samples were
measured in a quartz cuvette with a 1mm path length. A cuvettes equipped with a Kontes
top valve was utilized for air-sensitive samples.
UV-Vis absorption of thin-films was measured using a Perkin Elmer Lambda 950
Spectrometer with a 60mm InGaAs integrating sphere. The instrument was calibrated
using Labsphere SRS-99-010 certified reference standard and bare CaF2 substrate.

34
2.4.2 Electronic Emission
Emission spectra for compounds were collected using a SPEX Fluoromax-2
spectrophotometer. Samples were prepared into a 1.0 cm2 quartz cuvette dissolved in
THF for room temperature analysis and 2-methyl-THF for 77 K analysis.
2.4.3 FT-IR
Ground state infrared (IR) spectra were collected on a Perkin Elmer Spectrum 65
spectrometer in transmission mode equipped with a vertical sample holder. For liquid
samples, a Perkin-Elmer rectangular semidemountable cell with a 100 micron Teflon
spacer between two CaF2 (28 mm x 4 mm) rectangular windows was utilized. An IR
spectrum for a liquid sample was produced by subtracting the corresponding solvent
spectrum in order to identify vibrational signatures unique to the sample. IR spectra for
films on CaF2 substrates were collected with no preparation, but the resulting spectra
were baseline corrected.
2.5 Ultrafast Instrumentation
2.5.1 Transient Absorption
A femtosecond broadband UV-Vis Transient Absorption (TA) Spectrometer was
used to study excited state electronic absorption of various molecules and materials. The

35
home-built setup has been described previously.85 The system consists of a Coherent
Astrella laser package that includes a short pulse titanium-sapphire oscillator that seeds a
regenerative amplifier. The output of the regenerative amplifier is 800 nm, 8 mJ pulses
with a 1kHz repetition rate and 35 fs pulse width. The majority of the fundamental is split
to the pump path, while a small portion of the beam is sent to the probe path. The pump
or excitation pulse is generated by an optical parametric amplifier with computerized
controls (Coherent OPerA Solo). The pump beam is then directed to an optical delay line
that produces an experimental window between -100 and 4000 ps. The probe beam is
directed and focused onto a CaF2 white light continuum crystal (cut [001], where the
surface of the crystal is perpendicular to the [001] axis) on a rotating mount where a
supercontinuum of while light is produced. A 50 mm lens collimates the continuum. The
continuum is split into a probe and reference beam by using the reflections of a 6 mm
thick CaF2 plate. The probe and reference beams are focused at the location of the
sample, but only the pump beam is focused and overlapped with the probe beam at the
sample. The pump is focused to approximately 400 micron and the probe is focused to
300 microns. The angle between the pump and probe beam is 5°. The polarizations
between the pump and probe are set to the magic angle (54.7°) to reduce rotational
effects. After the sample, the probe and reference are dispersed on a Triax 550 (Jobin
Yvon, holographic grating, operating in 250-800 nm, 150 gr/mm) spectrograph and
detected by a PIXIS CCD camera (Princeton Instruments). The detection system
communicates with a home-built LabView program, which also controls the delay stage,

36
shutters and CaF2 rotation. The instrument response of the system is 85 fs, determined
from the optical Kerr effect in cyclohexane.
The pump pulse energy is about 4-6 mJ at the sample position. Samples are
prepared into a quartz cuvette with a 1 mm path length to a concentration of about 0.6
OD at the excitation wavelength. A quartz cuvette equipped with a Kontes top is utilized
for air-sensitive compounds. TA spectra are corrected for chirp or group velocity
dispersion (GVD) in the probe continuum after collection.
2.5.2 Time-Resolved Infrared Spectroscopy
Femtosecond time-resolved infrared (TRIR) experiments were performed using
an instrument described previously65,86 with some modifications. The system is
comprised of a Coherent Ti:sapphire oscillator (Mantis, 50 fs FWHM, full width half
maximum) that seeds a Coherent regenerative amplifier (Legend, 1KHz, 50 fs FWHM)
with an output of 2.5 W. The output is split between two optical parametric amplifiers
(OPA) which generate the pump and probe pulses separately. The pump pulses are
generated and tuned by an OPA with a tunable Sum Frequency Generation (SFG) or
UV-Visible (UV/VIS) attachment, filtered using dichroic mirrors and aligned to an
optical delay line to generate pump-probe time delays. All pump energies are optimized
to less than 1% deviation of power after the SFG/UVVIS module. After the optical delay
line, the pump is focused at the sample position with a spot size of approximately 500
37
micron. The average pump power at the sample position is adjusted to an experimental
range of 1 – 2 mW using irises and optical density filters.
The mid-IR probe pulses are generated with an OPA and difference frequency
generation (DFG) attachment that generates probe energies ranging from approximately
800 – 3500 cm−1. This OPA generates a signal and idler beam. The beams are separated
by a dichroic filter before being directed collinearly through a DFG module (DFG crystal,
EKSPLA; AgGaS2, Type II, θ=50°, φ=0°, 6x6x2mm, anti-reflective coated 1.1-25 μm
front, 2.6-11 μm back). The resulting mid-IR pulse has a typical energy of 3μJ and a
spectral FWHM of ~100 cm-1.86 The IR pulse is split with a germanium beam splitter
into a reference and probe beam. Only the probe beam overlaps with the pump at the
sample. The reference beam is approximately 5 mm below the probe beam and collects
ground state spectra. Pump and probe polarizations are set relative to one another at the
magic angle (54.7°) to eliminate rotational and reorientation effects.
After the probe and reference beams pass through the sample, they are spectrally
dispersed in a grating spectrometer (Triax 320) and imaged on a liquid nitrogen cooled
HgCdTe detector (2x32 elements with 17 nm resolution). Every other pump pulse is
blocked by a synchronized chopper (500 Hz) that is phase locked to the pulse train of the
amplifier. This generates the pump on/off measurements. Transient absorption or optical
density (ΔOD) signal at every time delay and pixel on the array are calculated using
Equation 3 from Chapter 1.

38
Energy resolution considerations occur at acquisition after the signal is collected
by the MCT detector. From the detector, the analog signal travels through 32 wires (one
wire for each pixel in the array) to be processed by boxcar integration. This is triggered
by a transistor-transistor logic (TTL) signal, so it has the same frequency and constant
phase relative to the laser pulse train. TTL triggering and duration is optimized by
adjusting the gating signal by a computer. The integrated signal continues to an
analog-to-digital conversion (ADC) and performed on all channels at a rate of 1 kHz. The
conversion is 16 bit from -10 V to +10 V. This provides an energy resolution of 3.1 ×
10−1 𝑉. A I0 signal level of 8 V will obtain a ΔOD resolution of 17 × 10−6. The digital
signal is then transferred to the computer for software (LabView) processing.86
Measurements were collected at different pump-probe delay times (up to 3
nanoseconds) using an optical delay line consisting of a computer-controlled, motorized
translation stage mounted with a retroreflector.
The data collected was in ΔOD. Spectra were collected at different pump-probe
delay times (up to 3 nanoseconds) using an optical delay line consisting of a
computer-controlled, motorized translation stage mounted with a retroreflector. Average
pump power was recorded between 1.0–1.5 mW at the sample position, with a pump
diameter of 500 microns. The instrument response FWHM is approximately 300 fs. All
experiments were performed at room temperature.

39
2.6 Kinetic decay analysis
Kinetic traces of ultrafast spectra with respect to time delay were analyzed with
various techniques to determine the time components involved with the signal decay.
Typically, a lifetime of a process is derived from a kinetic trace as an exponential (Ai
exp(−t/τi) , where Ai is amplitude and, lifetime τi). Observed kinetic traces can be more
complex and may be fit to a sum of discrete exponentials, where we consider the fit a
bi-exponential, tri-exponential, etc. Oftentimes with a homogenous sample, such as a
compound dissolved in a solvent, the kinetic analysis will converge to one or two
exponentials, with minimal error. The small error may be a consequence of the
homogenous nature of the sample where every molecule is in an identical solvent
environment and at a small enough concentration, molecules under study will not interact
with one another. In this case, an analysis using a discrete number of exponentials can
describe the data sufficiently.
Kinetic traces from heterogeneous samples, such as a thin film with many grain
boundaries, typically do not typically converge to meaningful time constants when
subjected to conventional kinetic analysis. The errors associated with each time constants
are often large and the discrete number of exponentials are not completely
straightforward. The Maximum Entropy Method87–89 is a powerful data analysis
technique that fits the kinetics to an ensemble of possible lifetimes or probability
distribution of lifetimes that may correctly fit the data. Typically 300 bins are sufficient
to account for heterogeneity and varied microenvironment of a sample. With a

40
conventional single kinetic analysis technique, the number of exponentials must be
dictated by the user, but in an MEM analysis, no a priori assumption is necessary to fit
the given data, nor is extra structure introduced to the data. With this method, unequal or
heterogeneous line broadening of a lifetime can be observed. As a point in its power,
MEM can converge to single lifetime with little variance the same way conventional
kinetic analysis will fit for a homogenous sample.
2.6.1 Conventional single kinetic analysis
Conventional analysis of kinetic data was analyzed using Igor Pro 7 and an
exponential fit function package. Excited state lifetimes were determined from kinetic
trace data by fitting transient or bleach features to a sum of exponential decays, 𝑆(𝑡) =
∑ 𝐴𝑖𝑒−𝑡
𝜏𝑖⁄ + 𝐶𝑖 , where Ai an independent amplitude, τi is the lifetime of process i, and C
is an offset.
2.6.2 Maximum Entropy Method
The Maximum Entropy Method macro package, Clementine,90 is available in Igor
Pro 7 program. MEM analyzes a data set by maximizing the function Q= λS−C where S
is an entropy-like function, λ is a Lagrange multiplier and the C term guarantees that the
solution is bound by χ2 statistic (C = (1
𝑛⁄ ) ∑ ( 𝑌𝑖 −𝑛𝑖=1 ∑ 𝐷𝑖
𝑘𝑎𝑘𝑁𝑖=1 )2/𝑌
𝑖 , where Yi is the
number of photons counted in the iith channel n is the number of channels and 𝐷𝑖𝑘 is a

41
convolution matrix). The entropy-like function used is Shannon–Jayes entropy and is
defined as S = −∑ 𝑎𝑖 log(𝑎𝑖 / 𝑎𝑡𝑜𝑡𝑁𝑖=1 ) where 𝑎𝑡𝑜𝑡 = ∑ 𝑎𝑖 and the ai variables are
pre-exponential factors in the model decay function, F(t), containing N terms or bins
where F(t) = ∑ 𝑎𝑖 ex𝑝(𝑡 /𝜏𝑖𝑁𝑖=1 ).

42
Chapter 3: Mo2 paddlewheel complexes and their application to dye sensitized solar cells
Work based on studies conducted under the guidance of Professor Malcolm H. Chisholm
at The Ohio State University
3.1 Introduction
In recent years, the solar energy field has been focused on achieving highly
efficient and stable devices. Since Grätzel’s groundbreaking discovery that launched
interest into dye-sensitized solar cells (DSSCs), TiO2 has been studied extensively for the
n-type photoanode compartment of DSSCs.91 Components such as the anchoring group,
electron donor and acceptor system of the dye-sensitizer can be studied to optimize and
generate more efficient solar cells. Ultrafast pump probe spectroscopies are powerful
techniques to study the dynamics of dye-sensitized systems upon photoexcitation. The
electron dynamics that occur at the dye and semiconductor interface can be monitored
and then associated with the dye’s structure. Previous studies have been conducted on
cis-dimolybdenum (Mo2) heteroleptic compounds in their application to the DSSC
community by studying charge injection into TiO2.92 This family of molecules makes an
excellent material to study due to its well-studied transient spectrum, long lived singlet

43
metal-to-ligand charge transfer (MLCT) excited state and ease of functionalization. In
this work, we incorporate a pyridine N-oxide electron acceptor anchoring group to the
dye which will also provide a vibrational mode, ν(NO), that can be monitored using
TRIR. Energy level considerations from oxidation-reduction potentials combined with
electron transfer kinetics can develop a structure-function relationship that will lead to a
more intelligent design of charge transfer systems and dye-sensitized devices.
Photon harvesting for the synthesis of fuels or direct production of electricity is an
attractive alternative due to the abundance of light.93 In more recent years, photon driven
chemical reactions have become a popular direction in chemistry. Dye-sensitized
photoelectrochemical cells (DSPECs) produce solar fuels, such as H2, in contrast to
dye-sensitized solar cells (DSSCs) which produce electrical current directly upon
illumination.94. The dye design is an essential component that can be optimized to
produce better performing devices.
Recently, tandem dye-sensitized systems have been designed that replace the
expensive platinum counter electrode with a dye-sensitized p-type photocathode thus
greatly reducing the cost of the device.95 A tandem design is also advantageous because
there are two photoactive working electrodes, as opposed to one.96 Electrons are
generated at the photoanode, while holes are generated at the photocathode and travel in
the opposite direction as seen in Figure 12. On the photocathode side, light will excite the
dye, D to D*, leaving a hole in the dye’s highest-occupied molecular orbital (HOMO).
An electron from the valence band of a p-type semiconductor, like NiO can fill this

44
vacancy. This is also referred to as hole injection. Consequently, D* will be reduced to
D- . An appropriate redox mediator can oxidize D- back to D, thus regenerating the dye.
On the photoanode side, light excites D to D*. The excited electron in the LUMO of D*
injects into the conduction band of an n-type semiconductor, like TiO2. This process
oxidizes D* to D+. The redox mediator will regenerate the dye. In either case, the redox
mediator may be replaced with a catalyst that can facilitate a chemical reaction.
Figure 12 - Energy level diagram of a tandem dye-sensitized photoelectrochemical cell
system. The photoanode is connected to the photocathode by an external circuit96
The work of Grätzel in the 1990’s established the field of photovoltaics that
utilizes ruthenium based inorganic-organic hybrid dyes on a nanostructured
semiconductor, TiO2.91 Unfortunately, ruthenium minerals are scarce and expensive.
This document utilize cis-Mo2 paddlewheel complexes as a highly functionalizable class
of hybrid dyes that act as the dye on the photoanode side of a photoelectrochemical cell,

45
much like ruthenium analogs introduced by Grätzel. This system provides an affordable
alternative to ruthenium based dyes without sacrificing electronic character and system
control.
Mo2 quadruply bonded paddlewheel complexes are a unique class of
organometallic molecules. They are distinctive because they exhibit long-lived charge
separated metal-to-ligand charge transfer singlet excited states (1MLCT), 100x longer
than current Ru based dyes.22,97 The absorbance spectrum of these molecules is tunable
by changing the identity of the coordinated ligands as well as replacing the Mo2 core with
one or two tungsten atoms. Enhancement of spectral coverage can be obtained by
conscientious design.98
The two types of template Mo2 complexes discussed in this document are
presented in Figure 2. The trans complex (1) of the first type is tetracarboxylate and
typically incorporates two conjugated carboxylate ligands, L and two unconjugated
carboxylate ligands, L’ (such as TiPB = triisopropylbenzoate, where the aryl group is
twisted ~90° from the carboxylate) to form heteroleptic Mo2L2L’2. When homoleptic
Mo2(TiPB)4 starting material is reacted with two equivalents of a conjugated carboxylic
acid, L, steric relief drives the reaction to replace two TiPB ligands with L so they are
trans to one another. Additionally, this geometry is thermodynamically preferred due to
the continuous conjugation of L-Mo2-L that stabilizes the molecule.22 This synthetic
scheme is exploited so the ligand type of interest, L, can be studied with little electronic
contribution from the ancillary ligand.99 The cis complex (2) of the second type utilizes

46
tetraamidinate Mo2 homoleptic starting materials to ultimately achieve non-trans
heteroleptic configurations. Preparation involves a salt metathesis reaction between a
di-cation, cis-Mo2(amidinate)22+ and the carboxylate anion (2 equiv), resulting in a
dicarboxylate-diamidinate coordination environment about the Mo2 core. Cis-geometries
are favored by the trans-influence, where amidinates are stronger trans directors
compared to acetonitrile, as seen in the cis-Mo2(amidinate)22+ salt crystal structure.7
Amidinate-type ligands are not as labile as carboxylates due to their less active
lonepairs,21 so upon addition a carboxylate anion, the amidinate ligands will remain in the
cis position.
Figure 13 - Comparison of trans vs. cis geometries in Mo2 complexes. 1 adopts a trans
geometry, where the ancillary ligands are TiPB = triisoproylbenzoate. 2 adopts a cis
geometry, where the ancillary ligands are DAniF = dianisoleformamidinate.

47
A frontier molecular orbital diagram of the ground state of a generalized Mo2
complex was presented in the introduction, Figure 7. Typically the HOMO is Mo2δ
based. The lowest-occupied molecular orbital (LUMO) is δ* but when conjugation in the
ligand is extended, the energy of L π* is stabilized below δ*, therefore changing the
LUMO to L π* based. The absolute energy of the HOMO is largely based upon the
environment around the Mo2 core, due to δ and ligand mixing. As a result, A
tetracarboxylate supported complex will have a more stable δ and δ* combination
compared to a tetraamidinate supported complex, due to the increased electronegativity
of oxygen.22,100 This work explores complexes that incorporate conjugated ligands with
low-lying π*. They exhibit intense absorption bands due to a fully allowed
HOMO-LUMO (Mo2 δL π*) MLCT, while masking the Laporte forbidden δδ*
transition. The LUMO and LUMO+1 of these complexes are the in-phase and
out-of-phase ligand π*combinations interacting with the symmetry allowed Mo2 δ
molecular orbital. The energy difference between LUMO and LUMO+1 is a measure of
electronic coupling between the two carboxylate ligands, with the Mo2 core acting as an
electronic mediator or bridge.22
48
3.2 Results and Discussion
3.2.1 Synthesis
Mo2(TiPB)4 homoleptic
The homoleptic paddlewheel complex of the carboxylate type, Mo2TiPB4 was
synthesized as a precursor to the trans heteroleptic series. A detailed procedure has been
published previously.99 Briefly, Mo(CO)6 was refluxed with 8 equivalence of TiPB-H
acid in 1,2-dichlorobenzene/THF for 3 days. The resulting solid was worked up with
toluene and hexanes in a glass frit under inert atmosphere.
Mo2(para-nicotinic-NOxide)2(TiPB)2 – trans complex (1)
Synthesis of trans type carboxylate complexes has been studied previously.99 Two
equivalences of isotonic acid N-oxide was introduced to Mo2TiPB4 in toluene. An
immediate color change indicated a ligand exchange, most likely due to the lability of
TiPB ligands. The trans geometry is preferred thermodynamically due to the continuous
conjugation of the added carboxylate ligands.22 The resulting mixture was reduced in
volume and worked up in hexanes to remove excess TiPB-H acid.
1HNMR (400 MHz, dTHF): δ = 8.29 (d, 4H, J = 8 Hz), 8.12 (d, 4H, J = 8 Hz), 7.04 (s,
4H), 3.06-3.00 (m, 4H), 2.93-2.86 (m, 2H), 1.24 (d, 12H, J = 8 Hz), 1.10 (d, 24H, J = 8
Hz)
MALDI-TOF: Calculated: 967.2 Found: 968 (M+)

49
See Appendix A for NMR and MALDI-TOF spectra.
Mo2(DAnif)4
The homoleptic paddlewheel complex of the amidinate type, Mo2(DAnif)4 was
synthesized as a precursor to the cis heteroleptic carboxylate amidinate series. A detailed
procedure has been published previously.21 Briefly, Mo(CO)6 was refluxed with 8
equivalence of DAniF-H acid in 1,2-dichlorobenzene/THF for 3 days. The resulting solid
was worked up with toluene and hexanes in a glass frit under inert atmosphere.
1HNMR (400 MHz, CDCl3): δ = 8.366 (s, 4H), 6.497 (d, 16H, J = 8 Hz), 6.156 (d, 16H, J
= 8 Hz), 3.697 (s, 24H) – See Appendix A - Figure 70 for NMR spectrum
[Mo2(DAnif)2(CH3CN)6][BF4]2 – cis dication
This complex is utilized as a dicationic cis intermediate to the final cis-heteroleptic
complex. A detailed procedure has been published previously.99 Briefly, approximately 6
equivalence of Me3OBF4 was introduced to a mixture of homoleptic Mo2(DAnif)4
complex in acetonitrile until the solid became completely dissolved and a red color
change was observed. The reaction mixture was reduced in volume and crystallized by
slow vapor diffusion of ether in order to obtain pure crystals of only the dicationic
complex to be utilized in subsequent synthetic steps.
1HNMR (400 MHz, CD3CN): δ = 8.713 (s, 2H), 6.729 (s, 16H), 3.727 (s, 12 H) – See
Appendix A - Figure 71 for NMR spectrum

50
Tetrabutylammonium (TBA) isonicotinate N-oxide
The cationic form of the ligand of interest must be used in the salt metathesis reaction
that produces the molybdenum dicarboxylate-diamidinate complex. The acid form,
isonicotinic acid N-oxide was reacted with 1.0 M tetrabutylammonium hydroxide in
dichloromethane. The resulting mixture was crystallized by layering with ether to provide
NMR pure crystals to be used in subsequent synthetic steps.
1HNMR (400 MHz, CDCl3): δ = 8.114 (d, 2H, J = 7 Hz), 7.914 (d, 2H, J = 7 Hz),
3.366-3.298 (m, 8H), 1.686-1.588 (m, 24H), 1.487-1.369 (m, 8H), 1.340-0.946 (m, 12H)
– See Appendix A - Figure 69 for NMR spectrum
cis - Mo2(pNicoNO)2DAnif2 (2)
The dicarboxylate-diamidinate complex was synthesized through a salt metathesis
reaction between [Mo2DAnif2][BF4]2 and two equivalence of TBA isonicotinate N-oxide
in acetonitrile. An immediate color change from red to purple was observed. The
resulting solution was reduced in volume worked up with hexanes and ether via
centrifugation.
1HNMR (400 MHz, CDCl3): δ = 8.485 (s, 2H), 8.182 (s, 4H), 8.026 (s, 4H), 6.642 (d,
16H, J = 12 Hz), 3.727 (s, 12H)
MALDI-TOF: Calculated: 983.1 Observed: 984 (M-H+)
See Appendix A for NMR and MALDI-TOF spectra.

51
TiO2 nanoparticle suspension (2@TiO2)
The attachment of cis - Mo2(pNicoNO)2DAnif2 (2) was carried out by preparing a
suspension of 25 nm TiO2 in CDCl3. This mixture was added to a solution of the dye in
situ, where an immediate color change of the particles was observed. The particles were
washed with CDCl3 until the supernatant ran clear. The dye bound particles were
suspended in CDCl3 for ultrafast analysis.
3.2.2 Electronic Structure Calculations
Density functional theory (DFT) was used to aid in the interpretation of electronic
spectra, electrochemical data and ultrafast analysis. In order to reduce computational
resources to the calculation, some simplification of the system was employed. For
compound 1, the O2C-TiPB ligands have been simplified to a formate group, O2C-H. It is
typical of trans type Mo2 complexes to exhibit a 90° rotation of the aryl ring system on
the bulky TiPB ligand from the rest of the carboxylate group. This conformation removes
the aryl ring from conjugation and blocks all electronic communication along the
direction of the TiPB ligands. This phenomena has been discussed previously.99 For
compound 2, the p-anisyl groups off the nitrogen formamidinate ligand
(anisole-NC(H)N-anisole) were also replaced with hydrogens (H-NC(H)N-H) to reduce
computational time. We will refer to the simplified complexes utilized in computations as
1’ and 2’ in subsequent sections.

52
A graphical representation of the frontier molecular orbitals and energy level
diagram for 1’ and 2’ (calculated from the gas phase) are shown in Figure 14. For
complex 1’, the HOMO is primarily Mo2 δ in character, with some pNicoNO, L,
contribution by the CO2 linkage. The LUMO is exclusively L π* in character with no
metal center contribution. At LUMO+2 we see another L π* with some metal Mo2 δ
contribution. The LUMO and LUMO+2 are the in and out of phase L π* interactions. The
Mo2 δ* energy appears between the two L π* interactions. For complex 2’, we see similar
orbital interactions. The HOMO is Mo2 δ in character with significant L mixing. LUMO
and LUMO+1 are the in and out of phase combinations of L π* and LUMO+2 is Mo2 δ*.
The HOMO for 2’ is destabilized by 1.20 eV compared to 1’. This is due to the higher
relative energy of the amidinate, NCN, in 2’, while 1’ combines with a more stable
carboxylate, CO2. This relative energy is clearly seen in the HOMO-1 and HOMO-2
ligand bonding orbitals for both compounds. The higher relative energy of the amidinate
also raises Mo2 δ* above the in and out of phase L π* combinations.

53
Figure 14 – Frontier molecular orbital diagram of 1’ (left) and 2’ (right) together with the
GaussView 5.0.8 isosurface (isovalue = 0.02) electron density contour plots of selected
frontier orbitals. Energy vs. vacuum
Time-dependent DFT calculations predict that the lowest energy allowed
electronic transition is the Mo2 δ to in-phase L π* or MLCT for both complexes. These
types of complexes also exhibit a higher energy Mo2 δ to δ* of lower oscillator strength
that will be masked by the more intense MLCT.
The energy difference between the in and out of phase L π* combinations is an
indication of degree of electronic communication or delocalization through the metal
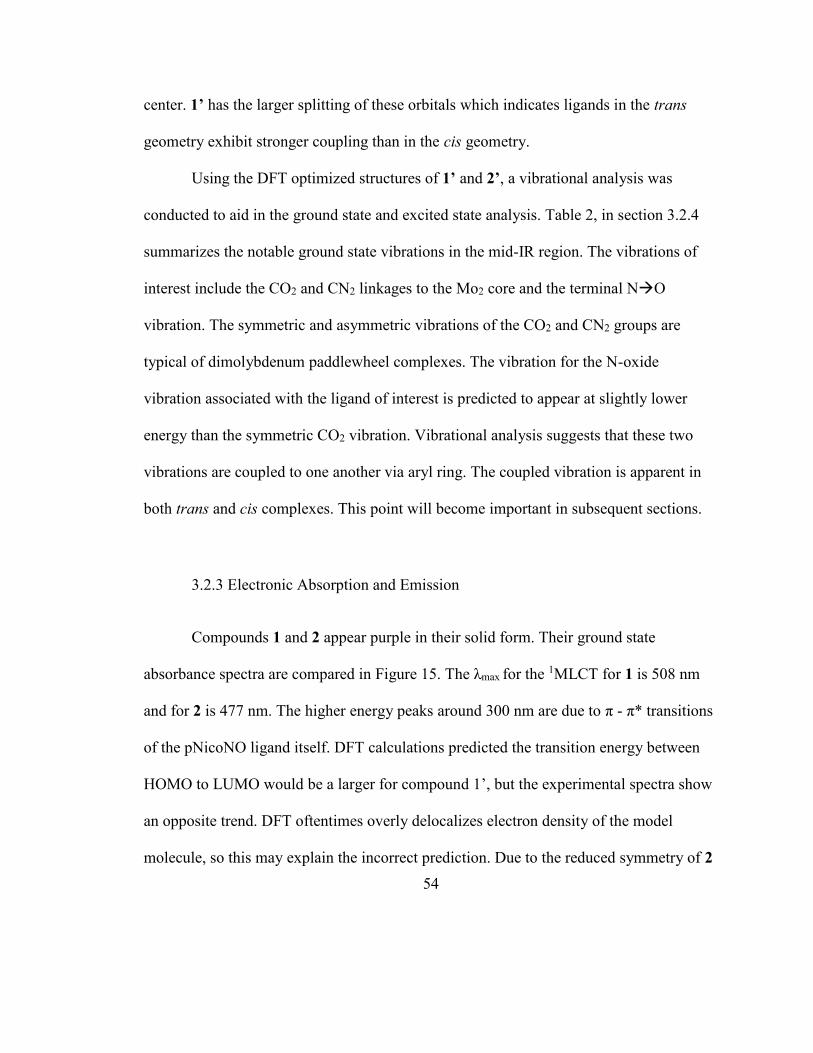
54
center. 1’ has the larger splitting of these orbitals which indicates ligands in the trans
geometry exhibit stronger coupling than in the cis geometry.
Using the DFT optimized structures of 1’ and 2’, a vibrational analysis was
conducted to aid in the ground state and excited state analysis. Table 2, in section 3.2.4
summarizes the notable ground state vibrations in the mid-IR region. The vibrations of
interest include the CO2 and CN2 linkages to the Mo2 core and the terminal NO
vibration. The symmetric and asymmetric vibrations of the CO2 and CN2 groups are
typical of dimolybdenum paddlewheel complexes. The vibration for the N-oxide
vibration associated with the ligand of interest is predicted to appear at slightly lower
energy than the symmetric CO2 vibration. Vibrational analysis suggests that these two
vibrations are coupled to one another via aryl ring. The coupled vibration is apparent in
both trans and cis complexes. This point will become important in subsequent sections.
3.2.3 Electronic Absorption and Emission
Compounds 1 and 2 appear purple in their solid form. Their ground state
absorbance spectra are compared in Figure 15. The λmax for the 1MLCT for 1 is 508 nm
and for 2 is 477 nm. The higher energy peaks around 300 nm are due to π - π* transitions
of the pNicoNO ligand itself. DFT calculations predicted the transition energy between
HOMO to LUMO would be a larger for compound 1’, but the experimental spectra show
an opposite trend. DFT oftentimes overly delocalizes electron density of the model
molecule, so this may explain the incorrect prediction. Due to the reduced symmetry of 2

55
(C2v in 2 vs D2h in 1), both the in and out of phase L π* transitions are accessible, with an
energy difference of 0.11 eV, according to TD-DFT. While both compounds 1 and 2
exhibit fully allowed HOMOLUMO MLCTs, 2 exhibits an additional allowed
HOMOLUMO+1 transition, involving the out-of-phase L π* molecular orbital. This
phenomena presents itself as the observed MLCT peak broadening for compound 2.
Figure 15 – Electronic absorption spectra of 1 and 2 collected in THF at room
temperature where MLCT peak normalized to 1
Steady state emission spectra for compounds 1 and 2 were obtained at room
temperature and 77 K. The samples were irradiated into their MLCT with 500 nm light
for 1 and 480 nm for 2. The spectra are presented in Figure 16. Absorption spectra are

56
combined with emission spectra in Figure 17 and all peak maxima are summarized in
Table 1. At room temperature, both compounds show weak singlet emission from the
1MLCT. The Stokes shift observed for 1 is ~4500 cm-1 and ~6000 cm-1 for compound 2.
The cis compound, 2, also exhibits observable room temperature phosphorescence, while
1 does not. Upon cooling to 77 K, the trans compound, 1, shows measurable
phosphorescence. Previous studies in these types of dimolybdenum complexes have
shown that phosphorescence occurs from a 3MoMoδδ* state, due to the presence of
vibronic features that are separated by the ν(MoMo) at ~400 cm-1-. Although, vibronic
features are not apparent in the measured emission, the energy at which they emit is
consistent with typical phosphorescence in dimolybdenum complexes.

57
Figure 16 – Emission spectra of 1 (top) and 2 (bottom) at room temperature and 77 K. λex
= 480 nm (1) and 500 nm (2)
Figure 17 - From left to right: Absorption, steady-state singlet and triplet emission spectra
of compounds 1 (blue) and 2 (red). Emission spectra were measured at 77 K in
2-methyltetrahydrofuran. λex = 500 nm (1), 480 nm (2)

58
Table 1 - Summary of electronic and electrochemical data for trans-(I) and cis-(II) Mo2
para-isonicotinate N-oxide complexes.
aDetermined from peak of absorbance or emission spectrum
3.2.4 Vibrational Spectroscopy and Characterization
Ground state infrared studies were conducted on the two complexes to aide in the
ultrafast time-resolved infrared analysis. Firstly, Figure 18 shows the ground state IR
spectra for compounds 1 and 2 in their free form, dissolved in THF and CDCl3
respectively. We must consider the solvent window and solubility of the complexes when
choosing an appropriate solvent system for infrared studies. Sample solutions must be
made concentrated enough to produce sufficient vibrational absorbance with a 100
micron path length. Table 2 summarizes the calculated vibrational energies for DFT and
the experimental energies. The energy of the NO vibrational band is consistent with a
N-oxide with considerable double bond character, N=O, where previous studies have
observed N-oxide single bond101 vibrational bands ~1250 cm-1 and N-oxide double

59
bond102 vibrational band ~1400 cm-1. The disappearance in the intense νs(CO2) is
apparent in comparing 1 and 2. Previous work in Mo2 complexes in the cis geometry92
observed the νs(CO2) vibration to occur at 1390 cm-1, so both these vibrations may
obscure one another.
Figure 18 - Ground state IR of 1 (in THF) and 2 (in CDCl3)
Table 2 - Comparison of select vibrational modes of ground state 1’ and 2’ from DFT
calculations and experimental GS-IR of complexes 1 and 2
*symmetric CO2 and NO stretch both occur at the same energy

60
After 2 was attached to TiO2 nanoparticles (2@TiO2), the particles were
suspended back into CDCl3 for analysis. It is predicted that the dye will attach by the
N-oxide group, so it is expected the energy associated with this vibration will change.
Figure 19 shows the infrared spectrum for 2 and 2 adsorbed onto TiO2. Once adsorbed
onto TiO2, the 1390 cm-1, associated with both the symmetric CO2 stretch and N-oxide
stretch peak disappears from this region and possibly moves to lower energy.
It is postulated that the NO group adsorbs to the surface of TiO2 through the
Brønsted acid sites, or terminal Ti-OH sites, much like the carboxylate anchoring group
on N719.103 A pyridine anchoring group associates with the TiO2 surface by Lewis acid
sites, or open Ti3+ sites through a dative interaction with the lone pair on the pyridine N.
The oxygen on N-oxide is less basic but more nucleophilic than pyridine and previous
dye loading studies have shown that N-oxide dyes exhibit 3x more loading than a
pyridine dye equivalent.101 This indicates that N-oxide adsorbs through the more
abundant Brønsted acid sites on the surface of TiO2. Once adsorbed, the interface will
resemble a N-O-Ti bond, which should occur at lower energy compared to the quasi N=O
stretch of the free dye. This type of association would explain why the 1390 cm-1 peak
disappears from the region, where the vibration decreases in energy and is obscured by
the other prominent peaks and solvent artifacts in the 1200-1300 cm-1 region. The
νas(CO2) and νas and νs(CN2) stretches are still very apparent in the 2@TiO2 spectrum, so
it is clear that there is dye on the particles, with only an absence of a νs(CO2) or ν(NO).

61
Figure 19 – Ground state IR of 2 and 2@TiO2 in CDCl3
3.2.5 Electrochemical studies
The oxidative and reductive potentials of the series were determined using
differential pulse voltammetry (DPV). The potentials are summarized in Table 3 together
with the E0-0, calculated from the intersection of the absorbance and fluorescence bands.
For compounds 1 and 2, a reversible oxidation is observed at 0.19 V and 0.04 V vs.
ferrocene/ferrocinium oxidation couple respectively. It has been studied previously that
the oxidation process involves the reversible removal of an electron of the Mo2 δ bonding
orbital. The potential of the process is very close to that of the ferrocene/ferrocinium
couple and is consistent with other dimolybdenum paddlewheel complexes. Compound 2

62
has a lower oxidative potential than 1 which is corroborated by the elevated HOMO level
calculated from DFT as well as the predicted destabilization of the δ and δ* combination
common with amidinate coordination.21
The reductive wave visible within the solvent window for both compounds have
two separate one electron processes that are irreversible, -1.00 V and -1.33 V for 1 and
0.01 and -0.32 V for 2 (vs. Fc/Fc+). DFT calculations of molecular orbitals and previous
studies indicate this is a ligand based reduction. The LUMO for both compounds are L π*
in character. The trans vs. cis geometry of the complex does seem to effect the reductive
potential of this ligand based reductive process. This may be related to the degree of
ligand electronic coupling facilitated by the di-metal center. The trans complex has more
electronic coupling than that of the cis complex, as seen by the degree of splitting
between the in and out of phase L π* combinations in the molecular orbital diagram. The
addition of one reductive electron to the trans complex is more favorable for a highly
coupled or delocalized complex. Compare this potential to the less favorable potential to
add an electron to a complex that exhibits more localized L π* character.

63
Table 3 - Summary of electronic and electrochemical data for trans-(1) and cis-(2) Mo2
para-isonicotinate N-oxide complexes
aDetermined from peak of absorbance or emission spectrum. bCalculated from intersection between
absorption and fluorescence spectra. cObtained from the onset of phosphorescence. dValues obtained from
differential pulse voltammetry in THF solution and internally referenced to Fc/Fc+. V vs. NHE
Figure 20 depicts the energy alignment of 2, using the oxidation potential, E0-0 and
triplet emission energy in Table 3 to the conduction band of TiO2. This is compared to
the popular hybrid dye, N719, a Ruthenium (II) dicarboxypyridine heteroleptic dye.103
Both dyes have metal based oxidations. Ru type dyes have two electron transfer
components: a fast component (<100 fs)97,104 from the 1MLCT and a slower component
(1-100 ps) from the 3MLCT. For N719, both components are energetically favorable to
undergo charge injection into the conduction band of TiO2. The Mo2 type dye studied
previously also had a 1MLCT based fast component (<1ps).92 The slow contribution from
the triplet state, although energetically favorable, does not contribute significantly, due to
the Mo2δδ* nature. It is predicted that compound 2 will behave similarly to previous
reports92 and undergo charge injection from a hot 1MLCT state. Using compound 2 in a

64
proposed DSSC cell, there is a significant driving force of 300 mV to regenerate Mo2
from the oxidized species with the most common redox mediator, I-/I3-,.105
Figure 20 - Energy level diagram comparing the oxidation potentials of the ground state
(black), singlet state (red) and triplet (blue) state of 2 and the Ru(II) N719103 dye
referenced to NHE. Redox potential of I-/I3- couple is included.
3.2.6 Ultrafast UV-Vis Transient Absorption Spectroscopy
The excited state of complexes 1 and 2 were studied with femtosecond transient
absorption spectroscopy in their free form. 1 was dissolved in THF and excited at 565 nm
(Figure 21), while 2 was dissolved in DCM and excited at 515 nm (Figure 22). Both
spectra reveal a transient peak at higher energy and ground state bleach with partial

65
recovery within the window of the experiment. The ground state bleach for 2 is partially
obscured by scatter of the 515 nm pump. The benefit of exciting on the low energy side
of the absorption band in 1, allows us to see the entirety of bleach.
Figure 21 – TA spectrum of 1 in THF, λex = 565 nm
Figure 22 - TA spectrum of 2 in DCM, λex = 515 nm
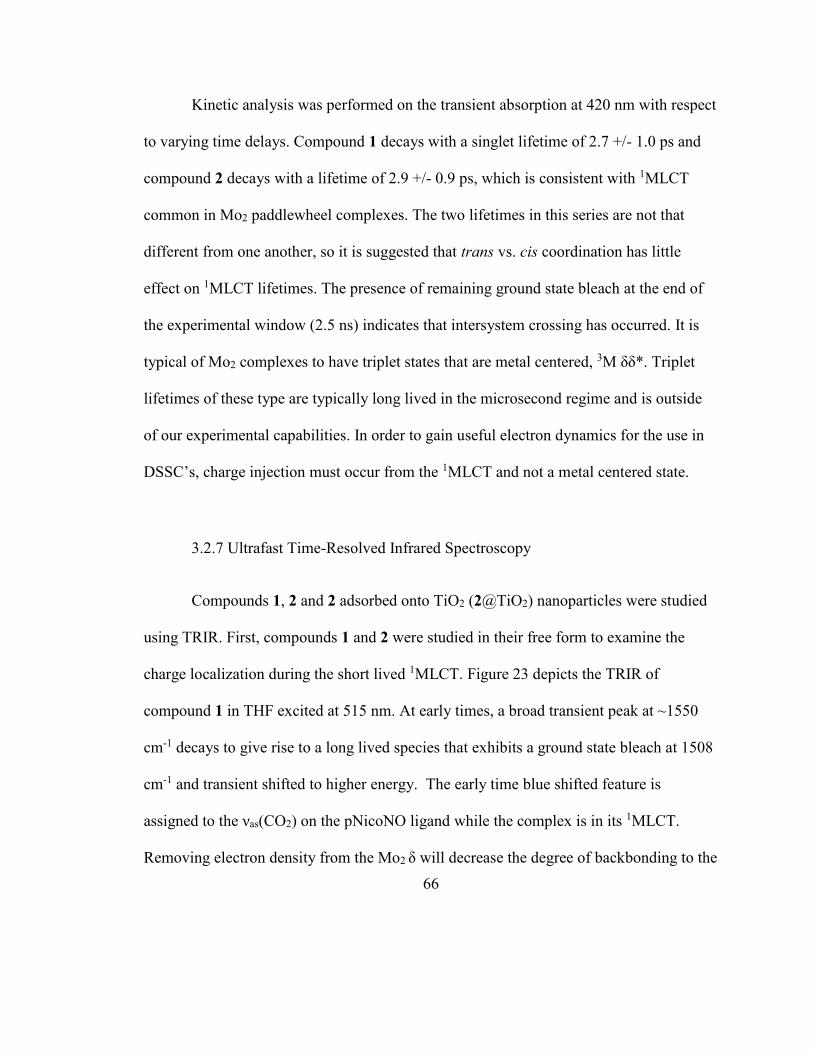
66
Kinetic analysis was performed on the transient absorption at 420 nm with respect
to varying time delays. Compound 1 decays with a singlet lifetime of 2.7 +/- 1.0 ps and
compound 2 decays with a lifetime of 2.9 +/- 0.9 ps, which is consistent with 1MLCT
common in Mo2 paddlewheel complexes. The two lifetimes in this series are not that
different from one another, so it is suggested that trans vs. cis coordination has little
effect on 1MLCT lifetimes. The presence of remaining ground state bleach at the end of
the experimental window (2.5 ns) indicates that intersystem crossing has occurred. It is
typical of Mo2 complexes to have triplet states that are metal centered, 3M δδ*. Triplet
lifetimes of these type are typically long lived in the microsecond regime and is outside
of our experimental capabilities. In order to gain useful electron dynamics for the use in
DSSC’s, charge injection must occur from the 1MLCT and not a metal centered state.
3.2.7 Ultrafast Time-Resolved Infrared Spectroscopy
Compounds 1, 2 and 2 adsorbed onto TiO2 (2@TiO2) nanoparticles were studied
using TRIR. First, compounds 1 and 2 were studied in their free form to examine the
charge localization during the short lived 1MLCT. Figure 23 depicts the TRIR of
compound 1 in THF excited at 515 nm. At early times, a broad transient peak at ~1550
cm-1 decays to give rise to a long lived species that exhibits a ground state bleach at 1508
cm-1 and transient shifted to higher energy. The early time blue shifted feature is
assigned to the νas(CO2) on the pNicoNO ligand while the complex is in its 1MLCT.
Removing electron density from the Mo2 δ will decrease the degree of backbonding to the

67
CO2 stretch, strengthening the bond. As the complex relaxes to the 3Mδδ*, the transient
remains blue shifted from the ground state. This can be explained by the degree of CO2
mixing in the δ molecular orbital and lack of mixing in the δ* molecular orbital (See
Figure 14). Removing electron density from the HOMO, δ molecular orbital, will also
remove the CO2 π* contribution of the molecular orbital, overall strengthening the CO2 π
bond and vibrational band.
In the ~1400 cm-1 region, we will discuss the coupling of νs(CO2) and ν(NO) on
the pNicoNO ligand. It is surprising both peaks have long lived transient absorptions due
to the fact that the triplet is 3Mδδ* in character. But upon closer inspection of the
molecular orbital diagram, the HOMO contains δ bonding, CO2 out-of-phase L π* and
the out of phase NO- p-orbital contribution. Depletion of electron density contributing
to the δ orbital and its mixed orbital character results in a slight blue shift of these two
vibrations. Decay of these early time features disappear with a time constant of ~3 ps
which is consistent with 1MCLT measurements from TA.

68
Figure 23 – TRIR spectrum of 1in THF, λex = 515 nm
Figure 24 depicts the TRIR spectrum for 2 in CDCl3 excited at 515 nm. The most
notable feature is a sharp ground state bleach ~1500 cm-1 with a red shifted transient at
earlier times which does not recover at long times. This peak is taken to be νas(CO2) of
the ligand. Although the 1MLCT transient band energy behavior is opposite of what was
observed for the trans species, it can be anticipated that the formamidinate and
carboxylate linkages influence the metal backbonding and mixing unequally. It is
possible that the enhanced donation from the amidinate ligand can cause a lower
observed energy for νas(CO2) of the carboxylate ligand in the 1MLCT, as predicted in
anion calculations in DFT. Additional ground state bleaches are observed at ~1608 cm-1
and ~1270 cm-1 and are likely bands associated with a pyridine ring stretch of the
nicotinate ligand and formamidinate N-H wag of the ancillary DAnif ligand. These
assignments were made with the aid of DFT calculations.
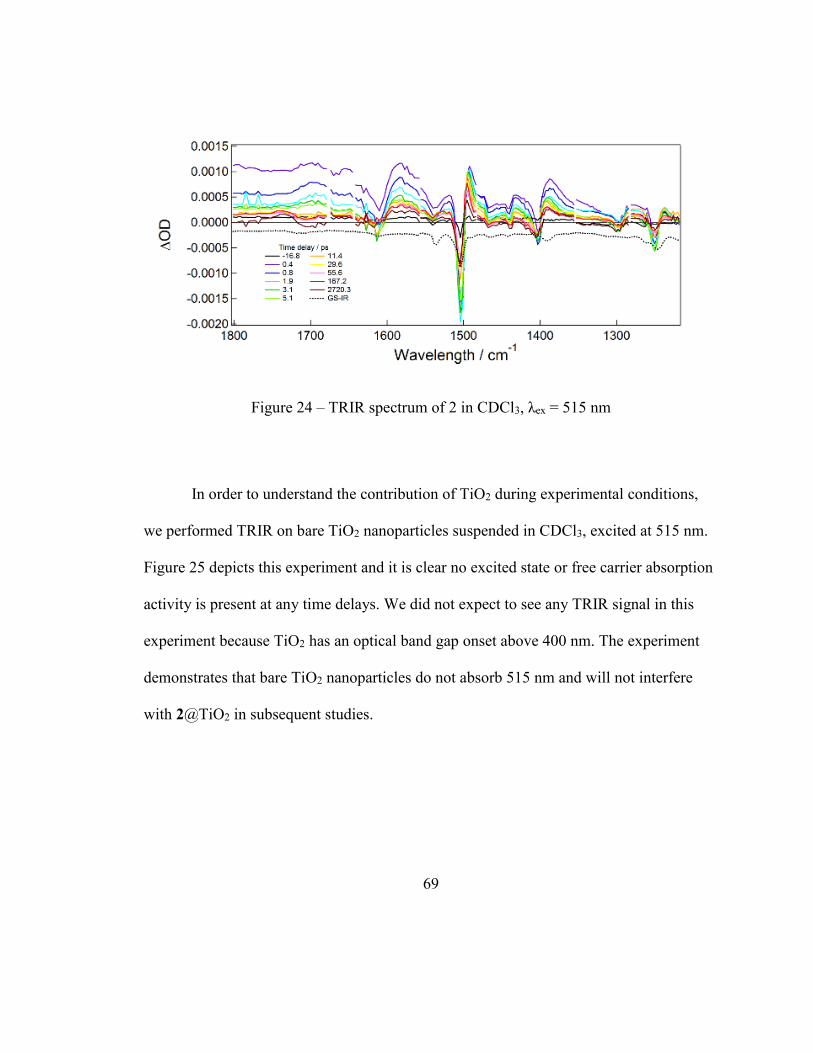
69
Figure 24 – TRIR spectrum of 2 in CDCl3, λex = 515 nm
In order to understand the contribution of TiO2 during experimental conditions,
we performed TRIR on bare TiO2 nanoparticles suspended in CDCl3, excited at 515 nm.
Figure 25 depicts this experiment and it is clear no excited state or free carrier absorption
activity is present at any time delays. We did not expect to see any TRIR signal in this
experiment because TiO2 has an optical band gap onset above 400 nm. The experiment
demonstrates that bare TiO2 nanoparticles do not absorb 515 nm and will not interfere
with 2@TiO2 in subsequent studies.

70
Figure 25 – TRIR spectrum of TiO2 nanoparticles (p25) suspended in CDCl3, λex = 515
nm
Upon adsorbing 2 on to TiO2 nanoparticles to produce 2@TiO2, TRIR was
conducted on the particles suspended in CDCl3 and excited at 515 nm as seen in Figure
26. Free carrier absorption at positive delay times is the most prominent feature in this
spectrum. Direct excitation into the bandgap of a semiconductor produces a free carrier
state and TRIR probes this state as an absorption of low energy mid-IR to promote free
electrons in the occupied conduction band. It has been demonstrated that a 515 nm pump
on bare TiO2 cannot excite the semiconducting nanoparticles directly, instead we are
seeing the indirect charge injection from what can be presumed as the 1MLCT state of the
dye into the conduction band of TiO2. 1MLCT is ligand based and will have electron
density in closer proximity to the TiO2 for charge injection through the NO anchoring
group. The 3Mo2 δδ* is far removed from the anchoring site, so it is expected that the
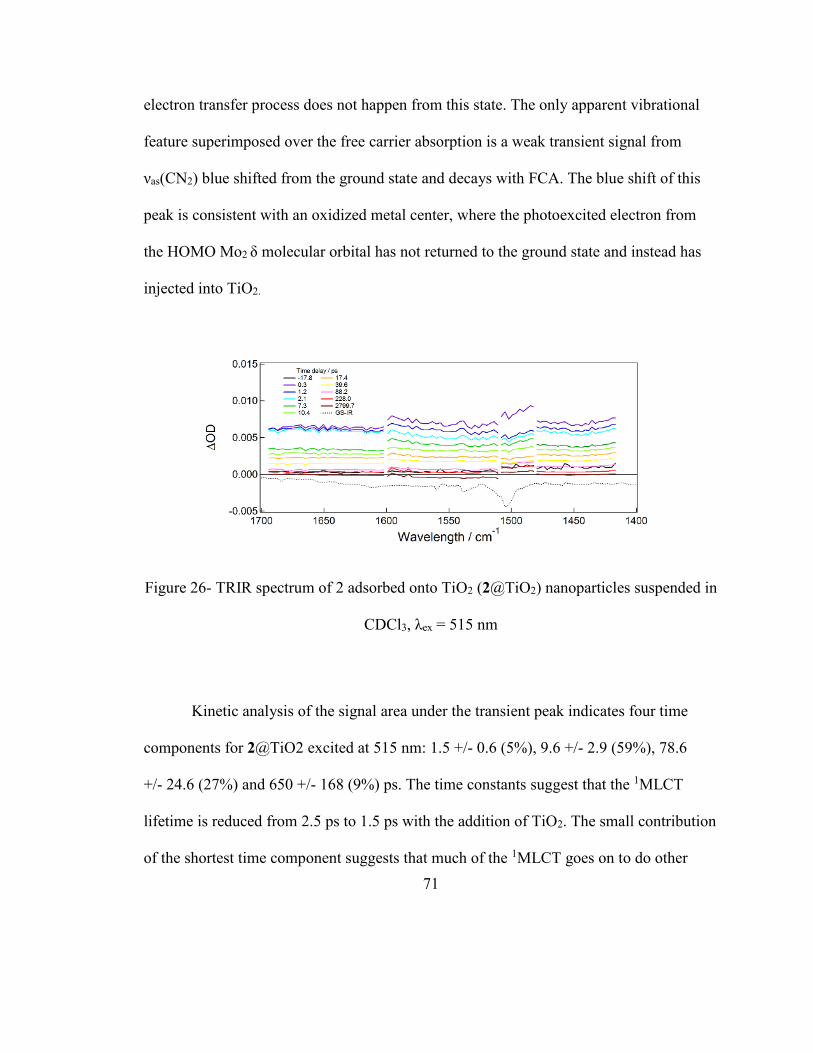
71
electron transfer process does not happen from this state. The only apparent vibrational
feature superimposed over the free carrier absorption is a weak transient signal from
νas(CN2) blue shifted from the ground state and decays with FCA. The blue shift of this
peak is consistent with an oxidized metal center, where the photoexcited electron from
the HOMO Mo2 δ molecular orbital has not returned to the ground state and instead has
injected into TiO2.
Figure 26- TRIR spectrum of 2 adsorbed onto TiO2 (2@TiO2) nanoparticles suspended in
CDCl3, λex = 515 nm
Kinetic analysis of the signal area under the transient peak indicates four time
components for 2@TiO2 excited at 515 nm: 1.5 +/- 0.6 (5%), 9.6 +/- 2.9 (59%), 78.6
+/- 24.6 (27%) and 650 +/- 168 (9%) ps. The time constants suggest that the 1MLCT
lifetime is reduced from 2.5 ps to 1.5 ps with the addition of TiO2. The small contribution
of the shortest time component suggests that much of the 1MLCT goes on to do other
72
processes and only 5% returns to the ground state. The ~10 ps and ~80 ps time constants
may be assigned as hot carrier cooling and trap assisted recombination respectively. The
longest time constant ~650 ps can be assigned to back electron transfer.11,92
3.3 Concluding Remarks
This chapter explores the photophysical behaviors of trans and cis geometry Mo2
paddlewheel complexes and the application of cis type Mo2 complexes in the field of
n-type dye sensitized solar cells. Solution based chemistry and analysis lends itself to
both TA and TRIR. It was observed that both complexes 1 and 2 decay from their
1MLCT with similar time constants of ~2.5 ps. This indicates that the geometry around
the metal center has little effect on the 1MLCT lifetime. It is known that the geometry
does has a large effect on the electronic coupling of the two ligands across the metal
center due to the reduction of symmetry and orbital alignment in the cis complex. This
detail manifests itself into this work when looking at the energy alignment of
semiconducting levels.
In this the cis dye, 2, the NO reporter vibration and symmetric CO2 stretch
obscure one another in the ground state, but the complex still behaves in a predictable
manner in the excited state. 2@TiO2 displays a disappearance of the band ~1390 cm-1
which indicates the adsorption of the dye through the terminal NO group. In the TRIR,
vibrational signatures unique to the dye are weak, though a blue shifted CN2 assymetric
stretch is seen which is consistent with a photooxidized Mo2+ core. Time constants that fit

73
the decay of the free-carrier absorption are consistent with TiO2 semiconducting material.
In order to use the anchoring group, NO, to its full capability, it is proposed to
decouple its vibration for CO2 by using the meta- position version of the ligand. Although
this process may affect the anchoring capability of the dye, we would hopefully be able to
see the NO vibration behave independently from the rest of the dye.

74
Chapter 4: Ultrafast infrared analysis of hybrid perovskites
Work based on a collaboration with Professor Patrick M. Woodward at The Ohio State
University
4.1 Introduction
Perovskites have become a widely popular semiconductor system of study for
spectroscopist. Hybrid perovskites are composed of both an inorganic semiconductor
network and organic A-site cation. The dual composition of hybrid perovskites are well
suited for TRIR studies, where the electronic behaviors of the semiconductor can be
observed along with vibrational specificity from the organic moiety. The literature is
dominated by studies using time-resolved photoluminescence (TRPL),57,106 microwave107
and terahertz spectroscopy108,109 in order to reveal the characteristics of charge carriers,
such as their emissive decay, photoconductivity and induced conductivity, respectively.
Transient absorption (TA) techniques that use UV-Visible probes, are also a popular
technique to study perovskites,56,110 but transient features in the visible range will reflect
band gap shifts, an indirect consequence of free carrier population. Not all decay
pathways of a photoexcited electron are radiative106,111 while only certain electronic
structural changes can be extracted from TA. As an alternative, ultrafast time-resolved
infrared spectroscopy (TRIR) offers additional vibrational energy insight that
complements electronic structure information that is collected by TA.

75
There are a limited number perovskite studies that use time-resolved broadband
spectroscopies and the majority of the studies utilize visible probes. The Ho-Baillie group
used TA to study MAPbBr3 perovskite films and describe the features of the spectrum
produced by a Burstein-Moss band gap shift upon an increase of free carriers.56 The
decay time constants associated with the new features originate from phenomena such as
free carrier recombination, phonon scattering and trap state assisted recombination. The
magnitude and net contribution to the signal is affected by fluence of the pump pulse and
charge carrier density.106,107,111
Few perovskite studies involving broadband TRIR have been reported to
date.112,113 Asbury114 et al. studied the excited state spectra in the mid-IR region (1500–
4800 cm−1) of MAPbI3 films in the nanosecond regime. Another recent publication113
crossed the ultrafast regime and utilized TRIR using above bandgap excitation on
MAPbI3 films in order to understand the dynamics between organic and inorganic
vibrational modes. The relationship between high energy phonon modes in a rotationally
locked organic component and low energy phonon modes in the inorganic cage are not
easily described by typical heat transport arguments, but instead are governed by
temperature dependent equilibria. The authors completed this study on MAPbI3 with an
excitation energy nearly 1 eV above the band gap as well as with high fluences. High
excitation energies or power densities may lead to sample degradation, as evidence by
previous Raman Spectroscopy studies115,116 on MAPbI3 which utilized sub-bandgap
excitation to avoid chemical degradation of the material. A recent letter112 explored the

76
role of formamidinium cation in FAPbI3 films while utilizing a near band gap pump. The
progression of these experiments leads us to consider near band gap excitation in ultrafast
vibrational studies described in this work.
The MA cation has been used as a reporter molecule in other spectroscopic
studies such as in Raman spectroscopy as reported by Mathies et al.117 Specificity can be
accomplished by observing wavenumber shifts of excited state vibrations and observing
vibrational mode changes with electron density and polarization. Using TRIR, the
vibrational energy of NH3 and CH3 bending and stretching modes in MA and C=N
stretch in FA after photoexcitation can be monitored in the carrier state which reflect the
changes in microenvironments within the lead-halide cage.
Typically, visible probe transmission techniques are utilized with the relatively
transparent films and substrates. However, conductive glass is not infrared transparent, so
TRIR experiments require CaF2 or sapphire substrates in this work.
4.2 Results and Discussion
4.2.1 Synthesis
One-step synthesis – MAPbX3 series
Thin films of MAPbX3 were deposited on 25 mm diameter × 1 mm thick CaF2 substrates
for TRIR analysis. Precursor perovskite solutions were prepared to 1 M concentration in
the following solvents: 1:1 DMSO:DMF for chloride118, DMF for bromide119, and

77
γ-butyrolactone for iodide119. All solutions were filtered before spin coating. CaF2
substrates were spin coated at 2000 rpm with a 200 rps/s acceleration for 30 seconds.
Approximately 5 drops of the corresponding perovskite precursor solution was added at
top speed. The crystallization process was driven by use of a heat gun at the end of the
spin cycle.
Two step synthesis – APbBr3 series
APbBr3 [A = Cs+, MA+, FA+; MA = methylammonium, CH3NH3+; FA = formamidinium,
CH(NH2)2+], lead bromide perovskite thin-films were deposited on CaF2 substrates via a
two-step method.120 In the first step a nominally 1 M solution of lead (II) bromide in
dimethylformamide (DMF) was spin coated onto preheated calcium fluoride substrates
and then annealed. In the second step the substrates were submerged in isopropanol
solutions containing ABr salts, forming the perovskite films. PbBr2 (25 mmol, 9.1572g)
was weighed and transferred to a 25-mL volumetric flask, which was filled with DMF.
The solution was stirred and heated at 75 °C on a hotplate until no solids were observed.
The solution was filtered using a syringe and 0.2 μm PTFE filter before transferring to an
amber storage bottle. The PbBr2 solution is prepared and filtered when needed because
PbBr2 crystals typically form in the storage bottle over time.
The following reagents were used as purchased: cesium bromide (Alfa Aesar,
99%), methylammonium bromide (Aldrich, 98%; “MABr”), lead (II) bromide (ACROS
Organics, ≥ 98%), N,N-dimethylformamide (ACROS Organics, 99+%). Formamidinium
78
bromide was prepared from the stoichiometric reaction of formamidine acetate (Santa
Cruz Biotechnology) and hydrobromic acid (Sigma-Aldrich, ACS reagent, 48%) in 10
mL of neat ethanol. The white salt was recovered by using a rotary evaporator at 65 °C,
washing with diethyl ether, and drying overnight in a vacuum oven at room temperature.
Thin-films of the three compounds were obtained by first spin-coating the lead(II)
bromide solution onto calcium fluoride substrates. Initially the solutions would bead-up
and run off of the pristine substrate surfaces, but slightly scuffing the substrates with a
fine polishing sandpaper (1500 grit) allowed the solution to adhere to the substrates. A
Ni-Lo Scientific spin coater was implemented, using 2500 rpm, a 250 rpm/s acceleration,
and a total spin time of 40 seconds. Substrates were preheated to 75 °C on a hotplate.
Once the substrate was at top speed, approximately 8 drops of the solutions were
deposited. The substrates were returned to the hot plate to annealed for 30 minutes,
yielding an opaque white film. In the second step, 15 mg/mL solutions of ABr in
isopropanol were preheated to 50 °C, and the PbBr2 films were submerged for 10
minutes. The samples were then washed with fresh isopropanol, dried with a light stream
of nitrogen, and then annealed for 30 minutes at 100 °C. X-ray diffraction was used to
confirm crystallization of the desired perovskite phases (Appendix B, Figure 72 – Figure
74).

79
4.2.2 Exploration of perovskite powders, pellets and films
At the beginning of this project, spectroscopic studies were performed with single
crystal phase powdered perovskites, MAPbCl3, MAPbBr3 and MAPbI3 where MA is
methylammonium. In order to prepare samples for TRIR spectroscopy, the powdered
samples were mixed, ground and pressed into KBr (potassium bromide) pellets. Although
we were able to collect TRIR spectra of these pellets, a few concerns arose from this
procedure. Eventually, a new thin film synthesis method and perovskite series were
considered to complete the study. The process in shifting our work from pellets to thin
films will be discussed here.
The sample preparation technique utilizing KBr pellets for transmission infrared
spectroscopy is commonly used in analysis of solid phase organic molecules. KBr is an
infrared transparent material that can also act as a matrix in a pellet. In this form, the
sample is robust enough for manipulation and the KBr matrix does not interfere with
mid-infrared absorption unique to the analyte. It was straightforward to apply this
technique to the preparation of previously synthesized solid perovskite samples for
further spectroscopic studies.
During the process of mixing, grinding and pressing the three perovskites into
pellets, some observations were made. Combining KBr with MAPbBr3 and KBr with
MAPbI3 yielded orange and black/grey pellets respectively, where no major color change
from the pure perovskite to the pellet were observed during the grinding and pressing
processes. Combining colorless crystalline KBr with white powdery MAPbCl3 produced

80
a color change to yellow/orange upon pressing. It has been observed in previous
perovskite studies that bromide anion substitution readily occurs in the inorganic
framework of some perovskite materials. The chloride perovskite will readily exchange
with bromide to produce a perovskite with mixed composition.121 This phenomenon has
been heavily utilized in band gap energy tuning, but a mixture of crystal phases is not
desired in this work. The iodide perovskite does not undergo anion substitution. A KCl
salt matrix could have been utilized to prevent anion substitution for MAPbCl3 in a
pressed pellet. This method was not perused in this work because a different thin film
method was eventually utilized for the remainder of the study. In the subsequent pellet
data that was collected before switching to a thin film method will still be discussed in
this chapter but we will focus solely on MAPbBr3 and MAPbI3.
Pellets were pressed to a circular diameter of 13 mm with a pellet press that
provided pressures of approximately 10 tons. Initially, pellets were made with a large
amount of material to aid in the robustness of the sample. Pellets with 2-3 mm in
thickness were still IR transparent enough for use in TRIR. Figure 27 shows preliminary
TRIR data for a 2 mm thick pellet of MAPbI3 in KBr taken at the beginning of this
project. The broad feature at positive time delays in this spectrum is attributed to free
carrier absorption. The band gap for MAPbI3 is typically measured around 820 nm.
Exciting above this energy, such as 515 nm, promotes an electron from the valence band,
iodide in character, to the conduction band, lead in character. The semiconducting
properties of the perovskite material allows for the promotion free electrons in the

81
conduction band absorption with mid-IR light. This phenomenon is wavelength
dependent in the mid-IR region and has been demonstrated in the ground state. In
numerous other mid-IR studies of semiconductor materials, it is seen that a strong feature
arising from free charge carrier absorption is wavelength dependent and would increase
in intensity with increasing wavelength (decreasing energy).114,122 What is not seen in this
spectrum are vibrational features from the organic A-site cation MA, methylammonium,
even though signature vibrational peaks are observed in the ground state IR (see
Appendix B for ground state IR spectra of perovskite pellets, Figure 75). It is predicted
that analysis of a thick film will produce a large amount of peak broadening in vibrational
signatures, while free carrier absorption may obscure weak vibrational peaks, if present.
Due to the nature of transmission spectroscopy, the thicker the sample path length the
probe travels through results in an average of many perovskite crystal orientations that
may result in additional line broadening.

82
Figure 27 – TRIR spectrum for MAPbI3 KBr pellet (2 mm thick), λex = 515 nm
To address the absence of vibrational features in the TRIR in the pellet study,
thinner pellets were made to limit the amount of sample the probe beam travels through.
As predicted, a thin MAPbI3 pellet, less than 1 mm in thickness produced a TRIR
spectrum containing intense transient vibrations (Figure 28) when excited slightly above
the bandgap energy (λex = 750 nm). A notable blue shift of the –NH3 symmetric bending
mode is seen and will be explained in later sections. Another less intense transient
vibration appears at 1375 cm-1 which seems to arise from the symmetric –CH3 bending
mode. This transient is less intense and red shifted from the ground state absorption. The
same two transient peaks are seen when the sample is excited at 780 nm (Appendix B,
Figure 76). A blue shifted –NH3 transient vibrational peak is also observed in a MAPbBr3
thin pellet (<1mm thick) as seen in (Appendix B, Figure 77). Although in these spectra,

83
the lower energy red shifted –CH3 is not seen, possibly due to the quality of the TRIR
data. The difference between red vs. blue shifting of the symmetric bending modes is
difficult to explain due to the difficulty to reproduce these experimental conditions. Thin
pellets are fragile and easily broken while also difficult to reproduce via pellet press.
After this preliminary TRIR data gathered on KBr pellets, it was decided to peruse the
rest of this study using thin films on CaF2 substrates in order to maintain reproducibility
as well as keep vibrational resolution.
Figure 28 – TRIR spectrum for MAPbI3 KBr pellet (<1 mm thick), λex = 750 nm
While switching to thinner pellets resulted in visible vibrational features in the
TRIR spectra, thin pellets also introduced a sloping baseline to the broad free carrier
absorption features. At higher probe energies the shape of the spectra dips to negative
84
absorptions. Due to the population of the conduction band and increase in concentration
of free carriers, the band gap undergoes a Burstein–Moss shift to higher energy, which is
apparent in the ultra-fast transient absorption spectra of these materials. Previous studies
of low band-gap semiconductor materials have shown that in the presence of
photoexcited carriers at band-edge sites leads to a decreased number of available electron
and electron holes available for ground state absorption thus resulting in a negative
signal.123 Free carrier absorption is wavelength dependent in the mid-IR region and has
been demonstrated extensively in the ground state and excited state.114,122 With these two
phenomena together, less available ground state absorption and weak free carrier
absorption at high energy, may lead to a negative feature. A study that would combine
transmission and reflectance spectroscopy in the excited state may circumvent this
experimental artifact.124 An experiment that minimizes the reflective component of the
signal would also address the negatively sloped baseline. It was proposed to fabricate the
pellets/films thick enough so the transmission component that we measure is large
enough to allow us to ignore the reflective component of the probe absorption event.
Many different synthesis methods were tested for thin film fabrication in order to meet
these requirements. Two-step spin coating synthetic methods were favored over one-step
methods due to the reproducibility, quality and thickness of the perovskite sample on
CaF2 substrates (~600 nm thick perovskite films). The preliminary goals of this project
explored the methylammonium series with varying halides (MAPbX3 series where X =
Cl, Br or I) in both pellet and film form. Eventually, a reproducible two-step synthetic

85
method was achieved with the bromide member of the series, so further work focused on
this two-step synthesis with varying A-site cations. The first step fabrication involves
laying down a film of the Pb-X framework on CaF2. Suitable solvent systems were not
found for the chloride and iodide members, resulting in thin and lesser quality films.
Pb-Br inorganic framework films were approximately 600 nm thick. The second step of
the two-step synthesis involves submerging the inorganic framework in a solution of the
A-site salt. A series was formulated involving the A-site cation, while maintaining the
Pb-Br framework (APbBr3 series where A = Cs+, MA+ or FA+). Both series will be
discussed for the remainder of this chapter, where the MAPbX3 series was fabricated by a
one-step spin coating method while the APbBr3 a two-step method.
4.2.3 Steady state absorption
The UV-Vis transmission data for the MAPbX3 and APbBr3 series are presented
in Figure 29 and Figure 30 and serve as a basis of the experimental design for the
ultra-fast time-resolved experiments. The optical band gaps for the MAPbX3 and APbBr3
perovskite series films, measured by extrapolating the absorption onset, agree with
previous studies.56,125–128 The band gaps are summarized in Table 4.

86
Figure 29 - Ground state UV-Vis of MAPbI3, MAPbBr3 and MAPbCl3

87
Figure 30 - Ground state UV-Vis of CsPbBr3, MAPbBr3 and FAPbBr3 films

88
Table 4 – Summary of band gap energies for MAPbX3 series and APbBr3 series (where X
= I, Br and I and A = Cs, MA and FA)
For the MAPbX3 family of perovskites, the band structure and density of states
indicate the valance band is mainly halide (X p) character and the conduction band is
metal (Pb 6p) in character, so the energy of the band gap increases in energy from Cl to
Br to I due to relative energies of the 3p to 4p to 5p orbitals.129–131 For the APbBr3 family
of perovskites, the band structure and density of states indicate the valance band is
mainly bromide (Br 4p) character and the conduction band is metal (Pb 6p) in
character.61,130,131 The A-site cation does not typically contribute in a significant way to
the valence or conduction bands, instead plays a role in crystal structure distortion, which
in turn alters the band gap energy slightly.132 In this chapter, we design the excitation
pump to photoexcite the perovskite films as close to the bandgap energy regime as
possible as indicated by the measured UV-Vis spectrum. By pumping closer to the band
edge energy, a narrower distribution of excited state species is generated and beam

89
damage to the sample is minimized. We also pump the samples slightly above the band
gap (~0.15 eV in excess) in order to compare TRIR spectra with minimal vs. excess
photoexcitation energy. TRIR experiments conducted in this work utilized multiple pump
wavelengths and average powers (500 nm (1.0 mW) and 535 nm, (1.5 mW)). By
applying repetition rate and spot size (500 microns) of the pump, we can calculate the
fluence of the pump beam as seen in Equation 4.
𝐹𝑙𝑢𝑒𝑛𝑐𝑒 = 𝐴𝑣𝑔.𝑃𝑜𝑤𝑒𝑟
𝐴𝑟𝑒𝑎 ×𝑅𝑒𝑝.𝑟𝑎𝑡𝑒 [Eq. 4]
Carrier injection level56,110 can be estimated with Equation 5:
𝑛0 =𝐴(𝜆)×𝐹𝑙𝑢𝑒𝑛𝑐𝑒
𝐸𝑝ℎ𝑜𝑡𝑜𝑛(𝜆)×𝑤 [Eq. 5]
Where A(λ) is the absorbance of the film at the specific pump wavelength, fluence is
calculated from Equation 4, Ephoton is the photon energy of the pump and w is the
thickness of the sample. Table 5 and Table 6 summarizes the experimental conditions of
the TRIR experiments conducted on the MAPbX3 and APbBr3 series of perovskites at
two different excitation energies for each sample.

90
Table 5 - Summary of optical bandgaps, experimental pump wavelengths and calculated
carrier injection levels for MAPbX3 where X = I-, Br- or Cl-
Table 6 – Summary of optical bandgaps, experimental pump wavelengths and calculated
carrier injection levels for APbBr3 where A = Cs+, MA+ or FA+

91
4.2.4 Vibrational spectroscopy
Perovskite films used in these experiment were deposited on CaF2 substrates by
spin coating in a one-step or two-step synthetic procedure as outlined in the Synthesis
section. The ground state IR spectra of MAPbBr3 and FAPbBr3 films are presented in
Figure 31 and their respective peak assignments in Table 7. The infrared active vibrations
of interest within our probe window (800 – 3500 cm−1) arise from the MA or FA moiety.
Vibrations of the inorganic network appear outside the probe window at very low
energies (<100 cm−1).133 The C–H and N–H stretches are located on either side of 3000
cm−1 while the C–H and N–H bends are around 1500 cm−1. For FAPbBr3, the ground
state IR (Figure 31) is dominated by a strong sharp vibrational signature from the C=N
symmetric stretch of the formamidinium cation centered at 1717 cm−1.52,112 Assignments
for the N–H stretching region include a quartet of broad, moderately strong peaks from
the N–H moiety on FA split by four hydrogen bonds between FA and Br.134 The all
inorganic perovskite, CsPbBr3 does not display any prominent vibrational signatures in
the mid-IR region as expected.

92
Figure 31 – Ground state IR spectra of MAPbBr3 and FAPbBr3 (left) stretching modes,
(right) rocking and bending modes
Table 7 - Measured vibrational modes (in cm−1) and peak assignments for MAPbBr3 and
FAPbBr3

93
Vibrational energies associated with the MA moiety in MAPbBr3 follow a trend
within the perovskite halide series (I- < Br- < Cl-) due to the decreasing polarizability of
the inorganic cage from I- to Br- to Cl-.135 This phenomenon, known as the Lorentz–
Lorenz shift,136,137 is derived from the Clausius–Mossotti relation, which relates atomic
polarizability to the overall dielectric or refractive index of the material. These
relationships have been applied to perovskite films previously.138 The N–H stretch is
most sensitive to this effect, most likely due to the presence of hydrogen bonding, while
the other stretches and bends follow the Lorentz–Lorenz trend to a smaller extent. This
phenomena was observed in the ground state IR for the MAPbX3 series presented in
Figure 32 and Table 8.
Figure 32 - Relative transmittance spectra of MAPbI3 (black), MAPbBr3 (orange), and
MAPbCl3 (blue) films (left) stretching modes, (right) rocking and bending modes.

94
Table 8 - Measured vibrational modes (in cm−1) and assignments for the MAPbX3 series
4.2.5 Time resolved infrared spectroscopy
APbBr3 series
The TRIR excited state characteristics of the perovskite series were analyzed in
several ways. There are a few features in the spectra that are interesting to this
discussion, including the shape of the spectrum, kinetics associated with free carrier
absorption, and transient shifts from ground state vibrations at different pump energies
and injection levels.56 The full excited state spectra for a MAPbBr3 film pumped at two
different energies are presented in Figure 33. In addition to the prototypical MAPbBr3
perovskite, we also studied formamidinium lead bromide (FAPbBr3). Figure 34 depicts
the full TRIR spectrum of the FAPbBr3 film excited with a 500 and 530 nm pump. The
formamidium cation contains the C=N vibrational mode that has much higher oscillator

95
strength than the vibrations associated with methylammonium. We will discuss the both
materials together in the following sections.
Figure 33 - Full TRIR spectrum of MAPbBr3 with excitation energy (top) above band gap
(λex = 500 nm) and (bottom) near the bandgap onset (λex = 535 nm). The black dotted line
denotes ground state absorption, while solid lines represent the transient spectrum at
different time delays between −100 ps and 2.7 ns.

96
Figure 34 - Full TRIR spectrum of FAPbBr3 with excitation energy (top) above band gap
(λex = 500 nm) and (bottom) near the bandgap onset (λex = 530 nm). The black dotted line
denotes ground state absorption, while solid lines represent the transient spectrum at
different time delays between −100 ps and 2.5 ns.

97
For the TRIR spectra for MAPbBr3, in Figure 33, at positive time delays the probe
pulse reaches the sample after the pump pulse. Within the instrument response time,
electrons populate the conduction band as free-carriers. It is well known in literature that
free carriers have absorption in the mid-IR region in both the ground state and excited
state.139,140 All spectra exhibit a positive baseline signal at positive time delays and low
probe energies, which is attributed to free carrier absorption. This phenomenon is
wavelength dependent in the mid-IR region and has been demonstrated in the ground
state.114,122
Numerous vibrational features are seen superimposed on the free-carrier
absorption signal. To demonstrate that the transient vibrations have origins from the
organic MA moiety, TRIR was conducted on an all inorganic perovskite analog,
CsPbBr3. In the all inorganic perovskite, the electronic character and bandgap energy is
retained in relation to the APbBr3 series. Since a cesium cation will have no active
vibrational modes in the mid-IR range, it was expected for the TRIR spectrum to only
exhibit free carrier absorption for this material. This is what was observed for a CsPbBr3
film excited at 500 nm (1.0 mW) and 530 nm (1.5 mW) as seen in Figure 35 and Figure
36. The lack of distinct vibrational features for the all inorganic perovskite indicate that
transient peaks for MAPbBr3 that are superimposed on the free carrier absorption signal
have MA organic cation origins. A negative, bleach signal ~2350 cm-1 is also present in
all films, regardless of A-site cation or pump energy. We attribute this bleach to the
asymmetric and symmetric stretches of atmospheric CO2 that may be adsorbed to the film

98
surface. This CO2 interaction has been studied in a previous study that used perovskite
quantum dots as a CO2 reduction photocatalyst.125
Figure 35 - Full TRIR spectrum of CsPbBr3 with excitation energy above band gap (500
nm. Colored solid lines represent the transient spectrum at different time delays between
−100 ps and 2.7 ns.

99
Figure 36 - Full TRIR spectrum of CsPbBr3 with excitation energy near band gap (530
nm. Colored solid lines represent the transient spectrum at different time delays between
−100 ps and 2.5 ns
The kinetics associated with the decay of free carriers were analyzed using the
Maximim Entropy Method to avoid assumptions about the number of exponentials
necessary to fit the spectra. The decay of free carrier absorption for MAPbBr3, FAPbBr3
and CsPbBr3 (centered at 1600 cm-1) was fit to three or four predominant time constants
and are shown in Table 9 and additional MEM information in Appendix B. There are
time constants in the range of a few picoseconds, tens of picoseconds, and hundreds of
picosecond. Previous studies have attributed these time constants to hot carrier cooling,
trap assisted recombination, and surface trapping, respectively.11,56 This work investigates
the role of free carrier lifetime of an organic A-site cation to the all inorganic Cs
perovskite counterpart. Comparing the two fastest time components (1’s and 10’s of
picoseconds) across the series, it is evident that the all inorganic CsPbBr3 has time

100
constants at least two times longer than that of the hybrid perovskites. Also in general,
the longest time component (100’s of ps) for CsPbBr3 contributes more to the overall
kinetic decay than the hybrid species. These time constants agree with the argument that
accessible high energy phonon modes in MAPbBr3 and FAPbBr3, associated with organic
A-site cations, can lead to free carrier relaxation.113 A study on FAPbI3 measured the
isotropic 2DIR spectra on the C=N vibration at differing early times and revealed a ~3 ps
time constant associated with the reorientation of FA using C=N.112 A similar time
constant is associated with methylammonium reorientation within the inorganic cage.141
CsPbBr3 cannot access high energy phonon modes associated with the hybrid perovskites
so there are fewer channels available for deactivation.113 Charge carrier lifetimes are
overall shorter for the hybrid perovskites due to the ability for MA or FA to reorient and
couple to the low-energy inorganic lattice phonon modes vs. only displacement for Cs.142
The forth and longest time component (1.6 ns) for MAPbBr3 excited at 535 nm excitation
is consistent with surface recombination that has been previously studied using time
resolved photoluminescent spectroscopy.143,144

101
Table 9 - Time constant components and contribution (%) to the TRIR signal decay taken
at 1600 cm−1 for the APbBr3 series
A previous TRIR study113 that focused on MAPbI3 observed derivative-like
transient peak shapes where there is a dip on the low energy side and a positive peak on
the high energy of the mode. The authors propose the peak shapes are not due to an
excited state141 but instead a consequence of photoexcitation that changes the real
permittivity of the material through Kramers–Kronig relation. A change in local
permittivity of the medium that the probe beam travels through will produce a derivative
like feature centered at the ground state absorption. Other work utilizing TRIR on hybrid
perovskites observed a transient vibrational feature upon photoexcitation, but produced
no complementary bleach feature.112 The authors attribute the transient feature to an

102
induced internal electric field producing a vibrational Stark shift, resulting in a 5 cm-1
blue shift, which aligns with the blue shifts we have measured in this work. Simply, the
vibrational Stark effect involves an interaction between an external field and a dipole that
is not aligned with the field, where the observed vibrational frequency correlates linearly
with the applied field.145 Photoexcitation generates charge carriers thus an internal
electric field changes the environment surrounding the organic A-site cations. The
internal field of the Pb-X framework disturbs the fundamental frequency of the vibrations
associated with the organic moieties.112 Photoexcitation into the band gap of perovskite
materials induces a large change in dielectric constant. Previous studies indicate that
perovskite materials of MAPbX3 type exhibit a 1000x increase in the real and imaginary
portions of complex permittivity under 1 sun illumination due to the increased population
of charge carriers.146 Also, because the organic A-site cation does not participate in the X
np/Pb Pb 6s electronic transition, we can view this vibrational Stark shift picture as the
organic moiety reacting to an induced field from the inorganic framework.112
It is work noting that the transient vibrational features in the –NH3 bending region
for MAPbBr3 and C=N vibration for FAPbBr3 are blue shifted within the same magnitude
of ~5 cm-1 observed in previous studies.112 In the N-H stretching region ~3000 cm-1,
transient vibrational features are blue shifted to a larger extent, >10 cm-1. It is postulated
that the lower energy vibrations (~1475 and ~1720 cm-1 for MA and FA respectively)
exhibit a linear Stark effect, where the blue shift varies linearly with applied electric field,
due to the absence of these vibrations interacting with the inorganic framework. We can

103
consider this a simple vibrational response to an applied field. The N-H stretches of
hybrid perovskite materials are known to interact with the halide of the inorganic cage
through hydrogen bonding.134 Hydrogen bonding contributions have been made in
solvatochromic vibrational Stark shift measurements, where both the linear dielectric
component, and an H-bonding component contribute to the vibrational shift. The
presence of standard hydrogen bond donors, such as N-H bonds, possess large dipole
moments and can exert electric fields that are larger than a simple dipole-dipole
interaction.145 Hydrogen atoms are also small and able to associate with surrounding
heavy atom donors more closely than other atoms. The field produced by a dipole
diminishes with an increase in distance cubed, so close proximity to the inorganic cage
may explain why N-H stretches exhibit larger transient vibrational stark shifts.145
Zhu and co-workers have reported a study concerning polaron formation in hybrid
perovskites.142 They claim a sub-picosecond large polaron formation time due to
deformations in the lead halide cage. The formation and decay time constants were
affected by the presence of the dipolar MA cation vs. an all inorganic perovskite with a
cesium cation. They assert deformation and structural orientation upon photoexcitation, is
aided by the MA cation in hybrid perovskites. This deformation of the inorganic cage and
delocalization of the photoexcited electron in the conduction band can affect the
frequency of vibrations in the excited state. Other reports discuss this
molecule-framework interaction in terms of the permanent dipole on MA inducing a

104
dipole interaction on the polarizable halide.131 Both interactions are electrostatic and
depend on deformations of the inorganic framework to shift the vibrational spectra.
A more in depth investigation of the peak shifts and peak FWHM with time were
conducted using a multipeak fit package in Igor in order to quantify local heating effects.
Local heating manifests itself in a TRIR spectrum typically by a bleaching component
that arises from spectral diffusion due to change in transmittance of the infrared probe.147
A refractive index change, by thermal effects, is similar to the mechanism of the
vibrational Stark shift from creation of an internal field. Thermal effects are often
isotropic and difficult to distinguish from excited state absorption features. The bleach
and transient dual features seen in the majority of the TRIR spectra are identified as a
local heating artifact and Stark shift, respectively. Another research group conducted
TRIR on FAPbI3 and observed a blue shifted transient feature associated with νs(C=N)
but the spectra lacks a ground state bleach due to their low pulse energies with pump
energies near the band gap onset.112 The authors also note that the thermal effects could
not be separated from the excited state absorptions in 2DIR. Other work has shown that
under thermal stress, MAPbI3 films and other hybrid perovskites exhibit blue shifted
organic vibrational features148 and line broadening149,150 with the increase in temperature
to the thermal effect phenomena. With these experimental observations at hand, it cannot
be ruled out that the transient/bleach features measured in this work, mostly evident in
FAPbBr3, are due to a thermal effect and may be masking a transient absorption from a
vibrational Stark shift. Figure 37 depicts the peak position and FWHM of the

105
transient/bleach features of FAPbBr3 at two different excitation energies with time. In
excess excitation energy (500 nm), the transient and bleach features associated with
νs(C=N) blue shift and broaden, consistent with the presence of thermal heating. At a
minimal excitation energy (530 nm), the degree of peak shifting and broadening is
minimized.
Figure 37 – FAPbBr3 peak position and FWHM of transient/bleach C=N feature with
time (top: 500 nm pump, bottom: 530 nm pump)

106
FAPbBr3 in the N-H stretching region seems exhibit a different trend where peak
position red shifts and FWHM broadens or remains consistent with time, as seen in
Figure 38. In the ground state, this vibrational features is assigned to the N-H stretch of
FA+, split to a quartet by a nearby bromide of the inorganic lattice. In the TRIR spectrum,
the quartet is not resolved, and could only be fit by a single peak. It is hypothesized the
strong H-bonding interactions of the N-H stretch to the lattice by bromide will provide a
path for correlation between the organic moiety and perovskite lattice properties involved
in the polaronic transport state.148
Figure 38 - FAPbBr3 peak position and FWHM of transient N-H stretch feature with time
(left: 500 nm pump, right: 530 nm pump)

107
A peak position and FWHM analysis was also conducted on MAPbBr3. The
single transient feature ~1490 cm−1 assigned to –NH3+ symmetric bend was fit to one
peak, while the asymmetric and symmetric –NH3+ stretch at ~3200 cm−1 and ~3500 cm−1
respectively were fit to two distinct peaks. The absence of a prominent bleach feature
associated with –NH3+ bend indicates that local heating is minimized. Figure 39 depicts
the peak position and FWHM of transient –NH3+ bend feature with time. Peak shift with
time seems to be minimized, while the FWHM only slightly broadens.
Figure 39 - MAPbBr3 peak position and FWHM of transient –NH3+ bend feature with
time (left: 500 nm pump, right: 535 nm pump)
Figure 40 illustrates the trends in peak position and FWHM of the asymmetric
and symmetric –NH3+ stretches. It seems regardless of pump energy, peak position of the

108
transient features change with time. It is evident the higher energy (~3500 cm−1)
asymmetric –NH3+ stretch blue shifts with time, while the lower energy (~3200 cm−1)
symmetric feature red shifts with time. With respect to pump energy, FWHM seems to
narrow at the lower pump energy, 535 nm, perhaps due to the absence of local heating.
At the higher pump energy, 500 nm, FWHM appears to slightly broaden or stay the same.
The opposite trend between the asymmetric and symmetric component of this vibrational
mode is interesting, and may be a consequence of strong H-bonding interactions with the
bromide of the inorganic lattice.

109
Figure 40 - MAPbBr3 peak position and FWHM of dual transient feature with time,
assigned to asymmetric and symmetric –NH3+ stretches (top: 500 nm pump, bottom: 535
nm pump)
MAPbX3 series
The MAPbX3 series spin coated as a thin film on CaF2 was fabricated using a less
reproducible one-step synthetic method. TRIR data was obtained, but a very obvious
negative sloping baseline at higher mid-IR probe energies made for difficult vibrational
interpretation. It was concluded that these one-step films were too thin so the complex

110
absorption of the probe had considerable reflectance contribution in addition to
transmission component. Since the experimental setup only allows for transmission
detection, these data sets tell an incomplete story. A new experimental setup that would
combine transmission and reflectance spectroscopy would circumvent this issue.124 But
this study will still be included in this chapter because some conclusions can still be made
with the given data.
The full excited state spectra for the series are presented in Figure 41 where each
film was pumped at an energy above the band gap and another near the band gap energy.
Figure 43 focuses on the low probe energy transient features across the entire series.

111
Figure 41 - Full TRIR spectra of MAPbX3 series – (top to bottom) MAPbI3, MAPbBr3,
and MAPbCl3 with excitation energy above band gap (750 nm, 500 nm, and 377 nm
respectively) and near band gap excitation (780 nm, 532 nm, and 407 nm respectively).

112
The TRIR spectra presented are in the mid-IR range (ca. 1200 – 3600 cm−1)
which includes many of the major vibrations of the MA cation. Within the instrument
response time, electrons populate the conduction band as free-carriers. It is well known in
literature that free-carriers have absorption in the mid-IR region in both the ground stand
and excited state.139,140 All spectra exhibit a positive baseline signal at positive time
delays and low probe energies, which is attributed to free carrier absorption.
The kinetics associated with the decay of free carriers were analyzed with MEM, as to
not assume the discrete number of exponentials needed to fit the kinetics. In 5 of the 6
kinetic traces, the decay was fit to three predominant time constants (two time constants
for MAPbI3) and are shown in Table 10 and the MEM data in Appendix B. There are
time constants in the range of a few picoseconds, tens of picoseconds, and hundreds of
picosecond for the non-iodide perovskite samples. For MAPbI3 pumped at 780 nm, there
are only two fast time constants. We believe the emergence of the negative feature in the
1250 cm−1 region masked the longest time constant. These time constants correlate to hot
carrier cooling, trap assisted recombination, and surface trapping according to previous
studies.11,56 The early time kinetics for the series are presented in Figure 42. It is clear
these three materials exhibit different decay dynamics by examining the shape of the
decay. Films typically display different kinetic behavior, shorter lifetimes, than their
single crystals counterparts due to the increased number of grain boundaries and surface
trapping contribution.135 MAPbCl3 seems to exhibit vastly faster kinetic decay than the
other two materials. This may be a consequence of its larger exciton contribution151 and

113
overall smaller charge carrier mobility compared to MAPbI3.135 This overall fast kinetic
decay in MAPbCl3 may be indication of inferior solar cell performance, when compared
to the bromide and iodide counterparts. The absence of a long decay time component for
MAPbI3 at low excitation energy is peculiar, because exciting into the Urbach absorption
tail of the material tends to photogenerate mostly free carriers instead of excitons.152
Additional experiments that account for both reflectance and transmission transient signal
are necessary for a more thorough and acceptable analysis of the kinetic data, but is
outside the scope of this spectrally broadband investigation.
Table 10 - Time constant components and contribution (%) to the TRIR signal decay
taken at 1250 cm−1 of MAPbX3 series

114
Figure 42 - Early time kinetics (taken at 1250 cm-1) of MAPBX3 series pumped at
different energies
The simplicity of MA gives rise to a few vibrations of interest within this
perovskite system. MA is not a strong IR absorber in the ground state and typically is not
an IR reporter of interest in molecular systems. Therefore, it is surprising that MA

115
exhibits a very strong excited state vibrational signature in these materials. In this study,
we will focus on the low energy –NH3+ bend and higher energy C–H and N–H stretches.
In all cases, the –NH3+ symmetric bend ca. 1470 cm−1 exhibits a strong (1–5 ΔmOD)
transient vibrational signal that is slightly blue shifted (5–15 cm−1) from the ground state
absorption. Due to the vibrational Stark effect, the material undergoes a large change in
dielectric medium as described with the APbBr3 series, resulting in a blue shift of
vibrational bands.153

116
Figure 43 - TRIR spectra of MAPbX3 series at low probe energy – (top to bottom)
MAPbI3, MAPbBr3, and MAPbCl3 with excitation energy above band gap (750 nm, 500
nm, and 377 nm respectively) and near band gap excitation (780 nm, 532 nm, and 407
nm respectively)

117
There are some other vibrations of interest in this low probe energy region, such
as the –NH3+ asymmetric bend. Transient signals from this vibration are not consistent
through the series and are difficult to interpret due to the large negative baseline. It seems
only MAPbI3 and MAPbCl3 exhibit transient signals from the –NH3+ asymmetric bend.
For these two perovskites, the transient signal is blue shifted from the ground state,
following the same trend as the symmetric –NH3+ bend explained previously in response
to the Stark effect.
At higher probe energies in the N–H stretch region, vibrational absorption is
superimposed on top of the bleach signal. It is interesting to note the intensity of these
vibrational signatures (10–40 ΔmOD), perhaps due to enhancement from polaron
formation. For the whole series, the N–H stretch transient appears slightly blue shifted in
the excited state. The stretch is most shifted for MAPbI3 (20-40 cm−1 shift) and less
shifted for MAPbCl3 (5 cm−1). The peak shifts are presented in Table 11. The shift in N–
H stretch for MAPbI3 seems to be the most sensitive in the series due to the largest
degree of polarizability for the soft iodide anion. This seems reasonable due to MAPbI3
being most shifted due to the Lorentz – Lorenz relationship in the ground state as well as
the excited state. By moving electron density from the valence band iodide p orbitals to
the relatively smaller Pb2+ atom, the polarizability of the Pb–I cage changes the most in
terms of the halide series, and therefore exhibits the most blue shifted vibrational energies
in the photoexcited state. The size of the cavity in which the MA resides decreases from
iodide to chloride due to the nature of the Pb–X bond lengths. The proximity of MA to its
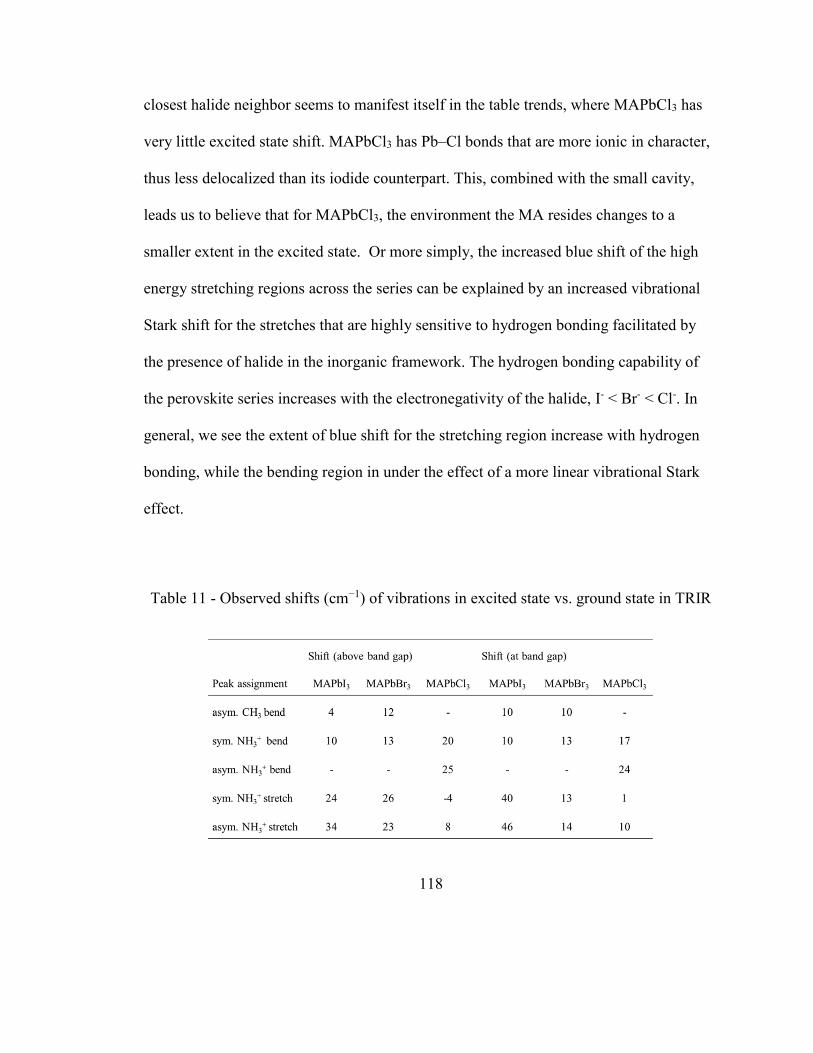
118
closest halide neighbor seems to manifest itself in the table trends, where MAPbCl3 has
very little excited state shift. MAPbCl3 has Pb–Cl bonds that are more ionic in character,
thus less delocalized than its iodide counterpart. This, combined with the small cavity,
leads us to believe that for MAPbCl3, the environment the MA resides changes to a
smaller extent in the excited state. Or more simply, the increased blue shift of the high
energy stretching regions across the series can be explained by an increased vibrational
Stark shift for the stretches that are highly sensitive to hydrogen bonding facilitated by
the presence of halide in the inorganic framework. The hydrogen bonding capability of
the perovskite series increases with the electronegativity of the halide, I- < Br- < Cl-. In
general, we see the extent of blue shift for the stretching region increase with hydrogen
bonding, while the bending region in under the effect of a more linear vibrational Stark
effect.
Table 11 - Observed shifts (cm−1) of vibrations in excited state vs. ground state in TRIR

119
It is important to note in all six spectra across the series, there is a signal ca. 2350
cm−1 which we attribute to the asymmetric and symmetric stretches of atmospheric CO2,
a feature also present in the APbBr3 series.
This study examines the charge carrier state of these materials under two different
charge injection levels. When pumping a sample above the bandgap, at nearly double the
injection level than pumping at the band gap, we introduce broader and an increased
number of accessible vibrational states that are observable in the mid-IR region. The
difference in FWHM of the –NH3+ bends when pumped at different energies and
injection levels indicates that injection level is a source of peak broadening. Table 12
presents the FWHM of the –NH3+ bends for the perovskite series at different injection
levels. It is sensible to predict that further increasing the injection level and excited state
population will increase the FWHM of this transient peak.
Table 12 - FWHM of –NH3+ bend transient with respect to pump energy

120
4.2.6 Maximum Entropy Method for kinetic analysis of heterogeneity of pellets
and films
Kinetic analysis of free carrier absorption of these materials proved to be difficult
to interpret regardless of pellet of film form. Pellets and films are inherently
heterogeneous. Grinding of a pellet can homogenize a sample visually, but perhaps not
enough on a microscopic scale. It is expected that some perovskite crystals will be
oriented differently with respect to the detector as well as have different crystal size and
environment from other parts of the pellet. A thin film may be comprised of a
microcrystalline topography with varying crystal size and heterogeneous grain
boundaries. The degree of heterogeneity in solid samples contrasts solution spectroscopy,
which typically exhibits kinetic behavior with little variability or small FWHM. Large
FWHM of kinetic data is somewhat cumbersome to analyze, so we have proposed using
the Maximum Entropy Method (MEM) to analyze such data. Using this analysis method
has revealed consistent time constants in MAPbBr3 perovskite across three different
preparation methods.
A conventional kinetic analysis summary is presented in Figure 44 for a
MAPbBr3 KBr pellet at three different free carrier absorption regions in the mid-IR, all
will the same experimental conditions. A tri-exponential was fit to each of the three
regions separately resulting in three time constants, a fast ~8 ps component, a ~40 ps
component and a ~170 ps component. The errors associated with each time constant seem
to suggest the calculated time constants remain consistent in each of the absorption

121
regions, but also occupy some range due to the inhomogeneity of the sample. The percent
contribution of each time constant also seems to remain somewhat constant in the three
regions, but also exhibit a range of values.
Figure 44 – Conventional kinetic analysis of MAPbBr3 in KBr pellet, λex = 515 nm
Using the conventional kinetic analysis technique requires some chemical
intuition to choose a tri-exponential fit for this sample. In order to analyze the data with
no user influence of fit and to measure the degree of heterogeneity of the sample, MEM
was the preferred analysis method. Figure 45 depicts the same kinetic data used in Figure
44 but analyzed with MEM. With no user input, the data converges to a tri-exponential.

122
The resulting probability distribution of time constants indicates three main time
constants that are consistent with the conventional kinetic analysis values. For MEM
analysis, the standard deviation associated with each time component is not error
connected to the fit but instead the range of time constants that can fit the data set. In
other words, the standard deviation is related to the heterogeneity of the sample and takes
into account the varied environment of the sample.
Figure 45 – MEM analysis of MAPbBr3 in KBr pellet, λex = 515 nm
It was predicted that perovskite thin films would be a higher quality material to
study compared to perovskite pellets. Due to the absence of KBr matrix, a thin film

123
should behave more homogenously than a pellet, but not purely homogenous. Figure 46
and Figure 47 depict MEM analyses of MAPbBr3 thin films fabricated in a one-step
method and two step method respectively. When compared to the standard deviation,
time constant width in the pellet version of the material, the thin films result in much
more narrow time constants. This indicates that thin films are indeed less heterogeneous
than pellets of the same MAPbBr3 material. Across all three MEM analyses, free carrier
dynamics of MAPbBr3 remains consistent in three different preparation methods. The
longest time component in the hundreds of ps regime seems to be faster for the pellet
version than the films (150 ps vs. 260-280 ps). This long time component is typically
attributed to surface trapping dynamics. Surface defects likely more prevalent in a pellet
due to the grinding process. The percent contribution of this longest component is also
less for the two-step film method compared to the one-step method (9% vs. 30%) which
is likely related to the quality difference between the two synthetic methods.
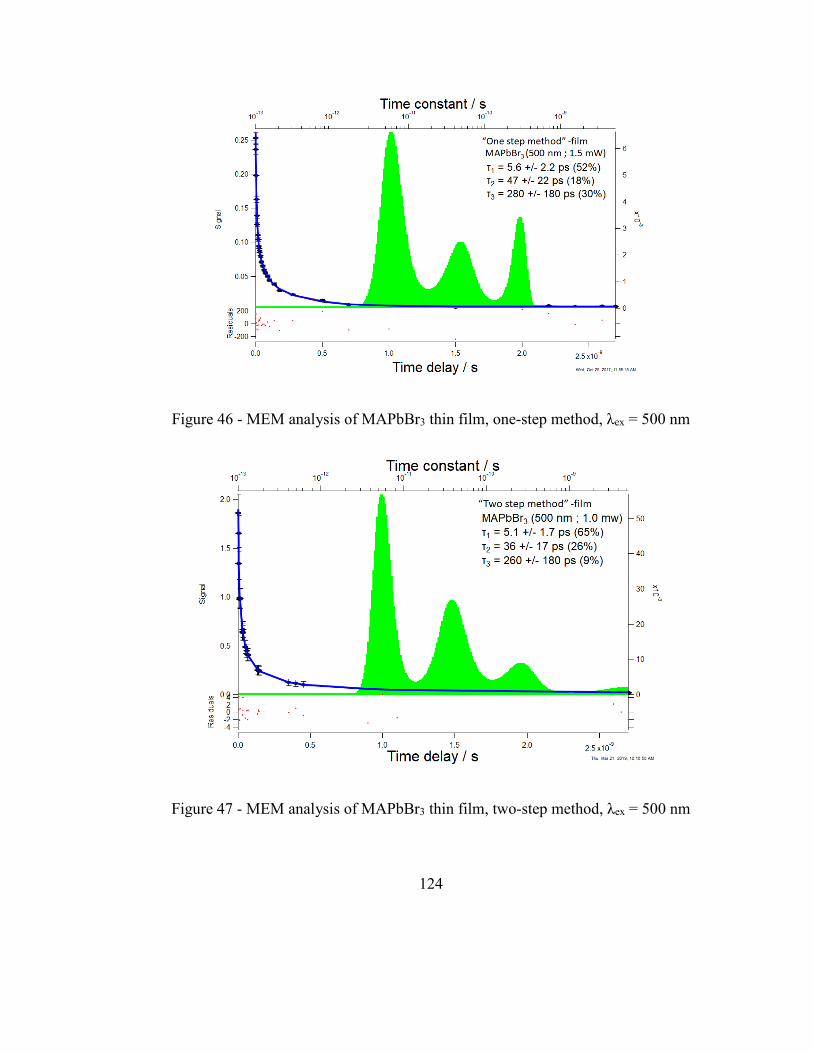
124
Figure 46 - MEM analysis of MAPbBr3 thin film, one-step method, λex = 500 nm
Figure 47 - MEM analysis of MAPbBr3 thin film, two-step method, λex = 500 nm

125
4.3 Concluding Remarks
In summary, we have presented the excited state spectra in the mid-IR of the
MAPbX3 and APbBr3 series pumped at two different energies using TRIR. The spectra
not only display free charge carrier absorption, but also transient vibrational absorption
from the organic cation moiety. The bends and stretches associated with MA or FA are
shifted to higher energy due to the vibrational Stark effect, indicating a change of
polarizability and refractive index of the dielectric medium, represented by the lead
halide framework. The increased blue shift observed in the –NH3 bending region may be
indicative of the addition of hydrogen bonding to the Stark effect. The intense response
observed from the organic MA or FA moieties within the context of hybrid perovskites
opens the door to probing the excited state behaviors of a wide variety of hybrid
organic-inorganic perovskite materials. Finally we note that hybrid perovskites have a
larger proportion of their decay kinetics attributed to fast (1’s and 10’s of ps) components
associated with hot carrier cooling and trap assisted recombination, when compared to
their all inorganic counterpart, CsPbBr3. This is thought to be due to the presence of high
energy phonon modes available for deactivation. The presence of additional phonon
modes may have implications towards stability and longer lasting perovskite LED or
lasing materials.
This work is another example that highlights the versatility of TRIR in the study
of solid and crystalline materials. Semiconducting materials are particularly interesting to
vibrational spectroscopists due to the strong mid-IR response of free carrier absorption.

126
Hybrid perovskites provide an additional mid-IR probe into the material as a
superimposed signal on top of free carrier absorption that can reveal excited state
behaviors of the material. It was concluded that the presence of a hybrid A-site cation
aided in the fastest component decay due to coupled high energy phonon modes. We
hope to reveal more relationships in the next steps forward by expanding our TRIR work
to the double perovskite family and others.

127
Chapter 5. Solvent stabilization of tripyrazolylborate iron (III) complexes upon LMCT
absorption
Work based on a collaboration with Professor Stephen M. Holmes at the Department of
Chemistry and Biochemistry, University of Missouri – St. Louis, St. Louis, MO
5.1 Introduction
Cyanometalates and TpRFeIII(CN)3- type complexes are interesting to vibrational
spectroscopists because of the presence of high oscillator strength cyanide ligands. Like
the CO ligand, CN- is highly sensitive to changes in electron density and environment
particularly in organometallic systems. The structure-function relationships in
mononuclear tripyrazolylborate iron (III) building block complexes were studied
previously in the ground state.154 The authors describe a trend in electronic and
vibrational behavior by changing of the donor strength of a fac 3-coordinate ancillary TpR
group on an Fe(III) center. This work investigates TpRFeIII(CN)3- complexes. The series,
A-E are presented in Figure 48.

128
Figure 48 - Representative TpRFeIII(CN)3- complex in the fac geometry and series of
poly(pyrazol-1-yl)borate ligands investigated in this study154,155
TRIR studies have been conducted previously on the parent complex,
ferricynaide, Fe(CN)63-,156 and somewhat similar ReI(bpy)(X)(CO)3 complexes.27
Gaffney, et al.,27 studied ferricyanide using TRIR, excited at 400 nm, which is the blue
side of the absorption band. In their study, they observed a red shifted transient band,
originating from ν(CN), at early time delays, then different two bands emerge at later
time. They suggest after photo excitation, the electron hole delocalizes on all 6
CN- ligands at early times, then the solvent aids in the stabilization of the hole on one
CN- ligand some time later (the two band feature). Two peaks emerge at later times due
to a reduction of symmetry. The red shifted transient ν(CN) originates from the LMCT
process that puts additional electron density on the metal center, (xy, xz, yz)5 (xy, xz,
yz)*6), increasing the ability for metal to ligand π* backbonding, decreasing the effective
bond order of CN-.

129
TJ Meyer’s work on rhenium systems can be compared to this work, with both
systems as examples in structure function relationships.27 In their ReI(bpy)(X)(CO)3
system, the authors systematically increase the donor strength of X and observe the
changes on v(CO). CO and CN- ligands are isoelectronic, exhibit similar electronic
behaviors and are both excellent IR reporters. The absorption band for this family of
complexes is MLCT in nature, where light photo-oxidizes the metal center, ReI to ReII,
and puts that electron on bpy. As previously stated, an increase of donor strength of X
will weaken v(CO) in the ground state. The hydride version of the complex has the
lowest v(CO) vibrational energy because hydride is the strongest sigma donor and can be
explained by backbonding. In addition to ligand basicity, ligand π acid ability will
strengthen v(CO) because of π* competition. Upon photoexcitation, the MLCT
undergoes dπ6 dπ5 π*1 (bpy). There is now less electron density within the d manifold
of Re, so less backbonding to CO therefore the MLCT produces a 50-100 cm-1 blue shift
in the excited state. The structure function studies on Rhenium carbonyl complexes
provides context and precedence to the cyano iron (III) complexes discussed here.
5.2 Results and Discussion
5.2.1 Synthesis
Complexes A-E were received from the Holmes research group as crystalline
solids. The Holmes group has reported the synthetic procedure for complexes A-E.154,157

130
Briefly, for A, B and E, Fe(OAc)2 was treated with its respective KTpR ligand, followed
by an excess of [NEt4]CN in acetonitrile which gives the divalent, Fe(II) complex. The
trivalent complex is obtained by hydrogen peroxide addition to a mixture of DCM,
isopropanol and the divalent precursor. For C, D, [NEt4]2[Fe2OCl6] was used as the iron
source and follows the same procedure as A, using the appropriate KTpR salt.
5.2.2 Spectroscopic trends in A-E
Thorough investigation of ground state properties is necessary for complete
understanding of subsequent ultrafast properties. These TpRFeIII(CN)3- complexes exhibit
a very straightforward CN- π back-bonding picture. The stronger the sigma donor of the
TpR ligand, the more electron density on the Fe(III) metal center. π* orbitals on the
CN- ligand possess the symmetry to interact with occupied Fe d orbitals. In general, we
observe a weaker ν(CN) frequency with a stronger metal-TpR interaction. Due to
backbonding, a trend is evident with a decrease in v(CN) around 2120 cm-1 in the ground
state IR with the increase of sigma donor strength of a TpR ligand (Figure 49). This
back-bonding phenomena is also seen in other organometallic studies. T.J. Meyer, et al.
studied rhenium and osmium systems and observed a trend of decreasing v(CN)
frequency with increasing sigma donor strength of other ligands.27 Meyer also concluded
that strong π-acid ancillary ligands will increase the ν(CN) stretching frequency due to
competition of accessible π* orbitals.

131
Figure 49 – Spectroscopic trends of the TpRFeIII(CN)3- series with different TpR ligands,
Adapted from reference154
The reduction potential of the Fe(III) core is affected by the σ-basicity or electron
richness of the TpR ligand. As seen in Figure 49, reduction potential will increase with
increase of the σ-donation of the TpR ligand. The donor strength of TpR ligands increase
with steric demand,154,155 where the donor strength observed in the Fe complex series
decreases A to E (ligand trend: TpMe* > Tp* > TpMe > pz0TpMe > pzTp). The most
negative reduction potential corresponds with the complex with the strongest σ-donor,
TpMe*. This demonstrates that A is the most electron rich metal complex while complex
E, utilizing pzTp, is the most electron deficient with the most positive reduction potential.
With increased ligand donation, there is stronger M-L interaction and increased
d-splitting of xz, yz orbitals. A consequence of the strong interaction, the energy
difference between the xz,yz and the ligand, t1u (for decreased symmetry in C3v, split to e
+ a) will decrease, thus decreasing the ligand-to-metal charge transfer (LMCT) energy,

132
red shifting the absorption maximum. Meyer and coworkers applied the sample principles
to explain spectroscopic trends in metal to ligand charge transfer (MLCT) systems.27
In the electronic structure of Fe(III), d5, the HOMO is (xz, yz)3. The symmetry of
the TpR complex is reduced from Oh to C3v, when compared to the homoleptic
counterpart. DFT and previous studies indicate the ordering of these complexes to be
metal based: z2 < (xz, yz) < (x2-y2, xy), while a purely homoleptic cyano Fe(III) complex
would form the typical octahedral electron configuration of (xy, xz, yz)5 < (z2, x2-y2).154
It important to note that the unpaired electron in the d manifold is what gives rise to the
LMCT state under investigation in this study. In ferricyanide, the LMCT process is
symmetry allowed (CN- ligand to Fe3+) in character, t1uσ t2gπ (d), as seen in Figure 50.
C3v symmetry exhibits a 2E (xz,yz) state instead of a 2T2g (xy,xz,yz) state in octahedral
symmetry.

133
Figure 50 – Frontier molecular orbital diagram for high spin Fe3+ and ferricyanide
[Fe(CN)6]3-
, Adapted from reference158
Figure 51 is a qualitative representation of the frontier molecular orbitals,
determined by DFT calculations, for a few representative Fe(III) complexes. According
to the previous study, the strongest TpR sigma donor initiates the most d(yz,xz) orbital
CNπ* ligand mixing, meaning the strongest back-bonding interaction. This detail will
prove important later when we explore the nature of the photoexcited state using an
infrared probe.

134
Figure 51 - Representation of [TpRFe(CN)3]- frontier orbitals from DFT calculations27
5.2.3 Time-resolved Infrared Spectroscopy
In this study, TRIR experiments were performed on the Tp*Me pzTp series
dissolved in MeCN to the highest concentration possible so the v(CN) around 2120 cm-1
exhibited intense absorption. All samples were excited at 440 nm and energy of 2 uJ per
pulse (average 2 mW power). Exciting on the red side of the absorption band limits the
amount of excess energy and vibrationally hot states that may obscure other dynamics of
interest. Along with the visible pump, the samples were probed with mid-IR light,
centered at the v(CN) stretching frequency. The time delays studied were between -100
ps and 600 ps after the pump pulse with a resolution of 300 fs. The excited state
processes for these complexes are all completed before 1 ns.

135
The TRIR spectra for the series all contain the same features. Complexes A and B
in MeCN are presented below in Figure 52 and Figure 53 as representative spectra for the
series. All spectra contain (1) a ground state bleach at the same wavenumber of the GS
absorption of the ν(CN) stretch, (2) a transient feature at lower wavenumber, red shift,
with respect to the GS bleach, and (3) a shoulder peak on the transient feature that may be
separated by 10-15 cm-1. The values of interest to us are the separation of the GS bleach
and transient, ∆ ν(CN), and the decay lifetime of the transient feature.
Across the series, the transient red shifts around ~65 cm-1. The time constants for
the disappearance of the transient peak range from 3-16 ps (in MeCN). A has the fastest
decay time constant of ~3 ps, while the rest of the series have decay of about ~13-16 ps.
The fast decay of complex A (vs B) is very apparent when comparing Figure 52 and
Figure 53. These time constants suggest that the more steric bulk on ligand, near the
metal center produces faster decay kinetics, perhaps due to sterics preventing solvation. A
summary of the TRIR data in MeCN is presented in Table 13 and the remaining TRIR
spectra for C-E can be found in Appendix C.

136
Figure 52 – TRIR spectrum of A in MeCN, λex = 440 nm
Figure 53 - TRIR spectrum of B in MeCN, λex = 440 nm

137
Table 13 – Summary of TRIR data of A-E taken in MeCN and DMSO
The same TRIR experiment was performed on the series, A-E, but dissolved in
DMSO. Solvation dynamics of the solvent DMSO are slower than they are in MeCN, in
general.159 Gaffney reports the solvation of ferricynide in MeCN proceeds with a time
constant of 1.9 ps while in DMSO is 4.9 ps. In this study, upon photoexcitation, we
should expect the absence of solvent stabilization of the LMCT state in DMSO. It was
also predicted that the shoulders disappear in DMSO. Complexes A and B dissolved in
DMSO are presented below in Figure 54 and Figure 55 as representative spectra for the
series, while the remaining TRIR spectra for C-E can be found in Appendix C.. The
entire series all contain the same features as previously described. Firstly, the shoulders
still persist, but we also see that the decay time constants are overall faster in DMSO that
in MeCN. The time constant of ~3-6 ps is consistent with the solvation dynamics of
DMSO.160 It is uncertain if the time constants of the series in DMSO follow an opposite
trend (E the fastest, while A and B the slowest) as the MeCN trend, but these data are

138
consistent with decay of Tp* in DMSO measured with TRIR is consistent with TA
measurements, described later. The excited state red shift trend with the series follows the
similar trend as seen with MeCN as the solvent. The extent of the ∆v(CN) red shift trends
with ligand strength in MeCN. As stated previously, the stronger sigma donor ligands
have more metal ligand CN π* mixing. So once the LMCT state is populated, there will
be an increase of electron density on the metal based orbitals, xz,yz. This will weaken the
v(CN) bond and red shift the vibration. The most red shift will be seen with the complex
with the most M-L mixing (Tp*Me, A).
Figure 54 – TRIR spectrum of A in DMSO, λex = 440 nm

139
Figure 55 - TRIR spectrum of B in DMSO, λex = 440 nm
The shoulder that appears on the transient peaks may be due to multiple normal
modes contributing to the local mode. Both Gaffney and Meyer discuss in their papers
symmetry reduction of the excited state and multiple peaks in the TRIR originating from
one excited state species.27,156 In Gaffney’s work,156 the two peaks that emerge at later
times look more resolved than what is observed here, but seem to be separated by 15-20
cm-1 which is not too far off from the shoulder peaks observed in this work (shoulder
separation of 10-15 cm-1). This indicates that the excited state contains a localized hole
on one of the three CN- ligands.

140
5.2.4 Ultrafast UV-Vis Transient Absorption Spectroscopy
TA experiments conducted on A-E were mainly used to corroborate decay
lifetimes in TRIR. The series was dissolved in MeCN and excited at 400 nm and 480 nm
depending on the location of the ground state absorption band of the complex. The
samples were probed with visible light, to investigate the subsequent excited state
UV-Vis spectra or electronic spectra with time. A second TA experiment designed as a
solvent dependent study with complex B.
The types of features in the TA include (1) a derivative like - high energy bleach/transient
feature, where the bleach occurs at the same energy as the GS LMCT and the transient
feature at higher energy with respect to the bleach and (2) a low energy broad feature that
occurs to the red of the pump wavelength. Alternatively, these two features may actually
be one broad transient absorption that spans a few hundred nanometers, with the ground
state bleach superimposed over it and more obscured from the pump wavelength scatter.
So the positive transients on either side of the pump may be from the same
feature/excited state species. The time constants for the decay of the two positive features
are within the same magnitude of one another, so it is reasonable to say that the two
features originate from one excited state species or the same excited state absorption. A
summary of TA decay dynamics is presented in Table 14 and the TA spectra for the
remaining complexes A, C, D and E can be found in Appendix C. The character of this
transient absorption (S1Sn) could be a d-d transition from (xz,yz)4 to the higher lying
(xy, x2-y2) because the transient feature is not very intense.

141
Figure 56 – TA spectrum of A in MeCN, λex = 400 nm
Figure 57 - TA spectrum of B in MeCN, λex = 400 nm
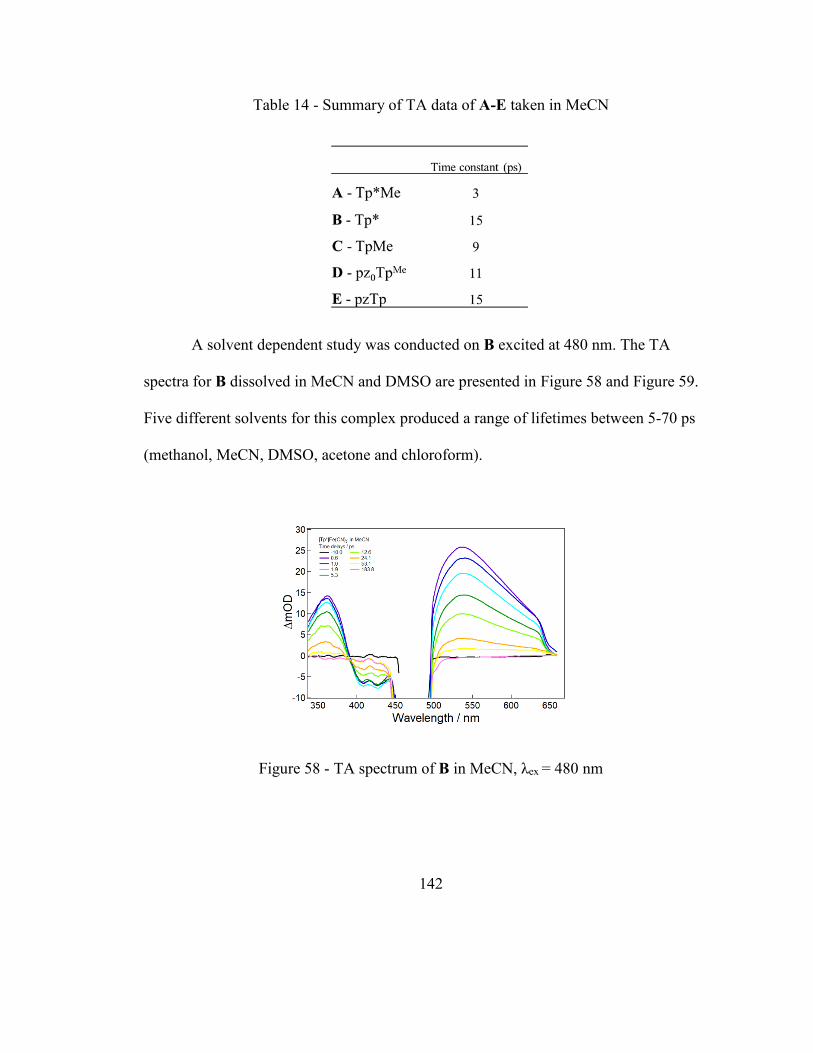
142
Table 14 - Summary of TA data of A-E taken in MeCN
A solvent dependent study was conducted on B excited at 480 nm. The TA
spectra for B dissolved in MeCN and DMSO are presented in Figure 58 and Figure 59.
Five different solvents for this complex produced a range of lifetimes between 5-70 ps
(methanol, MeCN, DMSO, acetone and chloroform).
Figure 58 - TA spectrum of B in MeCN, λex = 480 nm

143
Figure 59 - TA spectrum of B in DMSO, λex = 480 nm
Gaffney and coworkers studied the TRIR of ferricyanide with two different
solvents, MeCN and DMSO.156 The solvation time of MeCN significantly faster than
DMSO. This explains why the decay of ferricynide in DMSO is fastest due to the
inability of the solvent to stabilize the LMCT of the complex. The TA decay time
constant measured for Tp* in DMSO is 5 ps. This 5 ps time constant is the same
solvation lifetime that the authors calculated for DMSO for ferricyanide. This suggests
that the ES species will revert back to the GS rather than be stabilized or solvated because
of the slow solvation dynamics of DMSO. The authors also calculated a solvation time of
~2 ps for MeCN. The solvation response of MeCN is fast enough to stabilize the ES
species resulting in a longer lifetime.
The large range in lifetimes for B in different solvents along with corresponding
solvent properties are summarized in Table 15. It is thought that the short lifetimes

144
observed in DMSO and methanol are due to the long solvation dynamics of the two
solvents. DMSO is highly viscous and methanol possesses hydrogen bonding, both
preventing the solvent from responding to stabilizing the photoinduced dipole on the
complex of interest. The lifetime gathered from in MeCN corroborates the lifetime
measured using TRIR in the same solvent. A trend arises from the time constants of B
measured in MeCN < acetone < chloroform. Decay kinetics appear to lengthen as
polarity and dipole moment decrease in the solvent. The sustaining of the excited state for
B seems to be due to a reduced time-dependent dielectric friction component, which is
related to the stabilizing power of the solvent molecules as it responds to a photoinduced
dipole.161 The increasing lifetime observed in methanol, acetonitrile and acetone follow
the trend of decreasing stabilizing power (dipole moment) and decreasing initial solvent
friction values take as solvation time.162–164

145
Table 15 – Summary of TA kinetics of B and solvent properties
Solvent properties can be found in the following references: a165 ; b156 ; c164
5.3 Concluding Remarks
This chapter explored the ultrafast behavior of a series of mononuclear
tripyrazolylborate iron (III) building block complexes capped with a facial 3-coordinate
TpR ligand. With the increase of donor strength of TpR, ground state properties such as
reduction potential and vibrational frequency of ν(CN) change with a predictable trend.
The trend is also evident in the excited state which was observed with both TRIR and
ultrafast TA. Photoexcitation involved an LMCT transition, effectively photoreducing the
Fe (III) to Fe (II). The TRIR spectra of the series dissolved in MeCN displayed a
prominent red shift of the ν(CN) by ~65 cm-1 upon photoexcitation. The transient signal
decays with lifetimes between 5-20 ps in MeCN. The extent of the red shift can be
explained by the synergistic Fe(d) and CNπ* back donation and contribution by the

146
sigma donation of the TpR ligand. The complex with the most bulky ligand, Tp*Me or
complex A exhibited the shortest lifetime. It was proposed that solvation stabilization by
MeCN of the photoexcited state explains the meaning of the trend. The same experiment
was conducted with the series dissolved in DMSO, which has slower solvation dynamics.
The complexes across the entire series has time constants ~5 ps, due to the inability of
DMSO to stabilize the positive charge on the CN- ligands.
TA was conducted on the series in MeCN to corroborate the lifetimes taken from
TRIR. A solvent dependent study on complex B, Tp* ligand, was conducted using TA.
Methanol and DMSO, again, proved to have poor solvation properties due to hydrogen
bonding and viscosity respectively, evident by the short lifetimes of B in these solvents.
Lifetimes measured in MeCN, acetone and chloroform increase as dielectric of the
solvent decreases. This may be due to the polarity matching of the solvent and ES
species.
This work is a significant part in the investigation of small molecule magnets
building blocks, such as tripyrazolylborate iron (III) in its application to Prussian blue
analogs. The presence of CN- ligands lends itself to vibrational spectroscopy due to its
high oscillator strength. Ultrafast spectroscopies can reveal behaviors that agree with
other electronic properties. We can also use the technique to explore the behavior of
solvent response of photoexcited species. The next step forward in this project would be
to apply the ultrafast kinetics and vibrational behavior and apply a trend from a
mononuclear building block to a macromolecule small molecule magnet.

147
Chapter 6. Ultrafast dynamics of aromatic donor-acceptor liquid crystals
Work based on a collaboration with Professor Joseph J. Reczek at the Department of
Chemistry and Biochemistry, Denison University, Granville OH
6.1 Introduction
Self-assembly is a molecular driven process that is attractive to large scale
synthetic procedures in industry. Material chemists are interested in combining
interesting behaviors with self-assembling molecules in order to design more valuable
materials. More specifically, columnar liquid crystals (CLCs) are a novel group of
materials that self-assemble by π-stacking of the aromatic rings of the molecular
ensemble. These materials have been shown to have thermotropic mesophase behavior166
and have many applications in the field of organic photovoltatics.167 A CLC that
possesses donor-acceptor components are a subclass called aromatic donor-acceptor
columnar liquid crystals (DACLCs).75
DACLCs consist of an electron rich donor and electron poor acceptor, which can
self-assemble into columnar structures through π-π stacking. Charge transfer (CT) bands
of the organized material can occur in the visible spectrum. CT energy can be tuned by
the alignment of the HOMO and LUMO levels of the donor and acceptor respectively
(Figure 60). CT has been studied heavily in solution based chemistries, but DACLCs are
unique in that there is no solvent present, instead the material is a liquid crystal phase and

148
can exhibit 10-100 more CT absorption than solution based systems.168 Tuning of the CT
band requires a systematic modification of the donor and acceptor components. CT
tuning of DACLCs has been studied and reported previously where the authors utilized
the liquid crystals in the design of laser rewritable dichroic materials.168–170
Figure 60 – Schematic of HOMO-LUMO alignment of donor/acceptor system for charge
transfer band
The emergence of a CT band in the visible region is an interesting phenomena to
study using ultrafast spectroscopies. TRIR can reveal specificity to electron localization
during the CT event and may provide insight into anisotropy and photoswitchable
behaviors of these materials. A multitude of donor-acceptor systems have been studied
using ultrafast spectroscopies, but at this time none on this subclass of liquid crystals
using TRIR. A prototypical DACLC was provided as a representative material to assess

149
its response with ultrafast vibrational spectroscopy. The material is comprised of a donor
molecule, 1,5 diaminonaphthalene derivative with alkylated aryl amines (D1) and the
common acceptor molecule, naphthalene diimide (NDI, A1) as seen in Figure 61.
Figure 61 – DACLC, electron rich donor D1 and electron deficient acceptor A1 used in
this study
A frontier orbital depiction of the HOMO of D1 and LUMO of A1 is presented in
Figure 62. The CT transition of this material is a spin-allowed πD1-π*A1. It is important to
note that the extinction coefficient for this material is ~6000 M-1cm-1, which is greater
than other solvent based donor-acceptor systems by a factor of 10.168 This family of
DACLCs is highly tunable. The authors who have pioneered this area studied this
material with a different acceptor component that possesses a doubly degenerate LUMO,
and they observed a doubling of the extinction coefficient.168
Liquid crystal mesophases typically only exist in a small temperature range
between the solid and liquid state. These mesophase transitions occur at 22°C, 99°C and
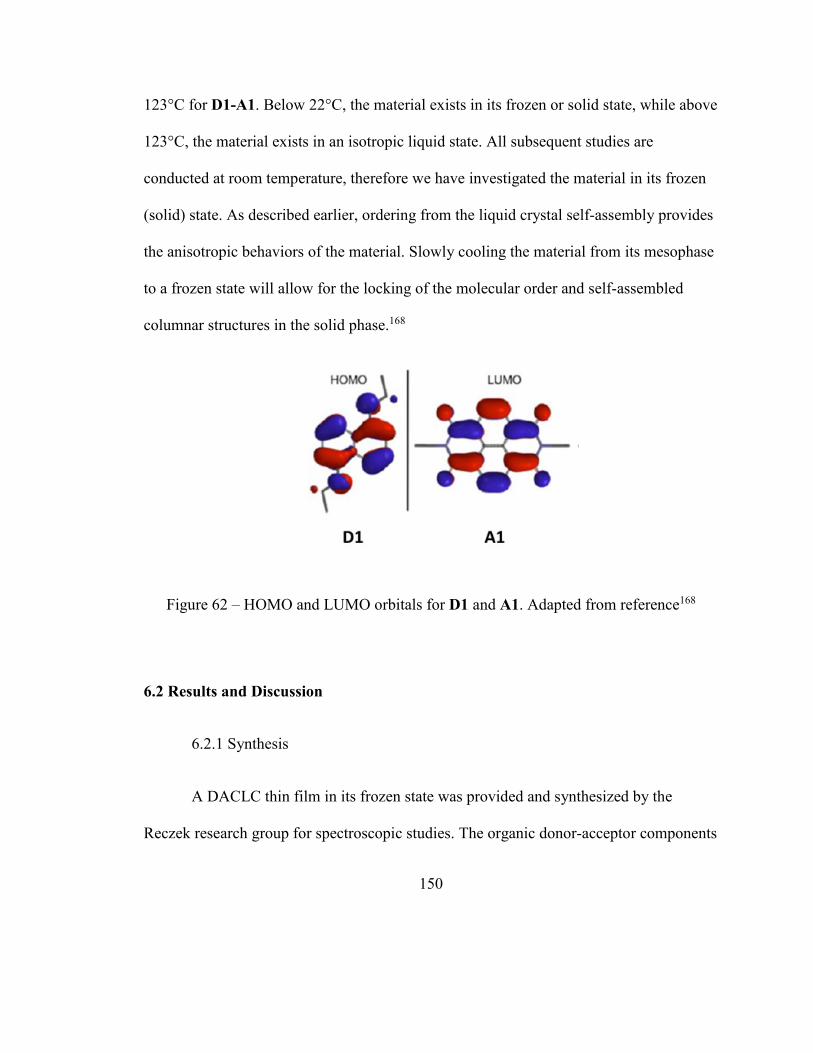
150
123°C for D1-A1. Below 22°C, the material exists in its frozen or solid state, while above
123°C, the material exists in an isotropic liquid state. All subsequent studies are
conducted at room temperature, therefore we have investigated the material in its frozen
(solid) state. As described earlier, ordering from the liquid crystal self-assembly provides
the anisotropic behaviors of the material. Slowly cooling the material from its mesophase
to a frozen state will allow for the locking of the molecular order and self-assembled
columnar structures in the solid phase.168
Figure 62 – HOMO and LUMO orbitals for D1 and A1. Adapted from reference168
6.2 Results and Discussion
6.2.1 Synthesis
A DACLC thin film in its frozen state was provided and synthesized by the
Reczek research group for spectroscopic studies. The organic donor-acceptor components

151
of D1-A1 were synthesized separately by methods that have been previously described.168
Briefly, the DACLC self-assembly was fabricated by combining a 1:1 molar ratio of the
donor acceptor solid components, D1 and A1, in a small vial. The vial was heated and
mixed continually until completely melted into an isotropic mixture. Upon melting, a
drastic color change from colorless individual components to a black melt was observed,
corresponding to the emergence of the new CT band. The melt was transferred to a CaF2
plate and sandwiched with another CaF2 plate to produce a thin film. The material was
allowed to cool and stored in the dark at room temperature. Subsequent spectroscopies
were performed with the sample as is.
6.2.2 Ground State Vibrational Spectroscopy
The ground state IR of D1-A1 in its frozen or non-mesophase is presented in
Figure 63 and Figure 64. The peaks centered at 3424 cm-1 are assigned to the secondary
amine, -NRH of D1. C-H stretches are seen in the ~2900 cm-1 region assigned to the alkyl
groups of A1 and D1. The weak peaks at 1923 and 1875 cm-1 are assigned as the C=C-H
bend overtones, where the fundamental peaks are masked by the lower energy CaF2
absorption. The peaks at 1699 and 1655 cm-1 are assigned to the antisymmetric and
symmetric C=O stretches on A1, respectively. The C=C conjugated stretching modes on
A1 occur at 1537 cm-1 region, and 1583 cm-1 region for D1.

152
Figure 63 – Ground state IR spectrum of D1-A1 in the CH stretch region
Figure 64 - Ground state IR spectrum of D1-A1 in the C=O and conjugated CC stretch
region

153
6.2.3 Time-resolved Infrared Spectroscopy
The TRIR spectrum for D1-A1 excited at 450 nm and 700 are presented in Figure
65 and Figure 66 respectively. This material exhibits two CT absorption bands, one with
a maximum at 636 nm and another shoulder with an onset at 500 nm. The higher energy
CT originates from a HOMO-1 (on D1) to LUMO (on A1) transition.168 The TRIR
experiments presented here excite into both CT bands to explore any differences that may
arise between the two states.
Figure 65 – TRIR spectrum of D1-A1, λex = 450 nm

154
In general, Figure 65 and Figure 66 show spectra that look and behave similarly.
Both exhibit broad absorption at early times across the entire mid-IR region studies. This
is likely due to a broad electronic absorption band, as a consequence of the π- π ring
stacking along the columnar structure. Previous studies of PDI have observed similar
spectra shapes.171 A1 exhibits red shifted C=C aromatic stretch around ~1530 cm-1. These
observations are consistent with the addition of an electron on A1 into its LUMO, which
is mainly pyrlene ring π* in character. Although, the C=O symmetric and antisymmetric
stretches on A1 in the ~1650 cm-1 region exhibit blue shifted peaks in the excited state.
According to the LUMO orbital diagram, as seen in Figure 62, the photoexcited electron
will occupy an orbital that is mainly π* in character, but also possesses O non-bonding
character. Perhaps the additional electron density on O will result in a stronger adjacent
C=O vibration. A radical anion of NDI has not yet been studied with TRIR, so
calculations would perhaps indicate if this formation is plausible. The CC conjugated
stretching mode at 1583 cm-1 for D1 is slightly blue shifted at early times, but shifts to the
red side of the ground state absorption band by the end of the experimental window. The
red shift is consistent with a removal of electron from the HOMO or HOMO-1, which are
pyrlene π in character.

155
Figure 66 - TRIR spectrum of D1-A1, λex = 700 nm
The kinetics associated with both excitation experiments contain a fast ~0.5 ps
component and a slower ~4 ps component. The fastest component has been previously
identified as the relaxation to the S1 state of NDI.172,173 According to previous work, the 4
ps component is consistent with the decay of S1 of NDI as well as the formation of a
charge separated state (D1+-A1-).172,174 At later times, A1 still exhibits blue shifted
symmetric C=O stretch and red shifted C=C. Interestingly, the C=C of D1 seems to
display a red shift with time, where at the end of the experimental window (~2.5 ns) the
C=C transient is ~3 cm-1 red shifted from the ground state absorption. This species

156
present at late times may be remaining 1NDI, where there is still residual electron density
on the π* of the acceptor.174,175
The broad IR absorption present across the entire spectrum may be identified as a
broad electronic absorption. This material is a highly ordered liquid crystal that adopts a
face-centered electrostatic self-assembly. This may allow an electron to move freely
within the orderly structure through π-π stacking of the D1 and A1 ring systems. CLC’s
are known to possess anisotropic electron transport properties along the ring faces, as
described in the Introduction section 1.4.2, so the presence of broad absorption is
expected.
There are no apparent differences between the 450 nm and 700 nm experiments in
terms of spectra and kinetic behavior. It is hypothesized that the vacancy in the HOMO-1
when exciting at a higher energy will be filled quickly by the π system of naphthalene or
HOMO. This process may occur faster than the time resolution of the experiment.
6.3 Concluding Remarks
This chapter investigates the vibrational spectra of a donor-acceptor columnar
liquid crystalline material in both the ground state and excited state. The D1-A1 system
described here possesses two charge transfer bands, owning to the near degenerate
HOMO and HOMO-1 on the D1 component. Ground state vibrations were assigned to
C=C aromatic ring stretch of D1 and A1, as well as the symmetric and antisymmetric
C=O stretched of A1 all within the 1500 – 1800 cm-1 region. Two different experiments

157
were conducted, where we excited into the low energy CT band as well as the higher
energy CT band. No discernible differences in spectra or kinetics were observed with
differing excitation energy. In the excited state, red shifted C=C stretches on A1 were
observed. C=C stretches on D1 were observed to blue shift at early times and shift to the
red at later times, which is consistent with depletion of the HOMO. Also, broad mid-IR
absorption was measured which may be due to the order and crystallinity allowing for
free carrier-like delocalization of electrons. The kinetics associated with the transient
signal at ~1600 cm-1 decay with a time component of 0.5 ps and 4 ps. The fast component
is thought to be the fast relaxation to the singlet radical anion of A1. After 4 ps, a longer
lived species is observed which may be residual singlet of A1.174,175
The significance of this work brings to light the strength and versatility of TRIR
as a spectroscopic tool of solid or crystalline materials. DACLC is just one of many
examples of the use of ultrafast infrared spectroscopy in order to explore the electron
dynamics of during an absorption event. The specificity provided by TRIR corroborate
the predictions made by DFT calculations. Although the ultrafast kinetics cannot be
traced to a single macroscopic property yet, it is proposed to examine more
donor-acceptor systems in this manner in order to determine a structure-function
relationship that relates ultrafast dynamics to the versatile behaviors of DACLCs.

158
Chapter 7. Perspective
The meaning and significance of this work was not completely apparent during
the long nights on the ultrafast laser system or during the hours of data workup. In
writing this dissertation and looking at the entirety of this work, it is apparent that TRIR
is a powerful tool that can reveal details of a variety of substances in a variety of physical
states. Ultrafast spectroscopy can provide insight into the brief behaviors of molecules or
materials when they absorb light. Hopefully this document can add to the current field of
photophysical processes of photovoltaics as well as encourage the pursuit of knowledge
surrounding the utilization of the solar spectrum as an energy source.
Chapter 3 focused on a projected pioneered by Malcolm Chisholm, studying
electron delocalization of dimolybdenum complexes. The colorful compounds and their
intense metal-to-ligand charge transfer transitions lend themselves to their application in
dye-sensitized solar cells. TRIR was the technique of choice to monitor changes in
electron density on complexes, as well as observe the electronic structure on a TiO2
nanoparticle. Molecular domains that were most useful were the C=O or C≡N reporter
ligands that acted as a window into the ultrafast photophysical processes. One of the roles
of the dye in a DSSC system is to lower the band gap energy of semiconductor/dye
material in order to potentially harvest more of the solar spectrum. Future directions
based on this work could explore a more conjugated anchoring group ligand. Adding an
alkynyl, (-C≡C-) functional group between the O2C- linkage and para-pyridine N-oxide

159
anchoring group. Employing this functionalization will both lower the LUMO of the dye
and red shifting the MLCT absorbance band, which is more applicable to the DSSC
community. The addition of an akynyl group will also serve as an additional IR reporter,
where ν(C≡C) occurs at approximately ~2200 cm-1. This group has proven to be a strong
reporter ligand in previous studies.33 Since this functional group is not directly involved
in the anchoring to TiO2, we can draw more insight into the 1MLCT, together with the
NO functional anchoring group.
TRIR investigations extended to the solid realm involving semiconductors with a
collaboration with Eric McClure from Patrick Woodward’s research group. Bulk
processes differ from typical molecular photophysics, so kinetic data needed to be
examined with a different kind of toolbox. It is important to note that ultrafast
spectroscopy on perovskites is a brand new territory in an emergent field, so there was
little precedent and literature to guide this work. At the beginning of this work, analysis
was made through the lens of a molecular spectroscopist, but soon it was realized that a
new method would need to be invoked to achieve reproducible data and results. A new
kinetic analysis technique, maximum entropy method, was used to analyze the kinetic
data associated with free carrier absorption as well as address the inhomogeneity of solid
samples. The power of MEM was highlighted when analyzing pellets and films. These
materials are microcrystalline in nature, so analysis of a perovskite single crystal would
provide a complete the story. There are many possible directions in this developing field.
TRIR could be used to analyze other possible organic A-site hybrid perovskite systems.

160
Methylammonium and formamidinium have been the two most studied A-site cations,
but additional cations include hydrazinium (NH3NH2+), imidazolium (C3N2H5
+) and
tetramethylammonium ((CH3)4N+). In these examples, the effective ionic radius of the A-
site cation increases, thus the tolerance factor increases closer to ideal where t =1, so it
would be interesting to see the extent of vibrational shifts in the charge carrier state as a
function of distortion of the inorganic cage and dielectric medium.
Another molecular collaboration involving a series of iron (III) cyanide
complexes provided an excellent study into ligand-to-metal charge transfer processes that
complements the metal-to-ligand charge transfer spectroscopic work conducted on Mo2
complexes discussed earlier. The complexes under study were expertly made by the
synthetic inorganic chemists in Stephen Holmes’ research group at University of
Missouri – St. Louis. Like the CO stretch in carboxylate, CN- is also a sensitive IR
reporter that proved to be an essential tool in ultrafast vibrational spectroscopy. In both
molecular projects, the synergistic and competitive metal-to-ligand π-backbonding
phenomenon was a significant component in analyzing the TRIR data. Solvent played a
large role in the stabilization of the excited state and charge localization on the
CN- ligand. It would be interesting to conduct a solvent dependent study on complex A
(Tp*Me), which was observed to have a short lifetime, on the same order of the solvent
dynamics of MeCN. Sterics may be preventing solvent stabilization of the photoexcited
species, so a solvent study on A would determine the point in which solvation could

161
overcome sterics. Perhaps a solvent with a small time-dependent fiction value, such as
pyridine could stabilize A and result in a longer ES lifetime.
In chapter 6, the CO vibrational stretch, again, proved to be an important reporter
group in another collaboration, this time with Joseph Reczek and his organic/polymer
chemistry research group comprised of motivated undergraduate students at Denison
University. His group skillfully produced thin films of donor-acceptor columnar liquid
crystals of suitable quality for TRIR studies. It was unsure whether this frozen state liquid
crystal would show any TRIR response, but once in front of the laser system, a surprising
amount of vibrational bands were observed. The ordering of a columnar liquid crystal
provides the proper electronic structure required for electron transport behavior and we
observed this behavior as free carrier absorption in the TRIR spectrum. This particular
system contained both molecular components and bulk material behaviors, which
provided an all-inclusive analysis that would require all the skills gained from molecular
and solid state analyses discussed in the document. The next step of this project could
involve the investigation of the electronic absorption observed in the TRIR to electron
transport measurements performed on the solid. With changing the components of the D-
A CLC system, a structure-function relationship could be developed by using TRIR and
electron transport measurements to give insight into the electron hopping mechanism that
defines these material’s interesting conductivity behaviors.
This dissertation has shown four distinct examples that highlight the versatility
and strength of TRIR that improves our understanding of ultrafast processes and how

162
they may relate to bulk behaviors. In the process, we uncovered more valuable and
convenient methods to analyze kinetic data of solid materials. Heterogeneity can now be
quantified in the kinetic analysis, separately from error. I hope researchers continue to
use this instrument and the other ultrafast spectroscopic methods housed in the Center for
Chemical and Biophysical Dynamics and at OSU. The fundamentals of the solar energy
field depend on spectroscopists to unveil the behaviors of molecules and materials when
they absorb light. Light interactions have always interested me. It was the reason I began
my graduate studies. As I begin the rest of my academic career, I will share my
fascination to light with my students and hopefully encourage future chemists to continue
the significant fundamental research needed to expand the limits of human knowledge.

163
Appendix A: Supplementary Information for Chapter 2
Figure 67 - 1H NMR (400 MHz, d8 – THF) and MALDI-TOF of (1)

164
Figure 68 - 1H NMR (400 MHz, CDCl3) and MALDI-TOF of (2)

165
Figure 69 – 1H NMR (250 MHz, CDCl3) of tetrabutylammonium isonicotinate N-oxide

166
Figure 70 - 1H NMR (250 MHz, CDCl3) of Mo2(DAnif)4 homoleptic

167
Figure 71 - 1H NMR (250 MHz, CD3CN) of [Mo2(DAnif)2(CH3CN)6][BF4]2

168
Appendix B: Supplementary Information for Chapter 3
Figure 72 - X-Ray diffraction pattern and fit for CsPbBr3 film

169
Figure 73 - X-Ray diffraction pattern and fit for MAPbBr3 film
Figure 74 - X-Ray diffraction pattern and fit for FAPbBr3 film

170
Figure 75 –Ground state IR spectra of MAPbX3 series (where X = I, Br or Cl) as KBr
pellet
Figure 76 - TRIR spectrum for MAPbI3 KBr pellet (<1 mm thick), λex = 780 nm
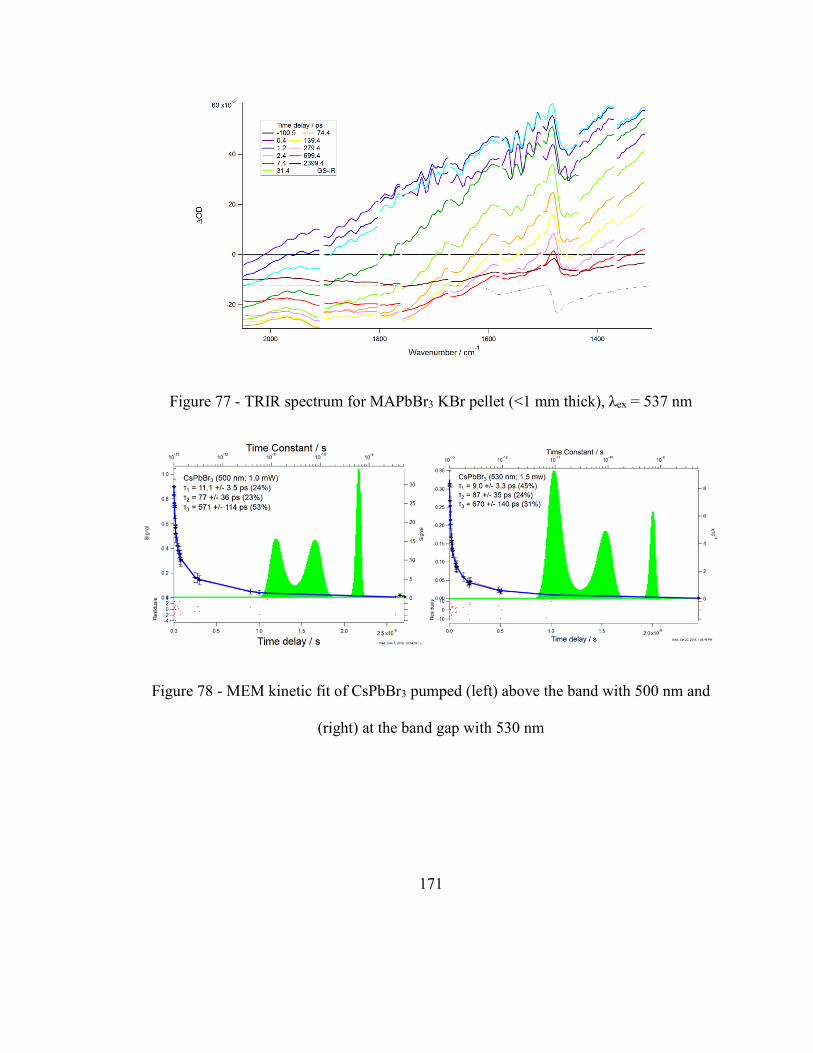
171
Figure 77 - TRIR spectrum for MAPbBr3 KBr pellet (<1 mm thick), λex = 537 nm
Figure 78 - MEM kinetic fit of CsPbBr3 pumped (left) above the band with 500 nm and
(right) at the band gap with 530 nm

172
Figure 79 - MEM kinetic fit of MAPbBr3 pumped (left) above the band with 500 nm and
(right) at the band gap with 535 nm
Figure 80 - MEM kinetic fit of FAPbBr3 pumped (left) above the band with 500 nm and
(right) at the band gap with 530 nm

173
Figure 81 - MEM kinetic fit of FAPbBr3 pumped (left) above the band with 750 nm and
(right) at the band gap with 780 nm
Figure 82 - MEM kinetic fit of MAPbBr3 pumped (left) above the band with 500 nm and
(right) at the band gap with 532 nm

174
Figure 83 - MEM kinetic fit of FAPbBr3 pumped (left) above the band with 377 nm and
(right) at the band gap with 407 nm

175
Appendix C: Supplementary Information for Chapter 4
Figure 84 - TRIR spectrum of C in MeCN, λex = 440 nm
Figure 85 - TRIR spectrum of D in MeCN, λex = 440 nm

176
Figure 86 - TRIR spectrum of E in MeCN, λex = 440 nm
Figure 87 - TRIR spectrum of C in DMSO, λex = 440 nm

177
Figure 88 - TRIR spectrum of D in DMSO, λex = 440 nm
Figure 89 - TRIR spectrum of E in DMSO, λex = 440 nm

178
Figure 90 – TA spectra of A in MeCN, λex = (top) 400 nm ; (bottom) 480 nm

179
Figure 91 - TA spectra of C in MeCN, λex = (top) 400 nm ; (bottom) 480 nm

180
Figure 92 - TA spectra of D in MeCN, λex = (top) 400 nm ; (bottom) 480 nm

181
Figure 93 - TA spectra of E in MeCN, λex = (top) 400 nm ; (bottom) 480 nm

182
Figure 94 - TA spectra of B in methanol, λex = 480 nm
Figure 95 - TA spectra of B in acetone, λex = 480 nm

183
Figure 96 - TA spectra of B in chloroform, λex = 480 nm
184
References
(1) Condensed‐Phase Molecular Spectroscopy and Photophysics
https://onlinelibrary.wiley.com/doi/10.1002/9781118493052 (accessed Oct 24,
2019). https://doi.org/10.1002/9781118493052.
(2) Andrews, D. Molecular Photophysics and Spectroscopy; Morgan & Claypool
Publishers, 2014. https://doi.org/10.1088/978-1-627-05288-7.
(3) Hollas, J. M. Modern Spectroscopy, 4th ed.; J. Wiley: Chichester ; Hoboken, NJ,
2004.
(4) Kasha, M. Characterization of Electronic Transitions in Complex Molecules.
Discuss. Faraday Soc. 1950, 9 (0), 14–19.
https://doi.org/10.1039/DF9500900014.
(5) Iwata, K.; Hamaguchi, H. Microscopic Mechanism of Solute−Solvent Energy
Dissipation Probed by Picosecond Time-Resolved Raman Spectroscopy. J. Phys.
Chem. A 1997, 101 (4), 632–637. https://doi.org/10.1021/jp962010l.
(6) Owrutsky, J. C.; Raftery, D.; Hochstrasser, R. M. Vibrational Relaxation
Dynamics in Solutions. Annu. Rev. Phys. Chem. 1994, 45 (1), 519–555.
https://doi.org/10.1146/annurev.pc.45.100194.002511.
(7) Pigliucci, A.; Vauthey, E. Vibrational Relaxation Dynamics of Polyatomic
Molecules in Solution. Chimia 2003, 57 (4), 200–203.
(8) Photophysical Processes. In Condensed-Phase Molecular Spectroscopy and
Photophysics; John Wiley & Sons, Ltd, 2012; pp 163–190.
https://doi.org/10.1002/9781118493052.ch9.
(9) Barbara, P. F.; Meyer, T. J.; Ratner, M. A. Contemporary Issues in Electron
Transfer Research. J. Phys. Chem. 1996, 100 (31), 13148–13168.
https://doi.org/10.1021/jp9605663.
(10) Asbury, J. B. Ultrafast Infrared Probes of Electronic Processes in Materials.
Ultrafast Infrared Vib. Spectrosc. 2013, 239–268.
(11) Smith, C. T.; Leontiadou, M. A.; Page, R.; O’Brien, P.; Binks, D. J. Ultrafast
Charge Dynamics in Trap-Free and Surface-Trapping Colloidal Quantum Dots.
Adv. Sci. 2015, 2 (10), 1500088. https://doi.org/10.1002/advs.201500088.
(12) Sibbett, W.; Lagatsky, A. A.; Brown, C. T. A. The Development and Application
of Femtosecond Laser Systems. Opt. Express 2012, 20 (7), 6989–7001.
https://doi.org/10.1364/OE.20.006989.
(13) Li, C. Optical Kerr Effect and Self-Focusing. In Nonlinear Optics: Principles and
Applications; Li, C., Ed.; Springer Singapore: Singapore, 2017; pp 109–147.
https://doi.org/10.1007/978-981-10-1488-8_5.
(14) Vaillancourt, G.; Norris, T. B.; Coe, J. S.; Bado, P.; Mourou, G. A. Operation of a
1-kHz Pulse-Pumped Ti:sapphire Regenerative Amplifier. Opt. Lett. 1990, 15 (6),
317–319. https://doi.org/10.1364/OL.15.000317.

185
(15) Shchatsinin, I. Free Clusters and Free Molecules in Strong, Shaped Laser Fields.
PhD Thesis, Free University of Berlin, Berlin, Germany, 2009.
(16) Ultrafast optical parametric amplifiers. Rev. Sci. Instrum. 74, 1-18 | Request PDF
https://www.researchgate.net/publication/234894804_Ultrafast_optical_parametri
c_amplifiers_Rev_Sci_Instrum_74_1-18 (accessed Oct 24, 2019).
https://doi.org/http://dx.doi.org/10.1063/1.1523642.
(17) Ye, S.; Nihonyanagi, S.; Fujishima, K.; Uosaki, K. Conformational Order of
Octadecanethiol (ODT) Monolayer at Gold/Solution Interface: Internal Reflection
Sum Frequency Generation (SFG) Study. In Studies in Surface Science and
Catalysis; Iwasawa, Y., Oyama, N., Kunieda, H., Eds.; Proceedings of the
International Conference on Colloid and Surface Science; Elsevier, 2001; Vol.
132, pp 705–710. https://doi.org/10.1016/S0167-2991(01)82185-6.
(18) Cotton, F. A.; Harris, C. B. The Crystal and Molecular Structure of Dipotassium
Octachlorodirhenate(III) Dihydrate, K2[Re2Cl8]2H2O. Inorg. Chem. 1965, 4 (3),
330–333. https://doi.org/10.1021/ic50025a015.
(19) Collman, J. P.; Woo, L. K. Rotational Barrier of a Molybdenum-Molybdenum
Quadruple Bond. Proc. Natl. Acad. Sci. U. S. A. 1984, 81 (8), 2592–2596.
(20) Cotton, F. A. Molybdenum Compounds. In Multiple Bonds Between Metal
Atoms; Springer, 2005; pp 69–182.
(21) Chisholm, M. H.; Cotton, F. A.; Daniels, L. M.; Folting, K.; Huffman, J. C.; Iyer,
S. S.; Lin, C.; Macintosh, A. M.; Murillo, C. A. Compounds in Which the Mo24+
Unit Is Embraced by One, Two or Three Formamidinate Ligands Together with
Acetonitrile Ligands. J. Chem. Soc. Dalton Trans. 1999, No. 9, 1387–1392.
https://doi.org/10.1039/A900389D.
(22) Chisholm, M. H. Charge Distribution in Metal to Ligand Charge Transfer States
of Quadruply Bonded Metal Complexes. Coord. Chem. Rev. 2015, 282–283, 60–
65. https://doi.org/10.1016/j.ccr.2014.03.034.
(23) Alberding, B. G.; Chisholm, M. H.; Chou, Y.-H.; Gallucci, J. C.; Ghosh, Y.;
Gustafson, T. L.; Patmore, N. J.; Reed, C. R.; Turro, C. Quadruply Bonded
Dimetal Units Supported by 2,4,6-Triisopropylbenzoates MM(TiPB)4 (MM =
Mo2, MoW, and W2): Preparation and Photophysical Properties. Inorg. Chem.
2009, 48 (10), 4394–4399. https://doi.org/10.1021/ic900092c.
(24) Wrighton, M. Photochemistry of Metal Carbonyls. Chem. Rev. 1974, 74 (4), 401–
430. https://doi.org/10.1021/cr60290a001.
(25) Griffith, W. P. Cyanide Complexes of the Transition Metals. Q. Rev. Chem. Soc.
1962, 16 (2), 188–207.
(26) Hocking, R. K.; Hambley, T. W. Database Analysis of Transition Metal Carbonyl
Bond Lengths: Insight into the Periodicity of π Back-Bonding, σ Donation, and
the Factors Affecting the Electronic Structure of the TM−C⋮O Moiety.
Organometallics 2007, 26 (11), 2815–2823. https://doi.org/10.1021/om061072n.
(27) Dattelbaum, D. M.; Omberg, K. M.; Schoonover, J. R.; Martin, R. L.; Meyer, T.
J. Application of Time-Resolved Infrared Spectroscopy to Electronic Structure in

186
Metal-to-Ligand Charge-Transfer Excited States. Inorg. Chem. 2002, 41 (23),
6071–6079. https://doi.org/10.1021/ic020400i.
(28) Hayton, T. W.; Legzdins, P.; Sharp, W. B. Coordination and Organometallic
Chemistry of Metal−NO Complexes. Chem. Rev. 2002, 102 (4), 935–992.
https://doi.org/10.1021/cr000074t.
(29) Frank, P.; Ghosh, P.; Hodgson, K. O.; Taube, H. Cooperative Ligation, Back-
Bonding, and Possible Pyridine−Pyridine Interactions in
Tetrapyridine−Vanadium(II): A Visible and X-Ray Spectroscopic Study. Inorg.
Chem. 2002, 41 (12), 3269–3279. https://doi.org/10.1021/ic011221o.
(30) Bursten, B. E.; Chisholm, M. H.; Hadad, C. M.; Li, J.; Wilson, P. J. Electronic
Coupling between Molybdenum and Tungsten Quadruple Bonds in Molecular
Squares and Extended Chains Linked by Oxalate, Acetylenedicarboxylate, and
Perfluoroterephthalate Bridges. Isr. J. Chem. 2001, 41 (3), 187–195.
https://doi.org/10.1560/6820-JH3K-EA64-9TT6.
(31) Alberding, B. G.; Chisholm, M. H.; Gustafson, T. L. Detection of the Singlet and
Triplet MM Δδ* States in Quadruply Bonded Dimetal Tetracarboxylates (M =
Mo, W) by Time-Resolved Infrared Spectroscopy. Inorg. Chem. 2012, 51 (1),
491–498. https://doi.org/10.1021/ic201957a.
(32) Chisholm, M. H.; Gustafson, T. L.; Turro, C. Photophysical Properties of MM
Quadruply Bonded Complexes Supported by Carboxylate Ligands, MM = Mo2,
MoW, or W2. Acc. Chem. Res. 2013, 46 (2), 529–538.
https://doi.org/10.1021/ar3002206.
(33) Alberding, B. G.; Chisholm, M. H.; Gallucci, J. C.; Ghosh, Y.; Gustafson, T. L.
Electron Delocalization in the S1 and T1 Metal-to-Ligand Charge Transfer States
of Trans-Substituted Metal Quadruply Bonded Complexes. Proc. Natl. Acad. Sci.
2011, 108 (20), 8152–8156. https://doi.org/10.1073/pnas.1103082108.
(34) Alberding, B. G.; Brown-Xu, S. E.; Chisholm, M. H.; Gustafson, T. L.; Reed, C.
R.; Naseri, V. Photophysical Properties of MM Quadruply Bonded Complexes
(M = Mo, W) Supported by Carboxylate Ligands: Charge Delocalization and
Dynamics in S1 and T1 States. Dalton Trans. 2012, 41 (42), 13097–13104.
https://doi.org/10.1039/C2DT30490B.
(35) Mathonière, C. Metal-to-Metal Electron Transfer: A Powerful Tool for the
Design of Switchable Coordination Compounds: Metal-to-Metal Electron
Transfer: A Powerful Tool for the Design of Switchable Coordination
Compounds. Eur. J. Inorg. Chem. 2018, 2018 (3–4), 248–258.
https://doi.org/10.1002/ejic.201701194.
(36) Bleuzen, A.; Lomenech, C.; Escax, V.; Villain, F.; Varret, F.; Cartier dit Moulin,
C.; Verdaguer, M. Photoinduced Ferrimagnetic Systems in Prussian Blue
Analogues CIxCo4[Fe(CN)6]y (CI = Alkali Cation). 1. Conditions to Observe the
Phenomenon. J. Am. Chem. Soc. 2000, 122 (28), 6648–6652.
https://doi.org/10.1021/ja000348u.

187
(37) Oshio, H.; Tamada, O.; Onodera, H.; Ito, T.; Ikoma, T.; Tero-Kubota, S. Cyanide-
Bridged Iron−Copper Molecular Squares with Doublet and Quintet Spin Ground
States. Inorg. Chem. 1999, 38 (25), 5686–5689.
https://doi.org/10.1021/ic990617l.
(38) Ramabhadran, R. O.; Hua, Y.; Flood, A. H.; Raghavachari, K. C vs N: Which
End of the Cyanide Anion Is a Better Hydrogen Bond Acceptor? J. Phys. Chem.
A 2014, 118 (35), 7418–7423. https://doi.org/10.1021/jp412816w.
(39) Gütlich, P.; Garcia, Y.; Goodwin, H. A. Spin Crossover Phenomena in Fe(ii)
Complexes. Chem. Soc. Rev. 2000, 29 (6), 419–427.
https://doi.org/10.1039/b003504l.
(40) Karaman, N.; Bayri, A.; Ekmekçi, S. An Energy Competition of Co 3+ and Co 4+
Ions during Spin State Transition in Ca 3 Co 4 O 9 Complex. J. Phys. Conf. Ser.
2016, 667, 012008. https://doi.org/10.1088/1742-6596/667/1/012008.
(41) Zerdane, S.; Cammarata, M.; Balducci, L.; Bertoni, R.; Catala, L.; Mazerat, S.;
Mallah, T.; Pedersen, M. N.; Wulff, M.; Nakagawa, K.; et al. Probing Transient
Photoinduced Charge Transfer in Prussian Blue Analogues with Time-Resolved
XANES and Optical Spectroscopy: Probing Transient Photoinduced Charge
Transfer in Prussian Blue Analogues with Time-Resolved XANES and Optical
Spectroscopy. Eur. J. Inorg. Chem. 2018, 2018 (3–4), 272–277.
https://doi.org/10.1002/ejic.201700657.
(42) Decurtins, S.; Gütlich, P.; Köhler, C. P.; Spiering, H.; Hauser, A. Light-Induced
Excited Spin State Trapping in a Transition-Metal Complex: The Hexa-1-
Propyltetrazole-Iron (II) Tetrafluoroborate Spin-Crossover System. Chem. Phys.
Lett. 1984, 105 (1), 1–4. https://doi.org/10.1016/0009-2614(84)80403-0.
(43) Jeon, I.-R.; Mathonière, C.; Clérac, R.; Rouzières, M.; Jeannin, O.; Trzop, E.;
Collet, E.; Fourmigué, M. Photoinduced Reversible Spin-State Switching of an
FeIII Complex Assisted by a Halogen-Bonded Supramolecular Network. Chem.
Commun. 2017, 53 (74), 10283–10286. https://doi.org/10.1039/C7CC03797J.
(44) Hauser, A. Reversibility of Light-Induced Excited Spin State Trapping in the
Fe(ptz)6(BF4)2, and the Zn1−xFex(ptz)6(BF4)2 Spin-Crossover Systems. Chem.
Phys. Lett. 1986, 124 (6), 543–548. https://doi.org/10.1016/0009-2614(86)85073-
4.
(45) Suaud, N.; Bonnet, M.-L.; Boilleau, C.; Labèguerie, P.; Guihéry, N. Light-
Induced Excited Spin State Trapping: Ab Initio Study of the Physics at the
Molecular Level. J. Am. Chem. Soc. 2009, 131 (2), 715–722.
https://doi.org/10.1021/ja805626s.
(46) Arnett, D. C.; Voehringer, P.; Scherer, N. F. Excitation Dephasing, Product
Formation, and Vibrational Coherence in an Intervalence Charge-Transfer
Reaction. J. Am. Chem. Soc. 1995, 117 (49), 12262–12272.
https://doi.org/10.1021/ja00154a028.
(47) Asahara, A.; Nakajima, M.; Fukaya, R.; Tokoro, H.; Ohkoshi, S.; Suemoto, T.
Ultrafast Dynamics of Reversible Photoinduced Phase Transitions in Rubidium

188
Manganese Hexacyanoferrate Investigated by Midinfrared CN Vibration
Spectroscopy. Phys. Rev. B 2012, 86 (19), 195138.
https://doi.org/10.1103/PhysRevB.86.195138.
(48) Moritomo, Y.; Nakagawa, T.; Fukuyama, Y.; Yasuda, N.; Oosawa, H.; Kim, J.
E.; Kamioka, H.; Kato, K.; Tanaka, Y.; Kimura, S.; et al. Photoinduced Dynamics
of Prussian Blue Type Cyanide. J. Phys. Conf. Ser. 2009, 148, 012028.
https://doi.org/10.1088/1742-6596/148/1/012028.
(49) Green, M. A.; Ho-Baillie, A.; Snaith, H. J. The Emergence of Perovskite Solar
Cells. Nat. Photonics 2014, 8 (7), 506–514.
https://doi.org/10.1038/nphoton.2014.134.
(50) Saliba, M.; Matsui, T.; Seo, J.-Y.; Domanski, K.; Correa-Baena, J.-P.;
Khaja Nazeeruddin, M.; M. Zakeeruddin, S.; Tress, W.; Abate, A.; Hagfeldt, A.;
et al. Cesium-Containing Triple Cation Perovskite Solar Cells: Improved
Stability, Reproducibility and High Efficiency. Energy Environ. Sci. 2016, 9 (6),
1989–1997. https://doi.org/10.1039/C5EE03874J.
(51) Kojima, A.; Teshima, K.; Shirai, Y.; Miyasaka, T. Organometal Halide
Perovskites as Visible-Light Sensitizers for Photovoltaic Cells. J. Am. Chem. Soc.
2009, 131 (17), 6050–6051. https://doi.org/10.1021/ja809598r.
(52) Yang, W. S.; Park, B.-W.; Jung, E. H.; Jeon, N. J.; Kim, Y. C.; Lee, D. U.; Shin,
S. S.; Seo, J.; Kim, E. K.; Noh, J. H.; et al. Iodide Management in
Formamidinium-Lead-Halide–based Perovskite Layers for Efficient Solar Cells.
Science 2017, 356 (6345), 1376–1379. https://doi.org/10.1126/science.aan2301.
(53) Herz, L. M. Charge-Carrier Dynamics in Organic-Inorganic Metal Halide
Perovskites. Annu. Rev. Phys. Chem. 2016, 67 (1), 65–89.
https://doi.org/10.1146/annurev-physchem-040215-112222.
(54) Green, M. A.; Hishikawa, Y.; Dunlop, E. D.; Levi, D. H.; Hohl‐Ebinger, J.;
Yoshita, M.; Ho‐Baillie, A. W. Y. Solar Cell Efficiency Tables (Version 53).
Prog. Photovolt. Res. Appl. 2019, 27 (1), 3–12. https://doi.org/10.1002/pip.3102.
(55) Jena, A. K.; Kulkarni, A.; Miyasaka, T. Halide Perovskite Photovoltaics:
Background, Status, and Future Prospects. Chem. Rev. 2019, 119 (5), 3036–3103.
https://doi.org/10.1021/acs.chemrev.8b00539.
(56) Deng, X.; Wen, X.; Huang, S.; Sheng, R.; Harada, T.; Kee, T. W.; Green, M.; Ho-
Baillie, A. Ultrafast Carrier Dynamics in Methylammonium Lead Bromide
Perovskite. J. Phys. Chem. C 2016, 120 (5), 2542–2547.
https://doi.org/10.1021/acs.jpcc.5b11640.
(57) Bretschneider, S. A.; Laquai, F.; Bonn, M. Trap-Free Hot Carrier Relaxation in
Lead–Halide Perovskite Films. J. Phys. Chem. C 2017, 121 (21), 11201–11206.
https://doi.org/10.1021/acs.jpcc.7b03992.
(58) Wu, X.; Trinh, M. T.; Niesner, D.; Zhu, H.; Norman, Z.; Owen, J. S.; Yaffe, O.;
Kudisch, B. J.; Zhu, X.-Y. Trap States in Lead Iodide Perovskites. J. Am. Chem.
Soc. 2015, 137 (5), 2089–2096. https://doi.org/10.1021/ja512833n.

189
(59) Chemically diverse and multifunctional hybrid organic–inorganic perovskites |
Nature Reviews Materials https://www.nature.com/articles/natrevmats201699
(accessed Oct 24, 2019).
(60) Ananthakumar, S.; Moorthy Babu, S. Progress on Synthesis and Applications of
Hybrid Perovskite Semiconductor nanomaterials—A Review. Synth. Met. 2018,
246, 64–95. https://doi.org/10.1016/j.synthmet.2018.10.003.
(61) Gao, W.; Gao, X.; Abtew, T. A.; Sun, Y.-Y.; Zhang, S.; Zhang, P. Quasiparticle
Band Gap of Organic-Inorganic Hybrid Perovskites: Crystal Structure, Spin-Orbit
Coupling, and Self-Energy Effects. Phys. Rev. B 2016, 93 (8), 085202.
https://doi.org/10.1103/PhysRevB.93.085202.
(62) Yang, Y.; Ostrowski, D. P.; France, R. M.; Zhu, K.; van de Lagemaat, J.; Luther,
J. M.; Beard, M. C. Observation of a Hot-Phonon Bottleneck in Lead-Iodide
Perovskites. Nat. Photonics 2016, 10 (1), 53–59.
https://doi.org/10.1038/nphoton.2015.213.
(63) Wright, A. D.; Verdi, C.; Milot, R. L.; Eperon, G. E.; Pérez-Osorio, M. A.;
Snaith, H. J.; Giustino, F.; Johnston, M. B.; Herz, L. M. Electron–phonon
Coupling in Hybrid Lead Halide Perovskites. Nat. Commun. 2016, 7 (1), 1–9.
https://doi.org/10.1038/ncomms11755.
(64) Price, M. B.; Butkus, J.; Jellicoe, T. C.; Sadhanala, A.; Briane, A.; Halpert, J. E.;
Broch, K.; Hodgkiss, J. M.; Friend, R. H.; Deschler, F. Hot-Carrier Cooling and
Photoinduced Refractive Index Changes in Organic–inorganic Lead Halide
Perovskites. Nat. Commun. 2015, 6 (1), 1–8.
https://doi.org/10.1038/ncomms9420.
(65) Wang, J.; Burdzinski, G.; Kubicki, J.; Platz, M. S. Ultrafast UV−Vis and IR
Studies of P-Biphenylyl Acetyl and Carbomethoxy Carbenes. J. Am. Chem. Soc.
2008, 130 (33), 11195–11209. https://doi.org/10.1021/ja803096p.
(66) Caplins, B. W.; Lomont, J. P.; Nguyen, S. C.; Harris, C. B. Vibrational Cooling
Dynamics of a [FeFe]-Hydrogenase Mimic Probed by Time-Resolved Infrared
Spectroscopy. J. Phys. Chem. A 2014, 118 (49), 11529–11540.
https://doi.org/10.1021/jp510517z.
(67) Andrienko, D. Introduction to Liquid Crystals. J. Mol. Liq. 2018, 267, 520–541.
https://doi.org/10.1016/j.molliq.2018.01.175.
(68) Iannacchione, G. S. Review of Liquid-Crystal Phase Transitions with Quenched
Random Disorder. Fluid Phase Equilibria 2004, 222–223, 177–187.
https://doi.org/10.1016/j.fluid.2004.06.022.
(69) Pelzl, G.; Hauser, A. Birefringence and Phase Transitions in Liquid Crystals.
Phase Transit. 1991, 37 (1), 33–62. https://doi.org/10.1080/01411599108203447.
(70) Miyajima, D.; Araoka, F.; Takezoe, H.; Kim, J.; Kato, K.; Takata, M.; Aida, T.
Columnar Liquid Crystal with a Spontaneous Polarization along the Columnar
Axis. J. Am. Chem. Soc. 2010, 132 (25), 8530–8531.
https://doi.org/10.1021/ja101866e.

190
(71) Wöhrle, T.; Wurzbach, I.; Kirres, J.; Kostidou, A.; Kapernaum, N.; Litterscheidt,
J.; Haenle, J. C.; Staffeld, P.; Baro, A.; Giesselmann, F.; et al. Discotic Liquid
Crystals. Chem. Rev. 2016, 116 (3), 1139–1241.
https://doi.org/10.1021/acs.chemrev.5b00190.
(72) Arikainen, E. O.; Boden, N.; Bushby, R. J.; Clements, J.; Movaghar, B.; Wood,
A. Effects of Side-Chain Length on the Charge Transport Properties of Discotic
Liquid Crystals and Their Implications for the Transport Mechanism. J. Mater.
Chem. 1995, 5 (12), 2161–2165. https://doi.org/10.1039/JM9950502161.
(73) Marcus, R. A. Electron Transfer Reactions in Chemistry Theory and Experiment.
J. Electroanal. Chem. 1997, 438 (1–2), 251–259.
(74) Marcus, R. A. Electron Transfer Reactions in Chemistry: Theory and Experiment
(Nobel Lecture). Angew. Chem. Int. Ed. Engl. 1993, 32 (8), 1111–1121.
https://doi.org/10.1002/anie.199311113.
(75) Kouwer, P. H. J.; Jager, W. F.; Mijs, W. J.; Picken, S. J. Charge Transfer
Complexes of Discotic Liquid Crystals: A Flexible Route to a Wide Variety of
Mesophases. Macromolecules 2002, 35 (11), 4322–4329.
https://doi.org/10.1021/ma0118567.
(76) Emmett, L.; M. Prentice, G.; Dan Pantoş, G. Donor–acceptor Interactions in
Chemistry. Annu. Rep. Sect. B Org. Chem. 2013, 109 (0), 217–234.
https://doi.org/10.1039/C3OC90004E.
(77) Brédas, J.-L.; Beljonne, D.; Coropceanu, V.; Cornil, J. Charge-Transfer and
Energy-Transfer Processes in π-Conjugated Oligomers and Polymers: A
Molecular Picture. Chem. Rev. 2004, 104 (11), 4971–5004.
https://doi.org/10.1021/cr040084k.
(78) Wasielewski, M. R. Energy, Charge, and Spin Transport in Molecules and Self-
Assembled Nanostructures Inspired by Photosynthesis. J. Org. Chem. 2006, 71
(14), 5051–5066. https://doi.org/10.1021/jo060225d.
(79) Magnuson, A.; Anderlund, M.; Johansson, O.; Lindblad, P.; Lomoth, R.; Polivka,
T.; Ott, S.; Stensjö, K.; Styring, S.; Sundström, V.; et al. Biomimetic and
Microbial Approaches to Solar Fuel Generation. Acc. Chem. Res. 2009, 42 (12),
1899–1909. https://doi.org/10.1021/ar900127h.
(80) Frisch, M.; Trunks, G.; Schlegel, H.; Scuseria, G.; Robb, M.; Cheeseman, J.;
Vreven, T.; et al. Gaussian 09; Gaussian, Inc: Wallingford, CT, 2009.
(81) Parr, R. G.; Weitao, Y. Density-Functional Theory of Atoms and Molecules;
Oxford University Press, 1989.
(82) Becke, A. D. Density-Functional Exchange-Energy Approximation with Correct
Asymptotic Behavior. Phys. Rev. A 1988, 38 (6), 3098–3100.
https://doi.org/10.1103/PhysRevA.38.3098.
(83) Kohn, W.; Sham, L. J. Quantum Density Oscillations in an Inhomogeneous
Electron Gas. Phys. Rev. 1965, 137 (6A), A1697–A1705.
https://doi.org/10.1103/PhysRev.137.A1697.
191
(84) Dennington, R.; Keith, T.; Millam, J.; Eppinnett, K.; Hovell, W. L.; Gilliland, R.
Gaussview; Semichem Inc: Shawnee Mission, KS, 2003.
(85) Burdzinski, G.; Hackett, J. C.; Wang, J.; Gustafson, T. L.; Hadad, C. M.; Platz,
M. S. Early Events in the Photochemistry of Aryl Azides from Femtosecond
UV/Vis Spectroscopy and Quantum Chemical Calculations. J. Am. Chem. Soc.
2006, 128 (41), 13402–13411. https://doi.org/10.1021/ja061520i.
(86) Middleton, C. T. Vibrational and Excited-State Dynamics of DNA Bases
Revealed by UV and Infrared Femtosecond Time-Resolved Spectroscopy. PhD
Thesis, The Ohio State University, 2008.
(87) Ablonczy, Z.; Lukács, A.; Papp, E. Application of the Maximum Entropy Method
to Absorption Kinetic Rate Processes. Biophys. Chem. 2003, 104 (1), 249–258.
https://doi.org/10.1016/S0301-4622(02)00379-4.
(88) Livesey, A. K.; Brochon, J. C. Analyzing the Distribution of Decay Constants in
Pulse-Fluorimetry Using the Maximum Entropy Method. Biophys. J. 1987, 52
(5), 693–706.
(89) Steinbach, P. J.; Ionescu, R.; Matthews, C. R. Analysis of Kinetics Using a
Hybrid Maximum-Entropy/Nonlinear-Least-Squares Method: Application to
Protein Folding. Biophys. J. 2002, 82 (4), 2244–2255.
(90) Ilavsky, J. Clementine, Package for Modeling Decay Kinetics Using MEM and
Least Square Fitting; WaveMetrics, 2011.
(91) O’Regan, B.; Grätzel, M. A Low-Cost, High-Efficiency Solar Cell Based on Dye-
Sensitized Colloidal TiO2 Films. Nature 1991, 353 (6346), 737–740.
https://doi.org/10.1038/353737a0.
(92) Brown-Xu, S. E.; Chisholm, M. H.; Durr, C. B.; Gustafson, T. L.; Spilker, T. F.
Photophysical Properties of Cis-Mo2 Quadruply Bonded Complexes and
Observation of Photoinduced Electron Transfer to Titanium Dioxide. J. Am.
Chem. Soc. 2014, 136 (32), 11428–11435. https://doi.org/10.1021/ja504944d.
(93) Nocera, D. G. The Artificial Leaf. Acc. Chem. Res. 2012, 45 (5), 767–776.
https://doi.org/10.1021/ar2003013.
(94) Grätzel, M. Photoelectrochemical Cells. Nature 2001, 414 (6861), 338–344.
https://doi.org/10.1038/35104607.
(95) Li, F.; Fan, K.; Xu, B.; Gabrielsson, E.; Daniel, Q.; Li, L.; Sun, L. Organic Dye-
Sensitized Tandem Photoelectrochemical Cell for Light Driven Total Water
Splitting. J. Am. Chem. Soc. 2015, 137 (28), 9153–9159.
https://doi.org/10.1021/jacs.5b04856.
(96) Fan, K.; Li, F.; Wang, L.; Daniel, Q.; Gabrielsson, E.; Sun, L. Pt-Free Tandem
Molecular Photoelectrochemical Cells for Water Splitting Driven by Visible
Light. Phys. Chem. Chem. Phys. 2014, 16 (46), 25234–25240.
https://doi.org/10.1039/C4CP04489D.
(97) Asbury, J. B.; Anderson, N. A.; Hao, E.; Ai, X.; Lian, T. Parameters Affecting
Electron Injection Dynamics from Ruthenium Dyes to Titanium Dioxide

192
Nanocrystalline Thin Film. J. Phys. Chem. B 2003, 107 (30), 7376–7386.
https://doi.org/10.1021/jp034148r.
(98) Brown-Xu, S. E.; Chisholm, M. H.; Durr, C. B.; Lewis, S. A.; Naseri, V.; Spilker,
T. F. MM Quadruple Bonds Supported by Cyanoacrylate Ligands. Extending
Photon Harvesting into the near Infrared and Studies of the MLCT States. Chem.
Sci. 2013, 4 (5), 2105–2116. https://doi.org/10.1039/C3SC50322D.
(99) Cotton, F. A.; Daniels, L. M.; Hillard, E. A.; Murillo, C. A. Filling a Void:
Isolation and Characterization of Tetracarboxylato Dimolybdenum Cations.
Inorg. Chem. 2002, 41 (6), 1639–1644. https://doi.org/10.1021/ic011079r.
(100) Brown-Xu, S. E.; Chisholm, M. H.; Durr, C. B.; Lewis, S. A.; Spilker, T. F.;
Young, P. J. Molybdenum–molybdenum Quadruple Bonds Supported by 9,10-
Anthraquinone Carboxylate Ligands. Molecular, Electronic, Ground State and
Unusual Photoexcited State Properties. Chem. Sci. 2014, 5 (7), 2657–2666.
https://doi.org/10.1039/C4SC00341A.
(101) Wang, L.; Yang, X.; Li, S.; Cheng, M.; Sun, L. A New Type of Organic
Sensitizers with Pyridine-N-Oxide as the Anchoring Group for Dye-Sensitized
Solar Cells. RSC Adv. 2013, 3 (33), 13677–13680.
https://doi.org/10.1039/C3RA41182F.
(102) Łukomska, M.; Rybarczyk-Pirek, A. J.; Jabłoński, M.; Palusiak, M. The Nature of
NO-Bonding in N-Oxide Group. Phys. Chem. Chem. Phys. 2015, 17 (25), 16375–
16387. https://doi.org/10.1039/C5CP02148K.
(103) Borgwardt, M.; Wilke, M.; Kampen, T.; Mähl, S.; Xiang, W.; Spiccia, L.; Lange,
K. M.; Kiyan, I. Y.; Aziz, E. F. Injection Kinetics and Electronic Structure at the
N719/TiO2 Interface Studied by Means of Ultrafast XUV Photoemission
Spectroscopy. J. Phys. Chem. C 2015, 119 (17), 9099–9107.
https://doi.org/10.1021/acs.jpcc.5b01216.
(104) Kallioinen, J.; Benkö, G.; Sundström, V.; Korppi-Tommola, J. E. I.; Yartsev, A.
P. Electron Transfer from the Singlet and Triplet Excited States of
Ru(dcbpy)2(NCS)2 into Nanocrystalline TiO2 Thin Films. J. Phys. Chem. B
2002, 106 (17), 4396–4404. https://doi.org/10.1021/jp0143443.
(105) Vougioukalakis, G. C.; Stergiopoulos, T.; Kontos, A. G.; Pefkianakis, E. K.;
Papadopoulos, K.; Falaras, P. Novel Ru(II) Sensitizers Bearing an Unsymmetrical
Pyridine-Quinoline Hybrid Ligand with Extended π-Conjugation: Synthesis and
Application in Dye-Sensitized Solar Cells. Dalton Trans. 2013, 42 (18), 6582–
6591. https://doi.org/10.1039/C3DT33063J.
(106) Stranks, S. D.; Burlakov, V. M.; Leijtens, T.; Ball, J. M.; Goriely, A.; Snaith, H.
J. Recombination Kinetics in Organic-Inorganic Perovskites: Excitons, Free
Charge, and Subgap States. Phys. Rev. Appl. 2014, 2 (3).
https://doi.org/10.1103/PhysRevApplied.2.034007.
(107) Marchioro, A.; Teuscher, J.; Friedrich, D.; Kunst, M.; van de Krol, R.; Moehl, T.;
Grätzel, M.; Moser, J.-E. Unravelling the Mechanism of Photoinduced Charge

193
Transfer Processes in Lead Iodide Perovskite Solar Cells. Nat. Photonics 2014, 8
(3), 250–255. https://doi.org/10.1038/nphoton.2013.374.
(108) Wehrenfennig, C.; Eperon, G. E.; Johnston, M. B.; Snaith, H. J.; Herz, L. M.
High Charge Carrier Mobilities and Lifetimes in Organolead Trihalide
Perovskites. Adv. Mater. 2014, 26 (10), 1584–1589.
https://doi.org/10.1002/adma.201305172.
(109) Luo, L.; Men, L.; Liu, Z.; Mudryk, Y.; Zhao, X.; Yao, Y.; Park, J. M.; Shinar, R.;
Shinar, J.; Ho, K.-M.; et al. Ultrafast Terahertz Snapshots of Excitonic Rydberg
States and Electronic Coherence in an Organometal Halide Perovskite. Nat.
Commun. 2017, 8, ncomms15565. https://doi.org/10.1038/ncomms15565.
(110) Manser, J. S.; Kamat, P. V. Band Filling with Free Charge Carriers in
Organometal Halide Perovskites. Nat. Photonics 2014, 8 (9), 737–743.
https://doi.org/10.1038/nphoton.2014.171.
(111) Wetzelaer, G.-J. A. H.; Scheepers, M.; Sempere, A. M.; Momblona, C.; Ávila, J.;
Bolink, H. J. Trap-Assisted Non-Radiative Recombination in Organic-Inorganic
Perovskite Solar Cells. Adv. Mater. 2015, 27 (11), 1837–1841.
https://doi.org/10.1002/adma.201405372.
(112) Taylor, V. C. A.; Tiwari, D.; Duchi, M.; Donaldson, P. M.; Clark, I. P.; Fermin,
D. J.; Oliver, T. A. A. Investigating the Role of the Organic Cation in
Formamidinium Lead Iodide Perovskite Using Ultrafast Spectroscopy. J. Phys.
Chem. Lett. 2018, 9 (4), 895–901. https://doi.org/10.1021/acs.jpclett.7b03296.
(113) Guo, P.; Gong, J.; Sadasivam, S.; Xia, Y.; Song, T.-B.; Diroll, B. T.; Stoumpos,
C. C.; Ketterson, J. B.; Kanatzidis, M. G.; Chan, M. K. Y.; et al. Slow Thermal
Equilibration in Methylammonium Lead Iodide Revealed by Transient Mid-
Infrared Spectroscopy. Nat. Commun. 2018, 9 (1), 2792.
https://doi.org/10.1038/s41467-018-05015-9.
(114) Munson, K. T.; Grieco, C.; Kennehan, E. R.; Stewart, R. J.; Asbury, J. B. Time-
Resolved Infrared Spectroscopy Directly Probes Free and Trapped Carriers in
Organo-Halide Perovskites. ACS Energy Lett. 2017, 2 (3), 651–658.
https://doi.org/10.1021/acsenergylett.7b00033.
(115) Ledinský, M.; Löper, P.; Niesen, B.; Holovský, J.; Moon, S.-J.; Yum, J.-H.; De
Wolf, S.; Fejfar, A.; Ballif, C. Raman Spectroscopy of Organic–Inorganic Halide
Perovskites. J. Phys. Chem. Lett. 2015, 6 (3), 401–406.
https://doi.org/10.1021/jz5026323.
(116) Leguy, A. M. A.; Goñi, A. R.; Frost, J. M.; Skelton, J.; Brivio, F.; Rodríguez-
Martínez, X.; Weber, O. J.; Pallipurath, A.; Alonso, M. I.; Campoy-Quiles, M.; et
al. Dynamic Disorder, Phonon Lifetimes, and the Assignment of Modes to the
Vibrational Spectra of Methylammonium Lead Halide Perovskites. Phys. Chem.
Chem. Phys. 2016, 18 (39), 27051–27066. https://doi.org/10.1039/C6CP03474H.
(117) Park, M.; Kornienko, N.; Reyes-Lillo, S. E.; Lai, M.; Neaton, J. B.; Yang, P.;
Mathies, R. A. Critical Role of Methylammonium Librational Motion in
Methylammonium Lead Iodide (CH 3 NH 3 PbI 3 ) Perovskite Photochemistry.

194
Nano Lett. 2017, 17 (7), 4151–4157.
https://doi.org/10.1021/acs.nanolett.7b00919.
(118) Maculan, G.; Sheikh, A. D.; Abdelhady, A. L.; Saidaminov, M. I.; Haque, M. A.;
Murali, B.; Alarousu, E.; Mohammed, O. F.; Wu, T.; Bakr, O. M. CH3NH3PbCl3
Single Crystals: Inverse Temperature Crystallization and Visible-Blind UV-
Photodetector. J. Phys. Chem. Lett. 2015, 6 (19), 3781–3786.
https://doi.org/10.1021/acs.jpclett.5b01666.
(119) Saidaminov, M. I.; Abdelhady, A. L.; Murali, B.; Alarousu, E.; Burlakov, V. M.;
Peng, W.; Dursun, I.; Wang, L.; He, Y.; Maculan, G.; et al. High-Quality Bulk
Hybrid Perovskite Single Crystals within Minutes by Inverse Temperature
Crystallization. Nat. Commun. 2015, 6. https://doi.org/10.1038/ncomms8586.
(120) Bing, J.; Kim, J.; Zhang, M.; Zheng, J.; Lee, D. S.; Cho, Y.; Deng, X.; Lau, C. F.
J.; Li, Y.; Green, M. A.; et al. The Impact of a Dynamic Two-Step Solution
Process on Film Formation of Cs0.15(MA0.7FA0.3)0.85PbI3 Perovskite and
Solar Cell Performance. Small 2019, 15 (9), 1804858.
https://doi.org/10.1002/smll.201804858.
(121) Nedelcu, G.; Protesescu, L.; Yakunin, S.; Bodnarchuk, M. I.; Grotevent, M. J.;
Kovalenko, M. V. Fast Anion-Exchange in Highly Luminescent Nanocrystals of
Cesium Lead Halide Perovskites (CsPbX3, X = Cl, Br, I). Nano Lett. 2015, 15
(8), 5635–5640. https://doi.org/10.1021/acs.nanolett.5b02404.
(122) Kessler, F. R. Infrared Absorption of Free Carriers Produced in Semiconductors
by Photoeffect. J. Phys. Chem. Solids 1959, 8 (Supplement C), 275–277.
https://doi.org/10.1016/0022-3697(59)90335-X.
(123) Yu, Z. G.; Krishnamurthy, S.; Guha, S. Photoexcited-Carrier-Induced Refractive-
Index Change in Small Band-Gap Semiconductors (Preprint); AIR FORCE
RESEARCH LAB WRIGHT-PATTERSON AFB OH SURVIVABILITY AND
SENSOR MATERIALS DIV/HARDENED MATERIALS, 2006.
(124) Gustafson, T. L.; Scher, H.; Roberts, D. M.; Collins, R. W. Picosecond
Photoinduced Absorption as a Probe of Metastable Light-Induced Defects in
Intrinsic Hydrogenated Amorphous Silicon. Phys. Rev. Lett. 1988, 60 (2), 148.
(125) Xu, Y.-F.; Yang, M.-Z.; Chen, B.-X.; Wang, X.-D.; Chen, H.-Y.; Kuang, D.-B.;
Su, C.-Y. A CsPbBr3 Perovskite Quantum Dot/Graphene Oxide Composite for
Photocatalytic CO2 Reduction. J. Am. Chem. Soc. 2017, 139 (16), 5660–5663.
https://doi.org/10.1021/jacs.7b00489.
(126) Formamidinium Lead Halide Perovskite Crystals with Unprecedented Long
Carrier Dynamics and Diffusion Length - ACS Energy Letters (ACS
Publications)
https://pubs.acs.org/doi/full/10.1021/acsenergylett.6b00002?src=recsys (accessed
Mar 21, 2019).
(127) Subbiah, A. S.; Mahuli, N.; Agarwal, S.; van Hest, M. F. A. M.; Sarkar, S. K.
Towards All-Inorganic Transport Layers for Wide-Band-Gap Formamidinium

195
Lead Bromide-Based Planar Photovoltaics. Energy Technol. 2017, 5 (10), 1800–
1806. https://doi.org/10.1002/ente.201700361.
(128) Su, X.; Zhang, J.; Bai, G. Facile Synthesis and Characterization of CsPbBr3 and
CsPb2Br5 Powders. Bull. Mater. Sci. 2018, 41 (2).
https://doi.org/10.1007/s12034-018-1566-6.
(129) Gao, W.; Gao, X.; Abtew, T. A.; Sun, Y.-Y.; Zhang, S.; Zhang, P. Quasiparticle
Band Gap of Organic-Inorganic Hybrid Perovskites: Crystal Structure, Spin-Orbit
Coupling, and Self-Energy Effects. Phys. Rev. B 2016, 93 (8), 085202.
https://doi.org/10.1103/PhysRevB.93.085202.
(130) Even, J.; Pedesseau, L.; Jancu, J.-M.; Katan, C. Importance of Spin–Orbit
Coupling in Hybrid Organic/Inorganic Perovskites for Photovoltaic Applications.
J. Phys. Chem. Lett. 2013, 4 (17), 2999–3005. https://doi.org/10.1021/jz401532q.
(131) Walsh, A. Principles of Chemical Bonding and Band Gap Engineering in Hybrid
Organic–Inorganic Halide Perovskites. J. Phys. Chem. C 2015, 119 (11), 5755–
5760. https://doi.org/10.1021/jp512420b.
(132) Li, Z.; Chen, Y.; Burda, C. Photoexcited Dynamics in Metal Halide Perovskites:
From Relaxation Mechanisms to Applications. J. Phys. Chem. C 2019, 123 (6),
3255–3269. https://doi.org/10.1021/acs.jpcc.8b11347.
(133) Vibrational Properties of the Organic–Inorganic Halide Perovskite CH3NH3PbI3
from Theory and Experiment: Factor Group Analysis, First-Principles
Calculations, and Low-Temperature Infrared Spectra - The Journal of Physical
Chemistry C (ACS Publications)
http://pubs.acs.org/doi/abs/10.1021/acs.jpcc.5b07432 (accessed Nov 9, 2017).
(134) Hills-Kimball, K.; Nagaoka, Y.; Cao, C.; Chaykovsky, E.; Chen, O. Synthesis of
Formamidinium Lead Halide Perovskite Nanocrystals through Solid–liquid–solid
Cation Exchange. J. Mater. Chem. C 2017, 5 (23), 5680–5684.
https://doi.org/10.1039/C7TC00598A.
(135) Sendner, M.; Nayak, P. K.; Egger, D. A.; Beck, S.; Müller, C.; Epding, B.;
Kowalsky, W.; Kronik, L.; Snaith, H. J.; Pucci, A.; et al. Optical Phonons in
Methylammonium Lead Halide Perovskites and Implications for Charge
Transport. Mater. Horiz. 2016, 3 (6), 613–620.
https://doi.org/10.1039/C6MH00275G.
(136) Jackson, J. D. Classical Electrodynamics; Wiley: New York, 1999.
(137) Aspnes, D. E. Local‐field Effects and Effective‐medium Theory: A Microscopic
Perspective. Am. J. Phys. 1982, 50 (8), 704–709. https://doi.org/10.1119/1.12734.
(138) Glaser, T.; Müller, C.; Sendner, M.; Krekeler, C.; Semonin, O. E.; Hull, T. D.;
Yaffe, O.; Owen, J. S.; Kowalsky, W.; Pucci, A.; et al. Infrared Spectroscopic
Study of Vibrational Modes in Methylammonium Lead Halide Perovskites. J.
Phys. Chem. Lett. 2015, 6 (15), 2913–2918.
https://doi.org/10.1021/acs.jpclett.5b01309.
(139) Osamura, K.; Murakami, Y. Free Carrier Absorption in N-GaAs. Jpn. J. Appl.
Phys. 1972, 11 (3), 365. https://doi.org/10.1143/JJAP.11.365.

196
(140) Iwata, K.; Takaya, T.; Hamaguchi, H.; Yamakata, A.; Ishibashi, T.; Onishi, H.;
Kuroda, H. Carrier Dynamics in TiO2 and Pt/TiO2 Powders Observed by
Femtosecond Time-Resolved Near-Infrared Spectroscopy at a Spectral Region of
0.9−1.5 Μm with the Direct Absorption Method. J. Phys. Chem. B 2004, 108
(52), 20233–20239. https://doi.org/10.1021/jp047531k.
(141) Bakulin, A. A.; Selig, O.; Bakker, H. J.; Rezus, Y. L. A.; Müller, C.; Glaser, T.;
Lovrincic, R.; Sun, Z.; Chen, Z.; Walsh, A.; et al. Real-Time Observation of
Organic Cation Reorientation in Methylammonium Lead Iodide Perovskites. J.
Phys. Chem. Lett. 2015, 6 (18), 3663–3669.
https://doi.org/10.1021/acs.jpclett.5b01555.
(142) Miyata, K.; Meggiolaro, D.; Trinh, M. T.; Joshi, P. P.; Mosconi, E.; Jones, S. C.;
De Angelis, F.; Zhu, X.-Y. Large Polarons in Lead Halide Perovskites. Sci. Adv.
2017, 3 (8), e1701217.
(143) Wu, B.; Nguyen, H. T.; Ku, Z.; Han, G.; Giovanni, D.; Mathews, N.; Fan, H. J.;
Sum, T. C. Discerning the Surface and Bulk Recombination Kinetics of Organic–
Inorganic Halide Perovskite Single Crystals. Adv. Energy Mater. 2016, 6 (14),
1600551. https://doi.org/10.1002/aenm.201600551.
(144) Wang, K.-H.; Li, L.-C.; Shellaiah, M.; Sun, K. W. Structural and Photophysical
Properties of Methylammonium Lead Tribromide (MAPbBr 3 ) Single Crystals.
Sci. Rep. 2017, 7 (1), 13643. https://doi.org/10.1038/s41598-017-13571-1.
(145) Fried, S. D.; Boxer, S. G. Measuring Electric Fields and Noncovalent Interactions
Using the Vibrational Stark Effect. Acc. Chem. Res. 2015, 48 (4), 998–1006.
https://doi.org/10.1021/ar500464j.
(146) Juarez-Perez, E. J.; Sanchez, R. S.; Badia, L.; Garcia-Belmonte, G.; Kang, Y. S.;
Mora-Sero, I.; Bisquert, J. Photoinduced Giant Dielectric Constant in Lead Halide
Perovskite Solar Cells. J. Phys. Chem. Lett. 2014, 5 (13), 2390–2394.
https://doi.org/10.1021/jz5011169.
(147) Yuzawa, T.; Kato, C.; George, M. W.; Hamaguchi, H.-O. Nanosecond Time-
Resolved Infrared Spectroscopy with a Dispersive Scanning Spectrometer. Appl.
Spectrosc. 1994, 48 (6), 684–690.
(148) Munson, K. T.; Kennehan, E. R.; Asbury, J. B. Structural Origins of the
Electronic Properties of Materials via Time-Resolved Infrared Spectroscopy. J.
Mater. Chem. C 2019, 7 (20), 5889–5909. https://doi.org/10.1039/C9TC01348B.
(149) Onoda-Yamamuro, N.; Matsuo, T.; Suga, H. Calorimetric and IR Spectroscopic
Studies of Phase Transitions in Methylammonium Trihalogenoplumbates (II)†. J.
Phys. Chem. Solids 1990, 51 (12), 1383–1395. https://doi.org/10.1016/0022-
3697(90)90021-7.
(150) Ptak, M.; Mączka, M.; Gągor, A.; Sieradzki, A.; Stroppa, A.; Di Sante, D.; Perez-
Mato, J. M.; Macalik, L. Experimental and Theoretical Studies of Structural
Phase Transition in a Novel Polar Perovskite-like [C 2 H 5 NH 3 ][Na 0.5 Fe 0.5
(HCOO) 3 ] Formate. Dalton Trans. 2016, 45 (6), 2574–2583.
https://doi.org/10.1039/C5DT04536C.

197
(151) Yang, Y.; Yang, M.; Li, Z.; Crisp, R.; Zhu, K.; Beard, M. C. Comparison of
Recombination Dynamics in CH3NH3PbBr3 and CH3NH3PbI3 Perovskite
Films: Influence of Exciton Binding Energy. J. Phys. Chem. Lett. 2015, 6 (23),
4688–4692. https://doi.org/10.1021/acs.jpclett.5b02290.
(152) Sheng, C.; Zhang, C.; Zhai, Y.; Mielczarek, K.; Wang, W.; Ma, W.; Zakhidov,
A.; Vardeny, Z. V. Exciton versus Free Carrier Photogeneration in Organometal
Trihalide Perovskites Probed by Broadband Ultrafast Polarization Memory
Dynamics. Phys. Rev. Lett. 2015, 114 (11), 116601.
https://doi.org/10.1103/PhysRevLett.114.116601.
(153) Tekin, N.; Cebe, M. Solvents Effect on Infrared Spectra of Trimethyl Phosphate
in Organic Solvents. Vib. Spectrosc. 2004, 36 (1), 129–133.
https://doi.org/10.1016/j.vibspec.2004.05.001.
(154) Zhang, Y.; Malik, U. P.; Quiggins, B.; Nguyen, H.; Beedle, C. C.; Kovalev, A.
E.; Clérac, R.; Hill, S.; Bythell, B. J.; Holmes, S. M. Structure-Property
Relationships in Tricyanoferrate(III) Building Blocks and Trinuclear Cyanide-
Bridged Complexes. Eur. J. Inorg. Chem. 2016, 2016 (15–16), 2432–2442.
https://doi.org/10.1002/ejic.201600199.
(155) Zhang, Y.-Z.; Ferko, P.; Siretanu, D.; Ababei, R.; Rath, N. P.; Shaw, M. J.;
Clérac, R.; Mathonière, C.; Holmes, S. M. Thermochromic and Photoresponsive
Cyanometalate Fe/Co Squares: Toward Control of the Electron Transfer
Temperature. J. Am. Chem. Soc. 2014, 136 (48), 16854–16864.
https://doi.org/10.1021/ja508280n.
(156) Zhang, W.; Ji, M.; Sun, Z.; Gaffney, K. J. Dynamics of Solvent-Mediated
Electron Localization in Electronically Excited Hexacyanoferrate(III). J. Am.
Chem. Soc. 2012, 134 (5), 2581–2588. https://doi.org/10.1021/ja207306t.
(157) Li, D.; Parkin, S.; Wang, G.; Yee, G. T.; Prosvirin, A. V.; Holmes, S. M. Single-
Molecule Magnets Constructed from Cyanometalates:
{[Tp*FeIII(CN)3MII(DMF)4]2[OTf]2}·2DMF (MII = Co, Ni). Inorg. Chem.
2005, 44 (14), 4903–4905. https://doi.org/10.1021/ic048367i.
(158) Pinjari, R. V.; Delcey, M. G.; Guo, M.; Odelius, M.; Lundberg, M. Restricted
Active Space Calculations of L-Edge X-Ray Absorption Spectra: From Molecular
Orbitals to Multiplet States. J. Chem. Phys. 2014, 141 (12), 124116.
https://doi.org/10.1063/1.4896373.
(159) Biswas, R.; Bagchi, B. Solvation Dynamics in Nonassociated Polar Solvents. J.
Phys. Chem. A 1999, 103 (15), 2495–2500. https://doi.org/10.1021/jp983739s.
(160) Dynamics of Solvent-Mediated Electron Localization in Electronically Excited
Hexacyanoferrate(III) - Journal of the American Chemical Society (ACS
Publications) https://pubs.acs.org/doi/10.1021/ja207306t (accessed May 16,
2019).
(161) Rosspeintner, A.; Lang, B.; Vauthey, E. Ultrafast Photochemistry in Liquids.
Annu. Rev. Phys. Chem. 2013, 64, 247–271. https://doi.org/10.1146/annurev-
physchem-040412-110146.

198
(162) Kosower, E. M. The Effect of Solvent on Spectra. I. A New Empirical Measure
of Solvent Polarity: Z-Values. J. Am. Chem. Soc. 1958, 80 (13), 3253–3260.
https://doi.org/10.1021/ja01546a020.
(163) Van der Zwan, G.; Hynes, J. T. Time-Dependent Fluorescence Solvent Shifts,
Dielectric Friction, and Nonequilibrium Solvation in Polar Solvents. J. Phys.
Chem. 1985, 89 (20), 4181–4188.
(164) Maroncelli, M. Continuum Estimates of Rotational Dielectric Friction and Polar
Solvation. J. Chem. Phys. 1997, 106 (4), 1545–1557.
https://doi.org/10.1063/1.473276.
(165) Sigma-Aldrich. Physical Properties of Solvents
https://www.sigmaaldrich.com/content/dam/sigma-
aldrich/docs/Aldrich/General_Information/labbasics_pg144.pdf (accessed Nov
11, 2019).
(166) Kaafarani, B. R. Discotic Liquid Crystals for Opto-Electronic Applications.
Chem. Mater. 2011, 23 (3), 378–396. https://doi.org/10.1021/cm102117c.
(167) Hains, A. W.; Liang, Z.; Woodhouse, M. A.; Gregg, B. A. Molecular
Semiconductors in Organic Photovoltaic Cells. Chem. Rev. 2010, 110 (11), 6689–
6735. https://doi.org/10.1021/cr9002984.
(168) Leight, K. R.; Esarey, B. E.; Murray, A. E.; Reczek, J. J. Predictable Tuning of
Absorption Properties in Modular Aromatic Donor–Acceptor Liquid Crystals.
Chem. Mater. 2012, 24 (17), 3318–3328. https://doi.org/10.1021/cm3007765.
(169) Winkle, M. V.; Scrymgeour, D. A.; Kaehr, B.; Reczek, J. J. Laser Rewritable
Dichroics through Reconfigurable Organic Charge-Transfer Liquid Crystals. Adv.
Mater. 2018, 30 (20), 1706787. https://doi.org/10.1002/adma.201706787.
(170) Bé, A. G.; Tran, C.; Sechrist, R.; Reczek, J. J. Strongly Dichroic Organic Films
via Controlled Assembly of Modular Aromatic Charge-Transfer Liquid Crystals.
Org. Lett. 2015, 17 (19), 4834–4837. https://doi.org/10.1021/acs.orglett.5b02399.
(171) Mauck, C. M.; Young, R. M.; Wasielewski, M. R. Characterization of Excimer
Relaxation via Femtosecond Shortwave- and Mid-Infrared Spectroscopy. J. Phys.
Chem. A 2017, 121 (4), 784–792. https://doi.org/10.1021/acs.jpca.6b11388.
(172) Brown, K. E.; Veldkamp, B. S.; Co, D. T.; Wasielewski, M. R. Vibrational
Dynamics of a Perylene–Perylenediimide Donor–Acceptor Dyad Probed with
Femtosecond Stimulated Raman Spectroscopy. J. Phys. Chem. Lett. 2012, 3 (17),
2362–2366. https://doi.org/10.1021/jz301107c.
(173) Alberding, B. G.; Brown-Xu, S. E.; Chisholm, M. H.; Epstein, A. J.; Gustafson,
T. L.; Lewis, S. A.; Min, Y. Photoinduced Charge Transfer Involving a MoMo
Quadruply Bonded Complex to a Perylene Diimide. Dalton Trans. 2013, 42 (15),
5275–5280. https://doi.org/10.1039/C3DT32750G.
(174) Ganesan, P.; Baggerman, J.; Zhang, H.; Sudhölter, E. J. R.; Zuilhof, H.
Femtosecond Time-Resolved Photophysics of 1,4,5,8-Naphthalene Diimides. J.
Phys. Chem. A 2007, 111 (28), 6151–6156. https://doi.org/10.1021/jp0719558.

199
(175) Martinez, J. F.; La Porte, N. T.; Wasielewski, M. R. Electron Transfer from
Photoexcited Naphthalene Diimide Radical Anion to Electrocatalytically Active
Re(bpy)(CO)3Cl in a Molecular Triad. J. Phys. Chem. C 2018, 122 (5), 2608–
2617. https://doi.org/10.1021/acs.jpcc.7b11999.
Related Documents