i Investigation of Recycled PET and Its Application for Blow Moulded Containers Requiring Thermal Stability at Elevated Temperatures A thesis submitted in fulfilment of the requirements for a Master Degree in Manufacturing Engineering by Research By Mr Joseph Patuto School of Mechanical and Manufacturing Engineering RMIT University Victoria, Australia

Welcome message from author
This document is posted to help you gain knowledge. Please leave a comment to let me know what you think about it! Share it to your friends and learn new things together.
Transcript
i
Investigation of Recycled PET and Its
Application for Blow Moulded Containers
Requiring Thermal Stability at Elevated
Temperatures
A thesis submitted in fulfilment of the requirements for a
Master Degree in Manufacturing Engineering by
Research
By
Mr Joseph Patuto
School of Mechanical and Manufacturing Engineering
RMIT University
Victoria, Australia

ii
Acknowledgements
I begin my acknowledgements to the person who worked as hard and was as
challenged as I had been during my studies, my wife Silvana. You have taught me
patience; you have shown me the meaning of commitment, as you have supported me
during this time of part-time study and full-time employment. Our four children are
blessed to have you as their mother, and I praised the Lord Jesus for your dedication
and love to us all each day. Your leadership has taught me to demonstrate my love to
you in practical ways, and having an action love for you, not just in word. You are
more than my wife. You are where God speaks these words “For this reason a man
will leave his father and mother and be united to his wife, and they will become one
flesh.” Genesis 2:24. Silvana, I love you. Thank you for serving the LORD.
Secondly, I thank my children, Priscilla, Nathanael, Jonah and Elijah. You have given
up so much for your dad to do this project, and to complete it. I cannot thank enough
the Lord Jesus in words expressing my feelings for your patience and understanding,
even at this young and tender age. I wish to serve you and to be a standing stone, a
living testimony to you for years to come.
I wish to thank the team of people who supported me during my tenure. To Dr. Fugen
Daver, who took a chance on me to undertake this project; I have enjoyed working
with you. I thank you for your tenacity, your direction and trust, which you
demonstrated in me during this project. You were always interested in my trials,
concerned for my progress and listened to my difficulties in raising a family,
supporting my wife, and being a father and friend to my children during this tenure.
iii
You gave me latitude even though you may have not been certain of the outcome.
You have allowed me to learn and to continue my education and for that I thank you.
I also wish to thank Adjunct Professor Edward Kosior, who gave me an opportunity
to undertake this project, and supported me as my industry consultant. I respect your
ability and professionalism, and the example you have given the polymer and
packaging industry. Your work ethic and value in people is unquestionable. And your
concern for the environment will be remembered for many years.
I thank Dr. Chris Friedl who has aided me in difficult areas. You have been patient
with me, and were able to break down complex ideas for my comprehension. There
was never a time that was an inconvenience to you. I thank you for your feedback on
my thesis and your direction during my practical experiments and thesis writing. You
have spent valuable time with me, and for this I give you thanks. You are not boastful
concerning your knowledge and ability, and yet at any given time were prepared to
share your knowledge. You have assisted me in my learning and education. Thank
you!
I thank Peter Tkatchyk and Terry Rosewarne for their assistance in my laboratory
pracs and ISBM experiment set-ups. I also wish to thank Tracey Hanely from
ANSTO, who conducted all SAXS experiments. I also wish to thank Dr. Ferenc Cser,
whose tutelage concerning TMDSC experiments and data interpretation was
invaluable. Also to Steve Shamis from Waters Australia, who supported me with key
contacts for TMDSC and rheological experiments.

iv
I wish to acknowledge MoldFlow Australia, for allowing myself to perform density
measurements. Furthermore a sincere thanks to Visy Plastic for the supply of all PET
materials used for this research study. I also wish to thank Graeme Moad from CSIRO
for conducting the rheological tests. I also thank our family friend Barbara
Gottliebsen for the initial editing of this thesis. I also thank my employer, Kangan
Batman TAFE for giving me great latitude and time to undertake these studies.
My final acknowledgement is to the Lord Jesus Christ, through whom all things
blessings do flow. With much pray, and your leading you have given me the strength,
patience, endurance and the commitment to complete this project. There were times
when I wished to give up, as I felt the inadequacy in my role as a husband, and father
and friend to my children and wife. But you reminded me of my calling, and the
reasons for undertaking this project. Lord Jesus, I love you and I wish this thesis is to
be used to your Glory. AMEN.

v
Declaration
I, Joseph Patuto herby certify that the work embodied in this thesis is the result of
original research and has not been submitted for higher degree to any other
University or Institution.
__________________
Joseph Patuto
vi
Conference Proceedings
Recycled Poly (ethylene terephthalate) (PET) Blends for Hot - fill Bottles
(Patuto et al. 2007)
Abstract Injection stretch blow moulded PET bottles offer glass like clarity, excellent gas
barrier properties and good overall mechanical strength. However, PET bottles
required for hot - fill (85 oC) applications have encountered limitations due to the
relatively low glass transition temperature of PET.
In this study, three different PET materials are blended with post consumer recycled
PET. The heat-setting technique is used for the manufacture of injection stretch blow
moulded bottles for ‘hot - fill’ applications. The process parameters (preform
temperature, heat-setting timing and blow mould temperature) and the material blend
ratios for PET bottles are optimised based on thermal and mechanical
characterisation.
vii
Abstract
Polyethylene Terephthalate (PET) has become the preferred material of choice for
many packaging applications. A preference over glass due to its low weight, similar
transparency to glass and cost consideration, including the availability of recycled
PET feedstock via kerbside collection has provided newer opportunities for hot-fill
applications. Ostensibly, this material is used for beverage markets requiring cold and
hot filling (85 oC) of liquid foods. However due to the poor thermal stability of PET –
due to its low glass transition temperature – an increase in elevated temperatures
limits the number of market segments the material can be utilised.
Current practices incorporate the heat-set process, aimed at improving the
crystallisation kinetics within the amorphous and crystalline region. This body of
work incorporates a single stage Injection Stretch Blow Moulding machine (ISBM).
Modifications to conventional carbonated soft drink (CSD) beverage containers to
include heat-set capabilities are incorporated.
The current research study investigates the potential benefits of RPET blends for
improving thermal stability at elevated temperatures. This study investigates changes
in mechanical properties which include
• Youngs modulus,
• top load strength,
• burst strength,
• Thermal analysis specifically investigating changes in
• Glass transition temperature,
viii
• enthalpy changes due to heat-set conditions
• Percentage crystallinity changes as a function of heat-set conditions
Rheological characteristics to all materials used were investigates. Furthermore,
changes in the physical properties to each PET beverage container were
investigated which include;
• process shrinkage (S1),
• hot-fill shrinkage (S2)
• Density changes via optimised DoE parameters.
A combination of cold (80 oC) and hot moulds (150
oC) as measured via Forward
Looking Infrared (FLIR) at the exterior to the blow mould and their affect on
percentage crystallinity was studied. Preform surface temperature (PST) and strain
induced crystallinity, assisting in molecular relaxation is analysed.
Upon completion to an exhaustive experimental ISBM trial, a DoE software package
– in this case Echip – was used to analyse and predict optimised hot-fill shrinkage
values of 2.5 percent with a maximum constrained RPET blend value totalling 40
percent. ISBM optimised conditions demonstrated advantages when combining an
increased preform surface temperature, RPET blends and optimised ISBM process
conditions as indicated via the DoE at low heat-set temperatures.
ix
Table of Contents
Acknowledgements........................................................................................................ii
Declaration.....................................................................................................................v
Conference Proceedings................................................................................................vi
Abstract ........................................................................................................................vii
Table of Contents..........................................................................................................ix
List of Figures .................................................................................................................i
List of Tables ..................................................................................................................i
List of Equations .......................................................................................................... iii
1. Chapter 1: Introduction ..........................................................................................1
1.1. Introduction........................................................................................................2
1.2. Overview of recycling........................................................................................3
1.3. Heat-set technologies .........................................................................................5
1.4. Project aim .........................................................................................................6
1.5. Research Questions............................................................................................7
1.6. Contribution to new knowledge.........................................................................8
2. Chapter 2: Literature Review.................................................................................9
2.1. Introduction......................................................................................................10
2.2. Market Sector...................................................................................................13
2.3. Bottle Design Developments ...........................................................................14
2.4. Material Developments....................................................................................15
x
2.5. Material Distribution by Type .........................................................................16
2.6. PET Synthesis ..................................................................................................18
2.6.1. Synthesis of PEIT ........................................................................................24
2.6.2. Heat-set Materials ........................................................................................27
2.6.3. Synthesis of PC-PET....................................................................................29
2.6.4. Melt Recovery of PET .................................................................................30
2.6.5. Glycolysis ....................................................................................................32
2.7. Mechanical Testing..........................................................................................35
2.7.1. Izod Impact Test. .........................................................................................35
2.7.2. Tensile Testing.............................................................................................36
2.8. Rheological Characteristics .............................................................................37
2.8.1. Parallel Plate Rheometer..............................................................................38
2.9. Dilute Solution Viscosity.................................................................................39
2.9.1. Melt Flow Index Test...................................................................................42
2.10. Thermal Analysis .........................................................................................44
2.10.1. Crystallinity measured via Differential Scanning Calorimetry ...................44
2.10.2. Temperature Modulated Differential Scanning Calorimetry.......................45
2.10.3. Molecular Weight Distribution ....................................................................49
2.11. Crystallinity and Density .............................................................................49
2.12. Heat-set Process ...........................................................................................51
2.13. Mechanical response via Strain Induced Crystallinity.................................55
xi
2.14. Morphology of PET Beverage Bottles.........................................................56
3. Chapter 3: Materials, Sample Preparation and Experimental Set-up ..................60
3.1. Introduction......................................................................................................61
3.2. Materials for Heat Set Applications.................................................................62
3.3. Raw Material Preparation ................................................................................64
3.4. Material dying conditions for PET ..................................................................64
3.5. Sample preparation of compression moulded plaque ......................................64
3.6. Rheological characterisation............................................................................67
3.6.1. Analysis intrinsic viscosity of PET..............................................................67
3.6.2. Melt flow index test .....................................................................................68
3.6.3. Parallel Plate Rheometer..............................................................................69
3.7. Thermal characterisation..................................................................................70
3.7.1. Temperature modulated differential scanning calorimetry..........................70
3.8. Mechanical characterisation.............................................................................72
3.8.1. Injection Moulding.......................................................................................73
3.8.2. Izod Impact Test ..........................................................................................74
3.8.3. Tensile Testing.............................................................................................74
3.8.4. Top Load Testing.........................................................................................75
4. Chapter 4: ISBM Experimental Set-up Procedure and Bottle Characterisation ..76
4.1 ISBM Experimental Set-up..............................................................................77
4.2. Heat-set Capabilities of ISBM.........................................................................79
xii
4.2.1. Validation of Heat Set Mould Temperatures ...............................................84
4.3. ISBM Bottle Production Set-up .......................................................................87
4.3.1. Heat-set Bottle Production...........................................................................87
4.3.2. Infrared Camera Set-up................................................................................90
4.4. Carbonated Soft Drink Bottle Configuration (CSD) .......................................92
4.5. Sample Selection for Analysis .........................................................................93
4.6. Thermal Stability at Elevated Temperature Characterisation..........................94
4.6.1. Volume Capacity Determination .................................................................94
4.6.2. Hot-fill Procedure ........................................................................................95
4.7. Burst Strength Test ..........................................................................................97
4.8. Wall Thickness Measurement Procedure.........................................................97
4.9. Mechanical Characterisation............................................................................99
4.9.1. Top Load Procedure.....................................................................................99
4.9.2. Tensile test panel section ...........................................................................100
4.10. Density measurement spot panel procedure ..............................................101
4.11. Density measurement panel section procedure..........................................102
5. Chapter 5: Design of Experiment ......................................................................104
5.1. Introduction....................................................................................................105
5.2. Design of Experiment ....................................................................................106
5.3. Contour 1-D Plots ..........................................................................................108
5.3.1. Pareto Effects to Initial DoE......................................................................113
xiii
5.4. Contour 2-D plots ..........................................................................................117
5.5. Results summary table augmented results .....................................................123
5.6.1. Results contour 1-D augmented DoE plots................................................124
5.6.2. Results contour 2-D augmented plots ........................................................126
5.7. DoE Optimised Condition for ISBM Process................................................129
5.8. Optimised DoE heat-set temperatures ...........................................................132
5.8.1. Optimised heat-set conditions....................................................................132
5.8.2. Optimised heat-set conditions via Goal Seek parameters..........................133
5.8.3. Optimised heat-set conditions via trade off constraints.............................136
5.9. Validation of Optimised ISBM DoE..............................................................137
6. Chapter 6: Heat-set thermal analysis and characterisation. ...............................138
6.1 Thermal Analysis ...........................................................................................139
6.2. Glass Transition .............................................................................................140
6.3. Integration limits via extrapolation method...................................................141
6.4. Initial crystallinity via TMDSC method ........................................................144
6.5. Density Measurements...................................................................................146
6.6. Validation of Tg Temperature using DMTA..................................................147
6.7. Morphological analysis of heat-set containers...............................................148
7. Chapter 7: Results and Discussions ...................................................................152
7.1. Mechanical Properties for PET samples used................................................153
7.1.1. Comparative Results for Maximum Yield stress. ......................................153
xiv
7.1.2. Comparative Results for Young Modulus .................................................154
7.1.3. Comparative Results for Elongation at break ............................................155
7.1.4. Izod Impact test..........................................................................................156
7.2. Rheological properties ...................................................................................157
7.2.1. Intrinsic Viscosity ......................................................................................157
7.2.2. Parallel Plate Complex Viscosity data.......................................................158
7.2.3. Polydispersity Index determination. ..........................................................160
7.2.4. Storage Modulus via Parallel plate ............................................................161
7.2.5. Loss Modulus via Parallel plate Rheometer ..............................................162
7.3. Optimisation via Augmented DoE.................................................................163
7.3.1. Preform Surface Temperature....................................................................163
7.3.2. Process Shrinkage (S1)...............................................................................168
7.4. Targeted Optimisation via Augmented DoE..................................................171
7.4.1. Hot-fill shrinkage (S2)................................................................................171
7.4.2. Burst Test ...................................................................................................177
7.4.3. Panel Wall thickness ..................................................................................181
7.4.4. Top load strength .......................................................................................182
7.5. Mechanical Properties via Optimised DoE....................................................184
7.5.1. Elastic Modulus of Panel section via Optimised DoE...............................184
7.5.2. Tensile Strength of Panel section via Optimised DoE...............................186
7.6. Dimensional Stability via Optimised DoE.....................................................187
xv
7.6.1. Process Shrinkage (S1) results ...................................................................187
7.6.2. Hot-fill Shrinkage (S2) results....................................................................189
7.6.3. Burst test results via optimised DoE..........................................................192
7.7. Thermal Analysis. ..........................................................................................194
7.7.1. Glass transition temperature via TMDSC..................................................194
7.7.2. Percentage Crystallinity via Optimised DoE. ............................................198
7.8. Density results via Optimised DoE................................................................199
7.9. DMTA Analysis.............................................................................................202
7.10. Orientation assessment via SAXS .............................................................204
8. Chapter 8. Conclusion and recommendation for further research work............206
8.1. Conclusions....................................................................................................207
8.1.1. Critical factors controlling thermal stability ..............................................207
8.1.2. Optimum process conditions for Single Stage ISBM................................208
8.1.3. Thermal stability and material integrity via RPET inclusion ....................209
8.2. Recommendations for Further Work .............................................................211
References..................................................................................................................213
Appendices.................................................................................................................224
i
List of Figures Figure 1.2-1 Flow diagram to the recycling of PC-PET to palletised RPET.................5
Figure 2.5-1 Material Distribution from SSP .............................................................16
Figure 2.6-1 Polymerisation Process via Transesterification reaction for PET
Synthesis ......................................................................................................................21
Figure 2.6-2 Polymerisation Process via esterification reaction for PET Synthesis...21
Figure 2.6.1-1 An example of Isosorbide structure (Khanarian et al. 2000c) .............24
Figure 2.6.1-2 Stereochemistry reaction used by DuPont for the manufacture of PEIT
(Storebeck et al. 1996).................................................................................................26
Figure 2.6.5-1 Depolymerisation of PC-PET via Glycolysis reaction (Scheirs 1998) 33
Figure 2.6.5-2 Stereochemistry reaction of DMT extraction from Polymerisation of
PET via Glycolysis reaction.........................................................................................34
Figure 3.8.3-1Schematic of tensile bar used for all tensile testing ..............................75
Figure 4.2-1 Schematic of heater cartridge location with reference to the 375 ml blow
moulding cavity ...........................................................................................................81
Figure 4.2.1-1 Set-point temperature versus actual mould temperature to validate of
electrical heater cartridge installation for heat set temperature control .......................87
Figure 4.4-1 Schematic of 375 ml panel-less, ribless PET container used for ISBM
bottle production and Hot fill experiments. .................................................................93
Figure 4.6.2-1 Standard code letters reference to neck dimension for 375 ml CSD
beverage container .......................................................................................................96
Figure 4.8-1 Wall thickness bottle location along axial length and circumference of
PET beverage container ...............................................................................................98
Figure 4.9.1-1 A sample graph for top – load test results..........................................100
ii
Figure 4.9.2-1 Tensile Tests panel section taken from PET beverage container panel
....................................................................................................................................101
Figure 4.10-1 Panel section cut out for all density measurements from localised area.
....................................................................................................................................102
Figure 4.11-1 Panel section cut out for all density measurements from entire panel
section. .......................................................................................................................103
Figure 5.3-1 Contour 1-D plot for hot-fill shrinkage against mould temperature .....109
Figure 5.3-2 Contour 1-D plots from Initial DoE for hot-fill and blow time ............110
Figure 5.3-3 Contour 1-D plots from Initial DoE for hot-fill versus preform cooling
time ............................................................................................................................111
Figure 5.3.1-1 Pareto effects chart for hot-fill shrinkage...........................................114
Figure 5.3.1-2 Pareto affects charts for Process Shrinkage (S1). ...............................115
Figure 5.3.1-3 Pareto affects charts from initial DoE for Absolute Shrinkage (St) ..115
Figure 5.3.1-4 Pareto affects charts from initial DoE for Burst Test (BS) ................116
Figure 5.3.1-5 Pareto affects charts from initial DoE for Top-load (TLS)................116
Figure 5.4-1 Outside design Contour 2-D plot for hot-fill shrinkage and Mould
temperature ................................................................................................................118
Figure 5.4-2 Hot-fill shrinkage optimised 2-D Contour plot post outside design .....118
Figure 5.4-3 Outside design Contour 2-D plot for process shrinkage and preform
cooling time. ..............................................................................................................119
Figure 5.4-4 Process shrinkage optimised 2-D Contour plot post outside design .....120
Figure 5.6.1-1 Contour 1-D plot for hot-fill shrinkage against mould temperature ..124
Figure 5.6.1-2 Contour 1-D plot for hot-fill shrinkage and preform cooling time ....125
Figure 5.6.1-3 Pareto effects augmented chart for hot-fill shrinkage ........................126
iii
Figure 5.6.2-1 Augmented 2-D Interaction plots for hot-fill shrinkage against mould
temperature and blow time.........................................................................................127
Figure 5.6.2-2 Augmented 2-D Interaction plots for hot-fill shrinkage against mould
temperature and preform cooling time.......................................................................128
Figure 5.7-1 Hot-fill shrinkage results obtained via augmented DoE presenting all S2
results below 5 percent shrinkage, measuring a total of 40 percent of all data points
including repeats ........................................................................................................130
Figure 5.7-2 Process shrinkage as a function of heat-set temperatures. ....................131
Figure 5.8.1-1 Response graph demonstrating Optimum point for Heat-set
Application.................................................................................................................133
Figure 5.8.2-1 Burst strength (BS), S2 and top – load results observed without
constraints. .................................................................................................................135
Figure 5.8.3-1 Results from constraint values for burst, S2 and top load results
observed from Echip. .................................................................................................136
Figure 6.2-1 Derivative reversing heat capacity curve for optimised heat-set BB7755
– RPET blend.............................................................................................................141
Figure 6.3-1Example integration limits procedure used for thermal analysis
investigation for optimised heat-set PET beverage containers. .................................142
Figure 6.3-2 Thermograph for optimised heat-set 120 oC 60 % BB7755 – 40 % RPET
extrapolation method .................................................................................................144
Figure 6.7-1 Schematic layout indicating beam direction for all SAXS measurements
indicating hoop and axial direction of panel section .................................................149
Figure 6.7-2 A typical SAXS 2D scattering pattern example for panel section for
optimised DoE 60 % BB7755 – 40 % RPET.............................................................151
iv
Figure 7.1.1-1Tensile test results demonstrating yield stress (max) for all PET
samples used in this study..........................................................................................154
Figure 7.1.2-1Comparative Young’s modulus results to all PET samples via tensile
testing before heat-set analysis. .................................................................................155
Figure 7.1.3-1Comparative elongation at break results to all PET samples via tensile
testing before heat-set analysis. .................................................................................156
Figure 7.1.4-1Izod impact results for PET materials.................................................157
Figure 7.2.2-1 Complex viscosity measurements results via parallel plate Rheometer
for Voridian CA 12, SkyPET BB7755 and Visy RPET. ...........................................159
Figure 7.2.4-1. Storage modulus comparisons results via parallel plate Rheometer for
Voridian CA 12, SkyPET BB7755 and Visy RPET. .................................................161
Figure 7.2.5-1 Loss modulus results via parallel plate Rheometer for Voridian CA 12,
SkyPET BB7755 and Visy RPET..............................................................................162
Figure 7.3.1-1 Perform surface temperature recorded at point 3 (base). ...................165
Figure 7.3.1-2 Perform surface temperature recorded at point 01 (top of bottle
shoulder). ...................................................................................................................167
Figure 7.3.1-3 Perform surface temperature recorded at point 02 (panel section). ..167
Figure 7.3.2-1 Top 4 performing process shrinkage (S1) results via Augmented DoE
....................................................................................................................................169
Figure 7.3.2-2 High process shrinkage (S1) for Augmented DoE .............................171
Figure 7.4.1-1 Best performing hot-fill shrinkage values via Augmented DoE........172
Figure 7.4.1-2 Worst performing hot-fill shrinkage values via Augmented DoE .....173
Figure 7.4.1-3 Contour 2-D plot for hot-fill shrinkage with targeted mechanical
properties for minimised shrinkage. ..........................................................................176
Figure 7.4.2-1 Best performing burst strength result via Augmented DoE ...............178
v
Figure 7.4.2-2 Worst burst strength results via Augmented DoE..............................179
Figure 7.4.2-3 Burst test results via maximised constrained values ..........................180
Figure 7.4.3-1 Top 4 performing wall thickness measurements via Augmented DoE
....................................................................................................................................181
Figure 7.4.4-1. A 2-D contour plot for top load strength versus preform cooling time
....................................................................................................................................182
Figure 7.4.4-2 Top load predicted results via Echip DoE software...........................184
Figure 7.5.1-1 Tensile panel modulus results via optimised DoE heat-set conditions
for BB7755 60 % - RPET 40 % blends .....................................................................186
Figure 7.5.2-1 Maximum yield strength for optimised BB7755 60 % RPET 40 %
heat-set conditions .....................................................................................................187
Figure 7.6.1-1 Process shrinkage via optimised heat-set DoE for BB7755 60 % -
RPET 40 % blends .....................................................................................................188
Figure 7.6.1-2 Process shrinkage data for optimised Voridian CA12 96 % – RPET 4%
blend...........................................................................................................................188
Figure 7.6.2-1 Optimised BB7755 60 % – RPET 40 % DoE results for hot-fill
shrinkage. ...................................................................................................................190
Figure 7.6.2-2 Optimised CA12 96 % – RPET 4 % DoE results for hot-fill shrinkage.
....................................................................................................................................192
Figure 7.6.3-1 Burst strength results for optimised BB7755 60 % – RPET 40 % blends
....................................................................................................................................193
Figure 7.6.3-2 Burst strength results for optimised CA 12 96 % – RPET 4% blends
....................................................................................................................................193
Figure 7.6.3-3 A 2-D contour plot for constrained optimised BB7755 – RPET material
blend for heat-set conditions......................................................................................194
vi
Figure 7.7.1-1 Glass transition results as a function of heat-set temperature via
derivative ρC curve. ..................................................................................................197
Figure 7.8-1 Localised density measurements for optimised BB7755 60 % – RPET 40
% blends.....................................................................................................................201
Figure 7.8-2 Density measurements for entire panel section for Optimise BB7755 60
% – RPET 40 % blend DoE.......................................................................................202
Figure 7.9-1 Tan delta results via DMTA for optimised BB7755 60 % – RPET 40 %
blends .........................................................................................................................203
Figure 7.9-2 Comparison to glass transition temperatures via DMTA and TMDSC 204
i
List of Tables Table 2.5-1 Production totals of Melt Phase Resins Manufacturers............................16
Table 2.5-2 Production totals of SSP Manufacturers...................................................17
Table 2.5-3 Manufacturers and trade name for PET materials. www.matweb.com....18
Table 3.2-1 Thermal, physical and mechanical properties of SkyPET BB7755 PET
Material Used...............................................................................................................63
Table 3.2-2 Thermal, physical and mechanical properties of SkyPET BB7755 PET
Material Used...............................................................................................................63
Table 3.7.1-1 TMDSC weight results for each material run........................................71
Table 3.8.1-1 Injection Moulding Operating Conditions.............................................73
Table 4.2-1 Process conditions for bottle production to heat-set experimental runs
manufactured via Aoki.................................................................................................82
Table 4.2-2. ISBM Process conditions for 60 % SkyPET BB7755 – 40 % RPET heat-
set process. ...................................................................................................................83
Table 4.2-3. ISBM Process conditions for 60 % Voridian CA12 – 40 % RPET heat-set
process..........................................................................................................................84
Table 4.3.2-1 Example of IR Spot Temperature Location...........................................91
Table 4.7-1 Sample Burst Test results .........................................................................97
Table 4.8-1 A sample measurement positions for wall thickness location..................99
Table 5.2-1 Initial DoE for heat-set ISBM Process ...................................................107
Table 5.3-1 Results summary table for initial DoE using Quadratic Model .............112
Table 5.4-1 How many trial summary table from Augmented Quadratic Model with
increase G Efficiency Value ......................................................................................121
Table 5.4-2 DoE augmented experimental run for improved resolution ...................122
ii
Table 5.5-1 Results summary table to Optimised Echip Results using Augmented
Quadratic Model ........................................................................................................123
Table 5.7-1 Example of temperature recordings for PST experimental 15 ...............130
Table 6.5-1 Localised density and percentage crystallinity measurements. ..............146
Table 6.5-2 Entire panel section density and percentage crystallinity measurements.
....................................................................................................................................147
Table 7.2.1-1 Results summary table to molecular number and weight average,
Polydispersity index and end group concentration. ...................................................158
Table 7.3.1-1 Preform surface temperature for the best performing hot-fill shrinkage
results .........................................................................................................................166
Table 7.3.1-2 Preform surface temperature for the poorest performing hot-fill
shrinkage results.........................................................................................................166
Table 7.7.1-1 Thermal analysis results obtained from TMDSC for all PET raw
materials.....................................................................................................................195
Table 7.7.1-2 Thermal analysis summary results table for optimised heat-set 60
percent BB7755 – 40 percent RPET blend. ...............................................................196
Table 7.7.1-3 Thermal analysis data for 96 % CA12 – 4 % RPET Optimised DoE
beverage containers....................................................................................................196
iii
List of Equations Equation 2.8-1..............................................................................................................38
Equation 2.8.1-1...........................................................................................................38
Equation 2.9-1..............................................................................................................41
Equation 2.9-2..............................................................................................................41
Equation 2.9.1-1...........................................................................................................43
Equation 2.9.1-2...........................................................................................................44
Equation 2.10.2-1.........................................................................................................46
Equation 2.10.2-2.........................................................................................................47
Equation 2.10.2-3.........................................................................................................48
Equation 2.10.2-4.........................................................................................................48
Equation 2.10.2-5.........................................................................................................48
Equation 2.10.2-6.........................................................................................................48
Equation 4.2-1..............................................................................................................79
Equation 4.4-1..............................................................................................................92
Equation 4.4-2..............................................................................................................92
Equation 4.4-3..............................................................................................................92
Equation 4.6.1-1...........................................................................................................94
Equation 4.6.2-1...........................................................................................................96
Equation 6-1...............................................................................................................139
Equation 6.3-1............................................................................................................143
Equation 6.4-1............................................................................................................145
Equation 6.7-1............................................................................................................149
Equation 6.7-2............................................................................................................150
Equation 7.2.1-1.........................................................................................................157

iv
Equation 7.2.3-1.........................................................................................................160
Equation 7.5.1-1.........................................................................................................185
Equation 7.8-1............................................................................................................199

Chapter 1 Introduction
1
1. Chapter 1: Introduction
Chapter 1 Introduction
2
1.1. Introduction Polyethylene Terephthalate (PET) has become the preferred material over glass and
metal in packaging applications. As virgin PET consumption increases within the
packaging sector, a new feedstock material – in this case Post consumable PET – has
become available. Post Consumable PET (PC-PET) material is not biodegradable. As
such, a waste management problem within particular regions of the world has
surfaced. Local, State and Federal governments in Australia are taking a leading
interest in this waste problem. A waste management strategy via curb side collection
has been implemented to recycle PC-PET feedstock into new applications.
Manufacturing applications for Recycled Polyethylene Terephthalate (RPET) include
• Films
• Sheets
• Fibres
• Automotive components
• Beverage containers etc.
This study will evaluate RPET - virgin PET blends for hot-fill applications
incorporating heat-set technologies. The research study will manufacture heat-set
beverage containers utilising a Single Stage Injection Stretch Blow Moulding (ISBM)
process. A detailed explanation concerning heat-set methodologies is presented in
chapter 2.11. Morphological changes due to heat-set conditions are presented in the
current research study.
Chapter 1 Introduction
3
The ISBM process is complex. Controlled process variables are needed to maintain a
stable processing condition. The optimisation of the process parameters directly
affects the final properties of a PET beverage container. Control over these process
variables for the Design of Experiment (DoE) is of principle importance. Process
variables include blow time; preform cooling time, heat-set temperature and virgin
material and RPET blend formulation. These are discussed in the preceding chapters:
• Chapter 4.1 experimental set-up
• Chapter 4.2 implementations of heat-set capabilities.
• Chapter 5 method for use and validation for DOE.
1.2. Overview of recycling PET consumption has seen steady growth over the last 10 years. PC-PET is now
readily available. New techniques for recycling PET (RPET) have been developed.
Moreover, investigations of newer methodologies are being developed to improve
efficiencies for increased purification of the final properties of RPET. Economic
considerations for recycling PET include:-
• method of collection of PET containers
• the recycling process
• Separation of commingled feedstock causing contamination of the feedstock
• end product use. (Oromiehie et al. 2004).
Chapter 1 Introduction
4
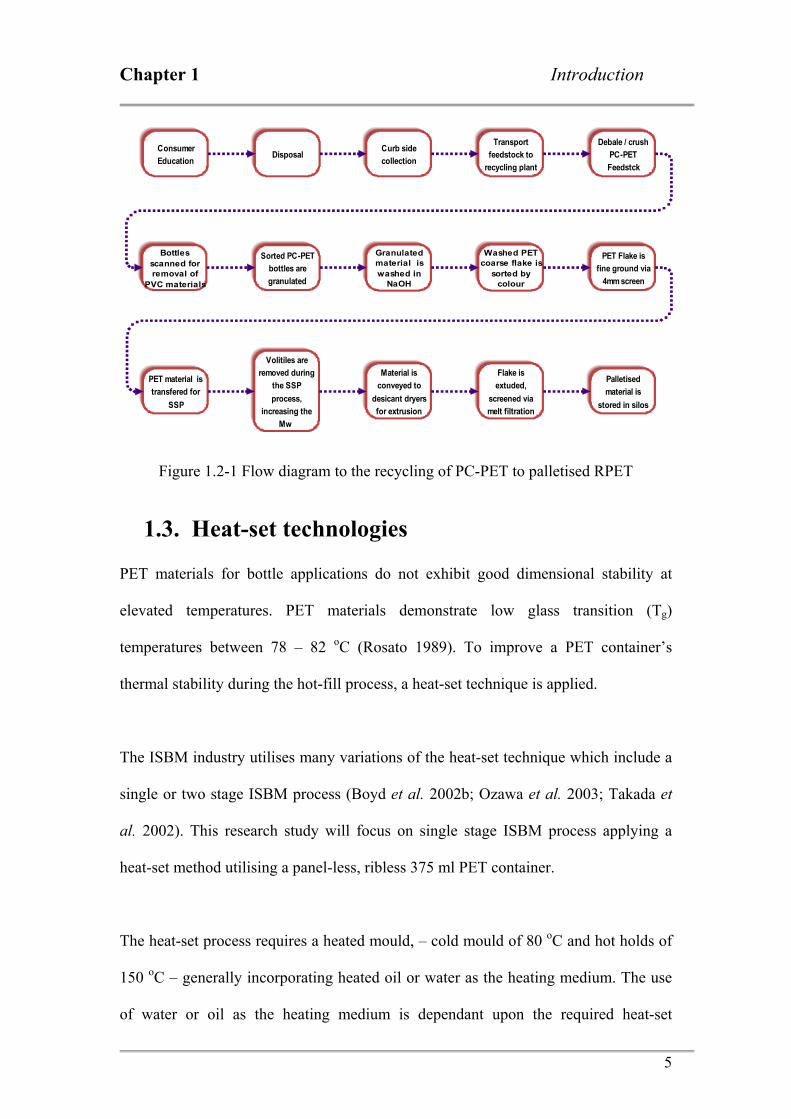
The consumer is critical to the recycling process. Education has been given via local
council in the form of booklets and flow charts. Used containers are placed into
specified recycling bins with other plastic items. The commingled polymer is
accumulated via curb side collection, sorted, baled and sent to PET recyclers. The
composed material is crushed by way of a debaler. In the proceeding stage, the
crushed material is transferred into a trammel and sorted by size. The main feedstock
consists of PET and Polyvinyl Chloride (PVC) bottles. Care must be taken to separate
these two incompatible materials from the waste stream. The bottles are passed via
x-ray scanners, designed to identify PVC bottles from the waste stream (Dvorak et al.
2000).
Wet grinders are used to granulate the beverage containers. This material is washed in
sodium hydroxide, dried and sorted for colour. The material is dried, then ground via
4mm screens. The dried material is later transferred to the solid state polymerisation
process where the material is subjected to vacuum and temperature for 12 hours. This
process increases the materials molecular weight (Mw) and intrinsic viscosity (IV).
The material is later transferred to desiccant dryers where the PET flake is extruded
for further melt filtration and later stored into silos. A flow diagram from consumer
education to RPET material feedstock availability is presented in figure 1.2-1
Chapter 1 Introduction
5
g
Consumer Education
DisposalCurb side collection
Transport feedstock to
recycling plant
Debale / crush PC-PET Feedstck
Bottles scanned for removal of
PVC materials
Sorted PC-PET bottles are granulated
Granulated material is washed in
NaOH
Washed PET coarse flake is
sorted by colour
PET Flake is fine ground via
4mm screen
PET material is transfered for
SSP
Volitiles are removed during
the SSP process,
increasing the Mw
Material is conveyed to
desicant dryers for extrusion
Flake is extuded,
screened via melt filtration
Palletised material is
stored in silos
Figure 1.2-1 Flow diagram to the recycling of PC-PET to palletised RPET
1.3. Heat-set technologies PET materials for bottle applications do not exhibit good dimensional stability at
elevated temperatures. PET materials demonstrate low glass transition (Tg)
temperatures between 78 – 82 oC (Rosato 1989). To improve a PET container’s
thermal stability during the hot-fill process, a heat-set technique is applied.
The ISBM industry utilises many variations of the heat-set technique which include a
single or two stage ISBM process (Boyd et al. 2002b; Ozawa et al. 2003; Takada et
al. 2002). This research study will focus on single stage ISBM process applying a
heat-set method utilising a panel-less, ribless 375 ml PET container.
The heat-set process requires a heated mould, – cold mould of 80 oC and hot holds of
150 oC – generally incorporating heated oil or water as the heating medium. The use
of water or oil as the heating medium is dependant upon the required heat-set
Chapter 1 Introduction
6
temperature. Furthermore the use of water as a heating medium is limited in achieving
mould temperatures above 73 oC. The current research study re-engineered an existing
carbonated soft drink (CSD) blow mould tool. An on–off temperature control console
was used to manage heat-set temperature via electrical heater cartridges. This
technology was chosen as the most cost effective control device due to the lack of
funds to invest in oil heating. Details concerning the blow mould heat-set
modification are discussed in chapter 4.2 and proceeding to section 4.3.1.
1.4. Project aim There is no available information concerning the influence of Virgin - RPET blends
for hot-fill applications incorporating heat-set process. Additionally, no published
works were found for the inclusion of RPET blends for beverage container application
and the influence of hot-fill performance at elevated temperatures.
The research aims to characterise RPET and heat-set intended for heat set markets.
These materials include virgin homopolymer and copolymer PET materials. This
research will assess the performance of RPET blends with high performance
homopolymer and copolymer PET at elevated temperatures for thermal stability and
material integrity. The research will describe quantitatively the optimum processing
parameters for a single stage Injection Stretch Blow Moulding (ISBM) machine using
virgin - RPET blends.
The research aims to investigate RPET, RPET blends, virgin copolymer and
homopolymer PET to improve thermal stability of PET containers at elevated
Chapter 1 Introduction
7
temperatures. The research will compare all materials with respect to their application
in injection stretch blow moulding for the manufacture of containers having enhanced
thermal stability and material integrity suitable for hot-fill processes.
1.5. Research Questions A comprehensive understanding via the influence on thermal stability with virgin -
RPET blends for hot-fill applications was required. Research questions were
developed to increase our knowledge. This included a thorough knowledge
concerning heat-set methodologies and preform surface temperature influence on
thermal stability at elevated temperatures. Questions constructed included:-
1. What are the critical factors that control thermal stability and material integrity
of the PET Homopolymer, PET Copolymer and RPET Copolymer containers?
2. What is the optimum processing condition for a single stage Injection Stretch
Blow Moulding Machine for the manufacturing of containers using PET
Homopolymer, PET Copolymer and RPET blends?
3. How does the RPET Copolymer container’s performance in terms of thermal
stability and material integrity compare to those made out of PET
Homopolymer and PET Copolymer?
4. How does RPET blend material characterisation in terms of percentage
crystallinity, glass transition temperature, and morphology relate to the
container performance in terms of thermal stability and material integrity?
5. What is the influence of RPET and PET Homopolymer and Copolymer Blend
composition on the thermal stability and material integrity of the containers?
Chapter 1 Introduction
8
1.6. Contribution to new knowledge The research will focus on the use of RPET for improving mechanical properties and
thermal stability. The proposed research will be based on existing expertise in the area
of material characterisation and polymer processing. Characterisation and processing
of both virgin PET and RPET and their applications in ISBM have been the topic of
ongoing research as final year projects and postgraduate research in the ‘Materials and
Manufacturing Discipline’.

Chapter 2 Literature Review
9
2. Chapter 2: Literature Review
Chapter 2 Literature Review
10
2.1. Introduction The last thirty years has seen dramatic changes in traditional packaging materials used
for beverage containers. PET has challenged glass, Polyvinyl Chloride (PVC) beverage
applications as well as metal. PET is considered as the preferred packaging material over
these materials. Although weight, safety concerns such as its drop impact properties over
glass and cost reduction have influenced this trend, PET has demonstrated excellent
properties (tensile and impact strength) whilst maintaining glass like optical clarity. PET
yields excellent gas barrier properties (Jones 2002). Other new developments include
bio-based PET materials used for the production of beverage containers (Charbonneau et
al. 2000)
As PET has replaced traditional packaging materials, an improved recycling collection
system has also been established within Australia. This has seen an increase in the
amount of Recycled PET (RPET) material made available for the manufacturing of
beverage containers (Baxter et al. 2003). Although PET has embraced improved
recycling techniques, glass is still preferred due to its ease of cleaning and refilling
capabilities when compared with RPET (Rule 2000). Limitations exist for liquid fluids
requiring increased dimensional stability at hot-fill temperatures above 85 – 90 oC. Due
to this limitation, glass is preferred as the material of choice. However, new bio-based
PET materials are available to compete with glass due to an increase in this materials Tg
temperature (Charbonneau et al. 2000). Furthermore, the inclusion of RPET has
demonstrated potentially improved thermal stability at elevated temperatures,
minimising the dimensional shrinkage undertaken during the hot-fill process (Fann et al.
1996).
Chapter 2 Literature Review
11
The hot-fill process is an established method for filling high acid foods with pH levels
<4.6 providing sufficient shelf life at stable ambient environments (Tekkanat. 2000).
The food contents are enclosed in heat exchangers as temperatures are elevated between
90 – 95 oC for 30 seconds. This technique allows the sterilisation of liquid food whilst
minimising the growth of micro-organisms during product storage. The contents are
then cooled and dispensed into beverage containers between temperature ranges of 85 –
95 oC. Upon dispensing, the beverage container is capped immediately. The container is
required to stand on its base between 1 - 3 minutes. Upon completion of this time, the
container is placed on its side for 1 – 2 minutes and dispensed into cooling baths
thereafter (Maruhashi 2001; Tekkanat 2000).
The hot-fill process acts as a sterilisation mechanism for the inner walls of the container.
Other hot-fill methodologies include pasteurisation and retort process (Boyd 2004).
These additional hot-fill techniques are utilised in killing pathogens and harmful micro-
organisms, suppressing potential bacterial overgrowth in the food product during storage
(Mc Chesney et al. 1983; Ophir et al. 2004; Tekkanat. 2000). However, PET has poor
thermal stability properties at elevated temperatures.
To allow for the hot filling of liquids foods and drink products, a heat-set process is used
to increase dimensional stability to a PET beverage container for the hot-fill process as
well as beverage container preparation for hot-filling. This heat-set process minimises
the overall shrinkage and distortion exposure of a beverage container during the hot-fill
process. It enables temperature increase of the food contents during the hot-fill process,
to assist in the prevention of food spoilage. The heat-set process is applied during
Chapter 2 Literature Review
12
Injection Stretch Blow Moulding (ISBM) bottle production. This method of production
enhances the thermal and mechanical properties to a given container.
Studies have shown an increase in the materials glass transition temperature (Tg) as a
function of the heat-set process (Mc Chesney et al. 1983; Ophir et al. 2004). A decrease
in hot-fill volume shrinkage (S2) – that is improved thermal stability –, improved
Youngs modulus (E), and an increase in the percentage crystallinity as a function of
heat-set time have all been observed in previous studies. (Fann et al. 1996; Jabarin 1995;
Mc Chesney et al. 1983).
Additional research has demonstrated heat-set temperatures of 130 oC, 145 oC and 160
oC for homopolymer PET to increase the materials heat of fusion ( HΔ ). Moreover, top
load strengths were reported to increase due to the heat-set process (Mc Chesney et al.
1983; Ophir et al. 2004). Moreover, an increase in the refractive index with increase
mould temperatures during the heat-set process is observed (Sototo et al. 2000).
However, the glass transition Tg temperature has been shown not to be the determining
factor for improved thermal stability (Boyd 2004; Gohil 1993a; Gohil 1993b; Gohil
1994; Maruhashi 2001; Maruhashi Y et al. 1992; Natu et al. 2005).
Chapter 2 provides a comprehensive description of poly(ethylene terephthalate) (PET)
made for beverage container application. Polyester synthesis and manufacturing
techniques will be reviewed in this chapter. This will include RPET synthesis via
commercial Post Consumable PET (PC-PET) techniques used to recycle PC-PET into
RPET. There is little literature concerning the mechanical, thermal, morphological and
rheological properties with increased levels of RPET – PET blends for hot-fill
Chapter 2 Literature Review
13
applications. This discussion will include the removal of contaminant from PC-PET
waste stream. Methods include glycolysis, methanolysis and hydrolysis and are
discussed in chapter 2.6 and preceeding sections.
The current body of knowledge for rheological and thermal experimental techniques is
presented in chapter 2, section 2.8 and 2.9. This section will include dilute solution
viscometry, melt flow index and rheological characterisation using parallel plate
viscomters. Thermal analysis techniques, of Differential Scanning Calorimeter (DSC)
and Temperature Modulated Differential Scanning Calorimeter (TMDSC) are presented.
This research study will present the current limitations for RPET and virgin PET blends.
It will describe the single Injection Stretch Blow Moulding (ISBM) process and
application. A review of heat-set methodologies is presented in section 2.11. Such
techniques are used for possible filling of high acid foods with pH levels less than 4.6
(Tekkanat. 2000). These techniques allow stress relaxation within the amorphous region
prior to hot-filling. Section 2.15 discusses the current heat-set technology and methods
for improving the degree of crystallinity, mechanical and thermal properties.
2.2. Market Sector Ten percent of the global community consumes 54 percent of the worlds soft drink
market (Elliot B, 2003). PET fibre production totals 70 percent of global consumption
with bottle grade resin totalling 22 percent (SRI Consulting). In 2000, the total global
consumption of PET performs totalled 6.96 million tons.
Chapter 2 Literature Review
14
In 2001, the fastest growth sector in PET beverage containers was observed in still water
and carbonated soft drink (CSD) markets with North America followed by Latin
American leading this trend. During 2000 – 2001, the usage of PET within this
packaging sector rose 14 percent when compared with 1995 data (Biron 2004). Sales for
2002 in (CSD) for US markets sold 10.1 billion 5.78 litre (lt.) cases with Coke Cola and
Pepsi retaining 7.64 Billion (5.78 lt. cases) market share (Sicher J 2003). This data
suggest a healthy supply of PC-PET feedstock available for the manufacture of PET
ISBM beverage containers.
The 560 ml beverage container is the preferred packaging product within this market
sector. However, in the United States of America, the recycling rates for PET have been
declining since 1995 (NAPCOR 2002). The European market in 2004 collected 665,000
tonnes PET bottles. It is projected by year 2014, an increase to 1,612,000 tonnes of PET
bottles available for recycling (Bertelli 2005). This data suggest a healthy supply of PC-
PET feedstock available for the manufacture of PET ISBM beverage containers.
2.3. Bottle Design Developments The rigid packaging sector includes heat-set bottles incorporating vacuum panels; this to
provide integral strength and assist with dimensional stability of the packaging material
during the hot-fill process (Akiho 1989; Collette et al. 1989; Gaydosh. K et al. 2000).
The vacuum panel designs are engineered to control molecular relaxation whilst in
contact with the heated fluid. The current designs panels are aesthetically flawed and do
not provide a smooth surface for labelling purposes. The consumer does not like the feel
of vacuum panels and limitation to the labelling process discourages point of sale. The
Chapter 2 Literature Review
15
current heat-set bottles have increased ratio of mass per unit volume, meaning they
contain additional weight to improve dimensional stability (Caldicott 1999).
Until recently the market has seen developments in PET beverage container not
including side or vacuum panels (Lisch. et al. 2005). This has included a redesign in the
base of the beverage container. The new base design incorporates pinch grips and
vacuum panels. Under vacuum the pinch grips and vacuum panels deform inwardly,
minimising the final shrinkage of the container during hot-fill process. Extensive
preform and bottle redesign is incorporated, enhancing the final properties of the PET
container (Lisch. et al. 2005). This coupled with optimised ISBM have allowed such
improvements.
2.4. Material Developments Post consumer PET (PC-PET) in Australia has seen a steady increase since its
introduction into the Australia market. In 2004 PET consumption totalled 131,708 tons.
Of this total, 17,190 tons was reprocessed into RPET for domestic markets. Another 18,
862 tons was further recycled into RPET for Asian export markets. A total of 27.4
percent return into RPET material is observed (O’Farrell et al. 2005). The above
mentioned figures indicate an increase in domestic market usage from 2003 results. PC-
PET has an established recycling system in Australia, which at present represents the
highest material recycled in Australia. The national average of recycling for all materials
in 2004 calendar year is 12.6 percent. PET has demonstrated a recycling yield of 27.4
percent. Although this figure is less than 2003, it clearly demonstrates the success and
availability in feed stock from PC-PET for beverage containers.
Chapter 2 Literature Review
16
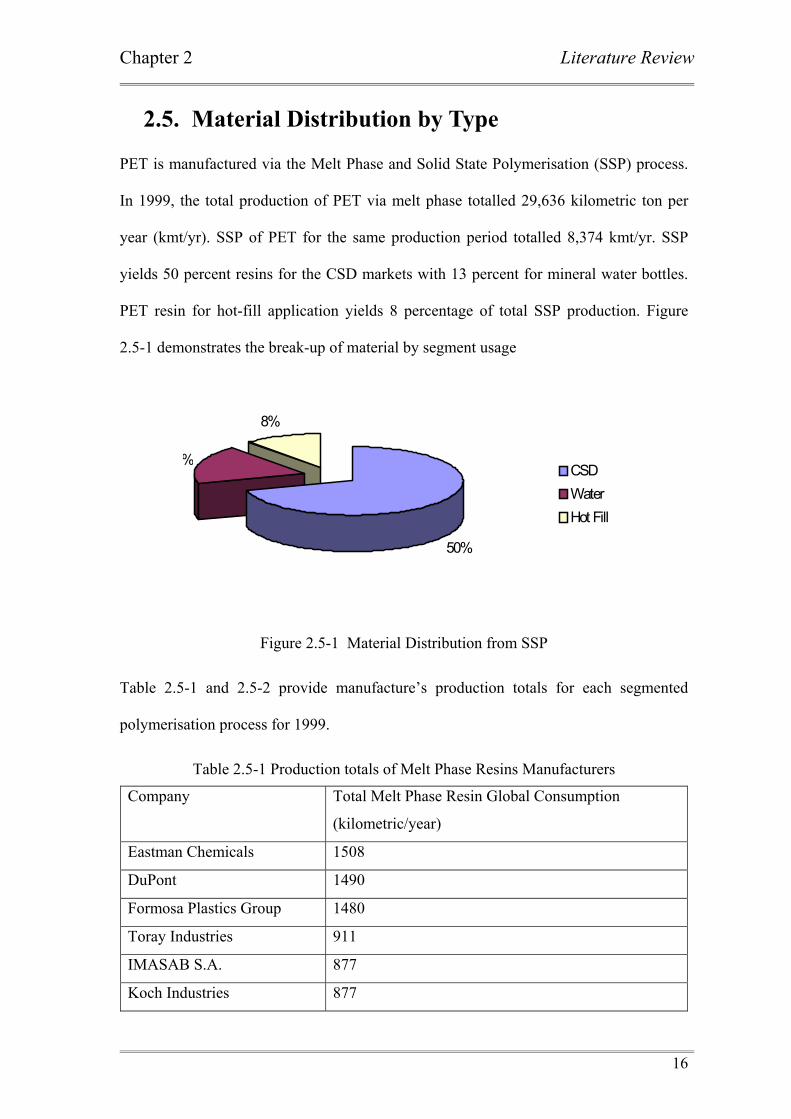
2.5. Material Distribution by Type PET is manufactured via the Melt Phase and Solid State Polymerisation (SSP) process.
In 1999, the total production of PET via melt phase totalled 29,636 kilometric ton per
year (kmt/yr). SSP of PET for the same production period totalled 8,374 kmt/yr. SSP
yields 50 percent resins for the CSD markets with 13 percent for mineral water bottles.
PET resin for hot-fill application yields 8 percentage of total SSP production. Figure
2.5-1 demonstrates the break-up of material by segment usage
50%
%
8%
CSDWaterHot Fill
Figure 2.5-1 Material Distribution from SSP
Table 2.5-1 and 2.5-2 provide manufacture’s production totals for each segmented
polymerisation process for 1999.
Table 2.5-1 Production totals of Melt Phase Resins Manufacturers
Company Total Melt Phase Resin Global Consumption
(kilometric/year)
Eastman Chemicals 1508
DuPont 1490
Formosa Plastics Group 1480
Toray Industries 911
IMASAB S.A. 877
Koch Industries 877
Chapter 2 Literature Review
17
Hualon 836
Wellman 779
Reliance Industries 690
Yizheng Chemical Fibre 670
Far Eastern Textiles 658
Kohap 655
Tuntex Group 650
Shell 621
Texmaco Jaya 592
Others 16,343
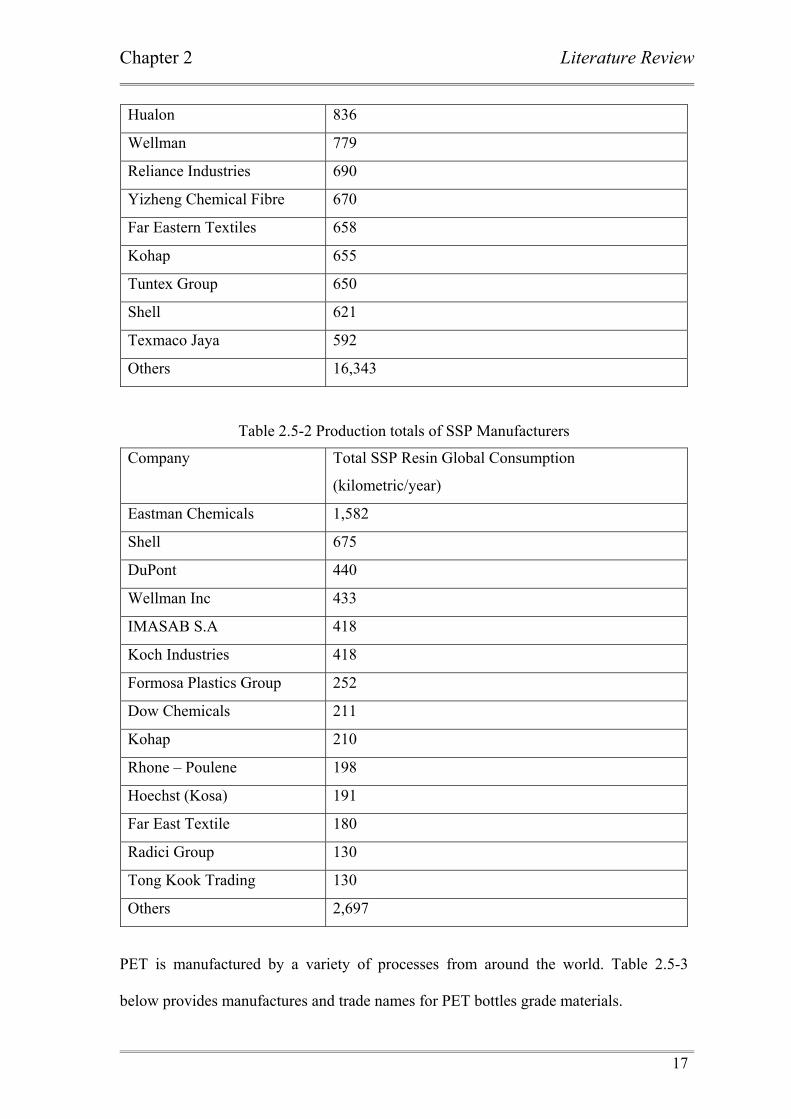
Table 2.5-2 Production totals of SSP Manufacturers
Company Total SSP Resin Global Consumption
(kilometric/year)
Eastman Chemicals 1,582
Shell 675
DuPont 440
Wellman Inc 433
IMASAB S.A 418
Koch Industries 418
Formosa Plastics Group 252
Dow Chemicals 211
Kohap 210
Rhone – Poulene 198
Hoechst (Kosa) 191
Far East Textile 180
Radici Group 130
Tong Kook Trading 130
Others 2,697
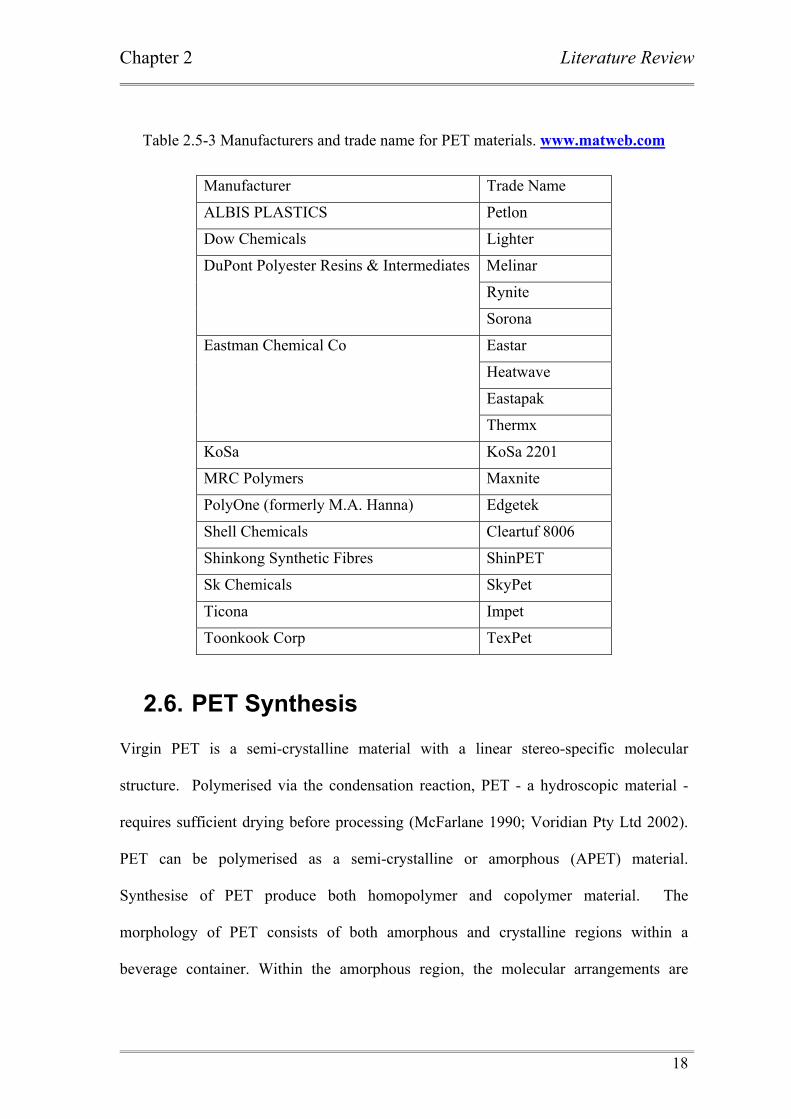
PET is manufactured by a variety of processes from around the world. Table 2.5-3
below provides manufactures and trade names for PET bottles grade materials.
Chapter 2 Literature Review
18
Table 2.5-3 Manufacturers and trade name for PET materials. www.matweb.com
Manufacturer Trade Name
ALBIS PLASTICS Petlon
Dow Chemicals Lighter
Melinar
Rynite
DuPont Polyester Resins & Intermediates
Sorona
Eastar
Heatwave
Eastapak
Eastman Chemical Co
Thermx
KoSa KoSa 2201
MRC Polymers Maxnite
PolyOne (formerly M.A. Hanna) Edgetek
Shell Chemicals Cleartuf 8006
Shinkong Synthetic Fibres ShinPET
Sk Chemicals SkyPet
Ticona Impet
Toonkook Corp TexPet
2.6. PET Synthesis Virgin PET is a semi-crystalline material with a linear stereo-specific molecular
structure. Polymerised via the condensation reaction, PET - a hydroscopic material -
requires sufficient drying before processing (McFarlane 1990; Voridian Pty Ltd 2002).
PET can be polymerised as a semi-crystalline or amorphous (APET) material.
Synthesise of PET produce both homopolymer and copolymer material. The
morphology of PET consists of both amorphous and crystalline regions within a
beverage container. Within the amorphous region, the molecular arrangements are
Chapter 2 Literature Review
19
completely random. This entangled arrangement results in small spherulitic cell
structures providing glass like optical clarity.
Furthermore, the total amounts of residual monomer found in PET materials effects the
materials crystallisation rates. Studies have demonstrated via Small Angel X-ray
Scattering (SAXS) show that spherulitic growth rates are directly proportional to the
molecular weight of the material (Fann et al. 1996).
The type and amount of catalyst used for the manufacture of PET materials also affects
the rate of crystallisation. It has been demonstrated less than 5 percent of cyclohexane
dimethanol (CHDM) impairs the crystallisation rate for PET materials. Diethylene
glycol (DEG) and isophthalic acid (IPA) have also demonstrated similar results (Brooks
2000). Crystallisation can commence once the preform is heated above the Tg of the
material and the preform blown into the blow mould tool. This delay in crystallisation
allows for the manufacture of beverage containers. This ensures controlled spherulitic
structures providing glass like clarity when compared to homopolymer grade PET
containers (Scheirs et al. 2003).
Intrinsic viscosity (IV) of PET varies, determined by its end use application. Textile
fibres, the most commonly used material has an IV range of 0.57 – 0.65 decilitres per
gram (dL/g); bottle grade PET 0.72 – 0.85 dL/g; tray PET 0.85 – 0.95 dL/g and tire cord
PET an IV between 0.95 – 1.05 dL/g. Production of PET bottle grade material yields
molecular weights ( wM ) >24,000 (Duh 2001).
Chapter 2 Literature Review
20
IV properties are affected by the thermal history exposed to PET materials. It is found
that continued processing of PET will see a decrease in IV properties (Fann et al. 1996).
This will also see a reduction in molecular weight (Mw).
Synthesis of PET begins by manufacturing a pre-polymer using the melt phase
polymerisation process. Dibasic acid, in this case terephthalic acid (TPA) or dimethyl
terephthalic acid (DMT) is reacted with ethylene glycol (EG). Manufacturers of PET
materials currently use pure terephthalic acid (PTA) and ethylene glycol (Jones 2002).
Copolymers of poly(ethylene terephthalate) contain 1,4 – cyclohexylene dimethylene
terephthalate (PCT) and 1,4 – cyclohexane dimethanol (CHDM) for the production of
carbonated drink bottles (CSD) (Brooks 2000).
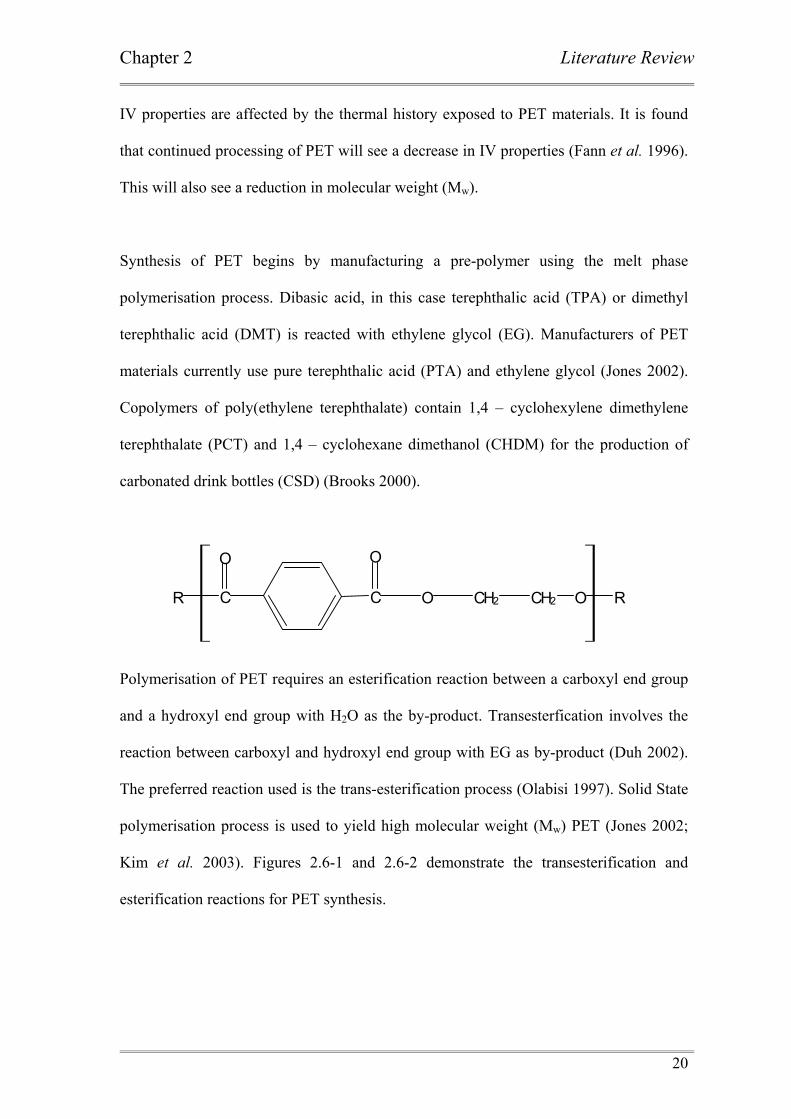
Polymerisation of PET requires an esterification reaction between a carboxyl end group
and a hydroxyl end group with H2O as the by-product. Transesterfication involves the
reaction between carboxyl and hydroxyl end group with EG as by-product (Duh 2002).
The preferred reaction used is the trans-esterification process (Olabisi 1997). Solid State
polymerisation process is used to yield high molecular weight (Mw) PET (Jones 2002;
Kim et al. 2003). Figures 2.6-1 and 2.6-2 demonstrate the transesterification and
esterification reactions for PET synthesis.
C
O
C
O
O CH2R CH2 O R
Chapter 2 Literature Review
21
+
OC
O
CH2 OHCH2
O
COCH2 CH2OH
Transesterification
OC
O
CH2CH2
O
CO
OHCH2 CH2OH+
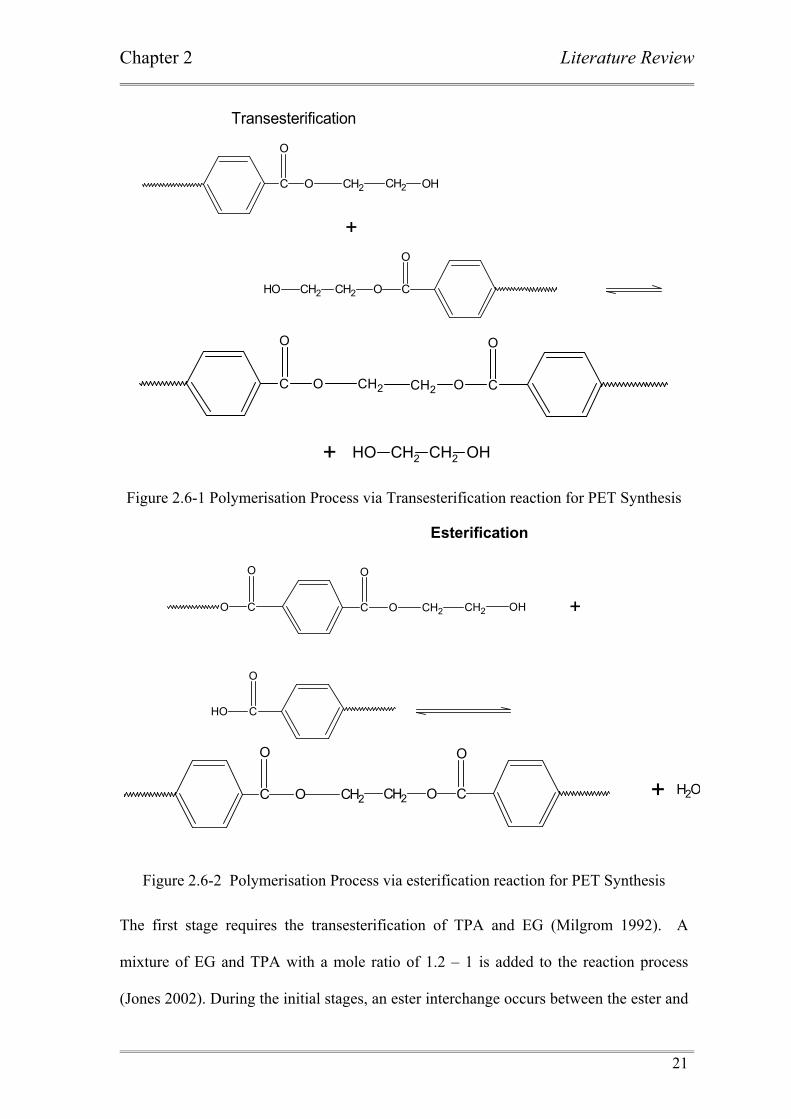
Figure 2.6-1 Polymerisation Process via Transesterification reaction for PET Synthesis
+OC
OO
CO CH2 OHCH2
Esterification
O
COH
C
O
O CH2 CH2
O
CO OH2+
Figure 2.6-2 Polymerisation Process via esterification reaction for PET Synthesis
The first stage requires the transesterification of TPA and EG (Milgrom 1992). A
mixture of EG and TPA with a mole ratio of 1.2 – 1 is added to the reaction process
(Jones 2002). During the initial stages, an ester interchange occurs between the ester and
Chapter 2 Literature Review
22
alcohol until the IV has achieved 0.15 – 0.45 dL/g (Charbonneau et al. 2000). The ester
interchange is a result of heating and stirring the monomers with reactants under dry
nitrogen environment between 100 – 200 kPa (Charbonneau et al. 2000).
Temperatures are raised to 260 - 280 oC within the first reaction vessel. Pressure is
increased and maintained to 300 kPa (Charbonneau et al. 2000). The reaction is
continued; termination occurs once the degree of esterification reaches 98 percent. The
pressure within the reactor is decreased to 100 kPa. EG is recovered during the
esterification process and returned to the reaction vessel. The esterification process
forms bis(2-hydroxythyl) terephthalate (BHET) between 220 - 265 oC under autogenous
pressure (Schiavone 2002a). The direct esterification reaction is usually carried out
without the use of a catalyst.
The pre-polymer is then transferred into another condensation reactor, where the process
is assisted using metal alkoxide compounds. These include titanium (Ti), tin (Sn), and
antimony (Sb). A crystallite size of less than 9 nanometer (nm) with a target IV of 0.30
dL/g to 0.36 dL/g is desired. A target density at room temperature of 1.413 g/cc is
achieved (Schiavone 2002a). Time of reaction occurs between 1 to 4 hours. It is
understood that the lower the reaction temperature, the longer the reaction needed to
complete the process (Jones 2002)
Stabilisers, including phosphorous (P) are used to react with catalysts before the
polycondensation process. This enables the control of high carboxyl end groups (Jones
2002). Carboxiimide or Epoxide can also be used to control the potential of carboxyl
end group degradation (Duh 1980). During the initial melt phase polymerisation
Chapter 2 Literature Review
23
process, by-products including Acetaldehyde (AA) less than 50 ppm) can occur
(Charbonneau et al. 2000). This impurity can limit the end use application of PET (Duh
2001; Rosato 1989).Other by-products include water (H2O), EG, and methanol.
The second stage includes the polycondensation reaction. Catalysts such as antimony
oxide (Sb2O3) at addition levels of 100-600 parts per million (ppm) are used
(Charbonneau et al. 2000). Germanium (Ge) catalysts are also used with addition rates
between 90 to 150 ppm (Jones 2002). Titanium (Ti) at 10 ppm is used within the
initiation phase in high levels to promote reactive sites for polymer growth (Jones 2002).
. Magnesium (Mg), Cobalt (Co) and Zinc (Zn) are commonly used catalysts for PET
production. Temperatures are increase to 285 oC (Charbonneau et al. 2000; Jones 2002;
Schiavone 2002a). Residence time for the reaction is kept to 65 to 70 minutes, where
the reaction vessel is brought to atmospheric pressure (Charbonneau et al. 2000; Jones
2002; Schiavone 2002a).
Solid State polymerisation (SSP) is then used to increase the molecular weight (Mw) of
PET. Within a rotary vacuum tumble dryer with less than 0.1 kPa is applied; the pre-
polymer is subjected to a residence time of 54 hours. Vacuum is applied to the process
to remove residual EG and H2O vapour. This increases the materials molecular weight
(Mw) (Charbonneau et al. 2000; Schiavone 2002b). An IV of 0.81 dL/g and density at
room temperature of 1.4151 g/cc is observed. An apparent crystal size of 8.2 nm is
found by X-ray diffraction (Schiavone 2002b).
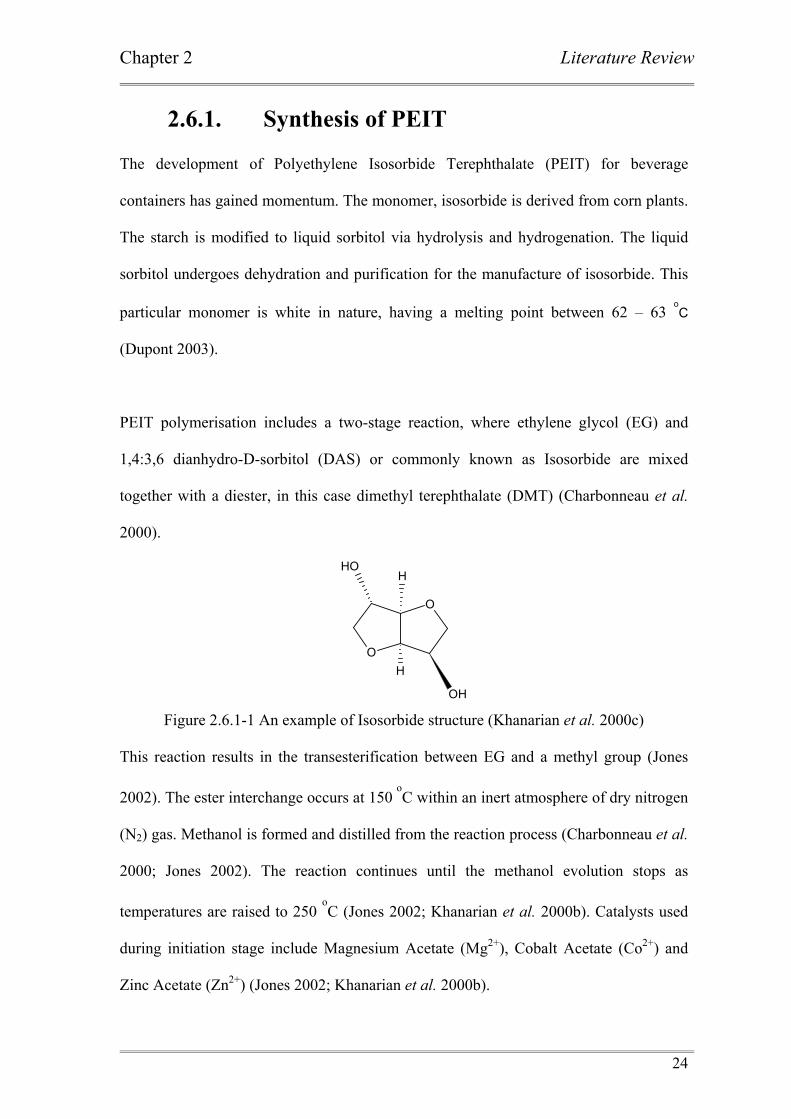
Chapter 2 Literature Review
24
2.6.1. Synthesis of PEIT The development of Polyethylene Isosorbide Terephthalate (PEIT) for beverage
containers has gained momentum. The monomer, isosorbide is derived from corn plants.
The starch is modified to liquid sorbitol via hydrolysis and hydrogenation. The liquid
sorbitol undergoes dehydration and purification for the manufacture of isosorbide. This
particular monomer is white in nature, having a melting point between 62 – 63 oC
(Dupont 2003).
PEIT polymerisation includes a two-stage reaction, where ethylene glycol (EG) and
1,4:3,6 dianhydro-D-sorbitol (DAS) or commonly known as Isosorbide are mixed
together with a diester, in this case dimethyl terephthalate (DMT) (Charbonneau et al.
2000).
H
O
O
OH
H
OH
Figure 2.6.1-1 An example of Isosorbide structure (Khanarian et al. 2000c)
This reaction results in the transesterification between EG and a methyl group (Jones
2002). The ester interchange occurs at 150 oC within an inert atmosphere of dry nitrogen
(N2) gas. Methanol is formed and distilled from the reaction process (Charbonneau et al.
2000; Jones 2002). The reaction continues until the methanol evolution stops as
temperatures are raised to 250 oC (Jones 2002; Khanarian et al. 2000b). Catalysts used
during initiation stage include Magnesium Acetate (Mg2+), Cobalt Acetate (Co2+) and
Zinc Acetate (Zn2+) (Jones 2002; Khanarian et al. 2000b).
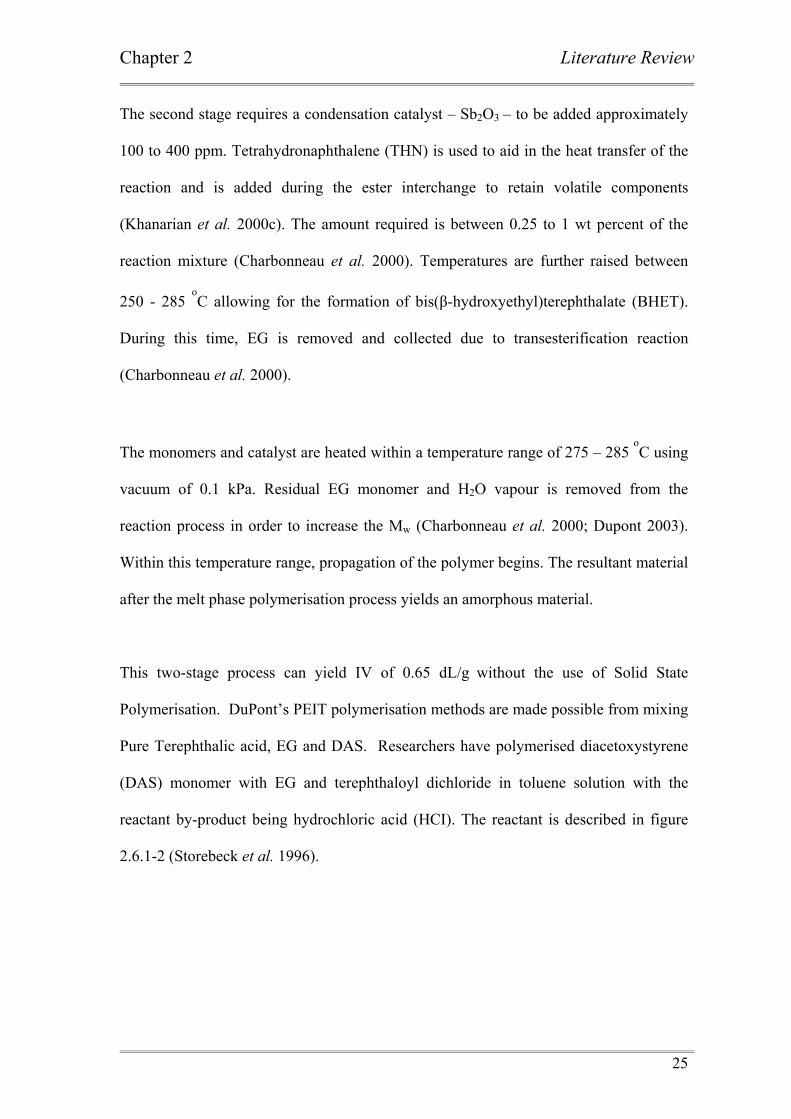
Chapter 2 Literature Review
25
The second stage requires a condensation catalyst – Sb2O3 – to be added approximately
100 to 400 ppm. Tetrahydronaphthalene (THN) is used to aid in the heat transfer of the
reaction and is added during the ester interchange to retain volatile components
(Khanarian et al. 2000c). The amount required is between 0.25 to 1 wt percent of the
reaction mixture (Charbonneau et al. 2000). Temperatures are further raised between
250 - 285 oC allowing for the formation of bis(β-hydroxyethyl)terephthalate (BHET).
During this time, EG is removed and collected due to transesterification reaction
(Charbonneau et al. 2000).
The monomers and catalyst are heated within a temperature range of 275 – 285 oC using
vacuum of 0.1 kPa. Residual EG monomer and H2O vapour is removed from the
reaction process in order to increase the Mw (Charbonneau et al. 2000; Dupont 2003).
Within this temperature range, propagation of the polymer begins. The resultant material
after the melt phase polymerisation process yields an amorphous material.
This two-stage process can yield IV of 0.65 dL/g without the use of Solid State
Polymerisation. DuPont’s PEIT polymerisation methods are made possible from mixing
Pure Terephthalic acid, EG and DAS. Researchers have polymerised diacetoxystyrene
(DAS) monomer with EG and terephthaloyl dichloride in toluene solution with the
reactant by-product being hydrochloric acid (HCI). The reactant is described in figure
2.6.1-2 (Storebeck et al. 1996).
Chapter 2 Literature Review
26
OO
C
OH
C
OH
+ OHCH2
CH2
OH
H
O
O
OH
H
OH
+
PTA EGDAS
Figure 2.6.1-2 Stereochemistry reaction used by DuPont for the manufacture of PEIT (Storebeck et al. 1996)
The third stage is to increase the IV of the polymer suitable for bottle manufacture. The
use of solid-state polymerisation is used above 0.70 dL/g. Composition of EG,
Isosorbide and TPA with a 0.25 to 10-mole percent may increase their molecular weight
(Mw) by solid-state polymerisation. Crystallinity of the PET granule can be achieved by
heating to temperatures between 115 – 140 oC with a residence time between 2 to 12
hours (Charbonneau et al. 2000; Khanarian et al. 1998).
DuPont patent for Isosorbide PET production demonstrate good results with less
isosorbide monomer between 0.25 - 3 mole percentage due to improved crystallinity
kinetics (Charbonneau et al. 2000; Khanarian et al. 2000a). During solid-state
polymerisation, the amorphous polymer is placed within a stream of nitrogen gas
between 195 – 198 oC for 10 hours. The results are IV 0.8 dL/g and greater
(Charbonneau et al. 2000; Khanarian et al. 2000c).
PEIT has been manufactured with the glass Tg well above 100 oC, whilst maintaining
physical and mechanical properties. (Charbonneau LF 2000; Khanarian G 2000). This
material has potential benefits for hot-fill applications
Chapter 2 Literature Review
27
2.6.2. Heat-set Materials High Performance PET polymers – materials developed for heat set applications – have
been designed to meet elevated hot-fill temperature. One such improvement has been
due to the development of infrared absorbers used in material compounds. Carbon black
(CB) is used in small addition rates (ppm) without effecting optical clarity. Temperature
uniformity of the preform prior to inflation in the blow moulding process is observed
using CB, ensuring even wall thickness distribution during stretching in the biaxial
direction. CB has demonstrated to be responsible for an increase in Tg properties.
Current evidence shows CB to be an effective nucleating agent, promoting smaller
spherulitic size structures within the morphology of the polymer (Kegel et al. 2002) .
As mentioned in section 2.6.1 an increase in glass transition temperature (Tg ) was
observed in Polyethylene Isosorbide Terephthalate (PEIT) – a high performance
polymer – polymerised by using terephthaloyl moieties, ethylene glycol moieties and
1,4:3,6 dianhydro – D – sorbitol referred as isosorbide moieties. Existing studies
demonstrate that increasing isosorbide monomer content in PEIT yields an increase in Tg
values to over 100 oC. The Tg temperature for Isosorbide materials is well above current
Tg values for bottle grade PET materials. Polyesters such as PEIT have yielded Tg
temperatures of 200 oC.
Thermal stability of PEIT were analysed by exposing samples to 280 oC for 15 min, and
then cooled to ambient temperature. The results were analysed by Proton Nuclear
Magnetic Resonance (H-NMR and C-NMR) spectroscopy and showed no evidence of
degradation. Research conducted by HNA Holdings, Inc found the inclusion of an
Chapter 2 Literature Review
28
isosorbide monomer provides less molecular chain mobility at elevated temperatures
preventing material degradation (Charbonneau et al. 2000; Storebeck et al. 1996).
Cyclohexane dimethanol (CHDM) is used in favour of Isophthalic Acid (IPA) to
manufacture copolymer PET. An increase in Tg is observed. Investigatory work has
found CHDM is used as a crystallisation inhabitant. The results found an increase of 9
oC in Tg, improving the optical clarity and the processing window for the ISBM process
(Brooks 2000).
A direct correlation exists between the rate of Carbon Dioxide (CO2) permeability and
wall thickness for a PET container as well as Mw (Mc Chesney et al. 1983). Oxygen
(O2) permeabilities affect the shelf life for liquid foods products in PET containers (Mc
Chesney et al. 1983; Natu et al. 2005). This CO2 loss is directly proportional to the total
wall thickness to a PET container and the total volume capacity of the container (Mc
Chesney et al. 1983; Scheirs 1998).
Intrinsic viscosity (IV) values are an important parameter for the ISBM process. This
important property is necessary for the manufacture of PET beverage containers via the
ISBM. PET materials utilised for Injection Stretch Blow Moulding (ISBM)
manufacturing require IV values greater than 0.70 dL/g. PET materials have poor melt
strength. Increases in IV demonstrate increases in Mw. This increases the melt strength
of PET materials, allowing for the production of beverage containers within the (ISBM)
process (Awaja et al. 2004)
Chapter 2 Literature Review
29
2.6.3. Synthesis of PC-PET PET does not create a direct hazard to the eco system. PC-PET is seen as a noxious
material due to its high resistance to atmospheric and biological agents (Scheirs 1998).
Recycling of PET bottles requires the combination of sorting and separation techniques.
Sensory devices (X-ray) are used to remove PVC bottles and HDPE bottles from the
PET waste stream. Recyclers of PET now receive sorted PET bails.
Manual sorting system does not supply 100 percentage contamination free PET bottles:
the presence of PVC bottles remain. Further separation is required to minimise the
possible contaminates. RPET contaminated with 1 ppm of PVC or more can discolour
PET. PVC of 2000 ppm in PET can severely reduce the viscosity of PET when
compared to virgin PET. This in turn results in a reduction of Mw and IV, hence
decreasing the melt strength of the polymer (Scheirs 1998).
A novel technique known as Froth Flotation may provide an economic and improved
method of separation of PC-PET household plastics (Teichmann D et al. 2002). This
method utilises material density properties within a fluid (water and salt solution)
rotating at high speed within a centrifugal bowl. As materials have varying densities
within a suspended fluid, separation of recyclates form due to a changed density within
the fluid medium.
One known sorting recycled system for PET separation utilises an automated device
called the MSS Bottlesort® system (Dvorak et al. 2000). This x-ray sensory device
identifies the chlorine atom present in PVC bottles. This allows for ease of detection, as
PVC bottles are 59 percentage chlorine by weight (Dvorak et al. 2000). Due to
Chapter 2 Literature Review
30
contamination, the recycling process of PC-PET looses 15 – 20 percentage due to the
presence of labels, caps, Polyvinyl Chloride (PVC) bottles, Ethylene Vinyl Acetate
(EVA) wading found inside the Low Density Polyethylene (LDPE) caps, glues, and
other incompatible materials. This incompatibility of materials further adds to the
complexities of recycling PET for food grade applications (Scheirs 1998).
A two-litre PET bottle can weigh 60 grams, a cap weighs 1 gram (g), a label and glue
weights 5g (Milgrom 1992; Scheirs 1998). These contaminants allow for the formation
of acidic compounds, catalysing via hydrolysis the PET ester linkage. Contaminations of
flake PVC bottles at elevated temperatures (below 205 oC) release Hydrochloric Acid
(HCI) (Milgrom 1992). One method in preventing PVC degradation requires blending
PET with acrylic copolymers. This allows epoxy groups to bond on the PET side chains.
This method neutralises the hydrochloric acid (HCl) group via the epoxy group
preventing degradation, reacting with the PET carboxylic group (Milgrom 1992).
2.6.4. Melt Recovery of PET A variety of Technologies can be applied to the recovery of PET. One method is via
melt polymerisation, a second is purification and depolymerisation, and a third to
convert into energy (Mathews 2002; Nichols et al. 1999; Scheirs 1998). One
disadvantage in the melt polymerisation technique is an increase in the Acetaldehyde
(AA) content to 50 parts per million (ppm) (Bashir et al. 2000).
The process begins by washing PET bottles to remove surface contamination at a micro
level. This two stage process allows the removal of dirt, stones, paper, glue, labels, and
Chapter 2 Literature Review
31
waded seals within a basic sodium hydroxide (NaOH) solution and detergents within a
temperature range of 20 – 75 oC (Nichols et al 1999). The Wellman process includes
washing flake PET, drying under temperatures between 130 - 200 oC whilst preventing
hydrolytic degradation. Higher temperatures can be used by performing the process in
an inert Nitrogen (N2) atmosphere. Dried PET is extruded into a two stage vented
extruder to remove impurities from the melt stream. A reduction of IV is found between
0.6 – 0.7 dL/g. The melt is blended 75 percentage virgin PET with IV approximately
0.58 – 0.64 dL/g and 25 percentage RPET via static mixers. The molten material is
extruded and pelletised. The material is then solid stated to further remove volatiles and
other impurities, whilst increasing the Mw and IV of the material (Nichols et al. 1999;
Scheirs 1998).
Another disadvantage of melt processing is the reduction of IV via thermal and
hydrolytic degradation. It is well know that PET requires drying before processing due
to its polycondensate nature, - its ability to absorb and release moisture - . Final moisture
content is 0.005 percent or less is required. An IV of 1.05 dL/g after one extrusion pass
will demonstrate a loss of 0.07 dL/g units. A starting IV of 0.5 dL/g will demonstrate a
loss of 0.03 dL/g units (Kegel et al. 2002).
Cyclic and linear oligomers can result during melt processing, effecting the printability
and dyeability of PET. Discolouration of PET as well as black spec (contamination) can
also result in small quantities (ppb). Studies have shown small amounts of CB can yield
increases in Tg, Temperature melting point (Tm), improved modulus properties (E),
tensile, and impact strength (Kegel et al. 2002).
Chapter 2 Literature Review
32
Raw material suppliers are utilising CB to improve the reheat process for preforms
required to manufacture CSD bottles (Eastman Chemicals ). To insure correct stretch
ratio during the ISBM process, a uniform temperature profile is desirable within the
preform. This allows the manufacturer of CSD bottles to achieve greater temperature
uniformity within the preform (Jones 2002; Scheirs 1998).
Purification of PC-PET includes a variety of technologies to meet stringent FDA
approval standards. One such method is solid state polymerisation (SSP). Flake material,
once inspected and separated from the waste stream is placed into a SSP reactor. The
flake is subjected to 0.6 – 0.7 mbar vacuum for 10 hours. Temperatures are elevated to
200 -206 oC with a residence time of 4 hours. Temperatures are reduced to 198 oC for 6
hours. The final hours include cooling time. The resultant PET flake achieves an IV of
0.83 - 0.86 dL/g. At the conclusion of this process, the PET flake with increased IV is
then extruded where the IV is reduced to 0.76 dL/g.
RPET needs to demonstrate excellent colour stability. Recycling PC-PET produces a
yellow granule. This is due to the intermolecular crosslinking and oxidations reactions.
Another disadvantage is the small presence (ppb) of carbon black (CB) within the RPET
granule. This can lead to contamination issues; particularly within the fibre industry as
line breakage could occur resulting in costly downtimes.
2.6.5. Glycolysis Recovery of PC-PET is undertaken via glycolysis. The depolymerisation of PET flake is
performed under pressure in an inert atmosphere (N2), to prevent degradation. The PET
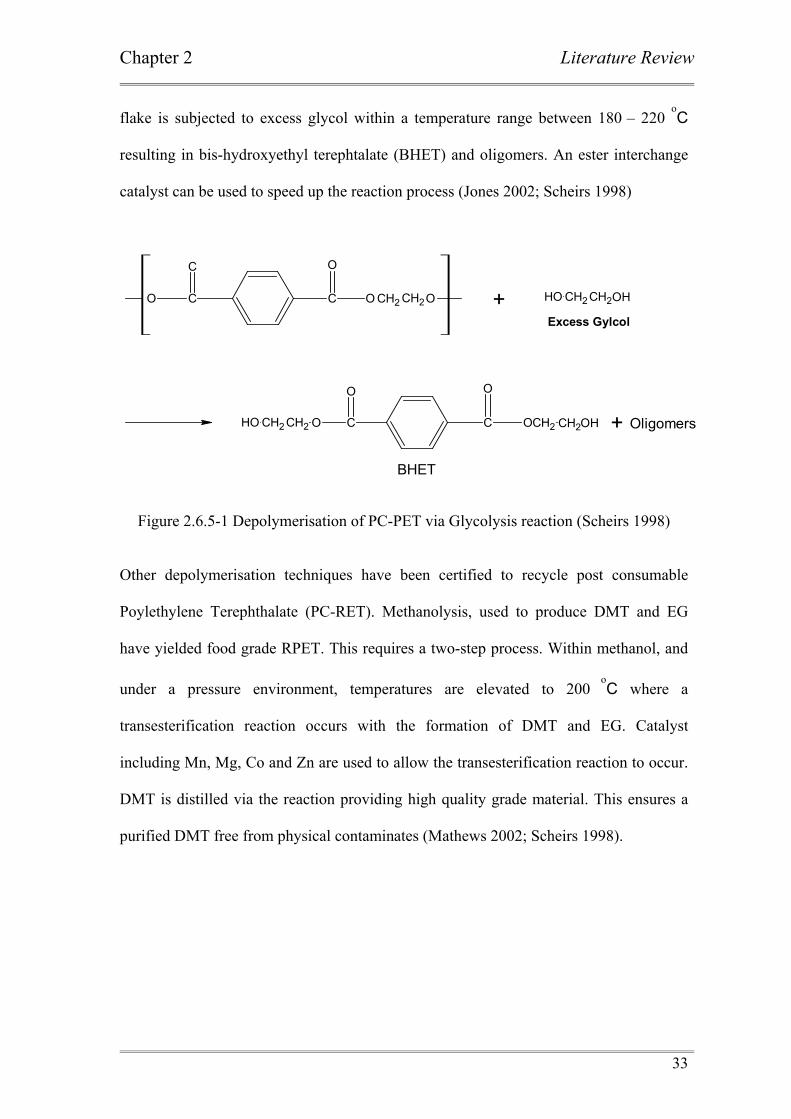
Chapter 2 Literature Review
33
flake is subjected to excess glycol within a temperature range between 180 – 220 oC
resulting in bis-hydroxyethyl terephtalate (BHET) and oligomers. An ester interchange
catalyst can be used to speed up the reaction process (Jones 2002; Scheirs 1998)
O
O
C CH2 CH2OC
C
O CH2 CH2OHOH+
CH2 CH2OH O
O
CC
O
O CH2 CH2OH + Oligomers
Excess Gylcol
BHET
Figure 2.6.5-1 Depolymerisation of PC-PET via Glycolysis reaction (Scheirs 1998)
Other depolymerisation techniques have been certified to recycle post consumable
Poylethylene Terephthalate (PC-RET). Methanolysis, used to produce DMT and EG
have yielded food grade RPET. This requires a two-step process. Within methanol, and
under a pressure environment, temperatures are elevated to 200 oC where a
transesterification reaction occurs with the formation of DMT and EG. Catalyst
including Mn, Mg, Co and Zn are used to allow the transesterification reaction to occur.
DMT is distilled via the reaction providing high quality grade material. This ensures a
purified DMT free from physical contaminates (Mathews 2002; Scheirs 1998).
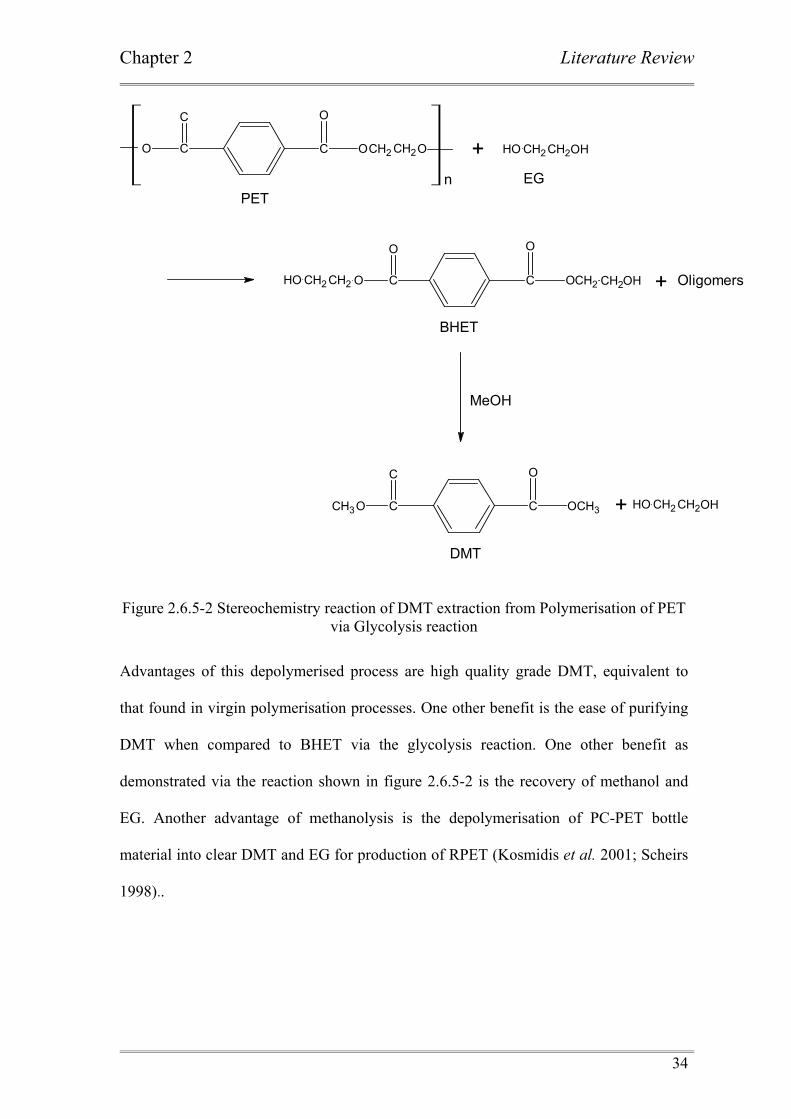
Chapter 2 Literature Review
34
O
O
C CH2 CH2OC
C
O CH2 CH2OHOH+
CH2 CH2OH O
O
CC
O
O CH2 CH2OH + Oligomers
BHET
n
MeOH
O
O
C CH3C
C
OCH3 + CH2 CH2OHOH
DMT
PETEG
Figure 2.6.5-2 Stereochemistry reaction of DMT extraction from Polymerisation of PET
via Glycolysis reaction
Advantages of this depolymerised process are high quality grade DMT, equivalent to
that found in virgin polymerisation processes. One other benefit is the ease of purifying
DMT when compared to BHET via the glycolysis reaction. One other benefit as
demonstrated via the reaction shown in figure 2.6.5-2 is the recovery of methanol and
EG. Another advantage of methanolysis is the depolymerisation of PC-PET bottle
material into clear DMT and EG for production of RPET (Kosmidis et al. 2001; Scheirs
1998)..
Chapter 2 Literature Review
35
2.7. Mechanical Testing
2.7.1. Izod Impact Test. This research study will focus on izod impact test for Voridian CA12, SkyPET BB7755
and Visy RPET injection moulded samples. Impact test is a commonly used method in
which a pendulum is released to collide with a specimen of known dimensions. There
are two methods used in the field to determine the brittleness or ductility of a given
material. Both methods employ a pendulum with stored energy to collide into a
specimen and record the energy absorbed to break each sample.
Many factors influence the results gathered for impact testing. These include service
temperatures during test conditions, type of notch used, processing temperatures to
manufacture test samples and process used to manufacture each test specimen.
Furthermore, the conditioning method used and notch depth and radius types have
detrimental effects on the final result.
Therefore, limitations to each test method exist. A poor correlation is observed between
test data results and product performance. Furthermore, variations in test results from
different testing agencies can occur. The impact resistance of a PET material properties
provides valuable information on a materials ability to withstand accidental knocks
within a field of application (Crawford 1998). In practice, the energy observed to break a
test specimen for izod and charpy impact test provide initial strength of polymer
materials.
Chapter 2 Literature Review
36
In practice, the impact behaviour of PET materials is influenced by the applied stress.
This triaxial displacement promotes brittleness within the material (Brostow et al. 1986;
Crawford 1998). Studies have shown notch type specimen depth and temperature affect
the impact energy observed to break each specimen (Crawford 1998).
Izod impact tests are useful for quality control and specification purposes, however not
for the prediction of end product performance of polymer applications (Crawford 1998).
Impact strength of polymers when following test method ISO 180 are defined as the
energy to break per unit area (J/m2) or energy to break per unit width (J/m) as set out by
ASTM D 256.
2.7.2. Tensile Testing Tensile testing analysis is important to understand a give PET materials strength and
stiffness characteristics when compared to RPET materials. Knowledge concerning the
materials viscoelastic properties provides the engineer an understanding to the materials
behaviour under stress, and its response to strain as a function of temperature and time
during testing (Crawford 1998). A materials relative stiffness can also be understood
utilising tensile testing measurements.
This is an important mechanical property, providing an understanding to the elastic
limits to each material. Previous work has demonstrated an increase in tensile properties,
as well as elongational properties with RPET blend (Fann et al. 1996). However, very
little published work is available concerning the tensile properties for PET – RPET
blends by way of heat-set beverage container applications. Chapter 7.1 presents results
Chapter 2 Literature Review
37
for tensile testing; Young modulus (E) and tensile properties to the panel side wall via
optimised SkyPET BB7755 – RPET blends are discussed in chapter 7.7.5.
2.8. Rheological Characteristics Rheological characterisation of all materials will be determined by applied shear rate
(γ& ) and constant temperature to obtain rheological data and predict its performance.
Two methods have been developed for analytical purposes. The first method includes a
cone and plate viscometer, sometimes referred to as rheological spectrometer (RMS)
(Chung 2000a).
The second requires a parallel plate viscometer. For this study, a parallel plate
viscometer is used to characterise Voridian CA12, SkyPET BB7755 and Visy RPET test
samples.
Rheological measurements are widely used in the field of material flow characterisation.
Steady Flow viscosity and Dynamic Viscosity is used to characterise a materials
viscosity (η ), shear storage modulus (G′ ) and shear loss modulus (G ′′ ). Rheological
measurements have also been used to determine a material’s Mw and MWD.
Furthermore, a materials viscosity - shear rate dependence can often be expressed in a
power law form as shown in equation 2.8-1.

Chapter 2 Literature Review
38
( ) ( )1−•= noγηγη &&
Equation 2.8-1
Where
oη = Viscosity at zero shear
n = power law exponent
γ& = shear rate
2.8.1. Parallel Plate Rheometer Parallel plate viscometers observe the measured shear stress (σ ) applying a controlled
shear rate (γ& ) within measured time. The measured (σ ) within parallel plate rheometers
is located at the outer radius of the parallel disk (γ& a). This expressed in equation 2.8.1-1.
This type of viscometer was initially developed to observe rheological properties of
rubber (Baird et al. 1998; Mooney 1947).
HRa ωγ =
Equation 2.8.1-1
Where
ω = Angular velocity (rad / sec)
R = Radius of outer disk (m)
H = Gap between plates (m)
Chapter 2 Literature Review
39
These types of viscometers generally apply low shear rates to the test samples. Cone and
plate viscometers apply lower shear rates (γ& ) when compared with parallel plates. This
is to prevent the sample from fracture and losing contact between the plate faces during
execution of experiments (Baird et al. 1998; Mooney 1947). Due to low shear rated (γ& )
applied and limitation expressed, parallel plate rheometer was used to characterise PET
samples.
2.9. Dilute Solution Viscosity Viscometric characterisation of polymer solutions is useful to the experimentalist. The
molecular number ( nΜ ), viscosity ( vΜ ), and weight ( wΜ ) average molecular weight
and molecular weight distribution (MWD) determines end use application for PET
materials (Cha 1964; Painter et al. 1994). The viscosity of a fluid is the measure of a
materials resistance to flow. This relationship reflects the frictional forces between
molecules (Chuah H. et al. 2001). As the dissolved polymer is present in solvent
solutions, polymer molecules slide past the solvent solution molecules. This results in an
increase in the solvent solution viscosity. The resulting viscosity measurements provide
a measure between the single point viscosity (η ) of a polymer solution and its number
( nΜ ) and weight ( wΜ ) average molecular weight.
The viscometric characterisation technique Intrinsic Viscosity (IV) provides quantitative
measurements of a materials degree of branching, polymer dimensions, and chain
flexibility. nΜ and wΜ of a PET material can be determined by the Mark –Houwink –
Sakurada (M-H-S) equation (Chuah et al. 2001).
Chapter 2 Literature Review
40
The number average molecular weight ( nΜ ) for all samples where first calculated using
the M-H-S equation αη nkΜ=][ . Constant k and α are not universal constants. These
constants vary with polymer type, temperature and solvent used (Cha 1964; Painter et al.
1994). However, this equation is not an absolute method for the determination of
molecular weight. The values represented are apparent molecular weight measurements
due to the theoretical interpretations for k and α are incomplete (Cha 1964;
Hergenrother et al. 1974)
In standard IV measurements, solution viscosity is measured at three different
concentrations and in triplicates (Chuah et al. 2001). Final results are plotted on a
Huggins or Kraemer logarithmic plot and extrapolated to zero concentration (Chuah et
al. 2001). This method is time consuming and is extremely expensive. A method has
been devised to calculate the apparent single point IV. Measuring the specific viscosity
( spη ) and relative viscosity ( relη ) at one specific concentration can approximate single
point IV (Grulke et al. 1999; Hergenrother et al. 1974).
Mark Houwink constants have been well tabulated for numerous PET materials and
solvents (Barth et al. 1991; Torres N et al. 2000). There are numerous constants k and
α published for 60:40 Chlorophenol / Tetrachloroethane solvents at 25 oC (Cha 1964;
Painter et al. 1994) . However very little is published for k and α for solvent mixture
60:40 Chlorophenol / Tetrachloroethane at 30 oC
The M-H-S k constant of gdL /1021 4−× and α 0.58 constants are reported for
polymer dissolved in 60/40 w/w phenol / tetrachloroethane at 30 °C by titration (Cha
Chapter 2 Literature Review
41
1964; Hergenrother et al. 1974). This equation is used to determine the Mn average for
all PET samples used in this work. Equation 2.8-1 is used to determine the Mn average
via measured IV data
58.041021 nM××= −η
Equation 2.9-1
Care needs to be exercised when wΜ less than or equal to 20,000 g / mol. Although low
η measurements are recorded, the M-H-S equations relation is not valid at low wΜ .
Researchers concluded this phenomenon is due to the molecules becoming wormlike in
behaviour at low molecular weight. The result is the non-Gaussian behaviour of short
chain molecules (Moore 1960).
The weight average molecular weights ( wΜ ) for PET can be approximated from single
point IV According to Equation 2.8.2:-.
68.041068.4 wM××= −η
Equation 2.9-2
This equation was used to determine the molecular weight average ( wΜ ) of all PET
samples. The equation was developed using Gel Permeation Chromatography (GPC)
with solvent mixture of 60:40 phenol / tetrachloroethane at 25 oC (Moore 1960).
Chapter 2 Literature Review
42
2.9.1. Melt Flow Index Test The melt flow index (MFI) test is the most common test used to characterise materials.
However, MFI measures single point viscosity results at a very low shear rate (Rosato et
al. 1989). Decisions to use MFI equipment are due to its low capital outlays and it’s
simplicity of use.
MFI is used to characterise the processability of a polymer. The test method has extreme
simplicity and is well understood within the industry. MFI is a constant shear stress
capillary rheometer (Whelan et al. 1988) . The test method requires a know weight
(force) applied for a period, producing an accurate weight of molten polymer. As
polymer melts are viscoelastic in behaviour, time is given during the test for the polymer
to reach a steady – state flow. The molten polymer is extruded through a predefined
orifice at a specific temperature for a period of time. The results are reported as weight
of extrudate (g) per ten minutes.
However, limitations exist due to the short capillary length used. Generally, the length to
diameter (L/D) ratio is 3.818 with a flat entry angle (90o). Such geometric characteristics
emphasize the elasticity of a material melt. The elastic response during testing affects
the materials MFI results. At high shear rates (γ& ), shear stress (σ ) are exceeded,
resulting in melt fracture. Materials with the same MFI results can vary in viscosity and
elasticities (Chung 2000c)
As mentioned previously, MFI is a low shear rate test. Loads of 2.16 kg result in force of
21.2 N. Shear rates can vary depending on load and temperatures used during
Chapter 2 Literature Review
43
experiments, as well as the materials themselves because they are generally shear
thinning. A 21 kg load can yield shear rates of approximately 300 s-1
, depending on the
viscosity of the melt.
Polymers can demonstrate the same MFI value – single point viscosity – for a single
point measurement. Plotting viscosity curves at varying forces demonstrate varying
viscosities and elastic properties at increase shear rate (γ& ) levels used to characterise
each material (Chung 2000a). The shear sensitivity to a given polymer can be
determined using MFI measured with varying weights. Varied temperatures can be
applied to a material to determine materials temperature sensitivity without changing the
applied force (Chung 2000a).
A materials viscoelastic response, in this case die swell ratio can be obtained via MFI
equipment. Die swell ratio is determined by equation 2.9.2-1
2
⎟⎟⎠
⎞⎜⎜⎝
⎛=
C
e
DDSR
Equation 2.9.1-1
DC
= capillary diameter
De = extrudate diameter
Two procedures are used to date for MFI. ASTM D 1238 method A utilises a manual cut
off procedure, used for materials with flow rates between 0.15 to 50 g / 10 min. (Whelan
et al. 1988). Materials are equilibrated within the MFI equipment for 3 minutes duration.
This allows proper heat-soak time for each material. Materials are recorded once the first
Chapter 2 Literature Review
44
reference mark is level to the top of the barrel instrument. During this time, material is
frequently cut from the MFI machine until the top reference mark is inline with the top
of the barrel instrument. To calculate flow rate, expressed as g / 10 minutes, Equation
2.9.2-2 is used
tM
MFI p 600×=
Equation 2.9.1-2
t = cut off interval in seconds
Mp = mass of extruded polymer (grams)
Method B incorporates an automated process to measure the flow rate for polymer
materials with flow rates of 0.50 – 1200 grams / 10 minutes (Whelan et al. 1988).
2.10. Thermal Analysis Thermal Analysis is an established technique for measuring thermal events arising from
physical and chemical changes during experimentation. Its primary function is to
measure energy difference from a reference sample and the test sample as a function of
temperature and time within a controlled temperature environment (Blaine 2004;
Danley. 2003; Ramachandran 2002).
2.10.1. Crystallinity measured via Differential Scanning Calorimetry
Many techniques are used to investigate the thermal behaviour of polymer materials.
One such technique used is Differential Scanning Calorimetry (DSC). This technique
measures the heat flow to a particular sample, as temperature is varied whilst applying a
Chapter 2 Literature Review
45
controlled temperature program (Fann et al. 1996). DSC enables the measurement of
enthalpy changes within the first order transition (ASTM D3417).
Differential Scanning Calorimetry (DSC) – as well as other techniques – is used in
measuring the crystallinity ( χ ) of polymers. However, very little is understood
concerning the crystallisation kinetics of RPET for PET bottle applications. Studies have
found RPET materials exhibit increased levels of Tg temperature, tensile and impact
strength. Demonstrated improvements to RPET blends elongation properties are shown
when compared to virgin PET injection moulding samples (Fann et al. 1996; Schawe
1995). Furthermore, current research has shown RPET materials demonstrate a
reduction in elongation at break during tensile testing. This is attributed to variations in
crystallinity and level of contaminants found in RPET materials when compared with
virgin PET (Torres et al. 2000).
2.10.2. Temperature Modulated Differential Scanning Calorimetry
TMDSC provides unique information, which is not possible with DSC. The measure of
heat flow (Φ ) is common for both DSC and TMDSC methods. However, TMDSC
measure heat capacity and well as heat flow (Cser et al. 1997). The conventional DSC
method applies an isothermal or linear heating or cooling ramp to the test sample (Cser
et al. 1997; Schawe 1995). TMSDC is further improved by applying a sinusoidal
temperature oscillation curve to the sample (Thomas 2004). This sinusoidal modulation
(Ta) is overlaid to the linear heating ramp or cooling change with an applied angular
frequency ( oω ). The heat flow rate of the sample can be calculated by adding the
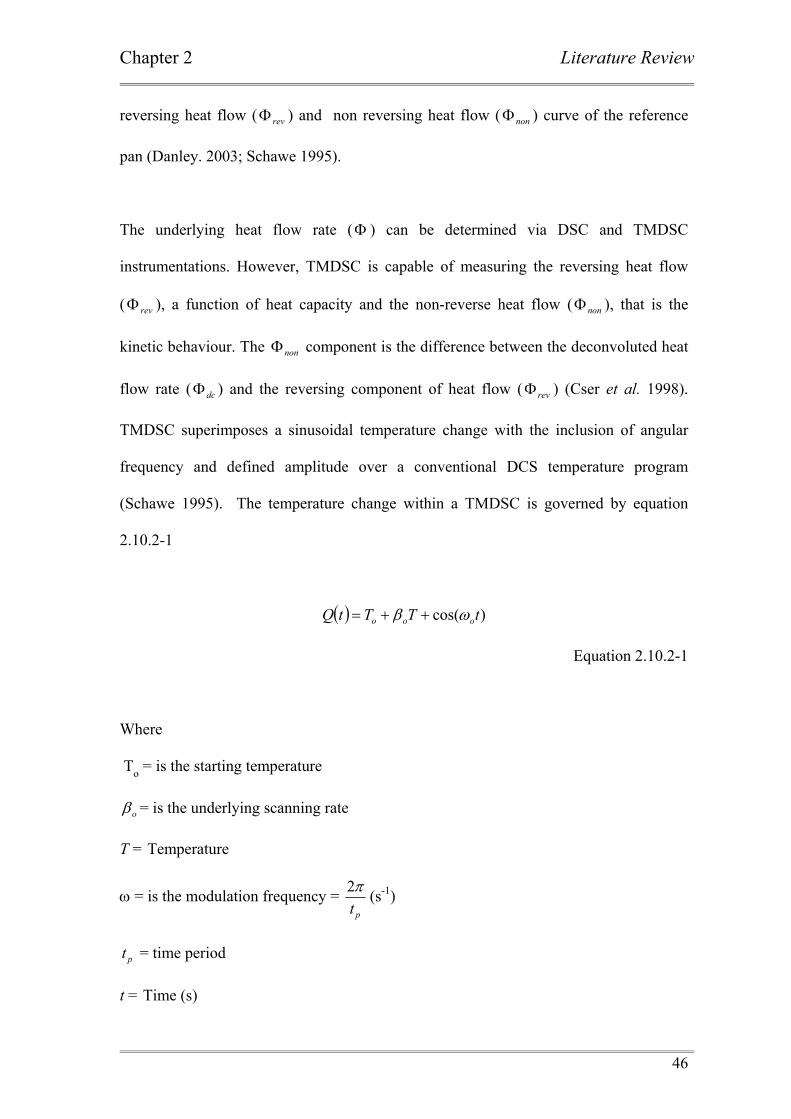
Chapter 2 Literature Review
46
reversing heat flow ( revΦ ) and non reversing heat flow ( nonΦ ) curve of the reference
pan (Danley. 2003; Schawe 1995).
The underlying heat flow rate (Φ ) can be determined via DSC and TMDSC
instrumentations. However, TMDSC is capable of measuring the reversing heat flow
( revΦ ), a function of heat capacity and the non-reverse heat flow ( nonΦ ), that is the
kinetic behaviour. The nonΦ component is the difference between the deconvoluted heat
flow rate ( dcΦ ) and the reversing component of heat flow ( revΦ ) (Cser et al. 1998).
TMDSC superimposes a sinusoidal temperature change with the inclusion of angular
frequency and defined amplitude over a conventional DCS temperature program
(Schawe 1995). The temperature change within a TMDSC is governed by equation
2.10.2-1
( ) )cos( tTTtQ ooo ωβ ++=
Equation 2.10.2-1
Where
To = is the starting temperature
oβ = is the underlying scanning rate
T = Temperature
ω = is the modulation frequency = ptπ2 (s-1)
pt = time period
t = Time (s)
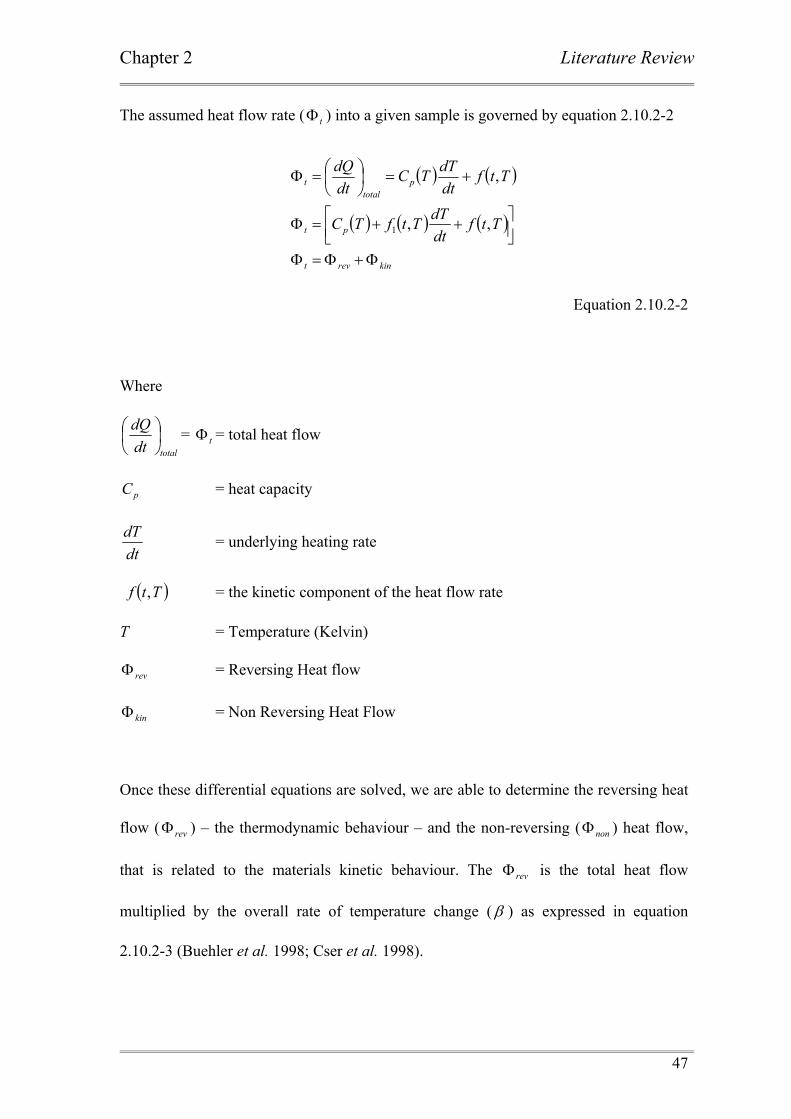
Chapter 2 Literature Review
47
The assumed heat flow rate ( tΦ ) into a given sample is governed by equation 2.10.2-2
( ) ( )
( ) ( ) ( )
kinrevt
pt
ptotal
t
TtfdtdTTtfTC
TtfdtdTTC
dtdQ
Φ+Φ=Φ
⎥⎦⎤
⎢⎣⎡ ++=Φ
+=⎟⎠⎞
⎜⎝⎛=Φ
,,
,
1
Equation 2.10.2-2
Where
totaldtdQ
⎟⎠⎞
⎜⎝⎛ = tΦ = total heat flow
pC = heat capacity
dtdT = underlying heating rate
( )Ttf , = the kinetic component of the heat flow rate
T = Temperature (Kelvin)
revΦ = Reversing Heat flow
kinΦ = Non Reversing Heat Flow
Once these differential equations are solved, we are able to determine the reversing heat
flow ( revΦ ) – the thermodynamic behaviour – and the non-reversing ( nonΦ ) heat flow,
that is related to the materials kinetic behaviour. The revΦ is the total heat flow
multiplied by the overall rate of temperature change (β ) as expressed in equation
2.10.2-3 (Buehler et al. 1998; Cser et al. 1998).
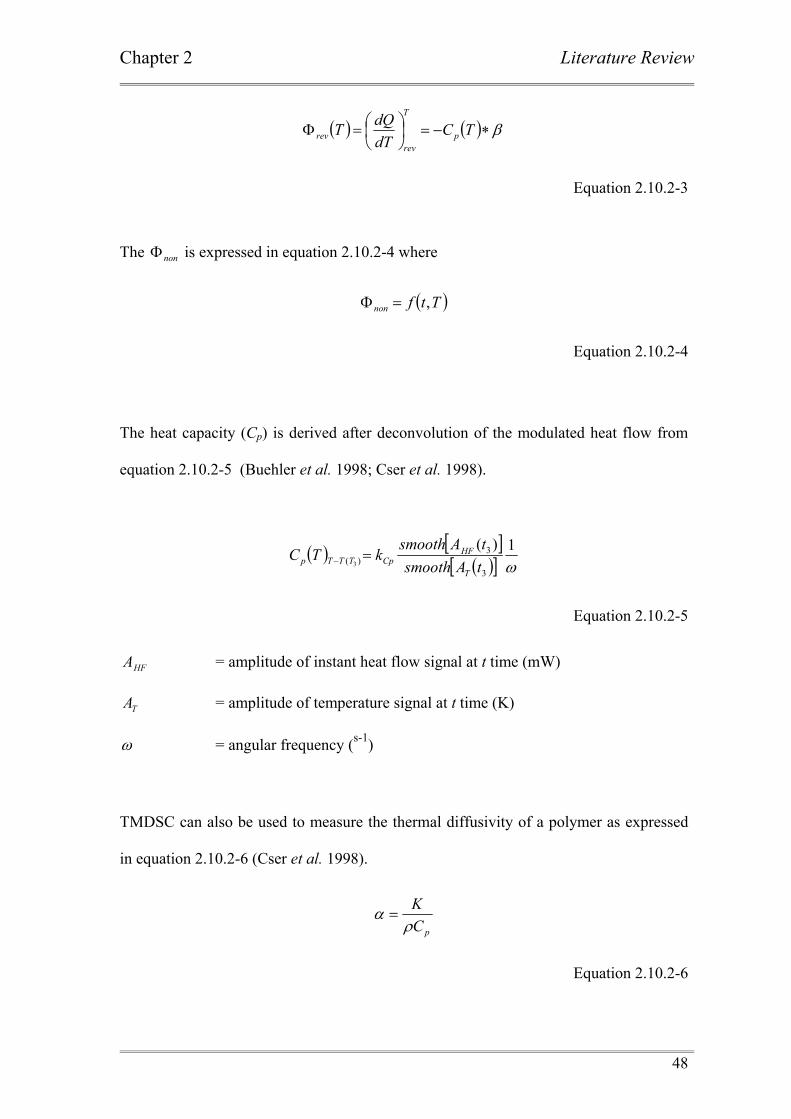
Chapter 2 Literature Review
48
( ) ( ) β∗−=⎟⎠⎞
⎜⎝⎛=Φ TC
dTdQT p
T
revrev
Equation 2.10.2-3
The nonΦ is expressed in equation 2.10.2-4 where
( )Ttfnon ,=Φ
Equation 2.10.2-4
The heat capacity (Cp) is derived after deconvolution of the modulated heat flow from
equation 2.10.2-5 (Buehler et al. 1998; Cser et al. 1998).
( ) ][( )[ ] ω
1)(
3
3)( 3 tAsmooth
tAsmoothkTC
T
HFCpTTTp =−
Equation 2.10.2-5
HFA = amplitude of instant heat flow signal at t time (mW)
TA = amplitude of temperature signal at t time (K)
ω = angular frequency (s-1)
TMDSC can also be used to measure the thermal diffusivity of a polymer as expressed
in equation 2.10.2-6 (Cser et al. 1998).
pCKρ
α =
Equation 2.10.2-6
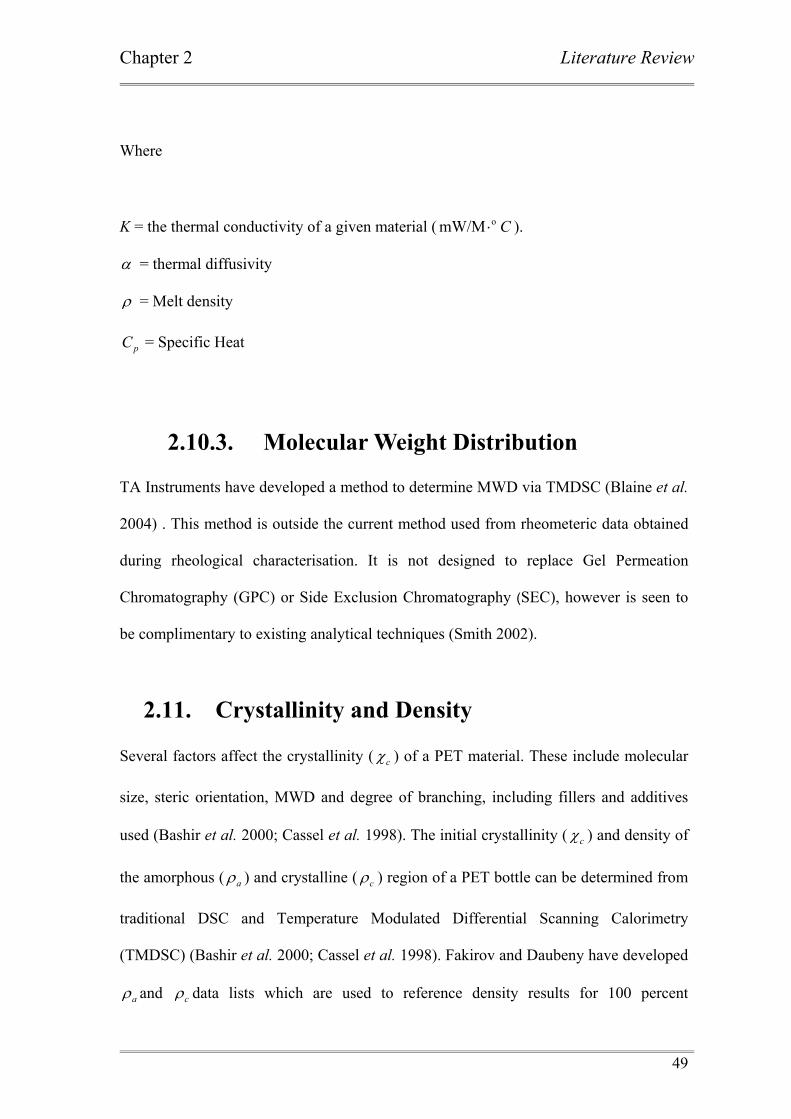
Chapter 2 Literature Review
49
Where
K = the thermal conductivity of a given material ( Co mW/M ⋅ ).
α = thermal diffusivity
ρ = Melt density
pC = Specific Heat
2.10.3. Molecular Weight Distribution TA Instruments have developed a method to determine MWD via TMDSC (Blaine et al.
2004) . This method is outside the current method used from rheometeric data obtained
during rheological characterisation. It is not designed to replace Gel Permeation
Chromatography (GPC) or Side Exclusion Chromatography (SEC), however is seen to
be complimentary to existing analytical techniques (Smith 2002).
2.11. Crystallinity and Density Several factors affect the crystallinity ( cχ ) of a PET material. These include molecular
size, steric orientation, MWD and degree of branching, including fillers and additives
used (Bashir et al. 2000; Cassel et al. 1998). The initial crystallinity ( cχ ) and density of
the amorphous ( aρ ) and crystalline ( cρ ) region of a PET bottle can be determined from
traditional DSC and Temperature Modulated Differential Scanning Calorimetry
(TMDSC) (Bashir et al. 2000; Cassel et al. 1998). Fakirov and Daubeny have developed
aρ and cρ data lists which are used to reference density results for 100 percent
Chapter 2 Literature Review
50
amorphous and 100 percent crystalline PET materials (Fakirov S 1997). Discrepancies
in aρ and cρ for PET resins have been reported when compared with small angle x-ray
(SAXS) measurements obtained (Bashir et al. 2000). Although SAXS is an important
tool to determine polymer crystallinity, there are still questions concerning its accuracy
when compared to other measuring techniques (Gruver et al. 2000).
Other methods used for determining polymer crystallinity include Fourier transform
spectrometry (FTIR), DSC and x-ray diffraction (XRD). Some suggest FTIR to be the
most valuable analytical method for determining polymer crystallinity (Gruver et al.
2000).
A gradient column is one method used to determine polymer density. It is the most
commonly used instrument for obtaining density values for PET (Bashir et al. 2000;
Schiavone 2002a). It is a sound technique, demonstrating repeatable results when
determining density of PET materials (Bashir et al. 2000). The test condition used is in
accordance with ASTM D 1505 – 85. Calibration of the density column uses glass bead
density standards.
An additional measure of density is via ASTM D 792 test method. The test method
provides specific gravity data, also obtaining the density of a solid. This method is
simple to use, and enables the measurement of changing crystallinity and density values.
Chapter 2 Literature Review
51
2.12. Heat-set Process Physical properties for PET are determined by the materials degree of crystallinity and
its degree of orientation. Morphology of PET materials also affect the barrier properties
of the material (Caldicott 1998; Gaydosh et al. 2000; Jabarin 1995). Furthermore,
preform and bottle design play an important role for temperature resistant PET beverage
containers at elevated temperatures (Jabarin 1995). Wall thickness distribution,
influenced via process optimisation contribute to the final physical properties of a PET
beverage container (Jabarin 1984). Preform surface temperatures have also been
demonstrated to influence the final hot-fill (S2) shrinkage
Traditional PET carbonated soft drink markets (CSD) bottle production do not
incorporate heated moulds in the production cycle. The result is a beverage container not
suitable for hot-fill applications. A simple experiment to demonstrate this phenomenon
is the filling of a PET container with boiled water which is allowed to stand. Due to the
materials relatively low Tg of 72 oC, the molecules within the container relax, allowing
for dimensional changes, and therefore a reduction in hot-fill volume (V2).
Thermal processing of oriented PET containers, which is known as ‘heat-setting’,
introduces thermal crystallinity, hence increasing the glass transition temperature (Tg) of
PET. The process utilises traditional PET bottle production techniques, however
involves holding the container against a heated (above 115 oC) mould for a period of
time (approximately 1 – 60 seconds) before ejecting the blown container (Boyd et al.
2002b; Jabarin 1983; Potter et al. 2001). Heat-setting and its various forms yield
Chapter 2 Literature Review
52
increased ‘hot-fill temperatures’ at which the food content is filled at elevated
temperatures.
True Heat-set TM process increases the level of crystallinity (30 percent and higher) in
the sidewall of a beverage container. This method utilises traditional ISBM techniques,
incorporating a high temperature gas during the blow moulding inflation cycle. This gas
is introduced via the stretch rod. The temperature of the high pressurised gas ranges
from 285 to 370 oC. The pressurised gas is combined with a fluid mixture to inflate the
heated preform against a heated mould cavity (130 – 170 oC) to induce crystallinity. This
process is maintained between 3 – 7 seconds or until the require level of crystallinity is
obtained. High air pressure is used to inflate the preform against the mould cavity. This
method increases the crystallinity during the blow moulding cycle.
Although an increase in crystallinity is achieved, transparency is maintained due to the
small spherulitic (crystal size) structure. The container undergoes annealing (relieving
the stress and strain within the molecules) during this process (Maruhashi et al. 1996).
Furthermore, work at Schmalbach-Lubeca AG demonstrated that dimensional stability
of a PET container is controlled via the draw ratio, stretch speed and temperature of
stretching (Boyd et al. 2002a; Potter et al. 2001). Similar results have been demonstrate
from previous work undertaken on heat-set PET film structures (Maruhashi et al.
1992b).
Limitations exist in conventional beverage containers utilising heat-set technology.
These limitation include a decrease in refractive index with increased crystallinity
(Maruhashi et al. 1992b). Furthermore, the inclusion of vacuum panels is used to
suppress hot-fill (S2) shrinkage when exposed to pasteurisation, hot-fill and retort
Chapter 2 Literature Review
53
processes. For retort process, food spoilage is controlled by heating the produce to
between 100 – 121 oC for a duration of 1 hour (Tekkanat 2000). The molecular weight
(Mw) or more frequently referenced the intrinsic value (IV) of a material decreases
during processing. It has been found that a reduction in IV from 0.85 dl/g to 0.58 dl/g
leads to a reduction in the degree of crystallinity by a factor of two (Silberman et al.
1998)
At present, researcher are investigating increases in the initial crystallinity to a PET
material whilst maintaining optical clarity. A unique heat-set method is used to increase
the crystallinity level to over 50 percent whilst maintaining glass like clarity (Boyd et al.
2002b). A mould temperature of 250 oC is used (Ajmera 1989; Jabarin 1983; Jabarin
1995).
This method incorporates a change in heating oil within the mould and circulating a
continuous flow of oil at room temperature, cooling the container after inflation and
heat-setting. Although an increase in crystallinity is achieved – ensuring optical clarity –
such a container cannot be withdrawn from the process at high temperature. Doing so
would allow the container to collapse, as the PET material is close to Tm. One known
disadvantage to this technology is an increase in cycle times. An increase in cycle time
is required to reduce the temperature of the PET container from a material temperature
of 250 oC to the quench temperature – varying from 170 – 148 °C via the continuous
flow of oil.
Time and temperature are important considerations when producing dimensionally
stable PET beverage containers. Mechanical and physical properties for hot-fill
Chapter 2 Literature Review
54
applications need to be considered. Previous studies shown on PET sheets incorporating
draw ratios of 3:3 and increased stretch rate increase the percentage crystallinity at low
heat-set (85 oC) temperatures (Maruhashi 2001). At relative low heat-set temperatures,
the rate of dimensional stability also improved due to the stretch speeds. This promotes
strain induced crystallinity, raising the temperature of the preform before inflation (Boyd
2004; Maruhashi 2001). Therefore, dimensional stability is controlled via increased
heat-set temperatures and the draw ratio and speed of stretching. Heat-set temperatures
above 110 oC with increased blow time or increasing heat-set temperature likewise
increases in percentage crystallinity.
Morphology of the final heat-set material is dependant of the original PET material
(Maruhashi et al. 1992b). At low draw ratios (1.6:1.6) with a stretching speed of 2.5
m/min, an increase in heat-set temperatures do not provided increased levels of
crystallinity. A combination of medium draw ratio (2.1:2.1) found increased levels of
crystallinity. Increased draw ratios within increase heat-set temperatures saw small
increases in crystallinity, however little or no change observed in the amorphous region
(Maruhashi et al. 1992b). Stretch speed, draw ratio at low temperatures have
demonstrated similar physical properties and thermal stability when compared to high
heat-set applications. Further studies have been undertaken into investigating increased
draw ratios and stretch rates similar to ISBM process (Maruhashi 2001). Factors
affecting the percentage crystallinity and dimensional stability via heat-setting
methodologies have demonstrated results obtained previous (Maruhashi et al. 1992b).
Chapter 2 Literature Review
55
Heat-set process increases the level of crystallinity whilst decreasing the crystal size to
the material. This ensures the crystallites are small enough to be seen as an amorphous
material, even though the container has high degree of crystallinity (Brooks 2000).
Current literature demonstrates low heat-set temperatures improved thermal stability
with increased stretch speeds and draw ratios. Further studies are needed to gain
additional knowledge concerning PET morphological changes in the amorphous density
and crystalline regions rendered by the heat-set process. A comprehensive understanding
of the ISBM process conditions is necessary. This requires additional knowledge
concerning virgin - RPET blends, observing possible improvements for hot-fill
applications.
2.13. Mechanical response via Strain Induced Crystallinity
The degree of crystallinity is an important characteristic for thermal stability. However
this parameter is not the only determinant required to improve dimensional stability of
beverage containers at elevated temperatures via the heat-set process. Properties
including modulus of elasticity, transparency and tensile strength are affected by
crystallinity and its distribution in the morphology phase. (Caldicott 1998; Silberman et
al. 1998). Process conditions including the preform temperature, mould temperature,
blow pressure, stretch duration and heat-set temperature and blow time influence the
final mechanical properties.
Chapter 2 Literature Review
56
The manufacturing process of PET containers requires the PET preform be heated above
the Tg value. In general terms a preform temperature of 15 oC above the Tg temperature
and closer to the Tc of the material is sought (Silberman et al. 1998; Tekkanat 2000).
Prior to the inflation process, the preform is stretched in an axial direction. Air is
inflated into the preform blowing the material in a biaxial direction against the mould.
To demonstration this phenomenon, place a PET bottle in an oven for one hour,
allowing quiescent cooling to take place. Upon completion, shrinkage of the container
shapes tries to shrink into its previous shape. In this case the original preform prior to
inflation or stretching. However, part of the strain has exceeded the elastic point of the
material. Thus a non recoverable deformation has taken place, as the stretch ratio has
exceeded the yield point of the material. Surpassing the yield point the molecules begin
to realign themselves in the axial direction. The preform, under load via the stretch rod,
compels the molecules to slip past themselves realigning in the stretching direction. The
material begins to reach a strain hardening point. This behaviour is temperature, speed
of stretching and Mw dependent. At this point the molecules become rigid due to
established entanglements. During stretching in the axial direction, molecules rotate and
uncoil. As a result strain induced crystallisation takes place (Silberman et al. 1998;
Tekkanat. 2000).
2.14. Morphology of PET Beverage Bottles Crystalline PET materials can be processed demonstrating glasslike clarity.
Alternatively, in the presence of quiescence cooling, molecules reorient into densely
packed molecules forming spherulitic macrostructures – being the crystalline region of
the polymer – and non-spherulitic portions. This non-spherulitic portion of the polymer
Chapter 2 Literature Review
57
matrix represents the random arrangement of molecules, inturn effecting the amorphous
region (Jabarin 1995). This combination of crystalline and amorphous region influences
whether the PET container will demonstrate clear or opaque appearance. These
attributes are controlled via the ISBM process condition (Silberman et al. 1998).
This changing morphology is also influenced by the exposure to cooling time and
temperature of the mould during the blow moulding process (Jabarin 1996). PET
materials cooled above the Tg rapidly will increase spherulitic macrostructures in the
beverage container, hence changing the final morphological properties. The result is an
increase in random molecular structure. An increase in the amorphous region, and
decrease in the crystalline region, giving glass like transparency is the result. However,
quiescence cooling can also effect the morphology of the material, increasing the
crystalline region, and give the material an opaque appearance (Jabarin 1995).
Many studies have investigated the effects of thermal stability of PET made from sheets
or fibre incorporating heat-set experimental condition. Literature has shown improved
thermal stability of PET materials under heat-setting condition (Groeninckx et al. 1980a;
Jabarin 1983; Jabarin 1995; Maruhashi et al. 1992a). However, the literature survey
found very little concerning experimental conditions for ISBM bottle containers under a
heat-set application, although widely used within industry (Billmeyer 1984).
However it has been shown that in the absence of heat-set process, shrinkage is mainly
influenced via the degree of draw ratio (Maruhashi et al. 1992a; Silberman et al. 1998).
The stretch ratio also has an influence on the final crystallinity value after inflation. For
a material of 0.85 dl/g IV, crystallinity increases from 4 to 31 percentage with an
Chapter 2 Literature Review
58
increase in stretch ratio from 1 to 5.8 (Silberman et al. 1998). Variation in Tg is reported.
Silberman reports as a function of stretch rate (SR) the outer layer of the PET beverage
container to yield the highest Tg value, with the inner layer in the same location
reporting the lowest value.
Furthermore, three regions of crystallinity values are reported as a function of stretch
ratio (SR). Changes in crystallinity are related to the panel thickness and (SR) conditions
(Silberman et al. 1998). The material closest to the mould cavity undergoes the greatest
increase in crystallinity with high SR. This has been attributed to the initial rapid
annealing when first contact is made with the blow mould cavity. As the material cools,
an increase in crystallinity is due to further stretching, resulting in strain induced
crystallinity (Jabarin 1992). At low crystallinity, draw ratio leads to molecular
relaxation, with no increase in crystallinity with heat-set present (Maruhashi et al.
1992b). Other studies have found similar results (Maruhashi 2001; Maruhashi et al.
1996; Silberman et al. 1998).
Maruhashi et al (1996) found that for PET polymers with high (SR) greater than 2,
higher crystallinity is produced. Furthermore this work observed this improvement with
low heat-set temperatures (85 oC). The improved dimensionally stable material was
determined to have an improved relaxation in the tie molecules in the amorphous region
of the polymer. An increase in amorphous density is observed due to increase draw ratio
and higher stretch speed. The result is fewer unconstrained molecular entanglements
within the amorphous region hence an increase in thermal stability at elevated
temperatures.
Chapter 2 Literature Review
59
Much of the has been focused on virgin and RPET blends for injection moulded
applications (Maruhashi et al. 1996; Nobbs et al. 1976). Some work has also been done
on PET films for heat-set applications (Groeninckx et al. 1980a; Groeninckx et al.
1980b; Maruhashi 2001). Only limited reported information exists for PET bottle heat
set bottle manufacture (Liu et al. 2004; Mc Chesney et al. 1983).
The perceived benefits for hot-fill applications due to RPET reported physical and
mechanical properties are yet to be well documented for virgin - RPET blends. The
influence on crystallinity, and its change on Tg and dimensional stability (S2) at elevated
heat-set temperature with the inclusion of RPET blends must be explored. Furthermore,
maintaining industry accepted process shrinkage (S1) at elevated heat-set temperatures
needs to be addressed and defined.

Chapter 3 Materials, Sample Preparation and Experimental Set-up
60
3. Chapter 3: Materials, Sample Preparation and
Experimental Set-up
Chapter 3 Materials, Sample Preparation and Experimental Procedures
61
3.1. Introduction Chapter 3 presents PET materials used for this research study in heat-set application for
Injection Stretch Blow Moulding process (ISBM). A description of each thermal and
mechanical characterisation is included. Sample preparations and experimental
procedures used are incorporated and discussed. The following lists experimental
characterisation techniques used. These include:-
Intrinsic Viscosity Test (IV)
Melt Flow Index Test (MFI)
Thermal Characterisation via Temperature Modulated Differential Scanning Calorimetry
(TMDSC)
Injection Stretch Blow Moulding Process (ISBM)
Rheological Characterisation via Advanced Rheometric Expansion System (ARES)
Parallel-Plate Rheometer,
Burst Strength test
Top Load Strength test
Tensile Test
Hot Fill test
Characterisation of each raw material used in this research study allows evaluations of
each materials rheological, morphological, physical and mechanical properties.
Chapter 3 Materials, Sample Preparation and Experimental Procedures
62
3.2. Materials for Heat Set Applications Three grades of polyethylene terephthalate have been chosen for investigation of hot-fill
applications. Voridian CA12 was obtained from Eastman Chemical Company. SK
Chemicals SkyPET BB 7755 homopolymer was obtained from SK Chemicals and Visy
recycled polyethylene terephthalate (RPET) food grade pallets were obtained from Visy
Plastics, Australia.
Voridian CA12 is a copolymer material based on isopropyl alcohol (IPA) glycol
monomer, with low parts per million (ppm) of activated carbon. This enhances
temperature uniformity of the preform prior to stretching within the ISBM process. The
material application is generally designed for two stage ISBM processes.
SkyPET BB 7755 is homopolymer material specifically designed for hot-fill applications
with a low level of acetalaldehyde (AA). SkyPET BB7755 material is manufactured using
Antimony (Sb) as the catalyst.
Visy RPET material is manufactured from PC-PET material. RPET has an IV of 0.76
dL/g
The basic properties of each material obtained from the material manufacturer are
outlined in table 3.2-1 and 3.2-2
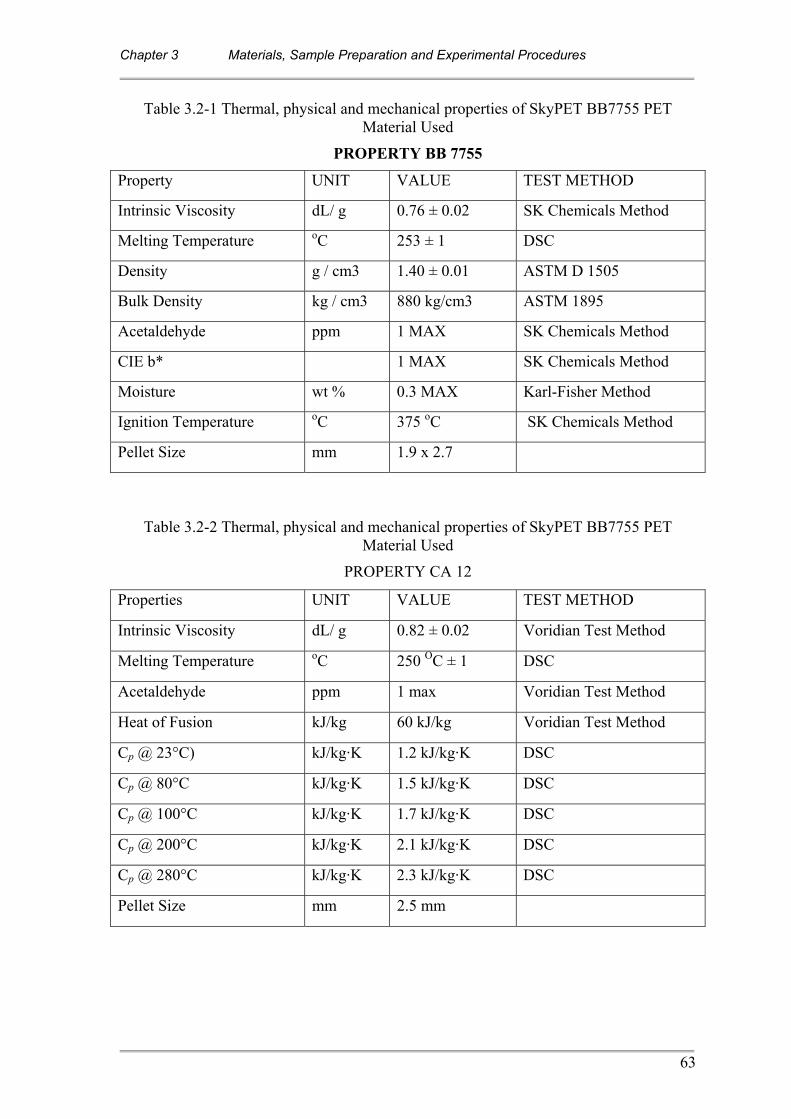
Chapter 3 Materials, Sample Preparation and Experimental Procedures
63
Table 3.2-1 Thermal, physical and mechanical properties of SkyPET BB7755 PET Material Used
PROPERTY BB 7755
Property UNIT VALUE TEST METHOD
Intrinsic Viscosity dL/ g 0.76 ± 0.02 SK Chemicals Method
Melting Temperature oC 253 ± 1 DSC
Density g / cm3 1.40 ± 0.01 ASTM D 1505
Bulk Density kg / cm3 880 kg/cm3 ASTM 1895
Acetaldehyde ppm 1 MAX SK Chemicals Method
CIE b* 1 MAX SK Chemicals Method
Moisture wt % 0.3 MAX Karl-Fisher Method
Ignition Temperature oC 375 oC SK Chemicals Method
Pellet Size mm 1.9 x 2.7
Table 3.2-2 Thermal, physical and mechanical properties of SkyPET BB7755 PET Material Used
PROPERTY CA 12
Properties UNIT VALUE TEST METHOD
Intrinsic Viscosity dL/ g 0.82 ± 0.02 Voridian Test Method
Melting Temperature oC 250 OC ± 1 DSC
Acetaldehyde ppm 1 max Voridian Test Method
Heat of Fusion kJ/kg 60 kJ/kg Voridian Test Method
Cp @ 23°C) kJ/kg·K 1.2 kJ/kg·K DSC
Cp @ 80°C kJ/kg·K 1.5 kJ/kg·K DSC
Cp @ 100°C kJ/kg·K 1.7 kJ/kg·K DSC
Cp @ 200°C kJ/kg·K 2.1 kJ/kg·K DSC
Cp @ 280°C kJ/kg·K 2.3 kJ/kg·K DSC
Pellet Size mm 2.5 mm
Chapter 3 Materials, Sample Preparation and Experimental Procedures
64
3.3. Raw Material Preparation Virgin and RPET blends incorporated a Maguire 100 Series Weigh Scale Blender (WSB).
This unit was chosen for its accuracy in material blending formulations to an accuracy of
0.1 % of requested formulation (MAGUIRE 2004).
3.4. Material dying conditions for PET Care was taken not to affect each material’s physical and chemical properties. Molecular
weight ( wM ) as indicated by the materials’ intrinsic viscosity (IV) is important to the
manufacturing process of PET bottles. The material had been subject to drying before
ISBM and injection moulding (IM) process. PET, a hydroscopic material is subjected to
control drying with inlet temperature of 153 oC for 5.5 hours. An optimum pellet dwell
time for PET is suggested at approximately 6 hours (Voridian Pty Ltd 2002). Dew point
less than -20 oC was observed with an airflow rate of 0.045 m3 / (kg). A good dryer
design criterion allows 0.062 m3 / kg/h (Voridian Pty Ltd 2002). A hopper ratio of 4:1
was used during experiments. The hopper height to diameter (h/d) ratio should be 2:1, or
preferable 3:1 (Voridian Pty Ltd 2002). A total batch size of 10 kilograms (kg) was used
for each experimental run.
3.5. Sample preparation of compression moulded plaque
Compression moulded samples were prepared for rheological characterisation by ARES
parallel-plate rheometer. Voridian copolymer CA12, SkyPET homopolymer BB 7755 and
RPET (Visy) were dried in a vacuum oven at 100 oC for 24 hours. The compression-
moulded tool incorporated 4 heating cartridges maintaining temperature between the
Chapter 3 Materials, Sample Preparation and Experimental Procedures
65
upper and lower mould. Each mould was provided with separate temperature control
units.
A rectangular plaque was used to produce test samples by the compression moulding
process. Dimensions of length (l) 152 mm width (w) 153 mm thickness (h) 2 mm
were recorded. At the completion of the compression moulding cycle, unmelted PET
pellets were observed. An increase in residence time demonstrated polymer degradation
within localised areas of the test sample. Test specimens samples of 25 mm in diameter
were required for rheological testing. During the cutting process, PET material shattered.
No good samples were obtained from this test plaque. As sample preparation failed using
a rectangular plaque, a new approach was taken.
The new approach utilised a plaque comprising 9 25 mm diameter disk impressions
with a measured thickness of 2mm. A total of 9 rheological test specimens could be
produced by compression moulding. This mould showed improved melting of the PET
granules and degradation was eliminated during the compression moulding process. The
mould temperatures for each sample were set to 280 oC. The plaques produced were
suitable for the Rheological characterisation via the ARES Parallel Plate Rheometer.
An experimental procedure was developed to achieve optimum compression moulded
samples. Initial trials found un-molten granules suspended within a molten layer of
polymer at the conclusion of compression moulding. The cooling rate was not optimum,
nor efficient. During the cooling cycle, a temperature differential of 60 – 70 oC was
observed between top and bottom mould halves.
Chapter 3 Materials, Sample Preparation and Experimental Procedures
66
The mould required water cooling with the water inlet entering the top half of the
compression moulding tool. Water circulated from the top mould half, then exit and enter
the bottom half of the compression mould. Uneven cooling was observed, due to an
increase in fluid temperature from cooling the top mould. A decrease in heat transfer
capacity in cooling the 9 plaque 25 mm diameter PET plaque samples was the result..
During the compression moulding cycle, unmolten PET granules remained. This had been
corrected by increasing the residence time to three minutes before applying force to the
compression mould halves.
Uniform samples were obtained under the following conditions. PET granules were
removed from a vacuum oven and placed into 9 25 mm diameter sample plaque.
Polytetrafluoroethylene (PTFE) sheets where incorporated to prevent PET material
sticking to the two-mould halves. This provided ease of separation under extreme
temperature environments.
PET material were placed between the mould halves at 250 oC and allowed to equilibrate
to temperature. Time taken for temperature to equilibrate to 280 oC was 7 minutes. Once
the equilibration of temperature was reached, a force of 150 kN was applied to the
moulds. PET materials were subjected to constant pressure and temperature for 3 minutes.
Mould temperatures were decreased to 150 oC, mould samples removed from the
compression moulding machine and further cooled in constant running tap water.
Samples were removed and placed in sealed bags.
Chapter 3 Materials, Sample Preparation and Experimental Procedures
67
3.6. Rheological characterisation Rheological characterisation of all materials were broken into three areas to improve
understanding of each material’s viscoelastic response to stress. Data obtained via each
experimental test were used to quantify results. Complex viscosity *)(η as a function of
stress and strain was compared. Storage, loss modulus (G′ andG ′′ ) and Tan Delta ( )δtan
were evaluated. This yields an understanding of each materials viscosity, elasticity and
glass transition temperature.
3.6.1. Analysis intrinsic viscosity of PET Experiments were taken to quantify the intrinsic viscosity ( )η to each PET material in
solution. The weight average molecular weight ( )wM and number average ( )nM
molecular weight were calculated. The test procedure is outlined by the American
Standard Test Method (ASTM) 4603 – 03, however modifications were made. Each test
sample was dried at 100 °C for 18 hours. PET granules where dissolved at concentrations
of 0.50% in a 60/40, w/w o-chlorophenol and 1,1,2,2 tetrachloroethane solvent mixture
The weight of each volumetric flask and lid was taken. Dried PET samples were
accurately weighed in the range of 0.1225 to 0.1275 g. Accuracy of 0.2 mg was required.
The solution mixture was measured to 25 ml total volume, and placed into a volumetric
flask. The combined contents were placed into a water bath with a set-point temperature
of 30 oC. Each solvent and sample mixture was allowed to equilibrate for 10 minutes.
Sample and solvent mixture were weighed and recorded at 30 oC. A PTFE coated stirring
bar was placed into the solvent mixture to assist with stirring material and solvent.
Chapter 3 Materials, Sample Preparation and Experimental Procedures
68
The volumetric flask was placed into a preheated canola oil bath (100 oC). Temperature
was maintained between 100 - 110 oC. This was to prevent degradation of each sample.
Each sample dissolved within 30 minutes. Once dissolved, the volumetric flask was
removed from the oil bath and cooled to room temperature. The solvent mixture was
allowed to cool for 30 minutes. The stirring bars where removed with a magnetic
retriever. Each solvent mixture was poured into Whatman #1 filter paper and drained into
dry 50 ml vials. Once completed, polypropylene (PP) caps were placed on each vial.
An AMV 200 Rolling Ball viscometer combined with a SP3-V sampler exchanger was
used to conduct the IV experiment. A water bath and IBM compatible personal computer
was used. The analysis routine was set to ASTM 4603 with a set temperature of 30 oC.
An inclination angle )(α of 70 o was applied.
3.6.2. Melt flow index test Material preparation was undertaken using ASTM method D 1238 – 01. Material was
dried in an oven with a set point temperature of 100 oC for 16 hours. Test conditions
included a temperature of 285 oC with a 2.16kg applied force. The orifice diameter of
2.092 mm was used. Length of the orifice is 8 mm.
Melt flow index results were recorded for SkyPET BB7755 and Voridian CA 12 for two-
minute duration. Due to increase flow rates for Visy RPET, a one-minute duration was
used. All results were extrapolated and expressed as grams per ten minutes. Each material
included a heat soak time of 3 minutes before the commencement of each test.
Chapter 3 Materials, Sample Preparation and Experimental Procedures
69
3.6.3. Parallel Plate Rheometer Parallel plate rheometric experiments were conducted to measure the Storage ( )G′ and
Loss ( )G′′ modulus. Furthermore, complex viscosity ( )*η and were also performed.
Sample preparations for parallel plate rheomter have been discussed in section 3.3. An
ARES – LS Rheometer from TA Instruments was used to conduct rheological
characterisations for each material. Software used was TA Orchestrator version 7.0.8.23.
Zero Motor inertia was applied to the rheometer. Test samples were conditioned within a
nitrogen (N2) atmosphere. As PET is hydroscopic, the inclusion of N2 prevents PET from
hydrolysis (Sonia. et al. 2001). This was used to minimise material degradation. Materials
where dried at 100 oC under vacuum for 24 hours prior to testing.
A 25 mm aluminium (Al) plate diameter with a 1.5 mm gap was set for each experiment.
A linear Viscoelastic Region (LVR) was established using a Dynamic Strain Sweep.
Equilibration time of 50 seconds was used. The samples were subjected to a 10 rad/s
frequency with 0.1 initial strain tested at 280 oC; a maximum of 400 % final strain was
applied. The software was set to record data at 10 points per decade in log mode. A pre-
shear of 10 s was applied to eliminate possible shear and molecular orientation remaining
from the compression moulding process. The pre shear time also allows for any molecular
structure to rebuild prior to testing (Mazzeo 2004).
In Dynamic Strain Frequency Sweep mode, a frequency of 0.1 to 100 rad/s was applied.
Strain amplitude of 300 % was used. A sampling rate of 10 points per decade in log mode
was used. A parallel plate gap of 1.5 mm was set for each experiment. Measurements
Chapter 3 Materials, Sample Preparation and Experimental Procedures
70
where performed at 280 oC. The Dynamic Strain Sweep experiments took 12 minutes to
complete for each material. Results and discussion are found in chapter 7.2
3.7. Thermal characterisation
3.7.1. Temperature modulated differential scanning calorimetry
Thermal analysis was performed using TA Instruments Temperature Modulated
Differential Scanning Calorimetry (TMDSC) 2920. The software used to analyse all data
points was performed utilising TA Instruments Universal Analysis Version 3.8. A
comprehensive understanding of each materials thermal and kinetic changes as a function
of time were analysed for this research study (Ramachandran 2002). TMDSC is similar to
Differential Scanning Calorimetry (DSC). Discussion concerning differences can be
located in chapters 2.9 and 2.9.1.
A compression moulder was used for sample preparation. During sample preparation,
PET granules where placed between compression moulding plates with a set-point
temperature of 270 oC. As materials were placed within the compression moulding plates,
a decrease in temperatures bewteen 8 to 10 oC was observed. It was found that the
temperature rose to the set point temperature within two to three minutes for each
material. A preheat time of three minutes was applied before the commencement of
moulding each samples. Clamp pressure of 150 kN force was applied for duration of three
minutes. At the completion of the compression moulding cycle time, test samples where
removed and quench cooled within tepid water.
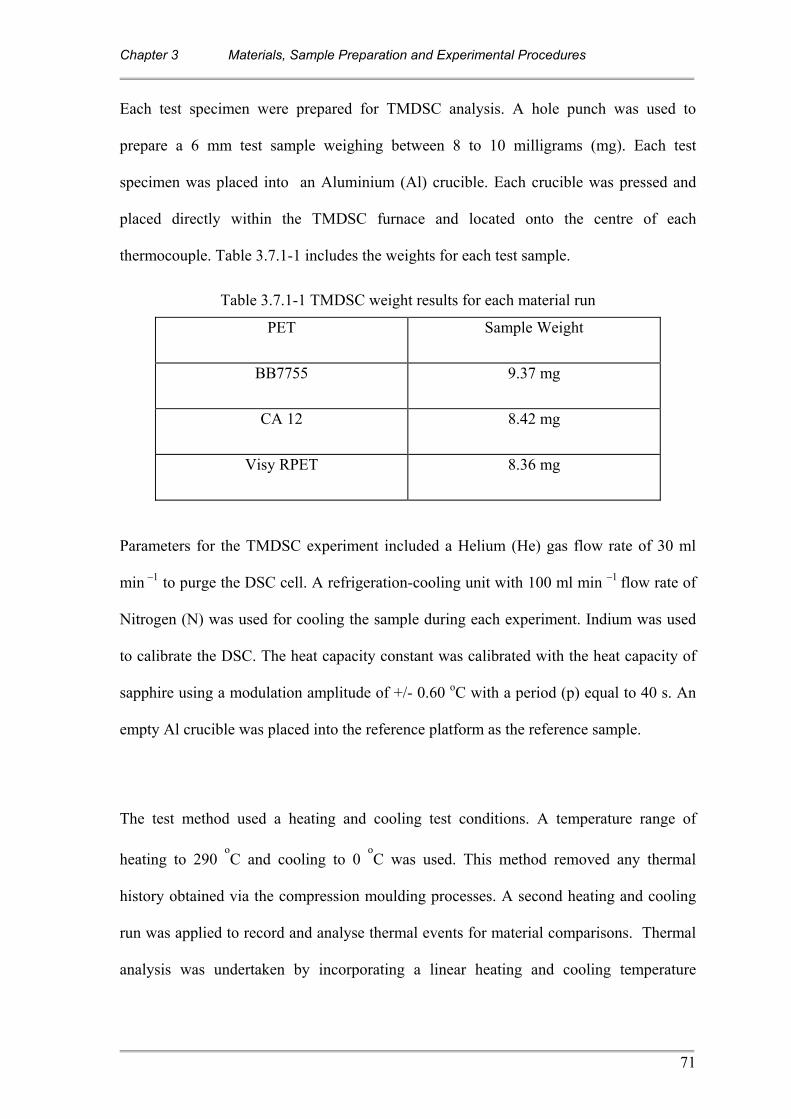
Chapter 3 Materials, Sample Preparation and Experimental Procedures
71
Each test specimen were prepared for TMDSC analysis. A hole punch was used to
prepare a 6 mm test sample weighing between 8 to 10 milligrams (mg). Each test
specimen was placed into an Aluminium (Al) crucible. Each crucible was pressed and
placed directly within the TMDSC furnace and located onto the centre of each
thermocouple. Table 3.7.1-1 includes the weights for each test sample.
Table 3.7.1-1 TMDSC weight results for each material run
PET Sample Weight
BB7755 9.37 mg
CA 12 8.42 mg
Visy RPET 8.36 mg
Parameters for the TMDSC experiment included a Helium (He) gas flow rate of 30 ml
min –1 to purge the DSC cell. A refrigeration-cooling unit with 100 ml min –1 flow rate of
Nitrogen (N) was used for cooling the sample during each experiment. Indium was used
to calibrate the DSC. The heat capacity constant was calibrated with the heat capacity of
sapphire using a modulation amplitude of +/- 0.60 oC with a period (p) equal to 40 s. An
empty Al crucible was placed into the reference platform as the reference sample.
The test method used a heating and cooling test conditions. A temperature range of
heating to 290 oC and cooling to 0
oC was used. This method removed any thermal
history obtained via the compression moulding processes. A second heating and cooling
run was applied to record and analyse thermal events for material comparisons. Thermal
analysis was undertaken by incorporating a linear heating and cooling temperature
Chapter 3 Materials, Sample Preparation and Experimental Procedures
72
profile. TMDSC incorporates an oscillating time and temperature sinusoidal profile
superimposed onto the conventional linear heating ramp (Ramachandran 2002)
Thermal analysis commenced with decreasing the temperature of the sample to 0 °C then
ramp temperatures to 20 oC and kept isothermal for six minutes. An instantaneous
heating rate of 2 oC / minute with an underlying heating rate (β ) and sinusoidal
modulation period ( ΤA ) of +/- 0.60 oC every 40 seconds was applied from 20
oC to 290
oC. Once test specimen reached 290
oC, samples were kept isothermal for 2 minutes. A
temperature ramp of 2 oC / minute to 0
oC was applied to determine the cold
crystallisation temperature (Tcc) for each PET material. The test was performed twice, in
order to capture the material true thermal characteristics.
A second heating and cooling run were applied to analyse the materials temperature
melting peaks (Tm), glass transition (Tg) temperature at inflection point via reversing
specific heat (Rev Cp) and enthalpy of melting from total heat flow curves. Cold
crystallisation temperatures (Tcc) and enthalpy of cold crystallisation (ΔHcc) where taken
from the first and second heating run. The degree of crystallinity for each material was
taken from the first and second heating run. Heat of fusion for 100 percent crystalline
PET material is reported to require 135 J/g of energy (Bashir et al. 2000).
3.8. Mechanical characterisation Mechanical tests were undertaken to gain knowledge concerning the mechanical
properties for end use applications due to mechanical loading (Shah 1998). All data points
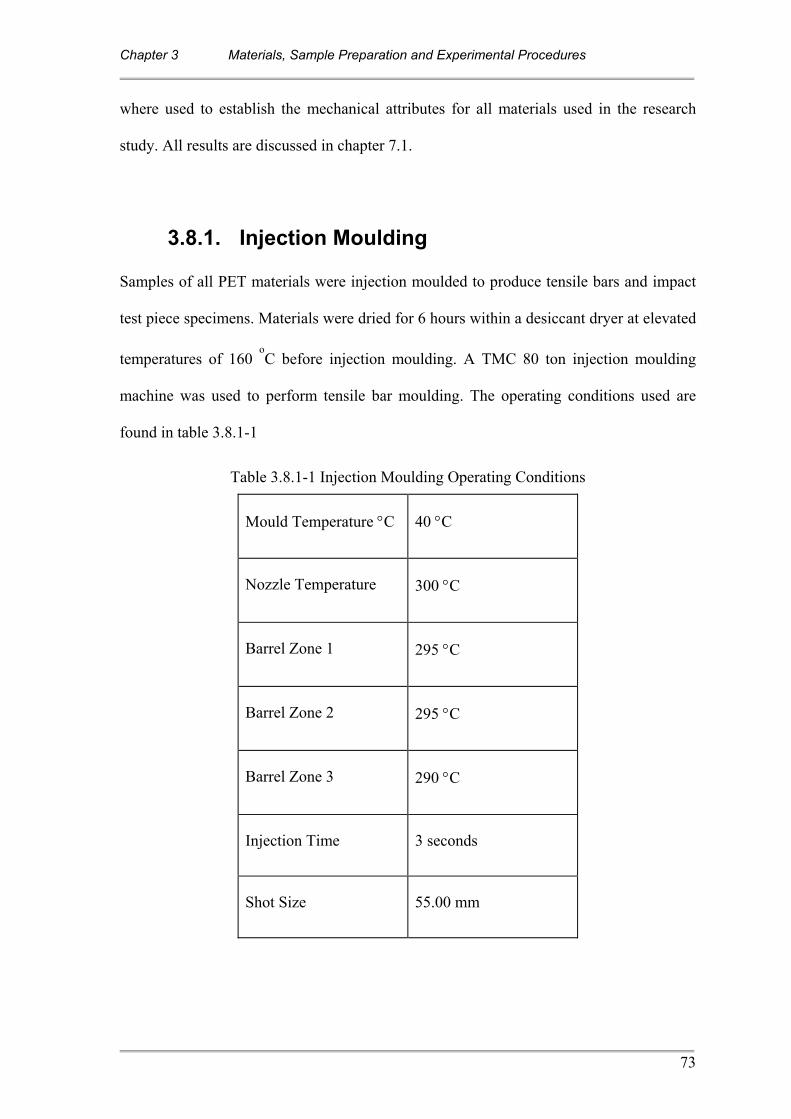
Chapter 3 Materials, Sample Preparation and Experimental Procedures
73
where used to establish the mechanical attributes for all materials used in the research
study. All results are discussed in chapter 7.1.
3.8.1. Injection Moulding Samples of all PET materials were injection moulded to produce tensile bars and impact
test piece specimens. Materials were dried for 6 hours within a desiccant dryer at elevated
temperatures of 160 oC before injection moulding. A TMC 80 ton injection moulding
machine was used to perform tensile bar moulding. The operating conditions used are
found in table 3.8.1-1
Table 3.8.1-1 Injection Moulding Operating Conditions
Mould Temperature °C 40 °C
Nozzle Temperature 300 °C
Barrel Zone 1 295 °C
Barrel Zone 2 295 °C
Barrel Zone 3 290 °C
Injection Time 3 seconds
Shot Size 55.00 mm
Chapter 3 Materials, Sample Preparation and Experimental Procedures
74
3.8.2. Izod Impact Test PET specimens were conditioned for 40 hours at 23 ± 2
oC and 50 ± 5 % relative
humidity in accordance with Australian Standard (AS) 1327 – 2001. A pendulum impact
test Coesfeild PSW utilising a 1 J hammer was used to carry out impact stress analysis.
Test parameters 1146.1 – 2001 was chosen to carry out impact testing applied to
specimen type 4. Calibration of the equipment was in accordance with AS 1146.3 to
determine the total energy loss due to friction. Impact velocity for the pendulum hammer
was within AS limits.
Notch type A was machined into each specimen. A minimum of ten specimen samples
were tested. This was to ensure the coefficient of variation of impact energy was less than
5 percent. Furthermore, an increase in population provided greater accuracy of the
materials impact properties. Samples where inspected according to preparation 6.3.5 of
AS 1146.1 – 2001. Each specimen was placed edgewise into the vice clamps following
the procedure outlined within AS 1146.1 – 2001. Results are discussed in chapter 7.1.1
3.8.3. Tensile Testing The tensile properties were conducted using an Instron Instruments 4500 Series machine.
Tensile tests were conducted on dumbell shaped specimens. A total number of 5 sample
specimens were used and marked according to type 1A test specimen as described in AS
1145.1 – 2001. All specimens were subjected to ambient conditioning for a period of 72
hours. Air temperature was recorded hourly for 8 hours to investigate the temperature
range. A temperature range from 21 to 23 oC was recorded. Relative Humidity was
recorded between 41 to 43 percent for the same corresponding period. Conditioning of
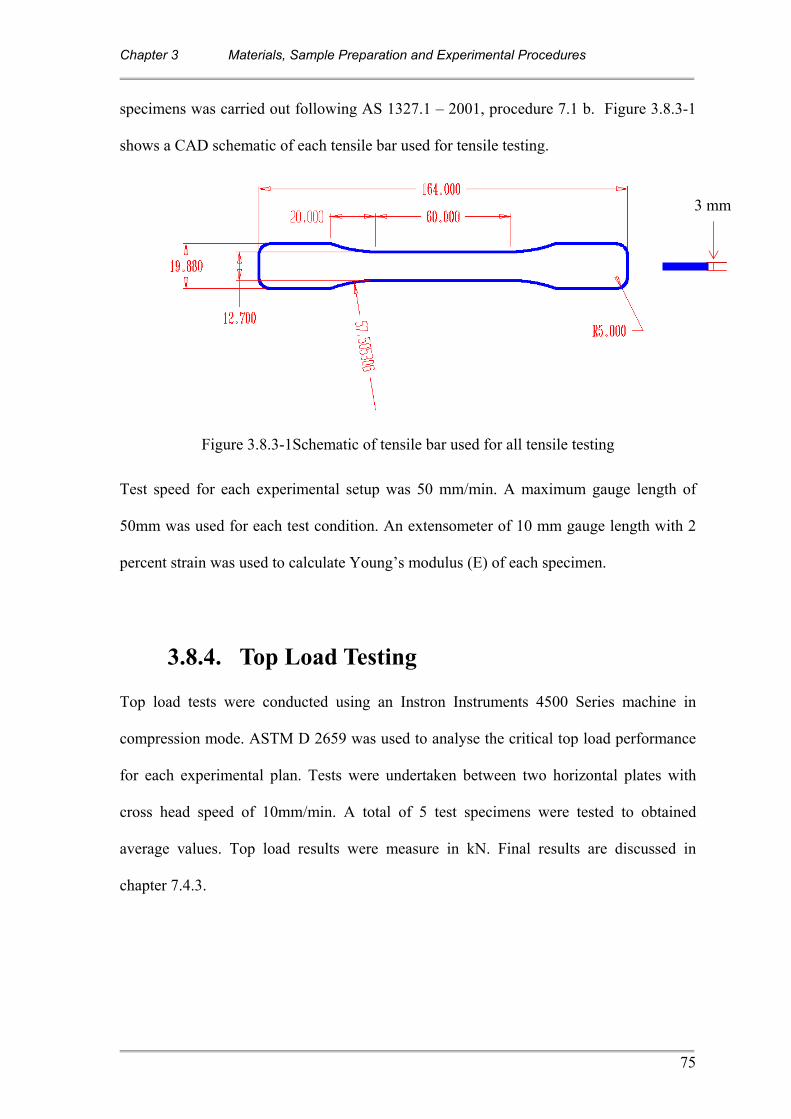
Chapter 3 Materials, Sample Preparation and Experimental Procedures
75
specimens was carried out following AS 1327.1 – 2001, procedure 7.1 b. Figure 3.8.3-1
shows a CAD schematic of each tensile bar used for tensile testing.
Figure 3.8.3-1Schematic of tensile bar used for all tensile testing
Test speed for each experimental setup was 50 mm/min. A maximum gauge length of
50mm was used for each test condition. An extensometer of 10 mm gauge length with 2
percent strain was used to calculate Young’s modulus (E) of each specimen.
3.8.4. Top Load Testing Top load tests were conducted using an Instron Instruments 4500 Series machine in
compression mode. ASTM D 2659 was used to analyse the critical top load performance
for each experimental plan. Tests were undertaken between two horizontal plates with
cross head speed of 10mm/min. A total of 5 test specimens were tested to obtained
average values. Top load results were measure in kN. Final results are discussed in
chapter 7.4.3.
3 mm

Chapter 4 ISBM Experimental Set-up Procedure and Bottle Characterisation
76
4. Chapter 4: ISBM Experimental Set-up Procedure and
Bottle Characterisation
Chapter 4 ISBM Experimental Set-up Procedure and Bottle Characterisation
77
4.1 ISBM Experimental Set-up To add value to the existing body of knowledge, substantial changes to the DoE model
were needed. Further knowledge considering the process mechanic used to improve
thermal stability was required to address the research questions. Further analysis into the
glass transition temperature (Tg) as a function of heat-set were required. The relationship
between the heat-set process and its influence on enthalpy changes to determine
percentage crystallinity was required. Inclusion of RPET and its effects on the mechanical
properties of a PET container needed to be analysed. Therefore, a heat-set temperature
range of 80 to 110 oC was chosen. Results to this research study are discussed in chapter 7
and in proceeding section.
PET beverage containers were manufactured using a single stage Aoki SB3 – 100 H –15
ISBM. Experiments were carried out incorporating a 375 ml conventional carbonated soft
drink (CSD) single cavity tool. The beverage container utilises a champagne base. Initial
setup of the process ensured a stable process condition via the manufacturing of SkyPET
BB7755 material. The Aoki ISBM was modified to record fluid temperature of the
bottom mould and the blow mould cavity. A temperature control unit with heating and
cooling function was used to maintain the heat-set temperature. The initial DoE model
incorporated a heat-set temperature range of 80 – 95 oC.
Analysis was undertaken to determine the final shrinkage (S2) results as a function of
draw ratio and preform surface temperature. Previous studies have found in the absence
of heat-setting, final shrinkage (S2) is determined by the draw ratio and strain rate
Chapter 4 ISBM Experimental Set-up Procedure and Bottle Characterisation
78
(Maruhashi 2001). The 375 ml PET bottle configuration is discussed in section 4.4.
Shrinkage is also determined via the preform surface temperature. Final shrinkage (S2) is
further influenced by the temperature a beverage container comes into contact with a fluid
at elevated temperature during hot-filling process (Maruhashi et al. 1992b).
Thermocouples were used to measure the water outlet temperatures located close to the
blow mould cavity. Validation of the temperature control unit indicated a set-point
temperature of 95 oC maintained heat-set temperatures of 74
oC. The heat loss from the
temperature heating and cooling unit to the water outlet to the blow mould cavity was in
the order of 21 oC. A final temperature of 74
oC was not sufficient for heat-setting
necessary for improved dimensional stability of the PET container (Greener et al. 1999).
Incidentally, a heat-set temperature of 74 oC is below Tg values for all experimental
materials used.
TMDSC analysis was undertaken of the bottle panel section to validate the influence of
heat-set temperatures on the Tg value. The results from TMDSC confirmed the actual
heat-set temperatures of 74 oC – incorporating a set-point temperature of 95
oC – did not
change the Tg value of the material. Heat-set temperatures were required due to excessive
heat loss from the current heat-set system. Additional energy was required to increase the
heat-set temperature needed for this research study. This additional heat-set temperature
is required to increase the glass transition (Tg) temperature of the material, and enhance
morphological changes which yield improved dimensional stability of the container.
Chapter 4 ISBM Experimental Set-up Procedure and Bottle Characterisation
79
Due to the initial validation process, a new temperature range was considered. Knowledge
concerning the influence of low heat-set temperatures affecting hot-fill shrinkage (S2) was
required. This knowledge would provide an understanding concerning the final hot-fill
shrinkage (S2) results influenced via strain induced crystallisation. The current evidence
indicates strain induced crystallisation can further enhance dimensional stability of a PET
container at elevated hot-fill temperatures.
The existing body of knowledge indicates hot-fill shrinkage S2 can be minimised with
low heat-set temperatures (Greener et al. 1999; Maruhashi et al. 1992a). The final
shrinkage remains low, regardless of the degree of draw ratio. Moreover, the influence of
preform surface temperatures and its influence on the final hot-fill shrinkage (S2) needed
to be investigated (Greener et al. 1999; Maruhashi et al. 1992a). Therefore, a thorough
knowledge of virgin - RPET blends and its influence via low heat-set temperatures and
its domination on dimensional stability at elevated temperatures was considered.
4.2. Heat-set Capabilities of ISBM Heater Cartridges of 240 Volts (V), 380 Watts (W) were used to heat the blow mould
cavity block. Equation 4.2-1 is used to determine the energy required to heat the
aluminium blow mould cavity block expressed as
TmCQ p Δ××=
Equation 4.2-1
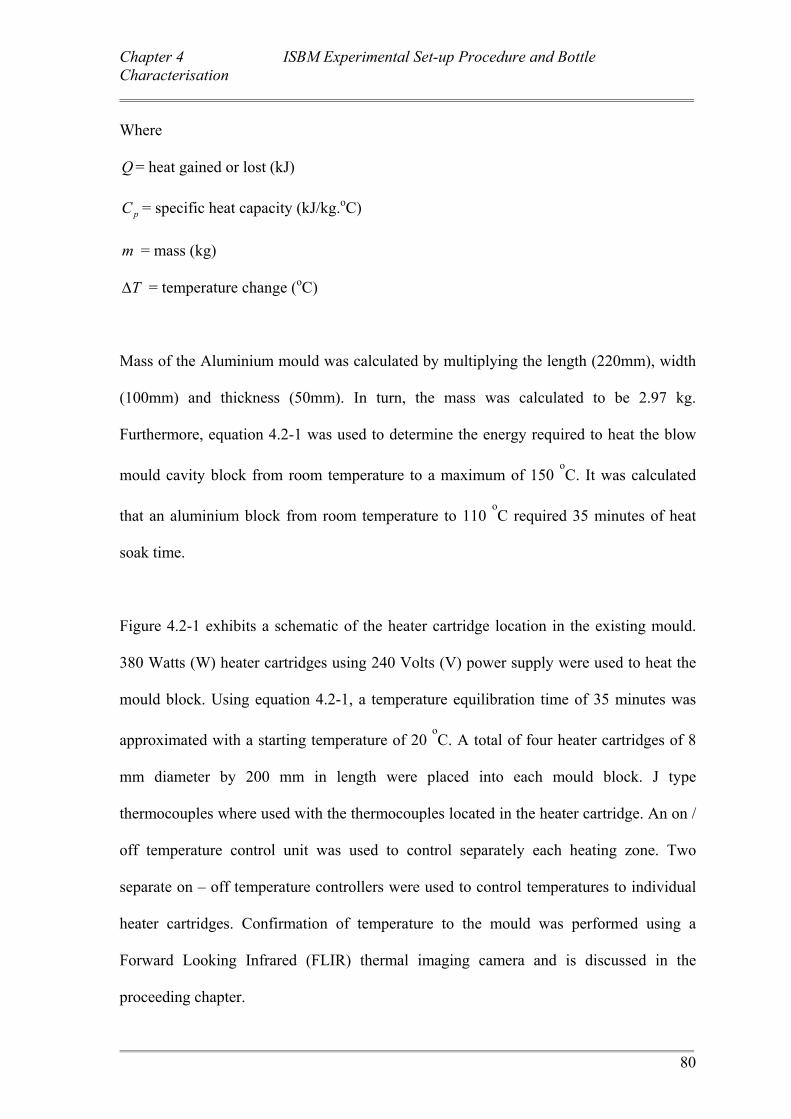
Chapter 4 ISBM Experimental Set-up Procedure and Bottle Characterisation
80
Where
Q = heat gained or lost (kJ)
pC = specific heat capacity (kJ/kg.oC)
m = mass (kg)
TΔ = temperature change (oC)
Mass of the Aluminium mould was calculated by multiplying the length (220mm), width
(100mm) and thickness (50mm). In turn, the mass was calculated to be 2.97 kg.
Furthermore, equation 4.2-1 was used to determine the energy required to heat the blow
mould cavity block from room temperature to a maximum of 150 oC. It was calculated
that an aluminium block from room temperature to 110 oC required 35 minutes of heat
soak time.
Figure 4.2-1 exhibits a schematic of the heater cartridge location in the existing mould.
380 Watts (W) heater cartridges using 240 Volts (V) power supply were used to heat the
mould block. Using equation 4.2-1, a temperature equilibration time of 35 minutes was
approximated with a starting temperature of 20 oC. A total of four heater cartridges of 8
mm diameter by 200 mm in length were placed into each mould block. J type
thermocouples where used with the thermocouples located in the heater cartridge. An on /
off temperature control unit was used to control separately each heating zone. Two
separate on – off temperature controllers were used to control temperatures to individual
heater cartridges. Confirmation of temperature to the mould was performed using a
Forward Looking Infrared (FLIR) thermal imaging camera and is discussed in the
proceeding chapter.
Chapter 4 ISBM Experimental Set-up Procedure and Bottle Characterisation
81
Figure 4.2-1 Schematic of heater cartridge location with reference to the 375 ml blow
moulding cavity
Further experiments were conducted with improved heat-set capacity. Additional fine
tuning – adjustment to barrel and hot runner temperatures – to run a stable process was
accomplished. The manufacturing of quality PET bottles was paramount. An approach
was taken to manufacture PET beverage containers that would meet industry standards.
Experimental runs included SkyPET BB7755 material as the baseline material.
The process was considered optimum once quality bottles had been achieved without
defects or visual blemishes. Production trials included obtaining the maximum and
8mm
70 mm
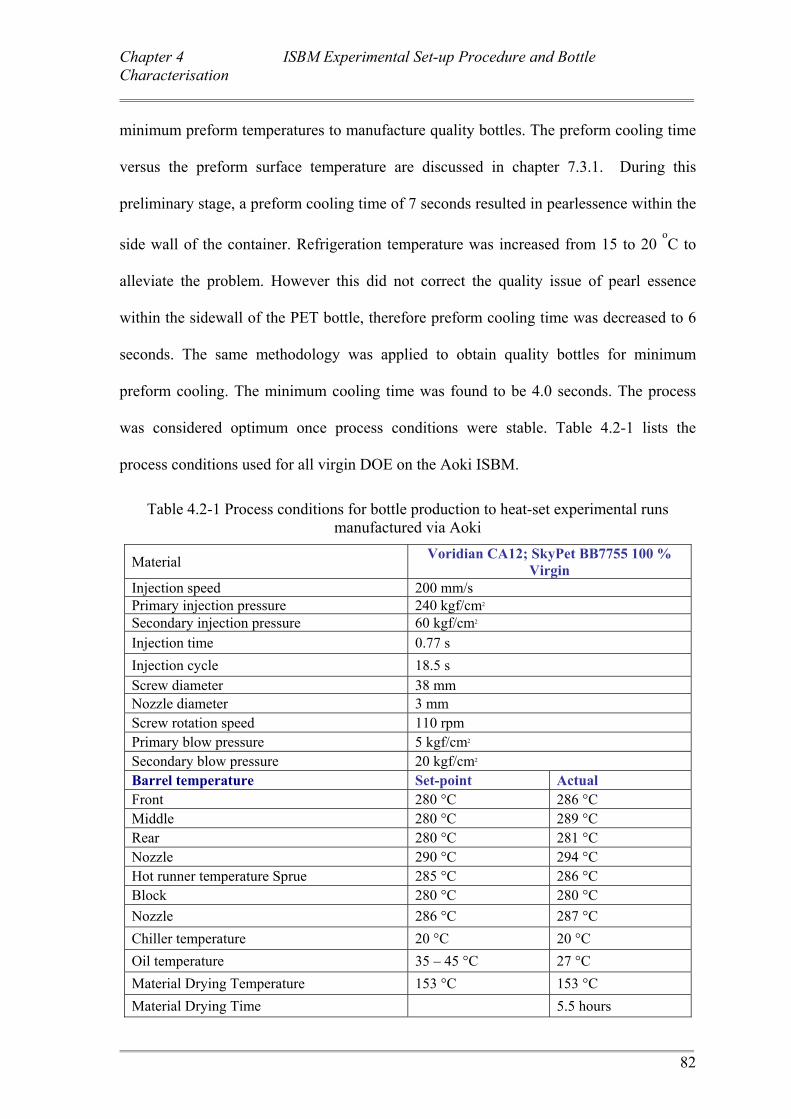
Chapter 4 ISBM Experimental Set-up Procedure and Bottle Characterisation
82
minimum preform temperatures to manufacture quality bottles. The preform cooling time
versus the preform surface temperature are discussed in chapter 7.3.1. During this
preliminary stage, a preform cooling time of 7 seconds resulted in pearlessence within the
side wall of the container. Refrigeration temperature was increased from 15 to 20 oC to
alleviate the problem. However this did not correct the quality issue of pearl essence
within the sidewall of the PET bottle, therefore preform cooling time was decreased to 6
seconds. The same methodology was applied to obtain quality bottles for minimum
preform cooling. The minimum cooling time was found to be 4.0 seconds. The process
was considered optimum once process conditions were stable. Table 4.2-1 lists the
process conditions used for all virgin DOE on the Aoki ISBM.
Table 4.2-1 Process conditions for bottle production to heat-set experimental runs manufactured via Aoki
Material Voridian CA12; SkyPet BB7755 100 % Virgin
Injection speed 200 mm/s Primary injection pressure 240 kgf/cm2
Secondary injection pressure 60 kgf/cm2
Injection time 0.77 s Injection cycle 18.5 s Screw diameter 38 mm Nozzle diameter 3 mm Screw rotation speed 110 rpm Primary blow pressure 5 kgf/cm2 Secondary blow pressure 20 kgf/cm2 Barrel temperature Set-point Actual Front 280 °C 286 °C Middle 280 °C 289 °C Rear 280 °C 281 °C Nozzle 290 °C 294 °C Hot runner temperature Sprue 285 °C 286 °C Block 280 °C 280 °C Nozzle 286 °C 287 °C Chiller temperature 20 °C 20 °C Oil temperature 35 – 45 °C 27 °C Material Drying Temperature 153 °C 153 °C Material Drying Time 5.5 hours
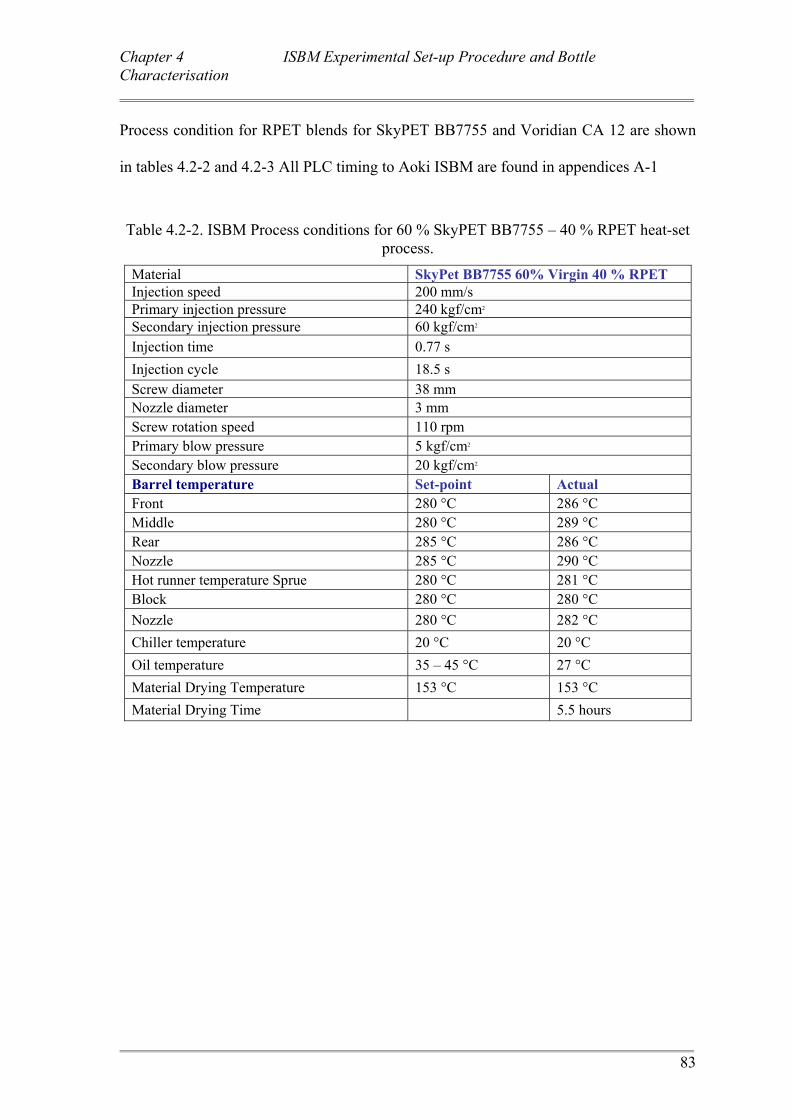
Chapter 4 ISBM Experimental Set-up Procedure and Bottle Characterisation
83
Process condition for RPET blends for SkyPET BB7755 and Voridian CA 12 are shown
in tables 4.2-2 and 4.2-3 All PLC timing to Aoki ISBM are found in appendices A-1
Table 4.2-2. ISBM Process conditions for 60 % SkyPET BB7755 – 40 % RPET heat-set process.
Material SkyPet BB7755 60% Virgin 40 % RPET Injection speed 200 mm/s Primary injection pressure 240 kgf/cm2
Secondary injection pressure 60 kgf/cm2
Injection time 0.77 s Injection cycle 18.5 s Screw diameter 38 mm Nozzle diameter 3 mm Screw rotation speed 110 rpm Primary blow pressure 5 kgf/cm2 Secondary blow pressure 20 kgf/cm2 Barrel temperature Set-point Actual Front 280 °C 286 °C Middle 280 °C 289 °C Rear 285 °C 286 °C Nozzle 285 °C 290 °C Hot runner temperature Sprue 280 °C 281 °C Block 280 °C 280 °C Nozzle 280 °C 282 °C Chiller temperature 20 °C 20 °C Oil temperature 35 – 45 °C 27 °C Material Drying Temperature 153 °C 153 °C Material Drying Time 5.5 hours
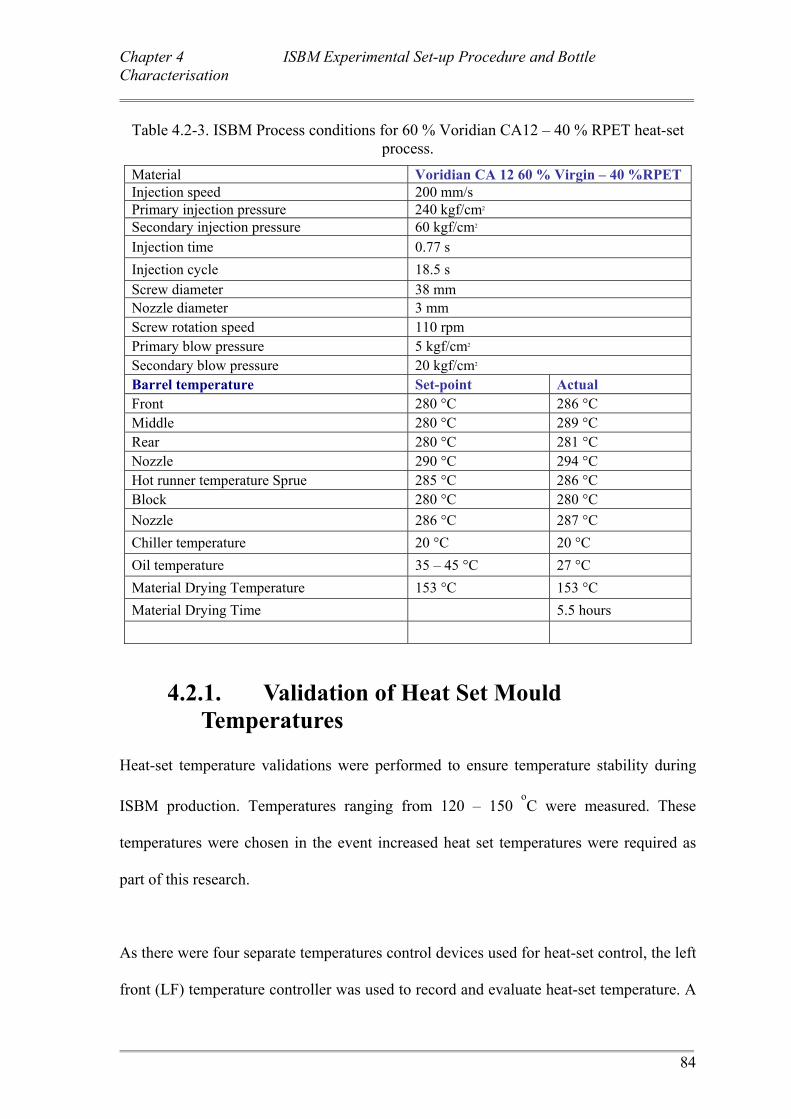
Chapter 4 ISBM Experimental Set-up Procedure and Bottle Characterisation
84
Table 4.2-3. ISBM Process conditions for 60 % Voridian CA12 – 40 % RPET heat-set process.
Material Voridian CA 12 60 % Virgin – 40 %RPET Injection speed 200 mm/s Primary injection pressure 240 kgf/cm2
Secondary injection pressure 60 kgf/cm2
Injection time 0.77 s Injection cycle 18.5 s Screw diameter 38 mm Nozzle diameter 3 mm Screw rotation speed 110 rpm Primary blow pressure 5 kgf/cm2 Secondary blow pressure 20 kgf/cm2 Barrel temperature Set-point Actual Front 280 °C 286 °C Middle 280 °C 289 °C Rear 280 °C 281 °C Nozzle 290 °C 294 °C Hot runner temperature Sprue 285 °C 286 °C Block 280 °C 280 °C Nozzle 286 °C 287 °C Chiller temperature 20 °C 20 °C Oil temperature 35 – 45 °C 27 °C Material Drying Temperature 153 °C 153 °C Material Drying Time 5.5 hours
4.2.1. Validation of Heat Set Mould Temperatures
Heat-set temperature validations were performed to ensure temperature stability during
ISBM production. Temperatures ranging from 120 – 150 oC were measured. These
temperatures were chosen in the event increased heat set temperatures were required as
part of this research.
As there were four separate temperatures control devices used for heat-set control, the left
front (LF) temperature controller was used to record and evaluate heat-set temperature. A
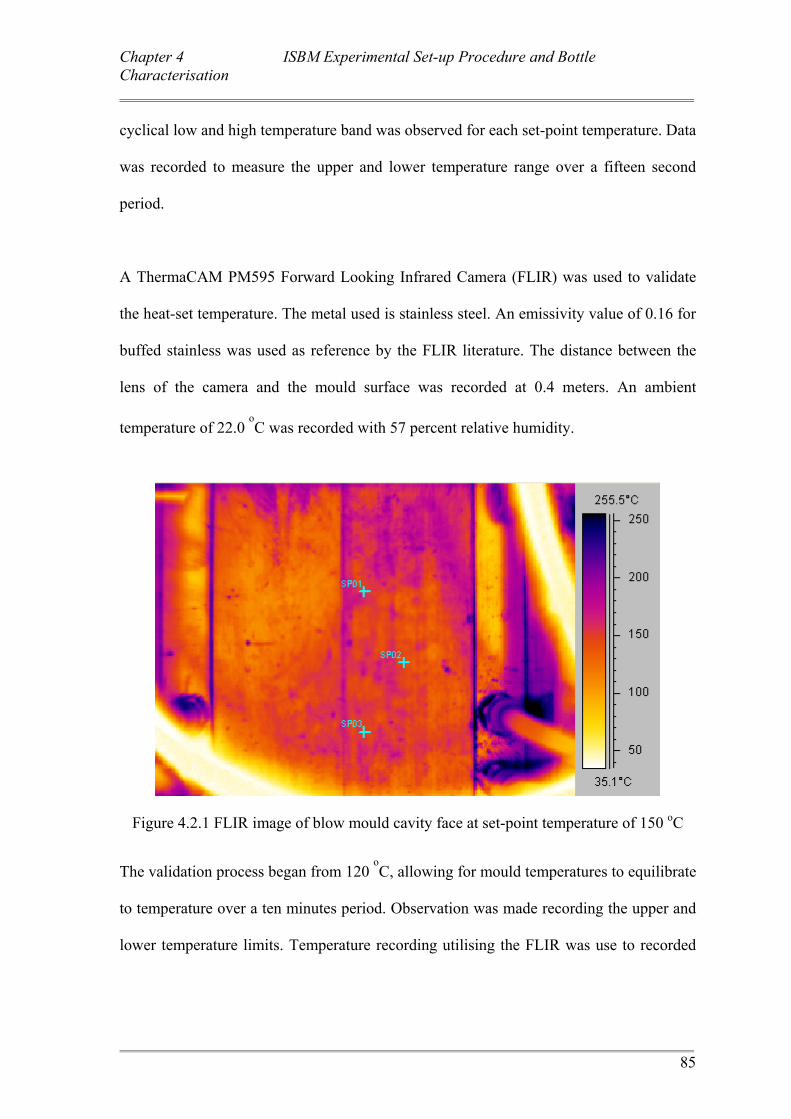
Chapter 4 ISBM Experimental Set-up Procedure and Bottle Characterisation
85
cyclical low and high temperature band was observed for each set-point temperature. Data
was recorded to measure the upper and lower temperature range over a fifteen second
period.
A ThermaCAM PM595 Forward Looking Infrared Camera (FLIR) was used to validate
the heat-set temperature. The metal used is stainless steel. An emissivity value of 0.16 for
buffed stainless was used as reference by the FLIR literature. The distance between the
lens of the camera and the mould surface was recorded at 0.4 meters. An ambient
temperature of 22.0 oC was recorded with 57 percent relative humidity.
Figure 4.2.1 FLIR image of blow mould cavity face at set-point temperature of 150 oC
The validation process began from 120
oC, allowing for mould temperatures to equilibrate
to temperature over a ten minutes period. Observation was made recording the upper and
lower temperature limits. Temperature recording utilising the FLIR was use to recorded
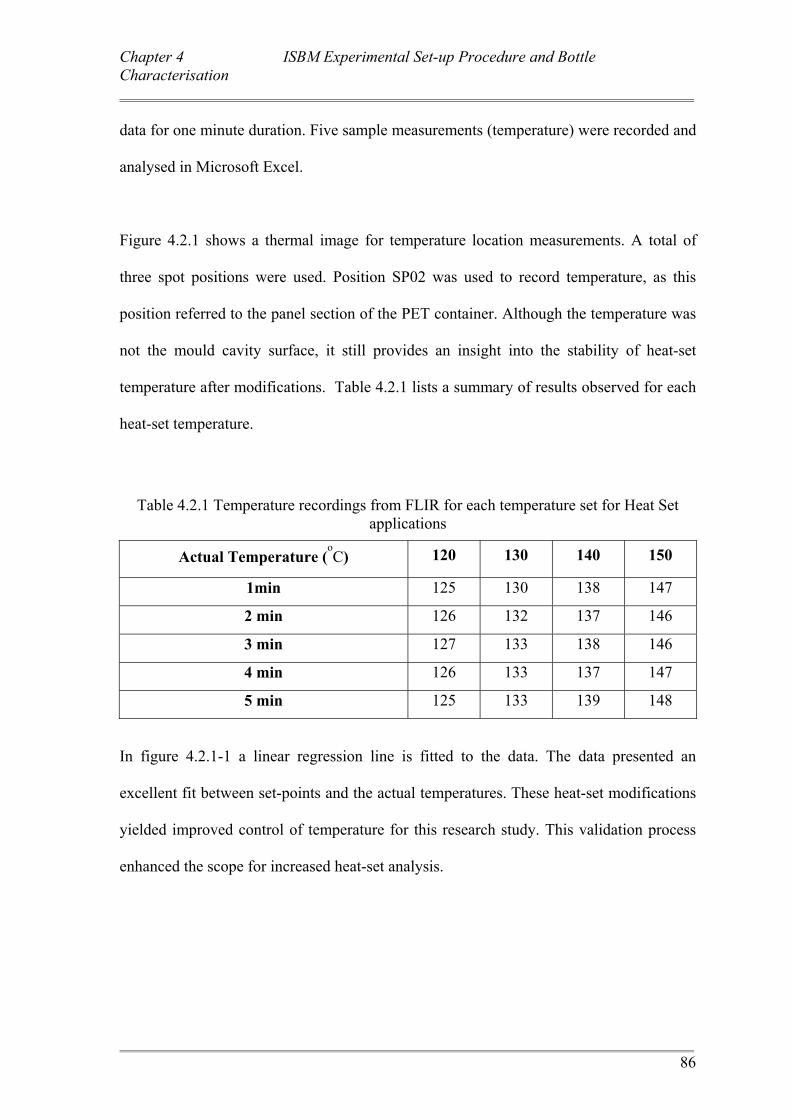
Chapter 4 ISBM Experimental Set-up Procedure and Bottle Characterisation
86
data for one minute duration. Five sample measurements (temperature) were recorded and
analysed in Microsoft Excel.
Figure 4.2.1 shows a thermal image for temperature location measurements. A total of
three spot positions were used. Position SP02 was used to record temperature, as this
position referred to the panel section of the PET container. Although the temperature was
not the mould cavity surface, it still provides an insight into the stability of heat-set
temperature after modifications. Table 4.2.1 lists a summary of results observed for each
heat-set temperature.
Table 4.2.1 Temperature recordings from FLIR for each temperature set for Heat Set applications
Actual Temperature (oC) 120 130 140 150
1min 125 130 138 147
2 min 126 132 137 146
3 min 127 133 138 146
4 min 126 133 137 147
5 min 125 133 139 148
In figure 4.2.1-1 a linear regression line is fitted to the data. The data presented an
excellent fit between set-points and the actual temperatures. These heat-set modifications
yielded improved control of temperature for this research study. This validation process
enhanced the scope for increased heat-set analysis.
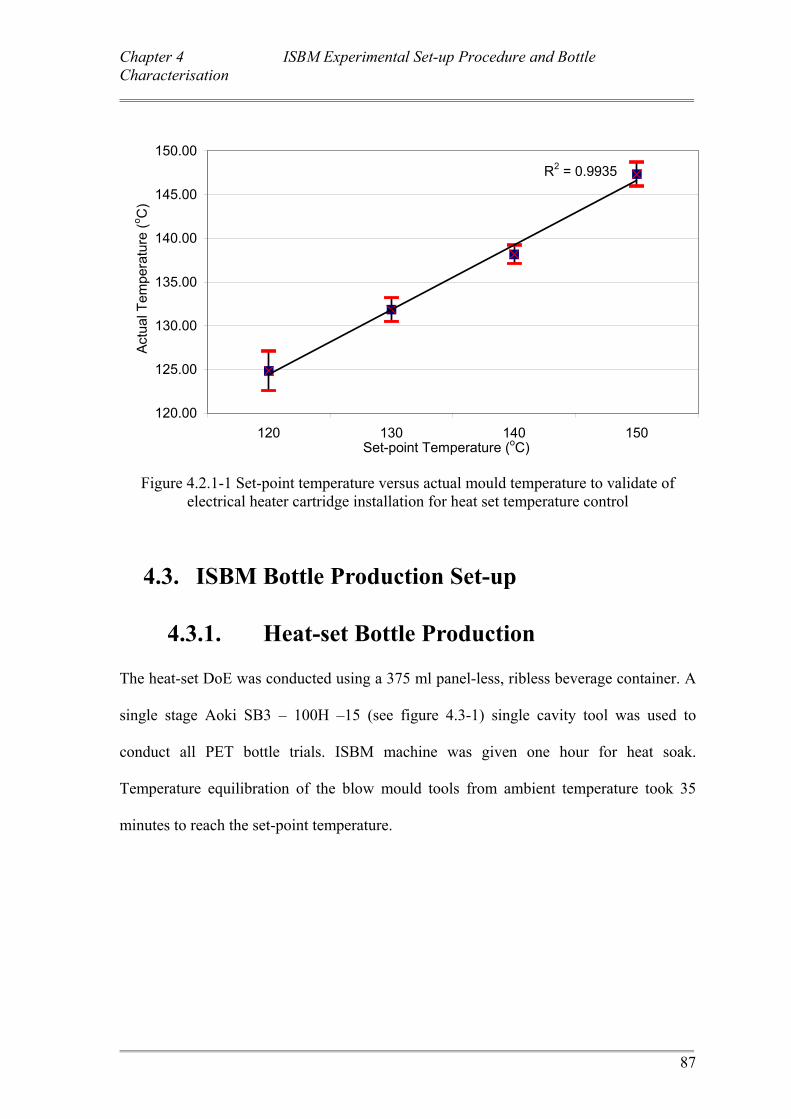
Chapter 4 ISBM Experimental Set-up Procedure and Bottle Characterisation
87
R2 = 0.9935
120.00
125.00
130.00
135.00
140.00
145.00
150.00
120 130 140 150Set-point Temperature (oC)
Actu
al T
empe
ratu
re (o C
)
Figure 4.2.1-1 Set-point temperature versus actual mould temperature to validate of electrical heater cartridge installation for heat set temperature control
4.3. ISBM Bottle Production Set-up
4.3.1. Heat-set Bottle Production The heat-set DoE was conducted using a 375 ml panel-less, ribless beverage container. A
single stage Aoki SB3 – 100H –15 (see figure 4.3-1) single cavity tool was used to
conduct all PET bottle trials. ISBM machine was given one hour for heat soak.
Temperature equilibration of the blow mould tools from ambient temperature took 35
minutes to reach the set-point temperature.
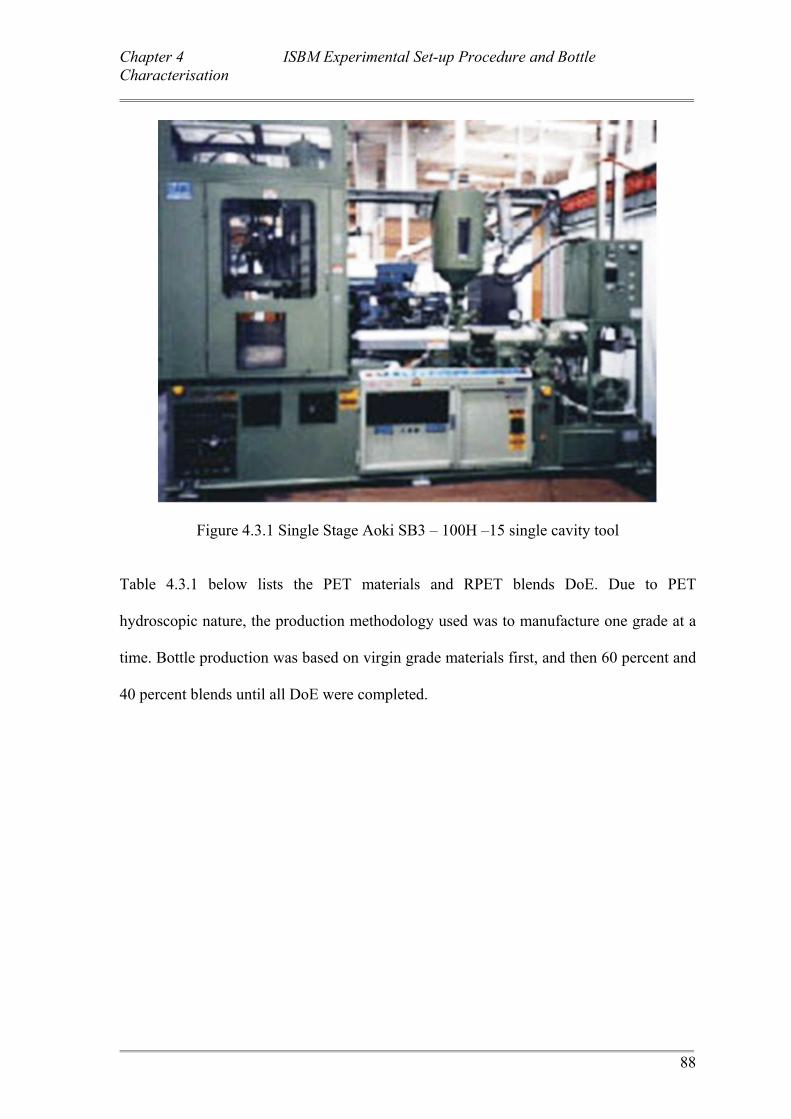
Chapter 4 ISBM Experimental Set-up Procedure and Bottle Characterisation
88
Figure 4.3.1 Single Stage Aoki SB3 – 100H –15 single cavity tool
Table 4.3.1 below lists the PET materials and RPET blends DoE. Due to PET
hydroscopic nature, the production methodology used was to manufacture one grade at a
time. Bottle production was based on virgin grade materials first, and then 60 percent and
40 percent blends until all DoE were completed.
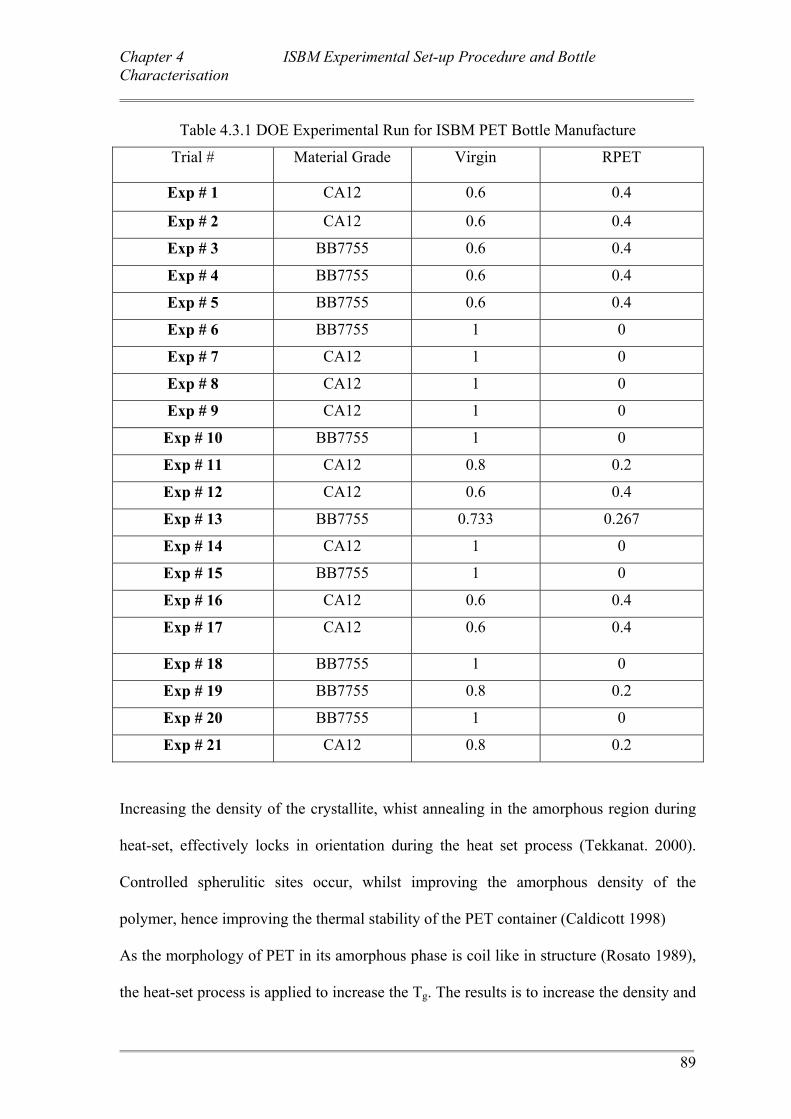
Chapter 4 ISBM Experimental Set-up Procedure and Bottle Characterisation
89
Table 4.3.1 DOE Experimental Run for ISBM PET Bottle Manufacture
Trial # Material Grade Virgin RPET
Exp # 1 CA12 0.6 0.4
Exp # 2 CA12 0.6 0.4
Exp # 3 BB7755 0.6 0.4
Exp # 4 BB7755 0.6 0.4
Exp # 5 BB7755 0.6 0.4
Exp # 6 BB7755 1 0
Exp # 7 CA12 1 0
Exp # 8 CA12 1 0
Exp # 9 CA12 1 0
Exp # 10 BB7755 1 0
Exp # 11 CA12 0.8 0.2
Exp # 12 CA12 0.6 0.4
Exp # 13 BB7755 0.733 0.267
Exp # 14 CA12 1 0
Exp # 15 BB7755 1 0
Exp # 16 CA12 0.6 0.4
Exp # 17 CA12 0.6 0.4
Exp # 18 BB7755 1 0
Exp # 19 BB7755 0.8 0.2
Exp # 20 BB7755 1 0
Exp # 21 CA12 0.8 0.2
Increasing the density of the crystallite, whist annealing in the amorphous region during
heat-set, effectively locks in orientation during the heat set process (Tekkanat. 2000).
Controlled spherulitic sites occur, whilst improving the amorphous density of the
polymer, hence improving the thermal stability of the PET container (Caldicott 1998)
As the morphology of PET in its amorphous phase is coil like in structure (Rosato 1989),
the heat-set process is applied to increase the Tg. The results is to increase the density and
Chapter 4 ISBM Experimental Set-up Procedure and Bottle Characterisation
90
size of the crystallite, hence control spherulitic size within the side walls of the PET
container (Tekkanat 2000). This allows nucleation with the inclusion of RPET and
growth of high temperature stable crystal sites within the amorphous phase. Of particular
interest is to increase the nucleation and crystal growth within the sidewall of a PET
container.
4.3.2. Infrared Camera Set-up The temperature of the PET surface preform was recorded by a ThermaCAM PM595
Forward Looking Infrared Camera (FLIR). The emissivity value was determined
measuring a single point temperature within a heated preform. The emissivity of the IR
camera was then altered until good temperature agreement was made between the single
point temperature via a hand held thermocouple and the IR camera. The ambient
temperature and relative humidity was recorded using a thermo-hygrometer Testo 610
relative humidity and temperature control device. The distance between the preform and
the FLIR was measured between the lens of the FLIR and the preform
During the manufacturing process, the ThermaCAM TM Infrared (IR) camera incorporated
a built-in 24 o optical lens to measure preform surface temperatures for each DoE. At the
conclusion of each experimental run, the preform surface temperature was recorded.
Three reference points were recorded. The recording of preform surface temperatures is
important as studies have demonstrated a reduction of process (S1) and hot-fill (S2)
shrinkage with increased preform surface temperatures (Nakamura 1989).
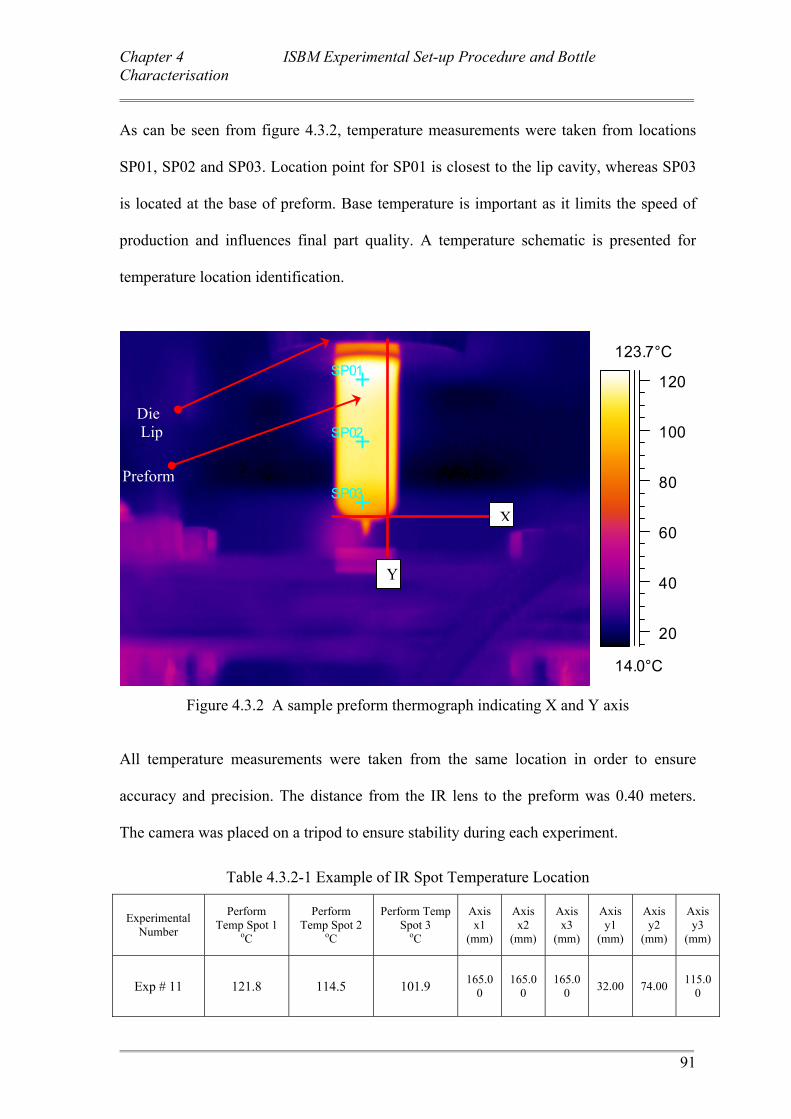
Chapter 4 ISBM Experimental Set-up Procedure and Bottle Characterisation
91
As can be seen from figure 4.3.2, temperature measurements were taken from locations
SP01, SP02 and SP03. Location point for SP01 is closest to the lip cavity, whereas SP03
is located at the base of preform. Base temperature is important as it limits the speed of
production and influences final part quality. A temperature schematic is presented for
temperature location identification.
14.0°C
123.7°C
20
40
60
80
100
120SP01
SP02
SP03
Figure 4.3.2 A sample preform thermograph indicating X and Y axis
All temperature measurements were taken from the same location in order to ensure
accuracy and precision. The distance from the IR lens to the preform was 0.40 meters.
The camera was placed on a tripod to ensure stability during each experiment.
Table 4.3.2-1 Example of IR Spot Temperature Location
Experimental Number
Perform Temp Spot 1
oC
Perform Temp Spot 2
oC
Perform Temp Spot 3
oC
Axis x1
(mm)
Axis x2
(mm)
Axis x3
(mm)
Axis y1
(mm)
Axis y2
(mm)
Axis y3
(mm)
Exp # 11 121.8 114.5 101.9 165.00
165.00
165.00 32.00 74.00 115.0
0
X
Y
Preform
Die Lip C
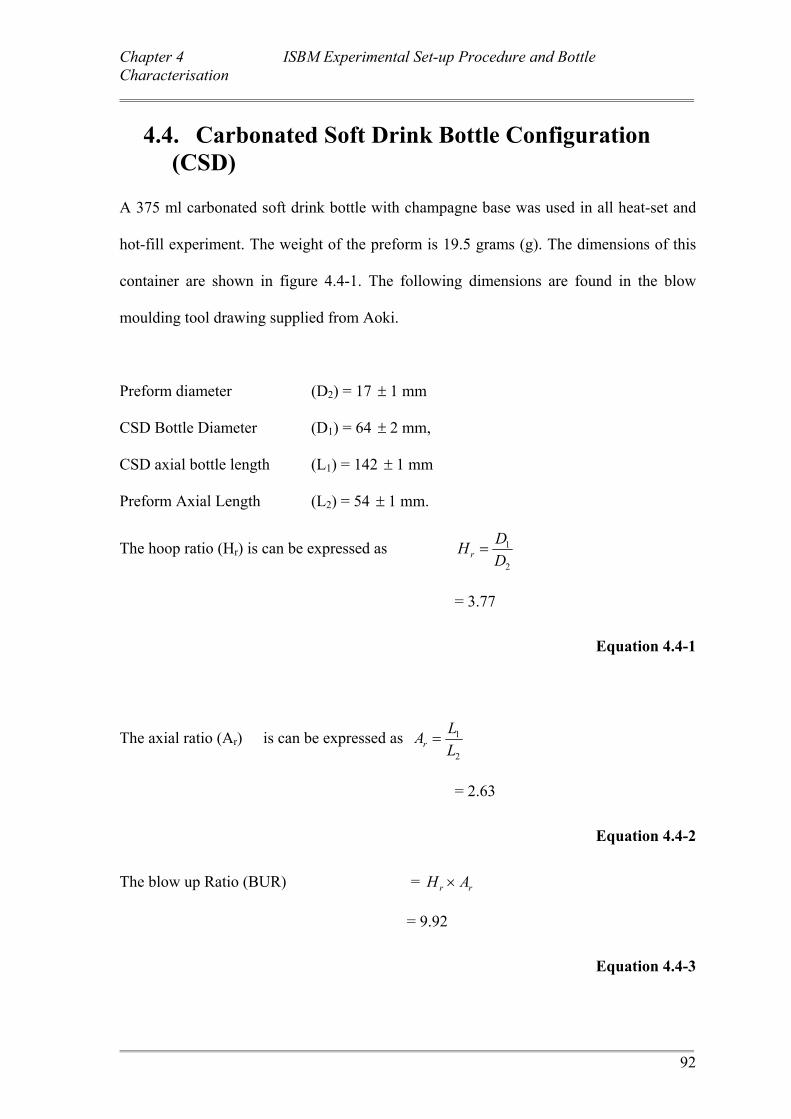
Chapter 4 ISBM Experimental Set-up Procedure and Bottle Characterisation
92
4.4. Carbonated Soft Drink Bottle Configuration (CSD)
A 375 ml carbonated soft drink bottle with champagne base was used in all heat-set and
hot-fill experiment. The weight of the preform is 19.5 grams (g). The dimensions of this
container are shown in figure 4.4-1. The following dimensions are found in the blow
moulding tool drawing supplied from Aoki.
Preform diameter (D2) = 17 ± 1 mm
CSD Bottle Diameter (D1) = 64 ± 2 mm,
CSD axial bottle length (L1) = 142 ± 1 mm
Preform Axial Length (L2) = 54 ± 1 mm.
The hoop ratio (Hr) is can be expressed as 2
1
DDHr =
= 3.77
Equation 4.4-1
The axial ratio (Ar) is can be expressed as 2
1
LLAr =
= 2.63
Equation 4.4-2
The blow up Ratio (BUR) = rr AH ×
= 9.92
Equation 4.4-3
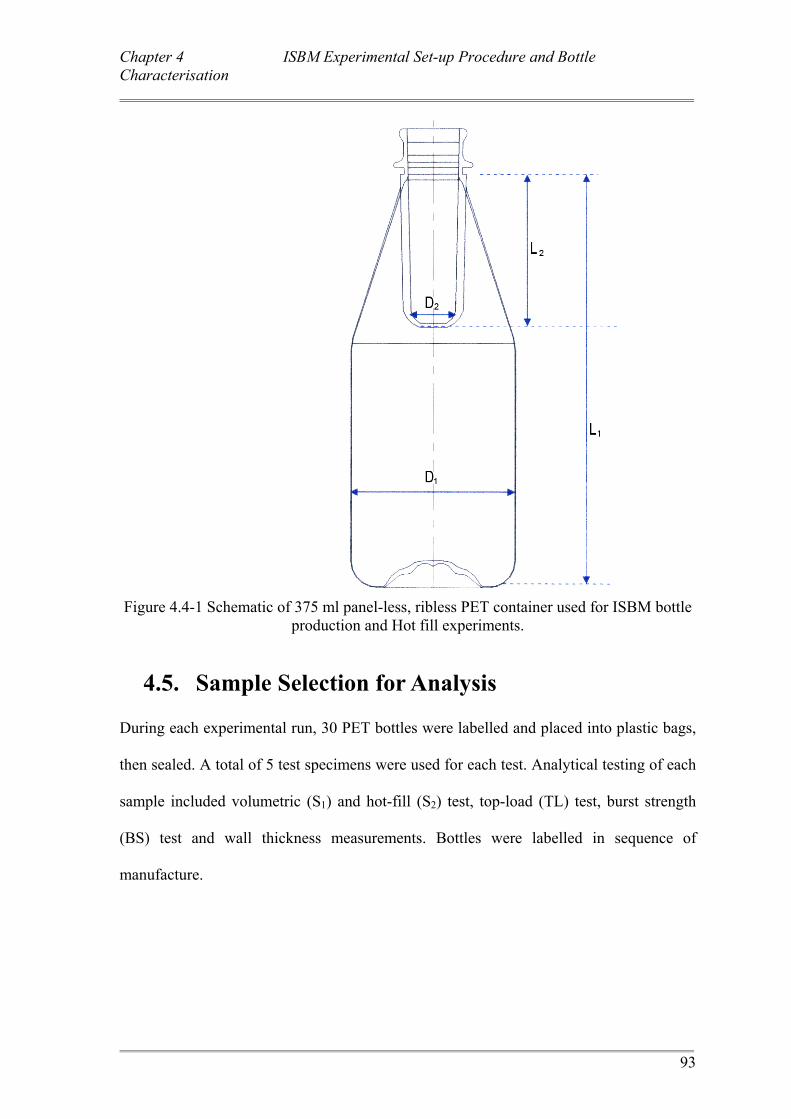
Chapter 4 ISBM Experimental Set-up Procedure and Bottle Characterisation
93
Figure 4.4-1 Schematic of 375 ml panel-less, ribless PET container used for ISBM bottle
production and Hot fill experiments.
4.5. Sample Selection for Analysis During each experimental run, 30 PET bottles were labelled and placed into plastic bags,
then sealed. A total of 5 test specimens were used for each test. Analytical testing of each
sample included volumetric (S1) and hot-fill (S2) test, top-load (TL) test, burst strength
(BS) test and wall thickness measurements. Bottles were labelled in sequence of
manufacture.
Chapter 4 ISBM Experimental Set-up Procedure and Bottle Characterisation
94
4.6. Thermal Stability at Elevated Temperature
Characterisation
4.6.1. Volume Capacity Determination All PET beverage containers were weighed to record each container’s volume capacity.
Each container was conditioned for one week. As PET is a semi crystalline material, most
of its shrinkage takes place between twenty four to forty eight hours. Time was given for
each container to shrink within the given time period. All bottles were filled at 21 oC with
tepid water. An electronic scale was used to record each beverage containers weight. The
final process shrinkage (S1) is determined via equation 4.6.1-1
1000
101 ×
−=
VVVS
Equation 4.6.1-1
Where
1S = Process Shrinkage
0V = Volume of 375 ml CSD PET container to meniscus level
1V = Volume of heat-set beverage container
Chapter 4 ISBM Experimental Set-up Procedure and Bottle Characterisation
95
4.6.2. Hot-fill Procedure The hot-fill method used implemented current industry hot-fill practices (Tekkanat 2000).
An 8 litre capacity urn was used. The urn had temperature tolerance of ± 1 oC. The
temperature was set to 85 oC. Crown seals measuring 28 mm were used to seal each PET
container. The each crown seal was applied by utilising a manual crown seal closure
device.
Tepid water was used to fill the urn to 8 litre capacity. Once the water reached 85 oC, a
further 30 minutes was given to ensure that the water temperature reached equilibration.
A manual thermometer was used to confirm water temperature had reached the set-point
temperature.
Each bottle was filled until heated water reached the undercut (u) level of the CSD bottle.
This is approximately 16 mm from the top of the seal bottle surface (H) as shown in
4.6.2-1. It is important to note that initial shrinkage takes places during this time. Speed in
placing the crown seal on each beverage container and sealing the neck surface is
imperative. Upon completion, the PET container was allowed to stand on its base for a
duration of 60 sec. The beverage container was laid on its side for 5 minutes. After 300
seconds, the beverage container was immersed in a cold water bath.
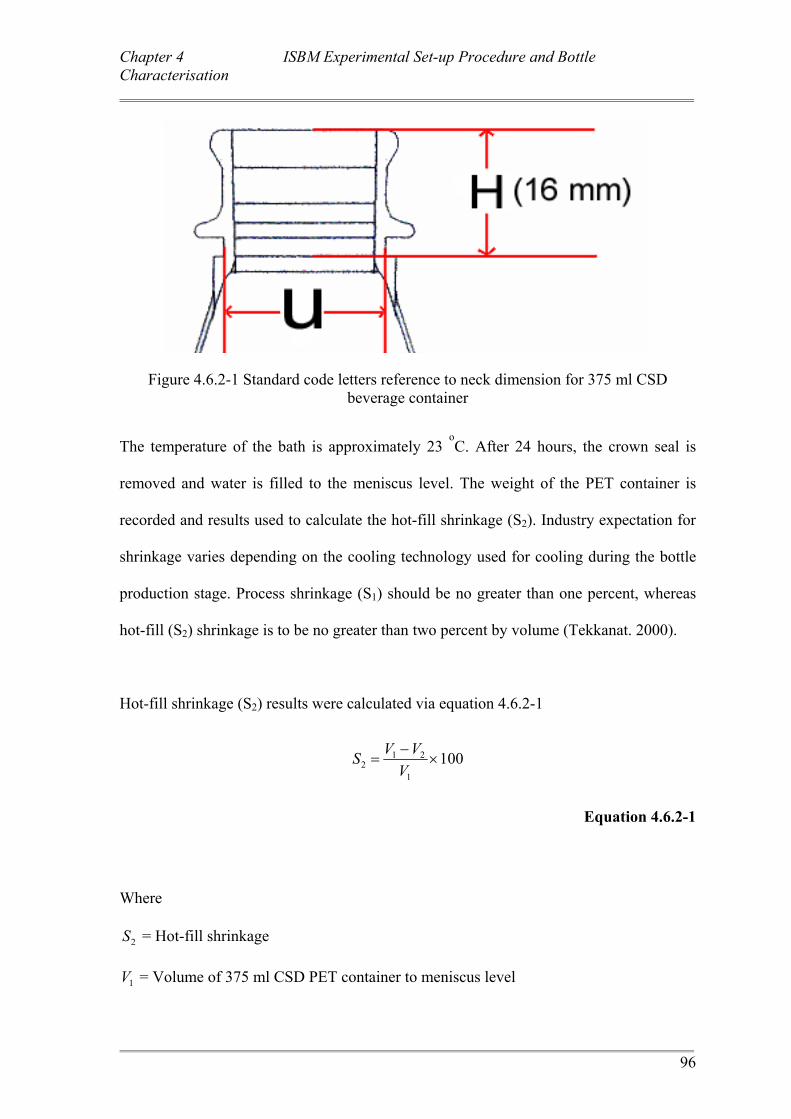
Chapter 4 ISBM Experimental Set-up Procedure and Bottle Characterisation
96
Figure 4.6.2-1 Standard code letters reference to neck dimension for 375 ml CSD beverage container
The temperature of the bath is approximately 23
oC. After 24 hours, the crown seal is
removed and water is filled to the meniscus level. The weight of the PET container is
recorded and results used to calculate the hot-fill shrinkage (S2). Industry expectation for
shrinkage varies depending on the cooling technology used for cooling during the bottle
production stage. Process shrinkage (S1) should be no greater than one percent, whereas
hot-fill (S2) shrinkage is to be no greater than two percent by volume (Tekkanat. 2000).
Hot-fill shrinkage (S2) results were calculated via equation 4.6.2-1
1001
212 ×
−=
VVVS
Equation 4.6.2-1
Where
2S = Hot-fill shrinkage
1V = Volume of 375 ml CSD PET container to meniscus level
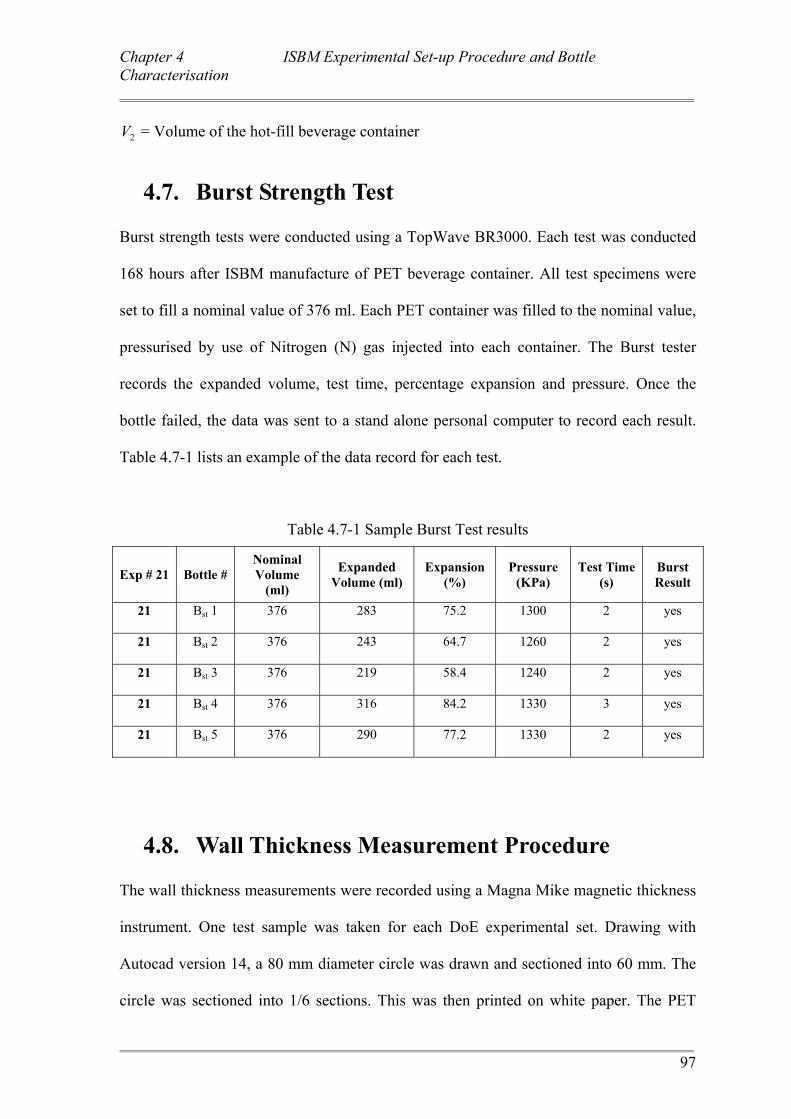
Chapter 4 ISBM Experimental Set-up Procedure and Bottle Characterisation
97
2V = Volume of the hot-fill beverage container
4.7. Burst Strength Test Burst strength tests were conducted using a TopWave BR3000. Each test was conducted
168 hours after ISBM manufacture of PET beverage container. All test specimens were
set to fill a nominal value of 376 ml. Each PET container was filled to the nominal value,
pressurised by use of Nitrogen (N) gas injected into each container. The Burst tester
records the expanded volume, test time, percentage expansion and pressure. Once the
bottle failed, the data was sent to a stand alone personal computer to record each result.
Table 4.7-1 lists an example of the data record for each test.
Table 4.7-1 Sample Burst Test results
Exp # 21 Bottle # Nominal Volume
(ml)
Expanded Volume (ml)
Expansion (%)
Pressure (KPa)
Test Time (s)
Burst Result
21 Bst 1 376 283 75.2 1300 2 yes
21 Bst 2 376 243 64.7 1260 2 yes
21 Bst 3 376 219 58.4 1240 2 yes
21 Bst 4 376 316 84.2 1330 3 yes
21 Bst 5 376 290 77.2 1330 2 yes
4.8. Wall Thickness Measurement Procedure The wall thickness measurements were recorded using a Magna Mike magnetic thickness
instrument. One test sample was taken for each DoE experimental set. Drawing with
Autocad version 14, a 80 mm diameter circle was drawn and sectioned into 60 mm. The
circle was sectioned into 1/6 sections. This was then printed on white paper. The PET
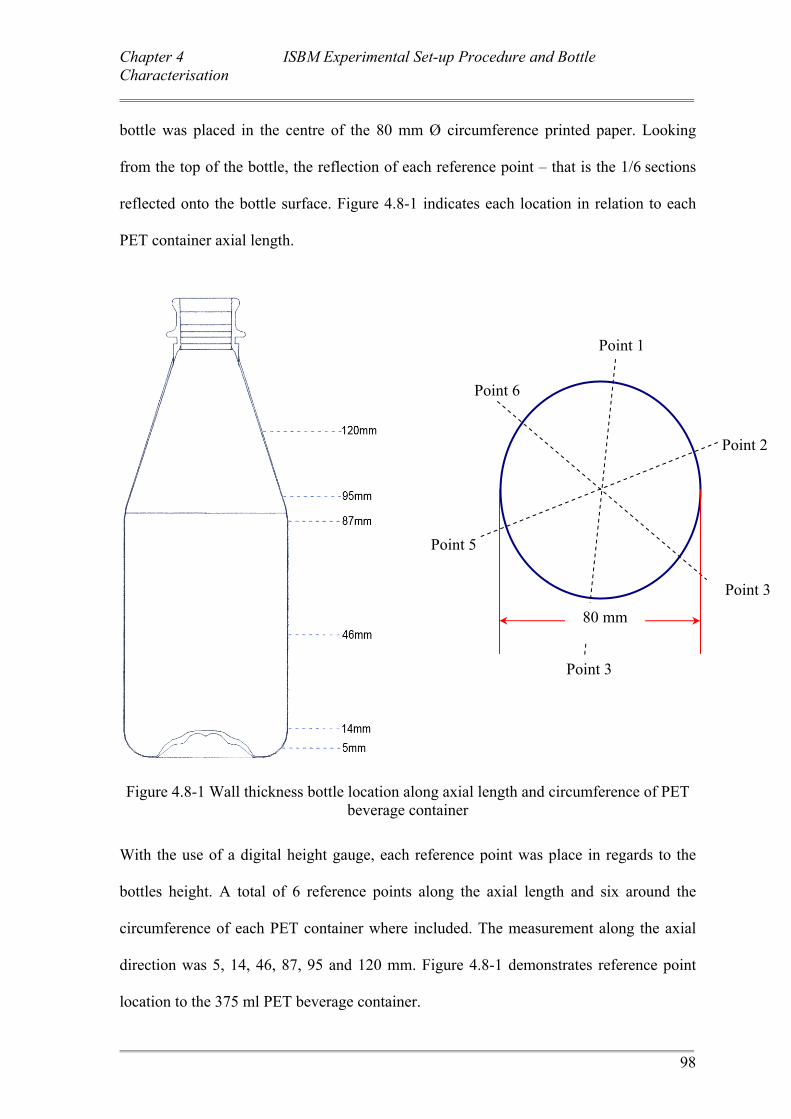
Chapter 4 ISBM Experimental Set-up Procedure and Bottle Characterisation
98
bottle was placed in the centre of the 80 mm Ø circumference printed paper. Looking
from the top of the bottle, the reflection of each reference point – that is the 1/6 sections
reflected onto the bottle surface. Figure 4.8-1 indicates each location in relation to each
PET container axial length.
Figure 4.8-1 Wall thickness bottle location along axial length and circumference of PET beverage container
With the use of a digital height gauge, each reference point was place in regards to the
bottles height. A total of 6 reference points along the axial length and six around the
circumference of each PET container where included. The measurement along the axial
direction was 5, 14, 46, 87, 95 and 120 mm. Figure 4.8-1 demonstrates reference point
location to the 375 ml PET beverage container.
Point 1
Point 2
Point 3
Point 6
Point 5
Point 3
80 mm
Chapter 4 ISBM Experimental Set-up Procedure and Bottle Characterisation
99
Measurements 5 – 125 mm were marked perpendicular to the bottle. This ensures straight
lines and accurate reproduction of bottle markings for each experimental set. Table 4.8-1
provides an example of each reference point around the bottles circumference in relations
to the bottles height.
Table 4.8-1 A sample measurement positions for wall thickness location
Exp #
11 Measurement
Base Radius
5mm
Panel Base 14
mm
Panel Middle
46 mm
Panel Top
87 mm
Shoulder
Bottom 95
mm
Shoulder
Middle
120 mm
Point # 1 0.423 0.358 0.288 0.283 0.302 0.394
Point # 2 0.391 0.326 0.293 0.293 0.299 0.364
Point # 3 0.36 0.319 0.287 0.277 0.295 0.374
Point # 4 0.407 0.33 0.29 0.279 0.293 0.366
Point # 5 0.553 0.38 0.313 0.295 0.311 0.403
Point # 6 0.536 0.371 0.296 0.304 0.312 0.407
4.9. Mechanical Characterisation
4.9.1. Top Load Procedure Top load test were conducted utilising an Instron 4466 tensile tester. Each bottle was
placed between two horizontal plates. The tensile tester had been set to compression
mode. Each test required wall thickness average measurements, height of PET containers
and diameter average for each beverage container. A cross head speed of 10 mm / minute
was used recording 10 point per second. The results were transferred and analysed using
Instron Series IX software. Figure 4.9.1-1 demonstrates an example top load result plotted
with Microsoft Excel 2003.
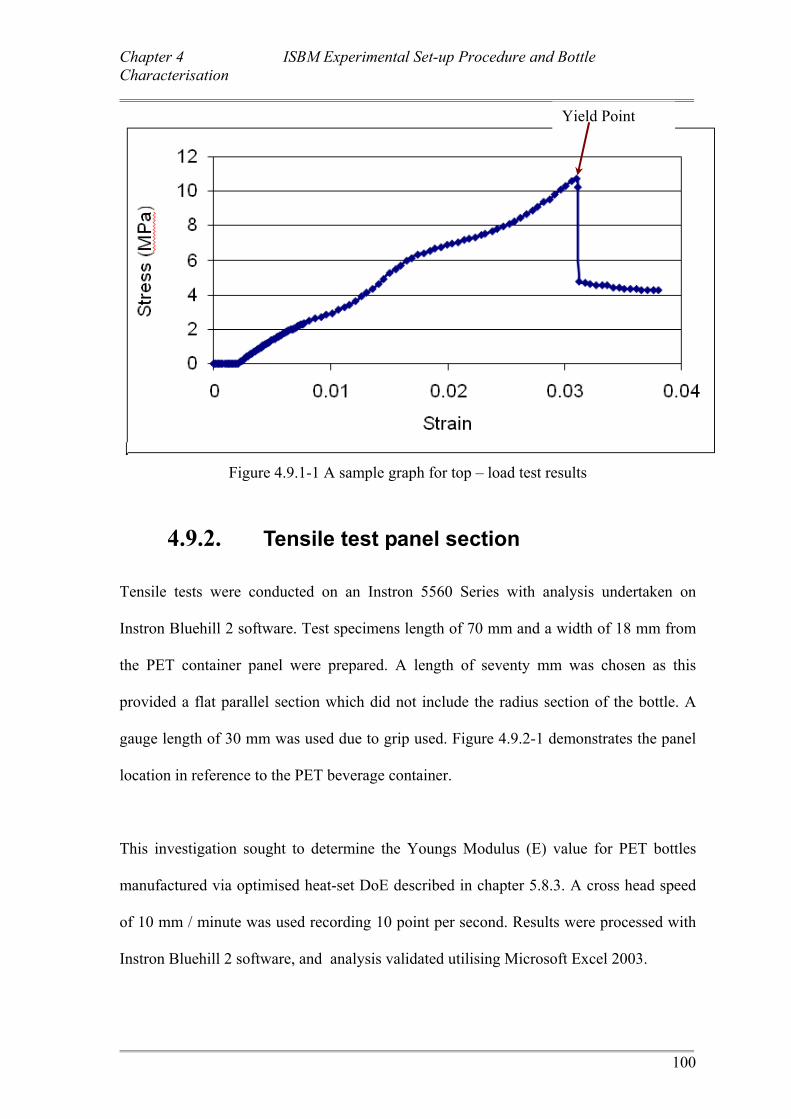
Chapter 4 ISBM Experimental Set-up Procedure and Bottle Characterisation
100
Figure 4.9.1-1 A sample graph for top – load test results
4.9.2. Tensile test panel section Tensile tests were conducted on an Instron 5560 Series with analysis undertaken on
Instron Bluehill 2 software. Test specimens length of 70 mm and a width of 18 mm from
the PET container panel were prepared. A length of seventy mm was chosen as this
provided a flat parallel section which did not include the radius section of the bottle. A
gauge length of 30 mm was used due to grip used. Figure 4.9.2-1 demonstrates the panel
location in reference to the PET beverage container.
This investigation sought to determine the Youngs Modulus (E) value for PET bottles
manufactured via optimised heat-set DoE described in chapter 5.8.3. A cross head speed
of 10 mm / minute was used recording 10 point per second. Results were processed with
Instron Bluehill 2 software, and analysis validated utilising Microsoft Excel 2003.
Yield Point
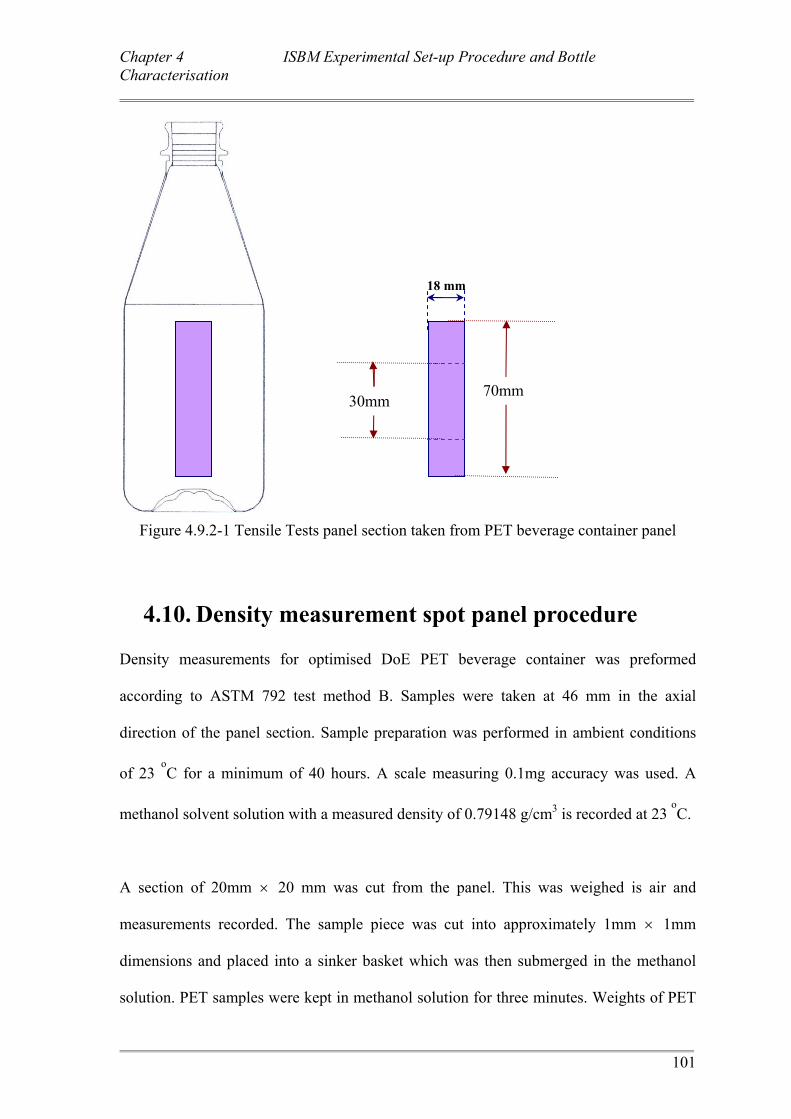
Chapter 4 ISBM Experimental Set-up Procedure and Bottle Characterisation
101
Figure 4.9.2-1 Tensile Tests panel section taken from PET beverage container panel
4.10. Density measurement spot panel procedure Density measurements for optimised DoE PET beverage container was preformed
according to ASTM 792 test method B. Samples were taken at 46 mm in the axial
direction of the panel section. Sample preparation was performed in ambient conditions
of 23 oC for a minimum of 40 hours. A scale measuring 0.1mg accuracy was used. A
methanol solvent solution with a measured density of 0.79148 g/cm3 is recorded at 23 oC.
A section of 20mm × 20 mm was cut from the panel. This was weighed is air and
measurements recorded. The sample piece was cut into approximately 1mm × 1mm
dimensions and placed into a sinker basket which was then submerged in the methanol
solution. PET samples were kept in methanol solution for three minutes. Weights of PET
18 mm
30mm 70mm
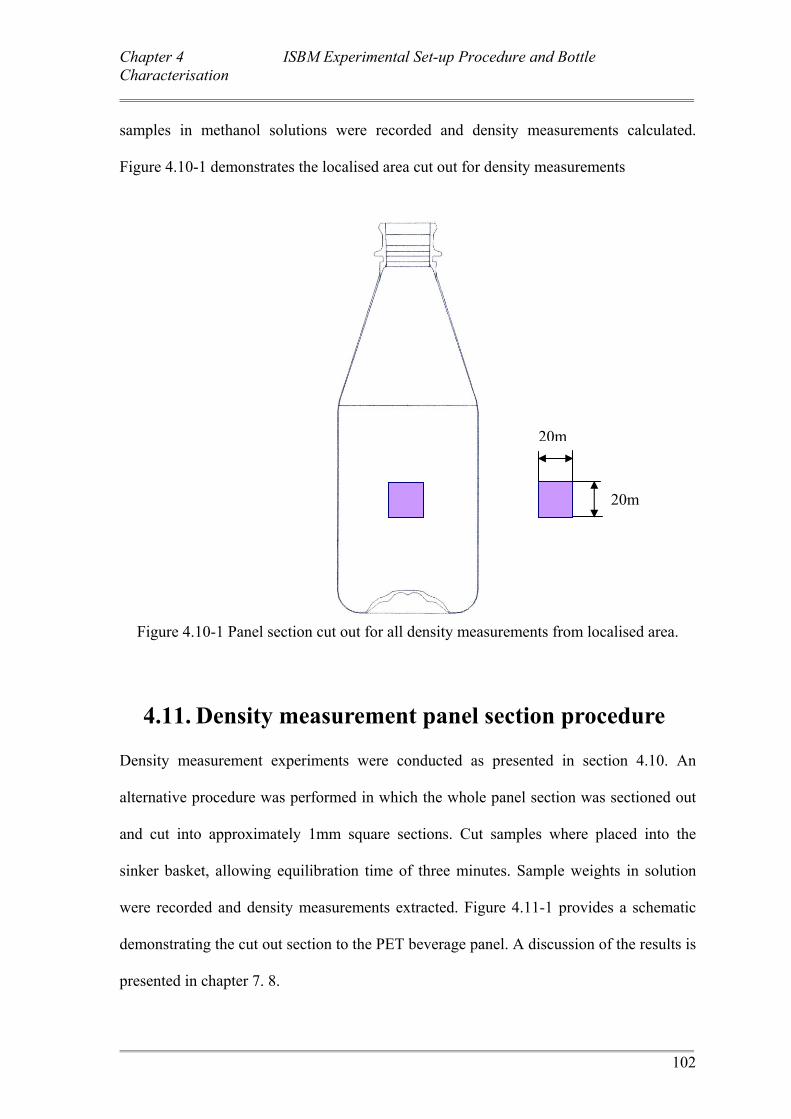
Chapter 4 ISBM Experimental Set-up Procedure and Bottle Characterisation
102
samples in methanol solutions were recorded and density measurements calculated.
Figure 4.10-1 demonstrates the localised area cut out for density measurements
Figure 4.10-1 Panel section cut out for all density measurements from localised area.
4.11. Density measurement panel section procedure Density measurement experiments were conducted as presented in section 4.10. An
alternative procedure was performed in which the whole panel section was sectioned out
and cut into approximately 1mm square sections. Cut samples where placed into the
sinker basket, allowing equilibration time of three minutes. Sample weights in solution
were recorded and density measurements extracted. Figure 4.11-1 provides a schematic
demonstrating the cut out section to the PET beverage panel. A discussion of the results is
presented in chapter 7. 8.
20m
20m
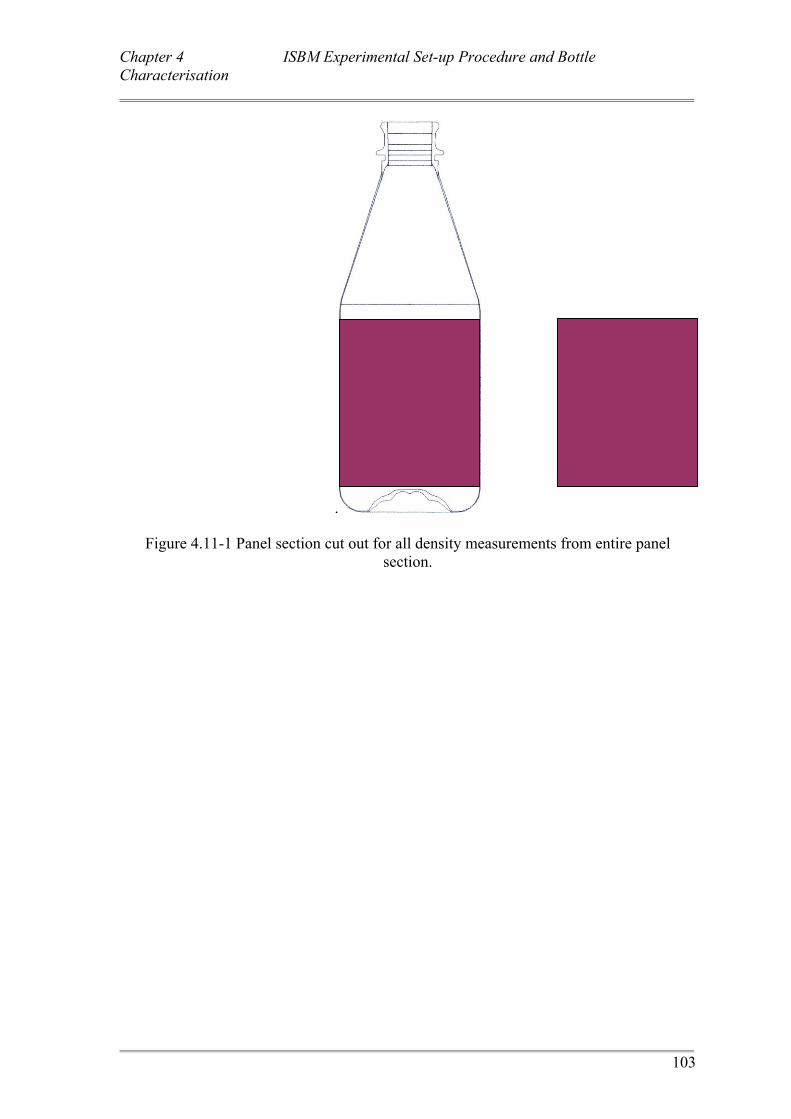
Chapter 4 ISBM Experimental Set-up Procedure and Bottle Characterisation
103
.
Figure 4.11-1 Panel section cut out for all density measurements from entire panel section.

Chapter 5 Design of Experiment
104
5. Chapter 5: Design of Experiment
Chapter 5 Design of Experiment
105
5.1. Introduction The DoE is used to evaluate and quantify areas of variation from within the ISBM
process (Rauwendaal 2000). Knowledge concerning process variables and its direct
influence in maintaining a stable ISBM process provides clarity when constructing a
DoE. Areas assisting in the construction of the projects DoE included:-
• Define areas that affect part quality
• Determine design variables and their relationship with response variables
• Reduce possible variations which can harm response variables results
• Establish minimum tolerances needed to prevent non-conforming beverage
container.
The DoE software used was Echip Version 7. The use of Echip provides guidance in
developing an experimental model. Results obtained via the DoE demonstrate statistical
significant results via the established model terms. As discussed in chapter 3, the design
variables were chosen which directly influenced the heat-set process and the final
shrinkage of a PET beverage container (Caldicott 1998). Design variables are considered
as process conditions that can be controlled from the process (Wheeler et al. 2002a). An
example can include blow time or preform cooling time.
Echip is a DoE tool, allowing the user to determine whether the number of trails required
is to large or small when considering the standard deviation for each design variable
(Wheeler et al. 2002b) . This particular DoE allows the construction of contour plots and
the construction of optimised and predictive process model plots. Furthermore, Echip is
Chapter 5 Design of Experiment
106
able to report on multiple optimised response models for the ISBM process, whilst
constraining certain response and design variables (Betsch 2000). It provides clarity in
determining whether the fields of interest are too small or too large for analysis.
Echip allows the user to examine each field of interest and include targeted standard
deviation (SD) for each response variable. This provided a measure of success or failure
utilising the DoE model terms expressed before experiments are conducted. This is an
important part to the DoE process. Echip calculates the number of trials based on the
recorded information. Determining the total trials necessary for each response variable is
crucial. This particular validation methodology allows separate examination of each
design and response variable.
5.2. Design of Experiment Echip software calculated 21 unique trials with 5 repeats. As part of this preliminary
stage, a G efficiency value of one is set as default by Echip. A final G efficiency value of
0.452 was calculated after DoE design. The G efficiency value is used by Echip to
establish the standard deviation of an optimal design and the maximum variance for a
given design (Wheeler et al. 2002a). EchipDoE software suggests a G efficiency value of
0.50 for optimal analysis. Based on the calculated G efficiency value and the inclusion of
5 repeats, the design was considered to provide practicable statistical results. A standard
deviation (SD) of 0.5 was factored for each response variable.
Randomisation is an important feature of the DoE as it can minimise experimental error
due to ambient conditions. Although randomisation of trial order is suggested by the DoE,
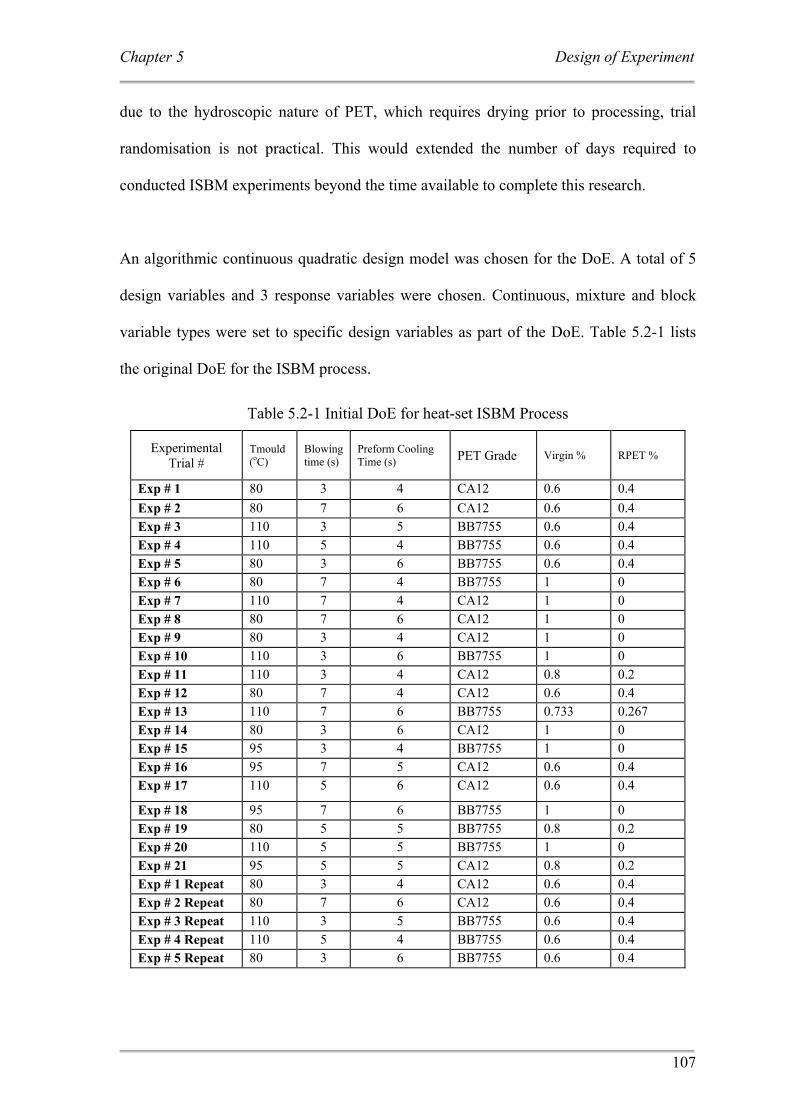
Chapter 5 Design of Experiment
107
due to the hydroscopic nature of PET, which requires drying prior to processing, trial
randomisation is not practical. This would extended the number of days required to
conducted ISBM experiments beyond the time available to complete this research.
An algorithmic continuous quadratic design model was chosen for the DoE. A total of 5
design variables and 3 response variables were chosen. Continuous, mixture and block
variable types were set to specific design variables as part of the DoE. Table 5.2-1 lists
the original DoE for the ISBM process.
Table 5.2-1 Initial DoE for heat-set ISBM Process
Experimental Trial #
Tmould (oC)
Blowing time (s)
Preform Cooling Time (s) PET Grade Virgin % RPET %
Exp # 1 80 3 4 CA12 0.6 0.4 Exp # 2 80 7 6 CA12 0.6 0.4 Exp # 3 110 3 5 BB7755 0.6 0.4 Exp # 4 110 5 4 BB7755 0.6 0.4 Exp # 5 80 3 6 BB7755 0.6 0.4 Exp # 6 80 7 4 BB7755 1 0 Exp # 7 110 7 4 CA12 1 0 Exp # 8 80 7 6 CA12 1 0 Exp # 9 80 3 4 CA12 1 0 Exp # 10 110 3 6 BB7755 1 0 Exp # 11 110 3 4 CA12 0.8 0.2 Exp # 12 80 7 4 CA12 0.6 0.4 Exp # 13 110 7 6 BB7755 0.733 0.267 Exp # 14 80 3 6 CA12 1 0 Exp # 15 95 3 4 BB7755 1 0 Exp # 16 95 7 5 CA12 0.6 0.4 Exp # 17 110 5 6 CA12 0.6 0.4
Exp # 18 95 7 6 BB7755 1 0 Exp # 19 80 5 5 BB7755 0.8 0.2 Exp # 20 110 5 5 BB7755 1 0 Exp # 21 95 5 5 CA12 0.8 0.2 Exp # 1 Repeat 80 3 4 CA12 0.6 0.4 Exp # 2 Repeat 80 7 6 CA12 0.6 0.4 Exp # 3 Repeat 110 3 5 BB7755 0.6 0.4 Exp # 4 Repeat 110 5 4 BB7755 0.6 0.4 Exp # 5 Repeat 80 3 6 BB7755 0.6 0.4
Chapter 5 Design of Experiment
108
A 2-D surface response model graphing both design and response variables were plotted
within Echip. Burst strength test, top load test, process shrinkage (S1) and hot-fill
shrinkage (S2) data points were analysed using Microsoft Excel 2003. Mean and standard
deviation results were recorded for each experimental run. Calculated mean results were
placed into Echip software for analysis. All response variable data points were collated
and a results summary table plotted, establishing the relationship between response and
design variables. Further discussion concerning the result summary table are presented in
section 5.3 and 5.6
5.3. Contour 1-D Plots Contour 1-D plots were constructed demonstrating relationships between response and
design variables. This is a quick and easy way for determining a design variables
influence on response variable properties. Analysis of hot-fill shrinkage (S2) and mould
temperature (heat-set temperature) via 1-D plot was undertaken. Figure 5.3-1
demonstrates a contour 1-D graph for hot-fill shrinkage (S2) and mould temperature.
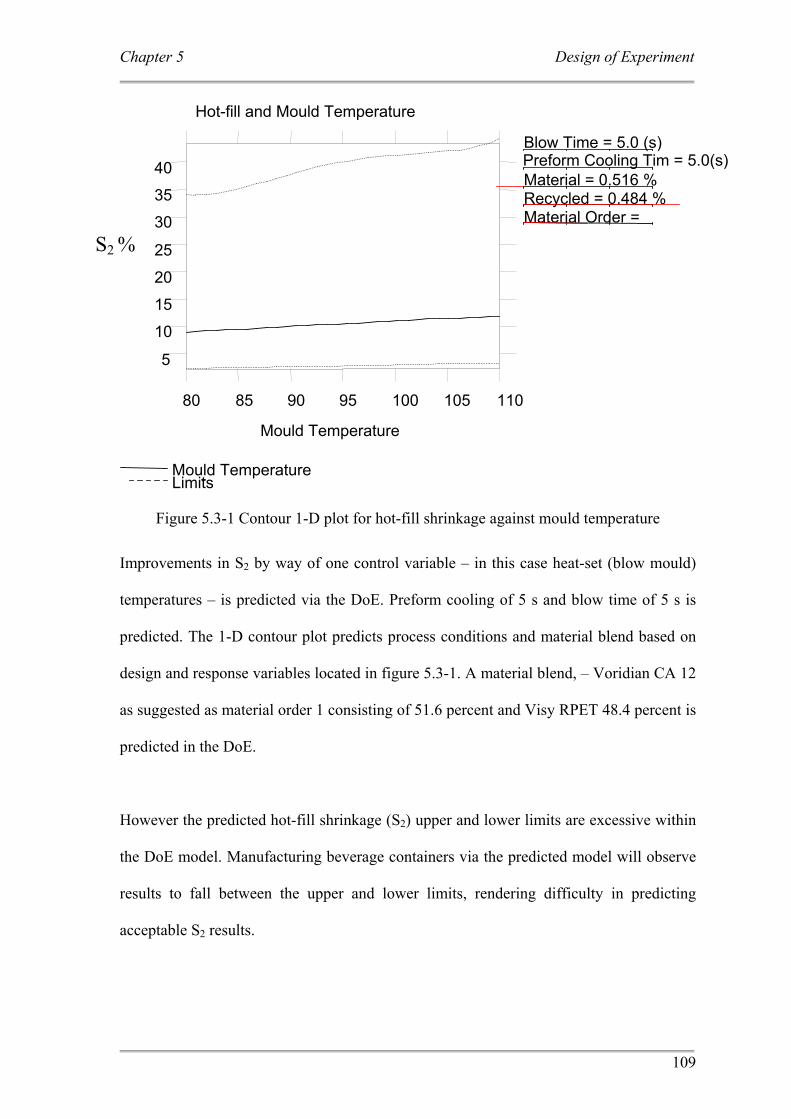
Chapter 5 Design of Experiment
109
Figure 5.3-1 Contour 1-D plot for hot-fill shrinkage against mould temperature
Improvements in S2 by way of one control variable – in this case heat-set (blow mould)
temperatures – is predicted via the DoE. Preform cooling of 5 s and blow time of 5 s is
predicted. The 1-D contour plot predicts process conditions and material blend based on
design and response variables located in figure 5.3-1. A material blend, – Voridian CA 12
as suggested as material order 1 consisting of 51.6 percent and Visy RPET 48.4 percent is
predicted in the DoE.
However the predicted hot-fill shrinkage (S2) upper and lower limits are excessive within
the DoE model. Manufacturing beverage containers via the predicted model will observe
results to fall between the upper and lower limits, rendering difficulty in predicting
acceptable S2 results.
Preform Cooling Tim = 5.0(s)
5
10
15
20
25
30
35
40
80 85 90 95 100 105 110
Mould Temperature
Hot-fill and Mould Temperature
Limits Mould Temperature
Blow Time = 5.0 (s)
Material = 0.516 %Recycled = 0.484 %Material Order =
S2 %
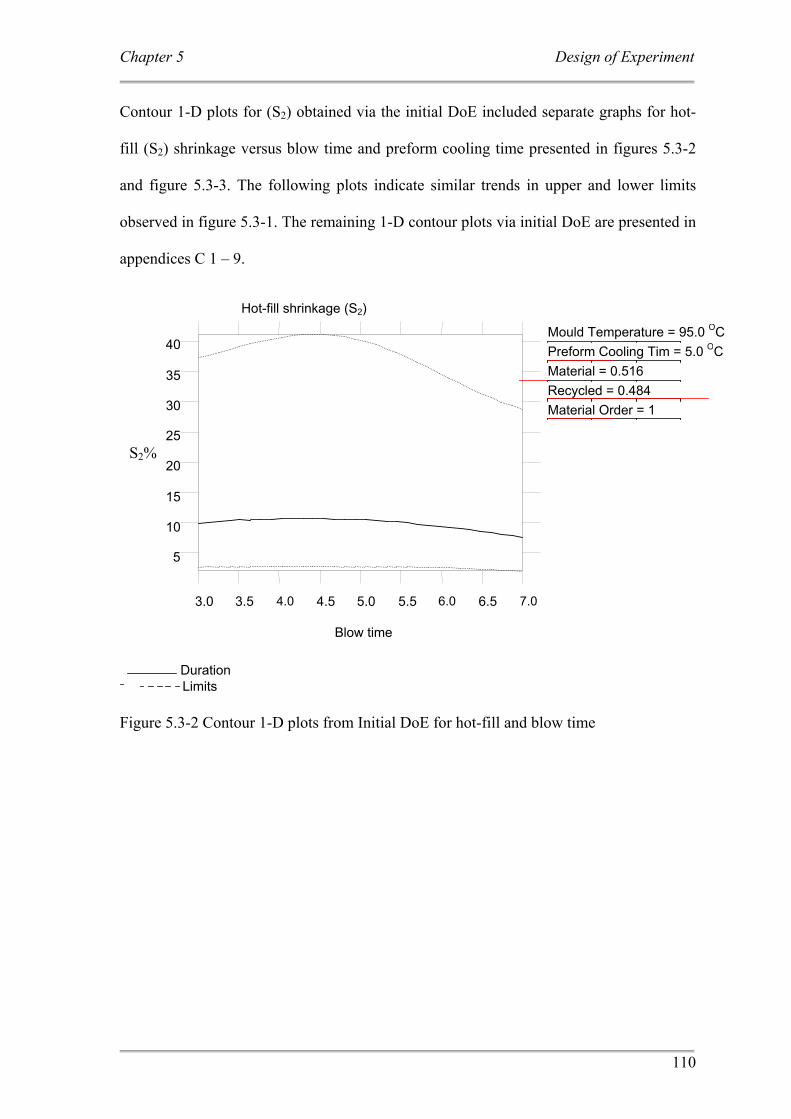
Chapter 5 Design of Experiment
110
Contour 1-D plots for (S2) obtained via the initial DoE included separate graphs for hot-
fill (S2) shrinkage versus blow time and preform cooling time presented in figures 5.3-2
and figure 5.3-3. The following plots indicate similar trends in upper and lower limits
observed in figure 5.3-1. The remaining 1-D contour plots via initial DoE are presented in
appendices C 1 – 9.
Figure 5.3-2 Contour 1-D plots from Initial DoE for hot-fill and blow time
LimitsDuration
5
10
15
20
25
30
35
40
3.0 3.5 4.0 4.5 5.0 5.5 6.0 6.5 7.0
Blow time
Hot-fill shrinkage (S2)
Mould Temperature = 95.0 OCPreform Cooling Tim = 5.0 OCMaterial = 0.516 Recycled = 0.484 Material Order = 1
S2%
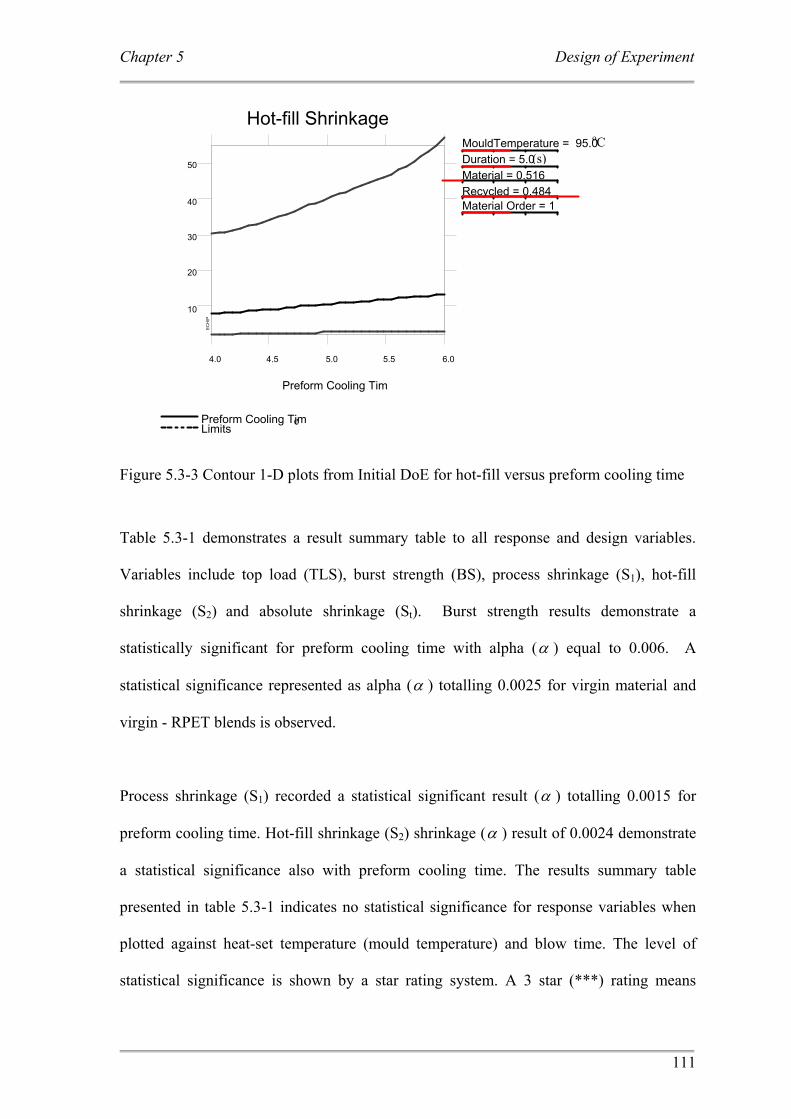
Chapter 5 Design of Experiment
111
EC
HIP
10
20
30
40
50
4.0 4.5 5.0 5.5 6.0
Preform Cooling Tim
Hot-fill Shrinkage
LimitsPreform Cooling Tim
MouldTemperature = 95.0Duration = 5.0Material = 0.516Recycled = 0.484Material Order = 1
Figure 5.3-3 Contour 1-D plots from Initial DoE for hot-fill versus preform cooling time
Table 5.3-1 demonstrates a result summary table to all response and design variables.
Variables include top load (TLS), burst strength (BS), process shrinkage (S1), hot-fill
shrinkage (S2) and absolute shrinkage (St). Burst strength results demonstrate a
statistically significant for preform cooling time with alpha (α ) equal to 0.006. A
statistical significance represented as alpha (α ) totalling 0.0025 for virgin material and
virgin - RPET blends is observed.
Process shrinkage (S1) recorded a statistical significant result (α ) totalling 0.0015 for
preform cooling time. Hot-fill shrinkage (S2) shrinkage (α ) result of 0.0024 demonstrate
a statistical significance also with preform cooling time. The results summary table
presented in table 5.3-1 indicates no statistical significance for response variables when
plotted against heat-set temperature (mould temperature) and blow time. The level of
statistical significance is shown by a star rating system. A 3 star (***) rating means
oC (s)
e
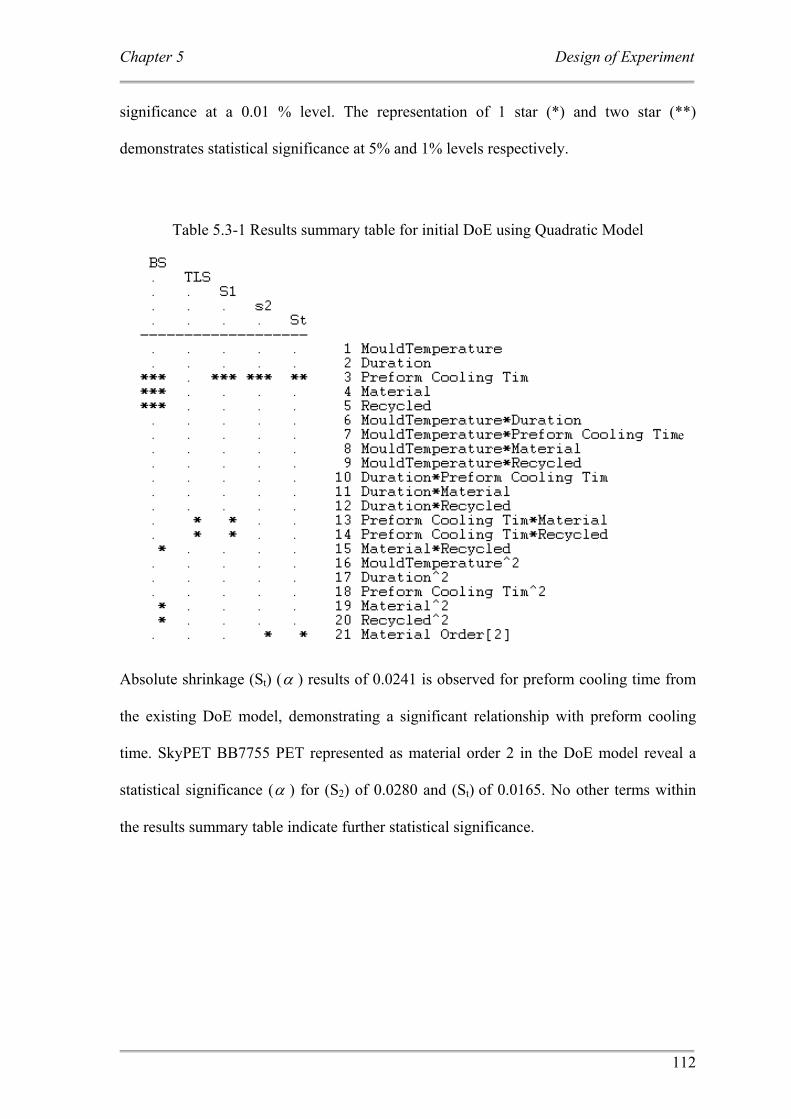
Chapter 5 Design of Experiment
112
significance at a 0.01 % level. The representation of 1 star (*) and two star (**)
demonstrates statistical significance at 5% and 1% levels respectively.
Table 5.3-1 Results summary table for initial DoE using Quadratic Model
Absolute shrinkage (St) (α ) results of 0.0241 is observed for preform cooling time from
the existing DoE model, demonstrating a significant relationship with preform cooling
time. SkyPET BB7755 PET represented as material order 2 in the DoE model reveal a
statistical significance (α ) for (S2) of 0.0280 and (St) of 0.0165. No other terms within
the results summary table indicate further statistical significance.
e
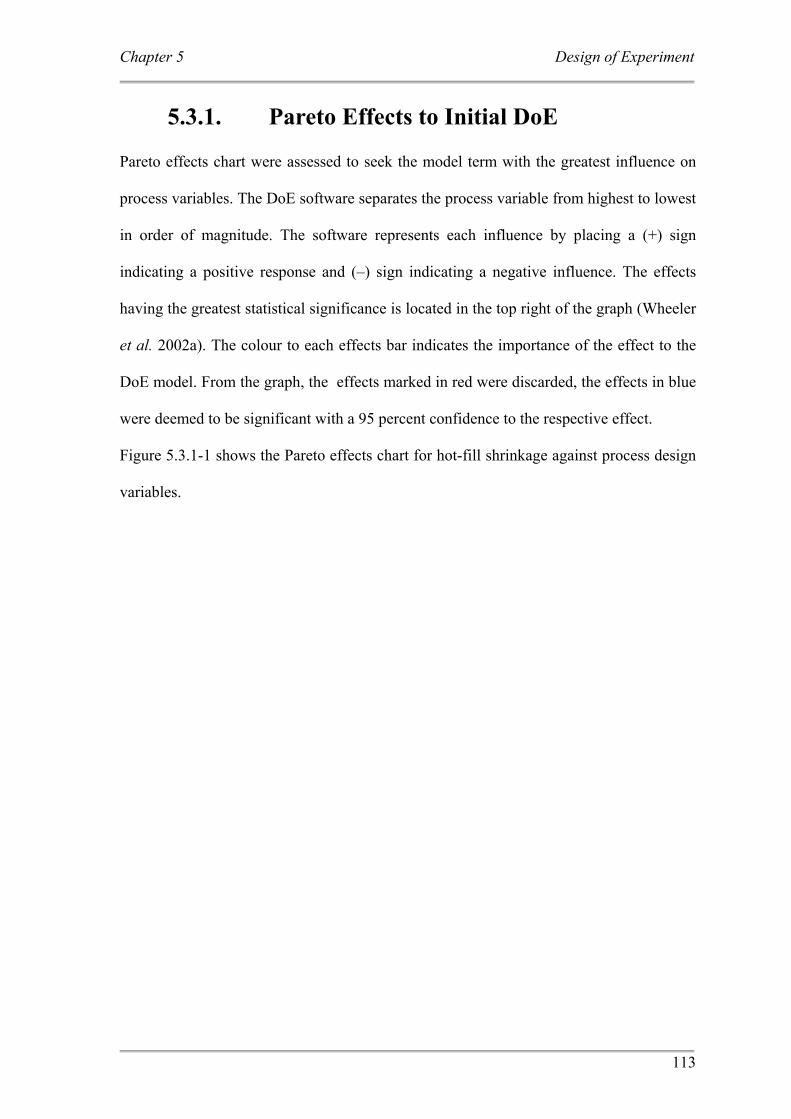
Chapter 5 Design of Experiment
113
5.3.1. Pareto Effects to Initial DoE Pareto effects chart were assessed to seek the model term with the greatest influence on
process variables. The DoE software separates the process variable from highest to lowest
in order of magnitude. The software represents each influence by placing a (+) sign
indicating a positive response and (–) sign indicating a negative influence. The effects
having the greatest statistical significance is located in the top right of the graph (Wheeler
et al. 2002a). The colour to each effects bar indicates the importance of the effect to the
DoE model. From the graph, the effects marked in red were discarded, the effects in blue
were deemed to be significant with a 95 percent confidence to the respective effect.
Figure 5.3.1-1 shows the Pareto effects chart for hot-fill shrinkage against process design
variables.
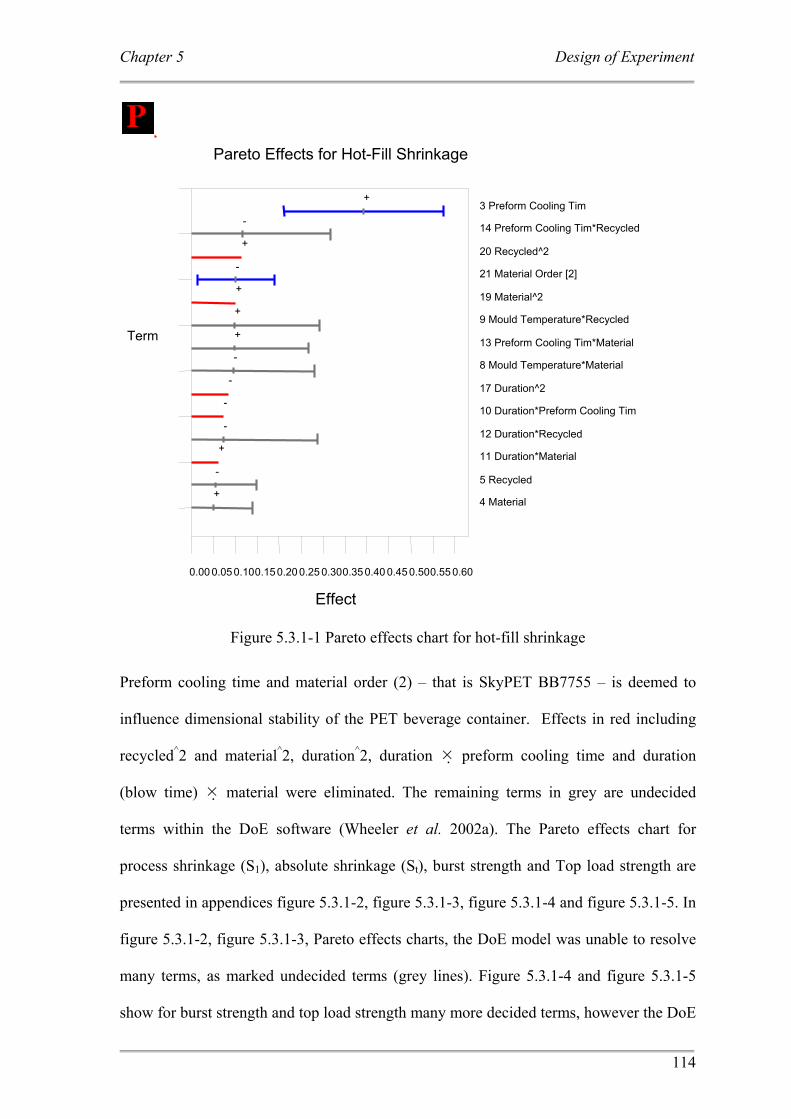
Chapter 5 Design of Experiment
114
Figure 5.3.1-1 Pareto effects chart for hot-fill shrinkage
Preform cooling time and material order (2) – that is SkyPET BB7755 – is deemed to
influence dimensional stability of the PET beverage container. Effects in red including
recycled^2 and material^2, duration^2, duration preform cooling time and duration
(blow time) material were eliminated. The remaining terms in grey are undecided
terms within the DoE software (Wheeler et al. 2002a). The Pareto effects chart for
process shrinkage (S1), absolute shrinkage (St), burst strength and Top load strength are
presented in appendices figure 5.3.1-2, figure 5.3.1-3, figure 5.3.1-4 and figure 5.3.1-5. In
figure 5.3.1-2, figure 5.3.1-3, Pareto effects charts, the DoE model was unable to resolve
many terms, as marked undecided terms (grey lines). Figure 5.3.1-4 and figure 5.3.1-5
show for burst strength and top load strength many more decided terms, however the DoE
Term
0.00 0.05 0.10 0.15 0.20 0.25 0.300.350.40 0.45 0.500.55 0.60
Effect
Pareto Effects for Hot-Fill Shrinkage
3 Preform Cooling Tim +
14 Preform Cooling Tim*Recycled -
20 Recycled^2+
21 Material Order [2] -
19 Material^2+
9 Mould Temperature*Recycled +
13 Preform Cooling Tim*Material +
8 Mould Temperature*Material -
17 Duration^2-
10 Duration*Preform Cooling Tim -
12 Duration*Recycled -
11 Duration*Material +
5 Recycled-
4 Material+
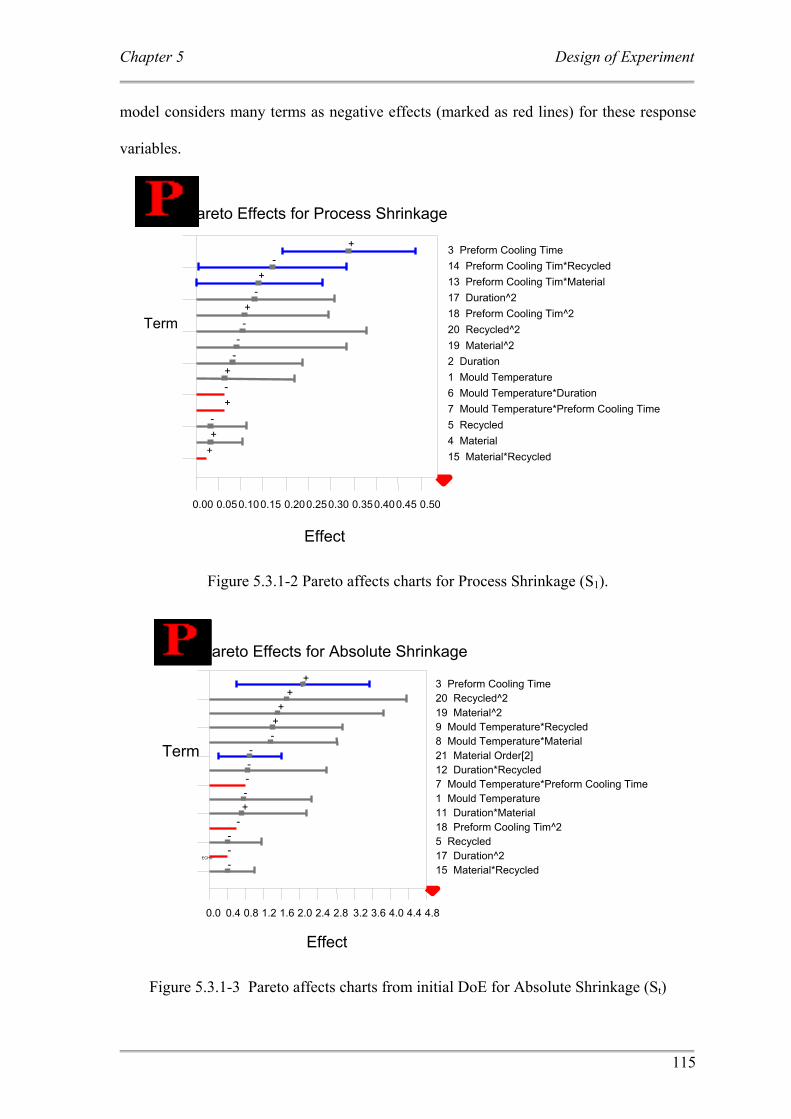
Chapter 5 Design of Experiment
115
model considers many terms as negative effects (marked as red lines) for these response
variables.
Figure 5.3.1-2 Pareto affects charts for Process Shrinkage (S1).
Figure 5.3.1-3 Pareto affects charts from initial DoE for Absolute Shrinkage (St)
Term
0.00 0.050.10 0.15 0.20 0.250.30 0.350.400.45 0.50
Effect
Pareto Effects for Process Shrinkage
3 Preform Cooling Time +
14 Preform Cooling Tim*Recycled - 13 Preform Cooling Tim*Material +
17 Duration^2- 18 Preform Cooling Tim^2 +
20 Recycled^2- 19 Material^2-
2 Duration-
1 Mould Temperature+
6 Mould Temperature*Duration - 7 Mould Temperature*Preform Cooling Time+
5 Recycled- 4 Material+ 15 Material*Recycled+
ECHIP
Term
0.0 0.4 0.8 1.2 1.6 2.0 2.4 2.8 3.2 3.6 4.0 4.4 4.8
Effect
Pareto Effects for Absolute Shrinkage
3 Preform Cooling Time+
20 Recycled^2+ 19 Material^2+
9 Mould Temperature*Recycled + 8 Mould Temperature*Material - 21 Material Order[2]- 12 Duration*Recycled- 7 Mould Temperature*Preform Cooling Time - 1 Mould Temperature- 11 Duration*Material+
18 Preform Cooling Tim^2 -
5 Recycled- 17 Duration^2- 15 Material*Recycled-
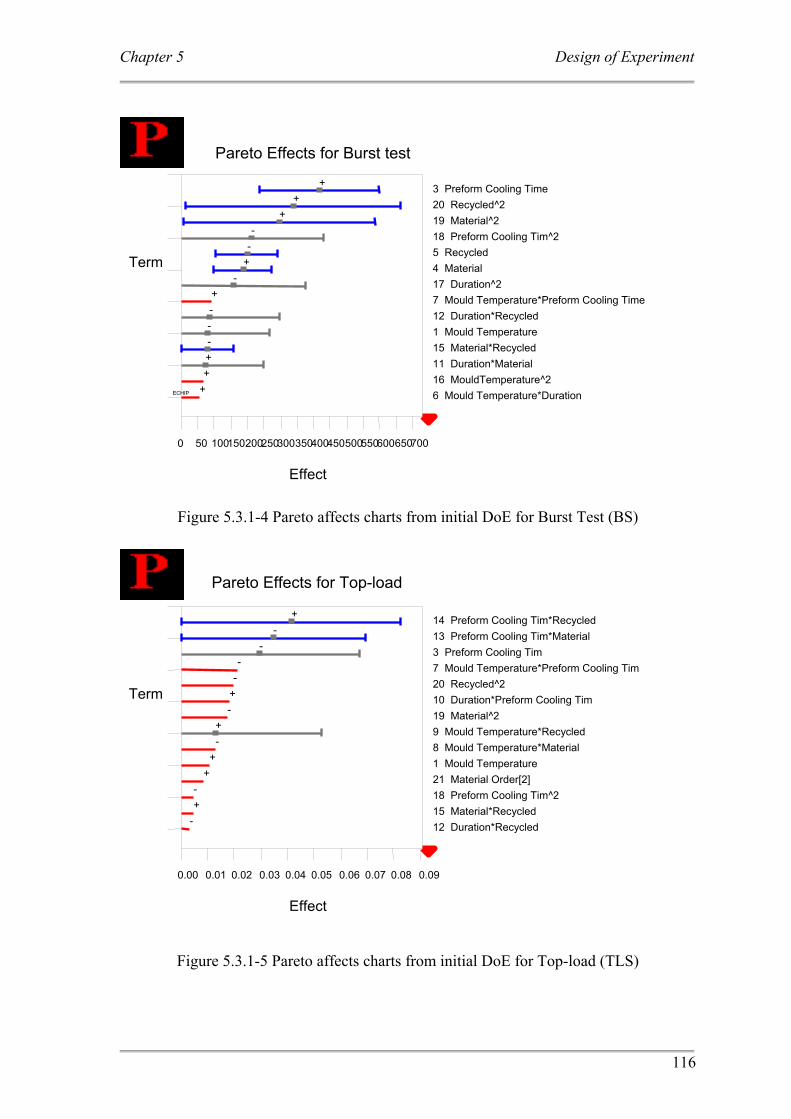
Chapter 5 Design of Experiment
116
Figure 5.3.1-4 Pareto affects charts from initial DoE for Burst Test (BS)
Figure 5.3.1-5 Pareto affects charts from initial DoE for Top-load (TLS)
ECHIP
Term
0 50 100 150200 250 300 350 400450500550600650700
Effect
Pareto Effects for Burst test
3 Preform Cooling Time+ 20 Recycled^2+ 19 Material^2+ 18 Preform Cooling Tim^2- 5 Recycled- 4 Material+ 17 Duration^2-
7 Mould Temperature*Preform Cooling Time + 12 Duration*Recycled- 1 Mould Temperature- 15 Material*Recycled- 11 Duration*Material+ 16 MouldTemperature^2+ 6 Mould Temperature*Duration +
Term
0.00 0.01 0.02 0.03 0.04 0.05 0.06 0.07 0.08 0.09
Effect
Pareto Effects for Top-load
14 Preform Cooling Tim*Recycled + 13 Preform Cooling Tim*Material - 3 Preform Cooling Tim- 7 Mould Temperature*Preform Cooling Tim -
20 Recycled^2-
10 Duration*Preform Cooling Tim+
19 Material^2- 9 Mould Temperature*Recycled + 8 Mould Temperature*Material - 1 Mould Temperature+ 21 Material Order[2]+ 18 Preform Cooling Tim^2- 15 Material*Recycled+ 12 Duration*Recycled-
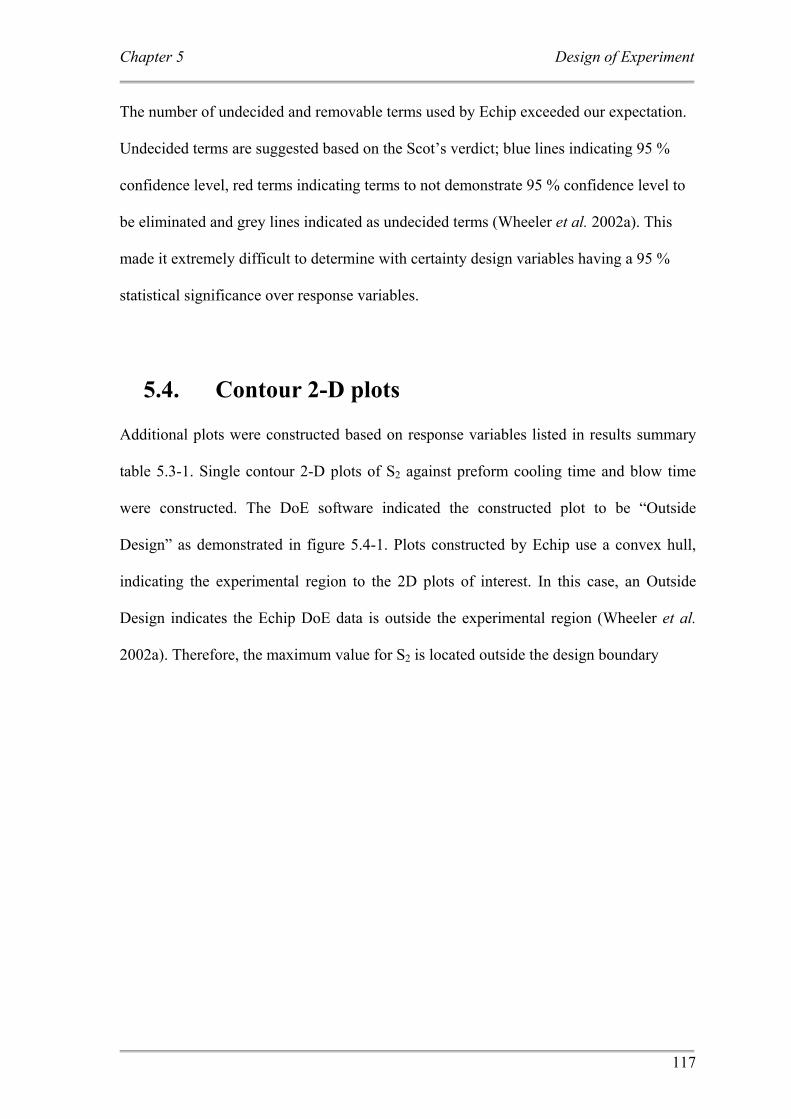
Chapter 5 Design of Experiment
117
The number of undecided and removable terms used by Echip exceeded our expectation.
Undecided terms are suggested based on the Scot’s verdict; blue lines indicating 95 %
confidence level, red terms indicating terms to not demonstrate 95 % confidence level to
be eliminated and grey lines indicated as undecided terms (Wheeler et al. 2002a). This
made it extremely difficult to determine with certainty design variables having a 95 %
statistical significance over response variables.
5.4. Contour 2-D plots Additional plots were constructed based on response variables listed in results summary
table 5.3-1. Single contour 2-D plots of S2 against preform cooling time and blow time
were constructed. The DoE software indicated the constructed plot to be “Outside
Design” as demonstrated in figure 5.4-1. Plots constructed by Echip use a convex hull,
indicating the experimental region to the 2D plots of interest. In this case, an Outside
Design indicates the Echip DoE data is outside the experimental region (Wheeler et al.
2002a). Therefore, the maximum value for S2 is located outside the design boundary
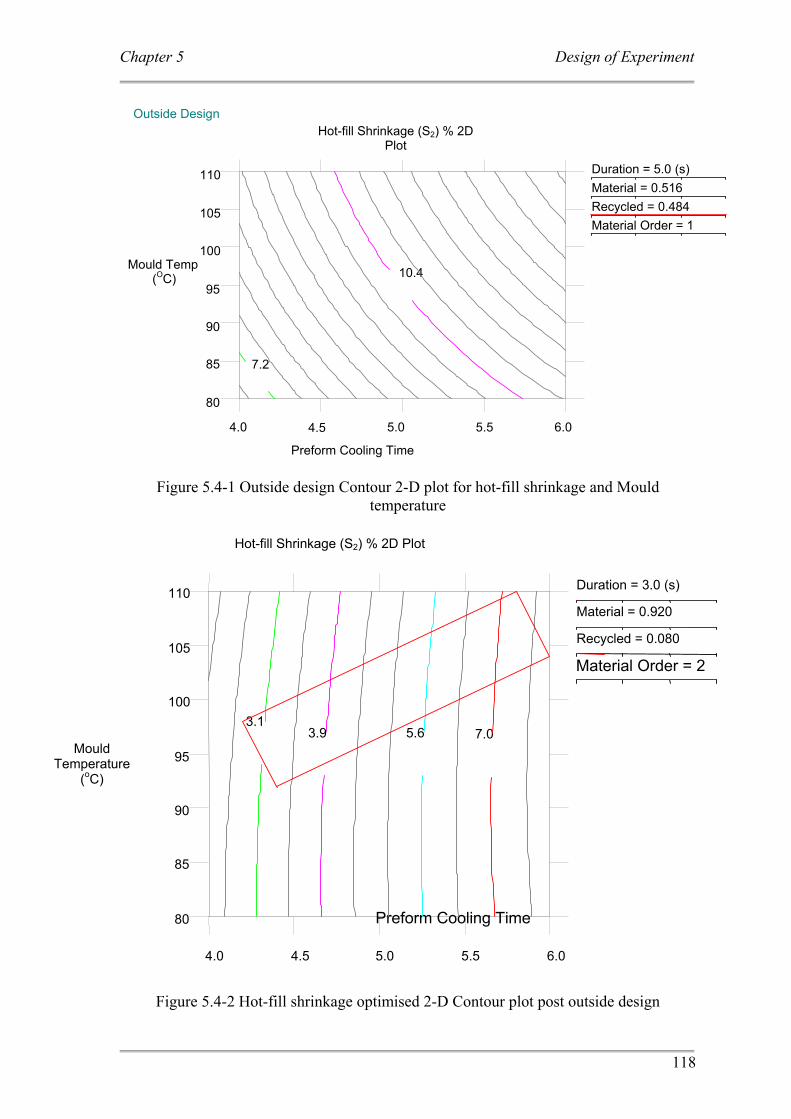
Chapter 5 Design of Experiment
118
Figure 5.4-1 Outside design Contour 2-D plot for hot-fill shrinkage and Mould temperature
Figure 5.4-2 Hot-fill shrinkage optimised 2-D Contour plot post outside design
Preform Cooling Time
Material Order = 2
Preform Cooling Time
80
85
90
95
100
105
110
Mould Temp (OC)
4.0 4.5 5.0 5.5 6.0
Hot-fill Shrinkage (S2) % 2D Plot
7.2
10.4
Duration = 5.0 (s)Material = 0.516 Recycled = 0.484 Material Order = 1
Outside Design
Mould Temperature
(oC)
80
85
90
95
100
105
110
4.0 4.5 5.0 5.5 6.0
Hot-fill Shrinkage (S2) % 2D Plot
3.1 3.9 5.6 7.0
Duration = 3.0 (s)
Material = 0.920
Recycled = 0.080
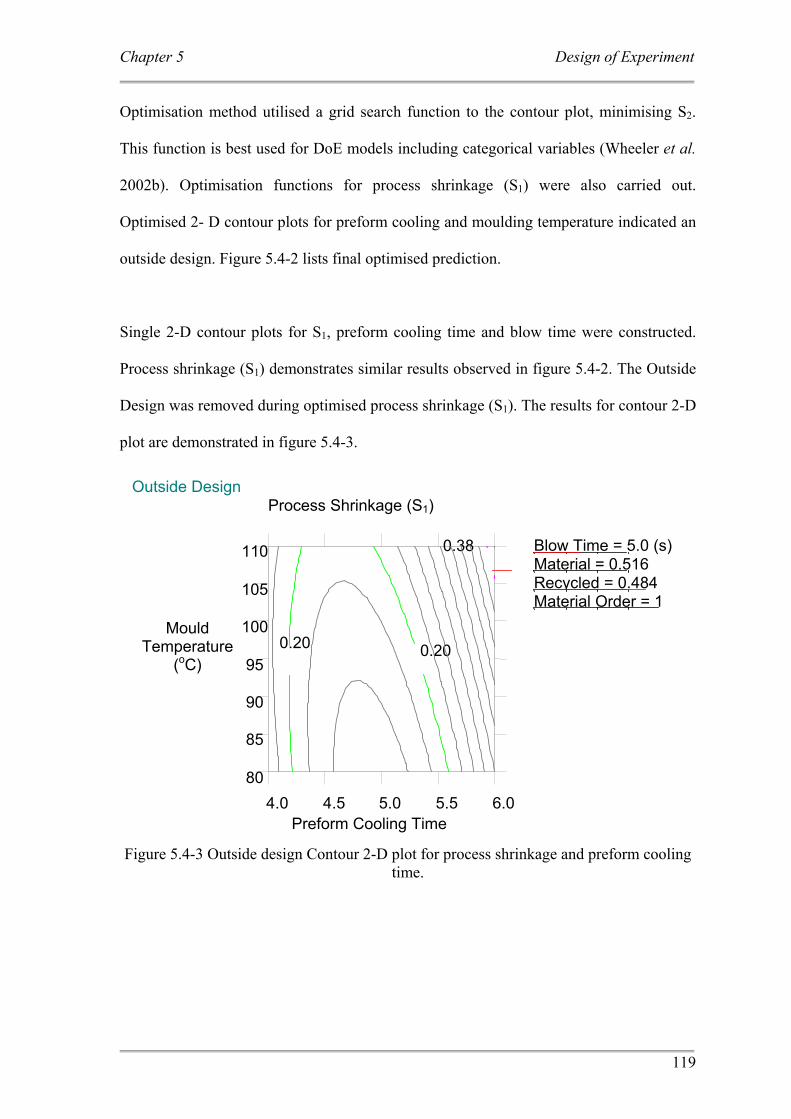
Chapter 5 Design of Experiment
119
Optimisation method utilised a grid search function to the contour plot, minimising S2.
This function is best used for DoE models including categorical variables (Wheeler et al.
2002b). Optimisation functions for process shrinkage (S1) were also carried out.
Optimised 2- D contour plots for preform cooling and moulding temperature indicated an
outside design. Figure 5.4-2 lists final optimised prediction.
Single 2-D contour plots for S1, preform cooling time and blow time were constructed.
Process shrinkage (S1) demonstrates similar results observed in figure 5.4-2. The Outside
Design was removed during optimised process shrinkage (S1). The results for contour 2-D
plot are demonstrated in figure 5.4-3.
Figure 5.4-3 Outside design Contour 2-D plot for process shrinkage and preform cooling
time.
Outside Design
0.38
Process Shrinkage (S1)
Preform Cooling Time
Mould Temperature
(oC)
80
85
90
95
100
105
110
4.0 4.5 5.0 5.5 6.0
0.20 0.20
Blow Time = 5.0 (s) Material = 0.516 Recycled = 0.484Material Order = 1
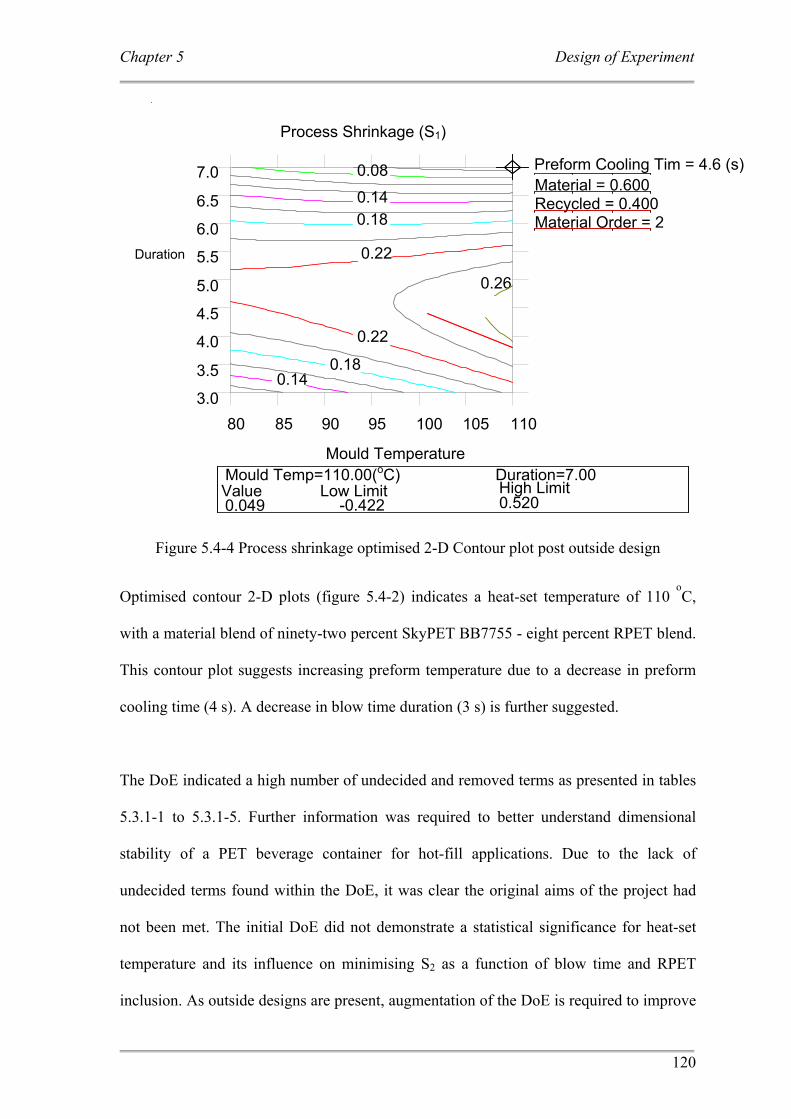
Chapter 5 Design of Experiment
120
Figure 5.4-4 Process shrinkage optimised 2-D Contour plot post outside design
Optimised contour 2-D plots (figure 5.4-2) indicates a heat-set temperature of 110
oC,
with a material blend of ninety-two percent SkyPET BB7755 - eight percent RPET blend.
This contour plot suggests increasing preform temperature due to a decrease in preform
cooling time (4 s). A decrease in blow time duration (3 s) is further suggested.
The DoE indicated a high number of undecided and removed terms as presented in tables
5.3.1-1 to 5.3.1-5. Further information was required to better understand dimensional
stability of a PET beverage container for hot-fill applications. Due to the lack of
undecided terms found within the DoE, it was clear the original aims of the project had
not been met. The initial DoE did not demonstrate a statistical significance for heat-set
temperature and its influence on minimising S2 as a function of blow time and RPET
inclusion. As outside designs are present, augmentation of the DoE is required to improve
Duration
3.0
3.5
4.0
4.5
5.0
5.5
6.0
6.5
7.0
80 85 90 95 100 105 110
Mould Temperature
Process Shrinkage (S1)
0.08
0.14
0.14
0.18
0.18
0.22
0.22
0.26
Material = 0.600 Recycled = 0.400 Material Order = 2
Low Limit High Limit 0.049 -0.422 0.520
MouldTem=110.00 Duration=7.00 Value Low Limit High Limit
0.520
Mould Temp=110.00(oC) Duration=7.00
Preform Cooling Tim = 4.6 (s)
0.049 -0.422
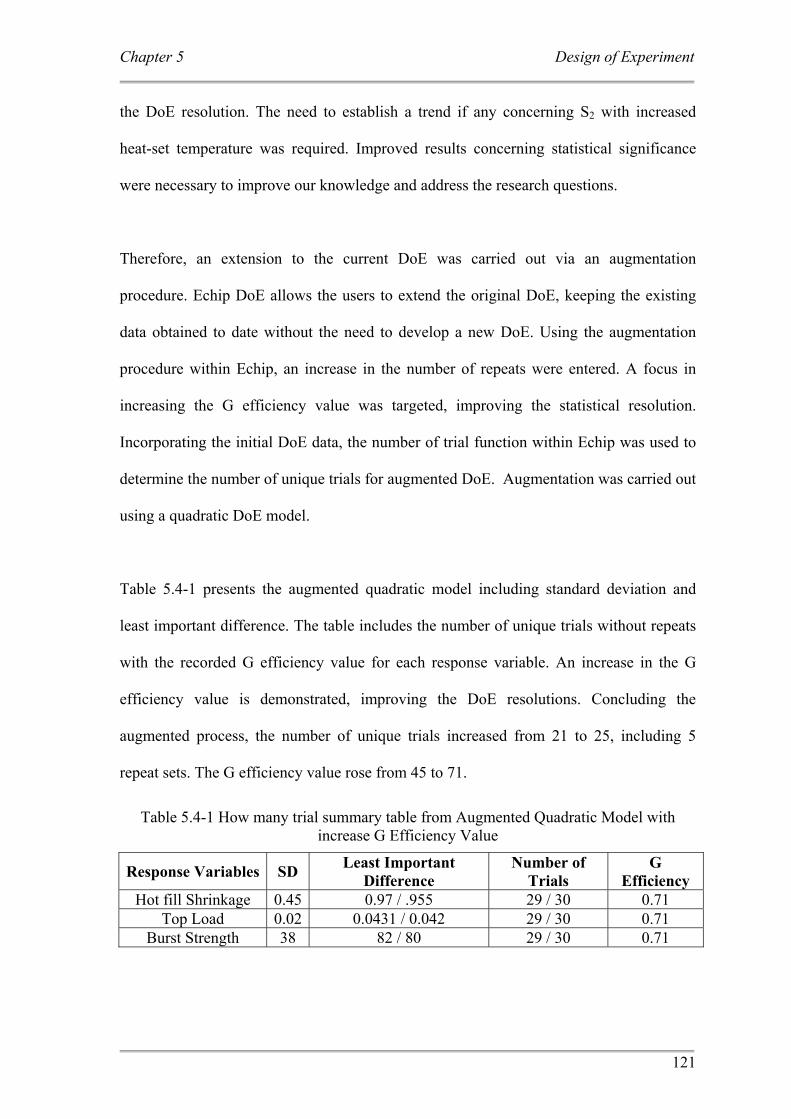
Chapter 5 Design of Experiment
121
the DoE resolution. The need to establish a trend if any concerning S2 with increased
heat-set temperature was required. Improved results concerning statistical significance
were necessary to improve our knowledge and address the research questions.
Therefore, an extension to the current DoE was carried out via an augmentation
procedure. Echip DoE allows the users to extend the original DoE, keeping the existing
data obtained to date without the need to develop a new DoE. Using the augmentation
procedure within Echip, an increase in the number of repeats were entered. A focus in
increasing the G efficiency value was targeted, improving the statistical resolution.
Incorporating the initial DoE data, the number of trial function within Echip was used to
determine the number of unique trials for augmented DoE. Augmentation was carried out
using a quadratic DoE model.
Table 5.4-1 presents the augmented quadratic model including standard deviation and
least important difference. The table includes the number of unique trials without repeats
with the recorded G efficiency value for each response variable. An increase in the G
efficiency value is demonstrated, improving the DoE resolutions. Concluding the
augmented process, the number of unique trials increased from 21 to 25, including 5
repeat sets. The G efficiency value rose from 45 to 71.
Table 5.4-1 How many trial summary table from Augmented Quadratic Model with increase G Efficiency Value
Response Variables SD Least Important Difference
Number of Trials
G Efficiency
Hot fill Shrinkage 0.45 0.97 / .955 29 / 30 0.71 Top Load 0.02 0.0431 / 0.042 29 / 30 0.71
Burst Strength 38 82 / 80 29 / 30 0.71
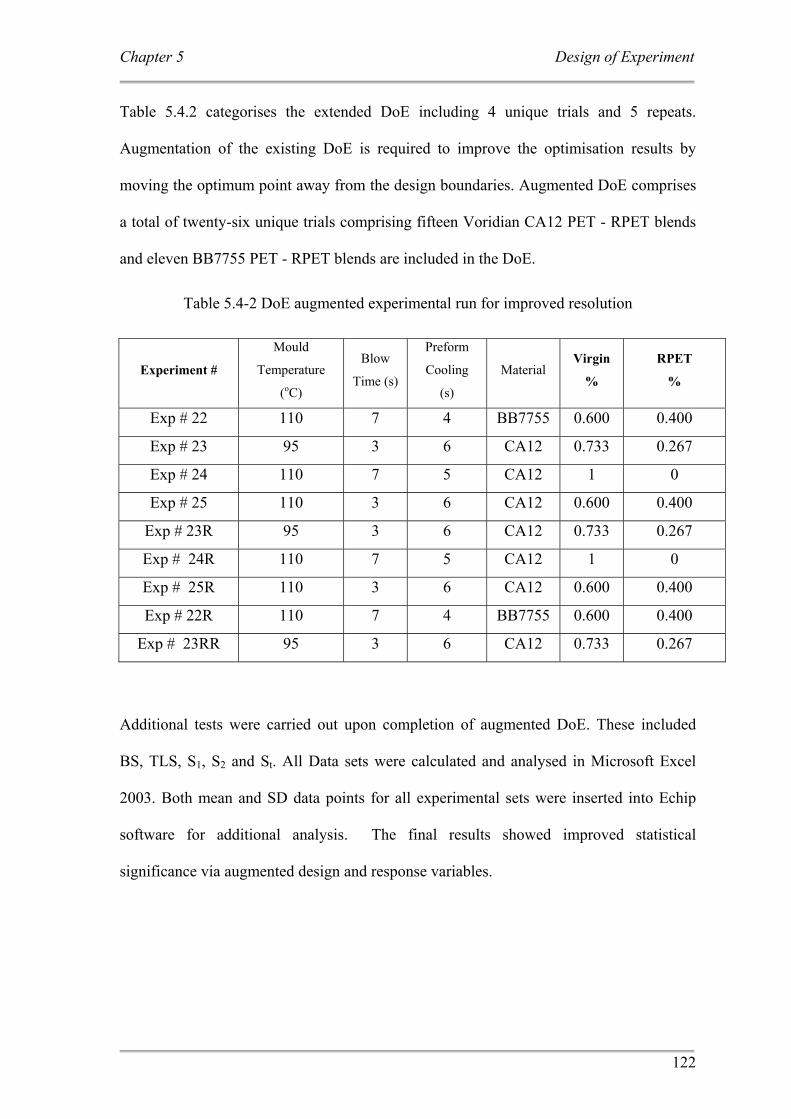
Chapter 5 Design of Experiment
122
Table 5.4.2 categorises the extended DoE including 4 unique trials and 5 repeats.
Augmentation of the existing DoE is required to improve the optimisation results by
moving the optimum point away from the design boundaries. Augmented DoE comprises
a total of twenty-six unique trials comprising fifteen Voridian CA12 PET - RPET blends
and eleven BB7755 PET - RPET blends are included in the DoE.
Table 5.4-2 DoE augmented experimental run for improved resolution
Experiment #
Mould
Temperature
(oC)
Blow
Time (s)
Preform
Cooling
(s)
Material Virgin
%
RPET
%
Exp # 22 110 7 4 BB7755 0.600 0.400
Exp # 23 95 3 6 CA12 0.733 0.267
Exp # 24 110 7 5 CA12 1 0
Exp # 25 110 3 6 CA12 0.600 0.400
Exp # 23R 95 3 6 CA12 0.733 0.267
Exp # 24R 110 7 5 CA12 1 0
Exp # 25R 110 3 6 CA12 0.600 0.400
Exp # 22R 110 7 4 BB7755 0.600 0.400
Exp # 23RR 95 3 6 CA12 0.733 0.267
Additional tests were carried out upon completion of augmented DoE. These included
BS, TLS, S1, S2 and St. All Data sets were calculated and analysed in Microsoft Excel
2003. Both mean and SD data points for all experimental sets were inserted into Echip
software for additional analysis. The final results showed improved statistical
significance via augmented design and response variables.
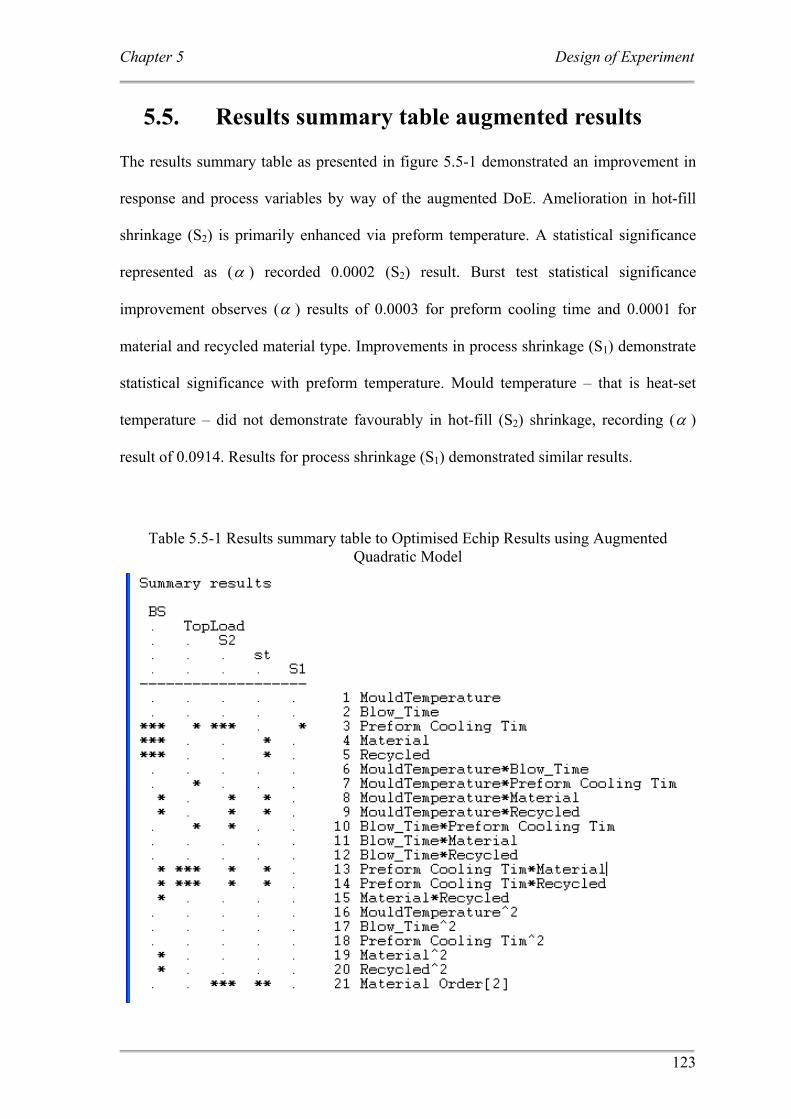
Chapter 5 Design of Experiment
123
5.5. Results summary table augmented results The results summary table as presented in figure 5.5-1 demonstrated an improvement in
response and process variables by way of the augmented DoE. Amelioration in hot-fill
shrinkage (S2) is primarily enhanced via preform temperature. A statistical significance
represented as (α ) recorded 0.0002 (S2) result. Burst test statistical significance
improvement observes (α ) results of 0.0003 for preform cooling time and 0.0001 for
material and recycled material type. Improvements in process shrinkage (S1) demonstrate
statistical significance with preform temperature. Mould temperature – that is heat-set
temperature – did not demonstrate favourably in hot-fill (S2) shrinkage, recording (α )
result of 0.0914. Results for process shrinkage (S1) demonstrated similar results.
Table 5.5-1 Results summary table to Optimised Echip Results using Augmented Quadratic Model
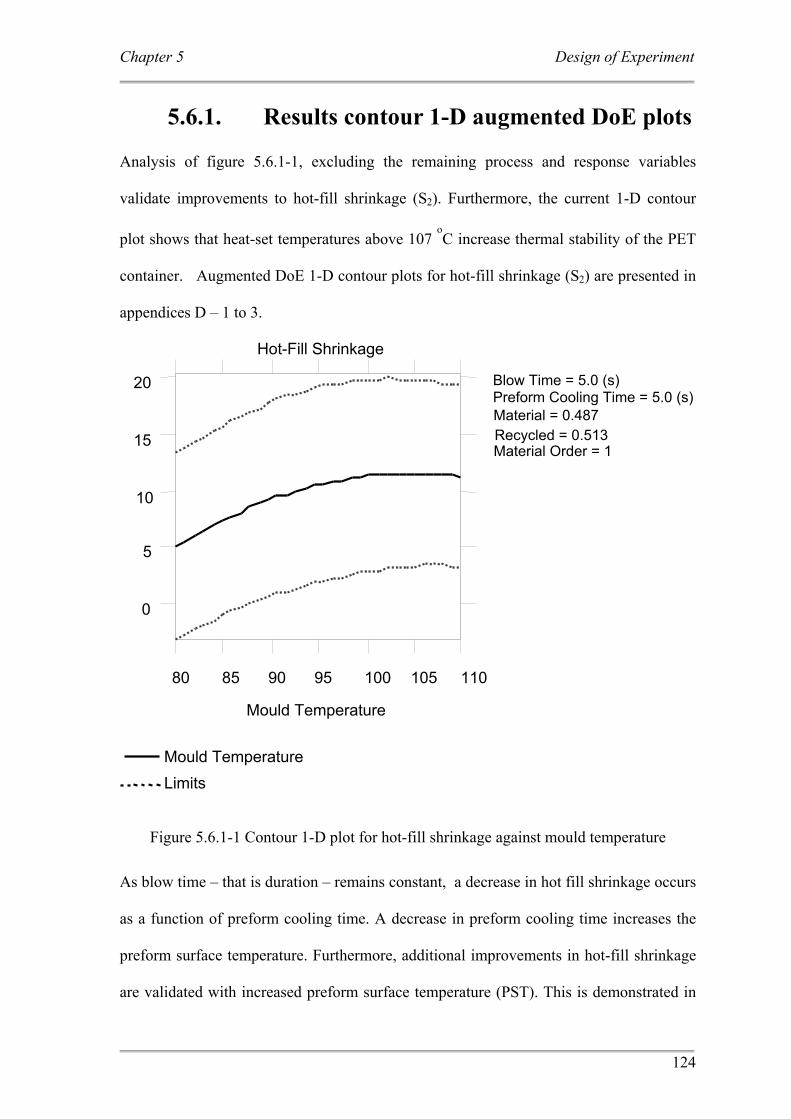
Chapter 5 Design of Experiment
124
5.6.1. Results contour 1-D augmented DoE plots Analysis of figure 5.6.1-1, excluding the remaining process and response variables
validate improvements to hot-fill shrinkage (S2). Furthermore, the current 1-D contour
plot shows that heat-set temperatures above 107 oC increase thermal stability of the PET
container. Augmented DoE 1-D contour plots for hot-fill shrinkage (S2) are presented in
appendices D – 1 to 3.
Figure 5.6.1-1 Contour 1-D plot for hot-fill shrinkage against mould temperature
As blow time – that is duration – remains constant, a decrease in hot fill shrinkage occurs
as a function of preform cooling time. A decrease in preform cooling time increases the
preform surface temperature. Furthermore, additional improvements in hot-fill shrinkage
are validated with increased preform surface temperature (PST). This is demonstrated in
Hot-Fill Shrinkage
0
5
10
15
20
80 85 90 95 100 105 110
Mould Temperature
Limits
Mould Temperature
Material Order = 1
Material = 0.487 Recycled = 0.513
Blow Time = 5.0 (s) Preform Cooling Time = 5.0 (s)
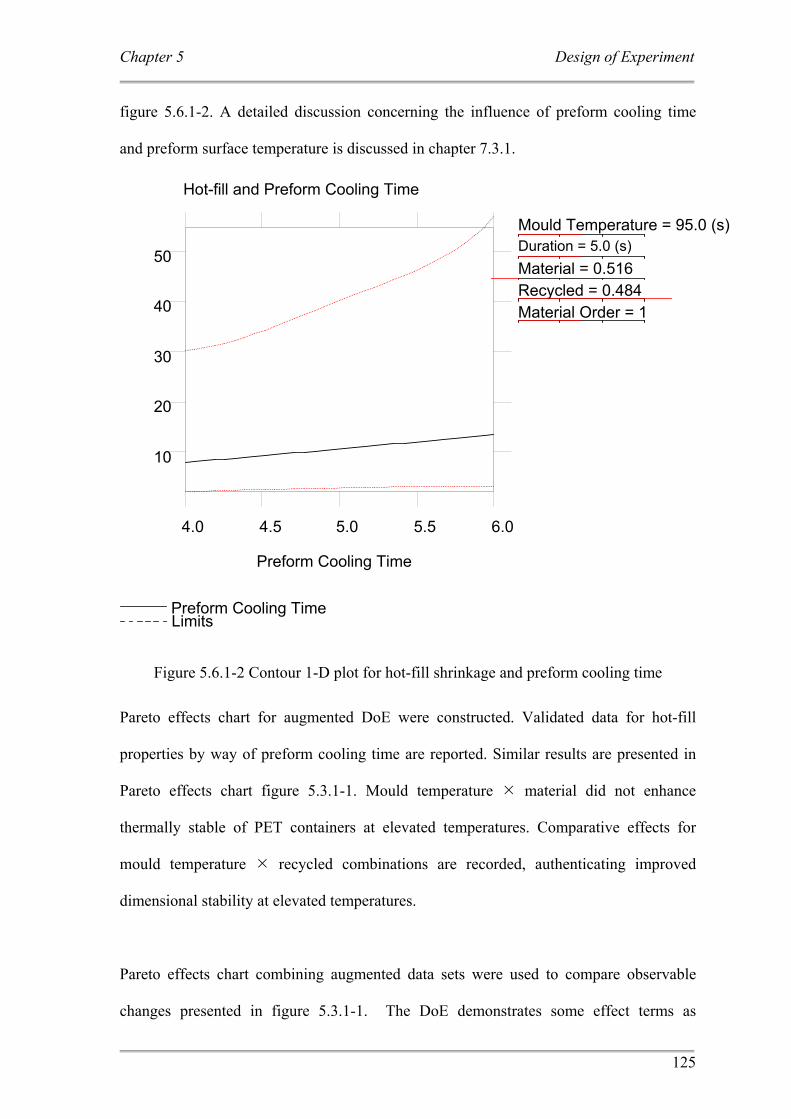
Chapter 5 Design of Experiment
125
figure 5.6.1-2. A detailed discussion concerning the influence of preform cooling time
and preform surface temperature is discussed in chapter 7.3.1.
Figure 5.6.1-2 Contour 1-D plot for hot-fill shrinkage and preform cooling time
Pareto effects chart for augmented DoE were constructed. Validated data for hot-fill
properties by way of preform cooling time are reported. Similar results are presented in
Pareto effects chart figure 5.3.1-1. Mould temperature material did not enhance
thermally stable of PET containers at elevated temperatures. Comparative effects for
mould temperature recycled combinations are recorded, authenticating improved
dimensional stability at elevated temperatures.
Pareto effects chart combining augmented data sets were used to compare observable
changes presented in figure 5.3.1-1. The DoE demonstrates some effect terms as
10
20
30
40
50
4.0 4.5 5.0 5.5 6.0
Preform Cooling Time
Hot-fill and Preform Cooling Time
Preform Cooling Time
Mould Temperature = 95.0 (s)Duration = 5.0 (s) Material = 0.516 Recycled = 0.484 Material Order = 1
Limits
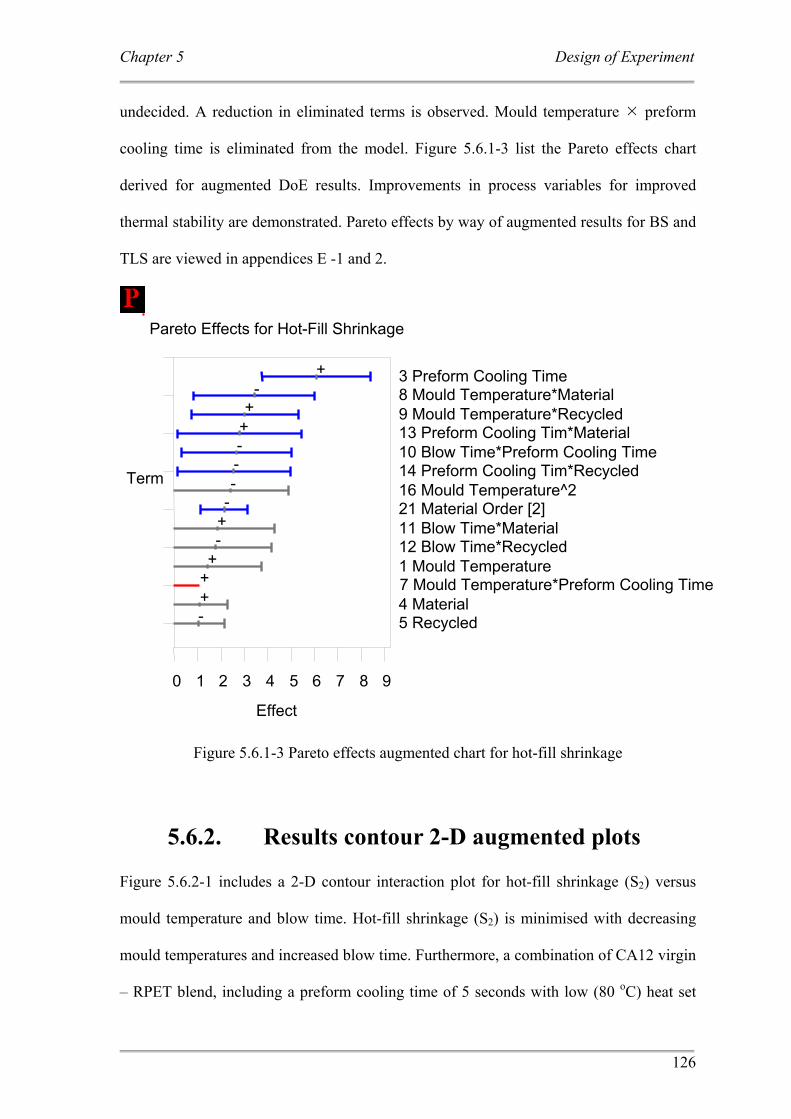
Chapter 5 Design of Experiment
126
undecided. A reduction in eliminated terms is observed. Mould temperature preform
cooling time is eliminated from the model. Figure 5.6.1-3 list the Pareto effects chart
derived for augmented DoE results. Improvements in process variables for improved
thermal stability are demonstrated. Pareto effects by way of augmented results for BS and
TLS are viewed in appendices E -1 and 2.
Figure 5.6.1-3 Pareto effects augmented chart for hot-fill shrinkage
5.6.2. Results contour 2-D augmented plots Figure 5.6.2-1 includes a 2-D contour interaction plot for hot-fill shrinkage (S2) versus
mould temperature and blow time. Hot-fill shrinkage (S2) is minimised with decreasing
mould temperatures and increased blow time. Furthermore, a combination of CA12 virgin
– RPET blend, including a preform cooling time of 5 seconds with low (80 oC) heat set
Effect
7 Mould Temperature*Preform Cooling Time
Term
0 1 2 3 4 5 6 7 8 9
Pareto Effects for Hot-Fill Shrinkage
3 Preform Cooling Time+8 Mould Temperature*Material -9 Mould Temperature*Recycled +13 Preform Cooling Tim*Material +10 Blow Time*Preform Cooling Time-14 Preform Cooling Tim*Recycled-16 Mould Temperature^2-21 Material Order [2]-11 Blow Time*Material+12 Blow Time*Recycled-1 Mould Temperature+
+ 4 Material+ 5 Recycled-
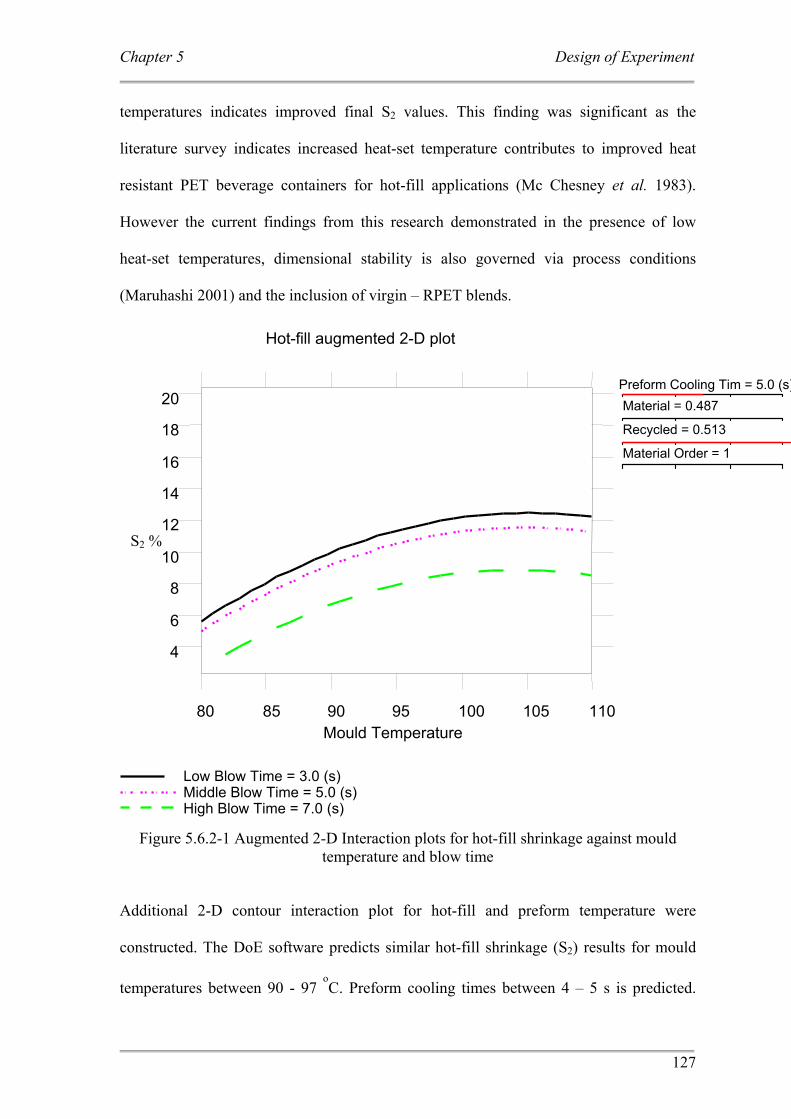
Chapter 5 Design of Experiment
127
temperatures indicates improved final S2 values. This finding was significant as the
literature survey indicates increased heat-set temperature contributes to improved heat
resistant PET beverage containers for hot-fill applications (Mc Chesney et al. 1983).
However the current findings from this research demonstrated in the presence of low
heat-set temperatures, dimensional stability is also governed via process conditions
(Maruhashi 2001) and the inclusion of virgin – RPET blends.
Figure 5.6.2-1 Augmented 2-D Interaction plots for hot-fill shrinkage against mould temperature and blow time
Additional 2-D contour interaction plot for hot-fill and preform temperature were
constructed. The DoE software predicts similar hot-fill shrinkage (S2) results for mould
temperatures between 90 - 97 oC. Preform cooling times between 4 – 5 s is predicted.
Middle Blow Time = 5.0 (s) High Blow Time = 7.0 (s)
Preform Cooling Tim = 5.0 (s)
4
6
8
10
12
14
16
18
20
80 85 90 95 100 105 110 Mould Temperature
Hot-fill augmented 2-D plot
Low Blow Time = 3.0 (s)
Material = 0.487
Recycled = 0.513
Material Order = 1
S2 %
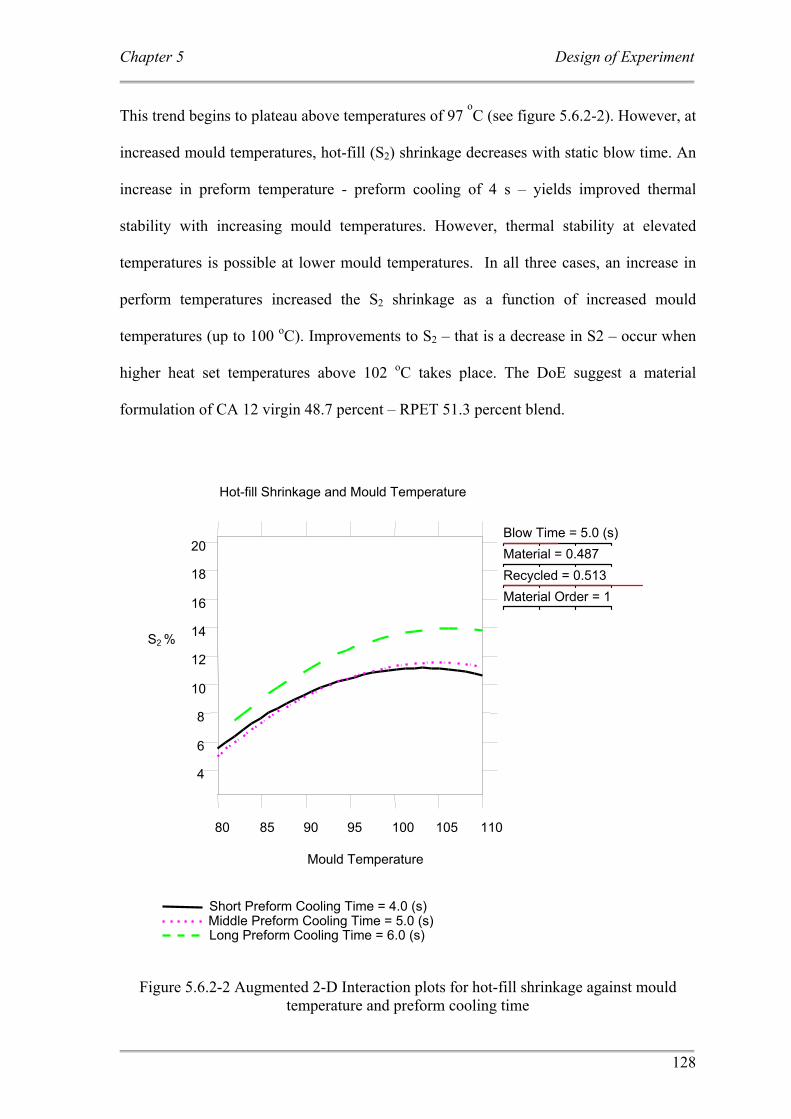
Chapter 5 Design of Experiment
128
This trend begins to plateau above temperatures of 97 oC (see figure 5.6.2-2). However, at
increased mould temperatures, hot-fill (S2) shrinkage decreases with static blow time. An
increase in preform temperature - preform cooling of 4 s – yields improved thermal
stability with increasing mould temperatures. However, thermal stability at elevated
temperatures is possible at lower mould temperatures. In all three cases, an increase in
perform temperatures increased the S2 shrinkage as a function of increased mould
temperatures (up to 100 oC). Improvements to S2 – that is a decrease in S2 – occur when
higher heat set temperatures above 102 oC takes place. The DoE suggest a material
formulation of CA 12 virgin 48.7 percent – RPET 51.3 percent blend.
Figure 5.6.2-2 Augmented 2-D Interaction plots for hot-fill shrinkage against mould temperature and preform cooling time
Middle Preform Cooling Time = 5.0 (s) Long Preform Cooling Time = 6.0 (s)
4
6
8
10
12
14
16
18
20
80 85 90 95 100 105 110
Mould Temperature
Hot-fill Shrinkage and Mould Temperature
Short Preform Cooling Time = 4.0 (s)
Blow Time = 5.0 (s) Material = 0.487 Recycled = 0.513 Material Order = 1
S2 %
Chapter 5 Design of Experiment
129
5.7. DoE Optimised Condition for ISBM Process Addressing the research aims needed to gain knowledge in the following areas. These
include:-
• An increase in heat-set temperatures and its effects on hot-fill shrinkage (S2)
• inclusion of Visy RPET and its effects on thermal stability at elevated
temperatures with increased heat-set temperatures.
Figure 5.7-1 is a compilation of the top 5% hot-fill shrinkage results demonstrating
superior dimensional stability. Experimental number 15 demonstrates the best S2
results for all experimental data. Hot-fill shrinkage (S2) of 2.14 % was observed. A
preform surface temperature (PST) of 117 oC is recorded at SP02, located in the
middle of the preform. A base PST of 102.5 oC (SP03) was recorded including 125.3
oC observed for SP01. Chapter 4.3-2 provides a schematic to PST data points. Figure
5.7-1 demonstrates the top 5 % validated results for minimised hot-fill shrinkage (S2).
Reference to all ISBM experimental data is found in appendices B- 1.
Complete 2-D contour plots for burst strength test versus mould temperature, hot-fill
shrinkage (S2) versus preform cooling time and top load versus preform cooling time
graphs via augmented DoE results are made public in appendices F – 1 to 3.
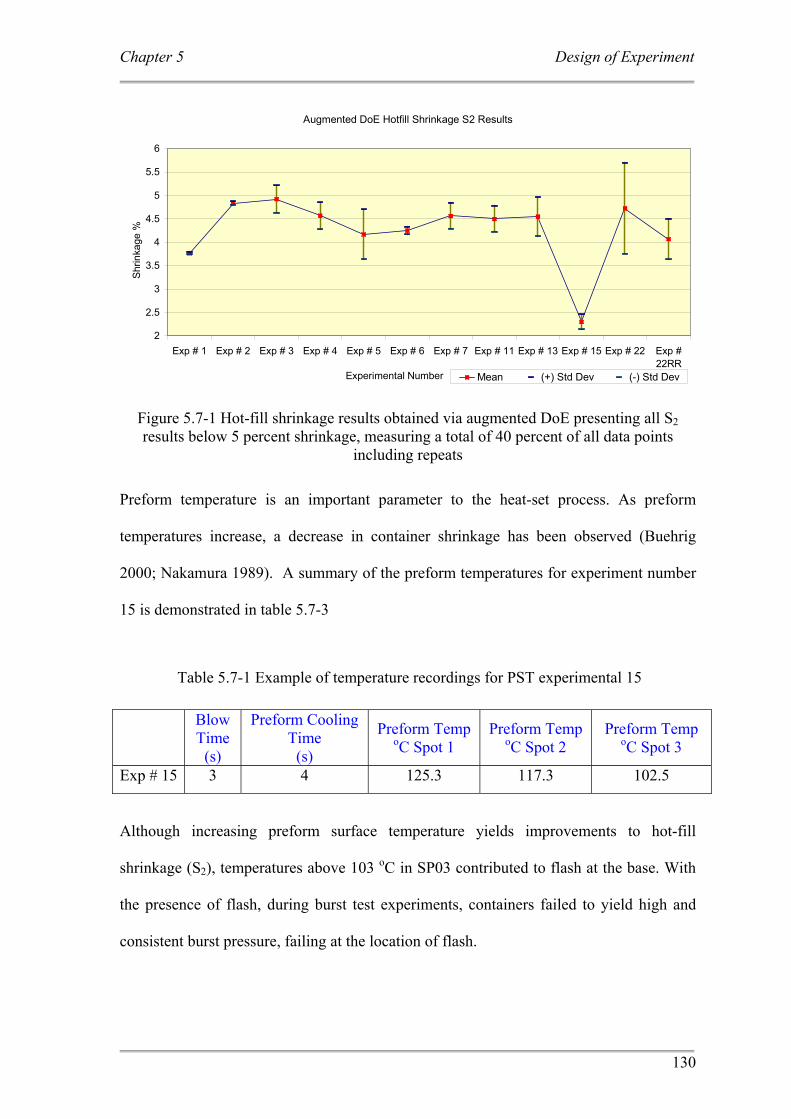
Chapter 5 Design of Experiment
130
Augmented DoE Hotfill Shrinkage S2 Results
2
2.5
3
3.5
4
4.5
5
5.5
6
Exp # 1 Exp # 2 Exp # 3 Exp # 4 Exp # 5 Exp # 6 Exp # 7 Exp # 11 Exp # 13 Exp # 15 Exp # 22 Exp #22RR
Experimental Number
Shrin
kage
%
Mean (+) Std Dev (-) Std Dev
Figure 5.7-1 Hot-fill shrinkage results obtained via augmented DoE presenting all S2 results below 5 percent shrinkage, measuring a total of 40 percent of all data points
including repeats
Preform temperature is an important parameter to the heat-set process. As preform
temperatures increase, a decrease in container shrinkage has been observed (Buehrig
2000; Nakamura 1989). A summary of the preform temperatures for experiment number
15 is demonstrated in table 5.7-3
Table 5.7-1 Example of temperature recordings for PST experimental 15
Although increasing preform surface temperature yields improvements to hot-fill
shrinkage (S2), temperatures above 103 oC in SP03 contributed to flash at the base. With
the presence of flash, during burst test experiments, containers failed to yield high and
consistent burst pressure, failing at the location of flash.
Blow Time
(s)
Preform Cooling Time
(s)
Preform Temp oC Spot 1
Preform Temp oC Spot 2
Preform Temp oC Spot 3
Exp # 15 3 4 125.3 117.3 102.5
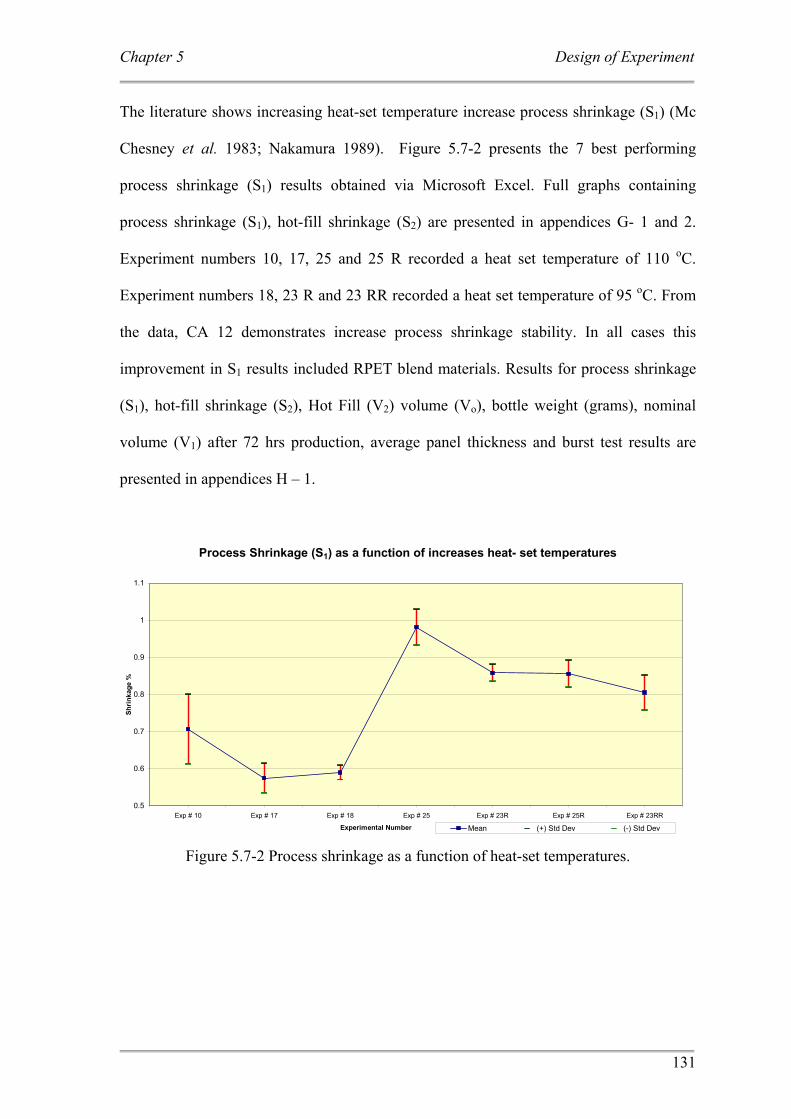
Chapter 5 Design of Experiment
131
The literature shows increasing heat-set temperature increase process shrinkage (S1) (Mc
Chesney et al. 1983; Nakamura 1989). Figure 5.7-2 presents the 7 best performing
process shrinkage (S1) results obtained via Microsoft Excel. Full graphs containing
process shrinkage (S1), hot-fill shrinkage (S2) are presented in appendices G- 1 and 2.
Experiment numbers 10, 17, 25 and 25 R recorded a heat set temperature of 110 oC.
Experiment numbers 18, 23 R and 23 RR recorded a heat set temperature of 95 oC. From
the data, CA 12 demonstrates increase process shrinkage stability. In all cases this
improvement in S1 results included RPET blend materials. Results for process shrinkage
(S1), hot-fill shrinkage (S2), Hot Fill (V2) volume (Vo), bottle weight (grams), nominal
volume (V1) after 72 hrs production, average panel thickness and burst test results are
presented in appendices H – 1.
Process Shrinkage (S1) as a function of increases heat- set temperatures
0.5
0.6
0.7
0.8
0.9
1
1.1
Exp # 10 Exp # 17 Exp # 18 Exp # 25 Exp # 23R Exp # 25R Exp # 23RR
Experimental Number
Shrin
kage
%
Mean (+) Std Dev (-) Std Dev Figure 5.7-2 Process shrinkage as a function of heat-set temperatures.
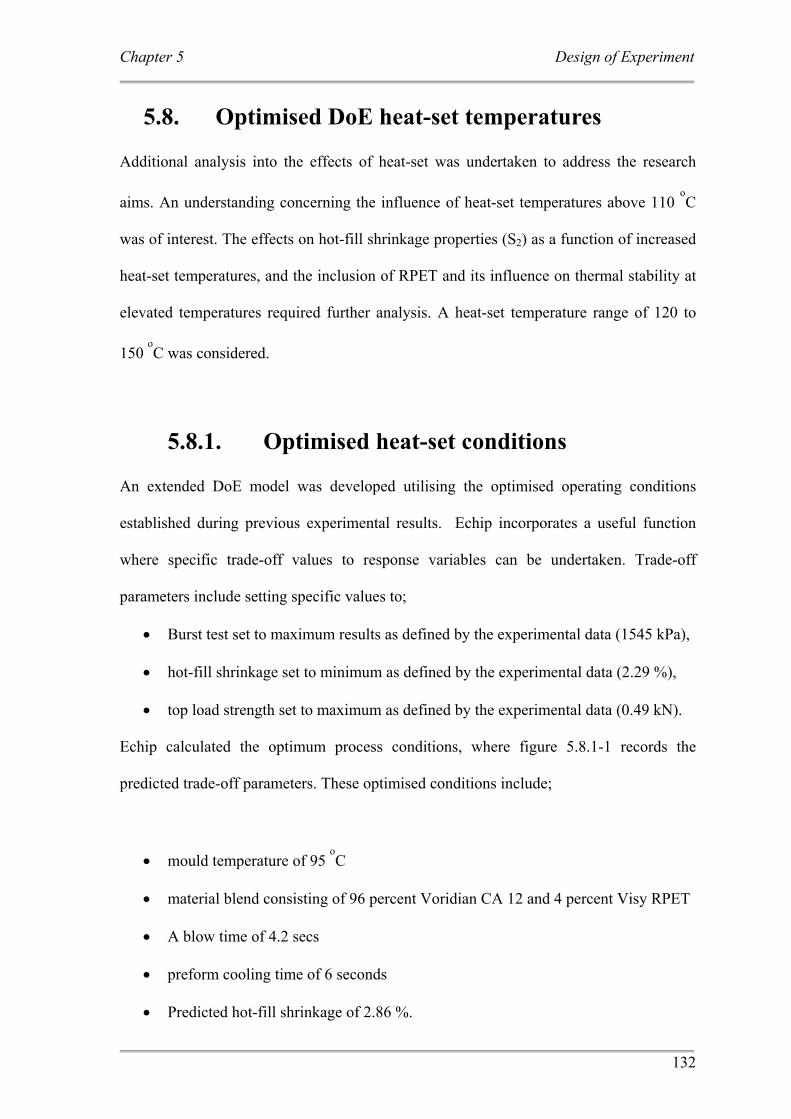
Chapter 5 Design of Experiment
132
5.8. Optimised DoE heat-set temperatures Additional analysis into the effects of heat-set was undertaken to address the research
aims. An understanding concerning the influence of heat-set temperatures above 110 oC
was of interest. The effects on hot-fill shrinkage properties (S2) as a function of increased
heat-set temperatures, and the inclusion of RPET and its influence on thermal stability at
elevated temperatures required further analysis. A heat-set temperature range of 120 to
150 oC was considered.
5.8.1. Optimised heat-set conditions An extended DoE model was developed utilising the optimised operating conditions
established during previous experimental results. Echip incorporates a useful function
where specific trade-off values to response variables can be undertaken. Trade-off
parameters include setting specific values to;
• Burst test set to maximum results as defined by the experimental data (1545 kPa),
• hot-fill shrinkage set to minimum as defined by the experimental data (2.29 %),
• top load strength set to maximum as defined by the experimental data (0.49 kN).
Echip calculated the optimum process conditions, where figure 5.8.1-1 records the
predicted trade-off parameters. These optimised conditions include;
• mould temperature of 95 oC
• material blend consisting of 96 percent Voridian CA 12 and 4 percent Visy RPET
• A blow time of 4.2 secs
• preform cooling time of 6 seconds
• Predicted hot-fill shrinkage of 2.86 %.
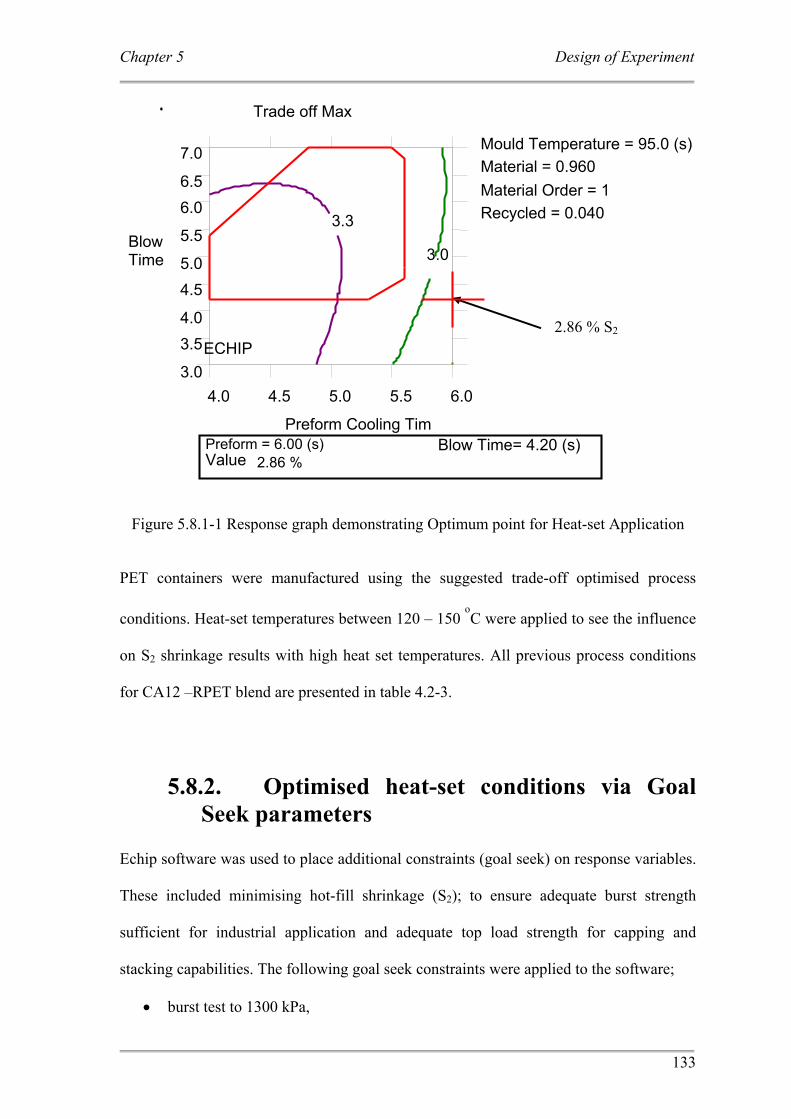
Chapter 5 Design of Experiment
133
Figure 5.8.1-1 Response graph demonstrating Optimum point for Heat-set Application
PET containers were manufactured using the suggested trade-off optimised process
conditions. Heat-set temperatures between 120 – 150 oC were applied to see the influence
on S2 shrinkage results with high heat set temperatures. All previous process conditions
for CA12 –RPET blend are presented in table 4.2-3.
5.8.2. Optimised heat-set conditions via Goal Seek parameters
Echip software was used to place additional constraints (goal seek) on response variables.
These included minimising hot-fill shrinkage (S2); to ensure adequate burst strength
sufficient for industrial application and adequate top load strength for capping and
stacking capabilities. The following goal seek constraints were applied to the software;
• burst test to 1300 kPa,
Trade off Max
Blow Time
2.86 % S2 ECHIP
3.0
3.5 4.0
4.5 5.0
5.5
6.0 6.5
7.0
4.0 4.5 5.0 5.5 6.0
Preform Cooling Tim
3.0
3.3 Recycled = 0.040 Material Order = 1
Value 2.86 % Preform = 6.00 (s) Blow Time= 4.20 (s)
Material = 0.960 Mould Temperature = 95.0 (s)
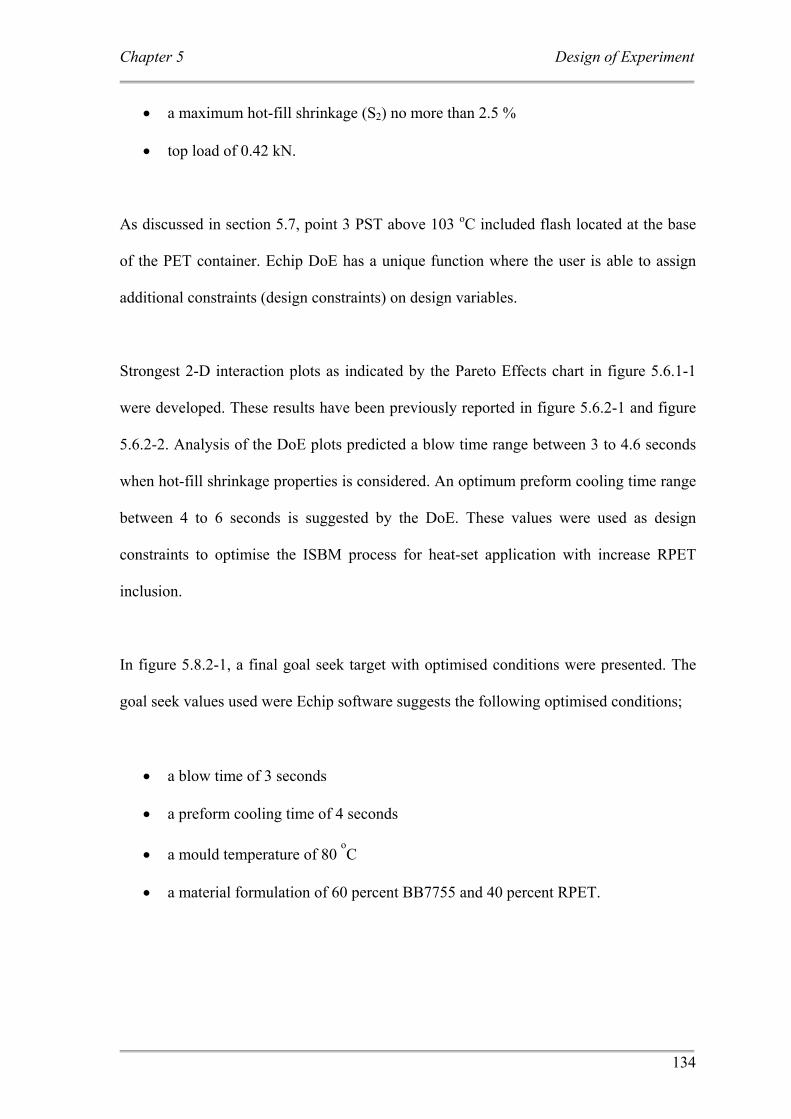
Chapter 5 Design of Experiment
134
• a maximum hot-fill shrinkage (S2) no more than 2.5 %
• top load of 0.42 kN.
As discussed in section 5.7, point 3 PST above 103 oC included flash located at the base
of the PET container. Echip DoE has a unique function where the user is able to assign
additional constraints (design constraints) on design variables.
Strongest 2-D interaction plots as indicated by the Pareto Effects chart in figure 5.6.1-1
were developed. These results have been previously reported in figure 5.6.2-1 and figure
5.6.2-2. Analysis of the DoE plots predicted a blow time range between 3 to 4.6 seconds
when hot-fill shrinkage properties is considered. An optimum preform cooling time range
between 4 to 6 seconds is suggested by the DoE. These values were used as design
constraints to optimise the ISBM process for heat-set application with increase RPET
inclusion.
In figure 5.8.2-1, a final goal seek target with optimised conditions were presented. The
goal seek values used were Echip software suggests the following optimised conditions;
• a blow time of 3 seconds
• a preform cooling time of 4 seconds
• a mould temperature of 80 oC
• a material formulation of 60 percent BB7755 and 40 percent RPET.
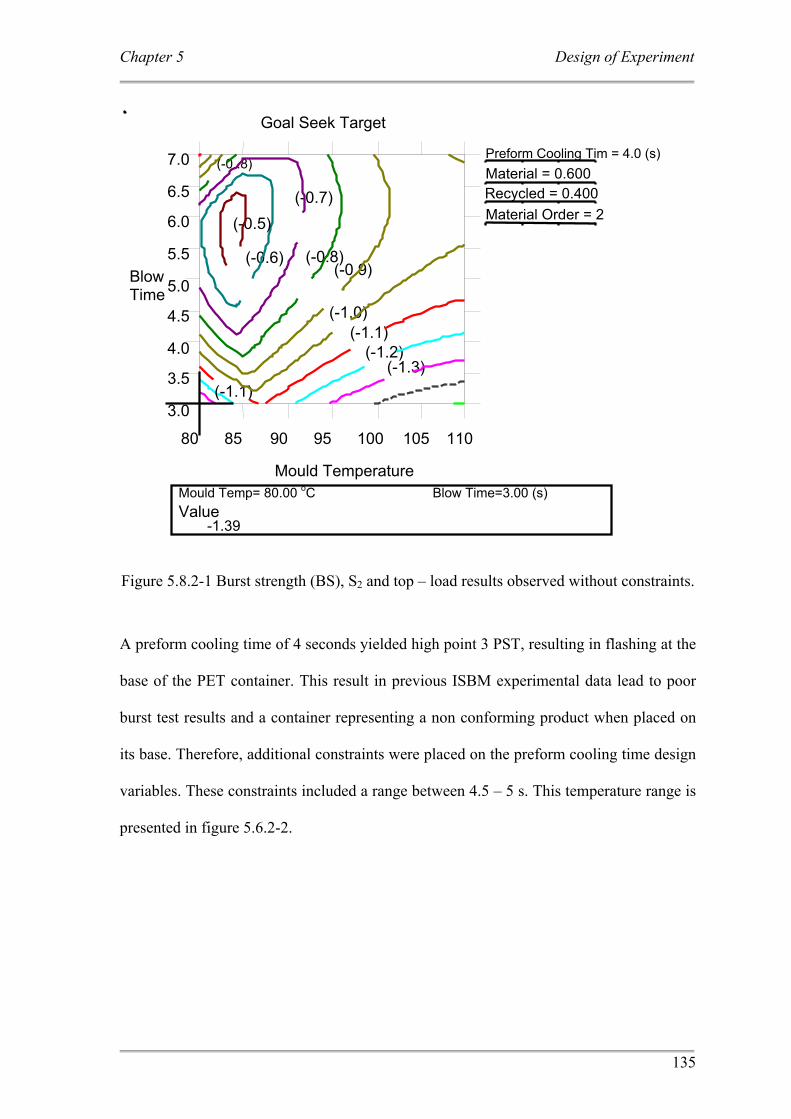
Chapter 5 Design of Experiment
135
Figure 5.8.2-1 Burst strength (BS), S2 and top – load results observed without constraints.
A preform cooling time of 4 seconds yielded high point 3 PST, resulting in flashing at the
base of the PET container. This result in previous ISBM experimental data lead to poor
burst test results and a container representing a non conforming product when placed on
its base. Therefore, additional constraints were placed on the preform cooling time design
variables. These constraints included a range between 4.5 – 5 s. This temperature range is
presented in figure 5.6.2-2.
3.0
3.5
4.0
4.5
5.0
5.5
6.0
6.5
7.0
80 85 90 95 100 105 110
Mould Temperature
Goal Seek Target
(-1.3) (-1.2)
(-1.1)
(-1.1)
(-1.0)
(-0.9)
(-0..8)
(-0.8)
(-0.7)
(-0.6)
(-0.5)
Preform Cooling Tim = 4.0 (s) Material = 0.600 Recycled = 0.400 Material Order = 2
Value -1.39
Mould Temp= 80.00 oC Blow Time=3.00 (s)
Blow Time
Chapter 5 Design of Experiment
136
5.8.3. Optimised heat-set conditions via trade off constraints
Figure 5.8.3-1 recommend final results obtained via Echip software incorporating
constrained design variables, as suggested in section 5.8.2.
Figure 5.8.3-1 Results from constraint values for burst, S2 and top load results observed from Echip.
The final optimised ISBM conditions according to Echip for hot-fill applications include
suggest;
• preform cooling time of 4.5 seconds
• material blend of 60 percent SkyPET BB7755 and 40 percent Visy RPET.
• Mould temperature of 80 oC
• Blow time of 7 s
ECHIP
3.0
3.54.0
4.55.0
5.5
6.06.5
7.0
BlowTime (s)
80 85 90 95 100 105 110
Mould Temperature
Trade off Goal Seek Target
(-0.9)
(-0.8)
(-0.8)
(-0.7) (-0.7)
(-0.7)
(-0.6)
(-0.5)
Preform Cooling Tim = 4.5 (s) Material = 0.600 Recycled = 0.400 Material Order = 2
Value -0.95
Mould Tem= 80.00 oC Blow Time=7.00 (s)
Chapter 5 Design of Experiment
137
The recommended heat-set temperatures of 80 oC were ignored, and heat-set temperatures
between 120 – 150 oC were applied.
5.9. Validation of Optimised ISBM DoE During the manufacturing of optimised CA12 – RPET blends as described in section 5.8-
1; an interest in the accuracy of the DoE was undertaken. An increase in point 3 PST
resulted in flashing at the base. During the manufacturing of beverage containers
including 96 percent CA 12 and 4 percent RPET, 0.1 second decrease in preform cooling
time was applied. This resulted in flashing existing at the base of the PET container.
Increasing the preform cooling time back to the optimised cycle time (4.2 seconds)
eliminated flashing from the base of the container. This demonstrated the DoE software
was running close to the processing window, and that the details generated reflected the
ISBM process.

Chapter 6 Heat-set thermal analysis and characterisation
138
6. Chapter 6: Heat-set thermal analysis and characterisation.
Chapter 6 Heat-set thermal analysis and characterisation
139
6.1 Thermal Analysis Thermal analysis was used to characterise thermal properties of each polymer material.
PET samples were prepared – as introduced in chapter 3.6 titled Thermal Analysis – and
results analysed via TA Instruments Universal software version 3.9A. MDSC is used to
measure quantitatively the percentage crystallinity )(χ for PET samples (Gruver et al.
2000). Endothermic and exothermic behavioural changes present in the PET panel
sections due to optimised process conditions were investigated. Thermal events
concerning the kinetics and heat constants of glass transition temperature (Tg), cold
crystallisation temperature (Tcc), heat of fusion cold crystallisation peak ( ( ),ccHΔ specific
heat ( )Cρ , temperature melting point (Tm), enthalpy of melting ,( )m totalHΔ , enthalpy of
melting Non reverse heat flow( )NRHΔ , enthalpy of melting reverse heat flow ( )RHΔ ,
heat of fusion crystallisation peak ( )cHΔ and percentage crystallinity )(χ as a function of
heat-set time was investigated.
DSC methods have been used to investigate the degree of crystallinity )(χ for PET
samples (Bashir Z et al. 2000; Gohil 1994; Kong et al. 2002; Reading et al. 2001). In the
absence of Tcc, equation 6-1 is used to determine the )(χ by the DSC method.
100, ×Δ
Δ=
c
totalmc H
Hχ
Equation 6-1
Chapter 6 Heat-set thermal analysis and characterisation
140
Where
totalmH ,Δ = Enthalpy of melting
cHΔ = Heat of fusion 100 % crystalline PET material
6.2. Glass Transition Kinetic responses within the glass transition temperature as a response to thermal history
was analysed. The reversing heat capacity (rev ρC ) data obtained during thermal analysis
was used to determine the Tg temperature. One other method for obtaining Tg temperature
is by way of the derivative rev ρC curve. In most cases semicrystalline materials Tg
temperature step is mostly asymmetric (Cser 2007). This method was also included to
define Tg temperature as the derivative curve increases the sensitivity of the thermal
change as a function of time.
The thermal analysis software does not include a Gaussian fitting function to determine
the Tg peak. Therefore the maximum peak was established between the full widths of the
thermal events. Two data points are contained within the derivative curve and the peak
position is defined as the Tg temperature. An example of Tg temperature defined by the
above mentioned procedure is demonstrated in figure 6.2-1. The remaining Tg
temperatures attained are presented in appendices N - a, b, c and d. Full analysis of Tg
temperature are presented in chapter 7.7.1. Complete derivative rev ρC and rev ρC
thermographs are presented in appendices I – a, b, c, d; J – a, b, c, d; K – a, b, c, d; L – a,
b, c, d.
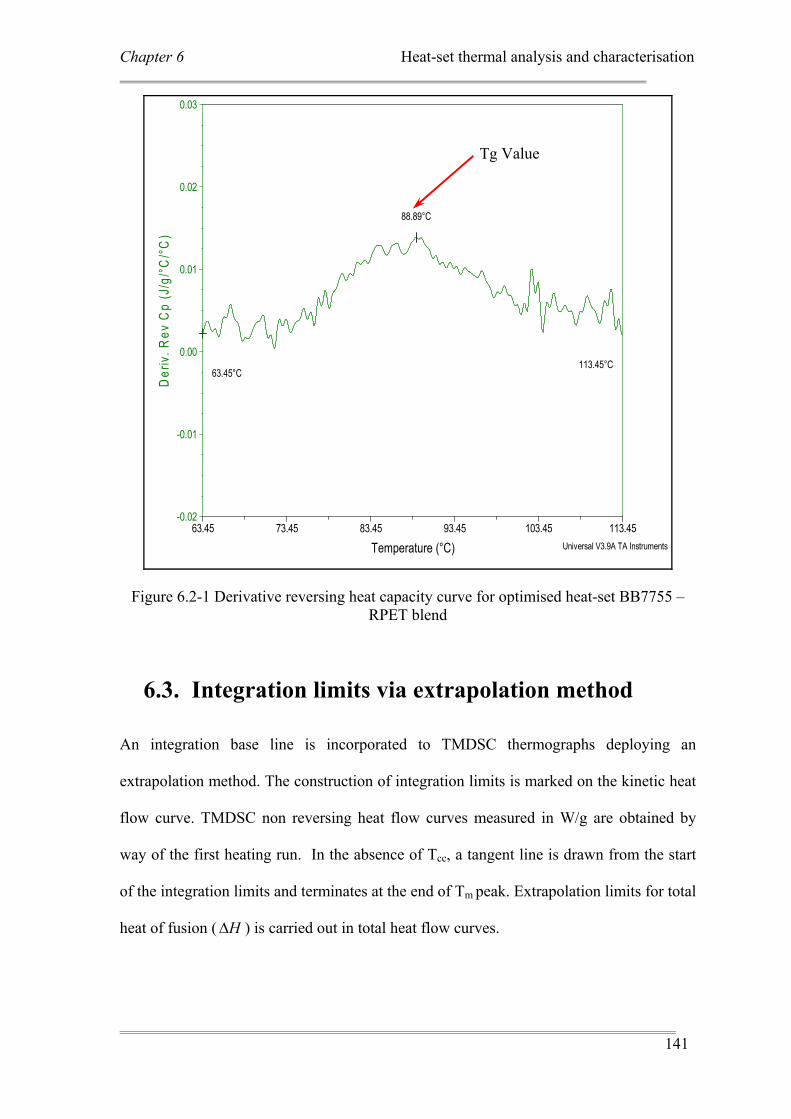
Chapter 6 Heat-set thermal analysis and characterisation
141
63.45°C113.45°C
88.89°C
-0.02
-0.01
0.00
0.01
0.02
0.03
Der
iv. R
ev C
p (J
/g/°
C/°
C)
63.45 73.45 83.45 93.45 103.45 113.45
Temperature (°C) Universal V3.9A TA Instruments
Figure 6.2-1 Derivative reversing heat capacity curve for optimised heat-set BB7755 – RPET blend
6.3. Integration limits via extrapolation method An integration base line is incorporated to TMDSC thermographs deploying an
extrapolation method. The construction of integration limits is marked on the kinetic heat
flow curve. TMDSC non reversing heat flow curves measured in W/g are obtained by
way of the first heating run. In the absence of Tcc, a tangent line is drawn from the start
of the integration limits and terminates at the end of Tm peak. Extrapolation limits for total
heat of fusion ( HΔ ) is carried out in total heat flow curves.
Tg Value
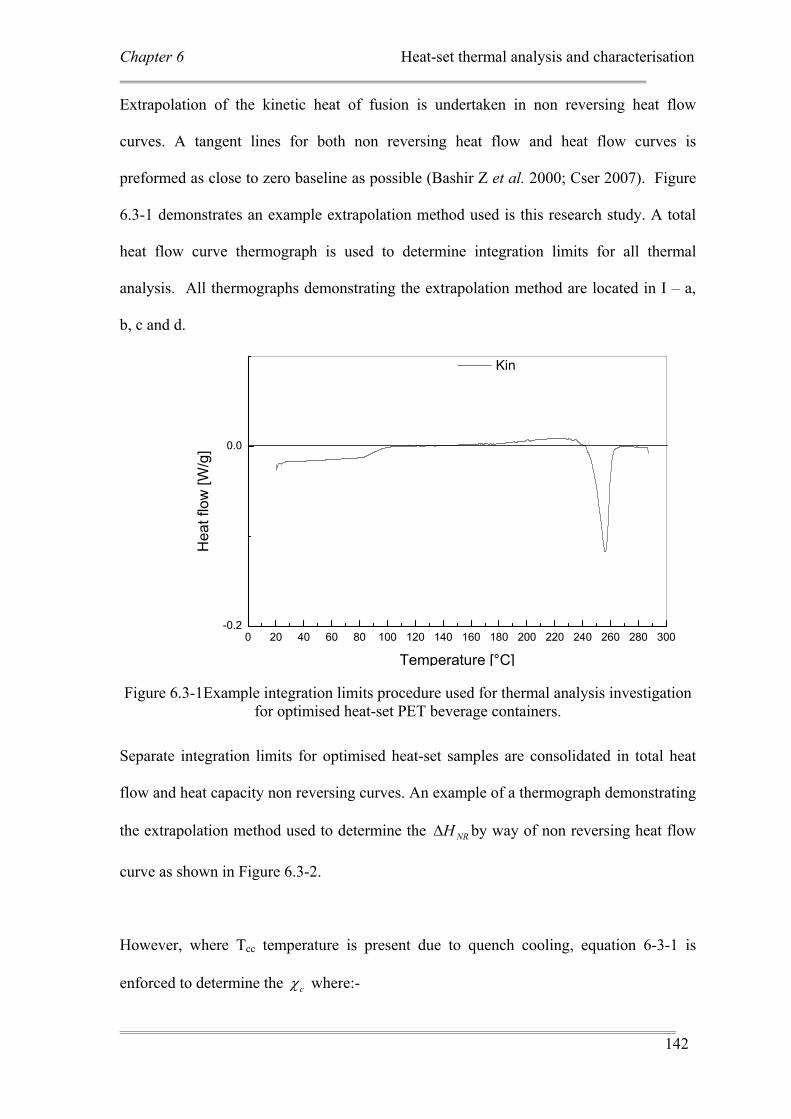
Chapter 6 Heat-set thermal analysis and characterisation
142
Extrapolation of the kinetic heat of fusion is undertaken in non reversing heat flow
curves. A tangent lines for both non reversing heat flow and heat flow curves is
preformed as close to zero baseline as possible (Bashir Z et al. 2000; Cser 2007). Figure
6.3-1 demonstrates an example extrapolation method used is this research study. A total
heat flow curve thermograph is used to determine integration limits for all thermal
analysis. All thermographs demonstrating the extrapolation method are located in I – a,
b, c and d.
0 20 40 60 80 100 120 140 160 180 200 220 240 260 280 300-0.2
0.0
Kin
Hea
t flo
w [W
/g]
Temperature [°C]
Figure 6.3-1Example integration limits procedure used for thermal analysis investigation for optimised heat-set PET beverage containers.
Separate integration limits for optimised heat-set samples are consolidated in total heat
flow and heat capacity non reversing curves. An example of a thermograph demonstrating
the extrapolation method used to determine the NRHΔ by way of non reversing heat flow
curve as shown in Figure 6.3-2.
However, where Tcc temperature is present due to quench cooling, equation 6-3-1 is
enforced to determine the cχ where:-
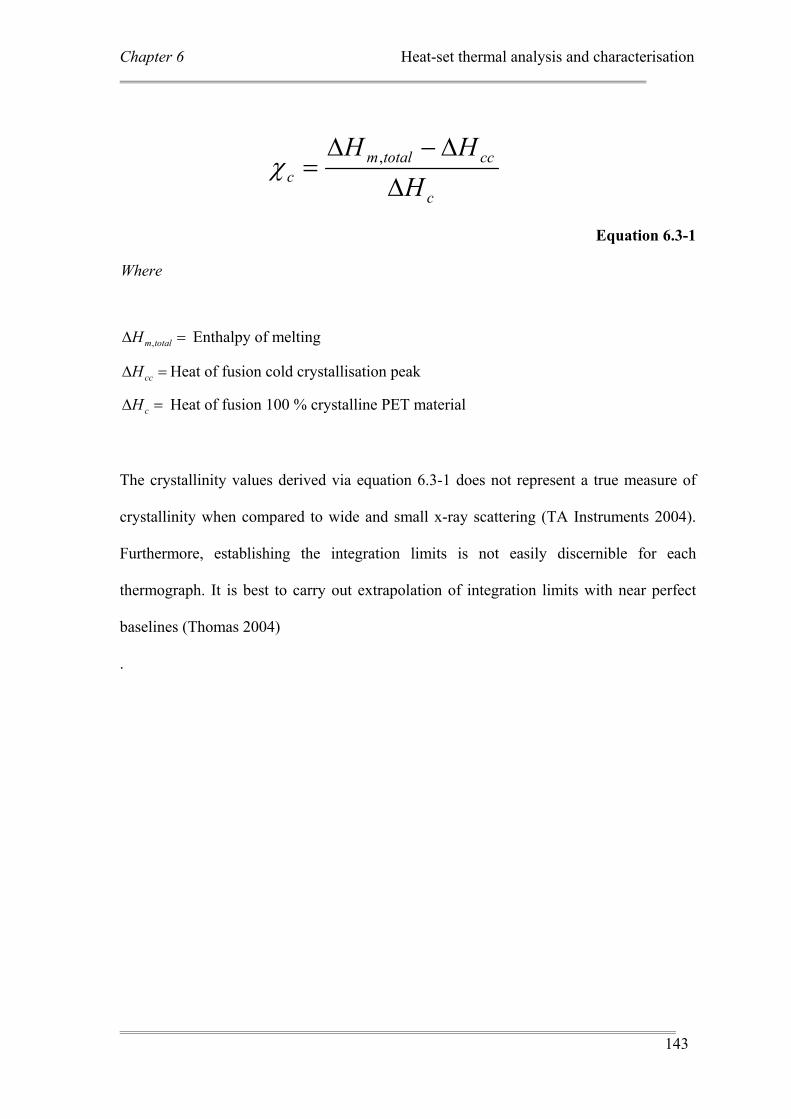
Chapter 6 Heat-set thermal analysis and characterisation
143
c
cctotalmc H
HHΔ
Δ−Δ= ,χ
Equation 6.3-1
Where
=Δ totalmH , Enthalpy of melting
=Δ ccH Heat of fusion cold crystallisation peak
=Δ cH Heat of fusion 100 % crystalline PET material
The crystallinity values derived via equation 6.3-1 does not represent a true measure of
crystallinity when compared to wide and small x-ray scattering (TA Instruments 2004).
Furthermore, establishing the integration limits is not easily discernible for each
thermograph. It is best to carry out extrapolation of integration limits with near perfect
baselines (Thomas 2004)
.
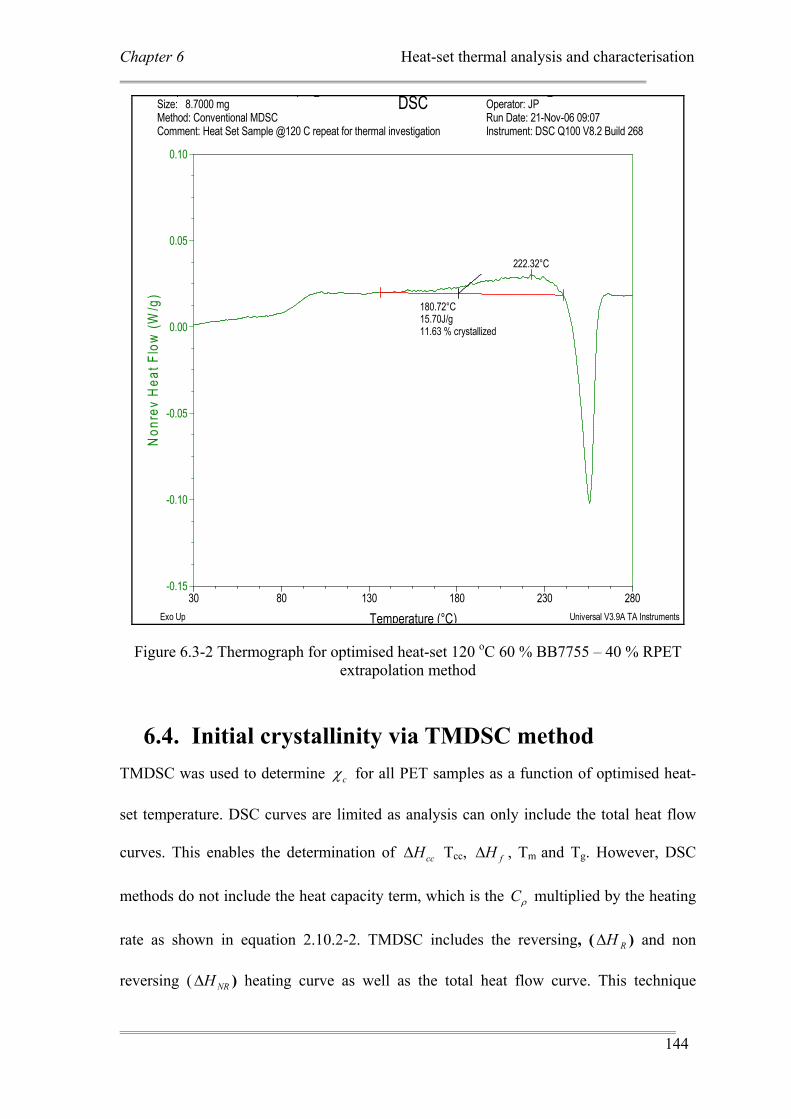
Chapter 6 Heat-set thermal analysis and characterisation
144
222.32°C
180.72°C15.70J/g11.63 % crystallized
-0.15
-0.10
-0.05
0.00
0.05
0.10N
onre
v H
eat F
low
(W/g
)
30 80 130 180 230 280
Temperature (°C)
p p @Size: 8.7000 mgMethod: Conventional MDSCComment: Heat Set Sample @120 C repeat for thermal investigation
DSC@
Operator: JPRun Date: 21-Nov-06 09:07Instrument: DSC Q100 V8.2 Build 268
Exo Up Universal V3.9A TA Instruments
Figure 6.3-2 Thermograph for optimised heat-set 120 oC 60 % BB7755 – 40 % RPET extrapolation method
6.4. Initial crystallinity via TMDSC method TMDSC was used to determine cχ for all PET samples as a function of optimised heat-
set temperature. DSC curves are limited as analysis can only include the total heat flow
curves. This enables the determination of ccHΔ Tcc, fHΔ , Tm and Tg. However, DSC
methods do not include the heat capacity term, which is the ρC multiplied by the heating
rate as shown in equation 2.10.2-2. TMDSC includes the reversing, ( RHΔ ) and non
reversing ( NRHΔ ) heating curve as well as the total heat flow curve. This technique
Chapter 6 Heat-set thermal analysis and characterisation
145
provides greater sensitivity when determining the crystallinity value for a polymer.
Doubts concerning the TMDSC method have been expressed (Bashir et al. 2000).
However, due to the improved resolution when determining the initial crystallinity cχ via
TMDSC, this method was used for this research study. Equation 6-4-1 is expressed as:-
c
Rtotalmc H
HHΔ
Δ−Δ= ,χ
Equation 6.4-1
Where
=Δ totalmH , Enthalpy of melting
=Δ RH Enthalpy of melting Non reversing heat flow
=Δ cH Heat of fusion 100 % crystalline PET material
Integration limits were chosen as described in section 6.2. Thermograph plots for
optimised heat-set temperatures were undertaken. Results were collated and analysed for
changes in thermal properties as a function of optimised heat-set temperature. Table 6.3-1
lists the thermal properties for optimised 60 percent BB7755 – 40 percent RPET blends.
Thermal analysis results for all raw material PET samples as supplied from raw material
manufactures can be found in appendices N- 1.
The literature values for cHΔ varies from 84.5 J/g (Miyagi et al. 1972) to 165 J/g (Grulke
et al. 1999). As part of this analysis, cHΔ of 135 J/g was used as being the most common
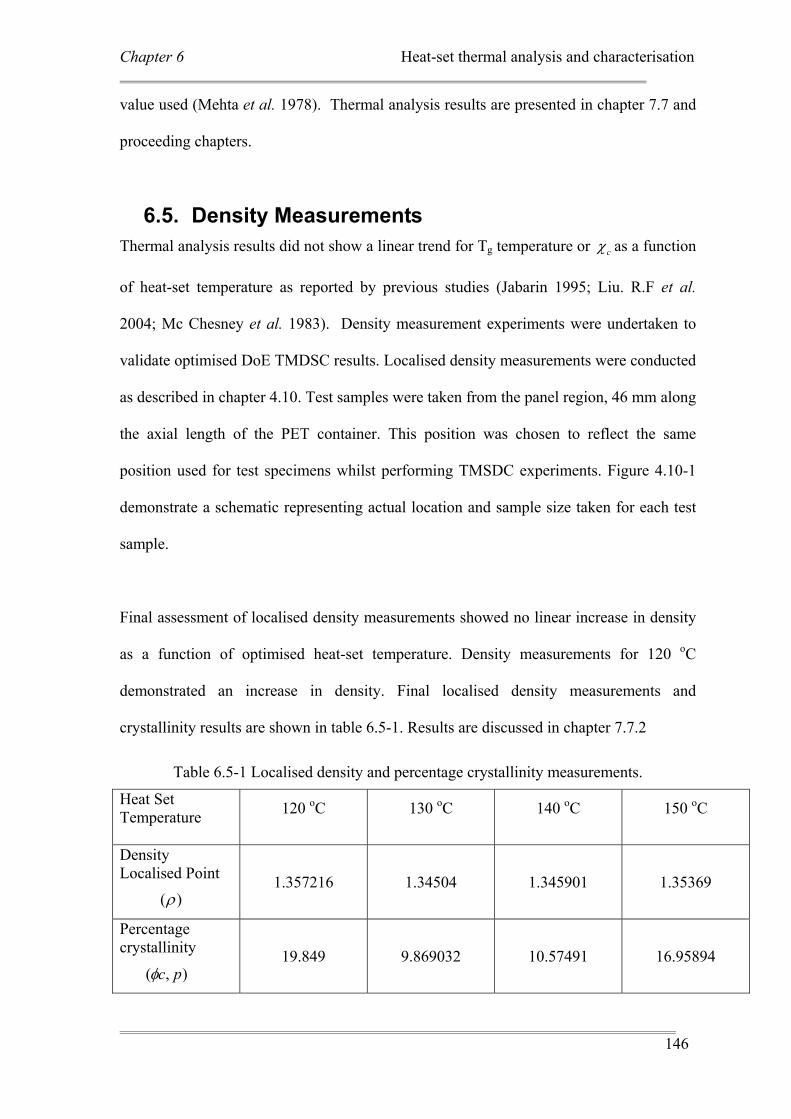
Chapter 6 Heat-set thermal analysis and characterisation
146
value used (Mehta et al. 1978). Thermal analysis results are presented in chapter 7.7 and
proceeding chapters.
6.5. Density Measurements Thermal analysis results did not show a linear trend for Tg temperature or cχ as a function
of heat-set temperature as reported by previous studies (Jabarin 1995; Liu. R.F et al.
2004; Mc Chesney et al. 1983). Density measurement experiments were undertaken to
validate optimised DoE TMDSC results. Localised density measurements were conducted
as described in chapter 4.10. Test samples were taken from the panel region, 46 mm along
the axial length of the PET container. This position was chosen to reflect the same
position used for test specimens whilst performing TMSDC experiments. Figure 4.10-1
demonstrate a schematic representing actual location and sample size taken for each test
sample.
Final assessment of localised density measurements showed no linear increase in density
as a function of optimised heat-set temperature. Density measurements for 120 oC
demonstrated an increase in density. Final localised density measurements and
crystallinity results are shown in table 6.5-1. Results are discussed in chapter 7.7.2
Table 6.5-1 Localised density and percentage crystallinity measurements.
Heat Set Temperature
120 oC 130 oC 140 oC 150 oC
Density Localised Point 1.357216 1.34504 1.345901 1.35369
Percentage crystallinity 19.849 9.869032 10.57491 16.95894
)(ρ
),( pcφ
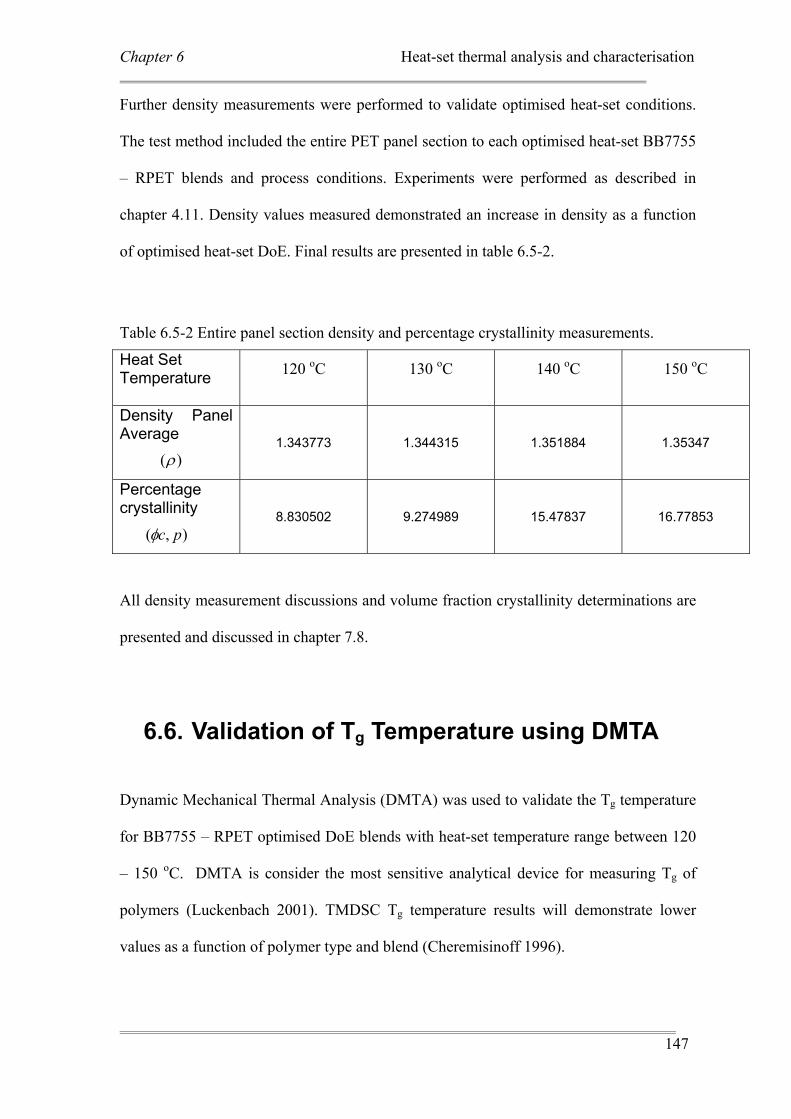
Chapter 6 Heat-set thermal analysis and characterisation
147
Further density measurements were performed to validate optimised heat-set conditions.
The test method included the entire PET panel section to each optimised heat-set BB7755
– RPET blends and process conditions. Experiments were performed as described in
chapter 4.11. Density values measured demonstrated an increase in density as a function
of optimised heat-set DoE. Final results are presented in table 6.5-2.
Table 6.5-2 Entire panel section density and percentage crystallinity measurements.
Heat Set Temperature
120 oC 130 oC 140 oC 150 oC
Density Panel Average 1.343773 1.344315 1.351884 1.35347
Percentage crystallinity 8.830502 9.274989 15.47837 16.77853
All density measurement discussions and volume fraction crystallinity determinations are
presented and discussed in chapter 7.8.
6.6. Validation of Tg Temperature using DMTA
Dynamic Mechanical Thermal Analysis (DMTA) was used to validate the Tg temperature
for BB7755 – RPET optimised DoE blends with heat-set temperature range between 120
– 150 oC. DMTA is consider the most sensitive analytical device for measuring Tg of
polymers (Luckenbach 2001). TMDSC Tg temperature results will demonstrate lower
values as a function of polymer type and blend (Cheremisinoff 1996).
)(ρ
),( pcφ
Chapter 6 Heat-set thermal analysis and characterisation
148
A DMA 2980 TA Instruments was used for this experiment. DMTA was chosen to
measure the mechanical properties to each optimised DoE BB7755 – RPET blend. This
included loss tangent ( )δtan and storage ( )G′ and loss )(G ′′ modulus with comparisons
made to incremental heat-set temperatures. Test samples were measured between
temperature ranges of 25 – 200 oC. A programmed step rate temperature scan of 5 oC /
minute and frequency of 1 rad / s was applied. Thermographs where plotted in Microsoft
Excel 2003, which reported storage modulus ( )G′ and loss modulus )(G ′′ . Further graphs
including ( )δtan versus temperature were also reported. Results are presented in chapter
7.9.
6.7. Morphological analysis of heat-set containers Small angle x-ray scattering (SAXS) studies were undertaken to analyse evolutional
changes to morphology. 2D scattering patterns from SAXS data were used to measure
qualitative changes in crystallinity and morphology as a function of optimised BB7755 –
RPET heat-set temperatures. Details outlining the optimised DoE are presented in chapter
5.8.2 titled Optimised heat-set conditions via goal seeks parameters.
Test samples were taken from similar positions to TMDSC and density studies. Figure
6.7-1 makes evident the experimental preparation of the sample.
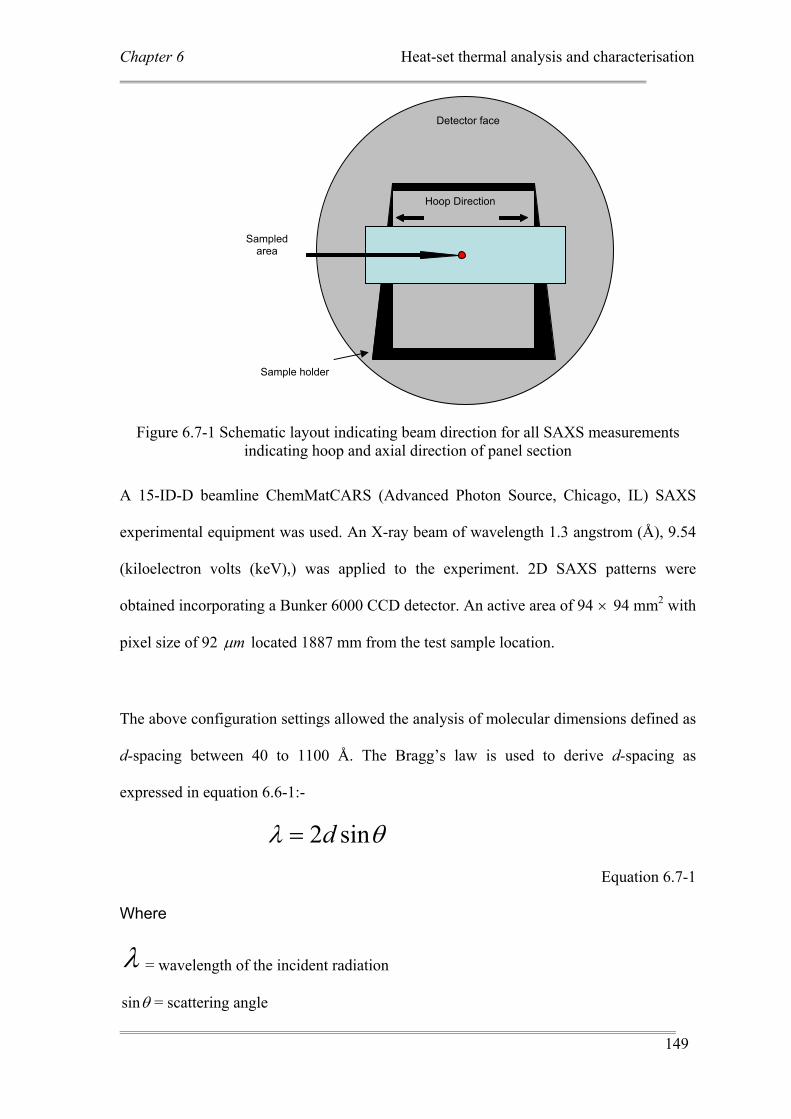
Chapter 6 Heat-set thermal analysis and characterisation
149
Figure 6.7-1 Schematic layout indicating beam direction for all SAXS measurements indicating hoop and axial direction of panel section
A 15-ID-D beamline ChemMatCARS (Advanced Photon Source, Chicago, IL) SAXS
experimental equipment was used. An X-ray beam of wavelength 1.3 angstrom (Å), 9.54
(kiloelectron volts (keV),) was applied to the experiment. 2D SAXS patterns were
obtained incorporating a Bunker 6000 CCD detector. An active area of 94 × 94 mm2 with
pixel size of 92 mμ located 1887 mm from the test sample location.
The above configuration settings allowed the analysis of molecular dimensions defined as
d-spacing between 40 to 1100 Å. The Bragg’s law is used to derive d-spacing as
expressed in equation 6.6-1:-
θλ sin2d=
Equation 6.7-1
Where
λ = wavelength of the incident radiation
θsin = scattering angle
Sample holder
Hoop Direction
Detector face
Sampled area
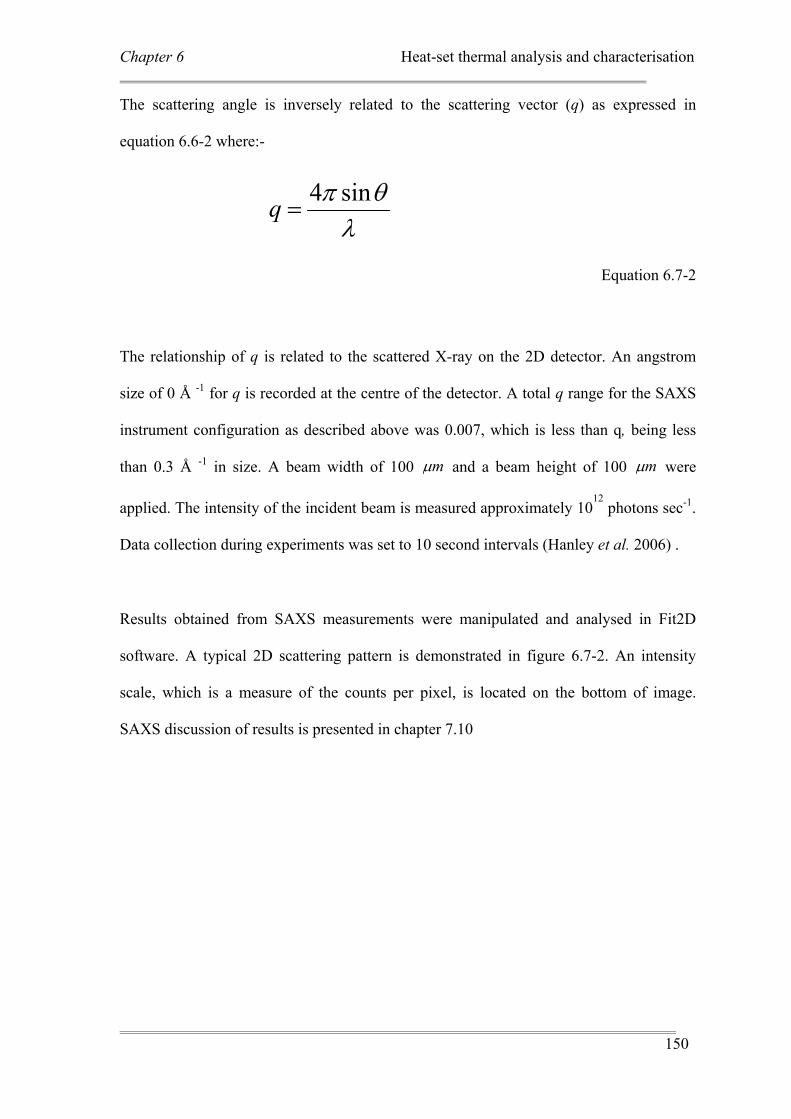
Chapter 6 Heat-set thermal analysis and characterisation
150
The scattering angle is inversely related to the scattering vector (q) as expressed in
equation 6.6-2 where:-
λθπ sin4
=q
Equation 6.7-2
The relationship of q is related to the scattered X-ray on the 2D detector. An angstrom
size of 0 Å -1 for q is recorded at the centre of the detector. A total q range for the SAXS
instrument configuration as described above was 0.007, which is less than q, being less
than 0.3 Å -1 in size. A beam width of 100 mμ and a beam height of 100 mμ were
applied. The intensity of the incident beam is measured approximately 1012
photons sec-1.
Data collection during experiments was set to 10 second intervals (Hanley et al. 2006) .
Results obtained from SAXS measurements were manipulated and analysed in Fit2D
software. A typical 2D scattering pattern is demonstrated in figure 6.7-2. An intensity
scale, which is a measure of the counts per pixel, is located on the bottom of image.
SAXS discussion of results is presented in chapter 7.10
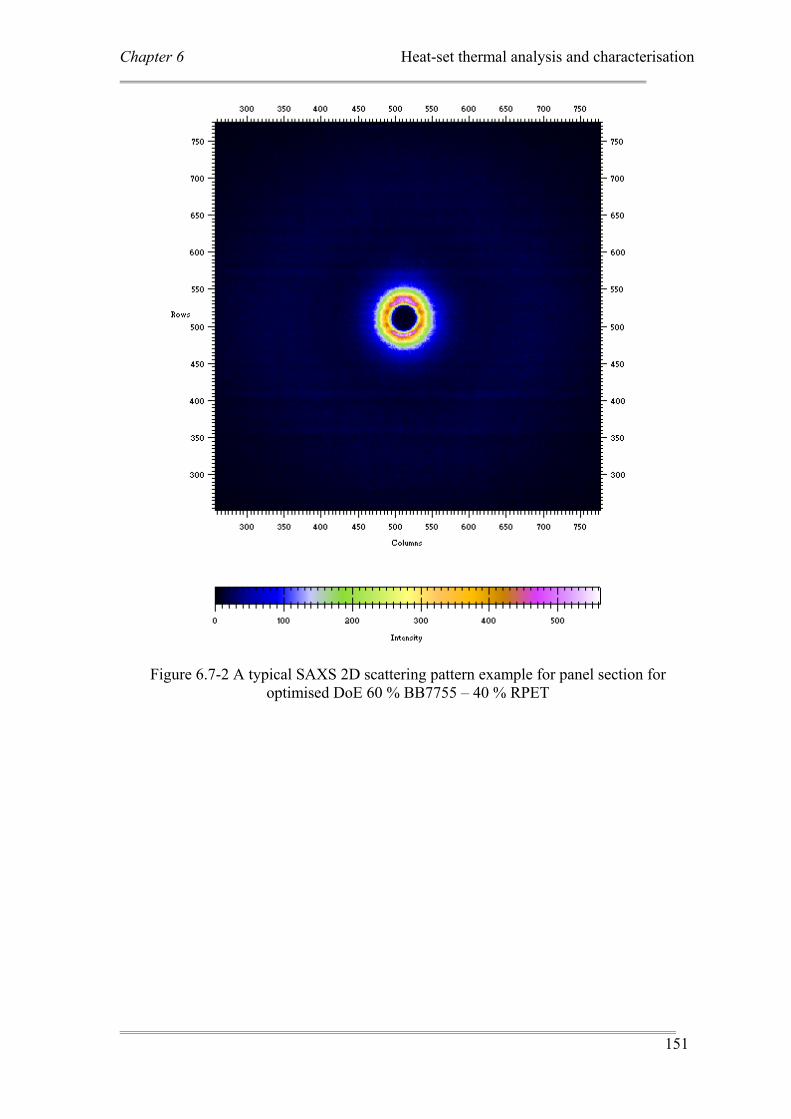
Chapter 6 Heat-set thermal analysis and characterisation
151
Figure 6.7-2 A typical SAXS 2D scattering pattern example for panel section for optimised DoE 60 % BB7755 – 40 % RPET

Chapter 7 Results and Discussions
152
7. Chapter 7: Results and Discussions
Chapter 7 Results and Discussions
153
7.1. Mechanical Properties for PET samples used. Tensile strength, elastic modulus and shrinkage properties are mechanical attributes
governed by the final crystallinity of the material, crystalline structure and amorphous
arrangements for oriented PET (Jabarin 1996). Tensile tests were undertaken to quantify
the following mechanical and elastic properties of Voridian CA 12, SkyPET BB7755 and
Visy RPET materials. These include
• yield stress ( maxσ )
• Youngs modulus (E)
• Percentage elongation at break.
Injection moulding process conditions are detailed in chapter 3.7.1. Tensile testing
conditions and sample preparation have been presented in chapter 3.7.3.
7.1.1. Comparative Results for Maximum Yield
stress. Figure 7.1.1-1 presents maximum yield stress ( maxσ ) for all materials. Voridian CA12
demonstrates superior yield stress when compared to other test samples. Mechanical
properties are dependent on the amorphous morphology of the material (Gohil 1993b).
Standard deviation and coefficient variations (CV) for all tensile test results are presented
in appendices O – 1.
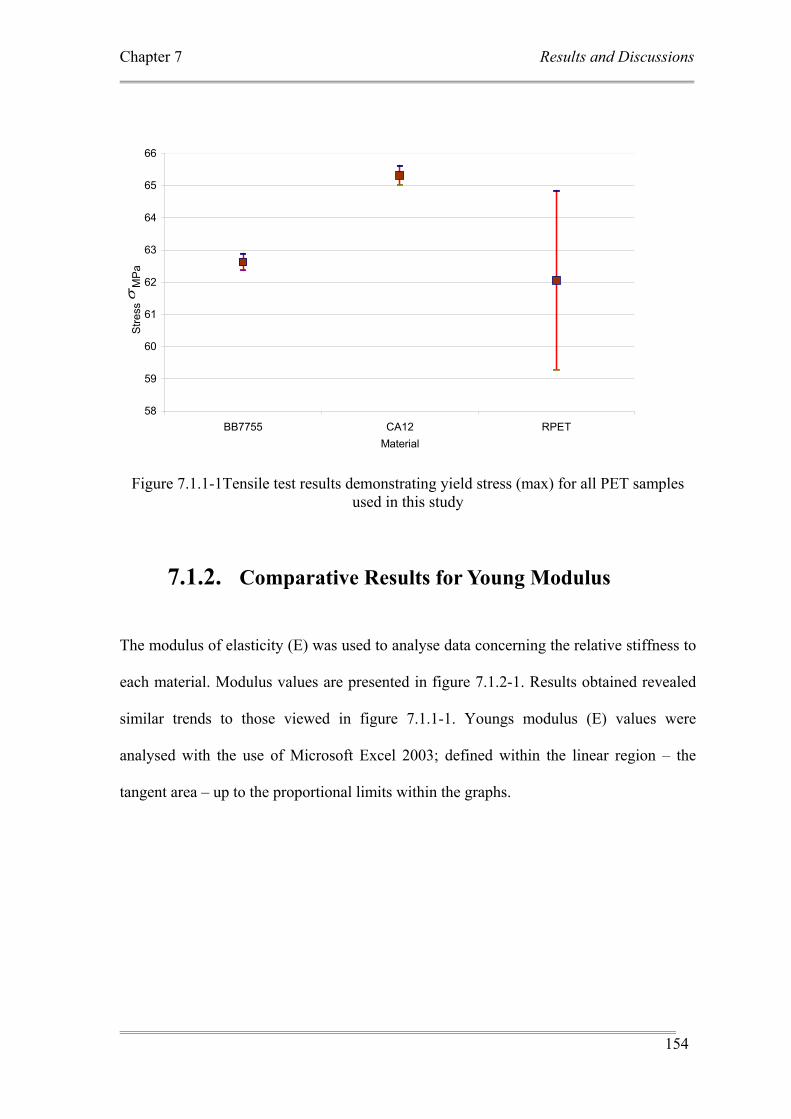
Chapter 7 Results and Discussions
154
58
59
60
61
62
63
64
65
66
BB7755 CA12 RPETMaterial
Stre
ss
MP
aσ
Figure 7.1.1-1Tensile test results demonstrating yield stress (max) for all PET samples used in this study
7.1.2. Comparative Results for Young Modulus
The modulus of elasticity (E) was used to analyse data concerning the relative stiffness to
each material. Modulus values are presented in figure 7.1.2-1. Results obtained revealed
similar trends to those viewed in figure 7.1.1-1. Youngs modulus (E) values were
analysed with the use of Microsoft Excel 2003; defined within the linear region – the
tangent area – up to the proportional limits within the graphs.
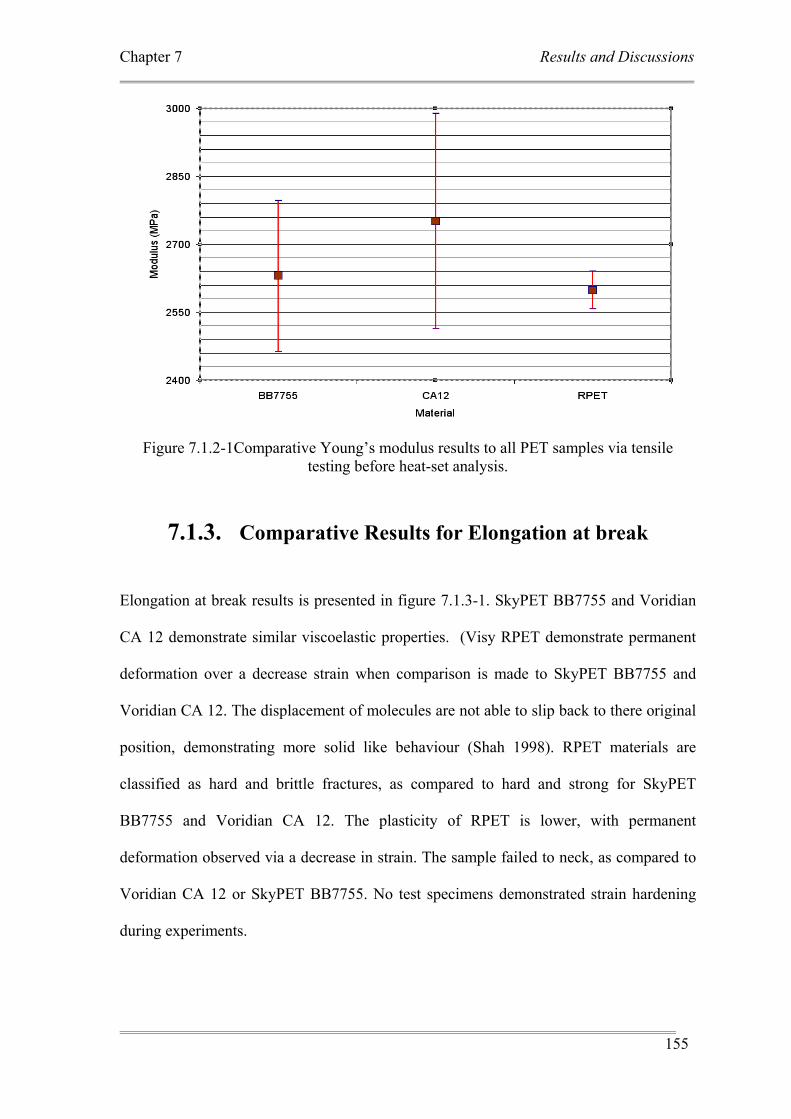
Chapter 7 Results and Discussions
155
Figure 7.1.2-1Comparative Young’s modulus results to all PET samples via tensile testing before heat-set analysis.
7.1.3. Comparative Results for Elongation at break
Elongation at break results is presented in figure 7.1.3-1. SkyPET BB7755 and Voridian
CA 12 demonstrate similar viscoelastic properties. (Visy RPET demonstrate permanent
deformation over a decrease strain when comparison is made to SkyPET BB7755 and
Voridian CA 12. The displacement of molecules are not able to slip back to there original
position, demonstrating more solid like behaviour (Shah 1998). RPET materials are
classified as hard and brittle fractures, as compared to hard and strong for SkyPET
BB7755 and Voridian CA 12. The plasticity of RPET is lower, with permanent
deformation observed via a decrease in strain. The sample failed to neck, as compared to
Voridian CA 12 or SkyPET BB7755. No test specimens demonstrated strain hardening
during experiments.
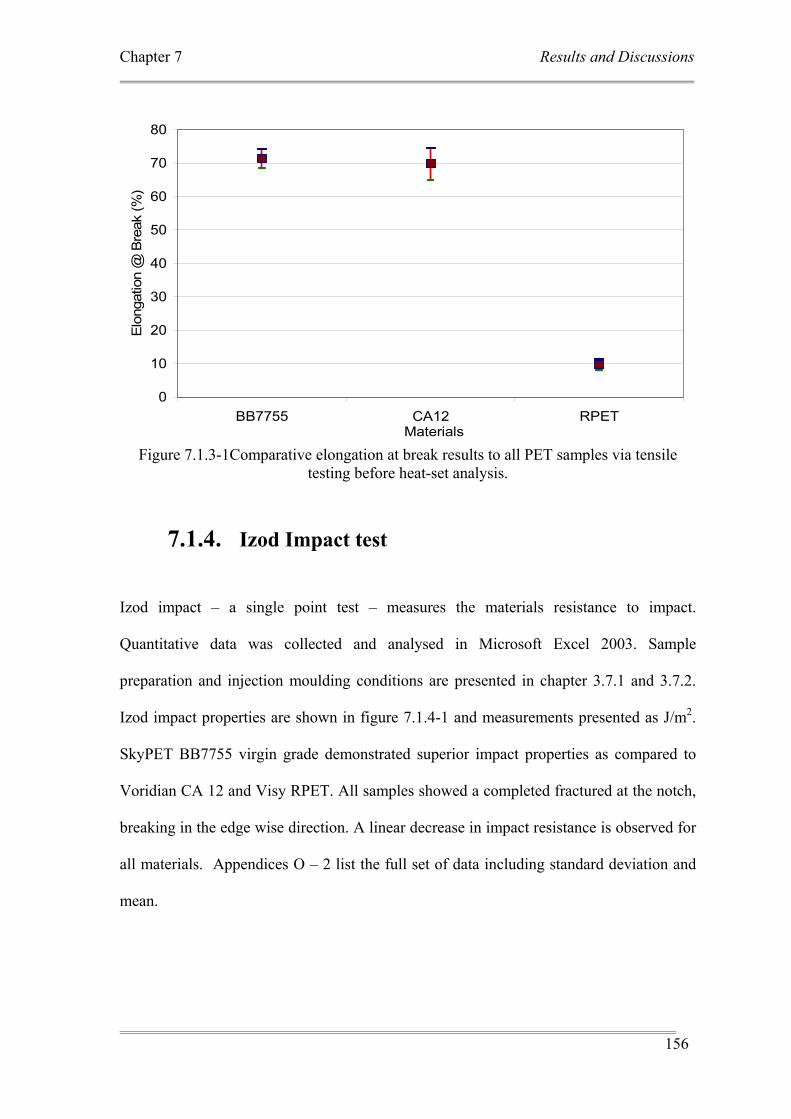
Chapter 7 Results and Discussions
156
0
10
20
30
40
50
60
70
80
BB7755 CA12 RPETMaterials
Elo
ngat
ion
@ B
reak
(%)
Figure 7.1.3-1Comparative elongation at break results to all PET samples via tensile
testing before heat-set analysis.
7.1.4. Izod Impact test
Izod impact – a single point test – measures the materials resistance to impact.
Quantitative data was collected and analysed in Microsoft Excel 2003. Sample
preparation and injection moulding conditions are presented in chapter 3.7.1 and 3.7.2.
Izod impact properties are shown in figure 7.1.4-1 and measurements presented as J/m2.
SkyPET BB7755 virgin grade demonstrated superior impact properties as compared to
Voridian CA 12 and Visy RPET. All samples showed a completed fractured at the notch,
breaking in the edge wise direction. A linear decrease in impact resistance is observed for
all materials. Appendices O – 2 list the full set of data including standard deviation and
mean.
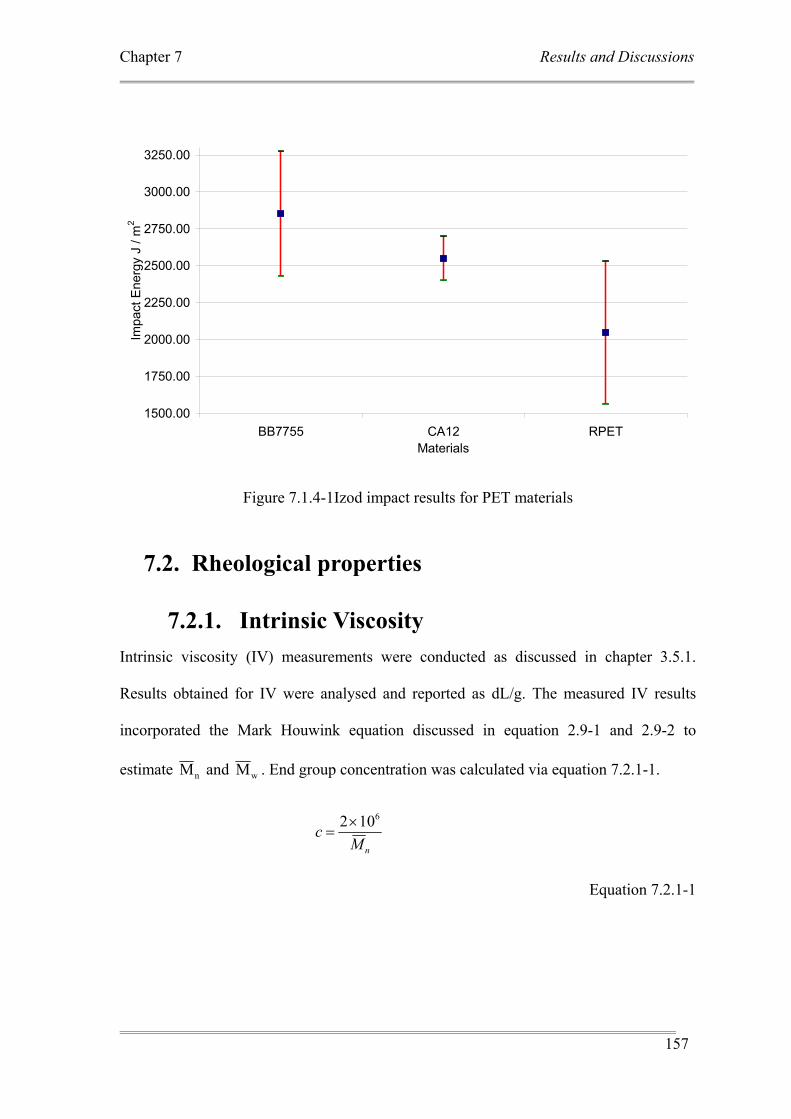
Chapter 7 Results and Discussions
157
1500.00
1750.00
2000.00
2250.00
2500.00
2750.00
3000.00
3250.00
BB7755 CA12 RPETMaterials
Impa
ct E
nerg
y J
/ m2
Figure 7.1.4-1Izod impact results for PET materials
7.2. Rheological properties
7.2.1. Intrinsic Viscosity Intrinsic viscosity (IV) measurements were conducted as discussed in chapter 3.5.1.
Results obtained for IV were analysed and reported as dL/g. The measured IV results
incorporated the Mark Houwink equation discussed in equation 2.9-1 and 2.9-2 to
estimate nM and wM . End group concentration was calculated via equation 7.2.1-1.
nMc
6102×=
Equation 7.2.1-1
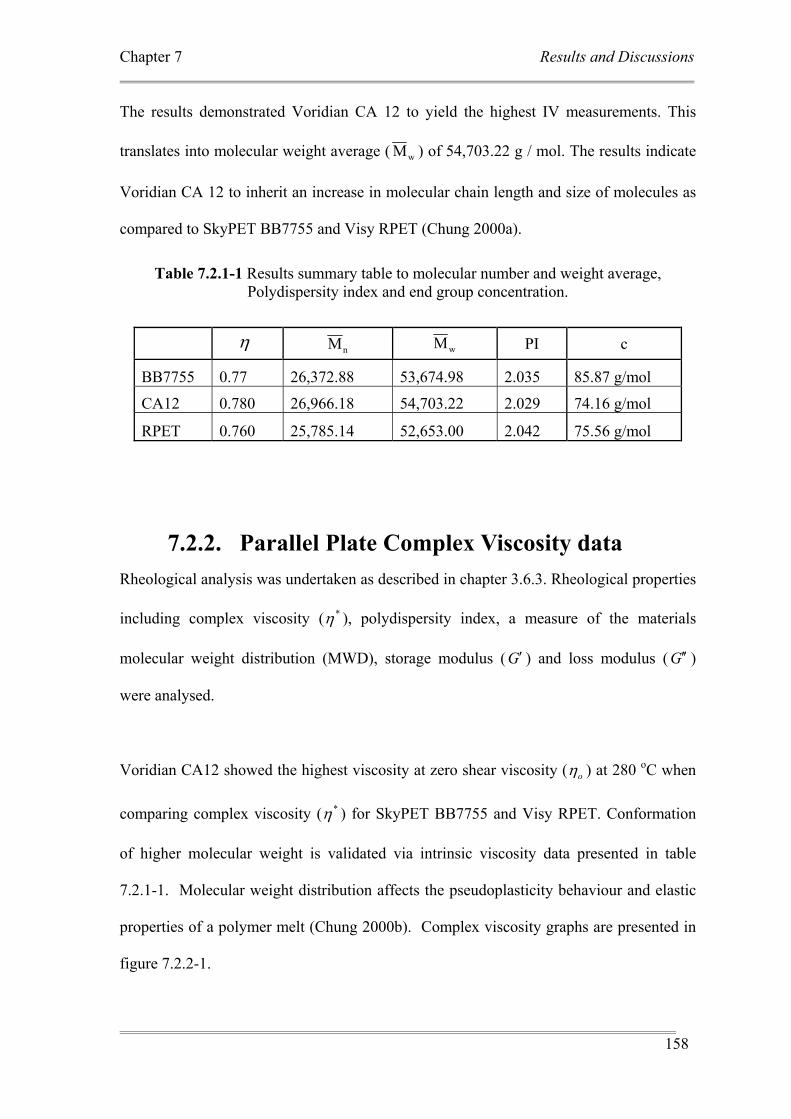
Chapter 7 Results and Discussions
158
The results demonstrated Voridian CA 12 to yield the highest IV measurements. This
translates into molecular weight average ( wM ) of 54,703.22 g / mol. The results indicate
Voridian CA 12 to inherit an increase in molecular chain length and size of molecules as
compared to SkyPET BB7755 and Visy RPET (Chung 2000a).
Table 7.2.1-1 Results summary table to molecular number and weight average, Polydispersity index and end group concentration.
nM wM PI c
BB7755 0.77 26,372.88 53,674.98 2.035 85.87 g/mol
CA12 0.780 26,966.18 54,703.22 2.029 74.16 g/mol
RPET 0.760 25,785.14 52,653.00 2.042 75.56 g/mol
7.2.2. Parallel Plate Complex Viscosity data Rheological analysis was undertaken as described in chapter 3.6.3. Rheological properties
including complex viscosity ( *η ), polydispersity index, a measure of the materials
molecular weight distribution (MWD), storage modulus (G′ ) and loss modulus ( G ′′ )
were analysed.
Voridian CA12 showed the highest viscosity at zero shear viscosity ( oη ) at 280 oC when
comparing complex viscosity ( *η ) for SkyPET BB7755 and Visy RPET. Conformation
of higher molecular weight is validated via intrinsic viscosity data presented in table
7.2.1-1. Molecular weight distribution affects the pseudoplasticity behaviour and elastic
properties of a polymer melt (Chung 2000b). Complex viscosity graphs are presented in
figure 7.2.2-1.
η
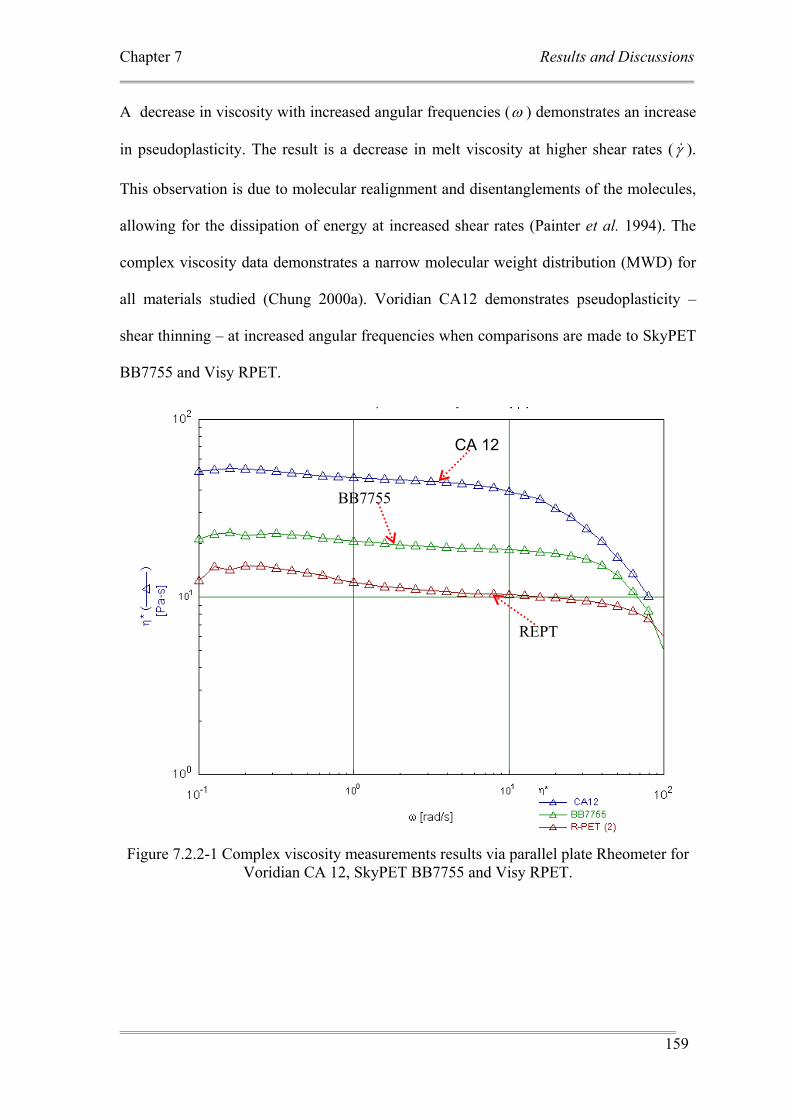
Chapter 7 Results and Discussions
159
A decrease in viscosity with increased angular frequencies (ω ) demonstrates an increase
in pseudoplasticity. The result is a decrease in melt viscosity at higher shear rates (γ& ).
This observation is due to molecular realignment and disentanglements of the molecules,
allowing for the dissipation of energy at increased shear rates (Painter et al. 1994). The
complex viscosity data demonstrates a narrow molecular weight distribution (MWD) for
all materials studied (Chung 2000a). Voridian CA12 demonstrates pseudoplasticity –
shear thinning – at increased angular frequencies when comparisons are made to SkyPET
BB7755 and Visy RPET.
Figure 7.2.2-1 Complex viscosity measurements results via parallel plate Rheometer for Voridian CA 12, SkyPET BB7755 and Visy RPET.
CA 12
BB7755
REPT
Chapter 7 Results and Discussions
160
7.2.3. Polydispersity Index determination. Polydispersity index (PI) values are presented in table 7.2.1-1. Voridian CA12
demonstrates the lowest end group concentration. The PI values, – a reflection of MWD –
is a measure of the reaction time during polymerisation (Odian 1981). The polydispersity
index is expressed in equation 7.2.3-1:
MM
n
w⎟⎟⎠
⎞⎜⎜⎝
⎛=PI
Equation 7.2.3-1
Where
PI = Polydispersity Index
wM = Molecular weight average
nM = Molecular number average
Results for end group concentration of 74.16 g / mol is reported in table 7.2.3-1 for
Voridian CA12; in this case representing the lowest values for all materials. End group
analysis is helpful to validate the carboxyl / hydroxyl ratio. This knowledge is critical, as
Sodium hydroxide (NaOH) and the carboxyl end groups can yield improvements in
dimensional stability via heterogeneous nucleation. A comprehensive discussion is
presented in section 7.3.4.
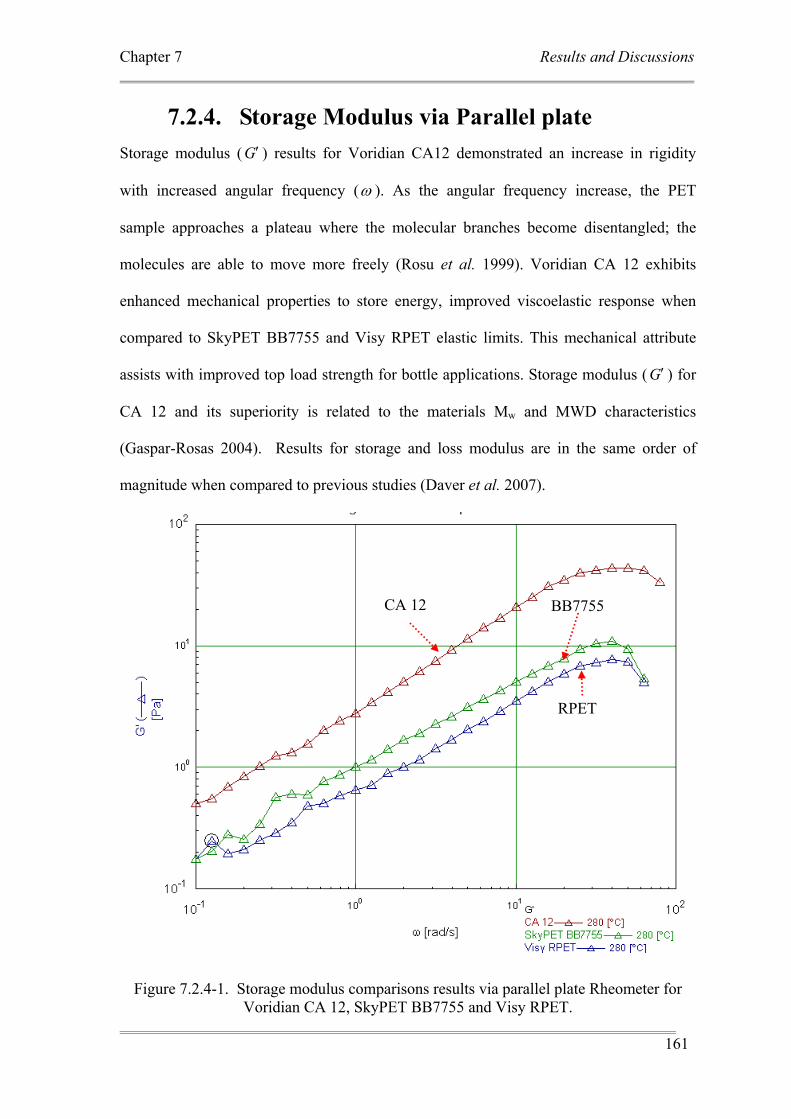
Chapter 7 Results and Discussions
161
7.2.4. Storage Modulus via Parallel plate Storage modulus (G′ ) results for Voridian CA12 demonstrated an increase in rigidity
with increased angular frequency (ω ). As the angular frequency increase, the PET
sample approaches a plateau where the molecular branches become disentangled; the
molecules are able to move more freely (Rosu et al. 1999). Voridian CA 12 exhibits
enhanced mechanical properties to store energy, improved viscoelastic response when
compared to SkyPET BB7755 and Visy RPET elastic limits. This mechanical attribute
assists with improved top load strength for bottle applications. Storage modulus (G′ ) for
CA 12 and its superiority is related to the materials Mw and MWD characteristics
(Gaspar-Rosas 2004). Results for storage and loss modulus are in the same order of
magnitude when compared to previous studies (Daver et al. 2007).
Figure 7.2.4-1. Storage modulus comparisons results via parallel plate Rheometer for Voridian CA 12, SkyPET BB7755 and Visy RPET.
CA 12 BB7755
RPET
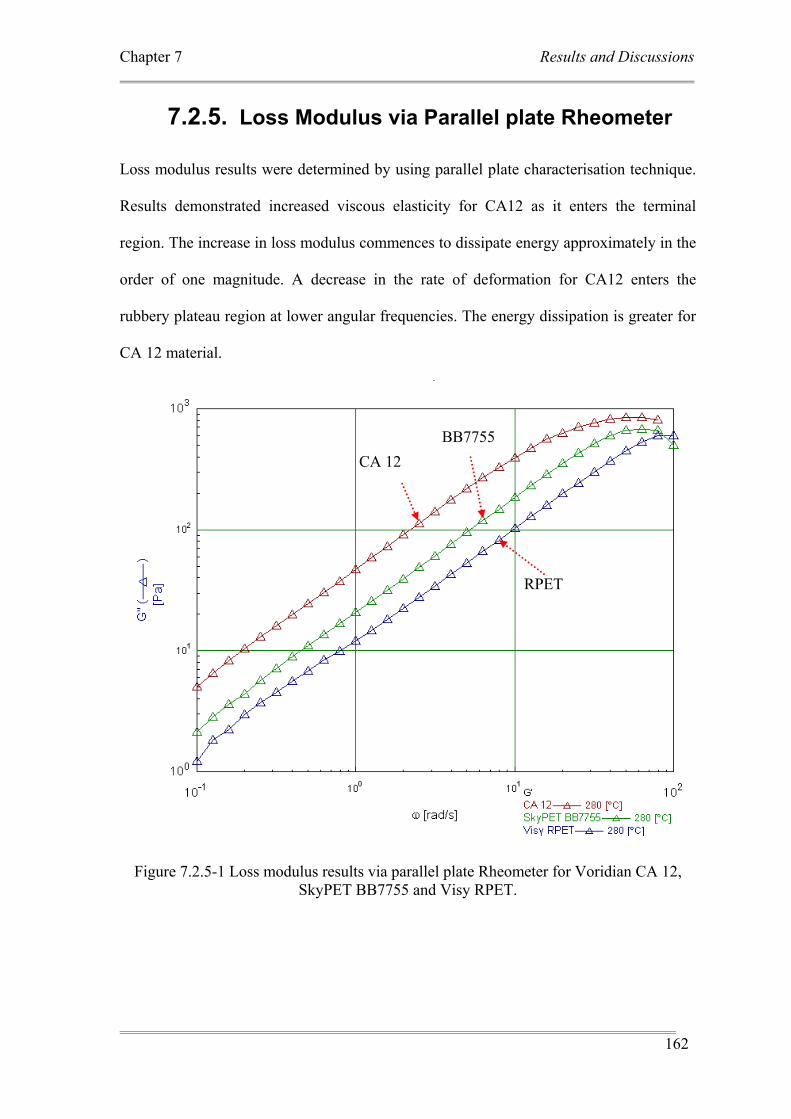
Chapter 7 Results and Discussions
162
7.2.5. Loss Modulus via Parallel plate Rheometer Loss modulus results were determined by using parallel plate characterisation technique.
Results demonstrated increased viscous elasticity for CA12 as it enters the terminal
region. The increase in loss modulus commences to dissipate energy approximately in the
order of one magnitude. A decrease in the rate of deformation for CA12 enters the
rubbery plateau region at lower angular frequencies. The energy dissipation is greater for
CA 12 material.
Figure 7.2.5-1 Loss modulus results via parallel plate Rheometer for Voridian CA 12, SkyPET BB7755 and Visy RPET.
CA 12 BB7755
RPET
Chapter 7 Results and Discussions
163
RPET is less viscous in behaviour at higher rates of deformation, entering the rubbery
plateau region with increasing angular frequencies, indicating retention of molecular
rotation, hence improving RPET mechanical properties for top load applications.
7.3. Optimisation via Augmented DoE
7.3.1. Preform Surface Temperature The current wisdom concerning improved thermal stability of PET beverage containers is
to increase the percentage crystallinity. Previous studies have shown improving thermal
and mechanical properties to PET materials is not only influenced via heat-set process in
order to increase percentage crystallinity (Boyd 2004; Maruhashi et al. 1996). The main
predisposition used to explain crystallinity increases to sustain an increase in hot-fill
performance is due to increase heat set temperatures.
The degree of crystallinity is an approximation when dealing with the topic of thermal
stability of beverage containers of hot-fill temperatures up to 95 oC (Boyd 2004). The
relationship between thermal stability and percentage crystallinity is more accurately
understood as the interaction in thermal stability - preform surface temperature. The
percentage crystallinity is the result of direct interaction of preform surface temperature
generated during axial stretching. Therefore the improvements to thermal stability of
beverage containers depend on the relaxation phenomena within the amorphous segments
of the material.
Chapter 7 Results and Discussions
164
Temperature distribution to the PET preform was controlled via injection moulding
cooling time. Preform surface temperatures (PST) were recorded as discussed in section
4.3.2. Analysis was undertaken in Microsoft Excel 2003 and Echip DoE software.
Aoki’s recommended operating process conditions for Eastman 9921 W CSD beverage
containers observes a mean PST of 90.74 oC (Cheng 2004). Temperature determination
for PST carried out by Cheng records the base (SP03) temperatures to the preform.
Reference to the PST temperature locations can be referred to section 4.3.2.
Results demonstrated a preform cooling time of 7 seconds yields the lowest base PST.
Preform cooling time of 7 seconds for SkyPET BB7755 recorded a PST at point 3 of 85.7
oC. A decrease in cooling time to 5 seconds increases PST temperature by 9 %. A further
reduction in preform cooling time to four seconds increases PST temperature by 7 %.
Results are presented in Figure 7.3.1-1.
Preform cooling time had a direct effect on the final properties of each PET beverage
container. A linear regression fit is applied to PST vs. perform cooling time. Microsoft
Excel indicates a R2 of 0.9622, indicating good agreement between PST and preform
cooling time.
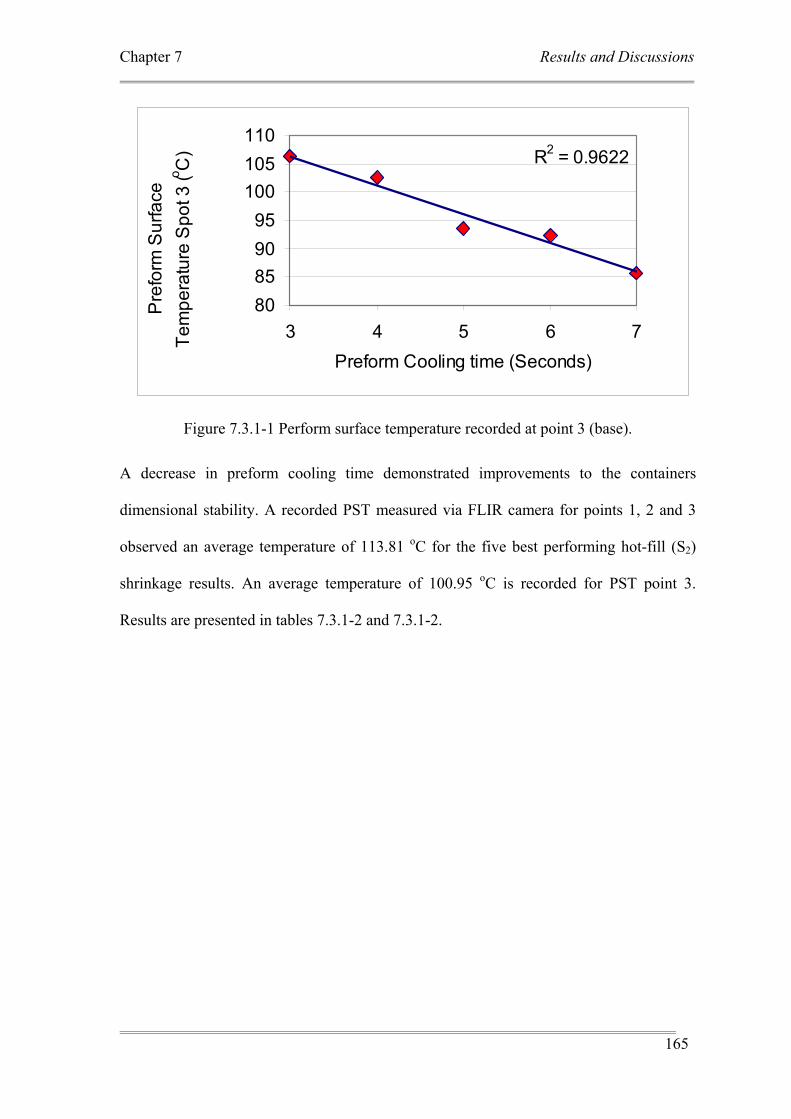
Chapter 7 Results and Discussions
165
R2 = 0.9622
80859095
100105110
3 4 5 6 7Preform Cooling time (Seconds)
Pre
form
Sur
face
Te
mpe
ratu
re S
pot 3
(o C)
Figure 7.3.1-1 Perform surface temperature recorded at point 3 (base).
A decrease in preform cooling time demonstrated improvements to the containers
dimensional stability. A recorded PST measured via FLIR camera for points 1, 2 and 3
observed an average temperature of 113.81 oC for the five best performing hot-fill (S2)
shrinkage results. An average temperature of 100.95 oC is recorded for PST point 3.
Results are presented in tables 7.3.1-2 and 7.3.1-2.
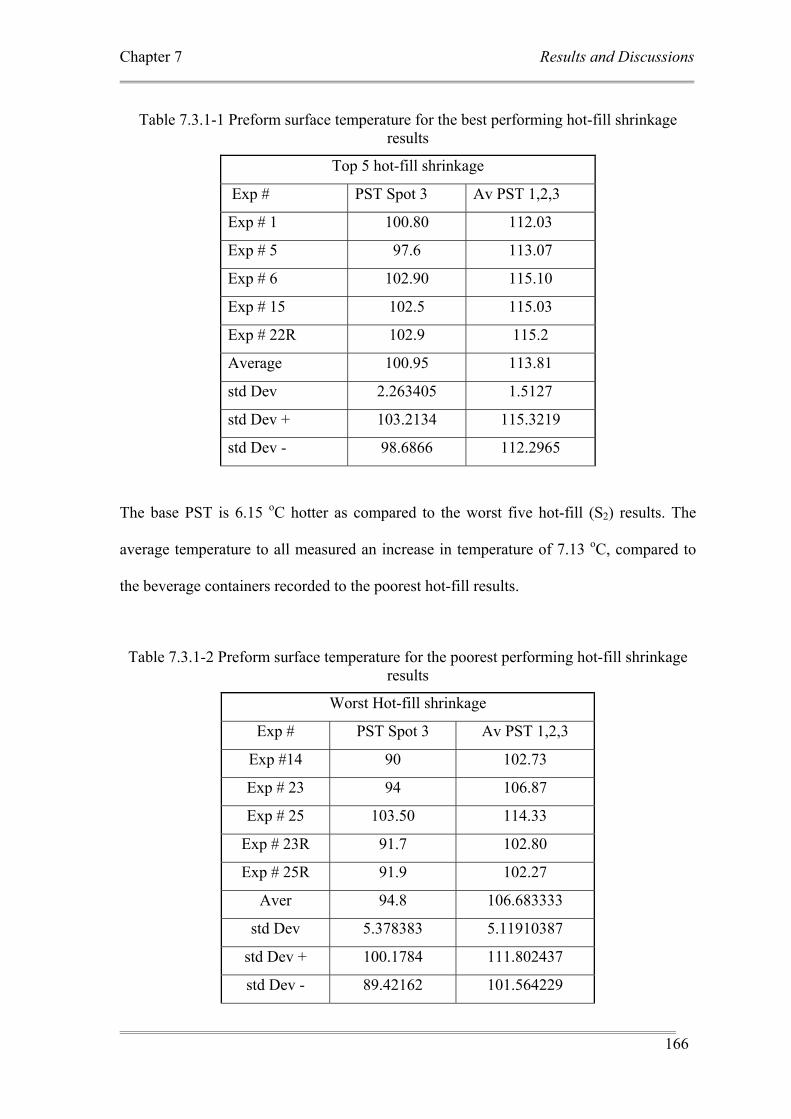
Chapter 7 Results and Discussions
166
Table 7.3.1-1 Preform surface temperature for the best performing hot-fill shrinkage results
Top 5 hot-fill shrinkage
Exp # PST Spot 3 Av PST 1,2,3
Exp # 1 100.80 112.03
Exp # 5 97.6 113.07
Exp # 6 102.90 115.10
Exp # 15 102.5 115.03
Exp # 22R 102.9 115.2
Average 100.95 113.81
std Dev 2.263405 1.5127
std Dev + 103.2134 115.3219
std Dev - 98.6866 112.2965
The base PST is 6.15 oC hotter as compared to the worst five hot-fill (S2) results. The
average temperature to all measured an increase in temperature of 7.13 oC, compared to
the beverage containers recorded to the poorest hot-fill results.
Table 7.3.1-2 Preform surface temperature for the poorest performing hot-fill shrinkage results
Worst Hot-fill shrinkage
Exp # PST Spot 3 Av PST 1,2,3
Exp #14 90 102.73
Exp # 23 94 106.87
Exp # 25 103.50 114.33
Exp # 23R 91.7 102.80
Exp # 25R 91.9 102.27
Aver 94.8 106.683333
std Dev 5.378383 5.11910387
std Dev + 100.1784 111.802437
std Dev - 89.42162 101.564229
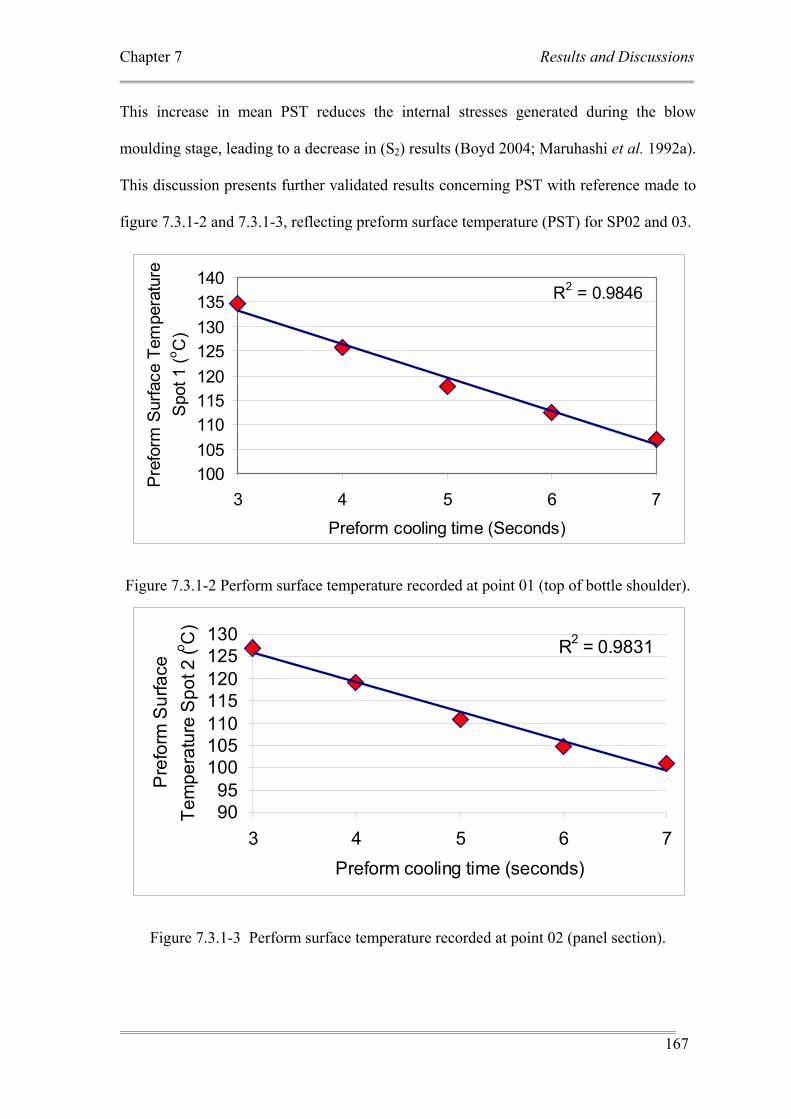
Chapter 7 Results and Discussions
167
This increase in mean PST reduces the internal stresses generated during the blow
moulding stage, leading to a decrease in (S2) results (Boyd 2004; Maruhashi et al. 1992a).
This discussion presents further validated results concerning PST with reference made to
figure 7.3.1-2 and 7.3.1-3, reflecting preform surface temperature (PST) for SP02 and 03.
R2 = 0.9846
100105110115120125130135140
3 4 5 6 7
Preform cooling time (Seconds)
Pre
form
Sur
face
Tem
pera
ture
S
pot 1
(o C)
Figure 7.3.1-2 Perform surface temperature recorded at point 01 (top of bottle shoulder).
R2 = 0.9831
9095
100105110115120125130
3 4 5 6 7Preform cooling time (seconds)
Pre
form
Sur
face
Te
mpe
ratu
re S
pot 2
(o C)
Figure 7.3.1-3 Perform surface temperature recorded at point 02 (panel section).
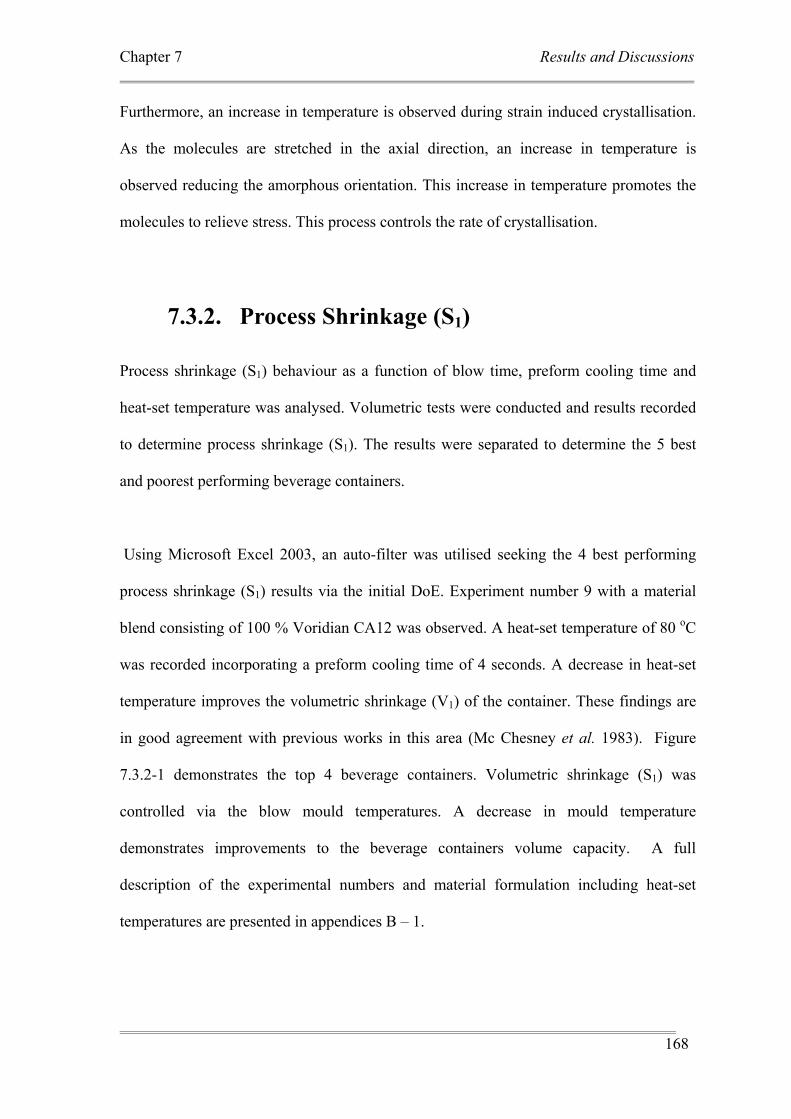
Chapter 7 Results and Discussions
168
Furthermore, an increase in temperature is observed during strain induced crystallisation.
As the molecules are stretched in the axial direction, an increase in temperature is
observed reducing the amorphous orientation. This increase in temperature promotes the
molecules to relieve stress. This process controls the rate of crystallisation.
7.3.2. Process Shrinkage (S1) Process shrinkage (S1) behaviour as a function of blow time, preform cooling time and
heat-set temperature was analysed. Volumetric tests were conducted and results recorded
to determine process shrinkage (S1). The results were separated to determine the 5 best
and poorest performing beverage containers.
Using Microsoft Excel 2003, an auto-filter was utilised seeking the 4 best performing
process shrinkage (S1) results via the initial DoE. Experiment number 9 with a material
blend consisting of 100 % Voridian CA12 was observed. A heat-set temperature of 80 oC
was recorded incorporating a preform cooling time of 4 seconds. A decrease in heat-set
temperature improves the volumetric shrinkage (V1) of the container. These findings are
in good agreement with previous works in this area (Mc Chesney et al. 1983). Figure
7.3.2-1 demonstrates the top 4 beverage containers. Volumetric shrinkage (S1) was
controlled via the blow mould temperatures. A decrease in mould temperature
demonstrates improvements to the beverage containers volume capacity. A full
description of the experimental numbers and material formulation including heat-set
temperatures are presented in appendices B – 1.
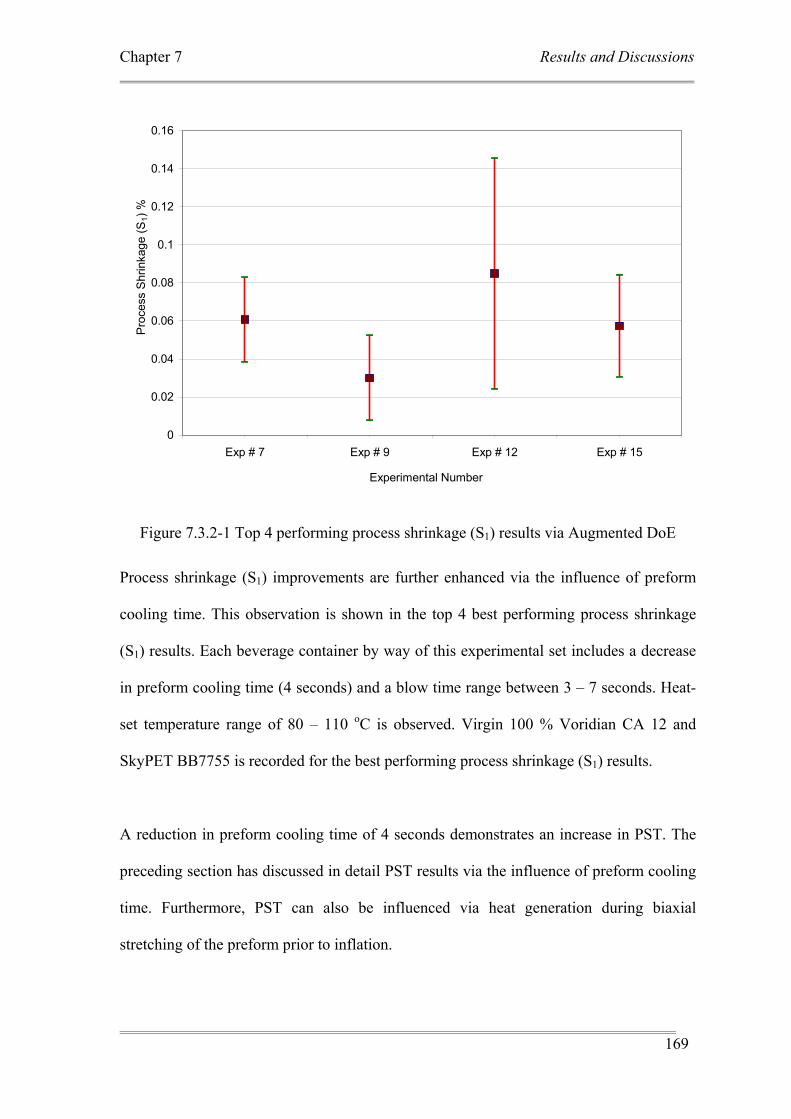
Chapter 7 Results and Discussions
169
0
0.02
0.04
0.06
0.08
0.1
0.12
0.14
0.16
Exp # 7 Exp # 9 Exp # 12 Exp # 15
Experimental Number
Pro
cess
Shr
inka
ge (S
1) %
Figure 7.3.2-1 Top 4 performing process shrinkage (S1) results via Augmented DoE Process shrinkage (S1) improvements are further enhanced via the influence of preform
cooling time. This observation is shown in the top 4 best performing process shrinkage
(S1) results. Each beverage container by way of this experimental set includes a decrease
in preform cooling time (4 seconds) and a blow time range between 3 – 7 seconds. Heat-
set temperature range of 80 – 110 oC is observed. Virgin 100 % Voridian CA 12 and
SkyPET BB7755 is recorded for the best performing process shrinkage (S1) results.
A reduction in preform cooling time of 4 seconds demonstrates an increase in PST. The
preceding section has discussed in detail PST results via the influence of preform cooling
time. Furthermore, PST can also be influenced via heat generation during biaxial
stretching of the preform prior to inflation.
Chapter 7 Results and Discussions
170
The process stability (S1) is controlled in concert with blow time and preform cooling
time. Relaxation of the amorphous chains is governed by kinetic shrinkage behaviour. As
inflation of the preform occurs, the pressurised air is used to hold the preform against a
heated mould. During the ISBM exhaust cycle, pressurised air used to hold the preform in
contact with the mould is no longer present. The shrinkage kinetics provides freedom to
the extended chain length located in the amorphous region; hence relaxation occurs. As
polymers vary in molecular lengths, the energies required to cool the molecules vary.
Therefore material solidification will vary depending on blow time and mean PST, as
well as amorphous orientation.
The worst performing process shrinkage (S1) results are presented in figure 7.3.3-2. Each
beverage container by way of this experimental set includes an increase in preform
cooling time (6 seconds) and a blow time of 3 seconds. Heat-set temperature range of 95
– 110 oC is observed. Voridian CA 12 and RPET blend is recorded for the worst
performing process shrinkage (S1) results.
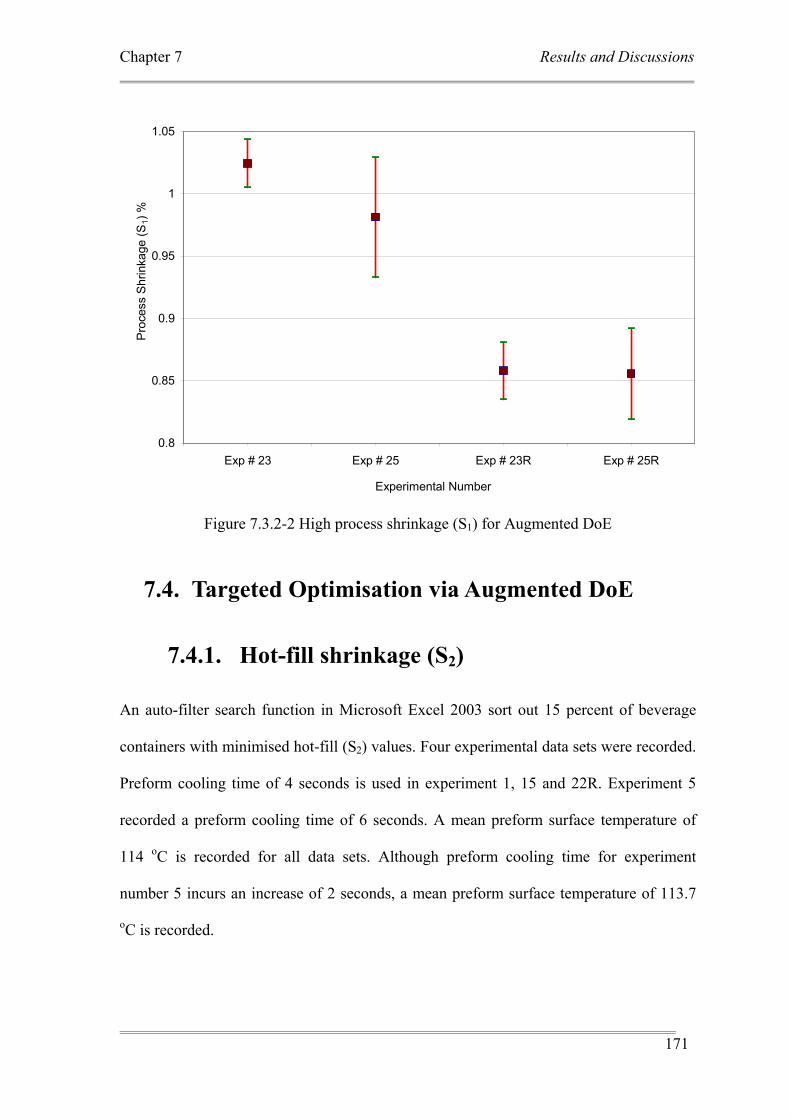
Chapter 7 Results and Discussions
171
0.8
0.85
0.9
0.95
1
1.05
Exp # 23 Exp # 25 Exp # 23R Exp # 25R
Experimental Number
Pro
cess
Shr
inka
ge (S
1) %
Figure 7.3.2-2 High process shrinkage (S1) for Augmented DoE
7.4. Targeted Optimisation via Augmented DoE
7.4.1. Hot-fill shrinkage (S2) An auto-filter search function in Microsoft Excel 2003 sort out 15 percent of beverage
containers with minimised hot-fill (S2) values. Four experimental data sets were recorded.
Preform cooling time of 4 seconds is used in experiment 1, 15 and 22R. Experiment 5
recorded a preform cooling time of 6 seconds. A mean preform surface temperature of
114 oC is recorded for all data sets. Although preform cooling time for experiment
number 5 incurs an increase of 2 seconds, a mean preform surface temperature of 113.7
oC is recorded.
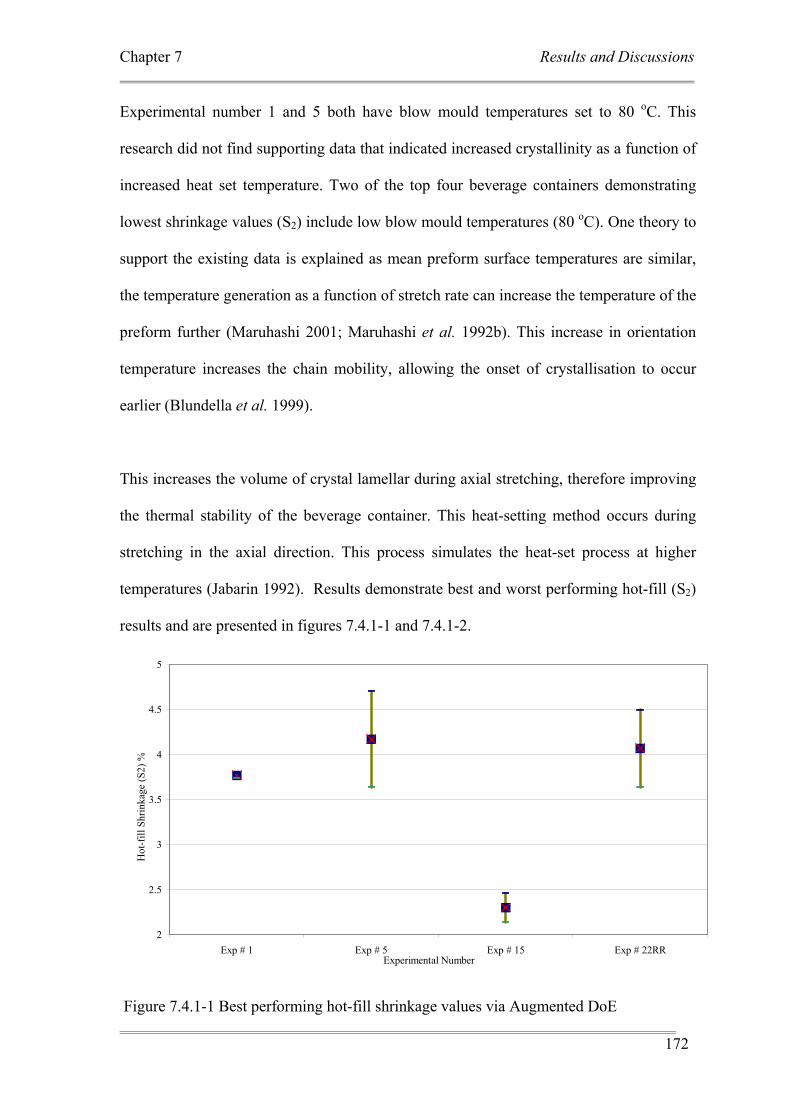
Chapter 7 Results and Discussions
172
Experimental number 1 and 5 both have blow mould temperatures set to 80 oC. This
research did not find supporting data that indicated increased crystallinity as a function of
increased heat set temperature. Two of the top four beverage containers demonstrating
lowest shrinkage values (S2) include low blow mould temperatures (80 oC). One theory to
support the existing data is explained as mean preform surface temperatures are similar,
the temperature generation as a function of stretch rate can increase the temperature of the
preform further (Maruhashi 2001; Maruhashi et al. 1992b). This increase in orientation
temperature increases the chain mobility, allowing the onset of crystallisation to occur
earlier (Blundella et al. 1999).
This increases the volume of crystal lamellar during axial stretching, therefore improving
the thermal stability of the beverage container. This heat-setting method occurs during
stretching in the axial direction. This process simulates the heat-set process at higher
temperatures (Jabarin 1992). Results demonstrate best and worst performing hot-fill (S2)
results and are presented in figures 7.4.1-1 and 7.4.1-2.
2
2.5
3
3.5
4
4.5
5
Exp # 1 Exp # 5 Exp # 15 Exp # 22RRExperimental Number
Hot
-fill
Shr
inka
ge (S
2) %
Figure 7.4.1-1 Best performing hot-fill shrinkage values via Augmented DoE
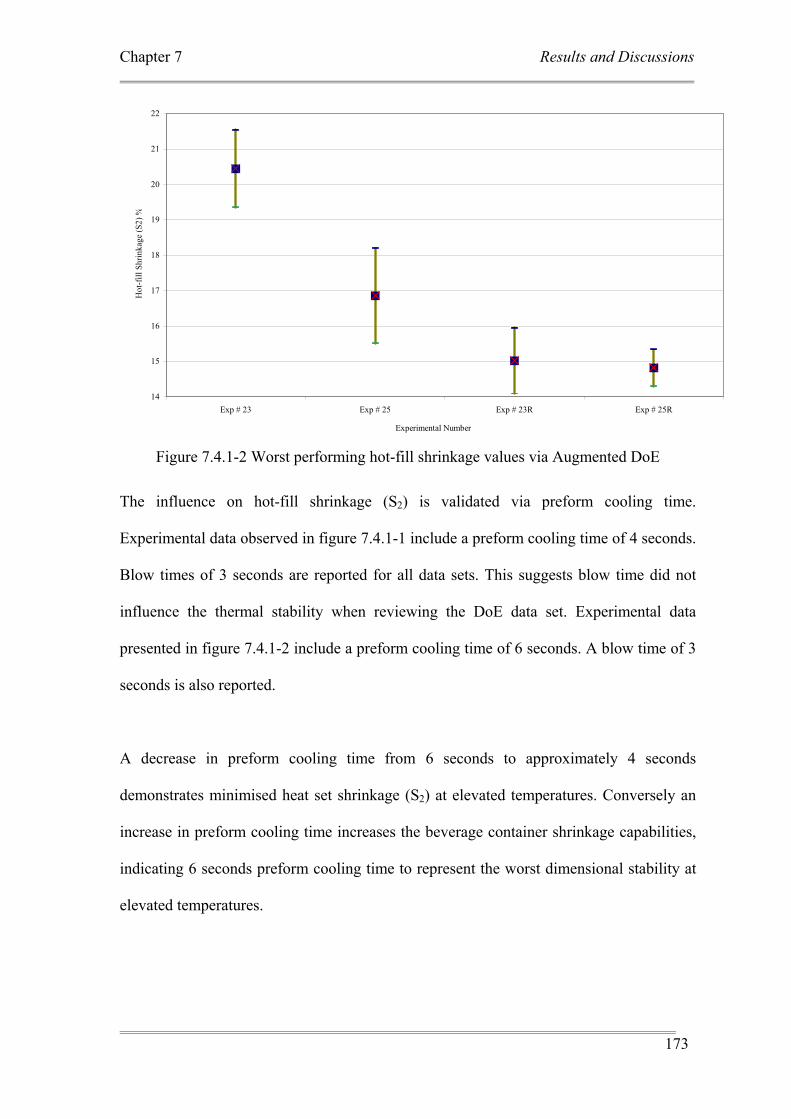
Chapter 7 Results and Discussions
173
14
15
16
17
18
19
20
21
22
Exp # 23 Exp # 25 Exp # 23R Exp # 25R
Experimental Number
Hot
-fill
Shr
inka
ge (S
2) %
Figure 7.4.1-2 Worst performing hot-fill shrinkage values via Augmented DoE
The influence on hot-fill shrinkage (S2) is validated via preform cooling time.
Experimental data observed in figure 7.4.1-1 include a preform cooling time of 4 seconds.
Blow times of 3 seconds are reported for all data sets. This suggests blow time did not
influence the thermal stability when reviewing the DoE data set. Experimental data
presented in figure 7.4.1-2 include a preform cooling time of 6 seconds. A blow time of 3
seconds is also reported.
A decrease in preform cooling time from 6 seconds to approximately 4 seconds
demonstrates minimised heat set shrinkage (S2) at elevated temperatures. Conversely an
increase in preform cooling time increases the beverage container shrinkage capabilities,
indicating 6 seconds preform cooling time to represent the worst dimensional stability at
elevated temperatures.
Chapter 7 Results and Discussions
174
A mean preform surface temperature of 106.57 oC is recorded for data set presented in
figure 7.3.3-2. This is representative of the preform surface temperature results due to an
increase in preform cooling time. The average preform cooling temperature obtained via
figure 7.3.3-1 recorded 113.81 oC. One possible explanation for poor hot-fill (S2)
stability is attributed to low preform surface temperature; upon the ISBM exhaust cycle of
pressurised air allows the bottle to spring away from the blow mould cavity. This is
further complicated by a decrease in amorphous density as the crystallisation rate
increases, allowing an increase in potential shrinkage. Therefore increases in preform
surface temperatures improve thermal stability of PET containers.
The existing wisdom on improving thermal stability of PET beverage containers is to
increase the percentage crystallinity. Previous studies have demonstrated an increase in
percentage crystallinity does not improve the thermal properties (Boyd 2004).
Furthermore, the final crystallinity value is not a good measure of the thermal stability of
a container, and its effects on oxygen permeability (Liu et al. 2004).
Improvements to thermal stability depend on the relaxation phenomena within the
morphology of the material. This result is further validated as all beverage containers
yielding the least performing hot-fill shrinkage values (S2) recorded a preform cooling
time of 6 seconds and 3 seconds blow time. Reference can be made to the DoE model
located in appendices B - 1.
Preform surface temperature has demonstrated a direct influence on the thermal stability
at elevated temperatures. The influence of RPET blends on thermal stability is addressed
in the current section. Analysis was performed incorporating the augmented DoE model,
as discussed in chapter 5.5. Echip DoE software was used for analysis.
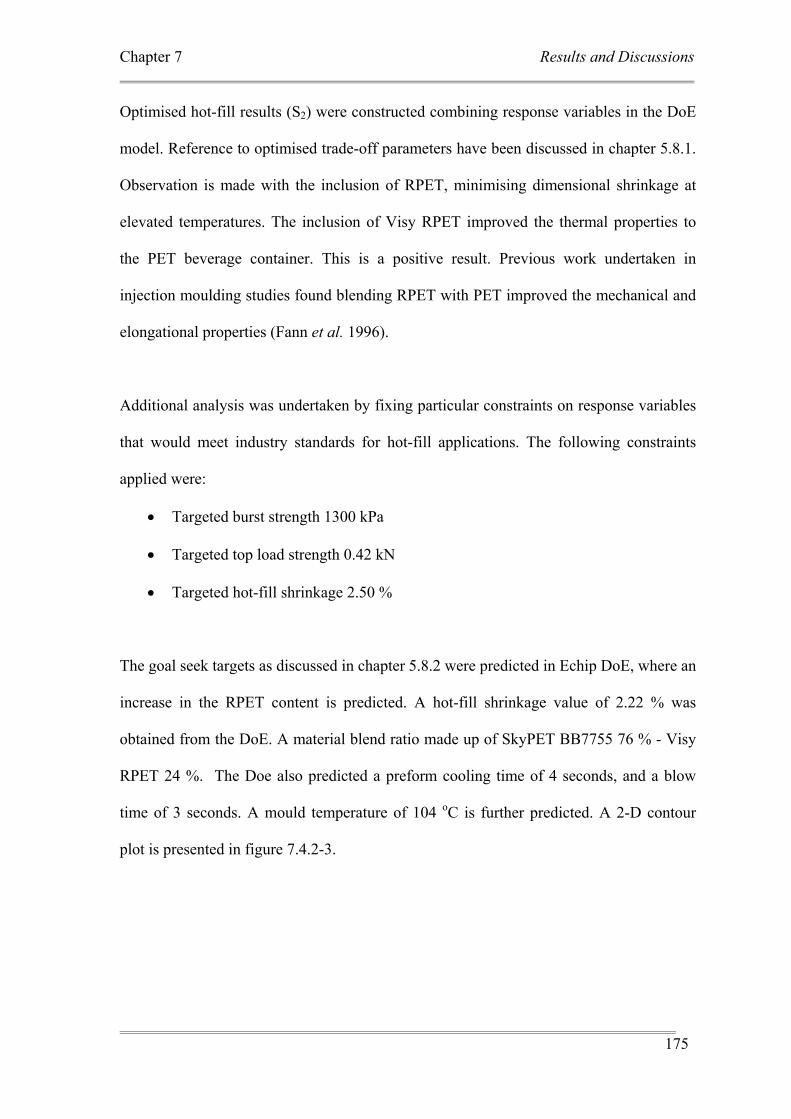
Chapter 7 Results and Discussions
175
Optimised hot-fill results (S2) were constructed combining response variables in the DoE
model. Reference to optimised trade-off parameters have been discussed in chapter 5.8.1.
Observation is made with the inclusion of RPET, minimising dimensional shrinkage at
elevated temperatures. The inclusion of Visy RPET improved the thermal properties to
the PET beverage container. This is a positive result. Previous work undertaken in
injection moulding studies found blending RPET with PET improved the mechanical and
elongational properties (Fann et al. 1996).
Additional analysis was undertaken by fixing particular constraints on response variables
that would meet industry standards for hot-fill applications. The following constraints
applied were:
• Targeted burst strength 1300 kPa
• Targeted top load strength 0.42 kN
• Targeted hot-fill shrinkage 2.50 %
The goal seek targets as discussed in chapter 5.8.2 were predicted in Echip DoE, where an
increase in the RPET content is predicted. A hot-fill shrinkage value of 2.22 % was
obtained from the DoE. A material blend ratio made up of SkyPET BB7755 76 % - Visy
RPET 24 %. The Doe also predicted a preform cooling time of 4 seconds, and a blow
time of 3 seconds. A mould temperature of 104 oC is further predicted. A 2-D contour
plot is presented in figure 7.4.2-3.
Chapter 7 Results and Discussions
176
Figure 7.4.1-3 Contour 2-D plot for hot-fill shrinkage with targeted mechanical properties for minimised shrinkage.
Improvements to hot-fill (S2) results by way of RPET inclusion can be attributed to the
presence of sodium hydroxide (NaOH). Sodium salts chemically react with the ester
linkages, in this case carboxyl end groups forming sodium carboxylate (Scheirs 2003).
The in situ ionomer can aggregate chain ends and initiate heterogeneous nucleation. It is
found oligomers are obtained via hydrolysis reaction during recycling of PC-PET in the
presence of sodium hydroxide.
Care must be given during the wash cycle in recycling PC-PET. NaOH can reduce IV
properties if not properly removed after washing via the rinse step cycle (Kosior 2007).
This reduction in IV will decrease the wM , and more importantly Tg. This is not favoured
80
85
90
95
100
105
110
4.0 4.5 5.0 5.5 6.0
Preform Cooling Time
Hot Fill Shrinkage
3 4
5 7 8
9
11
Blow_Time = 3.0 Material = 0.760 Recycled = 0.240 Material Order = 2
Value Low Limit High Limit 2.22 -4.05 8.49
Preform =4.00 MouldTem=104.00 Value Low Limit High Limit 2.22 -4.05 8.49
Preform =4.00 Mould Temp=104.00
Mould Temperature
Chapter 7 Results and Discussions
177
for hot-fill applications. The presence of sodium carboxylate (COO- Na+) is an effective
nucleating agent in PET (Pilati et al. 1997; Scheirs 2003). A decrease in the Tc is
observed, decreasing the rate of crystallisation.
Furthermore, the presence of residual catalyst, in this case Sb3O2 influence the
crystallisation rate of PET (Kang 2001; Pilati et al. 1997). Residual Sb3O2 is present due
to the polymerisation reaction of SkyPET BB7755. Improved thermal stability is
observed due to residual Sb3O2 catalyst (Göltner 2004). Therefore, the surplus amount of
Sb3 acts to improve the uniformity of temperature within the preform. An improvement to
thermal stability of the container is demonstrated. The presence of Sb3 ensures uniform
mean preform surface temperature before the inflation process. The inclusion of activated
carbon present in Voridian CA12 imitate similar perform surface temperature
performance.
7.4.2. Burst Test Burst test were analysed to determine mechanical properties of PET beverage containers
and compared results to RPET blends results using Excel 2003. Results are presented in
figure 7.4.2-1. The top 7 burst test results were investigated. The results show an increase
in blow time improves the burst strength performance. Furthermore, an increase in heat
set temperatures also demonstrates improvements to burst test results. However, The
beverage containers withstanding high burst pressure did not include RPET material or
blends. Furthermore, preform cooling times range between 5 – 6 seconds. Experimental
numbers 1, 2, 5, 7, 11, 12 and 22 demonstrated the poorest burst test results. Results for
the worst burst strength are shown in figure 7.4.2-2.
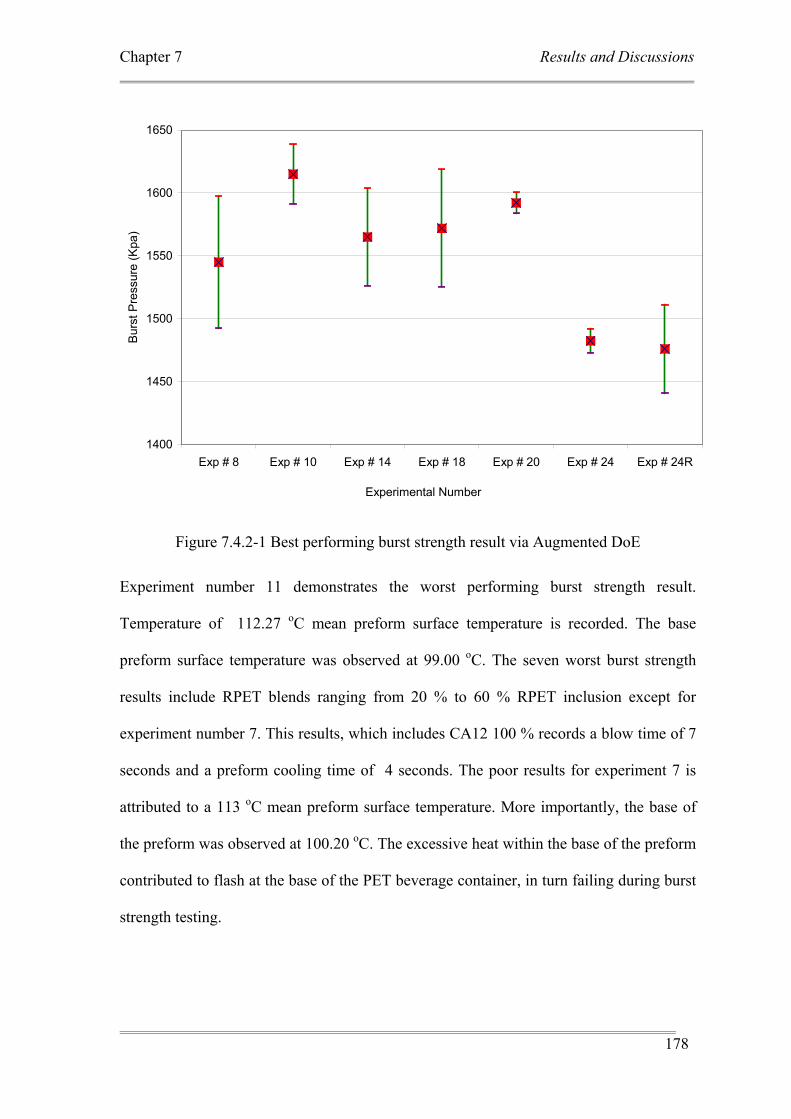
Chapter 7 Results and Discussions
178
1400
1450
1500
1550
1600
1650
Exp # 8 Exp # 10 Exp # 14 Exp # 18 Exp # 20 Exp # 24 Exp # 24R
Experimental Number
Bur
st P
ress
ure
(Kpa
)
Figure 7.4.2-1 Best performing burst strength result via Augmented DoE
Experiment number 11 demonstrates the worst performing burst strength result.
Temperature of 112.27 oC mean preform surface temperature is recorded. The base
preform surface temperature was observed at 99.00 oC. The seven worst burst strength
results include RPET blends ranging from 20 % to 60 % RPET inclusion except for
experiment number 7. This results, which includes CA12 100 % records a blow time of 7
seconds and a preform cooling time of 4 seconds. The poor results for experiment 7 is
attributed to a 113 oC mean preform surface temperature. More importantly, the base of
the preform was observed at 100.20 oC. The excessive heat within the base of the preform
contributed to flash at the base of the PET beverage container, in turn failing during burst
strength testing.
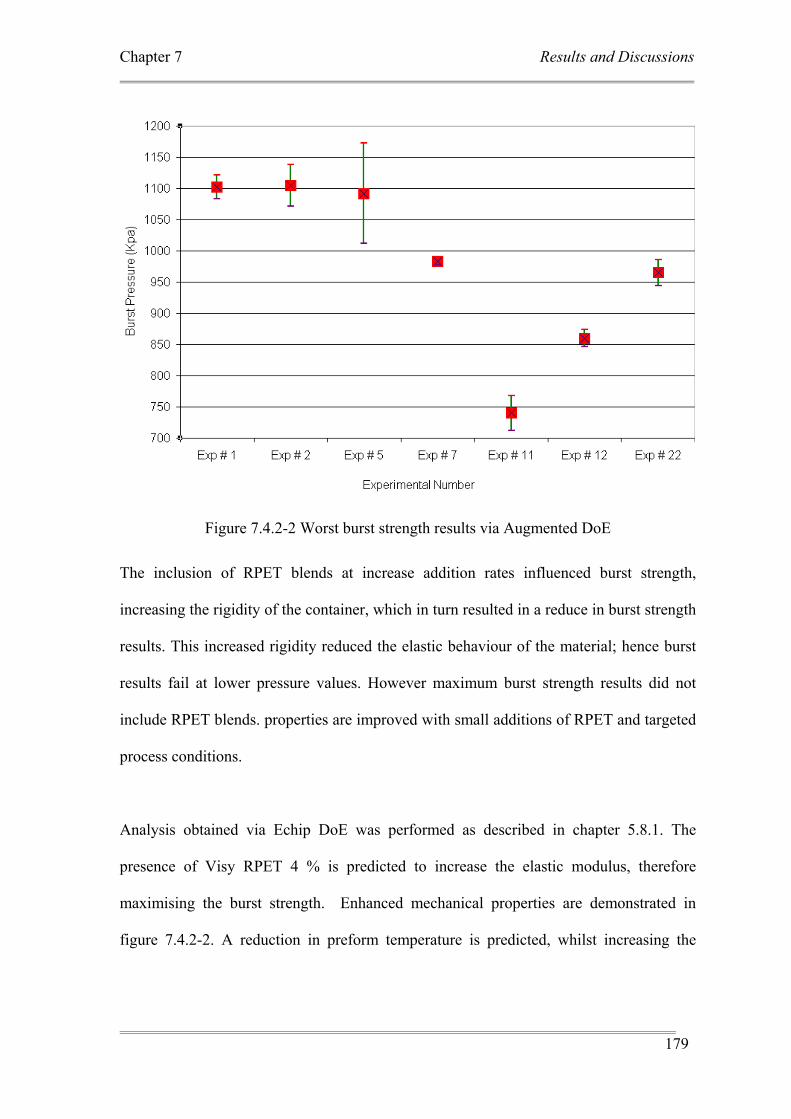
Chapter 7 Results and Discussions
179
Figure 7.4.2-2 Worst burst strength results via Augmented DoE
The inclusion of RPET blends at increase addition rates influenced burst strength,
increasing the rigidity of the container, which in turn resulted in a reduce in burst strength
results. This increased rigidity reduced the elastic behaviour of the material; hence burst
results fail at lower pressure values. However maximum burst strength results did not
include RPET blends. properties are improved with small additions of RPET and targeted
process conditions.
Analysis obtained via Echip DoE was performed as described in chapter 5.8.1. The
presence of Visy RPET 4 % is predicted to increase the elastic modulus, therefore
maximising the burst strength. Enhanced mechanical properties are demonstrated in
figure 7.4.2-2. A reduction in preform temperature is predicted, whilst increasing the
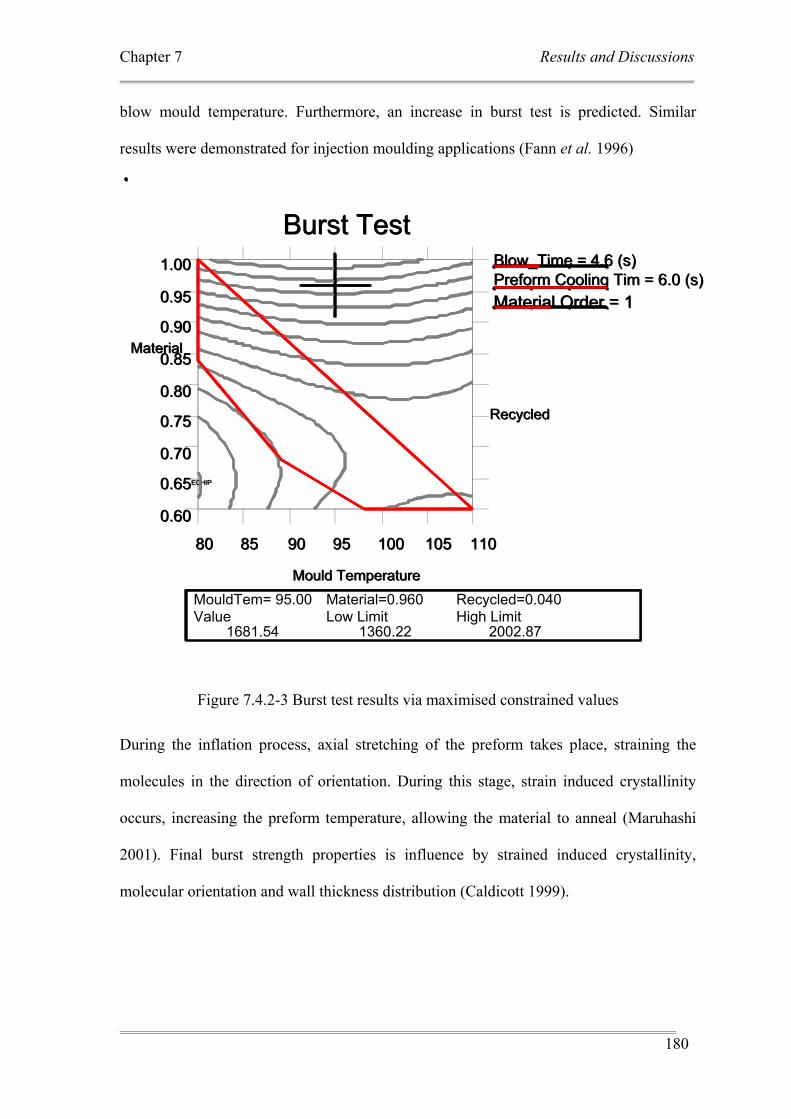
Chapter 7 Results and Discussions
180
blow mould temperature. Furthermore, an increase in burst test is predicted. Similar
results were demonstrated for injection moulding applications (Fann et al. 1996)
Figure 7.4.2-3 Burst test results via maximised constrained values
During the inflation process, axial stretching of the preform takes place, straining the
molecules in the direction of orientation. During this stage, strain induced crystallinity
occurs, increasing the preform temperature, allowing the material to anneal (Maruhashi
2001). Final burst strength properties is influence by strained induced crystallinity,
molecular orientation and wall thickness distribution (Caldicott 1999).
ECHIP
0.60
0.65
0.70
0.75
0.80
0.85
0.90
0.95
1.00
Material
Recycled
80 85 90 95 100 105 110
Mould Temperature
Burst TestBlow_Time = 4.6 (s) Preform Cooling Tim = 6.0 (s) Material Order = 1
Value Low Limit High Limit 1681.54 1360.22 2002.87
MouldTem= 95.00 Material=0.960 Recycled=0.040
ECHIP
0.60
0.65
0.70
0.75
0.80
0.85
0.90
0.95
1.00
Material
Recycled
80 85 90 95 100 105 110
Mould Temperature
Burst TestBlow_Time = 4.6 (s)Preform Cooling Tim = 6.0 (s)Material Order = 1
Value Low Limit High Limit 1681.54 1360.22 2002.87
MouldTem= 95.00 Material=0.960 Recycled=0.040
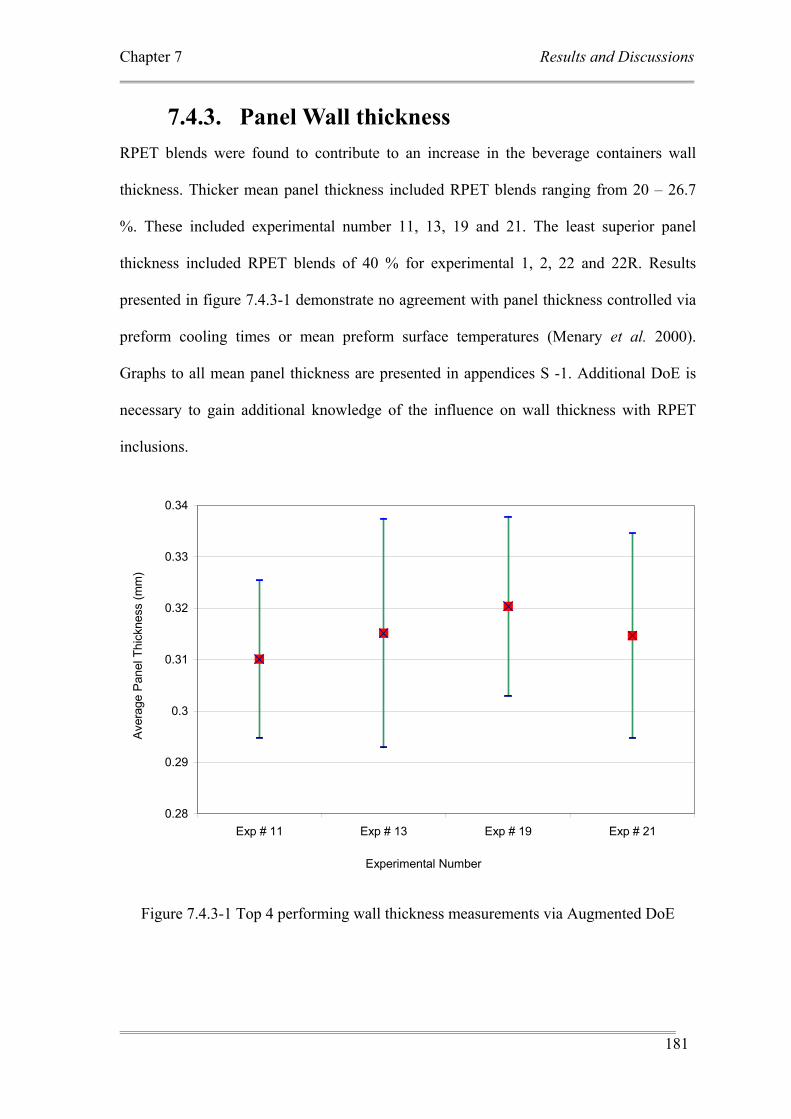
Chapter 7 Results and Discussions
181
7.4.3. Panel Wall thickness RPET blends were found to contribute to an increase in the beverage containers wall
thickness. Thicker mean panel thickness included RPET blends ranging from 20 – 26.7
%. These included experimental number 11, 13, 19 and 21. The least superior panel
thickness included RPET blends of 40 % for experimental 1, 2, 22 and 22R. Results
presented in figure 7.4.3-1 demonstrate no agreement with panel thickness controlled via
preform cooling times or mean preform surface temperatures (Menary et al. 2000).
Graphs to all mean panel thickness are presented in appendices S -1. Additional DoE is
necessary to gain additional knowledge of the influence on wall thickness with RPET
inclusions.
0.28
0.29
0.3
0.31
0.32
0.33
0.34
Exp # 11 Exp # 13 Exp # 19 Exp # 21
Experimental Number
Ave
rage
Pan
el T
hick
ness
(mm
)
Figure 7.4.3-1 Top 4 performing wall thickness measurements via Augmented DoE
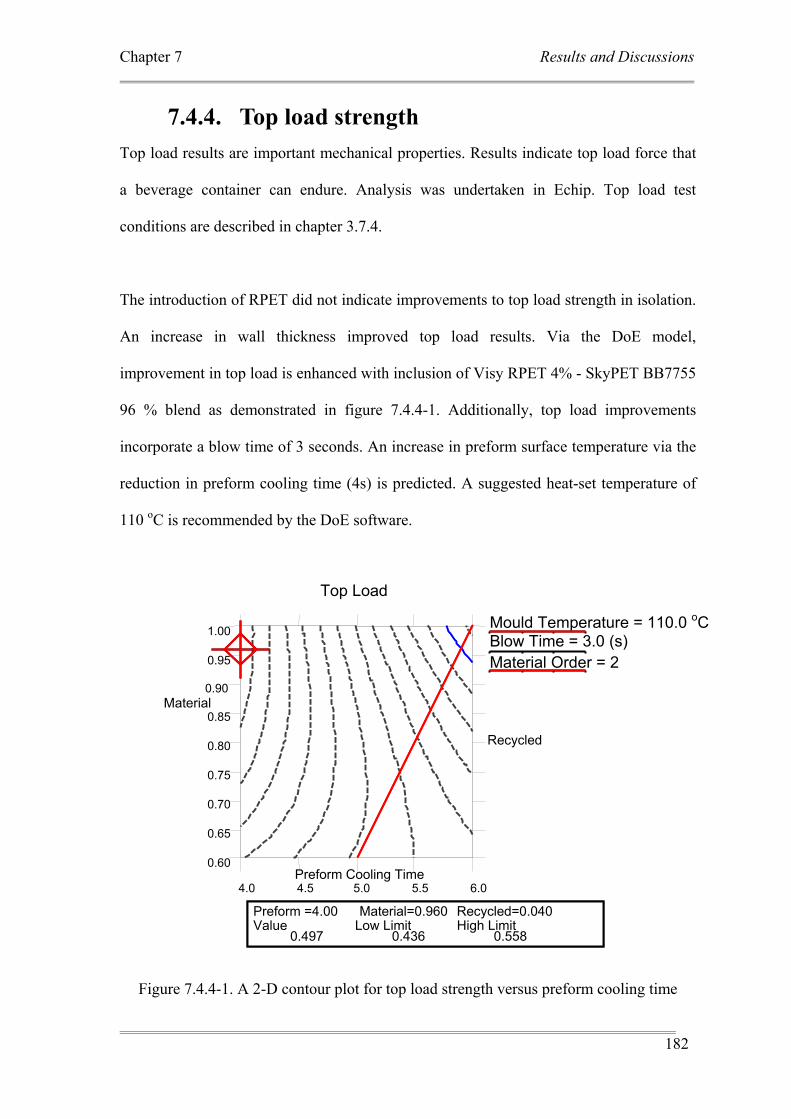
Chapter 7 Results and Discussions
182
7.4.4. Top load strength Top load results are important mechanical properties. Results indicate top load force that
a beverage container can endure. Analysis was undertaken in Echip. Top load test
conditions are described in chapter 3.7.4.
The introduction of RPET did not indicate improvements to top load strength in isolation.
An increase in wall thickness improved top load results. Via the DoE model,
improvement in top load is enhanced with inclusion of Visy RPET 4% - SkyPET BB7755
96 % blend as demonstrated in figure 7.4.4-1. Additionally, top load improvements
incorporate a blow time of 3 seconds. An increase in preform surface temperature via the
reduction in preform cooling time (4s) is predicted. A suggested heat-set temperature of
110 oC is recommended by the DoE software.
Figure 7.4.4-1. A 2-D contour plot for top load strength versus preform cooling time
Material
Preform Cooling Time
Value Low Limit High Limit 0.497 0.436 0.558
Preform =4.00 Material=0.960 Recycled=0.040 Value Low Limit High Limit 0.497 0.436 0.558
Preform =4.00 Material=0.960 Recycled=0.040
Recycled
0.60
0.65
0.70
0.75
0.80
0.85
0.90
0.95
1.00
4.0 4.5 5.0 5.5 6.0
Top Load
Mould Temperature = 110.0 oC Blow Time = 3.0 (s) Material Order = 2
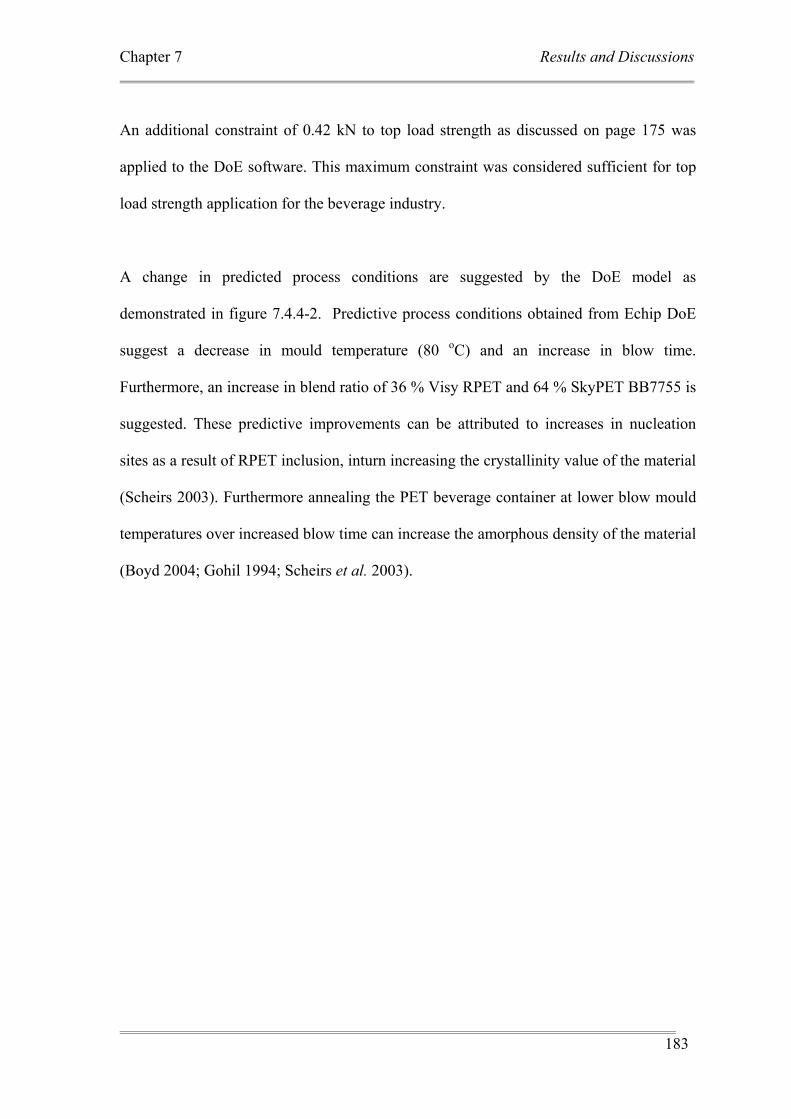
Chapter 7 Results and Discussions
183
An additional constraint of 0.42 kN to top load strength as discussed on page 175 was
applied to the DoE software. This maximum constraint was considered sufficient for top
load strength application for the beverage industry.
A change in predicted process conditions are suggested by the DoE model as
demonstrated in figure 7.4.4-2. Predictive process conditions obtained from Echip DoE
suggest a decrease in mould temperature (80 oC) and an increase in blow time.
Furthermore, an increase in blend ratio of 36 % Visy RPET and 64 % SkyPET BB7755 is
suggested. These predictive improvements can be attributed to increases in nucleation
sites as a result of RPET inclusion, inturn increasing the crystallinity value of the material
(Scheirs 2003). Furthermore annealing the PET beverage container at lower blow mould
temperatures over increased blow time can increase the amorphous density of the material
(Boyd 2004; Gohil 1994; Scheirs et al. 2003).
Chapter 7 Results and Discussions
184
Figure 7.4.4-2 Top load predicted results via Echip DoE software
7.5. Mechanical Properties via Optimised DoE
7.5.1. Elastic Modulus of Panel section via
Optimised DoE Optimised DoE beverage containers for BB7755 and RPET blends where analysed for
changes in mechanical properties as a function of increased heat-set temperatures. Sample
dimensions and test conditions have been discussed in chapter 4.9.2.
The Youngs modulus (E) was constructed by drawing a tangent line where stress ( )σ is
proportional to strain ( )ε . Two points were chosen and stress was then divided by the
3.0
3.5
4.0
4.5
5.0
5.5
6.0
6.5
7.0
Blow Time
80 85 90 95 100 105 110
Mould Temperature
TopLoad x 10^-3 (N)
438
453
Preform Cooling Tim = 4.6 (s) Material = 0.640 Recycled = 0.360 Material Order = 2
Value Low Limit High Limit 0.445 0.389 0.501
Mould Temp= 80.00 Blow Time=5.00
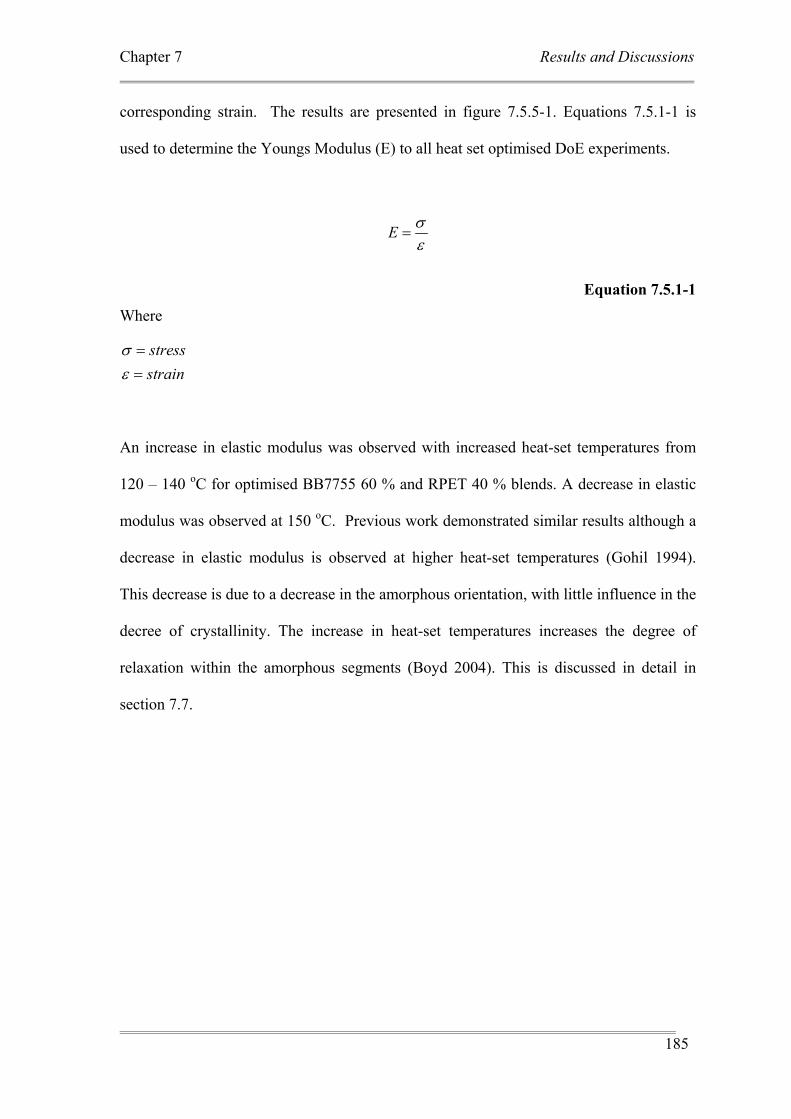
Chapter 7 Results and Discussions
185
corresponding strain. The results are presented in figure 7.5.5-1. Equations 7.5.1-1 is
used to determine the Youngs Modulus (E) to all heat set optimised DoE experiments.
E σε
=
Equation 7.5.1-1 Where
stressstrain
σε==
An increase in elastic modulus was observed with increased heat-set temperatures from
120 – 140 oC for optimised BB7755 60 % and RPET 40 % blends. A decrease in elastic
modulus was observed at 150 oC. Previous work demonstrated similar results although a
decrease in elastic modulus is observed at higher heat-set temperatures (Gohil 1994).
This decrease is due to a decrease in the amorphous orientation, with little influence in the
decree of crystallinity. The increase in heat-set temperatures increases the degree of
relaxation within the amorphous segments (Boyd 2004). This is discussed in detail in
section 7.7.
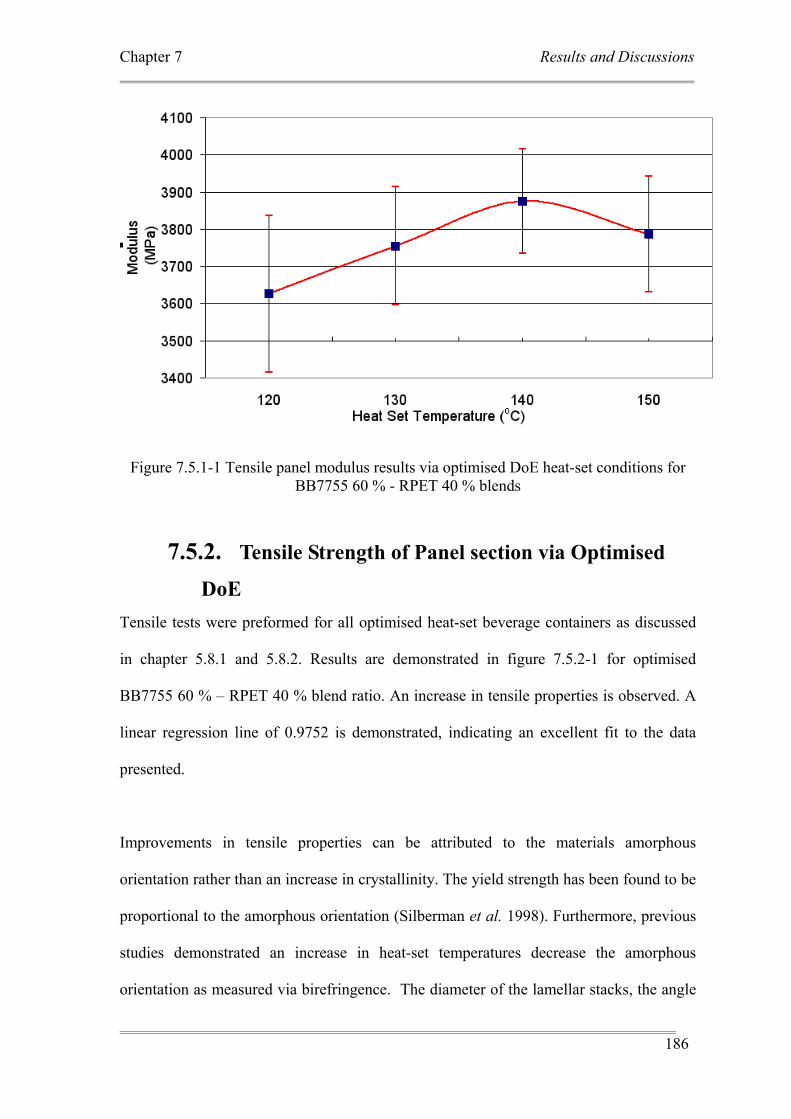
Chapter 7 Results and Discussions
186
Figure 7.5.1-1 Tensile panel modulus results via optimised DoE heat-set conditions for BB7755 60 % - RPET 40 % blends
7.5.2. Tensile Strength of Panel section via Optimised
DoE Tensile tests were preformed for all optimised heat-set beverage containers as discussed
in chapter 5.8.1 and 5.8.2. Results are demonstrated in figure 7.5.2-1 for optimised
BB7755 60 % – RPET 40 % blend ratio. An increase in tensile properties is observed. A
linear regression line of 0.9752 is demonstrated, indicating an excellent fit to the data
presented.
Improvements in tensile properties can be attributed to the materials amorphous
orientation rather than an increase in crystallinity. The yield strength has been found to be
proportional to the amorphous orientation (Silberman et al. 1998). Furthermore, previous
studies demonstrated an increase in heat-set temperatures decrease the amorphous
orientation as measured via birefringence. The diameter of the lamellar stacks, the angle
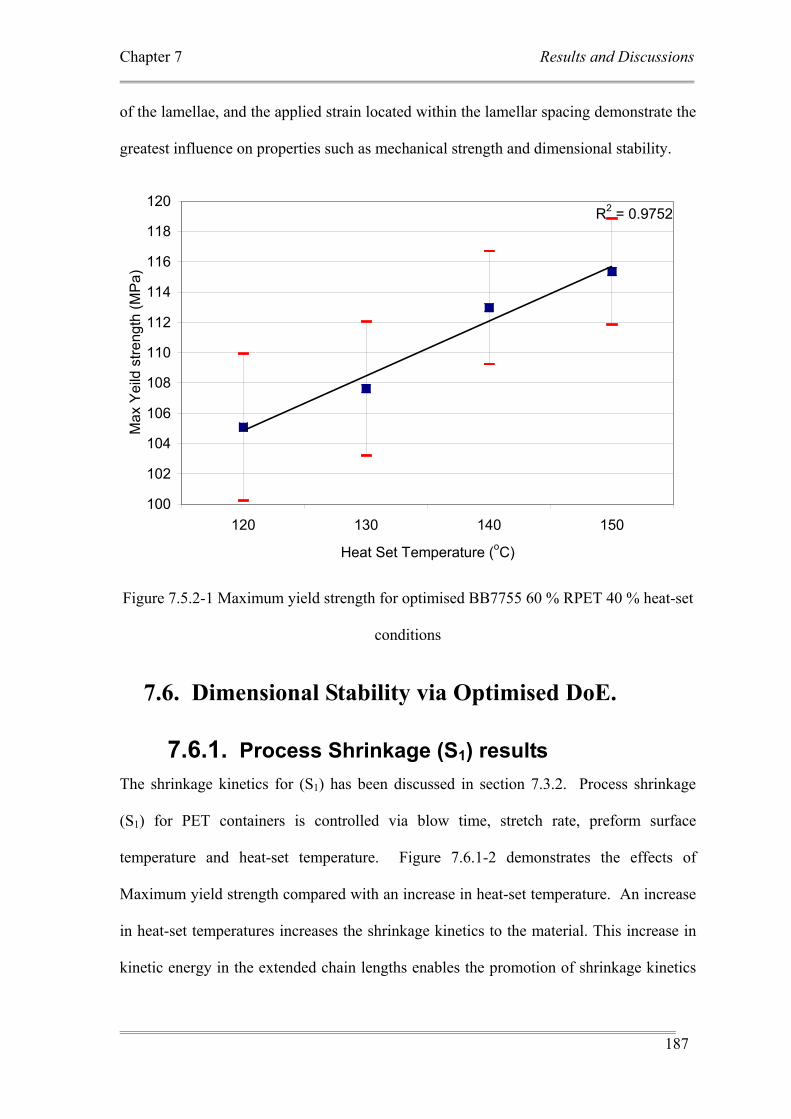
Chapter 7 Results and Discussions
187
of the lamellae, and the applied strain located within the lamellar spacing demonstrate the
greatest influence on properties such as mechanical strength and dimensional stability.
R2 = 0.9752
100
102
104
106
108
110
112
114
116
118
120
120 130 140 150
Heat Set Temperature (oC)
Max
Yei
ld s
treng
th (M
Pa)
Figure 7.5.2-1 Maximum yield strength for optimised BB7755 60 % RPET 40 % heat-set
conditions
7.6. Dimensional Stability via Optimised DoE.
7.6.1. Process Shrinkage (S1) results The shrinkage kinetics for (S1) has been discussed in section 7.3.2. Process shrinkage
(S1) for PET containers is controlled via blow time, stretch rate, preform surface
temperature and heat-set temperature. Figure 7.6.1-2 demonstrates the effects of
Maximum yield strength compared with an increase in heat-set temperature. An increase
in heat-set temperatures increases the shrinkage kinetics to the material. This increase in
kinetic energy in the extended chain lengths enables the promotion of shrinkage kinetics
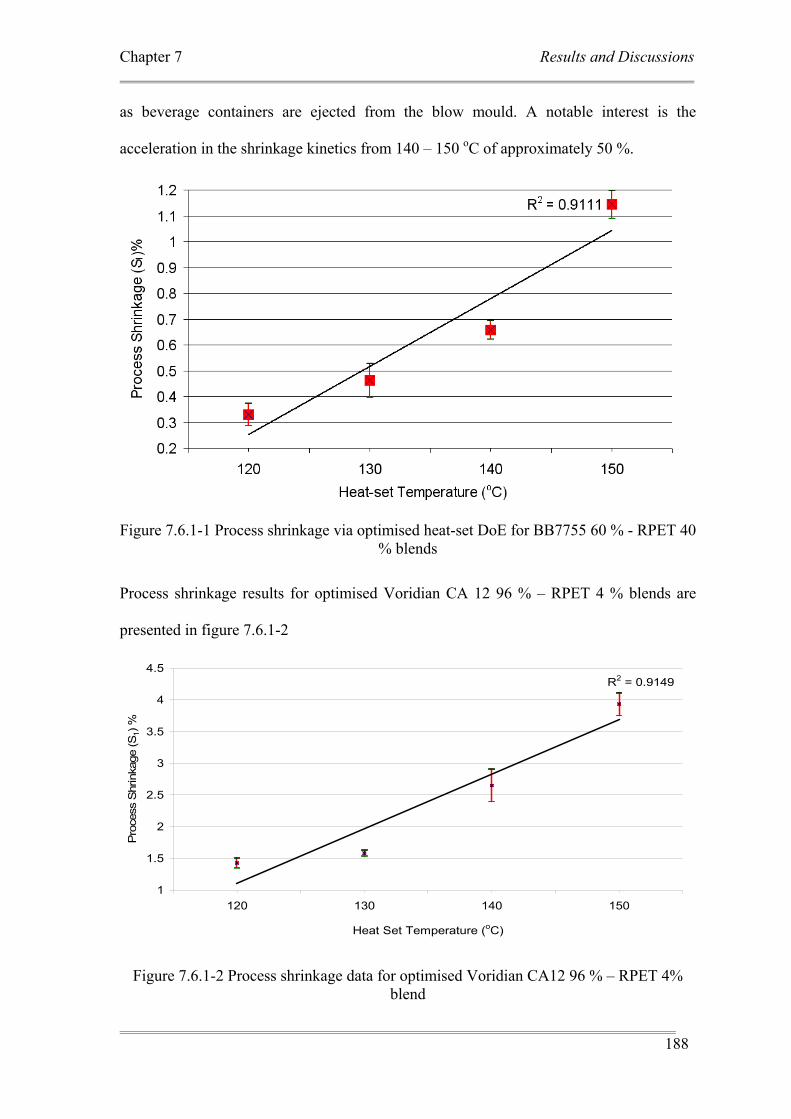
Chapter 7 Results and Discussions
188
as beverage containers are ejected from the blow mould. A notable interest is the
acceleration in the shrinkage kinetics from 140 – 150 oC of approximately 50 %.
Figure 7.6.1-1 Process shrinkage via optimised heat-set DoE for BB7755 60 % - RPET 40 % blends
Process shrinkage results for optimised Voridian CA 12 96 % – RPET 4 % blends are
presented in figure 7.6.1-2
R2 = 0.9149
1
1.5
2
2.5
3
3.5
4
4.5
120 130 140 150
Heat Set Temperature (oC)
Pro
cess
Shr
inka
ge (S
1) %
Figure 7.6.1-2 Process shrinkage data for optimised Voridian CA12 96 % – RPET 4% blend
Chapter 7 Results and Discussions
189
7.6.2. Hot-fill Shrinkage (S2) results Axial stretch speeds were calculated with assumptions made for stretch rod axial
movement of 88 mm / 0.5 seconds. This measurement was obtained via the
measurement of bottle length less the preform axial length. Time used for stretch rod
start to finish time (extension of the stretch rod during axial stretch direction) is
approximated for empirical use.
This approximation calculates a stretch speed of 21.12 m / min. This increase in
stretch speeds increases preform surface temperatures during the stretching process.
Stretch speeds above 20 m /min increases the thermal stability via relaxation of
amorphous segments. (Maruhashi et al. 1996). However in this study, stretch speeds
were not altered, therefore hot-fill shrinkage was analysed for DoE beverage
containers as a function of heat-set temperatures.
Much of the discussion in chapter 7 has clearly demonstrated increases in preform
temperatures yield improved thermal stability at elevated temperatures. The maximum
amount of crystallinity observed via stretch speed, – that is increases in preform
temperature via strain induced crystallisation – is 35 % (Boyd 2004). This result does
not include post heat-setting. However the belief that increased crystallinity via
increased heat-setting temperatures yields improved thermal stability has been
previously discussed in section 7.3.1.
This research study demonstrated the lest amount of S2 shrinkage incorporating low
heat-set temperatures (80 – 110 oC) – a result of 2.295 % – recorded for experiment
15. Comparisons to results obtained via optimised DoE BB7755 60 % – RPET 40 %
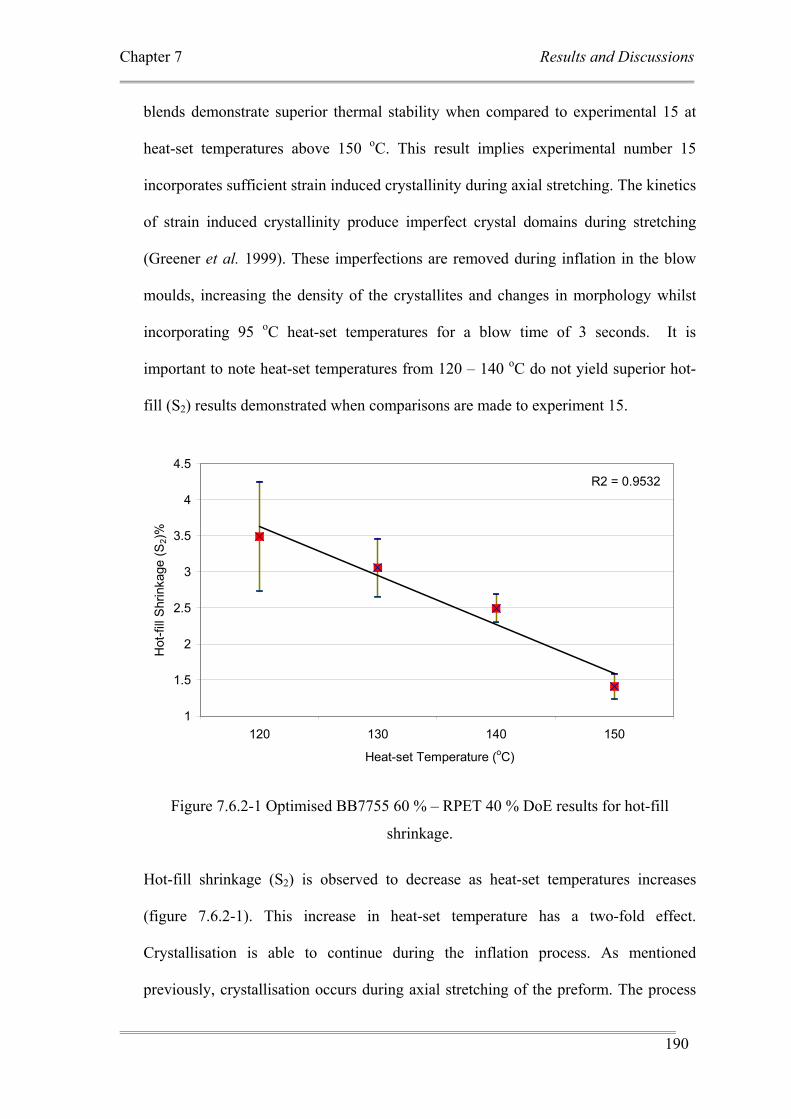
Chapter 7 Results and Discussions
190
blends demonstrate superior thermal stability when compared to experimental 15 at
heat-set temperatures above 150 oC. This result implies experimental number 15
incorporates sufficient strain induced crystallinity during axial stretching. The kinetics
of strain induced crystallinity produce imperfect crystal domains during stretching
(Greener et al. 1999). These imperfections are removed during inflation in the blow
moulds, increasing the density of the crystallites and changes in morphology whilst
incorporating 95 oC heat-set temperatures for a blow time of 3 seconds. It is
important to note heat-set temperatures from 120 – 140 oC do not yield superior hot-
fill (S2) results demonstrated when comparisons are made to experiment 15.
R2 = 0.9532
1
1.5
2
2.5
3
3.5
4
4.5
120 130 140 150
Heat-set Temperature (oC)
Hot
-fill
Shr
inka
ge (S
2)%
Figure 7.6.2-1 Optimised BB7755 60 % – RPET 40 % DoE results for hot-fill
shrinkage.
Hot-fill shrinkage (S2) is observed to decrease as heat-set temperatures increases
(figure 7.6.2-1). This increase in heat-set temperature has a two-fold effect.
Crystallisation is able to continue during the inflation process. As mentioned
previously, crystallisation occurs during axial stretching of the preform. The process
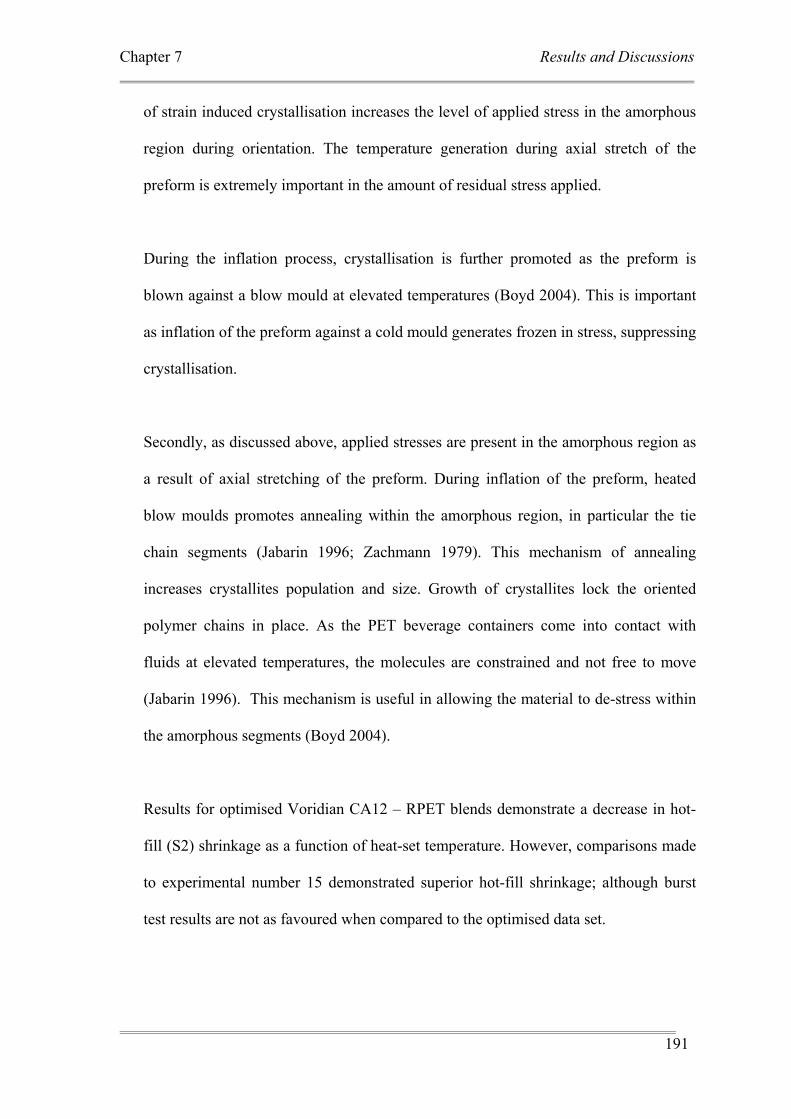
Chapter 7 Results and Discussions
191
of strain induced crystallisation increases the level of applied stress in the amorphous
region during orientation. The temperature generation during axial stretch of the
preform is extremely important in the amount of residual stress applied.
During the inflation process, crystallisation is further promoted as the preform is
blown against a blow mould at elevated temperatures (Boyd 2004). This is important
as inflation of the preform against a cold mould generates frozen in stress, suppressing
crystallisation.
Secondly, as discussed above, applied stresses are present in the amorphous region as
a result of axial stretching of the preform. During inflation of the preform, heated
blow moulds promotes annealing within the amorphous region, in particular the tie
chain segments (Jabarin 1996; Zachmann 1979). This mechanism of annealing
increases crystallites population and size. Growth of crystallites lock the oriented
polymer chains in place. As the PET beverage containers come into contact with
fluids at elevated temperatures, the molecules are constrained and not free to move
(Jabarin 1996). This mechanism is useful in allowing the material to de-stress within
the amorphous segments (Boyd 2004).
Results for optimised Voridian CA12 – RPET blends demonstrate a decrease in hot-
fill (S2) shrinkage as a function of heat-set temperature. However, comparisons made
to experimental number 15 demonstrated superior hot-fill shrinkage; although burst
test results are not as favoured when compared to the optimised data set.
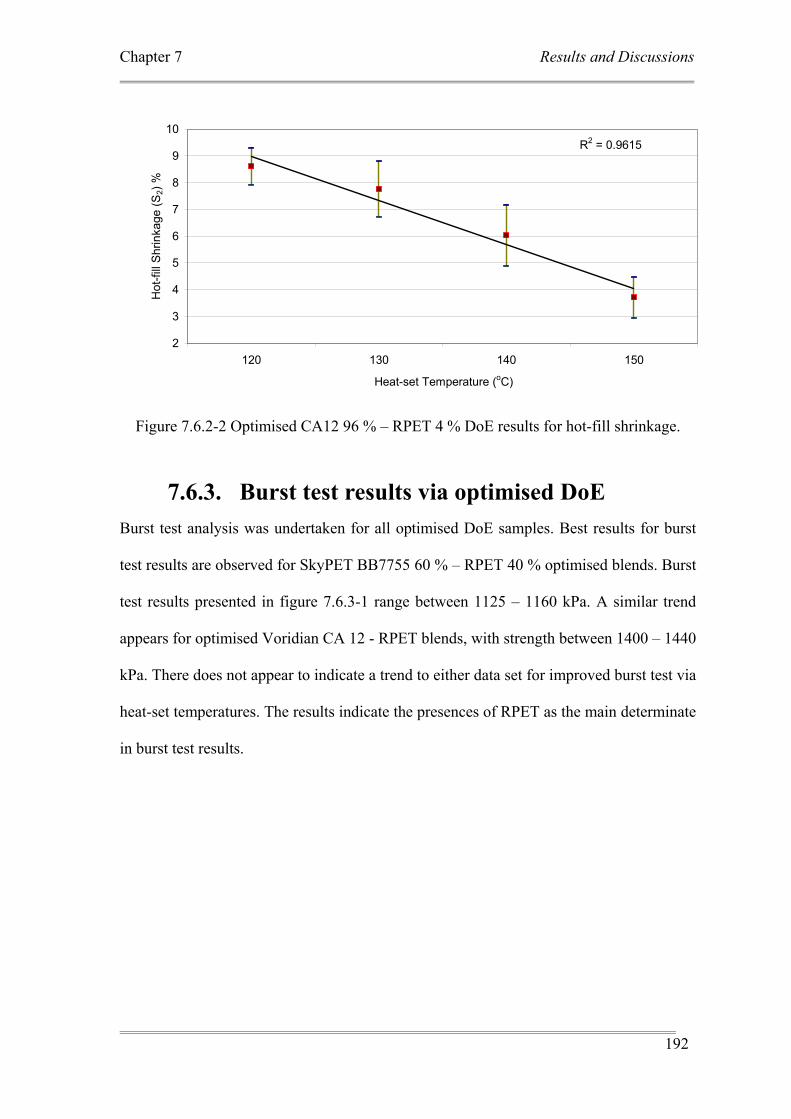
Chapter 7 Results and Discussions
192
R2 = 0.9615
2
3
4
5
6
7
8
9
10
120 130 140 150
Heat-set Temperature (oC)
Hot
-fill
Shrin
kage
(S2)
%
Figure 7.6.2-2 Optimised CA12 96 % – RPET 4 % DoE results for hot-fill shrinkage.
7.6.3. Burst test results via optimised DoE Burst test analysis was undertaken for all optimised DoE samples. Best results for burst
test results are observed for SkyPET BB7755 60 % – RPET 40 % optimised blends. Burst
test results presented in figure 7.6.3-1 range between 1125 – 1160 kPa. A similar trend
appears for optimised Voridian CA 12 - RPET blends, with strength between 1400 – 1440
kPa. There does not appear to indicate a trend to either data set for improved burst test via
heat-set temperatures. The results indicate the presences of RPET as the main determinate
in burst test results.
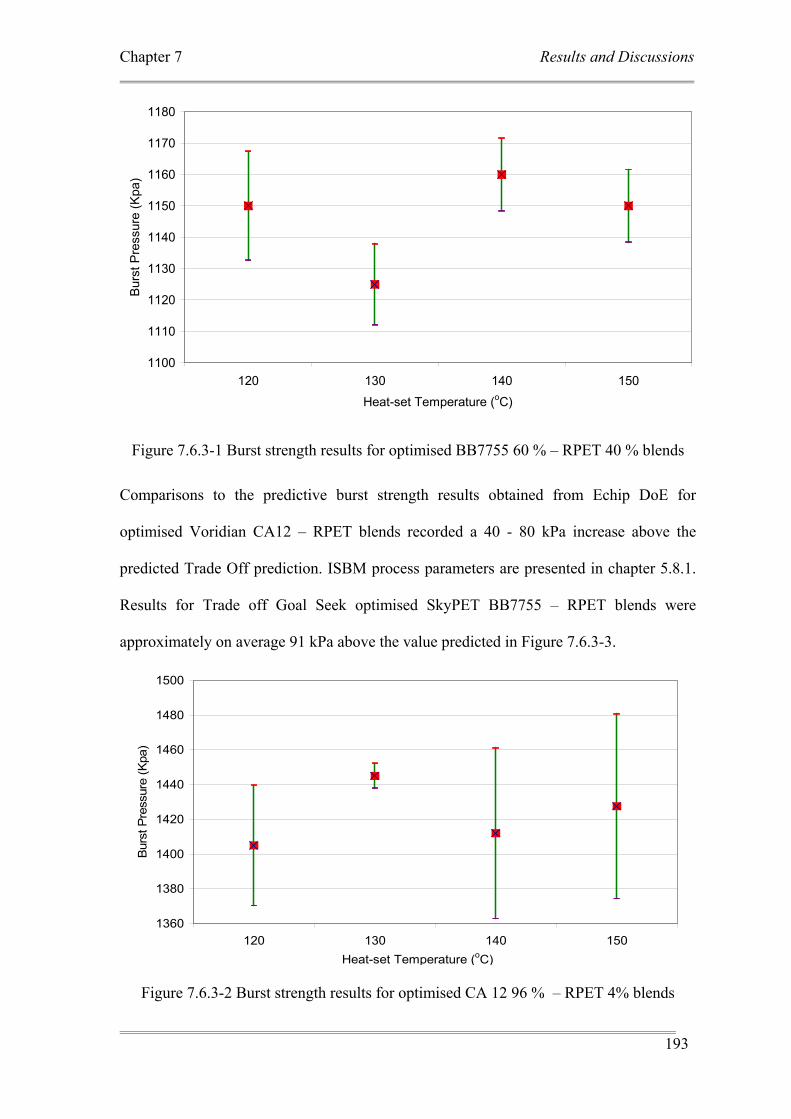
Chapter 7 Results and Discussions
193
1100
1110
1120
1130
1140
1150
1160
1170
1180
120 130 140 150
Heat-set Temperature (oC)
Bur
st P
ress
ure
(Kpa
)
Figure 7.6.3-1 Burst strength results for optimised BB7755 60 % – RPET 40 % blends
Comparisons to the predictive burst strength results obtained from Echip DoE for
optimised Voridian CA12 – RPET blends recorded a 40 - 80 kPa increase above the
predicted Trade Off prediction. ISBM process parameters are presented in chapter 5.8.1.
Results for Trade off Goal Seek optimised SkyPET BB7755 – RPET blends were
approximately on average 91 kPa above the value predicted in Figure 7.6.3-3.
1360
1380
1400
1420
1440
1460
1480
1500
120 130 140 150Heat-set Temperature (oC)
Bur
st P
ress
ure
(Kpa
)
Figure 7.6.3-2 Burst strength results for optimised CA 12 96 % – RPET 4% blends
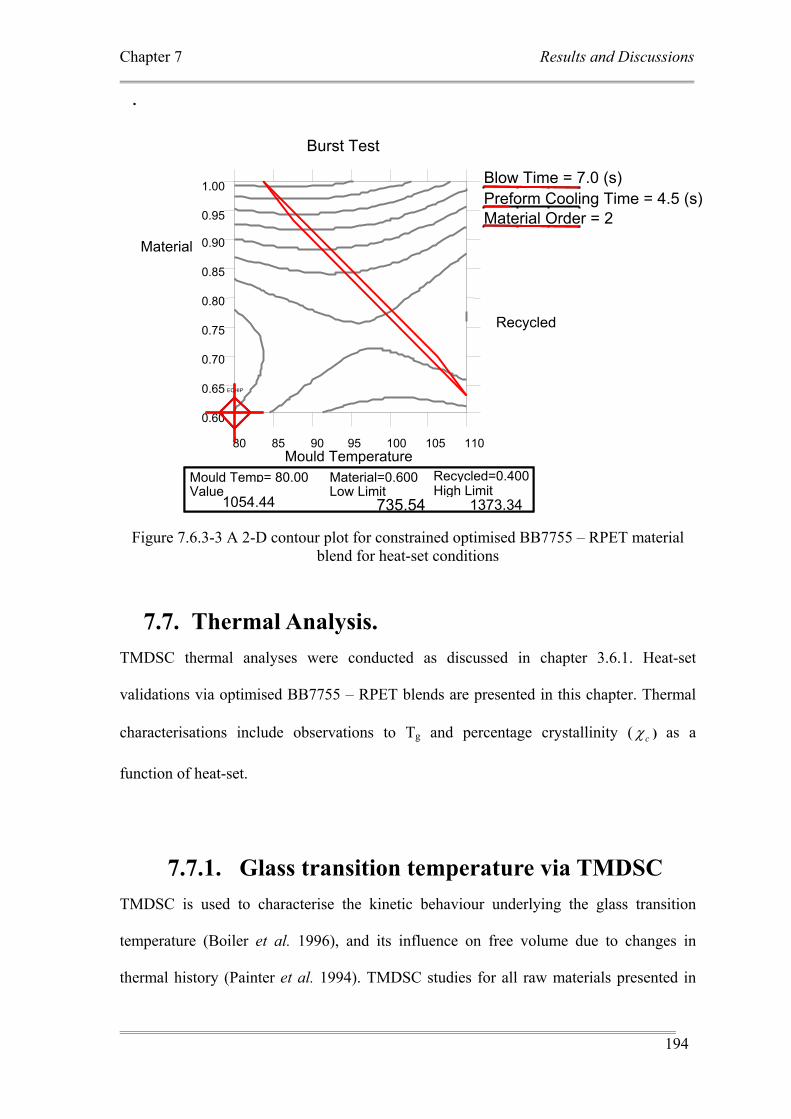
Chapter 7 Results and Discussions
194
Figure 7.6.3-3 A 2-D contour plot for constrained optimised BB7755 – RPET material blend for heat-set conditions
7.7. Thermal Analysis. TMDSC thermal analyses were conducted as discussed in chapter 3.6.1. Heat-set
validations via optimised BB7755 – RPET blends are presented in this chapter. Thermal
characterisations include observations to Tg and percentage crystallinity ( cχ ) as a
function of heat-set.
7.7.1. Glass transition temperature via TMDSC TMDSC is used to characterise the kinetic behaviour underlying the glass transition
temperature (Boiler et al. 1996), and its influence on free volume due to changes in
thermal history (Painter et al. 1994). TMDSC studies for all raw materials presented in
Material
Mould Temperature
Recycled
ECHIP
0.60
0.65
0.70
0.75
0.80
0.85
0.90
0.95
1.00
80 85 90 95 100 105 110
Burst Test
Blow Time = 7.0 (s) Preform Cooling Time = 4.5 (s) Material Order = 2
Value Low Limit High Limit 1054.44 735.54
1373.34MouldTem= 80.00 Material=0.600 Recycled=0.400Value Low Limit High Limit 1054.44 1373.34
Mould Temp= 80.00 Material=0.600 Recycled=0.400
735.54
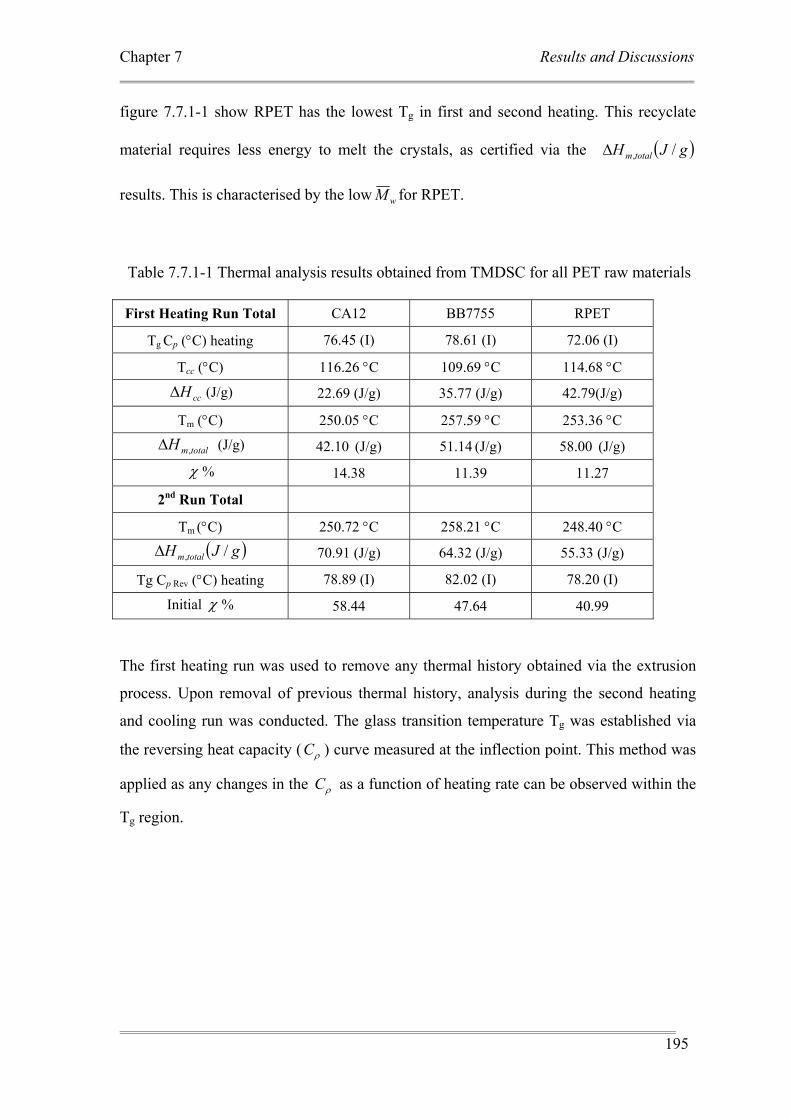
Chapter 7 Results and Discussions
195
figure 7.7.1-1 show RPET has the lowest Tg in first and second heating. This recyclate
material requires less energy to melt the crystals, as certified via the ( )gJH totalm /,Δ
results. This is characterised by the low wM for RPET.
Table 7.7.1-1 Thermal analysis results obtained from TMDSC for all PET raw materials
First Heating Run Total CA12 BB7755 RPET
Tg Cp (°C) heating 76.45 (I) 78.61 (I) 72.06 (I)
Tcc (°C) 116.26 °C 109.69 °C 114.68 °C
ccHΔ (J/g) 22.69 (J/g) 35.77 (J/g) 42.79(J/g)
Tm (°C) 250.05 °C 257.59 °C 253.36 °C
totalmH ,Δ (J/g) 42.10 (J/g) 51.14 (J/g) 58.00 (J/g)
χ % 14.38 11.39 11.27
2nd Run Total
Tm (°C) 250.72 °C 258.21 °C 248.40 °C
( )gJH totalm /,Δ 70.91 (J/g) 64.32 (J/g) 55.33 (J/g)
Tg Cp Rev (°C) heating 78.89 (I) 82.02 (I) 78.20 (I)
Initial χ % 58.44 47.64 40.99
The first heating run was used to remove any thermal history obtained via the extrusion
process. Upon removal of previous thermal history, analysis during the second heating
and cooling run was conducted. The glass transition temperature Tg was established via
the reversing heat capacity ( ρC ) curve measured at the inflection point. This method was
applied as any changes in the ρC as a function of heating rate can be observed within the
Tg region.
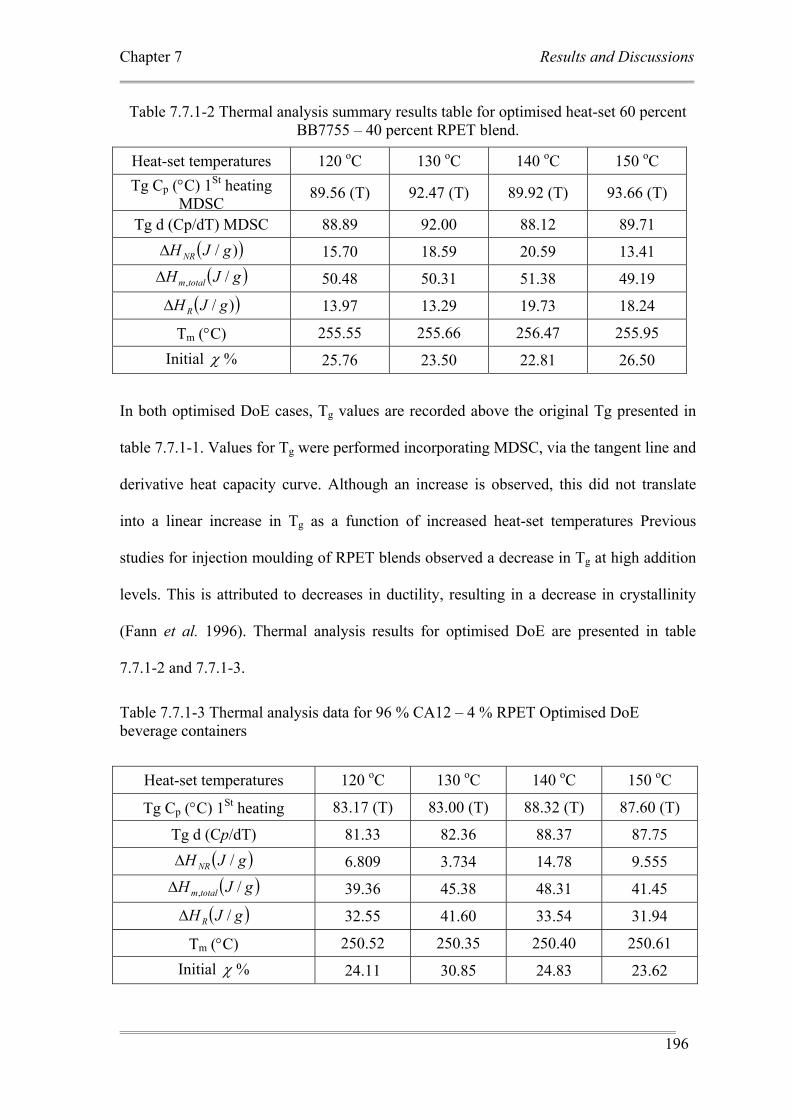
Chapter 7 Results and Discussions
196
Table 7.7.1-2 Thermal analysis summary results table for optimised heat-set 60 percent BB7755 – 40 percent RPET blend.
Heat-set temperatures 120 oC 130 oC 140 oC 150 oC Tg Cp (°C) 1St heating
MDSC 89.56 (T) 92.47 (T) 89.92 (T) 93.66 (T)
Tg d (Cp/dT) MDSC 88.89 92.00 88.12 89.71 ( ))/ gJH NRΔ 15.70 18.59 20.59 13.41 ( )gJH totalm /,Δ 50.48 50.31 51.38 49.19
( ))/ gJH RΔ 13.97 13.29 19.73 18.24
Tm (°C) 255.55 255.66 256.47 255.95 Initial χ % 25.76 23.50 22.81 26.50
In both optimised DoE cases, Tg values are recorded above the original Tg presented in
table 7.7.1-1. Values for Tg were performed incorporating MDSC, via the tangent line and
derivative heat capacity curve. Although an increase is observed, this did not translate
into a linear increase in Tg as a function of increased heat-set temperatures Previous
studies for injection moulding of RPET blends observed a decrease in Tg at high addition
levels. This is attributed to decreases in ductility, resulting in a decrease in crystallinity
(Fann et al. 1996). Thermal analysis results for optimised DoE are presented in table
7.7.1-2 and 7.7.1-3.
Table 7.7.1-3 Thermal analysis data for 96 % CA12 – 4 % RPET Optimised DoE beverage containers
Heat-set temperatures 120 oC 130 oC 140 oC 150 oC
Tg Cp (°C) 1St heating 83.17 (T) 83.00 (T) 88.32 (T) 87.60 (T)
Tg d (Cp/dT) 81.33 82.36 88.37 87.75 ( )gJH NR /Δ 6.809 3.734 14.78 9.555 ( )gJH totalm /,Δ 39.36 45.38 48.31 41.45
( )gJH R /Δ 32.55 41.60 33.54 31.94
Tm (°C) 250.52 250.35 250.40 250.61 Initial χ % 24.11 30.85 24.83 23.62
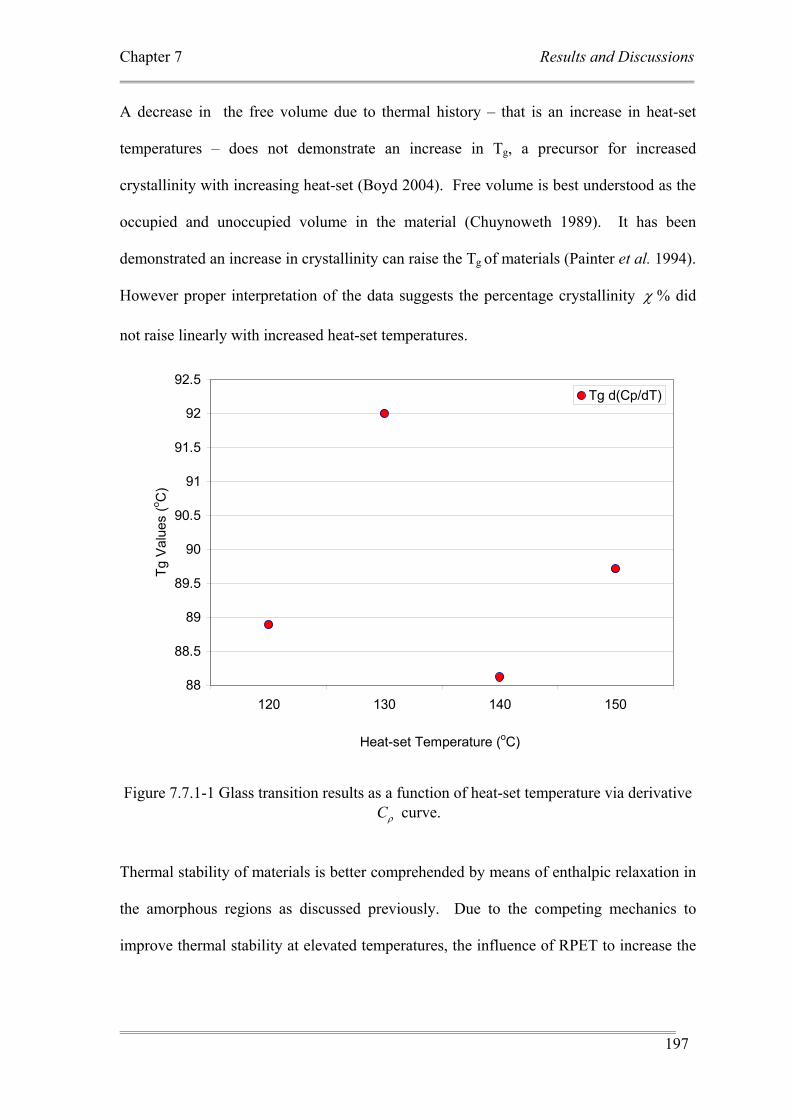
Chapter 7 Results and Discussions
197
A decrease in the free volume due to thermal history – that is an increase in heat-set
temperatures – does not demonstrate an increase in Tg, a precursor for increased
crystallinity with increasing heat-set (Boyd 2004). Free volume is best understood as the
occupied and unoccupied volume in the material (Chuynoweth 1989). It has been
demonstrated an increase in crystallinity can raise the Tg of materials (Painter et al. 1994).
However proper interpretation of the data suggests the percentage crystallinity χ % did
not raise linearly with increased heat-set temperatures.
88
88.5
89
89.5
90
90.5
91
91.5
92
92.5
120 130 140 150
Heat-set Temperature (oC)
Tg V
alue
s (o C
)
Tg d(Cp/dT)
Figure 7.7.1-1 Glass transition results as a function of heat-set temperature via derivative ρC curve.
Thermal stability of materials is better comprehended by means of enthalpic relaxation in
the amorphous regions as discussed previously. Due to the competing mechanics to
improve thermal stability at elevated temperatures, the influence of RPET to increase the
Chapter 7 Results and Discussions
198
Tg values was difficult to interpret. Further studies are required to address this question in
full.
7.7.2. Percentage Crystallinity via Optimised DoE.
Percentage crystallinity did not demonstrate to be the dominant factor when considering
thermal stability. It is clear the ability to anneal (relieve stress) via heat treatment
encourages molecular relaxation increasing molecular mobility in the amorphous region
(Matthews et al. 2000; Venkateswaran et al. 1998).
Crystallinity results presented in table 7.7.1-2 via TMDSC analysis demonstrated
decreases in percentage crystallinity ( χ %) while increasing heat-set temperatures. An
increase is observed at heat-set temperature of 150 oC. One suggested reason is due to the
strain induced crystallisation influence prior to inflation. As mentioned in preceding
chapters, stretch speed during axial deformation increases the temperature of the preform.
This increased orientation increases preform temperature, which yields greater relaxed
amorphous segments.
Heat-set results for 150 oC can be explained in the following way. Preform temperatures
are lower than the applied heat-set temperature in the blow mould. During the heat-setting
process, the amorphous region undergoes further molecular relaxation due to high mould
temperatures when in contact at the surface of the preform. This process decreases the
free volume of the material. This is quantified by an increase in Tg, demonstrating an
increase in χ %. The final χ % is influence via stretch speed, strain rate, extension rate,
Chapter 7 Results and Discussions
199
preform temperature, material properties and the influence in molecular relaxation of the
non-crystalline region (Boyd 2004).
7.8. Density results via Optimised DoE Results presented in section 7.7.1 did not show χ % (via DSC analysis) to increase
linearly with increasing heat set temperatures. The current literature suggests increases
the percentage crystallinity χ % is dependant on heat-set temperatures (Mc Chesney et al.
1983). This thesis did not reproduce similar results. Therefore, additional studies
concerning the Volume fraction crystallinity ( cV ) and calculate χ %. The analysis sort to
address the influence in amorphous morphology and its ability to demonstrate the DoE
experimental data set superior thermal stability properties.
Density measurements (see section 6.4) were conducted and results analysed. Density
measurements were used to extrapolate crystallinity measurements expressed in equation
7.8-1;
ac
acV
ρρρρ
−−
=
Equation 7.8-1
Where
cV = Volume fraction crystallinity
aρ = amorphous density
cρ = theoretical 100 % crystalline density of PET
ρ = density of the sample
Chapter 7 Results and Discussions
200
Values used for 100 % amorphous density and 100 % crystalline density for equation 7.8-
1 include 1.333 and 1.455 g/cc respectively (Jabarin 1996). Much discussion concerning
the accuracy of crystallinity has been published (Bashir et al. 2000). The density
measurement method is not without errors. In this case for oriented PET beverage
container samples, equation 7.8-1 may overestimate crystallinity results. This is due to the
two-phase model which assumes a constant amorphous and crystalline structure (Bashir
et al. 2000; Boyd 2004; Farrow et al. 1960; Segerman et al. 1966).
Secondly, equation 7.8-1 assumes a constant amorphous density. However, amorphous
densities vary with changes in heat-set temperatures (Liu et al. 2004). PET beverage
containers do not yield as high an orientation when compared to highly oriented PET
samples. Therefore small changes in amorphous densities are observed. Due to small
variation in orientation, small errors in amorphous density measurement results is
possible (Boyd 2004). Due to the above, cV measurements is a good approximation and
is used to determine amorphous density changes as a function of heat-set temperature
(Greener et al. 1999).
Localised density measurements were conducted as described in chapter 4.10. The section
chosen for analysis were the same location taken to conduct DSC analysis. Results were
converted to g/cm 3 and presented in figure 7.8-1. The results did not show a linear
increase in χ % values as a function of heat set. Temperatures above 135 oC to 150 oC
show an increase in χ %.
Due to the nature of measuring localised density values, which does note reflect the entire
panel density, additional analysis was undertaken. Density measurement results found
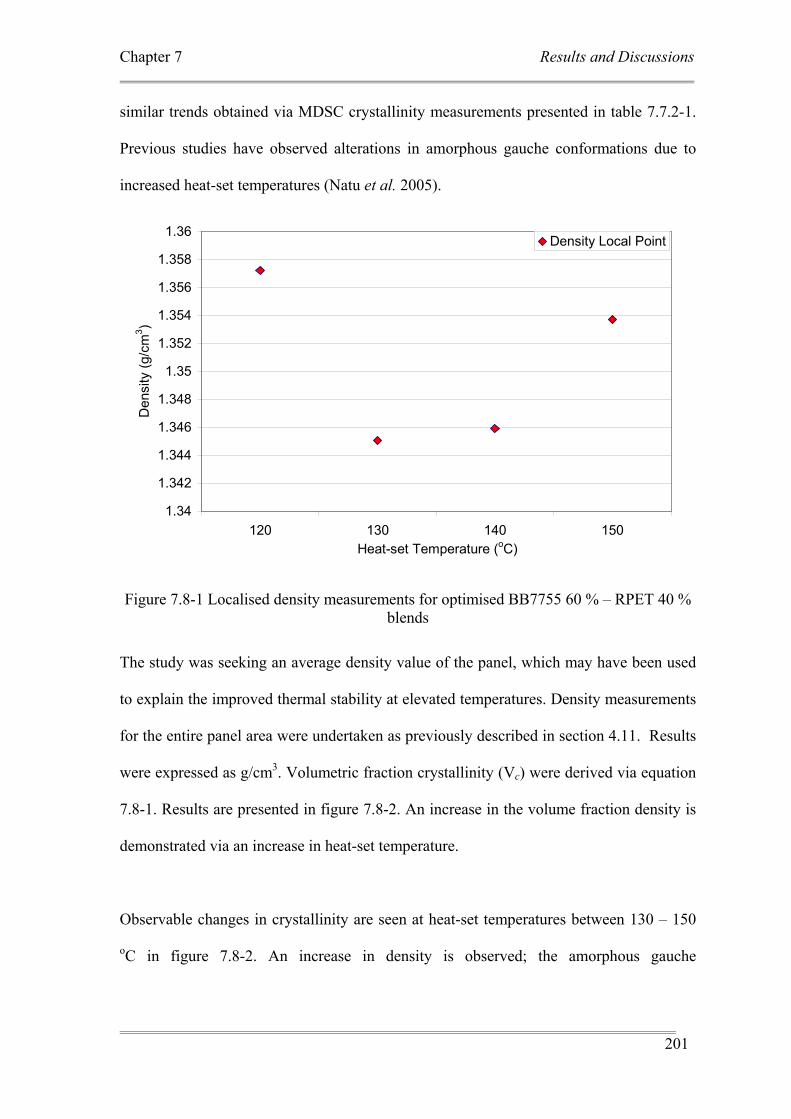
Chapter 7 Results and Discussions
201
similar trends obtained via MDSC crystallinity measurements presented in table 7.7.2-1.
Previous studies have observed alterations in amorphous gauche conformations due to
increased heat-set temperatures (Natu et al. 2005).
1.34
1.342
1.344
1.346
1.348
1.35
1.352
1.354
1.356
1.358
1.36
120 130 140 150Heat-set Temperature (oC)
Den
sity
(g/c
m3 )
Density Local Point
Figure 7.8-1 Localised density measurements for optimised BB7755 60 % – RPET 40 % blends
The study was seeking an average density value of the panel, which may have been used
to explain the improved thermal stability at elevated temperatures. Density measurements
for the entire panel area were undertaken as previously described in section 4.11. Results
were expressed as g/cm3. Volumetric fraction crystallinity (Vc) were derived via equation
7.8-1. Results are presented in figure 7.8-2. An increase in the volume fraction density is
demonstrated via an increase in heat-set temperature.
Observable changes in crystallinity are seen at heat-set temperatures between 130 – 150
oC in figure 7.8-2. An increase in density is observed; the amorphous gauche
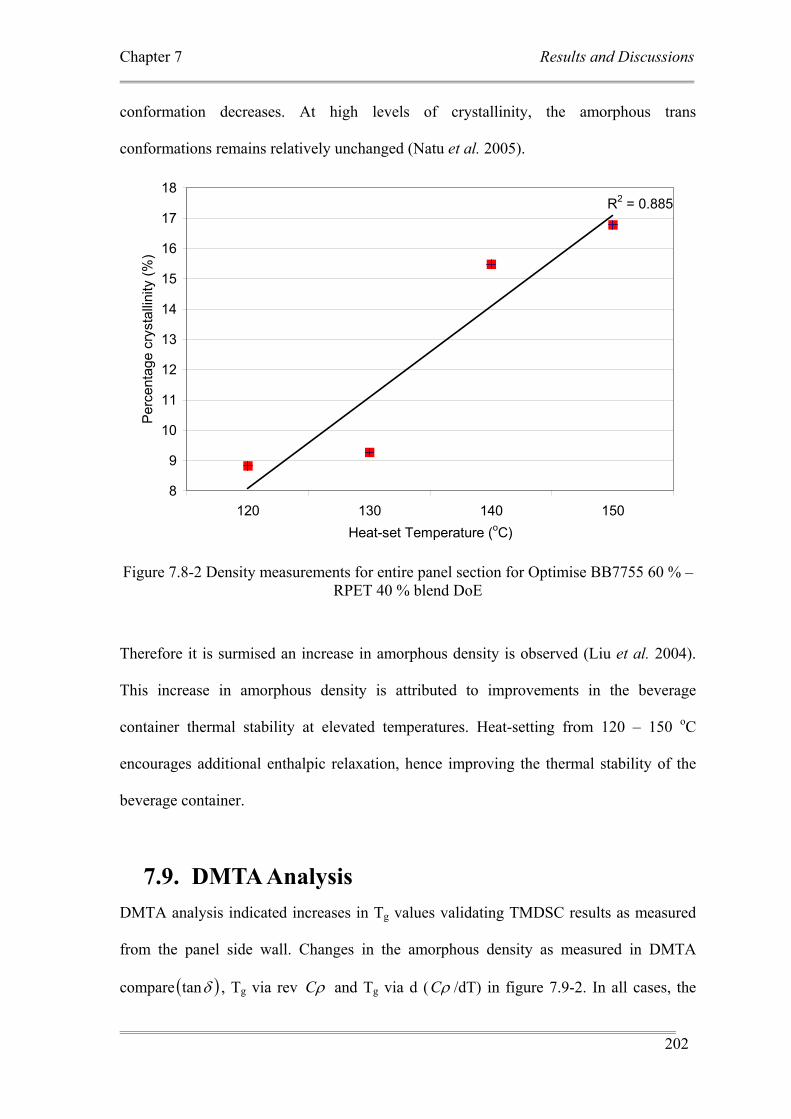
Chapter 7 Results and Discussions
202
conformation decreases. At high levels of crystallinity, the amorphous trans
conformations remains relatively unchanged (Natu et al. 2005).
R2 = 0.885
8
9
10
11
12
13
14
15
16
17
18
120 130 140 150Heat-set Temperature (oC)
Per
cent
age
crys
talli
nity
(%)
Figure 7.8-2 Density measurements for entire panel section for Optimise BB7755 60 % – RPET 40 % blend DoE
Therefore it is surmised an increase in amorphous density is observed (Liu et al. 2004).
This increase in amorphous density is attributed to improvements in the beverage
container thermal stability at elevated temperatures. Heat-setting from 120 – 150 oC
encourages additional enthalpic relaxation, hence improving the thermal stability of the
beverage container.
7.9. DMTA Analysis DMTA analysis indicated increases in Tg values validating TMDSC results as measured
from the panel side wall. Changes in the amorphous density as measured in DMTA
compare ( )δtan , Tg via rev ρC and Tg via d ( ρC /dT) in figure 7.9-2. In all cases, the
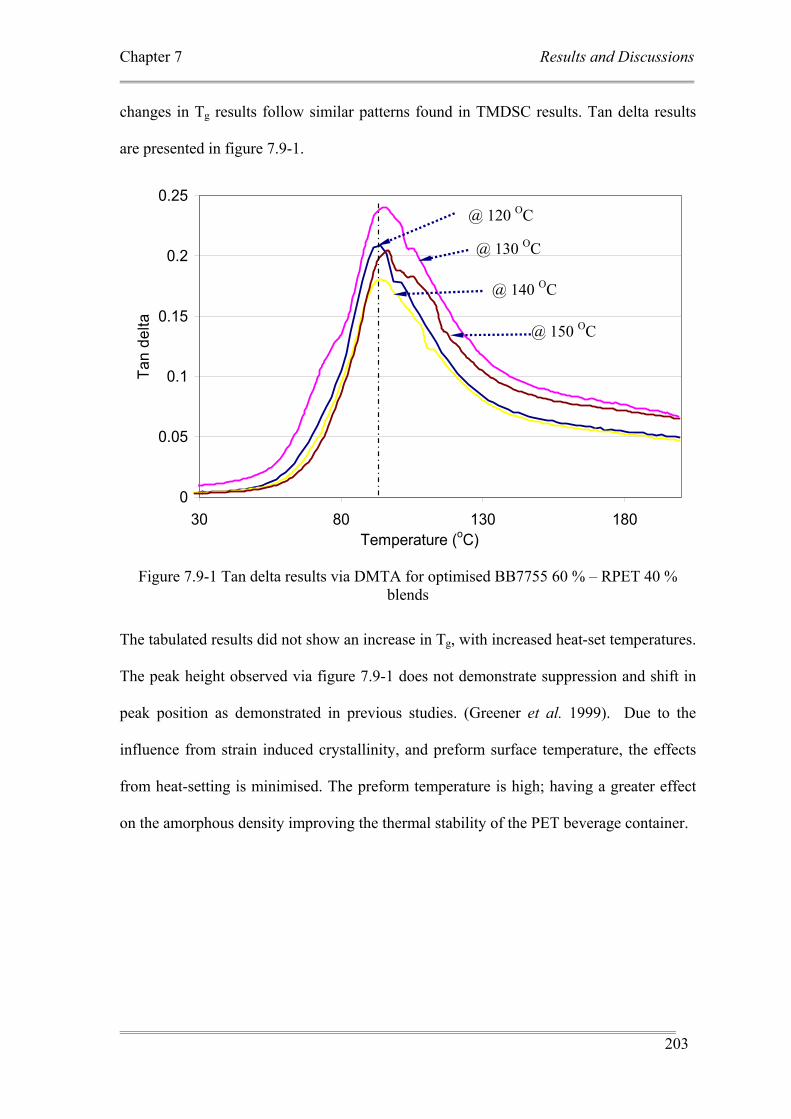
Chapter 7 Results and Discussions
203
changes in Tg results follow similar patterns found in TMDSC results. Tan delta results
are presented in figure 7.9-1.
0
0.05
0.1
0.15
0.2
0.25
30 80 130 180Temperature (oC)
Tan
delta
Figure 7.9-1 Tan delta results via DMTA for optimised BB7755 60 % – RPET 40 % blends
The tabulated results did not show an increase in Tg, with increased heat-set temperatures.
The peak height observed via figure 7.9-1 does not demonstrate suppression and shift in
peak position as demonstrated in previous studies. (Greener et al. 1999). Due to the
influence from strain induced crystallinity, and preform surface temperature, the effects
from heat-setting is minimised. The preform temperature is high; having a greater effect
on the amorphous density improving the thermal stability of the PET beverage container.
@ 120 OC
@ 130 OC
@ 140 OC
@ 150 OC
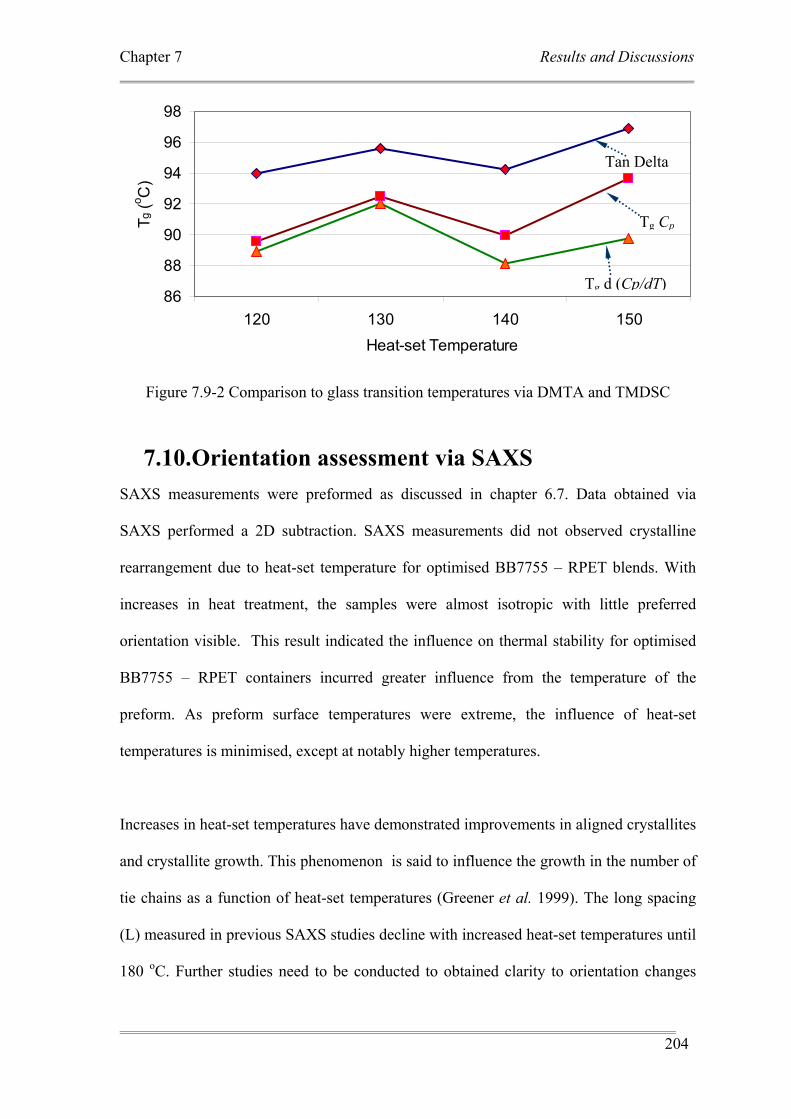
Chapter 7 Results and Discussions
204
86
88
90
92
94
96
98
120 130 140 150Heat-set Temperature
Tg (o C
)
Figure 7.9-2 Comparison to glass transition temperatures via DMTA and TMDSC
7.10. Orientation assessment via SAXS SAXS measurements were preformed as discussed in chapter 6.7. Data obtained via
SAXS performed a 2D subtraction. SAXS measurements did not observed crystalline
rearrangement due to heat-set temperature for optimised BB7755 – RPET blends. With
increases in heat treatment, the samples were almost isotropic with little preferred
orientation visible. This result indicated the influence on thermal stability for optimised
BB7755 – RPET containers incurred greater influence from the temperature of the
preform. As preform surface temperatures were extreme, the influence of heat-set
temperatures is minimised, except at notably higher temperatures.
Increases in heat-set temperatures have demonstrated improvements in aligned crystallites
and crystallite growth. This phenomenon is said to influence the growth in the number of
tie chains as a function of heat-set temperatures (Greener et al. 1999). The long spacing
(L) measured in previous SAXS studies decline with increased heat-set temperatures until
180 oC. Further studies need to be conducted to obtained clarity to orientation changes
Tan Delta
Tg Cp
Tg d (Cp/dT)

Chapter 7 Results and Discussions
205
due to increases in heat-set temperatures. SAXS diffraction patterns are found in
appendices M – 1 to M – 4.

Chapter 8 Conclusion and recommendation for further research work
206
8. Chapter 8. Conclusion and recommendation for
further research work
Chapter 8 Conclusion and recommendation for further research work
207
8.1. Conclusions
8.1.1. Critical factors controlling thermal stability Thermal stability for beverage applications is important for the hot-fill process. The
literature survey established conclusively heat-set beverage containers are able to
demonstrate superior dimensional stability. The there is a current argument for possible
improvement to thermal stability is via increased crystallinity properties. Present research
demonstrates other factors other than crystallinity enhances of beverage containers
thermal stability at elevated temperatures.
Morphological factors controlling thermal stability include changes in morphological
structure within the amorphous and crystalline region. This study observed preform
surface temperature to be an important parameter when considering dimensional stability
during the hot-fill process. Furthermore, strain induced crystallisation during axial
stretching is considered to influence the final hot-fill shrinkage results. In this study,
improvements in thermal stability is attributed to the mean preform surface time. This
was controlled via preform cooling time as measured via FLIR camera recorded 113 oC to
be considered optimum. Conversely, mean preform surface temperature for the same
locations recording 106 oC demonstrated the poorest final hot-fill shrinkage results.
The inclusion of RPET and its influence on nucleation within homopolymer SkyPET
BB7755 have influenced the final hot-fill shrinkage properties. Residual Antimony (Sb3)
catalyst are equally important in assisting in uniformed perform temperature prior to
inflation to ensure thermal stability. In this research, the heat-set temperature did not
Chapter 8 Conclusion and recommendation for further research work
208
seem to be a dominant factor in improving thermal stability at elevated temperatures.
Blow time in concert with preform cooling time assist in thermal stability.
It is difficult to predict precisely the morphological structure in this research, as it
requires numerous methods to quantify changes in the amorphous phase. Volumetric
fraction crystallinity measurements illustrate changes present in the amorphous region
due to increases in heat-set temperatures. However quantifying the morphological
changes required additional investigation.
The current research did not observed an increase in percentage crystallinity as a function
of increased heat-set temperatures as measured via TMDSC. An observed increase in
volumetric fraction crystallinity was observed via density measurements of the PET
beverage container panel section via optimised heat-set conditions.
8.1.2. Optimum process conditions for Single
Stage ISBM Acceptable thermal stability was achieved; however optimised process conditions are
essential to increase the level of RPET use. Optimised virgin and RPET blends are
suggested by the DoE model. The first includes Voridian CA 12 (96 %) - Visy RPET
(4%) blend. The inclusion of RPET blends observed increases the thermal stability of the
beverage container.
The results obtained via the first optimised condition were poor. An increase in process
shrinkage (S1) was observed, with the poorest value above 1 %. This is not an accepted
value for industry standards; the container is considered non-conforming. Process
Chapter 8 Conclusion and recommendation for further research work
209
conditions for optimised Voridian CA12 – RPET blends included preform cooling time of
6 seconds. A decrease in preform surface temperature is the result. A predicted hot-fill
(S2) values of 2.86 is suggested. Final shrinkage result at 150 oC recorded 3.70 %.
The second optimised BB7755 – RPET blend demonstrated improved thermal stability
above 140 oC heat-set temperatures. A reduction in preform cooling time (4.5 seconds), a
blow time of 7 seconds and material formulation of SkyPET BB7755 (60 %) - Visy
RPET (40 %) is suggested. Improved hot-fill shrinkage results are observed when
compared to experimental # 15 augmented DoE shrinkage results. A predicted hot-fill
shrinkage result via the second optimised DoE of 0.95 % is suggested. A final hot-fill
shrinkage result of 1.41 % is observed at 150 oC.
Improved thermal stability incorporating a ribless, panelless CSD, non heat-set beverage
container is possible with lower heat-set temperatures. Controlled process shrinkage (S1)
within 0.2 percent is validated. Hot-fill shrinkage of 2.29 percent is possible incorporating
heat-set temperature of 95 oC. Process conditions of 3 seconds blow time and 4 seconds
blow time including homopolymer 100 % virgin SkyPET BB7755 yielded best results.
Proper preform design utilising optimised process conditions can produce beverage
containers incorporating less energy with increased cycle times.
8.1.3. Thermal stability and material integrity via
RPET inclusion The addition of RPET influences the mechanical properties of PET beverage containers.
Via augmented DoE, an increase in thermal properties is demonstrated by way of 100
Chapter 8 Conclusion and recommendation for further research work
210
percent virgin SkyPET BB7755. Furthermore, controlled inclusion of Visy RPET
enhances thermal stability. An improvement in thermal stability is characterised by
(NaOH) in RPET. The sodium salts combine with end chain groups, initiating
heterogeneous nucleation.
Increased heat-set temperatures increase the glass transition temperature to all materials
used in this study. Hence, it can be deduced that an increase in the amorphous density is
expected. An increase in glass transition temperature is observed as compared to the
materials original glass transition temperature. However, this rise does not increase
linearly with increasing heat-set temperatures.
Process conditions however influence the final hot-fill shrinkage results. The final DoE
was complex; the inclusion of many design variables and its affects from RPET blends
via glass transitions temperature was difficult to interpret. The relationship between
thermal stability and an increase in percentage crystallinity was not established.
The inclusion of RPET blends observed a decrease in the beverage containers ductile
property. A reduction in the elastic properties is attributed to a reduction in preform
surface temperature and RPET blend inclusion. Average preform surface temperatures of
106.00 oC is demonstrated for the top 7 performing burst strength results. A preform
cooling time range of 5 – 6 seconds is recorded. An increase in RPET blends increases
the rigidity of the beverage container. This is turn decreases the chain mobility of the
molecules. Hence superior burst strength results include 100 percent virgin PET material.
Chapter 8 Conclusion and recommendation for further research work
211
8.2. Recommendations for Further Work a) Construct a DoE placing static constraints on preform cooling time. This includes the
evaluation of one material for analysis in separate DoE. This will provide increase
resolution when incorporating RPET and virgin RPET blends for acceptable thermal
stability at elevated temperatures
b) Perform DoE in Partial Cubic mode. This will increase the resolution required to
improve the ISBM optimisation process for the production of increased levels of PET
– RPET blends to gain additional knowledge for improved thermal stability at
elevated temperatures.
c) Perform Birefringence measurements via Fourier transform infrared (FTIR)
spectroscopy determining end group analysis via the inclusion of RPET. Additional
measurements of conformational changes to amorphous trans and gauche changes as a
function of heat-set temperature with RPET inclusion.
d) Undertake a more comprehensive SAXS measurement study in hoop and axial
direction, measuring changes in crystalline orientation as a function of RPET
inclusion and its influence in preform surface temperature.
e) Include a more detailed morphological analysis of the influence of RPET for thermal
stability at elevated temperatures. This includes NMR studies to evaluate detailed
microstructure of the polymer and determine end group analysis and the number of
end groups due to influence of NaOH with PET blends. A detailed analysis to the
Chapter 8 Conclusion and recommendation for further research work
212
materials molecular structure, in particular the non crystalline region will contribute
additional knowledge to the scientific community.
f) The knowledge gained in this research study provides scientifically optimised ISBM
conditions for inclusion of RPET at increase levels to improved thermal stability at
elevated temperatures.
g) Other than the above mentioned, the existing research also provides additional
knowledge in modifying non heat-set containers into a workable heat-set instrument,
assisting in improving the thermal stability to a PET beverage container for hot-fill
applications.
References
213
References
Ajmera, P. (1989). Heat Set Method for Oval Containers. US, Owens-Illinois Plastic
Products Inc. US 4,883,631.
Akiho, O. (1989). Container Having Collapse Panels with Longitudinally Extending Ribs.
Japan, Yoshino Kogyosho Co., Ltd. US 4,805,788.
Awaja, F., F. Daver, et al. (2004). "Recycled Poly(Ethylene Terephthalate) Chain
Extension by a Reactive Extrusion Process." Polymer Engineering and Science
44(8): 1579-1587.
Baird, D. G. and D. I. Collias (1998). Polymer Processing : Principles and Design,Wiley,
New York.
Barth, H. G. and J. W. Mays (1991). Modern Methods of Polymer Characterization,
Wiley, New York.
Bashir Z, Aloush AL, et al. (2000). "Evaluation of Three Methods for the Measurement
of Crystallinity of Pet Resin, Preforms and Bottles." Polymer Engineering and
Science 40(11): 2442 - 2455.
Bashir, Z., A. Aloush, et al. (2000). "Evaluation of Three Methods for the Measurement
of Crystallinity of Pet Resin, Preforms and Bottles." Polymer Engineering and
Science 40(11): 2442 - 2455.
Baxter, F. and V. Lenihan. (2003). National Plastics Recycling Survey 2003: Polymer Re-
Use and Capability Report. J. Nolan. Melbourne, Plastics and Chemicals
Industries Association 2003 and Nolan-ITU Pty Ltd 200: 1 - 29.
Bertelli, C. (2005). Recycling Pet:Bottle to Bottle Process Application Bottle Application.
Polyester 2005 10th World Congress., The Netherlands Amsterdam.
Betsch, R. (2000). Experimentation by Design. A tool to achieve maximum results with
minimum resources, Echip Incorporated. 2000.
Billmeyer, F. W. (1984). Morphology and Order in Crystalline Polymers. Textbook of
Polymer Science. New York, Wiley: xviii, 578 p.
Biron, M. (2004). Packaging Likes Polymers Iii – Bottles and Other Blow-Moulded
Containers and Items, WWW.Omnexus.com. 2006.
Blaine, R. L. (2004). The Case for a Generic Definition of Differential Scanning
Calorimetry. TA Instruments, Inc.
References
214
Blaine, R. L. and L. E. Waguespack (2004). Determination of Polymer Molecular Weight
Distribution by Dsc, TA Instruments Inc: 1 - 6.
Blundella, D. J., A. Mahendrasingam, et al. (1999). "Orientation Prior to Crystallisation
During Drawing of Poly(Ethylene Terephthalate)." Polymer 41: 7793–7802.
Boiler, A., I. Okazaki, et al. (1996). "Modulated Differential Scanning Calorimetry in the
Glass Transition Region. Part Iii. Evaluation of Polystyrene and Poly(Ethylene
Tetrephthalate)." Thermochimica Acta 284: 1-19.
Boyd, T. and K. Silvers (2002a). Plastics Container Having Geometry Minimizing
Spherulitic Crystallization Below the Finish and Method. US, Schmalbach-
Lubeca. US 6,413,466 B1.
Boyd, T., K. Silvers, et al. (2002b). Blow Moulding Method for Producing Pasteurization
Containers. US, Schmalbach - Lubeca AG. US 6,484,670.
Boyd, T. J. (2004). Transient Crystallization of Poly(Ethylene Terephthalate) Bottles.
Chemical Engineering, The University of Toledo. PhD.
Brooks, D. W. (2000). Types of Plastic Materials, Barrier Properties and Applications.
Pet Packaging Technology. Sheffield, England, Sheffield Academic Press: 17 -
18.
Brostow, W. and R. D. Corneliussen (1986). Failure of Plastics,Hanser, Munich.
Buehler, F. U., C. J. Martin, et al. (1998). "Temperature Modulated Differential Scanning
Calorimetry through Heat Diffusion Analysis." Journal of Thermal Analysis 54:
501 - 519.
Buehrig, L. (2000). Heat-Set Analysis, Eastman Kodak: Comparison of varying Heat-set
PET grade materials for two stage ISBM process.
Caldicott, R. J. (1998). Fundamentals of Pet Stretch Blow Molded Containers. ANTEC.
Caldicott, R. J. (1999). The Basics of Stretch Blow Molding Pet Containers. Bridging the
Millennia, New York, Society of Plastics Engineers.
Cassel, B. and B. Twombly (1998). "Determination of Initial Crystallinity of
Polyethylene Terephthalate Using Dsc and the Extrapolated Enthalpy Technique."
ANTEC.
Cha, C. (1964). "Tritium Exchange Studies on Poly(Ethylene Terephthalate)." Polymer
Letters 2: 1069 - 1073.
Charbonneau, L. and R. Johnson (2000). Polyester Container and Method for Making
Same. US, HNA Holdings, Inc. US 6,063,465.
References
215
Charbonneau LF, J. R. (2000). Polyester Container and Method for Making Same. US,
HNA Holdings, Inc.
Cheng, P. N. (2004). Optimisation of Injection Stretch Blow Moulding by Response
Surface Methodology. School of Mechanical and Manufacturing Engineering.
Melbourne, Royal Melbourne Institute of Technology. Masters 152.
Cheremisinoff, N. P. (1996). "Polymer Characterization : Laboratory Techniques and
Analysis." from http://buddy2.lib.unimelb.edu.au/cgi-in/buddyrun.cgi/NET/10926
Connect (University of Melbourne only)
Chuah H., Lin-Vien D, et al. (2001). "Poly(Trimethylene Terephthalate) Molecular
Weight and Mark - Houwink Equation." Polymer 42: 7137-7139.
Chung, C. I. (2000a). Extrusion of Polymers : Theory and Practice,Hanser Gardner
Publications, Munich Cincinnati.
Chung, C. I. (2000b). Fundermentals of Polymers. Extrusion of Polymers :. Munich
Cincinnati, Hanser Gardner Publications: xiv, 369 p.
Chung, C. I. (2000c). Fundermentals of Polymers. Extrusion of Polymers : Theory and
Practice. Munich, Cincinnati, Hanser Publishers ; Hanser Gardner Publications
[distributor]: 51-167.
Chuynoweth, K. (1989). Glass Transition and Crystallisation. Polymer Update : Science
and Engineering. W. D. Cook and G. B. Guise. Parkville, Vic., Polymer Division,
Royal Australian Chemical Institute: xx, 285 p.
Collette, W., S. Krishnakumar, et al. (1989). Hot Fill Containers. US, Continental PET
Tecnologies, Inc. US,4,863,046.
Crawford, R. J. (1998). Plastics Engineering. 3rd,Butterworth-Heinemann, Boston.
Cser, F. (2007). Tg Determination and Intergration Limits for Pet Samples, Personal
Communications.
Cser, F., F. Rasoul, et al. (1997). "Modulated Differential Scanning Calorimetry." Journal
of Thermal Analysis and Calorimetry, 50(5): 727 - 744.
Cser, F., F. Rasoul, et al. (1998). "Reversible Melting of Semi Crystalline Polymers:
Frequency Dependence on the Melting Enthalpy." Journal of Thermal Analysis
52: 293 - 313.
Danley., R. I. (2003). Differential Scanning Calorimeter. US, TA Instruments - Waters
LLC.
References
216
Daver, F., R. Gupta, et al. (2007). "Rheological Characterisation of Recycled Poly
(Ethylene Terephthalate) Modified by Reactive Extrusion." Journal of Materials
Processing Tech.
Duh, B. (1980). Method for Production of High Molecular Weight Polyester with Low
Catalyst Level and Low Corboxyl Content. US, The Goodyear Tire and Rubber
Company. US 4,205,157.
Duh, B. (2001). "Reaction Kinetics for Solid - State Polymerization of Poly(Ethylene
Terephthalate)." Journal of Applied Polymer Science 81(7): 811748-1761.
Duh, B. (2002). "Effects of the Carboxyl Concentration on the Solid-State Polymerization
of Poly(Ethylene Terephthalate)." Journal of Applied Polymer Science 83: 1288–
1304.
Dupont (2003). Synthesis of PEIT, Internal Publication.
Dvorak, R., P. Lovenitti, et al. (2000). Increasing the Process Efficiency of Recycling
Post - Consumer Plastic Bottles Via Sorting Processes. Profiles in Industrial
Research. Toncich D. Hawthorn, Australia, Swinburne University of Technology.
Eastman Chemicals (2003). CA12. B. Elliot, Internal Publication.
Fakirov S (1997). Polyethylene Terephthalate. Handbook of Thermoplastics. D. Hudgin.
New York, Marcel Dekker: 449-464.
Fann, D. W., S. K. Huang, et al. (1996). "Kinetics and Thermal Crystallinity of Recycled
Pet. 1. Dynamic Cooling Crystallization Studies on Blends Recycled with
Engineering Pet." Journal of Applied Polymer Science 61: 1375 - 1385.
Farrow, G. and I. M. Ward (1960). "Crystallinity in Poly (Ethylene Terephthalate): A
Comparison of X-Ray, Infra-Red and Density Measurements." Polymer 1: 330-
339.
Gaspar-Rosas, A. (2004). Rheology Seminar. IRIS, Australia.
Gaydosh, K., R. Steih, et al. (2000). Hot Fill Containers with Improved Top Load
Capabilites. Germany, Schmalbach-Lubeca. US6,016,932.
Gohil, R. M. (1993a). "Morphology-Permeability Relationships in Biaxially Oriented Pet
Films: A Relationship between Oxygen Permeability and Prof." Journal of
Applied Polymer Science 48(9): 1649-1664.
Gohil, R. M. (1993b). "Morphology-Property Relationships in Oriented Pet Films: A Role
of in-Plane Crystalline Orientation Distribution on the Film Properties." Journal of
Applied Polymer Science 48(9): 1635-1648.
References
217
Gohil, R. M. (1994). "Morphology-Property Relationship in Oriented Pet Films:
Microstructural Reorganization During Heat Treatment." Journal of Applied
Polymer Science 52(7): 925-944.
Göltner, W. (2004). Relationship between Polyester Quality and Processability: Hands-on
Experience. Modern Polyesters: Chemistry and Technology of Polyesters and
Copolyesters. T. E. L. John Scheirs: 435-493.
Greener, J., A. H. Tsou, et al. (1999). "Physical and Microstructural Effects of Heat
Setting in Polyester Films." Polymer Engineering & Science 39(12): 2403-2418.
Groeninckx, G. and H. Reynaers (1980a). "Morphology and Melting Behavior of
Semicrystalline Poly(Ethylene Terephthalate). Ii. Annealed Pet." Journal of
Polymer Science: Polymer Physics Edition 18(6): 1325-1341.
Groeninckx, G., H. Reynaers, et al. (1980b). "Morphology and Melting Behavior of
Semicrystalline Poly(Ethy1ene Terephthalate). I. Isothermally Crystallized Pet."
Journal of Polymer Science: 18: 1311-1324.
Grulke, E. A., J. Brandrup, et al. (1999). Polymer Handbook. 4th,Wiley, New York.
Gruver, V., D. Showers, et al. (2000). "The Determination of Pet Crystallinity by
Different Analytical Techniques." ANTEC.
Hanley, T., D. Sutton, et al. (2006). "Molecular Morphology of Petaloid Bases of Pet
Bottles: A Small-Angle X-Ray Scattering Study." Journal of Applied Polymer
Science 99(6): 3328-3335.
Hergenrother, W. and C. Nelson (1974). "Viscosity-Molecular Weight Relationship for
Fractionated Poly (Ethylene Terephthalate)." JOURNAL OF POLYMER
SCIENCE: 12: 2905-2915.
Jabarin, S. (1984). Polyethylene Terephthalate Articles and Method. US, Owens Illinios,
Inc. US 4,476,170.
Jabarin, S. (1992). "Strain-Induced Crystallization of Poly(Ethyleneterephthalate)."
Polymer Engineering & Science 18(32): 1341.
Jabarin, S. (1995). Crystallisation and Thermal Stabilisation of Heat Set Petp. 11th
Annual High Performance Blow Molding Conference: Technical Innovations in
Blow Molding. Retec Proceedings, Cleveland, Oh., Society of Plastic Engineers.
Jabarin, S. (1996). Polyethylene Terephthalate: Heat Setting and Thermal Stabilization.
Polymeric Materials Encyclopedia. Jabarin S. A. Boca Raton, CRC Press. 12 v.
(9218 p.): 6091 - 6099.
References
218
Jones, K. (2002). Pet Materials and Applications. Pet Packaging Technology. Sheffield,
UK, Sheffield Academic Press: pp 36-97.
Kang, H. (2001). Synthesis and Characterization of Novel Telechelic High Performance
Polyester Ionomers. Chemistry. Blacksburg,, Virginia Polytechnic Institute and
State University. Masters in Chemistry: 161.
Kegel, M., I. Sbarski, et al. (2002). The Effect of Additives on the Processing and
Physical Properties of Recycled Pet. Annual Technical Conference and
Exhibition, San Francisco, CA, USA.
Khanarian, G., L. Charbonneau, et al. (2000). Sheets Formed from Polyesters Including
Isosorbide. US, HNA Holdings, Inc. US 6,025,061.
Khanarian, G., L. Charbonneau, et al. (2000b). Optical Articles Comprising Isosorbide
Polyester and Method for Making Same. US, E.I. Dupont de Nemours and
Company. US 6,126,992.
Khanarian, G., L. Charbonneau, et al. (2003). Polyester Including Isosorbide as a
Comonmer Blended with Other Thermoplastic Polymers. US, E.I. Dupont de
Nemours and Company. US 6,359,070.
Kim, T. Y., E. A. Lofgren, et al. (2003). "Solid State Polymerization of Poly(Ethylene
Terephthalate). I. Experimental Study of the Reaction Kinectics and Properties."
Journal of Applied Polymer Science 89: 179-212.
Kong, Y. and J. N. Hay (2002). "The Measurement of the Crystallinity of Polymers by
Dsc." Polymer 43(14): 3873-3878.
Kosior, E. (2007). RPET and Its Effects on Morphology, Personal Communication.
Kosmidis, V., D. S. Achillias, et al. (2001). "Polyethylene Terephthalate Recycling and
Recovery of Pure Terephthalic Acid. Kinetics of a Phase Transfer Catalysed
Alkaline Hydrolysis." Macromolecular Materials and Engineering 286(10): 640 -
647.
Lisch., D., K. Silvers., et al. (2005). Container Base Structure Responsive to Vacuum
Related Forces. Vailliencourt, Manchester, MI (US) Amcor Limited, Victoria
(AU) 1-12.
Liu, R.F., Y. S. Hu, et al. (2004). "Crystallinity and Oxygen Transport Properties of Pet
Bottle Walls." Journal of Applied Polymer Science 94(2): 671-677.
Luckenbach, T. A. (2001). Dynamic Mechanical Thermal Analysis, Rheometrics, Inc.: 1-
13.
References
219
MAGUIRE. (2004). "100 Series Weigh Scale Blender (Wsb)." from
http://www.maguire.com/page.php/100series.htm.
Maruhashi, Y. (2001). "Structure and Physical Properties of Biaxially Stretched
Polyethylene Terephthalate Sheets under Different Heat-Set and Stretch
Conditions." Polymer Engineering & Science 41(12): 2194-2200.
Maruhashi, Y. and T. Asada (1992a). "Structure and Physical Properties of Biaxially
Stretched Polyethylene Terephthalate Sheet after Heat-Setting." Polymer
Engineering and Science 32(7): 481.
Maruhashi, Y. and T. Asada (1992b). "Structure and Physical Properties of Biaxially
Stretched Polyethylene Terephthalate Sheet after Heat-Setting." Polymer
Engineering & Science 32(7): 481-487.
Maruhashi, Y. and T. Asada (1996). "Structure and Properties of Biaxially Stretched
Poly(Ethylene Terephthalate) Sheets." Polymer Engineering & Science 36(4):
483-494.
Mathews, V. (2002). Environmental and Recycling Considerations. Pet Packaging
Technology. Giles G. London, Sheffield Academic Press Ltd. 1: 315-364.
Matthews, R. G., A. Ajji, et al. (2000). "The Effects of Stress Relaxation on the Structure
and Orientation of Tensile Drawn Poly(Ethylene Terephthalate)." Polymer 41(19):
7139-7145.
Mazzeo, F. (2004). An Approach to Testing a Rheologically Unknown Material. TA
Instruments. TA Instruments, 109 Lukens Drive, New Castle, DE-19720, USA: 1-
7.
Mc Chesney, C. and T. S. Chung (1983). "Reduced Carbonation Loss and Increased Hot
Fill Capability of Injection Stretch Blow Pet Bottles." ANTEC 83: plastics-
engineering today for tomorrow's world : conference proceedings:(29).
McFarlane, F. E. (1990). Thermoplastic Polyesters, Poly(Ethylene Terephthalate).
Handbook of Plastic Materials and Technology. s. J. W. a. Sons:: pp 639-647.
Mehta, A., U. Gaur, et al. (1978). "Equilibrium Melting Parameters of Poly(Ethylene
Terephthalate)." Journal of Polymer Science: Polymer Physics Edition 16(2): 289-
296.
Menary, G. H., C. G. Armstrong, et al. (2000). "Modelling of Poly(Ethylene
Terephthalate) in Injection Stretch-Blow Moulding." Plastics, rubber and
composites 29(7): 360-370
References
220
Milgrom, J. (1992). Polyethylene Terephthalate (Pet). Plastics Recycling : Products and
Processes. R. J. Ehrig. Munich ; New York, Hanser Publishers ; Distributed in the
U.S.A. and Canada by Oxford University Press: vi, 289 p.
Miyagi, A. and B. Wunderlich (1972). "Annealing During Polymerization of Crystalline
Poly(Ethylene Terephthalate)." Journal of Polymer Science: Polymer Physics
Edition 10(10): 2085-2092.
Mooney, M. (1947). "The Rheology of Processing Quality of Raw Rubber." Colloid
polymer Science 2: 69-80.
Moore, L. (1960). "Comparison of Solution Properties of Polyethylene Terethphalate and
Poly (1,4 -Cyclohexylenedimethylene Terethphalate." American Chemical
Society 1(4): 234 - 243.
Nakamura, Y. (1989). Injection Strecth Blow Molding. Blow Molding Handbook :
Technology, Performance, Markets, Economics : The Complete Blow Molding
Operation, Munich ; New York, xxvii, 1010 p.
NAPCOR (2002). Report on Post Consumer Pet Container Recycling Activity. REPORT
ON POST CONSUMER PET CONTAINER RECYCLING ACTIVITY. North
Carolina, National Association for PET Container Resources: 1-9.
Natu, A. A., E. A. Lofgren, et al. (2005). "Effect of Morphology on Barrier Properties of
Poly(Ethylene Terephthalate)." Polymer Engineering & Science 45(3): 400-409.
Nichols, C. and T. Moore (1999). Food Quality Polyester Recycling. US, Wellman Inc.
Nobbs, J. H., D. I. Bower, et al. (1976). "A Study of Molecular Orientation in Drawn and
Shrunk Poly(Ethylene Terephthalate) by Means of Birefringence, Polarized
Fluorescence and X-Ray Diffraction Measurements." Polymer 17(1): 25-36.
O’Farrell, K. and P. Allan (2005). "2005 National Plastics Recycling Survey." 1-52.
Odian, G. (1981). Principles of Polymerization. 2nd,Wiley, New York.
Olabisi, O. (1997). Handbook of Thermoplastics,Marcel Dekker, New York.
Ophir, A., S. Keng, et al. (2004). "Hot Fillable Containers Containing Pet / Pen
Copolymers and Blends." Polymer Engineering and Science 44(9).
Oromiehie, A. and A. Mamizadeh (2004). "Recycling Pet Beverage Bottles and
Improving Properties." Polymer International 53(6): 728-732.
Ozawa, T., T. Hayakawa, et al. (2003). Bottle for Hot Fill Use, Equipment with Vacuum
Absorbtion Panels in the Body Portion. Tokyo, Yoshino Kogyosho Co, Ltd.
References
221
Painter, Paul C, et al. (1994). Fundamentals of Polymer Science : An Introductory Text.
Lancaster, Pa, Technomic Pub. Co.: xiii, 433 p.
Patuto, J., F. Daver, et al. (2007). Recycled Poly (Ethylene Terephthalate) (Pet) Blends
for Hot - Fill Bottles. ANTEC, Cincinnati, Ohio, Society of Plastics Engineers.
Pilati, F., M. Toselli, et al. (1997). "On Specific Factors Affecting the Crystallization of
Pet: The Role of Carboxyl Terminal Groups and Residual Catalysts on the
Crystallization Rate." Polymer 38(17): 4469-4476.
Potter, T., P. Hatas, et al. (2001). Crystallizing Process. US, Schmalbach-Lubeca AG.
Ramachandran, V. S. (2002). Handbook of Thermal Analysis of Construction
Materials,Noyes Publications, Norwich, N.Y.
Rauwendaal, C. (2000). Spc : Statistical Process Control in Injection Molding and
Extrusion,Hanser Publishers; Hanser Gardner Publications, Munich Cincinnati.
Reading, M., D. Price, et al. (2001). "Measurement of Crystallinity in Polymers Using
Modulated Temperature Differential Scanning Calorimetry." Material
Characterisation by Dynamic and Modulated Thermal Analytical Techniques: 17-
31.
Rosato, D. V. (1989). Polyethylene Terephthalate. Blow Molding Handbook. D. V. R.
Donald V. Rosato. Cincinnati, Hanser Gardner: 539-569.
Rosato, D. V., D. V. Rosato, et al. (1989). Blow Molding Handbook : Technology,
Performance, Markets, Economics : The Complete Blow Molding
Operation,Hanser Publishers ;Distributed in the U.S. by Oxford University Press,
Munich ; New York.
Rosu, R. F., R. A. Shanks, et al. (1999). "Shear Rheology and Thermal Properties of
Linear and Branched Poly(Ethylene Terephthalate) Blends." Polymer 40(21):
Polymer
Rule, M. (2000). Process for Removing Contaminants from Polyesters and Controlling
Polymer Molecular Weight. United States Patent. US, The Coca-Cola Company:
1-11.
Schawe, J. (1995). "A Comparison of Different Evaluation Methods in Modulated
Temperature Dsc." Thermochimica Acta 260 (1995): 1-16.
Scheirs, J. (1998). Polymer Recycling : Science, Technology, and Applications,Wiley,
Chichester ; New York.
References
222
Scheirs, J. (2003). Additives for the Modification of Poly(Ethylene Terephthalate) to
Produce Engineering-Grade Polymers. Modern Polyesters : Chemistry and
Technology of Polyesters and Copolyesters. J. Scheirs and T. E. Long. Chicester,
John Wiley: xxxi, 750 p.
Scheirs, J. and T. E. Long (2003). Modern Polyesters : Chemistry and Technology of
Polyesters and Copolyesters,John Wiley, Chicester.
Schiavone, R. (2002a). Method of Perparing Modified Polyester Bottle Resin. US,
Wellman Inc. US 6,284,866.
Schiavone, R. (2002b). Synthesis of Pet. Fig. Tranesterification.
Segerman, E. and P. G. Stern (1966). "Two-Phase Model for Structure of Polymers."
Nature 210(5042): 1258-1259.
Shah, V. (1998). Handbook of Plastics Testing Technology. 2nd,Wiley, New York.
Sicher J (2003). Top 10 Us Carbonated Soft Drink Companies and Brands for 2002.
Beverage Digest. 42: 1-2.
Silberman, A., M. Omer, et al. (1998). The Effects of Stretch and Heat Transfer on the
Thermo-Mechanical Properties of Pet Bottles. 56th Annual Technical Conference
and Exhibition, Atlanta, Georgia, Society of Plastic Engineers.
Smith, R. (2002). Rheology Software for Calculation of Molecular Weight Distribution
[Mwd]. T. Instruments.
Sonia., J. and L. Andre. (2001). "Molecular Characterization and Rheological Properties
of Modified Poly(Ethylene Terephthalate Obtained by Reaction Extrusion."
Polymer Engineering and Science 41(8): 1299-1308.
Sototo, R., T. Hama, et al. (2000). "Correlation of Thermally Stimulated Current and
Blow Moulding Conditions in Poly(Ethylene Terephthalate Bottles." Polymer
Engineering and Science 40(2): 391- 397.
Storebeck, R. and M. Ballauff (1996). "Synthesis and Thermal Analysis of Copolyesters
Deriving from 1,4:3,6-Dianhydrosorbitol, Ethylene Glycol, and Terephthalic
Acid." Journal of Applied Polymer Science 59: 1199-1202.
TA Instruments (2004) "Determination of Initial Crystallinity by Modulated DSC."
Internal Publication
Takada, M., K. Sato, et al. (2002). Method of Molding Heat Resistant Containers, Nissei
ASB Machine Co., Ltd.
References
223
Teichmann D, Masood S, et al., Eds. (2002). Development of High Performance Sorting
Process for Recyling of Plastics. Profiles in Instrial Research Knowledge and
Innovation. Melbourne, Swinburne University of Technology (IRIS).
Tekkanat, B. (2000). Hot-Fill, Heat - Set, Pasteurisation and Retort Technologies. Pet
Packaging Technology. Sheffield, England, Sheffield Academic Press: 292-314.
Thomas, L. (2004). Characterization of Melting Phenomena in Linear Low Density
Polyethylene by Modulated Dsc. TA Instruments, Inc.,.
Torres N, Robin J, et al. (2000). "Study of Thermal and Mechanical Properties of Virgin
and Recycled Poly(Ethylene Terephthalate) before and after Injection." European
Polymer Journal 36: 2075-2080.
Venkateswaran, G., M. Cameron, et al. (1998). "Effects of Temperature Profiles through
Preform Thickness on the Properties of Reheat-Blown Pet Containers." Advances
in Polymer Technology 17(3): 237-249.
Voridian Pty Ltd (2002). Drying for Use in Preforms for Bottles and Containers.
Kingsport, TN, Internal Publication.
Wheeler, B. and R. Betsch (2002a). Echip Reference Manual, Internal Publication.
Wheeler, B., R. Betsch, et al.,(2002b),Users Guide. Software for the Design of
Experiments,
Whelan, T., D. Dunning, et al. (1988). The Dynisco Extrusion Processors Handbook.
1st,Dynisco Inc., Norwood, Mass.
Zachmann, H. G. (1979). "Determination of the Structure of the Noncrystalline Regions
in Isotropic and Oriented Poly(Ethylene Terephthalate)." Polymer Engineering &
Science 19(14): 966-974.

Appendices
224
Appendices
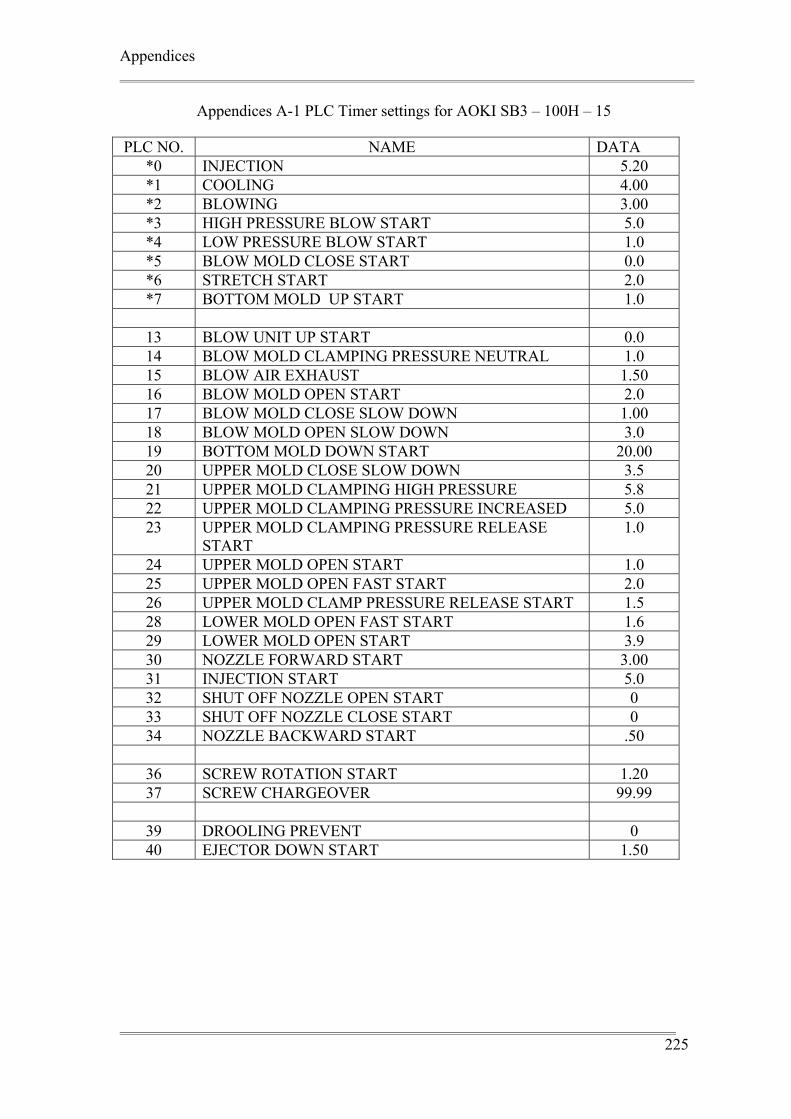
Appendices
225
Appendices A-1 PLC Timer settings for AOKI SB3 – 100H – 15
PLC NO. NAME DATA *0 INJECTION 5.20 *1 COOLING 4.00 *2 BLOWING 3.00 *3 HIGH PRESSURE BLOW START 5.0 *4 LOW PRESSURE BLOW START 1.0 *5 BLOW MOLD CLOSE START 0.0 *6 STRETCH START 2.0 *7 BOTTOM MOLD UP START 1.0
13 BLOW UNIT UP START 0.0 14 BLOW MOLD CLAMPING PRESSURE NEUTRAL 1.0 15 BLOW AIR EXHAUST 1.50 16 BLOW MOLD OPEN START 2.0 17 BLOW MOLD CLOSE SLOW DOWN 1.00 18 BLOW MOLD OPEN SLOW DOWN 3.0 19 BOTTOM MOLD DOWN START 20.00 20 UPPER MOLD CLOSE SLOW DOWN 3.5 21 UPPER MOLD CLAMPING HIGH PRESSURE 5.8 22 UPPER MOLD CLAMPING PRESSURE INCREASED 5.0 23 UPPER MOLD CLAMPING PRESSURE RELEASE
START 1.0
24 UPPER MOLD OPEN START 1.0 25 UPPER MOLD OPEN FAST START 2.0 26 UPPER MOLD CLAMP PRESSURE RELEASE START 1.5 28 LOWER MOLD OPEN FAST START 1.6 29 LOWER MOLD OPEN START 3.9 30 NOZZLE FORWARD START 3.00 31 INJECTION START 5.0 32 SHUT OFF NOZZLE OPEN START 0 33 SHUT OFF NOZZLE CLOSE START 0 34 NOZZLE BACKWARD START .50
36 SCREW ROTATION START 1.20 37 SCREW CHARGEOVER 99.99
39 DROOLING PREVENT 0 40 EJECTOR DOWN START 1.50
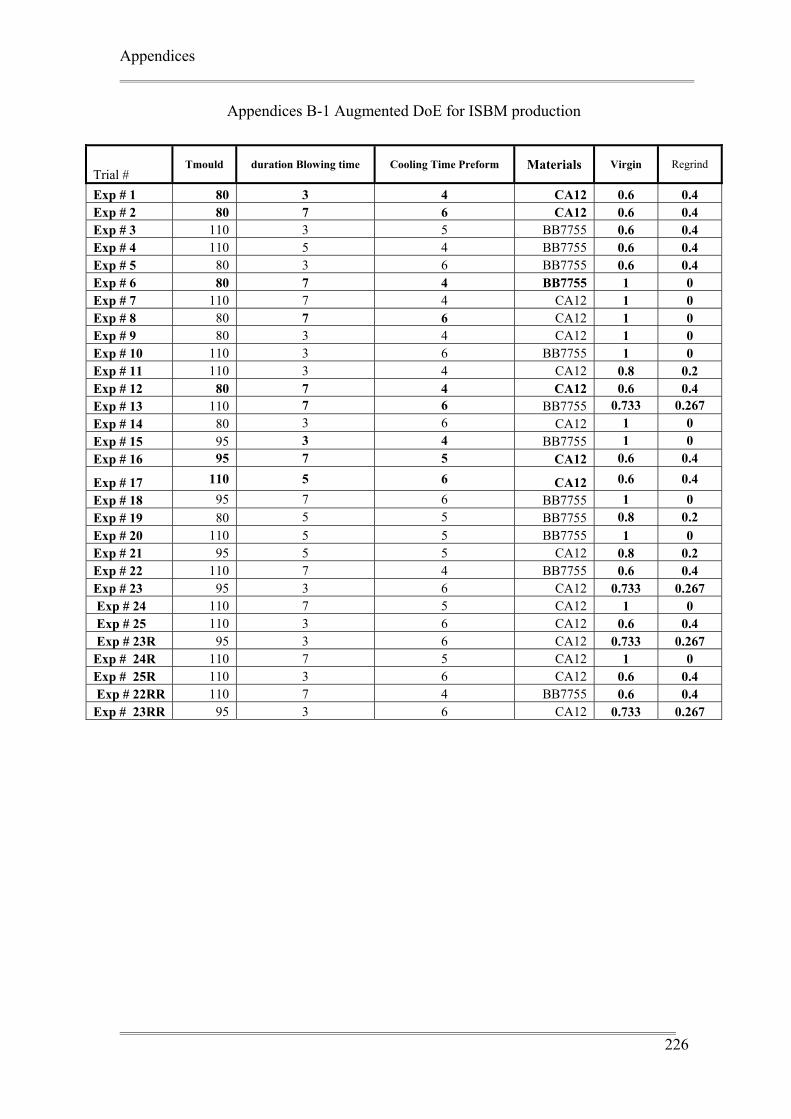
Appendices
226
Appendices B-1 Augmented DoE for ISBM production
Trial # Tmould duration Blowing time Cooling Time Preform Materials Virgin Regrind
Exp # 1 80 3 4 CA12 0.6 0.4 Exp # 2 80 7 6 CA12 0.6 0.4 Exp # 3 110 3 5 BB7755 0.6 0.4 Exp # 4 110 5 4 BB7755 0.6 0.4 Exp # 5 80 3 6 BB7755 0.6 0.4 Exp # 6 80 7 4 BB7755 1 0 Exp # 7 110 7 4 CA12 1 0 Exp # 8 80 7 6 CA12 1 0 Exp # 9 80 3 4 CA12 1 0 Exp # 10 110 3 6 BB7755 1 0 Exp # 11 110 3 4 CA12 0.8 0.2 Exp # 12 80 7 4 CA12 0.6 0.4 Exp # 13 110 7 6 BB7755 0.733 0.267 Exp # 14 80 3 6 CA12 1 0 Exp # 15 95 3 4 BB7755 1 0 Exp # 16 95 7 5 CA12 0.6 0.4
Exp # 17 110 5 6 CA12 0.6 0.4 Exp # 18 95 7 6 BB7755 1 0 Exp # 19 80 5 5 BB7755 0.8 0.2 Exp # 20 110 5 5 BB7755 1 0 Exp # 21 95 5 5 CA12 0.8 0.2 Exp # 22 110 7 4 BB7755 0.6 0.4 Exp # 23 95 3 6 CA12 0.733 0.267 Exp # 24 110 7 5 CA12 1 0 Exp # 25 110 3 6 CA12 0.6 0.4 Exp # 23R 95 3 6 CA12 0.733 0.267 Exp # 24R 110 7 5 CA12 1 0 Exp # 25R 110 3 6 CA12 0.6 0.4 Exp # 22RR 110 7 4 BB7755 0.6 0.4 Exp # 23RR 95 3 6 CA12 0.733 0.267
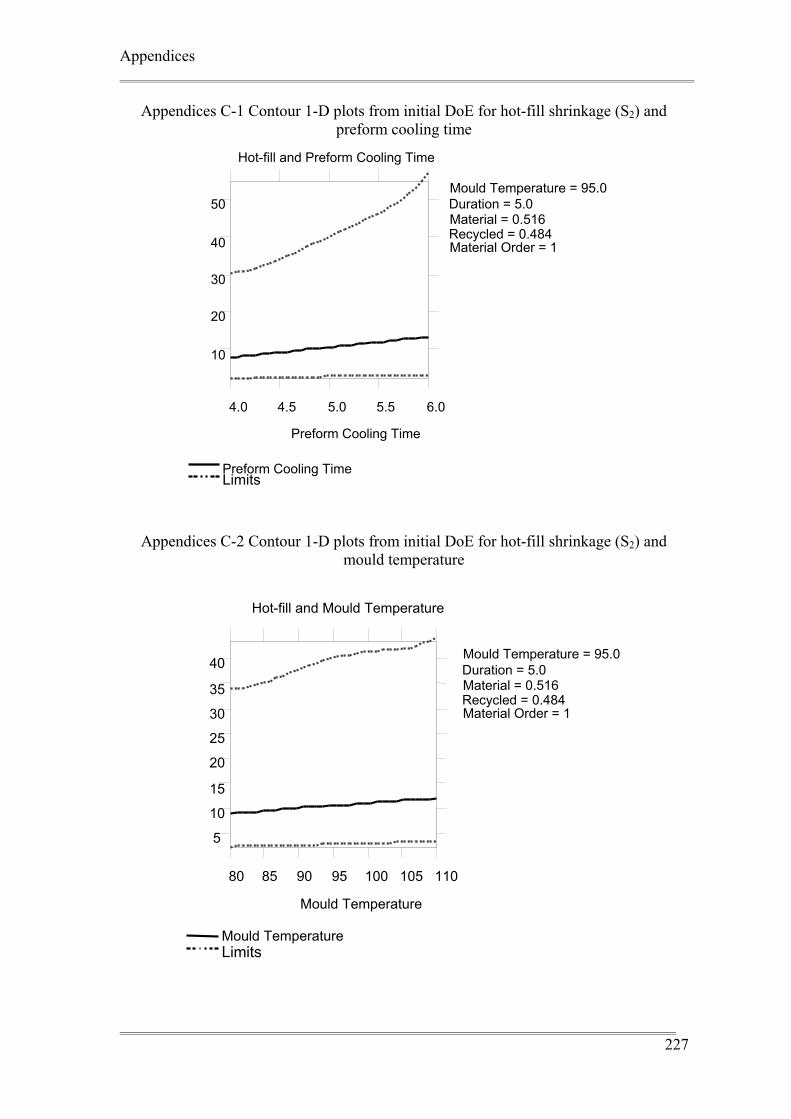
Appendices
227
Appendices C-1 Contour 1-D plots from initial DoE for hot-fill shrinkage (S2) and preform cooling time
Appendices C-2 Contour 1-D plots from initial DoE for hot-fill shrinkage (S2) and mould temperature
5
10
15
20
25
30
35
40
80 85 90 95 100 105 110
Mould Temperature
Hot-fill and Mould Temperature
LimitsMould Temperature
Mould Temperature = 95.0Duration = 5.0Material = 0.516Recycled = 0.484Material Order = 1
10
20
30
40
50
4.0 4.5 5.0 5.5 6.0
Preform Cooling Time
Hot-fill and Preform Cooling Time
Limits Preform Cooling Time
Mould Temperature = 95.0Duration = 5.0Material = 0.516Recycled = 0.484Material Order = 1
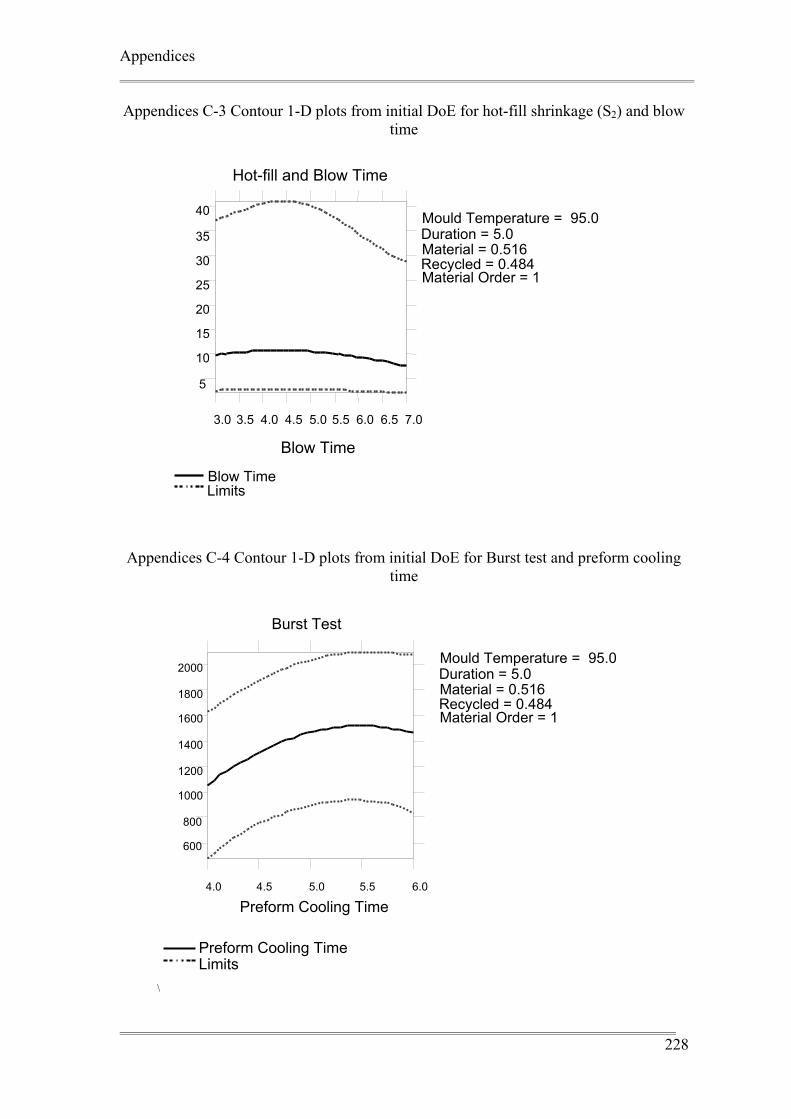
Appendices
228
Appendices C-3 Contour 1-D plots from initial DoE for hot-fill shrinkage (S2) and blow time
Appendices C-4 Contour 1-D plots from initial DoE for Burst test and preform cooling time
\
5
10
15
20
25
30
35
40
3.0 3.5 4.0 4.5 5.0 5.5 6.0 6.5 7.0
Blow Time
Hot-fill and Blow Time
LimitsBlow Time
Mould Temperature = 95.0Duration = 5.0Material = 0.516Recycled = 0.484Material Order = 1
600
800
1000
1200
1400
1600
1800
2000
4.0 4.5 5.0 5.5 6.0
Preform Cooling Time
Burst Test
LimitsPreform Cooling Time
Mould Temperature = 95.0Duration = 5.0Material = 0.516Recycled = 0.484Material Order = 1
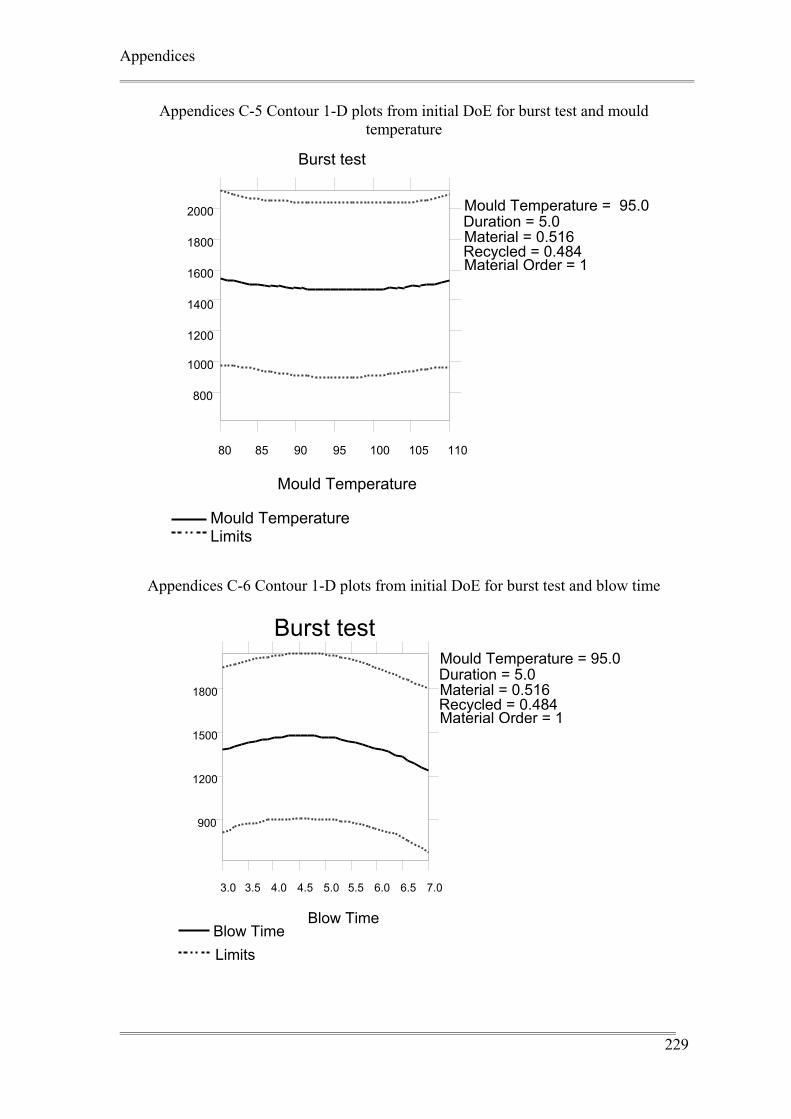
Appendices
229
Appendices C-5 Contour 1-D plots from initial DoE for burst test and mould temperature
Appendices C-6 Contour 1-D plots from initial DoE for burst test and blow time
800
1000
1200
1400
1600
1800
2000
80 85 90 95 100 105 110
Mould Temperature
Burst test
LimitsMould Temperature
Mould Temperature = 95.0Duration = 5.0Material = 0.516Recycled = 0.484Material Order = 1
900
1200
1500
1800
3.0 3.5 4.0 4.5 5.0 5.5 6.0 6.5 7.0
Blow Time
Burst test
LimitsBlow Time
Mould Temperature = 95.0Duration = 5.0Material = 0.516Recycled = 0.484Material Order = 1
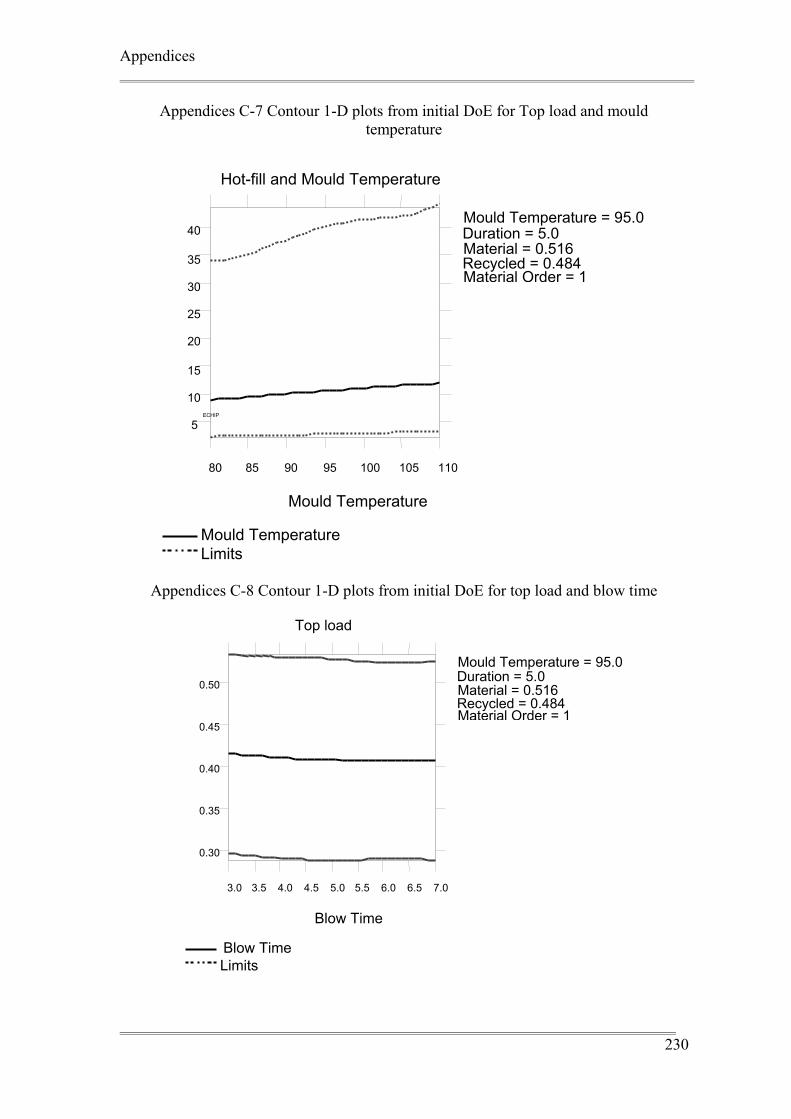
Appendices
230
Appendices C-7 Contour 1-D plots from initial DoE for Top load and mould temperature
Appendices C-8 Contour 1-D plots from initial DoE for top load and blow time
ECHIP
5
10
15
20
25
30
35
40
80 85 90 95 100 105 110
Mould Temperature
Hot-fill and Mould Temperature
LimitsMould Temperature
Mould Temperature = 95.0Duration = 5.0Material = 0.516Recycled = 0.484Material Order = 1
0.30
0.35
0.40
0.45
0.50
3.0 3.5 4.0 4.5 5.0 5.5 6.0 6.5 7.0
Blow Time
Top load
Limits Blow Time
Mould Temperature = 95.0 Duration = 5.0Material = 0.516Recycled = 0.484 Material Order = 1
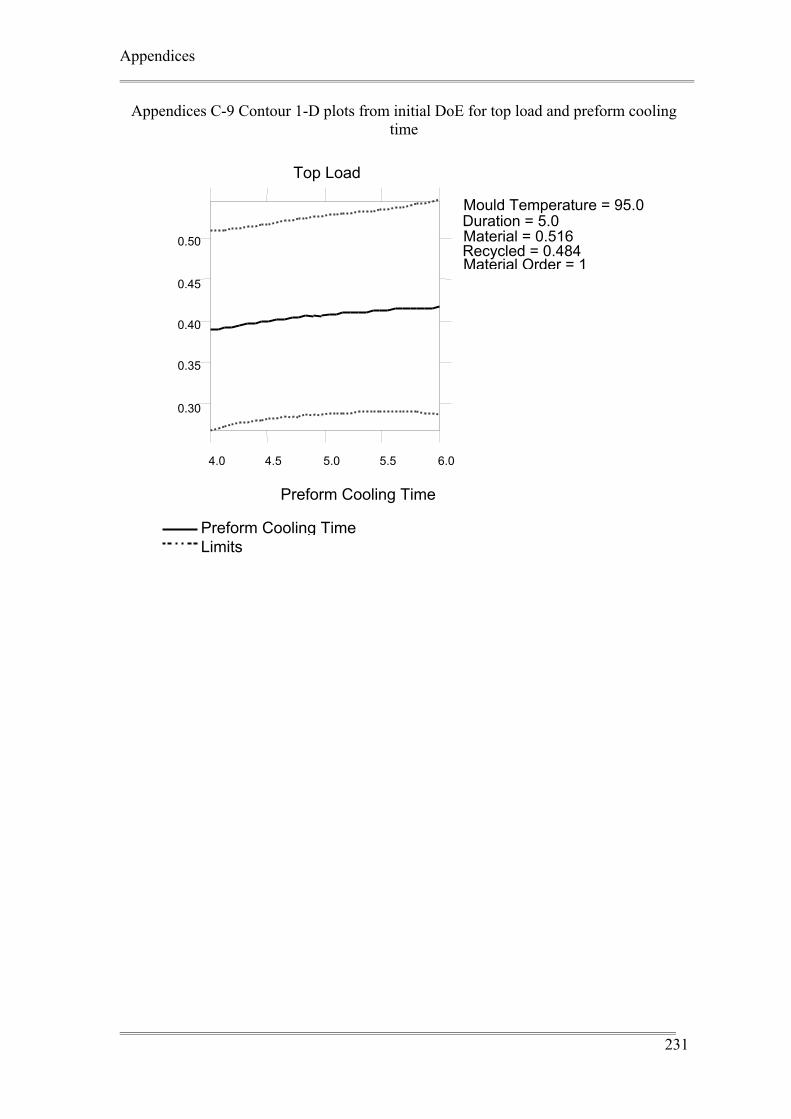
Appendices
231
Appendices C-9 Contour 1-D plots from initial DoE for top load and preform cooling time
0.30
0.35
0.40
0.45
0.50
4.0 4.5 5.0 5.5 6.0
Preform Cooling Time
Top Load
LimitsPreform Cooling Time
Mould Temperature = 95.0Duration = 5.0Material = 0.516Recycled = 0.484Material Order = 1
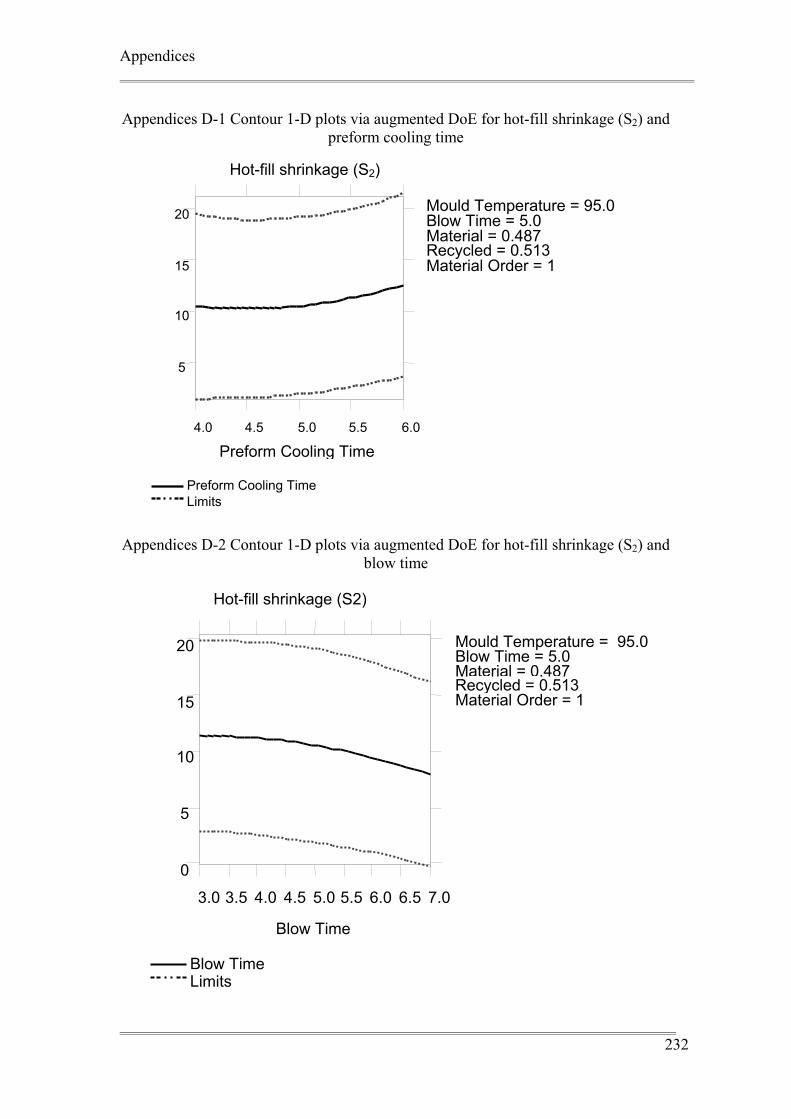
Appendices
232
Appendices D-1 Contour 1-D plots via augmented DoE for hot-fill shrinkage (S2) and preform cooling time
Appendices D-2 Contour 1-D plots via augmented DoE for hot-fill shrinkage (S2) and
blow time
5
10
15
20
4.0 4.5 5.0 5.5 6.0
Preform Cooling Time
Hot-fill shrinkage (S2)
LimitsPreform Cooling Time
Mould Temperature = 95.0 Blow Time = 5.0Material = 0.487Recycled = 0.513Material Order = 1
0
5
10
15
20
3.0 3.5 4.0 4.5 5.0 5.5 6.0 6.5 7.0
Blow Time
Hot-fill shrinkage (S2)
LimitsBlow Time
Mould Temperature = 95.0 Blow Time = 5.0Material = 0.487 Recycled = 0.513 Material Order = 1
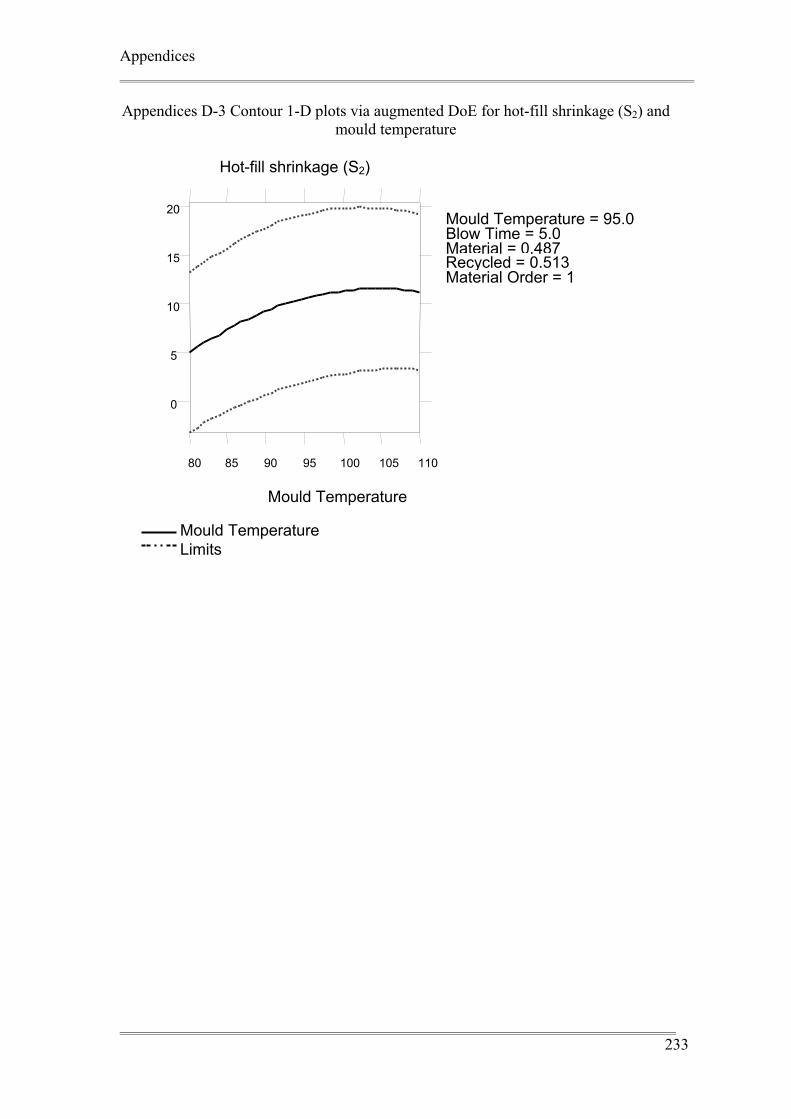
Appendices
233
Appendices D-3 Contour 1-D plots via augmented DoE for hot-fill shrinkage (S2) and mould temperature
0
5
10
15
20
80 85 90 95 100 105 110
Mould Temperature
Hot-fill shrinkage (S2)
Limits Mould Temperature
Mould Temperature = 95.0 Blow Time = 5.0Material = 0.487 Recycled = 0.513 Material Order = 1
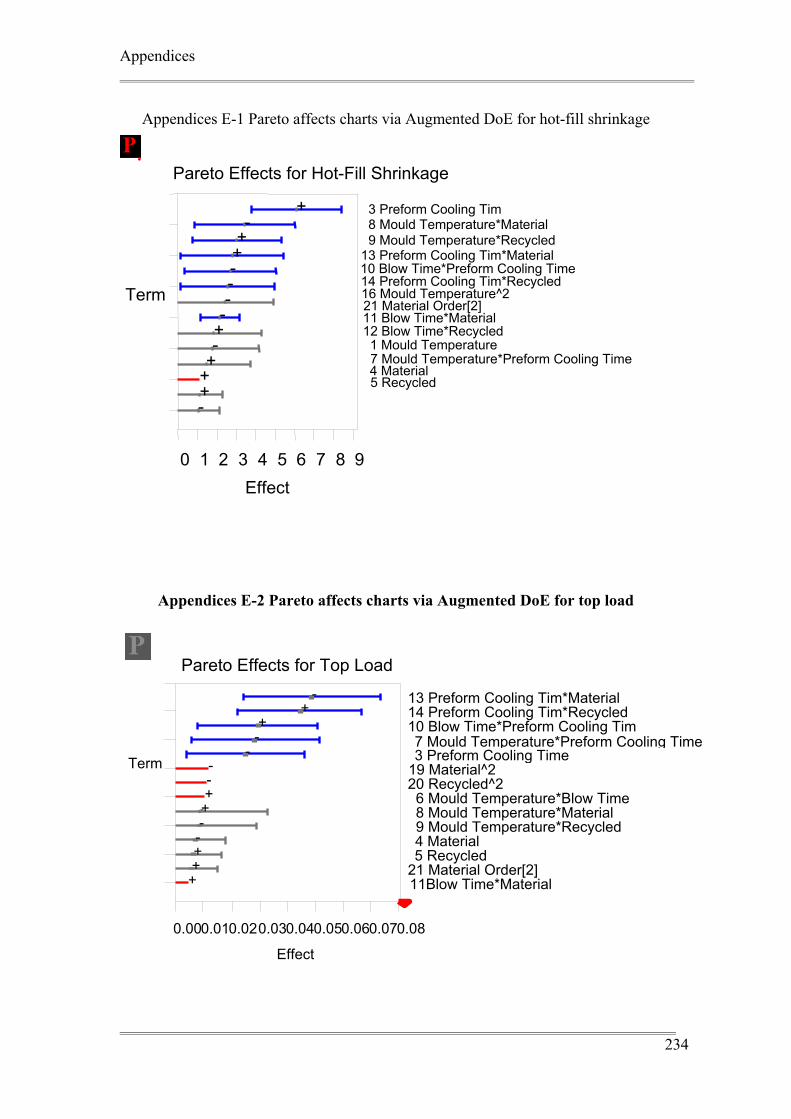
Appendices
234
Appendices E-1 Pareto affects charts via Augmented DoE for hot-fill shrinkage
Appendices E-2 Pareto affects charts via Augmented DoE for top load
Term
0 1 2 3 4 5 6 7 8 9Effect
Pareto Effects for Hot-Fill Shrinkage
3 Preform Cooling Tim+8 Mould Temperature*Material- 9 Mould Temperature*Recycled+
13 Preform Cooling Tim*Material+10 Blow Time*Preform Cooling Time -14 Preform Cooling Tim*Recycled-16 Mould Temperature^2- 21 Material Order[2]- 11 Blow Time*Material
+ 12 Blow Time*Recycled- 1 Mould Temperature
+ 7 Mould Temperature*Preform Cooling Time+ 4 Material+ 5 Recycled
-
Term
0.00 0.01 0.02 0.03 0.04 0.050.060.070.08
Effect
Pareto Effects for Top Load
13 Preform Cooling Tim*Material - 14 Preform Cooling Tim*Recycled + 10 Blow Time*Preform Cooling Tim+
- 3 Preform Cooling Time -
19 Material^2- 20 Recycled^2-6 Mould Temperature*Blow Time + 8 Mould Temperature*Material + 9 Mould Temperature*Recycled- 4 Material- 5 Recycled+
21 Material Order[2]+ 11Blow Time*Material+
7 Mould Temperature*Preform Cooling Time
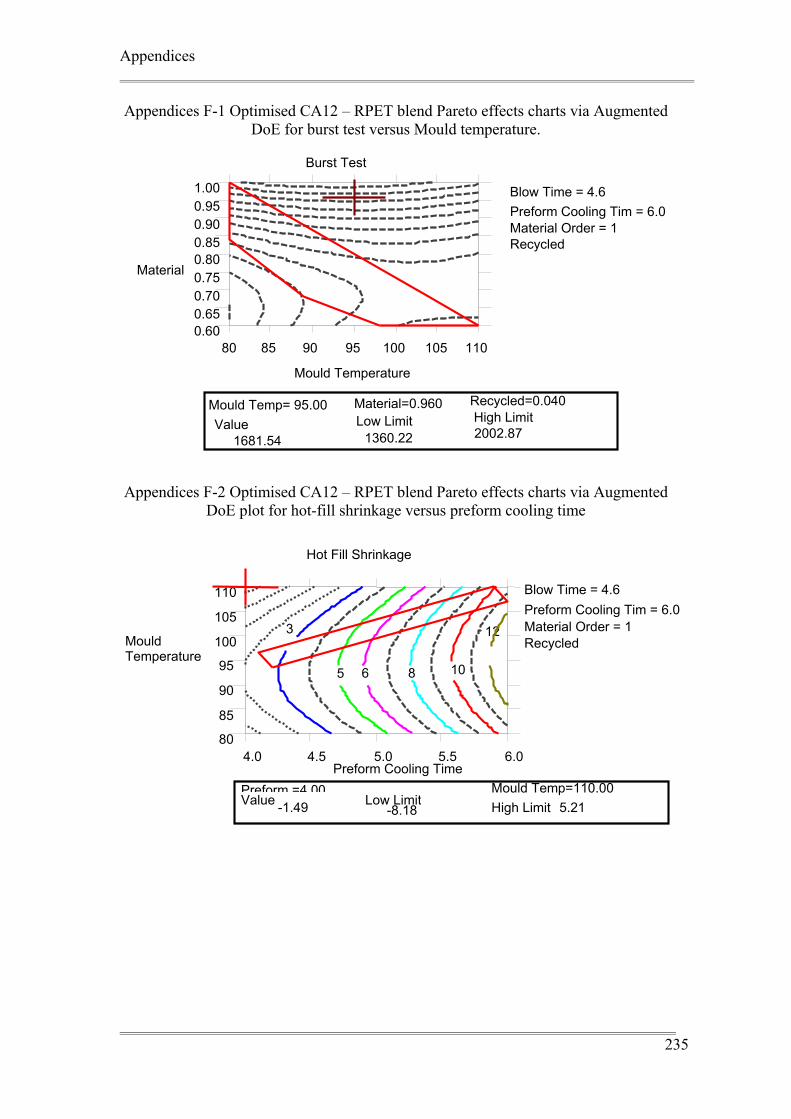
Appendices
235
Appendices F-1 Optimised CA12 – RPET blend Pareto effects charts via Augmented DoE for burst test versus Mould temperature.
Appendices F-2 Optimised CA12 – RPET blend Pareto effects charts via Augmented DoE plot for hot-fill shrinkage versus preform cooling time
0.600.650.700.750.800.850.900.951.00
Material
Recycled
80 85 90 95 100 105 110
Burst Test
Blow Time = 4.6Preform Cooling Tim = 6.0 Material Order = 1
1681.54 2002.87
Mould Temperature
1360.22
Recycled=0.040 High Limit
Material=0.960Low Limit
Mould Temp= 95.00Value
80
85
90
95
100
105
110
Mould Temperature
4.0 4.5 5.0 5.5 6.0
Hot Fill Shrinkage
3
5 6 8 10
12
Value Low Limit High Limit -1.49 -8.18 5.21 Preform =4 00 Mould Temp=110.00
Recycled
Blow Time = 4.6Preform Cooling Tim = 6.0 Material Order = 1
Preform Cooling Time
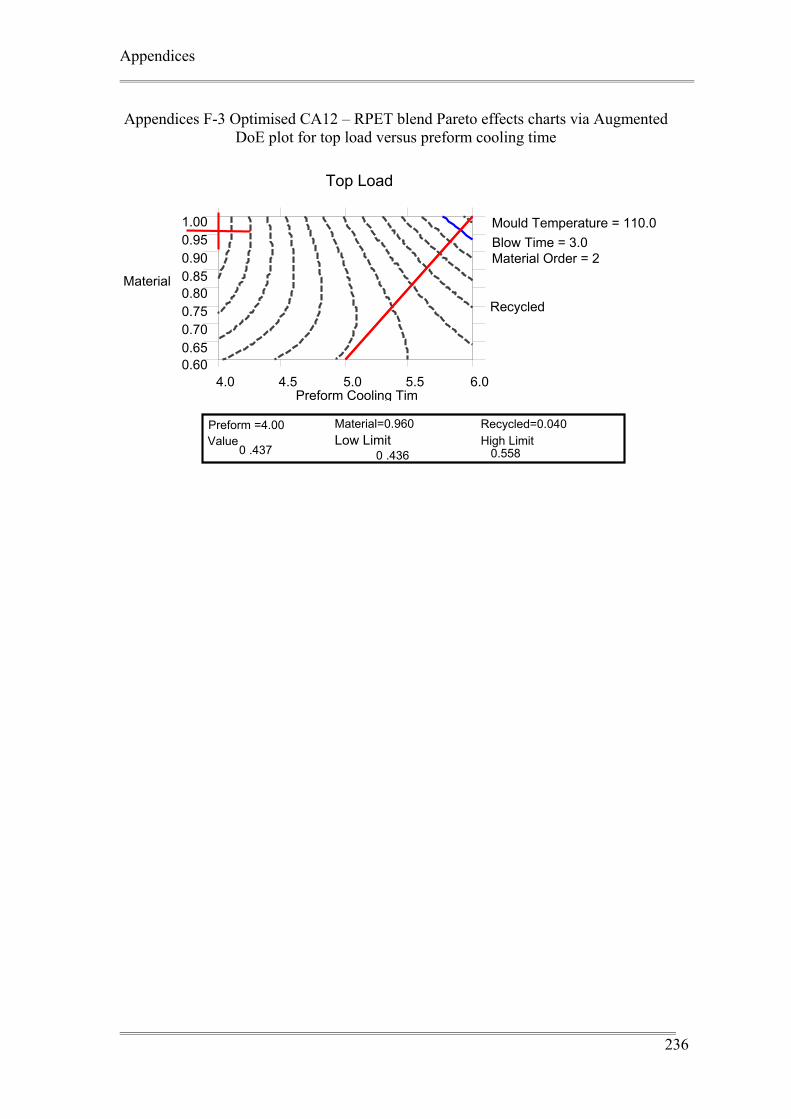
Appendices
236
Appendices F-3 Optimised CA12 – RPET blend Pareto effects charts via Augmented DoE plot for top load versus preform cooling time
0.600.650.700.750.800.850.900.951.00
Recycled
4.0 4.5 5.0 5.5 6.0Preform Cooling Tim
Mould Temperature = 110.0Blow Time = 3.0 Material Order = 2
Material
Top Load
ValuePreform =4.00
0 .437
Material=0.960Low Limit
0.558
Recycled=0.040 High Limit
0 .436
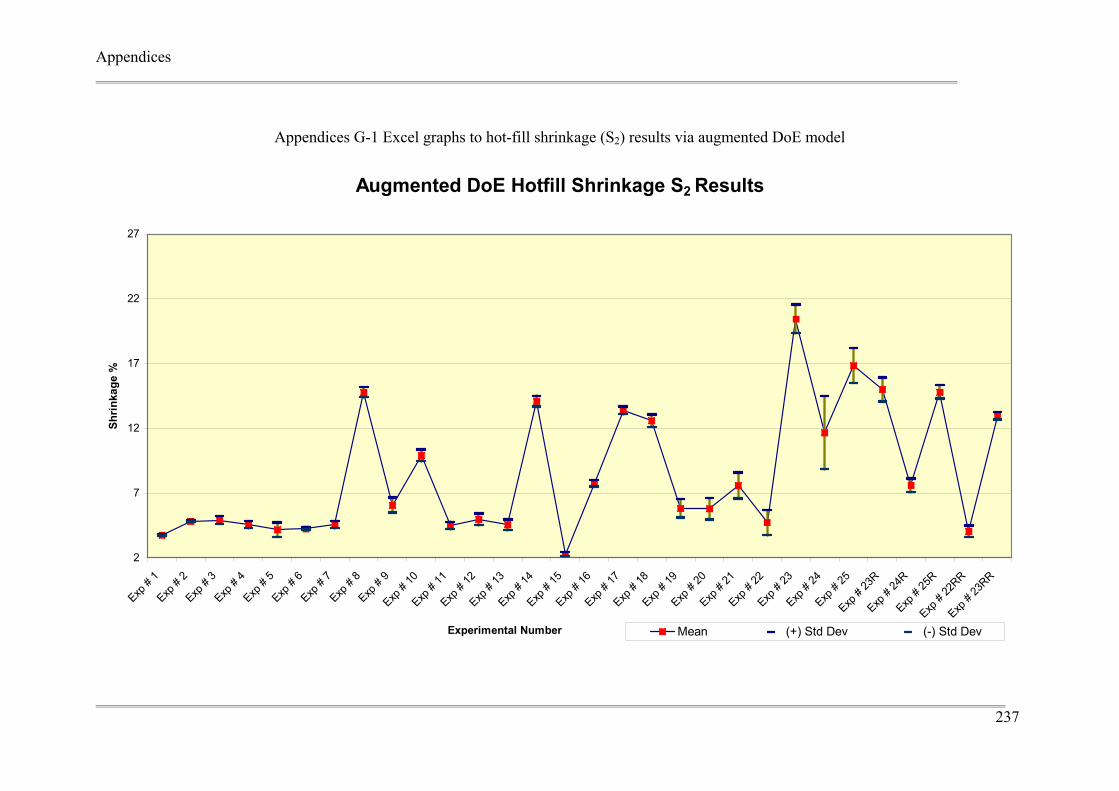
Appendices
237
Appendices G-1 Excel graphs to hot-fill shrinkage (S2) results via augmented DoE model
Augmented DoE Hotfill Shrinkage S2 Results
2
7
12
17
22
27
Exp #
1Exp
# 2
Exp #
3Exp
# 4
Exp #
5Exp
# 6
Exp #
7Exp
# 8
Exp #
9Exp
# 10
Exp #
11Exp
# 12
Exp #
13Exp
# 14
Exp #
15Exp
# 16
Exp #
17Exp
# 18
Exp #
19Exp
# 20
Exp #
21Exp
# 22
Exp #
23Exp
# 24
Exp #
25Exp
# 23
RExp
# 24
RExp
# 25
RExp
# 22
RRExp
# 23
RR
Experimental Number
Shrin
kage
%
Mean (+) Std Dev (-) Std Dev
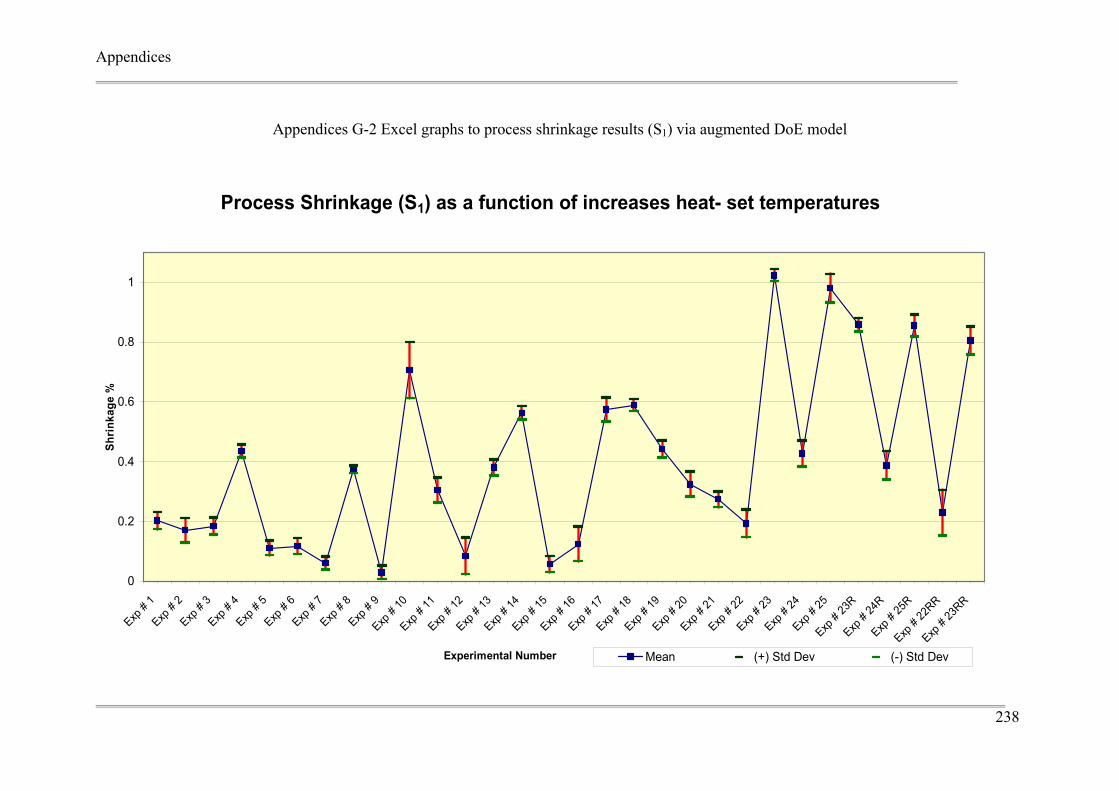
Appendices
238
Appendices G-2 Excel graphs to process shrinkage results (S1) via augmented DoE model
Process Shrinkage (S1) as a function of increases heat- set temperatures
0
0.2
0.4
0.6
0.8
1
Exp #
1Exp
# 2
Exp #
3Exp
# 4
Exp #
5Exp
# 6
Exp #
7Exp
# 8
Exp #
9Exp
# 10
Exp #
11Exp
# 12
Exp #
13Exp
# 14
Exp #
15Exp
# 16
Exp #
17Exp
# 18
Exp #
19Exp
# 20
Exp #
21Exp
# 22
Exp #
23Exp
# 24
Exp #
25Exp
# 23
RExp
# 24
RExp
# 25
RExp
# 22
RRExp
# 23
RR
Experimental Number
Shrin
kage
%
Mean (+) Std Dev (-) Std Dev
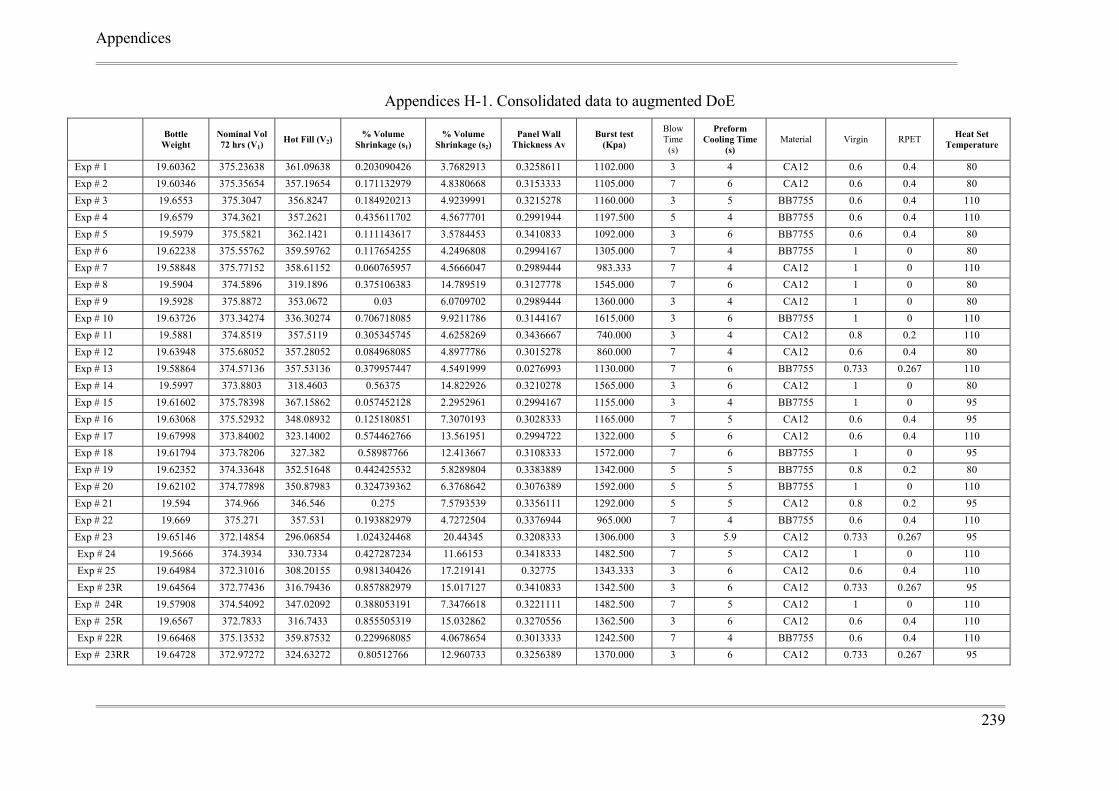
Appendices
239
Appendices H-1. Consolidated data to augmented DoE
Bottle Weight
Nominal Vol 72 hrs (V1)
Hot Fill (V2) % Volume
Shrinkage (s1) % Volume
Shrinkage (s2) Panel Wall
Thickness Av Burst test
(Kpa)
Blow Time
(s)
Preform Cooling Time
(s) Material Virgin RPET Heat Set
Temperature
Exp # 1 19.60362 375.23638 361.09638 0.203090426 3.7682913 0.3258611 1102.000 3 4 CA12 0.6 0.4 80 Exp # 2 19.60346 375.35654 357.19654 0.171132979 4.8380668 0.3153333 1105.000 7 6 CA12 0.6 0.4 80 Exp # 3 19.6553 375.3047 356.8247 0.184920213 4.9239991 0.3215278 1160.000 3 5 BB7755 0.6 0.4 110 Exp # 4 19.6579 374.3621 357.2621 0.435611702 4.5677701 0.2991944 1197.500 5 4 BB7755 0.6 0.4 110 Exp # 5 19.5979 375.5821 362.1421 0.111143617 3.5784453 0.3410833 1092.000 3 6 BB7755 0.6 0.4 80 Exp # 6 19.62238 375.55762 359.59762 0.117654255 4.2496808 0.2994167 1305.000 7 4 BB7755 1 0 80 Exp # 7 19.58848 375.77152 358.61152 0.060765957 4.5666047 0.2989444 983.333 7 4 CA12 1 0 110 Exp # 8 19.5904 374.5896 319.1896 0.375106383 14.789519 0.3127778 1545.000 7 6 CA12 1 0 80 Exp # 9 19.5928 375.8872 353.0672 0.03 6.0709702 0.2989444 1360.000 3 4 CA12 1 0 80 Exp # 10 19.63726 373.34274 336.30274 0.706718085 9.9211786 0.3144167 1615.000 3 6 BB7755 1 0 110 Exp # 11 19.5881 374.8519 357.5119 0.305345745 4.6258269 0.3436667 740.000 3 4 CA12 0.8 0.2 110 Exp # 12 19.63948 375.68052 357.28052 0.084968085 4.8977786 0.3015278 860.000 7 4 CA12 0.6 0.4 80 Exp # 13 19.58864 374.57136 357.53136 0.379957447 4.5491999 0.0276993 1130.000 7 6 BB7755 0.733 0.267 110 Exp # 14 19.5997 373.8803 318.4603 0.56375 14.822926 0.3210278 1565.000 3 6 CA12 1 0 80 Exp # 15 19.61602 375.78398 367.15862 0.057452128 2.2952961 0.2994167 1155.000 3 4 BB7755 1 0 95 Exp # 16 19.63068 375.52932 348.08932 0.125180851 7.3070193 0.3028333 1165.000 7 5 CA12 0.6 0.4 95 Exp # 17 19.67998 373.84002 323.14002 0.574462766 13.561951 0.2994722 1322.000 5 6 CA12 0.6 0.4 110 Exp # 18 19.61794 373.78206 327.382 0.58987766 12.413667 0.3108333 1572.000 7 6 BB7755 1 0 95 Exp # 19 19.62352 374.33648 352.51648 0.442425532 5.8289804 0.3383889 1342.000 5 5 BB7755 0.8 0.2 80 Exp # 20 19.62102 374.77898 350.87983 0.324739362 6.3768642 0.3076389 1592.000 5 5 BB7755 1 0 110 Exp # 21 19.594 374.966 346.546 0.275 7.5793539 0.3356111 1292.000 5 5 CA12 0.8 0.2 95 Exp # 22 19.669 375.271 357.531 0.193882979 4.7272504 0.3376944 965.000 7 4 BB7755 0.6 0.4 110 Exp # 23 19.65146 372.14854 296.06854 1.024324468 20.44345 0.3208333 1306.000 3 5.9 CA12 0.733 0.267 95 Exp # 24 19.5666 374.3934 330.7334 0.427287234 11.66153 0.3418333 1482.500 7 5 CA12 1 0 110 Exp # 25 19.64984 372.31016 308.20155 0.981340426 17.219141 0.32775 1343.333 3 6 CA12 0.6 0.4 110 Exp # 23R 19.64564 372.77436 316.79436 0.857882979 15.017127 0.3410833 1342.500 3 6 CA12 0.733 0.267 95 Exp # 24R 19.57908 374.54092 347.02092 0.388053191 7.3476618 0.3221111 1482.500 7 5 CA12 1 0 110 Exp # 25R 19.6567 372.7833 316.7433 0.855505319 15.032862 0.3270556 1362.500 3 6 CA12 0.6 0.4 110 Exp # 22R 19.66468 375.13532 359.87532 0.229968085 4.0678654 0.3013333 1242.500 7 4 BB7755 0.6 0.4 110 Exp # 23RR 19.64728 372.97272 324.63272 0.80512766 12.960733 0.3256389 1370.000 3 6 CA12 0.733 0.267 95
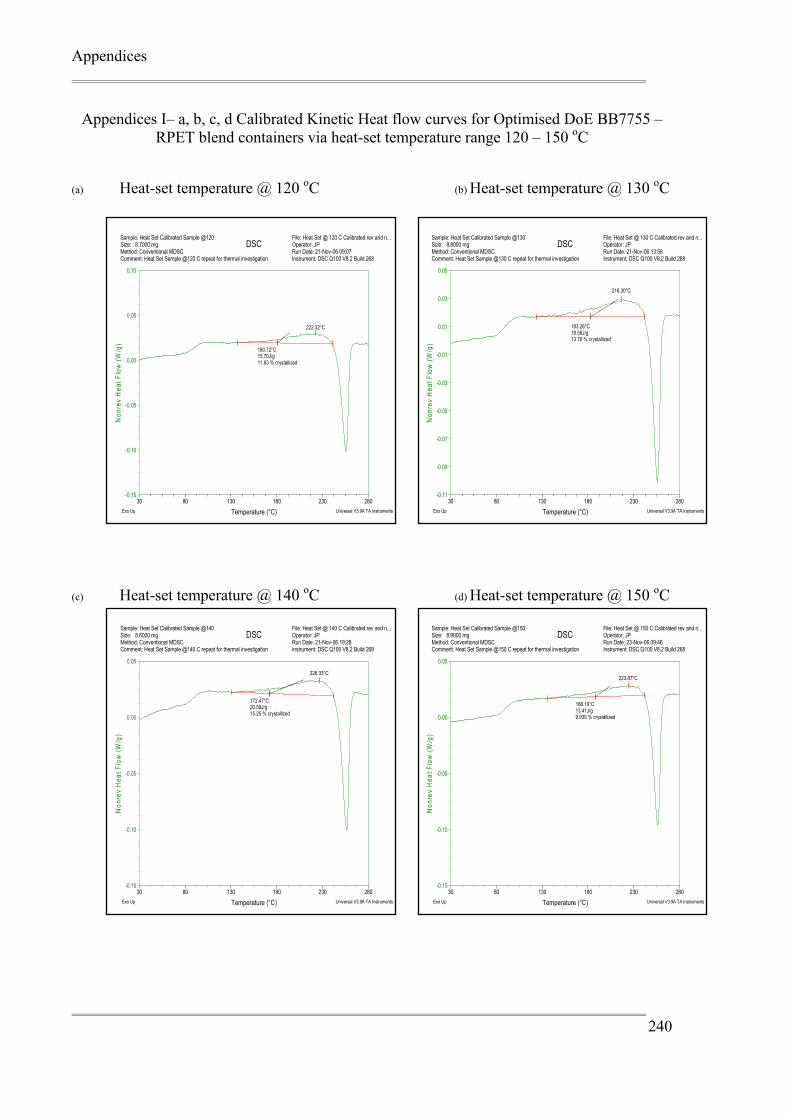
Appendices
240
Appendices I– a, b, c, d Calibrated Kinetic Heat flow curves for Optimised DoE BB7755 – RPET blend containers via heat-set temperature range 120 – 150 oC
(a) Heat-set temperature @ 120 oC (b) Heat-set temperature @ 130 oC
(c) Heat-set temperature @ 140 oC (d) Heat-set temperature @ 150 oC
216.30°C
183.26°C18.58J/g13.76 % crystallized
-0.11
-0.09
-0.07
-0.05
-0.03
-0.01
0.01
0.03
0.05
Non
rev
Hea
t Flo
w (W
/g)
30 80 130 180 230 280
Temperature (°C)
Sample: Heat Set Calibrated Sample @130Size: 8.8000 mgMethod: Conventional MDSCComment: Heat Set Sample @130 C repeat for thermal investigation
DSCFile: Heat Set @ 130 C Calibrated rev and n...Operator: JPRun Date: 21-Nov-06 13:58Instrument: DSC Q100 V8.2 Build 268
Exo Up Universal V3.9A TA Instruments
226.33°C
172.47°C20.59J/g15.25 % crystallized
-0.15
-0.10
-0.05
0.00
0.05
Non
rev
Hea
t Flo
w (W
/g)
30 80 130 180 230 280
Temperature (°C)
Sample: Heat Set Calibrated Sample @140Size: 8.6000 mgMethod: Conventional MDSCComment: Heat Set Sample @140 C repeat for thermal investigation
DSCFile: Heat Set @ 140 C Calibrated rev and n...Operator: JPRun Date: 21-Nov-06 19:28Instrument: DSC Q100 V8.2 Build 268
Exo Up Universal V3.9A TA Instruments
223.87°C
188.10°C13.41J/g9.930 % crystallized
-0.15
-0.10
-0.05
0.00
0.05
Non
rev
Hea
t Flo
w (W
/g)
30 80 130 180 230 280
Temperature (°C)
Sample: Heat Set Calibrated Sample @150Size: 8.9000 mgMethod: Conventional MDSCComment: Heat Set Sample @150 C repeat for thermal investigation
DSCFile: Heat Set @ 150 C Calibrated rev and n...Operator: JPRun Date: 23-Nov-06 09:46Instrument: DSC Q100 V8.2 Build 268
Exo Up Universal V3.9A TA Instruments
222.32°C
180.72°C15.70J/g11.63 % crystallized
-0.15
-0.10
-0.05
0.00
0.05
0.10
Non
rev
Hea
t Flo
w (W
/g)
30 80 130 180 230 280
Temperature (°C)
Sample: Heat Set Calibrated Sample @120Size: 8.7000 mgMethod: Conventional MDSCComment: Heat Set Sample @120 C repeat for thermal investigation
DSCFile: Heat Set @ 120 C Calibrated rev and n...Operator: JPRun Date: 21-Nov-06 09:07Instrument: DSC Q100 V8.2 Build 268
Exo Up Universal V3.9A TA Instruments
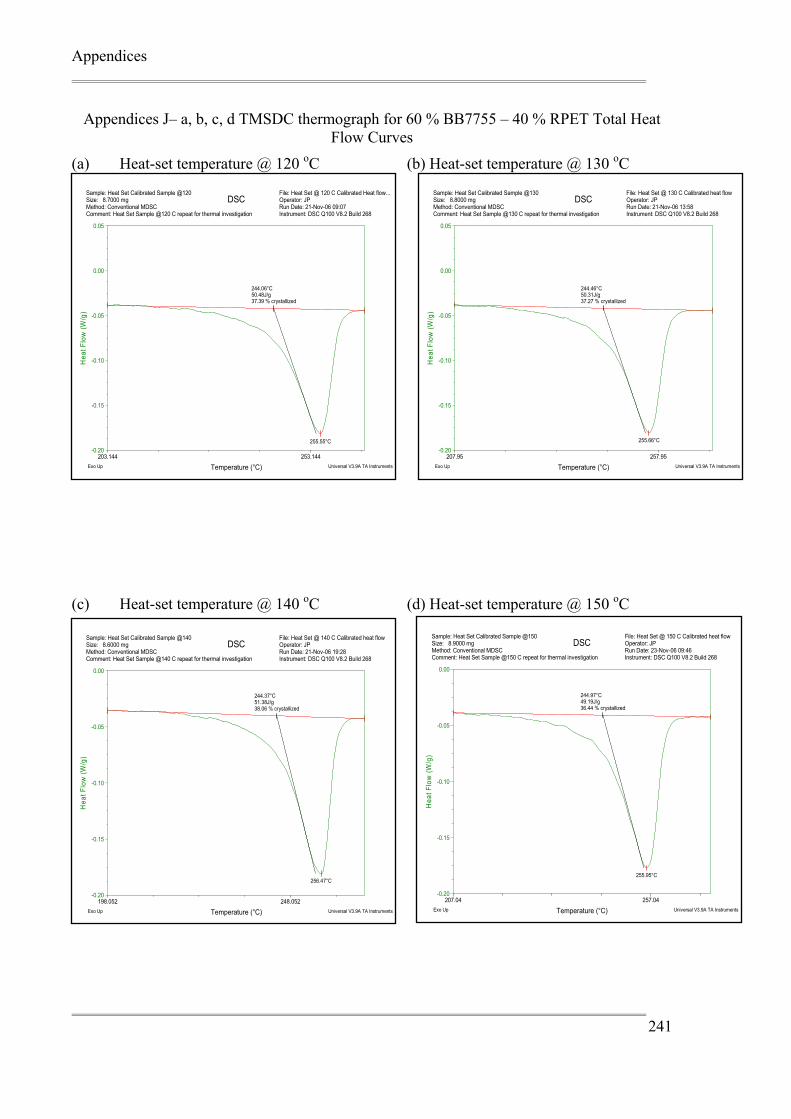
Appendices
241
Appendices J– a, b, c, d TMSDC thermograph for 60 % BB7755 – 40 % RPET Total Heat Flow Curves
(a) Heat-set temperature @ 120 oC (b) Heat-set temperature @ 130 oC (c) Heat-set temperature @ 140 oC (d) Heat-set temperature @ 150 oC
255.55°C
244.06°C50.48J/g37.39 % crystallized
-0.20
-0.15
-0.10
-0.05
0.00
0.05
Hea
t Flo
w (W
/g)
203.144 253.144
Temperature (°C)
Sample: Heat Set Calibrated Sample @120Size: 8.7000 mgMethod: Conventional MDSCComment: Heat Set Sample @120 C repeat for thermal investigation
DSCFile: Heat Set @ 120 C Calibrated Heat flow...Operator: JPRun Date: 21-Nov-06 09:07Instrument: DSC Q100 V8.2 Build 268
Exo Up Universal V3.9A TA Instruments
255.66°C
244.46°C50.31J/g37.27 % crystallized
-0.20
-0.15
-0.10
-0.05
0.00
0.05
Hea
t Flo
w (W
/g)
207.95 257.95
Temperature (°C)
Sample: Heat Set Calibrated Sample @130Size: 8.8000 mgMethod: Conventional MDSCComment: Heat Set Sample @130 C repeat for thermal investigation
DSCFile: Heat Set @ 130 C Calibrated heat flowOperator: JPRun Date: 21-Nov-06 13:58Instrument: DSC Q100 V8.2 Build 268
Exo Up Universal V3.9A TA Instruments
256.47°C
244.37°C51.38J/g38.06 % crystallized
-0.20
-0.15
-0.10
-0.05
0.00
Hea
t Flo
w (W
/g)
198.052 248.052
Temperature (°C)
Sample: Heat Set Calibrated Sample @140Size: 8.6000 mgMethod: Conventional MDSCComment: Heat Set Sample @140 C repeat for thermal investigation
DSCFile: Heat Set @ 140 C Calibrated heat flowOperator: JPRun Date: 21-Nov-06 19:28Instrument: DSC Q100 V8.2 Build 268
Exo Up Universal V3.9A TA Instruments
255.95°C
244.97°C49.19J/g36.44 % crystallized
-0.20
-0.15
-0.10
-0.05
0.00
Hea
t Flo
w (W
/g)
207.04 257.04
Temperature (°C)
Sample: Heat Set Calibrated Sample @150Size: 8.9000 mgMethod: Conventional MDSCComment: Heat Set Sample @150 C repeat for thermal investigation
DSCFile: Heat Set @ 150 C Calibrated heat flowOperator: JPRun Date: 23-Nov-06 09:46Instrument: DSC Q100 V8.2 Build 268
Exo Up Universal V3.9A TA Instruments
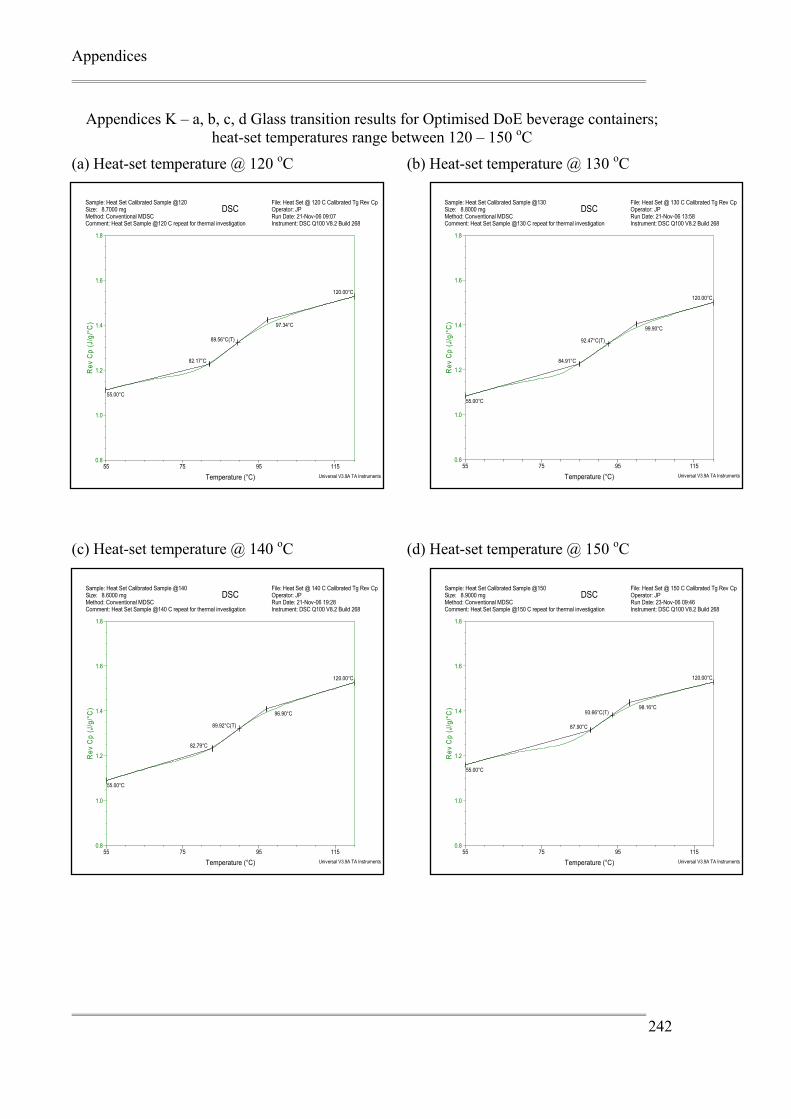
Appendices
242
89.56°C(T)
82.17°C
97.34°C
55.00°C
120.00°C
0.8
1.0
1.2
1.4
1.6
1.8
Rev
Cp
(J/g
/°C
)
55 75 95 115
Temperature (°C)
Sample: Heat Set Calibrated Sample @120Size: 8.7000 mgMethod: Conventional MDSCComment: Heat Set Sample @120 C repeat for thermal investigation
DSCFile: Heat Set @ 120 C Calibrated Tg Rev CpOperator: JPRun Date: 21-Nov-06 09:07Instrument: DSC Q100 V8.2 Build 268
Universal V3.9A TA Instruments
Appendices K – a, b, c, d Glass transition results for Optimised DoE beverage containers; heat-set temperatures range between 120 – 150 oC
(a) Heat-set temperature @ 120 oC (b) Heat-set temperature @ 130 oC
(c) Heat-set temperature @ 140 oC (d) Heat-set temperature @ 150 oC
92.47°C(T)
84.91°C
99.90°C
55.00°C
120.00°C
0.8
1.0
1.2
1.4
1.6
1.8
Rev
Cp
(J/g
/°C
)
55 75 95 115
Temperature (°C)
Sample: Heat Set Calibrated Sample @130Size: 8.8000 mgMethod: Conventional MDSCComment: Heat Set Sample @130 C repeat for thermal investigation
DSCFile: Heat Set @ 130 C Calibrated Tg Rev CpOperator: JPRun Date: 21-Nov-06 13:58Instrument: DSC Q100 V8.2 Build 268
Universal V3.9A TA Instruments
89.92°C(T)
82.79°C
96.90°C
55.00°C
120.00°C
0.8
1.0
1.2
1.4
1.6
1.8
Rev
Cp
(J/g
/°C
)
55 75 95 115
Temperature (°C)
Sample: Heat Set Calibrated Sample @140Size: 8.6000 mgMethod: Conventional MDSCComment: Heat Set Sample @140 C repeat for thermal investigation
DSCFile: Heat Set @ 140 C Calibrated Tg Rev CpOperator: JPRun Date: 21-Nov-06 19:28Instrument: DSC Q100 V8.2 Build 268
Universal V3.9A TA Instruments
93.66°C(T)
87.90°C
98.16°C
55.00°C
120.00°C
0.8
1.0
1.2
1.4
1.6
1.8
Rev
Cp
(J/g
/°C
)
55 75 95 115
Temperature (°C)
Sample: Heat Set Calibrated Sample @150Size: 8.9000 mgMethod: Conventional MDSCComment: Heat Set Sample @150 C repeat for thermal investigation
DSCFile: Heat Set @ 150 C Calibrated Tg Rev CpOperator: JPRun Date: 23-Nov-06 09:46Instrument: DSC Q100 V8.2 Build 268
Universal V3.9A TA Instruments
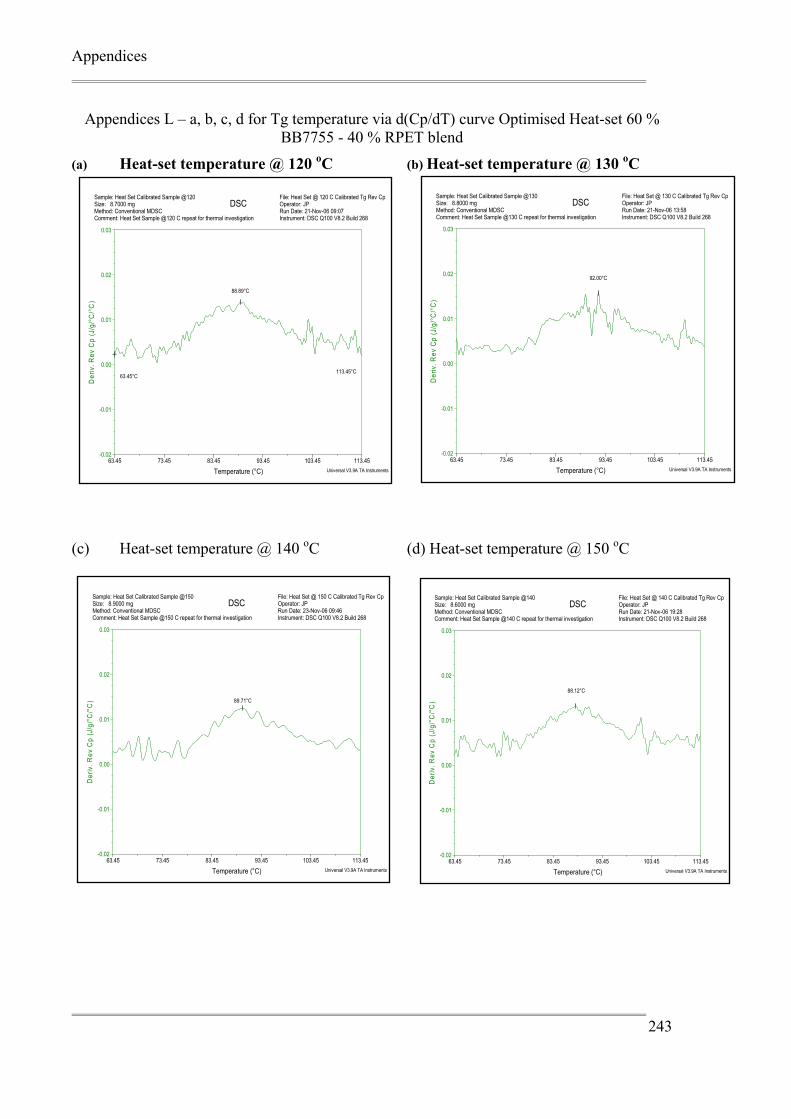
Appendices
243
Appendices L – a, b, c, d for Tg temperature via d(Cp/dT) curve Optimised Heat-set 60 % BB7755 - 40 % RPET blend
(a) Heat-set temperature @ 120 oC (b) Heat-set temperature @ 130 oC
(c) Heat-set temperature @ 140 oC (d) Heat-set temperature @ 150 oC
92.00°C
-0.02
-0.01
0.00
0.01
0.02
0.03
Der
iv. R
ev C
p (J
/g/°
C/°
C)
63.45 73.45 83.45 93.45 103.45 113.45
Temperature (°C)
Sample: Heat Set Calibrated Sample @130Size: 8.8000 mgMethod: Conventional MDSCComment: Heat Set Sample @130 C repeat for thermal investigation
DSCFile: Heat Set @ 130 C Calibrated Tg Rev CpOperator: JPRun Date: 21-Nov-06 13:58Instrument: DSC Q100 V8.2 Build 268
Universal V3.9A TA Instruments
88.12°C
-0.02
-0.01
0.00
0.01
0.02
0.03
Der
iv. R
ev C
p (J
/g/°
C/°
C)
63.45 73.45 83.45 93.45 103.45 113.45
Temperature (°C)
Sample: Heat Set Calibrated Sample @140Size: 8.6000 mgMethod: Conventional MDSCComment: Heat Set Sample @140 C repeat for thermal investigation
DSCFile: Heat Set @ 140 C Calibrated Tg Rev CpOperator: JPRun Date: 21-Nov-06 19:28Instrument: DSC Q100 V8.2 Build 268
Universal V3.9A TA Instruments
89.71°C
-0.02
-0.01
0.00
0.01
0.02
0.03
Der
iv. R
ev C
p (J
/g/°
C/°
C)
63.45 73.45 83.45 93.45 103.45 113.45
Temperature (°C)
Sample: Heat Set Calibrated Sample @150Size: 8.9000 mgMethod: Conventional MDSCComment: Heat Set Sample @150 C repeat for thermal investigation
DSCFile: Heat Set @ 150 C Calibrated Tg Rev CpOperator: JPRun Date: 23-Nov-06 09:46Instrument: DSC Q100 V8.2 Build 268
Universal V3.9A TA Instruments
63.45°C113.45°C
88.89°C
-0.02
-0.01
0.00
0.01
0.02
0.03
Der
iv. R
ev C
p (J
/g/°
C/°
C)
63.45 73.45 83.45 93.45 103.45 113.45
Temperature (°C)
Sample: Heat Set Calibrated Sample @120Size: 8.7000 mgMethod: Conventional MDSCComment: Heat Set Sample @120 C repeat for thermal investigation
DSCFile: Heat Set @ 120 C Calibrated Tg Rev CpOperator: JPRun Date: 21-Nov-06 09:07Instrument: DSC Q100 V8.2 Build 268
Universal V3.9A TA Instruments
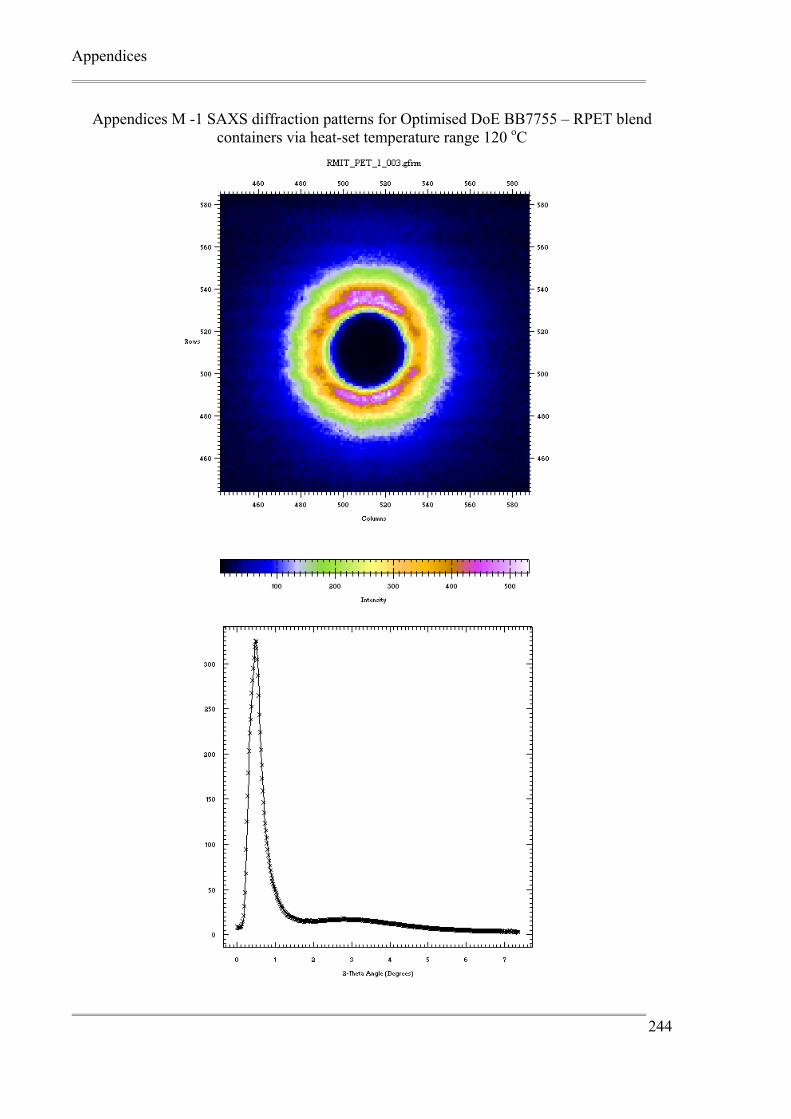
Appendices
244
Appendices M -1 SAXS diffraction patterns for Optimised DoE BB7755 – RPET blend containers via heat-set temperature range 120 oC
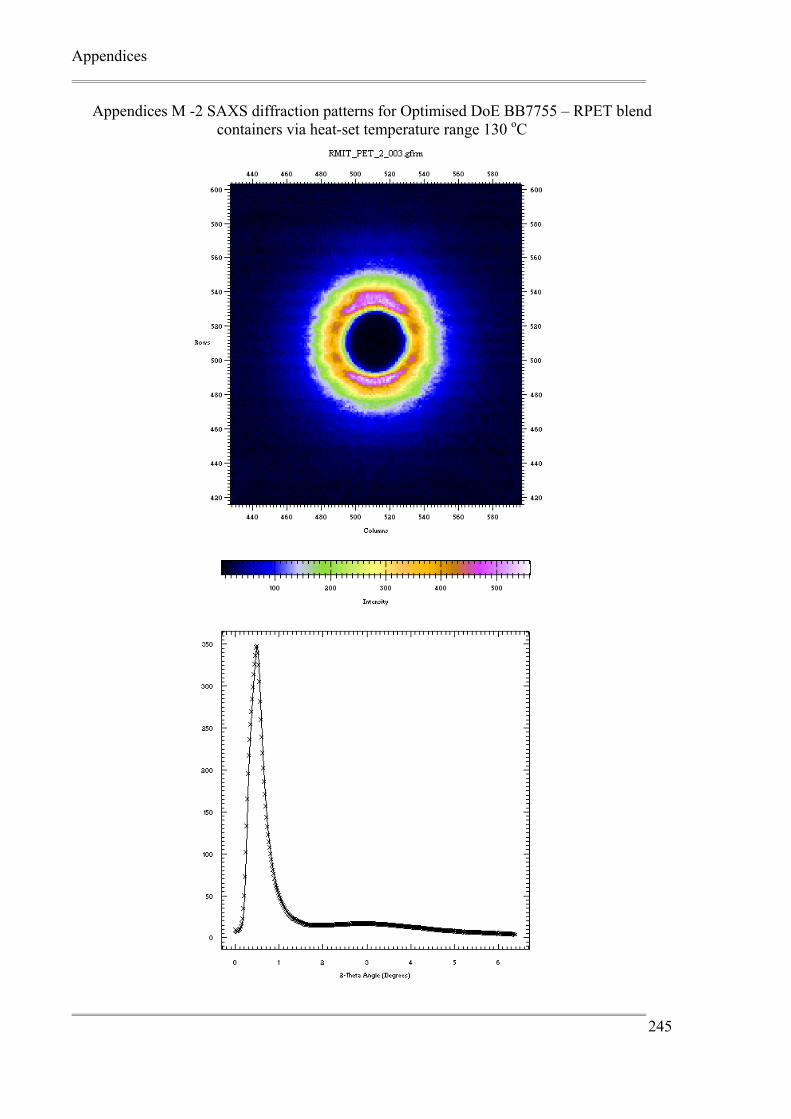
Appendices
245
Appendices M -2 SAXS diffraction patterns for Optimised DoE BB7755 – RPET blend containers via heat-set temperature range 130 oC
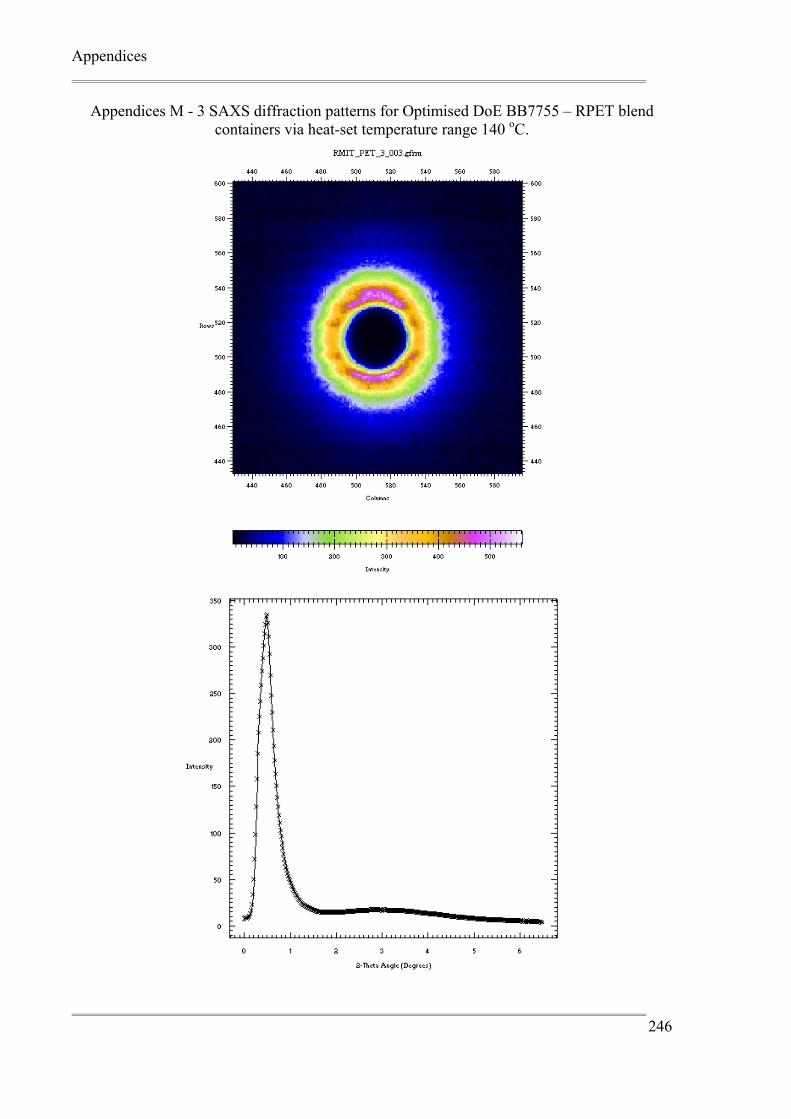
Appendices
246
Appendices M - 3 SAXS diffraction patterns for Optimised DoE BB7755 – RPET blend containers via heat-set temperature range 140 oC.
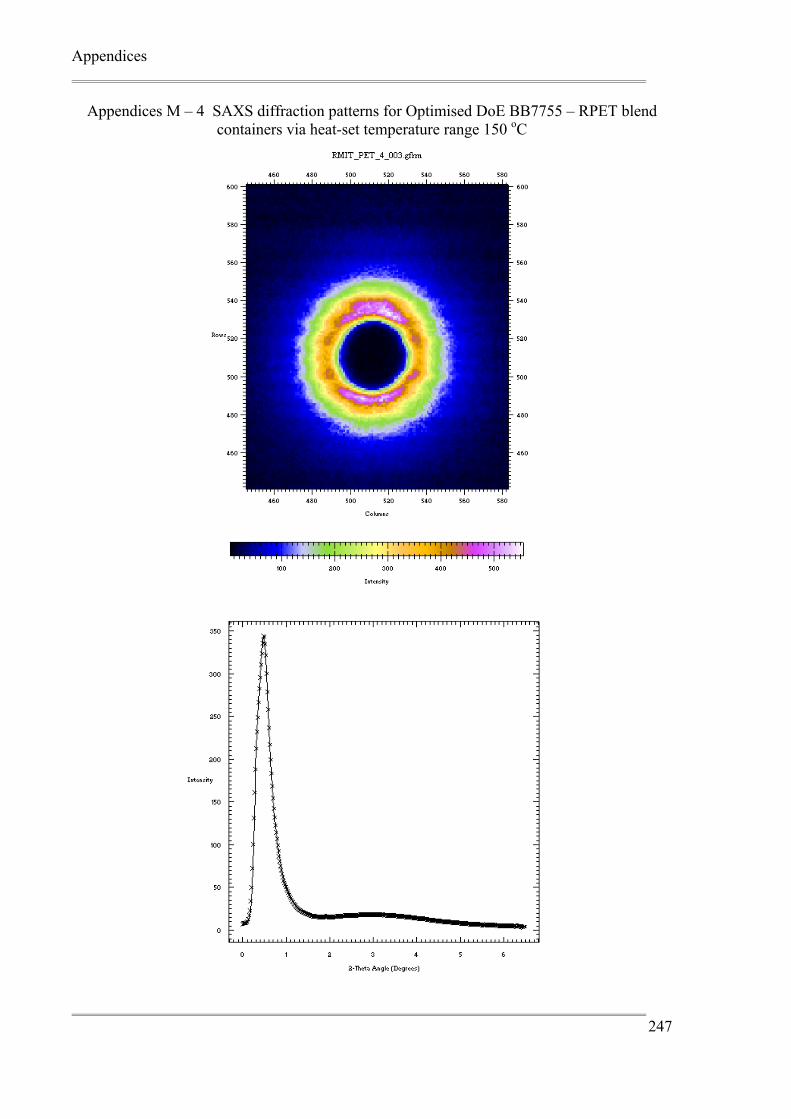
Appendices
247
Appendices M – 4 SAXS diffraction patterns for Optimised DoE BB7755 – RPET blend containers via heat-set temperature range 150 oC
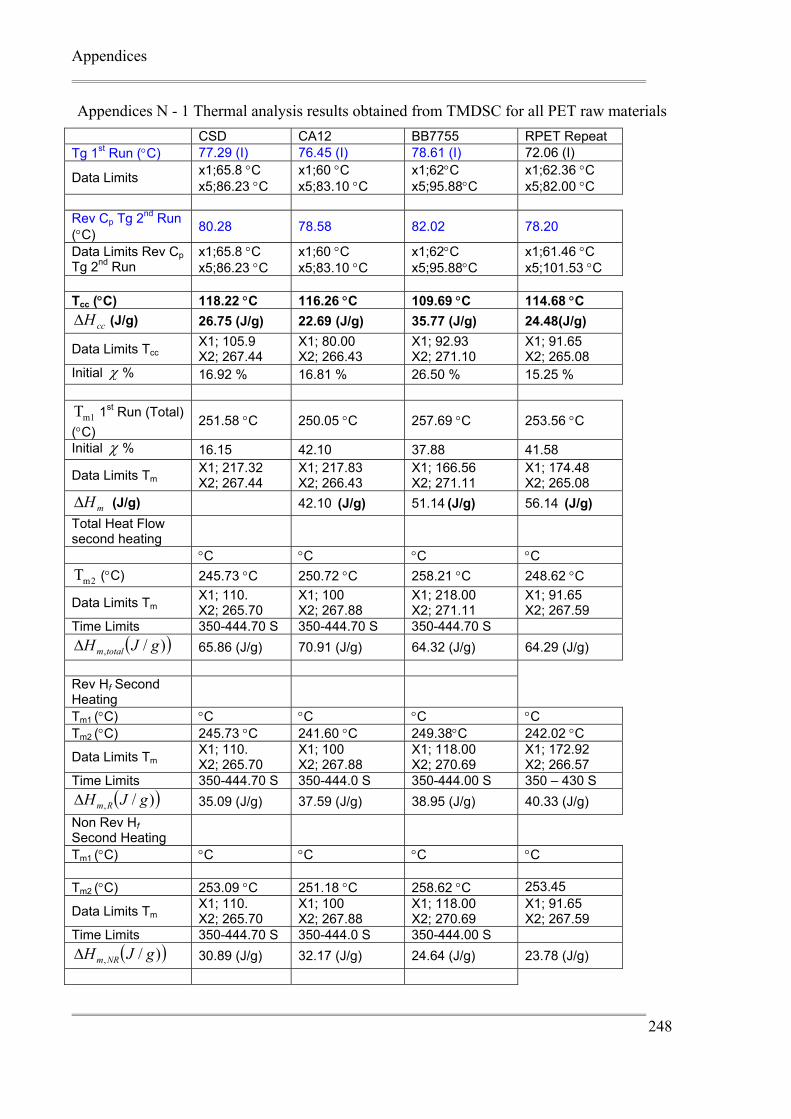
Appendices
248
Appendices N - 1 Thermal analysis results obtained from TMDSC for all PET raw materials CSD CA12 BB7755 RPET Repeat Tg 1st Run (°C) 77.29 (I) 76.45 (I) 78.61 (I) 72.06 (I)
Data Limits x1;65.8 °C x5;86.23 °C
x1;60 °C x5;83.10 °C
x1;62°C x5;95.88°C
x1;62.36 °C x5;82.00 °C
Rev Cp Tg 2nd Run (°C) 80.28 78.58 82.02 78.20
Data Limits Rev Cp Tg 2nd Run
x1;65.8 °C x5;86.23 °C
x1;60 °C x5;83.10 °C
x1;62°C x5;95.88°C
x1;61.46 °C x5;101.53 °C
Tcc (°C) 118.22 °C 116.26 °C 109.69 °C 114.68 °C
ccHΔ (J/g) 26.75 (J/g) 22.69 (J/g) 35.77 (J/g) 24.48(J/g)
Data Limits Tcc X1; 105.9 X2; 267.44
X1; 80.00 X2; 266.43
X1; 92.93 X2; 271.10
X1; 91.65 X2; 265.08
Initial χ % 16.92 % 16.81 % 26.50 % 15.25 %
m1T 1st Run (Total) (°C)
251.58 °C 250.05 °C 257.69 °C 253.56 °C
Initial χ % 16.15 42.10 37.88 41.58
Data Limits Tm X1; 217.32 X2; 267.44
X1; 217.83 X2; 266.43
X1; 166.56 X2; 271.11
X1; 174.48 X2; 265.08
mHΔ (J/g) 42.10 (J/g) 51.14 (J/g) 56.14 (J/g) Total Heat Flow second heating
°C °C °C °C 2mT (°C) 245.73 °C 250.72 °C 258.21 °C 248.62 °C
Data Limits Tm X1; 110. X2; 265.70
X1; 100 X2; 267.88
X1; 218.00 X2; 271.11
X1; 91.65 X2; 267.59
Time Limits 350-444.70 S 350-444.70 S 350-444.70 S ( ))/, gJH totalmΔ 65.86 (J/g) 70.91 (J/g) 64.32 (J/g) 64.29 (J/g)
Rev Hf Second Heating
Tm1 (°C) °C °C °C °C Tm2 (°C) 245.73 °C 241.60 °C 249.38°C 242.02 °C
Data Limits Tm X1; 110. X2; 265.70
X1; 100 X2; 267.88
X1; 118.00 X2; 270.69
X1; 172.92 X2; 266.57
Time Limits 350-444.70 S 350-444.0 S 350-444.00 S 350 – 430 S ( ))/, gJH RmΔ 35.09 (J/g) 37.59 (J/g) 38.95 (J/g) 40.33 (J/g)
Non Rev Hf Second Heating
Tm1 (°C) °C °C °C °C Tm2 (°C) 253.09 °C 251.18 °C 258.62 °C 253.45
Data Limits Tm X1; 110. X2; 265.70
X1; 100 X2; 267.88
X1; 118.00 X2; 270.69
X1; 91.65 X2; 267.59
Time Limits 350-444.70 S 350-444.0 S 350-444.00 S ( ))/, gJH NRmΔ 30.89 (J/g) 32.17 (J/g) 24.64 (J/g) 23.78 (J/g)

Appendices
249
2nd Cooling Tc 211.50 °C 200.46 °C 206.17°C 215.50
( )gJHc /Δ 54.78 (J/g) 51.26 (J/g) 59.12 (J/g) 56.32 (J/g) Initial χ % 40.58 % 37.97 % 43.80 % 40.23 % Time Limits 350-560 S 448 - 560 S 350-560 S
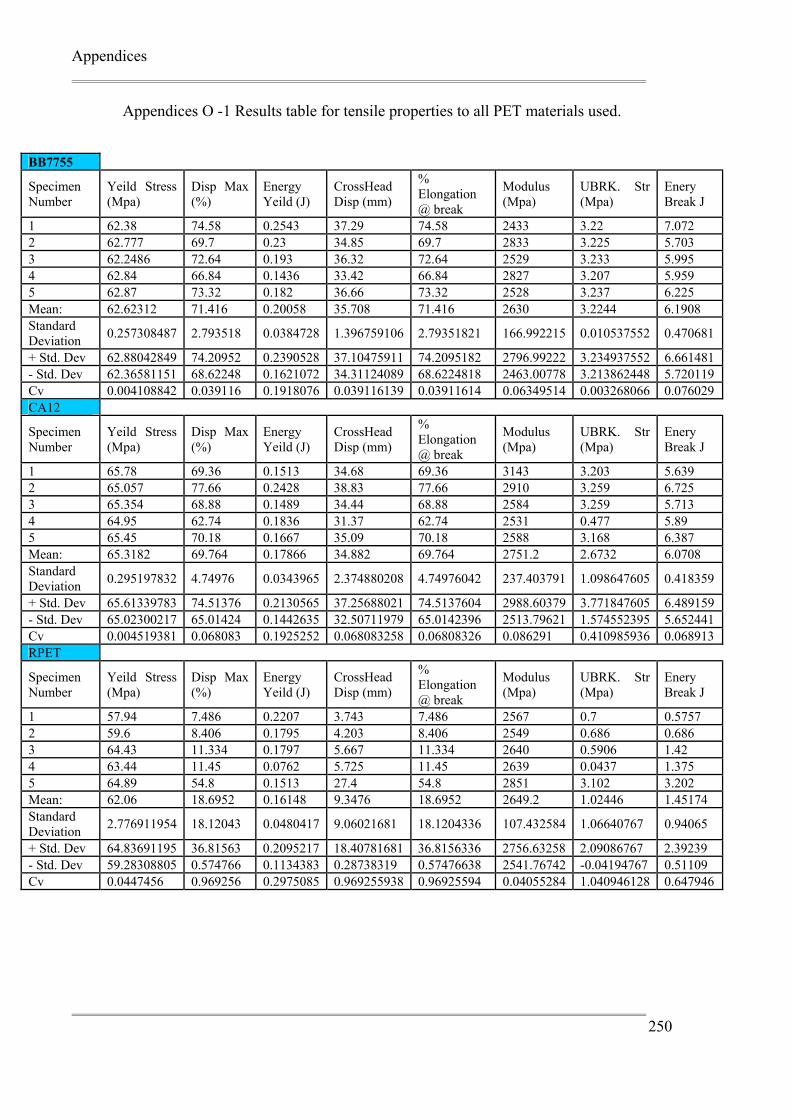
Appendices
250
Appendices O -1 Results table for tensile properties to all PET materials used.
BB7755
Specimen Number
Yeild Stress (Mpa)
Disp Max (%)
Energy Yeild (J)
CrossHead Disp (mm)
% Elongation @ break
Modulus (Mpa)
UBRK. Str (Mpa)
Enery Break J
1 62.38 74.58 0.2543 37.29 74.58 2433 3.22 7.072 2 62.777 69.7 0.23 34.85 69.7 2833 3.225 5.703 3 62.2486 72.64 0.193 36.32 72.64 2529 3.233 5.995 4 62.84 66.84 0.1436 33.42 66.84 2827 3.207 5.959 5 62.87 73.32 0.182 36.66 73.32 2528 3.237 6.225 Mean: 62.62312 71.416 0.20058 35.708 71.416 2630 3.2244 6.1908 Standard Deviation 0.257308487 2.793518 0.0384728 1.396759106 2.79351821 166.992215 0.010537552 0.470681
+ Std. Dev 62.88042849 74.20952 0.2390528 37.10475911 74.2095182 2796.99222 3.234937552 6.661481 - Std. Dev 62.36581151 68.62248 0.1621072 34.31124089 68.6224818 2463.00778 3.213862448 5.720119 Cv 0.004108842 0.039116 0.1918076 0.039116139 0.03911614 0.06349514 0.003268066 0.076029 CA12
Specimen Number
Yeild Stress (Mpa)
Disp Max (%)
Energy Yeild (J)
CrossHead Disp (mm)
% Elongation @ break
Modulus (Mpa)
UBRK. Str (Mpa)
Enery Break J
1 65.78 69.36 0.1513 34.68 69.36 3143 3.203 5.639 2 65.057 77.66 0.2428 38.83 77.66 2910 3.259 6.725 3 65.354 68.88 0.1489 34.44 68.88 2584 3.259 5.713 4 64.95 62.74 0.1836 31.37 62.74 2531 0.477 5.89 5 65.45 70.18 0.1667 35.09 70.18 2588 3.168 6.387 Mean: 65.3182 69.764 0.17866 34.882 69.764 2751.2 2.6732 6.0708 Standard Deviation 0.295197832 4.74976 0.0343965 2.374880208 4.74976042 237.403791 1.098647605 0.418359
+ Std. Dev 65.61339783 74.51376 0.2130565 37.25688021 74.5137604 2988.60379 3.771847605 6.489159 - Std. Dev 65.02300217 65.01424 0.1442635 32.50711979 65.0142396 2513.79621 1.574552395 5.652441 Cv 0.004519381 0.068083 0.1925252 0.068083258 0.06808326 0.086291 0.410985936 0.068913 RPET
Specimen Number
Yeild Stress (Mpa)
Disp Max (%)
Energy Yeild (J)
CrossHead Disp (mm)
% Elongation @ break
Modulus (Mpa)
UBRK. Str (Mpa)
Enery Break J
1 57.94 7.486 0.2207 3.743 7.486 2567 0.7 0.5757 2 59.6 8.406 0.1795 4.203 8.406 2549 0.686 0.686 3 64.43 11.334 0.1797 5.667 11.334 2640 0.5906 1.42 4 63.44 11.45 0.0762 5.725 11.45 2639 0.0437 1.375 5 64.89 54.8 0.1513 27.4 54.8 2851 3.102 3.202 Mean: 62.06 18.6952 0.16148 9.3476 18.6952 2649.2 1.02446 1.45174 Standard Deviation 2.776911954 18.12043 0.0480417 9.06021681 18.1204336 107.432584 1.06640767 0.94065
+ Std. Dev 64.83691195 36.81563 0.2095217 18.40781681 36.8156336 2756.63258 2.09086767 2.39239 - Std. Dev 59.28308805 0.574766 0.1134383 0.28738319 0.57476638 2541.76742 -0.04194767 0.51109 Cv 0.0447456 0.969256 0.2975085 0.969255938 0.96925594 0.04055284 1.040946128 0.647946
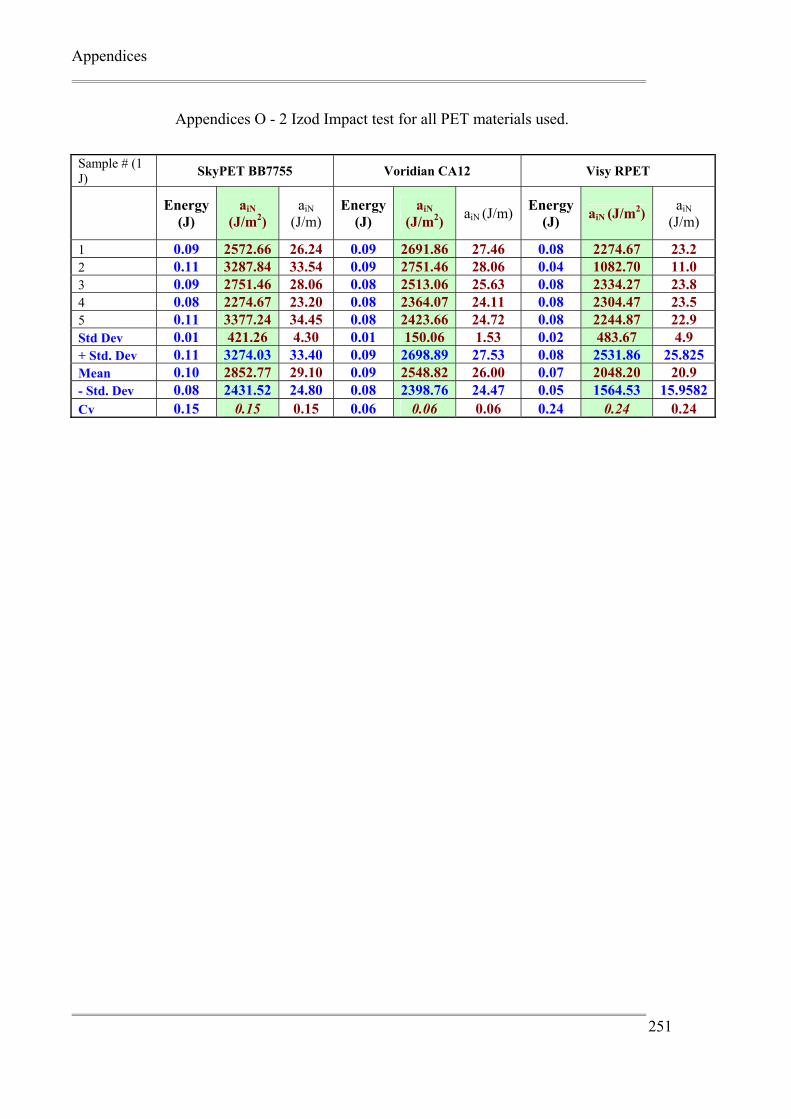
Appendices
251
Appendices O - 2 Izod Impact test for all PET materials used.
Sample # (1 J) SkyPET BB7755 Voridian CA12 Visy RPET
Energy (J)
aiN (J/m2)
aiN (J/m)
Energy (J)
aiN (J/m2) aiN (J/m) Energy
(J) aiN (J/m2) aiN (J/m)
1 0.09 2572.66 26.24 0.09 2691.86 27.46 0.08 2274.67 23.2 2 0.11 3287.84 33.54 0.09 2751.46 28.06 0.04 1082.70 11.0 3 0.09 2751.46 28.06 0.08 2513.06 25.63 0.08 2334.27 23.8 4 0.08 2274.67 23.20 0.08 2364.07 24.11 0.08 2304.47 23.5 5 0.11 3377.24 34.45 0.08 2423.66 24.72 0.08 2244.87 22.9 Std Dev 0.01 421.26 4.30 0.01 150.06 1.53 0.02 483.67 4.9 + Std. Dev 0.11 3274.03 33.40 0.09 2698.89 27.53 0.08 2531.86 25.825 Mean 0.10 2852.77 29.10 0.09 2548.82 26.00 0.07 2048.20 20.9 - Std. Dev 0.08 2431.52 24.80 0.08 2398.76 24.47 0.05 1564.53 15.9582Cv 0.15 0.15 0.15 0.06 0.06 0.06 0.24 0.24 0.24
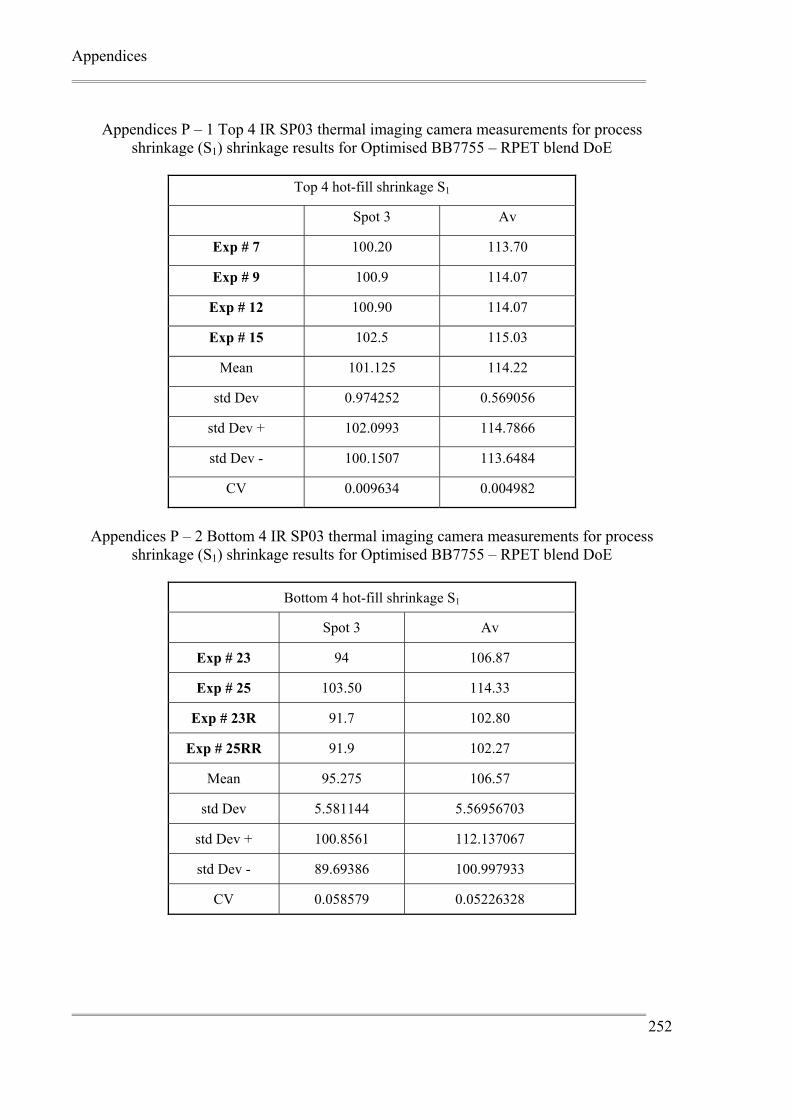
Appendices
252
Appendices P – 1 Top 4 IR SP03 thermal imaging camera measurements for process
shrinkage (S1) shrinkage results for Optimised BB7755 – RPET blend DoE
Top 4 hot-fill shrinkage S1
Spot 3 Av
Exp # 7 100.20 113.70
Exp # 9 100.9 114.07
Exp # 12 100.90 114.07
Exp # 15 102.5 115.03
Mean 101.125 114.22
std Dev 0.974252 0.569056
std Dev + 102.0993 114.7866
std Dev - 100.1507 113.6484
CV 0.009634 0.004982
Appendices P – 2 Bottom 4 IR SP03 thermal imaging camera measurements for process
shrinkage (S1) shrinkage results for Optimised BB7755 – RPET blend DoE
Bottom 4 hot-fill shrinkage S1
Spot 3 Av
Exp # 23 94 106.87
Exp # 25 103.50 114.33
Exp # 23R 91.7 102.80
Exp # 25RR 91.9 102.27
Mean 95.275 106.57
std Dev 5.581144 5.56956703
std Dev + 100.8561 112.137067
std Dev - 89.69386 100.997933
CV 0.058579 0.05226328
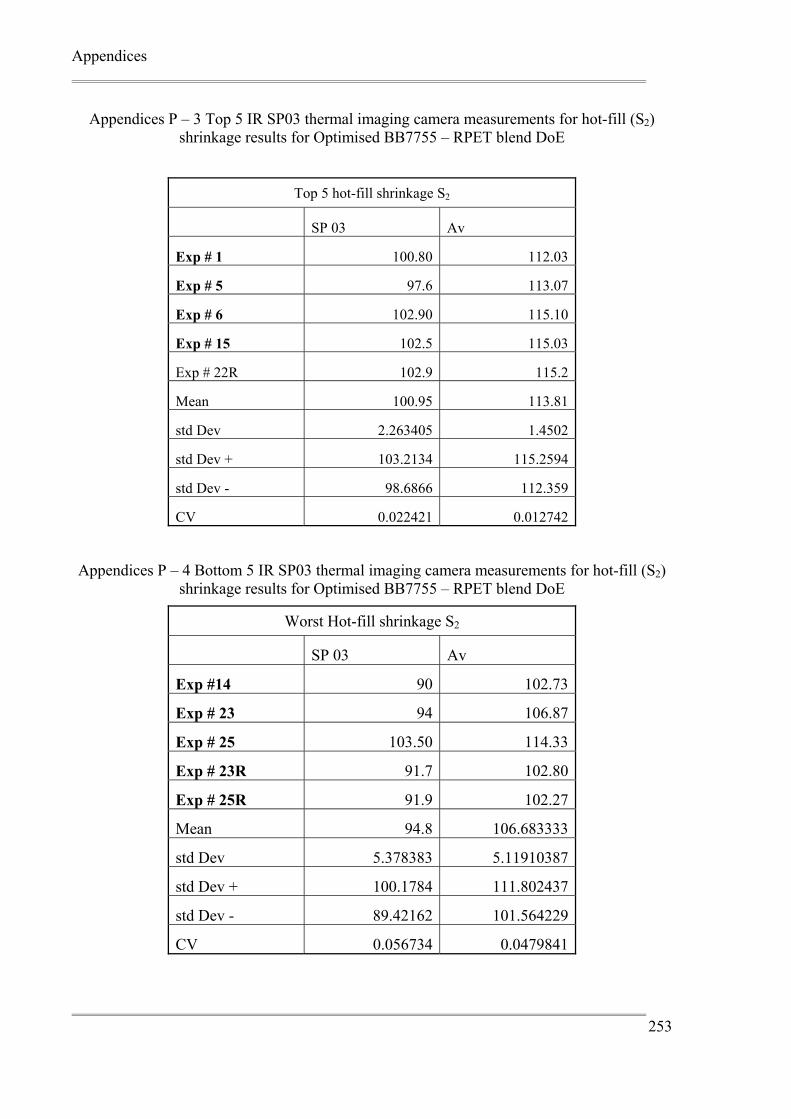
Appendices
253
Appendices P – 3 Top 5 IR SP03 thermal imaging camera measurements for hot-fill (S2) shrinkage results for Optimised BB7755 – RPET blend DoE
Top 5 hot-fill shrinkage S2
SP 03 Av
Exp # 1 100.80 112.03
Exp # 5 97.6 113.07
Exp # 6 102.90 115.10
Exp # 15 102.5 115.03
Exp # 22R 102.9 115.2
Mean 100.95 113.81
std Dev 2.263405 1.4502
std Dev + 103.2134 115.2594
std Dev - 98.6866 112.359
CV 0.022421 0.012742
Appendices P – 4 Bottom 5 IR SP03 thermal imaging camera measurements for hot-fill (S2) shrinkage results for Optimised BB7755 – RPET blend DoE
Worst Hot-fill shrinkage S2
SP 03 Av
Exp #14 90 102.73
Exp # 23 94 106.87
Exp # 25 103.50 114.33
Exp # 23R 91.7 102.80
Exp # 25R 91.9 102.27
Mean 94.8 106.683333
std Dev 5.378383 5.11910387
std Dev + 100.1784 111.802437
std Dev - 89.42162 101.564229
CV 0.056734 0.0479841
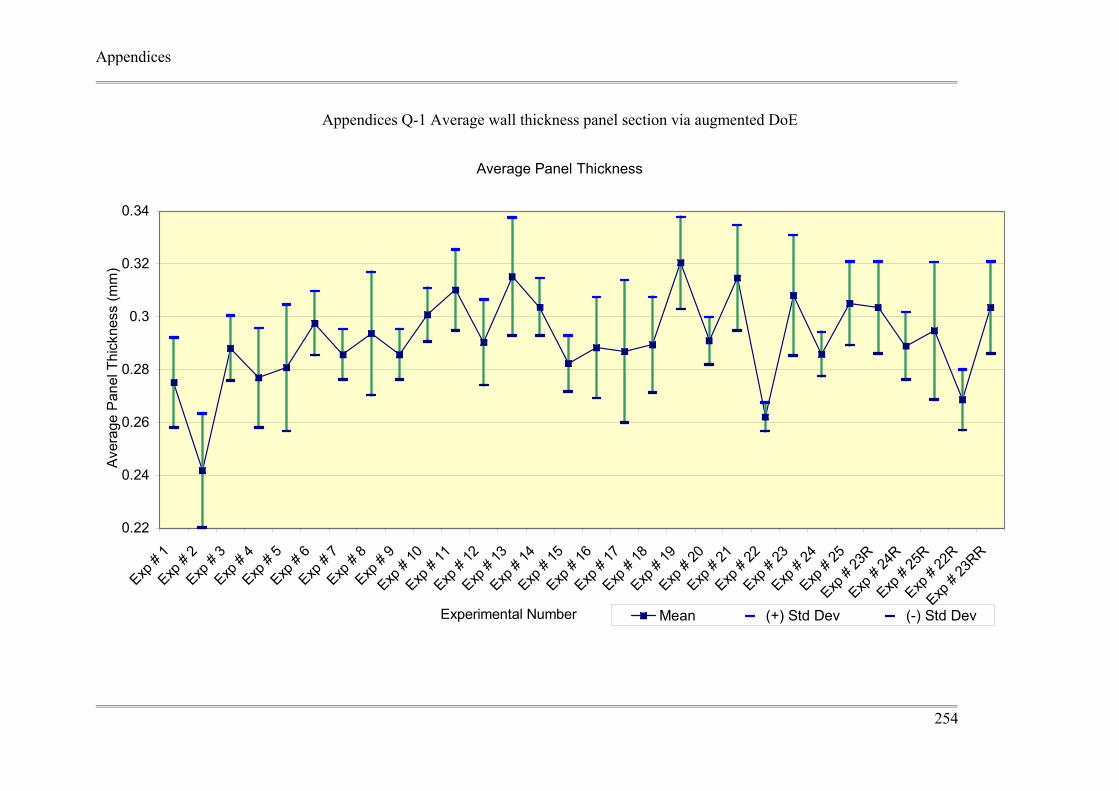
Appendices
254
Appendices Q-1 Average wall thickness panel section via augmented DoE
Average Panel Thickness
0.22
0.24
0.26
0.28
0.3
0.32
0.34
Exp #
1Exp
# 2
Exp #
3Exp
# 4
Exp #
5Exp
# 6
Exp #
7Exp
# 8
Exp #
9Exp
# 10
Exp #
11Exp
# 12
Exp #
13Exp
# 14
Exp #
15Exp
# 16
Exp #
17Exp
# 18
Exp #
19Exp
# 20
Exp #
21Exp
# 22
Exp #
23Exp
# 24
Exp #
25Exp
# 23
RExp
# 24
RExp
# 25
RExp
# 22
RExp
# 23
RR
Experimental Number
Ave
rage
Pan
el T
hick
ness
(mm
)
Mean (+) Std Dev (-) Std Dev
Related Documents