Investigation of Plasma Electrolytic Oxidation of Commercially Pure Magnesium For Biomedical Applications This dissertation is submitted in fulfilment for the degree of Doctor of Philosophy by Yonghao Gao Department of Materials Science and Engineering May 2014

Welcome message from author
This document is posted to help you gain knowledge. Please leave a comment to let me know what you think about it! Share it to your friends and learn new things together.
Transcript
Investigation of Plasma Electrolytic Oxidation of Commercially Pure Magnesium For
Biomedical Applications
This dissertation is submitted in fulfilment for the degree of Doctor of Philosophy
by
Yonghao Gao
Department of Materials Science and Engineering
May 2014

Abstract
I
Abstract
Permanently implanted biomaterials may cause problems to the host body associated
with long term chronic inflammation which would eventually require revision surgery.
The development of biodegradable materials which can be absorbed, consumed and
excreted by the patient is therefore of interest. Magnesium alloys have for a long time
been considered as potential biomaterials for load-bearing applications due to their
excellent biological properties including superior biochemical and biomechanical
compatibility compared to other alternatives such as biodegradable polymers and
bioceramics.
However, the application of magnesium material in the biological area is still limited
due to its intrinsically poor corrosion performance in the biological environments.
Therefore, various methods have been explored to control the degradation rate of
magnesium in biological fluid, of which plasma electrolytic oxidation (PEO) is the most
promising method. PEO is a plasma-assisted anodising process that can convert the
surface of magnesium into a ceramic layer, thus preventing the corrosive medium
contacting the substrate; therefore, the degradation rate can be reduced. Furthermore,
highly biocompatible coatings can be produced when appropriate electrolytes are
used in the PEO process.
Motivated by the beneficial properties of magnesium and corrosion protection
provided by the PEO technique, considerable efforts have been devoted towards the
development of magnesium implants based on PEO protection. Nevertheless, the
corrosion rate of magnesium has not been reduced to an acceptable level and a
universal PEO process appropriate for magnesium has not yet been established.
In the present study, PEO processes on commercially pure (cp) magnesium and the
resulting coating characteristics have been systematically studied. Through this
progressive study, a biologically friendly electrolyte containing Ca and P compounds
have been developed. An appropriate current regime for this electrolyte has also been
studied. Finally, a hydroxyapatite layer, intended to enhance the sample bioactivity,
was deposited on the PEO coated cp magnesium. The PEO process was studied

Abstract
II
according to key electrical characteristics including voltage transient, and
voltage/current waveforms. Scanning electron microscopy (SEM), energy dispersive
X-ray spectroscopy (EDX) and X-ray diffraction (XRD) were employed to study the
surface and cross-sectional morphology, elemental composition, phase composition
of the coatings. Residual stress induced by the PEO process is also studied using
XRD method. The corrosion properties of the coated samples in simulated body fluid
(SBF) were studied using electrochemical methods including open circuit potential
(OCP) monitoring, electrochemical impedance spectroscopy (EIS) measurement, and
potentiodynamic polarisation scans. The mechanical properties, including static
tensile properties and cyclic fatigue performance of the coated samples were also
studied to verify the applicability of magnesium in biological areas from the
mechanical point of view.
The results indicated that the combination of a pulsed unipolar (PUP) current regime
of 3000 Hz and an electrolyte composed of 12 g/l Na3PO4·12H2O and 2g/l Ca(OH)2
provides the best process stability and success of Ca and P incorporation. Moreover,
the corrosion resistance of cp magnesium in the SBF could be improved by more than
10 times. Nevertheless, such protection is very limited as the coating was degraded
rapidly in the simulated body fluid, which is due to the chemical instability of MgO at
the pH of SBF. Tensile and cyclic fatigue tests demonstrated that the PEO coated cp
magnesium possesses sufficient mechanical properties for general load-bearing
biomedical applications even though the fatigue strength is significantly deteriorated
by the surface modification. Further work required to achieve better control over the
biodegradation process of Mg implants can be outlined as follows: (i) robustness of
the developed PEO process should be explored on other corrosion resistant
magnesium alloys containing biologically friendly elements (like Ca, Zn, Mn); (ii)
addition of F-, SiO32- in the electrolyte to facilitate the formation of stable compounds
besides MgO in the PEO coating, thus reducing the degradation rate of magnesium
based implants.

Acknowledgements
III
Acknowledgements
As the Chinese proverb states: ‘A single thread cannot make a cord, nor a single tree a forest.’
This thesis would never be possible without the support and encouragement of numerous
people. Towards the end of my PhD study, it is a great opportunity here to express my sincere
gratitude to those who have contributed in various ways to the success of this thesis.
I would like to express my great appreciation to the UK department for Business, Innovation
and Skills (BIS) and the Chinese Scholarship Council (CSC) for their joint financial support for
my PhD study, without which my study in the UK was impossible.
I would like to send my sincerest thanks to my supervisors, Dr. Aleksey Yerokhin and
Professor Allan Matthews. Their patience and encouragement have been the main
motivations during my PhD study. With their immense knowledge and strict research attitude,
they have been providing insightful discussion and suggestions about the research.
Financial support provided by Dr Yerokhin and Professor Matthews is also greatly
appreciated.
I am also grateful to Dr Adrian Leyland and Dr Russell Goodall, as my annual progress
examiners, they successfully turned the annual examination process into a process of free
and fruitful discussion on my research project. Help from members of the Research Centre in
Surface Engineering (Dr Po-Jen Chu, Dr Chen-Jui Liang, Dr Heqing Li, Dr Omoniyi Fasuba,
Mr Alan Jarvis, Miss Wing Kiu Yeung, Mrs Josephine Lawal, Mrs Fahima Indeir and Dr Alison
Beck) is also greatly appreciated.
My sincere thanks also goes to my friends (Junheng Gao, Feng Qian, Zhihong Chen,
Xingguang Liu, Chang Liu, Lian Liu, Ming Sun, Dikai Guan, Peng Gong, Zhilun Lu), not only
for the help they provided, but also and more importantly for the fun they brought into my life.
Special appreciation is sent to my parents and girlfriend Sihui Wang for being proud of me
and supporting me spiritually.
Yonghao Gao
University of Sheffield
May 2014

Table of Contents
IV
Table of Contents
Abstract ································ ································ ································ ············ I
Acknowledgements································ ································ ····························· III
Table of Contents ································ ································ ······························ IV
Figure Captions ································ ································ ······························· VIII
Table Captions ································ ································ ································ XII
Acronyms and Abbreviations································ ································ ··············· XIII
Chapter 1 Introduction ································ ································ ························· 1
1.1 Background ································ ································ ······························ 1
1.2 Aim and Objectives ································ ································ ····················· 2
1.3 Thesis Overview ································ ································ ························ 2
Chapter 2 Magnesium as a Biomaterial ································ ································ ··· 5
2.1 A Brief History of Biomaterials ································ ································ ······· 5
2.2 The State-of-the-Art in Biomaterials ································ ································ 6
2.3 Biodegradable Magnesium Alloys ································ ································ ·· 8
2.3.1 Advantages of Magnesium Biomaterials ································ ····················· 9
2.3.2 Disadvantages of Magnesium Biomaterials ································ ················ 11
2.3.3 Methods to Improve Corrosion Resistance of Magnesium Alloys····················· 13
Chapter 3 Introduction to Plasma Electrolytic Oxidation ································ ············· 17
3.1 State-of-the-art Research Activity on PEO································ ······················· 17
3.1.1 General Characteristics of PEO Treatment ································ ················ 17
3.1.2 Effect of Current Regime on the PEO Process ································ ············ 19
3.1.3 Effect of Electrolyte ································ ································ ·············· 23
3.1.4 Effect of Substrate Type ································ ································ ········ 23
3.1.5 Effect of Treatment Time ································ ································ ······· 24
3.2 Coating Formation Mechanisms································ ································ ···· 25
3.2.1 Electrical Transients ································ ································ ············· 25
3.2.2 Discharge Events Evaluation ································ ································ ·· 27
3.3 PEO Treatment of Magnesium for Biomedical Applications ································ · 28
3.3.1 PEO Treatments of Mg Alloys ································ ································ · 28
3.3.2 Production of Bioactive PEO Coatings on Mg Alloys ································ ···· 31
Chapter 4 Experimental Procedures ································ ································ ······ 34
4.1 PEO Coating Unit ································ ································ ······················ 34
4.2 Mg Substrate Preparation ································ ································ ············ 35

Table of Contents
V
4.3 Electrolyte Preparation ································ ································ ··············· 35
4.4 Hydroxyapatite Deposition ································ ································ ··········· 36
4.5 Coating Morphology Characterisation ································ ···························· 37
4.5.1 Coating Thickness Measurements ································ ··························· 37
4.5.2 Coating Morphology Observation by Scanning Electron Microscopy ················ 37
4.5.3 Coating Phase Characterisation by XRD ································ ··················· 38
4.5.4 Residual Stress of the Coatings by XRD ································ ··················· 39
4.6 In vitro Electrochemical Corrosion Evaluation ································ ·················· 40
4.7 Evaluation of Mechanical Properties of the PEO Coated Magnesium ···················· 45
4.7.1 Tensile Property Characterisation ································ ···························· 45
4.7.2 Fatigue Property Characterisation ································ ···························· 46
4.8 Summary ································ ································ ································ · 47
Chapter 5 Effects of Electrolyte on PEO Treatment of Commercially Pure Magnesium ······ 48
5.1 Coating Fabrication ································ ································ ···················· 48
5.2 Characteristics of PEO Process ································ ································ ···· 49
5.3 Coating Morphology ································ ································ ··················· 53
5.4 Surface Chemical and Phase Composition ································ ······················ 58
5.5 Corrosion Evaluation ································ ································ ·················· 59
5.5.1 Electrochemical Impedance Spectroscopy ································ ················· 59
5.5.2 Potentiodynamic Polarisation Evaluation ································ ··················· 66
5.6 Summary ································ ································ ································ · 69
Chapter 6 Effects of Pulse Frequency on PEO treatment of cp-Mg for Biomedical Application ································ ································ ································ ····················· 71
6.1 Coating Fabrication ································ ································ ···················· 71
6.2 Characteristics of PEO Process ································ ································ ···· 71
6.3 Coating Thickness Evaluation ································ ································ ······ 78
6.4 Coating Chemical and Phase Composition ································ ······················ 79
6.5 Coating Morphology ································ ································ ··················· 82
6.6 Residual Stress Characterisation ································ ································ ·· 86
6.7 Electrochemical Corrosion Evaluation ································ ···························· 88
6.7.1 Open Circuit Potential Evolution ································ ······························ 88
6.7.1 Electrochemical Impedance Spectroscopy ································ ················· 88
6.7.2 Potentiodynamic Polarisation Evaluation ································ ··················· 94
6.7.3 Corrosion Morphology Analysis ································ ······························· 95
6.8 Summary ································ ································ ······························· 100
Table of Contents
VI
Chapter 7 Effects of Negative Pulsing on PEO Treatment of Commercially Pure Magnesium ································ ································ ································ ··················· 102
7.1 Coating Fabrication ································ ································ ·················· 102
7.2 PEO Process Characterisation ································ ································ ··· 103
7.3 Coating Morphologies ································ ································ ·············· 105
7.4 Chemical and Phase Composition of the Coatings ································ ·········· 107
7.5 Electrochemical Corrosion Evaluation ································ ·························· 110
7.5.1 Open Circuit Potential ································ ································ ········· 110
7.5.2 Electrochemical Impedance Spectroscopy ································ ··············· 112
7.5.3 Potentiodynamic Polarisation Evaluation ································ ················· 118
7.5.4 Corroded Surface Appearance ································ ······························ 122
7.6 Summary ································ ································ ······························· 123
Chapter 8 Effects of Hydroxyapatite Coating on in vitro Corrosion Performance of PEO Coated Magnesium································ ································ ·························· 125
8.1 Coating Fabrication ································ ································ ·················· 125
8.2 Characterisation of Surface Treatment Processes ································ ·········· 126
8.3 Coating Morphology and Structure Characterisation ································ ········ 126
8.4 Electrochemical Corrosion Evaluation ································ ·························· 131
8.4.1 Open Circuit Potential ································ ································ ········· 131
8.4.2 EIS Analysis ································ ································ ····················· 132
8.4.3 Potendiodynamic Polarisation Evaluation ································ ················ 137
8.4.4 Corroded Surface Morphology ································ ······························ 138
8.5 Discussion ································ ································ ····························· 140
8.5.1 Coating Evolution in Each Stage of the PEO process ································ · 140
8.5.2 Mechanisms Underlying HA Deposition ································ ··················· 142
8.5.3 Mechanisms underlying in Vitro Electrochemical Corrosion Behaviour ··········· 143
8.6 Summary ································ ································ ······························· 151
Chapter 9 Mechanical Properties of cp Magnesium with Duplex Hydroxyapatite and PEO Coatings ································ ································ ································ ······· 152
9.1 Experimental Procedure ································ ································ ············ 152
9.2 Potential Transient during CED Treatment ································ ···················· 153
9.3. Coating Morphology ································ ································ ················ 154
9.4. Tensile Mechanical Properties ································ ································ ··· 158
9.5. Fatigue Properties ································ ································ ·················· 165
9.6. Summary ································ ································ ······························ 172
Conclusions and Perspectives ································ ································ ············ 174

Table of Contents
VII
Conclusions ································ ································ ································ 174
Future Work ································ ································ ································ 176
References ································ ································ ································ ···· 178
Appendix A Calculation of stress distribution in the fatigue test ································ ·· 184
Appendix B Research activities during PhD study ································ ··················· 186
Conference Attendance ································ ································ ················· 186
Paper Publications ································ ································ ························ 186
Paper Prepared ································ ································ ··························· 186

Figure Captions
VIII
Figure Captions
Figure 2-1 Schematic diagrams of artificial hip joint (left) and knee implant (right) [18] ········ 7 Figure 2-2 Annual publications yield for the past ten years on research of magnesium and its
alloys as well as stainless steel as biomaterials [27] ································ ············· 9 Figure 2-3 Pourbaix diagram of magnesium in water at 25 oC [45] ································ 12 Figure 2-4 Average hydrogen evolution rates of various magnesium alloys (a) [47] and the
accumulation of the hydrogen gas around magnesium implant (b) [39] ···················· 13 Figure 3-1 Schematic Illustration of the PEO process ································ ················ 17 Figure 3-2 Typical porous morphology of coating produced on AM50 magnesium alloy in
Na3PO4 and KOH electrolyte by pulsed unipolar current PEO treatment, the coating thickness is about 37 µm [69]. ································ ································ ········ 19
Figure 3-3 Major electric waveforms utilised in the PEO process, (a) DC, (b) AC , (c) pulsed unipolar (PUP), (d) pulsed bipolar (PBP) and (e) modified PBP current regime. ········· 20
Figure 3-4 Surface morphology of PEO coatings produced on ZM5 magnesium alloy in an electrolyte composed of 0.018 M NaOH + 0.016 M (NaPO3)6 + 0.19 M NaF at 2 A/dm2 at different frequencies (a) and (c) 100 Hz; (b) and (d) 800 Hz for various processing time 60 min (a and b) and 100 min (c and d). Adapted from [97] ································ ··· 22
Figure 3-5 (a) Linear [112] and (b) non-linear growth [113] of the PEO coating with processing time ································ ································ ································ ·········· 25
Figure 3-6 Voltage transient recorded during the PEO treatment of 6082 aluminium alloy the treatment is conducted in 1 g/l KOH electrolyte with current density of 467 A∙m2. Figure is reproduced from [124]. (a) and identification of different PEO stages based on voltage transient (b) ································ ································ ······························· 26
Figure 3-7 Evolution of discharge events with PEO treatment of AA5754 Al alloy in the electrolyte of Na2SiO3 and KOH at a current density of 100 mA/cm2, (a) 5 s, (b) 60 s, · 27
Figure 3-8 Micro CT images of implanted ZX50 pins with and without PEO coatings after different periods of implantation. The PEO coating was produced at constant current density of 14 mA/cm2.The picture is reproduced from reference [135] ······················ 31
Figure 4-1 Schematic diagrams showing dimensions of cp-Mg disc (a) and connecting aluminium rod (b) used in the PEO treatment ································ ····················· 36
Figure 4-2 Schematic illustration of XRD principle (the black dots represent atoms) ········· 39 Figure 4-3 Schematic illustration of potentiodynamic polarisation curve analysis using Tafel
extrapolation ································ ································ ······························ 42 Figure 4-4 Schematic illustration of the plane three-electrode cell used for the electrochemical
corrosion evaluation ································ ································ ····················· 44 Figure 4-5 A drawing of the sample used for tensile experiment ································ ··· 46 Figure 4-6 A drawing of the sample used for fatigue tests ································ ··········· 46 Figure 4-7 Schematic illustration of the rotating bending fatigue test operation ················ 47 Figure 4-8 Illustration of the dynamic stress imposed on the samples during fatigue tests ·· 47 Figure 5-1 Voltage vs. time response for PEO treatments at different current densities
(mA·cm2) (a,b) and current variation at 70 V (c) within: (a) base electrolyte; (b) calcium modified electrolyte and (c) nitrate-modified electrolyte ································ ········ 51
Figure 5-2 SEM surface morphologies of PEO coatings produced in the base electrolyte at current densities (mA/cm2) of : (a) 30, (b) 40 and (c) 50································ ········ 54
Figure 5-3 SEM surface morphologiies of PEO coatings produced in the calcium modified electrolyte at current densities (mA/cm2) of: (a) 30, (b) 40 and (c) 50 ······················· 55
Figure 5-4 SEM morphologies of PEO coatings produced in the nitrate modified electrolyte at the voltage of: (a) 70 V, (b) 70 V+ 80 V, (c) 80 V and (d) 90 V/0.5 min ····················· 56
Figure 5-5 Cross-sectional morphologies of PEO coatings obtained at different current densities in: (A) base electrolyte, (B) Calcium-modified electrolyte and (C) Nitrate-modified electrolyte ································ ································ ············ 56
Figure Captions
IX
Figure 5-6 Coating thickness evolution with applied (a) current density in base and calcium- modified electrolyte and (b) voltage amplitude in nitrate-modified electrolyte ············· 57
Figure 5-7 Typical EDX spectra of PEO coatings obtained with different process parameters in (a) base and calcium-modified electrolyte and (b) nitrate-modified electrolyte········· 58
Figure 5-8 X-ray diffraction of cp-Mg samples PEO coated in: (a) base, (b) calcium-modified and (c) nitrate-modified electrolyte ································ ································ ··· 61
Figure 5-9 EIS analysis of PEO coatings obtained in the base electrolyte at different current densities: (a) complex plot, (b) Bode plots, (c) equivalent circuit for coating A1 and (d) equivalent circuit for coatings A2 and A3. The solid lines in the figure represent the fitting results ································ ································ ································ ······· 62
Figure 5-10 EIS analysis of coatings obtained in the calcium-modified electrolyte at different current densities: (a) complex plot, (b) Bode plots, and (c) equivalent circuit for coating B2 ································ ································ ································ ············ 63
Figure 5-11 EIS analysis of PEO coatings obtained in the nitrate-modified electrolyte at different voltages (a) and (b) complex plots and (c) Bode plots ······························ 64
Figure 5-12 Potentiodynamic polarisation curves of cp-Mg samples with PEO coatings obtained in different electrolytes: (a) base, (b) calcium-modified and (c) nitrate-modified electrolyte ································ ································ ································ ·· 67
Figure 6-1 Voltage vs. time response for PUP-PEO treatments at different frequencies ····· 72 Figure 6-2 Typical electrical waveforms collected during PEO process at 3000 Hz ··········· 74 Figure 6-3 Voltage waveforms collected at different pulse frequencies with fitting results by
solid lines: (a) 100 Hz, (b) 2000 Hz and (c) 3000 Hz ································ ············ 76 Figure 6-4 Relaxation time constants derived from voltage waveforms and final coating
residual stress at different pulse frequencies ································ ····················· 77 Figure 6-5 Dependence of PUP-PEO coating thickness produced on cp Mg at various pulse
frequencies ································ ································ ································ 79 Figure 6-6 Correlation between the final voltage and coating thickness of the PUP-PEO
coatings produced at various frequencies ································ ························· 79 Figure 6-7 Representative EDX spectrum of the PUP-PEO coating produced at 3000 Hz ·· 80 Figure 6-8 XRD patterns of the coatings produced at different frequencies ····················· 81 Figure 6-9 Dependence of MgO crystallite size on the current pulse frequency in the
PUP-PEO processes ································ ································ ···················· 82 Figure 6-10 Surface morphologies of PUP-PEO coatings produced at different frequencies83 Figure 6-11 Dependence of average pore size in the PEO coatings on the pulse frequency 84 Figure 6-12 Pore size distributions of the PUP-PEO coatings produced at different
frequencies ································ ································ ································ 85 Figure 6-13 Cross sectional morphologies of PUP-PEO coatings produced at different
frequencies ································ ································ ································ 86 Figure 6-14 Open Circuit Potential Evolution of cp Mg with PUP-PEO coatings produced at
various pulse frequencies in the SBF at 37 oC ································ ···················· 89 Figure 6-15 Impedance spectra of the PUP-PEO coated samples in SBF:(a) Complex plots
and (b) Bode Plots ································ ································ ······················· 93 Figure 6-16 Typical K-K transformation of the real and imaginary components of the EIS
collected after 1 hour in vitro immersion of the PEO coating produced at 3000 Hz, the solid lines represents the calculated results ································ ······················· 94
Figure 6-17 Equivalent circuits used to represent the EIS diagram of magnesium shown in Figure 6-15 ································ ································ ································ 94
Figure 6-18 Potentiodynamic polarisation behaviour of cp-Mg samples with PUP-PEO coatings produced at different pulse frequencies after 3 hours’ immersion in SBF ······ 97
Figure 6-19 Surface morphologies of PEO coated samples after potentiodynamic polarisation tests ································ ································ ································ ········· 98
Figure 6-20 Different Corrosion Morphologies of the PEO coatings produced at 5000Hz and corresponding chemical compositions ································ ······························ 99
Figure 7-1 Positive Voltage Transients of the (a) PUP-PEO process and PBP-PEO treatment with negative current density of (b) 10 mA/cm2 and (c) 20 mA/cm2 ························ 103
Figure Captions
X
Figure 7-2 Correlation of the PBP-PEO coating thickness with the applied negative current density ································ ································ ································ ···· 105
Figure 7-3 Appearance of the coatings formed at negative current density (a) 0 mA/cm2 and (b) 10 mA/cm2 ································ ································ ·························· 106
Figure 7-4 SEM images of the PBP-PEO coatings fabricated in the present chapter at negative current density of (a): 0 and (b) 10 mA/cm2 ································ ········· 107
Figure 7-5 Cross-sectional morphologies of the PBP-PEO coatings produced in the present chapter at negative current density of (a) 0 and (b) 10 mA/cm2 ···························· 107
Figure 7-6 Typical EDX spectrum of the coatings produced under PBP-PEO conditions ·· 108 Figure 7-7 XRD patterns of the coatings produced under PUP- and PBP current regimes in
the presented study ································ ································ ··················· 110 Figure 7-8 Open circuit potential of the cp Mg with PUP- and PBP-PEO coatings in the SBF at
37±1 oC ································ ································ ································ ···· 111 Figure 7-9 EIS spectra of the samples with PEO coatings of different current regimes in the
SBF at 37±1 oC after immersion of 2 hour (a) Complex plots and (b) Bode plots (The fitting results are represented by the solid lines) ································ ··············· 114
Figure 7-10 Potentiodynamic polarisation curves of bare cp-Mg sample and those with PUP-and PBP-PEO coatings after 3 hours’ immersion in SBF at 37±1 oC ··············· 119
Figure 7-11 Corroded surface appearance of the coatings produced at current regimes of (a) unipolar and (b) bipolar (10 mA/cm2 negative biasing) ································ ······· 122
Figure 7-12 Schematic illustration of the mechanisms underlying the formation of blisters 123 Figure 8-1 Voltage transient during the PEO treatment of the present study ·················· 127 Figure 8-2 Surface and cross-sectional morphologies of PEO coatings without (a),(b) and
with (c),(d) CED layers································ ································ ················ 127 Figure 8-3 Typical EDX spectrum from the PUP-PEO coating following CED treatment ··· 129 Figure 8-4 Elemental distribution within the duplex PEO-CED treatments ····················· 130 Figure 8-5 XRD patterns from the PEO-coated Mg samples with and without CED treatment
································ ································ ································ ············· 130 Figure 8-6 OCP evolution of the PEO coated cp Mg with and without CED treatment in SBF at
37±1 oC within the (a) 1st hour (b) 2nd hour (c) 3rd hour (d) 4th hour ························ 132 Figure 8-7 Comparison of EIS spectra for the cp Mg substrate with PEO and PEO/CED
treatments obtained after 1 hour immersion (a) complex plots, (b) impedance amplitude vs. frequency plots and (c) phase vs. frequency Bode plots ································ 134
Figure 8-8 Variation with immersion time of the impedance spectra for the PEO coating without CED treatment (a) complex plots and (b) Bode plots ······························· 135
Figure 8-9 Variation with immersion time of the impedance spectra for the PEO coating with CED treatment (a) complex plots and (b) Bode plots ································ ········· 135
Figure 8-10 Potentiodynamic polarisation curves of PEO coated cp Mg with and without CED treatment after 4 hours’ immersion in SBF ································ ······················· 137
Figure 8-11 Corrosion morphologies of the PEO coated cp-Mg. Figures (b), (c),(d) and (e) correspond to regions (B),(C),(D) and (E), respectively of Figure (a). Figure (f) shows the enlarged feature around the crack (region F) indicated in Figure (c) ······················ 139
Figure 8-12 Corrosion morphologies of the CED treated PEO coatings on Mg, with images (b) and (c) corresponding to the circled regions in (a) and image (d) to the circled region in (b) ································ ································ ································ ············· 140
Figure 8-13 Schematic illustration of the equivalent circuit proposed for the EIS analysis · 144 Figure 8-14 Variation of coating resistance (a) and capacitance (b) with immersion time ·· 147 Figure 8-15 Evolution of polarisation resistance of the PEO coated cp Mg with and without
CED treatment (a) derived from EIS diagram, and (b) the degradation of protection provided by the coatings ································ ································ ············· 148
Figure 9-1 Potential transient during the galvanostatic CED process with current density of 0.4 mA/cm2 utilised in the present study ································ ························· 153
Figure 9-2 Surface morphologies of (a),(b) PEO coating and (c),(d) PEO coating following HA deposition. ································ ································ ······························· 155
Figure 9-3 Cross sectional morphologies of PEO coatings before (a) and after (b) CED
Figure Captions
XI
treatment ································ ································ ································ · 156 Figure 9-4 XRD patterns of the PEO coated samples before and after CED treatment ···· 158 Figure 9-5 (a) Tensile curves of the samples used in the present study (a); (b) enlarged view
of the initial parts of the curves as shown in (a) ································ ················ 161 Figure 9-6 Surface of the PEO coated cp magnesium during the tensile test. (The elongation
is 7.5%) ································ ································ ································ ··· 161 Figure 9-7 Cracking patterns in the PEO coating after the tensile test ·························· 162 Figure 9-8 Macroscale fracture appearance of (a) bare magnesium and (b) PEO+CED
treated magnesium samples after tensile tests ································ ················· 163 Figure 9-9 (a) and (c) formation of interface notches during tensile tests and (b) fracture of the
sample at one of the interface notches ································ ··························· 164 Figure 9-10 Secondary electron images of tensile fracture topography of (a) (b) pure
magnesium, and (c) PEO coated sample ································ ························ 165 Figure 9-11 S-N fatigue curves of the samples studied, the point defined by the two dashed
red lines indicates the requirement on the load-bearing implants in a service life of 12 weeks based on the results published in [15, 162] ································ ············ 166
Figure 9-12 (a): Fatigue fractography analysis of the PEO+CED treated magnesium at low-cycle condition (applied stress of 40 MPa) and magnified SEM images of corresponding regions (b),(c) and (d) in (a). ································ ····················· 168
Figure 9-13 (a) Fractography analysis of the PEO+CED treated magnesium sample failed in the high cycle fatigue region (applied stress of 20 MPa); (b) crack propagation beach marks; (c) a typical crack nucleation site and (d) cracks penetrating into the substrate. ································ ································ ································ ············· 169
Figure 9-14 (a) Fatigue fractograpy analysis of the corroded sample with PEO+CED coating and (b) magnified image showing corrosion effects. (The applied external stress for the fatigue test is 15 MPa) ································ ································ ················ 170
Figure 9-15 Cross-sectional SEM images of PEO+CED treated samples after fatigue fracture: (a) 40 MPa, (b) 20 MPa and (c) fatigue cross sectional image of corroded sample with external stress of 20 MPa. ································ ································ ··········· 172
Figure A-1 Fatigue test setup ································ ································ ············· 184 Figure A-2 The bending stress distribution along the longitudinal direction with different
applied forces ································ ································ ··························· 185

Table Captions
XII
Table Captions
Table 2-1 Summary of common biomaterials in practical application [21] .............................. 8 Table 2-2 Summary of mechanical properties of metallic biomaterials [25, 26, 35, 36] ........ 10 Table 4-1 Chemical composition of cp-Mg substrate material .............................................. 35 Table 4-2 The reagents used to prepare 1L SBF ................................................................. 40 Table 5-1 Parameters of DC-PEO process used in the present study ................................. 49 Table 5-2 Summary of EDX results ..................................................................................... 59 Table 5-3 Results of EIS data fitting by equivalent circuits presented in Figures 5-9, 5-10 and
5-11 .............................................................................................................................. 66 Table 5-4 Results of potentiodynamic data analysis of PEO coated and uncoated cp-Mg
samples and equivalent thickness loss (after 12 weeks in service) converted by Faraday’s law ............................................................................................................... 69
Table 6-1 Corresponding fitting parameter values for the recorded voltage decay ............... 75 Table 6-2 Chemical composition of the PUP-PEO coatings produced at varies pulse
frequencies .................................................................................................................. 80 Table 6-3 .Results of EIS data fitting by equivalent circuits presented in Figure 6-15 .......... 96 Table 7-1 Chemical composition of the PUP- and PBP-PEO coatings with different negative
current densities......................................................................................................... 109 Table 7-2 Fitting results for impedance spectra of the PUP- and PBP-PEO coated samples
shown in Figure 7-9 ................................................................................................... 118 Table 7-3 Results of potentiodynamic polarisation curves analysis for cp-Mg with and without
coatings ..................................................................................................................... 120 Table 8-1 Elemental composition of the PUP-PEO coatings with and without CED treatment
identified by EDX (at.%) ............................................................................................. 129 Table 8-2 Chemical composition of different regions in the corroded samples identified by
EDX ........................................................................................................................... 141 Table 8-3 Results of EIS data fitting by equivalent circuit presented in Figure 6-17 .......... 146 Table 9-1 Summary of tensile mechanical properties of the samples ................................ 162

Acronyms and Symbols
XIII
Acronyms and Abbreviations
cp Commercially pure PEO Plasma electrolytic oxidation PVD Physical vapour deposition CED Cathodic electrodeposition SE Secondary electron AC Alternating current PUP Pulsed unipolar PBP Pulsed bipolar HA Hydroxyapatite SBF Simulated body fluid XRD X-ray diffraction SEM Scanning electron microscopy EDX Energy dispersive X-ray spectroscopy SCE Saturated calomel electrode OCP Open Circuit Potential W Warburg element ICP Inductance Coupled Plasma OES Optical Emission Spectroscopy CPE Constant phase element EIS Electrochemical Impedance Spectroscopy

Acronyms and Symbols
XIV
Symbols
Symbols Meaning Units
ψ Tilt angle degree λ X-ray wavelength nm θ Diffraction angle degree f Frequency Hz τ Time constant μs F Faraday constant C/mol δ Pulse duty cycle % icorr Corrosion current density A/cm2
Ecorr Corrosion potential Volt ba Anodic Tafel slope Volt/decade bc Cathodic Tafel slope Volt/decade Rp Polarisation resistance ohm·cm2
Rct Charge transfer resistance ohm·cm2 Z Impedance ohm·cm2 j Imaginary element - ω Radial frequency radian / second 𝐶𝑒𝑓𝑓 Effective capacitance Faraday C Capacitance Faraday R Resistance ohm L Inductance Henry ε0 Permittivity of free space Faraday/meter A Area m2
D Coating Thickness μm E Young’s Modulus GPa σ Stress MPa Ra Roughness μm F Load Newton (N) W Warburg Impedance ohm·cm2 𝜎𝑌 Yielding strength MPa 𝜎𝑈𝑇𝑆 Ultimate strength MPa

Chapter 1 Introduction
1
Chapter 1 Introduction
1.1 Background
Magnesium and its alloys are considered promising biomaterials due to their good
biocompatibility and mechanical properties. However, the application of magnesium alloys in
the biomedical sector is hindered because of their poor corrosion performance in the
corrosive physiological environment. Fortunately, plasma electrolytic oxidation (PEO) (also
known as micro-arc oxidation (MAO) or spark anodising) has provided an effective means to
reduce the corrosion rate of magnesium by converting its surface into a barrier oxide ceramic
layer. Such conversion occurs on the surfaces of anodically polarised valve metals with the
assistance of plasma discharge events. PEO treatments are usually conducted in an
apparatus composed of a conventional electrolytic cell and a power supply with high voltage
output. By applying high voltage/current between the anode (the component to be treated)
and the cathode made of a noble metal (usually stainless steel), a ceramic coating is formed.
The PEO process and the final coating characteristics are highly dependent on several
factors, including the electrolyte composition, substrate material, power supply regime and
even the geometry of the electrolytic cell. It should be born in mind that these factors are
essentially interdependent, making the process quite complex.
The PEO technique has been attracting extensive interest as it could provide significant
advantages from two aspects: the process itself and the coating properties. Besides low
capital cost, the PEO process is flexible and there is almost no limitation on the shape and
size of the components made of valve metals (Mg, Al, Ti, Zr). Moreover, the PEO process
allows utilising of non-toxic compounds, thus can be considered as an environmentally
friendly technique compared with other coating processes like conversion treatments. The
coatings produced by this technique can possess a wide thickness range, providing wear and
corrosion protection to the substrate. Other protective, decorative as well as multifunctional
coatings could also be produced by adjusting the process parameters.
Recently, the application of PEO techniques has been expanded into the biomedical area. In
vivo studies have proven that porous PEO coatings are able to stimulate the regeneration of
bone tissue. In addition, considering the good biocompatibility of magnesium alloys,
Chapter 1 Introduction
2
significant research effort has been devoted towards development of magnesium based
biomaterials with their degradation rate being controlled using PEO technique. The bioactivity
of the magnesium based implants can also be enhanced by incorporating Ca and P into the
PEO coatings [1]. However, in the existing publications, PEO coatings are mainly produced in
Ca-free electrolyte, which makes the formation of Ca containing PEO coating impossible. The
possibility of Ca and P incorporation in the PEO coating has been investigated in some
preliminary work [2, 3]. Nevertheless, this work is mainly focused on producing coatings and
characterise their properties and the results have not always been satisfactory. For the
purpose of practical application (reduced degradation rate and enhanced bioactivity),
systematic study of the PEO process on magnesium substrate is absolutely necessary.
1.2 Aim and Objectives
The main objective of this project is to facilitate development of novel biodegradable
magnesium alloy implants with the degradation rate controlled and the bioactivity enhanced
by PEO-based coatings. This involves optimisation of PEO process parameters including
electrolyte composition and current regime as well as development of appropriate post
treatments. Upon the completion of the research at this stage, the following progressive
objectives are intended to be achieved:
(i) A Ca- and P- containing electrolyte is to be developed to meet the prerequisite of
producing bioactive PEO coating;
(ii) A current regime suitable for the developed electrolyte in (i), without compromising the
PEO process stability, is to be explored;
(iii) A suitable post treatment capable of producing hydroxyapatite on the PEO coated cp
Mg is to be studied;
(iv) The corrosion process in the simulated body fluid of the surface engineered cp Mg
using the parameters developed through (i) to (iii) will be discussed;
(v) Mechanical applicability of the surface engineered Mg biomaterials is to be studied.
1.3 Thesis Overview
In order to meet the above mentioned objectives, various studies are included in this work,
which is distributed into the various chapters of this thesis.
Chapter 2 reviews the history of biomaterials development and explains why magnesium is
Chapter 1 Introduction
3
considered as a prospective biomaterial from the historical viewpoint. The advantages and
disadvantages of magnesium-based biomaterials are reviewed.
Chapter 3 provides a brief review of the background literature on the PEO technique,
including essential details of the coating formation process with emphasis on the effects of
electrolyte, current regimes (DC or unipolar/bipolar pulsed DC) on the process
phenomenology and resulting coating characteristics.
Chapter 4 describes the experimental equipment and procedures utilised in the present work
with principles of each method briefly explained. The experimental methods used here
include specimen preparation, plasma electrolytic oxidation process, coating thickness
measurement, SEM and EDX analysis, XRD phase and residual stress analysis. The
corrosion performance of the coatings is studied using in vitro electrochemical methods, while
static tensile tests and cyclic fatigue experiments are conducted to evaluate the mechanical
properties of the coated samples.
Chapter 5 introduces the effects of electrolyte composition and DC current density amplitude
on the PEO process stability and final coating properties. The coatings produced in a
conventional electrolyte are compared with those produced in novel calcium containing
electrolyte. The optimised electrolyte and DC current density is selected based on PEO
process stability and final coating performance in a simulated physiological environment.
Chapter 6 discusses the effects of pulsing frequency on the PEO coatings produced using
pulsed unipolar PEO process (PUP-PEO coatings) by comparing the coatings produced over
a frequency range of 100 Hz upto 5000 Hz. The PEO process is studied by numerical
analysis of the current and voltage waveforms during the PEO process. Residual stress
within the PEO coating is characterised using the XRD sin2ψ method. The relationship
between the PEO process characteristics, residual stress within the coating and final coating
corrosion performance is addressed.
Chapter 7 compares the coatings produced in the pulsed unipolar (PUP) and pulsed bipolar
(PBP) DC current regime with adjusted negative biasing amplitude. It concludes that for the
studied electrolyte and Mg combination, the introduction of negative biasing could deteriorate
the coating morphology and properties due to hydrogen liberation during the negative
biasing.
Chapter 1 Introduction
4
Chapter 8 successfully applies an external hydroxyapatite (HA) layer on the surface of a
PEO coating using electrodeposition (CED) methods. The pores within the PEO coating are
partially sealed with the HA layer and the corrosion properties of the PEO coating are
moderately enhanced. The degradation of the coatings in the SBF at 37±1 oC is carefully
studied through the comparison of EIS spectra with different immersion periods, it is found
that the coatings could only provide temporary corrosion protection. By study of the corroded
morphologies, different stages of the corrosion process are identified.
Chapter 9 deals with the mechanical properties of the coated samples. By comparing the
static tensile properties and cyclic fatigue performance with those published in the literature,
the applicability of magnesium for biomedical application is demonstrated from a mechanical
viewpoint.
Chapter 10 provides a combined discussion based on the previous results obtained from
Chapters 5 to 9. Together with the overall conclusions of this thesis, the outlook for the
prospective of the magnesium based biomaterials is also drawn in this chapter.
Chapter 2 Magnesium as Biomaterials
5
Chapter 2 Magnesium as a Biomaterial
2.1 A Brief History of Biomaterials
A biomaterial has been defined as “a nonviable material used in a medical device, intended to
interact with biological systems” by Williams in 1987 [4]. The use of biomaterials dates far
back into ancient civilisations [5, 6], mainly driven by the desire to pursue improved life quality.
It is found that gold was used in dentistry by Chinese, Aztecs and Romans about 2500 years
ago [7]. Actually, almost all the accessible materials had been tried as biomaterials by our
ancestors; from natural non-metallic materials like wood and sea shells to metallic ones like
gold, bronze and iron. These materials were implanted in almost every part of the body from
eyes and nose to teeth and legs to restore the impaired body function or just for the purpose
of decoration. Nevertheless, early attempts at using materials in the body were hit-and-miss,
with a rather low success rate owing to the lack of knowledge in the related areas. About 150
years ago, scientists and surgeons began to systematically study the reactions between the
body and implanted materials.
The success rate of implant operations has improved significantly since the development of
aseptic surgical techniques in 1860s by British surgeon Joseph Lister [8, 9], who is believed
to be the founder of modern biomaterials. Moreover, driven by the development of materials
synthesis and processing technology, the materials accessible for biomedical applications
have increased dramatically since the beginning of the 20th century. Around the 1930s,
stainless steel and cobalt chromium alloys were introduced in the biomedical area. The first
research paper on polyethylene as a synthetic implant material was published in 1947 [10]. At
somewhat later, first totally artificial hip was successfully implanted by Charnley [11, 12] ,
which is regarded as another milestone in the history of biomaterials. Based on the early
pioneering works, the concept of biocompatibility was proposed around 1950s, after which
the research in this field had transformed from “try it out” stage to the modern designed
biomaterials era.
Gradually, surgeons began to realise that the designed implants must be able to perform the
intended functions without causing any adverse effect to the host body; this requirement is
generally called ‘biocompatibility’. At the very beginning, a material was usually considered as
Chapter 2 Magnesium as Biomaterials
6
biocompatible if no toxic effects were caused to the host body. However, more experience
has proven that even if an implant is not causing any toxic effect, it cannot be simply regarded
as biocompatible if it is seriously rejected by the host body. Therefore, a more general
definition of biocompatibility was proposed by Williams as the ability of an implant to perform
with an appropriate host response in a specific application [13].
2.2 The State-of-the-Art in Biomaterials
Progressive investigations together with advances in related subjects like biological science,
materials science and engineering, biochemistry and even gene engineering have led to the
increased availability of biomaterials, which is of significance not only in terms of elimination
of patient morbidity but also from the economic aspect. Today the biomedical devices industry
has blossomed into a huge market of about $100 billion US dollars worldwide affecting more
than 20 million patients, and an annual increase of 5-7% is expected owing to the aging
population and increased accidents [14]. A survey carried out by Lysaght [14] has shown that
about 35% of all the implants are related with the hard tissues, such as, bone replacement
and support. The growing demand as well as the huge market have been stimulating the
development of novel bone substitutions for clinical application.
To develop desirable implants for orthopaedic applications, the implant materials have to be
carefully selected. The implants must be tolerated by the host body, which is guaranteed by
their biocompatibility. As an organ supporting human body, bone is experiencing mechanical
forces of different types. Yousif [15] has investigated the biomechanical properties of femur
bone using the finite element modelling method and claims that the stress imposed on the
bone at walking is about 9.48 MPa, and the value can be as high as 35 MPa in landing from a
normal jump [16]. The fact that the bones undergo dynamic rather than static forces in most
cases has further increased the complexity of the situation. Therefore, orthopaedic implants
must possess appropriate mechanical properties to fulfil their designed functionality.
Furthermore, it is a prerequisite to make sure the implants are corrosion-resistant during their
service life, because the service environment of the implants contains corrosive species [17].
Corrosion attack may cause serious problems not only to the implant itself but also to the host
body. The mechanical integrity of the implants will be seriously deteriorated by the corrosion
process. Furthermore, the corrosion products will accumulate around the implant sites,
causing inflammatory reactions and, in the worst case, the death of the patient.

Chapter 2 Magnesium as Biomaterials
7
Figure 2-1 Schematic diagrams of artificial hip joint (left) and knee implant (right) [18]
Based on the aforementioned requirements, different types of orthopaedic devices have been
developed according to their implantation site and corresponding service environments, as
shown in Table 2-1. Currently, permanent orthopaedic implants can be made of metal alloys
(stainless steel, cobalt-base alloys and titanium-base alloys), polymers (ultrahigh molecular
weight polyethylene (UHMWPE)), ceramics (alumina (Al2O3), zirconia (Zr2O3), and
hydroxyapatite (HA)) and composites (eg Al2O3/PTFE) in clinical practice; their advantages
and limitations are summarised in Table 2-1. Sometimes, different types of materials are
utilised together in a specific case to produce improved properties. A ceramic coating may be
applied on a metallic implant to offer improved wear resistance and bioactivity while
maintaining the toughness of the base metal. Figure 2-1 schematically shows that an artificial
hip joint is usually made up of different materials, where the hip stem and metallic cup are
made of Ti-6Al-4V alloy providing the necessary mechanical strength. A ceramic coating
applied on the outer surface of the metallic cup is beneficial for the biological response of the
implants. Polymers are also utilised in the cases shown in Figure 2-1 to reduce the friction
between the metallic cup and femoral head.
Despite wide applications, these permanent implants inevitably cause problems to the host
body. Issues may arise due to the discrepancy between the elastic moduli of metallic or
ceramic implants and the natural bone. After implantation, a larger proportion of the normal
mechanical load is borne by the metallic implant because of its higher elastic modulus [19].
Correspondingly, the load imposed on the bone will be lower, and the bone will be gradually
remodelled to adopt the lower load, resulting in a weaker bone [19]. This phenomenon is
known as “stress shielding”. This effect, whereby a reduction in bone density occurs as a
result of reduction in the normal stress on the bone due to an implantation, can be reduced by

Chapter 2 Magnesium as Biomaterials
8
the implantation of a device with an elastic modulus similar to that of natural bone [20].
Although the stress shielding effect for the polymeric implants is not that significant, they do
suffer from opposite problems associated with insufficient mechanical strength. Moreover,
in the long term after implantation, implant debris are gradually released into the surrounding
tissues because of wear, leading to chronic inflammatory reactions. A revision surgery is
usually required to replace the implant when the chronic inflammation is unacceptably
significant, thus increasing the morbidity of patients as well as the costs of health care. In
some cases like a fractured bone in a young teenager, a permanent implant is not necessarily
required because of the high remodelling ability of the bones. In such cases, a temporary
implant which can be gradually dissolved, consumed and excreted on the completion of
self-healing process is usually desired. Taking these considerations into account,
development of biodegradable and bioactive materials that can stimulate the regeneration of
host tissue in contrast with the traditional bio-inert materials has become an attractive
research topic.
Table 2-1 Summary of common biomaterials in practical application [21]
Material Advantage Disadvantage Application Polymers
Nylon Ductile, Not strong Artificial ligament PTFE Light, Prone to creep Suture Polyester Easy to Fabricate Accetabular cup Silicone Vascular
Prosthesis Metals
Stainless Steel Ductile Prone to corrosion Artificial joint Cobalt Alloy Strong Unwanted release Bone plate and
screw Titanium Alloy Tough Dent root implant
Ceramics Aluminum
Oxide Bioactive Brittle Dental prosthesis
Carbon Biocompatible Weak in tension Joint prosthesis Hydroxyapitate Strong in
compression, Stiff
Fragile Orthopedic implant
2.3 Biodegradable Magnesium Alloys
The history of magnesium alloys as biomaterials dates back to 1878, when physician Edward

Chapter 2 Magnesium as Biomaterials
9
C. Huse used some magnesium wires as ligatures to stop bleeding blood vessels of three
human patients [22]. After that, numerous efforts have been devoted towards the
improvement of magnesium alloys performance in physiological environments. Magnesium
alloys have been tried as ligature wires, blood vessel anastomosis connectors, aneurysm
treatment wires, artificial joints and other applications [22]. Up to now, magnesium alloys
have been widely regarded as potential biomaterials thanks to their outstanding
biocompatibility as well as excellent mechanical properties [23-26]. Therefore, magnesium
has attracted more research attention than traditional permanent implants made of stainless
steel, as presented in Figure 2-2.
Figure 2-2 Annual publications yield for the past ten years on research of magnesium and its
alloys as well as stainless steel as biomaterials [27]
2.3.1 Advantages of Magnesium Biomaterials
The biocompatibility of magnesium alloys is much better than stainless steel, titanium and
cobalt alloys. Magnesium ions are the fourth most abundant cations in the human body and
are essential for biological function of all the living cells [28, 29]. About 30 grams magnesium
are contained in a 70-kg human body [30], and are involved in various biological processes
such as DNA repair, protein transformation, enzyme activation and cellular respiration [31]. In
addition, the presence of magnesium has been reported to be beneficial to the regeneration
and growth of bone tissue [32], making it suitable for bone fixtures. The important role of Mg
in these biological processes makes Mg deficiency a potential health risk [28]. In order to
maintain normal activity of the human body, about 420 mg magnesium per day is
recommended for an adult man and the number is 320 mg for woman by US Food and
Chapter 2 Magnesium as Biomaterials
10
Nutrition Board [33]. Moreover, extra magnesium can be excreted through urine, thus leading
to no harm to the body [29]. Actually, there are no inflammatory reactions reported in the
areas adjacent to magnesium alloy implants [34].
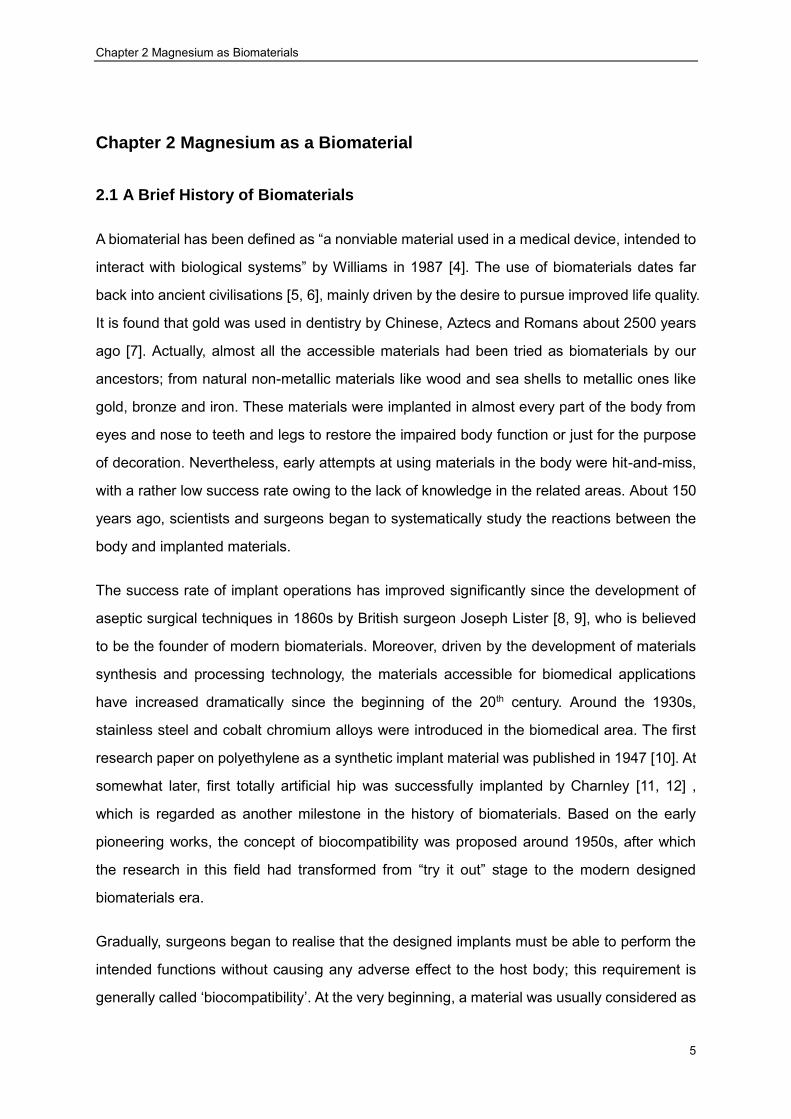
Apart from biocompatibility, mechanical properties also contribute to making magnesium
alloys ideal candidates for biomaterials. The density of magnesium alloys and nature bone
are 1.7-2.0 g/cm3 and 1.8-2.1 g/cm3 , respectively. The elastic modulus of magnesium alloys
is 41-45 GPa, much closer to that of human bone (3-20 GPa) compared with other metallic
biomaterials (Table 2-2). So the risk of stress shielding effects from implanted magnesium
alloys can be greatly reduced compared with their titanium, cobalt, and stainless steel
counterparts [19]. Although the static mechanical strength of magnesium is usually much
lower than the conventional metallic biomaterials, it is still sufficient for the application in the
human body. For example, the compressive strength of AZ31 alloy varies from 110 MPa to
about 189 MPa depending on the deformation procedure and following heat treatment, which
is closer to that of natural bone (160-240 MPa) compared with other metallic implants.
Table 2-2 Summary of mechanical properties of metallic biomaterials [25, 26, 35, 36]
Materials/Tissue Density /(g/cm3)
Elastic Modulus/GPa
Compressive Yield Strength/MPa
Tensile Strength/MPa
Cortical Bone 1.8-2.0 5-23 164-240 35-283 Ti6Al4V 4.4-4.5 110-117 758-1117 830-1025 Stainless Steel 7.9-8.1 189-205 170-310 480-620 Co-Cr Alloy 8.3-9.2 230 450-1000 1000 Mg Alloy 1.74-2.0 41-45 65-100 125-135
Stimulated by their outstanding properties, various magnesium alloys have been studied for
medical applications. The current studies have been focused on several aspects. The
biomedical performance of industrial commercialised magnesium alloys has been studied
both in vitro and in vivo. Cortical bone screws made of commercial AZ31 alloy were implanted
into hip-bones of sheep by Ozgur [37]; it was found that the bone tissue regeneration ability is
enhanced by the implants. Improved cytocompatibility and cell growth has been claimed by
Witecka et al when AZ91 alloy was investigated in vitro [38]. Similar results have been
published by Witte [39] in his comparative study on the in vivo biological response of AZ31,
AZ91, WE43, LAE442 alloys. Developments of biodegradable materials from commercial

Chapter 2 Magnesium as Biomaterials
11
magnesium alloys are facilitated by their vast availability. However, the biomedical application
of these commercial alloys is rather controversial because of the content of biologically toxic
elements in these alloys. Therefore, novel alloys containing biologically friendly elements
have been widely studied. Due to their non-toxicity in the human body, Zn, Ca and Mn have
been suggested as promising alloying elements to develop biomedical magnesium alloys
[40-42].
2.3.2 Disadvantages of Magnesium Biomaterials
Despite the attractive advantages mentioned above and considerable investigations in this
area, the development of magnesium alloys as biomaterials is still in its infancy. The intrinsic
poor corrosion resistance of magnesium alloys significantly restricts their clinical application
[43]. The standard electrode potential of magnesium is only -2.37V so magnesium alloys are
very susceptible to corrosion attack, especially when they are contacted with other metals
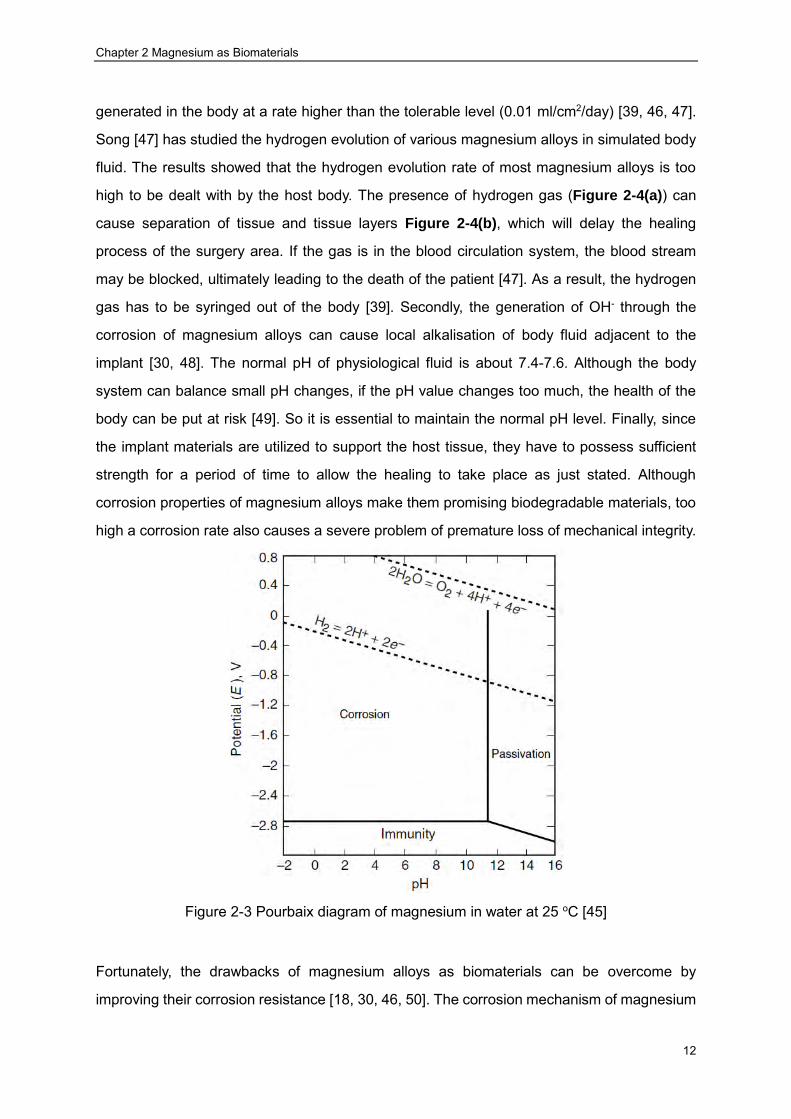
facilitating the formation of galvanic cell. The Pourbaix diagram of magnesium in water
presented in Figure 2-3 suggests that corrosion is the thermodynamically favourable process
when magnesium is placed in aqueous solution of pH<11.3.
Worse still, the Pilling-Bedworth ratio of magnesium alloy is only 0.81, less than 1, so the film
formed on the surface of magnesium alloy cannot provide effective protection from further
corrosion. In weak alkaline aqueous solution of the human body fluid (pH=7.4), magnesium
alloys will react with the surrounding environment as follows:
Anodic reaction: Mg → Mg2+ + 2e− ( 2.1 )
Cathodic reaction: 2H2O + 2e− → H2 ↑ +2OH− ( 2.2 )
Overall reaction: Mg + 2H2O → H2 ↑ +Mg(OH)2 ( 2.3 )
The corrosion product of magnesium hydroxide Mg(OH)2 can serve as a temporary protective
layer. However, in a chloride containing environment, if the Cl- concentration is more than 30
mmol/L, Mg(OH)2 will transfer into soluble MgCl2 which would cause pitting corrosion, thus
losing its protection [43-45]. So in physiological fluid, where the chloride concentration is
about 150 mmol/L, magnesium alloys will suffer from severe corrosion. Although the anodic
product, Mg2+, can be tolerated by the human body as stated, the corrosion products from the
cathodic reaction cause serious problems to the host tissue. Firstly, hydrogen gas can be
Chapter 2 Magnesium as Biomaterials
12
generated in the body at a rate higher than the tolerable level (0.01 ml/cm2/day) [39, 46, 47].
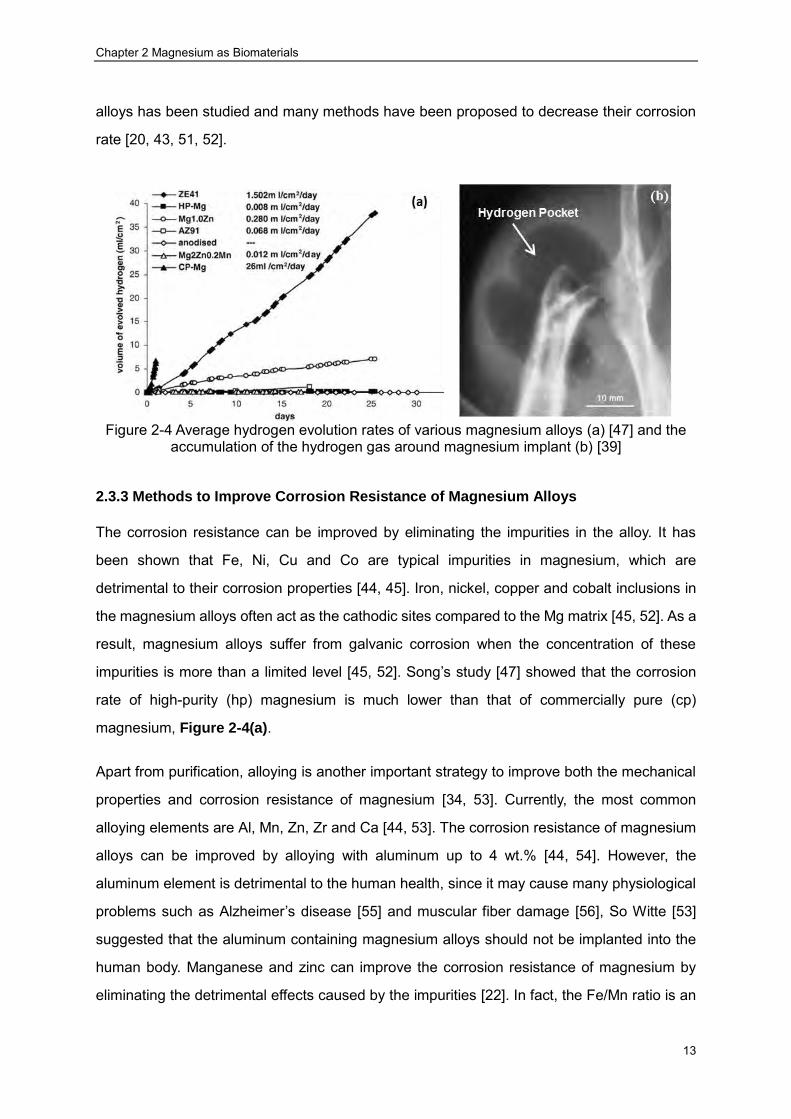
Song [47] has studied the hydrogen evolution of various magnesium alloys in simulated body
fluid. The results showed that the hydrogen evolution rate of most magnesium alloys is too
high to be dealt with by the host body. The presence of hydrogen gas (Figure 2-4(a)) can
cause separation of tissue and tissue layers Figure 2-4(b), which will delay the healing
process of the surgery area. If the gas is in the blood circulation system, the blood stream
may be blocked, ultimately leading to the death of the patient [47]. As a result, the hydrogen
gas has to be syringed out of the body [39]. Secondly, the generation of OH- through the
corrosion of magnesium alloys can cause local alkalisation of body fluid adjacent to the
implant [30, 48]. The normal pH of physiological fluid is about 7.4-7.6. Although the body
system can balance small pH changes, if the pH value changes too much, the health of the
body can be put at risk [49]. So it is essential to maintain the normal pH level. Finally, since
the implant materials are utilized to support the host tissue, they have to possess sufficient
strength for a period of time to allow the healing to take place as just stated. Although
corrosion properties of magnesium alloys make them promising biodegradable materials, too
high a corrosion rate also causes a severe problem of premature loss of mechanical integrity.
Figure 2-3 Pourbaix diagram of magnesium in water at 25 oC [45]
Fortunately, the drawbacks of magnesium alloys as biomaterials can be overcome by
improving their corrosion resistance [18, 30, 46, 50]. The corrosion mechanism of magnesium
Chapter 2 Magnesium as Biomaterials
13
alloys has been studied and many methods have been proposed to decrease their corrosion
rate [20, 43, 51, 52].
Figure 2-4 Average hydrogen evolution rates of various magnesium alloys (a) [47] and the
accumulation of the hydrogen gas around magnesium implant (b) [39]
2.3.3 Methods to Improve Corrosion Resistance of Magnesium Alloys
The corrosion resistance can be improved by eliminating the impurities in the alloy. It has
been shown that Fe, Ni, Cu and Co are typical impurities in magnesium, which are
detrimental to their corrosion properties [44, 45]. Iron, nickel, copper and cobalt inclusions in
the magnesium alloys often act as the cathodic sites compared to the Mg matrix [45, 52]. As a
result, magnesium alloys suffer from galvanic corrosion when the concentration of these
impurities is more than a limited level [45, 52]. Song’s study [47] showed that the corrosion
rate of high-purity (hp) magnesium is much lower than that of commercially pure (cp)
magnesium, Figure 2-4(a).
Apart from purification, alloying is another important strategy to improve both the mechanical
properties and corrosion resistance of magnesium [34, 53]. Currently, the most common
alloying elements are Al, Mn, Zn, Zr and Ca [44, 53]. The corrosion resistance of magnesium
alloys can be improved by alloying with aluminum up to 4 wt.% [44, 54]. However, the
aluminum element is detrimental to the human health, since it may cause many physiological
problems such as Alzheimer’s disease [55] and muscular fiber damage [56], So Witte [53]
suggested that the aluminum containing magnesium alloys should not be implanted into the
human body. Manganese and zinc can improve the corrosion resistance of magnesium by
eliminating the detrimental effects caused by the impurities [22]. In fact, the Fe/Mn ratio is an

Chapter 2 Magnesium as Biomaterials
14
important factor influencing the corrosion rate of magnesium alloys. The corrosion rate
remains low when the Fe/Mn ratio is lower than 0.032 [22], but increases dramatically beyond
that. Rare-earth elements can be employed to improve the corrosion resistance as well as the
mechanical properties [39, 57]. However, they are usually toxic for implant applications.
Therefore they are not appropriate alloying elements in biomaterials.
Besides alloying, another appropriate way to improve the corrosion resistance of magnesium
alloys is surface treatment [30, 46, 58]. Coatings can separate the substrate from its
surrounding corrosive environment, thus reducing the corrosion rate. Song [30, 47] compared
the in vitro corrosion property of AZ91 alloy with and without anodized coating. While
hydrogen evolution from AZ91 is about 0.5 ml/cm2 per day, it is negligible from the anodised
alloy. Currently many coating methods have been proposed, such as conversion coating,
anodising and plating.[46, 59].
Conversion coatings are produced by chemical or electrochemical treatment of a metal
surface to produce a superficial layer of substrate metal oxides, chromates, phosphates or
other compounds that are chemically bonded to the surface [60]. They are used on metals for
corrosion protection, optimized surface mechanical properties or just for decorative purposes.
Conversion coatings are now the most common methods for magnesium protection.
Numerous efforts have been made towards investigation of the coating process. The
corrosion performance of AZ31 magnesium alloy with zinc phosphate conversion coatings is
much better than that of the bare alloy [61]. However, this technique has to be improved to
avoid the use of environmentally hazardous Cr6+ before being accepted as a valuable coating
process for implant applications [46, 54].
Electrochemical plating has been proved effective to protect magnesium alloys from
corrosion attack [53, 54]. In the process, a metal salt is reduced to its metallic form on the
surface of the workpiece, providing a barrier between the substrate and environment. If the
metal is reduced by an external polarisation, the process is called electroplating, otherwise it
is electroless plating. The corrosion resistance of ZM6 magnesium alloy can be improved by
a modified electroless nickel plating with a novel pretreatment procedure as claimed by Gao
[62]. Sun [63] performed electroless plating on anodised AZ31 alloy, and the corrosion current
density decreased from 1.66×10⁻⁵ A/cm2 to 2.72×10⁻⁶ A/cm2, suggesting an increased
corrosion resistance. Unfortunately, electrochemical plating faces several challenges. Firstly,

Chapter 2 Magnesium as Biomaterials
15
for the electroplating process, the coating is generally not uniform due to the uneven
distribution of current density. Secondly, electrochemical plating requires a proper
pretreatment procedure which usually involves toxic chemicals and is time-consuming. As a
result, different pretreatments have to be developed for different alloys. Finally, eliminating
toxic chemicals is also necessary to create an environmentally friendly plating process for
coating magnesium alloys.
Protective coatings can also be produced by condensation of a vaporised material on the
surface of a substrate, and this technique is called physical vapor deposition (PVD). The PVD
process has been proven to be a suitable method for protection of magnesium alloys from
corrosion and wear [46, 60]. Wu [64] studied corrosion properties of PVD coated AZ31 alloy
and found that after being coated with Al2O3, the corrosion resistance was much better than
that of the bare material. Similar results were also obtained by Atun [65] when TiN coating
was deposited on AZ91 magnesium alloy. The PVD process has to be performed in high
vacuum environment, which contributes to high capital costs. The line-of-sight process
makes it difficult to be applied on complex samples like the bone fixtures. Moreover, due to its
high electronegativity, the surface of magnesium is usually covered by an oxide film, which
would inevitably lead to poor adhesion between the coating and substrate.
Anodising is an electrolytic process for producing a thick, stable oxide film on metals and
alloys [60]. Due to the excellent corrosion and wear resistance provided by this technique, the
anodising process has been widely studied and greatly developed since its first industrial
scale utilization in 1923 [51]. Now the anodising process is one of the main surface treatment
techniques for protection of various substrates such as aluminum, magnesium, and titanium
alloys. [51, 60]. A big step forward in the development of anodising technique was made
when plasma has been introduced to this technology in 1960s [66]. Several plasma assisted
anodising processes such as the Magoxid, Anomag, HAE and Keronite processes have been
currently commercialised [51, 60]. Plasma electrolytic oxidation (PEO) is a generic term used
to describe the plasma assisted anodising processes. The PEO process is much better than
the aforementioned coating processes in the following aspects. The electrolyte used in PEO
is more environmentally benign than those in conversion coatings. The adhesion strength
between the coating and substrate is higher than the plated coatings. Another advantage of
PEO over plating lies in a much easier pretreatment procedure. There is almost no limitation
to the size and shape of the workpiece in PEO; therefore the processes are quite flexible.

Chapter 2 Magnesium as Biomaterials
16
Compared to PVD processes, the equipment used for PEO is much cheaper. Actually, PEO
has been considered as one of the most suitable surface treatments for magnesium alloys for
implant applications by offering a biologically favourable environment [67, 68]. This technique
has been given major attention in the present work.
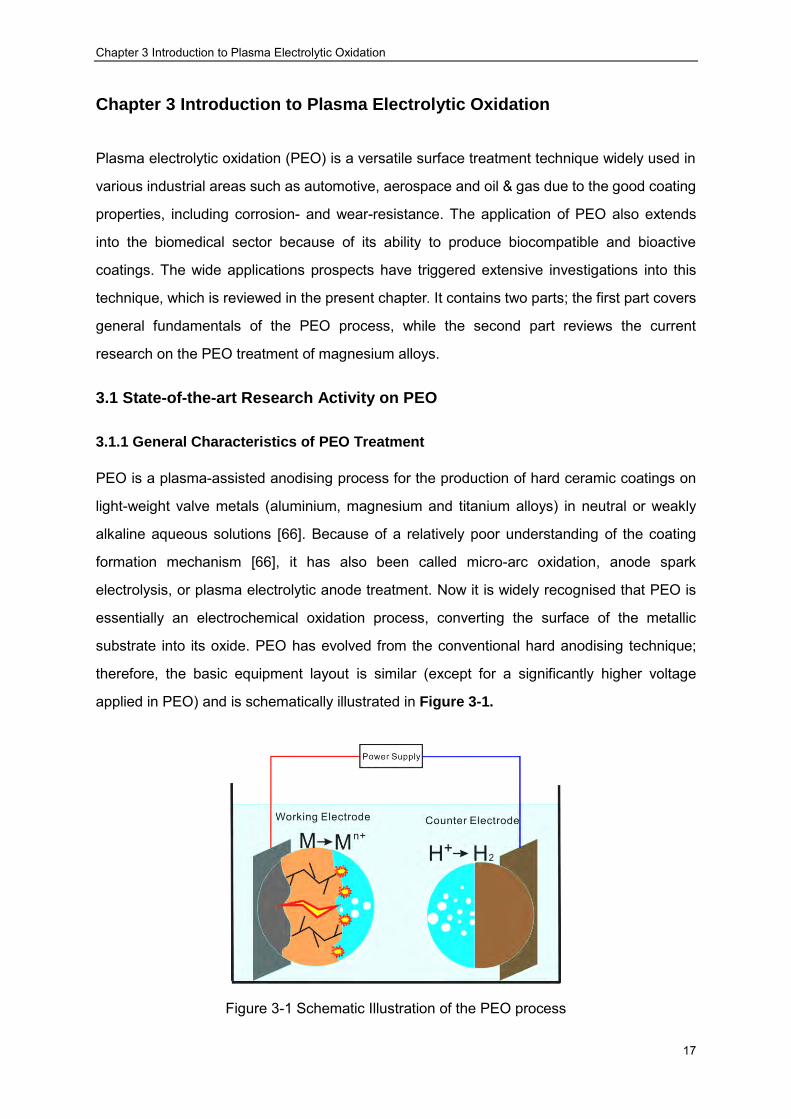
Chapter 3 Introduction to Plasma Electrolytic Oxidation
17
Chapter 3 Introduction to Plasma Electrolytic Oxidation
Plasma electrolytic oxidation (PEO) is a versatile surface treatment technique widely used in
various industrial areas such as automotive, aerospace and oil & gas due to the good coating
properties, including corrosion- and wear-resistance. The application of PEO also extends
into the biomedical sector because of its ability to produce biocompatible and bioactive
coatings. The wide applications prospects have triggered extensive investigations into this
technique, which is reviewed in the present chapter. It contains two parts; the first part covers
general fundamentals of the PEO process, while the second part reviews the current
research on the PEO treatment of magnesium alloys.
3.1 State-of-the-art Research Activity on PEO
3.1.1 General Characteristics of PEO Treatment
PEO is a plasma-assisted anodising process for the production of hard ceramic coatings on
light-weight valve metals (aluminium, magnesium and titanium alloys) in neutral or weakly
alkaline aqueous solutions [66]. Because of a relatively poor understanding of the coating
formation mechanism [66], it has also been called micro-arc oxidation, anode spark
electrolysis, or plasma electrolytic anode treatment. Now it is widely recognised that PEO is
essentially an electrochemical oxidation process, converting the surface of the metallic
substrate into its oxide. PEO has evolved from the conventional hard anodising technique;
therefore, the basic equipment layout is similar (except for a significantly higher voltage
applied in PEO) and is schematically illustrated in Figure 3-1.
Figure 3-1 Schematic Illustration of the PEO process
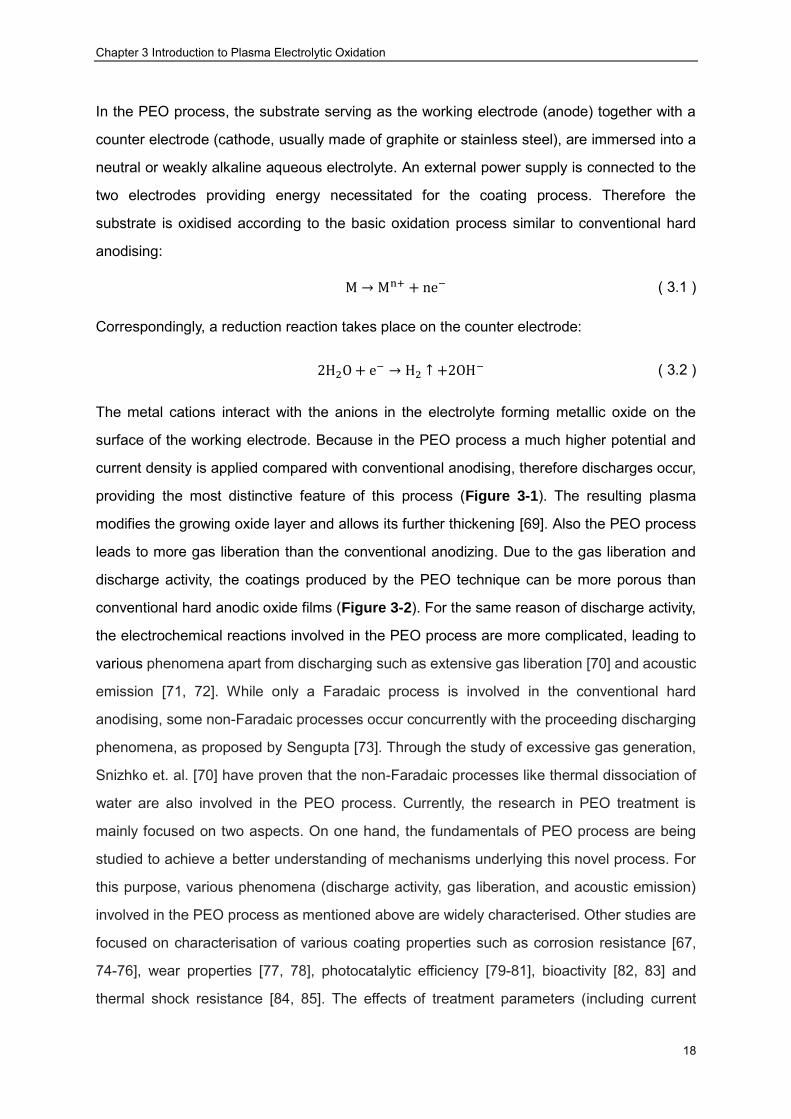
Chapter 3 Introduction to Plasma Electrolytic Oxidation
18
In the PEO process, the substrate serving as the working electrode (anode) together with a
counter electrode (cathode, usually made of graphite or stainless steel), are immersed into a
neutral or weakly alkaline aqueous electrolyte. An external power supply is connected to the
two electrodes providing energy necessitated for the coating process. Therefore the
substrate is oxidised according to the basic oxidation process similar to conventional hard
anodising:
M → Mn+ + ne− ( 3.1 )
Correspondingly, a reduction reaction takes place on the counter electrode:
2H2O + e− → H2 ↑ +2OH− ( 3.2 )
The metal cations interact with the anions in the electrolyte forming metallic oxide on the
surface of the working electrode. Because in the PEO process a much higher potential and
current density is applied compared with conventional anodising, therefore discharges occur,
providing the most distinctive feature of this process (Figure 3-1). The resulting plasma
modifies the growing oxide layer and allows its further thickening [69]. Also the PEO process
leads to more gas liberation than the conventional anodizing. Due to the gas liberation and
discharge activity, the coatings produced by the PEO technique can be more porous than
conventional hard anodic oxide films (Figure 3-2). For the same reason of discharge activity,
the electrochemical reactions involved in the PEO process are more complicated, leading to
various phenomena apart from discharging such as extensive gas liberation [70] and acoustic
emission [71, 72]. While only a Faradaic process is involved in the conventional hard
anodising, some non-Faradaic processes occur concurrently with the proceeding discharging
phenomena, as proposed by Sengupta [73]. Through the study of excessive gas generation,
Snizhko et. al. [70] have proven that the non-Faradaic processes like thermal dissociation of
water are also involved in the PEO process. Currently, the research in PEO treatment is
mainly focused on two aspects. On one hand, the fundamentals of PEO process are being
studied to achieve a better understanding of mechanisms underlying this novel process. For
this purpose, various phenomena (discharge activity, gas liberation, and acoustic emission)
involved in the PEO process as mentioned above are widely characterised. Other studies are
focused on characterisation of various coating properties such as corrosion resistance [67,
74-76], wear properties [77, 78], photocatalytic efficiency [79-81], bioactivity [82, 83] and
thermal shock resistance [84, 85]. The effects of treatment parameters (including current
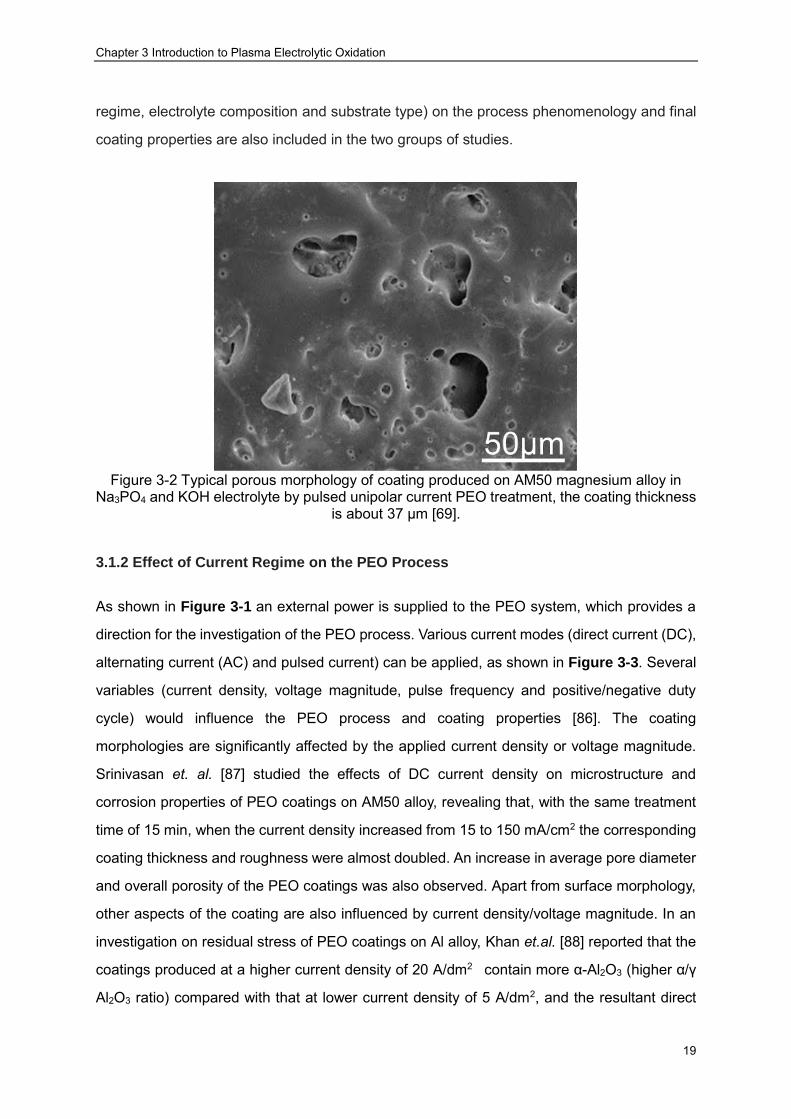
Chapter 3 Introduction to Plasma Electrolytic Oxidation
19
regime, electrolyte composition and substrate type) on the process phenomenology and final
coating properties are also included in the two groups of studies.
Figure 3-2 Typical porous morphology of coating produced on AM50 magnesium alloy in
Na3PO4 and KOH electrolyte by pulsed unipolar current PEO treatment, the coating thickness is about 37 µm [69].
3.1.2 Effect of Current Regime on the PEO Process
As shown in Figure 3-1 an external power is supplied to the PEO system, which provides a
direction for the investigation of the PEO process. Various current modes (direct current (DC),
alternating current (AC) and pulsed current) can be applied, as shown in Figure 3-3. Several
variables (current density, voltage magnitude, pulse frequency and positive/negative duty
cycle) would influence the PEO process and coating properties [86]. The coating
morphologies are significantly affected by the applied current density or voltage magnitude.
Srinivasan et. al. [87] studied the effects of DC current density on microstructure and
corrosion properties of PEO coatings on AM50 alloy, revealing that, with the same treatment
time of 15 min, when the current density increased from 15 to 150 mA/cm2 the corresponding
coating thickness and roughness were almost doubled. An increase in average pore diameter
and overall porosity of the PEO coatings was also observed. Apart from surface morphology,
other aspects of the coating are also influenced by current density/voltage magnitude. In an
investigation on residual stress of PEO coatings on Al alloy, Khan et.al. [88] reported that the
coatings produced at a higher current density of 20 A/dm2 contain more α-Al2O3 (higher α/γ
Al2O3 ratio) compared with that at lower current density of 5 A/dm2, and the resultant direct
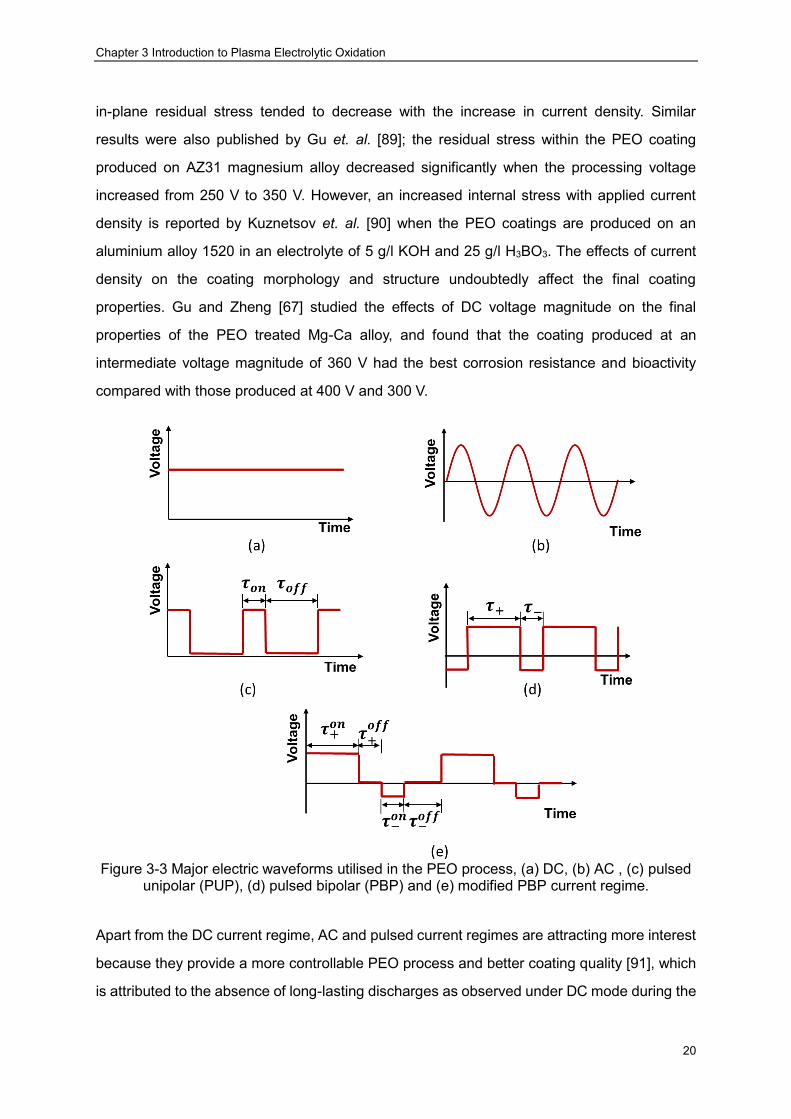
Chapter 3 Introduction to Plasma Electrolytic Oxidation
20
in-plane residual stress tended to decrease with the increase in current density. Similar
results were also published by Gu et. al. [89]; the residual stress within the PEO coating
produced on AZ31 magnesium alloy decreased significantly when the processing voltage
increased from 250 V to 350 V. However, an increased internal stress with applied current
density is reported by Kuznetsov et. al. [90] when the PEO coatings are produced on an
aluminium alloy 1520 in an electrolyte of 5 g/l KOH and 25 g/l H3BO3. The effects of current
density on the coating morphology and structure undoubtedly affect the final coating
properties. Gu and Zheng [67] studied the effects of DC voltage magnitude on the final
properties of the PEO treated Mg-Ca alloy, and found that the coating produced at an
intermediate voltage magnitude of 360 V had the best corrosion resistance and bioactivity
compared with those produced at 400 V and 300 V.
Figure 3-3 Major electric waveforms utilised in the PEO process, (a) DC, (b) AC , (c) pulsed
unipolar (PUP), (d) pulsed bipolar (PBP) and (e) modified PBP current regime.
Apart from the DC current regime, AC and pulsed current regimes are attracting more interest
because they provide a more controllable PEO process and better coating quality [91], which
is attributed to the absence of long-lasting discharges as observed under DC mode during the
Chapter 3 Introduction to Plasma Electrolytic Oxidation
21
PEO process [92], and this hypothesis was confirmed by Arrabal et. al. [71]. The average
pore size (a result of the discharging events) in PEO coatings produced using a pulsed
unipolar (PUP) current is much smaller than that under DC condition. Comparative studies of
the coating morphologies produced under DC and PUP modes confirm that the coating
produced in PUP mode is more compact with smaller pores [78]. Not only is the surface
morphology improved, the bond strength of the coating with the substrate is also enhanced
by the pulsed current regime, as claimed by Xin et. al. [93]. Correspondingly, worse corrosion
resistance of the coatings under the DC condition than those produced in the AC regime was
observed. These results are in good agreement with other publications [78, 94, 95]. By
introducing AC or pulsed current mode an additional parameter, pulse frequency may affect
the PEO processes and corresponding coating properties. According to Figure 3-3, the pulse
frequency is defined as follows:
For unipolar pulsed current mode: 𝑓𝑢 =1
𝜏𝑜𝑛 + 𝜏𝑜𝑓𝑓 ( 3.3 )
or
In Equation (3.4), 𝜏+𝑜𝑓𝑓 and 𝜏−
𝑜𝑓𝑓 may be 0 for the calculation of pulse frequency of the
current waveform shown in Figure 3-3 (d).
The final PEO coating characteristics including morphology, corrosion and mechanical
properties, can be controlled by adjusting the parameters regarding to the pulsed current
regime. Firstly, the pulse frequency and duty cycle affect the final coating properties to
different extents. After investigating coatings produced at various pulse frequencies,
Srinivasan et. al. [96] reported a decreased average pore diameter within the PEO coating
fabricated at higher frequencies upto 1000 Hz compared with those produced at 10 Hz. Su et.
al. [97] also reported enlarged pore diameter and increased porosity due to higher discharge
activity and more vigorous gas liberation at lower pulse frequencies when producing PEO
coatings on ZM5 magnesium alloy at various frequencies, as shown in Figure 3-4. Such
correlations between the pulse frequency and coating morphology are quite universal and
present good consistency among the results published by other researchers [97, 98].
For modified bipolar pulsed current mode:
𝑓𝑏 =1
𝜏+𝑜𝑛 + 𝜏+
𝑜𝑓𝑓+ 𝜏−
𝑜𝑛 + 𝜏−𝑜𝑓𝑓
( 3.4 )

Chapter 3 Introduction to Plasma Electrolytic Oxidation
22
Apart from pulse frequency, characteristics of PEO coatings are also affected by the duty
cycle, an important parameter describing the pulsed current regime. Following Figure 3-3,
the duty cycle can be defined as follows:
For unipolar pulsed current 𝛿 = 𝜏𝑜𝑛𝑓𝑢 ( 3.5 )
For positive duty cycle of bipolar pulsed current:
𝛿+ = 𝜏+𝑜𝑛𝑓𝑏 ( 3.6 )
And negative duty cycle of bipolar pulsed current:
𝛿− = 𝜏−𝑜𝑛𝑓𝑏 ( 3.7 )
Figure 3-4 Surface morphology of PEO coatings produced on ZM5 magnesium alloy in an electrolyte composed of 0.018 M NaOH + 0.016 M (NaPO3)6 + 0.19 M NaF at 2 A/dm2 at
different frequencies (a) and (c) 100 Hz; (b) and (d) 800 Hz for various processing time 60 min (a and b) and 100 min (c and d). Adapted from [97]
Dehnavi et. al [99]. systematically studied the effects of applied current density and duty cycle
on the growth behaviour of PEO coating on 6061 aluminum alloy, and the results indicated
that the duty cycle would affect the coating morphology, i.e. a lower duty cycle would lead to a
more uniform Si distribution in the coating and a higher porosity. The difference in the coating
morphology will certainly result in different coating properties; for example, a higher
microhardness with smoother profile across the coating thickness at lower duty cycles was

Chapter 3 Introduction to Plasma Electrolytic Oxidation
23
found by Aliofkhazraei et. al. [100] when producing PEO coating on cp titanium substrate
using unipolar current regimes of variable duty cycles in an electrolyte of 15 g/l NaAlO2 + 2 g/l
Na3PO4.
In the pulsed bipolar (PBP) current mode an extra parameter, negative biasing amplitude
would also affect the PEO coatings. A more compact and less porous PEO coating could be
produced when the negative biasing magnitude was increased, as reported by Su et. al. [101]
in their study of PEO treatment on ZK60 magnesium alloy using PBP current mode. This
effect appears to be consistent, as similar results were published independently by Yao et.al.
[102].
3.1.3 Effect of Electrolyte
Apart from the current mode, electrolyte is another important factor influencing the PEO
process and the resulting coating properties [103-106]. The composition and concentration of
the electrolyte are the two factors that affect the PEO process. Firstly, electrolyte additives
influence coating characteristics, including chemical composition, thickness and surface
morphology, leading to different coating composition, structure and performance. Ghasemi et.
al. [103] produced PEO coatings on AM50 magnesium alloy in KOH electrolyte with different
additives, and found that the coating produced in a silicate-containing electrolyte had a
thickness of about 8 µm, and around 1 µm in the aluminate-containing electrolyte. Moreover,
the coatings produced in different electrolytes contained different phase constituents, with
Mg2SiO4, Mg3(PO4)2 and MgAl2O4 being identified in the Si-, P- and Al-containing electrolyte,
respectively. Secondly, the PEO coatings produced in electrolytes with the same additives but
with different concentrations can also have different characteristics. It is established that an
increased electrolyte concentration would result in thicker and more porous PEO coatings [88,
105, 107]. Up to now, many different alkaline solutions have been studied in the PEO
technique [108].
3.1.4 Effect of Substrate Type
Currently, PEO coatings have been produced on various types of valve metals; it is obvious
that substrates composition and morphology influence both the PEO process and the
coatings from different aspects. The electrolytes commonly used for the PEO treatment of Al
alloys would not be suitable for the treatment of Ti- and Mg- based alloys, and vice versa.

Chapter 3 Introduction to Plasma Electrolytic Oxidation
24
Moreover, PEO coatings produced on similar metallic substrate with different alloying
elements also present different characteristics. After systematically studying PEO coatings on
different magnesium alloys, Arrabal et. al. [71] concluded that the coating growth rate was
dependent on the elemental composition of the substrate; the chemical phase content of the
coating is also affected after the oxidation and incorporation of alloying elements into the
PEO coating. Moreover, PEO coatings produced on substrates with the same alloying
contents but different microstructures show different morphologies. More porous PEO
coatings were obtained on Ti6Al4V alloy compared with those produced on Ti6Al7Nb alloy, as
published by Apachitei et. al. [109]. Jiang et. al. [110] fabricated PEO coatings on AZ91D
magnesium alloy with different grain sizes, and it was found the coating produced on the
ultra-fine grained substrate was more compact and less porous, providing better corrosion
protection in a 3.5 wt.% NaCl solution. PEO treatment of shot peened Ti-6Al-4V alloy
presented significantly different voltage transients compared to the unpeened alloy, as found
by Apachitei et. al. [111].
3.1.5 Effect of Treatment Time
The processing time has multiple effects on the PEO coatings. The coating thickness is found
to increase with prolonged processing time, however, with different increment behaviour. For
example, Hussein et. al. [112] reported a linear increase in coating thickness with processing
time (Figure 3-5 (a)), whereas non-linear behaviour is reported by Wang et. al. [113] (Figure
3-5 (b)). Longer PEO treatments usually result in a larger average pore diameter, as shown in
Figure 3-4, which is consistent with the results reported by Sundararajan et. al. [114] and
Duan et. al. [115]. Correspondingly, the coating roughness increases dramatically at the start
of the PEO treatment, and afterwards remains almost constant, as found by Rožić et. al.
[116].
Studies on the effects of the various processing parameters (electrolyte chemistry,
processing time, current regime) on the PEO coating characteristics provide large amounts of
information regarding to the PEO process, and the results from different studies are
consistent, i.e. the coating porosity and average pore diameter within the coating can be
increased by either increasing the supplying energy density (high voltage/current density,
longer pulse time) or by increasing the electrolyte conductivity (higher electrolyte
concentration) or by increasing PEO treatment time. Based on these results, researchers are
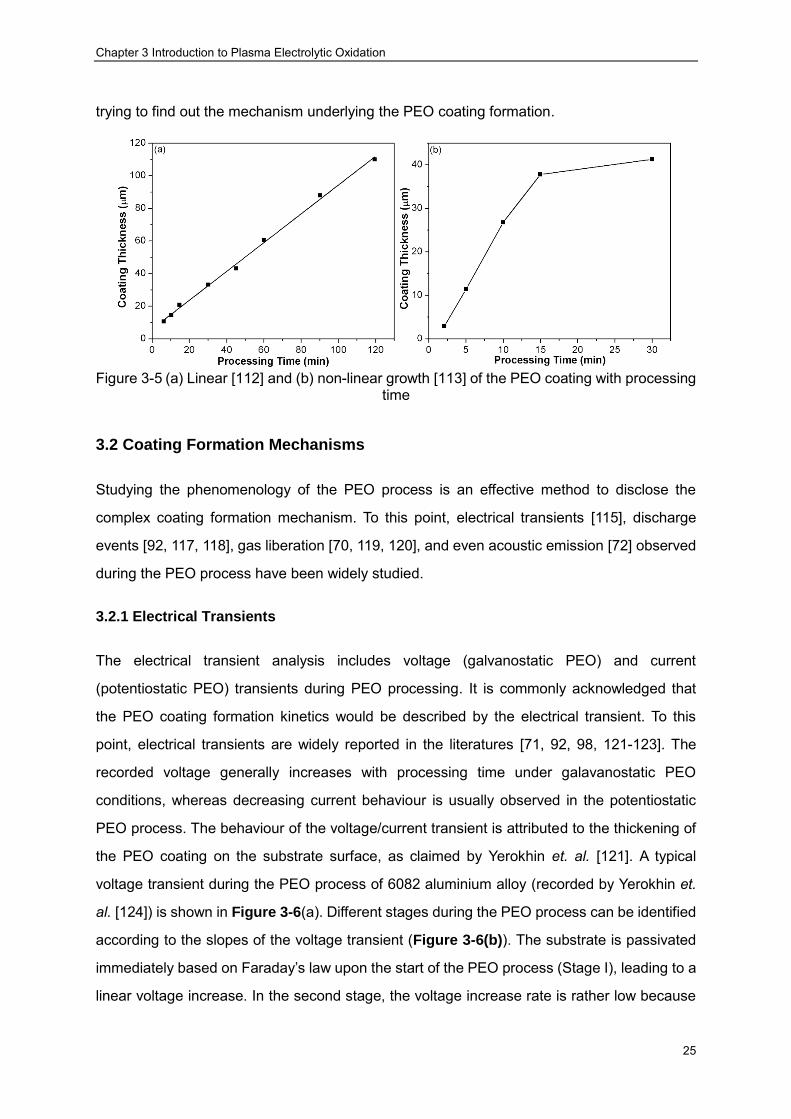
Chapter 3 Introduction to Plasma Electrolytic Oxidation
25
trying to find out the mechanism underlying the PEO coating formation.
Figure 3-5 (a) Linear [112] and (b) non-linear growth [113] of the PEO coating with processing
time
3.2 Coating Formation Mechanisms
Studying the phenomenology of the PEO process is an effective method to disclose the
complex coating formation mechanism. To this point, electrical transients [115], discharge
events [92, 117, 118], gas liberation [70, 119, 120], and even acoustic emission [72] observed
during the PEO process have been widely studied.
3.2.1 Electrical Transients
The electrical transient analysis includes voltage (galvanostatic PEO) and current
(potentiostatic PEO) transients during PEO processing. It is commonly acknowledged that
the PEO coating formation kinetics would be described by the electrical transient. To this
point, electrical transients are widely reported in the literatures [71, 92, 98, 121-123]. The
recorded voltage generally increases with processing time under galavanostatic PEO
conditions, whereas decreasing current behaviour is usually observed in the potentiostatic
PEO process. The behaviour of the voltage/current transient is attributed to the thickening of
the PEO coating on the substrate surface, as claimed by Yerokhin et. al. [121]. A typical
voltage transient during the PEO process of 6082 aluminium alloy (recorded by Yerokhin et.
al. [124]) is shown in Figure 3-6(a). Different stages during the PEO process can be identified
according to the slopes of the voltage transient (Figure 3-6(b)). The substrate is passivated
immediately based on Faraday’s law upon the start of the PEO process (Stage I), leading to a
linear voltage increase. In the second stage, the voltage increase rate is rather low because

Chapter 3 Introduction to Plasma Electrolytic Oxidation
26
oxidation and dissolution of the coatings occurs concurrently. Afterwards, the voltage
increases further, indicating the continuous growth of the PEO coating, which is accompanied
by a considerable amount of tiny sparks moving around the substrate surface. When the PEO
process enters the final stage, the voltage increases even slower, indicating a slower rate of
coating thickness increase [121]. The sparking in this stage becomes less populous
compared with that in the previous stages. According to Duan et. al. [115], large defects
within the PEO coating are mainly developed in this final stage .
Although the 4 stages are commonly identified in the literature, the duration of each stage is
strongly dependent on the electrolyte chemistry, current mode and substrate type [122, 123,
125]. The second stage mentioned above is hardly identified on the voltage transient curve in
the work carried out by Liang et. al. [123] when the PEO coating was produced on AM60
magnesium alloy in electrolyte containing Na2SiO3 and KOH. A similar method can also be
applied for the analysis of current transient during the potentiostatic PEO process, however, it
should be borne in mind that, instead of increasing, the overall current will decrease because
of the growth of PEO coating.
Figure 3-6 Voltage transient recorded during the PEO treatment of 6082 aluminium alloy the
treatment is conducted in 1 g/l KOH electrolyte with current density of 467 A∙m2. Figure is reproduced from [124]. (a) and identification of different PEO stages based on voltage
transient (b)
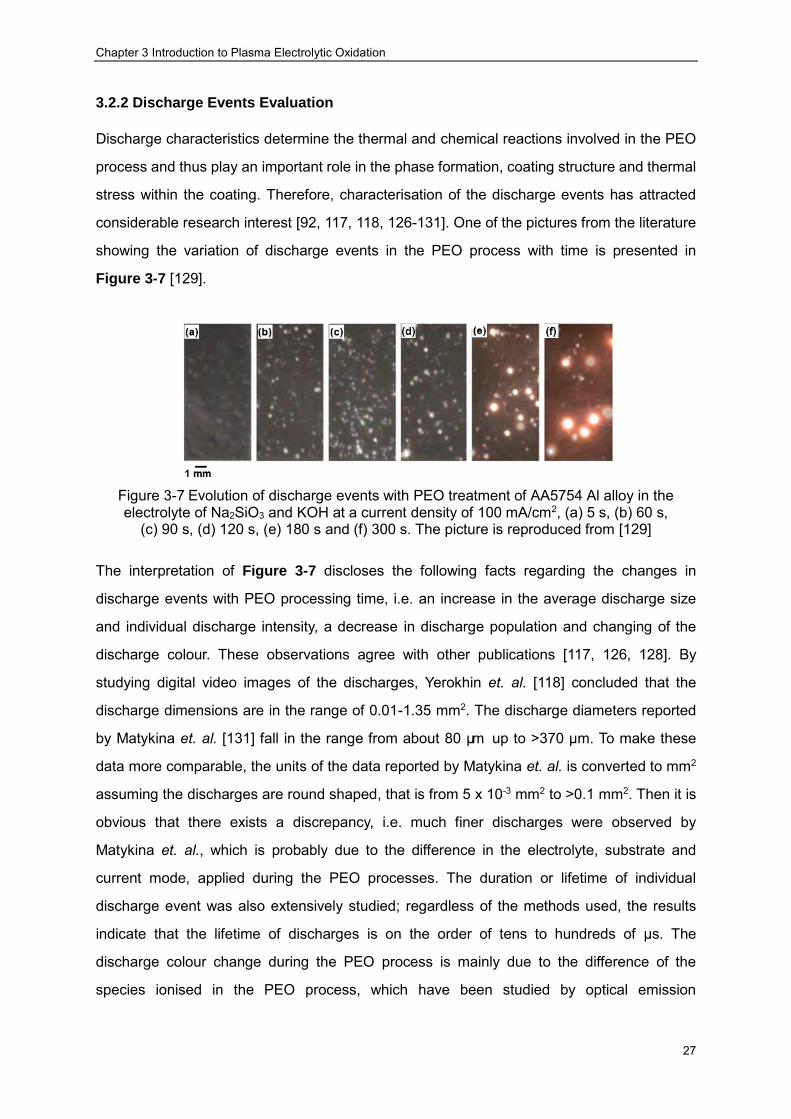
Chapter 3 Introduction to Plasma Electrolytic Oxidation
27
3.2.2 Discharge Events Evaluation
Discharge characteristics determine the thermal and chemical reactions involved in the PEO
process and thus play an important role in the phase formation, coating structure and thermal
stress within the coating. Therefore, characterisation of the discharge events has attracted
considerable research interest [92, 117, 118, 126-131]. One of the pictures from the literature
showing the variation of discharge events in the PEO process with time is presented in
Figure 3-7 [129].
Figure 3-7 Evolution of discharge events with PEO treatment of AA5754 Al alloy in the electrolyte of Na2SiO3 and KOH at a current density of 100 mA/cm2, (a) 5 s, (b) 60 s,
(c) 90 s, (d) 120 s, (e) 180 s and (f) 300 s. The picture is reproduced from [129]
The interpretation of Figure 3-7 discloses the following facts regarding the changes in
discharge events with PEO processing time, i.e. an increase in the average discharge size
and individual discharge intensity, a decrease in discharge population and changing of the
discharge colour. These observations agree with other publications [117, 126, 128]. By
studying digital video images of the discharges, Yerokhin et. al. [118] concluded that the
discharge dimensions are in the range of 0.01-1.35 mm2. The discharge diameters reported
by Matykina et. al. [131] fall in the range from about 80 µm up to >370 µm. To make these
data more comparable, the units of the data reported by Matykina et. al. is converted to mm2
assuming the discharges are round shaped, that is from 5 x 10⁻³ mm2 to >0.1 mm2. Then it is
obvious that there exists a discrepancy, i.e. much finer discharges were observed by
Matykina et. al., which is probably due to the difference in the electrolyte, substrate and
current mode, applied during the PEO processes. The duration or lifetime of individual
discharge event was also extensively studied; regardless of the methods used, the results
indicate that the lifetime of discharges is on the order of tens to hundreds of µs. The
discharge colour change during the PEO process is mainly due to the difference of the
species ionised in the PEO process, which have been studied by optical emission
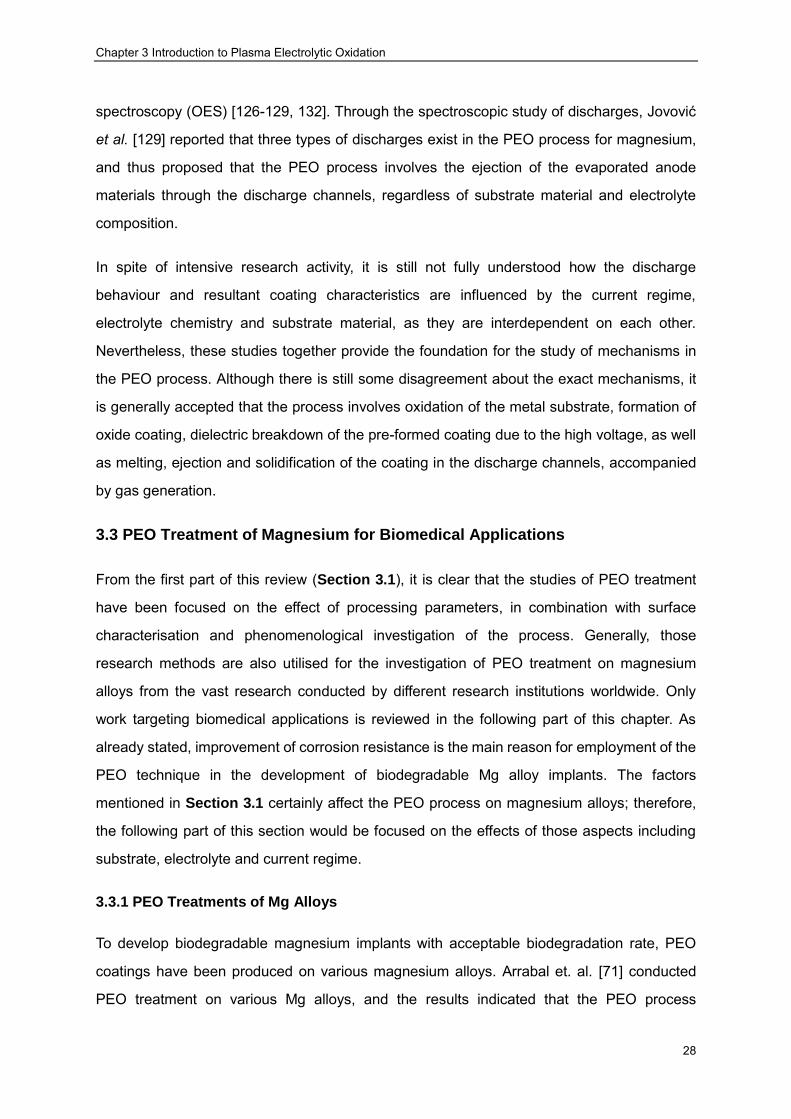
Chapter 3 Introduction to Plasma Electrolytic Oxidation
28
spectroscopy (OES) [126-129, 132]. Through the spectroscopic study of discharges, Jovović
et al. [129] reported that three types of discharges exist in the PEO process for magnesium,
and thus proposed that the PEO process involves the ejection of the evaporated anode
materials through the discharge channels, regardless of substrate material and electrolyte
composition.
In spite of intensive research activity, it is still not fully understood how the discharge
behaviour and resultant coating characteristics are influenced by the current regime,
electrolyte chemistry and substrate material, as they are interdependent on each other.
Nevertheless, these studies together provide the foundation for the study of mechanisms in
the PEO process. Although there is still some disagreement about the exact mechanisms, it
is generally accepted that the process involves oxidation of the metal substrate, formation of
oxide coating, dielectric breakdown of the pre-formed coating due to the high voltage, as well
as melting, ejection and solidification of the coating in the discharge channels, accompanied
by gas generation.
3.3 PEO Treatment of Magnesium for Biomedical Applications
From the first part of this review (Section 3.1), it is clear that the studies of PEO treatment
have been focused on the effect of processing parameters, in combination with surface
characterisation and phenomenological investigation of the process. Generally, those
research methods are also utilised for the investigation of PEO treatment on magnesium
alloys from the vast research conducted by different research institutions worldwide. Only
work targeting biomedical applications is reviewed in the following part of this chapter. As
already stated, improvement of corrosion resistance is the main reason for employment of the
PEO technique in the development of biodegradable Mg alloy implants. The factors
mentioned in Section 3.1 certainly affect the PEO process on magnesium alloys; therefore,
the following part of this section would be focused on the effects of those aspects including
substrate, electrolyte and current regime.
3.3.1 PEO Treatments of Mg Alloys
To develop biodegradable magnesium implants with acceptable biodegradation rate, PEO
coatings have been produced on various magnesium alloys. Arrabal et. al. [71] conducted
PEO treatment on various Mg alloys, and the results indicated that the PEO process

Chapter 3 Introduction to Plasma Electrolytic Oxidation
29
(discharge activity, electrical transient) and the coating characteristics (surface morphology,
phase composition and corrosion resistance) were affected by alloying elements. Currently
PEO coatings have been produced on AM50 [2], AZ91D [77], WE43 [133], AZ31 [74],
Mg-Zn-Ca [134], ZX50 [135], ZK60 [136] in order to develop biodegradable magnesium
implants. However, those efforts have various limitations. Firstly, Al and rare-earth elements
are usually biologically toxic causing problems to the host body, which is particularly
important for resorbable implants. Secondly, the PEO process parameters (electrolyte,
current regime and treatment time) used in those works are different, leading to scattered
results, because of which, universal PEO process parameters that are suitable for all types of
magnesium alloys have not been established. Producing PEO coatings on cp Mg can be of
significance considering the elimination of possible adverse effects of toxic elements and
developing generic PEO process parameters that may be suitable for a range of magnesium
alloys.
Various electrolytes have been studied in the PEO treatment of Mg alloys, which is usually
performed in the base electrolyte of KOH/NaOH with different additives like silicate (SiO32-),
phosphate (PO43-), aluminate (AlO2
-) and fluoride (F-) species [137]. KOH/NaOH
concentration has certainly significant influence on the PEO process and coating properties.
The correlation of KOH concentration with PEO coating characteristics was studied by Ko et.
al. [138]. The results revealed that coatings prepared in an electrolyte with a higher
concentration of KOH exhibited superior corrosion resistance. In addition, the increase in
KOH concentration decreases the breakdown voltage [138] because of the increase in
electrolyte conductivity. Passivation of Mg alloys may also be promoted by the increase in the
KOH/NaOH concentration, thus leading to a higher growth rate of PEO coatings [76].
However, more coating defects can be produced in the coatings in more concentrated
electrolytes (more KOH/NaOH) because of the stronger discharging activity caused by the
high electrolyte conductivity [105, 107]. After comparing PEO coatings on AZ91 alloy
produced in an electrolyte based on Na2SiO3 (18 g/l) and tannic acid (4 g/l) with different
amounts of NaOH, Zhang et. al. [139] concluded coatings produced in an electrolyte with 10
g/l (0.25 M) NaOH addition performed best in terms of corrosion resistance. However, for the
electrolytes with other additives, this optimised NaOH/KOH concentration may not result in
the best corrosion resistance.
Additions of phosphate, silicate, fluoride, aluminate and some other salts to the base

Chapter 3 Introduction to Plasma Electrolytic Oxidation
30
KOH/NaOH electrolyte extend the process window for growth of PEO coatings with desirable
anti-corrosion properties. Each of the additives can influence the final coating thickness,
morphology, phase composition and anti-corrosion performance in different ways. The
addition of phosphate and fluoride in the electrolyte promotes the formation of stable phases
like Mg3(PO4)2 [104] and MgF2 [140, 141] which can be used as a physical barrier layer,
protecting the substrate from corrosion attack. The coating deposition rate is increased in the
presence of silicate because of the rise in electrolyte conductivity [103, 142]. Borate can
facilitate oxide film growth by providing oxygen to the magnesium cation through
decomposition of B4O72- anions [104]. Furthermore, other additives like permanganate [75]
and various nanoparticles [125] have also been considered for the PEO treatment of
magnesium for corrosion protection.
It has been acknowledged that fluoride is the most effective additive in the electrolyte in terms
of corrosion protection. Yan et. al. [104] compared PEO coatings prepared on AZ91D
magnesium alloys in the base electrolyte of 3-8 g/l KOH with different additions of NaH2PO4
(4-8 g/l), Na2B4O7 (5-10 g/l) and KF (5-10 g/l) under pulsed voltage mode (340-400 V) for 1-2
h; the final results indicated that the addition of KF significantly increased the corrosion
resistance of the coatings in 3.5 wt.% NaCl solution (corrosion rate 3 x 10⁻⁹ A/cm2).
Various current regimes have also been applied in order to produce coatings with the best
corrosion resistance [71, 143, 144]. The interdependence of the electrolyte chemistry and
current regimes applied in the PEO process makes it impossible to find a universal current
regime for all types of electrolyte. However, it is generally accepted that a constant current
density mode provides better process control and considerable savings in treatment time
[145].
In vitro and in vivo corrosion evaluation of the PEO coatings produced in base electrolytes
with those additives coupled with different current regimes indicates that, with proper current
regime and electrolyte composition, the corrosion rate of magnesium in a simulated biological
environment could be reduced significantly compared with that of the bare substrate [74, 77,
135, 146]. However, these PEO coatings can only provide temporary protection from
corrosion attack and, after penetration of the electrolyte through coating defects, the
corrosion rate will be significantly accelerated [135]. Figure 3-8 shows the in vivo degradation
process of ZX50 implant pins with time; in the first 4 weeks, the pins with the PEO coating
Chapter 3 Introduction to Plasma Electrolytic Oxidation
31
perform much better (larger volume left). Afterwards, the degradation rate of the PEO coated
alloy is increased and the sample completely vanished within 12 weeks.
3.3.2 Production of Bioactive PEO Coatings on Mg Alloys
Generally, biodegradable implants should exhibit sufficient corrosion resistance and
mechanical integrity for at least 12 weeks in the human body [147]. Therefore, the corrosion
protection offered by PEO coatings is still insufficient, which stimulates more investigation on
the PEO treatment of magnesium alloy to further reduce the degradation rate. Reducing the
degradation rate still remains the primary strategy; however, attention has gradually moved
towards bioactive coatings which can promote the healing process with minimum adverse
effects while providing sufficient corrosion protection. Based on this requirement,
considerable research efforts have been devoted towards producing PEO coatings
containing biologically friendly compositions [1, 148, 149]. Hydroxyapatite (Ca10(PO4)6(OH)2,
HA) can promote bone calcification and resorption due to its similarity to the natural bone
apatite [21, 148, 150]. Tricalcium phosphate (Ca3(PO4)2, TCP), also possesses significant
bioactivity, which can be attributed to the fact that TCP can transform to HA in the biological
environment [21]. Apart from its high bioactivity, HA also possesses high stability in human
body fluid and thus can protect the implants by preventing the corrosive medium from
penetrating into the substrate. The in vivo characterisation of HA coated Mg-Zn-Ca alloy
carried out by Wang et. al. [151] revealed accelerated bone regeneration and reduced
degradation rate. Ca and P are the main elemental constituents of HA and TCP; therefore,
incorporation of Ca and P compounds into PEO coatings is a prerequisite to the formation of
HA or TCP, thus enhancing the bioactivity of PEO coatings on magnesium alloys.
Figure 3-8 Micro CT images of implanted ZX50 pins with and without PEO coatings after
different periods of implantation. The PEO coating was produced at constant current density of 14 mA/cm2.The picture is reproduced from reference [135]
Chapter 3 Introduction to Plasma Electrolytic Oxidation
32
Following the fact that the ionic species in the electrolyte will be present in the PEO coatings
[103], preparing Ca- and P-containing electrolyte for the PEO process is the most
straightforward method to incorporate Ca and P elements into the resultant PEO coating,
which has been proven effective by Yao et. al. [3]. It is found that the Ca/P ratio in PEO
coatings is dependent on the processing parameters, i.e. a longer processing time results in a
higher Ca/P ratio in the PEO coating [3]. However, no Ca and/or P containing phases can be
determined by XRD results in Yao’s publication [3]. Nevertheless, the potentiodynamic
polarisation results suggested significant improvement in corrosion resistance of the PEO
coatings.
In an effort to produce Ca- and P- containing PEO coatings on AM50 magnesium alloy, Bala
Srinivasan et. al. [2] prepared the base electrolyte using Ca(OH)2 rather than KOH/NaOH
with additives of Na3PO4. The coatings are produced under a pulsed DC current mode
(current density: 30 mA/cm2). The EDX results indicate appreciable amounts of Ca and P
content in the PEO coatings. Again, similar to Yao’s results, the XRD results cannot identify
any Ca-containing phases although Mg3(PO4)2 is present in the coating. After the immersion
corrosion test for 150 hours, most of the coating survives, indicating effective corrosion
protection.
Through addition of Ca- and P-contained compounds into the electrolyte for the PEO
treatment, Ca and P elements were also successfully incorporated into the resultant coatings
by other researchers [152, 153]. These preliminary results are quite encouraging from the
aspect of successful incorporation of Ca and P, which, however, is not the end of the story
because of the absence of Ca and P containing phases in the PEO coatings. Moreover,
attention is mainly focused on the effects of the electrolyte on Ca and P content in the PEO
coating in the preliminary efforts, and the importance of the current regime is, unfortunately,
not highlighted in the literature. Therefore, systematic studies on the optimised electrolyte
composition and corresponding current regime are still required to further improve the implant
bioactivity and corrosion resistance.
Apart from the research activities regarding the optimisation of processing parameters to
produce stable Ca and P containing phases in PEO coatings, other efforts are devoted
towards the enhancement of coating bioactivity through post treatments [46, 149, 154]. Not
only can the bioactivity be enhanced, but also the corrosion resistance can be improved
Chapter 3 Introduction to Plasma Electrolytic Oxidation
33
because: (a) the pores produced in the PEO coating can be sealed by the top layer [155] and
(b) the bioactive layer itself provides an additional barrier layer protecting the substrate from
corrosion attack. Additional bioactive layers have been successfully produced on magnesium
surfaces through the sol-gel method [156, 157], electrophoretic deposition [158, 159], and
electrodeposition methods [160, 161]. By dipping the PEO coated Mg-Zn-Ca alloy into a
chitosan solution, the pores and other defects within the coatings can be sealed, as found by
Hu et. al. [155]. An additional HA layer was fabricated through electrochemical deposition on
top of the PEO coated Mg-Zn-Ca alloy by Guan et. al. [134]. The in vivo degradation rate
remained at 0.12 mm/year in the first 12 weeks after implantation, which increased to 1.24
mm/year after 18 weeks of implantation. The degradation rate of the coated samples is much
smaller than that of the bare substrate over the whole process of implantation, which is
attributed to the additional HA layer, as follows from comparison with the results shown in
Figure 3-8.
As stated in the previous chapter, mechanical performance is the other factor determining the
in-service applications of magnesium-based implants besides corrosion resistance;
mechanical properties are however not highlighted in the literature. Although the strength of
bare magnesium alloys is sufficient for most static load-bearing biomedical applications, the
situation becomes far more complex when the movements of patients is considered, where
dynamic stress can be imposed on the magnesium implants. For example, in a paper by
Morlock et. al. [162] it was reported that about 1 million walking steps are taken by patients
with hip joint operations. Moreover, Yousif et. al. [15] claimed a stress of about 10 MPa to be
imposed to the bones in each step for a patient of 70 kg. Therefore, it is of significance to
study the mechanical properties of biodegradable magnesium alloys with PEO coatings,
which can be conducted from two aspects: (a) the effects of PEO coatings on the static
tensile strength and dynamic fatigue performance of magnesium alloys; (b) the effects of in
vitro corrosion on the fatigue properties of the coated magnesium alloys. From the limited
publications in the literature, it can be concluded that the fatigue properties of the sample
would be deteriorated by the presence of a PEO coating [109, 163-165]. However, none of
these publications deal with the underlying mechanism causing the reduction in fatigue
endurance, other than reporting the experimental results. Moreover, whether or not the
fatigue properties of the coated magnesium alloys are still sufficient for load-bearing implant
applications is not demonstrated. Therefore, further research in this aspect is still needed.
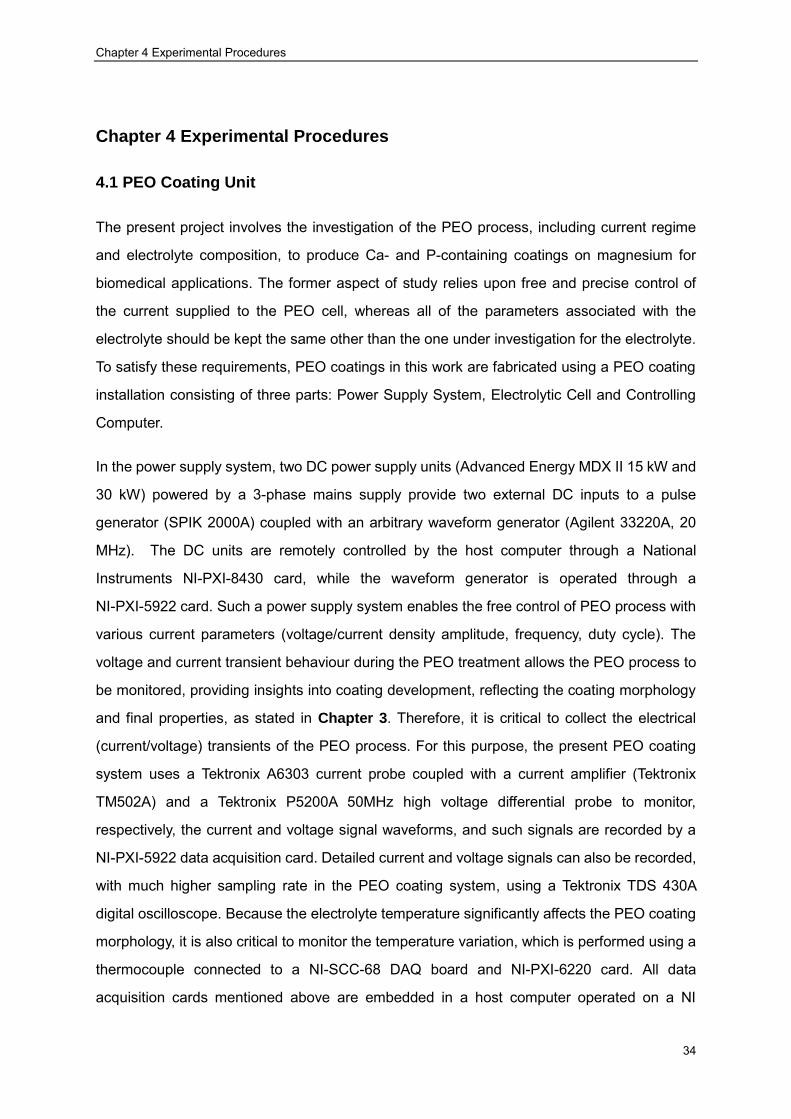
Chapter 4 Experimental Procedures
34
Chapter 4 Experimental Procedures
4.1 PEO Coating Unit
The present project involves the investigation of the PEO process, including current regime
and electrolyte composition, to produce Ca- and P-containing coatings on magnesium for
biomedical applications. The former aspect of study relies upon free and precise control of
the current supplied to the PEO cell, whereas all of the parameters associated with the
electrolyte should be kept the same other than the one under investigation for the electrolyte.
To satisfy these requirements, PEO coatings in this work are fabricated using a PEO coating
installation consisting of three parts: Power Supply System, Electrolytic Cell and Controlling
Computer.
In the power supply system, two DC power supply units (Advanced Energy MDX II 15 kW and
30 kW) powered by a 3-phase mains supply provide two external DC inputs to a pulse
generator (SPIK 2000A) coupled with an arbitrary waveform generator (Agilent 33220A, 20
MHz). The DC units are remotely controlled by the host computer through a National
Instruments NI-PXI-8430 card, while the waveform generator is operated through a
NI-PXI-5922 card. Such a power supply system enables the free control of PEO process with
various current parameters (voltage/current density amplitude, frequency, duty cycle). The
voltage and current transient behaviour during the PEO treatment allows the PEO process to
be monitored, providing insights into coating development, reflecting the coating morphology
and final properties, as stated in Chapter 3. Therefore, it is critical to collect the electrical
(current/voltage) transients of the PEO process. For this purpose, the present PEO coating
system uses a Tektronix A6303 current probe coupled with a current amplifier (Tektronix
TM502A) and a Tektronix P5200A 50MHz high voltage differential probe to monitor,
respectively, the current and voltage signal waveforms, and such signals are recorded by a
NI-PXI-5922 data acquisition card. Detailed current and voltage signals can also be recorded,
with much higher sampling rate in the PEO coating system, using a Tektronix TDS 430A
digital oscilloscope. Because the electrolyte temperature significantly affects the PEO coating
morphology, it is also critical to monitor the temperature variation, which is performed using a
thermocouple connected to a NI-SCC-68 DAQ board and NI-PXI-6220 card. All data
acquisition cards mentioned above are embedded in a host computer operated on a NI
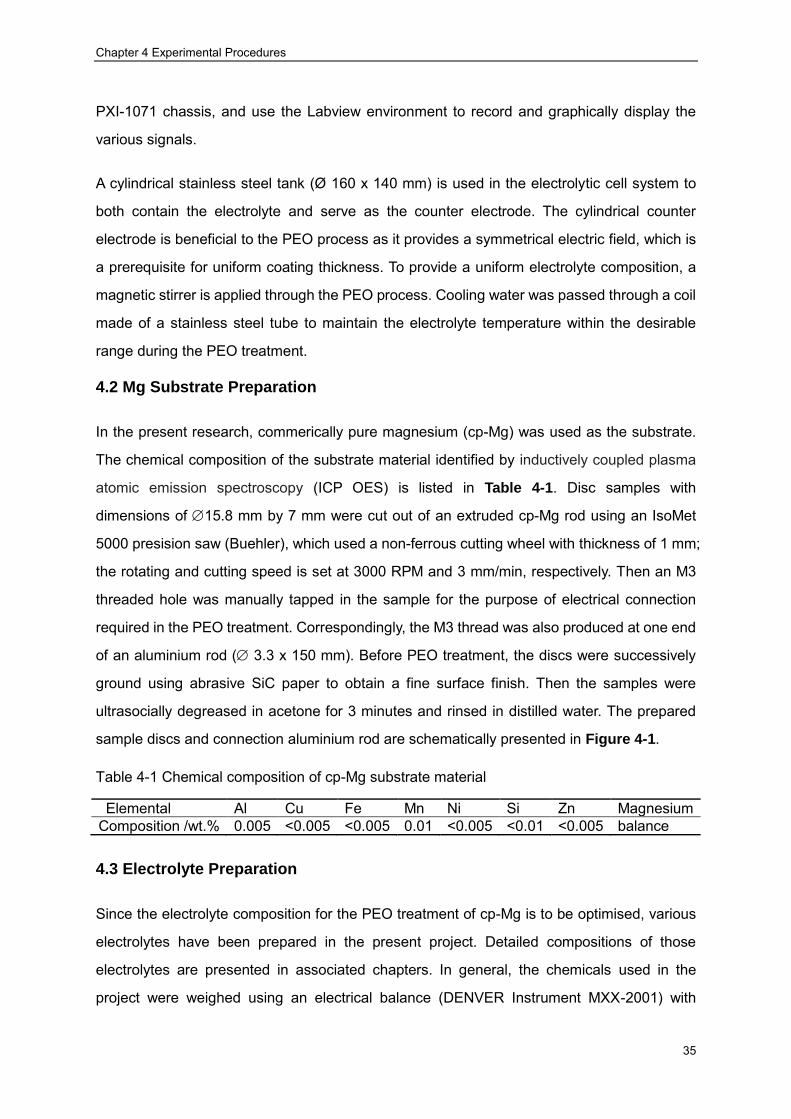
Chapter 4 Experimental Procedures
35
PXI-1071 chassis, and use the Labview environment to record and graphically display the
various signals.
A cylindrical stainless steel tank (Ø 160 x 140 mm) is used in the electrolytic cell system to
both contain the electrolyte and serve as the counter electrode. The cylindrical counter
electrode is beneficial to the PEO process as it provides a symmetrical electric field, which is
a prerequisite for uniform coating thickness. To provide a uniform electrolyte composition, a
magnetic stirrer is applied through the PEO process. Cooling water was passed through a coil
made of a stainless steel tube to maintain the electrolyte temperature within the desirable
range during the PEO treatment.
4.2 Mg Substrate Preparation
In the present research, commerically pure magnesium (cp-Mg) was used as the substrate.
The chemical composition of the substrate material identified by inductively coupled plasma
atomic emission spectroscopy (ICP OES) is listed in Table 4-1. Disc samples with
dimensions of 15.8 mm by 7 mm were cut out of an extruded cp-Mg rod using an IsoMet
5000 presision saw (Buehler), which used a non-ferrous cutting wheel with thickness of 1 mm;
the rotating and cutting speed is set at 3000 RPM and 3 mm/min, respectively. Then an M3
threaded hole was manually tapped in the sample for the purpose of electrical connection
required in the PEO treatment. Correspondingly, the M3 thread was also produced at one end
of an aluminium rod ( 3.3 x 150 mm). Before PEO treatment, the discs were successively
ground using abrasive SiC paper to obtain a fine surface finish. Then the samples were
ultrasocially degreased in acetone for 3 minutes and rinsed in distilled water. The prepared
sample discs and connection aluminium rod are schematically presented in Figure 4-1.
Table 4-1 Chemical composition of cp-Mg substrate material
Elemental Al Cu Fe Mn Ni Si Zn Magnesium Composition /wt.% 0.005 <0.005 <0.005 0.01 <0.005 <0.01 <0.005 balance
4.3 Electrolyte Preparation
Since the electrolyte composition for the PEO treatment of cp-Mg is to be optimised, various
electrolytes have been prepared in the present project. Detailed compositions of those
electrolytes are presented in associated chapters. In general, the chemicals used in the
project were weighed using an electrical balance (DENVER Instrument MXX-2001) with
Chapter 4 Experimental Procedures
36
precision of ±0.1 g. After completely dissolving the chemicals in distilled water, the electrolyte
conductivity and pH were measured using a conductivity meter (HANNA HI9835) and a pH
meter (HANNA pH 211), respectively.
Figure 4-1 Schematic diagrams showing dimensions of cp-Mg disc (a) and connecting aluminium rod (b) used in the PEO treatment
4.4 Hydroxyapatite Deposition
As stated in Chapter 3, formation of hydroxyapatite on the sample surface could stimulate
beneficial effects to the implant/host response. In the present study, the cathodic
electrodeposition (CED) method was utilised to form hydroxyapatite layers to enhance the
bioactivity of PEO coatings. An apparatus similar to that used for the PEO treatment was
utilised for the CED process, containing an electrolytic cell, a counter electrode (stainless
steel plate) and working electrodes (sample to be treated). A saturated calomel electrode
(SCE) was also utilised to monitor the polarisation behaviour during the CED treatment. In the
CED process, the sample was cathodically polarised using a Solartron 1286 potentiostat. The
treatment was carried out in either potentiostatic or galvanostatic mode, with details provided
in Chapters 8 and 9. An electrolyte composed of (M) 0.043 Ca(NO3)2, 0.025 NH4H2PO4 and
0.1 NaNO3 was prepared by dissolving the corresponding chemical agents in distilled water.
NaNO3 was used to enhance the ionic strength of the electrolyte. The pH of the electrolyte
was adjusted to pH=5 at room temperature by addition of an appropriate amount of
(HOCH2)3CNH2 (Tris), considering the maximum solubility of HA at this pH value. The
deposition process was carried out at a temperature range of 75±3 oC using a water bath
(Clifton NE4-8T).
(a) (b)

Chapter 4 Experimental Procedures
37
4.5 Coating Morphology Characterisation
Since the properties of PEO coated magnesium are directly determined by the morphology, it
is critical to observe the coating morphology development under different treatment
conditions. It is a prerequisite to reveal the relationship between the morphology, processing
parameters and final coating properties.
4.5.1 Coating Thickness Measurements
The coating thickness is of interest here because of the following reasons. On one hand, the
corrosion resistance and mechanical properties which are important for biomedical
application are influenced by the coating thickness; on the other hand, coating thickness
reflects the PEO process efficiency. For a given processing time and applied voltage, a
greater coating thickness suggests higher process efficiency. In the present study, the
thickness of the PEO coatings was analysed using an Electrometer 355 Coating Thickness
Gauge equipped with N4 standard anodisers probe with an accuracy of ±1 µm. The probe
utilises a relatively high frequency signal (up to several mega-Hertz) to generate an
alternating electric field in the substrate beneath the coating. The field causes eddy currents
to circulate in the substrate which in turn induce associated magnetic fields. These fields
interact with the probe and cause electrical impedance changes that are dependent on the
coating thickness. Before performing the measurement, the thickness gauge was zeroed by
pressing the probe against a well-polished sample surface made of the same material as the
substrate. Then the gauge was calibrated using dielectric films of known thickness. About 20
measurements were taken from each coated sample. The results of the measurements were
statistically analysed, and the arithmetic average is taken as the coating thickness.
4.5.2 Coating Morphology Observation by Scanning Electron Microscopy
Scanning electron microscopy (SEM) is a widely used technique in various areas like
materials, physics, biology, etc.. In SEM, the electron beam generated by a biased filament is
focused by electromagnetic lens and directed towards the sample, where the high energy
electrons will interact with the atoms of the specimen, emitting different kinds of signals. Of
the signals, secondary electrons (SE) are very sensitive to characteristics of surface
morphology such as roughness, porosity, cracks, etc.; as a result, the interpretation of SE
image is of significance to reveal surface morphologies. Apart from SE images, the

Chapter 4 Experimental Procedures
38
elementary composition within the sample surface can also be evaluated by collecting
characteristic EDX spectra using a detector attached to the SEM.
In the present study, the plain surface and cross sectional morphologies of the coatings were
observed using JEOL JSM-6400 and/or FEI Inspect F SEM instruments operated at an
acceleration voltage of 15-20 kV. The chemical composition of the coatings was evaluated by
EDX attachments (Oxford instruments) to the electron microscopies. To prepare the
cross-sectional specimens, the coated magnesium discs were firstly cut into halves using the
IsoMet 5000 precision saw mentioned in Section 4.2. However, the cutting speed was
reduced to 1.5 mm/min to eliminate the risk of damaging the coating. Then the sample was
cold mounted using an epoxy resin (MetPrep Ltd.) before being subjected to grinding and
polishing. The samples were firstly ground using SiC abrasive papers of upto 4000 grit. Then
a polish cloth of 1 μm was used for polishing. Since magnesium is a relative soft material, just
soapy water was used during the polishing for the purpose of lubrication. It also prevents the
temperature increase, eliminating the oxidation of magnesium substrate.
For surface plane SEM observation, the samples were stuck on an aluminium stub (Ø30 x 10
mm) using electrical conductive carbon tape. Both the cold mounted cross sectional samples
and the surface plane samples were sputter coated with carbon to eliminate the charging
effects under electron bombmartment during the SEM observation.
4.5.3 Coating Phase Characterisation by XRD
The phase composition of the coating was characterised using X-ray diffraction method. The
basics of this technique rely on the fact that crystals contain periodic arrangements of atoms.
When the incident X-ray beam interacts with a crystal, it is reflected by different atomic planes.
When the reflected beams are in phase, they will be amplified (constructive diffraction),
otherwise they will be dismissed (destructive diffraction). The schematic of the XRD principle
is illustrated in Figure 4-2. Then the relationship between the crystal lattice plane spacing,
wavelength of incident X-ray and the incident angle follows the Bragg’s Law:
2𝑑𝑠𝑖𝑛𝜃 = 𝑛𝜆 ( 4.1 )
Where 𝑑 is the crystal lattice plane spacing, 𝜃 is the incident angle and 𝝀 is the incident
X-ray wavelength. This equation clearly shows the relationship between the diffraction
pattern observed when X-ray is diffracted through the crystal lattice and the atomic plane
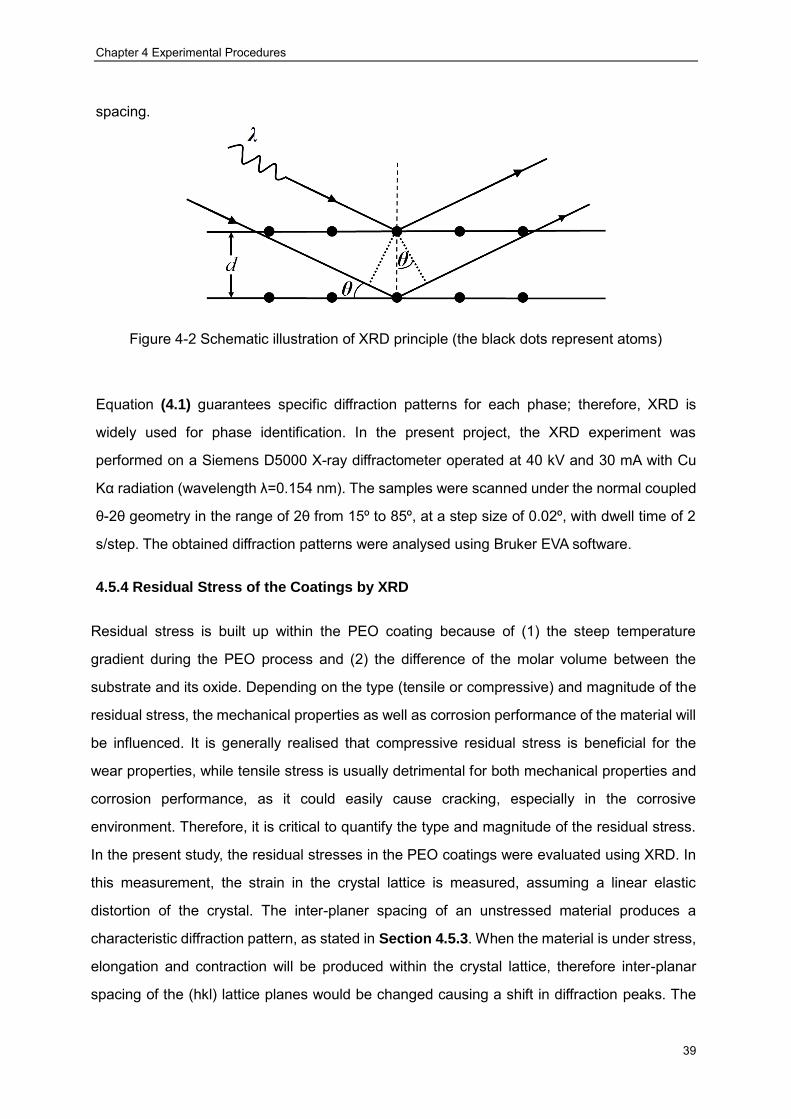
Chapter 4 Experimental Procedures
39
spacing.
Figure 4-2 Schematic illustration of XRD principle (the black dots represent atoms)
Equation (4.1) guarantees specific diffraction patterns for each phase; therefore, XRD is
widely used for phase identification. In the present project, the XRD experiment was
performed on a Siemens D5000 X-ray diffractometer operated at 40 kV and 30 mA with Cu
Kα radiation (wavelength λ=0.154 nm). The samples were scanned under the normal coupled
θ-2θ geometry in the range of 2θ from 15º to 85º, at a step size of 0.02º, with dwell time of 2
s/step. The obtained diffraction patterns were analysed using Bruker EVA software.
4.5.4 Residual Stress of the Coatings by XRD
Residual stress is built up within the PEO coating because of (1) the steep temperature
gradient during the PEO process and (2) the difference of the molar volume between the
substrate and its oxide. Depending on the type (tensile or compressive) and magnitude of the
residual stress, the mechanical properties as well as corrosion performance of the material will
be influenced. It is generally realised that compressive residual stress is beneficial for the
wear properties, while tensile stress is usually detrimental for both mechanical properties and
corrosion performance, as it could easily cause cracking, especially in the corrosive
environment. Therefore, it is critical to quantify the type and magnitude of the residual stress.
In the present study, the residual stresses in the PEO coatings were evaluated using XRD. In
this measurement, the strain in the crystal lattice is measured, assuming a linear elastic
distortion of the crystal. The inter-planer spacing of an unstressed material produces a
characteristic diffraction pattern, as stated in Section 4.5.3. When the material is under stress,
elongation and contraction will be produced within the crystal lattice, therefore inter-planar
spacing of the (hkl) lattice planes would be changed causing a shift in diffraction peaks. The

Chapter 4 Experimental Procedures
40
magnitude of the shift (strain) could be calculated by comparing the inter-planar spacing with
and without stress defined by Equation (4.1). By solving the generalised Hooke’s law, the
stress generating the strain can be calculated through the following equation:
𝜎 =𝐸
(1 + 𝑣)𝑠𝑖𝑛2𝜓∙
𝑑𝜓 − 𝑑0
𝑑0 ( 4.2 )
Where 𝜎 is the direct in-plane residual stress, 𝐸 and 𝑣 are the Elastic’s modulus and
Possion’s ratio of the material under investigation, respectively; 𝑑𝜓 is the crystal plane
spacing of the stressed crystal at the tilt angle 𝜓. 𝑑0 is the unstressed crystal lattice spacing,
which can be obtained from the X-ray diffraction pattern of the unstressed crystal powder.
In the present study, the measurement was performed at the diffracted peak corresponding
with the (422) crystal plane of MgO at 2𝜽=127.28° because of its high sensivity to strain. The
test was conducted on the same X-ray diffractrometer mentioned in Section 4.4.3 in the 2𝜽
range of 125o to 130o at different 𝜓 angles (-45o, -33.75o, -22.5o, -11.25o, 0o, 11.25o, 22.5o,
33.75o). The final results are analysed using a Bruker stress software package .
4.6 In vitro Electrochemical Corrosion Evaluation
As stated in Chapter 2, the application of magnesium in the biomedical area is limited by its
poor corrosion performance. Therefore, investigating the effects of PEO coatings on
corrosion behaviour of Mg comprises the major research activity within this project. To
characterise the corrosion properties of PEO coated magnesium, electrochemical methods
were utilised. The simplified simulated body fluid (8.74 g/l NaCl, 0.35 g/l NaHCO3 and 0.28
g/l Na3PO4·12H2O) utilised previously in [121] was prepared for the electrochemical corrosion
test in Chapter 5. For the corrosion tests in Chapters 6-9, a more universal SBF was
prepared according to the procedure suggested by Kokubo [166, 167], the composition of
which is listed in Table 4-2.
Table 4-2 The reagents used to prepare 1L SBF
Reagent NaCl NaHCO3 KCl K2HPO4·3H2O MgCl2·6H2O CaCl2 Na2SO4 Tris 1.0M-HCl
Mass /g 8.035 0.355 0.225 0.231 0.311 0.292 0.072 6.118 Adjust pH to 7.4
Basically, the corrosion of magnesium is a result of the balance between metallic magnesium
oxidation (anodic reaction) and reduction of corrosive species (cathodic reaction), which
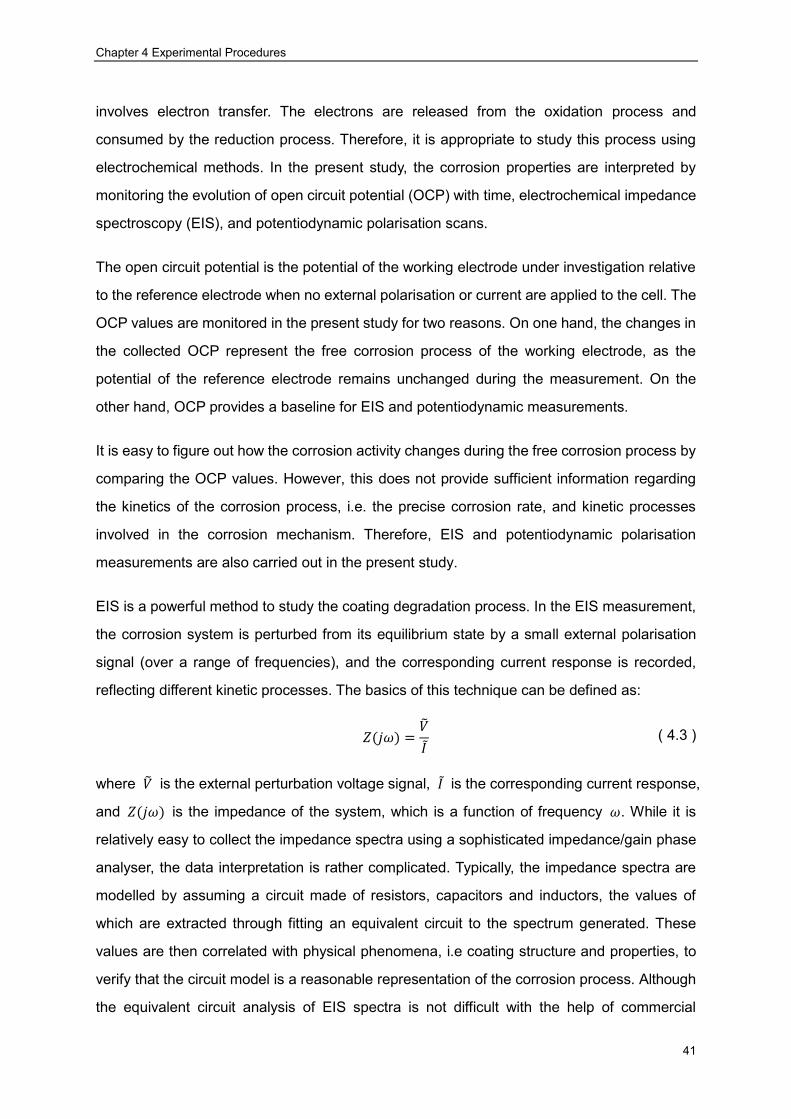
Chapter 4 Experimental Procedures
41
involves electron transfer. The electrons are released from the oxidation process and
consumed by the reduction process. Therefore, it is appropriate to study this process using
electrochemical methods. In the present study, the corrosion properties are interpreted by
monitoring the evolution of open circuit potential (OCP) with time, electrochemical impedance
spectroscopy (EIS), and potentiodynamic polarisation scans.
The open circuit potential is the potential of the working electrode under investigation relative
to the reference electrode when no external polarisation or current are applied to the cell. The
OCP values are monitored in the present study for two reasons. On one hand, the changes in
the collected OCP represent the free corrosion process of the working electrode, as the
potential of the reference electrode remains unchanged during the measurement. On the
other hand, OCP provides a baseline for EIS and potentiodynamic measurements.
It is easy to figure out how the corrosion activity changes during the free corrosion process by
comparing the OCP values. However, this does not provide sufficient information regarding
the kinetics of the corrosion process, i.e. the precise corrosion rate, and kinetic processes
involved in the corrosion mechanism. Therefore, EIS and potentiodynamic polarisation
measurements are also carried out in the present study.
EIS is a powerful method to study the coating degradation process. In the EIS measurement,
the corrosion system is perturbed from its equilibrium state by a small external polarisation
signal (over a range of frequencies), and the corresponding current response is recorded,
reflecting different kinetic processes. The basics of this technique can be defined as:
𝑍(𝑗𝜔) =�̃�
𝐼 ( 4.3 )
where �̃� is the external perturbation voltage signal, 𝐼 is the corresponding current response,
and 𝑍(𝑗𝜔) is the impedance of the system, which is a function of frequency 𝜔. While it is
relatively easy to collect the impedance spectra using a sophisticated impedance/gain phase
analyser, the data interpretation is rather complicated. Typically, the impedance spectra are
modelled by assuming a circuit made of resistors, capacitors and inductors, the values of
which are extracted through fitting an equivalent circuit to the spectrum generated. These
values are then correlated with physical phenomena, i.e coating structure and properties, to
verify that the circuit model is a reasonable representation of the corrosion process. Although
the equivalent circuit analysis of EIS spectra is not difficult with the help of commercial
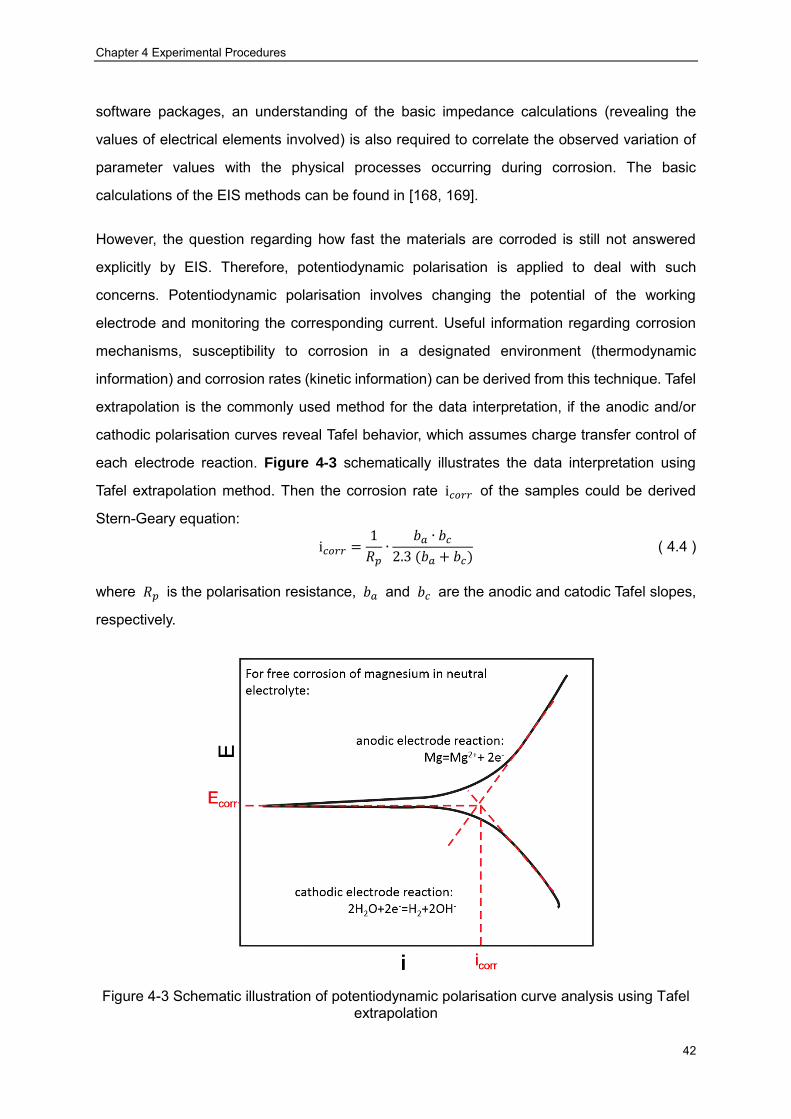
Chapter 4 Experimental Procedures
42
software packages, an understanding of the basic impedance calculations (revealing the
values of electrical elements involved) is also required to correlate the observed variation of
parameter values with the physical processes occurring during corrosion. The basic
calculations of the EIS methods can be found in [168, 169].
However, the question regarding how fast the materials are corroded is still not answered
explicitly by EIS. Therefore, potentiodynamic polarisation is applied to deal with such
concerns. Potentiodynamic polarisation involves changing the potential of the working
electrode and monitoring the corresponding current. Useful information regarding corrosion
mechanisms, susceptibility to corrosion in a designated environment (thermodynamic
information) and corrosion rates (kinetic information) can be derived from this technique. Tafel
extrapolation is the commonly used method for the data interpretation, if the anodic and/or
cathodic polarisation curves reveal Tafel behavior, which assumes charge transfer control of
each electrode reaction. Figure 4-3 schematically illustrates the data interpretation using
Tafel extrapolation method. Then the corrosion rate i𝑐𝑜𝑟𝑟 of the samples could be derived
Stern-Geary equation:
i𝑐𝑜𝑟𝑟 =1
𝑅𝑝∙
𝑏𝑎 ∙ 𝑏𝑐
2.3 (𝑏𝑎 + 𝑏𝑐) ( 4.4 )
where 𝑅𝑝 is the polarisation resistance, 𝑏𝑎 and 𝑏𝑐 are the anodic and catodic Tafel slopes,
respectively.
Figure 4-3 Schematic illustration of potentiodynamic polarisation curve analysis using Tafel
extrapolation

Chapter 4 Experimental Procedures
43
As illustrated in Figure 4-3, the intersection of the two Tafel branches defines the corrosion
process. The corrosion potential, Ecorr is related to thermodynamic aspect, revealing the
susceptibility to corrosion, whereas the corrosion current density icorr, defines the averaged
rate of corrosion over the sampled surface area. Generally, a higher Ecorr and a lower icorr
usually mean a higher corrosion resistance and a better anti-corrosion performance.
It is worth noting that this method is only valid when apparent Tafel behaviour is observed, i.e.
the anodic and/or cathodic polarisation is/are controlled by activation polarisation processes.
Unfortunately, this is not always the case; in practice, the activation polaristion is usually
complicated by other polarisation mechanisms, including mass transfer processes, which
makes the data interpretation difficult. Various methods have been proposed to solve this
problem. For the mass transfer controlled process, the limiting current density revealed by the
polarisation curve is usually taken as the measure of corrosion current density icorr, whereas
for the curves showing multiple activation polarisation processes, the different processes
involved are firstly figured out before applying the Tafel analysis for icorr identification. The icorr
is an electrochemical term, which can be converted to linear corrosion rate assuming
occurrence of uniform corrosion based on Faraday’s Law:
ℎ =𝐼𝑐𝑜𝑟𝑟 ∙ 𝑀
𝑛 ∙ 𝐹 ∙ 𝜌 ( 4.5 )
Where ℎ is the corrosion rate in m/s, 𝑀 in g/mol and ρ in g/m3 are, respectively, the molar
mass and density of the metal under corrosion, 𝑛 is the number of electrons transferred in
the corrosion process, and 𝐹= 96485 C/mol is the Faraday constant. Equation (4.4) helps in
converting icorr to a more convenient term. However, such conversion of corrosion rates also
depends on the form of corrosion process and is not applicable for localised corrosion. The
interpretation of corrosion rate is carefully discussed in the relevant chapters.
The aforementioned electrochemical corrosion properties were evaluated using a Solartron
1286 potentiostat coupled with a 1260 frequency gain/phase analyser. Since the surface of
the sample is of primary concern, a standard plain three-electrode cell was utilised for this
purpose, as illustrated in Figure 4-4. A platinum plate (10 x 25 mm) was used as the counter
electrode, whereas a saturated calomel electrode (SCE) (0.2444 V vs. standard hydrogen
electrode (SHE)) was used as a reference electrode. Both the reference electrode and the
counter electrode were inserted into appropriate holes in the cell as shown in Figure 4-4. The
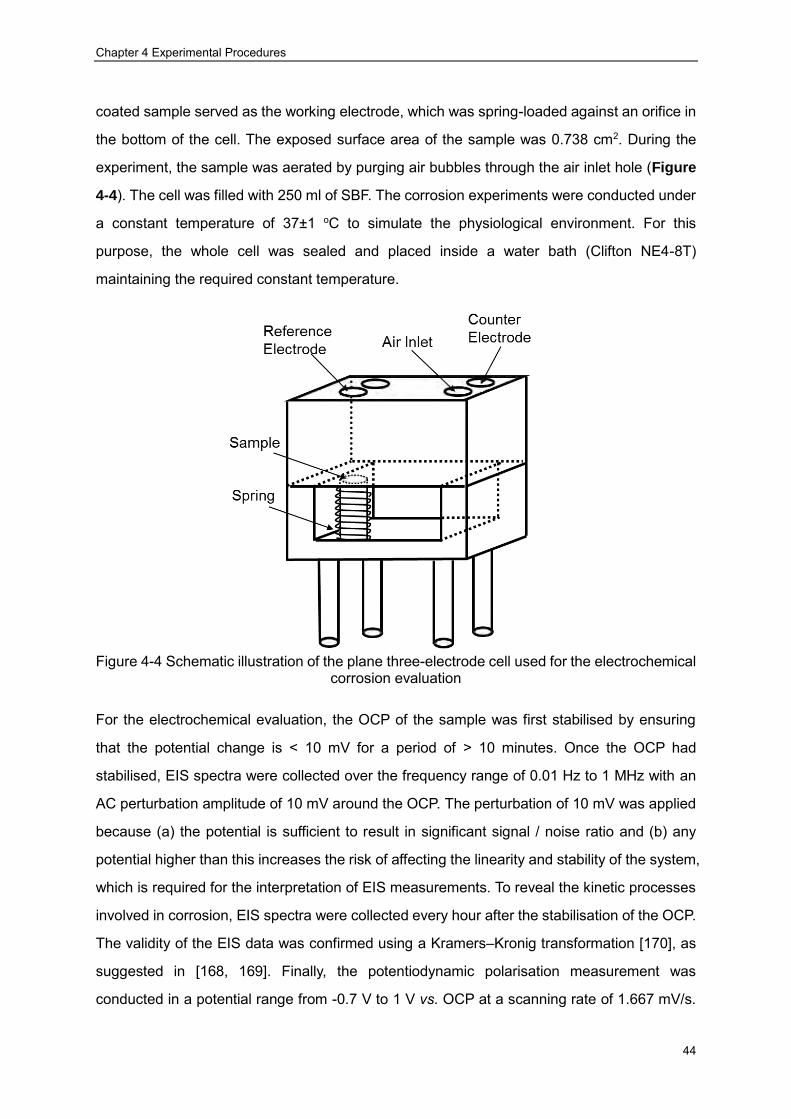
Chapter 4 Experimental Procedures
44
coated sample served as the working electrode, which was spring-loaded against an orifice in
the bottom of the cell. The exposed surface area of the sample was 0.738 cm2. During the
experiment, the sample was aerated by purging air bubbles through the air inlet hole (Figure
4-4). The cell was filled with 250 ml of SBF. The corrosion experiments were conducted under
a constant temperature of 37±1 oC to simulate the physiological environment. For this
purpose, the whole cell was sealed and placed inside a water bath (Clifton NE4-8T)
maintaining the required constant temperature.
Figure 4-4 Schematic illustration of the plane three-electrode cell used for the electrochemical
corrosion evaluation
For the electrochemical evaluation, the OCP of the sample was first stabilised by ensuring
that the potential change is < 10 mV for a period of > 10 minutes. Once the OCP had
stabilised, EIS spectra were collected over the frequency range of 0.01 Hz to 1 MHz with an
AC perturbation amplitude of 10 mV around the OCP. The perturbation of 10 mV was applied
because (a) the potential is sufficient to result in significant signal / noise ratio and (b) any
potential higher than this increases the risk of affecting the linearity and stability of the system,
which is required for the interpretation of EIS measurements. To reveal the kinetic processes
involved in corrosion, EIS spectra were collected every hour after the stabilisation of the OCP.
The validity of the EIS data was confirmed using a Kramers–Kronig transformation [170], as
suggested in [168, 169]. Finally, the potentiodynamic polarisation measurement was
conducted in a potential range from -0.7 V to 1 V vs. OCP at a scanning rate of 1.667 mV/s.

Chapter 4 Experimental Procedures
45
After the corrosion evaluation, the samples were subjected to SEM observation in order to
find out a correlation between the corrosion processes identified by the EIS analysis and the
corroded morphologies. It is worth noting here that the corrosion products were retained on
the corroded samples in order to provide indications about the corrosion process. The SEM
sample preparation and observation were conducted according to the standard procedure
described in Section 4.5.2.
4.7 Evaluation of Mechanical Properties of the PEO Coated Magnesium
Apart from sufficient corrosion resistance, implants (bone fixtures, screws) made of
magnesium should also possess adequate mechanical properties, i.e. strength, ductility to
support the fractured bones. In the present project, mechanical properties of the samples are
characterised from different aspects.
4.7.1 Tensile Property Characterisation
Tensile testing is an easy and reliable method to determine two basic mechanical properties
of concern, i.e. strength and ductility. To reveal the effects of the coatings on the mechanical
properties of magnesium, tensile tests were conducted on samples with and without coatings.
Tensile samples were manufactured according to ASTM E8-04, as presented in Figure 4-5.
The gauge length was 33 mm, and the diameter of the gauge part was 6 mm. The fillet radius
was set at 6 mm. The grip length of 25 mm was assumed to be sufficient to provide a robust
locking of the sample during the test. After machining, the samples were manually ground
using SiC abrasive paper of 4000 grit to remove all the machining grooves, which could
concentrate the stress and affect the evaluation of the tensile properties. After the grinding, a
surface finish of Ra ~ 20 nm was achieved. After being thoroughly cleaned, the sample
surface was modified with PEO coating followed by cathodic electrodeposition (CED)
treatment, where the PEO coated sample is cathodically polarised in an electrolyte saturated
with HA. The production of CED layer is described correspondingly in Chapter 9. The tensile
tests were conducted at room temperature using a universal tensile testing machine
(Hounsfield Test Equipment). The tensile rate was set at 5 mm/min.
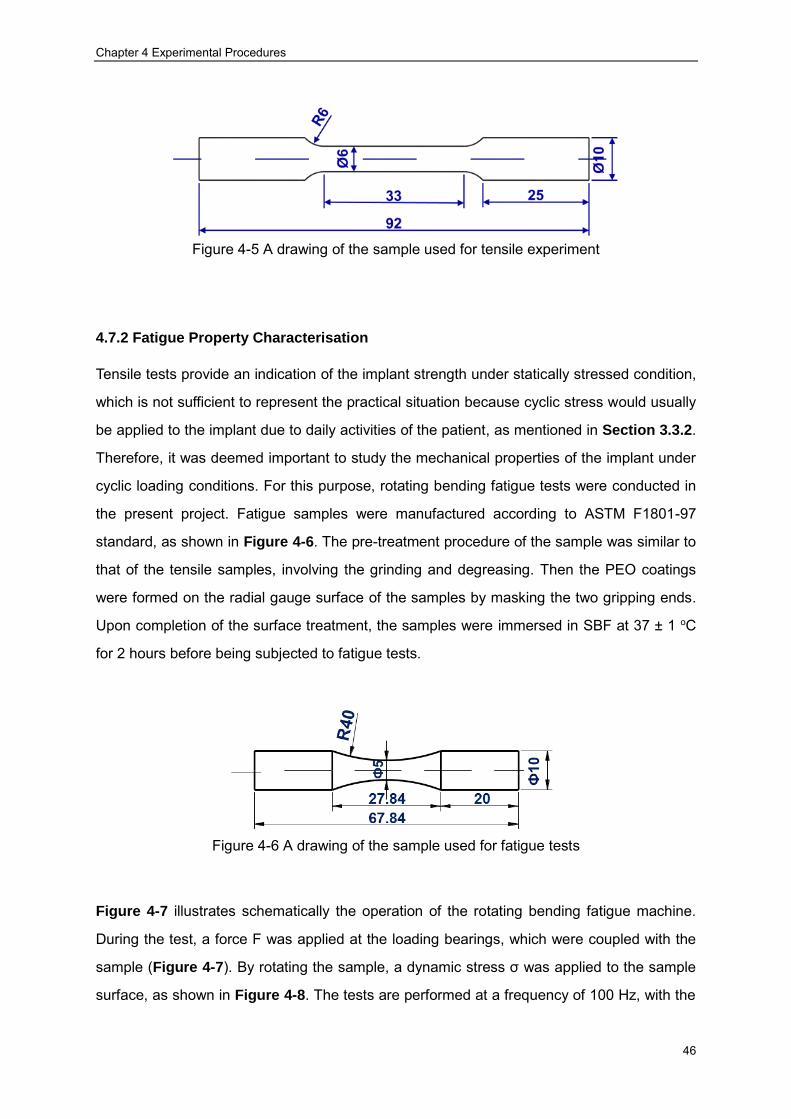
Chapter 4 Experimental Procedures
46
Figure 4-5 A drawing of the sample used for tensile experiment
4.7.2 Fatigue Property Characterisation
Tensile tests provide an indication of the implant strength under statically stressed condition,
which is not sufficient to represent the practical situation because cyclic stress would usually
be applied to the implant due to daily activities of the patient, as mentioned in Section 3.3.2.
Therefore, it was deemed important to study the mechanical properties of the implant under
cyclic loading conditions. For this purpose, rotating bending fatigue tests were conducted in
the present project. Fatigue samples were manufactured according to ASTM F1801-97
standard, as shown in Figure 4-6. The pre-treatment procedure of the sample was similar to
that of the tensile samples, involving the grinding and degreasing. Then the PEO coatings
were formed on the radial gauge surface of the samples by masking the two gripping ends.
Upon completion of the surface treatment, the samples were immersed in SBF at 37 ± 1 oC
for 2 hours before being subjected to fatigue tests.
Figure 4-6 A drawing of the sample used for fatigue tests
Figure 4-7 illustrates schematically the operation of the rotating bending fatigue machine.
During the test, a force F was applied at the loading bearings, which were coupled with the
sample (Figure 4-7). By rotating the sample, a dynamic stress σ was applied to the sample
surface, as shown in Figure 4-8. The tests are performed at a frequency of 100 Hz, with the

Chapter 4 Experimental Procedures
47
stress ratio R= -1. It is worth noting that the magnitude of the stress varies along the
longitudinal direction of the sample because of the variation of the bending moment along this
direction. Meanwhile, the stress is also varied in the transverse direction, and the maximum
stress is imposed on the sample surface. The detailed calculation of stress distribution along
longitudinal direction of the sample is presented in Appendix A, which demonstrates that the
maximum stress value is imposed in the middle of the sample. The fatigue test was set up to
achieve either complete specimen fracture or 107 load cycles if the specimen does not fail.
The fatigue life and strength were determined using the obtained S-N curves.
Figure 4-7 Schematic illustration of the rotating bending fatigue test operation
Figure 4-8 Illustration of the dynamic stress imposed on the samples during fatigue tests
4.8 Summary
The experimental methods and procedures mentioned above are essential to achieve the
objectives listed in Section 1.2. And those methods are followed in Chapters 5-9.
Nevertheless, the methods mentioned here are too generalised to provide all the
experimental details required in each specific chapter. For example, the detailed composition
of electrolyte used for the PEO treatment is not described here but presented in each specific
chapter. Therefore, in order to get a clear picture of the experimental parameters applied
(Chapters 5-9), the reader is recommended to refer to the specific chapter of interest.
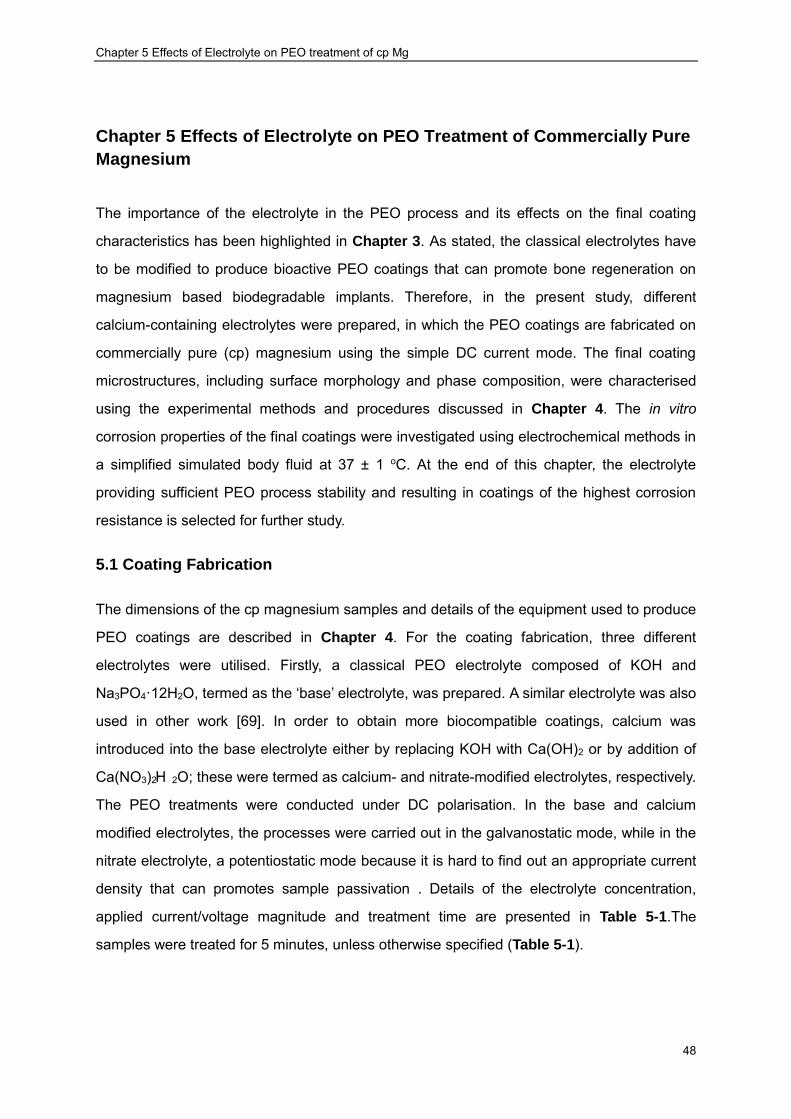
Chapter 5 Effects of Electrolyte on PEO treatment of cp Mg
48
Chapter 5 Effects of Electrolyte on PEO Treatment of Commercially Pure
Magnesium
The importance of the electrolyte in the PEO process and its effects on the final coating
characteristics has been highlighted in Chapter 3. As stated, the classical electrolytes have
to be modified to produce bioactive PEO coatings that can promote bone regeneration on
magnesium based biodegradable implants. Therefore, in the present study, different
calcium-containing electrolytes were prepared, in which the PEO coatings are fabricated on
commercially pure (cp) magnesium using the simple DC current mode. The final coating
microstructures, including surface morphology and phase composition, were characterised
using the experimental methods and procedures discussed in Chapter 4. The in vitro
corrosion properties of the final coatings were investigated using electrochemical methods in
a simplified simulated body fluid at 37 ± 1 oC. At the end of this chapter, the electrolyte
providing sufficient PEO process stability and resulting in coatings of the highest corrosion
resistance is selected for further study.
5.1 Coating Fabrication
The dimensions of the cp magnesium samples and details of the equipment used to produce
PEO coatings are described in Chapter 4. For the coating fabrication, three different
electrolytes were utilised. Firstly, a classical PEO electrolyte composed of KOH and
Na3PO4·12H2O, termed as the ‘base’ electrolyte, was prepared. A similar electrolyte was also
used in other work [69]. In order to obtain more biocompatible coatings, calcium was
introduced into the base electrolyte either by replacing KOH with Ca(OH)2 or by addition of
Ca(NO3)2·H 2O; these were termed as calcium- and nitrate-modified electrolytes, respectively.
The PEO treatments were conducted under DC polarisation. In the base and calcium
modified electrolytes, the processes were carried out in the galvanostatic mode, while in the
nitrate electrolyte, a potentiostatic mode because it is hard to find out an appropriate current
density that can promotes sample passivation . Details of the electrolyte concentration,
applied current/voltage magnitude and treatment time are presented in Table 5-1.The
samples were treated for 5 minutes, unless otherwise specified (Table 5-1).
Chapter 5 Effects of Electrolyte on PEO treatment of cp Mg
49
Table 5-1 Parameters of DC-PEO process used in the present study
Sample ID Anodising Conditions
Electrolyte Current Mode Time /min
Composition C /g·L-1 i / mA·cm-2 U /V
A1 KOH
Na3PO4·12H2O
2
3
30 - 5
A2 40 - 5
A3 50 - 5
B1 Ca(OH)2
Na3PO4·12H2O
2
12
30 - 5
B2 40 - 5
B3 50 - 5
C1 NaOH
Ca(NO3)2·4H2O
Na3PO4·12H2O
120
53
80
- 70 5
C2 - 70+80 5+5
C3 - 80 5
C4 - 90 0.5
5.2 Characteristics of PEO Process
The recorded voltage transients during the PEO process in the base and calcium modified
electrolytes and the current transient in the nitrate electrolyte are shown in Figure 5-1. Under
DC conditions, the PEO cell can be simply considered as a series combination of resistances
RM, Rc and Re corresponding to the Mg substrate, PEO coating and electrolyte, respectively.
Therefore the overall voltage V at the power supply output can be described as follows:
𝑉 = 𝐼(𝑅𝑀 + 𝑅𝑐 + 𝑅𝑒) ( 5.1 )
Considering RM and Re do not change during the PEO process, then the voltage variation with
time can be derived by the differentiation of equation (5.1) with respect to time:
𝑑𝑉
𝑑𝑡= 𝐼
𝑑𝑅𝑐
𝑑𝑡 ( 5.2 )
When a dense coating is assumed, the coating resistance Rc can be related to its thickness D
and overall surface area A, according to the following equation:
𝑅𝑐 = 𝜌𝐷
𝐴 ( 5.3 )
Where ρ, the resistivity of the coating material, together with A can be considered as constant

Chapter 5 Effects of Electrolyte on PEO treatment of cp Mg
50
for a given sample. It is easy to obtain the following equation by substituting equation (5.3) to
(5.2):
𝑑𝑉
𝑑𝑡=
𝐼𝜌
𝐴×
𝑑𝐷
𝑑𝑡 ( 5.4 )
Under the galvanostatic PEO mode, the current I is maintained constant. If all the constant
parameters are combined in equation (5.4), it is easy to conclude that the rate of voltage
change (the slope in the voltage transient curve) is proportional to the coating growth rate.
For the voltage control mode, the voltage remains constant during the PEO process, and the
relationship between the recorded current and oxide coating growth behaviour can be
obtained from Equation (5.5):
𝑑(𝐼−1)
𝑑𝑡=
𝜌
𝐴𝑉×
𝑑𝐷
𝑑𝑡 ( 5.5 )
Where 𝑉 is the applied external voltage and 𝐼 is the corresponding current measurements.
Therefore, it is straightforward that the coating growth rate 𝑑𝐷
𝑑𝑡 is inversely proportional to the
current decay behaviour.
Based on equations (5.4) and (5.5), the coating growth behaviour can be reflected by the
voltage and current transients during the PEO process. Correspondingly, the voltage
presents an increasing trend at constant current PEO mode while a decreasing trend is
recorded for the potentiostatic PEO process, as shown in Figure 5-1(c). In the present case,
the voltage increases rapidly following a linear behaviour within a very short period of time,
(about 15 s), upon the start of PEO process as shown in Figure 5-1 (a) and (b), suggesting a
rapid passivation of magnesium in the electrolyte. It has been recognised that the passivation
in this stage is governed by Faraday’s law. When the voltage increased further to a critical
value of >50 V in both the base and calcium-modified electrolytes, tiny sparks began to
appear on the sample surface, which was also accompanied by intense gas liberation. During
this period, the voltage increased further but at a lower rate, indicating a lower rate of coating
thickness increase according to Equation (5.4). It is obvious that the growth rate in this period
is dependent on the applied current density and the electrolyte composition. By fitting the
voltage transient behaviour in this period recorded in the base electrolyte, it is found that
when the applied current density increased from 30 to 40 mA/cm2, the voltage transient also
increased from 2.52 to 3.82 V/s, respectively. When a current density of 50 mA/cm2 was
applied, the voltage became quite unstable in this period, featuring a downward through

Chapter 5 Effects of Electrolyte on PEO treatment of cp Mg
51
(Figure 5-1(a)), which is believed to come from the coating dissolution.
Figure 5-1 Voltage vs. time response for PEO treatments at different current densities (mA·cm2) (a,b) and current variation at 70 V (c) within: (a) base electrolyte; (b) calcium
modified electrolyte and (c) nitrate-modified electrolyte
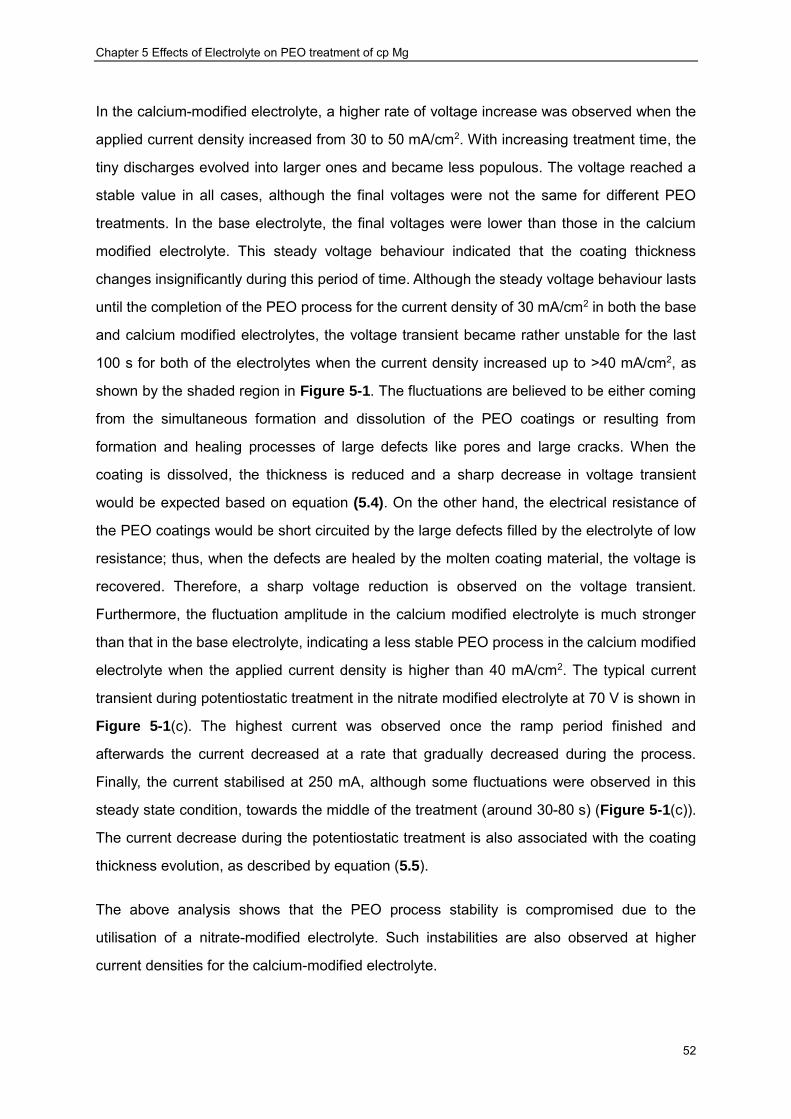
Chapter 5 Effects of Electrolyte on PEO treatment of cp Mg
52
In the calcium-modified electrolyte, a higher rate of voltage increase was observed when the
applied current density increased from 30 to 50 mA/cm2. With increasing treatment time, the
tiny discharges evolved into larger ones and became less populous. The voltage reached a
stable value in all cases, although the final voltages were not the same for different PEO
treatments. In the base electrolyte, the final voltages were lower than those in the calcium
modified electrolyte. This steady voltage behaviour indicated that the coating thickness
changes insignificantly during this period of time. Although the steady voltage behaviour lasts
until the completion of the PEO process for the current density of 30 mA/cm2 in both the base
and calcium modified electrolytes, the voltage transient became rather unstable for the last
100 s for both of the electrolytes when the current density increased up to >40 mA/cm2, as
shown by the shaded region in Figure 5-1. The fluctuations are believed to be either coming
from the simultaneous formation and dissolution of the PEO coatings or resulting from
formation and healing processes of large defects like pores and large cracks. When the
coating is dissolved, the thickness is reduced and a sharp decrease in voltage transient
would be expected based on equation (5.4). On the other hand, the electrical resistance of
the PEO coatings would be short circuited by the large defects filled by the electrolyte of low
resistance; thus, when the defects are healed by the molten coating material, the voltage is
recovered. Therefore, a sharp voltage reduction is observed on the voltage transient.
Furthermore, the fluctuation amplitude in the calcium modified electrolyte is much stronger
than that in the base electrolyte, indicating a less stable PEO process in the calcium modified
electrolyte when the applied current density is higher than 40 mA/cm2. The typical current
transient during potentiostatic treatment in the nitrate modified electrolyte at 70 V is shown in
Figure 5-1(c). The highest current was observed once the ramp period finished and
afterwards the current decreased at a rate that gradually decreased during the process.
Finally, the current stabilised at 250 mA, although some fluctuations were observed in this
steady state condition, towards the middle of the treatment (around 30-80 s) (Figure 5-1(c)).
The current decrease during the potentiostatic treatment is also associated with the coating
thickness evolution, as described by equation (5.5).
The above analysis shows that the PEO process stability is compromised due to the
utilisation of a nitrate-modified electrolyte. Such instabilities are also observed at higher
current densities for the calcium-modified electrolyte.

Chapter 5 Effects of Electrolyte on PEO treatment of cp Mg
53
5.3 Coating Morphology
The surface morphologies of the PEO coatings obtained in the base electrolyte are shown in
Figure 5-2. Typical porous morphologies are observed at all current densities, which are
attributed to the discharge activity and gas evolution during the PEO process, as stated in
Chapter 3. While the smallest pores in all the coatings are less than 1 µm, the largest pore
diameters increased from ~10.5 µm at a current density of 30 mA/cm2 to ~23.2 µm and ~45.3
µm for a current density of 40 mA/cm2 and 50 mA/cm2, respectively. On average, larger
pore diameters are observed in the coatings produced at higher current densities. After
analysis of the SEM images using ImageJ software, it is found that the average pore
diameters for the coatings obtained at i=30, 40, and 50 mA/cm2 are 2.51, 4.25, and 5.7 µm,
respectively. The increase in the pore size with current density is probably due to the more
powerful discharges caused by the higher energy injection. It is worth noting that the pores
are sometimes overlapped with finer pores being observed at the bottom of larger ones, as
marked by the white circles in Figure 5-2. Moreover, there are cracks present in the
coatings, as indicated by the white arrows in Figure 5-2. It is believed that the cracks are
attributed to significant temperature difference between the coating and electrolyte, creating
rapid cooling. During the PEO process, the temperature within the discharge channels can be
as high as several thousand degrees Celsius [117], and the cooling rate provided by the cold
(<30 oC) electrolyte is considerable. Resultant local thermal shocks cause cracking in the
ceramic surface layer. Generally, the local temperatures in the discharge channels at higher
current densities are greater than those at lower current densities [128], which results in
longer overall crack lengths in the coatings produced at higher current densities (Figure 5-2).
Similar porous morphologies are also observed in the coatings produced within the calcium
modified electrolyte, which show numerous small pores (Figure 5-3). Specifically, the pore
diameters in the coating produced at 30 mA/cm2 fall in the range from <1 µm to ~9 µm. When
the current density increases to 40 mA/cm2, the final pore size does not increase significantly.
In contrast, the pore diameters increase dramatically when the applied current density
increased up to 50 mA/cm2, being in the range from <1 µm to >9 µm,. In contrast with the
results observed in the base electrolyte, very few cracks are seen in the coatings produced at
30 and 40 mA/cm2 although much larger cracks are observed in the coating produced at 50
mA/cm2 in the calcium modified electrolyte compared with that produced at the equivalent
base electrolyte (Figures 5-2(c) and 5-3(c)).

Chapter 5 Effects of Electrolyte on PEO treatment of cp Mg
54
Figure 5-2 SEM surface morphologies of PEO coatings produced in the base electrolyte at
current densities (mA/cm2) of : (a) 30, (b) 40 and (c) 50
In contrast, the morphologies of the coatings obtained in the nitrate electrolyte are
significantly different (Figure 5-4), featuring much finer porosity. This may result from the high
dissolution rate of the coatings, consistent with the fluctuations in current transient shown in
Figure 5-1(c).
Cross-sectional morphologies shown in Figure 5-5 give further details of the coating
microstructure. Obvious porosity observed in the cross-sectional morphologies is generally
consistent with the results of surface plane SEM analysis (Figure 5-2). In addition, some
pores are large enough to penetrate through the coating thickness, as indicated by the circle
in Figure 5-5. Nevertheless, the calcium-modified electrolyte yielded much more compact
coatings through the thickness than its two counterparts, therefore, a better corrosion
resistance could be predicted. Moreover, the coatings showed high roughness, both surface
and interfacial, and some evidence of weakened bonding with the substrate, e.g. sites of
delamination and interfacial porosity in the coatings produced in calcium electrolyte at 40

Chapter 5 Effects of Electrolyte on PEO treatment of cp Mg
55
mA/cm2; at the same time the bonding of other coatings appeared to be better (Figure 5-5).
No apparent coating was observed on the samples treated in the nitrate modified electrolyte
at 90 V (Figure 5-4(d)), which is probably due to the dissolution rate of magnesium
exceeding the oxide formation rate under these conditions.
Figure 5-3 SEM surface morphologiies of PEO coatings produced in the calcium modified
electrolyte at current densities (mA/cm2) of: (a) 30, (b) 40 and (c) 50
Apart from the coating morphologies, cross-sectional SEM images also revealed the coating
thickness, which is analysed using a computer programme called ImageJ. 15 data points
are randomly selected on the cross-sectional images, the average of which is taken as the
coating thickness (Figure 5-6). It is evident that higher current densities would result in
higher coating thickness, i.e. the coating thickness increased from 9.58 µm at 30 mA/cm2 to
15.69 µm at 40 mA/cm2 in the base electrolyte. The calcium modified electrolyte yielded a
coating thickness of 5.55 µm at 30mA/cm2 to 9.18 µm at 50 mA/cm2. Therefore, the
coatings obtained in the calcium modified electrolyte were much thinner at all the applied
current densities. The coating produced in the nitrate electrolyte at 70 V is thinner than that
produced in the base electrolyte at 30 mA/cm2; even thinner coatings are produced when the

Chapter 5 Effects of Electrolyte on PEO treatment of cp Mg
56
applied voltage is increased and the coating is too thin to be observed when the voltage is
increased up to 90 V.
Figure 5-4 SEM morphologies of PEO coatings produced in the nitrate modified electrolyte at
the voltage of: (a) 70 V, (b) 70 V+ 80 V, (c) 80 V and (d) 90 V/0.5 min
Figure 5-5 Cross-sectional morphologies of PEO coatings obtained at different current
densities in: (A) base electrolyte, (B) Calcium-modified electrolyte and (C) Nitrate-modified electrolyte

Chapter 5 Effects of Electrolyte on PEO treatment of cp Mg
57
In addition, the coating roughness is related to the applied current density and voltage. In
the calcium modified electrolyte, the coating roughness increases with increasing current
density, as reflected by the higher thickness deviations (Figure 5-6), this is in good
agreement with the analysis of the voltage transient (heavier fluctuations at higher current
densities) (Figure 5-1). In contrast, finer coating roughness is observed with increasing
current densities in the base electrolyte, as shown by the thickness deviations in Figure 5-6.
The highest roughness is observed in the coatings produced in the nitrate-modified
electrolyte at 70 V. From the analysis of the cross-sectional SEM images, it could be
concluded that the coating formation ability is reduced when the base electrolyte is modified
as in the present study.
Figure 5-6 Coating thickness evolution with applied (a) current density in base and calcium-
modified electrolyte and (b) voltage amplitude in nitrate-modified electrolyte

Chapter 5 Effects of Electrolyte on PEO treatment of cp Mg
58
5.4 Surface Chemical and Phase Composition
Typical EDX spectra from the coatings produced in the present study are shown in Figure 5-7,
with relative contents of elements detected being summarised in Table 5-2. The EDX spectra
from coatings in the base and calcium modified electrolyte are similar, containing Mg, O and
P (Figure 5-7(a)), but surprisingly phosphorus was not detected in the coatings obtained in
the nitrate-modified electrolyte (Figure 5-7(b)), although the concentration of phosphate salt
there was very high. Moreover, Ca is also absent in all spectra of the coatings produced in the
calcium containing electrolytes. This is inconsistent with the result published by Srinivasan et
al [122], where an appreciable amount of Ca was identified in the PEO coatings produced
using a pulsed unipolar current mode. According to general understanding of the coating
formation mechanism during PEO processing [114], cations and anions are driven in opposite
directions by the electric field developed in the discharge channels. This can explain the
absence of Ca in DC-PEO coatings, suggesting that its incorporation under pulsed unipolar
conditions as published by Srinivasan et al [122] may be associated with either direct
adsorption or precipitation in the form of calcium phosphate during the pulse off time. The
absence of phosphorus in the coatings produced in the nitrate modified electrolyte may be
due to nitrate anions preventing adsorption of phosphate groups on the oxidised surfaces.
Moreover, the P contents detected from the coatings obtained in the base electrolyte are
almost the same, regardless of the applied current density. In contrast, the phosphorus
content of the coating fabricated in the calcium modified electrolyte is significantly reduced to
9 at.% at the current density of 30 mA/cm2. Afterwards, P content climbs up to 14 at.% when
the current density increases to 40 mA/cm2.
Figure 5-7 Typical EDX spectra of PEO coatings obtained with different process parameters
in (a) base and calcium-modified electrolyte and (b) nitrate-modified electrolyte

Chapter 5 Effects of Electrolyte on PEO treatment of cp Mg
59
XRD patterns of the coated samples are shown in Figure 5-8. Strong magnesium peaks in
the patterns correspond to the metal substrate. The coatings produced in the base electrolyte
(Figure 5-8(a)) are mainly composed of magnesium oxide (MgO) and a relatively minor
amount of magnesium phosphate (Mg3(PO4)2). Similarly, the coatings fabricated in the
calcium modified electrolyte are composed of magnesium oxide (Figure 5-8(b)), but,
surprisingly, no phosphorus containing phase was identified although the EDX analysis
suggested an appreciable amount of phosphorus in these coatings. This indicates that in the
presence of calcium hydroxide, phosphate crystallisation is suppressed and it tends to be
incorporated into the coating as an amorphous component rather than a crystallite compound.
In the coatings formed in the nitrate electrolyte MgO is also the only crystalline phase (Figure
5-8(c)), which is consistent with the results of EDX analysis.
Table 5-2 Summary of EDX results
Sample ID Elements (at.%)
Mg O P
A1 37 48 15
A2 39 47 14
A3 35 50 15
B1 45 46 9
B2 39 47 14
B3 38 50 12
C1 65 35 -
C2 64 36 -
C3 62 38 -
5.5 Corrosion Evaluation
5.5.1 Electrochemical Impedance Spectroscopy
After the open circuit potential in the simplified simulated body fluid has been stabilised for 1
hour, the electrochemical impedance spectroscopy response of the samples was measured
to reveal the corrosion properties of the coatings. Characteristic impedance diagrams of
PEO-coated cp-Mg samples in the simplified simulated body fluid are presented in Figures

Chapter 5 Effects of Electrolyte on PEO treatment of cp Mg
60
5-9, 5-10 and 5-11. The EIS behaviour is significantly affected by the PEO process
parameters, i.e. electrolyte and voltage / current magnitude. Specifically, the overall
impedance of the samples treated in the base electrolyte (Figure 5-9) increases with
increasing current density, indicating an increase in corrosion protection [171]. The complex
plot from the sample coated at 30 mA/cm2 exhibits two loops: the capacitive loop at high and
medium frequencies is believed to originate from the charge transfer process, and the other
one at low frequencies is in the inductive domain, indicating the presence of pitting corrosion
process [172]. The data can be adequately fitted by the equivalent circuit shown in Figure
5-9(c) , in which Rct represents the charge transfer resistance and the constant phase
element (CPE1) reflects a non-ideal behaviour (e.g. distributed properties resulting from
roughness and porosity) of the double layer capacitance.
Complex and Bode plots obtained from the coatings produced in the base electrolyte at 40
and 50 mA/cm2 are also presented in Figure 5-9(a) and (b). Although a loop at high to
medium frequencies appears as a similar depressed semicircle (as in the aforementioned
situation), the complex plot show a linear behaviour rather than an inductive loop at low
frequencies in these cases. Also in the low frequency domain, the phase Bode plot
intersected with the vertical axis at about ~π/8 (Figure 5-9(b)), suggesting the existence of a
mass transport process through the porous coatings [172, 173]. The high impedance
magnitude resulting from the mass transport process demonstrates that the corrosion
process was dominated by the mass transport / diffusion process. As a result, a classical
Randles type equivalent circuit (containing a normal semi-infinite Warburg element,
representing the diffusional mass transport) was utilised to analogise the corrosion process,
as shown in (Figure 5-9(d)). Similar equivalent circuits has also been utilised in the scientific
literature to represent the kinetic corrosion processes involving charge transfer processes
[174-176].

Chapter 5 Effects of Electrolyte on PEO treatment of cp Mg
61
Figure 5-8 X-ray diffraction of cp-Mg samples PEO coated in: (a) base, (b) calcium-modified
and (c) nitrate-modified electrolyte

Chapter 5 Effects of Electrolyte on PEO treatment of cp Mg
62
Figure 5-9 EIS analysis of PEO coatings obtained in the base electrolyte at different current
densities: (a) complex plot, (b) Bode plots, (c) equivalent circuit for coating A1 and (d) equivalent circuit for coatings A2 and A3. The solid lines in the figure represent the fitting
results
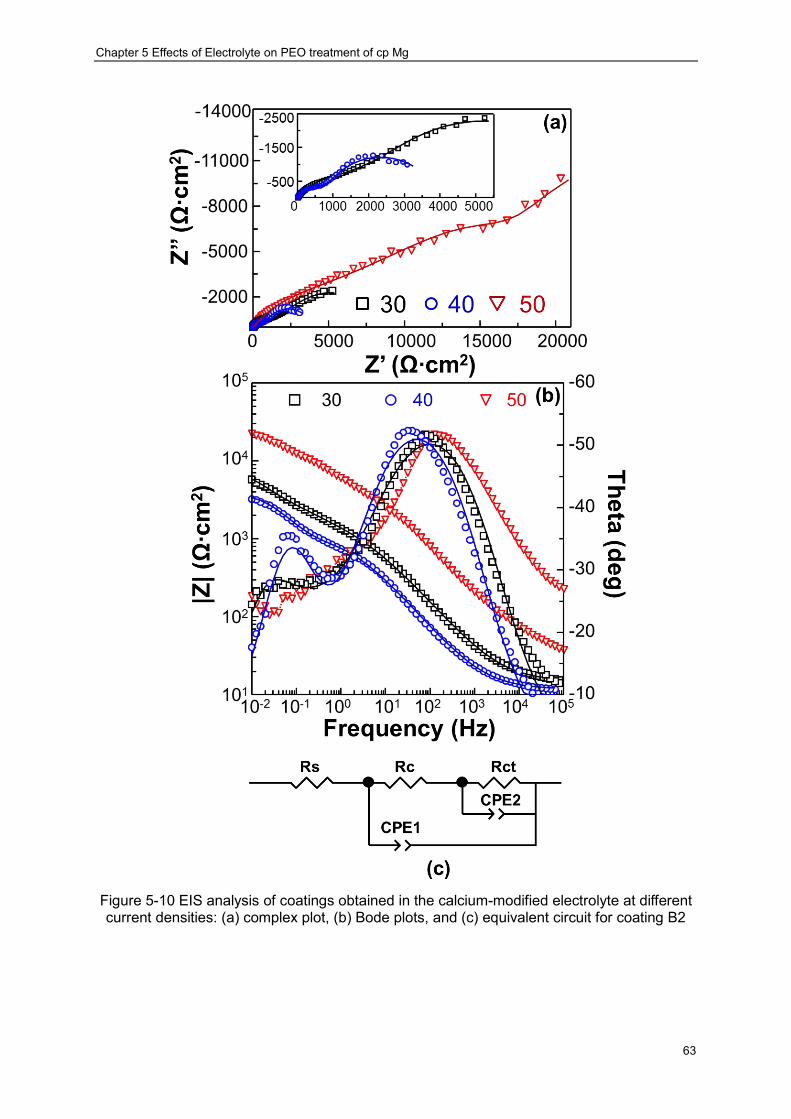
Chapter 5 Effects of Electrolyte on PEO treatment of cp Mg
63
Figure 5-10 EIS analysis of coatings obtained in the calcium-modified electrolyte at different current densities: (a) complex plot, (b) Bode plots, and (c) equivalent circuit for coating B2
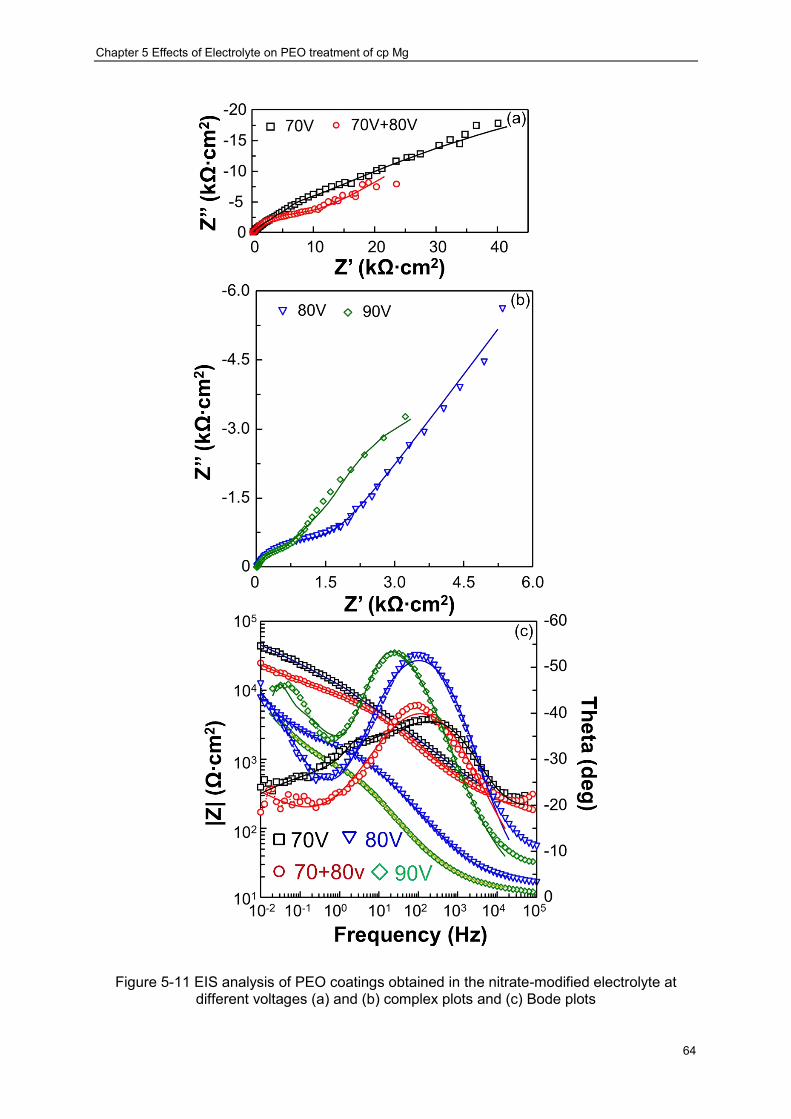
Chapter 5 Effects of Electrolyte on PEO treatment of cp Mg
64
Figure 5-11 EIS analysis of PEO coatings obtained in the nitrate-modified electrolyte at different voltages (a) and (b) complex plots and (c) Bode plots

Chapter 5 Effects of Electrolyte on PEO treatment of cp Mg
65
Similar diffusion-controlled impedance behaviour was observed for the coatings produced in
the calcium modified electrolyte at 30 and 50 mA/cm2 (Figure 5-10), and also in the nitrate
electrolyte at 70 V, both alone and followed by a subsequent further treatment at 80 V (Figure
5-11).
However, the previously established equivalent circuits were not appropriate to analogise the
impedance behaviour of those coatings fabricated in the calcium-modified electrolyte at 40
mA/cm2 (Figure 5-10), and in nitrate-modified electrolyte at 80 V (Figure 5-11). In the phase
angle Bode plots, two time constants were clearly seen; one-in the medium to high frequency
range and the other at low frequencies. The additional time constant compared to the former
situation was attributed to the contribution of the bulk of the PEO coating to the corrosion
protection. This is consistent with the cross-sectional morphologies of these coatings which
appear to be much better adhered to the substrate compared to other coatings (Figure
5-5(b)). Taking into consideration the coating morphology, an equivalent circuit containing
two time constants was proposed to interpret the EIS behaviour (Figure 5-10(c)) and is fitted
well with the experimental data. In the circuit, CPE1 represents the outer porous region of
PEO coatings and CPE2 corresponds to the inner dense region of the coatings. The
equivalent circuit data for all the proposed circuits are summarised in Table 5-3.
By comparing the values of the circuit elements, the contributions of the corresponding kinetic
reactions to the overall corrosion process can be analysed. For all coatings where the
behaviour involves diffusion processes, the corrosion resistance from the Warburg
impedance (W), due to the semi-infinite diffusion of charged particles, is significantly larger
than that of the resistance of the charge transfer process (Rct) and the resistance of the
coatings (Rc), as listed in Table 5-3, suggesting that the corrosion rate is mainly determined
by a mass transfer process. Overall, the sum of Rct and coating resistance Rc, together with
the diffusion impedance W can be considered as a measure of corrosion impedance 𝑍 [172,
177]:
𝑍 = 𝑅𝑐 + 𝑅𝑐𝑡 + 𝑊𝑅 ( 5.6 )
After substituting the relevant data from Table 5-3 into the above equation, it is easy to
conclude that the coatings of B1, B3, C1 and C2 showed the highest corrosion resistance.
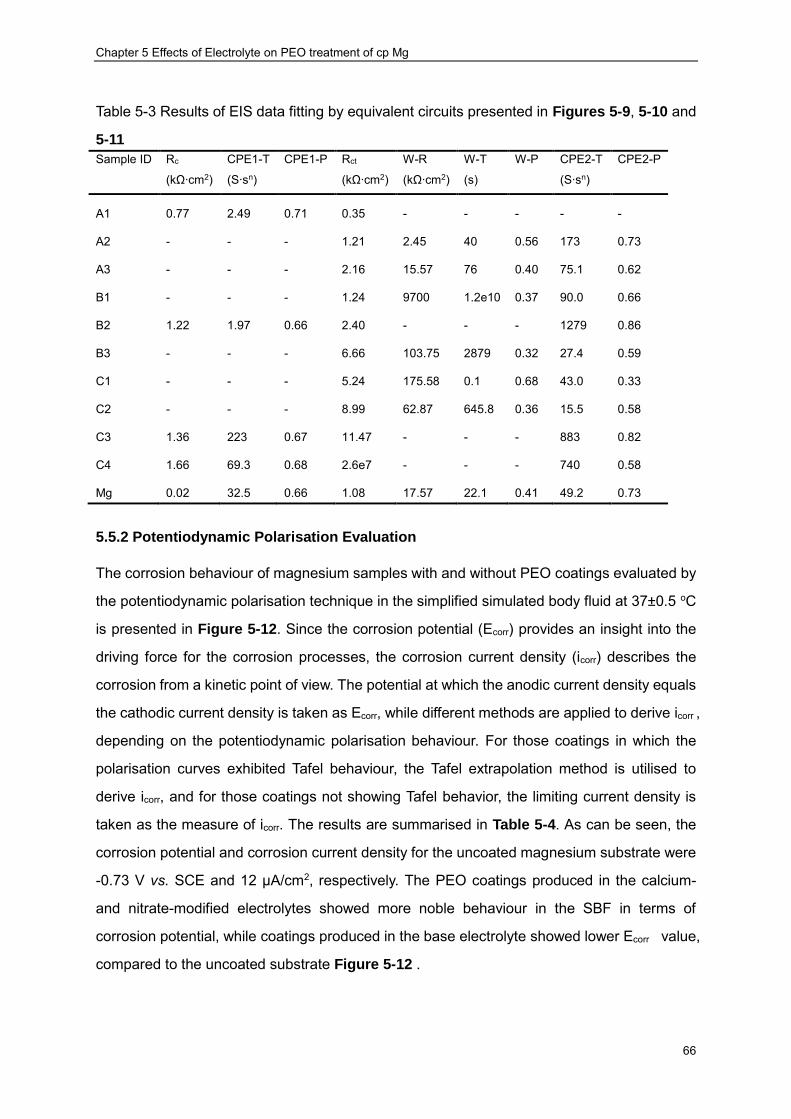
Chapter 5 Effects of Electrolyte on PEO treatment of cp Mg
66
Table 5-3 Results of EIS data fitting by equivalent circuits presented in Figures 5-9, 5-10 and
5-11
Sample ID Rc
(kΩ∙cm2)
CPE1-T
(S∙sn)
CPE1-P Rct
(kΩ∙cm2)
W-R
(kΩ∙cm2)
W-T
(s)
W-P
CPE2-T
(S∙sn)
CPE2-P
A1 0.77 2.49 0.71 0.35 - - - - -
A2 - - - 1.21 2.45 40 0.56 173 0.73
A3 - - - 2.16 15.57 76 0.40 75.1 0.62
B1 - - - 1.24 9700 1.2e10 0.37 90.0 0.66
B2 1.22 1.97 0.66 2.40 - - - 1279 0.86
B3 - - - 6.66 103.75 2879 0.32 27.4 0.59
C1 - - - 5.24 175.58 0.1 0.68 43.0 0.33
C2 - - - 8.99 62.87 645.8 0.36 15.5 0.58
C3 1.36 223 0.67 11.47 - - - 883 0.82
C4 1.66 69.3 0.68 2.6e7 - - - 740 0.58
Mg 0.02 32.5 0.66 1.08 17.57 22.1 0.41 49.2 0.73
5.5.2 Potentiodynamic Polarisation Evaluation
The corrosion behaviour of magnesium samples with and without PEO coatings evaluated by
the potentiodynamic polarisation technique in the simplified simulated body fluid at 37±0.5 oC
is presented in Figure 5-12. Since the corrosion potential (Ecorr) provides an insight into the
driving force for the corrosion processes, the corrosion current density (icorr) describes the
corrosion from a kinetic point of view. The potential at which the anodic current density equals
the cathodic current density is taken as Ecorr, while different methods are applied to derive icorr ,
depending on the potentiodynamic polarisation behaviour. For those coatings in which the
polarisation curves exhibited Tafel behaviour, the Tafel extrapolation method is utilised to
derive icorr, and for those coatings not showing Tafel behavior, the limiting current density is
taken as the measure of icorr. The results are summarised in Table 5-4. As can be seen, the
corrosion potential and corrosion current density for the uncoated magnesium substrate were
-0.73 V vs. SCE and 12 µA/cm2, respectively. The PEO coatings produced in the calcium-
and nitrate-modified electrolytes showed more noble behaviour in the SBF in terms of
corrosion potential, while coatings produced in the base electrolyte showed lower Ecorr value,
compared to the uncoated substrate Figure 5-12 .

Chapter 5 Effects of Electrolyte on PEO treatment of cp Mg
67
Figure 5-12 Potentiodynamic polarisation curves of cp-Mg samples with PEO coatings obtained in different electrolytes: (a) base, (b) calcium-modified and (c) nitrate-modified
electrolyte

Chapter 5 Effects of Electrolyte on PEO treatment of cp Mg
68
For the coatings produced in the base electrolyte at 30 mA/cm2, Tafel behaviour was
observed in the anodic and cathodic branches of the potentiodydnamic polarisation curve and
the icorr determined by the Stern-Geary analysis was 6.16 µA/cm2. The absence of Tafel
behaviour in other coatings was attributed to the fact that the charge transfer process was
affected by diffusion, which is consistent with the EIS results.
Since a higher corrosion potential does not necessarily mean a lower corrosion rate, it is
more reasonable to take icorr for the corrosion evaluation. The coatings could improve
corrosion protection to some extent if their icorr was lower compared with that of the uncoated
magnesium substrate. From this point of view, the coatings produced in the base electrolyte
at 30 mA/cm2, in the calcium-modified electrolyte at 40 and 50 mA/cm2, and in the
nitrate-modified electrolyte at 70 V alone and followed by the treatment of 80 V are all able to
inhibit the corrosion process. Although the coating obtained in the base electrolyte at 30
mA/cm2 presented an icorr lower than 12 µA/cm2, the driving force for the corrosion process
was even higher than that of the magnesium substrate. Therefore, the protection ability of this
coating should be considered with care. It is likely that the coatings obtained in the base
electrolyte would not provide the best protection to the magnesium substrate. Moreover, the
coatings fabricated in the nitrate-modified electrolyte at 70 V showed the lowest corrosion
rate, which is lower than that of the uncoated substrate by a factor of 5. The high corrosion
resistance from these coatings was consistent with the EIS results, and was also attributed to
a better bonding between coating and substrate (Figure 5-5). However, a limited ability would
exist for the coating produced in this electrolyte to control a biological response by introducing
calcium phosphorus containing compounds into their structure. From this study, it was found
that, with the appropriate treatment process, it is possible to produce a PEO coating on
magnesium alloy with improved corrosion performance in a simulated body fluid.
Assuming uniform corrosion, icorr can be used to estimate equivalent thickness loss h
according to Faraday’s law as described by Equation 4.4. Estimated thickness losses of the
sample due to corrosion attack for 12 weeks which is recognized as the minimum time
required to accomplish the in vivo healing process is summarised in Table 5-4. It can be seen
that the sample would suffer several microns of thickness loss; however the detrimental
effects of corrosion would be under estimated by the Equation 4.4. In practice the
degradation of Mg often proceeds via pitting mechanism and is influenced by the cells,
protein and flowing body fluid [178] compared to the static electrolyte in the electrochemical

Chapter 5 Effects of Electrolyte on PEO treatment of cp Mg
69
cell. Moreover, a possibility of anodic reactions generating Mg+ ions [179] should also be
taken into account.
Table 5-4 Results of potentiodynamic data analysis of PEO coated and uncoated cp-Mg samples and equivalent thickness loss (after 12 weeks in service) converted by Faraday’s law
Sample ID A1 A2 A3 B1 B2 B3 C1 C2 C3 C4 Mg
Ecorr /mV -1.42 -0.88 -0.74 -0.65 -0.49 -0.59 -0.65 -0.52 -0.71 -0.62 -0.73
Icorr /µA∙cm-2 6.16 21 14.4 61.4 4.34 8.48 2.52 5.24 22.6 68.8 12
h /µm 33.7 111.5 76.4 326 23 45 13.3 27.8 120 365.3 63
5.6 Summary
DC plasma electrolytic oxidation in three different electrolytes with different current modes
was utilised to produce coatings on cp-Mg samples. The In vitro corrosion performance of
these coatings was evaluated with various electrochemical techniques, and the following
inferences can be made:
(1) The PEO process becomes rather unstable in the calcium-modified electrolyte
when the applied current density is >40 mA/cm2. The coating growth rate in
the nitrate-modified electrolyte is too low because of the higher dissolution rate
compared with the coating growth rate.
(2) PEO coatings produced in the base electrolyte consist of crystallite MgO and
Mg3(PO4)2 phases, while the formation of Mg3(PO4)2 is hindered in the
calcium- and nitrate-modified electrolytes, possibly due to the presence of
calcium salts in the electrolyte.
(3) PEO coatings produced in the calcium-modified electrolyte at 40 and 50
mA/cm2 and those fabricated in the nitrate-modified electrolyte at 70 V (and at
70 V followed by further treatment at 80 V), showed a superior corrosion
performance in the simplified simulated body fluid compared with coatings
produced in the base electrolyte and the uncoated substrate.
(4) Considering the PEO process stability, coating composition and corrosion
performance, identification of PEO parameters resulting in the best coating
characteristics for development of Mg-based biodegradable implants involves

Chapter 5 Effects of Electrolyte on PEO treatment of cp Mg
70
the utilisation of the calcium-modified electrolyte prepared in the present study.
For the sake of simplicity, DC current was applied at this stage. However, the
current regime could be optimised for Ca incorporation and further
improvement of corrosion performance by employing pulsed DC current
regimes, which is the target of the next research stage discussed in the
following chapter.
Chapter 6 Effects of Pulse Frequency on PEO treatment of cp Mg
71
Chapter 6 Effects of Pulse Frequency on PEO treatment of cp-Mg for
Biomedical Application
As reviewed in Chapter 3, the utilisation of pulsed DC current regimes during PEO treatment
generally results in better process control and superior coating corrosion resistance due to
the absence of large long-lasting discharge events compared with the simple DC current
mode. Also, by comparing the results presented in Chapter 5 and those published by
Srinivasan et al [122], an assumption was made in Chapter 5 that the introduction of pulsed
DC regime would be essential to incorporate Ca into the PEO coatings thus improving the
bioactivity of the coatings for biomedical applications; this, however, still needed to be proved.
Moreover, it is widely acknowledged that the pulse frequency significantly affects the PEO
process and coating properties. However, the correlation between the applied pulse
frequency and the final coating characteristics has not been established. It was the objective
to solve such problems in the work presented in this chapter. For this purpose, PEO coatings
were produced on cp-magnesium substrates, using the calcium-modified electrolyte
developed in the previous chapter, under unipolar pulsed current regimes with a range of
pulse frequencies. Correspondingly, the PEO process and coating properties are
characterised following the experimental procedures described in Chapter 4.
6.1 Coating Fabrication
The PEO coatings were produced on cp-magnesium substrates, the preparation of which
involved cutting, degreasing and rinsing following the procedures described in Chapter 4.
The electrolyte used in the present study contained: 2 g/l Ca(OH)2 and 12 g/l Na3PO4∙12H2O
(pH = 12.6; = 13.2 mS cm-1). The electrolyte preparation procedure has been mentioned in
Chapter 4. The PEO treatments were carried out for 10 minutes at an average current
density of 30 mA/cm2. The coatings were produced under unipolar pulsed current mode with
10% duty cycle and with the pulse frequency varied from 100 to 5000 Hz.
6.2 Characteristics of PEO Process
Recorded voltage transients of the PEO processes at different pulse frequencies are shown
in Figure 6-1. As explained in Chapter 5, the main potential increase during the PEO process

Chapter 6 Effects of Pulse Frequency on PEO treatment of cp Mg
72
contributes to the growing ceramic coating. Considering that the electrical resistance of the
coating is proportional to its thickness, the coating growth behaviour during the galvanostatic
PEO process can be simply represented by the voltage transient as described by Equation
(5.4).
Figure 6-1 Voltage vs. time response for PUP-PEO treatments at different frequencies
It is clear from Figure 6-1 that, regardless of the pulse frequency, all the voltage curves show
similar behaviour. Initially, the voltage increases rapidly at a rate of about 6 V∙s-1, indicating
fast passivation of the sample surface associated with the beginning of oxidation process.
After about 1 minute, the voltage growth rate slows down to 1.33 V∙s-1. During this period, the
oxide growth is accompanied with intense gas liberation, with tiny sparks becoming visible,
rapidly moving around on the sample surface. When the voltage reaches about 470 V, the
PEO process enters its final stage, during which the voltage increases only slightly,
suggesting a marginal increment in the coating thickness. The most significant observation at
this stage is that the spark population on the sample surface degrades, while the average
spark size increases. Some of the discharges also remain relatively static on the sample
surface, rather than moving around as in the second stage. As shown in the inset in Figure
6-1, at the beginning of PEO treatments carried out with higher pulse frequencies, the
voltages increased much more slowly. However in the final stage, they climb up at slightly
higher rates compared with those of the coatings produced at lower pulsing frequencies,
ending up with higher final values. Therefore, thicker coatings are expected from the
Chapter 6 Effects of Pulse Frequency on PEO treatment of cp Mg
73
treatments with higher pulse frequencies.
The coating performance is determined not only by its thickness but also by its quality, i.e. the
defects within it. The first passivation stage is critical to the final coating morphology and
resultant properties; therefore it is important to understand the corresponding voltage
behaviour shown in the inset in Figure 6-1. For treatments carried out at 100 Hz, there is a
plateau in the voltage transient from 17 up to 24 s (marked by the arrow in Figure 6-1), which
indicates that oxidation is balanced by some other processes (like dissolution of oxidised
coating). In addition, for a pulse frequency of 2000 Hz, the voltage drops sharply at about 17
s for 3 seconds, a feature which is also observed for 5000 Hz. This abnormal voltage drop
can be explained from two aspects. On one hand, the coating dissolution rate may
temporarily exceed the formation rate. The coating (and even substrate) dissolution process
will lead to local alkalisation of the electrolyte, favouring re-passivation, as suggested by the
Pourbaix diagram of magnesium (Figure 2-3). Therefore the voltage would further increase.
On the other hand, some defects may be formed in the coating, providing local paths of low
resistance. Increased current through the defect sites will facilitate their healing so the
voltage would continue to increase. No matter which process dominates, it will be detrimental
to the inner part of the final coating, creating less compact inner regions with worse corrosion
performance.
Figure 6-2 depicts characteristic current and voltage waveforms recorded during the PEO
process at 3000 Hz. Both waveforms deviate from the ideal rectangular pulse shape shown in
Figure 3-3(c). Sharp peaks are observed at the front of current pulses during which the
current fluctuates vigorously. These fluctuations disappear abruptly at the end of each pulse,
with no current through the cell observed during the pauses, indicating that they may be
caused by the discharging activity during the PEO process. Analysis of the current response
to the voltage step may potentially be useful for understanding discharge mechanisms [180],
but it is hardly applicable here due to large deviations in the current behaviour.

Chapter 6 Effects of Pulse Frequency on PEO treatment of cp Mg
74
Figure 6-2 Typical electrical waveforms collected during PEO process at 3000 Hz
In contrast, the voltage remains relatively steady during the pulse and reduces gradually
during the pause. The rate and extent of the voltage drop varies with the pulse frequency as
shown in Figure 6-3, reflecting post-discharge relaxation processes taking place in the
system. Evaluation of the voltage behaviour during the pause is therefore of significance, as it
may provide information on the effects of pulsed current parmeters on the properties of
resulting coatings. Considering the dielectric nature of the PEO coating and the configuration
of the PEO system, the voltage decay behaviour can be simply represented by superposition
of several processes, each of which can be described by a universally regonised Debye-type
dielectric relaxation with characteristic magnitude Ui and time constant 𝜏𝑖. Since the voltage
decay exhibits a periodic relaxation type behaviour, it is sufficient to analytically fit it with the
following equation [181]:
𝑈(𝑡) = 𝑈𝑡→∞ + ∑ 𝑈𝑖 ∙ exp [−(𝑡−𝑡0)
𝜏𝑖
𝑛𝑖=1 ] ( 6.1 )
Where U(t) is the instant voltage value at time t, 𝑈𝑡→∞ is the voltage at sufficiently long after
the pulse is paused, t0 is the pause start time and n is the number of relaxation processes
involved. The characteristic parameters of the relaxation processes were revealed by
non-linear least squares fitting of the voltage transient by equation (6.1), realised by a
trust-region algorithm [182]. Through comparing the R2 values along with the standard errors
for the curves fitted with different n = 1…4, the best fits were obtained with n = 2 for the pulse
frequencies <2000 Hz, indicating that two relaxation processes were involved, whereares n =
0 200 400 600 800 1000100
200
300
400
500
600
Time (s)
Vo
ltag
e (
V)
-1
0
1
2
3
4
5
6
Cu
rren
t (A
)
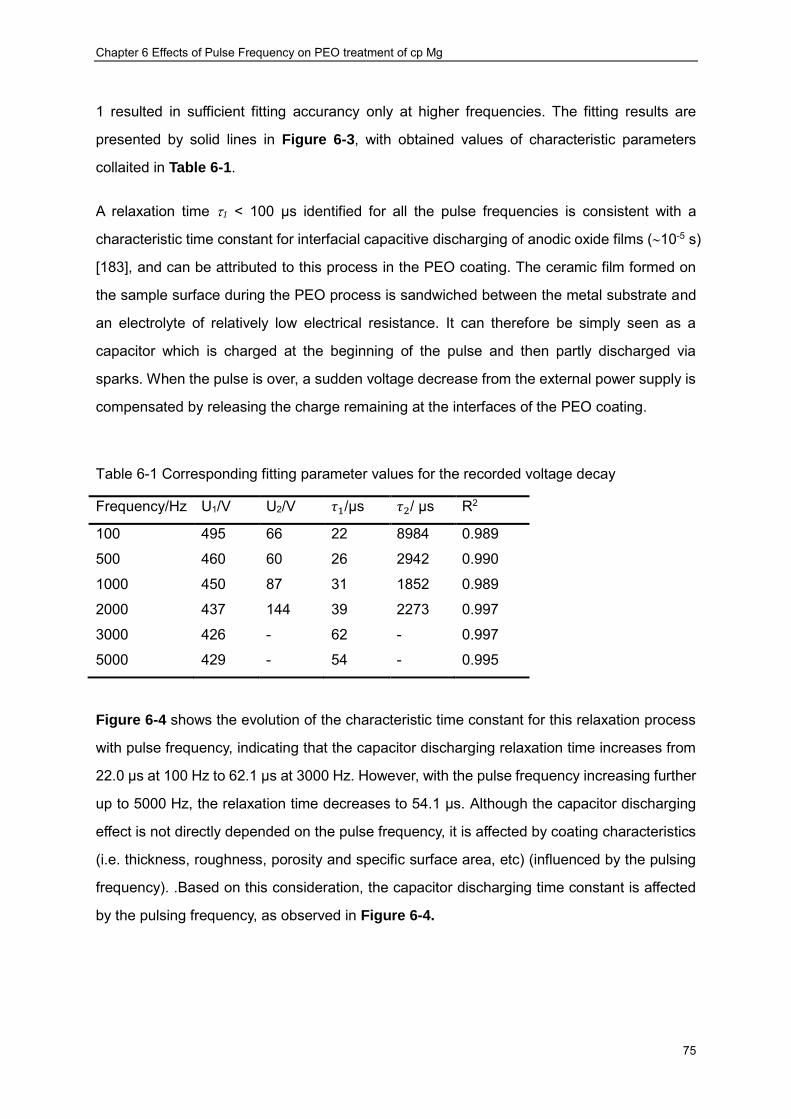
Chapter 6 Effects of Pulse Frequency on PEO treatment of cp Mg
75
1 resulted in sufficient fitting accurancy only at higher frequencies. The fitting results are
presented by solid lines in Figure 6-3, with obtained values of characteristic parameters
collaited in Table 6-1.
A relaxation time 1 < 100 µs identified for all the pulse frequencies is consistent with a
characteristic time constant for interfacial capacitive discharging of anodic oxide films (10-5 s)
[183], and can be attributed to this process in the PEO coating. The ceramic film formed on
the sample surface during the PEO process is sandwiched between the metal substrate and
an electrolyte of relatively low electrical resistance. It can therefore be simply seen as a
capacitor which is charged at the beginning of the pulse and then partly discharged via
sparks. When the pulse is over, a sudden voltage decrease from the external power supply is
compensated by releasing the charge remaining at the interfaces of the PEO coating.
Table 6-1 Corresponding fitting parameter values for the recorded voltage decay
Frequency/Hz U1/V U2/V 𝜏1/µs 𝜏2/ µs R2
100 495 66 22 8984 0.989
500 460 60 26 2942 0.990
1000 450 87 31 1852 0.989
2000 437 144 39 2273 0.997
3000 426 - 62 - 0.997
5000 429 - 54 - 0.995
Figure 6-4 shows the evolution of the characteristic time constant for this relaxation process
with pulse frequency, indicating that the capacitor discharging relaxation time increases from
22.0 µs at 100 Hz to 62.1 µs at 3000 Hz. However, with the pulse frequency increasing further
up to 5000 Hz, the relaxation time decreases to 54.1 µs. Although the capacitor discharging
effect is not directly depended on the pulse frequency, it is affected by coating characteristics
(i.e. thickness, roughness, porosity and specific surface area, etc) (influenced by the pulsing
frequency). .Based on this consideration, the capacitor discharging time constant is affected
by the pulsing frequency, as observed in Figure 6-4.

Chapter 6 Effects of Pulse Frequency on PEO treatment of cp Mg
76
Figure 6-3 Voltage waveforms collected at different pulse frequencies with fitting results by
solid lines: (a) 100 Hz, (b) 2000 Hz and (c) 3000 Hz
0 5000 10000 15000 200000
100
200
300
400
500
Volta
ge (V
)
Time (ms)
0 200 400 600 800 1000
100
200
300
400
500
600
Volta
ge (V
)
Time (ms)
200 300 400 500 600 700 800100
200
300
400
500
600
Volta
ge (V
)
Time (ms)
(a)
(b)
(c)
Chapter 6 Effects of Pulse Frequency on PEO treatment of cp Mg
77
Figure 6-4 Relaxation time constants derived from voltage waveforms and final coating
residual stress at different pulse frequencies
In order to characterise the PEO process through this relaxation process, an assumption was
made that the pores formed in the PEO coating are cylindrical and deep enough to penetrate
throughout the coating. This allows the coating immersed in the electrolyte to be represented
by a parallel combination of the coating capacitance Ccoat, and resistance of the electrolyte in
the pores Rpore. Then the capacitive discharging time constant can be calculated by [184]:
τ1 = R𝑝𝑜𝑟𝑒 ∙ C𝑐𝑜𝑎𝑡 ( 6.2 )
Considering the fraction of the substrate surface area A0 covered by pores is α, Rpore can be
obtained by [184]:
Rpore = ρ ∙ h/(α ∙ A0) ( 6.3 )
where is the electrolyte resistivity in the pores, h is the coating thickness. The coating
capacitance can easily be derived through the basic relationship [184]:
C𝑐𝑜𝑎𝑡 = ε0 ∙ ε ∙ (1 − α) ∙ A0/h ( 6.4 )
Where = 8.85×10⁻¹² F m-1 is the permittivity of free space, and is the relative permittivity of
the coating, which can be considered as being constant (because the permittivity is only
0 1000 2000 3000 4000 500010
20
30
40
50
60
70
Die
lec
tric
Re
lax
ati
on
Tim
e C
on
sta
nt
(ms
)
Ca
pa
cit
or
Dis
ch
arg
ing
Tim
e C
on
sta
nt
(s
)
120
140
160
180
200
220
240R
es
idu
al S
tres
s (M
Pa
)
Frequency (Hz)
0
2
4
6
8
10
Residual Stress
Capacitor Discharging
Dielectric Relaxation
Chapter 6 Effects of Pulse Frequency on PEO treatment of cp Mg
78
determined by coating composition). By substituting equations (6.3) and (6.4) into equation
(6.2), the relaxation time constant can be derived:
τ1 = 𝜌 ∙ 휀0 ∙ 휀 ∙ (1 − 𝛼)/𝛼 ( 6.5 )
Assuming = const, 1 is inversely proportional to the basal area of the pores. Therefore, the
increased relaxation time constant obtained with increasing pulse frequency suggests
decreased coating porosity.
Moreover, for the pulse frequencies <2000 Hz, another relaxation process with much longer
characteristic time constant (2= 10-2…10-3 s) contributing to the voltage decay was identified,
as shown in Figure 6-4. This may be caused by the dielectric relaxation of the coating
material [183]. During each current pulse, the coating material is polarised by the high electric
field forming stretched electric dipoles in the oxide structure that gradually return to the initial
state upon removal of the external polarisation. Thus the dielectric relaxation mechanism can
also compensate for the cut off of the external power supply but in a different time scale. It is
understandable that this relaxation process should take place for all the pulse frequencies,
however above 2000 Hz, the pause is too short to reveal the characteristic relaxation time
constant.
By comparing the weight contribution of the two relaxation processes to the overall voltage
decay, it is evident that most of it is due to the capacitive discharging process and the
contribution of the dielectric relaxation only accounts for a small fraction and can even be
neglected at higher pulse frequencies (>2000 Hz).
6.3 Coating Thickness Evaluation
Coating thicknesses measured using the Elcometer 355 eddy current gauge are presented
by the bar chart shown in Figure 6-5. All the coatings are thicker than 20 µm; the thickest
coating (25.1 µm) corresponds to the pulse frequency of 5000 Hz, and the thinnest one (20.6
µm) – to 100 Hz. The coating thickness is not uniformly distributed as indicated by the
standard deviation bars shown in Figure 6-5. The overall trend is that higher pulse
frequencies lead to thicker PEO coatings, although the coating produced at 500 Hz is almost
as thick as that at 3000 Hz. Figure 6-6 shows strong correlation between the final voltage
and the coating thickness, which is consistent with the theoretical analysis of the voltage
transients discussed in Section 6.2.

Chapter 6 Effects of Pulse Frequency on PEO treatment of cp Mg
79
Figure 6-5 Dependence of PUP-PEO coating thickness produced on cp Mg at various pulse
frequencies
Figure 6-6 Correlation between the final voltage and coating thickness of the PUP-PEO
coatings produced at various frequencies
6.4 Coating Chemical and Phase Composition
The EDX results indicate that, regardless of the pulse frequency, all coatings are composed
of Mg, O, P, Ca, and Na; only the spectrum of the coating produced at 3000 Hz is therefore
presented in Figure 6-7. However, atomic concentrations of these elements are slightly
different, as summarised in Table 6-2. The coatings produced at higher frequencies tend to
contain less Mg and more O (with the coating produce at 5000 Hz being an exception). This
100 500 1000 2000 3000 500010
15
20
25
30
Th
ick
ne
ss
(m
)
Frequency (Hz)
505 510 515 520 525 530 535 540 54520
21
22
23
24
25
Co
ati
ng
Th
ick
ne
ss (m
)
Final Voltage (V)
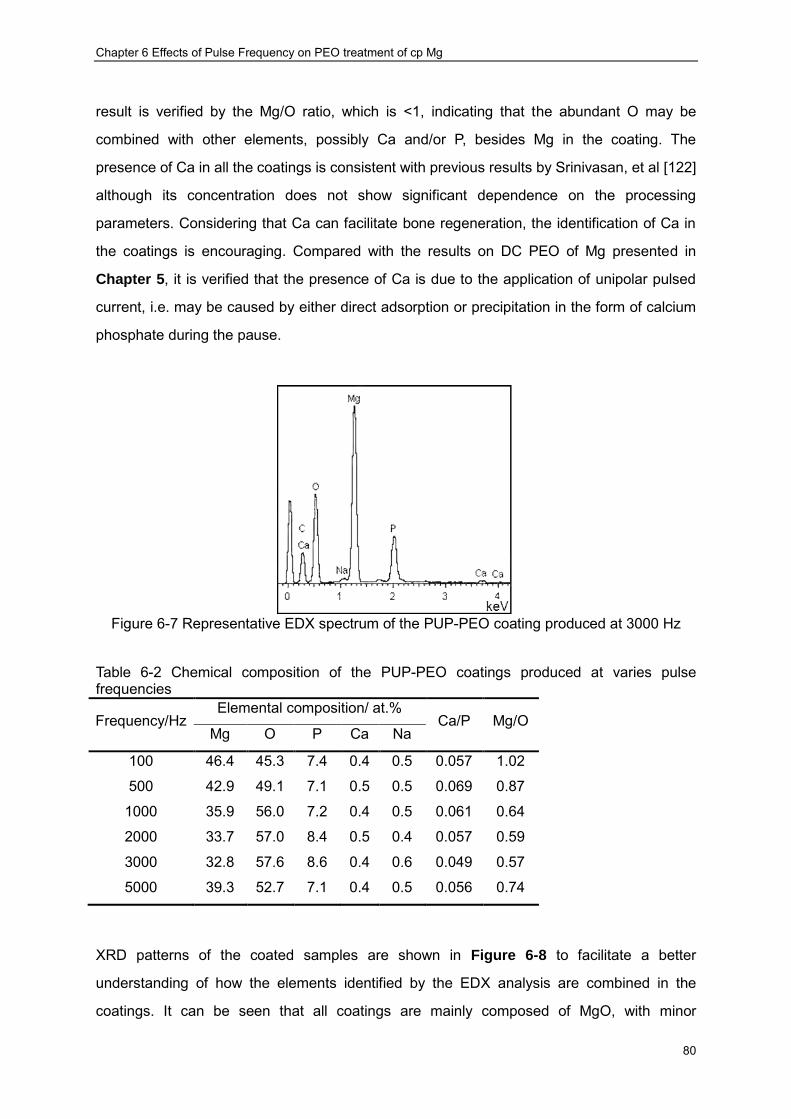
Chapter 6 Effects of Pulse Frequency on PEO treatment of cp Mg
80
result is verified by the Mg/O ratio, which is <1, indicating that the abundant O may be
combined with other elements, possibly Ca and/or P, besides Mg in the coating. The
presence of Ca in all the coatings is consistent with previous results by Srinivasan, et al [122]
although its concentration does not show significant dependence on the processing
parameters. Considering that Ca can facilitate bone regeneration, the identification of Ca in
the coatings is encouraging. Compared with the results on DC PEO of Mg presented in
Chapter 5, it is verified that the presence of Ca is due to the application of unipolar pulsed
current, i.e. may be caused by either direct adsorption or precipitation in the form of calcium
phosphate during the pause.
Figure 6-7 Representative EDX spectrum of the PUP-PEO coating produced at 3000 Hz
Table 6-2 Chemical composition of the PUP-PEO coatings produced at varies pulse frequencies
Frequency/Hz Elemental composition/ at.%
Ca/P Mg/O Mg O P Ca Na
100 46.4 45.3 7.4 0.4 0.5 0.057 1.02
500 42.9 49.1 7.1 0.5 0.5 0.069 0.87
1000 35.9 56.0 7.2 0.4 0.5 0.061 0.64
2000 33.7 57.0 8.4 0.5 0.4 0.057 0.59
3000 32.8 57.6 8.6 0.4 0.6 0.049 0.57
5000 39.3 52.7 7.1 0.4 0.5 0.056 0.74
XRD patterns of the coated samples are shown in Figure 6-8 to facilitate a better
understanding of how the elements identified by the EDX analysis are combined in the
coatings. It can be seen that all coatings are mainly composed of MgO, with minor

Chapter 6 Effects of Pulse Frequency on PEO treatment of cp Mg
81
Na4Ca(PO3)6 and Mg peaks corresponding to the metal substrate. In the PEO process,
magnesium is anodically oxidised to Mg2+ which is driven through the discharge channels
towards the coating/electrolyte interface to react with OH- and/or O2, forming MgO. In all the
samples, the strongest MgO peaks correspond to the (200) crystal planes and the analysis of
relative intensities of other peaks suggests that magnesia crystallites are randomly oriented
in the coating. This allows the crystallite sizes of the MgO phases to be evaluated using
Scherrer’s equation as shown in Figure 6-9. It is clearly seen that the crystallite size
decreases with increasing pulse frequency, although the coating produced at 100 Hz has a
crystallite size smaller than that for 500 Hz. In the PEO process, once the MgO crystals are
initiated, their growth rate is affected by several factors, of which temperature is the most
significant. A longer-lasting discharging activity resulting from lower pulse frequencies may
lead to higher local temperatures, favouring the crystal growth and resulting in larger
crystalline sizes. The P and Ca containing crystalline phase Na4Ca(PO4)6 was identified at
2=29.0o and 30.8o in all the coatings, which is in contrast with previous study results
presented in Chapter 5. However, the Ca/P ratio identified by the EDX analysis (Table 6-2) is
about 0.06, which is about 2 times less that of the stoichiometric ratio in Na4Ca(PO4)6. It may
be that the new phase only consumes part of the Ca and P content, with the remainder being
incorporated in the MgO matrix as an amorphous constituent.
Figure 6-8 XRD patterns of the coatings produced at different frequencies

Chapter 6 Effects of Pulse Frequency on PEO treatment of cp Mg
82
Figure 6-9 Dependence of MgO crystallite size on the current pulse frequency in the
PUP-PEO processes
6.5 Coating Morphology
Surface plane SEM micrographs shown in Figure 6-10 are typical for PEO coatings porous
morphologies, with porosity varying depending on the pulse frequency. We used ImageJ
software for the coating porosity analysis because it is easy to operate even though there has
been many ways to characterize coating porosity [185]. The mean average pore size
presented in Figure 6-11 tends to reduce with increasing frequency from 5.1 µm at 100 Hz to
about 3.4 µm at 5000 Hz, however a rather large scatter of individual data points makes this
trend statistically insignificant. In order to make certain of such observation, Figure 6-12
provides pore size distribution histograms based on statistical analysis of over 300 pores
randomly selected in the microscopic images of each coating. All but the coating produced at
100 Hz have the most abundant pore size at around 2 m, which is virtually independent of
frequency, whereas the main frequency effect consists in narrowing down the pore size
distribution at the expense of large pores (this is also reflected in smaller standard deviations
of data points corresponding to higher frequencies in Figure 6-11). While pores <1 µm were
identified in all the coatings, the size of largest pores decreased gradually from >22 µm to <9
µm when the pulse frequency increased from 100 Hz to 5000 Hz, which is consistent with the
results of the voltage decay analysis discussed in Section 6.2.
100 500 1000 2000 3000 5000
20
30
40
50
Cry
sta
llin
e S
ize
(n
m)
Frequency (Hz)
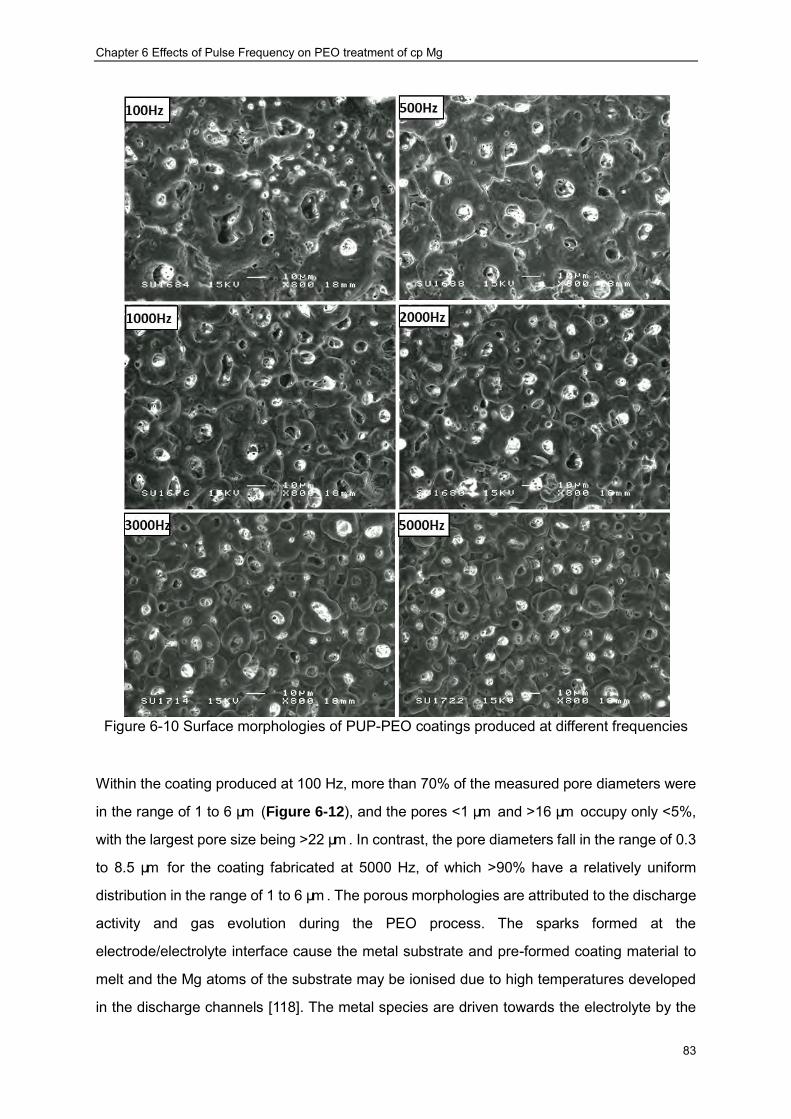
Chapter 6 Effects of Pulse Frequency on PEO treatment of cp Mg
83
Figure 6-10 Surface morphologies of PUP-PEO coatings produced at different frequencies
Within the coating produced at 100 Hz, more than 70% of the measured pore diameters were
in the range of 1 to 6 µm (Figure 6-12), and the pores <1 µm and >16 µm occupy only <5%,
with the largest pore size being >22 µm . In contrast, the pore diameters fall in the range of 0.3
to 8.5 µm for the coating fabricated at 5000 Hz, of which >90% have a relatively uniform
distribution in the range of 1 to 6 µm . The porous morphologies are attributed to the discharge
activity and gas evolution during the PEO process. The sparks formed at the
electrode/electrolyte interface cause the metal substrate and pre-formed coating material to
melt and the Mg atoms of the substrate may be ionised due to high temperatures developed
in the discharge channels [118]. The metal species are driven towards the electrolyte by the
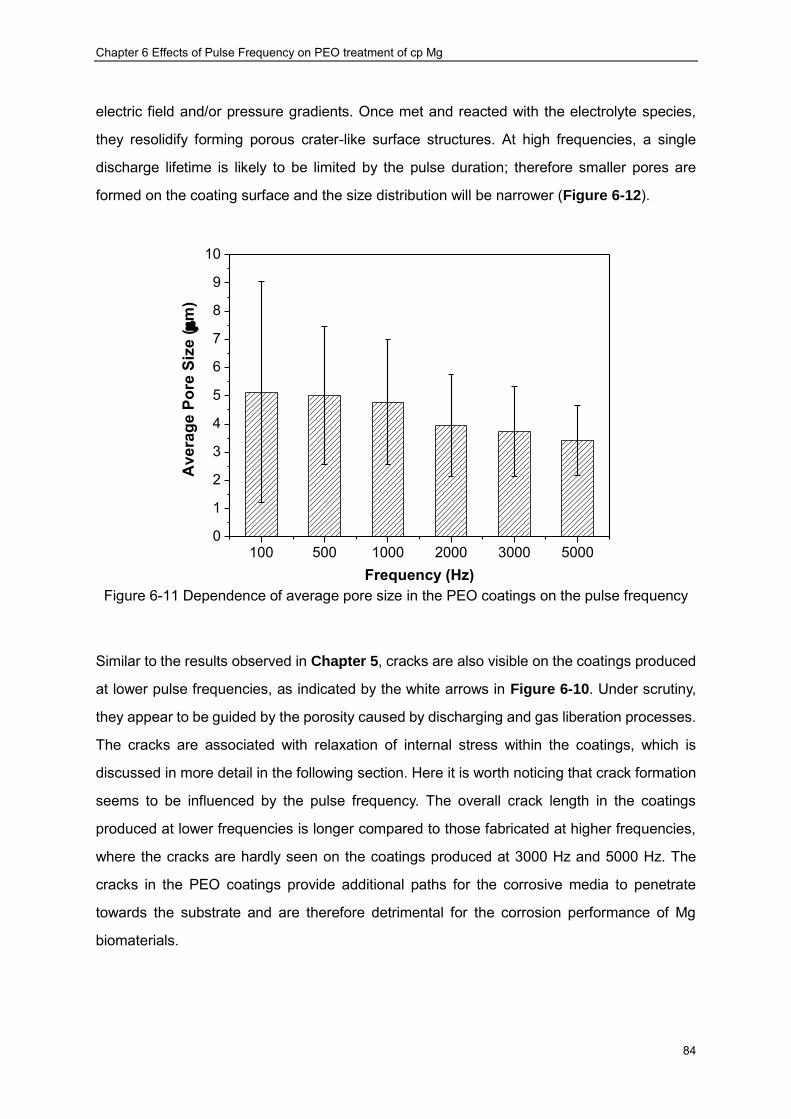
Chapter 6 Effects of Pulse Frequency on PEO treatment of cp Mg
84
electric field and/or pressure gradients. Once met and reacted with the electrolyte species,
they resolidify forming porous crater-like surface structures. At high frequencies, a single
discharge lifetime is likely to be limited by the pulse duration; therefore smaller pores are
formed on the coating surface and the size distribution will be narrower (Figure 6-12).
Figure 6-11 Dependence of average pore size in the PEO coatings on the pulse frequency
Similar to the results observed in Chapter 5, cracks are also visible on the coatings produced
at lower pulse frequencies, as indicated by the white arrows in Figure 6-10. Under scrutiny,
they appear to be guided by the porosity caused by discharging and gas liberation processes.
The cracks are associated with relaxation of internal stress within the coatings, which is
discussed in more detail in the following section. Here it is worth noticing that crack formation
seems to be influenced by the pulse frequency. The overall crack length in the coatings
produced at lower frequencies is longer compared to those fabricated at higher frequencies,
where the cracks are hardly seen on the coatings produced at 3000 Hz and 5000 Hz. The
cracks in the PEO coatings provide additional paths for the corrosive media to penetrate
towards the substrate and are therefore detrimental for the corrosion performance of Mg
biomaterials.
100 500 1000 2000 3000 50000
1
2
3
4
5
6
7
8
9
10
Av
era
ge
Po
re S
ize
(m
)
Frequency (Hz)

Chapter 6 Effects of Pulse Frequency on PEO treatment of cp Mg
85
Figure 6-12 Pore size distributions of the PUP-PEO coatings produced at different frequencies
Cross-sectional micrographs of the PEO coatings presented in Figure 6-13 provide details of
morphological features across the coating thickness as well as its bonding to the substrate.
Porous features can be observed across all coatings, which is consistent with corresponding
surface morphologies (Figure 6-10). The pore size at the coating surface is generally larger
than that closer to the interface and some pores are deep enough to go through the coating
and reach the substrate (Figure 6-13), which supports the assumptions made in the voltage
waveform analysis (Section 6.2). Undulated coating-substrate interfaces are typically
observed, indicating coating formation by a localised inward propagation mechanism, rather

Chapter 6 Effects of Pulse Frequency on PEO treatment of cp Mg
86
than uniform oxide film growth across the whole surface. The interfacial waviness is reduced
in the coatings produced at higher frequencies, supporting the speculation of discharge size
being limited by the pulse duration under such conditions. The implication for the corrosion
performance is that these coatings should demonstrate a lesser tendency for pitting as their
resistance would be more uniformly distributed across the surface.
Figure 6-13 Cross sectional morphologies of PUP-PEO coatings produced at different
frequencies
6.6 Residual Stress Characterisation
In-plane direct residual stresses identified by the sin2 XRD method in the studied coatings
Chapter 6 Effects of Pulse Frequency on PEO treatment of cp Mg
87
are presented in Figure 6-4. The stresses are tensile and the overall trend is that the stress
magnitude decreases with increasing pulse frequency from 192 MPa at 100 Hz to 141 MPa at
5000 Hz. However, the coating produced at 2000 Hz shows the highest in-plane internal
stress of about 212 MPa. The residual stress state is a trade-off between internal stress
generation and relaxation processes. Internal stresses in the PEO coatings are generated
due to surface oxidation, electrostriction of the formed dielectric film and its local heating by
discharge activity [186]. The surface oxidation of Mg occurs with a negative volume change,
which puts the coating under tension whereas the underlying substrate is compressed to
maintain the intimate bonding with it. This is consistent with general observation of tensile
residual stresses in the coatings but would not explain the quantitative difference between
them as all the coatings are in the same thickness range. The second contributing factor –
electrostriction, appears only during the current pulse. It forces Mg2+-O2- dipoles to align along
the electric field, i.e. normally to the sample surface, which would add to in-plane tension
within the coating. However, this addition is also independent of the pulse frequency as the
electrostriction, being a quadratic function of electric field across the coating, is also
independent of the current density. Nevertheless subsequent dielectric relaxation is
frequency-dependent, as discussed in Section 6.2, and should be significant only for the
frequencies <2000 Hz.
Finally, temperature gradients developed in radial directions of discharge channels [118]
would result in thermal stress that is proportional to the gradient magnitude considering the
same thermal expansion/contraction coefficient. The temperature field around the
discharge site depends on the event lifetime which is not restricted by the pulse duration at
lower frequencies, resulting in higher maximum temperatures and steeper gradients.
Therefore, the thermal stress would tend to be higher at lower frequencies, concentrating
around the pores and promoting crack formation at these sites. When the stress induced in
the coating is locally high enough, the elastic strain energy stored in the material structure is
released to form new surfaces. Thus most of the thermal stress will be released through the
cracks at lower frequencies (<2000Hz) whereas at this threshold value it would be barely
sufficient to cause cracking. Although the stress generated at 2000 Hz seems to be not as
high as that at lower frequencies, most of it would be built up in the coating, with only slight
relaxation through cracking so that much shorter cracks would appear as observed in Figure
6-10. At higher frequencies (3000 Hz), the pulse duration is so short that not enough stress
Chapter 6 Effects of Pulse Frequency on PEO treatment of cp Mg
88
could be built up; therefore, cracks are hardly observed and lower residual stresses are
developed. Thus, the maximum residual stress observed for the coating formed at 2000 Hz
could be explained based on the superposition of thermal stress generation, dielectric
relaxation and cracking processes. The accumulation of tensile residual stress in the coating
would be expected to facilitate corrosion processes as the surface energy of the system is
increased.
6.7 Electrochemical Corrosion Evaluation
6.7.1 Open Circuit Potential Evolution
As already advised in Chapter 4, the open circuit potential (OCP) is an important parameter
describing the susceptibility of a material to corrosion degradation in a given environment.
The OCP evolution behaviour of the cp magnesium with PEO coatings produced at various
pulse frequencies is presented in Figure 6-14. The OCP of the coated samples exhibited
broadly similar behaviour. Immediately after immersion, the OCP values of the coated
samples shifted in the negative direction, which might be attributed to the penetration of the
SBF through the PEO coating defects towards the substrate. Such a process happens
quickly (within <20 min), after which the OCP moves back to more noble values, possibly due
to the gradual accumulation of corrosion products within the coating defects. The OCP
values were eventually stabilised, suggesting a stable corrosion condition was established.
However, the OCP of the cp-Mg behaved slightly differently within the initial 5 minutes of
immersion. Specifically, an upward rather than downward shift was observed on the OCP
curves of the cp-Mg sample in the first 5 minutes of immersion; such behaviour has been
regarded as occurring due to rapid formation of a passive film on the sample surface. After
this short period, the OCP of cp-Mg behaved like those of the other PEO coated samples,
and finally stabilised. The inset table in Figure 6-14 summarises the stable OCP values
after 3 hours’ immersion. It is obvious that the stable OCP values of the coated samples were
dependent on the pulse frequency of the PEO process. Moreover, the coated samples
exhibited more noble OCP values than the bare cp-Mg, suggesting that the coated samples
are less susceptible to corrosion attack.
6.7.1 Electrochemical Impedance Spectroscopy
Characteristic EIS spectra of the PEO coated Mg samples after 1 hour of immersion in the
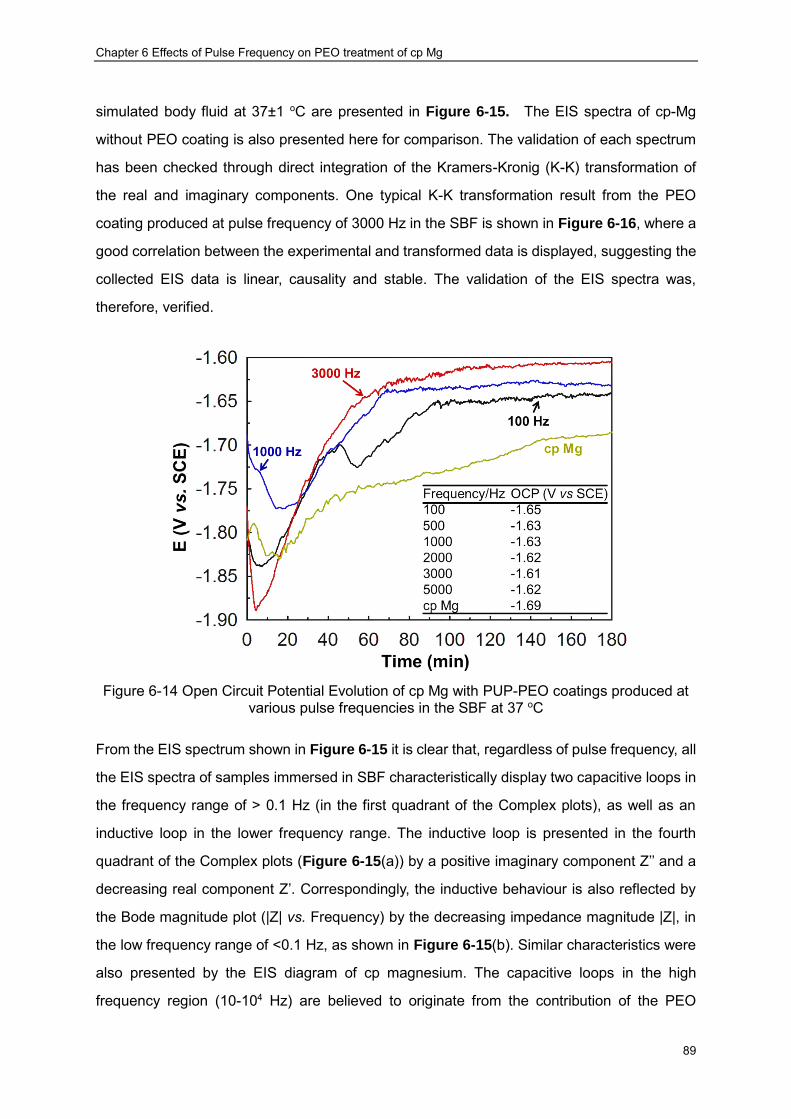
Chapter 6 Effects of Pulse Frequency on PEO treatment of cp Mg
89
simulated body fluid at 37±1 oC are presented in Figure 6-15. The EIS spectra of cp-Mg
without PEO coating is also presented here for comparison. The validation of each spectrum
has been checked through direct integration of the Kramers-Kronig (K-K) transformation of
the real and imaginary components. One typical K-K transformation result from the PEO
coating produced at pulse frequency of 3000 Hz in the SBF is shown in Figure 6-16, where a
good correlation between the experimental and transformed data is displayed, suggesting the
collected EIS data is linear, causality and stable. The validation of the EIS spectra was,
therefore, verified.
Figure 6-14 Open Circuit Potential Evolution of cp Mg with PUP-PEO coatings produced at
various pulse frequencies in the SBF at 37 oC
From the EIS spectrum shown in Figure 6-15 it is clear that, regardless of pulse frequency, all
the EIS spectra of samples immersed in SBF characteristically display two capacitive loops in
the frequency range of > 0.1 Hz (in the first quadrant of the Complex plots), as well as an
inductive loop in the lower frequency range. The inductive loop is presented in the fourth
quadrant of the Complex plots (Figure 6-15(a)) by a positive imaginary component Z’’ and a
decreasing real component Z’. Correspondingly, the inductive behaviour is also reflected by
the Bode magnitude plot (|Z| vs. Frequency) by the decreasing impedance magnitude |Z|, in
the low frequency range of <0.1 Hz, as shown in Figure 6-15(b). Similar characteristics were
also presented by the EIS diagram of cp magnesium. The capacitive loops in the high
frequency region (10-104 Hz) are believed to originate from the contribution of the PEO
Chapter 6 Effects of Pulse Frequency on PEO treatment of cp Mg
90
coating to the corrosion process. As magnesium has high oxygen affinity, a passive film
naturally formed on its surface. Such fact has been reflected by the OCP evolution shown in
Figure 6-14. In this regard, a capacitive loop in the high frequency region is also observed
for the cp magnesium sample. Obviously, the natural film is considerably thinner than the
PEO coating, therefore, its semi-circle in this frequency region is much smaller than the
coated samples (Figure 6-15(a)). The capacitive semi-circles in the medium frequency
range (0.1-10 Hz) are associated with the charge transfer process. The inductive behaviour,
originating from the coverage of corrosion sites at the coating/substrate interface by the
corrosion products [187], has been recognised in several independent publications [188] as
an evidence of active corrosion processes involving adsorption and/or desorption of a
corrosion intermediates Mg+ ion. Actually, the formation of intermediate single-charged Mg
has been proposed by Song [189] to explain the abnormal negative difference effect of
magnesium corrosion, and this hypothesis has also been accepted by other researchers
[190]. Corresponding with the three loops presented by the complex plots, three regions
could also be identified in the phase angle Bode plots of all the samples (Figure 6-15(b)): a
complete peak in the high frequency region (10-104 Hz), a depressed peak in the medium
frequency region (0.1-10 Hz), and inductive behaviour in the low frequency region (<0.1 Hz),
featuring positive phase angle.
The corrosion resistance of the samples is qualitatively comparable through the EIS spectra
considering that larger semi-circles usually indicate higher corrosion resistance. In this regard,
PEO coating produced at 3000 Hz exhibits the highest in vitro corrosion resistance in the SBF
as it provides the largest semi-circles and the highest overall impedance (|Z| vs. Frequency
Bode plots (Figure 6-15(b)) compared with other samples. Meanwhile, the smallest
semi-circles are observed in the EIS spectra of the cp-magnesium sample, suggesting the
corrosion resistance of cp magnesium in SBF at 37±1 oC has been improved significantly by
PEO coating.
It is common practice to interpret EIS results with the assistance of equivalent circuits [173].
The three loops mentioned above indicate that three kinetic processes with different time
constants were involved in the in vitro degradation of magnesium with and without PEO
treatment. Based on the characteristics of the EIS spectra, three parts should be included in
the equivalent circuits for the degradation of PEO coated magnesium. Firstly, the porous
oxide coating, weather it is naturally formed (cp-Mg) or artificially fabricated (PEO-Mg), could
Chapter 6 Effects of Pulse Frequency on PEO treatment of cp Mg
91
be represented by a parallel combination of resistor and capacitor [168], of which, the resistor
describes the resistance of the pores filled with corrosive electrolyte, and the capacitor
defines the capacitance originating from the coating itself. Secondly, the charge transfer
process involved in the corrosion process can generally be analogised by a parallel
combination of a resistor (charge transfer resistance) and a capacitor (double layer
capacitance) [168]. The inductive loop exhibited by the EIS spectra could be represented by a
series combination of resistor and inductor. In the practical situation, the capacitors are
usually replaced by constant phase elements (CPEs) due to the dispersive characteristics of
the systems attributed to the coating defects and interface roughness [168]. Although the
inclusion of the three parts in the equivalent circuit is widely acknowledged, there has been
dispute on how the three parts should be connected. Some researchers suggests series
connection [191], while others prefer parallel combination [190]. There is no doubt that these
can all result in sufficient accuracy of fit by adjusting the values of the elements; however, it is
hard to find the physical ground of those simple connections for the far more complicated
system with porous coatings To evaluate the corrosion rate of magnesium, Birbilis et. al. [188]
used a more complicated equivalent circuit as shown in Figure 6-17. The circuit provides a
reasonable combination of the first two parts associated with the coating and charge transfer
process, the physical meaning of the connection of the third part (inductor) is also verified
considering the inductive behaviour arising from the coating/substrate interface covered by
the corrosion product. Similar circuits have also been used by others to interpret the EIS
diagram of AZ31 magnesium alloy with composite coatings [192].
In the circuit, Rs= ~35 Ω cm2 represents the resistance of SBF between the substrate and the
reference electrode. A least squares fitting method was used to fit the experimental data
against the proposed circuits, and the fitted elemental values are summarised in Table 6-3.
With the values shown in Table 6-3, the circuits could provide sufficient fit (χ2<0.01) to the
experimental data. The fitting results are also plotted in Figure 6-15 by the solid lines.
After the circuit has been verified, the impedance of the corrosion system can be expressed
according to the following equation [188]:
𝑍 = (
1
𝑍𝑅1 + (1
𝑍𝑅2+
1𝑍𝐶𝑃𝐸2
)−1 +
1
𝑍𝐶𝑃𝐸1+
1
𝑍𝑅3 + 𝑍𝐿)−1 + 𝑍𝑅𝑠 ( 6.6 )

Chapter 6 Effects of Pulse Frequency on PEO treatment of cp Mg
92
where Zi represents the impedance value of each involved element In his publication on the
corrosion rate determination of magnesium, Birbilis et al [188] stated that the polarisation
resistance Rp (an important parameter in determining corrosion rate), could be defined as the
difference in impedance between zero frequency impedance (|Z| where f→0) and the solution
resistance (|Z| where f→infinity). When the frequency is sufficiently low (f→0), the impedance
of capacitive components (CPEs) in Figure 6-17 tends to be infinite, while the inductive
component can be considered short circuited (|Z|→0). Therefore, the polarisation resistance
of the corrosion system could be obtained as [188]:
𝑅𝑝 = |𝑍|𝑓→0 − |𝑍|𝑓→∞ = (1
𝑅1 + 𝑅2+
1
𝑅3)−1 ( 6.7 )
By substituting the corresponding values in Table 6-3 into equation (6.7), it is easy to derive
the polarisation resistance of the different coatings. To make the corrosion degradation rate
comparable, the Rp values are also summarised in Table 6-3. It can be seen that the coating
produced at a pulse frequency of 3000 Hz results in the highest polarisation resistance of
862.67 Ω∙cm2, which is significantly higher than that of the cp magnesium (69.56 Ω∙cm2).
Considering that corrosion rate is inversely proportional to the polarisation resistance [193], it
is straightforward that the coating produced at 3000 Hz provides best protection to the
underlying magnesium substrate over in vitro corrosion attack, and the corrosion resistance
of the cp magnesium is significantly improved by the PEO coating. The improvement factor ∆
could be obtained by the following equation:
∆=𝑅𝑝(𝑐𝑜𝑎𝑡𝑖𝑛𝑔) − 𝑅𝑝(𝑐𝑝 − 𝑚𝑔)
𝑅𝑝(𝑐𝑝 − 𝑚𝑔)× 100% ( 6.8 )
where Rp(coating) and Rp(cp-mg) are the polarisation resistance of the cp magnesium with
and without PEO coating, respectively. According to equation (6.8), the extent to which the
in vitro corrosion resistance of cp magnesium is improved could be calculated, and the results
are also listed in Table 6-3. Therefore, the protection ability of the coatings produced at
different frequencies could also be assessed. It is now clear that the best two PEO coatings in
terms of corrosion protection are produced at pulse frequency of 3000 Hz and 500 Hz, and
have improved the corrosion resistance by more than 10 times, while the least protection
(about 3 times) is provided by the coating produced at 2000 Hz, which might be due to the
highest elastic strain energy caused by its highest internal stress.
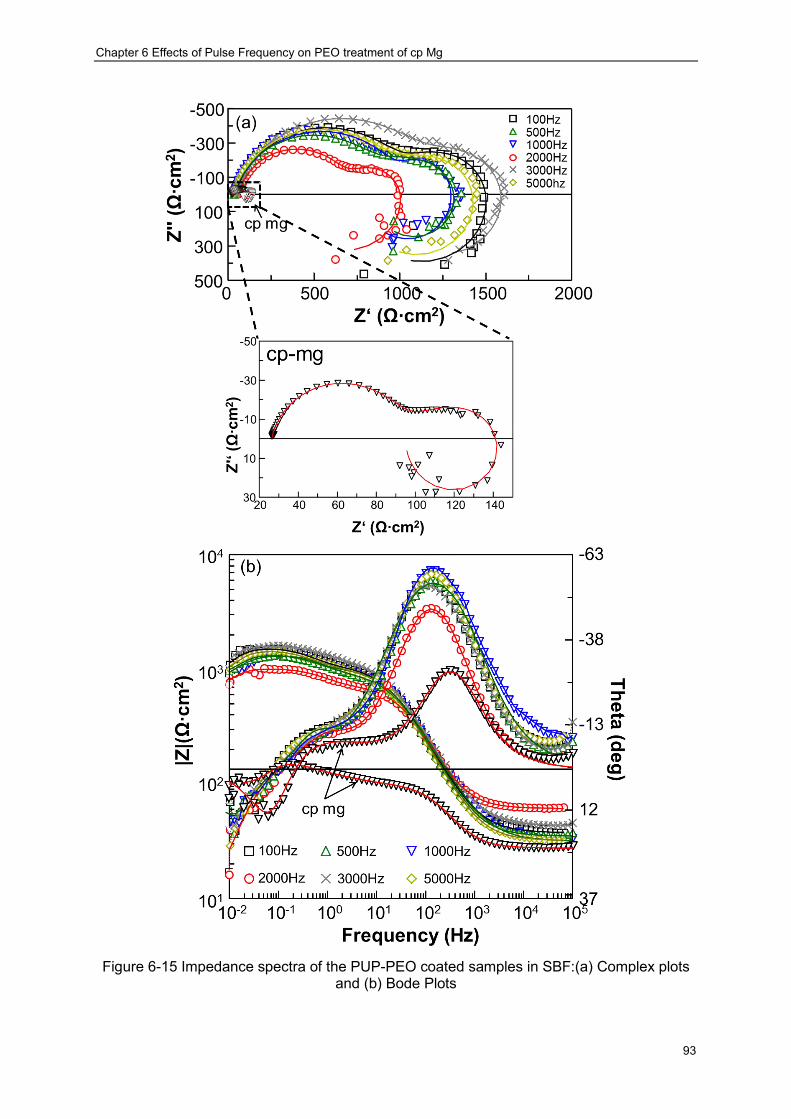
Chapter 6 Effects of Pulse Frequency on PEO treatment of cp Mg
93
Figure 6-15 Impedance spectra of the PUP-PEO coated samples in SBF:(a) Complex plots
and (b) Bode Plots
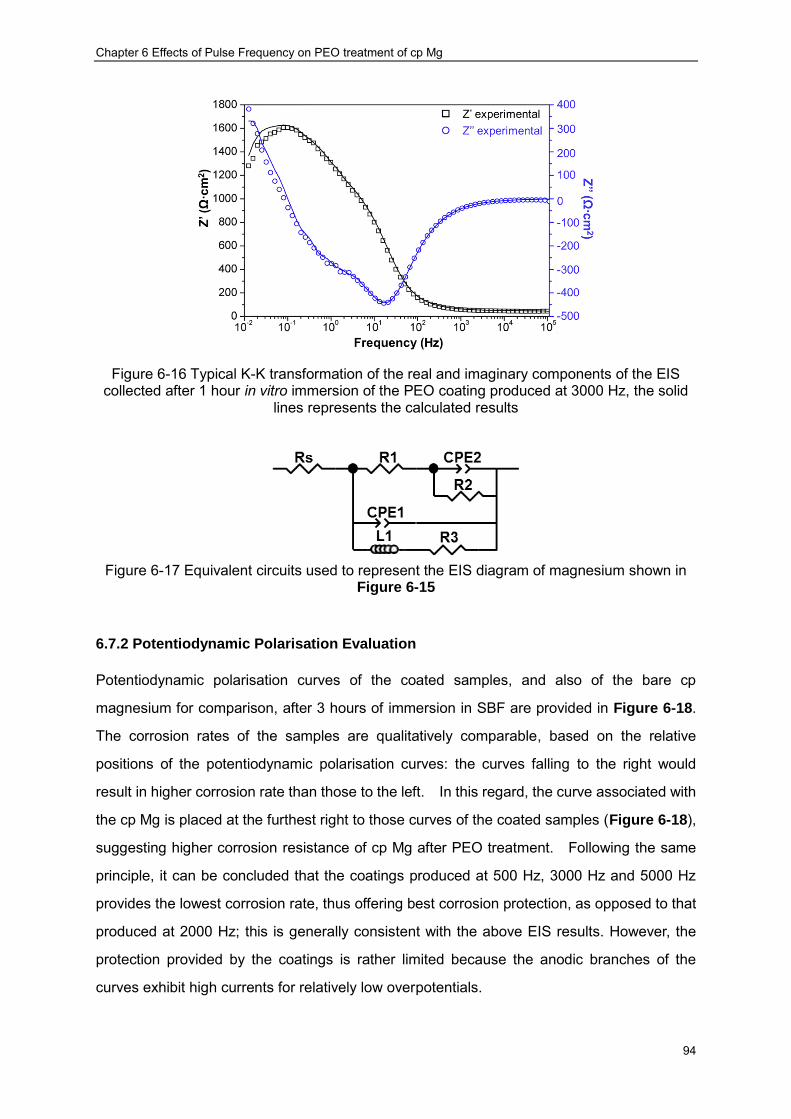
Chapter 6 Effects of Pulse Frequency on PEO treatment of cp Mg
94
Figure 6-16 Typical K-K transformation of the real and imaginary components of the EIS
collected after 1 hour in vitro immersion of the PEO coating produced at 3000 Hz, the solid lines represents the calculated results
Figure 6-17 Equivalent circuits used to represent the EIS diagram of magnesium shown in
Figure 6-15
6.7.2 Potentiodynamic Polarisation Evaluation
Potentiodynamic polarisation curves of the coated samples, and also of the bare cp
magnesium for comparison, after 3 hours of immersion in SBF are provided in Figure 6-18.
The corrosion rates of the samples are qualitatively comparable, based on the relative
positions of the potentiodynamic polarisation curves: the curves falling to the right would
result in higher corrosion rate than those to the left. In this regard, the curve associated with
the cp Mg is placed at the furthest right to those curves of the coated samples (Figure 6-18),
suggesting higher corrosion resistance of cp Mg after PEO treatment. Following the same
principle, it can be concluded that the coatings produced at 500 Hz, 3000 Hz and 5000 Hz
provides the lowest corrosion rate, thus offering best corrosion protection, as opposed to that
produced at 2000 Hz; this is generally consistent with the above EIS results. However, the
protection provided by the coatings is rather limited because the anodic branches of the
curves exhibit high currents for relatively low overpotentials.

Chapter 6 Effects of Pulse Frequency on PEO treatment of cp Mg
95
Additionally, neither the anodic nor the cathodic branches of the polarisation curves present
any reliable Tafel regions, which makes it impossible to derive an accurate corrosion rate
using conventional Tafel extrapolation methods. Nevertheless, the free corrosion potential
Ecorr could still be derived from the tip where the anodic current density equals the cathodic
current density of the curves. The free corrosion potential, falling in the range of –(1.6…1.4) V
vs. SCE, could be derived from the polarisation curves. Such Ecorr values present good
agreement with other published data [65, 188, 194].
6.7.3 Corrosion Morphology Analysis
Figure 6-19 shows surface morphologies of the coated samples following the
electrochemical tests. Compared to the original coating morphologies (Figure 6-10), it is
evident that the corrosion attack caused partial damage to all the coatings, resulting in
formation of corrosion pits. In some areas however the original porous morphology of each
coating could still be resolved, although the pore edges appear distorted. Mud cracks are also
observed at the bottom of the corrosion pits as shown by the insets in Figure 6-19, which is
consistent with other work [195]. A simplified assessment of the protection provided by the
PEO coating can be made using the fraction of coating left after the corrosion test, with higher
fraction suggesting better surface protection. Following this procedure, the smallest damage
was incurred by the coating produced at 3000 Hz (Figure 6-19), which is in agreement with
EIS and polarisation curve analysis.
Besides the two aforementioned areas, other morphological regions can be observed on the
surface where corrosion pits have not yet been formed but the PEO coating had been
attacked severely. Figure 6-20 discloses characteristic details of these regions for the
coating produced at 5000 Hz. As can be seen, the reaction of the PEO coating material with
the SBF results in formation of needle-like crystalline precipitates. To understand possible
mechanisms underlying such precipitation, EDX analysis was carried out for surface areas
(A)-(D), with results presented in the inset table in Figure 6-20. After the corrosion test, Cl
appears on the surface, indicating that the Cl- species contained in the SBF were involved in
the corrosion process. Also the Ca/P ratio in the mud-crack area (C) has increased from
0.056 to 0.57, which is due to the release of soluble calcium phosphates into the SBF,
indicating possible chemical dissolution of the coating material during in-vitro corrosion

Chapter 6 Effects of Pulse Frequency on PEO treatment of cp Mg
96
Table 6-3 .Results of EIS data fitting by equivalent circuits presented in Figure 6-15
Frequency/Hz R1
/Ω·cm2 R2 /Ω·cm2 R3 /Ω·cm2 CPE1-T
/S∙sn CPE1-P CPE2-T /
S∙sn CPE2-P L Rp
/Ω·cm2 Δ χ2
100 1044 465.9 1314 2.1×10⁻⁵ 0.81 9.0×10⁻⁴ 0.88 36153 702.58 9.1 0.0074 500 886 452.5 2026 1.8×10⁻⁵ 0.84 8.0×10⁻⁴ 0.79 29578 806.00 10.6 0.0032 1000 1024 258.5 1849 2.2×10⁻⁵ 0.79 9.6×10⁻⁴ 1 27349 757.25 9.9 0.011 2000 664.07 292.3 453 1.7×10⁻⁵ 0.85 8.7×10⁻⁴ 0.88 25129 307.40 3.4 0.0048 3000 1207 367.6 1908 2.1×10⁻⁵ 0.80 7.2×10⁻⁴ 0.91 48986 862.67 11.4 0.0040 5000 985.3 472.3 1421 2.0×10⁻⁵ 0.83 9.4×10⁻⁴ 0.81 30560 719.53 9.3 0.0037 Cp-mg 68.06 86.05 126.8 3.7×10⁻⁵ 0.87 7.9×10⁻³ 0.57 435 69.56 - 0.0028
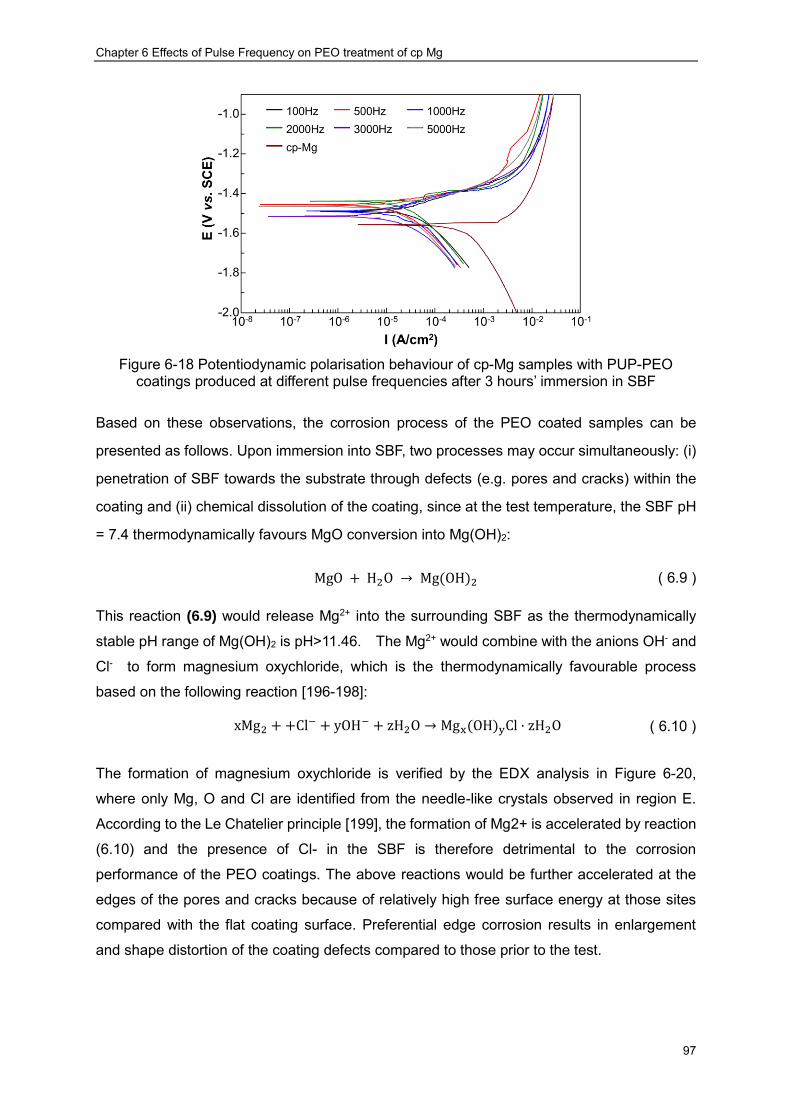
Chapter 6 Effects of Pulse Frequency on PEO treatment of cp Mg
97
Figure 6-18 Potentiodynamic polarisation behaviour of cp-Mg samples with PUP-PEO
coatings produced at different pulse frequencies after 3 hours’ immersion in SBF
Based on these observations, the corrosion process of the PEO coated samples can be
presented as follows. Upon immersion into SBF, two processes may occur simultaneously: (i)
penetration of SBF towards the substrate through defects (e.g. pores and cracks) within the
coating and (ii) chemical dissolution of the coating, since at the test temperature, the SBF pH
= 7.4 thermodynamically favours MgO conversion into Mg(OH)2:
MgO + H2O → Mg(OH)2 ( 6.9 )
This reaction (6.9) would release Mg2+ into the surrounding SBF as the thermodynamically
stable pH range of Mg(OH)2 is pH>11.46. The Mg2+ would combine with the anions OH- and
Cl- to form magnesium oxychloride, which is the thermodynamically favourable process
based on the following reaction [196-198]:
xMg2 + +Cl− + yOH− + zH2O → Mgx(OH)yCl · zH2O ( 6.10 )
The formation of magnesium oxychloride is verified by the EDX analysis in Figure 6-20,
where only Mg, O and Cl are identified from the needle-like crystals observed in region E.
According to the Le Chatelier principle [199], the formation of Mg2+ is accelerated by reaction
(6.10) and the presence of Cl- in the SBF is therefore detrimental to the corrosion
performance of the PEO coatings. The above reactions would be further accelerated at the
edges of the pores and cracks because of relatively high free surface energy at those sites
compared with the flat coating surface. Preferential edge corrosion results in enlargement
and shape distortion of the coating defects compared to those prior to the test.

Chapter 6 Effects of Pulse Frequency on PEO treatment of cp Mg
98
Figure 6-19 Surface morphologies of PEO coated samples after potentiodynamic polarisation tests
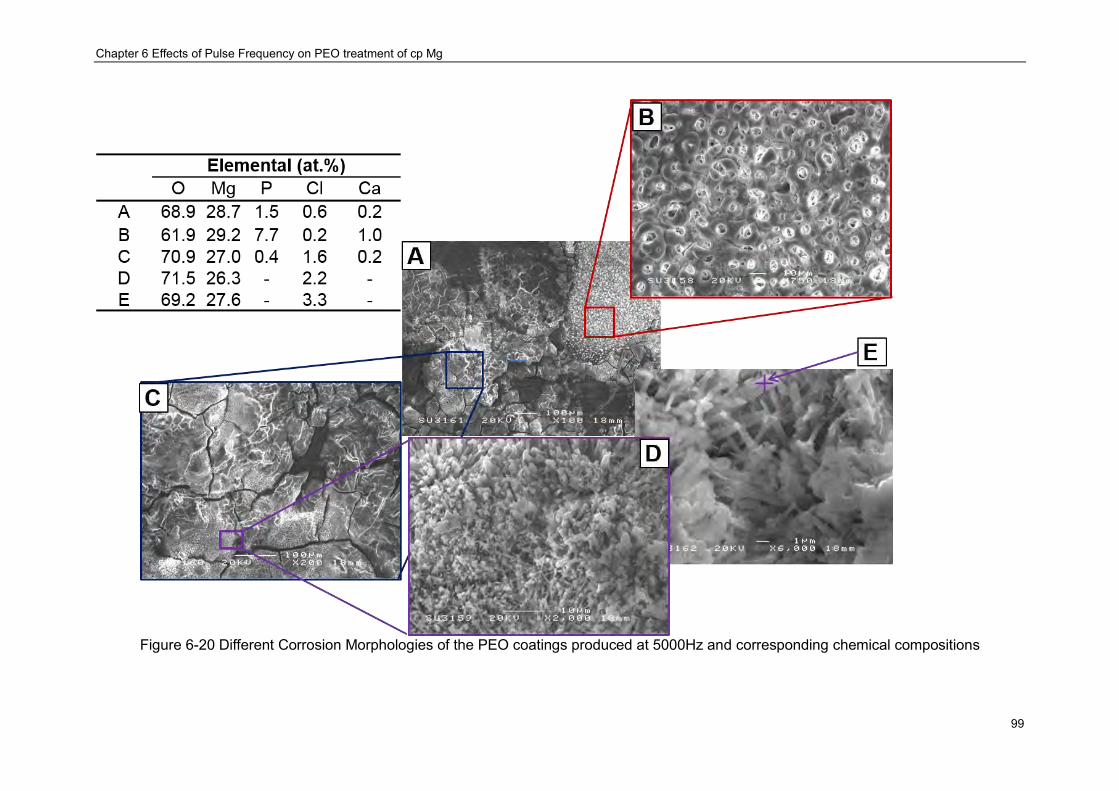
Chapter 6 Effects of Pulse Frequency on PEO treatment of cp Mg
99
Figure 6-20 Different Corrosion Morphologies of the PEO coatings produced at 5000Hz and corresponding chemical compositions

Chapter 6 Effects of Pulse Frequency on PEO treatment of cp Mg
100
Until the electrolyte reaches the metal substrate, these chemical dissolution processes would
prevail in the overall corrosion process, with underlying magnesium being hardly affected.
With corrosion proceeding, the coating is eventually perforated at certain weak points, i.e.
deep pores and large cracks, and electrochemical corrosion of magnesium based on
reactions (2.1)-(2.3) commences, yielding corrosion pits on the sample surface. Further
corrosion causes the pH value within the pits to increase, making Mg(OH)2
thermodynamically stable; thus the pits become filled with the corrosion product. Additionally,
the mud-cracks observed in Figures 6-19 and 6-20 within the corrosion pits are likely to
result from dehydration of Mg(OH)2 due to electron bombardment during the SEM
observation:
Mg(OH)2 → MgO + H2O ( 6.11 )
The molar volume of Mg(OH)2 is larger than that of MgO, therefore, when Mg(OH)2 is
dehydrated to MgO, the cracks are expected to be formed.
6.8 Summary
This chapter has discussed correlations between characteristics of the pulsed unipolar PEO
process and associated Ca- and P-containing coatings on biodegradable magnesium, in
connection with their corrosion behaviour in-vitro, and resulted in the following findings:
(1) The PEO coatings possess a porous morphology regardless of the processing frequency.
However, the average pore size and distribution are frequency dependent, so that higher
pulse frequencies result in coatings having a more uniformly distributed porosity with a
smaller mean average pore size. This is likely to be due to discharge lifetime being
limited by the pulse duration at frequencies 3000 Hz.
(2) Calcium is incorporated into all coatings which also contained Mg, O, P and Na. With
increasing pulse frequency, the content of P increased; however, the Ca content did not
show significant changes, indicating that its incorporation may be due to either direct
adsorption or precipitation in the form of calcium phosphate during the pulse off period.
(3) Tensile residual stresses are developed in the PEO coatings on Mg as a result of
superposition of oxidation, electrostriction and thermal stresses influenced by dielectric
relaxation and cracking processes. Generally the stress tends to relax with increasing
pulse frequency, which is mainly due to reduction of thermal load on the system,
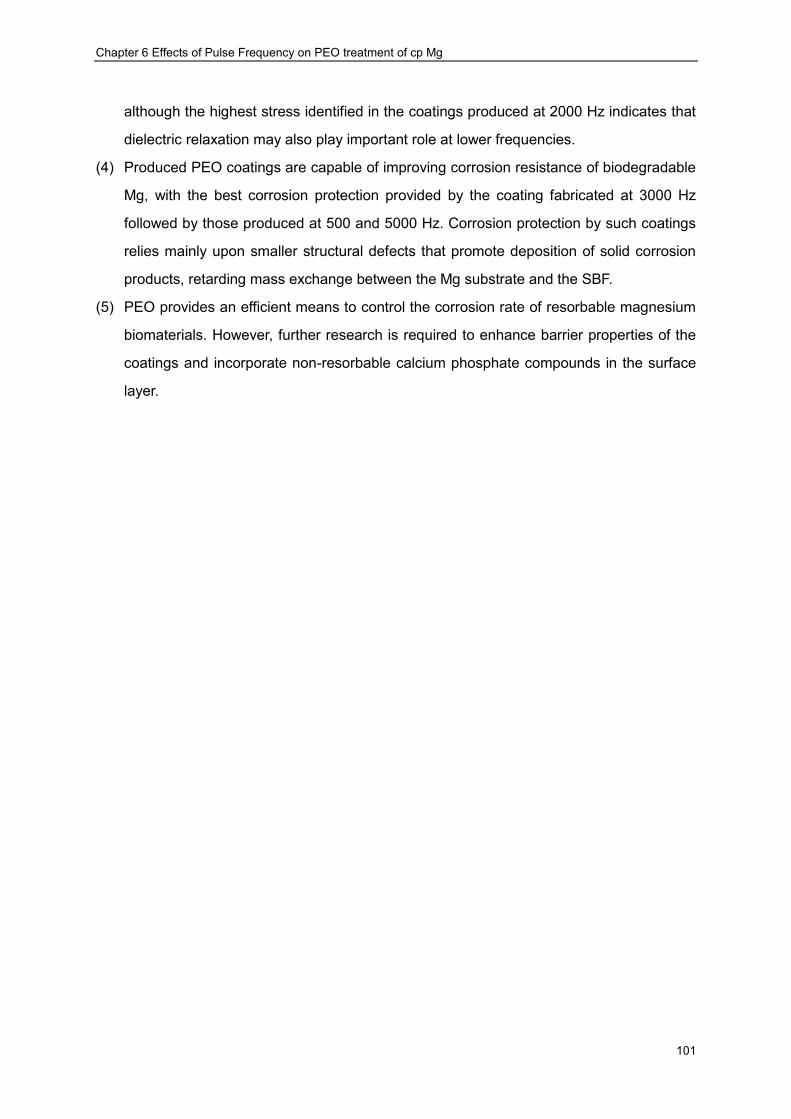
Chapter 6 Effects of Pulse Frequency on PEO treatment of cp Mg
101
although the highest stress identified in the coatings produced at 2000 Hz indicates that
dielectric relaxation may also play important role at lower frequencies.
(4) Produced PEO coatings are capable of improving corrosion resistance of biodegradable
Mg, with the best corrosion protection provided by the coating fabricated at 3000 Hz
followed by those produced at 500 and 5000 Hz. Corrosion protection by such coatings
relies mainly upon smaller structural defects that promote deposition of solid corrosion
products, retarding mass exchange between the Mg substrate and the SBF.
(5) PEO provides an efficient means to control the corrosion rate of resorbable magnesium
biomaterials. However, further research is required to enhance barrier properties of the
coatings and incorporate non-resorbable calcium phosphate compounds in the surface
layer.

Chapter 7 Effects of negative biasing on PEO treatment of cp Mg
102
Chapter 7 Effects of Negative Pulsing on PEO Treatment of Commercially
Pure Magnesium
As outlined in Chapter 6, PEO coatings were produced in the optimised electrolyte
determined in Chapter 5 under the unipolar pulsed current mode. The effects of pulse
frequency on the PEO process and final coating characterisation were discussed. It was
concluded that the PEO coating produced at 3000 Hz presented the best in vitro corrosion
performance compared with its counterparts produced at other frequencies. As stated in
Chapter 3, apart from unipolar pulsed current regime, PEO coatings can also be produced
under bipolar pulsed current mode. It has also been claimed in other studies that applying
negative biasing during the PEO process will result in much better coating properties [78, 93,
94, 108]. However, the effects of the negative biasing on the PEO coating have not been
established because the negative biasing is highly dependent on other parameters such as
electrolyte composition and pulse frequency. The effects of negative biasing on the PEO
coating produced in the electrolyte investigated in Chapter 5 are studied in the present
chapter.
7.1 Coating Fabrication
PEO coatings were produced on commercially pure magnesium, and the details of the
substrates including chemical composition, dimensions and preparation procedures were
described in Chapter 4. The PEO treatments were conducted in the biologically friendly
electrolyte containing 2 g/l Ca(OH)2 and 12 g/l Na3PO4∙12H2O, as identified in Chapter 5.
Following the study in Chapter 6, a pulsed bipolar current regime (schematically illustrated in
Figure 3-3(e)) was developed and applied here. Based on the results in Chapter 6, the
applied pulsing frequency 𝑓 = 1/(𝜏+𝑜𝑛 + 𝜏+
𝑜𝑓𝑓+ 𝜏−
𝑜𝑛 + 𝜏−𝑜𝑓𝑓)was set at 3000 Hz. The positive
current density and duty cycle were set at i+=30 mA/cm2 and 𝜏+𝑜𝑛/(𝜏+
𝑜𝑛 + 𝜏+𝑜𝑓𝑓
+ 𝜏−𝑜𝑛 + 𝜏−
𝑜𝑓𝑓)=
10%, respectively. The negative duty cycle 𝜏−𝑜𝑛/(𝜏+
𝑜𝑛 + 𝜏+𝑜𝑓𝑓
+ 𝜏−𝑜𝑛 + 𝜏−
𝑜𝑓𝑓) was also set at
10%, with negative current density varied from 10 to 20 mA/cm2. All the treatments were
carried out for 10 minutes, except for those not providing sufficient passivation to sustain the
oxidation process.
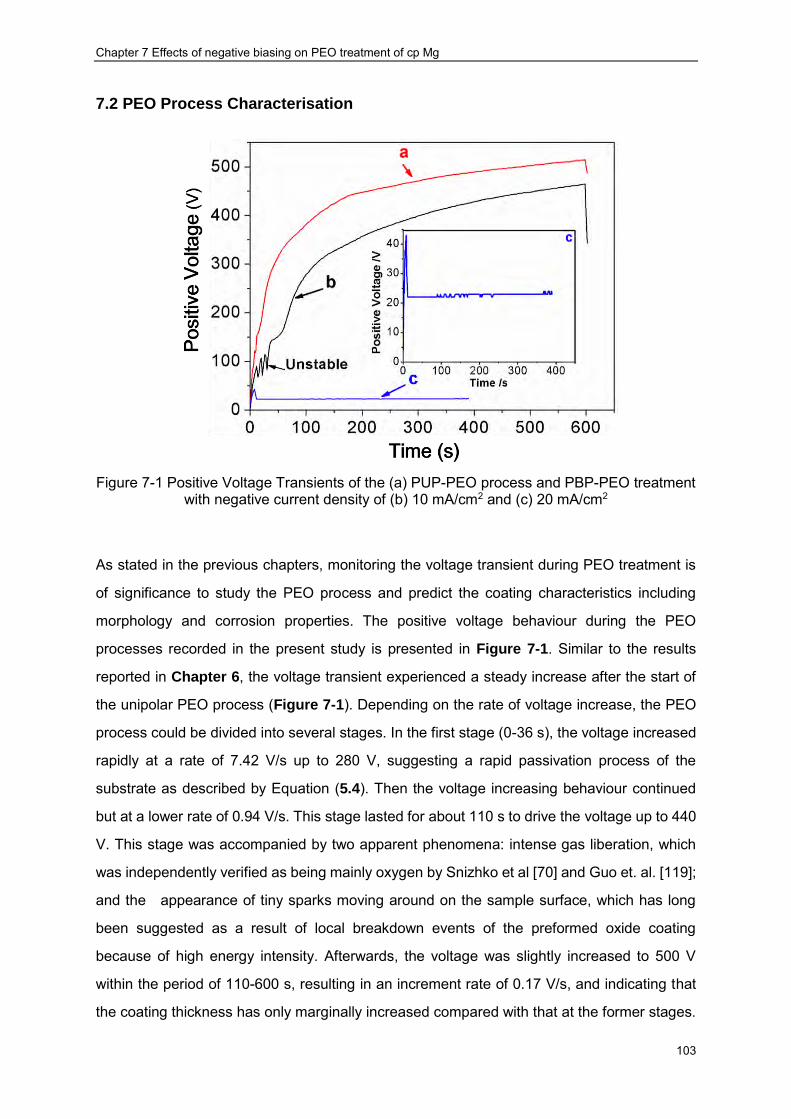
Chapter 7 Effects of negative biasing on PEO treatment of cp Mg
103
7.2 PEO Process Characterisation
Figure 7-1 Positive Voltage Transients of the (a) PUP-PEO process and PBP-PEO treatment
with negative current density of (b) 10 mA/cm2 and (c) 20 mA/cm2
As stated in the previous chapters, monitoring the voltage transient during PEO treatment is
of significance to study the PEO process and predict the coating characteristics including
morphology and corrosion properties. The positive voltage behaviour during the PEO
processes recorded in the present study is presented in Figure 7-1. Similar to the results
reported in Chapter 6, the voltage transient experienced a steady increase after the start of
the unipolar PEO process (Figure 7-1). Depending on the rate of voltage increase, the PEO
process could be divided into several stages. In the first stage (0-36 s), the voltage increased
rapidly at a rate of 7.42 V/s up to 280 V, suggesting a rapid passivation process of the
substrate as described by Equation (5.4). Then the voltage increasing behaviour continued
but at a lower rate of 0.94 V/s. This stage lasted for about 110 s to drive the voltage up to 440
V. This stage was accompanied by two apparent phenomena: intense gas liberation, which
was independently verified as being mainly oxygen by Snizhko et al [70] and Guo et. al. [119];
and the appearance of tiny sparks moving around on the sample surface, which has long
been suggested as a result of local breakdown events of the preformed oxide coating
because of high energy intensity. Afterwards, the voltage was slightly increased to 500 V
within the period of 110-600 s, resulting in an increment rate of 0.17 V/s, and indicating that
the coating thickness has only marginally increased compared with that at the former stages.
Chapter 7 Effects of negative biasing on PEO treatment of cp Mg
104
It is worth noting here that less discharge events were observed, whereas the average
discharge dimensions were considerably larger compared with those in the former stage.
A similar increasing trend was also recorded when the process has been conducted under
the unipolar current regime with a negative current density of 10 mA/cm2 (curve b in Figure
7-1), which, however, presented two apparently different features. On one hand, the
application of negative current biasing of 10 mA/cm2 resulted in lower overall voltages during
the PEO process (i.e. curve-b is placed below curve-a in Figure 7-1), and the final voltage
reduced from 500 V to 460 V, indicating a thinner PEO coating. On the other hand, vigorous
fluctuations were present in the initial stage (0-50 s) of the PEO process with negative current
density of 10 mA/cm2 as marked in Figure 7-1, suggesting that the stability of the PEO
process with such parameters was undermined compared with the unipolar treatment.
According to Equation (5.4), it is expected that these fluctuations resulted from concurrent
coating formation and dissolution. Furthermore, when the negative current density was
further increased to 20 mA/cm2, the PEO process was unsuccessful, which is reflected by the
voltage behaviour as shown by curve-c in Figure 7-1. Upon the start of the PEO process, the
voltage rapidly increased to about 43 V within the first 5 seconds; afterwards, it decreased
sharply to 22 V, which was not sufficient to sustain the oxide film growth. Then the voltage
remained at this level although with some minor variations with magnitude of <2 V (inset in
Figure 7-1). Due to the high sample dissolution rate under these conditions, the treatment
was stopped after 400 s. Finally, a smooth metallic surface finish rather than a ceramic
coating was achieved after this treatment. It was highly possible that the dissolution process
overcame the oxidation process when the negative pulse amplitude was 20 mA/cm2.
The unipolar PEO process can be considered as a bipolar PEO process with negative current
density of 0 mA/cm2. Therefore, from the analysis of the voltage transients during the PEO
processes, it can be predicted that increasing the negative current density from 0 to 20
mA/cm2 could result in thinner ceramic coatings, which was verified by the measurements
using the eddy-current method (Figure 7-2); such results are in good agreement with those
reported by Yao et al [102].

Chapter 7 Effects of negative biasing on PEO treatment of cp Mg
105
Figure 7-2 Correlation of the PBP-PEO coating thickness with the applied negative current
density
7.3 Coating Morphologies
The appearance of the PBP-PEO coatings produced with different negative pulse current
densities are presented in Figure 7-3. Under unipolar conditions, the coating exhibited a
smooth surface as shown in Figure 7-3(a), and no obvious defects can be observed by
naked eye. However, apparent scars of about 1 mm in diameter, inside which the ceramic
coating was only loosely bonded with the substrate, could be identified for the bipolar PEO
coating produced with negative biasing of 10 mA/cm2 (as indicated by the white arrows in
Figure 7-3(b)). Comparing the two images, it is likely that the defects observed in Figure
7-3(b) may be formed during the negative pulsing of the PEO treatment. While the dominate
process at the substrate during the positive biasing of the PEO process was the coating
thickening, the main reaction involved during the negative biasing was H2 gas generation
underneath the coating. Then gas would eventually be liberated, leaving scars on the coating.
Similar process would also affect the corrosion process of the coated Mg, which would be
explained in detail later. Apparently, the integrity of the PEO coating was deteriorated by
these scars. Correspondingly, detrimental effects of the scars on the corrosion protection
ability of the coating could be predicted.

Chapter 7 Effects of negative biasing on PEO treatment of cp Mg
106
Figure 7-3 Appearance of the coatings formed at negative current density (a) 0 mA/cm2 and
(b) 10 mA/cm2
While the optical images presented in Figure 7-3 only reveal the macro morphology of the
coating, SEM images disclosing those on the micro scale as presented in Figure 7-4. The
two coatings exhibited typical porous morphologies, even if the differences in pore diameter
were significant. Qualitative analysis of the SEM images indicated that the average pore
diameter of the bipolar PEO coating was apparently smaller than that of the unipolar PEO
coating. To reveal quantitative information, the SEM images were statistically analysed and
the results indicated that the pore diameters of the coating fabricated under unipolar current
regime ranged from 0.3 µm to around 6.9 µm, which resulted in an average pore diameter of
2.83±1.54 µm. However, the pore diameters fell in the range of 0.2 to 4.3 µm for the PBP
PEO coating with a negative pulse current density of 10 mA/cm2. Correspondingly, the
average pore diameter was reduced to 1.47±0.80 µm. This result is consistent with that
published by Xin et. al.[93] who reported a more compact ceramic coating after applying
cathodic current pulses. The presence of the pores within the PEO coatings has been
attributed to the appearance of discharge events during the PEO treatment, i.e. higher
discharge intensities normally result in larger pore diameters. Therefore, smaller pore
diameters might result from two aspects; reduced discharge intensity in each cycle and/or
avoidance of repeating discharge at one location. Since the anodic current density remained
the same in the present study, the intensity of the discharge which only occurs during the
anodic cycle was also the same. According to Sah et. al. [200], it is likely that the cathodic
duty cycle promotes randomisation of the anodic breakdown, thus reducing the pore
diameters within the PEO coating.

Chapter 7 Effects of negative biasing on PEO treatment of cp Mg
107
Figure 7-4 SEM images of the PBP-PEO coatings fabricated in the present chapter at
negative current density of (a): 0 and (b) 10 mA/cm2
Figure 7-5 Cross-sectional morphologies of the PBP-PEO coatings produced in the present chapter at negative current density of (a) 0 and (b) 10 mA/cm2
Cross-sectional morphologies of the coatings produced in the present study are shown in
Figure 7-5, which exhibited a much thinner coating for the PBP process with negative current
density of 10 mA/cm2, compared with the PUP treatment (consistent with the eddy current
probe measurements (Figure 7-2)). Corresponding to the surface images shown in Figure
7-4, the cross-sectional morphologies also presented porous characteristics, and the pores in
the unipolar PEO coating were much larger than those of the bipolar coating. Moreover, the
large pores were largely confined to the outer regions of the coating, whereas the pores close
to the substrate interface were much finer.
7.4 Chemical and Phase Composition of the Coatings
The EDX results indicate that, regardless of current regime, all the coatings were composed
of Mg, O, P, Ca, and Na; therefore, only the representative spectrum of the coating produced
under the bipolar current regime with negative biasing of 10 mA/cm2 is presented in Figure
7-6. Atomic concentrations of the elements in the PEO coatings are summarised in Table 7-1.
Substrate
Coating
Resin Resin
Coating
Substrate

Chapter 7 Effects of negative biasing on PEO treatment of cp Mg
108
Taking account the accuracy of the EDX technique, there was no significant difference in
concentrations of the chemical elements between the coatings. While the coatings contained
considerable amounts of Mg and O, the concentration of P was much lower. Only trace
amounts of Ca and Na were identified in the coatings. The ratio of Mg/O is <1, indicating that
the abundant O may be combined with other elements, possibly Ca and/or P, besides Mg in
the coating. The presence of Ca in all the coatings was consistent with previous results
published by Srinivasan [122], and was in good agreement with the results presented in
Chapter 6, even though its concentration does not show significant dependence on the
processing parameters, i.e. the current regime.
Figure 7-6 Typical EDX spectrum of the coatings produced under PBP-PEO conditions
Considering the fact that the elements O, P, Ca and Na only existed in the electrolyte before
the PEO treatment, the identification of these elements in the PEO coating is roughly
suggestive of the coating formation mechanism. During the PEO process, the substrate was
first passivated rapidly in the electrolyte, forming a thin barrier oxide layer on the substrate
surface. This is supported by the behaviour of the voltage transient presented in Section 7.2.
Once the voltage reached a critical value (usually called the breakdown voltage), discharge
events took place. Driven by the electric field in the discharge channels, the cations, Mg2+,
moved outwards while the anions of OH-, O2-, PO43- were driven inwards through the
discharge channels. The combination of cations with anions resulted in thickening of the
coating. The following two possible reasons might lead to the incorporation of cations Na+
and Ca2+ presented in the electrolyte into the PEO coating; (i) Due to the high energy injection,
the cations Na+ and Ca2+ are further ionised, forming part of the plasma, as being confirmed
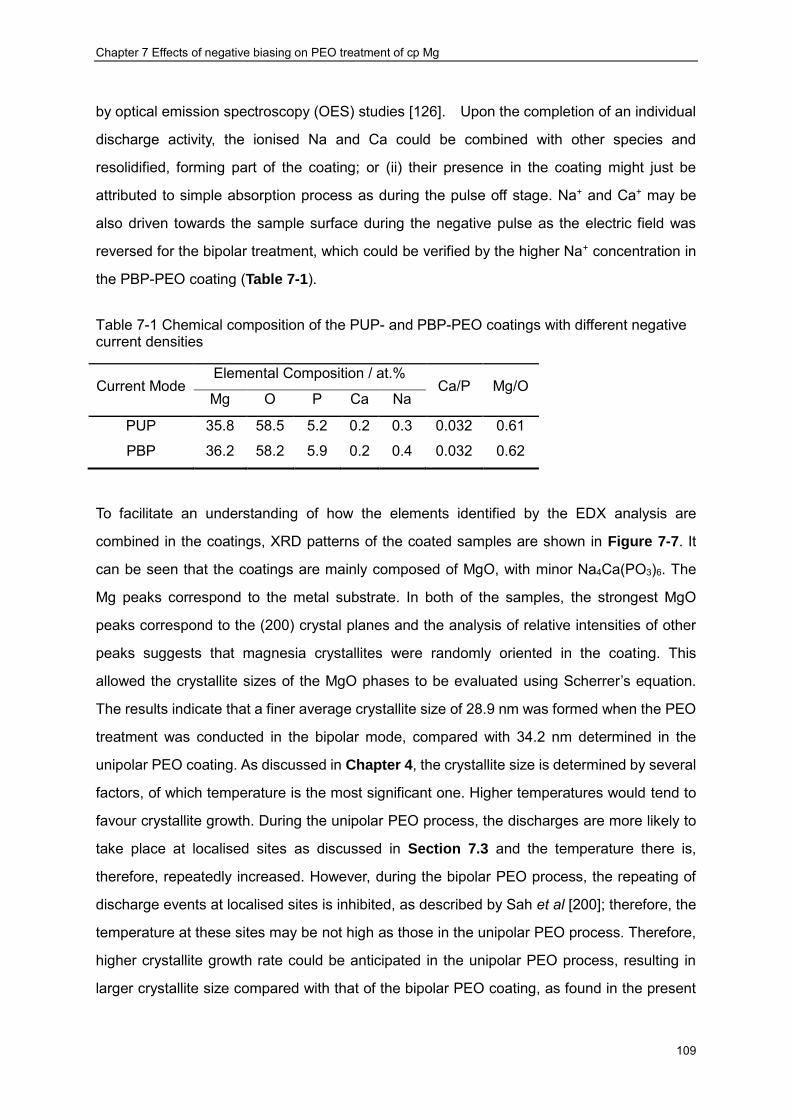
Chapter 7 Effects of negative biasing on PEO treatment of cp Mg
109
by optical emission spectroscopy (OES) studies [126]. Upon the completion of an individual
discharge activity, the ionised Na and Ca could be combined with other species and
resolidified, forming part of the coating; or (ii) their presence in the coating might just be
attributed to simple absorption process as during the pulse off stage. Na+ and Ca+ may be
also driven towards the sample surface during the negative pulse as the electric field was
reversed for the bipolar treatment, which could be verified by the higher Na+ concentration in
the PBP-PEO coating (Table 7-1).
Table 7-1 Chemical composition of the PUP- and PBP-PEO coatings with different negative current densities
Current Mode Elemental Composition / at.%
Ca/P Mg/O Mg O P Ca Na
PUP 35.8 58.5 5.2 0.2 0.3 0.032 0.61
PBP 36.2 58.2 5.9 0.2 0.4 0.032 0.62
To facilitate an understanding of how the elements identified by the EDX analysis are
combined in the coatings, XRD patterns of the coated samples are shown in Figure 7-7. It
can be seen that the coatings are mainly composed of MgO, with minor Na4Ca(PO3)6. The
Mg peaks correspond to the metal substrate. In both of the samples, the strongest MgO
peaks correspond to the (200) crystal planes and the analysis of relative intensities of other
peaks suggests that magnesia crystallites were randomly oriented in the coating. This
allowed the crystallite sizes of the MgO phases to be evaluated using Scherrer’s equation.
The results indicate that a finer average crystallite size of 28.9 nm was formed when the PEO
treatment was conducted in the bipolar mode, compared with 34.2 nm determined in the
unipolar PEO coating. As discussed in Chapter 4, the crystallite size is determined by several
factors, of which temperature is the most significant one. Higher temperatures would tend to
favour crystallite growth. During the unipolar PEO process, the discharges are more likely to
take place at localised sites as discussed in Section 7.3 and the temperature there is,
therefore, repeatedly increased. However, during the bipolar PEO process, the repeating of
discharge events at localised sites is inhibited, as described by Sah et al [200]; therefore, the
temperature at these sites may be not high as those in the unipolar PEO process. Therefore,
higher crystallite growth rate could be anticipated in the unipolar PEO process, resulting in
larger crystallite size compared with that of the bipolar PEO coating, as found in the present

Chapter 7 Effects of negative biasing on PEO treatment of cp Mg
110
study. The P and Ca containing crystalline phase Na4Ca(PO3)6 was identified in both coatings
by the peaks at 2=29.0o and 30.8o. Such a phase was also identified in the coatings
produced under unipolar pulsed current regime, as discussed in Chapter 6. The bipolar PEO
process resulted in a higher content of Na4Ca(PO3)6 phase in the coating, i.e higher
Na4Ca(PO3)6/MgO intensity ratio compared with the unipolar PEO treatment was observed.
Moreover, the Ca/P peak ratio identified by EDX analysis (Table 7-1) is about 0.03, which is
much lower than that of the stoichiometric ratio in Na4Ca(PO3)6. It may be that this phase only
consumes part of the Ca and P content, with the remainder being incorporated in the crystal
lattice of MgO
Figure 7-7 XRD patterns of the coatings produced under PUP- and PBP current regimes in
the presented study
7.5 Electrochemical Corrosion Evaluation
7.5.1 Open Circuit Potential
As stated in Chapter 4, the evaluation of OCP behaviour might predict the degradation
susceptibility of the coatings. Based on this consideration the OCP evolution with immersion
time was recorded for different samples including the bare magnesium substrate for the sake
of comparison, as shown in Figure 7-8. It is clear that the OCP value of bare magnesium was

Chapter 7 Effects of negative biasing on PEO treatment of cp Mg
111
more negative than the two coated samples within 3 hours of immersion, indicating that the
PEO coatings provided positive effects to the samples in terms of corrosion protection. The
OCP value of the bare cp Mg first increased to -1.79 V vs. SCE from -1.81 V vs. SCE within
250 s before going down to -1.83 V vs. SCE up to 500 s after immersion, suggesting the
destruction of the passive film on the magnesium surface upon immersion. Then the OCP
value gradually shifts in the noble direction. Therefore, reconstruction of a thin protective film
on the substrate surface could be expected.
Figure 7-8 Open circuit potential of the cp Mg with PUP- and PBP-PEO coatings in the SBF at
37±1 oC
Immediately after immersion into the SBF, the PBP PEO coating with a negative current
density of 10 mA/cm2 presented the same OCP value of -1.76 V vs. SCE (Figure 7-8). Then it
started to shift to the negative direction by 30 mV within 700 s for the Mg substrate with PEO
coating produced under PUP condition, indicating the penetration of SBF through the coating
defects due to the chemical instability of MgO in SBF, as claimed by Liang et. al.[201]. With
prolonged immersion time, the SBF gradually penetrated through the defects towards the
interface between the PEO coating and substrate, resulting in corrosion of the substrate. The
corrosion sites at the interface of the coating and substrate were gradually covered by the
corrosion products, which imposed an inhibition effect to the corrosion process. Therefore,
Chapter 7 Effects of negative biasing on PEO treatment of cp Mg
112
the OCP value increased gradually at a rate of 0.072 mV/s to -1.58 V vs. SCE within the
period of 700-3400 s, as shown in Figure 7-8. Thereafter, the OCP value remained stable
with some minor variations of magnitude less than 10 mV, indicating the establishment of
stable conditions. The minor variations displayed by the OCP curves in the final stages can
be attributed to the formation and passivation of corrosion pits during the immersion process.
Once a new corrosion pit was formed, it would be reflected by a decrease in the OCP value,
which would increase again as the corrosion products were developed and extruded into the
pitted area.
The unipolar PEO coating produced similar OCP behaviour during the immersion process,
and the final OCP value was slightly lower than that of the bipolar coating. However, it took a
longer time (about 5000 s) before the OCP reached a stable level as compared with that of
the bipolar coating, indicating that it took longer time for the SBF to penetrate through the
coating because of the higher coating thickness as presented in Figures 7-3 and 7-6.
7.5.2 Electrochemical Impedance Spectroscopy
Figure 7-9 compares the EIS behaviour after 2 hours of immersion for the coated samples
and the bare substrate. Analysis of these plots could disclose effects of the current regime
utilised in the present study, on the corrosion performance of the samples in SBF at 37±1 ºC.
The complex plots exhibited two depressed semicircles in the first quadrant, and an
additional loop was also observed in the fourth quadrant (inductive loop) for all samples
(Figure 7-9 (a)). As discussed in Chapter 6, the presence of the three loops indicates three
kinetic processes involved in the corrosion process. For the surface modified samples, the
semicircles at high frequency (1 to 10000 Hz) correspond to the contribution of the outer
porous region of the coating and the loops at medium frequency (0.1 to 1 Hz) are attributed to
the effects of the inner compact region of the PEO coating (Figure 7-5). When the frequency
was low enough (0.01 to 0.1 Hz), the inductive response from the corrosion process became
significant, which indicates the samples may be affected by pitting corrosion [202]. The
inductive behaviour was believed to be caused by relaxation of monovalent Mg+ intermediate
ions in the corrosion pits [168]. Actually, the assumption of the presence of Mg+ ions is
reasonable, as it provides a satisfactory explanation of negative difference effect (NDE)
during the corrosion process of Mg [44]. As discussed in Section 7.5.1, a passive film was
formed on the substrate surface immediately after being immersed into the SBF, therefore the
three-loop behaviour was also present on the EIS spectra collected for the bare substrate, as
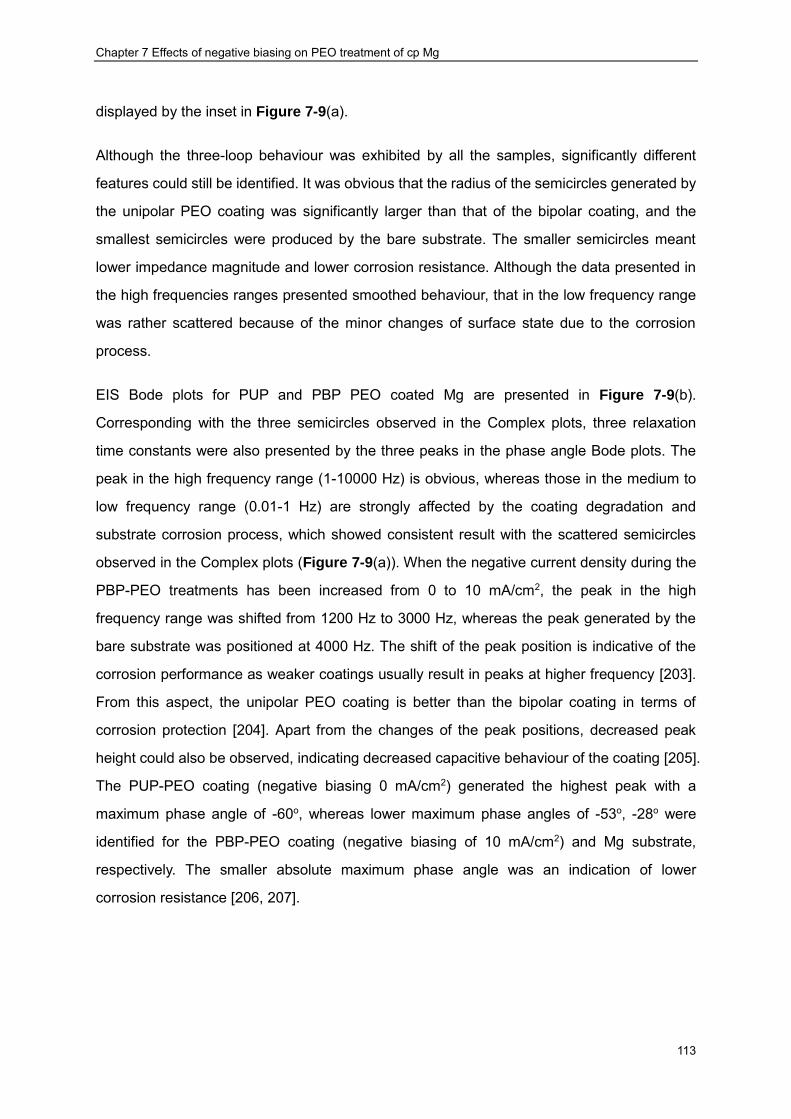
Chapter 7 Effects of negative biasing on PEO treatment of cp Mg
113
displayed by the inset in Figure 7-9(a).
Although the three-loop behaviour was exhibited by all the samples, significantly different
features could still be identified. It was obvious that the radius of the semicircles generated by
the unipolar PEO coating was significantly larger than that of the bipolar coating, and the
smallest semicircles were produced by the bare substrate. The smaller semicircles meant
lower impedance magnitude and lower corrosion resistance. Although the data presented in
the high frequencies ranges presented smoothed behaviour, that in the low frequency range
was rather scattered because of the minor changes of surface state due to the corrosion
process.
EIS Bode plots for PUP and PBP PEO coated Mg are presented in Figure 7-9(b).
Corresponding with the three semicircles observed in the Complex plots, three relaxation
time constants were also presented by the three peaks in the phase angle Bode plots. The
peak in the high frequency range (1-10000 Hz) is obvious, whereas those in the medium to
low frequency range (0.01-1 Hz) are strongly affected by the coating degradation and
substrate corrosion process, which showed consistent result with the scattered semicircles
observed in the Complex plots (Figure 7-9(a)). When the negative current density during the
PBP-PEO treatments has been increased from 0 to 10 mA/cm2, the peak in the high
frequency range was shifted from 1200 Hz to 3000 Hz, whereas the peak generated by the
bare substrate was positioned at 4000 Hz. The shift of the peak position is indicative of the
corrosion performance as weaker coatings usually result in peaks at higher frequency [203].
From this aspect, the unipolar PEO coating is better than the bipolar coating in terms of
corrosion protection [204]. Apart from the changes of the peak positions, decreased peak
height could also be observed, indicating decreased capacitive behaviour of the coating [205].
The PUP-PEO coating (negative biasing 0 mA/cm2) generated the highest peak with a
maximum phase angle of -60o, whereas lower maximum phase angles of -53o, -28o were
identified for the PBP-PEO coating (negative biasing of 10 mA/cm2) and Mg substrate,
respectively. The smaller absolute maximum phase angle was an indication of lower
corrosion resistance [206, 207].
Chapter 7 Effects of negative biasing on PEO treatment of cp Mg
114
Figure 7-9 EIS spectra of the samples with PEO coatings of different current regimes in the SBF at 37±1 oC after immersion of 2 hour (a) Complex plots and (b) Bode plots (The fitting
results are represented by the solid lines)
Chapter 7 Effects of negative biasing on PEO treatment of cp Mg
115
As suggested in [203, 207, 208], the breakpoint frequency fb, at which the phase angle equals
45o can be used as another parameter describing the corrosion performance of the samples,.
In the present study, fb was increased from 27 Hz to 60 Hz when the negative current during
the PEO process increased from 0 (PUP) to 10 mA/cm2 (PBP), respectively, as marked by
the dashed horizontal line in Figure 7-9(b), which indicated a higher number of active
corrosion sites at the interface of the PBP-PEO coating [203, 207, 208]. It should be
mentioned here that a breakpoint frequency was not observed for the bare substrate due to
the fact that the naturally formed passive film in the SBF on the substrate surface was too thin
[208]. Since the EIS spectra in the high frequency range reflect the performance of the
coating, the changes in the phase peaks (including the position and height) at high frequency
provided some indications about the coating characteristics in the SBF. The shift of highest
peaks and breakpoint frequency to the high frequency direction showed good agreement with
the model proposed by Mansfeld [208] and suggested worse corrosion performance of the
coatings as claimed in other publications [208, 209]. Based on these observations, it can be
confidently concluded that after PEO treatments, the corrosion performance of the
magnesium substrate in the SBF was improved and the PUP PEO coating regime provided
better corrosion protection than the bipolar regime.
The corrosion performance of the samples can also be illustrated by the impedance
magnitude Bode plots, which are also presented in Figure 7-9(b). The highest impedance
magnitude in the test frequency range was observed for the unipolar PEO coating, indicating
superior corrosion performance, while the bare substrate showed the least corrosion
resistance as reflected by its lowest impedance magnitude. Corresponding with the highest
peaks of the phase angle Bode plots, straight lines with slopes (∆|Z|/∆log (𝑓)) of <1 could be
identified in the impedance magnitude Bode plots of the coated samples; however, a linear
region was not apparent in the curve generated by the bare substrate (Figure 7-9 (b)). Such
straight lines could be ascribed to the capacitance behaviour of the coatings. Theoretically,
the ideal capacitor should have resulted in a straight line with the slope of 1, smaller slopes in
the present study were due to dispersed capacitance behaviour caused by the coating
characteristics, like roughness and defects. In addition, the two ǀZǀ vs. Frequency Bode plots
generated by the coated samples almost coincided with each other when the frequency was
higher than 100 Hz, suggesting similar effects of the outer porous coating on the corrosion
process. However, when the frequency was lower than 100 Hz, the difference of the two

Chapter 7 Effects of negative biasing on PEO treatment of cp Mg
116
curves became apparent and significantly lower impedance magnitude was observed for the
bipolar PEO coating, indicating a lower corrosion resistance.
The above analysis of the EIS spectra provides a qualitative comparison of the coating
performance in the SBF which, however, is not sufficient. In the present study, the EIS
spectra were also analysed using the equivalent circuit (EC) method. Because of the
similarity of the cross-sectional features and EIS characteristics of the coatings in the present
study with those of the PUP-PEO coatings produced in Chapter 6, the EC proposed in
Figure 6-17 is also utilised here to fit the EIS spectra. In the proposed EC, Rs represents the
resistance of the electrolyte between the sample and counter electrolyte, R1 is used to
describe the resistance of the pores filled with the SBF, CPE1 illustrates the dispersed
capacitance behaviour of the outer porous region of the coatings, R2 is the charge transfer
resistance resulting from the compact region of the coatings. CPE2 represents the double
layer capacitance in the electrochemical corrosion process and, as stated above, the inductor
L is employed to represent the adsorption of intermediate Mg+ ions at the corrosion sites. In
the present study, the capacitive behaviour is represented by the constant phase elements
(CPE1 and CPE2) (rather than ideal capacitors) because of inhomogeneities in the surface
condition. The impedance of a constant phase element is a function of frequency and can be
defined as [168]:
𝑍(𝜔) =
1
𝑄(𝑗𝜔)𝛼 ( 7.1 )
where 𝝎 is the angular frequency, 𝑗 = √−1, 0<α<1, and Q is a constant with dimension 𝐹 ∙
𝑠α−1. When α=1, equation (7.1) describes an ideal capacitor, and the impedance of a pure
resistor can be calculated when α=0.
The fitting results are represented by the solid lines in Figure 7-9. From phase element and
quality of fit values (2) shown in Table 7-2, it can be seen that all the EIS curves are fitted
with adequate accuracy. The corrosion performance of the samples can be assessed by
comparing the elements values. It is clear that the PUP PEO coating provides the highest R1
value of 750.2 Ω·cm2, almost 2 and 10 times higher than that of PBP PEO coating and the
bare substrate, respectively.
Based on the physical meaning of R1, the value of which could be described as:

Chapter 7 Effects of negative biasing on PEO treatment of cp Mg
117
𝑅1 = 𝜌𝑑
𝐴 ( 7.2 )
where quantities d and A are directly proportional to the average pore depth and diameter,
and ρ is the electrical resistivity of the electrolyte in the pores.
According to the surface morphology analysis of the coatings (Figure 7-4), smaller pores
were identified in the PBP PEO coating, which is expected to have larger R1 than that of
unipolar PEO coating. The unexpected behaviour of R1 could be attributed to the scars
observed on the bipolar PEO coating (Figure 7-3), which were significantly larger defects
than the micro pores, i.e. a larger A value in Equation (7.2), resulting in lower R1. For the
same reason, a slightly smaller R2 is generated by the bipolar coating than the unipolar
coating, suggesting a more vigorous corrosion process. The values of CPE2-T for the coated
samples presented a considerable difference, i.e. the unipolar coating generated much larger
CPE2-T value (about 2 times) than the bipolar coating. As CPE2 was raised from the
corrosion pits, its capacitance could be attributed to the accumulation of corrosion products.
Assuming the overall surface area involved in the corrosion process was A’ and the thickness
of corrosion product was D, its effective capacitance Ceff could be calculated by [184]:
C𝑒𝑓𝑓 = ε0εA’/D ( 7.3 )
where ε0 is the permittivity of free space and ε is the relative dielectric constant of corrosion
products. Since the CPE constant CPE-T is directly proportional to its effective capacitance
Ceff [210], a higher Ceff could be derived for the unipolar PEO coated sample. Because the A’
of the bipolar coating is much larger than that of unipolar coating then, considering that the
corrosion process mainly took place at the scars (Figure 7-3), thicker corrosion products
must have been accumulated for the bipolar coating resulting in lower Ceff. From the above
comparison of R1, R2 and CPE2-T values, it could also be concluded that the corrosion
resistance of the unipolar coating was significantly higher than that of the bipolar coating.
The corrosion performance of the samples presented here is also compared based on their
polarisation resistance Rp values, that can be calculated following equation (6.7). With the Rp
values summarised in Table 7-2, it is clear that the polarisation resistance of the unipolar
PEO coated sample (508 Ω·cm2) is much higher than that of the sample with bipolar PEO
coating (113 Ω·cm2). Correspondingly, after 2 hours immersion in SBF, the unipolar PEO
Chapter 7 Effects of negative biasing on PEO treatment of cp Mg
118
coating has improved the corrosion resistance of cp Mg by a factor of 6, whereas the bipolar
PEO coating only improved the corrosion resistance by a factor of 0.6.
Table 7-2 Fitting results for impedance spectra of the PUP- and PBP-PEO coated samples shown in Figure 7-9 Sample ID
R1 /Ω·cm2
R2 /Ω·cm2
R3 /Ω·cm2
CPE1-T /S∙sn
CPE1-P CPE2-T / S∙sn
CPE2-P L Rp /Ω·cm2
Δ χ2
Unipolar 783.6 333.9 932.6 2.3e-5 0.85 1.1e-3 0.91 35639 508.35 6.3 0.0016 Bipolar 331.3 118.6 151.2 2.3e-5 0.85 6.0e-4 0.17 7653 113.16 0.6 0.0053 cp-Mg 68.06 86.05 126.8 3.7e-5 0.87 7.9e-3 0.57 435 69.56 - 0.0028
7.5.3 Potentiodynamic Polarisation Evaluation
As stated in Chapter 4, comparison of EIS spectra cannot always provide a precise corrosion
rate. Therefore, potentiodynamic polarisation tests were performed in the present study, and
the polarisation curves of all the samples are presented in Figure 7-10. It can be clearly seen
that after the surface modification the tips of the polarisation curves were shifted to a more
positive region from -1.56 V vs. SCE for the bare Mg to -1.41 V vs. SCE and -1.43 V vs.SCE
for the unipolar and bipolar PEO coating, respectively. Furthermore, the overall curves of the
coated samples were also moved to the lower current density direction, indicating the
corrosion properties of the magnesium substrates were inhibited by the PEO coatings. In
detail, the recorded current density of the bare cp Mg increased dramatically when it was
anodically polarised even by a small overpotential, i.e. the current density increased by two
orders of magnitude when the polarisation potential was increased by 20 mV to -1.54 V vs.
SCE, suggesting a marginal corrosion resistance. Afterwards, when the sample was further
polarised anodically, the current density increased only slightly (even when the polarisation
potential was increased by 900 mV to -0.62 V vs. SCE), which is due to the accumulation of
corrosion products covering the sample surface. The anodic branches of the PEO coated
samples exhibited different behaviour (Figure 7-10). When the samples were anodically
polarised by the same potential magnitude, a higher increase of current density was
observed on the bipolar PEO coated samples, suggesting a worse inhibition efficiency
compared with that of the unipolar PEO coating. When the samples were sufficiently
polarised (with potential > -1.0 V vs. SCE), the two curves almost coincided with each other
and were in parallel with that of the bare magnesium, which meant that the corrosion process
was reduced by the accumulation of corrosion products. The processes taking place during
cathodic polarisation should be the same, as indicated by the overlapped cathodic
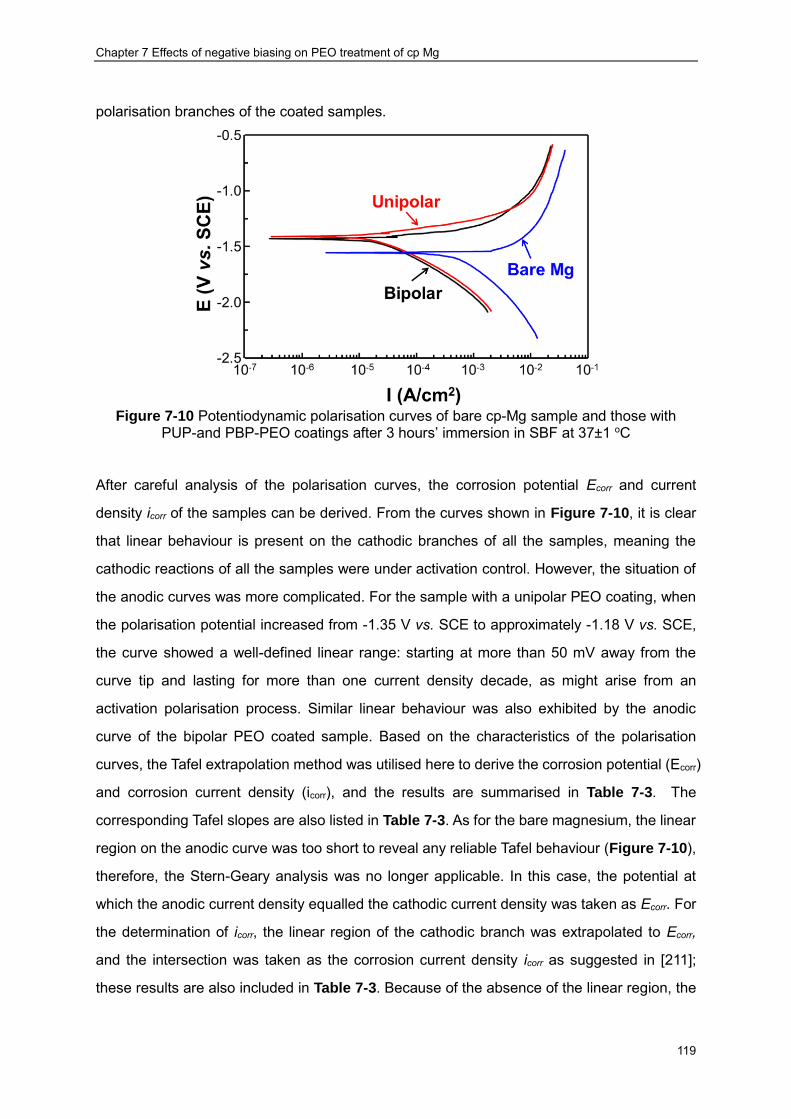
Chapter 7 Effects of negative biasing on PEO treatment of cp Mg
119
polarisation branches of the coated samples.
Figure 7-10 Potentiodynamic polarisation curves of bare cp-Mg sample and those with
PUP-and PBP-PEO coatings after 3 hours’ immersion in SBF at 37±1 oC
After careful analysis of the polarisation curves, the corrosion potential Ecorr and current
density icorr of the samples can be derived. From the curves shown in Figure 7-10, it is clear
that linear behaviour is present on the cathodic branches of all the samples, meaning the
cathodic reactions of all the samples were under activation control. However, the situation of
the anodic curves was more complicated. For the sample with a unipolar PEO coating, when
the polarisation potential increased from -1.35 V vs. SCE to approximately -1.18 V vs. SCE,
the curve showed a well-defined linear range: starting at more than 50 mV away from the
curve tip and lasting for more than one current density decade, as might arise from an
activation polarisation process. Similar linear behaviour was also exhibited by the anodic
curve of the bipolar PEO coated sample. Based on the characteristics of the polarisation
curves, the Tafel extrapolation method was utilised here to derive the corrosion potential (Ecorr)
and corrosion current density (icorr), and the results are summarised in Table 7-3. The
corresponding Tafel slopes are also listed in Table 7-3. As for the bare magnesium, the linear
region on the anodic curve was too short to reveal any reliable Tafel behaviour (Figure 7-10),
therefore, the Stern-Geary analysis was no longer applicable. In this case, the potential at
which the anodic current density equalled the cathodic current density was taken as Ecorr. For
the determination of icorr, the linear region of the cathodic branch was extrapolated to Ecorr,
and the intersection was taken as the corrosion current density icorr as suggested in [211];
these results are also included in Table 7-3. Because of the absence of the linear region, the

Chapter 7 Effects of negative biasing on PEO treatment of cp Mg
120
Tafel slopes cannot be derived for the bare substrate in the present study.
Table 7-3 Results of potentiodynamic polarisation curves analysis for cp-Mg with and without
coatings
Current Regime Ecorr (V vs. SCE) icorr ( µA·cm2) ba (mV/decade) bc (mV/decade)
Unipolar -1.41 10.45 73 -243
Bipolar -1.43 18.08 45 -254
Bare Mg -1.56 437.62 - -
By comparing the corresponding values, the effects of the coatings on the corrosion process
could be evaluated. After applying the PEO coatings, the corrosion current density of bare
magnesium decreased by more than 40 times from 437.62 µA·cm2 to 10.45 µA·cm2 and
18.08 µA·cm2 respectively when the negative current density increased from 0 (unipolar) to
10 (bipolar) mA/cm2, and better corrosion protection was provided by the unipolar PEO
coating, suggesting that applying a negative biasing has a detrimental effect on the corrosion
performance, which is in good agreement with the analysis of coating appearance and EIS
results. Such results are also reflected by a lower anodic Tafel slope of the bipolar coating
compared with that of the unipolar coating, as shown in Table 7-3.
The cathodic Tafel slope bc exhibited a value close to the theoretical value (-240 mV/decade)
for the 2-electron charge transfer process, which verifies the applicability of Tafel
extrapolation for the cathodic branches. Also from the obtained Tafel slope value, the
cathodic reaction (2.2) of Mg corrosion could be verified.
2H2O + 2e− → H2 ↑ +2OH− (2.2)
However, if the corrosion process of magnesium is as simple as that described by Reaction
(2.1):
Mg → Mg2+ + 2𝑒− (2.1)
Then, as a 2-electron charge transfer process, it should also have resulted in an anodic Tafel
slope of around 240 mV/decade. Apparently, it is not the case, as significantly smaller anodic
Tafel slopes were derived for the coated samples, indicating the corrosion process is much
more complicated. Actually, the anodic Tafel slope is close to the theoretical value of (40

Chapter 7 Effects of negative biasing on PEO treatment of cp Mg
121
mV/decade) for the multistep 1-electron charge transfer process [212], this provides some
indication on the corrosion mechanism of magnesium in SBF. Reaction (2.1) occurs more
readily through some elementary electrode processes. In the analysis of EIS results, the
involvement of Mg+ during the corrosion process was assumed. Actually, according to the
results published by Song et al [189] and Cao et al [187] the following elementary steps are
involved in the magnesium corrosion. Firstly, Mg is converted to a monovalent ionic specie
Mg+:
Mg ⇔ Mg+ + 𝑒− ( 7.4 )
As Mg+ has high reactivity, it can quickly be oxidised into the expected divalent species Mg2+
in aqueous SBF according to the following reaction:
Mg+ + H2O → Mg2+ + OH− + 1/2H2 ( 7.5 )
This 2-step mechanism would reduce the energy barrier for the corrosion process and,
therefore, is kinetically more favourable than reaction (2.1). Since reaction (7.4) has, a much
slower rate, it determines the overall corrosion rate and the resulting Tafel slope. From Table
7-3, it is clear that the derived anodic Tafel slopes, especially from the unipolar PEO coated
sample, are slightly higher than the theoretical value (40 mV/decade) determined from the
elementary reactions (7.4) and (7.5), which might be attributed to the concurrence of reaction
(2.1) with the elementary reactions. Actually, Natta [213] has found that the occurrence of
reactions (7.4) and (7.5) cannot prevent reaction (2.1). Therefore, strictly speaking, the
measured polarisation curves come from two different kinetic processes. Normally, the
presence of more than 1 charge transfer processes would result in the absence of a linear
region in the polarisation curves, which is in contrast to the present situation where a
well-defined linear part is observed. This may be because the contribution of reaction (2.1) is
too small. Assuming the fractional contribution of reaction (2.1) is X, then the elementary
reactions contributes the rest (1-X) fraction, then the overall anodic Tafel slope might be
calculated according to the following equation:
b𝑎 = 240𝑋 + 40(1 − 𝑋) ( 7.6 )
Substituting the b𝑎 values in Table 7-3 into Equation (7.6), it is concluded that only 16.5%
and 2.5% of the current density originates from reaction (2.1) for the unipolar and bipolar
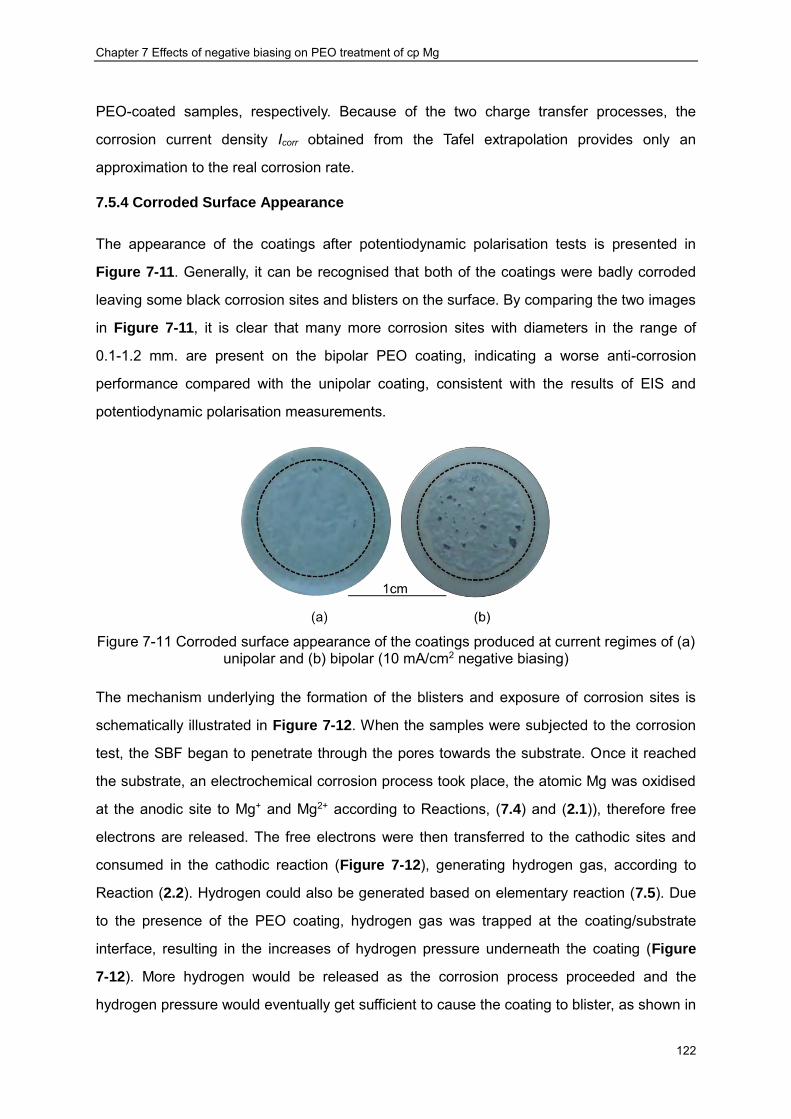
Chapter 7 Effects of negative biasing on PEO treatment of cp Mg
122
PEO-coated samples, respectively. Because of the two charge transfer processes, the
corrosion current density Icorr obtained from the Tafel extrapolation provides only an
approximation to the real corrosion rate.
7.5.4 Corroded Surface Appearance
The appearance of the coatings after potentiodynamic polarisation tests is presented in
Figure 7-11. Generally, it can be recognised that both of the coatings were badly corroded
leaving some black corrosion sites and blisters on the surface. By comparing the two images
in Figure 7-11, it is clear that many more corrosion sites with diameters in the range of
0.1-1.2 mm. are present on the bipolar PEO coating, indicating a worse anti-corrosion
performance compared with the unipolar coating, consistent with the results of EIS and
potentiodynamic polarisation measurements.
Figure 7-11 Corroded surface appearance of the coatings produced at current regimes of (a)
unipolar and (b) bipolar (10 mA/cm2 negative biasing)
The mechanism underlying the formation of the blisters and exposure of corrosion sites is
schematically illustrated in Figure 7-12. When the samples were subjected to the corrosion
test, the SBF began to penetrate through the pores towards the substrate. Once it reached
the substrate, an electrochemical corrosion process took place, the atomic Mg was oxidised
at the anodic site to Mg+ and Mg2+ according to Reactions, (7.4) and (2.1)), therefore free
electrons are released. The free electrons were then transferred to the cathodic sites and
consumed in the cathodic reaction (Figure 7-12), generating hydrogen gas, according to
Reaction (2.2). Hydrogen could also be generated based on elementary reaction (7.5). Due
to the presence of the PEO coating, hydrogen gas was trapped at the coating/substrate
interface, resulting in the increases of hydrogen pressure underneath the coating (Figure
7-12). More hydrogen would be released as the corrosion process proceeded and the
hydrogen pressure would eventually get sufficient to cause the coating to blister, as shown in
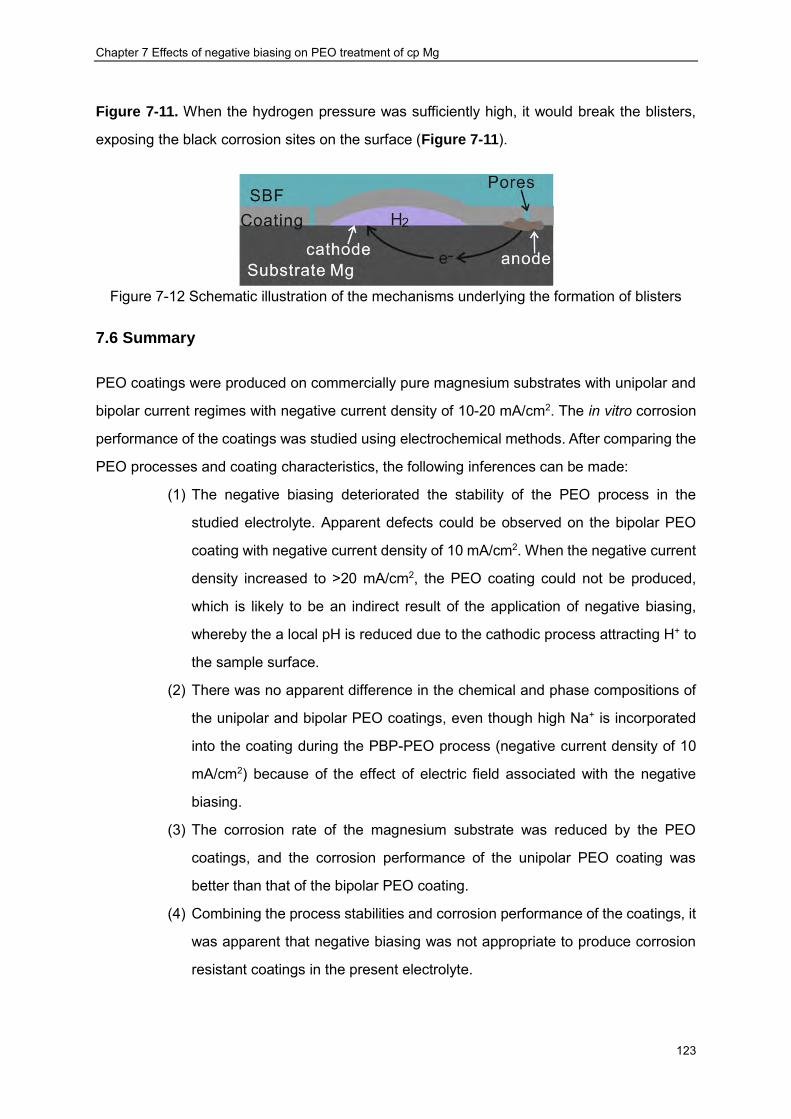
Chapter 7 Effects of negative biasing on PEO treatment of cp Mg
123
Figure 7-11. When the hydrogen pressure was sufficiently high, it would break the blisters,
exposing the black corrosion sites on the surface (Figure 7-11).
Figure 7-12 Schematic illustration of the mechanisms underlying the formation of blisters
7.6 Summary
PEO coatings were produced on commercially pure magnesium substrates with unipolar and
bipolar current regimes with negative current density of 10-20 mA/cm2. The in vitro corrosion
performance of the coatings was studied using electrochemical methods. After comparing the
PEO processes and coating characteristics, the following inferences can be made:
(1) The negative biasing deteriorated the stability of the PEO process in the
studied electrolyte. Apparent defects could be observed on the bipolar PEO
coating with negative current density of 10 mA/cm2. When the negative current
density increased to >20 mA/cm2, the PEO coating could not be produced,
which is likely to be an indirect result of the application of negative biasing,
whereby the a local pH is reduced due to the cathodic process attracting H+ to
the sample surface.
(2) There was no apparent difference in the chemical and phase compositions of
the unipolar and bipolar PEO coatings, even though high Na+ is incorporated
into the coating during the PBP-PEO process (negative current density of 10
mA/cm2) because of the effect of electric field associated with the negative
biasing.
(3) The corrosion rate of the magnesium substrate was reduced by the PEO
coatings, and the corrosion performance of the unipolar PEO coating was
better than that of the bipolar PEO coating.
(4) Combining the process stabilities and corrosion performance of the coatings, it
was apparent that negative biasing was not appropriate to produce corrosion
resistant coatings in the present electrolyte.

Chapter 7 Effects of negative biasing on PEO treatment of cp Mg
124
(5) The corrosion resistance of the coatings was still too low, and further research
in this area was still required.

Chapter 8 Effects of HA coating on corrosion performance of PEO coated cp Mg
125
Chapter 8 Effects of Hydroxyapatite Coating on in vitro Corrosion
Performance of PEO Coated Magnesium
The corrosion performance of cp magnesium in simulated body fluid has been improved
through optimisation of plasma electrolytic oxidation parameters (electrolyte, electrical
parameters) as described in Chapters 5 and 6. However, the efforts to synthesise and
incorporate hydroxyapatite (HA) into PEO coatings seems unsatisfactory, even though Ca
and P were successfully incorporated into the PEO coatings by combination of Ca and P
containing electrolyte and unipolar pulsed DC current mode. Considering the information
presented in Chapter 3, calcium phosphate compounds are essential to enhance the
osteoconduction of magnesium implants. Calcium phosphate compounds, ideally HA, can be
deposited on the implant surfaces through other methods as stated in Chapter 3. In the
present chapter, the fabrication of a HA layer on top of the PEO coated magnesium through a
cathodic electrodeposition (CED) method is discussed, and the in vitro corrosion properties of
the coated samples are evaluated using electrochemical methods including open circuit
potential measurement, electrochemical impedance spectroscopy and potentiodynamic
polarisation characterisation.
8.1 Coating Fabrication
Duplex coatings comprising the base PEO coating and top HA layer were produced on the
surface of cp magnesium substrates in the present chapter. The PEO coating was produced
in the optimised electrolyte composed of 2 g/l Ca(OH)2 and 12 g/l Na3PO4∙12H2O.
Considering the published beneficial effects of fluoride on the HA deposition published in the
literature [72], another electrolyte was prepared by addition of 5 g/l KF to the optimised
electrolyte for PEO coating fabrication. The PEO treatments were conducted under the
unipolar pulsed DC current regime optimised in Chapter 6 with a current density of 30
mA/cm2, a duty cycle of 10% and a frequency of 3000 Hz.
Once the PEO coatings had been produced, the samples were thoroughly rinsed before
being subjected to HA deposition, which was carried out using a cathodic electrodeposition
technique. The electrolyte used for HA deposition contained 0.043 M Ca(NO3)·4H2O, 0.025 M
NH4H2PO4 and 0.1 M NaNO3, to provide a Ca to P ratio of 1.72. This is slightly higher than the
Chapter 8 Effects of HA coating on corrosion performance of PEO coated cp Mg
126
theoretical value of 1.67 in the stoichiometric HA and would therefore favour its precipitation.
The electrolyte pH was adjusted to 5 at room temperature using tris(hydroxymethyl)amino
methane (HOCH2)3CNH2). During the deposition process, the PEO coated magnesium discs
were the cathode, and a cylinder (60 mm by 20 mm) made of 1 mm thick stainless steel
plate was placed around the magnesium disc and served as the anode. A constant voltage of
1 V was provided between the two electrodes. The deposition process was conducted at
75±3 oC for 20 minutes.
8.2 Characterisation of Surface Treatment Processes
A typical voltage transient during the PEO process used in the present study is presented in
Figure 8-1. The voltage behaviour is similar to that presented in Chapter 6 (Figure 6-1), and
nothing unexpected was observed, indicating the high repeatability of the PEO process under
the optimised parameters. Once the process was started, the voltage increased, however
with different rates at different periods of time. The PEO treatment can therefore be divided
into four stages (Figure 8-1). In stage Ⅰ, lasting for about 25 s, the voltage increased rapidly
in a linear manner. In stage Ⅱ (25-75 s), the voltage increased further at a lower rate, with
intense gas bubbles appearing on the sample surface, and at the end of this stage the
voltage increased up to 300 V. In the third stage, the voltage increased gradually to about 430
V; Similar to the stage Ⅱ, intense gas liberation was observed at the sample surface. When
the voltage reached 340 V, numerous tiny sparks began to randomly move around on the
sample surface. In the final stage, the voltage increased to about 490 V, with previously
observed tiny sparks becoming larger and less populous.
Once the PEO coated samples were subjected to the CED treatment, numerous tiny bubbles
began to appear on the sample surface. As the potential was applied, the bubbles built up
and a progressive decrease in the current was observed, reflecting the accumulation of CED
coating on the sample surface.
8.3 Coating Morphology and Structure Characterisation
Morphologies of the produced coatings are shown in Figure 8-2. Consistent with the results
presented in Chapter 6, a typical crater-like porous topography is observed on the PEO
coated magnesium (Figure 8-2 (a) and (b)).
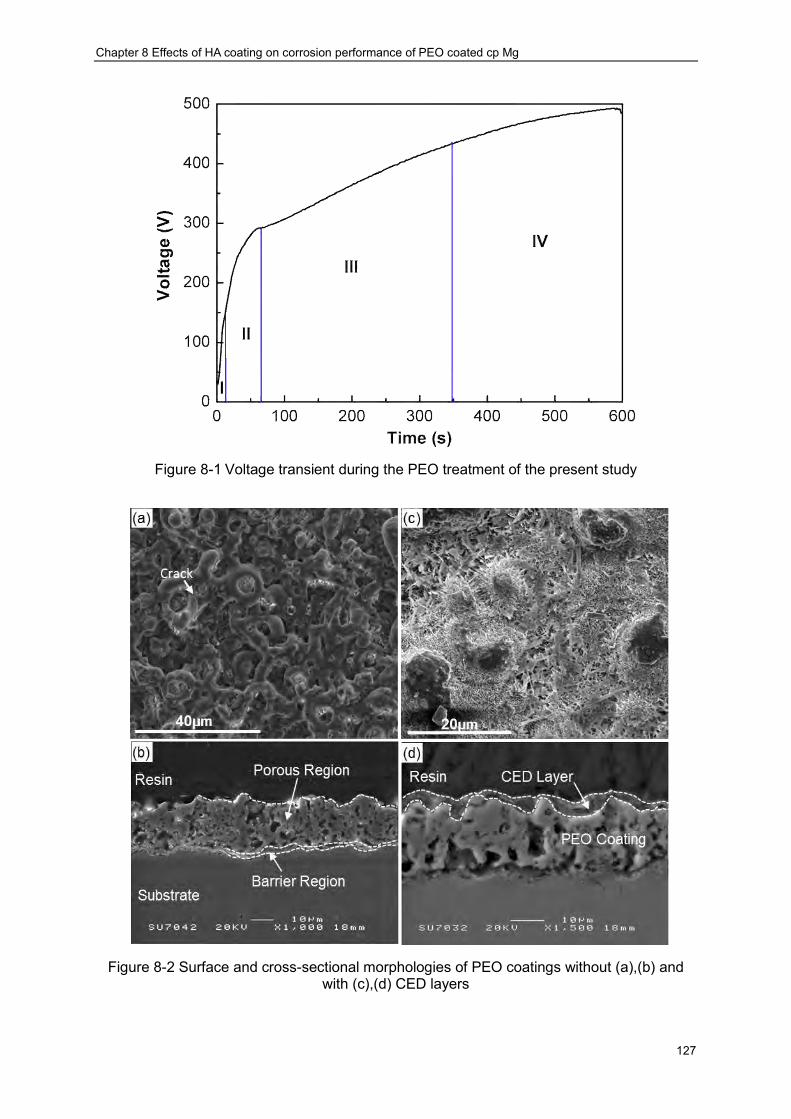
Chapter 8 Effects of HA coating on corrosion performance of PEO coated cp Mg
127
Figure 8-1 Voltage transient during the PEO treatment of the present study
Figure 8-2 Surface and cross-sectional morphologies of PEO coatings without (a),(b) and with (c),(d) CED layers
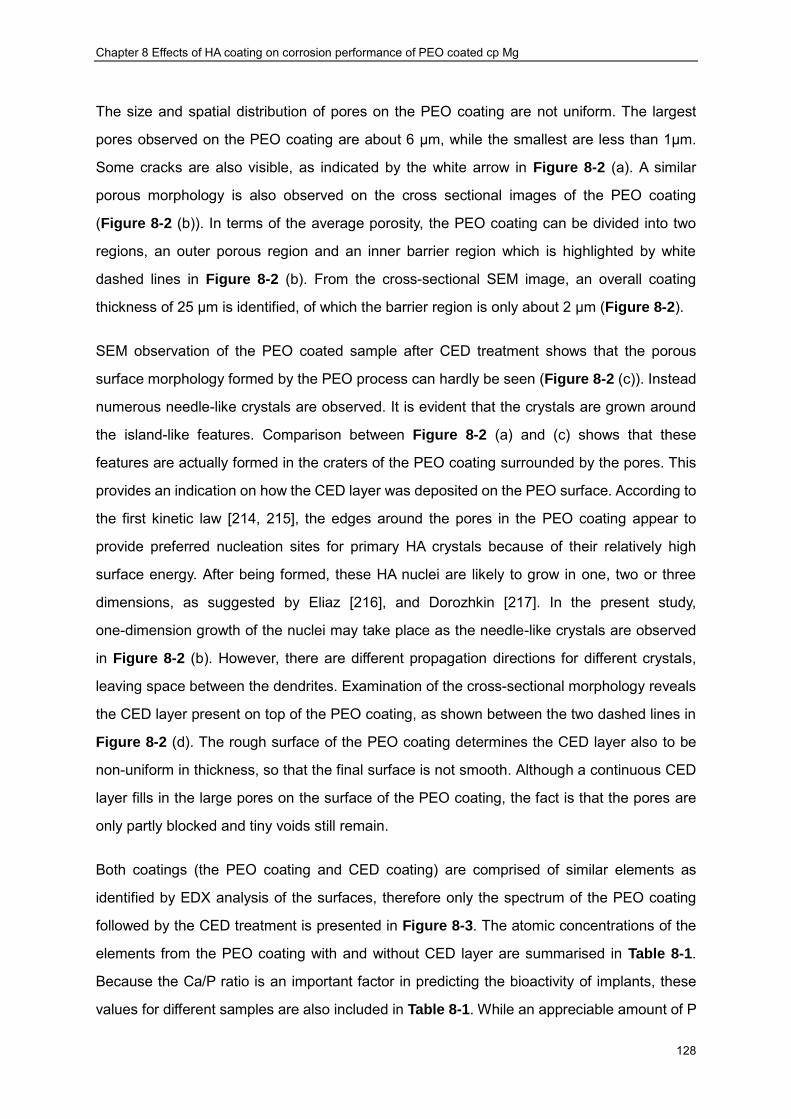
Chapter 8 Effects of HA coating on corrosion performance of PEO coated cp Mg
128
The size and spatial distribution of pores on the PEO coating are not uniform. The largest
pores observed on the PEO coating are about 6 µm, while the smallest are less than 1µm.
Some cracks are also visible, as indicated by the white arrow in Figure 8-2 (a). A similar
porous morphology is also observed on the cross sectional images of the PEO coating
(Figure 8-2 (b)). In terms of the average porosity, the PEO coating can be divided into two
regions, an outer porous region and an inner barrier region which is highlighted by white
dashed lines in Figure 8-2 (b). From the cross-sectional SEM image, an overall coating
thickness of 25 µm is identified, of which the barrier region is only about 2 µm (Figure 8-2).
SEM observation of the PEO coated sample after CED treatment shows that the porous
surface morphology formed by the PEO process can hardly be seen (Figure 8-2 (c)). Instead
numerous needle-like crystals are observed. It is evident that the crystals are grown around
the island-like features. Comparison between Figure 8-2 (a) and (c) shows that these
features are actually formed in the craters of the PEO coating surrounded by the pores. This
provides an indication on how the CED layer was deposited on the PEO surface. According to
the first kinetic law [214, 215], the edges around the pores in the PEO coating appear to
provide preferred nucleation sites for primary HA crystals because of their relatively high
surface energy. After being formed, these HA nuclei are likely to grow in one, two or three
dimensions, as suggested by Eliaz [216], and Dorozhkin [217]. In the present study,
one-dimension growth of the nuclei may take place as the needle-like crystals are observed
in Figure 8-2 (b). However, there are different propagation directions for different crystals,
leaving space between the dendrites. Examination of the cross-sectional morphology reveals
the CED layer present on top of the PEO coating, as shown between the two dashed lines in
Figure 8-2 (d). The rough surface of the PEO coating determines the CED layer also to be
non-uniform in thickness, so that the final surface is not smooth. Although a continuous CED
layer fills in the large pores on the surface of the PEO coating, the fact is that the pores are
only partly blocked and tiny voids still remain.
Both coatings (the PEO coating and CED coating) are comprised of similar elements as
identified by EDX analysis of the surfaces, therefore only the spectrum of the PEO coating
followed by the CED treatment is presented in Figure 8-3. The atomic concentrations of the
elements from the PEO coating with and without CED layer are summarised in Table 8-1.
Because the Ca/P ratio is an important factor in predicting the bioactivity of implants, these
values for different samples are also included in Table 8-1. While an appreciable amount of P

Chapter 8 Effects of HA coating on corrosion performance of PEO coated cp Mg
129
is identified in the PEO coating, only a trace amount of Ca is detected. However, after CED
treatment, the Ca content on the coating surface has increased by a factor of about 140, the
P content is doubled compared with the PEO coating, while the O concentration is only
increased slightly.
The Ca/P ratio on the surface has significantly increased from 0.017 to 1.230, slightly less
than the theoretical value (1.667) in stoichiometric HA. This can be explained from two
aspects: phosphorus in the PEO coating can also be detected on the CED treated sample,
and it maybe that a Ca-deficient rather than the stoichiometric HA has been formed in the
CED process. Another explanation relies on the fact the EDX is a surface characterisation
method, it is therefore reasonable to assume that the Ca is mainly located on the CED layer,
which is also verified by the elemental mapping shown in Figure 8-4. Mg is not identified in
the top Ca-rich layer which can simply be regarded as the CED coating (Figure 8-4). The
absence of Mg in the CED layer indicates that the CED coating is simply precipitated on the
top of the PEO coating, and no chemical reactions with the PEO coating material are involved
in the CED treatment.
Figure 8-3 Typical EDX spectrum from the PUP-PEO coating following CED treatment
Table 8-1 Elemental composition of the PUP-PEO coatings with and without CED treatment identified by EDX (at.%)
Sample O F Na Mg P Ca Ca/P PEO 53.0 6.6 2.9 31.4 6.0 0.1 0.017 PEO+CED 67.2 1.6 1.0 3.8 11.8 14.6 1.230
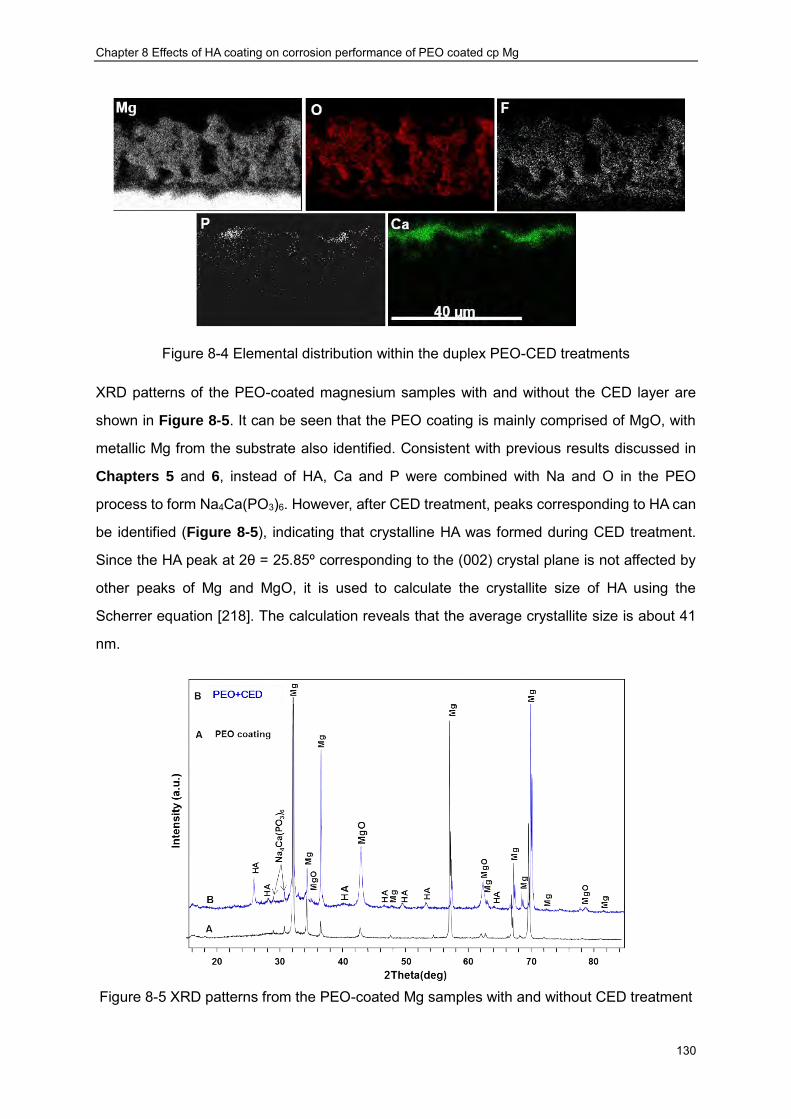
Chapter 8 Effects of HA coating on corrosion performance of PEO coated cp Mg
130
Figure 8-4 Elemental distribution within the duplex PEO-CED treatments
XRD patterns of the PEO-coated magnesium samples with and without the CED layer are
shown in Figure 8-5. It can be seen that the PEO coating is mainly comprised of MgO, with
metallic Mg from the substrate also identified. Consistent with previous results discussed in
Chapters 5 and 6, instead of HA, Ca and P were combined with Na and O in the PEO
process to form Na4Ca(PO3)6. However, after CED treatment, peaks corresponding to HA can
be identified (Figure 8-5), indicating that crystalline HA was formed during CED treatment.
Since the HA peak at 2θ = 25.85º corresponding to the (002) crystal plane is not affected by
other peaks of Mg and MgO, it is used to calculate the crystallite size of HA using the
Scherrer equation [218]. The calculation reveals that the average crystallite size is about 41
nm.
Figure 8-5 XRD patterns from the PEO-coated Mg samples with and without CED treatment
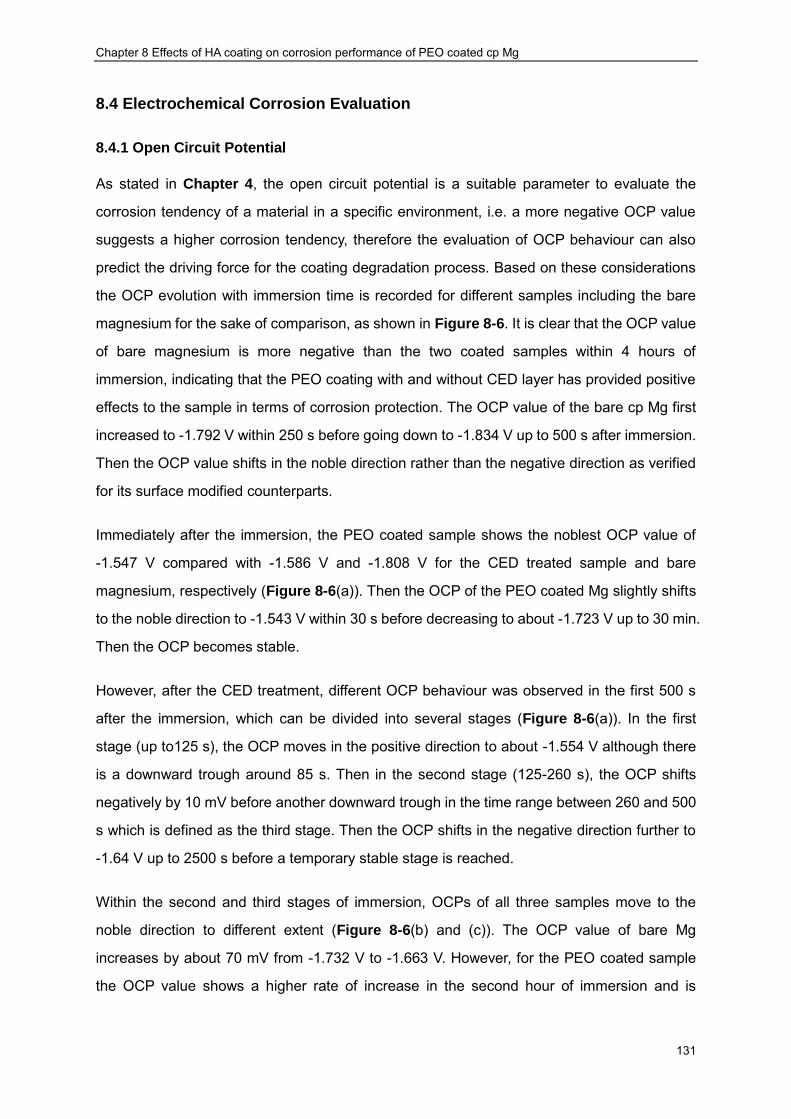
Chapter 8 Effects of HA coating on corrosion performance of PEO coated cp Mg
131
8.4 Electrochemical Corrosion Evaluation
8.4.1 Open Circuit Potential
As stated in Chapter 4, the open circuit potential is a suitable parameter to evaluate the
corrosion tendency of a material in a specific environment, i.e. a more negative OCP value
suggests a higher corrosion tendency, therefore the evaluation of OCP behaviour can also
predict the driving force for the coating degradation process. Based on these considerations
the OCP evolution with immersion time is recorded for different samples including the bare
magnesium for the sake of comparison, as shown in Figure 8-6. It is clear that the OCP value
of bare magnesium is more negative than the two coated samples within 4 hours of
immersion, indicating that the PEO coating with and without CED layer has provided positive
effects to the sample in terms of corrosion protection. The OCP value of the bare cp Mg first
increased to -1.792 V within 250 s before going down to -1.834 V up to 500 s after immersion.
Then the OCP value shifts in the noble direction rather than the negative direction as verified
for its surface modified counterparts.
Immediately after the immersion, the PEO coated sample shows the noblest OCP value of
-1.547 V compared with -1.586 V and -1.808 V for the CED treated sample and bare
magnesium, respectively (Figure 8-6(a)). Then the OCP of the PEO coated Mg slightly shifts
to the noble direction to -1.543 V within 30 s before decreasing to about -1.723 V up to 30 min.
Then the OCP becomes stable.
However, after the CED treatment, different OCP behaviour was observed in the first 500 s
after the immersion, which can be divided into several stages (Figure 8-6(a)). In the first
stage (up to125 s), the OCP moves in the positive direction to about -1.554 V although there
is a downward trough around 85 s. Then in the second stage (125-260 s), the OCP shifts
negatively by 10 mV before another downward trough in the time range between 260 and 500
s which is defined as the third stage. Then the OCP shifts in the negative direction further to
-1.64 V up to 2500 s before a temporary stable stage is reached.
Within the second and third stages of immersion, OCPs of all three samples move to the
noble direction to different extent (Figure 8-6(b) and (c)). The OCP value of bare Mg
increases by about 70 mV from -1.732 V to -1.663 V. However, for the PEO coated sample
the OCP value shows a higher rate of increase in the second hour of immersion and is

Chapter 8 Effects of HA coating on corrosion performance of PEO coated cp Mg
132
stabilised at -1.608 V at the end of the third stage. In the fourth immersion hour (Figure 8-6
(d)), while the CED treated sample suffers a slight decrease in OCP by 10 mV, the OCP of the
PEO coated sample increases by 20 mV before reaching a new stable level at -1.578 V.
Figure 8-6 OCP evolution of the PEO coated cp Mg with and without CED treatment in SBF at
37±1 oC within the (a) 1st hour (b) 2nd hour (c) 3rd hour (d) 4th hour
8.4.2 EIS Analysis
Figure 8-7 compares the EIS behaviour after 1 hour of immersion for all the samples.
Analysis of these plots can disclose effects of the surface modification methods utilised in the
present study on the corrosion performance of the samples in SBF at 37±1 ºC. The complex
plots present two depressed semicircles in the first quadrant, and additional loops are also
observed in the fourth quadrant (inductive loop) for all the samples (Figure 8-7(a)). The
presence of the three loops indicates that (as seen in the previous chapters) there are three
processes with different time constants taking place in the corrosion process for all the
samples. For the surface modified samples, the semicircles at high frequencies (10 to 1000
Hz) correspond to the contribution of the outer porous region of the coating and the loops at
the medium frequency (0.1 to 10 Hz) directly result from the inner barrier region of the coating,
consistent with the cross-sectional morphologies in Figure 8-2. When the frequency is low
enough (0.01 to 0.1 Hz), the inductive response from the corrosion process becomes
0 500 1000 1500 2000 2500 3000 3500-1.84
-1.80
-1.76
-1.72
-1.68
-1.64
-1.60
-1.56
-1.52
E (
Vo
lts vs.
SC
E)
Time (s)
PEO+CED
PEO
Bare Mg
0 500 1000 1500 2000 2500 3000 3500-1.84
-1.80
-1.76
-1.72
-1.68
-1.64
-1.60
-1.56
-1.52
E (
Vo
lts vs.
SC
E)
Time (s)
PEO+CED
PEO
Bare Mg
0 500 1000 1500 2000 2500 3000 3500-1.84
-1.80
-1.76
-1.72
-1.68
-1.64
-1.60
-1.56
-1.52
E (
Vo
lts v
s.
SC
E)
Time (s)
Bare Mg
PEO+CED
PEO
0 500 1000 1500 2000 2500 3000 3500-1.84
-1.80
-1.76
-1.72
-1.68
-1.64
-1.60
-1.56
-1.52E
(V
olt
s vs.
SC
E)
Time (s)
Bare Mg
PEO
PEO+CED
(a) (b)
(c) (d)
Chapter 8 Effects of HA coating on corrosion performance of PEO coated cp Mg
133
significant, which indicates that the samples are suffering from pitting corrosion [202]. A thin
film is formed on the sample surface immediately after immersion. As a result, three similar
loops are also observed in the EIS spectra of bare Mg as displayed by the inset in Figure
8-7(a). In addition, the samples with surface modification provide higher overall impedance
magnitudes compared with their bare Mg counterpart, and the highest impedance magnitude
is observed from the sample with the CED treatment (Figure 8-7(b)). Similar to the
characteristic feature of the complex plots, three different time constants could also be
verified in the phase vs. frequency Bode plots as well (Figure 8-7(c)), reflected by one
complete peak in the frequency range of >10 Hz, a depressed peak in the frequency range of
0.1-10 Hz and the positive phase in the low frequency range of <0.1 Hz. To be specific, the
overall phase angle of the bare Mg is lower than the coated samples throughout the studied
frequency range (Figure 8-7(c)). This is straightforward considering the passive film on bare
Mg is much thinner than the fabricated coatings. After the CED treatment, the maximum
phase angle in the high frequency range (10 to 1000 Hz) has been shifted to higher
frequency compared with the sample with a single PEO coating.
The comparison of EIS data from each sample after different immersion periods provides
insights into the degradation behaviour of all of the samples. The spectra obtained from the
bare Mg in the first four hours coincide with each other, indicating that once the stable
condition was established in the first hour after immersion, the surface condition of the bare
Mg does not experience significant changes. However, for the coated samples different
behaviour can be observed because of the coating degradation, as shown in Figures 8-8 and
8-9.

Chapter 8 Effects of HA coating on corrosion performance of PEO coated cp Mg
134
Figure 8-7 Comparison of EIS spectra for the cp Mg substrate with PEO and PEO/CED
treatments obtained after 1 hour immersion (a) complex plots, (b) impedance amplitude vs. frequency plots and (c) phase vs. frequency Bode plots
Chapter 8 Effects of HA coating on corrosion performance of PEO coated cp Mg
135
The complex plots of the PEO coated Mg with different immersion periods from 1 h to 4 h are
shown in Figure 8-8(a). It can generally be seen that with the immersion time prolonged from
1h to 4h, the radius of the semicircles become smaller indicating less corrosion protection
provided by the coating. Within the first 2 hours of immersion in SBF, there is no significant
change in the EIS behaviour in the high frequency range (f>10 Hz), although at lower
frequencies, a smaller semicircle is identified. After 3 hours immersion, the semicircles in the
high frequency range show significant shrinkage while those at medium frequency,
corresponding to the barrier region of the PEO coating, become negligible, which suggests
that the PEO coating is gradually degraded during the immersion process. The decrease in
the overall impedance magnitude, especially after 2 hours of immersion can be clearly seen
in the Bode plots as shown in Figure 8-8(b), which demonstrates worsening corrosion
protection provided by the PEO coating with increased immersion time. The phase angle
Bode plots present different behavior, although three different time constants can be
identified in all the plots (Figure 8-8(b)). The maximum phase angles in the high frequency
range (f>10 Hz) become smaller and shifted to lower frequencies. Consistent with the
complex plots, the extremes of phase angle at medium frequency (0.1 to 10Hz) have become
so small that they have to be identified with extreme care.
Similar degradation behaviour is also observed for the duplex PEO plus CED treated Mg, by
analysing the EIS behaviour after different immersion times, which is shown in Figure 8-9
However, different features compared with the PEO coating without the CED treatment can
still be identified. Compared with the complex plot after an immersion period of 1 hour,
smaller semicircles are identified not only at low frequencies but also in the high frequency
range (Figure 8-9(a)), which is not the case for the sample with only PEO coating. From the
impedance magnitude Bode plots (Figure 8-9(b)) it is obvious that, with increasing immersion
time, the overall impedance decreases especially in the lower frequency range. Three
extremes in phase angle Bode plots is also observed, which further indicates three time
constants in the tested frequency range (Figure 8-9(b)).

Chapter 8 Effects of HA coating on corrosion performance of PEO coated cp Mg
136
Figure 8-8 Variation with immersion time of the impedance
spectra for the PEO coating without CED reatment (a) complex plots and (b) Bode plots
Figure 8-9 Variation with immersion time of the impedance spectra for the PEO coating with CED treatment (a) complex
plots and (b) Bode plots
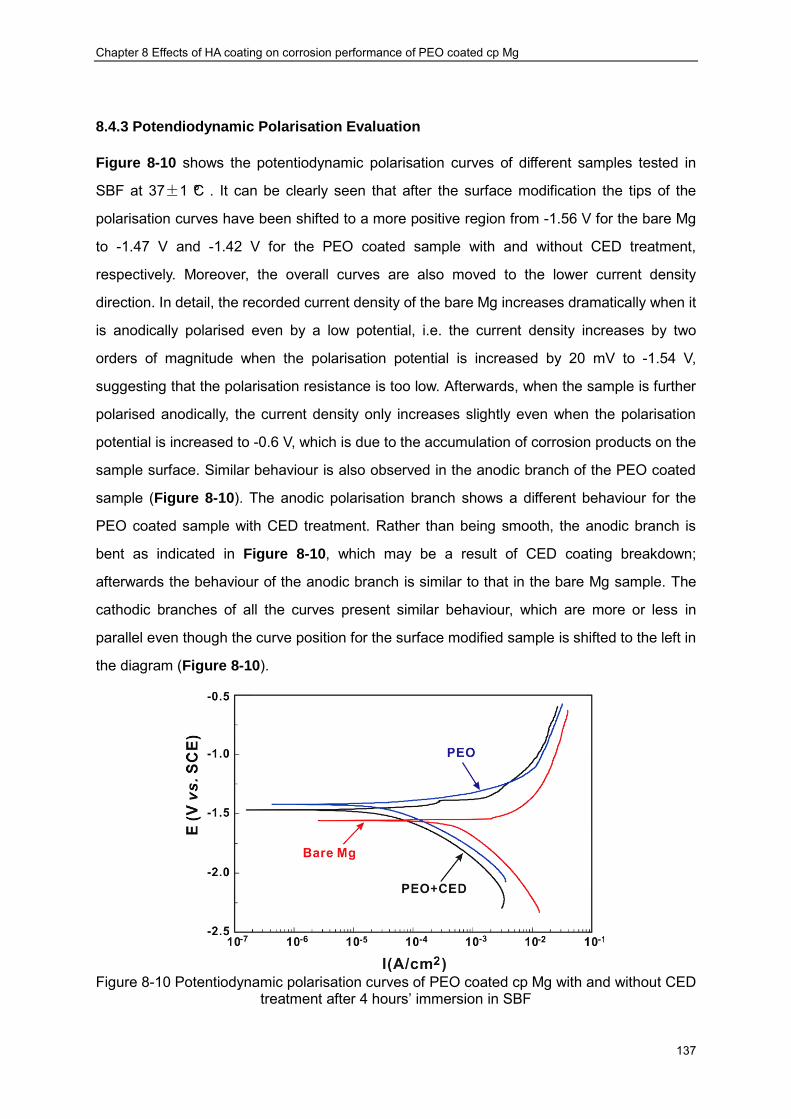
Chapter 8 Effects of HA coating on corrosion performance of PEO coated cp Mg
137
8.4.3 Potendiodynamic Polarisation Evaluation
Figure 8-10 shows the potentiodynamic polarisation curves of different samples tested in
SBF at 37±1 ºC . It can be clearly seen that after the surface modification the tips of the
polarisation curves have been shifted to a more positive region from -1.56 V for the bare Mg
to -1.47 V and -1.42 V for the PEO coated sample with and without CED treatment,
respectively. Moreover, the overall curves are also moved to the lower current density
direction. In detail, the recorded current density of the bare Mg increases dramatically when it
is anodically polarised even by a low potential, i.e. the current density increases by two
orders of magnitude when the polarisation potential is increased by 20 mV to -1.54 V,
suggesting that the polarisation resistance is too low. Afterwards, when the sample is further
polarised anodically, the current density only increases slightly even when the polarisation
potential is increased to -0.6 V, which is due to the accumulation of corrosion products on the
sample surface. Similar behaviour is also observed in the anodic branch of the PEO coated
sample (Figure 8-10). The anodic polarisation branch shows a different behaviour for the
PEO coated sample with CED treatment. Rather than being smooth, the anodic branch is
bent as indicated in Figure 8-10, which may be a result of CED coating breakdown;
afterwards the behaviour of the anodic branch is similar to that in the bare Mg sample. The
cathodic branches of all the curves present similar behaviour, which are more or less in
parallel even though the curve position for the surface modified sample is shifted to the left in
the diagram (Figure 8-10).
Figure 8-10 Potentiodynamic polarisation curves of PEO coated cp Mg with and without CED
treatment after 4 hours’ immersion in SBF
Chapter 8 Effects of HA coating on corrosion performance of PEO coated cp Mg
138
8.4.4 Corroded Surface Morphology
The SEM surface morphology images of the PEO coated Mg after the potentiodynamic
polarisation tests are presented in Figure 8-11. Figure 8-11(a) shows that corrosion pits are
visible on the coating surface. In terms of the extent of corrosion damage, different regions
can be identified as marked by the circles in Figure 8-11(a). Figure 8-11(b) shows the
features of region (B), which is furthest away from the corrosion pit. It is clearly seen that the
porous morphology of the PEO coating is retained in this region after the test, although the
shape of the pores is distorted compared with the features before testing. When moving to
the region (C), closer to the corrosion pits, large cracks begin to show up within the PEO
coating. Although thermal shock cracks have already been present on the surface before the
corrosion test, these cracks became much larger as a result of the corrosion process and
provide preferred corrosion sites where needle-like deposits are observed (Figure 8-11(f)).
Region (D) in Figure 8-11(a) is located just at the pit edge; this is the most active site for the
corrosion to proceed. The enlarged feature derived from this region presents a considerable
amount of needle-like crystals as shown in Figure 8-11(d). Figure 8-11(e) illustrates the heart
of one corrosion pit; similarly to region (D) in Figure 8-11(a), the typical topology of the PEO
coating cannot be identified anymore. Instead, large mud cracks are observed (Figure
8-11(e)), this observation is in good agreement of other publications [195, 219].
Figure 8-12 shows the corrosion morphology of the PEO combined with CED treated Mg
after the electrochemical corrosion test. Similarly to the sample with PEO coating, corrosive
pits are also present on the CED treated sample surface after the corrosion test, as shown in
Figure 8-12, with characteristic regions marked as (B) and (C). Region (B) is relatively far
away from the corrosion pit, indicating the least corrosion attack. The needle-like features
originally observed on the surface of the CED coating (Figure 8-2) can hardly be seen after
the corrosion test. Instead a distorted porous morphology is identified as shown in Figure
8-12(b). Moreover, in the sites where the corrosion process proceeds, the surface coating is
not completely removed, as indicated by the arrows in Figure 8-12(b). One of the sites is
enlarged in Figure 8-12(c), providing the detailed morphology inside it. After the surface
coatings have been destroyed by the corrosion process, mud cracks are left in the corrosion
pits, as illustrated in Figure 8-12(c). The formation of mud cracks are due to the dehydration
of Mg(OH)2 in the SEM observation.

Chapter 8 Effects of HA coating on corrosion performance of PEO coated cp Mg
139
Figure 8-11 Corrosion morphologies of the PEO coated cp-Mg. Figures (b), (c),(d) and (e) correspond to regions (B),(C),(D) and (E), respectively of Figure (a). Figure (f) shows the
enlarged feature around the crack (region F) indicated in Figure (c)
The chemical composition of the regions marked in Figures 8-11 and 8-12 is listed in Table
8-2. It is evident that it differs significantly for the different regions. Specifically, Cl is observed
in all the regions, while F is not identified in the regions which have undergone severe
corrosion attack (PEO-D,E and CED-D). The presence of Cl indicates its involvement in the
corrosion process. As F is only contained in the PEO coatings, the absence of F in the severe
corrosion sites can be attributed to the dissolution of the coatings during the corrosion

Chapter 8 Effects of HA coating on corrosion performance of PEO coated cp Mg
140
process. Comparing the chemical composition before and after the corrosion test, the Ca
content in the PEO coated sample is considerably enriched with P by corrosion process. The
Ca/P ratio in regions (B) and (C) that are corroded to the least extent have increased by
almost 10 times to 0.14 compared with the value of 0.017 before the corrosion test. Even
when the coatings are completely corroded away in the PEO-E region, an increased Ca/P
ratio is identified. However, after the corrosion test, the overall Ca/P ratio of the CED treated
sample is decreased from 1.23 to about 1.02. The CED-D region provides a Ca/P ratio of
0.58.
Figure 8-12 Corrosion morphologies of the CED treated PEO coatings on Mg, with images (b)
and (c) corresponding to the circled regions in (a) and image (d) to the circled region in (b)
8.5 Discussion
8.5.1 Coating Evolution in Each Stage of the PEO process
As described in Chapter 5, the PEO cell can simply be considered as a series of resistances
corresponding to the Mg substrate, PEO coating, and electrolyte between the working
electrode and counter electrode under DC condition. Therefore, the overall voltage is
distributed proportionately among these elements according to their electrical resistance

Chapter 8 Effects of HA coating on corrosion performance of PEO coated cp Mg
141
based on Ohm’s law. Throughout the PEO process the resistance of the substrate and
electrolyte are assumed to remain constant. Increased coating thickness leads to increased
electrical resistance, thus the corresponding overall voltage is also subject to increase
(Figure 8-1). From this standpoint, analysis of the voltage transient provides insight into the
coating thickness evolution.
Table 8-2 Chemical composition of different regions in the corroded samples identified by EDX
Region
ID
Element / at.% Ca/P
Mg O P Ca Na F Cl
PEO-b 22.6 55.4 9.0 1.3 3.6 8.0 0.2 0.14
PEO-c 21.1 55.6 9.1 1.2 3.6 8.0 1.5 0.13
PEO-d 24.0 73.0 - - - - 3.0 -
PEO-e 27.3 69.9 1.1 0.6 0.5 - 0.5 0.52
CED-a 17.4 70.6 4.2 4.3 0.5 2.7 0.4 1.02
CED-b 8.7 62.8 9.6 10.4 1.6 6.8 0.1 1.08
CED-c 28.8 70.3 0.4 0.2 0.2 - 0.1 0.58
CED-d 13.2 61.7 9.3 6.8 1.3 7.0 0.7 0.74
The voltage transient in stage I of Figure 8-1 is linearly fitted with a slope of 7.07 V/s, while in
stage III, the value is only 0.56 V/s, and in the fourth stage the voltage only marginally
increased with the slope of 0.18 V/s, indicating a marginal increase in coating thickness.
Other publications also reported the similar voltage behaviour and concluded the coating
thickness remains almost constant in the final stage of the PEO treatment [121]. The result in
the present study indicates that the coating growth rate in the first stage is more than 30 times
higher than that in the following stages. However, this value may be overestimated because
the coating resistance can be partially short circuited by the discharge channels filled with
electrolyte in the following stages. From this viewpoint, it may be that the coating thickness in
the final PEO stage is also increased, but it becomes more porous, which is consistent with
other publications [68, 113, 220].
The PEO process directly results in the porous morphology observed in Figure 8-2. In PEO
treatment, when the voltage is high enough to cause breakdown of the preformed passive
films (stage I and II in Figure 8-1), discharge channels are formed through the films (stage III
Chapter 8 Effects of HA coating on corrosion performance of PEO coated cp Mg
142
in Figure 8-1). The temperature within the discharge channels is sufficient to melt the
substrate metal. Driven by the high electric field, the melted metal is moving through the
channels towards the coating surface, and the anion species like OH- move in the opposite
direction. When the melted metal reacts with the anion species, coating material is formed.
The resolidification of the melted material around the discharge channel leads to the
crater-like pores. Also the gas liberation in the process can contribute to the porous
morphology.
8.5.2 Mechanisms Underlying HA Deposition
CED treatment has resulted in HA layer deposited on top of the PEO coating, as observed in
Figure 8-2 and verified by XRD analysis (Figure 8-5). The precipitation of HA is mainly due to
the electrolyte prepared for the CED treatment according to the following reaction [21]:
5Ca2+ + 3PO43− + OH− → Ca5(PO4)3(OH) ( 8.1 )
Therefore the equilibrium solubility product of HA, Ksp can be calculated as:
Ksp = [Ca2+]5 ∙ [PO43−]3 ∙ [OH−] ( 8.2 )
Here the bracketed symbols indicate activities of corresponding species that can be
approximated by their concentrations in the solution to simplify the evaluation. Despite the
large variation in the Ksp value due to the presence of other species like CO32- in the solution,
it is in the order of 10-58 [221, 222]. In the present study, the concentrations of Ca2+, PO43- and
OH- are 0.0043 M, 0.025 M and 10-9 M, respectively. The ion product in the electrolyte is
much higher than the equilibrium value, therefore the electrolyte used in the CED process is
oversaturated with respect to HA, leading to the spontaneous precipitation of HA.
However, this explanation, without considering the effects of electric field and the multiple
species associated with phosphorus, e.g. H2PO4-, HPO4
2- and PO43-, can only be used to
pre-screen the possibility of HA precipitation from the thermodynamic point of view. The
kinetic aspect is essential to figure out the role of those factors in the HA precipitation
procedure. Since the PEO coated Mg sample is connected to the cathodic terminal, it is
understandable that the tiny bubbles are the result of hydrogen evolution in the electrolyte of
pH 5 according to reaction (8.3):
2H+ + 2e− → H2 ↑ ( 8.3 )
Chapter 8 Effects of HA coating on corrosion performance of PEO coated cp Mg
143
As the above reaction proceeds, H+ will be depleted near the corroding surface, leading to a
locally increased pH value, therefore, further hydrogen may be liberated by reaction (8.4):
2H2O + 2e− → 2OH− + H2 ↑ ( 8.4 )
As a result, there will be an increase in pH values in the vicinity of the sample surface,
causing a decrease in H+ concentration according to the Hendersion-Hasselbalch equation
[223]. Correspondingly, local HPO42- concentration will be increased according to Le
Chatelier's principle [199] based on the following reaction:
H2PO4− → HPO4
2− + H+ ( 8.5 )
As a consequence, the formation of CaHPO4∙2H2O is promoted, according to the following process:
Ca2+ + HPO42− + 2H2O → CaHPO4 ∙ 2H2O ( 8.6 )
Since CaHPO4∙2H2O is well recognised to be a precursor of apatite nucleation [224], it
should promote the HA formation. Actually, it may transform into thermodynamically stable
apatitic calcium phosphate by a dissolution-precipitation mechanism as suggested by Tang
[225]. Since the sample is negatively biased, Ca2+ is driven towards the sample surface by
the electric field, which favours the CaHPO4∙2H2O transformation:
(6 − x)CaHPO4 ∙ 2H2O + (4 − x)Ca2+ + (2 − x)H2O→ Ca10−x(HPO4)𝑥(PO4)6−x(OH)2−x + 8H+ + 12H2O ( 8.7 )
Where x is a constant, if it is equal to 0, stoichiometric HA is formed, otherwise, the product
will be Ca deficient apatite which is the most likely result according to the EDX results.
8.5.3 Mechanisms underlying in Vitro Electrochemical Corrosion Behaviour
The EIS technique provides detailed insights into the degradation behaviour of the samples in
the physiological environment. The higher overall impedance from the CED treated sample
suggests better protection compared to the sample with single PEO coating, and both the
samples with surface modification are superior to the bare Mg in terms of corrosion protection
(Figure 8-7). Right after immersion in SBF, the coatings are gradually degraded with time,
resulting in lower overall impedance (Figures 8-8 and 8-9). Based on the cross-sectional
morphologies (as well as the EIS behavior), the EIS curves can be fitted using equivalent

Chapter 8 Effects of HA coating on corrosion performance of PEO coated cp Mg
144
circuits (EC), which is a widely used method in EIS analysis. Since the EIS spectra exhibited
similar characteristics as those observed in Chapter 6, the EC proposed in Chapter 6 (Figure
6-17) is also used here for the interpretation of the present EIS diagram. The experimental
data is fitted against the proposed EC and the corresponding fitting results are presented by
the solid lines in Figures 8-7, 8-8 and 8-9, the corresponding values of each element are
listed in Table 8-3.
In the proposed EC, Rs is the electrolyte resistance between the sample and counter
electrode. R1 and the first constant phase element (CPE1) are used to represent the
resistance and capacitance behaviour attributed to the outer porous coating (Figure 8-2). R2
represents the charge transfer resistance originated from the inner barrier region (Figure 8-2)
during the corrosion process and the corresponding capacitance is represented using CPE2.
To define the physical meaning of each element more clearly, the equivalent circuit is
schematically explained in Figure 8-13. The use of constant phase elements rather than pure
capacitors illustrates the dispersed properties originating from the porous and rough coatings.
With the element values shown in Table 8-3, all the EIS curves are fitted with adequate
accuracy (see 2 values in Table 8-3). It is easy to assess the coating degradation behaviour
by analysing the evolution of EC elements with immersion time. In Table 8-3, HA-1 means
immersion of the PEO coating with CED treatment for 1 hour, whereas the PEO-1 means the
immersion of the single PEO coating for 1 hour in the SBF.
Figure 8-13 Schematic illustration of the equivalent circuit proposed for the EIS analysis
Once the porous sample is immersed into the SBF, the pores are filled in with the electrolyte.
Chapter 8 Effects of HA coating on corrosion performance of PEO coated cp Mg
145
The associated resistance, sometimes called pore resistance [69], is termed as R1 here.
Assuming that the average pore length is d, cross-sectional area is a and the electrolyte
resistivity is s, the coating resistance can be obtained by:
R1 = ρ𝑠 ∙ d/a ( 8.8 )
It is easy to conclude that the coating resistance is proportional to the pore lengths and
inversely proportional to the cross-sectional area of the pore. Since the coating material MgO
is only thermodynamically stable at pH>13.83 [44], it will be dissolved gradually in the SBF
with pH= 7.4. Therefore, the coating is becoming thinner, leading to a decreased pore length
d. Moreover, the dissociation of the coating material around the pores will result in a larger
pore cross sectional area a, which can be observed in the corroded surfaces (Figures 8-11
and 8-12). Therefore decreased R1 with immersion time is observed according to the EIS
curves, as shown in Figure 8-14.
After CED treatment, the pores within the PEO coating are partially blocked (Figure 8-2 (c)),
resulting in a decreased cross-sectional area a. Therefore higher R1 is derived from the CED
treated sample compared with the sample with only PEO coating within the immersion period
from 1 to 4 hours (Figure 8-14(a)). Although the apatite produced by the CED treatment can
hardly be dissolved in SBF, the coating integrity is gradually reduced because the underneath
PEO layer is gradually dissolved by the SBF penetration into the coating (Figure 8-12).
Therefore, a tendency for the coating resistance R1 to decrease is derived from the CED
treated sample as shown in Figure 8-14(a).
However, upon immersion of the sample with single PEO coating in the SBF, it can easily
penetrate into the large pores within the outer region (Figure 8-2). According to the EIS data,
the corrosion process takes place at the interface between the substrate and PEO coating,
which will lead to an increase in local pH of the SBF in the pores. As a result, the dissolution
of MgO, the coating material, is inhibited, resulting in a constant coating resistance R1 within
the first two hours after immersion. A sharp decrease of R1 is observed when the sample is
immersed for 3 hours (Figure 8-14(a)). Corrosion pits may have formed at this stage to short
circuit the barrier coating resistance. Afterwards, the coating resistance increased slightly;
this may be due to the deposited film of corrosion products covering the corrosion pits, or
corrosion products exporting and extruding into the pits to block the porosity
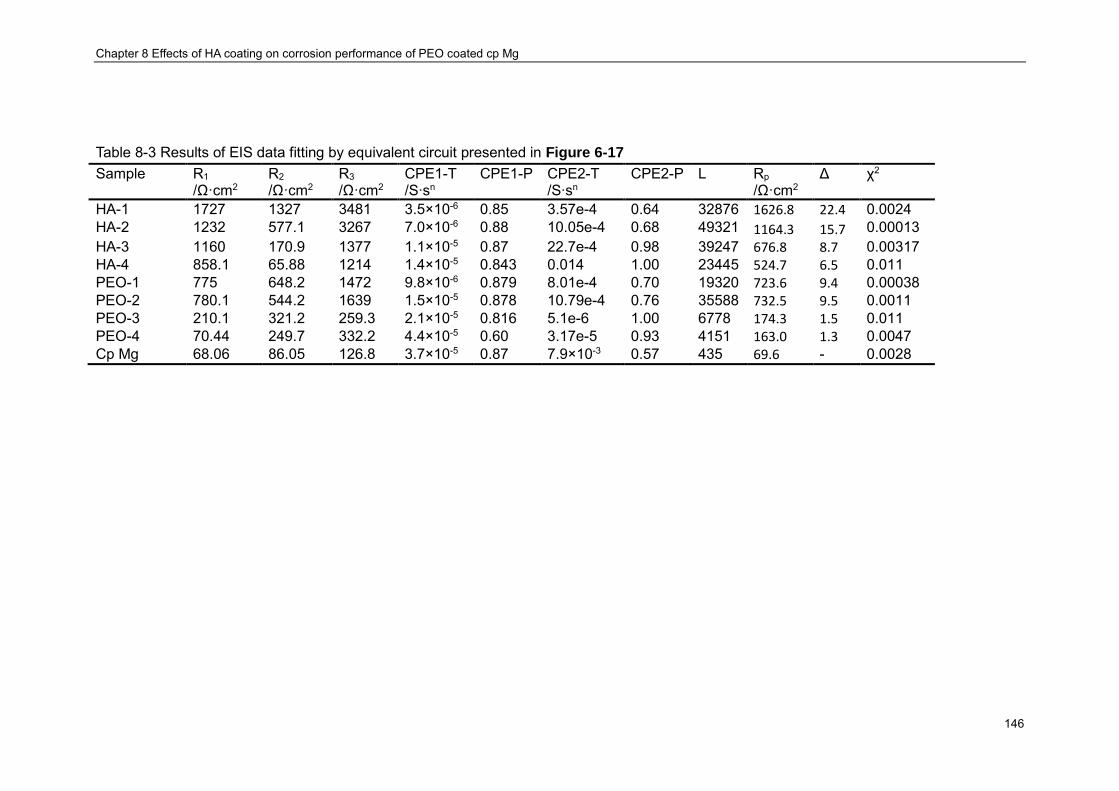
Chapter 8 Effects of HA coating on corrosion performance of PEO coated cp Mg
146
Table 8-3 Results of EIS data fitting by equivalent circuit presented in Figure 6-17 Sample R1
/Ω·cm2 R2 /Ω·cm2
R3 /Ω·cm2
CPE1-T /S∙sn
CPE1-P CPE2-T /S∙sn
CPE2-P L Rp /Ω·cm2
Δ χ2
HA-1 1727 1327 3481 3.5×10⁻⁶ 0.85 3.57e-4 0.64 32876 1626.8 22.4 0.0024 HA-2 1232 577.1 3267 7.0×10⁻⁶ 0.88 10.05e-4 0.68 49321 1164.3 15.7 0.00013 HA-3 1160 170.9 1377 1.1×10⁻⁵ 0.87 22.7e-4 0.98 39247 676.8 8.7 0.00317 HA-4 858.1 65.88 1214 1.4×10⁻⁵ 0.843 0.014 1.00 23445 524.7 6.5 0.011 PEO-1 775 648.2 1472 9.8×10⁻⁶ 0.879 8.01e-4 0.70 19320 723.6 9.4 0.00038 PEO-2 780.1 544.2 1639 1.5×10⁻⁵ 0.878 10.79e-4 0.76 35588 732.5 9.5 0.0011 PEO-3 210.1 321.2 259.3 2.1×10⁻⁵ 0.816 5.1e-6 1.00 6778 174.3 1.5 0.011 PEO-4 70.44 249.7 332.2 4.4×10⁻⁵ 0.60 3.17e-5 0.93 4151 163.0 1.3 0.0047 Cp Mg 68.06 86.05 126.8 3.7×10⁻⁵ 0.87 7.9×10⁻³ 0.57 435 69.6 - 0.0028

Chapter 8 Effects of HA coating on corrosion performance of PEO coated cp Mg
147
Figure 8-14 Variation of coating resistance (a) and capacitance (b) with immersion time
The coating capacitance C can be calculated according to the following equation:
C = ε0 ∙ 휀 ∙ 𝐴/𝐷 ( 8.9 )
where 𝛆𝟎 is the free space permeability and 𝜺 is the relative permeability of the coating
material, MgO.
Therefore, the capacitance is proportional to the surface area 𝑨 and inversely proportional to
the coating thickness 𝑫 . Upon immersion, the coating thickness gradually decreases
because of dissociation of the coating material, as mentioned above. In contrast, the effective
surface area of the coating increases. As a result, the capacitance of the PEO coated
samples with and without CED treatment decreases with prolonged immersion time as shown
in Figure 8-14(b).
The evolution of the empirical constant (CPE-P) of the constant phase element with
immersion time provides further details about the contribution of different coating regions to
the corrosion process. CPE1-P, the empirical constant of CPE1, remains higher than 0.8
throughout the immersion up to 4 hours, indicating distorted capacitance behaviour of the
outer porous coating, as suggested by Vladikova [226]. However, significant change is
observed on the empirical constant attributed to the inner barrier region for both the PEO
coated samples with and without CED layer. Up to 2 hours after immersion, the values of
CPE2-P for the sample with the CED layer are almost the same at about 0.6 (Table 8-3),
suggesting a distorted diffusion behaviour [226], which means that in the first 2 hours the SBF
penetrates towards the substrate through a diffusion process. During this immersion period,
the barrier region is not significantly dissolved, revealing capacitive behaviour, which
distorted the diffusion process. Afterwards, the CPE2-P values reduce significantly to about
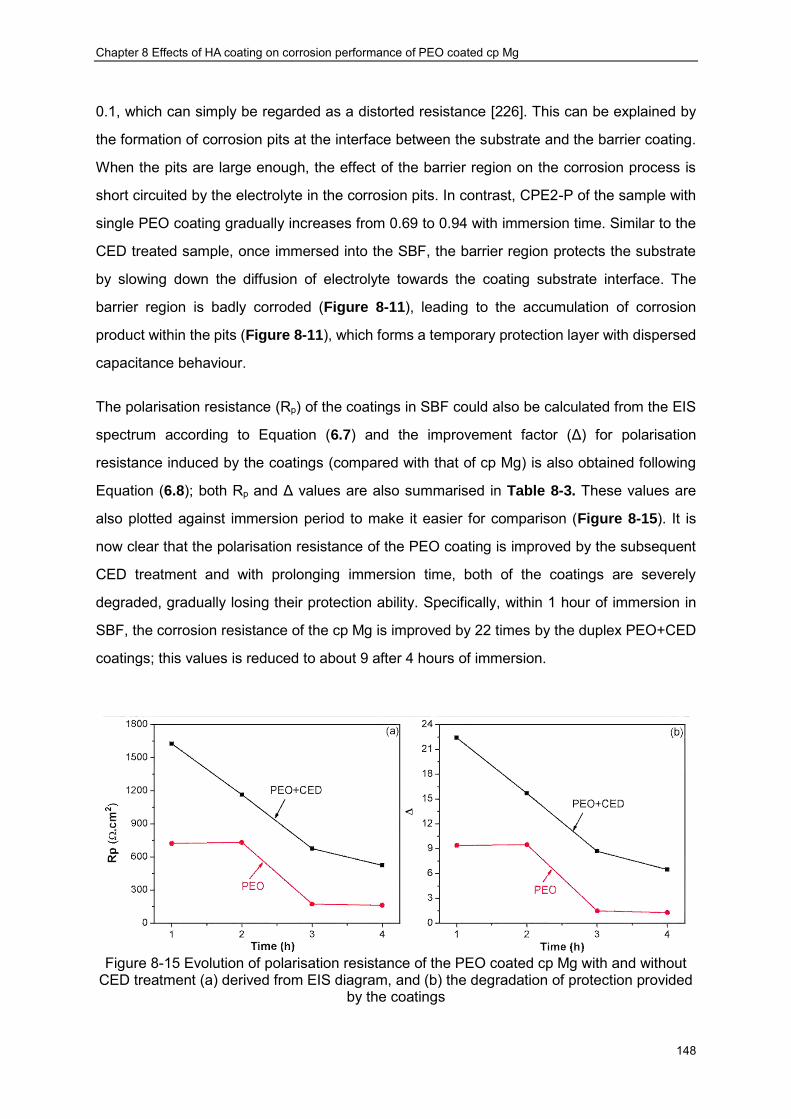
Chapter 8 Effects of HA coating on corrosion performance of PEO coated cp Mg
148
0.1, which can simply be regarded as a distorted resistance [226]. This can be explained by
the formation of corrosion pits at the interface between the substrate and the barrier coating.
When the pits are large enough, the effect of the barrier region on the corrosion process is
short circuited by the electrolyte in the corrosion pits. In contrast, CPE2-P of the sample with
single PEO coating gradually increases from 0.69 to 0.94 with immersion time. Similar to the
CED treated sample, once immersed into the SBF, the barrier region protects the substrate
by slowing down the diffusion of electrolyte towards the coating substrate interface. The
barrier region is badly corroded (Figure 8-11), leading to the accumulation of corrosion
product within the pits (Figure 8-11), which forms a temporary protection layer with dispersed
capacitance behaviour.
The polarisation resistance (Rp) of the coatings in SBF could also be calculated from the EIS
spectrum according to Equation (6.7) and the improvement factor (Δ) for polarisation
resistance induced by the coatings (compared with that of cp Mg) is also obtained following
Equation (6.8); both Rp and Δ values are also summarised in Table 8-3. These values are
also plotted against immersion period to make it easier for comparison (Figure 8-15). It is
now clear that the polarisation resistance of the PEO coating is improved by the subsequent
CED treatment and with prolonging immersion time, both of the coatings are severely
degraded, gradually losing their protection ability. Specifically, within 1 hour of immersion in
SBF, the corrosion resistance of the cp Mg is improved by 22 times by the duplex PEO+CED
coatings; this values is reduced to about 9 after 4 hours of immersion.
Figure 8-15 Evolution of polarisation resistance of the PEO coated cp Mg with and without
CED treatment (a) derived from EIS diagram, and (b) the degradation of protection provided by the coatings

Chapter 8 Effects of HA coating on corrosion performance of PEO coated cp Mg
149
Apart from the coating degradation behaviour revealed by the EIS curves, corroded
morphologies also disclose details of the corrosion processes. Since regions separated from
the corroded morphology experience corrosion attack to different extents, they can be taken
as examples of surface degradation at different stages of corrosion. When the PEO coated
sample is immersed into the SBF (Figure 8-11(b)), two processes take place: penetration of
SBF towards the substrate interface through the coating defects, i.e. cracks and pores, and
dissolution of MgO. Firstly, the coating material MgO is converted to Mg(OH)2 according to
reaction (6.9). As discussed, Mg(OH)2 is readily dissolved in the SBF (pH=7.4) as the
thermodynamically stable pH range of Mg(OH)2 is pH>11.46 [44], therefore Mg2+ will be
released into the SBF. At this stage the coating still provides protection to the substrate,
although becoming thinner and partly damaged, which is consistent with the EIS analysis and
observation of the corroded morphology (Figure 8-11(b)).
Then, with longer immersion time, the released Mg2+ combines with Cl- and OH- anions in
coating defects to form magnesium oxychloride, which is the thermodynamically favourable
process based on reaction (6.10) [196-198, 227]:
The formation of magnesium oxychloride is verified by the EDX analysis in Figure 8-11(d),
where only Mg, O and Cl are identified. The formed magnesium oxychloride is shaped in
needle-like structures as observed in Figure 8-11(d) and (f).
With longer immersion times, the SBF finally reaches the substrate at some localised sites,
where corrosion pits are formed. At the bottom of the corrosion pits, the oxidation of the
substrate according to Reaction (2.1) and the elementary Reactions (7.4) and (7.5)
dominates the corrosion process:
Mg → Mg2+ + 2e− (2.1)
Mg ⇔ Mg+ + 𝑒− (7.4)
Mg+ + H2O → Mg2+ + OH− + 1/2H2 (7.5)
The product of the above reactions (Mg2+) can be further transformed to magnesium
oxychloride according to reaction (6.10). As a redox process, the oxidation of Mg is coupled
with the cathodic reduction of H2O according to reaction (2.2).
For the CED treated sample the corrosion mechanism is generally the same: including the
Chapter 8 Effects of HA coating on corrosion performance of PEO coated cp Mg
150
dissolution of coating and oxidation of substrate. However one should bear in mind that the
top CED layer provides an additional barrier effect on the penetration of SBF towards the
substrate, thus lowering the corrosion rate. It should be mentioned here that once the
corrosion pits are formed, the oxidation of the substrate and the dissolution of the coating
material MgO would take place simultaneously, and more pits at discrete sites could be
formed.
The electrochemical corrosion only takes place at the bottom of the corrosion pits, therefore
there is limited exchange of the electrolyte inside the pits with the main volumed SBF
electrolyte. According to reaction (8.4), the pH value inside the pits will increase
spontaneously, with corrosion process proceeding. When the pH is high enough to drive the
substrate to reach the passivity zone in the Pourbaix diagram, Mg(OH)2 is accumulated in the
pits. In the EDX data taken from the bottom of a pit (PEO-e in Table 8-2), the ratio of
Mg/(O+Cl) is about 0.38, less than the theoretical value of 0.5 when only Mg(OH)2 and MgCl2
are present; this is because a part of the detected O may come from a compound containing
Ca, P, O and H. Therefore, the accumulation of Mg(OH)2 is verified by the EDX results.
The presence of mud cracks in the PEO coating has been attributed by the dehydration of
Mg(OH)2 as suggested by [228] according to:
Mg(OH)2 → MgO + H2O ( 8.10 )
The molar volume of Mg(OH)2 is larger than that of MgO, therefore, when Mg(OH)2 is
dehydrated to MgO, the cracks are expected to be formed as observed in Figure 8-11(e) and
Figure 8-12(c).
The accumulation of corrosion products and limited access of the SBF electrolyte volume to
the corrosion pits significantly affects the potentiodynamic polarisation behaviour of the
samples. When the samples are slightly polarised in the anodic direction, the oxidation of Mg
is under activation control. However, when the polarisation potential moves further away from
the free corrosion potential, the effect of the corrosion product accumulation takes place.
Then the corrosion process is under activation/concentration polarisation control, leading to
quasi passivation tails in the anodic branches (Figure 8-10). These passivation tails are
almost in parallel, indicating that similar corrosion processes take place for all the samples.
When the samples are cathodically polarised, the cathodic branches in Figure 8-10 represent
Chapter 8 Effects of HA coating on corrosion performance of PEO coated cp Mg
151
the reduction of H2O according to reactions (8.4).
8.6 Summary
A cathodic electrochemically deposited (CED) Hydroxyapatite layer has been successfully
deposited on PEO coated biodegradable cp Mg, and the corrosion performance of the coated
samples was evaluated using electrochemical techniques, including impedance spectroscopy
and potentiodynamic polarisation test. The findings in the present work are as follows:
(1) The porous PEO coating is covered with the CED layer, which possesses needle-like
crystalline structures of HA;
(2) The PEO coating decreased the corrosion rate of Mg by ~9 times, which is further
reduced by ~22 times due to the subsequent CED treatment;
(3) The following three processes occur simultaneously upon immersion of the coated Mg
samples into the SBF (leading to in vitro corrosion) is: (i) penetration of the SBF
towards the coating/substrate interface, (iii) the chemical dissolution of the PEO
coating and (iii) electrochemical corrosion of the substrate.
(4) The PEO treatment combined with the CED coating provides a novel method to
develop biocompatible magnesium-based materials with lower corrosion rates. The
bioactivity of the implants is also expected to be enhanced. This, however, needs to
be verified in further research.
Chapter 9 Mechanical properties of cp Mg with duplex HA/PEO coatings
152
Chapter 9 Mechanical Properties of cp Magnesium with Duplex
Hydroxyapatite and PEO Coatings
In vitro Corrosion performance of cp magnesium in the physiological environment was
improved by PEO coating through the optimisation of electrolyte combination (2 g/l Ca(OH)2
and 12 g/l Na3PO4∙12H2O, Chapter 5), current regime parameters (Chapters 6 and 7) and
post treatment procedures (Chapter 8). However, these studies dealt mainly with corrosion
performance of the coatings, whereas the mechanical properties were overlooked. The
importance of mechanical properties of the biomedical implants has been highlighted in
Chapters 2 and 3. At this point, the mechanical properties of the coated samples need to be
evaluated. In the present chapter, the effects of the duplex surface treatments combining
PEO coating and electrodeposited HA layer on the static tensile strength as well as fatigue
performance of cp magnesium samples are discussed. After comparing the mechanical
properties of the samples with those published elsewhere [15, 16, 162], the applicability of the
surface engineered cp magnesium for load bearing biomedical applications is demonstrated.
9.1 Experimental Procedure
In the present chapter, tensile properties and fatigue strength of the PEO and PEO+CED
treated samples (as well as bare cp magnesium) were evaluated. For this purpose, two types
of samples were prepared. For tensile tests, the samples were produced according to ASTM
E8-04 standard with dimensions presented in Figure 4-7. Fatigue samples were made
according to ASTM F1801-97 (Figure 4-8). Disc samples of the dimensions described in
Chapter 4 were also prepared for the purpose of coating morphology evaluation. The sample
surfaces were manually polished using SiC paper to achieve the final roughness of Ra ~0.02
mm. Prior to PEO treatment, the samples are ultrasonically degreased using acetone. The
PEO treatment was conducted using the optimised electrolyte (2 g/l Ca(OH)2 and 12 g/l
Na3PO4∙12H2O). Because fluoride could enhance the stability of HA, 5 g/l NaF was also
added into the PEO electrolyte. The unipolar pulsed current regime (frequency: 3000 Hz, duty
cycle: 10%, current density: 30 mA/cm2) was utilised as suggested in Chapters 5 and 6 to
fabricate the PEO coatings.
Then the PEO coated samples were thoroughly rinsed before being subjected to the HA
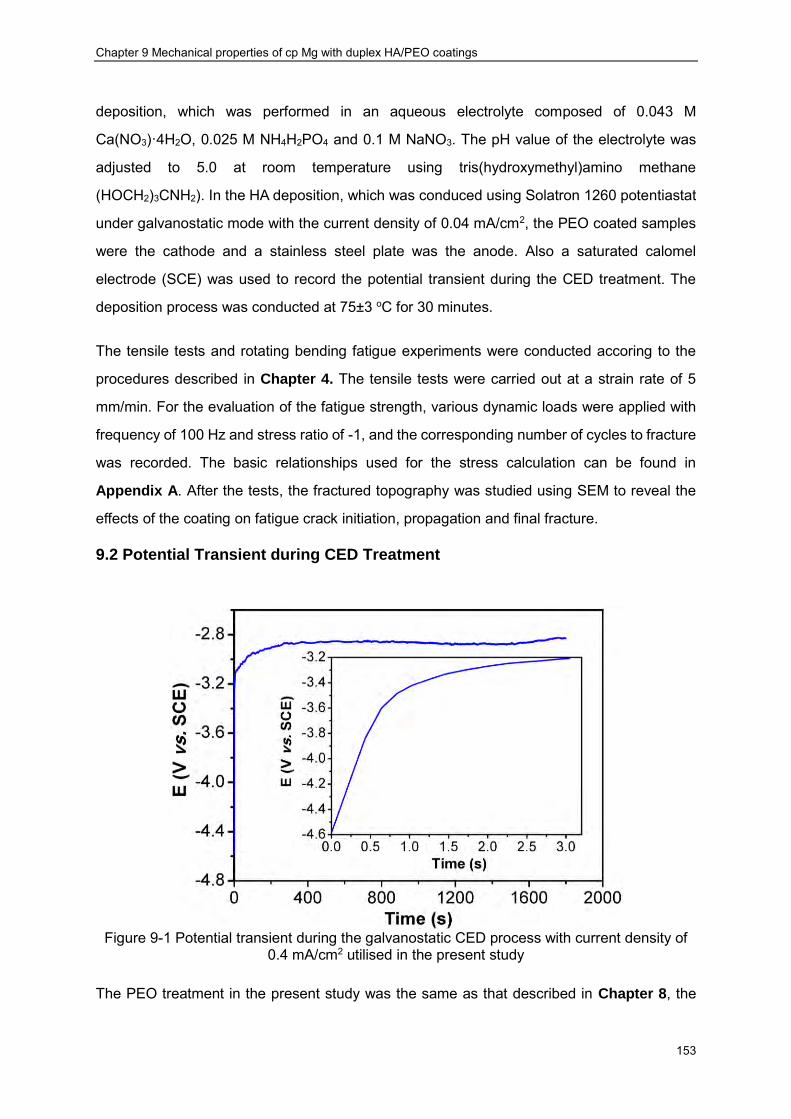
Chapter 9 Mechanical properties of cp Mg with duplex HA/PEO coatings
153
deposition, which was performed in an aqueous electrolyte composed of 0.043 M
Ca(NO3)·4H2O, 0.025 M NH4H2PO4 and 0.1 M NaNO3. The pH value of the electrolyte was
adjusted to 5.0 at room temperature using tris(hydroxymethyl)amino methane
(HOCH2)3CNH2). In the HA deposition, which was conduced using Solatron 1260 potentiastat
under galvanostatic mode with the current density of 0.04 mA/cm2, the PEO coated samples
were the cathode and a stainless steel plate was the anode. Also a saturated calomel
electrode (SCE) was used to record the potential transient during the CED treatment. The
deposition process was conducted at 75±3 oC for 30 minutes.
The tensile tests and rotating bending fatigue experiments were conducted accoring to the
procedures described in Chapter 4. The tensile tests were carried out at a strain rate of 5
mm/min. For the evaluation of the fatigue strength, various dynamic loads were applied with
frequency of 100 Hz and stress ratio of -1, and the corresponding number of cycles to fracture
was recorded. The basic relationships used for the stress calculation can be found in
Appendix A. After the tests, the fractured topography was studied using SEM to reveal the
effects of the coating on fatigue crack initiation, propagation and final fracture.
9.2 Potential Transient during CED Treatment
Figure 9-1 Potential transient during the galvanostatic CED process with current density of
0.4 mA/cm2 utilised in the present study
The PEO treatment in the present study was the same as that described in Chapter 8, the
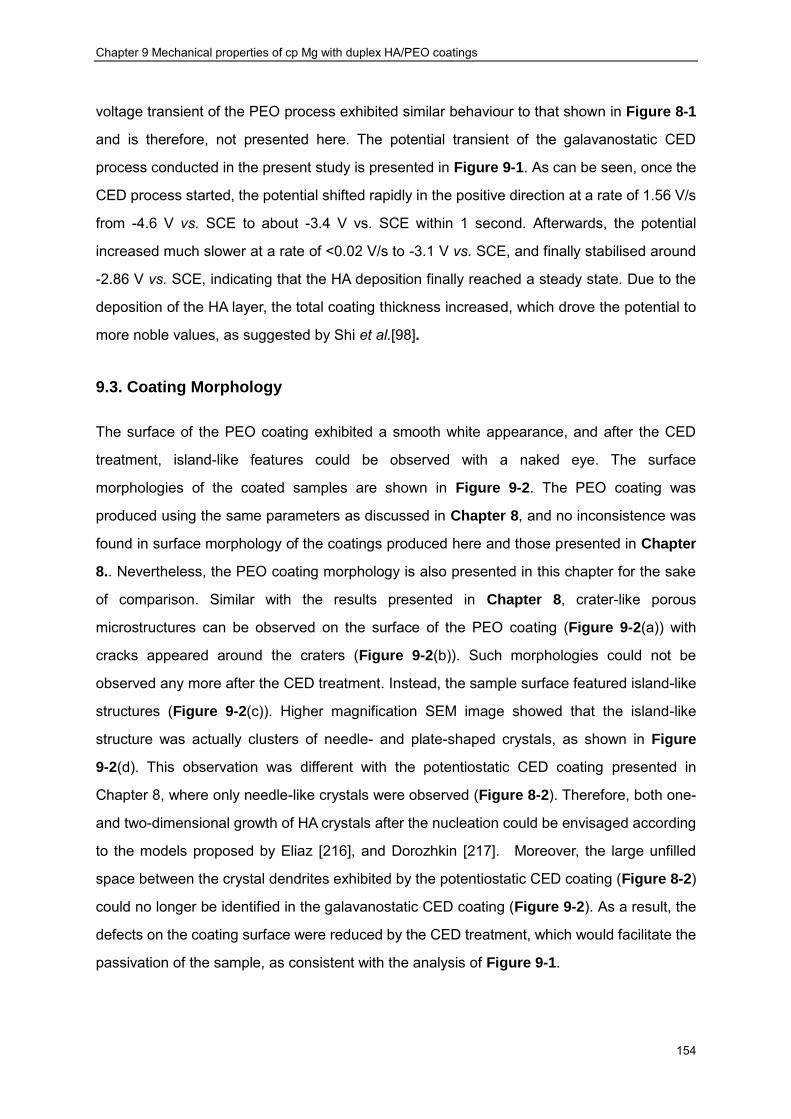
Chapter 9 Mechanical properties of cp Mg with duplex HA/PEO coatings
154
voltage transient of the PEO process exhibited similar behaviour to that shown in Figure 8-1
and is therefore, not presented here. The potential transient of the galavanostatic CED
process conducted in the present study is presented in Figure 9-1. As can be seen, once the
CED process started, the potential shifted rapidly in the positive direction at a rate of 1.56 V/s
from -4.6 V vs. SCE to about -3.4 V vs. SCE within 1 second. Afterwards, the potential
increased much slower at a rate of <0.02 V/s to -3.1 V vs. SCE, and finally stabilised around
-2.86 V vs. SCE, indicating that the HA deposition finally reached a steady state. Due to the
deposition of the HA layer, the total coating thickness increased, which drove the potential to
more noble values, as suggested by Shi et al.[98].
9.3. Coating Morphology
The surface of the PEO coating exhibited a smooth white appearance, and after the CED
treatment, island-like features could be observed with a naked eye. The surface
morphologies of the coated samples are shown in Figure 9-2. The PEO coating was
produced using the same parameters as discussed in Chapter 8, and no inconsistence was
found in surface morphology of the coatings produced here and those presented in Chapter
8.. Nevertheless, the PEO coating morphology is also presented in this chapter for the sake
of comparison. Similar with the results presented in Chapter 8, crater-like porous
microstructures can be observed on the surface of the PEO coating (Figure 9-2(a)) with
cracks appeared around the craters (Figure 9-2(b)). Such morphologies could not be
observed any more after the CED treatment. Instead, the sample surface featured island-like
structures (Figure 9-2(c)). Higher magnification SEM image showed that the island-like
structure was actually clusters of needle- and plate-shaped crystals, as shown in Figure
9-2(d). This observation was different with the potentiostatic CED coating presented in
Chapter 8, where only needle-like crystals were observed (Figure 8-2). Therefore, both one-
and two-dimensional growth of HA crystals after the nucleation could be envisaged according
to the models proposed by Eliaz [216], and Dorozhkin [217]. Moreover, the large unfilled
space between the crystal dendrites exhibited by the potentiostatic CED coating (Figure 8-2)
could no longer be identified in the galavanostatic CED coating (Figure 9-2). As a result, the
defects on the coating surface were reduced by the CED treatment, which would facilitate the
passivation of the sample, as consistent with the analysis of Figure 9-1.
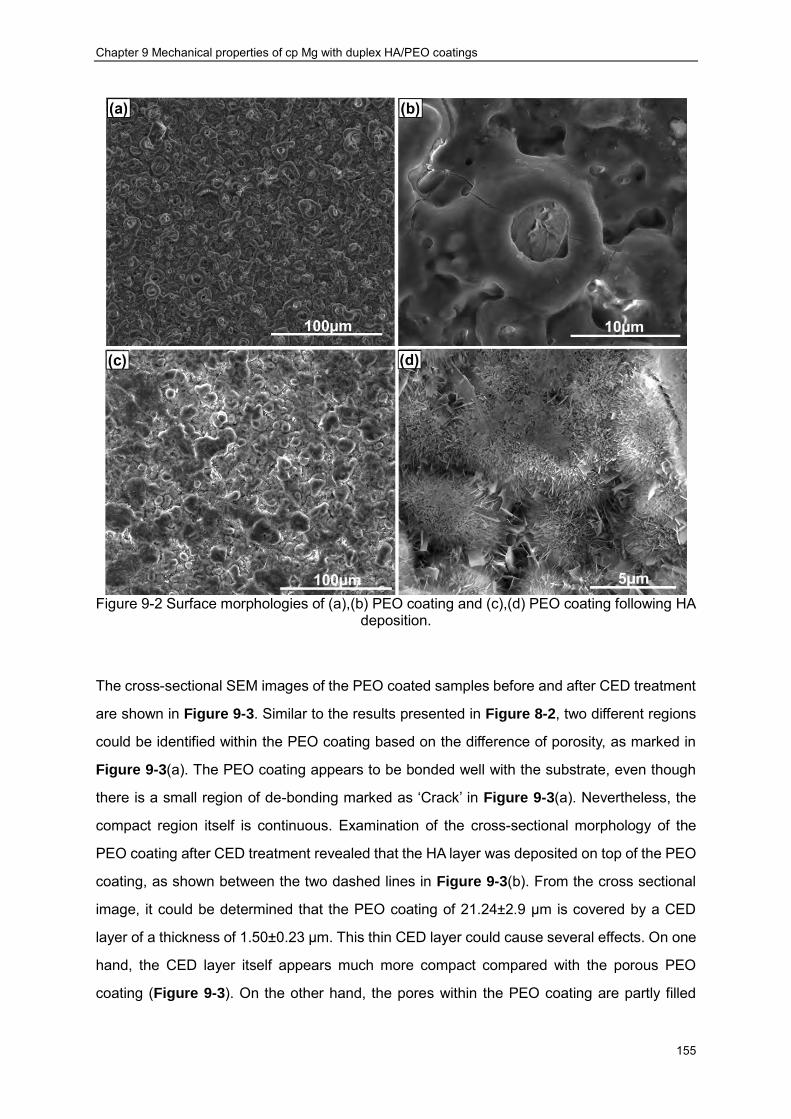
Chapter 9 Mechanical properties of cp Mg with duplex HA/PEO coatings
155
Figure 9-2 Surface morphologies of (a),(b) PEO coating and (c),(d) PEO coating following HA
deposition.
The cross-sectional SEM images of the PEO coated samples before and after CED treatment
are shown in Figure 9-3. Similar to the results presented in Figure 8-2, two different regions
could be identified within the PEO coating based on the difference of porosity, as marked in
Figure 9-3(a). The PEO coating appears to be bonded well with the substrate, even though
there is a small region of de-bonding marked as ‘Crack’ in Figure 9-3(a). Nevertheless, the
compact region itself is continuous. Examination of the cross-sectional morphology of the
PEO coating after CED treatment revealed that the HA layer was deposited on top of the PEO
coating, as shown between the two dashed lines in Figure 9-3(b). From the cross sectional
image, it could be determined that the PEO coating of 21.24±2.9 µm is covered by a CED
layer of a thickness of 1.50±0.23 µm. This thin CED layer could cause several effects. On one
hand, the CED layer itself appears much more compact compared with the porous PEO
coating (Figure 9-3). On the other hand, the pores within the PEO coating are partly filled

Chapter 9 Mechanical properties of cp Mg with duplex HA/PEO coatings
156
after CED treatment, resulting in a finer porosity, as determined from Figure 9-3. It could be
predicted that the compact coating would inhibit the penetration of corrosive medium towards
the substrate, thus improving the corrosion resistance of the substrate. Again, such
observations provide further explanation to the potential transient behaviour during the CED
process (Figure 9-1).
Figure 9-3 Cross sectional morphologies of PEO coatings before (a) and after (b) CED
treatment
Apart from the positive effect of reduced defects, CED treatment also induced detrimental
effects to the PEO coating. In detail, the continuity of the compact region within the PEO
coating as discussed above was compromised; as a result, the two regions of the PEO
coating could not be observed any more. Yet worse, some areas of delamination of the
coatings could be determined, as shown in Figure 9-3(b). Such delamination must be raised
during the CED process considering the much better bonding exhibited by the single PEO
coating, as shown in Figure 9-3(a). In the CED process, considerable amount of H2 gas was
generated at the interface between the substrate and PEO coating. Such gas was initially
accumulated underneath the PEO coating because of the continuity of the compact PEO
region and the hydrogen pressure was increased gradually, causing local delamination of the
PEO coating from the substrate. When the pressure was high enough, the hydrogen gas
would be liberated out of the sample surface and such phenomenon had been observed
throughout the CED process. During the CED treatment, the gaps between the coating and
substrate were filled with electrolyte. Such process would compromise the increasing
potential transient of the CED process presented in Figure 9-1. Moreover, such delamination

Chapter 9 Mechanical properties of cp Mg with duplex HA/PEO coatings
157
could possibly deteriorate the corrosion resistance of the coated samples.
The XRD patterns of the PEO coated samples before and after CED treatment are presented
in Figure 9-4. By comparing the two patterns, it was clear that randomly oriented HA
crystals have been formed during the CED treatment. The mean HA crystallite size of 77.7
nm could be calculated according to the Scherrer equation. Such crystallite size is
significantly larger than that observed in Chapter 8, which might be attributed to a longer
crystal growth time allowed by the CED treatment (10 minutes longer here than that applied
in Chapter 8). Moreover, after comparing the patterns shown in Figure 9-4 with the standard
diffraction pattern of perfect HA crystal, it was found that all the peaks associated with the HA
crystals were shifted to the positions of higher 2θ angles. For example, the strongest HA peak
at 2θ=26.042o in Figure 9-4 should be positioned at 2θ=25.897o for the perfect HA crystal. As
a hexagonal packed crystal, the inter-lattice spacing of the HA crystals could be calculated by
[229]:
𝑑 =
1
√43
(ℎ2 + ℎ𝑘 + 𝑘2
𝑎2 ) +𝑙2
𝑐2
( 9.1 )
where 𝑑 is the inter-lattice spacing of (ℎ𝑘𝑙) lattice plane, 𝑎 and 𝑐 are the lattice constants
of HA crystal. The shifts of the X-ray diffraction peaks indicated that the HA crystals deposited
in the presented study were strained, and a smaller inter-lattice spacing could be predicted
according to the Braggers Law. According to Equation ( 9.1 ), smaller 𝑎 and 𝑐 could be
predicted compared with the perfect crystals. Therefore, compressive stress was imposed to
the HA crystals deposited in the CED process. Such compressive stress may be attributed to
the substitution of OH- with other cations, possibly F-. Actually, such substitution could readily
occur on thermodynamic grounds (ΔE=-0.4…-0.6) kJ/mol) [230]. After incorporation of F-, the
lattice parameters are changed accordingly. Since F- (1.32 Å) is smaller than OH- (1.68 Å),
such substitution would result in the contraction in the a-axis [230]. Since F only substituted a
small fraction of the total OH groups, the crystals were still identified as HA rather than
fluorapatite from the XRD patterns (Figure 9-4).
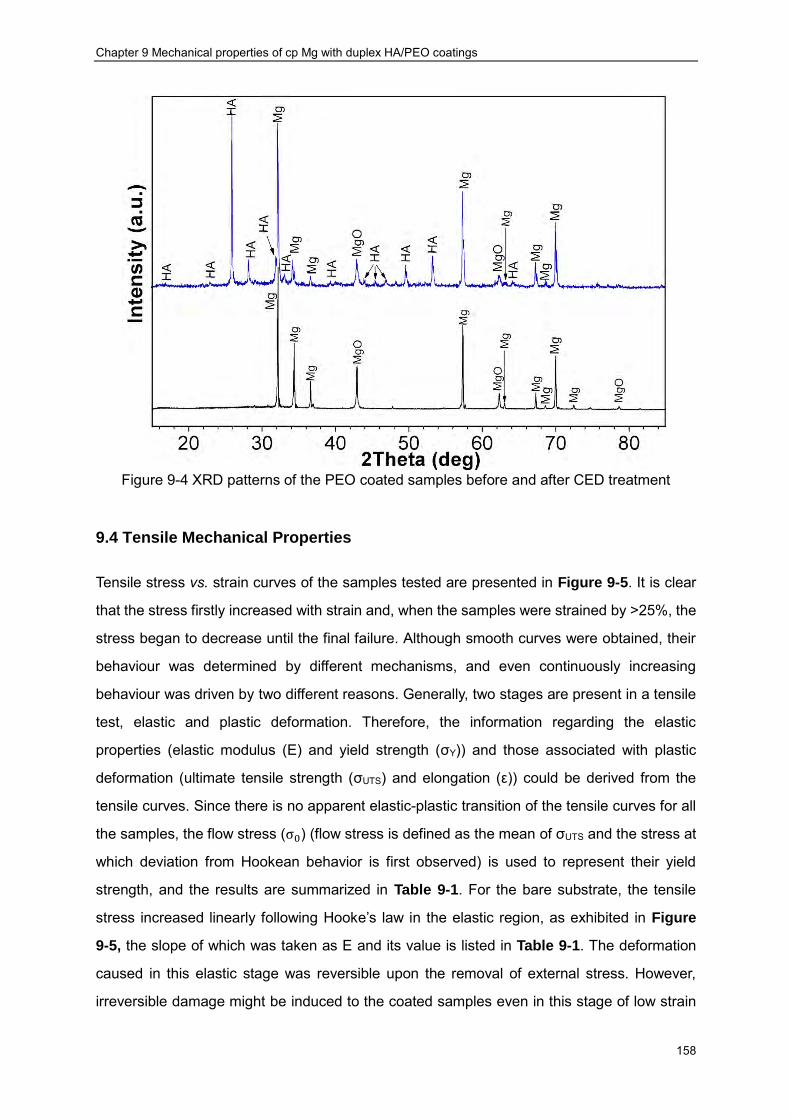
Chapter 9 Mechanical properties of cp Mg with duplex HA/PEO coatings
158
Figure 9-4 XRD patterns of the PEO coated samples before and after CED treatment
9.4 Tensile Mechanical Properties
Tensile stress vs. strain curves of the samples tested are presented in Figure 9-5. It is clear
that the stress firstly increased with strain and, when the samples were strained by >25%, the
stress began to decrease until the final failure. Although smooth curves were obtained, their
behaviour was determined by different mechanisms, and even continuously increasing
behaviour was driven by two different reasons. Generally, two stages are present in a tensile
test, elastic and plastic deformation. Therefore, the information regarding the elastic
properties (elastic modulus (E) and yield strength (σY)) and those associated with plastic
deformation (ultimate tensile strength (σUTS) and elongation (ε)) could be derived from the
tensile curves. Since there is no apparent elastic-plastic transition of the tensile curves for all
the samples, the flow stress (σ0) (flow stress is defined as the mean of σUTS and the stress at
which deviation from Hookean behavior is first observed) is used to represent their yield
strength, and the results are summarized in Table 9-1. For the bare substrate, the tensile
stress increased linearly following Hooke’s law in the elastic region, as exhibited in Figure
9-5, the slope of which was taken as E and its value is listed in Table 9-1. The deformation
caused in this elastic stage was reversible upon the removal of external stress. However,
irreversible damage might be induced to the coated samples even in this stage of low strain
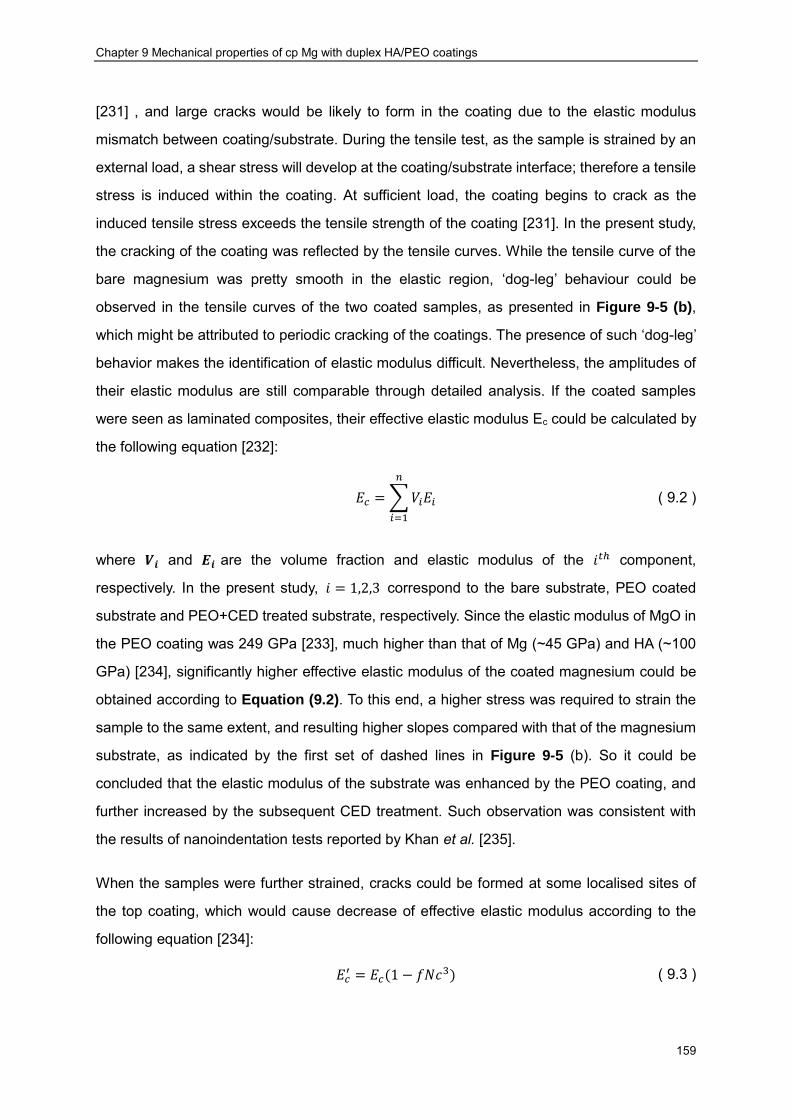
Chapter 9 Mechanical properties of cp Mg with duplex HA/PEO coatings
159
[231] , and large cracks would be likely to form in the coating due to the elastic modulus
mismatch between coating/substrate. During the tensile test, as the sample is strained by an
external load, a shear stress will develop at the coating/substrate interface; therefore a tensile
stress is induced within the coating. At sufficient load, the coating begins to crack as the
induced tensile stress exceeds the tensile strength of the coating [231]. In the present study,
the cracking of the coating was reflected by the tensile curves. While the tensile curve of the
bare magnesium was pretty smooth in the elastic region, ‘dog-leg’ behaviour could be
observed in the tensile curves of the two coated samples, as presented in Figure 9-5 (b),
which might be attributed to periodic cracking of the coatings. The presence of such ‘dog-leg’
behavior makes the identification of elastic modulus difficult. Nevertheless, the amplitudes of
their elastic modulus are still comparable through detailed analysis. If the coated samples
were seen as laminated composites, their effective elastic modulus Ec could be calculated by
the following equation [232]:
𝐸𝑐 = ∑ 𝑉𝑖𝐸𝑖
𝑛
𝑖=1
( 9.2 )
where 𝑽𝒊 and 𝑬𝒊 are the volume fraction and elastic modulus of the 𝑖𝑡ℎ component,
respectively. In the present study, 𝑖 = 1,2,3 correspond to the bare substrate, PEO coated
substrate and PEO+CED treated substrate, respectively. Since the elastic modulus of MgO in
the PEO coating was 249 GPa [233], much higher than that of Mg (~45 GPa) and HA (~100
GPa) [234], significantly higher effective elastic modulus of the coated magnesium could be
obtained according to Equation (9.2). To this end, a higher stress was required to strain the
sample to the same extent, and resulting higher slopes compared with that of the magnesium
substrate, as indicated by the first set of dashed lines in Figure 9-5 (b). So it could be
concluded that the elastic modulus of the substrate was enhanced by the PEO coating, and
further increased by the subsequent CED treatment. Such observation was consistent with
the results of nanoindentation tests reported by Khan et al. [235].
When the samples were further strained, cracks could be formed at some localised sites of
the top coating, which would cause decrease of effective elastic modulus according to the
following equation [234]:
𝐸𝑐′ = 𝐸𝑐(1 − 𝑓𝑁𝑐3) ( 9.3 )

Chapter 9 Mechanical properties of cp Mg with duplex HA/PEO coatings
160
where 𝐸𝑐 is the original effective elastic modulus of the specimen without cracking, 𝑁 is the
volumetric crack density, 𝑐 is proportional to the crack length and f is a function of crack
orientation. Such decreased effective elastic modulus was reflected by the decreased slopes
on the tensile curves, as shown by the second set of dashed lines in Figure 9-5 (b). As
tension proceeded, the un-cracked coating helped in bearing the stress, causing an increase
in the slope of the tensile curves, as presented by the set of dash lines 3 in Figure 9-5 (b).
This process repeated, and sequentially cracked the majority of the coating; therefore, such
‘dog-leg’ behaviour was not apparent in the tensile curves of the later stages (Figure 9-5). It
is worthwhile mentioning that such periodic sequential cracking of brittle coatings on elastic
substrates was also proposed by Thouless et al. [236, 237] through theoretical calculation.
Actually, formation of cracks during the tensile experiment could be observed on the sample
surface, which is presented in Figure 9-6.
When the bare magnesium substrate was strained beyond the elastic region, it underwent
plastic deformation. As shown in Figure 9-5, increasing stress with strain was also observed
at this stage; this was believed to be driven by work hardening mechanism, as described by
the Ramberg-Osgood equation [238]:
ε =𝜎
𝐸+ (
𝜎
𝐾)
1𝑛 ( 9.4 )
where σ is the stress at plastic strain 휀, 𝐾 is the strength co-efficient and 𝑛 is the work
hardening exponent. The decreasing stress presented at the final stage of the tensile curves
was due to the formation of fatal cracks and/or localised plastic deformation of the sample.
Also at this stage, large cracks became apparent on the sample surface, as presented in
Figure 9-6. Regardless of the mechanisms, the maximum stress at each curve was attributed
to σUTS, and the results are summarised in Table 9-1. It is obvious that after the PEO
treatment, the elongation of the system at the UTS slightly increased from 33.1% to 36.3%,
and was marginally decreased to 35.7% by the subsequent CED treatment. The σUTS values
of 157.2 MPa and 158.0 MPa were derived for the cp magnesium samples before and after
the PEO treatment, respectively, indicating the σUTS was not affected by the PEO coating.
However, after CED treatment, the σUTS of the sample increased by almost 10 MPa to 166.4
MPa, as shown in Figure 9-5 and Table 9-1.

Chapter 9 Mechanical properties of cp Mg with duplex HA/PEO coatings
161
Figure 9-5 (a) Tensile curves of the samples used in the present study (a); (b) enlarged view
of the initial parts of the curves as shown in (a)
Figure 9-6 Surface of the PEO coated cp magnesium during the tensile test. (The elongation
is 7.5%)
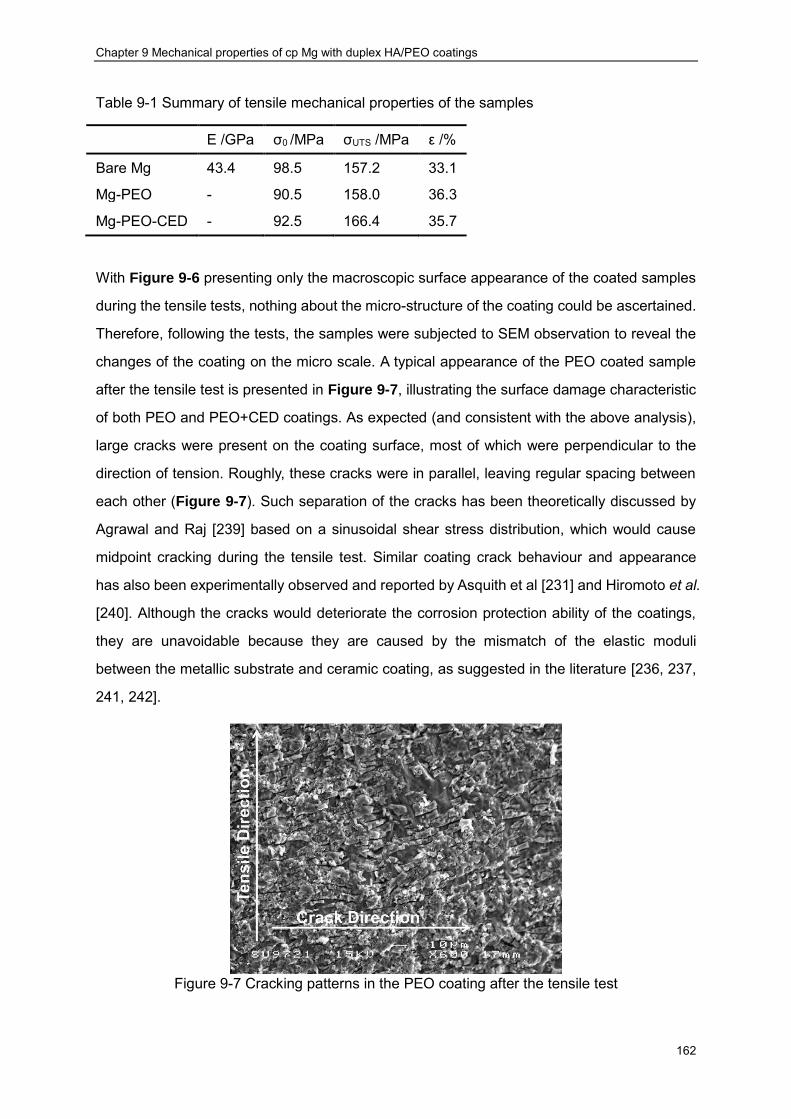
Chapter 9 Mechanical properties of cp Mg with duplex HA/PEO coatings
162
Table 9-1 Summary of tensile mechanical properties of the samples
E /GPa σ0 /MPa σUTS /MPa ε /%
Bare Mg 43.4 98.5 157.2 33.1
Mg-PEO - 90.5 158.0 36.3
Mg-PEO-CED - 92.5 166.4 35.7
With Figure 9-6 presenting only the macroscopic surface appearance of the coated samples
during the tensile tests, nothing about the micro-structure of the coating could be ascertained.
Therefore, following the tests, the samples were subjected to SEM observation to reveal the
changes of the coating on the micro scale. A typical appearance of the PEO coated sample
after the tensile test is presented in Figure 9-7, illustrating the surface damage characteristic
of both PEO and PEO+CED coatings. As expected (and consistent with the above analysis),
large cracks were present on the coating surface, most of which were perpendicular to the
direction of tension. Roughly, these cracks were in parallel, leaving regular spacing between
each other (Figure 9-7). Such separation of the cracks has been theoretically discussed by
Agrawal and Raj [239] based on a sinusoidal shear stress distribution, which would cause
midpoint cracking during the tensile test. Similar coating crack behaviour and appearance
has also been experimentally observed and reported by Asquith et al [231] and Hiromoto et al.
[240]. Although the cracks would deteriorate the corrosion protection ability of the coatings,
they are unavoidable because they are caused by the mismatch of the elastic moduli
between the metallic substrate and ceramic coating, as suggested in the literature [236, 237,
241, 242].
Figure 9-7 Cracking patterns in the PEO coating after the tensile test
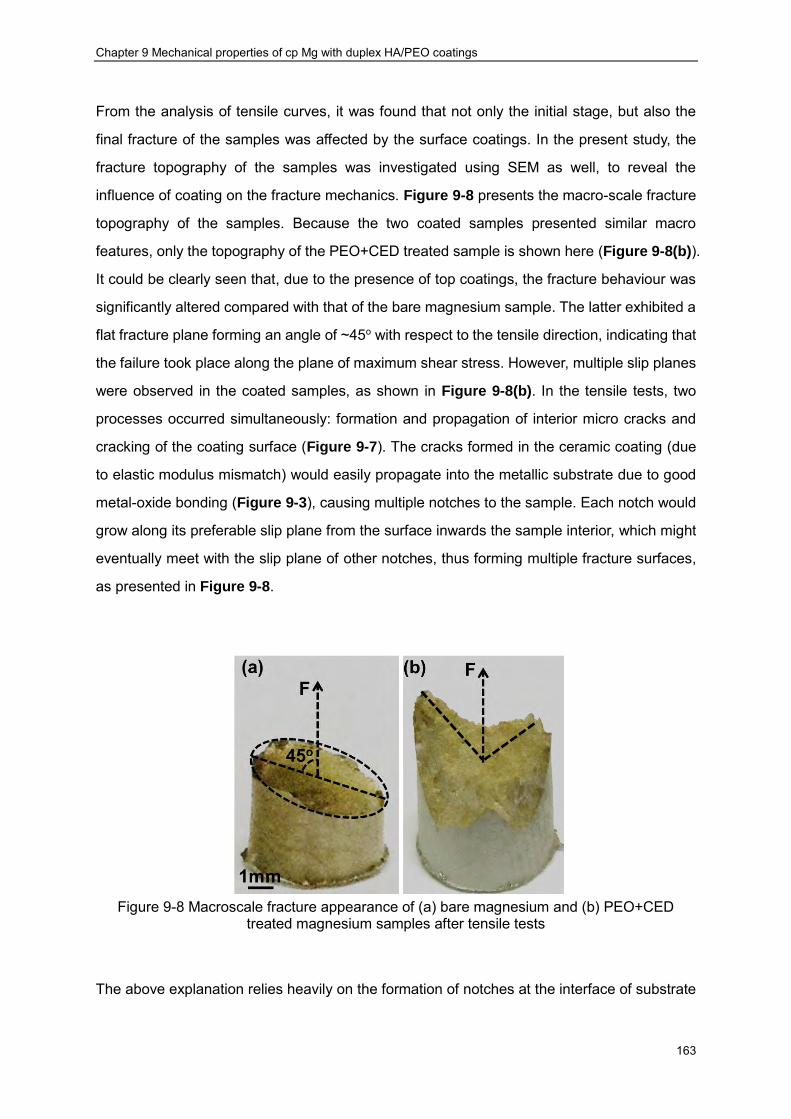
Chapter 9 Mechanical properties of cp Mg with duplex HA/PEO coatings
163
From the analysis of tensile curves, it was found that not only the initial stage, but also the
final fracture of the samples was affected by the surface coatings. In the present study, the
fracture topography of the samples was investigated using SEM as well, to reveal the
influence of coating on the fracture mechanics. Figure 9-8 presents the macro-scale fracture
topography of the samples. Because the two coated samples presented similar macro
features, only the topography of the PEO+CED treated sample is shown here (Figure 9-8(b)).
It could be clearly seen that, due to the presence of top coatings, the fracture behaviour was
significantly altered compared with that of the bare magnesium sample. The latter exhibited a
flat fracture plane forming an angle of ~45o with respect to the tensile direction, indicating that
the failure took place along the plane of maximum shear stress. However, multiple slip planes
were observed in the coated samples, as shown in Figure 9-8(b). In the tensile tests, two
processes occurred simultaneously: formation and propagation of interior micro cracks and
cracking of the coating surface (Figure 9-7). The cracks formed in the ceramic coating (due
to elastic modulus mismatch) would easily propagate into the metallic substrate due to good
metal-oxide bonding (Figure 9-3), causing multiple notches to the sample. Each notch would
grow along its preferable slip plane from the surface inwards the sample interior, which might
eventually meet with the slip plane of other notches, thus forming multiple fracture surfaces,
as presented in Figure 9-8.
Figure 9-8 Macroscale fracture appearance of (a) bare magnesium and (b) PEO+CED
treated magnesium samples after tensile tests
The above explanation relies heavily on the formation of notches at the interface of substrate
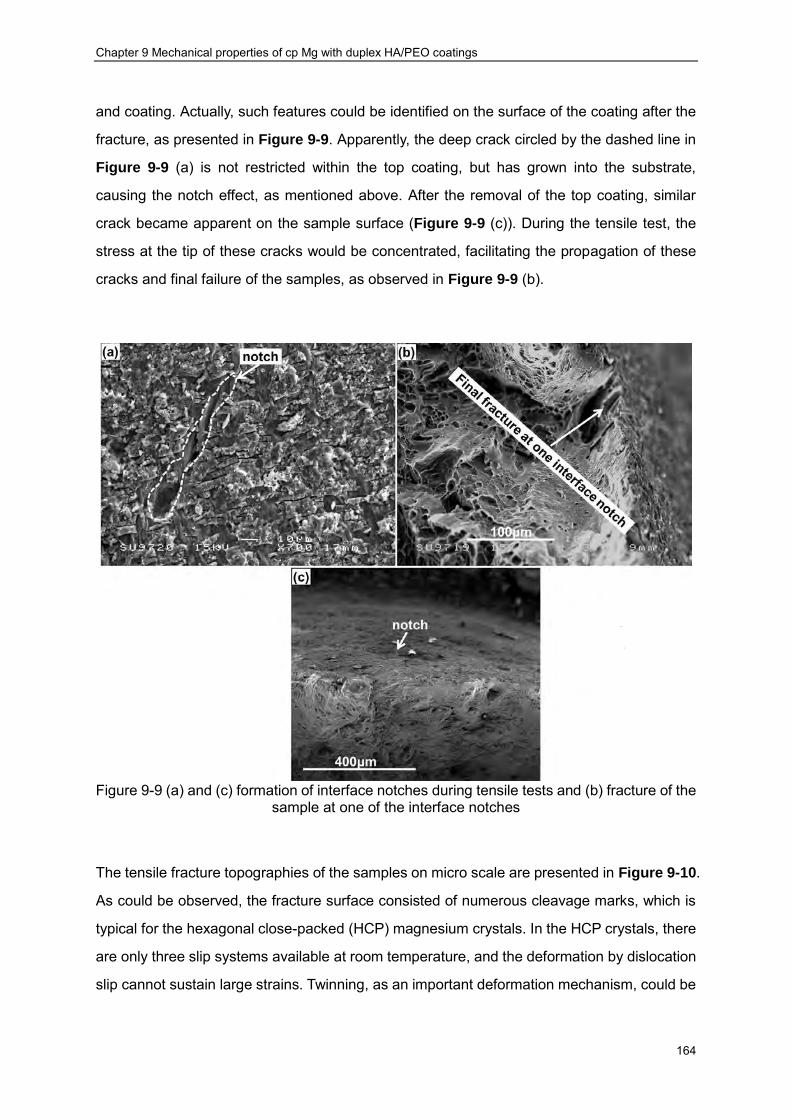
Chapter 9 Mechanical properties of cp Mg with duplex HA/PEO coatings
164
and coating. Actually, such features could be identified on the surface of the coating after the
fracture, as presented in Figure 9-9. Apparently, the deep crack circled by the dashed line in
Figure 9-9 (a) is not restricted within the top coating, but has grown into the substrate,
causing the notch effect, as mentioned above. After the removal of the top coating, similar
crack became apparent on the sample surface (Figure 9-9 (c)). During the tensile test, the
stress at the tip of these cracks would be concentrated, facilitating the propagation of these
cracks and final failure of the samples, as observed in Figure 9-9 (b).
Figure 9-9 (a) and (c) formation of interface notches during tensile tests and (b) fracture of the
sample at one of the interface notches
The tensile fracture topographies of the samples on micro scale are presented in Figure 9-10.
As could be observed, the fracture surface consisted of numerous cleavage marks, which is
typical for the hexagonal close-packed (HCP) magnesium crystals. In the HCP crystals, there
are only three slip systems available at room temperature, and the deformation by dislocation
slip cannot sustain large strains. Twinning, as an important deformation mechanism, could be
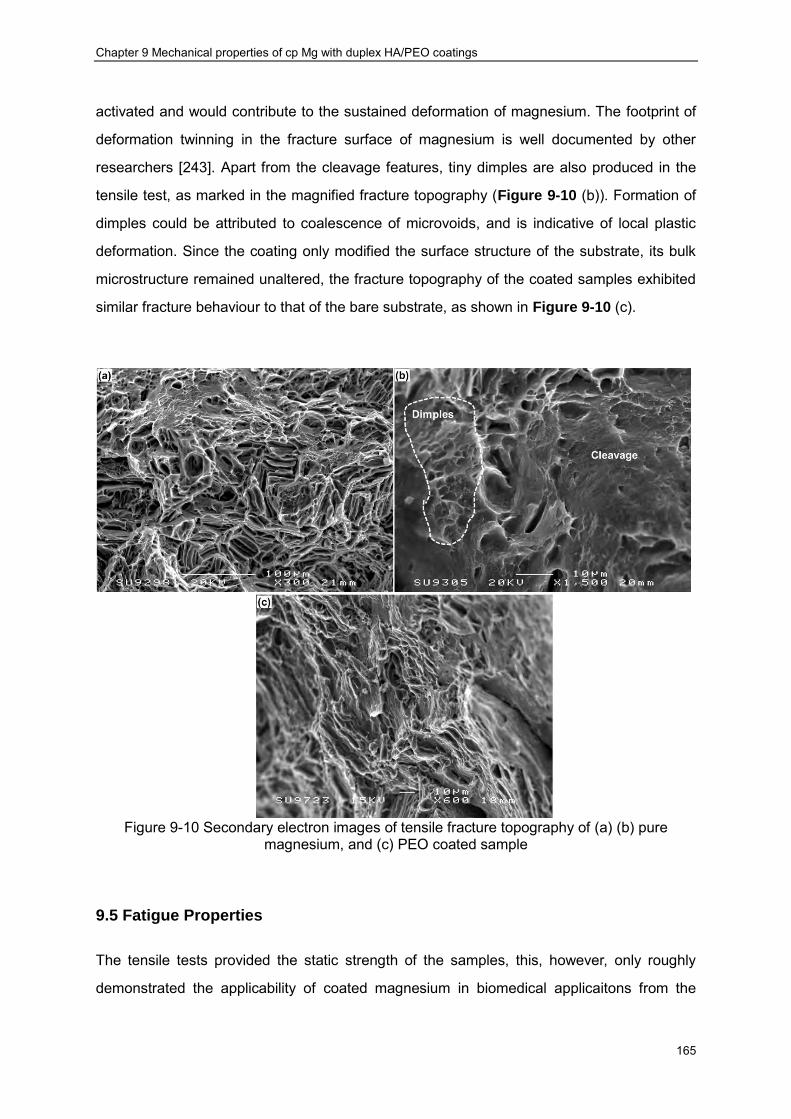
Chapter 9 Mechanical properties of cp Mg with duplex HA/PEO coatings
165
activated and would contribute to the sustained deformation of magnesium. The footprint of
deformation twinning in the fracture surface of magnesium is well documented by other
researchers [243]. Apart from the cleavage features, tiny dimples are also produced in the
tensile test, as marked in the magnified fracture topography (Figure 9-10 (b)). Formation of
dimples could be attributed to coalescence of microvoids, and is indicative of local plastic
deformation. Since the coating only modified the surface structure of the substrate, its bulk
microstructure remained unaltered, the fracture topography of the coated samples exhibited
similar fracture behaviour to that of the bare substrate, as shown in Figure 9-10 (c).
Figure 9-10 Secondary electron images of tensile fracture topography of (a) (b) pure
magnesium, and (c) PEO coated sample
9.5 Fatigue Properties
The tensile tests provided the static strength of the samples, this, however, only roughly
demonstrated the applicability of coated magnesium in biomedical applicaitons from the
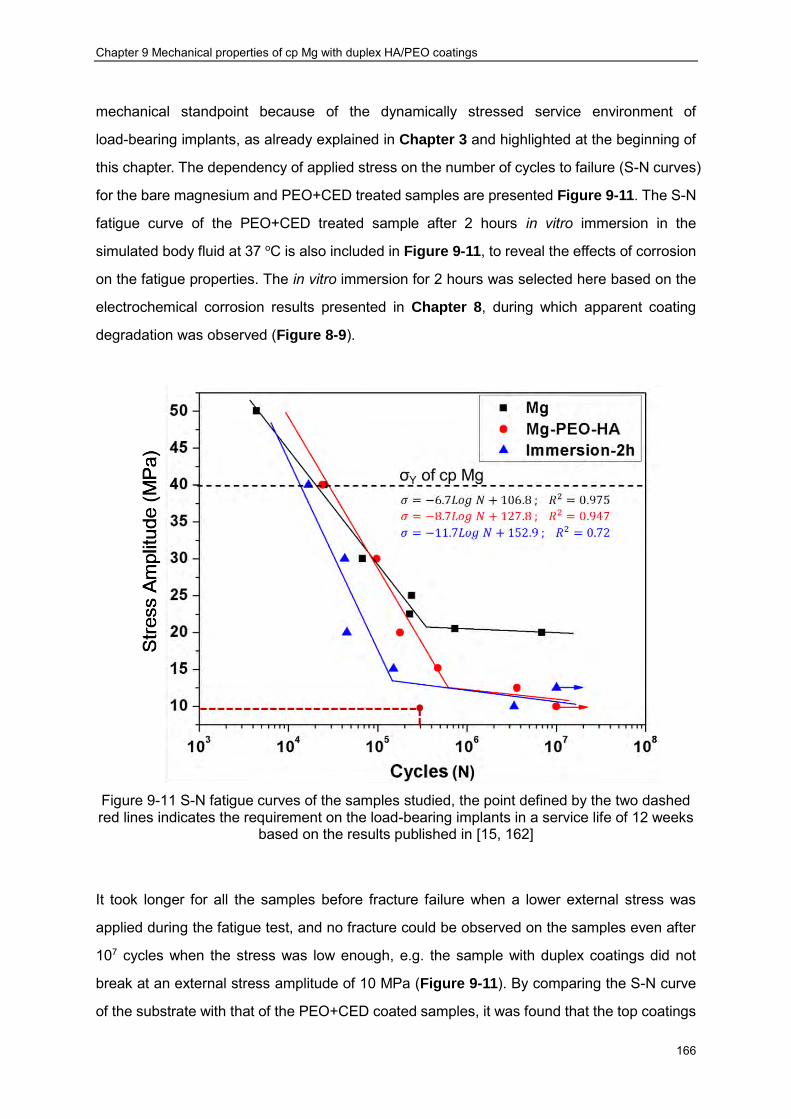
Chapter 9 Mechanical properties of cp Mg with duplex HA/PEO coatings
166
mechanical standpoint because of the dynamically stressed service environment of
load-bearing implants, as already explained in Chapter 3 and highlighted at the beginning of
this chapter. The dependency of applied stress on the number of cycles to failure (S-N curves)
for the bare magnesium and PEO+CED treated samples are presented Figure 9-11. The S-N
fatigue curve of the PEO+CED treated sample after 2 hours in vitro immersion in the
simulated body fluid at 37 oC is also included in Figure 9-11, to reveal the effects of corrosion
on the fatigue properties. The in vitro immersion for 2 hours was selected here based on the
electrochemical corrosion results presented in Chapter 8, during which apparent coating
degradation was observed (Figure 8-9).
Figure 9-11 S-N fatigue curves of the samples studied, the point defined by the two dashed red lines indicates the requirement on the load-bearing implants in a service life of 12 weeks
based on the results published in [15, 162]
It took longer for all the samples before fracture failure when a lower external stress was
applied during the fatigue test, and no fracture could be observed on the samples even after
107 cycles when the stress was low enough, e.g. the sample with duplex coatings did not
break at an external stress amplitude of 10 MPa (Figure 9-11). By comparing the S-N curve
of the substrate with that of the PEO+CED coated samples, it was found that the top coatings
Chapter 9 Mechanical properties of cp Mg with duplex HA/PEO coatings
167
tend to deteriorate the fatigue performance of cp magnesium in the region of high cycles, i.e.
lower fatigue strength limit (i.e survival at 107 stress cycles) was observed for the coated
sample compared with the bare substrate. Similar effects of a porous coating on the fatigue
performance of the substrate were also reported by other researchers [109, 111, 165, 244].
Specifically, the fatigue strength of the bare magnesium decreased from 20 MPa to 10 MPa
after PEO+CED treatment. However, the fatigue performance of the bare magnesium was
enhanced slightly by the surface treatments in the low cycle region (σ>σY), as indicated by
Figure 9-11. The worst fatigue performance was observed after 2 hours’ in vitro immersion
test when the applied external stress amplitude was >15 MPa. The S-N curves of the
PEO+CED treated sample before and after in vitro corrosion almost coincided with each
other when external stress amplitude was <15 MPa, indicating similar fatigue performance. A
fatigue strength limit of 10 MPa was produced from the coated sample after in vitro corrosion
test (Figure 9-11). By comparing the cyclic fatigue strength limit with the static tensile
strength of the samples, it was found that the fracture strength in the fatigue condition was
only around 10% of that under the static tensile condition. Nevertheless, the fatigue strength
limit was still higher than that required in the daily activities of the patient, as indicated in
Figure 9-11. Therefore, the applicability of magnesium based implants using the PEO+CED
surface treatment was demonstrated from the viewpoint of fatigue performance.
Up to now, there is considerable debate concerning the cause of fatigue reduction of the PEO
coated substrates. Nevertheless, it was still acknowledged that three factors may be
responsible for such change in fatigue performance [244]: (a) the change in the
microstructure of the underlying substrate as a consequence of surface treatment, (b)
formation of defects, like notches, on the surface of the magnesium substrate during the
coating process and (c) stress concentrations at the interface to the porous layer (and within
the coating). Actually, accumulation of internal stress was reported in Chapter 6, where
compressive stress was identified at the surface of the underlying magnesium substrate.
Compressive internal stress was also found within the top HA layer from the analysis of XRD
results in Section 9.3. The cross sectional SEM images of the coatings (Figure 9-3) indicated
rough coating surface and coating/substrate interface, inducing numerous defects. Based
on these observations, factors (b) and (c) could be originated in the PEO process, affecting
the fatigue performance. In fact, Apachitei et al [109] had attributed the reduced fatigue
strength to the combination of these two factors. How these factors may influence the fatigue

Chapter 9 Mechanical properties of cp Mg with duplex HA/PEO coatings
168
performance will be discussed in the following part of this chapter through the analysis of the
fatigue fractographs of the samples together with corresponding S-N curves (Figure 9-11).
Figure 9-12 (a): Fatigue fractography analysis of the PEO+CED treated magnesium at
low-cycle condition (applied stress of 40 MPa) and magnified SEM images of corresponding regions (b),(c) and (d) in (a).
The fatigue fractography analysis of the PEO+CED treated sample in the low cycle region is
shown in Figure 9-12 (a), in which three regions could be identified and are marked as region
(b), (c) and (d). These three regions could be seen, respectively, as the footprints of the three
stages in the fatigue process, i.e. crack initiation, crack propagation and final fracture.
Therefore, fatigue life of the sample was determined by the three stages. It is evident that the
cracks were firstly initiated (region (a)), then propagate to the base metal (region (c)), leading
to the final failure at the centre of the sample (region (d)). To clearly reveal the effect of the
fatigue process, magnified features of the three regions are also presented in Figure 9-12.
One of the crack initiation sites can be identified in Figure 9-12 (b). Even though part of the

Chapter 9 Mechanical properties of cp Mg with duplex HA/PEO coatings
169
coating is damaged by the final fracture, most of it is still bonding well with the substrate
(Figure 9-12 (b)). A crack with length of >20 μm is evident in Figure 9-12 (b), which must
have been initiated at the top coating and propagated down to the base metal considering the
well-bonded coating after fracture The propagation of the cracks formed in the crack
initiation sites was characterised by the beach marks ( Region (c) of Figure 9-12(a)).
Simultaneously, crack coalescence also took place, as shown in Figure 9-12 (c). The
ultimate failure of the sample was manifested in the appearance of intergranular fracture
facets, in contrast with the ductile fracture observed in the static tensile test.
Figure 9-13 (a) Fractography analysis of the PEO+CED treated magnesium sample failed in the high cycle fatigue region (applied stress of 20 MPa); (b) crack propagation beach marks;
(c) a typical crack nucleation site and (d) cracks penetrating into the substrate.
However, when the applied external stress was reduced to 20 MPa, different appearance of
fatigue fracture was produced, as shown in Figure 9-13. The three regions mentioned in
Figure 9-12 are not quite distinguishable. Unlike the numerous crack initiation sites observed

Chapter 9 Mechanical properties of cp Mg with duplex HA/PEO coatings
170
in Figure 9-12, much less crack initiation sites could be observed, as being circled by dashed
lines in Figure 9-13 (a). A magnified image of one of the sites is presented in Figure 9-13 (c),
where it is clear that the crack originated at the coating/substrate interface (Figure 9-13 (d)),
which could be judged by noticeable delamination of the top coating from the substrate
(Figure 9-13 (c)). Similar with the observations of Figure 9-12 (c), beach marks (indicated by
the arrows in Figure 9-13(b)) were also identified due to the crack propagation process.
The fatigue fractograpy analysis of corroded sample with PEO+CED coatings is presented in
Figure 9-14. Due to the presence of corrosion effect, totally different fatigue fracture
appearance was observed. Based on the observations presented in Figure 7-13, the coating
was also delaminated from the substrate because of cathodic hydrogen liberation during
corrosion process. Yet worse, the corrosion process left numerous corrosion pits that could
penetrate to the magnesium substrate. Such corrosion pits could provide notch-like effect to
the materials under fatigue test. Therefore, the crack initiation process was much easier than
for uncorroded samples, causing worse fatigue performance, as shown in Figure 9-11.
Figure 9-14 (a) Fatigue fractograpy analysis of the corroded sample with PEO+CED coating
and (b) magnified image showing corrosion effects. (The applied external stress for the fatigue test is 15 MPa)
The above analysis concluded that the fatigue fracture behaviour of the PEO+CED treated
sample was different when different external stress was applied. In the low cycle region (high
external stress) condition, cracks were initiated within the brittle coating, while
coating/substrate interface provided preferable crack initiation sites for the low stress (20
Chapter 9 Mechanical properties of cp Mg with duplex HA/PEO coatings
171
MPa) condition. Such conclusions could be confined by examination of cross sectional
images of the samples after fatigue fracture. The samples were sectioned at a distance away
from the final fracture surface to avoid its influence on the cross-sectional features. The
comparison of the cross-sectional images is exhibited in Figure 9-15. Consistent with the
features presented in Figures 9-12 and 9-13, the bonding of the coating with the substrate at
the external stress of 40 MPa was not affected. Therefore, the cracks formed in the brittle
coating could easily penetrate into the substrate while such penetration was unlikely when
the stress was reduced to 20 MPa because of serious delamination (Figure 9-15 (b)).
According to the above observations, the compressive residual stress (see Chapter 6)
induced to the underlying substrate was present throughout the low-cycle fatigue life, which
would inhibit the crack formation and propagation. Therefore, a better fatigue performance
was observed in this low-cycle region compared with the bare substrate of free surface that
could not provide any inhibition to crack development. In the high cycles region (low applied
stress) however, the effect of compressive residual stress was likely to be eliminated due to
residual stress relaxation. In fact, the relaxation of residual stress in the high cycle fatigue test
has been extensively reported in the literature [245, 246]. Also, due to the relaxation of
residual stress, the coating became delaminated from the substrate, as observed in Figure
9-15 (b). In this case, another factor induced by the PEO process, increased interfacial
roughness, determined the fatigue behaviour. The rough interface could be seen as
preformed notched defects. Therefore, fatigue cracks were more readily initiated, causing a
worse fatigue performance as compared with the finely polished uncoated substrate,
according to the following equation [247]:
𝜎𝑚𝑎𝑥 = 𝜎(1 + 2√𝑎/𝜌) ( 9.5 )
where 𝜎𝑚𝑎𝑥 is the actual stress at the tip of the crack, 𝜎 is the applied external stress, 2𝑎
is the crack length and 𝜌 is the radius of curvature of the crack tip. In the present study,
infinite 𝜌 could be expected for the finely polished surface of the uncoated magnesium;
therefore, the stress is not concentrated at the sample surface. However, notches would be
induced at the coating/substrate interface, as be marked in Figure 9-15 (a). Since the tips of
the notches are sharp, a relatively small 𝜌 could be expected. Therefore, the stress at these
tips is substantially concentrated, favouring crack formation and propagation.
After in vitro corrosion, the effect of coating was compromised by the damage induced by

Chapter 9 Mechanical properties of cp Mg with duplex HA/PEO coatings
172
corrosion process. Corrosion channels could be identified after in vitro immersion of the
PEO+CED treated samples Figure 9-15 (c), which were due to periodic fracture of the HA
layer. At the bottom of such corrosion channels, large cracks were observed to penetrate into
the substrate, which could possibly induce the final fracture. The applied stress would be
concentrated at the tips of the corrosion cracks (notches), causing the local stress to become
much higher than the applied nominal stress, allowing fast crack development (initiation and
propagation). It should be mentioned here that the notches formed in the corrosion process
were sharper and deeper than those mentioned in the above paragraph, thus being much
more detrimental to the fatigue performance, according to Equation (9.4).Therefore, the
worst fatigue performance was observed from the corroded samples as shown in Figure
9-11.
Figure 9-15 Cross-sectional SEM images of PEO+CED treated samples after fatigue fracture:
(a) 40 MPa, (b) 20 MPa and (c) fatigue cross sectional image of corroded sample with external stress of 20 MPa.
9.6 Summary
In the present Chapter, duplex PEO+HA coatings were successfully fabricated on the top of

Chapter 9 Mechanical properties of cp Mg with duplex HA/PEO coatings
173
cp magnesium and the static tensile and cyclic fatigue mechanical properties of the samples
were evaluated. The influence of top coatings on the mechanical properties of the samples
was discussed, and the findings are as follows:
(a) The subsequent CED treatment could provide effective sealing to the pores of the
PEO coating. However, the coating bonding with the substrate was deteriorated due
to hydrogen liberation at the coating/substrate interface during the CED process.
(b) The static tensile mechanical properties of the bare substrate were not significantly
affected by the top coatings. However, the periodic cracking of the top coatings due to
elastic moduli mismatch affected the fracture behaviour.
(c) The fatigue performance of the bare substrate was enhanced by the top coatings in
the low-cycle region possibly due to the presence of compressive residual stress.
However, a reduced fatigue limit was observed in the high-cycle region because of
increased roughness of the coating/substrate interface.
(d) The fatigue performance of the coated samples was further reduced by the
subsequent in vitro corrosion process, with fatigue cracks being initiated at the
corrosion pits.
(e) The applicability of the surface treated cp magnesium in biomedical applications was
demonstrated from the mechanical standpoint.
The corrosion fatigue tests that involved evaluation of fatigue performance during corrosion
exposure could be more desirable for practical purpose, which, however, would be a subject
of future work.

Conclusions and Perspectives
174
Conclusions and Perspectives
Conclusions
In the present project, the PEO processing parameters have been progressively optimised to
facilitate the development of biodegradable magnesium implants with their degradation rate
and biological response controlled by engineered surfaces based on PEO coatings. Firstly,
one promising electrolyte composed of only physiologically friendly compounds has been
selected from the modification of conventional phosphate based electrolyte. Then, the effects
of current regime parameters have been studied by comparing coatings produced with
different PEO current waveforms. Finally, a post treatment producing a crystalline HA layer on
the PEO coating has also been investigated in order to enhance the bioactive properties of
cp-Mg. The optimised PEO processing parameters have been selected based on two basic
criteria through the present project: (i) the process stability should not be compromised and (ii)
the corrosion resistance of the cp magnesium substrate should be improved. To this end, two
basic experimental procedures have been conducted: PEO process characterisation and
evaluation of resulting coatings. The mechanical properties of the magnesium substrates with
PEO+HA coatings produced using the optimised parameters have also been studied to
demonstrate their applicability in the biomedical area. The findings of this project are
summarised in the following part of this chapter.
i) The electrolyte used for the PEO treatment of magnesium must be capable of
providing a wide region of stable passivation; otherwise PEO coating could not be
produced. For this reason, the electrolyte composed of Ca(NO3)2 , NaOH, and
Na3PO4∙12H2O is not suitable for the coating production on cp magnesium using
PEO treatment.
ii) Current regimes, i.e. DC (with different current density), pulse unipolar (with
various pulse frequency and duty cycle) and pulse bipolar (with different negative
biasing amplitude) strongly affect the PEO process and final coating
characteristics in the following ways:
a) Increasing the DC current densities during the PEO process would
possibly affect the process stability, especially at the later stage of PEO
treatment. Correspondingly, coatings produced at a current density of 30
Conclusions and Perspectives
175
mA/cm2 provide superior corrosion protection compared with those
produced at higher current densities of 40 mA/cm2 and 50 mA/cm2.
b) Compared with DC PEO coatings, those produced under pulsed unipolar
current conditions possess better corrosion protection. After characterising
the coatings produced at various frequencies from 100 Hz to 5000 Hz, the
pulsing frequency is optimised at 3000 Hz, which results in lower residual
stress in the PEO coating and the best corrosion performance.
c) When introducing negative biasing to the optimised unipolar current
(frequency 3000 Hz, current density of 30 mA/cm2 and duty cycle of 10%),
it was found that the integrity of the coating deteriorated, due to hydrogen
liberation at the coating/substrate interface during the negative bias step.
Correspondingly, a worse in vitro corrosion performance was observed. It
was concluded therefore, that the bipolar PEO process is not an option for
the present electrolyte.
d) In DC PEO treatment, only Mg, O and P were identified in the resulting
coatings, even though a significant amount of Ca was present in the
electrolyte. After applying pulsed PEO treatment, Ca was successfully
incorporated into the coating, and the Ca content seems to be independent
of the pulsing parameters (frequency, negative biasing current density).
e) Even though the incorporation of Ca and P in the coating was successful,
the formation of HA in the PEO coating has been failed and the coatings
are mainly composed of MgO.
iii) Subsequent treatment using a cathodic electrodeposition (CED) technique
successfully applied a HA layer on top of the PEO coating. Such relatively dense
coating could partially seal the pores and defects within the PEO coating.
Consequently, the corrosion resistance of the coated sample is further increased
by ~22 times compared with that of the PEO coated cp-Mg.
iv) The duplex PEO+HA coatings on cp-Mg could only provide temporary corrosion
protection, exhibiting a high degradation rate in the corrosive simulated body fluid
environment.
v) Several stages could possibly take place during the corrosion process of the
surface of duplex PEO+CED treated cp magnesium. Initially, the corrosive
medium penetrates through the top HA coating towards the PEO coating and
Conclusions and Perspectives
176
substrate. Then the PEO coating is dissolved, resulting in larger surface defects.
Due to the PEO coating dissolution, the top HA layer becomes detached from the
surface, reducing its corrosion resistance. When the corrosive medium reaches
the coating/substrate interface, the substrate starts corroding, leading to partial
delamination of the coating due to hydrogen liberation and formation of corrosion
pits.
vi) A minor increase of the static tensile strength of the bare magnesium is observed
after the PEO+CED treatment. However, the fracture behaviour is significantly
altered by the top coatings. Periodic cracking of the coatings is observed and
multiple fracture surfaces are present on the coated samples.
vii) The fatigue performance of the bare substrate was enhanced by the coatings in
the low cycle region possibly due to the induction of compressive residual stress.
But reduced fatigue limit was observed in the high cycles region because of
increased roughness of the coating/substrate interface. The fatigue performance
of coated samples was further reduced by the subsequent in vitro corrosion
process, where the corrosion pits served as preformed notches at the
coating/substrate interface. Nevertheless, the static/cyclic mechanical properties
can still satisfy the practical requirement for load-bearing biomedical applications.
Future Work
The corrosion resistance of cp magnesium in SBF has been improved by the optimised PEO
process and further enhanced by subsequent CED post treatment to form a HA film. However,
its degradation rate in the simulated physiological environment is still too fast for future
clinical applications. Further studies are still needed to reduce the corrosion rate, which
remains the priority of future research. The high degradation rate of PEO-coated magnesium
is determined by several factors, which indicate further research directions. Firstly, the
optimised PEO processing parameters would be applied on other corrosion resistant
magnesium alloys containing biologically friendly elements (like Ca, Zn, Mn) to evaluate their
universality. Secondly, formation of stable phases other than MgO would possibly reduce the
degradation rate because MgO will essentially be dissolved in the SBF at a pH of 7.4; such a
strategy could be achieved by addition of compounds formed by oxidising electrolyte anions
(like F- or SiO32-) that could easily passivate magnesium in the existing electrolyte. Thirdly, the
Conclusions and Perspectives
177
defects (pores and cracks) within the PEO coatings should be reduced or ideally eliminated
the penetration of corrosive medium towards the substrate.
The post PEO treatment CED-HA film could enhance the bioactivity of the coated samples.
However, two contradictory effects could influence the corrosion performance of the
substrates. On one hand, defects within the PEO coating would be partially sealed, reducing
the corrosion rate. On the other hand, liberation of excess hydrogen in the deposition process
could deteriorate the bonding of PEO coating with the substrate, which is detrimental for the
corrosion protection. Therefore, it is an essential requirement to balance the two aspects,
probably by adjusting the deposition time and current density.
In terms of coating properties, the present work only evaluates the in vitro corrosion
performance of the coated samples using electrochemical methods. However, the toxicity of
the coated samples remains to be assessed, which could be conducted through simple in
vitro cell culture experiments or through practical in vivo implant operation.
The effects of pre-corrosion on the fatigue performance of the coated samples were
investigated in the present project. Corrosion fatigue tests that involved fatigue performance
during exposure to the corrosion environment are more desirable for practical purpose, which
should be planned as future work.
References
178
References
[1] C. Castellani, R.A. Lindtner, P. Hausbrandt, E. Tschegg, S.E. Stanzl-Tschegg, G. Zanoni, S. Beck, A.-M. Weinberg, Acta Biomaterialia, 7 (2011) 432-440. [2] P. Bala Srinivasan, J. Liang, C. Blawert, M. Störmer, W. Dietzel, Journal of Materials Science, 45 (2010) 1406-1410. [3] Z. Yao, L. Li, Z. Jiang, Applied Surface Science, 255 (2009) 6724-6728. [4] D.F. Williams, Definitions in biomaterials: proceedings of a consensus conference of the European Society for Biomaterials, Chester, England, March 3-5, 1986, Elsevier Science Ltd, 1987. [5] B.D. Ratner, A.S. Hoffman, F.J. Schoen, J. Lemons, Biomaterials Science: An Introduction to Materials in Medicine, (2004) 1-9. [6] B.D. Ratner, S.J. Bryant, Annual Review of Biomedical Engineering, 6 (2004) 41-75. [7] J.A. Donaldson, Gold Bull, 13 (1980) 117-124. [8] J. Lister, British medical journal, 2 (1867) 246. [9] J. Lister, British medical journal, 2 (1868) 53. [10] M. Moukwa, JOM, 49 (1997) 46-50. [11] J. Charnley, A. Kamangar, M. Longfield, Medical and biological engineering, 7 (1969) 31-39. [12] J. Charnley, Proc. Proceedings of the Institution of Mechanical Engineers, Conference Proceedings, 1966. [13] D. Williams, Medical device technology, 14 (2003) 10-13. [14] M.J. Lysaght, J.A. O'Loughlin, ASAIO Journal, 46 (2000) 515-521. [15] M.Y.A. A.E.Yousif, JOSR Journal of Engineering, 2 (2012) 13-19. [16] R. Bartlett, Introduction to Sports Biomechanics: Analysing Human Movement Patterns, Routledge, 2007. [17] J.J. Jacobs, J.L. Gilbert, R.M. Urban, The Journal of Bone & Joint Surgery, 80 (1998) 268-282. [18] E.F. Virginia Sáenz de Viteri, Titanium and Titanium Alloys as Biomaterials in: J. Gegner (Ed.) Tribology - Fundamentals and Advancements, Intech, 2013. [19] J. Nagels, M. Stokdijk, P.M. Rozing, Journal of Shoulder and Elbow Surgery, 12 (2003) 35-39. [20] J.R. Davis, A. International, Handbook of materials for medical devices, ASM International, 2003. [21] D. Shi, Introduction to Biomaterials, in, Tsinghua University Press, 2006. [22] F. Witte, Acta Biomaterialia, 6 (2010) 1680-1692. [23] R.K.S.R. M. Bobby Kannan, Materials Science Forum, 618-619 (2009) 83-86. [24] T. Kraus, S.F. Fischerauer, A.C. Hänzi, P.J. Uggowitzer, J.F. Löffler, A.M. Weinberg, Acta Biomaterialia, 8 (2012) 1230-1238. [25] M. Staiger, A. Pietak, J. Huadmai, G. Dias, Biomaterials, 27 (2006) 1728-1734. [26] H. Brar, M. Platt, M. Sarntinoranont, P. Martin, M. Manuel, JOM Journal of the Minerals, Metals and Materials Society, 61 (2009) 31-34. [27] K.F. Farraro, K.E. Kim, S.L.Y. Woo, J.R. Flowers, M.B. McCullough, Journal of biomechanics, 47 (2014) 1979-1986. [28] N.-E.L. Saris, E. Mervaala, H. Karppanen, J.A. Khawaja, A. Lewenstam, Clinica Chimica Acta, 294 (2000) 1-26. [29] J. Vormann, Molecular Aspects of Medicine, 24 (2003) 27-37. [30] G. Song, S. Song, Advanced Engineering Materials, 9 (2007) 5. [31] K. Pasternak, J. Kocot, A. Horecka, Journal of Elementology, 15 (2010) 16. [32] H. Zreiqat, C.R. Howlett, A. Zannettino, P. Evans, G. Schulze-Tanzil, C. Knabe, M. Shakibaei, Journal of Biomedical Materials Research, 62 (2002) 175-184. [33] Dietary Reference Intakes for Calcium, Phosphorus, Magnesium, Vitamin D, and Fluoride, in, Food and Nutrition Board, Institute of Medicine, Washington DC, 1997. [34] L. Xu, G. Yu, E. Zhang, F. Pan, K. Yang, Journal of Biomedical Materials Research Part A, 83A (2007) 703-711. [35] P.P.G. Nitesh R. Patel, International Journal of Emerging Technology and Advaned Engineering, 2 (2012) 91-101. [36] Y.S.A. Jabbari, The Journal of Advanced Prosthodontics, 6 (2014) 138-145. [37] Duygulu, Ozgur, Kaya, R. Alper, Oktay, Gizem, Kaya, A. Arslan, Investigation on the potential of magnesium alloy AZ31 as a bone implant, in, Trans Tech, Stafa-Zurich, SUISSE, 2007, pp. 4. [38] W. Agnieszka, Y. Akiko, D. Henryk, S. Wojciech, Science and Technology of Advanced Materials, 13 (2012) 064214. [39] F. Witte, V. Kaese, H. Haferkamp, E. Switzer, A. Meyer-Lindenberg, C. Wirth, H. Windhagen, Biomaterials, 26 (2005) 3557-3563. [40] Z. Li, X. Gu, S. Lou, Y. Zheng, Biomaterials, 29 (2008) 1329-1344. [41] X. Gu, Y. Zheng, Y. Cheng, S. Zhong, T. Xi, Biomaterials, 30 (2009) 484-498. [42] H.R. Bakhsheshi-Rad, M.H. Idris, M.R. Abdul-Kadir, A. Ourdjini, M. Medraj, M. Daroonparvar, E. Hamzah, Materials & Design, 53 (2014) 283-292. [43] G. Song, Advanced Engineering Materials, 7 (2005) 24. [44] G. Song, A. Atrens, Advanced Engineering Materials, 1 (1999) 11-33. [45] A. Froats, T. Aune, D. Hawke, ASM handbook: volume 13 corrosionn in, ASM International, USA, 1987, pp.

References
179
740-754. [46] R. Zeng, W. Dietzel, F. Witte, N. Hort, C. Blawert, Advanced Engineering Materials, 10 (2008) B3-B14. [47] G. Song, Corrosion Science, 49 (2007) 1696-1701. [48] C. Seal, K. Vince, M. Hodgson, IOP Conference Series: Materials Science and Engineering, 4 (2009) 012011. [49] R. Young, Articles of Health, in, 2009. [50] X.-N. Gu, Y.-F. Zheng, Frontiers of Materials Science in China, 4 (2010) 111-115. [51] C. Blawert, W. Dietzel, E. Ghali, G. Song, Advanced Engineering Materials, 8 (2006) 511-533. [52] Y. Song, D. Shan, R. Chen, F. Zhang, E.-H. Han, Materials Science and Engineering: C, 29 (2009) 1039-1045. [53] Advantages and Challenges of Biodegradable Magnesium Implants Addressed at MEDTEC Europe, in, 2011. [54] G. Song, A. Atrens, Advanced Engineering Materials, 5 (2003) 837-858. [55] P.C. Ferreira, K.d.A. Piai, A.M.M. Takayanagui, S.I. Segura-Muñoz, Revista Latino-Americana de Enfermagem, 16 (2008) 151-157. [56] J.H. Meena Shingde, Ross Boadle, Edward J Wills, Roger Pamphlett The Medical journal of Australia, 183 (2005) 145-146. [57] N. Hort, Y. Huang, D. Fechner, M. Störmer, C. Blawert, F. Witte, C. Vogt, H. Drücker, R. Willumeit, K. Kainer, F. Feyerabend, Acta Biomaterialia, 6 (2010) 1714-1725. [58] S. Guan, J. Hu, L. Wang, S. Zhu, H. Wang, J. Wang, W. Li, Z. Ren, S. Chen, E. Meng, J. Gao, S. Hou, B. Wang, B. Chen, Mg Alloys Development and Surface Modification for Biomedical Application, in: F. Czerwinski (Ed.) Magnesium Alloys-Corrosion and Surface Treatments, InTech, Croatia, 2011, pp. 121-164. [59] J. Zhang, C. Wu, Recent Patents on Corrosion Science, 2 (2010) 55-64. [60] J.E. Gray, B. Luan, Journal of Alloys and Compounds, 336 (2002) 88-113. [61] Q. Li, S. Xu, J. Hu, S. Zhang, X. Zhong, X. Yang, Electrochimica Acta, 55 (2010) 887-894. [62] Y. Gao, C. Liu, S. Fu, J. Jin, X. Shu, Y. Gao, Surface and Coatings Technology, 204 (2010) 3629-3635. [63] S. Sun, J. Liu, C. Yan, F. Wang, Applied Surface Science, 254 (2008) 5016-5022. [64] G. Wu, X. Zeng, W. Ding, X. Guo, S. Yao, Applied Surface Science, 252 (2006) 7422-7429. [65] H. Altun, H. Sinici, Materials Characterization, 59 (2008) 266-270. [66] A.L. Yerokhin, X. Nie, A. Leyland, A. Matthews, S.J. Dowey, Surface and Coatings Technology, 122 (1999) 73-93. [67] X.N. Gu, N. Li, W.R. Zhou, Y.F. Zheng, X. Zhao, Q.Z. Cai, L. Ruan, Acta Biomaterialia, 7 (2011) 1880-1889. [68] L. Zhao, C. Cui, Q. Wang, S. Bu, Corrosion Science, 52 (2010) 2228-2234. [69] J. Liang, P.B. Srinivasan, C. Blawert, M. Störmer, W. Dietzel, Electrochimica Acta, 54 (2009) 3842-3850. [70] L.O. Snizhko, A.L. Yerokhin, N.L. Gurevina, V.A. Patalakha, A. Matthews, Thin Solid Films, 516 (2007) 460-464. [71] R. Arrabal, E. Matykina, T. Hashimoto, P. Skeldon, G.E. Thompson, Surface and Coatings Technology, 203 (2009) 2207-2220. [72] M. Boinet, S. Verdier, S. Maximovitch, F. Dalard, Surface and Coatings Technology, 199 (2005) 141-149. [73] S.K. Sengupta, R. Singh, A.K. Srivastava, Journal of The Electrochemical Society, 145 (1998) 2209-2213. [74] Y. Gu, C.-f. Chen, S. Bandopadhyay, C. Ning, Y. Zhang, Y. Guo, Applied Surface Science, 258 (2012) 6116-6126. [75] D.Y. Hwang, Y.M. Kim, D. Park, B. Yoo, D.H. Shin, Electrochimica Acta, 54 (2009) 5479-5485. [76] C.E. Barchiche, E. Rocca, C. Juers, J. Hazan, J. Steinmetz, Electrochimica Acta, 53 (2007) 417-425. [77] X. Zhang, Z. Zhao, F. Wu, Y. Wang, J. Wu, Journal of Materials Science, 42 (2007) 8523-8528. [78] F. Jin, P.K. Chu, G. Xu, J. Zhao, D. Tang, H. Tong, Materials Science and Engineering: A, 435-436 (2006) 123-126. [79] H. Jiang, Z. Shao, B. Jing, Procedia Earth and Planetary Science, 2 (2011) 156-161. [80] X. Wu, X. Ding, W. Qin, W. He, Z. Jiang, Journal of Hazardous Materials, 137 (2006) 192-197. [81] Z. Yao, F. Jia, S. Tian, C. Li, Z. Jiang, X. Bai, ACS Applied Materials & Interfaces, 2 (2010) 2617-2622. [82] P. Huang, K.-W. Xu, Y. Han, Materials Letters, 59 (2005) 185-189. [83] Y. Han, S.-H. Hong, K. Xu, Surface and Coatings Technology, 168 (2003) 249-258. [84] Y. Xu, Z. Yao, F. Jia, Y. Wang, Z. Jiang, H. Bu, Current Applied Physics, 10 (2010) 698-702. [85] Z. Jiang, X. Zeng, Z. Yao, Rare Metals, 25 (2006) 270-273. [86] J. Martin, A. Melhem, I. Shchedrina, T. Duchanoy, A. Nominé, G. Henrion, T. Czerwiec, T. Belmonte, Surface and Coatings Technology, 221 (2013) 70-76. [87] P. Bala Srinivasan, J. Liang, C. Blawert, M. Störmer, W. Dietzel, Applied Surface Science, 255 (2009) 4212-4218. [88] R.H.U. Khan, A. Yerokhin, X. Li, H. Dong, A. Matthews, Surface and Coatings Technology, 205 (2010) 1679-1688. [89] Y. Gu, W. Xiong, C. Ning, J. Zhang, Journal of Materials Engineering and Performance, 21 (2012) 1085-1090. [90] Y. Kuznetsov, A. Kossenko, B. Kazansky, 108-116. [91] E. Matykina, R. Arrabal, P. Skeldon, G.E. Thompson, Electrochimica Acta, 54 (2009) 6767-6778. [92] S. Moon, Y. Jeong, Corrosion Science, 51 (2009) 1506-1512. [93] S. Xin, L. Song, R. Zhao, X. Hu, Thin Solid Films, 515 (2006) 326-332. [94] S.V. Gnedenkov, O.A. Khrisanfova, A.G. Zavidnaya, S.L. Sinebryukhov, V.S. Egorkin, M.V. Nistratova, A. Yerokhin, A. Matthews, Surface and Coatings Technology, 204 (2010) 2316-2322. [95] X. Guo, K. Du, Q. Guo, Y. Wang, F. Wang, ECS Electrochemistry Letters, 2 (2013) C11-C14. [96] P. Bala Srinivasan, J. Liang, R.G. Balajeee, C. Blawert, M. Störmer, W. Dietzel, Applied Surface Science, 256 (2010) 3928-3935.
References
180
[97] P. Su, X. Wu, Z. Jiang, Y. Guo, International Journal of Applied Ceramic Technology, 8 (2011) 112-119. [98] I.J. Hwang, D.Y. Hwang, Y.G. Ko, D.H. Shin, Surface and Coatings Technology, 206 (2012) 3360-3365. [99] V. Dehnavi, B.L. Luan, D.W. Shoesmith, X.Y. Liu, S. Rohani, Surface and Coatings Technology, 226 (2013) 100-107. [100] M. Aliofkhazraei, A.S. Rouhaghdam, Applied Surface Science, 258 (2012) 2093-2097. [101] P. Su, X. Wu, Y. Guo, Z. Jiang, Journal of Alloys and Compounds, 475 (2009) 773-777. [102] Z. Yao, Y. Xu, Z. Jiang, F. Wang, Journal of Alloys and Compounds, 488 (2009) 273-278. [103] A. Ghasemi, V.S. Raja, C. Blawert, W. Dietzel, K.U. Kainer, Surface and Coatings Technology, 204 (2010) 1469-1478. [104] H. Duan, C. Yan, F. Wang, Electrochimica Acta, 52 (2007) 3785-3793. [105] H. Luo, Q. Cai, B. Wei, B. Yu, D. Li, J. He, Z. Liu, Journal of Alloys and Compounds, 464 (2008) 537-543. [106] D.Y. Hwang, J.Y. Cho, D.H. Lee, B.Y. Yoo, D.H. Shin, Materials Transactions, 49 (2008) 1600-1605. [107] L. Rama Krishna, G. Poshal, G. Sundararajan, Metallurgical and Materials Transactions A, 41 (2010) 3499-3508. [108] A.L. Yerokhin, A. Shatrov, V. Samsonov, P. Shashkov, A. Pilkington, A. Leyland, A. Matthews, Surface and Coatings Technology, 199 (2005) 150-157. [109] I. Apachitei, B. Lonyuk, L.E. Fratila-Apachitei, J. Zhou, J. Duszczyk, Scripta Materialia, 61 (2009) 113-116. [110] J. Jiang, Q. Zhou, J. Yu, A. Ma, D. Song, F. Lu, L. Zhang, D. Yang, J. Chen, Surface and Coatings Technology, 216 (2013) 259-266. [111] I. Apachitei, A. Leoni, A.C. Riemslag, L.E. Fratila-Apachitei, J. Duszczyk, Applied Surface Science, 257 (2011) 6941-6944. [112] R.O. Hussein, X. Nie, D.O. Northwood, Electrochimica Acta, 112 (2013) 111-119. [113] Y. Wang, T. Lei, B. Jiang, L. Guo, Applied Surface Science, 233 (2004) 258-267. [114] G. Sundararajan, L. Rama Krishna, Surface and Coatings Technology, 167 (2003) 269-277. [115] H. Duan, Y. Li, Y. Xia, S. Chen, International Journal of Electrochemical Science, 7 (2012) 7619-7630. [116] L.J. Rožić, S. Petrović, N. Radić, S. Stojadinović, R. Vasilić, P. Stefanov, B. Grbić, Thin Solid Films, 539 (2013) 112-116. [117] A.L. Yerokhin, L.O. Snizhko, N.L. Gurevina, A. Leyland, A. Pilkington, A. Matthews, Surface and Coatings Technology, 177-178 (2004) 779-783. [118] A Yerokhin, L Snizhko, N Gurevina, A Leyland, A Pilkington, A. Matthews, Journal of Physics D: Applied Physics, 36 (2003) 11. [119] H. Guo, M. An, S. Xu, H. Huo, Thin Solid Films, 485 (2005) 53-58. [120] J. Kronsbein, Journal of The Electrochemical Society, 94 (1948) 353-366. [121] A. Yerokhin, X. Nie, A. Leyland, A. Matthews, Surface and Coatings Technology, 130 (2000) 195-206. [122] P.B. Srinivasan, J. Liang, C. Blawert, M. Störmer, W. Dietzel, Applied Surface Science, 256 (2010) 4017-4022. [123] J. Liang, L. Hu, J. Hao, Applied Surface Science, 253 (2007) 4490-4496. [124] L. Snizhko, A. Yerokhin, A. Pilkington, N. Gurevina, D. Misnyankin, A. Leyland, A. Matthews, Electrochimica Acta, 49 (2004) 2085-2095. [125] R. Arrabal, E. Matykina, F. Viejo, P. Skeldon, G.E. Thompson, M.C. Merino, Applied Surface Science, 254 (2008) 6937-6942. [126] S. Stojadinović, R. Vasilić, M. Petković, I. Belča, B. Kasalica, M. Perić, L. Zeković, Electrochimica Acta, 59 (2012) 354-359. [127] L. Wang, L. Chen, Z. Yan, W. Fu, Surface and Coatings Technology, 205 (2010) 1651-1658. [128] R.O. Hussein, et al., Journal of Physics D: Applied Physics, 43 (2010) 105203. [129] J. Jovović, S. Stojadinović, N.M. Šišović, N. Konjević, Journal of Quantitative Spectroscopy and Radiative Transfer, 113 (2012) 1928-1937. [130] C.S. Dunleavy, I.O. Golosnoy, J.A. Curran, T.W. Clyne, Surface and Coatings Technology, 203 (2009) 3410-3419. [131] E. Matykina, A. Berkani, P. Skeldon, G.E. Thompson, Electrochimica Acta, 53 (2007) 1987-1994. [132] R.O. Hussein, X. Nie, D.O. Northwood, Materials Chemistry and Physics, 134 (2012) 484-492. [133] X. Gu, W. Zhou, Y. Zheng, Y. Cheng, S.C. Wei, S. Zhong, T. Xi, L. Chen, Acta Biomaterialia, 6 (2010) 4605-4613. [134] S. Chen, S. Guan, W. Li, H. Wang, J. Chen, Y. Wang, H. Wang, Journal of Biomedical Materials Research Part B: Applied Biomaterials, 100B (2012) 533-543. [135] S.F. Fischerauer, T. Kraus, X. Wu, S. Tangl, E. Sorantin, A.C. Hänzi, J.F. Löffler, P.J. Uggowitzer, A.M. Weinberg, Acta Biomaterialia, 9 (2013) 5411-5420. [136] Y.K. Pan, C.Z. Chen, D.G. Wang, X. Yu, Journal of Biomedical Materials Research Part B: Applied Biomaterials, 100B (2012) 1574-1586. [137] D. Sreekanth, N. Rameshbabu, K. Venkateswarlu, Ceramics International, 38 (2012) 4607-4615. [138] Y.G. Ko, S. Namgung, D.H. Shin, Surface and Coatings Technology, 205 (2010) 2525-2531. [139] S. Zhang, R. Zhang, W. Li, Y. Zhong, Advanced Materials Research, 482-484 (2012) 909-913. [140] A. Němcová, P. Skeldon, G.E. Thompson, B. Pacal, Surface and Coatings Technology, 232 (2013) 827-838. [141] L. Wang, L. Chen, Z. Yan, H. Wang, J. Peng, Journal of Alloys and Compounds, 480 (2009) 469-474. [142] R.F. Zhang, S.F. Zhang, J.H. Xiang, L.H. Zhang, Y.Q. Zhang, S.B. Guo, Surface and Coatings Technology, 206 (2012) 5072-5079. [143] R.O. Hussein, D.O. Northwood, X. Nie, Journal of Alloys and Compounds, 541 (2012) 41-48.
References
181
[144] S. Verdier, M. Boinet, S. Maximovitch, F. Dalard, Corrosion Science, 47 (2005) 1429-1444. [145] J. Liang, L. Hu, J. Hao, Applied Surface Science, 253 (2007) 6939-6945. [146] A. Alabbasi, M. Bobby Kannan, R. Walter, M. Störmer, C. Blawert, Materials Letters, 106 (2013) 18-21. [147] D.R. Marsh, G. Li, British Medical Bulletin, 55 (1999) 856-869. [148] S. Shadanbaz, G.J. Dias, Acta Biomaterialia, 8 (2012) 20-30. [149] H. Hornberger, S. Virtanen, A. Boccaccini, Acta Biomaterialia, 8 (2012) 2442-2455. [150] O.J. L., C.D.C. N., Critical reviews in biomedical engineering 28 (2000) 667-707. [151] H. Wang, S. Guan, Y. Wang, H. Liu, H. Wang, L. Wang, C. Ren, S. Zhu, K. Chen, Colloids and Surfaces B: Biointerfaces, 88 (2011) 254-259. [152] T.-N. Vu, D. Veys-Renaux, E. Rocca, Journal of Biomedical Materials Research Part B: Applied Biomaterials, 100 (2012) 1846-1853. [153] Y.K. Pan, C.Z. Chen, D.G. Wang, Z.Q. Lin, Materials Chemistry and Physics, 141 (2013) 842-849. [154] J. Yang, F. Cui, I. Lee, Annals of Biomedical Engineering, 39 (2011) 1857-1871. [155] K. Bai, Y. Zhang, Z. Fu, C. Zhang, X. Cui, E. Meng, S. Guan, J. Hu, Materials Letters, 73 (2012) 59-61. [156] S. Ziani, S. Meski, H. Khireddine, International Journal of Applied Ceramic Technology, 11 (2013) 83-91. [157] Y. Zhang, K. Bai, Z. Fu, C. Zhang, H. Zhou, L. Wang, S. Zhu, S. Guan, D. Li, J. Hu, Applied Surface Science, 258 (2012) 2939-2943. [158] X. Nie, A. Leyland, A. Matthews, Surface and Coatings Technology, 125 (2000) 407-414. [159] A.R. Boccaccini, S. Keim, R. Ma, Y. Li, I. Zhitomirsky, Journal of The Royal Society Interface, 7 (2010) s581-s613. [160] J.X. Yang, F.Z. Cui, I.S. Lee, Y. Zhang, Q.S. Yin, H. Xia, S.X. Yang, Journal of Biomaterials Applications, 27 (2011) 153-164. [161] C. Wen, S. Guan, L. Peng, C. Ren, X. Wang, Z. Hu, Applied Surface Science, 255 (2009) 6433-6438. [162] M. Morlock, E. Schneider, A. Bluhm, M. Vollmer, G. Bergmann, V. Müller, M. Honl, Journal of biomechanics, 34 (2001) 873-881. [163] Y. Chen, Y. Zhang, Y. Li, T. Zhang, Advanced Materials Research, 152-153 (2011) 51-57. [164] A.L. Yerokhin, A. Shatrov, V. Samsonov, P. Shashkov, A. Leyland, A. Matthews, Surface and Coatings Technology, 182 (2004) 78-84. [165] B. Lonyuk, I. Apachitei, J. Duszczyk, Surface and Coatings Technology, 201 (2007) 8688-8694. [166] T. Kokubo, H. Takadama, Biomaterials, 27 (2006) 2907-2915. [167] T. Kokubo, H. Kushitani, S. Sakka, T. Kitsugi, T. Yamamuro, Journal of Biomedical Materials Research, 24 (1990) 721-734. [168] M. Orazem, B. Tribollet, Electrochemical Impedance Spectroscopy, in, John Wiley & Sonss, Inc, New Jersey, 2008. [169] J.R.M. Evgenij Barsoukov, Impedance Spectroscopy: Theory, Experiment, and Applications, 2nd Edition, in, John Wiley & Sons, Inc., New Jersey, 2005, pp. 616. [170] A. Hassanzadeh, Corrosion Science, 49 (2007) 1895-1906. [171] S. Jin, S. Amira, E. Ghali, Advanced Engineering Materials, 9 (2007) 75-83. [172] D.D. Macdonald, Electrochimica Acta, 51 (2006) 1376-1388. [173] J.R. Macdonald, W.B. Johnson, Applications of Impedance Spectroscopy, in: Impedance Spectroscopy, John Wiley & Sons, Inc., 2005, pp. 382-429. [174] R. Vedarajan, T. Nishimura, J Solid State Electrochem, 14 (2010) 1457-1464. [175] F.D. Wall, M.A. Martinez, N.A. Missert, R.G. Copeland, A.C. Kilgo, Corrosion Science, 47 (2005) 17-32. [176] K.M. Yin, L.I. Lu, Journal of Coatings Technology, 75 (2003) 65-72. [177] U. Retter, H. Lohse, Electrochemical Impedance Spectroscopy, in: F. Scholz (Ed.) Electroanalytical Methods: Guide to Experiments and Applications, Springer-Verlag, Berlin, 2010, pp. 159-177. [178] V. Sannakaisa, Materials Science and Engineering: B, 176 (2011) 1600-1608. [179] G. Song, A. Atrens, D. Stjohn, J. Nairn, Y. Li, Corrosion Science, 39 (1997) 855-875. [180] X. Zhang, Z. Yao, Z. Jiang, Y. Zhang, X. Liu, Corrosion Science, 53 (2011) 2253-2262. [181] K. Weron, Journal of Physics: Condensed Matter, 3 (1991) 9151. [182] R.H. Byrd, R.B. Schnabel, G.A. Shultz, SIAM Journal on Numerical Analysis, 24 (1987) 1152-1170. [183] M.M. Lohrengel, Materials Science and Engineering: R: Reports, 11 (1993) 243-294. [184] R.Serway, J. Faughn, C. Vuille, College Physics (8th edition), Volume 2, Brooks Cole, 2008. [185] F.C. Walsh, C. Ponce de León, C. Kerr, S. Court, B.D. Barker, Surface and Coatings Technology, 202 (2008) 5092-5102. [186] R.H.U. Khan, A.L. Yerokhin, A. Matthews, Philosophical Magazine, 88 (2008) 795-807. [187] F.H. Cao, V.H. Len, Z. Zhang, J.Q. Zhang, Russ J Electrochem, 43 (2007) 837-843. [188] A.D. King, N. Birbilis, J.R. Scully, Electrochimica Acta, 121 (2014) 394-406. [189] G. Song, A. Atrens, D.S. John, X. Wu, J. Nairn, Corrosion Science, 39 (1997) 1981-2004. [190] G. Baril, G. Galicia, C. Deslouis, N. Pébère, B. Tribollet, V. Vivier, Journal of The Electrochemical Society, 154 (2007) C108-C113. [191] A.M. Fekry, Electrochemical Corrosion Behavior of Magnesium Alloys in Biological Solutions, in: F. Czerwinski (Ed.) Magnesium Alloys-Corrosion and Surface Treatments, InTech, 2011, pp. 65-92. [192] T. Ishizaki, Y. Masuda, K. Teshima, Surface and Coatings Technology, 217 (2013) 76-83. [193] M. Stern, A.L. Geary, Journal of The Electrochemical Society, 104 (1957) 56-63. [194] F. Witte, J. Fischer, J. Nellesen, H.-A. Crostack, V. Kaese, A. Pisch, F. Beckmann, H. Windhagen, Biomaterials, 27 (2006) 1013-1018.
References
182
[195] K. Murakami, M. Hino, K. Nakai, S. Kobayashi, A. Saijo, T. Kanadani, Materials Transactions, 49 (2008) 1057-1064. [196] D. Dehua, Z. Chuanmei, Cement and concrete research, 29 (1999) 1365-1371. [197] H. Bilinski, B. Matković, C. MAŽURANIĆ, T.B. ŽUNIĆ, Journal of the American Ceramic Society, 67 (1984) 266-269. [198] X. Zhou, L. Jiang, P. Wu, Y. Sun, Y. Yu, G. Wei, H. Ge, Int. J. Electrochem. Sci, 9 (2014) 304-314. [199] H.D.B. Jenkins, Le Chatelier's Principle, in: Chemical Thermodynamics at a Glance, Blackwell Publishing Ltd, 2008, pp. 160-163. [200] S.P. Sah, E. Tsuji, Y. Aoki, H. Habazaki, Corrosion Science, 55 (2012) 90-96. [201] J. Liang, P.B. Srinivasan, C. Blawert, W. Dietzel, Corrosion Science, 51 (2009) 2483-2492. [202] Y. Song, D. Shan, R. Chen, E.-H. Han, Corrosion Science, 51 (2009) 1087-1094. [203] F. Mansfeld, C.H. Tsai, Corrosion, 47 (1991) 958-963. [204] I.C. Lavos-Valereto, S. Wolynec, I. Ramires, A.C. Guastaldi, I. Costa, Journal of Materials Science: Materials in Medicine, 15 (2004) 55-59. [205] C. Liu, Q. Bi, A. Leyland, A. Matthews, Corrosion Science, 45 (2003) 1257-1273. [206] O.-C. Choi, Y.-S. Park, H.-Y. Ryu, Int. J. of Concrete Structures and Materials, 2 (2008) 99-105. [207] C.H. Tsai, F. Mansfeld, Corrosion, 49 (1993) 726-737. [208] F. Mansfeld, Journal of Applied Electrochemistry, 25 (1995) 187-202. [209] F. Mansfeld, M.W. Kendig, S. Tsai, Corrosion, 38 (1982) 478-485. [210] B. Hirschorn, M.E. Orazem, B. Tribollet, V. Vivier, I. Frateur, M. Musiani, Electrochimica Acta, 55 (2010) 6218-6227. [211] E. McCafferty, Corrosion Science, 47 (2005) 3202-3215. [212] K. Vasu, M. Noel, Cyclic voltammetry and the frontiers of electrochemistry, in, Oxford & IBH Publishing Co. PVT. lTD., 1990. [213] M.G.Natta, López-Buisán, Corrosion, 57 (2001) 712-720. [214] E. Budevski, G. Staikov, W.J. Lorenz, Initial Stages of Bulk Phase Formation, in: Electrochemical Phase Formation and Growth, Wiley-VCH Verlag GmbH, 2007, pp. 149-199. [215] A. Milchev, Electrochimica Acta, 42 (1997) 1533-1536. [216] N. Eliaz, M. Eliyahu, Journal of Biomedical Materials Research Part A, 80A (2007) 621-634. [217] S. Dorozhkin, Prog Biomater, 1 (2012) 1-40. [218] U. Holzwarth, N. Gibson, Nat Nano, 6 (2011) 534-534. [219] M. Jamesh, S. Kumar, T.S.N. Sankara Narayanan, Corrosion Science, 53 (2011) 645-654. [220] H. Duan, C. Yan, F. Wang, Electrochimica Acta, 52 (2007) 5002-5009. [221] E.C.G. Moreno, T.M.; Brown, W.E. , Journal of Research of the National Bureau of Standards. Section A: Physics and Chemistry 72A (1968) 773-782. [222] S. Larsen, Nature, 212 (1966) 605-605. [223] H.N. Po, N.M. Senozan, Journal of Chemical Education, 78 (2001) 1499. [224] A.C. Tas, S.B. Bhaduri, Journal of the American Ceramic Society, 87 (2004) 2195-2200. [225] R. Tang, C.A. Orme, G.H. Nancollas, The Journal of Physical Chemistry B, 107 (2003) 10653-10657. [226] D. Vladikova, Proc. Advanced Techniques for Energy Sources Investigation and Testing, Sofia, Bulgaria, 4-9 September, 2004, 2004. [227] H. Ba, H. Guan, Journal of Wuhan University of Technology-Mater. Sci. Ed., 24 (2009) 476-481. [228] A. Abdel Aal, Journal of Materials Science, 43 (2008) 2947-2954. [229] W.D. Callister, Fundamentals of Materials Science and Engineering, in: W. Anderson (Ed.), John Wiley&Sons, Inc., New York, 2001. [230] S.Z. Yanli Cai, Soon-Eng Ong, Xianting Zeng, Wilson Wang, Simultaneous Incorporation of Magnesium and Fluorine Ions in Hydroxyapatite Coatings on Metallic Implant for Osseointegration and Stability, in: S. Zhang (Ed.) Hydroxyapatite Coatings for Biomedical Applications, CRC Press, Boca Raton, FL, 2013, pp. 55-144. [231] Y.H.T. D.T.Asquith, C.X. Wong, J.R. Yates, A. Matthews, A. L. Yerokhin, Proc. 17th European Conference on Fracture, Brno, Czech Republic, 2-5 September, 2008. [232] N. Pan, Science and Engineering of Composite Materials, 5 (1996) 63-72. [233] Magnesium oxide (MgO) Young’s, shear and bulk moduli, Poisson’s ratio, in: O. Madelung, U. Rössler, M. Schulz (Eds.) II-VI and I-VII Compounds; Semimagnetic Compounds, vol. 41B, Springer Berlin Heidelberg, 1999, pp. 1-3. [234] X. Fan, E.D. Case, M.J. Baumann, Journal of Materials Science, 47 (2012) 6333-6345. [235] R.H.U. Khan, Characteristics and Stress State of Plasma Electrolytic Oxidation Coatings, in, University of Sheffield, Department of Engineering Materials, 2008. [236] M.D. Thouless, E. Olsson, A. Gupta, Acta Metallurgica et Materialia, 40 (1992) 1287-1292. [237] M.D. Thouless, Z. Li, N.J. Douville, S. Takayama, Journal of the Mechanics and Physics of Solids, 59 (2011) 1927-1937. [238] Z.X. Guo, The deformation and processing of structural materials, in, Woodhead Publishing Limited, Cambridge, 2005. [239] D.C. Agrawal, R. Raj, Acta Metallurgica, 37 (1989) 1265-1270. [240] S. Hiromoto, M. Tomozawa, N. Maruyama, Journal of the Mechanical Behavior of Biomedical Materials, 25 (2013) 1-10. [241] K.S. Lee, Y.-W. Rhee, D.H. Blackburn, B.R. Lawn, Journal of Materials Research, 15 (2000) 1653-1656. [242] M.D. Thouless, Journal of the American Ceramic Society, 73 (1990) 2144-2146.

References
183
[243] Y.Z. Lü, Q.D. Wang, W.J. Ding, X.Q. Zeng, Y.P. Zhu, Materials Letters, 44 (2000) 265-268. [244] D.H. Kohn, P. Ducheyne, Journal of Biomedical Materials Research, 24 (1990) 1483-1501. [245] J.-C. Kim, S.-K. Cheong, H. Noguchi, International Journal of Fatigue, 56 (2013) 114-122. [246] M.A.S. Torres, H.J.C. Voorwald, International Journal of Fatigue, 24 (2002) 877-886. [247] W. Soboyejo, Fundamentals of Fracture Mechanics, in: Mechanical Properties of Engineered Materials, Marcel Dekker, Inc., New York, 2002, pp. 315-365.

Appendix A Calculation of stress distribution in the fatigue test
184
Appendix A Calculation of stress distribution in the fatigue test
This appendix deals with the calculation of stress distribution during the rotating bending
fatigue test as mentioned in Chapter 4. To make the calculation more general, all the
dimensions are replaced by letters, as shown in Figure.A-1. A coordinate system is built with
the x axis along the longitudinal direction of the sample and y axis is along its transverse
direction (Figure.A-1).
Then the equation describing the radius part of the sample can be derived as:
(𝑥 −𝐿0
2)2 + [𝑦 − (𝑅 +
𝑑0
2)]2 = 𝑅2 ( A.1 )
Then 𝑦, the vertical distance of the sample surface from the neutral axis (𝑥 axis)can be
expressed as a function of 𝑥:
𝑦𝑥 = 𝑅 +𝑑0
2− √𝑅2 − (𝑥 −
𝐿0
2)2 ( A.2 )
When a force of F is applied at the end of shaft, as shown in Figure.A-1, the resulting
bending moment 𝑀 at point of 𝑥 can be expressed as:
𝑀𝑥 = 𝐹(𝐿0 + 𝐿1 − 𝑥) ( A.3 )
Where 𝐹0 is the gravity of the shaft.
According to engineering mechanics, the stress caused by the bending moment at the point
of 𝑥 can be calculated through:
𝜎𝑥 =𝑀𝑥 ∙ 𝑦𝑥
𝐼 ( A.4 )
Where 𝜎𝑥 is the bending stress at point 𝑥, 𝐼 is the moment of intertia around the neutral
Figure A-1 Fatigue test setup F

Appendix A Calculation of stress distribution in the fatigue test
185
axis.
For a beam with circular cross section, 𝐼 can be expressed as:
𝐼 =𝜋 ∙ 𝑦𝑥
4
4 ( A.5 )
Substituting equations ( A.2 )( A.3 )( A.5 ) to equation ( A.4 ), the stress distribution on the
sample surface along the 𝑥 axis can be calculated based on the following equation:
𝜎𝑥 =
4𝐹(𝐿0 + 𝐿1 − 𝑥)
𝜋[𝑅 +𝑑02 − √𝑅2 − (𝑥 −
𝐿02 )
2
]3
( A.6 )
It can be found that the bending stress imposed on the sample surface at point of 𝑥 is
directly proportional to the applied force 𝐹.
The bending stress distribution on the sample surface along the long the longitudinal direction
can be derived by substituting the sample dimension in to Equation ( A.6 ):
𝜎𝑥 =4𝐹(101 − 𝑥)
𝜋[42.5 − √1600 − (𝑥 − 13.92)2]3 ( A.7 )
According to Equation ( A.7 ), the distribution of bending stress on the sample surface with
different applied forces can be calculated and the result is presented in Figure A-2. It seems
that, the maximum stress is applied exactly at the middle of the sample, which increases with
increased force applied at the end of driven shaft.
Figure A-2 The bending stress distribution along the longitudinal direction with different
applied forces
Appendix B Research Activities during PhD study
186
Appendix B Research activities during PhD study
Conference Attendance
[1]. Euromat 2011 conference, France, September 2011, Poster on PhD project.
[2]. 20th Annual International Anodizing Conference & Exposition, October 2011, USA, Poster on PhD project.
[3]. International conference on Metallurgical Coatings and Thin Films (ICMCTF), USA, April 2012, Oral Presentation on PhD project.
[4]. Department Poster Competition, May 2012, Sheffield, Poster on PhD project.
[5]. Leonardo Tribology Centre Launch, December 2012, Sheffield, Poster on PhD project.
[6]. Departmental 3rd year PhD student seminar, March 2013, Sheffield, Oral presentation on PhD project.
[7]. Euro BioMAT conference, April 2013, Germany, Oral Presentation
[8]. The 19th International Vacuum Congress, September 2013, Paris, Oral Presentation.
[9]. 14th international conference on plasma surface engineering, September 2014, Garmisch, Poster presentation
Paper Publications
[1]. Y. Gao, A. Yerokhin, A. Matthews, DC plasma electrolytic oxidation of biodegradable
cp-Mg: In-vitro corrosion studies, Surface and Coatings Technology, 234 (2013)
132-142.
[2]. Yonghao Gao, Aleksey Yerokhin, Allan Matthews, Effect of current mode on PEO
treatment of magnesium in Ca- and P-containing electrolyte and resulting coatings,
Applied Surface Science, 316 (2014) 558–567.
Paper Prepared
[1]. Y. Gao, A. Yerokhin, A. Matthews, In Vitro Corrosion Evaluation of Duplex
Hydroxyapatite and Plasma Electrolytic Oxidation Coatings on Commercially Pure
Magnesium, Corrosion Science, Submitted Manuscript.
[2]. Yonghao Gao, Aleksey Yerokhin, Evgeny Parfenov, Allan Matthews, Application of
Voltage Pulse Transient Analysis during Plasma Electrolytic Oxidation for Assessment of

Appendix B Research Activities during PhD study
187
Characteristics and Anti-Corrosion Performance of Ca- and P-containing Coatings on
Magnesium, Electrochemicia Acta, Submitted Manuscript.
[3]. Yonghao Gao, Aleksey Yerokhin, Allan Matthews, Effects of duplex hydroxyapatite and
PEO coatings on the mechanical properties of cp magnesium, Journal of the Mechanical
Behavior of Biomedical Materials, Submitted Manuscript.
[4]. Y. Gao, L. Snizhko, A. Yerokhin, A. Matthews, Anodic gas evolution during plasma
electrolytic oxidation of 6082 aluminium alloy, Prepared Manuscript.
Related Documents


![Plasma Electrolytic Oxidation Coatings on Aluminum Alloys: … · 2019-11-07 · fatigue strength, wear resistance, and surface hardness [14,17,19]. Furthermore, PEO process is environmental](https://static.cupdf.com/doc/110x72/5e882e4d2ba34b64d166bc15/plasma-electrolytic-oxidation-coatings-on-aluminum-alloys-2019-11-07-fatigue.jpg)


![Porous PEO coatings on titanium, obtained under DC regime ... · Keywords: Plasma Electrolytic Oxidation (PEO); Micro Arc Oxidation (MAO); ... Standard electropolishing (EP) [1-5],](https://static.cupdf.com/doc/110x72/5afa7c4d7f8b9ad2208f534f/porous-peo-coatings-on-titanium-obtained-under-dc-regime-plasma-electrolytic.jpg)