University of Wollongong University of Wollongong Research Online Research Online University of Wollongong Thesis Collection 2017+ University of Wollongong Thesis Collections 2019 Investigation of Molybdenum based Nanomaterials as High Performance Investigation of Molybdenum based Nanomaterials as High Performance Anodes for Advanced Lithium Ion Battery Anodes for Advanced Lithium Ion Battery Jing Cuan University of Wollongong Follow this and additional works at: https://ro.uow.edu.au/theses1 University of Wollongong University of Wollongong Copyright Warning Copyright Warning You may print or download ONE copy of this document for the purpose of your own research or study. The University does not authorise you to copy, communicate or otherwise make available electronically to any other person any copyright material contained on this site. You are reminded of the following: This work is copyright. Apart from any use permitted under the Copyright Act 1968, no part of this work may be reproduced by any process, nor may any other exclusive right be exercised, without the permission of the author. Copyright owners are entitled to take legal action against persons who infringe their copyright. A reproduction of material that is protected by copyright may be a copyright infringement. A court may impose penalties and award damages in relation to offences and infringements relating to copyright material. Higher penalties may apply, and higher damages may be awarded, for offences and infringements involving the conversion of material into digital or electronic form. Unless otherwise indicated, the views expressed in this thesis are those of the author and do not necessarily Unless otherwise indicated, the views expressed in this thesis are those of the author and do not necessarily represent the views of the University of Wollongong. represent the views of the University of Wollongong. Recommended Citation Recommended Citation Cuan, Jing, Investigation of Molybdenum based Nanomaterials as High Performance Anodes for Advanced Lithium Ion Battery, Doctor of Philosophy thesis, School of Mechanical, Materials and Mechatronic Engineering, University of Wollongong, 2019. https://ro.uow.edu.au/theses1/565 Research Online is the open access institutional repository for the University of Wollongong. For further information contact the UOW Library: [email protected]

Welcome message from author
This document is posted to help you gain knowledge. Please leave a comment to let me know what you think about it! Share it to your friends and learn new things together.
Transcript
University of Wollongong University of Wollongong
Research Online Research Online
University of Wollongong Thesis Collection 2017+ University of Wollongong Thesis Collections
2019
Investigation of Molybdenum based Nanomaterials as High Performance Investigation of Molybdenum based Nanomaterials as High Performance
Anodes for Advanced Lithium Ion Battery Anodes for Advanced Lithium Ion Battery
Jing Cuan University of Wollongong
Follow this and additional works at: https://ro.uow.edu.au/theses1
University of Wollongong University of Wollongong
Copyright Warning Copyright Warning
You may print or download ONE copy of this document for the purpose of your own research or study. The University
does not authorise you to copy, communicate or otherwise make available electronically to any other person any
copyright material contained on this site.
You are reminded of the following: This work is copyright. Apart from any use permitted under the Copyright Act
1968, no part of this work may be reproduced by any process, nor may any other exclusive right be exercised,
without the permission of the author. Copyright owners are entitled to take legal action against persons who infringe
their copyright. A reproduction of material that is protected by copyright may be a copyright infringement. A court
may impose penalties and award damages in relation to offences and infringements relating to copyright material.
Higher penalties may apply, and higher damages may be awarded, for offences and infringements involving the
conversion of material into digital or electronic form.
Unless otherwise indicated, the views expressed in this thesis are those of the author and do not necessarily Unless otherwise indicated, the views expressed in this thesis are those of the author and do not necessarily
represent the views of the University of Wollongong. represent the views of the University of Wollongong.
Recommended Citation Recommended Citation Cuan, Jing, Investigation of Molybdenum based Nanomaterials as High Performance Anodes for Advanced Lithium Ion Battery, Doctor of Philosophy thesis, School of Mechanical, Materials and Mechatronic Engineering, University of Wollongong, 2019. https://ro.uow.edu.au/theses1/565
Research Online is the open access institutional repository for the University of Wollongong. For further information contact the UOW Library: [email protected]
I
Investigation of Molybdenum based Nanomaterials as High
Performance Anodes for Advanced Lithium Ion Battery
This thesis is presented as part of the requirements for the
Award of the Degree of
Doctor of Philosophy
from the
University of Wollongong
by
JING CUAN
B. Sc., M. Sc.
School of Mechanical, Materials and Mechatronic Engineering
Faculty of Engineering and Information Sciences
March 2019
II
CERTIFICATION
I, Jing Cuan, declare that this thesis, submitted in partial fulfilment of the requirements for the award
of Doctor of Philosophy, in the Institute for Superconducting & Electronic Materials (ISEM), Faculty
of Engineering, University of Wollongong, NSW, Australia, is wholly my own work unless otherwise
referenced or acknowledged. This thesis has not been submitted for qualifications at any other
academic institutions.
Jing Cuan
06/03/2019

III
DEDICATION
To my dear family who are always with me.
IV
ACKNOWLEDGEMENTS
First and foremost, I would like to express my sincere gratitude to my respected supervisor, Prof.
Zaiping Guo. I am impressed by her acute academic insights, modesty, enthusiasm and profound
knowledge. She encourages, motivates and teaches me most time when I stay with her. During my
PhD studies, whenever I met with research problems, difficulties or being depressed, she always tries
her best to support me and inculcates me to come out solutions to accomplish my goal. She taught me
how to be a researcher and how to determine appropriate solution methodologies, discussions to
organize research findings in good logic. She gives me so much valuable guidance on academy and
life, which I will always remember, insist on not giving up in the past time, now and future. When I
met with difficulties in research, she always preserved her confidence in my ability to solve the
problems. I feel lucky and proud to be a PhD student under the supervision of Prof. Guo. Here, I owe
my highest respects to my supervisor Prof. Zaiping Guo.
Furthermore, I am grateful for Prof. Huakun Liu for her help and advices during group meetings.
I would like to thank Prof. Xuebin Yu, Prof. Hong Li for their guidance and support for my PhD work
when I went to Fudan University and Institute of Physics, Chinese Academy of Sciences as a visiting
student. Many gratitude to Mr. Yang Zheng, Dr. Kun Rui (Nanjing University of Technology), Dr.
Lijuan Zhang, Dr. Tengfei Zhou, Dr. Wei Kong Pang, Dr. Shudi Min (East China University of Science
and Technology), Dr. Si Zhou (Dalian University of Technology), who have all been very helpful,
sharing their experience and knowledge. I would also like to thank Dr. Tania Silver, Jonathan C. Knott
for their critical reading of my manuscripts and thesis.
I am appreciated for the technical assistance from Dr. Gilberto Casillas (TEM), Dr. Patricia Hayes
(Raman spectroscopy), Dr. Dongqi Shi (XPS), Dr. Germanas Peleckis (XRD), Prof. Konstantin
Konstantinov (TGA and BET), Dr. Tony Romeo (FE-SEM), and Mr. Robert Morgan (technical staff).
Moreover, I would like to thank Dr. Jianwen Liu (Hubei University), Ms. Shaolan Wang (Xi’an
V
Jiaotong University), Dr. Jun Wang (Lanzhou University), Dr. Ji Liang, Dr. Chao Wu, Dr. Li Li, Dr.
Dan Li, Dr. Kuok Hua Seng, Dr. Qing Meng, Dr. Sha Li, Dr. Jianfeng Mao, Mr. Hongqiang Wang,
Mr. Sujith Kalluri, Dr. Yunxiao Wang, Ms. Hong Gao, Ms. Yajie Liu, Ms. Qing Zhang, Mr. Wenchao
Zhang, Dr. Qinghong Wang, Dr. Yuanzhen Chen, Dr. Peng Zhang, Dr. Guanglin Xia, Mr. Jian Hong,
Ms. Yuqing Huang, Ms. Fan Zhang, Mr. Hongyu Zhang, Ms. Weili Liu, Ms. Lijun Zhang, Mr. Yingbin
Tan, Ms. Qili Gao, Ms. Baoping Zhang, Mr. Keyao Wang, Mr. Xianyun Peng, Mr. Jicheng Jiang, Ms.
Lili Liu, Ms. Hanna He, Ms. Ningyan Cheng, Ms. Lina Sang, Mr. Guangsai Yang, Mr. Xiaobo Zheng,
Prof. Li Li (Ningxia University), Ms. Xuejuan Huang (South-Central University for Nationalities), Mr.
Alexander Morlando, Ms. Sha Hu (South-Central University for Nationalities), Dr. Shigang Ling
(Institute of Physics, Chinese Academy of Sciences), Dr. Bukeyan Miao (Fudan University), Mr.
Shilin Zhang, Mr. Junnan Hao, Mr. Zhibin Wu, Mr. Fuhua Yang, Ms. Sailin Liu, Mr. Zhijie Wang,
Mr. Bin Cao, Mr. Gemeng Liang, Mr. Yang Wang, Dr. Sijiang Hu, Ms. Shan Cao, Prof. Juncheng Hu,
Mr. Qining Fan, Mr. Hao Zheng, Prof. Yuanyuan Li, Mr. Chengling Zhu, Mr. Jun Long, Mr. Anoop
Somanathan Pillai Sushamakumari Amma, Dr. Christophe Didier, Prof. Wei Li, Prof. Haiping Liu, Mr.
Qi Zhang, Mr. Weiyao Zhao, Ms. Yang Li, Ms. Huilin Yang, Dr. Liang Shao, Prof. Bing Yan. Ms.
Sailin Liu, Ms. Xiaohui Zeng, Mr. Jingxing Wu et al. I also owe my gratitude to other staff members
and students in in the Institute for Superconducting & Electronic Materials (ISEM) at the University
of Wollongong (UOW), Australia, I am grateful to their kindly help and willingness to share
knowledge with me during this research.
I would like to express many special thanks to my dear parents, for their continuous support and
love to me during the whole period of my PhD study. They are always being there whenever I need
them and give me so many encouragements, love and strength.
Finally, I owe my gratitude to everyone who are important to the success of my PhD goal in the
University of Wollongong and are very enthusiastic to help me. Thank you very much!
VI
ABSTRACT
Electrodes adopting multi-electron reactions provide significant opportunities for the development of
high-energy lithium ion batteries. Most conversion reaction based transition metal compounds exhibit
much higher theoretical capacities than graphite. Among the transition metal compounds, molybdenum
compounds have proved to be very interesting, since they often exhibit various stoichiometry, tuned
band gaps, and rich chemical valences. These features provide an extraordinary basis for the full
utilization of molybdenum compounds in advanced energy storage systems.
To meet the requirements of both research and commercial use, an overwhelming number of
functionalized molybdenum compounds have been well designed and prepared, using strategies
covering solid, liquid and vapor-phase based approaches. In this doctoral thesis, optimizing the
electrochemical activities and properties of molybdenum compounds (involving MoO3, MoO2 and
molybdenum carbides such as MoC, Mo2C) have been conducted in each chapter from distinctive
perspectives.
Molybdenum oxycarbide has been unveiled as a high-energy electrode material after the
negatively charged carbide (C4-) anion substitution for part of the lattice oxygen in pristine MoO2. X-
ray photoelectron spectroscopy demonstrated that, comparing with its carbide and oxide counterparts,
MoOC features oxygen vacancies, high catalytic activity, and elevated Mo valences, etc. The evolution
of the crystallographic structure and lithium storage mechanisms of well-designed MoOC/MoO2
hetero-structured material as anode for lithium ion batteries have been investigated. Lithium storage
in MoO2 was effectively facilitated due to the introduction of MoOC. Remarkably, MoOC/MoO2-N-
doped carbon nanowires (MoOC/MoO2-NCNW) has well-maintained capacity after 1000 cycles at
2A·g-1 and fully resumed rate performance. In detail, MoOC/MoO2-NCNW electrode delivered
average discharge capacities of ~ 860, 840, 750, 610, 480, 580, 710, and 830 mA·h·g-1 at current
densities of 0.5, 1, 2, 5, 10, 5, 2, and 1 A·g-1, respectively. After the current density has been switched
VII
back to 0.5 A·g-1, the specific capacity can fully resume with a moderate capacity increase, attaining
~1120 mA·h·g-1 after 300 cycles. The time-resolved structural evolution of the dominant MoO2 phase
in MoOC/MoO2 hetero-structures exhibited only slight d-spacing variations (d1 1 1 < 1% ) in the full
lithiation/delithiation state, which implies that only small volumetric variation occurs during
electrochemical reactions. The long term cycling stability and impressive rate capability of
MoO2/MoOC may correlate with the job-sharing design of the MoO2/MoOC heterostructure, through
which MoOC participates in the activation of the cleavage of Mo-O bonds and enables a reduced
electrochemical reaction barrier for the MoO2. This work underscores the importance of incorporating
the oxycarbide configuration into transition metal oxides as a strategy for accelerating the
electrochemical reactions of electrode materials.
Mo2C are impressive due to their unique attributes in metallic band states, and substantial catalytic
sites. Nevertheless, “Gordian knots” represented by sluggish charge transfer kinetics, low initial
coulombic efficiency, and large volume expansion often hinder their practical applications. Artificial
interfaces are convenient strategies to realize unexpected states of matter and multi-functionality
through synergistic coupling between interconnected components, which may induce modifications in
terms of reconstructed charge distributions, defects, or altered structural symmetry. Inspired by these
advantages and the abundant valences of molybdenum, MoC with a smaller Mo stoichiometry was
integrated with Mo2C to construct binary-carbide heterostructures, which was achieved via an
ingenious disproportionation reaction by tuning the carbothermal process of Mo precursor. The MoC-
Mo2C-heteronanowires (hnws) were revealed as a promising electrode with high rate performance, as
the electrode could fully resume its capacity after rate testing. MoC-Mo2C-hnws exhibit average
discharge capacities of ~ 640, 610, 560, 560, 520, 490, and 470 mA·h·g-1 at 0.5, 1, 2, 3, 5, 8, and 10
A·g-1, respectively, with nearly 100 % Coulombic efficiency (CE). When the current density was
switched back to 8, 5, 3, 2, 1, and 0.5 A·g-1, the discharge capacities were retained with no obvious
fading. Impressively, a similar case reoccurred when the electrode was tested repeatedly using C-rates

VIII
of 1, 2, 3, 5, and 10 A·g-1 after 260 cycles. Following the former repeated high-rate testing, an average
discharge capacity of ~790 mA·h·g-1 was achieved by MoC-Mo2C-hnws over 380 cycles at 0.5 A·g-1.
The MoC-Mo2C-hnws had 2.3 (1.9) fold higher capacities than Mo2C-nws (MoC-nws), and the highest
specific capacity over the whole cycling test confirmed that a superior structure was achieved by the
design of the MoC-Mo2C-hnws materials. Such improvements are mainly due to enhancements
enabling higher lithium accommodation capability and fast electron transport/solid-state lithium
diffusion triggered by interfacial component interactions, as verified by electrochemical impedance
spectroscopy and the galvanostatic intermittent titration technique. This work may shed some light on
optimizing multi-electron reactions by synthesizing simple yet stoichiometry-tunable heteromaterials
for further applications that are not limited to batteries.
A series of Mo2C-C⊂x-MoO3 (x = 1, 3, 6, 14) hetero-electrodes have been fabricated through a
facile electrospinning strategy. Transmission electron microscopy and scanning electron microscopy
showed the hetero-structural evolution of the Mo2C-C⊂x-MoO3 (x = 0, 1, 3, 6, 14) series and the
growing particle sizes of Mo2C and MoO3 phases as x increased. The results of cyclic voltammetry,
and galvanostatic discharge–charge testing illustrated the effects of hetero-structure variations towards
tuning the Li+ transport features, over-potential and lithium storage capacity of Mo2C-C⊂x-MoO3 (x
= 1, 3, 6, 14). In the long-term cycling, the discharge capacities of Mo2C-C⊂x-MoO3 (x = 0, 3, 6, 14)
are 395, 712, 305 and 154 mA·h·g-1, respectively, while Mo2C-C⊂1-MoO3 anode maintains ~890
mA·h·g-1 over 300 cycles at 1000 mA·g-1. The lithium storage performances of Mo2C-C⊂x-MoO3 at
x = 1, 3 appear better among the four investigated hetero-compositions. Moreover, the rate performance
of Mo2C-C⊂x-MoO3 (x = 1, 3) are also noticeably ameliorated in comparison with those of Mo2C-
C⊂x-MoO3 (x = 0, 6, 14) composites. For Mo2C-C⊂3-MoO3, the rate performance resembles that of
Mo2C-C⊂1-MoO3 in the initial 40 cycles, and drops slightly at 200 mA·g-1 in the following cycles.
With regard to Mo2C-C⊂6-MoO3, the discharge capacity drastically reduces to 647 mA·h·g-1 at the
110th cycle at 200 mA·g-1, although it exceeds those of both the Mo2C-C⊂14-MoO3 and Mo2C-C⊂0-
IX
MoO3. Among these as-prepared samples, Mo2C-C⊂1-MoO3 showed the smallest over-potential and
voltage hysteresis among Mo2C-C⊂x-MoO3 (x = 1, 3, 6, 14) hetero-electrodes, and afforded an ultra-
stable long-term cycling and rate performance. The results demonstrate that structural features (e.g.
robust skeleton, smaller grain sizes, and high quality hybridity) play an important role in engendering
faster charge transfer and narrowing over-potential than that at the level of micrometer scales.
X
TABLE OF CONTENTS
CERTIFICATION .................................................................................................................................................... II
ACKNOWLEDGEMENTS .................................................................................................................................... IV
ABSTRACT ............................................................................................................................................................. VI
TABLE OF CONTENTS .......................................................................................................................................... X
LIST OF FIGURES .............................................................................................................................................. XIII
LIST OF TABLES ................................................................................................................................................ XIX
NOMENCLATURE ................................................................................................................................................ XX
Chapter 1 INTRODUCTION ................................................................................................................................... 1
Chapter 2 LITERATURE REVIEW ....................................................................................................................... 5
2.1 Rechargeable batteries ................................................................................................................................... 5
2.2 History ........................................................................................................................................................... 6
2.3 Basic operations ............................................................................................................................................. 8
2.4 Cathode materials .......................................................................................................................................... 9
2.4.1 Layered LiMO2 ................................................................................................................................. 10
2.4.2 Phosphate cathodes ........................................................................................................................... 12
2.4.3 Lithium silicates and fluorosulfate .................................................................................................... 14
2.5 Anodes ......................................................................................................................................................... 14
2.5.1 Carbonaceous materials .................................................................................................................... 15
2.5.2 Alloy based anodes ........................................................................................................................... 18
2.5.3 Molybdenum nanocomposite anodes adopting conversion type reactions ....................................... 27
2.6 References ................................................................................................................................................... 42
CHAPTER 3 EXPERIMENTAL METHODS ...................................................................................................... 51
3.1 Chemicals .................................................................................................................................................... 51
3.2 Experimental procedures ............................................................................................................................. 51
3.3 Material preparation ..................................................................................................................................... 52
3.3.1 Electrospinning ................................................................................................................................. 52
3.3.2 Chelating reaction induced self-assembly ........................................................................................ 55
3.4 Techniques for characterization ................................................................................................................... 56
3.4.1 Laboratory X-ray diffraction/ synchrotron X-ray diffraction ........................................................... 56
3.4.2 Scanning electron microscopy and Energy-dispersive X-ray spectroscopy ..................................... 57
3.4.3 Transmission electron microscopy .................................................................................................... 58
XI
3.4.4 Thermo-gravimetric analysis ............................................................................................................ 58
3.4.5 Brunauer-Emmett-Teller surface area characterization ..................................................................... 59
3.4.6 Raman spectroscopy ......................................................................................................................... 59
3.4.7 X-ray photoelectron spectroscopy .................................................................................................... 60
3.5 Electrode preparation and cell assembly ...................................................................................................... 60
3.6 Electrochemical characterization ................................................................................................................. 61
3.6.1 Cyclic voltammetry .......................................................................................................................... 61
3.6.2 Galvanostatic electrochemical testing ............................................................................................... 63
3.6.3 Electrochemical Impedance Spectroscopy........................................................................................ 63
3.6.4 Galvanostatic intermittent titration technique (GITT) method ......................................................... 64
3.7 References ................................................................................................................................................... 65
CHAPTER 4 Oxycarbide Interface Integration Reinforced Multielectron Reactions for Advanced Lithium Ion
Batteries .................................................................................................................................................................... 67
4.1 Introduction ................................................................................................................................................. 67
4.2 Experimental methods ................................................................................................................................. 70
4.2.1 Material synthesis ............................................................................................................................. 70
4.2.2 Material characterization .................................................................................................................. 71
4.2.3 Electrochemical measurements ......................................................................................................... 72
4.3 Results and Discussion ................................................................................................................................ 73
4.3.1 Physical characterizations ................................................................................................................. 73
4.3.2 Electrochemical performance ........................................................................................................... 84
4.4 Conclusions ................................................................................................................................................. 93
4.5 References ................................................................................................................................................... 94
CHAPTER 5 Electrochemical Energy Storage Reinforced by Component Interaction in Stoichiometry
Tunable Hetero-Carbides via Artificial Interface Engineering ........................................................................... 98
5.1 Introduction ................................................................................................................................................. 98
5.2 Experimental methods ............................................................................................................................... 100
5.2.1 Material synthesis ........................................................................................................................... 100
5.2.2 Material characterization ................................................................................................................ 102
5.2.3 Electrochemical measurements ....................................................................................................... 102
5.3 Results and discussion ............................................................................................................................... 104
5.3.1 Physical characterization of morphology and structure .................................................................. 104
5.3.2 Electrochemical properties .............................................................................................................. 112
5.4 Conclusion .................................................................................................................................................. 118
5.5 References .................................................................................................................................................. 119
CHAPTER 6 Hetero-structure Manipulation towards Ameliorating MoO3 Electrodes for Better Lithium
Storage Capability ................................................................................................................................................. 122
6.1 Introduction ............................................................................................................................................... 122
XII
6.2 Experimental methods ............................................................................................................................... 124
6.2.1 Material synthesis ........................................................................................................................... 124
6.2.2 Material characterization ................................................................................................................ 126
6.2.3 Electrochemical measurements ....................................................................................................... 126
6.3 Results and Discussion .............................................................................................................................. 127
6.3.1 Physical Characterizations of Mo2C-C⊂ x-MoO3 composites ....................................................... 127
6.3.2 Electrochemical properties ............................................................................................................. 136
6.4 Conclusion ................................................................................................................................................. 142
6.5 References ................................................................................................................................................. 143
CHAPTER 7 CONCLUSIONS AND OUTLOOK.............................................................................................. 147
7.1 General conclusions ................................................................................................................................... 147
7.2 Outlook ...................................................................................................................................................... 149
Appendix A: LIST of PUBLICATIONS .............................................................................................................. 152
Appendix B: AWARDS RECEIVED .................................................................................................................... 153
XIII
LIST OF FIGURES
Figure 2. 1 Schematic illustration of a first-generation LiCoO2/graphite lithium-ion battery. Upon discharging, lithium
ions migrate to the LiCoO2 electrode as electrons flow in the external circuit, producing useful power to be consumed
by the device. During charging process, the reverse process will occur. [11]................................................................ 9
Figure 2. 2 Galvanostatic curves of batteries using LiNO2-based cathode materials: (a) LiNiO2, 2% Ga-LiNiO2, and
LiNi0.75Ti0.125Mg0.125O2 (b) Li(Ni0.7Co0.3-zAlz)O2.[18] .................................................................................................. 11
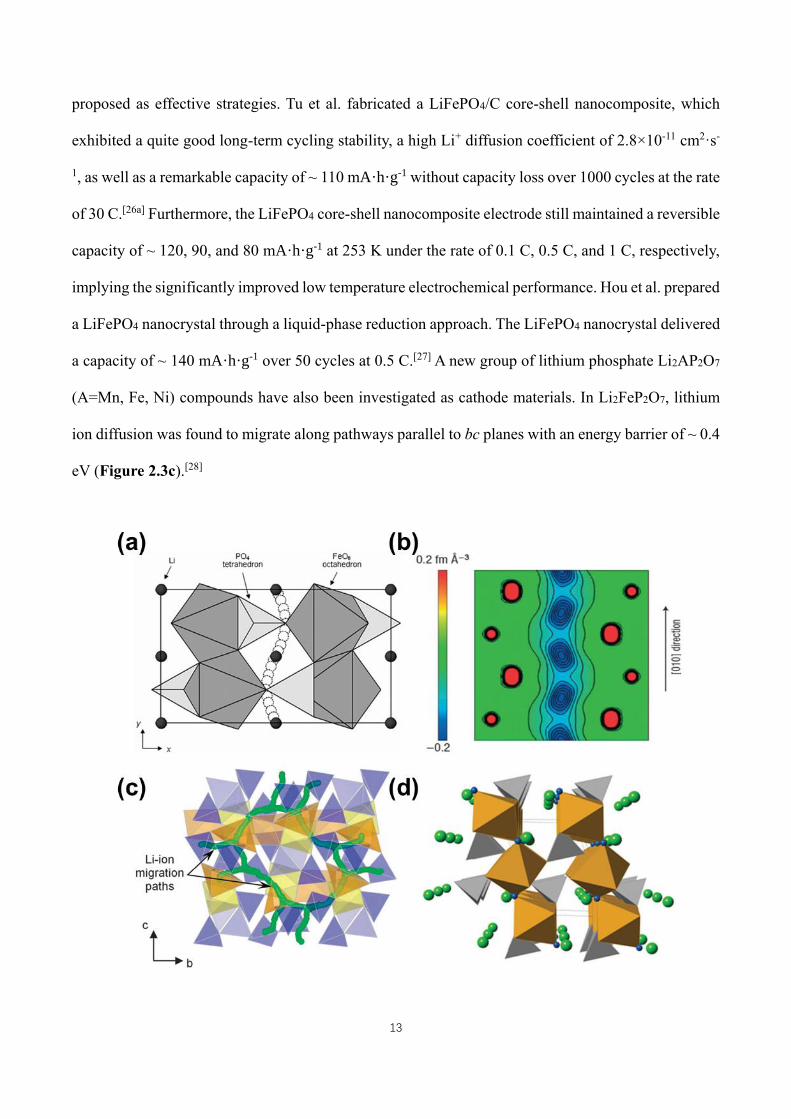
Figure 2. 3 (a) Schematic illustration of the calculated Li+ conduction trajectories of LiFePO4 along [0 1 0] channels
viewed from a perpendicular direction to the ab plane.[29] (b) Contour map of the (0 0 1) plane in LixFePO4 obtained
from the joint methods of powder neutron diffraction and the maximum entropy method.[30] (c) Schematic illustration
of the calculated pathways (green curves) for Li+ conduction in Li2FeP2O7, viewed from a perpendicular direction to
the bc plane. Yellow octahedral: FeO6 octahedral; Blue polyhedral: P2O7 units; mixed occupancy of FeO5–LiO5
components are shown in orange and pyrophosphate in blue. [31] (d) Crystal structure of LiFeSO4F cathode material
for lithium-ion batteries. Light green spheres: Li ions; Brown polyhedral: Fe–O units; Grey tetrahedral: SO4 units;
Dark blue spheres: fluoride ions. Black lines represent demarcated lines between each unit in the structure. [11] .... 14
Figure 2. 4 (a) Electrochemical charge/discharge curves of graphite anode. (b) Stage information of graphite
corresponding to (a). The stage indices are marked. [34] ............................................................................................ 18
Figure 2. 5 Periodic table with the active elements in red and blue color that are known to form compounds with
lithium. The elements in red are discussed in this PhD work. The elements in blue are not included. [51] ................ 19
Figure 2. 6 The structures and lithium storage capacities of elements in Group IV. (a) Crystal structures of cubic
silicon (blue balls: Si atoms), cubic germanium (green balls: Ge atoms), tetragonal tin (red balls: Sn atoms), and cubic
lead (orange balls: Pb atoms). (b) The summarized gravimetric and volumetric theoretical capacities of C and Group
IV elements (including Si, Ge, Sn, and Pb).[8] ........................................................................................................... 19
Figure 2. 7 SEM images of (a) the silica template, (b) a 0D hollow Ge nanoparticle assembly, (c) a 3D porous Ge
nanoparticle assembly, and (d) the magnified image of (c).[80] .................................................................................. 27
Figure 2. 8 The illustration of the crystal structures of non-stoichiometric molybdenum oxides (a) Mo8O23, (b) Mo9O26,
(c) Mo4O11, (d) Mo17O47, (e) MoO2, (f) Mo18O52.[86-87] ............................................................................................. 29
Figure 2. 9 (a,b) SEM image, (c,e) STEM image, (d) TEM image and (f) HRTEM images of highly ordered
mesoporous MoO2 materials. Electrochemical performance of ordered mesoporous MoO2 (SBET = 115m2·g-1) and
XIV
bulk MoO2 (Aldrich, SBET=0.23m2·g-1): (g) Snapshots of the ordered mesoporous MoO2 electrode with the increase
of Li inserted, calculated by DFT. [110] ....................................................................................................................... 36
Figure 3. 1 Outline of the characterization methods used in this doctoral thesis. ...................................................... 52
Figure 3. 2 The schematic illustrations of the basic setup for electrospinning process. [1] (a) Typical vertical setup of
electrospinning apparatus.[2] (b) Horizontal set up of electrospinning apparatus.[3] The insets of (a) and (b) display the
drawings of the forces acting on the charged droplet and typical FE-SEM images of polyurethane nanofibrous
membranes. ................................................................................................................................................................ 53
Figure 3. 3 Examples of static self-assembly. (a) Crystal structure of a ribosome. [6] (b) Micrometer-sized metallic
polyhedral folded from planar substrates. [7] (c) A three-dimensional aggregate of micrometer plates assembled by
capillary forces. [8] (d) An array of millimeter-sized polymeric plates assembled at a water/perfuorodecalin interface
by capillary interactions. [4] (e) Thin film of a nematic liquid crystal on an isotropic substrate. [4] (f) Self-assembled
nanofibers. [9].............................................................................................................................................................. 55
Figure 3. 4 The specially customized CR2032 coin cells were fabricated for the in-situ synchrotron X-ray powder
diffractions (SXRPD). [10] .......................................................................................................................................... 57
Figure 3. 5 The schematic illustration of coin cell component assembly process. [16] ............................................... 61
Figure 4. 1 (a) SEM image of Mo3O10(C6H8N)2·2H2O nanowire precursor. (b) SEM image of MoO2-NCNW. (c) SEM
image of bulk MoO2. (d) SEM image of bulk MoOC/MoO2. ................................................................................... 73
Figure 4. 2 (a-c) TEM images and selected-area electron diffraction (SAED) pattern of Mo3O10(C6H8N)2·2H2O. (d-
f) TEM images and selected-area electron diffraction (SAED) pattern of MoO2-NCNW. ........................................ 74
Figure 4. 3 Investigation of the morphological properties of MoOC/MoO2-NCNW. (a) SEM image of MoOC/MoO2-
NCNW. (b) TEM image of MoOC/MoO2-NCNW. (c) Selected area electron diffraction (SAED) pattern of
MoOC/MoO2-NCNW. (d-e) High resolution TEM images of MoOC/MoO2-NCNW. The area outlined by white
dashed line represents amorphous carbon. Yellow labels represent MoO2 phase and white labels represent MoOC
phase. (f) Schematic illustration of MoOC/MoO2 hetero-interfaces. (g-k) Energy dispersive spectroscopy (EDS)
mapping of MoOC/MoO2-NCNW. Scale bar = 1μm. ................................................................................................ 74
Figure 4. 4 XRD pattern of Mo3O10(C6H8N)2·2H2O nanowire precursor. ................................................................. 76
Figure 4. 5 (a) XRD patterns of the as-collected samples:A (MoOC/MoO2-NCNW), B (bulk MoO2/MoOC), C
(MoO2-NCNW), and D (bulk MoO2). (b) XRD patterns of the indicated area in (a). (c) Rietveld refinement analysis
of MoOC/MoO2-NCNW obtained from the XRD data for MoOC/MoO2-NCNW. (d) C 1s high resolution XPS spectra
XV
of MoOC/MoO2-NCNW, MoO2-NCNW, and bulk MoOC/MoO2. (e) O 1s high resolution XPS spectra of
MoOC/MoO2-NCNW and MoO2-NCNW. (f) Mo 3d high resolution XPS spectra of MoOC/MoO2-NCNW and
MoO2-NCNW. (g) Electron paramagnetic resonance (EPR) spectra of MoOC/MoO2-NCNW and MoO2-NCNW. (h)
Raman spectra of MoOC/MoO2-NCNW and MoO2-NCNW within the Raman shift of 100-1100 cm-1. ................. 77
Figure 4. 6 Initial structure of (a) monoclinic MoO2 (left) and cubic MoOC (right). Red balls: Mo atoms. Blue balls:
O atoms. Grey balls: C atoms. (b) The initial crystallographic structure of MoO2 phase. ........................................ 79
Figure 4. 7 TGA profiles of MoOC/MoO2-NCNW (A) and MoO2-NCNW (B) tested under air atmosphere. .......... 80
Figure 4. 8 (a) N 1s high resolution XPS spectra of MoO2-NCNW and MoOC/MoO2-NCNW. (b) O 1s high resolution
XPS spectra of bulk MoO2 and bulk MoOC/MoO2, (c) Mo 3d high resolution XPS spectra of bulk MoO2 and bulk
MoOC/MoO2. ............................................................................................................................................................ 81
Figure 4. 9 Raman spectra of MoOC/MoO2-NCNW and MoO2-NCNW within the range of 1100 - 2000 cm-1. ..... 84
Figure 4. 10 Cyclic voltammetry profiles of bulk MoOC/MoO2 and bulk MoO2. .................................................... 84
Figure 4. 11 (a) Cyclic voltammetry profiles of MoOC/MoO2-NCNW and MoO2-NCNW for the second cycle. (b)
Initial charge and discharge profiles of MoOC/MoO2-NCNW, bulk MoO2/MoOC, MoO2-NCNW, and bulk MoO2
samples at 100 mA·g-1. (c) Long-term galvanostatic cycling comparisons of MoOC/MoO2-NCNW, bulk
MoO2/MoOC, MoO2-NCNW, and bulk MoO2 samples at 0.5 A·g-1. (d) The galvanostatic cycling performance
(specific discharge capacity and columbic efficiency comparison) of MoOC/MoO2-NCNW under the current density
of 2 A·g-1. (e) Rate performances (specific discharge capacity) of all the samples under the current density of 0.5, 1,
2, 5, 10, 5, 2, 1, 0.5 A·g-1. (f) State-of-the-art reported molybdenum dioxide (abbreviated as MO) based electrodes
for LIBs. [8b, 9, 25a, 36] .................................................................................................................................................... 85
Figure 4. 12 Electrochemical impedance spectra of the as-collected samples tested after 100 cycles (fully discharged
down to 0.05 V) at 1000 mA·g-1. ............................................................................................................................... 88
Figure 4. 13 (a) Galvanostatic intermittent titration technique (GITT) profiles of the as-collected samples. (b) The
plots of the lithium chemical diffusion coefficients for the samples in the discharged state obtained by GITT as a
function of potential. The inset is an enlargement of the curve for bulk MoO2. ........................................................ 88
Figure 4. 14 (a) Contour plots using operando synchrotron X-ray powder diffraction data of bulk MoOC/MoO2,
collected during electrochemical cycling, showing the variation of the most sensitive (111) reflections of MoO2
component.( b) The variations of d111 in MoO2 phase calculated from the (111) reflections in (a). (c) The total
density of states (TDOS) and partial density of states (PDOS) profiles for pristine MoO2 (left frame) and MoOC
XVI
(right frame). (d) The estimated lithium storage mechanisms responsible for the different electrochemical
performances of MoO2-NCNW and MoOC/MoO2-NCNW. ..................................................................................... 90
Figure 4. 15 TEM images of (a- c) MoO2-NCNW and (d-f) MoOC/MoO2-NCNW samples after 100 cycles at 100
mA·g-1. ....................................................................................................................................................................... 90
Figure 4. 16 Comparison of charge distribution around Mo atoms of MoO2 and MoOC compounds simulated based
on first-principles DFT calculations: a) monoclinic MoO2 phase, b) cubic MoOC phase. The yellow and blue colors
in Figure S13a, b indicate decrease and increase of the charge density, respectively. ............................................... 91
Figure 5. 1 (a) Schematic illustration of synthesis procedure for MoC-Mo2C-hnws. MoC-Mo2C-hnws (b) SEM, (c)
TEM, and (d) high-resolution TEM, and (e) SAED pattern. Mo2C-nws (f) SEM, (g) TEM, and (h) high-resolution
TEM, and (i) SAED pattern. MoC-nws (j) SEM, (k) TEM, and (l) high-resolution TEM, and (m) SAED pattern. 104
Figure 5. 2 TEM images of (a, b) MoC-Mo2C-hnws, (c,d) MoC-nws, (e, f) Mo2C-nws. ....................................... 105
Figure 5. 3 XRD pattern of Mo3O10(C6H8N)2·2H2O nanowire precursor. ............................................................... 106
Figure 5. 4 (a) X-ray diffraction patterns of MoC-Mo2C-hnws, Mo2C-nws, and MoC-nws. (b) Raman spectra of MoC-
Mo2C-hnws, Mo2C-nws, and MoC-nws. (c) Thermo-gravimetric analysis (TGA) of MoC-Mo2C-hnws, Mo2C-nws,
and MoC-nws. (d-f) Nitrogen adsorption and desorption isotherms for MoC-Mo2C-hnws, Mo2C-nws, and MoC-nws
................................................................................................................................................................................. 107
Figure 5. 5 (a) Rietveld refinement of MoC-Mo2C-hnws from the X-ray powder diffraction data. Rwp: weighted profile
reliability factor; GOF: goodness of fit. Crystal structures of (b) MoC and (c) Mo2C lattices. ................................ 110
Figure 5. 6 (a) Mo 3d high resolution spectra and (b) C 1s high resolution spectra of MoC-nws and Mo2C-nws. .. 111
Figure 5. 7 (a) Cyclic voltammetry profiles of MoC-Mo2C-hnws for the initial three cycles (scan rate = 0.1 mV·s-1).
(b) Comparison of the initial discharge/charge curves (100 mA·g-1) of MoC-Mo2C-hnws, Mo2C-nws, mixed sample
(0.5MoC+0.5Mo2C-nws), and MoC-nws electrodes. (c) Long-term cycling performances of MoC-Mo2C-hnws,
Mo2C-nws, mixed sample (0.5MoC+0.5Mo2C-nws), and MoC-nws electrodes at 1 A·g-1. (d) Discharge/charge curves
of MoC-Mo2C-hnws electrode at the current densities of 0.5, 1, 2, 3, 5, 8, and 10 A·g-1. (e) (Top frame) the
corresponding coulombic efficiency of the rate performance of MoC-Mo2C-hnws electrode; (bottom frame)
comparison of the rate performances of MoC-Mo2C-hnws, Mo2C-nws, mixed sample (0.5MoC+0.5Mo2C-nws), and
MoC-nws electrodes at 0.5, 1, 2, 3, 5, 8, 10 ,8, 5, 3, 2, 1, 0.5, 1, 2, 3, 5, 10, and 0.5 A·g-1, where the initial cycle was
activated under the current density of 0.1 A·g-1. CV curves at different scan rates of (f) MoC-Mo2C-hnws, (g) Mo2C-
nws, and (h) MoC-nws. (i) Linear relationship of peak currents versus V0.5·s−0.5 and the corresponding linear fits for
XVII
MoC-Mo2C-hnws, Mo2C-nws, and MoC-nws electrodes. The data of peak currents are extracted from A* in Figure
3f, B* in Figure 3g, and C* in Figure 3h. ................................................................................................................. 112
Figure 5. 8 (a) Electrochemical impedance spectra of MoC-nws, Mo2C-nws, MoC-Mo2C-hnws, and the mixed sample
(0.5MoC+0.5Mo2C-nws) after the 0100th cycle. The inset shows an enlargement of the indicated region. (b)
galvanostatic intermittent titration profiles of MoC-Mo2C-hnws, MoC-nws, and Mo2C-nws in the initial cycle. (c)
Comparison of lithium ion diffusion coefficients of MoC-Mo2C-hnws, MoC-nws, and Mo2C-nws. ...................... 118
Figure 6. 1 Schematic illustration of Mo2C-C⊂x-MoO3 (x = 0, 1, 3, 6, 14) nanofibers (NFs) prepared via an
electrospinning process with a single-needle nozzle. :Mo-PVA nanofiber. :C nanofiber matrix. : Mo2C particle.
: MoO3 particle. .................................................................................................................................................. 127
Figure 6. 2 (a) XRD patterns of all the samples, involving Mo2C-C⊂x-MoO3 (x= 0, 1, 3, 6, 14) composites. The PDF
card (JCPDS No.72-1683) corresponds to orthorhombic Mo2C (Pbcn(60)), while the other JCPDS card (No. 35-0609)
is ascribed to orthorhombic MoO3 (Pbnm(62)). (b) The Rietveld refinement of the X-ray diffraction pattern for Mo2C-
C⊂1-MoO3. (c) Raman spectra of Mo2C-C⊂x-MoO3 (x = 0, 1, 3, 6, 14) composites. (d-f) High resolution Mo3d, O1s,
C1s XPS spectra for Mo2C-C⊂1-MoO3 composite. ................................................................................................ 128
Figure 6. 3 (a) The X-ray diffraction patterns of bulk MoO3, and bulk Mo2C. The Rietveld refinement of X-ray
diffraction patterns for (b) Mo2C-C⊂3-MoO3, (c) Mo2C-C⊂6-MoO3, (d) Mo2C-C⊂14-MoO3. ............................ 129
Figure 6. 4 TG curves of Mo2C-C⊂ x-MoO3 (x = 0, 1, 3, 6, 14) sample in air at 4℃/min from room temperature to
600 ℃. ..................................................................................................................................................................... 130
Figure 6. 5 Left frame (a, d, g, j, m): Zoomed-in schematic illustration of the interior morphology of a singular
nanofiber in Mo2C-C⊂x-MoO3 (x = 0, 1, 3, 6, 14) within the same size of selected area. Grey color represents carbon
phase, and pink red color stands for Mo2C phase. Light blue color represents MoO3 phase. Middle frame (b, e, h, k,
n): TEM images of Mo2C-C⊂x-MoO3 (x = 0, 1, 3, 6, 14), respectively. Right frame (c, f, i, l, o): SEM images of
Mo2C-C⊂x-MoO3 (x = 0, 1, 3, 6, 14) composites, respectively. ............................................................................. 133
Figure 6. 6 TEM image of (a) Mo2C-C⊂1-MoO3, (b) Mo2C-C⊂3-MoO3, (c) Mo2C-C⊂0-MoO3.......................... 135
Figure 6. 7 SEM image of Mo-PVA nanofiber precursor. ....................................................................................... 135
Figure 6. 8 The TG profile of pure PVA-C nanofiber heated at 300℃ for 400 min. ............................................... 136
Figure 6. 9 (a) The initial discharge–charge profiles of all the samples for LIBs at the current density of 100 mA·g-1.
(b) The corresponding coulombic efficiency of all as-collected electrodes. The first cycle was tested at 100 mA·g-1,
while the subsequent cycles were tested at 1000 mA·g-1. (c) The comparisons of galvanostatic discharge profiles for
XVIII
all the electrodes and the corresponding coulombic efficiency of Mo2C-C⊂1-MoO3 at 1000 mA·g-1. (d) Rate
performances (discharge capacities) of all the samples, at the current densities of 200, 500, 1000, 2000, and 200
mA·g-1, respectively. (e) The comparison of the second cyclic voltammetry profiles of Mo2C-C⊂x-MoO3 (x = 0, 1,
3, 6, 14) samples within voltage range of 0.05-3 V vs. Li+/Li. (f) The Nyquist plots of Mo2C-C⊂x-MoO3 (x = 0, 1, 3,
6, 14) in the frequency range of 1 kHz–10 mHz after 30 cycling tests at 200 mA·g-1. The inset is the equivalent circuit
used to analyze the impedance plots. ....................................................................................................................... 136
Figure 6. 10 TEM images of (a, b) Mo2C-C⊂1-MoO3, (c, d) Mo2C-C⊂3-MoO3, (e) Mo2C-C⊂6-MoO3, (f) Mo2C-
C⊂14-MoO3 after 30 cycles at 200 mA·g-1. ............................................................................................................ 140
Figure 6. 11 (a) The schematic illustration of lithium diffusion process in Mo2C-C⊂x-MoO3 composites. (b) The
estimated trend of hybridity in Mo2C-C⊂x-MoO3. ................................................................................................. 141
XIX
LIST OF TABLES
Table 2. 1: Practical LIB configurations and electrochemical performance of commercialized EVs in past and current
production. [5] ............................................................................................................................................................... 8
Table 3. 1: The chemicals used in this thesis. ............................................................................................................ 51
Table 3. 2: Different polymers used in electrospinning and electro-spinning/netting, solution properties and their
applications. [1] ........................................................................................................................................................... 54
Table 4. 1: Crystallographic details of the as-prepared samples. ............................................................................... 79
Table 4. 2: Comparison of lattice constants and Mo-O bond length between pristine MoO2, MoO2 reported in previous
work, and MoO2 phase in MoOC/MoO2 composite. Unit: Angstrom ....................................................................... 79
Table 4. 3: Weight ratio of carbon, MoO2, and MoOC. ............................................................................................. 80
Table 5. 1: Lattice parameters of MoC and Mo2C phases. ....................................................................................... 111
Table 5. 2: Weight ratios of carbon, Mo2C, and MoC. .............................................................................................. 111
Table 5. 3: Comparison of the electrochemical performance of MoC-Mo2C-hnws with previously reported Mo2C-
based materials as anode in lithium ion batteries. (1 C = 1000 mAh g-1). Three-dimensional hierarchically
porous=3DHP. Mesoporous heteronanowires=MHNW. ........................................................................................... 114
Table 6. 1: The obtained weight ratio of Mo2C to MoO3 by Rietveld refinement. .................................................. 131
Table 6. 2: Impedance parameters for all samples from the fitted equivalent circuits R1(R2CPE1)((R3Ws)CPE2). In the
equivalent circuit, R1 represents the electrolyte and contact resistance, R2 and CPE1 represent the resistance of the as-
formed solid electrolyte interphase, and constant phase element, respectively. R3 and Ws represent charge-transfer
resistance and Warburg diffusion impedance, respectively. CPE2 represent the constant phase element. j0 is calculated
according to j0 = RT/nFRct, where j0 refers to the exchange current density. R is the gas constant, T is the absolute
temperature, n is the number of transferred electrons, and F is the Faraday constant. ............................................ 139
XX
NOMENCLATURE
List of Abbreviations
Abbreviation Full Name Abbreviation Full Name
NW nanowire 1D One-dimensional
CS chitosan 2D Two-dimensional
PU polyurethane 3D Three-dimensional
PANI polyaniline TFA trifluoroacetic acid
a.u. Arbitrary unit PAA polyacrylic acid
PA-6 polyamide-6 PVA polyvinil alcohol
EV Electric vehicle MC methylene chloride
THF Tetrahydrofuran PEO polyethylene oxide
EC Ethylene carbonate CNC cellulose nanocrystal
DEC Diethyl carbonate SIBs Sodium ion batteries
CV Cyclic voltammogram HEVs Hybrid electric vehicles
LIBs Lithium ion batteries DMF N,N-dimethylformamide
OCV Open circuit voltage EES Electrical energy storage
BET Brunauer-Emmett-Teller SWCNT single wall carbon nanotube
CMC Carboxymethyl cellulose PIBs Potassium ion batteries
NMP 1-methyl-2-pyrrolidinone MPEG methoxy poly(ethylene glycol)
PTT poly(trimethylene
terephthalate)
EDS Energy dispersive X-ray
spectroscopy
FE-SEM Field-emission scanning
electron microscopy
EIS Electrochemical impedance
spectroscopy
HRTEM High-resolution transmission
electron microscopy
JCPDS Joint Committee on Powder
Diffraction Standards
XXI
List of Symbols
Symbol Name Unit
2θ Peak position in XRD °
C Charge or discharge rate C
d Lattice spacing nm
I Current mA
m Active material mass g
λ X-ray wavelength Å
η Coulombic efficiency %
V Voltage volt
T Temperature K or °C
t Time s
SP Specific power W·kg-1
SE Specific energy W·h·kg-1
SBET Specific BET surface area m2·g-1
Q Specific capacity mA·h·g-1
R Resistance Ω
P/P0 Relative pressure --
N Avogadro's number = 6.022 × 10⁻²³ mol-1

XXII
List of Organizations
Abbreviation Full name
ISEM Institute for Superconducting and Electronic Materials
UOW University of Wollongong
FDU Fudan University
Chinese Acad Sci, Inst Phys Chinese Academy of Sciences, Institute of Physics
1
Chapter 1 INTRODUCTION 1
Among the diverse energy resources (such as coal, crude oil, natural gas, wood, wind, solar energy, 2
etc.), fossil fuels have supported the development of human society for thousand years, and to date, 3
our society still heavily relies on this energy resource. However, the rapid consumption of fossil fuels 4
coupled with environmental concerns call for the replacement of the traditional energy resources by 5
clean and sustainable alternatives, which involve solar energy, wind energy, tidal energy, geothermal 6
energy resources, etc. Although these representative sustainable energy resources are environmentally 7
friendly and renewable, in contrast with fossil fuels, they have emerged as intermittent energy supplies, 8
which are determined by the weather, season, time, etc., and this will greatly limit their large-scale 9
applications. Energy storage systems, in particular, electrochemical energy storage systems have 10
revealed their advantages and commercial value as efficient solution to overcome this problematic 11
issue after the energy conversion into electricity. Batteries are inspiring researchers in terms of efficient 12
energy utilization, safety and convenience, etc., and they have experienced enormous progress from 13
the discovery of novel electrode materials and new reaction mechanisms with significantly desirable 14
properties. As anodes based on intercalation reaction mechanisms have almost approached their 15
theoretical limits, however, the design and development of high performance anode nanomaterials still 16
require the further efforts of researchers to satisfy the ever-growing demands. 17
Conversion-type electrodes (usually transition metal compounds, including nitrides, fluorides, 18
oxides, sulfides, carbides etc.) could deliver much higher theoretical capacities, even several fold 19
higher, than those of intercalation-type electrodes. Nevertheless, the commercialization of conversion-20
type electrodes is still hampered by several major problems: low electric conductivity, limited cycling 21
life, and large voltage hysteresis. Strategies involving morphology control, multiple-level structural 22
engineering, the creation of atomic defect sites, interface and material composition optimization, etc. 23
have been adopted towards addressing these issues. 24
2
Among the transition metal compounds, molybdenum compounds are of high research interests, 1
considering their easy functionality arising from their abundant stoichiometry, band gaps, and rich 2
chemical environments. As the controllable preparation of advanced molybdenum compounds 3
flourishes with the development of nanotechnology, molybdenum nano-compounds have witnessed 4
outstanding improvements in their electrochemical performances, from constructing interconnected 5
electron/ion pathways, reducing electron/ion diffusion distances, nano-confinement and chemical 6
binding in a robust matrix, etc. The current research focus and future directions in optimizing 7
molybdenum-based electrodes could be summarized as: 8
(1) Fabricating Mo-based nano-electrodes with carefully designed and advantageous 9
nanostructures. 10
(2) Combining molybdenum compounds with different forms of carbon. 11
(3) Exploring novel Mo-based anodes. 12
(4) Understanding the charge transfer mechanisms and exploring the reaction mechanisms in high-13
performance Mo-based anodes and finding the optimal structures for good electrochemical 14
performance/rate capability. 15
In this doctoral work, the key points are summarized under the following aspects: 16
(1) Investigation of the structural evolution in the composition and physical structure as functions 17
of the electrochemical processes by in-situ and ex-situ X-ray diffraction (XRD), powder 18
diffraction (PD), and X-ray photoelectron spectroscopy (XPS) in order to optimize the active 19
materials and electrolytes, and to further improve the energy storage performance. 20
(2) Exploring novel Mo-based anodes (such as MoOC). 21
(3) Synthesis of nanostructured Mo-based carbonaceous materials to reduce the Li+ diffusion 22
distance and electrical resistance. 23
3
(4) Investigating the reaction mechanisms of the novel designed Mo-based anodes. 1
(5) Mitigating the shortcomings (such as low electrochemical activity, large over-potential, and 2
voltage hysteresis) of Mo-based anodes. 3
(6) Optimizing the lithium storage capability of molybdenum compounds through interface 4
engineering of well-designed hetero-structures. 5
A brief overview of the chapters in this thesis: 6
Chapter 1 gives a brief introduction to the general background of this research work, its major 7
challenges, the corresponding strategies for enhancing the electrochemical performance of 8
rechargeable batteries, and the objectives of this study. 9
Chapter 2 presents a literature review on the background of energy storage systems and state-of-the-10
art lithium ion batteries. The investigated topics include discussions on anode materials with different 11
electrochemical reaction mechanisms, the current state of research status, and the prospects for their 12
future development. 13
Chapter 3 summarizes the experimental procedures, chemicals used in this work, synthesis techniques 14
to prepare electrode materials, and the physical/electrochemical measurements used to characterize the 15
properties of all the as-prepared materials. 16
Chapter 4 investigates the electrochemical performance of an interface engineered MoO2 electrode. 17
Compared with bulk MoO2 and MoO2 nanowire electrodes, the coupling of MoOC could contribute 18
remarkably to both the charge transfer process and the solid-state Li+ diffusion process in MoO2 19
electrode, resulting in good rate capability and long-term cycling stability, which implies the 20
significant role of interface engineering in improving the performance of anodes for advanced lithium 21
ion batteries (LIBs). 22
Chapter 5 presented a study on the electrochemical performances of molybdenum carbide-based 23
4
anodes. Molybdenum carbides are often considered as electrochemically inactive as anode materials, 1
but in this work, the well-designed MoC-Mo2C nanowire electrode exhibits good electrochemical 2
reaction kinetics, resulting in improved lithium storage capability and stable rate capability. This work 3
revealed that, the hetero-structures contribute to improving the electrochemical activity of 4
molybdenum carbide, which provides some perspectives for the future development of carbide-based 5
anodes. 6
Chapter 6 discussed the effects of different hetero-structures (composition, morphology) on the 7
electrochemical performance (lithium storage capability, voltage hysteresis, kinetics) of MoO3 8
electrodes, which have been fabricated through a versatile electrospinning technique. This research 9
work revealed that hetero-matrix with a well-defined architecture could better facilitate the electron 10
and ion transfer kinetics in the MoO3 active phase, which greatly improves the electrode’s lithium 11
storage capability and cycling stability, as well as effectively reducing the voltage hysteresis of redox 12
pairs. 13
Chapter 7 presents a general summary of this doctoral thesis and also provides some perspectives and 14
the outlook for further developing the pertinent electrodes. 15
16
5
Chapter 2 LITERATURE REVIEW
2.1 Rechargeable batteries
For the last 200 years, the development of human society has been mainly powered by energy from
fossil fuel resources, and more recently, the ever-growing demands for transportation, electricity
production, operation of factories, etc. show our high dependence on fossil fuels, which lead to fast
declining resource reserves, as well as the threat of environmental destruction, such as by pollution
and global warming. High concentrations of particulate matter less than 2.5 micrometers in size
(PM2.5) which come from substantial increases in car exhaust and fossil combustion, have resulted
frequent haze episodes in China and have become a major health risk, since small particles can enter
into the alveoli of the lungs through inhalation.[1] Recent reports have demonstrated that secondary
inorganic aerosols (SIA) and secondary organic aerosols (SOA) play a dominate role in facilitating the
rapid formation and evolution of haze,[2] implying the importance of reducing the precursors of SIA
and SOA, which involve sulfur dioxide, nitrogen oxide, volatile organic components (VOCs), etc., for
cutting down the PM2.5 level. Another major problem in terms of the combustion of fossil fuels is
global warming, leading to the rise of sea level.[3] It is reported that the average increase in sea level
approached ~ 3.1 mm per year, and continuous sea level rise would inundate some island countries.[4]
To address the energy crisis and environmental problems, electricity production using sustainable
energy sources and using electrical propulsion in electric vehicles for ground transportation have
emerged as promising alternatives. In recent years, the techniques to obtain sustainable energy have
witnessed remarkable development, including in photo-thermal receivers, photovoltaic cells, better
wind turbines, etc. As an advanced energy storage technique, rechargeable batteries with high energy
efficiency offer a great opportunity to promote the development of a sustainable energy economy by
enhancing the quality of the energy harvested from renewable energy resources, which have attracted
6
high interest from both governments and industry, leading to abundant research in this field over recent
years. In addition, the extensive applications of rechargeable batteries involve portable electronics, the
aerospace industry, storage photovoltaic-generated dc electricity, public transport involving plug-in
hybrid and pure-electric vehicles (PHEVs and EVs), etc. Batteries that feature high safety, affordable
price, long service lifetime, and light weight are considered as key components to supply power,
promote and popularize PHEVs and EVs in road transport, serving the aim of cutting CO2 emissions.
2.2 History
As electrochemical energy storage techniques, the state-of-the-art batteries that are mostly used
include the lead–acid battery, nickel–iron battery, nickel metal hydride (NiMH) battery, and Li-ion
batteries (LIBs).[4a] Electric vehicles powered by lead-acid batteries experienced fast development in
the years from 1900 to 1912, with sales volume reaching several tens of thousands. Lead-acid batteries
possess a working voltage of ~ 2 V, coulombic efficiency ~ 80%, and energy efficiency of ~ 70%,
approaching a practical gravimetric and volumetric energy content that only amounts to 40 W·h·kg-1
and 90 W·h·L-1, respectively.[5] After the lead-acid battery, nickel–metal hydride batteries with
operation voltage of ~ 1.2 V have been developed as the primary alternative for hybrid electric vehicles
(HEVs), [6] which are reported to afford an energy content of ~ 80 W·h·kg-1 and ~ 250 W·h·L-1,
respectively. Nonetheless, NiMH batteries show lower values in terms of coulombic efficiency of ~
70% and energy efficiency of ~ 65% in comparison with lead-acid batteries.[5] As competitive
alternatives to NiMH batteries, theoretically speaking, both the gravimetric and volumetric energy
densities of LIBs are the highest among the various battery alternatives due to their having the lowest
reduction potentials and the fastest ion hopping among solid phase of batteries, as well as the light
weight of Li.
As Dey’s work demonstrated, Li metal could alloy with other metals during the electrochemical
reactions, affording higher specific capacity than graphite (372 mA·h·g-1).[7] Nonetheless, the large
7
volume changes in the alloying materials during cycling induced the continuous formation of an
unstable solid-state interface film, leading to a large reversible capacity loss. The commercialization
of the Stalion battery developed by Fuji (using a tin composite oxide anode) in 1997 was hampered
due to low coulombic efficiency.[7-8] Well-designed electrode materials may mitigate this problematic
issue to an acceptable level. The Nexelion battery announced by Sony in 2005 adopted the Sn/Co/C/Ti
nanostructured composite created through a high energy mechanical milling (HEMM) approach,[8]
which could better accommodate the volume changes and the mechanical strains during
lithiation/delithiation processes. The fast development of nanotechnology has offered great
opportunities for advanced LIBs, and it was reported that LIBs have a substantial market share (10
billion dollars, in 2008) to supply power for electronics such as smart watches, mobile phones, digital
cameras, laptops after the first commercialization of LIBs in early 1990s by Sony Corporation.[8]
Currently, LIBs have become the mainstream power for PHEVs and battery-electric vehicles (BEVs),
affording high coulombic efficiency (~ 99%) and energy efficiency (~ 95%), with energy content of ~
260 W·H·kg-1 and ~700 W·h·L-1, in addition, LIBs could offer tunable power to energy ratios for
HEVs, PHEVs, and BEVs, since high energy density is preferred for BEVs, cycle life is an important
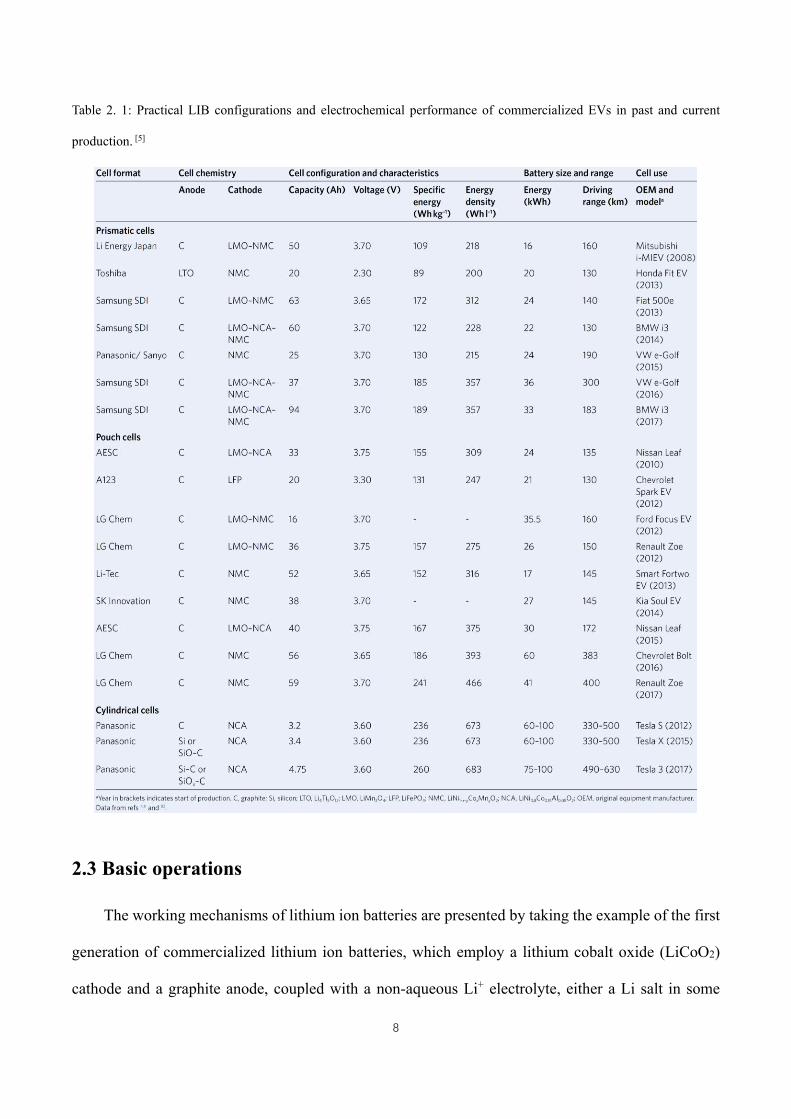
parameter for PHEVs, and both low cost and moderate power for HEVs.[6, 9] A parameter overview in
terms of practical LIB configurations and electrochemical performance of commercial EVs is
presented in Table 2.1.[5] The near future goal of BEVs is targeted at a mileage range exceeding 500
km, requiring, as estimated by the US Department of Energy and the Advanced Battery Consortium,
us to approach the energy content of 235 W·h·kg-1 and 500 W·h·L-1 for the battery pack level, 350
W·h·kg-1 and 750 W·h·L-1 for the cell level with pack cost less than 125 US$ kW·h-1, while current
energy content is around 140 W·h·kg-1 and over 210 W·h·L-1, respectively for automotive LIB
packs.[9b, 10] Therefore, the future development of lithium ion batteries is placing a high demand on
improvements in terms of performance, production, and cost.
8
Table 2. 1: Practical LIB configurations and electrochemical performance of commercialized EVs in past and current
production. [5]
2.3 Basic operations
The working mechanisms of lithium ion batteries are presented by taking the example of the first
generation of commercialized lithium ion batteries, which employ a lithium cobalt oxide (LiCoO2)
cathode and a graphite anode, coupled with a non-aqueous Li+ electrolyte, either a Li salt in some
9
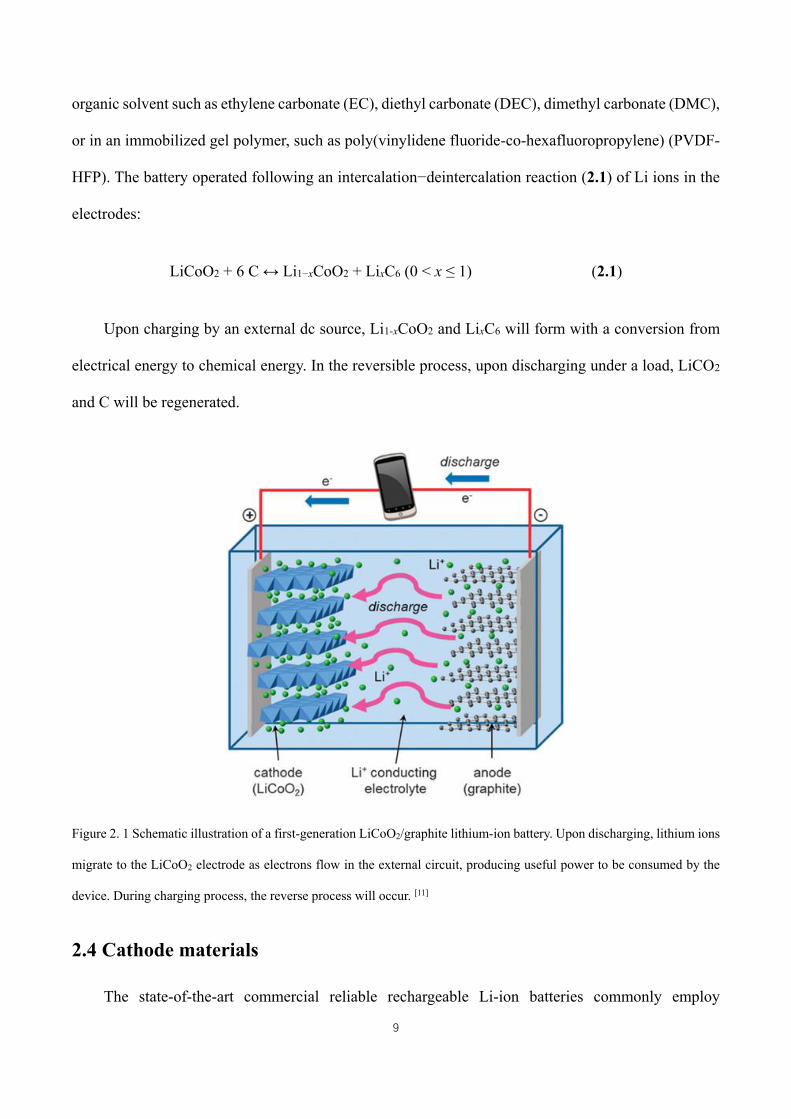
organic solvent such as ethylene carbonate (EC), diethyl carbonate (DEC), dimethyl carbonate (DMC),
or in an immobilized gel polymer, such as poly(vinylidene fluoride-co-hexafluoropropylene) (PVDF-
HFP). The battery operated following an intercalation−deintercalation reaction (2.1) of Li ions in the
electrodes:
LiCoO2 + 6 C ↔ Li1−xCoO2 + LixC6 (0 < x ≤ 1) (2.1)
Upon charging by an external dc source, Li1-xCoO2 and LixC6 will form with a conversion from
electrical energy to chemical energy. In the reversible process, upon discharging under a load, LiCO2
and C will be regenerated.
Figure 2. 1 Schematic illustration of a first-generation LiCoO2/graphite lithium-ion battery. Upon discharging, lithium ions
migrate to the LiCoO2 electrode as electrons flow in the external circuit, producing useful power to be consumed by the
device. During charging process, the reverse process will occur. [11]
2.4 Cathode materials
The state-of-the-art commercial reliable rechargeable Li-ion batteries commonly employ
10
electrodes entailing the intercalation lithium storage mechanism, such as LiNi0.8Co0.15Al0.05O2 (NCA),
LiNi0.5Mn1.5O4-C, LiFePO4-C, LiCoO2-C, LiNixMnyCozO2-C, LiNiO2 and LiNixMnyCozO2 (NMC)
with different stoichiometry and “lithium-rich’’ intercalation cathodes (such as Li2MnO3,
Li[Li0.2Mn0.534Ni0.133Co0.133]O2, Li1.2Mn0.525Ni0.175Co0.1O2, etc.).[4a, 12] Apart from the intercalation
mechanism, other reported conversion-type cathodes contain chalcogens (Te, Se, S etc.),
chalcogenides (Li2S, Li2Se, Li2Te, CuS, NiS, FeS, FeSe, CoSe2 etc.), metal fluorides (CuF2, FeF2, FeF3,
CoF2, NiF2 etc.). Here, we mainly give an overview of the cathodes entailing the intercalation
mechanism.
2.4.1 Layered LiMO2
The LiMO2 layered family includes LiCoO2, LiNiO2, LiMnO2, and binary and ternary compounds
such as Li[Ni1-y-zCoyAlz]O2 (denoted as NCA) and Li[Ni1-y-zMnyCoz]O2 (denoted as NMC). As a
conventional LIB cathode material for more than 20 years, LiCoO2 cathode possesses a rhombohedral
structure, in which a near cubic packed O2- lattice is coordinated octahedrally by cobalt ions and
lithium ions, thereby forming alternating layers of cobalt acid anions and lithium ions.[11] For the
reliable operation of batteries, however, delithiation of LiCoO2/C batteries should be restricted to
below 0.5 Li per formula unit, implying that the utilization ratio of material capacity is limited to
50%.[13] Furthermore, due to the low capacity output, high cost and toxicity of cobalt, and the structural
instability of the charged-state intermediate of this cathode, the application of LiCoO2 was hindered,
thus requiring replacement of cobalt by other multivalent elements that are less expensive and
environmentally friendly.[11] LiNiO2 was considered as an alternative cathode for LiCoO2 in terms of
lower cost, environmental friendliness and improved reversible capacity (200 mA·h·g-1).[14] The
structure of LiNiO2 experiences changes during repeated cycling, in which the reduced Ni2+ diffuses
into the Li+ layer, and blocked the Li+ migration paths, thus leading to detrimental influences on the
electrochemical performance.[15] LiMnO2 has been fabricated and investigated as cathode for LIBs.
11
The similar radii of Li+ and high spin configured Mn3+ limit the stabilization of layered LiMnO2,
leading to fading electrochemical performance.[16] Research to achieve stable LiMnO2 layered
compounds has therefore been conducted. Dahn et al. fabricated an O2 type Li-Mn-oxide to overcome
the conversion to spinel LiMnO2 with poor electrochemical activity.[17] Furthermore, partial chemical
substitution on the metal sites by other types of metals leads to the formation of binary and ternary
compounds, which functions to overcome the problematic issues that the entrance of some transition
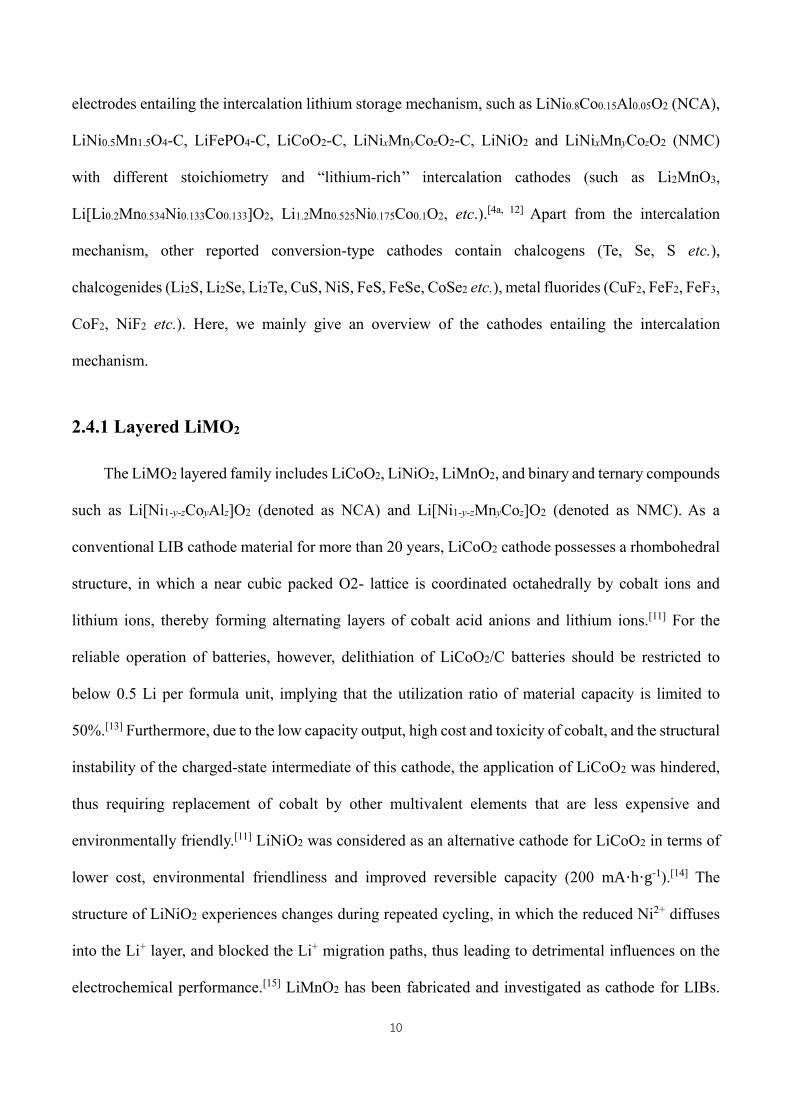
metal ions into Li+ layers will block the Li+ diffusivity. A series of Mg, Ga, Al, Ca, Nb and Ti
substitutions on nickel sites in LiNiO2 were verified as effective to restrain the detrimental phase
transitions of the electrodes,[18] showing improved cycling durability of the batteries (Figure 2.2).
Figure 2. 2 Galvanostatic curves of batteries using LiNO2-based cathode materials: (a) LiNiO2, 2% Ga-LiNiO2, and
LiNi0.75Ti0.125Mg0.125O2 (b) Li(Ni0.7Co0.3-zAlz)O2.[18]
When LiNi1-yCoyO2 (y > 0.3) compounds were tested under cycling, no nickel was observed in
the Li-layers, leading to a stabilized layer character, in addition, the compounds could reach the
capacity of 180 mA·h·g-1, corresponding to 0.7 Li reversible uptake/removal. [19] Al was introduced to
enhance the thermal stability of the Li(Ni, Co)O2 solid solution, forming Li[Ni1-y-zCoyAlz]O2 cathode
materials for LIBs. Ohzuku et al. revealed the positive role of Al doping in LiNiO2, in which the
reversibility of the redox process was significantly improved.[20] The LiNi0.8Co0.15Al0.05O2 (NCA)
cathodes with a reliable discharge capacity around 200 mA·h·g-1 and long service lifespan were applied
12
for commercial use, for instance, in Panasonic batteries for Tesla EVs, nonetheless, the rapid decay of
electrochemical performance at higher temperature (313-343 K) is still a challenge, which may be
attributed to the continuous formation of the unstable solid electrolyte interphase (SEI).[21] Sun et al.
fabricated a Li[(Ni0.8Co0.1Mn0.1)0.8(Ni0.5Mn0.5)0.2]O2 compound, with Li[Ni0.8Co0.1Mn0.1]O2 as the core
and Li[Ni0.5Mn0.5]O2 as the shell material. The thermal stability of delithiated
Li[(Ni0.8Co0.1Mn0.1)0.8(Ni0.5Mn0.5)0.2]O2 was increased to 523 K, which was higher than that of Li1-
xNiO2 electrode. The enhanced thermal stability of Li[(Ni0.8Co0.1Mn0.1)0.8(Ni0.5Mn0.5)0.2]O2 may be
attributed to the unique core-shell structure, in which the outer thermally stable Li[Ni0.5Mn0.5]O2 could
effectively restrain the O2 release of the delithiated Li1-x[Ni0.8Co0.1Mn0.1]O2, contributing to a
significant improvement in the whole structure.[22]
2.4.2 Phosphate cathodes
Li+ diffusion barriers in a series of lithium phosphate olivine (LixAPO4, A = Mn, Ni, Fe) have
been estimated by density functional theory (DFT) calculations. [23] A low Li+ diffusion barrier (around
0.1-0.2 eV) along the predicted one-dimensional (1D) pathways (shown in Figure 2.3a) has been
identified, furthermore, the experimentally measured value was lower than the theoretically predicted
one. LiFePO4 has a theoretical capacity of ~ 170 mA·h·g-1, operation voltage of 3.45 V, and the
advantages such as environmental compatibility, safety, and cheaper price.[24] Atomistic defect
modelling analysis of LiFePO4 demonstrated that Li+ migration tended to adopt a curved trajectory
along the [0 1 0] channel in the orthorhombic crystals of LiFePO4 (Figure 2.3b). Furthermore, the Li+
diffusion coefficient in LiFePO4 showed a dependence on particle size, according to the research by
Malik et al.,[25] implying that nanosized LiFePO4 composite electrodes will afford better
electrochemical performance than bulk LiFePO4 crystals.
The main problems of LiFePO4 lie in its poor electronic conductivity and low temperature
performance.[26] To overcome these limitations, carbon coating and fabricating nanosized LiFePO4 are
13
proposed as effective strategies. Tu et al. fabricated a LiFePO4/C core-shell nanocomposite, which
exhibited a quite good long-term cycling stability, a high Li+ diffusion coefficient of 2.8×10⁻¹¹ cm2·s-
1, as well as a remarkable capacity of ~ 110 mA·h·g-1 without capacity loss over 1000 cycles at the rate
of 30 C.[26a] Furthermore, the LiFePO4 core-shell nanocomposite electrode still maintained a reversible
capacity of ~ 120, 90, and 80 mA·h·g-1 at 253 K under the rate of 0.1 C, 0.5 C, and 1 C, respectively,
implying the significantly improved low temperature electrochemical performance. Hou et al. prepared
a LiFePO4 nanocrystal through a liquid-phase reduction approach. The LiFePO4 nanocrystal delivered
a capacity of ~ 140 mA·h·g-1 over 50 cycles at 0.5 C.[27] A new group of lithium phosphate Li2AP2O7
(A=Mn, Fe, Ni) compounds have also been investigated as cathode materials. In Li2FeP2O7, lithium
ion diffusion was found to migrate along pathways parallel to bc planes with an energy barrier of ~ 0.4
eV (Figure 2.3c).[28]
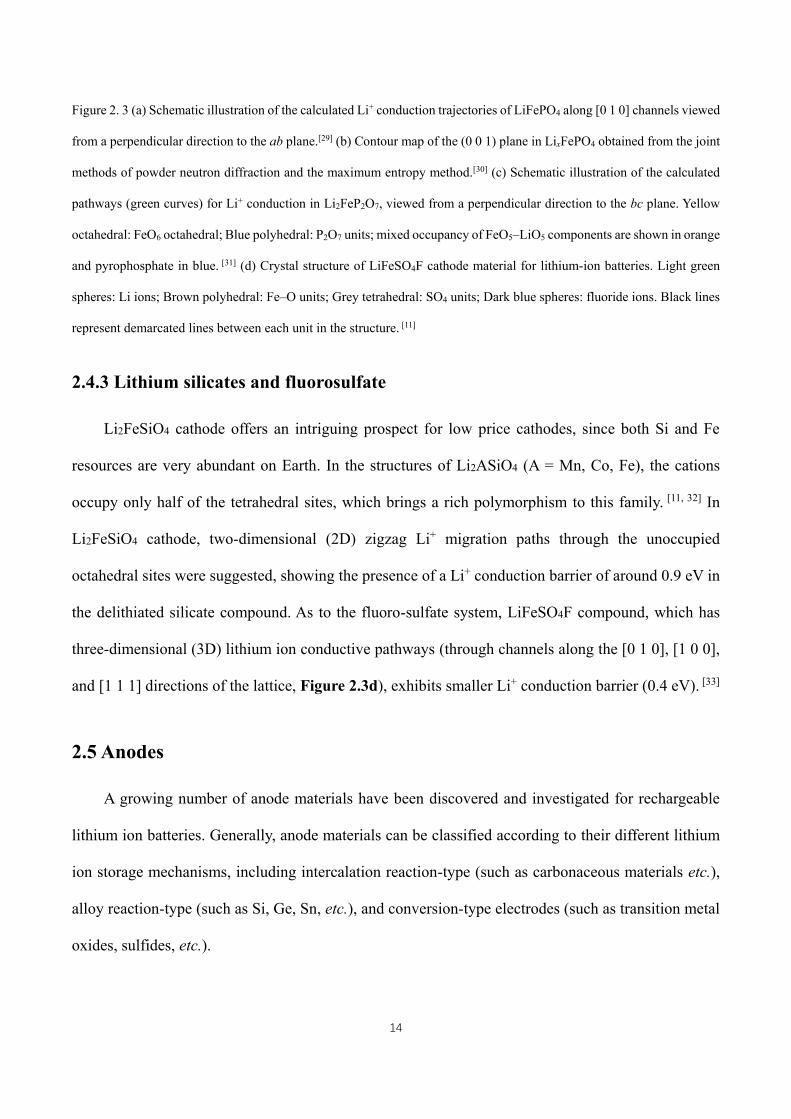
14
Figure 2. 3 (a) Schematic illustration of the calculated Li+ conduction trajectories of LiFePO4 along [0 1 0] channels viewed
from a perpendicular direction to the ab plane.[29] (b) Contour map of the (0 0 1) plane in LixFePO4 obtained from the joint
methods of powder neutron diffraction and the maximum entropy method.[30] (c) Schematic illustration of the calculated
pathways (green curves) for Li+ conduction in Li2FeP2O7, viewed from a perpendicular direction to the bc plane. Yellow
octahedral: FeO6 octahedral; Blue polyhedral: P2O7 units; mixed occupancy of FeO5–LiO5 components are shown in orange
and pyrophosphate in blue. [31] (d) Crystal structure of LiFeSO4F cathode material for lithium-ion batteries. Light green
spheres: Li ions; Brown polyhedral: Fe–O units; Grey tetrahedral: SO4 units; Dark blue spheres: fluoride ions. Black lines
represent demarcated lines between each unit in the structure. [11]
2.4.3 Lithium silicates and fluorosulfate
Li2FeSiO4 cathode offers an intriguing prospect for low price cathodes, since both Si and Fe
resources are very abundant on Earth. In the structures of Li2ASiO4 (A = Mn, Co, Fe), the cations
occupy only half of the tetrahedral sites, which brings a rich polymorphism to this family. [11, 32] In
Li2FeSiO4 cathode, two-dimensional (2D) zigzag Li+ migration paths through the unoccupied
octahedral sites were suggested, showing the presence of a Li+ conduction barrier of around 0.9 eV in
the delithiated silicate compound. As to the fluoro-sulfate system, LiFeSO4F compound, which has
three-dimensional (3D) lithium ion conductive pathways (through channels along the [0 1 0], [1 0 0],
and [1 1 1] directions of the lattice, Figure 2.3d), exhibits smaller Li+ conduction barrier (0.4 eV). [33]
2.5 Anodes
A growing number of anode materials have been discovered and investigated for rechargeable
lithium ion batteries. Generally, anode materials can be classified according to their different lithium
ion storage mechanisms, including intercalation reaction-type (such as carbonaceous materials etc.),
alloy reaction-type (such as Si, Ge, Sn, etc.), and conversion-type electrodes (such as transition metal
oxides, sulfides, etc.).
15
2.5.1 Carbonaceous materials
Graphite, which is composed of stacking graphene layers and is found in the forms of hexagonal
graphite and rhombohedral graphite, has been employed as the anode material for commercial lithium
ion batteries. It features an intercalation lithium storage mechanism (2.2) as follows:[34]
6 C + x Li+ + x e- ↔ LixC6 (2.2)
When x = 1, the maximum capacity of ~ 370 mA·h·g-1 could be gained. Lee et al. proposed that
Li+ storage in graphite featured a “stage formation” process, which reflected the stepwise generation
of a periodic array of unoccupied layer gaps in the graphite at a low concentration of lithium ions. [35]
As seen in Figure 2.4, the stage index corresponds to the layer numbers of two nearest guest graphene
layers. As the graphite electrode has almost approached its theoretical limit, to further develop the
battery technology, nanocarbon materials have attracted the attention of researchers. Nanocarbon
materials could facilitate the electrochemical reactions that are sluggish in materials consisting of
micro-sized particles, thus delivering a higher lithium storage capacity (see Equation 2.3). The reduced
particle sizes play a significant role in improving the electron transfer and lithium uptake/removal,
which are benefitted from the short diffusion distances.
t =𝐿2
𝐷 (2.3)
where, t, L, and D represent the diffusion time constant, diffusion length, and diffusion constant.
[36] Nanocarbon materials such as carbon nanotubes (CNTs), carbon nanofibers (CNF), graphene, etc.,
have been intensively investigated, and they show many inspiring properties in terms of unique
morphology, smaller particle size, and defects in comparison with bulk graphite.
Carbon nanotubes (CNTs) possess the tubular graphite sheet structure, and exhibit lithium storage
capacity within 300-600 mA·h·g-1, [34] in addition, other desirable properties such as low density,
16
tensile strength higher than 60 GPa and the electric conductivity ≥ 105 S·cm-1 are also featured by
CNTs.[34, 37] The lithium ion storage in CNTs is reported to occur on the internal and external surfaces
of the tubes, and the internal site Li+ adsorption was found more energy expensive. As the diameters
of the CNTs increase, the adsorption energy on the inside and outside also changes. Although Li+
shuttling across the sidewalls of CNTs will not occur, the rich topological defects (> 9-numbered
carbon rings) and fractured sections of the CNTs allow Li+ entrance into the tubes. The lithium storage
capacity is greatly affected by the quality of the CNTs. Kawasaki and coworkers investigated metallic
SWCNTs and semiconducting SWCNTs electrodes for lithium ion batteries. The former delivered five-
fold higher Li+ storage capacity than the latter, which may be attributed to the difference in the Li+
adsorption potential of the two samples.[38] Well-aligned CNTs deliver improved rate capabilities due
to the enhanced ion diffusivity and electron transfer (good contact with current collector).[39] CNTs
with open caps, functional heteroatoms (in particular N atoms), or defective sites are also reported to
exhibit higher capacities.[40] As revealed by many theoretical and experimental evidences, N-doping is
reported to be beneficial for enhancing the wettability of electrolytes, improving the electric
conductivity and electrochemical activity of electrodes.[41] Nevertheless, some challenges still hinder
the commercialization of CNTs electrode materials, including the controllable synthesis of CNTs
(including morphology, metallicity etc.), suppression of capacity loss, and the large voltage hysteresis
of CNTs.
Carbon nanofibers (CNF) are often obtained through nanocasting, catalytic chemical vapor
deposition (CVD), and electrospinning techniques. Among these methods, electrospinning appears to
be superior in feasibility, efficiency and cost. Huang et al. synthesized N-doped CNF webs by calcining
polypyrrole nanofibers, which afforded a discharge capacity of 605 mA·h·g-1 at 0.1 A·g-1 (over 10
cycles).[42] The CNF webs were further treated by KOH to improve the porosity of the electrode
materials. The obtained porous CNF webs showed a reversible discharge capacity of 943 mA·h·g-1 at
0.1 A·g-1 (the 600th cycle). This good electrochemical performance could be attributed to the unique
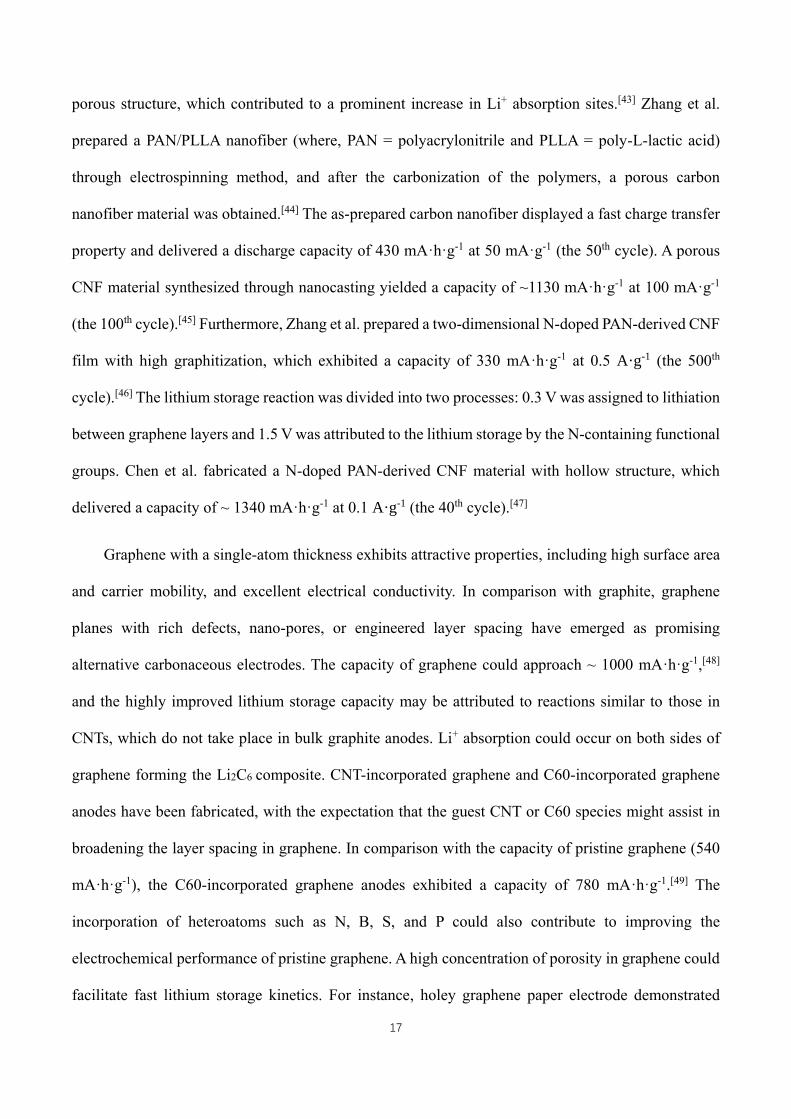
17
porous structure, which contributed to a prominent increase in Li+ absorption sites.[43] Zhang et al.
prepared a PAN/PLLA nanofiber (where, PAN = polyacrylonitrile and PLLA = poly-L-lactic acid)
through electrospinning method, and after the carbonization of the polymers, a porous carbon
nanofiber material was obtained.[44] The as-prepared carbon nanofiber displayed a fast charge transfer
property and delivered a discharge capacity of 430 mA·h·g-1 at 50 mA·g-1 (the 50th cycle). A porous
CNF material synthesized through nanocasting yielded a capacity of ~1130 mA·h·g-1 at 100 mA·g-1
(the 100th cycle).[45] Furthermore, Zhang et al. prepared a two-dimensional N-doped PAN-derived CNF
film with high graphitization, which exhibited a capacity of 330 mA·h·g-1 at 0.5 A·g-1 (the 500th
cycle).[46] The lithium storage reaction was divided into two processes: 0.3 V was assigned to lithiation
between graphene layers and 1.5 V was attributed to the lithium storage by the N-containing functional
groups. Chen et al. fabricated a N-doped PAN-derived CNF material with hollow structure, which
delivered a capacity of ~ 1340 mA·h·g-1 at 0.1 A·g-1 (the 40th cycle).[47]
Graphene with a single-atom thickness exhibits attractive properties, including high surface area
and carrier mobility, and excellent electrical conductivity. In comparison with graphite, graphene
planes with rich defects, nano-pores, or engineered layer spacing have emerged as promising
alternative carbonaceous electrodes. The capacity of graphene could approach ~ 1000 mA·h·g-1,[48]
and the highly improved lithium storage capacity may be attributed to reactions similar to those in
CNTs, which do not take place in bulk graphite anodes. Li+ absorption could occur on both sides of
graphene forming the Li2C6 composite. CNT-incorporated graphene and C60-incorporated graphene
anodes have been fabricated, with the expectation that the guest CNT or C60 species might assist in
broadening the layer spacing in graphene. In comparison with the capacity of pristine graphene (540
mA·h·g-1), the C60-incorporated graphene anodes exhibited a capacity of 780 mA·h·g-1.[49] The
incorporation of heteroatoms such as N, B, S, and P could also contribute to improving the
electrochemical performance of pristine graphene. A high concentration of porosity in graphene could
facilitate fast lithium storage kinetics. For instance, holey graphene paper electrode demonstrated
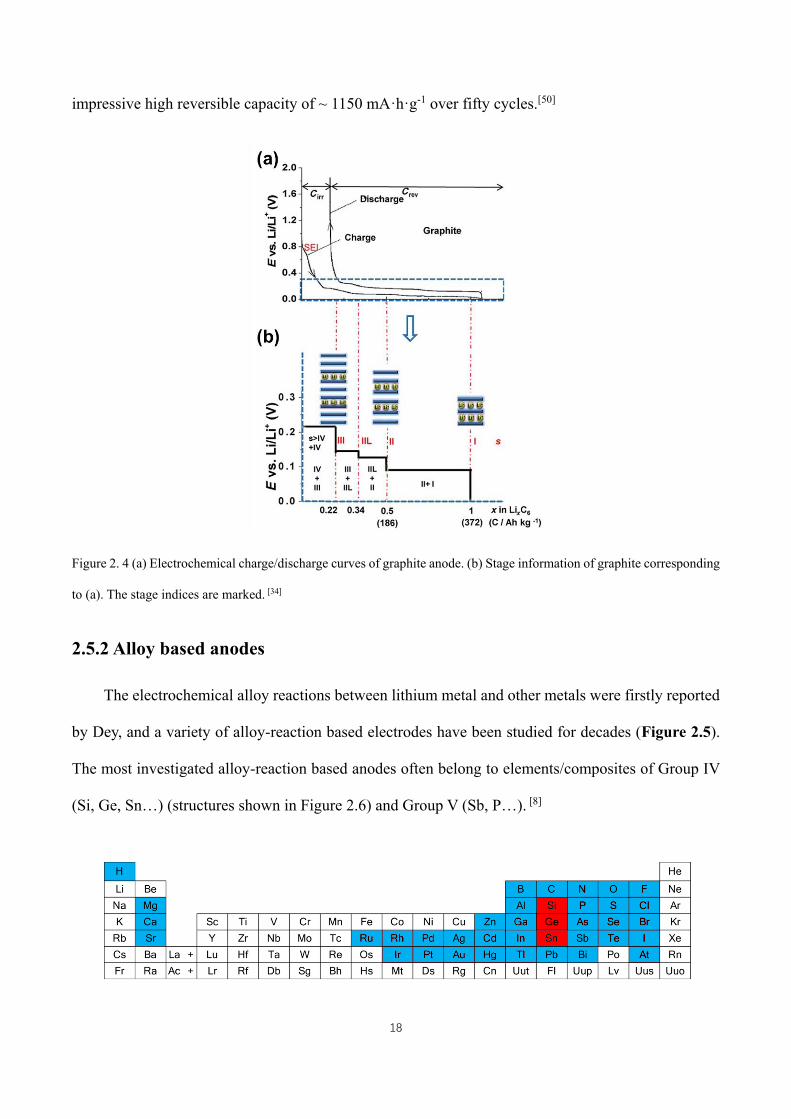
18
impressive high reversible capacity of ~ 1150 mA·h·g-1 over fifty cycles.[50]
Figure 2. 4 (a) Electrochemical charge/discharge curves of graphite anode. (b) Stage information of graphite corresponding
to (a). The stage indices are marked. [34]
2.5.2 Alloy based anodes
The electrochemical alloy reactions between lithium metal and other metals were firstly reported
by Dey, and a variety of alloy-reaction based electrodes have been studied for decades (Figure 2.5).
The most investigated alloy-reaction based anodes often belong to elements/composites of Group IV
(Si, Ge, Sn…) (structures shown in Figure 2.6) and Group V (Sb, P…). [8]
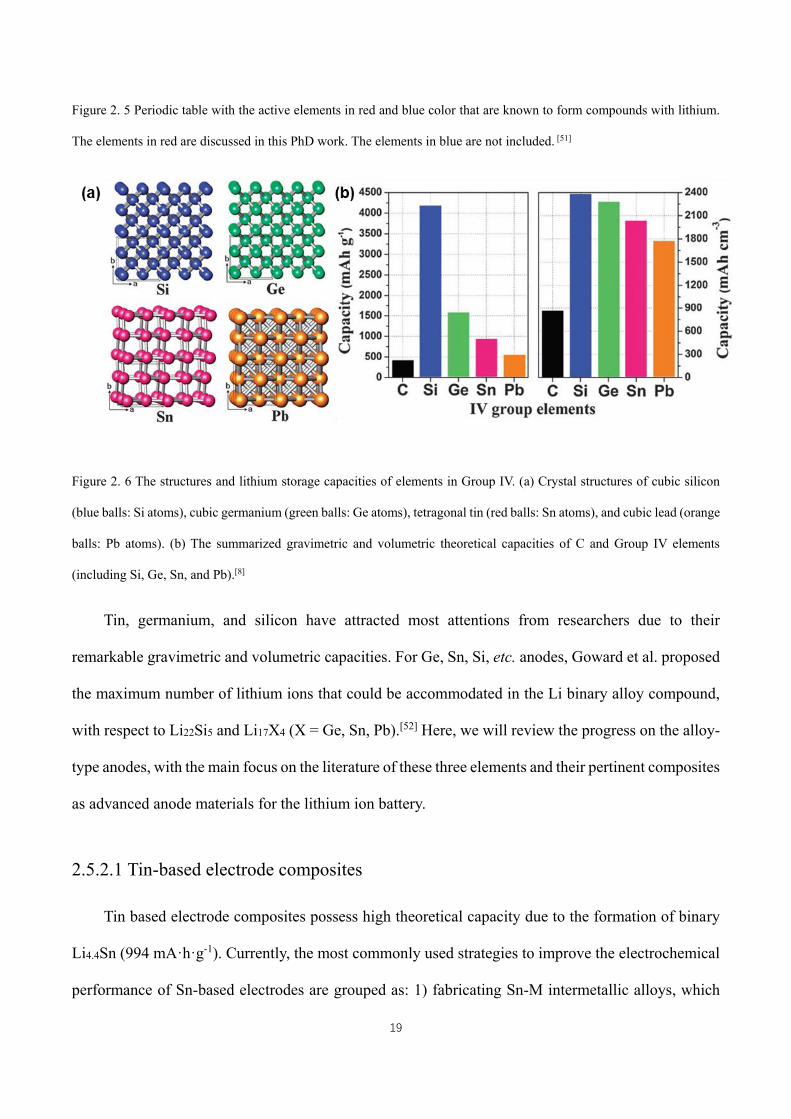
19
Figure 2. 5 Periodic table with the active elements in red and blue color that are known to form compounds with lithium.
The elements in red are discussed in this PhD work. The elements in blue are not included. [51]
Figure 2. 6 The structures and lithium storage capacities of elements in Group IV. (a) Crystal structures of cubic silicon
(blue balls: Si atoms), cubic germanium (green balls: Ge atoms), tetragonal tin (red balls: Sn atoms), and cubic lead (orange
balls: Pb atoms). (b) The summarized gravimetric and volumetric theoretical capacities of C and Group IV elements
(including Si, Ge, Sn, and Pb).[8]
Tin, germanium, and silicon have attracted most attentions from researchers due to their
remarkable gravimetric and volumetric capacities. For Ge, Sn, Si, etc. anodes, Goward et al. proposed
the maximum number of lithium ions that could be accommodated in the Li binary alloy compound,
with respect to Li22Si5 and Li17X4 (X = Ge, Sn, Pb).[52] Here, we will review the progress on the alloy-
type anodes, with the main focus on the literature of these three elements and their pertinent composites
as advanced anode materials for the lithium ion battery.
2.5.2.1 Tin-based electrode composites
Tin based electrode composites possess high theoretical capacity due to the formation of binary
Li4.4Sn (994 mA·h·g-1). Currently, the most commonly used strategies to improve the electrochemical
performance of Sn-based electrodes are grouped as: 1) fabricating Sn-M intermetallic alloys, which
20
could greatly improve the electrical conductivity of the Sn active phases; 2) decreasing the particle
sizes of bulk Sn through nanotechnology; and 3) incorporating nano-sized Sn particles in a high quality
conductive matrix. Wang et al. fabricated a series of intermetallic M-Sn (M=Co, Fe, Ni, Cu) nano-
sphere electrodes. The experimental capacities of the as-prepared Sn-based alloys were in the order:
FeSn2 (theoretical capacity: 804 mA·h·g-1) the highest, Cu6Sn5 (theoretical capacity: 605 mA·h·g-1)
and CoSn3 (theoretical capacity: 852 mA·h·g-1) the middle, and Ni3Sn4 (725 mA·h·g-1) the lowest. The
highest capacity of FeSn2 may be attributed to the beneficial open channels in the lattice, which is
beneficial to the penetration of electrolyte and alloy reactions with Li.[53] Xin et al. fabricated a
Fe0.5Co0.5Sn5 intermetallic electrode.[54] In comparison with FeSn5 (750 mA·h·g-1 with rapid capacity
degradation) and CoSn5 electrode (460 mA·h·g-1), Fe0.5Co0.5Sn5 delivered a discharge capacity of
around 730 mA·h·g-1, with a capacity retention ratio of ~ 93% over 100 cycles. To improve the
electrical conductivity and the mechanical stability of Sn electrode, combination with a carbon matrix
has also been investigated. Yu et al. prepared a bamboo-shaped hollow Sn-C nanofiber electrode for
lithium ion battery, which delivered a reversible capacity of ~ 730 mA·h·g-1 at 0.5 C (the 200th cycle)
and of ~ 480 mA·h·g-1 at 5 C. The void structure was beneficial to accommodate large volume
variations during electrochemical reactions, which makes this electrode promising for lithium ion
batteries.[55] Zhi et al. prepared a graphene wrapped Sn nano-sheet electrode (2D/2D composite), which
delivered a capacity of ~ 590 mA·h·g-1 at 50 mA·g-1 (the 60th cycle).[56] The 2D/2D structured Sn-
based electrode showed better electrochemical performance than the zero-dimensional (0D)/2D Sn-
graphene composite (500 mA·h·g-1) in previous reports.[57] Yang et al. reported a hollow Sn-graphene
hybrid material, which could yield a capacity of 660 mA·h·g-1 at 50 mA·g-1 (the 50th cycle).[58] Wang
et al. fabricated a Sn-C composite with 10 nm Sn nanoparticles in a spherical carbon matrix, which
delivered a capacity of 600 mA·h·g-1 at 20 C. The stable rate capability of this electrode may originate
from the buffering carbon matrix, which can maintain the pristine morphology of the Sn active phase
after repeated cycles, as well as facilitating the convenient and continuous charge transfer at solid
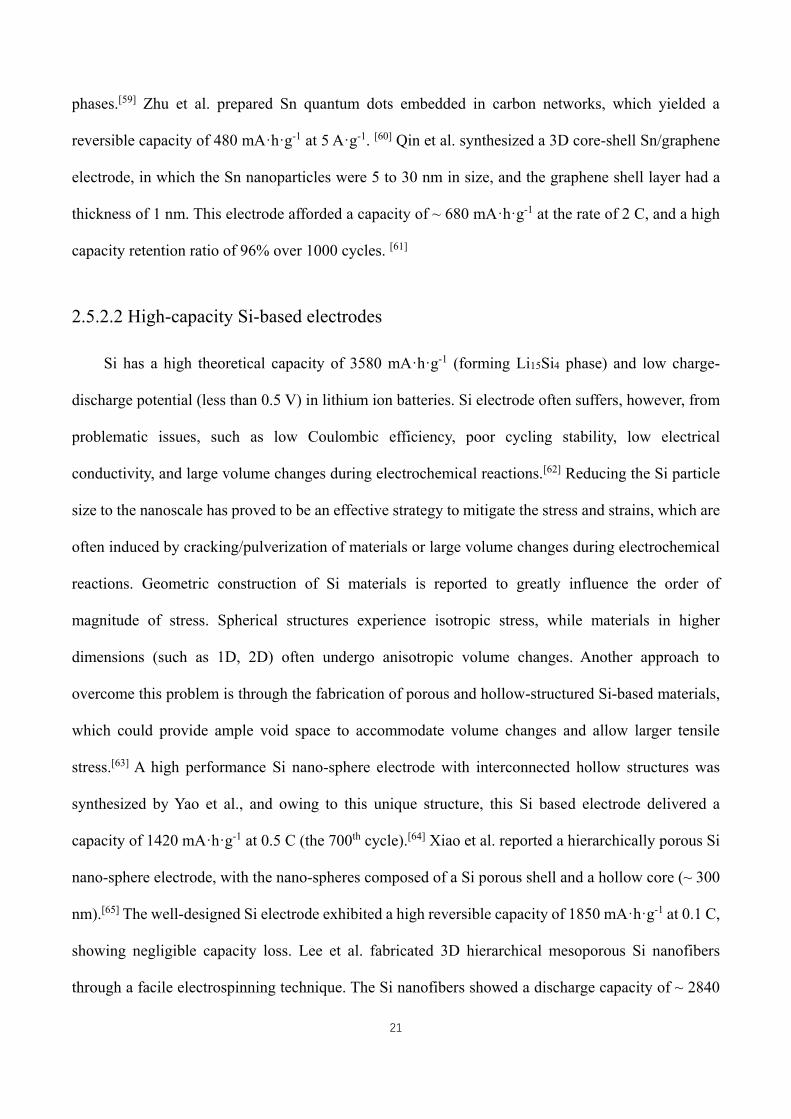
21
phases.[59] Zhu et al. prepared Sn quantum dots embedded in carbon networks, which yielded a
reversible capacity of 480 mA·h·g-1 at 5 A·g-1. [60] Qin et al. synthesized a 3D core-shell Sn/graphene
electrode, in which the Sn nanoparticles were 5 to 30 nm in size, and the graphene shell layer had a
thickness of 1 nm. This electrode afforded a capacity of ~ 680 mA·h·g-1 at the rate of 2 C, and a high
capacity retention ratio of 96% over 1000 cycles. [61]
2.5.2.2 High-capacity Si-based electrodes
Si has a high theoretical capacity of 3580 mA·h·g-1 (forming Li15Si4 phase) and low charge-
discharge potential (less than 0.5 V) in lithium ion batteries. Si electrode often suffers, however, from
problematic issues, such as low Coulombic efficiency, poor cycling stability, low electrical
conductivity, and large volume changes during electrochemical reactions.[62] Reducing the Si particle
size to the nanoscale has proved to be an effective strategy to mitigate the stress and strains, which are
often induced by cracking/pulverization of materials or large volume changes during electrochemical
reactions. Geometric construction of Si materials is reported to greatly influence the order of
magnitude of stress. Spherical structures experience isotropic stress, while materials in higher
dimensions (such as 1D, 2D) often undergo anisotropic volume changes. Another approach to
overcome this problem is through the fabrication of porous and hollow-structured Si-based materials,
which could provide ample void space to accommodate volume changes and allow larger tensile
stress.[63] A high performance Si nano-sphere electrode with interconnected hollow structures was
synthesized by Yao et al., and owing to this unique structure, this Si based electrode delivered a
capacity of 1420 mA·h·g-1 at 0.5 C (the 700th cycle).[64] Xiao et al. reported a hierarchically porous Si
nano-sphere electrode, with the nano-spheres composed of a Si porous shell and a hollow core (~ 300
nm).[65] The well-designed Si electrode exhibited a high reversible capacity of 1850 mA·h·g-1 at 0.1 C,
showing negligible capacity loss. Lee et al. fabricated 3D hierarchical mesoporous Si nanofibers
through a facile electrospinning technique. The Si nanofibers showed a discharge capacity of ~ 2840
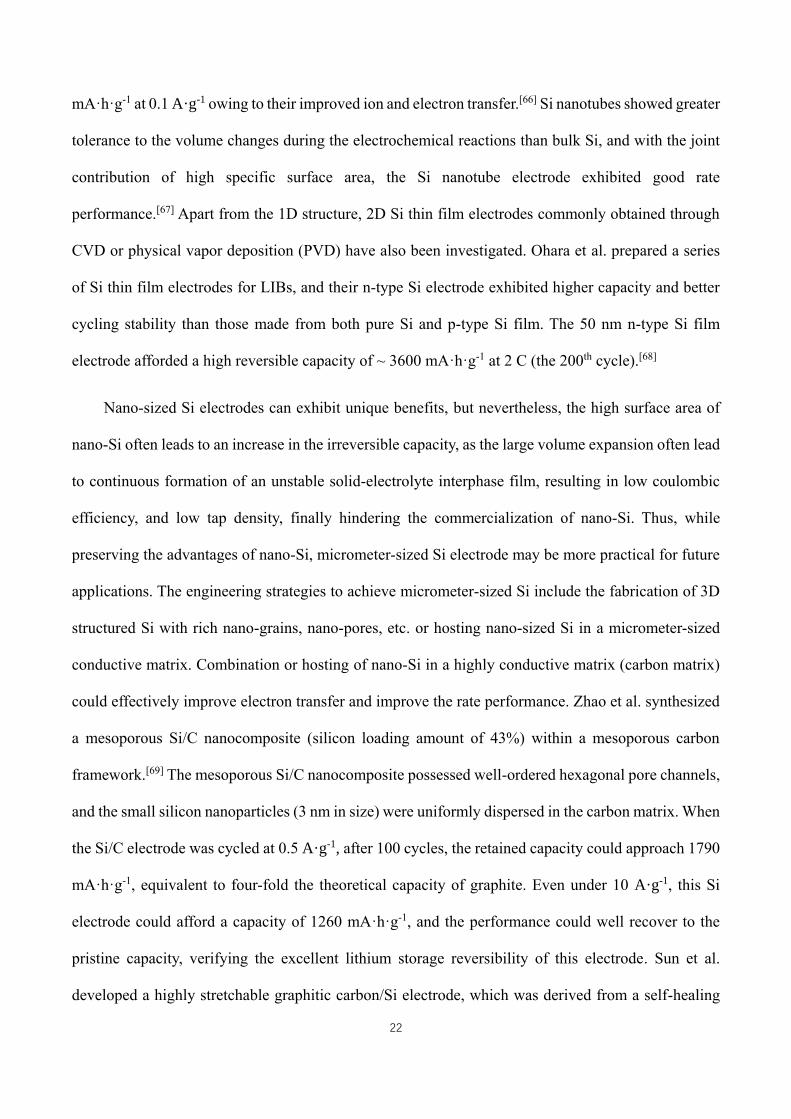
22
mA·h·g-1 at 0.1 A·g-1 owing to their improved ion and electron transfer.[66] Si nanotubes showed greater
tolerance to the volume changes during the electrochemical reactions than bulk Si, and with the joint
contribution of high specific surface area, the Si nanotube electrode exhibited good rate
performance.[67] Apart from the 1D structure, 2D Si thin film electrodes commonly obtained through
CVD or physical vapor deposition (PVD) have also been investigated. Ohara et al. prepared a series
of Si thin film electrodes for LIBs, and their n-type Si electrode exhibited higher capacity and better
cycling stability than those made from both pure Si and p-type Si film. The 50 nm n-type Si film
electrode afforded a high reversible capacity of ~ 3600 mA·h·g-1 at 2 C (the 200th cycle).[68]
Nano-sized Si electrodes can exhibit unique benefits, but nevertheless, the high surface area of
nano-Si often leads to an increase in the irreversible capacity, as the large volume expansion often lead
to continuous formation of an unstable solid-electrolyte interphase film, resulting in low coulombic
efficiency, and low tap density, finally hindering the commercialization of nano-Si. Thus, while
preserving the advantages of nano-Si, micrometer-sized Si electrode may be more practical for future
applications. The engineering strategies to achieve micrometer-sized Si include the fabrication of 3D
structured Si with rich nano-grains, nano-pores, etc. or hosting nano-sized Si in a micrometer-sized
conductive matrix. Combination or hosting of nano-Si in a highly conductive matrix (carbon matrix)
could effectively improve electron transfer and improve the rate performance. Zhao et al. synthesized
a mesoporous Si/C nanocomposite (silicon loading amount of 43%) within a mesoporous carbon
framework.[69] The mesoporous Si/C nanocomposite possessed well-ordered hexagonal pore channels,
and the small silicon nanoparticles (3 nm in size) were uniformly dispersed in the carbon matrix. When
the Si/C electrode was cycled at 0.5 A·g-1, after 100 cycles, the retained capacity could approach 1790
mA·h·g-1, equivalent to four-fold the theoretical capacity of graphite. Even under 10 A·g-1, this Si
electrode could afford a capacity of 1260 mA·h·g-1, and the performance could well recover to the
pristine capacity, verifying the excellent lithium storage reversibility of this electrode. Sun et al.
developed a highly stretchable graphitic carbon/Si electrode, which was derived from a self-healing
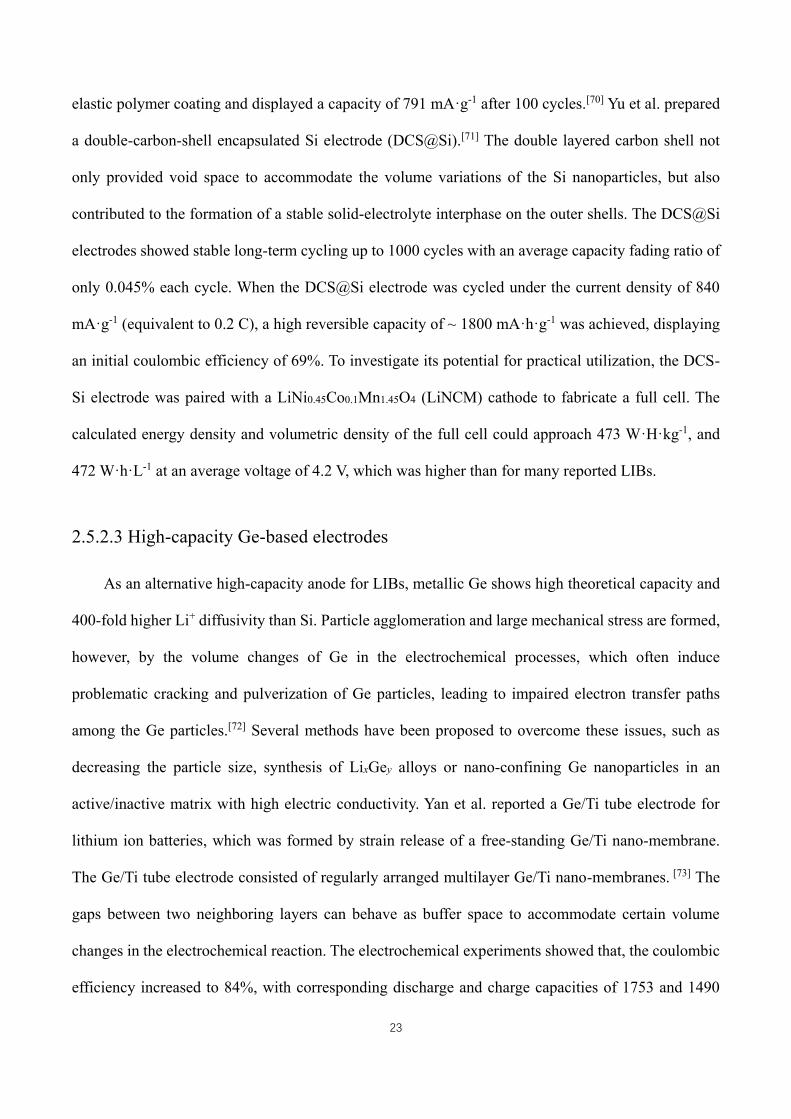
23
elastic polymer coating and displayed a capacity of 791 mA·g-1 after 100 cycles.[70] Yu et al. prepared
a double-carbon-shell encapsulated Si electrode (DCS@Si).[71] The double layered carbon shell not
only provided void space to accommodate the volume variations of the Si nanoparticles, but also
contributed to the formation of a stable solid-electrolyte interphase on the outer shells. The DCS@Si
electrodes showed stable long-term cycling up to 1000 cycles with an average capacity fading ratio of
only 0.045% each cycle. When the DCS@Si electrode was cycled under the current density of 840
mA·g-1 (equivalent to 0.2 C), a high reversible capacity of ~ 1800 mA·h·g-1 was achieved, displaying
an initial coulombic efficiency of 69%. To investigate its potential for practical utilization, the DCS-
Si electrode was paired with a LiNi0.45Co0.1Mn1.45O4 (LiNCM) cathode to fabricate a full cell. The
calculated energy density and volumetric density of the full cell could approach 473 W·H·kg-1, and
472 W·h·L-1 at an average voltage of 4.2 V, which was higher than for many reported LIBs.
2.5.2.3 High-capacity Ge-based electrodes
As an alternative high-capacity anode for LIBs, metallic Ge shows high theoretical capacity and
400-fold higher Li+ diffusivity than Si. Particle agglomeration and large mechanical stress are formed,
however, by the volume changes of Ge in the electrochemical processes, which often induce
problematic cracking and pulverization of Ge particles, leading to impaired electron transfer paths
among the Ge particles.[72] Several methods have been proposed to overcome these issues, such as
decreasing the particle size, synthesis of LixGey alloys or nano-confining Ge nanoparticles in an
active/inactive matrix with high electric conductivity. Yan et al. reported a Ge/Ti tube electrode for
lithium ion batteries, which was formed by strain release of a free-standing Ge/Ti nano-membrane.
The Ge/Ti tube electrode consisted of regularly arranged multilayer Ge/Ti nano-membranes. [73] The
gaps between two neighboring layers can behave as buffer space to accommodate certain volume
changes in the electrochemical reaction. The electrochemical experiments showed that, the coulombic
efficiency increased to 84%, with corresponding discharge and charge capacities of 1753 and 1490
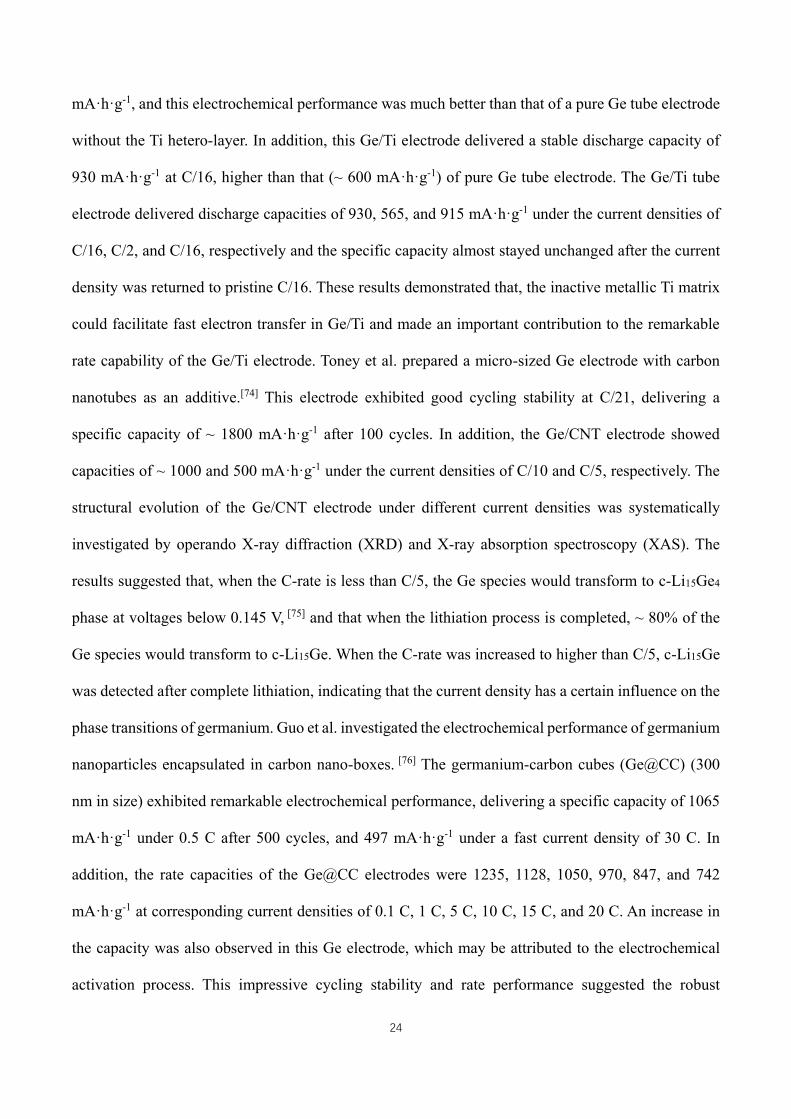
24
mA·h·g-1, and this electrochemical performance was much better than that of a pure Ge tube electrode
without the Ti hetero-layer. In addition, this Ge/Ti electrode delivered a stable discharge capacity of
930 mA·h·g-1 at C/16, higher than that (~ 600 mA·h·g-1) of pure Ge tube electrode. The Ge/Ti tube
electrode delivered discharge capacities of 930, 565, and 915 mA·h·g-1 under the current densities of
C/16, C/2, and C/16, respectively and the specific capacity almost stayed unchanged after the current
density was returned to pristine C/16. These results demonstrated that, the inactive metallic Ti matrix
could facilitate fast electron transfer in Ge/Ti and made an important contribution to the remarkable
rate capability of the Ge/Ti electrode. Toney et al. prepared a micro-sized Ge electrode with carbon
nanotubes as an additive.[74] This electrode exhibited good cycling stability at C/21, delivering a
specific capacity of ~ 1800 mA·h·g-1 after 100 cycles. In addition, the Ge/CNT electrode showed
capacities of ~ 1000 and 500 mA·h·g-1 under the current densities of C/10 and C/5, respectively. The
structural evolution of the Ge/CNT electrode under different current densities was systematically
investigated by operando X-ray diffraction (XRD) and X-ray absorption spectroscopy (XAS). The
results suggested that, when the C-rate is less than C/5, the Ge species would transform to c-Li15Ge4
phase at voltages below 0.145 V, [75] and that when the lithiation process is completed, ~ 80% of the
Ge species would transform to c-Li15Ge. When the C-rate was increased to higher than C/5, c-Li15Ge
was detected after complete lithiation, indicating that the current density has a certain influence on the
phase transitions of germanium. Guo et al. investigated the electrochemical performance of germanium
nanoparticles encapsulated in carbon nano-boxes. [76] The germanium-carbon cubes (Ge@CC) (300
nm in size) exhibited remarkable electrochemical performance, delivering a specific capacity of 1065
mA·h·g-1 under 0.5 C after 500 cycles, and 497 mA·h·g-1 under a fast current density of 30 C. In
addition, the rate capacities of the Ge@CC electrodes were 1235, 1128, 1050, 970, 847, and 742
mA·h·g-1 at corresponding current densities of 0.1 C, 1 C, 5 C, 10 C, 15 C, and 20 C. An increase in
the capacity was also observed in this Ge electrode, which may be attributed to the electrochemical
activation process. This impressive cycling stability and rate performance suggested the robust
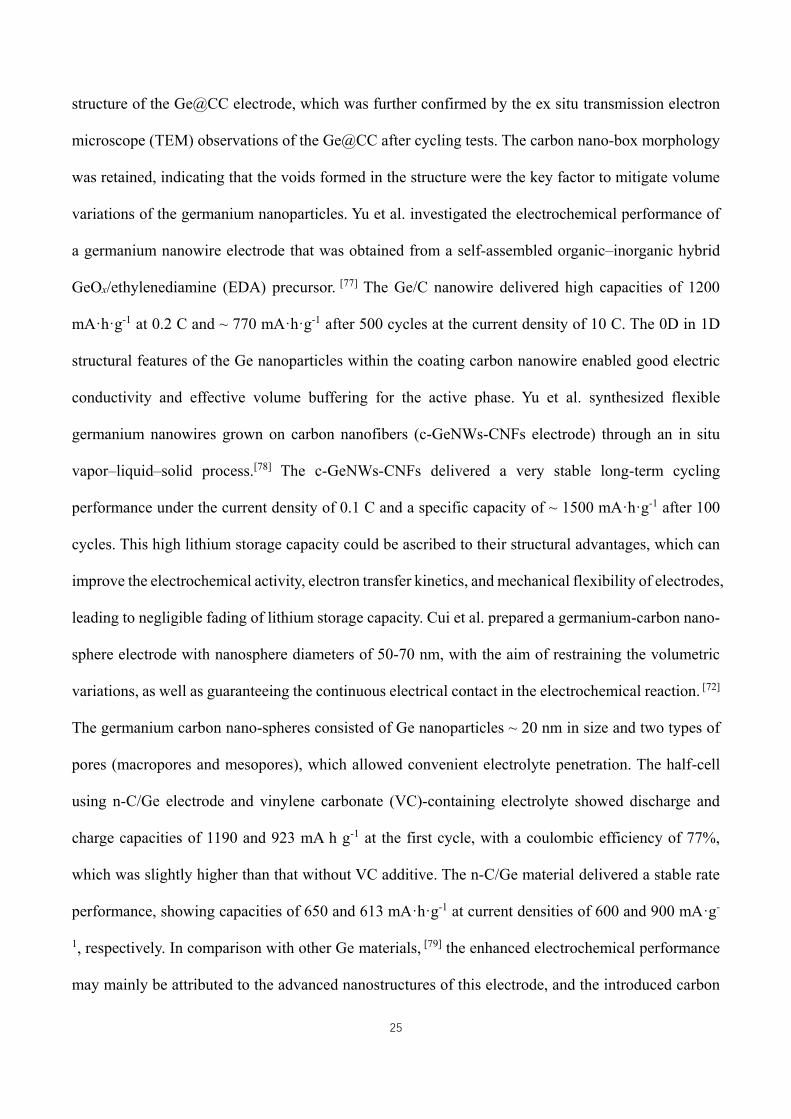
25
structure of the Ge@CC electrode, which was further confirmed by the ex situ transmission electron
microscope (TEM) observations of the Ge@CC after cycling tests. The carbon nano-box morphology
was retained, indicating that the voids formed in the structure were the key factor to mitigate volume
variations of the germanium nanoparticles. Yu et al. investigated the electrochemical performance of
a germanium nanowire electrode that was obtained from a self-assembled organic–inorganic hybrid
GeOx/ethylenediamine (EDA) precursor. [77] The Ge/C nanowire delivered high capacities of 1200
mA·h·g-1 at 0.2 C and ~ 770 mA·h·g-1 after 500 cycles at the current density of 10 C. The 0D in 1D
structural features of the Ge nanoparticles within the coating carbon nanowire enabled good electric
conductivity and effective volume buffering for the active phase. Yu et al. synthesized flexible
germanium nanowires grown on carbon nanofibers (c-GeNWs-CNFs electrode) through an in situ
vapor–liquid–solid process.[78] The c-GeNWs-CNFs delivered a very stable long-term cycling
performance under the current density of 0.1 C and a specific capacity of ~ 1500 mA·h·g-1 after 100
cycles. This high lithium storage capacity could be ascribed to their structural advantages, which can
improve the electrochemical activity, electron transfer kinetics, and mechanical flexibility of electrodes,
leading to negligible fading of lithium storage capacity. Cui et al. prepared a germanium-carbon nano-
sphere electrode with nanosphere diameters of 50-70 nm, with the aim of restraining the volumetric
variations, as well as guaranteeing the continuous electrical contact in the electrochemical reaction. [72]
The germanium carbon nano-spheres consisted of Ge nanoparticles ~ 20 nm in size and two types of
pores (macropores and mesopores), which allowed convenient electrolyte penetration. The half-cell
using n-C/Ge electrode and vinylene carbonate (VC)-containing electrolyte showed discharge and
charge capacities of 1190 and 923 mA h g-1 at the first cycle, with a coulombic efficiency of 77%,
which was slightly higher than that without VC additive. The n-C/Ge material delivered a stable rate
performance, showing capacities of 650 and 613 mA·h·g-1 at current densities of 600 and 900 mA·g-
1, respectively. In comparison with other Ge materials, [79] the enhanced electrochemical performance
may mainly be attributed to the advanced nanostructures of this electrode, and the introduced carbon
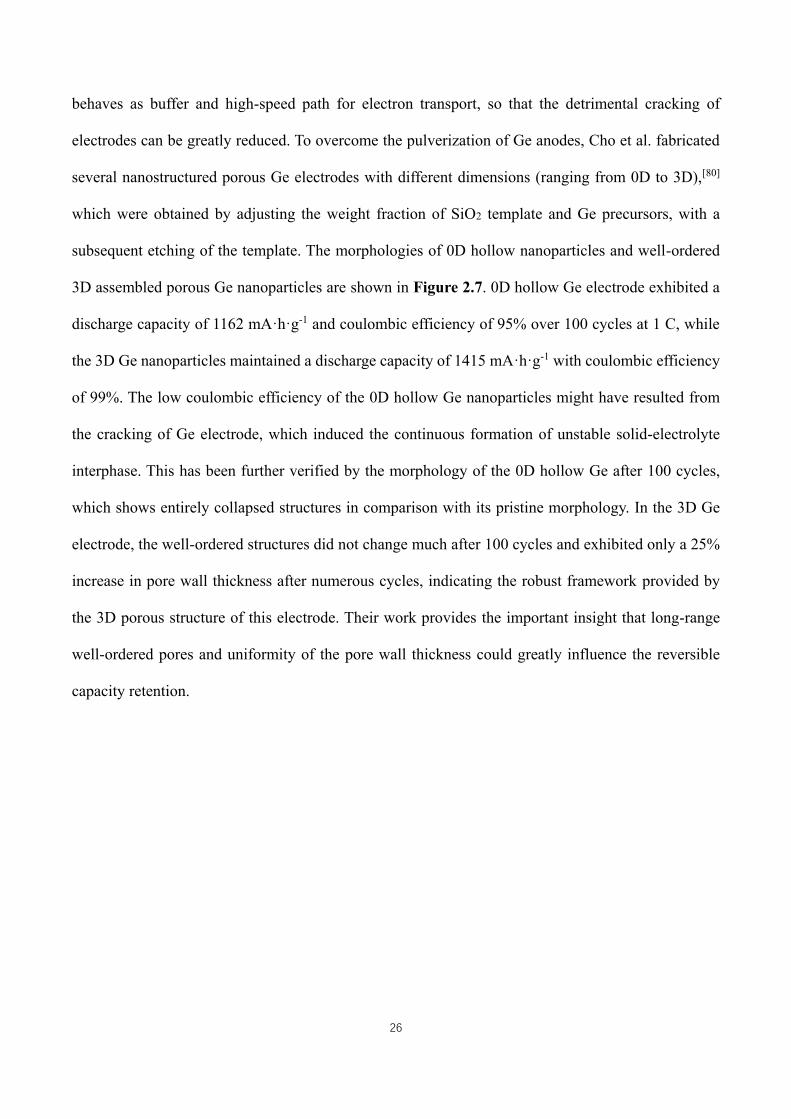
26
behaves as buffer and high-speed path for electron transport, so that the detrimental cracking of
electrodes can be greatly reduced. To overcome the pulverization of Ge anodes, Cho et al. fabricated
several nanostructured porous Ge electrodes with different dimensions (ranging from 0D to 3D),[80]
which were obtained by adjusting the weight fraction of SiO2 template and Ge precursors, with a
subsequent etching of the template. The morphologies of 0D hollow nanoparticles and well-ordered
3D assembled porous Ge nanoparticles are shown in Figure 2.7. 0D hollow Ge electrode exhibited a
discharge capacity of 1162 mA·h·g-1 and coulombic efficiency of 95% over 100 cycles at 1 C, while
the 3D Ge nanoparticles maintained a discharge capacity of 1415 mA·h·g-1 with coulombic efficiency
of 99%. The low coulombic efficiency of the 0D hollow Ge nanoparticles might have resulted from
the cracking of Ge electrode, which induced the continuous formation of unstable solid-electrolyte
interphase. This has been further verified by the morphology of the 0D hollow Ge after 100 cycles,
which shows entirely collapsed structures in comparison with its pristine morphology. In the 3D Ge
electrode, the well-ordered structures did not change much after 100 cycles and exhibited only a 25%
increase in pore wall thickness after numerous cycles, indicating the robust framework provided by
the 3D porous structure of this electrode. Their work provides the important insight that long-range
well-ordered pores and uniformity of the pore wall thickness could greatly influence the reversible
capacity retention.
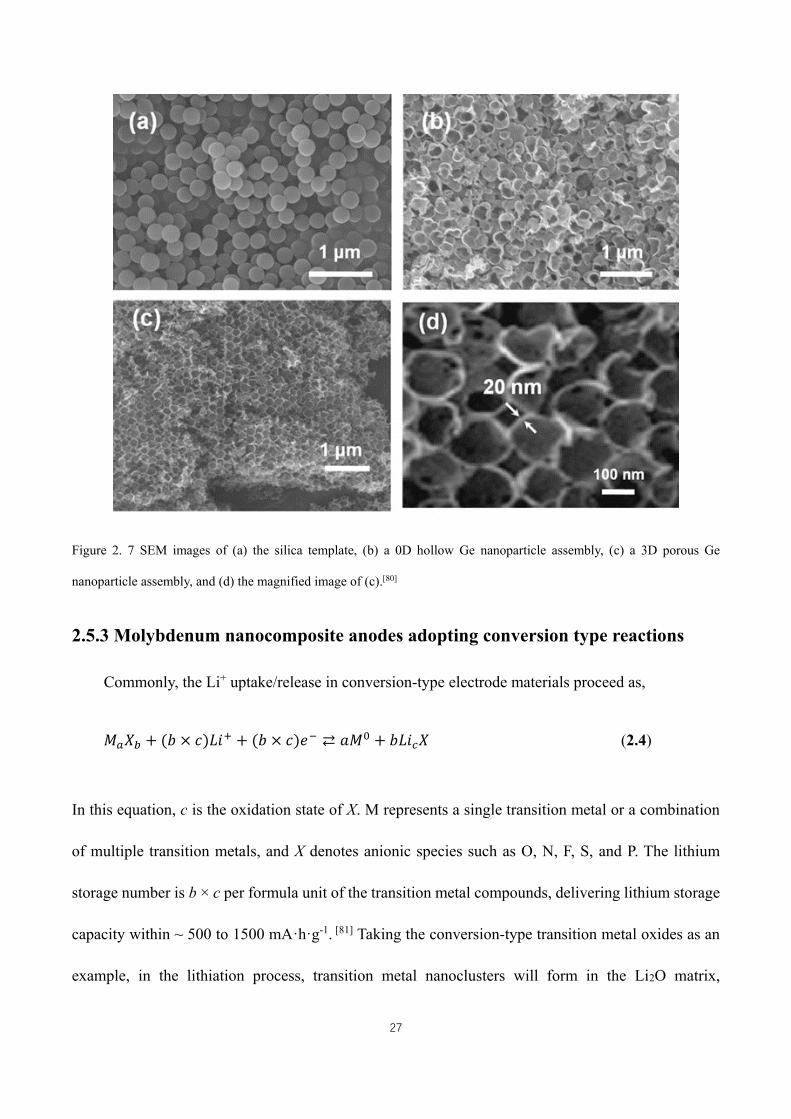
27
Figure 2. 7 SEM images of (a) the silica template, (b) a 0D hollow Ge nanoparticle assembly, (c) a 3D porous Ge
nanoparticle assembly, and (d) the magnified image of (c).[80]
2.5.3 Molybdenum nanocomposite anodes adopting conversion type reactions
Commonly, the Li+ uptake/release in conversion-type electrode materials proceed as,
𝑀𝑎𝑋𝑏 + (𝑏 × 𝑐)𝐿𝑖+ + (𝑏 × 𝑐)𝑒− ⇄ 𝑎𝑀0 + 𝑏𝐿𝑖𝑐𝑋 (2.4)
In this equation, c is the oxidation state of X. M represents a single transition metal or a combination
of multiple transition metals, and X denotes anionic species such as O, N, F, S, and P. The lithium
storage number is b × c per formula unit of the transition metal compounds, delivering lithium storage
capacity within ~ 500 to 1500 mA·h·g-1. [81] Taking the conversion-type transition metal oxides as an
example, in the lithiation process, transition metal nanoclusters will form in the Li2O matrix,
28
accompanied by a large volume expansion, while during the delithiation process, the metal species
will be transformed back to the transition metal oxide in a more amorphous form. Transition metal
oxides and sulfides have emerged as promising anode materials for high performance rechargeable
batteries due to their remarkable electrochemical properties, while some of their fluoride counterparts
show more possibility as cathodes. [81] The lithium storage capabilities of a vast range of transition
metal compounds have been investigated. For instance, Abruna et al. prepared a hollow Co3O4/C
nanoparticle electrode, which could deliver a capacity of 880 mA·h·g-1 after 50 cycles, nearly reaching
its theoretical capacity of 890 mA·h·g-1. [82] Lee et al. reported Fe3O4 mesoporous clusters with rich
voids, which could accommodate the volume expansion as well as reducing the Li+ diffusion
distance.[83] The as-prepared electrodes yielded a high discharge capacity of 867 mA·h·g-1 after 80
cycles. Wang et al. incorporated Mn3O4 nanoparticles onto a reduced graphene oxide (RGO) support,
and the resultant electrode showed a discharge capacity of 900 mA·h·g-1 at 40 mA·g-1 and 390 mA·h·g-
1 at 1600 mA·g-1.[84] The hierarchical structure could improve the electrical conductivity of the active
phase Mn3O4, as well as preventing the aggregation of Mn3O4 nanoparticles after repeated cycling.
Furthermore, as the reaction voltage of conversion-type electrodes shows a dependence on the cation,
Oh et al. prepared a Mn3-xFexO4 nano-cage electrode and demonstrated the tuning of reaction voltages
by changing the ratio of metal ions (the ratio of Mn ions to Fe ions) in this composite. [85]
Among the various transition metal compounds, Mo-based compounds are especially interesting
as advanced electrode materials for rechargeable batteries, in view of their unique electric conductivity,
high mechanical/thermal stability, rich chemistry, and multiple oxidation valence states of Mo (VI, V,
IV, and II, etc.) (Figure 2.8). These characteristics endow Mo-based anodes with typical physical and
chemical properties. For instance, molybdenum oxides exhibited tailored band gaps with different
stoichiometry, ranging from MoO3 (band gap larger than 2.7 eV) featured with full stoichiometry,
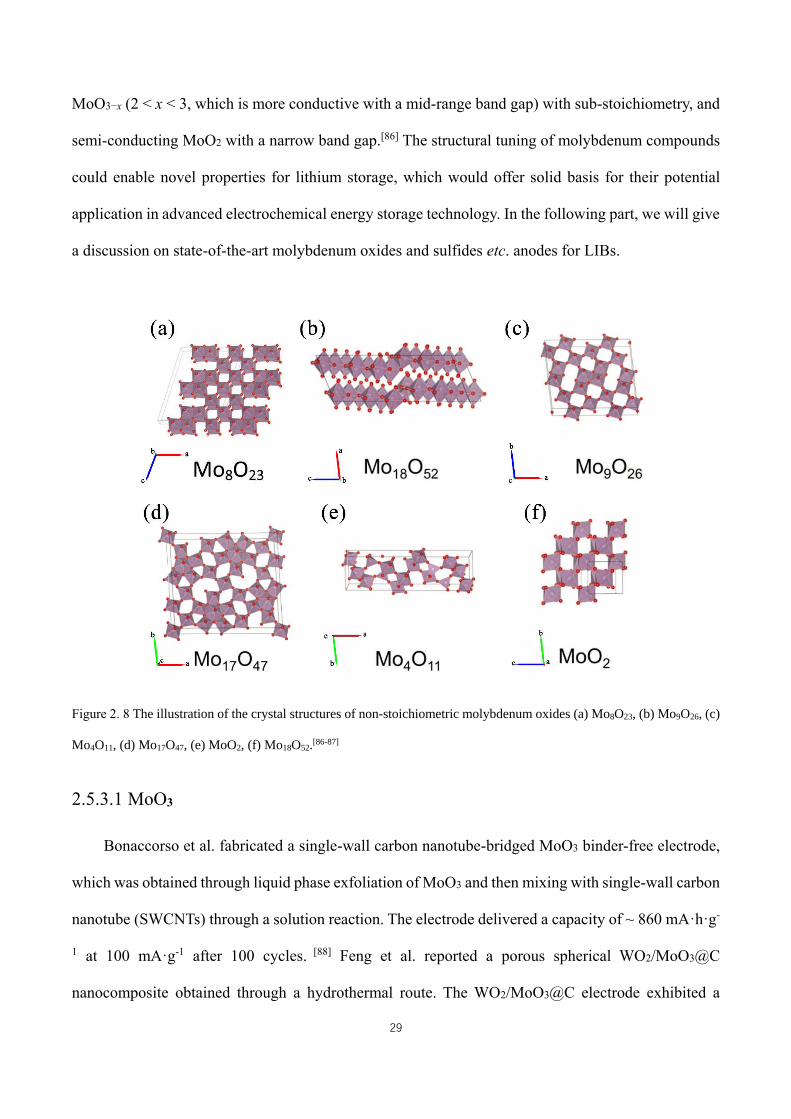
29
MoO3−x (2 < x < 3, which is more conductive with a mid-range band gap) with sub-stoichiometry, and
semi-conducting MoO2 with a narrow band gap.[86] The structural tuning of molybdenum compounds
could enable novel properties for lithium storage, which would offer solid basis for their potential
application in advanced electrochemical energy storage technology. In the following part, we will give
a discussion on state-of-the-art molybdenum oxides and sulfides etc. anodes for LIBs.
Figure 2. 8 The illustration of the crystal structures of non-stoichiometric molybdenum oxides (a) Mo8O23, (b) Mo9O26, (c)
Mo4O11, (d) Mo17O47, (e) MoO2, (f) Mo18O52.[86-87]
2.5.3.1 MoO3
Bonaccorso et al. fabricated a single-wall carbon nanotube-bridged MoO3 binder-free electrode,
which was obtained through liquid phase exfoliation of MoO3 and then mixing with single-wall carbon
nanotube (SWCNTs) through a solution reaction. The electrode delivered a capacity of ~ 860 mA·h·g-
1 at 100 mA·g-1 after 100 cycles. [88] Feng et al. reported a porous spherical WO2/MoO3@C
nanocomposite obtained through a hydrothermal route. The WO2/MoO3@C electrode exhibited a
30
lithium storage capacity of ~ 1120 mA·h·g-1 at 0.15 A·g-1 after 100 cycles. [89] Tian et al. obtained
MoO3@C nanofibers through a simple approach that involved calcining cotton pads that were loaded
with molybdate salt precursors. The MoO3@C nanofiber electrode showed a discharge capacity of ~
1070 mA·g-1 under the current density of 100 mA·g-1. [90] Zhang et al. demonstrated that oxygen
vacancies played a significant role in modifying the electrochemical performance of MoO3-x nano-
belts. The MoO3-x nano-belt electrode exhibited a capacity of 400 mA·h·g-1 at 100 mA·g-1, which
showed three-times higher capacity than the pristine MoO3 nano-belts. The introduction of oxygen
vacancies is beneficial for improving the electrical conductivity of the active phase, which is among
the key ways to enhance the specific capacity and rate performance. [91] Kim et al. reported a Mo-
MoO3-graphene nanocomposite. The Mo-MoO3-graphene electrode afforded a reversible capacity of
~ 610 mA·h·g-1 at 0.1 C (the 50th cycle). Both Mo and graphene contributed greatly to improve the
electron transfer of MoO3 nanoparticles, in addition, it was observed that the lithium ion diffusivity
was also significantly enhanced in the hybrid structure.[92] Wang et al. prepared a SnO2/MoO3/CNTs
electrode, which showed a reversible capacity of ~ 1030 mA·h·g-1 at 200 mA·g-1 and ~ 880 mA·g-1 at
500 mA·g-1 after 50 cycles.[93] Wang et al. prepared MoO3 particles within a foam-like carbon nano-
flake electrode, which showed a discharge capacity of ~ 790 and ~ 600 mA·h·g-1 after 100 cycles,
under the current density of 500 and 2000 mA·g-1, respectively.[94] Chang et al. prepared a MoO3-C
nano-rod electrode, which showed a capacity retention ratio of ~ 90% under different C-rates, and
delivered a long-term cycling capacity of ~ 850 (the 110th cycle) and ~ 485 mA·h·g-1 (the 300th cycle)
at 0.1 C and 0.5 C, respectively.[95] Feng et al. fabricated a MoO3/WO2@C electrode, with WO2 nano-
dots and MoO3 nano-rods well encapsulated by a carbon layer. The electrode showed a very stable
discharge capacity of 80 mA·h·g-1 at 1 C over 5000 cycles, and a reversible capacity of ~ 810 mA·h·g-
1 at the current density of 0.05 C (the 100th cycle).[96] Yu et al. fabricated hollow MoO3 nano-rods
wrapped by reduced graphene oxide. The MoO3@rGO electrode could yield a reversible capacity of
~ 840 and 455 mA·h·g-1 at 0.1 and 2 A·g-1, respectively. Under the long-term cycling, the MoO3@rGO
31
electrode delivered a capacity of ~ 770 mA·h·g-1 after 200 cycles at the current density of 0.1 A·g-1.
The good electrochemical performance may be attributed to the unique core-shell structure of the
nanocomposite, which offered robust support for MoO3 active phase, as well as accommodating the
volume changes of MoO3 during the electrochemical reactions.[97] Zhao et al. synthesized
interconnected MoO3/WO3 nano-sheets encapsulated in graphene, which yielded a high lithium
storage capacity of ~ 1000 mA·h·g-1 with negligible capacity loss, almost reaching the theoretical
capacity of MoO3 and WO3.[98] Yang et al. fabricated vertically grown MoO3 nano-sheets on a graphene
matrix, which yielded a gravimetric capacity of ~ 1500 mA·h·g-1, and exhibited a long-term cycling
stability up to 1000 cycles.[99] Mai et al. prepared FeOx-α-MoO3 nanocomposites. The FeOx
nanoparticles were selectively deposited on the [1 0 0] and [0 0 1] facets of the anisotropic α-MoO3
nano-belts, and the unique structure was found to feature improved electron transfer. The FeOx-MoO3
delivered a lithium storage capacity of ~ 910 and ~ 540 mA·h·g-1 after 100 cycles, at 200 and 1000
mA·g-1, respectively.[100] Huang et al. fabricated a SnS2-α-MoO3 core-shell structured nanocomposite,
in which α-MoO3 nano-rods were wrapped by SnS2 nano-sheets. The SnS2-α-MoO3 composite showed
a retained discharge capacity of 568 mA·h·g-1 after 100 cycles at 60 mA·g-1.[101] Yu et al. fabricated
single-crystalline α-MoO3 micro-belts with exposed (0 k 0) planes, which exhibited a capacity
retention ratio of ~ 89% (with respect to the initial capacity) after 200 cycles.[102] Huang et al. prepared
a porous MoO3 anode for LIBs, which exhibited a capacity retention ratio of ~ 100% over 100 cycles
and good rate performance of 567 mA·h·g-1 at 2 C.[103] Guo et al. fabricated a single crystalline α-
MoO3 nano-rod electrode, which exhibited a coulombic efficiency of ~ 100%, illustrating the excellent
reversibility of this electrode material.[104] Huang et al. synthesized a series of MoO3-TiO2
nanocomposite electrodes through a self-assembly approach. The MoO3-76%-TiO2 electrode
displayed a discharge capacity of ~ 520 mA·h·g-1 at 100 mA·g-1. [105] Yu et al. fabricated a MoO3-x
nano-sheet electrode with rich oxygen vacancies for LIBs, and the capacity of this electrode
approached ~ 1020 mA·h·g-1 after 150 cycles. The presence of oxygen vacancies contributed
32
significantly to the electrical conductivity, as well as the Li+ diffusivity and cycling stability. [106]
2.5.3.2 MoO2
2.5.3.2.1 Nanostructured MoO2
Rutile molybdenum dioxide (MoO2) has emerged as an attractive semi-conducting transition
metal oxide, which shows remarkable physi-chemical and electrochemical properties from the aspects
of good chemical stability against aggressive agents, and high theoretical lithium storage capacity. In
particular, the electrical conductivity of MoO2 was superior to those of many other transition metal
oxides, such as tungsten oxide, rhenium oxide, osmium oxide, iridium oxide, and rubidium oxide,
etc.[87a, 107] The wide applications of molybdenum oxide cover many important fields, involving field
emission techniques, optics and electronics, electrochemical energy storage technologies (super-
capacitors, batteries), selective catalysis for the isomerization of alkanes, electrochromic displays and
sensing, etc.[86, 108] MoO2, with a density of 6.5 g·cm-3, commonly shows a lithium storage capacity of
400-800 mA·h·g-1, demonstrating the potential of this material to achieve both high gravimetric and
high volumetric capacity.[108b] The electrochemical activity towards lithium of bulk MoO2 is low,
which resembles the low activity of the bulk counterparts of other rutile type transition metal oxides
(MnO2, TiO2 etc.).[109] Decreasing the particle size has been adopted to improve the lithium storage
performance of MoO2 based materials. Nanostructured MoO2 can be synthesized through methods
such as the nano-replication strategy,[110] hydrothermal reduction of nanostructured MoO3,[111]
electrochemical deposition, hydrothermal reaction, and electrochemical deposition, etc.[112] Through
these approaches, MoO2 in a variety of morphologies can be obtained, including highly ordered
mesoporous MoO2 nanocrystals,[108b] tremella-like structured MoO2,[111] MoO2 nanobelts,[113] MoO2
monoliths with a hierarchical secondary structure,[114] hollow core-shell structured MoO2
microspheres,[115] etc. Loh et al. synthesized a MoO2 nano-belt (NB) electrode wrapped by reduced
graphene oxide (denoted as rGO/MoO2 NBs).[113] The rGO/MoO2 NBs exhibited a reversible capacity
33
of ~ 1000 mA·h·g-1 at 60 mA·g-1, and in the subsequent cycles at 1000 mA·g-1 (750 cycles) and 5000
mA·g-1 (1900 cycles), the coulombic efficiency remained almost 100% with negligible changes. The
retained capacity could still approach 420 mA·h·g-1 after almost 1900 cycles. The lithium storage
capacity of the rGO/MoO2 NBs electrode exceeded the theoretical capacity of MoO2, and was much
higher than the total capacities of the individual components, rGO and nanostructured MoO2, which
may be mainly due to the synergistic effects between rGO and MoO2. The Li+ uptake/release process
of rGO/MoO2 NBs may proceed according to multi-electron conversion reactions as follows,
𝑀𝑜𝑂2 + 𝐿𝑖+ + 𝑒− ↔ 𝐿𝑖0.98𝑀𝑜𝑂2 (2.5)
𝐿𝑖0.98𝑀𝑜𝑂2 + 3𝐿𝑖+ + 3𝑒− ↔ 𝑀𝑜 + 2𝐿𝑖2𝑂 (2.6)
Due to the strong Mo-O bond, it was often reported that only the first-step lithiation reaction
occurred in bulk MoO2.[112] From the above results, it was demonstrated that the lithiation depth of
MoO2/rGO composite was greatly enhanced, which may mainly originate from the following aspects:
1) During the reduction of MoO3 NBs, rich pores were created on the MoO2 NBs, thus, with the
combined contribution from the porous rGO scaffold and a large amount of active sites in the
MoO2/rGO composite, the Li+ insertion reaction and heterogeneous electron transfer have been
significantly improved,[116] as well as the Li+ diffusion being accelerated.[113] Mai et al.[117] prepared
ultrathin MoO2 nano-sheets within flexible carbon matrix through thermal reduction of self-assembled
MoO3 nano-sheet, showing thickness of ~ 2-7 nm. The MoO2/C ultrathin nano-sheet presented a
metallic electron conductive way with high initial coulombic efficiency ~ 78% and remarkable rate
capability, affording capacities of 939, 874, 606, and 544 mA·h·g-1 under current densities of 0.5, 1, 5,
and 10 A·g-1, respectively. The MoO2 nano-sheets exhibited pseudo-capacitive performance, and the
fast lithium storage kinetics may mainly be facilitated by the ultrathin architecture of the nano-sheets,
which greatly reduced the charge transfer resistance and provided enough accessible surface pathways
34
for ion and electron transport. Stucky et al. investigated the lithium storage capability in highly ordered
mesoporous MoO2 material, which was nanostructured in a Ia3d cubic symmetry, and replicated the
nanostructures of the KIT-6 template in reverse. [108b] The mesoporous MoO2 showed a fast electron
transfer capability (0.01 Ω·cm-1) and relative high surface area. In comparison with bulk MoO2,
mesoporous MoO2 electrode showed quite different Li+ uptake/release behavior, where a stable
capacity was maintained for discharging below 1 V, delivering a reversible capacity of 750 mA·h·g-1
under the current density of 42 mA·g-1 (equivalent to ~ C/20). In addition, mesoporous MoO2 showed
a pronounced increase in reversible capacity at C/10, and this may be attributed to an activation process
during repeated charging and discharging. [118] The regenerated MoO2 became more amorphous-like,
lost its pristine high crystallinity, and contributed to improving the Li storage capability. The walls and
interconnected mesoporous channels of this MoO2 electrode were only on a scale of several
nanometers, thus significantly facilitating the solid-state diffusion of ions and electrons, and further
improving the pristine sluggish lithium storage kinetics of bulk MoO2. Stucky et al. further synthesized
a series of mesoporous MoO2-x electrodes (where x refers to the temperature used to synthesize the
silica hard templates). [110] The observed reversible capacities of these mesoporous MoO2-x electrodes
showed a dependence on their surface areas. In comparison with the lithium storage capacities of 422
and 1022 mA·h·g-1 of MoO2 (Brunauer-Emmett-Teller surface area (SBET) = 39 m2·g-1), with regard to
the initial charge and discharge processes, when the surface area of MoO2-x was increased to 115 m2·g-
1, the initial charge and discharge capacities could approach 1308 and 1594 mA·h·g-1, respectively.
The mesoporous MoO2 (SBET = 115 m2·g-1) electrode showed a highly ordered mesoporous structure.
The big differences between the different MoO2 electrodes illustrated that the quality of the
nanostructures played an important role in both their electrochemical activity and their capability. The
ex-situ XRD patterns of mesoporous MoO2 electrode confirmed the reversible regeneration of
mesoporous MoO2 electrode after a completed lithiation and delithiation process, proving the
remarkable reversibility of lithium intercalation in mesoporous MoO2. Furthermore, in comparison
35
with its bulk crystalline counterparts, the advanced meso-structures with regularly arranged meso-
pores were reported to be robust enough to preserve their pristine morphology after many repeated Li
intercalation/deintercalation cycles. The lithium storage mechanism of the mesoporous MoO2
electrode was investigated by density functional theory (DFT) calculations, and the calculation results
suggested that additional Li atoms were preferentially deposited beside the former Li atoms, forming
an Li-rich phase (between the domains of the LixMoO2 nanocrystals), which was found to be an
energetically less expensive position for Li atom siting than random positions. This has been further
verified by the negligible volumetric expansion in the lithiated Li-rich phase, showing only an
increasing depth of the lithiation layer in the lithiated Li-rich phase. The calculated density of states of
the Li s-band confirmed that in LixMoO2 (x > 1.5), the electronic states of Li were transformed into a
metallic-like state, which may be mainly due to the intercalation of metallic Li into the domains of
LixMoO2. This work proposed that the lithium storage process in the high-quality mesostructured
MoO2 was realized through an unexpected lithium storage mechanism, by which the metallic Li
occupied the domain space of Li+-intercalated MoO2 (Figure 2.9). This was different from the
commonly reported Li-storage mechanism of MoO2 through the conversion reaction. The rate
capabilities of meso-MoO2 with different wall thickness were also compared, and the sample with a
wall thickness of 5.8 nm showed a slightly better rate performance than the one with wall thickness of
7 nm, which may mainly benefit from the reduced solid-state diffusion distances for Li+ and electrons.
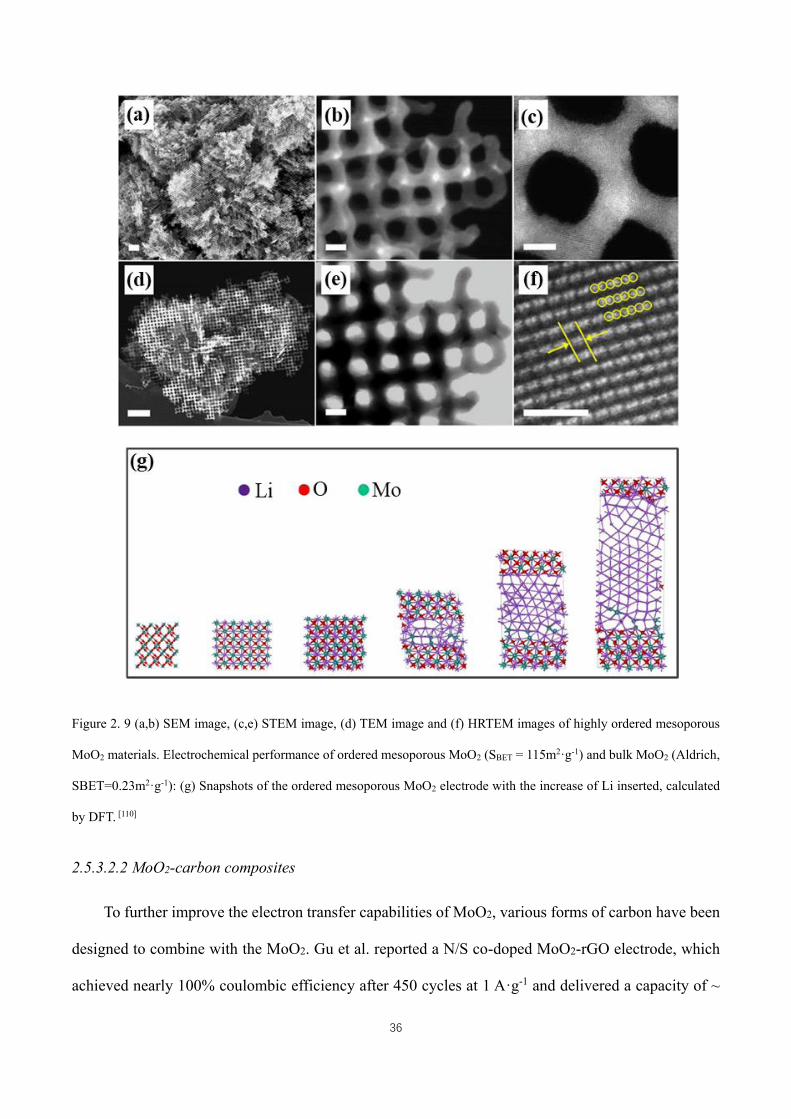
36
Figure 2. 9 (a,b) SEM image, (c,e) STEM image, (d) TEM image and (f) HRTEM images of highly ordered mesoporous
MoO2 materials. Electrochemical performance of ordered mesoporous MoO2 (SBET = 115m2·g-1) and bulk MoO2 (Aldrich,
SBET=0.23m2·g-1): (g) Snapshots of the ordered mesoporous MoO2 electrode with the increase of Li inserted, calculated
by DFT. [110]
2.5.3.2.2 MoO2-carbon composites
To further improve the electron transfer capabilities of MoO2, various forms of carbon have been
designed to combine with the MoO2. Gu et al. reported a N/S co-doped MoO2-rGO electrode, which
achieved nearly 100% coulombic efficiency after 450 cycles at 1 A·g-1 and delivered a capacity of ~
37
1250 mA·h·g-1 over 100 cycles at 0.2 A·g-1.[119] Fichou et al. prepared a carbon encapsulated porous
MoO2 nano-flower electrode, which was composed of MoO2 nano-flakes and delivered a reversible
lithium storage capacity of ~ 780 mA·h·g-1 at 90 mA·g-1 after 60 cycles.[120] Sun et al. prepared a MoO2
electrode by engineering hollow MoO2 nano-spheres on graphene, and the electrode exhibited
enhanced rate performance, delivering a capacity of ~ 410 mA·h·g-1 at the current density of 2 C after
1000 cycles. The improved rate performance could be attributed to the unique C-O-Mo linkage, which
facilitated the fast charge transfer.[121] Lin et al. created a MoO2-Cu/C/graphene nanocomposite (with
the C network derived from the calcination of a metal-organic framework) with three types of
conductive paths through a chemical precipitation method. The quadruple MoO2 based electrode
delivered a reversible capacity of ~ 1110 mA·h·g-1 under the current density of 0.1 A·g-1 after 100
cycles and good rate capability (890 mA·h·g-1 at 1A·g-1 and 700 mA·h·g-1 at 2 A·g-1).[122] Chai et al.
reported a MoO2-Mo2C-C microsphere electrode using poly-dopamine as the carbon source. Due to
the conductive Mo2C-C matrix, the MoO2 electrode showed a lithium storage capacity of ~ 1180
mA·h·g-1 at 100 mA·g-1 after 250 cycles.[123] Kim et al. engineered MoO2/Mo2C core-shell particles
on reduced graphene oxide (rGO) through a supercritical fluid route.[124] The MoO2/Mo2C/rGO
electrode exhibited better electrochemical performance in terms of cycling stability and lithium storage
capability (~ 500 mA·h·g-1 after 150 cycles at 50 mA·g-1), which was higher than that (280 mA·h·g-1)
of MoO2/rGO electrode, and may have benefited from the important role of Mo2C in providing good
electric conductivity and suppressing the volume expansion. Zhang et al. reported a hierarchical
mesoporous MoO2/Mo2C/C microsphere electrode, which afforded a lithium storage capacity of ~ 660
and 580 mA·h·g-1 at 100 and 200 mA·g-1, respectively, after 100 cycles.[125] Cao et al. prepared a
tubular MoO2 through a self-assembly strategy. The tubular MoO2 electrode exhibited a quite stable
rate capability and achieved capacity retention of ~ 98% after the current density was returned to 100
mA·g-1. The tubular MoO2 electrode delivered a highly reversible lithium storage capacity of ~ 500
mA·h·g-1 at 2 A·g-1 over 200 cycles. In addition, this tubular MoO2 exhibited a sodium storage capacity
38
of ~ 80 mA·h·g-1 at 10 A·g-1 over 10000 cycles. The excellent electrochemical performance was
attributed to the unique structural features of this MoO2-based electrode, which had a high pseudo-
capacitive lithium/sodium ion storage capability. Due to its unique structural features, the charge
transport kinetics were significantly improved.[126] Wu et al. reported a hollow MoO2/C composite
synthesized through a metal-organic framework mediated strategy. The hollow MoO2/C electrode
exhibited a lithium storage capacity of ~ 810 mA·h·g-1 over 600 cycles at 1 A·g-1. The good rate
capacity may be mainly attributed to the synergistic effects of its structural advantages (shortened Li+
diffusion distance, more active sites, direct current pathways), capacitive effects, and beneficial N-
doped sites, which played an important role in improving the electric conductivity and electrochemical
performance.[127] Qian et al. prepared a reduced graphene oxide coated MoO2 sphere electrode, which
yielded a reversible capacity of ~ 710 mA·h·g-1 at 0.5 A·g-1 after 50 cycles and 473 mA·h·g-1 at 2 A·g-
1, exhibiting good rate performance.[128]
2.5.3.3 Nanostructured MoS2
Li et al. constructed a MoS2 microsphere electrode, which displayed a discharge capacity of ~
850 mA·h·g-1 over 50 cycles at 100 mA·g-1.[129] Chang et al. fabricated a fullerene-like MoS2 hollow
nano-cage electrode, the design of which could afford ample space for the volume variations during
the electrochemical reactions, thus contributing to improved reversible long-term cycling stability and
rate capability, as well as negligible capacity loss.[130] He et al. synthesized a 3D honeycomb shaped
MoS2 in a robust structure with intimately bonded neighboring walls. The as-prepared MoS2
nanocomposite displayed a high initial coulombic efficiency of ~ 93%, implying that the unique
structure could contribute to reducing the capacity loss and improving the reversibility of the MoS2-
based material. Furthermore, the electrode delivered a capacity of ~ 1030 mA·h·g-1 over 50 cycles
with negligible capacity loss.[131] Liu et al. prepared a MoS2-carbon nanofiber film, in which MoS2
uniformly coated to a depth of 5-7 layers on the porous carbon fibers. The MoS2-porous carbon fiber
39
electrode exhibited a capacity of ~ 470 mA·h·g-1 at 1 A·g-1.[132] Chen et al. discovered that borophene
as a conductive additive could improve the electrochemical performance of MoS2-based electrode
materials through reducing the Li+ hopping barriers among the MoS2 particles.[133] Wan et al. fabricated
highly conductive 1T-MoS2/graphene nano-sheets through a hydrothermal route. The 1T-
MoS2/graphene electrode displayed good rate performance and afforded a lithium storage capacity of
~ 910 and ~ 1480 mA·h·g-1 at 500 and 100 mA·g-1, respectively, over 60 cycles.[134] Ding et al. prepared
a hierarchical column-structured MoS2 composed of edge-terminated MoS2 nanosheets, which showed
a discharge capacity of ~ 840 mA·h·g-1 at 200 mA·g-1.[135] Jiang et al. fabricated a MoS2 carbon
nanocomposite with interconnected structures, owing to the strong atomic interface effect. The MoS2-
C composite displayed stable cycling after 500 cycles, affording a capacity of ~ 1110 mA·g-1 at 400
mA·g-1, which was much better than the performance of MoS2 nano-sheet or graphene.[136] Wang et al.
fabricated a MoS2 single-walled carbon nanotube film electrode for LIBs, which exhibited the
advantages of improved cycling stability and electric conductivity, and displayed a reversible capacity
of ~ 990 mA·h·g-1 over 100 cycles, with a capacity retention ratio of ~ 80%.[135] Ji et al. developed a
polypyrrole wrapped MoS2 which was anchored vertically on graphene. This composite showed a fast
electron transfer rate owing to the presence of conductive graphene and the polypyrrole coating layer,
yielding a reversible capacity of ~ 970 mA·h·g-1 at 0.1 A·g-1.[137] Ma et al. fabricated interlayer-
expanded MoS2-C nano-sheets (layer number less than 5) with rich defect sites, which achieved a
capacity fading ratio of merely 0.03% per cycle at the current density of 200 mA·g-1.[138] Park et al.
fabricated a MoS2-TiN nanocomposite electrode through a sputtering deposition approach. The lithium
storage capacity of the MoS2-TiN electrode was maintained at ~ 700 mA·h·g-1 over 300 cycles,
demonstrating that the incorporation of TiN played a significant role in improving the cycling stability
of the MoS2 material.[139] Yuan et al. anchored metal-organic-framework derived Co3O4 on MoS2 nano-
sheets for LIB electrode, and the lithium storage capacity of this electrode approached ~ 1200 mA·h·g-
1 at 100 mA·g-1 over 100 cycles, showing superior electrochemical performances to those of both the
40
Co3O4 and MoS2 components as individual electrodes. In addition, when the current density was varied
from 100 to 800 mA·g-1, the electrode still exhibited a capacity range from ~ 900 to ~ 400 mA·h·g-1.
This demonstrated that the hetero-structured MoS2 material possessed good rate capability due to the
accelerated ion and electron transfer of Co3O4 component, furthermore, the buffering MoS2 nanosheet
on the external layer could alleviate the volume expansion of Co3O4 interior particles. [140] MoS2 was
also adopted as a high-performance electrode for sodium ion batteries. Feng et al. investigated both
the lithium and the sodium storage properties of a MoS2 based electrode containing 95wt% MoS2 nano-
sheet, in which the MoS2 nanosheets were vertically aligned on electrochemically exfoliated graphene.
The electrode exhibited a high reversible capacity of 1250 mA·h·g-1 at 1 A·g-1 for 150 cycles in a LIB
and a specific capacity of 509 and 423 mA·h·g-1 at 1 and 2 A·g-1, respectively, in a sodium ion battery.
The MoS2-graphene electrode showed superior electrochemical performance to most other MoS2 based
materials in previous reports, and the impressive electrochemical performance may mainly be
attributed to the well-designed architecture of MoS2-grahene electrode, featuring well-interconnected
electron/ion transport networks and rapid charge transfer, as well as good wettability of the active
phase due to the effective exposure through vertically aligned configuration.[141] Analogous to MoS2,
molybdenum chalcogenides such as MoSe2 and MoTe2, also exhibited electrochemical lithium storage
activity. Hu et al. reported a mesoporous MoSe2 electrode for LIBs obtained through a nanocasting
approach, which displayed a high reversible capacity of ~ 630 mA·h·g-1. This electrode exhibited better
rate capability than mesoporous MoS2 obtained through an analogous synthesis approach, implying
that MoSe2 was a promising anode for LIBs. [142]
2.5.3.4 Other Mo-based electrodes
2.5.3.4.1 Mo-based polymetallic oxide electrodes
Mo-based polymetallic oxide electrodes (MMoOx: where M represents a single transition metal
or a combination of multiple transition metals, i.e. M = bismuth, iron, nickel, zinc, cobalt, calcium,
41
manganese etc.) have attracted great attention, since the combination of two metal species often leads
to the discovery of new structures and properties. White et al. investigated the electrochemical
performance of a CaMoO4-C nanocomposite electrode, which was obtained through a sol-gel approach.
The CaMoO4-C electrode exhibited a discharge capacity of ~ 500 mA·h·g-1 with a coulombic
efficiency of around 98%. The electrochemical lithium storage mechanism of CaMoO4-C was
considered to resemble that of LixMoOy.[143] Ding et al. developed a series of molybdate hydrates,
including NiMoO4-C, CoMoO4-C nano-rods, and MnMoO4 microplate electrodes through a
hydrothermal route. In comparison with the lithium storage capacity of 130 and 180 mA·h·g-1 for
CoMoO4-C and MnMoO4-C, respectively, NiMoO4 showed the best electrochemical performance,
delivering a capacity of ~ 850 mA·h·g-1 within the range of 1.2 to 4 V vs. Li+/Li at 0.1 mA·cm-2, which
may be attributed to a more convenient Li+ uptake/removal process in NiMoO4-C due to the rich
vacancies in the structures.[144] Guo et al. developed a Bi2MoO6 nanosheet electrode for LIBs, which
displayed a high reversible capacity (nearly 100% coulombic efficiency) of ~ 480 mA·h·g-1 at 2000
mA·g-1 over 1500 cycles. The significantly enhanced electrochemical performance relies closely on
the structure of the Bi2MoO6 nano-sheets, in which the unbalanced charge distribution induces a fast
charge transport, contributing significantly to the fast Li+ uptake/removal kinetics.[145] Furthermore,
Park et al. prepared a Ni0.75Co0.25MoO4 nanowire electrode through the hydrothermal method, which
afforded a reversible capacity of ~ 520 mA·h·g-1 over 20 cycles at 196 mA·g-1.[146] In comparison with
previously reported XMoO4 (X = Ni, Co) electrodes,[147] the much better electrochemical performance
of Ni0.75Co0.25MoO4 nanowires was mainly attributed to the good electron transport capability and the
large specific surface area of the nanowires.
2.5.3.4.2 Polymolybdic oxysalt electrodes
Das et al. developed a series of hexagonal polymolybdic oxysalt electrodes, such as M2Mo3O8
(M = Zn, Mn, Co) and LiMMo3O8 (M = Ho, Y). [148] The hierarchical Mn2Mo3O8 nano-sheets yielded
42
a reversible capacity of ~ 920 mA·h·g-1 at 200 mA·g-1 over 20 cycles, but with increasing cycle number,
the capacity gradually increased to a stable value of ~ 950 mA·h·g-1. The further combination of
Mn2Mo3O8 with graphene led to good rate performance, with a capacity of ~ 670 mA·h·g-1 at 1500
mA·g-1. Huang et al. prepared a Fe2Mo3O8-rGO nanocomposite, which displayed a capacity of ~ 830
mA·h·g-1 at 200 mA·g-1 over 40 cycles. In situ XRD analysis demonstrated the conversion from
Fe2Mo3O8 to Mo, Fe, and Li2O upon lithiation, indicating that a highly reversible conversion reaction
occurred in the composite during electrochemical reactions. [149]
2.6 References
[1] (a) Y. Sun, Z. Wang, O. Wild, W. Xu, C. Chen, P. Fu, W. Du, L. Zhou, Q. Zhang, T. Han, Sci. Rep. 2016, 6,
20668; (b) Y. Sun, Z. Wang, P. Fu, T. Yang, Q. Jiang, H. Dong, J. Li, J. Jia, Atmos. Chem. Phys. 2013, 13,
4577; (c) S. Guo, M. Hu, M. L. Zamora, J. Peng, D. Shang, J. Zheng, Z. Du, Z. Wu, M. Shao, L. Zeng, Proc.
Natl. Acad. Sci. 2014, 111, 17373; (d) Y. Yang, X. Liu, Y. Qu, J. An, R. Jiang, Y. Zhang, Y. Sun, Z. Wu, F.
Zhang, W. Xu, Atmos. Chem. Phys. 2015, 15, 8165; (e) X. Zhao, P. Zhao, J. Xu, W. Meng, W. Pu, F. Dong,
D. He, Q. Shi, Atmos. Chem. Phys. 2013, 13, 5685.
[2] (a) Y. Sun, Q. Jiang, Z. Wang, P. Fu, J. Li, T. Yang, Y. Yin, J. Geophys. Res.: Atmos. 2014, 119, 4380; (b) R.
Huang, Y. Zhang, C. Bozzetti, K. F. Ho, J. Cao, Y. Han, K. R. Daellenbach, J. G. Slowik, S. M. Platt, F.
Canonaco, Nature 2014, 514, 218; (c) Q. Jiang, Y. Sun, Z. Wang, Y. Yin, Atmos. Chem. Phys. 2015, 15, 6023.
[3] M. Carson, A. Köhl, D. Stammer, A. Slangen, C. Katsman, R. Van de Wal, J. Church, N. White, Clim. Change
2016, 134, 269.
[4] (a) F. Wu, G. Yushin, Energy Environ. Sci. 2017, 10, 435; (b) J. E. Yusuf, K. Neill, B. S. John III, I. K. Ash,
K. Mahar, Environment and Planning C: Government and Policy 2016, 34, 228; (c) M. Mengel, A.
Levermann, K. Frieler, A. Robinson, B. Marzeion, R. Winkelmann, Proc. Natl. Acad. Sci. 2016, 113, 2597.
[5] R. Schmuch, R. Wagner, G. Hörpel, T. Placke, M. Winter, Nat. Energy 2018, 3, 267.
[6] B. Scrosati, J. Garche, W. Tillmetz, Advances in battery technologies for electric vehicles, Woodhead
Publishing, Cambridge, 2015.
[7] A. Dey, J. Electrochem. Soc. 1971, 118, 1547.
43
[8] C. M. Park, J. H. Kim, H. Kim, H. J. Sohn, Chem. Soc. Rev. 2010, 39, 3115.
[9] (a) T. Placke, R. Kloepsch, S. Dühnen, M. Winter, J. Solid State Electrochem. 2017, 21, 1939; (b) D. Andre,
S. J. Kim, P. Lamp, S. F. Lux, F. Maglia, O. Paschos, B. Stiaszny, J. Mater. Chem. A 2015, 3, 6709; (c) M.
Hagen, D. Hanselmann, K. Ahlbrecht, R. Maça, D. Gerber, J. Tübke, Adv. Energy Mater. 2015, 5, 1401986.
[10] O. Gröger, H. A. Gasteiger, J. P. Suchsland, J. Electrochem. Soc. 2016, 162, A2605.
[11] M. S. Islam, C. A. Fisher, Chem. Soc. Rev. 2014, 43, 185.
[12] A. Kraytsberg, Y. Ein-Eli, J. Solid State Electrochem. 2017, 21, 1907.
[13] P. Rozier, J. M. Tarascon, J. Electrochem. Soc. 2015, 162, A2490.
[14] (a) J. Dahn, U. von Sacken, C. Michal, Solid State Ionics 1990, 44, 87; (b) J. Dahn, U. Von Sacken, M.
Juzkow, H. Al‐Janaby, J. Electrochem. Soc. 1991, 138, 2207.
[15] (a) J. Morales, C. Perez-Vicente, J. Tirado, Mater. Res. Bull. 1990, 25, 623; (b) R. Kanno, H. Kubo, Y.
Kawamoto, T. Kamiyama, F. Izumi, Y. Takeda, M. Takano, J. Solid State Chem. 1994, 110, 216; (c) I. J.
Pickering, J. T. Lewandowski, A. J. Jacobson, J. A. Goldstone, Solid State Ionics 1992, 53, 405; (d) A.
Rougier, P. Gravereau, C. Delmas, J. Electrochem. Soc. 1996, 143, 1168; (e) R. Gummow, M. Thackeray,
Solid State Ionics 1992, 53, 681; (f) C. Pouillerie, L. Croguennec, P. Biensan, P. Willmann, C. Delmas, J.
Electrochem. Soc. 2000, 147, 2061.
[16] S. Mishra, G. Ceder, Phys. Rev. B 1999, 59, 6120.
[17] J. Paulsen, C. Thomas, J. Dahn, J. Electrochem. Soc. 1999, 146, 3560.
[18] R. Robert, C. Villevieille, P. Novák, J. Mater. Chem. A 2014, 2, 8589.
[19] (a) C. Delmas, I. Saadoune, A. Rougier, J. Power Sources 1993, 44, 595; (b) I. Saadoune, C. Delmas, J.
Mater. Chem. 1996, 6, 193; (c) A. Rougier, I. Saadoune, P. Gravereau, P. Willmann, C. Delmasa, Solid State
Ionics 1996, 90, 83; (d) E. Zhecheva, R. Stoyanova, Solid State Ionics 1993, 66, 143.
[20] T. Ohzuku, T. Yanagawa, M. Kouguchi, A. Ueda, J. Power Sources 1997, 68, 131.
[21] (a) N. Nitta, F. Wu, J. T. Lee, G. Yushin, Mater. Today 2015, 18, 252; (b) I. Bloom, S. A. Jones, V. S. Battaglia,
G. L. Henriksen, J. P. Christophersen, R. B. Wright, C. D. Ho, J. R. Belt, C. G. Motloch, J. Power Sources
2003, 124, 538; (c) Y. Itou, Y. Ukyo, J. Power Sources 2005, 146, 39.
[22] Y. Sun, S. T. Myung, M. H. Kim, J. Prakash, K. Amine, J. Am. Chem. Soc. 2005, 127, 13411.
[23] (a) Z. Liu, X. Huang, Solid State Ionics 2010, 181, 1209; (b) D. Morgan, A. Van der Ven, G. Ceder,
Electrochem. Solid-State Lett. 2004, 7, A30.
44
[24] (a) B. L. Ellis, K. T. Lee, L. F. Nazar, Chem. Mater. 2010, 22, 691; (b) A. K. Padhi, K. S. Nanjundaswamy,
J. B. Goodenough, J. Electrochem. Soc. 1997, 144, 1188.
[25] R. Malik, A. Abdellahi, G. Ceder, J. Electrochem. Soc. 2013, 160, A3179.
[26] (a) W. Liu, J. Tu, Y. Qiao, J. Zhou, S. Shi, X. Wang, C. Gu, J. Power Sources 2011, 196, 7728; (b) L. Yuan,
Z. Wang, W. Zhang, X. Hu, J. Chen, Y. Huang, J. B. Goodenough, Energy Environ. Sci. 2011, 4, 269.
[27] J. Jiang, W. Liu, J. Chen, Y. Hou, ACS Appl. Mater. Interfaces 2012, 4, 3062.
[28] S. Y. Chung, S. Y. Choi, T. Yamamoto, Y. Ikuhara, Phys. Rev. Lett. 2008, 100, 125502.
[29] M. S. Islam, D. J. Driscoll, C. A. Fisher, P. R. Slater, Chem. Mater. 2005, 17, 5085.
[30] S. I. Nishimura, G. Kobayashi, K. Ohoyama, R. Kanno, M. Yashima, A. Yamada, Nat. Mater. 2008, 7, 707.
[31] J. M. Clark, S. I. Nishimura, A. Yamada, M. S. Islam, Angew. Chem., Int. Ed. 2012, 51, 13149.
[32] (a) A. Nytén, A. Abouimrane, M. Armand, T. Gustafsson, J. O. Thomas, Electrochem. Commun. 2005, 7,
156; (b) C. Sirisopanaporn, R. Dominko, C. Masquelier, A. R. Armstrong, G. Mali, P. G. Bruce, J. Mater.
Chem. 2011, 21, 1782; (c) M. S. Islam, R. Dominko, C. Masquelier, C. Sirisopanaporn, A. R. Armstrong, P.
G. Bruce, J. Mater. Chem. 2011, 21, 9811.
[33] R. Tripathi, G. R. Gardiner, M. S. Islam, L. F. Nazar, Chem. Mater. 2011, 23, 2278.
[34] F. Yao, D. T. Pham, Y. H. Lee, ChemSusChem 2015, 8, 2284.
[35] (a) E. Hazrati, G. A. de Wijs, G. Brocks, Phys. Rev. B 2014, 90; (b) V. A. Sethuraman, L. J. Hardwick, V.
Srinivasan, R. Kostecki, J. Power Sources 2010, 195, 3655; (c) M. Winter, J. O. Besenhard, M. E. Spahr, P.
Novak, Adv. Mater. 1998, 10, 725.
[36] T. Tran, K. Kinoshita, J. Electroanal. Chem. 1995, 386, 221.
[37] C. De las Casas, W. Li, J. Power Sources 2012, 208, 74.
[38] S. Kawasaki, T. Hara, Y. Iwai, Y. Suzuki, Mater. Lett. 2008, 62, 291.
[39] (a) D. T. Welna, L. Qu, B. E. Taylor, L. Dai, M. F. Durstock, J. Power Sources 2011, 196, 1455; (b) H. Zhang,
G. Cao, Y. Yang, Z. Gu, J. Electrochem. Soc. 2008, 155, K19; (c) H. Zhang, G. Cao, Z. Wang, Y. Yang, Z.
Shi, Z. Gu, Electrochim. Acta 2010, 55, 2873.
[40] (a) L. Bulusheva, A. Okotrub, A. Kurenya, H. Zhang, H. Zhang, X. Chen, H. Song, Carbon 2011, 49, 4013;
(b) X. Li, X. Zhu, Y. Zhu, Z. Yuan, L. Si, Y. Qian, Carbon 2014, 69, 515.
[41] L. Yang, X. Li, S. He, G. Du, X. Yu, J. Liu, Q. Gao, R. Hu, M. Zhu, J. Mater. Chem. A 2016, 4, 10842.
[42] Z. Wang, X. Xiong, L. Qie, Y. Huang, Electrochim. Acta 2013, 106, 320.
45
[43] L. Qie, W. Chen, Z. Wang, Q. Shao, X. Li, L. Yuan, X. Hu, W. Zhang, Y. Huang, Adv. Mater. 2012, 24, 2047.
[44] L. Ji, X. Zhang, Nanotechnology 2009, 20, 155705.
[45] Y. Xing, Y. Wang, C. Zhou, S. Zhang, B. Fang, ACS Appl. Mater. Interfaces 2014, 6, 2561.
[46] B. Zhang, Y. Yu, Z. Xu, S. Abouali, M. Akbari, Y. He, F. Kang, J. K. Kim, Adv. Energy Mater. 2014, 4,
1301448.
[47] Y. Chen, X. Li, X. Zhou, H. Yao, H. Huang, Y. Mai, L. Zhou, Energy Environ. Sci. 2014, 7, 2689.
[48] (a) H. J. Hwang, J. Koo, M. Park, N. Park, Y. Kwon, H. Lee, J. Phys. Chem. C 2013, 117, 6919; (b) D. Pan,
S. Wang, B. Zhao, M. Wu, H. Zhang, Y. Wang, Z. Jiao, Chem. Mater. 2009, 21, 3136; (c) J. Hou, Y. Shao,
M. W. Ellis, R. B. Moore, B. Yi, Phys. Chem. Chem. Phys. 2011, 13, 15384; (d) Z. Wang, D. Xu, H. Wang,
Z. Wu, X. Zhang, ACS Nano 2013, 7, 2422; (e) T. Bhardwaj, A. Antic, B. Pavan, V. Barone, B. D. Fahlman,
J. Am. Chem. Soc. 2010, 132, 12556.
[49] E. Yoo, J. Kim, E. Hosono, H. S. Zhou, T. Kudo, I. Honma, Nano Lett. 2008, 8, 2277.
[50] (a) S. Yin, Y. Zhang, J. Kong, C. Zou, C. Li, X. Lu, J. Ma, F. Y. C. Boey, X. Chen, ACS Nano 2011, 5, 3831;
(b) X. Zhao, C. M. Hayner, M. C. Kung, H. H. Kung, ACS Nano 2011, 5, 8739; (c) Y. Fang, Y. Lv, R. Che,
H. Wu, X. Zhang, D. Gu, G. Zheng, D. Zhao, J. Am. Chem. Soc. 2013, 135, 1524.
[51] M. N. Obrovac, V. L. Chevrier, Chem. Rev. 2014, 114, 11444.
[52] G. Goward, N. Taylor, D. Souza, L. Nazar, J. Alloys Compd. 2001, 329, 82.
[53] X. Wang, W. Han, J. Chen, J. Graetz, ACS Appl. Mater. Interfaces 2010, 2, 1548.
[54] F. Xin, X. Wang, J. Bai, W. Wen, H. Tian, C. Wang, W. Han, J. Mater. Chem. A 2015, 3, 7170.
[55] Y. Yu, L. Gu, C. Wang, A. Dhanabalan, P. A. Van Aken, J. Maier, Angew. Chem., Int. Ed. 2009, 48, 6485.
[56] B. Luo, B. Wang, X. Li, Y. Jia, M. Liang, L. Zhi, Adv. Mater. 2012, 24, 3538.
[57] G. Wang, B. Wang, X. Wang, J. Park, S. Dou, H. Ahn, K. Kim, J. Mater. Chem. 2009, 19, 8378.
[58] X. Zheng, W. Lv, Y. B. He, C. Zhang, W. Wei, Y. Tao, B. Li, Q. H. Yang, J. Nanomater. 2014, 2014, 1.
[59] Y. Xu, Q. Liu, Y. Zhu, Y. Liu, A. Langrock, M. R. Zachariah, C. Wang, Nano Lett. 2013, 13, 470.
[60] Z. Zhu, S. Wang, J. Du, Q. Jin, T. Zhang, F. Cheng, J. Chen, Nano Lett. 2013, 14, 153.
[61] J. Qin, C. He, N. Zhao, Z. Wang, C. Shi, E. Liu, J. Li, ACS Nano 2014, 8, 1728.
[62] K. Feng, M. Li, W. Liu, A. G. Kashkooli, X. Xiao, M. Cai, Z. Chen, Small 2018, 14, 1702737.
[63] W. Chen, Z. Fan, A. Dhanabalan, C. Chen, C. Wang, J. Electrochem. Soc. 2011, 158, A1055.
[64] Y. Yao, M. T. McDowell, I. Ryu, H. Wu, N. Liu, L. Hu, W. D. Nix, Y. Cui, Nano Lett. 2011, 11, 2949.
46
[65] Q. Xiao, M. Gu, H. Yang, B. Li, C. Zhang, Y. Liu, F. Liu, F. Dai, L. Yang, Z. Liu, Nat. Commun. 2015, 6,
8844.
[66] D. J. Lee, H. Lee, M. H. Ryou, G. B. Han, J. N. Lee, J. Song, J. Choi, K. Y. Cho, Y. M. Lee, J. K. Park, ACS
Appl. Mater. Interfaces 2013, 5, 12005.
[67] M. H. Park, M. G. Kim, J. Joo, K. Kim, J. Kim, S. Ahn, Y. Cui, J. Cho, Nano Lett. 2009, 9, 3844.
[68] S. Ohara, J. Suzuki, K. Sekine, T. Takamura, J. Power Sources 2004, 136, 303.
[69] R. Zhang, Y. Du, D. Li, D. Shen, J. Yang, Z. Guo, H. Liu, A. A. Elzatahry, D. Zhao, Adv. Mater. 2014, 26,
6749.
[70] Y. Sun, J. Lopez, H. W. Lee, N. Liu, G. Zheng, C. Wu, J. Sun, W. Liu, J. W. Chung, Z. Bao, Adv. Mater. 2016,
28, 2455.
[71] S. Chen, L. Shen, P. A. van Aken, J. Maier, Y. Yu, Adv. Mater. 2017, 29, 1605650.
[72] G. Cui, L. Gu, L. Zhi, N. Kaskhedikar, P. A. van Aken, K. Müllen, J. Maier, Adv. Mater. 2008, 20, 3079.
[73] C. Yan, W. Xi, W. Si, J. Deng, O. G. Schmidt, Adv. Mater. 2013, 25, 539.
[74] L. Y. Lim, S. Fan, H. H. Hng, M. F. Toney, Adv. Energy Mater. 2015, 5, 1500599.
[75] L. Y. Lim, N. Liu, Y. Cui, M. F. Toney, Chem. Mater. 2014, 26, 3739.
[76] D. Li, H. Wang, H. Liu, Z. Guo, Adv. Energy Mater. 2016, 6, 1501666.
[77] J. Liu, K. Song, C. Zhu, C. Chen, P. A. van Aken, J. Maier, Y. Yu, ACS Nano 2014, 8, 7051.
[78] W. Li, M. Li, Z. Yang, J. Xu, X. Zhong, J. Wang, L. Zeng, X. Liu, Y. Jiang, X. Wei, L. Gu, Y. Yu, Small 2015,
11, 2762.
[79] (a) J. Graetz, C. Ahn, R. Yazami, B. Fultz, J. Electrochem. Soc. 2004, 151, A698; (b) H. Lee, M. G. Kim, C.
H. Choi, Y. K. Sun, C. S. Yoon, J. Cho, J. Phys. Chem. B 2005, 109, 20719; (c) B. Laforge, L. Levan-Jodin,
R. Salot, A. Billard, J. Electrochem. Soc. 2008, 155, A181.
[80] M. H. Park, K. Kim, J. Kim, J. Cho, Adv. Mater. 2010, 22, 415.
[81] S. H. Yu, X. Feng, N. Zhang, J. Seok, H. D. Abruna, Acc. Chem. Res. 2018, 51, 273.
[82] D. Wang, Y. Yu, H. He, J. Wang, W. Zhou, H. D. Abruna, ACS Nano 2015, 9, 1775.
[83] S. H. Lee, S. H. Yu, J. E. Lee, A. Jin, D. J. Lee, N. Lee, H. Jo, K. Shin, T. Y. Ahn, Y. W. Kim, Nano Lett.
2013, 13, 4249.
[84] H. Wang, L. F. Cui, Y. Yang, H. S. Casalongue, J. T. Robinson, Y. Liang, Y. Cui, H. Dai, J. Am. Chem. Soc.
2010, 132, 13978.
47
[85] M. H. Oh, T. Yu, S. H. Yu, B. Lim, K. T. Ko, M. G. Willinger, D. H. Seo, B. H. Kim, M. G. Cho, J. H. Park,
Science 2013, 340, 964.
[86] I. A. de Castro, R. S. Datta, J. Z. Ou, A. C Castellanos-Gomez, S. Sriram, T. Daeneke, K. Kalantar-Zadeh,
Adv. Mater. 2017, 29, 1701619.
[87] (a) K. Inzani, M. Nematollahi, F. Vullum-Bruer, T. Grande, T. W. Reenaas, S. M. Selbach, Phys. Chem. Chem.
Phys. 2017, 19, 9232; (b) D. Wang, D. Su, R. Schlögl, Cryst. Res. Technol. 2003, 38, 153.
[88] H. Sun, D. Hanlon, D. A. Dinh, J. B. Boland, A. E. Del Rio Castillo, C. D. Giovanni, A. Ansaldo, V. Pellegrini,
J. N. Coleman, F. Bonaccorso, 2D Mater. 2017, 5, 015024.
[89] Y. Li, L. Cao, W. Li, L. Feng, J. Huang, J. Li, Mater. Lett. 2018, 214, 26.
[90] Q. Xia, P. Wang, Q. Tan, Mater. Lett. 2018, 215, 221.
[91] Z. Sun, C. Yang, G. Liu, H. Lu, R. Zhang, L. Wang, H. Wang, Electrochim. Acta 2017, 239, 16.
[92] H. J. Lee, H. W. Shim, J. C. Kim, D. W. Kim, Electrochim. Acta 2017, 251, 81.
[93] D. Cao, H. Gu, C. Xie, B. Li, H. Wang, C. Niu, J. Colloid Interface Sci. 2017, 504, 230.
[94] D. Cao, Y. Dai, S. Xie, H. Wang, C. Niu, J. Colloid Interface Sci. 2018, 514, 686.
[95] J. Ding, S. A. Abbas, C. Hanmandlu, L. Lin, C. Lai, P. Wang, L. Li, C. Chu, C. Chang, J. Power Sources 2017,
348, 270.
[96] L. Cao, Y. Li, J. Wu, W. Li, J. Huang, Y. Feng, C. Yao, J. Li, R. Wang, Q. Kang, L. Feng, J. Alloys Compd.
2018, 744, 672.
[97] C. Yang, X. Zhong, Y. Jiang, Y. Yu, Chin. Chem. Lett. 2017, 28, 2231.
[98] P. Wang, Z. Cheng, G. Lv, L. Qu, Y. Zhao, Nanoscale 2017, 10, 396.
[99] S. Wang, H. Zhang, D. Zhang, Y. Ma, X. Bi, S. Yang, J. Mater. Chem. A 2018, 6, 672.
[100] Y. Yao, N. Xu, D. Guan, J. Li, Z. Zhuang, L. Zhou, C. Shi, X. Liu, L. Mai, ACS Appl. Mater. Interfaces 2017,
9, 39425.
[101] X. Chen, Y. Huang, K. Zhang, Electrochim. Acta 2016, 222, 956.
[102] D. Yan, X. Luo, H. Zhang, G. Zhu, L. Chen, G. Chen, H. Xu, A. Yu, J. Alloys Compd. 2016, 688, 481.
[103] J. Huang, J. Yan, J. Li, L. Cao, Z. Xu, J. Wu, L. Zhou, Y. Luo, J. Alloys Compd. 2016, 688, 588.
[104] R. Nadimicherla, R. Zha, L. Wei, X. Guo, J. Alloys Compd. 2016, 687, 79.
[105] D. Qi, Y. Zhang, D. Jia, J. Huang, Energy Technology 2017, 5, 2015.
[106] C. Yang, X. Liu, Z. Yang, L. Gu, Y. Yu, Adv. Mater. Interfaces 2016, 3, 1600730.
48
[107] (a) A. Magneli, G. Andersson, Acta Chem. Scand.. 1955, 9, 1378; (b) D. B. Rogers, R. D. Shannon, A. W.
Sleight, J. L. Gillson, Inorg. Chem. 1969, 8, 841.
[108] (a) C. Bouchy, C. Pham-Huu, B. Heinrich, C. Chaumont, M. J. Ledoux, J. Catal. 2000, 190, 92; (b) Y. Shi,
B. Guo, S. A. Corr, Q. Shi, Y. S. Hu, K. R. Heier, L. Chen, R. Seshadri, G. D. Stucky, Nano Lett. 2009, 9,
4215; (c) K. Inzani, M. Nematollahi, F. Vullum-Bruer, T. Grande, T. W. Reenaas, S. M. Selbach, Phys. Chem.
Chem. Phys. 2017, 19, 9232; (d) H. Mitsuoka, S. I. Morita, T. Suzuki, Y. Matsuura, Y. Katsumoto, H. Sato,
Appl. Phys. Express 2009, 2, 027001; (e) J. Liu, Z. Zhang, C. Pan, Y. Zhao, X. Su, Y. Zhou, D. Yu, Mater.
Lett. 2004, 58, 3812; (f) T. Ressler, J. Catal. 2002, 210, 67; (g) B. Hu, L. Mai, W. Chen, F. Yang, ACS Nano
2009, 3, 478.
[109] (a) F. Jiao, P. G. Bruce, Adv. Mater. 2007, 19, 657; (b) J. Luo, J. Zhang, Y. Xia, Chem. Mater. 2006, 18, 5618;
(c) Y. Hu, L. Kienle, Y. Guo, J. Maier, Adv. Mater. 2006, 18, 1421.
[110] J. K. Shon, H. S. Lee, G. O. Park, J. Yoon, E. Park, G. S. Park, S. S. Kong, M. Jin, J. M. Choi, H. Chang, S.
Doo, J. M. Kim, W. S. Yoon, C. Pak, H. Kim, G. D. Stucky, Nat. Commun. 2016, 7, 11049.
[111] L. Yang, Q. Gao, Y. Zhang, Y. Tang, Y. Wu, Electrochem. Commun. 2008, 10, 118.
[112] Q. Yang, H. Xue, Y. Xia, Z. Guan, Y. Cheng, S. Tsang, C. Lee, Electrochim. Acta 2015, 185, 83.
[113] W. Tang, C. Peng, C. Nai, J. Su, Y. Liu, M. V. Reddy, M. Lin, K. P. Loh, Small 2015, 11, 2446.
[114] Y. Sun, X. Hu, J. Yu, Q. Li, W. Luo, L. Yuan, W. Zhang, Y. Huang, Energy Environ. Sci. 2011, 4, 2870.
[115] (a) Y. Lei, J. Hu, H. Liu, J. Li, Mater. Lett. 2012, 68, 82; (b) X. Zhang, X. Song, S. Gao, Y. Xu, X. Cheng, H.
Zhao, L. Huo, J. Mater. Chem. A 2013, 1, 6858.
[116] (a) H. Wang, L. Cui, Y. Yang, H. S. Casalongue, J. T. Robinson, Y. Liang, Y. Cui, H. Dai, J. Am. Chem. Soc.
2010, 132, 13978; (b) S. Yang, X. Feng, S. Ivanovici, K. Mullen, Angew. Chem., Int. Ed. Engl. 2010, 49,
8408.
[117] J. Ni, Y. Zhao, L. Li, L. Mai, Nano Energy 2015, 11, 129.
[118] F. Ma, A. Yuan, J. Xu, P. Hu, ACS Appl. Mater. Interfaces 2015, 7, 15531.
[119] J. Pei, H. Geng, H. Ang, L. Zhang, H. Wei, X. Cao, J. Zheng, H. Gu, Nanotechnology 2018, 29, 295404.
[120] S. Tang, L. Yang, J. Liu, D. Fichou, Mater. Res. Bull. 2018, 102, 277.
[121] P. Wang, Y. Zhang, Y. Yin, L. Fan, N. Zhang, K. Sun, Chem. Eng. J. 2018, 334, 257.
[122] K. Zhang, H. Yang, M. Lü, C. Yan, H. Wu, A. Yuan, S. Lin, J. Alloys Compd. 2018, 731, 646.
[123] X. Yang, Q. Li, H. Wang, J. Feng, M. Zhang, R. Yuan, Y. Chai, Chem. Eng. J. 2018, 337, 74.
49
[124] W. Devina, J. Hwang, J. Kim, Chem. Eng. J. 2018, 345, 1.
[125] X. Li, Q. Xiao, H. Zhang, H. Xu, Y. Zhang, J. Energy Chem. 2018, 27, 940.
[126] X. Zhao, H. Wang, X. Chen, J. Cao, Y. Zhao, Z. Garbe Neale, W. Cai, J. Sui, G. Cao, Energy Storage
Materials 2018, 11, 161.
[127] W. Tian, H. Hu, Y. Wang, P. Li, J. Liu, J. Liu, X. Wang, X. Xu, Z. Li, Q. Zhao, H. Ning, W. Wu, M. Wu, ACS
Nano 2018, 12, 1990.
[128] X. Chen, R. Liu, L. Zeng, X. Huang, Y. Fang, J. Liu, Y. Xu, Q. Chen, M. Wei, Q. Qian, Mater. Lett. 2018,
212, 198.
[129] J. Xu, H. Tang, Y. Chu, C. Li, RSC Adv. 2015, 5, 48492.
[130] X. Zuo, K. Chang, J. Zhao, Z. Xie, H. Tang, B. Li, Z. Chang, J. Mater. Chem. A 2016, 4, 51.
[131] J. Zhou, J. Qin, N. Zhao, C. Shi, E. Z. Liu, F. He, J. Li, C. He, J. Mater. Chem. A 2016, 4, 8734.
[132] Y. Miao, Y. Huang, L. Zhang, W. Fan, F. Lai, T. Liu, Nanoscale 2015, 7, 11093.
[133] P. Xiang, X. Chen, J. Liu, B. Xiao, L. Yang, J. Phys. Chem. C 2018, 122, 9302.
[134] X. Zheng, S. Wang, C. Xiong, G. Hu, Carbon 2018, 133, 162.
[135] J. Wang, L. Lu, M. Lotya, J. N. Coleman, S. Chou, H. Liu, A. I. Minett, J. Chen, Adv. Energy Mater. 2013,
3, 798.
[136] H. Jiang, D. Ren, H. Wang, Y. Hu, S. Guo, H. Yuan, P. Hu, L. Zhang, C. Li, Adv. Mater. 2015, 27, 3687.
[137] H. Zhang, X. Lv, F. Wang, Z. Hu, H. Han, X. Fan, J. Ji, Ceram. Int. 2018, 44, 7611.
[138] B. Chen, H. Lu, N. Zhao, C. Shi, E. Liu, C. He, L. Ma, J. Power Sources 2018, 387, 16.
[139] S. H. Moon, S. J. Kim, M. C. Kim, G. H. Lee, H. S. Choe, S. B. Han, J. H. Choi, K. W. Park, J. Alloys Compd.
2018, 741, 1048.
[140] J. Wang, H. Zhou, M. Zhu, A. Yuan, X. Shen, J. Alloys Compd. 2018, 744, 220.
[141] G. Wang, J. Zhang, S. Yang, F. Wang, X. Zhuang, K. Müllen, X. Feng, Adv. Energy Mater. 2018, 8, 1702254.
[142] Y. Shi, C. Hua, B. Li, X. Fang, C. Yao, Y. Zhang, Y. S. Hu, Z. Wang, L. Chen, D. Zhao, Adv. Funct. Mater.
2013, 23, 1832.
[143] N. Sharma, K. Shaju, G. Subba Rao, B. V. Chowdari, Z. L. Dong, T. J. White, Chem. Mater. 2004, 16, 504.
[144] Y. Ding, Y. Wan, Y. Min, W. Zhang, S. H. Yu, Inorg. Chem. 2008, 47, 7813.
[145] Y. Zheng, T. Zhou, X. Zhao, W. Pang, H. Gao, S. Li, Z. Zhou, H. Liu, Z. Guo, Adv. Mater. 2017, 29, 1700396.
[146] K. S. Park, S. D. Seo, H. W. Shim, D. W. Kim, Nanoscale Res. Lett. 2012, 7, 35.
50
[147] W. Xiao, J. Chen, C. Li, R. Xu, X. Lou, Chem. Mater. 2009, 22, 746.
[148] (a)B. Das, M. Reddy, C. Krishnamoorthi, S. Tripathy, R. Mahendiran, G. S. Rao, B. Chowdari, Electrochim.
Acta 2009, 54, 3360; (b)B. Das, M. Reddy, G. S. Rao, B. Chowdari, J. Solid State Electrochem. 2008, 12,
953.
[149] Y. Sun, X. Hu, W. Luo, J. Shu, Y. Huang, J. Mater. Chem. A 2013, 1, 4468.
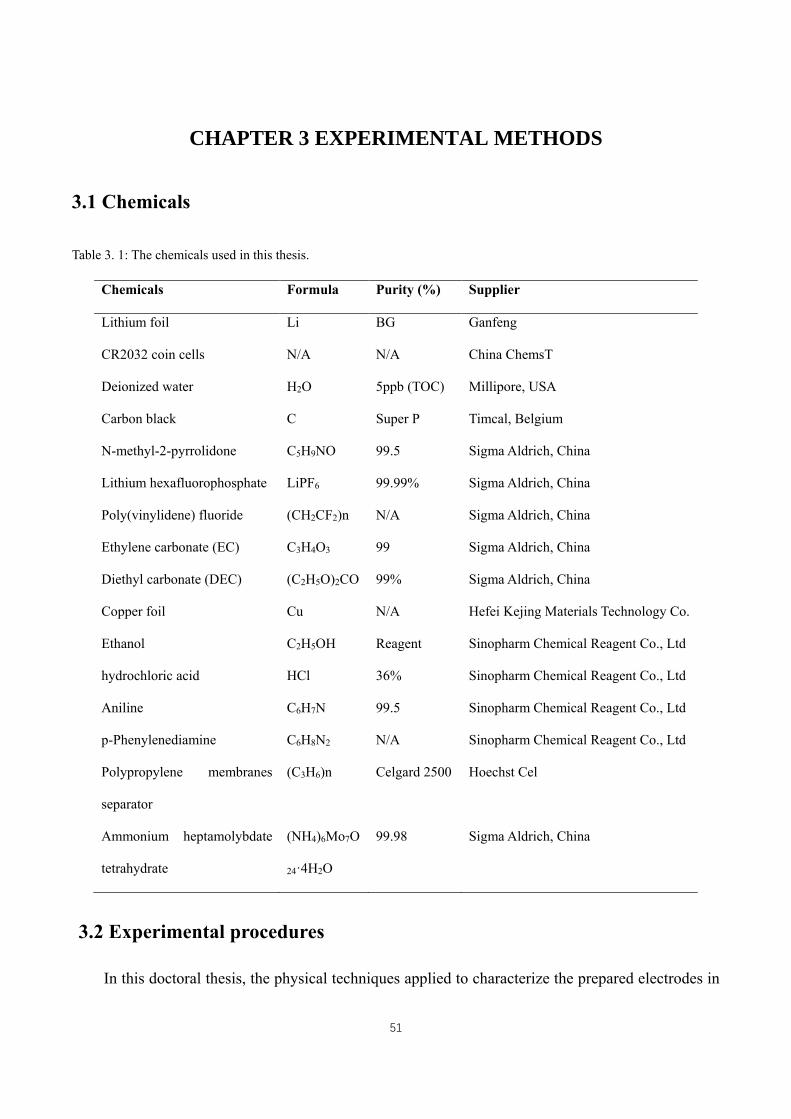
51
CHAPTER 3 EXPERIMENTAL METHODS
3.1 Chemicals
Table 3. 1: The chemicals used in this thesis.
Chemicals Formula Purity (%) Supplier
Lithium foil Li BG Ganfeng
CR2032 coin cells N/A N/A China ChemsT
Deionized water H2O 5ppb (TOC) Millipore, USA
Carbon black C Super P Timcal, Belgium
N-methyl-2-pyrrolidone C5H9NO 99.5 Sigma Aldrich, China
Lithium hexafluorophosphate LiPF6 99.99% Sigma Aldrich, China
Poly(vinylidene) fluoride (CH2CF2)n N/A Sigma Aldrich, China
Ethylene carbonate (EC) C3H4O3 99 Sigma Aldrich, China
Diethyl carbonate (DEC) (C2H5O)2CO 99% Sigma Aldrich, China
Copper foil Cu N/A Hefei Kejing Materials Technology Co.
Ethanol C2H5OH Reagent Sinopharm Chemical Reagent Co., Ltd
hydrochloric acid HCl 36% Sinopharm Chemical Reagent Co., Ltd
Aniline C6H7N 99.5 Sinopharm Chemical Reagent Co., Ltd
p-Phenylenediamine C6H8N2 N/A Sinopharm Chemical Reagent Co., Ltd
Polypropylene membranes
separator
(C3H6)n Celgard 2500 Hoechst Cel
Ammonium heptamolybdate
tetrahydrate
(NH4)6Mo7O
24·4H2O
99.98 Sigma Aldrich, China
3.2 Experimental procedures
In this doctoral thesis, the physical techniques applied to characterize the prepared electrodes in
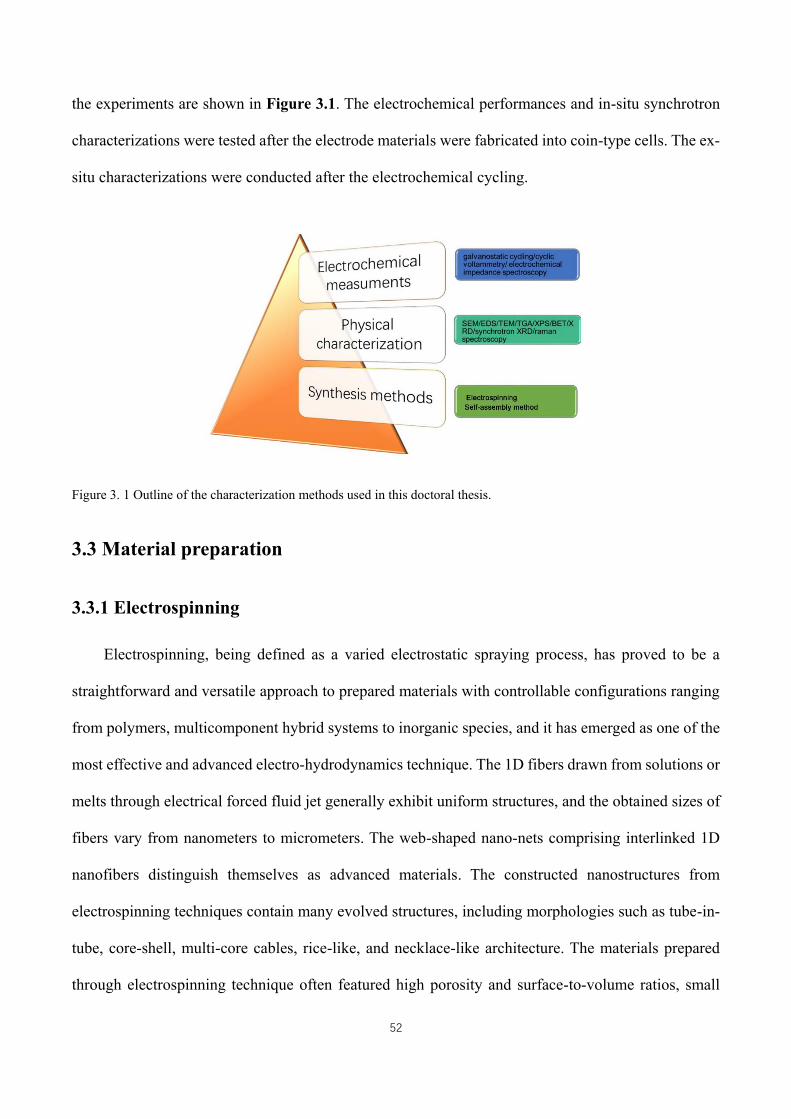
52
the experiments are shown in Figure 3.1. The electrochemical performances and in-situ synchrotron
characterizations were tested after the electrode materials were fabricated into coin-type cells. The ex-
situ characterizations were conducted after the electrochemical cycling.
Figure 3. 1 Outline of the characterization methods used in this doctoral thesis.
3.3 Material preparation
3.3.1 Electrospinning
Electrospinning, being defined as a varied electrostatic spraying process, has proved to be a
straightforward and versatile approach to prepared materials with controllable configurations ranging
from polymers, multicomponent hybrid systems to inorganic species, and it has emerged as one of the
most effective and advanced electro-hydrodynamics technique. The 1D fibers drawn from solutions or
melts through electrical forced fluid jet generally exhibit uniform structures, and the obtained sizes of
fibers vary from nanometers to micrometers. The web-shaped nano-nets comprising interlinked 1D
nanofibers distinguish themselves as advanced materials. The constructed nanostructures from
electrospinning techniques contain many evolved structures, including morphologies such as tube-in-
tube, core-shell, multi-core cables, rice-like, and necklace-like architecture. The materials prepared
through electrospinning technique often featured high porosity and surface-to-volume ratios, small
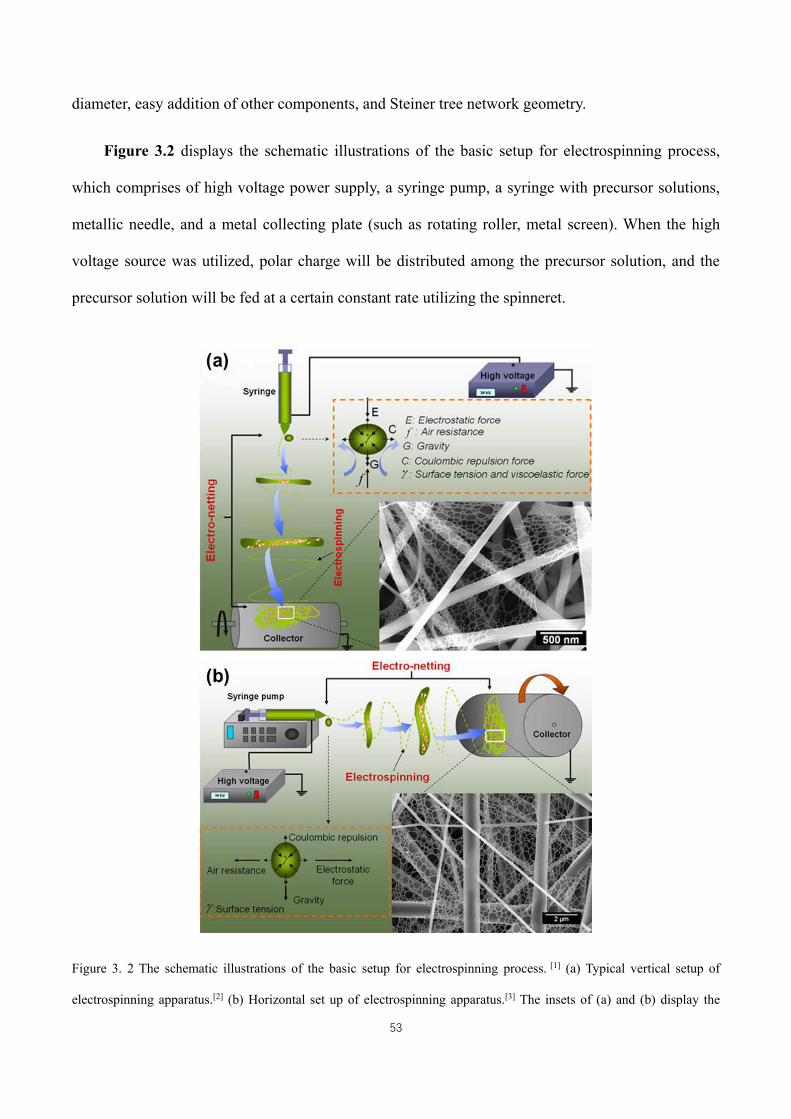
53
diameter, easy addition of other components, and Steiner tree network geometry.
Figure 3.2 displays the schematic illustrations of the basic setup for electrospinning process,
which comprises of high voltage power supply, a syringe pump, a syringe with precursor solutions,
metallic needle, and a metal collecting plate (such as rotating roller, metal screen). When the high
voltage source was utilized, polar charge will be distributed among the precursor solution, and the
precursor solution will be fed at a certain constant rate utilizing the spinneret.
Figure 3. 2 The schematic illustrations of the basic setup for electrospinning process. [1] (a) Typical vertical setup of
electrospinning apparatus.[2] (b) Horizontal set up of electrospinning apparatus.[3] The insets of (a) and (b) display the
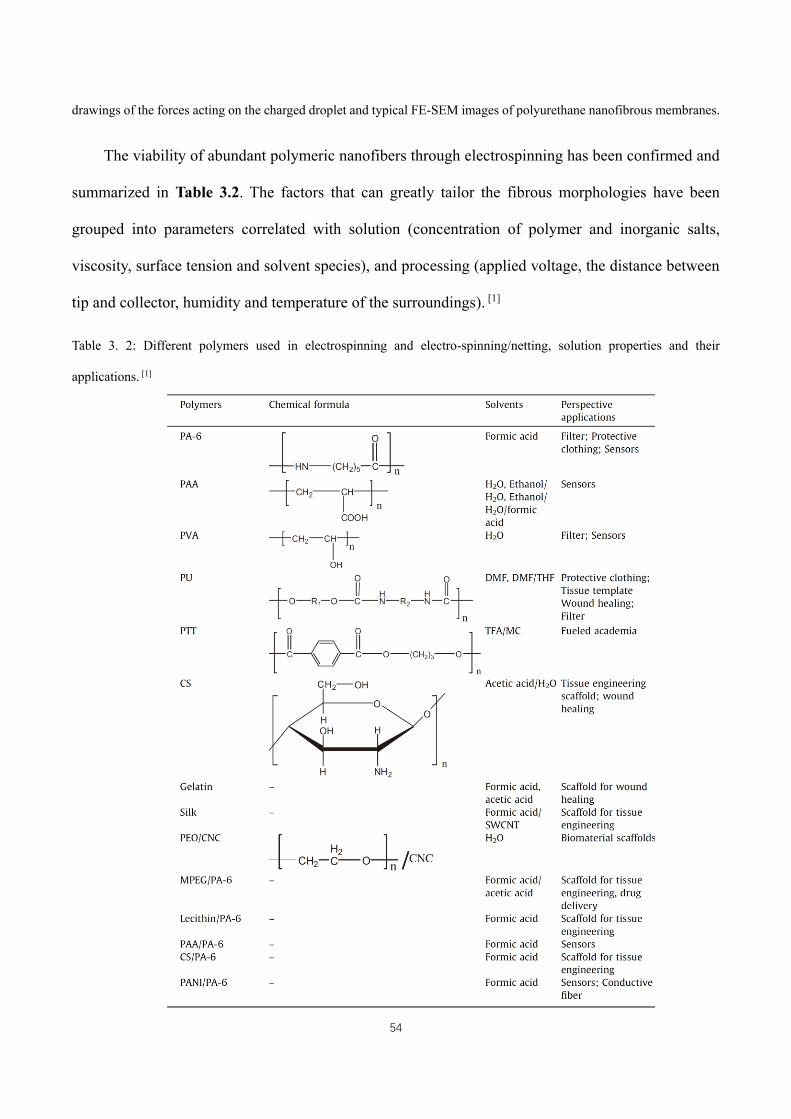
54
drawings of the forces acting on the charged droplet and typical FE-SEM images of polyurethane nanofibrous membranes.
The viability of abundant polymeric nanofibers through electrospinning has been confirmed and
summarized in Table 3.2. The factors that can greatly tailor the fibrous morphologies have been
grouped into parameters correlated with solution (concentration of polymer and inorganic salts,
viscosity, surface tension and solvent species), and processing (applied voltage, the distance between
tip and collector, humidity and temperature of the surroundings). [1]
Table 3. 2: Different polymers used in electrospinning and electro-spinning/netting, solution properties and their
applications. [1]
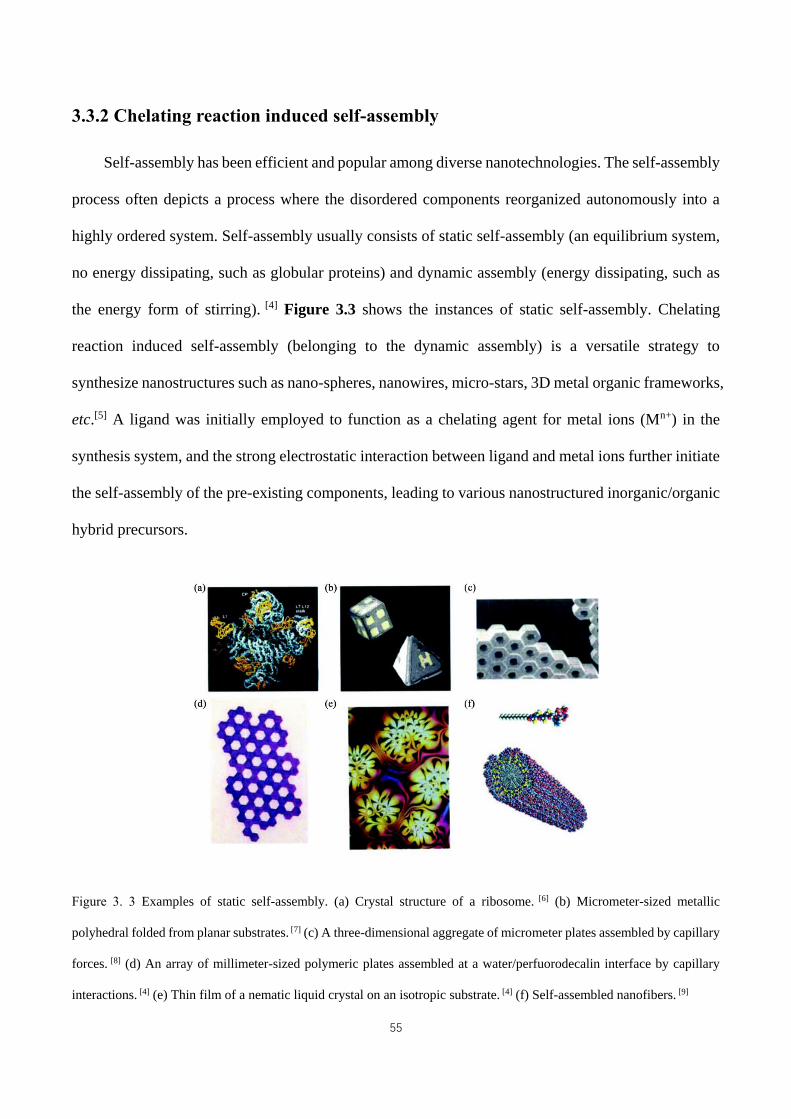
55
3.3.2 Chelating reaction induced self-assembly
Self-assembly has been efficient and popular among diverse nanotechnologies. The self-assembly
process often depicts a process where the disordered components reorganized autonomously into a
highly ordered system. Self-assembly usually consists of static self-assembly (an equilibrium system,
no energy dissipating, such as globular proteins) and dynamic assembly (energy dissipating, such as
the energy form of stirring). [4] Figure 3.3 shows the instances of static self-assembly. Chelating
reaction induced self-assembly (belonging to the dynamic assembly) is a versatile strategy to
synthesize nanostructures such as nano-spheres, nanowires, micro-stars, 3D metal organic frameworks,
etc.[5] A ligand was initially employed to function as a chelating agent for metal ions (Mn+) in the
synthesis system, and the strong electrostatic interaction between ligand and metal ions further initiate
the self-assembly of the pre-existing components, leading to various nanostructured inorganic/organic
hybrid precursors.
Figure 3. 3 Examples of static self-assembly. (a) Crystal structure of a ribosome. [6] (b) Micrometer-sized metallic
polyhedral folded from planar substrates. [7] (c) A three-dimensional aggregate of micrometer plates assembled by capillary
forces. [8] (d) An array of millimeter-sized polymeric plates assembled at a water/perfuorodecalin interface by capillary
interactions. [4] (e) Thin film of a nematic liquid crystal on an isotropic substrate. [4] (f) Self-assembled nanofibers. [9]
56
3.4 Techniques for characterization
3.4.1 Laboratory X-ray diffraction/ synchrotron X-ray diffraction
X-ray diffraction technique is used to analyze the phase purity, preferential orientation of
polycrystalline, crystallographic structure, grain size and compositions of materials. The X-ray
diffractions are generally based on the X-ray radiation of electromagnetic wave (wavelength ~1 Å),
and the resultant characteristic interference generated in specific directions, which reflect the
information correlated with certain lattice planes in the crystals. The obtained diffraction pattern
containing one or several sets of diffraction peaks could be further indexed to unique phases according
to the information of JCPDS card. The average occupancy of the atoms could also be determined from
the intensity. The conversion between d-spacings and incident angles can be achieved by Bragg’s Law:
𝑛𝜆 = 2𝑑sin𝜃 (3.1)
Note, n, λ, θ refer to integer, the wavelength of the incident X-ray beam, and the incident angle. And
d represents the width of lattice fringes of crystals. In this doctoral thesis, the XRD data were collected
by a D8 Advance, Bruker AXS X-ray diffractometer using Cu Ka radiation (40 kV, 40 mA) at a scan
rate of 10 o·min-1 (λ =1.54056 Å), at Fudan University, China.
In-situ X-ray diffraction could provide the information of simultaneous structural evolution of
electrodes in their electrochemical charging and discharging process, which plays an important role in
the in-situ investigation of batteries, better understanding of the mechanisms and further improving
the electrochemical performance of batteries at the electrodes. Specially customized CR2032 coin cells
were fabricated for the in-situ synchrotron X-ray powder diffractions (SXRPD) (Figure 3.4). The cells
were cycled within 0.05–3.0 V (vs. Li+/Li) at a constant current density in recording the diffraction
data. In this doctoral thesis, the SXRPD data were recorded by the Powder Diffraction beamline at the
Australian Synchrotron at a constant time interval during charge and discharge using a MYTHEN
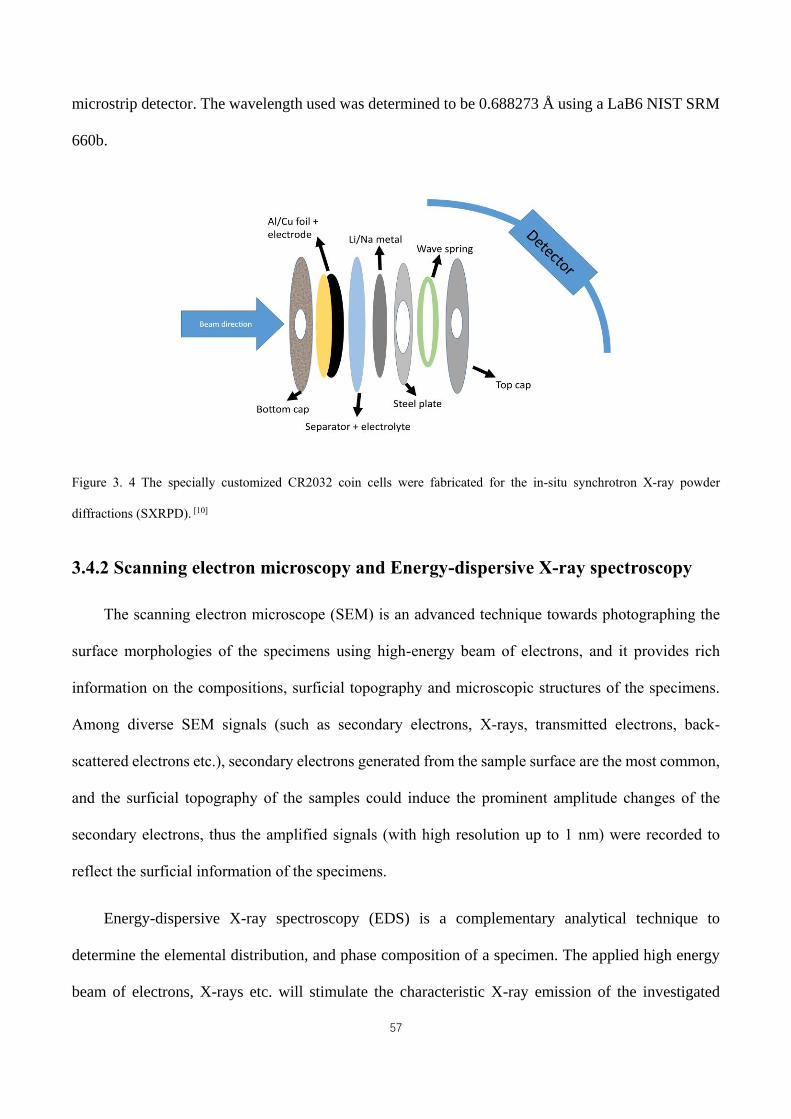
57
microstrip detector. The wavelength used was determined to be 0.688273 Å using a LaB6 NIST SRM
660b.
Figure 3. 4 The specially customized CR2032 coin cells were fabricated for the in-situ synchrotron X-ray powder
diffractions (SXRPD). [10]
3.4.2 Scanning electron microscopy and Energy-dispersive X-ray spectroscopy
The scanning electron microscope (SEM) is an advanced technique towards photographing the
surface morphologies of the specimens using high-energy beam of electrons, and it provides rich
information on the compositions, surficial topography and microscopic structures of the specimens.
Among diverse SEM signals (such as secondary electrons, X-rays, transmitted electrons, back-
scattered electrons etc.), secondary electrons generated from the sample surface are the most common,
and the surficial topography of the samples could induce the prominent amplitude changes of the
secondary electrons, thus the amplified signals (with high resolution up to 1 nm) were recorded to
reflect the surficial information of the specimens.
Energy-dispersive X-ray spectroscopy (EDS) is a complementary analytical technique to
determine the elemental distribution, and phase composition of a specimen. The applied high energy
beam of electrons, X-rays etc. will stimulate the characteristic X-ray emission of the investigated
58
element, and based on the collected signals, both the qualitative and quantitative analysis of the
elements can be achieved. In this doctoral thesis, the SEM images and EDS mapping were taken using
a field-emission scanning electron microscope (JEOL 7500).
3.4.3 Transmission electron microscopy
As one of the most important microscopic analysis method, transmission electron microscopy
(TEM) featured the advantages to analyze the selected area electron diffraction (SAED) at a high
resolution via the narrow de Broglie wavelength of electrons. This enables the instrument to capture
fine details of the atomic/internal structures of samples (such as lattice spacing, crystal orientation,
electronic configurations), thus record the correlated crystallographic data of samples. In the SAED
technique, atoms arranged as diffraction gratings to the applied high-energy electrons, by which some
electrons will be scattered at certain angles, and several sets of spots will be recorded, attributing to
the characteristic crystalline information in the specimen. The preparation of TEM samples follows
the procedure: the samples were homogeneously dispersed in cyclohexane/ethanol through ultrasonic
dispersion method, and then add one drop of the solution to the carbon support film on a copper grid.
In this doctoral thesis, the testing TEM instruments were JEOL 2011 (200 keV) and JEOL JEM-
ARM200F.
3.4.4 Thermo-gravimetric analysis
Thermo-gravimetric analysis (TGA) is a method to determine the component changes of materials
under certain gas atmosphere according to a controlled temperature program. The pertinent physical
or chemical changes (such as sublimation, desorption, decomposition, oxidation, reduction etc.) could
be reflected by weight difference in the TGA profiles. In this doctoral thesis, TGA has been utilized to
calculate the contents of different components in hetero-structure, and the specimens are tested under
air atmosphere employing the SETARAM Thermo-Gravimetric Analyzer (France) or a PerkinElmer
59
TG/DTA 6300 in KETI.
3.4.5 Brunauer-Emmett-Teller surface area characterization
Brunauer-Emmett-Teller (BET) method has been an important technique to investigate the
porosity of materials and determine the specific surface area of materials. Brunauer, Emmett and Teller
originally gave a typical elaboration of the BET theory. [11] The entire surfaces of porous materials are
in proportion relationship with the amount of physically adsorbed gas. The surface areas and pore size
distributions were measured at 77 K (liquid nitrogen temperature) and can be calculated using the
Brunauer–Emmett–Teller (BET) method and the Barrett–Joyner–Halenda (BJH) model, respectively.
In this thesis, the BET surface areas were recorded by a Quanta Chrome Nova 1000 instrument.
3.4.6 Raman spectroscopy
Raman spectroscopy is a very useful and convenience optical technique to analyze the vibrations
of chemical bonds, symmetry of molecules and yield rich information about the molecular structures
of the materials. In comparison with the infrared absorption spectroscopy, Raman techniques can be
utilized in various environment and require very simple sample preparation procedure. In the Raman
testing process, the optical fiber probes play an important role in transporting both the excitation laser
light to the sample and the scattered light to the spectrograph, enabling long distance recording of
Raman signals. [12] The applied excitation laser has a big influence on the spatial and temporal
resolution of the Raman scatterings. The correlated high resolution Raman techniques include
Multichannel Hadamard Transform Raman Microscopy. [13] Raman spectra could be recorded on the
picosecond time scale, which are advantageous in analyzing special samples, such as short-lived
species (in excited states) and certain reaction intermediates.[14] In this doctoral thesis, the Raman
spectra were collected by a JOBIN Yvon Horiba Raman Spectrometer model HR800 employing a 10
mW helium/neon laser at 632.8 nm.
60
3.4.7 X-ray photoelectron spectroscopy
As one of the routinely used surface-quantity and quality analysis measurement, the XPS
instruments are utilized to probe into the surface chemistry of a wide range of materials, such as metal
alloys, polymers, inorganic compounds, ion-modified materials, etc., in various states. The XPS
instruments comprise of three major components: X-ray source, photoelectron energy analyzer and
detector. X-ray photoelectron spectroscopy (XPS) operated through irradiating the monochromatic X-
ray beam on materials, and simultaneously recorded the kinetic energy and escaping electrons from
the surface of the tested materials. By this technique, the information involving elemental compositions,
chemical/electronic configurations, valence states of elements, etc., could be analyzed from the spectra.
In this study, the XPS data were characterized by VG Scientific ESCALAB 2201XL instrument, and
a Thermo Scientific Sigma Probe instrument in KETI using Al Kα X-ray radiation and fixed analyzer
transmission mode.
3.5 Electrode preparation and cell assembly
The homogeneous electrode slurries were obtained by thoroughly mixing the as-synthesized
active materials, dry carbon black (conductive reagents), and 2.5wt% polyvinylidene difluoride/NMP
solution in specific ratios (in this thesis, the corresponding weight ratio is 8:1:1). After this, the
electrode slurries were pasted onto a clean copper foil (current collector) by a doctor blade, and were
dried for 12 h in a vacuum oven under 393 K. The obtained copper foil was punched into discs, which
was finally pressed under 20 MPa. The electrode discs were stored in an argon filled glove box (H2O
and O2 concentration less than 1 ppm) before assembling coin cells. [15] In this thesis, 2032-type coin
cell were employed and assembled in the Argon glovebox. The stacking of coin cell components
follows the order shown in Figure 3.5. Firstly, the electrode disc was initially placed on the positive
cap and wetted by several drops of electrolyte (in this work, the electrolyte was 1 mol·L-1 LiPF6 in
ethylene carbonate/dimethyl carbonate/ethyl methyl carbonate, solvent volumetric ratio 1:1:1, with
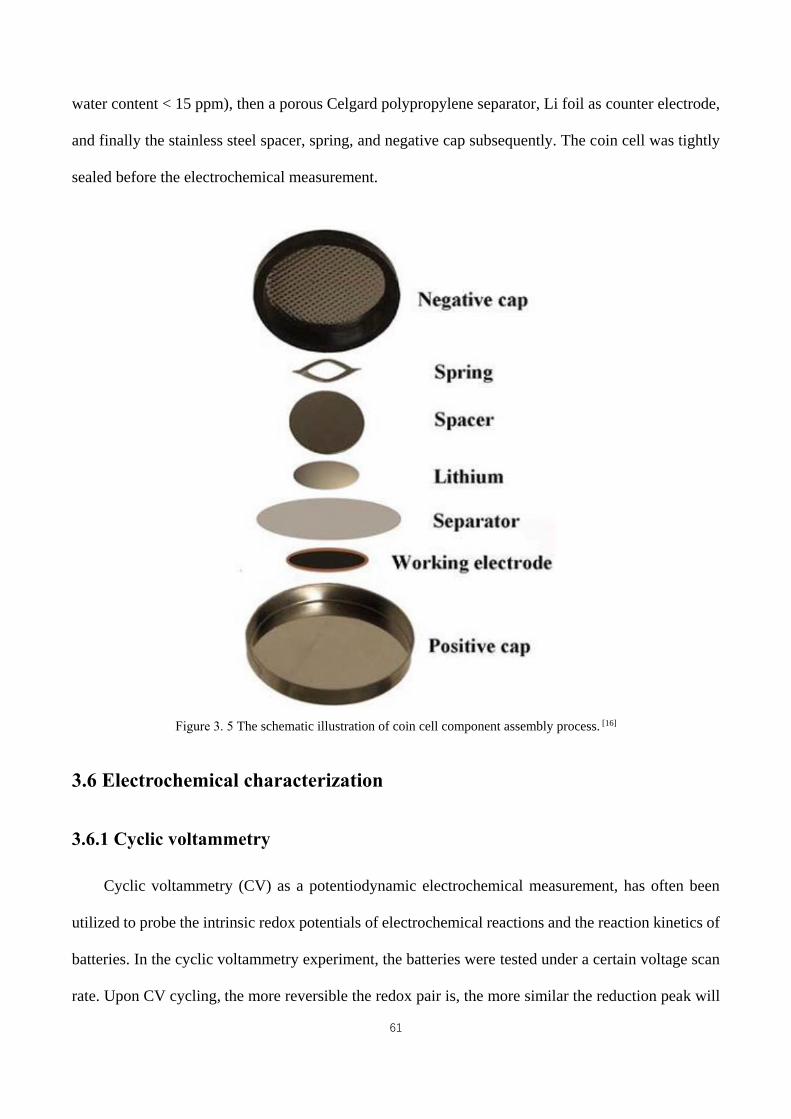
61
water content < 15 ppm), then a porous Celgard polypropylene separator, Li foil as counter electrode,
and finally the stainless steel spacer, spring, and negative cap subsequently. The coin cell was tightly
sealed before the electrochemical measurement.
Figure 3. 5 The schematic illustration of coin cell component assembly process. [16]
3.6 Electrochemical characterization
3.6.1 Cyclic voltammetry
Cyclic voltammetry (CV) as a potentiodynamic electrochemical measurement, has often been
utilized to probe the intrinsic redox potentials of electrochemical reactions and the reaction kinetics of
batteries. In the cyclic voltammetry experiment, the batteries were tested under a certain voltage scan
rate. Upon CV cycling, the more reversible the redox pair is, the more similar the reduction peak will
62
be in shape to the oxidation peak. The obtained CV profiles are plotted as current (i) versus applied
potential. The CV measurements of coin cells (for example, lithium ion batteries) belong to a two-
electrode model and Li foil functioned as both reference electrode and counter electrode. The reaction
kinetics of batteries were often investigated by plotting CV profiles at different voltage scan rates. As
the scan rate increases, the redox peak intensities arise simultaneously, well preserving their pristine
CV profiles with a quick signal feedback to increased scan rate. As the discharge and charge reaction
rates depend highly on diffusion process, [15] the Li+ diffusion coefficients (DLi+) of electrodes were
compared based on the Randles–Sevcik equation (Equation (3.2)).[17]
𝑖𝑝 = 0.4663𝑛𝐹𝐴𝐶√𝑛𝐹𝐷𝑣
𝑅𝑇 (3.2)
In this equation: ip, D, n, A, v correspond to the intensity of peak current, diffusion coefficient, the
number of electrons involved in the reaction of the redox couple, the surface area of the electrodes,
and the rate at which the potential is swept. F, T, and R refer to the Faraday constant, absolute
temperature during the testing, and the gas constant, respectively. C is the concentration of Li+. If the
tested cells have been fabricated in the same procedure, the Randles–Sevcik equation to calculate Li+
diffusion coefficient could be simplified as Equation (3.3): [15, 18]
𝑖𝑝 = 𝑘√𝐷√𝑣 (3.3)
In which, k is considered to be a constant for the cells. Thus, the Li+ diffusion coefficient could be
redefined as kD1/2, which could be obtained from the linear relationship between the peak currents and
the square roots of the scan rates (ν1/2). In this thesis, the CV profiles were recorded using Biologic
VMP-3 and CHI 660E electrochemical workstation.
63
3.6.2 Galvanostatic electrochemical testing
The long-term cycling performance (cycling stability and capacity) of the as-prepared electrodes
were investigated through galvanostatic electrochemical testing. The batteries were charged and
discharged under a constant current mode within a typical cut-off voltage range. The charge and
discharge capacities equivalent to the total electron charge of one fully charge or discharge process,
which can be calculated as Q = I × t, from the tested current and the overall time of one complete
electrochemical process. The rate capabilities of the electrodes were also investigated using the same
testing technique, only testing the batteries under different current densities. In this thesis, all the
galvanostatic electrochemical performances were collected using the Land battery tester (Wuhan,
China), in air atmosphere at 298 K.
3.6.3 Electrochemical Impedance Spectroscopy
Electrochemical Impedance Spectroscopy (EIS) is a useful method to evaluate the
electrochemical resistance, charge transfer capability and chemical reactions of batteries. In this
doctoral thesis, the electrochemical impedance spectroscopy was measured by applying an alternating
current (AC) voltage to the studied electrode materials. The Nyquist plots and Bode plots drawn from
the electrochemical impedance spectra could directly reflect the capacitive behavior or diffusive
behavior of the entire electrochemical reaction kinetics (including solid state diffusion of Li+/Na+/K+
into the structures of active materials). As Warburg impedance in the low frequency reflects solid state
diffusion process, the correlated diffusion coefficient of Li+/Na+/K+ can be deduced according to the
equation: [19]
𝐷𝐿𝑖+ =𝑅2𝑇2
2𝐴2𝑛4𝐹4𝐶2𝜎2 (3.4)
Note: R, T, A, n, F, C, and σ correspond to the gas constant (8.14 J·mol-1·K-1), the absolute temperature
64
(in this work, this temperature equals to 298 K), the interface area between the electrolyte and the
active material, the number of electrons involved in the reaction of the redox couple, the Faraday
constant (96500 C·mol-1), the concentration of lithium ions, and Warburg factor. The Warburg factor
can be calculated by the following equation: [19a]
Z’re=Re + Rct +σ ω-1/2 (3.5)
In this equation, Re, Rct, and ω correspond to the resistance of electrolyte, the charge transfer resistance,
and the angular frequency in low frequency region, which could be calculated from the EIS
measurements. In this doctoral thesis, EIS data were measured by Biologic VMP-3 and CHI 660E
electrochemical workstation.
3.6.4 Galvanostatic intermittent titration technique (GITT) method
The galvanostatic intermittent titration technique (GITT) is an efficient experimental method to
evaluate the ion transport capabilities of electrodes, which can be deduced according to the following
equation by Weppner and Huggins: [19a, 20]
𝐷𝐿𝑖+ =4
𝜋(𝑚𝑉𝑀
𝑀𝐴)2(
∆𝐸𝑠
𝜏(𝑑𝐸𝜏/𝑑√𝜏))2 (
𝜏≪𝐿2
𝐷𝐿𝑖+) (3.6)
In the equation, VM is the molar volume of the compound. M, m and A refer to the molecular weight,
mass of the electrode material, and the contact area between electrolyte and active material,
respectively. 𝐸𝑆 and 𝐸𝜏 refer to voltage changes during the process of applied current pulse and that
during the turned off current pulse, respectively, and L represents the particle radius of the active
material. This equation can be written as a more simplified form when E is in a linear relationship with
τ1/2 over the entire time period of current flux:
𝐷𝐿𝑖+ =4
𝜋𝜏(𝑚𝑉𝑀
𝑀𝐴)2(
∆𝐸𝑆
∆𝐸𝜏)2 (3.7)

65
In this doctoral thesis, the GITT measurement was conducted on battery testing instrument (LAND,
CT2001A) (Wuhan, China).
3.7 References
[1] X. Wang, B. Ding, G. Sun, M. Wang, J. Yu, Prog. Mater. Sci. 2013, 58, 1173.
[2] X. Wang, B. Ding, J. Yu, J. Yang, Colloids Surf., B 2011, 86, 345.
[3] S. Yang, X. Wang, B. Ding, J. Yu, J. Qian, G. Sun, Nanoscale 2011, 3, 564.
[4] G. M. Whitesides, B. Grzybowski, Science 2002, 295, 2418.
[5] (a) Y. Ma, Y. Zhang, X. Wang, M. Fan, K. Li, T. Wang, Y. Liu, Q. Huo, Z. Qiao, S. Dai, Nanoscale 2018, 10,
5731; (b) A. Beziau, S. A. Baudron, G. Rogez, M. W. Hosseini, Inorg. Chem. 2015, 54, 2032; (c) A. Wang, Q.
Liao, J. Feng, P. Zhang, Z. Zhang, J. R. Chen, Cryst. Growth Des. 2012, 12, 832.
[6] N. Ban, P. Nissen, J. Hansen, P. B. Moore, T. A. Steitz, Science 2000, 289, 905.
[7] D. H. Gracias, V. Kavthekar, J. C. Love, K. E. Paul, G. M. Whitesides, Adv. Mater. 2002, 14, 235.
[8] T. D. Clark, J. Tien, D. C. Duffy, K. E. Paul, G. M. Whitesides, J. Am. Chem. Soc. 2001, 123, 7677.
[9] J. D. Hartgerink, E. Beniash, S. I. Stupp, Science 2001, 294, 1684.
[10] J. C. Pramudita, R. Aughterson, W. M. Dose, S. W. Donne, H. E. A. Brand, N. Sharma, J. Mater. Res. 2014, 30,
381.
[11] S. Brunauer, P. H. Emmett, E. Teller, J. Am. Chem. Soc. 1938, 60, 309.
[12] K. Kneipp, H. Kneipp, I. Itzkan, R. R. Dasari, M. S. Feld, Chem. Rev. 1999, 99, 2957.
[13] (a) P. J. Treado, M. D. Morris, Appl. Spectrosc. 1990, 44, 1; (b) M. L. McGlashen, K. L. Davis, M. D. Morris,
Anal. Chem. 1990, 62, 846.
[14] T. R. Rizzo, Laser techniques in chemistry, Wiley, 1995.
[15] W. Sun, X. Rui, D. Yang, Z. Sun, B. Li, W. Zhang, Y. Zong, S. Madhavi, S. Dou, Q. Yan, ACS Nano 2015, 9,
11371.
[16] X. Ji, K. T. Lee, R. Holden, L. Zhang, J. Zhang, G. A. Botton, M. Couillard, L. F. Nazar, Nat. Chem. 2010, 2,
286.
[17] J. Qin, T. Wang, D. Liu, E. Liu, N. Zhao, C. Shi, F. He, L. Ma, C. He, Adv. Mater. 2018, 30, 1704670.
[18] (a) X. Rui, N. Yesibolati, S. Li, C. Yuan, C. Chen, Solid State Ionics 2011, 187, 58; (b) S. Tang, M. Lai, L. Lu,
J. Alloys Compd. 2008, 449, 300; (c) H. Wang, W. Zhang, H. Liu, Z. Guo, Angew. Chem., Int. Ed. 2016, 55,
66
3992.
[19] (a) W. Liu, J. Tu, Y. Qiao, J. Zhou, S. Shi, X. Wang, C. Gu, J. Power Sources 2011, 196, 7728; (b) R. Zeng, W.
Li, D. Lu, Q. Huang, J. Power Sources 2007, 174, 592; (c) Y. Cui, X. Zhao, R. Guo, Electrochim. Acta 2010,
55, 922; (d) J. Xiang, J. Tu, Y. Qiao, X. Wang, J. Zhong, D. Zhang, C. Gu, J. Phys. Chem. C 2011, 115, 2505.
[20] W. Weppner, R. A. Huggins, J. Electrochem. Soc. 1977, 124, 1569.
67
CHAPTER 4 Oxycarbide Interface Integration Reinforced
Multielectron Reactions for Advanced Lithium Ion Batteries
4.1 Introduction
To date, the development of society still relies heavily on fossil fuels, which have long been our
major energy resource, although the problematic issues of deteriorating pollution coupled with the
precipitous decline in fossil fuel reserves demand the pursuit of greener and more renewable
alternatives, such as energy from the sun, water, wind, biomass, waves, tides, ocean temperature
differences, and geothermal sources, etc.[1] To promote the large-scale applications of renewable
energy, it is highly essential to overcome their intermittent and scattered features by constructing
effective energy storage systems, especially rechargeable batteries, which have inspired researchers in
terms of efficient energy utilization, safety, convenience etc.[2] Among all the types of rechargeable
batteries, lithium ion battery has been widely developed. As graphite anodes have almost approached
their theoretical limits, improving the energy density for state-of-the-art commercialized lithium ion
batteries place high demands on novel types of anodes, which feature the convenient accommodation
of electrons and ions at substantial speeds and in substantial amounts.[3] Conversion-type electrodes
(generally transition metal compounds, denoted as TMCs, including nitrides, fluorides, oxides, sulfides,
carbides, etc.) have emerged as appealing candidates and could deliver much higher theoretical
capacities up to 1500 mA·h·g−1,[4] which are several folds higher than those of graphite electrodes. In
addition, it was reported that some properly engineered TMOs could accommodate more Li+ than the
theoretically predicted based on conversion reactions due to interfacial reactions.[5] Nevertheless, the
commercialization of conversion-type electrodes is still hampered by several major problems:
undesirable rate performance originating from the high resistance in the electron and ion transport
processes, low initial coulombic efficiency, structural collapse due to lithiation induced volume
68
expansion, and large voltage hysteresis etc.[4a, 4b]
As a subclass of TMC, molybdenum based electrodes are of high research interest due to their
easy functionality, tunable band gaps, high mechanical/thermal stability, and affordable cost, and
MoO2 has shown especially promising electrochemical properties.[6] One issue with MoO2 electrode
is that its sluggish kinetics in electrochemical Li+ storage, which is restricting the electrochemical
performance of MoO2 based electrodes. Recently, some pioneering work revealed that heterogeneous
charge transfer at the interfaces and/or easy Mo–O bond cleavage could enhance lithium storage and
reduce the activation energy barrier, thus facilitating the conversion reactions in MoO2.[7]
As the controllable preparation of advanced MoO2 electrodes flourished with the development of
nanotechnology, a plenty of well-defined MoO2-based nanostructures with improved electrochemical
performance have been synthesized, based on careful consideration of constructing interconnected
electron/ion pathways, reducing electron/ion diffusion distances, nano-confinement, chemical binding
in a robust matrix, engineering atomic deficiencies, etc.[8],[9] In addition, hetero-structures with the
combined merits of each component are becoming a research focus in the field of nanomaterials, as
the synergistic effects between different species have been reported to markedly influence and enhance
specific properties such as selective catalysis, supercapacitance, and photocatalytic/surface
reaction/charge transfer activity.[10] Several works revealed that hetero-structures can enable faster
charge transfer in materials.[10b],[10a, 11],[12] For instance, hetero-structured MnMoO4/CoMoO4 exhibited
super-capacitive properties in comparison with either their individual molybdate or physical
mixtures.[10b] Gong et al. found that in Co3O4/BiVO4 hetero-structures, an internal electric field
emerged around the p-n heterojunction, which contributes to faster charge transport and surface
reaction kinetics.[10a] We have designed a SnS/SnO2 hetero-electrode, and the unique interface effect
induced facilitated ion and electron transfer in the electrode, contributing to its excellent rate
capability.[11] Walukiewicz et al. reported that both the charge transfer and electron mobility are
enhanced at CdO/SnTe heterointerfaces.[12] The heterostructures offer alluring interfacial properties,
69
which might conveniently make it feasible to obtain an internal charge‐transfer driving force to further
facilitate ion/electron diffusion.
Therefore, it is promising to combine the design of conventional MoO2 with new materials that
feature sufficient redox chemistry, appreciably high energy per unit mass/volume, and eco-friendly
synthetic procedures, which may bring forth marked progress in energy storage. Molybdenum
oxycarbides, which are formed after partially replacing coordinate oxygen (with -2 charge) in the
MoO2 lattices by equivalent carbide anions (with more negative charge), exhibit alluring potentials. In
comparison with its MoO2 counterpart, MoOC exhibits the higher oxidation valence of molybdenum,
intrinsic catalytic selectivity, etc.[13] The elevated oxidation valence of Mo is highly desirable for multi-
electron reactions, which could enable higher lithium accommodation per unit mass of molybdenum
compounds. With these considerations in mind, herein, MoOC modified MoO2 hetero-electrode has
been designed, and its correlative electrochemical performances have also been investigated
systematically. The MoOC/MoO2 hetero-structure exhibits enhanced rate performance and cycling
stability compared to MoO2-N-doped carbon nanowires (MoO2-NCNW), implying that the pristine
electrochemical reaction sluggishness of MoO2 has been significantly improved in this hetero-design,
as evidenced by in-situ synchrotron X-ray diffraction (XRD) and electrochemical kinetic analysis,
which may benefit from a synergistic effect between MoO2 and MoOC. This work highlights oxy-
carbide incorporation as a strategy to promote the charge storage kinetics of conventional conversion
type materials, which may open up a broad, previously less explored space of transition metal
compounds.
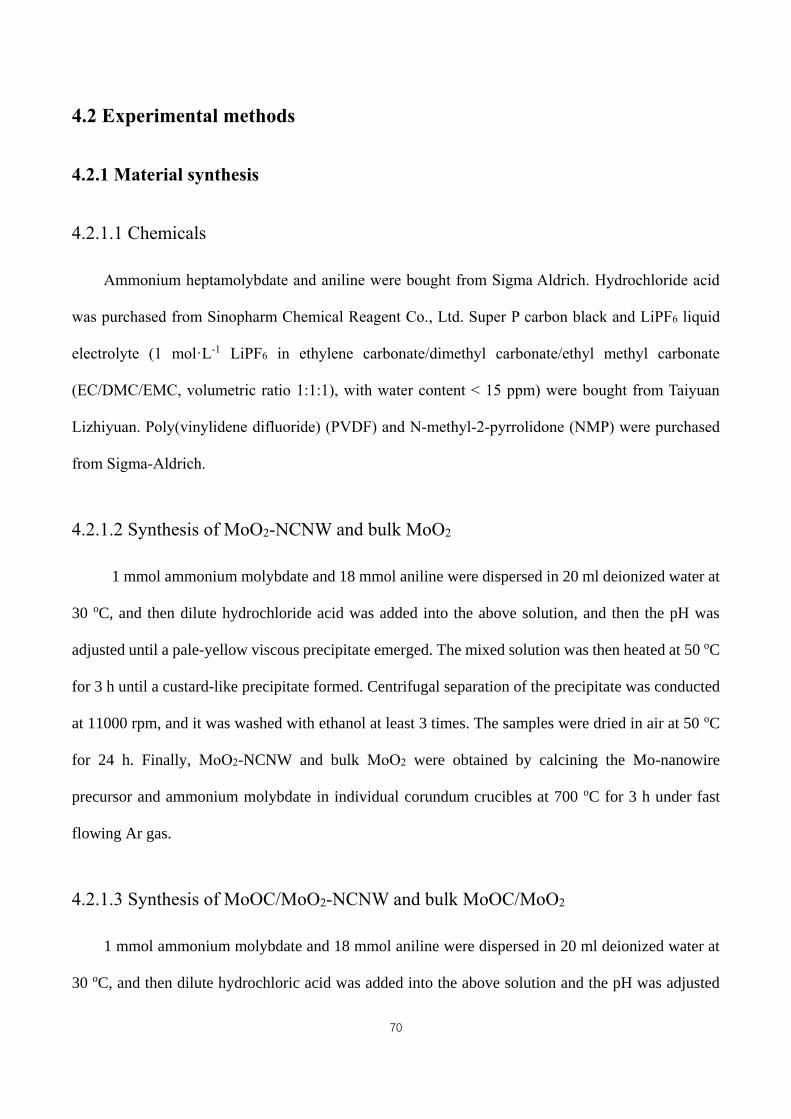
70
4.2 Experimental methods
4.2.1 Material synthesis
4.2.1.1 Chemicals
Ammonium heptamolybdate and aniline were bought from Sigma Aldrich. Hydrochloride acid
was purchased from Sinopharm Chemical Reagent Co., Ltd. Super P carbon black and LiPF6 liquid
electrolyte (1 mol·L-1 LiPF6 in ethylene carbonate/dimethyl carbonate/ethyl methyl carbonate
(EC/DMC/EMC, volumetric ratio 1:1:1), with water content < 15 ppm) were bought from Taiyuan
Lizhiyuan. Poly(vinylidene difluoride) (PVDF) and N-methyl-2-pyrrolidone (NMP) were purchased
from Sigma-Aldrich.
4.2.1.2 Synthesis of MoO2-NCNW and bulk MoO2
1 mmol ammonium molybdate and 18 mmol aniline were dispersed in 20 ml deionized water at
30 oC, and then dilute hydrochloride acid was added into the above solution, and then the pH was
adjusted until a pale-yellow viscous precipitate emerged. The mixed solution was then heated at 50 oC
for 3 h until a custard-like precipitate formed. Centrifugal separation of the precipitate was conducted
at 11000 rpm, and it was washed with ethanol at least 3 times. The samples were dried in air at 50 oC
for 24 h. Finally, MoO2-NCNW and bulk MoO2 were obtained by calcining the Mo-nanowire
precursor and ammonium molybdate in individual corundum crucibles at 700 oC for 3 h under fast
flowing Ar gas.
4.2.1.3 Synthesis of MoOC/MoO2-NCNW and bulk MoOC/MoO2
1 mmol ammonium molybdate and 18 mmol aniline were dispersed in 20 ml deionized water at
30 oC, and then dilute hydrochloric acid was added into the above solution and the pH was adjusted
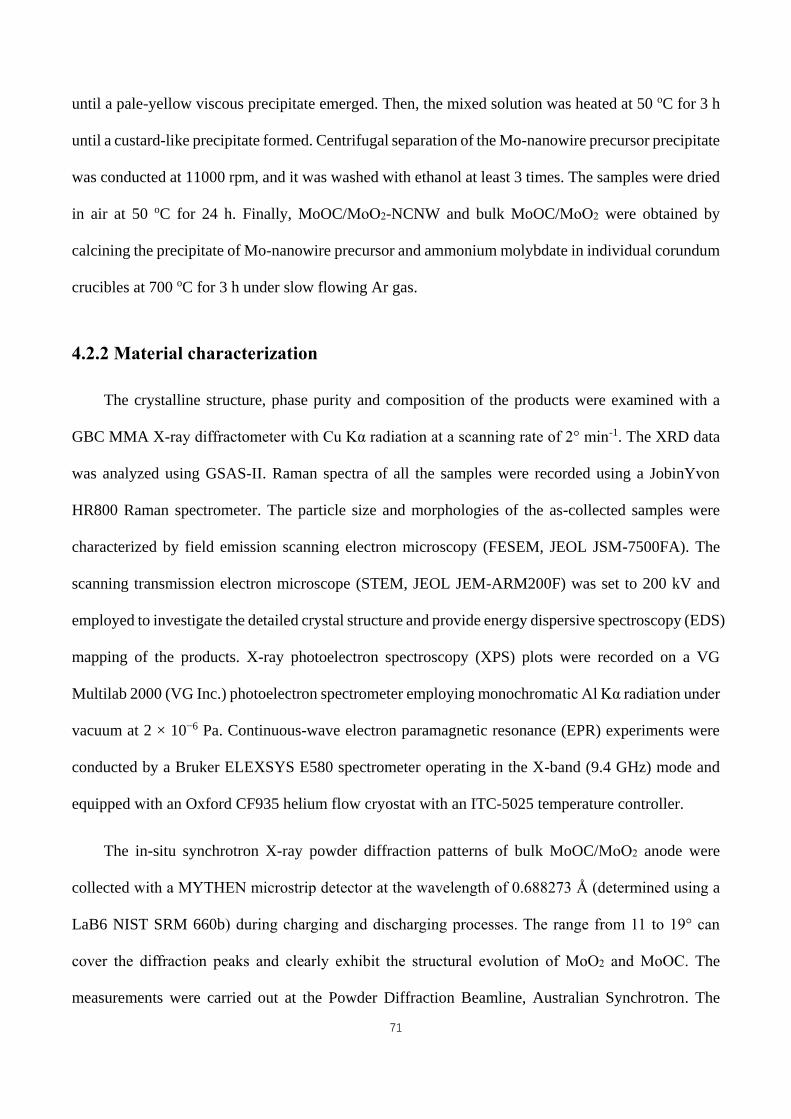
71
until a pale-yellow viscous precipitate emerged. Then, the mixed solution was heated at 50 oC for 3 h
until a custard-like precipitate formed. Centrifugal separation of the Mo-nanowire precursor precipitate
was conducted at 11000 rpm, and it was washed with ethanol at least 3 times. The samples were dried
in air at 50 oC for 24 h. Finally, MoOC/MoO2-NCNW and bulk MoOC/MoO2 were obtained by
calcining the precipitate of Mo-nanowire precursor and ammonium molybdate in individual corundum
crucibles at 700 oC for 3 h under slow flowing Ar gas.
4.2.2 Material characterization
The crystalline structure, phase purity and composition of the products were examined with a
GBC MMA X-ray diffractometer with Cu Kα radiation at a scanning rate of 2° min-1. The XRD data
was analyzed using GSAS-II. Raman spectra of all the samples were recorded using a JobinYvon
HR800 Raman spectrometer. The particle size and morphologies of the as-collected samples were
characterized by field emission scanning electron microscopy (FESEM, JEOL JSM-7500FA). The
scanning transmission electron microscope (STEM, JEOL JEM-ARM200F) was set to 200 kV and
employed to investigate the detailed crystal structure and provide energy dispersive spectroscopy (EDS)
mapping of the products. X-ray photoelectron spectroscopy (XPS) plots were recorded on a VG
Multilab 2000 (VG Inc.) photoelectron spectrometer employing monochromatic Al Kα radiation under
vacuum at 2 × 10⁻⁶ Pa. Continuous-wave electron paramagnetic resonance (EPR) experiments were
conducted by a Bruker ELEXSYS E580 spectrometer operating in the X-band (9.4 GHz) mode and
equipped with an Oxford CF935 helium flow cryostat with an ITC-5025 temperature controller.
The in-situ synchrotron X-ray powder diffraction patterns of bulk MoOC/MoO2 anode were
collected with a MYTHEN microstrip detector at the wavelength of 0.688273 Å (determined using a
LaB6 NIST SRM 660b) during charging and discharging processes. The range from 11 to 19° can
cover the diffraction peaks and clearly exhibit the structural evolution of MoO2 and MoOC. The
measurements were carried out at the Powder Diffraction Beamline, Australian Synchrotron. The
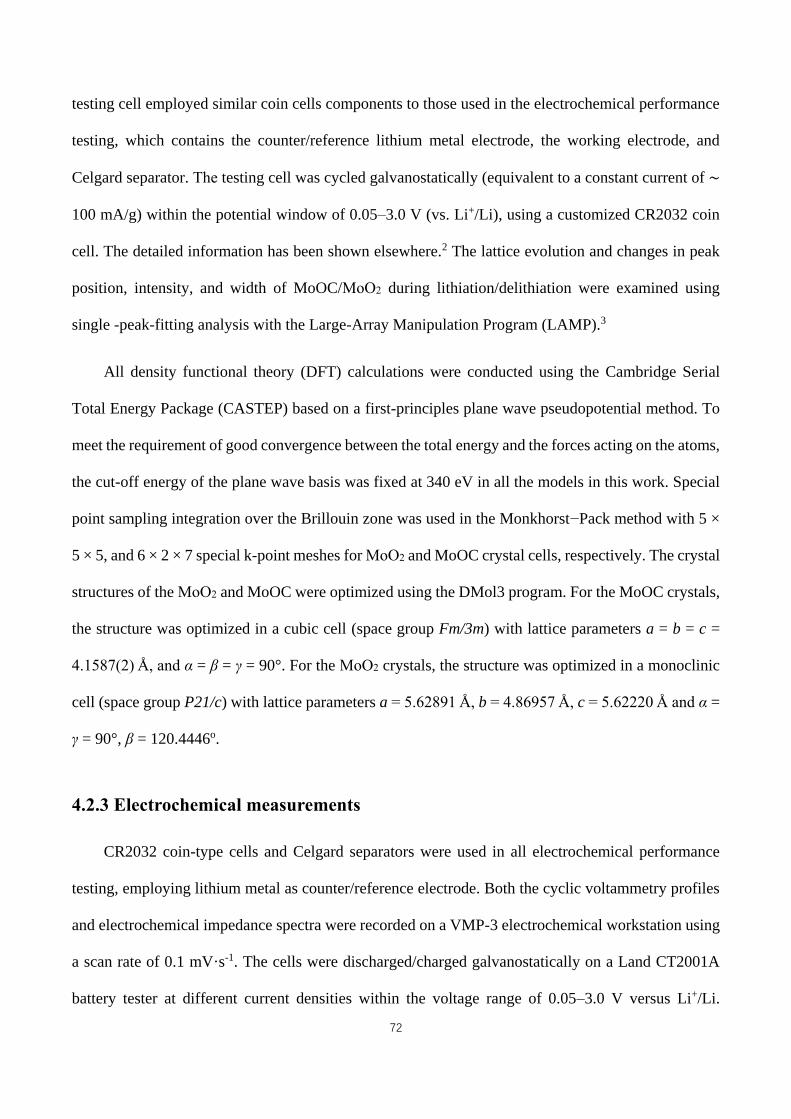
72
testing cell employed similar coin cells components to those used in the electrochemical performance
testing, which contains the counter/reference lithium metal electrode, the working electrode, and
Celgard separator. The testing cell was cycled galvanostatically (equivalent to a constant current of ∼
100 mA/g) within the potential window of 0.05–3.0 V (vs. Li+/Li), using a customized CR2032 coin
cell. The detailed information has been shown elsewhere.2 The lattice evolution and changes in peak
position, intensity, and width of MoOC/MoO2 during lithiation/delithiation were examined using
single -peak-fitting analysis with the Large-Array Manipulation Program (LAMP).3
All density functional theory (DFT) calculations were conducted using the Cambridge Serial
Total Energy Package (CASTEP) based on a first-principles plane wave pseudopotential method. To
meet the requirement of good convergence between the total energy and the forces acting on the atoms,
the cut-off energy of the plane wave basis was fixed at 340 eV in all the models in this work. Special
point sampling integration over the Brillouin zone was used in the Monkhorst−Pack method with 5 ×
5 × 5, and 6 × 2 × 7 special k-point meshes for MoO2 and MoOC crystal cells, respectively. The crystal
structures of the MoO2 and MoOC were optimized using the DMol3 program. For the MoOC crystals,
the structure was optimized in a cubic cell (space group Fm/3m) with lattice parameters a = b = c =
4.1587(2) Å, and α = β = γ = 90°. For the MoO2 crystals, the structure was optimized in a monoclinic
cell (space group P21/c) with lattice parameters a = 5.62891 Å, b = 4.86957 Å, c = 5.62220 Å and α =
γ = 90°, β = 120.4446o.
4.2.3 Electrochemical measurements
CR2032 coin-type cells and Celgard separators were used in all electrochemical performance
testing, employing lithium metal as counter/reference electrode. Both the cyclic voltammetry profiles
and electrochemical impedance spectra were recorded on a VMP-3 electrochemical workstation using
a scan rate of 0.1 mV·s-1. The cells were discharged/charged galvanostatically on a Land CT2001A
battery tester at different current densities within the voltage range of 0.05–3.0 V versus Li+/Li.
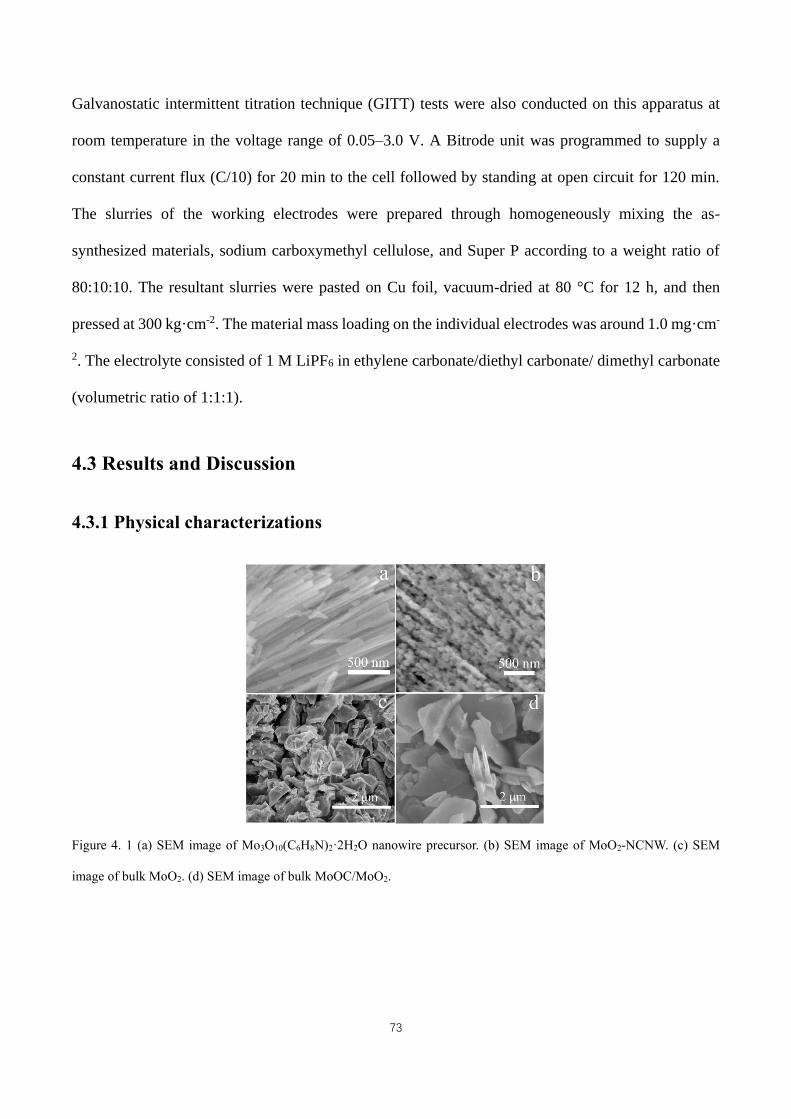
73
Galvanostatic intermittent titration technique (GITT) tests were also conducted on this apparatus at
room temperature in the voltage range of 0.05–3.0 V. A Bitrode unit was programmed to supply a
constant current flux (C/10) for 20 min to the cell followed by standing at open circuit for 120 min.
The slurries of the working electrodes were prepared through homogeneously mixing the as-
synthesized materials, sodium carboxymethyl cellulose, and Super P according to a weight ratio of
80:10:10. The resultant slurries were pasted on Cu foil, vacuum-dried at 80 °C for 12 h, and then
pressed at 300 kg·cm-2. The material mass loading on the individual electrodes was around 1.0 mg·cm-
2. The electrolyte consisted of 1 M LiPF6 in ethylene carbonate/diethyl carbonate/ dimethyl carbonate
(volumetric ratio of 1:1:1).
4.3 Results and Discussion
4.3.1 Physical characterizations
Figure 4. 1 (a) SEM image of Mo3O10(C6H8N)2·2H2O nanowire precursor. (b) SEM image of MoO2-NCNW. (c) SEM
image of bulk MoO2. (d) SEM image of bulk MoOC/MoO2.
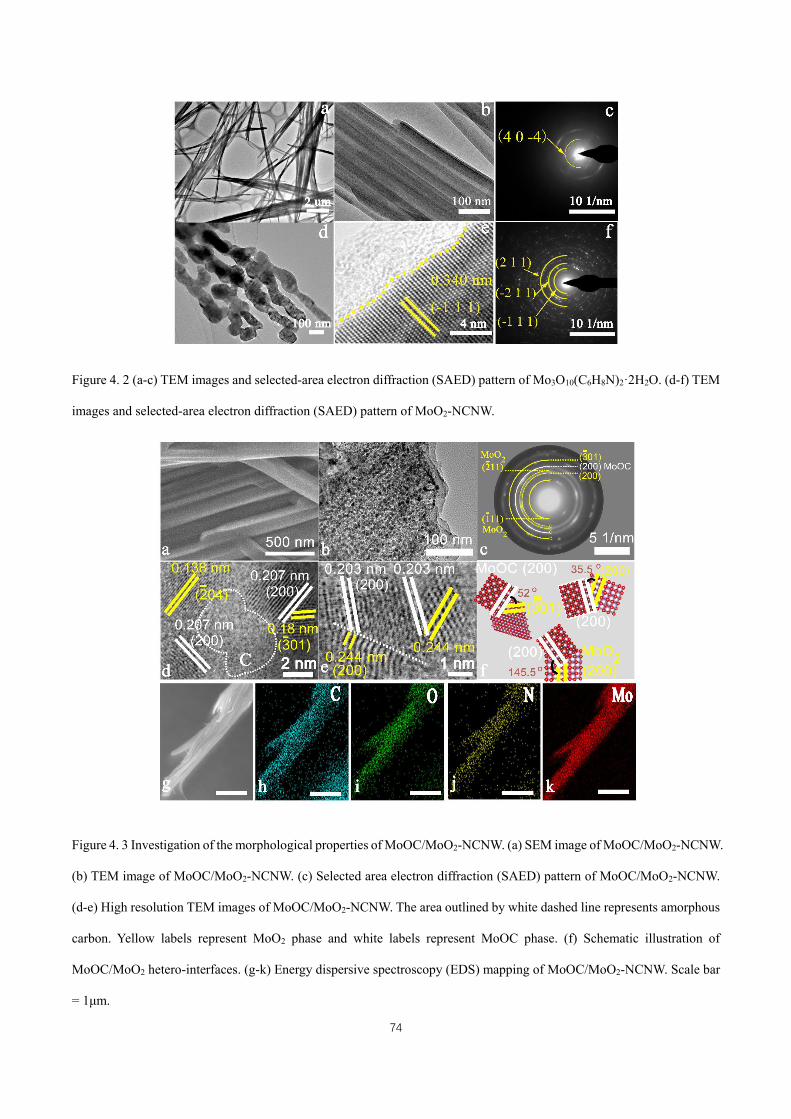
74
Figure 4. 2 (a-c) TEM images and selected-area electron diffraction (SAED) pattern of Mo3O10(C6H8N)2·2H2O. (d-f) TEM
images and selected-area electron diffraction (SAED) pattern of MoO2-NCNW.
Figure 4. 3 Investigation of the morphological properties of MoOC/MoO2-NCNW. (a) SEM image of MoOC/MoO2-NCNW.
(b) TEM image of MoOC/MoO2-NCNW. (c) Selected area electron diffraction (SAED) pattern of MoOC/MoO2-NCNW.
(d-e) High resolution TEM images of MoOC/MoO2-NCNW. The area outlined by white dashed line represents amorphous
carbon. Yellow labels represent MoO2 phase and white labels represent MoOC phase. (f) Schematic illustration of
MoOC/MoO2 hetero-interfaces. (g-k) Energy dispersive spectroscopy (EDS) mapping of MoOC/MoO2-NCNW. Scale bar
= 1μm.
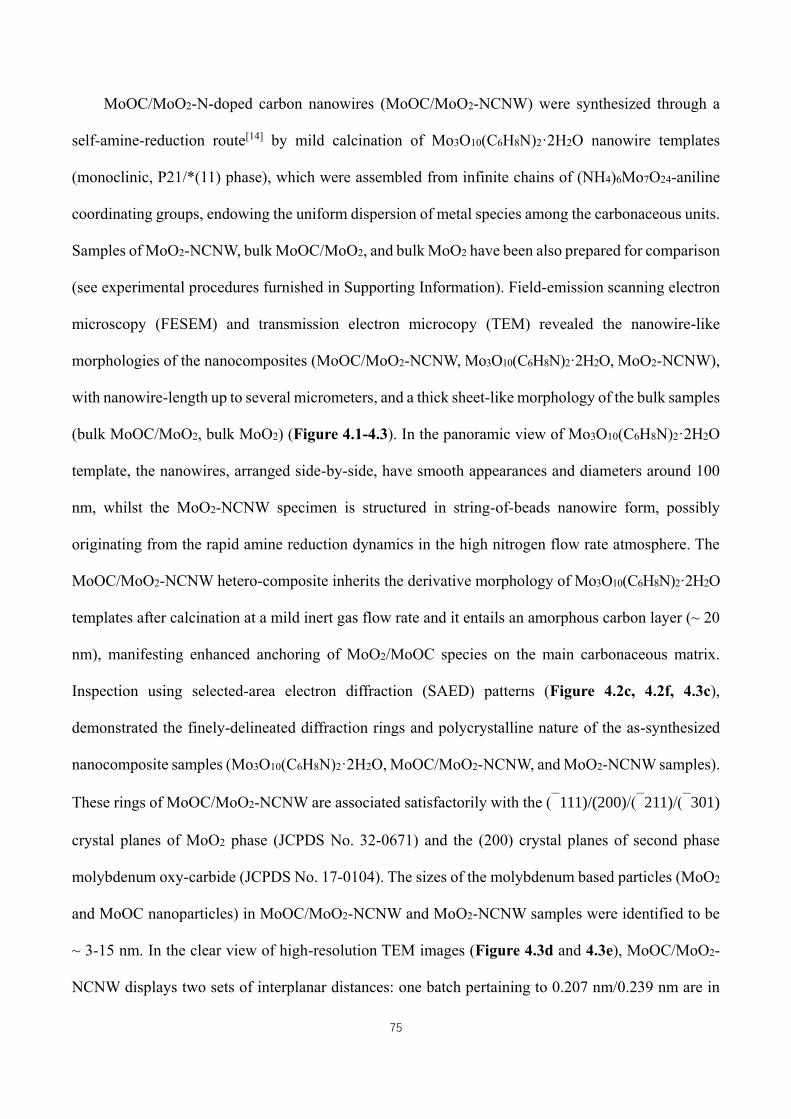
75
MoOC/MoO2-N-doped carbon nanowires (MoOC/MoO2-NCNW) were synthesized through a
self-amine-reduction route[14] by mild calcination of Mo3O10(C6H8N)2·2H2O nanowire templates
(monoclinic, P21/*(11) phase), which were assembled from infinite chains of (NH4)6Mo7O24-aniline
coordinating groups, endowing the uniform dispersion of metal species among the carbonaceous units.
Samples of MoO2-NCNW, bulk MoOC/MoO2, and bulk MoO2 have been also prepared for comparison
(see experimental procedures furnished in Supporting Information). Field-emission scanning electron
microscopy (FESEM) and transmission electron microcopy (TEM) revealed the nanowire-like
morphologies of the nanocomposites (MoOC/MoO2-NCNW, Mo3O10(C6H8N)2·2H2O, MoO2-NCNW),
with nanowire-length up to several micrometers, and a thick sheet-like morphology of the bulk samples
(bulk MoOC/MoO2, bulk MoO2) (Figure 4.1-4.3). In the panoramic view of Mo3O10(C6H8N)2·2H2O
template, the nanowires, arranged side-by-side, have smooth appearances and diameters around 100
nm, whilst the MoO2-NCNW specimen is structured in string-of-beads nanowire form, possibly
originating from the rapid amine reduction dynamics in the high nitrogen flow rate atmosphere. The
MoOC/MoO2-NCNW hetero-composite inherits the derivative morphology of Mo3O10(C6H8N)2·2H2O
templates after calcination at a mild inert gas flow rate and it entails an amorphous carbon layer (~ 20
nm), manifesting enhanced anchoring of MoO2/MoOC species on the main carbonaceous matrix.
Inspection using selected-area electron diffraction (SAED) patterns (Figure 4.2c, 4.2f, 4.3c),
demonstrated the finely-delineated diffraction rings and polycrystalline nature of the as-synthesized
nanocomposite samples (Mo3O10(C6H8N)2·2H2O, MoOC/MoO2-NCNW, and MoO2-NCNW samples).
These rings of MoOC/MoO2-NCNW are associated satisfactorily with the (111)/(200)/(211)/(301)
crystal planes of MoO2 phase (JCPDS No. 32-0671) and the (200) crystal planes of second phase
molybdenum oxy-carbide (JCPDS No. 17-0104). The sizes of the molybdenum based particles (MoO2
and MoOC nanoparticles) in MoOC/MoO2-NCNW and MoO2-NCNW samples were identified to be
~ 3-15 nm. In the clear view of high-resolution TEM images (Figure 4.3d and 4.3e), MoOC/MoO2-
NCNW displays two sets of interplanar distances: one batch pertaining to 0.207 nm/0.239 nm are in
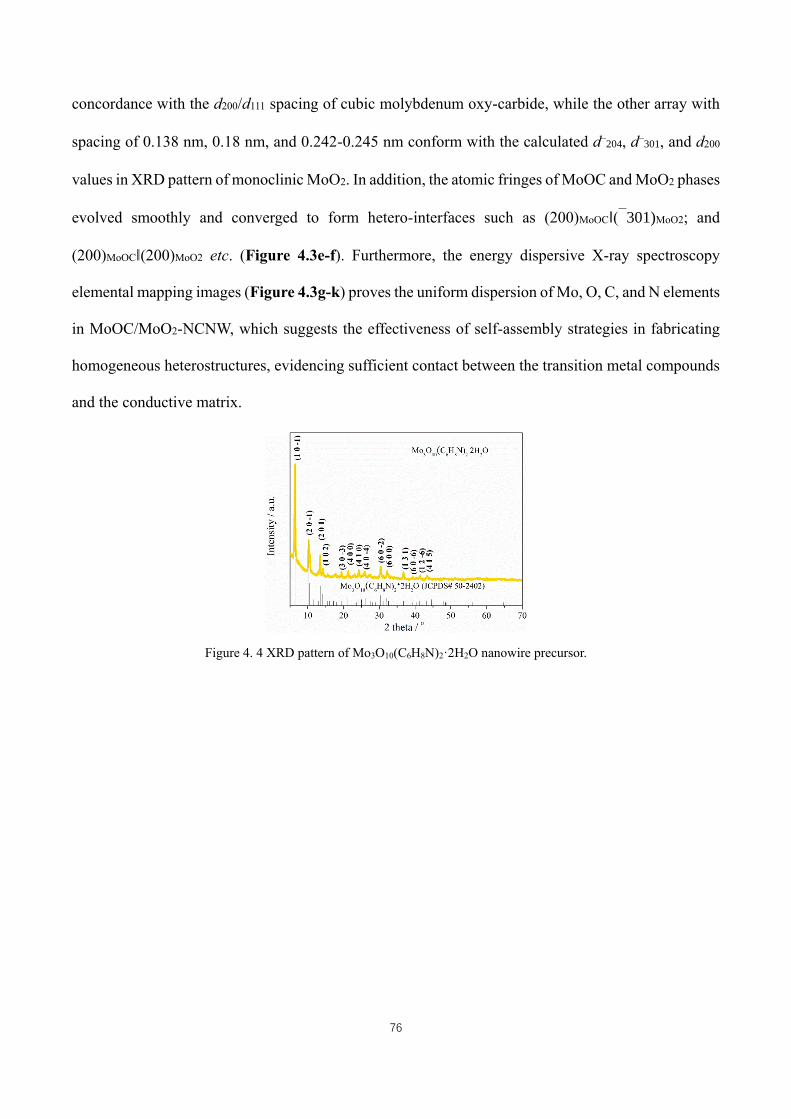
76
concordance with the d200/d111 spacing of cubic molybdenum oxy-carbide, while the other array with
spacing of 0.138 nm, 0.18 nm, and 0.242-0.245 nm conform with the calculated d204, d301, and d200
values in XRD pattern of monoclinic MoO2. In addition, the atomic fringes of MoOC and MoO2 phases
evolved smoothly and converged to form hetero-interfaces such as (200)MoOC‖(301)MoO2; and
(200)MoOC‖(200)MoO2 etc. (Figure 4.3e-f). Furthermore, the energy dispersive X-ray spectroscopy
elemental mapping images (Figure 4.3g-k) proves the uniform dispersion of Mo, O, C, and N elements
in MoOC/MoO2-NCNW, which suggests the effectiveness of self-assembly strategies in fabricating
homogeneous heterostructures, evidencing sufficient contact between the transition metal compounds
and the conductive matrix.
Figure 4. 4 XRD pattern of Mo3O10(C6H8N)2·2H2O nanowire precursor.
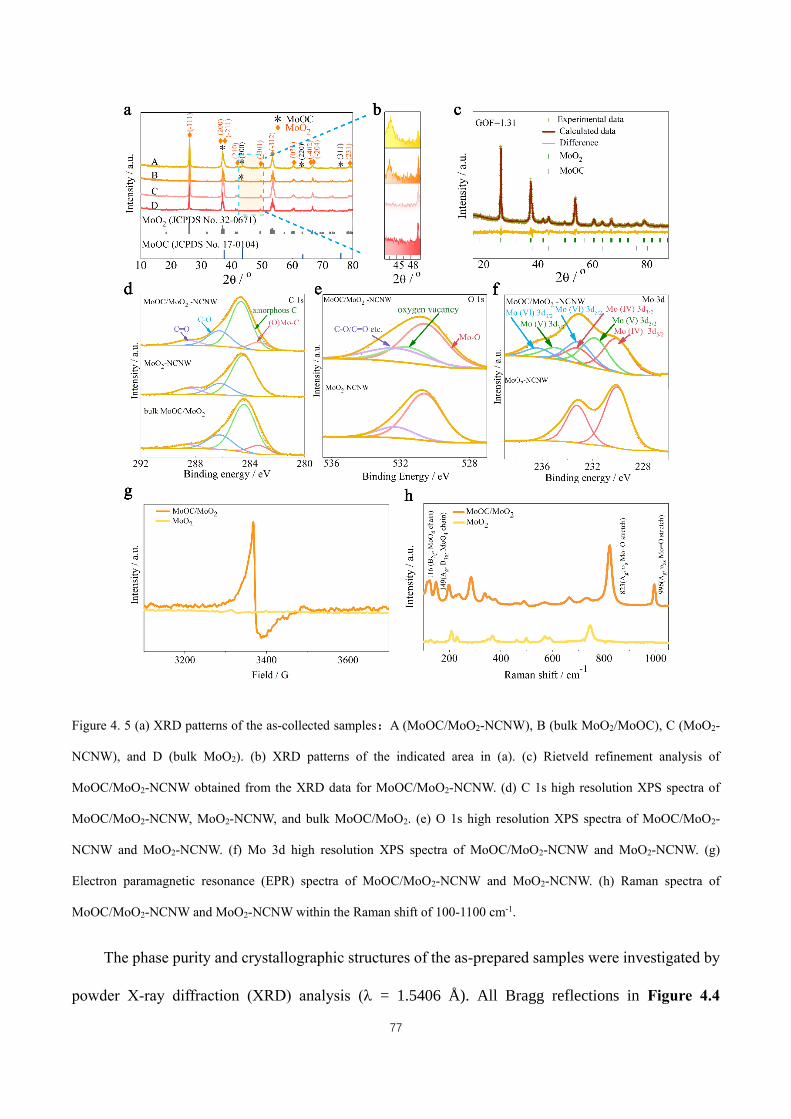
77
Figure 4. 5 (a) XRD patterns of the as-collected samples:A (MoOC/MoO2-NCNW), B (bulk MoO2/MoOC), C (MoO2-
NCNW), and D (bulk MoO2). (b) XRD patterns of the indicated area in (a). (c) Rietveld refinement analysis of
MoOC/MoO2-NCNW obtained from the XRD data for MoOC/MoO2-NCNW. (d) C 1s high resolution XPS spectra of
MoOC/MoO2-NCNW, MoO2-NCNW, and bulk MoOC/MoO2. (e) O 1s high resolution XPS spectra of MoOC/MoO2-
NCNW and MoO2-NCNW. (f) Mo 3d high resolution XPS spectra of MoOC/MoO2-NCNW and MoO2-NCNW. (g)
Electron paramagnetic resonance (EPR) spectra of MoOC/MoO2-NCNW and MoO2-NCNW. (h) Raman spectra of
MoOC/MoO2-NCNW and MoO2-NCNW within the Raman shift of 100-1100 cm-1.
The phase purity and crystallographic structures of the as-prepared samples were investigated by
powder X-ray diffraction (XRD) analysis ( = 1.5406 Å). All Bragg reflections in Figure 4.4
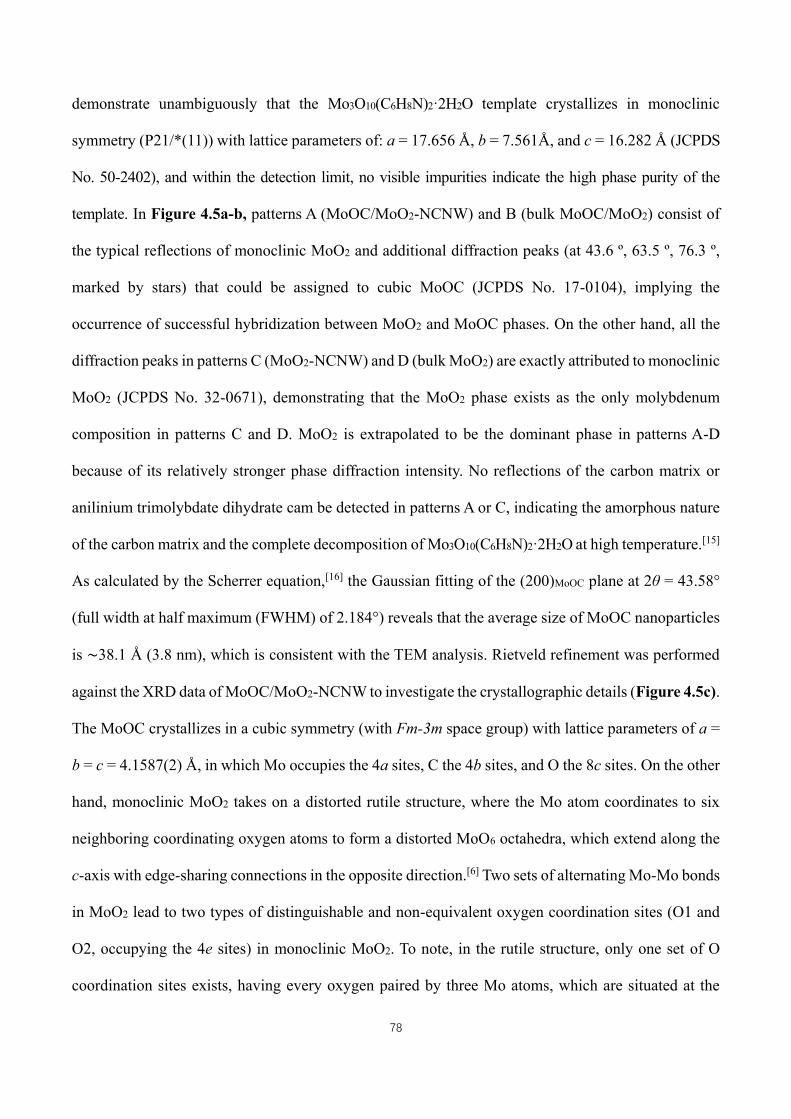
78
demonstrate unambiguously that the Mo3O10(C6H8N)2·2H2O template crystallizes in monoclinic
symmetry (P21/*(11)) with lattice parameters of: a = 17.656 Å, b = 7.561Å, and c = 16.282 Å (JCPDS
No. 50-2402), and within the detection limit, no visible impurities indicate the high phase purity of the
template. In Figure 4.5a-b, patterns A (MoOC/MoO2-NCNW) and B (bulk MoOC/MoO2) consist of
the typical reflections of monoclinic MoO2 and additional diffraction peaks (at 43.6 º, 63.5 º, 76.3 º,
marked by stars) that could be assigned to cubic MoOC (JCPDS No. 17-0104), implying the
occurrence of successful hybridization between MoO2 and MoOC phases. On the other hand, all the
diffraction peaks in patterns C (MoO2-NCNW) and D (bulk MoO2) are exactly attributed to monoclinic
MoO2 (JCPDS No. 32-0671), demonstrating that the MoO2 phase exists as the only molybdenum
composition in patterns C and D. MoO2 is extrapolated to be the dominant phase in patterns A-D
because of its relatively stronger phase diffraction intensity. No reflections of the carbon matrix or
anilinium trimolybdate dihydrate cam be detected in patterns A or C, indicating the amorphous nature
of the carbon matrix and the complete decomposition of Mo3O10(C6H8N)2·2H2O at high temperature.[15]
As calculated by the Scherrer equation,[16] the Gaussian fitting of the (200)MoOC plane at 2θ = 43.58°
(full width at half maximum (FWHM) of 2.184°) reveals that the average size of MoOC nanoparticles
is ∼38.1 Å (3.8 nm), which is consistent with the TEM analysis. Rietveld refinement was performed
against the XRD data of MoOC/MoO2-NCNW to investigate the crystallographic details (Figure 4.5c).
The MoOC crystallizes in a cubic symmetry (with Fm-3m space group) with lattice parameters of a =
b = c = 4.1587(2) Å, in which Mo occupies the 4a sites, C the 4b sites, and O the 8c sites. On the other
hand, monoclinic MoO2 takes on a distorted rutile structure, where the Mo atom coordinates to six
neighboring coordinating oxygen atoms to form a distorted MoO6 octahedra, which extend along the
c-axis with edge-sharing connections in the opposite direction.[6] Two sets of alternating Mo-Mo bonds
in MoO2 lead to two types of distinguishable and non-equivalent oxygen coordination sites (O1 and
O2, occupying the 4e sites) in monoclinic MoO2. To note, in the rutile structure, only one set of O
coordination sites exists, having every oxygen paired by three Mo atoms, which are situated at the
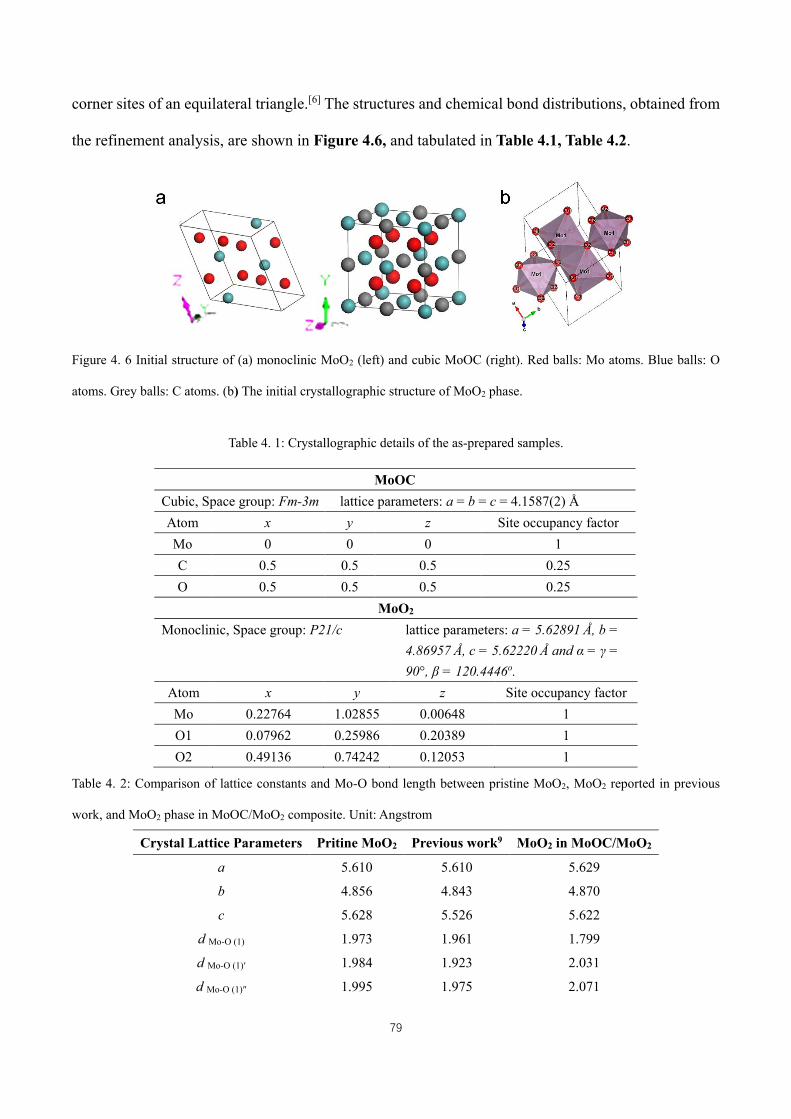
79
corner sites of an equilateral triangle.[6] The structures and chemical bond distributions, obtained from
the refinement analysis, are shown in Figure 4.6, and tabulated in Table 4.1, Table 4.2.
Figure 4. 6 Initial structure of (a) monoclinic MoO2 (left) and cubic MoOC (right). Red balls: Mo atoms. Blue balls: O
atoms. Grey balls: C atoms. (b) The initial crystallographic structure of MoO2 phase.
Table 4. 1: Crystallographic details of the as-prepared samples.
MoOC
Cubic, Space group: Fm-3m lattice parameters: a = b = c = 4.1587(2) Å
Atom x y z Site occupancy factor
Mo 0 0 0 1
C 0.5 0.5 0.5 0.25
O 0.5 0.5 0.5 0.25
MoO2
Monoclinic, Space group: P21/c lattice parameters: a = 5.62891 Å, b =
4.86957 Å, c = 5.62220 Å and α = γ =
90°, β = 120.4446o.
Atom x y z Site occupancy factor
Mo 0.22764 1.02855 0.00648 1
O1 0.07962 0.25986 0.20389 1
O2 0.49136 0.74242 0.12053 1
Table 4. 2: Comparison of lattice constants and Mo-O bond length between pristine MoO2, MoO2 reported in previous
work, and MoO2 phase in MoOC/MoO2 composite. Unit: Angstrom
Crystal Lattice Parameters Pritine MoO2 Previous work9 MoO2 in MoOC/MoO2
a 5.610 5.610 5.629
b 4.856 4.843 4.870
c 5.628 5.526 5.622
d Mo-O (1) 1.973 1.961 1.799
d Mo-O (1)′ 1.984 1.923 2.031
d Mo-O (1)″ 1.995 1.975 2.071
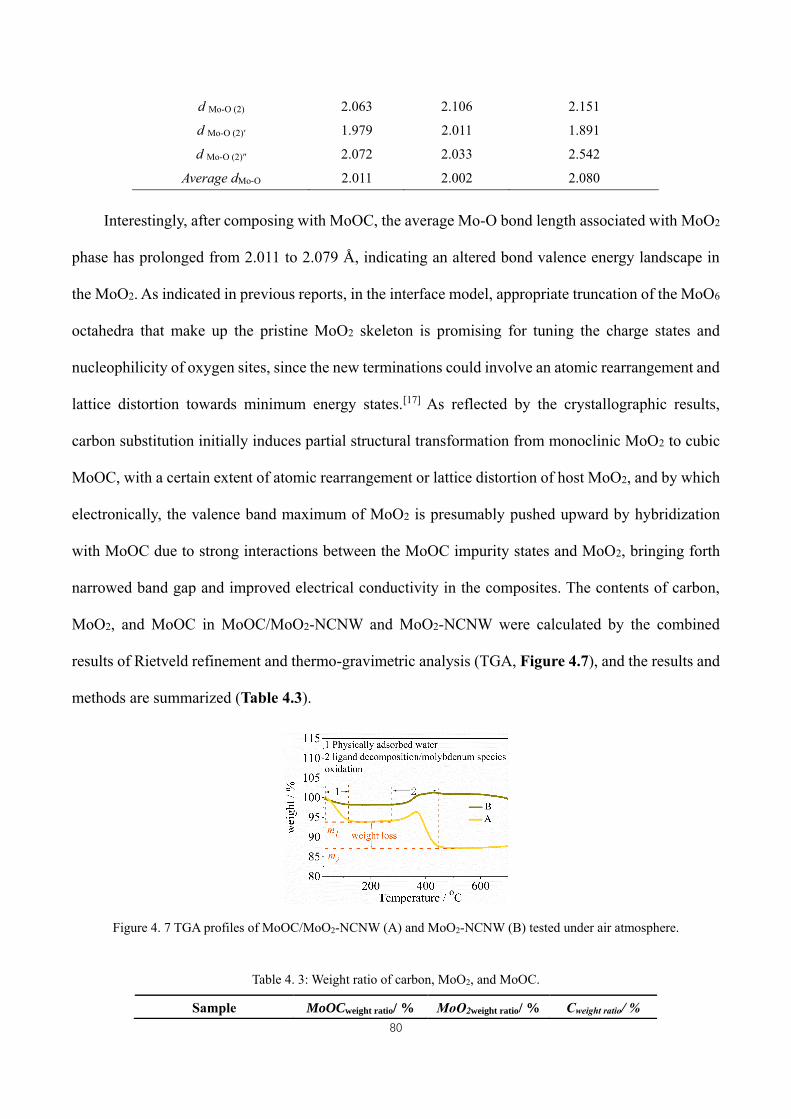
80
d Mo-O (2) 2.063 2.106 2.151
d Mo-O (2)′ 1.979 2.011 1.891
d Mo-O (2)″ 2.072 2.033 2.542
Average dMo-O 2.011 2.002 2.080
Interestingly, after composing with MoOC, the average Mo-O bond length associated with MoO2
phase has prolonged from 2.011 to 2.079 Å, indicating an altered bond valence energy landscape in
the MoO2. As indicated in previous reports, in the interface model, appropriate truncation of the MoO6
octahedra that make up the pristine MoO2 skeleton is promising for tuning the charge states and
nucleophilicity of oxygen sites, since the new terminations could involve an atomic rearrangement and
lattice distortion towards minimum energy states.[17] As reflected by the crystallographic results,
carbon substitution initially induces partial structural transformation from monoclinic MoO2 to cubic
MoOC, with a certain extent of atomic rearrangement or lattice distortion of host MoO2, and by which
electronically, the valence band maximum of MoO2 is presumably pushed upward by hybridization
with MoOC due to strong interactions between the MoOC impurity states and MoO2, bringing forth
narrowed band gap and improved electrical conductivity in the composites. The contents of carbon,
MoO2, and MoOC in MoOC/MoO2-NCNW and MoO2-NCNW were calculated by the combined
results of Rietveld refinement and thermo-gravimetric analysis (TGA, Figure 4.7), and the results and
methods are summarized (Table 4.3).
Figure 4. 7 TGA profiles of MoOC/MoO2-NCNW (A) and MoO2-NCNW (B) tested under air atmosphere.
Table 4. 3: Weight ratio of carbon, MoO2, and MoOC.
Sample MoOCweight ratio/ % MoO2weight ratio/ % Cweight ratio/ %
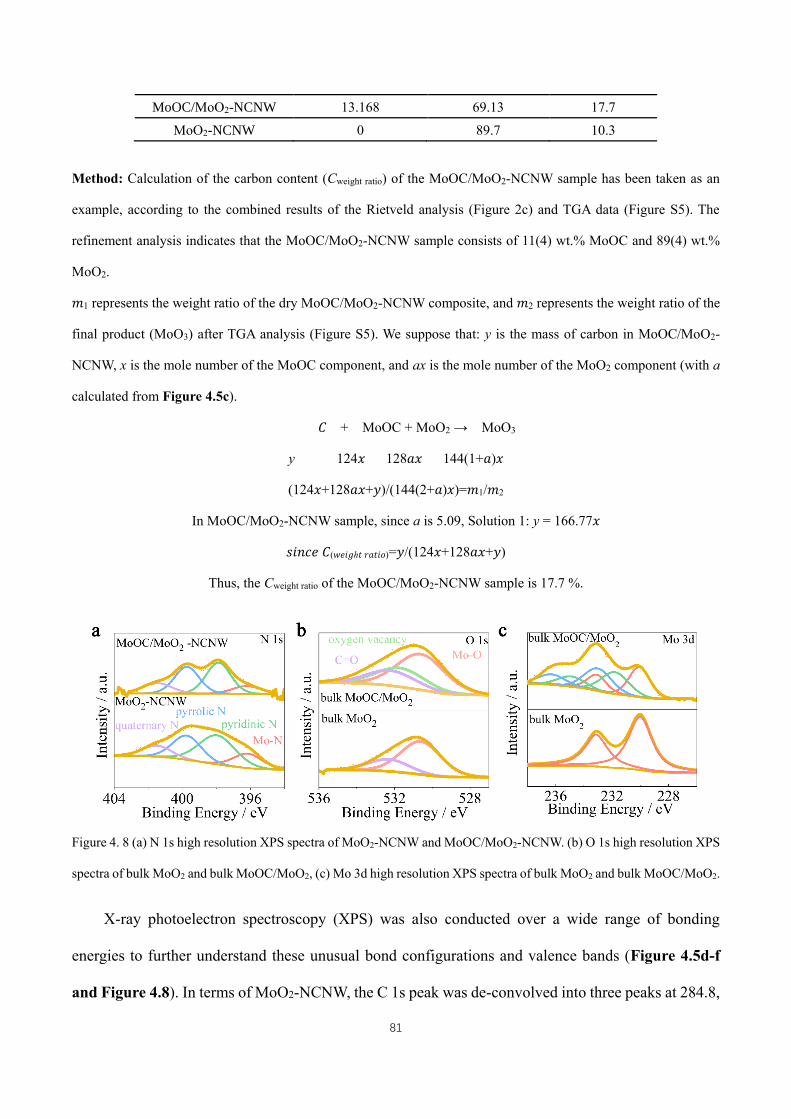
81
MoOC/MoO2-NCNW 13.168 69.13 17.7
MoO2-NCNW 0 89.7 10.3
Method: Calculation of the carbon content (Cweight ratio) of the MoOC/MoO2-NCNW sample has been taken as an
example, according to the combined results of the Rietveld analysis (Figure 2c) and TGA data (Figure S5). The
refinement analysis indicates that the MoOC/MoO2-NCNW sample consists of 11(4) wt.% MoOC and 89(4) wt.%
MoO2.
𝑚1 represents the weight ratio of the dry MoOC/MoO2-NCNW composite, and 𝑚2 represents the weight ratio of the
final product (MoO3) after TGA analysis (Figure S5). We suppose that: y is the mass of carbon in MoOC/MoO2-
NCNW, x is the mole number of the MoOC component, and ax is the mole number of the MoO2 component (with a
calculated from Figure 4.5c).
𝐶 + MoOC + MoO2 → MoO3
y 124𝑥 128𝑎𝑥 144(1+𝑎)𝑥
(124𝑥+128𝑎𝑥+𝑦)/(144(2+𝑎)𝑥)=𝑚1/𝑚2
In MoOC/MoO2-NCNW sample, since a is 5.09, Solution 1: y = 166.77𝑥
𝑠𝑖𝑛𝑐𝑒 𝐶(𝑤𝑒𝑖𝑔ℎ𝑡 𝑟𝑎𝑡𝑖𝑜)=𝑦/(124𝑥+128𝑎𝑥+𝑦)
Thus, the Cweight ratio of the MoOC/MoO2-NCNW sample is 17.7 %.
Figure 4. 8 (a) N 1s high resolution XPS spectra of MoO2-NCNW and MoOC/MoO2-NCNW. (b) O 1s high resolution XPS
spectra of bulk MoO2 and bulk MoOC/MoO2, (c) Mo 3d high resolution XPS spectra of bulk MoO2 and bulk MoOC/MoO2.
X-ray photoelectron spectroscopy (XPS) was also conducted over a wide range of bonding
energies to further understand these unusual bond configurations and valence bands (Figure 4.5d-f
and Figure 4.8). In terms of MoO2-NCNW, the C 1s peak was de-convolved into three peaks at 284.8,
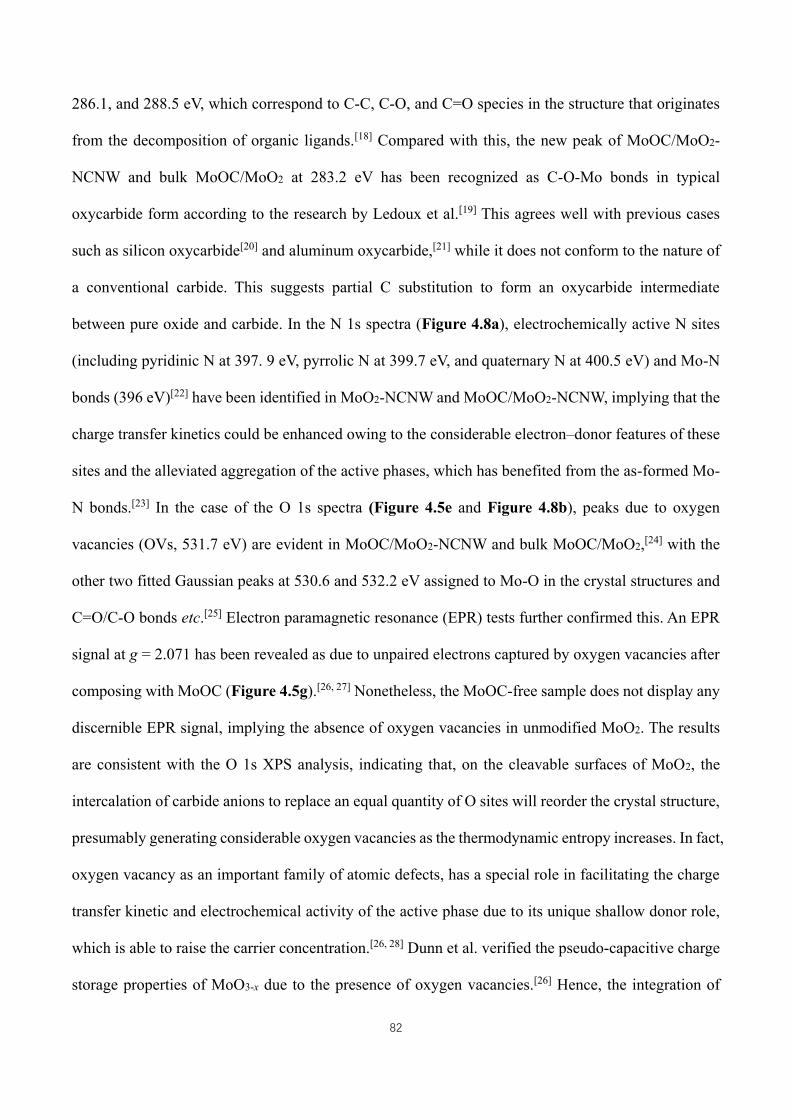
82
286.1, and 288.5 eV, which correspond to C-C, C-O, and C=O species in the structure that originates
from the decomposition of organic ligands.[18] Compared with this, the new peak of MoOC/MoO2-
NCNW and bulk MoOC/MoO2 at 283.2 eV has been recognized as C-O-Mo bonds in typical
oxycarbide form according to the research by Ledoux et al.[19] This agrees well with previous cases
such as silicon oxycarbide[20] and aluminum oxycarbide,[21] while it does not conform to the nature of
a conventional carbide. This suggests partial C substitution to form an oxycarbide intermediate
between pure oxide and carbide. In the N 1s spectra (Figure 4.8a), electrochemically active N sites
(including pyridinic N at 397. 9 eV, pyrrolic N at 399.7 eV, and quaternary N at 400.5 eV) and Mo-N
bonds (396 eV)[22] have been identified in MoO2-NCNW and MoOC/MoO2-NCNW, implying that the
charge transfer kinetics could be enhanced owing to the considerable electron–donor features of these
sites and the alleviated aggregation of the active phases, which has benefited from the as-formed Mo-
N bonds.[23] In the case of the O 1s spectra (Figure 4.5e and Figure 4.8b), peaks due to oxygen
vacancies (OVs, 531.7 eV) are evident in MoOC/MoO2-NCNW and bulk MoOC/MoO2,[24] with the
other two fitted Gaussian peaks at 530.6 and 532.2 eV assigned to Mo-O in the crystal structures and
C=O/C-O bonds etc.[25] Electron paramagnetic resonance (EPR) tests further confirmed this. An EPR
signal at g = 2.071 has been revealed as due to unpaired electrons captured by oxygen vacancies after
composing with MoOC (Figure 4.5g).[26, 27] Nonetheless, the MoOC-free sample does not display any
discernible EPR signal, implying the absence of oxygen vacancies in unmodified MoO2. The results
are consistent with the O 1s XPS analysis, indicating that, on the cleavable surfaces of MoO2, the
intercalation of carbide anions to replace an equal quantity of O sites will reorder the crystal structure,
presumably generating considerable oxygen vacancies as the thermodynamic entropy increases. In fact,
oxygen vacancy as an important family of atomic defects, has a special role in facilitating the charge
transfer kinetic and electrochemical activity of the active phase due to its unique shallow donor role,
which is able to raise the carrier concentration.[26, 28] Dunn et al. verified the pseudo-capacitive charge
storage properties of MoO3-x due to the presence of oxygen vacancies.[26] Hence, the integration of
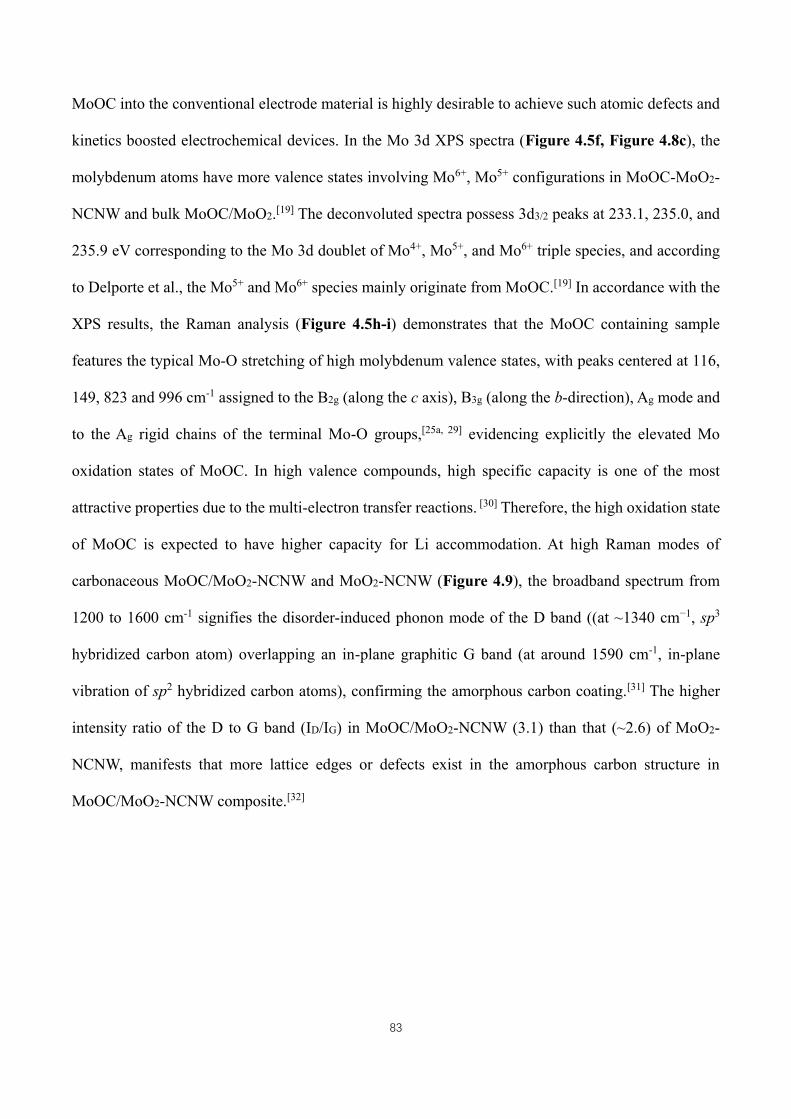
83
MoOC into the conventional electrode material is highly desirable to achieve such atomic defects and
kinetics boosted electrochemical devices. In the Mo 3d XPS spectra (Figure 4.5f, Figure 4.8c), the
molybdenum atoms have more valence states involving Mo6+, Mo5+ configurations in MoOC-MoO2-
NCNW and bulk MoOC/MoO2.[19] The deconvoluted spectra possess 3d3/2 peaks at 233.1, 235.0, and
235.9 eV corresponding to the Mo 3d doublet of Mo4+, Mo5+, and Mo6+ triple species, and according
to Delporte et al., the Mo5+ and Mo6+ species mainly originate from MoOC.[19] In accordance with the
XPS results, the Raman analysis (Figure 4.5h-i) demonstrates that the MoOC containing sample
features the typical Mo-O stretching of high molybdenum valence states, with peaks centered at 116,
149, 823 and 996 cm-1 assigned to the B2g (along the c axis), B3g (along the b-direction), Ag mode and
to the Ag rigid chains of the terminal Mo-O groups,[25a, 29] evidencing explicitly the elevated Mo
oxidation states of MoOC. In high valence compounds, high specific capacity is one of the most
attractive properties due to the multi-electron transfer reactions. [30] Therefore, the high oxidation state
of MoOC is expected to have higher capacity for Li accommodation. At high Raman modes of
carbonaceous MoOC/MoO2-NCNW and MoO2-NCNW (Figure 4.9), the broadband spectrum from
1200 to 1600 cm-1 signifies the disorder-induced phonon mode of the D band ((at ~1340 cm−1, sp3
hybridized carbon atom) overlapping an in-plane graphitic G band (at around 1590 cm-1, in-plane
vibration of sp2 hybridized carbon atoms), confirming the amorphous carbon coating.[31] The higher
intensity ratio of the D to G band (ID/IG) in MoOC/MoO2-NCNW (3.1) than that (~2.6) of MoO2-
NCNW, manifests that more lattice edges or defects exist in the amorphous carbon structure in
MoOC/MoO2-NCNW composite.[32]
84
Figure 4. 9 Raman spectra of MoOC/MoO2-NCNW and MoO2-NCNW within the range of 1100 - 2000 cm-1.
4.3.2 Electrochemical performance
Figure 4. 10 Cyclic voltammetry profiles of bulk MoOC/MoO2 and bulk MoO2.

85
Figure 4. 11 (a) Cyclic voltammetry profiles of MoOC/MoO2-NCNW and MoO2-NCNW for the second cycle. (b) Initial
charge and discharge profiles of MoOC/MoO2-NCNW, bulk MoO2/MoOC, MoO2-NCNW, and bulk MoO2 samples at 100
mA·g-1. (c) Long-term galvanostatic cycling comparisons of MoOC/MoO2-NCNW, bulk MoO2/MoOC, MoO2-NCNW,
and bulk MoO2 samples at 0.5 A·g-1. (d) The galvanostatic cycling performance (specific discharge capacity and columbic
efficiency comparison) of MoOC/MoO2-NCNW under the current density of 2 A·g-1. (e) Rate performances (specific
discharge capacity) of all the samples under the current density of 0.5, 1, 2, 5, 10, 5, 2, 1, 0.5 A·g-1. (f) State-of-the-art
reported molybdenum dioxide (abbreviated as MO) based electrodes for LIBs. [8b, 9, 25a, 36]
The evolved cyclic voltammograms (CVs) (namely, second-cycle) of MoOC substituted and
substitution-free MoO2 composites in Li half-cells (Figure 4.10 and Figure 4.11a) portray multiple
86
redox pairs during Li+ intecalation/deinterclation into (from) these composites. In Figure 4.11a, aside
from the broadband redox peaks (centered at 1.25/1.40 V, signature of MoO2 redox reactions), there is
a new voltage plateau (oxidation peak ~ 1.7 V vs. Li+/Li) in MoOC/MoO2-NCNW, while, there is no
visible new voltage plateau in MoO2-NCNW. What is more, this signal is hardly isolated in bulk
MoOC-MoO2 due to the perturbation from high crystallized MoO2 (Figure 4.10), since the reduction
peaks at 1.27 and 1.56 V are associated with Li+ intercalation into MoO2 to form LixMoO2 phase, while
the oxidation peaks at 1.39 and l.69 V are assigned to Li extraction reactions.[33] As can be envisaged
from the results, the new voltage platform presumably belongs to MoOC, which may entail a
conversion reaction similar to that in its counterpart MoO2, considering that its lithium storage capacity
reaches a full conversion type reaction according to Kim et. al. [34]
As illustrated in the CV plots, composing MoOC could reduce the over-potentials between redox
pairs, which is beneficial to improve the reversibility of conventional MoO2. In the basic galvanostatic
discharge–charge (GDC) measurements under 100 mA·g-1 (Figure 4.11b), the MoOC/MoO2-NCNW
electrode shows a first-cycle discharge capacity of 1204 mA·h·g-1 with initial coulombic efficiency
(ICE) of 69.9 %. The irreversible capacity of the as-collected electrodes may mainly originate from
the formation of solid-electrolyte interphase and possible side reactions of the cell components. [4c, 35]
MoO2-NCNW, bulk MoOC/MoO2, and bulk MoO2 afford discharge capacities of 974.5, 514, and 564.4
mA·h·g-1, with initial CE of 61.7 %, 66.8 %, and 46.1 %, respectively. As revealed, the higher values
of the ICEs in MoOC-containing group further demonstrate that, the redox reactions corresponding to
initial lithium storage have been enhanced. To evaluate the long-term discharging/charging durability,
the cells were activated under 0.1 A·g-1 in the first cycle. MoOC/MoO2-NCNW delivered a reversible
capacity of 905 mA·h·g-1 after 600 cycles in the prolonged cycling at 0.5 A·g-1 (Figure 4.11c), higher
than that of MoO2-NCNW. Bulk MoOC/MoO2 shows higher discharge capacity than bulk MoO2 in
the first 100 cycles, although from 200 cycles, the capacities of both bulk composites are basically flat.
In the initial several tens of cycles, the only obvious capacity increase was observed in the MoOC-
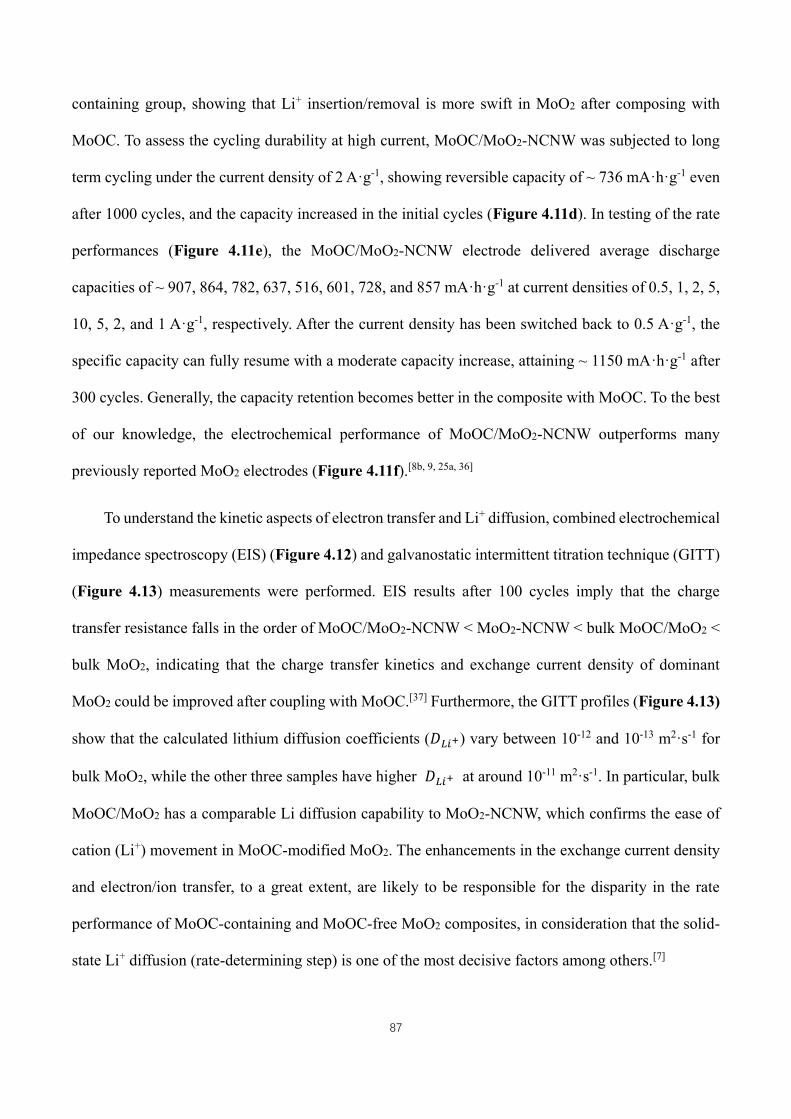
87
containing group, showing that Li+ insertion/removal is more swift in MoO2 after composing with
MoOC. To assess the cycling durability at high current, MoOC/MoO2-NCNW was subjected to long
term cycling under the current density of 2 A·g-1, showing reversible capacity of ~ 736 mA·h·g-1 even
after 1000 cycles, and the capacity increased in the initial cycles (Figure 4.11d). In testing of the rate
performances (Figure 4.11e), the MoOC/MoO2-NCNW electrode delivered average discharge
capacities of ~ 907, 864, 782, 637, 516, 601, 728, and 857 mA·h·g-1 at current densities of 0.5, 1, 2, 5,
10, 5, 2, and 1 A·g-1, respectively. After the current density has been switched back to 0.5 A·g-1, the
specific capacity can fully resume with a moderate capacity increase, attaining ~ 1150 mA·h·g-1 after
300 cycles. Generally, the capacity retention becomes better in the composite with MoOC. To the best
of our knowledge, the electrochemical performance of MoOC/MoO2-NCNW outperforms many
previously reported MoO2 electrodes (Figure 4.11f).[8b, 9, 25a, 36]
To understand the kinetic aspects of electron transfer and Li+ diffusion, combined electrochemical
impedance spectroscopy (EIS) (Figure 4.12) and galvanostatic intermittent titration technique (GITT)
(Figure 4.13) measurements were performed. EIS results after 100 cycles imply that the charge
transfer resistance falls in the order of MoOC/MoO2-NCNW < MoO2-NCNW < bulk MoOC/MoO2 <
bulk MoO2, indicating that the charge transfer kinetics and exchange current density of dominant
MoO2 could be improved after coupling with MoOC.[37] Furthermore, the GITT profiles (Figure 4.13)
show that the calculated lithium diffusion coefficients (𝐷𝐿𝑖+) vary between 10-12 and 10-13 m2·s-1 for
bulk MoO2, while the other three samples have higher 𝐷𝐿𝑖+ at around 10-11 m2·s-1. In particular, bulk
MoOC/MoO2 has a comparable Li diffusion capability to MoO2-NCNW, which confirms the ease of
cation (Li+) movement in MoOC-modified MoO2. The enhancements in the exchange current density
and electron/ion transfer, to a great extent, are likely to be responsible for the disparity in the rate
performance of MoOC-containing and MoOC-free MoO2 composites, in consideration that the solid-
state Li+ diffusion (rate-determining step) is one of the most decisive factors among others.[7]
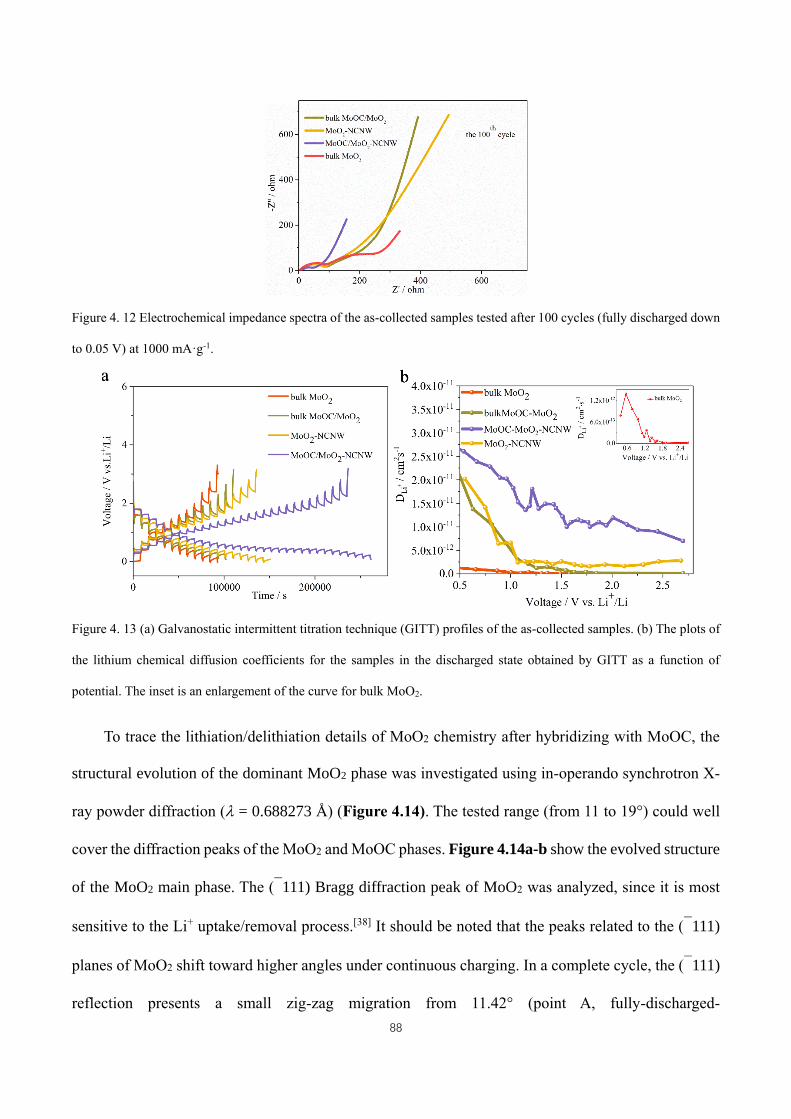
88
Figure 4. 12 Electrochemical impedance spectra of the as-collected samples tested after 100 cycles (fully discharged down
to 0.05 V) at 1000 mA·g-1.
Figure 4. 13 (a) Galvanostatic intermittent titration technique (GITT) profiles of the as-collected samples. (b) The plots of
the lithium chemical diffusion coefficients for the samples in the discharged state obtained by GITT as a function of
potential. The inset is an enlargement of the curve for bulk MoO2.
To trace the lithiation/delithiation details of MoO2 chemistry after hybridizing with MoOC, the
structural evolution of the dominant MoO2 phase was investigated using in-operando synchrotron X-
ray powder diffraction ( = 0.688273 Å) (Figure 4.14). The tested range (from 11 to 19°) could well
cover the diffraction peaks of the MoO2 and MoOC phases. Figure 4.14a-b show the evolved structure
of the MoO2 main phase. The (111) Bragg diffraction peak of MoO2 was analyzed, since it is most
sensitive to the Li+ uptake/removal process.[38] It should be noted that the peaks related to the (111)
planes of MoO2 shift toward higher angles under continuous charging. In a complete cycle, the (111)
reflection presents a small zig-zag migration from 11.42° (point A, fully-discharged-
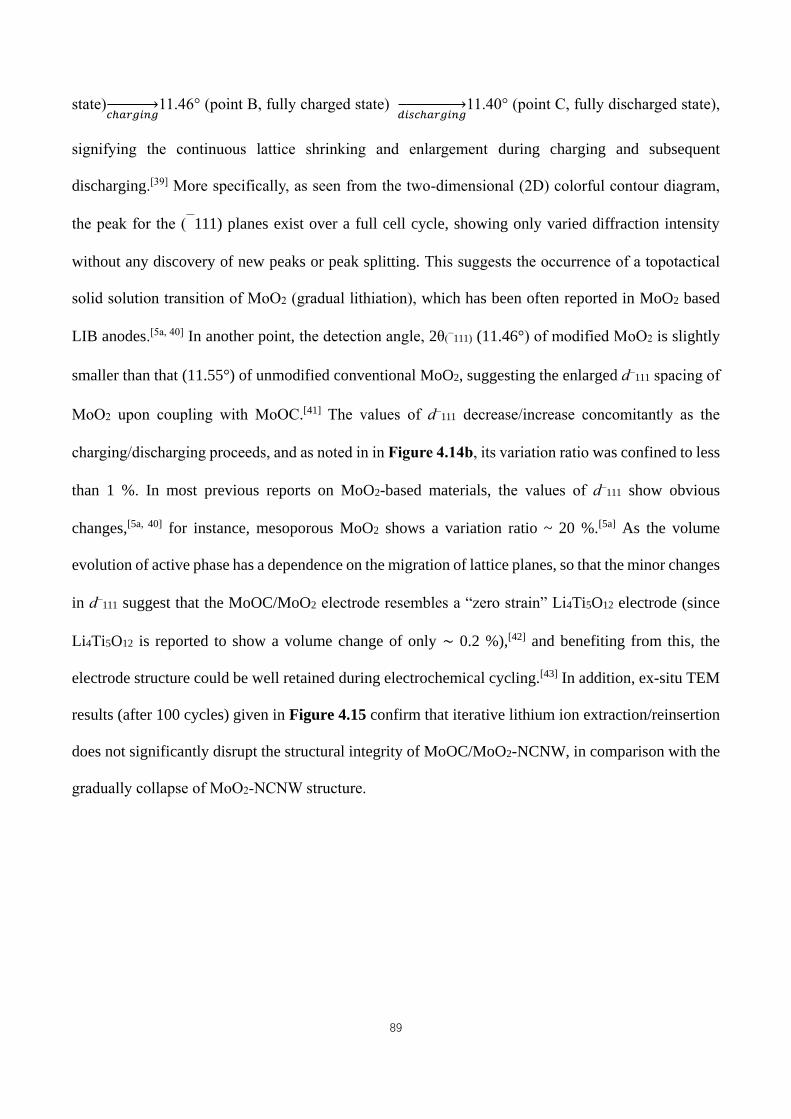
89
state)𝑐ℎ𝑎𝑟𝑔𝑖𝑛𝑔→ 11.46° (point B, fully charged state)
𝑑𝑖𝑠𝑐ℎ𝑎𝑟𝑔𝑖𝑛𝑔→ 11.40° (point C, fully discharged state),
signifying the continuous lattice shrinking and enlargement during charging and subsequent
discharging.[39] More specifically, as seen from the two-dimensional (2D) colorful contour diagram,
the peak for the (111) planes exist over a full cell cycle, showing only varied diffraction intensity
without any discovery of new peaks or peak splitting. This suggests the occurrence of a topotactical
solid solution transition of MoO2 (gradual lithiation), which has been often reported in MoO2 based
LIB anodes.[5a, 40] In another point, the detection angle, 2θ(111) (11.46°) of modified MoO2 is slightly
smaller than that (11.55°) of unmodified conventional MoO2, suggesting the enlarged d111 spacing of
MoO2 upon coupling with MoOC.[41] The values of d111 decrease/increase concomitantly as the
charging/discharging proceeds, and as noted in in Figure 4.14b, its variation ratio was confined to less
than 1 %. In most previous reports on MoO2-based materials, the values of d111 show obvious
changes,[5a, 40] for instance, mesoporous MoO2 shows a variation ratio ~ 20 %.[5a] As the volume
evolution of active phase has a dependence on the migration of lattice planes, so that the minor changes
in d111 suggest that the MoOC/MoO2 electrode resembles a “zero strain” Li4Ti5O12 electrode (since
Li4Ti5O12 is reported to show a volume change of only ∼ 0.2 %),[42] and benefiting from this, the
electrode structure could be well retained during electrochemical cycling.[43] In addition, ex-situ TEM
results (after 100 cycles) given in Figure 4.15 confirm that iterative lithium ion extraction/reinsertion
does not significantly disrupt the structural integrity of MoOC/MoO2-NCNW, in comparison with the
gradually collapse of MoO2-NCNW structure.
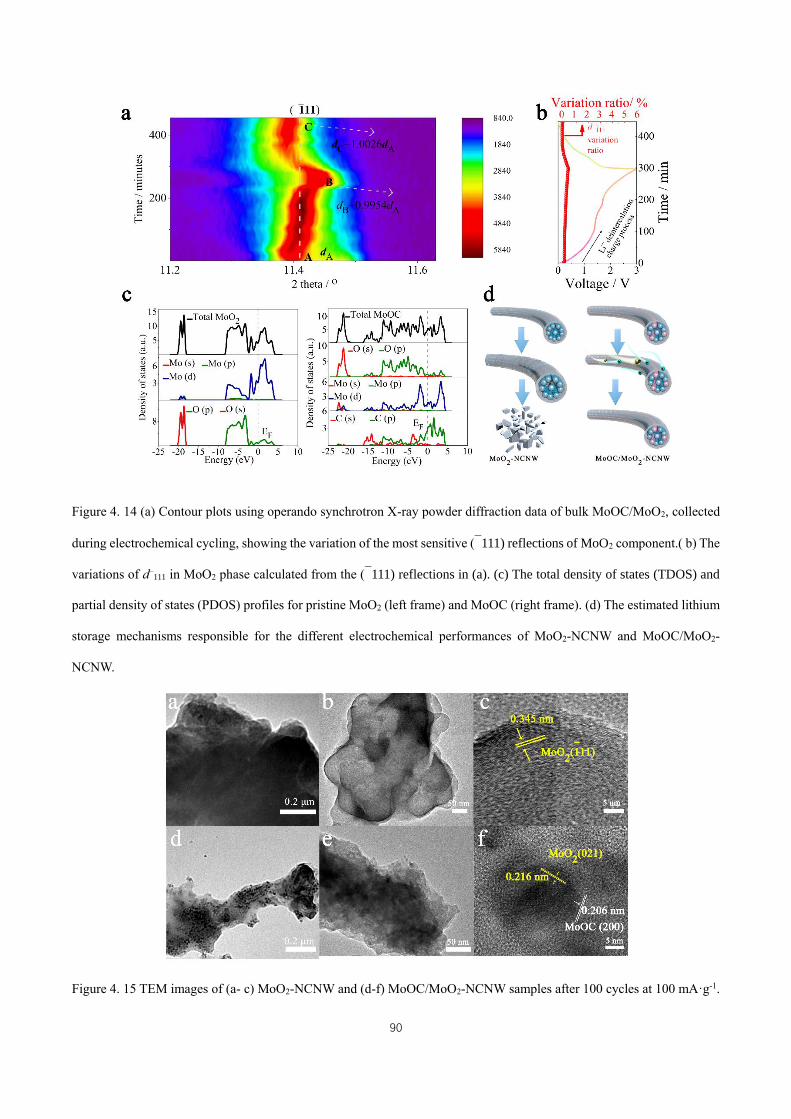
90
Figure 4. 14 (a) Contour plots using operando synchrotron X-ray powder diffraction data of bulk MoOC/MoO2, collected
during electrochemical cycling, showing the variation of the most sensitive (111) reflections of MoO2 component.( b) The
variations of d111 in MoO2 phase calculated from the (111) reflections in (a). (c) The total density of states (TDOS) and
partial density of states (PDOS) profiles for pristine MoO2 (left frame) and MoOC (right frame). (d) The estimated lithium
storage mechanisms responsible for the different electrochemical performances of MoO2-NCNW and MoOC/MoO2-
NCNW.
Figure 4. 15 TEM images of (a- c) MoO2-NCNW and (d-f) MoOC/MoO2-NCNW samples after 100 cycles at 100 mA·g-1.
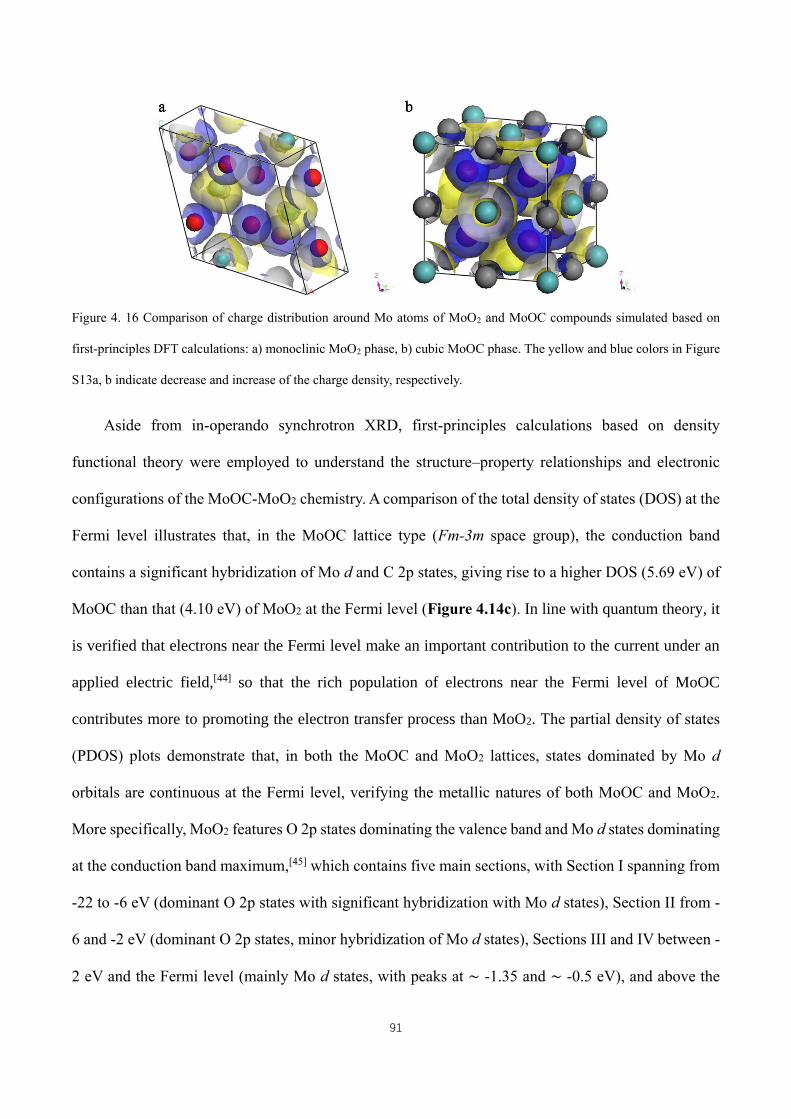
91
Figure 4. 16 Comparison of charge distribution around Mo atoms of MoO2 and MoOC compounds simulated based on
first-principles DFT calculations: a) monoclinic MoO2 phase, b) cubic MoOC phase. The yellow and blue colors in Figure
S13a, b indicate decrease and increase of the charge density, respectively.
Aside from in-operando synchrotron XRD, first-principles calculations based on density
functional theory were employed to understand the structure–property relationships and electronic
configurations of the MoOC-MoO2 chemistry. A comparison of the total density of states (DOS) at the
Fermi level illustrates that, in the MoOC lattice type (Fm-3m space group), the conduction band
contains a significant hybridization of Mo d and C 2p states, giving rise to a higher DOS (5.69 eV) of
MoOC than that (4.10 eV) of MoO2 at the Fermi level (Figure 4.14c). In line with quantum theory, it
is verified that electrons near the Fermi level make an important contribution to the current under an
applied electric field,[44] so that the rich population of electrons near the Fermi level of MoOC
contributes more to promoting the electron transfer process than MoO2. The partial density of states
(PDOS) plots demonstrate that, in both the MoOC and MoO2 lattices, states dominated by Mo d
orbitals are continuous at the Fermi level, verifying the metallic natures of both MoOC and MoO2.
More specifically, MoO2 features O 2p states dominating the valence band and Mo d states dominating
at the conduction band maximum,[45] which contains five main sections, with Section I spanning from
-22 to -6 eV (dominant O 2p states with significant hybridization with Mo d states), Section II from -
6 and -2 eV (dominant O 2p states, minor hybridization of Mo d states), Sections III and IV between -
2 eV and the Fermi level (mainly Mo d states, with peaks at ∼ -1.35 and ∼ -0.5 eV), and above the
92
Fermi level with distinct peaks at ∼1.75 and 3.41 eV (mainly Mo d states). In comparison, MoOC has
a notable outward shift of its PDOS plots, showing more dispersive and delocalized patterns of energy
bands. The simulated charge density difference plots of MoOC and MoO2 (Figure 4.16) indicated that
MoOC may have stronger electronic polarization than MoO2, and the unbalanced polarization may
induce an effective intra-band electronic coupling, as is typically understood, especially at the
heterojunctions, where have a high content of defects or lattice edges.[46] Concomitantly, previous work
reported that MoO2 is vulnerable to Jahn-Teller effect owing to the less stable 4d2 orbitals of the
molybdenum (IV) centers.[44] In view of the favorable thermodynamics, the unstable 4d2 orbitals of
Mo4+ in MoO2 tends to bring forth a structural adjustment, inducing the 4d levels to split into t2g and
eg states, and the prior occupation of t2g orbitals by the two electrons. The t2g states of MoO2 are
correlated with the in-plane orbitals defined by the shared octahedral edges.[45] Under altered crystal
field stabilization energy (CFSE) and Jahn-Teller effect, pristine octahedral (Oh) components that
build up MoO2 are expected to take on tetragonal distortion, resulting in the low symmetry of
octahedral (Oh) components and the dissonant structure. On account of this, the atomic coupling
between MoOC and MoO2 presumably induces bandgap modifications, increased structural
dissonance (involving the variations in dangling Mo-O bonds, electronic states, and pristine planarity),
and more distortions in electron cloud symmetry of MoO2 towards minimum energy states. This allows
the rationally interpretation about the elongated Mo-O bonds in MoO2 phase (from 201 ppm in
conventional MoO2 to 208 ppm in MoOC modified MoO2) after coupling with oxycarbides, illustrating
that the easy Mo-O bond cleavage will make multi-electron reactions of this conventional oxide
electrode more feasible. The above analysis has shown oxycarbide integration as a facile strategy to
reinforce the electrochemical storage performance of conventional oxide electrode. In comparison with
MoO2-NCNW, the superior electrochemical performances of MoOC-MoO2-NCNW may benefit
significantly from the accelerated ion/electron movement, facilitated multi-electron redox reactions,
and mitigated volume changes after coupling with oxycarbide (Figure 4.14d), which renders the stable
93
high-rate capacity (~ 730 mA·h·g-1 at 2 A·g-1, 1000 cycles) of MoOC-MoO2-NCNW.
4.4 Conclusions
In summary, an ingeniously designed oxycarbide-oxide hetero-structure is systematically
investigated for LIB electrodes in this work, in terms of its reconfigured crystal and electronic
structures, electrochemical behaviors (Li+/electron transfer capability, lithium storage performance),
structural evolutions during full lithiation/delithiation cycles etc. For the oxycarbide materials, the
more negatively charged carbide anion substitution of partial lattice oxygen (-2) in pristine oxide,
enables elevated Mo valences, abundant oxygen vacancy and higher lithium accommodation per unit.
The investigations, supported by experiments (in-operando synchrotron XRD) and theoretical
modelling, reveal the elongated Mo-O bond length of MoO2 phase where Mo-O bond is more cleavable,
and a regime where multiple electron reactions from the MoOC/MoO2 hetero-structure becomes more
feasible. Electronically, this may benefit from a strong interaction of the MoOC impurity states and
MoO2 host valence bands, which drastically induces lattice distortion of the truncated MoO2 lattices
towards minimum energy states, causing modified density of states and intrinsically enhanced electron
transport capability of MoO2. Furthermore, MoOC-MoO2 hetero-composite has lower d-spacing
variations (d1 1 1 < 1% ) during cycling, demonstrating significantly alleviated volume changes after
composing with MoOC. Results demonstrate that compounds with multiple anions (involving
oxynitride, oxysulfide, the proposed oxycarbide material, etc.) beyond the single-oxide anions, offer a
new platform from which superior functionality may arise. It has attractive applications in the fields
of energy storage, conversion, and beyond, which may open up a broad, previously less explored space
of transition metal compounds. Although the extension of the correlative research towards renewal of
conventional transition metal compounds, nonetheless, remains to be investigated in detail, it is still
anticipated that carbon substitution into transition metal compounds is promising to bring forth the
renaissance for a wide range of traditional metal materials, whose properties used to be limited yet are
94
greatly attractive for charge storage.
4.5 References
[1] (a) N. S. Choi, Z. Chen, S. A. Freunberger, X. Ji, Y. K. Sun, K. Amine, G. Yushin, L. F. Nazar, J. Cho, P. G.
Bruce, Angew. Chem., Int. Ed. 2012, 51, 9994; (b) K. Kang, Y. S. Meng, J. Bréger, C. P. Grey, G. Ceder, Science 2006,
311, 977.
[2] (a) H. Wu, G. Chan, J. W. Choi, I. Ryu, Y. Yao, M. T. McDowell, S. W. Lee, A. Jackson, Y. Yang, L. Hu, Nat.
Nanotechnol. 2012, 7, 310; (b) Y. G. Guo, J. S. Hu, L. J. Wan, Adv. Mater. 2008, 20, 2878; (c) Y. Wang, X. Yu, S. Xu,
J. Bai, R. Xiao, Y. S. Hu, H. Li, X. Q. Yang, L. Chen, X. Huang, Nat. Commun. 2013, 4, 2365; (d) V. Etacheri, R.
Marom, R. Elazari, G. Salitra, D. Aurbach, Energy Environ. Sci. 2011, 4, 3243; (e) J. Lu, Y. Lei, K. C. Lau, X. Luo,
P. Du, J. Wen, R. S. Assary, U. Das, D. J. Miller, J. W. Elam, Nat. Commun. 2013, 4, 2383; (f) J. B. Goodenough, K.
Park, J. Am. Chem. Soc. 2013, 135, 1167.
[3] (a) P. Simon, Y. Gogotsi, B. Dunn, Science 2014, 343, 1210; (b) H. Zhou, S. Zhu, M. Hibino, I. Honma, M.
Ichihara, Adv. Mater. 2003, 15, 2107; (c) L. Xia, S. Wang, G. Liu, L. Ding, D. Li, H. Wang, S. Qiao, Small 2016, 12,
853; (d) J. Liang, X. Y. Yu, H. Zhou, H. B. Wu, S. Ding, X. W. Lou, Angew. Chem., Int. Ed. 2014, 53, 12803.
[4] (a) S. H. Yu; X. Feng; N. Zhang; J. Seok, H. D. Abruna, Acc. Chem. Res. 2018, 51, 273.; (b) S. H. Yu; S. H. Lee;
D. J. Lee; Y. E. Sung; T. Hyeon. Small 2016, 12, 2146; (c) H. Wang, L. F. Cui, Y. Yang, H. S. Casalongue, J. T.
Robinson, Y. Liang, Y. Cui, H. Dai, J. Am. Chem. Soc. 2010, 132, 13978.
[5] (a) J. K. Shon, H. S. Lee, G. O. Park, J. Yoon, E. Park, G. S. Park, S. S. Kong, M. Jin, J. M. Choi, H. Chang, S.
Doo, J. M. Kim, W. S. Yoon, C. Pak, H. Kim, G. D. Stucky, Nat. Commun. 2016, 7, 11049; (b) H. Li, G. Richter, J.
Maier, Adv. Mater. 2003, 15, 736.
[6] I. A. de Castro, R. S. Datta, J. Z. Ou, A. Castellanos-Gomez, S. Sriram, T. Daeneke, K. Kalantar-Zadeh, Adv.
95
Mater. 2017, 29, 1701619.
[7] X. Hu, W. Zhang, X. Liu, Y. Mei, Y. Huang, Chem. Soc. Rev. 2015, 44, 2376.
[8] (a) J. Ni, Y. Zhao, L. Li, L. Mai, Nano Energy 2015, 11, 129; (b) Y. Wang, L. Yu, X. W. Lou, Angew. Chem., Int.
Ed. 2016, 55, 14668.
[9] S. Petnikota, K. W. Teo, L. Chen, A. Sim, S. K. Marka, M. V. Reddy, V. V. Srikanth, S. Adams, B. V. Chowdari,
ACS Appl. Mater. Interfaces 2016, 8, 10884.
[10] (a) X. Chang, T. Wang, P. Zhang, J. Zhang, A. Li, J. Gong, J. Am. Chem. Soc. 2015, 137, 8356; (b) L. Q. Mai, F.
Yang, Y. L. Zhao, X. Xu, L. Xu, Y. Z. Luo, Nat. Commun. 2011, 2, 381.
[11] Y. Zheng, T. Zhou, C. Zhang, J. Mao, H. Liu, Z. Guo, Angew. Chem., Int. Ed. 2016, 55, 3408.
[12] J. Nishitani, K. M. Yu, W. Walukiewicz, Appl. Phys. Lett. 2014, 105, 132103.
[13] H. Wang; S. Liu; K. J. Smith. Energy Fuels 2016, 30, 6039.
[14] Q. Gao, L. Yang, X. Lu, J. Mao, Y. Zhang, Y. Wu, Y. Tang, J. Mater. Chem. 2010, 20, 2807.
[15] (a) X. Yao, N. Huang, F. Han, Q. Zhang, H. Wan, J. P. Mwizerwa, C. Wang, X. Xu, Adv. Energy Mater. 2017, 7,
1602923; (b) S. Dong, X. Chen, L. Gu, X. Zhou, L. Li, Z. Liu, P. Han, H. Xu, J. Yao, H. Wang, Energy Environ. Sci.
2011, 4, 3502.
[16] A. Patterson, Phys. Rev. 1939, 56, 978.
[17] R. Tokarz-Sobieraj; M. Witko. Adsorpt. Sci. Technol. 2007, 25, 583.
[18] S. Yuan, J. L. Bao, L. Wang, Y. Xia, D. G. Truhlar, Y. Wang, Adv. Energy Mater. 2016, 6, 1501733.
[19] P. Delporte, C. Pham-Huu, P. Vennegues, M. J. Ledoux, J. Guille, Catal. Today 1995, 23, 251.
[20] L. Porte, A. Sartre, J. Mater. Sci. 1989, 24, 271.
[21] M. Bou, J. Martin, T. Le Mogne, L. Vovelle, Appl. Surf. Sci. 1991, 47, 149.
[22] X. Wang, Y. Xiao, J. Wang, L. Sun, M. Cao, J. Power Sources 2015, 274, 142.
96
[23] B. Li, B. Xi, Z. Feng, Y. Lin, J. Liu, J. Feng, Y. Qian, S. Xiong, Adv. Mater. 2018, 30, 1705788.
[24] H. Tan, Z. Zhao, W.-b. Zhu, E. N. Coker, B. Li, M. Zheng, W. Yu, H. Fan, Z. Sun, ACS Appl. Mater. Interfaces
2014, 6, 19184.
[25] (a) C. Wang, L. Sun, F. Zhang, X. Wang, Q. Sun, Y. Cheng, L. Wang, Small 2017, 13, 1701246; (b) J. Liu, S.
Tang, Y. Lu, G. Cai, S. Liang, W. Wang, X. Chen, Energy Environ. Sci. 2013, 6, 2691.
[26] H. S. Kim, J. B. Cook, H. Lin, J. S. Ko, S. H. Tolbert, V. Ozolins, B. Dunn, Nat. Mater. 2017, 16, 454.
[27] Z. Wang, C. Yang, T. Lin, H. Yin, P. Chen, D. Wan, F. Xu, F. Huang, J. Lin, X. Xie, Adv. Funct. Mater. 2013, 23,
5444.
[28] J. Zheng, Y. Lyu, R. Wang, C. Xie, H. Zhou, S. P. Jiang, S. Wang, Nat. Commun. 2018, 9, 3572.
[29] M. Dieterle, G. Weinberg, G. Mestl, Phys. Chem. Chem. Phys. 2002, 4, 812.
[30] X. P. Gao, H. X. Yang, Energy Environ. Sci. 2010, 3, 174.
[31] D. Guo, J. Qin, Z. Yin, J. Bai, Y. K. Sun, M. Cao, Nano Energy 2018, 45, 136.
[32] J. Geng, B. S. Kong, S. B. Yang, S. C. Youn, S. Park, T. Joo, H. T. Jung, Adv. Funct. Mater. 2008, 18, 2659.
[33] X. Zhao, H. E. Wang, X. Chen, J. Cao, Y. Zhao, Z. Garbe Neale, W. Cai, J. Sui, G. Cao, Energy Storage Materials
2018, 11, 161.
[34] Z. Xiu, D. Kim, M. H. Alfaruqi, J. Song, S. Kim, P. T. Duong, V. Mathew, J. P. Baboo, J. Kim, J. Alloys Compd.
2017, 696, 143.
[35] S. W. Lee, N. Yabuuchi, B. M. Gallant, S. Chen, B. S. Kim, P. T. Hammond, Y. Shao-Horn, Nat. Nanotechnol.
2010, 5, 531.
[36] (a) Y. Che, X. Zhu, J. Li, J. Sun, Y. Liu, C. Jin, C. Dong, RSC Adv. 2016, 6, 106230; (b) L. Zeng, X. Huang, X.
Chen, C. Zheng, R. Liu, G. Chen, Q. Qian, Q. Chen, M. Wei, RSC Adv. 2016, 6, 105558; (c) G. Xia, D. Liu, F. Zheng,
Y. Yang, J. Su, Q. Chen, J. Mater. Chem. A 2016, 4, 12434; (d) L. C. Yang, W. Sun, Z. W. Zhong, J. W. Liu, Q. S.
97
Gao, R. Z. Hu, M. Zhu, J. Power Sources 2016, 306, 78; (e) Y. Zhu, S. Wang, Y. Zhong, R. Cai, L. Li, Z. Shao, J.
Power Sources 2016, 307, 552; (f) D. Zhao, J. Qin, L. Zheng, M. Cao, Chem. Mater. 2016, 28, 4180; (g) D. Xiao, J.
Zhang, X. Li, D. Zhao, H. Huang, J. Huang, D. Cao, Z. Li, C. Niu, ACS Nano 2016, 10, 9509.
[37] G. Zhou, D. W. Wang, L. Li, N. Li, F. Li, H. M. Cheng, Nanoscale 2013, 5, 1576.
[38] U. Kumar Sen, A. Shaligram, S. Mitra, ACS Appl. Mater. Interfaces 2014, 6, 14311.
[39] S. Wang, J. Yang, X. Wu, Y. Li, Z. Gong, W. Wen, M. Lin, J. Yang, Y. Yang, J. Power Sources 2014, 245, 570.
[40] B. Guo, X. Fang, B. Li, Y. Shi, C. Ouyang, Y.-S. Hu, Z. Wang, G. D. Stucky, L. Chen, Chem. Mater. 2012, 24,
457.
[41] N. Katsumi, K. Yonebayashi, M. Okazaki, Soil Sci. Plant Nutr. 2015, 61, 603.
[42] T. Yuan, Z. Tan, C. Ma, J. Yang, Z. F. Ma, S. Zheng, Adv. Energy Mater. 2017, 7, 1601625.
[43] T. Ohzuku, A. Ueda, N. Yamamoto, J. Electrochem. Soc. 1995, 142, 1431.
[44] L. Bai, Y. Zhang, L. Zhang, Y. Zhang, L. Sun, N. Ji, X. Li, H. Si, Y. Zhang, H. Huang, Nano Energy 2018, 53,
982.
[45] D. O. Scanlon, G. W. Watson, D. Payne, G. Atkinson, R. Egdell, D. Law, J. Phys. Chem. C 2010, 114, 4636.
[46] Y. Li, H. R. Zhang, Y. Lei, Y. Z. Chen, N. Pryds, B. Shen, J. Sun, Sci. Rep. 2016, 6, 22418.
98
CHAPTER 5 Electrochemical Energy Storage Reinforced by
Component Interaction in Stoichiometry Tunable Hetero-Carbides via
Artificial Interface Engineering
5.1 Introduction
The ever-growing global energy consumption, coupled with concerns about environmental
pollution are placing urgent demands on clean and renewable energy sources. Rechargeable batteries
are attractive energy storage technologies and offer great opportunities for large-scale sustainable
energy storage applications in smart grids. Of particular, lithium ion batteries (LIBs) have been
extensively developed and witnessed giant popularity in the markets for diverse portable electronics
and electric vehicles/ hybrid electric vehicles over the past several decades.[1] Higher energy density
and extended service lifetimes for LIBs are ongoing needs, coupled with the ever-growing requirement
to enhance their power capability. To approach these aims, an abundance of electrode materials and
battery components have been developed to optimize the energy density, cycling stability, service
lifetime, and safety of LIBs. In most research, an emphasis is placed on the challenges of high
performance electrode materials with well-balanced electrochemical properties, more efficient charge
storage performance, and affordable price,[2] making highly energy-dense materials employing multi-
electron redox reactions with battery-like capacity and capacitor-like response kinetics especially
desirable. Transition metal compounds (TMCs) have emerged as attractive candidates, since their
theoretical capacity is several-fold higher than that of the commercialized graphite, and in some cases,
even higher practical capacity could be achieved than has been theoretically calculated due to
surface/near surface reactions.[3] Nonetheless, there are several challenges that need to be addressed
for transition metal compound electrodes: 1 low initial coulombic efficiency and large voltage potential;
2 volume expansion; 3 impeded kinetic processes rooted in poor electric conductivity and ion transport,
99
especially at fast lithiation/delithiation rates, which, in turn, threatens safety due to the generation of
substantial heat.[4]
Transition metal carbides with high electron conductivity have emerged as promising electrodes,
and among them, Mo2C, possesses the integrated physiochemical properties of covalent solids,
transition metals, and ionic crystals,[5] leading to fascinating merits in terms of pseudo-capacitance,
suitable lithiation pathways, a narrow band gap and a similar d-band electronic density of states to Pt
at the Fermi level, which led to far-reaching applications in catalysis, energy storage techniques, etc.[6]
As LIB electrode, however, the multi-electron reaction kinetics of Mo2C with lithium have hindered
its employment in advanced LIBs.[7] As such, to address these problematic issues and further accelerate
the electron transfer rate/ mass transport of molybdenum carbides, diverse strategies have been utilized
involving morphology control, creation of atomic defect sites, multiple-level structural engineering,
interface and material composition optimization, etc.[8] [7b] [7a, 9] With respect to these strategies,
forming composites allows an intriguing synergistic means for lithium accommodation,[10] as is
revealed by some research showing that high quality interfaces could induce effective charge
redistribution or modified bandgaps,[11] which could facilitate intrinsic electrochemical reaction
kinetics (the fast transport of electrons/lithium ions).[12] For instance, Wang et al. verified the presence
of a deuterogenic additional electromotive force (φE) at hetero-interfaces through the combination of
density functional theory (DFT) calculations and the climbing image nudged elastic band (CI-NEB)
method, which could contribute significantly to boosting the electrochemical performance of
SnSe/SnO2@graphene anode.[10a] Hong et al. detected ultrafast charge transfer in MoS2/WS2
heterostructures using photoluminescence mapping and femtosecond pump-probe spectroscopy.[13]
Fan et al. conducted first-principles calculations based on density functional theory for graphene/blue
phosphorus heterostructures, which indicated much enhanced Na absorption in the hetero-design.[14]
This demonstrates that it is quite promising to modulate the charge transfer process by designing Mo2C
heterocomposites.
100
To avoid complicated synthesis procedures and the heavy masses of TMCs, it is rational to make
use of the in-situ transformation process that is based on the disproportionation reaction, and desirable
to choose lightweight elements or compositions to combine with Mo2C. Inspired by this, mono MoC
with smaller Mo stoichiometry have been selected to integrate with Mo2C via controlled carbothermal
processing of the precursor. Electrochemical investigations have demonstrated that the as-prepared
MoC-Mo2C-heteronanowires (MoC-Mo2C-heterostructure nws (hnws)) have better lithium storage
capability and stability than MoC-nanowires (nws) and Mo2C-nws. Impressively, MoC-Mo2C-hnws
could fully resume its pristine capacity after rate testing, which reveals its promising high-rate
capability. As verified by electrochemical impedance spectroscopy and the galvanostatic intermittent
titration technique, the enhanced lithium storage performance of MoC-Mo2C-hnws should be
attributed to the significantly improved charge transfer process within the heterostructures, which is
closely associated with synergistic coupling between MoC and Mo2C in the interconnected
architecture. The boosted Li-storage properties demonstrate that the optimized strategy of structural
engineering has good prospects to improve energy storage applications.
5.2 Experimental methods
5.2.1 Material synthesis
5.2.1.1 Chemicals
Ammonium heptamolybdate and aniline were bought from Sigma Aldrich, and hydrochloride
acid was purchased from Sinopharm Chemical Reagent Co., Ltd. Super P and LiPF6 liquid electrolyte
(1 mol·L-1 LiPF6 in ethylene carbonate/dimethyl carbonate/ethyl methyl carbonate (EC/DMC/EMC,
volumetric ratio 1:1:1), with water content < 15 ppm) were bought from Taiyuan Lizhiyuan.
Poly(vinylidene difluoride) (PVDF) and N-methyl-2-pyrrolidone (NMP) were purchased from Sigma-
Aldrich.
101
5.2.1.2 Synthesis of MoC-Mo2C-hnws
1 mmol ammonium heptamolybdate and 18 mmol aniline were dispersed in 20 ml deionized water
at 30 oC, and then dilute hydrochloric acid was added into the above solution. The pH of the solution
was adjusted to ~ 4.5, when large amounts of yellow-white viscous precipitate emerged. After this, the
mixture was stirred in an oil bath at 50 oC for 3 h, and then the mixture was filtered and washed in
ethanol for at least 3 times to collect the Mo3O10(C6H5NH3)2·2H2O nanowires. Finally, the
Mo3O10(C6H5NH3)2·2H2O nanowires were dried in a vacuum oven for 24 h at 50 oC. The MoC-Mo2C-
heteronanowires were obtained by calcining the Mo3O10(C6H5NH3)2·2H2O nanowires at 750 oC for 5
h under Ar atmosphere with a heating rate of 5 oC·min-1.
5.2.1.3 Synthesis of MoC-nws
1 mmol ammonium heptamolybdate and 18 mmol aniline were dispersed in 20 ml deionized water
at 30 oC, then dilute hydrochloric acid was added into the above solution. The pH of the solution was
adjusted to ~ 4.5, when large amounts of yellow-white viscous precipitate emerged. After this, the
mixture was stirred at 50 oC for 3 h in an oil bath, and then the mixture was filtered and washed in
ethanol for at least 3 times to collect Mo3O10(C6H5NH3)2·2H2O nanowires. Finally, the
Mo3O10(C6H5NH3)2·2H2O nanowires were dried for 24 h at 50 oC in a vacuum oven. The MoC-N-C
nanowires were obtained by calcining the Mo3O10(C6H5NH3)2·2H2O nanowires under Ar atmosphere
at 700 oC for 5 h with a ramping rate of 5 oC·min-1.
5.2.1.4 Synthesis of Mo2C-nws
1 mmol ammonium heptamolybdate and 18 mmol aniline were dispersed in 20 ml deionized water
at 30 oC, and then dilute hydrochloric acid was added into the above solution. The pH of the solution
was adjusted to ~ 4.5, when large amounts of yellow-white viscous precipitate emerged. After this, the
102
mixture was stirred at 50 oC for 3 h in an oil bath, and then the mixture was filtered and washed in
ethanol for at least 3 times to collect the Mo3O10(C6H5NH3)2·2H2O nanowires. The
Mo3O10(C6H5NH3)2·2H2O nanowires were dried at 50 oC for 24 h in a vacuum oven. The Mo2C-N-C
nanowires were obtained by calcining the Mo3O10(C6H5NH3)2·2H2O nanowires under Ar atmosphere
at 750 oC for 5 h with a ramping rate of 2 oC·min-1.
5.2.2 Material characterization
The X-ray diffraction patterns of all the samples were collected by a D8 Advance, Bruker AXS
X-ray diffractometer using Cu Ka radiation (40 kV, 40 mA) at a scan rate of 10 o·min-1. The
microstructure and morphology of the samples were studied using a field emission scanning electron
microscope (FE-SEM; JEOL7500FA, Tokyo, Japan) and a transmission electron microscope (TEM;
JEOL 2011 F, Tokyo, Japan). Elemental analysis was conducted with an Elementar Vario EL3
elemental analyzer. Thermal property measurements were conducted using thermos-gravimetric
analyzer (TG, STA 409C) with a heating rate of 4 °C·min−1 under flowing air. Nitrogen
absorption/desorption isotherms were recorded on a Quantachrome NOVA 4200e instrument. Energy
dispersive X-ray spectroscopy (EDS) was conducted on the TEM system, which was equipped with
an EDS attachment. The surface valence and bonding information of the samples were collected by X-
ray photoelectron spectroscopy (XPS; Surface Science Instruments S-probe spectrometer). Raman
spectroscopy was conducted on a Renishaw RM-1000 confocal Raman micro-spectrometer with an
excitation laser wavelength of 514.5 nm at room temperature.
5.2.3 Electrochemical measurements
Battery measurements of all the as-collected electrodes were conducted using standard CR2032-
type coin cells. The preparation of the MoC-Mo2C-hnw working electrode is taken as an example.
First, the MoC-Mo2C-hnw active material, Super P carbon black, and polyvinylidene fluoride (in a
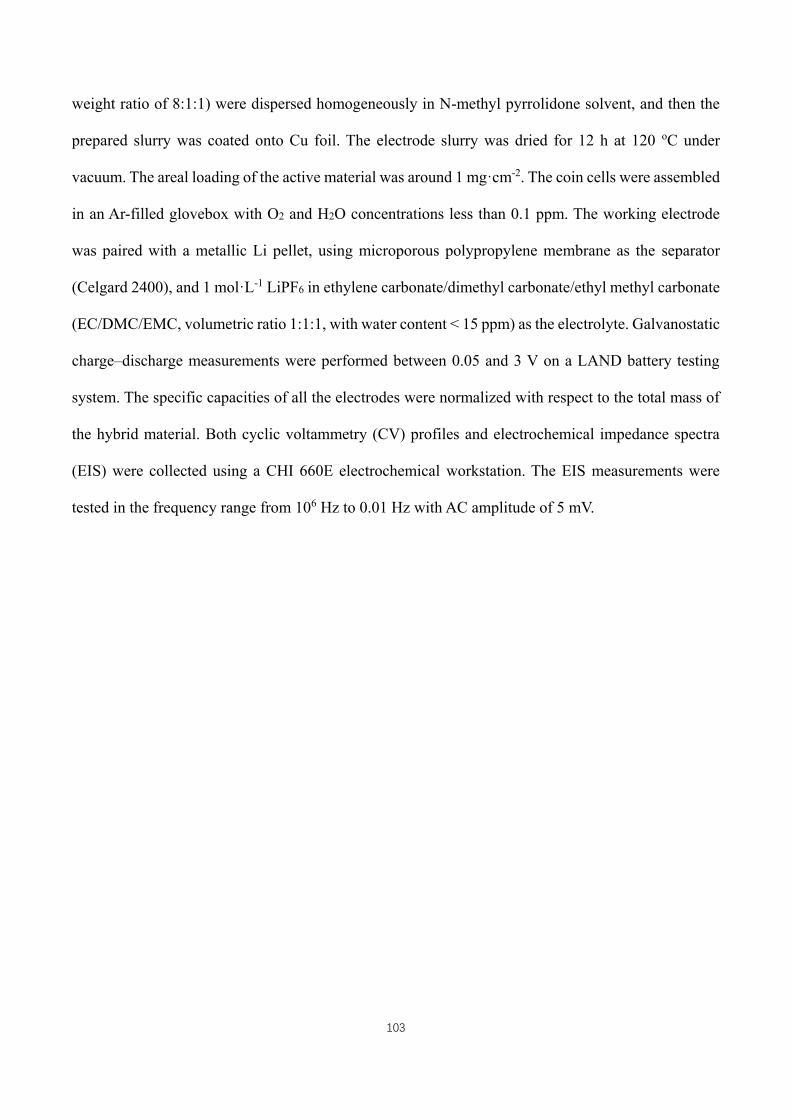
103
weight ratio of 8:1:1) were dispersed homogeneously in N-methyl pyrrolidone solvent, and then the
prepared slurry was coated onto Cu foil. The electrode slurry was dried for 12 h at 120 oC under
vacuum. The areal loading of the active material was around 1 mg·cm-2. The coin cells were assembled
in an Ar-filled glovebox with O2 and H2O concentrations less than 0.1 ppm. The working electrode
was paired with a metallic Li pellet, using microporous polypropylene membrane as the separator
(Celgard 2400), and 1 mol·L-1 LiPF6 in ethylene carbonate/dimethyl carbonate/ethyl methyl carbonate
(EC/DMC/EMC, volumetric ratio 1:1:1, with water content < 15 ppm) as the electrolyte. Galvanostatic
charge–discharge measurements were performed between 0.05 and 3 V on a LAND battery testing
system. The specific capacities of all the electrodes were normalized with respect to the total mass of
the hybrid material. Both cyclic voltammetry (CV) profiles and electrochemical impedance spectra
(EIS) were collected using a CHI 660E electrochemical workstation. The EIS measurements were
tested in the frequency range from 106 Hz to 0.01 Hz with AC amplitude of 5 mV.
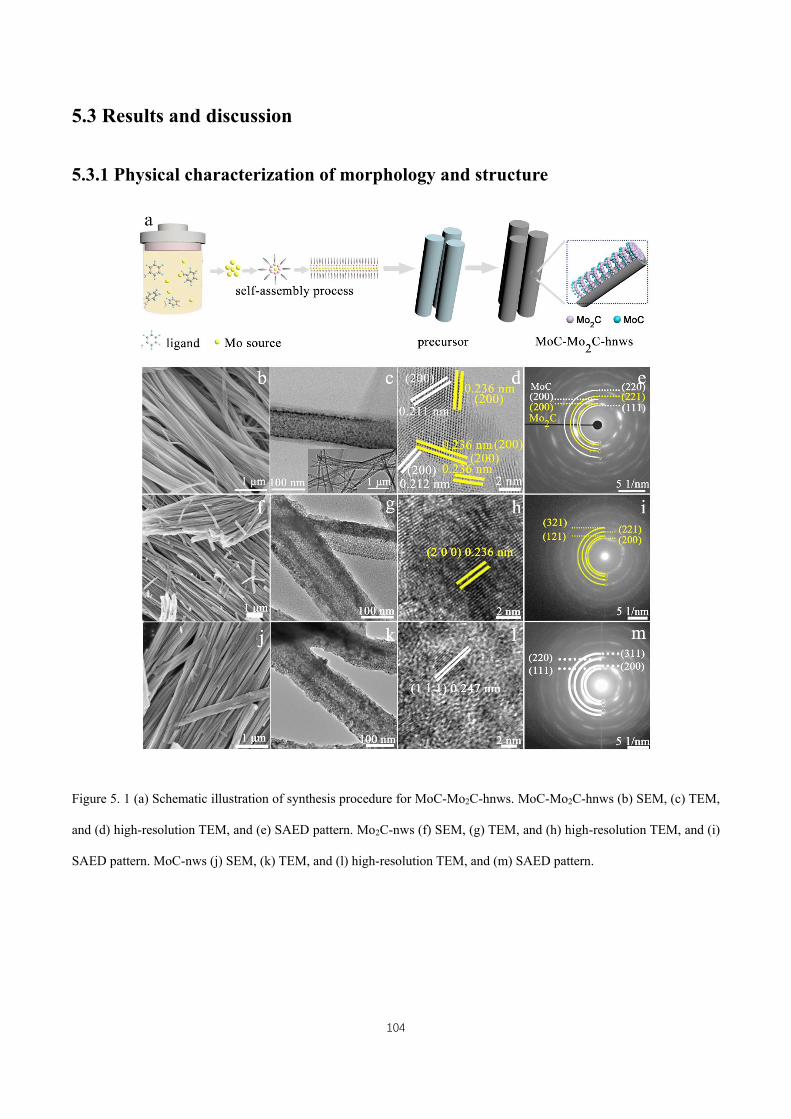
104
5.3 Results and discussion
5.3.1 Physical characterization of morphology and structure
Figure 5. 1 (a) Schematic illustration of synthesis procedure for MoC-Mo2C-hnws. MoC-Mo2C-hnws (b) SEM, (c) TEM,
and (d) high-resolution TEM, and (e) SAED pattern. Mo2C-nws (f) SEM, (g) TEM, and (h) high-resolution TEM, and (i)
SAED pattern. MoC-nws (j) SEM, (k) TEM, and (l) high-resolution TEM, and (m) SAED pattern.
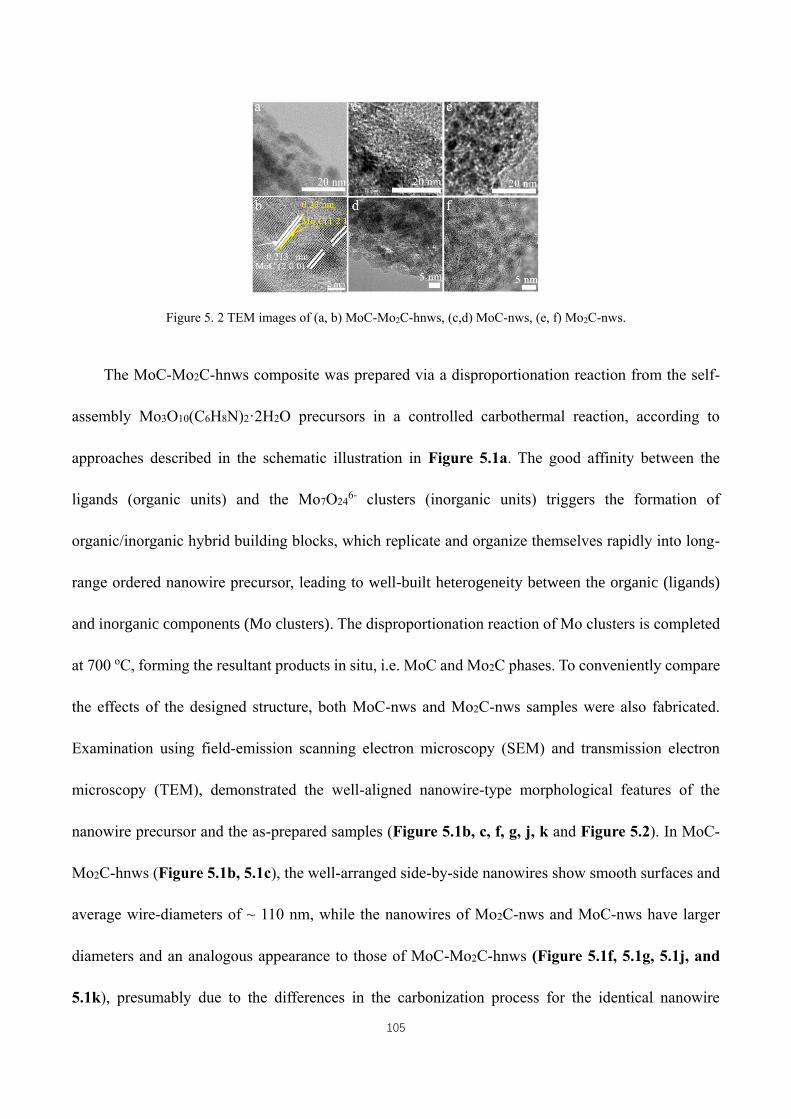
105
Figure 5. 2 TEM images of (a, b) MoC-Mo2C-hnws, (c,d) MoC-nws, (e, f) Mo2C-nws.
The MoC-Mo2C-hnws composite was prepared via a disproportionation reaction from the self-
assembly Mo3O10(C6H8N)2·2H2O precursors in a controlled carbothermal reaction, according to
approaches described in the schematic illustration in Figure 5.1a. The good affinity between the
ligands (organic units) and the Mo7O246- clusters (inorganic units) triggers the formation of
organic/inorganic hybrid building blocks, which replicate and organize themselves rapidly into long-
range ordered nanowire precursor, leading to well-built heterogeneity between the organic (ligands)
and inorganic components (Mo clusters). The disproportionation reaction of Mo clusters is completed
at 700 oC, forming the resultant products in situ, i.e. MoC and Mo2C phases. To conveniently compare
the effects of the designed structure, both MoC-nws and Mo2C-nws samples were also fabricated.
Examination using field-emission scanning electron microscopy (SEM) and transmission electron
microscopy (TEM), demonstrated the well-aligned nanowire-type morphological features of the
nanowire precursor and the as-prepared samples (Figure 5.1b, c, f, g, j, k and Figure 5.2). In MoC-
Mo2C-hnws (Figure 5.1b, 5.1c), the well-arranged side-by-side nanowires show smooth surfaces and
average wire-diameters of ~ 110 nm, while the nanowires of Mo2C-nws and MoC-nws have larger
diameters and an analogous appearance to those of MoC-Mo2C-hnws (Figure 5.1f, 5.1g, 5.1j, and
5.1k), presumably due to the differences in the carbonization process for the identical nanowire
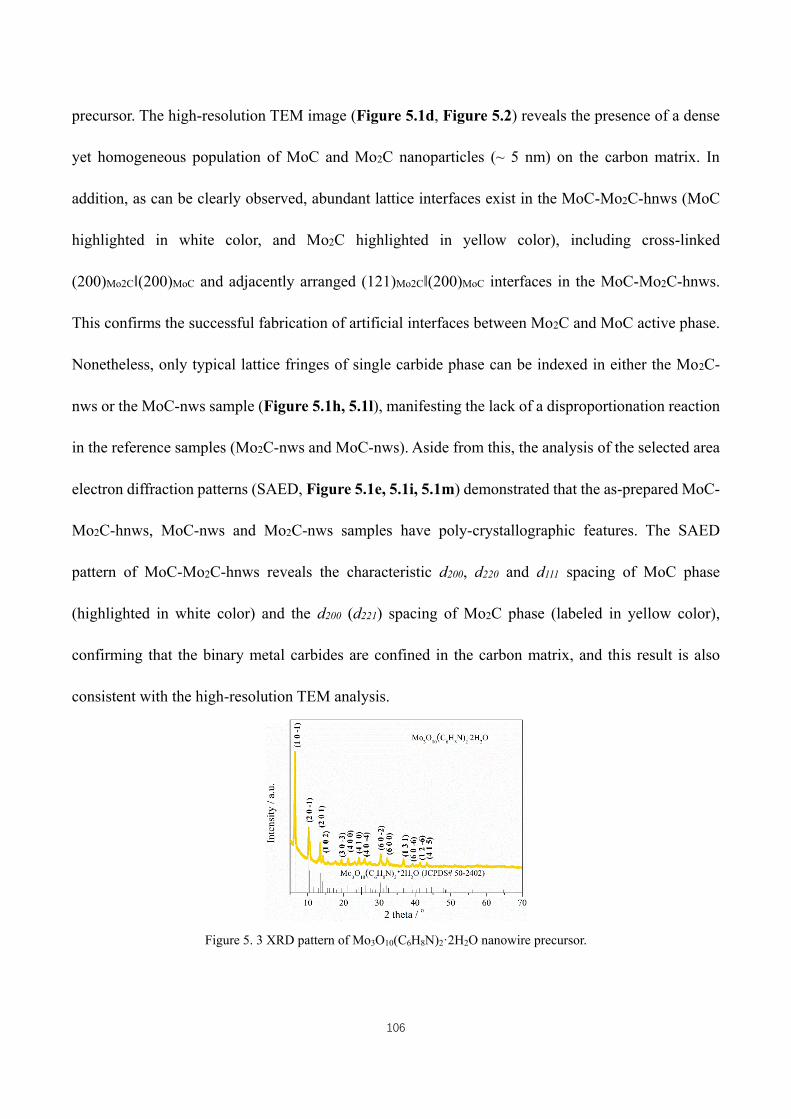
106
precursor. The high-resolution TEM image (Figure 5.1d, Figure 5.2) reveals the presence of a dense
yet homogeneous population of MoC and Mo2C nanoparticles (~ 5 nm) on the carbon matrix. In
addition, as can be clearly observed, abundant lattice interfaces exist in the MoC-Mo2C-hnws (MoC
highlighted in white color, and Mo2C highlighted in yellow color), including cross-linked
(200)Mo2C‖(200)MoC and adjacently arranged (121)Mo2C‖(200)MoC interfaces in the MoC-Mo2C-hnws.
This confirms the successful fabrication of artificial interfaces between Mo2C and MoC active phase.
Nonetheless, only typical lattice fringes of single carbide phase can be indexed in either the Mo2C-
nws or the MoC-nws sample (Figure 5.1h, 5.1l), manifesting the lack of a disproportionation reaction
in the reference samples (Mo2C-nws and MoC-nws). Aside from this, the analysis of the selected area
electron diffraction patterns (SAED, Figure 5.1e, 5.1i, 5.1m) demonstrated that the as-prepared MoC-
Mo2C-hnws, MoC-nws and Mo2C-nws samples have poly-crystallographic features. The SAED
pattern of MoC-Mo2C-hnws reveals the characteristic d200, d220 and d111 spacing of MoC phase
(highlighted in white color) and the d200 (d221) spacing of Mo2C phase (labeled in yellow color),
confirming that the binary metal carbides are confined in the carbon matrix, and this result is also
consistent with the high-resolution TEM analysis.
Figure 5. 3 XRD pattern of Mo3O10(C6H8N)2·2H2O nanowire precursor.
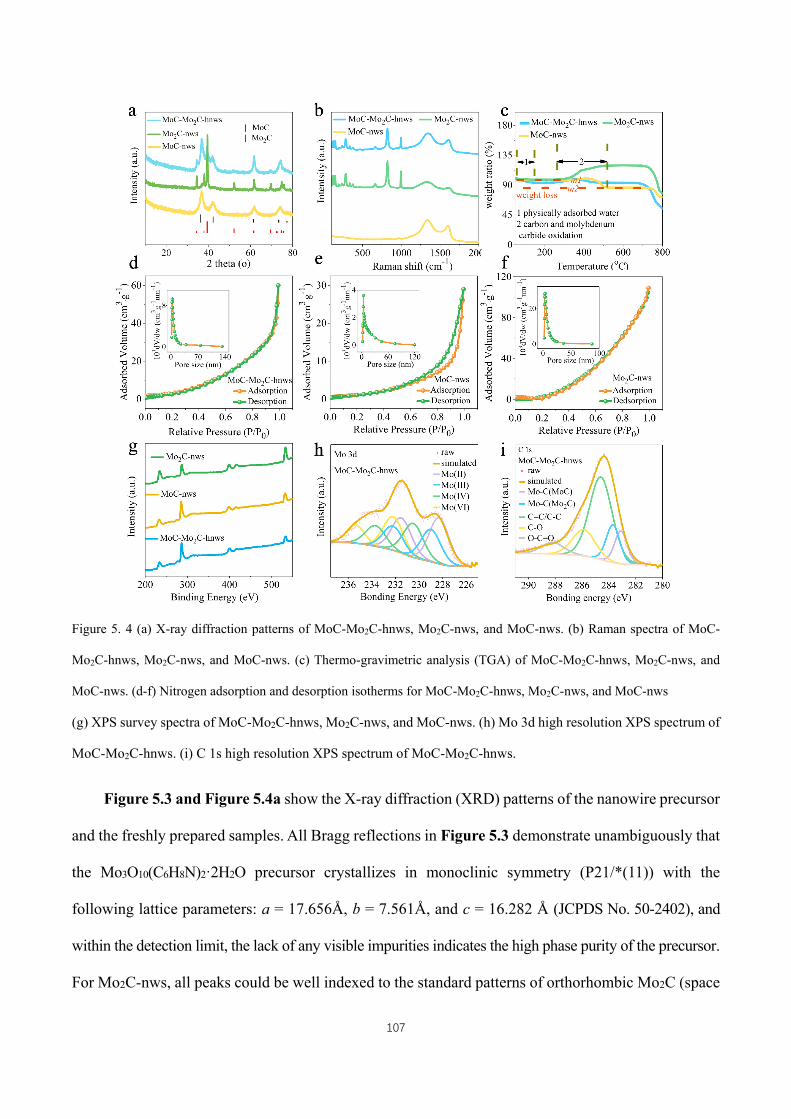
107
Figure 5. 4 (a) X-ray diffraction patterns of MoC-Mo2C-hnws, Mo2C-nws, and MoC-nws. (b) Raman spectra of MoC-
Mo2C-hnws, Mo2C-nws, and MoC-nws. (c) Thermo-gravimetric analysis (TGA) of MoC-Mo2C-hnws, Mo2C-nws, and
MoC-nws. (d-f) Nitrogen adsorption and desorption isotherms for MoC-Mo2C-hnws, Mo2C-nws, and MoC-nws
(g) XPS survey spectra of MoC-Mo2C-hnws, Mo2C-nws, and MoC-nws. (h) Mo 3d high resolution XPS spectrum of
MoC-Mo2C-hnws. (i) C 1s high resolution XPS spectrum of MoC-Mo2C-hnws.
Figure 5.3 and Figure 5.4a show the X-ray diffraction (XRD) patterns of the nanowire precursor
and the freshly prepared samples. All Bragg reflections in Figure 5.3 demonstrate unambiguously that
the Mo3O10(C6H8N)2·2H2O precursor crystallizes in monoclinic symmetry (P21/*(11)) with the
following lattice parameters: a = 17.656Å, b = 7.561Å, and c = 16.282 Å (JCPDS No. 50-2402), and
within the detection limit, the lack of any visible impurities indicates the high phase purity of the precursor.
For Mo2C-nws, all peaks could be well indexed to the standard patterns of orthorhombic Mo2C (space
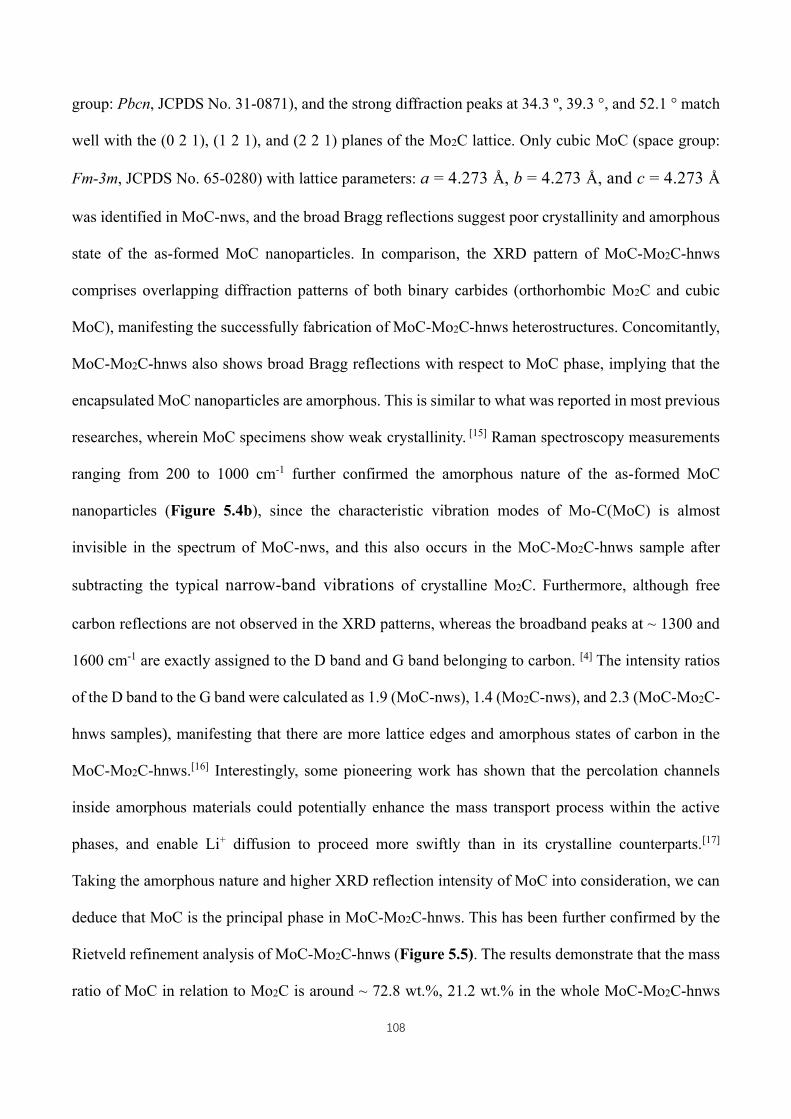
108
group: Pbcn, JCPDS No. 31-0871), and the strong diffraction peaks at 34.3 º, 39.3 °, and 52.1 ° match
well with the (0 2 1), (1 2 1), and (2 2 1) planes of the Mo2C lattice. Only cubic MoC (space group:
Fm-3m, JCPDS No. 65-0280) with lattice parameters: a = 4.273 Å, b = 4.273 Å, and c = 4.273 Å
was identified in MoC-nws, and the broad Bragg reflections suggest poor crystallinity and amorphous
state of the as-formed MoC nanoparticles. In comparison, the XRD pattern of MoC-Mo2C-hnws
comprises overlapping diffraction patterns of both binary carbides (orthorhombic Mo2C and cubic
MoC), manifesting the successfully fabrication of MoC-Mo2C-hnws heterostructures. Concomitantly,
MoC-Mo2C-hnws also shows broad Bragg reflections with respect to MoC phase, implying that the
encapsulated MoC nanoparticles are amorphous. This is similar to what was reported in most previous
researches, wherein MoC specimens show weak crystallinity. [15] Raman spectroscopy measurements
ranging from 200 to 1000 cm-1 further confirmed the amorphous nature of the as-formed MoC
nanoparticles (Figure 5.4b), since the characteristic vibration modes of Mo-C(MoC) is almost
invisible in the spectrum of MoC-nws, and this also occurs in the MoC-Mo2C-hnws sample after
subtracting the typical narrow-band vibrations of crystalline Mo2C. Furthermore, although free
carbon reflections are not observed in the XRD patterns, whereas the broadband peaks at ~ 1300 and
1600 cm-1 are exactly assigned to the D band and G band belonging to carbon. [4] The intensity ratios
of the D band to the G band were calculated as 1.9 (MoC-nws), 1.4 (Mo2C-nws), and 2.3 (MoC-Mo2C-
hnws samples), manifesting that there are more lattice edges and amorphous states of carbon in the
MoC-Mo2C-hnws.[16] Interestingly, some pioneering work has shown that the percolation channels
inside amorphous materials could potentially enhance the mass transport process within the active
phases, and enable Li+ diffusion to proceed more swiftly than in its crystalline counterparts.[17]
Taking the amorphous nature and higher XRD reflection intensity of MoC into consideration, we can
deduce that MoC is the principal phase in MoC-Mo2C-hnws. This has been further confirmed by the
Rietveld refinement analysis of MoC-Mo2C-hnws (Figure 5.5). The results demonstrate that the mass
ratio of MoC in relation to Mo2C is around ~ 72.8 wt.%, 21.2 wt.% in the whole MoC-Mo2C-hnws
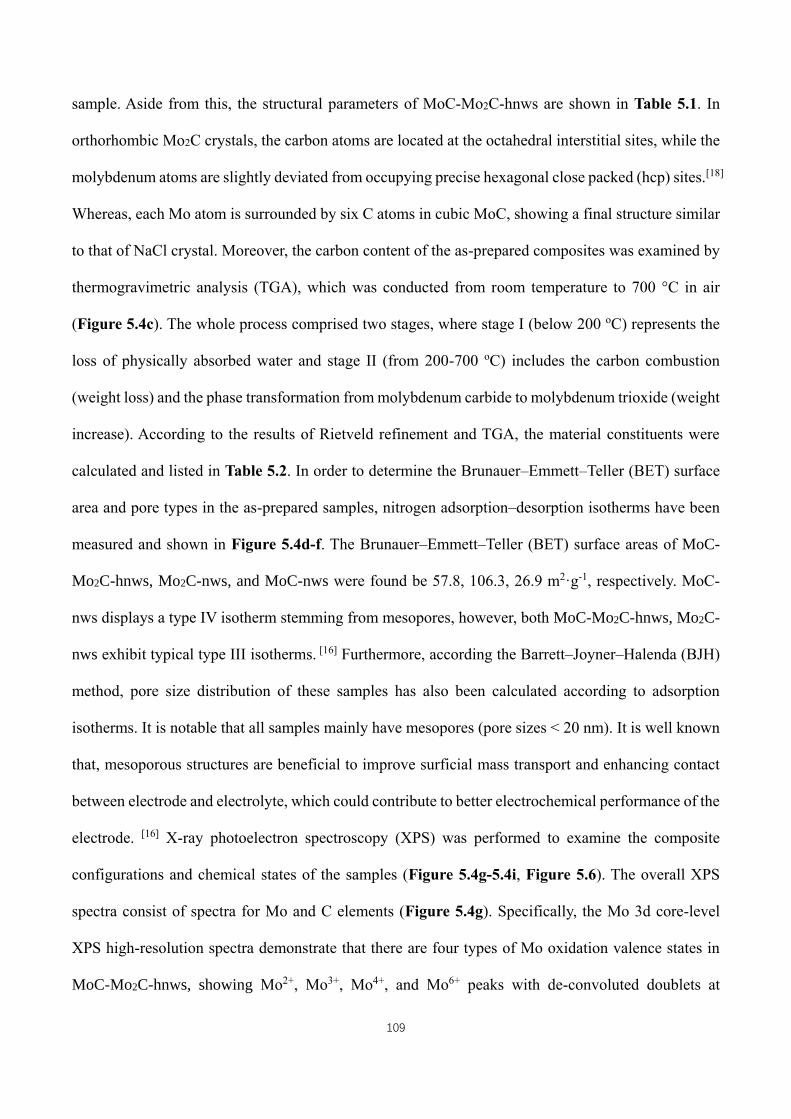
109
sample. Aside from this, the structural parameters of MoC-Mo2C-hnws are shown in Table 5.1. In
orthorhombic Mo2C crystals, the carbon atoms are located at the octahedral interstitial sites, while the
molybdenum atoms are slightly deviated from occupying precise hexagonal close packed (hcp) sites.[18]
Whereas, each Mo atom is surrounded by six C atoms in cubic MoC, showing a final structure similar
to that of NaCl crystal. Moreover, the carbon content of the as-prepared composites was examined by
thermogravimetric analysis (TGA), which was conducted from room temperature to 700 °C in air
(Figure 5.4c). The whole process comprised two stages, where stage I (below 200 oC) represents the
loss of physically absorbed water and stage II (from 200-700 oC) includes the carbon combustion
(weight loss) and the phase transformation from molybdenum carbide to molybdenum trioxide (weight
increase). According to the results of Rietveld refinement and TGA, the material constituents were
calculated and listed in Table 5.2. In order to determine the Brunauer–Emmett–Teller (BET) surface
area and pore types in the as-prepared samples, nitrogen adsorption–desorption isotherms have been
measured and shown in Figure 5.4d-f. The Brunauer–Emmett–Teller (BET) surface areas of MoC-
Mo2C-hnws, Mo2C-nws, and MoC-nws were found be 57.8, 106.3, 26.9 m2·g-1, respectively. MoC-
nws displays a type IV isotherm stemming from mesopores, however, both MoC-Mo2C-hnws, Mo2C-
nws exhibit typical type III isotherms. [16] Furthermore, according the Barrett–Joyner–Halenda (BJH)
method, pore size distribution of these samples has also been calculated according to adsorption
isotherms. It is notable that all samples mainly have mesopores (pore sizes < 20 nm). It is well known
that, mesoporous structures are beneficial to improve surficial mass transport and enhancing contact
between electrode and electrolyte, which could contribute to better electrochemical performance of the
electrode. [16] X-ray photoelectron spectroscopy (XPS) was performed to examine the composite
configurations and chemical states of the samples (Figure 5.4g-5.4i, Figure 5.6). The overall XPS
spectra consist of spectra for Mo and C elements (Figure 5.4g). Specifically, the Mo 3d core-level
XPS high-resolution spectra demonstrate that there are four types of Mo oxidation valence states in
MoC-Mo2C-hnws, showing Mo2+, Mo3+, Mo4+, and Mo6+ peaks with de-convoluted doublets at
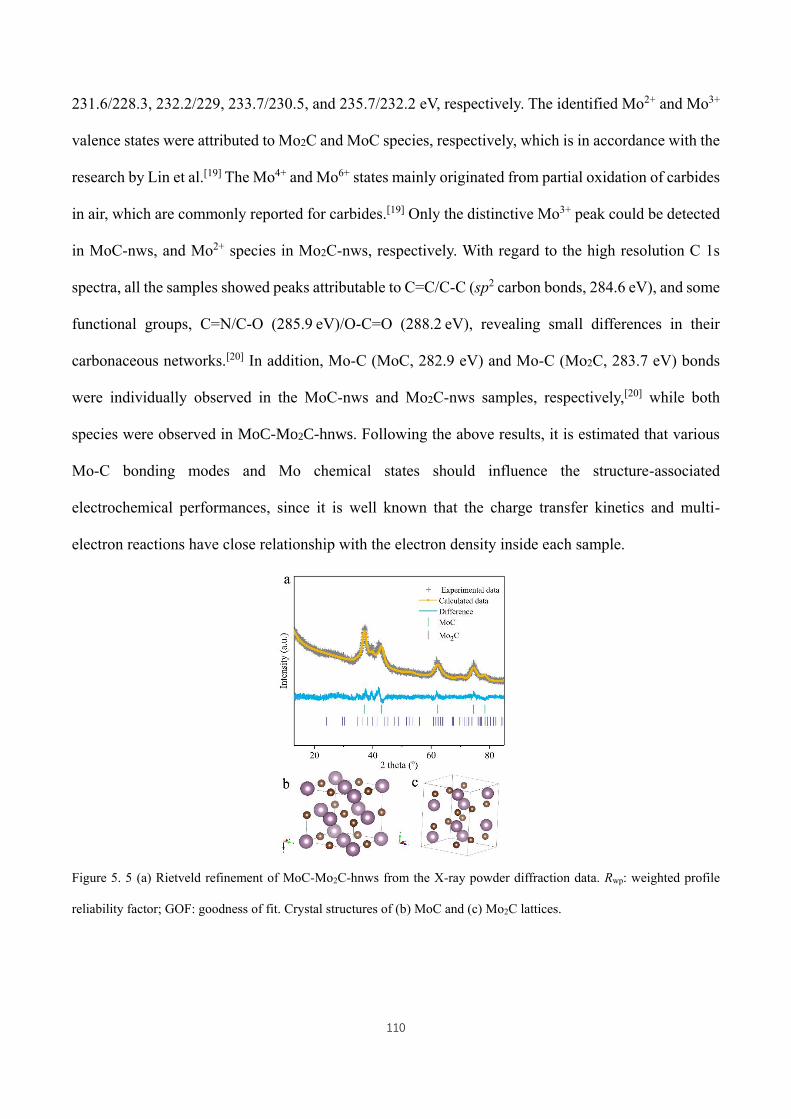
110
231.6/228.3, 232.2/229, 233.7/230.5, and 235.7/232.2 eV, respectively. The identified Mo2+ and Mo3+
valence states were attributed to Mo2C and MoC species, respectively, which is in accordance with the
research by Lin et al.[19] The Mo4+ and Mo6+ states mainly originated from partial oxidation of carbides
in air, which are commonly reported for carbides.[19] Only the distinctive Mo3+ peak could be detected
in MoC-nws, and Mo2+ species in Mo2C-nws, respectively. With regard to the high resolution C 1s
spectra, all the samples showed peaks attributable to C=C/C-C (sp2 carbon bonds, 284.6 eV), and some
functional groups, C=N/C-O (285.9 eV)/O-C=O (288.2 eV), revealing small differences in their
carbonaceous networks.[20] In addition, Mo-C (MoC, 282.9 eV) and Mo-C (Mo2C, 283.7 eV) bonds
were individually observed in the MoC-nws and Mo2C-nws samples, respectively,[20] while both
species were observed in MoC-Mo2C-hnws. Following the above results, it is estimated that various
Mo-C bonding modes and Mo chemical states should influence the structure-associated
electrochemical performances, since it is well known that the charge transfer kinetics and multi-
electron reactions have close relationship with the electron density inside each sample.
Figure 5. 5 (a) Rietveld refinement of MoC-Mo2C-hnws from the X-ray powder diffraction data. Rwp: weighted profile
reliability factor; GOF: goodness of fit. Crystal structures of (b) MoC and (c) Mo2C lattices.
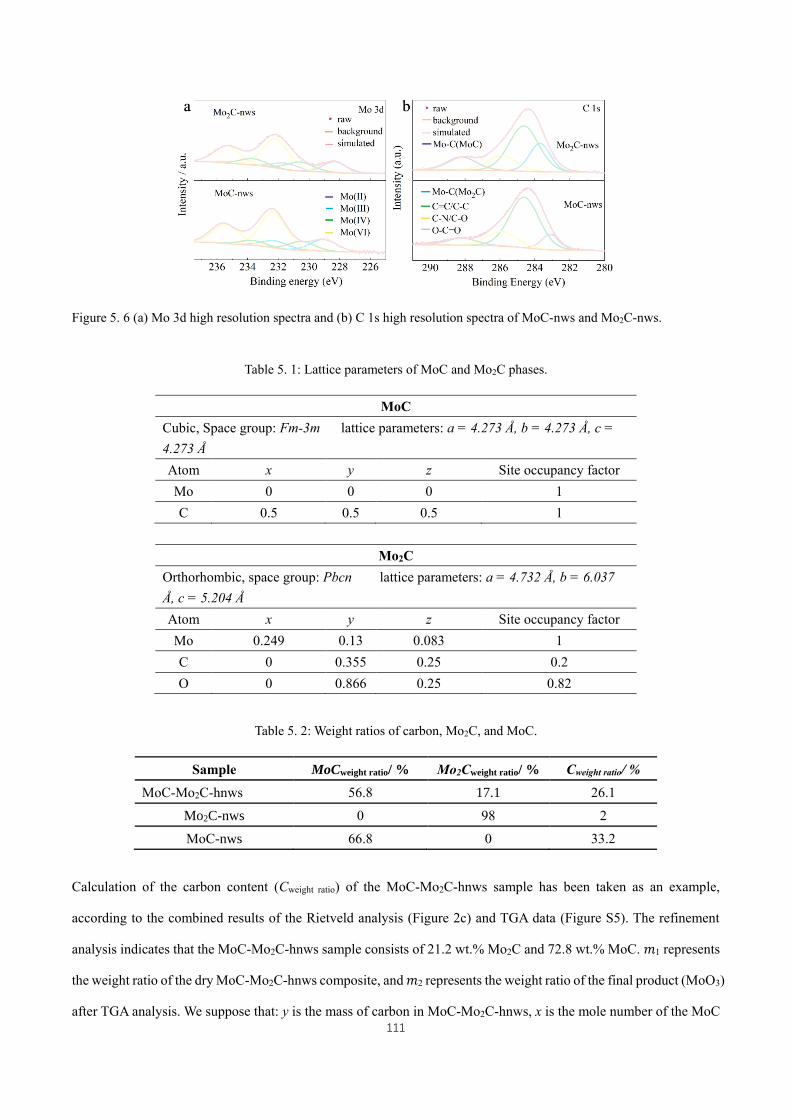
111
Figure 5. 6 (a) Mo 3d high resolution spectra and (b) C 1s high resolution spectra of MoC-nws and Mo2C-nws.
Table 5. 1: Lattice parameters of MoC and Mo2C phases.
MoC
Cubic, Space group: Fm-3m lattice parameters: a = 4.273 Å, b = 4.273 Å, c =
4.273 Å
Atom x y z Site occupancy factor
Mo 0 0 0 1
C 0.5 0.5 0.5 1
Mo2C
Orthorhombic, space group: Pbcn lattice parameters: a = 4.732 Å, b = 6.037
Å, c = 5.204 Å
Atom x y z Site occupancy factor
Mo 0.249 0.13 0.083 1
C 0 0.355 0.25 0.2
O 0 0.866 0.25 0.82
Table 5. 2: Weight ratios of carbon, Mo2C, and MoC.
Sample MoCweight ratio/ % Mo2Cweight ratio/ % Cweight ratio/ %
MoC-Mo2C-hnws 56.8 17.1 26.1
Mo2C-nws 0 98 2
MoC-nws 66.8 0 33.2
Calculation of the carbon content (Cweight ratio) of the MoC-Mo2C-hnws sample has been taken as an example,
according to the combined results of the Rietveld analysis (Figure 2c) and TGA data (Figure S5). The refinement
analysis indicates that the MoC-Mo2C-hnws sample consists of 21.2 wt.% Mo2C and 72.8 wt.% MoC. 𝑚1 represents
the weight ratio of the dry MoC-Mo2C-hnws composite, and 𝑚2 represents the weight ratio of the final product (MoO3)
after TGA analysis. We suppose that: y is the mass of carbon in MoC-Mo2C-hnws, x is the mole number of the MoC
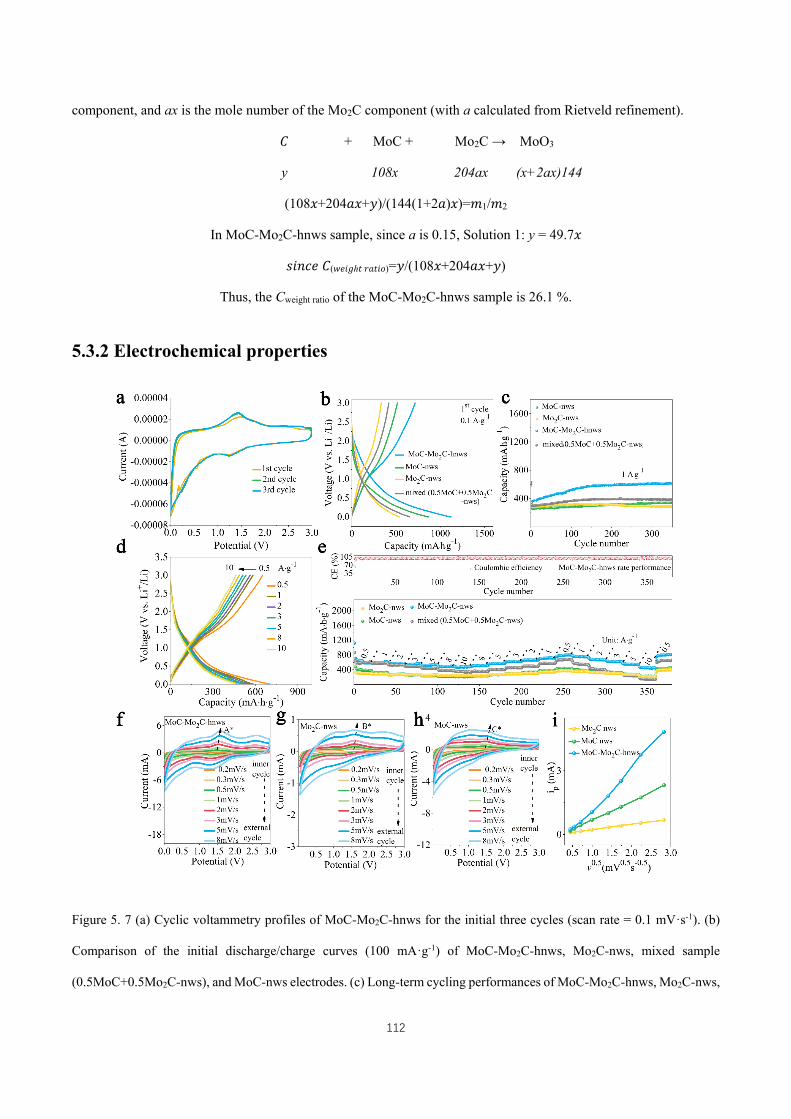
112
component, and ax is the mole number of the Mo2C component (with a calculated from Rietveld refinement).
𝐶 + MoC + Mo2C → MoO3
y 108x 204ax (x+2ax)144
(108𝑥+204𝑎𝑥+𝑦)/(144(1+2𝑎)𝑥)=𝑚1/𝑚2
In MoC-Mo2C-hnws sample, since a is 0.15, Solution 1: y = 49.7𝑥
𝑠𝑖𝑛𝑐𝑒 𝐶(𝑤𝑒𝑖𝑔ℎ𝑡 𝑟𝑎𝑡𝑖𝑜)=𝑦/(108𝑥+204𝑎𝑥+𝑦)
Thus, the Cweight ratio of the MoC-Mo2C-hnws sample is 26.1 %.
5.3.2 Electrochemical properties
Figure 5. 7 (a) Cyclic voltammetry profiles of MoC-Mo2C-hnws for the initial three cycles (scan rate = 0.1 mV·s-1). (b)
Comparison of the initial discharge/charge curves (100 mA·g-1) of MoC-Mo2C-hnws, Mo2C-nws, mixed sample
(0.5MoC+0.5Mo2C-nws), and MoC-nws electrodes. (c) Long-term cycling performances of MoC-Mo2C-hnws, Mo2C-nws,
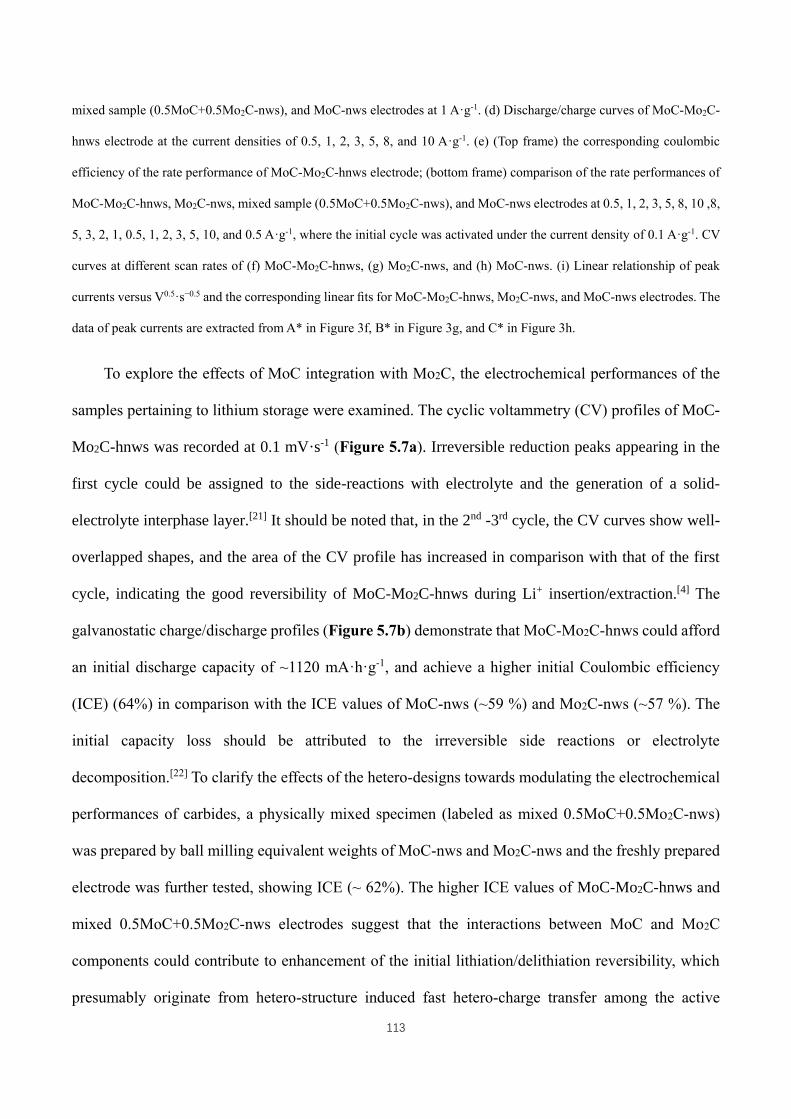
113
mixed sample (0.5MoC+0.5Mo2C-nws), and MoC-nws electrodes at 1 A·g-1. (d) Discharge/charge curves of MoC-Mo2C-
hnws electrode at the current densities of 0.5, 1, 2, 3, 5, 8, and 10 A·g-1. (e) (Top frame) the corresponding coulombic
efficiency of the rate performance of MoC-Mo2C-hnws electrode; (bottom frame) comparison of the rate performances of
MoC-Mo2C-hnws, Mo2C-nws, mixed sample (0.5MoC+0.5Mo2C-nws), and MoC-nws electrodes at 0.5, 1, 2, 3, 5, 8, 10 ,8,
5, 3, 2, 1, 0.5, 1, 2, 3, 5, 10, and 0.5 A·g-1, where the initial cycle was activated under the current density of 0.1 A·g-1. CV
curves at different scan rates of (f) MoC-Mo2C-hnws, (g) Mo2C-nws, and (h) MoC-nws. (i) Linear relationship of peak
currents versus V0.5·s−0.5 and the corresponding linear fits for MoC-Mo2C-hnws, Mo2C-nws, and MoC-nws electrodes. The
data of peak currents are extracted from A* in Figure 3f, B* in Figure 3g, and C* in Figure 3h.
To explore the effects of MoC integration with Mo2C, the electrochemical performances of the
samples pertaining to lithium storage were examined. The cyclic voltammetry (CV) profiles of MoC-
Mo2C-hnws was recorded at 0.1 mV·s-1 (Figure 5.7a). Irreversible reduction peaks appearing in the
first cycle could be assigned to the side-reactions with electrolyte and the generation of a solid-
electrolyte interphase layer.[21] It should be noted that, in the 2nd -3rd cycle, the CV curves show well-
overlapped shapes, and the area of the CV profile has increased in comparison with that of the first
cycle, indicating the good reversibility of MoC-Mo2C-hnws during Li+ insertion/extraction.[4] The
galvanostatic charge/discharge profiles (Figure 5.7b) demonstrate that MoC-Mo2C-hnws could afford
an initial discharge capacity of ~1120 mA·h·g-1, and achieve a higher initial Coulombic efficiency
(ICE) (64%) in comparison with the ICE values of MoC-nws (~59 %) and Mo2C-nws (~57 %). The
initial capacity loss should be attributed to the irreversible side reactions or electrolyte
decomposition.[22] To clarify the effects of the hetero-designs towards modulating the electrochemical
performances of carbides, a physically mixed specimen (labeled as mixed 0.5MoC+0.5Mo2C-nws)
was prepared by ball milling equivalent weights of MoC-nws and Mo2C-nws and the freshly prepared
electrode was further tested, showing ICE (~ 62%). The higher ICE values of MoC-Mo2C-hnws and
mixed 0.5MoC+0.5Mo2C-nws electrodes suggest that the interactions between MoC and Mo2C
components could contribute to enhancement of the initial lithiation/delithiation reversibility, which
presumably originate from hetero-structure induced fast hetero-charge transfer among the active
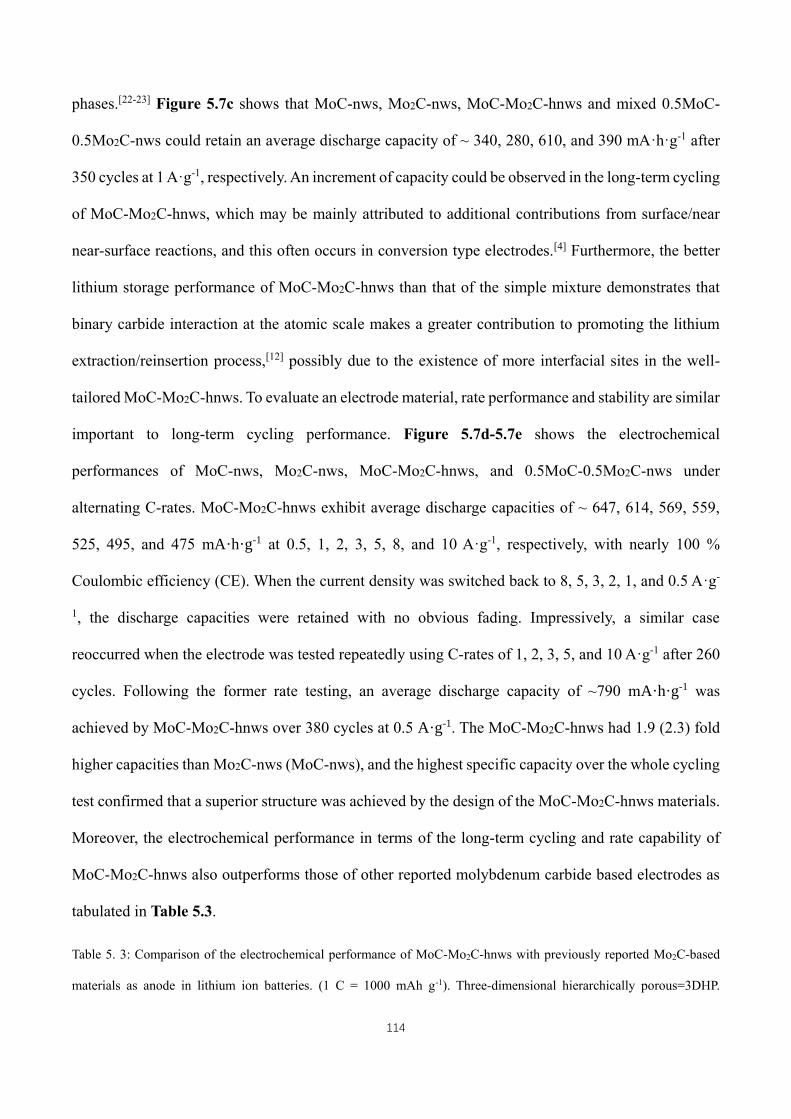
114
phases.[22-23] Figure 5.7c shows that MoC-nws, Mo2C-nws, MoC-Mo2C-hnws and mixed 0.5MoC-
0.5Mo2C-nws could retain an average discharge capacity of ~ 340, 280, 610, and 390 mA·h·g-1 after
350 cycles at 1 A·g-1, respectively. An increment of capacity could be observed in the long-term cycling
of MoC-Mo2C-hnws, which may be mainly attributed to additional contributions from surface/near
near-surface reactions, and this often occurs in conversion type electrodes.[4] Furthermore, the better
lithium storage performance of MoC-Mo2C-hnws than that of the simple mixture demonstrates that
binary carbide interaction at the atomic scale makes a greater contribution to promoting the lithium
extraction/reinsertion process,[12] possibly due to the existence of more interfacial sites in the well-
tailored MoC-Mo2C-hnws. To evaluate an electrode material, rate performance and stability are similar
important to long-term cycling performance. Figure 5.7d-5.7e shows the electrochemical
performances of MoC-nws, Mo2C-nws, MoC-Mo2C-hnws, and 0.5MoC-0.5Mo2C-nws under
alternating C-rates. MoC-Mo2C-hnws exhibit average discharge capacities of ~ 647, 614, 569, 559,
525, 495, and 475 mA·h·g-1 at 0.5, 1, 2, 3, 5, 8, and 10 A·g-1, respectively, with nearly 100 %
Coulombic efficiency (CE). When the current density was switched back to 8, 5, 3, 2, 1, and 0.5 A·g-
1, the discharge capacities were retained with no obvious fading. Impressively, a similar case
reoccurred when the electrode was tested repeatedly using C-rates of 1, 2, 3, 5, and 10 A·g-1 after 260
cycles. Following the former rate testing, an average discharge capacity of ~790 mA·h·g-1 was
achieved by MoC-Mo2C-hnws over 380 cycles at 0.5 A·g-1. The MoC-Mo2C-hnws had 1.9 (2.3) fold
higher capacities than Mo2C-nws (MoC-nws), and the highest specific capacity over the whole cycling
test confirmed that a superior structure was achieved by the design of the MoC-Mo2C-hnws materials.
Moreover, the electrochemical performance in terms of the long-term cycling and rate capability of
MoC-Mo2C-hnws also outperforms those of other reported molybdenum carbide based electrodes as
tabulated in Table 5.3.
Table 5. 3: Comparison of the electrochemical performance of MoC-Mo2C-hnws with previously reported Mo2C-based
materials as anode in lithium ion batteries. (1 C = 1000 mAh g-1). Three-dimensional hierarchically porous=3DHP.
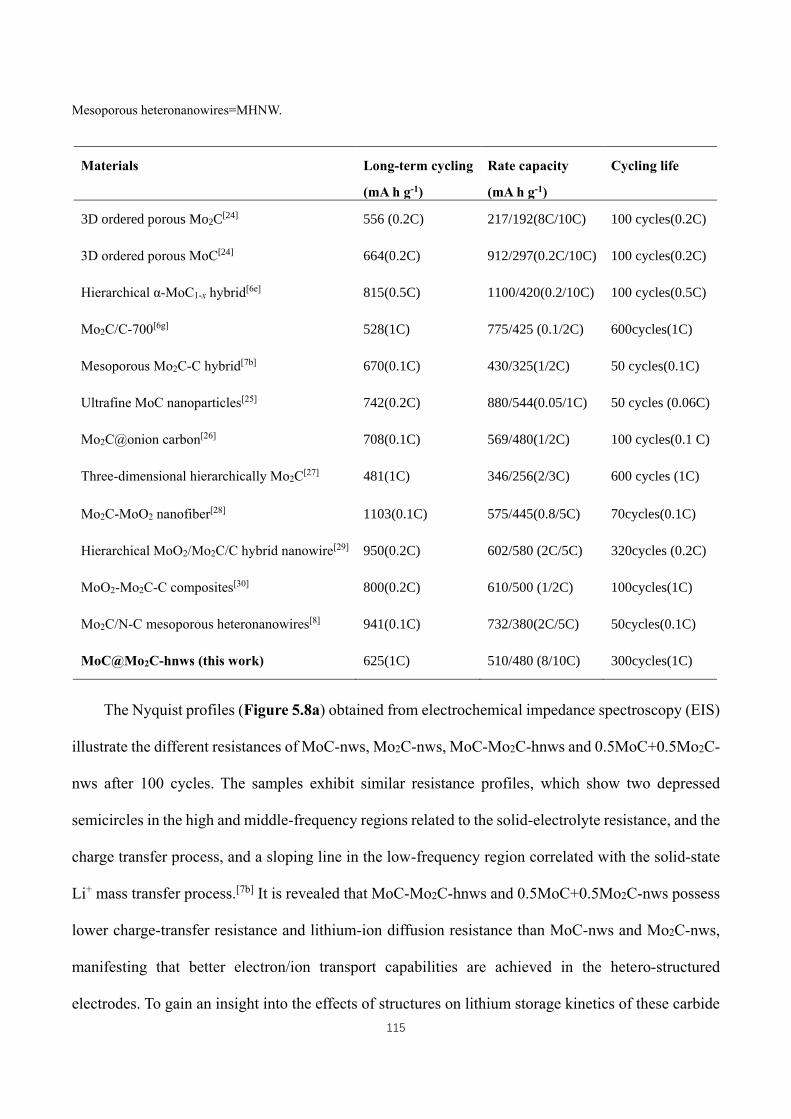
115
Mesoporous heteronanowires=MHNW.
The Nyquist profiles (Figure 5.8a) obtained from electrochemical impedance spectroscopy (EIS)
illustrate the different resistances of MoC-nws, Mo2C-nws, MoC-Mo2C-hnws and 0.5MoC+0.5Mo2C-
nws after 100 cycles. The samples exhibit similar resistance profiles, which show two depressed
semicircles in the high and middle-frequency regions related to the solid-electrolyte resistance, and the
charge transfer process, and a sloping line in the low-frequency region correlated with the solid-state
Li+ mass transfer process.[7b] It is revealed that MoC-Mo2C-hnws and 0.5MoC+0.5Mo2C-nws possess
lower charge-transfer resistance and lithium-ion diffusion resistance than MoC-nws and Mo2C-nws,
manifesting that better electron/ion transport capabilities are achieved in the hetero-structured
electrodes. To gain an insight into the effects of structures on lithium storage kinetics of these carbide
Materials Long-term cycling
(mA h g-1)
Rate capacity
(mA h g-1)
Cycling life
3D ordered porous Mo2C[24] 556 (0.2C) 217/192(8C/10C) 100 cycles(0.2C)
3D ordered porous MoC[24] 664(0.2C) 912/297(0.2C/10C) 100 cycles(0.2C)
Hierarchical α-MoC1-x hybrid[6e] 815(0.5C) 1100/420(0.2/10C) 100 cycles(0.5C)
Mo2C/C-700[6g] 528(1C) 775/425 (0.1/2C) 600cycles(1C)
Mesoporous Mo2C-C hybrid[7b] 670(0.1C) 430/325(1/2C) 50 cycles(0.1C)
Ultrafine MoC nanoparticles[25] 742(0.2C) 880/544(0.05/1C) 50 cycles (0.06C)
Mo2C@onion carbon[26] 708(0.1C) 569/480(1/2C) 100 cycles(0.1 C)
Three-dimensional hierarchically Mo2C[27] 481(1C) 346/256(2/3C) 600 cycles (1C)
Mo2C-MoO2 nanofiber[28] 1103(0.1C) 575/445(0.8/5C) 70cycles(0.1C)
Hierarchical MoO2/Mo2C/C hybrid nanowire[29] 950(0.2C) 602/580 (2C/5C) 320cycles (0.2C)
MoO2-Mo2C-C composites[30] 800(0.2C) 610/500 (1/2C) 100cycles(1C)
Mo2C/N-C mesoporous heteronanowires[8] 941(0.1C) 732/380(2C/5C) 50cycles(0.1C)
MoC@Mo2C-hnws (this work) 625(1C) 510/480 (8/10C) 300cycles(1C)
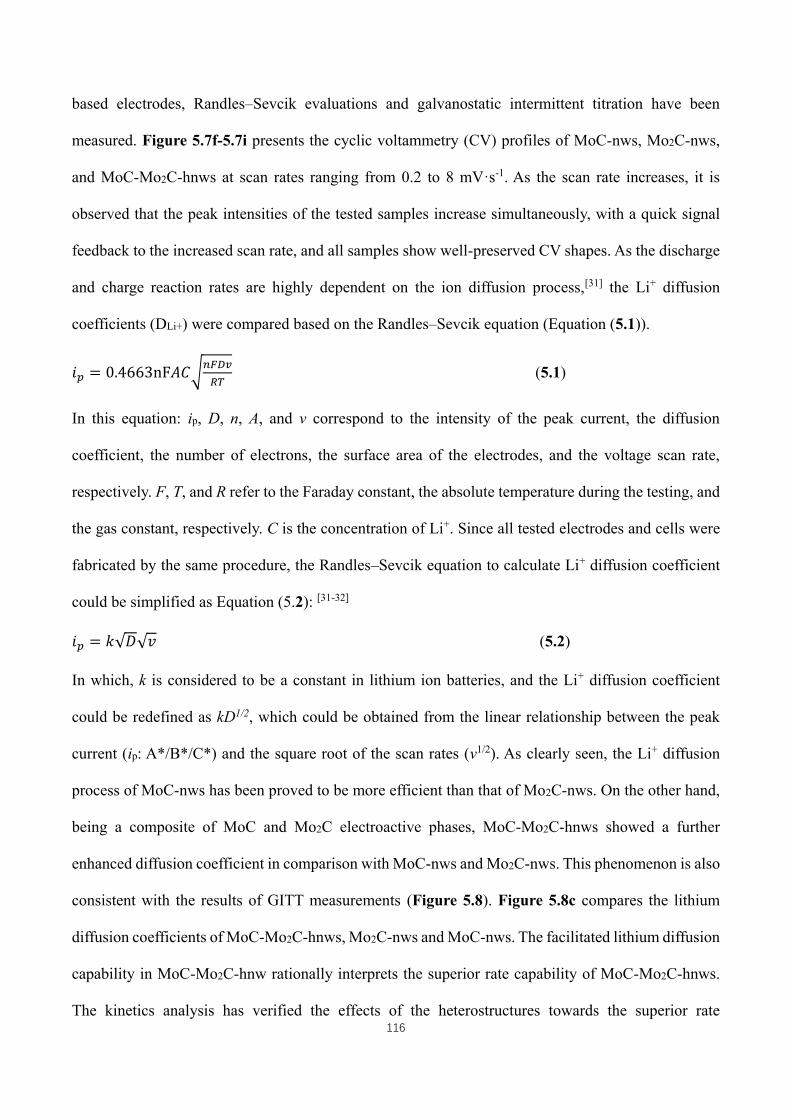
116
based electrodes, Randles–Sevcik evaluations and galvanostatic intermittent titration have been
measured. Figure 5.7f-5.7i presents the cyclic voltammetry (CV) profiles of MoC-nws, Mo2C-nws,
and MoC-Mo2C-hnws at scan rates ranging from 0.2 to 8 mV·s-1. As the scan rate increases, it is
observed that the peak intensities of the tested samples increase simultaneously, with a quick signal
feedback to the increased scan rate, and all samples show well-preserved CV shapes. As the discharge
and charge reaction rates are highly dependent on the ion diffusion process,[31] the Li+ diffusion
coefficients (DLi+) were compared based on the Randles–Sevcik equation (Equation (5.1)).
𝑖𝑝 = 0.4663nF𝐴𝐶√𝑛𝐹𝐷𝑣
𝑅𝑇 (5.1)
In this equation: ip, D, n, A, and v correspond to the intensity of the peak current, the diffusion
coefficient, the number of electrons, the surface area of the electrodes, and the voltage scan rate,
respectively. F, T, and R refer to the Faraday constant, the absolute temperature during the testing, and
the gas constant, respectively. C is the concentration of Li+. Since all tested electrodes and cells were
fabricated by the same procedure, the Randles–Sevcik equation to calculate Li+ diffusion coefficient
could be simplified as Equation (5.2): [31-32]
𝑖𝑝 = 𝑘√𝐷√𝑣 (5.2)
In which, k is considered to be a constant in lithium ion batteries, and the Li+ diffusion coefficient
could be redefined as kD1/2, which could be obtained from the linear relationship between the peak
current (ip: A*/B*/C*) and the square root of the scan rates (ν1/2). As clearly seen, the Li+ diffusion
process of MoC-nws has been proved to be more efficient than that of Mo2C-nws. On the other hand,
being a composite of MoC and Mo2C electroactive phases, MoC-Mo2C-hnws showed a further
enhanced diffusion coefficient in comparison with MoC-nws and Mo2C-nws. This phenomenon is also
consistent with the results of GITT measurements (Figure 5.8). Figure 5.8c compares the lithium
diffusion coefficients of MoC-Mo2C-hnws, Mo2C-nws and MoC-nws. The facilitated lithium diffusion
capability in MoC-Mo2C-hnw rationally interprets the superior rate capability of MoC-Mo2C-hnws.
The kinetics analysis has verified the effects of the heterostructures towards the superior rate
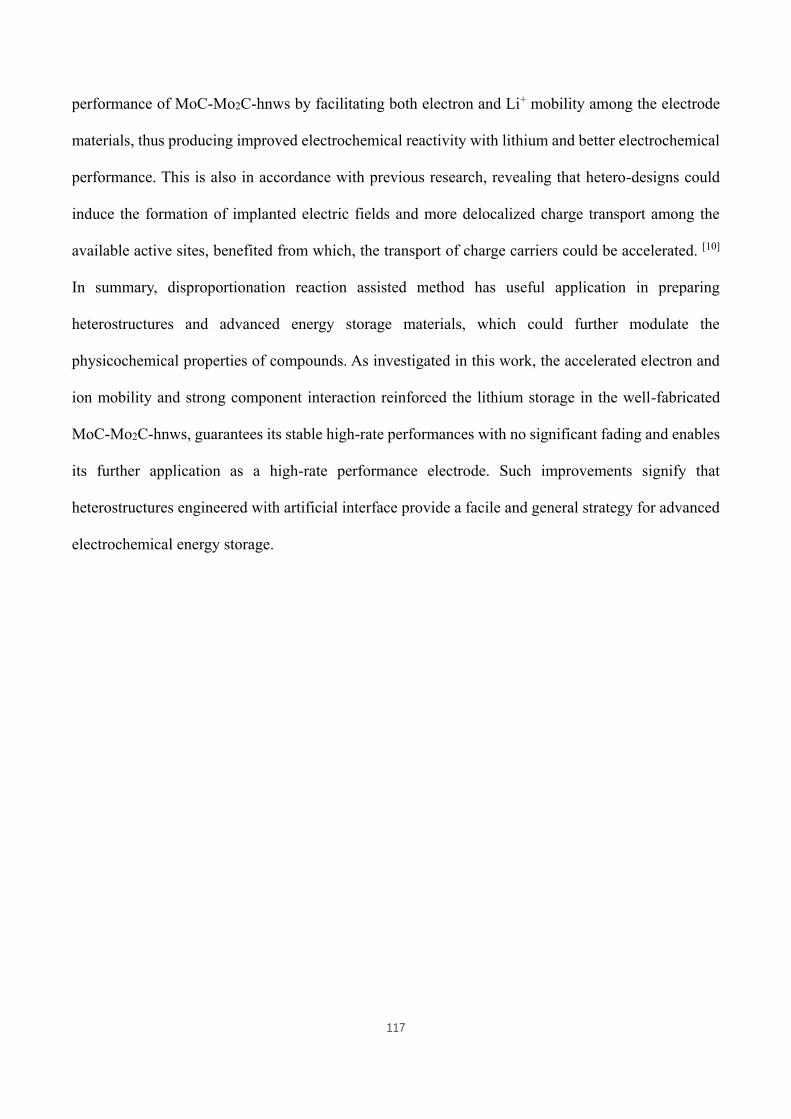
117
performance of MoC-Mo2C-hnws by facilitating both electron and Li+ mobility among the electrode
materials, thus producing improved electrochemical reactivity with lithium and better electrochemical
performance. This is also in accordance with previous research, revealing that hetero-designs could
induce the formation of implanted electric fields and more delocalized charge transport among the
available active sites, benefited from which, the transport of charge carriers could be accelerated. [10]
In summary, disproportionation reaction assisted method has useful application in preparing
heterostructures and advanced energy storage materials, which could further modulate the
physicochemical properties of compounds. As investigated in this work, the accelerated electron and
ion mobility and strong component interaction reinforced the lithium storage in the well-fabricated
MoC-Mo2C-hnws, guarantees its stable high-rate performances with no significant fading and enables
its further application as a high-rate performance electrode. Such improvements signify that
heterostructures engineered with artificial interface provide a facile and general strategy for advanced
electrochemical energy storage.
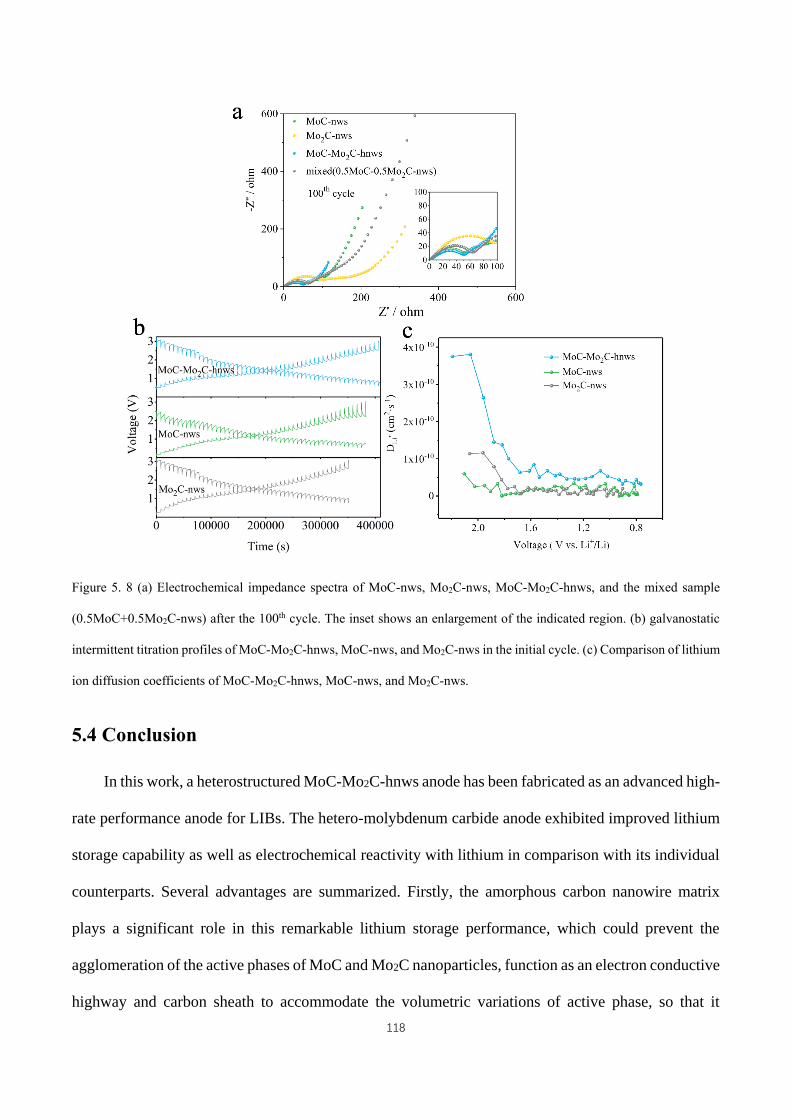
118
Figure 5. 8 (a) Electrochemical impedance spectra of MoC-nws, Mo2C-nws, MoC-Mo2C-hnws, and the mixed sample
(0.5MoC+0.5Mo2C-nws) after the 100th cycle. The inset shows an enlargement of the indicated region. (b) galvanostatic
intermittent titration profiles of MoC-Mo2C-hnws, MoC-nws, and Mo2C-nws in the initial cycle. (c) Comparison of lithium
ion diffusion coefficients of MoC-Mo2C-hnws, MoC-nws, and Mo2C-nws.
5.4 Conclusion
In this work, a heterostructured MoC-Mo2C-hnws anode has been fabricated as an advanced high-
rate performance anode for LIBs. The hetero-molybdenum carbide anode exhibited improved lithium
storage capability as well as electrochemical reactivity with lithium in comparison with its individual
counterparts. Several advantages are summarized. Firstly, the amorphous carbon nanowire matrix
plays a significant role in this remarkable lithium storage performance, which could prevent the
agglomeration of the active phases of MoC and Mo2C nanoparticles, function as an electron conductive
highway and carbon sheath to accommodate the volumetric variations of active phase, so that it
119
contributes significantly to the cycling stability of the MoC-Mo2C-hnws electrode. Furthermore, the
strong component interactions of the heterostructures alters the interfacial kinetics, giving rise to
accelerated transport of mass and charge carriers, making MoC-Mo2C-hnws as a promising high-rate
performance electrode. This work highlights the significance of superior structural designs in
improving electrochemical energy storage, and the proposed stoichiometry-tunable strategy may open
up a new way to improve the properties of other carbide-based materials and reveal their full potential
as advanced anodes for next-generation LIBs.
5.5 References
[1] (a)M. Rahman, G. Song, A. I. Bhatt, Y. C. Wong, C. Wen, Adv. Funct. Mater. 2016, 26, 647; (b)Z. Yao, X. Xia,
C. a. Zhou, Y. Zhong, Y. Wang, S. Deng, W. Wang, X. Wang, J. Tu, Adv. Sci. 2018, 5, 1700786.
[2] (a)K. Kang, Y. S. Meng, J. Bréger, C. P. Grey, G. Ceder, Science 2006, 311, 977; (b)B. Dunn, H. Kamath, J. M.
Tarascon, Science 2011, 334, 928-935; (c)D. Larcher, J. M. Tarascon, Nat. Chem. 2015, 7, 19.
[3] J. K. Shon, H. S. Lee, G. O. Park, J. Yoon, E. Park, G. S. Park, S. S. Kong, M. Jin, J. M. Choi, H. Chang, S. Doo,
J. M. Kim, W. S. Yoon, C. Pak, H. Kim, G. D. Stucky, Nat. Commun. 2016, 7, 11049.
[4] C. Zhao, C. Yu, B. Qiu, S. Zhou, M. Zhang, H. Huang, B. Wang, J. Zhao, X. Sun, J. Qiu, Adv. Mater. 2018, 30,
1702486.
[5] (a)R. Levy, M. Boudart, science 1973, 181, 547 (b)C. Xu, L. Wang, Z. Liu, L. Chen, J. Guo, N. Kang, X. L. Ma,
H. M. Cheng, W. Ren, Nat. Mater. 2015, 14, 1135; (c)J. G. Chen, Chem. Rev. 1996, 96, 1477; (d)H. H. Hwu, J.
G. Chen, Chem. Rev. 2005, 105, 185; (e)S. Oyama, Catal. Today 1992, 15, 179.
[6] (a)J. Zhu, K. Sakaushi, G. Clavel, M. Shalom, M. Antonietti, T. P. Fellinger, J Am Chem Soc 2015, 137, 5480;
(b)H. J. Zhang, K. X. Wang, X. Y. Wu, Y. M. Jiang, Y. B. Zhai, C. Wang, X. Wei, J. S. Chen, Adv. Funct. Mater.
2014, 24, 3399; (c)D. Çakır, C. Sevik, O. Gülseren, F. M. Peeters, J. Mater. Chem. A 2016, 4, 6029; (d)Q. Sun,
Y. Dai, Y. Ma, T. Jing, W. Wei, B. Huang, J. Phys. Chem. Lett. 2016, 7, 937; (e)J. Chen, Y. Huang, F. Zhao, H. Ye,
Y. Wang, J. Zhou, Y. Liu, Y. Li, J. Mater. Chem. A 2017, 5, 8125; (f)Q. Sun, Y. Dai, Y. Ma, T. Jing, W. Wei, B.
Huang, J. Phys. Chem. Lett. 2016, 7, 937; (g)W. Tian, H. Hu, Y. Wang, P. Li, J. Liu, J. Liu, X. Wang, X. Xu, Z. Li,
Q. Zhao, H. Ning, W. Wu, M. Wu, ACS Nano 2018, 12, 1990.
[7] (a)B. Wang, G. Wang, H. Wang, J. Mater. Chem. A 2015, 3, 17403; (b)Q. Gao, X. Zhao, Y. Xiao, D. Zhao, M.
120
Cao, Nanoscale 2014, 6, 6151.
[8] L. Yang, X. Li, S. He, G. Du, X. Yu, J. Liu, Q. Gao, R. Hu, M. Zhu, J. Mater. Chem. A 2016, 4, 10842.
[9] R. Li, S. Wang, W. Wang, M. Cao, Phys. Chem. Chem. Phys. 2015, 17, 24803.
[10] (a)K. Chen, X. Wang, G. Wang, B. Wang, X. Liu, J. Bai, H. Wang, Chem. Eng. J. 2018, 347, 552; (b)R. Comes,
S. Chambers, Phys. Rev. Lett. 2016, 117, 226802; (c)K. Chen, X. Wang, G. Wang, B. Wang, X. Liu, J. Bai, H.
Wang, Chem. Eng. J. 2018, 347, 552; (d)A. Nourbakhsh, A. Zubair, M. S. Dresselhaus, T. S. Palacios, Nano Lett.
2016, 16, 1359.
[11] (a)L. Wang, X. Gu, L. Zhao, B. Wang, C. Jia, J. Xu, Y. Zhao, J. Zhang, Electrochim. Acta 2019, 295, 107; (b)J.
Maier, Angew. Chem., Int. Ed. 2013, 52, 4998; (c)Y. Jing, X. Mu, C. Xie, H. Liu, R. Yan, H. Dai, C. Liu, X.-D.
Zhang, Int. J. Hydrogen Energy 2019, 44, 809.
[12] (a)C. Yuan, H. B. Wu, Y. Xie, X. W. Lou, Angew. Chem., Int. Ed. 2014, 53, 1488; (b)K. X. Wang, X. H. Li, J. S.
Chen, Adv. Mater. 2015, 27, 527.
[13] X. Hong, J. Kim, S. F. Shi, Y. Zhang, C. Jin, Y. Sun, S. Tongay, J. Wu, Y. Zhang, F. Wang, Nat. Nanotechnol. 2014,
9, 682.
[14] K. Fan, T. Tang, S. Wu, Z. Zhang, Int. J. Mod. Phys. B 2018, 32, 1850010.
[15] C. Wan, N. A. Knight, B. M. Leonard, Chem. Commun. 2013, 49, 10409.
[16] Y. Yang, M. Luo, Y. Xing, S. Wang, W. Zhang, F. Lv, Y. Li, Y. Zhang, W. Wang, S. Guo, Adv. Mater. 2018, 30,
1706085.
[17] T. Zhou, Y. Zheng, H. Gao, S. Min, S. Li, H. K. Liu, Z. Guo, Adv. Sci. 2015, 2, 1500027.
[18] H. H. Hwu, and J. Chen, Chem. Rev. 2005, 105, 185.
[19] H. Lin, Z. Shi, S. He, X. Yu, S. Wang, Q. Gao, Y. Tang, Chem. Sci. 2016, 7, 3399.
[20] (a)Y. S. Ye, Y. N. Chen, J. S. Wang, J. Rick, Y. J. Huang, F. C. Chang, B. J. Hwang, Chem. Mater. 2012, 24, 2987;
(b)G. Gao, D. Liu, S. Tang, C. Huang, M. He, Y. Guo, X. Sun, B. Gao, Sci. Rep. 2016, 6, 20034; (c)J. Qiu, Z.
Yang, Q. Li, Y. Li, X. Wu, C. Qi, Q. Qiao, J. Mater. Chem. A 2016, 4, 13296.
[21] X. Zhao, H. E. Wang, X. Chen, J. Cao, Y. Zhao, Z. Garbe Neale, W. Cai, J. Sui, G. Cao, Energy Storage Materials
2018, 11, 161.
[22] Y. Liu, X. Y. Yu, Y. Fang, X. Zhu, J. Bao, X. Zhou, X. W. Lou, Joule 2018, 2, 725.
[23] X. Zhou, L. Yu, X. W. D. Lou, Adv. Energy Mater. 2016, 6, 1600451.
[24] H. Yu, H. Fan, J. Wang, Y. Zheng, Z. Dai, Y. Lu, J. Kong, X. Wang, Y. J. Kim, Q. Yan, J. M. Lee, Nanoscale 2017,
121
9, 7260.
[25] M. Li, S. Yu, Z. Chen, Z. Wang, F. Lv, B. Nan, Y. Zhu, Y. Shi, W. Wang, S. Wu, H. Liu, Y. Tang, Z. Lu, Inorg.
Chem. Front. 2017, 4, 289.
[26] X. Liu, Z. Li, S. Zhang, H. Long, H. Wei, H. Zhang, H. Li, C. Zhao, Ceram. Int. 2017, 43, 14446.
[27] T. Meng, L. Zheng, J. Qin, D. Zhao, M. Cao, J. Mater. Chem. A 2017, 5, 20228.
[28] H. Li, H. Ye, Z. Xu, C. Wang, J. Yin, H. Zhu, Phys. Chem. Chem. Phys. 2017, 19, 2908.
[29] L. Yang, X. Li, Y. Ouyang, Q. Gao, L. Ouyang, R. Hu, J. Liu, M. Zhu, ACS Appl. Mater. Interfaces 2016, 8, 19987.
[30] Y. Zhu, S. Wang, Y. Zhong, R. Cai, L. Li, Z. Shao, J. Power Sources 2016, 307, 552.
[31] W. Sun, X. Rui, D. Yang, Z. Sun, B. Li, W. Zhang, Y. Zong, S. Madhavi, S. Dou, Q. Yan, ACS nano 2015, 9, 11371.
[32] (a)X. Rui, N. Yesibolati, S. Li, C. Yuan, C. Chen, Solid State Ionics 2011, 187, 58; (b)S. Tang, M. Lai, L. Lu, J.
Alloys Compd. 2008, 449, 300; (c)H. Wang, W. Zhang, H. Liu, Z. Guo, Angew. Chem., Int. Ed. 2016, 55, 3992.
122
CHAPTER 6 Hetero-structure Manipulation towards Ameliorating
MoO3 Electrodes for Better Lithium Storage Capability
6.1 Introduction
As the power system and cornerstones for energy storage techniques, charge carrier plays an
important role in the well-operation of electrochemical devices, especially for the popular rechargeable
lithium ion batteries (LIBs), which have wide applications in portable devices and electrification of
transport. The ever-growing demands for high performance LIBs place requirements for electrode that
could combine the high capacity of batteries and fast kinetics of capacitors.[1] Conversion reaction-
based transition metal compounds have been proposed as promising candidates, which can
accommodate more than one Li+ in each molecular, with specific gravimetric capacities ~2-3 times
larger than for electrodes that react through classical intercalation reactions.[1o] Upon a charging and
discharging cycle, the active phase of transition metal compound will experience a reversible phase
transformation between its counterpart metal element. However, despite their superiority in high
theoretical capacity, grand challenges still remained. The low solid-state charge transport and sluggish
mass/charge transfer kinetics across grain boundaries in most conversion type systems have been
proved as the primary causes for giant voltage hysteresis and over-potential between a redox pair.
Therefore, the resulted impaired roundtrip efficiency of conversion type systems can hardly approach
the level of practical applications, which require further studies to address the associated problems.[1a,
2]
Compared with homo-structures, materials made from hetero-structures show great potential to
modify the dynamics and chemistry of charge carriers, which have been widely used to build devices
that can be utilized for diode, capacitor, transistor, photocatalysis and non-volatile memory, etc.[3-4] For
instance, Kim et al. has verified that after the construction of van der Waals hetero-interfaces between
123
graphene and molybdenum dichalcogenide (MoX2, X = S, Se), nearly 0.5 V negative-shift of
intercalation potential and 10-times accumulation of charges have been achieved in comparison with
MoX2/MoX2 homo-interfaces.[5] Loh et al. fabricated a graphene/black phosphorus hetero-structure,
which induced a strong pseudo-magnetic fields (PMFs), leading to the formation of pseudo-Landau
levels and valley Hall effect in graphene. Furthermore, as the relative orientation of graphene and black
phosphorus changes, the spatial distribution of PMF and the intertwined moiré pattern could be tailored,
which prominently influenced the transport properties of the composites.[6] Pan et al. fabricated a
WSe2/SnS2 composite, which had one order higher hole mobility than pristine WSe2 compound,
showing that the charge transport capability of WSe2 has been improved greatly in the hetero-
structured composite.[7] Based on this, the chemically engineered hetero-structures are promising to
reinforce the interactions between the active phases, as well as to tune the charge transport and
thermodynamic landscapes of electrodes, which are anticipated to regulate the reversibility and over-
potential of redox pairs. Nonetheless, these rational ameliorations of such electrochemical properties
place demands on rigorous understanding of accurate hetero-structure manipulation, namely precise
hetero-design, which is inaccessible in evaluating a given static hetero-structure.
This work reported a dynamic hetero-structure evolution, in which an ensemble of electrodes with
sequential hetero-structure-shifting have been compared to scrutinize the effects of hetero-structure
manipulation on the electrochemical behaviors of conversion type electrodes. In this work, Mo2C-
C⊂x-MoO3 (x = 1, 3, 6, 14) hetero-electrodes have been taken as examples, considering the
complementary advantages of Mo2C and MoO3 at diffusion barrier, electric conductivity, and lithium
storage capacity, etc.[1b, 8-14] Here, four investigated compositions (x = 1, 3, 6, 14) were selected to
check the associated hetero-architecture effects on electrochemical behaviors, mainly in view of their
noticeable structural divergence, which could be reckoned as four representative stages during the
hetero-morphology shifting. The inspection of physical characterizations (Rietveld refinement,
transmission electron microscopy, field emission scanning electron microscopy, etc.) imply that as a
124
result of varied component proportion and grain sizes, the structural integrity and hybridity (quantity
and dispersibility of hetero-interfaces) in each composite has changed greatly. The evaluated
electrochemical properties show that the electrochemical reactions of Mo2C-C⊂x-MoO3 with lithium
are more facilitated at a lower value of x, yielding higher lithium storage capacity. Simultaneously, the
over-potential and charge transfer resistance have a visible response to the variations of x. Among the
four investigated compositions, Mo2C-C⊂1-MoO3 shows superior electrochemical performance to its
other counterparts. The examination of kinetic results revealed that this outperformance may mainly
be attributed to the synergistic effects of robust fibrous construction, smaller grain sizes and high
quality hybridity in its superior architecture, which could reduce the electron/lithium ion diffusion
distance, boost the reaction kinetics, and provide rich interfacial electrochemical active sites at
nanoscale. Such improvements signify the significance of hetero-structure manipulation in better
ameliorating electrodes for advanced batteries and devices in other fields.
6.2 Experimental methods
6.2.1 Material synthesis
6.2.1.1 Chemicals
Poly(vinyl alcohol) (PVA) was purchased from Alfa Aesar. (NH4)6Mo7O24·4H2O was supplied by
Adamas. Super P and LiPF6 liquid electrolyte (a solution of 1 mol·L-1 LiPF6 in ethylene carbonate/
dimethyl carbonate/ ethyl methyl carbonate (EC/DMC/EMC, volumetric ratio 1:1:1), with water
content < 15 ppm.) were bought from Taiyuan Lizhiyuan. Poly(vinylidene difluoride) (PVDF) and N-
methyl-2-pyrrolidone (NMP) were purchased from Sigma-Aldrich. Bulk MoO3 and bulk Mo2C were
bought from Aladdin and Shanghai Naiou Nano Technology Co. Ltd., respectively.
125
6.2.1.2 Preparation of Mo2C-C⊂ x-MoO3 composites and pure PVA-C nanofibers
The nanofibers were obtained when the ammonium heptamolybdate–poly(vinyl alcohol) (AHM-
PVA) precursor solution was ejected by a repulsive electric force from the charged jet to the metal
collecting plate under a critical current [1], and the detailed steps are as follows: 2.5 g PVA was
dispersed into 25 mL deionized water and vigorously stirred for 18 h at 80 °C. After this, 0.625 g
(NH4)6Mo7O24·4H2O was added and stirring was continued for 24 h at room temperature. The
precursor solution was sucked into a syringe with an 18-gauge blunt-tip needle. The flow rate was 330
μL/h. The applied voltage (DC) was 15 kV, and the distance between the syringe needle and the
grounded collector (iron net) was 11 cm. The collected nanofibers were stabilized by the procedures
below: they were dried for 12 h at 80 °C in air and after that, heated to 180 °C at a heating rate of
1 °C ·min-1 and held at that temperature for 60 min, before increasing the temperature to 300 °C at the
same heating rate and holding them at 300 °C for 70 min. The stabilization process for Mo-C
nanofibers was then complete. The preparation of Mo2C nanofiber: The Mo2C-C nanofibers were
obtained by calcining Mo-C nanofiber at 750 °C for 4 h in pure N2 flow with a heating rate of 3 °C·min-
1. The final synthesis of Mo2C-C⊂x-MoO3 nanofibers (x = 1, 3, 6, 14) was achieved by a post-annealing
of the Mo2C-C nanofibers in air for x hours (x =1, 3, 6, 14) at 300 °C, with a heating rate of 2 °C·min-
1. Mo2C-C⊂x-MoO3 (x = 0) also stands for Mo2C-C nanofiber.
Preparation of pure PVA-C nanofibers: 2.5 g PVA was dispersed into 25 mL deionized water and
vigorously stirred for 18 h at 80 °C. The precursor solution was sucked into a syringe with an 18-gauge
blunt-tip needle. The flow rate was 330 μL/h. The applied voltage (DC) was 15 kV, and the distance
between the syringe needle and the grounded collector (iron net) was 11 cm. The collected nanofibers
were stabilized by the procedures below: they were dried for 12 h at 80 °C in air and after that, heated
to 180 °C at a heating rate of 1 °C ·min-1 and held at that temperature for 60 min, before increasing the
temperature to 300 °C at the same heating rate and holding them at 300 °C for 70 min.
126
6.2.2 Material characterization
The phase compositions of all materials were examined by X-ray diffraction (XRD; D8 Advance,
Bruker AXS) using filtered Cu Kα radiation, with the detection angle 2θ ranging from 10° to 80° at
room temperature. The microstructure and morphology of the samples were studied using a field
emission scanning electron microscope (FE-SEM; JEOL7500FA, Tokyo, Japan) and a transmission
electron microscope (TEM; JEOL 2011 F, Tokyo, Japan). Elemental analysis was conducted with an
Elementar Vario EL3 elemental analyzer. Thermal property measurements were conducted using
thermogravimetry (TG, STA 409C) with a heating rate of 4 °C·min−1 under air. Nitrogen
absorption/desorption isotherms was recorded on a Quantachrome NOVA 4200e instrument. Energy
dispersive X-ray spectroscopy (EDS) was conducted on the TEM system, which was equipped with
an EDS attachment. The surface valence and bonding information for the samples was collected by X-
ray photoelectron spectroscopy (XPS; Surface Science Instruments S-probe spectrometer). Raman
spectroscopy was conducted on a Renishaw RM-1000 confocal Raman micro-spectrometer with an
excitation laser wavelength of 514.5 nm at room temperature.
6.2.3 Electrochemical measurements
The electrochemical performances of all the samples were tested by using coin type 2032 cells.
The electrode slurry for all the samples was obtained by homogeneously mixing the active material
with acetylene black (Shanxi Lizhiyuan Battery Material Co., Ltd) and poly(vinylidene difluoride)
(PVDF, Sigma-Aldrich) binder in a weight ratio of 80:10:10 in N-methyl-2-pyrrolidone (NMP) solvent.
After the preparation, the slurry was coated on clean and fresh Cu foil. The loading amount of electrode
materials was about 1 mg/cm2. The liquid electrolyte was a solution of 1 mol·L-1 LiPF6 in ethylene
carbonate/ dimethyl carbonate/ ethyl methyl carbonate (EC/DMC/EMC, volumetric ratio 1:1:1), with
water content < 15 ppm. All the cells were assembled in an argon-filled glovebox with O2/H2O less
than 0.1 ppm, and pure lithium metal pellet was used as the counter electrode and Celgard 2500

127
polypropylene membrane as the separator. The galvanostatic charge and discharge operations were
conducted on a LAND-CT2001C test system within the voltage window of 0.001-3 V. The rate
performances were tested under different current densities. Cyclic voltammetry was conducted at a
scan rate of 0.2 mV·s-1 from 0.01 to 3 V. The diffraction data for various Mo2C-C⊂x-MoO3 (x = 1, 3,
6, 14) samples were collected on a X-ray diffraction (XRD; D8 Advance, Bruker AXS) using filtered
Cu Kα radiation, with the detection angle 2θ ranging from 10° to 80° at room temperature. The Rietveld
refinement of the XRD data was performed using the General Structure Analysis System-II (GSAS-II)
software package. The refinements were performed using the structural models of orthorhombic Mo2C
(Pbcn(60), JCPDS No.72-1683) and orthorhombic MoO3 (Pbnm(62), JCPDS No. 35-0609).
6.3 Results and Discussion
6.3.1 Physical Characterizations of Mo2C-C⊂ x-MoO3 composites
Figure 6. 1 Schematic illustration of Mo2C-C⊂x-MoO3 (x = 0, 1, 3, 6, 14) nanofibers (NFs) prepared via an electrospinning
process with a single-needle nozzle. :Mo-PVA nanofiber. :C nanofiber matrix. : Mo2C particle. : MoO3 particle.
Figure 6.1 delineates the synthesis procedure of the hetero-molybdenum composite series. The
pristine Mo-PVA nanofiber (PVA=polyvinyl alcohol) was fabricated through a facile electrospinning
method and calcined under Ar atmosphere to form Mo2C-C nanofiber. Subsequently, the collected
Mo2C-C nanofiber were grouped into four batches, and were treated under flowing air for 1 h, 3 h, 6
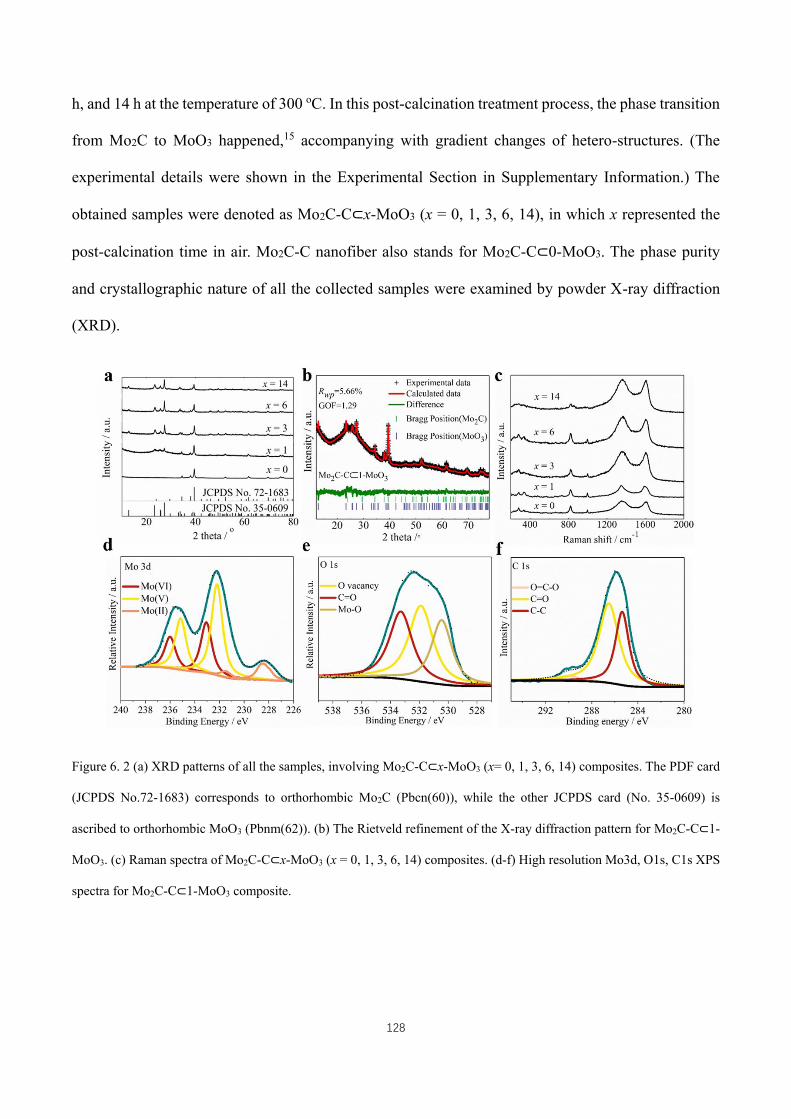
128
h, and 14 h at the temperature of 300 oC. In this post-calcination treatment process, the phase transition
from Mo2C to MoO3 happened,15 accompanying with gradient changes of hetero-structures. (The
experimental details were shown in the Experimental Section in Supplementary Information.) The
obtained samples were denoted as Mo2C-C⊂x-MoO3 (x = 0, 1, 3, 6, 14), in which x represented the
post-calcination time in air. Mo2C-C nanofiber also stands for Mo2C-C⊂0-MoO3. The phase purity
and crystallographic nature of all the collected samples were examined by powder X-ray diffraction
(XRD).
Figure 6. 2 (a) XRD patterns of all the samples, involving Mo2C-C⊂x-MoO3 (x= 0, 1, 3, 6, 14) composites. The PDF card
(JCPDS No.72-1683) corresponds to orthorhombic Mo2C (Pbcn(60)), while the other JCPDS card (No. 35-0609) is
ascribed to orthorhombic MoO3 (Pbnm(62)). (b) The Rietveld refinement of the X-ray diffraction pattern for Mo2C-C⊂1-
MoO3. (c) Raman spectra of Mo2C-C⊂x-MoO3 (x = 0, 1, 3, 6, 14) composites. (d-f) High resolution Mo3d, O1s, C1s XPS
spectra for Mo2C-C⊂1-MoO3 composite.
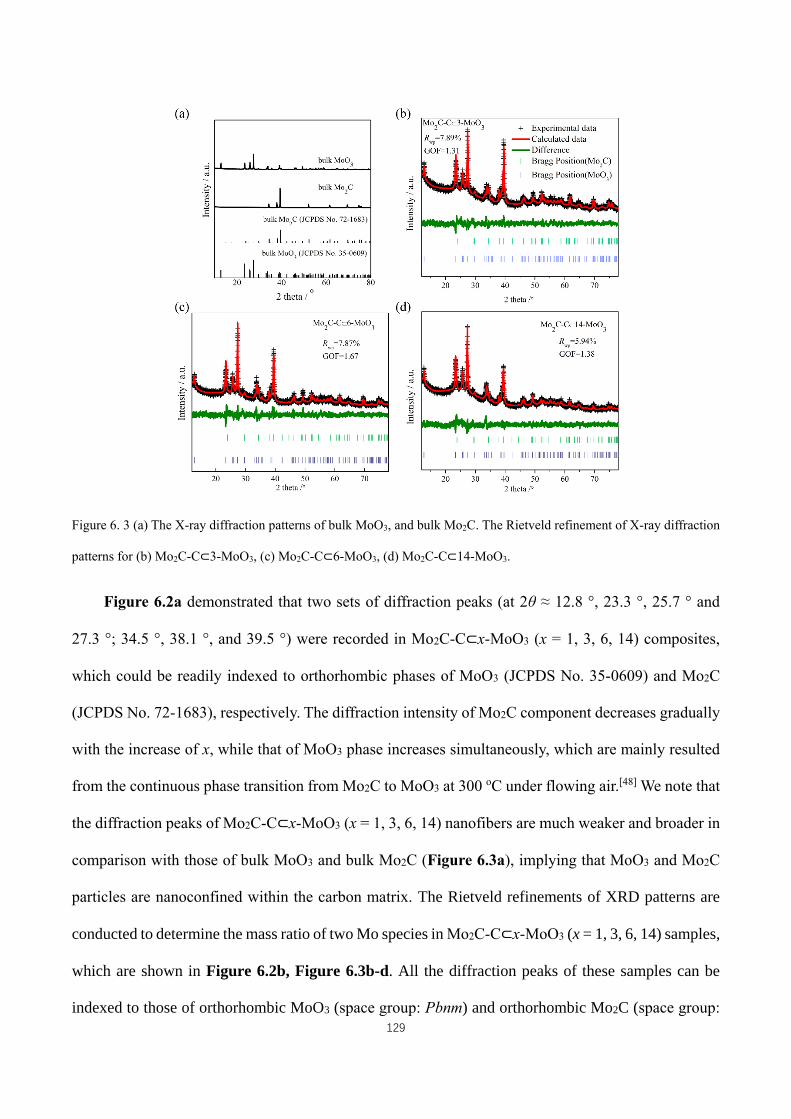
129
Figure 6. 3 (a) The X-ray diffraction patterns of bulk MoO3, and bulk Mo2C. The Rietveld refinement of X-ray diffraction
patterns for (b) Mo2C-C⊂3-MoO3, (c) Mo2C-C⊂6-MoO3, (d) Mo2C-C⊂14-MoO3.
Figure 6.2a demonstrated that two sets of diffraction peaks (at 2θ ≈ 12.8 °, 23.3 °, 25.7 ° and
27.3 °; 34.5 °, 38.1 °, and 39.5 °) were recorded in Mo2C-C⊂x-MoO3 (x = 1, 3, 6, 14) composites,
which could be readily indexed to orthorhombic phases of MoO3 (JCPDS No. 35-0609) and Mo2C
(JCPDS No. 72-1683), respectively. The diffraction intensity of Mo2C component decreases gradually
with the increase of x, while that of MoO3 phase increases simultaneously, which are mainly resulted
from the continuous phase transition from Mo2C to MoO3 at 300 oC under flowing air.[48] We note that
the diffraction peaks of Mo2C-C⊂x-MoO3 (x = 1, 3, 6, 14) nanofibers are much weaker and broader in
comparison with those of bulk MoO3 and bulk Mo2C (Figure 6.3a), implying that MoO3 and Mo2C
particles are nanoconfined within the carbon matrix. The Rietveld refinements of XRD patterns are
conducted to determine the mass ratio of two Mo species in Mo2C-C⊂x-MoO3 (x = 1, 3, 6, 14) samples,
which are shown in Figure 6.2b, Figure 6.3b-d. All the diffraction peaks of these samples can be
indexed to those of orthorhombic MoO3 (space group: Pbnm) and orthorhombic Mo2C (space group:
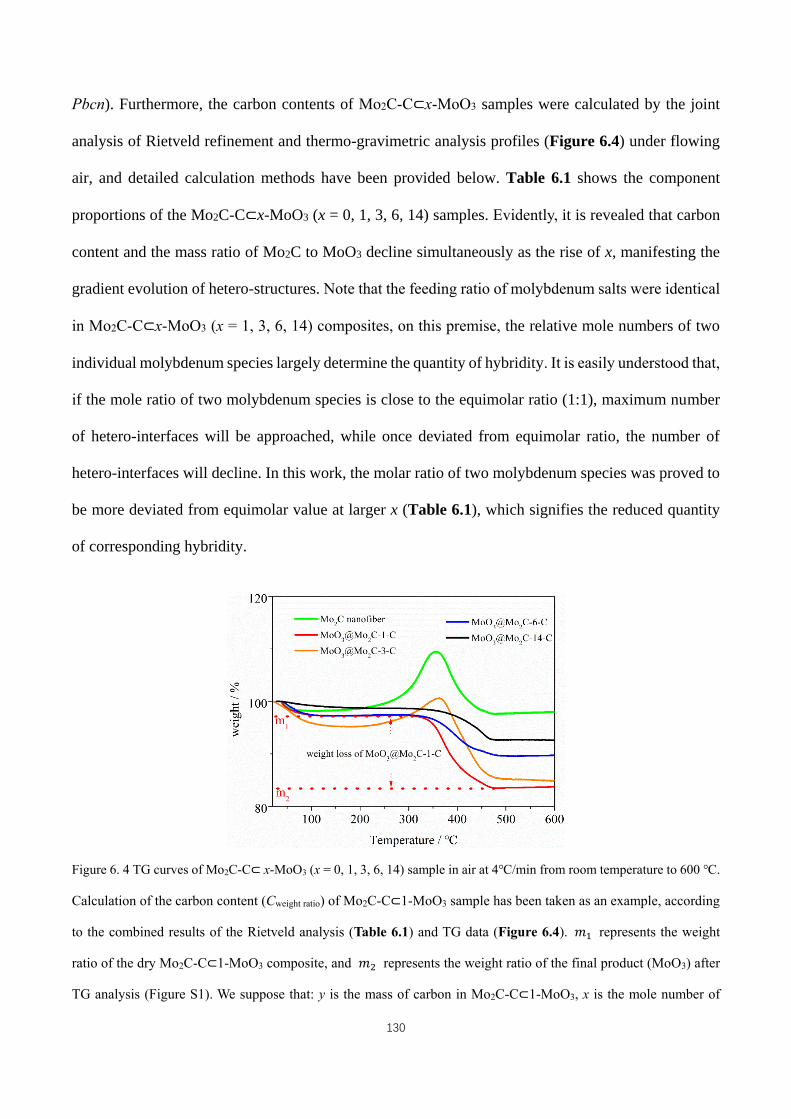
130
Pbcn). Furthermore, the carbon contents of Mo2C-C⊂x-MoO3 samples were calculated by the joint
analysis of Rietveld refinement and thermo-gravimetric analysis profiles (Figure 6.4) under flowing
air, and detailed calculation methods have been provided below. Table 6.1 shows the component
proportions of the Mo2C-C⊂x-MoO3 (x = 0, 1, 3, 6, 14) samples. Evidently, it is revealed that carbon
content and the mass ratio of Mo2C to MoO3 decline simultaneously as the rise of x, manifesting the
gradient evolution of hetero-structures. Note that the feeding ratio of molybdenum salts were identical
in Mo2C-C⊂x-MoO3 (x = 1, 3, 6, 14) composites, on this premise, the relative mole numbers of two
individual molybdenum species largely determine the quantity of hybridity. It is easily understood that,
if the mole ratio of two molybdenum species is close to the equimolar ratio (1:1), maximum number
of hetero-interfaces will be approached, while once deviated from equimolar ratio, the number of
hetero-interfaces will decline. In this work, the molar ratio of two molybdenum species was proved to
be more deviated from equimolar value at larger x (Table 6.1), which signifies the reduced quantity
of corresponding hybridity.
Figure 6. 4 TG curves of Mo2C-C⊂ x-MoO3 (x = 0, 1, 3, 6, 14) sample in air at 4℃/min from room temperature to 600 ℃.
Calculation of the carbon content (Cweight ratio) of Mo2C-C⊂1-MoO3 sample has been taken as an example, according
to the combined results of the Rietveld analysis (Table 6.1) and TG data (Figure 6.4). 𝑚1 represents the weight
ratio of the dry Mo2C-C⊂1-MoO3 composite, and 𝑚2 represents the weight ratio of the final product (MoO3) after
TG analysis (Figure S1). We suppose that: y is the mass of carbon in Mo2C-C⊂1-MoO3, x is the mole number of
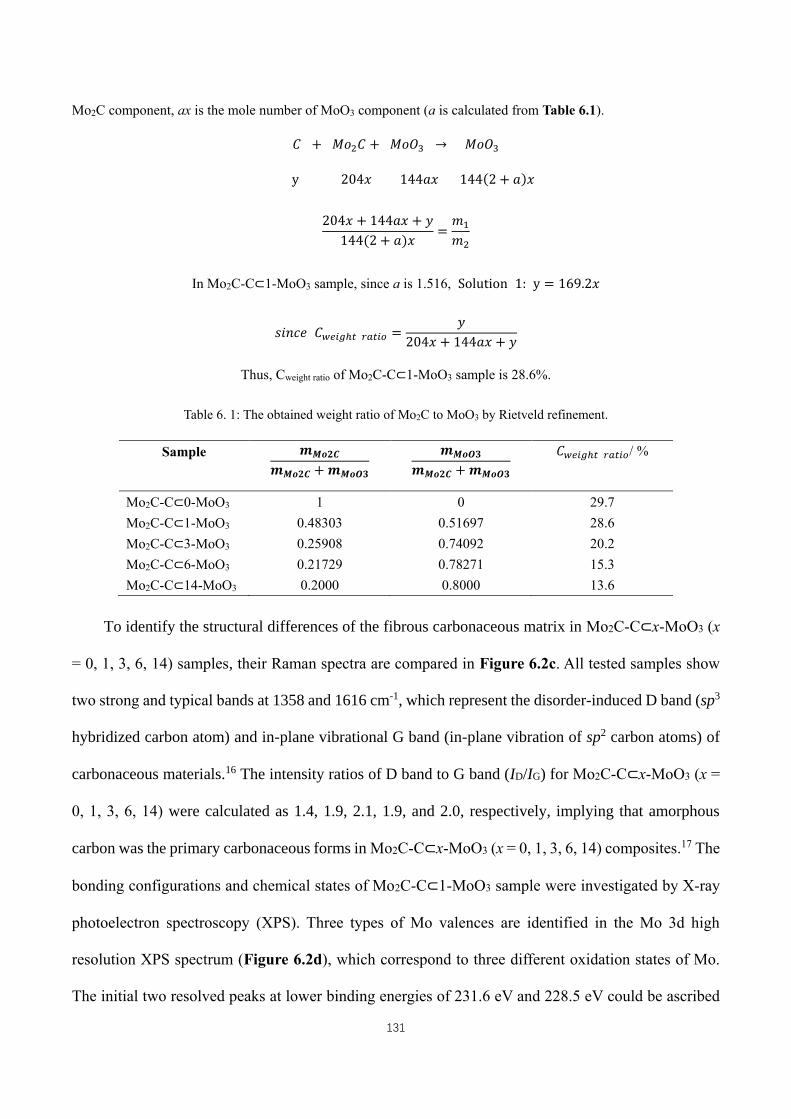
131
Mo2C component, ax is the mole number of MoO3 component (a is calculated from Table 6.1).
𝐶 + 𝑀𝑜2𝐶 + 𝑀𝑜𝑂3 → 𝑀𝑜𝑂3
y 204𝑥 144𝑎𝑥 144(2 + 𝑎)𝑥
204𝑥 + 144𝑎𝑥 + 𝑦
144(2 + 𝑎)𝑥=𝑚1𝑚2
In Mo2C-C⊂1-MoO3 sample, since a is 1.516, Solution 1: y = 169.2𝑥
𝑠𝑖𝑛𝑐𝑒 𝐶𝑤𝑒𝑖𝑔ℎ𝑡 𝑟𝑎𝑡𝑖𝑜 =𝑦
204𝑥 + 144𝑎𝑥 + 𝑦
Thus, Cweight ratio of Mo2C-C⊂1-MoO3 sample is 28.6%.
Table 6. 1: The obtained weight ratio of Mo2C to MoO3 by Rietveld refinement.
Sample 𝒎𝑴𝒐𝟐𝑪
𝒎𝑴𝒐𝟐𝑪 +𝒎𝑴𝒐𝑶𝟑
𝒎𝑴𝒐𝑶𝟑
𝒎𝑴𝒐𝟐𝑪 +𝒎𝑴𝒐𝑶𝟑
𝐶𝑤𝑒𝑖𝑔ℎ𝑡 𝑟𝑎𝑡𝑖𝑜/ %
Mo2C-C⊂0-MoO3 1 0 29.7
Mo2C-C⊂1-MoO3 0.48303 0.51697 28.6
Mo2C-C⊂3-MoO3 0.25908 0.74092 20.2
Mo2C-C⊂6-MoO3 0.21729 0.78271 15.3
Mo2C-C⊂14-MoO3 0.2000 0.8000 13.6
To identify the structural differences of the fibrous carbonaceous matrix in Mo2C-C⊂x-MoO3 (x
= 0, 1, 3, 6, 14) samples, their Raman spectra are compared in Figure 6.2c. All tested samples show
two strong and typical bands at 1358 and 1616 cm-1, which represent the disorder-induced D band (sp3
hybridized carbon atom) and in-plane vibrational G band (in-plane vibration of sp2 carbon atoms) of
carbonaceous materials.16 The intensity ratios of D band to G band (ID/IG) for Mo2C-C⊂x-MoO3 (x =
0, 1, 3, 6, 14) were calculated as 1.4, 1.9, 2.1, 1.9, and 2.0, respectively, implying that amorphous
carbon was the primary carbonaceous forms in Mo2C-C⊂x-MoO3 (x = 0, 1, 3, 6, 14) composites.17 The
bonding configurations and chemical states of Mo2C-C⊂1-MoO3 sample were investigated by X-ray
photoelectron spectroscopy (XPS). Three types of Mo valences are identified in the Mo 3d high
resolution XPS spectrum (Figure 6.2d), which correspond to three different oxidation states of Mo.
The initial two resolved peaks at lower binding energies of 231.6 eV and 228.5 eV could be ascribed
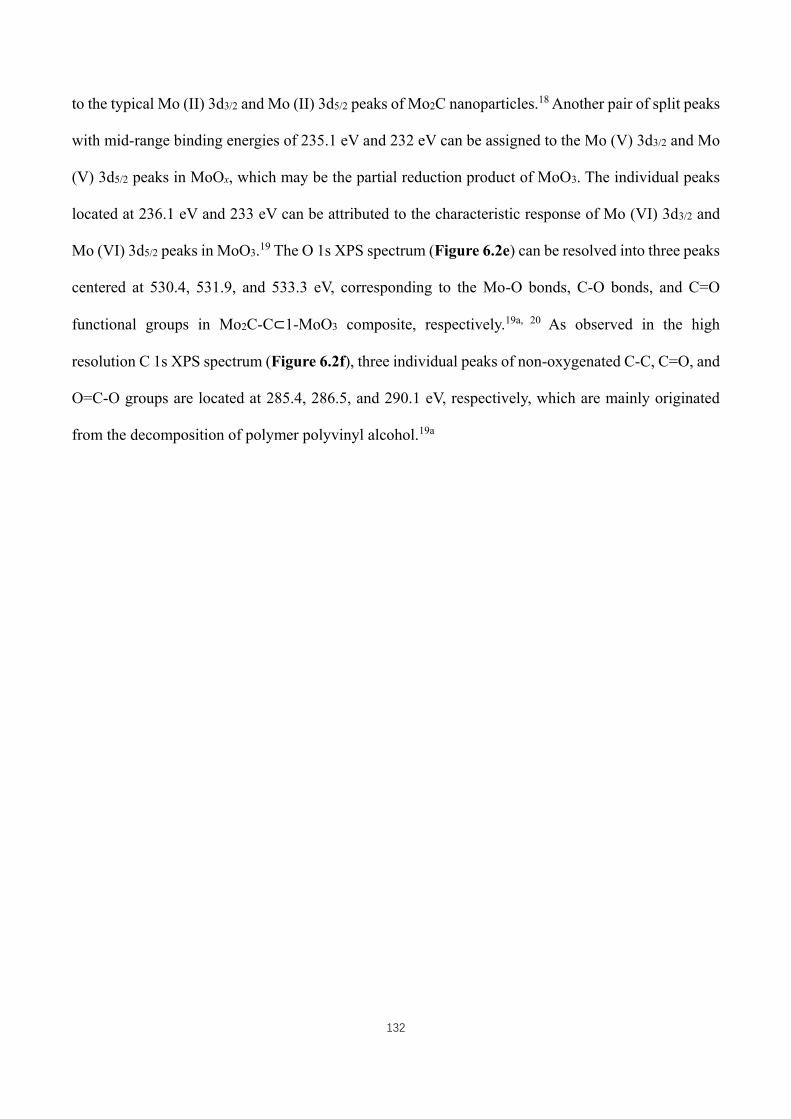
132
to the typical Mo (II) 3d3/2 and Mo (II) 3d5/2 peaks of Mo2C nanoparticles.18 Another pair of split peaks
with mid-range binding energies of 235.1 eV and 232 eV can be assigned to the Mo (V) 3d3/2 and Mo
(V) 3d5/2 peaks in MoOx, which may be the partial reduction product of MoO3. The individual peaks
located at 236.1 eV and 233 eV can be attributed to the characteristic response of Mo (VI) 3d3/2 and
Mo (VI) 3d5/2 peaks in MoO3.19 The O 1s XPS spectrum (Figure 6.2e) can be resolved into three peaks
centered at 530.4, 531.9, and 533.3 eV, corresponding to the Mo-O bonds, C-O bonds, and C=O
functional groups in Mo2C-C⊂1-MoO3 composite, respectively.19a, 20 As observed in the high
resolution C 1s XPS spectrum (Figure 6.2f), three individual peaks of non-oxygenated C-C, C=O, and
O=C-O groups are located at 285.4, 286.5, and 290.1 eV, respectively, which are mainly originated
from the decomposition of polymer polyvinyl alcohol.19a
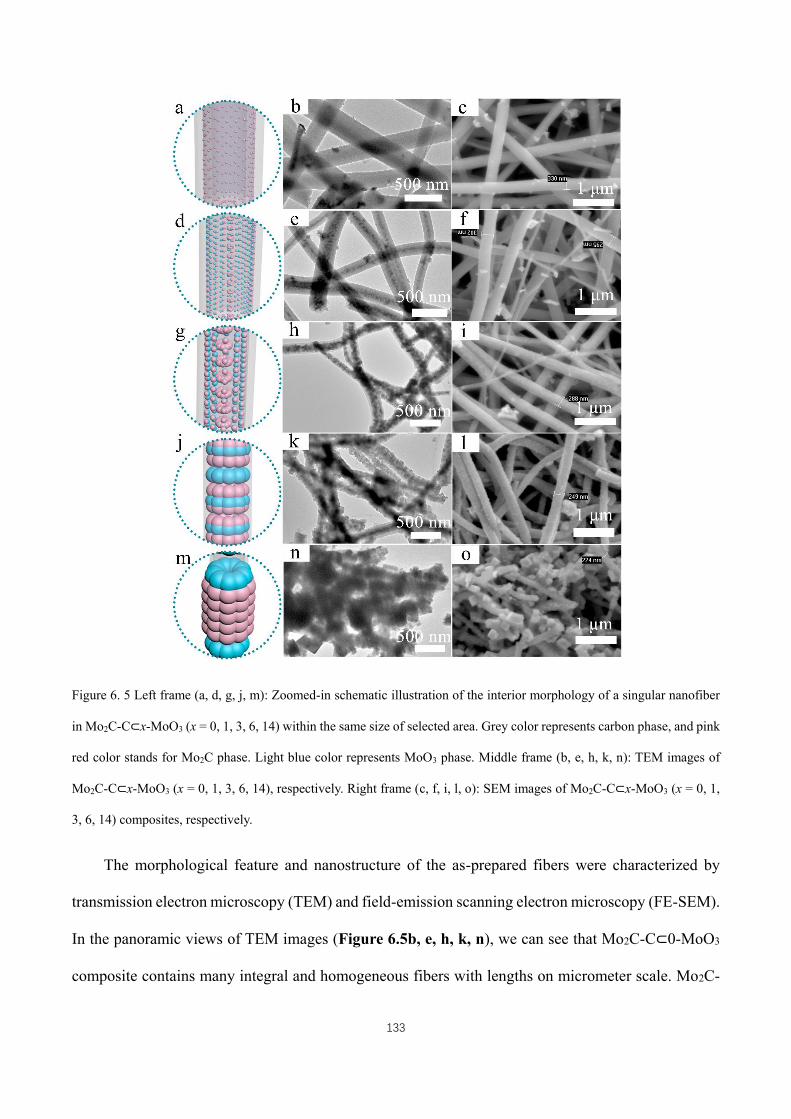
133
Figure 6. 5 Left frame (a, d, g, j, m): Zoomed-in schematic illustration of the interior morphology of a singular nanofiber
in Mo2C-C⊂x-MoO3 (x = 0, 1, 3, 6, 14) within the same size of selected area. Grey color represents carbon phase, and pink
red color stands for Mo2C phase. Light blue color represents MoO3 phase. Middle frame (b, e, h, k, n): TEM images of
Mo2C-C⊂x-MoO3 (x = 0, 1, 3, 6, 14), respectively. Right frame (c, f, i, l, o): SEM images of Mo2C-C⊂x-MoO3 (x = 0, 1,
3, 6, 14) composites, respectively.
The morphological feature and nanostructure of the as-prepared fibers were characterized by
transmission electron microscopy (TEM) and field-emission scanning electron microscopy (FE-SEM).
In the panoramic views of TEM images (Figure 6.5b, e, h, k, n), we can see that Mo2C-C⊂0-MoO3
composite contains many integral and homogeneous fibers with lengths on micrometer scale. Mo2C-
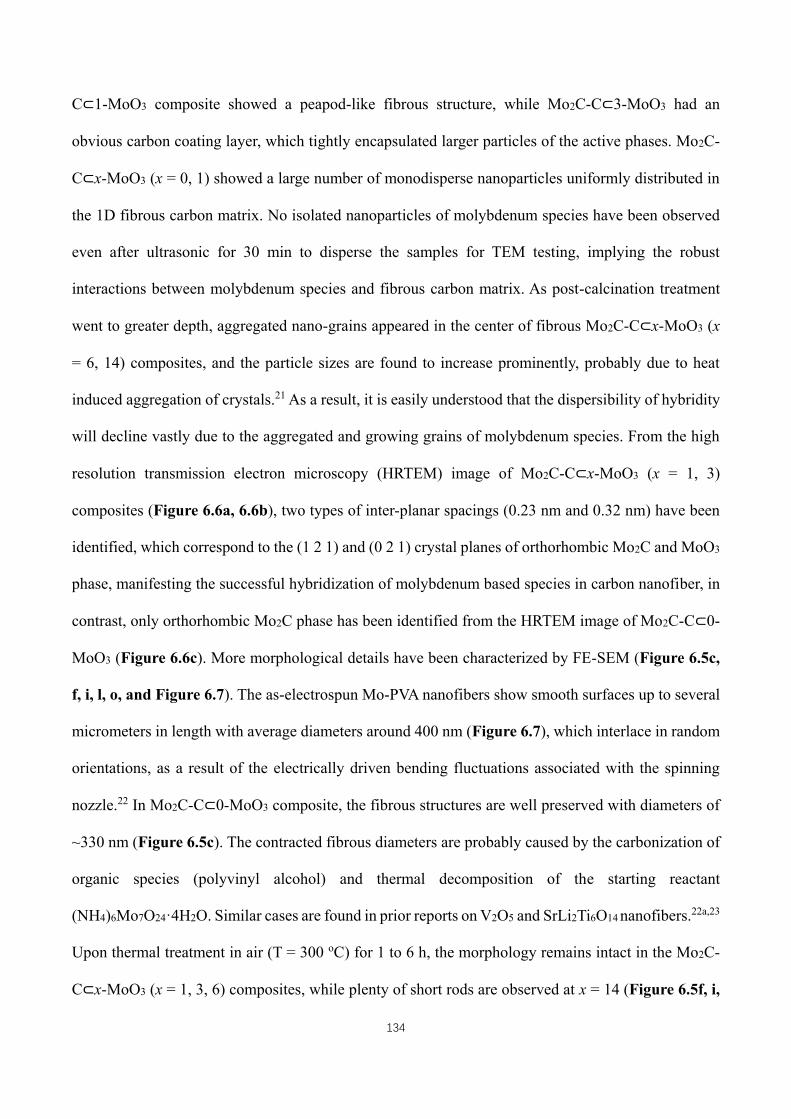
134
C⊂1-MoO3 composite showed a peapod-like fibrous structure, while Mo2C-C⊂3-MoO3 had an
obvious carbon coating layer, which tightly encapsulated larger particles of the active phases. Mo2C-
C⊂x-MoO3 (x = 0, 1) showed a large number of monodisperse nanoparticles uniformly distributed in
the 1D fibrous carbon matrix. No isolated nanoparticles of molybdenum species have been observed
even after ultrasonic for 30 min to disperse the samples for TEM testing, implying the robust
interactions between molybdenum species and fibrous carbon matrix. As post-calcination treatment
went to greater depth, aggregated nano-grains appeared in the center of fibrous Mo2C-C⊂x-MoO3 (x
= 6, 14) composites, and the particle sizes are found to increase prominently, probably due to heat
induced aggregation of crystals.21 As a result, it is easily understood that the dispersibility of hybridity
will decline vastly due to the aggregated and growing grains of molybdenum species. From the high
resolution transmission electron microscopy (HRTEM) image of Mo2C-C⊂x-MoO3 (x = 1, 3)
composites (Figure 6.6a, 6.6b), two types of inter-planar spacings (0.23 nm and 0.32 nm) have been
identified, which correspond to the (1 2 1) and (0 2 1) crystal planes of orthorhombic Mo2C and MoO3
phase, manifesting the successful hybridization of molybdenum based species in carbon nanofiber, in
contrast, only orthorhombic Mo2C phase has been identified from the HRTEM image of Mo2C-C⊂0-
MoO3 (Figure 6.6c). More morphological details have been characterized by FE-SEM (Figure 6.5c,
f, i, l, o, and Figure 6.7). The as-electrospun Mo-PVA nanofibers show smooth surfaces up to several
micrometers in length with average diameters around 400 nm (Figure 6.7), which interlace in random
orientations, as a result of the electrically driven bending fluctuations associated with the spinning
nozzle.22 In Mo2C-C⊂0-MoO3 composite, the fibrous structures are well preserved with diameters of
~330 nm (Figure 6.5c). The contracted fibrous diameters are probably caused by the carbonization of
organic species (polyvinyl alcohol) and thermal decomposition of the starting reactant
(NH4)6Mo7O24·4H2O. Similar cases are found in prior reports on V2O5 and SrLi2Ti6O14 nanofibers.22a,23
Upon thermal treatment in air (T = 300 oC) for 1 to 6 h, the morphology remains intact in the Mo2C-
C⊂x-MoO3 (x = 1, 3, 6) composites, while plenty of short rods are observed at x = 14 (Figure 6.5f, i,
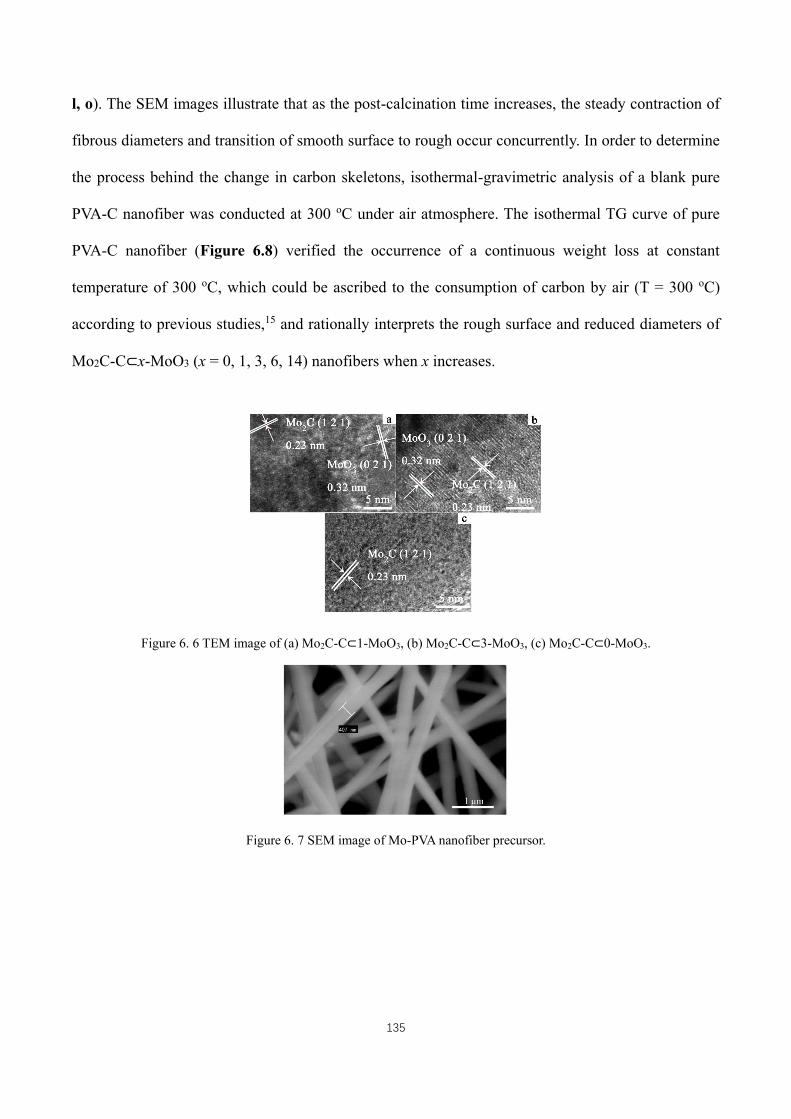
135
l, o). The SEM images illustrate that as the post-calcination time increases, the steady contraction of
fibrous diameters and transition of smooth surface to rough occur concurrently. In order to determine
the process behind the change in carbon skeletons, isothermal-gravimetric analysis of a blank pure
PVA-C nanofiber was conducted at 300 oC under air atmosphere. The isothermal TG curve of pure
PVA-C nanofiber (Figure 6.8) verified the occurrence of a continuous weight loss at constant
temperature of 300 oC, which could be ascribed to the consumption of carbon by air (T = 300 oC)
according to previous studies,15 and rationally interprets the rough surface and reduced diameters of
Mo2C-C⊂x-MoO3 (x = 0, 1, 3, 6, 14) nanofibers when x increases.
Figure 6. 6 TEM image of (a) Mo2C-C⊂1-MoO3, (b) Mo2C-C⊂3-MoO3, (c) Mo2C-C⊂0-MoO3.
Figure 6. 7 SEM image of Mo-PVA nanofiber precursor.
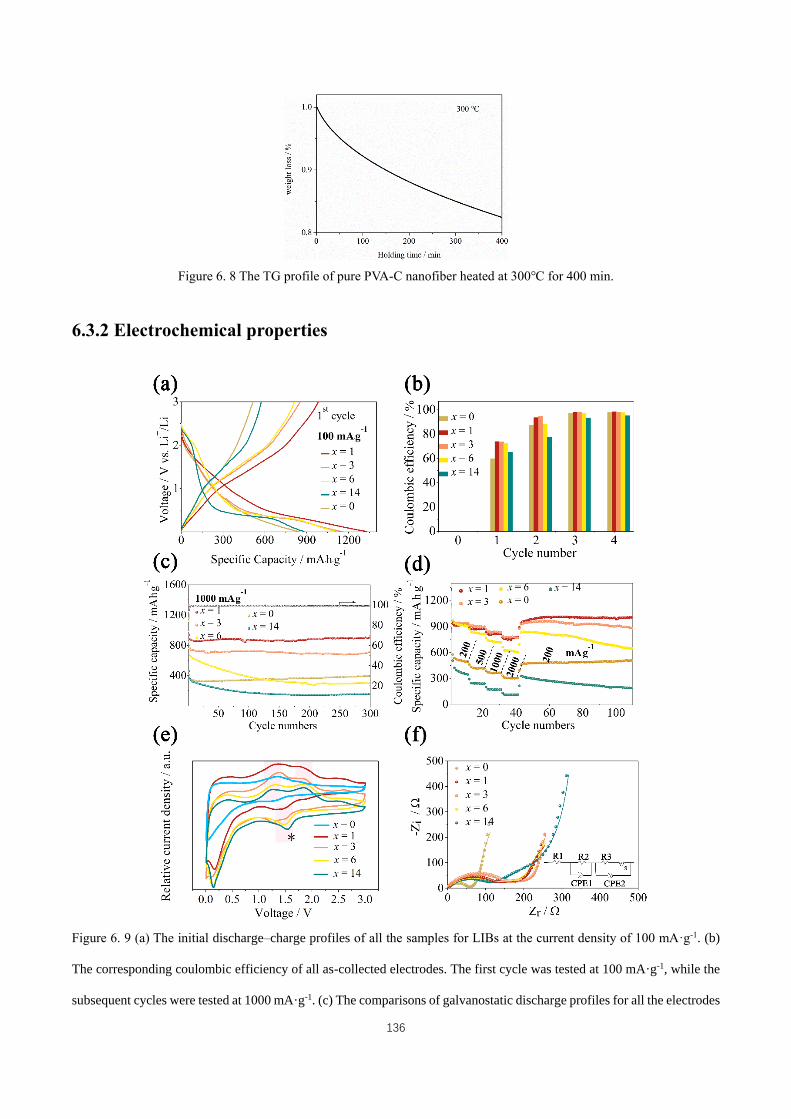
136
Figure 6. 8 The TG profile of pure PVA-C nanofiber heated at 300℃ for 400 min.
6.3.2 Electrochemical properties
Figure 6. 9 (a) The initial discharge–charge profiles of all the samples for LIBs at the current density of 100 mA·g-1. (b)
The corresponding coulombic efficiency of all as-collected electrodes. The first cycle was tested at 100 mA·g-1, while the
subsequent cycles were tested at 1000 mA·g-1. (c) The comparisons of galvanostatic discharge profiles for all the electrodes
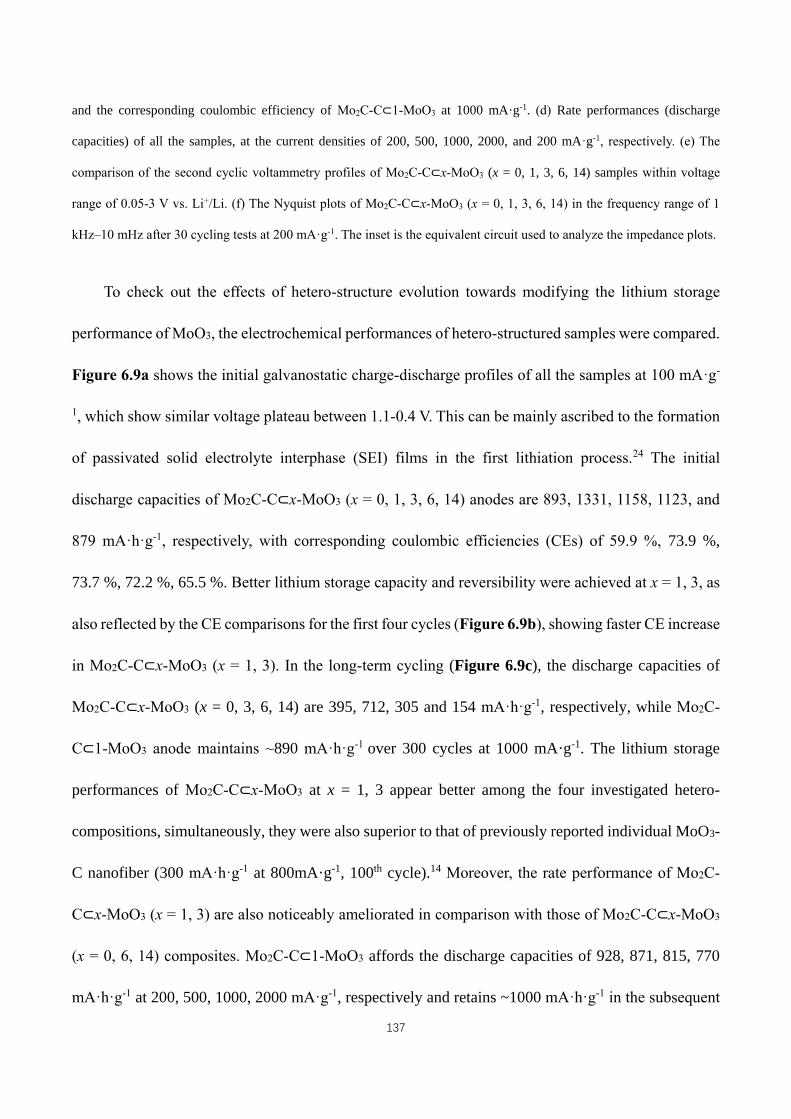
137
and the corresponding coulombic efficiency of Mo2C-C⊂1-MoO3 at 1000 mA·g-1. (d) Rate performances (discharge
capacities) of all the samples, at the current densities of 200, 500, 1000, 2000, and 200 mA·g-1, respectively. (e) The
comparison of the second cyclic voltammetry profiles of Mo2C-C⊂x-MoO3 (x = 0, 1, 3, 6, 14) samples within voltage
range of 0.05-3 V vs. Li+/Li. (f) The Nyquist plots of Mo2C-C⊂x-MoO3 (x = 0, 1, 3, 6, 14) in the frequency range of 1
kHz–10 mHz after 30 cycling tests at 200 mA·g-1. The inset is the equivalent circuit used to analyze the impedance plots.
To check out the effects of hetero-structure evolution towards modifying the lithium storage
performance of MoO3, the electrochemical performances of hetero-structured samples were compared.
Figure 6.9a shows the initial galvanostatic charge-discharge profiles of all the samples at 100 mA·g-
1, which show similar voltage plateau between 1.1-0.4 V. This can be mainly ascribed to the formation
of passivated solid electrolyte interphase (SEI) films in the first lithiation process.24 The initial
discharge capacities of Mo2C-C⊂x-MoO3 (x = 0, 1, 3, 6, 14) anodes are 893, 1331, 1158, 1123, and
879 mA·h·g-1, respectively, with corresponding coulombic efficiencies (CEs) of 59.9 %, 73.9 %,
73.7 %, 72.2 %, 65.5 %. Better lithium storage capacity and reversibility were achieved at x = 1, 3, as
also reflected by the CE comparisons for the first four cycles (Figure 6.9b), showing faster CE increase
in Mo2C-C⊂x-MoO3 (x = 1, 3). In the long-term cycling (Figure 6.9c), the discharge capacities of
Mo2C-C⊂x-MoO3 (x = 0, 3, 6, 14) are 395, 712, 305 and 154 mA·h·g-1, respectively, while Mo2C-
C⊂1-MoO3 anode maintains ~890 mA·h·g-1 over 300 cycles at 1000 mA·g-1. The lithium storage
performances of Mo2C-C⊂x-MoO3 at x = 1, 3 appear better among the four investigated hetero-
compositions, simultaneously, they were also superior to that of previously reported individual MoO3-
C nanofiber (300 mA·h·g-1 at 800mA·g-1, 100th cycle).14 Moreover, the rate performance of Mo2C-
C⊂x-MoO3 (x = 1, 3) are also noticeably ameliorated in comparison with those of Mo2C-C⊂x-MoO3
(x = 0, 6, 14) composites. Mo2C-C⊂1-MoO3 affords the discharge capacities of 928, 871, 815, 770
mA·h·g-1 at 200, 500, 1000, 2000 mA·g-1, respectively and retains ~1000 mA·h·g-1 in the subsequent
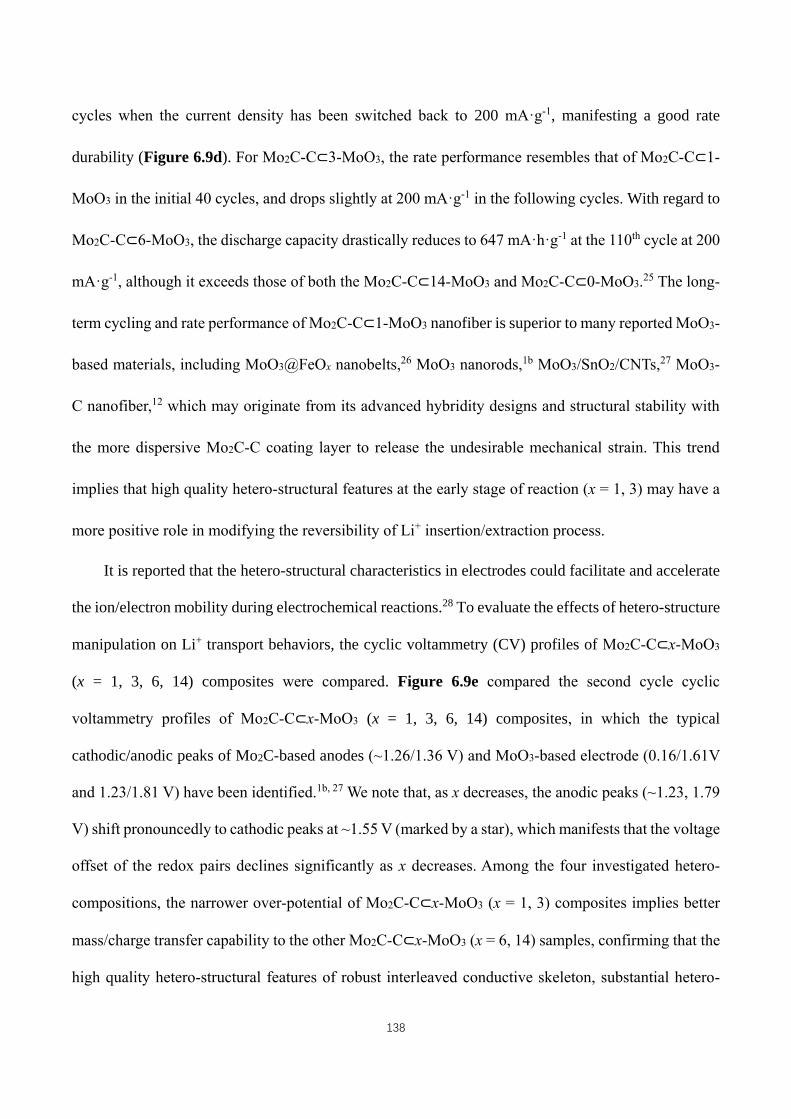
138
cycles when the current density has been switched back to 200 mA·g-1, manifesting a good rate
durability (Figure 6.9d). For Mo2C-C⊂3-MoO3, the rate performance resembles that of Mo2C-C⊂1-
MoO3 in the initial 40 cycles, and drops slightly at 200 mA·g-1 in the following cycles. With regard to
Mo2C-C⊂6-MoO3, the discharge capacity drastically reduces to 647 mA·h·g-1 at the 110th cycle at 200
mA·g-1, although it exceeds those of both the Mo2C-C⊂14-MoO3 and Mo2C-C⊂0-MoO3.25 The long-
term cycling and rate performance of Mo2C-C⊂1-MoO3 nanofiber is superior to many reported MoO3-
based materials, including MoO3@FeOx nanobelts,26 MoO3 nanorods,1b MoO3/SnO2/CNTs,27 MoO3-
C nanofiber,12 which may originate from its advanced hybridity designs and structural stability with
the more dispersive Mo2C-C coating layer to release the undesirable mechanical strain. This trend
implies that high quality hetero-structural features at the early stage of reaction (x = 1, 3) may have a
more positive role in modifying the reversibility of Li+ insertion/extraction process.
It is reported that the hetero-structural characteristics in electrodes could facilitate and accelerate
the ion/electron mobility during electrochemical reactions.28 To evaluate the effects of hetero-structure
manipulation on Li+ transport behaviors, the cyclic voltammetry (CV) profiles of Mo2C-C⊂x-MoO3
(x = 1, 3, 6, 14) composites were compared. Figure 6.9e compared the second cycle cyclic
voltammetry profiles of Mo2C-C⊂x-MoO3 (x = 1, 3, 6, 14) composites, in which the typical
cathodic/anodic peaks of Mo2C-based anodes (~1.26/1.36 V) and MoO3-based electrode (0.16/1.61V
and 1.23/1.81 V) have been identified.1b, 27 We note that, as x decreases, the anodic peaks (~1.23, 1.79
V) shift pronouncedly to cathodic peaks at ~1.55 V (marked by a star), which manifests that the voltage
offset of the redox pairs declines significantly as x decreases. Among the four investigated hetero-
compositions, the narrower over-potential of Mo2C-C⊂x-MoO3 (x = 1, 3) composites implies better
mass/charge transfer capability to the other Mo2C-C⊂x-MoO3 (x = 6, 14) samples, confirming that the
high quality hetero-structural features of robust interleaved conductive skeleton, substantial hetero-
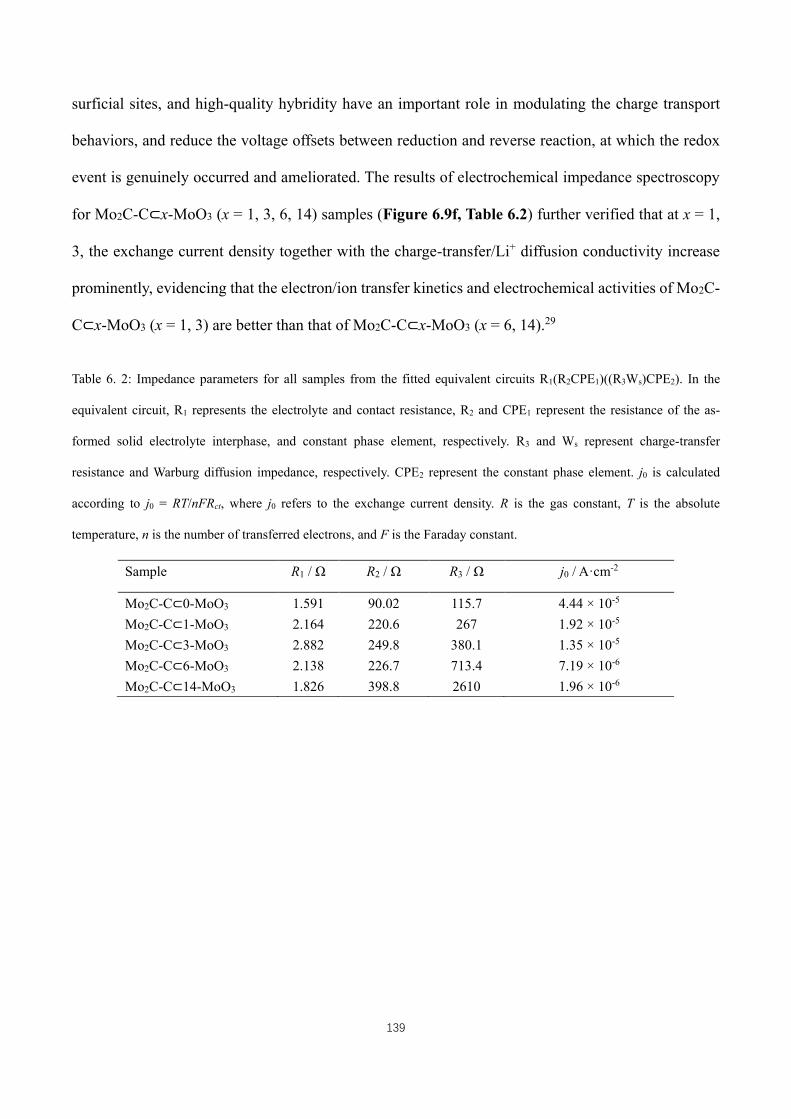
139
surficial sites, and high-quality hybridity have an important role in modulating the charge transport
behaviors, and reduce the voltage offsets between reduction and reverse reaction, at which the redox
event is genuinely occurred and ameliorated. The results of electrochemical impedance spectroscopy
for Mo2C-C⊂x-MoO3 (x = 1, 3, 6, 14) samples (Figure 6.9f, Table 6.2) further verified that at x = 1,
3, the exchange current density together with the charge-transfer/Li+ diffusion conductivity increase
prominently, evidencing that the electron/ion transfer kinetics and electrochemical activities of Mo2C-
C⊂x-MoO3 (x = 1, 3) are better than that of Mo2C-C⊂x-MoO3 (x = 6, 14).29
Table 6. 2: Impedance parameters for all samples from the fitted equivalent circuits R1(R2CPE1)((R3Ws)CPE2). In the
equivalent circuit, R1 represents the electrolyte and contact resistance, R2 and CPE1 represent the resistance of the as-
formed solid electrolyte interphase, and constant phase element, respectively. R3 and Ws represent charge-transfer
resistance and Warburg diffusion impedance, respectively. CPE2 represent the constant phase element. j0 is calculated
according to j0 = RT/nFRct, where j0 refers to the exchange current density. R is the gas constant, T is the absolute
temperature, n is the number of transferred electrons, and F is the Faraday constant.
Sample R1 / Ω R2 / Ω R3 / Ω j0 / A·cm-2
Mo2C-C⊂0-MoO3 1.591 90.02 115.7 4.44 × 10⁻⁵
Mo2C-C⊂1-MoO3 2.164 220.6 267 1.92 × 10⁻⁵
Mo2C-C⊂3-MoO3 2.882 249.8 380.1 1.35 × 10⁻⁵
Mo2C-C⊂6-MoO3 2.138 226.7 713.4 7.19 × 10⁻⁶
Mo2C-C⊂14-MoO3 1.826 398.8 2610 1.96 × 10⁻⁶

140
Figure 6. 10 TEM images of (a, b) Mo2C-C⊂1-MoO3, (c, d) Mo2C-C⊂3-MoO3, (e) Mo2C-C⊂6-MoO3, (f) Mo2C-C⊂14-
MoO3 after 30 cycles at 200 mA·g-1.
Furthermore, the hetero-structures of Mo2C-C⊂x-MoO3 (x = 1, 3, 6) electrodes have been well
maintained after repeated cycle testing, showing intact fibrous structures (Figure 6.10a-e), while that
of Mo2C-C⊂14-MoO3 aggregated severely after cycling tests (Figure 6.10f), implying that Mo2C-
C⊂x-MoO3 hetero-electrode at lower value of x is more robust to accommodate repeated volume
changes during electrochemical reactions. Based on the above analysis, Mo2C-C⊂x-MoO3 designs at
lower x (e.g. x = 1, 3) has more advantageous structural features such as robust conductive skeleton,
high quality hybridity, and substantial hetero-surficial sites, which could give rise to high intrinsic
electronic conductivity and facilitated lithium ion mobility in Mo2C-C⊂x-MoO3. The structural
features are reminiscent of several pioneering work, which have shown that with the introduction of
hybridity designs, lopsided charge distribution could be induced in the interior of electrodes. The
unbalanced charge distribution could further engender the formation of inbuilt electric field at
heterojunctions, and contributes to accelerating the ion diffusion/electron transfer among the active
phases.5-7 Based on the above analysis and the as-verified high-rate capability/enhanced
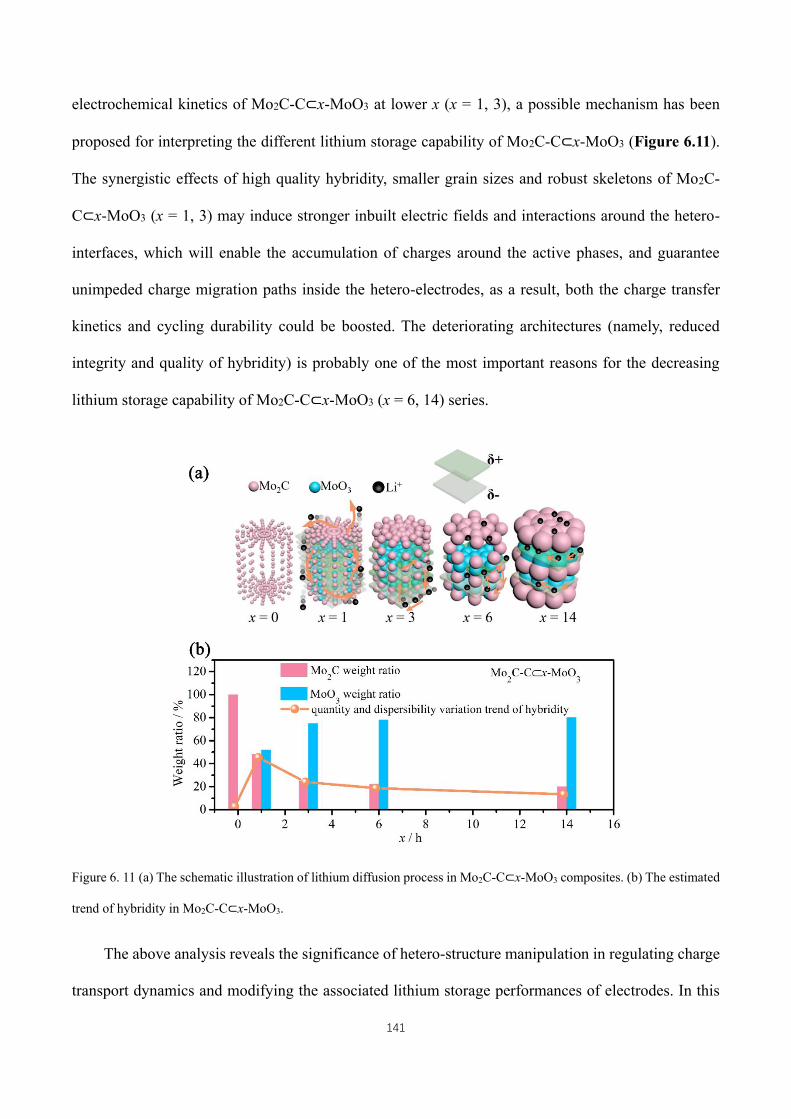
141
electrochemical kinetics of Mo2C-C⊂x-MoO3 at lower x (x = 1, 3), a possible mechanism has been
proposed for interpreting the different lithium storage capability of Mo2C-C⊂x-MoO3 (Figure 6.11).
The synergistic effects of high quality hybridity, smaller grain sizes and robust skeletons of Mo2C-
C⊂x-MoO3 (x = 1, 3) may induce stronger inbuilt electric fields and interactions around the hetero-
interfaces, which will enable the accumulation of charges around the active phases, and guarantee
unimpeded charge migration paths inside the hetero-electrodes, as a result, both the charge transfer
kinetics and cycling durability could be boosted. The deteriorating architectures (namely, reduced
integrity and quality of hybridity) is probably one of the most important reasons for the decreasing
lithium storage capability of Mo2C-C⊂x-MoO3 (x = 6, 14) series.
Figure 6. 11 (a) The schematic illustration of lithium diffusion process in Mo2C-C⊂x-MoO3 composites. (b) The estimated
trend of hybridity in Mo2C-C⊂x-MoO3.
The above analysis reveals the significance of hetero-structure manipulation in regulating charge
transport dynamics and modifying the associated lithium storage performances of electrodes. In this
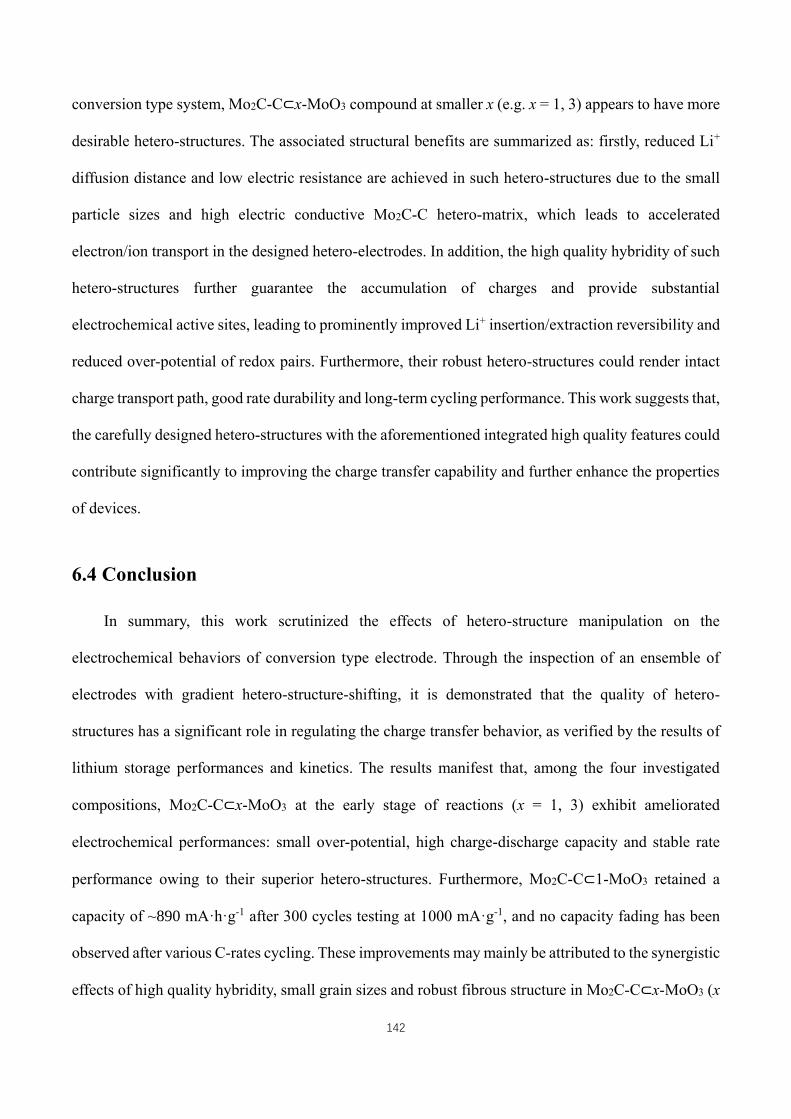
142
conversion type system, Mo2C-C⊂x-MoO3 compound at smaller x (e.g. x = 1, 3) appears to have more
desirable hetero-structures. The associated structural benefits are summarized as: firstly, reduced Li+
diffusion distance and low electric resistance are achieved in such hetero-structures due to the small
particle sizes and high electric conductive Mo2C-C hetero-matrix, which leads to accelerated
electron/ion transport in the designed hetero-electrodes. In addition, the high quality hybridity of such
hetero-structures further guarantee the accumulation of charges and provide substantial
electrochemical active sites, leading to prominently improved Li+ insertion/extraction reversibility and
reduced over-potential of redox pairs. Furthermore, their robust hetero-structures could render intact
charge transport path, good rate durability and long-term cycling performance. This work suggests that,
the carefully designed hetero-structures with the aforementioned integrated high quality features could
contribute significantly to improving the charge transfer capability and further enhance the properties
of devices.
6.4 Conclusion
In summary, this work scrutinized the effects of hetero-structure manipulation on the
electrochemical behaviors of conversion type electrode. Through the inspection of an ensemble of
electrodes with gradient hetero-structure-shifting, it is demonstrated that the quality of hetero-
structures has a significant role in regulating the charge transfer behavior, as verified by the results of
lithium storage performances and kinetics. The results manifest that, among the four investigated
compositions, Mo2C-C⊂x-MoO3 at the early stage of reactions (x = 1, 3) exhibit ameliorated
electrochemical performances: small over-potential, high charge-discharge capacity and stable rate
performance owing to their superior hetero-structures. Furthermore, Mo2C-C⊂1-MoO3 retained a
capacity of ~890 mA·h·g-1 after 300 cycles testing at 1000 mA·g-1, and no capacity fading has been
observed after various C-rates cycling. These improvements may mainly be attributed to the synergistic
effects of high quality hybridity, small grain sizes and robust fibrous structure in Mo2C-C⊂x-MoO3 (x
143
= 1, 3), which have significantly facilitated the electron and ion transfer among the active phase, as
well as enhancing the cycling stability of electrodes. Compositions with such high quality hetero-
structural features shed light on better ameliorating electrodes for advanced batteries and devices in
other fields and further promoting the round-trip efficiency for batteries employing electrodes via
conversion reactions.
6.5 References
[1] (a) K. Rui, Z. Y. Wen, Y. Lu, J. Jin, C. Shen, Adv. Energy Mater. 2015, 5, 1401716. (b) J. Ding, S. A. Abbas, C.
Hanmandlu, L. Lin, C. S. Lai, P. C. Wang, et al. J. Power Sources 2017, 348, 270. (c) T. Zhou, Y. Zheng, H. Gao, S. Min,
S. Li, H. Liu, et al. Adv. Sci. 2015, 2, 1500027. (d) Y. Zheng, T. Zhou, X. Zhao, W. Pang, H. Gao, S. Li, et al. Adv. Mater.
2017, 29, 1700396. (e) D. Li, H. Wang, T. Zhou, W. Zhang, H. K. Liu, Z. Guo, Adv. Energy Mater. 2017, 7, 1700488. (f)
J. B. Goodenough, Y. Kim, Chem. Mater. 2009, 22, 587.
(g) B. L. Ellis, K. T. Lee, L. F. Nazar, Chem. Mater. 2010, 22, 691. (h) P. G. Bruce, B. Scrosati, J. M. Tarascon, Angew.
Chem., Int. Ed. 2008, 47, 2930. (i) M. Dresselhaus, I. Thomas, Nature 2001, 414, 332. (j) L. Shen, E. Uchaker, X. Zhang,
G. Cao, Adv. Mater. 2012, 24, 6502. (k) X. Zhou, L. J. Wan, Y. Guo, Nanoscale 2012, 4, 5868-5871. (l) M. Reddy, G.
Subba Rao, B. Chowdari, Chem. Rev. 2013, 113, 5364. (m) C. M. Park, J. H. Kim, H. Kim, H. J. Sohn, Chem. Soc. Rev.
2010, 39, 3115-3141. (n) S. Xiong, J. Chen, X. Lou, H. Zeng, Adv. Funct. Mater. 2012, 22, 861. (o) J. Cabana, L.
Monconduit, D. Larcher, M. R. Palacin, Adv. Mater. 2010, 22, E170. (p) K. Cao, L. Jiao, H. Liu, Y. Liu, Y. Wang, Z. Guo,
H. Yuan, Adv. Energy Mater. 2015, 5, 1401421.
[2] (a) S. H. Yu, S. H. Lee, D. J. Lee, Y. E. Sung, T. Hyeon, Small 2016, 12, 2146. (b) K. Cao, T. Jin, L. Yang, L. Jiao,
Mater. Chem. Front. 2017, 1, 2213. (c) R. Malini, U. Uma, T. Sheela, M. Ganesan, N.G. Renganathan, Ionics 2008, 15,
301. (d) Y. Cao, Y. Yang, Z. Ren, N. Jian, M. Gao, Y. Wu, M. Zhu, F. Pan, Y. Liu, H. Pan, Adv. Funct. Mater. 2017, 27,
1700342. (e) Z. Yang, K. Qian, J. Lv, W. Yan, J. Liu, J. Ai, Y. Zhang, T. Guo, X. Zhou, S. Xu, Z. Guo, Sci. Rep. 2016,
144
6, 27957.
[3] Y. Wu, Nat. Electronics 2018, 1, 331.
[4] J. Wang, J. Liu, H. Yang, D. Chao, J. Yan, S. V. Savilov, J. Lin, Z. X. Shen, Nano Energy 2016, 20, 1.
[5] D. K. Bediako, M. Rezaee, H. Yoo, D. T. Larson, S. Y. F. Zhao, T. Taniguchi, et al. Nature 2018, 558, 425.
[6] Y. Liu, J. N. B. Rodrigues, Y. Z. Luo, L. Li, A. Carvalho, M. Yang, et al. Nat. Nanotechnol. 2018, 13, 828.
[7] T. Yang, B. Zheng, Z. Wang, T. Xu, C. Pan, J. Zou, et al. Nat. Commun. 2017, 8, 1906.
[8] (a) D. Yan, X. Luo, H. Zhang, G. Zhu, L. Chen, G. Chen, et al. J. Alloys Compd. 2016, 688, 481. (b) M. Santos-
Beltrán, F. Paraguay-Delgado, A. Santos-Beltrán, L. Fuentes, J. Alloys Compd. 2015, 648, 445. (c) L. Zhou, L. Yang, P.
Yuan, J. Zou, Y. Wu, C. Yu, J. Phys. Chem. C 2010, 114, 21868. (d) P. Meduri, E. Clark, J. H. Kim, E. Dayalan, G. U.
Sumanasekera, Nano Lett. 2012, 12, 1784. (e) L. Cai, P. M. Rao, X. Zheng, Nano Lett. 2011, 11, 872. (f) D. Zhang, Y.
Zhou, J. Cuan, N. Gan, CrystEngComm 2018, 20, 1264. (g) J. Chen, Y. L. Cheah, S. Madhavi, X. Lou, J. Phys. Chem. C
2010, 114, 8675. (h) M. A. Ibrahem, F. Y. Wu, D. A. Mengistie, C. S. Chang, L. J. Li, C. W. Chu, Nanoscale 2014, 6, 5484.
(i) J. Zhou, N. Lin, L. Wang, K. Zhang, Y. Zhu, Y. Qian, J. Mater. Chem. A 2015, 3, 7463. (j) D. Mariotti, H. Lindström, A.
C. Bose, K. K. Ostrikov, Nanotechnology 2008, 19, 495302. (k) K. Dewangan, N. N. Sinha, P. K. Sharma, A. C. Pandey,
N. Munichandraiah, N. Gajbhiye, CrystEngComm 2011, 13, 927.
[9] (a) X. Chen, Y. Huang, K. Zhang, Electrochim. Acta 2016, 222, 956. (b) M. F. Hassan, Z. Guo, Z. Chen, H. Liu, J.
Power Sources 2010, 195, 2372.
[10] (a) H. Li, M. Liang, W. Sun, Y. Wang, Adv. Funct. Mater. 2016, 26, 1098. (b) W. Pang, S. Kalluri, V. K. Peterson, S.
Dou, Z. Guo, Phys. Chem. Chem. Phys. 2014, 16, 25377. (c) J. Jiang, Y. Li, J. Liu, X. Huang, C. Yuan, X. Lou, Adv. Mater.
2012, 24, 5166. (d) L. Liu, H. Guo, J. Liu, F. Qian, C. Zhang, T. Li, W. Chen, X. Yang, Y. Guo, Chem. Commun. 2014, 50,
9485.
[11] P. J. Lu, M. Lei, J. Liu, CrystEngComm 2014, 16, 6745.
145
[12] X. Li, J. Xu, L. Mei, Z. Zhang, C. Cui, H. Liu, J. Ma, S. Dou, J. Mater. Chem. A 2015, 3, 3257.
[13] Y. N. Ko, S. B. Park, K. Y. Jung, Y. C. Kang, Nano Lett. 2013, 13, 5462.
[14] G. Wang, J. Ni, H. Wang, L. Gao, J. Mater. Chem. A 2013, 1, 4112.
[15] Y. Luo, Z. Wang, Y. Fu, C. Jin, Q. Wei, R. Yang, J. Mater. Chem. A 2016, 4, 12583.
[16] (a) N. Kalaiselvi, A. Manthiram, J. Power Sources 2010, 195, 2894. (b) Y. Zhu, S. Wang, Y. Zhong, R. Cai, L. Li, Z.
Shao, J. Power Sources 2016, 307, 552. (c) Y. Cheng, L. Huang, X. Xiao, B. Yao, L. Yuan, T. Li, Z. Hu, B. Wang, J. Wan,
J. Zhou, Nano Energy 2015, 15, 66.
[17] H. Li, Y. Su, W. Sun, Y. Wang, Adv. Funct. Mater. 2016, 26, 8345.
[18] J. Chi, K. Yan, W. Gao, B. Dong, X. Shang, Y. Liu, et al. J. Alloys Compd. 2017, 714, 26.
[19] (a) F. Ruiz, Z. Benzo, A. Garaboto, V. León, F. Ruette, A. Albornoz, J.L. Brito, Spectrochim. Acta, Part B 2017, 133,
1. (b) Y. Sun, J. Wang, B. Zhao, R. Cai, R. Ran, Z. Shao, J. Mater. Chem. A 2013, 1, 4736. (c) Z. Wu, W. Lei, J. Wang, R.
Liu, K. Xia, C. Xuan, D. Wang, ACS Appl. Mater. Interfaces 2017, 9, 12366.
[20] Q. Gao, X. Zhao, Y. Xiao, D. Zhao, M. Cao, Nanoscale 2014, 6, 6151.
[21] (a) A. A. Kharieky, K. R. E. Saraee, W. Strek, J. Lumin. 2017, 190, 443. (b) J. Lee, S. Y. Kwak, Cryst. Growth Des.
2017, 17, 4496.
[22] (a) H. Li, L. Shen, B. Ding, G. Pang, H. Dou, X. Zhang, Nano Energy 2015, 13, 18. (b) A. S. Arico, P. Bruce, B.
Scrosati, J. M. Tarascon, W. V. Schalkwijk, Nat. Mater. 2005, 4, 366.
[23] P. Viswanathamurthi, Scr. Mater. 2003, 49, 577.
[24] (a) P. Wang, Z. Cheng, G. Lv, L. Qu, Y. Zhao, Nanoscale 2017, 10, 396. (b) M. Ihsan, H. Wang, S. R. Majid, J. Yang,
S. J. Kennedy, Z. Guo, H. K. Liu, Carbon 2016, 96, 1200.
[25] W. Tian, H. Hu, Y. Wang, P. Li, J. Liu, J. Liu, X. Wang, X. Xu, Z. Li, Q. Zhao, ACS nano 2018, 12, 1990.
[26] Y. Yao, N. Xu, D. Guan, J. Li, Z. Zhuang, L. Zhou, et al. ACS Appl. Mater. Interfaces 2017, 9, 39425.

146
[27] D. Cao, H. Gu, C. Xie, B. Li, H. Wang, C. Niu, J. Colloid Interface Sci. 2017, 504, 230.
[28] (a) Y. Zheng, T. Zhou, C. Zhang, J. Mao, H. Liu, Z. Guo, Angew. Chem. 2016, 125, 3469. (b) X. Chang, T. Wang, P.
Zhang, J. Zhang, A. Li, J. Gong, J. Am. Chem. Soc. 2015, 137, 8356. (c) J. Wang, Y. Zhou, Z. Shao, Electrochim. Acta 2013,
97, 386.
[29] (a) A. Y. Kim, J. S. Kim, C. Hudaya, D. Xiao, D. Byun, L. Gu, et al. Carbon 2015, 94, 539. (b) G. Zhou, D. Wang, L.
Li, N. Li, F. Li, H. Cheng, Nanoscale 2013, 5, 1576.
147
CHAPTER 7 CONCLUSIONS AND OUTLOOK
7.1 General conclusions
This doctoral work studied the preparation, physical characterization, and electrochemical
behaviors and performances of different molybdenum based systems, including MoOC, MoO2, MoO3,
MoC, Mo2C etc. The investigations of these well-designed nanostructures provide a new perspective
to the current understanding of molybdenum oxides/carbides, involving the structural evolutions, and
correlative lithium storage kinetics and mechanisms. The electrochemical performances of Mo-based
electrode materials are highly dependent on key factors involving morphology, crystalline phase/ size,
surface areas, ion diffusion barrier and electric conductivity etc., which shed big influence on the Li+
transfer paths, lithium absorption sites/energy, and electrochemical reaction kinetics of electrode
materials. These as-prepared electrodes exhibited remarkable rate capability and durability, showing
negligible capacity decay. In particular, MoC-Mo2C-N-C and MoOC/MoO2-NCNW samples
delivered increased discharge capacities after different C-rates testing, implying their stable structures
and great potential for fast charge and discharge devices. The lithium storage mechanism of MoOC
was systematically investigated by in-operando synchrotron X-ray powder diffraction, which
demonstrated an excellent lithium storage reversibility of MoOC. These findings could broaden the
current knowledge and understanding of Mo-based anode family. The results of this doctoral work
have been summarized in the following sections.
A self-assembly route combined with subsequent reduction process was used to fabricate the
MoOC/MoO2-NCNW and MoO2-NCNW nanocomposites. A similar procedure has also been adopted
to synthesize the corresponding bulk MoOC/MoO2 and bulk MoO2 materials. In comparison with
single-component MoO2 composites, abundant oxygen vacancies were identified in the as-prepared
MoOC containing composites. The MoOC containing hetero-electrodes exhibited improved
148
electrochemical reactivity in the initial cycles in comparison with the single-component MoO2
composites. MoOC/MoO2-NCNW delivered remarkable discharge capacities of 907, 864, 782, 637,
516, 601, 728, 857 mA·h·g-1 under the current density of 0.5, 1, 2, 5, 10, 5, 2, 1 A·g-1, respectively.
After the current density was switched back to 0.5 A·g-1, the maintained capacity of MoOC/MoO2-
NCNW can approach 1156 mA·h·g-1. This superior electrochemical performance was mainly
attributed to the hierarchical structure of the MoOC/MoO2-NCNW composite, in which the N-doped
carbon network can function to accommodate the volume changes of the Mo-based active phase and
improve the entire electric conductivity. In comparison with MoO2, MoOC has better lithium storage
reversibility and a higher theoretical capacity (considering the higher Mo6+ oxidation valence), which
could ameliorate the electrochemical performance of MoO2 in the MoOC/MoO2-NCNW. The
presence of abundant oxygen vacancies could induce the unbalanced charge redistribution at the
hetero-interfaces, driven by this, the charge transfer kinetics of MoOC/MoO2-NCNW have been
significantly improved, leading to a boosted multi-electron reaction of MoO2-based electrodes.
Hetero-structured molybdenum carbides electrodes have been developed for lithium ion battery.
The as-prepared hetero-electrode employed MoC/Mo2C couple in the N-doped carbon nanowires, and
the ultra-small MoC/Mo2C nanoparticles were well distributed inside the carbon nanowire matrix,
forming high electric conductive path and abundant interface interplay sites. In particular, MoC-Mo2C-
hws anode showed excellent rate performance, and delivered discharge capacities of 647, 614, 569,
559, 525, 495 and 475 mA·h·g-1 at the current density of 500, 1000, 2000, 3000, 5000, 8000 and 10000
A·g-1, respectively. More impressively, after the C-rates testing, when the current density was switched
back to 500 mA·g-1, MoC-Mo2C-hws anode showed an excellent lithium storage reversibility and high
discharge capacity ~ 810 mA·h·g-1 over 380 cycles at 500 mA·g-1. The significantly improved
electrochemical performance of MoC-Mo2C-hws may mainly be attributed to the good electric
conductivity of the as-prepared molybdenum hetero-carbides and the synergistic effects between MoC
and Mo2C components. The results demonstrated that the carefully designed carbide hetero-structures
149
with good rate durability could endow the high electric conductive family as promising anode materials
for lithium ion battery.
A series of Mo2C-C⊂x-MoO3 (x = 0, 1, 3, 6, 14) nanocomposites were fabricated through a facile
electrospinning method with a subsequent calcination. The carbon encapsulation through an
electrospinning technique is anticipated to engender better carbon distribution of the active phases and
enable a high affinity between each components of the composites, which could enhance the
electrochemical performance. The Mo2C-C⊂x-MoO3 (x = 1, 3, 6, 14) composites showed reduced
voltage hysteresis and over-potential as x decreases, illustrating an interesting dependence of voltage
hysteresis on hetero-structures. The obtained Mo2C-C⊂1-MoO3 hetero-electrode exhibited the best
charge and discharge performance, affording a retained discharge capacity of ~ 901 mA·h·g-1 over 300
cycles at 1000 mA·g-1 and ultra-stable rate cycling. It was demonstrated that the interfacial interplay
between MoO3 and Mo2C component plays an important role in regulating the charge transport kinetics
of MoO3 based materials. This work revealed that and a high-quality hetero-structure of Mo2C-C⊂1-
MoO3 contributed mostly to the obviously improved electrochemical performances, involving better
cycling durability, reduced over-potential and voltage hysteresis, etc., which is significant to mitigate
the primary drawback of conversion type systems and enable their further applications for advanced
lithium ion batteries.
7.2 Outlook
This doctoral work has mainly focused on molybdenum compounds based anode materials for
lithium ion batteries. The techniques utilized, such as self-assembly, electrospinning etc., are facile yet
convenient techniques for the fabrication of hierarchical structured nanomaterials. In the following
researches, anode materials with battery-like capacity and capacitor-like kinetics are still highly
demanded to develop the next generation LIBs, in addition, the investigation and optimization of
correlative electrolytes, binders are also required at the same time. Based on this doctoral work and
150
our understanding on the conversion-type systems, some perspectives regarding the further research
efforts have been summarized as follows:
To wisely select transition metal compounds as research subject, several factors as the premise
should be considered, involving properties of working voltage, theoretical capacity, and electrical
conductivity etc., which are dominated by the intrinsic nature of active phase. In subsequent work,
research efforts should put into conversion type MaXb compounds (M=transition metal, X = F, S, Te,
Se, N, P, or H) etc., since the electrochemical properties (such as reaction mechanism/potential and
voltage hysteresis) are significantly influenced by the anionic species.
To further optimize the electrochemical performance and mitigate the intrinsic drawbacks of
conversion type electrodes, more research efforts should be devoted, including introducing dopants in
deep doping depth, developing novel electrode materials, adopting more powerful synthesis methods
and adjusting the morphology of the hetero-structures. Furthermore, promising constituent parts
should be carefully selected to couple with these high-capacity anodes for the performance
optimization of batteries. The drawbacks of nanocomposites with high surface areas such as more side
reactions, electrolytes consumption, and loss of reversible capacity require an effective surface
manipulation to wisely design nanomaterials.
For the performance optimization of electrodes, high sensitive characterization techniques
involving X-ray absorption near edge structure spectroscopy and in-situ techniques (in-situ neutron
diffraction, in-situ Raman spectroscopy, in-situ TEM, in-situ synchrotron diffraction etc.) are ideal and
powerful characterizations to reflect the surface chemical bonding, reaction kinetics, electrochemical
reaction induced structural changes more visually, since sometimes, due to the reduced crystallinity of
the delithiated and lithiated products, the structural variations are hardly to be recorded by conventional
characterization techniques. As a complementary to the experiments, the theoretical computation is
also needed to better understand the electrochemical behaviors of these electrode materials.

151
Conversion type compounds as a vast family group still attract lots of research interest in
rechargeable batteries. Although this doctoral work has focused on their applications for lithium ion
batteries, the general concepts and ideas regarding with conversion-type systems can also be extended
to sodium-ion batteries and potassium ion batteries. In particular, the knowledge of conversion type
compounds in potassium ion batteries is still lacking, as currently only limited work has been done in
this field. The intrinsic nature, potassium transport kinetics and structural differences of conversion
type compounds in potassium storage could be investigated in the subsequent work.
In conclusion, we are confident that the current problems of anodes have been gradually mitigated,
and that studies are advancing in the right way, which will enable a promising future for the next
generation of batteries ahead.
152
Appendix A: LIST of PUBLICATIONS
1 J. Cuan, F. Zhang, H. Zhang, J. Long, S. L. Zhang, G. M. Liang, Q. L. Gao, J. N. Hao, L. X. Dong,
G. F. Wang, X. B. Yu, Heterostructure Manipulation toward Ameliorating Electrodes for Better
Lithium Storage Capability, ACS Sustainable Chemistry & Engineering, 2018, 6, 17267.
2 J Cuan, Y. Zhou, T. Zhou, S. Ling, K. Rui, Z. Guo, H. Liu, X. Yu, Borohydride Scaffolded Li/Na/Mg
Fast Ionic Conductors for Promising Solid-State Electrolytes, Advanced Materials. 2018, 31,
18035332
3 J Cuan, F. Zhang, Y. Zheng, T. Zhou, S. Zhang, Z. P. Guo, W. K. Pang, X. B. Yu, Electrochemical
Energy Storage Reinforced by Component Interaction in Stoichiometry Tunable Hetero-Carbides via
Artificial Interface Engineering, In preparation.
4 J. Cuan, Y. Zhou, J. Zhang, T. Zhou, G. Liang, S. Li, X. B. Yu, W. K. Pang, and Z. P. Guo, Oxycarbide
Interface Integration Reinforced Multielectron Reactions for Advanced Lithium Ion Batteries,
Advanced Materials, under revision.

153
Appendix B: AWARDS RECEIVED
International Postgraduate Research Scholarships Australian Government, 03/2015-08/2018.
Related Documents