Investigation of Mediational Processes Using Parallel Process Latent Growth Curve Modeling JeeWon Cheong, Department of Psychology, State University of New York at Albany David P. MacKinnon, and Department of Psychology, Arizona State University Siek Toon Khoo Department of Psychology, Arizona State University Abstract This study investigated a method to evaluate mediational processes using latent growth curve modeling. The mediator and the outcome measured across multiple time points were viewed as 2 separate parallel processes. The mediational process was defined as the independent variable influencing the growth of the mediator, which, in turn, affected the growth of the outcome. To illustrate modeling procedures, empirical data from a longitudinal drug prevention program, Adolescents Training and Learning to Avoid Steroids, were used. The program effects on the growth of the mediator and the growth of the outcome were examined first in a 2-group structural equation model. The mediational process was then modeled and tested in a parallel process latent growth curve model by relating the prevention program condition, the growth rate factor of the mediator, and the growth rate factor of the outcome. Most prevention studies are based on theories that specify causal variables that have an effect on the outcome, and the prevention programs include the components designed to modify these causal variables to obtain the desired outcome. For example, a drug prevention program based on Social Learning Theory (Bandura, 1977) may include program components to teach adolescents refusal skills and correct their misperception of the prevalence of drug use, aiming to reduce the social environmental influences. A drug prevention program based on the Health Belief Model (Janz & Becker, 1984) may seek to increase adolescents’ perception of susceptibility to the negative effects of drugs. If the theory is correct, changing the causal variables, such as social environmental influence for Social Learning Theory and perceived susceptibility for Health Behavior Theory, will prevent drug use. Despite the theoretical basis of prevention programs, most evaluation studies neglect the link between theory and evaluation (Judd & Kenny, 1981; MacKinnon & Dwyer, 1993). Until recently, the success of a prevention trial has been assessed only by the change in the outcome; that is, whether the treatment program reduced the harmful outcome or enhanced the desired outcome. Assessing a prevention trial only by the change in the outcome variable may provide a gross assessment of whether or not a program works, but may fail to identify the underlying mechanisms concerning how the program achieved or failed to achieve its effects. The evaluation of a program should involve more specific investigation by laying out program Requests for reprints should be sent to David P. MacKinnon, Department of Psychology, Arizona State University, Box 871104, Tempe, AZ 85287–1104. [email protected]. NIH Public Access Author Manuscript Struct Equ Modeling. Author manuscript; available in PMC 2010 February 12. Published in final edited form as: Struct Equ Modeling. 2003 April 1; 10(2): 238. doi:10.1207/S15328007SEM1002_5. NIH-PA Author Manuscript NIH-PA Author Manuscript NIH-PA Author Manuscript

Welcome message from author
This document is posted to help you gain knowledge. Please leave a comment to let me know what you think about it! Share it to your friends and learn new things together.
Transcript
Investigation of Mediational Processes Using Parallel ProcessLatent Growth Curve Modeling
JeeWon Cheong,Department of Psychology, State University of New York at Albany
David P. MacKinnon, andDepartment of Psychology, Arizona State University
Siek Toon KhooDepartment of Psychology, Arizona State University
AbstractThis study investigated a method to evaluate mediational processes using latent growth curvemodeling. The mediator and the outcome measured across multiple time points were viewed as 2separate parallel processes. The mediational process was defined as the independent variableinfluencing the growth of the mediator, which, in turn, affected the growth of the outcome. Toillustrate modeling procedures, empirical data from a longitudinal drug prevention program,Adolescents Training and Learning to Avoid Steroids, were used. The program effects on the growthof the mediator and the growth of the outcome were examined first in a 2-group structural equationmodel. The mediational process was then modeled and tested in a parallel process latent growth curvemodel by relating the prevention program condition, the growth rate factor of the mediator, and thegrowth rate factor of the outcome.
Most prevention studies are based on theories that specify causal variables that have an effecton the outcome, and the prevention programs include the components designed to modify thesecausal variables to obtain the desired outcome. For example, a drug prevention program basedon Social Learning Theory (Bandura, 1977) may include program components to teachadolescents refusal skills and correct their misperception of the prevalence of drug use, aimingto reduce the social environmental influences. A drug prevention program based on the HealthBelief Model (Janz & Becker, 1984) may seek to increase adolescents’ perception ofsusceptibility to the negative effects of drugs. If the theory is correct, changing the causalvariables, such as social environmental influence for Social Learning Theory and perceivedsusceptibility for Health Behavior Theory, will prevent drug use.
Despite the theoretical basis of prevention programs, most evaluation studies neglect the linkbetween theory and evaluation (Judd & Kenny, 1981; MacKinnon & Dwyer, 1993). Untilrecently, the success of a prevention trial has been assessed only by the change in the outcome;that is, whether the treatment program reduced the harmful outcome or enhanced the desiredoutcome. Assessing a prevention trial only by the change in the outcome variable may providea gross assessment of whether or not a program works, but may fail to identify the underlyingmechanisms concerning how the program achieved or failed to achieve its effects. Theevaluation of a program should involve more specific investigation by laying out program
Requests for reprints should be sent to David P. MacKinnon, Department of Psychology, Arizona State University, Box 871104, Tempe,AZ 85287–1104. [email protected].
NIH Public AccessAuthor ManuscriptStruct Equ Modeling. Author manuscript; available in PMC 2010 February 12.
Published in final edited form as:Struct Equ Modeling. 2003 April 1; 10(2): 238. doi:10.1207/S15328007SEM1002_5.
NIH
-PA Author Manuscript
NIH
-PA Author Manuscript
NIH
-PA Author Manuscript

components and identifying causal links based on theory (Chen, 1990; Donaldson, Graham,& Hansen, 1994; MacKinnon, 1994).
Mediation analysis has been introduced as an appropriate method for theory-driven evaluationof prevention trials (MacKinnon & Dwyer, 1993; MacKinnon et al., 1991). Mediation analysisis important in that it allows researchers not only to assess the success of the program, but alsoto obtain more specific information on how the program succeeded or failed. Throughmediation analysis, researchers can obtain information on whether the prevention programsuccessfully changed the mediating variable and whether the change in the mediating variablewas responsible for the change in the outcome (Baron & Kenny, 1986; MacKinnon & Dwyer,1993). Furthermore, researchers can estimate and test the significance of the mediated effect(MacKinnon, 2000; MacKinnon & Dwyer, 1993; MacKinnon, Warsi, & Dwyer, 1995). Forexample, if adolescent drug use decreased in the group receiving a social influences based drugprevention program, researchers may want to explore whether the resistance skills enhancedby the prevention program were responsible for the success of the program. Such informationmay be more valuable when a prevention trial was not successful. If the treatment program didnot work as expected, findings about which components were successful and which were notcan provide valuable information for the design of future studies.
As the main goal of prevention trials is to change outcomes, using the appropriate methods toestimate the change has been a critical issue. Recently, researchers have pointed out theinadequacy of using pre- and postintervention measures to estimate the longitudinal change(Rogosa, 1988; Rogosa, Brandt, & Zimowski, 1982; Willett & Sayer, 1994). Measures at twotime points contain only minimal information on individual change, and it may be misleadingto specify individual changes over time with two data points when the trajectory follows ashape other than a straight line (e.g., quadratic or exponential) or when there is a fluctuationof scores between the two time points. Longitudinal growth modeling has been advocated asa better method for answering questions about individual change over time and individualdifferences in change (Rogosa, 1988; Rogosa et al., 1982; Willett & Sayer, 1994). In particular,the investigation of how each construct changes over time should precede the examination ofthe relation between the two constructs (Raudenbush, 2001; Rogosa, 1988), when the researchquestion involves the long-term relation between two different constructs, such as a mediatorand an outcome.
The purpose of this study is to illustrate how to carry out mediation analysis using latent growthmodeling (LGM) in the case of longitudinal randomized prevention trials. Several studies (e.g.,Muthén & Curran, 1997; Raudenbush, 2001; Willett & Sayer, 1994) have described methodsfor LGM, and studies evaluating the effect of prevention programs using LGM (e.g., Park etal., 2000; Taylor, Graham, Cumsille, & Hansen, 2000) have started to appear in scholarlyjournals. In this study, we expand the application of the LGM approach to mediation analysis.The modeling procedures are demonstrated by estimating a series of latent growth models usinga data set from a longitudinal drug prevention study designed to reduce adolescent footballplayers’ anabolic steroid use (Goldberg et al., 1996; Goldberg et al., 2000).
ESTIMATION AND TEST OF THE MEDIATED EFFECTThe basic single mediator causal model, on which the prevention trials are based, is illustratedin Figure 1. Here, the theory-based causal variables can be conceptualized as potentialmediating variables (M) intervening in the relation between the prevention program (X) andthe outcome variable (Y). The prevention program influences the outcome directly and alsoindirectly through the mediator. Chen (1990) used the term action theory to refer to the linkbetween the treatment program and the mediating variables and the term conceptual theory torefer to the link between the mediating variables and the outcome variable.
Cheong et al. Page 2
Struct Equ Modeling. Author manuscript; available in PMC 2010 February 12.
NIH
-PA Author Manuscript
NIH
-PA Author Manuscript
NIH
-PA Author Manuscript

One of the most commonly used methods to obtain the point estimate of the mediated effectis the product of coefficients method (Aroian, 1947; Goodman, 1960; MacKinnon & Dwyer,1993; MacKinnon, Lockwood, Hoffman, West, & Sheets, 2002; MacKinnon et al., 1995;Sobel, 1982). In the product of coefficients method, the following regression equations areestimated to obtain the mediated effect:
(1)
(2)
In Equation 1, the potential mediator M is regressed on the prevention program X. In Equation2, the outcome variable Y is regressed on the prevention program X and the potential mediatorM. The coefficient α represents the effect of the prevention program on the potential mediator.The coefficient β denotes the effect of the potential mediator on the outcome after controllingfor the effect of the prevention program. Similarly, the coefficient τ′ represents the effect ofthe prevention program on the outcome variable after controlling for the effect of the mediator.The constants β01 and β02 are the regression intercept terms and ε1 and ε2 are residuals in thetwo equations. The mediated effect is estimated by the product of the two regressioncoefficients for α and β, conveying that the mediated effect is determined by the extent to whichthe treatment program changes the mediator (α) and the extent to which the mediator, in turn,changes the outcome (β).
There are several ways to estimate the variance of the product of two coefficients (αβ), any ofwhich can be used for estimation of the standard error of the mediated effect to conduct asignificance test and to obtain confidence intervals (CIs) of the mediated effect (seeMacKinnon, Lockwood, Hoffman, et al., 2002). One of the most commonly used formulas forthe standard error of the product of two coefficients is based on the multivariate delta method(Sobel, 1982) or the first-order Taylor series as follows:
(3)
where α and σα are the regression coefficient and its standard error in Equation 1 and β andσβ are the regression coefficient and its standard error in Equation 2. For observed data, sampleestimates of α, σα, β, and σβ are inserted in Equation 3. The significance test of the mediatedeffect is conducted by dividing the estimate of the mediated effect (αβ) by the estimatedstandard error (σαβ), which is compared to a standard normal distribution. The first-ordersolution method (Sobel, 1982) is widely used, being implemented in the SEM softwareprograms such as LISREL and EQS; however, it was found to have low statistical powerbecause the distribution of the product of the two random variables is not always normallydistributed (MacKinnon, Lockwood, & Williams, 2002).
In an alternative method called the asymmetric CI method (MacKinnon, Lockwood, Hoffman,et al., 2002), both α and β coefficients are converted to z scores (i.e., zα = α/σα and zβ = β/σβ)and the critical values for the two z scores are found from the tables in Meeker et al. (1981) toconstruct the CI. Because the distribution of the product of αβ is often asymmetric, differentvalues are used for the upper and lower critical values. Using these critical values, the lowerconfidence limits (LCLs) and upper confidence limits (UCLs) are computed by UCL = αβ +(upper critical value)*σαβ and LCL = αβ + (lower critical value)*σαβ. When the CI does notinclude zero, the mediated effect is considered statistically significant. According to an
Cheong et al. Page 3
Struct Equ Modeling. Author manuscript; available in PMC 2010 February 12.
NIH
-PA Author Manuscript
NIH
-PA Author Manuscript
NIH
-PA Author Manuscript
extensive simulation study (MacKinnon, Lockwood, Hoffman, et al., 2002), the asymmetricCI method has greater power compared to other methods for testing mediation.
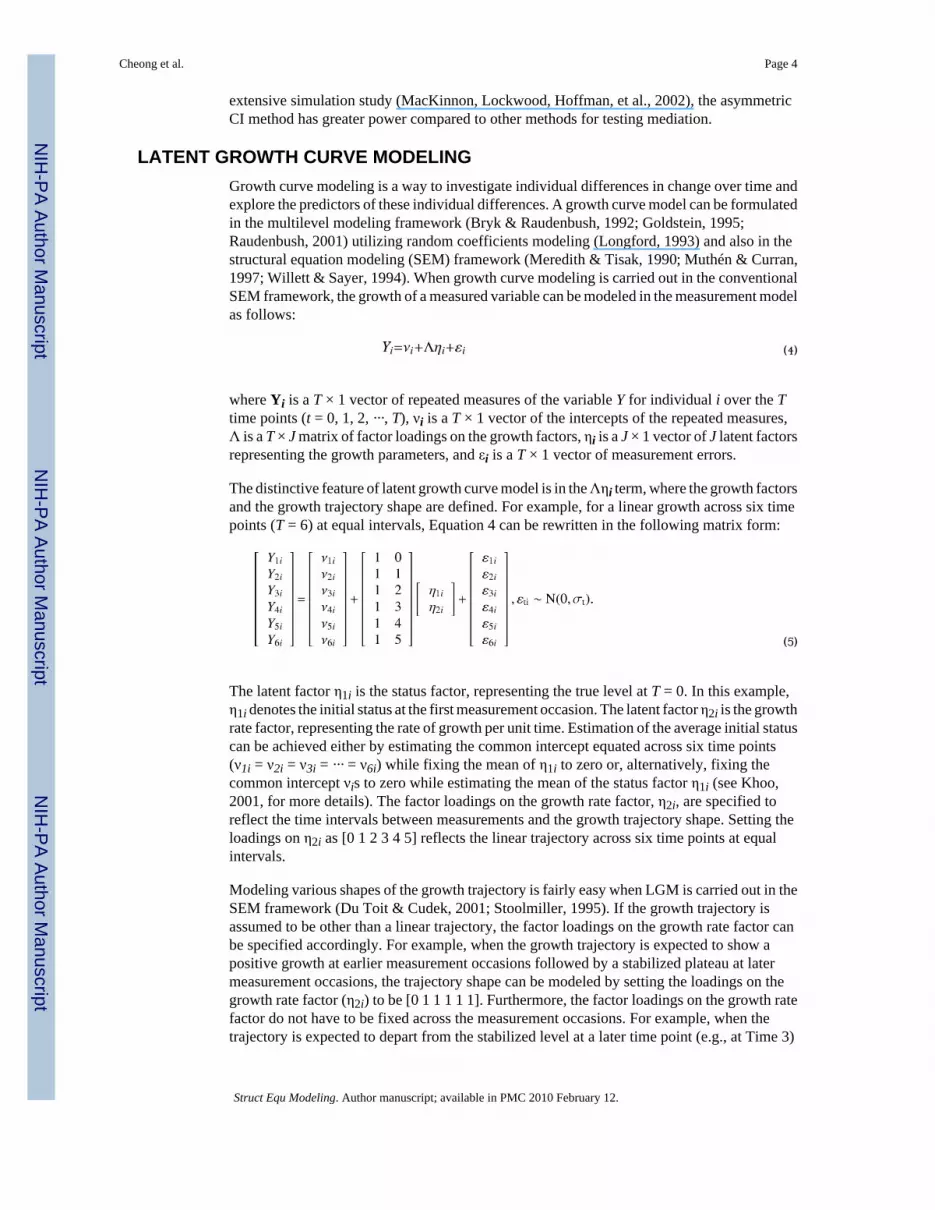
LATENT GROWTH CURVE MODELINGGrowth curve modeling is a way to investigate individual differences in change over time andexplore the predictors of these individual differences. A growth curve model can be formulatedin the multilevel modeling framework (Bryk & Raudenbush, 1992; Goldstein, 1995;Raudenbush, 2001) utilizing random coefficients modeling (Longford, 1993) and also in thestructural equation modeling (SEM) framework (Meredith & Tisak, 1990; Muthén & Curran,1997; Willett & Sayer, 1994). When growth curve modeling is carried out in the conventionalSEM framework, the growth of a measured variable can be modeled in the measurement modelas follows:
(4)
where Yi is a T × 1 vector of repeated measures of the variable Y for individual i over the Ttime points (t = 0, 1, 2, ···, T), νi is a T × 1 vector of the intercepts of the repeated measures,Λ is a T × J matrix of factor loadings on the growth factors, ηi is a J × 1 vector of J latent factorsrepresenting the growth parameters, and εi is a T × 1 vector of measurement errors.
The distinctive feature of latent growth curve model is in the Ληi term, where the growth factorsand the growth trajectory shape are defined. For example, for a linear growth across six timepoints (T = 6) at equal intervals, Equation 4 can be rewritten in the following matrix form:
(5)
The latent factor η1i is the status factor, representing the true level at T = 0. In this example,η1i denotes the initial status at the first measurement occasion. The latent factor η2i is the growthrate factor, representing the rate of growth per unit time. Estimation of the average initial statuscan be achieved either by estimating the common intercept equated across six time points(ν1i = ν2i = ν3i = ··· = ν6i) while fixing the mean of η1i to zero or, alternatively, fixing thecommon intercept νis to zero while estimating the mean of the status factor η1i (see Khoo,2001, for more details). The factor loadings on the growth rate factor, η2i, are specified toreflect the time intervals between measurements and the growth trajectory shape. Setting theloadings on η2i as [0 1 2 3 4 5] reflects the linear trajectory across six time points at equalintervals.
Modeling various shapes of the growth trajectory is fairly easy when LGM is carried out in theSEM framework (Du Toit & Cudek, 2001; Stoolmiller, 1995). If the growth trajectory isassumed to be other than a linear trajectory, the factor loadings on the growth rate factor canbe specified accordingly. For example, when the growth trajectory is expected to show apositive growth at earlier measurement occasions followed by a stabilized plateau at latermeasurement occasions, the trajectory shape can be modeled by setting the loadings on thegrowth rate factor (η2i) to be [0 1 1 1 1 1]. Furthermore, the factor loadings on the growth ratefactor do not have to be fixed across the measurement occasions. For example, when thetrajectory is expected to depart from the stabilized level at a later time point (e.g., at Time 3)
Cheong et al. Page 4
Struct Equ Modeling. Author manuscript; available in PMC 2010 February 12.
NIH
-PA Author Manuscript
NIH
-PA Author Manuscript
NIH
-PA Author Manuscript

the factor loadings on the growth rate factor can be specified as [0 1 * 1 1 1] to freely estimatethe growth at Time 3. The estimated loading smaller than 1 indicates a lower level at Time 3than other posttest measurements. These specifications will be utilized in our example forillustration.
Individual differences in growth are captured in the variances of the initial status factor andthe growth rate factor. When the variances of the growth factors are substantial, the latentgrowth factors can be regressed on individual background variables such as Xi as in thefollowing:
(6)
For example, the initial status and the growth rate of drinking alcohol among college studentsmight be related to how much the individuals were involved in problem behaviors in the past.This can be studied by regressing the growth factors of alcohol consumption on the problembehavior indicators (e.g., Harford & Muthén, 2001). Program effects in random experimentscan also be assessed in this way. For example, adolescent alcohol use might increase over timein general, but the individuals in the treatment group might show a slower increase than thosein the control group. Then the growth rate factor can be regressed on the prevention programcondition to explain the different growth trajectories in the two groups (e.g., Taylor et al.,2000).
MEDIATION IN LGMIn a pretest–posttest situation, mediation is supported when the prevention program changesthe level of the mediator and the change in the mediator, in turn, affects the level of the outcome.When both the outcome variable and the hypothesized mediating variable are measuredrepeatedly over time, the growth of the mediator and the growth of the outcome can be viewedas two distinctive processes. In such situations, the mediational process can be modeled as theprevention program influencing the growth of the outcome indirectly through its effect on thegrowth of the mediator. Mediation is supported when the prevention program significantlychanges the trajectory of the mediator, which, in turn, affects the trajectory of the outcome.
Evaluation of the mediational process in longitudinal studies can be carried out using theparallel process LGM. Figure 2 shows a parallel process growth curve model where themediator and the outcome are measured across six time points and the growth of each processis modeled as linear. The upper half of Figure 2 represents the mediator process and the lowerhalf represents the outcome process. The mediational process is modeled by relating theprevention program X and the latent growth factors of the two parallel processes.
In parallel process latent growth curve models, the growth of the mediator process and thegrowth of the outcome process are modeled in the measurement model. Examining the growthof the mediator and the growth of the outcome separately, each process can be written asfollows:
(7)
where the superscript (m) denotes the mediator process, Mi is a 6 × 1 vector of the repeatedmeasures of the mediator, νi(m) is a 6 × 1 vector of the common intercepts of the mediator,Λ(m) is a 6 × 2 matrix of factor loadings on the two growth factors, ηi(m) is a 2 × 1 vector ofthe latent growth factors for the mediator, and εi(m) is a 6 × 1 vector of the measurement errorsof the mediator.
Cheong et al. Page 5
Struct Equ Modeling. Author manuscript; available in PMC 2010 February 12.
NIH
-PA Author Manuscript
NIH
-PA Author Manuscript
NIH
-PA Author Manuscript

(8)
where the superscript (y) denotes the outcome process, Yi is a 6 × 1 vector of the repeatedmeasures of the outcome, νi(y) is a 6 × 1 vector of the common intercepts of the outcome,Λ(y) is a 6 × 2 matrix of factor loadings on the two growth factors, ηi(y) is a 2 × 1 vector of thelatent growth factors for the outcome, and εi(y) is a 6 × 1 vector of the measurement errors ofthe outcome.
Once the growth of each process is satisfactorily modeled and the effects of the preventionprogram on the growth of each process is investigated, the two separate growth curve modelsare combined into one parallel process growth curve model. The mediation is modeled in thestructural model by relating the prevention program condition, the growth factors of themediator process, and the growth factors of the outcome process. The structural relations areexpressed in terms of each latent factor (η1i, η2i, η3i, and η4i) as follows:
(9)
(10)
(11)
(12)
where η1i is the initial status factor of the mediator process, η2i is the growth rate factor of themediator process, η3i is the initial status factor of the outcome process, and η4i is the growthrate factor of the outcome process.
Equations 9 and 11 model the relations between the prevention program Xi and the initial statusfactors (η1i and η3i) of the mediator process and the outcome process. In these equations,π0
(m) and π0(y) denote the regression intercepts. The coefficients γ1 and γ3 represent the
difference between the treatment group and the control group in the status factors of themediator process and the outcome process, respectively. Equations 10 and 12 model therelations between the prevention program and the growth rate factors and the relations amongthe latent factors of the two processes. In these equations, π1
(m) and π1(y) denote the regression
intercepts. Equation 10 models the regression of the growth rate factor of the mediator process(η2i) on the prevention program condition (Xi) and the initial status factor of the outcomeprocess (η3i). The coefficient α represents the mean difference in the average growth ratebetween the two groups and a significant α coefficient suggests that the prevention program iseffective in changing the growth trajectory of the mediator process. Similarly, Equation 12models the regression of the growth rate factor of the outcome process (η4i) on the preventionprogram (Xi), the initial status of the mediator process (η1i), and, more important, the growthrate factor of the mediator process (η2i). A significant β coefficient indicates a significantassociation between the growth rate of the mediator process and the growth rate of the outcomeprocess.
Cheong et al. Page 6
Struct Equ Modeling. Author manuscript; available in PMC 2010 February 12.
NIH
-PA Author Manuscript
NIH
-PA Author Manuscript
NIH
-PA Author Manuscript

The point estimate of the mediated effect can be obtained by taking the product of thecoefficients (αβ). Testing the significance of the mediated effect and obtaining the CI can beconducted as described in the previous section using the first-order solution method (Sobel,1982) or the asymmetric CI test (MacKinnon, Lockwood, Hoffman, et al., 2002).
ILLUSTRATION OF LGM MEDIATION ANALYSISAdolescents Training and Learning to Avoid Steroids (ATLAS) Prevention Study
This study used part of the data from a longitudinal prevention study entitled ATLAS (Goldberget al., 1996; Goldberg et al., 2000). The goals of the ATLAS project were to reduce high schoolfootball players’ use of anabolic androgenic steroids (AAS) and other drugs and to improvetheir health behaviors (e.g., eating a nutritional diet and strength training). The ATLASprogram was designed to change a number of potential mediators based on health behaviortheories. Based on Social Learning Theory (Bandura, 1977), the ATLAS program targeted tochange social environmental influences: The program sessions were delivered by coachingstaff and peer team leaders and the program activities consisted of small group projects anddiscussions. As suggested by Theory of Planned Behavior (Ajzen & Madden, 1986; Fishbein& Ajzen, 1975), the ATLAS program included several components to change norms, beliefs,and attitudes about AAS: The treatment group students discussed the reasons to use and not touse AAS, analyzed media advertisements on AAS effects, and developed an anti-AASadvertisement. The treatment group also received classroom sessions providing the alternativesto steroid use, such as nutrition and strength training. Furthermore, as suggested by HealthBelief Model (Janz & Becker, 1984), the ATLAS program emphasized harmful effects of AASand susceptibility to these negative effects. More details regarding the ATLAS program andthe primary research findings can be found elsewhere (Goldberg et al., 1996; Goldberg et al.,2000; MacKinnon et al., 2001).
ATLAS design—The ATLAS project lasted for 4 years beginning in 1994. A total of 31 highschool football teams in Oregon and Washington states were randomly assigned to thetreatment group or the control group. The participants were followed until they graduated fromhigh school and a new cohort of participants was added in each study year.
The prevention program was delivered in full length in the first year and the shortened versionof the booster program was delivered in the following years. There were a total of eightmeasurement occasions over the 4 project years. This study included the first six measurementoccasions: baseline measurement (Time 1), posttest after the initial full prevention program(Time 2), 1-year follow-up (Time 3), posttest after the first booster program (Time 4), 2-yearfollow-up (Time 5), and posttest after the second booster program (Time 6). The intervalsbetween the two measurements before and after the program delivery (Time 1 and Time 2,Time 3 and Time 4, Time 5 and Time 6) were about 2 months, whereas the intervals betweenposttests and the 1- and 2-year follow-up measures (Time 2 and Time 3, Time 4 and Time 5)were about 10 months.
Measures—In this study, nutrition behaviors (Nutrit) was used as an outcome variable.Perceived importance of team leaders as an information source (PerLeader) was used as amediator. The high school football players in the treatment group participated in the discussionson drug prevention and healthy alternatives to drug use led by the team leaders. It washypothesized that these program activities would increase the perception of team leaders as avalid information source about diet, and this, in turn, would improve nutrition behaviors.
There were seven items measuring nutrition behaviors on 7-point Likert type scales thatconsisted of Over the last few months I have tried to improve my diet, I eat a diet that has nomore than 30% calories from fat, I am aware of the calorie content of the foods I eat, I set
Cheong et al. Page 7
Struct Equ Modeling. Author manuscript; available in PMC 2010 February 12.
NIH
-PA Author Manuscript
NIH
-PA Author Manuscript
NIH
-PA Author Manuscript

goals for my nutrition, I keep track of the calories I eat, I keep track of the protein I eat, andI choose healthy foods when I eat at a fast food restaurant. The mean score of these sevenitems was used for analyses. Higher scale scores reflected better nutrition behaviors. In theprior analyses for the scale development, these seven items were found to constitute one factorin exploratory factor analysis. The Cronbach’s α at baseline measurement was .810.
Perceived importance of team leaders as an information source was measured with three itemson 7-point Likert type scales: My team leaders help me learn about drug prevention, My teamleaders help me learn about sports nutrition, and My team leaders help me learn about weightlifting. The mean score of these three items was used for analyses. Higher scores representedgreater perception of peer team leaders as a valid information source. The Cronbach’s α forthese items measured at baseline was .844.
A dummy variable was created to represent group membership. The treatment group was codedas 1 and the control group as 0.
Sample—The participants included in this study were the first cohort of high school footballplayers who participated in the ATLAS study from 1994 to 1996. There were 1,506 participants(Control N = 804; Treatment N = 702) at baseline in 1994. Among those, 1,339 participants(Control N = 730; Treatment N = 609), who were present at both baseline and at least one ofthe follow-up assessments, were included in the analysis. The main sources of missing datawere graduation, quitting the football team, injury during the football season, and absenteeismon the assessment day. The attrition rate was consistent with the estimated rate of students’quitting the football team during the season (20%). The attrition rate from the study was actuallyless than the nominal high school dropout rate in the area (28%). The analyses in this studywere conducted adjusting for missing data.
General Steps of Modeling and Testing Mediational Process in LGM FrameworkConducting mediation analysis using parallel process LGM method involves several steps.First, the growth trajectory shape of each process is investigated. The main goals of this stepare to test whether the hypothesized trajectory shape fits the data and to examine whether thegrowth rates are different in the treatment and the control groups. In the second step, the twolatent growth curve models investigated in the first step are combined to one parallel processmodel and the hypothesized relations among the prevention program and the growth factorsof the two processes are modeled. Finally, the estimates of the mediated effect and the estimatedstandard error are calculated to test the significance of the mediated effect and to construct theCI. The analyses were conducted using the Mplus 2.0 (Muthén & Muthén, 2001) SEM program.The programs used in this article are available by writing to JeeWon Cheong or at the Web site(http://www.public.asu.edu/~davidpm/ripl).
Investigation of Growth Trajectory and Assessment of Program EffectsWhen the prevention program is effective, the growth of the mediator and the growth of theoutcome are expected to be different in the treatment group and the control group. In theATLAS study, the initial full prevention program implemented in the first year was expectedto increase the football players’ nutrition behaviors (Nutrit) and perceived importance of teamleaders as a valid information source (PerLeader). In addition, the booster programs deliveredin the later years were expected to recover and maintain the program effect achieved by thefull prevention program, when and if there was a decay of effects. Thus, the factor loadings onthe growth rate factor of the mediator and the outcome were specified as [0 1 * 1 1 1]. Wespecified the status factor to represent the initial status, the true level at baseline. By settingthe loadings on the growth rate factor for Time 2, Time 4, Time 5, and Time 6 to be 1, wehypothesized that the effects achieved by the initial full prevention program would be recovered
Cheong et al. Page 8
Struct Equ Modeling. Author manuscript; available in PMC 2010 February 12.
NIH
-PA Author Manuscript
NIH
-PA Author Manuscript
NIH
-PA Author Manuscript
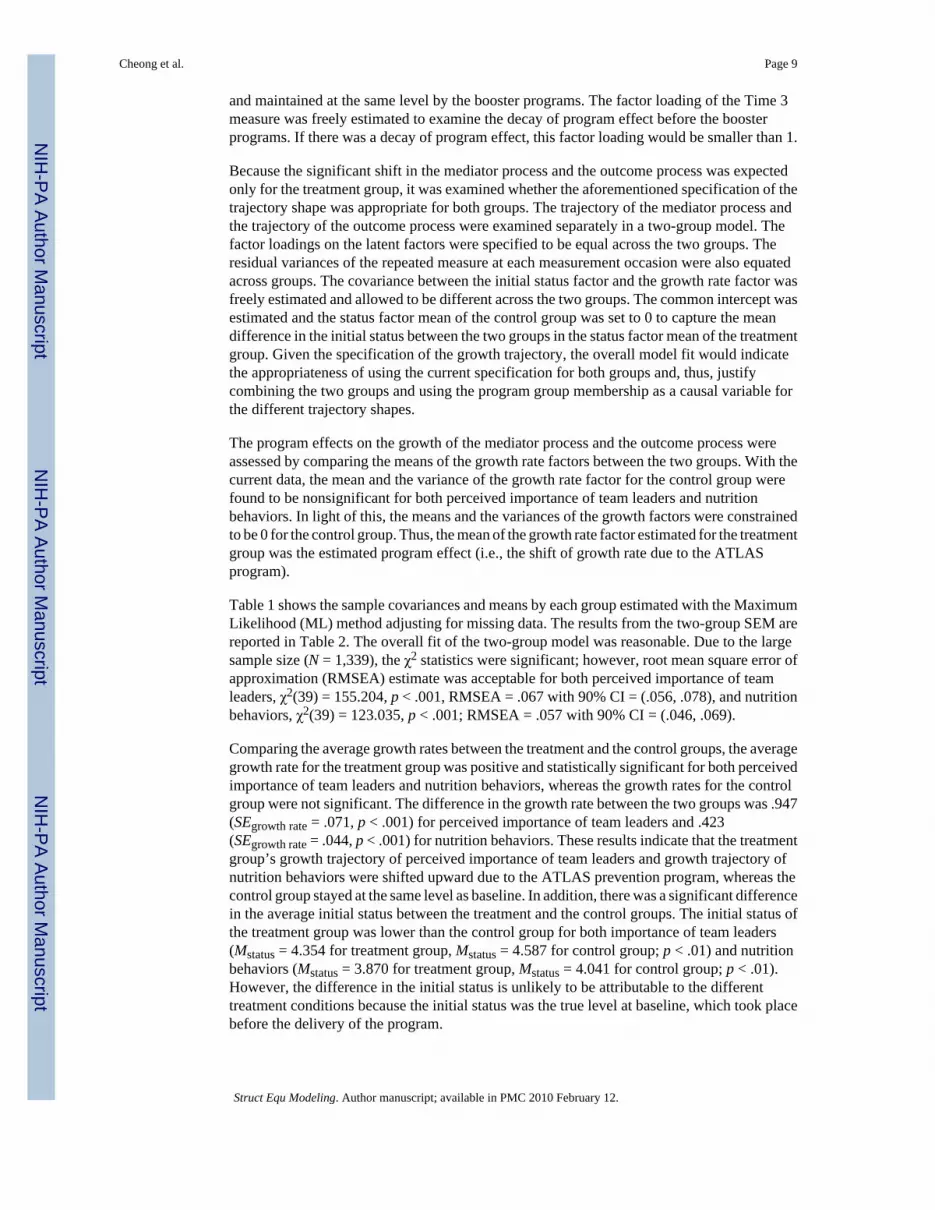
and maintained at the same level by the booster programs. The factor loading of the Time 3measure was freely estimated to examine the decay of program effect before the boosterprograms. If there was a decay of program effect, this factor loading would be smaller than 1.
Because the significant shift in the mediator process and the outcome process was expectedonly for the treatment group, it was examined whether the aforementioned specification of thetrajectory shape was appropriate for both groups. The trajectory of the mediator process andthe trajectory of the outcome process were examined separately in a two-group model. Thefactor loadings on the latent factors were specified to be equal across the two groups. Theresidual variances of the repeated measure at each measurement occasion were also equatedacross groups. The covariance between the initial status factor and the growth rate factor wasfreely estimated and allowed to be different across the two groups. The common intercept wasestimated and the status factor mean of the control group was set to 0 to capture the meandifference in the initial status between the two groups in the status factor mean of the treatmentgroup. Given the specification of the growth trajectory, the overall model fit would indicatethe appropriateness of using the current specification for both groups and, thus, justifycombining the two groups and using the program group membership as a causal variable forthe different trajectory shapes.
The program effects on the growth of the mediator process and the outcome process wereassessed by comparing the means of the growth rate factors between the two groups. With thecurrent data, the mean and the variance of the growth rate factor for the control group werefound to be nonsignificant for both perceived importance of team leaders and nutritionbehaviors. In light of this, the means and the variances of the growth factors were constrainedto be 0 for the control group. Thus, the mean of the growth rate factor estimated for the treatmentgroup was the estimated program effect (i.e., the shift of growth rate due to the ATLASprogram).
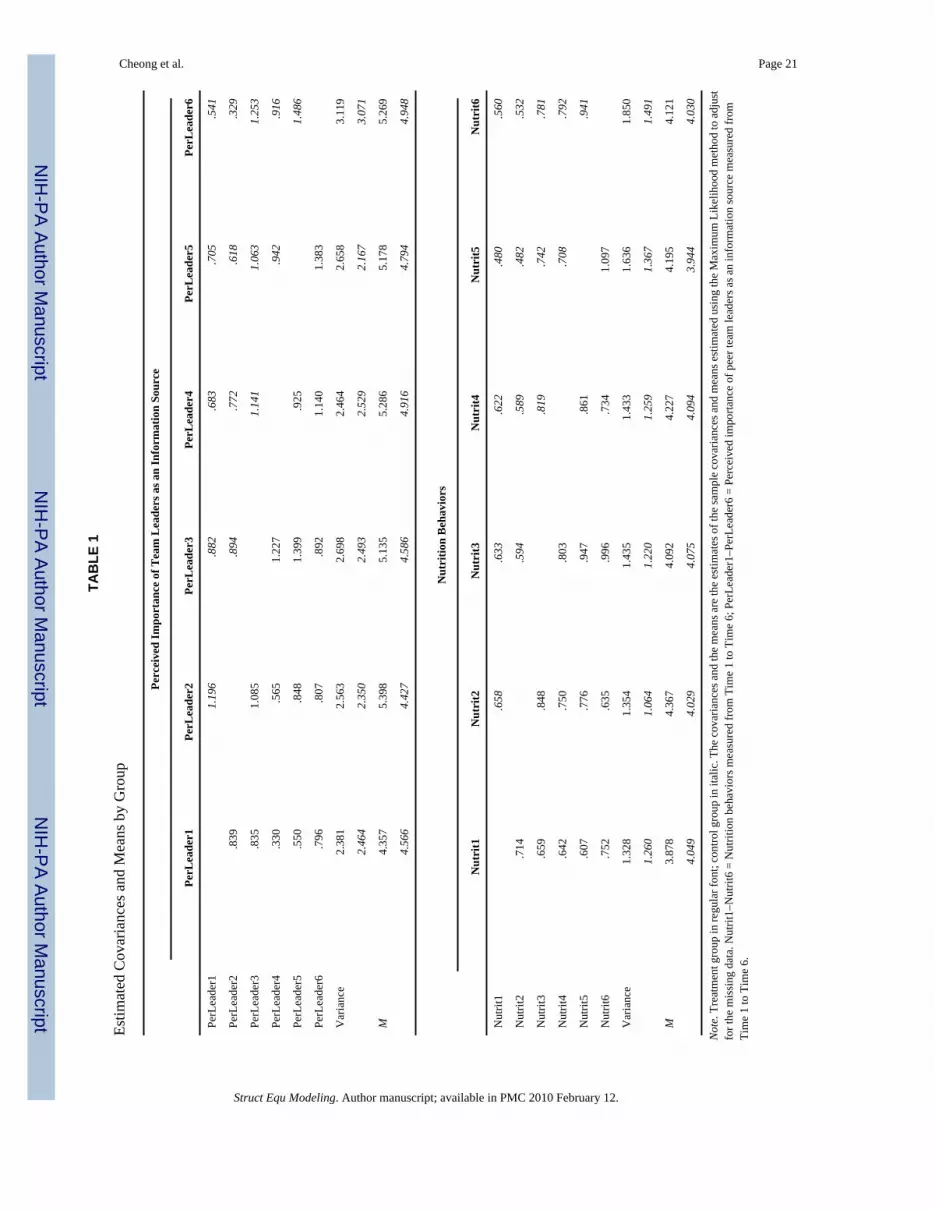
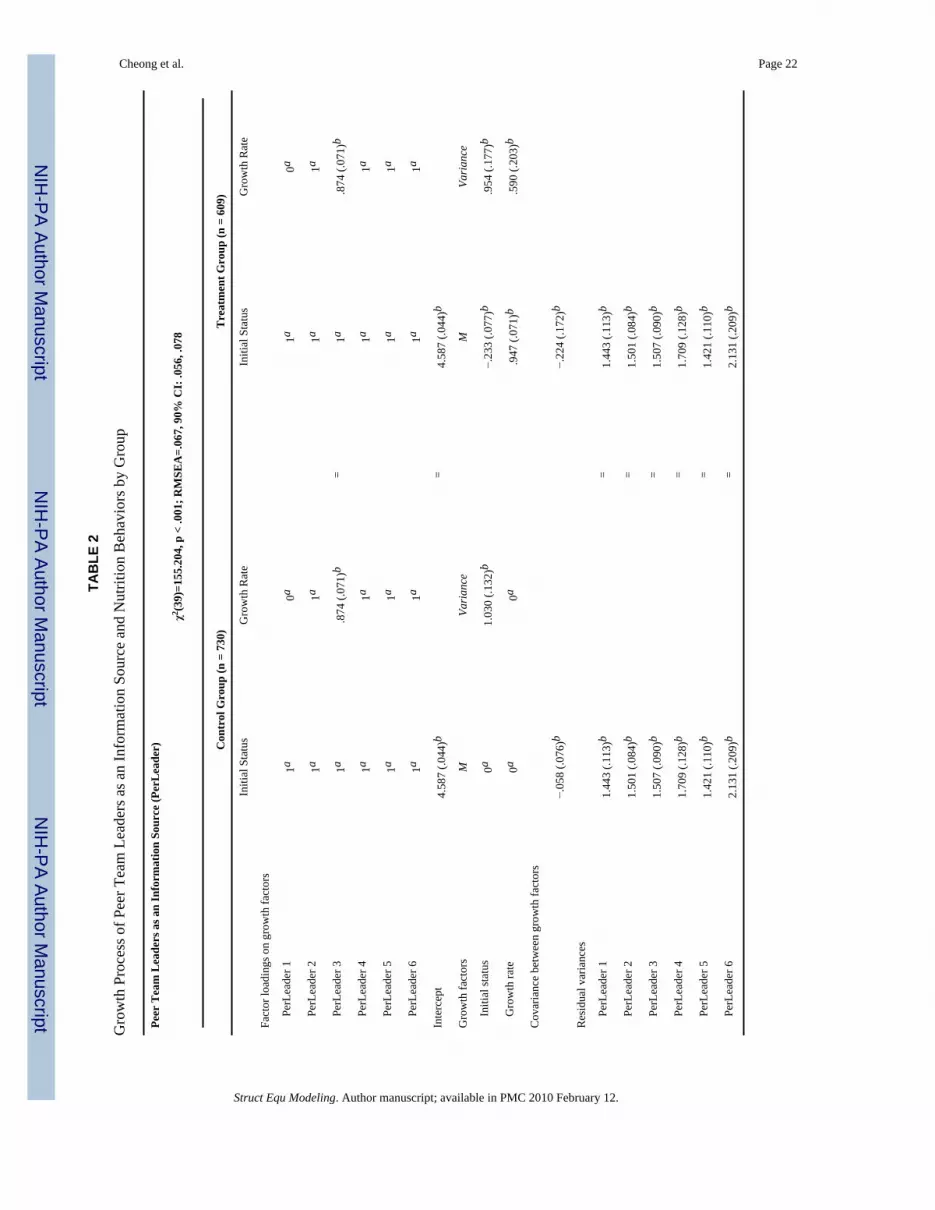
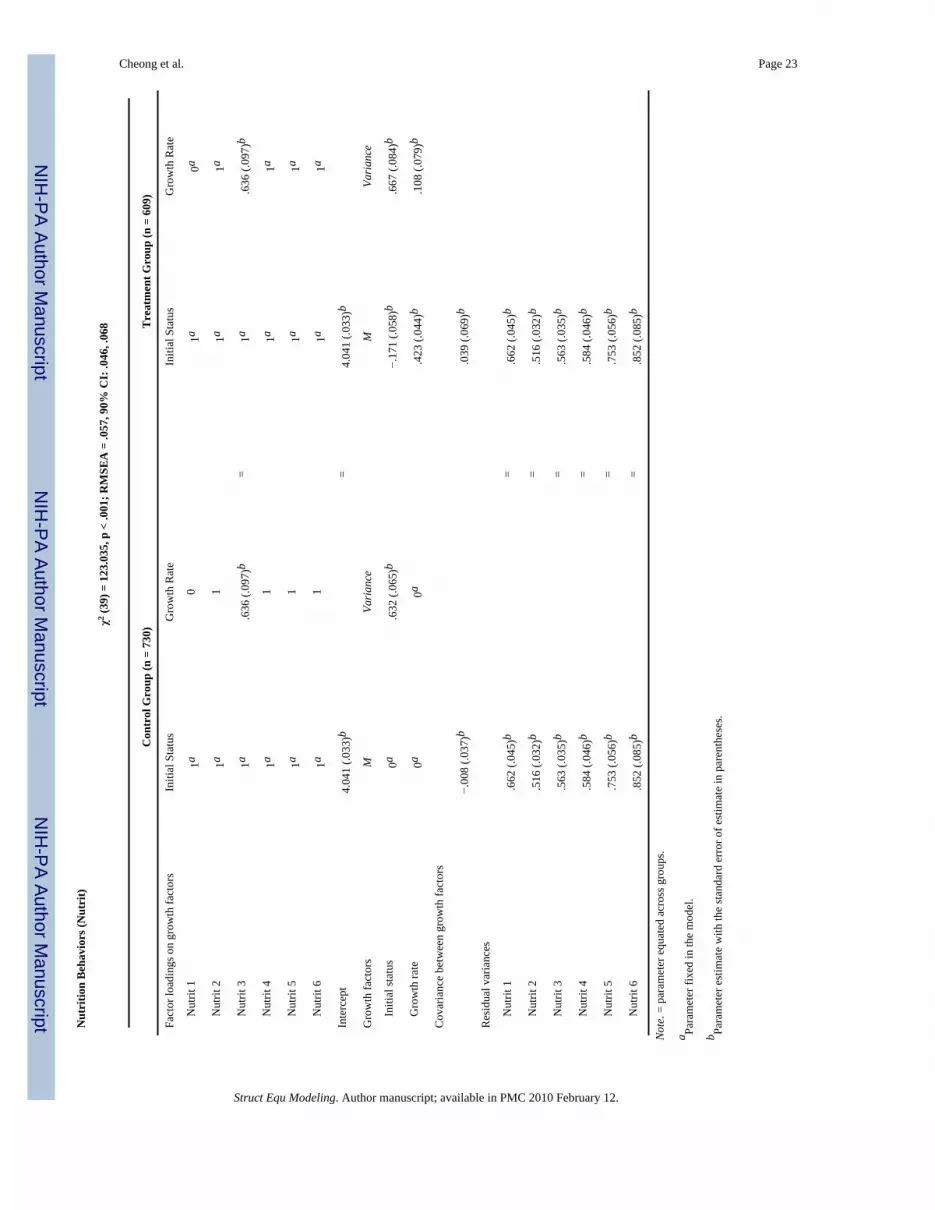
Table 1 shows the sample covariances and means by each group estimated with the MaximumLikelihood (ML) method adjusting for missing data. The results from the two-group SEM arereported in Table 2. The overall fit of the two-group model was reasonable. Due to the largesample size (N = 1,339), the χ2 statistics were significant; however, root mean square error ofapproximation (RMSEA) estimate was acceptable for both perceived importance of teamleaders, χ2(39) = 155.204, p < .001, RMSEA = .067 with 90% CI = (.056, .078), and nutritionbehaviors, χ2(39) = 123.035, p < .001; RMSEA = .057 with 90% CI = (.046, .069).
Comparing the average growth rates between the treatment and the control groups, the averagegrowth rate for the treatment group was positive and statistically significant for both perceivedimportance of team leaders and nutrition behaviors, whereas the growth rates for the controlgroup were not significant. The difference in the growth rate between the two groups was .947(SEgrowth rate = .071, p < .001) for perceived importance of team leaders and .423(SEgrowth rate = .044, p < .001) for nutrition behaviors. These results indicate that the treatmentgroup’s growth trajectory of perceived importance of team leaders and growth trajectory ofnutrition behaviors were shifted upward due to the ATLAS prevention program, whereas thecontrol group stayed at the same level as baseline. In addition, there was a significant differencein the average initial status between the treatment and the control groups. The initial status ofthe treatment group was lower than the control group for both importance of team leaders(Mstatus = 4.354 for treatment group, Mstatus = 4.587 for control group; p < .01) and nutritionbehaviors (Mstatus = 3.870 for treatment group, Mstatus = 4.041 for control group; p < .01).However, the difference in the initial status is unlikely to be attributable to the differenttreatment conditions because the initial status was the true level at baseline, which took placebefore the delivery of the program.
Cheong et al. Page 9
Struct Equ Modeling. Author manuscript; available in PMC 2010 February 12.
NIH
-PA Author Manuscript
NIH
-PA Author Manuscript
NIH
-PA Author Manuscript

The variance of the growth rate factor for the treatment group was significant for importanceof team leaders, Var (Growth RatePerLeader) = .590, SE = .203, p < .01, indicating that althoughthe treatment program increased the perceived importance of peer team leaders on average, theincrement was different across individuals. The variance of the growth rate factor for nutritionbehaviors was not significant for the treatment group, Var (Growth RateNutrit) = .108, SE = .079, ns. The covariance between the initial status and the growth rate factors was negative butwas not statistically significant for both groups for both processes. Figures 3 and 4 show theestimated means of perceived importance of team leaders and nutrition behaviors across timefor the treatment and control groups.
As expected, there was a slight decay of program effect at Time 3 (1-year follow-up). Thefactor loading of Time 3 on the growth rate factor was slightly smaller than 1 but significantlydifferent from 0 for both importance of team leaders, λ32
(m) = .874, SE = .071, p < .001, andnutrition behaviors, λ32
(y) = .636, SE = .097, p < .001. These results suggest that the programeffect achieved by the initial full prevention program could deteriorate in time without thebooster programs.
Assessment of MediationThe latent growth model for the mediator process and the latent growth model for the outcomeprocess were combined into one parallel process latent growth model. The trajectory shapewas specified as in the previous step. Now that the treatment and the control groups were foundto be different in their average growth rates, the variable coding the group membership wasintroduced as a covariate to explain the group differences in growth trajectory.
As an intermediate step, the two growth curve models for the mediator and the outcomeprocesses were combined as parallel processes influenced only by the treatment program andthe relations among growth factors of the two processes were not estimated. The model fit ofthis intermediate model yielded a χ2 of 487.427 with 76 df (p < .001) and the RMSEA estimateof .064 with 90% CI = (.058, .069). Following the estimation of the intermediate model, therelation between the growth factors of the two processes was added (Figure 5). The modelshown in Figure 5 fits the data well, χ2(72) = 317.298, p < .001; RMSEA = .050 with 90% CI= (.045, .056). The chi-square difference between the intermediate model and the final modelwas statistically significant, Δχ2(4) = 170.131, p < .001, indicating that modeling the relationsamong the latent growth factors improves the model fit significantly and thus justifies inclusionof the mediational process in the model.
The main interest in the parallel process growth curve model in Figure 5 is in the relationsamong the prevention program and the growth rate factors of the two processes. The estimatesof these relations are shown in Figure 5 and the more detailed results are reported in Table 3.The effect of the treatment program on the growth rate factor of importance of team leaderswas significant (α = .859, SE = .089, p < .001) and the effect of the growth rate factor ofimportance of team leaders on the growth rate factor of nutrition behaviors was also significant(β = .891, SE = .226, p < .001). This implies a mediational process in such a way that theexposure to the ATLAS program led to positive change in perceived importance of team leadersover time, which, in turn, led to positive change in nutrition behaviors over time. The estimatedmediated effect (αβ) was .765 and the estimated standard error of the mediated effect (σαβ)based on the first-order solution was .210, indicating a significant mediated effect (zαβ = 3.643,p < .001). The mediated effect tested based on the asymmetric CI method was also significant,95% CI = (.372, 1.196).
Cheong et al. Page 10
Struct Equ Modeling. Author manuscript; available in PMC 2010 February 12.
NIH
-PA Author Manuscript
NIH
-PA Author Manuscript
NIH
-PA Author Manuscript

DISCUSSIONProcedures for applying latent growth curve modeling to the examination of program effectsand mediation effects were outlined in this study. An example from a prevention study, entitledATLAS, was used to illustrate the method. First, the growth trajectory of the mediator processand the growth trajectory of the outcome process were investigated, followed by assessing theprogram effect on the growth trajectories. The growth trajectory across six measurementoccasions was modeled to reflect the program effect achieved by the full prevention program,a slight decay of effect, and a program effect recovered and maintained by the booster programs.Because the prevention programs were delivered only to the treatment group, it was examinedwhether this specification was appropriate to describe the data from both groups. Using thetwo-group SEM technique, the appropriateness of the specification of the growth trajectorywas assessed by the overall model fit and the program effect on the growth trajectory wasevaluated by comparing the means of the growth rate factors between the treatment and thecontrol groups. Alternatively, the investigation of different trajectory shapes between the twogroups can be carried out by examining each group’s trajectory separately. When the trajectoryform is found to be appropriate for both treatment and control groups, two groups can becombined and the latent growth factors can be regressed on the group membership to accountfor the trajectory differences between the groups. The coefficient of the growth rate factor onthe group membership represents the program effect; that is, the mean shift in the growth ratedue to the prevention program.
It appears that the ATLAS prevention program shifted the growth trajectory of the mediatorand the growth trajectory of the outcome upward. Perceived importance of team leadersincreased and nutrition behaviors improved for the treatment group after the full preventionprogram was implemented in the first year. A slight decay of the program effect was foundduring the long period between the full prevention program and the 1-year follow-upassessment; however, this decay was recovered and maintained by the booster programsdelivered in the later years. These results suggest not only the effectiveness of the ATLASprevention program but also the importance of booster programs. The program effect achievedby the full prevention program could deteriorate in time and the booster programs may beneeded to maintain the program effects.
The mediation was modeled and estimated using the parallel process LGM method. In thisapproach, mediation is defined such that the treatment program influences the growth of theoutcome process indirectly by influencing the growth of the mediator process. Thus, thepresence of significant mediation depends on whether the treatment program changes thegrowth trajectory of the mediator and whether the change of the growth trajectory of themediator, in turn, is related to the change in the growth trajectory of the outcome variable. Inthis study, it was found that the ATLAS prevention program significantly increased bothperceived importance of the team leaders (mediator) and nutrition behaviors (outcome) overtime. Furthermore, the growth trajectory of perceived importance of team leaders wassignificantly related to the growth trajectory of nutrition behaviors such that the greater theincrease in perceived importance of team leaders over time, the greater the improvement innutrition behaviors over time. The test of mediation indicates that the ATLAS program shiftedthe growth trajectory of the nutrition behaviors upward by changing the growth trajectory ofthe positive peer influence (i.e., perceiving that the team leaders are a valuable informationsource about healthy diet, strength training, and drug prevention).
Although growth curve modeling is beginning to appear in the context of mediation analysis(e.g., Muthén & Curran, 1997), parallel process latent growth curve modeling has been appliedin only a few studies investigating mediation (e.g., Cheong, MacKinnon, & Khoo, 2001;Sandler, Tein, Mehta, Wolchik, & Ayers, 2000). In our previous study (Cheong et al., 2001),
Cheong et al. Page 11
Struct Equ Modeling. Author manuscript; available in PMC 2010 February 12.
NIH
-PA Author Manuscript
NIH
-PA Author Manuscript
NIH
-PA Author Manuscript
we investigated the possibility of applying the parallel process LGM to mediation analysis forrandomized prevention trials. Sandler et al. (2000) modeled three latent growth processes andexamined the relations among the growth process of independent variable, the growth processof the mediator, and the growth process of the outcome. However, Sandler et al. (2000) didnot include a randomized treatment group situation.
There are several advantages of the parallel process LGM method for mediation analysis. Thisapproach allows for estimation of the individual differences in growth over time. In real lifesituations, there are considerable individual differences in development and modeling theindividual differences is more representative of the reality. Another advantage of the parallelprocess LGM method is that the growth of the mediator and the growth of the outcome can bemodeled simultaneously and the change in the mediator can be related to the change in theoutcome variable in the structural model. This provides a superior method for investigatingmediational processes in longitudinal studies. Furthermore, the flexibility of SEM is allowedin the parallel process LGM method for assessing mediation. For example, the growth curveof the mediator and the outcome can be modeled to reflect various trajectory shapes, includinga linear or a curvilinear trajectory. Also, the trajectory shape of the mediator can be modeleddifferently from the trajectory of the outcome. The growth curve of the mediator can be astraight line, whereas the growth curve of the outcome is a stabilized plateau after the initialshift, as modeled in this study.
When the group membership variable represents random assignment to treatment or controlgroups, the interpretability of the mediation model is improved because the effect of theprogram on the growth of the mediator and the growth of the outcome can be attributed moreconfidently to the program assignment. Under random assignment, the counterfactualtrajectory, the trajectory that would have been obtained if the individuals had been assigned tothe other condition, is missing completely at random. Thus, the difference in the meantrajectories of the two groups can be used as an unbiased estimate of the average treatmenteffect (Raudenbush, 2001). On the other hand, the relation between the growth of the mediatorprocess and the growth of the outcome process is more complicated. Although the explicitmodeling of longitudinal growth in the mediator and the outcome makes it a better test of thisrelation than the cross-sectional data because multiple measurements are used to estimate truelong-term change, a causal statement regarding the relation between the growth rate factors ofthe two processes should be based on strong theory. Without strong theory, the relation betweenthe growth rate factors of the two processes may only be interpreted as correlational becausethe mediator and the outcome variables were measured simultaneously on each occasion andlevels on the mediator were not randomly assigned.
As the number of measurement occasions increases, more complex models can be estimated.For example, the growth across time can be evaluated in two different phases by usingpiecewise growth models (e.g., Khoo, 2001). In the two-phase piecewise models, the growthat the earlier phase and the growth at the later phase can be modeled simultaneously in onemodel. One of the benefits of the two-phase parallel process model is that the change in oneprocess at the earlier phase can be modeled to predict the change in the other process at thelater phase. This would provide a more convincing test of the mediational hypothesis becausethe change in the mediator preceding the change in the outcome may be investigated.
There are a few issues to be considered in the present study. One issue is the influence ofattrition. In the ATLAS study, participants who graduated from high school or quit the footballteam were no longer available for follow-up measurements. To adjust for the missing data, weused the ML method. The ML estimates adjusting for missing data are less biased than theestimates obtained by pairwise or listwise deletion, even when the assumption of missing atrandom is not strictly satisfied (Arbuckle, 1996; Little & Rubin, 1989; Muthén, Kaplan, &
Cheong et al. Page 12
Struct Equ Modeling. Author manuscript; available in PMC 2010 February 12.
NIH
-PA Author Manuscript
NIH
-PA Author Manuscript
NIH
-PA Author Manuscript
Hollis, 1987). Also, the ML estimates are slightly more efficient than the estimates obtainedby Multiple Imputation when the sample size is reasonably large (Schafer & Olsen, 1998).However, it is not clear how the use of these methods and the amount of attrition affect theaccuracy of growth curve models. Another issue is the nesting of individuals within schoolteams. In this study, data were analyzed at the individual level because the theories on whichthe ATLAS prevention program was based were conceptualized at the individual level and theintraclass correlations (ICC) at the baseline assessment were small (ICC = .03 for nutritionbehavior; ICC = .02 for perceived importance of team leaders). However, other nonparametricmethods such as the bootstrapping method can be used to estimate the standard errors andconstruct CIs or multilevel modeling can be incorporated when the magnitude of the ICCs issubstantial.
There are at least two future directions for this research. First, simulation studies can beconducted. Although applications of parallel process LGM have begun to appear in thesubstantive research, little is known about how accurately the parameters are recovered.Researchers can set the parameter values of the population model for the parallel process andinvestigate the conditions under which an accurate representation of the true population modelis reproduced. In addition, Type I error rates and statistical power can be investigated. Second,more applications of the parallel process growth model are needed to understand practicalissues. For example, researchers can probe questions such as whether the mediated effectestimated with this approach is statistically significant or how accurately the growth trajectoriescan be identified across different substantive areas. In any case, latent growth curve modelsfor the investigation of the mediational process show considerable promise.
AcknowledgmentsThis project was supported by Grants R01–DA07356 and R01–DA09757–04 from the National Institute on DrugAbuse.
ReferencesAjzen I, Madden TJ. Prediction of goal-directed behavior: Attitudes, intentions, and perceived behavioral
control. Journal of Experimental Social Psychology 1986;22:453–474.Arbuckle, JL. Full information estimation in the presence of incomplete data. In: Marcoulides, GA.;
Schumacker, RE., editors. Advanced structural equation modeling: Issues and techniques. Mahwah,NJ: Lawrence Erlbaum Associates, Inc; 1996. p. 243-277.
Aroian LA. The probability function of the product of two normally distributed variables. Annals ofMathematical Statistics 1947;18:265–271.
Bandura, A. Social learning theory. Englewood Cliffs, NJ: Prentice Hall; 1977.Baron RM, Kenny DA. The moderator–mediator distinction in social psychological research: Conceptual,
strategic, and statistical considerations. Journal of Personality and Social Psychology 1986;51:1173–1182. [PubMed: 3806354]
Bryk, AS.; Raudenbush, SW. Hierarchical linear models for social and behavioral research: Applicationsand data analysis methods. Newbury Park, CA: Sage; 1992.
Chen, H-T. Theory-driven evaluations. Newbury Park, CA: Sage; 1990.Cheong, J.; MacKinnon, DP.; Khoo, ST. A latent growth modeling approach to mediation analysis
[Abstract]. In: Collins, L.; Sayer, A., editors. New methods for the analysis of change. Washington,DC: American Psychological Association; 2001. p. 390-392.
Donaldson SI, Graham JW, Hansen WB. Testing the generalizability of intervening mechanism theories:Understanding the effects of adolescent drug use prevention interventions. Journal of BehavioralMedicine 1994;17:195–216. [PubMed: 8035452]
Du Toit, SHC.; Cudeck, R. The analysis of nonlinear random coefficient regression models with LISRELusing constraints. In: Cudeck, R.; Du Toit, SHC.; Sörbom, D., editors. Structural equation modeling:Present and future. Lincolnwood, IL: Scientific Software International; 2001. p. 259-278.
Cheong et al. Page 13
Struct Equ Modeling. Author manuscript; available in PMC 2010 February 12.
NIH
-PA Author Manuscript
NIH
-PA Author Manuscript
NIH
-PA Author Manuscript

Fishbein, M.; Ajzen, I. Beliefs, attitude, intention, and behavior: An introduction to theory and research.Reading, MA: Addison-Wesley; 1975.
Goldberg L, Elliot D, Clarke GN, MacKinnon DP, Moe E, Zoref L, et al. Effects of a multidimensionalanabolic steroid prevention intervention: The Adolescents Training and Learning to Avoid Steroids(ATLAS) program. Journal of the American Medical Association 1996;276:1555–1562. [PubMed:8918852]
Goldberg L, MacKinnon D, Elliot D, Moe E, Clarke G, Cheong J. The ATLAS program: Preventing druguse and promoting health behaviors. Archives of Pediatric and Adolescent Medicine 2000;154:332–338.
Goldstein, H. Multilevel statistical models. 2. New York: Wiley; 1995.Goodman LA. On the exact variance of products. Journal of the American Statistical Association
1960;55:708–713.Harford TC, Muthén BO. Alcohol use among college students: The effects of prior problem behaviors
and change of residence. Journal of Studies of Alcohol 2001;62:306–312.Janz NK, Becker MH. The health belief model: A decade later. Health Education Quarterly 1984;11:1–
47. [PubMed: 6392204]Judd CM, Kenny DA. Process analysis: Estimating mediation in treatment evaluations. Evaluation
Review 1981;5:602–619.Khoo ST. Assessing program effects in the presence of treatment–baseline interactions: A latent curve
approach. Psychological Methods 2001;6:234–257. [PubMed: 11570230]Little RJA, Rubin DB. The analysis of social science data with missing values. Sociological Methods
and Research 1989;18:292–326.Longford, N. Random coefficient models. Oxford, England: Clarendon; 1993.MacKinnon, DP. Analysis of mediating variables in prevention intervention studies. In: Cazares, A.;
Beatty, LA., editors. Scientific methods for prevention intervention research. NIDA researchmonograph 139. Washington, DC: U.S. Government Printing Office; 1994. p. 127-153.DHHS Pub.Number 94-3631
MacKinnon, DP. Mediating variable. In: Smelser, NJ.; Baltes, PB., editors. International encyclopediaof the social and behavioral sciences. New York: Elsevier; 2001. p. 9503-9507.
MacKinnon DP, Dwyer JH. Estimating mediated effects in prevention studies. Evaluation Review1993;17:144–158.
MacKinnon DP, Goldberg L, Clarke GN, Elliot DL, Cheong J, Lapin A, et al. Mediating mechanisms ina program to reduce intentions to use anabolic steroids and improve exercise self-efficacy and dietarybehavior. Prevention Science 2001;2:15–28. [PubMed: 11519372]
MacKinnon DP, Johnson CA, Pentz MA, Dwyer JH, Hansen WB, Flay BR, et al. Mediating mechanismsin a school-based drug prevention program: First-year effects of the Mid-western prevention project.Health Psychology 1991;10:164–172. [PubMed: 1879388]
MacKinnon DP, Lockwood CM, Hoffman JM, West SG, Sheets V. A comparison of methods to testmediation and other intervening variable effects. Psychological Methods 2002;7:83–104. [PubMed:11928892]
MacKinnon DP, Lockwood CM, Williams J. Confidence limits for the indirect effect: Distribution of theproduct and resampling methods. 2002 Manuscript submitted for publication.
MacKinnon DP, Warsi G, Dwyer JH. A simulation study of mediated effect measures. MultivariateBehavioral Research 1995;30:41–62. [PubMed: 20157641]
Meredith W, Tisak J. Latent curve analysis. Psychometrika 1990;55:107–122.Muthén BO, Curran PJ. General longitudinal modeling of individual differences in experimental designs:
A latent variable framework for analysis and power estimation. Psychological Methods 1997;2:371–402.
Muthén BO, Kaplan D, Hollis M. On structural equation modeling with data that are not missingcompletely at random. Psychometrika 1987;52:431–462.
Muthén, BO.; Muthén, L. Mplus user’s guide. Los Angeles: Author; 2001.
Cheong et al. Page 14
Struct Equ Modeling. Author manuscript; available in PMC 2010 February 12.
NIH
-PA Author Manuscript
NIH
-PA Author Manuscript
NIH
-PA Author Manuscript

Park J, Kosterman R, Hawkins JD, Haggerty KP, Duncan TE, Duncan SC, et al. Effects of the “preparingfor the drug free years” curriculum on growth in alcohol use and risk for alcohol use in earlyadolescence. Prevention Science 2000;1:125–138. [PubMed: 11525344]
Raudenbush SW. Comparing personal trajectories and drawing causal inferences from longitudinal data.Annual Reviews of Psychology 2001;52:501–525.
Rogosa, D. Myths about longitudinal research. In: Schaie, KW.; Campbell, RT.; Meredith, W.; Rawlings,SC., editors. Methodological issues in aging research. NewYork: Springer; 1988. p. 171-205.
Rogosa D, Brandt D, Zimowski M. A growth curve approach to the measurement of change.Psychological Bulletin 1982;90:726–748.
Sandler IN, Tein JY, Mehta P, Wolchik S, Ayers T. Coping efficacy and psychological problems ofchildren of divorce. Child Development 2000;71:1099–1118. [PubMed: 11016569]
Schafer JL, Olsen MK. Multiple imputation of multivariate missing-data problems: A data analyst’sperspective. Multivariate Behavioral Research 1998;33:545–571.
Sobel, ME. Asymptotic confidence intervals for indirect effects in structural equation models. In:Leinhard, S., editor. Sociological methodology 1982. Washington, DC: American SociologicalAssociation; 1982. p. 290-312.
Stoolmiller, M. Using latent growth curve models to study developmental processes. In: Gottman, JM.,editor. The analysis of change. Mahwah, NJ: Lawrence Erlbaum Associates, Inc; 1995. p. 103-138.
Taylor BJ, Graham JW, Cumsille P, Hansen WB. Modeling prevention program effects on growth insubstance use: Analysis of five years of data from the adolescent alcohol prevention trial. PreventionScience 2000;1:183–197. [PubMed: 11523747]
Willett JB, Sayer AG. Using covariance structure analysis to detect correlates and predictors of individualchange over time. Psychological Bulletin 1994;116:363–381.
Cheong et al. Page 15
Struct Equ Modeling. Author manuscript; available in PMC 2010 February 12.
NIH
-PA Author Manuscript
NIH
-PA Author Manuscript
NIH
-PA Author Manuscript

FIGURE 1.A single mediator model.
Cheong et al. Page 16
Struct Equ Modeling. Author manuscript; available in PMC 2010 February 12.
NIH
-PA Author Manuscript
NIH
-PA Author Manuscript
NIH
-PA Author Manuscript

FIGURE 2.A parallel process latent growth model for mediation. X = treatment program condition; Y =outcome; M = mediator; η1 = initial status factor of mediator; η2 = growth rate factor ofmediator; η3 = initial status factor of outcome; η4 = growth rate factor of outcome.
Cheong et al. Page 17
Struct Equ Modeling. Author manuscript; available in PMC 2010 February 12.
NIH
-PA Author Manuscript
NIH
-PA Author Manuscript
NIH
-PA Author Manuscript

FIGURE 3.Model-based change in peer team leaders as an information source over six measurement timepoints.
Cheong et al. Page 18
Struct Equ Modeling. Author manuscript; available in PMC 2010 February 12.
NIH
-PA Author Manuscript
NIH
-PA Author Manuscript
NIH
-PA Author Manuscript
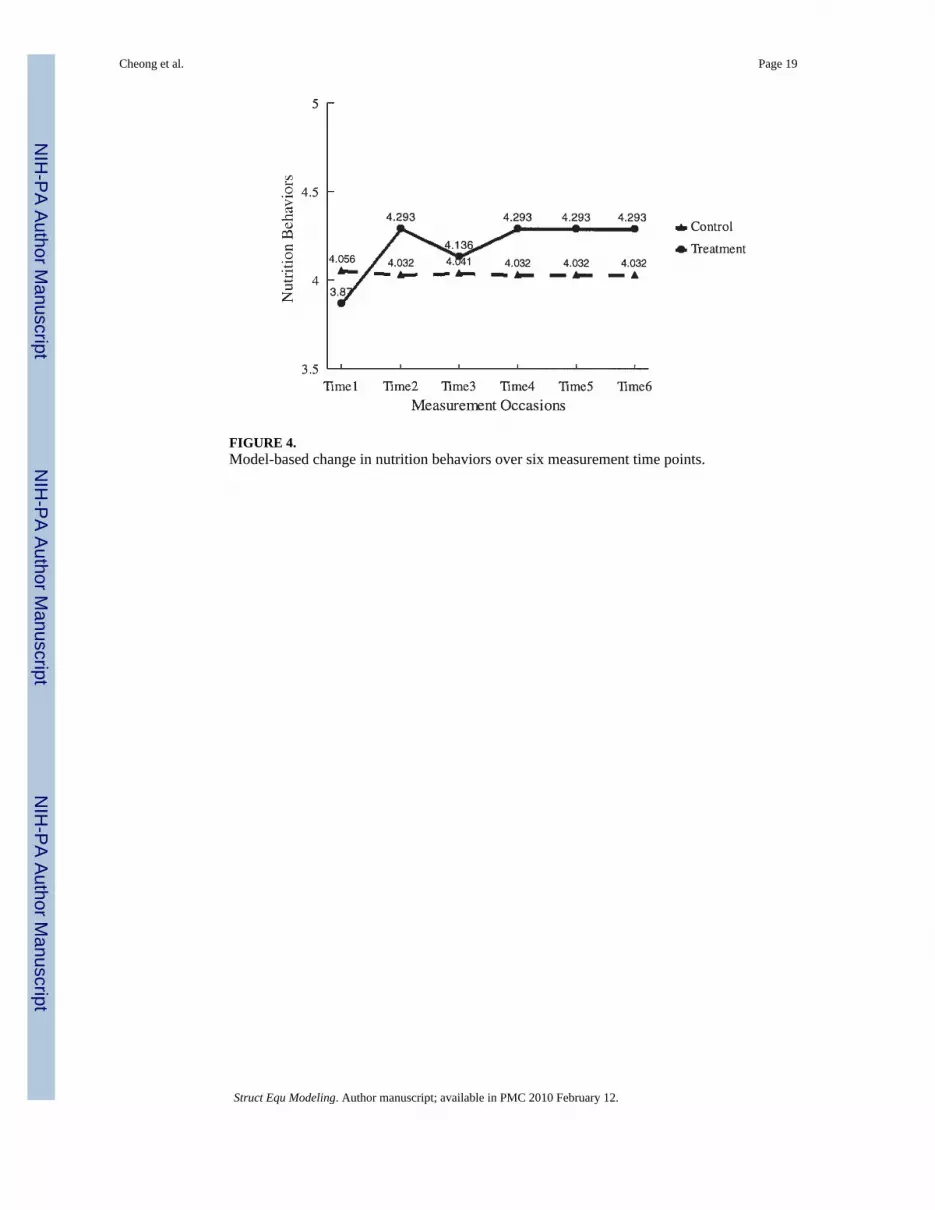
FIGURE 4.Model-based change in nutrition behaviors over six measurement time points.
Cheong et al. Page 19
Struct Equ Modeling. Author manuscript; available in PMC 2010 February 12.
NIH
-PA Author Manuscript
NIH
-PA Author Manuscript
NIH
-PA Author Manuscript
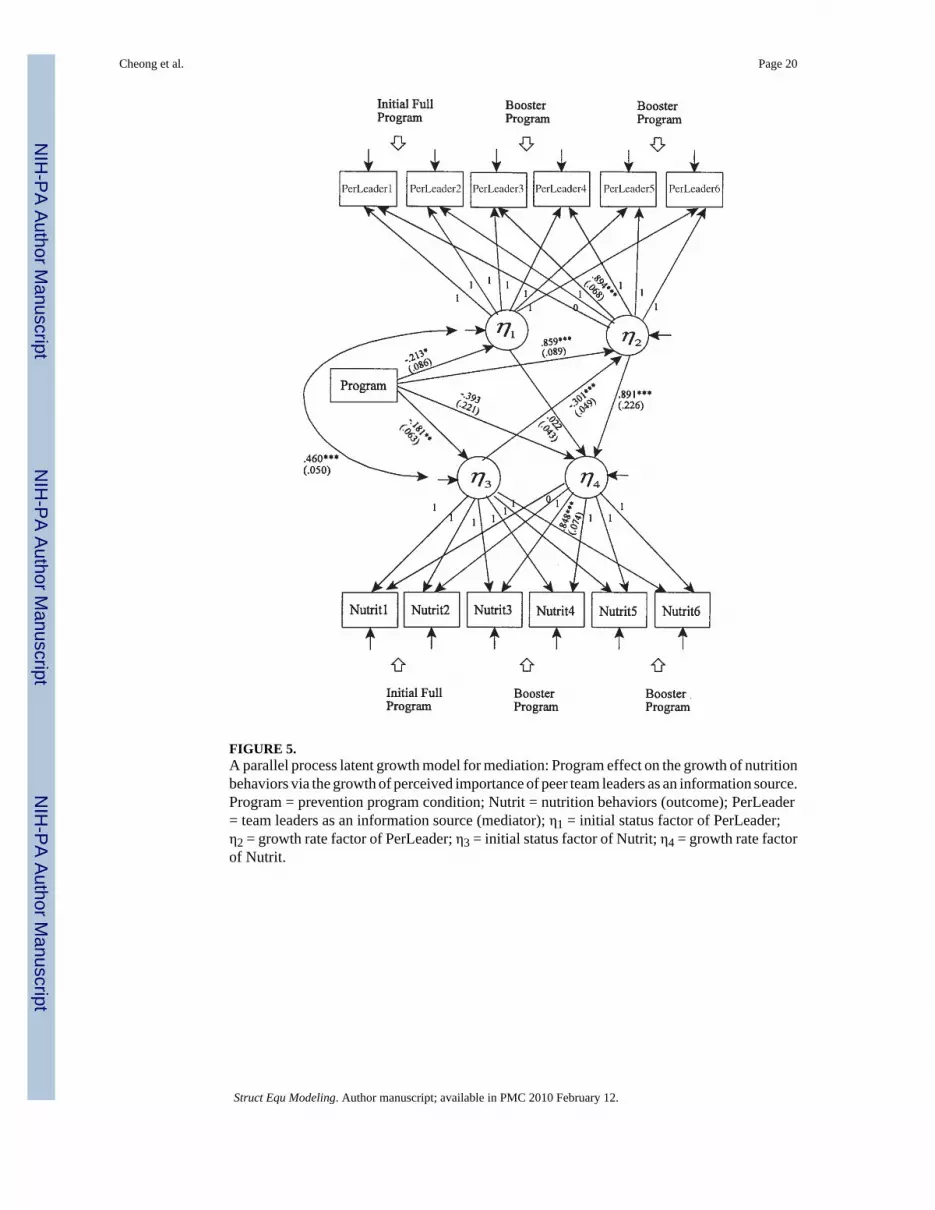
FIGURE 5.A parallel process latent growth model for mediation: Program effect on the growth of nutritionbehaviors via the growth of perceived importance of peer team leaders as an information source.Program = prevention program condition; Nutrit = nutrition behaviors (outcome); PerLeader= team leaders as an information source (mediator); η1 = initial status factor of PerLeader;η2 = growth rate factor of PerLeader; η3 = initial status factor of Nutrit; η4 = growth rate factorof Nutrit.
Cheong et al. Page 20
Struct Equ Modeling. Author manuscript; available in PMC 2010 February 12.
NIH
-PA Author Manuscript
NIH
-PA Author Manuscript
NIH
-PA Author Manuscript
NIH
-PA Author Manuscript
NIH
-PA Author Manuscript
NIH
-PA Author Manuscript
Cheong et al. Page 21
TAB
LE 1
Estim
ated
Cov
aria
nces
and
Mea
ns b
y G
roup
Perc
eive
d Im
port
ance
of T
eam
Lea
ders
as a
n In
form
atio
n So
urce
PerL
eade
r1Pe
rLea
der2
PerL
eade
r3Pe
rLea
der4
PerL
eade
r5Pe
rLea
der6
PerL
eade
r11.
196
.882
.683
.705
.541
PerL
eade
r2.8
39.8
94.7
72.6
18.3
29
PerL
eade
r3.8
351.
085
1.14
11.
063
1.25
3
PerL
eade
r4.3
30.5
651.
227
.942
.916
PerL
eade
r5.5
50.8
481.
399
.925
1.48
6
PerL
eade
r6.7
96.8
07.8
921.
140
1.38
3
Var
ianc
e2.
381
2.56
32.
698
2.46
42.
658
3.11
9
2.46
42.
350
2.49
32.
529
2.16
73.
071
M4.
357
5.39
85.
135
5.28
65.
178
5.26
9
4.56
64.
427
4.58
64.
916
4.79
44.
948
Nut
ritio
n B
ehav
iors
Nut
rit1
Nut
rit2
Nut
rit3
Nut
rit4
Nut
rit5
Nut
rit6
Nut
rit1
.658
.633
.622
.480
.560
Nut
rit2
.714
.594
.589
.482
.532
Nut
rit3
.659
.848
.819
.742
.781
Nut
rit4
.642
.750
.803
.708
.792
Nut
rit5
.607
.776
.947
.861
.941
Nut
rit6
.752
.635
.996
.734
1.09
7
Var
ianc
e1.
328
1.35
41.
435
1.43
31.
636
1.85
0
1.26
01.
064
1.22
01.
259
1.36
71.
491
M3.
878
4.36
74.
092
4.22
74.
195
4.12
1
4.04
94.
029
4.07
54.
094
3.94
44.
030
Not
e. T
reat
men
t gro
up in
regu
lar f
ont;
cont
rol g
roup
in it
alic
. The
cov
aria
nces
and
the
mea
ns a
re th
e es
timat
es o
f the
sam
ple
cova
rianc
es a
nd m
eans
est
imat
ed u
sing
the
Max
imum
Lik
elih
ood
met
hod
to a
djus
tfo
r the
mis
sing
dat
a. N
utrit
1–N
utrit
6 =
Nut
ritio
n be
havi
ors m
easu
red
from
Tim
e 1
to T
ime
6; P
erLe
ader
1–Pe
rLea
der6
= P
erce
ived
impo
rtanc
e of
pee
r tea
m le
ader
s as a
n in
form
atio
n so
urce
mea
sure
d fr
omTi
me
1 to
Tim
e 6.
Struct Equ Modeling. Author manuscript; available in PMC 2010 February 12.
NIH
-PA Author Manuscript
NIH
-PA Author Manuscript
NIH
-PA Author Manuscript
Cheong et al. Page 22
TAB
LE 2
Gro
wth
Pro
cess
of P
eer T
eam
Lea
ders
as a
n In
form
atio
n So
urce
and
Nut
ritio
n B
ehav
iors
by
Gro
up
Peer
Tea
m L
eade
rs a
s an
Info
rmat
ion
Sour
ce (P
erL
eade
r)
χ2(3
9)=1
55.2
04, p
< .0
01; R
MSE
A=.
067,
90%
CI:
.056
, .07
8
Con
trol
Gro
up (n
= 7
30)
Tre
atm
ent G
roup
(n =
609
)
Initi
al S
tatu
sG
row
th R
ate
Initi
al S
tatu
sG
row
th R
ate
Fact
or lo
adin
gs o
n gr
owth
fact
ors
Pe
rLea
der 1
1a0a
1a0a
Pe
rLea
der 2
1a1a
1a1a
Pe
rLea
der 3
1a.8
74 (.
071)
b=
1a.8
74 (.
071)
b
Pe
rLea
der 4
1a1a
1a1a
Pe
rLea
der 5
1a1a
1a1a
Pe
rLea
der 6
1a1a
1a1a
Inte
rcep
t4.
587
(.044
)b=
4.58
7 (.0
44)b
Gro
wth
fact
ors
MVa
rian
ceM
Vari
ance
In
itial
stat
us0a
1.03
0 (.1
32)b
−.23
3 (.0
77)b
.954
(.17
7)b
G
row
th ra
te0a
0a.9
47 (.
071)
b.5
90 (.
203)
b
Cov
aria
nce
betw
een
grow
th fa
ctor
s
−.05
8 (.0
76)b
−.22
4 (.1
72)b
Res
idua
l var
ianc
es
Pe
rLea
der 1
1.44
3 (.1
13)b
=1.
443
(.113
)b
Pe
rLea
der 2
1.50
1 (.0
84)b
=1.
501
(.084
)b
Pe
rLea
der 3
1.50
7 (.0
90)b
=1.
507
(.090
)b
Pe
rLea
der 4
1.70
9 (.1
28)b
=1.
709
(.128
)b
Pe
rLea
der 5
1.42
1 (.1
10)b
=1.
421
(.110
)b
Pe
rLea
der 6
2.13
1 (.2
09)b
=2.
131
(.209
)b
Struct Equ Modeling. Author manuscript; available in PMC 2010 February 12.
NIH
-PA Author Manuscript
NIH
-PA Author Manuscript
NIH
-PA Author Manuscript
Cheong et al. Page 23N
utri
tion
Beh
avio
rs (N
utri
t)
χ2 (3
9) =
123
.035
, p <
.001
; RM
SEA
= .0
57, 9
0% C
I: .0
46, .
068
Con
trol
Gro
up (n
= 7
30)
Tre
atm
ent G
roup
(n =
609
)
Fact
or lo
adin
gs o
n gr
owth
fact
ors
Initi
al S
tatu
sG
row
th R
ate
Initi
al S
tatu
sG
row
th R
ate
N
utrit
11a
01a
0a
N
utrit
21a
11a
1a
N
utrit
31a
.636
(.09
7)b
=1a
.636
(.09
7)b
N
utrit
41a
11a
1a
N
utrit
51a
11a
1a
N
utrit
61a
11a
1a
Inte
rcep
t4.
041
(.033
)b=
4.04
1 (.0
33)b
Gro
wth
fact
ors
MVa
rian
ceM
Vari
ance
In
itial
stat
us0a
.632
(.06
5)b
−.17
1 (.0
58)b
.667
(.08
4)b
G
row
th ra
te0a
0a.4
23 (.
044)
b.1
08 (.
079)
b
Cov
aria
nce
betw
een
grow
th fa
ctor
s
−.00
8 (.0
37)b
.039
(.06
9)b
Res
idua
l var
ianc
es
N
utrit
1.6
62 (.
045)
b=
.662
(.04
5)b
N
utrit
2.5
16 (.
032)
b=
.516
(.03
2)b
N
utrit
3.5
63 (.
035)
b=
.563
(.03
5)b
N
utrit
4.5
84 (.
046)
b=
.584
(.04
6)b
N
utrit
5.7
53 (.
056)
b=
.753
(.05
6)b
N
utrit
6.8
52 (.
085)
b=
.852
(.08
5)b
Not
e. =
par
amet
er e
quat
ed a
cros
s gro
ups.
a Para
met
er fi
xed
in th
e m
odel
.
b Para
met
er e
stim
ate
with
the
stan
dard
err
or o
f est
imat
e in
par
enth
eses
.
Struct Equ Modeling. Author manuscript; available in PMC 2010 February 12.

NIH
-PA Author Manuscript
NIH
-PA Author Manuscript
NIH
-PA Author Manuscript
Cheong et al. Page 24
TABLE 3
Parameter Estimates in the Parallel Process Latent Growth Curve Model for Mediation
χ2 (38) = 122.648, p < .001; RMSEA = .058, 90% CI: .046, .069
Mediator process: Peer team leaders as an information source (PerLeader)
Factor loadings on growthfactors
Initial Status Growth Rate Residual Variances
PerLeader 1 1a 0a 1.421 (.077)b
PerLeader 2 1a 1a 1.472 (.088)b
PerLeader 3 1a .894 (.068)b 1.504 (.084)b
PerLeader 4 1a 1a 1.718 (.128)b
PerLeader 5 1a 1a 1.430 (.110)b
PerLeader 6 1a 1a 2.078 (.204)b
Intercepts
PerLeader 1–6 4.564 (.058)b
Initial status(p) 0a .997 (.069)b
Growth rate(p) .033 (.060)b .224 (.069)b
Outcome process: Nutrition behaviors (Nutrit)
Factor loadings on growthfactors
Initial Status Growth Rate Residual Variances
Nutrit 1 1a 0a .430 (.069)b
Nutrit 2 1a 1a .583 (.036)b
Nutrit 3 1a .848 (.074)b .507 (.032)b
Nutrit 4 1a 1a .578 (.045)b
Nutrit 5 1a 1a .759 (.057)b
Nutrit 6 1a 1a .843 (.084)b
Intercepts
Nutrit 1–6 4.052 (.042)b
Initial status(n) 0a .868 (.077)b
Growth rate(n) −.049 (.061)b .067 (.041)b
Group M .455 (.014)b Variance .248 (.010)b
Mediational process
Group → Growth rate(p) .859 (.089)b
Growth Rate(p) → Growthrate(n)
.891 (.226)b
Group → Growth rate(n) −.393 (.221)b
Initial Status(p) →Growthrate(n)
.022 (.043)b
Initial Status(n) → Growthrate(p)
−.301 (.048)b
Struct Equ Modeling. Author manuscript; available in PMC 2010 February 12.

NIH
-PA Author Manuscript
NIH
-PA Author Manuscript
NIH
-PA Author Manuscript
Cheong et al. Page 25
χ2 (38) = 122.648, p < .001; RMSEA = .058, 90% CI: .046, .069
Group → Initial status(n) −.181 (.063)b
Group → Initial status(p) −.213 (.086)b
Note. Initial status(p) = status factor of PerLeader; Growth rate(p) = growth rate factor of PerLeader; Initial status(n) = status factor of Nutrit; Growth
rate(n) = growth rate factor of Nutrit.
aParameter fixed in the model.
bParameter estimate with the standard error of estimate in parentheses.
Struct Equ Modeling. Author manuscript; available in PMC 2010 February 12.
Related Documents