INVESTIGATION OF LIPID-LOWERING MECHANISM OF TAMARINDUS INDICA FRUIT PULP IN HEPG2 CELLS USING PROTEOMIC AND TRANSCRIPTOMIC APPROACHES URSULA CHONG RHO WAN THESIS SUBMITTED IN FULFILMENT OF THE REQUIREMENT FOR THE DEGREE OF DOCTOR OF PHILOSOPHY FACULTY OF MEDICINE UNIVERSITY OF MALAYA KUALA LUMPUR 2014

Welcome message from author
This document is posted to help you gain knowledge. Please leave a comment to let me know what you think about it! Share it to your friends and learn new things together.
Transcript

INVESTIGATION OF LIPID-LOWERING MECHANISM OF
TAMARINDUS INDICA FRUIT PULP IN HEPG2 CELLS
USING PROTEOMIC AND TRANSCRIPTOMIC APPROACHES
URSULA CHONG RHO WAN
THESIS SUBMITTED IN FULFILMENT
OF THE REQUIREMENT FOR THE
DEGREE OF DOCTOR OF PHILOSOPHY
FACULTY OF MEDICINE
UNIVERSITY OF MALAYA
KUALA LUMPUR
2014
UNIVERSITI MALAYA
ORIGINAL LITERARY WORK DECLARATION
Name of Candidate: URSULA CHONG RHO WAN (I.C/Passport No: 861218-14-5152)
Registration/Matric No: MHA110060
Name of Degree: DOCTOR OF PHILOSOPHY
Title of Project Paper/Research Report/Dissertation/Thesis (“this Work”):
INVESTIGATION OF LIPID-LOWERING MECHANISM OF TAMARINDUS INDICA FRUIT
PULP IN HEPG2 CELLS USING PROTEOMIC AND TRANSCRIPTOMIC APPROACHES
Field of Study: MOLECULAR MEDICINE
I do solemnly and sincerely declare that:
(1) I am the sole author/writer of this Work; (2) This Work is original; (3) Any use of any work in which copyright exists was done by way of fair dealing and
for permitted purposes and any excerpt or extract from, or reference to or reproduction of any copyright work has been disclosed expressly and sufficiently and the title of the Work and its authorship have been acknowledged in this Work;
(4) I do not have any actual knowledge nor do I ought reasonably to know that the making of this work constitutes an infringement of any copyright work;
(5) I hereby assign all and every rights in the copyright to this Work to the University of Malaya (“UM”), who henceforth shall be owner of the copyright in this Work and that any reproduction or use in any form or by any means whatsoever is prohibited without the written consent of UM having been first had and obtained;
(6) I am fully aware that if in the course of making this Work I have infringed any copyright whether intentionally or otherwise, I may be subject to legal action or any other action as may be determined by UM.
Candidate’s Signature Date
Subscribed and solemnly declared before,
Witness’s Signature Date
Name: Designation:
iii
ABSTRACT
Tamarindus indica (T. indica), or tamarind, is an edible fruit widely used in
many applications including culinary, industrial, and medicinal purposes. It has been
shown to exhibit hypolipidaemic effects in hamsters and humans. Previous studies have
also shown that the methanol extract of T. indica fruit pulp regulated genes related to
lipid metabolism. However, the lipid-lowering mechanism of the fruit has not been fully
understood. The objective of this present study is to determine the lipid-lowering
mechanism of T. indica fruit pulp using proteomic and transcriptomic approaches.
Proteomic analyses were first performed to formulate a hypothesis on the
hypolipidaemic action of the fruit. When secreted proteins extracted from control and T.
indica fruit-treated HepG2 cells were subjected to 2-dimensional gel electrophoresis,
the expression of seven proteins was found to be significantly different (p < 0.03125).
As for the HepG2 cell lysate proteins, 20 spots were found to be significantly altered (p
< 0.05). Fourteen spots were identified and categorised based on their biological
functions, namely the oxidative phosphorylation, metabolism, protein biosynthesis, cell
proliferation and differentiation and mRNA splicing. When the altered secreted proteins
and cell lysate proteins were co-analysed using Ingenuity Pathway Analysis (IPA)
software, lipid metabolism was found to be the top network being regulated, with a
score of 31. Further data mining of the proteomic data as well as previously obtained
microarray data indicated that the fruit pulp extract modulates its lipid-lowering effect
through the activation of PPARα. To further demonstrate the hypolipidaemic effect of
the fruit, lipid studies were conducted. DNA microarray analyses were also conducted
to elucidate its mechanism of action, and fenofibrate, a hypolipidaemic drug which is a
ligand to PPARα, was used as a comparison to T. indica fruit which was hypothesised
to lower lipids in a similar mode of action. HepG2 cells were first treated with 0.3 mM

iv
palmitic acid to induce hepatic steatosis. The lipid loaded-cells were then treated with
different concentrations of T. indica fruit pulp extract and the total triglyceride and
cholesterol levels were measured. Total cellular RNA was then extracted for DNA
microarray analysis and the significantly regulated genes were subjected to IPA
software analysis. Results showed that treatment with 0.1 mg/ml T. indica fruit pulp
extract reduced total triglyceride and total cholesterol by 40 % and 18 % respectively, a
level comparable to fenofibrate. DNA microarray analyses showed that treatment of
lipid loaded-HepG2 cells with the same concentration of T. indica fruit extract regulated
140 genes (p < 0.05) when compared to control. Further data mining using IPA analysis
showed that 21 genes were involved in lipid metabolism network and PPARα and
PPARγ activation could be responsible for the lipid-lowering effects, possibly attributed
to proanthocyanidins, the major polyphenol found in T. indica fruit extract. As a
conclusion, the methanol extract of T. indica fruit pulp lowers lipid levels significantly,
particularly triglyceride and it does so through the activation of PPARα, a mechanism
similar to fenofibrate.
v
ABSTRAK
Buah Tamarindus indica (T. indica), atau asam jawa boleh dimakan serta
digunakan secara meluas dalam pelbagai aplikasi termasuk masakan, perindustrian, dan
untuk tujuan perubatan. Ia telah terbukti mempamerkan kesan hipolipidemik dalam
hamster dan manusia. Kajian kami sebelum ini juga telah menunjukkan bahawa ekstrak
metanol buah T. indica mengawal atur gen yang berkaitan dengan metabolisme lipid.
Walau bagaimanapun, mekanisme tindakan hipolipodemik buah T. indica masih belum
difahami sepenuhnya. Objektif kajian ini adalah untuk menjelaskan mekanisme
perendahan lipid oleh buah T. indica dengan menggunakan pendekatan proteomik dan
transkriptomik. Analisa proteomik dijalankan terlebih dahulu untuk merangka hipotesis
mengenai tindakan hipolipidemik buah asam jawa. Apabila dianalisa melalui kaedah
elektroforesis 2-dimensi, terdapat perubahan signifikan dikesan bagi ekspresi tujuh
tompokan protein (p < 0.03125) dalam ekstrak protein dari rembesan sel-sel HepG2
yang dirawat dengan buah T. indica berbanding dengan sel-sel kawalan yang tidak
menerima rawatan. Bagi protein lysate sel HepG2 pula, perubahan ekspresi 20
tompokan protein pada gel didapati signifikan (p < 0.05). Empat belas tompokan
protein telah dikenal pasti dan dikategori berdasarkan fungsi biologi, iaitu
pemfosforilan oksidatif, metabolisme, biosintesis protein, percambahan sel dan
pembezaan dan pemotongan mRNA. Apabila rembesan protein dan protein lysate sel
dianalisasi dengan menggunakan perisian Ingenuity Pathway Analysis (IPA), rangkaian
utama yang dikawal atur adalah metabolisme lipid, dengan skor 31. Maklumat lanjut
analisis perlombongan data proteomik serta data mikroarray kami yang terdahulu
menunjukkan bahawa ekstrak buah asam jawa merendahkan lipid melalui pengaktifan
PPARα. Untuk membuktikan kesan hipolipidemik buah tersebut, kajian lipid telah
dijalankan untuk mengukur kesan perendahan lipid. Analisis mikroarray DNA juga
vi
telah digunakan untuk menjelaskan mekanisme tindakan, dan fenofibrate, ubat
hipolipidemik yang merupakan ligan untuk PPARα telah digunakan sebagai
perbandingan dengan buah T. indica yang dijangka merendahkan lipid melalui
mekanisme tindakan yang sama. Sel-sel HepG2 terlebih dahulu dirawat dengan 0.3 mM
asid palmitik untuk mengaruh steatosis pada sel hepar. Sel yang kaya-lipid, kemudian
dirawat dengan ekstrak buah T. indica pada kepekatan berbeza dan jumlah trigliserida
dan paras kolesterol telah diukur. tcRNA sel kemudiannya diekstrak untuk analisis
mikroarray DNA dan gen yang dikawal atur dengan ketara telah dianalisa menggunakan
perisian IPA. Hasil kajian menunjukkan bahawa rawatan dengan 0.1 mg/ml ekstrak
buah T. indica mengurangkan paras trigliserida dan kolesterol masing-masing sebanyak
40 % dan 18 %, setanding dengan 0.1 mM fenofibrate. Analisis mikroarray DNA
menunjukkan bahawa rawatan sel HepG2 yang kaya-lipid dengan ekstrak buah T.
indica pada kepekatan 0.1 mg/ml mengubah ekspresi 140 gen (p < 0.05) berbanding
dengan kawalan. Perlombongan data menggunakan perisian IPA menunjukkan bahawa
21 gen terlibat dalam rangkaian metabolisme lipid, dan pengaktifan PPARα dan PPARγ
bertanggungjawab untuk kesan perendahan lipid, mungkin disebabkan oleh
proantosianidin, polifenol utama yang terdapat dalam ekstrak buah T. indica.
Kesimpulannya, ekstrak metanol buah T. indica merendahkan lipid dengan ketara,
terutamanya trigliserida dan ia merendahkan lipid melalui pengaktifan PPARα,
mekanisme yang sama dengan fenofibrate.

vii
ACKNOWLEDGEMENT
First and foremost, I would like to express my utmost gratitude to my
supervisors, A/P Dr. Sarni Mat Junit, Dr. Puteri Shafinaz Akmar Abdul-Rahman and
A/P Dr. Azlina Abdul Aziz. The route to graduate with a PhD can be a daunting
experience, especially when unforeseen circumstances arose like experiments did not
turn out as expected, insufficient funding, equipment broke down and etc. I am lucky to
have my supervisors for being very supportive academically, financially and
emotionally as well. If not for your support and guidance, I would not be able to make it
through my study.
A special thank goes to Prof. Dr. Onn Haji Hashim for his guidance and
suggestions in my studies, particularly in paper writing and publishing. I would also like
to thank all the friendly staff and students in Department of Molecular Medicine. I am
indebted to my colleagues and friends who had helped me in this study, Christina, Tan
Eng Chong, Rama Rao, Shahram, Izlina, Hani, Jessie, Kak Amy, Chor Yin, Yasmin,
Nani, Iman, Ann, Kong, Shay, Wei Lian, Sook Shien and Cheng Siang. I would also
like to express my gratitude to the friendly staff in Biotechnology Lab, Kak Sri, Kak Ju
and Kak Athi for their guidance and help with the analysis of mass spectrophotometer.
Thanks Jamie for the assistance in statistical analysis and troubleshooting with the mass
spectrophotometer. A deep appreciation goes to my friends, Melissa, Thanes, Nadia,
Alfred, Kong and Joe for friendship and support. I would also like to thank UM for
granting me the SBUM.
Last but not least, I would like to thank my family for their love, support and
understanding. If not for them, I would not be able to make it throughout this study. I
am truly grateful for all the support, care and guidance I received from all of you.
viii
TABLE OF CONTENTS
ABSTRACT iii
ABSTRAK v
ACKNOWLEDGEMENTS vii
TABLE OF CONTENTS viii
LIST OF FIGURES xiv
LIST OF TABLES xvii
LIST OF SYMBOLS AND ABBREVIATIONS xix
LIST OF APPENDICES xxiii
CHAPTER 1 INTRODUCTION 1
1.1 Objectives 4
CHAPTER 2 LITERATURE REVIEW 5
2.1 Significance of lipid-lowering studies 5
2.2 Lipid-lowering mechanisms 6
2.2.1 Commercial lipid-lowering drugs 6
2.2.2 Alternative medicine to treat hyperlipidaemia 8
2.2.2.1 Flavonoids 9
2.2.2.2 Other plant compounds with hypolipidaemic effect 10
2.3 Tamarindus indica (T. indica) 12
2.3.1 Description of T. indica 12
2.3.2 Taxonomical classification 13
2.3.3 Chemical composition of T. indica fruit pulp 13
2.3.4 T. indica applications 14
ix
2.3.4.1 Food and product 14
2.3.4.2 Medicinal uses 15
2.3.5 Current studies of T. indica 19
2.4 Foodomics 21
2.4.1 Proteomics 23
2.4.1.1 Two-dimensional gel electrophoresis (2D-GE) 24
2.4.1.2 Protein sample preparation 24
2.4.1.3 First dimension separation (IEF) and 26
second dimension separation (SDS-PAGE)
2.4.1.4 Visualisation of 2-dimensional (2D) gels 27
2.4.1.5 Further analysis of protein spots 29
2.4.2 Transcriptomics 29
2.4.2.1 DNA microarray 30
2.4.2.2 Types of DNA microarray 30
2.4.2.3 Normalisation and data analysis 32
2.4.2.4 Validation of microarray analysis 34
CHAPTER 3 MATERIALS AND METHODS 36
3.1 Materials 36
3.1.1 Chemicals 36
3.1.2 Apparatus 40
3.1.3 Kits 41
3.1.4 Software 41
3.1.5 Cell culture 42
3.2 Methods 43
3.2.1 Nomenclature 43
x
3.2.2 Sampling and sample preparation 43
3.2.3 Cell culture and treatment 43
3.2.4 Recovery of secreted proteins from cell culture media 44
3.2.5 Cell lysate extraction 44
3.2.6 Cell viability 45
3.2.7 Two-dimensional gel electrophoresis (2D-GE) 45
3.2.7.1 Sample preparation and rehydration of IPG gel strips 45
3.2.7.2 First dimension separation of protein through IEF 46
3.2.7.3 Second dimension separation of protein through 46
SDS-PAGE
3.2.8 Silver staining of gel 47
3.2.9 Gel image and data analysis 48
3.2.10 In-gel tryptic digestion 48
3.2.11 Mass spectrometry and database searching 49
3.2.12 Western blot 49
3.2.13 Data mining using Ingenuity Pathways Analysis (IPA) software 50
3.2.14 Lipid Studies 51
3.2.14.1 Cell culture and treatment to study lipid-lowering 51
effects of T. indica fruit extract in HepG2 cells
3.2.14.2 Preparation of palmitic acid/fatty acid-free bovine 51
serum albumin complex
3.2.14.3 Cell viability 52
3.2.14.4 Oil Red O staining 52
3.2.14.5 Triglyceride quantification 53
3.2.14.6 Cholesterol quantification 53
3.2.15 DNA microarray analyses 53
xi
3.2.15.1 Total cellular RNA (tcRNA) extraction 53
3.2.15.2 tcRNA to cDNA conversion 54
3.2.15.3 Data analyses using Partek Genomic Suite (GS) 55
software
3.2.15.4 Functional analyses using IPA software 55
3.2.15.5 DNA microarray data validation using quantitative 56
real-time polymerase chain reaction (qRT-PCR)
CHAPTER 4 RESULTS 58
4.1 Cell viability in serum-free medium 58
4.2 Proteomic analyses of secreted proteins and cell lysate of HepG2 cells 58
4.2.1 Optimisation of 2D-GE for secreted proteins and cell lysate 58
4.2.2 2D-GE of secreted proteins and cell lysate proteins 63
4.2.2.1 2D-GE of secreted proteins 63
4.2.2.2 2D-GE of cell lysate proteins 63
4.2.3 Gel image analyses 67
4.2.3.1 Secretome analysis 67
4.2.3.2 Cell lysate analysis 67
4.2.4 Identification of differentially expressed proteins 70
4.2.4.1 Secretome 70
4.2.4.2 Cell lysate 70
4.2.5 Western blot analyses 76
4.2.6 Pathway interactions and biological process analysis 76
4.3 In vitro evaluation of hypolipidaemic properties of T. indica fruit pulp 84
extract
4.3.1 Cell viability and Oil Red O staining of HepG2 cells in different 85
xii
concentrations of palmitic acid and T. indica fruit extract
4.3.2 Total triglyceride and cholesterol quantification 90
4.4 Transcriptomic studies 93
4.4.1 Assessment of the integrity of tcRNA extracted from HepG2 93
cells
4.4.2 Principal component analysis (PCA) mapping of different 95
treatment groups
4.4.3 Identification of significantly regulated genes using Partek 95
Software
4.4.4 Functional analyses of significantly regulated genes using 111
IPA software
4.4.4.1 Network and functional analysis 111
4.4.4.2 Canonical pathway analysis 117
4.4.4.3 Upstream regulators analysis 121
4.4.5 Identification of significantly regulated genes that were 128
reverted to expression level similar to control
4.4.6 Validation of microarray data using qRT-PCR 132
CHAPTER 5 DISCUSSIONS 134
5.1 Proteomic studies 134
5.1.1 Methanol extract of T. indica fruit pulp altered the secretion of 135
proteins from HepG2 cells
5.1.2 Methanol extract of T. indica fruit pulp altered the abundance of 138
cytosolic proteins in HepG2 cells
5.1.3 PPARα activation: possible mode of action of lipid-lowering 142
effect of T. indica fruit pulp extract
xiii
5.2 Transciptomic studies 147
5.2.1 T. indica fruit extract regulated genes that are involved in fatty 148
acid oxidation
5.2.2 T. indica fruit extract regulated genes that are involved in 151
gluconeogenesis
5.2.3 T. indica fruit extract lowers lipid through the activation of 152
PPARα
5.2.4 PPARGC1A or PGC1A: the key regulator of multiple nuclear 157
receptors
5.2.5 T. indica fruit activates PPARγ 160
5.2.6 T. indica fruit modulates apoptosis and cell death 164
5.2.6.1 Induction of endoplasmic reticulum (ER) stress 164
5.2.6.2 Tumour suppressing genes involved in TP53, FOXO3 166
and c-MYC downstream pathways
5.3 Polyphenols in T. indica fruit that may attribute to the activities 168
CHAPTER 6 CONCLUSION 170
6.1 Future study 170
REFERENCES 172
LIST OF ISI-PUBLICATIONS AND CONFERENCE PAPERS 217
PRESENTATION
APPENDIX 221
xiv
LIST OF FIGURES
Figure 2.1 (From the left) Tamarindus indica fruit pulp seeds, skin, flesh
and leaves
12
Figure 2.2 Effects of dietary nutrients on nucleic acids, proteins and
metabolites, a typical representation of tools used in
foodomics analyses, and the major applications of foodomics.
(Adapted from (Ganesh & Hettiarachchy, 2012; Garcia-
Canas, Simo, Herrero, Ibanez, & Cifuentes, 2012).
22
Figure 4.1 MTT analysis to assess the cell viability of HepG2 cells in A)
serum and serum-free media B) control (serum-free medium +
0.02 % DMSO) and 0.06 mg/ml methanol extract of T. indica
fruit pulp in serum-free condition
59
Figure 4.2 Optimisation of protein amount to be loaded per gel for
secreted protein
60
Figure 4.3 Optimisation of protein amount to load per gel for cell lysate
protein
61
Figure 4.4 Minimising streaking in the 2D-GE of HepG2 cell lysate
proteins
62
Figure 4.5 2D-GE of secretomes of HepG2 cells of A) control; B)
treatment with 0.06 mg/ml methanol extract of T. indica fruit
pulp
64
Figure 4.6 2D-GE of cell lysate of HepG2 cells of A) control; B)
treatment with 0.06 mg/ml methanol extract of T. indica fruit
pulp
65
Figure 4.7 An enlarged proteome map of HepG2 cell lysate
66
Figure 4.8 Western blot analyses of NDUFA10, PCYT2 and UQCRC2
77
Figure 4.9 IPA graphical representation of the molecular relationships
between differentially expressed secreted proteins in HepG2
cells treated with T. indica fruit extract
78
xv
Figure 4.10 IPA graphical representation of the molecular relationships
between HepG2 secreted and cytosolic proteins after
treatment
80
Figure 4.11 Predicted canonical pathway affected by T. indica fruit extract
82
Figure 4.12 MTT analysis to assess the viability of HepG2 cells treated
with different concentrations of palmitic acid after 24 and 48
h
86
Figure 4.13 Oil Red O staining of lipid droplets in HepG2 cells treated
with different concentrations of palmitic acid
87
Figure 4.14 MTT assay of HepG2 cells treated with different
concentrations of T. indica fruit extract (TI) and 0.3 mM
palmitic acid (PA) for 24 h
88
Figure 4.15 Oil Red O staining of lipid droplets in HepG2 cells treated
with fenofibrate and different concentrations of T. indica fruit
extract
89
Figure 4.16 Measurement of total triglyceride in HepG2 cells after
treatment
91
Figure 4.17 Measurement of total cholesterol in HepG2 cells after
treatment
92
Figure 4.18 Assessment of tcRNA integrity using denaturing agarose gel
electrophoresis and Agilent Bioanalyzer 2100
94
Figure 4.19 PCA mapping of 4 different treatment groups in DNA
microarray analysis
96
Figure 4.20 Venn diagram of number of genes that were significantly
regulated (p < 0.05) by at least 1.5-fold in DNA microarray
analyses
97
Figure 4.21 IPA graphical representation of the molecular relationships in
“Lipid Metabolism, Small Molecule Biochemistry, Metabolic
Disease” network in TI+PA vs control treatment overlaid with
oxidation of fatty acid function
115
Figure 4.22 PXR/RXR activation pathway generated by IPA software in
the canonical pathway analysis
119
xvi
Figure 4.23 Mitochondrial L-carnitine shuttle pathway generated by IPA
software in the canonical pathway analysis
120
Figure 4.24 IPA illustration of upstream analysis of the genes dataset
linked to PPARA, PPARG, PPARGC1A and FOXO3 in
TI+PA vs control treatment
127
Figure 4.25 Validation of microarray data using quantitative real-time
polymerase chain reaction (qRT-PCR)
133
Figure 5.1 Proposed mechanism of action induced by T. indica fruit pulp
through activation of peroxisome proliferator-activated
receptor alpha (PPARα)
146
Figure 5.2 Significantly regulated genes involved in PPARα activation in
hepatocyte
156
Figure 5.3 Lipin-1 (LPIN1) enhances fatty acid oxidation by forming a
complex with PPARGC1A and PPARA
159
xvii
LIST OF TABLES
Table 2.1 Medicinal uses of tamarind fruit in Africa summarised from a
review by Havinga et al. (2010)
16
Table 3.1 Primer sequences of genes selected for verification of DNA
microarray analysis in qRT-PCR
57
Table 4.1 Average percentage of volume of spots, adjusted p-values and
the fold change of secreted proteins in T. indica-treated cells
versus control
68
Table 4.2 Average percentage of volume of spots, p-values and the fold
change of cell lysate proteins in T. indica-treated cells versus
control
69
Table 4.3 List of differentially expressed secreted proteins in T. indica
fruit extract-treated cells identified by MALDI-MS/MS
72
Table 4.4 List of cell lysate proteins of altered abundance in T. indica
fruit extract-treated cells identified by MALDI-TOF/TOF
MS/MS
73
Table 4.5 Genes commonly regulated in all treatment groups (TI+PA vs
control, PA vs control and FF+PA vs control)
98
Table 4.6 Significantly regulated genes in T. indica treatment group and
fenofibrate treatment group (TI+PA vs control and FF+PA vs
control)
100
Table 4.7 Significantly regulated genes in T. indica treatment group and
palmitic acid treatment group (TI+PA vs control and PA vs
control)
101
Table 4.8 Significantly regulated genes in fenofibrate treatment group
and palmitic acid treatment group (FF+PA vs control and PA
vs control)
103
Table 4.9 Genes exclusively regulated in fenofibrate treatment group
(FF+PA vs control)
103
Table 4.10 Genes exclusively regulated in T. indica treatment group
(TI+PA vs control)
104
xviii
Table 4.11 Genes exclusively regulated in palmitic acid treatment group
(PA vs control)
107
Table 4.12 Top three networks generated by Ingenuity Pathways
Analysis (IPA) software when significantly regulated genes
from different treatments were analysed
113
Table 4.13 Genes related to oxidation of fatty acid that were significantly
regulated in the microarray analyses of the different
treatments on HepG2 cells
114
Table 4.14 Top three canonical pathways generated by Ingenuity
Pathway Analysis (IPA) software when significantly regulated
genes from different treatments were analysed
118
Table 4.15 Upstream regulators predicted to be regulated in different
treatments using IPA software
122
Table 4.16 Genes related to PPARA activation that were significantly
regulated in the microarray analyses of the different
treatments on HepG2 cells
123
Table 4.17 Genes related to PPARG activation that are significantly
regulated in the microarray analyses of the different
treatments on HepG2 cells
125
Table 4.18 Significantly regulated genes that were reverted to a level
similar to that of a control after treatment with TI+PA and
FF+PA
129
Table 4.19 Significantly regulated genes that were reverted to a level
similar to control after treatment with TI+PA
130
Table 4.20 Significantly regulated genes that were reverted to a level
similar to control after treatment with FF+PA
131
xix
LIST OF SYMBOLS AND ABBREVIATIONS
°C Degree in Celcius
µA microampere
µg microgram
µl microlitre
µM micromolar
µm micrometer
2D Two-dimensional
2D-GE Two-dimensional gel electrophoresis
3D Three dimensional
ABCA1 ATP binding cassette transporter, subfamily A, member 1
ABCG5 ATP-binding cassette, subfamily G (WHITE), member 5
ABCG8 ATP-binding cassette, subfamily G (WHITE), member 8
ACN Acetonitrile
AMPK Adenosine monophosphate-activated protein kinase
ANOVA Analysis of variance
apoA-I Apolipoprotein A-I
apoA-IV Apolipoprotein A-IV
apoA-V Apolipoprotein A-V
BCA Bicinchoninic acid
bp Base pair
BSA Bovine serum albumin
CDC Centre of Disease Control
cDNA Complementary DNA
CHAPS 3-[(3-cholamidopropyl)dimethylammonio]-1-propanesulfonate
cm centimeter
CS Complement system
CT Threshold cycle
Da Dalton
dL decilitre
DMEM Dulbecco’s modified Eagle’s medium
DMSO Dimethylsulphoxide
DNA Deoxyribonucleic acid
DTT Dithiothreitol
EDTA Ethylenediaminetetraacetic acid
EGC Epigallocatechin
EGCG Epigallocatechin gallate
ELISA Enzyme-linked immunosorbent assay
ENO1 Alpha enolase
ER Endoplasmic reticulum
FA Fatty acid
FA Formic acid
FAS Fatty acid synthase
xx
FBS Foetal bovine serum
FDA Food and Drug Administration
FDR False discovery rate
FF Fenofibrate
fg femtogram
g gram
x g Gravity force
GAE Gallic acid equivalents
GAPDH Glyceraldehyde 3-phosphate dehydrogenase
GC Guanine and cytosine
GDI-2 Rab GDP dissociation inhibitor beta
h hour
HCl Hydrochloric acid
HDL High density lipoprotein
HEPES 4-(2-hydroxyethyl)-1-piperazineethanesulfonic acid
HMG-CoA 3-hydroxy-3-methylglutaryl coenzyme A
HNF4 Hepatocyte nuclear factor 4
HPLC High performance liquid chromatography
IEF Isoelectric focusing
IL-1β Interleukin-1 beta
IPA Ingenuity Pathways Analysis
IPG Immobilised pH gradient
JNK Janus kinase
kDa Kilodalton
kg Kilogram
kV Kilovolt
L Litre
LDL Low density lipoprotein
LXR Liver X receptor
M Molar
mA milliampere
MALDI-TOF MS Matrix-assisted laser desorption ionisation time of flight mass
spectrometry
MAPK Mitogen-activated protein kinase
mg milligram
min minutes
ml millilitre
mM millimolar
mmol millimole
mRNA Messenger ribonucleic acid
MS Mass spectrometry
MTT 3-(4,5-dimethyl-2-thiazolyl)-2,5-diphenyl-2H-tetrazolium
bromide
MTTP Microsomal triglyceride transfer protein
NaCl Sodium chloride
xxi
NAFLD Non-alcoholic fatty liver disease
NaOH Sodium hydroxide
NDUFA10 NADH dehydrogenase (ubiquinone) 1 alpha subcomplex
subunit 10
NDUFV1 NADH dehydrogenase (ubiquinone) flavoprotein 1
ng nanogram
NH4HCO3 Ammonium bicarbonate
NL Non-linear
nm Nanometre
OD Optical density
PA Palmitic acid
PBS Phosphate buffered saline
PC Phosphatidylcholine
PCA Principle component analysis
PCR Polymerase chain reaction
PCYT2 Ethanolamine-phosphate cytidylyltransferase
PE Phosphatidylethanolamine
PGC-1α PPARγ coactivator-1α
pI Isoelectric points
PM Perfect-match
PPAR Peroxisome proliferator-activated receptor
PPARA Locus encoding for PPARα
PPARG Locus encoding for PPARγ
PPARGC1A/PGC1A Locus encoding for PPARG coactivator 1 alpha
PPO 2,4-diphenyloxazole
PTM Post translational modification
PVDF Polyvinylidene fluoride
PXR Nuclear receptor subfamily 1, group I, member 2
qRT-PCR Quantitative real time-polymerase chain reaction
RE Rutin equivalents
RMA Robust Multi-array Average
RNA Ribonucleic acid
ROS Reactive oxygen species
rpm Revolutions per minute
RXR Retinoid X receptor
SD Standard deviation
SDS Sodium dodecyl sulphate
SDS-PAGE Sodium dodecyl sulphate-polyacrylamide gel electrophoresis
SEM Standard error of mean
TCM Traditional Chinese Medicine
tcRNA Total cellular RNA
TEMED N,N,N’,N’-Tetramethylethylenediamine
TFA Trifluoroacetic acid
TI Tamarindus indica
TNFα Tumour necrosis factor α
TTR Transthyretin
xxii
TZD Thiazolidinediones
U.S. United States of America
UPR Unfolded Protein Response
UQCRC2 Ubiquinol-cytochrome-c reductase complex core protein 2
V Volt
v/v Volume over volume
w/v Weight over volume
WHO World Health Organisation
xxiii
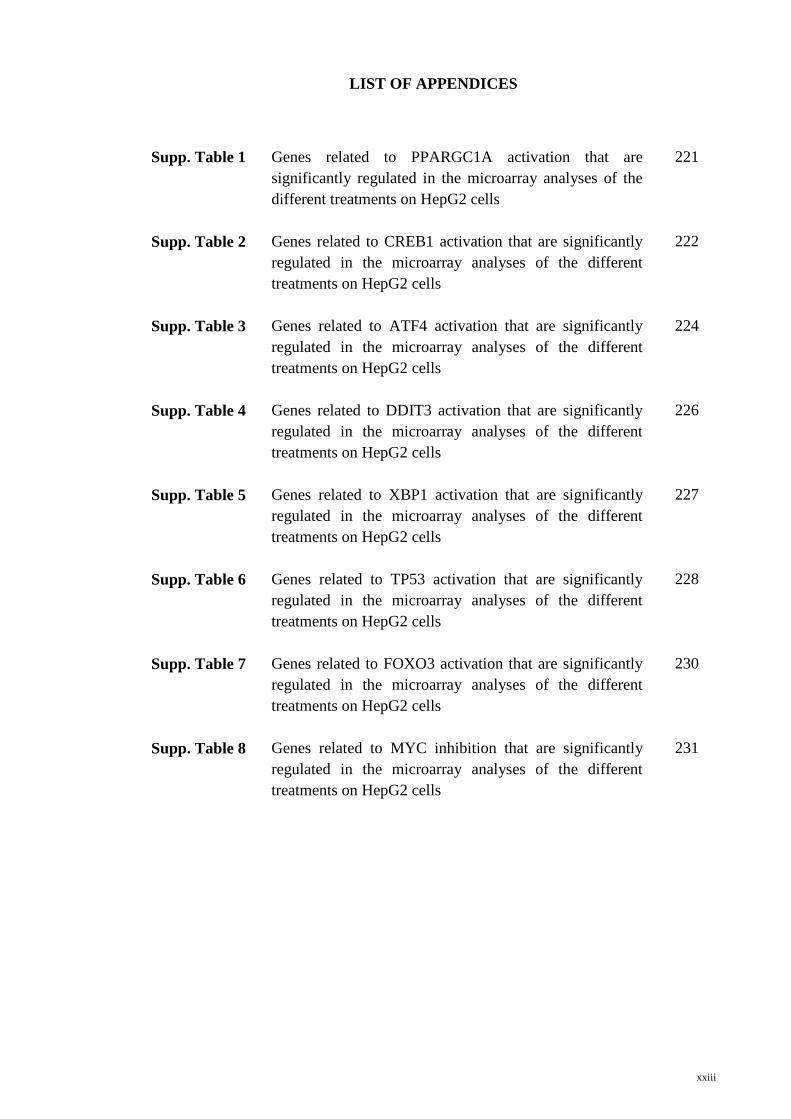
LIST OF APPENDICES
Supp. Table 1 Genes related to PPARGC1A activation that are
significantly regulated in the microarray analyses of the
different treatments on HepG2 cells
221
Supp. Table 2 Genes related to CREB1 activation that are significantly
regulated in the microarray analyses of the different
treatments on HepG2 cells
222
Supp. Table 3 Genes related to ATF4 activation that are significantly
regulated in the microarray analyses of the different
treatments on HepG2 cells
224
Supp. Table 4 Genes related to DDIT3 activation that are significantly
regulated in the microarray analyses of the different
treatments on HepG2 cells
226
Supp. Table 5 Genes related to XBP1 activation that are significantly
regulated in the microarray analyses of the different
treatments on HepG2 cells
227
Supp. Table 6 Genes related to TP53 activation that are significantly
regulated in the microarray analyses of the different
treatments on HepG2 cells
228
Supp. Table 7 Genes related to FOXO3 activation that are significantly
regulated in the microarray analyses of the different
treatments on HepG2 cells
230
Supp. Table 8 Genes related to MYC inhibition that are significantly
regulated in the microarray analyses of the different
treatments on HepG2 cells
231
1
CHAPTER 1
INTRODUCTION
Lipids are essential building blocks in many biosynthetic pathways. For example
cholesterol is an important component of the cell membrane and is a precursor for
steroid hormones and bile acids. Triglyceride, an ester derived from glycerol and three
fatty acids, functions mainly as energy storage. However, excessive lipid in the blood, a
condition known as hyperlipidaemia, could lead to diseases such as coronary artery
diseases. Individuals with high total cholesterol have approximately twice the risk of
heart disease than those with optimal levels. In fact, ischemic heart disease was the
leading cause of death in Malaysia in year 2008 (Malaysia Department of Statistics,
2010) and also the top cause of death in the world in 2012 (WHO, 2012). Other than
changing to a healthier lifestyle and diet, the current medication for hyperlipidaemia is
mainly through prescription of lipid-lowering drugs like statins and fibrates. However
these drugs may cause adverse effects at higher doses and can be costly depending on
the types and brands of drugs used. In view of this matter, alternative medicinal
research has come into the limelight in the hope of searching for a cheaper and more
effective alternative to, or to be used in combination with the existing medications.
Since the ancient time, many natural products were used as medicines and some
were well documented for its medicinal properties. Traditional medicines like the
Ayurveda from India or the Traditional Chinese Medicine (TCM) are a few traditional
medicinal practices that are still being practised until today. While the scientific
evidence for the use of many of these medicinal plants still remain to be proven, some
have indeed been shown to possess potent medicinal properties. In fact, several
prescription drugs are extracted or derived from these plants. For example vinblastine

2
and vincristine extracted from the flowering plant, Catharanthus roseus, are potent anti-
cancer drugs used in the treatment of leukaemia and Hodgkin’s lymphoma (Moudi, Go,
Yien, & Nazre, 2013). Lovastatin, a cholesterol-lowering drug, was initially derived
from fungi. It can also be found naturally in red yeast rice (J. Ma et al., 2000) and oyster
mushrooms (Bobek, Ozdin, & Galbavy, 1998). This reflects the endless possibilities
that can be discovered through the research on natural products.
Tamarindus indica or tamarind is a tropical fruit tree native to the African
savannahs but it can now be found in many tropical countries. The sweet and sour taste
of its fruit pulp is used to add flavour to local cuisines. Besides culinary, tamarind is
also used in traditional medicine as laxative, diuretic, anti-bacterial agents as well as in
treatment of fever and malarial infections (Bhadoriya, Ganeshpurkar, Narwaria, Rai, &
Jain, 2011; Havinga, et al., 2010). Previous biochemical analyses have demonstrated
that extracts of T. indica fruit pulp possess high antioxidant activities (Lim, Mat Junit,
Abdulla, & Abdul Aziz, 2013; Martinello et al., 2006; Sudjaroen et al., 2005). In
addition, T. indica extracts have also been shown to reduce the levels of blood
cholesterol and triacylglycerol in hypercholesterolaemic hamsters (Lim, et al., 2013;
Martinello, et al., 2006), in obese rats (Azman et al., 2012; Jindal, Dhingra, Sharma,
Parle, & Harna, 2011), and in humans (Iftekhar, Rayhan, Quadir, Akhteruzzaman, &
Hasnat, 2006). However, the mechanisms of action at the molecular levels have yet to
be deciphered.
Analysis of the methanol extract of the tamarind fruit pulp by HPLC revealed
the presence of (+)-catechin, (–)-epicatechin, procyanidins, naringenin, apigenin,
luteolin, taxifolin and eriodictyol (Sudjaroen, et al., 2005). The jasmine green tea
epicatechin has been shown to reduce the levels of triacylglycerol and cholesterol in the
3
sera of hamsters fed with a high-fat diet (Chan et al., 1999). The observed
hypolipidaemic effects of epicatechin were postulated to involve inhibition of the
absorption of dietary fat and/or cholesterol or through the reabsorption of bile acids
since it did not inhibit liver HMG-CoA reductase (Chan, et al., 1999). It was also shown
that tea catechins like epigallocatechin gallate (EGCG) and epigallocatechin (EGC)
were able to activate PPARα (K. Lee, 2004), a nuclear receptor that promotes fatty acid
oxidation and is also a target for the hypolipidaemic fibrates. Naringenin from
grapefruit was shown to regulate lipid metabolism through partial activation of PPARα
(Goldwasser et al., 2010). Another study showed that the procyanidin B1 flavangenol
extracted from pine bark was able to enhance fatty acid oxidation (Shimada et al.,
2012). This suggests that T. indica fruit extract may have exerted its hypolipidaemic
effect through regulating nuclear receptors such as peroxisome proliferator-activated
receptor (PPAR) and liver X receptor (LXR). Earlier studies have also shown that
proanthocyanidins, which constitutes more than 73 % of the total phenolic content of T.
indica extract (Sudjaroen, et al., 2005), were able to modulate the activation of
LXR/RXR (Jiao, Zhang, Yu, Huang, & Chen, 2010).
More recently, we have shown that the methanol extract of T. indica fruit pulps
significantly up-regulated the expression of a total of 590 genes and down-regulated the
expression of 656 genes in HepG2 cells (Razali, Aziz, & Junit, 2010). Amongst the
genes that were altered in expression were those that encode proteins associated with
lipoprotein metabolism, including ApoA-I, ApoA-IV, ApoA-V and ABCG5 but not the
HMG-CoA reductase. Both ApoA-I and ABCG5 are involved in the reverse cholesterol
transport, where the latter, together with ABCG8, are involved in the hepatobiliary
cholesterol secretion.
4
1.1 Objectives
The main objective of this study is to further investigate the mechanism of
action of the lipid-lowering effect of T. indica fruit pulp extract. Previous microarray
study by Razali et al. (2010) revealed that T. indica fruit significantly regulated genes
involved in lipid metabolism and antioxidant activities; however the molecular
mechanism has yet to be deciphered. Thus this study was designed as a continuation
from the previous study.
Therefore, the objectives of this study are to
1) hypothesise a lipid-lowering mechanism of T. indica fruit by performing
proteomic analyses on cell lysate and secreted proteins of HepG2 cells treated
with T. indica fruit extract.
2) evaluate the lipid-lowering effect of T. indica fruit extract on steatotic HepG2
cells by comparing to a commercial lipid-lowering drug.
3) verify the lipid-lowering hypothesis by examining the global gene expression of
T. indica-treated steatotic HepG2 cells.
The integration of the proteomic and transcriptomic approaches may help to
elucidate and provide a better insight into the relevant molecular pathways associated
with the multi-functional effects of T. indica fruit pulp.
5
CHAPTER 2
LITERATURE REVIEW
2.1 Significance of lipid-lowering studies
Hyperlipidaemia is characterised by elevated levels of any or all lipids in the
blood. Hyperlipidaemia is generally classified into 2 subtypes, primary or secondary.
The primary or familial hyperlipidaemia is usually caused by genetic abnormalities
while the secondary or acquired hyperlipidaemia is normally a condition caused by
underlying disorders like diabetes that leads to altered plasma lipid or lipoprotein
metabolism (Chait & Brunzell, 1990). Hyperlipidaemia is also characterised based on
the type of lipid that is elevated in the blood, i.e. hypercholesterolaemia,
hypertriglyceridaemia or combined hyperlipidaemia.
Hyperlipidaemia, particularly hypercholesterolaemia is associated with diseases
like cardiovascular diseases, which is the leading cause of death in the world (WHO,
2012). In America, 71 million adults (33.5 %) have high LDL cholesterol and only 1 out
of every 3 adults with high LDL cholesterol has the condition under control while less
than half of adults with high LDL cholesterol got treatment (CDC, 2011). Individuals
with high total cholesterol have approximately twice the risk of heart disease than those
with optimal levels. The average total cholesterol level for adult Americans is about 200
mg/dL, which is borderline high risk (Roger et al., 2012) while in Malaysia, the number
of individuals suffering from high cholesterol rose from 20.7 % in 2006 to 35.1 % in
2011 (NHMS, 2011). This could be attributed to the sedentary lifestyles and
consumption of food high in fat content.
6
The liver is the major site for fatty acid oxidation in mammals. Decreased
turnover of hepatic lipid droplets can lead to the development of fatty liver disease in
man (Greenberg et al., 2011). Recently, the rapid rise in the prevalence of obesity and
diabetes in the general population has contributed to a parallel increase in “non-
alcoholic fatty liver disease” (NAFLD) in many parts of the world. It is currently
estimated that up to 46 % of the adult U.S. population may have hepatosteatosis (C. D.
Williams et al., 2011). Presently, there are no effective drug therapies for NAFLD, now
considered a risk factor for Type II diabetes (Anstee, Targher, & Day, 2013).
2.2 Lipid-lowering mechanisms
2.2.1 Commercial lipid-lowering drugs
Other than changing to a healthier lifestyle such as exercising regularly and
reducing fat intake in food, drugs are also prescribed to aid in the lipid-lowering
process. Generally, the lipid-lowering drugs exert their effects by reducing cholesterol
biosynthesis, increasing fatty acid oxidation, increasing lipid clearance or inhibiting
lipid uptake from food. The most common lipid-lowering drugs are classified mainly
into 2 groups, statins and fibrates.
Statins are a class of lipid-lowering drug that inhibits the 3-hydroxy-3-
methylglutaryl coenzyme A (HMG-CoA) reductase, a key rate-limiting enzyme
involved in the cholesterol biosynthetic pathway. As structural analogues of HMG-
CoA, statins inhibit HMG-CoA reductase competitively with an affinity of about 1,000-
10,000 times greater than its natural substrate. The first generation of statins, mevastatin
and lovastatin, were first discovered in fungi. The second-generation and third-
generation statins such as simvastatin, pravastatin, fluvastatin, atorvastatin, rosuvastatin
and pitavastatin were either modification from the first-generation statins or chemically
7
synthesised in the laboratory (Steinmetz, 2002). Besides inhibiting the cholesterol
biosynthetic pathway, statins were also reported to lower plasma cholesterol indirectly
through the up-regulation of LDL receptor (Vaziri & Liang, 2004).
While statins are mainly used to lower plasma cholesterol level, fibrates are the
primary drugs used to treat hypertriglyceridaemia. Fibrates are peroxisome proliferator-
activated receptor (PPAR) agonists. PPARs are a group of nuclear receptors that govern
many metabolic processes such as lipid metabolism, glucose regulation and energy
production. There are three isoforms of PPARs, PPARα, PPARγ and PPARβ/δ. Fibrates
exert their lipid-lowering effects by enhancing beta oxidation of fatty acids. The first
fibrate, clofibrate was discovered in Japan (Ozawa & Ozawa, 2002), and subsequently
other fibrate derivatives such as bezafibrate, ciprofibrate, fenofibrate, and gemfibrozil
were developed. Different fibrates act on different PPAR isoforms, for example
fenofibrate and clofibrate have a 10-fold selectivity towards PPARα than PPARγ
(Willson & Wahli, 1997). On the other hand, bezafibrate is a pan-agonist which
activates all three PPARs with similar potency. However, only fenofibrate and
gemfibrozil are used in treating humans as their effects were milder as compared to
other fibrates, which were reported to cause hepatomegaly and tumour formation in the
liver of rodents after prolonged usage (Gray, Beamand, Lake, Foster, & Gangolli, 1982;
Lazarow, Shio, & Leroy-Houyet, 1982; Leighton, Coloma, & Koenig, 1975; M. S. Rao,
Subbarao, & Reddy, 1986; Reddy & Krishnakantha, 1975).
Besides these two main lipid-lowering drugs, other lipid-lowering drugs are
used either stand-alone or with statin/fibrate to treat hyperlipidaemia. Ezetimibe is used
to lower cholesterol by inhibiting intestinal cholesterol absorption (Vasudevan & Jones,
2005). Bile acid sequestrants like cholestyramine, colestipol, and colesevelam are also
8
prescribed to lower plasma cholesterol level. These bile acid sequestrants increase the
rate of bile acid excretion and therefore promote cholesterol conversion to bile acid
(Steinmetz, 2002). Apart from these, microsomal triglyceride transfer protein (MTTP)
inhibitor like lomitapide was also used to treat familial hypercholesterolaemia (Perry,
2013; Raal, 2013). Niacin and its derivatives which are commonly used as supplements
are also prescribed to lower lipid by modifying lipoproteins (Vasudevan & Jones,
2005).
2.2.2 Alternative medicine to treat hyperlipidaemia
As mentioned earlier, the mainstay to treat hyperlipidaemia is mainly through
weight reduction, dietary changes, exercise and lipid-lowering drugs. However, these
oral medications may inevitably lead to adverse effects. High doses of statins have been
reported to cause myositis and myalgia, possibly caused by dose-dependent reduction of
coenzyme Q10 (Golomb & Evans, 2008). Fibrates are associated with a slightly
increased risk (<1.0 %) for myopathy, cholelithiasis, and venous thrombosis (Davidson,
Armani, McKenney, & Jacobson, 2007). In view of this matter, medicinal plants have
garnered much attention due to their generally milder, if any, adverse effects that may
result from the consumption. Epidemiological studies had also shown that high intake
of fruits and vegetables coupled with low consumption of trans-fat, cholesterol,
saturated fat and salt reduced the risk of CVD (Bazzano et al., 2002; Bendinelli et al.,
2011; Joshipura et al., 2001). This finding is also supported by the number of deaths
worldwide associated with low fruit and vegetable consumption (WHO, 2009).
9
2.2.2.1 Flavonoids
Flavonoids are a family of phenolic compounds with strong bioactivities that are
present in fruits, vegetables, and herbs. More than 5000 distinct flavonoids have been
identified in plants, and several hundreds are known to occur in commonly consumed
fruits, vegetables, grains, herbal products, and beverages. Structurally, flavonoids have
a common basic chemical structure that consists of 2 aromatic rings linked by a 3-
carbon chain that forms an oxygenated heterocyclic ring. Differences in the generic
structure of the heterocyclic ring, as well as the oxidation state and functional groups of
the ring, classify flavonoids as flavonols, flavan-3-ols (flavans), flavanones, flavones
and isoflavones (Erdman et al., 2007).
Flavonols are the most widespread flavonoids in foods, and the most prominent
flavonols in food are quercetin and kaempferol (Erdman, et al., 2007). Red wine and tea
can also contain a significant amount of flavonols. Flavan-3-ols are present in many
fruits such as grape products, teas, cocoa, and chocolate. They are found either as
monomers (epicatechin and catechin) or oligomers (e.g., proanthocyanidins). Catechin
and epicatechin are the main flavan-3-ols in fruits and cocoa. Flavanones are present in
high concentrations in citrus fruits. The main aglycones in citrus are naringenin,
hesperetin, and eriodictyol. In contrast, flavones are less common than flavonols in
fruits and vegetables. The major flavones in food are luteolin and apigenin. Parsley and
celery are the primary food sources. Soy and soybean-derived products are the main
sources of isoflavones, which are structurally analogous to oestrogens. The 3 common
soybean isoflavones are genistein, daidzein, and glycitein.
Flavonoids are excellent antioxidants (Rice-Evans, 2001), and because of their
antioxidant activities as well as their abundance in fruit and vegetables, they may partly
10
contribute to the health benefits of plant foods (Arts & Hollman, 2005). Many
flavonoids are reported to exhibit hypolipidaemic properties. Green tea, which is rich in
catechin and epigallocatechin gallate, has been shown to lower triglyceride and
cholesterol in humans and rats (Bursill & Roach, 2006; Nagao et al., 2005; Richard et
al., 2009; Unno et al., 2005). Naringenin-rich-ethyl acetate fraction of fenugreek seeds
was also reported to possess lipid-lowering activities when fed to high-cholesterol-fed
rats (Belguith-Hadriche et al., 2010). The famed resveratrol from red wine has also
garnered much attention for its cardioprotective and anticarcinogenic potential
(Boddicker, Whitley, Davis, Birt, & Spurlock, 2011; Guerrero, Garcia-Parrilla, Puertas,
& Cantos-Villar, 2009; Pal et al., 2003; Szmitko & Verma, 2005). Proanthocyanidin-
rich grape seed extract has also been reported to lower lipid (Yamakoshi, Kataoka,
Koga, & Ariga, 1999).
2.2.2.2 Other plant compounds with hypolipidaemic effect
There are a few well known natural products that possess hypolipidaemic effects
and red yeast rice is one of them. It has been traditionally used as food and medicine for
centuries in China to lower cholesterol, improve blood circulation and help digestive
problems (Monograph. Monascus purpureus (red yeast rice), 2004; J. Wang et al.,
1997). It is made by fermenting a type of yeast, Monascus purpureus over red rice.
Several studies had shown that red yeast rice was able to lower high cholesterol (Becker
& Gordon, 2011; Cicero et al., 2013; Feuerstein & Bjerke, 2012; Venero, Venero,
Wortham, & Thompson, 2010). In a meta-analysis involving 9625 patients in 93
randomised trials, 3 different commercial preparation of red yeast rice produced a mean
reduction in total cholesterol of 0.91 mmol/L, LDL-cholesterol of 0.73 mmol/L,
triglyceride of 0.41 mmol/L and a mean rise in HDL-cholesterol of 0.15 mmol/L (J. Liu
et al., 2006). The active compound that attributes to the lipid-lowering activities is
11
monacolin K, a compound identical to lovastatin (J. Ma, et al., 2000). As lovastatin is a
prescription drug, the Food and Drug Administration (FDA) considered monacolin K as
a drug and prohibited selling of red yeast rice that contains monacolin K. However
since monacolin K is not listed in the label, the presence of monacolin K in red yeast
rice supplements remains ambiguous (Childress, Gay, Zargar, & Ito, 2013).
Berberine is another effective lipid-lowering agent. It is an isoquinoline alkaloid
that can be extracted from Goldenseal (Hydrastis canadensis), Oregon grape (Berberis
aquifolium), Barberry (Berberis vulgaris), and Chinese Goldthread (Coptis chinensis).
Two other berberine-containing plants that are familiar to practitioners of Chinese
medicine are Phellodendron chinense and Phellodendron amurense. In 2004, a study on
berberine treatment on 32 hypercholesterolaemic patients reduced serum cholesterol by
29 %, triglycerides by 35 %, and LDL-cholesterol by 25 % (Kong et al., 2004). Another
study in 2009 reported that berberine was able to prevent the development of fatty liver
in rats (W. S. Kim et al., 2009). This was followed by a randomised controlled trial of
60 humans with fatty liver disease. Patients given 0.5 g berberine twice per day showed
improvement in their liver ultrasounds and this was accompanied with lowered serum
triglyceride and cholesterol (Xie, Meng, Zhou, Shu, & Kong, 2011). The lipid-lowering
activities of berberine is attributed to its ability to activate adenosine monophosphate-
activated protein kinase (AMPK) (Cheng et al., 2006; Y. S. Lee et al., 2006; Q. Wang et
al., 2011). Since AMPK regulates an array of biological activities that normalise lipid,
glucose and energy imbalances, its activation is especially useful in treating metabolic
syndromes that includes hyperglycaemia, diabetes, lipid abnormalities and energy
imbalances (Srivastava et al., 2012).
12
2.3 Tamarindus indica (T. indica)
2.3.1 Description of T. indica
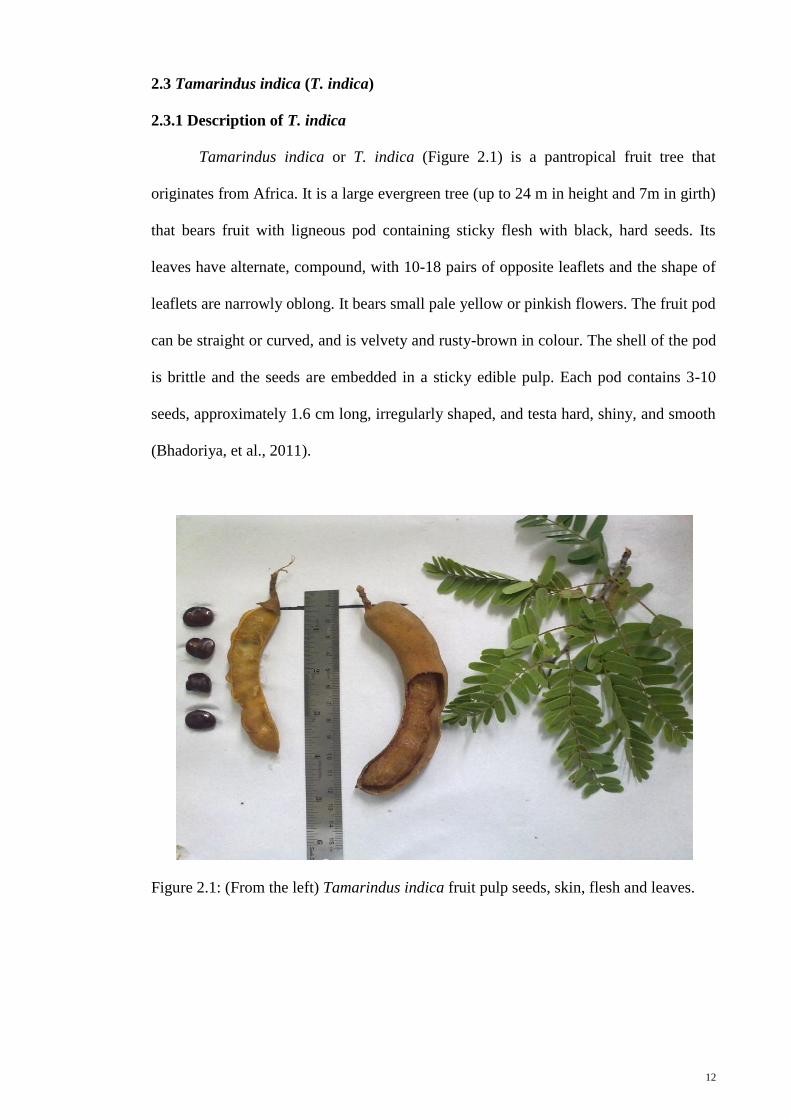
Tamarindus indica or T. indica (Figure 2.1) is a pantropical fruit tree that
originates from Africa. It is a large evergreen tree (up to 24 m in height and 7m in girth)
that bears fruit with ligneous pod containing sticky flesh with black, hard seeds. Its
leaves have alternate, compound, with 10-18 pairs of opposite leaflets and the shape of
leaflets are narrowly oblong. It bears small pale yellow or pinkish flowers. The fruit pod
can be straight or curved, and is velvety and rusty-brown in colour. The shell of the pod
is brittle and the seeds are embedded in a sticky edible pulp. Each pod contains 3-10
seeds, approximately 1.6 cm long, irregularly shaped, and testa hard, shiny, and smooth
(Bhadoriya, et al., 2011).
Figure 2.1: (From the left) Tamarindus indica fruit pulp seeds, skin, flesh and leaves.
13
2.3.2 Taxonomical classification
T. indica is categorised as a monospecific genus in the family of Leguminosae
(Bhadoriya, et al., 2011). The following is the taxonomical classification of T. indica.
Kingdom: Plantae
Phylum: Spermatophyte
Class: Angiosperm
Sub class: Dicotyledone
Family: Leguminosae
Subfamily: Caesalpiniaceae
Genus: Tamarindus
Species: indica
2.3.3 Chemical composition of T. indica fruit pulp
T. indica fruit pulp is characterised by its sweet and sour taste. Its acidity is
mostly attributed to tartaric acid (2,3-dihydroxybutanedioic acid, C4H6O6, a
dihydroxydicarboxylic acid), which remains in the pulp upon ripening. However when
added together with the increasing sugar levels during ripening, the fruit tasted
simultaneously sweet and acidic (Lewis & Neelakantan, 1964). Other organic acids that
were found in the tamarind fruit pulp are malic acid, ascorbic acid, oxalic acid, succinic
acid, citric acid and quinic acid (Ishola, Agbaji, & Agbaji, 1990; Lewis & Neelakantan,
1964; Lewis, Neelakantan, & Bhatia, 1961).
The ripe fruit also contains saponins, flavonoids, tannins, invert sugar, pipecolic
acid, citric acid, nicotinic acid, 1-malic acid, vitexin, isovitexin, orientin, isoorientin,
vitamin B3, volatile oils (geranial, geraniol, limonene), cinnamates, serine, beta-alanine,
pectin, praline, phenylalanine, leucine, potassium and lipids (Dalimartha, 2006).
14
Sudjaroen et al. (2005) reported that the methanol extract of tamarind fruit pulp was
dominated by proanthocyanidins (73.4 %) in various forms (+)-catechin (2.0 %),
procyanidin B2 (8.2 %), (-)-epicatechin (9.4 %), procyanidin trimer (11.3 %),
procyanidin tetramer (22.2 %), procyanidin pentamer (11.6 %), procyanidin hexamer
(12.8 %) along with taxifolin (7.4 %), apigenin (2.0 %), eriodictyol (6.9 %), luteolin
(5.0 %) and naringenin (1.4 %).
2.3.4 T. indica applications
2.3.4.1 Food and product
T. indica fruit pulp is commonly used in culinary to add flavour for its sweet and
sour taste. Besides adding the juice of the fruit pulp into cooked dishes, it is also eaten
raw or made into food products. In Malaysia, it is most commonly used as a condiment
in many local cuisines. Besides this, the fruit is also made into juice, jam, candy and
syrup. A sweeter cultivar of the fruit produced mainly in Thailand, is usually eaten
fresh.
In other parts of Asia, the immature green pods are often eaten by children and
adults dipped in salt as a snack. More commonly, the acidic pulp is used as a favourite
ingredient in culinary preparations such as curries, chutneys, sauces, ice cream and
sherbet in countries where the tree grows naturally (Little & Wadsworth, 1964). In Sri
Lanka, tamarind is widely used in cuisine as an alternative to lime and also in pickles
and chutneys. It is also used in India, to make ‘tamarind fish’, a sea-food pickle, which
is considered a great delicacy. The juice is also an ingredient of Worcestershire and
other barbecue sauces, commonly used in European and North American countries. In
the Philippines, Sri Lanka and Thailand, fibres are removed from the fruit pulp, which
is mixed with sugar, wrapped in paper and sold as toffees. The pulp is also used to make
sweet meats mixed with sugar called ‘tamarind balls’ (Purseglove, 1987); in Senegal,
15
they are called ‘bengal’. Similarly in India, the pulp is eaten raw and sweetened with
sugar.
2.3.4.2 Medicinal uses
The use of plants as herbal medicines had been practiced since the ancient times.
In fact, it is still being used as the main medicine in many countries especially in
countries where medical treatments are not easily accessible. In other parts of the world,
traditional medicine commonly serves as a complementary or alternative treatment to
the available medical treatment. Traditional medicine is favoured because it is
commonly believed to have minimal side effects as compared to current medical
treatments. The use of plants in traditional medicine can be explained by
physiologically active phytochemical compounds of a species and also by its ascribed
meaning in a culture (Etkin, 1986). Medicinal plants with a long history of safe and
effective use are likely to have a pharmaceutical effect (Tabuti, 2008).
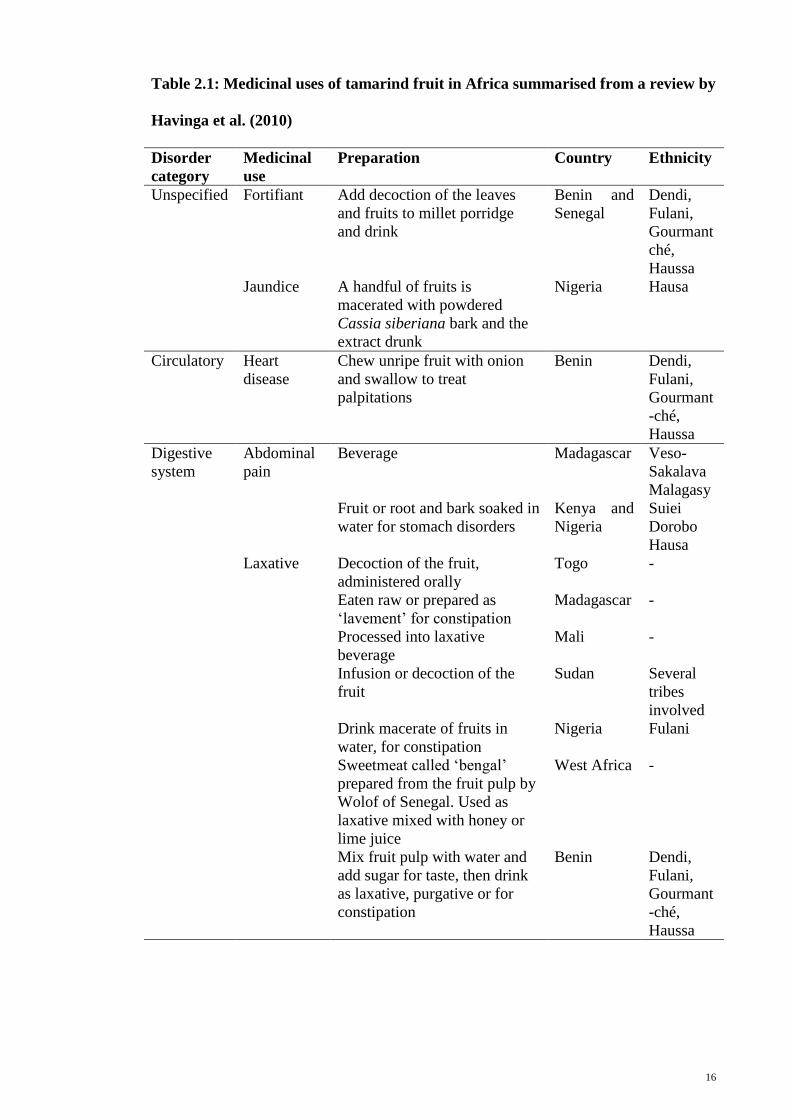
T. indica fruit has been used as a traditional medicine to treat several ailments in
countries where the tree is indigenous. In Africa, tamarind has been used either on its
own or with other plants to treat diseases of the circulatory system, digestive system,
genitourinary system, sensory system, infections or infestations, injuries, mental
problems and pregnancy-related disorders (Table 2.1). In traditional Thai medicine, the
fruit of the tamarind is used as a digestive aid, carminative, laxative, expectorant, and
blood tonic (Farnsworth & Bunyapraphatsara, 1992).
16
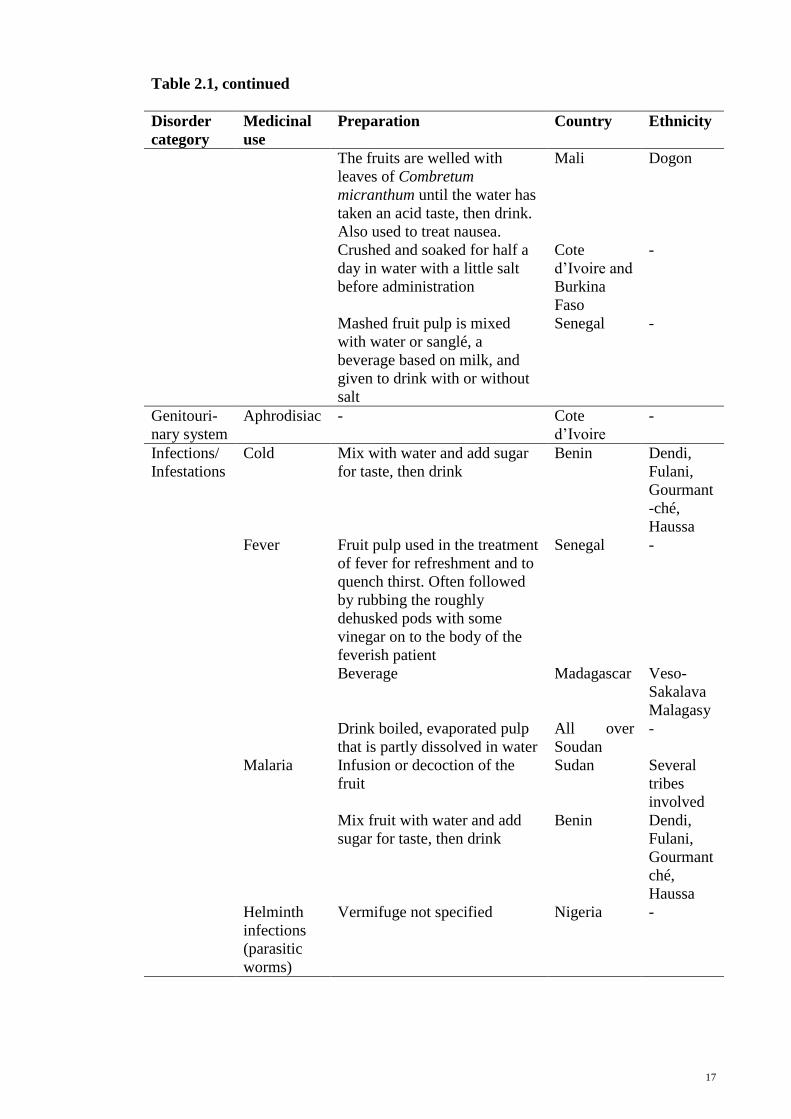
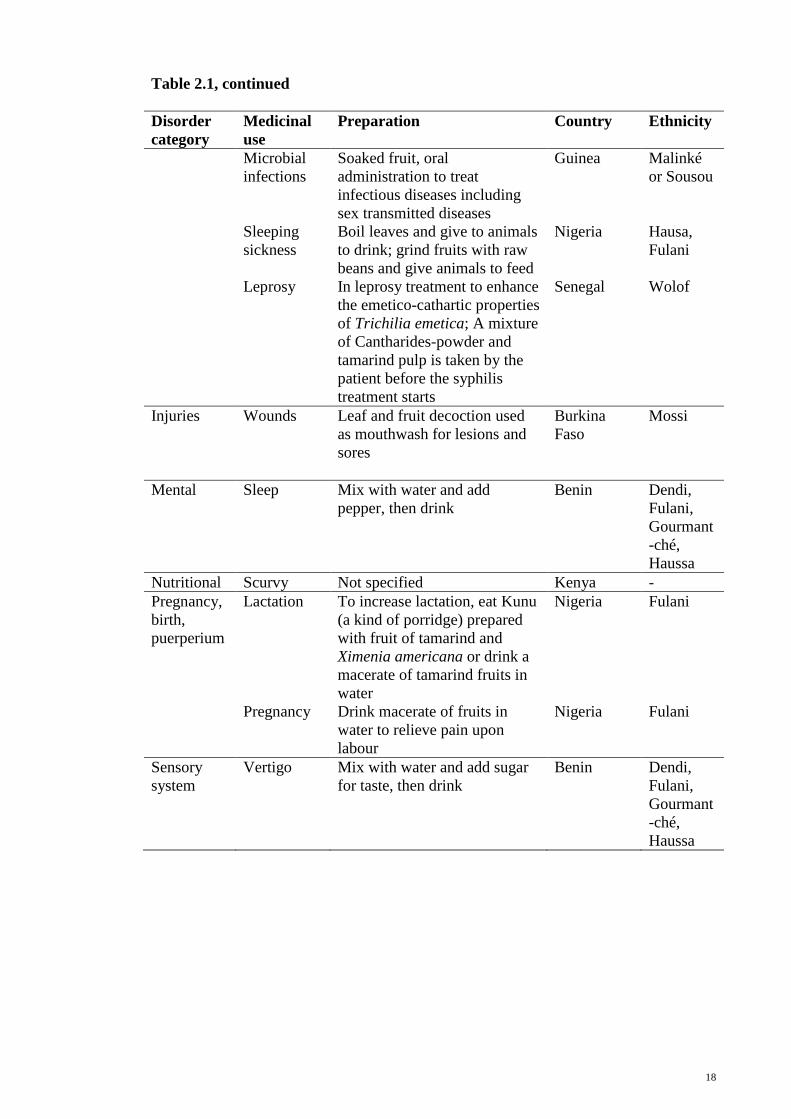
Table 2.1: Medicinal uses of tamarind fruit in Africa summarised from a review by
Havinga et al. (2010)
Disorder
category
Medicinal
use
Preparation Country Ethnicity
Unspecified Fortifiant Add decoction of the leaves
and fruits to millet porridge
and drink
Benin and
Senegal
Dendi,
Fulani,
Gourmant
ché,
Haussa
Jaundice A handful of fruits is
macerated with powdered
Cassia siberiana bark and the
extract drunk
Nigeria Hausa
Circulatory Heart
disease
Chew unripe fruit with onion
and swallow to treat
palpitations
Benin Dendi,
Fulani,
Gourmant
-ché,
Haussa
Digestive
system
Abdominal
pain
Beverage Madagascar Veso-
Sakalava
Malagasy
Fruit or root and bark soaked in
water for stomach disorders
Kenya and
Nigeria
Suiei
Dorobo
Hausa
Laxative Decoction of the fruit,
administered orally
Togo -
Eaten raw or prepared as
‘lavement’ for constipation
Madagascar -
Processed into laxative
beverage
Mali -
Infusion or decoction of the
fruit
Sudan Several
tribes
involved
Drink macerate of fruits in
water, for constipation
Nigeria Fulani
Sweetmeat called ‘bengal’
prepared from the fruit pulp by
Wolof of Senegal. Used as
laxative mixed with honey or
lime juice
West Africa -
Mix fruit pulp with water and
add sugar for taste, then drink
as laxative, purgative or for
constipation
Benin Dendi,
Fulani,
Gourmant
-ché,
Haussa
17
Table 2.1, continued
Disorder
category
Medicinal
use
Preparation Country Ethnicity
The fruits are welled with
leaves of Combretum
micranthum until the water has
taken an acid taste, then drink.
Also used to treat nausea.
Mali Dogon
Crushed and soaked for half a
day in water with a little salt
before administration
Cote
d’Ivoire and
Burkina
Faso
-
Mashed fruit pulp is mixed
with water or sanglé, a
beverage based on milk, and
given to drink with or without
salt
Senegal -
Genitouri-
nary system
Aphrodisiac - Cote
d’Ivoire
-
Infections/
Infestations
Cold Mix with water and add sugar
for taste, then drink
Benin Dendi,
Fulani,
Gourmant
-ché,
Haussa
Fever Fruit pulp used in the treatment
of fever for refreshment and to
quench thirst. Often followed
by rubbing the roughly
dehusked pods with some
vinegar on to the body of the
feverish patient
Senegal -
Beverage Madagascar Veso-
Sakalava
Malagasy
Drink boiled, evaporated pulp
that is partly dissolved in water
All over
Soudan
-
Malaria Infusion or decoction of the
fruit
Sudan Several
tribes
involved
Mix fruit with water and add
sugar for taste, then drink
Benin
Dendi,
Fulani,
Gourmant
ché,
Haussa
Helminth
infections
(parasitic
worms)
Vermifuge not specified
Nigeria -
18
Table 2.1, continued
Disorder
category
Medicinal
use
Preparation Country Ethnicity
Microbial
infections
Soaked fruit, oral
administration to treat
infectious diseases including
sex transmitted diseases
Guinea Malinké
or Sousou
Sleeping
sickness
Boil leaves and give to animals
to drink; grind fruits with raw
beans and give animals to feed
Nigeria Hausa,
Fulani
Leprosy In leprosy treatment to enhance
the emetico-cathartic properties
of Trichilia emetica; A mixture
of Cantharides-powder and
tamarind pulp is taken by the
patient before the syphilis
treatment starts
Senegal Wolof
Injuries Wounds Leaf and fruit decoction used
as mouthwash for lesions and
sores
Burkina
Faso
Mossi
Mental Sleep Mix with water and add
pepper, then drink
Benin Dendi,
Fulani,
Gourmant
-ché,
Haussa
Nutritional Scurvy Not specified Kenya -
Pregnancy,
birth,
puerperium
Lactation To increase lactation, eat Kunu
(a kind of porridge) prepared
with fruit of tamarind and
Ximenia americana or drink a
macerate of tamarind fruits in
water
Nigeria Fulani
Pregnancy Drink macerate of fruits in
water to relieve pain upon
labour
Nigeria
Fulani
Sensory
system
Vertigo Mix with water and add sugar
for taste, then drink
Benin Dendi,
Fulani,
Gourmant
-ché,
Haussa
19
2.3.5 Current studies of T. indica
T. indica fruit pulp has been shown to have good antioxidant activities.
Sudjaroen et al. (2005) reported that the methanolic extract of T. indica fruit pulp has
better antioxidant capacity than the seeds even though the total phenolic content of the
seed is much higher than the T. indica fruit pulp. Lim et al. (2013) showed that the fruit
had significant amount of phenolic (244.9 ± 10.1 mg GAE/extract) and flavonoid (93.9
± 2.6 mg RE/g extract) content and possessed considerable antioxidant activities.
Similarly, Martinello et al. (2006) observed that the fruit pulp extract of T. indica
showed radical scavenging ability in vitro, and improved the efficiency of the
antioxidant defense system in vivo when the tamarind extract was administered at a
concentration of 5 %. Other studies were also in agreement with the considerable anti-
oxidant activities of tamarind fruit extract (Khairunnuur et al., 2009; Lamien-Meda et
al., 2008; Ramos et al., 2003).
Besides this, the fruit has been shown to have anti-bacterial properties. Nwodo
et al. (2011) reported that the aqueous and ethanolic extracts of T. indica fruit pulp
exhibited wide spectrum of antibiotic properties. The methanol and hexane extracts of
the fruit had antibacterial effect too (Adeola, Adeola, & Dosumu, 2010). Others studies
(Dabur et al., 2007; Melendez & Capriles, 2006) also supported the antibacterial
activities of tamarind fruit extract. In a recent study, the fruit has also been
demonstrated to reduce the secretion of aflatoxin from Aspergillus flavus and A.
parasiticus, although the aqueous extract did not inhibit their growth (El-Nagerabi,
Elshafie, & Elamin, 2013). Koudouvo et al. (2011) reported that the aqueous extract of
tamarind fruit exhibit antiplasmodial activity.
20
T. indica fruit has also been shown to exhibit hypolipidaemic effects. The crude
extracts from the fruits had been shown to have a lipid-lowering effect in
hypercholesterolaemic hamsters (Martinello, et al., 2006), and in cafeteria diet- and
sulpiride-induced obese rats (Jindal, et al., 2011). Azman et al. (2012) had reported that
the aqueous extract of T. indica fruit pulp improved obesity-related parameters in blood,
liver, and adipose tissue in a rat model and suppressed obesity induced by a high-fat
diet, possibly by regulating lipid metabolism and lowering plasma leptin and fatty acid
synthase (FAS) levels. A similar effect was reported by Lim et al. (2013) in which the
methanol extracts of T. indica fruit had high content of phenolic and flavonoid
compounds and possessed antioxidant activities and lowered triglyceride, cholesterol
and LDL but not HDL in hyperlipidaemic hamsters. The hypolipidaemic results were in
agreement with the human study where the dried and pulverised T. indica fruits,
significantly reduced both total cholesterol and LDL-cholesterol levels in humans
(Iftekhar, et al., 2006). In vitro study on HepG2 cells by Razali et al. (2010) showed that
the methanol extract of T. indica fruit pulp significantly regulated thousands of genes
and many of which were involved in cholesterol synthesis and lipoprotein metabolism.
Tamarind fruit was shown to ameliorate fluoride toxicity in rats (Dey, Swarup,
Saxena, & Dan, 2011) and in rabbits (Ranjan, Swarup, Patra, & Chandra, 2009). It has
also been shown to delay progression of fluorosis by enhancing urinary excretion of
fluoride (Khandare, Rao, & Lakshmaiah, 2002). Besides this, it also exhibits anti-
spasmolytic effect in rabbits (Ali & Shah, 2010) and anti-nociceptive activities in
rodents (Khalid et al., 2010). Rimbau et al. (1999) had also reported anti-inflammatory
effect of the fruit. Landi Librandi et al. (2007) determined the effect of T. indica fruit
extract on the complement system (CS) in vitro and in vivo; the hydroalcoholic extract
increased complement components and complement lytic activity in vitro, but had no
21
effect on the CS in vivo. Additional analysis and efforts to isolate the compounds of the
extract that act on the CS could lead to its therapeutic use as an inflammation
modulator.
2.4 Foodomics
Foodomics is a relatively recent scientific discipline that studies food and
nutrition with the use of advance “omics” technologies (Herrero, Simo, Garcia-Canas,
Ibanez, & Cifuentes, 2012). Traditionally, the main aim of food analysis is to ensure
food safety. Analytical chemistry was, and is still the main tool being used to achieve
this goal. However there is also a general trend in food science to link food and health.
Therefore, food is considered not only a source of energy but also an alternative to
prevent diseases. This has led to the introduction of food analysis using advanced
“omics” approaches known as foodomics. Foodomics enables us to study the effect of
food ingredient(s) at the genomic/transcriptomic/proteomic and/or metabolomic level,
making possible new investigations at the molecular level on food bioactivity and its
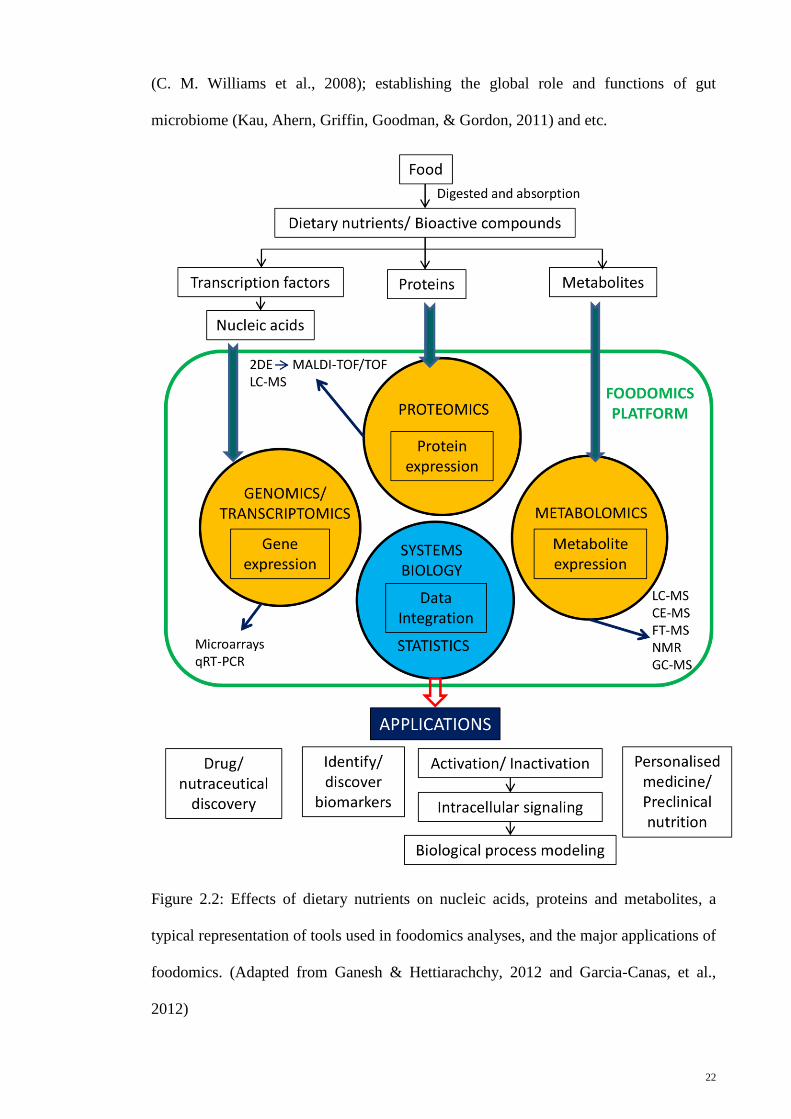
effect on human health. Generally, foodomics is presented as a global discipline in
which food (including nutrition), advanced analytical techniques (mainly omics tools),
and bioinformatics are combined (Figure 2.2). This opens up a whole new window to
study food once thought to require multidisciplinary expertise to achieve, as traditional
food analysis mostly involve analytical chemistry. This had also permitted us to address
issues like understanding the beneficial or adverse effects of a certain bioactive food
compound on cellular or molecular level using nutrigenomic approaches (Wittwer et al.,
2011); determining the effect of bioactive food constituents on crucial molecular
pathways (Corella et al., 2011); understanding the gene-based differences among
individuals in response to a specific dietary pattern following nutrigenetic approaches
22
(C. M. Williams et al., 2008); establishing the global role and functions of gut
microbiome (Kau, Ahern, Griffin, Goodman, & Gordon, 2011) and etc.
Figure 2.2: Effects of dietary nutrients on nucleic acids, proteins and metabolites, a
typical representation of tools used in foodomics analyses, and the major applications of
foodomics. (Adapted from Ganesh & Hettiarachchy, 2012 and Garcia-Canas, et al.,
2012)
23
2.4.1 Proteomics
Nutriproteomics is one of the “omics” technologies used in foodomics studies.
Proteomics is the study of nature of proteins and the correlation with their underlying
biological processes, therefore allowing the identification of the proteins, their
expressional changes, levels of production, post translational modifications (PTM),
amino acid substitution and polymorphisms to be determined (Dutt & Lee, 2000;
Pandey & Mann, 2000). Physiological, pathological and nutritional alterations can play
a pivotal role in altering the proteome of an individual (Fuchs et al., 2005; H. Kim,
Page, & Barnes, 2004; J. Wang, Li, Dangott, & Wu, 2006). A key step in proteomics
analysis is to separate the protein mixtures in order to quantify or characterise it,
depending on the objective of the study. This can be accomplished either as gel-based
or gel-free approaches. In the gel-based approach, two-dimensional gel electrophoresis
and mass spectrophotometry (MS) are used. Basically, the proteins are separated using
two dimensions, i.e. to separate them based on their isoelectric points and molecular
mass, in which the latter involves running an SDS-PAGE. Gel-free approach involves
the direct digestion of proteins in solution and the resulting peptides are resolved using
liquid chromatography coupled with mass spectrophotometer. More than one type of
column is often used in the separation of peptides to give better separation, for example
a strong cation exchange column and reverse-phase HPLC coupled with MS is a
common setup for gel-free approach. This is also known as the multi-dimensional
protein identification technology (MudPIT). Both approaches have their pros and cons.
Gel-based approach allows high throughput analysis and the ability to detect isoforms
and PTMs, both of which are not achievable through gel-free approach. Gel-free
approach is more sensitive and needs only a small amount of sample. It also separates
protein with extreme characteristics (extremes in isoelectric points, molecular weights,
quantities and hydrophobicity) better (Ganesh & Hettiarachchy, 2012).
24
2.4.1.1 Two-dimensional gel electrophoresis (2D-GE)
2D-GE was first introduced by O’Farrell in 1975 (O'Farrell, 1975). It is a robust
and common technique used to separate protein mixture from cells, tissues, or other
biological samples. This technique separates proteins in two steps, the first-dimension
separation, isoelectric focusing (IEF), which separates proteins according to their
isoelectric points (pI); and the second-dimension separation, sodium dodecyl sulphate-
polyacrylamide gel electrophoresis (SDS-PAGE), which separates proteins according to
their molecular mass. The advent of 2D-GE has revolutionised proteomic analyses,
however its application had only started to gain significance with a number of
developments. In the original technique introduced by O’Farrell, the first-dimension
separation was carried in carrier-ampholyte-containing polyacrylamide gels cast in
narrow tubes. This method was improved with the introduction of immobilised pH
gradient (IPG) strips which significantly increased the resolution and reproducibility of
first-dimension separation. The improvement in protein identification from the protein
spot has also contributed to the robustness in 2D-GE application. This includes more
sensitive mass spectrometry techniques for rapid identification of small amount of
peptides or proteins; more powerful, less expensive computers and software rendering
thorough computerised evaluations of highly complex 2D patterns to become
economically feasible; and protein sequences are being added on a daily basis to
databases available on the public domain, thus increasing the possibility to identify a
protein.
2.4.1.2 Protein sample preparation
A good protein sample is crucial for any downstream proteomic applications.
Therefore, protein sample preparation is the key to successful proteomic analysis.
Generally, a good protein sample should have minimal degradation and this can be
25
achieved by extracting protein at low temperature, the addition of protease inhibitor in
lysis buffer and avoiding freeze-thawing protein samples multiple times. The protein
sample should also be free of contaminating substances that will interfere with the
protein separation such as salts, detergents, nucleic acids and lipids. Besides this, in
order to achieve a well-focused first-dimensional separation, the protein sample should
also be completely solubilised, disaggregated, denatured and reduced. This ensures that
each protein is present in only one conformation and that aggregation and
intermolecular interaction is avoided. Therefore, all sample preparation solution for
first-dimension separation will include denaturant, detergent, reducing agents and
solubilising agent. Urea is a common denaturant used to solubilise and unfold most
proteins to their fully random conformation, with all ionisable groups exposed to
solution. Studies have shown that the use of thiourea in addition to urea can improve
solubilisation, especially membrane proteins (Molloy et al., 1998; Musante, Candiano,
& Ghiggeri, 1998; Rabilloud, 1998; Rabilloud, Adessi, Giraudel, & Lunardi, 1997). A
non-ionic or zwitterionic detergent like 3-[(3-cholamidopropyl) dimethylammonio]-1-
propanesulfonate (CHAPS) is commonly used to ensure complete sample solubilisation
and to prevent aggregation through hydrophobic interactions. CHAPS is more effective
for solubilising a wide range of samples than NP-40 or Triton X-100 (Perdew, Schaup,
& Selivonchick, 1983), both of which were used originally as non-ionic detergent
before CHAPS (Bjellqvist et al., 1982; O'Farrell, 1975). SDS, a powerful anionic
detergent, was not recommended as it is charged and forms complexes with proteins.
Dithiothreitol (DTT) is used as reducing agents to break any disulfide bonds present and
to maintain all proteins in their fully reduced state. Lastly, carrier ampholytes or IPG
Buffer is added to enhance solubility by minimising protein aggregation due to charge-
charge interactions.
26
2.4.1.3 First dimension separation (IEF) and second-dimension separation (SDS-
PAGE)
In first-dimension separation, also known as isoelectric focusing (IEF), proteins
are separated according to their isoelectric points (pI) using immobilised pH gradient
(IPG) strips. Proteins are amphoteric in nature, i.e. they are positively charged,
negatively charged or neutral depending on the pH of their surrounding environment.
Isoeletric point (pI) is the specific pH at which the net charge of the protein is zero. By
applying high voltage, typically 8000V, the proteins will move to pH points where their
net charges are zero, thus separating the protein mixture.
After IEF, the IPG strip is then equilibrated by saturating the IPG strip with SDS
buffer system required for the second-dimension separation. The equilibration solution
typically contains buffer, urea, glycerol, reductant, SDS, and dye. An additional
equilibration step replaces the reductant with iodoacetamide to stabilise the reduced
proteins. The function of urea and glycerol is to reduce the effects of electroendosmosis
which will interfere with protein transfer from the strip to the second-dimension gel by
increasing the viscosity of the buffer (Gorg, Postel, & Gunther, 1988). SDS functions to
denature proteins and forms negatively charged protein-SDS complexes. This is
important as the proteins in the IPG strips are neutral in charge and SDS confers the
proteins negative charge for separation in SDS-PAGE.
After equilibration, the strip is ready for second-dimension separation, or SDS-
PAGE, which separates proteins according to their molecular mass. The technique is
performed in polyacrylamide gels containing SDS. The SDS in the sample and gel
denatures the proteins and confers them in negative charge which will then be separated
through polyacrylamide gel electrophoresis. Besides SDS, a reducing agent such as
27
DTT is also added to break any disulfide bonds present in the proteins. When proteins
are treated with both SDS and a reducing agent, the degree of electrophoretic separation
within a polyacrylamide gel depends largely on the molecular mass of the protein. In
fact, there is an approximately linear relationship between the logarithm of the
molecular mass and the relative distance of migration of the SDS-polypeptide complex.
It should be noted that this linear relationship is only valid for a certain molecular mass
range, which is determined by the polyacrylamide percentage. The most commonly
used buffer system for second-dimension SDS-PAGE is the Tris-glycine system
described by Laemmli (1970). This buffer system separates proteins at high pH, which
confers the advantage of minimal protein aggregation and clean separation even at
relatively heavy protein loads. The Laemmli buffer system has the disadvantage of a
limited gel shelf life. Other buffer systems can also be used, particularly the Tris-tricine
system of Schagger and von Jagow (1987) for improving resolution of polypeptides
with molecular mass values below 10 kDa.
2.4.1.4 Visualisation of 2-dimensional (2D) gels
There are a few methods that can be employed to visualise a 2D gel. Generally,
the desirable features of the gel staining method include high sensitivity, wide linear
range for quantification, compatibility with mass spectrometry, low toxicity and
environmentally friendly.
The two most common methods used are silver staining and Coomassie staining.
Silver staining is a sensitive non-radioactive method that is able to detect protein
amount of below 1 ng. However, it is a complex, multi-step process utilising numerous
reagents for which quality is critical. By omitting glutaraldehyde from the sensitiser and
formaldehyde from the silver nitrate solution, the method becomes compatible with
28
mass spectrometry analysis (Shevchenko, Wilm, Vorm, & Mann, 1996), although at the
expense of sensitivity. Coomassie staining, although 50- to 100-fold less sensitive than
silver staining, is a relatively simple method compared to silver staining. Coomassie
blue is preferable when relative amounts of protein are to be determined by
densitometry. An improved method of Coomassie blue, colloidal staining methods has a
higher sensitivity which can detect down to 100 ng/protein spot (Neuhoff, Arold,
Taube, & Ehrhardt, 1988; Neuhoff, Stamm, & Eibl, 1985).
Other staining methods like negative zinc-imidazole staining has a detection
limit of approximately 15 ng protein/spot (Fernandez-Patron et al., 1998) and is
compatible with mass spectrometry, but is a poor quantitation technique. Fluorescent
labelling (Unlu, Morgan, & Minden, 1997) and fluorescent staining (Mackintosh et al.,
2003) provide significant advantages over Coomassie blue or silver staining.
Fluorescent detection offers increased sensitivity, simple, robust staining protocols, and
quantitative reproducibility over a broad dynamic range. The method is also compatible
with mass spectrometry. Autoradiography and fluorography are the most sensitive
detection methods (down to 200 fg of protein). To employ these techniques, the sample
must contain protein radiolabeled in vivo using either 35
S, 14
C, 3H or, in the case of
phosphoproteins, 32
P or 33
P. For autoradiographic detection, the gel is simply dried and
exposed to X-ray film or- for quicker results and superior dynamic range of
quantitation- to a storage phosphor screen. Fluorography is a technique that provides
extra sensitivity by impregnating the gel in a scintillant such as 2,4-diphenyloxazole
(PPO) prior to drying.
29
2.4.1.5 Further analysis of protein spots
After staining, the gels are scanned using a gel scanner. Dedicated software for
2D-GE application is used to compare and contrast 2D gels. The protein spot of interest
can be excised and digested using enzyme, typically trypsin, into peptides. The peptides
are then mixed with matrix-assisted laser desorption ionisation time of flight mass
spectrometry (MALDI-TOF MS) matrix material, and spotted onto MALDI-TOF MS
plates. Time-of-flight mass spectrometry is a technique for analysing molecular weights
based on the motion of ionised samples in an electrical field. In MALDI-TOF MS, a
matrix-bound sample is bombarded with a pulsed laser beam to generate ions for
subsequent detection. The MS spectrum generated from these peptides can then be
identified using public databases such as SWISS-PROT and NCBI.
2.4.2 Transcriptomics
Nutritranscriptomics is another “omics” technology used in the foodomics
studies. Transcriptomics examines the mRNA expression levels in a cell population.
The most common method used in transcriptomic studies is DNA microarray
technology. Recently, a technique named RNA-seq which employs next-generation
sequencing technology emerged as a method of choice to measure the transcriptomes in
an organism (Z. Wang, Gerstein, & Snyder, 2009), although DNA microarray is still
being used. In the nutrition field, the global analysis of transcripts could elucidate the
effect of a nutrient or diet on metabolic pathways; identify potential biomarkers in
chronic diseases; and determine the impact of a diet and/or a single nutrient on a human
pathology (Garcia-Canas, et al., 2012; Wittwer, et al., 2011).
30
2.4.2.1 DNA microarray
DNA microarray is a useful tool to simultaneously and rapidly examine the
expression of thousands of genes. Before the advent of DNA microarray, Northern blot
was used to visualise gene expression of targeted genes. Ever since the establishment of
microarray two decades ago (DeRisi et al., 1996; Lockhart et al., 1996; Schena, Shalon,
Davis, & Brown, 1995), it has become one of the most widely used technique to study
transcriptomes of an organism. A microarray is a glass slide or silicon chip onto which
DNA molecules (probes) are bound at fixed locations called spots. This allows the
labelled cDNA transcribed from mRNA of sample of interest to hybridise to the probes,
which can then be quantified by measuring the fluorescence intensity emitted by the
labelled cDNA. Generally there are two types of microarray: spotted microarrays like
cDNA microarray and oligonucleotide microarray, and the Affymetrix GeneChip
system, which involves direct synthesis of oligonucleotides onto a chip.
2.4.2.2 Types of DNA microarray
Spotted cDNA microarray was the first widely used microarray technique. In a
typical spotted microarray, cDNA fragments, representing different genes, are amplified
using PCR and printed at high density onto microscope glass slides with special surface
chemistry that allows binding of the spotted DNA. Two different cDNA populations
derived from independent RNA samples are labelled with red (Cy5) and green (Cy3)
fluorescent dyes, respectively, and hybridised to the slide. The array is subsequently
washed and scanned by lasers that excite the different dyes. A fluorescent signal is
computed for each spot on the array and the ratio of Cy3:Cy5-induced fluorescence for
each spot corresponds to the relative amount of transcript in the samples. While this
method is especially useful for examining transcriptomes in organisms that have little or
no genome sequences, its uniformity across each microarray slides remains challenging
31
due to probes of varying length. This method also measures only one gene per probe as
compared to Affymetrix GeneChip which has multiple probes for a gene, this impacts
on the sensitivity of spotted microarray in detecting the genes.
The next microarray technology to emerge involved in situ-synthesised
oligonucleotide arrays using photolithographic technology (Affymetrix). Affymetrix
GeneChip technology employs a series of 25-mer oligonucleotides, which are designed
using a computer algorithm to represent known or predicted open reading frames
(Lipshutz, Fodor, Gingeras, & Lockhart, 1999). However, it is only limited to
organisms with a significant amount of genome information. There are between 10 and
20 different oligonucleotides representing each gene to control for variation in
hybridisation efficiency due to factors such as GC content. A control for cross-
hybridisation with similar short sequences in transcripts other than the one being probed
for is a mismatch oligonucleotide next to each oligonucleotide with a single base pair
change at its centre. Under stringent hybridisation conditions, this control should not
hybridise to the exact match cDNA. The level of expression of each gene is calculated
using a procedure provided by the Affymetrix software, which computes the weighted
average of the difference between the perfect match and mismatch. The high density
arrays are constructed on silicon wafers using a technique called photolithography and
combinatorial chemistry. The process used to prepare the arrays is expensive and
processing requires a proprietary hybridisation station, scanner and software, thus is
more expensive than the spotted microarrays. The target cDNA is labelled using
amplified RNA and only a single sample is hybridised to each chip.
Another technique that uses in situ synthesis oligonucleotide arrays is the ink-jet
technology by Agilent. Instead of using 25-mer probes like in Affymetrix GeneChips,
32
this technique uses longer oligonucleotide probes (60-mer). Unlike the Affymetrix
counterpart, this technique is analogous to the spotted cDNA microarray in the sense
that it only detects one gene per probe as oppose to multiple probes detecting a gene in
Affymetrix GeneChip technique and it also uses a 2-dye system. Agilent microarrays
have improved selectivity over conventional spotted cDNA microarray due to increased
probe length and sequence optimisation. However, this advantage may be compromised
by relatively high background fluorescence.
2.4.2.3 Normalisation and data analysis
DNA microarray data were obtained as scanned image files. Before subjecting
those files for expression analysis, they have to be normalised to standardise microarray
data and to differentiate between real (biological) variations in gene expression levels
and variations due to the measurement process. Generally, normalisation of data from
two-colour microarray systems like spotted cDNA microarray is achieved by linear
regressions. This process requires raw data manipulation, owing to differences in the
chemistry of the dyes, before differences in transcript levels can be identified. It is
necessary to normalise the fluorescence ratios in order to compensate for systematic
variations (Bilban, Buehler, Head, Desoye, & Quaranta, 2002). Normalisation of
Affymetrix GeneChip array expression data is often done by utilising the Robust Multi-
array Average (RMA) algorithm. RMA is a method for normalising and summarising
probe-level intensity measurements from Affymetrix GeneChips. Starting with the
probe-level data from a set of GeneChips, the perfect-match (PM) values are
background-corrected, normalised and finally summarised resulting in a set of
expression measures. The background correction used in RMA is a non-linear
correction, done on a per-chip basis. It is based on the distribution of PM values
amongst probes on an Affymetrix array. The normalisation used in RMA is quantile
33
normalisation, which is non-linear method. This usually gives very sharp
normalisations. Once the probe-level PM values have been background-corrected and
normalised, they are summarised into a single expression measure per probe-set, per
chip. The summarisation used is motivated by the assumption that observed log-
transformed PM values follow a linear additive model containing a probe affinity effect,
a gene specific effect and an error term. For RMA, the probe affinity effects are
assumed to sum to zero, and the gene expression level is estimated using median
polishing. Median polishing is a robust model fitting technique that protects against
outlier probes.
After normalising the microarray expression data, the data are ready to be
analysed. The most basic method to analyse the huge amount of microarray expression
data is to filter them by fold-change when comparing samples with two or more
different parameters. Often changes of ≥ 1.5-fold may be sufficient to identify a list of
candidate genes. To further strengthen the fact that the changes in genes identified are
likely to be due to the defined parameter rather than random fluctuations, one- or two-
way analysis of variance (ANOVA) is performed. ANOVA is performed separately for
each gene, and only those genes that pass the significance level are retained for further
analysis. Another method is based on grouping genes that have similar patterns of gene
expression throughout the whole experiment. There are two ways of grouping, class
discovery analysis or class prediction analysis. Class discovery analysis is also known
as unsupervised classification or knowledge discovery. The idea of clustering genes
together in groups based on iterative pattern recognition or statistical learning methods
to find an optimal number of clusters in data allows the discovery of new groups that
otherwise were not reported (Peterson, 2013). Examples of class discover analysis
include hierarchical cluster analysis, k-means cluster analyses, self-organising maps and
34
model-based cluster analysis (Rimbach, Fuchs, & Packer, 2005). Another clustering
method is the class prediction analysis or supervised classification. It uses sample
associated parameters or classes to identify gene lists that can associate unknown
samples with these parameter or classes (Soinov, 2003). Principle component analysis
(PCA) is a common method used to reduce the number of dimensions prior to data
analysis (Peterson, 2013). It identifies the correlations between gene expression profiles
and attempts to explain a majority of the variance in the entire data set. It is a
decomposition technique that produces a set of expression patterns that are known as
principle components. Diagonal or 3D combinations of these patterns can be assembled
to represent the behaviour of all of the genes in a given data set (Remy & Michnick,
2003).
2.4.2.4 Validation of microarray analysis
As mentioned earlier, DNA microarray is an extremely powerful tool for the
analysis of gene expression. However it should be noted that there are technical
limitations that may distort the data analysis. The type (cDNA or oligonucleotide), the
size (in bp), and the location in the target gene of microarray probes may affect
efficiency of the hybridisation reaction and thus the ability of the technique to
accurately detect differences in gene expression levels. Therefore, an additional test or
assay is normally performed to confirm and increase confidence of the microarray
expression results.
Quantitative real-time polymerase chain reaction or qRT-PCR is the most
common method used to validate microarray results. qRT-PCR allows the continuous
measurement of products produced during the course of PCR reaction. This can be done
by using either TAQman based fluorescent probe method or by using Sybr Green to
detect double stranded DNA products. Both chemistries rely on the detection of product

35
molecule present throughout the numerous cycles occurring during a complete PCR
reaction. The exponential growth in PCR products is related to the cycle threshold point
and from this crossing point (CT value), the number of targets present in the input
sample can be determined.
36
CHAPTER 3
MATERIALS AND METHODS
3.1 Materials
3.1.1 Chemicals
Merck, Germany:
i. Sodium carbonate
ii. Silver nitrate
iii. Ammonium peroxodisulphate
iv. EDTA disodium
v. Potassium hexacyanoferrate (III)
vi. Sodium hydrogen carbonate
vii. N,N,N’,N’-Tetramethylethylenediamine (TEMED)
viii. Iodoacetamide
ix. Dithiothreitol (DTT)
x. Urea
xi. Ammonium hydrogen carbonate
xii. Acetonitrile
xiii. Glycine
xiv. Thiourea
xv. Isopropanol
xvi. Sodium acetate trihydrate
xvii. 3-(4,5-dimethyl-2-thiazolyl)-2,5-diphenyl-2H-tetrazolium bromide (MTT)
xviii. Sodium thiosulphate pentahydrate
xix. Sodium hydroxide
xx. Formaldehyde solution 37%
37
xxi. Acrylamide
xxii. Trifluoroacetic acid (TFA)
Sigma-Aldrich Chemical Company, USA:
i. Fenofibrate
ii. Palmitic acid
iii. Oil Red O
iv. Gluteraldehyde
v. Albumin from bovine serum, fatty acid free
vi. Tris-base
vii. Trypsin-EDTA
viii. Trypan blue
ix. Orange G
x. Glycerol
xi. Sterile dimethylsulphoxide (DMSO)
xii. N,N’-methylenebisacrylamide
GE Healthcare, USA:
i. Sodium dodecyl sulphate (SDS)
ii. Glycine
iii. Drystrip cover fluid
iv. Immobiline pH gradient (IPG) strips, pH 3-10 NL, 13 cm
v. IPG buffer, pH 3-10 NL
Hyclone, Australia:
i. Dulbecco’s modified Eagle medium (DMEM)
38
ii. Foetal bovine serum (FBS)
iii. 4-(2-hydroxyethyl)-1-piperazineethanesulfonic acid (HEPES)
Thermo Scientific, USA:
i. Halt protease inhibitor cocktail 100X
ii. Trypsin
Fisher Scientific, UK:
i. Methanol analytical grade
ii. Ethanol
Invitrogen, UK:
i. Ethidium bromide
Vivantis, USA:
i. Agarose
Flowlab, Australia:
i. Penicillin and streptomycin
Bio-rad, USA:
i. Bradford reagent
ii. Beta-mercaptoethanol
SRL, India:
i. Deoxycholic acid sodium salt
39
Oxoid, UK:
i. Phosphate buffered saline (Dulbecco A)
Calbiochem, USA:
i. 3-[(3-cholamidopropyl)dimethylammonio]-1-propanesulfonate (CHAPS)
Acros Organics, USA:
i. Bromophenol blue
Applichem, Germany:
i. Triton X-100
Applied Biosystems, USA:
i. Fast SYBR® Green Master Mix
40
3.1.2 Apparatus
i. Rotary evaporator (Buchi, Switzerland)
ii. Weighing machine (Denver Instrument, USA)
iii. Vortex mixer (Labnet, USA)
iv. Orbital shaker (Biometra, Germany)
v. Sorvall Legend Micro 17 centrifuge (Thermo Scientific, USA)
vi. JOUAN CR3i Multifunction centrifuge (Thermo Scientific, USA)
vii. Sorvall Biofuge Primo R centrifuge ( Thermo Scientific, USA)
viii. Magnetic stirrer (Thermo Scientific, USA)
ix. PCR Thermocycler (Biometra, Germany)
x. Dry Block Heating Thermostat (Biosan, Latvia)
xi. ELISA Plate Reader (Bio-Rad, USA)
xii. Hybridization Oven 640 (Affymetrix, USA)
xiii. Fluidics Station 450 (Affymetrix, USA)
xiv. GeneQuantpro Spectrophotometre (GE Healthcare, USA)
xv. Gel Doc 1000/2000 (Bio-Rad, USA)
xvi. StepOne Real-Time PCR System (Applied Biosystems, USA)
xvii. Ettan IPGphor III Isoelectric Focusing System (GE Healthcare, Sweden)
xviii. SE 600 Ruby electrophoresis system (GE Healthcare, Sweden)
xix. ImageScanner III (GE Healthcare, Sweden)
xx. Applied Biosystems 4800 Plus MALDI TOF/TOF (Applied Biosystems,
USA)
xxi. Vivaspin® 20 ultrafiltration device with 5 kDa molecular weight cut off PES
membrane (Sartorius Stedim, Germany)
41
3.1.3 Kits
i. RNeasy Mini Kit (Qiagen, Germany)
ii. High Capacity RNA-to-cDNA kit (Applied Biosystems, USA)
iii. RNase-free DNase set (Qiagen, Germany)
iv. BCA assay (Pierce, Thermo Scientific, USA)
v. 2D-cleanup kit (GE Healthcare, USA)
vi. Western Dot 625 Goat Anti-Rabbit Western Blot kit (Invitrogen, USA)
vii. Triglyceride quantification kit (Abcam, UK)
viii. Cholesterol/cholesteryl ester quantification kit (Abcam, UK)
ix. Applause WT-AMP ST System (NuGEN Technologies, USA)
x. Encore Biotin Module (NuGEN Technologies, USA)
xi. MinElute Reaction Cleanup Kit (Qiagen, Germany)
3.1.4 Software
i. Image Master 2D Platinum V 7.0 software (GE Healthcare, Sweden)
ii. GPS Explorer software (Applied Biosystems, USA)
iii. MASCOT program (Matrix Science, UK)
iv. ImageJ software (http://rsb.info.nih.gov/ij/)
v. Ingenuity Pathways Analysis (IPA) software (Ingenuity® Systems,
www.ingenuity.com)
vi. Partek Genomics Suite TM (Partek, USA)
vii. Microarray Suite 5 software (Affymetrix, USA)
viii. GeneChip Operating Software (GCOS) (Affymetrix, USA)
ix. Sequence Detection System (SDS) software (Applied Biosystems, USA)
x. Quantity One Software (Bio-Rad, USA)
xi. StepOne Software (Applied Biosystems, USA)

42
xii. Primer-BLAST software (http://www.ncbi.nlm.nih.gov/tools/primer-blast/)
3.1.5 Cell culture
i. Human hepatoblastoma cell line, HepG2 (American Type Culture
Collection, ATCC)
43
3.2 Methods
3.2.1 Nomenclature
Human gene symbols are italicised with all letters in uppercase while mouse or
rat gene symbols are italicised with the first letter in uppercase followed by all
lowercase letters. Protein symbols are at uppercase and not italicised. With regards to
proteomics, in the context of 2D-GE, the terms “protein abundance” and “differentially
modulated” are used to reflect the variations in protein levels, including transcription
(up-regulation and down-regulation), post-translational modifications, translocation,
degradation, accumulation and trafficking (Cohen et al., 2008, Godovac-Zimmermann
et al., 2005, Nesvizhskii & Aebersold, 2005) that occur when proteomes are perturbed
in various conditions especially. In contrast, the term “differentially expressed” is more
tractable and suitable for describing detected protein from MS-based proteomics.
3.2.2 Sampling and sample preparation
Whole, ripe T. indica fruits were collected from Kedah in the northern region of
Malaysia. The voucher specimen of the sample with an identification number, KLU
45976, was deposited in the Rimba Ilmu Herbarium, the University of Malaya. A
measure of 10 g of T. indica fruit pulp powder was suspended in 200 ml of methanol at
room temperature. The mixture was then stirred with a magnetic stirrer for 1 h and
incubated in the dark for 24 h. The supernatant was filtered with a filter paper. The
crude extracts of T. indica fruit pulp were obtained after evaporating methanol to
dryness in a rotary evaporator.
3.2.3 Cell culture and treatment
HepG2 cells were cultured in Dulbecco’s modified Eagle medium (DMEM),
with 5 mM glucose, supplemented with 10 % foetal bovine serum (HyClone, Australia),
44
0.37 % (w/v) sodium bicarbonate and 0.48% (w/v) HEPES, pH 7.4, in a CO2 humid
incubation chamber at 37 °C. To study the effects of methanol extract of T. indica fruit
pulp on HepG2 cells, the cells were seeded at a density of 9.0 ×10⁶ in 75 cm
2 flask for
18–24 h, then the cells were extensively washed with PBS to remove any remaining
serum. The cells were then incubated in serum-free DMEM with a final concentration
of 0.02 % DMSO (vehicle) as control and 60 µg/ml methanol extract of T. indica fruit
pulp as treatment. After 24 h, the secreted proteins and the cell lysate were harvested.
3.2.4 Recovery of secreted proteins from cell culture media
The medium containing the secreted proteins was collected and centrifuged at
1000 x g for 5 min to remove cellular debris. The medium was further filtered through
0.22 µm syringe filter. The supernatant was then concentrated by ultrafiltration through
a spin column with 5 kDa molecular weight cut off membrane (Sartorius Stedim,
Germany) at 7000 x g for 2 h. The protein concentration in the concentrated medium
was then determined using Bradford assay kit (Bio-Rad).
3.2.5 Cell lysate extraction
The cells were detached using trypsin-EDTA. They were then spun at 261 x g to
pellet the cells. The pellet was washed with ice-cold PBS twice and thiourea rehydration
solution (7 M urea, 2 M thiourea, 2 % w/v CHAPS, 0.5% v/v IPG buffer, orange G,
protease inhibitor) was added to lyse the cells. Vigorous pipetting and sonication were
performed to ensure the cells were thoroughly ruptured. The mixture was then
incubated on ice and vortexed every 10 min for a time span of 30 min. After
incubation, the mixture was centrifuged at 17,000 x g for 20 min at 4 °C to remove the
cell debris. The supernatant containing the proteins were then aliquoted and kept at -80
45
°C for downstream application. Protein concentration was determined using Bradford
assay.
3.2.6 Cell viability
To ensure that the cell was still above 90% viable after the treatment, the
percentage of viable cells during secretion period and after treatment was estimated by
3-(4,5-dimethyl-2-thiazolyl)-2,5-diphenyl-2H-tetrazolium bromide (MTT) assay.
Briefly, cells were plated at a density of 1.5 104 cells per well in a 6-well plate and
cultured exactly as mentioned. Medium was then removed and 100 μl of 5 mg/ml MTT
(Merck, Germany) was added to each well. Cells were incubated for 4 h and the MTT
solution was discarded and the precipitate in each well was resuspended in 2 ml of
isopropanol. The optical density (OD) of the samples was read at 570 nm.
3.2.7 Two-dimensional gel electrophoresis (2D-GE)
2D-GE is a method employed to separate proteins based on two dimensions; the
first dimension separates proteins based on their isoelectric focusing points (pI) using
immobilised pH gradient (IPG) gel strip, while in the second dimension the proteins
were separated based on their molecular mass through SDS-polyacrylamide gel
electrophoresis. The gel can then be stained using Coomassie blue or silver staining to
visualise the protein spots. The gel is then scanned and image can be analysed for
downstream application.
3.2.7.1 Sample preparation and rehydration of IPG gel strips
The optimum amount of protein to load per gel and sample preparation was
optimised for better separation of proteins. Forty micrograms of secreted protein or cell
lysate was first cleaned-up using 2D clean-up kit (GE Healthcare, Piscataway, USA).
46
The resulting protein pellet after cleaning up was reconstituted in 20 µl of thiourea
rehydration solution (7 M urea, 2 M thiourea, 2% w/v CHAPS, 0.5% v/v pH 3-10 NL
IPG buffer, Orange G), 80 µl of sample buffer (7 M urea, 2 M thiourea, 4% w/v
CHAPS, 2% v/v pH 3-10 NL IPG buffer, 40 mM DTT) and topped up to 250 µl with
thiourea rehydration solution. For cell lysate sample, the sample buffer was slightly
modified with DTT reduced by half and the addition of DeStreak reagent (GE
Healthcare, USA). Treated and untreated samples, containing the same protein amount,
were rehydrated passively for 18 h at room temperature on immobilised pH gradient
strips (13 cm, non-linear, pH 3-10, GE Healthcare, Uppsala, Sweden).
3.2.7.2 First dimension separation of protein through IEF
First dimension separation was carried out with Ettan IPGphor III Isoelectric
Focusing System and a standard strip holder (GE Healthcare, Uppsala, Sweden).
Isoelectric focusing (IEF) was performed under the following conditions: (i) 500 V, 1 h
10 min, step and hold; (ii) 1000 V, 1 h, gradient; (iii) 8000 V, 2 h 30 min, gradient and
(iv) 8000 V, 55 min, step and hold. The temperature was maintained at 20°C and the
current was kept at 50 µA per strip. The strips were either used immediately for second
dimension separation or kept in -80 °C for further use.
3.2.7.3 Second dimension separation of protein through SDS-PAGE
Upon completion of IEF, strips were equilibrated in equilibration buffer (6 M
urea, 75 mM Tris-HCl, pH 8.8, 29.3 % v/v glycerol, 2 % w/v SDS, 0.002 % w/v
bromophenol blue, 1 % w/v DTT) for 15 min. The solution was then discarded and
replaced with equilibration buffer containing 4.5 % w/v iodoacetamide instead of DTT
for another 15 min. The second dimension separation was carried out at 15 °C on 12.5
% SDS slab gels using a SE 600 Ruby electrophoresis system (GE Healthcare, Uppsala,
47
Sweden), with the IPG strips sealed on the top of the gels with 0.5 % (w/v) agarose in
SDS-electrophoresis buffer (25 mM Tris base, 192 mM glycine, 0.1 % w/v SDS and a
trace amount of bromophenol blue). SDS-PAGE was run at constant power of 50 V and
40 µA/gel for 20 min, and then switched to 500 V and 40 µA/gel until the bromophenol
blue marker was 1 mm away from the bottom of the gel.
3.2.8 Silver staining of gel
After SDS-PAGE, the gel was fixed in fixing solution (40 % (v/v) ethanol, 10 %
acetic acid) for 40 min. The solution was discarded and the gel was immersed in
incubation solution (30 % (v/v) ethanol, 0.5 M sodium acetate, 8 mM sodium
thiosulphate, 0.13 % (v/v) glutaraldehyde) for 40 min. Gluteraldehyde was added
freshly prior to gel immersion. The gel was then washed three times in distilled water
for 5 min. Silver staining solution (5.9 mM silver nitrite, 0.02 % (v/v) formaldehyde)
was then used to stain the gel. Formaldehyde was only added prior to use. To develop
the stained gel, developing solution (0.24 M sodium carbonate, 0.2 % (v/v)
formaldehyde) was added. Formaldehyde was added immediately before use. After
developing the gel, the reaction was halted by adding the stop solution containing 40
mM EDTA-Na2.2H20. All the silver staining steps were performed on orbital shaker at
60 rpm. After staining, the gels were scanned with ImageScanner III (GE Healthcare,
Uppsala, Sweden).
For gels to be used for mass spectrophotometry analyses, gluteraldehyde and
formaldehyde were omitted from the silver staining protocol, but at the expense of
reduced sensitivity. To compensate with that, the protein amount loaded was doubled
for gels that were used in mass spectrophotometry analyses.
48
3.2.9 Gel image and data analysis
The 2D gel images were analysed using the Image Master 2D Platinum V 7.0
software (GE Healthcare, Uppsala, Sweden). In brief, the 2D gel images were subjected
to spot detection and quantification in the differential in-gel analyses module. To
minimise the variations in between gels within the same groups, the protein spots were
normalised using percentage of volume. Statistically significance (p < 0.05, Student’s t-
test) and presence in all 4 gels were two criteria for the acceptance of the differentially-
expressed protein spots. The selected spots were filtered based on an average expression
level change of at least 1.5-fold.
3.2.10 In-gel tryptic digestion
Differentially expressed protein spots were excised manually from the 2D gels,
and washed with 100 mM NH4HCO3 for 15 min. The gel plugs were then destained
twice with 15 mM potassium ferricyanide/50 mM sodium thiosulphate with shaking
until gel plugs became clear. After destaining, the gel plugs were reduced with 10 mM
DTT at 60 °C for 30 min and alkylated with 55 mM iodoacetamide in the dark at room
temperature for 20 min. The gel plugs were later washed thrice with 500 µl of 50 %
ACN/ 50 mM NH4HCO3 for 20 min, dehydrated with 100 % ACN for 15 min and
SpeedVac the gel plugs till dry. Finally the gel plugs were digested in 6 ng/µl trypsin
(Pierce, Rockford, IL USA), in 50 mM NH4HCO3 at 37 °C for at least 16 h. Peptide
mixtures were then extracted twice with 50 % ACN and 100 % ACN respectively and
finally concentrated using Speedvac until completely dry. The dried peptide was then
kept in -20 °C or reconstituted with 10 µL of 0.1 % FA prior to desalting using Zip Tip
C18 micropipette tips (Millipore, Billerica, MA, USA).
49
3.2.11 Mass spectrometry and database searching
Peptide mixtures were analysed by using a mass spectrometer (Applied
Biosystems 4800 Plus MALDI TOF/TOF, Foster City, CA, USA). The trypsin digest
were crystallised with alpha-cyano-4-hydroxycinnamic acid matrix solution (10 mg/ml,
70 % ACN in 0.1 % (v/v) TFA aqueous solution) and spotted onto a MALDI target
(192-well) plate. The MS results were automatically acquired with a trypsin autodigest
exclusion list and the 20 most intense ions selected for MS/MS analysis, with a
minimum S/N (signal/noise) of at least 25. The collision gas was nitrogen gas and the
energy was 4.3 kV. Interpretation was carried out using the GPS Explorer software
(Applied Biosystems, Foster City, CA, USA) and database searching using the in-house
MASCOT program (Matrix Science, London, UK). Both combined MS and MS/MS
searches were conducted with the following settings: Swiss-Prot database, Homo
sapiens, peptide tolerance at 200 ppm, MS/MS tolerance at 0.4 Da,
carbamidomethylation of cysteine (variable modification) and methionine oxidation
(variable modifications).
3.2.12 Western blot
Three of the altered proteins, ethanolamine-phosphate cytidylyltransferase
(PCYT2), NADH dehydrogenase (ubiquinone) 1 alpha subcomplex subunit 10
(NDUFA10) and ubiquinol-cytochrome-c reductase complex core protein 2 (UQCRC2)
were selected to be validated using Western blotting. HepG2 cells (3 X 10⁶) were
treated with 0.06 mg/ml T. indica fruit extract for 24 h. The cells were then trypsinised
and lysed with RIPA buffer (150 mM NaCl; 50 mM Tris-HCl, pH 7.4; 1 mM EDTA; 1
% Triton X-100; 1 % sodium deoxycholate; 0.1 % SDS). The total cell lysate proteins
were quantified using BCA assay kit (Pierce, Rockford, IL, USA). Forty micrograms of
cell lysate protein was separated on a 12.5 % SDS-PAGE, and the separated proteins
50
were transferred onto a PVDF membrane with 0.45 µm pore size (Thermo Scientific,
IL, USA) at 100 V, 110 mA for 90 min. The blot was then blocked overnight and
developed against anti-PCYT2 (ab126142, rabbit polyclonal, Abcam, UK), anti-
NDUFA10 (ab103026, rabbit polyclonal, Abcam, UK), anti-UQCRC2 (ab103616,
rabbit polyclonal, Abcam, UK) and anti-beta actin (ab8227, rabbit polyclonal, Abcam,
UK), the loading control using the WesternDot 625 Goat Anti-Rabbit Western Blot kit
(Invitrogen, Oregon, USA). Quantification of the band intensity was calculated using
ImageJ software.
3.2.13 Data mining using Ingenuity Pathways Analysis (IPA) software
The proteomics data were further analysed using the Ingenuity Pathways
Analysis (IPA) software (Ingenuity®
Systems, www.ingenuity.com) to predict networks
that are affected by the differentially expressed proteins. Details of proteins identified to
be differentially released, their quantitative expression values (fold change difference of
at least 1.5) and p-values (p < 0.05) were imported into the IPA software. Each protein
identifier was mapped to its corresponding protein object and was overlaid onto a global
molecular network developed from information contained in the Ingenuity Knowledge
Base. Network of proteins were then algorithmically generated based on their
connectivity. Right-tailed Fischer’s exact test was used to calculate a p-value indicating
the probability that each biological function assigned to the network is due to chance
alone.
51
3.2.14 Lipid Studies
3.2.14.1 Cell culture and treatment to study lipid-lowering effects of T. indica fruit
extract in HepG2 cells
HepG2 cells were cultured in Dulbecco’s modified Eagle medium (DMEM),
with 5 mM glucose, supplemented with 10 % foetal bovine serum (HyClone, Australia),
0.37 % (w/v) sodium bicarbonate and 0.48 % (w/v) HEPES, pH 7.4, in a CO2 humid
incubation chamber at 37 °C. To study the lipid-lowering effects of methanol extract of
T. indica fruit pulp on HepG2 cells, steatosis was first induced in the cells by culturing
them in palmitic acid-containing media. The cells were seeded and incubated for 18–24
h, after which they were treated with 0.3 mM palmitic acid complexed to fatty acid-free
bovine serum albumin and T. indica fruit extract or 0.1 mM fenofibrate (a positive
control) or 0.02 % DMSO (vehicle, a negative control). The cells were then incubated
for 24 or 48 h before various assays were performed.
3.2.14.2 Preparation of palmitic acid/fatty acid-free bovine serum albumin
complex
Ten percent fatty acid-free bovine serum albumin (FA free-BSA) was prepared
by dissolving the FA free-BSA powder in phosphate buffered saline (PBS) and the pH
was adjusted to 7.0 using 7.5 % (w/v) sodium bicarbonate. The solution was then
sterile-filtered using a 0.2 µm filter syringe.
A stock solution of 100 mM palmitic acid was prepared by dissolving the
palmitic acid in 0.1 M NaOH at 70 °C. Before complexing the palmitic acid to the FA
free-BSA, the 10 % FA free-BSA solution was first incubated at 55 °C, and palmitic
acid solution was added slowly to the FA free-BSA solution while swirling to achieve
52
the desired concentration. The solution was then sterile-filtered using a 0.45 µm filter
syringe and kept in -20 °C.
3.2.14.3 Cell viability
To assess the cell viability of HepG2 during the treatment, MTT assay was
performed. Briefly, cells were plated at a density of 216,000 cells per well in a 24-well
plate. After 24 h, the media was removed and the wells were washed gently with PBS
twice. The cells were then incubated for 24 or 48 h in DMEM supplemented with
different concentrations of palmitic acid/10 % FA-free BSA and treatments with 0.1
mM fenofibrate or different concentrations of T. indica fruit extract or 0.02 % DMSO
(vehicle). After incubation, 50 µL of 5 mg/ml MTT (Merck, Germany) was added to
each well and incubated for another 4 h. The media was then removed and 1 mL of
isopropanol was added to each well to dissolve the formazan crystal. The optical density
of the sample was read at 570 nm.
3.2.14.4 Oil Red O staining
Oil Red O staining was performed to stain the lipid droplets in the cells. Cells
were seeded in a 24-well plate and cultured as described in Section 3.2.14.1. After
removing the media, the plate was rinsed gently with PBS twice and fixed in 10 %
formalin for 1 h. The formalin was then removed and each well was rinsed gently with
double distilled water. Sixty percent (v/v) isopropanol was added to each well to fix the
cells for 5 min. After that, the isopropanol was removed and Oil Red O working
solution was added to each well to stain the lipid droplets in the cells for 5 min. Before
viewing, Oil Red O was removed and the plate was rinsed with water until the water
rinsed off clear.
53
3.2.14.5 Triglyceride quantification
After treatment, three million of cells were homogenised in 300 µl of 5 %
Triton-X100 in water and were slowly heated to 90 °C for 5 min. The samples were
cooled down to room temperature before heating them again to solubilise all
triglycerides. The samples were then centrifuged for 5 min to remove any insoluble
materials. Samples were diluted 10-fold with double distilled water before the
quantification assay using the triglyceride quantification kit (Abcam, UK) was
performed. Assay was done in triplicate and the data were normalised to the amount of
protein for each sample to eliminate statistical bias caused by cell death.
3.2.14.6 Cholesterol quantification
After treatment, three million of cells were dissolved in 500 µl of
chloroform:isopropanol:Triton X-100 (7:11:0.1) solution. The samples were then
centrifuged for 5 min at 17,000 x g. The supernatant was then transferred to a new tube
and air-dried at 50 °C to remove chloroform. After removing the chloroform, the
samples were put under vacuum to remove traces of organic solvents or until dry. Prior
to the quantification assay, the dried lipid was reconstituted with 200 µl of cholesterol
assay buffer and quantitated using the cholesterol/cholesteryl ester quantification kit
(Abcam, UK). The quantification assay was performed in triplicate and the data were
normalised to the amount of protein for each sample to eliminate statistical bias caused
by cell death.
3.2.15 DNA microarray analyses
3.2.15.1 Total cellular RNA (tcRNA) extraction
HepG2 cells were cultured as described in Section 3.2.14.1. The cells were then
harvested and total cellular RNA (tcRNA) was extracted using the RNeasy mini kit
54
(Qiagen, Germany), and DNase I (Qiagen, Germany) was used to remove
contaminating DNA. The extracted tcRNA was then quantitated using GeneQuantpro
Spectrophotometre (GE Healthcare, USA) and the integrity of the tcRNA extracted was
assessed using Agilent Bioanalyzer 2100 and agarose gel electrophoresis. The extracted
tcRNA was then kept at -20 °C until use.
3.2.15.2 tcRNA to cDNA conversion
The tcRNA was converted to cDNA for the microarray analyses using the
Applause WT-AMP ST System (NuGEN Technologies, USA) in accordance to the
manufacturer’s instructions. Briefly, 200 ng of tcRNA was used to prepare the first
strand cDNA using a unique first strand DNA/RNA chimeric primer mix and reverse
transcriptase. The resulting cDNA/mRNA hybrid molecule was then used to generate a
DNA/RNA heteroduplex double-stranded cDNA. This was then amplified and cDNA
with sequence complementary to the original mRNA was generated. After purifying the
resulting cDNA with MinElute Reaction Cleanup Kit (Qiagen, Germany), 2.5 µg of
cDNA was then fragmented and labelled with biotin using Encore Biotin Module
(NuGEN Technologies, USA). The biotinylated fragments were then hybridised to
Affymetrix Human Gene 1.0 ST array at 45 °C for 16 h in Hybridization Oven 640
(Affymetrix, USA). After this, the gene chips were stained and washed in the
Affymetrix GeneChip Fluidics Station 450 using Affymetrix protocol FS450_0007. The
stained arrays were scanned at 532 nm using Affymetrix GeneChip Scanner 3000 7G
and CEL files were generated using Affymetrix GeneChip Operating Software (GCOS).
The quality of the data was assessed using Affymetrix GeneChip Command Console
Version 3.
55
3.2.15.3 Data analyses using Partek Genomic Suite (GS) software
The CEL files generated from each array were imported into Partek Genomic
Suite software for statistical analyses and visualisation of the microarray data. The CEL
files were normalised using the Robust Multi-array Average (RMA) algorithm and GC
content was adjusted for pre-background adjustment. The gene list produced was then
filtered for statistically significant genes based on the one-way analysis of variance
(ANOVA) of P value less than 0.05 and fold-change of at least 1.5-fold. The
significantly regulated genes were then subjected to Gene Ontology (GO) Enrichment
tool in the Partek Genomic Suite Software to categorise the genes based on their
involvement in biological processes, molecular function and cellular component.
3.2.15.4 Functional analyses using IPA software
Significantly regulated genes identified using Partek GS software were
subjected to functional analyses using Ingenuity Pathways Analysis (IPA) software. The
application was used to query databases for interactions between sets of differentially
expressed genes and all other genes stored in the Ingenuity Knowledge Base to generate
a set of interactive networks taking into consideration canonical pathways, relevant
biological interactions as well as cellular and disease processes. The IPA system
computes a score for each network according to the fit of the set of the supplied ‘‘focus
genes’’. The p-value scores for such a set indicate the likelihood of focused genes to
belong to a network versus those obtained by chance.
56
3.2.15.5 DNA microarray data validation using quantitative real-time polymerase
chain reaction (qRT-PCR)
Eight significantly regulated genes from DNA microarray analysis were chosen
to be validated using qRT-PCR. Primer sets for qPCR were designed using Primer-
BLAST software (http://www.ncbi.nlm.nih.gov/tools/primer-blast/) with the following
settings: PCR product size, 70-180 bp; optimum melting temperature, 60 °C; exon
junction spanning; organism: Homo sapiens. The primer sets were further analysed
using online nucleotide tool, BLAST program (http://blast.ncbi.nlm.nih.gov/Blast.cgi)
to ensure the specificity of the amplification product. The list of primers is listed in
Table 3.1.
Two micrograms of tcRNA extracted from the control and treated cells were
converted to cDNA using High Capacity RNA-to-cDNA kit (Applied Biosystems,
USA). qPCR was carried out using the StepOne Real-Time PCR System (Applied
Biosystems, USA) with 40 amplification cycles. Melting curve analyses were
performed for all primers to ensure single amplification product. Each reaction
consisted 20 ng of cDNA, 0.2 mM forward and reverse primers, 2X Fast SYBR® Green
Master Mix (Applied Biosystems, USA) in a final volume of 20 µl. All qRT-PCR
experiments were repeated with 3 biological replicates from different experiments and
reactions were performed in triplicates. Gene expressions were normalised against beta
actin, a housekeeping gene and fold change was expressed as mean ± SEM.
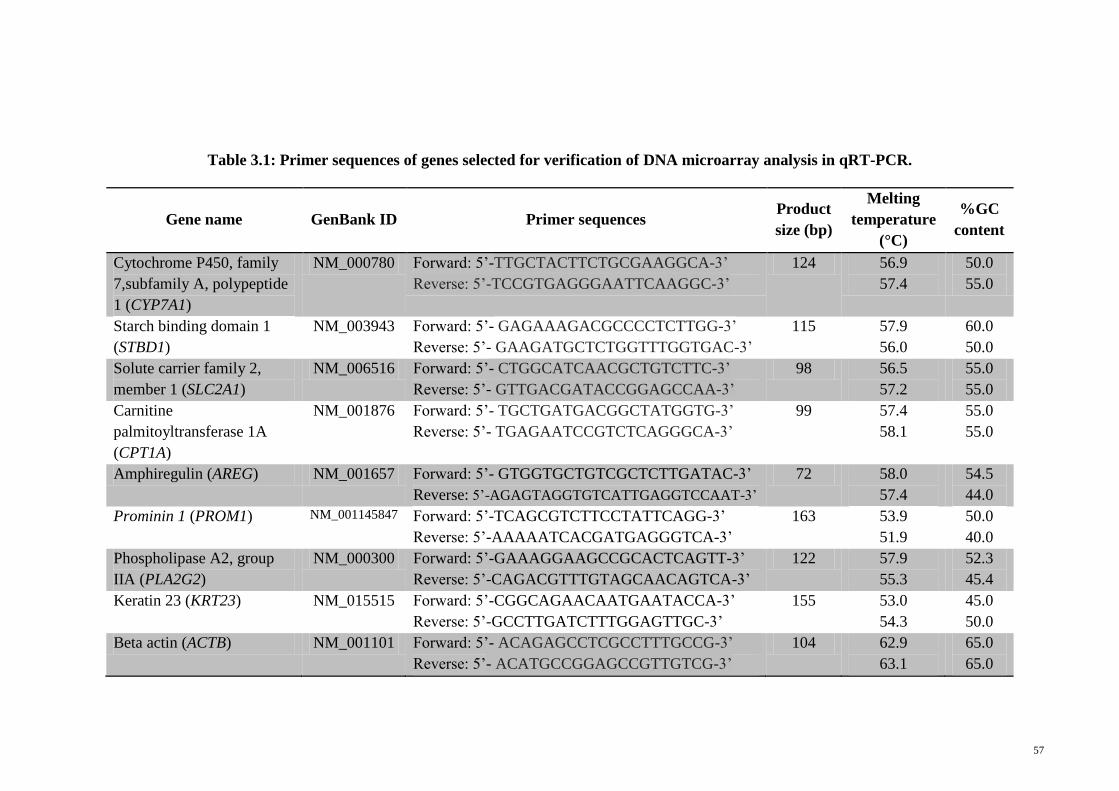
57
Table 3.1: Primer sequences of genes selected for verification of DNA microarray analysis in qRT-PCR.
Gene name GenBank ID Primer sequences Product
size (bp)
Melting
temperature
(°C)
%GC
content
Cytochrome P450, family
7,subfamily A, polypeptide
1 (CYP7A1)
NM_000780 Forward: 5’-TTGCTACTTCTGCGAAGGCA-3’
Reverse: 5’-TCCGTGAGGGAATTCAAGGC-3’
124 56.9
57.4
50.0
55.0
Starch binding domain 1
(STBD1)
NM_003943 Forward: 5’- GAGAAAGACGCCCCTCTTGG-3’
Reverse: 5’- GAAGATGCTCTGGTTTGGTGAC-3’
115 57.9
56.0
60.0
50.0
Solute carrier family 2,
member 1 (SLC2A1)
NM_006516 Forward: 5’- CTGGCATCAACGCTGTCTTC-3’
Reverse: 5’- GTTGACGATACCGGAGCCAA-3’
98 56.5
57.2
55.0
55.0
Carnitine
palmitoyltransferase 1A
(CPT1A)
NM_001876 Forward: 5’- TGCTGATGACGGCTATGGTG-3’
Reverse: 5’- TGAGAATCCGTCTCAGGGCA-3’
99 57.4
58.1
55.0
55.0
Amphiregulin (AREG) NM_001657 Forward: 5’- GTGGTGCTGTCGCTCTTGATAC-3’
Reverse: 5’-AGAGTAGGTGTCATTGAGGTCCAAT-3’
72 58.0
57.4
54.5
44.0
Prominin 1 (PROM1) NM_001145847 Forward: 5’-TCAGCGTCTTCCTATTCAGG-3’
Reverse: 5’-AAAAATCACGATGAGGGTCA-3’
163 53.9
51.9
50.0
40.0
Phospholipase A2, group
IIA (PLA2G2)
NM_000300 Forward: 5’-GAAAGGAAGCCGCACTCAGTT-3’
Reverse: 5’-CAGACGTTTGTAGCAACAGTCA-3’
122 57.9
55.3
52.3
45.4
Keratin 23 (KRT23) NM_015515 Forward: 5’-CGGCAGAACAATGAATACCA-3’
Reverse: 5’-GCCTTGATCTTTGGAGTTGC-3’
155 53.0
54.3
45.0
50.0
Beta actin (ACTB) NM_001101 Forward: 5’- ACAGAGCCTCGCCTTTGCCG-3’
Reverse: 5’- ACATGCCGGAGCCGTTGTCG-3’
104 62.9
63.1
65.0
65.0
58
CHAPTER 4
RESULTS
4.1 Cell viability in serum-free medium
MTT analysis was carried out to determine the influence of serum-free medium
and methanol extract of T. indica fruit pulp on viability of HepG2 cells. Our results
showed no significant difference in viability of cells that were grown in complete or
serum-free media (Figure 4.1). Viability of HepG2 cells that were grown in the
presence of the methanol extract of the T. indica fruit pulp at a final concentration of 60
µg/ml was also not significantly different from those grown in the control serum-free
medium in the presence of 0.02 % (v/v) DMSO (Figure 4.1).
4.2 Proteomic analyses of secreted proteins and cell lysate of HepG2 cells
4.2.1 Optimisation of 2D-GE for secreted proteins and cell lysate
In order to obtain a good representation of the HepG2 proteome, the optimum
protein quantity to be loaded per gel was optimised. Ideally the proteins should be well
separated and of high resolution with minimal streaking. Based on these, the optimum
protein amount to be loaded per gel was determined to be 40 µg for both secreted
proteins (Figure 4.2) and cell lysate (Figure 4.3).
The sample was first cleaned-up using the 2D-cleanup kit (GE Healthcare, USA)
to minimise the streaking at the acidic pH region of the gel caused by excessive salt in
the cell lysate protein sample (Figure 4.4A). DeStreak reagent (GE Healthcare, USA)
was also added to the rehydration solution to reduce the gap in the basic pH region of
the gel which was caused by non-specific oxidation of the proteins (Figure 4.4B).
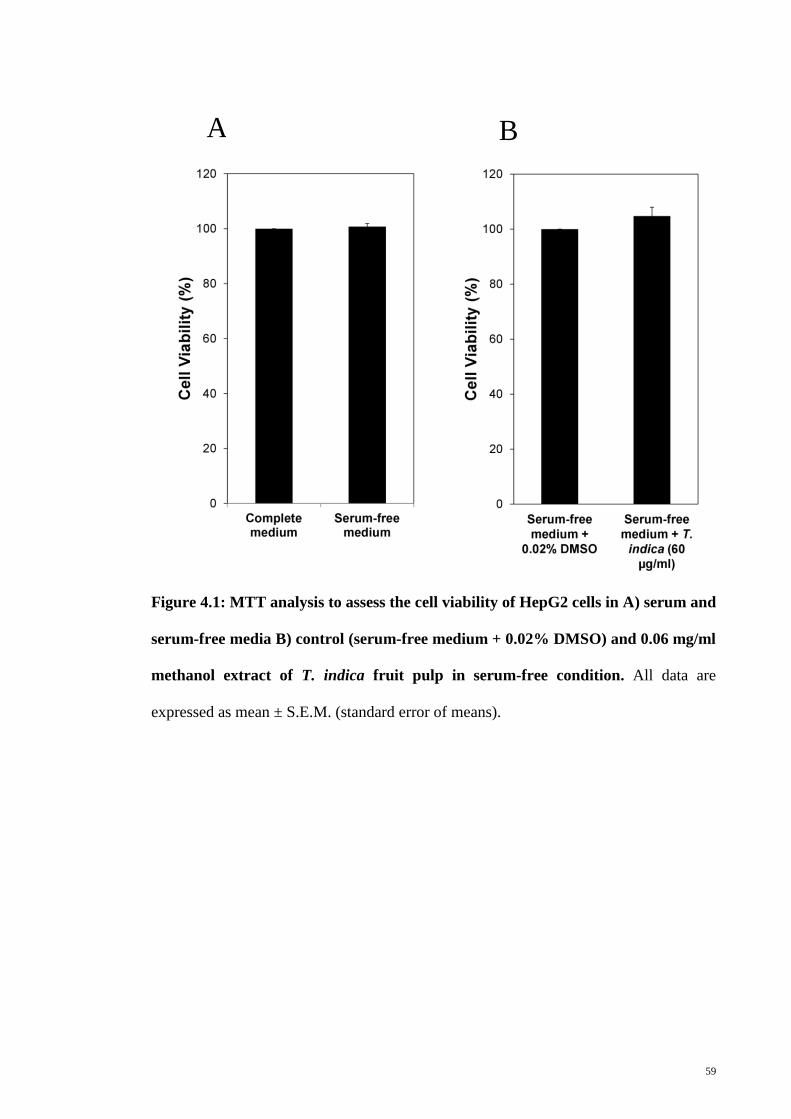
59
Figure 4.1: MTT analysis to assess the cell viability of HepG2 cells in A) serum and
serum-free media B) control (serum-free medium + 0.02% DMSO) and 0.06 mg/ml
methanol extract of T. indica fruit pulp in serum-free condition. All data are
expressed as mean ± S.E.M. (standard error of means).
A B
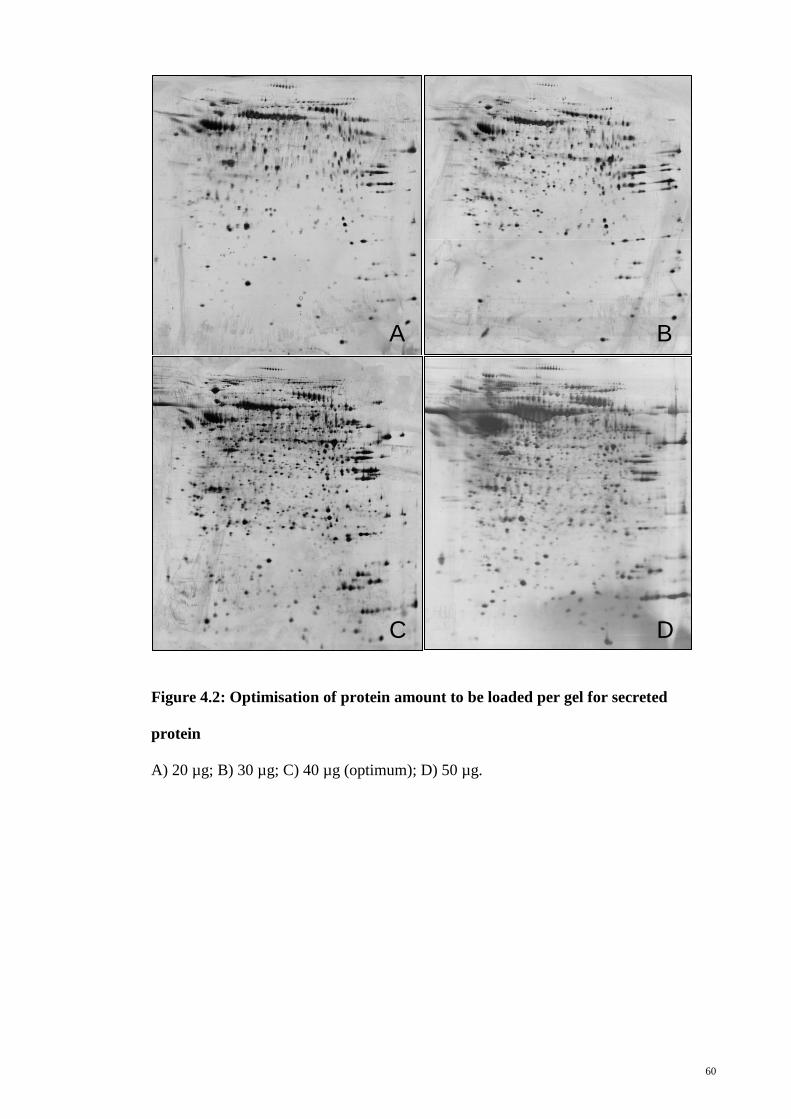
60
Figure 4.2: Optimisation of protein amount to be loaded per gel for secreted
protein
A) 20 µg; B) 30 µg; C) 40 µg (optimum); D) 50 µg.
A B
C D
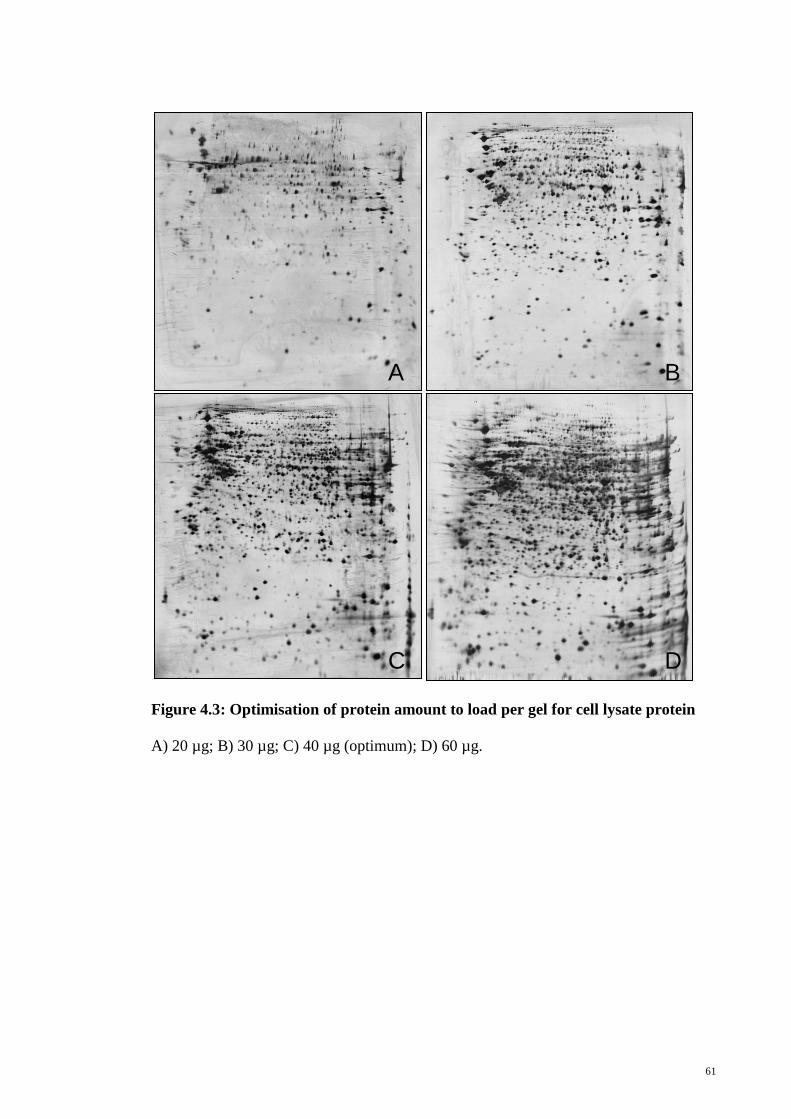
61
Figure 4.3: Optimisation of protein amount to load per gel for cell lysate protein
A) 20 µg; B) 30 µg; C) 40 µg (optimum); D) 60 µg.
A B
C D
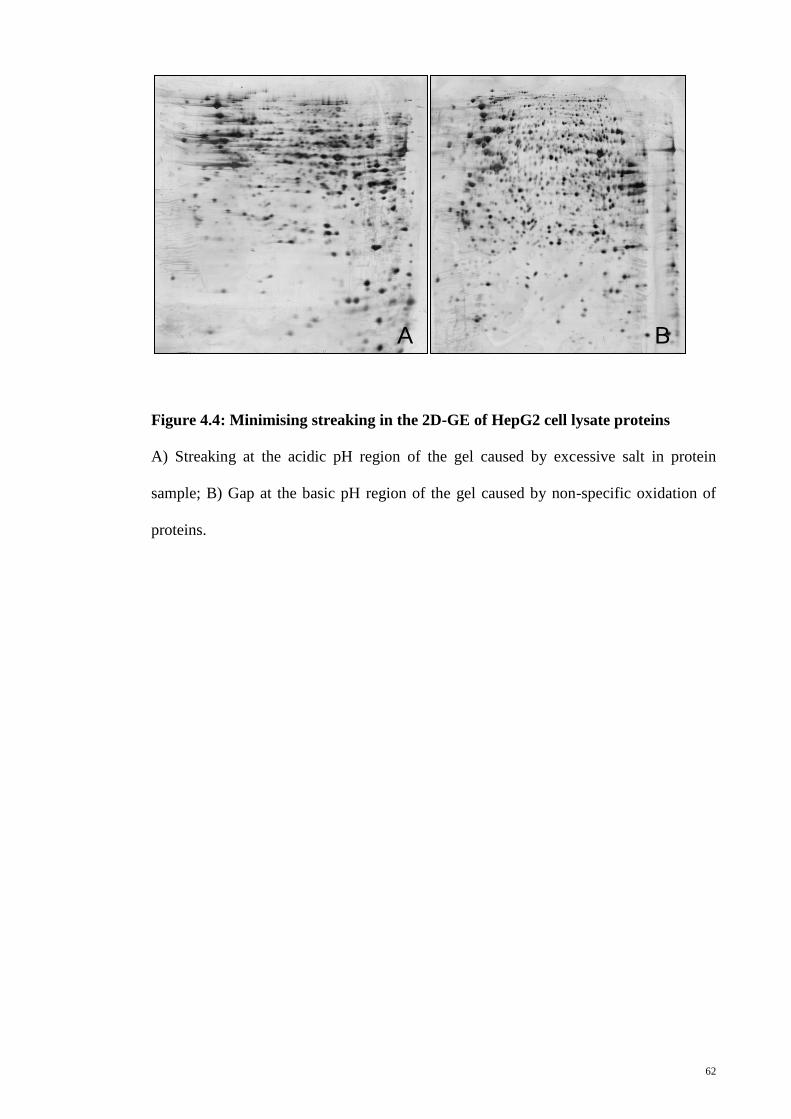
62
Figure 4.4: Minimising streaking in the 2D-GE of HepG2 cell lysate proteins
A) Streaking at the acidic pH region of the gel caused by excessive salt in protein
sample; B) Gap at the basic pH region of the gel caused by non-specific oxidation of
proteins.
A B
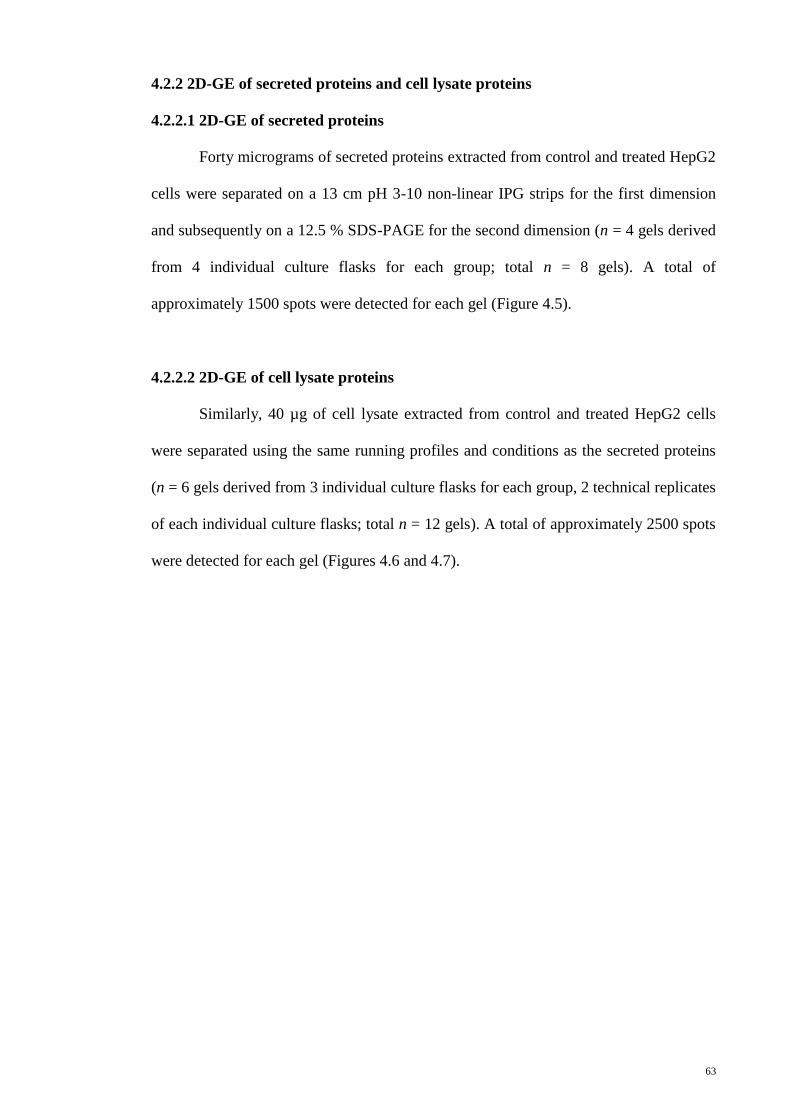
63
4.2.2 2D-GE of secreted proteins and cell lysate proteins
4.2.2.1 2D-GE of secreted proteins
Forty micrograms of secreted proteins extracted from control and treated HepG2
cells were separated on a 13 cm pH 3-10 non-linear IPG strips for the first dimension
and subsequently on a 12.5 % SDS-PAGE for the second dimension (n = 4 gels derived
from 4 individual culture flasks for each group; total n = 8 gels). A total of
approximately 1500 spots were detected for each gel (Figure 4.5).
4.2.2.2 2D-GE of cell lysate proteins
Similarly, 40 µg of cell lysate extracted from control and treated HepG2 cells
were separated using the same running profiles and conditions as the secreted proteins
(n = 6 gels derived from 3 individual culture flasks for each group, 2 technical replicates
of each individual culture flasks; total n = 12 gels). A total of approximately 2500 spots
were detected for each gel (Figures 4.6 and 4.7).
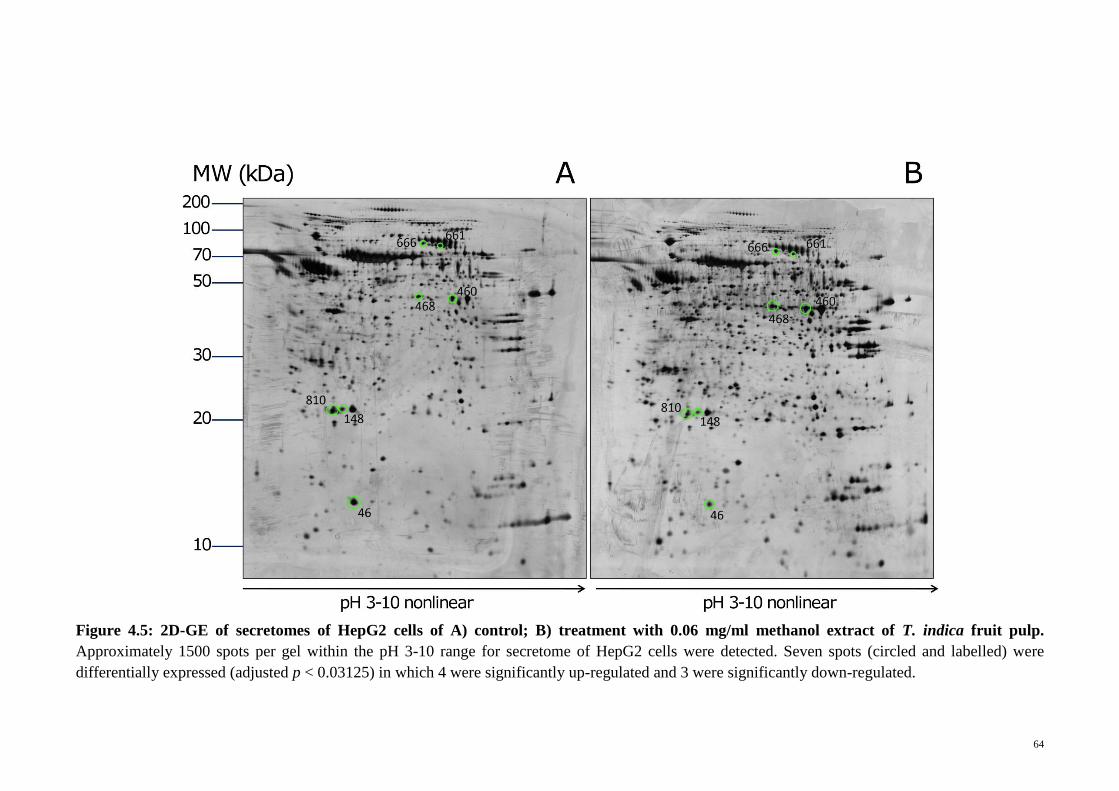
64
Figure 4.5: 2D-GE of secretomes of HepG2 cells of A) control; B) treatment with 0.06 mg/ml methanol extract of T. indica fruit pulp.
Approximately 1500 spots per gel within the pH 3-10 range for secretome of HepG2 cells were detected. Seven spots (circled and labelled) were
differentially expressed (adjusted p < 0.03125) in which 4 were significantly up-regulated and 3 were significantly down-regulated.
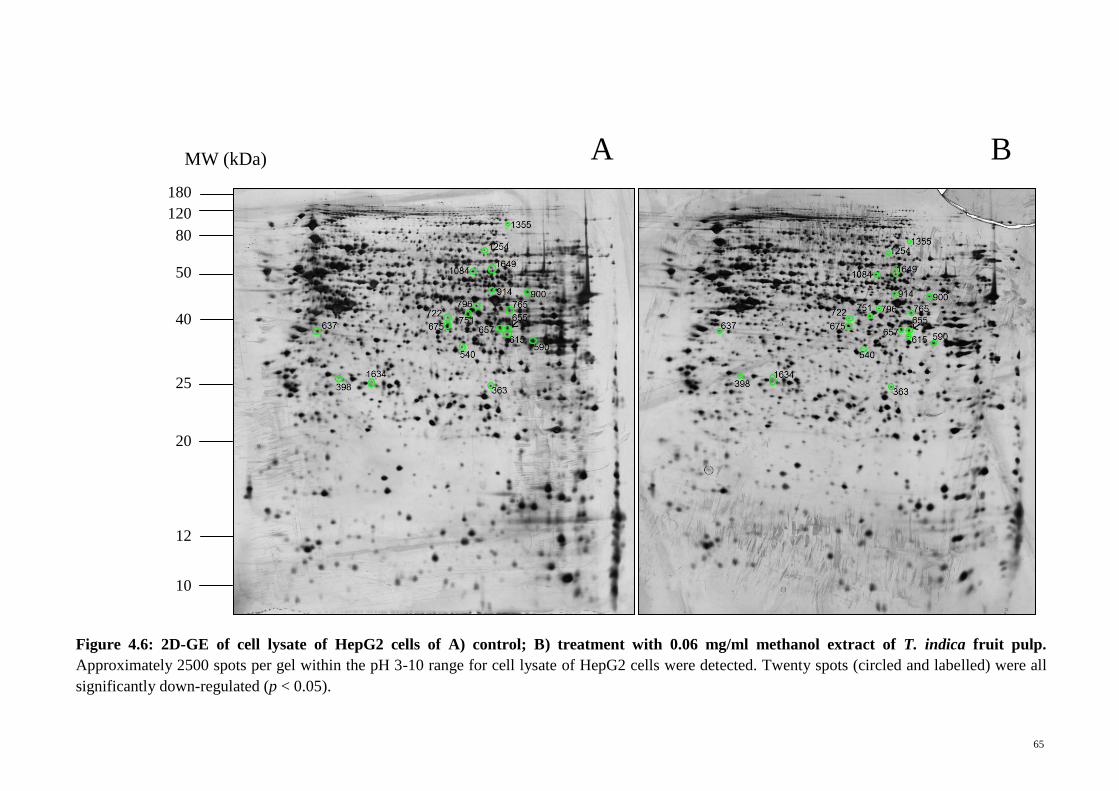
65
Figure 4.6: 2D-GE of cell lysate of HepG2 cells of A) control; B) treatment with 0.06 mg/ml methanol extract of T. indica fruit pulp.
Approximately 2500 spots per gel within the pH 3-10 range for cell lysate of HepG2 cells were detected. Twenty spots (circled and labelled) were all
significantly down-regulated (p < 0.05).
80
50
40
25
20
12
10
120
180
MW (kDa) A B
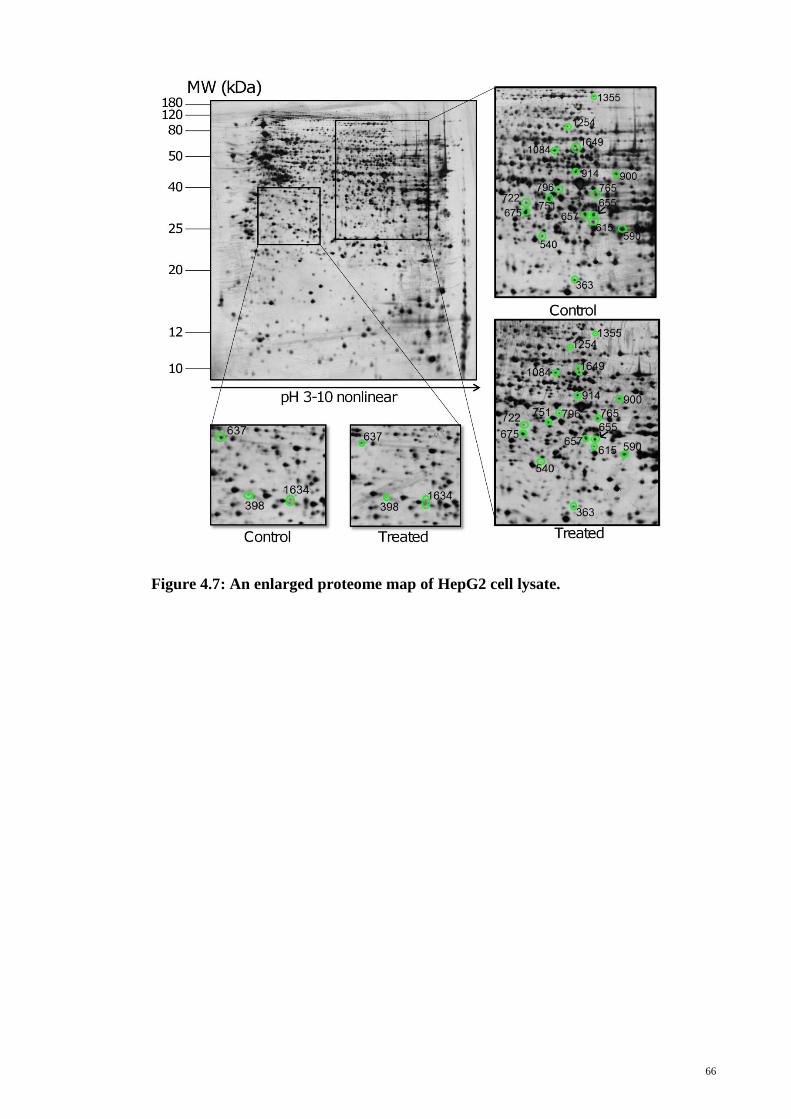
66
Figure 4.7: An enlarged proteome map of HepG2 cell lysate.
67
4.2.3 Gel image analyses
4.2.3.1 Secretome analysis
Using ImageMaster 2D Platinum V 7.0 software, the percentage of volume for
each spot was obtained and the fold change was acquired. Spots that were significantly
regulated at more than 1.5 fold (p < 0.05) and must be present in all 4 gels were filtered
out. Based on these criteria, 9 protein spots were differentially expressed in which 4
were significantly up-regulated and 5 were significantly down-regulated. The spots
were further subjected to false discovery rate (FDR) analysis and two spots were found
to be false-positive based on the Benjamini-Hochberg’s method (Benjamini, 1995),
leaving only 7 spots to be truly differentially expressed (Table 4.1).
4.2.3.2 Cell lysate analysis
Using the same software, approximately 2500 spots were detected in each gel.
After acquiring the percentage of volume for each spot, the fold change for each spot
was obtained. Spots that are significantly regulated at more than 1.5 fold (p < 0.05) and
must be present in at least 5 gels were filtered out. Based on these criteria, 20 spots
were significantly altered and they were all down-regulated (Table 4.2).
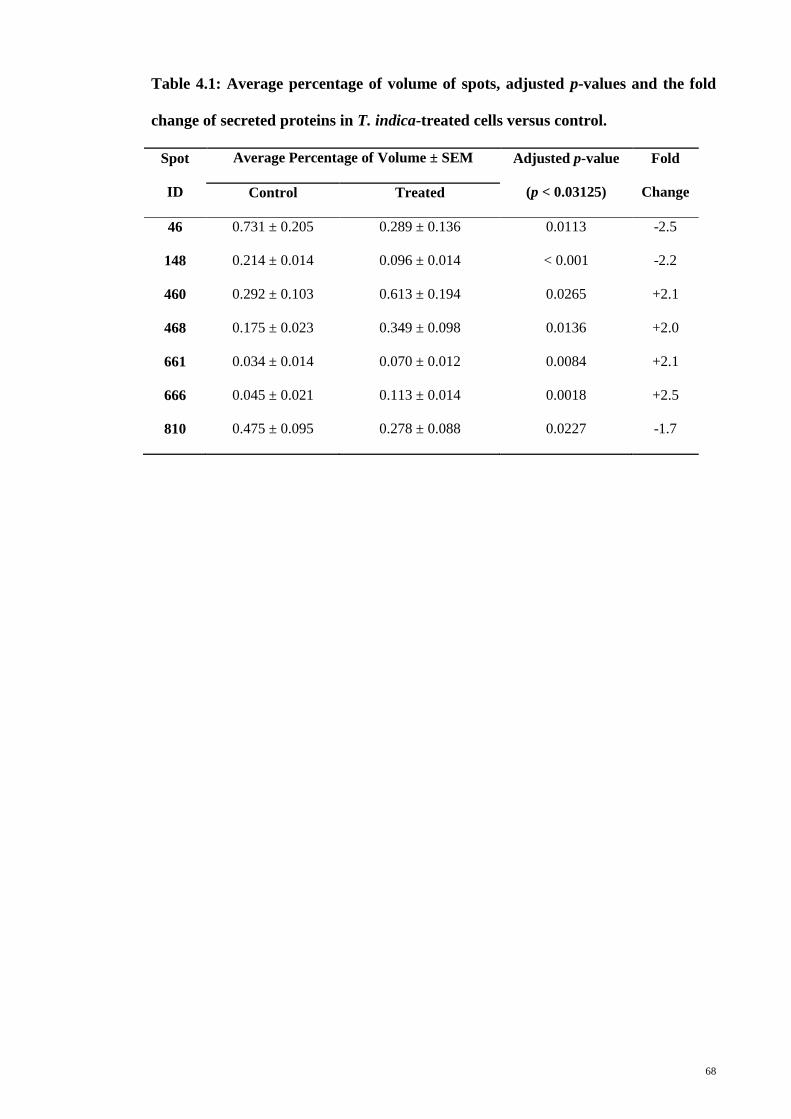
68
Table 4.1: Average percentage of volume of spots, adjusted p-values and the fold
change of secreted proteins in T. indica-treated cells versus control.
Spot
ID
Average Percentage of Volume ± SEM Adjusted p-value
(p < 0.03125)
Fold
Change Control Treated
46 0.731 ± 0.205 0.289 ± 0.136 0.0113 -2.5
148 0.214 ± 0.014 0.096 ± 0.014 < 0.001 -2.2
460 0.292 ± 0.103 0.613 ± 0.194 0.0265 +2.1
468 0.175 ± 0.023 0.349 ± 0.098 0.0136 +2.0
661 0.034 ± 0.014 0.070 ± 0.012 0.0084 +2.1
666 0.045 ± 0.021 0.113 ± 0.014 0.0018 +2.5
810 0.475 ± 0.095 0.278 ± 0.088 0.0227 -1.7
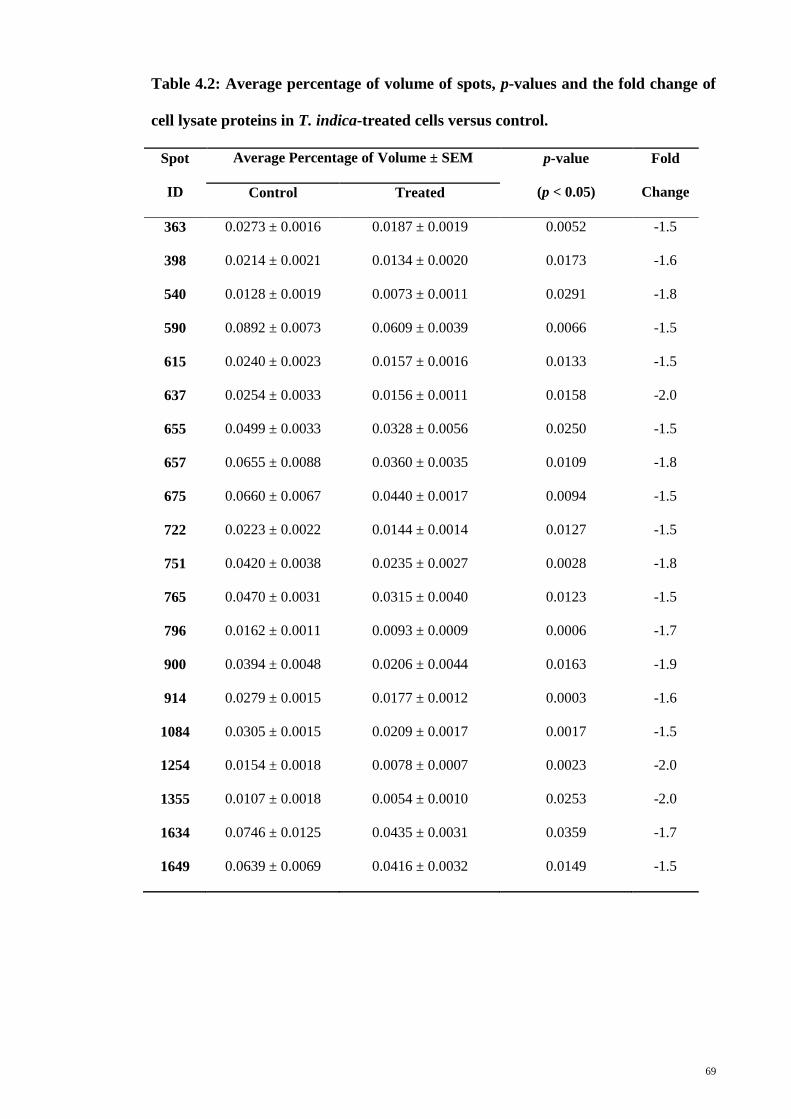
69
Table 4.2: Average percentage of volume of spots, p-values and the fold change of
cell lysate proteins in T. indica-treated cells versus control.
Spot
ID
Average Percentage of Volume ± SEM p-value
(p < 0.05)
Fold
Change Control Treated
363 0.0273 ± 0.0016 0.0187 ± 0.0019 0.0052 -1.5
398 0.0214 ± 0.0021 0.0134 ± 0.0020 0.0173 -1.6
540 0.0128 ± 0.0019 0.0073 ± 0.0011 0.0291 -1.8
590 0.0892 ± 0.0073 0.0609 ± 0.0039 0.0066 -1.5
615 0.0240 ± 0.0023 0.0157 ± 0.0016 0.0133 -1.5
637 0.0254 ± 0.0033 0.0156 ± 0.0011 0.0158 -2.0
655 0.0499 ± 0.0033 0.0328 ± 0.0056 0.0250 -1.5
657 0.0655 ± 0.0088 0.0360 ± 0.0035 0.0109 -1.8
675 0.0660 ± 0.0067 0.0440 ± 0.0017 0.0094 -1.5
722 0.0223 ± 0.0022 0.0144 ± 0.0014 0.0127 -1.5
751 0.0420 ± 0.0038 0.0235 ± 0.0027 0.0028 -1.8
765 0.0470 ± 0.0031 0.0315 ± 0.0040 0.0123 -1.5
796 0.0162 ± 0.0011 0.0093 ± 0.0009 0.0006 -1.7
900 0.0394 ± 0.0048 0.0206 ± 0.0044 0.0163 -1.9
914 0.0279 ± 0.0015 0.0177 ± 0.0012 0.0003 -1.6
1084 0.0305 ± 0.0015 0.0209 ± 0.0017 0.0017 -1.5
1254 0.0154 ± 0.0018 0.0078 ± 0.0007 0.0023 -2.0
1355 0.0107 ± 0.0018 0.0054 ± 0.0010 0.0253 -2.0
1634 0.0746 ± 0.0125 0.0435 ± 0.0031 0.0359 -1.7
1649 0.0639 ± 0.0069 0.0416 ± 0.0032 0.0149 -1.5
70
4.2.4 Identification of differentially expressed proteins
4.2.4.1 Secretome
Among the seven protein spots that were altered in expression, five spots
(protein spot ID: 46, 148, 460, 468 and 810) were identified by mass spectrometry and
database search. Spots 661 and 666 were not successfully identified by MS/MS analysis
as their scores were lower than the cut off value for positive inclusion criteria. This
could probably be due to their close proximity to the high abundant proteins which
hinder the detection of their peptides. The five differentially expressed proteins that
were identified include transthyretin (TTR – spot 46), two isoforms of apolipoprotein
A-I (ApoA-I – spots 148 and 810), alpha enolase (ENO1 – spot 460) and rab GDP
dissociation inhibitor beta (GDI-2 – spot 468) (Table 4.3). ENO1 and GDI-2 were
apparently up-regulated by approximately 2-fold, while TTR was down-regulated by
2.5-fold. The two spots identified as ApoA-1 was down-regulated by 2.2- and 1.7-folds.
4.2.4.2 Cell lysate
Among the 20 protein spots that were significantly reduced in abundance, 14
were successfully identified by mass spectrometry and database search (Table 4.4). Six
spots (protein spot ID 398, 615, 637, 1254, 1355 and 1649) were considered not
successfully identified as their scores were lower than the cut-off value for positive
inclusion criteria. The 14 identified proteins may be grouped according to their
biological processes using the UniProt Protein Knowledgebase (UniProtKB). NADH
dehydrogenase (ubiquinone) 1 alpha subcomplex subunit 10, ubiquinol-cytochrome-c
reductase complex core protein 2 and NADH dehydrogenase (ubiquinone) flavoprotein
1 were grouped under “mitochondrial respiratory chain” category. Three proteins, i.e.
eukaryotic translation initiation factor 3 subunit 3, elongation factor Tu and tyrosyl-
tRNA synthetase are involved in “protein biosynthesis”. Another six proteins were
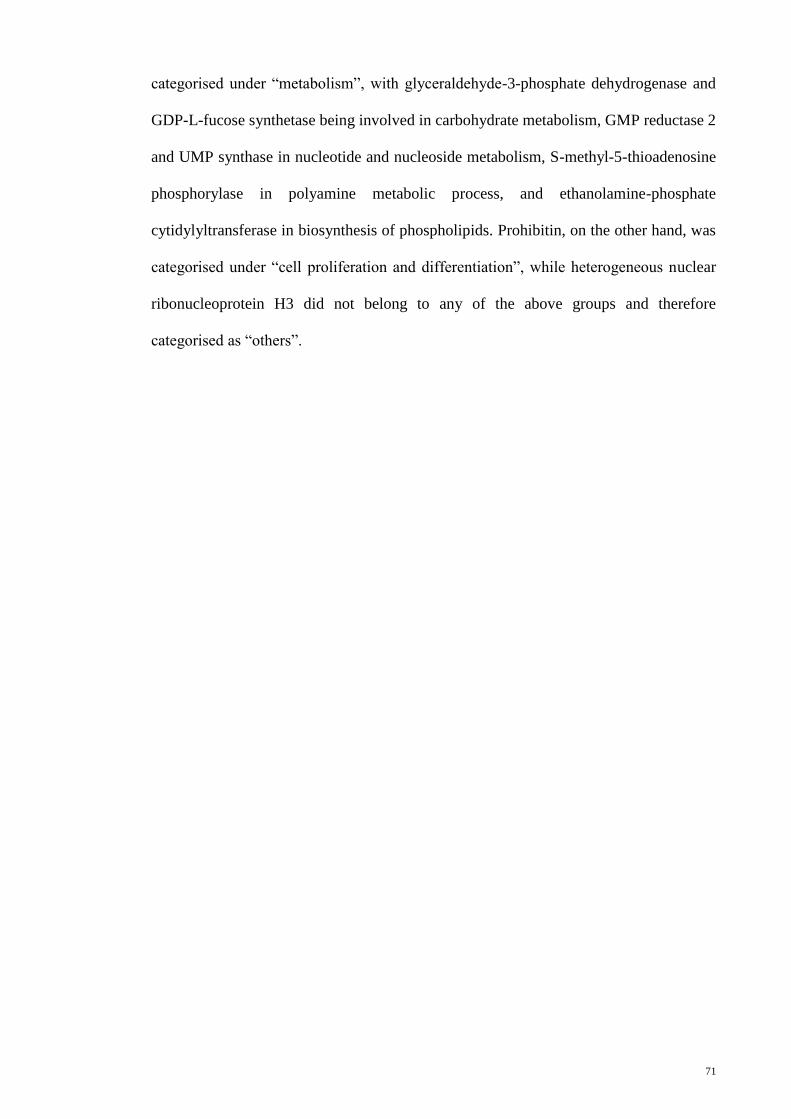
71
categorised under “metabolism”, with glyceraldehyde-3-phosphate dehydrogenase and
GDP-L-fucose synthetase being involved in carbohydrate metabolism, GMP reductase 2
and UMP synthase in nucleotide and nucleoside metabolism, S-methyl-5-thioadenosine
phosphorylase in polyamine metabolic process, and ethanolamine-phosphate
cytidylyltransferase in biosynthesis of phospholipids. Prohibitin, on the other hand, was
categorised under “cell proliferation and differentiation”, while heterogeneous nuclear
ribonucleoprotein H3 did not belong to any of the above groups and therefore
categorised as “others”.
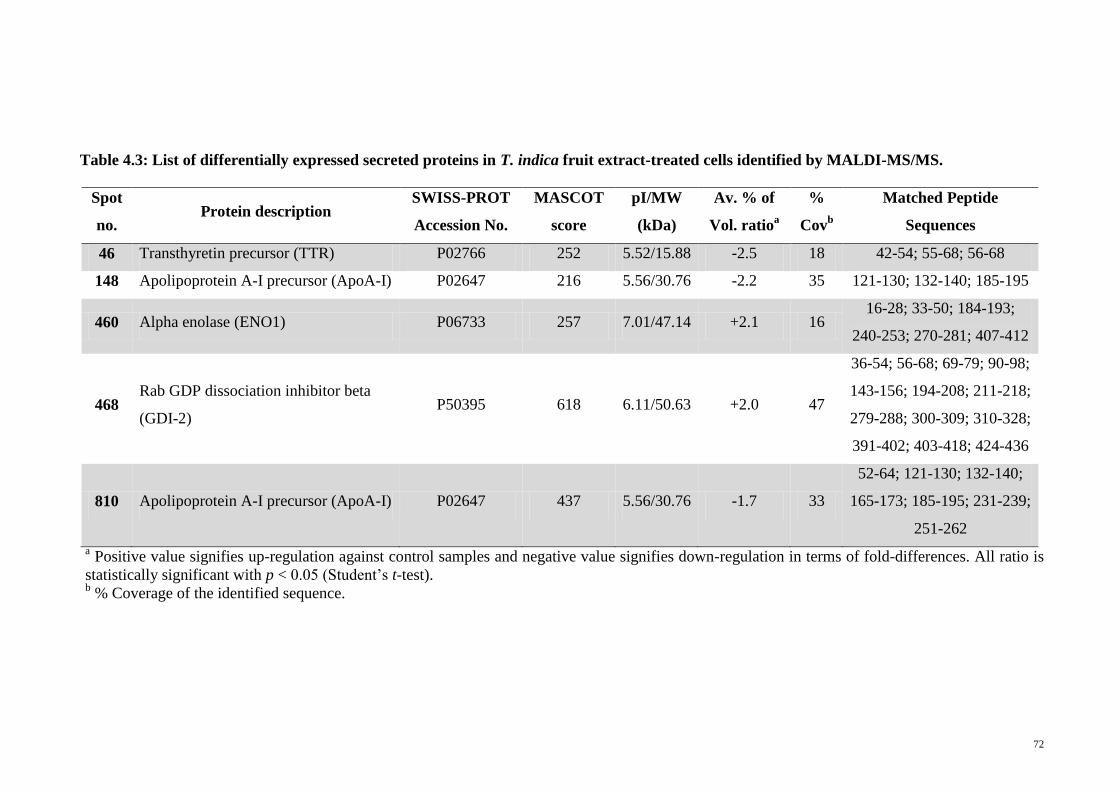
72
Table 4.3: List of differentially expressed secreted proteins in T. indica fruit extract-treated cells identified by MALDI-MS/MS.
Spot
no. Protein description
SWISS-PROT
Accession No.
MASCOT
score
pI/MW
(kDa)
Av. % of
Vol. ratioa
%
Covb
Matched Peptide
Sequences
46 Transthyretin precursor (TTR) P02766 252 5.52/15.88 -2.5 18 42-54; 55-68; 56-68
148 Apolipoprotein A-I precursor (ApoA-I) P02647 216 5.56/30.76 -2.2 35 121-130; 132-140; 185-195
460 Alpha enolase (ENO1) P06733 257 7.01/47.14 +2.1 16 16-28; 33-50; 184-193;
240-253; 270-281; 407-412
468 Rab GDP dissociation inhibitor beta
(GDI-2) P50395 618 6.11/50.63 +2.0 47
36-54; 56-68; 69-79; 90-98;
143-156; 194-208; 211-218;
279-288; 300-309; 310-328;
391-402; 403-418; 424-436
810 Apolipoprotein A-I precursor (ApoA-I) P02647 437 5.56/30.76 -1.7 33
52-64; 121-130; 132-140;
165-173; 185-195; 231-239;
251-262
a Positive value signifies up-regulation against control samples and negative value signifies down-regulation in terms of fold-differences. All ratio is
statistically significant with p < 0.05 (Student’s t-test). b % Coverage of the identified sequence.
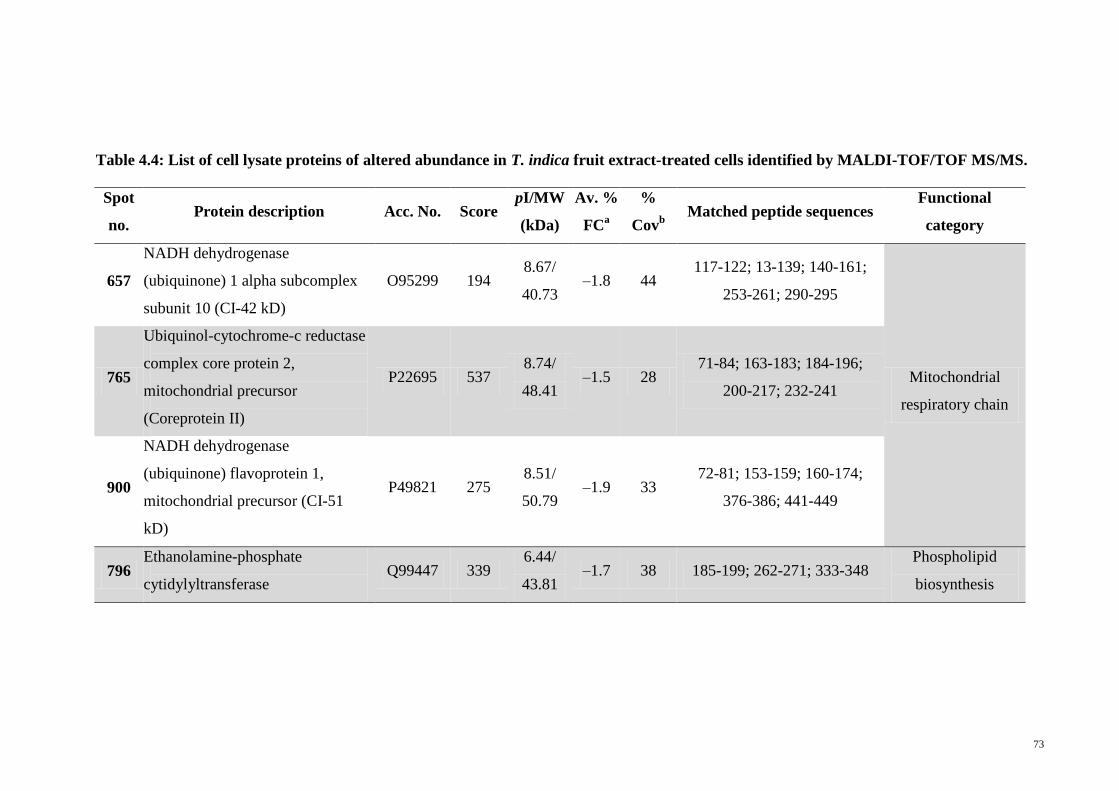
73
Table 4.4: List of cell lysate proteins of altered abundance in T. indica fruit extract-treated cells identified by MALDI-TOF/TOF MS/MS.
Spot
no. Protein description Acc. No. Score
pI/MW
(kDa)
Av. %
FCa
%
Covb
Matched peptide sequences Functional
category
657
NADH dehydrogenase
(ubiquinone) 1 alpha subcomplex
subunit 10 (CI-42 kD)
O95299 194 8.67/
40.73 –1.8 44
117-122; 13-139; 140-161;
253-261; 290-295
Mitochondrial
respiratory chain
765
Ubiquinol-cytochrome-c reductase
complex core protein 2,
mitochondrial precursor
(Coreprotein II)
P22695 537 8.74/
48.41 –1.5 28
71-84; 163-183; 184-196;
200-217; 232-241
900
NADH dehydrogenase
(ubiquinone) flavoprotein 1,
mitochondrial precursor (CI-51
kD)
P49821 275 8.51/
50.79 –1.9 33
72-81; 153-159; 160-174;
376-386; 441-449
796 Ethanolamine-phosphate
cytidylyltransferase Q99447 339
6.44/
43.81 –1.7 38 185-199; 262-271; 333-348
Phospholipid
biosynthesis
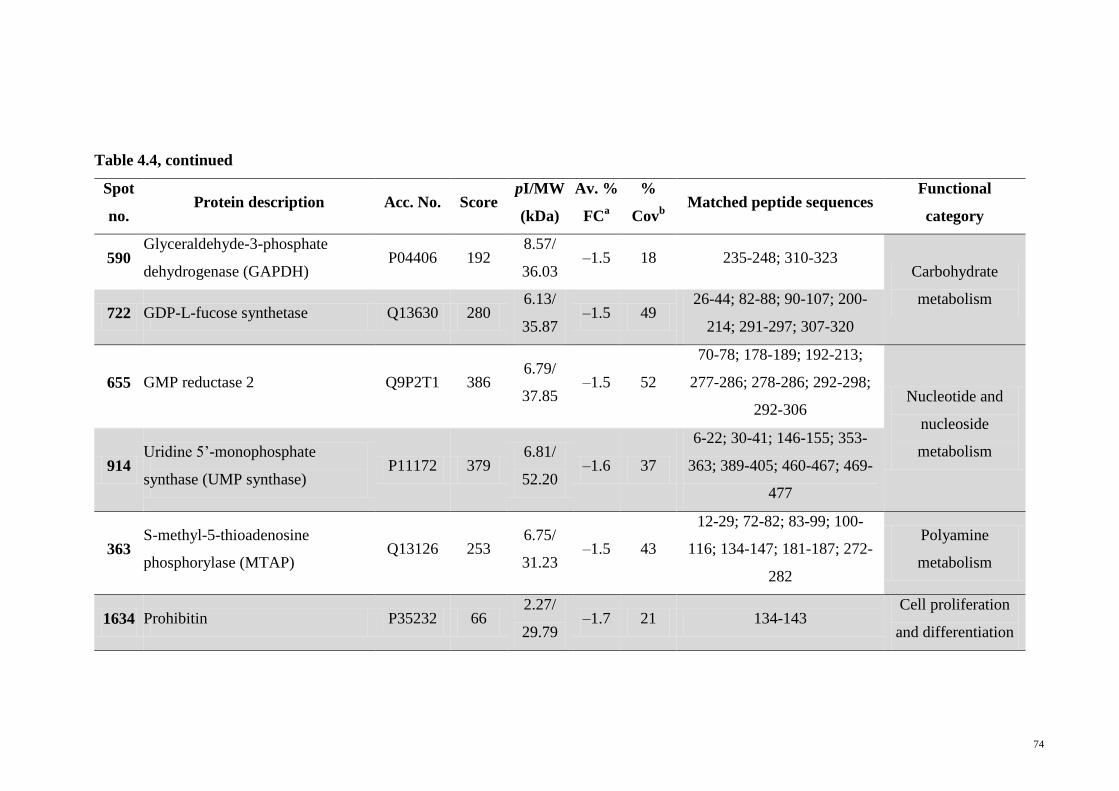
74
Table 4.4, continued
Spot
no. Protein description Acc. No. Score
pI/MW
(kDa)
Av. %
FCa
%
Covb
Matched peptide sequences Functional
category
590 Glyceraldehyde-3-phosphate
dehydrogenase (GAPDH) P04406 192
8.57/
36.03 –1.5 18 235-248; 310-323
Carbohydrate
metabolism 722 GDP-L-fucose synthetase Q13630 280
6.13/
35.87 –1.5 49
26-44; 82-88; 90-107; 200-
214; 291-297; 307-320
655 GMP reductase 2 Q9P2T1 386 6.79/
37.85 –1.5 52
70-78; 178-189; 192-213;
277-286; 278-286; 292-298;
292-306 Nucleotide and
nucleoside
metabolism 914
Uridine 5’-monophosphate
synthase (UMP synthase) P11172 379
6.81/
52.20 –1.6 37
6-22; 30-41; 146-155; 353-
363; 389-405; 460-467; 469-
477
363 S-methyl-5-thioadenosine
phosphorylase (MTAP) Q13126 253
6.75/
31.23 –1.5 43
12-29; 72-82; 83-99; 100-
116; 134-147; 181-187; 272-
282
Polyamine
metabolism
1634 Prohibitin P35232 66 2.27/
29.79 –1.7 21 134-143
Cell proliferation
and differentiation
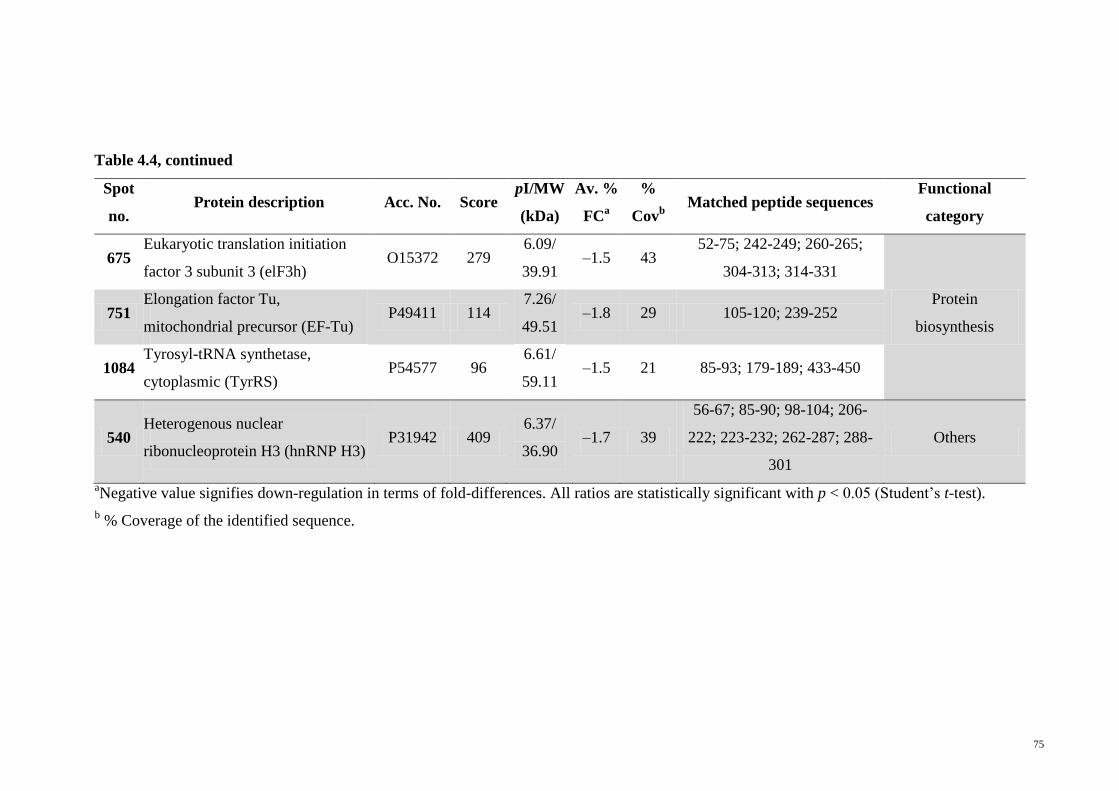
75
Table 4.4, continued
Spot
no. Protein description Acc. No. Score
pI/MW
(kDa)
Av. %
FCa
%
Covb
Matched peptide sequences Functional
category
675 Eukaryotic translation initiation
factor 3 subunit 3 (elF3h) O15372 279
6.09/
39.91 –1.5 43
52-75; 242-249; 260-265;
304-313; 314-331
Protein
biosynthesis 751
Elongation factor Tu,
mitochondrial precursor (EF-Tu) P49411 114
7.26/
49.51 –1.8 29 105-120; 239-252
1084 Tyrosyl-tRNA synthetase,
cytoplasmic (TyrRS) P54577 96
6.61/
59.11 –1.5 21 85-93; 179-189; 433-450
540 Heterogenous nuclear
ribonucleoprotein H3 (hnRNP H3) P31942 409
6.37/
36.90 –1.7 39
56-67; 85-90; 98-104; 206-
222; 223-232; 262-287; 288-
301
Others
aNegative value signifies down-regulation in terms of fold-differences. All ratios are statistically significant with p < 0.05 (Student’s t-test).
b % Coverage of the identified sequence.
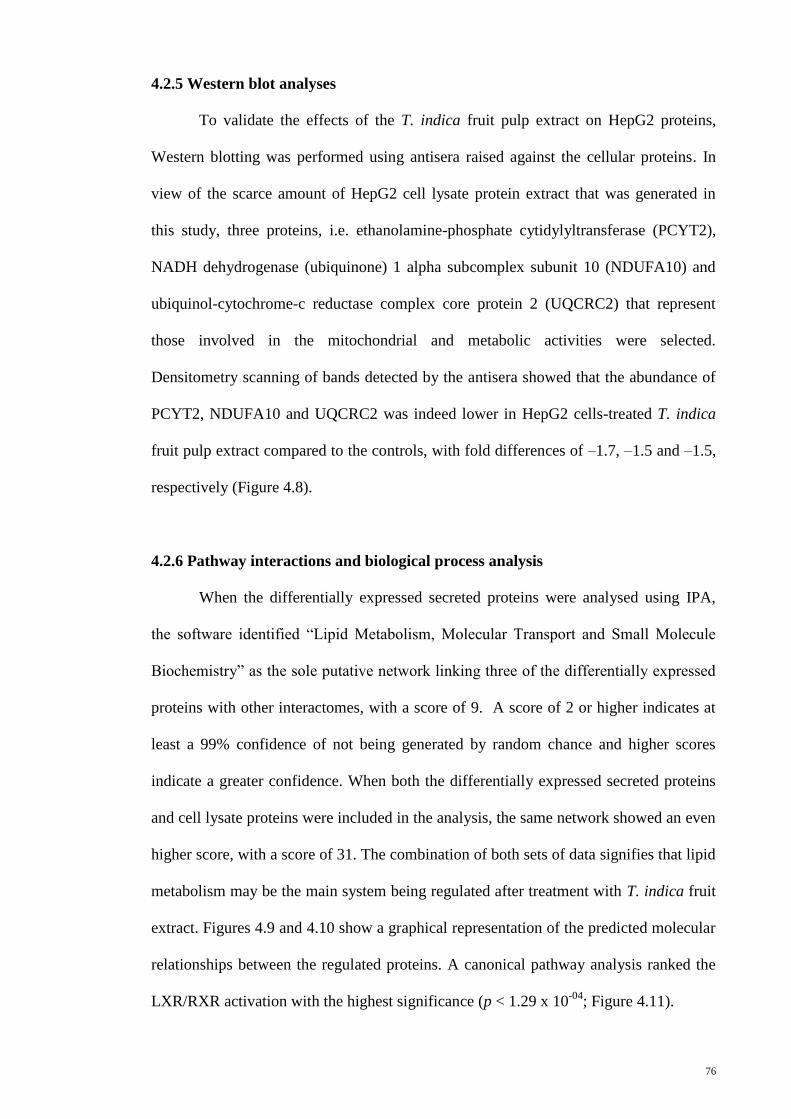
76
4.2.5 Western blot analyses
To validate the effects of the T. indica fruit pulp extract on HepG2 proteins,
Western blotting was performed using antisera raised against the cellular proteins. In
view of the scarce amount of HepG2 cell lysate protein extract that was generated in
this study, three proteins, i.e. ethanolamine-phosphate cytidylyltransferase (PCYT2),
NADH dehydrogenase (ubiquinone) 1 alpha subcomplex subunit 10 (NDUFA10) and
ubiquinol-cytochrome-c reductase complex core protein 2 (UQCRC2) that represent
those involved in the mitochondrial and metabolic activities were selected.
Densitometry scanning of bands detected by the antisera showed that the abundance of
PCYT2, NDUFA10 and UQCRC2 was indeed lower in HepG2 cells-treated T. indica
fruit pulp extract compared to the controls, with fold differences of –1.7, –1.5 and –1.5,
respectively (Figure 4.8).
4.2.6 Pathway interactions and biological process analysis
When the differentially expressed secreted proteins were analysed using IPA,
the software identified “Lipid Metabolism, Molecular Transport and Small Molecule
Biochemistry” as the sole putative network linking three of the differentially expressed
proteins with other interactomes, with a score of 9. A score of 2 or higher indicates at
least a 99% confidence of not being generated by random chance and higher scores
indicate a greater confidence. When both the differentially expressed secreted proteins
and cell lysate proteins were included in the analysis, the same network showed an even
higher score, with a score of 31. The combination of both sets of data signifies that lipid
metabolism may be the main system being regulated after treatment with T. indica fruit
extract. Figures 4.9 and 4.10 show a graphical representation of the predicted molecular
relationships between the regulated proteins. A canonical pathway analysis ranked the
LXR/RXR activation with the highest significance (p < 1.29 x 10-04
; Figure 4.11).
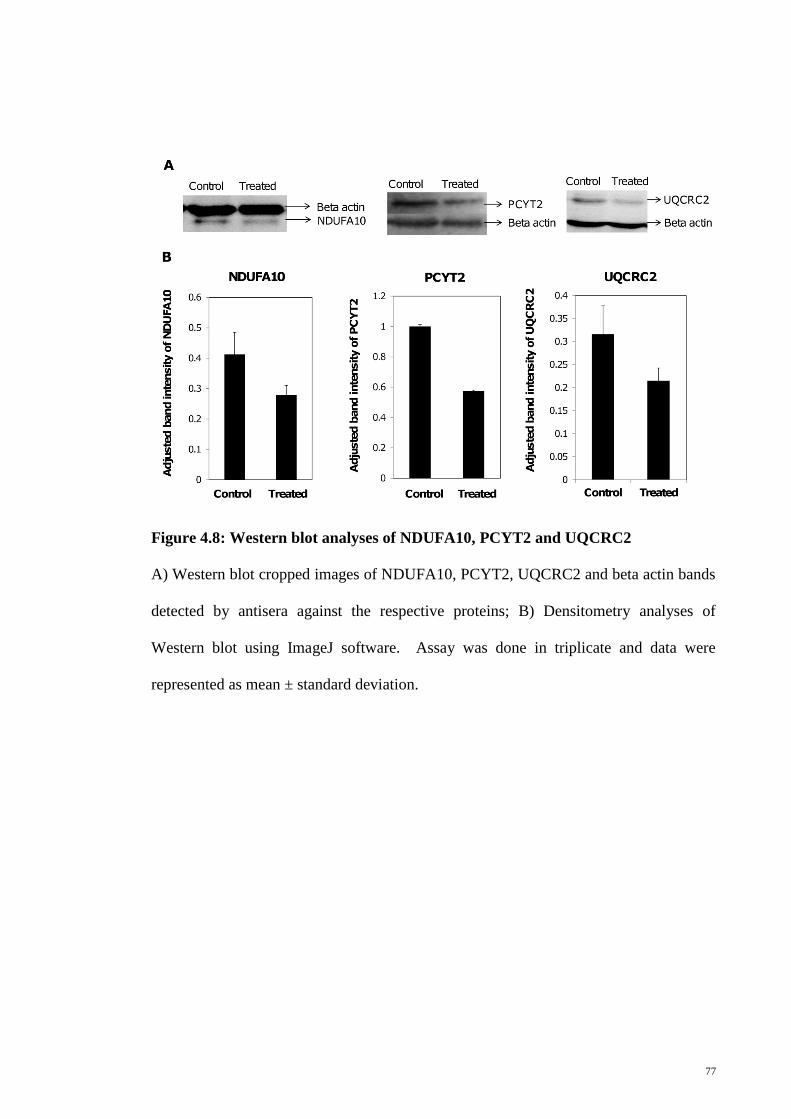
77
Figure 4.8: Western blot analyses of NDUFA10, PCYT2 and UQCRC2
A) Western blot cropped images of NDUFA10, PCYT2, UQCRC2 and beta actin bands
detected by antisera against the respective proteins; B) Densitometry analyses of
Western blot using ImageJ software. Assay was done in triplicate and data were
represented as mean ± standard deviation.
78
Figure 4.9: IPA graphical representation of the molecular relationships between
differentially expressed secreted proteins in HepG2 cells treated with T. indica
fruit extract
The network is displayed graphically as nodes (proteins) and edges (the biological
relationships between the nodes). Nodes in red indicate up-regulated proteins while
those in green represent down-regulated proteins. Nodes without colours indicate
unaltered expression. Various shapes of the nodes represent the functional class of the
proteins. The different arrow shapes represent different types of interactions. Edges are
displayed with various labels that describe the nature of the relationship between the
nodes. Names of proteins corresponding to the abbreviations are as follows: APOA1,
Apolipoprotein A-1; APOA2, Apolipoprotein A-2; APOA4, Apolipoprotein A-4;
APOA5, Apolipoprotein A-5; APOC1, Apolipoprotein C-1; APOC2, Apolipoprotein
C-2; APOE, Apolipoprotein E; APOM, Apolipoprotein M; APOL1, Apolipoprotein L-
1; ACACB, acetyl-CoA-carboxylase 2; SAA2, serum amyloid A2; LCAT, lecithin
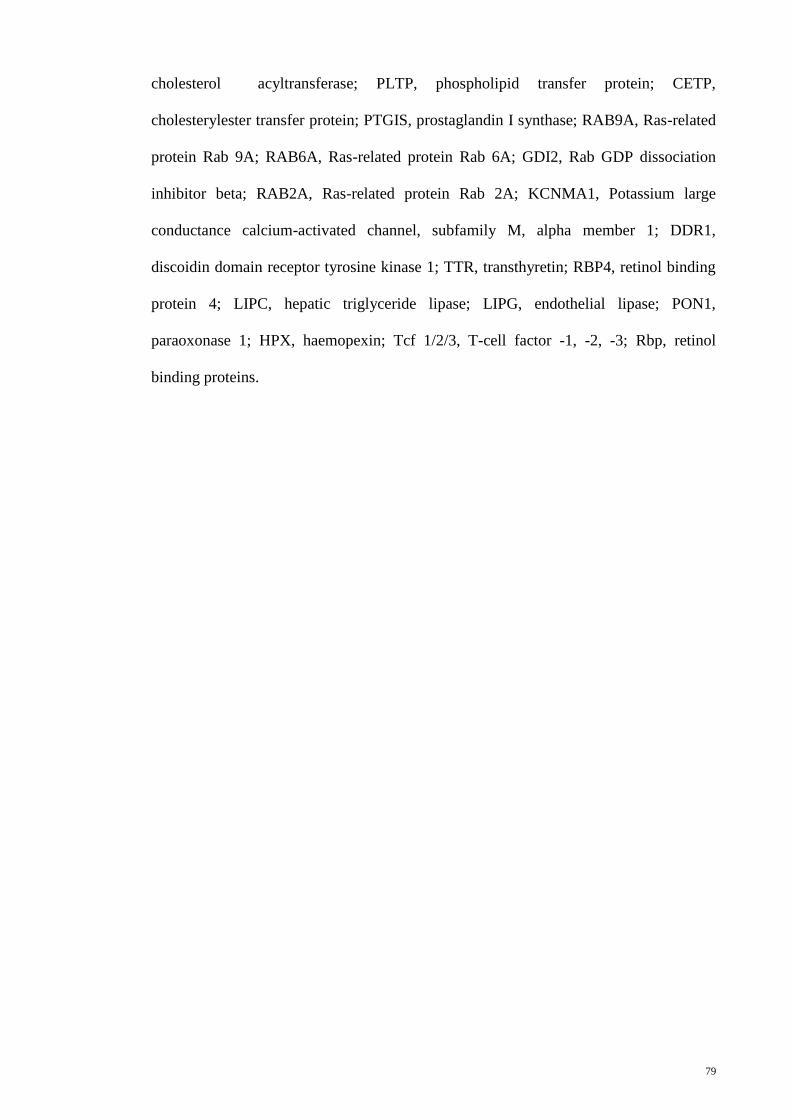
79
cholesterol acyltransferase; PLTP, phospholipid transfer protein; CETP,
cholesterylester transfer protein; PTGIS, prostaglandin I synthase; RAB9A, Ras-related
protein Rab 9A; RAB6A, Ras-related protein Rab 6A; GDI2, Rab GDP dissociation
inhibitor beta; RAB2A, Ras-related protein Rab 2A; KCNMA1, Potassium large
conductance calcium-activated channel, subfamily M, alpha member 1; DDR1,
discoidin domain receptor tyrosine kinase 1; TTR, transthyretin; RBP4, retinol binding
protein 4; LIPC, hepatic triglyceride lipase; LIPG, endothelial lipase; PON1,
paraoxonase 1; HPX, haemopexin; Tcf 1/2/3, T-cell factor -1, -2, -3; Rbp, retinol
binding proteins.
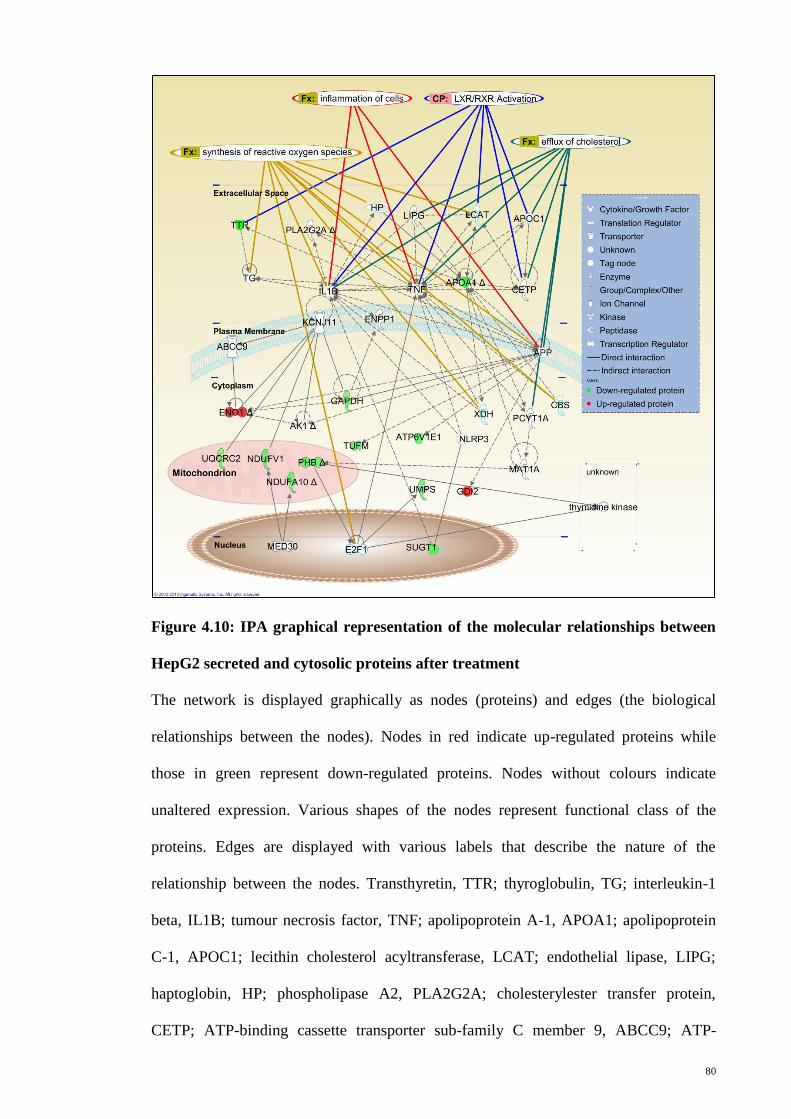
80
Figure 4.10: IPA graphical representation of the molecular relationships between
HepG2 secreted and cytosolic proteins after treatment
The network is displayed graphically as nodes (proteins) and edges (the biological
relationships between the nodes). Nodes in red indicate up-regulated proteins while
those in green represent down-regulated proteins. Nodes without colours indicate
unaltered expression. Various shapes of the nodes represent functional class of the
proteins. Edges are displayed with various labels that describe the nature of the
relationship between the nodes. Transthyretin, TTR; thyroglobulin, TG; interleukin-1
beta, IL1B; tumour necrosis factor, TNF; apolipoprotein A-1, APOA1; apolipoprotein
C-1, APOC1; lecithin cholesterol acyltransferase, LCAT; endothelial lipase, LIPG;
haptoglobin, HP; phospholipase A2, PLA2G2A; cholesterylester transfer protein,
CETP; ATP-binding cassette transporter sub-family C member 9, ABCC9; ATP-
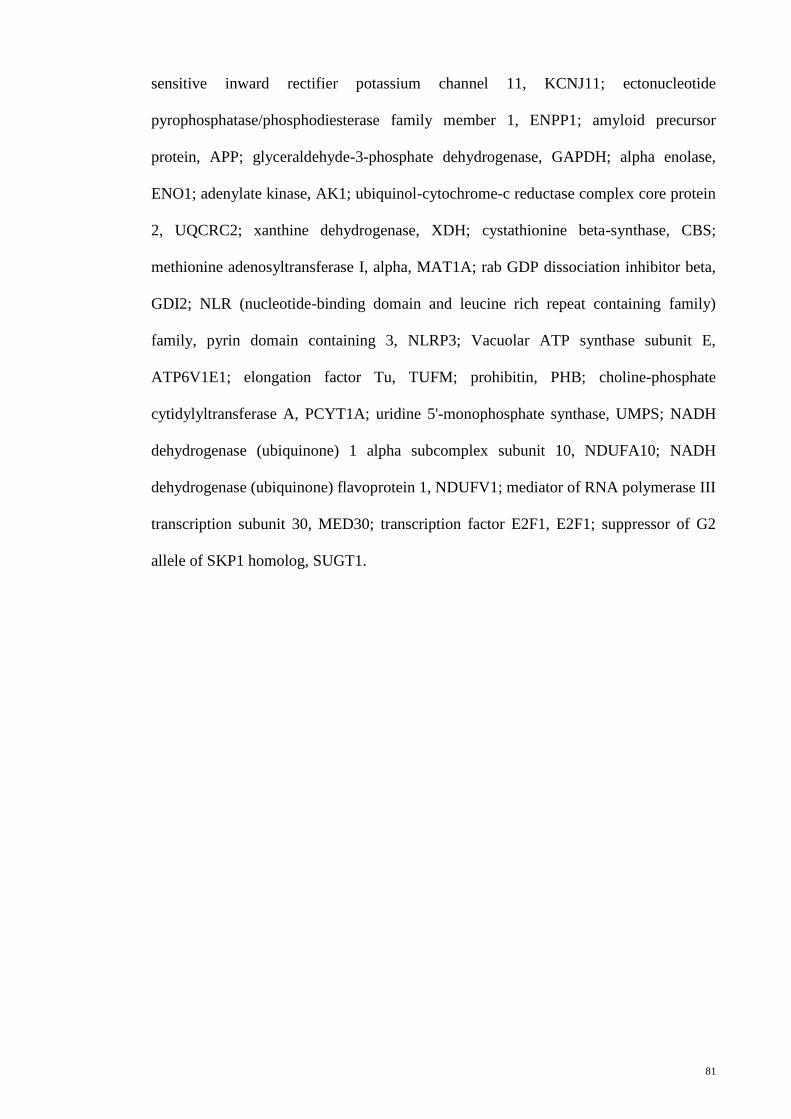
81
sensitive inward rectifier potassium channel 11, KCNJ11; ectonucleotide
pyrophosphatase/phosphodiesterase family member 1, ENPP1; amyloid precursor
protein, APP; glyceraldehyde-3-phosphate dehydrogenase, GAPDH; alpha enolase,
ENO1; adenylate kinase, AK1; ubiquinol-cytochrome-c reductase complex core protein
2, UQCRC2; xanthine dehydrogenase, XDH; cystathionine beta-synthase, CBS;
methionine adenosyltransferase I, alpha, MAT1A; rab GDP dissociation inhibitor beta,
GDI2; NLR (nucleotide-binding domain and leucine rich repeat containing family)
family, pyrin domain containing 3, NLRP3; Vacuolar ATP synthase subunit E,
ATP6V1E1; elongation factor Tu, TUFM; prohibitin, PHB; choline-phosphate
cytidylyltransferase A, PCYT1A; uridine 5'-monophosphate synthase, UMPS; NADH
dehydrogenase (ubiquinone) 1 alpha subcomplex subunit 10, NDUFA10; NADH
dehydrogenase (ubiquinone) flavoprotein 1, NDUFV1; mediator of RNA polymerase III
transcription subunit 30, MED30; transcription factor E2F1, E2F1; suppressor of G2
allele of SKP1 homolog, SUGT1.
82
Figure 4.11: Predicted canonical pathway affected by T. indica fruit extract
IPA identified ‘LXR/RXR activation’ as the canonical pathway with the highest
predicted potential/significance of being affected by the altered levels of TTR, ApoA-I
and GDI-2 in HepG2 cells that were treated with T. indica fruit extract. Lines between
the proteins represent known interactions. Red nodes indicate over expression of genes
induced by the extract, which was based on our previous report (Razali, et al., 2010).

83
Abbreviation: ABCA1, ATP-binding cassette sub-family A member 1; ABCG1, ATP-
binding cassette sub-family G member 1; ABCG5, ATP-binding cassette sub-family G
member 5; ABCG8, ATP-binding cassette sub-family G member 8; ECHS, enoyl CoA
hydratase; HADH, hydroxyacyl-CoA dehydrogenase; HMGCR, HMG-CoA reductase;
CYP7A1, cytochrome P450, family 7, subfamily A, polypeptide 1; LDLR, low density
lipoprotein receptor; CETP, cholesterylester transfer protein; CD36, cluster of
differentiation 36; NCOR, nuclear receptor corepressor; LXR, liver X receptor; RXR,
retinoid X receptor; 9-cis-RA, 9-cis-retinoic acid; LPL, lipoprotein lipase; PLTP,
phospholipid transfer protein; SREBP-1c, sterol regulatory element-binding protein 1c;
FASN, fatty acid synthase; SCD1, stearoyl-conzyme A desaturase 1; ACC, acetyl-CoA
carboxylase; APOA4, apolipoprotein A-4; LDL, low density lipoprotein; HDL, high
density lipoprotein.
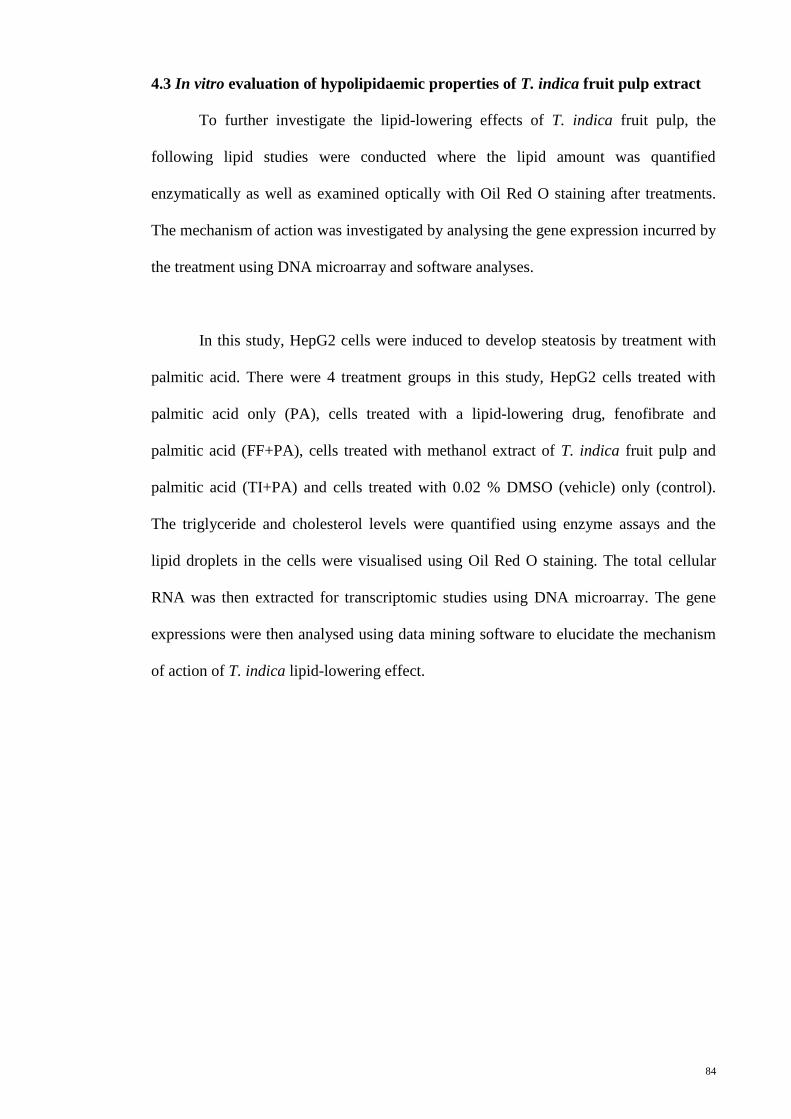
84
4.3 In vitro evaluation of hypolipidaemic properties of T. indica fruit pulp extract
To further investigate the lipid-lowering effects of T. indica fruit pulp, the
following lipid studies were conducted where the lipid amount was quantified
enzymatically as well as examined optically with Oil Red O staining after treatments.
The mechanism of action was investigated by analysing the gene expression incurred by
the treatment using DNA microarray and software analyses.
In this study, HepG2 cells were induced to develop steatosis by treatment with
palmitic acid. There were 4 treatment groups in this study, HepG2 cells treated with
palmitic acid only (PA), cells treated with a lipid-lowering drug, fenofibrate and
palmitic acid (FF+PA), cells treated with methanol extract of T. indica fruit pulp and
palmitic acid (TI+PA) and cells treated with 0.02 % DMSO (vehicle) only (control).
The triglyceride and cholesterol levels were quantified using enzyme assays and the
lipid droplets in the cells were visualised using Oil Red O staining. The total cellular
RNA was then extracted for transcriptomic studies using DNA microarray. The gene
expressions were then analysed using data mining software to elucidate the mechanism
of action of T. indica lipid-lowering effect.
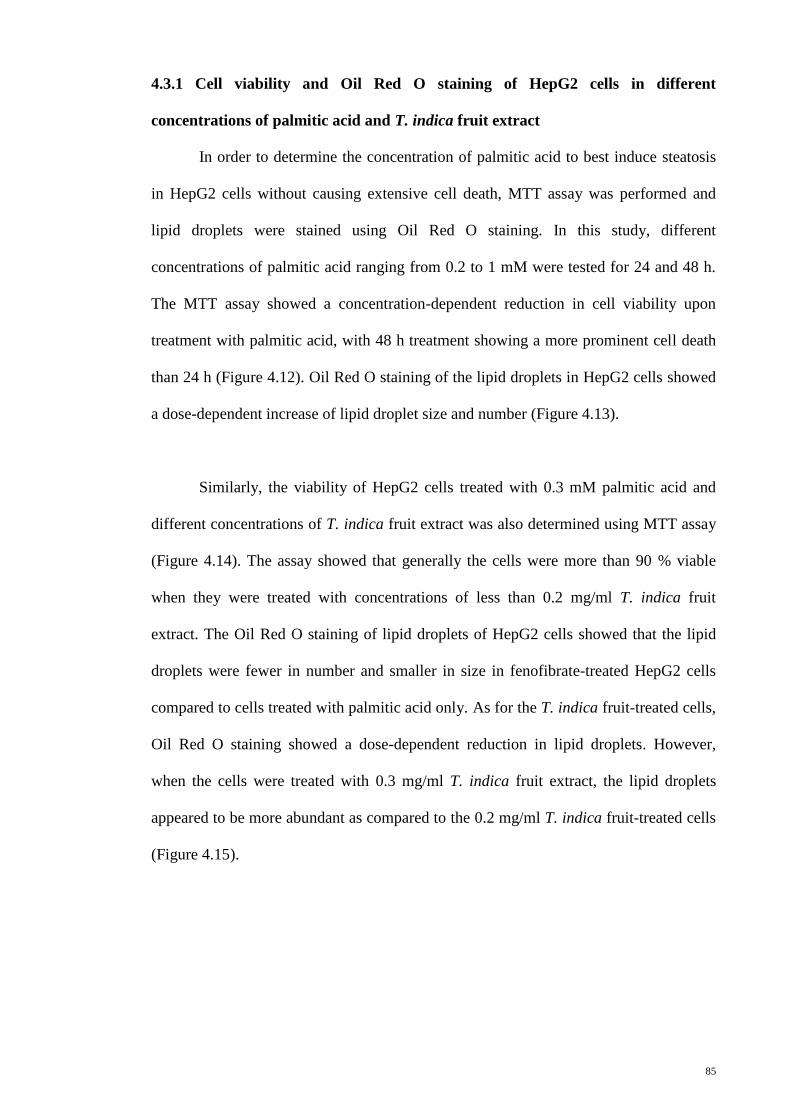
85
4.3.1 Cell viability and Oil Red O staining of HepG2 cells in different
concentrations of palmitic acid and T. indica fruit extract
In order to determine the concentration of palmitic acid to best induce steatosis
in HepG2 cells without causing extensive cell death, MTT assay was performed and
lipid droplets were stained using Oil Red O staining. In this study, different
concentrations of palmitic acid ranging from 0.2 to 1 mM were tested for 24 and 48 h.
The MTT assay showed a concentration-dependent reduction in cell viability upon
treatment with palmitic acid, with 48 h treatment showing a more prominent cell death
than 24 h (Figure 4.12). Oil Red O staining of the lipid droplets in HepG2 cells showed
a dose-dependent increase of lipid droplet size and number (Figure 4.13).
Similarly, the viability of HepG2 cells treated with 0.3 mM palmitic acid and
different concentrations of T. indica fruit extract was also determined using MTT assay
(Figure 4.14). The assay showed that generally the cells were more than 90 % viable
when they were treated with concentrations of less than 0.2 mg/ml T. indica fruit
extract. The Oil Red O staining of lipid droplets of HepG2 cells showed that the lipid
droplets were fewer in number and smaller in size in fenofibrate-treated HepG2 cells
compared to cells treated with palmitic acid only. As for the T. indica fruit-treated cells,
Oil Red O staining showed a dose-dependent reduction in lipid droplets. However,
when the cells were treated with 0.3 mg/ml T. indica fruit extract, the lipid droplets
appeared to be more abundant as compared to the 0.2 mg/ml T. indica fruit-treated cells
(Figure 4.15).
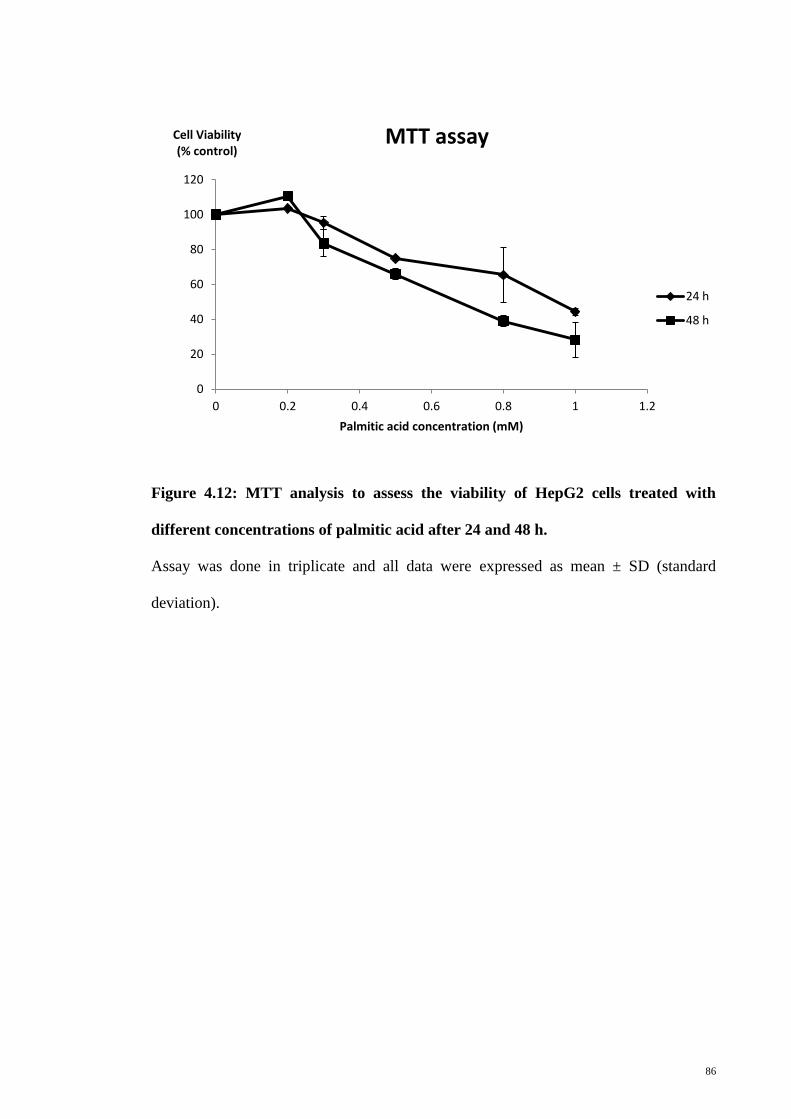
86
Figure 4.12: MTT analysis to assess the viability of HepG2 cells treated with
different concentrations of palmitic acid after 24 and 48 h.
Assay was done in triplicate and all data were expressed as mean ± SD (standard
deviation).
0
20
40
60
80
100
120
0 0.2 0.4 0.6 0.8 1 1.2
Cell Viability (% control)
Palmitic acid concentration (mM)
MTT assay
24 h
48 h
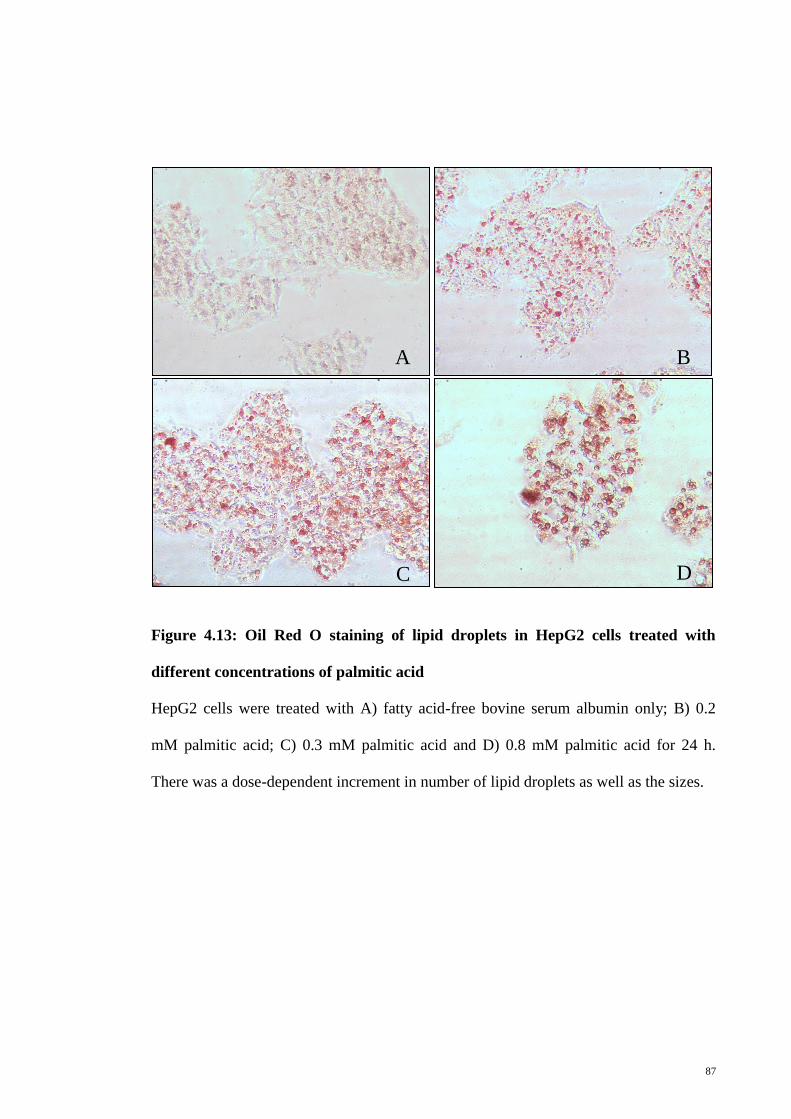
87
Figure 4.13: Oil Red O staining of lipid droplets in HepG2 cells treated with
different concentrations of palmitic acid
HepG2 cells were treated with A) fatty acid-free bovine serum albumin only; B) 0.2
mM palmitic acid; C) 0.3 mM palmitic acid and D) 0.8 mM palmitic acid for 24 h.
There was a dose-dependent increment in number of lipid droplets as well as the sizes.
A B
C D
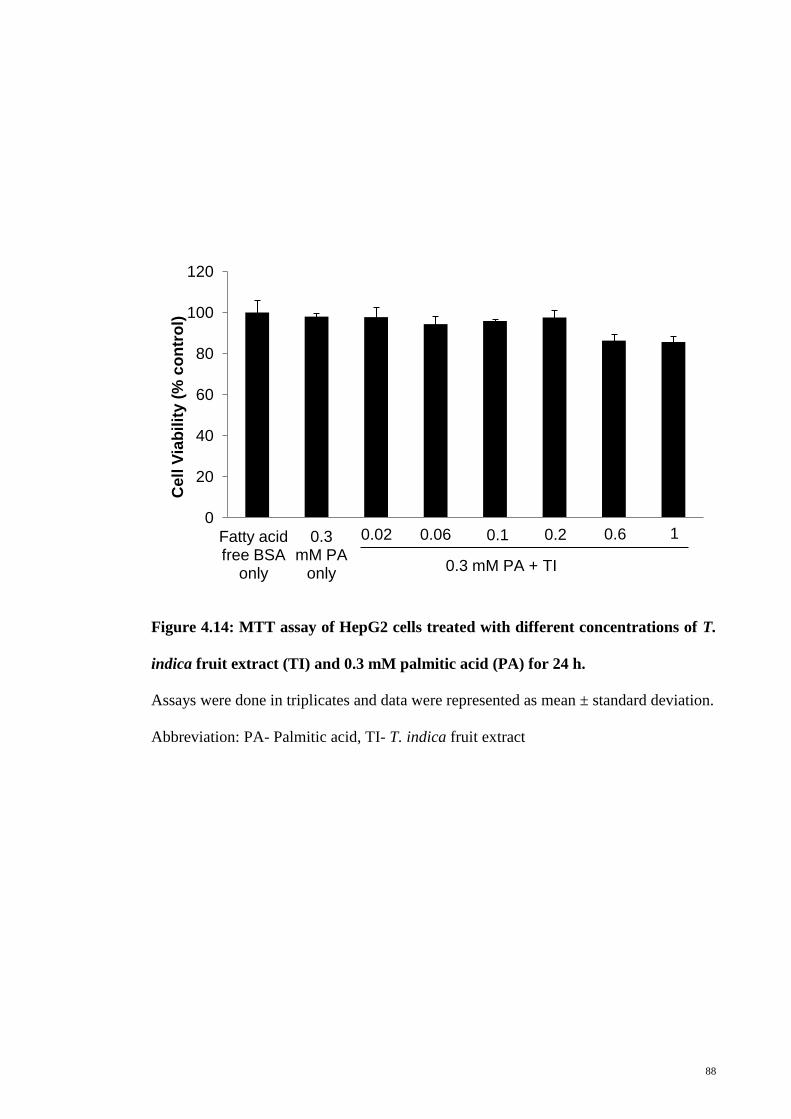
88
Figure 4.14: MTT assay of HepG2 cells treated with different concentrations of T.
indica fruit extract (TI) and 0.3 mM palmitic acid (PA) for 24 h.
Assays were done in triplicates and data were represented as mean ± standard deviation.
Abbreviation: PA- Palmitic acid, TI- T. indica fruit extract
0
20
40
60
80
100
120
Cell
Via
bilit
y (
% c
on
tro
l)
Fatty acid free BSA
only
0.3 mM PA
only
0.02 0.06 0.1 0.2 0.6 1
0.3 mM PA + TI
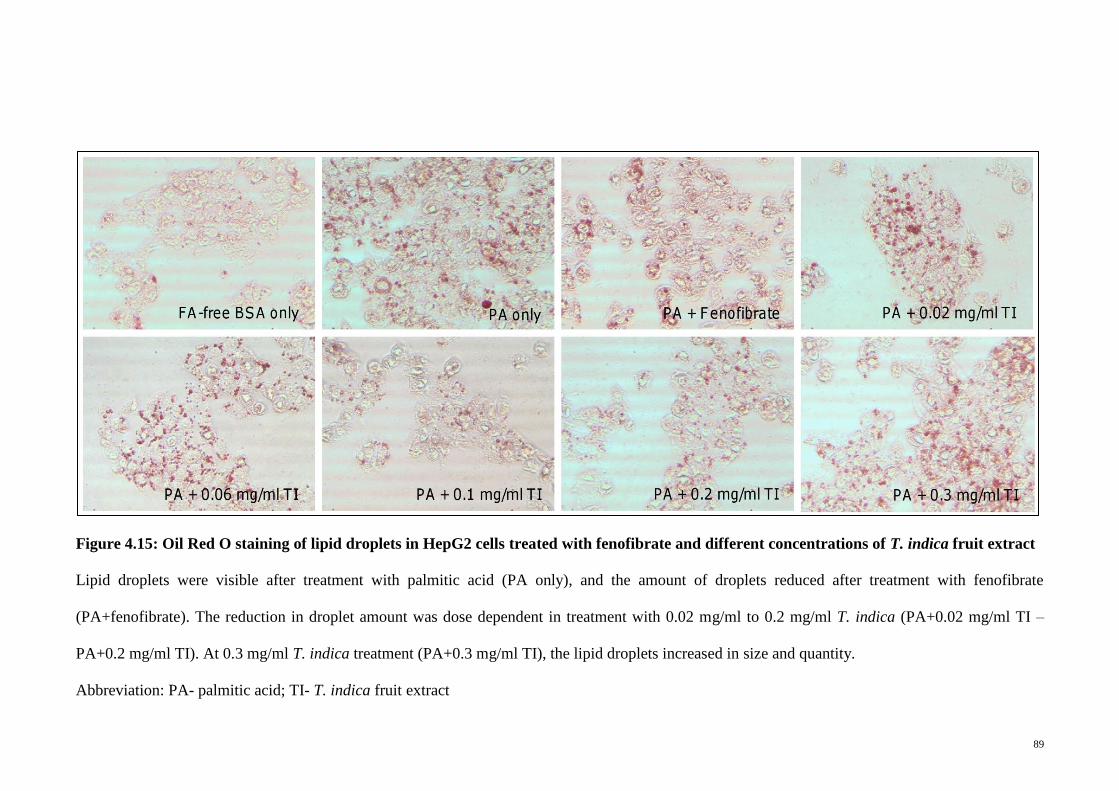
89
Figure 4.15: Oil Red O staining of lipid droplets in HepG2 cells treated with fenofibrate and different concentrations of T. indica fruit extract
Lipid droplets were visible after treatment with palmitic acid (PA only), and the amount of droplets reduced after treatment with fenofibrate
(PA+fenofibrate). The reduction in droplet amount was dose dependent in treatment with 0.02 mg/ml to 0.2 mg/ml T. indica (PA+0.02 mg/ml TI –
PA+0.2 mg/ml TI). At 0.3 mg/ml T. indica treatment (PA+0.3 mg/ml TI), the lipid droplets increased in size and quantity.
Abbreviation: PA- palmitic acid; TI- T. indica fruit extract
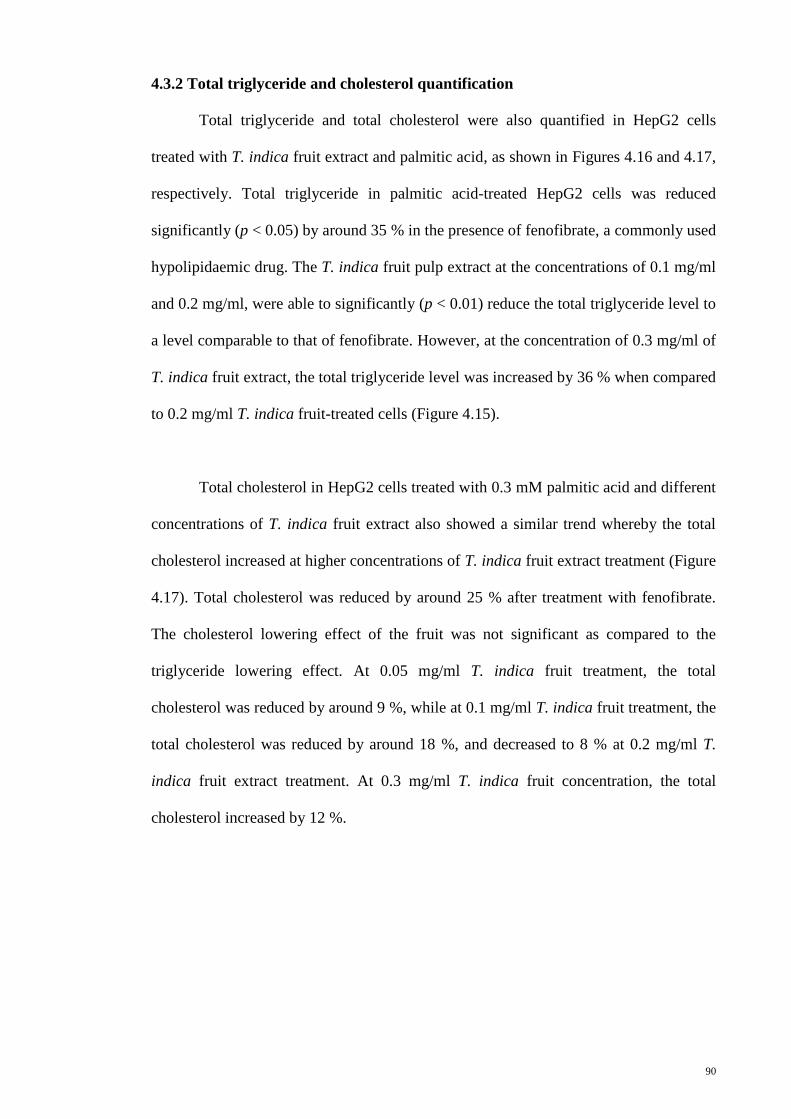
90
4.3.2 Total triglyceride and cholesterol quantification
Total triglyceride and total cholesterol were also quantified in HepG2 cells
treated with T. indica fruit extract and palmitic acid, as shown in Figures 4.16 and 4.17,
respectively. Total triglyceride in palmitic acid-treated HepG2 cells was reduced
significantly (p < 0.05) by around 35 % in the presence of fenofibrate, a commonly used
hypolipidaemic drug. The T. indica fruit pulp extract at the concentrations of 0.1 mg/ml
and 0.2 mg/ml, were able to significantly (p < 0.01) reduce the total triglyceride level to
a level comparable to that of fenofibrate. However, at the concentration of 0.3 mg/ml of
T. indica fruit extract, the total triglyceride level was increased by 36 % when compared
to 0.2 mg/ml T. indica fruit-treated cells (Figure 4.15).
Total cholesterol in HepG2 cells treated with 0.3 mM palmitic acid and different
concentrations of T. indica fruit extract also showed a similar trend whereby the total
cholesterol increased at higher concentrations of T. indica fruit extract treatment (Figure
4.17). Total cholesterol was reduced by around 25 % after treatment with fenofibrate.
The cholesterol lowering effect of the fruit was not significant as compared to the
triglyceride lowering effect. At 0.05 mg/ml T. indica fruit treatment, the total
cholesterol was reduced by around 9 %, while at 0.1 mg/ml T. indica fruit treatment, the
total cholesterol was reduced by around 18 %, and decreased to 8 % at 0.2 mg/ml T.
indica fruit extract treatment. At 0.3 mg/ml T. indica fruit concentration, the total
cholesterol increased by 12 %.
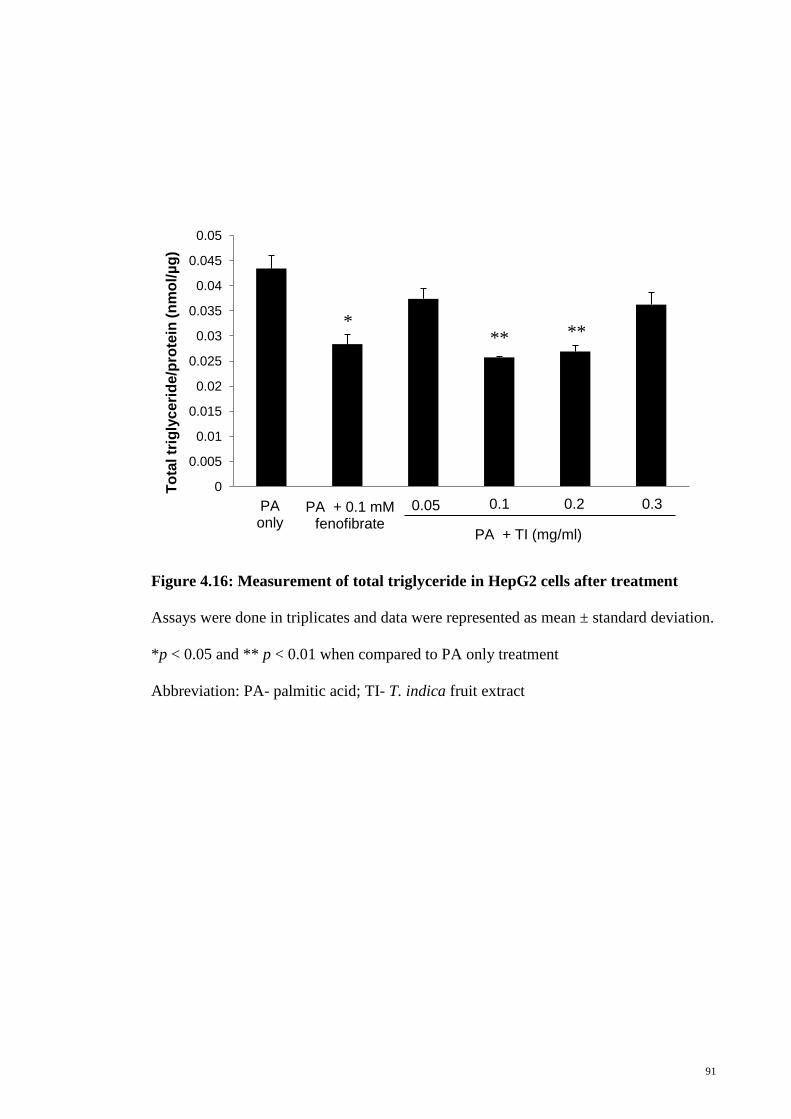
91
Figure 4.16: Measurement of total triglyceride in HepG2 cells after treatment
Assays were done in triplicates and data were represented as mean ± standard deviation.
*p < 0.05 and ** p < 0.01 when compared to PA only treatment
Abbreviation: PA- palmitic acid; TI- T. indica fruit extract
0
0.005
0.01
0.015
0.02
0.025
0.03
0.035
0.04
0.045
0.05
To
tal tr
igly
ceri
de/p
rote
in (
nm
ol/
µg
)
PA only
PA + 0.1 mM fenofibrate
0.05 0.1 0.2 0.3
PA + TI (mg/ml)
** ** *
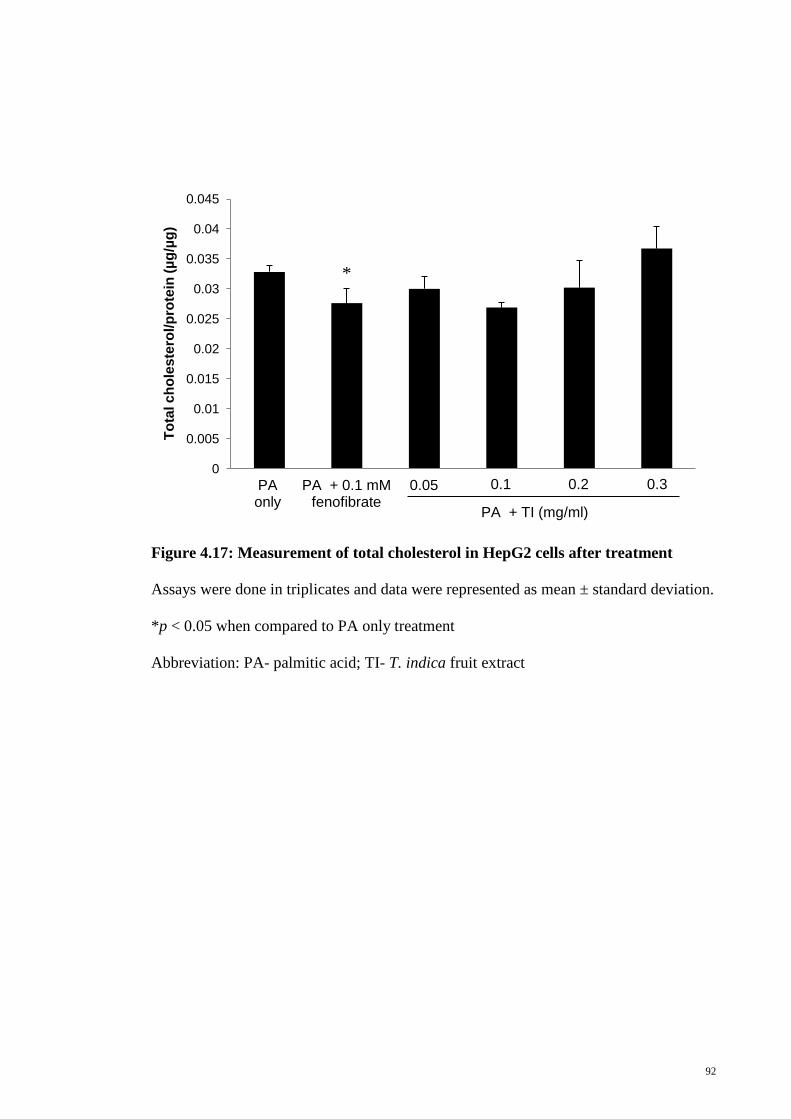
92
Figure 4.17: Measurement of total cholesterol in HepG2 cells after treatment
Assays were done in triplicates and data were represented as mean ± standard deviation.
*p < 0.05 when compared to PA only treatment
Abbreviation: PA- palmitic acid; TI- T. indica fruit extract
0
0.005
0.01
0.015
0.02
0.025
0.03
0.035
0.04
0.045
To
tal c
ho
les
tero
l/p
rote
in (
µg
/µg
)
PA only
PA + 0.1 mM fenofibrate
0.05 0.1 0.2 0.3
PA + TI (mg/ml)
*
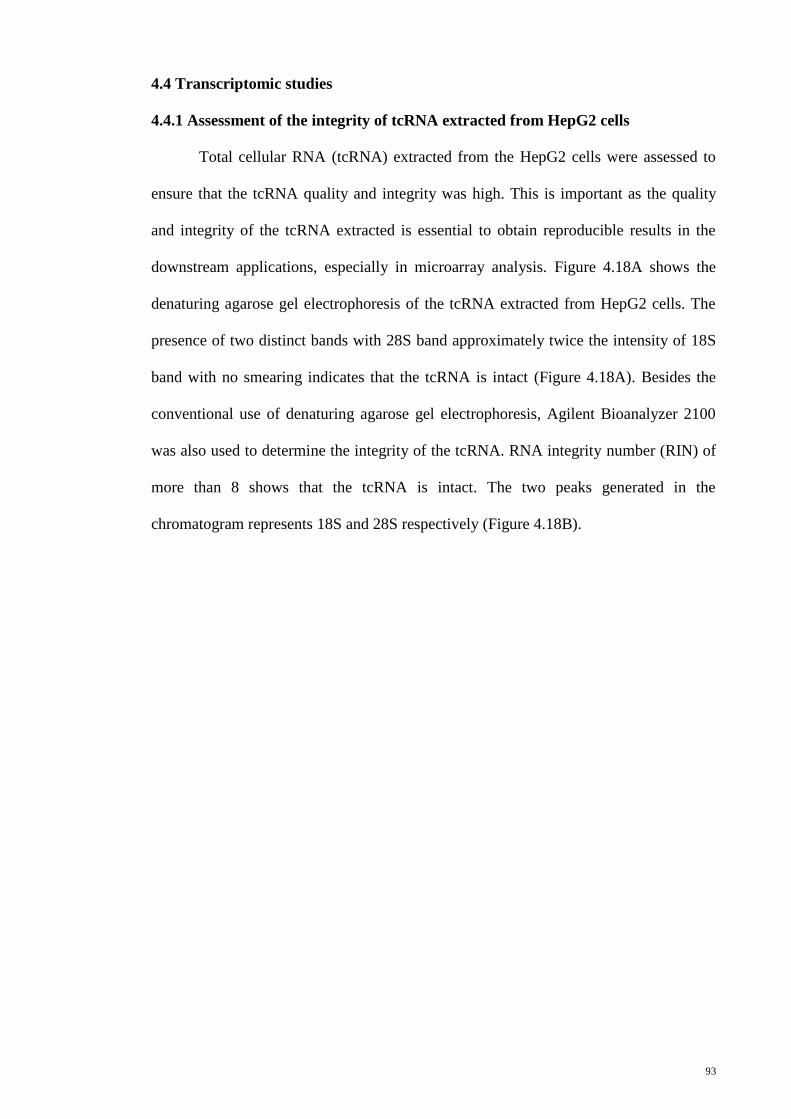
93
4.4 Transcriptomic studies
4.4.1 Assessment of the integrity of tcRNA extracted from HepG2 cells
Total cellular RNA (tcRNA) extracted from the HepG2 cells were assessed to
ensure that the tcRNA quality and integrity was high. This is important as the quality
and integrity of the tcRNA extracted is essential to obtain reproducible results in the
downstream applications, especially in microarray analysis. Figure 4.18A shows the
denaturing agarose gel electrophoresis of the tcRNA extracted from HepG2 cells. The
presence of two distinct bands with 28S band approximately twice the intensity of 18S
band with no smearing indicates that the tcRNA is intact (Figure 4.18A). Besides the
conventional use of denaturing agarose gel electrophoresis, Agilent Bioanalyzer 2100
was also used to determine the integrity of the tcRNA. RNA integrity number (RIN) of
more than 8 shows that the tcRNA is intact. The two peaks generated in the
chromatogram represents 18S and 28S respectively (Figure 4.18B).
94
Figure 4.18: Assessment of tcRNA integrity using denaturing agarose gel
electrophoresis and Agilent Bioanalyzer 2100
A) Denaturing agarose gel electrophoresis of tcRNA extracted from HepG2 cells. B) An
example of a tcRNA sample analysed using Agilent Bioanalyzer 2100.
95
4.4.2 Principal component analysis (PCA) mapping of different treatment groups
PCA is a statistical technique for determining the key variables in a
multidimensional data set that explain the differences in the observations. Figure 4.19
demonstrates the PCA mapping of different treatment groups in the DNA microarray
analysis. It can be seen that the control group is furthest from all other treatments,
indicating that the gene expression differed the most. Other treatments were closer to
each other, forming 3 clusters but remained separated, signifying different sets of gene
were being regulated.
4.4.3 Identification of significantly regulated genes using Partek Software
A total of 160, 77 and 169 genes were significantly regulated (p < 0.05) by at
least 1.5-fold in HepG2 cells treated with 0.1 mg/ml T. indica fruit extract (TI+PA vs
control), fenofibrate (FF+PA vs control) and palmitic acid (PA vs control), respectively
when compared to control (Figure 4.20). Thirty seven genes were significantly altered
in all 3 treatments (Figure 4.20) and the names of the genes are listed in Table 4.5.
Twenty four genes were commonly regulated in T. indica and fenofibrate treatments
(Table 4.6) while 34 genes were commonly regulated in T. indica treatment and
palmitic acid treatment alone (Table 4.7). Only 3 genes were commonly altered in
fenofibrate treatment and palmitic acid treatment (Table 4.8). Sixty five, 13 and 95
genes were uniquely regulated in T. indica treatment, fenofibrate treatment and palmitic
acid treatment respectively (Tables 4.9, 4.10 and 4.11).
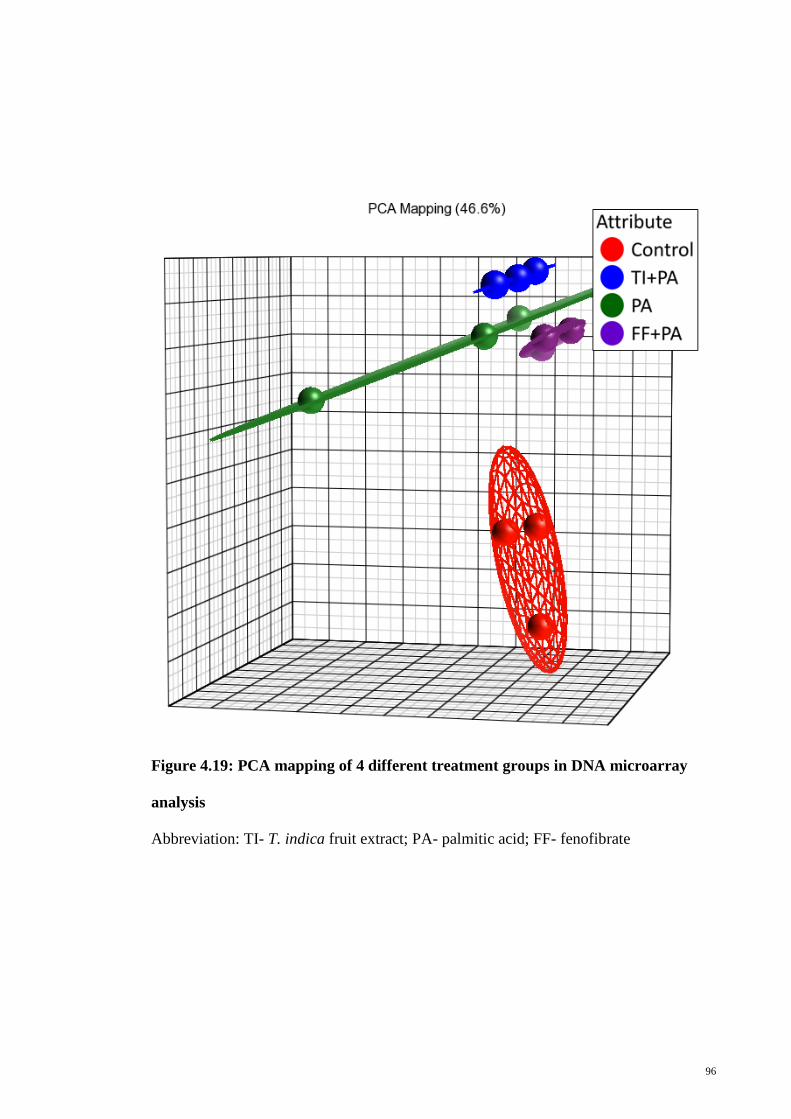
96
Figure 4.19: PCA mapping of 4 different treatment groups in DNA microarray
analysis
Abbreviation: TI- T. indica fruit extract; PA- palmitic acid; FF- fenofibrate
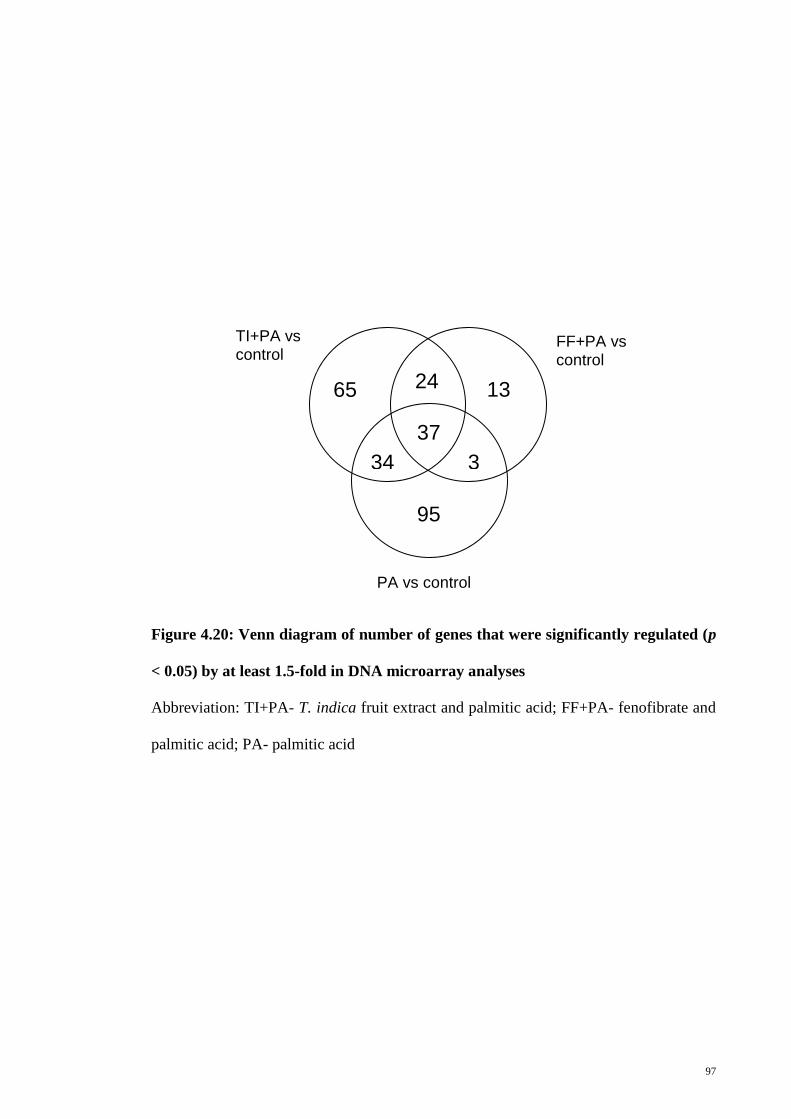
97
Figure 4.20: Venn diagram of number of genes that were significantly regulated (p
< 0.05) by at least 1.5-fold in DNA microarray analyses
Abbreviation: TI+PA- T. indica fruit extract and palmitic acid; FF+PA- fenofibrate and
palmitic acid; PA- palmitic acid
65 13
95
24
37
34 3
TI+PA vs control
FF+PA vs control
PA vs control
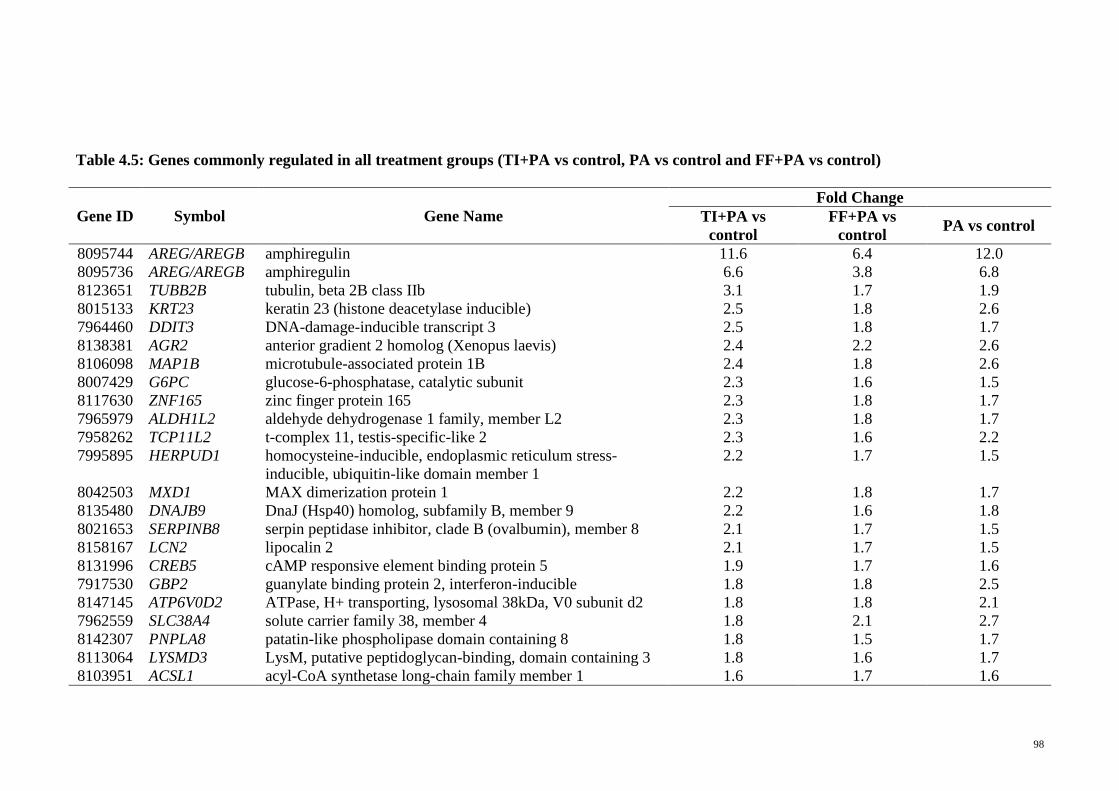
98
Table 4.5: Genes commonly regulated in all treatment groups (TI+PA vs control, PA vs control and FF+PA vs control)
Gene ID Symbol Gene Name
Fold Change
TI+PA vs
control
FF+PA vs
control PA vs control
8095744 AREG/AREGB amphiregulin 11.6 6.4 12.0
8095736 AREG/AREGB amphiregulin 6.6 3.8 6.8
8123651 TUBB2B tubulin, beta 2B class IIb 3.1 1.7 1.9
8015133 KRT23 keratin 23 (histone deacetylase inducible) 2.5 1.8 2.6
7964460 DDIT3 DNA-damage-inducible transcript 3 2.5 1.8 1.7
8138381 AGR2 anterior gradient 2 homolog (Xenopus laevis) 2.4 2.2 2.6
8106098 MAP1B microtubule-associated protein 1B 2.4 1.8 2.6
8007429 G6PC glucose-6-phosphatase, catalytic subunit 2.3 1.6 1.5
8117630 ZNF165 zinc finger protein 165 2.3 1.8 1.7
7965979 ALDH1L2 aldehyde dehydrogenase 1 family, member L2 2.3 1.8 1.7
7958262 TCP11L2 t-complex 11, testis-specific-like 2 2.3 1.6 2.2
7995895
HERPUD1 homocysteine-inducible, endoplasmic reticulum stress-
inducible, ubiquitin-like domain member 1
2.2 1.7 1.5
8042503 MXD1 MAX dimerization protein 1 2.2 1.8 1.7
8135480 DNAJB9 DnaJ (Hsp40) homolog, subfamily B, member 9 2.2 1.6 1.8
8021653 SERPINB8 serpin peptidase inhibitor, clade B (ovalbumin), member 8 2.1 1.7 1.5
8158167 LCN2 lipocalin 2 2.1 1.7 1.5
8131996 CREB5 cAMP responsive element binding protein 5 1.9 1.7 1.6
7917530 GBP2 guanylate binding protein 2, interferon-inducible 1.8 1.8 2.5
8147145 ATP6V0D2 ATPase, H+ transporting, lysosomal 38kDa, V0 subunit d2 1.8 1.8 2.1
7962559 SLC38A4 solute carrier family 38, member 4 1.8 2.1 2.7
8142307 PNPLA8 patatin-like phospholipase domain containing 8 1.8 1.5 1.7
8113064 LYSMD3 LysM, putative peptidoglycan-binding, domain containing 3 1.8 1.6 1.7
8103951 ACSL1 acyl-CoA synthetase long-chain family member 1 1.6 1.7 1.6
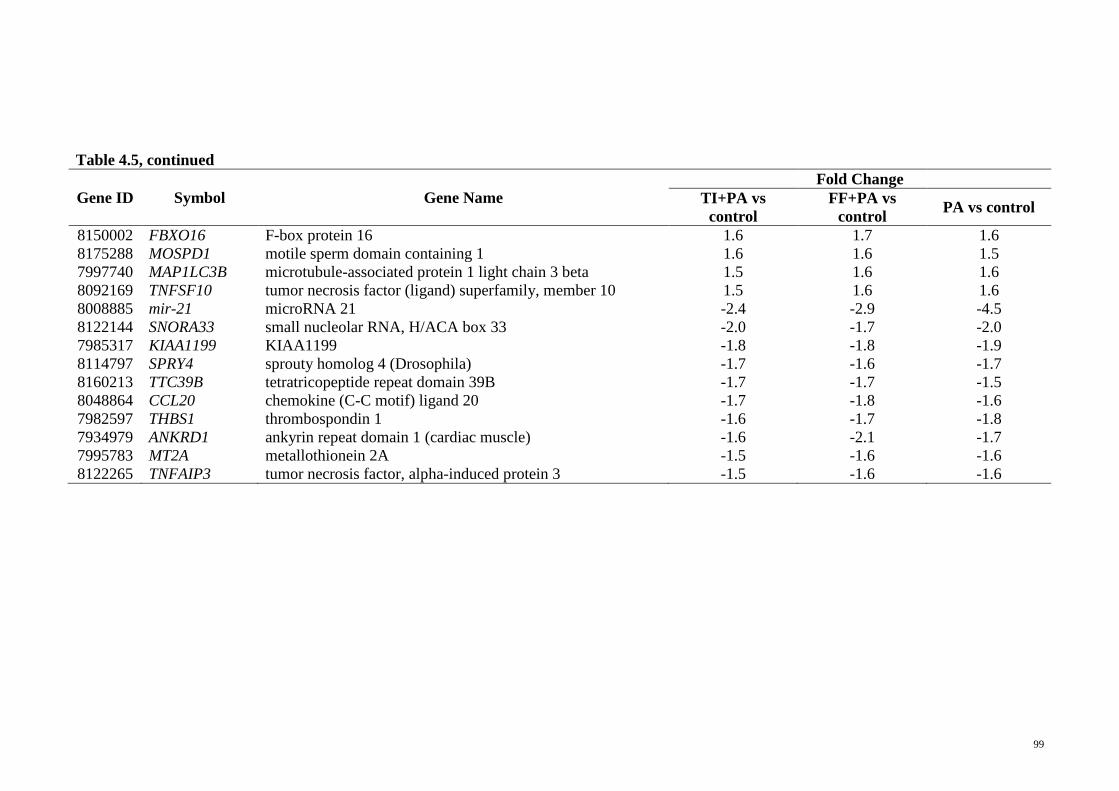
99
Table 4.5, continued
Gene ID Symbol Gene Name
Fold Change
TI+PA vs
control
FF+PA vs
control PA vs control
8150002 FBXO16 F-box protein 16 1.6 1.7 1.6
8175288 MOSPD1 motile sperm domain containing 1 1.6 1.6 1.5
7997740 MAP1LC3B microtubule-associated protein 1 light chain 3 beta 1.5 1.6 1.6
8092169 TNFSF10 tumor necrosis factor (ligand) superfamily, member 10 1.5 1.6 1.6
8008885 mir-21 microRNA 21 -2.4 -2.9 -4.5
8122144 SNORA33 small nucleolar RNA, H/ACA box 33 -2.0 -1.7 -2.0
7985317 KIAA1199 KIAA1199 -1.8 -1.8 -1.9
8114797 SPRY4 sprouty homolog 4 (Drosophila) -1.7 -1.6 -1.7
8160213 TTC39B tetratricopeptide repeat domain 39B -1.7 -1.7 -1.5
8048864 CCL20 chemokine (C-C motif) ligand 20 -1.7 -1.8 -1.6
7982597 THBS1 thrombospondin 1 -1.6 -1.7 -1.8
7934979 ANKRD1 ankyrin repeat domain 1 (cardiac muscle) -1.6 -2.1 -1.7
7995783 MT2A metallothionein 2A -1.5 -1.6 -1.6
8122265 TNFAIP3 tumor necrosis factor, alpha-induced protein 3 -1.5 -1.6 -1.6
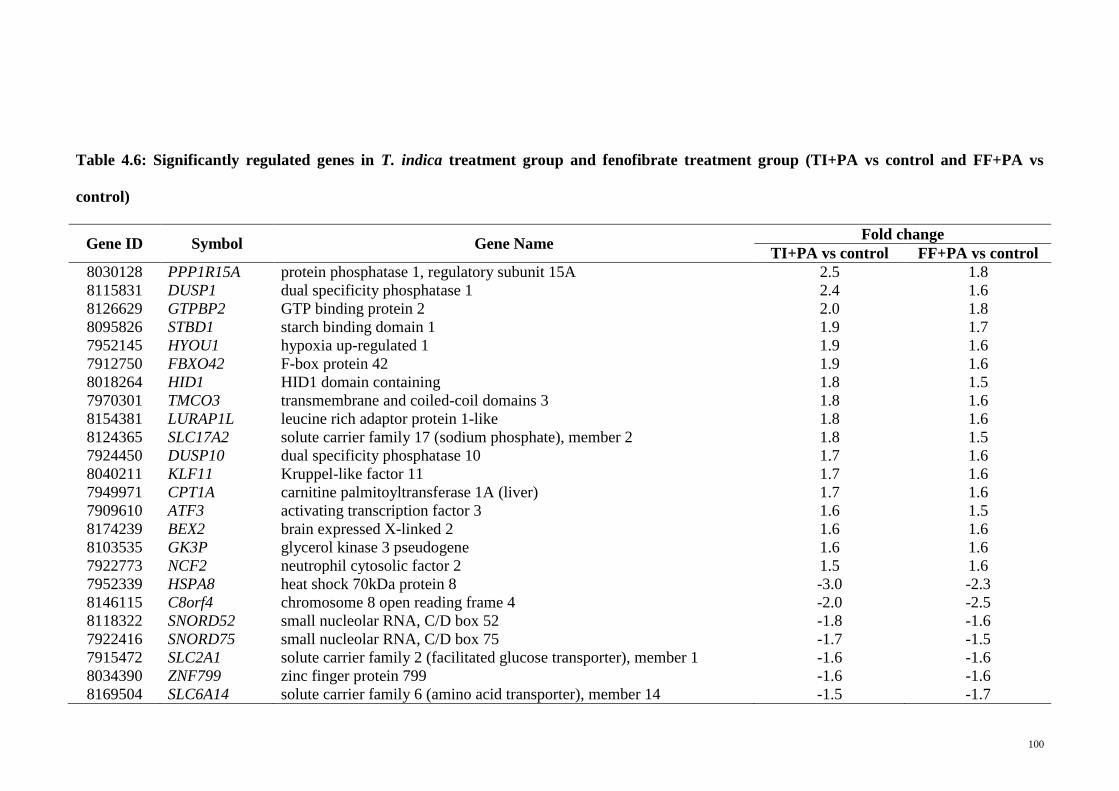
100
Table 4.6: Significantly regulated genes in T. indica treatment group and fenofibrate treatment group (TI+PA vs control and FF+PA vs
control)
Gene ID Symbol Gene Name Fold change
TI+PA vs control FF+PA vs control
8030128 PPP1R15A protein phosphatase 1, regulatory subunit 15A 2.5 1.8
8115831 DUSP1 dual specificity phosphatase 1 2.4 1.6
8126629 GTPBP2 GTP binding protein 2 2.0 1.8
8095826 STBD1 starch binding domain 1 1.9 1.7
7952145 HYOU1 hypoxia up-regulated 1 1.9 1.6
7912750 FBXO42 F-box protein 42 1.9 1.6
8018264 HID1 HID1 domain containing 1.8 1.5
7970301 TMCO3 transmembrane and coiled-coil domains 3 1.8 1.6
8154381 LURAP1L leucine rich adaptor protein 1-like 1.8 1.6
8124365 SLC17A2 solute carrier family 17 (sodium phosphate), member 2 1.8 1.5
7924450 DUSP10 dual specificity phosphatase 10 1.7 1.6
8040211 KLF11 Kruppel-like factor 11 1.7 1.6
7949971 CPT1A carnitine palmitoyltransferase 1A (liver) 1.7 1.6
7909610 ATF3 activating transcription factor 3 1.6 1.5
8174239 BEX2 brain expressed X-linked 2 1.6 1.6
8103535 GK3P glycerol kinase 3 pseudogene 1.6 1.6
7922773 NCF2 neutrophil cytosolic factor 2 1.5 1.6
7952339 HSPA8 heat shock 70kDa protein 8 -3.0 -2.3
8146115 C8orf4 chromosome 8 open reading frame 4 -2.0 -2.5
8118322 SNORD52 small nucleolar RNA, C/D box 52 -1.8 -1.6
7922416 SNORD75 small nucleolar RNA, C/D box 75 -1.7 -1.5
7915472 SLC2A1 solute carrier family 2 (facilitated glucose transporter), member 1 -1.6 -1.6
8034390 ZNF799 zinc finger protein 799 -1.6 -1.6
8169504 SLC6A14 solute carrier family 6 (amino acid transporter), member 14 -1.5 -1.7
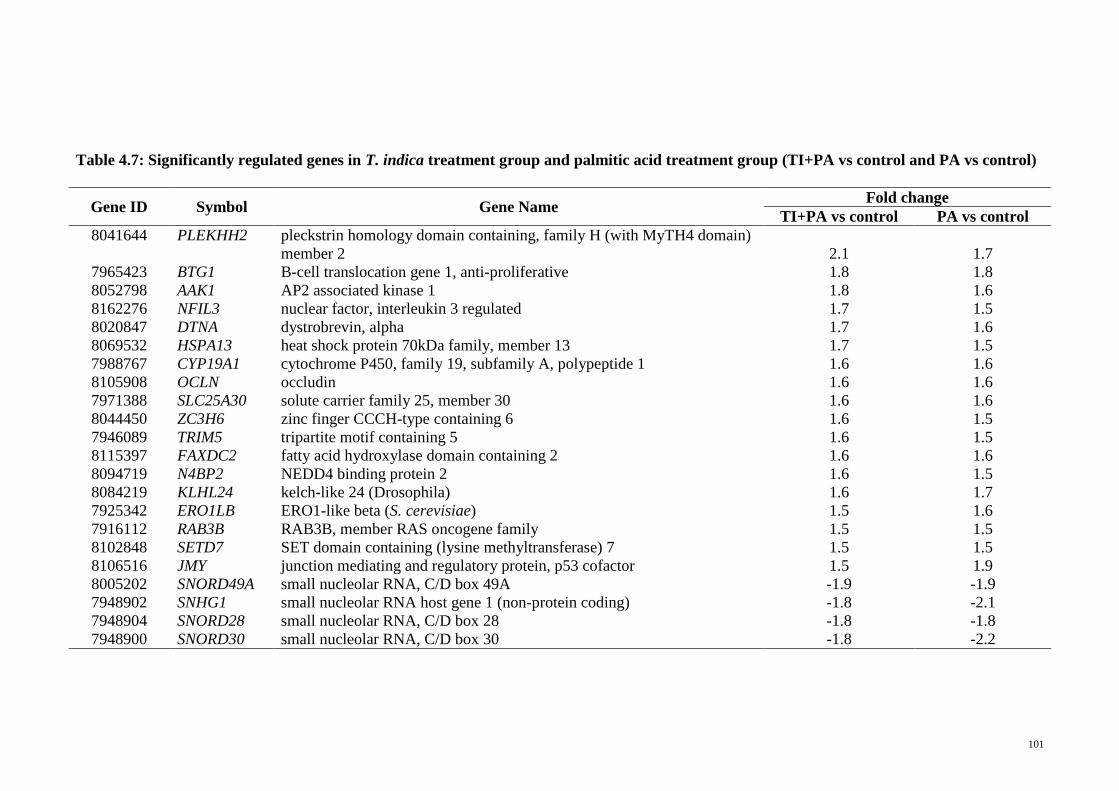
101
Table 4.7: Significantly regulated genes in T. indica treatment group and palmitic acid treatment group (TI+PA vs control and PA vs control)
Gene ID Symbol Gene Name Fold change
TI+PA vs control PA vs control
8041644
PLEKHH2 pleckstrin homology domain containing, family H (with MyTH4 domain)
member 2 2.1 1.7
7965423 BTG1 B-cell translocation gene 1, anti-proliferative 1.8 1.8
8052798 AAK1 AP2 associated kinase 1 1.8 1.6
8162276 NFIL3 nuclear factor, interleukin 3 regulated 1.7 1.5
8020847 DTNA dystrobrevin, alpha 1.7 1.6
8069532 HSPA13 heat shock protein 70kDa family, member 13 1.7 1.5
7988767 CYP19A1 cytochrome P450, family 19, subfamily A, polypeptide 1 1.6 1.6
8105908 OCLN occludin 1.6 1.6
7971388 SLC25A30 solute carrier family 25, member 30 1.6 1.6
8044450 ZC3H6 zinc finger CCCH-type containing 6 1.6 1.5
7946089 TRIM5 tripartite motif containing 5 1.6 1.5
8115397 FAXDC2 fatty acid hydroxylase domain containing 2 1.6 1.6
8094719 N4BP2 NEDD4 binding protein 2 1.6 1.5
8084219 KLHL24 kelch-like 24 (Drosophila) 1.6 1.7
7925342 ERO1LB ERO1-like beta (S. cerevisiae) 1.5 1.6
7916112 RAB3B RAB3B, member RAS oncogene family 1.5 1.5
8102848 SETD7 SET domain containing (lysine methyltransferase) 7 1.5 1.5
8106516 JMY junction mediating and regulatory protein, p53 cofactor 1.5 1.9
8005202 SNORD49A small nucleolar RNA, C/D box 49A -1.9 -1.9
7948902 SNHG1 small nucleolar RNA host gene 1 (non-protein coding) -1.8 -2.1
7948904 SNORD28 small nucleolar RNA, C/D box 28 -1.8 -1.8
7948900 SNORD30 small nucleolar RNA, C/D box 30 -1.8 -2.2
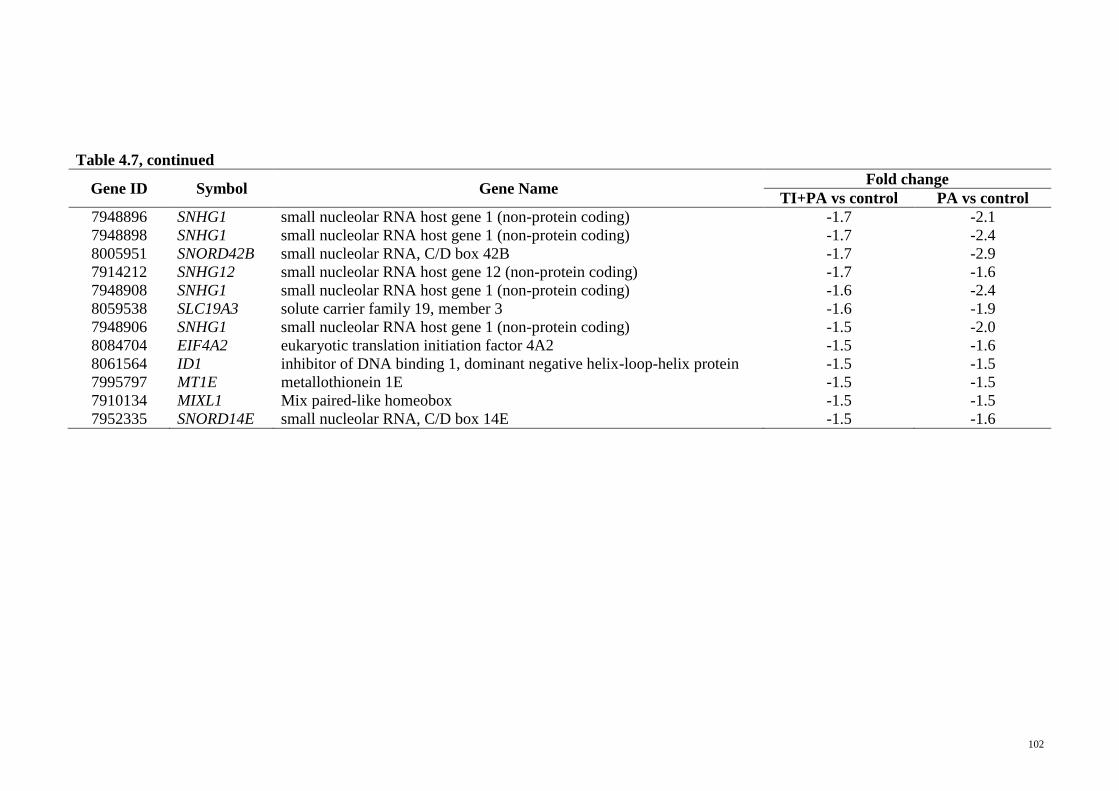
102
Table 4.7, continued
Gene ID Symbol Gene Name Fold change
TI+PA vs control PA vs control
7948896 SNHG1 small nucleolar RNA host gene 1 (non-protein coding) -1.7 -2.1
7948898 SNHG1 small nucleolar RNA host gene 1 (non-protein coding) -1.7 -2.4
8005951 SNORD42B small nucleolar RNA, C/D box 42B -1.7 -2.9
7914212 SNHG12 small nucleolar RNA host gene 12 (non-protein coding) -1.7 -1.6
7948908 SNHG1 small nucleolar RNA host gene 1 (non-protein coding) -1.6 -2.4
8059538 SLC19A3 solute carrier family 19, member 3 -1.6 -1.9
7948906 SNHG1 small nucleolar RNA host gene 1 (non-protein coding) -1.5 -2.0
8084704 EIF4A2 eukaryotic translation initiation factor 4A2 -1.5 -1.6
8061564 ID1 inhibitor of DNA binding 1, dominant negative helix-loop-helix protein -1.5 -1.5
7995797 MT1E metallothionein 1E -1.5 -1.5
7910134 MIXL1 Mix paired-like homeobox -1.5 -1.5
7952335 SNORD14E small nucleolar RNA, C/D box 14E -1.5 -1.6
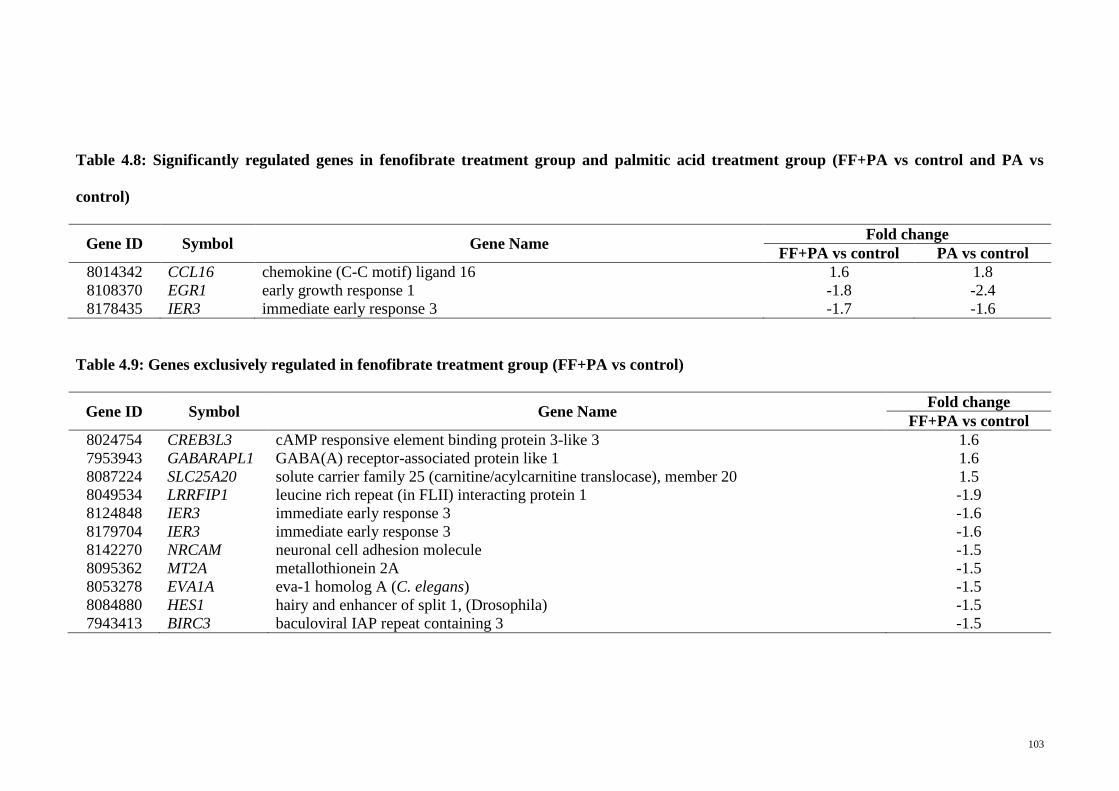
103
Table 4.8: Significantly regulated genes in fenofibrate treatment group and palmitic acid treatment group (FF+PA vs control and PA vs
control)
Gene ID Symbol Gene Name Fold change
FF+PA vs control PA vs control
8014342 CCL16 chemokine (C-C motif) ligand 16 1.6 1.8
8108370 EGR1 early growth response 1 -1.8 -2.4
8178435 IER3 immediate early response 3 -1.7 -1.6
Table 4.9: Genes exclusively regulated in fenofibrate treatment group (FF+PA vs control)
Gene ID Symbol Gene Name Fold change
FF+PA vs control
8024754 CREB3L3 cAMP responsive element binding protein 3-like 3 1.6
7953943 GABARAPL1 GABA(A) receptor-associated protein like 1 1.6
8087224 SLC25A20 solute carrier family 25 (carnitine/acylcarnitine translocase), member 20 1.5
8049534 LRRFIP1 leucine rich repeat (in FLII) interacting protein 1 -1.9
8124848 IER3 immediate early response 3 -1.6
8179704 IER3 immediate early response 3 -1.6
8142270 NRCAM neuronal cell adhesion molecule -1.5
8095362 MT2A metallothionein 2A -1.5
8053278 EVA1A eva-1 homolog A (C. elegans) -1.5
8084880 HES1 hairy and enhancer of split 1, (Drosophila) -1.5
7943413 BIRC3 baculoviral IAP repeat containing 3 -1.5
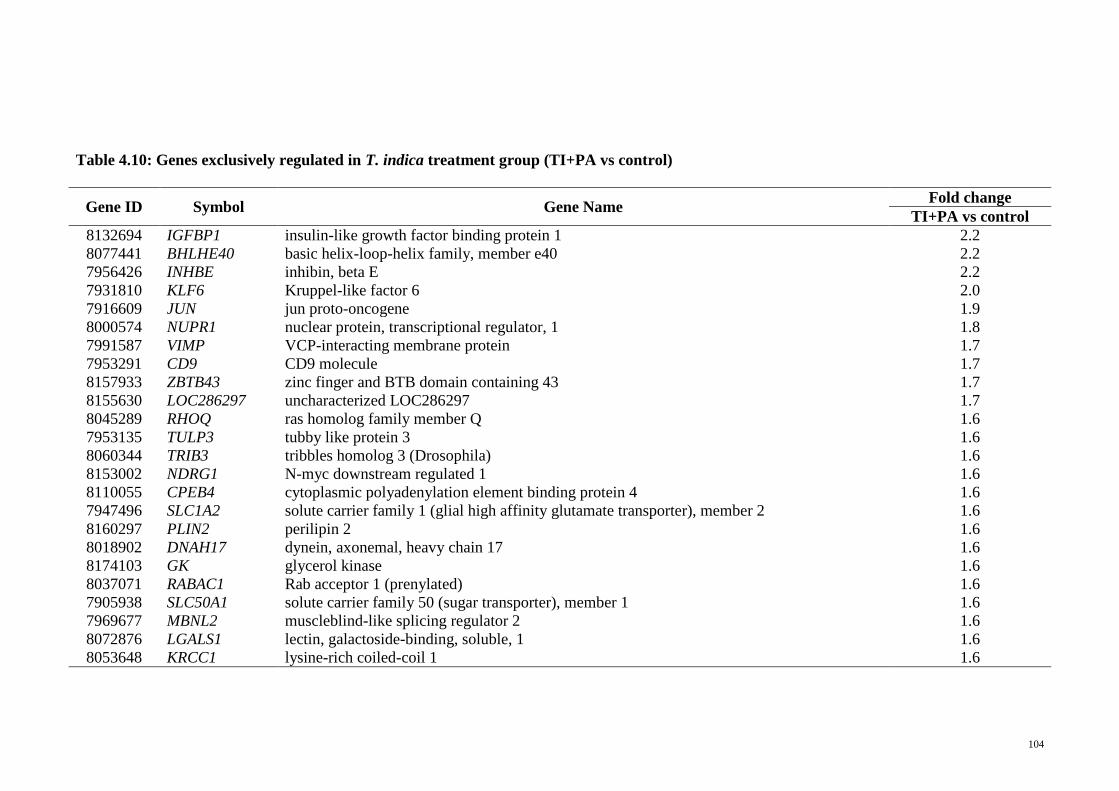
104
Table 4.10: Genes exclusively regulated in T. indica treatment group (TI+PA vs control)
Gene ID Symbol Gene Name Fold change
TI+PA vs control
8132694 IGFBP1 insulin-like growth factor binding protein 1 2.2
8077441 BHLHE40 basic helix-loop-helix family, member e40 2.2
7956426 INHBE inhibin, beta E 2.2
7931810 KLF6 Kruppel-like factor 6 2.0
7916609 JUN jun proto-oncogene 1.9
8000574 NUPR1 nuclear protein, transcriptional regulator, 1 1.8
7991587 VIMP VCP-interacting membrane protein 1.7
7953291 CD9 CD9 molecule 1.7
8157933 ZBTB43 zinc finger and BTB domain containing 43 1.7
8155630 LOC286297 uncharacterized LOC286297 1.7
8045289 RHOQ ras homolog family member Q 1.6
7953135 TULP3 tubby like protein 3 1.6
8060344 TRIB3 tribbles homolog 3 (Drosophila) 1.6
8153002 NDRG1 N-myc downstream regulated 1 1.6
8110055 CPEB4 cytoplasmic polyadenylation element binding protein 4 1.6
7947496 SLC1A2 solute carrier family 1 (glial high affinity glutamate transporter), member 2 1.6
8160297 PLIN2 perilipin 2 1.6
8018902 DNAH17 dynein, axonemal, heavy chain 17 1.6
8174103 GK glycerol kinase 1.6
8037071 RABAC1 Rab acceptor 1 (prenylated) 1.6
7905938 SLC50A1 solute carrier family 50 (sugar transporter), member 1 1.6
7969677 MBNL2 muscleblind-like splicing regulator 2 1.6
8072876 LGALS1 lectin, galactoside-binding, soluble, 1 1.6
8053648 KRCC1 lysine-rich coiled-coil 1 1.6
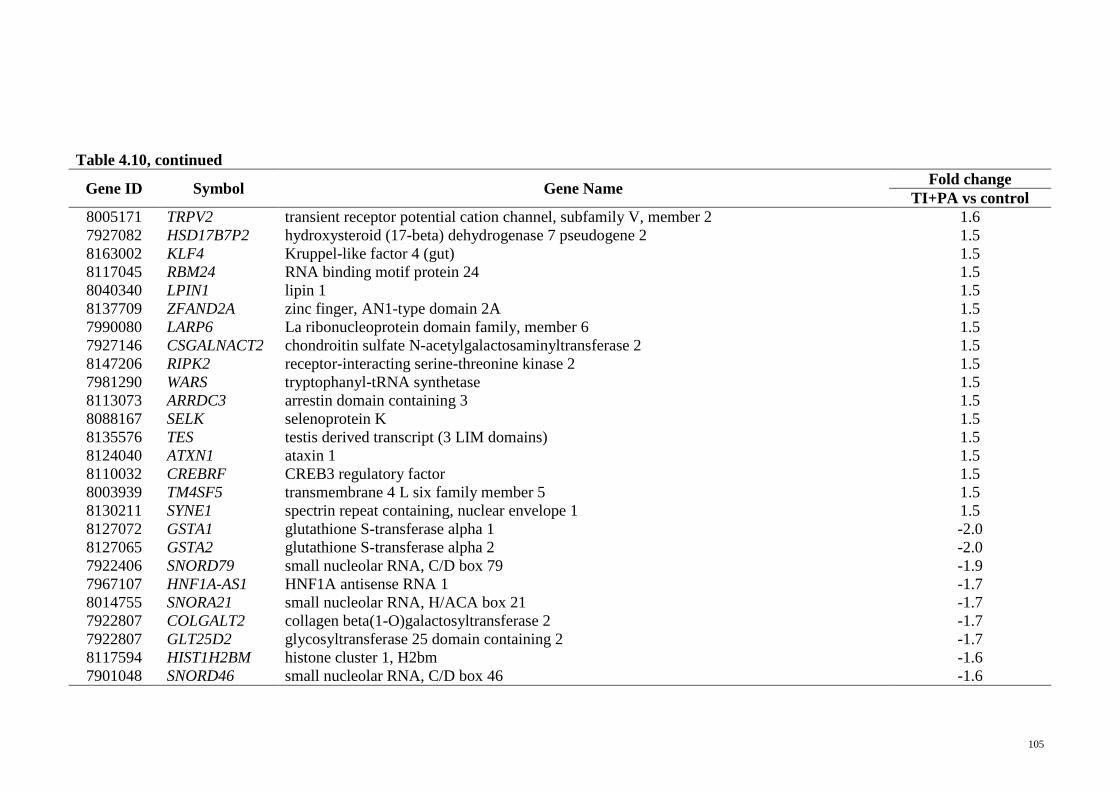
105
Table 4.10, continued
Gene ID Symbol Gene Name Fold change
TI+PA vs control
8005171 TRPV2 transient receptor potential cation channel, subfamily V, member 2 1.6
7927082 HSD17B7P2 hydroxysteroid (17-beta) dehydrogenase 7 pseudogene 2 1.5
8163002 KLF4 Kruppel-like factor 4 (gut) 1.5
8117045 RBM24 RNA binding motif protein 24 1.5
8040340 LPIN1 lipin 1 1.5
8137709 ZFAND2A zinc finger, AN1-type domain 2A 1.5
7990080 LARP6 La ribonucleoprotein domain family, member 6 1.5
7927146 CSGALNACT2 chondroitin sulfate N-acetylgalactosaminyltransferase 2 1.5
8147206 RIPK2 receptor-interacting serine-threonine kinase 2 1.5
7981290 WARS tryptophanyl-tRNA synthetase 1.5
8113073 ARRDC3 arrestin domain containing 3 1.5
8088167 SELK selenoprotein K 1.5
8135576 TES testis derived transcript (3 LIM domains) 1.5
8124040 ATXN1 ataxin 1 1.5
8110032 CREBRF CREB3 regulatory factor 1.5
8003939 TM4SF5 transmembrane 4 L six family member 5 1.5
8130211 SYNE1 spectrin repeat containing, nuclear envelope 1 1.5
8127072 GSTA1 glutathione S-transferase alpha 1 -2.0
8127065 GSTA2 glutathione S-transferase alpha 2 -2.0
7922406 SNORD79 small nucleolar RNA, C/D box 79 -1.9
7967107 HNF1A-AS1 HNF1A antisense RNA 1 -1.7
8014755 SNORA21 small nucleolar RNA, H/ACA box 21 -1.7
7922807 COLGALT2 collagen beta(1-O)galactosyltransferase 2 -1.7
7922807 GLT25D2 glycosyltransferase 25 domain containing 2 -1.7
8117594 HIST1H2BM histone cluster 1, H2bm -1.6
7901048 SNORD46 small nucleolar RNA, C/D box 46 -1.6
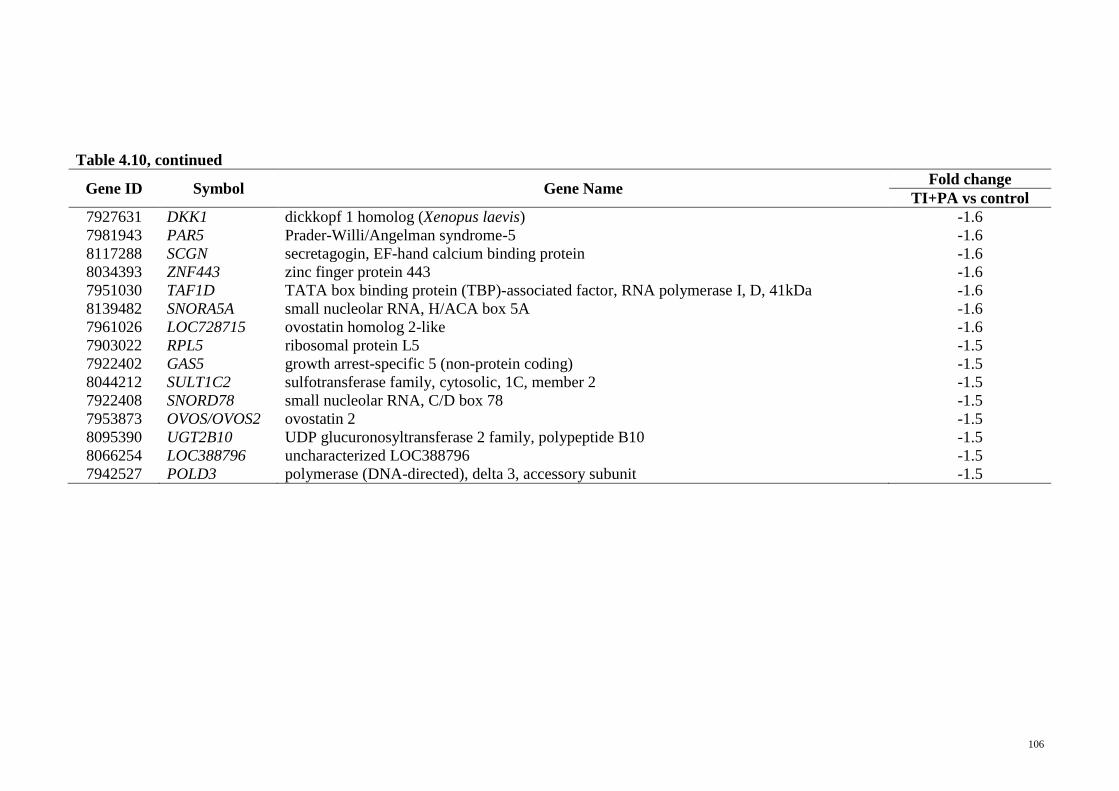
106
Table 4.10, continued
Gene ID Symbol Gene Name Fold change
TI+PA vs control
7927631 DKK1 dickkopf 1 homolog (Xenopus laevis) -1.6
7981943 PAR5 Prader-Willi/Angelman syndrome-5 -1.6
8117288 SCGN secretagogin, EF-hand calcium binding protein -1.6
8034393 ZNF443 zinc finger protein 443 -1.6
7951030 TAF1D TATA box binding protein (TBP)-associated factor, RNA polymerase I, D, 41kDa -1.6
8139482 SNORA5A small nucleolar RNA, H/ACA box 5A -1.6
7961026 LOC728715 ovostatin homolog 2-like -1.6
7903022 RPL5 ribosomal protein L5 -1.5
7922402 GAS5 growth arrest-specific 5 (non-protein coding) -1.5
8044212 SULT1C2 sulfotransferase family, cytosolic, 1C, member 2 -1.5
7922408 SNORD78 small nucleolar RNA, C/D box 78 -1.5
7953873 OVOS/OVOS2 ovostatin 2 -1.5
8095390 UGT2B10 UDP glucuronosyltransferase 2 family, polypeptide B10 -1.5
8066254 LOC388796 uncharacterized LOC388796 -1.5
7942527 POLD3 polymerase (DNA-directed), delta 3, accessory subunit -1.5
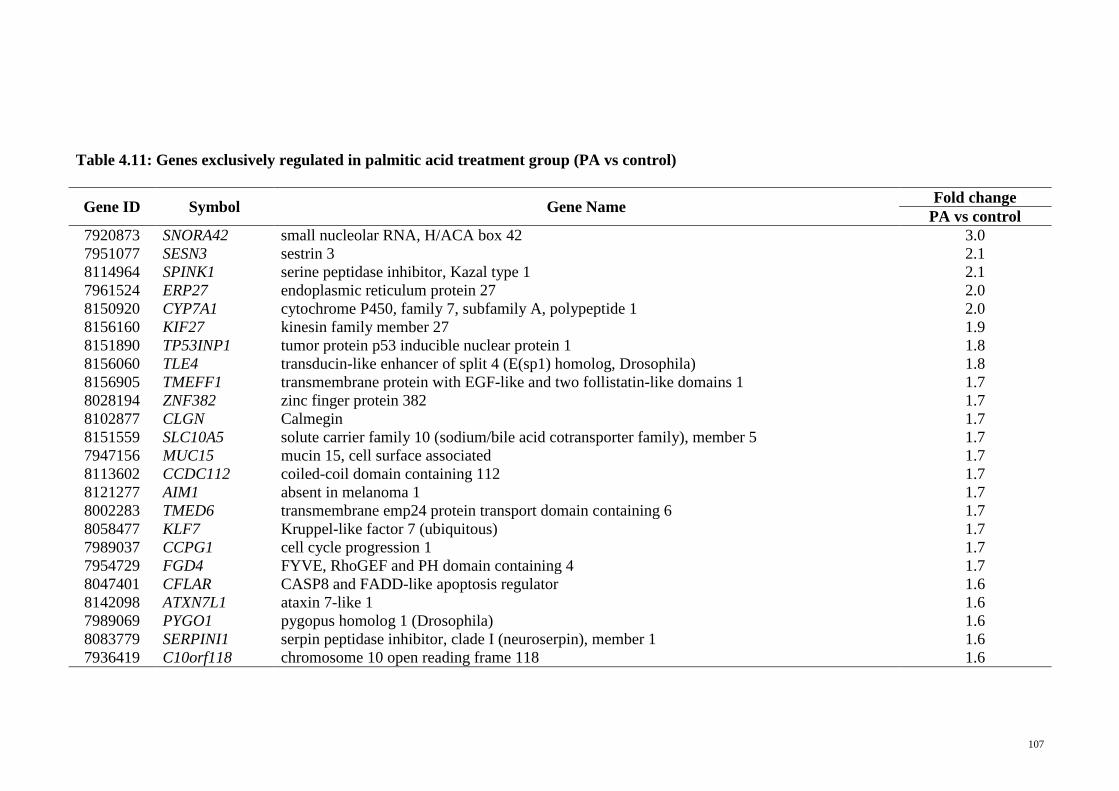
107
Table 4.11: Genes exclusively regulated in palmitic acid treatment group (PA vs control)
Gene ID Symbol Gene Name Fold change
PA vs control
7920873 SNORA42 small nucleolar RNA, H/ACA box 42 3.0
7951077 SESN3 sestrin 3 2.1
8114964 SPINK1 serine peptidase inhibitor, Kazal type 1 2.1
7961524 ERP27 endoplasmic reticulum protein 27 2.0
8150920 CYP7A1 cytochrome P450, family 7, subfamily A, polypeptide 1 2.0
8156160 KIF27 kinesin family member 27 1.9
8151890 TP53INP1 tumor protein p53 inducible nuclear protein 1 1.8
8156060 TLE4 transducin-like enhancer of split 4 (E(sp1) homolog, Drosophila) 1.8
8156905 TMEFF1 transmembrane protein with EGF-like and two follistatin-like domains 1 1.7
8028194 ZNF382 zinc finger protein 382 1.7
8102877 CLGN Calmegin 1.7
8151559 SLC10A5 solute carrier family 10 (sodium/bile acid cotransporter family), member 5 1.7
7947156 MUC15 mucin 15, cell surface associated 1.7
8113602 CCDC112 coiled-coil domain containing 112 1.7
8121277 AIM1 absent in melanoma 1 1.7
8002283 TMED6 transmembrane emp24 protein transport domain containing 6 1.7
8058477 KLF7 Kruppel-like factor 7 (ubiquitous) 1.7
7989037 CCPG1 cell cycle progression 1 1.7
7954729 FGD4 FYVE, RhoGEF and PH domain containing 4 1.7
8047401 CFLAR CASP8 and FADD-like apoptosis regulator 1.6
8142098 ATXN7L1 ataxin 7-like 1 1.6
7989069 PYGO1 pygopus homolog 1 (Drosophila) 1.6
8083779 SERPINI1 serpin peptidase inhibitor, clade I (neuroserpin), member 1 1.6
7936419 C10orf118 chromosome 10 open reading frame 118 1.6
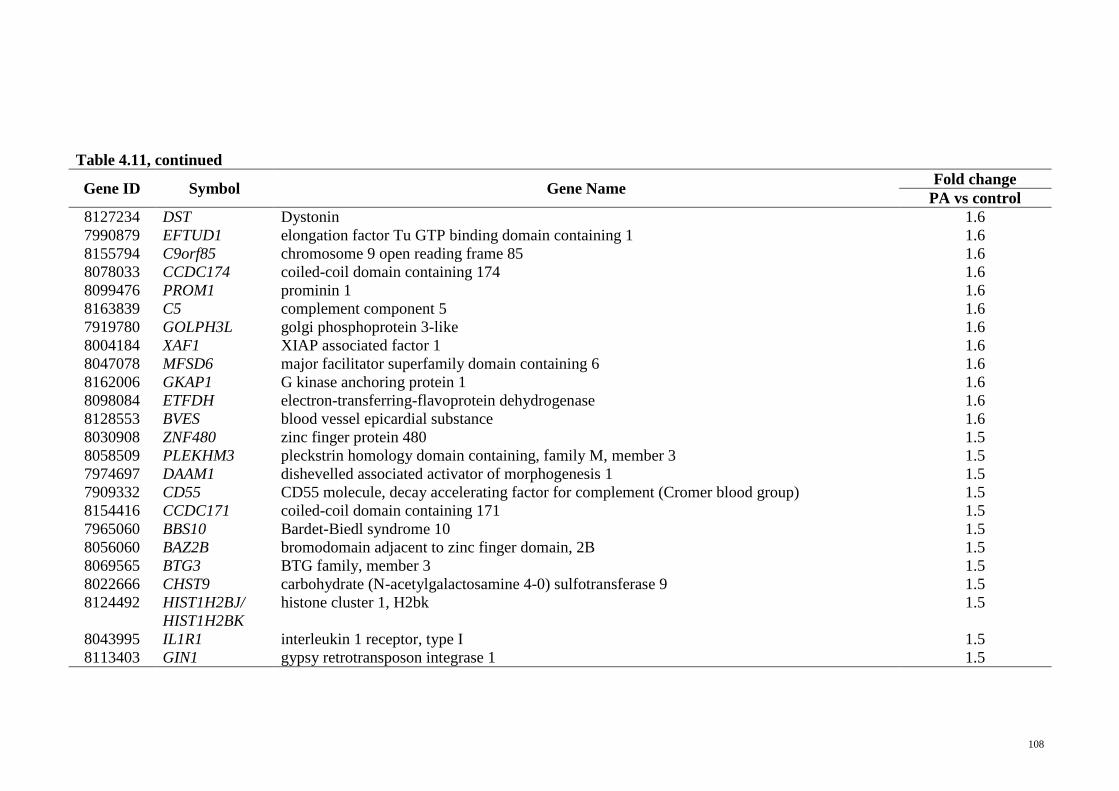
108
Table 4.11, continued
Gene ID Symbol Gene Name Fold change
PA vs control
8127234 DST Dystonin 1.6
7990879 EFTUD1 elongation factor Tu GTP binding domain containing 1 1.6
8155794 C9orf85 chromosome 9 open reading frame 85 1.6
8078033 CCDC174 coiled-coil domain containing 174 1.6
8099476 PROM1 prominin 1 1.6
8163839 C5 complement component 5 1.6
7919780 GOLPH3L golgi phosphoprotein 3-like 1.6
8004184 XAF1 XIAP associated factor 1 1.6
8047078 MFSD6 major facilitator superfamily domain containing 6 1.6
8162006 GKAP1 G kinase anchoring protein 1 1.6
8098084 ETFDH electron-transferring-flavoprotein dehydrogenase 1.6
8128553 BVES blood vessel epicardial substance 1.6
8030908 ZNF480 zinc finger protein 480 1.5
8058509 PLEKHM3 pleckstrin homology domain containing, family M, member 3 1.5
7974697 DAAM1 dishevelled associated activator of morphogenesis 1 1.5
7909332 CD55 CD55 molecule, decay accelerating factor for complement (Cromer blood group) 1.5
8154416 CCDC171 coiled-coil domain containing 171 1.5
7965060 BBS10 Bardet-Biedl syndrome 10 1.5
8056060 BAZ2B bromodomain adjacent to zinc finger domain, 2B 1.5
8069565 BTG3 BTG family, member 3 1.5
8022666 CHST9 carbohydrate (N-acetylgalactosamine 4-0) sulfotransferase 9 1.5
8124492
HIST1H2BJ/
HIST1H2BK
histone cluster 1, H2bk 1.5
8043995 IL1R1 interleukin 1 receptor, type I 1.5
8113403 GIN1 gypsy retrotransposon integrase 1 1.5
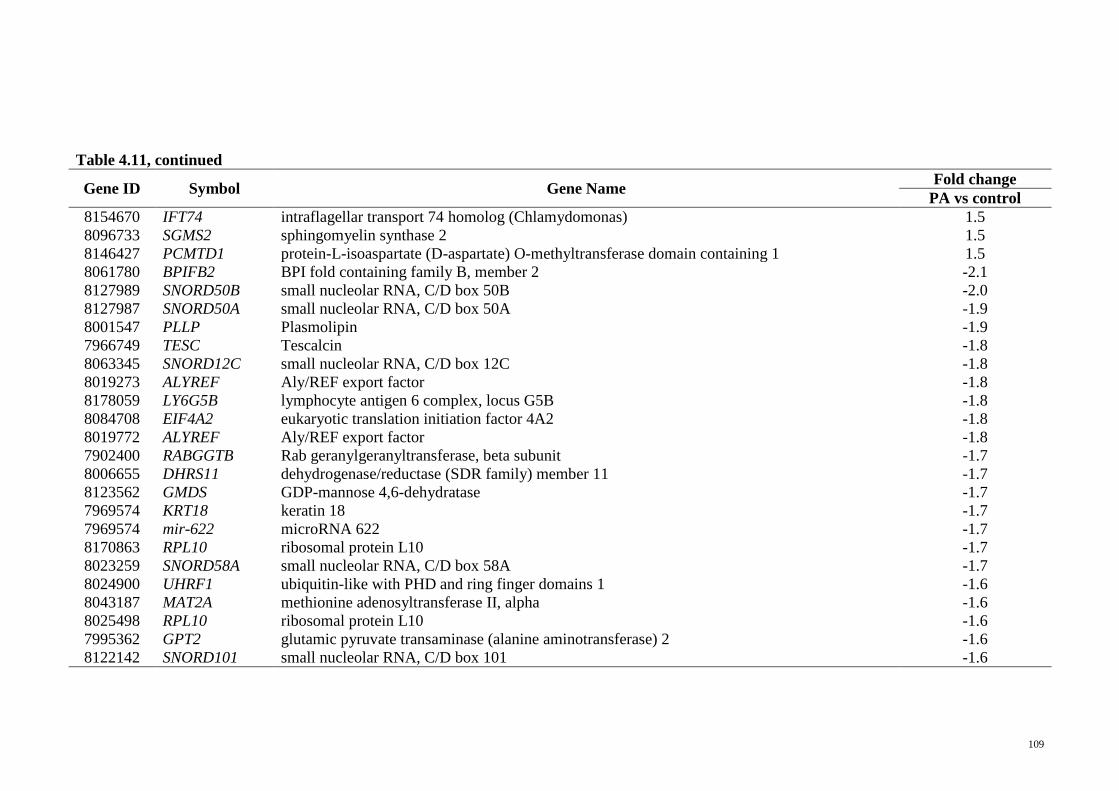
109
Table 4.11, continued
Gene ID Symbol Gene Name Fold change
PA vs control
8154670 IFT74 intraflagellar transport 74 homolog (Chlamydomonas) 1.5
8096733 SGMS2 sphingomyelin synthase 2 1.5
8146427 PCMTD1 protein-L-isoaspartate (D-aspartate) O-methyltransferase domain containing 1 1.5
8061780 BPIFB2 BPI fold containing family B, member 2 -2.1
8127989 SNORD50B small nucleolar RNA, C/D box 50B -2.0
8127987 SNORD50A small nucleolar RNA, C/D box 50A -1.9
8001547 PLLP Plasmolipin -1.9
7966749 TESC Tescalcin -1.8
8063345 SNORD12C small nucleolar RNA, C/D box 12C -1.8
8019273 ALYREF Aly/REF export factor -1.8
8178059 LY6G5B lymphocyte antigen 6 complex, locus G5B -1.8
8084708 EIF4A2 eukaryotic translation initiation factor 4A2 -1.8
8019772 ALYREF Aly/REF export factor -1.8
7902400 RABGGTB Rab geranylgeranyltransferase, beta subunit -1.7
8006655 DHRS11 dehydrogenase/reductase (SDR family) member 11 -1.7
8123562 GMDS GDP-mannose 4,6-dehydratase -1.7
7969574 KRT18 keratin 18 -1.7
7969574 mir-622 microRNA 622 -1.7
8170863 RPL10 ribosomal protein L10 -1.7
8023259 SNORD58A small nucleolar RNA, C/D box 58A -1.7
8024900 UHRF1 ubiquitin-like with PHD and ring finger domains 1 -1.6
8043187 MAT2A methionine adenosyltransferase II, alpha -1.6
8025498 RPL10 ribosomal protein L10 -1.6
7995362 GPT2 glutamic pyruvate transaminase (alanine aminotransferase) 2 -1.6
8122142 SNORD101 small nucleolar RNA, C/D box 101 -1.6
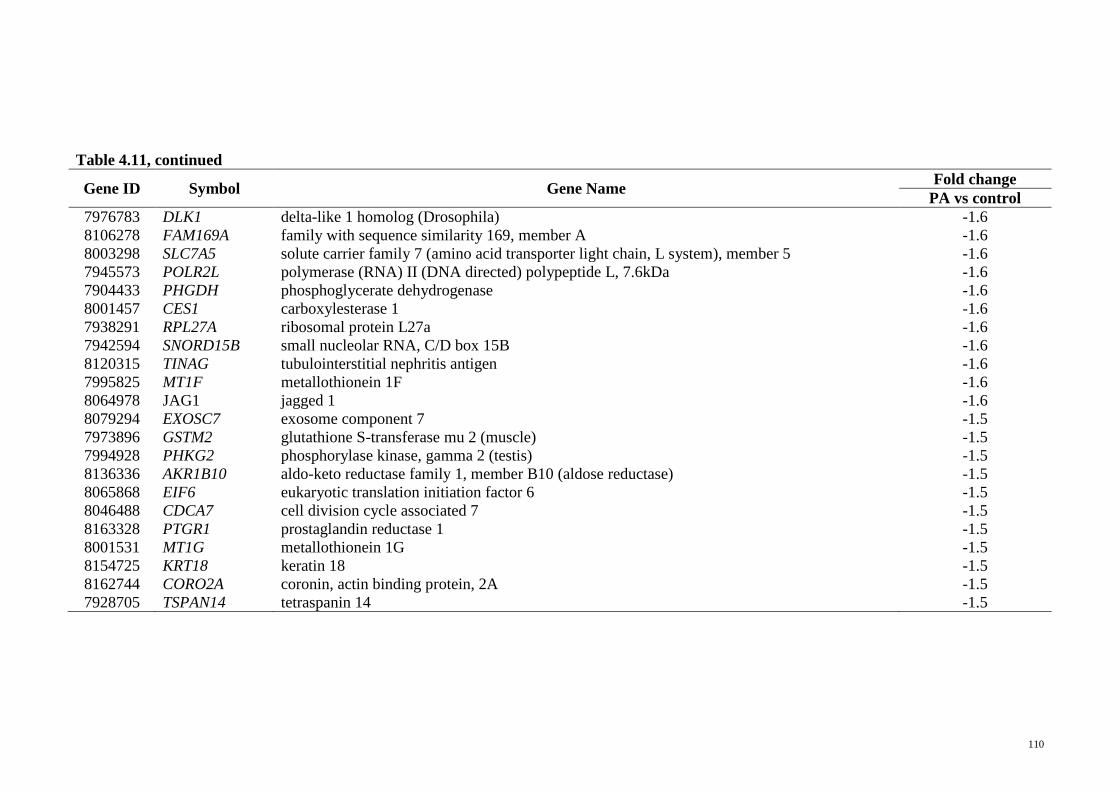
110
Table 4.11, continued
Gene ID Symbol Gene Name Fold change
PA vs control
7976783 DLK1 delta-like 1 homolog (Drosophila) -1.6
8106278 FAM169A family with sequence similarity 169, member A -1.6
8003298 SLC7A5 solute carrier family 7 (amino acid transporter light chain, L system), member 5 -1.6
7945573 POLR2L polymerase (RNA) II (DNA directed) polypeptide L, 7.6kDa -1.6
7904433 PHGDH phosphoglycerate dehydrogenase -1.6
8001457 CES1 carboxylesterase 1 -1.6
7938291 RPL27A ribosomal protein L27a -1.6
7942594 SNORD15B small nucleolar RNA, C/D box 15B -1.6
8120315 TINAG tubulointerstitial nephritis antigen -1.6
7995825 MT1F metallothionein 1F -1.6
8064978 JAG1 jagged 1 -1.6
8079294 EXOSC7 exosome component 7 -1.5
7973896 GSTM2 glutathione S-transferase mu 2 (muscle) -1.5
7994928 PHKG2 phosphorylase kinase, gamma 2 (testis) -1.5
8136336 AKR1B10 aldo-keto reductase family 1, member B10 (aldose reductase) -1.5
8065868 EIF6 eukaryotic translation initiation factor 6 -1.5
8046488 CDCA7 cell division cycle associated 7 -1.5
8163328 PTGR1 prostaglandin reductase 1 -1.5
8001531 MT1G metallothionein 1G -1.5
8154725 KRT18 keratin 18 -1.5
8162744 CORO2A coronin, actin binding protein, 2A -1.5
7928705 TSPAN14 tetraspanin 14 -1.5
111
4.4.4 Functional analyses of significantly regulated genes using IPA software
The significantly regulated genes were subjected to functional analyses using
IPA Core Analysis software. The genes were mapped to the Ingenuity Knowledge Base
creating molecular networks which were generated de novo. The software also
determines over represented signalling and metabolic canonical pathways and identifies
the cascade of upstream transcriptional regulators that can explain the observed gene
expression changes in the study, from which illuminates the biological activities
occurring in the cells being studied.
4.4.4.1 Network and functional analysis
Network analysis of significantly regulated genes in all treatments revealed that
different network functions were involved (Table 4.12). In all three treatments, cancer,
cell growth and proliferation, as well as cell death-related networks appeared as the
dominant associated network functions. Lipid metabolism-related network was shown
to be regulated in TI+PA vs control treatment group only, with a score of 40. In the
FF+PA vs control group, carbohydrate metabolism was generated as one of the
associated network functions, with a score of 42 and 28. On the other hand, in the PA vs
control group, cellular growth and proliferation-related networks were dominant.
Figure 4.21 illustrates the molecular relationships in “Lipid Metabolism, Small
Molecule Biochemistry, Metabolic Disease” network generated in TI+PA vs control
group. It can be seen from the network that the nodes converged to a few central nodes,
namely the Rxr, ERK1/2, MAP2K1/2, CYP19A1, FSH and LH, indicating that these
genes may be of significant importance in regulating this particular network.
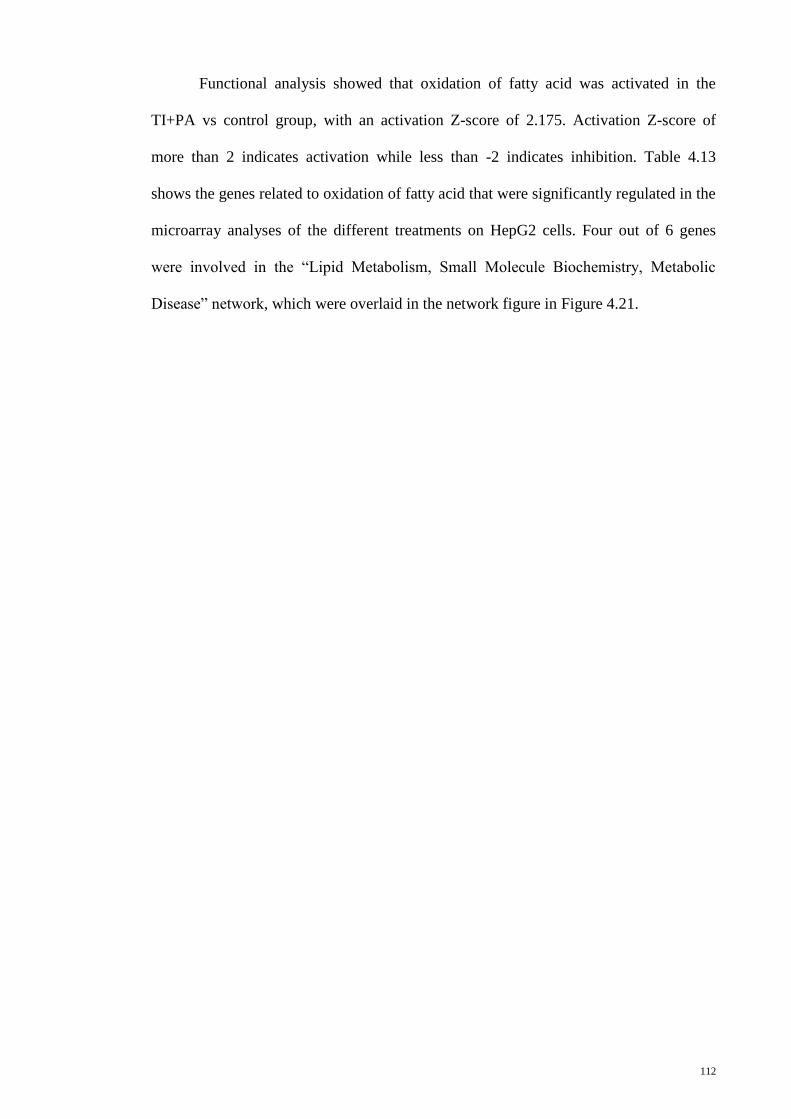
112
Functional analysis showed that oxidation of fatty acid was activated in the
TI+PA vs control group, with an activation Z-score of 2.175. Activation Z-score of
more than 2 indicates activation while less than -2 indicates inhibition. Table 4.13
shows the genes related to oxidation of fatty acid that were significantly regulated in the
microarray analyses of the different treatments on HepG2 cells. Four out of 6 genes
were involved in the “Lipid Metabolism, Small Molecule Biochemistry, Metabolic
Disease” network, which were overlaid in the network figure in Figure 4.21.
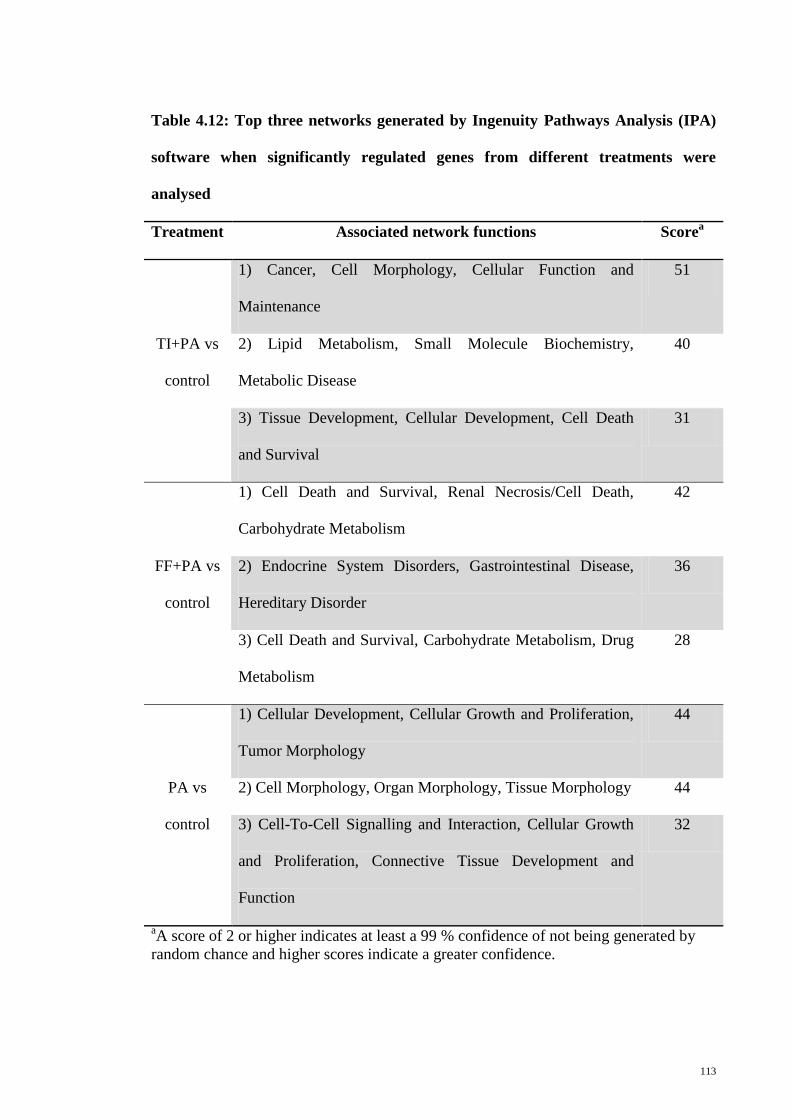
113
Table 4.12: Top three networks generated by Ingenuity Pathways Analysis (IPA)
software when significantly regulated genes from different treatments were
analysed
Treatment Associated network functions Scorea
TI+PA vs
control
1) Cancer, Cell Morphology, Cellular Function and
Maintenance
51
2) Lipid Metabolism, Small Molecule Biochemistry,
Metabolic Disease
40
3) Tissue Development, Cellular Development, Cell Death
and Survival
31
FF+PA vs
control
1) Cell Death and Survival, Renal Necrosis/Cell Death,
Carbohydrate Metabolism
42
2) Endocrine System Disorders, Gastrointestinal Disease,
Hereditary Disorder
36
3) Cell Death and Survival, Carbohydrate Metabolism, Drug
Metabolism
28
PA vs
control
1) Cellular Development, Cellular Growth and Proliferation,
Tumor Morphology
44
2) Cell Morphology, Organ Morphology, Tissue Morphology 44
3) Cell-To-Cell Signalling and Interaction, Cellular Growth
and Proliferation, Connective Tissue Development and
Function
32
aA score of 2 or higher indicates at least a 99 % confidence of not being generated by
random chance and higher scores indicate a greater confidence.
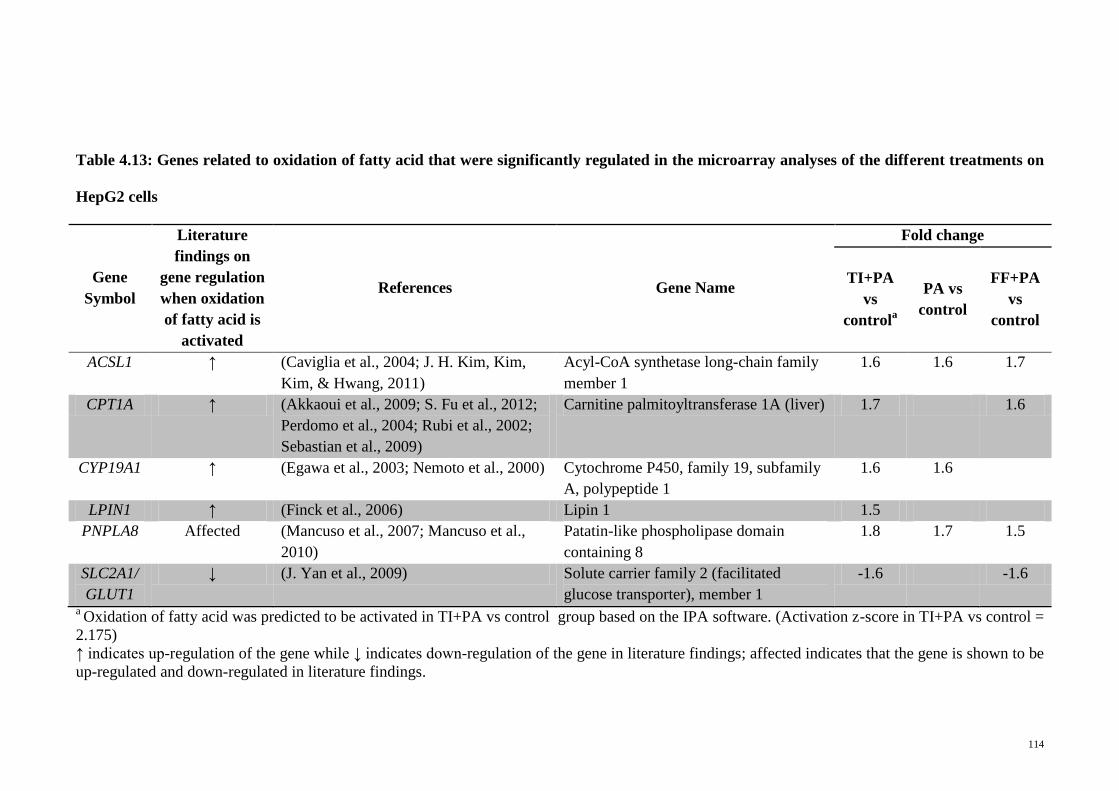
114
Table 4.13: Genes related to oxidation of fatty acid that were significantly regulated in the microarray analyses of the different treatments on
HepG2 cells
Gene
Symbol
Literature
findings on
gene regulation
when oxidation
of fatty acid is
activated
References Gene Name
Fold change
TI+PA
vs
controla
PA vs
control
FF+PA
vs
control
ACSL1 ↑ (Caviglia et al., 2004; J. H. Kim, Kim,
Kim, & Hwang, 2011)
Acyl-CoA synthetase long-chain family
member 1
1.6 1.6 1.7
CPT1A ↑ (Akkaoui et al., 2009; S. Fu et al., 2012;
Perdomo et al., 2004; Rubi et al., 2002;
Sebastian et al., 2009)
Carnitine palmitoyltransferase 1A (liver) 1.7 1.6
CYP19A1 ↑ (Egawa et al., 2003; Nemoto et al., 2000) Cytochrome P450, family 19, subfamily
A, polypeptide 1
1.6 1.6
LPIN1 ↑ (Finck et al., 2006) Lipin 1 1.5
PNPLA8 Affected (Mancuso et al., 2007; Mancuso et al.,
2010)
Patatin-like phospholipase domain
containing 8
1.8 1.7 1.5
SLC2A1/
GLUT1
↓ (J. Yan et al., 2009) Solute carrier family 2 (facilitated
glucose transporter), member 1
-1.6 -1.6
a Oxidation of fatty acid was predicted to be activated in TI+PA vs control group based on the IPA software. (Activation z-score in TI+PA vs control =
2.175)
↑ indicates up-regulation of the gene while ↓ indicates down-regulation of the gene in literature findings; affected indicates that the gene is shown to be
up-regulated and down-regulated in literature findings.
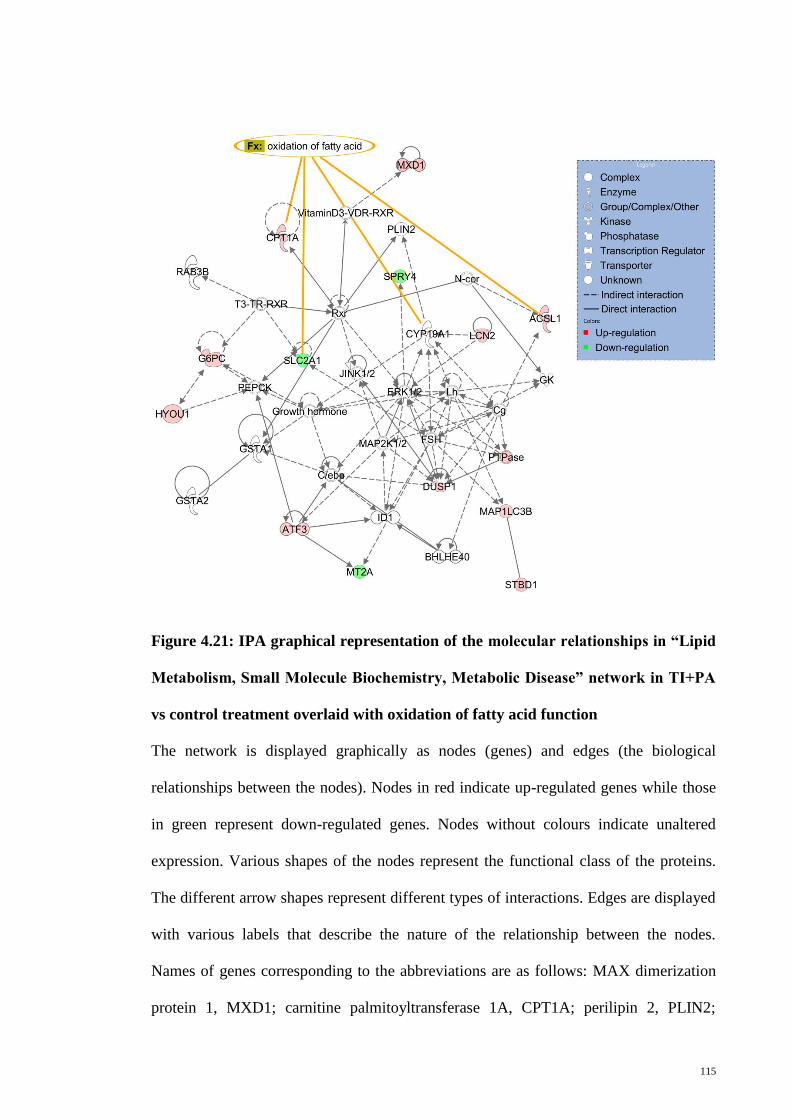
115
Figure 4.21: IPA graphical representation of the molecular relationships in “Lipid
Metabolism, Small Molecule Biochemistry, Metabolic Disease” network in TI+PA
vs control treatment overlaid with oxidation of fatty acid function
The network is displayed graphically as nodes (genes) and edges (the biological
relationships between the nodes). Nodes in red indicate up-regulated genes while those
in green represent down-regulated genes. Nodes without colours indicate unaltered
expression. Various shapes of the nodes represent the functional class of the proteins.
The different arrow shapes represent different types of interactions. Edges are displayed
with various labels that describe the nature of the relationship between the nodes.
Names of genes corresponding to the abbreviations are as follows: MAX dimerization
protein 1, MXD1; carnitine palmitoyltransferase 1A, CPT1A; perilipin 2, PLIN2;
116
sprouty homolog 4, SPRY4; retinoid receptor, Rxr; glucose-6-phosphatase, G6PC;
hypoxia up-regulated 1, HYOU1; phosphoenolpyruvate carboxykinase, PEPCK;
glutathione S-transferase alpha 1, GSTA1; glutathione S-transferase alpha 2, GSTA2;
JNK p54, JINK1/2; lutenizing hormone, Lh; chorionic gonadotrophin, Cg; glycerol
kinase, GK; acyl-coA synthetase long-chain family member 1, ACSL1; follicle-
stimulating hormone, FSH; lipocalin 2, LCN2; activating transcription factor 3, ATF3;
metallothionein 2A, MT2A; inhibitor of DNA binding 1, dominant negative helix-loop-
helix protein, ID1; dual specificity phosphatase 1, DUSP1; phosphotyrosine
phosphatase, PTPase; microtubule-associated protein 1 light chain 3 beta, MAP1LC3B;
starch binding domain 1, STBD1; basic helix-loop-helix family e40, BHLHE40;
cytochrome p450, family 19, subfamily A, polypeptide 1, CYP19A1; solute carrier
family 2 (facilitated glucose transporter), member 1, SLC2A1.
117
4.4.4.2 Canonical pathway analysis
The top three canonical pathways generated by IPA software are shown in Table
4.14. PXR/RXR activation was shown as the top canonical pathway in TI+PA vs
control and PA vs control treatment groups with p-values of 1.03E-04 and 1.47E-02
respectively. Figure 4.22 illustrates the relationship between the regulated genes with
other interactomes in the PXR/RXR pathway and their implications on gluconeogenesis
and lipid metabolism.
Mitochondrial L-carnitine shuttle pathway was one of the top three canonical
pathways in TI+PA vs control and FF+PA vs control treatment groups with p-values of
6.97E-03 and 1.86E-03, respectively. Figure 4.23 depicts the molecular relationships of
the regulated genes and other interactomes in the pathway.
Other pathways like LPS/IL-1 mediated inhibition of RXR function was the
second canonical pathway generated in the TI+PA vs control treatment. P38 MAPK
signalling and TNFR2 signalling were involved in FF+PA vs control treatment while
alanine degradation III and alanine biosynthesis II were predicted to be regulated in PA
vs control treatment.
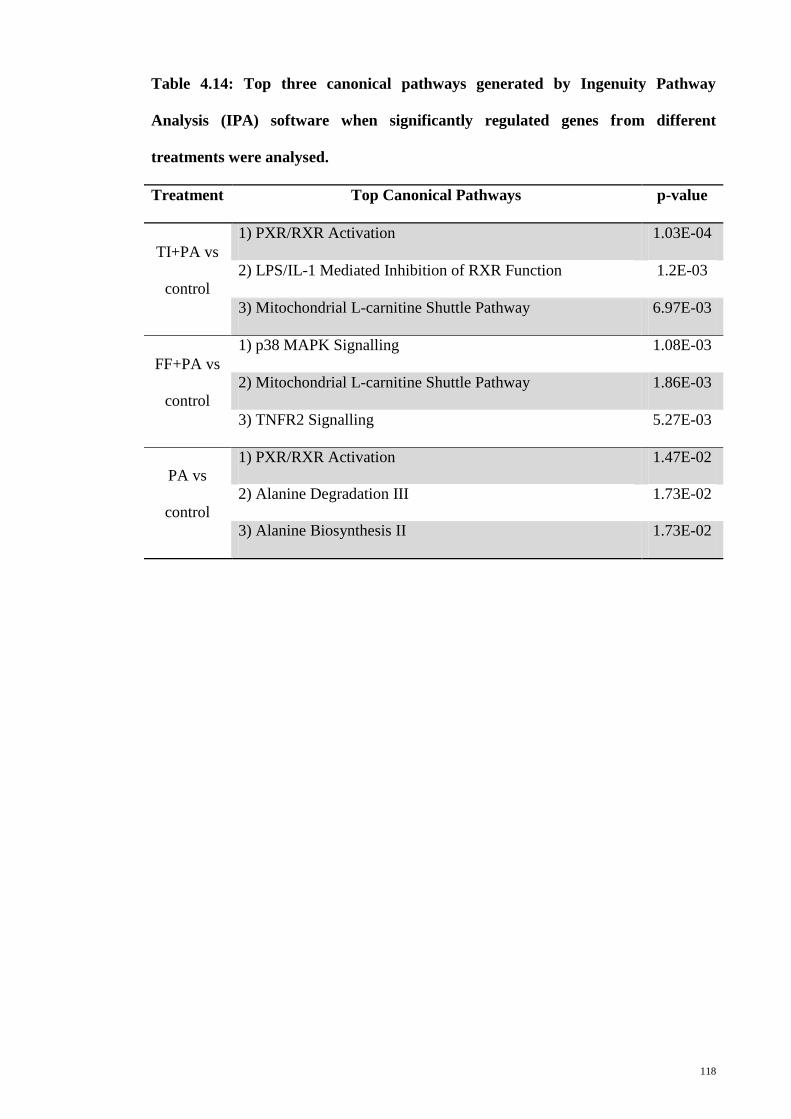
118
Table 4.14: Top three canonical pathways generated by Ingenuity Pathway
Analysis (IPA) software when significantly regulated genes from different
treatments were analysed.
Treatment Top Canonical Pathways p-value
TI+PA vs
control
1) PXR/RXR Activation 1.03E-04
2) LPS/IL-1 Mediated Inhibition of RXR Function 1.2E-03
3) Mitochondrial L-carnitine Shuttle Pathway 6.97E-03
FF+PA vs
control
1) p38 MAPK Signalling 1.08E-03
2) Mitochondrial L-carnitine Shuttle Pathway 1.86E-03
3) TNFR2 Signalling 5.27E-03
PA vs
control
1) PXR/RXR Activation 1.47E-02
2) Alanine Degradation III 1.73E-02
3) Alanine Biosynthesis II 1.73E-02
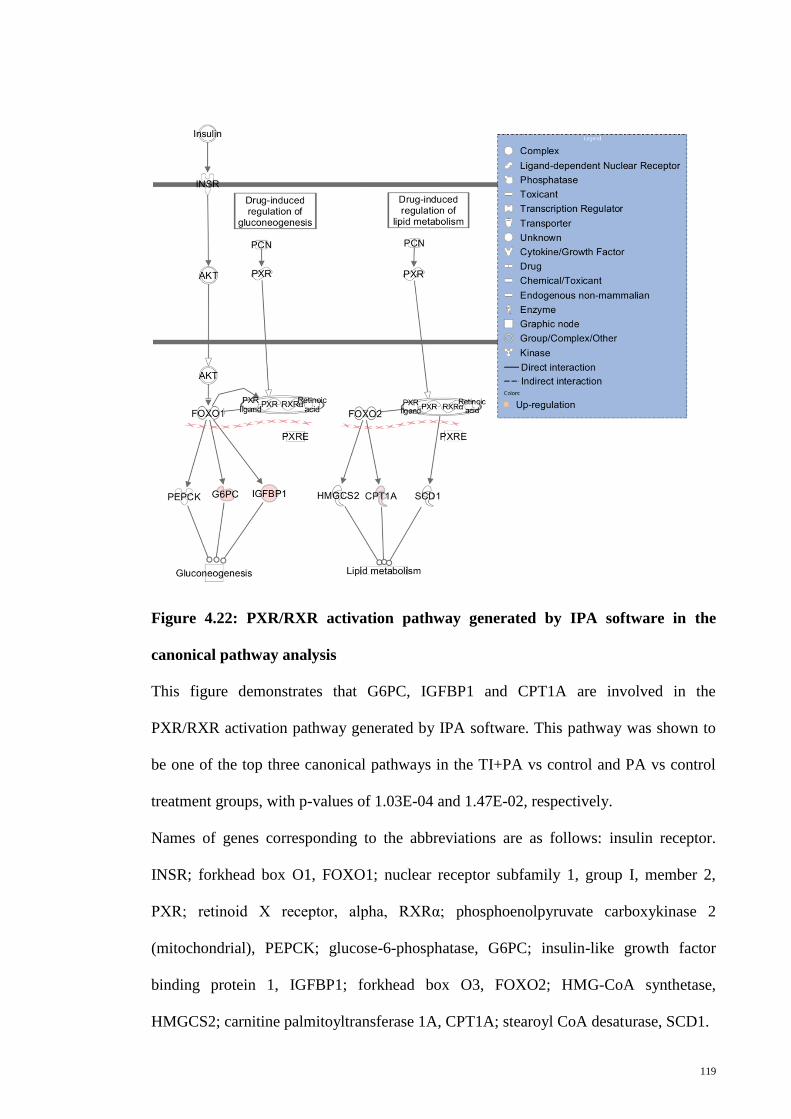
119
Figure 4.22: PXR/RXR activation pathway generated by IPA software in the
canonical pathway analysis
This figure demonstrates that G6PC, IGFBP1 and CPT1A are involved in the
PXR/RXR activation pathway generated by IPA software. This pathway was shown to
be one of the top three canonical pathways in the TI+PA vs control and PA vs control
treatment groups, with p-values of 1.03E-04 and 1.47E-02, respectively.
Names of genes corresponding to the abbreviations are as follows: insulin receptor.
INSR; forkhead box O1, FOXO1; nuclear receptor subfamily 1, group I, member 2,
PXR; retinoid X receptor, alpha, RXRα; phosphoenolpyruvate carboxykinase 2
(mitochondrial), PEPCK; glucose-6-phosphatase, G6PC; insulin-like growth factor
binding protein 1, IGFBP1; forkhead box O3, FOXO2; HMG-CoA synthetase,
HMGCS2; carnitine palmitoyltransferase 1A, CPT1A; stearoyl CoA desaturase, SCD1.
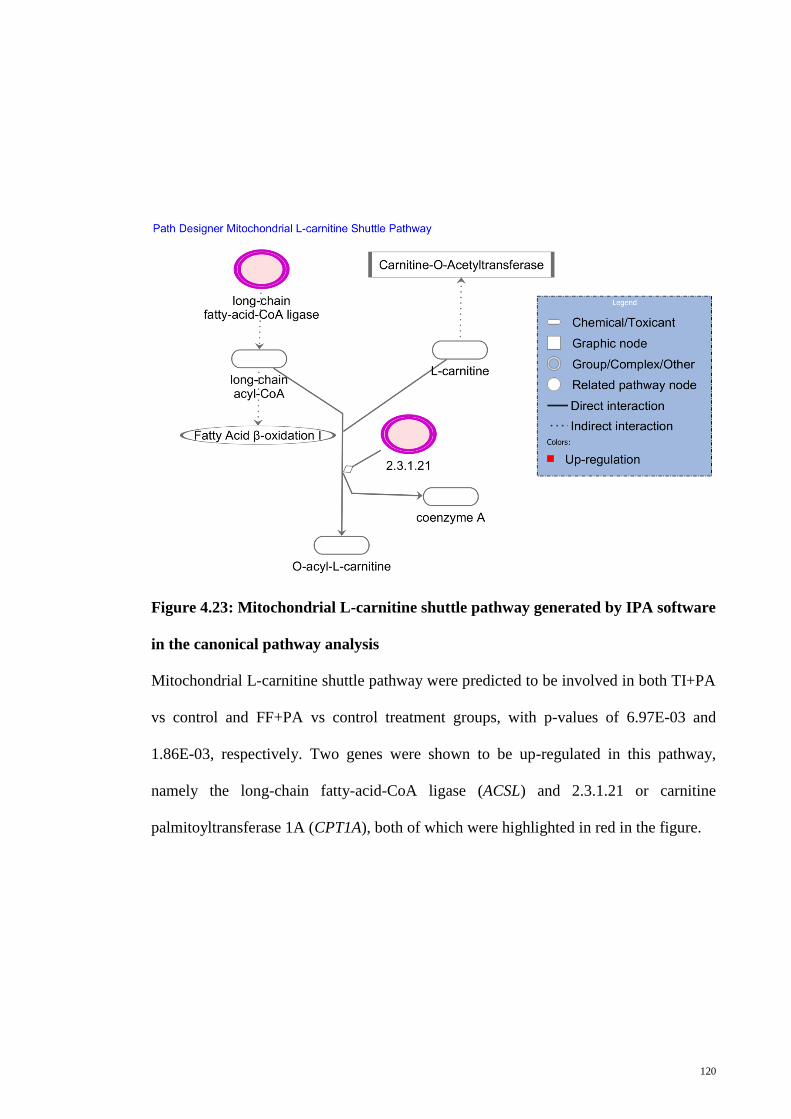
120
Figure 4.23: Mitochondrial L-carnitine shuttle pathway generated by IPA software
in the canonical pathway analysis
Mitochondrial L-carnitine shuttle pathway were predicted to be involved in both TI+PA
vs control and FF+PA vs control treatment groups, with p-values of 6.97E-03 and
1.86E-03, respectively. Two genes were shown to be up-regulated in this pathway,
namely the long-chain fatty-acid-CoA ligase (ACSL) and 2.3.1.21 or carnitine
palmitoyltransferase 1A (CPT1A), both of which were highlighted in red in the figure.
121
4.4.4.3 Upstream regulators analysis
The upstream regulator analysis is based on prior knowledge of expected effects
between transcriptional regulators and their target genes stored in the Ingenuity
Knowledge Base. The analysis examines how many known targets of each transcription
regulator are present in the dataset, and also compares their direction of change to what
is expected from the literature in order to predict likely relevant transcriptional
regulators.
Table 4.15 shows the upstream regulators predicted to be regulated in HepG2
cells exposed to the different treatments. Activation Z-score of more than 2 indicates
activation while less than -2 indicates inhibition. Twelve transcription factors were
predicted to be regulated in the TI+PA vs control treatment, in which 11 were up-
regulated and 1 was down-regulated. In the FF+PA vs control treatment, 5 were
predicted to be altered while 3 were predicted to be activated in the PA vs control
treatment group. XBP1 was shown to be commonly activated in all treatments. PPARA
and FOXO3 were predicted to be activated in TI+PA vs control group and FF+PA vs
control group.
Tables 4.16 and 4.17 show the significantly regulated genes that were involved
in the downstream mechanism of the predicted activation of PPARA and PPARG.
Figure 4.24 displays the molecular interactions between the 4 upstream regulators and
the downstream molecules.
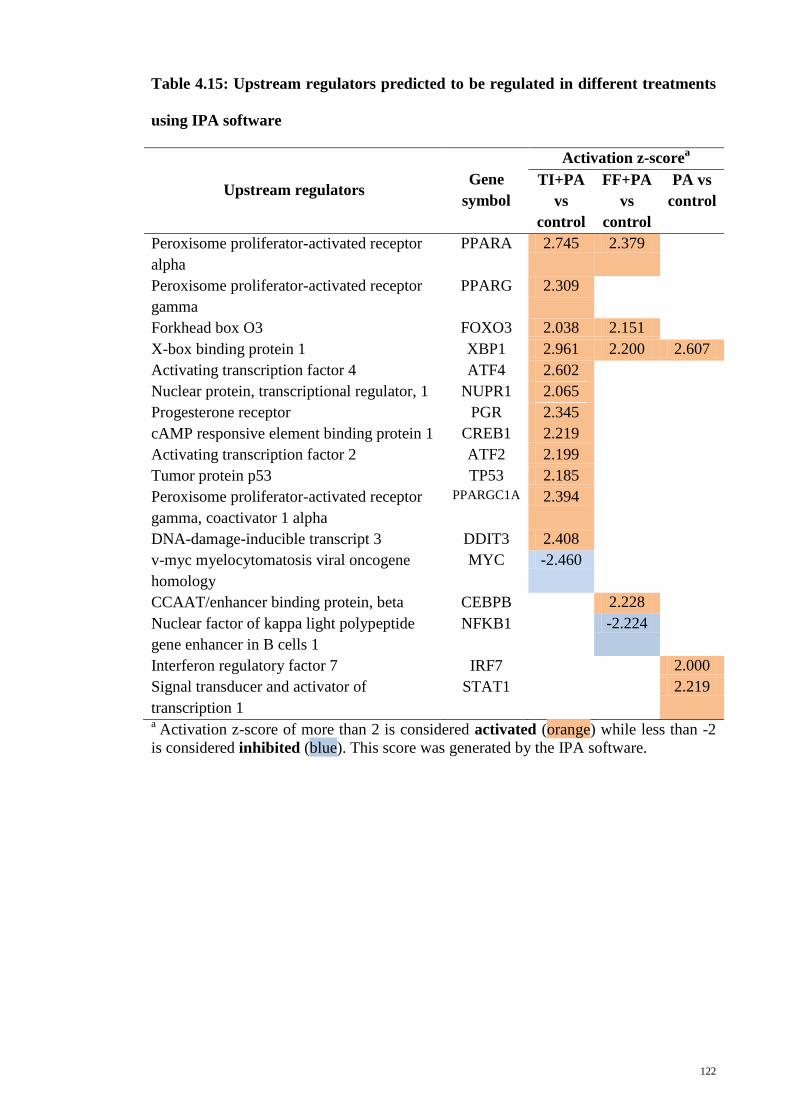
122
Table 4.15: Upstream regulators predicted to be regulated in different treatments
using IPA software
Upstream regulators Gene
symbol
Activation z-scorea
TI+PA
vs
control
FF+PA
vs
control
PA vs
control
Peroxisome proliferator-activated receptor
alpha
PPARA 2.745 2.379
Peroxisome proliferator-activated receptor
gamma
PPARG 2.309
Forkhead box O3 FOXO3 2.038 2.151
X-box binding protein 1 XBP1 2.961 2.200 2.607
Activating transcription factor 4 ATF4 2.602
Nuclear protein, transcriptional regulator, 1 NUPR1 2.065
Progesterone receptor PGR 2.345
cAMP responsive element binding protein 1 CREB1 2.219
Activating transcription factor 2 ATF2 2.199
Tumor protein p53 TP53 2.185
Peroxisome proliferator-activated receptor
gamma, coactivator 1 alpha
PPARGC1A 2.394
DNA-damage-inducible transcript 3 DDIT3 2.408
v-myc myelocytomatosis viral oncogene
homology
MYC -2.460
CCAAT/enhancer binding protein, beta CEBPB 2.228
Nuclear factor of kappa light polypeptide
gene enhancer in B cells 1
NFKB1 -2.224
Interferon regulatory factor 7 IRF7 2.000
Signal transducer and activator of
transcription 1
STAT1 2.219
a Activation z-score of more than 2 is considered activated (orange) while less than -2
is considered inhibited (blue). This score was generated by the IPA software.
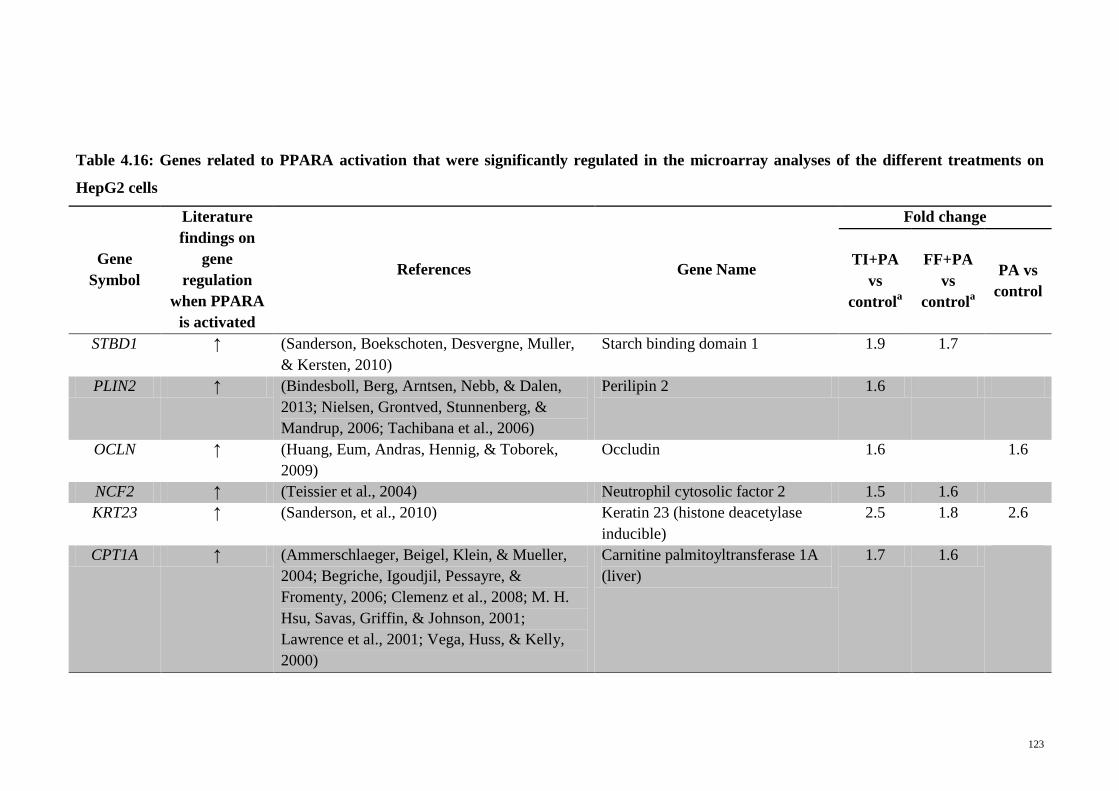
123
Table 4.16: Genes related to PPARA activation that were significantly regulated in the microarray analyses of the different treatments on
HepG2 cells
Gene
Symbol
Literature
findings on
gene
regulation
when PPARA
is activated
References Gene Name
Fold change
TI+PA
vs
controla
FF+PA
vs
controla
PA vs
control
STBD1 ↑ (Sanderson, Boekschoten, Desvergne, Muller,
& Kersten, 2010)
Starch binding domain 1 1.9 1.7
PLIN2 ↑ (Bindesboll, Berg, Arntsen, Nebb, & Dalen,
2013; Nielsen, Grontved, Stunnenberg, &
Mandrup, 2006; Tachibana et al., 2006)
Perilipin 2 1.6
OCLN ↑ (Huang, Eum, Andras, Hennig, & Toborek,
2009)
Occludin 1.6 1.6
NCF2 ↑ (Teissier et al., 2004) Neutrophil cytosolic factor 2 1.5 1.6
KRT23 ↑ (Sanderson, et al., 2010) Keratin 23 (histone deacetylase
inducible)
2.5 1.8 2.6
CPT1A ↑ (Ammerschlaeger, Beigel, Klein, & Mueller,
2004; Begriche, Igoudjil, Pessayre, &
Fromenty, 2006; Clemenz et al., 2008; M. H.
Hsu, Savas, Griffin, & Johnson, 2001;
Lawrence et al., 2001; Vega, Huss, & Kelly,
2000)
Carnitine palmitoyltransferase 1A
(liver)
1.7 1.6
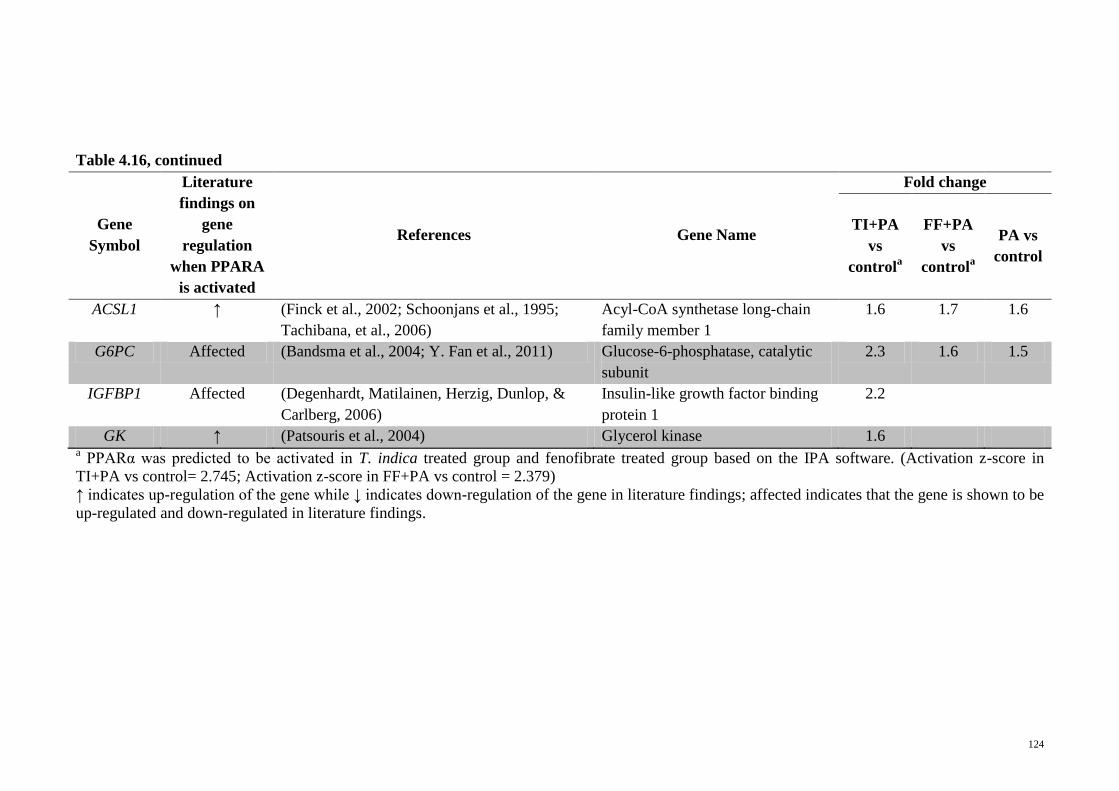
124
Table 4.16, continued
Gene
Symbol
Literature
findings on
gene
regulation
when PPARA
is activated
References Gene Name
Fold change
TI+PA
vs
controla
FF+PA
vs
controla
PA vs
control
ACSL1 ↑ (Finck et al., 2002; Schoonjans et al., 1995;
Tachibana, et al., 2006)
Acyl-CoA synthetase long-chain
family member 1
1.6 1.7 1.6
G6PC Affected (Bandsma et al., 2004; Y. Fan et al., 2011) Glucose-6-phosphatase, catalytic
subunit
2.3 1.6 1.5
IGFBP1 Affected (Degenhardt, Matilainen, Herzig, Dunlop, &
Carlberg, 2006)
Insulin-like growth factor binding
protein 1
2.2
GK ↑ (Patsouris et al., 2004) Glycerol kinase 1.6 a PPARα was predicted to be activated in T. indica treated group and fenofibrate treated group based on the IPA software. (Activation z-score in
TI+PA vs control= 2.745; Activation z-score in FF+PA vs control = 2.379)
↑ indicates up-regulation of the gene while ↓ indicates down-regulation of the gene in literature findings; affected indicates that the gene is shown to be
up-regulated and down-regulated in literature findings.
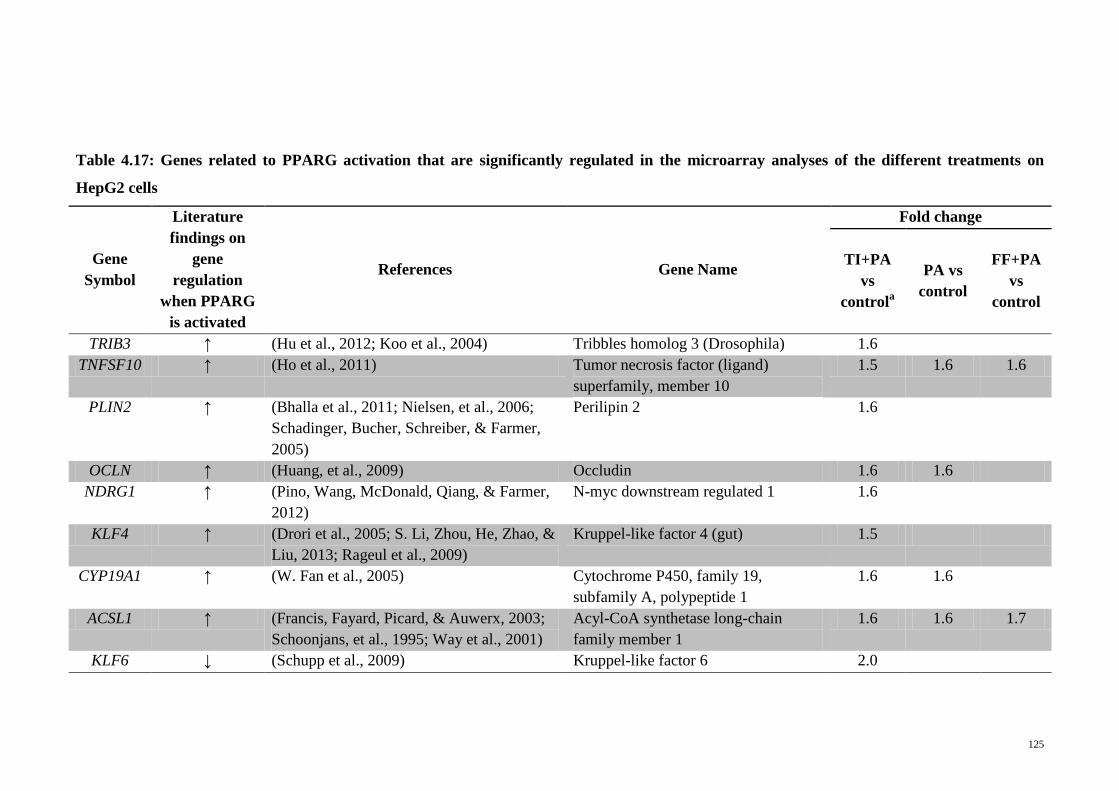
125
Table 4.17: Genes related to PPARG activation that are significantly regulated in the microarray analyses of the different treatments on
HepG2 cells
Gene
Symbol
Literature
findings on
gene
regulation
when PPARG
is activated
References Gene Name
Fold change
TI+PA
vs
controla
PA vs
control
FF+PA
vs
control
TRIB3 ↑ (Hu et al., 2012; Koo et al., 2004) Tribbles homolog 3 (Drosophila) 1.6
TNFSF10 ↑ (Ho et al., 2011) Tumor necrosis factor (ligand)
superfamily, member 10
1.5 1.6 1.6
PLIN2 ↑ (Bhalla et al., 2011; Nielsen, et al., 2006;
Schadinger, Bucher, Schreiber, & Farmer,
2005)
Perilipin 2 1.6
OCLN ↑ (Huang, et al., 2009) Occludin 1.6 1.6
NDRG1 ↑ (Pino, Wang, McDonald, Qiang, & Farmer,
2012)
N-myc downstream regulated 1 1.6
KLF4 ↑ (Drori et al., 2005; S. Li, Zhou, He, Zhao, &
Liu, 2013; Rageul et al., 2009)
Kruppel-like factor 4 (gut) 1.5
CYP19A1 ↑ (W. Fan et al., 2005) Cytochrome P450, family 19,
subfamily A, polypeptide 1
1.6 1.6
ACSL1 ↑ (Francis, Fayard, Picard, & Auwerx, 2003;
Schoonjans, et al., 1995; Way et al., 2001)
Acyl-CoA synthetase long-chain
family member 1
1.6 1.6 1.7
KLF6 ↓ (Schupp et al., 2009) Kruppel-like factor 6 2.0
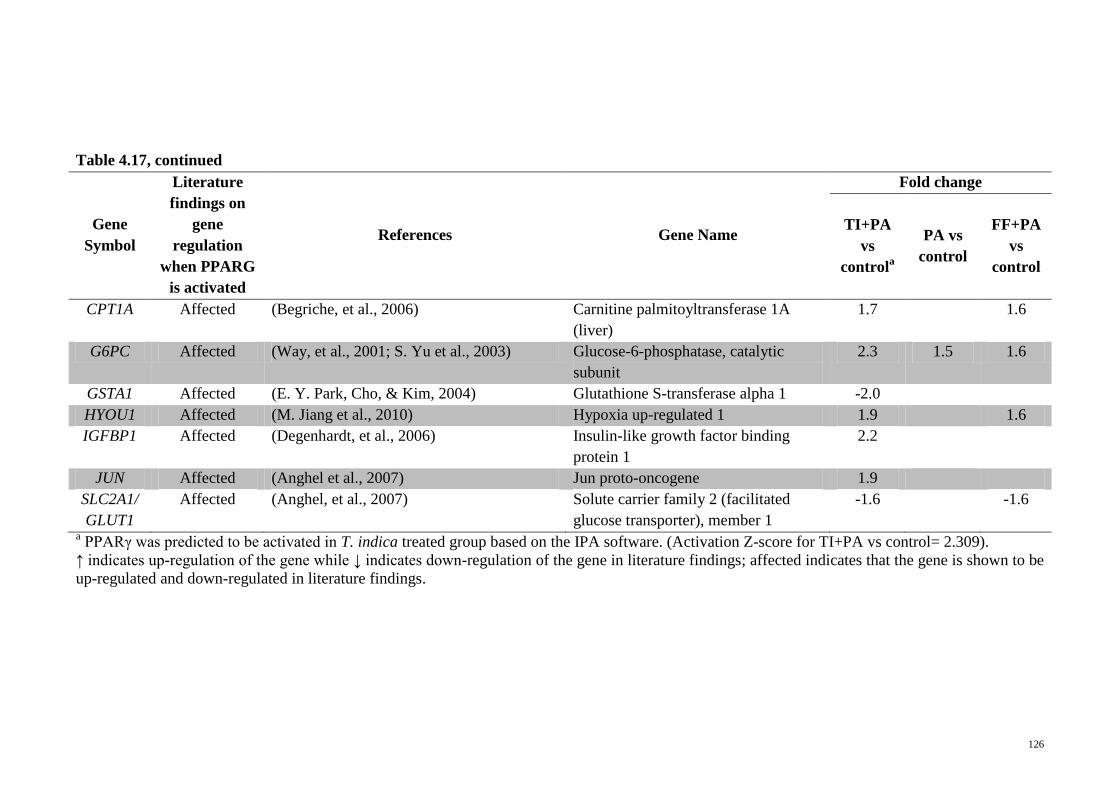
126
Table 4.17, continued
Gene
Symbol
Literature
findings on
gene
regulation
when PPARG
is activated
References Gene Name
Fold change
TI+PA
vs
controla
PA vs
control
FF+PA
vs
control
CPT1A Affected (Begriche, et al., 2006) Carnitine palmitoyltransferase 1A
(liver)
1.7 1.6
G6PC Affected (Way, et al., 2001; S. Yu et al., 2003) Glucose-6-phosphatase, catalytic
subunit
2.3 1.5 1.6
GSTA1 Affected (E. Y. Park, Cho, & Kim, 2004) Glutathione S-transferase alpha 1 -2.0
HYOU1 Affected (M. Jiang et al., 2010) Hypoxia up-regulated 1 1.9 1.6
IGFBP1 Affected (Degenhardt, et al., 2006) Insulin-like growth factor binding
protein 1
2.2
JUN Affected (Anghel et al., 2007) Jun proto-oncogene 1.9
SLC2A1/
GLUT1
Affected (Anghel, et al., 2007) Solute carrier family 2 (facilitated
glucose transporter), member 1
-1.6 -1.6
a PPARγ was predicted to be activated in T. indica treated group based on the IPA software. (Activation Z-score for TI+PA vs control= 2.309).
↑ indicates up-regulation of the gene while ↓ indicates down-regulation of the gene in literature findings; affected indicates that the gene is shown to be
up-regulated and down-regulated in literature findings.
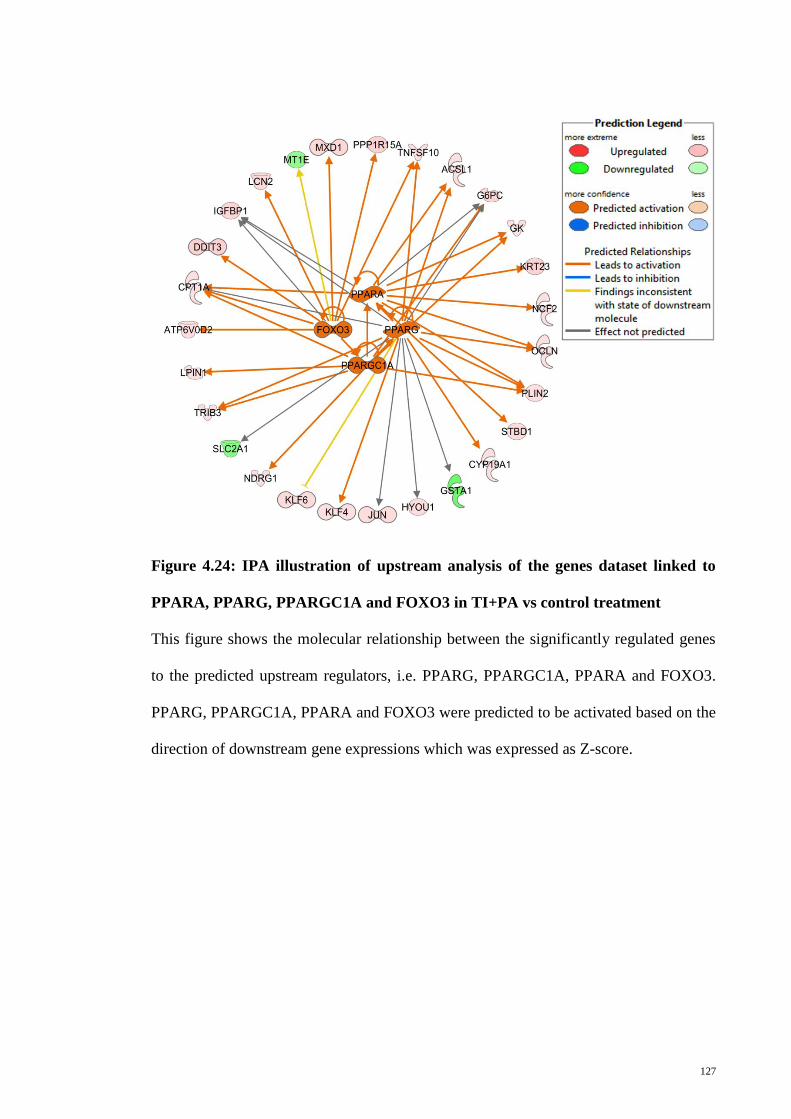
127
Figure 4.24: IPA illustration of upstream analysis of the genes dataset linked to
PPARA, PPARG, PPARGC1A and FOXO3 in TI+PA vs control treatment
This figure shows the molecular relationship between the significantly regulated genes
to the predicted upstream regulators, i.e. PPARG, PPARGC1A, PPARA and FOXO3.
PPARG, PPARGC1A, PPARA and FOXO3 were predicted to be activated based on the
direction of downstream gene expressions which was expressed as Z-score.
128
4.4.5 Identification of significantly regulated genes that were reverted to
expression level similar to control
A set of significantly regulated genes were found to revert to control level after
treatment with either TI+PA or FF+PA or both when compared to PA only treatment.
Nine genes in which 7 were down-regulated and 2 were up-regulated reverted to the
expression level similar to control after treatment with TI+PA and FF+PA (Table 4.18).
In the TI+PA treatment, six genes were reverted to level similar to control where 3 were
up-regulated and 3 were down-regulated (Table 4.19). All 9 genes but 1 were up-
regulated to control level in the FF+PA treatment (Table 4.20).
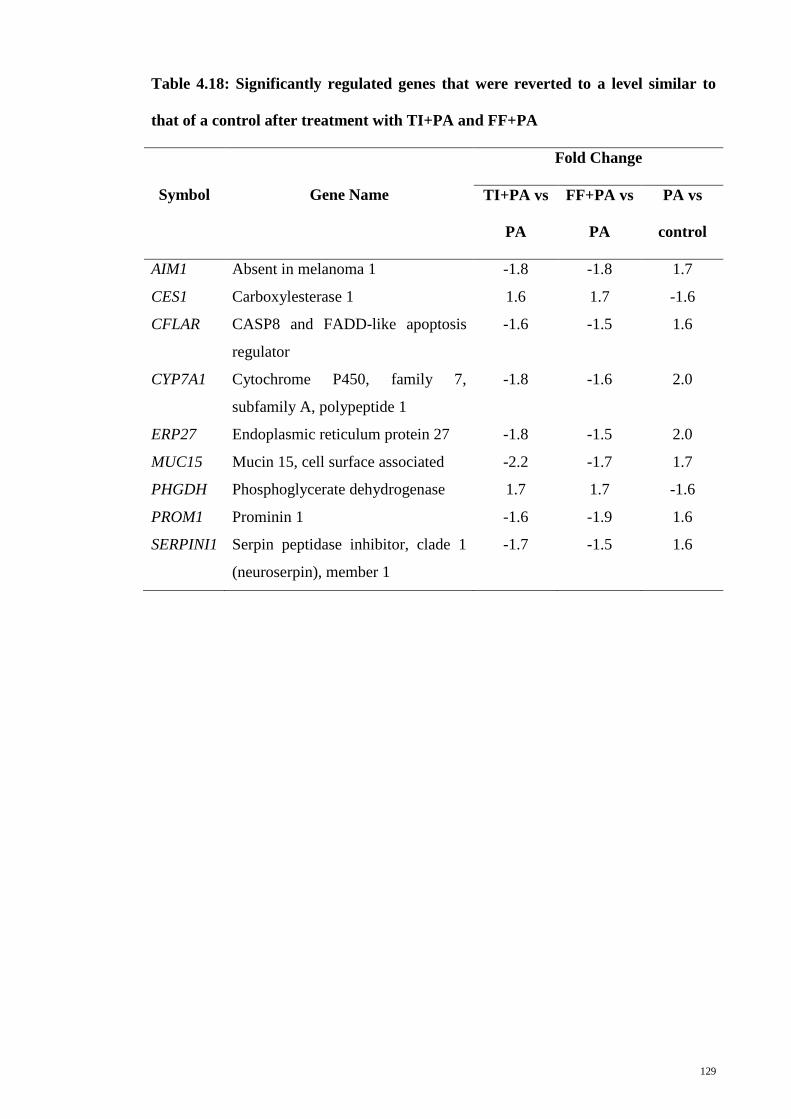
129
Table 4.18: Significantly regulated genes that were reverted to a level similar to
that of a control after treatment with TI+PA and FF+PA
Symbol Gene Name
Fold Change
TI+PA vs
PA
FF+PA vs
PA
PA vs
control
AIM1 Absent in melanoma 1 -1.8 -1.8 1.7
CES1 Carboxylesterase 1 1.6 1.7 -1.6
CFLAR CASP8 and FADD-like apoptosis
regulator
-1.6 -1.5 1.6
CYP7A1 Cytochrome P450, family 7,
subfamily A, polypeptide 1
-1.8 -1.6 2.0
ERP27 Endoplasmic reticulum protein 27 -1.8 -1.5 2.0
MUC15 Mucin 15, cell surface associated -2.2 -1.7 1.7
PHGDH Phosphoglycerate dehydrogenase 1.7 1.7 -1.6
PROM1 Prominin 1 -1.6 -1.9 1.6
SERPINI1 Serpin peptidase inhibitor, clade 1
(neuroserpin), member 1
-1.7 -1.5 1.6
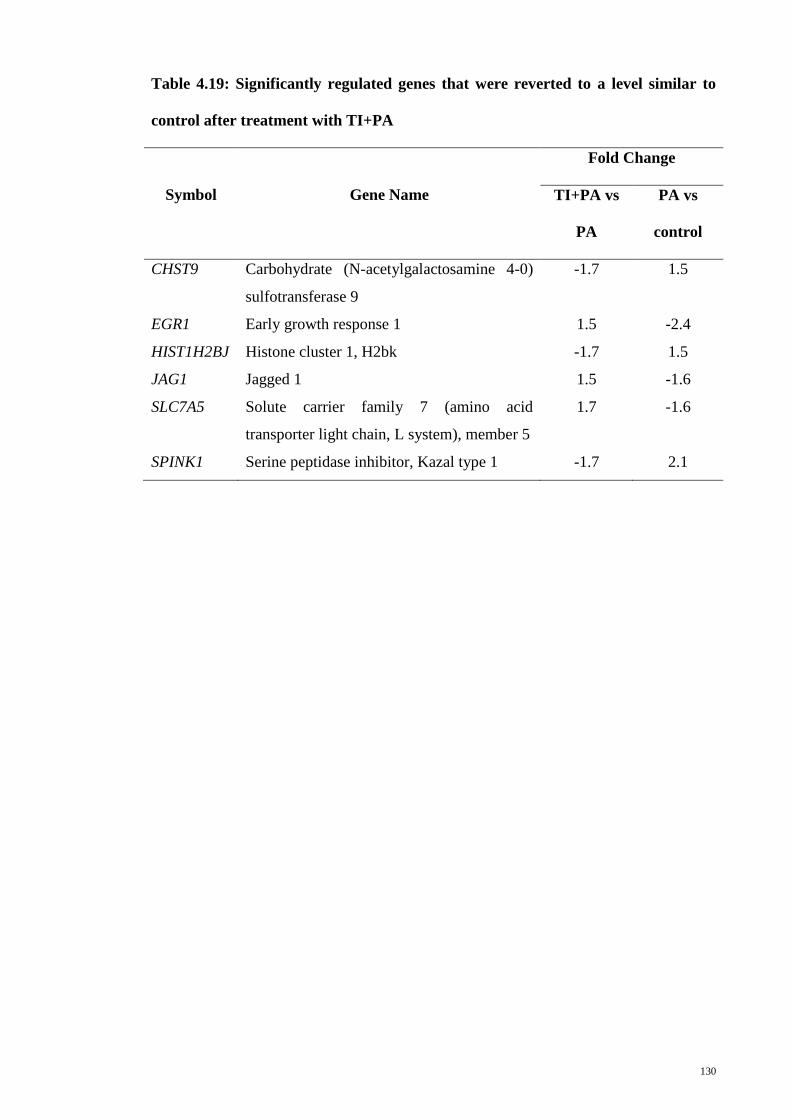
130
Table 4.19: Significantly regulated genes that were reverted to a level similar to
control after treatment with TI+PA
Symbol Gene Name
Fold Change
TI+PA vs
PA
PA vs
control
CHST9 Carbohydrate (N-acetylgalactosamine 4-0)
sulfotransferase 9
-1.7 1.5
EGR1 Early growth response 1 1.5 -2.4
HIST1H2BJ Histone cluster 1, H2bk -1.7 1.5
JAG1 Jagged 1 1.5 -1.6
SLC7A5 Solute carrier family 7 (amino acid
transporter light chain, L system), member 5
1.7 -1.6
SPINK1 Serine peptidase inhibitor, Kazal type 1 -1.7 2.1
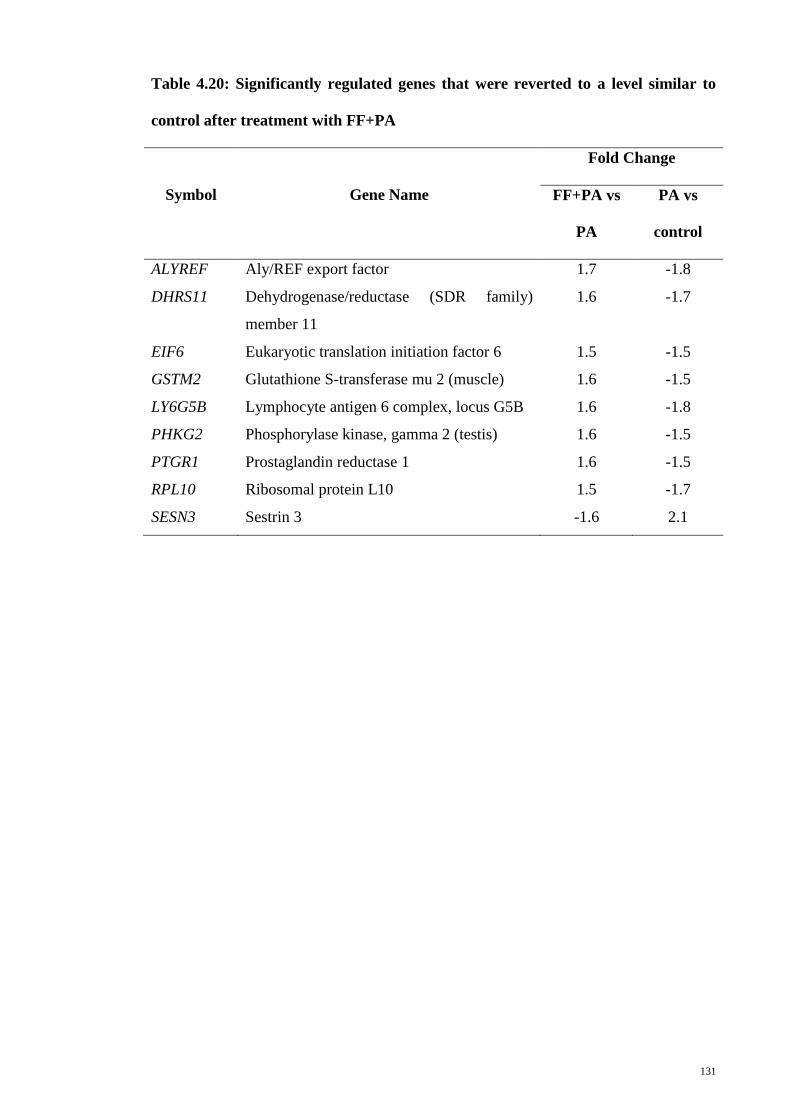
131
Table 4.20: Significantly regulated genes that were reverted to a level similar to
control after treatment with FF+PA
Symbol Gene Name
Fold Change
FF+PA vs
PA
PA vs
control
ALYREF Aly/REF export factor 1.7 -1.8
DHRS11 Dehydrogenase/reductase (SDR family)
member 11
1.6 -1.7
EIF6 Eukaryotic translation initiation factor 6 1.5 -1.5
GSTM2 Glutathione S-transferase mu 2 (muscle) 1.6 -1.5
LY6G5B Lymphocyte antigen 6 complex, locus G5B 1.6 -1.8
PHKG2 Phosphorylase kinase, gamma 2 (testis) 1.6 -1.5
PTGR1 Prostaglandin reductase 1 1.6 -1.5
RPL10 Ribosomal protein L10 1.5 -1.7
SESN3 Sestrin 3 -1.6 2.1
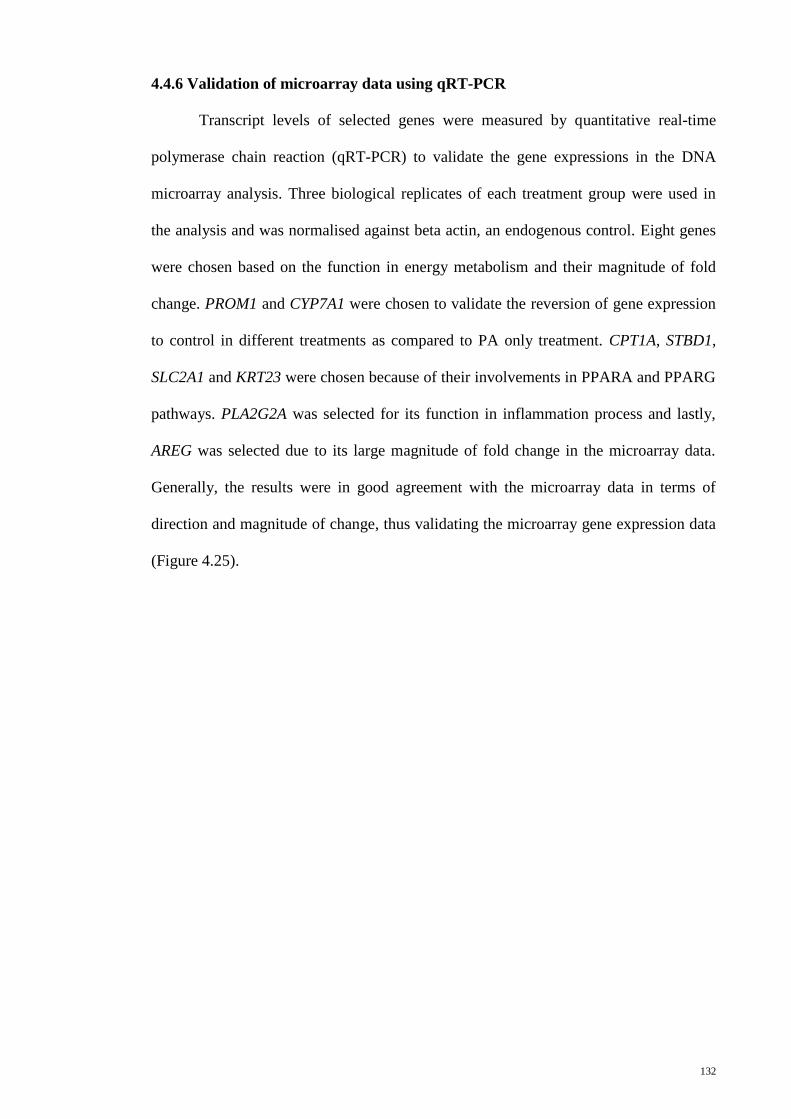
132
4.4.6 Validation of microarray data using qRT-PCR
Transcript levels of selected genes were measured by quantitative real-time
polymerase chain reaction (qRT-PCR) to validate the gene expressions in the DNA
microarray analysis. Three biological replicates of each treatment group were used in
the analysis and was normalised against beta actin, an endogenous control. Eight genes
were chosen based on the function in energy metabolism and their magnitude of fold
change. PROM1 and CYP7A1 were chosen to validate the reversion of gene expression
to control in different treatments as compared to PA only treatment. CPT1A, STBD1,
SLC2A1 and KRT23 were chosen because of their involvements in PPARA and PPARG
pathways. PLA2G2A was selected for its function in inflammation process and lastly,
AREG was selected due to its large magnitude of fold change in the microarray data.
Generally, the results were in good agreement with the microarray data in terms of
direction and magnitude of change, thus validating the microarray gene expression data
(Figure 4.25).
133
Figure 4.25: Validation of microarray data using quantitative real-time polymerase chain reaction (qRT-PCR)
Assays were done using three biological replicates and three technical replicates and data were represented as mean ± standard error.
Legend abbreviations: TI- T. indica fruit extract; PA- palmitic acid; FF- fenofibrate
Gene name abbreviations: AREG, amphiregulin; KRT23, keratin 23; PLA2G2, phospholipase A2, group IIA; PROM1, prominin 1; CYP7A1, cytochrome P450, family 7, subfamily
A, polypeptide 1; SLC2A1, solute carrier family 2, member 1; STBD1, starch binding domain 1; CPT1A, carnitine palmitoyltransferase 1A.
134
CHAPTER 5
DISCUSSIONS
Previous microarray study by Razali et al. (2010) revealed that T. indica fruit
extract significantly regulated genes that are involved in lipid metabolism and
antioxidant activities; however the molecular mechanism has yet to be deciphered.
Therefore, this is a continuation study from Razali et al. (2010), with the main objective
is to further investigate the mechanism of action of the lipid-lowering effect of the T.
indica fruit pulp extract. In view of the extensive possibilities that could attribute to the
hypolipidaemic effect, proteomic analyses were first performed on the cell lysate and
secretome of HepG2 cells treated with T. indica fruit extract to narrow down the
possible mechanisms. Based on the proteins that were significantly altered in proteomic
study and genes that were differentially expressed in the previous microarray data, a
proposed mode of action was formulated, which was then tested using DNA microarray.
The lipid-lowering activities of T. indica fruit were also measured in HepG2 cells.
5.1 Proteomic studies
In this study, proteomic techniques were used to analyse the expression of
cytosolic proteins as well as proteins that were released by HepG2 cells in response to
treatment with the methanol extract of T. indica fruit pulp. Serum-free DMEM culture
media from HepG2 cells grown for 24 h in the absence and presence of T. indica fruit
pulp extract were initially subjected to 2D-GE. The use of serum-free medium was
necessary for the proteomic analysis to avoid masking of the proteins released by the
cells as opposed to the highly abundant proteins present in FBS. The results of our MTT
assays showed that viability of the HepG2 cells was not affected by use of serum-free
135
medium and neither was it significantly different when the cells were exposed to the T.
indica fruit pulp extract.
5.1.1 Methanol extract of T. indica fruit pulp altered the secretion of proteins from
HepG2 cells
Among the thousands of protein spots that were detected in the 2D-GE profiles
of culture media isolated from HepG2 cells grown in the absence or presence of the
methanol extract of T. indica fruit pulp, only seven were found to be altered in
expression. Five of the protein spots were identified by using mass spectrometry
analysis and found to be those of TTR, ENO1, GDI-2 and ApoA-I (2 isoforms), whilst
two spots were not successfully identified. Exposure of the HepG2 cells to the T. indica
fruit pulp extract appeared to have caused the increased release of ENO1 and GDI-2 but
decreased secretion of TTR and ApoA-I. While the two latter proteins are known to be
secretory proteins, ENO1 and GDI-2 are apparently cytosolic proteins (Pfeffer, Dirac-
Svejstrup, & Soldati, 1995). However, several earlier studies had also detected the
presence of ENO1 and GDI-2 in the culture media of HepG2 cells (Bottoni, Giardina,
Vitali, Boninsegna, & Scatena, 2009; Higa et al., 2008).
When the differentially expressed proteins were subjected to analysis using IPA,
all but ENO1 were found to be interconnected with interactomes in lipid metabolism.
ENO1, although more popularly known as a glycolytic enzyme, is apparently a
multifunctional protein that also acts as a receptor, activator and regulator molecule
(Pancholi & Fischetti, 1998; Subramanian & Miller, 2000). Hence, the ENO1 that was
detected in the culture media in this study may not be involved in glycolysis. Due to the
multiple roles played by ENO1, it is difficult to speculate the reason why the release of
136
the protein was increased when HepG2 cells were exposed to the T. indica fruit pulp
extract.
Interestingly, the three differentially expressed proteins that are involved in lipid
metabolism appeared to be commonly associated with the same hormonal regulation,
i.e., estradiol, and the homeostasis of cholesterol. GDI-2 functions to translocate
prenylated Rab proteins from the cytosol to the membrane to form nascent transport
vesicles. The protein also assists the subsequent retrieval of Rab proteins (Pfeffer, et al.,
1995; Stenmark & Olkkonen, 2001), which are key regulators for the transport of lipids
and proteins between cell organelles from target membranes (Pfeffer, 2001; Stenmark &
Olkkonen, 2001; Zerial & McBride, 2001). To date, approximately 70 Rab proteins had
been identified but their specific functions are still largely unknown (Agola, Jim, Ward,
Basuray, & Wandinger-Ness, 2011). These include Rab11, whose over expression has
been shown to block the recycling of cholesterol from the endosome recycling
compartment to the plasma membrane (Holtta-Vuori, Tanhuanpaa, Mobius,
Somerharju, & Ikonen, 2002; Soccio & Breslow, 2004). On the other hand, Rab8 has
been shown to assist the redistribution of cholesterol from late endosomes to the cell
periphery and stimulate cholesterol efflux through the ABCA1/ApoA-I pathway (Linder
et al., 2007). The increased release of GDI-2 by HepG2 cells when they were exposed
to the methanol extract of T. indica fruit pulp was probably to enable the recycling of
Rab proteins that are involved in the cholesterol homeostasis in the cell.
TTR is a protein that is mainly synthesised in the liver and the choroid plexus of
the brain (Aleshire, Bradley, Richardson, & Parl, 1983). Its two main functions are to
transport thyroxine and retinol through binding to the hormone and retinol-binding
protein, respectively (Hagen & Solberg, 1974; Raz & Goodman, 1969). However, a
137
small fraction of plasma TTR (1-3 %) is apparently associated with ApoA-I, the major
apoprotein found in the anti-atherogenic lipoprotein HDL. ApoA-I is synthesised in the
liver (as well as the intestine) and its secretion is believed to be either in a lipid-
free/poor or pre-lipidated forms (intracellularly assembled nascent HDL) (Chisholm,
Burleson, Shelness, & Parks, 2002). Ohnsorg (Ohnsorg et al., 2011), Liz (Liz, Gomes,
Saraiva, & Sousa, 2007) and their co-workers showed that TTR cleaves the C-terminus
of ApoA-I, which is necessary for the transport of lipid-free ApoA-I through the aortic
endothelial cells. When HepG2 cells were exposed to the tamarind extract in this study,
secretion of both TTR and ApoA-I was reduced by more than 2-fold. The two proteins
were also shown to be interconnected via our IPA analysis. This alteration reflects the
indirect effects of T. indica fruit pulp extract in regulating the function of HDL in the
reverse transport of cholesterol and also in line with the earlier findings on the
cholesterol and triacylglycerol lowering effects of the fruit extract in
hypercholesterolaemic hamsters (Martinello, et al., 2006) and in humans (Iftekhar, et
al., 2006).
Earlier report by Razali et al. (2010), described the up-regulated expression of
the APOA1 gene by 1.2-fold when HepG2 cells were exposed to the same concentration
of T. indica fruit pulp extract (Razali, et al., 2010). The high ApoA-I mRNA levels that
were detected in HepG2 cells upon exposure to the extract as opposed to the low levels
of ApoA-I that appeared in the media could be either due to the decrease in the rate of
export of the apoprotein or that the mRNA may not be translated into ApoA-I. Previous
study by the same group also showed that the T. indica fruit pulp extract induced the
expression of the ABCG5 gene. ABCG5 apparently forms a dimer with ABCG8 to
assist the secretion of cholesterol into the bile and its subsequent excretion via the
faeces. Therefore, the lower ApoA-I secretion that was detected in the present study
138
suggests that the T. indica fruit pulp extract may be promoting the excretion of
cholesterol via the ABCG5 instead of the ApoA-I transport system. Interestingly, the
ABCG5/8-mediated cholesterol excretion and absorption and ABCA-1-mediated
cholesterol efflux are apparently controlled by the liver X receptors, LXRs, which was
also in agreement to the canonical pathway generated in IPA analysis (Figure 4.11).
5.1.2 Methanol extract of T. indica fruit pulp altered the abundance of cytosolic
proteins in HepG2 cells
In this study, the abundance of 20 cell lysate proteins was found to be
significantly reduced when HepG2 cells were exposed to the T. indica fruit pulp extract.
Fourteen of the proteins were identified by mass spectrometry and database search, and
the reduced abundance of three representative identified HepG2 mitochondrial and
metabolic proteins were subsequently validated by Western blotting.
Among the identified HepG2 proteins, three components of the mitochondrial
respiratory chain, i.e. ubiquinol-cytochrome-c reductase complex core protein 2
(UQCRC2), NADH dehydrogenase (ubiquinone) 1 alpha subcomplex subunit 10
(NDUFA10) and NADH dehydrogenase (ubiquinone) flavoprotein 1 (NDUFV1), were
found to be reduced in abundance when HepG2 cells were exposed to T. indica fruit
pulp extract. UQCRC2 belongs to complex III of the mitochondrial respiratory chain
while NDUFA10 and NDUFV1 are components of complex I. In mitochondria, only
complex I (Barja & Herrero, 1998; Genova et al., 2001) and complex III (Boveris,
Cadenas, & Stoppani, 1976) of the respiratory chain are known to produce reactive
oxygen species (ROS). Hence, the decreased amount of the three mitochondrial
components may indicate reduced production of free radicals, although the functionality
of the mitochondria is yet to be confirmed. Nevertheless, earlier studies in obese rat
139
muscles have shown that reduced levels of respiratory chain complex I and diminished
ROS production that were induced by chronic supplementation with grape seed
proanthocyanidins did not affect the function of the mitochondria (Pajuelo et al., 2011).
In addition to the mitochondrial respiratory chain proteins, the glycolytic
enzyme glyceraldehyde 3-phosphate dehydrogenase (GAPDH), as well as GDP-L-
fucose synthetase (TSTA3), also appeared to be down-regulated after treatment with T.
indica fruit pulp extract. Oxidative stress is known to induce up-regulation of GAPDH
levels (De Marco et al., 2012; Ito, Pagano, Tornheim, Brecher, & Cohen, 1996). Hence,
the reduced amount of GAPDH in this case may possibly indicate a state of repressed
oxidative stress. This, together with the earlier data on the reduced mitochondrial
respiratory chain proteins, may shed some light on molecular mechanisms involved in
the well acclaimed antioxidant properties of T. indica (Martinello, et al., 2006;
Sudjaroen, et al., 2005).
The fruit pulp extract of T. indica also appeared to cause decreased abundance
of proteins involved in the metabolism of nucleic acids and polyamines in HepG2 cells.
To the best of our knowledge, these have not been previously reported and their
rationale is not quite understood. On the other hand, decreased abundance of
ethanolamine-phosphate cytidylyltransferase (PCYT2), the rate-limiting enzyme which
catalyses conversion of phosphoethanolamine to cytidylylphosphoethanolamine in the
biosynthesis of phosphatidylethanolamine, in HepG2 cells exposed to the fruit extract of
T. indica may compromise availability of the phospholipid, which stores arachidonic
acid for the production of prostaglandins. This could possibly explain the anti-
inflammatory action of T. indica that was earlier reported (Rimbau, et al., 1999).
A
140
Prohibitin is another mitochondrial protein that was shown to be of reduced
abundance in HepG2 cells exposed to T. indica fruit pulp extract. The depletion of
prohibitin has been reported to promote the lifespan of an organism, although it has not
been shown on higher organisms and it is dependent on the metabolic state of the
organism (Artal-Sanz & Tavernarakis, 2010). Prohibitin is an evolutionary highly
conserved protein that is located in the mitochondria. Many roles have been suggested
for this protein such as acting like a chaperone (Nijtmans et al., 2000), protease
(Steglich, Neupert, & Langer, 1999) and scaffolding proteins (Osman et al., 2009).
Certain review papers also mentioned that it plays a role in cell cycle regulation,
regulation of transcription and cell surface signalling (Mishra, Murphy, & Murphy,
2006; Rajalingam & Rudel, 2005). However, the true biochemical function of prohibitin
remains elusive. While some studies showed that the depletion of prohibitin shortened
the lifespan of wild-type Caenorhabditis elegans (Artal-Sanz & Tavernarakis, 2009)
and yeast (Berger & Yaffe, 1998), a study by Artal-Sanz and Tavernarakis (2009) had
shown that under certain metabolic conditions, the reduced prohibitin can prolong the
lifespan of the animal. It is interesting that the result from the study coincides with this
study in certain manner, for example prohibitin depletion results in reduced fat content,
in all genetic backgrounds where prohibitin deficiency extends lifespan (Artal-Sanz &
Tavernarakis, 2009). T. indica has been used traditionally to treat hyperlipidaemia, and
studies have shown that it possesses hypolipidaemic effect in vivo (Lim, et al., 2013;
Martinello, et al., 2006). In this study, prohibitin was down-regulated by 1.7-fold. While
there may be no direct relationship in between prohibitin depletion and lipid-lowering-
effect, the depletion of prohibitin in HepG2 cells upon exposure to the fruit pulp extract
of T. indica appears to suggest a similar mechanism in attempt to extend lifespan of the
cells.
141
Adding to that, the reduced amount of proteins involved in protein biosynthesis,
i.e. eukaryotic translation initiation factor 3 subunit 3 (eIF3H), tyrosyl-tRNA synthetase
(YARS) and elongation factor Tu (EFTU), which may indicate lowered protein
synthesis rate, had been shown to increase lifespan of C. elegans (Hansen et al., 2007;
Pan et al., 2007; Syntichaki, Troulinaki, & Tavernarakis, 2007). Hipkiss, AR (2007)
pointed out that this could be due to lesser error proteins such as misfolded proteins
being produced, therefore increasing the availability of proteases and chaperones for the
removal of erroneous proteins that may lead to amyloidal accumulation. These reduced
proteins involved in protein biosynthesis may be key regulatory points of action of the
fruit pulp extract of T. indica. Suppression of these proteins by the extract may reflect
the underlying epigenetic mechanism that ultimately caused the reduced expression of
all the mitochondrial and metabolic proteins and enzymes.
Subjecting the altered abundance proteins to IPA analysis generated a single
network on “Hereditary disorder, metabolic disease, molecular transport”, which ranked
mitochondrial dysfunction with the highest significance (p < 3.65 x 10⁻⁴
). However,
“Lipid Metabolism, Molecular Transport, Small Molecule Biochemistry” became the
top network involved when IPA was reanalysed to include proteins that were previously
shown to be differentially secreted by HepG2 cells treated with the same fruit extract.
This network was not generated in the earlier analysis as PCYT2 was the sole cellular
protein involved in lipid metabolism that was affected when HepG2 cells were exposed
to T. indica fruit pulp extract. In the earlier IPA analysis of secreted proteins of altered
abundance from HepG2 exposed to the T. indica fruit pulp extract, a score of 9 was
obtained and this improved to 31 when the data were reanalysed to include cell lysate
proteins of reduced abundance, signifying markedly higher probability. In addition, the
IPA software also identified tumour necrosis factor (TNF) and interleukin-1 beta (IL-
142
1), both of which are potent inflammatory mediators, as interactomes in the network
affected by T. indica. This further supports our earlier speculation of the molecular
mechanism involved in anti-inflammatory effects of T. indica.
5.1.3 PPARα activation: possible mode of action of lipid-lowering effect of T. indica
fruit pulp extract
Peroxisome proliferator-activated receptors or PPARs are nuclear receptors.
There are 3 isoforms identified in humans: PPARα, PPARβ/δ and PPARγ. PPARα is
highly expressed in liver, brown adipose tissue, heart, skeletal muscle, kidney, and at
lower levels in other organs. PPARγ is highly expressed in adipose tissues and is
present in the colon and lymphoid organs while PPARβ/δ is expressed ubiquitously, but
its levels may vary considerably.
In this study, we proposed that the T. indica fruit extract exerts its lipid-lowering
effects through the activation of PPARα. In the liver, PPARα promotes fatty acid
oxidation and it is the target for the hypolipidaemic fibrates, such as fenofibrate,
clofibrate and gemfibrozil, which are used in the treatment of hypertriglyceridaemia.
This was shown by the up-regulation of genes involved in the mitochondrial β-
oxidation in the microarray analysis after T. indica fruit treatment (Figure 5.1) (Razali,
et al., 2010). Besides promoting fatty acid oxidation, it also mediates its action through
the activation of liver X receptor alpha (LXRα) (Johnston & Waxman, 2008), which
was also derived as the one of the canonical pathways generated in Ingenuity Pathway
Analysis (IPA) software (Figure 4.11). LXRs are oxysterol-activated nuclear receptors,
which control cholesterol homeostasis by modifying expression of genes involved in
cholesterol absorption and efflux from peripheral tissues. This process is mediated
through ABCA1-mediated cholesterol efflux and ABCG5/8-mediated cholesterol
143
excretion and absorption. In the microarray study, ABCG5 was up-regulated by 1.8-fold
(Razali, et al., 2010).
LXRs also regulate genes essential in lipogenesis, glucose metabolism, and
inflammation. A possible explanation for the anti-inflammatory action of T. indica fruit
pulp is that it reduces the arachidonic acid reservoir pool, the principal substrate of the
prostanoid inflammatory mediators by inhibiting phospholipid synthesis. Ethanolamine-
phosphate cytidylyltransferase (PCYT2) is the rate-limiting enzyme that catalyses the
conversion of phosphoethanolamine to cytidylylphosphoethanolamine in the Kennedy’s
pathway or the biosynthesis of phosphatidylethanolamine. After the treatment with T.
indica fruit extract, cytosolic PCYT2 expression was down-regulated by 1.7-fold which
is hypothesised to lead to lower production of phosphatidylethanolamine (PE). As one
of the component of the HDL phospholipids, its reduction could enhance the ABCA1-
mediated efflux and reduce the SR-BI- mediated efflux (Yancey et al., 2004). ABCA1-
mediated efflux has a higher efflux potential compared to SR-BI-mediated efflux.
Microarray study by Razali et al. (2010) also showed that choline kinase alpha (CHKA)
was down-regulated by 1.8-fold, which may lead to a decreased level of
phosphatidylcholine (PC). The lowered amount of phospholipids (PE and PC) could
reduce the availability of arachidonic acid, which will in turn reduce the prostaglandin
produced. This could possibly explain the anti-inflammatory action of this plant as
reported by many. Besides this, the network generated by the IPA software also
identified tumour necrosis factor (TNF) and interleukin-1 beta (IL1B) as two of the
interactomes in the network, both of which are potent inflammatory mediators (Figure
4.10). This suggests that the fruit may also play a role in mediating the inflammation
pathway, besides regulating the lipid metabolism.
144
Although studies have shown that PPARα raises the HDL in human plasma,
some researchers showed that it was otherwise (Berthou et al., 1996; Duez et al., 2002).
Huuskonen et al. (2006) reported that the LXR agonist, T0901317 inhibited the
synthesis of apoA-1. The lowered amount of transthyretin and apoA-1 is possibly due to
the inhibition of orphan nuclear receptor hepatocyte nuclear factor 4 (HNF4) by PPARα
activation. It has been shown that the PPARα agonist, Wy 14643, reduced the
expression of HNF4 in HepG2 cells (Marrapodi & Chiang, 2000). HNF4 is a liver-
enriched transcription factor that controls embryonic liver development and
regulates tissue-specific gene expression in adult liver cells. HNF4 activates several
hepatocyte-specific genes, including the gene encoding apoA-1 (Malik & Karathanasis,
1996) and transthyretin (J. W. Park, Lee, Choi, Park, & Jung, 2010; Z. Wang & Burke,
2007). Therefore, the inhibition of HNF4 by PPARα may account for the lowered
amount of apoA-1 and transthyretin after the treatment with T. indica fruit extract.
The lipid-lowering effects induced by plant polyphenols have been reported by
many. In fact, there is an upcoming trend of researches revealing the potentials of plant
polyphenols in regulating metabolic processes in vitro and in vivo. Methanolic extract
of T. indica fruit pulp contains catechin, epicatechin, procyanidins, naringenin,
apigenin, luteolin, taxifolin and eriodictyol (Sudjaroen, et al., 2005). It was shown that
tea catechins like epigallocatechin gallate (EGCG) and epigallocatechin (EGC) were
able to activate PPARα (K. Lee, 2004). Naringenin from grapefruit was shown to
regulate lipid metabolism through partial activation of PPARα (Goldwasser, et al.,
2010). Another study showed that flavangenol extracted from pine bark was able to
enhance fatty acid oxidation, mainly attributed to procyanidin B1 (Shimada, et al.,
2012). This shows that a number of polyphenols were able to regulate nuclear receptors
such as PPAR and LXR. Earlier studies have also shown that proanthocyanidins, which
145
constitutes more than 73 % of the total phenolic content of T. indica extract (Sudjaroen,
et al., 2005), were able to modulate the activation of LXR/RXR (Jiao, et al., 2010).
Hence, the data of this study, when taken together with that of our earlier report by
Razali et al. (2010), suggest that the T. indica fruit pulp extract exerts its lipid-lowering
effects and anti-inflammatory actions through the modulation of the LXRs, a conception
that was similarly derived from the canonical pathway analysis; or at a higher order,
that is the activation of PPARα, both of which were highly interrelated in terms of gene
regulated by their activations.
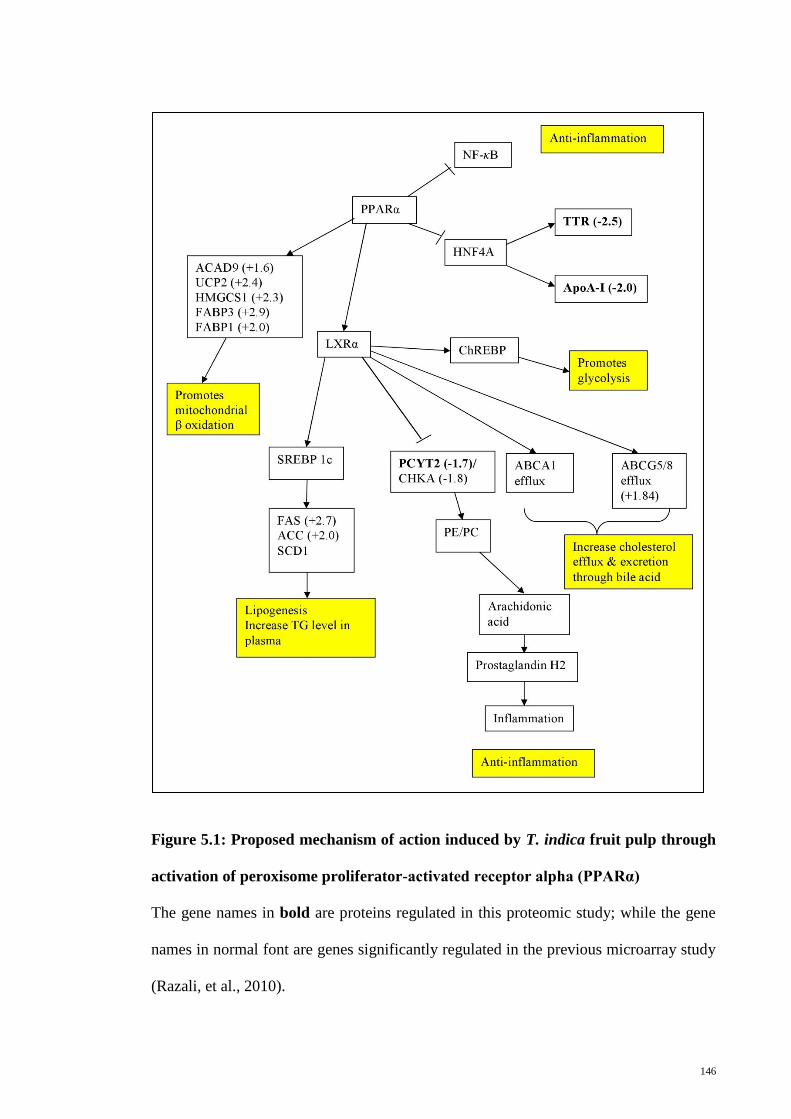
146
Figure 5.1: Proposed mechanism of action induced by T. indica fruit pulp through
activation of peroxisome proliferator-activated receptor alpha (PPARα)
The gene names in bold are proteins regulated in this proteomic study; while the gene
names in normal font are genes significantly regulated in the previous microarray study
(Razali, et al., 2010).
147
5.2 Transcriptomic studies
To further investigate the earlier hypothesis that T. indica fruit pulp extract
exerts its lipid-lowering effects through the activation of PPARα, transcriptome profiles
in steatotic HepG2 cells treated with either T. indica fruit extract or fenofibrate, a
PPARα agonist and a hypolipidaemic drug, were compared. HepG2 cells were treated
with palmitic acid to simulate steatotic condition, and the total triglyceride and
cholesterol were quantitated after treatment with the fruit. Cell viability was assessed
using MTT assay in order to determine the concentration of palmitic acid to best induce
steatotic effect in HepG2 cells without causing extensive cell death. A cell viability of
more than 90 % after treatment was considered to be appropriate for this study. Based
on this, treatment with 0.3 mM palmitic acid for 24 h was considered to induce
hyperlipidaemic effect in HepG2 cells. Oil Red O staining of the lipid droplets also
showed that at 0.3 mM of palmitic acid treatment, the lipid droplets were clearly visible.
Although at a higher concentration of palmitic acid treatment (0.8 mM palmitic acid)
the lipid droplets were much bigger and abundant, the cell death was quite extensive;
only 65 % of cells were still viable after 24 h.
The total triglyceride and cholesterol in HepG2 cells after treatment with
different concentrations of T. indica fruit extract was also quantified. At 0.1 mg/ml T.
indica fruit concentration, both total triglyceride and cholesterol content were reduced.
The lipid-lowering effect of the fruit extract was more prominent in reducing total
triglyceride than total cholesterol; even to the level comparable to that of fenofibrate at
the concentration of 0.1 mg/ml T. indica fruit extract. This is also in agreement to the
fact that fenofibrate was more efficient in lowering triglyceride than cholesterol,
probably signifying that the fruit may exert a similar mechanism to that of fenofibrate,
that is through the activation of PPARα. However, further analysis is still needed to
148
confirm the hypothesis. At higher concentrations of T. indica fruit treatment, the lipid
levels were increased. This was also supported by the Oil Red O staining of HepG2
cells which showed a more abundant lipid droplet in cells treated with high
concentration of T. indica fruit extract. The adverse effects of T. indica fruit extract at
high concentration could be due to the excessive oxidative stress exerted by compounds
like proanthocyanidin, the major polyphenol in T. indica fruit extract. It has been shown
that grape seed proanthocyanidins can induce pro-oxidant toxicity in cardiomyocytes at
high dose (Shao et al., 2003). However at low dose, proanthocyanidins are anti-oxidants
and were shown to be cardioprotective (Corder et al., 2006).
5.2.1 T. indica fruit extract regulated genes that are involved in fatty acid oxidation
Hepatic steatosis or fatty liver disease is characterised by accumulation of
triglycerides in the vacuoles of liver cells. Fatty liver disease can progress from simple
steatosis with no symptoms, through non-alcoholic steatohepatits (NASH), fibrosis and
cirrhosis, which can result in liver cancer, liver failure and death. The current treatment
for fatty liver disease is using drugs that are able to lower lipid levels particularly
triglyceride to reduce the accumulation of triglycerides in the liver for example the
fibrate drugs. The use of fibrate drug, which is a PPARα ligand induces fatty acid
oxidation, which in turn increases lipid catabolism and thus reducing lipid levels in the
liver. In this study, it was shown that the fruit exerts its lipid-lowering effect through the
activation of fatty acid oxidation, which was supported by the up-regulation of genes
involved in the process (ACSL1, CPT1A, CYP19A1, LPIN1, PNPLA8 and SLC2A1).
This was also supported by the IPA analysis in which the process was shown to be
activated with activation Z-score of 2.175.
149
Fatty acid oxidation is a process that breaks down fatty acids by beta-oxidation
to produce acetyl-CoA and it takes place in the mitochondrion. Before catabolising
long-chain fatty acids which are unable to pass through the inner mitochondrial
membrane, the fatty acids are first converted to acyl-CoA to be transported into the
mitochondria for the oxidation of fatty acid to occur. This process is mediated by the
mitochondrial L-carnitine shuttle pathway, which was one of the top canonical
pathways generated in the T. indica fruit and fenofibrate treatment groups. Two key
genes involved in this pathway, CPT1A and ACSL1 were up-regulated in both treatment
groups. ACSL1 gene codes for a rate limiting enzyme, acyl-CoA synthetase long-chain
family member 1. It converts long chain fatty acid to acyl-coA, which is then
transported across the outer mitochondrial membrane into the inner mitochondrial
membrane. CPT1A gene codes for carnitine palmitoyltransferase 1A, which is an
enzyme that catalyses the conversion of acyl-CoA into acylcarnitine. Acylcarnitine is
then translocated into the mitochondrial matrix for beta-oxidation to occur. Therefore,
the up-regulation of these 2 genes is indicative of increased fatty acid being shuttled
into the mitochondria for beta-oxidation of fatty acid.
CYP19A1 encodes a member of the cytochrome P450 superfamily of enzymes.
The cytochrome P450 proteins are monooxygenases which catalyse many reactions
involved in drug metabolism and synthesis of cholesterol, steroids and other lipids. This
protein localises to the endoplasmic reticulum and catalyses the last steps of estrogen
biosynthesis, three successive hydroxylations of the A ring of androgens. It has been
shown that homozygous mutant mouse aromatase (Cyp19a1) gene knockout in mouse
decreases beta-oxidation of palmitic acid in a cell-free system (Nemoto, et al., 2000).
Egawa et al. (2003) had also reported that pitavastatin increases beta-oxidation of lauric
acid in homogenate from mouse liver that is decreased by homozygous mutant mouse
150
Cyp19a1 gene knockout. This shows that the up-regulation of CYP19A1 is associated to
increased beta-oxidation of fatty acid.
LPIN1 was up-regulated by 1.5-fold in T. indica treatment group. This gene
encodes lipin 1, a magnesium-ion-dependent phosphatidic acid phosphohydrolase
enzyme that catalyses triglyceride synthesis including the dephosphorylation of
phosphatidic acid to yield diacylglycerol. Expression of this gene is required for
adipocyte differentiation, activation of hepatic fatty acid oxidation genes during fasting
conditions and it also functions as a nuclear transcriptional coactivator with peroxisome
proliferator-activated receptor a (PPARα) and PPARγ coactivator 1a (PPARGC1A) in a
complex that modulates fatty acid oxidation gene expression (Finck, et al., 2006).
Mutations in this gene are associated with metabolic syndrome, type 2 diabetes, and
autosomal recessive acute recurrent myoglobinuria (ARARM) (Reue & Dwyer, 2009).
SLC2A1 codes for GLUT 1, a major glucose transporter in the mammalian
blood-brain barrier and it was down-regulated in both T. indica and fenofibrate
treatment groups. Yan et al. (2009) reported that transgenic human SLC2A1 protein
decreased oxidation of fatty acid in mouse heart that was increased by high fat diet. The
down-regulation of this gene could imply an increase in fatty acid oxidation. However
in a recent study the down-regulation of SLC2A1 was linked to increased lipid
accumulation and oxidative stress in NAFLD induced liver. Despite the results, the
group was unsure that the down-regulation of SLC2A1 induces triglyceride
accumulation in liver or vice versa (Vazquez-Chantada et al., 2013). Nevertheless,
given that this gene was also down-regulated in fenofibrate treated group in this study,
which is a hypolipidaemic drug, the lowered expression of SLC2A1 is more likely to be
involved in the oxidation of fatty acid.
151
PNPLA8 encodes a member of the patatin-like phospholipase domain containing
protein family. Members of this family are phospholipases which catalyse the cleavage
of fatty acids from membrane phospholipids. The up-regulation of this gene is
correlated to increased fatty acid oxidation and this is in agreement with Mancuso et al.
(2007) whom reported that transgenic human PNPLA8 protein in cardiac myocytes
increased oxidation of palmitic acid in working isolated perfused heart from 4-7 month-
old adult mouse. However in 2010, the same author reported that homozygous mutant
mouse PNPLA8 gene knockout increased the rate of oxidation of palmitic acid in
epididymal adipose tissue explants from male mouse (Mancuso, et al., 2010).
5.2.2 T. indica fruit extract regulated genes that are involved in gluconeogenesis
T. indica fruit treatment had also led to the regulation of genes involved in
gluconeogenesis (G6PC, GK and SLC2A1). IPA analyses had also shown that T. indica
fruit decreased polysaccharide synthesis particularly glycogen based on the regulation
of genes involved in polysaccharide synthesis (G6PC, DKK1, VIMP, IGFBP1 and
CSGALNACT2), with an activation z-score of -2.000.
Gluconeogenesis is a metabolic process which produces glucose from non-
carbohydrate sources including glycerol derived from the breakdown of triglyceride.
G6PC gene encodes glucose-6-phosphatase, which catalyses the hydrolysis of D-
glucose 6-phosphate to D-glucose and orthophosphate. It is a key enzyme in glucose
homeostasis, functioning in gluconeogenesis and glycogenolysis. The up-regulation of
this gene is implicated with the increased activity of glycogenolysis and this is
supported by Aiston et al. (1999) whom reported that G6PC protein decreased synthesis
of glycogen in hepatocytes. The up-regulation of G6PC gene in this study could
152
indicate reduced glycogen synthesis. GK gene codes for glycerol kinase, an enzyme that
catalyses the conversion of glycerol to dihydroxyacetone phosphate, which will be
utilised in gluconeogenesis or glycolysis pathway. SLC2A1 codes for glucose
transporter 1 which facilitates transport of glucose across plasma membrane of
mammalian cells. The reduced expression of this gene is linked to increased glucose
levels (Hahn, Barth, Weiss, Mosgoeller, & Desoye, 1998). This may be a result of
increased glucose production by the cell. Increased expressions of IGFBP1 and VIMP
genes were also associated with decreased synthesis of glycogen (Gao et al., 2003;
Menuelle, Binoux, & Plas, 1995). Taken together, the regulation of these genes
indicates an increased production of glucose through gluconeogenesis or
glycogenolysis.
5.2.3 T. indica fruit extract lowers lipid through the activation of PPARα
Peroxisome proliferator activator receptor alpha or PPARα is a nuclear receptor
that regulates lipid metabolism and glucose homeostasis. In the body, it is activated in
fasting state and its activation will lead to regulations in an array of downstream genes
that eventually increase lipid metabolism, gluconeogenesis, glycogenolysis and ketone
bodies production.
In this study, PPARα was predicted to be activated in both T. indica fruit and
fenofibrate treatment groups in the IPA upstream regulator analysis, with activation z-
score of 2.745 and 2.379 respectively. While PPARα was expected to be activated in the
fenofibrate group since it is a ligand to the PPARα receptor, the activation of PPARα by
T. indica fruit treatment proved the hypothesis that was made prior to the microarray
analyses, that is PPARα activation could be responsible for the lipid-lowering effect of
153
the fruit. This was shown by the simultaneous regulation of downstream genes involved
in PPARα activation in both T. indica fruit and fenofibrate treatments.
Fatty acid oxidation is the hallmark of PPARα activation and it was indeed
shown to be activated in both T. indica and fenofibrate treatment groups. Two genes,
CPT1A and ACSL1 which are involved in the mitochondrial L-carnitine shuttle pathway
were shown to be up-regulated in both T. indica fruit and fenofibrate treatment. Besides
this, they were also shown to be increased in PPARα activation (Ammerschlaeger, et
al., 2004; Begriche, et al., 2006; Clemenz, et al., 2008; Finck, et al., 2002; M. H. Hsu, et
al., 2001; Lawrence, et al., 2001; Schoonjans, et al., 1995; Tachibana, et al., 2006;
Vega, et al., 2000). The up-regulation of both CPT1A and ACSL1 genes indicates that
PPARα was being activated in T. indica fruit treatment group. Besides this, fatty acid
oxidation genes were also shown to be up-regulated in the presence of lipin-1 gene,
which was up-regulated in T. indica fruit treatment. In the cytoplasm, lipin-1 is an
enzyme responsible in triglyceride accumulation and phospholipid synthesis; however
when translocated to the nucleus, it functions as a transcriptional co-activator together
with PPARGC1A to PPARα that leads to the induction of fatty acid oxidation genes
(Finck, et al., 2006).
PPARα activation also modulates glucose homeostasis. While contradictory
findings regarding the regulation of glucose by PPAR activation had been reported
(Peeters & Baes, 2010), it was certain that PPARα activation leads to the regulation of
glucose levels in fasting conditions. This was supported by studies showing that fasting
PPARα knockout mice displayed marked hypoglycaemia (Bandsma, et al., 2004;
Chakravarthy et al., 2005; Kersten et al., 1999; Leone, Weinheimer, & Kelly, 1999;
Patsouris, et al., 2004). As mentioned earlier, treatment with T. indica fruit regulated
154
genes involved in gluconeogenesis and it was supported by the IPA analysis which
showed that the synthesis of polysaccharide particularly glycogen was reduced. Since
glucose level or regulation is not studied in this experiment, a clear conclusion cannot
be drawn at this juncture. However a few genes regulated in this study pointed to the
activation of PPARα. For example, a key enzyme involved in gluconeogenesis and
glycogenolysis, G6PC was demonstrated to be modulated in the event of PPARα
activation. While it was shown that homozygous mutant mouse Ppara gene knockout
decreased expression of mouse G6pc mRNA that involves fasting by mouse (Bandsma,
et al., 2004), Fan et al. (2011) reported that inhibition of active human PPARA protein
increases expression of human G6PC mRNA in serum-deprived HepG2 cells and a
similar observation was seen in Ppara gene knockout mutant mouse. Another gene
involved in PPARα activation is the GK gene, which codes for glycerol kinase.
Patsouris et al. (2004) reported that PPARα induced gluconeogenic genes including
glycerol kinase during fasting in wild-type mice but not in PPARα null mice, indicating
that this gene is a target of PPARα activation.
PPARα activation is also implicated in the bile acid metabolism, although the
mechanism of action by which PPARα controls bile acid homeostasis remains unclear.
In this study, CYP7A1, a key gene responsible in the bile acid biosynthesis pathway,
was reduced in expression to the level similar to control. It has been shown that Cyp7a1
gene is down-regulated in PPARα null mice in fasting condition (Rakhshandehroo et
al., 2007). Ironically, synthetic PPARα agonists reduce Cyp7a1 expression in both mice
and human (Bertolotti et al., 1995; Post et al., 2001; Stahlberg, Angelin, & Einarsson,
1989; Stahlberg et al., 1995). In agreement with the latter observation, fibrate treatment
leads to decreased bile acid synthesis. The mechanism that led to change in Cyp7a1
level is unclear as PPARα also modulates the expression of other nuclear hormone
155
receptors such as FXR and LXR. It has also been suggested that PPARα can antagonise
LXR signaling and LXR-dependent activation of Cyp7a1 gene promoter (Gbaguidi &
Agellon, 2002; Miyata, McCaw, Patel, Rachubinski, & Capone, 1996; Yoshikawa et al.,
2003).
Other genes involved in PPARα activation that were also regulated in both T.
indica fruit and fenofibrate treatment groups are STBD1, KRT23 and NCF2. STBD1
encodes starch binding domain 1 while KRT23 codes for keratin 23. It was shown that
in male mouse, homozygous mutant mouse Ppara gene knockout decreases expression
of mouse Stbd1 and Krt23 mRNA in liver from male mouse that involves fasting
(Sanderson, et al., 2010). Similarly, the up-regulation of NCF2 was reported to be
associated with activation of PPARα in macrophages nuclei (Teissier, et al., 2004).
Perilipin 2 (PLIN2), another target gene of PPARα in liver was also up-regulated in the
treatment with T. indica fruit. A study showed that PPARα-induced-Plin2 prevents the
formation of VLDL by diverting fatty acids from the VLDL assembly pathway into
cytosolic triglycerides (Magnusson et al., 2006). Figure 5.2 depicts the significantly
regulated genes involved in PPARα activation in T. indica fruit treatment.
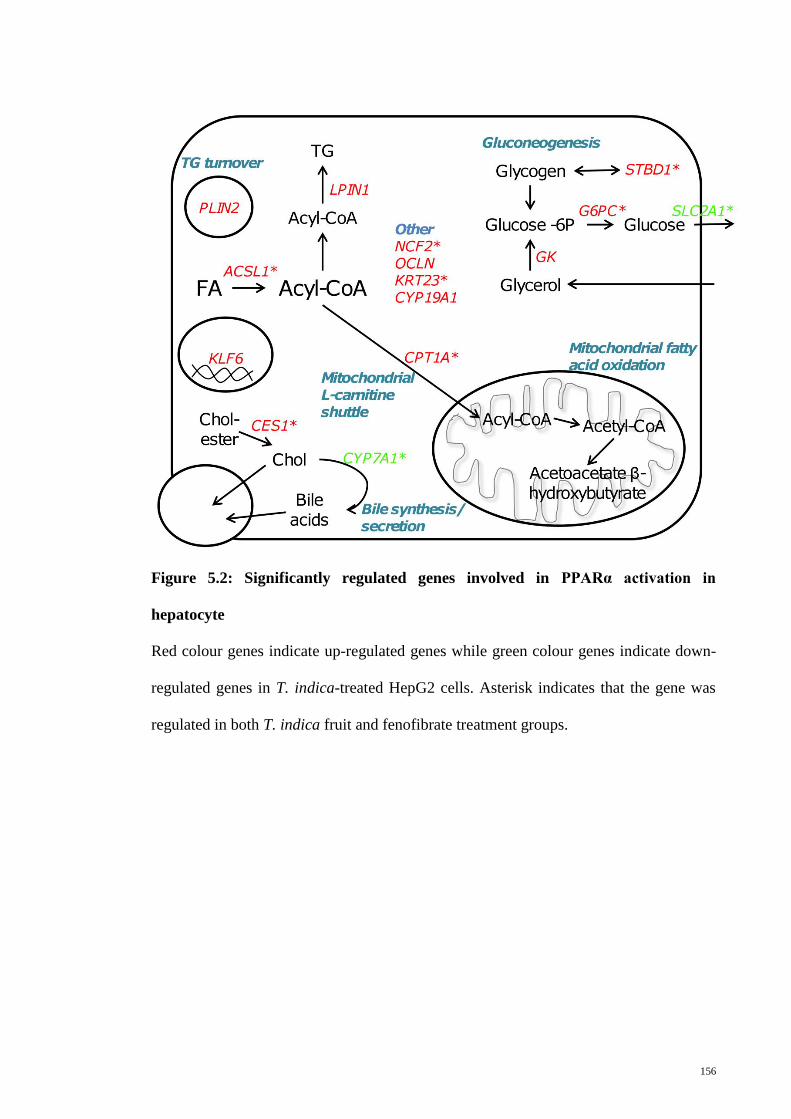
156
Figure 5.2: Significantly regulated genes involved in PPARα activation in
hepatocyte
Red colour genes indicate up-regulated genes while green colour genes indicate down-
regulated genes in T. indica-treated HepG2 cells. Asterisk indicates that the gene was
regulated in both T. indica fruit and fenofibrate treatment groups.
157
5.2.4 PPARGC1A or PGC1A: the key regulator of multiple nuclear receptors
Based on the genes that were significantly regulated after treatment with T.
indica fruit in the microarray study, it was shown that many transcription factors were
predicted to be activated and many of which are involved in lipid and glucose
homeostasis (PPARA, PPARG, CREB1 and PPARGC1A). This implies that the fruit
may have exerted its lipid-lowering effects through the activation of one or more of
these transcription factors. It should be noted that cross-talk can occur between
transcription factors, as seen in the overlapping of genes regulated by different
transcription factors (Figure 4.24). This further complicates the identification of a
precise mode of action of the fruit in lowering lipid. However the activation of PPARA
by the fruit was eminent based on the fact that it regulated genes involved in fatty acid
oxidation and was comparable to fenofibrate, both of which were predicted to activate
PPARA. However, the prediction about the activation of other transcription factors
could indicate that the fruit probably mediates its hypolipidaemic effects through
regulation at a higher order, or at an entirely different mechanism of action altogether.
The activation of multiple transcription factors could be explained by the
involvement of PPARGC1A. PPARGC1A or PGC1A is a transcriptional coactivator
responsible for the regulation of many metabolic processes like gluconeogenesis,
adaptive thermogenesis, positive regulator of mitochondrial biogenesis and respiration.
(Handschin & Spiegelman, 2006). PGC-1 coactivators functionally interact with
transcription factors like PPARG, PPARA, ERR, LXR and HNF-4a (Nagai et al., 2009;
Puigserver & Spiegelman, 2003; Yang, Williams, & Kelly, 2009) and non-nuclear
receptor transcription factors and regulatory elements including cAMP response
element-binding protein (CREB), sterol regulatory element-binding protein-1c (SREBP-
1c) and forkhead box O1 (FOXO1) (Gupta et al., 2005; Nakae et al., 2002; Puigserver
158
et al., 2003; Yamagata et al., 1996; J. C. Yoon et al., 2001). In a review by Sugden et al.
(2010), PGC1A works in orchestration with PPARA, FOXO1, HNF4A and CREB in
inducing hepatic gluconeogenesis. It was also shown that lipin-1 (LPIN1), which was
up-regulated in the microarray study, induces fatty acid oxidation by forming a complex
with PGC1A and PPARA (Figure 5.3). The authors also proposed that SIRT1 may be
the key molecule regulating the PPARs, PGCs and lipin-1 in modulating the metabolic
responses in tissues including liver and adipose tissues in varying nutrient and
physiological signals.
The transactivation of PPARα can be mediated by PPARα ligands or by the
presence of high levels of PPARGC1A (Sanderson et al., 2009). PPARGC1A was
predicted to be activated in the T. indica treatment group in the IPA upstream regulator
analysis, with an activation z-score of 2.394. The result was supported by the fact that
genes that were involved in the PPARGC1A activation were up-regulated, i.e. TRIB3,
PLIN2, LPIN1, G6PC and CPT1A. PPARGC1A is a transcription coactivator that
modulates lipid metabolism, energy production and glucose metabolism. It was shown
that lipin-1 (LPIN1) which was up-regulated in the T. indica fruit treatment enhanced
fatty acid oxidation by forming a complex with PPARGC1A and PPARA (Finck, et al.,
2006) (Figure 5.3).
The activation of PPARGC1A is also implicated in increased glucose production
in the liver (Herzig et al., 2001). In this study CREB1, FOXO1 and PPARGC1A were
predicted to be activated in the IPA analyses (Table 4.15). CREB was activated by
TORC2 in the presence of glucagon during fasting. The activated CREB subsequently
induces PPARGC1A and the formation of a complexion consisting of GR, FOXO1,
HNF4A and PPARα induces genes involved in gluconeogenesis (Dentin et al., 2007; X.
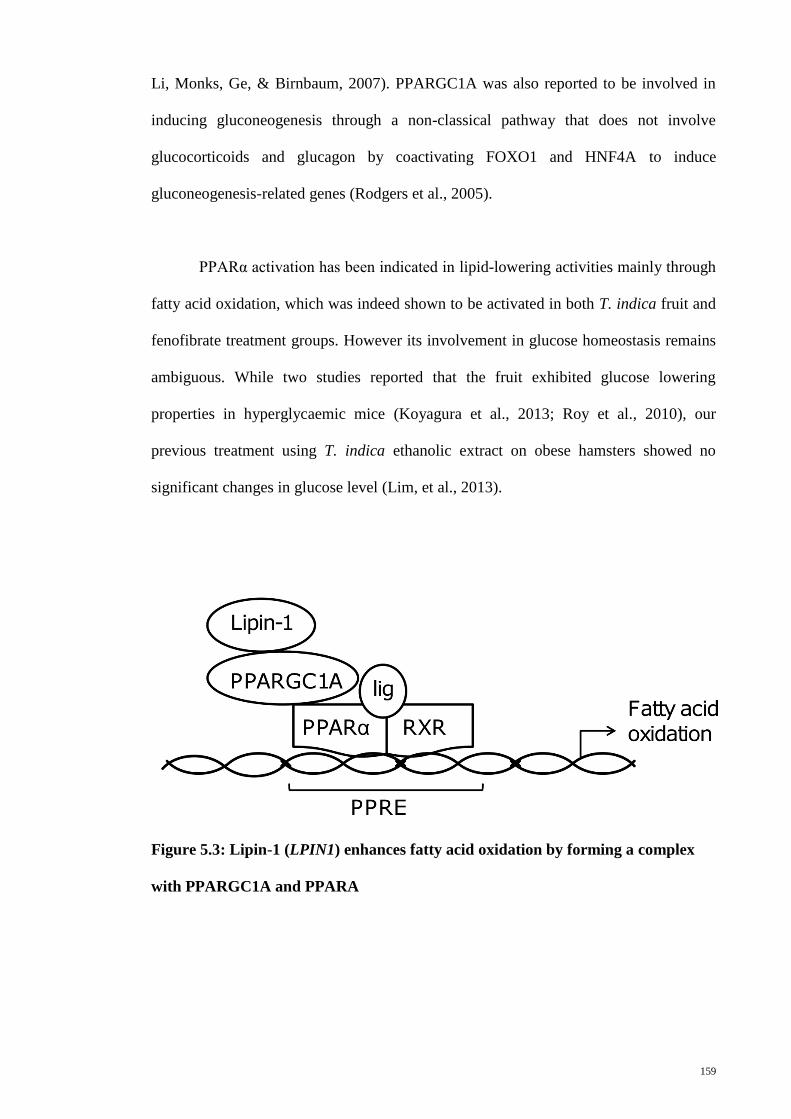
159
Li, Monks, Ge, & Birnbaum, 2007). PPARGC1A was also reported to be involved in
inducing gluconeogenesis through a non-classical pathway that does not involve
glucocorticoids and glucagon by coactivating FOXO1 and HNF4A to induce
gluconeogenesis-related genes (Rodgers et al., 2005).
PPARα activation has been indicated in lipid-lowering activities mainly through
fatty acid oxidation, which was indeed shown to be activated in both T. indica fruit and
fenofibrate treatment groups. However its involvement in glucose homeostasis remains
ambiguous. While two studies reported that the fruit exhibited glucose lowering
properties in hyperglycaemic mice (Koyagura et al., 2013; Roy et al., 2010), our
previous treatment using T. indica ethanolic extract on obese hamsters showed no
significant changes in glucose level (Lim, et al., 2013).
Figure 5.3: Lipin-1 (LPIN1) enhances fatty acid oxidation by forming a complex
with PPARGC1A and PPARA
160
5.2.5 T. indica fruit activates PPARγ
PPARγ, like PPARα is a member of the nuclear receptor superfamily of ligand-
activated transcription factors (Cornelius, MacDougald, & Lane, 1994) highly
expressed in adipocytes (Chawla, Schwarz, Dimaculangan, & Lazar, 1994; Tontonoz,
Hu, Graves, Budavari, & Spiegelman, 1994) and plays a role in improving glucose
homeostasis and adipocyte differentiation (Kallwitz, McLachlan, & Cotler, 2008).
Mutations of PPARγ results in the development of severe insulin resistant, type-2
diabetes, hypertension in the absence of obesity, elevated triglycerides and low HDL
levels and a number of components of the metabolic syndrome. Like other PPARs, free
fatty acid and their derivatives can bind and activate PPARγ. However, specific
mechanism of action related to fatty acids and their metabolites is still unclear as
identification of specific endogenous PPARγ ligands remains ambiguous (Forman,
Chen, & Evans, 1996; Forman et al., 1995). In contrast, synthetic ligands, such as
thiazolidinediones or TZDs, are potent activators of PPARγ with robust insulin-
sensitising activities (Kung & Henry, 2012). While TZDs are highly effective
hypoglycaemic drugs, side effects like weight gain, fluid retention and osteoporosis
were reported (Kung & Henry, 2012).
The protein encoded by TRIB3 gene is a putative protein kinase that is induced
by the transcription factor NF-kappaB. The encoded protein is a negative regulator of
NF-kappaB and can also sensitise cells to TNF- and TRAIL-induced apoptosis. In
addition, this protein can negatively regulate the cell survival serine-threonine kinase
AKT1. The up-regulation of this gene could probably explain the anti-inflammatory
action of this fruit (Rimbau, et al., 1999). Other than its involvement in apoptosis and
inflammation processes, it has been shown that human TRIB3 decreased biosynthesis
of fatty acid (Qi et al., 2006). Mouse Trib3 is involved in transport of glucose by
161
inhibiting Akt/PKB activation by insulin in liver (Du, Herzig, Kulkarni, & Montminy,
2003).
PLIN2, a gene up-regulated in the presence of PPARα and PPARγ
transactivation (Nielsen, et al., 2006), was shown to reduce fatty acid uptake, oxidation
and lipolysis when PLIN2 protein was down-regulated (Faleck et al., 2010). However, a
study using homozygous mutant mouse Plin2 gene knockout in obese mouse decreased
quantity of triglyceride and glucose in mouse liver (B. H. Chang, Li, Saha, & Chan,
2010). ACSL, which was shown to be up-regulated in fatty acid oxidation and PPARα
activation, was also up-regulated in PPARγ activation (Finck, et al., 2002; Schoonjans,
et al., 1995; Tachibana, et al., 2006).
The other two genes that were involved in lipid and glucose metabolism, CPT1A
and G6PC, were found to be regulated in the event of PPARγ transactivation. Begriche
et al. (2006) reported that CREB protein increased expression of CPT1A protein that
involves PPARγ protein. In a study using diabetic rats, it was found that the activation
of rat Pparg protein decreased expression of rat G6pc mRNA in fatty rat liver (Way, et
al., 2001). However in another study using mutant mouse with a homozygous knockout
of mouse Ppara gene, mouse PPARγ 1 protein increased the expression of mouse G6pc
mRNA (S. Yu, et al., 2003).
The effects of TZDs against NAFLD are controversial, according to a review by
Ables (2012). Studies using different experimental models showed either beneficial or
undesirable effects when TZDs were used. It was shown that TZDs improved insulin
sensitivity but with the concomitant development of hepatosteatosis, while some
showed otherwise (Ables, 2012). In this study PPARγ was predicted to be activated in
T. indica treatment, and the same effect was not shown in other groups like fenofibrate
162
and palmitic acid treatment groups based on the genes involved in PPARγ activation.
This indicates that the transactivation of PPARγ was attributed to T. indica fruit pulp
extract. While studies pointed that PPARγ can improve insulin sensitivity but induce
fatty liver, the lipid study in this experiment showed otherwise. Treatment with T.
indica fruit extract lowered triglyceride and cholesterol and the effect is comparable to
fenofibrate at 0.1 mg/ml T. indica fruit extract and was supported by the Oil Red O
staining showing lowered amount of lipid droplets in the cells after treatment. Taken
together, PPARγ activation was shown to regulate genes related to lipid and glucose
metabolism but without the adverse effect of lipid accumulation in liver cells.
It has been shown that PPARγ ligands have an anti-tumour effect in humans as
these compounds decrease cell growth and induce apoptosis in several malignant human
cell types, including hepatocellular carcinoma, breast adenocarcinoma and colon
adenocarcinoma (Boitier, Gautier, & Roberts, 2003). This effect was also observed in
the microarray study in which genes involved in apoptosis and cell death were
significantly regulated. For example, up-regulation of TNFSF10 gene is linked to
apoptosis (Baader et al., 2005; Ichikawa et al., 2001) and cell death (Di Pietro & Zauli,
2004). The protein encoded by this gene is a cytokine that belongs to the tumour
necrosis factor (TNF) ligand family. This protein preferentially induces apoptosis in
transformed and tumour cells, but does not appear to kill normal cells although it is
expressed at a significant level in most normal tissues. It has been shown that inhibition
of active mouse Pparg protein by GW9662 prevented transactivation of human
TNFSF10 gene in HuH7 cells that is dependent on human PPARG protein (Ho, et al.,
2011).
163
Other genes like OCLN, NDRG1, GSTA1, HYOU1 and JUN involved in
apoptosis were significantly regulated in the microarray study too. Occludin, the protein
encoded by OCLN gene was shown to be increased by human PPARG protein in co-
cultured U937 cells (Huang, et al., 2009). Ndrg1 gene encode N-myc downstream
regulated 1. This gene is a member of the N-myc downregulated gene family which
belongs to the alpha/beta hydrolase superfamily. The protein encoded by this gene is a
cytoplasmic protein involved in stress responses, hormone responses, cell growth, and
differentiation. The encoded protein is necessary for p53-mediated caspase activation
and apoptosis. Interference of mouse Pparg mRNA by siRNA was shown to decrease
expression of mouse Ndrg1 mRNA in mature 3T3-L1 adipocytes that is increased by
hypoxia (Pino, et al., 2012). GSTA1 and HYOU1 genes were found to be involved in
activation of PPARγ. 9-cis-retinoic acid and prostaglandin J2 increased binding of
PPRE from rat Gsta2 gene and a heterodimeric protein-protein complex consisting of
rat Pparg and of rat Rxr (E. Y. Park, et al., 2004). As for HYOU1, the findings by Jiang
et al. (2010) were contradictory. They reported that homozygous mutant mouse Pparg
gene knockout increased expression of mouse Hyou1 mRNA in epithelium from mouse
prostate gland. However, interference of mouse Pparg2 mRNA by siRNA decreased
expression of mouse Hyou1 mRNA in epithelial cells from mouse prostate gland.
KLF4 and KLF6 were both up-regulated by 1.5- and 2.0-fold respectively. These
genes encode members of the Kruppel-like family of transcription factors. The zinc
finger protein is a transcriptional activator, and functions as a tumour suppressor. It was
demonstrated that activation of PPARγ led to the increased expression of KLF4 protein
and mRNA (Drori, et al., 2005; S. Li, et al., 2013; Rageul, et al., 2009). While for
KLF6, it was shown that interference of mouse Pparg mRNA by siRNA increased
expression of mouse Klf6 mRNA in mature terminally differentiated 3T3-L1 adipocytes
164
(Schupp, et al., 2009). Taken together, T. indica fruit was shown to activate PPARγ
based on the genes regulated in microarray study.
5.2.6 T. indica fruit modulates apoptosis and cell death
T. indica fruit pulp is known to exhibit lipid-lowering effects and it has been
shown in this study that it could be mediated by fatty acid oxidation through the
activation of PPARα. While the regulations of lipid metabolism and to a certain extent,
carbohydrate metabolism were being modulated, the number of genes involved in
apoptosis and cell death were interestingly high. T. indica fruit extract has never been
reported to exhibit anti-proliferative effect to the best of our knowledge, and the MTT
assay in this study was in agreement to that fact. The extensive regulation of genes
involved in apoptosis and cell death in all treatments could probably explain that cancer,
cell growth and proliferation, as well as cell death-related networks as being the
dominant associated network functions in the IPA network analysis.
5.2.6.1 Induction of endoplasmic reticulum (ER) stress
Among the many mechanisms that could lead to apoptosis, one is associated
with the induction of ER stress. ER is a site for Ca2+
storage and also responsible for
synthesis, folding and maturation of secreted and transmembrane proteins. Pathological
or physiological conditions that interrupt protein folding in the ER can cause stress in
the endoplasmic reticulum and lead to the activation of signalling pathway known as the
Unfolded Protein Response (UPR) pathway.
In the IPA upstream regulator analysis, three transcription factors associated to
ER stress, DDIT3, ATF4 and XBP1 were predicted to be activated. While DDIT3 and
XBP1 were predicted to be activated in all treatment groups based on the genes
165
regulated, ATF4 was exclusively predicted to be activated in T. indica treatment group
only.
DDIT3 or CHOP is one of the key markers in ER stress induced pathway, UPR
pathway. It codes for C/EBP homologous protein, a member of the CCAAT/enhancer-
binding protein family. CHOP is implicated in adipogenesis and erythropoiesis, and is
activated by ER stress, and promotes apoptosis. In this study, it was up-regulated in all
treatments and its activation is supported by the IPA upstream regulator analysis based
on the genes regulated the T. indica fruit treatment. There are 6 DDIT3 target genes that
were significantly altered in this study, WARS, TRIB3, PPP1R15A, LCN2, ATF3, and
ANKRD1. Out of these 6 genes, 4 genes (WARS, TRIB3, PPP1R15A and ATF3) were
also shown to be regulated in the transactivation of ATF4, another transcription factor
that was shown to be activated based on the genes regulated (J. Han et al., 2013).
Activating transcription factor 4 or ATF4 is also induced by ER stress through
the UPR pathway. According to the IPA upstream regulator analysis, 9 genes have
expression direction consistent with the activation of ATF4, namely WARS, NDRG1,
MAP1LC3B, KLF4, HERPUD1, DDIT3, ATF3, TRIB3 and PPP1R5A. In a microarray
analysis done by Jousse et al. (2007), it was shown that amino acid starvation of Mef
cells increased expression of mouse genes like Wars, Herpud1, Ddit3, Areg and Trib3
that involves mouse Atf4 protein. The activation of ATF4 was also supported by the
regulations of genes like WARS, NDRG1, KLF4, HERPUD1 and ATF3 which were
found to be decreased in expression when Atf4 gene was knockout in mouse (Harding et
al., 2003). However in a recent study, tribbles 3 or TRIB3 which was up-regulated in
this study was shown to be up-regulated in high-fat feeding mice and humans with
166
obesity and type-2 diabetes. When the gene was knockout in high-fat feeding mice, the
mice showed improved insulin resistance in skeletal muscle (Koh et al., 2013).
Although these results were linked to the induction of ER stress, it was shown
that ER stress suppressed genes involved in maintaining energy and lipid homeostasis
such as PPARα, PGC1a and FOXO1. (Rutkowski et al., 2008). This finding is in
contrast with our results which were predicted to be activated based on the genes
regulated in the microarray study. It should be noted that classical pro-apoptotic
molecules like Bax, Bak, and caspases were not significantly regulated in this study,
indicating that apoptosis may not occur in the cells. Besides this, T. indica fruit was able
to lower lipid levels in HepG2 cells, which also defies the fact that ER stress leads to
hepatosteatosis. Furthermore, the MTT assay did not exhibit anti-proliferative activity
nor extensive cell death, thus eliminating the possibilities of ER stress-induced
apoptosis.
5.2.6.2 Tumour suppressing genes involved in TP53, FOXO3 and c-MYC
downstream pathways
Besides this, the microarray results also showed regulation of genes involved in
tumour suppressing activities. TP53 codes for tumour suppressor 53, which was
predicted to be activated in the IPA upstream regulator analysis based on the genes
regulated. As the name implies, it is a potent tumour suppressor in humans, based on the
fact that most of the human tumours have mutations or deletions in p53 gene itself or in
the p53 pathway (Vogelstein, Lane, & Levine, 2000). It responds to diverse cellular
stresses to regulate expression of target genes, thereby inducing cell cycle arrest,
apoptosis, senescence, DNA repair, or changes in metabolism. Mutations in p53 have
been linked to poor prognosis in a variety of human cancers, including lung (Quinlan,
167
Davidson, Summers, Warden, & Doshi, 1992), breast (Deng et al., 1994) and gastric
cancers (Scott et al., 1991), as well as lymphomas (Gaidano et al., 1991; Lo Coco et al.,
1993). Other than its involvement in tumour suppressing activities, it was also reported
to regulate fatty acid oxidation through the induction of lipin-1 (LPIN1), which was up-
regulated in the microarray study (Assaily et al., 2011).
Another tumour suppressor, FOXO3 is responsible for the expression of a
program of genes involved in cell cycle arrest, DNA repair, hypoxia response and
apoptosis (Bakker, Harris, & Mak, 2007; Brunet et al., 1999; Medema, Kops, Bos, &
Burgering, 2000; Tran et al., 2002). It is negatively regulated in response to insulin and
growth factors through phosphorylation-dependent nuclear export (Brunet, et al., 1999;
Nakae, Park, & Accili, 1999), while positive regulation occurs in the presence of
oxidative stress through JNK activity (Brunet et al., 2004; Essers et al., 2004). In recent
studies, it was shown that transactivation of FOXO3 is hepatoprotective against acute
and chronic alcohol-induced liver injury by inducing autophagy, a protective
mechanism against alcohol-induced liver injury by removing damaged mitochondria
(Ni, Du, You, & Ding, 2013; Tumurbaatar et al., 2013).
MYC is a transcription factor regulating genes involved in cell growth, cell
proliferation, cell cycle and apoptosis (Dang, 1999). Its activation is associated with
many types of cancers and its inhibition is a therapeutic target for anti-cancer research.
In this study it was predicted to be inhibited based on the genes regulated in T. indica
fruit treatment group (THBS1, TES, TAF1D, SNHG12, SLC2A1, RPL5, PPP1R15A,
NDRG1, LGALS1, ID1, DUSP1, DDIT3, CPT1A, CD9, KLF6 and MT1E). Down-
regulation of c-Myc has been reported to mediate anti-cancer effect. In fact, a number of
168
plant extracts were shown to inhibit cancer cell proliferation by inhibiting c-Myc
(Giessrigl et al., 2012; Othman et al., 2012; Unger et al., 2012).
The overall activation of tumour suppressors and inhibition of oncogene in this
microarray study may suggest anti-cancer properties of the fruit. However it should be
noted that the fruit did not affect cell viability significantly, as shown in the MTT assay
results. Moreover, there has been no studies reporting any anti-cancer activities in
relation to this fruit, although individual polyphenolic compounds found in the
methanol extract of T. indica has been shown to exhibit anti-proliferative effects.
5.3 Polyphenols in T. indica fruit that may attribute to the activities
The lipid-lowering effects induced by plant polyphenols have been reported by
many. In fact, there is an upcoming trend of researches revealing the potentials of plant
polyphenols in regulating metabolic processes in vitro and in vivo. Methanolic extract
of T. indica fruit pulp contains catechin, epicatechin, procyanidins, naringenin,
apigenin, luteolin, taxifolin and eriodictyol (Sudjaroen, et al., 2005). It was shown that
tea catechins like epigallocatechin gallate (EGCG) and epigallocatechin (EGC) were
able to activate PPARα (K. Lee, 2004). Naringenin from grapefruit was shown to
regulate lipid metabolism through partial activation of PPARα (Goldwasser, et al.,
2010). This was also supported by Mulvihill et al.(2009) who had shown that
naringenin was able to correct VLDL overproduction, ameliorate hepatic steatosis, and
attenuate dyslipidemia without affecting caloric intake or fat absorption in LDL
receptor null mice through the activation of PGC1A/PPARα activation. Interestingly,
naringenin from black elder flowers was shown to increase activation of PPARγ too
(Christensen, Petersen, Kristiansen, & Christensen, 2010). Another study showed that
flavangenol extracted from pine bark was able to enhance fatty acid oxidation, mainly
169
attributed to procyanidin B1 (Shimada, et al., 2012). Proanthocyanidins from hawthorn
had also been reported to lower lipid and glucose level by activating AMPK and
PPARα (Shih, Lin, Lin, & Wu, 2013). Tart cherries rich in anthocyanins had also been
shown to ameliorate hepatic steatosis and hyperlipidaemia through the activation of
PPARα (Seymour et al., 2008). This shows that a number of polyphenols in the
methanolic extract of T. indica fruit were able to regulate nuclear receptors such as
PPARα.
Although T. indica fruit did not exhibit anti-proliferative effect, genes related to
apoptosis were seen significantly regulated. The polyphenols in the fruit could be
accountable for the phenomenon. For instance procyanidins from grape seed and apple
had been shown to induce apoptosis through the induction of caspases (C. P. Hsu et al.,
2009; Miura et al., 2008). Similarly, catechins and green tea catechins which consist of
(−)-epigallocatechin-3-gallate (EGCG), (−)-epigallocatechin (EGC), (−)-epicatechin-3-
gallate (ECG) and (−)-epicatechin (EC) were also reported to induce apoptosis in cancer
cells (Al-Hazzani & Alshatwi, 2011; Alshatwi, 2010; Chung et al., 2001; Nakazato et
al., 2005; Philips, Coyle, Morrisroe, Chancellor, & Yoshimura, 2009). However in a
recent study, catechin was shown to increase viability and decrease apoptosis and
proliferation of epithelial cells and vascular smooth muscle cells (Negrao et al., 2013).
Apigenin is another polyphenol that exhibit anti-proliferative properties (Budhraja et al.,
2012; C. C. Lin et al., 2012; Zbidah et al., 2012). Yan et al. (2012) reported that luteolin
exhibited anti-cancer effect in non-small cell lung cancer xenograft mouse model
through the increased activity of TRAIL (TNFSF10), which was up-regulated in the
microarray study.
170
CHAPTER 6
CONCLUSION
In the present study, the lipid-lowering effect of T. indica fruit pulp was
investigated systematically. The study was performed in three stages, i) proteomic
analysis to corroborate with the previous microarray analysis and to formulate a
hypothesis; ii) measurement of lipid levels in hepatosteatotic HepG2 cells and iii)
transcriptomic analysis on T. indica fruit treated-hepatosteatotic HepG2 cells and
comparing the transcriptomic profile with fenofibrate treated cells. The first stage of
this study suggested that T. indica fruit could have exerted its hypolipidaemic effect
through the activation of PPARα. Lipid studies showed that 0.1 mg/ml methanolic
extract of T. indica fruit pulp was able to lower lipid (triglyceride and cholesterol) to a
level comparable to fenofibrate treatment. Based on the transcriptomic studies, T. indica
fruit mediates its hypolipidaemic effects by increasing fatty acid oxidation through the
transactivation of PPARα, a method similar to fenofibrate. In summary, the results from
this study suggest that such an integrated approach has led to a better understanding of
the lipid-lowering effects of T. indica fruit pulp.
6.1 Future study
The findings from this study demonstrated that T. indica fruit pulp is a
promising lipid-lowering agent and more in-depth studies should be warranted in the
future. To further validate the lipid-lowering action of T. indica fruit pulp through the
activation of PPARα, PPARα reporter assay can be performed. This assay allows the
monitoring of PPARα transcriptional activities in cells. Besides PPARα, other
transcription factors that were predicted to be activated or inhibited can also be
validated by using reporter assays for the respective transcription factors. The
171
hypothesis can also be tested in animal models by observing the effect of T. indica fruit
pulp in PPARα-knockout mice.
The individual compounds in T. indica fruit pulp extract can also be isolated and
assessed for bioactive properties. While pure compound is often more potent than crude
extract, it should be noted that complex mixture of compounds found in natural
products often interacts with each other either synergistically or antagonistically, thus
affecting the potency of the bioactive properties.
172
REFERENCES
Ables, G. P. (2012). Update on ppargamma and nonalcoholic Fatty liver disease. PPAR
Research, 2012, 912351. doi: 10.1155/2012/912351
Abramovitch, R., Tavor, E., Jacob-Hirsch, J., Zeira, E., Amariglio, N., Pappo, O., . . .
Honigman, A. (2004). A pivotal role of cyclic AMP-responsive element binding
protein in tumor progression. Cancer Research, 64(4), 1338-1346.
Adeola, A. A., Adeola, O. O., & Dosumu, O. O. (2010). Comparative analyses of
phytochemicals and antimicrobial properties of extracts of wild Tamarindus
indica pulps. African Journal of Microbiology Research, 4(24), 2769-2779.
Agola, J., Jim, P., Ward, H., Basuray, S., & Wandinger-Ness, A. (2011). Rab GTPases
as regulators of endocytosis, targets of disease and therapeutic opportunities.
Clinical Genetics, 80(4), 305-318. doi: 10.1111/j.1399-0004.2011.01724.x
Aiston, S., Trinh, K. Y., Lange, A. J., Newgard, C. B., & Agius, L. (1999). Glucose-6-
phosphatase overexpression lowers glucose 6-phosphate and inhibits glycogen
synthesis and glycolysis in hepatocytes without affecting glucokinase
translocation. Evidence against feedback inhibition of glucokinase. The Journal
of Biological Chemistry, 274(35), 24559-24566.
Akkaoui, M., Cohen, I., Esnous, C., Lenoir, V., Sournac, M., Girard, J., & Prip-Buus, C.
(2009). Modulation of the hepatic malonyl-CoA-carnitine palmitoyltransferase
1A partnership creates a metabolic switch allowing oxidation of de novo fatty
acids. The Biochemical Journal, 420(3), 429-438. doi: 10.1042/BJ20081932
Al-Hazzani, A. A., & Alshatwi, A. A. (2011). Catechin hydrate inhibits proliferation
and mediates apoptosis of SiHa human cervical cancer cells. Food and Chemical
Toxicology : an international journal published for the British Industrial
Biological Research Association, 49(12), 3281-3286. doi:
10.1016/j.fct.2011.09.023
Aleshire, S. L., Bradley, C. A., Richardson, L. D., & Parl, F. F. (1983). Localization of
human prealbumin in choroid plexus epithelium. The Journal of Histochemistry
and Cytochemistry : Official Journal of the Histochemistry Society, 31(5), 608-
612.
Ali, N., & Shah, S. (2010). Spasmolytic activity of fruits of Tamarindus indica L.
Journal of Young Pharmacists : JYP, 2(3), 261-264. doi: 10.4103/0975-
1483.66805
173
Alshatwi, A. A. (2010). Catechin hydrate suppresses MCF-7 proliferation through
TP53/Caspase-mediated apoptosis. Journal of Experimental & Clinical Cancer
Research : CR, 29, 167. doi: 10.1186/1756-9966-29-167
Ammerschlaeger, M., Beigel, J., Klein, K. U., & Mueller, S. O. (2004). Characterization
of the species-specificity of peroxisome proliferators in rat and human
hepatocytes. Toxicological Sciences : an official journal of the Society of
Toxicology, 78(2), 229-240. doi: 10.1093/toxsci/kfh071
Amundson, S. A., Bittner, M., Chen, Y., Trent, J., Meltzer, P., & Fornace, A. J., Jr.
(1999). Fluorescent cDNA microarray hybridization reveals complexity and
heterogeneity of cellular genotoxic stress responses. Oncogene, 18(24), 3666-
3672. doi: 10.1038/sj.onc.1202676
Amundson, S. A., Do, K. T., Vinikoor, L., Koch-Paiz, C. A., Bittner, M. L., Trent, J.
M., . . . Fornace, A. J., Jr. (2005). Stress-specific signatures: expression profiling
of p53 wild-type and -null human cells. Oncogene, 24(28), 4572-4579. doi:
10.1038/sj.onc.1208653
Amundson, S. A., Zhan, Q., Penn, L. Z., & Fornace, A. J., Jr. (1998). Myc suppresses
induction of the growth arrest genes gadd34, gadd45, and gadd153 by DNA-
damaging agents. Oncogene, 17(17), 2149-2154. doi: 10.1038/sj.onc.1202136
Anghel, S. I., Bedu, E., Vivier, C. D., Descombes, P., Desvergne, B., & Wahli, W.
(2007). Adipose tissue integrity as a prerequisite for systemic energy balance: a
critical role for peroxisome proliferator-activated receptor gamma. The Journal
of Biological Chemistry, 282(41), 29946-29957. doi: 10.1074/jbc.M702490200
Anstee, Q. M., Targher, G., & Day, C. P. (2013). Progression of NAFLD to diabetes
mellitus, cardiovascular disease or cirrhosis. Nature reviews. Gastroenterology
& hepatology, 10(6), 330-344. doi: 10.1038/nrgastro.2013.41
Artal-Sanz, M., & Tavernarakis, N. (2009). Prohibitin couples diapause signalling to
mitochondrial metabolism during ageing in C. elegans. Nature, 461(7265), 793-
797. doi: 10.1038/nature08466
Artal-Sanz, M., & Tavernarakis, N. (2010). Opposing function of mitochondrial
prohibitin in aging. Aging, 2(12), 1004-1011.
Arts, I. C., & Hollman, P. C. (2005). Polyphenols and disease risk in epidemiologic
studies. The American Journal of Clinical Nutrition, 81(1 Suppl), 317S-325S.
174
Assaily, W., Rubinger, D. A., Wheaton, K., Lin, Y., Ma, W., Xuan, W., . . . Benchimol,
S. (2011). ROS-mediated p53 induction of Lpin1 regulates fatty acid oxidation
in response to nutritional stress. Molecular Cell, 44(3), 491-501. doi:
10.1016/j.molcel.2011.08.038
Azman, K. F., Amom, Z., Azlan, A., Esa, N. M., Ali, R. M., Shah, Z. M., & Kadir, K.
K. (2012). Antiobesity effect of Tamarindus indica L. pulp aqueous extract in
high-fat diet-induced obese rats. Journal of Natural Medicines, 66(2), 333-342.
doi: 10.1007/s11418-011-0597-8
Baader, E., Toloczko, A., Fuchs, U., Schmid, I., Beltinger, C., Ehrhardt, H., . . .
Jeremias, I. (2005). Tumor necrosis factor-related apoptosis-inducing ligand-
mediated proliferation of tumor cells with receptor-proximal apoptosis defects.
Cancer Research, 65(17), 7888-7895. doi: 10.1158/0008-5472.CAN-04-4278
Babcock, J. T., Nguyen, H. B., He, Y., Hendricks, J. W., Wek, R. C., & Quilliam, L. A.
(2013). Mammalian target of rapamycin complex 1 (mTORC1) enhances
bortezomib-induced death in tuberous sclerosis complex (TSC)-null cells by a c-
MYC-dependent induction of the unfolded protein response. The Journal of
Biological Chemistry, 288(22), 15687-15698. doi: 10.1074/jbc.M112.431056
Bakker, W. J., Harris, I. S., & Mak, T. W. (2007). FOXO3a is activated in response to
hypoxic stress and inhibits HIF1-induced apoptosis via regulation of CITED2.
Molecular Cell, 28(6), 941-953. doi: 10.1016/j.molcel.2007.10.035
Bandsma, R. H., Van Dijk, T. H., Harmsel At, A., Kok, T., Reijngoud, D. J., Staels, B.,
& Kuipers, F. (2004). Hepatic de novo synthesis of glucose 6-phosphate is not
affected in peroxisome proliferator-activated receptor alpha-deficient mice but is
preferentially directed toward hepatic glycogen stores after a short term fast. The
Journal of Biological Chemistry, 279(10), 8930-8937. doi:
10.1074/jbc.M310067200
Barja, G., & Herrero, A. (1998). Localization at complex I and mechanism of the higher
free radical production of brain nonsynaptic mitochondria in the short-lived rat
than in the longevous pigeon. Journal of Bioenergetics and Biomembranes,
30(3), 235-243.
Barsyte-Lovejoy, D., Mao, D. Y., & Penn, L. Z. (2004). c-Myc represses the proximal
promoters of GADD45a and GADD153 by a post-RNA polymerase II
recruitment mechanism. Oncogene, 23(19), 3481-3486. doi:
10.1038/sj.onc.1207487
Baudino, T. A., McKay, C., Pendeville-Samain, H., Nilsson, J. A., Maclean, K. H.,
White, E. L., . . . Cleveland, J. L. (2002). c-Myc is essential for vasculogenesis
and angiogenesis during development and tumor progression. Genes &
Development, 16(19), 2530-2543. doi: 10.1101/gad.1024602
175
Bazzano, L. A., He, J., Ogden, L. G., Loria, C. M., Vupputuri, S., Myers, L., &
Whelton, P. K. (2002). Fruit and vegetable intake and risk of cardiovascular
disease in US adults: the first National Health and Nutrition Examination Survey
Epidemiologic Follow-up Study. The American Journal of Clinical Nutrition,
76(1), 93-99.
Becker, D. J., & Gordon, R. Y. (2011). The lipid-lowering properties of red yeast rice.
The Virtual Mentor : VM, 13(6), 365-368. doi:
10.1001/virtualmentor.2011.13.6.cprl1-1106
Begriche, K., Igoudjil, A., Pessayre, D., & Fromenty, B. (2006). Mitochondrial
dysfunction in NASH: causes, consequences and possible means to prevent it.
Mitochondrion, 6(1), 1-28. doi: 10.1016/j.mito.2005.10.004
Begum, N., Hockman, S., & Manganiello, V. C. (2011). Phosphodiesterase 3A
(PDE3A) deletion suppresses proliferation of cultured murine vascular smooth
muscle cells (VSMCs) via inhibition of mitogen-activated protein kinase
(MAPK) signaling and alterations in critical cell cycle regulatory proteins. The
Journal of Biological Chemistry, 286(29), 26238-26249. doi:
10.1074/jbc.M110.214155
Belguith-Hadriche, O., Bouaziz, M., Jamoussi, K., El Feki, A., Sayadi, S., & Makni-
Ayedi, F. (2010). Lipid-lowering and antioxidant effects of an ethyl acetate
extract of fenugreek seeds in high-cholesterol-fed rats. Journal of Agricultural
and Food Chemistry, 58(4), 2116-2122. doi: 10.1021/jf903186w
Bendinelli, B., Masala, G., Saieva, C., Salvini, S., Calonico, C., Sacerdote, C., . . .
Panico, S. (2011). Fruit, vegetables, and olive oil and risk of coronary heart
disease in Italian women: the EPICOR Study. The American Journal of Clinical
Nutrition, 93(2), 275-283. doi: 10.3945/ajcn.110.000521
Benjamini, Y., Hochberg, Y. (1995). Controlling the false discovery rate: A practical
and powerful approach to multiple testing. Journal of the Royal Statistical
Society. Series B (Methodological), 57(1), 289-300.
Berger, K. H., & Yaffe, M. P. (1998). Prohibitin family members interact genetically
with mitochondrial inheritance components in Saccharomyces cerevisiae.
Molecular and Cellular Biology, 18(7), 4043-4052.
Berthou, L., Duverger, N., Emmanuel, F., Langouet, S., Auwerx, J., Guillouzo, A., . . .
Branellec, D. (1996). Opposite regulation of human versus mouse
apolipoprotein A-I by fibrates in human apolipoprotein A-I transgenic mice. The
Journal of Clinical Investigation, 97(11), 2408-2416. doi: 10.1172/JCI118687
176
Bertolotti, M., Concari, M., Loria, P., Abate, N., Pinetti, A., Guicciardi, M. E., &
Carulli, N. (1995). Effects of different phenotypes of hyperlipoproteinemia and
of treatment with fibric acid derivatives on the rates of cholesterol 7 alpha-
hydroxylation in humans. Arteriosclerosis, Thrombosis, and Vascular Biology,
15(8), 1064-1069.
Bhadoriya, S. S., Ganeshpurkar, A., Narwaria, J., Rai, G., & Jain, A. P. (2011).
Tamarindus indica: Extent of explored potential. Pharmacognosy Reviews, 5(9),
73-81. doi: 10.4103/0973-7847.79102
Bhalla, K., Hwang, B. J., Choi, J. H., Dewi, R., Ou, L., McLenithan, J., . . . Girnun, G.
D. (2011). N-Acetylfarnesylcysteine is a novel class of peroxisome proliferator-
activated receptor gamma ligand with partial and full agonist activity in vitro
and in vivo. The Journal of Biological Chemistry, 286(48), 41626-41635. doi:
10.1074/jbc.M111.257915
Bilban, M., Buehler, L. K., Head, S., Desoye, G., & Quaranta, V. (2002). Normalizing
DNA microarray data. Current Issues in Molecular Biology, 4(2), 57-64.
Bindesboll, C., Berg, O., Arntsen, B., Nebb, H. I., & Dalen, K. T. (2013). Fatty acids
regulate perilipin5 in muscle by activating PPARdelta. Journal of Lipid
Research, 54(7), 1949-1963. doi: 10.1194/jlr.M038992
Bjellqvist, B., Ek, K., Righetti, P. G., Gianazza, E., Gorg, A., Westermeier, R., &
Postel, W. (1982). Isoelectric focusing in immobilized pH gradients: principle,
methodology and some applications. Journal of Biochemical and Biophysical
Methods, 6(4), 317-339.
Bobek, P., Ozdin, L., & Galbavy, S. (1998). Dose- and time-dependent
hypocholesterolemic effect of oyster mushroom (Pleurotus ostreatus) in rats.
Nutrition, 14(3), 282-286.
Boddicker, R. L., Whitley, E. M., Davis, J. E., Birt, D. F., & Spurlock, M. E. (2011).
Low-dose dietary resveratrol has differential effects on colorectal tumorigenesis
in adiponectin knockout and wild-type mice. Nutrition and Cancer, 63(8), 1328-
1338. doi: 10.1080/01635581.2011.607538
Boiko, A. D., Porteous, S., Razorenova, O. V., Krivokrysenko, V. I., Williams, B. R., &
Gudkov, A. V. (2006). A systematic search for downstream mediators of tumor
suppressor function of p53 reveals a major role of BTG2 in suppression of Ras-
induced transformation. Genes & Development, 20(2), 236-252. doi:
10.1101/gad.1372606
177
Boitier, E., Gautier, J. C., & Roberts, R. (2003). Advances in understanding the
regulation of apoptosis and mitosis by peroxisome-proliferator activated
receptors in pre-clinical models: relevance for human health and disease.
Comparative Hepatology, 2(1), 3.
Bottoni, P., Giardina, B., Vitali, A., Boninsegna, A., & Scatena, R. (2009). A proteomic
approach to characterizing ciglitazone-induced cancer cell differentiation in
Hep-G2 cell line. Biochimica et Biophysica Acta (BBA) - Proteins & amp;
Proteomics, 1794(4), 615-626. doi: 10.1016/j.bbapap.2009.01.006
Boveris, A., Cadenas, E., & Stoppani, A. O. (1976). Role of ubiquinone in the
mitochondrial generation of hydrogen peroxide. The Biochemical Journal,
156(2), 435-444.
Brunet, A., Bonni, A., Zigmond, M. J., Lin, M. Z., Juo, P., Hu, L. S., . . . Greenberg, M.
E. (1999). Akt promotes cell survival by phosphorylating and inhibiting a
Forkhead transcription factor. Cell, 96(6), 857-868.
Brunet, A., Sweeney, L. B., Sturgill, J. F., Chua, K. F., Greer, P. L., Lin, Y., . . .
Greenberg, M. E. (2004). Stress-dependent regulation of FOXO transcription
factors by the SIRT1 deacetylase. Science, 303(5666), 2011-2015. doi:
10.1126/science.1094637
Budhraja, A., Gao, N., Zhang, Z., Son, Y. O., Cheng, S., Wang, X., . . . Shi, X. (2012).
Apigenin induces apoptosis in human leukemia cells and exhibits anti-leukemic
activity in vivo. Molecular Cancer Therapeutics, 11(1), 132-142. doi:
10.1158/1535-7163.MCT-11-0343
Burrows, A. E., Smogorzewska, A., & Elledge, S. J. (2010). Polybromo-associated
BRG1-associated factor components BRD7 and BAF180 are critical regulators
of p53 required for induction of replicative senescence. Proceedings of the
National Academy of Sciences of the United States of America, 107(32), 14280-
14285. doi: 10.1073/pnas.1009559107
Bursill, C. A., & Roach, P. D. (2006). Modulation of cholesterol metabolism by the
green tea polyphenol (-)-epigallocatechin gallate in cultured human liver
(HepG2) cells. Journal of Agricultural and Food Chemistry, 54(5), 1621-1626.
doi: 10.1021/jf051736o
Cairo, S., De Falco, F., Pizzo, M., Salomoni, P., Pandolfi, P. P., & Meroni, G. (2005).
PML interacts with Myc, and Myc target gene expression is altered in PML-null
fibroblasts. Oncogene, 24(13), 2195-2203. doi: 10.1038/sj.onc.1208338
178
Campaner, S., Spreafico, F., Burgold, T., Doni, M., Rosato, U., Amati, B., & Testa, G.
(2011). The methyltransferase Set7/9 (Setd7) is dispensable for the p53-
mediated DNA damage response in vivo. Molecular Cell, 43(4), 681-688. doi:
10.1016/j.molcel.2011.08.007
Caricasole, A., Copani, A., Caraci, F., Aronica, E., Rozemuller, A. J., Caruso, A., . . .
Nicoletti, F. (2004). Induction of Dickkopf-1, a negative modulator of the Wnt
pathway, is associated with neuronal degeneration in Alzheimer's brain. The
Journal of neuroscience : the official journal of the Society for Neuroscience,
24(26), 6021-6027. doi: 10.1523/JNEUROSCI.1381-04.2004
Carriere, V., Le Gall, M., Gouyon-Saumande, F., Schmoll, D., Brot-Laroche, E.,
Chauffeton, V., . . . Rousset, M. (2005). Intestinal glucose-dependent expression
of glucose-6-phosphatase: involvement of the aryl receptor nuclear translocator
transcription factor. The Journal of Biological Chemistry, 280(20), 20094-
20101. doi: 10.1074/jbc.M502192200
Carter, C. J. (2007). eIF2B and oligodendrocyte survival: where nature and nurture meet
in bipolar disorder and schizophrenia? Schizophrenia Bulletin, 33(6), 1343-
1353. doi: 10.1093/schbul/sbm007
Caviglia, J. M., Li, L. O., Wang, S., DiRusso, C. C., Coleman, R. A., & Lewin, T. M.
(2004). Rat long chain acyl-CoA synthetase 5, but not 1, 2, 3, or 4, complements
Escherichia coli fadD. The Journal of Biological Chemistry, 279(12), 11163-
11169. doi: 10.1074/jbc.M311392200
CDC. (2011). Vital signs: prevalence, treatment, and control of high levels of low-
density lipoprotein cholesterol--United States, 1999-2002 and 2005-200.
MMWR. Morbidity and mortality weekly report, 60(4), 109-114.
Chait, A., & Brunzell, J. D. (1990). Acquired hyperlipidemia (secondary
dyslipoproteinemias). Endocrinology and Metabolism Clinics of North America,
19(2), 259-278.
Chakravarthy, M. V., Pan, Z., Zhu, Y., Tordjman, K., Schneider, J. G., Coleman, T., . . .
Semenkovich, C. F. (2005). "New" hepatic fat activates PPARalpha to maintain
glucose, lipid, and cholesterol homeostasis. Cell Metabolism, 1(5), 309-322. doi:
10.1016/j.cmet.2005.04.002
Chan, P. T., Fong, W. P., Cheung, Y. L., Huang, Y., Ho, W. K., & Chen, Z. Y. (1999).
Jasmine green tea epicatechins are hypolipidemic in hamsters (Mesocricetus
auratus) fed a high fat diet. [Research Support, Non-U.S. Gov't]. The Journal of
Nutrition, 129(6), 1094-1101.
179
Chang, B. D., Swift, M. E., Shen, M., Fang, J., Broude, E. V., & Roninson, I. B. (2002).
Molecular determinants of terminal growth arrest induced in tumor cells by a
chemotherapeutic agent. Proceedings of the National Academy of Sciences of
the United States of America, 99(1), 389-394. doi: 10.1073/pnas.012602599
Chang, B. H., Li, L., Saha, P., & Chan, L. (2010). Absence of adipose differentiation
related protein upregulates hepatic VLDL secretion, relieves hepatosteatosis,
and improves whole body insulin resistance in leptin-deficient mice. Journal of
Lipid Research, 51(8), 2132-2142. doi: 10.1194/jlr.M004515
Chawla, A., Schwarz, E. J., Dimaculangan, D. D., & Lazar, M. A. (1994). Peroxisome
proliferator-activated receptor (PPAR) gamma: adipose-predominant expression
and induction early in adipocyte differentiation. Endocrinology, 135(2), 798-
800.
Cheng, Z., Pang, T., Gu, M., Gao, A. H., Xie, C. M., Li, J. Y., . . . Li, J. (2006).
Berberine-stimulated glucose uptake in L6 myotubes involves both AMPK and
p38 MAPK. Biochimica et Biophysica Acta, 1760(11), 1682-1689. doi:
10.1016/j.bbagen.2006.09.007
Childress, L., Gay, A., Zargar, A., & Ito, M. K. (2013). Review of red yeast rice content
and current Food and Drug Administration oversight. Journal of Clinical
Lipidology, 7(2), 117-122. doi: 10.1016/j.jacl.2012.09.003
Chisholm, J. W., Burleson, E. R., Shelness, G. S., & Parks, J. S. (2002). ApoA-I
secretion from HepG2 cells: evidence for the secretion of both lipid-poor apoA-I
and intracellularly assembled nascent HDL. Journal of Lipid Research, 43(1),
36-44.
Christensen, K. B., Petersen, R. K., Kristiansen, K., & Christensen, L. P. (2010).
Identification of bioactive compounds from flowers of black elder (Sambucus
nigra L.) that activate the human peroxisome proliferator-activated receptor
(PPAR) gamma. Phytotherapy Research : PTR, 24 Suppl 2, S129-132. doi:
10.1002/ptr.3005
Chung, L. Y., Cheung, T. C., Kong, S. K., Fung, K. P., Choy, Y. M., Chan, Z. Y., &
Kwok, T. T. (2001). Induction of apoptosis by green tea catechins in human
prostate cancer DU145 cells. Life Sciences, 68(10), 1207-1214.
Cicero, A. F., Derosa, G., Parini, A., Maffioli, P., D'Addato, S., Reggi, A., . . . Borghi,
C. (2013). Red yeast rice improves lipid pattern, high-sensitivity C-reactive
protein, and vascular remodeling parameters in moderately
hypercholesterolemic Italian subjects. Nutrition Research, 33(8), 622-628. doi:
10.1016/j.nutres.2013.05.015
180
Clemenz, M., Frost, N., Schupp, M., Caron, S., Foryst-Ludwig, A., Bohm, C., . . .
Kintscher, U. (2008). Liver-specific peroxisome proliferator-activated receptor
alpha target gene regulation by the angiotensin type 1 receptor blocker
telmisartan. Diabetes, 57(5), 1405-1413. doi: 10.2337/db07-0839
Collier, J. J., Doan, T. T., Daniels, M. C., Schurr, J. R., Kolls, J. K., & Scott, D. K.
(2003). c-Myc is required for the glucose-mediated induction of metabolic
enzyme genes. The Journal of Biological Chemistry, 278(8), 6588-6595. doi:
10.1074/jbc.M208011200
Corder, R., Mullen, W., Khan, N. Q., Marks, S. C., Wood, E. G., Carrier, M. J., &
Crozier, A. (2006). Oenology: red wine procyanidins and vascular health.
Nature, 444(7119), 566. doi: 10.1038/444566a
Corella, D., Arnett, D. K., Tucker, K. L., Kabagambe, E. K., Tsai, M., Parnell, L. D., . .
. Ordovas, J. M. (2011). A high intake of saturated fatty acids strengthens the
association between the fat mass and obesity-associated gene and BMI. The
Journal of Nutrition, 141(12), 2219-2225. doi: 10.3945/jn.111.143826
Cornelius, P., MacDougald, O. A., & Lane, M. D. (1994). Regulation of adipocyte
development. Annual Review of Nutrition, 14, 99-129. doi:
10.1146/annurev.nu.14.070194.000531
Cowling, V. H., D'Cruz, C. M., Chodosh, L. A., & Cole, M. D. (2007). c-Myc
transforms human mammary epithelial cells through repression of the Wnt
inhibitors DKK1 and SFRP1. Molecular and Cellular Biology, 27(14), 5135-
5146. doi: 10.1128/MCB.02282-06
Dabur, R., Gupta, A., Mandal, T. K., Singh, D. D., Bajpai, V., Gurav, A. M., &
Lavekar, G. S. (2007). Antimicrobial activity of some Indian medicinal plants.
African Journal of Traditional, Complementary, and Alternative Medicines :
AJTCAM / African Networks on Ethnomedicines, 4(3), 313-318.
Dalimartha, S. (2006). Atlas Tumbuhan Indonesia (Vol. 4). Jakarta, Indonesia: Puspa
Swara.
Dameron, K. M., Volpert, O. V., Tainsky, M. A., & Bouck, N. (1994). Control of
angiogenesis in fibroblasts by p53 regulation of thrombospondin-1. Science,
265(5178), 1582-1584.
Dang, C. V. (1999). c-Myc target genes involved in cell growth, apoptosis, and
metabolism. Molecular and Cellular Biology, 19(1), 1-11.
181
Daoud, S. S., Munson, P. J., Reinhold, W., Young, L., Prabhu, V. V., Yu, Q., . . .
Pommier, Y. (2003). Impact of p53 knockout and topotecan treatment on gene
expression profiles in human colon carcinoma cells: a pharmacogenomic study.
Cancer Research, 63(11), 2782-2793.
Datta, S. R., Brunet, A., & Greenberg, M. E. (1999). Cellular survival: a play in three
Akts. Genes & Development, 13(22), 2905-2927.
Davidson, M. H., Armani, A., McKenney, J. M., & Jacobson, T. A. (2007). Safety
considerations with fibrate therapy. The American Journal of Cardiology,
99(6A), 3C-18C. doi: 10.1016/j.amjcard.2006.11.016
De Marco, F., Bucaj, E., Foppoli, C., Fiorini, A., Blarzino, C., Filipi, K., . . . Perluigi,
M. (2012). Oxidative stress in HPV-driven viral carcinogenesis: redox
proteomics analysis of HPV-16 dysplastic and neoplastic tissues. PloS One,
7(3), e34366. doi: 10.1371/journal.pone.0034366
Degenhardt, T., Matilainen, M., Herzig, K. H., Dunlop, T. W., & Carlberg, C. (2006).
The insulin-like growth factor-binding protein 1 gene is a primary target of
peroxisome proliferator-activated receptors. The Journal of Biological
Chemistry, 281(51), 39607-39619. doi: 10.1074/jbc.M605623200
Delpuech, O., Griffiths, B., East, P., Essafi, A., Lam, E. W., Burgering, B., . . . Schulze,
A. (2007). Induction of Mxi1-SR alpha by FOXO3a contributes to repression of
Myc-dependent gene expression. Molecular and Cellular Biology, 27(13), 4917-
4930. doi: 10.1128/MCB.01789-06
Deng, G., Chen, L. C., Schott, D. R., Thor, A., Bhargava, V., Ljung, B. M., . . . Smith,
H. S. (1994). Loss of heterozygosity and p53 gene mutations in breast cancer.
Cancer Research, 54(2), 499-505.
Dentin, R., Liu, Y., Koo, S. H., Hedrick, S., Vargas, T., Heredia, J., . . . Montminy, M.
(2007). Insulin modulates gluconeogenesis by inhibition of the coactivator
TORC2. Nature, 449(7160), 366-369. doi: 10.1038/nature06128
DeRisi, J., Penland, L., Brown, P. O., Bittner, M. L., Meltzer, P. S., Ray, M., . . . Trent,
J. M. (1996). Use of a cDNA microarray to analyse gene expression patterns in
human cancer. Nature Genetics, 14(4), 457-460. doi: 10.1038/ng1296-457
Dey, S., Swarup, D., Saxena, A., & Dan, A. (2011). In vivo efficacy of tamarind
(Tamarindus indica) fruit extract on experimental fluoride exposure in rats.
Research in Veterinary Science, 91(3), 422-425. doi: 10.1016/j.rvsc.2010.09.013
182
Di Pietro, R., & Zauli, G. (2004). Emerging non-apoptotic functions of tumor necrosis
factor-related apoptosis-inducing ligand (TRAIL)/Apo2L. Journal of Cellular
Physiology, 201(3), 331-340. doi: 10.1002/jcp.20099
Drori, S., Girnun, G. D., Tou, L., Szwaya, J. D., Mueller, E., Xia, K., . . . Spiegelman,
B. M. (2005). Hic-5 regulates an epithelial program mediated by PPARgamma.
Genes & Development, 19(3), 362-375. doi: 10.1101/gad.1240705
Du, K., Asahara, H., Jhala, U. S., Wagner, B. L., & Montminy, M. (2000).
Characterization of a CREB gain-of-function mutant with constitutive
transcriptional activity in vivo. Molecular and Cellular Biology, 20(12), 4320-
4327.
Du, K., Herzig, S., Kulkarni, R. N., & Montminy, M. (2003). TRB3: a tribbles homolog
that inhibits Akt/PKB activation by insulin in liver. Science, 300(5625), 1574-
1577. doi: 10.1126/science.1079817
Duez, H., Chao, Y. S., Hernandez, M., Torpier, G., Poulain, P., Mundt, S., . . . Staels, B.
(2002). Reduction of atherosclerosis by the peroxisome proliferator-activated
receptor alpha agonist fenofibrate in mice. The Journal of Biological Chemistry,
277(50), 48051-48057. doi: 10.1074/jbc.M206966200
Dutt, M. J., & Lee, K. H. (2000). Proteomic analysis. Current Opinion in
Biotechnology, 11(2), 176-179.
Egawa, T., Toda, K., Nemoto, Y., Ono, M., Akisaw, N., Saibara, T., . . . Onishi, S.
(2003). Pitavastatin ameliorates severe hepatic steatosis in aromatase-deficient
(Ar-/-) mice. Lipids, 38(5), 519-523.
El-Nagerabi, S. A. F., Elshafie, A. E., & Elamin, M. R. (2013). In vitro activity of
Balanites aegyptiaca and Tamarindus indica fruit extracts on growth and
aflatoxigenicity of Aspergillus flavus and A. parasiticus. Journal of Food
Research, 2(4), 68-80. doi: 10.5539/jfr.v2n4p68
Erdman, J. W., Jr., Balentine, D., Arab, L., Beecher, G., Dwyer, J. T., Folts, J., . . .
Burrowes, J. (2007). Flavonoids and Heart Health: Proceedings of the ILSI
North America Flavonoids Workshop, May 31-June 1, 2005, Washington, DC.
The Journal of Nutrition, 137(3 Suppl 1), 718S-737S.
Essers, M. A., Weijzen, S., de Vries-Smits, A. M., Saarloos, I., de Ruiter, N. D., Bos, J.
L., & Burgering, B. M. (2004). FOXO transcription factor activation by
oxidative stress mediated by the small GTPase Ral and JNK. The EMBO
Journal, 23(24), 4802-4812. doi: 10.1038/sj.emboj.7600476
183
Etkin, N. L. (1986). Multidisciplinary perspectives in the interpretation of plants used in
indigenous medicine and diet. In N. L. Etkin (Ed.), Plants in Indigenous
Medicine & Diet. Biobehavioral Approaches (pp. 2-29). New York: Redgrave
Publishing Company.
Faleck, D. M., Ali, K., Roat, R., Graham, M. J., Crooke, R. M., Battisti, R., . . . Imai, Y.
(2010). Adipose differentiation-related protein regulates lipids and insulin in
pancreatic islets. American Journal of Physiology. Endocrinology and
Metabolism, 299(2), E249-257. doi: 10.1152/ajpendo.00646.2009
Fan, W., Yanase, T., Morinaga, H., Mu, Y. M., Nomura, M., Okabe, T., . . . Nawata, H.
(2005). Activation of peroxisome proliferator-activated receptor-gamma and
retinoid X receptor inhibits aromatase transcription via nuclear factor-kappaB.
Endocrinology, 146(1), 85-92. doi: 10.1210/en.2004-1046
Fan, Y., Guo, Y., Hamblin, M., Chang, L., Zhang, J., & Chen, Y. E. (2011). Inhibition
of gluconeogenic genes by calcium-regulated heat-stable protein 1 via
repression of peroxisome proliferator-activated receptor alpha. The Journal of
Biological Chemistry, 286(47), 40584-40594. doi: 10.1074/jbc.M111.232918
Farnsworth, N. R., & Bunyapraphatsara, N. (1992). Thai Medicinal Plants
Recommended for Primary Health Care System. Prachachon, Thailand.
Feige, J. N., Gelman, L., Rossi, D., Zoete, V., Metivier, R., Tudor, C., . . . Desvergne,
B. (2007). The endocrine disruptor monoethyl-hexyl-phthalate is a selective
peroxisome proliferator-activated receptor gamma modulator that promotes
adipogenesis. The Journal of Biological Chemistry, 282(26), 19152-19166. doi:
10.1074/jbc.M702724200
Fernandez-Patron, C., Castellanos-Serra, L., Hardy, E., Guerra, M., Estevez, E., Mehl,
E., & Frank, R. W. (1998). Understanding the mechanism of the zinc-ion stains
of biomacromolecules in electrophoresis gels: generalization of the reverse-
staining technique. Electrophoresis, 19(14), 2398-2406. doi:
10.1002/elps.1150191407
Feuerstein, J. S., & Bjerke, W. S. (2012). Powdered red yeast rice and plant stanols and
sterols to lower cholesterol. Journal of Dietary Supplements, 9(2), 110-115. doi:
10.3109/19390211.2012.682645
Finck, B. N., Gropler, M. C., Chen, Z., Leone, T. C., Croce, M. A., Harris, T. E., . . .
Kelly, D. P. (2006). Lipin 1 is an inducible amplifier of the hepatic PGC-
1alpha/PPARalpha regulatory pathway. Cell Metabolism, 4(3), 199-210. doi:
10.1016/j.cmet.2006.08.005
184
Finck, B. N., Lehman, J. J., Leone, T. C., Welch, M. J., Bennett, M. J., Kovacs, A., . . .
Kelly, D. P. (2002). The cardiac phenotype induced by PPARalpha
overexpression mimics that caused by diabetes mellitus. The Journal of Clinical
Investigation, 109(1), 121-130. doi: 10.1172/JCI14080
Forman, B. M., Chen, J., & Evans, R. M. (1996). The peroxisome proliferator-activated
receptors: ligands and activators. Annals of the New York Academy of Sciences,
804, 266-275.
Forman, B. M., Tontonoz, P., Chen, J., Brun, R. P., Spiegelman, B. M., & Evans, R. M.
(1995). 15-Deoxy-delta 12, 14-prostaglandin J2 is a ligand for the adipocyte
determination factor PPAR gamma. Cell, 83(5), 803-812.
Francis, G. A., Fayard, E., Picard, F., & Auwerx, J. (2003). Nuclear receptors and the
control of metabolism. Annual Review of Physiology, 65, 261-311. doi:
10.1146/annurev.physiol.65.092101.142528
Frye, M., Gardner, C., Li, E. R., Arnold, I., & Watt, F. M. (2003). Evidence that Myc
activation depletes the epidermal stem cell compartment by modulating adhesive
interactions with the local microenvironment. Development, 130(12), 2793-
2808.
Fu, L., Balasubramanian, M., Shan, J., Dudenhausen, E. E., & Kilberg, M. S. (2011).
Auto-activation of c-JUN gene by amino acid deprivation of hepatocellular
carcinoma cells reveals a novel c-JUN-mediated signaling pathway. The Journal
of Biological Chemistry, 286(42), 36724-36738. doi: 10.1074/jbc.M111.277673
Fu, S., Deng, Q., Yang, W., Ding, H., Wang, X., Li, P., . . . Liu, G. (2012). Increase of
fatty acid oxidation and VLDL assembly and secretion overexpression of PTEN
in cultured hepatocytes of newborn calf. Cellular Physiology and Biochemistry :
International Journal of Experimental Cellular Physiology, Biochemistry, and
Pharmacology, 30(4), 1005-1013. doi: 10.1159/000341477
Fuchs, D., Winkelmann, I., Johnson, I. T., Mariman, E., Wenzel, U., & Daniel, H.
(2005). Proteomics in nutrition research: principles, technologies and
applications. The British Journal of Nutrition, 94(3), 302-314.
Gaidano, G., Ballerini, P., Gong, J. Z., Inghirami, G., Neri, A., Newcomb, E. W., . . .
Dalla-Favera, R. (1991). p53 mutations in human lymphoid malignancies:
association with Burkitt lymphoma and chronic lymphocytic leukemia.
Proceedings of the National Academy of Sciences of the United States of
America, 88(12), 5413-5417.
Ganesh, V., & Hettiarachchy, N. S. (2012). Nutriproteomics: a promising tool to link
diet and diseases in nutritional research. Biochimica et Biophysica Acta,
1824(10), 1107-1117. doi: 10.1016/j.bbapap.2012.06.006
185
Gao, Y., Walder, K., Sunderland, T., Kantham, L., Feng, H. C., Quick, M., . . . Collier,
G. R. (2003). Elevation in Tanis expression alters glucose metabolism and
insulin sensitivity in H4IIE cells. Diabetes, 52(4), 929-934.
Garcia-Canas, V., Simo, C., Herrero, M., Ibanez, E., & Cifuentes, A. (2012). Present
and future challenges in food analysis: foodomics. Analytical Chemistry, 84(23),
10150-10159. doi: 10.1021/ac301680q
Gbaguidi, G. F., & Agellon, L. B. (2002). The atypical interaction of peroxisome
proliferator-activated receptor alpha with liver X receptor alpha antagonizes the
stimulatory effect of their respective ligands on the murine cholesterol 7alpha-
hydroxylase gene promoter. Biochimica et Biophysica Acta, 1583(2), 229-236.
Genova, M. L., Ventura, B., Giuliano, G., Bovina, C., Formiggini, G., Parenti Castelli,
G., & Lenaz, G. (2001). The site of production of superoxide radical in
mitochondrial Complex I is not a bound ubisemiquinone but presumably iron-
sulfur cluster N2. FEBS letters, 505(3), 364-368.
Ghaffari, S., Jagani, Z., Kitidis, C., Lodish, H. F., & Khosravi-Far, R. (2003). Cytokines
and BCR-ABL mediate suppression of TRAIL-induced apoptosis through
inhibition of forkhead FOXO3a transcription factor. Proceedings of the National
Academy of Sciences of the United States of America, 100(11), 6523-6528. doi:
10.1073/pnas.0731871100
Giessrigl, B., Yazici, G., Teichmann, M., Kopf, S., Ghassemi, S., Atanasov, A. G., . . .
Krupitza, G. (2012). Effects of Scrophularia extracts on tumor cell proliferation,
death and intravasation through lymphoendothelial cell barriers. International
Journal of Oncology, 40(6), 2063-2074. doi: 10.3892/ijo.2012.1388
Ginsberg, D., Mechta, F., Yaniv, M., & Oren, M. (1991). Wild-type p53 can down-
modulate the activity of various promoters. Proceedings of the National
Academy of Sciences of the United States of America, 88(22), 9979-9983.
Goldwasser, J., Cohen, P. Y., Yang, E., Balaguer, P., Yarmush, M. L., & Nahmias, Y.
(2010). Transcriptional regulation of human and rat hepatic lipid metabolism by
the grapefruit flavonoid naringenin: role of PPARalpha, PPARgamma and
LXRalpha. PloS One, 5(8), e12399. doi: 10.1371/journal.pone.0012399
Golomb, B. A., & Evans, M. A. (2008). Statin adverse effects : a review of the literature
and evidence for a mitochondrial mechanism. American Journal of
Cardiovascular Drugs : Drugs, Devices, and other Interventions, 8(6), 373-418.
doi: 10.2165/0129784-200808060-00004
Gorg, A., Postel, W., & Gunther, S. (1988). The current state of two-dimensional
electrophoresis with immobilized pH gradients. Electrophoresis, 9(9), 531-546.
doi: 10.1002/elps.1150090913
186
Gray, T. J., Beamand, J. A., Lake, B. G., Foster, J. R., & Gangolli, S. D. (1982).
Peroxisome proliferation in cultured rat hepatocytes produced by clofibrate and
phthalate ester metabolites. Toxicology Letters, 10(2-3), 273-279.
Greenberg, A. S., Coleman, R. A., Kraemer, F. B., McManaman, J. L., Obin, M. S.,
Puri, V., . . . Mashek, D. G. (2011). The role of lipid droplets in metabolic
disease in rodents and humans. The Journal of Clinical Investigation, 121(6),
2102-2110. doi: 10.1172/JCI46069
Greer, E. L., Oskoui, P. R., Banko, M. R., Maniar, J. M., Gygi, M. P., Gygi, S. P., &
Brunet, A. (2007). The energy sensor AMP-activated protein kinase directly
regulates the mammalian FOXO3 transcription factor. The Journal of Biological
Chemistry, 282(41), 30107-30119. doi: 10.1074/jbc.M705325200
Guerrero, R. F., Garcia-Parrilla, M. C., Puertas, B., & Cantos-Villar, E. (2009). Wine,
resveratrol and health: a review. Natural Product Communications, 4(5), 635-
658.
Guo, Q. M., Malek, R. L., Kim, S., Chiao, C., He, M., Ruffy, M., . . . Liu, E. T. (2000).
Identification of c-myc responsive genes using rat cDNA microarray. Cancer
Research, 60(21), 5922-5928.
Gupta, R. K., Vatamaniuk, M. Z., Lee, C. S., Flaschen, R. C., Fulmer, J. T.,
Matschinsky, F. M., . . . Kaestner, K. H. (2005). The MODY1 gene HNF-4alpha
regulates selected genes involved in insulin secretion. The Journal of Clinical
Investigation, 115(4), 1006-1015. doi: 10.1172/JCI22365
Hagen, G. A., & Solberg, L. A., Jr. (1974). Brain and cerebrospinal fluid permeability
to intravenous thyroid hormones. Endocrinology, 95(5), 1398-1410.
Hahn, T., Barth, S., Weiss, U., Mosgoeller, W., & Desoye, G. (1998). Sustained
hyperglycemia in vitro down-regulates the GLUT1 glucose transport system of
cultured human term placental trophoblast: a mechanism to protect fetal
development? FASEB Journal : official publication of the Federation of
American Societies for Experimental Biology, 12(12), 1221-1231.
Hai, T., & Curran, T. (1991). Cross-family dimerization of transcription factors Fos/Jun
and ATF/CREB alters DNA binding specificity. Proceedings of the National
Academy of Sciences of the United States of America, 88(9), 3720-3724.
Hammond, E. M., Mandell, D. J., Salim, A., Krieg, A. J., Johnson, T. M., Shirazi, H.
A., . . . Giaccia, A. J. (2006). Genome-wide analysis of p53 under hypoxic
conditions. Molecular and Cellular Biology, 26(9), 3492-3504. doi:
10.1128/MCB.26.9.3492-3504.2006
187
Han, J., Back, S. H., Hur, J., Lin, Y. H., Gildersleeve, R., Shan, J., . . . Kaufman, R. J.
(2013). ER-stress-induced transcriptional regulation increases protein synthesis
leading to cell death. Nature Cell Biology, 15(5), 481-490. doi:
10.1038/ncb2738
Han, X. J., Chae, J. K., Lee, M. J., You, K. R., Lee, B. H., & Kim, D. G. (2005).
Involvement of GADD153 and cardiac ankyrin repeat protein in hypoxia-
induced apoptosis of H9c2 cells. The Journal of Biological Chemistry, 280(24),
23122-23129. doi: 10.1074/jbc.M501095200
Handschin, C., & Spiegelman, B. M. (2006). Peroxisome proliferator-activated receptor
gamma coactivator 1 coactivators, energy homeostasis, and metabolism.
Endocrine Reviews, 27(7), 728-735. doi: 10.1210/er.2006-0037
Hansen, M., Taubert, S., Crawford, D., Libina, N., Lee, S. J., & Kenyon, C. (2007).
Lifespan extension by conditions that inhibit translation in Caenorhabditis
elegans. Aging Cell, 6(1), 95-110. doi: 10.1111/j.1474-9726.2006.00267.x
Harding, H. P., Zhang, Y., Zeng, H., Novoa, I., Lu, P. D., Calfon, M., . . . Ron, D.
(2003). An integrated stress response regulates amino acid metabolism and
resistance to oxidative stress. [.]. Molecular Cell, 11(3), 619-633.
Harms, K. L., & Chen, X. (2007). Histone deacetylase 2 modulates p53 transcriptional
activities through regulation of p53-DNA binding activity. Cancer Research,
67(7), 3145-3152. doi: 10.1158/0008-5472.CAN-06-4397
Havinga, R. M., Hartl, A., Putscher, J., Prehsler, S., Buchmann, C., & Vogl, C. R.
(2010). Tamarindus indica L. (Fabaceae): patterns of use in traditional African
medicine. Journal of Ethnopharmacology, 127(3), 573-588. doi:
10.1016/j.jep.2009.11.028
Herrero, M., Simo, C., Garcia-Canas, V., Ibanez, E., & Cifuentes, A. (2012).
Foodomics: MS-based strategies in modern food science and nutrition. Mass
Spectrometry Reviews, 31(1), 49-69. doi: 10.1002/mas.20335
Herzig, S., Long, F., Jhala, U. S., Hedrick, S., Quinn, R., Bauer, A., . . . Montminy, M.
(2001). CREB regulates hepatic gluconeogenesis through the coactivator PGC-
1. Nature, 413(6852), 179-183. doi: 10.1038/35093131
Higa, L. M., Caruso, M. B., Canellas, F., Soares, M. R., Oliveira-Carvalho, A. L.,
Chapeaurouge, D. A., . . . Da Poian, A. T. (2008). Secretome of HepG2 cells
infected with dengue virus: implications for pathogenesis. Biochimica et
Biophysica Acta, 1784(11), 1607-1616. doi: 10.1016/j.bbapap.2008.06.015
188
Hipkiss, A. R. (2007). On why decreasing protein synthesis can increase lifespan.
Mechanisms of Ageing and Development, 128(5-6), 412-414. doi:
10.1016/j.mad.2007.03.002
Ho, T. C., Chen, S. L., Shih, S. C., Chang, S. J., Yang, S. L., Hsieh, J. W., . . . Tsao, Y.
P. (2011). Pigment epithelium-derived factor (PEDF) promotes tumor cell death
by inducing macrophage membrane tumor necrosis factor-related apoptosis-
inducing ligand (TRAIL). The Journal of Biological Chemistry, 286(41), 35943-
35954. doi: 10.1074/jbc.M111.266064
Holmgren, L., Jackson, G., & Arbiser, J. (1998). p53 induces angiogenesis-restricted
dormancy in a mouse fibrosarcoma. Oncogene, 17(7), 819-824. doi:
10.1038/sj.onc.1201993
Holtta-Vuori, M., Tanhuanpaa, K., Mobius, W., Somerharju, P., & Ikonen, E. (2002).
Modulation of cellular cholesterol transport and homeostasis by Rab11.
Molecular Biology of the Cell, 13(9), 3107-3122. doi: 10.1091/mbc.E02-01-
0025
Hsin, I. L., Hsiao, Y. C., Wu, M. F., Jan, M. S., Tang, S. C., Lin, Y. W., . . . Ko, J. L.
(2012). Lipocalin 2, a new GADD153 target gene, as an apoptosis inducer of
endoplasmic reticulum stress in lung cancer cells. [Research Support, Non-U.S.
Gov't]. Toxicology and applied pharmacology, 263(3), 330-337. doi:
10.1016/j.taap.2012.07.005
Hsu, C. P., Lin, Y. H., Chou, C. C., Zhou, S. P., Hsu, Y. C., Liu, C. L., . . . Chung, Y. C.
(2009). Mechanisms of grape seed procyanidin-induced apoptosis in colorectal
carcinoma cells. Anticancer Research, 29(1), 283-289.
Hsu, M. H., Savas, U., Griffin, K. J., & Johnson, E. F. (2001). Identification of
peroxisome proliferator-responsive human genes by elevated expression of the
peroxisome proliferator-activated receptor alpha in HepG2 cells. The Journal of
Biological Chemistry, 276(30), 27950-27958. doi: 10.1074/jbc.M100258200
Hu, S., Yao, J., Howe, A. A., Menke, B. M., Sivitz, W. I., Spector, A. A., & Norris, A.
W. (2012). Peroxisome proliferator-activated receptor gamma decouples fatty
acid uptake from lipid inhibition of insulin signaling in skeletal muscle.
Molecular Endocrinology, 26(6), 977-988. doi: 10.1210/me.2011-1253
Huang, W., Eum, S. Y., Andras, I. E., Hennig, B., & Toborek, M. (2009). PPARalpha
and PPARgamma attenuate HIV-induced dysregulation of tight junction proteins
by modulations of matrix metalloproteinase and proteasome activities. FASEB
journal : official publication of the Federation of American Societies for
Experimental Biology, 23(5), 1596-1606. doi: 10.1096/fj.08-121624
189
Hussain, S. P., Trivers, G. E., Hofseth, L. J., He, P., Shaikh, I., Mechanic, L. E., . . .
Harris, C. C. (2004). Nitric oxide, a mediator of inflammation, suppresses
tumorigenesis. Cancer Research, 64(19), 6849-6853. doi: 10.1158/0008-
5472.CAN-04-2201
Huuskonen, J., Vishnu, M., Chau, P., Fielding, P. E., & Fielding, C. J. (2006). Liver X
receptor inhibits the synthesis and secretion of apolipoprotein A1 by human
liver-derived cells. Biochemistry, 45(50), 15068-15074. doi: 10.1021/bi061378y
Ichikawa, K., Liu, W., Zhao, L., Wang, Z., Liu, D., Ohtsuka, T., . . . Zhou, T. (2001).
Tumoricidal activity of a novel anti-human DR5 monoclonal antibody without
hepatocyte cytotoxicity. Nature Medicine, 7(8), 954-960. doi: 10.1038/91000
Iftekhar, A. S., Rayhan, I., Quadir, M. A., Akhteruzzaman, S., & Hasnat, A. (2006).
Effect of Tamarindus indica fruits on blood pressure and lipid-profile in human
model: an in vivo approach. Pakistan Journal of Pharmaceutical Sciences,
19(2), 125-129.
Ishola, M. M., Agbaji, E. B., & Agbaji, A. S. (1990). A chemical study of Tamarindus
indica (Tsamiya) fruits grown in Nigeria. Journal of Science, Food and
Agriculture, 51, 141-143.
Ito, Y., Pagano, P. J., Tornheim, K., Brecher, P., & Cohen, R. A. (1996). Oxidative
stress increases glyceraldehyde-3-phosphate dehydrogenase mRNA levels in
isolated rabbit aorta. The American Journal of Physiology, 270(1 Pt 2), H81-87.
Jeong, B. S., Hu, W., Belyi, V., Rabadan, R., & Levine, A. J. (2010). Differential levels
of transcription of p53-regulated genes by the arginine/proline polymorphism:
p53 with arginine at codon 72 favors apoptosis. FASEB journal : official
publication of the Federation of American Societies for Experimental Biology,
24(5), 1347-1353. doi: 10.1096/fj.09-146001
Jiang, H. Y., Wek, S. A., McGrath, B. C., Lu, D., Hai, T., Harding, H. P., . . . Wek, R.
C. (2004). Activating transcription factor 3 is integral to the eukaryotic initiation
factor 2 kinase stress response. Molecular and Cellular Biology, 24(3), 1365-
1377.
Jiang, M., Fernandez, S., Jerome, W. G., He, Y., Yu, X., Cai, H., . . . Hayward, S. W.
(2010). Disruption of PPARgamma signaling results in mouse prostatic
intraepithelial neoplasia involving active autophagy. Cell Death and
Differentiation, 17(3), 469-481. doi: 10.1038/cdd.2009.148
Jiao, R., Zhang, Z., Yu, H., Huang, Y., & Chen, Z.-Y. (2010). Hypocholesterolemic
activity of grape seed proanthocyanidin is mediated by enhancement of bile acid
excretion and up-regulation of CYP7A1. The Journal of Nutritional
Biochemistry, 21(11), 1134-1139.
190
Jindal, V., Dhingra, D., Sharma, S., Parle, M., & Harna, R. K. (2011). Hypolipidemic
and weight reducing activity of the ethanolic extract of Tamarindus indica fruit
pulp in cafeteria diet- and sulpiride-induced obese rats. Journal of
Pharmacology & Pharmacotherapeutics, 2(2), 80-84. doi: 10.4103/0976-
500X.81896
Johnston, T. P., & Waxman, D. J. (2008). The induction of atherogenic dyslipidaemia in
poloxamer 407-treated mice is not mediated through PPARalpha. The Journal of
Pharmacy and Pharmacology, 60(6), 753-759. doi: 10.1211/jpp.60.6.0011
Joshipura, K. J., Hu, F. B., Manson, J. E., Stampfer, M. J., Rimm, E. B., Speizer, F. E., .
. . Willett, W. C. (2001). The effect of fruit and vegetable intake on risk for
coronary heart disease. Annals of Internal Medicine, 134(12), 1106-1114.
Jousse, C., Deval, C., Maurin, A. C., Parry, L., Cherasse, Y., Chaveroux, C., . . .
Fafournoux, P. (2007). TRB3 inhibits the transcriptional activation of stress-
regulated genes by a negative feedback on the ATF4 pathway. The Journal of
Biological Chemistry, 282(21), 15851-15861. doi: 10.1074/jbc.M611723200
Kallwitz, E. R., McLachlan, A., & Cotler, S. J. (2008). Role of peroxisome
proliferators-activated receptors in the pathogenesis and treatment of
nonalcoholic fatty liver disease. World Journal of Gastroenterology : WJG,
14(1), 22-28.
Kau, A. L., Ahern, P. P., Griffin, N. W., Goodman, A. L., & Gordon, J. I. (2011).
Human nutrition, the gut microbiome and the immune system. Nature,
474(7351), 327-336. doi: 10.1038/nature10213
Kersten, S., Seydoux, J., Peters, J. M., Gonzalez, F. J., Desvergne, B., & Wahli, W.
(1999). Peroxisome proliferator-activated receptor alpha mediates the adaptive
response to fasting. The Journal of Clinical Investigation, 103(11), 1489-1498.
doi: 10.1172/JCI6223
Khairunnuur, F. A., Jr., Zulkhairi, A., Azrina, A., Moklas, M. M., Khairullizam, S.,
Zamree, M. S., & Shahidan, M. A. (2009). Nutritional composition, in vitro
antioxidant activity and Artemia salina L. lethality of pulp and seed of
Tamarindus indica L. extracts. Malaysian Journal of Nutrition, 15(1), 65-75.
Khalid, S., Shaik Mossadeq, W. M., Israf, D. A., Hashim, P., Rejab, S., Shaberi, A. M.,
. . . Sulaiman, M. R. (2010). In vivo analgesic effect of aqueous extract of
Tamarindus indica L. fruits. Medical Principles and Practice : International
Journal of the Kuwait University, Health Science Centre, 19(4), 255-259. doi:
10.1159/000312710
191
Khandare, A. L., Rao, G. S., & Lakshmaiah, N. (2002). Effect of tamarind ingestion on
fluoride excretion in humans. European Journal of Clinical Nutrition, 56(1), 82-
85. doi: 10.1038/sj.ejcn.1601287
Kim, D. K., Kim, J. R., Koh, M., Kim, Y. D., Lee, J. M., Chanda, D., . . . Choi, H. S.
(2011). Estrogen-related receptor gamma (ERRgamma) is a novel
transcriptional regulator of phosphatidic acid phosphatase, LIPIN1, and inhibits
hepatic insulin signaling. The Journal of Biological Chemistry, 286(44), 38035-
38042. doi: 10.1074/jbc.M111.250613
Kim, H., Page, G. P., & Barnes, S. (2004). Proteomics and mass spectrometry in
nutrition research. Nutrition, 20(1), 155-165.
Kim, J. H., Kim, D., Kim, J., & Hwang, J. K. (2011). Euchresta horsfieldii Benn.
activates peroxisome proliferator-activated receptor alpha and regulates
expression of genes involved in fatty acid metabolism in human HepG2 cells.
Journal of Ethnopharmacology, 133(1), 244-247. doi: 10.1016/j.jep.2010.09.029
Kim, W. S., Lee, Y. S., Cha, S. H., Jeong, H. W., Choe, S. S., Lee, M. R., . . . Kim, J. B.
(2009). Berberine improves lipid dysregulation in obesity by controlling central
and peripheral AMPK activity. American Journal of Physiology. Endocrinology
and Metabolism, 296(4), E812-819. doi: 10.1152/ajpendo.90710.2008
Koh, H. J., Toyoda, T., Didesch, M. M., Lee, M. Y., Sleeman, M. W., Kulkarni, R. N., .
. . Goodyear, L. J. (2013). Tribbles 3 mediates endoplasmic reticulum stress-
induced insulin resistance in skeletal muscle. Nature Communications, 4, 1871.
doi: 10.1038/ncomms2851
Komarova, E. A., Diatchenko, L., Rokhlin, O. W., Hill, J. E., Wang, Z. J.,
Krivokrysenko, V. I., . . . Gudkov, A. V. (1998). Stress-induced secretion of
growth inhibitors: a novel tumor suppressor function of p53. Oncogene, 17(9),
1089-1096. doi: 10.1038/sj.onc.1202303
Kong, W., Wei, J., Abidi, P., Lin, M., Inaba, S., Li, C., . . . Jiang, J. D. (2004).
Berberine is a novel cholesterol-lowering drug working through a unique
mechanism distinct from statins. Nature Medicine, 10(12), 1344-1351. doi:
10.1038/nm1135
Koo, S. H., Satoh, H., Herzig, S., Lee, C. H., Hedrick, S., Kulkarni, R., . . . Montminy,
M. (2004). PGC-1 promotes insulin resistance in liver through PPAR-alpha-
dependent induction of TRB-3. Nature Medicine, 10(5), 530-534. doi:
10.1038/nm1044
192
Koudouvo, K., Karou, S. D., Ilboudo, D. P., Kokou, K., Essien, K., Aklikokou, K., . . .
Gbeassor, M. (2011). In vitro antiplasmodial activity of crude extracts from
Togolese medicinal plants. Asian Pacific Journal of Tropical Medicine, 4(2),
129-132. doi: 10.1016/S1995-7645(11)60052-7
Koves, T. R., Sparks, L. M., Kovalik, J. P., Mosedale, M., Arumugam, R., DeBalsi, K.
L., . . . Muoio, D. M. (2013). PPARgamma coactivator-1alpha contributes to
exercise-induced regulation of intramuscular lipid droplet programming in mice
and humans. Journal of Lipid Research, 54(2), 522-534. doi:
10.1194/jlr.P028910
Koyagura, N., Kumar, V. H., Jamadar, M. G., Huligol, S. V., Nayak, N., Yendigeri, S.
M., & Shamsuddin, M. (2013). Antidiabetic and hepatoprotective activities of
Tamarindus indica fruit pulp in alloxan induced diabetic rats. International
Journal of Pharmacology and Clinical Sciences, 2(2), 33-40.
Kung, J., & Henry, R. R. (2012). Thiazolidinedione safety. Expert Opinion on Drug
Safety, 11(4), 565-579. doi: 10.1517/14740338.2012.691963
Laemmli, U. K. (1970). Cleavage of structural proteins during the assembly of the head
of bacteriophage T4. Nature, 227(5259), 680-685.
Lamien-Meda, A., Lamien, C. E., Compaore, M. M., Meda, R. N., Kiendrebeogo, M.,
Zeba, B., . . . Nacoulma, O. G. (2008). Polyphenol content and antioxidant
activity of fourteen wild edible fruits from Burkina Faso. Molecules, 13(3), 581-
594.
Lamph, W. W., Dwarki, V. J., Ofir, R., Montminy, M., & Verma, I. M. (1990).
Negative and positive regulation by transcription factor cAMP response
element-binding protein is modulated by phosphorylation. Proceedings of the
National Academy of Sciences of the United States of America, 87(11), 4320-
4324.
Landi Librandi, A. P., Chrysostomo, T. N., Azzolini, A. E., Recchia, C. G., Uyemura, S.
A., & de Assis-Pandochi, A. I. (2007). Effect of the extract of the tamarind
(Tamarindus indica) fruit on the complement system: studies in vitro and in
hamsters submitted to a cholesterol-enriched diet. Food and Chemical
Toxicology : an international journal published for the British Industrial
Biological Research Association, 45(8), 1487-1495. doi:
10.1016/j.fct.2007.02.008
193
Lawrence, J. W., Li, Y., Chen, S., DeLuca, J. G., Berger, J. P., Umbenhauer, D. R., . . .
Zhou, G. (2001). Differential gene regulation in human versus rodent
hepatocytes by peroxisome proliferator-activated receptor (PPAR) alpha. PPAR
alpha fails to induce peroxisome proliferation-associated genes in human cells
independently of the level of receptor expresson. The Journal of Biological
Chemistry, 276(34), 31521-31527. doi: 10.1074/jbc.M103306200
Lazarow, P. B., Shio, H., & Leroy-Houyet, M. A. (1982). Specificity in the action of
hypolipidemic drugs: increase of peroxisomal beta-oxidation largely dissociated
from hepatomegaly and peroxisome proliferation in the rat. Journal of Lipid
Research, 23(2), 317-326.
Lee, A. H., Iwakoshi, N. N., & Glimcher, L. H. (2003). XBP-1 regulates a subset of
endoplasmic reticulum resident chaperone genes in the unfolded protein
response. Molecular and Cellular Biology, 23(21), 7448-7459.
Lee, K. (2004). Transactivation of peroxisome proliferator-activated receptor alpha by
green tea extracts. Journal of Veterinary Science, 5(4), 325-330.
Lee, Y. S., Kim, W. S., Kim, K. H., Yoon, M. J., Cho, H. J., Shen, Y., . . . Kim, J. B.
(2006). Berberine, a natural plant product, activates AMP-activated protein
kinase with beneficial metabolic effects in diabetic and insulin-resistant states.
Diabetes, 55(8), 2256-2264. doi: 10.2337/db06-0006
Leighton, F., Coloma, L., & Koenig, C. (1975). Structure, composition, physical
properties, and turnover of proliferated peroxisomes. A study of the trophic
effects of Su-13437 on rat liver. The Journal of Cell Biology, 67(2PT.1), 281-
309.
Lemberger, T., Parkitna, J. R., Chai, M., Schutz, G., & Engblom, D. (2008). CREB has
a context-dependent role in activity-regulated transcription and maintains
neuronal cholesterol homeostasis. FASEB journal : official publication of the
Federation of American Societies for Experimental Biology, 22(8), 2872-2879.
doi: 10.1096/fj.08-107888
Leone, T. C., Weinheimer, C. J., & Kelly, D. P. (1999). A critical role for the
peroxisome proliferator-activated receptor alpha (PPARalpha) in the cellular
fasting response: the PPARalpha-null mouse as a model of fatty acid oxidation
disorders. Proceedings of the National Academy of Sciences of the United States
of America, 96(13), 7473-7478.
Lewis, Y. S., & Neelakantan, S. (1964). The chemistry, biochemistry and technology of
tamarind. Journal of Science and Industrial Research, 23, 150-204.
Lewis, Y. S., Neelakantan, S., & Bhatia, D. S. (1961). Organic acid metabolism in
tamarind leaves. Current Science, 30, 381.
194
Li, M., Zhou, J. Y., Ge, Y., Matherly, L. H., & Wu, G. S. (2003). The phosphatase
MKP1 is a transcriptional target of p53 involved in cell cycle regulation. The
Journal of Biological Chemistry, 278(42), 41059-41068. doi:
10.1074/jbc.M307149200
Li, S., Zhou, Q., He, H., Zhao, Y., & Liu, Z. (2013). Peroxisome proliferator-activated
receptor gamma agonists induce cell cycle arrest through transcriptional
regulation of Kruppel-like factor 4 (KLF4). The Journal of Biological
Chemistry, 288(6), 4076-4084. doi: 10.1074/jbc.M111.317487
Li, X., Monks, B., Ge, Q., & Birnbaum, M. J. (2007). Akt/PKB regulates hepatic
metabolism by directly inhibiting PGC-1alpha transcription coactivator. Nature,
447(7147), 1012-1016. doi: 10.1038/nature05861
Lim, C. Y., Mat Junit, S., Abdulla, M. A., & Abdul Aziz, A. (2013). In vivo
biochemical and gene expression analyses of the antioxidant activities and
hypocholesterolaemic properties of Tamarindus indica fruit pulp extract. PloS
One, 8(7), e70058. doi: 10.1371/journal.pone.0070058
Lima, R. T., Busacca, S., Almeida, G. M., Gaudino, G., Fennell, D. A., & Vasconcelos,
M. H. (2011). MicroRNA regulation of core apoptosis pathways in cancer.
European Journal of Cancer, 47(2), 163-174. doi: 10.1016/j.ejca.2010.11.005
Lin, B., Morris, D. W., & Chou, J. Y. (1997). The role of HNF1alpha, HNF3gamma,
and cyclic AMP in glucose-6-phosphatase gene activation. Biochemistry,
36(46), 14096-14106. doi: 10.1021/bi9703249
Lin, C. C., Chuang, Y. J., Yu, C. C., Yang, J. S., Lu, C. C., Chiang, J. H., . . . Chung, J.
G. (2012). Apigenin induces apoptosis through mitochondrial dysfunction in U-
2 OS human osteosarcoma cells and inhibits osteosarcoma xenograft tumor
growth in vivo. Journal of Agricultural and Food Chemistry, 60(45), 11395-
11402. doi: 10.1021/jf303446x
Lin, J., Wu, P. H., Tarr, P. T., Lindenberg, K. S., St-Pierre, J., Zhang, C. Y., . . .
Spiegelman, B. M. (2004). Defects in adaptive energy metabolism with CNS-
linked hyperactivity in PGC-1alpha null mice. Cell, 119(1), 121-135. doi:
10.1016/j.cell.2004.09.013
Linder, M. D., Uronen, R. L., Holtta-Vuori, M., van der Sluijs, P., Peranen, J., &
Ikonen, E. (2007). Rab8-dependent recycling promotes endosomal cholesterol
removal in normal and sphingolipidosis cells. Molecular Biology of the Cell,
18(1), 47-56. doi: 10.1091/mbc.E06-07-0575
Lipshutz, R. J., Fodor, S. P., Gingeras, T. R., & Lockhart, D. J. (1999). High density
synthetic oligonucleotide arrays. Nature Genetics, 21(1 Suppl), 20-24. doi:
10.1038/4447
195
Little, E. L., & Wadsworth, F. W. (1964). Common Trees of Puerto Rico and the Virgin
Islands, Agriculture. Washington DC: US Department of Agriculture.
Liu, G., Su, L., Hao, X., Zhong, N., Zhong, D., Singhal, S., & Liu, X. (2012). Salermide
up-regulates death receptor 5 expression through the ATF4-ATF3-CHOP axis
and leads to apoptosis in human cancer cells. Journal of Cellular and Molecular
Medicine, 16(7), 1618-1628. doi: 10.1111/j.1582-4934.2011.01401.x
Liu, J., Zhang, J., Shi, Y., Grimsgaard, S., Alraek, T., & Fonnebo, V. (2006). Chinese
red yeast rice (Monascus purpureus) for primary hyperlipidemia: a meta-
analysis of randomized controlled trials. Chinese Medicine, 1, 4. doi:
10.1186/1749-8546-1-4
Liu, T., Laurell, C., Selivanova, G., Lundeberg, J., Nilsson, P., & Wiman, K. G. (2007).
Hypoxia induces p53-dependent transactivation and Fas/CD95-dependent
apoptosis. Cell Death and Differentiation, 14(3), 411-421. doi:
10.1038/sj.cdd.4402022
Liu, Y., Thor, A., Shtivelman, E., Cao, Y., Tu, G., Heath, T. D., & Debs, R. J. (1999).
Systemic gene delivery expands the repertoire of effective antiangiogenic
agents. [Research Support, Non-U.S. Gov't
Research Support, U.S. Gov't, P.H.S.]. The Journal of biological chemistry, 274(19),
13338-13344.
Liz, M. A., Gomes, C. M., Saraiva, M. J., & Sousa, M. M. (2007). ApoA-I cleaved by
transthyretin has reduced ability to promote cholesterol efflux and increased
amyloidogenicity. Journal of Lipid Research, 48(11), 2385-2395. doi:
10.1194/jlr.M700158-JLR200
Lo Coco, F., Gaidano, G., Louie, D. C., Offit, K., Chaganti, R. S., & Dalla-Favera, R.
(1993). p53 mutations are associated with histologic transformation of follicular
lymphoma. Blood, 82(8), 2289-2295.
Lockhart, D. J., Dong, H., Byrne, M. C., Follettie, M. T., Gallo, M. V., Chee, M. S., . . .
Brown, E. L. (1996). Expression monitoring by hybridization to high-density
oligonucleotide arrays. Nature Biotechnology, 14(13), 1675-1680. doi:
10.1038/nbt1296-1675
Lotem, J., Benjamin, H., Netanely, D., Domany, E., & Sachs, L. (2004). Induction in
myeloid leukemic cells of genes that are expressed in different normal tissues.
Proceedings of the National Academy of Sciences of the United States of
America, 101(45), 16022-16027. doi: 10.1073/pnas.0406966101
196
Louro, I. D., Bailey, E. C., Li, X., South, L. S., McKie-Bell, P. R., Yoder, B. K., . . .
Ruppert, J. M. (2002). Comparative gene expression profile analysis of GLI and
c-MYC in an epithelial model of malignant transformation. Cancer Research,
62(20), 5867-5873.
Ma, J., Li, Y., Ye, Q., Li, J., Hua, Y., Ju, D., . . . Chang, M. (2000). Constituents of red
yeast rice, a traditional Chinese food and medicine. Journal of Agricultural and
Food Chemistry, 48(11), 5220-5225.
Ma, K., Zhang, Y., Elam, M. B., Cook, G. A., & Park, E. A. (2005). Cloning of the rat
pyruvate dehydrogenase kinase 4 gene promoter: activation of pyruvate
dehydrogenase kinase 4 by the peroxisome proliferator-activated receptor
gamma coactivator. The Journal of Biological Chemistry, 280(33), 29525-
29532. doi: 10.1074/jbc.M502236200
Ma, Y., & Hendershot, L. M. (2004). Herp is dually regulated by both the endoplasmic
reticulum stress-specific branch of the unfolded protein response and a branch
that is shared with other cellular stress pathways. [Research Support, Non-U.S.
Gov't
Research Support, U.S. Gov't, P.H.S.]. The Journal of biological chemistry, 279(14),
13792-13799. doi: 10.1074/jbc.M313724200
Mackintosh, J. A., Choi, H. Y., Bae, S. H., Veal, D. A., Bell, P. J., Ferrari, B. C., . . .
Karuso, P. (2003). A fluorescent natural product for ultra sensitive detection of
proteins in one-dimensional and two-dimensional gel electrophoresis.
Proteomics, 3(12), 2273-2288. doi: 10.1002/pmic.200300578
Magnusson, B., Asp, L., Bostrom, P., Ruiz, M., Stillemark-Billton, P., Linden, D., . . .
Olofsson, S. O. (2006). Adipocyte differentiation-related protein promotes fatty
acid storage in cytosolic triglycerides and inhibits secretion of very low-density
lipoproteins. Arteriosclerosis, Thrombosis, and Vascular Biology, 26(7), 1566-
1571. doi: 10.1161/01.ATV.0000223345.11820.da
Malaysia Department of Statistics. (2010). Statistics on causes of deaths, Malaysia
2008. Putrajaya.
Malik, S., & Karathanasis, S. K. (1996). TFIIB-directed transcriptional activation by the
orphan nuclear receptor hepatocyte nuclear factor 4. Molecular and Cellular
Biology, 16(4), 1824-1831.
Mancuso, D. J., Han, X., Jenkins, C. M., Lehman, J. J., Sambandam, N., Sims, H. F., . .
. Gross, R. W. (2007). Dramatic accumulation of triglycerides and precipitation
of cardiac hemodynamic dysfunction during brief caloric restriction in
transgenic myocardium expressing human calcium-independent phospholipase
A2gamma. The Journal of Biological Chemistry, 282(12), 9216-9227. doi:
10.1074/jbc.M607307200
197
Mancuso, D. J., Sims, H. F., Yang, K., Kiebish, M. A., Su, X., Jenkins, C. M., . . .
Gross, R. W. (2010). Genetic ablation of calcium-independent phospholipase
A2gamma prevents obesity and insulin resistance during high fat feeding by
mitochondrial uncoupling and increased adipocyte fatty acid oxidation. The
Journal of Biological Chemistry, 285(47), 36495-36510. doi:
10.1074/jbc.M110.115766
Margariti, A., Li, H., Chen, T., Martin, D., Vizcay-Barrena, G., Alam, S., . . . Zeng, L.
(2013). XBP1 mRNA splicing triggers an autophagic response in endothelial
cells through BECLIN-1 transcriptional activation. [Research Support, Non-U.S.
Gov't]. The Journal of Biological Chemistry, 288(2), 859-872. doi:
10.1074/jbc.M112.412783
Marrapodi, M., & Chiang, J. Y. (2000). Peroxisome proliferator-activated receptor
alpha (PPARalpha) and agonist inhibit cholesterol 7alpha-hydroxylase gene
(CYP7A1) transcription. Journal of Lipid Research, 41(4), 514-520.
Martinello, F., Soares, S. M., Franco, J. J., Santos, A. C., Sugohara, A., Garcia, S. B., . .
. Uyemura, S. A. (2006). Hypolipemic and antioxidant activities from
Tamarindus indica L. pulp fruit extract in hypercholesterolemic hamsters. Food
and Chemical Toxicology, 44(6), 810-818. doi: 10.1016/j.fct.2005.10.011
McConnell, M. J., Chevallier, N., Berkofsky-Fessler, W., Giltnane, J. M., Malani, R. B.,
Staudt, L. M., & Licht, J. D. (2003). Growth suppression by acute promyelocytic
leukemia-associated protein PLZF is mediated by repression of c-myc
expression. Molecular and Cellular Biology, 23(24), 9375-9388.
Medema, R. H., Kops, G. J., Bos, J. L., & Burgering, B. M. (2000). AFX-like Forkhead
transcription factors mediate cell-cycle regulation by Ras and PKB through
p27kip1. Nature, 404(6779), 782-787. doi: 10.1038/35008115
Melendez, P. A., & Capriles, V. A. (2006). Antibacterial properties of tropical plants
from Puerto Rico. [Comparative Study]. Phytomedicine : International Journal
of Phytotherapy and Phytopharmacology, 13(4), 272-276. doi:
10.1016/j.phymed.2004.11.009
Menuelle, P., Binoux, M., & Plas, C. (1995). Regulation by insulin-like growth factor
(IGF) binding proteins of IGF-II-stimulated glycogenesis in cultured fetal rat
hepatocytes. Endocrinology, 136(12), 5305-5310.
Mishra, S., Murphy, L. C., & Murphy, L. J. (2006). The Prohibitins: emerging roles in
diverse functions. Journal of Cellular and Molecular Medicine, 10(2), 353-363.
198
Miura, T., Chiba, M., Kasai, K., Nozaka, H., Nakamura, T., Shoji, T., . . . Sato, T.
(2008). Apple procyanidins induce tumor cell apoptosis through mitochondrial
pathway activation of caspase-3. Carcinogenesis, 29(3), 585-593. doi:
10.1093/carcin/bgm198
Miyata, K. S., McCaw, S. E., Patel, H. V., Rachubinski, R. A., & Capone, J. P. (1996).
The orphan nuclear hormone receptor LXR alpha interacts with the peroxisome
proliferator-activated receptor and inhibits peroxisome proliferator signaling.
The Journal of Biological Chemistry, 271(16), 9189-9192.
Modur, V., Nagarajan, R., Evers, B. M., & Milbrandt, J. (2002). FOXO proteins
regulate tumor necrosis factor-related apoptosis inducing ligand expression.
Implications for PTEN mutation in prostate cancer. The Journal of Biological
Chemistry, 277(49), 47928-47937. doi: 10.1074/jbc.M207509200
Molloy, M. P., Herbert, B. R., Walsh, B. J., Tyler, M. I., Traini, M., Sanchez, J. C., . . .
Gooley, A. A. (1998). Extraction of membrane proteins by differential
solubilization for separation using two-dimensional gel electrophoresis.
Electrophoresis, 19(5), 837-844. doi: 10.1002/elps.1150190539
Monograph. Monascus purpureus (red yeast rice). (2004). Alternative Medicine Review
: a Journal of Clinical Therapeutic, 9(2), 208-210.
Morales, V., Gonzalez-Robayna, I., Hernandez, I., Quintana, J., Santana, P., Ruiz de
Galarreta, C. M., & Fanjul, L. F. (2003). The inducible isoform of CREM
(inducible cAMP early repressor, ICER) is a repressor of CYP19 rat ovarian
promoter. The Journal of Endocrinology, 179(3), 417-425.
Moudi, M., Go, R., Yien, C. Y., & Nazre, M. (2013). Vinca Alkaloids. International
Journal of Preventive Medicine, 4(11), 1231-1235.
Mu, Z. M., Yin, X. Y., & Prochownik, E. V. (2002). Pag, a putative tumor suppressor,
interacts with the Myc Box II domain of c-Myc and selectively alters its
biological function and target gene expression. The Journal of Biological
Chemistry, 277(45), 43175-43184. doi: 10.1074/jbc.M206066200
Mulvihill, E. E., Allister, E. M., Sutherland, B. G., Telford, D. E., Sawyez, C. G.,
Edwards, J. Y., . . . Huff, M. W. (2009). Naringenin prevents dyslipidemia,
apolipoprotein B overproduction, and hyperinsulinemia in LDL receptor-null
mice with diet-induced insulin resistance. Diabetes, 58(10), 2198-2210. doi:
10.2337/db09-0634
Murphy, D. J., Swigart, L. B., Israel, M. A., & Evan, G. I. (2004). Id2 is dispensable for
Myc-induced epidermal neoplasia. Molecular and Cellular Biology, 24(5),
2083-2090.
199
Musante, L., Candiano, G., & Ghiggeri, G. M. (1998). Resolution of fibronectin and
other uncharacterized proteins by two-dimensional polyacrylamide
electrophoresis with thiourea. Journal of Chromatography. B, Biomedical
Sciences and Applications, 705(2), 351-356.
Nagai, Y., Yonemitsu, S., Erion, D. M., Iwasaki, T., Stark, R., Weismann, D., . . .
Shulman, G. I. (2009). The role of peroxisome proliferator-activated receptor
gamma coactivator-1 beta in the pathogenesis of fructose-induced insulin
resistance. Cell Metabolism, 9(3), 252-264. doi: 10.1016/j.cmet.2009.01.011
Nagao, T., Komine, Y., Soga, S., Meguro, S., Hase, T., Tanaka, Y., & Tokimitsu, I.
(2005). Ingestion of a tea rich in catechins leads to a reduction in body fat and
malondialdehyde-modified LDL in men. The American Journal of Clinical
Nutrition, 81(1), 122-129.
Nakae, J., Biggs, W. H., 3rd, Kitamura, T., Cavenee, W. K., Wright, C. V., Arden, K.
C., & Accili, D. (2002). Regulation of insulin action and pancreatic beta-cell
function by mutated alleles of the gene encoding forkhead transcription factor
Foxo1. Nature Genetics, 32(2), 245-253. doi: 10.1038/ng890
Nakae, J., Park, B. C., & Accili, D. (1999). Insulin stimulates phosphorylation of the
forkhead transcription factor FKHR on serine 253 through a Wortmannin-
sensitive pathway. The Journal of Biological Chemistry, 274(23), 15982-15985.
Nakamura, K., Moore, R., Negishi, M., & Sueyoshi, T. (2007). Nuclear pregnane X
receptor cross-talk with FoxA2 to mediate drug-induced regulation of lipid
metabolism in fasting mouse liver. The Journal of Biological Chemistry,
282(13), 9768-9776. doi: 10.1074/jbc.M610072200
Nakazato, T., Ito, K., Miyakawa, Y., Kinjo, K., Yamada, T., Hozumi, N., . . . Kizaki, M.
(2005). Catechin, a green tea component, rapidly induces apoptosis of myeloid
leukemic cells via modulation of reactive oxygen species production in vitro and
inhibits tumor growth in vivo. Haematologica, 90(3), 317-325.
Negrao, R., Costa, R., Duarte, D., Gomes, T. T., Azevedo, I., & Soares, R. (2013).
Different effects of catechin on angiogenesis and inflammation depending on
VEGF levels. The Journal of Nutritional Biochemistry, 24(2), 435-444. doi:
10.1016/j.jnutbio.2011.12.011
Nemoto, Y., Toda, K., Ono, M., Fujikawa-Adachi, K., Saibara, T., Onishi, S., . . .
Shizuta, Y. (2000). Altered expression of fatty acid-metabolizing enzymes in
aromatase-deficient mice. The Journal of Clinical Investigation, 105(12), 1819-
1825. doi: 10.1172/JCI9575
200
Neuhoff, V., Arold, N., Taube, D., & Ehrhardt, W. (1988). Improved staining of
proteins in polyacrylamide gels including isoelectric focusing gels with clear
background at nanogram sensitivity using Coomassie Brilliant Blue G-250 and
R-250. Electrophoresis, 9(6), 255-262. doi: 10.1002/elps.1150090603
Neuhoff, V., Stamm, R., & Eibl, H. (1985). Clear background and highly sensitive
protein staining with Coomassie Blue dyes in polyacrylamide gels: A systematic
analysis. Electrophoresis, 6(9), 427-448. doi: 10.1002/elps.1150060905
NHMS. (2011). National Health And Morbidity Survey 2011. Retrieved from
http://www.moh.gov.my/images/gallery/Garispanduan/NHMS%202011%20FA
CT%20SHEET.pdf.
Ni, H. M., Du, K., You, M., & Ding, W. X. (2013). Critical Role of FoxO3a in Alcohol-
Induced Autophagy and Hepatotoxicity. The American Journal of Pathology,
183(6), 1815-1825. doi: 10.1016/j.ajpath.2013.08.011
Nielsen, R., Grontved, L., Stunnenberg, H. G., & Mandrup, S. (2006). Peroxisome
proliferator-activated receptor subtype- and cell-type-specific activation of
genomic target genes upon adenoviral transgene delivery. Molecular and
Cellular Biology, 26(15), 5698-5714. doi: 10.1128/MCB.02266-05
Nijtmans, L. G., de Jong, L., Artal Sanz, M., Coates, P. J., Berden, J. A., Back, J. W., . .
. Grivell, L. A. (2000). Prohibitins act as a membrane-bound chaperone for the
stabilization of mitochondrial proteins. The EMBO journal, 19(11), 2444-2451.
doi: 10.1093/emboj/19.11.2444
Nwodo, U. U., Obiiyeke, G. E., Chigor, V. N., & Okoh, A. I. (2011). Assessment of
Tamarindus indica extracts for antibacterial activity. International Journal of
Molecular Sciences, 12(10), 6385-6396. doi: 10.3390/ijms12106385
O'Connell, B. C., Cheung, A. F., Simkevich, C. P., Tam, W., Ren, X., Mateyak, M. K.,
& Sedivy, J. M. (2003). A large scale genetic analysis of c-Myc-regulated gene
expression patterns. The Journal of Biological Chemistry, 278(14), 12563-
12573. doi: 10.1074/jbc.M210462200
O'Farrell, P. H. (1975). High resolution two-dimensional electrophoresis of proteins.
The Journal of Biological Chemistry, 250(10), 4007-4021.
Ohnsorg, P. M., Rohrer, L., Perisa, D., Kateifides, A., Chroni, A., Kardassis, D., . . . von
Eckardstein, A. (2011). Carboxyl terminus of apolipoprotein A-I (ApoA-I) is
necessary for the transport of lipid-free ApoA-I but not prelipidated ApoA-I
particles through aortic endothelial cells. The Journal of Biological Chemistry,
286(10), 7744-7754. doi: 10.1074/jbc.M110.193524
201
Ongusaha, P. P., Ouchi, T., Kim, K. T., Nytko, E., Kwak, J. C., Duda, R. B., . . . Lee, S.
W. (2003). BRCA1 shifts p53-mediated cellular outcomes towards irreversible
growth arrest. Oncogene, 22(24), 3749-3758. doi: 10.1038/sj.onc.1206439
Osman, C., Haag, M., Potting, C., Rodenfels, J., Dip, P. V., Wieland, F. T., . . . Langer,
T. (2009). The genetic interactome of prohibitins: coordinated control of
cardiolipin and phosphatidylethanolamine by conserved regulators in
mitochondria. The Journal of Cell Biology, 184(4), 583-596. doi:
10.1083/jcb.200810189
Oster, S. K., Ho, C. S., Soucie, E. L., & Penn, L. Z. (2002). The myc oncogene:
MarvelouslY Complex. Advances in Cancer Research, 84, 81-154.
Osthus, R. C., Shim, H., Kim, S., Li, Q., Reddy, R., Mukherjee, M., . . . Dang, C. V.
(2000). Deregulation of glucose transporter 1 and glycolytic gene expression by
c-Myc. The Journal of Biological Chemistry, 275(29), 21797-21800. doi:
10.1074/jbc.C000023200
Othman, F., Motalleb, G., Lam Tsuey Peng, S., Rahmat, A., Basri, R., & Pei Pei, C.
(2012). Effect of Neem Leaf Extract (Azadirachta indica) on c-Myc Oncogene
Expression in 4T1 Breast Cancer Cells of BALB/c Mice. Cell Journal, 14(1),
53-60.
Ozawa, H., & Ozawa, T. (2002). [A 50-year year history of new drugs in Japan: the
developments of antituberculosis drugs and their influences on the
epidemiological aspects]. Yakushigaku Zasshi. The Journal of Japanese History
of Pharmacy, 37(1), 84-94.
Pajuelo, D., Fernandez-Iglesias, A., Diaz, S., Quesada, H., Arola-Arnal, A., Blade, C., .
. . Arola, L. (2011). Improvement of mitochondrial function in muscle of
genetically obese rats after chronic supplementation with proanthocyanidins.
Journal of Agricultural and Food Chemistry, 59(15), 8491-8498. doi:
10.1021/jf201775v
Pal, S., Ho, N., Santos, C., Dubois, P., Mamo, J., Croft, K., & Allister, E. (2003). Red
wine polyphenolics increase LDL receptor expression and activity and suppress
the secretion of ApoB100 from human HepG2 cells. The Journal of Nutrition,
133(3), 700-706.
Pan, K. Z., Palter, J. E., Rogers, A. N., Olsen, A., Chen, D., Lithgow, G. J., & Kapahi,
P. (2007). Inhibition of mRNA translation extends lifespan in Caenorhabditis
elegans. Aging Cell, 6(1), 111-119. doi: 10.1111/j.1474-9726.2006.00266.x
Pancholi, V., & Fischetti, V. A. (1998). Alpha-enolase, a novel strong plasmin(ogen)
binding protein on the surface of pathogenic streptococci. The Journal of
Biological Chemistry, 273(23), 14503-14515.
202
Pandey, A., & Mann, M. (2000). Proteomics to study genes and genomes. Nature,
405(6788), 837-846. doi: 10.1038/35015709
Park, E. Y., Cho, I. J., & Kim, S. G. (2004). Transactivation of the PPAR-responsive
enhancer module in chemopreventive glutathione S-transferase gene by the
peroxisome proliferator-activated receptor-gamma and retinoid X receptor
heterodimer. Cancer Research, 64(10), 3701-3713. doi: 10.1158/0008-
5472.CAN-03-3924
Park, J. W., Lee, M. H., Choi, J. O., Park, H. Y., & Jung, S. C. (2010). Tissue-specific
activation of mitogen-activated protein kinases for expression of transthyretin by
phenylalanine and its metabolite, phenylpyruvic acid. Experimental &
Molecular Medicine, 42(2), 105-115. doi: 10.3858/emm.2010.42.2.012
Park, S., Guo, J., Kim, D., & Cheng, J. Q. (2009). Identification of 24p3 as a direct
target of Foxo3a regulated by interleukin-3 through the phosphoinositide 3-
kinase/Akt pathway. The Journal of Biological Chemistry, 284(4), 2187-2193.
doi: 10.1074/jbc.M806131200
Patsouris, D., Mandard, S., Voshol, P. J., Escher, P., Tan, N. S., Havekes, L. M., . . .
Kersten, S. (2004). PPARalpha governs glycerol metabolism. The Journal of
Clinical Investigation, 114(1), 94-103. doi: 10.1172/JCI20468
Peeters, A., & Baes, M. (2010). Role of PPARalpha in Hepatic Carbohydrate
Metabolism. PPAR Research, 2010. doi: 10.1155/2010/572405
Perdew, G. H., Schaup, H. W., & Selivonchick, D. P. (1983). The use of a zwitterionic
detergent in two-dimensional gel electrophoresis of trout liver microsomes.
Analytical Biochemistry, 135(2), 453-455.
Perdomo, G., Commerford, S. R., Richard, A. M., Adams, S. H., Corkey, B. E.,
O'Doherty, R. M., & Brown, N. F. (2004). Increased beta-oxidation in muscle
cells enhances insulin-stimulated glucose metabolism and protects against fatty
acid-induced insulin resistance despite intramyocellular lipid accumulation. The
Journal of Biological Chemistry, 279(26), 27177-27186. doi:
10.1074/jbc.M403566200
Perry, C. M. (2013). Lomitapide: a review of its use in adults with homozygous familial
hypercholesterolemia. American Journal of Cardiovascular Drugs : Drugs,
Devices, and other Interventions, 13(4), 285-296. doi: 10.1007/s40256-013-
0030-7
Peterson, L. E. (2013). Classification analysis of DNA microarrays: Wiley-IEEE
Computer Society Pr; 1 edition.
203
Pfeffer, S. R. (2001). Rab GTPases: specifying and deciphering organelle identity and
function. Trends in Cell Biology, 11(12), 487-491.
Pfeffer, S. R., Dirac-Svejstrup, A. B., & Soldati, T. (1995). Rab GDP dissociation
inhibitor: putting rab GTPases in the right place. The Journal of Biological
Chemistry, 270(29), 17057-17059.
Philips, B. J., Coyle, C. H., Morrisroe, S. N., Chancellor, M. B., & Yoshimura, N.
(2009). Induction of apoptosis in human bladder cancer cells by green tea
catechins. Biomedical Research, 30(4), 207-215.
Pino, E., Wang, H., McDonald, M. E., Qiang, L., & Farmer, S. R. (2012). Roles for
peroxisome proliferator-activated receptor gamma (PPARgamma) and
PPARgamma coactivators 1alpha and 1beta in regulating response of white and
brown adipocytes to hypoxia. The Journal of Biological Chemistry, 287(22),
18351-18358. doi: 10.1074/jbc.M112.350918
Porcu, M., & Chiarugi, A. (2005). The emerging therapeutic potential of sirtuin-
interacting drugs: from cell death to lifespan extension. Trends in
Pharmacological Sciences, 26(2), 94-103. doi: 10.1016/j.tips.2004.12.009
Post, S. M., Duez, H., Gervois, P. P., Staels, B., Kuipers, F., & Princen, H. M. (2001).
Fibrates suppress bile acid synthesis via peroxisome proliferator-activated
receptor-alpha-mediated downregulation of cholesterol 7alpha-hydroxylase and
sterol 27-hydroxylase expression. Arteriosclerosis, Thrombosis, and Vascular
Biology, 21(11), 1840-1845.
Puigserver, P., Rhee, J., Donovan, J., Walkey, C. J., Yoon, J. C., Oriente, F., . . .
Spiegelman, B. M. (2003). Insulin-regulated hepatic gluconeogenesis through
FOXO1-PGC-1alpha interaction. Nature, 423(6939), 550-555. doi:
10.1038/nature01667
Puigserver, P., & Spiegelman, B. M. (2003). Peroxisome proliferator-activated receptor-
gamma coactivator 1 alpha (PGC-1 alpha): transcriptional coactivator and
metabolic regulator. Endocrine Reviews, 24(1), 78-90.
Purseglove, J. W. (1987). Tropical Crops. Dicotyledons: Longman Science and
Technology.
Qi, L., Heredia, J. E., Altarejos, J. Y., Screaton, R., Goebel, N., Niessen, S., . . .
Montminy, M. (2006). TRB3 links the E3 ubiquitin ligase COP1 to lipid
metabolism. Science, 312(5781), 1763-1766. doi: 10.1126/science.1123374
204
Qian, Y., & Chen, X. (2008). ID1, inhibitor of differentiation/DNA binding, is an
effector of the p53-dependent DNA damage response pathway. The Journal of
Biological Chemistry, 283(33), 22410-22416. doi: 10.1074/jbc.M800643200
Qian, Y., Zhang, J., Yan, B., & Chen, X. (2008). DEC1, a basic helix-loop-helix
transcription factor and a novel target gene of the p53 family, mediates p53-
dependent premature senescence. The Journal of Biological Chemistry, 283(5),
2896-2905. doi: 10.1074/jbc.M708624200
Quinlan, D. C., Davidson, A. G., Summers, C. L., Warden, H. E., & Doshi, H. M.
(1992). Accumulation of p53 protein correlates with a poor prognosis in human
lung cancer. Cancer Research, 52(17), 4828-4831.
Raal, F. J. (2013). Lomitapide for homozygous familial hypercholesterolaemia. Lancet,
381(9860), 7-8. doi: 10.1016/S0140-6736(12)61845-5
Rabilloud, T. (1998). Use of thiourea to increase the solubility of membrane proteins in
two-dimensional electrophoresis. Electrophoresis, 19(5), 758-760. doi:
10.1002/elps.1150190526
Rabilloud, T., Adessi, C., Giraudel, A., & Lunardi, J. (1997). Improvement of the
solubilization of proteins in two-dimensional electrophoresis with immobilized
pH gradients. Electrophoresis, 18(3-4), 307-316. doi: 10.1002/elps.1150180303
Rageul, J., Mottier, S., Jarry, A., Shah, Y., Theoleyre, S., Masson, D., . . . Denis, M. G.
(2009). KLF4-dependent, PPARgamma-induced expression of GPA33 in colon
cancer cell lines. International Journal of Cancer. Journal International du
Cancer, 125(12), 2802-2809. doi: 10.1002/ijc.24683
Rajalingam, K., & Rudel, T. (2005). Ras-Raf signaling needs prohibitin. Cell Cycle,
4(11), 1503-1505.
Rakhshandehroo, M., Sanderson, L. M., Matilainen, M., Stienstra, R., Carlberg, C., de
Groot, P. J., . . . Kersten, S. (2007). Comprehensive analysis of PPARalpha-
dependent regulation of hepatic lipid metabolism by expression profiling. PPAR
Research, 2007, 26839. doi: 10.1155/2007/26839
Ramos, A., Visozo, A., Piloto, J., Garcia, A., Rodriguez, C. A., & Rivero, R. (2003).
Screening of antimutagenicity via antioxidant activity in Cuban medicinal
plants. Journal of Ethnopharmacology, 87(2-3), 241-246.
Ranjan, R., Swarup, D., Patra, R. C., & Chandra, V. (2009). Tamarindus indica L. and
Moringa oleifera M. extract administration ameliorates fluoride toxicity in
rabbits. Indian Journal of Experimental Biology, 47(11), 900-905.
205
Rao, A., Luo, C., & Hogan, P. G. (1997). Transcription factors of the NFAT family:
regulation and function. Annual Review of Immunology, 15, 707-747. doi:
10.1146/annurev.immunol.15.1.707
Rao, M. S., Subbarao, V., & Reddy, J. K. (1986). Peroxisome proliferator-induced
hepatocarcinogenesis: histochemical analysis of ciprofibrate-induced
preneoplastic and neoplastic lesions for gamma-glutamyl transpeptidase activity.
Journal of the National Cancer Institute, 77(4), 951-956.
Raz, A., & Goodman, D. S. (1969). The interaction of thyroxine with human plasma
prealbumin and with the prealbumin-retinol-binding protein complex. The
Journal of Biological Chemistry, 244(12), 3230-3237.
Razali, N. (2010). The bioactivity of selected local plant extracts and their effects on the
expression of genes involved in cholesterol metabolism. Degree of Master of
Medical Science, University of Malaya, Kuala Lumpur.
Razali, N., Aziz, A. A., & Junit, S. M. (2010). Gene expression profiles in human
HepG2 cells treated with extracts of the Tamarindus indica fruit pulp. Genes &
Nutrition, 5(4), 331-341. doi: 10.1007/s12263-010-0187-5
Reddy, J. K., & Krishnakantha, T. P. (1975). Hepatic peroxisome proliferation:
induction by two novel compounds structurally unrelated to clofibrate. Science,
190(4216), 787-789.
Remy, I., & Michnick, S. W. (2003). Dynamic visualization of expressed gene
networks. Journal of Cellular Physiology, 196(3), 419-429. doi:
10.1002/jcp.10328
Reue, K., & Dwyer, J. R. (2009). Lipin proteins and metabolic homeostasis. Journal of
Lipid Research, 50 Suppl, S109-114. doi: 10.1194/jlr.R800052-JLR200
Rhee, J., Inoue, Y., Yoon, J. C., Puigserver, P., Fan, M., Gonzalez, F. J., & Spiegelman,
B. M. (2003). Regulation of hepatic fasting response by PPARgamma
coactivator-1alpha (PGC-1): requirement for hepatocyte nuclear factor 4alpha in
gluconeogenesis. Proceedings of the National Academy of Sciences of the
United States of America, 100(7), 4012-4017. doi: 10.1073/pnas.0730870100
Rice-Evans, C. (2001). Flavonoid antioxidants. Current Medicinal Chemistry, 8(7),
797-807.
Richard, D., Kefi, K., Barbe, U., Poli, A., Bausero, P., & Visioli, F. (2009). Weight and
plasma lipid control by decaffeinated green tea. Pharmacological Research : the
official journal of the Italian Pharmacological Society, 59(5), 351-354. doi:
10.1016/j.phrs.2009.01.015
206
Rimbach, G., Fuchs, J., & Packer, L. (2005). Nutrigenomics. Boca Raton:
Taylor&Francis.
Rimbau, V., Cerdan, C., Vila, R., & Iglesias, J. (1999). Antiinflammatory activity of
some extracts from plants used in the traditional medicine of north-African
countries (II). Phytotherapy Research : PTR, 13(2), 128-132.
Riu, E., Bosch, F., & Valera, A. (1996). Prevention of diabetic alterations in transgenic
mice overexpressing Myc in the liver. Proceedings of the National Academy of
Sciences of the United States of America, 93(5), 2198-2202.
Rodgers, J. T., Lerin, C., Haas, W., Gygi, S. P., Spiegelman, B. M., & Puigserver, P.
(2005). Nutrient control of glucose homeostasis through a complex of PGC-
1alpha and SIRT1. Nature, 434(7029), 113-118. doi: 10.1038/nature03354
Roger, V. L., Go, A. S., Lloyd-Jones, D. M., Benjamin, E. J., Berry, J. D., Borden, W.
B., . . . Turner, M. B. (2012). Heart disease and stroke statistics--2012 update: a
report from the American Heart Association. Circulation, 125(1), e2-e220. doi:
10.1161/CIR.0b013e31823ac046
Rounbehler, R. J., Fallahi, M., Yang, C., Steeves, M. A., Li, W., Doherty, J. R., . . .
Cleveland, J. L. (2012). Tristetraprolin impairs myc-induced lymphoma and
abolishes the malignant state. Cell, 150(3), 563-574. doi:
10.1016/j.cell.2012.06.033
Rouschop, K. M., van den Beucken, T., Dubois, L., Niessen, H., Bussink, J.,
Savelkouls, K., . . . Wouters, B. G. (2010). The unfolded protein response
protects human tumor cells during hypoxia through regulation of the autophagy
genes MAP1LC3B and ATG5. The Journal of Clinical Investigation, 120(1),
127-141. doi: 10.1172/JCI40027
Roy, M. G., Rahman, S., Rehana, F., Munmun, M., Sharmin, N., Hasan, Z., . . .
Rahmatullah, M. (2010). Evaluation of antihyperglycemic potential of
methanolic extract of Tamarindus Indica L. (Fabaceae) fruits and seeds in
glucose-induced hyperglycemic mice. Advances in Natural and Applied
Sciences, 4(2), 159-162.
Rubi, B., Antinozzi, P. A., Herrero, L., Ishihara, H., Asins, G., Serra, D., . . . Hegardt, F.
G. (2002). Adenovirus-mediated overexpression of liver carnitine
palmitoyltransferase I in INS1E cells: effects on cell metabolism and insulin
secretion. The Biochemical Journal, 364(Pt 1), 219-226.
Rutkowski, D. T., Wu, J., Back, S. H., Callaghan, M. U., Ferris, S. P., Iqbal, J., . . .
Kaufman, R. J. (2008). UPR pathways combine to prevent hepatic steatosis
caused by ER stress-mediated suppression of transcriptional master regulators.
Developmental Cell, 15(6), 829-840. doi: 10.1016/j.devcel.2008.10.015
207
Rzymski, T., Milani, M., Pike, L., Buffa, F., Mellor, H. R., Winchester, L., . . . Harris,
A. L. (2010). Regulation of autophagy by ATF4 in response to severe hypoxia.
Oncogene, 29(31), 4424-4435. doi: 10.1038/onc.2010.191
Sakoe, Y., Sakoe, K., Kirito, K., Ozawa, K., & Komatsu, N. (2010). FOXO3A as a key
molecule for all-trans retinoic acid-induced granulocytic differentiation and
apoptosis in acute promyelocytic leukemia. Blood, 115(18), 3787-3795. doi:
10.1182/blood-2009-05-222976
San-Marina, S., Han, Y., Suarez Saiz, F., Trus, M. R., & Minden, M. D. (2008). Lyl1
interacts with CREB1 and alters expression of CREB1 target genes. Biochimica
et Biophysica Acta, 1783(3), 503-517. doi: 10.1016/j.bbamcr.2007.11.015
Sanderson, L. M., Boekschoten, M. V., Desvergne, B., Muller, M., & Kersten, S.
(2010). Transcriptional profiling reveals divergent roles of PPARalpha and
PPARbeta/delta in regulation of gene expression in mouse liver. Physiological
Genomics, 41(1), 42-52. doi: 10.1152/physiolgenomics.00127.2009
Sanderson, L. M., Degenhardt, T., Koppen, A., Kalkhoven, E., Desvergne, B., Muller,
M., & Kersten, S. (2009). Peroxisome proliferator-activated receptor beta/delta
(PPARbeta/delta) but not PPARalpha serves as a plasma free fatty acid sensor in
liver. Molecular and Cellular Biology, 29(23), 6257-6267. doi:
10.1128/MCB.00370-09
Schadinger, S. E., Bucher, N. L., Schreiber, B. M., & Farmer, S. R. (2005).
PPARgamma2 regulates lipogenesis and lipid accumulation in steatotic
hepatocytes. American Journal of Physiology. Endocrinology and Metabolism,
288(6), E1195-1205. doi: 10.1152/ajpendo.00513.2004
Schagger, H., & von Jagow, G. (1987). Tricine-sodium dodecyl sulfate-polyacrylamide
gel electrophoresis for the separation of proteins in the range from 1 to 100 kDa.
Analytical Biochemistry, 166(2), 368-379.
Schena, M., Shalon, D., Davis, R. W., & Brown, P. O. (1995). Quantitative monitoring
of gene expression patterns with a complementary DNA microarray. Science,
270(5235), 467-470.
Schoonjans, K., Watanabe, M., Suzuki, H., Mahfoudi, A., Krey, G., Wahli, W., . . .
Auwerx, J. (1995). Induction of the acyl-coenzyme A synthetase gene by
fibrates and fatty acids is mediated by a peroxisome proliferator response
element in the C promoter. The Journal of Biological Chemistry, 270(33),
19269-19276.
208
Schupp, M., Cristancho, A. G., Lefterova, M. I., Hanniman, E. A., Briggs, E. R., Steger,
D. J., . . . Lazar, M. A. (2009). Re-expression of GATA2 cooperates with
peroxisome proliferator-activated receptor-gamma depletion to revert the
adipocyte phenotype. The Journal of Biological Chemistry, 284(14), 9458-9464.
doi: 10.1074/jbc.M809498200
Schwartzenberg-Bar-Yoseph, F., Armoni, M., & Karnieli, E. (2004). The tumor
suppressor p53 down-regulates glucose transporters GLUT1 and GLUT4 gene
expression. Cancer Research, 64(7), 2627-2633.
Scott, N., Sagar, P., Stewart, J., Blair, G. E., Dixon, M. F., & Quirke, P. (1991). p53 in
colorectal cancer: clinicopathological correlation and prognostic significance.
British Journal of Cancer, 63(2), 317-319.
Sebastian, D., Guitart, M., Garcia-Martinez, C., Mauvezin, C., Orellana-Gavalda, J. M.,
Serra, D., . . . Asins, G. (2009). Novel role of FATP1 in mitochondrial fatty acid
oxidation in skeletal muscle cells. Journal of Lipid Research, 50(9), 1789-1799.
doi: 10.1194/jlr.M800535-JLR200
Seymour, E. M., Singer, A. A., Kirakosyan, A., Urcuyo-Llanes, D. E., Kaufman, P. B.,
& Bolling, S. F. (2008). Altered hyperlipidemia, hepatic steatosis, and hepatic
peroxisome proliferator-activated receptors in rats with intake of tart cherry.
Journal of Medicinal Food, 11(2), 252-259. doi: 10.1089/jmf.2007.658
Shan, J., Ord, D., Ord, T., & Kilberg, M. S. (2009). Elevated ATF4 expression, in the
absence of other signals, is sufficient for transcriptional induction via CCAAT
enhancer-binding protein-activating transcription factor response elements. The
Journal of Biological Chemistry, 284(32), 21241-21248. doi:
10.1074/jbc.M109.011338
Shao, Z. H., Vanden Hoek, T. L., Xie, J., Wojcik, K., Chan, K. C., Li, C. Q., . . . Yuan,
C. S. (2003). Grape seed proanthocyanidins induce pro-oxidant toxicity in
cardiomyocytes. Cardiovascular Toxicology, 3(4), 331-339.
Shevchenko, A., Wilm, M., Vorm, O., & Mann, M. (1996). Mass spectrometric
sequencing of proteins silver-stained polyacrylamide gels. Analytical Chemistry,
68(5), 850-858.
Shih, C. C., Lin, C. H., Lin, Y. J., & Wu, J. B. (2013). Validation of the Antidiabetic
and Hypolipidemic Effects of Hawthorn by Assessment of Gluconeogenesis and
Lipogenesis Related Genes and AMP-Activated Protein Kinase
Phosphorylation. Evidence-based complementary and alternative medicine :
eCAM, 2013, 597067. doi: 10.1155/2013/597067
209
Shimada, T., Tokuhara, D., Tsubata, M., Kamiya, T., Kamiya-Sameshima, M.,
Nagamine, R., . . . Aburada, M. (2012). Flavangenol (pine bark extract) and its
major component procyanidin B1 enhance fatty acid oxidation in fat-loaded
models. European Journal of Pharmacology, 677(1-3), 147-153. doi:
10.1016/j.ejphar.2011.12.034
Soccio, R. E., & Breslow, J. L. (2004). Intracellular cholesterol transport.
Arteriosclerosis, Thrombosis, and Vascular Biology, 24(7), 1150-1160. doi:
10.1161/01.ATV.0000131264.66417.d5
Soinov, L. A. (2003). Supervised classification for gene network reconstruction.
Biochemical Society Transactions, 31(Pt 6), 1497-1502. doi: 10.1042/
Sriburi, R., Bommiasamy, H., Buldak, G. L., Robbins, G. R., Frank, M., Jackowski, S.,
& Brewer, J. W. (2007). Coordinate regulation of phospholipid biosynthesis and
secretory pathway gene expression in XBP-1(S)-induced endoplasmic reticulum
biogenesis. The Journal of Biological Chemistry, 282(10), 7024-7034. doi:
10.1074/jbc.M609490200
Srivastava, R. A., Pinkosky, S. L., Filippov, S., Hanselman, J. C., Cramer, C. T., &
Newton, R. S. (2012). AMP-activated protein kinase: an emerging drug target to
regulate imbalances in lipid and carbohydrate metabolism to treat cardio-
metabolic diseases. Journal of Lipid Research, 53(12), 2490-2514. doi:
10.1194/jlr.R025882
Stahlberg, D., Angelin, B., & Einarsson, K. (1989). Effects of treatment with clofibrate,
bezafibrate, and ciprofibrate on the metabolism of cholesterol in rat liver
microsomes. Journal of Lipid Research, 30(7), 953-958.
Stahlberg, D., Reihner, E., Rudling, M., Berglund, L., Einarsson, K., & Angelin, B.
(1995). Influence of bezafibrate on hepatic cholesterol metabolism in gallstone
patients: reduced activity of cholesterol 7 alpha-hydroxylase. Hepatology, 21(4),
1025-1030.
Steglich, G., Neupert, W., & Langer, T. (1999). Prohibitins regulate membrane protein
degradation by the m-AAA protease in mitochondria. Molecular and Cellular
Biology, 19(5), 3435-3442.
Stein, S., Thomas, E. K., Herzog, B., Westfall, M. D., Rocheleau, J. V., Jackson, R. S.,
2nd, . . . Liang, P. (2004). NDRG1 is necessary for p53-dependent apoptosis.
The Journal of Biological Chemistry, 279(47), 48930-48940. doi:
10.1074/jbc.M400386200
Steinmetz, K. L. (2002). Colesevelam hydrochloride. American Journal of Health-
system Pharmacy : AJHP : official journal of the American Society of Health-
System Pharmacists, 59(10), 932-939.
210
Stenmark, H., & Olkkonen, V. M. (2001). The Rab GTPase family. Genome Biology,
2(5), REVIEWS3007.
Su, Z. Z., Lebedeva, I. V., Sarkar, D., Gopalkrishnan, R. V., Sauane, M., Sigmon, C., . .
. Fisher, P. B. (2003). Melanoma differentiation associated gene-7, mda-7/IL-24,
selectively induces growth suppression, apoptosis and radiosensitization in
malignant gliomas in a p53-independent manner. Oncogene, 22(8), 1164-1180.
doi: 10.1038/sj.onc.1206062
Subramanian, A., & Miller, D. M. (2000). Structural analysis of alpha-enolase.
Mapping the functional domains involved in down-regulation of the c-myc
protooncogene. The Journal of Biological Chemistry, 275(8), 5958-5965.
Sudjaroen, Y., Haubner, R., Wurtele, G., Hull, W. E., Erben, G., Spiegelhalder, B., . . .
Owen, R. W. (2005). Isolation and structure elucidation of phenolic antioxidants
from Tamarind (Tamarindus indica L.) seeds and pericarp. Food and Chemical
Toxicology: an international journal published for the British Industrial
Biological Research Association, 43(11), 1673-1682. doi:
10.1016/j.fct.2005.05.013
Sugden, M. C., Caton, P. W., & Holness, M. J. (2010). PPAR control: it's SIRTainly as
easy as PGC. The Journal of Endocrinology, 204(2), 93-104. doi: 10.1677/JOE-
09-0359
Sugiura, K., Muro, Y., Futamura, K., Matsumoto, K., Hashimoto, N., Nishizawa, Y., . .
. Usukura, J. (2009). The unfolded protein response is activated in
differentiating epidermal keratinocytes. The Journal of Investigative
Dermatology, 129(9), 2126-2135. doi: 10.1038/jid.2009.51
Swarbrick, A., Akerfeldt, M. C., Lee, C. S., Sergio, C. M., Caldon, C. E., Hunter, L. J., .
. . Musgrove, E. A. (2005). Regulation of cyclin expression and cell cycle
progression in breast epithelial cells by the helix-loop-helix protein Id1.
Oncogene, 24(3), 381-389. doi: 10.1038/sj.onc.1208188
Syntichaki, P., Troulinaki, K., & Tavernarakis, N. (2007). eIF4E function in somatic
cells modulates ageing in Caenorhabditis elegans. Nature, 445(7130), 922-926.
doi: 10.1038/nature05603
Szmitko, P. E., & Verma, S. (2005). Cardiology patient pages. Red wine and your heart.
[Patient Education Handout]. Circulation, 111(2), e10-11. doi:
10.1161/01.CIR.0000151608.29217.62
Tabuti, J. R. (2008). Herbal medicines used in the treatment of malaria in Budiope
county, Uganda. Journal of Ethnopharmacology, 116(1), 33-42. doi:
10.1016/j.jep.2007.10.036
211
Tachibana, K., Anzai, N., Ueda, C., Katayama, T., Kirino, T., Takahashi, R., . . . Doi, T.
(2006). Analysis of PPAR alpha function in human kidney cell line using
siRNA. Nucleic Acids Symposium Series(50), 257-258. doi: 10.1093/nass/nrl128
Teissier, E., Nohara, A., Chinetti, G., Paumelle, R., Cariou, B., Fruchart, J. C., . . .
Staels, B. (2004). Peroxisome proliferator-activated receptor alpha induces
NADPH oxidase activity in macrophages, leading to the generation of LDL with
PPAR-alpha activation properties. Circulation Research, 95(12), 1174-1182.
doi: 10.1161/01.RES.0000150594.95988.45
Terragni, J., Nayak, G., Banerjee, S., Medrano, J. L., Graham, J. R., Brennan, J. F., . . .
Cooper, G. M. (2011). The E-box binding factors Max/Mnt, MITF, and USF1
act coordinately with FoxO to regulate expression of proapoptotic and cell cycle
control genes by phosphatidylinositol 3-kinase/Akt/glycogen synthase kinase 3
signaling. The Journal of Biological Chemistry, 286(42), 36215-36227. doi:
10.1074/jbc.M111.246116
Thomas-Tikhonenko, A., Viard-Leveugle, I., Dews, M., Wehrli, P., Sevignani, C., Yu,
D., . . . French, L. E. (2004). Myc-transformed epithelial cells down-regulate
clusterin, which inhibits their growth in vitro and carcinogenesis in vivo. Cancer
Research, 64(9), 3126-3136.
Tiraby, C., Tavernier, G., Lefort, C., Larrouy, D., Bouillaud, F., Ricquier, D., & Langin,
D. (2003). Acquirement of brown fat cell features by human white adipocytes.
The Journal of Biological Chemistry, 278(35), 33370-33376. doi:
10.1074/jbc.M305235200
Tontonoz, P., Hu, E., Graves, R. A., Budavari, A. I., & Spiegelman, B. M. (1994).
mPPAR gamma 2: tissue-specific regulator of an adipocyte enhancer. Genes &
Development, 8(10), 1224-1234.
Tran, H., Brunet, A., Grenier, J. M., Datta, S. R., Fornace, A. J., Jr., DiStefano, P. S., . .
. Greenberg, M. E. (2002). DNA repair pathway stimulated by the forkhead
transcription factor FOXO3a through the Gadd45 protein. Science, 296(5567),
530-534. doi: 10.1126/science.1068712
Tumurbaatar, B., Tikhanovich, I., Li, Z., Ren, J., Ralston, R., Kuravi, S., . . . Weinman,
S. A. (2013). Hepatitis C and Alcohol Exacerbate Liver Injury by Suppression
of FOXO3. The American Journal of Pathology, 183(6), 1803-1814. doi:
10.1016/j.ajpath.2013.08.013
Unger, C., Popescu, R., Giessrigl, B., Rarova, L., Herbacek, I., Seelinger, M., . . .
Krupitza, G. (2012). An apolar extract of Critonia morifolia inhibits c-Myc,
cyclin D1, Cdc25A, Cdc25B, Cdc25C and Akt and induces apoptosis.
International Journal of Oncology, 40(6), 2131-2139. doi:
10.3892/ijo.2012.1412
212
Unlu, M., Morgan, M. E., & Minden, J. S. (1997). Difference gel electrophoresis: a
single gel method for detecting changes in protein extracts. Electrophoresis,
18(11), 2071-2077. doi: 10.1002/elps.1150181133
Unno, T., Tago, M., Suzuki, Y., Nozawa, A., Sagesaka, Y. M., Kakuda, T., . . . Kondo,
K. (2005). Effect of tea catechins on postprandial plasma lipid responses in
human subjects. The British Journal of Nutrition, 93(4), 543-547.
van Grevenynghe, J., Cubas, R. A., Noto, A., DaFonseca, S., He, Z., Peretz, Y., . . .
Haddad, E. K. (2011). Loss of memory B cells during chronic HIV infection is
driven by Foxo3a- and TRAIL-mediated apoptosis. The Journal of Clinical
Investigation, 121(10), 3877-3888. doi: 10.1172/JCI59211
Vasseur, S., Hoffmeister, A., Garcia-Montero, A., Mallo, G. V., Feil, R., Kuhbandner,
S., . . . Iovanna, J. L. (2002). p8-deficient fibroblasts grow more rapidly and are
more resistant to adriamycin-induced apoptosis. Oncogene, 21(11), 1685-1694.
doi: 10.1038/sj.onc.1205222
Vasudevan, A. R., & Jones, P. H. (2005). Effective use of combination lipid therapy.
Current Cardiology Reports, 7(6), 471-479.
Vaziri, N. D., & Liang, K. (2004). Effects of HMG-CoA reductase inhibition on hepatic
expression of key cholesterol-regulatory enzymes and receptors in nephrotic
syndrome. American Journal of Nephrology, 24(6), 606-613. doi:
10.1159/000082510
Vazquez-Chantada, M., Gonzalez-Lahera, A., Martinez-Arranz, I., Garcia-Monzon, C.,
Regueiro, M. M., Garcia-Rodriguez, J. L., . . . Aransay, A. M. (2013). Solute
carrier family 2 member 1 is involved in the development of nonalcoholic fatty
liver disease. Hepatology, 57(2), 505-514. doi: 10.1002/hep.26052
Vega, R. B., Huss, J. M., & Kelly, D. P. (2000). The coactivator PGC-1 cooperates with
peroxisome proliferator-activated receptor alpha in transcriptional control of
nuclear genes encoding mitochondrial fatty acid oxidation enzymes. Molecular
and Cellular Biology, 20(5), 1868-1876.
Venero, C. V., Venero, J. V., Wortham, D. C., & Thompson, P. D. (2010). Lipid-
lowering efficacy of red yeast rice in a population intolerant to statins. The
American Journal of Cardiology, 105(5), 664-666. doi:
10.1016/j.amjcard.2009.10.045
Verfaillie, T., Salazar, M., Velasco, G., & Agostinis, P. (2010). Linking ER Stress to
Autophagy: Potential Implications for Cancer Therapy. International Journal of
Cell Biology, 2010, 930509. doi: 10.1155/2010/930509
213
Vikhanskaya, F., Bani, M. R., Borsotti, P., Ghilardi, C., Ceruti, R., Ghisleni, G., . . .
Taraboletti, G. (2001). p73 Overexpression increases VEGF and reduces
thrombospondin-1 production: implications for tumor angiogenesis. Oncogene,
20(50), 7293-7300. doi: 10.1038/sj.onc.1204896
Vogelstein, B., Lane, D., & Levine, A. J. (2000). Surfing the p53 network. Nature,
408(6810), 307-310. doi: 10.1038/35042675
Wang, D., Wengrod, J., & Gardner, L. B. (2011). Overexpression of the c-myc
oncogene inhibits nonsense-mediated RNA decay in B lymphocytes. The
Journal of Biological Chemistry, 286(46), 40038-40043. doi:
10.1074/jbc.M111.266361
Wang, J., Li, D., Dangott, L. J., & Wu, G. (2006). Proteomics and its role in nutrition
research. The Journal of Nutrition, 136(7), 1759-1762.
Wang, J., Lu, Z., Chi, J., Wang, W., Su, M., Kou, W., . . . Chang, J. (1997). Multicenter
clinical trial of the serum lipid-lowering effects of a Monascus purpureus (red
yeast) rice preparation from traditional Chinese medicine. Current Therapeutic
Research, Clinical and Experimental, 58(12), 964-978.
Wang, J., Shou, J., & Chen, X. (2000). Dickkopf-1, an inhibitor of the Wnt signaling
pathway, is induced by p53. Oncogene, 19(14), 1843-1848. doi:
10.1038/sj.onc.1203503
Wang, Q., Zhang, M., Liang, B., Shirwany, N., Zhu, Y., & Zou, M. H. (2011).
Activation of AMP-activated protein kinase is required for berberine-induced
reduction of atherosclerosis in mice: the role of uncoupling protein 2. PloS One,
6(9), e25436. doi: 10.1371/journal.pone.0025436
Wang, R., Dillon, C. P., Shi, L. Z., Milasta, S., Carter, R., Finkelstein, D., . . . Green, D.
R. (2011). The transcription factor Myc controls metabolic reprogramming upon
T lymphocyte activation. Immunity, 35(6), 871-882. doi:
10.1016/j.immuni.2011.09.021
Wang, Z., & Burke, P. A. (2007). Effects of hepatocyte nuclear factor-4alpha on the
regulation of the hepatic acute phase response. Journal of Molecular Biology,
371(2), 323-335. doi: 10.1016/j.jmb.2007.05.049
Wang, Z., Gerstein, M., & Snyder, M. (2009). RNA-Seq: a revolutionary tool for
transcriptomics. Nature Reviews. Genetics, 10(1), 57-63. doi: 10.1038/nrg2484
214
Way, J. M., Harrington, W. W., Brown, K. K., Gottschalk, W. K., Sundseth, S. S.,
Mansfield, T. A., . . . Kliewer, S. A. (2001). Comprehensive messenger
ribonucleic acid profiling reveals that peroxisome proliferator-activated receptor
gamma activation has coordinate effects on gene expression in multiple insulin-
sensitive tissues. Endocrinology, 142(3), 1269-1277.
WHO. (2009). Global health risks: Mortality and burden of disease attributable to
selected major risks. Geneva: WHO.
WHO. (2012). Cardiovascular disease. Retrieved from
http://www.who.int/cardiovascular_diseases/en/.
Williams, C. D., Stengel, J., Asike, M. I., Torres, D. M., Shaw, J., Contreras, M., . . .
Harrison, S. A. (2011). Prevalence of nonalcoholic fatty liver disease and
nonalcoholic steatohepatitis among a largely middle-aged population utilizing
ultrasound and liver biopsy: a prospective study. Gastroenterology, 140(1), 124-
131. doi: 10.1053/j.gastro.2010.09.038
Williams, C. M., Ordovas, J. M., Lairon, D., Hesketh, J., Lietz, G., Gibney, M., & van
Ommen, B. (2008). The challenges for molecular nutrition research 1: linking
genotype to healthy nutrition. Genes & Nutrition, 3(2), 41-49. doi:
10.1007/s12263-008-0086-1
Willson, T. M., & Wahli, W. (1997). Peroxisome proliferator-activated receptor
agonists. Current Opinion in Chemical Biology, 1(2), 235-241.
Wilson, J. W., Deed, R. W., Inoue, T., Balzi, M., Becciolini, A., Faraoni, P., . . . Norton,
J. D. (2001). Expression of Id helix-loop-helix proteins in colorectal
adenocarcinoma correlates with p53 expression and mitotic index. Cancer
Research, 61(24), 8803-8810.
Wittwer, J., Rubio-Aliaga, I., Hoeft, B., Bendik, I., Weber, P., & Daniel, H. (2011).
Nutrigenomics in human intervention studies: current status, lessons learned and
future perspectives. Molecular Nutrition & Food Research, 55(3), 341-358. doi:
10.1002/mnfr.201000512
Xie, X., Meng, X., Zhou, X., Shu, X., & Kong, H. (2011). [Research on therapeutic
effect and hemorrheology change of berberine in new diagnosed patients with
type 2 diabetes combining nonalcoholic fatty liver disease]. Zhongguo Zhong
Yao Za Zhi = Zhongguo Zhongyao Zazhi = China Journal of Chinese Materia
Medica, 36(21), 3032-3035.
Yamagata, K., Furuta, H., Oda, N., Kaisaki, P. J., Menzel, S., Cox, N. J., . . . Bell, G. I.
(1996). Mutations in the hepatocyte nuclear factor-4alpha gene in maturity-onset
diabetes of the young (MODY1). Nature, 384(6608), 458-460. doi:
10.1038/384458a0
215
Yamakoshi, J., Kataoka, S., Koga, T., & Ariga, T. (1999). Proanthocyanidin-rich extract
from grape seeds attenuates the development of aortic atherosclerosis in
cholesterol-fed rabbits. Atherosclerosis, 142(1), 139-149.
Yan, J., Wang, Q., Zheng, X., Sun, H., Zhou, Y., Li, D., . . . Wang, X. (2012). Luteolin
enhances TNF-related apoptosis-inducing ligand's anticancer activity in a lung
cancer xenograft mouse model. Biochemical and Biophysical Research
Communications, 417(2), 842-846. doi: 10.1016/j.bbrc.2011.12.055
Yan, J., Young, M. E., Cui, L., Lopaschuk, G. D., Liao, R., & Tian, R. (2009).
Increased glucose uptake and oxidation in mouse hearts prevent high fatty acid
oxidation but cause cardiac dysfunction in diet-induced obesity. Circulation,
119(21), 2818-2828. doi: 10.1161/CIRCULATIONAHA.108.832915
Yan, S., Zhou, C., Lou, X., Xiao, Z., Zhu, H., Wang, Q., . . . Xu, N. (2009). PTTG
overexpression promotes lymph node metastasis in human esophageal squamous
cell carcinoma. Cancer Research, 69(8), 3283-3290. doi: 10.1158/0008-
5472.CAN-08-0367
Yancey, P. G., Kawashiri, M. A., Moore, R., Glick, J. M., Williams, D. L., Connelly,
M. A., . . . Rothblat, G. H. (2004). In vivo modulation of HDL phospholipid has
opposing effects on SR-BI- and ABCA1-mediated cholesterol efflux. Journal of
Lipid Research, 45(2), 337-346. doi: 10.1194/jlr.M300231-JLR200
Yang, J., Williams, R. S., & Kelly, D. P. (2009). Bcl3 interacts cooperatively with
peroxisome proliferator-activated receptor gamma (PPARgamma) coactivator
1alpha to coactivate nuclear receptors estrogen-related receptor alpha and
PPARalpha. Molecular and Cellular Biology, 29(15), 4091-4102. doi:
10.1128/MCB.01669-08
Yilmazer, A., de Lazaro, I., Bussy, C., & Kostarelos, K. (2013). In vivo cell
reprogramming towards pluripotency by virus-free overexpression of defined
factors. PloS One, 8(1), e54754. doi: 10.1371/journal.pone.0054754
Yoon, H., Liyanarachchi, S., Wright, F. A., Davuluri, R., Lockman, J. C., de la
Chapelle, A., & Pellegata, N. S. (2002). Gene expression profiling of isogenic
cells with different TP53 gene dosage reveals numerous genes that are affected
by TP53 dosage and identifies CSPG2 as a direct target of p53. Proceedings of
the National Academy of Sciences of the United States of America, 99(24),
15632-15637. doi: 10.1073/pnas.242597299
Yoon, J. C., Puigserver, P., Chen, G., Donovan, J., Wu, Z., Rhee, J., . . . Spiegelman, B.
M. (2001). Control of hepatic gluconeogenesis through the transcriptional
coactivator PGC-1. Nature, 413(6852), 131-138. doi: 10.1038/35093050
216
Yoshikawa, T., Ide, T., Shimano, H., Yahagi, N., Amemiya-Kudo, M., Matsuzaka, T., .
. . Yamada, N. (2003). Cross-talk between peroxisome proliferator-activated
receptor (PPAR) alpha and liver X receptor (LXR) in nutritional regulation of
fatty acid metabolism. I. PPARs suppress sterol regulatory element binding
protein-1c promoter through inhibition of LXR signaling. Molecular
Endocrinology, 17(7), 1240-1254. doi: 10.1210/me.2002-0190
Yu, S., Matsusue, K., Kashireddy, P., Cao, W. Q., Yeldandi, V., Yeldandi, A. V., . . .
Reddy, J. K. (2003). Adipocyte-specific gene expression and adipogenic
steatosis in the mouse liver due to peroxisome proliferator-activated receptor
gamma1 (PPARgamma1) overexpression. The Journal of Biological Chemistry,
278(1), 498-505. doi: 10.1074/jbc.M210062200
Yu, X., Lv, J., Zhu, Y., Duan, L., & Ma, L. (2013). Homocysteine inhibits hepatocyte
proliferation via endoplasmic reticulum stress. PloS One, 8(1), e54265. doi:
10.1371/journal.pone.0054265
Zawacka-Pankau, J., Grinkevich, V. V., Hunten, S., Nikulenkov, F., Gluch, A., Li, H., .
. . Selivanova, G. (2011). Inhibition of glycolytic enzymes mediated by
pharmacologically activated p53: targeting Warburg effect to fight cancer. The
Journal of Biological Chemistry, 286(48), 41600-41615. doi:
10.1074/jbc.M111.240812
Zbidah, M., Lupescu, A., Jilani, K., Fajol, A., Michael, D., Qadri, S. M., & Lang, F.
(2012). Apigenin-induced suicidal erythrocyte death. Journal of Agricultural
and Food Chemistry, 60(1), 533-538. doi: 10.1021/jf204107f
Zerial, M., & McBride, H. (2001). Rab proteins as membrane organizers. Nature
Reviews. Molecular Cell Biology, 2(2), 107-117. doi: 10.1038/35052055
Zhang, H. M., Ye, X., Su, Y., Yuan, J., Liu, Z., Stein, D. A., & Yang, D. (2010).
Coxsackievirus B3 infection activates the unfolded protein response and induces
apoptosis through downregulation of p58IPK and activation of CHOP and
SREBP1. Journal of Virology, 84(17), 8446-8459. doi: 10.1128/JVI.01416-09
Zhang, W., Geiman, D. E., Shields, J. M., Dang, D. T., Mahatan, C. S., Kaestner, K. H.,
. . . Yang, V. W. (2000). The gut-enriched Kruppel-like factor (Kruppel-like
factor 4) mediates the transactivating effect of p53 on the p21WAF1/Cip1
promoter. The Journal of Biological Chemistry, 275(24), 18391-18398. doi:
10.1074/jbc.C000062200
Zhang, Y., Ma, K., Song, S., Elam, M. B., Cook, G. A., & Park, E. A. (2004).
Peroxisomal proliferator-activated receptor-gamma coactivator-1 alpha (PGC-1
alpha) enhances the thyroid hormone induction of carnitine palmitoyltransferase
I (CPT-I alpha). The Journal of Biological Chemistry, 279(52), 53963-53971.
doi: 10.1074/jbc.M406028200
217
LIST OF ISI-PUBLICATIONS AND CONFERENCE PAPERS
PRESENTATION
List of ISI-publications
1) Ursula Rho Wan Chong, Puteri Shafinaz Abdul-Rahman, Azlina Abdul-Aziz,
Onn Haji Hashim, Sarni Mat-Junit. Tamarindus indica Extract Alters Release of
Alpha Enolase, Apolipoprotein A-I, Transthyretin and Rab GDP Dissociation
Inhibitor Beta from HepG2 Cells. PLoS ONE 2012, 7(6), e39476.
doi:10.1371/journal.pone.0039476. (ISI-Cited Publication) (Impact factor: 3.73,
Q1)
2) Ursula R.W. Chong, Puteri S. Abdul-Rahman, Azlina Abdul-Aziz, Onn H.
Hashim, Sarni Mat-Junit. Effects of Tamarindus indica fruit pulp extract on
abundance of HepG2 cell lysate proteins and their possible consequential impact
on metabolism and inflammation. BioMed Research International, vol. 2013,
Article ID 459017, 9 pages, 2013. doi:10.1155/2013/459017 (ISI-Cited
Publication) (Impact factor: 2.88, Q2)
3) Ursula Rho Wan Chong, Puteri Shafinaz Abdul-Rahman, Azlina Abdul-Aziz,
Sarni Mat-Junit. Transcriptomic profiling of HepG2 cells treated with
Tamarindus indica fruit extract. (Manuscript in preparation)
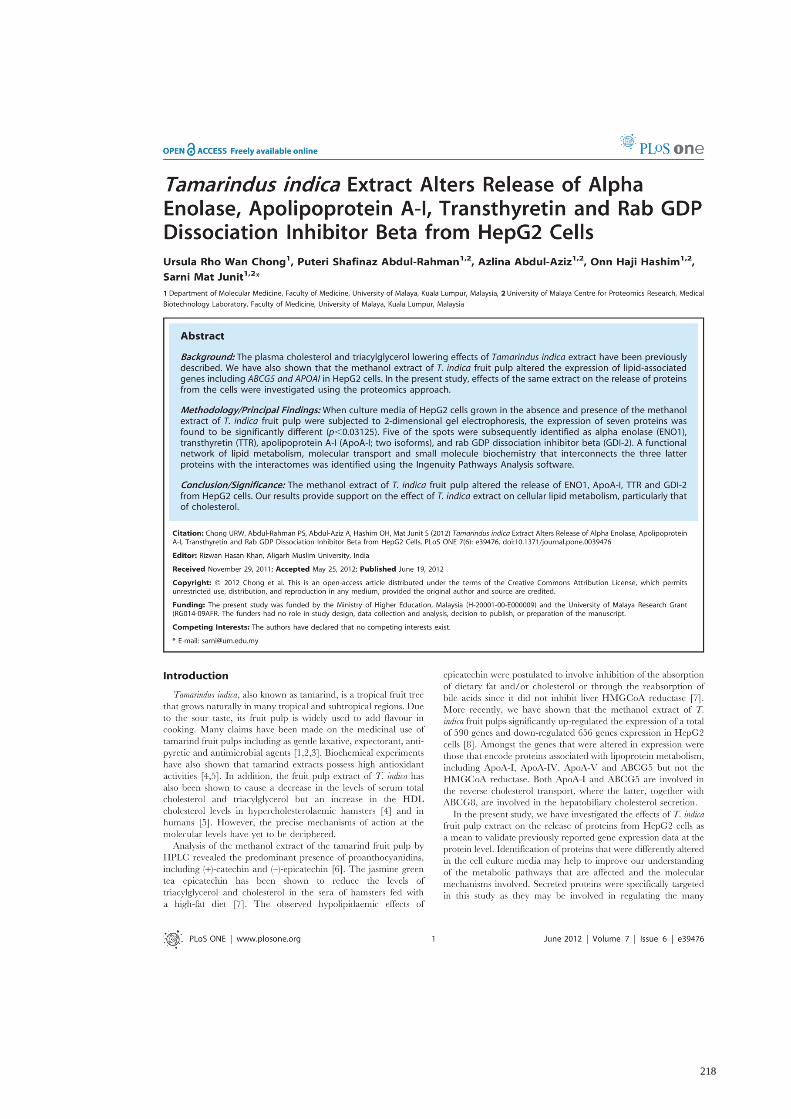
218
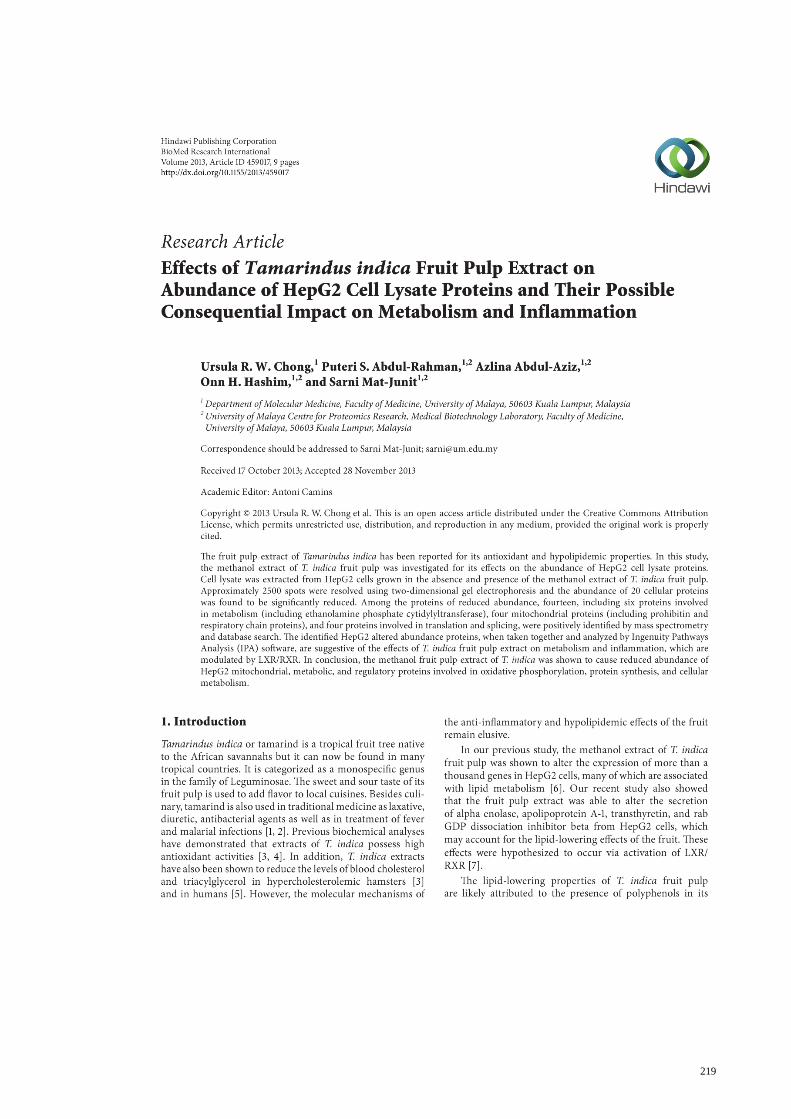
219

220
List of conference paper presentations
International Scientific Conference
1) Ursula Chong Rho Wan, Puteri Shafinaz Akmar Abdul-Rahman, Azlina Abdul
Aziz, Onn Haji Hashim and Sarni Mat Junit. Tamarindus indica fruit extract
modulates metabolism and inflammation in HepG2 cells, possibly through LXRα
activation (2013). International Conference on Natural Products and Health
2013, School of Biological Sciences, Nanyang Technological University,
Singapore.
National Scientific Conference
1) Ursula Chong Rho Wan, Puteri Shafinaz Akmar Abdul-Rahman, Azlina Abdul
Aziz, Onn Haji Hashim and Sarni Mat Junit. Preliminary analysis of the
secretome of HepG2 cells treated with methanol extracts of Tamarindus indica
fruit pulps (2011). Proc of the 36th Annual Conference of the Malaysian Society
for Biochemistry and Molecular Biology, Selangor, Malaysia.
2) Ursula Chong Rho Wan, Puteri Shafinaz Akmar Abdul-Rahman, Azlina Abdul
Aziz, Onn Haji Hashim and Sarni Mat Junit. Tamarindus indica fruit pulp
extract alters the secretion of lipid-associated proteins from HepG2 cells
(2012). Proc of the 37th Annual Conference of the Malaysian Society for
Biochemistry and Molecular Biology, Selangor, Malaysia.
3) Ursula Chong Rho Wan, Puteri Shafinaz Akmar Abdul-Rahman, Azlina Abdul
Aziz and Sarni Mat Junit. Tamarindus indica fruit pulp extract reduces palmitic
acid-induced lipid accumulation in HepG2 cells by modulating genes related to
lipid metabolism, possibly through PPARα and PPARγ activation (2013). Proc
of the 38th Annual Conference of the Malaysian Society for Biochemistry and
Molecular Biology, Putrajaya, Malaysia.
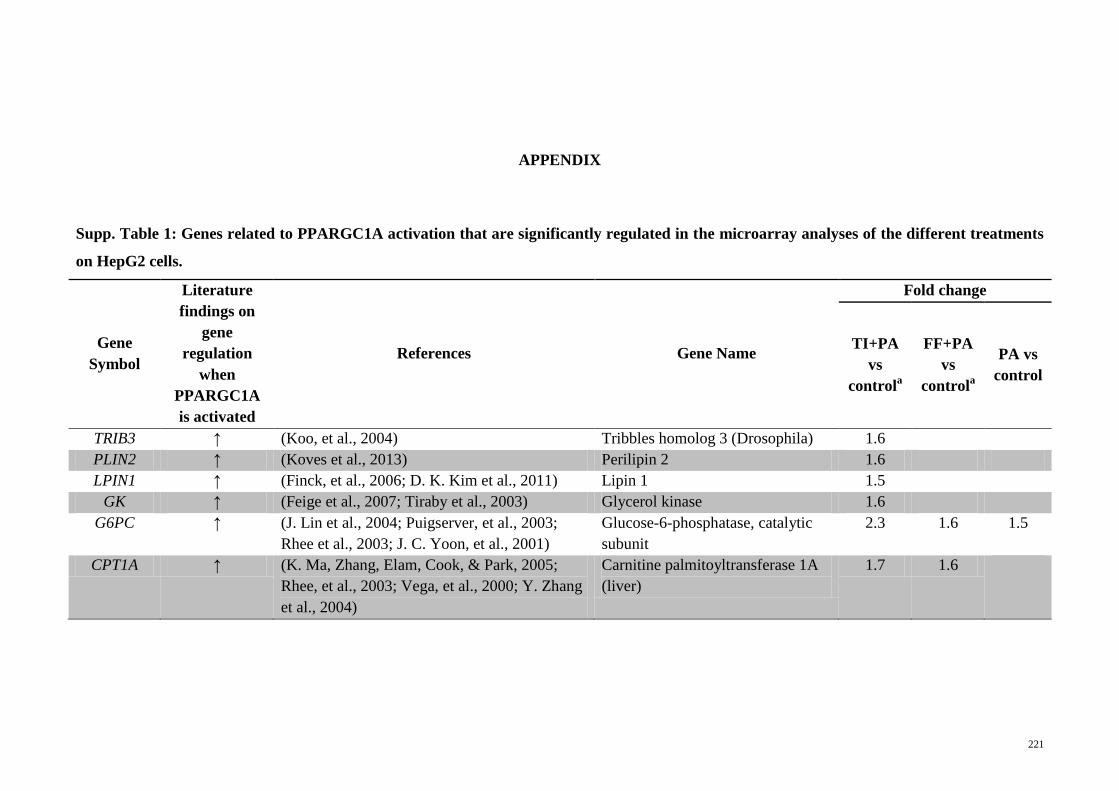
221
APPENDIX
Supp. Table 1: Genes related to PPARGC1A activation that are significantly regulated in the microarray analyses of the different treatments
on HepG2 cells.
Gene
Symbol
Literature
findings on
gene
regulation
when
PPARGC1A
is activated
References Gene Name
Fold change
TI+PA
vs
controla
FF+PA
vs
controla
PA vs
control
TRIB3 ↑ (Koo, et al., 2004) Tribbles homolog 3 (Drosophila) 1.6
PLIN2 ↑ (Koves et al., 2013) Perilipin 2 1.6
LPIN1 ↑ (Finck, et al., 2006; D. K. Kim et al., 2011) Lipin 1 1.5
GK ↑ (Feige et al., 2007; Tiraby et al., 2003) Glycerol kinase 1.6
G6PC ↑ (J. Lin et al., 2004; Puigserver, et al., 2003;
Rhee et al., 2003; J. C. Yoon, et al., 2001)
Glucose-6-phosphatase, catalytic
subunit
2.3 1.6 1.5
CPT1A ↑ (K. Ma, Zhang, Elam, Cook, & Park, 2005;
Rhee, et al., 2003; Vega, et al., 2000; Y. Zhang
et al., 2004)
Carnitine palmitoyltransferase 1A
(liver)
1.7 1.6
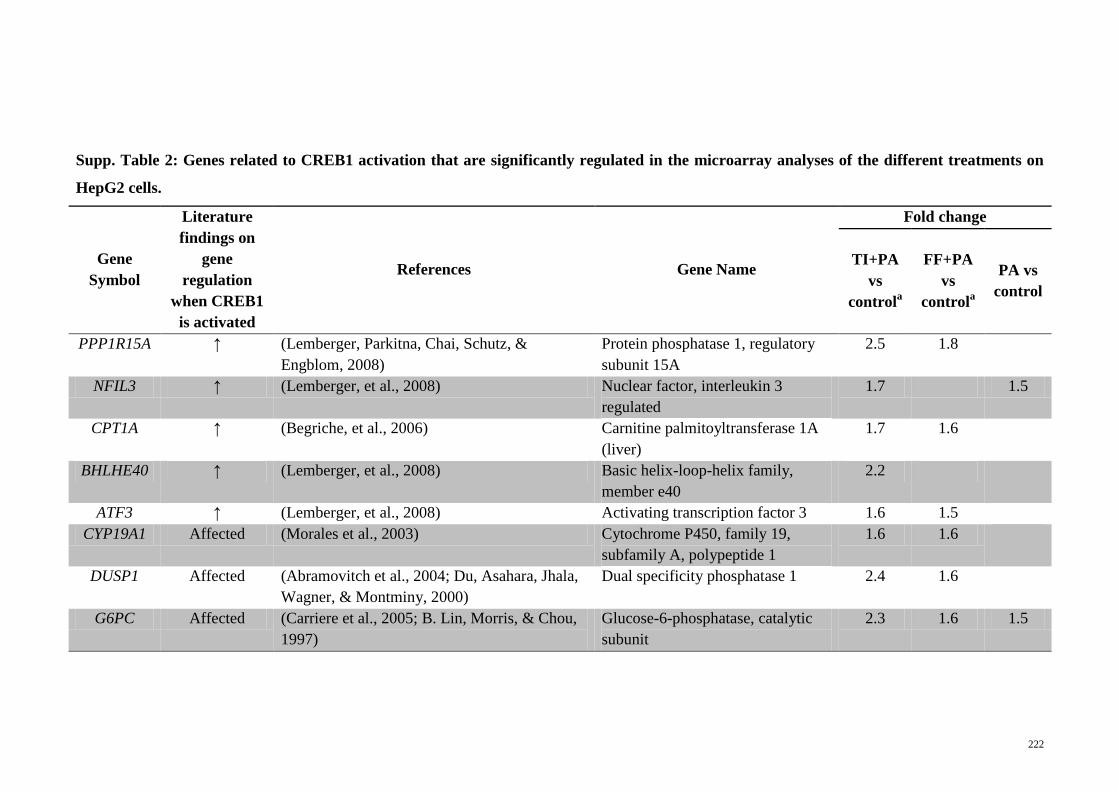
222
Supp. Table 2: Genes related to CREB1 activation that are significantly regulated in the microarray analyses of the different treatments on
HepG2 cells.
Gene
Symbol
Literature
findings on
gene
regulation
when CREB1
is activated
References Gene Name
Fold change
TI+PA
vs
controla
FF+PA
vs
controla
PA vs
control
PPP1R15A ↑ (Lemberger, Parkitna, Chai, Schutz, &
Engblom, 2008)
Protein phosphatase 1, regulatory
subunit 15A
2.5 1.8
NFIL3 ↑ (Lemberger, et al., 2008) Nuclear factor, interleukin 3
regulated
1.7 1.5
CPT1A ↑ (Begriche, et al., 2006) Carnitine palmitoyltransferase 1A
(liver)
1.7 1.6
BHLHE40 ↑ (Lemberger, et al., 2008) Basic helix-loop-helix family,
member e40
2.2
ATF3 ↑ (Lemberger, et al., 2008) Activating transcription factor 3 1.6 1.5
CYP19A1 Affected (Morales et al., 2003) Cytochrome P450, family 19,
subfamily A, polypeptide 1
1.6 1.6
DUSP1 Affected (Abramovitch et al., 2004; Du, Asahara, Jhala,
Wagner, & Montminy, 2000)
Dual specificity phosphatase 1 2.4 1.6
G6PC Affected (Carriere et al., 2005; B. Lin, Morris, & Chou,
1997)
Glucose-6-phosphatase, catalytic
subunit
2.3 1.6 1.5
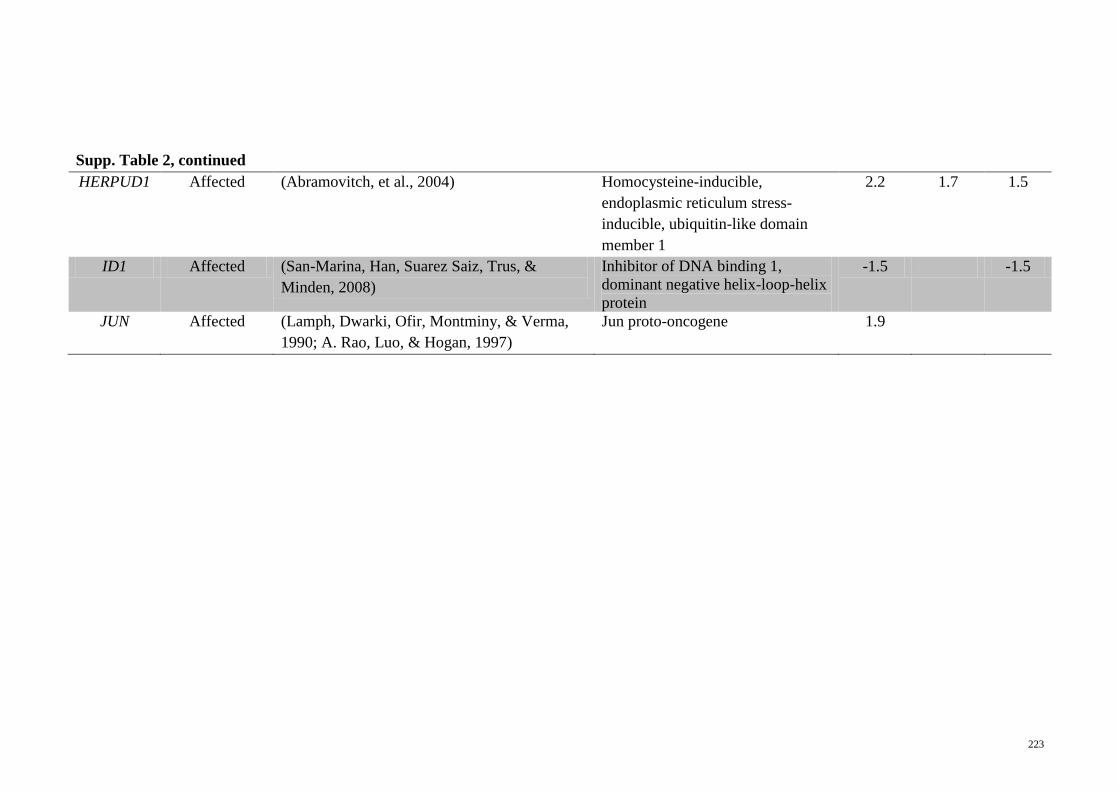
223
Supp. Table 2, continued
HERPUD1 Affected (Abramovitch, et al., 2004) Homocysteine-inducible,
endoplasmic reticulum stress-
inducible, ubiquitin-like domain
member 1
2.2 1.7 1.5
ID1 Affected (San-Marina, Han, Suarez Saiz, Trus, &
Minden, 2008)
Inhibitor of DNA binding 1,
dominant negative helix-loop-helix
protein
-1.5 -1.5
JUN Affected (Lamph, Dwarki, Ofir, Montminy, & Verma,
1990; A. Rao, Luo, & Hogan, 1997)
Jun proto-oncogene 1.9
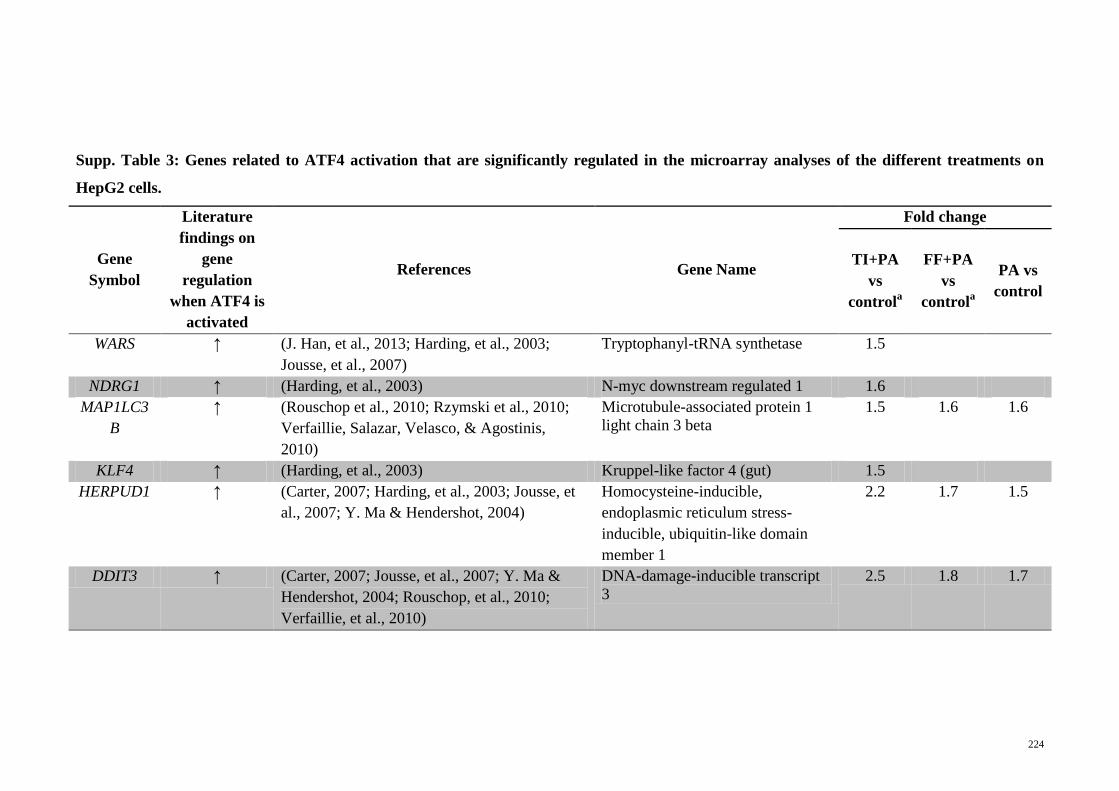
224
Supp. Table 3: Genes related to ATF4 activation that are significantly regulated in the microarray analyses of the different treatments on
HepG2 cells.
Gene
Symbol
Literature
findings on
gene
regulation
when ATF4 is
activated
References Gene Name
Fold change
TI+PA
vs
controla
FF+PA
vs
controla
PA vs
control
WARS ↑ (J. Han, et al., 2013; Harding, et al., 2003;
Jousse, et al., 2007)
Tryptophanyl-tRNA synthetase 1.5
NDRG1 ↑ (Harding, et al., 2003) N-myc downstream regulated 1 1.6
MAP1LC3
B
↑ (Rouschop et al., 2010; Rzymski et al., 2010;
Verfaillie, Salazar, Velasco, & Agostinis,
2010)
Microtubule-associated protein 1
light chain 3 beta
1.5 1.6 1.6
KLF4 ↑ (Harding, et al., 2003) Kruppel-like factor 4 (gut) 1.5
HERPUD1 ↑ (Carter, 2007; Harding, et al., 2003; Jousse, et
al., 2007; Y. Ma & Hendershot, 2004)
Homocysteine-inducible,
endoplasmic reticulum stress-
inducible, ubiquitin-like domain
member 1
2.2 1.7 1.5
DDIT3 ↑ (Carter, 2007; Jousse, et al., 2007; Y. Ma &
Hendershot, 2004; Rouschop, et al., 2010;
Verfaillie, et al., 2010)
DNA-damage-inducible transcript
3
2.5 1.8 1.7
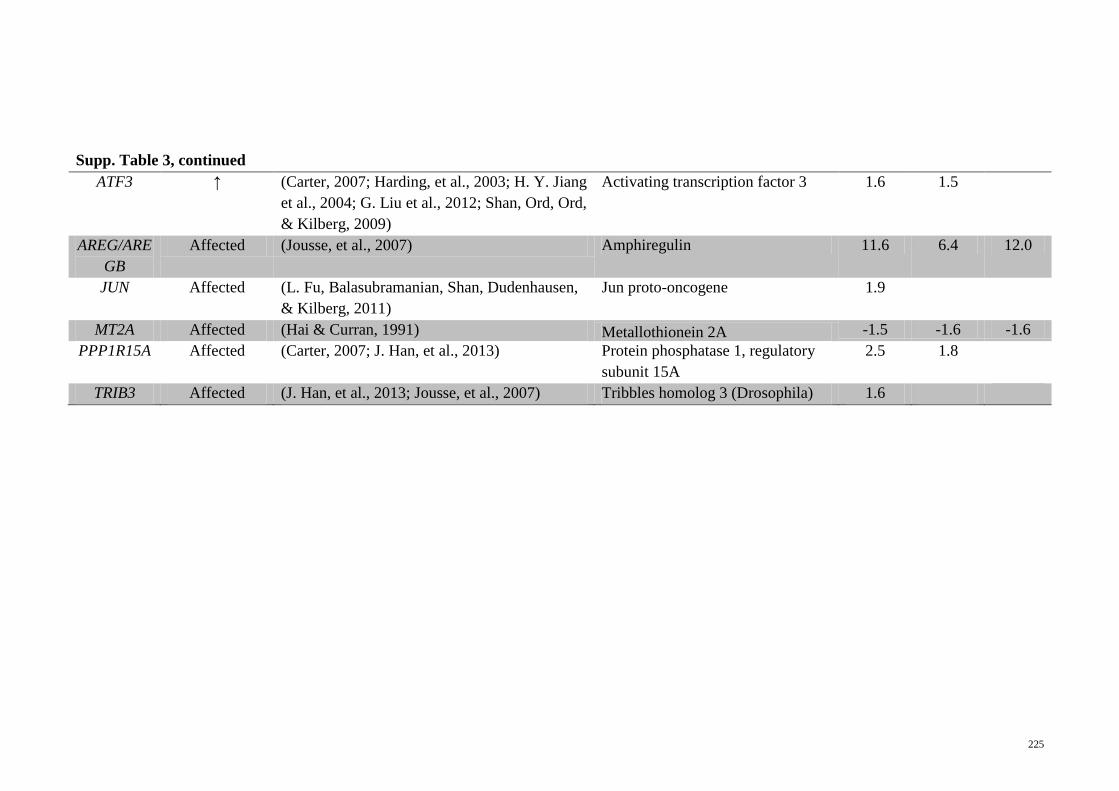
225
Supp. Table 3, continued
ATF3 ↑ (Carter, 2007; Harding, et al., 2003; H. Y. Jiang
et al., 2004; G. Liu et al., 2012; Shan, Ord, Ord,
& Kilberg, 2009)
Activating transcription factor 3 1.6 1.5
AREG/ARE
GB
Affected (Jousse, et al., 2007) Amphiregulin 11.6 6.4 12.0
JUN Affected (L. Fu, Balasubramanian, Shan, Dudenhausen,
& Kilberg, 2011)
Jun proto-oncogene 1.9
MT2A Affected (Hai & Curran, 1991) Metallothionein 2A -1.5 -1.6 -1.6
PPP1R15A Affected (Carter, 2007; J. Han, et al., 2013) Protein phosphatase 1, regulatory
subunit 15A
2.5 1.8
TRIB3 Affected (J. Han, et al., 2013; Jousse, et al., 2007) Tribbles homolog 3 (Drosophila) 1.6
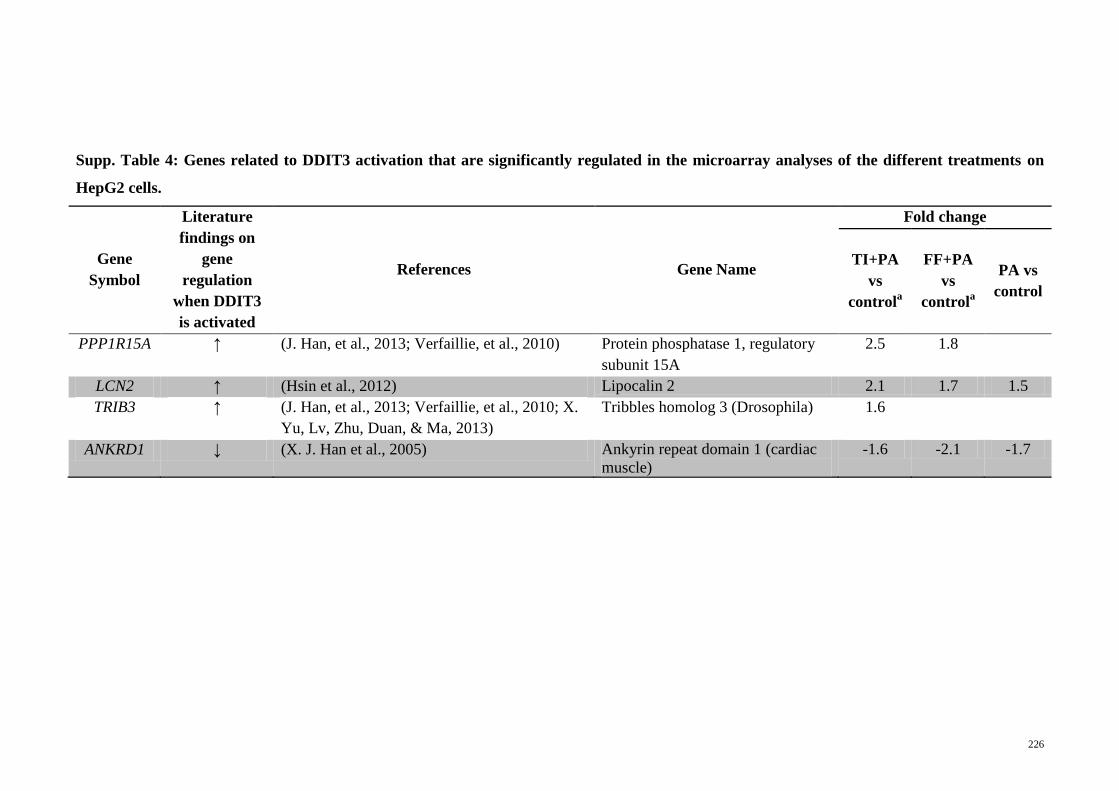
226
Supp. Table 4: Genes related to DDIT3 activation that are significantly regulated in the microarray analyses of the different treatments on
HepG2 cells.
Gene
Symbol
Literature
findings on
gene
regulation
when DDIT3
is activated
References Gene Name
Fold change
TI+PA
vs
controla
FF+PA
vs
controla
PA vs
control
PPP1R15A ↑ (J. Han, et al., 2013; Verfaillie, et al., 2010) Protein phosphatase 1, regulatory
subunit 15A
2.5 1.8
LCN2 ↑ (Hsin et al., 2012) Lipocalin 2 2.1 1.7 1.5
TRIB3 ↑ (J. Han, et al., 2013; Verfaillie, et al., 2010; X.
Yu, Lv, Zhu, Duan, & Ma, 2013)
Tribbles homolog 3 (Drosophila) 1.6
ANKRD1 ↓ (X. J. Han et al., 2005) Ankyrin repeat domain 1 (cardiac
muscle)
-1.6 -2.1 -1.7
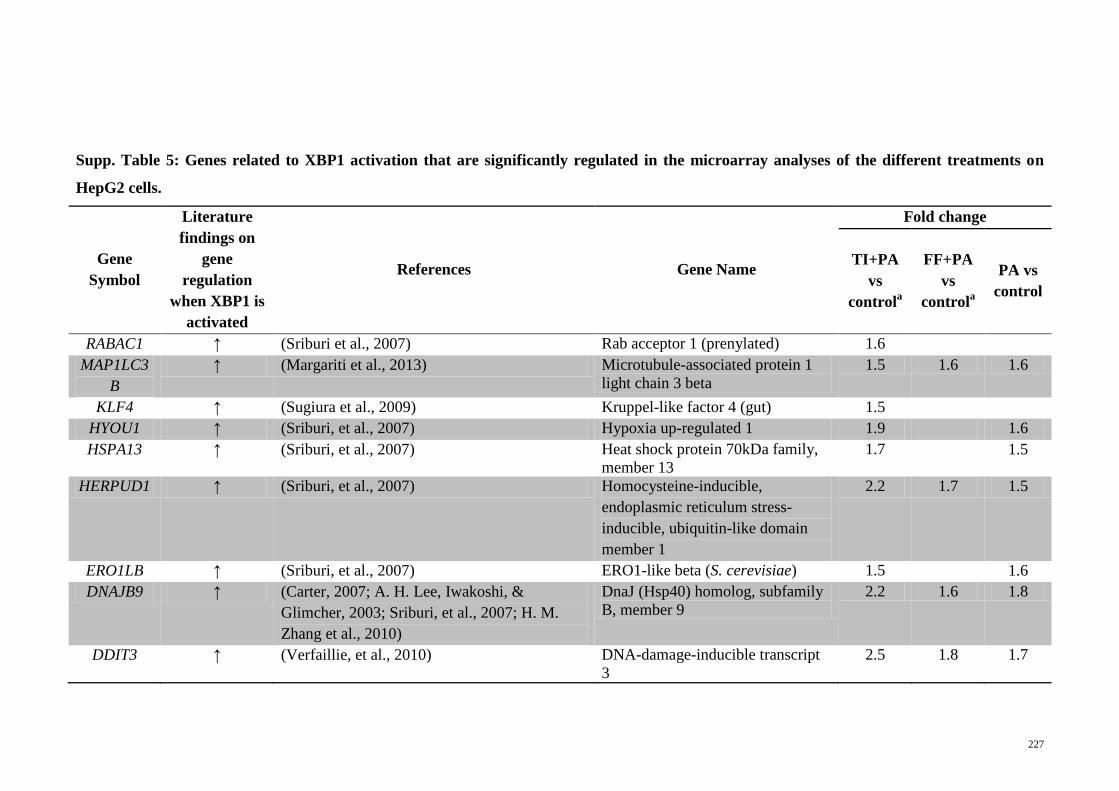
227
Supp. Table 5: Genes related to XBP1 activation that are significantly regulated in the microarray analyses of the different treatments on
HepG2 cells.
Gene
Symbol
Literature
findings on
gene
regulation
when XBP1 is
activated
References Gene Name
Fold change
TI+PA
vs
controla
FF+PA
vs
controla
PA vs
control
RABAC1 ↑ (Sriburi et al., 2007) Rab acceptor 1 (prenylated) 1.6
MAP1LC3
B
↑ (Margariti et al., 2013) Microtubule-associated protein 1
light chain 3 beta
1.5 1.6 1.6
KLF4 ↑ (Sugiura et al., 2009) Kruppel-like factor 4 (gut) 1.5
HYOU1 ↑ (Sriburi, et al., 2007) Hypoxia up-regulated 1 1.9 1.6
HSPA13 ↑ (Sriburi, et al., 2007) Heat shock protein 70kDa family,
member 13
1.7
1.5
HERPUD1 ↑ (Sriburi, et al., 2007) Homocysteine-inducible,
endoplasmic reticulum stress-
inducible, ubiquitin-like domain
member 1
2.2 1.7 1.5
ERO1LB ↑ (Sriburi, et al., 2007) ERO1-like beta (S. cerevisiae) 1.5 1.6
DNAJB9 ↑ (Carter, 2007; A. H. Lee, Iwakoshi, &
Glimcher, 2003; Sriburi, et al., 2007; H. M.
Zhang et al., 2010)
DnaJ (Hsp40) homolog, subfamily
B, member 9
2.2 1.6 1.8
DDIT3 ↑ (Verfaillie, et al., 2010) DNA-damage-inducible transcript
3
2.5 1.8 1.7
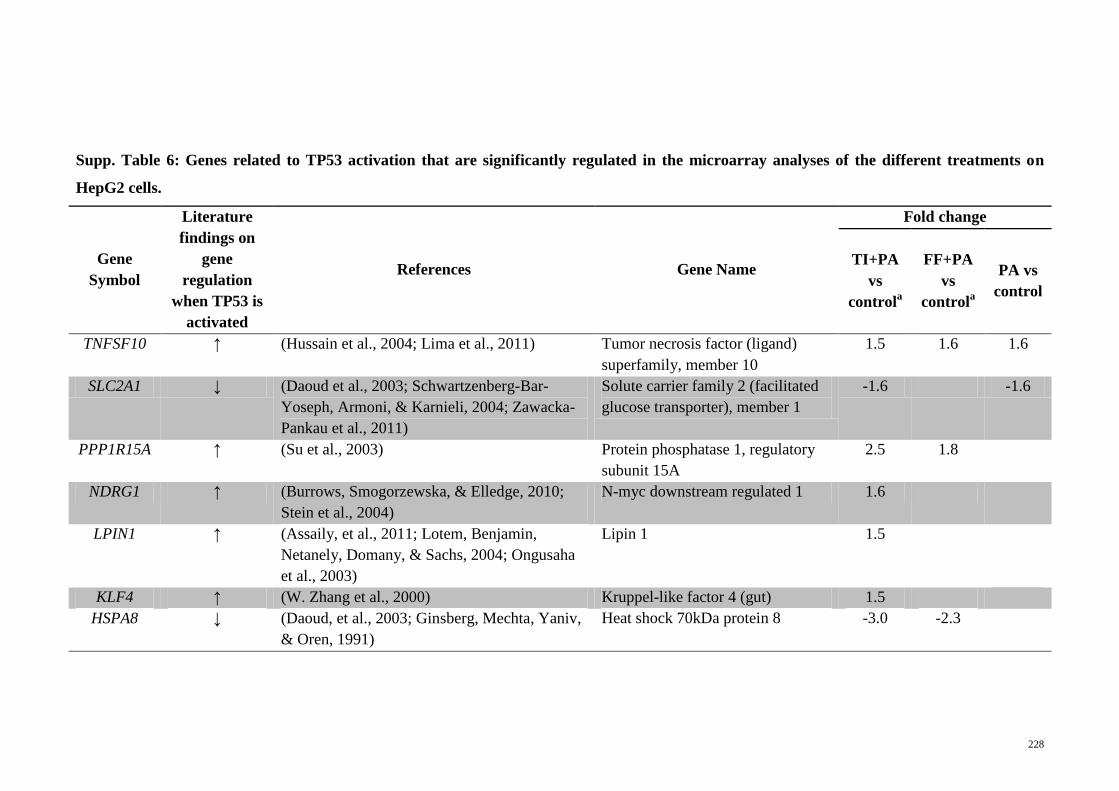
228
Supp. Table 6: Genes related to TP53 activation that are significantly regulated in the microarray analyses of the different treatments on
HepG2 cells.
Gene
Symbol
Literature
findings on
gene
regulation
when TP53 is
activated
References Gene Name
Fold change
TI+PA
vs
controla
FF+PA
vs
controla
PA vs
control
TNFSF10 ↑ (Hussain et al., 2004; Lima et al., 2011) Tumor necrosis factor (ligand)
superfamily, member 10
1.5 1.6 1.6
SLC2A1 ↓ (Daoud et al., 2003; Schwartzenberg-Bar-
Yoseph, Armoni, & Karnieli, 2004; Zawacka-
Pankau et al., 2011)
Solute carrier family 2 (facilitated
glucose transporter), member 1
-1.6 -1.6
PPP1R15A ↑ (Su et al., 2003) Protein phosphatase 1, regulatory
subunit 15A
2.5 1.8
NDRG1 ↑ (Burrows, Smogorzewska, & Elledge, 2010;
Stein et al., 2004)
N-myc downstream regulated 1 1.6
LPIN1 ↑ (Assaily, et al., 2011; Lotem, Benjamin,
Netanely, Domany, & Sachs, 2004; Ongusaha
et al., 2003)
Lipin 1 1.5
KLF4 ↑ (W. Zhang et al., 2000) Kruppel-like factor 4 (gut) 1.5
HSPA8 ↓ (Daoud, et al., 2003; Ginsberg, Mechta, Yaniv,
& Oren, 1991)
Heat shock 70kDa protein 8 -3.0 -2.3
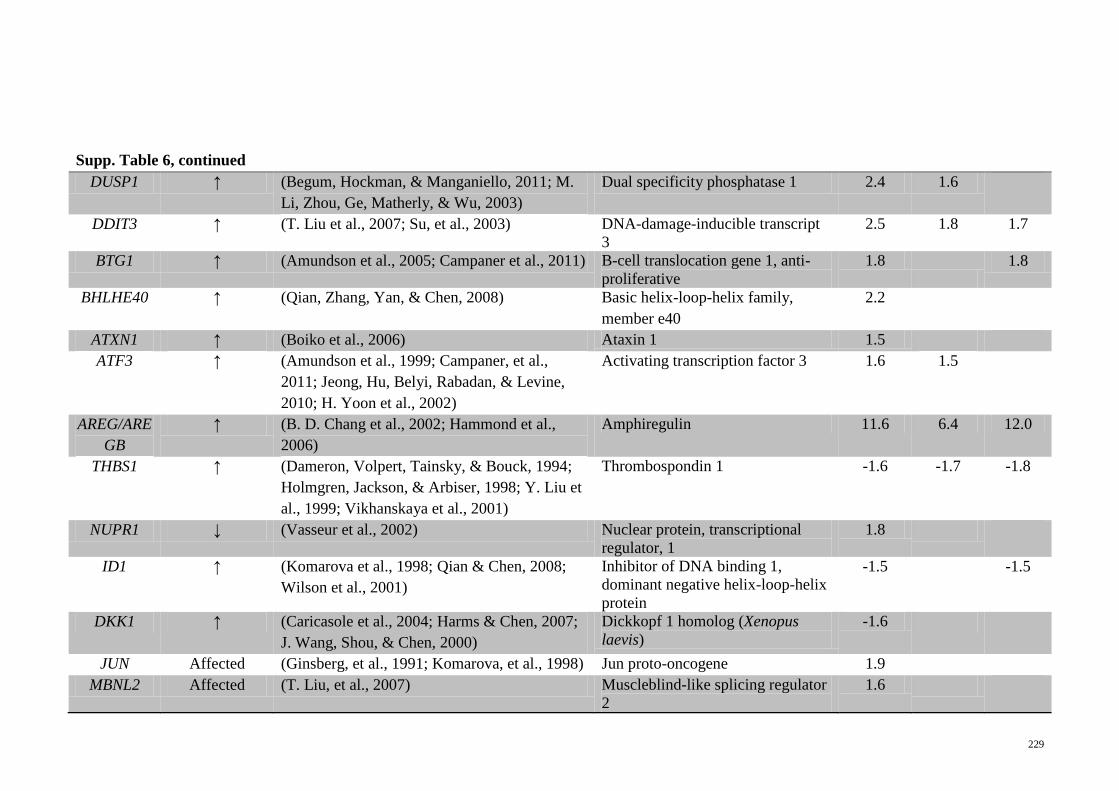
229
Supp. Table 6, continued
DUSP1 ↑ (Begum, Hockman, & Manganiello, 2011; M.
Li, Zhou, Ge, Matherly, & Wu, 2003)
Dual specificity phosphatase 1 2.4 1.6
DDIT3 ↑ (T. Liu et al., 2007; Su, et al., 2003) DNA-damage-inducible transcript
3
2.5 1.8 1.7
BTG1 ↑ (Amundson et al., 2005; Campaner et al., 2011) B-cell translocation gene 1, anti-
proliferative
1.8
1.8
BHLHE40 ↑ (Qian, Zhang, Yan, & Chen, 2008) Basic helix-loop-helix family,
member e40
2.2
ATXN1 ↑ (Boiko et al., 2006) Ataxin 1 1.5
ATF3 ↑ (Amundson et al., 1999; Campaner, et al.,
2011; Jeong, Hu, Belyi, Rabadan, & Levine,
2010; H. Yoon et al., 2002)
Activating transcription factor 3 1.6 1.5
AREG/ARE
GB
↑ (B. D. Chang et al., 2002; Hammond et al.,
2006)
Amphiregulin 11.6 6.4 12.0
THBS1 ↑ (Dameron, Volpert, Tainsky, & Bouck, 1994;
Holmgren, Jackson, & Arbiser, 1998; Y. Liu et
al., 1999; Vikhanskaya et al., 2001)
Thrombospondin 1 -1.6 -1.7 -1.8
NUPR1 ↓ (Vasseur et al., 2002) Nuclear protein, transcriptional
regulator, 1
1.8
ID1 ↑ (Komarova et al., 1998; Qian & Chen, 2008;
Wilson et al., 2001)
Inhibitor of DNA binding 1,
dominant negative helix-loop-helix
protein
-1.5 -1.5
DKK1 ↑ (Caricasole et al., 2004; Harms & Chen, 2007;
J. Wang, Shou, & Chen, 2000)
Dickkopf 1 homolog (Xenopus
laevis)
-1.6
JUN Affected (Ginsberg, et al., 1991; Komarova, et al., 1998) Jun proto-oncogene 1.9
MBNL2 Affected (T. Liu, et al., 2007) Muscleblind-like splicing regulator
2
1.6
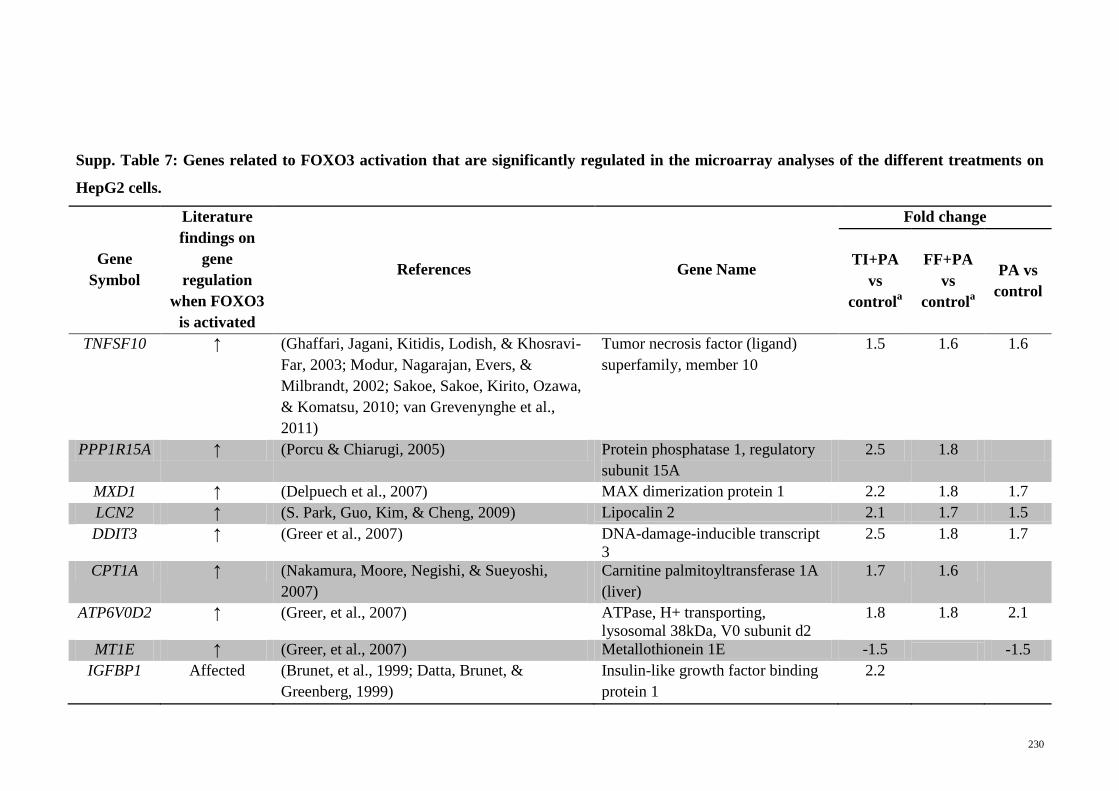
230
Supp. Table 7: Genes related to FOXO3 activation that are significantly regulated in the microarray analyses of the different treatments on
HepG2 cells.
Gene
Symbol
Literature
findings on
gene
regulation
when FOXO3
is activated
References Gene Name
Fold change
TI+PA
vs
controla
FF+PA
vs
controla
PA vs
control
TNFSF10 ↑ (Ghaffari, Jagani, Kitidis, Lodish, & Khosravi-
Far, 2003; Modur, Nagarajan, Evers, &
Milbrandt, 2002; Sakoe, Sakoe, Kirito, Ozawa,
& Komatsu, 2010; van Grevenynghe et al.,
2011)
Tumor necrosis factor (ligand)
superfamily, member 10
1.5 1.6 1.6
PPP1R15A ↑ (Porcu & Chiarugi, 2005) Protein phosphatase 1, regulatory
subunit 15A
2.5 1.8
MXD1 ↑ (Delpuech et al., 2007) MAX dimerization protein 1 2.2 1.8 1.7
LCN2 ↑ (S. Park, Guo, Kim, & Cheng, 2009) Lipocalin 2 2.1 1.7 1.5
DDIT3 ↑ (Greer et al., 2007) DNA-damage-inducible transcript
3
2.5 1.8 1.7
CPT1A ↑ (Nakamura, Moore, Negishi, & Sueyoshi,
2007)
Carnitine palmitoyltransferase 1A
(liver)
1.7 1.6
ATP6V0D2 ↑ (Greer, et al., 2007) ATPase, H+ transporting,
lysosomal 38kDa, V0 subunit d2
1.8 1.8 2.1
MT1E ↑ (Greer, et al., 2007) Metallothionein 1E -1.5 -1.5
IGFBP1 Affected (Brunet, et al., 1999; Datta, Brunet, &
Greenberg, 1999)
Insulin-like growth factor binding
protein 1
2.2
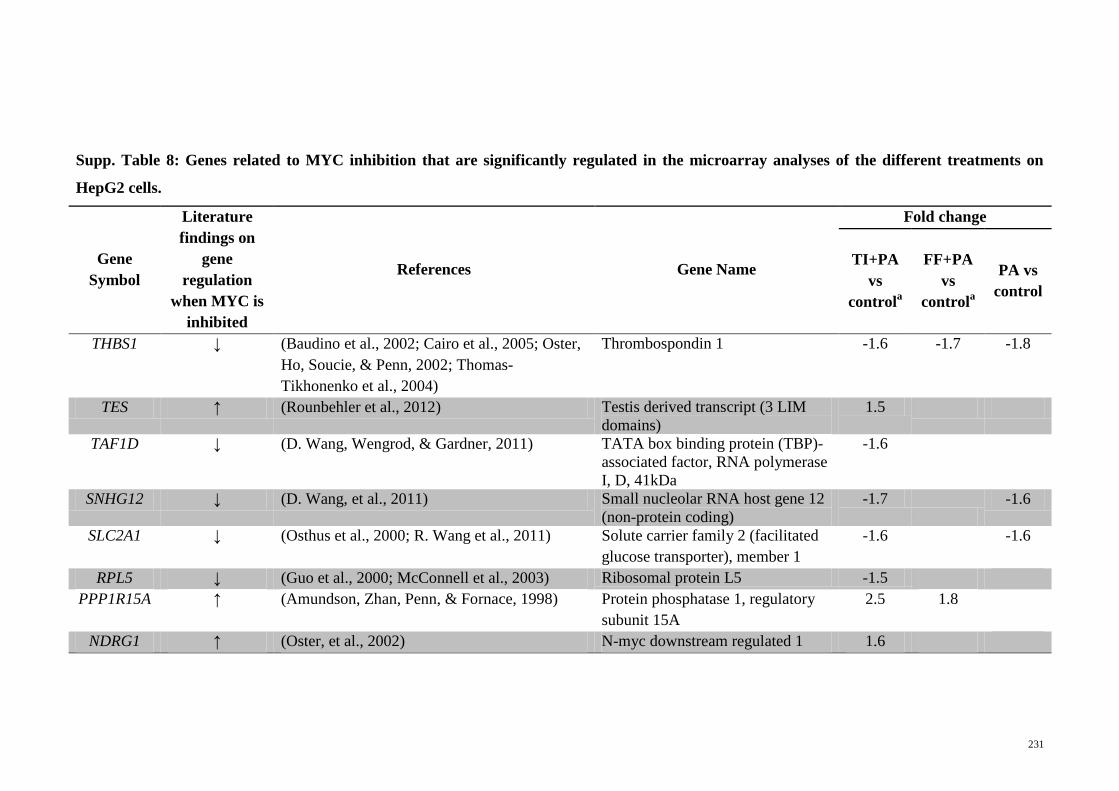
231
Supp. Table 8: Genes related to MYC inhibition that are significantly regulated in the microarray analyses of the different treatments on
HepG2 cells.
Gene
Symbol
Literature
findings on
gene
regulation
when MYC is
inhibited
References Gene Name
Fold change
TI+PA
vs
controla
FF+PA
vs
controla
PA vs
control
THBS1 ↓ (Baudino et al., 2002; Cairo et al., 2005; Oster,
Ho, Soucie, & Penn, 2002; Thomas-
Tikhonenko et al., 2004)
Thrombospondin 1 -1.6 -1.7 -1.8
TES ↑ (Rounbehler et al., 2012) Testis derived transcript (3 LIM
domains)
1.5
TAF1D ↓ (D. Wang, Wengrod, & Gardner, 2011) TATA box binding protein (TBP)-
associated factor, RNA polymerase
I, D, 41kDa
-1.6
SNHG12 ↓ (D. Wang, et al., 2011) Small nucleolar RNA host gene 12
(non-protein coding)
-1.7
-1.6
SLC2A1 ↓ (Osthus et al., 2000; R. Wang et al., 2011) Solute carrier family 2 (facilitated
glucose transporter), member 1
-1.6 -1.6
RPL5 ↓ (Guo et al., 2000; McConnell et al., 2003) Ribosomal protein L5 -1.5
PPP1R15A ↑ (Amundson, Zhan, Penn, & Fornace, 1998) Protein phosphatase 1, regulatory
subunit 15A
2.5 1.8
NDRG1 ↑ (Oster, et al., 2002) N-myc downstream regulated 1 1.6
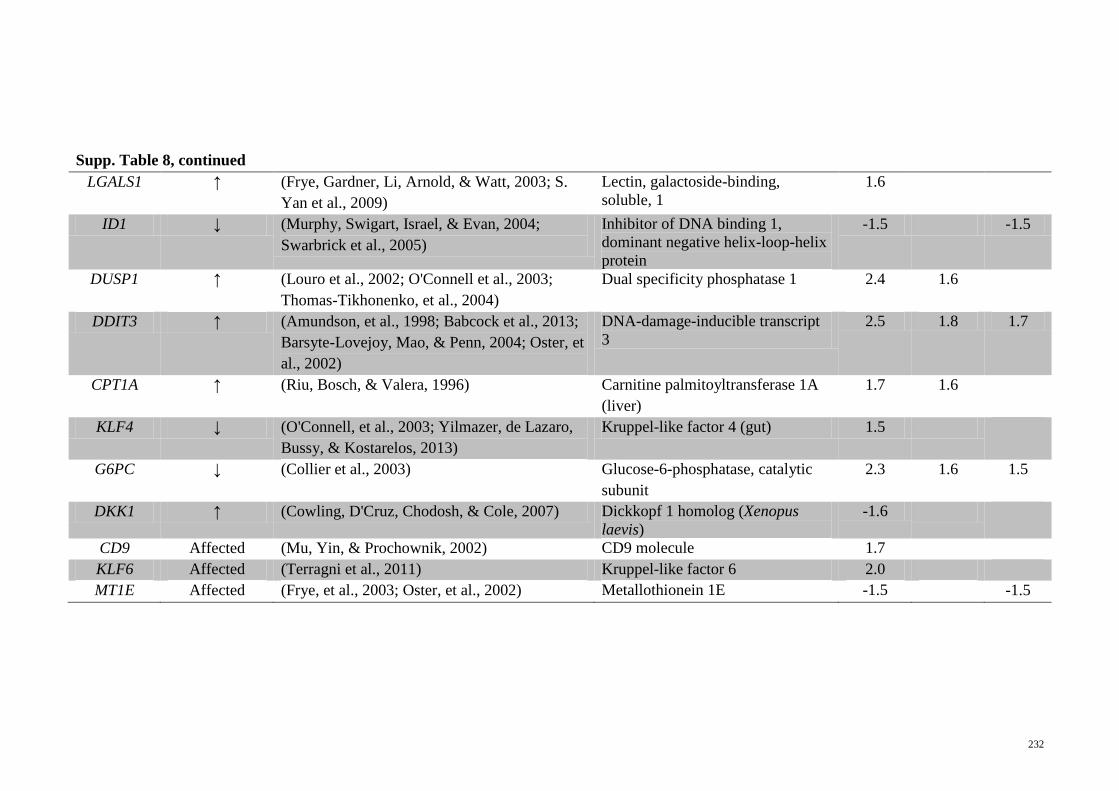
232
Supp. Table 8, continued
LGALS1 ↑ (Frye, Gardner, Li, Arnold, & Watt, 2003; S.
Yan et al., 2009)
Lectin, galactoside-binding,
soluble, 1
1.6
ID1 ↓ (Murphy, Swigart, Israel, & Evan, 2004;
Swarbrick et al., 2005)
Inhibitor of DNA binding 1,
dominant negative helix-loop-helix
protein
-1.5 -1.5
DUSP1 ↑ (Louro et al., 2002; O'Connell et al., 2003;
Thomas-Tikhonenko, et al., 2004)
Dual specificity phosphatase 1 2.4 1.6
DDIT3 ↑ (Amundson, et al., 1998; Babcock et al., 2013;
Barsyte-Lovejoy, Mao, & Penn, 2004; Oster, et
al., 2002)
DNA-damage-inducible transcript
3
2.5 1.8 1.7
CPT1A ↑ (Riu, Bosch, & Valera, 1996) Carnitine palmitoyltransferase 1A
(liver)
1.7 1.6
KLF4 ↓ (O'Connell, et al., 2003; Yilmazer, de Lazaro,
Bussy, & Kostarelos, 2013)
Kruppel-like factor 4 (gut) 1.5
G6PC ↓ (Collier et al., 2003) Glucose-6-phosphatase, catalytic
subunit
2.3 1.6 1.5
DKK1 ↑ (Cowling, D'Cruz, Chodosh, & Cole, 2007) Dickkopf 1 homolog (Xenopus
laevis)
-1.6
CD9 Affected (Mu, Yin, & Prochownik, 2002) CD9 molecule 1.7
KLF6 Affected (Terragni et al., 2011) Kruppel-like factor 6 2.0
MT1E Affected (Frye, et al., 2003; Oster, et al., 2002) Metallothionein 1E -1.5 -1.5
Related Documents