1 American Institute of Aeronautics and Astronautics Investigation of Liner Characteristics in the NASA Langley Curved Duct Test Rig Carl H. Gerhold,* Martha C. Brown,** Willie R. Watson, † and Michael G. Jones †† NASA Langley Research Center, Hampton, Virginia ABSTRACT The Curved Duct Test Rig (CDTR), which is designed to investigate propagation of sound in a duct with flow, has been developed at NASA Langley Research Center. The duct incorporates an adaptive control system to generate a tone in the duct at a specific frequency with a target Sound Pressure Level and a target mode shape. The size of the duct, the ability to isolate higher order modes, and the ability to modify the duct configuration make this rig unique among experimental duct acoustics facilities. An experiment is described in which the facility performance is evaluated by measuring the sound attenuation by a sample duct liner. The liner sample comprises one wall of the liner test section. Sound in tones from 500 to 2400 Hz, with modes that are parallel to the liner surface of order 0 to 5, and that are normal to the liner surface of order 0 to 2, can be generated incident on the liner test section. Tests are performed in which sound is generated without axial flow in the duct and with flow at a Mach number of 0.275. The attenuation of the liner is determined by comparing the sound power in a hard wall section downstream of the liner test section to the sound power in a hard wall section upstream of the liner test section. These experimentally determined attenuations are compared to numerically determined attenuations calculated by means of a finite element analysis code. The code incorporates liner impedance values educed from measured data from the NASA Langley Grazing Incidence Tube, a test rig that is used for investigating liner performance with flow and with (0,0) mode incident grazing. The analytical and experimental results compare favorably, indicating the validity of the finite element method and demonstrating that finite element prediction tools can be used together with experiment to characterize the liner attenuation. * Senior Research Engineer, Aeroacoustics Branch, phone: (757) 864-5279, email: [email protected], Associate Fellow, AIAA ** Aerospace Engineer, Aeroacoustics Branch, phone: (757) 864-6277, email: [email protected] † Senior Research Scientist, Computational Modeling and Simulation Branch, phone: (757) 864-5290, email: [email protected] , Senior Member, AIAA †† Senior Research Scientist, Structural Acoustics Branch, phone: (757) 864-5272, email: [email protected], Senior Member, AIAA https://ntrs.nasa.gov/search.jsp?R=20070021736 2020-03-28T07:23:16+00:00Z

Welcome message from author
This document is posted to help you gain knowledge. Please leave a comment to let me know what you think about it! Share it to your friends and learn new things together.
Transcript

1 American Institute of Aeronautics and Astronautics
Investigation of Liner Characteristics in the NASA Langley Curved Duct Test Rig
Carl H. Gerhold,* Martha C. Brown,** Willie R. Watson,† and Michael G. Jones†† NASA Langley Research Center, Hampton, Virginia
ABSTRACT
The Curved Duct Test Rig (CDTR), which is designed to investigate propagation of sound in a duct with flow, has been developed at NASA Langley Research Center. The duct incorporates an adaptive control system to generate a tone in the duct at a specific frequency with a target Sound Pressure Level and a target mode shape. The size of the duct, the ability to isolate higher order modes, and the ability to modify the duct configuration make this rig unique among experimental duct acoustics facilities. An experiment is described in which the facility performance is evaluated by measuring the sound attenuation by a sample duct liner. The liner sample comprises one wall of the liner test section. Sound in tones from 500 to 2400 Hz, with modes that are parallel to the liner surface of order 0 to 5, and that are normal to the liner surface of order 0 to 2, can be generated incident on the liner test section. Tests are performed in which sound is generated without axial flow in the duct and with flow at a Mach number of 0.275. The attenuation of the liner is determined by comparing the sound power in a hard wall section downstream of the liner test section to the sound power in a hard wall section upstream of the liner test section. These experimentally determined attenuations are compared to numerically determined attenuations calculated by means of a finite element analysis code. The code incorporates liner impedance values educed from measured data from the NASA Langley Grazing Incidence Tube, a test rig that is used for investigating liner performance with flow and with (0,0) mode incident grazing. The analytical and experimental results compare favorably, indicating the validity of the finite element method and demonstrating that finite element prediction tools can be used together with experiment to characterize the liner attenuation. * Senior Research Engineer, Aeroacoustics Branch, phone: (757) 864-5279, email: [email protected], Associate Fellow, AIAA ** Aerospace Engineer, Aeroacoustics Branch, phone: (757) 864-6277, email: [email protected] † Senior Research Scientist, Computational Modeling and Simulation Branch, phone: (757) 864-5290, email: [email protected], Senior Member, AIAA †† Senior Research Scientist, Structural Acoustics Branch, phone: (757) 864-5272, email: [email protected], Senior Member, AIAA
https://ntrs.nasa.gov/search.jsp?R=20070021736 2020-03-28T07:23:16+00:00Z
2 American Institute of Aeronautics and Astronautics
Nomenclature
!
A = complex wave amplitude (Pa)
a, b = width of duct (m), height of duct (m)
c, " = speed of sound (m/s), air density (kg/m3)
dx, dy = differential in x - direction, differential in y - direction
I, i = axial acoustic intensity (W/m2), unit imaginary number
K, k = Axial wave number (rad/m), free space wave number (rad/m)
M, Mc = axial flow Mach number, number of cut - on modes
p, PWL = sound pressure (Pa), Sound Power Level (dB re 10-12 W)
u, U = axial acoustic particle velocity (m/s), mean flow velocity in duct (m/s)
x, y, z = Cartesian coordintates (m)
zu,zd = source plane axial location (m), exit plane axial location (m)
#,$ = outgoing wave admittance (m2 % sec/kg), orthogonality constant (m2)
&dB,'(z) = attenuation (dB), sound power at axial location z (W)
( = hard wall mode shape in rectangular duct
),* = circular frequency (rad/s), real part of a complex expression
Subscripts :
m,n = vertical mode order, horizontal mode order
ref ,o = reference value, value at centerline of duct
Superscripts :
+,- = incident (positive - travelling) wave, reflected (negative - travelling) wave
* = complex conjugate
I. Introduction
A significant advancement in aircraft noise reduction has been the high bypass ratio
turbofan engine in which a large ducted fan provides most of the engine thrust. The fan generates noise that includes broadband as well as coherent noise in tones at the blade passage frequency and its harmonics. The tonal noise component is generated by interaction of the rotor wakes with downstream obstructions, such as struts or fan exit guide vanes, and propagates in modes defined by fan rotation speed and the relative number of blades and obstructions.1,2 Rice, et al3 showed that the modal structure and excitation frequency also determines the directivity of far field noise propagation. Heidelberg, et al4 investigated the effect that mode shape has on acoustic performance of a locally reacting liner.
In a previous paper, Gerhold, et al,5 discussed development of the Curved Duct Test Rig (CDTR) as a research tool whose purpose is to improve the understanding of the behavior of duct treatment in a curved duct, such as the aft bypass duct. The bypass duct flow path is often curved to accommodate the engine core, and the CDTR is designed to
3 American Institute of Aeronautics and Astronautics
address the effect of curvature on sound propagation, with the aim of determining whether use can be made of curvature to enhance liner performance. The test section cross-section is rectangular, rather than annular, in order to facilitate the design and manufacture of candidate duct liner configurations. Because of the similarity of the modal sound distribution between the bifurcated annular duct (typical of an aft bypass duct) and the rectangular duct, it is felt that the results obtained in the rectangular cross section duct can provide data that are applicable to engine installations. The experimental rig is relatively large, the test section dimensions are scaled to between 25 and 50% of the bypass duct of a range of modern engines. Air flow through the duct is designed to be typical of bypass duct flow. The CDTR is designed to be used to evaluate the performance of passive duct treatments, such as single and multiple degree of freedom liners;6 active duct wall treatments;7,8 other novel concepts, such as checkerboard liners,9 H-Q tubes,10 and bias flow;11 and to study sound propagation physics.12 The test section can accommodate sidewall treatments with flow path straight through or curved between the inlet and the discharge. The rig can currently be used to investigate the effect of flow up to a Mach number of 0.275. Turbulence and flow non-uniformity are controlled by a honeycomb and screens.
The CDTR is intended to serve two purposes in the study of liner physics. One purpose is to be a test bed to quantify the performance of current liner designs and to develop new concepts of duct liner treatments. The other major purpose of the CDTR is to provide experimental data to validate numerical models of noise propagation in ducts. This paper is a report on use of the CDTR to evaluate the performance of a sample duct liner. The liner uses elements that are typical of those found in engine nacelle liner treatments and is designed to be locally reacting. The liner acoustic performance is evaluated in the presence of grazing sound incident in the form of plane waves and of specified higher order modes. The measurements are made with no flow in the duct and with flow on at a Mach number of 0.275. The measured attenuation due to the liner sample is compared to numerical results computed using the Finite Element Method. The comparison is expected to identify the conditions under which the numerical model predicts liner attenuation, and to provide direction for improvement both of the numerical model and of the experimental procedure.
II. Attenuation Computations
In this section the expression for the acoustic power is derived in the rigid wall duct
with uniform flow in which the sound source is a pure tone at frequency ω. This formulation is used because, in the experiment, the sound is measured in rigid wall sections upstream and downstream of the liner. The attenuation due to the liner is the ratio of the acoustic power upstream to the acoustic power downstream expressed in dB. The calculated attenuation based on experimental data will be compared to attenuation predicted using the finite element computation. The basis for the measured and finite element attenuation computations is discussed in this section.

4 American Institute of Aeronautics and Astronautics
Figure 1. Schematic representation of rigid wall rectangular duct with uniform flow; m goes with the y-direction and n goes with the x-direction. A. Attenuation Computation from Pressure Measurements Figure 1 shows a rigid wall section of an a-wide by b-high rectangular cross-section duct carrying uniform air flow. The sound pressure in the duct assuming the time-dependent term is of the form
!
ei"t is written:
!
p(x, y,z) = Amn+eiKmn
+z + Amn
"eiKmn
"z[ ]#mn (x, y)
n= 0
$
%m= 0
$
% (1)
!
"mn (x, y) = cos(n#x
a) cos(
m#y
b) (2)
where:
!
Kmn
±
k=
Mom 1"
1"Mo
2
k2
#
$ %
&
' ( n)
a
#
$ %
&
' ( 2
+m)
b
#
$ %
&
' ( 2*
+ ,
-
. /
(1"Mo
2)
(3)
The modal amplitudes for each mode in the duct,
!
Amn
+ and
!
Amn
" , are known from the modal decomposition of sound measured in the duct. The sound pressure is measured in the duct, but not the axial acoustic particle velocity. The particle velocity is derived from the pressure by making use of the axial momentum equation in the following way.
!
icoku +Mo
"u
"z= #
1
$o
"p
"z (4)
Solving for the acoustic particle velocity in terms of the acoustic pressure gives:
5 American Institute of Aeronautics and Astronautics
!
u(x, y,z) = "mn
+Amn
+eiKmn
+z + "mn
#Amn#eiKmn
#z[ ]$mn (x, y)
n= 0
%
&m= 0
%
& (5)
where:
!
"mn
± =#K
mn
±
$ocok +M
oKmn
±( ) (6)
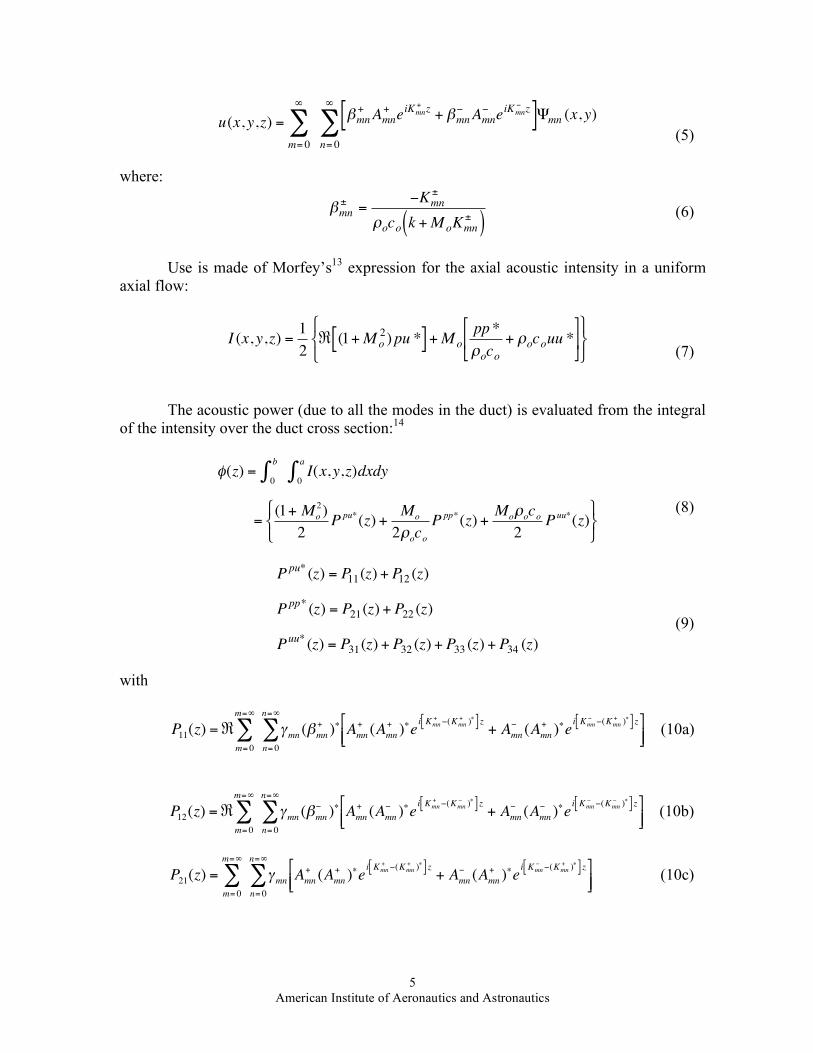
Use is made of Morfey’s13 expression for the axial acoustic intensity in a uniform axial flow:
!
I (x, y,z) =1
2" (1+Mo
2)pu *[ ] +Mo
pp*
#oco+ #ocouu *
$
% &
'
( )
* + ,
- . / (7)
The acoustic power (due to all the modes in the duct) is evaluated from the integral of the intensity over the duct cross section:14
!
"(z) =0
b
# I(x,y,z)dxdy0
a
#
=(1+ Mo
2)
2P
pu*(z) +
Mo
2$ocoP
pp*(z) +
Mo$oco2
Puu*
(z)% & '
( ) *
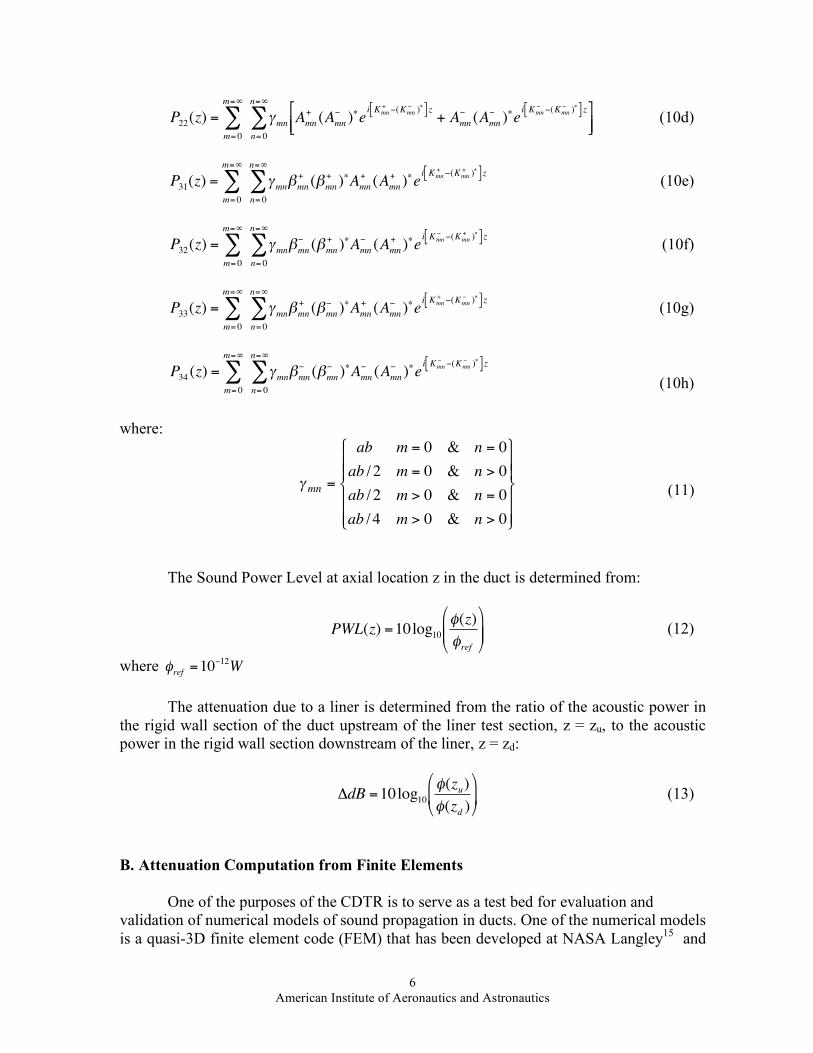
(8)
!
Ppu*(z) = P11(z) + P12 (z)
Ppp*(z) = P21(z) + P22 (z)
Puu*(z) = P31(z) + P32 (z) + P33 (z) + P34 (z)
(9)
with
!
P11(z) ="
m= 0
m=#
$ %mn(&
mn
+)'
n= 0
n=#
$ Amn
+(A
mn
+)'ei Kmn
+ ((Kmn
+)'[ ] z
+ Amn
((A
mn
+)'ei Kmn
( ((Kmn
+)'[ ] z)
* + , - . (10a)
!
P12(z) ="
m= 0
m=#
$ %mn(&
mn
')(
n= 0
n=#
$ Amn
+(A
mn
')(ei Kmn
+ '(Kmn
')([ ] z
+ Amn
'(A
mn
')(ei Kmn
' '(Kmn
')([ ] z)
* + , - . (10b)
!
P21(z) =
m= 0
m="
# $mn
n= 0
n="
# Amn
+(A
mn
+)%ei Kmn
+ &(Kmn
+)%[ ] z
+ Amn
&(A
mn
+)%ei Kmn
& &(Kmn
+)%[ ] z'
( ) * + , (10c)
6 American Institute of Aeronautics and Astronautics
!
P22(z) =
m= 0
m="
# $mn
n= 0
n="
# Amn
+(A
mn
%)&ei Kmn
+ %(Kmn
%)&[ ] z
+ Amn
%(A
mn
%)&ei Kmn
% %(Kmn
%)&[ ] z'
( ) * + , (10d)
!
P31(z) =
m= 0
m="
# $mn%mn
+(%
mn
+)&
n= 0
n="
# Amn
+(A
mn
+)&ei Kmn
+ '(Kmn
+)&[ ] z (10e)
!
P32(z) =
m= 0
m="
# $mn%mn
&(%
mn
+)'
n= 0
n="
# Amn
&(A
mn
+)'ei Kmn
& &(Kmn
+)'[ ] z (10f)
!
P33(z) =
m= 0
m="
# $mn%mn
+(%
mn
&)'
n= 0
n="
# Amn
+(A
mn
&)'ei Kmn
+ &(Kmn
&)'[ ] z (10g)
!
P34(z) =
m= 0
m="
# $mn%mn
&(%
mn
&)'
n= 0
n="
# Amn
&(A
mn
&)'ei Kmn
& &(Kmn
&)'[ ] z
(10h)
where:
!
"mn
=
ab m = 0 & n = 0
ab / 2 m = 0 & n > 0
ab / 2 m > 0 & n = 0
ab / 4 m > 0 & n > 0
#
$
% %
&
% %
'
(
% %
)
% %
(11)
The Sound Power Level at axial location z in the duct is determined from:
!
PWL(z) =10log10"(z)
"ref
#
$ % %
&
' ( ( (12)
where
!
"ref =10#12W
The attenuation due to a liner is determined from the ratio of the acoustic power in the rigid wall section of the duct upstream of the liner test section, z = zu, to the acoustic power in the rigid wall section downstream of the liner, z = zd:
!
"dB =10log10#(z
u)
#(zd)
$
% &
'
( ) (13)
B. Attenuation Computation from Finite Elements One of the purposes of the CDTR is to serve as a test bed for evaluation and validation of numerical models of sound propagation in ducts. One of the numerical models is a quasi-3D finite element code (FEM) that has been developed at NASA Langley15 and
7 American Institute of Aeronautics and Astronautics
is used extensively to educe duct liner impedance in the Langley Grazing Incidence Tube (GIT). The quasi-3D finite element code can also be configured in duct propagation mode for predicting acoustic pressure distribution throughout the duct. In this configuration, the FEM code uses as inputs the source pressure, the test liner impedance, and the exit plane impedance. The FEM model greatly reduces the computational time and memory required to obtain the numerical solution by reducing the 3-D problem to a 2-D problem for each vertical mode order. Because the upper and lower walls of the duct are rigid, the 3-D acoustic pressure field is separable and may be expanded into the Fourier series:
!
p(x,y,z) = cosm"y
b
#
$ %
&
' (
m= 0
m=)
* pm (x,z) (14)
where the function pm satisfies the convected Helmholtz equation:
!
(1"Mo
2)# 2pm#z2
+# 2pm#x 2
" 2ikMo
#pm#z
+ k2 "
m$
b
%
& '
(
) * 2+
, -
.
/ 0 pm = 0 (15)
and a time dependence of the form
!
ei"t has been assumed. Equation (15) requires wall
impedance boundary conditions at the surface of the test liner. The locally-reacting wall impedance boundary condition as presented by Myers,16 is
!
"#pm
#x= ik
pm
$+2Mo
$
#pm
#z+Mo
2
ik$
# 2pm
#z2 (16)
where ζ is infinite on the rigid wall at x = a, and is equal to the experimentally educed impedance of the liner sample at x = 0. Determination of this impedance will be discussed in the next section. The source pressure, ps(x), is computed from mode amplitude data that are determined in the hard wall section upstream of the liner section. The source pressure for the mth mode is determined from Equation (1), evaluated at the upstream location, zu.
!
ps(x) = Amn
+eiKmn
+zu + Amn
"eiKmn
"zu[ ]cos n#x
a
$
% &
'
( )
n= 0
*
+ (17)
The exit impedance is the ratio of the acoustic pressure to the axial acoustic particle velocity and is evaluated in the rigid wall section downstream of the liner test section at z = zd:
!
"m
= n= 0
n=#
$ Amn
+e
iKmn
+zd + A
mn
%e
iKmn
%zd[ ]cos n&x
a
'
( )
*
+ ,
n= 0
n=#
$A
mn
+
-mn
+e
iKmn
+zu +
Amn
%
-mn
%e
iKmn
%zu
.
/ 0
1
2 3 cos
n&x
a
'
( )
*
+ ,
(18)
8 American Institute of Aeronautics and Astronautics
!
"mn
± =# k + M
oK
mn
±[ ]K
mn
± (19)
The modal amplitudes
!
Amn
± that are used to evaluate the source pressure and the duct exit impedance are obtained from modal decomposition of the acoustic measurements made in the rigid wall sections upstream and downstream, respectively, of the liner test section in the duct. The finite element method provides the acoustic pressure field for each vertical mode, m. It does not, however, give the axial component of the acoustic particle velocity, which is required for the sound power determination. Thus the finite element results are therefore post-processed to determine the axial acoustic particle velocity. The acoustic pressure and axial particle velocity are coupled, as shown in Equation (4). The finite element solution in the downstream section, pm(x,y,zd), is expanded into rigid wall duct modes as in Equation (1) and the mode amplitudes in the section are extracted numerically. Equation (4) is then used to extract the axial velocity downstream of the liner from the known mode amplitudes. The acoustic power is determined by integrating the intensity, Equation (7), over the duct cross-section. A similar operation is performed on the finite element solution in the upstream rigid wall section for pm(x,y,zu). The finite element-generated attenuations, reported here, are then computed using the equation:
!
"dB =10log10
#m(z
u)
m= 0
m=M c$#m(z
d)
m= 0
m=M c$
%
&
' '
(
)
* * (20)
These calculations are compared to those computed from measured data, Equation (13).
III. Description of the Experiment
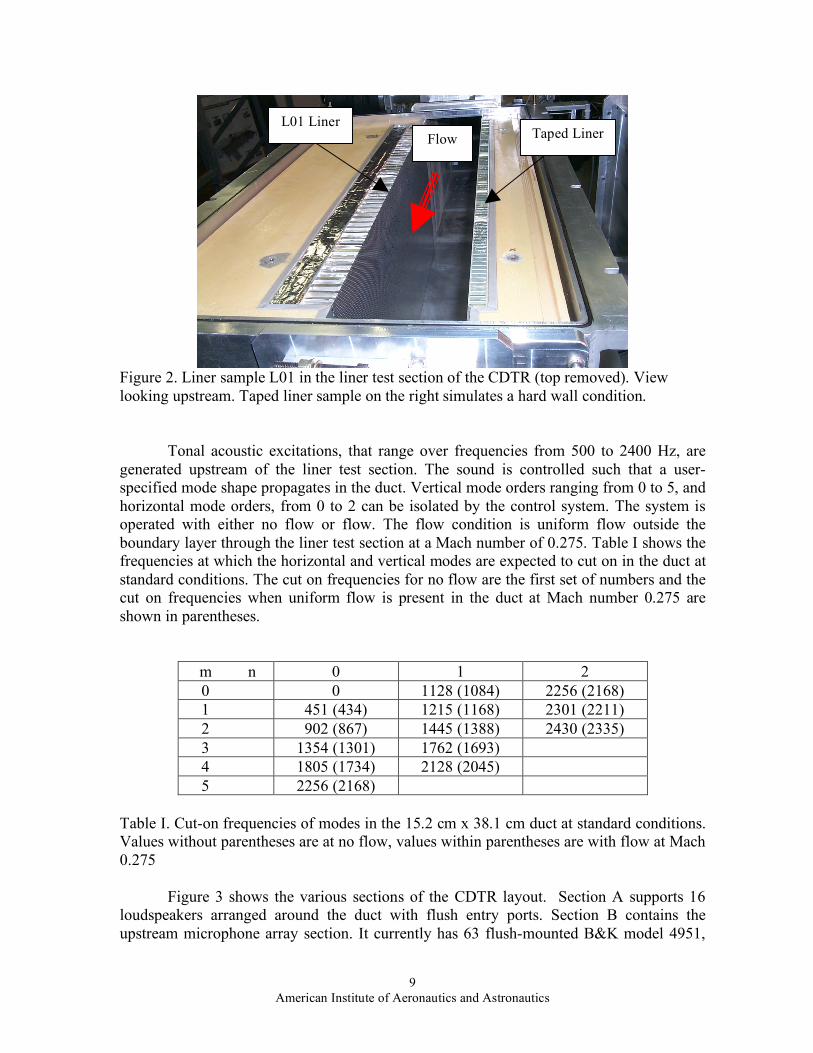
A straight liner sample was fabricated for testing in the Curved Duct Test Rig and for comparison to FEM. The liner, designated L01, consists of an impervious backing sheet, 38.1 mm (1.50-inch) thick honeycomb core, and perforate cover sheet. The perforate sheet thickness is 0.64 mm (0.025 inch). The perforate is 8.7% open area with 0.99 mm (0.039-inch) diameter holes. The liner core depth is selected so that the resonance frequency occurs in the middle of the operating range of the CDTR, between 300 and 2400 Hz. The L01 liner forms the left wall of the liner test section in the CDTR, as shown in Figure 2. The right side of the liner test section is a simulated hard wall consisting of another liner that has been covered with a combination of Aeroshell and Flashbreaker tape. The top and bottom walls of the liner test section are 12.7 mm (1/2 -inch) thick aluminum plate. The L01 liner sample is 38.1 cm (15 inch) high and 81.3 cm (32 inch) long in the flow direction. The space behind the liner sample is filled with a stiff and rigid foam which is used to hold the liner samples in place. Through bolts affix the liner sample firmly against the rigid foam and the wall of the liner test section.
9 American Institute of Aeronautics and Astronautics
Figure 2. Liner sample L01 in the liner test section of the CDTR (top removed). View looking upstream. Taped liner sample on the right simulates a hard wall condition.
Tonal acoustic excitations, that range over frequencies from 500 to 2400 Hz, are generated upstream of the liner test section. The sound is controlled such that a user-specified mode shape propagates in the duct. Vertical mode orders ranging from 0 to 5, and horizontal mode orders, from 0 to 2 can be isolated by the control system. The system is operated with either no flow or flow. The flow condition is uniform flow outside the boundary layer through the liner test section at a Mach number of 0.275. Table I shows the frequencies at which the horizontal and vertical modes are expected to cut on in the duct at standard conditions. The cut on frequencies for no flow are the first set of numbers and the cut on frequencies when uniform flow is present in the duct at Mach number 0.275 are shown in parentheses.
m n 0 1 2 0 0 1128 (1084) 2256 (2168) 1 451 (434) 1215 (1168) 2301 (2211) 2 902 (867) 1445 (1388) 2430 (2335) 3 1354 (1301) 1762 (1693) 4 1805 (1734) 2128 (2045) 5 2256 (2168)
Table I. Cut-on frequencies of modes in the 15.2 cm x 38.1 cm duct at standard conditions. Values without parentheses are at no flow, values within parentheses are with flow at Mach 0.275
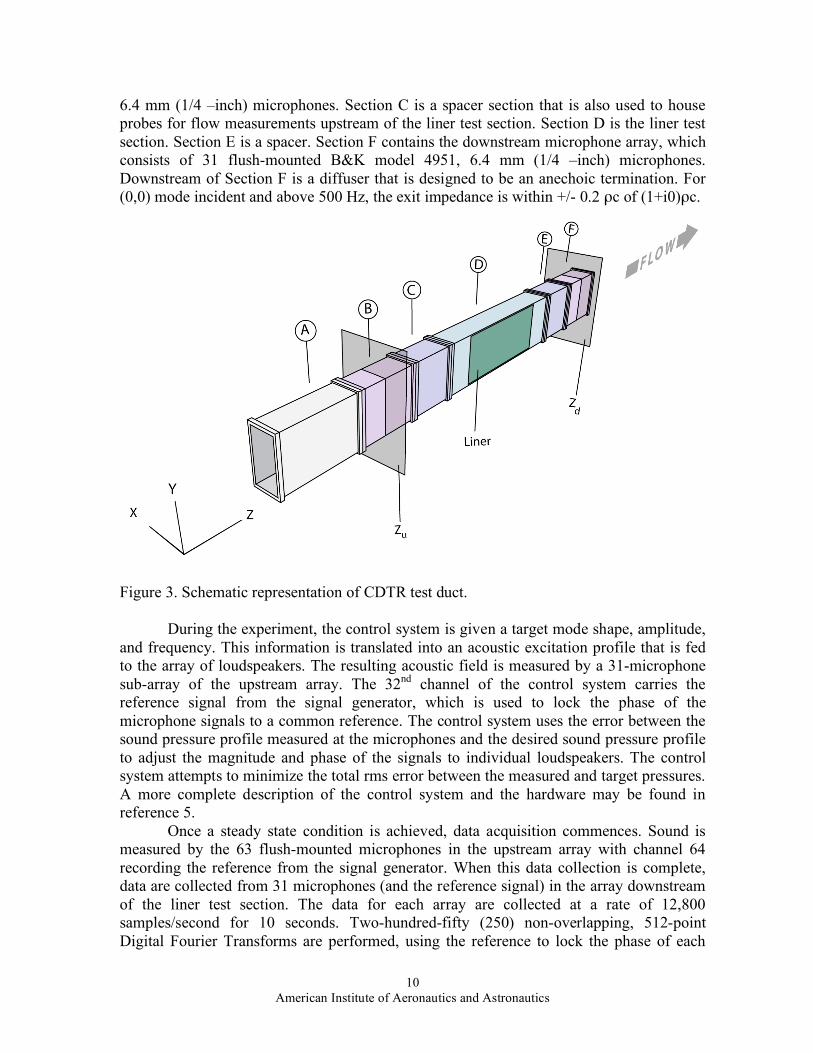
Figure 3 shows the various sections of the CDTR layout. Section A supports 16 loudspeakers arranged around the duct with flush entry ports. Section B contains the upstream microphone array section. It currently has 63 flush-mounted B&K model 4951,
Flow L01 Liner
Taped Liner
10 American Institute of Aeronautics and Astronautics
6.4 mm (1/4 –inch) microphones. Section C is a spacer section that is also used to house probes for flow measurements upstream of the liner test section. Section D is the liner test section. Section E is a spacer. Section F contains the downstream microphone array, which consists of 31 flush-mounted B&K model 4951, 6.4 mm (1/4 –inch) microphones. Downstream of Section F is a diffuser that is designed to be an anechoic termination. For (0,0) mode incident and above 500 Hz, the exit impedance is within +/- 0.2 ρc of (1+i0)ρc.
Figure 3. Schematic representation of CDTR test duct.
During the experiment, the control system is given a target mode shape, amplitude, and frequency. This information is translated into an acoustic excitation profile that is fed to the array of loudspeakers. The resulting acoustic field is measured by a 31-microphone sub-array of the upstream array. The 32nd channel of the control system carries the reference signal from the signal generator, which is used to lock the phase of the microphone signals to a common reference. The control system uses the error between the sound pressure profile measured at the microphones and the desired sound pressure profile to adjust the magnitude and phase of the signals to individual loudspeakers. The control system attempts to minimize the total rms error between the measured and target pressures. A more complete description of the control system and the hardware may be found in reference 5.
Once a steady state condition is achieved, data acquisition commences. Sound is measured by the 63 flush-mounted microphones in the upstream array with channel 64 recording the reference from the signal generator. When this data collection is complete, data are collected from 31 microphones (and the reference signal) in the array downstream of the liner test section. The data for each array are collected at a rate of 12,800 samples/second for 10 seconds. Two-hundred-fifty (250) non-overlapping, 512-point Digital Fourier Transforms are performed, using the reference to lock the phase of each
11 American Institute of Aeronautics and Astronautics
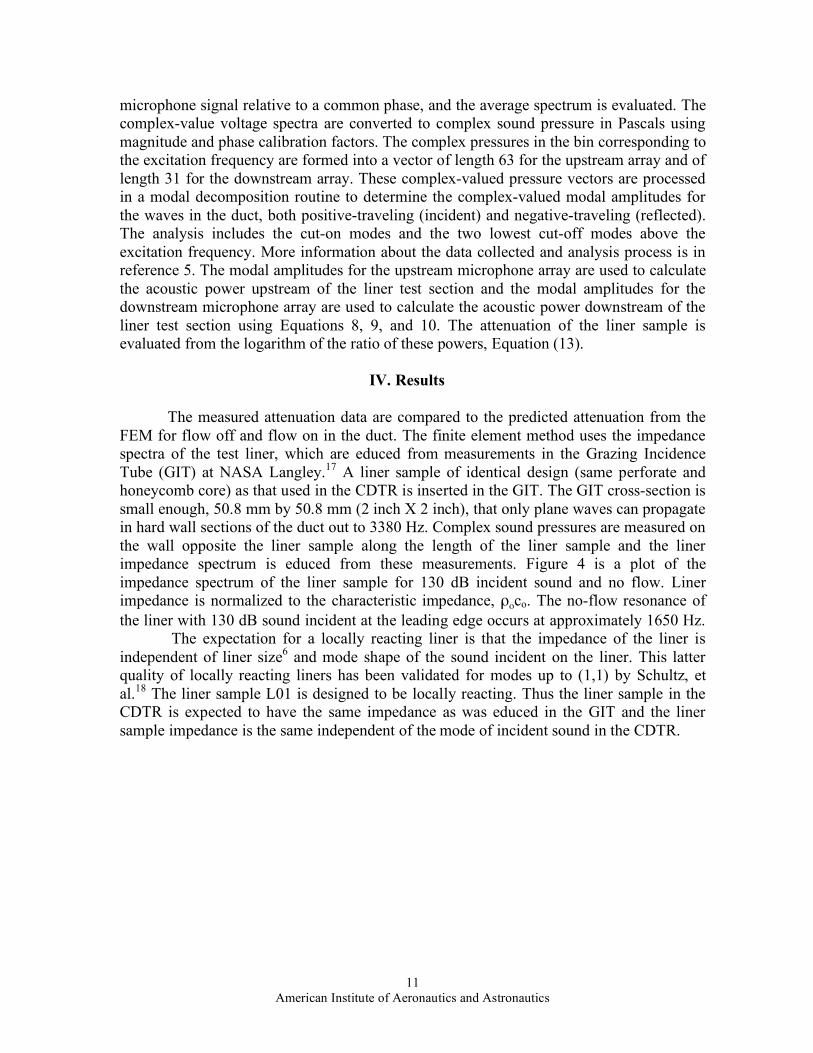
microphone signal relative to a common phase, and the average spectrum is evaluated. The complex-value voltage spectra are converted to complex sound pressure in Pascals using magnitude and phase calibration factors. The complex pressures in the bin corresponding to the excitation frequency are formed into a vector of length 63 for the upstream array and of length 31 for the downstream array. These complex-valued pressure vectors are processed in a modal decomposition routine to determine the complex-valued modal amplitudes for the waves in the duct, both positive-traveling (incident) and negative-traveling (reflected). The analysis includes the cut-on modes and the two lowest cut-off modes above the excitation frequency. More information about the data collected and analysis process is in reference 5. The modal amplitudes for the upstream microphone array are used to calculate the acoustic power upstream of the liner test section and the modal amplitudes for the downstream microphone array are used to calculate the acoustic power downstream of the liner test section using Equations 8, 9, and 10. The attenuation of the liner sample is evaluated from the logarithm of the ratio of these powers, Equation (13). IV. Results The measured attenuation data are compared to the predicted attenuation from the FEM for flow off and flow on in the duct. The finite element method uses the impedance spectra of the test liner, which are educed from measurements in the Grazing Incidence Tube (GIT) at NASA Langley.17 A liner sample of identical design (same perforate and honeycomb core) as that used in the CDTR is inserted in the GIT. The GIT cross-section is small enough, 50.8 mm by 50.8 mm (2 inch X 2 inch), that only plane waves can propagate in hard wall sections of the duct out to 3380 Hz. Complex sound pressures are measured on the wall opposite the liner sample along the length of the liner sample and the liner impedance spectrum is educed from these measurements. Figure 4 is a plot of the impedance spectrum of the liner sample for 130 dB incident sound and no flow. Liner impedance is normalized to the characteristic impedance, ροco. The no-flow resonance of the liner with 130 dB sound incident at the leading edge occurs at approximately 1650 Hz. The expectation for a locally reacting liner is that the impedance of the liner is independent of liner size6 and mode shape of the sound incident on the liner. This latter quality of locally reacting liners has been validated for modes up to (1,1) by Schultz, et al.18 The liner sample L01 is designed to be locally reacting. Thus the liner sample in the CDTR is expected to have the same impedance as was educed in the GIT and the liner sample impedance is the same independent of the mode of incident sound in the CDTR.

12 American Institute of Aeronautics and Astronautics
Figure 4. Educed impedance (normalized by ρoco) of liner L01, 130 dB sound level, no flow. A. Plane Wave and Higher Order Mode Excitation in the Duct without Flow It was demonstrated in the previous report on the CDTR5 that the control system generates the target mode at the target frequency and amplitude, and that it suppresses all other modes by at least 10 dB. Figure 5 is the attenuation in the CDTR for the liner L01 with (0,0) mode input at 130 dB. The figure shows both the measured and the FEM-predicted attenuations. The FEM results indicated by the solid blue symbols are determined using the liner impedance spectrum shown in Figure 4 and the measured attenuations are indicated by the solid red symbols. Additionally, the FEM results are computed with uncertainty errors of +/- 0.1 ρoco in the educed reactance. The effect of this uncertainty is represented by the error bars in Figure 5 and is thought to be representative of what can be expected in Langley's Grazing Incidence Tube. Note that the measured peak attenuation of about 10.2 dB occurs at 1000 Hz. The peak attenuation of nearly 14 dB is predicted by FEM and occurs at 1100 Hz. The measured and FEM attenuations are comparable except near the peak of the attenuation curve. The effect of the reactance uncertainty is barely noticeable at frequencies away from the peak. However, near the attenuation peak, the sensitivity of the numerical results to small errors in the educed reactance is seen to be significant. Finally, the Finite Element Method predicts lower attenuation by approximately 1 dB than were measured at frequencies above 1700 Hz.

13 American Institute of Aeronautics and Astronautics
Figure 5. Attenuation in duct with liner L01 on the right side-wall (looking downstream), opposite taped wall, and top and bottom walls rigid. No flow, (0,0) mode targeted. Figure 6 is the attenuation of the (1,0) incident mode by the L01 liner. The measured data and FEM prediction compare favorably. The attenuation peaks at approximately the same frequency as for (1,0) mode incident, between 1000 and 1100 Hz. The agreement between the measured and FEM is close and both show the peak attenuation to be approximately 15 dB. At frequencies above 1500 Hz, the measured attenuation is greater than predicted by 2 dB. Figure 7 is the attenuation of the (2,0) incident mode wave by the L01 liner. Again agreement between measurement and FEM is very good. Both show the peak attenuation occurring at 1100 Hz and the attenuation at the peak of approximately 25 dB. At high frequencies the measured attenuation is greater than predicted by 1-2 dB.

14 American Institute of Aeronautics and Astronautics
Figure 6. Measured and predicted attenuation in duct with L01 liner, (1,0) mode incident, 130 dB, no flow
Figure 7. Measured and predicted attenuation in duct with L01 liner, (2,0) mode incident, 130 dB, no flow When the horizontal mode of higher order is incident on the liner test section, the attenuation does not show peaks as clearly and the measured and FEM results do not agree as well. This is the case in Figure 8 for the (0,1) mode generated in the duct. The attenuation is relatively large at mode cut-on, and this is seen both in the measured and the
15 American Institute of Aeronautics and Astronautics
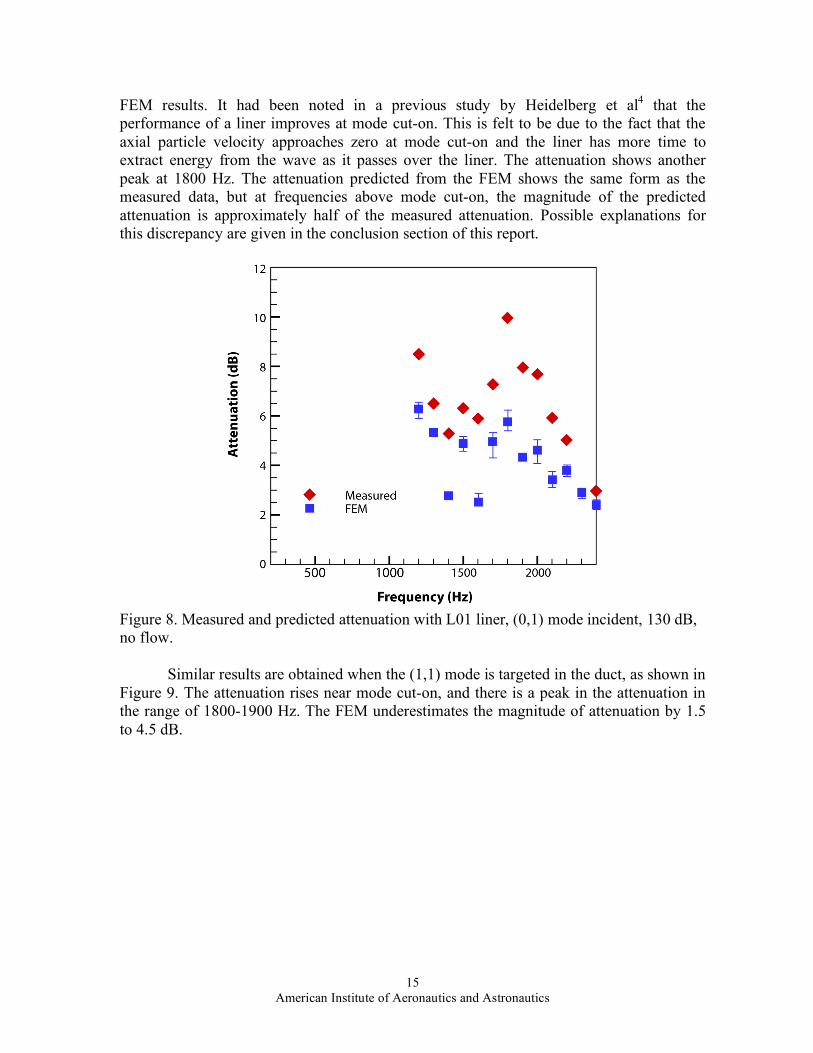
FEM results. It had been noted in a previous study by Heidelberg et al4 that the performance of a liner improves at mode cut-on. This is felt to be due to the fact that the axial particle velocity approaches zero at mode cut-on and the liner has more time to extract energy from the wave as it passes over the liner. The attenuation shows another peak at 1800 Hz. The attenuation predicted from the FEM shows the same form as the measured data, but at frequencies above mode cut-on, the magnitude of the predicted attenuation is approximately half of the measured attenuation. Possible explanations for this discrepancy are given in the conclusion section of this report.
Figure 8. Measured and predicted attenuation with L01 liner, (0,1) mode incident, 130 dB, no flow. Similar results are obtained when the (1,1) mode is targeted in the duct, as shown in Figure 9. The attenuation rises near mode cut-on, and there is a peak in the attenuation in the range of 1800-1900 Hz. The FEM underestimates the magnitude of attenuation by 1.5 to 4.5 dB.

16 American Institute of Aeronautics and Astronautics
Figure 9. Measured and predicted attenuation with L01 liner, (1,1) mode incident, 130 dB, no flow. The 0-order horizontal modes show clear peaks of attenuation for the 0-, 1-, and 2-order vertical modes. The frequency of peak attenuation for modes of horizontal order 0 is between 1000 and 1100 Hz. The magnitude of attenuation at the peak increases with increasing vertical mode order. Data for higher order vertical modes of the 0-order horizontal mode are not included in this paper because their cut-on frequencies exceed 1000 Hz. Agreement between measured and analytical liner performance is quite reasonable and supports the view that the impedance educed in the GIT is accurate enough for good FEM predictions except, perhaps, in the vicinity of the sharp attenuation peak. The measured attenuation is consistently higher than predicted at higher frequencies, generally by 1-2 dB. The frequency of peak attenuation for the horizontal order 1 modes is 1900 Hz, and the magnitude of the peak attenuation of the vertical order 1 mode is 1 dB greater than the peak of the vertical order 0 mode. In addition to the peak, the attenuation increases at mode cut-on. The FEM results show form similar to measured, but the predicted attenuations are consistently lower than measured by from 1.5 to 4.5 dB. B. L01 liner performance with flow on at Mach 0.275. Grazing flow at room temperature is introduced in the liner test section at Mach 0.275 and the flow characteristics in the duct have been studied. A flow control section in a low flow region well upstream of the test section contains a honeycomb flow straightener and several screens for flow uniformity and turbulence reduction. Flow quality measurements are acquired at stations immediately upstream of the liner test section. The instrumentation consists of a flattened-tip pitot probe and co-planar wall static tap for
17 American Institute of Aeronautics and Astronautics
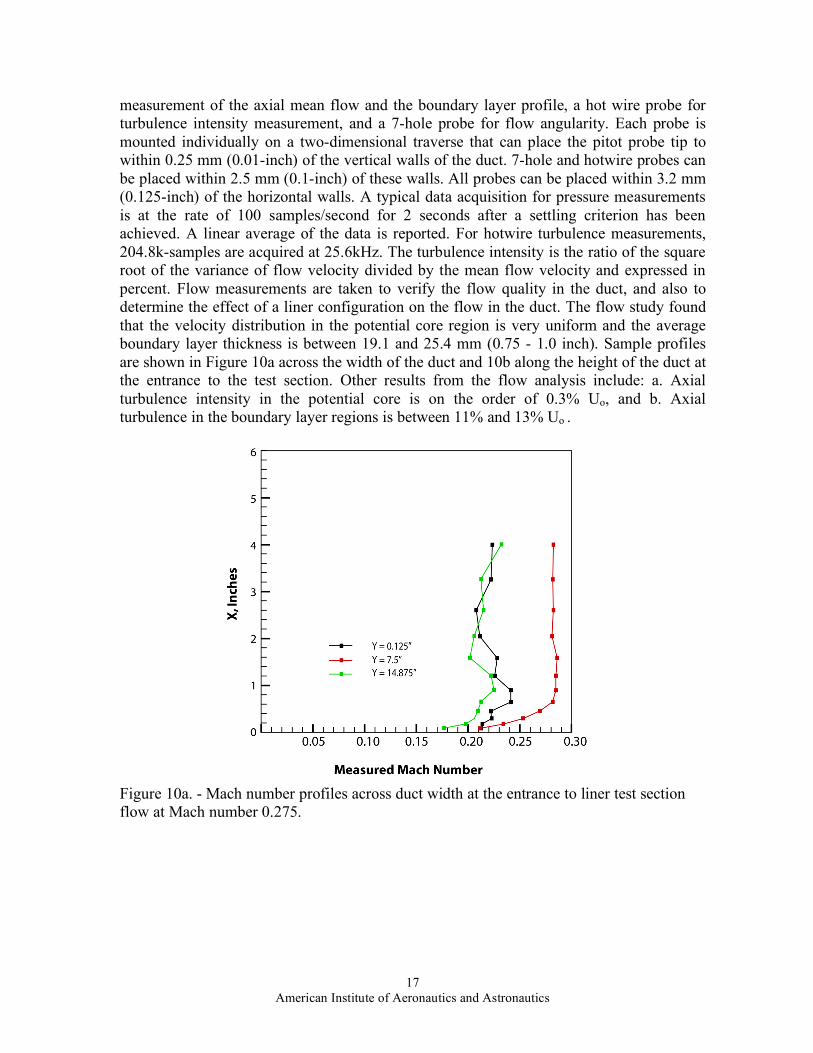
measurement of the axial mean flow and the boundary layer profile, a hot wire probe for turbulence intensity measurement, and a 7-hole probe for flow angularity. Each probe is mounted individually on a two-dimensional traverse that can place the pitot probe tip to within 0.25 mm (0.01-inch) of the vertical walls of the duct. 7-hole and hotwire probes can be placed within 2.5 mm (0.1-inch) of these walls. All probes can be placed within 3.2 mm (0.125-inch) of the horizontal walls. A typical data acquisition for pressure measurements is at the rate of 100 samples/second for 2 seconds after a settling criterion has been achieved. A linear average of the data is reported. For hotwire turbulence measurements, 204.8k-samples are acquired at 25.6kHz. The turbulence intensity is the ratio of the square root of the variance of flow velocity divided by the mean flow velocity and expressed in percent. Flow measurements are taken to verify the flow quality in the duct, and also to determine the effect of a liner configuration on the flow in the duct. The flow study found that the velocity distribution in the potential core region is very uniform and the average boundary layer thickness is between 19.1 and 25.4 mm (0.75 - 1.0 inch). Sample profiles are shown in Figure 10a across the width of the duct and 10b along the height of the duct at the entrance to the test section. Other results from the flow analysis include: a. Axial turbulence intensity in the potential core is on the order of 0.3% Uo, and b. Axial turbulence in the boundary layer regions is between 11% and 13% Uo .
Figure 10a. - Mach number profiles across duct width at the entrance to liner test section flow at Mach number 0.275.

18 American Institute of Aeronautics and Astronautics
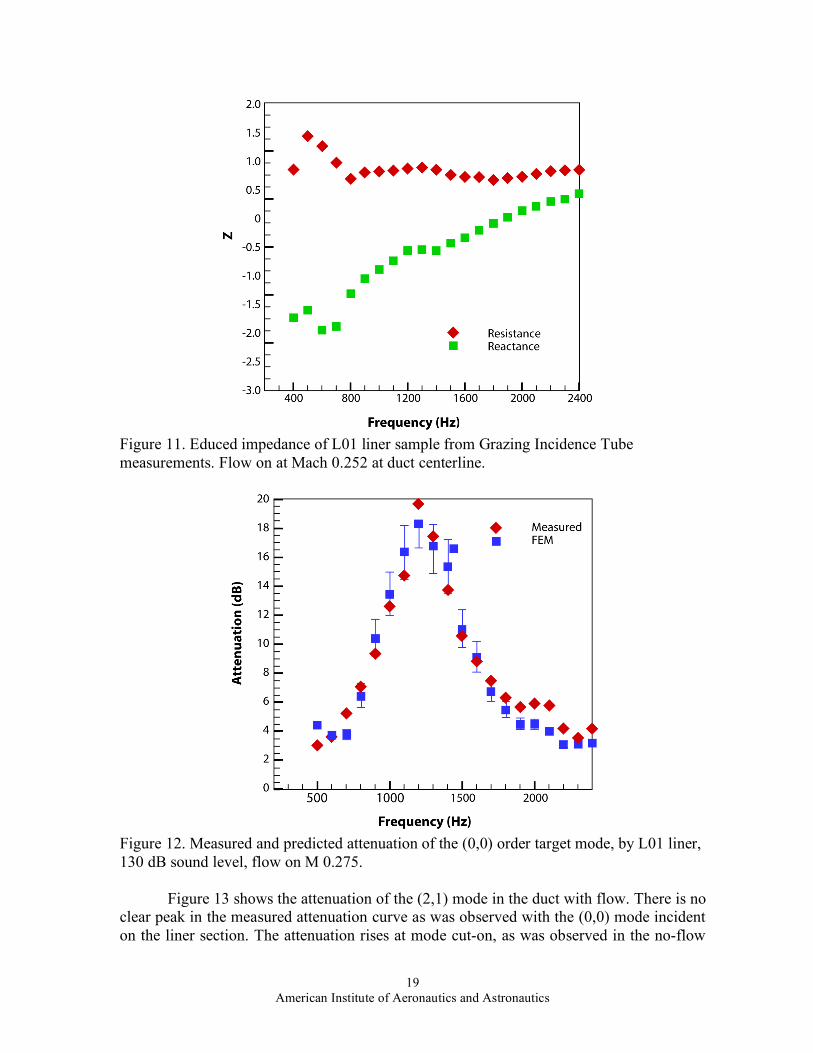
Figure 10b. - Mach number profiles across duct height at the entrance to the liner test section for flow at Mach 0.275. The flow measurement apparatus is removed when acoustic data are acquired. Acoustic testing with flow on includes the plane wave at frequencies from 500 to 2400 Hz, and the (2,1) mode at frequencies above its cut on, 1500 to 2400 Hz. Figure 11 shows the liner impedance spectrum that was educed in the GIT with flow on at Mach number of 0.252 as measured on the centerline of the GIT. Comparing this curve to figure 4, it is seen that the resonance shifts up in frequency by approximately 200 Hz, and the resistance increases by approximately 0.65ρc. The FEM analysis uses the impedance educed in the GIT at the flow condition nearest that in the CDTR. The impedance spectrum educed from measurements in the GIT at Mach number 0.252 is used by the FEM to compare to CDTR experiments at Mach number 0.275. Figure 12 is the attenuation of the (0,0) order mode by the liner with flow on at Mach number of 0.275. When the measured results are compared with the no-flow, Figure 5, it is seen that the presence of flow increases the frequency at which peak attenuation occurs, up to 1200 Hz. The magnitude of the peak attenuation is also increased, from 10 dB at no flow to 20 dB at Mach number 0.275. It is seen from Figure 12 that measurement and FEM show very good agreement both at the peak attenuation and at higher frequencies. The general increase of the attenuations relative to those for no-flow apparently is caused by the impedance spectrum moving to more nearly optimum values. Of all the results shown in this paper, this result shows the best agreement between measurement and FEM prediction.
19 American Institute of Aeronautics and Astronautics
Figure 11. Educed impedance of L01 liner sample from Grazing Incidence Tube measurements. Flow on at Mach 0.252 at duct centerline.
Figure 12. Measured and predicted attenuation of the (0,0) order target mode, by L01 liner, 130 dB sound level, flow on M 0.275. Figure 13 shows the attenuation of the (2,1) mode in the duct with flow. There is no clear peak in the measured attenuation curve as was observed with the (0,0) mode incident on the liner section. The attenuation rises at mode cut-on, as was observed in the no-flow
20 American Institute of Aeronautics and Astronautics
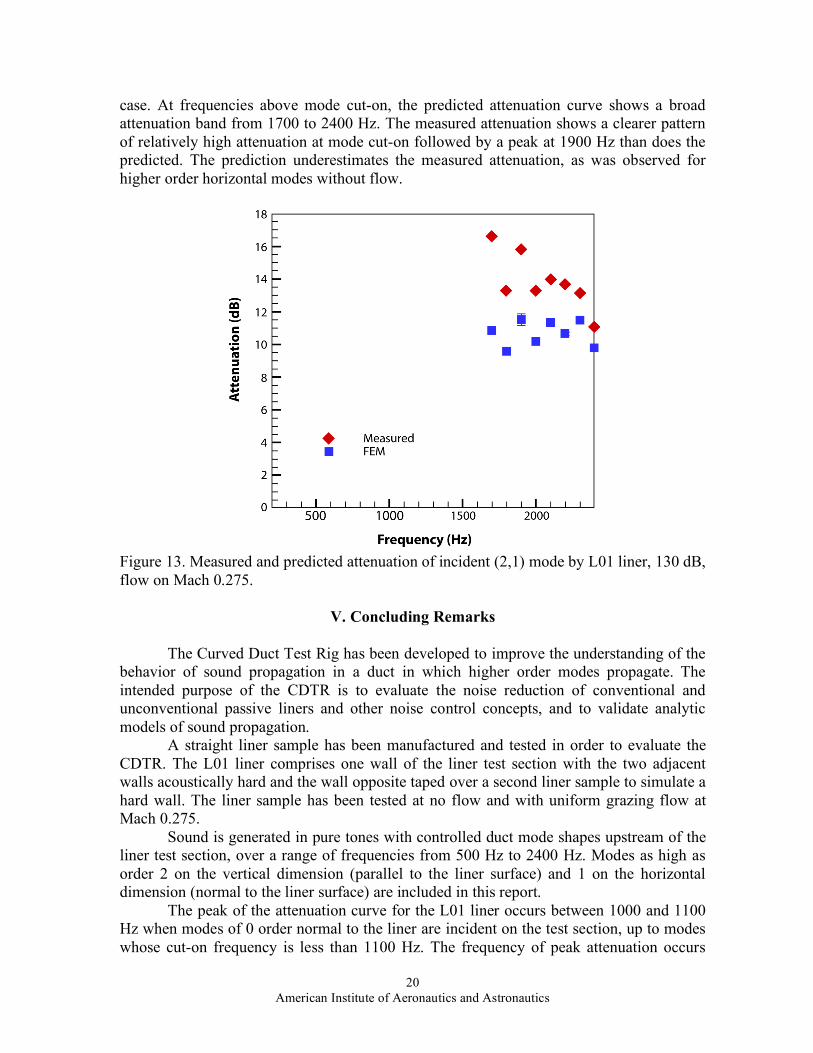
case. At frequencies above mode cut-on, the predicted attenuation curve shows a broad attenuation band from 1700 to 2400 Hz. The measured attenuation shows a clearer pattern of relatively high attenuation at mode cut-on followed by a peak at 1900 Hz than does the predicted. The prediction underestimates the measured attenuation, as was observed for higher order horizontal modes without flow.
Figure 13. Measured and predicted attenuation of incident (2,1) mode by L01 liner, 130 dB, flow on Mach 0.275.
V. Concluding Remarks
The Curved Duct Test Rig has been developed to improve the understanding of the behavior of sound propagation in a duct in which higher order modes propagate. The intended purpose of the CDTR is to evaluate the noise reduction of conventional and unconventional passive liners and other noise control concepts, and to validate analytic models of sound propagation. A straight liner sample has been manufactured and tested in order to evaluate the CDTR. The L01 liner comprises one wall of the liner test section with the two adjacent walls acoustically hard and the wall opposite taped over a second liner sample to simulate a hard wall. The liner sample has been tested at no flow and with uniform grazing flow at Mach 0.275. Sound is generated in pure tones with controlled duct mode shapes upstream of the liner test section, over a range of frequencies from 500 Hz to 2400 Hz. Modes as high as order 2 on the vertical dimension (parallel to the liner surface) and 1 on the horizontal dimension (normal to the liner surface) are included in this report. The peak of the attenuation curve for the L01 liner occurs between 1000 and 1100 Hz when modes of 0 order normal to the liner are incident on the test section, up to modes whose cut-on frequency is less than 1100 Hz. The frequency of peak attenuation occurs
21 American Institute of Aeronautics and Astronautics
between 1800 and 1900 Hz for modes with order 1 normal to the liner. In addition to this peak, the attenuation increases near mode cut-on. The magnitude of attenuation at the peak increases with increasing vertical mode order. When uniform flow of Mach 0.275 is introduced to the duct, the frequency of peak attenuation of the (0,0) wave shifts up to 1200 Hz. The presence of flow increases the magnitude of the peak attenuation for the (0,0) mode incident by 10 dB. No discernible peak in measured attenuation is seen in the (2,1) mode. The impedance of the liner sample was educed from measurements in the Grazing Incidence Tube at NASA Langley Research Center. These impedance values were used in a Finite Element Model formulation to predict the liner attenuation in the CDTR configuration. The attenuation predicted by FEM compares favorably with measured attenuation for modes of 0 order normal to the liner, both with and without flow in the duct. The comparison is better with flow than it is with no flow. The largest discrepancies occur at the sharp peak attenuation. In the no flow case, the measured attenuation is greater than the FEM attenuation by 1-2 dB at higher frequencies. The Finite Element Method and measurement attenuations follow similar forms for the order 1 modes normal to the liner, but the FEM consistently underestimates the attenuation. The predicted attenuation agrees with measured attenuation for modes of 0 order normal to the liner except at the peak and at high frequencies. The response at the peak is extremely sensitive to the educed impedance. The measured attenuation at high frequencies is greater than prediction, and this is felt to arise from the sound absorption by the taped wall opposite the liner sample. Redesign of the wall is underway. The discrepancy between measured and predicted attenuations for modes of higher order normal to the liner is also the subject of continuing investigation. Possible causes that will be examined include sound absorption by the taped wall of the test section and the change of liner impedance in the presence of higher order modes. Despite the differences, the results presented indicate that predicted attenuations compare with measured attenuations and thus it is felt that the FEM can be used in the future to design experiments that are more complex than the one considered in this paper. Such experiments include curved duct liners and multiple frequency designs such as checkerboard liners.
Acknowledgements The authors are grateful for contributions made to the successful completion of the project by Christal Kellam of NASA LaRC and Brian Howerton of Lockheed-Martin Engineering Services for experiment set-up and data collection.
References
1. Tyler, J.M. and Sofrin, T.G., "Axial Flow Compressor Noise Studies", SAE Transactions, vol. 70, 1962, pp 309-332
2. Woodward, RP and Balombin, JR, “Tone Generation By Rotor-Downstream Strut Interaction”, AIAA paper 83-0767, 1983
3. Rice, E.J. and Heidman, M.F., “Modal Propagation Angles in a Cylindrical Duct with Flow and Their Relationship to Sound Radiation”, AIAA paper AIAA-79-0183, 1979
4. Heidelberg, L.J., Rice, E.J., and Homyak, L., “Acoustic performance of inlet suppressors on an engine generating a single mode”, AIAA paper 81-1965, 1981
22 American Institute of Aeronautics and Astronautics
5. Gerhold, C.H., Cabell, R.H., and Brown, M.C., “Development of an Experimental Rig for Investigation of Higher Order Modes in Ducts”, AIAA paper AIAA-2006-2637, 2006.
6. Hubbard, H.H., ed, “Aeroacoustics of Flight Vehicles: Theory and Practice”, volume 2: Noise Control, NASA Publication 1258, vol. 2, 1991.
7. Gerhold, C.H., “Active Control of Fan-Generated Tone Noise”, AIAA Journal, vol. 35, no. 1, pp 17-22, January, 1997
8. Mazeaud, B., Galland, M., and Sellen, N., ”Design of an Adaptive Hybrid Liner for Flow Duct Applications”, AIAA Paper 2004-2852, 2004
9. Watson, W.R., Robinson, J., Jones, M.G., and Parrott, T. “Computational Study of Optimum and Off-design Performance of Checkerboard Liners”, AIAA Paper 2004-3030, 2004
10. Burdisso, R.A. and Ng,W.F., “Fan Noise Control Using Herschel-Quincke Resonators”, NASA CR-2003-212097, Jan, 2003.
11. Bielak, et al, “Advanced Nacelle Acoustic Lining Concepts Development”, NASA CR-2002-211672, Aug, 2002
12. Tester, B., Baker, N., and Kempton, A., “Validation of an Analytical Model for Scattering by Intake Liner Splices” AIAA Paper 2004-2906, 2004
13. Morfey, C.L., “Sound Transmission and Generation in Ducts with Flow”, Journal of Sound and Vibration, volume 14, number 2, pp 37-55, 1971.
14. Ville, J.M. and Foucart, F., “Experimental Setup for Measurement of Acoustic Power Dissipation in Lined Ducts for Higher Order Modes Propagation with Air Mean-flow Conditions”, Journal of the Acoustical Society of America, volume 114, number 4, part 1, pp 1742-1748, Oct, 2003
15. Watson, W. and Jones, M., “ Comparison of a Convected Helmholtz and Linearized Euler Method of Impedance Eduction in Flow”, AIAA Paper-2006-2643, May, 2006.
16. Myers, M.K., "On the Acoustic Boundary Condition in the Presence of Flow", Journal of Sound and Vibration, vol 71, no 3, 1980, pp 429-434.
17. Jones, M., Parrott, T., and Watson, W., “Comparison Of Acoustic Impedance Eduction Techniques For Locally-Reacting Liners,” AIAA Paper 2003-3306, May, 2003.
18. Schultz, T., Cattafesta, L.N., and Sheplak, M., "Modal Decomposition Method for Acoustic Impedance Testing in Square Ducts", Journal of the Acoustical Society of America, volume 120, number 6, pp 3750-3758, December, 2006.
Related Documents