INVESTIGATION OF INFLECTION POINTS AS BRACE POINTS IN MULTI-SPAN PURLIN ROOF SYSTEMS By Michael R. Bryant Thesis submitted to the Faculty of the Virginia Polytechnic Institute and State University In partial fulfillment of the requirements for the degree of MASTER OF SCIENCE In Civil Engineering APPROVED: __________________________ T.M. Murray, Chairman _________________ ________________ W.S. Easterling T. E. Cousins June, 1999 Blacksburg, Virginia

Welcome message from author
This document is posted to help you gain knowledge. Please leave a comment to let me know what you think about it! Share it to your friends and learn new things together.
Transcript

INVESTIGATION OF INFLECTION POINTS AS BRACE
POINTS IN MULTI-SPAN PURLIN ROOF SYSTEMS
By
Michael R. Bryant
Thesis submitted to the Faculty of the
Virginia Polytechnic Institute and State University
In partial fulfillment of the requirements for the degree of
MASTER OF SCIENCE
In
Civil Engineering
APPROVED:
__________________________T.M. Murray, Chairman
_________________ ________________W.S. Easterling T. E. Cousins
June, 1999Blacksburg, Virginia
ii
Investigation of Inflection Points as Brace Points in
Multi-Span Purlin Roof Systems
by
Michael R. Bryant
Committee Chairman: Thomas M. MurrayCivil Engineering
(ABSTRACT)
An experimental and analytical investigation was conducted to evaluate the
behavior of inflection points as brace points in multi-span purlin roof systems. Seven
tests were conducted using “C” and “Z” purlins attached to standing seam and through
fastened panels. These tests were subjected to uniform gravity loading by means of a
vacuum chamber. The experimental results were compared with analytical predictions
based on the 1996 AISI Specifications with and without the inflection point considered a
brace point. Finite element modeling of through fastened “C” and “Z” purlin tests were
conducted and compared to experimental through fastened results. Conclusions were
drawn on the status of the inflection point and on the design of multi-span purlin roof
systems with current AISI Specifications.

iii
Acknowledgements
I would like to express my appreciation to my committee chairman, Dr. Thomas
M. Murray. His guidance, advice, and patience over the course of this research was
indispensable. I would also like to thank Dr. Samuel Easterling and Dr. Thomas Cousins
for serving as committee members.
I was very lucky to have help from many people while conducting my research.
These people include: Mark Boorse, John Ryan, Tim Mays, Joe Howard, Ken Rux, Jim
Webler, Marc Graper, Michelle Rambo-Roddenberry, and Emmett Sumner. I would like
to extend my deepest gratitude to Brett Farmer and Dennis Huffman, first for their
friendship and second for all their hard work in helping build my test set-ups. I would
also like to thank Ann Crate for all her help.
I would like to thank the many friends I have made here in Blacksburg. They
have helped add many fond memories during my time here. Finally, I would like to
thank the people most responsible for my success: my Mom, my Dad, and my Sister.
They have given me their full support during my undergraduate and graduate work.
Their generosity was more than anyone could possibly ask for.
iv
TABLE OF CONTENTS
PageABSTRACT ............................................................................................................. ii
LIST OF FIGURES ................................................................................................. vi
LIST OF TABLES ................................................................................................... ix
CHAPTER
I. INTRODUCTION ....................................................................................... 1
1.1 Introduction ........................................................................................... 11.2 Literature Survey ................................................................................... 41.2.1 Doubly Symmetric Sections ............................................................... 41.2.2 Singly and Point Symmetric Sections ................................................ 71.3 Scope of the Research ........................................................................... 101.4 Overview of Research ........................................................................... 11
II. TEST DETAILS .......................................................................................... 12
2.1 Experimental Test Program ................................................................... 122.2 Components of the Test Assemblies ..................................................... 122.3 Test Setups ............................................................................................ 15
III. EXPERIMENTAL RESULTS ..................................................................... 25
3.1 General Comments ................................................................................ 253.2 Tensile Test Results .............................................................................. 263.3 Summary of Test Results ...................................................................... 27
IV. ANALYTICAL RESULTS .......................................................................... 33
4.1 Background ........................................................................................... 334.2 Z-Purlin Model ...................................................................................... 334.3 C-Purlin Model ..................................................................................... 39

v
Chapter Page
V. EVALUATION OF RESULTS ................................................................... 44
5.1 Introduction ........................................................................................... 445.2 Predicted and Measured Strains ............................................................ 445.3 Predicted and Measured Purlin Spread ................................................. 465.4 Strength Evaluation ............................................................................... 475.4.1 Evaluation Assumptions .................................................................... 475.4.2 1996 AISI Specification Provisions ................................................... 485.4.3 Strength Comparisons Assuming the
Inflection Point is not a Brace Point ................................................ 535.4.4 Strength Comparisons Assuming the
Inflection Point is a Brace Point ...................................................... 545.4.5 Strength Comparison Assuming a Fully Braced Cross-Section ........ 555.4.6 Summary of Test Results ................................................................... 565.4.7 Comparison of Results ....................................................................... 58
VI. SUMMARY AND CONCLUSIONS .......................................................... 60
6.1 Summary ................................................................................................ 606.2 Conclusions............................................................................................ 616.3 Recommendations ................................................................................. 62
References ................................................................................................................ 63
APPENDIX A - TEST 1 Z - TF DATA............................................................. 65
APPENDIX B - TEST 2 Z - SS DATA ............................................................. 80
APPENDIX C - TEST 3 C - SS DATA............................................................. 94
APPENDIX D - TEST 4 C - TF DATA ............................................................ 110
APPENDIX E - I. P. TEST 1 Z - SS DATA...................................................... 126
APPENDIX F - I. P. TEST 2 Z - SS DATA...................................................... 137
APPENDIX G - I. P. TEST 3 Z - TF DATA ..................................................... 148

vi
LIST OF FIGURES
Figure Page
1.1 Purlin Cross-Sections ................................................................................... 2
1.2 Typical Lap Configurations ......................................................................... 2
1.3 Typical Moment Diagram for Uniform Gravity Load ................................. 4
1.4 Yura Inflection Point Investigation .............................................................. 5
2.1 Through Fastened Panel Cross-Section ....................................................... 14
2.2 Standing Seam Panel Cross-Section and Sliding Clip ................................. 14
2.3 Virginia Tech Vacuum Chamber ................................................................. 16
2.4 Ceco Building Systems Vacuum Chamber – Plan View .............................. 17
2.5 Ceco Building Systems Vacuum Chamber – Section View ........................ 17
2.6 Ceco Building Systems Vacuum Chamber – Detail A ................................ 18
2.7 Test 1 Z-TF and Test 2 Z-SS Span and Lap Configurations ....................... 22
2.8 Test 3 C-SS and Test 4 C-TF Span and Lap Configurations ....................... 22
2.9 I.P. Test 1 Z-SS, I.P. Test 2 Z-SS, and I.P. Test 3 Z-TF Span and Lap
Configurations .............................................................................................. 22
2.10 Potentiometer Support Configuration .......................................................... 23
2.11 Spread Potentiometer locations in Test Bay ................................................ 23
2.12 Strain Gage Locations on Purlin Cross-Section ........................................... 24
2.13 Strain Gage Locations in Test Bay ............................................................... 24
3.1 Strain Gage Locations in Test Bay ............................................................... 29
3.2 Load vs. Strain Far Purlin Line .................................................................... 29

vii
Figure Page
3.3 Potentiometer Locations in Test Bay ........................................................... 30
3.4 Load vs. Spread Z–TF ................................................................................. 31
3.5 Load vs. Spread Z–SS ................................................................................. 31
3.6 Load vs. Spread C–TF ................................................................................ 32
3.7 Load vs. Spread C–SS ................................................................................ 32
4.1 Finite Element Cross-Section of Z–Purlin ................................................... 35
4.2 Finite Element Side View of Z–Purlin ......................................................... 35
4.3 Boundary Conditions for Z–Purlin Cross-Section ....................................... 35
4.4 Locations for Spread Measurements ............................................................ 37
4.5 Load vs. Spread for Finite Element Z–Purlin Model ................................... 37
4.6 Locations for Strain Measurements ............................................................. 38
4.7 Load vs. Strain for Finite Element Z–Purlin Model .................................... 38
4.8 Deflected Shape for Z-Purlin Model ............................................................ 39
4.9 Finite Element Cross-Section of C–Purlin ................................................... 41
4.10 Finite Element Side View of C–Purlin ........................................................ 41
4.11 Boundary Conditions for C–Purlin Cross-Section ....................................... 41
4.12 Locations for Spread Measurements ............................................................ 42
4.13 Load vs. Spread for Finite Element C–Purlin Model ................................... 42
4.14 Locations for Strain Measurements ............................................................. 43
4.15 Load vs. Strain for Finite Element C–Purlin Model .................................... 43
5.1 Finite Element and Experimental Strain Results for Test 1 Z–TF .............. 45
viii
Figure Page
5.2 Finite Element and Experimental Strain Results for Test 4 C–TF .............. 45
5.3 Finite Element and Experimental Spread Results for Test 1 Z–TF ............ 46
5.4 Finite Element and Experimental Spread Results for Test 4 C–TF ............ 47

ix
LIST OF TABLES
Table Page
2.1 Test Matrix ................................................................................................... 13
2.2 Test Details .................................................................................................. 21
3.1 Tensile Test Results ..................................................................................... 26
3.2 Summary of Failure Loads and Locations ................................................... 27
5.1 Purlin Properties ........................................................................................... 53
5.2 Strength Comparison (Inflection Point not as Brace Point)......................... 54
5.3 Strength Comparison (Inflection Point as Brace Point) .............................. 54
5.3 Strength Comparison (Fully Braced Cross-Section) .................................... 56

1
CHAPTER I
INTRODUCTION AND LITERATURE REVIEW
1.1 Introduction
Purlin supported metal roofs have become a very popular choice for commercial
buildings. The major reason behind the popularity is the advent of the standing seam
system. Standing seam roof systems are aesthetically pleasing and have eliminated much
of the leakage problems associated with metal roofs. Conventional through-fastened
panel systems are still used in construction but require more maintenance over the life of
the building.
The majority of purlin supported roof systems employ the use of multi-span
continuous purlins. The purlins may be continuous for only two spans or the purlins may
be continuous across each span of the building. Purlins are rolled in many
configurations, but the most widely used cross sections are stiffened “Z” and stiffened
“C” shapes. These cross sections are shown in Figure 1.1. Continuity across the spans is
achieved by lapping the purlins for a distance over each support. Typical lap
configurations for Z- and C-purlins are shown in Figure 1.2. When considering simple
spans subjected to uniform gravity loads, the entire purlin top flange is in compression
and the entire bottom flange is in tension, this condition is called positive bending or
positive moment. The top flange is fully braced when through fastened panel is used and
partially braced with standing seam systems. When multiple continuous spans are
subjected to uniform gravity loads, the conditions change. Regions near each internal

2
Z-PURLINCROSS-SECTION
C-PURLINCROSS-SECTION
Figure 1.1 Purlin Cross-Sections
SUPPORT
LAP LAPPURLIN
SPAN SPAN SPAN
Figure 1.2 Typical Lap Configurations

3
support experience negative moment. This means that the unsupported purlin bottom
flange is in compression between the support and the inflection point, while the top
flange that is attached to the decking is in tension. The inflection point on a continuous
beam is the point where the moment is zero (moment actually switches from negative to
positive at this point). The beam cross-section is subjected to negative moment between
the internal support and the inflection point. The cross-section is subjected to positive
moment between an inflection point and an exterior support or between inflection points
in an internal span. A typical moment diagram is shown in Figure 1.3.
A beam brace point is a location on the beam where the beam’s tendency to twist
and displace laterally is restrained. Inflection points have been assumed to act as brace
points in continuous beams (Salmon and Johnson 1996) and in continuous purlin roof
system design for some time (Murray and Elhouar 1994). Purlin supported roof systems
are constructed of point-symmetric and singly-symmetric sections with their top flanges
partially or fully braced by a sheeting diaphragm. Purlin roof systems are composed of
beams that are considered continuous across multiple spans and subjected to uniform
loads on all spans. This leads to inflection points that are much closer to the supports than
at mid-span. Inflection points acting as brace points have been the subject of much
discussion but little research has been conducted.
An experimental and analytical investigation was conducted to evaluate the
behavior of inflection points as brace points in multi-span purlin roof systems. Seven
tests were conducted using C- and Z-purlins attached to standing seam and through
fastened panel. These tests were subjected to uniform gravity loading by means of a
vacuum chamber. The experimental results were compared with analytical predictions
based on the 1996 AISI specification for the Design of Cold-Formed Steel Structural
Members (Specifications 1996), hereafter referred to as the 1996 AISI Specifications,
with and without the inflection point considered a brace point.

4
I. P. I. P.
LAP LAP
Lb POSITIVE MOMENT
NEGATIVEMOMENT
Load, W (plf)
Figure 1.3 Typical Moment Diagram
1.2 Literature Review
Much research has been performed on metal roofs supported by cold-formed
purlins. The majority of the most recent research was concerned with determining the
strength of standing seam roof systems. Little or no research has been conducted on
cold-formed purlin inflection points and their status as brace points. Considerable
research has been conducted on doubly symmetric shapes. Some of this research
addresses inflection points and brace points. This literature review first covers research
findings on hot-rolled doubly symmetric sections, followed by research on cold-formed
C- and Z-purlins.
1.2.1 Doubly Symmetric Sections
Beam and stability bracing has been studied by many over the years. Much of the
most recent research has been conducted by Professor Joseph Yura at the University of
Texas at Austin. Yura presents finite element and experimental results for various beam
bracing conditions using hot rolled W-sections (W16X26) with span lengths of 20 ft.
(Yura 1991, 1993). Yura concludes that restraining twist is the most critical component
5
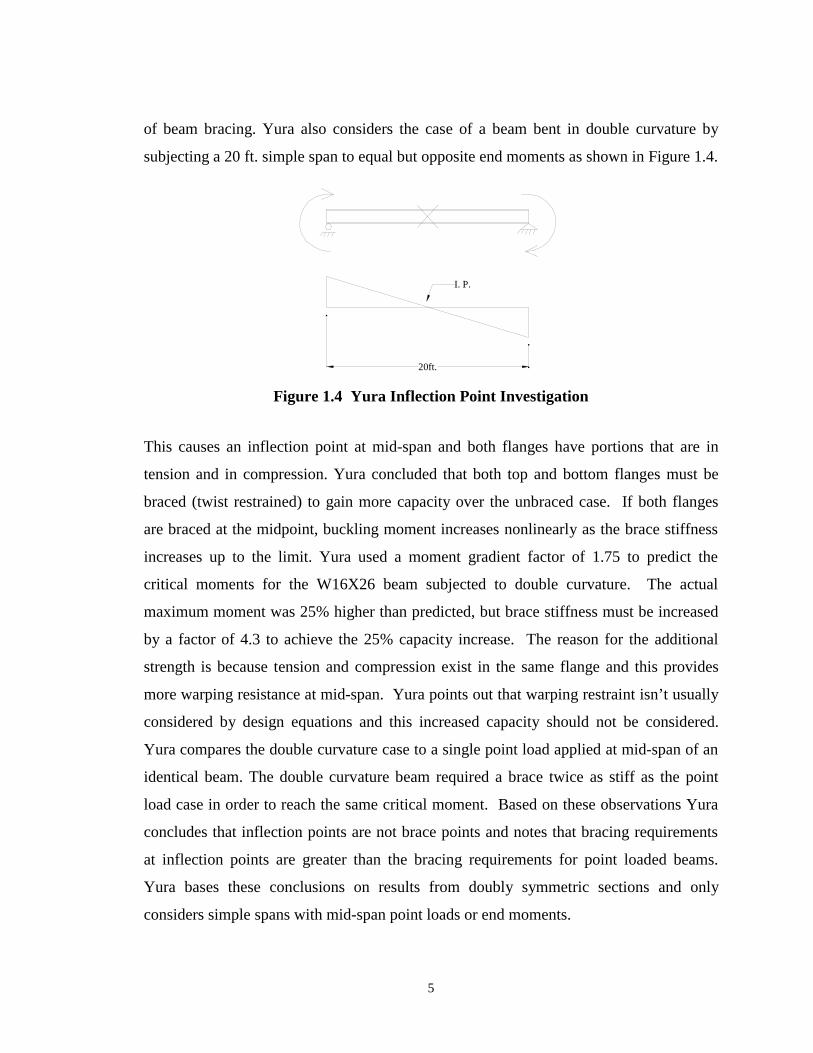
of beam bracing. Yura also considers the case of a beam bent in double curvature by
subjecting a 20 ft. simple span to equal but opposite end moments as shown in Figure 1.4.
I. P.
20ft.
Figure 1.4 Yura Inflection Point Investigation
This causes an inflection point at mid-span and both flanges have portions that are in
tension and in compression. Yura concluded that both top and bottom flanges must be
braced (twist restrained) to gain more capacity over the unbraced case. If both flanges
are braced at the midpoint, buckling moment increases nonlinearly as the brace stiffness
increases up to the limit. Yura used a moment gradient factor of 1.75 to predict the
critical moments for the W16X26 beam subjected to double curvature. The actual
maximum moment was 25% higher than predicted, but brace stiffness must be increased
by a factor of 4.3 to achieve the 25% capacity increase. The reason for the additional
strength is because tension and compression exist in the same flange and this provides
more warping resistance at mid-span. Yura points out that warping restraint isn’t usually
considered by design equations and this increased capacity should not be considered.
Yura compares the double curvature case to a single point load applied at mid-span of an
identical beam. The double curvature beam required a brace twice as stiff as the point
load case in order to reach the same critical moment. Based on these observations Yura
concludes that inflection points are not brace points and notes that bracing requirements
at inflection points are greater than the bracing requirements for point loaded beams.
Yura bases these conclusions on results from doubly symmetric sections and only
considers simple spans with mid-span point loads or end moments.

6
The Guide to Stability Design Criteria for Metal Structures (Galambos 1998)
addresses many topics related to beam buckling and beam bracing. Galambos sates that
if a beam cross-section is subjected to a non-uniform moment, then the modifier known
as Cb can account for the effect of moment gradient in design equations. Galambos also
states that it may be necessary to provide bracing to the compression (bottom) flange in
negative moment regions to prevent lateral-torsional buckling.
Johnson (1994) has published multiple papers on composite structures of steel and
concrete. Information is provided on continuous beams and composite construction. The
work presented is mainly for hot-rolled W sections shear connected to a concrete slab.
Johnson states that near internal supports of continuous beams the bottom flange is
compressed and the only lateral support for the bottom flange is provided by the flexible
web. The concrete slab prevents twisting of the section as a whole. The bottom flange
can only buckle if the web bends. This is referred to as distorstional lateral buckling.
This type of buckle consists of one half-wave on each side of an internal support. This
half-wave usually extends over most of the length of the negative moment region.
Johnson states that this half-wave is not sinusoidal and the point of maximum lateral
displacement is within two or three beam depths of the internal support. Johnson
presents equations based on a U-frame model that can be used to predict critical moments
for end span of a continuous beam. These equations apply to homogeneous doubly
symmetric beam. The critical moment equations are also dependent on the torsional
resistance provided by the concrete slab.
Salmon and Johnson (1996) present a discussion on lateral buckling and
continuous beams. Salmon and Johnson state that continuous beams have lateral end
restraint moments that develop as a result of continuity over several spans. Some lateral
restraint moment may result when adjacent spans are shorter, braced at closer intervals,
or less severely loaded than the span considered. This lateral restraint may develop but
should not be relied on in design because opposite unbraced spans might buckle in
opposite directions eliminating any restraint present.

7
The inflection point has often been treated as a braced point when design
equations did not provide for the effect of moment gradient (Salmon and Johnson 1996).
Current ASD and LRFD equations include the moment gradient except for those
equations used to determine a compact section (equations for Lc and Lp). Salmon and
Johnson state that one may wish to consider the inflection point as a possible braced
point when determining Lc or Lp. The present opinion of Salmon and Johnson (1996) is
that whenever moment gradient is included in a design equation, the inflection point
should not be considered a brace point. However, when moment gradient is not included,
in most cases the inflection point may be considered as a braced point. This is possible
because of the torsional restraint provided by the floor or roof system attachments and the
continuity at the support (point of maximum negative moment). The important factor in
this assumption is the amount of torsional restraint provided by the floor system at the
inflection point.
1.2.2 Singly- and Point Symmetric Sections
The Guide to Stability Design Criteria for Metal Structures (Galambos 1998)
includes a chapter discussing thin-walled metal construction. The chapter does not
present principles exclusive to continuous beam design, but several of the important
points will be summarized. First, the increased use of cold-formed steel members is
reflected by the existence of design specifications in Australia, China, Europe, Japan, and
North America. Moment capacity of thin-walled flexural members is governed by one or
more of the following: yielding of material, local buckling of compression flange or web,
and lateral buckling. It is stated that lateral buckling equations derived for I-beams can
be used for channels and other singly symmetric shapes with reasonable accuracy.
However, a Z-section with similar ratios will buckle laterally at lower stresses. To
account for this the AISI specifications have added a conservative factor of 0.5 to the
critical moment equations for Z-sections.
Salmon and Johnson (1996) present a section discussing lateral buckling of
channels, zees, monosymmetric I-shaped sections and tees. It is stated that the equations
for lateral-torsional buckling of symmetric I-shaped may be applied to channels for

8
design purposes. Both the ASD and LRFD versions of the AISC Specifications have
adopted this approach. It should be noted that an unconservative error of about 6 percent
may exist in extreme cases when using this approach. Salmon and Johnson (1996) state
that Z-sections are subject to unsymmetrical bending because the principle axis does not
lie in the plane of loading. This leads to biaxial bending. The effect of biaxial bending
on Z-sections was found to reduce the critical buckling moment by 5 to 10 percent.
Unbraced Z-sections are rare and AISC does not address them. Salmon and Johnson
recommend applying a factor of 0.5 to the critical moment equations for I-sections.
Murray and Elhouar (1994) conducted a study that examined the approach to
designing continuous Z- and C-purlins for gravity loading based on the 1986 AISI cold-
formed steel specifications. The paper begins by examining the assumptions commonly
used when designing through fastened purlin roof systems. First constrained bending is
assumed, this means that the purlin top flange is not free to rotate because it is directly
fastened to sheeting. Purlins are lapped for a certain distance over the supports and the
lapped portion is assumed to be fully continuous across the entire lap. The lapped region
is assumed to have section properties and strengths equal to the sum of the section
properties and strengths of the purlins that make up that lap. The region between the
support and the end of the lap is assumed fully braced. The inflection point is considered
a braced point. This is accounted for in design by considering the unbraced length for the
negative moment region as the distance between the inflection point and the end of the
lap. A moment gradient coefficient (Cb) is also incorporated into the moment capacity
equations. Usually Cb is taken as 1.75.
Murray and Elhouar collected data on multi-span continuous through fastened
purlin tests subjected to gravity loading. These tests were conducted at various testing
facilities. Each test was analyzed using the 1986 AISI Specifications and the
assumptions previously mentioned to determine a predicted failure load without applying
the ASD factors of safety. These values were then compared to the actual experimental
failure loads. It was concluded that the assumptions as well as the 1986 AISI
specifications were adequate for design. However, it should be noted that several of the

9
tests studied had experimental failure loads that were lower than the predicted values
(unconservative predicted failure loads).
Willis and Wallace (1991) presented a paper on the behavior of cold-formed steel
purlins under gravity loading in 1991. Their study dealt with two aspects of Z- and C-
purlin construction. The first aspect was the effect of fastener location on purlin capacity.
The second aspect dealt with the width of compression flange lip stiffeners. This study
reported analytical and experimental results on several single and three span tests. Willis
and Wallace used two purlin lines spaced 5 ft. on center for each test. The purlins used
were oriented with their top flanges opposed. The panel used in all tests was a standard
through fastened panel that was attached to the purlin top flange with self-tapping screws
with rubber washers. The only bracing applied to the bottom flange was at the supports
where the cross-section was attached to anti-roll clips. The parameter that was
intentionally varied was fastener location on the purlin top flange.
The Willis and Wallace study presents predicted ultimate loads that were obtained
by applying the provisions of the 1986 AISI Specifications to obtain an ASD allowable
load and multiplying that value by 1.67 to remove the ASD factor of safety. The vertical
deflection of each test is reported for a load that corresponds to the ASD allowable load.
The other parameter that is reported is lateral movement or spread of the purlin bottom
flange at the ASD allowable load. Spread and vertical deflection were both measured at
the point of maximum vertical deflection for the corresponding test. Finally the predicted
failure load is compared with the experimental failure load. The study concluded that Z-
purlins were not noticeably affected by fastener location, but C-purlin capacity could be
effected by as much as 10% by fastener location. The optimum fastener locations for C-
purlins in near the stiffener lip. It is important to note that in this study, the capacities
predicted by the 1986 AISI specification were near the experimental failure loads.
Epstein, et al (1998) presented a study on the design and analysis assumptions for
continuous cold-formed purlins. This report questions the validity of considering the
entire lapped region as laterally braced. This study also questions the use of the
inflection point as a braced point for determining the unbraced length for the negative
10
moment region. This study stresses that appropriate experimental testing is needed to
verify or deny the assumptions used in continuous purlin design and that the suggestions
presented by the authors should be verified experimentally. The only experimental
research referenced by Epstein, et al was a study conducted by Murray and Elhouar
(1994). Epstein, et al suggest that the Murray and Elhouar study did not support or verify
the 1986 AISI Specifications.
1.3 Scope of Research
One of the most important aspects of multi-span purlin roof system design is the
unbraced length of the compression flange in the negative moment region. The 1986
AISI Specifications considers the inflection point as a brace point, therefore the unbraced
length would be the distance between the end of the lap (which is considered braced) and
the inflection point. A moment gradient coefficient (Cb) is also used in this procedure and
incorporated into the lateral buckling equations. The 1996 AISI Specifications and the
AISI Guide for Designing with Standing Seam Roof Panels (Fisher and La Boube 1997),
hereafter referred to as the AISI Guide, recommend that the unbraced length still be
considered the distance between the end of the lap and the inflection point but the
inflection point is not considered braced and Cb is taken as 1.0.
The primary purpose of this research is to evaluate the accuracy of assuming the
inflection point as a brace point when using current AISI specification procedures to
predict the failure load of multiple span, multiple purlin line Z- and C-purlin supported
through fastened and standing seam roof systems. Experimental testing was conducted
involving multiple span Z- and C-purlins attached to standing seam and through fastened
panel. Limited finite element modeling was performed and compared to the experimental
results.
11
1.4 Overview
Chapter II describes in detail the parameters of the experimental testing program.
Purlin types and configurations as well as the types of panel and fasteners are discussed.
Testing locations and measured parameters are also discussed.
Chapter III presents all of the experimental results. Important observations are
discussed.
Chapter IV covers the finite element results. A simple model for both Z- and C-
purlins is discussed. Results for a particular loading and boundary conditions are
examined and compared to applicable experimental testing, as will be stresses at critical
sections.
Chapter V compares experimental results with the finite element modeling
discussed in Chapter IV. Next, experimental results were evaluated using three different
methods. The first approach is to assume the inflection point is not a brace point and
predict a failure load based on those assumptions from the 1996 AISI Specifications. The
second approach assumes the inflection point as a brace point and predicts failure loads
based on this assumption. The third approach assumes a fully braced cross-section.
Chapter VI presents conclusions based on all the information considered in this
research. Recommendations are made concerning design procedures and possible further
research. Appendices that contain summaries of all test data follow Chapter VI.

12
CHAPTER II
TEST DETAILS
2.1 Experimental Test Program
A series of seven tests were conducted. The first four tests were three span tests,
whereas the last three were two span tests. The purpose was to determine if an inflection
point is a brace point. Test components, procedures, and results are presented in the
following sections.
The test designations for these experiments are identified as “Test # X-YY”.
Where “#” notes the chronological order of the test, and X could be “Z” for a Z-purlin or
“C” for a C-purlin. The YY is used to denote the type of decking used, TF for through
fastened panel or SS for standing seam panel. Tests 1 to 4 were conducted at Virginia
Tech and I. P. Tests 1, 2, and 3 were conducted at Ceco Building Systems, Columbus,
Mississippi.
2.2 Components of the Test Assemblies
Manufacturers belonging to the Metal Building Manufactures Association
(MBMA) supplied components used in the testing program. All standing seam tests used
the same pan type panel and clips. Both three span through fastened tests used the same
through fastened panel, whereas the two span test used a different through fastened panel.
Table 2.1 shows the different test configurations used.
Purlins. Both Z– and C–purlins were used in the tests. Actual properties such as
depth, thickness, flange and stiffener length varied with each test. Measured purlin
dimensions can be found in Appendix A through Appendix G. Tensile coupon tests were
conducted from material taken from the web of representative purlins for each test.

13
Table 2.1 Test Matrix
Test
Designation
Purlin
Type
Depth
(in.)
Panel
Type
Spans(ft.)
Purlin
Orientation
Test 1 Z-TF Z 8 Through
Fastened
2 @ 25,
1 @ 23
Opposed
Test 2 Z-SS Z 10 Standing
Seam
2 @ 25,
1 @ 23
Opposed
Test 3 C-SS C 10 Standing
Seam
1 @ 24.5
1 @ 25
1 @ 23
Opposed
Test 4 C-TF C 8 Through
Fastened
1 @ 24.5
1 @ 25
1 @ 23
Opposed
I. P. Test 1
Z-SS
Z 8.5 Standing
Seam
2 @ 30 Opposed
I. P. Test 2
Z-SS
Z 8.5 Standing
Seam
2 @ 30 Opposed
I. P. Test 3
Z-TF
Z 8.5 Through
Fastened
2 @ 30 Opposed
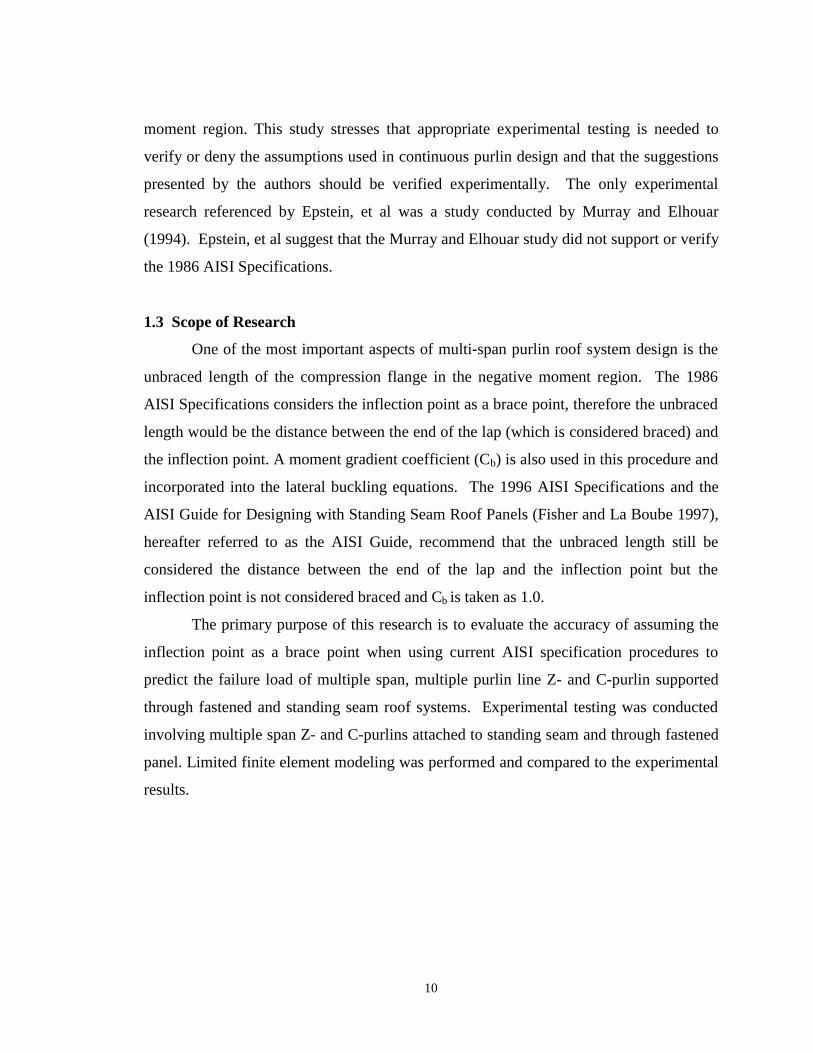
Panels. The panels used in the tests were of three basic configurations. The first
is a standard through fastened panel shown in Figure 2.1. The second configuration is a
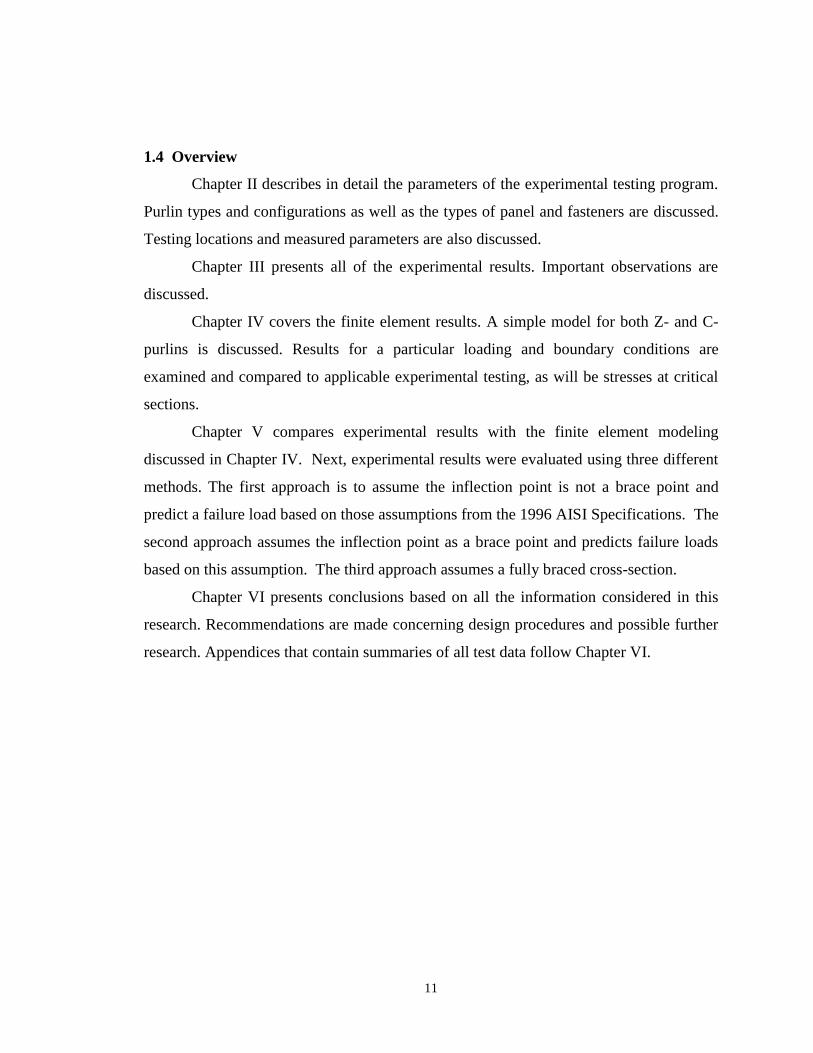
standing seam pan type panel with sliding clips shown in Figure 2.2. Finally the third
14
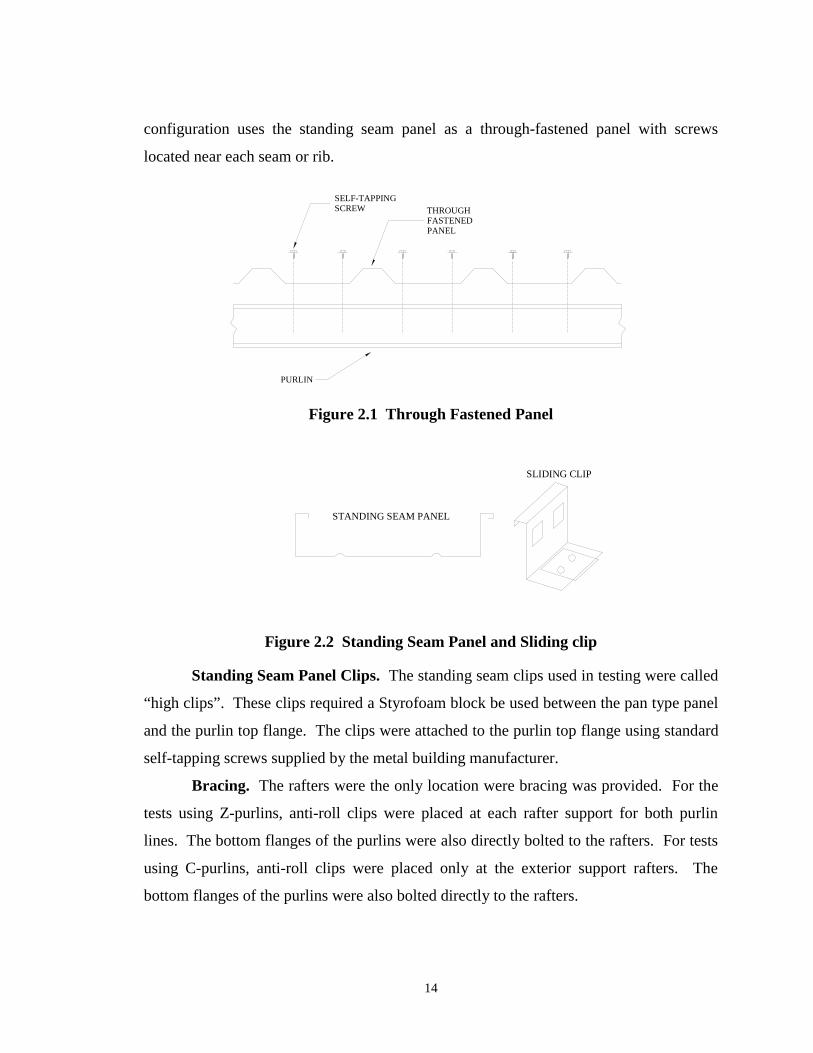
configuration uses the standing seam panel as a through-fastened panel with screws
located near each seam or rib.
THROUGH FASTENEDPANEL
SELF-TAPPING SCREW
PURLIN
Figure 2.1 Through Fastened Panel
STANDING SEAM PANEL
SLIDING CLIP
Figure 2.2 Standing Seam Panel and Sliding clip
Standing Seam Panel Clips. The standing seam clips used in testing were called
“high clips”. These clips required a Styrofoam block be used between the pan type panel
and the purlin top flange. The clips were attached to the purlin top flange using standard
self-tapping screws supplied by the metal building manufacturer.
Bracing. The rafters were the only location were bracing was provided. For the
tests using Z-purlins, anti-roll clips were placed at each rafter support for both purlin
lines. The bottom flanges of the purlins were also directly bolted to the rafters. For tests
using C-purlins, anti-roll clips were placed only at the exterior support rafters. The
bottom flanges of the purlins were also bolted directly to the rafters.

15
Tests I. P. Test 1, 2, and, 3 used anti-roll clips at each rafter support for both
purlin lines. Test I. P. Test 2 Z-SS also had a brace attached between the purlin lines.
The brace was attached at the theoretical inflection point.
2.3 Test Setups
All tests were subjected to gravity loading. The gravity load was simulated with
the use of a vacuum chamber. The vacuum chamber provides an airtight space around
the test setup. Air is pumped out of the chamber with one or more vacuum pumps. This
causes a negative differential pressure in the chamber. In essence the surrounding
atmospheric pressure loads the test specimens.
Tests were conducted in two locations, at the Virginia Tech Structures and
Materials Research Laboratory, and at the Ceco Building Systems Research Laboratory
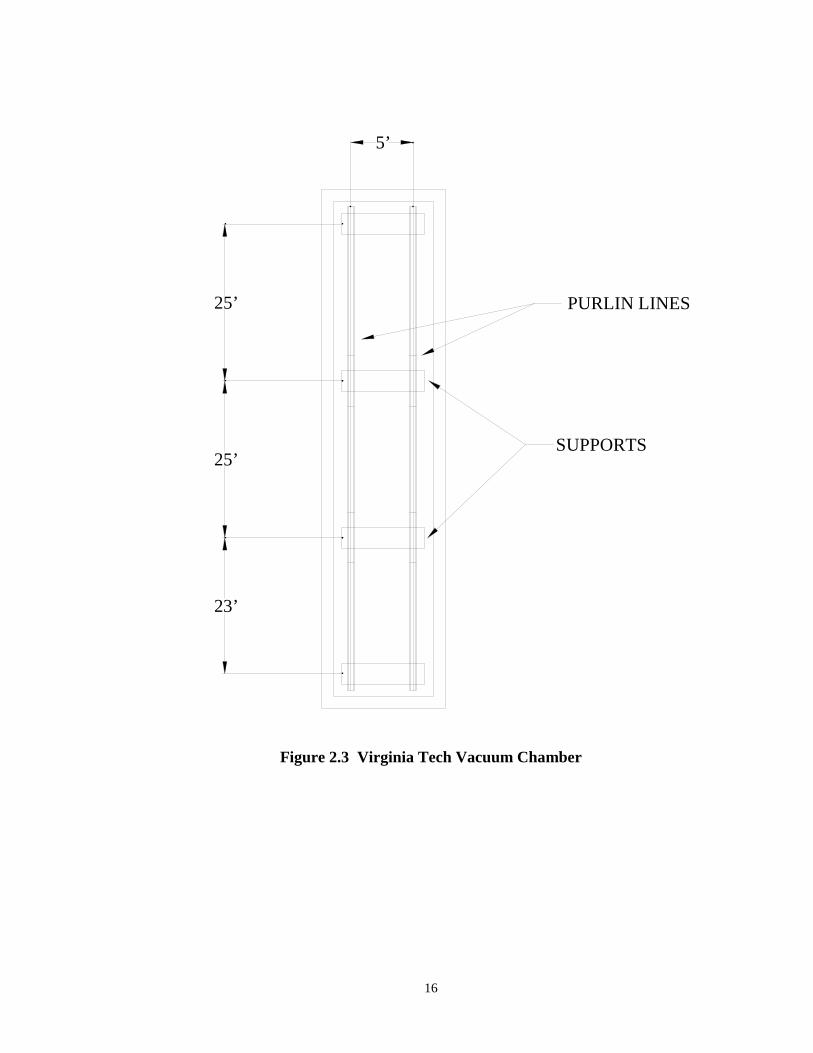
in Columbus, Mississippi. The Virginia Tech vacuum chamber consisted of a box 8ft. x
78 ft. x 3 ft. The chamber is constructed from 3 ft. x 8 ft. galvanized steel panels. The
joints between panels and between the panel and floor are sealed with caulk. Bulkhead
panels can be inserted in the chamber to shorten the chamber when the entire length is not
required. A plan view of the Virginia Tech vacuum chamber is shown in Figure 2.3.
The Ceco Building Systems chamber consisted of a box 10.58 ft. x 92 ft. x 3.83 ft.
The Ceco chamber is constructed from two built-up I-sections stacked on each other and
welded into place. The I-sections are sealed to the floor with caulk. Bulkhead panels can
be inserted into the chamber to shorten the chamber to the required length. The Ceco
chamber uses two additional purlin lines to reduce the width of the chamber to 8.5 ft. as
shown in Figure 2.4 through Figure 2.6.
16
SUPPORTS
PURLIN LINES
23’
25’
25’
5’
Figure 2.3 Virginia Tech Vacuum Chamber

17
10’-7
"C
C
1 2
1’-0" 30’-0"
92’-0" (NOT TO SCALE)
A
B
2 1/4" X
XFACE OFEND PLATE
END PLATEFACE OF
ROTARY BLOWERWITH "U" TUBEMANOMETER
FLEXIBLE HOSE
LEGEND:
ANTI- ROLL CLIP (CL203)
SUPPORT FOR TEST MEMBER
TEST MEMBER
2 1/4"
B-1
BU
LK
HE
AD
B-2
3
30’-0"
A-1 A-2
2’-0"
1’-0 1/2"
5’-0
"
1’-0 1/2"
1’-9"
1’-9"
FILL-IN MEMBER
Figure 2.4 Ceco Vacuum Chamber
5’-0"
(PANEL LENGTH)
(BETWEEN TEST BOX FLANGES)
W/(4) 3/4"Ø EXPANSION ANCHORSPLATE 5/8" X 8" X 1'-0 1/2"
(2) 1/2"Ø A307 BOLTS
W6X9 TIE DOWN BEAM
W14X30 SUPPORT BEAM
10’-7"
TEST BOXSIDE OF
3’-1
0"
3 ’-0
1/2
"
1’-1
1"
FLANGES
1’-1
1" 5"
W6X9 SUPPORTBEAM COLUMN
PURLIN
10"2 1/2"CL
1’-0"
10’-2"
7’-0"
(CONC. SLAB)FIN. FLOOR
DETAIL "A"
CLIP (CL203)ANTI-ROLL
BEAM COLUMNW6X9 SUPPORT
(2) 1/2"ØA325 BOLTS
5"
(2) 1/2"ØA325 BOLTS
FLANGES
PANEL
1’-0"
PURLIN
10"CL
2 1/2"9" 9"
CLIP (CL203)ANTI-ROLL
CL CL
Figure 2.5 Ceco Chamber Cross-Section

18
(6 MIL)POLYETHYLENE
PANEL
FILL-IN PURLIN
L2" X 2" X 1/8"CONTINUOUS
(AS REQ’D)"C" CLAMP
L2 1/2"
C
24 GA. ANGLE (NORTH AND1" X 1" X DOUBLE
10"
ONE FASTENEREACH SIDE OF RIB
SOUTH SIDE)
TEST BOX FLANGE
9"
8-1/2 Z88 FILL-INPURLINS TYPICAL ATNORTH AND SOUTH SIDE
RESTRAINTS
Figure 2.6 Ceco Chamber Edge Detail “A”
The configuration to be tested was then constructed inside the chamber. The top
of the chamber was sealed with a sheet of polyethylene (6 mil thick). At Virginia Tech
the air was removed from the chamber using a main vacuum pump and four auxiliary
“shop-type” vacuum pumps. The Ceco tests used only one main vacuum pump to
remove air from the chamber.
All tests consisted of two purlin lines spaced 5 ft. on center. The purlin flanges
were facing in the opposite direction for all tests. The panel used for all testing was 7 ft.
wide. This allowed for a 1-ft. overhang from the centerline of the web of each purlin.
All standing seam tests used sliding clips that were attached to the purlin with self-
drilling screws. The through-fastened panel was attached directly to the purlin with self-
drilling screws.
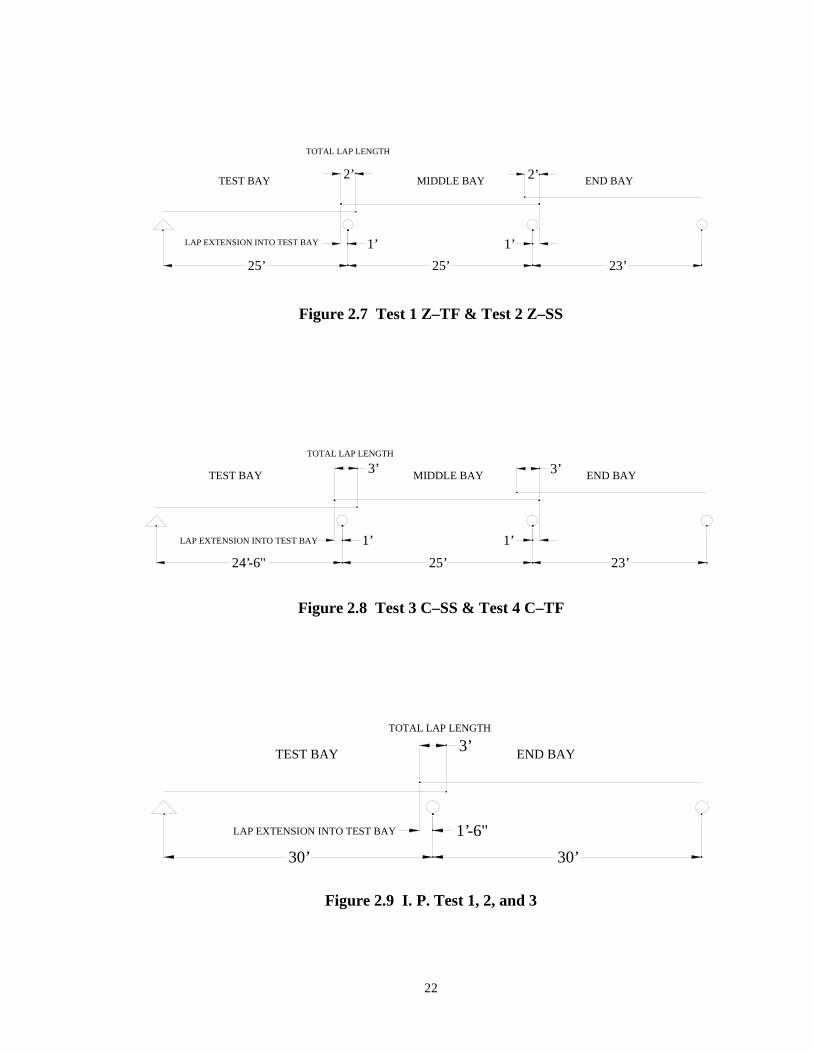
The three span tests had varying parameters. The tests with Z-purlins had the
span lengths of 25 ft., 25 ft., and 23 ft. The test bay with all instrumentation had a span
length of 25 ft. while the opposite exterior bay was shortened to 23 ft. Lap splices at each
interior support for the three span Z-purlin tests extended 1 ft. over each side of the
support for a total lap length of 2 ft. The tests with C-purlins had a test span of 24.5 ft., a

19
middle bay with a span of 25 ft., and an end span of 23 ft. This was done to help ensure
that failure occurred in the test bay. The lap splices at each interior support for the three
span C-purlin tests extended 1 ft. in the direction of the exterior support and 2 ft. into the
middle bay for a total lap length of 3 ft.
Three two span tests were conducted. All span lengths were 30 ft. All two span
tests used 8.5 in. deep Z-purlins. Two of the tests were conducted using standing seam
panel, while the third used a through-fastened panel. The lap splice at the interior support
of the two span tests extended 1.5 ft. beyond each support for a total lap length of 3 ft.
Details of the test parameters are given in Table 2.2 and in Figure 2.7 through Figure 2.9.
Data was collected electronically at Virginia Tech for the three span tests using a
personal computer based data acquisition system. The two span tests that were conducted
at Ceco Building Systems used manual data collection.
The gravity loadings for tests at both locations were measured using U-tube
manometers. The manometers have an accuracy of 0.1 in. of water. One inch of water is
equivalent to about 5.2 psf.
Vertical displacement transducers were used at Virginia Tech to measure
maximum vertical deflections in the test bay. Vertical deflection was measured at Ceco
building systems using a surveyor’s level to read a scale that was placed over the
theoretical point of maximum deflection. Measurements were taken for both purlins in
the test bay of each test. No Measurements were taken in non-test bays.
Lateral displacement of the test bay was measured for the three span standing
seam tests. A vertical displacement transducer was used with a pulley system that allows
the actual lateral movement to be calculated. This value was small because of the
opposite orientation of the purlins.
Spread of the test purlins was measured using potentiometers. Spread refers to
the roll or lateral displacement measured approximately two inches above the purlin
bottom flange with respect to the purlin top flange. The potentiometers were placed at
the location of maximum moment and 1 ft. away from the calculated inflection point on
both sides. The potentiometers were suspended from cold-formed angles that span across

20
the purlin lines in such a manner that they did not provided any additional bracing
between the purlin lines as shown in Figure 2.10 and Figure 2.11. The potentiometers
measured the spread of the purlin at about two inches above the purlin bottom flange.
Finally, tests conducted at Virginia Tech had strain gages placed on the top and
bottom surface of the purlin bottom flange. This was done to find the location of the true
inflection point. Ten gages were placed on each test purlin. They were located at the
calculated inflection point, and 6 in., and 12 in. on each side of the calculated inflection
point. The location of the inflection point was calculated using a non-prismatic stiffness
analysis. Figure 2.12 and Figure 2.13 show typical strain gage locations.

21
Table 2.2 Test Details
TEST # PURLIN
TYPE
SPANS TOTAL
LAP
LAP LENGTH
INTO
TEST BAY
PANEL
TYPE
Test 1 Z-TF 8 in. Z Test Bay: 25 ft.
Middle Bay: 25 ft.
End Bay: 23 ft.
2 ft. 1 ft. Through
Fastened
Test 2 Z-SS 10 in. Z Test Bay: 25 ft.
Middle Bay: 25 ft.
End Bay: 23 ft.
2 ft. 1 ft. Standing
Seam
Test 3 C-SS 10 in. C Test Bay: 24.5 ft.
Middle Bay: 25 ft.
End Bay: 23 ft.
3 ft. 1 ft. Standing
Seam
Test 4 C-TF 8 in. C Test Bay: 24.5 ft.
Middle Bay: 25 ft.
End Bay: 23 ft.
3 ft. 1 ft. Through
Fastened
I. P. Test 1
Z-SS
8.5 in. Z Test Bay: 30 ft.
End Bay: 30 ft.
3 ft. 1.5 ft. Standing
Seam
I. P. Test 2
Z-SS
8.5 in. Z Test Bay: 30 ft.
End Bay: 30 ft.
3 ft. 1.5 ft. Standing
Seam
I. P. Test 3
Z-TF
8.5 in. Z Test Bay: 30 ft.
End Bay: 30 ft.
3 ft. 1.5 ft. Through
Fastened
22
25’ 25’ 23’
1’
2’ 2’
1’
TEST BAY MIDDLE BAY END BAY
LAP EXTENSION INTO TEST BAY
TOTAL LAP LENGTH
Figure 2.7 Test 1 Z–TF & Test 2 Z–SS
24’-6" 25’ 23’
1’
3’ 3’
1’
TEST BAY MIDDLE BAY END BAY
LAP EXTENSION INTO TEST BAY
TOTAL LAP LENGTH
Figure 2.8 Test 3 C–SS & Test 4 C–TF
30’ 30’
1’-6"
3’TEST BAY END BAY
LAP EXTENSION INTO TEST BAY
TOTAL LAP LENGTH
Figure 2.9 I. P. Test 1, 2, and 3

23
POTENTIOMETER
COLD-FORMED SPPORT ANGLE
SCREW FASTENER
COLD-FORMED SUPPORT IS FREE TO SLIDE ACROSS TOP OF PURLIN
FASTENED END MOVESWITH PURLIN
POSITIVE SPREAD
DIRECTION
Figure 2.10 Potentiometer Support Configuration
Figure 2.11 Spread Potentiometer Support Locations in Test Bay

24
STRAIN GAGE LOCATIONS
STRAIN GAGE LOCATIONS
Figure 2.12 Z- and C-Purlin Strain Gage Locations
Figure 2.13 Strain Gage Locations in Test Bay
25
CHAPTER III
EXPERIMENTAL RESULTS
3.1 General Comments
Individual results for each test are found in Appendices A through G. Each set of
results includes a test summary sheet, measured purlin dimensions, section properties,
flexural strength, purlin arrangement within each test, tensile coupon results, and results
from a stiffness analysis. Each test appendix also includes individual data, plots of load
versus deflection, load versus strain, load versus purlin spread, and flexural strength
based on the assumption that the inflection point is a brace point and based on the
assumption that the inflection point is not a brace point.
A commercial software program was used to perform a non-prismatic stiffness
analysis of the each test configuration. A non-prismatic analysis is needed because of the
overlap of the purlins. The lapped region is stiffer and therefore attracts more moment.
The models were built with actual section properties and loaded with a uniform load of
100 pounds per foot. Moments and shears from critical locations were then recorded for
this loading, and were later scaled for other loadings. The stiffness models were also
used to calculate locations of maximum moment, maximum deflection, and to calculate
the location of the inflection point about which measurements were made.

26
3.2 Tensile Test Results
At least one standard ASTM coupon was cut and machined from the undamaged
web of a failed purlin from each test. The coupons were then tested according to ASTM
loading procedures; where more than one coupon was tested, average values are reported.
A summary of tensile test results is in Table 3.1.
Table 3.1 Summary of Tensile Test Results
Identification Thickness
(in.)
Width
(in.)
Yield
Stress
(ksi)
Tensile
Strength
(ksi)
Elongation
%
Test 1 Z-TF 0.104 1.504 55.5 76.7 37
Test 2 Z-SS 0.076 1.501 50.0 76.5 22
Test 3 C-SS 0.078 1.506 87.7 101.6 10
Test 4 C-TF 0.079 1.506 75.2 88.7 15
I.P. Test 1 Z-SS 0.077 1.502 69.5 78.3 20
I.P. Test 2 Z-SS 0.078 1.501 69.5 78.2 21
I.P. Test 3 Z-TF 0.077 2.050 69.5
27
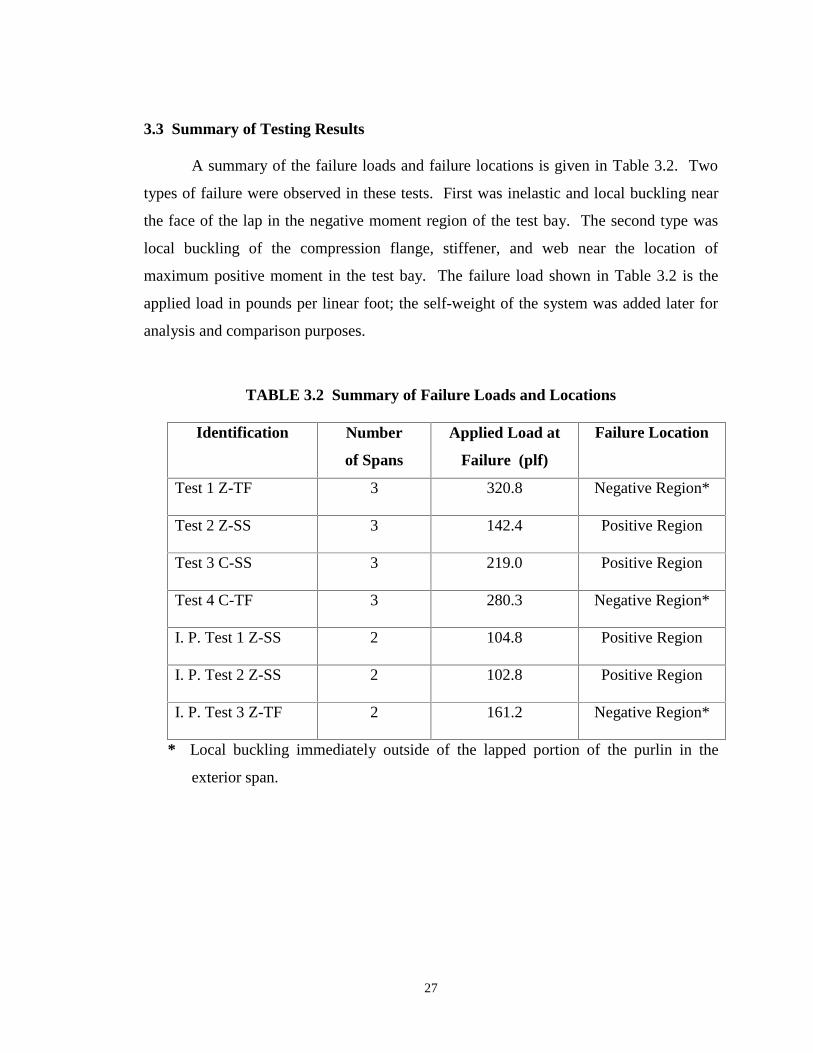
3.3 Summary of Testing Results
A summary of the failure loads and failure locations is given in Table 3.2. Two
types of failure were observed in these tests. First was inelastic and local buckling near
the face of the lap in the negative moment region of the test bay. The second type was
local buckling of the compression flange, stiffener, and web near the location of
maximum positive moment in the test bay. The failure load shown in Table 3.2 is the
applied load in pounds per linear foot; the self-weight of the system was added later for
analysis and comparison purposes.
TABLE 3.2 Summary of Failure Loads and Locations
Identification Number
of Spans
Applied Load at
Failure (plf)
Failure Location
Test 1 Z-TF 3 320.8 Negative Region*
Test 2 Z-SS 3 142.4 Positive Region
Test 3 C-SS 3 219.0 Positive Region
Test 4 C-TF 3 280.3 Negative Region*
I. P. Test 1 Z-SS 2 104.8 Positive Region
I. P. Test 2 Z-SS 2 102.8 Positive Region
I. P. Test 3 Z-TF 2 161.2 Negative Region*
* Local buckling immediately outside of the lapped portion of the purlin in the
exterior span.

28
As shown in Figure 3.1, the strain gage at position 8 is located at the calculated
inflection point, Figure 3.2 shows that the strain at this location remains very low
throughout the test demonstrating that the method used to calculate the inflection point is
adequate. Figure 3.2 is typical for all tests that were strain gaged. Other plots of load
versus strain can be found in the appendices.
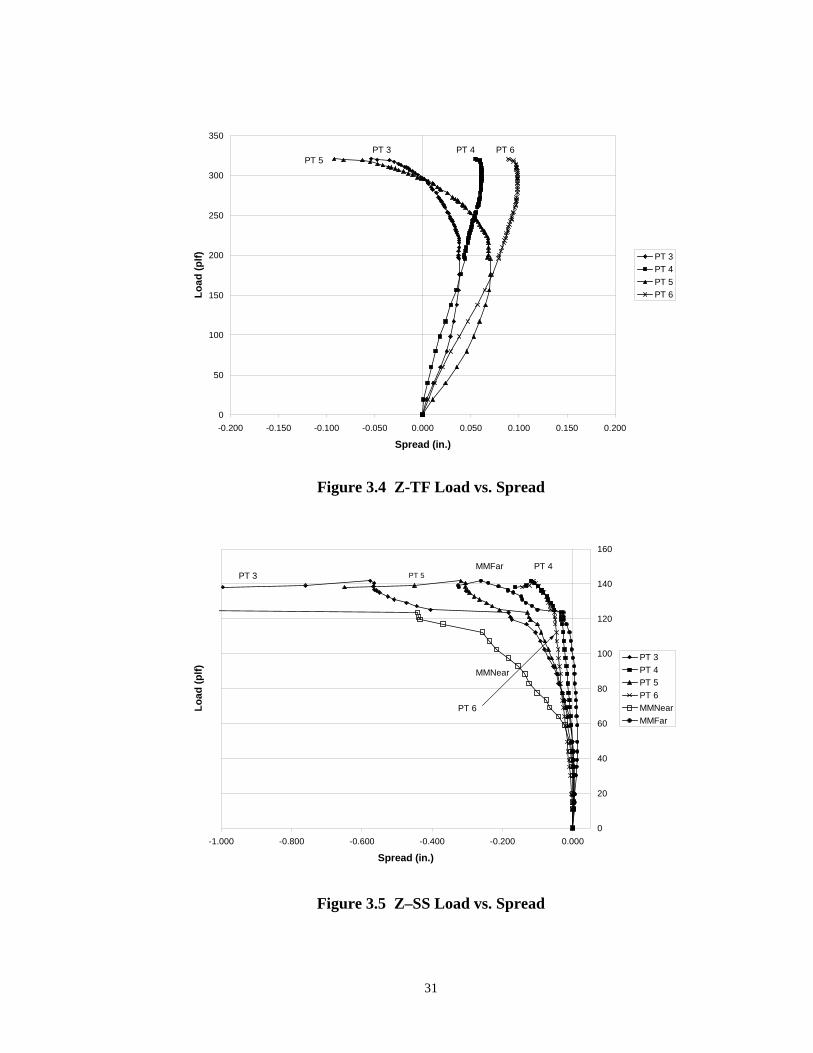
Figure 3.3 again shows the potentiometer locations for measuring purlin spread.
Spread was measured at 1 ft. inside the calculated inflection point (negative moment
region) and 1 ft. outside the inflection point (positive moment region). The spread was
also measured at the location of maximum moment for all tests except Test 1 Z-TF.
Figure 3.4 shows a plot of load versus spread for a typical through-fastened Z-purlin test.
Figure 3.5 shows typical spread of a standing seam Z-purlin test. Figure 3.6 shows the
typical behavior of a through-fastened C-purlin test and Figure 3.7 shows a typical
standing seam C-purlin test.
It was expected that very little movement would occur at an inflection point. It
was hypothesized that out-of-plane double curvature might be exhibited near the
inflection point, especially in the Z-purlin tests. The major reason for expecting this
behavior was because of the conditions at the inflection point and the properties of the
purlin cross-section. Negative moment is present between the interior support and the
inflection point, while positive moment is present between the inflection point and the
exterior support. The principle axis of a Z cross-section is inclined to the plane of
loading This would seem to lead to the section wanting to rotate in one direction on one

29
TEST BAY
NEAR PURLIN
FAR PURLIN
I. P.
EXTERIOR SUPPORTINTERIOR SUPPORT
109876STRAIN GAGE
POSITIONS
1 2 3 54 STRAIN GAGEPOSITIONS
Figure 3.1 Strain Gage Locations
0
50
100
150
200
250
300
-300 -200 -100 0 100 200 300 400 500
Strain (ue)
Lo
ad (
plf
) Position 6Position 7Position 8Position 9Position 10
7 8 9 10Position 6
Figure 3.2 Load vs. Strain Far Purlin Line

30
side of the inflection point and another direction on the other side of the inflection point.
The actual behavior was somewhat different.
As shown in the figures of this chapter and in the appendices, the inflection point
did not remain stationary in any test conducted. In general, the inflection point rolled
inward for the tests using Z-purlins and outward for tests using C-purlins. The values of
spread were small in all cases compared to the spread at maximum moment. It should be
noted that the spreads of the Z-purlins were much less that the C-purlin spread. Test data
and plots for each test can be found in appendices A through G.
TEST BAY
NEAR PURLIN
FAR PURLIN
I. P. MAXIMUM MOMENT
EXTERIOR SUPPORTINTERIOR SUPPORT
1’ 1’
PT 3PT 5
PT 6 PT 4
MMNEAR
MMFAR
Figure 3.3 Potentiometer Locations
31
0
50
100
150
200
250
300
350
-0.200 -0.150 -0.100 -0.050 0.000 0.050 0.100 0.150 0.200
Spread (in.)
Lo
ad (
plf
) PT 3PT 4
PT 5PT 6
PT 5PT 4 PT 6PT 3
Figure 3.4 Z-TF Load vs. Spread
0
20
40
60
80
100
120
140
160
-1.000 -0.800 -0.600 -0.400 -0.200 0.000
Spread (in.)
Lo
ad (
plf
)
PT 3
PT 4PT 5
PT 6MMNear
MMFar
MMNear
PT 3 PT 5MMFar
PT 6
PT 4
Figure 3.5 Z–SS Load vs. Spread

32
0
50
100
150
200
250
300
0.000 0.500 1.000 1.500 2.000 2.500 3.000 3.500
Spread (in.)
Lo
ad (
plf
)
PT 3
PT 4PT 5
PT 6MMNear
MMFar
MMNear
PT 3PT 6 PT 4 PT 5
MMFar
Figure 3.6 C–TF Load vs. Spread
0
50
100
150
200
250
0.000 0.500 1.000 1.500 2.000 2.500 3.000 3.500
Spread (in.)
Lo
ad (
plf
)
PT 3PT 4
PT 5PT 6
MMNearMMFar
MMNearMMFarPT 5 PT 6
PT 3 PT 4
Figure 3.7 C–SS Load vs. Spread
33
CHAPTER IV
ANALYTICAL RESULTS
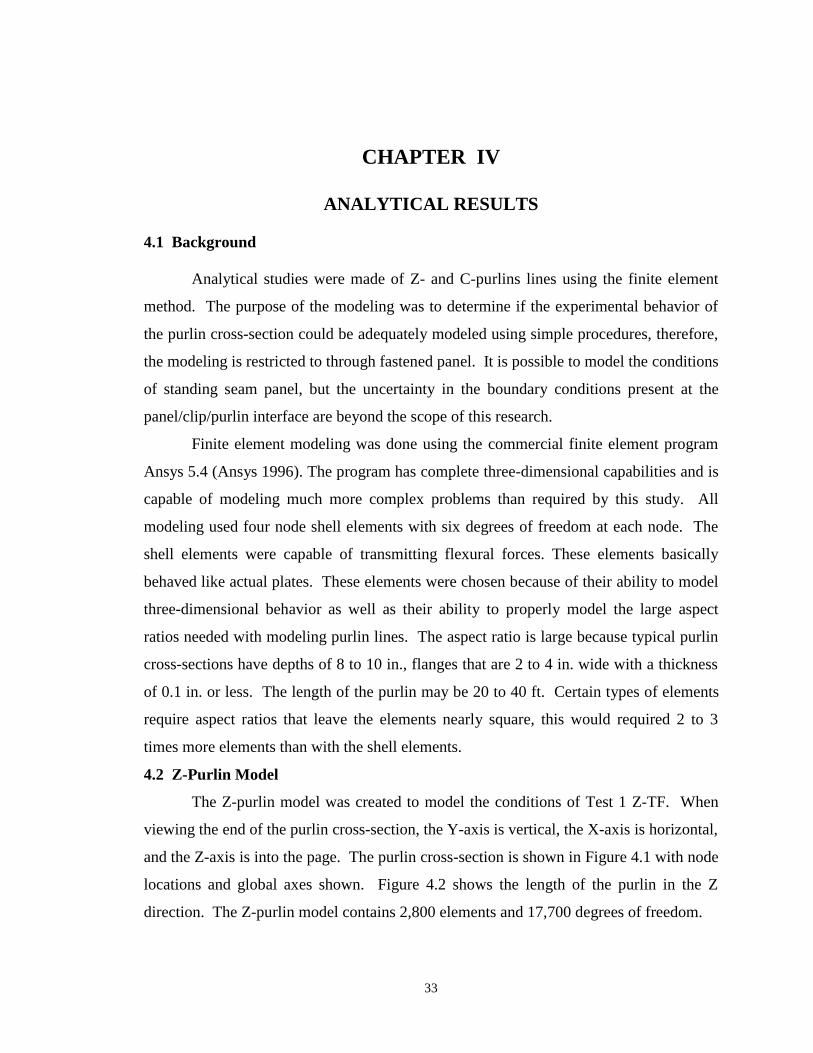
4.1 Background
Analytical studies were made of Z- and C-purlins lines using the finite element
method. The purpose of the modeling was to determine if the experimental behavior of
the purlin cross-section could be adequately modeled using simple procedures, therefore,
the modeling is restricted to through fastened panel. It is possible to model the conditions
of standing seam panel, but the uncertainty in the boundary conditions present at the
panel/clip/purlin interface are beyond the scope of this research.
Finite element modeling was done using the commercial finite element program
Ansys 5.4 (Ansys 1996). The program has complete three-dimensional capabilities and is
capable of modeling much more complex problems than required by this study. All
modeling used four node shell elements with six degrees of freedom at each node. The
shell elements were capable of transmitting flexural forces. These elements basically
behaved like actual plates. These elements were chosen because of their ability to model
three-dimensional behavior as well as their ability to properly model the large aspect
ratios needed with modeling purlin lines. The aspect ratio is large because typical purlin
cross-sections have depths of 8 to 10 in., flanges that are 2 to 4 in. wide with a thickness
of 0.1 in. or less. The length of the purlin may be 20 to 40 ft. Certain types of elements
require aspect ratios that leave the elements nearly square, this would required 2 to 3
times more elements than with the shell elements.
4.2 Z-Purlin Model
The Z-purlin model was created to model the conditions of Test 1 Z-TF. When
viewing the end of the purlin cross-section, the Y-axis is vertical, the X-axis is horizontal,
and the Z-axis is into the page. The purlin cross-section is shown in Figure 4.1 with node
locations and global axes shown. Figure 4.2 shows the length of the purlin in the Z
direction. The Z-purlin model contains 2,800 elements and 17,700 degrees of freedom.

34
The modeling of the purlin lap required special consideration. The lap region has
a thickness equal to the thickness of both purlins that are a part of the lap. In the case of
Test 1 Z-TF a thickness of 0.2 inches was used. This translates to twice the thickness and
twice the stiffness if the lap acts together as a unit. In actuality, the lap is connected by a
specified number of bolts. The most accurate model would model the lap as two separate
purlins bolted together at specified locations. However, the AISI Guide design models
assume that the lap acts as one unit. Therefore, the lap was modeled as one continuous
cross-section with twice the stiffness of one purlin. The lap region stiffness can be
increased by increasing the thickness of the elements or by increasing the modulus of
elasticity. Both properties were easy to modify and produced nearly identical results.
The results presented in this study were obtained by doubling the thickness of the
elements in the lapped region of the model.
The required boundary conditions also required special considerations. At the
supports, translations in the X and Y directions were restricted at locations that
corresponded to the anti-roll clips as shown in Figure 4.3. These locations were allowed
to rotate about the X-axis to simulate a pinned support condition. One end of the model

35
Y
XZGLOBAL AXES
NODE
SHELL ELEMENT
Figure 4.1 Z Model Cross-Section
NODES SHELL ELEMENTS
Figure 4.2 Z Model Side View
Y DIRECTION RESTRAINED
X DIRECTION RESTRAINED
NODE SYMBOL
LOAD LOCATION
Figure 4.3 Boundary Conditions at Supports

36
needed to have translation restricted in the Z direction to make the model stable. The
boundary conditions of the purlin top flange required special consideration. The purlin
top flange was fixed in the X direction at the intersection of the purlin top flange and
web. These are the conditions provided by through-fastened panel. The purlin lateral
movement or spread could be greatly effected by the location of load application. The
uniform line load was placed one-third of the flange width away from the purlin web.
Note that if load were transferred to the purlin top flange based on stiffness, the resultant
of that distribution would coincide with the load location used in this model. Figure 4.3
shows the final boundary conditions and load location used for the model.
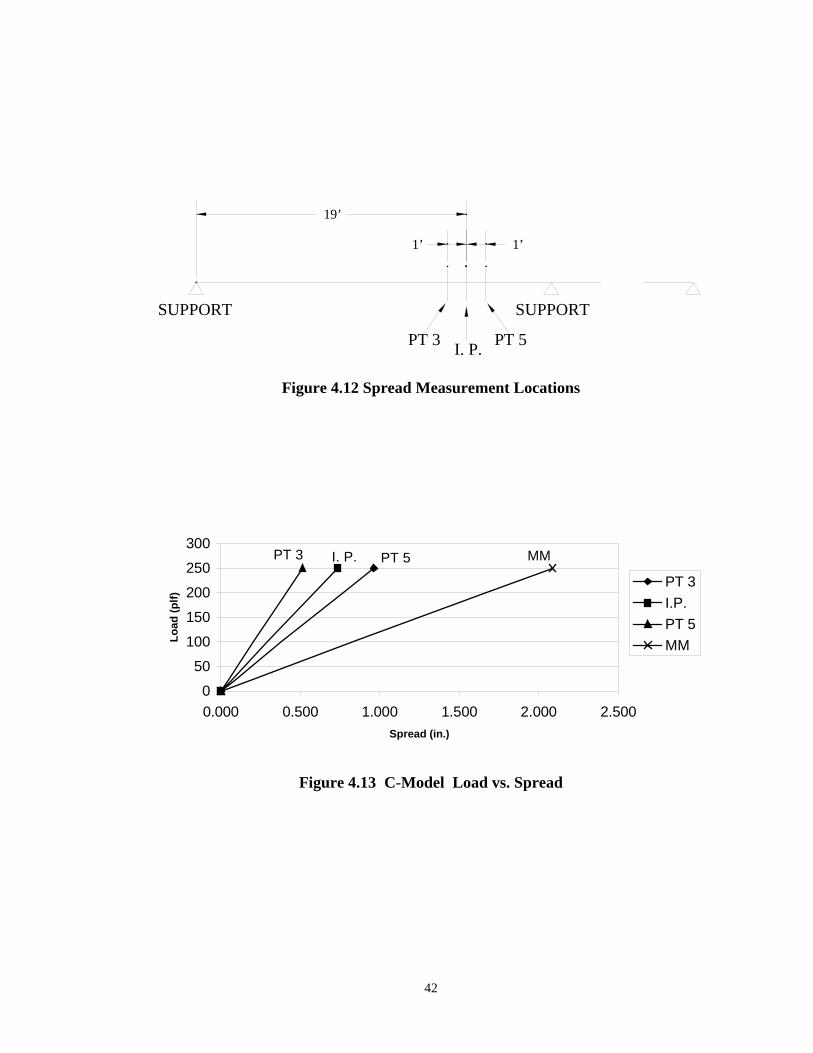
Lateral or spread movement of the purlins at the locations shown in Figure 4.4 is
plotted in Figure 4.5. The negative values imply movement of the purlin bottom flange
to the left for the orientation shown in Figure 4.1. As with the experimental results,
movement is greatest in the positive moment side of the inflection point and the entire
area moves to the left.
Loads versus strain at the locations shown in Figure 4.6 are plotted in Figure 4.7.
Finally, Figure 4.8 shows the deflected shape of the bottom flange of the Z-purlin model.
The values plotted in Figure 4.8 represent the lateral movement of the bottom flange at
the intersection with the purlin web as you move along the length of the purlin.

37
19’-6"
1’1’
PT 3I. P.
PT 5
SUPPORT SUPPORT
Figure 4.4 Spread Measurement Locations
0
50
100
150
200
250
300
350
-0.140 -0.120 -0.100 -0.080 -0.060 -0.040 -0.020 0.000
Spread (in.)
Lo
ad (
plf
) PT 3
I.P.
PT 5
PT 3
PT 5 I.P.
Figure 4.5 Z-Model Load vs. Spread

38
19’-6"
SUPPORTSUPPORT
POS 1POS 5
POS 4 POS 2
POS 3I. P.
6"6"6"
6"
Figure 4.6 Strain Measurement Locations
0
50
100
150
200
250
300
350
-400 -200 0 200 400 600
Strain (ue)
Lo
ad (
plf
)
POS 5
POS 4
POS 3
POS 2
POS 1
POS 1 POS 2 POS 3 POS 4 POS 5
Figure 4.7 Z-Model Load vs. Strain

39
0
5
10
15
20
25
30
35
-0.3 -0.25 -0.2 -0.15 -0.1 -0.05 0 0.05
Spread (in.)
Pos
itio
n (f
t.)
I. P.
Support
Support
Figure 4.8 Spread of Bottom Flange for Z-Purlin Model
4.3 C-Purlin Model
The C-purlin model was created to model the conditions of Test 4 C-TF. When
viewing the end of the purlin cross-section, the Y-axis is vertical, the X-axis is horizontal,
and the Z-axis is into the page. The purlin cross-section is shown in Figure 4.9 with node
locations and global axis shown. Figure 4.10 shows the length of the purlin in the Z
direction. The C-purlin model contains 2,500 elements and 15,000 degrees of freedom.
The lap region consists of two C-purlins with their webs back-to-back and
connected with bolts. The AISI Guide Design models and assumptions treat the lapped
region as if the lapped purlins are continuously connected. For this reason, the lap was
modeled by using one web with double the thickness of the purlins used in Test 4 C-TF.
The flanges of both purlins are attached to the double thickness web as was shown in
Figure 4.9. The single purlin web thickness is 0.08 in. and the lapped web thickness is
0.160 inches. In actuality, the lap is connected by a specified number of bolts. A more
accurate model would be to model the lap as two separate purlins bolted together at
specified locations.

40
The required boundary conditions needed special considerations. At the supports,
translations in the X and Y directions were restricted at locations that corresponded to the
anti-roll clips as shown in Figure 4.11. These locations were allowed to rotate about the
X-axis to simulate a pinned support condition. One end of the model needed to have
translation restricted in the Z direction to make the model stable. The boundary
conditions of the Purlin top flange required special attention. The purlin top flange was
fixed in the X direction at the intersection of the purlin top flange and web. These are the
conditions provided by through-fastened panel. The purlin lateral movement or spread
could be greatly effected by the location of the load application. The uniform line load
was placed at the intersection of the purlin web and top flange. Figure 4.11 shows the
final boundary conditions used for the model.
Lateral or spread movement of the purlins at the locations shown in Figure 4.12 is
plotted in Figure 4.13. The positive values imply movement of the purlin bottom flange
to the right for the orientation shown in Figure 4.8. As with the experimental results,
movement is greatest in the positive moment side of the inflection point and the entire
area moves to the right.
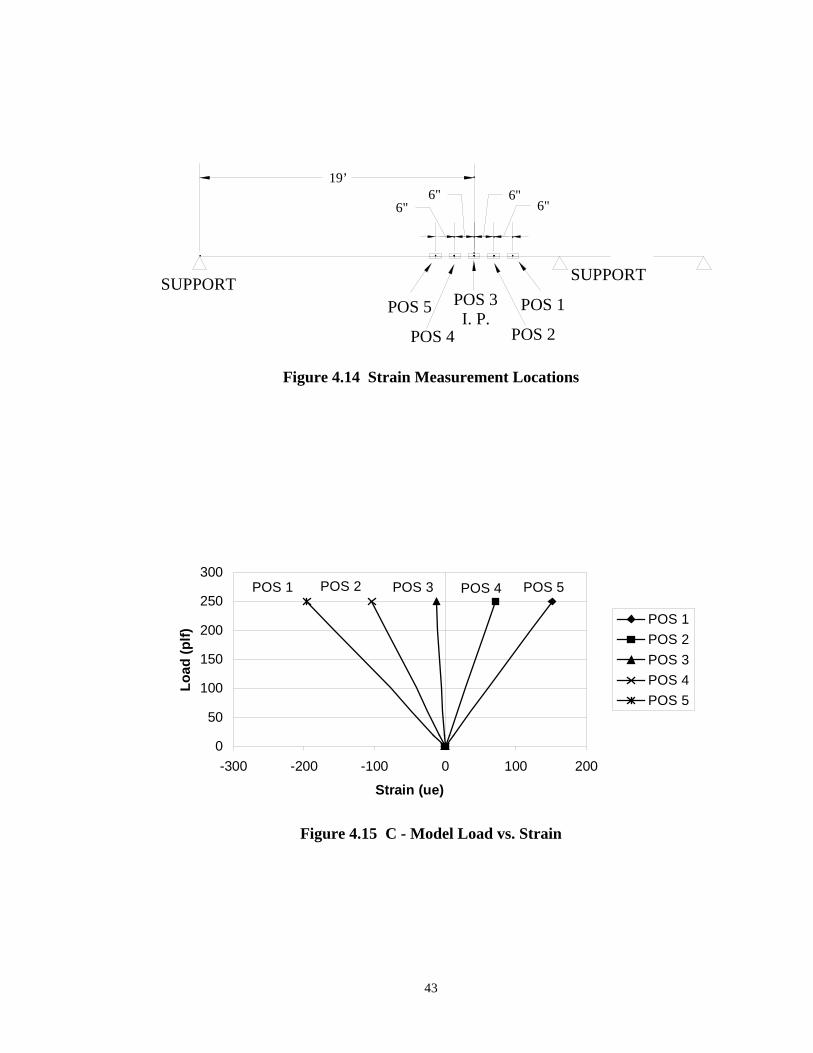
Loads versus strain at the locations shown in Figure 4.14 are plotted in Figure
4.15.

41
Y
XZGLOBAL AXES
NODE
SHELL ELEMENT
Figure 4.9 C-Model Cross-Section
NODES SHELL ELEMENTS
Figure 4.10 C-Model Side View
Y DIRECTION RESTRAINED
X DIRECTION RESTRAINED
NODE SYMBOL
LOAD LOCATION
Figure 4.11 C - Model Boundary Conditions at Supports
42
19’
1’1’
PT 3I. P.
PT 5
SUPPORT SUPPORT
Figure 4.12 Spread Measurement Locations
0
50
100
150
200
250
300
0.000 0.500 1.000 1.500 2.000 2.500Spread (in.)
Lo
ad (
plf
)
PT 3
I.P.
PT 5
MM
PT 3 I. P. PT 5 MM
Figure 4.13 C-Model Load vs. Spread
43
19’
SUPPORTSUPPORT
POS 1POS 5
POS 4 POS 2
POS 3I. P.
6"6"6"
6"
Figure 4.14 Strain Measurement Locations
0
50
100
150
200
250
300
-300 -200 -100 0 100 200
Strain (ue)
Lo
ad (
plf
)
POS 1
POS 2
POS 3
POS 4
POS 5
POS 1 POS 2 POS 3 POS 4 POS 5
Figure 4.15 C - Model Load vs. Strain
44
CHAPTER V
EVALUATION OF RESULTS
5.1 Introduction
The following sections include comparisons of Finite Element (FE) and
experimental strain values near the purlin line inflection point and purlin spread values at
the experimentally measured locations, as well as strength comparisons. The predicted
strengths of the test assemblies are based on the 1996 AISI Specifications and the design
suggestions in the AISI Guide for Designing with Standing Seam Roof Panels.
5.2 Predicted and Measured Strains
Strain values from the Z- and C-purlin FE models were compared with strain
gage data. The Z-purlin model strain comparison is shown in Figure 5.1. Figure 5.2
shows strain comparisons for the C-purlin model. In general, the finite element stains are
shifted to the right as compared to the experimental strains. This may indicate that the
finite element inflection point was shifted closer to the internal supports as compared to
the experimental data. Another possible explanation could be that the strain values are
effected by the cross-section twist. This is included in the finite element strains, but
might not be measured by the uniaxial strain gages used in the experimental testing.

45
0
50
100
150
200
250
300
350
-400 -200 0 200 400 600
Strain (ue)
Lo
ad (
plf
)
FE POS 5
FE POS 4
FE POS 3
FE POS 2
FE POS 1
POS 5
POS 4
POS 3
POS 2
POS 1
Figure 5.1 Finite Element and Experimental Strain Results for Test 1 Z–TF
0
50
100
150
200
250
300
-400 -200 0 200 400
Strain (ue)
Lo
ad (
plf
)
FE POS 5
FE POS 4
FE POS 3
FE POS 2
FE POS 1
POS 5
POS 4
POS 3
POS 2
POS 1
Figure 5.2 Finite Element and Experimental Strain Results for Test 4 C–TF
46
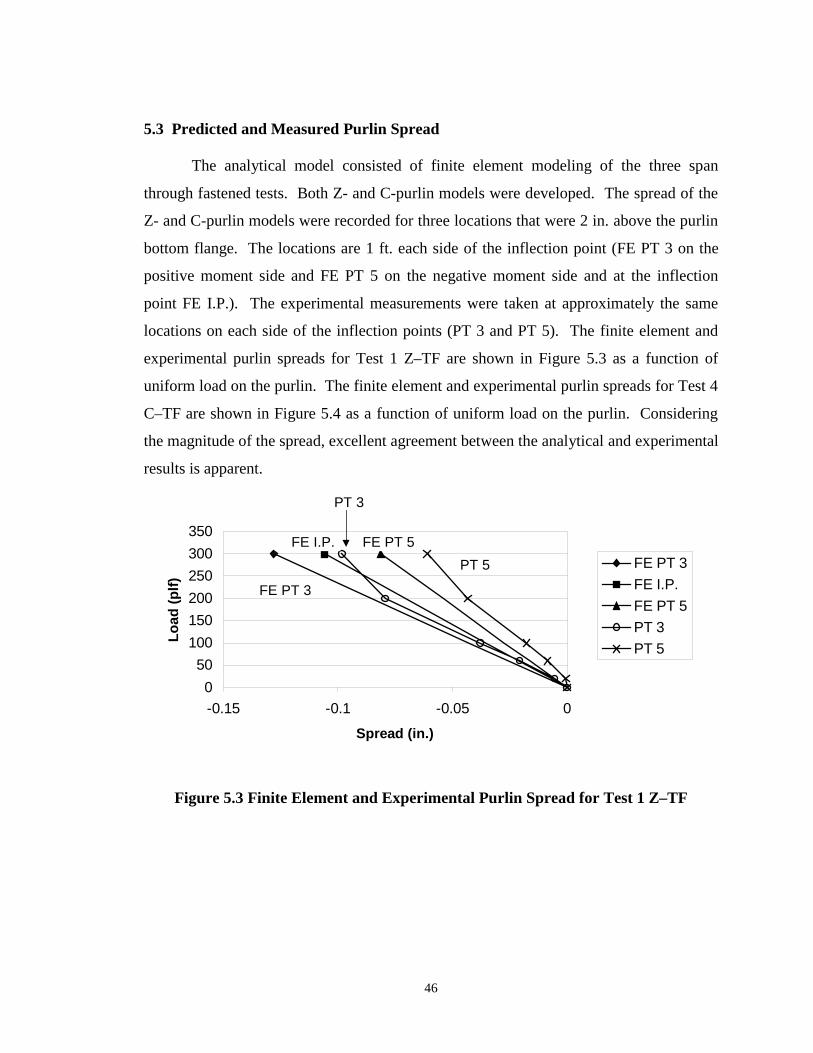
5.3 Predicted and Measured Purlin Spread
The analytical model consisted of finite element modeling of the three span
through fastened tests. Both Z- and C-purlin models were developed. The spread of the
Z- and C-purlin models were recorded for three locations that were 2 in. above the purlin
bottom flange. The locations are 1 ft. each side of the inflection point (FE PT 3 on the
positive moment side and FE PT 5 on the negative moment side and at the inflection
point FE I.P.). The experimental measurements were taken at approximately the same
locations on each side of the inflection points (PT 3 and PT 5). The finite element and
experimental purlin spreads for Test 1 Z–TF are shown in Figure 5.3 as a function of
uniform load on the purlin. The finite element and experimental purlin spreads for Test 4
C–TF are shown in Figure 5.4 as a function of uniform load on the purlin. Considering
the magnitude of the spread, excellent agreement between the analytical and experimental
results is apparent.
0
50
100
150
200
250
300
350
-0.15 -0.1 -0.05 0
Spread (in.)
Lo
ad (
plf
)
FE PT 3
FE I.P.
FE PT 5
PT 3
PT 5
FE PT 3
FE PT 5FE I.P.
PT 5
PT 3
Figure 5.3 Finite Element and Experimental Purlin Spread for Test 1 Z–TF

47
0
50
100
150
200
250
300
0.0 0.5 1.0 1.5 2.0 2.5 3.0
Spread (in.)
Lo
ad (
plf
)
FE PT 3
FE I.P.
FE PT 5
FE MM
PT 3
PT 5
MM
FE PT 3
FE I. P. FE PT 5
FE MM
MM
PT 5
PT 3
Figure 5.4 Finite Element and Experimental Purlin Spread for Test 4 C–TF
5.4 Strength Evaluation
5.4.1 Evaluation Assumptions
The 1986 edition of the AISI Specifications permitted the assumption that the
inflection point of an unbraced member is a brace point resulting in a moment gradient
factor, Cb, value of 1.75. The 1996 AISI Specifications states that an inflection point of
an unbraced member is not a brace point and the AISI Design Guide suggests that the
length of purlin between the end of the lap and the inflection point be designed as if the
section is a cantilever. The latter provision implies that Cb be taken as 1.0. Also, the
1986 and 1996 AISI Specifications have different provisions for the calculation of Cb.
Both the 1986 and 1996 AISI Specifications have the following sentence in
Section C3.1.2 Lateral Buckling Strength: “The provisions of this section do not apply to
laterally unbraced compression flanges of otherwise laterally stable sections.” This
sentence is a bit ambiguous but can be interpreted to apply to the distance between the
end of the lap and the inflection point for, at least through fastened roof systems. The
48
roof deck prevents lateral movement of the cross-section, but the compression flange is
free to move laterally in the negative moment region. Thus, both conditions are satisfied.
For standing seam roof systems, the restraint provided by the clips and deck is not
as great as for through fastened systems but may be sufficient to restrain the purlin in the
negative moment region.
Strength predictions for the seven tests conducted in this study were calculated
using the 1996 AISI Specifications nominal strength provisions assuming: (1) the
inflection point is not a brace point and with Cb equal to 1.0, (2) the inflection point is a
brace point and with Cb determined using the 1996 AISI Specifications Equation (Eq.
C3.1.2-11), and (3) the negative moment region of the purlin is fully braced. It is noted
that the second method is equivalent to that of the 1986 Specification method except for
the Cb relationship.
5.4.2 1996 AISI Specification Provisions
The 1996 AISI Specification provisions for determining Z- and C-purlin flexural,
shear, and combined bending and shear nominal strengths follow.
49
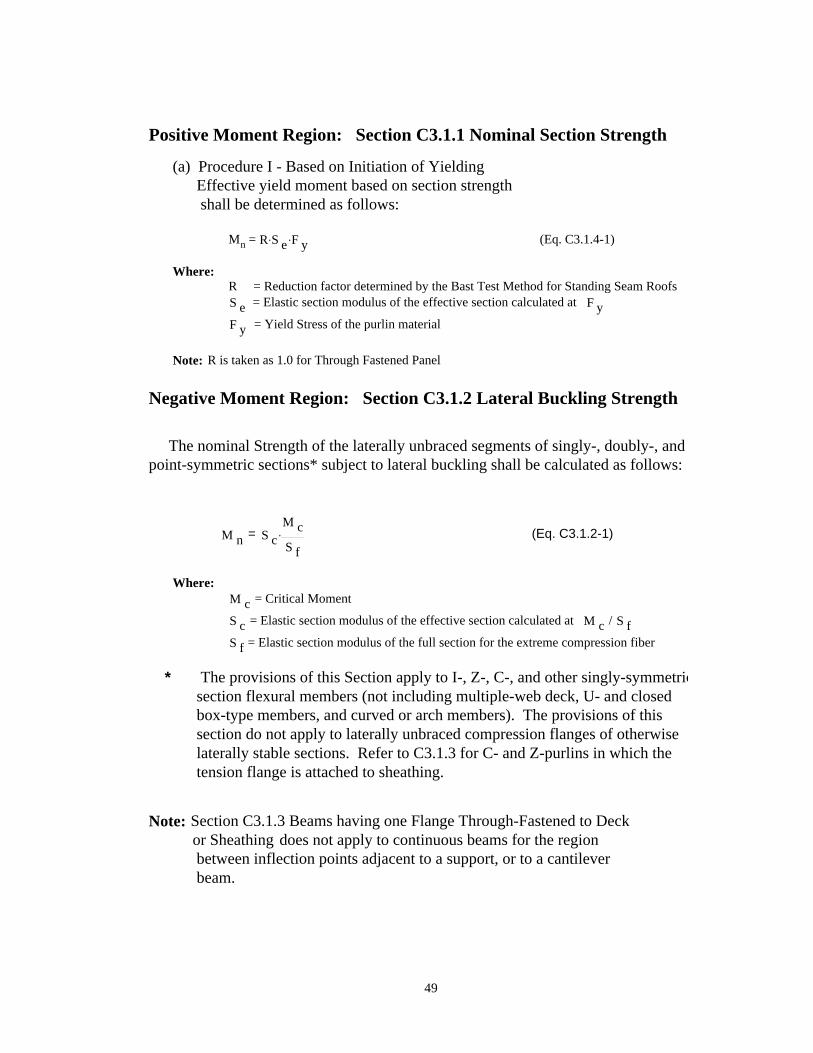
Positive Moment Region: Section C3.1.1 Nominal Section Strength
(a) Procedure I - Based on Initiation of Yielding Effective yield moment based on section strength shall be determined as follows:
Mn = R S e. F y
. (Eq. C3.1.4-1)
Where:R = Reduction factor determined by the Bast Test Method for Standing Seam RoofsS e = Elastic section modulus of the effective section calculated at F yF y = Yield Stress of the purlin material
Note: R is taken as 1.0 for Through Fastened Panel
Negative Moment Region: Section C3.1.2 Lateral Buckling Strength
The nominal Strength of the laterally unbraced segments of singly-, doubly-, and point-symmetric sections* subject to lateral buckling shall be calculated as follows:
M n = S cM c
S f
. (Eq. C3.1.2-1)
Where:M c = Critical Moment
S c = Elastic section modulus of the effective section calculated at M c / S fS f = Elastic section modulus of the full section for the extreme compression fiber
* The provisions of this Section apply to I-, Z-, C-, and other singly-symmetricsection flexural members (not including multiple-web deck, U- and closed box-type members, and curved or arch members). The provisions of this section do not apply to laterally unbraced compression flanges of otherwise laterally stable sections. Refer to C3.1.3 for C- and Z-purlins in which the tension flange is attached to sheathing.
Note: Section C3.1.3 Beams having one Flange Through-Fastened to Deck or Sheathing does not apply to continuous beams for the region between inflection points adjacent to a support, or to a cantilever beam.
50
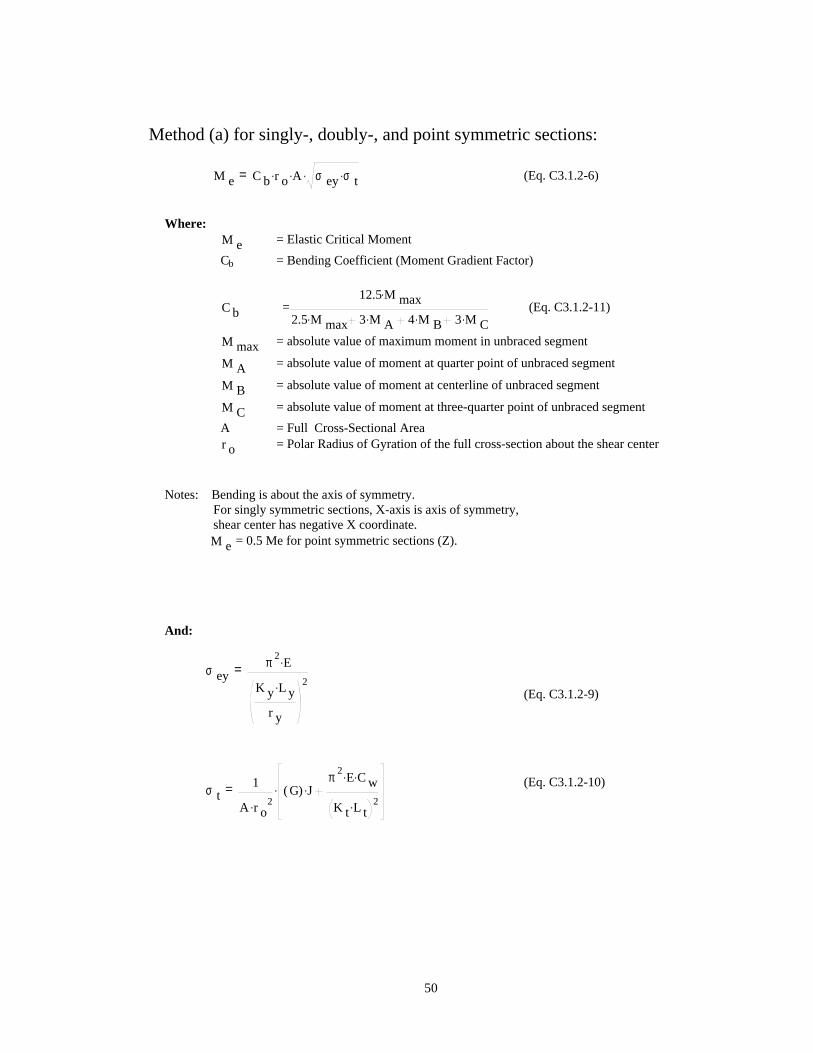
Method (a) for singly-, doubly-, and point symmetric sections:
M e = C b r o. A. σ ey σ t
.. (Eq. C3.1.2-6)
Where:M e = Elastic Critical Moment
Cb = Bending Coefficient (Moment Gradient Factor)
C b = 12.5 M max
.
2.5 M max. 3 M A
. 4 M B. 3 M C
. (Eq. C3.1.2-11)
M max = absolute value of maximum moment in unbraced segment
M A = absolute value of moment at quarter point of unbraced segment
M B = absolute value of moment at centerline of unbraced segment
M C = absolute value of moment at three-quarter point of unbraced segment
A = Full Cross-Sectional Arear o = Polar Radius of Gyration of the full cross-section about the shear center
Notes: Bending is about the axis of symmetry. For singly symmetric sections, X-axis is axis of symmetry, shear center has negative X coordinate. M e = 0.5 Me for point symmetric sections (Z).
And:
σ ey = π 2E.
K y L y.
r y
2
(Eq. C3.1.2-9)
(Eq. C3.1.2-10)σ t = 1
A r o2.
G( ) J.π 2
E. C w.
K t L t. 2
.
51
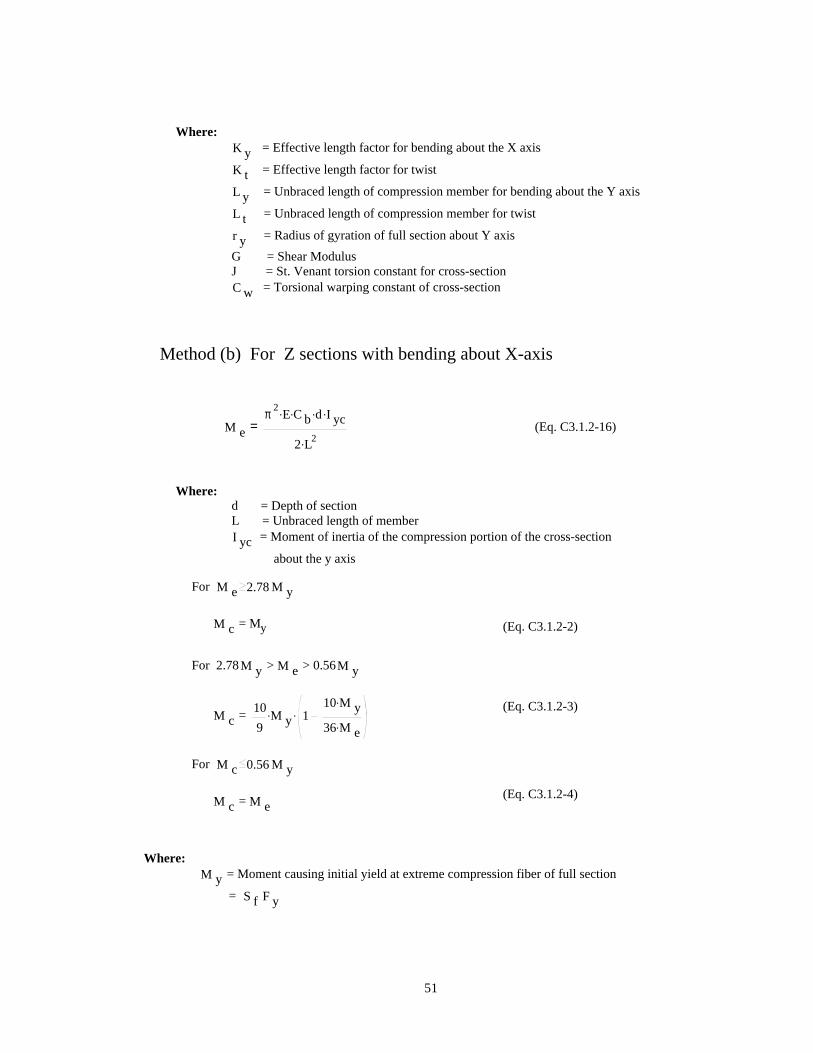
Where:K y = Effective length factor for bending about the X axis
K t = Effective length factor for twist
L y = Unbraced length of compression member for bending about the Y axis
L t = Unbraced length of compression member for twist
r y = Radius of gyration of full section about Y axis
G = Shear ModulusJ = St. Venant torsion constant for cross-sectionC w = Torsional warping constant of cross-section
Method (b) For Z sections with bending about X-axis
M e = π 2
E. C b. d. I yc
.
2 L2. (Eq. C3.1.2-16)
Where:d = Depth of sectionL = Unbraced length of memberI yc = Moment of inertia of the compression portion of the cross-section
about the y axis
For M e 2.78 M y
M c = My
For 2.78 M y > M e > 0.56 M y
M c = 10
9M y
. 110 M y
.
36 M e.
.
For M c 0.56 M y
M c = M e
(Eq. C3.1.2-2)
(Eq. C3.1.2-3)
(Eq. C3.1.2-4)
Where:M y = Moment causing initial yield at extreme compression fiber of full section
= S f F y
52
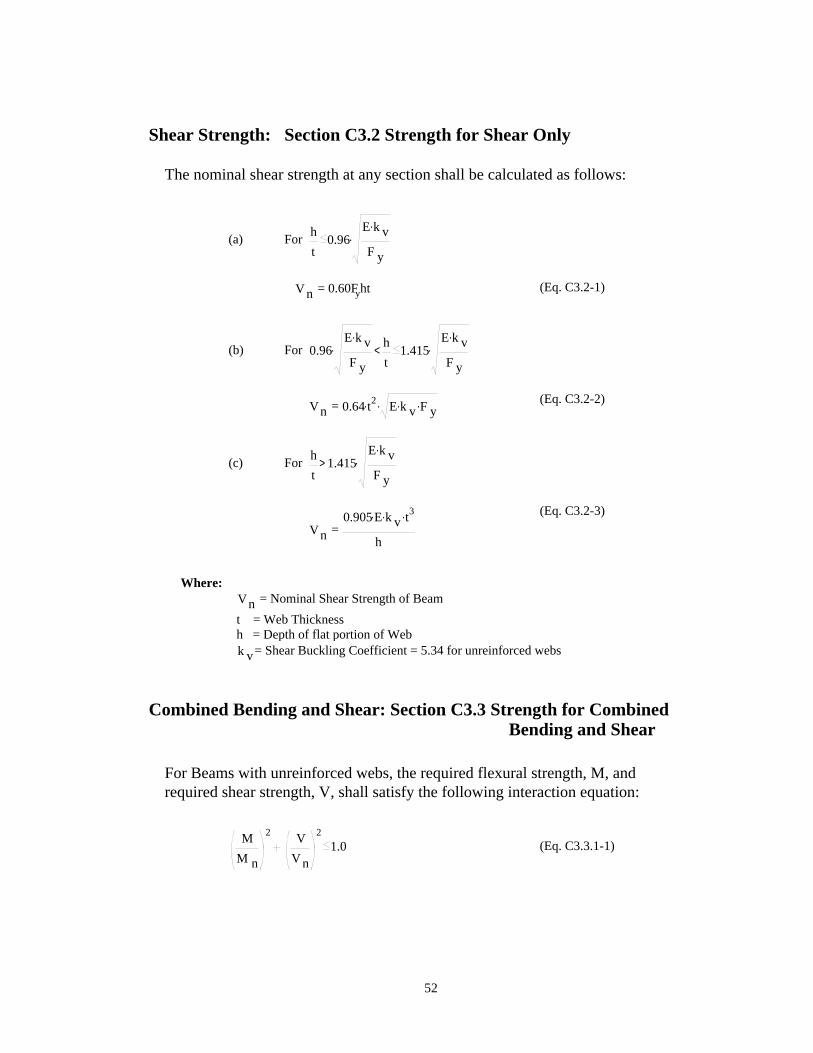
Shear Strength: Section C3.2 Strength for Shear Only
The nominal shear strength at any section shall be calculated as follows:
(a) For h
t0.96
E k v.
F y
.
V n = 0.60Fyht
(b) For 0.96E k v
.
F y
. h
t< 1.415
E k v.
F y
.
Vn = 0.64 t2. E k v. F y
..
(c) For h
t1.415
E k v.
F y
.>
Vn = 0.905 E. k v
. t3.
h
(Eq. C3.2-1)
(Eq. C3.2-2)
(Eq. C3.2-3)
Where:Vn = Nominal Shear Strength of Beam
t = Web Thicknessh = Depth of flat portion of Webk v= Shear Buckling Coefficient = 5.34 for unreinforced webs
Combined Bending and Shear: Section C3.3 Strength for Combined Bending and Shear
For Beams with unreinforced webs, the required flexural strength, M, and required shear strength, V, shall satisfy the following interaction equation:
M
M n
2 V
V n
2
1.0 (Eq. C3.3.1-1)

53
5.4.3 Strength Comparisons Assuming the Inflection Point is not a Brace Point
Table 5.1 lists the effective section modulus, Se, the measured material yield
stress, Fy, effective yield moment, SeFy, the distance from the end of the lap to the
theoretical inflection point, Lb, and the standing seam roof system reduction factor, R, for
the failed purlin in each test. The reduction factor R was determined using the AISI Base
Test Method.
Table 5.2 lists the moment and shear strength calculated using the above
specification provisions and the properties from Table 5.1. The negative moment
strength was determined using a Cb value of 1.0. The predicted failure load, determined
using the critical limit state, and the experimental failure load are also listed. (The
experimental failure load is the sum of the applied load plus the weight of the roof
sheeting times the tributary width plus the purlin weight.) The ratio of the experimental-
to-predicted failure loads varies between 0.955 and 1.226 with an average value of 1.056
and a standard deviation of 0.0896.
Table 5.1 Purlin Properties
Test Number Se Fy SeFy Lb R Cb
in3ksi in-kips in
Test 1 Z-TF 3.54 55.5 196.5 52.5 1.00 1.76
Test 2 Z-SS 3.78 50.6 191.3 54.8 0.44 1.77
Test 3 C-SS 3.15 87.5 275.6 53.2 0.45 1.76
Test 4 C-TF 2.42 75.0 181.5 53.2 1.00 1.76
I.P. Test 1 Z-SS 2.66 69.5 184.9 78.0 0.44 1.78I.P. Test 2 Z-SS 2.66 69.5 184.9 78.0 0.44 1.78I.P. Test 3 Z-TF 2.66 69.5 184.9 78.0 1.00 1.78
Note: Lb is the distance from the end of the lap to the inflection point in the test bay.

54
Table 5.2 Strength Comparison Assuming Inflection Point not as Brace point
Test Number Positive Negative Shear Critical Predicted Experimental Experimental / Predicted Experimental / PredictedMoment Moment Strength Limit State Failure Failure for forStrength Strength Load Load Shear Critical
+ Limit Statein-kips in-kips kips plf plf Bending
Test 1 Z-TF 196.5 195.7 19.8 Shear + Bending 295.7 320.8 1.085 1.085Test 2 Z-SS 83.4 191.3 8.4 Positive Moment 138.8 142.4 0.563 1.026Test 3 C-SS 125.0 275.6 7.2 Positive Moment 220.7 210.8 0.618 0.955Test 4 C-TF 181.5 179.1 9.1 Shear + Bending 255.7 280.3 1.096 1.096I.P. Test 1 Z-SS 80.5 162.1 8.3 Positive Moment 103.5 104.8 0.797 1.013I.P. Test 2 Z-SS 80.5 162.1 8.3 Positive Moment 103.5 102.8 0.782 0.993I.P. Test 3 Z-TF 184.9 162.1 8.3 Shear + Bending 131.5 161.2 1.226 1.226
164.4155.0155.0155.0
in-kips191.6171.9210.1
Shear + BendingNegativeMomentStrength
5.4.4 Strength Comparisons Assuming the Inflection Point is a Brace Point
Table 5.3 has the same data as Table 5.2 except that the negative moment
strength was calculated using the Cb value listed in Table 5.1 as determined from AISI
Specifications Equation C3.1.2-11. The ratio of the experimental-to-predicted failure
loads varies between 0.955 and 1.110 with an average value of 1.037 and a standard
deviation of 0.056.
Table 5.3 Strength Comparison Assuming Inflection Point as Brace Point
Test Number Positive Negative Shear Critical Predicted Experimental Experimental / Predicted Experimental / PredictedMoment Moment Strength Limit State Failure Failure for forStrength Strength Load Load Shear Critical
+ Limit State
in-kips in-kips kips plf plf Bending
Test 1 Z-TF 196.5 196.5 19.8 Shear + Bending 296.7 320.8 1.081 1.081Test 2 Z-SS 83.4 191.3 8.4 Positive Moment 138.8 142.4 0.563 1.026Test 3 C-SS 125.0 275.6 7.2 Positive Moment 220.7 210.8 0.618 0.955Test 4 C-TF 181.5 181.5 9.1 Shear + Bending 258.7 280.3 1.083 1.083I.P. Test 1 Z-SS 80.5 179.0 8.3 Positive Moment 103.5 104.8 0.722 1.013I.P. Test 2 Z-SS 80.5 179.0 8.3 Positive Moment 103.5 102.8 0.708 0.993I.P. Test 3 Z-TF 184.9 179.0 8.3 Shear + Bending 145.2 161.2 1.110 1.110
166.2170.1170.1170.0
in-kips192.2171.9
210.1
Shear + BendingNegativeMomentStrength
55
5.4.5 Strength Comparison Assuming a Fully Braced Cross-section
Lateral buckling strength is addressed in section C3.1.2 of the AISI Specifications
and important equations from this section are listed above in section 5.4.2. AISI
Specifications Section C3.1.2 states “The nominal strength of the laterally unbraced
segments of singly-, doubly-, and point-symmetric sections* subject to lateral buckling,
Mn shall be calculated as follows.” The asterisk (*) leads to a footnote that states “The
provisions of this Section apply to I-, Z-, C- and other singly-symmetric section flexural
members (not including multiple-web deck, U- and closed box-type members, and curved
or arch members). The Provisions of this section do not apply to laterally unbraced
compression flanges of otherwise laterally stable sections. Refer to C3.1.3 for C- and Z-
purlins in which the tension flange is attached to sheathing.”
The multiple span lapped continuous Z- and C-purlins evaluated in this research
have laterally unbraced compression flanges between the face of the lap and the
inflection point. However, the cross-section is otherwise laterally stable because of the
sheathing fastened to the top flange of the purlins. This would seem to indicate that
applicable strength provisions would be provided in Section C3.1.3. Section C3.1.3
Beams Having One Flange Through-Fastened to Deck or Sheathing begins by stating:
“This section does not apply to a continuous beam for the region between the inflection
points adjacent to a support, or to a cantilever beam”. This section clearly does not apply
to the negative moment region of the tests that were conducted. The AISI Specifications
provide no other guidance for predicting the strength of the negative moment region.
In the absence of design provisions the negative moment strength was set equal to
the effective yield moment, Mn = SeFy (Equation C3.1.1-1.of the AISI Specifications).
Predicted loads and strengths were calculated based on this assumption and compared to
experimental values. Table 5.4 lists the results. The ratio of predicted/experimental
failure loads ranged from 0.955 to 1.083. The average value was 1.033 and had a
standard deviation of 0.0504.

56
Table 5.4 Strength Comparison Assuming Fully Braced Cross-Section
Test Number Positive Negative Shear Critical Predicted Experimental Experimental / Predicted Experimental / PredictedMoment Moment Strength Limit State Failure Failure for forStrength Strength Load Load Shear Critical
+ Limit State
in-kips in-kips kips plf plf Bending
Test 1 Z-TF 196.5 196.5 19.8 Shear + Bending 296.7 320.8 1.081 1.081Test 2 Z-SS 83.4 191.3 8.4 Positive Moment 138.8 142.4 0.563 1.026Test 3 C-SS 125.0 275.6 7.2 Positive Moment 220.7 210.8 0.618 0.955Test 4 C-TF 181.5 181.5 9.1 Shear + Bending 258.7 280.3 1.083 1.083I.P. Test 1 Z-SS 80.5 184.9 8.3 Positive Moment 103.5 104.8 0.702 1.013I.P. Test 2 Z-SS 80.5 184.9 8.3 Positive Moment 103.5 102.8 0.689 0.993I.P. Test 3 Z-TF 184.9 184.9 8.3 Shear + Bending 149.2 161.2 1.080 1.080
Shear + BendingNegativeMomentStrength
in-kips192.2171.9210.1166.2174.6174.6174.6
5.4.6 Summary of Test Results
For Test 1 Z–TF the experimental failure load that was 8.5 percent higher than the
load predicted assuming the inflection point is not a brace point and 8.1 percent higher
than the predicted failure load assuming the inflection point is a brace point. The
experimental load is also 8.1 percent higher than the predicted load given by setting the
negative moment strength to the yield moment. It is noted that the provisions of AISI
Section C3.1.2 and the assumption that the inflection point is a brace point predict
negative moment strength equal to the effective yield moment strength. The purlins
rolled inward on both sides of the inflection point for this test. However, the inflection
point movement was quite small. The predicted failure mode was combined shear and
bending near the face of the lap for this test. The experimental failure occurred near the
lap in the negative moment region.
For Test 2 Z–SS the experimental failure load that was 2.6 percent higher than the
predicted load for the controlling limit state of positive moment strength using a R value
determined from the Base Test Method. The purlins rolled inward on both sides of the
inflection point for this test. The predicted and experimental failure mode was positive
moment failure.
For Test 3 C-SS the experimental failure load was 4.5 percent below the load
predicted by AISI Specifications and the Base Test Method. The purlins rolled outward
on both sides of the inflection point for this test. The predicted and experimental failure
mode was positive moment failure.
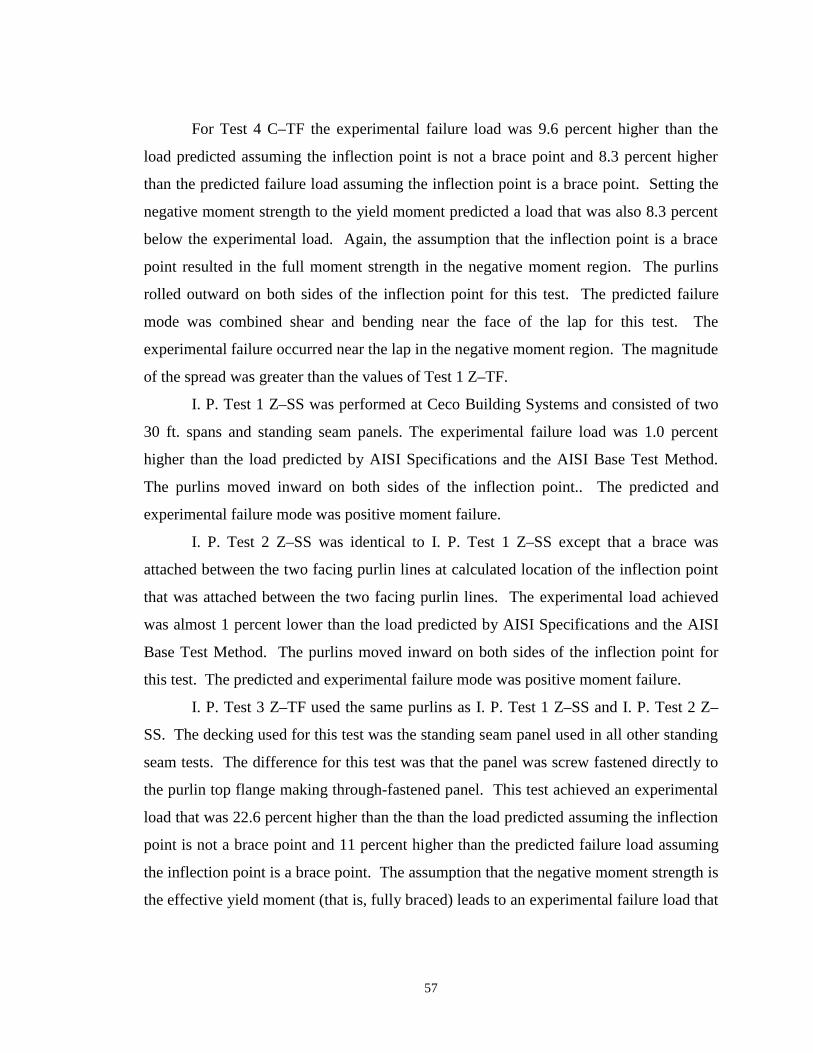
57
For Test 4 C–TF the experimental failure load was 9.6 percent higher than the
load predicted assuming the inflection point is not a brace point and 8.3 percent higher
than the predicted failure load assuming the inflection point is a brace point. Setting the
negative moment strength to the yield moment predicted a load that was also 8.3 percent
below the experimental load. Again, the assumption that the inflection point is a brace
point resulted in the full moment strength in the negative moment region. The purlins
rolled outward on both sides of the inflection point for this test. The predicted failure
mode was combined shear and bending near the face of the lap for this test. The
experimental failure occurred near the lap in the negative moment region. The magnitude
of the spread was greater than the values of Test 1 Z–TF.
I. P. Test 1 Z–SS was performed at Ceco Building Systems and consisted of two
30 ft. spans and standing seam panels. The experimental failure load was 1.0 percent
higher than the load predicted by AISI Specifications and the AISI Base Test Method.
The purlins moved inward on both sides of the inflection point.. The predicted and
experimental failure mode was positive moment failure.
I. P. Test 2 Z–SS was identical to I. P. Test 1 Z–SS except that a brace was
attached between the two facing purlin lines at calculated location of the inflection point
that was attached between the two facing purlin lines. The experimental load achieved
was almost 1 percent lower than the load predicted by AISI Specifications and the AISI
Base Test Method. The purlins moved inward on both sides of the inflection point for
this test. The predicted and experimental failure mode was positive moment failure.
I. P. Test 3 Z–TF used the same purlins as I. P. Test 1 Z–SS and I. P. Test 2 Z–
SS. The decking used for this test was the standing seam panel used in all other standing
seam tests. The difference for this test was that the panel was screw fastened directly to
the purlin top flange making through-fastened panel. This test achieved an experimental
load that was 22.6 percent higher than the than the load predicted assuming the inflection
point is not a brace point and 11 percent higher than the predicted failure load assuming
the inflection point is a brace point. The assumption that the negative moment strength is
the effective yield moment (that is, fully braced) leads to an experimental failure load that

58
is 8 percent above the predicted failure load The predicted failure mode was combined
shear plus bending near the face of the lap. The experimental failure occurred in the
negative moment region near the face of the lap. The purlins rolled inward on both sides
of the inflection point for this test.
5.4.7 Comparison of Results
Both the predicted and experimental failure limit state for Test 1 Z-TF and Test 4
C-TF is shear plus bending. For these tests the unbraced length in the negative moment
region of the test bay was approximately 53 in. For both tests, the predicted moment
strengths are essentially unaffected by the inflection/brace point assumption. (195.7 in-
kips versus 196.5 in-kips for Test 1 Z-TF and 179.1 in-kips and 181.5 in-kips for Test 4
C-TF.) The effective yield moment strengths are 196.5 in-kips for Test 1 Z-TF and 181.5
in-kips for Test 4 C-TF; the same as for the inflection point is a brace point assumption.
Tests 2 Z-SS and Test 3 C-SS were standing seam panel tests controlled by
positive moment strength. Because of low R- values (0.44) for the standing seam roof
system used in the tests, it was not possible to configure a reasonable system where
positive moment strength did not control. However, excellent agreement between the
predicted and experimental failure loads based on the limit state of positive moment
strength was found.
The unbraced lengths in the negative moment region of the test bay in Test 2 Z-
SS and Test 3 C-SS were approximately 55 and 53 in., respectively. There is no
difference between the negative moment strengths calculated using the three assumptions
(191.3 in-kips and 191.3 in-kips for Test 2 Z-SS and 378.0 in-kips and 378.0 in-kips for
Test 3 C-SS).
For the three I.P. designated tests, the unbraced length was 78 in. The predicted
negative moment strengths are considerably different 162.1 in-kips assuming the
inflection point is not a brace point and 179.0 in-kips for the opposite assumption. The
negative moment strength based on yield is 184.9 in-kips. The Z-SS I.P. tests were

59
designed for the limit state of shear plus bending, however, the purlins used in the tests
had an unexpected high yield stress causing the actual limit state to be positive moment
strength. Because the controlling limit state was positive bending, the addition of an
actual brace at the theoretical inflection point had essentially no effect on the test results.
I.P. Test 3 Z-TF was identical in configuration to the other two I.P. tests except
that the standing seam panel was through-fastened to the purlins in an attempt to limit
positive moment failure. The predicted and actual limit state was shear plus bending, but
the experimental failure loaded exceeded all predicted failure loads: 22.6 percent for the
inflection point is not a brace point assumption, 11.1 percent for the inflection point as a
brace point assumption, and 8.0 percent for the yield moment assumption.
60
CHAPTER VI
SUMMARY AND CONCLUSIONS
6.1 Summary
An experimental and analytical investigation was conducted in an attempt to
evaluate the inflection point as a brace point in multiple span lapped purlin roof systems
subjected to uniform gravity loading. Seven tests were conducted: four three-span
continuous and three two-span continuous. Five tests were conducted using Z-purlins and
two tests were conducted using C-purlins. Standing seam panels were used in four tests
and through-fastened panes were used in three tests. Anti-roll clips were used at all
purlin-to-rafter support locations. Intermediate lateral bracing was used only in IP test 2.
Instrumentation was used to verify the actual location of the inflection point and
to measure lateral movement or spread of the bottom flange of the purlins on each side of
the inflection point. The results were compared to movement predicted by finite element
models of two of the tests. Both the experimental and analytical results showed that
although lateral movement did occur at the inflection point, the movement was
considerably less than at other locations along the purlins.
From the lateral movement measurements and analytical results of the seven tests
conducted, it is apparent that relatively little movement occurs near the inflection point of
Z-purlin lapped systems. Both sides of the inflection point move in the same direction
and no double curvature was exhibited from either the experimental measurements or the
analytical results. Lateral movement near the inflection point was found to be much less
than that at the point of maximum moment. Systems using lapped C-purlins exhibit
larger movement than Z-purlin systems, but the values are still relatively small.
For the four tests using standing seam panels, both the predicted and experimental
controlling limit state was positive moment region failure. Also, excellent agreement
between the predicted and experimental failure loads was found. The predicted failure

61
loads were calculated using the AISI Specifications provisions and the Base Test Method
to determine the positive moment bending strength. The experimental-to-predicted load
ratios are 1.026, 0.955, 1.013, and 0.993.
The predicted and experimental controlling limit state for the three tests using
through fastened roof systems was shear plus bending failure immediately outside the lap
in the exterior test bay. The experimental failure loads were compared to predicted values
using provisions of the AISI Specifications and assuming (1) the inflection point is not a
brace point, (2) the inflection point is a brace point, and (3) the negative moment region
strength is equal to the effective yield moment (SeFy). For the two three-span continuous
tests, all three methods predict the same failure load. The ratios of experimental-to-
predicted load for these tests are 1.081 and 1.083 which means that the predictions are
approximately 8 percent conservative. For the two-span continuous test, the predicted
failure loads for the three assumptions are 131.5 plf, 145.2 plf, and 149.2 plf. The
experimental failure load is 161.2 plf, thus all three assumptions are conservation with
the fully braced assumption being the least conservative with an experimental-to-
predicted load ration of 1.080.
6.2 Conclusions
From the limited data developed in this research, it is difficult to draw definite
conclusions. It is clear that the bottom flange of a continuous purlin line move laterally
in the same direction on both sides of the inflection point but that the movement is
relatively small. It is also evident, that there is very little difference in predicted strength
of the negative moment region of continuous purlin lines for usual end of lap-to-
inflection point distances, that is, less than approximately 60 in. For larger distances, it
appears that even assuming full lateral restraint for through fastened roof systems is
conservative. It is believed that the full lateral restraint assumption for the negative
moment region of continuous purlin lines is permitted by the AISI Specifications,
however, the specification language is ambiguous.
62
6.3 Recommendations
From the limited results of this research, it is recommended that the negative
moment region of continuous purlin lines supporting through fastened roof systems be
designed using the effective yield moment strength, SeFy, as defined in Section C3.1.1 of
the AISI Specifications. It is also recommended that the AISI specification language in
Section C3.1.2 Lateral Buckling Strength be revised to clarify the intent. Finally, it is
recommended that several tests using Z- and C-purlins be conducted with the following
conditions: (1) standing seam roof panels, (2) configured such that the controlling limit
is shear plus bending, and (3) that the predicted limit state, assuming that distance from
the end of the lap to the inflection point is unbraced, is controlled by inelastic lateral
buckling using the provisions of Section C3.1.2 Lateral Buckling Strength.

63
REFERENCES
Ansys Basic Analysis Procedures Guide. (1996). Ansys Inc., SAS IP, Houston, PA.
Bathe, K. (1996). Finite Element Procedures. Prentice Hall, Upper Saddle River, NJ.
Brooks, S. D. (1989). Evaluation of the Base Test Method for Determining the Strengthof Standing Seam Roof Systems Under Gravity Loadings, Master’s Thesis, VirginiaPolytechnic Institute and State University, Blacksburg, VA
Epstein, H., Murtha-Smith, E., and Mitchell, J. D. (1998). “Analysis and DesignAssumptions for Continuous Cold-Formed Purlins.” Practice Periodical on StructuralDesign and Construction, 3(2), 60-67.
Fenske, T. E. and Yener, M. (1990). “Analysis and Design of Light Gage Steel RoofSystems.” Thin-Walled Structures, Elsevier Science, 10(3), 221-234.
Fisher, J. M. and La Boube, R. (1997). “A Guide for Designing with Standing SeamRoof Panels,” American Iron and Steel Institute (AISI) Committee, Washington,D.C.
Galambos, T. V., ed. (1988). Guide to Stability Design Criteria for Metal Structures 4th
Edition. John Wiley & Sons, New York, NY.
Johnson, R. P. (1994). Composite Structures of Steel and Concrete Volume 1: Beams,Slabs, Columns, and Frames for Buildings, Second Edition. Blackwell ScientificPublications, Oxford, U. K.
Johnson, R. P. and Buckby, R. J. (1986). Composite Structures of Steel and ConcreteVolume 2: Bridges, Second Edition. William Collins Sons & Co., London, U. K.
Johnston, N. and Hancock, G. (1994). “Design Approach for Purlins using AustralianTest Data.” Engineering Structures, 16(5), 342-347.
Lucas, R. M., Al-Bermani, F. G. A., and Kitipornchai, S. (1997). “Modeling of Cold-Formed Purlin-Sheeting Systems Part 1: Full Model.” Thin-Walled Structures, 27(3),223-243.
Lucas, R. M., Al-Bermani, F. G. A., and Kitipornchai, S. (1997). “Modeling of Cold-Formed Purlin-Sheeting Systems Part 2: Simplified Model.” Thin-Walled Structures,27(4), 263-286.

64
REFERENCES CONTINUED
Murray, T. M., and Elhouar, S. (1994). “North American approach to the design ofcontinuous Z- and C-purlins for gravity loading with experimental verification.”Engineering Structures, 16(5), 337-341.
Narayanan, R., ed. (1983). Beams and Beam Columns: Stability and Strength. AppliedScience Publishers, London, England.
Rhodes, J., and Walker, A. C., ed. (1984). Developments in Thin-Walled Structures-2.Elsevier, London, England.
Salmon, C. G. and Johnson, J. E. (1996). Steel Structures: design and Behavior 4th ed.Harper Collins College Publishers, New York, NY.
Specifications for the Design of Cold-Formed Steel Structural Members. (1986). “Cold-Formed Steel Design Manual,” American Iron and Steel Institute. (AISI),Washington, D.C.
Specifications for the Design of Cold-Formed Steel Structural Members withCommentary. (1996). “Cold-Formed Steel Design Manual,” American Iron andSteel Institute. (AISI), Washington, D.C.
Walker, A. C., ed. (1975). Design and Analysis of Cold-Formed Sections. John Wiley& Sons, New York, NY.
Willis, C. T. and Wallace, B. (1990). “Behavior of Cold-Formed Steel PurlinsUnder Gravity Loading.” Journal of Structural Engineering, ASCE, 116(8), 2061-2069.
Yura, J. A. (1993). “Fundamentals of Beam Bracing,” Proceedings, SRCC Conference-Is Your Structure Suitably Braced?, April 6-7, Milwaukee, WI.

65
APPENDIX A
TEST 1 Z–TF DATA

66
INFLECTION POINT INVESTIGATION TEST SUMMARY
TEST IDENTIFICATION: Test 1 Z-TFDATE: 8/26/98
TEST DESCRIPTION:Loading……………………………… GravityPanel Type……………………………Through Fastened PanelSpan……………………………………2@25’-0", 1@23'-0"Purlin Spacing……………………… 5’ o.c. with 1’ deck overhangLateral Bracing………………………NoneAnti-roll Clips……………………… At the supports of both purlin linesWeb Stiffeners……………………… NonePurlin Orientation……………………Top flanges opposedInsulation………………………….. None
FAILURE MODE:Combined Shear plus Bending at Face of Lap
EXPERIMENTAL FAILURE LOAD:Pressure = 16.45 in. of water
Applied Line Loading = 320.78 plfWeight of Deck = 4.00 plfWeight of Purlin = 5.05 plfTotal Applied Load = 329.82 plf
Maximum Pos. Moment = 190.61 kip in.Neg. Moment at Lap = 207.67 kip in.Shear at Lap = 4.68 kips
PREDICTED FAILURE LOAD: (Fy= 55.5 ksi)Inflection Point As BracepointCombined Shear + Bending:
Neg. Moment at Lap = 192.60 kip in.Shear at Lap = 4.33 kips
Predicted Line Load = 306.35 plfInflection Point Not As BracepointCombined Shear + Bending:
Neg. Moment at Lap = 191.56 kip in.Shear at Lap = 4.32 kips
Predicted Line Load = 304.85 plf
Experimental/Predicted: Failure/Predicted = 1.077 I.P. Braced Failure/Predicted = 1.082 I.P. Not Braced
329.82/306.35 =329.82/304.85 =

67

68

69
TEST 1 Z-TF 8 in. Z-TF 3 span CH 2
Purlin Geometry and Material Properties Bay #1 (Test Bay)
Top Bottom Ag 1.51 in2
Overall Lip Dimension 1.0649 in. 1.0119 in. Ix 14.60 in4
Lip Angle 45 o 48 o Iy 2.64 in4
Radii: Ixy 4.54 in4
Lip to Flange 0.4375 in. 0.4375 in. Flange to Web 0.2656 in. 0.2656 in. Ie 14.60 in4
Flange Width 2.505 in. 2.540 in. Se 3.63 in3
Purlin Depth 8.0625 in.Purlin Thickness 0.1035 in.
Yield Stress 55.5 ksiModulus of Elasticity 29500 ksi
TEST 1 Z-TF 8 in. Z-TF 3 span CH 4
Purlin Geometry and Material Properties Bay #1 (Test Bay)
Top Bottom Ag 1.48 in2
Overall Lip Dimension 0.9964 in. 1.0176 in. Ix 14.32 in4
Lip Angle 49 o 46 o Iy 2.48 in4
Radii: Ixy 4.36 in4
Lip to Flange 0.4375 in. 0.4375 in. Flange to Web 0.2656 in. 0.2656 in. Ie 14.32 in4
Flange Width 2.498 in. 2.498 in. Se 3.54 in3
Purlin Depth 8.0625 in.Purlin Thickness 0.1025 in. Other properties for CH 4
Yield Stress 55.5 ksi rx in.Modulus of Elasticity 29500 ksi ry in.
ro in.Cw in6
J in4
α o
28.1590.00519-18.204
Flexural Strength
3.10561.29473.3652
Purlin Properties
Flexural Strength
Results From Commercial Software
Purlin Properties

70
TEST 1 Z-TF 8 in. Z-TF 3 span CH 6
Purlin Geometry and Material Properties Bay #2 (Middle Bay)
Top Bottom Ag 1.49 in2
Overall Lip Dimension 1.004 in. 1.0398 in. Ix 14.46 in4
Lip Angle 49 o 46 o Iy 2.59 in4
Radii: Ixy 4.48 in4
Lip to Flange 0.3906 in. 0.3906 in. Flange to Web 0.2656 in. 0.2656 in. Ie 14.46 in4
Flange Width 2.545 in. 2.514 in. Se 3.58 in3
Purlin Depth 8.0625 in.Purlin Thickness 0.1025 in.
Yield Stress 55.5 ksiModulus of Elasticity 29500 ksi
TEST 1 Z-TF 8 in. Z-TF 3 span CH 8
Purlin Geometry and Material Properties Bay #2 (Middle Bay)
Top Bottom Ag 1.50 in2
Overall Lip Dimension 0.9673 in. 1.1116 in. Ix 14.52 in4
Lip Angle 49 o 45 o Iy 2.60 in4
Radii: Ixy 4.50 in4
Lip to Flange 0.3906 in. 0.3906 in. Flange to Web 0.2656 in. 0.2656 in. Ie 14.52 in4
Flange Width 2.505 in. 2.518 in. Se 3.57 in3
Purlin Depth 8.0625 in.Purlin Thickness 0.103 in.
Yield Stress 55.5 ksiModulus of Elasticity 29500 ksi
Flexural Strength
Purlin Properties
Flexural Strength
Purlin Properties

71
TEST 1 Z-TF 8 in. Z-TF 3 span CH 5
Purlin Geometry and Material Properties Bay #3 (End Bay)
Top Bottom Ag 1.50 in2
Overall Lip Dimension 1.0569 in. 1.0394 in. Ix 14.56 in4
Lip Angle 47 o 45 o Iy 2.63 in4
Radii: Ixy 4.53 in4
Lip to Flange 0.375 in. 0.375 in. Flange to Web 0.2656 in. 0.2656 in. Ie 14.56 in4
Flange Width 2.518 in. 2.505 in. Se 3.62 in3
Purlin Depth 8.0625 in.Purlin Thickness 0.103 in.
Yield Stress 55.5 ksiModulus of Elasticity 29500 ksi
TEST 1 Z-TF 8 in. Z-TF 3 span CH3
Purlin Geometry and Material Properties Bay #3 (End Bay)
Top Bottom Ag 1.50 in2
Overall Lip Dimension 0.983 in. 1.0329 in. Ix 14.53 in4
Lip Angle 50 o 46 o Iy 2.56 in4
Radii: Ixy 4.46 in4
Lip to Flange 0.4375 in. 0.4375 in. Flange to Web 0.2656 in. 0.2656 in. Ie 14.53 in4
Flange Width 2.535 in. 2.510 in. Se 3.60 in3
Purlin Depth 8.0625 in.Purlin Thickness 0.1035 in.
Yield Stress 55.5 ksiModulus of Elasticity 29500 ksi
Predicted Through Fastened Capacity (ASD) From Commercial Software
173.1 lbs/ft x 1.67 = lbs/ft
Flexural Strength
Purlin Properties
Flexural Strength
289.1
Purlin Properties

72
T est Designation: Chief Multispan T est #1S pecimen Identification: MB CH 4
Coupon Number: 9Date: 12/18/98
Gage length (in.): 2.000T otal length (in.): 8.0
Length between shoulders (in.): 10.0T hickness (in.): 0.104
Width (in.): 1.504
T est S etup: T est Data:Procedure: T ensile T est .1% Offset Yield: 53700 psi
Range 1 Rate: 50000 ps i/min .2% Offset Yield: 55500 psiEnd Level: 55000 ps i .5 in/in Yield: 56400 psi
Range 2 Rate: 10000 psi/minEnd Level: 0.2 in/in Ulimate S trength: 76700 psi
Range 3 Rate: 25000 ps i/min Modulus of elasticity: 29.0 ksiEnd Level: S ample Break % E longation: 37%
T E NS ION T E S T OF MAT ER IAL S(In accordance with AS T M A370-95)
01000020000300004000050000600007000080000
0.0000 0.0010 0.0020 0.0030 0.0040 0.0050
S train (in/in)
Stre
ss (
psi
)
0
10000
20000
30000
40000
50000
60000
70000
80000
90000
0.0000 0.0200 0.0400 0.0600 0.0800 0.1000 0.1200 0.1400
S train (in/in)
Stre
ss (
psi
)

73
Through Fastened2@25, 1@23 2’-0"1’-0"CH 4100 plf
Test BayMax. (+) Moment = 4.816 k-ft
Ix = 14.32 in4 Moment at End of Lap = 5.247 k-ftAg = 1.48 in2 Shear at End of Lap = 1.419 kIy = 2.48 in4 Moment at Support = 6.715 k-ft
Shear at Support = 1.519 kMax Deflection = 1.054 in.
Ix = 14.32 in4 Inflection Point Located at 19.63 ft. from exterior Support.Ag = 1.48 in2 Max. (+) Moment located at 9.789 ft. from exterior SupportIy = 2.48 in4 Max. Deflection Located at 10.5 ft. from exterior Support
Unbraced length (lu) between I. P. and Lap = 4.37 ft. = 52.44 in.
Ix = 14.32 in4
Ag = 1.48 in2
Iy = 2.48 in4
Mmax = 5.247 k-ftMa = 1.135 k-ftMb = 2.386 k-ft
Ix = 28.64 in4 Mc = 3.757 k-ftAg = 2.96 in2
Iy = 4.96 in4 Cb = 1.757
Lap Section Properties
RESULTS FROM STIFFNESS MODEL
TEST 1 Z-TF
End Bay Section Properties
Deck TypeSpans
Middle Bay Section Properties
Total Lap Length
Test Bay Section Properties
Extension into Test BayPurlin DesignationLoad applied to Model
C b12.5 Mmax.
2.5 Mmax. 3 Ma. 4 Mb. 3 Mc.Mmax
Mmax Ma Mb Mc
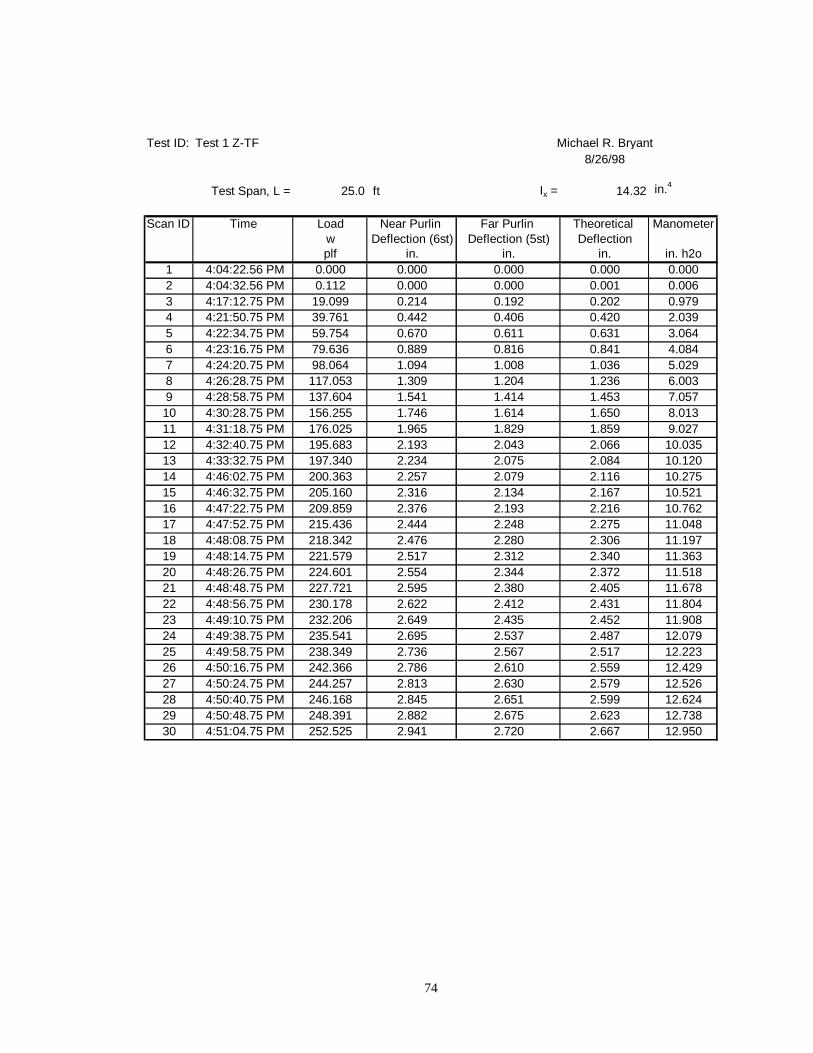
74
Test ID: Test 1 Z-TF Michael R. Bryant8/26/98
Test Span, L = 25.0 ft Ix = 14.32 in.4
Scan ID Time Load Near Purlin Far Purlin Theoretical Manometerw Deflection (6st) Deflection (5st) Deflectionplf in. in. in. in. h2o
1 4:04:22.56 PM 0.000 0.000 0.000 0.000 0.0002 4:04:32.56 PM 0.112 0.000 0.000 0.001 0.0063 4:17:12.75 PM 19.099 0.214 0.192 0.202 0.9794 4:21:50.75 PM 39.761 0.442 0.406 0.420 2.0395 4:22:34.75 PM 59.754 0.670 0.611 0.631 3.0646 4:23:16.75 PM 79.636 0.889 0.816 0.841 4.0847 4:24:20.75 PM 98.064 1.094 1.008 1.036 5.0298 4:26:28.75 PM 117.053 1.309 1.204 1.236 6.0039 4:28:58.75 PM 137.604 1.541 1.414 1.453 7.05710 4:30:28.75 PM 156.255 1.746 1.614 1.650 8.01311 4:31:18.75 PM 176.025 1.965 1.829 1.859 9.02712 4:32:40.75 PM 195.683 2.193 2.043 2.066 10.03513 4:33:32.75 PM 197.340 2.234 2.075 2.084 10.12014 4:46:02.75 PM 200.363 2.257 2.079 2.116 10.27515 4:46:32.75 PM 205.160 2.316 2.134 2.167 10.52116 4:47:22.75 PM 209.859 2.376 2.193 2.216 10.76217 4:47:52.75 PM 215.436 2.444 2.248 2.275 11.04818 4:48:08.75 PM 218.342 2.476 2.280 2.306 11.19719 4:48:14.75 PM 221.579 2.517 2.312 2.340 11.36320 4:48:26.75 PM 224.601 2.554 2.344 2.372 11.51821 4:48:48.75 PM 227.721 2.595 2.380 2.405 11.67822 4:48:56.75 PM 230.178 2.622 2.412 2.431 11.80423 4:49:10.75 PM 232.206 2.649 2.435 2.452 11.90824 4:49:38.75 PM 235.541 2.695 2.537 2.487 12.07925 4:49:58.75 PM 238.349 2.736 2.567 2.517 12.22326 4:50:16.75 PM 242.366 2.786 2.610 2.559 12.42927 4:50:24.75 PM 244.257 2.813 2.630 2.579 12.52628 4:50:40.75 PM 246.168 2.845 2.651 2.599 12.62429 4:50:48.75 PM 248.391 2.882 2.675 2.623 12.73830 4:51:04.75 PM 252.525 2.941 2.720 2.667 12.950
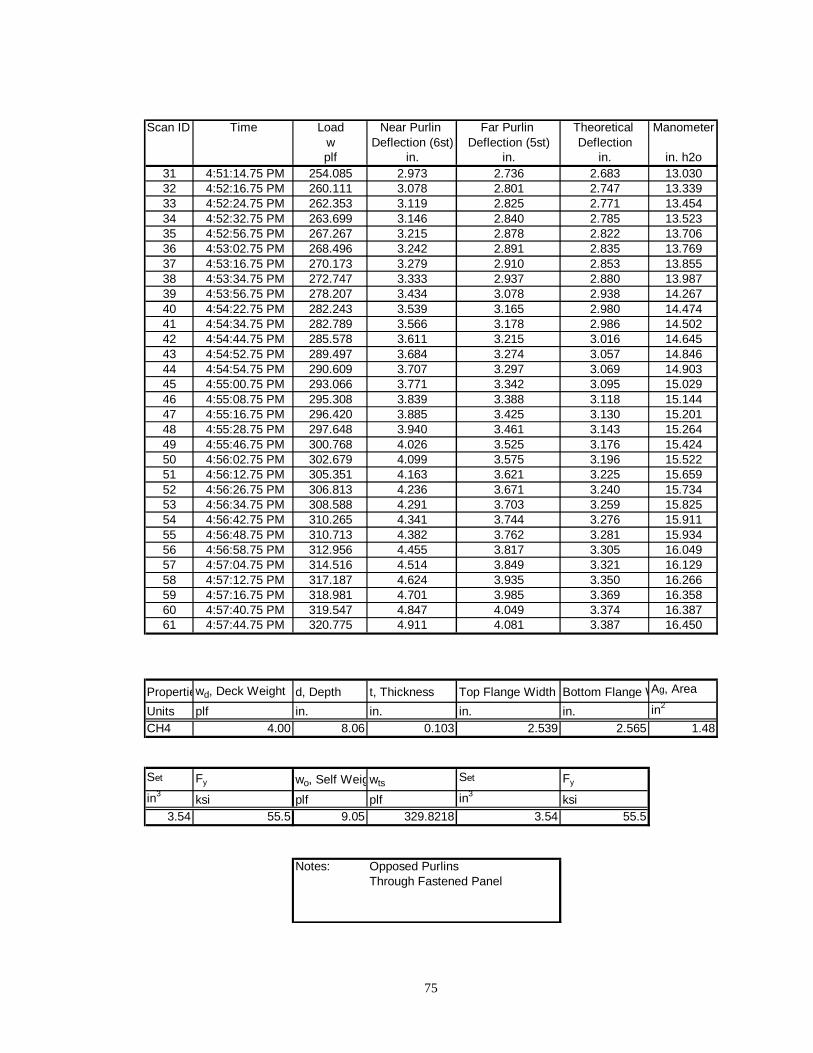
75
Scan ID Time Load Near Purlin Far Purlin Theoretical Manometerw Deflection (6st) Deflection (5st) Deflectionplf in. in. in. in. h2o
31 4:51:14.75 PM 254.085 2.973 2.736 2.683 13.03032 4:52:16.75 PM 260.111 3.078 2.801 2.747 13.33933 4:52:24.75 PM 262.353 3.119 2.825 2.771 13.45434 4:52:32.75 PM 263.699 3.146 2.840 2.785 13.52335 4:52:56.75 PM 267.267 3.215 2.878 2.822 13.70636 4:53:02.75 PM 268.496 3.242 2.891 2.835 13.76937 4:53:16.75 PM 270.173 3.279 2.910 2.853 13.85538 4:53:34.75 PM 272.747 3.333 2.937 2.880 13.98739 4:53:56.75 PM 278.207 3.434 3.078 2.938 14.26740 4:54:22.75 PM 282.243 3.539 3.165 2.980 14.47441 4:54:34.75 PM 282.789 3.566 3.178 2.986 14.50242 4:54:44.75 PM 285.578 3.611 3.215 3.016 14.64543 4:54:52.75 PM 289.497 3.684 3.274 3.057 14.84644 4:54:54.75 PM 290.609 3.707 3.297 3.069 14.90345 4:55:00.75 PM 293.066 3.771 3.342 3.095 15.02946 4:55:08.75 PM 295.308 3.839 3.388 3.118 15.14447 4:55:16.75 PM 296.420 3.885 3.425 3.130 15.20148 4:55:28.75 PM 297.648 3.940 3.461 3.143 15.26449 4:55:46.75 PM 300.768 4.026 3.525 3.176 15.42450 4:56:02.75 PM 302.679 4.099 3.575 3.196 15.52251 4:56:12.75 PM 305.351 4.163 3.621 3.225 15.65952 4:56:26.75 PM 306.813 4.236 3.671 3.240 15.73453 4:56:34.75 PM 308.588 4.291 3.703 3.259 15.82554 4:56:42.75 PM 310.265 4.341 3.744 3.276 15.91155 4:56:48.75 PM 310.713 4.382 3.762 3.281 15.93456 4:56:58.75 PM 312.956 4.455 3.817 3.305 16.04957 4:57:04.75 PM 314.516 4.514 3.849 3.321 16.12958 4:57:12.75 PM 317.187 4.624 3.935 3.350 16.26659 4:57:16.75 PM 318.981 4.701 3.985 3.369 16.35860 4:57:40.75 PM 319.547 4.847 4.049 3.374 16.38761 4:57:44.75 PM 320.775 4.911 4.081 3.387 16.450
Propertiewd, Deck Weight d, Depth t, Thickness Top Flange Width Bottom Flange WAg, Area
Units plf in. in. in. in. in2
CH4 4.00 8.06 0.103 2.539 2.565 1.48
Set Fy wo, Self Weigwts Set Fy
in3ksi plf plf in3
ksi3.54 55.5 9.05 329.8218 3.54 55.5
Notes: Opposed PurlinsThrough Fastened Panel

76
Scan ID Load Manometer PT #3 PT #4 PT #5 PT #6wplf in. h2o in. in. in. in.
1 0.000 0.000 -0.001 0.000 0.000 0.0002 0.112 0.006 -0.001 0.000 0.000 0.0003 19.099 0.979 0.004 0.001 0.010 0.0054 39.761 2.039 0.011 0.005 0.024 0.0125 59.754 3.064 0.018 0.009 0.035 0.0216 79.636 4.084 0.025 0.013 0.046 0.0297 98.064 5.029 0.029 0.018 0.053 0.0388 117.053 6.003 0.032 0.024 0.059 0.0479 137.604 7.057 0.035 0.029 0.065 0.057
10 156.255 8.013 0.037 0.035 0.069 0.06511 176.025 9.027 0.038 0.040 0.070 0.07212 195.683 10.035 0.038 0.044 0.070 0.07913 197.340 10.120 0.037 0.043 0.067 0.07914 200.363 10.275 0.037 0.043 0.068 0.07915 205.160 10.521 0.037 0.045 0.068 0.08116 209.859 10.762 0.038 0.045 0.068 0.08217 215.436 11.048 0.038 0.047 0.068 0.08418 218.342 11.197 0.038 0.047 0.068 0.08519 221.579 11.363 0.038 0.048 0.068 0.08620 224.601 11.518 0.037 0.048 0.067 0.08721 227.721 11.678 0.035 0.049 0.065 0.08722 230.178 11.804 0.035 0.049 0.064 0.08923 232.206 11.908 0.034 0.050 0.062 0.08924 235.541 12.079 0.034 0.051 0.060 0.08925 238.349 12.223 0.032 0.051 0.059 0.09026 242.366 12.429 0.031 0.052 0.057 0.09127 244.257 12.526 0.030 0.052 0.056 0.09228 246.168 12.624 0.029 0.054 0.054 0.09329 248.391 12.738 0.028 0.054 0.053 0.09330 252.525 12.950 0.027 0.055 0.050 0.094

77
Scan ID Load Manometer PT #3 PT #4 PT #5 PT #6wplf in. h2o in. in. in. in.
31 254.085 13.030 0.026 0.056 0.049 0.09532 260.111 13.339 0.023 0.057 0.045 0.09633 262.353 13.454 0.022 0.057 0.042 0.09634 263.699 13.523 0.021 0.058 0.041 0.09735 267.267 13.706 0.020 0.059 0.037 0.09736 268.496 13.769 0.019 0.059 0.036 0.09837 270.173 13.855 0.018 0.059 0.034 0.09838 272.747 13.987 0.016 0.060 0.031 0.09839 278.207 14.267 0.014 0.060 0.026 0.09840 282.243 14.474 0.010 0.060 0.019 0.09841 282.789 14.502 0.010 0.060 0.018 0.09842 285.578 14.645 0.009 0.060 0.015 0.09843 289.497 14.846 0.006 0.060 0.012 0.09844 290.609 14.903 0.006 0.060 0.010 0.09845 293.066 15.029 0.004 0.061 0.005 0.09846 295.308 15.144 0.001 0.061 0.002 0.09847 296.420 15.201 0.000 0.061 -0.002 0.09848 297.648 15.264 -0.002 0.061 -0.005 0.09849 300.768 15.424 -0.005 0.061 -0.010 0.09850 302.679 15.522 -0.008 0.061 -0.015 0.09851 305.351 15.659 -0.010 0.061 -0.020 0.09852 306.813 15.734 -0.013 0.061 -0.025 0.09853 308.588 15.825 -0.015 0.061 -0.029 0.09854 310.265 15.911 -0.017 0.060 -0.033 0.09855 310.713 15.934 -0.019 0.060 -0.035 0.09856 312.956 16.049 -0.023 0.060 -0.042 0.09757 314.516 16.129 -0.025 0.060 -0.047 0.09758 317.187 16.266 -0.030 0.060 -0.055 0.09559 318.981 16.358 -0.035 0.060 -0.063 0.09560 319.547 16.387 -0.048 0.056 -0.082 0.09061 320.775 16.450 -0.054 0.055 -0.092 0.089

78
0
50
100
150
200
250
300
350
0.000 1.000 2.000 3.000 4.000 5.000 6.000
Deflection (in.)
Lo
ad (
plf
)
Near PurlinFar PurlinTheroretical
Test 1 Z–TF Load vs. Deflection
0
50
100
150
200
250
300
350
-0.200 -0.150 -0.100 -0.050 0.000 0.050 0.100 0.150 0.200
Spread (in.)
Lo
ad (
plf
) PT 3PT 4
PT 5PT 6
PT 5PT 4 PT 6PT 3
Test 1 Z–TF Load vs. Spread

79
0
50
100
150
200
250
300
350
-500 -400 -300 -200 -100 0 100 200 300 400
Strain (ue)
Lo
ad (
plf
) Position 1Position 2Position 3Position 4Position 5
Position 1 3 2 4 5
Test 1 Z–TF Load vs. Strain Near Purlin Line
0
50
100
150
200
250
300
350
-600 -500 -400 -300 -200 -100 0 100 200 300
Strain (ue)
Load
(pl
f)
Position 6Position 7Position 8
Position 9position 10
Position 6 7 8 9 10
Test 1 Z–TF Load vs. Strain Far Purlin Line

80
APPENDIX B
TEST 2 Z–SS DATA

81
INFLECTION POINT INVESTIGATION TEST SUMMARY
TEST IDENTIFICATION: Test 2 Z-SSDATE: 1/5/99
TEST DESCRIPTION:Loading………………………………GravityPanel Type……………………………Standing Seam Panel R= 0.435Span………………………………… 2@25’-0", 1@23'-0"Purlin Spacing………………………5’ o.c. with 1’ deck overhangLateral Bracing………………………NoneAnti-roll Clips……………………… At the supports of both purlin linesWeb Stiffeners………………………NonePurlin Orientation……………………Top flanges opposedInsulation………………………….. 6 in. Blanket with foam blocks
FAILURE MODE:Positive moment failure of near purlin.
EXPERIMENTAL FAILURE LOAD:Pressure = 7.27 in. of water
Applied Line Loading = 141.72 plfWeight of Deck = 4.00 plfWeight of Purlin = 4.88 plfTotal Applied Load = 150.60 plf
Maximum Moment = 85.30 kip in.Neg. Moment at Lap = 99.07 kip in.Shear at Lap = 2.15 kips
PREDICTED FAILURE LOAD: (Fy= 50.6 ksi)
Inflection Point As Bracepoint
Moment = R Fy Seff = 50.6(2.39)(0.435)= 83.20 kip-in.Predicted Line Load = 147.71 plf
Inflection Point Not As Bracepoint
Moment = R Fy Seff = 50.6(2.39)(0.435)= 83.20 kip-in.Predicted Line Load = 147.71 plf
Experimental/Theoretical:Failure/Predicted = 150.60/147.71 = 1.020 I.P. BracedFailure/Predicted = 150.60/147.71 = 1.020 I.P. Not Braced

82
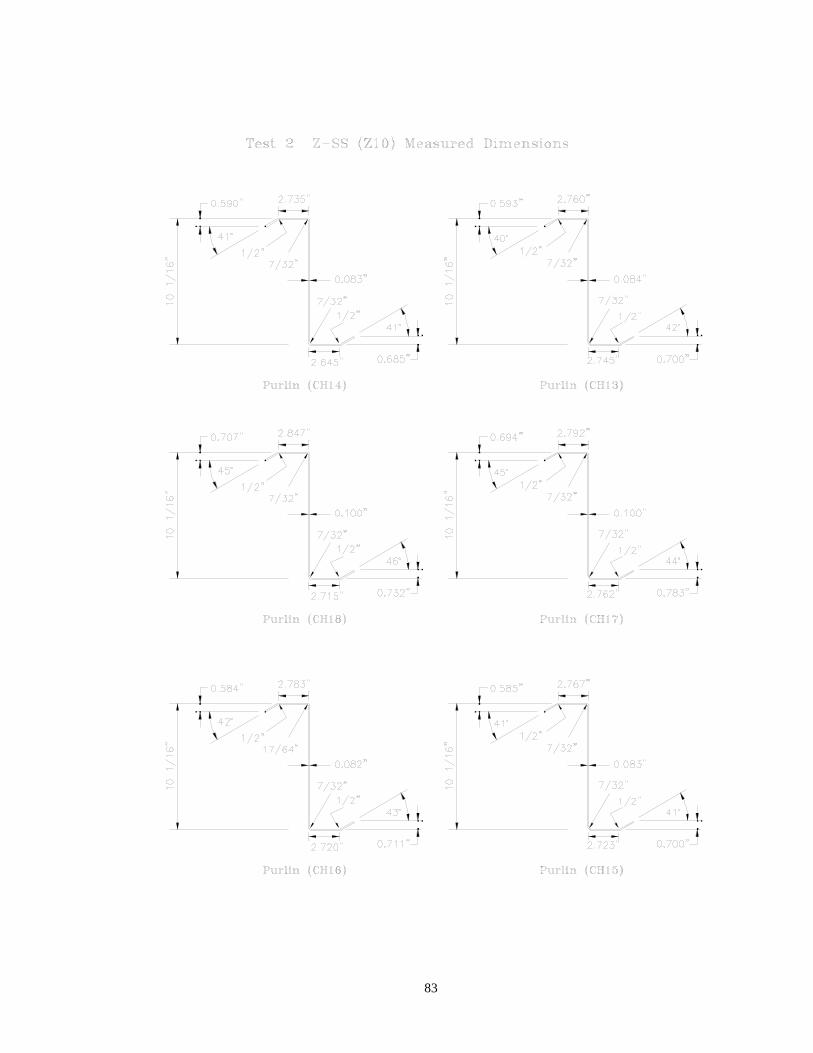
83

84
TEST 2 Z-SS 10 in. Z-SS 3 span CH 14
Purlin Geometry and Material Properties Bay #1 (Test Bay)
Top Bottom Ag 1.40 in2
Overall Lip Dimension 0.8993 in. 1.0441 in. Ix 20.70 in4
Lip Angle 41 o 41 o Iy 2.42 in4
Radii: Ixy 5.05 in4
Lip to Flange 0.5 in. 0.5 in. Flange to Web 0.2188 in. 0.2188 in. Ie 19.31 in4
Flange Width 2.735 in. 2.645 in. Se 3.68 in3
Purlin Depth 10.0625 in.Purlin Thickness 0.083 in.
Yield Stress 50.6 ksiModulus of Elasticity 29500 ksi
TEST 2 Z-SS 10 in. Z-SS 3 span CH 13
Purlin Geometry and Material Properties Bay #1 (Test Bay)
Top Bottom Ag 1.43 in2
Overall Lip Dimension 0.9964 in. 1.0176 in. Ix 21.12 in4
Lip Angle 49 o 46 o Iy 2.60 in4
Radii: Ixy 5.33 in4
Lip to Flange 0.4375 in. 0.4375 in. Flange to Web 0.2656 in. 0.2656 in. Ie 19.80 in4
Flange Width 2.498 in. 2.498 in. Se 3.78 in3
Purlin Depth 10.0625 in.Purlin Thickness 0.084 in. Other properties for CH 13
Yield Stress 50.6 ksi rx in.Modulus of Elasticity 29500 ksi ry in.
ro in.Cw in6
J in4
α o
42.6970.00249-14.982
Flexural Strength
3.84941.35384.0853
Purlin Properties
Flexural Strength
Results From Commercial Software
Purlin Properties

85
TEST 2 Z-SS 10 in. Z-SS 3 span CH 18
Purlin Geometry and Material Properties Bay #2 (Middle Bay)
Top Bottom Ag 1.71 in2
Overall Lip Dimension 1.0566 in. 1.0176 in. Ix 25.36 in4
Lip Angle 42 o 46 o Iy 3.23 in4
Radii: Ixy 6.49 in4
Lip to Flange 0.5 in. 0.5 in. Flange to Web 0.2188 in. 0.2188 in. Ie 24.97 in4
Flange Width 2.847 in. 2.715 in. Se 4.97 in3
Purlin Depth 10.0625 in.Purlin Thickness 0.100 in.
Yield Stress 50.6 ksiModulus of Elasticity 29500 ksi
TEST 2 Z-SS 10 in. Z-SS 3 span CH 17
Purlin Geometry and Material Properties Bay #2 (Middle Bay)
Top Bottom Ag 1.72 in2
Overall Lip Dimension 0.9815 in. 1.1272 in. Ix 25.41 in4
Lip Angle 45 o 44 o Iy 3.25 in4
Radii: Ixy 6.52 in4
Lip to Flange 0.5 in. 0.5 in. Flange to Web 0.2188 in. 0.2188 in. Ie 24.90 in4
Flange Width 2.792 in. 2.762 in. Se 4.86 in3
Purlin Depth 10.0625 in.Purlin Thickness 0.100 in.
Yield Stress 50.6 ksiModulus of Elasticity 29500 ksi
Purlin Properties
Flexural Strength
Purlin Properties
Flexural Strength

86
TEST 2 Z-SS 10 in. Z-SS 3 span CH 16
Purlin Geometry and Material Properties Bay #3 (End Bay)
Top Bottom Ag 1.39 in2
Overall Lip Dimension 0.8728 in. 1.0425 in. Ix 20.63 in4
Lip Angle 42 o 43 o Iy 2.48 in4
Radii: Ixy 5.12 in4
Lip to Flange 0.5 in. 0.5 in. Flange to Web 0.2188 in. 0.2188 in. Ie 19.03 in4
Flange Width 2.783 in. 2.720 in. Se 3.60 in3
Purlin Depth 10.0625 in.Purlin Thickness 0.082 in.
Yield Stress 50.6 ksiModulus of Elasticity 29500 ksi
TEST 2 Z-SS 10 in. Z-SS 3 span CH 15
Purlin Geometry and Material Properties Bay #3 (End Bay)
Top Bottom Ag 1.41 in2
Overall Lip Dimension 0.8917 in. 1.067 in. Ix 20.95 in4
Lip Angle 41 o 41 o Iy 2.55 in4
Radii: Ixy 5.23 in4
Lip to Flange 0.5 in. 0.5 in. Flange to Web 0.2188 in. 0.2188 in. Ie 19.43 in4
Flange Width 2.767 in. 2.723 in. Se 3.68 in3
Purlin Depth 10.0625 in.Purlin Thickness 0.083 in.
Yield Stress 50.6 ksiModulus of Elasticity 29500 ksi
Predicted Through Fastened Capacity (ASD) From Commercial Software
149.1 lbs/ft x 1.67 = lbs/ft
Purlin Properties
Flexural Strength
Purlin Properties
Flexural Strength
249

87
T est Designation: Chief Multispan T est #2S pecimen Identification: MB CH 13
Coupon Number: CH 13Date: 4/7/99
Gage length (in.): 8.010T otal length (in.): 8.0
Length between shoulders (in.): 10.0T hickness (in.): 0.076
Width (in.): 1.501
T est S etup: T est Data:Procedure: T ensile T est .1% Offset Yield: 46600 psi
Range 1 Rate: 50000 ps i/min .2% Offset Yield: 49300 psiEnd Level: 55000 ps i .5 in/in Yield: 50800 psi
Range 2 Rate: 10000 psi/minEnd Level: 0.2 in/in Ulimate S trength: 76000 psi
Range 3 Rate: 25000 ps i/min Modulus of elasticity: 37.1 ksiEnd Level: S ample Break % E longation: 23%
T E NS ION T E S T OF MAT ER IAL S(In accordance with AS T M A370-95)
01000020000300004000050000600007000080000
0.0000 0.0010 0.0020 0.0030 0.0040 0.0050
S train (in/in)
Stre
ss (
psi
)
0
10000
20000
30000
40000
50000
60000
70000
80000
0.0000 0.0050 0.0100 0.0150 0.0200 0.0250 0.0300 0.0350 0.0400 0.0450 0.0500
S train (in/in)
Stre
ss (
psi
)

88
T est Designation: Chief Multispan T est #2S pecimen Identification: MB CH 14
Coupon Number: CH 14Date: 4/7/99
Gage length (in.): 8.015T otal length (in.): 8.0
Length between shoulders (in.): 10.0T hickness (in.): 0.076
Width (in.): 1.500
T est S etup: T est Data:Procedure: T ensile T est .1% Offset Yield: 48300 psi
Range 1 Rate: 50000 ps i/min .2% Offset Yield: 50600 psiEnd Level: 55000 ps i .5 in/in Yield: 51800 psi
Range 2 Rate: 10000 psi/minEnd Level: 0.2 in/in Ulimate S trength: 77000 psi
Range 3 Rate: 25000 ps i/min Modulus of elasticity: 30.3 ksiEnd Level: S ample Break % E longation: 21%
T E NS ION T E S T OF MAT ER IAL S(In accordance with AS T M A370-95)
0
10000
20000
30000
40000
50000
60000
70000
0.0000 0.0010 0.0020 0.0030 0.0040 0.0050
S train (in/in)
Stre
ss (
psi
)
0
10000
20000
30000
40000
50000
60000
70000
80000
0.0000 0.0050 0.0100 0.0150 0.0200 0.0250 0.0300 0.0350
S train (in/in)
Stre
ss (
psi
)

89
Standing Seam2@25, 1@23 2’-0"1’-0"CH13, CH17, CH15100 plf
Test BayMax. (+) Moment = 4.735 k-ft
Ix = 18.75 in4 Moment at End of Lap = 5.445 k-ftAg = 1.25 in2 Shear at End of Lap = 1.427 kIy = 2.29 in4 Moment at Support = 6.922 k-ft
Shear at Support = 1.527 kMax Deflection = 0.7855 in.
Ix = 25.42 in4 Inflection Point Located at 19.43 ft. from exterior Support.Ag = 1.72 in2 Max. (+) Moment located at 9.737 ft. from exterior SupportIy = 3.25 in4 Max. Deflection Located at 10.9 ft. from exterior Support
Unbraced length (lu) between I. P. and Lap = 4.57 ft. = 54.84 in.
Ix = 18.75 in4
Ag = 1.25 in2
Iy = 2.29 in4
Mmax = 5.445 k-ftMa = 1.174 k-ftMb = 2.479 k-ft
Ix = 44.15 in4 Mc = 3.916 k-ftAg = 2.97 in2
Iy = 5.54 in4 Cb = 1.754
Total Lap Length
Test Bay Section Properties
Extension into Test BayPurlin DesignationLoad applied to Model
Lap Section Properties
RESULTS FROM STIFFNESS MODEL
TEST 2 Z-SS
End Bay Section Properties
Deck TypeSpans
Middle Bay Section Properties
C b12.5 Mmax.
2.5 Mmax. 3 Ma. 4 Mb. 3 Mc.Mmax
Mmax Ma Mb Mc

90
Test ID: Test 2 Z-SS Michael R. Bryant1/5/99
Test Span, L = 25.0 ft Ix = 21.12 in.4
Scan ID Time Load Near Purlin Far Purlin Theoretical Manometer Lateral w Deflection (7dc) Deflection (9dc) Deflection Deflectionplf in. in. in. in. h2o in.
1 2:33:40.87 PM 0.000 0.000 0.000 0.000 0.000 0.0002 2:35:33.87 PM 10.924 0.078 0.075 0.086 0.560 -0.0213 2:35:45.87 PM 14.859 0.105 0.101 0.117 0.762 -0.0204 2:37:04.87 PM 19.499 0.149 0.141 0.153 1.000 -0.0265 2:37:26.87 PM 30.246 0.231 0.215 0.238 1.551 -0.0326 2:37:47.87 PM 35.121 0.273 0.248 0.276 1.801 -0.0377 2:38:21.87 PM 39.115 0.309 0.281 0.307 2.006 -0.0358 2:39:17.87 PM 43.873 0.343 0.315 0.345 2.250 -0.0409 2:41:09.87 PM 49.511 0.393 0.354 0.389 2.539 -0.04310 2:42:20.87 PM 58.910 0.483 0.428 0.463 3.021 -0.05611 2:43:30.87 PM 64.077 0.534 0.468 0.503 3.286 -0.06912 2:45:16.87 PM 69.246 0.595 0.508 0.544 3.551 -0.09213 2:45:54.87 PM 73.299 0.630 0.541 0.576 3.759 -0.09614 2:46:48.87 PM 77.528 0.686 0.574 0.609 3.976 -0.11415 2:48:30.87 PM 82.813 0.743 0.614 0.651 4.247 -0.13116 2:49:40.87 PM 88.452 0.794 0.653 0.695 4.536 -0.13317 2:50:17.87 PM 92.740 0.839 0.695 0.728 4.756 -0.14118 2:51:26.87 PM 97.555 0.896 0.733 0.766 5.003 -0.15619 2:53:11.87 PM 102.430 0.952 0.774 0.805 5.253 -0.17220 2:53:52.87 PM 107.246 1.008 0.807 0.842 5.500 -0.18921 2:54:37.87 PM 112.238 1.057 0.854 0.882 5.756 -0.19722 2:55:23.87 PM 116.879 1.169 0.893 0.918 5.994 -0.26623 2:56:36.87 PM 119.463 1.240 0.914 0.938 6.126 -0.31324 2:56:45.87 PM 121.048 1.254 0.927 0.951 6.208 -0.30625 2:56:51.87 PM 123.573 1.275 0.947 0.971 6.337 -0.30826 2:57:07.87 PM 125.042 2.115 1.006 0.982 6.412 -1.07027 2:57:13.87 PM 127.333 2.262 1.027 1.000 6.530 -1.19328 2:57:22.87 PM 128.977 2.403 1.046 1.013 6.614 -1.30729 2:57:43.87 PM 130.915 2.546 1.073 1.028 6.714 -1.42430 2:58:08.87 PM 132.737 2.586 1.093 1.043 6.807 -1.44531 2:59:00.87 PM 135.028 2.802 1.127 1.061 6.925 -1.60732 2:59:19.87 PM 136.085 2.928 1.140 1.069 6.979 -1.70433 2:59:32.87 PM 136.613 2.951 1.147 1.073 7.006 -1.72234 3:00:28.87 PM 138.610 3.139 1.173 1.089 7.108 -1.85635 3:00:46.87 PM 140.490 3.371 1.206 1.104 7.205 -2.02936 3:01:14.87 PM 141.722 3.589 1.226 1.113 7.268 -2.19737 3:01:30.87 PM 138.904 4.415 1.241 1.091 7.123 -2.81938 3:01:44.87 PM 138.140 5.750 1.272 1.085 7.084 -3.720
Properties wd, Deck Weight d, Depth t, Thickness Top Flange Width Bottom Flange Width Ag, Area Set
Units plf in. in. in. in. in2 in3
CH13 4.00 10.06 0.084 2.760 2.745 1.43 3.78
wo, Self Weight wts Set Fy
plf plf in3ksi
8.88 150.60 3.78 50.6
Notes: Opposed PurlinsStanding Seam Panel6 in. blanket insulation
Foam Blocks
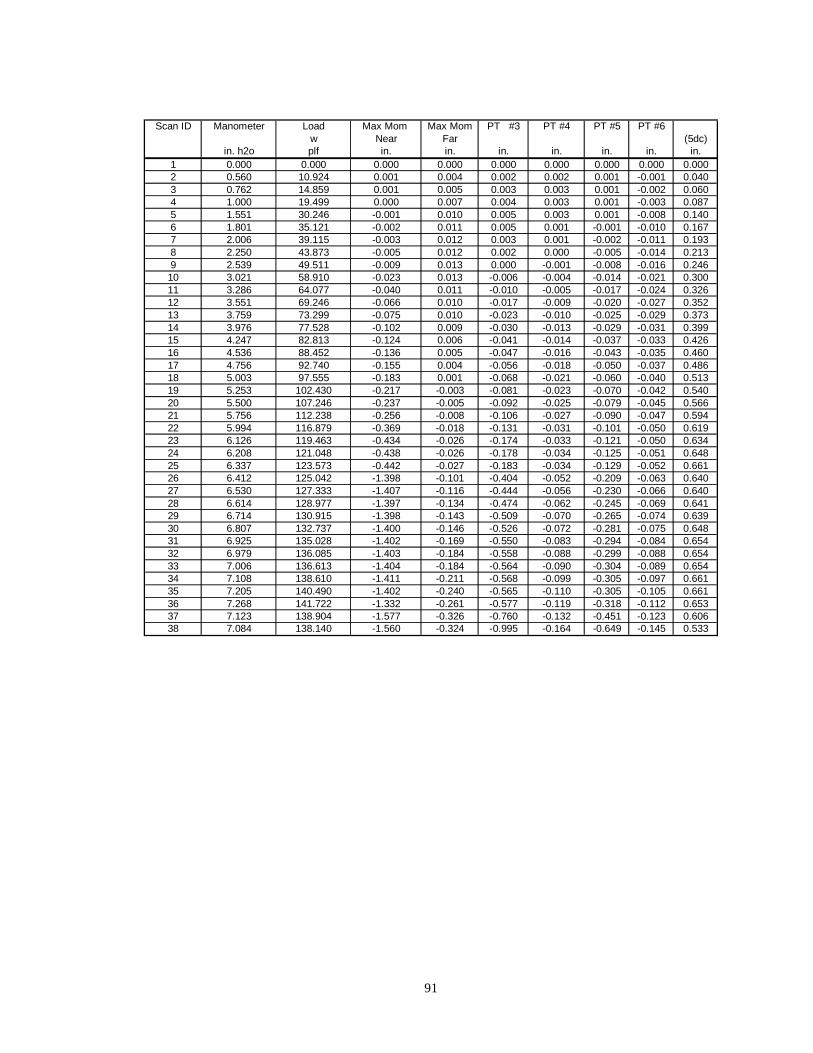
91
Scan ID Manometer Load Max Mom Max Mom PT #3 PT #4 PT #5 PT #6w Near Far (5dc)
in. h2o plf in. in. in. in. in. in. in.1 0.000 0.000 0.000 0.000 0.000 0.000 0.000 0.000 0.0002 0.560 10.924 0.001 0.004 0.002 0.002 0.001 -0.001 0.0403 0.762 14.859 0.001 0.005 0.003 0.003 0.001 -0.002 0.0604 1.000 19.499 0.000 0.007 0.004 0.003 0.001 -0.003 0.0875 1.551 30.246 -0.001 0.010 0.005 0.003 0.001 -0.008 0.1406 1.801 35.121 -0.002 0.011 0.005 0.001 -0.001 -0.010 0.1677 2.006 39.115 -0.003 0.012 0.003 0.001 -0.002 -0.011 0.1938 2.250 43.873 -0.005 0.012 0.002 0.000 -0.005 -0.014 0.2139 2.539 49.511 -0.009 0.013 0.000 -0.001 -0.008 -0.016 0.246
10 3.021 58.910 -0.023 0.013 -0.006 -0.004 -0.014 -0.021 0.30011 3.286 64.077 -0.040 0.011 -0.010 -0.005 -0.017 -0.024 0.32612 3.551 69.246 -0.066 0.010 -0.017 -0.009 -0.020 -0.027 0.35213 3.759 73.299 -0.075 0.010 -0.023 -0.010 -0.025 -0.029 0.37314 3.976 77.528 -0.102 0.009 -0.030 -0.013 -0.029 -0.031 0.39915 4.247 82.813 -0.124 0.006 -0.041 -0.014 -0.037 -0.033 0.42616 4.536 88.452 -0.136 0.005 -0.047 -0.016 -0.043 -0.035 0.46017 4.756 92.740 -0.155 0.004 -0.056 -0.018 -0.050 -0.037 0.48618 5.003 97.555 -0.183 0.001 -0.068 -0.021 -0.060 -0.040 0.51319 5.253 102.430 -0.217 -0.003 -0.081 -0.023 -0.070 -0.042 0.54020 5.500 107.246 -0.237 -0.005 -0.092 -0.025 -0.079 -0.045 0.56621 5.756 112.238 -0.256 -0.008 -0.106 -0.027 -0.090 -0.047 0.59422 5.994 116.879 -0.369 -0.018 -0.131 -0.031 -0.101 -0.050 0.61923 6.126 119.463 -0.434 -0.026 -0.174 -0.033 -0.121 -0.050 0.63424 6.208 121.048 -0.438 -0.026 -0.178 -0.034 -0.125 -0.051 0.64825 6.337 123.573 -0.442 -0.027 -0.183 -0.034 -0.129 -0.052 0.66126 6.412 125.042 -1.398 -0.101 -0.404 -0.052 -0.209 -0.063 0.64027 6.530 127.333 -1.407 -0.116 -0.444 -0.056 -0.230 -0.066 0.64028 6.614 128.977 -1.397 -0.134 -0.474 -0.062 -0.245 -0.069 0.64129 6.714 130.915 -1.398 -0.143 -0.509 -0.070 -0.265 -0.074 0.63930 6.807 132.737 -1.400 -0.146 -0.526 -0.072 -0.281 -0.075 0.64831 6.925 135.028 -1.402 -0.169 -0.550 -0.083 -0.294 -0.084 0.65432 6.979 136.085 -1.403 -0.184 -0.558 -0.088 -0.299 -0.088 0.65433 7.006 136.613 -1.404 -0.184 -0.564 -0.090 -0.304 -0.089 0.65434 7.108 138.610 -1.411 -0.211 -0.568 -0.099 -0.305 -0.097 0.66135 7.205 140.490 -1.402 -0.240 -0.565 -0.110 -0.305 -0.105 0.66136 7.268 141.722 -1.332 -0.261 -0.577 -0.119 -0.318 -0.112 0.65337 7.123 138.904 -1.577 -0.326 -0.760 -0.132 -0.451 -0.123 0.60638 7.084 138.140 -1.560 -0.324 -0.995 -0.164 -0.649 -0.145 0.533

92
0
20
40
60
80
100
120
140
160
0.000 1.000 2.000 3.000 4.000 5.000 6.000
Deflection (in.)
Lo
ad (
plf
)
Near PurlinFar PurlinTheroretical
Test 2 Z–SS Load vs. Vertical Deflection
0
20
40
60
80
100
120
140
160
-1.000 -0.800 -0.600 -0.400 -0.200 0.000
Spread (in.)
Lo
ad (
plf
)
PT 3
PT 4PT 5
PT 6MMNearMMFar
MMNear
PT 3 PT 5MMFa
PT 6
PT 4
Test 2 Z-SS Load vs. Strain

93
0
20
40
60
80
100
120
140
160
-500 -400 -300 -200 -100 0 100 200
Strain (ue)
Lo
ad (
plf
) Position 1Position 2Position 3Position 4Position 5
Position 1 2 3 4 5
Test 2 Z–SS Load vs. Strain Near Purlin Line
0
20
40
60
80
100
120
140
160
-150 -100 -50 0 50 100 150
Strain (ue)
Lo
ad (
plf
) Position 6
Position 7
Position 8
Position 9
position 10
Position 6 7 8 9 10
Test 2 Z–SS Load vs. Strain Far Purlin Line

94
APPENDIX C
TEST 3 C–SS DATA
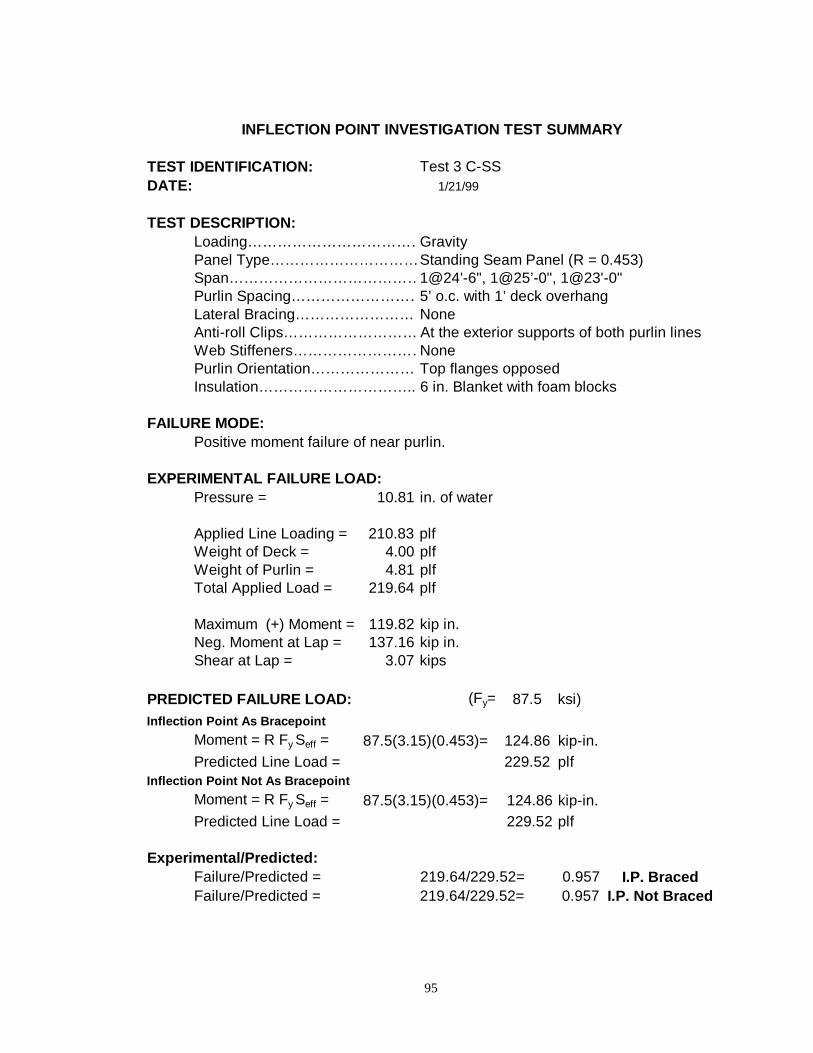
95
INFLECTION POINT INVESTIGATION TEST SUMMARY
TEST IDENTIFICATION: Test 3 C-SSDATE: 1/21/99
TEST DESCRIPTION:Loading………………………………GravityPanel Type…………………………Standing Seam Panel (R = 0.453)Span…………………………………1@24'-6", 1@25’-0", 1@23'-0"Purlin Spacing………………………5’ o.c. with 1’ deck overhangLateral Bracing………………………NoneAnti-roll Clips……………………… At the exterior supports of both purlin linesWeb Stiffeners………………………NonePurlin Orientation……………………Top flanges opposedInsulation………………………….. 6 in. Blanket with foam blocks
FAILURE MODE:Positive moment failure of near purlin.
EXPERIMENTAL FAILURE LOAD:Pressure = 10.81 in. of water
Applied Line Loading = 210.83 plfWeight of Deck = 4.00 plfWeight of Purlin = 4.81 plfTotal Applied Load = 219.64 plf
Maximum (+) Moment = 119.82 kip in.Neg. Moment at Lap = 137.16 kip in.Shear at Lap = 3.07 kips
PREDICTED FAILURE LOAD: (Fy= 87.5 ksi)Inflection Point As Bracepoint
Moment = R Fy Seff = 87.5(3.15)(0.453)= 124.86 kip-in.Predicted Line Load = 229.52 plf
Inflection Point Not As Bracepoint
Moment = R Fy Seff = 87.5(3.15)(0.453)= 124.86 kip-in.Predicted Line Load = 229.52 plf
Experimental/Predicted:Failure/Predicted = 219.64/229.52= 0.957 I.P. BracedFailure/Predicted = 219.64/229.52= 0.957 I.P. Not Braced

96

97

98
TEST 3 C-SS 10 in. C-SS 3 span CH 24
Purlin Geometry and Material Properties Bay #1 (Test Bay)
Top Bottom Ag 1.43 in2
Overall Lip Dimension 1.025 in. 0.9489 in. Ix 21.63 in4
Lip Angle 90 o 90 o Iy 2.28 in4
Radii: Ixy 0.23 in4
Lip to Flange 0.3438 in. 0.3438 in. Flange to Web 0.3438 in. 0.3438 in. Ie 18.24 in4
Flange Width 3.560 in. 3.524 in. Se 3.29 in3
Purlin Depth 10 in.Purlin Thickness 0.079 in.
Yield Stress 87.7 ksiModulus of Elasticity 29500 ksi
TEST 3 C-SS 10 in. C-SS 3 span CH 22
Purlin Geometry and Material Properties Bay #1 (Test Bay)
Top Bottom Ag 1.42 in2
Overall Lip Dimension 0.985 in. 0.939 in. Ix 21.56 in4
Lip Angle 90 o 90 o Iy 2.26 in4
Radii: Ixy 0.23 in4
Lip to Flange 0.3438 in. 0.3438 in. Flange to Web 0.3438 in. 0.3438 in. Ie 18.09 in4
Flange Width 3.570 in. 3.513 in. Se 3.25 in3
Purlin Depth 10 in.Purlin Thickness 0.079 in. Other properties for CH 22
Yield Stress 87.7 ksi rx in.Modulus of Elasticity 29500 ksi ry in.
ro in.Cw in6
J in4
Xo in.
Purlin Properties
Flexural Strength
Results From Commercial Software
Purlin Properties
Flexural Strength
3.8891.27424.794244.8490.00285-2.4946

99
TEST 3 C-SS 10 in. C-SS 3 span CH 21
Purlin Geometry and Material Properties Bay #2 (Middle Bay)
Top Bottom Ag 1.41 in2
Overall Lip Dimension 0.989 in. 0.943 in. Ix 21.31 in4
Lip Angle 90 o 90 o Iy 2.24 in4
Radii: Ixy 0.23 in4
Lip to Flange 0.3438 in. 0.3438 in. Flange to Web 0.3438 in. 0.3438 in. Ie 17.81 in4
Flange Width 3.570 in. 3.513 in. Se 3.19 in3
Purlin Depth 10 in.Purlin Thickness 0.078 in.
Yield Stress 87.7 ksiModulus of Elasticity 29500 ksi
TEST 3 C-SS 10 in. C-SS 3 span CH 23
Purlin Geometry and Material Properties Bay #2 (Middle Bay)
Top Bottom Ag 1.41 in2
Overall Lip Dimension 1.025 in. 0.948 in. Ix 21.36 in4
Lip Angle 90 o 90 o Iy 2.26 in4
Radii: Ixy 0.22 in4
Lip to Flange .0.3438 in. 0.3438 in. Flange to Web 0.3438 in. 0.3438 in. Ie 17.94 in4
Flange Width 3.560 in. 3.524 in. Se 3.23 in3
Purlin Depth 10 in.Purlin Thickness 0.078 in.
Yield Stress 87.7 ksiModulus of Elasticity 29500 ksi
Purlin Properties
Flexural Strength
Purlin Properties
Flexural Strength

100
TEST 3 C-SS 10 in. C-SS 3 span CH 19
Purlin Geometry and Material Properties Bay #3 (End Bay)
Top Bottom Ag 1.41 in2
Overall Lip Dimension 1.045 in. 0.931 in. Ix 21.44 in4
Lip Angle 90 o 90 o Iy 2.28 in4
Radii: Ixy 0.23 in4
Lip to Flange 0.3438 in. 0.3438 in. Flange to Web 0.3438 in. 0.3438 in. Ie 18.04 in4
Flange Width 3.565 in. 3.509 in. Se 3.25 in3
Purlin Depth 10 in.Purlin Thickness 0.078 in.
Yield Stress 87.7 ksiModulus of Elasticity 29500 ksi
TEST 3 C-SS 10 in. C-SS 3 span CH 20
Purlin Geometry and Material Properties Bay #3 (End Bay)
Top Bottom Ag 1.41 in2
Overall Lip Dimension 1.081 in. 0.947 in. Ix 21.30 in4
Lip Angle 90 o 90 o Iy 2.23 in4
Radii: Ixy 0.20 in4
Lip to Flange 0.3438 in. 0.3438 in. Flange to Web 0.3438 in. 0.3438 in. Ie 18.09 in4
Flange Width 3.500 in. 3.515 in. Se 3.28 in3
Purlin Depth 10 in.Purlin Thickness 0.078 in.
Yield Stress 87.7 ksiModulus of Elasticity 29500 ksi
Predicted Through Fastened Capacity (ASD) From Commercial Software
190.3 lbs/ft x 1.67 = lbs/ft
Purlin Properties
Flexural Strength
Purlin Properties
Flexural Strength
317.8

101
T est Designation: Chief Multispan T est #3S pecimen Identification: MB CH 24
Coupon Number: 1Date: 12/18/98
Gage length (in.): 8.007T otal length (in.): 8.0
Length between shoulders (in.): 10.0T hickness (in.): 0.079
Width (in.): 1.507
T est S etup: T est Data:Procedure: T ensile T est .1% Offset Yield: 87500 psi
Range 1 Rate: 50000 ps i/min .2% Offset Yield: 87700 psiEnd Level: 55000 ps i .5 in/in Yield: 87700 psi
Range 2 Rate: 10000 psi/minEnd Level: 0.2 in/in Ulimate S trength: 100700 psi
Range 3 Rate: 25000 ps i/min Modulus of elasticity: 36.0 ksiEnd Level: S ample Break % E longation: 10%
T E NS ION T E S T OF MAT ER IAL S(In accordance with AS T M A370-95)
0100002000030000400005000060000700008000090000
0.0000 0.0010 0.0020 0.0030 0.0040 0.0050
S train (in/in)
Stre
ss (
psi
)
0
10000
20000
30000
40000
50000
60000
70000
80000
90000
0.0000 0.0050 0.0100 0.0150 0.0200 0.0250
S train (in/in)
Stre
ss (
psi
)

102
T est Designation: Chief Multispan T est #3S pecimen Identification: MB CH 22
Coupon Number: 2Date: 12/18/98
Gage length (in.): 7.997T otal length (in.): 8.0
Length between shoulders (in.): 10.0T hickness (in.): 0.078
Width (in.): 1.505
T est S etup: T est Data:Procedure: T ensile T est .1% Offset Yield: 87600 psi
Range 1 Rate: 50000 ps i/min .2% Offset Yield: 87700 psiEnd Level: 55000 ps i .5 in/in Yield: 87700 psi
Range 2 Rate: 10000 psi/minEnd Level: 0.2 in/in Ulimate S trength: 102500 psi
Range 3 Rate: 25000 ps i/min Modulus of elasticity: 31.8 ksiEnd Level: S ample Break % E longation: 10%
T E NS ION T E S T OF MAT ER IAL S(In accordance with AS T M A370-95)
0100002000030000400005000060000700008000090000
0.0000 0.0010 0.0020 0.0030 0.0040 0.0050 0.0060
S train (in/in)
Stre
ss (
psi
)
0
10000
20000
30000
40000
50000
60000
70000
80000
90000
0.0000 0.0020 0.0040 0.0060 0.0080 0.0100 0.0120 0.0140 0.0160 0.0180
S train (in/in)
Stre
ss (
psi
)

103
Standing [email protected], 1@25, 1@23 3’-0"1’-0"CH22100 plf
Test BayMax. (+) Moment = 4.548 k-ft
Ix = 21.56 in4 Moment at End of Lap = 5.204 k-ftAg = 1.42 in2 Shear at End of Lap = 1.396 kIy = 2.26 in4 Moment at Support = 6.646 k-ft
Shear at Support = 1.496 kMax Deflection = 0.6168 in.
Ix = 21.56 in4 Inflection Point Located at 19.07 ft. from exterior Support.Ag = 1.42 in2 Max. (+) Moment located at 9.5 ft. from exterior SupportIy = 2.26 in4 Max. Deflection Located at 10.71 ft. from exterior Support
Unbraced length (lu) between I. P. and Lap = 4.43 ft. = 51.96 in.
Ix = 21.56 in4
Ag = 1.42 in2
Iy = 2.26 in4
Mmax = 5.204 k-ftMa = 1.117 k-ftMb = 2.356 k-ft
Ix = 43.12 in4 Mc = 3.719 k-ftAg = 2.84 in2
Iy = 4.52 in4 Cb = 1.761
Total Lap Length
Test Bay Section Properties
Extension into Test BayPurlin DesignationLoad applied to Model
Lap Section Properties
RESULTS FROM STIFFNESS MODEL
TEST 3 C-SS
End Bay Section Properties
Deck TypeSpans
Middle Bay Section Properties
C b12.5 Mmax.
2.5 Mmax. 3 Ma. 4 Mb. 3 Mc.Mmax
Mmax Ma Mb Mc
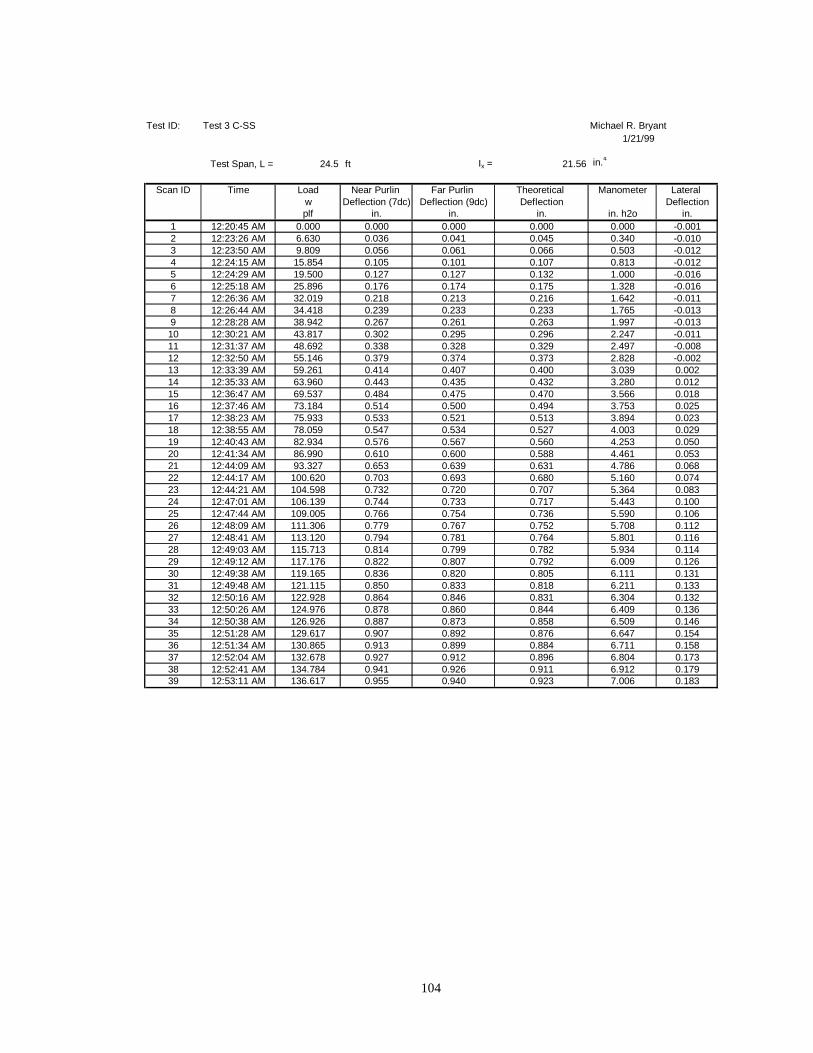
104
Test ID: Test 3 C-SS Michael R. Bryant1/21/99
Test Span, L = 24.5 ft Ix = 21.56 in.4
Scan ID Time Load Near Purlin Far Purlin Theoretical Manometer Lateral w Deflection (7dc) Deflection (9dc) Deflection Deflectionplf in. in. in. in. h2o in.
1 12:20:45 AM 0.000 0.000 0.000 0.000 0.000 -0.0012 12:23:26 AM 6.630 0.036 0.041 0.045 0.340 -0.0103 12:23:50 AM 9.809 0.056 0.061 0.066 0.503 -0.0124 12:24:15 AM 15.854 0.105 0.101 0.107 0.813 -0.0125 12:24:29 AM 19.500 0.127 0.127 0.132 1.000 -0.0166 12:25:18 AM 25.896 0.176 0.174 0.175 1.328 -0.0167 12:26:36 AM 32.019 0.218 0.213 0.216 1.642 -0.0118 12:26:44 AM 34.418 0.239 0.233 0.233 1.765 -0.0139 12:28:28 AM 38.942 0.267 0.261 0.263 1.997 -0.01310 12:30:21 AM 43.817 0.302 0.295 0.296 2.247 -0.01111 12:31:37 AM 48.692 0.338 0.328 0.329 2.497 -0.00812 12:32:50 AM 55.146 0.379 0.374 0.373 2.828 -0.00213 12:33:39 AM 59.261 0.414 0.407 0.400 3.039 0.00214 12:35:33 AM 63.960 0.443 0.435 0.432 3.280 0.01215 12:36:47 AM 69.537 0.484 0.475 0.470 3.566 0.01816 12:37:46 AM 73.184 0.514 0.500 0.494 3.753 0.02517 12:38:23 AM 75.933 0.533 0.521 0.513 3.894 0.02318 12:38:55 AM 78.059 0.547 0.534 0.527 4.003 0.02919 12:40:43 AM 82.934 0.576 0.567 0.560 4.253 0.05020 12:41:34 AM 86.990 0.610 0.600 0.588 4.461 0.05321 12:44:09 AM 93.327 0.653 0.639 0.631 4.786 0.06822 12:44:17 AM 100.620 0.703 0.693 0.680 5.160 0.07423 12:44:21 AM 104.598 0.732 0.720 0.707 5.364 0.08324 12:47:01 AM 106.139 0.744 0.733 0.717 5.443 0.10025 12:47:44 AM 109.005 0.766 0.754 0.736 5.590 0.10626 12:48:09 AM 111.306 0.779 0.767 0.752 5.708 0.11227 12:48:41 AM 113.120 0.794 0.781 0.764 5.801 0.11628 12:49:03 AM 115.713 0.814 0.799 0.782 5.934 0.11429 12:49:12 AM 117.176 0.822 0.807 0.792 6.009 0.12630 12:49:38 AM 119.165 0.836 0.820 0.805 6.111 0.13131 12:49:48 AM 121.115 0.850 0.833 0.818 6.211 0.13332 12:50:16 AM 122.928 0.864 0.846 0.831 6.304 0.13233 12:50:26 AM 124.976 0.878 0.860 0.844 6.409 0.13634 12:50:38 AM 126.926 0.887 0.873 0.858 6.509 0.14635 12:51:28 AM 129.617 0.907 0.892 0.876 6.647 0.15436 12:51:34 AM 130.865 0.913 0.899 0.884 6.711 0.15837 12:52:04 AM 132.678 0.927 0.912 0.896 6.804 0.17338 12:52:41 AM 134.784 0.941 0.926 0.911 6.912 0.17939 12:53:11 AM 136.617 0.955 0.940 0.923 7.006 0.183
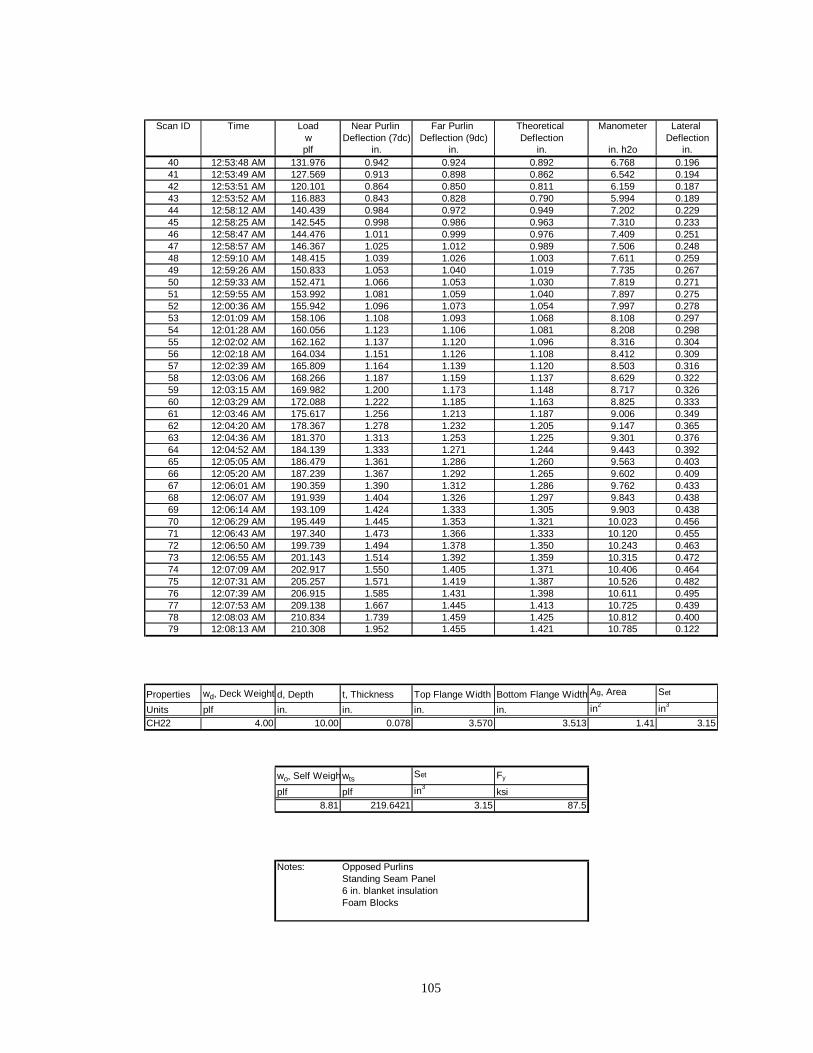
105
Scan ID Time Load Near Purlin Far Purlin Theoretical Manometer Lateral w Deflection (7dc) Deflection (9dc) Deflection Deflectionplf in. in. in. in. h2o in.
40 12:53:48 AM 131.976 0.942 0.924 0.892 6.768 0.19641 12:53:49 AM 127.569 0.913 0.898 0.862 6.542 0.19442 12:53:51 AM 120.101 0.864 0.850 0.811 6.159 0.18743 12:53:52 AM 116.883 0.843 0.828 0.790 5.994 0.18944 12:58:12 AM 140.439 0.984 0.972 0.949 7.202 0.22945 12:58:25 AM 142.545 0.998 0.986 0.963 7.310 0.23346 12:58:47 AM 144.476 1.011 0.999 0.976 7.409 0.25147 12:58:57 AM 146.367 1.025 1.012 0.989 7.506 0.24848 12:59:10 AM 148.415 1.039 1.026 1.003 7.611 0.25949 12:59:26 AM 150.833 1.053 1.040 1.019 7.735 0.26750 12:59:33 AM 152.471 1.066 1.053 1.030 7.819 0.27151 12:59:55 AM 153.992 1.081 1.059 1.040 7.897 0.27552 12:00:36 AM 155.942 1.096 1.073 1.054 7.997 0.27853 12:01:09 AM 158.106 1.108 1.093 1.068 8.108 0.29754 12:01:28 AM 160.056 1.123 1.106 1.081 8.208 0.29855 12:02:02 AM 162.162 1.137 1.120 1.096 8.316 0.30456 12:02:18 AM 164.034 1.151 1.126 1.108 8.412 0.30957 12:02:39 AM 165.809 1.164 1.139 1.120 8.503 0.31658 12:03:06 AM 168.266 1.187 1.159 1.137 8.629 0.32259 12:03:15 AM 169.982 1.200 1.173 1.148 8.717 0.32660 12:03:29 AM 172.088 1.222 1.185 1.163 8.825 0.33361 12:03:46 AM 175.617 1.256 1.213 1.187 9.006 0.34962 12:04:20 AM 178.367 1.278 1.232 1.205 9.147 0.36563 12:04:36 AM 181.370 1.313 1.253 1.225 9.301 0.37664 12:04:52 AM 184.139 1.333 1.271 1.244 9.443 0.39265 12:05:05 AM 186.479 1.361 1.286 1.260 9.563 0.40366 12:05:20 AM 187.239 1.367 1.292 1.265 9.602 0.40967 12:06:01 AM 190.359 1.390 1.312 1.286 9.762 0.43368 12:06:07 AM 191.939 1.404 1.326 1.297 9.843 0.43869 12:06:14 AM 193.109 1.424 1.333 1.305 9.903 0.43870 12:06:29 AM 195.449 1.445 1.353 1.321 10.023 0.45671 12:06:43 AM 197.340 1.473 1.366 1.333 10.120 0.45572 12:06:50 AM 199.739 1.494 1.378 1.350 10.243 0.46373 12:06:55 AM 201.143 1.514 1.392 1.359 10.315 0.47274 12:07:09 AM 202.917 1.550 1.405 1.371 10.406 0.46475 12:07:31 AM 205.257 1.571 1.419 1.387 10.526 0.48276 12:07:39 AM 206.915 1.585 1.431 1.398 10.611 0.49577 12:07:53 AM 209.138 1.667 1.445 1.413 10.725 0.43978 12:08:03 AM 210.834 1.739 1.459 1.425 10.812 0.40079 12:08:13 AM 210.308 1.952 1.455 1.421 10.785 0.122
Properties wd, Deck Weight d, Depth t, Thickness Top Flange Width Bottom Flange Width Ag, Area Set
Units plf in. in. in. in. in2 in3
CH22 4.00 10.00 0.078 3.570 3.513 1.41 3.15
wo, Self Weighwts Set Fy
plf plf in3ksi
8.81 219.6421 3.15 87.5
Notes: Opposed PurlinsStanding Seam Panel6 in. blanket insulationFoam Blocks

106
Scan ID Load Max Mom Max Mom PT #3 PT #4 PT #5 PT #6w Near Far (5dc)plf in. in. in. in. in. in. in.
1 0.000 -0.001 0.000 0.000 0.000 0.000 0.000 -0.0012 6.630 0.039 0.033 0.025 0.021 0.015 0.012 0.0183 9.809 0.058 0.051 0.038 0.032 0.022 0.018 0.0314 15.854 0.093 0.084 0.060 0.056 0.034 0.031 0.0655 19.500 0.115 0.106 0.074 0.072 0.041 0.040 0.0786 25.896 0.151 0.144 0.096 0.100 0.053 0.055 0.1127 32.019 0.190 0.180 0.120 0.127 0.064 0.071 0.1458 34.418 0.205 0.196 0.130 0.138 0.068 0.077 0.1589 38.942 0.228 0.221 0.142 0.158 0.073 0.090 0.178
10 43.817 0.257 0.251 0.159 0.181 0.080 0.104 0.20411 48.692 0.290 0.283 0.178 0.204 0.089 0.117 0.23112 55.146 0.329 0.322 0.202 0.234 0.099 0.135 0.26413 59.261 0.367 0.357 0.220 0.260 0.106 0.152 0.29114 63.960 0.398 0.388 0.237 0.283 0.114 0.166 0.31815 69.537 0.440 0.428 0.259 0.312 0.123 0.186 0.35116 73.184 0.474 0.459 0.276 0.336 0.130 0.202 0.37717 75.933 0.491 0.478 0.287 0.351 0.134 0.212 0.38918 78.059 0.509 0.495 0.296 0.363 0.137 0.221 0.40319 82.934 0.545 0.531 0.315 0.390 0.144 0.239 0.43820 86.990 0.579 0.563 0.331 0.415 0.151 0.257 0.46421 93.327 0.630 0.614 0.359 0.453 0.162 0.284 0.50422 100.620 0.681 0.659 0.390 0.489 0.172 0.310 0.54323 104.598 0.718 0.689 0.409 0.514 0.179 0.327 0.57024 106.139 0.747 0.724 0.420 0.538 0.179 0.346 0.59025 109.005 0.774 0.752 0.434 0.557 0.185 0.359 0.61026 111.306 0.791 0.769 0.445 0.570 0.189 0.368 0.62327 113.120 0.808 0.785 0.454 0.583 0.192 0.378 0.63628 115.713 0.826 0.803 0.465 0.597 0.198 0.387 0.64929 117.176 0.839 0.814 0.473 0.606 0.201 0.393 0.66330 119.165 0.860 0.833 0.485 0.620 0.206 0.404 0.67631 121.115 0.875 0.847 0.494 0.630 0.210 0.412 0.68732 122.928 0.896 0.865 0.506 0.646 0.215 0.423 0.69633 124.976 0.910 0.879 0.516 0.658 0.218 0.430 0.70934 126.926 0.927 0.893 0.526 0.670 0.223 0.439 0.72235 129.617 0.958 0.921 0.543 0.693 0.229 0.456 0.74236 130.865 0.967 0.929 0.549 0.699 0.231 0.461 0.74937 132.678 0.989 0.947 0.561 0.715 0.236 0.472 0.76938 134.784 1.008 0.965 0.571 0.730 0.240 0.482 0.78339 136.617 1.027 0.981 0.582 0.745 0.244 0.492 0.796

107
Scan ID Load Max Mom Max Mom PT #3 PT #4 PT #5 PT #6w Near Far (5dc)plf in. in. in. in. in. in. in.
40 131.976 1.031 0.984 0.575 0.745 0.236 0.493 0.79641 127.569 1.012 0.967 0.560 0.728 0.228 0.482 0.77542 120.101 0.976 0.938 0.532 0.700 0.214 0.464 0.73643 116.883 0.960 0.925 0.520 0.687 0.207 0.455 0.72344 140.439 1.077 1.041 0.598 0.790 0.238 0.526 0.84945 142.545 1.096 1.056 0.608 0.804 0.241 0.537 0.86246 144.476 1.116 1.074 0.620 0.820 0.246 0.548 0.88447 146.367 1.130 1.086 0.628 0.831 0.249 0.556 0.89148 148.415 1.147 1.100 0.639 0.845 0.253 0.566 0.90949 150.833 1.168 1.118 0.650 0.861 0.258 0.578 0.92450 152.471 1.182 1.130 0.659 0.872 0.261 0.586 0.93651 153.992 1.211 1.148 0.671 0.889 0.264 0.598 0.94952 155.942 1.231 1.169 0.682 0.907 0.269 0.610 0.96253 158.106 1.247 1.185 0.693 0.922 0.272 0.623 0.98454 160.056 1.265 1.199 0.704 0.936 0.276 0.632 0.99555 162.162 1.290 1.220 0.716 0.953 0.280 0.646 1.00956 164.034 1.307 1.233 0.726 0.966 0.283 0.656 1.02257 165.809 1.331 1.250 0.738 0.982 0.286 0.666 1.03658 168.266 1.354 1.268 0.752 1.000 0.291 0.680 1.05659 169.982 1.375 1.281 0.761 1.012 0.294 0.689 1.06860 172.088 1.430 1.301 0.778 1.027 0.296 0.700 1.08861 175.617 1.489 1.336 0.805 1.057 0.302 0.722 1.12362 178.367 1.546 1.368 0.829 1.088 0.308 0.744 1.15063 181.370 1.604 1.399 0.851 1.112 0.313 0.763 1.18264 184.139 1.638 1.424 0.872 1.134 0.320 0.779 1.20765 186.479 1.705 1.450 0.895 1.155 0.324 0.796 1.23466 187.239 1.727 1.464 0.906 1.168 0.327 0.808 1.24367 190.359 1.761 1.494 0.928 1.198 0.335 0.831 1.27668 191.939 1.794 1.508 0.938 1.209 0.338 0.839 1.28969 193.109 1.839 1.523 0.956 1.220 0.342 0.848 1.30370 195.449 1.908 1.544 0.977 1.240 0.346 0.864 1.33071 197.340 1.967 1.569 1.001 1.261 0.351 0.881 1.34972 199.739 2.009 1.587 1.019 1.278 0.357 0.894 1.36973 201.143 2.064 1.601 1.035 1.291 0.359 0.905 1.38974 202.917 2.186 1.626 1.070 1.313 0.365 0.924 1.40875 205.257 2.252 1.654 1.101 1.342 0.374 0.946 1.43576 206.915 2.274 1.674 1.116 1.356 0.378 0.958 1.45477 209.138 2.576 1.682 1.179 1.369 0.391 0.969 1.46978 210.834 2.875 1.700 1.253 1.378 0.413 0.974 1.48979 210.308 3.381 1.623 1.537 1.323 0.539 0.918 1.425

108
0
50
100
150
200
250
0.0 0.5 1.0 1.5 2.0 2.5 3.0 3.5 4.0
Deflection (in.)
Lo
ad (
plf
)
Near PurlinFar PurlinTheroretical
Test 3 C–SS Load vs. Vertical Deflection
0
50
100
150
200
250
0.000 0.500 1.000 1.500 2.000 2.500 3.000 3.500
Spread (in.)
Lo
ad (
plf
)
PT 3PT 4
PT 5PT 6MMNear
MMFar
MMNeaMMFarPT 5 PT 6
PT 3 PT 4
Test 3 C–SS Load vs. Spread

109
0
50
100
150
200
250
-400 -300 -200 -100 0 100 200 300
Strain (ue)
Lo
ad (
plf
)
Position 1Position 2Position 3Position 4Position 5
Position 1 2 3 4 5
Test 3 C–SS Load vs. Strain Near Purlin Line
0
50
100
150
200
250
-200 -150 -100 -50 0 50 100 150 200 250
Strain (ue)
Lo
ad (
plf
) Position 6Position 7Position 8
Position 9Position 10
Position 6
7 8 9 10
Test 3 C–SS Load vs. Strain Far Purlin Line

110
APPENDIX D
TEST 4 C–TF DATA

111
INFLECTION POINT INVESTIGATION TEST SUMMARY
TEST IDENTIFICATION: Test 4 C-TFDATE: 1/29/99
TEST DESCRIPTION:Loading……………………………… GravityPanel Type……………………………Through Fastened PanelSpan……………………………………1@24'-6", 1@25’-0", 1@23'-0"Purlin Spacing…………………………5’ o.c. with 1’ deck overhangLateral Bracing………………………NoneAnti-roll Clips……………………… At the exterior supports of both purlin linesWeb Stiffeners……………………… NonePurlin Orientation……………………Top flanges opposedInsulation………………………….. None
FAILURE MODE:Combined Shear + Bending at Lap of Near Purlin
EXPERIMENTAL FAILURE LOAD:Pressure = 14.36 in. of water
Applied Line Loading = 280.08 plfWeight of Deck = 4.00 plfWeight of Purlin = 3.99 plfTotal Applied Load = 288.07 plf
Maximum Pos. Moment = 157.15 kip in.Neg. Moment at Lap = 179.89 kip in.Shear at Lap = 4.02 kips
PREDICTED FAILURE LOAD: (Fy= 75.0 ksi)Inflection Point As BracepointCombined Shear + Bending:
Neg. Moment at Lap = 181.50 kip in.Shear at Lap = 4.10 kips
Predicted Line Load = 266.69 plfInflection Point Not As BracepointCombined Shear + Bending:
Neg. Moment at Lap = 179.10 kip in.Shear at Lap = 4.06 kips
Predicted Line Load = 263.69 plf
Experimental/Predicted: Failure/Predicted = 1.080 I.P. Braced Failure/Predicted = 1.092 I.P. Not Braced
288.08/266.69 =288.08/263.69 =

112

113
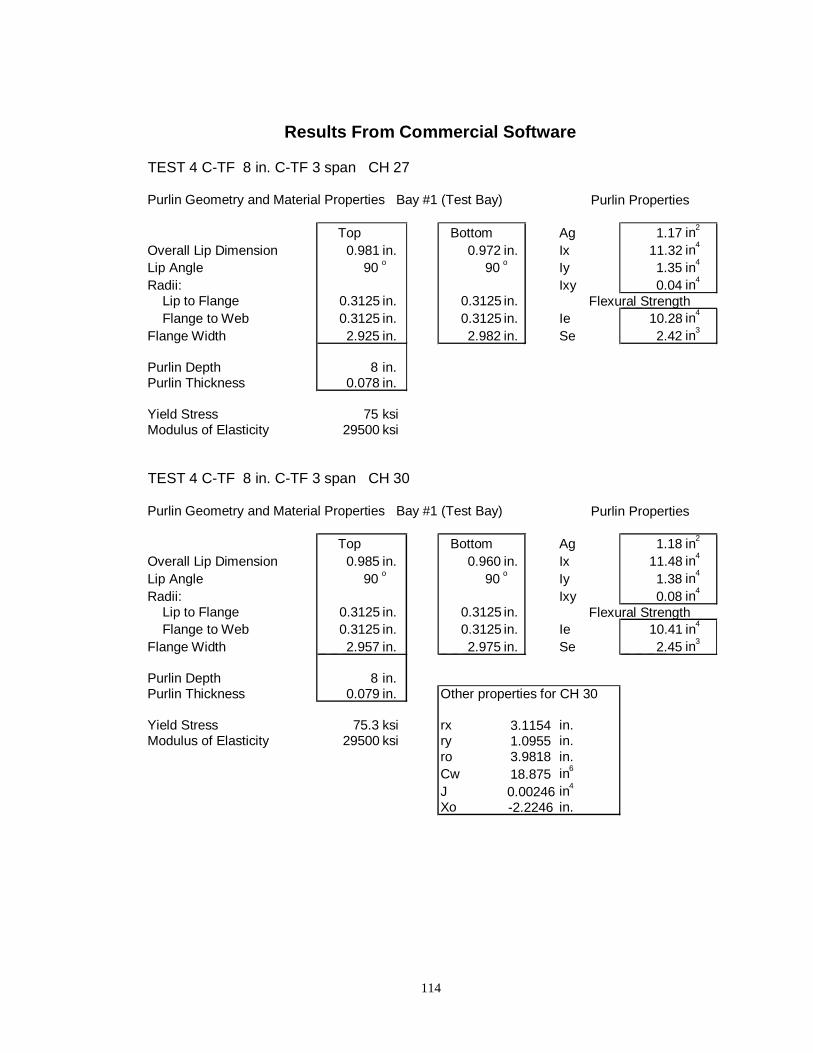
114
TEST 4 C-TF 8 in. C-TF 3 span CH 27
Purlin Geometry and Material Properties Bay #1 (Test Bay)
Top Bottom Ag 1.17 in2
Overall Lip Dimension 0.981 in. 0.972 in. Ix 11.32 in4
Lip Angle 90 o 90 o Iy 1.35 in4
Radii: Ixy 0.04 in4
Lip to Flange 0.3125 in. 0.3125 in. Flange to Web 0.3125 in. 0.3125 in. Ie 10.28 in4
Flange Width 2.925 in. 2.982 in. Se 2.42 in3
Purlin Depth 8 in.Purlin Thickness 0.078 in.
Yield Stress 75 ksiModulus of Elasticity 29500 ksi
TEST 4 C-TF 8 in. C-TF 3 span CH 30
Purlin Geometry and Material Properties Bay #1 (Test Bay)
Top Bottom Ag 1.18 in2
Overall Lip Dimension 0.985 in. 0.960 in. Ix 11.48 in4
Lip Angle 90 o 90 o Iy 1.38 in4
Radii: Ixy 0.08 in4
Lip to Flange 0.3125 in. 0.3125 in. Flange to Web 0.3125 in. 0.3125 in. Ie 10.41 in4
Flange Width 2.957 in. 2.975 in. Se 2.45 in3
Purlin Depth 8 in.Purlin Thickness 0.079 in. Other properties for CH 30
Yield Stress 75.3 ksi rx in.Modulus of Elasticity 29500 ksi ry in.
ro in.Cw in6
J in4
Xo in.
Purlin Properties
Flexural Strength
Results From Commercial Software
Purlin Properties
Flexural Strength
3.11541.09553.981818.8750.00246-2.2246

115
TEST 4 C-TF 8 in. C-TF 3 span CH 25
Purlin Geometry and Material Properties Bay #2 (Middle Bay)
Top Bottom Ag 1.18 in2
Overall Lip Dimension 0.950 in. 0.935 in. Ix 11.48 in4
Lip Angle 90 o 90 o Iy 1.38 in4
Radii: Ixy 0.09 in4
Lip to Flange 0.3125 in. 0.3125 in. Flange to Web 0.3125 in. 0.3125 in. Ie 10.37 in4
Flange Width 2.985 in. 2.983 in. Se 2.44 in3
Purlin Depth 8 in.Purlin Thickness 0.079 in.
Yield Stress 75.2 ksiModulus of Elasticity 29500 ksi
TEST 4 C-TF 8 in. C-TF 3 span CH 26
Purlin Geometry and Material Properties Bay #2 (Middle Bay)
Top Bottom Ag 1.17 in2
Overall Lip Dimension 0.962 in. 0.940 in. Ix 11.37 in4
Lip Angle 90 o 90 o Iy 1.38 in4
Radii: Ixy 0.08 in4
Lip to Flange 0.3125 in. 0.3125 in. Flange to Web 0.3125 in. 0.3125 in. Ie 10.26 in4
Flange Width 2.983 in. 2.995 in. Se 2.41 in3
Purlin Depth 8 in.Purlin Thickness 0.078 in.
Yield Stress 75.2 ksiModulus of Elasticity 29500 ksi
Purlin Properties
Flexural Strength
Purlin Properties
Flexural Strength

116
TEST 4 C-TF 8 in. C-TF 3 span CH 29
Purlin Geometry and Material Properties Bay #3 (End Bay)
Top Bottom Ag 1.18 in2
Overall Lip Dimension 0.999 in. 0.953 in. Ix 11.52 in4
Lip Angle 90 o 90 o Iy 1.40 in4
Radii: Ixy 0.10 in4
Lip to Flange 0.3125 in. 0.3125 in. Flange to Web 0.3125 in. 0.3125 in. Ie 10.45 in4
Flange Width 2.975 in. 2.980 in. Se 2.47 in3
Purlin Depth 8 in.Purlin Thickness 0.079 in.
Yield Stress 75.2 ksiModulus of Elasticity 29500 ksi
TEST 4 C-TF 8 in. C-TF 3 span CH 28
Purlin Geometry and Material Properties Bay #3 (End Bay)
Top Bottom Ag 1.18 in2
Overall Lip Dimension 0.950 in. 0.931 in. Ix 11.47 in4
Lip Angle 90 o 90 o Iy 0.10 in4
Radii: Ixy 4.46 in4
Lip to Flange 0.3125 in. 0.3125 in. Flange to Web 0.3125 in. 0.3125 in. Ie 10.36 in4
Flange Width 2.984 in. 2.975 in. Se 2.44 in3
Purlin Depth 8 in.Purlin Thickness 0.079 in.
Yield Stress 75.2 ksiModulus of Elasticity 29500 ksi
Predicted Through Fastened Capacity (ASD) From Commercial Software
157.3 lbs/ft x 1.67 = lbs/ft
Purlin Properties
Flexural Strength
Purlin Properties
Flexural Strength
262.7
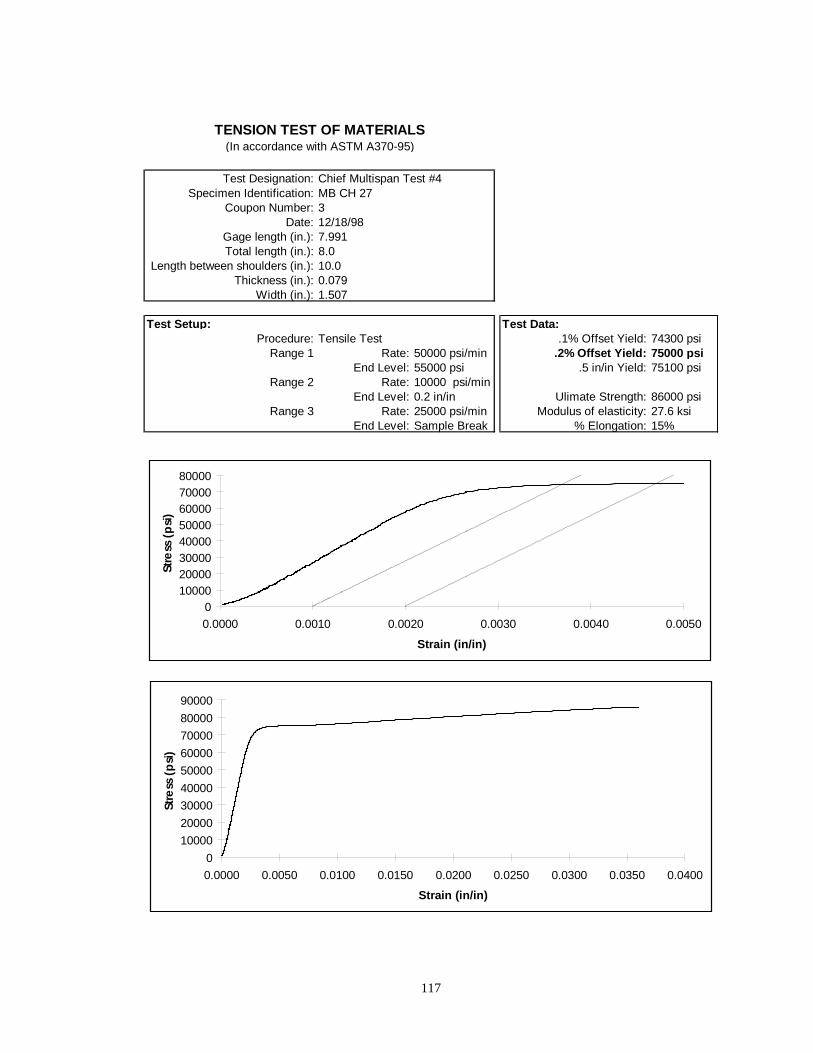
117
T est Designation: Chief Multispan T est #4S pecimen Identification: MB CH 27
Coupon Number: 3Date: 12/18/98
Gage length (in.): 7.991T otal length (in.): 8.0
Length between shoulders (in.): 10.0T hickness (in.): 0.079
Width (in.): 1.507
T est S etup: T est Data:Procedure: T ensile T est .1% Offset Yield: 74300 psi
Range 1 Rate: 50000 ps i/min .2% Offset Yield: 75000 psiEnd Level: 55000 ps i .5 in/in Yield: 75100 psi
Range 2 Rate: 10000 psi/minEnd Level: 0.2 in/in Ulimate S trength: 86000 psi
Range 3 Rate: 25000 ps i/min Modulus of elasticity: 27.6 ksiEnd Level: S ample Break % E longation: 15%
T E NS ION T E S T OF MAT ER IAL S(In accordance with AS T M A370-95)
01000020000300004000050000600007000080000
0.0000 0.0010 0.0020 0.0030 0.0040 0.0050
S train (in/in)
Stre
ss (
psi
)
0
10000
20000
30000
40000
50000
60000
70000
80000
90000
0.0000 0.0050 0.0100 0.0150 0.0200 0.0250 0.0300 0.0350 0.0400
S train (in/in)
Stre
ss (
psi
)

118
T est Designation: Chief Multispan T est #4S pecimen Identification: MB CH 30
Coupon Number: 4Date: 3/23/99
Gage length (in.): 7.994T otal length (in.): 8.0
Length between shoulders (in.): 10.0T hickness (in.): 0.079
Width (in.): 1.504
T est S etup: T est Data:Procedure: T ensile T est .1% Offset Yield: 74600 psi
Range 1 Rate: 50000 ps i/min .2% Offset Yield: 75300 psiEnd Level: 55000 ps i .5 in/in Yield: 75300 psi
Range 2 Rate: 10000 psi/minEnd Level: 0.2 in/in Ulimate S trength: 91400 psi
Range 3 Rate: 25000 ps i/min Modulus of elasticity: 24.4 ksiEnd Level: S ample Break % E longation: 14%
T E NS ION T E S T OF MAT ER IAL S(In accordance with AS T M A370-95)
01000020000300004000050000600007000080000
0.0000 0.0010 0.0020 0.0030 0.0040 0.0050 0.0060
S train (in/in)
Stre
ss (
psi
)
0
10000
20000
30000
40000
50000
60000
70000
80000
90000
0.0000 0.0020 0.0040 0.0060 0.0080 0.0100 0.0120 0.0140 0.0160
S train (in/in)
Stre
ss (
psi
)
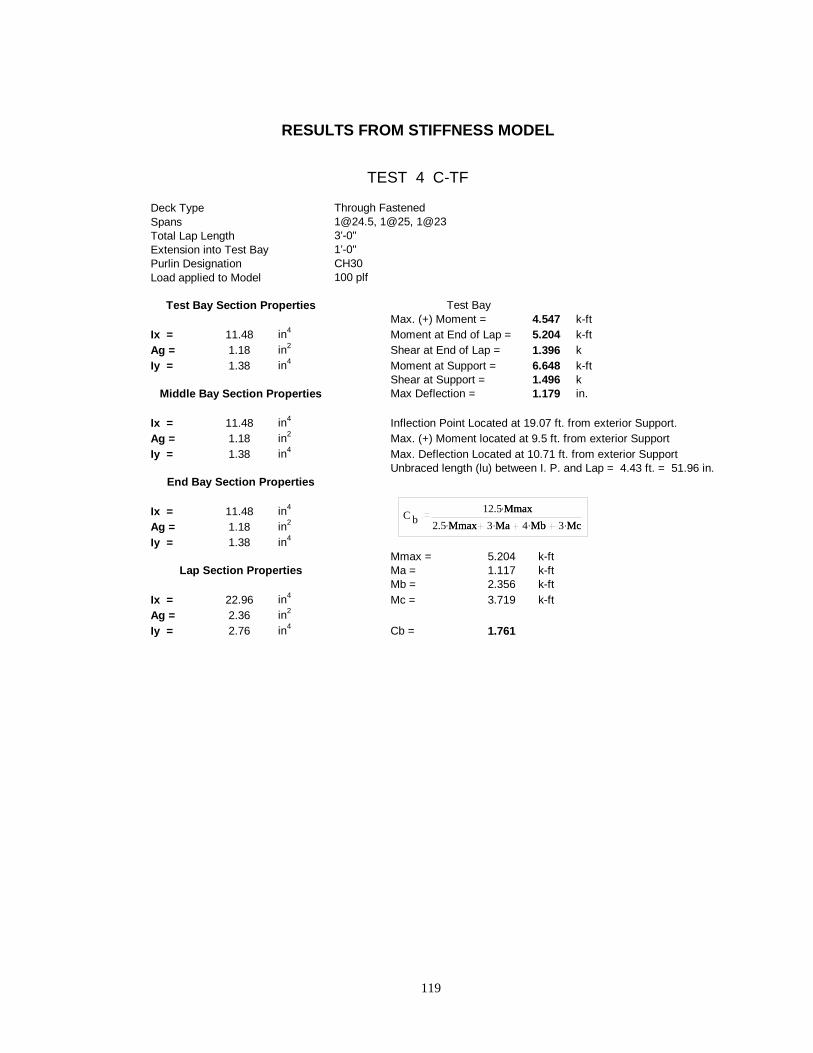
119
Through [email protected], 1@25, 1@23 3’-0"1’-0"CH30100 plf
Test BayMax. (+) Moment = 4.547 k-ft
Ix = 11.48 in4 Moment at End of Lap = 5.204 k-ftAg = 1.18 in2 Shear at End of Lap = 1.396 kIy = 1.38 in4 Moment at Support = 6.648 k-ft
Shear at Support = 1.496 kMax Deflection = 1.179 in.
Ix = 11.48 in4 Inflection Point Located at 19.07 ft. from exterior Support.Ag = 1.18 in2 Max. (+) Moment located at 9.5 ft. from exterior SupportIy = 1.38 in4 Max. Deflection Located at 10.71 ft. from exterior Support
Unbraced length (lu) between I. P. and Lap = 4.43 ft. = 51.96 in.
Ix = 11.48 in4
Ag = 1.18 in2
Iy = 1.38 in4
Mmax = 5.204 k-ftMa = 1.117 k-ftMb = 2.356 k-ft
Ix = 22.96 in4 Mc = 3.719 k-ftAg = 2.36 in2
Iy = 2.76 in4 Cb = 1.761
Total Lap Length
Test Bay Section Properties
Extension into Test BayPurlin DesignationLoad applied to Model
Lap Section Properties
RESULTS FROM STIFFNESS MODEL
TEST 4 C-TF
End Bay Section Properties
Deck TypeSpans
Middle Bay Section Properties
C b12.5 Mmax.
2.5 Mmax. 3 Ma. 4 Mb. 3 Mc.Mmax
Mmax Ma Mb Mc
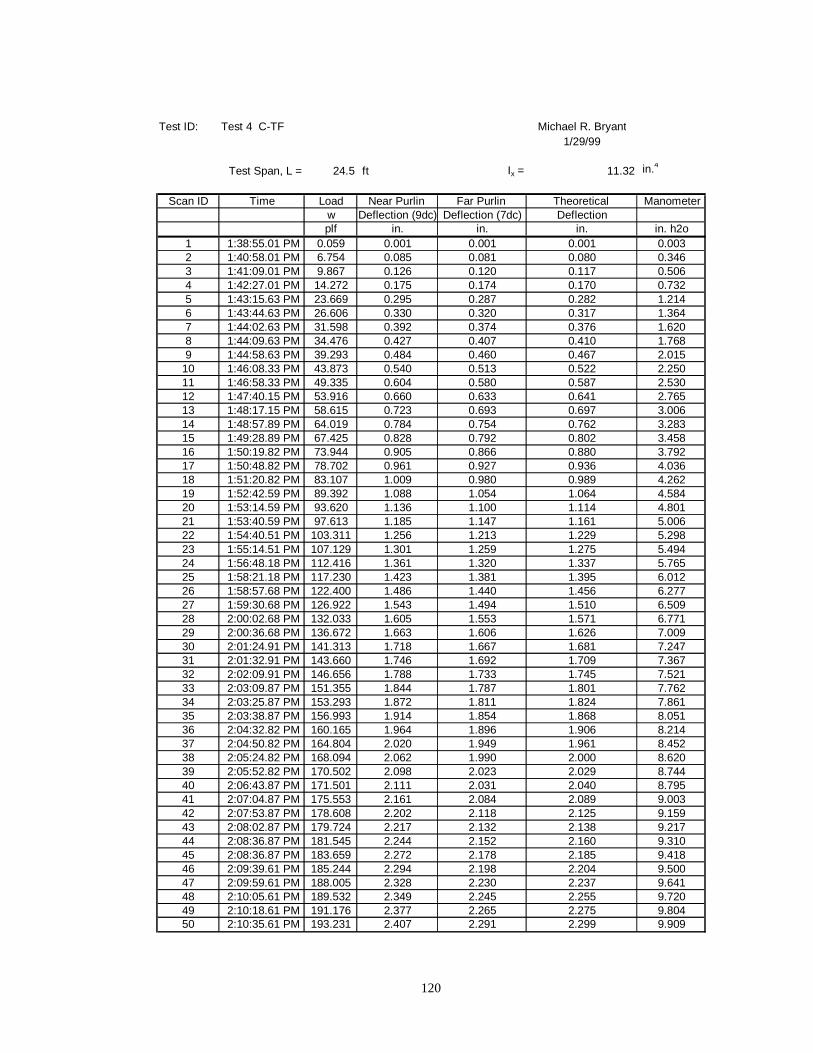
120
Test ID: Test 4 C-TF Michael R. Bryant1/29/99
Test Span, L = 24.5 ft Ix = 11.32 in.4
Scan ID Time Load Near Purlin Far Purlin Theoretical Manometerw Deflection (9dc) Deflection (7dc) Deflectionplf in. in. in. in. h2o
1 1:38:55.01 PM 0.059 0.001 0.001 0.001 0.0032 1:40:58.01 PM 6.754 0.085 0.081 0.080 0.3463 1:41:09.01 PM 9.867 0.126 0.120 0.117 0.5064 1:42:27.01 PM 14.272 0.175 0.174 0.170 0.7325 1:43:15.63 PM 23.669 0.295 0.287 0.282 1.2146 1:43:44.63 PM 26.606 0.330 0.320 0.317 1.3647 1:44:02.63 PM 31.598 0.392 0.374 0.376 1.6208 1:44:09.63 PM 34.476 0.427 0.407 0.410 1.7689 1:44:58.63 PM 39.293 0.484 0.460 0.467 2.015
10 1:46:08.33 PM 43.873 0.540 0.513 0.522 2.25011 1:46:58.33 PM 49.335 0.604 0.580 0.587 2.53012 1:47:40.15 PM 53.916 0.660 0.633 0.641 2.76513 1:48:17.15 PM 58.615 0.723 0.693 0.697 3.00614 1:48:57.89 PM 64.019 0.784 0.754 0.762 3.28315 1:49:28.89 PM 67.425 0.828 0.792 0.802 3.45816 1:50:19.82 PM 73.944 0.905 0.866 0.880 3.79217 1:50:48.82 PM 78.702 0.961 0.927 0.936 4.03618 1:51:20.82 PM 83.107 1.009 0.980 0.989 4.26219 1:52:42.59 PM 89.392 1.088 1.054 1.064 4.58420 1:53:14.59 PM 93.620 1.136 1.100 1.114 4.80121 1:53:40.59 PM 97.613 1.185 1.147 1.161 5.00622 1:54:40.51 PM 103.311 1.256 1.213 1.229 5.29823 1:55:14.51 PM 107.129 1.301 1.259 1.275 5.49424 1:56:48.18 PM 112.416 1.361 1.320 1.337 5.76525 1:58:21.18 PM 117.230 1.423 1.381 1.395 6.01226 1:58:57.68 PM 122.400 1.486 1.440 1.456 6.27727 1:59:30.68 PM 126.922 1.543 1.494 1.510 6.50928 2:00:02.68 PM 132.033 1.605 1.553 1.571 6.77129 2:00:36.68 PM 136.672 1.663 1.606 1.626 7.00930 2:01:24.91 PM 141.313 1.718 1.667 1.681 7.24731 2:01:32.91 PM 143.660 1.746 1.692 1.709 7.36732 2:02:09.91 PM 146.656 1.788 1.733 1.745 7.52133 2:03:09.87 PM 151.355 1.844 1.787 1.801 7.76234 2:03:25.87 PM 153.293 1.872 1.811 1.824 7.86135 2:03:38.87 PM 156.993 1.914 1.854 1.868 8.05136 2:04:32.82 PM 160.165 1.964 1.896 1.906 8.21437 2:04:50.82 PM 164.804 2.020 1.949 1.961 8.45238 2:05:24.82 PM 168.094 2.062 1.990 2.000 8.62039 2:05:52.82 PM 170.502 2.098 2.023 2.029 8.74440 2:06:43.87 PM 171.501 2.111 2.031 2.040 8.79541 2:07:04.87 PM 175.553 2.161 2.084 2.089 9.00342 2:07:53.87 PM 178.608 2.202 2.118 2.125 9.15943 2:08:02.87 PM 179.724 2.217 2.132 2.138 9.21744 2:08:36.87 PM 181.545 2.244 2.152 2.160 9.31045 2:08:36.87 PM 183.659 2.272 2.178 2.185 9.41846 2:09:39.61 PM 185.244 2.294 2.198 2.204 9.50047 2:09:59.61 PM 188.005 2.328 2.230 2.237 9.64148 2:10:05.61 PM 189.532 2.349 2.245 2.255 9.72049 2:10:18.61 PM 191.176 2.377 2.265 2.275 9.80450 2:10:35.61 PM 193.231 2.407 2.291 2.299 9.909

121
Scan ID Time Load Near Purlin Far Purlin Theoretical Manometerw Deflection (9dc) Deflection (7dc) Deflectionplf in. in. in. in. h2o
51 2:10:54.61 PM 195.156 2.434 2.317 2.322 10.00852 2:11:23.78 PM 197.223 2.462 2.339 2.346 10.11453 2:11:44.78 PM 199.095 2.491 2.363 2.369 10.21054 2:11:55.78 PM 199.914 2.504 2.370 2.379 10.25255 2:12:10.78 PM 201.338 2.525 2.384 2.395 10.32556 2:12:28.78 PM 202.391 2.539 2.397 2.408 10.37957 2:12:28.78 PM 203.034 2.553 2.410 2.416 10.41258 2:12:56.87 PM 205.082 2.581 2.431 2.440 10.51759 2:13:02.87 PM 207.383 2.611 2.457 2.467 10.63560 2:13:12.87 PM 210.132 2.652 2.484 2.500 10.77661 2:13:19.87 PM 211.205 2.671 2.497 2.513 10.83162 2:13:33.87 PM 212.550 2.693 2.518 2.529 10.90063 2:14:05.87 PM 214.656 2.728 2.538 2.554 11.00864 2:14:37.44 PM 216.899 2.763 2.563 2.581 11.12365 2:14:48.44 PM 219.063 2.798 2.591 2.606 11.23466 2:14:57.44 PM 220.838 2.826 2.611 2.627 11.32567 2:15:12.44 PM 222.417 2.854 2.632 2.646 11.40668 2:15:22.44 PM 224.640 2.890 2.657 2.673 11.52069 2:15:33.44 PM 226.824 2.926 2.684 2.699 11.63270 2:15:39.44 PM 228.638 2.959 2.704 2.720 11.72571 2:15:49.44 PM 230.393 2.994 2.731 2.741 11.81572 2:15:59.44 PM 231.465 3.015 2.744 2.754 11.87073 2:16:11.44 PM 232.226 3.037 2.750 2.763 11.90974 2:16:48.44 PM 234.098 3.077 2.777 2.785 12.00575 2:17:53.84 PM 236.106 3.121 2.797 2.809 12.10876 2:18:26.84 PM 238.212 3.169 2.824 2.834 12.21677 2:18:38.84 PM 240.377 3.211 2.850 2.860 12.32778 2:18:46.84 PM 242.151 3.254 2.870 2.881 12.41879 2:18:56.84 PM 244.140 3.309 2.889 2.905 12.52080 2:19:07.84 PM 246.207 3.371 2.911 2.929 12.62681 2:19:19.84 PM 247.845 3.443 2.929 2.949 12.71082 2:19:31.84 PM 248.723 3.505 2.936 2.959 12.75583 2:19:39.84 PM 250.380 3.582 2.951 2.979 12.84084 2:19:44.84 PM 247.611 3.832 2.914 2.946 12.69885 2:20:17.84 PM 280.080 3.689 3.315 3.332 14.363
Properties wd, Deck Weight d, Depth t, Thickness Top Flange WidthBottom Flange Width Ag, Area
Units plf in. in. in. in. in2
CH27 4.00 8.00 0.078 2.925 2.982 1.17
wo, Self Weight wts Set Fy
plf plf in3ksi
7.99 288.07 2.42 75.0
Notes:Through Fastened Panel
Opposed Purlins

122
Scan ID Manometer Load Max Mom Max Mom PT #3 PT #4 PT #5 PT #6w Near Far
in. h2o plf in. in. in. in. in. in.1 0.003 0.059 0.000 0.000 0.000 0.000 0.000 0.0002 0.346 6.754 0.061 0.046 0.042 0.025 0.026 0.0093 0.506 9.867 0.091 0.068 0.059 0.036 0.037 0.0154 0.732 14.272 0.129 0.097 0.083 0.054 0.052 0.0245 1.214 23.669 0.203 0.153 0.132 0.090 0.079 0.0416 1.364 26.606 0.226 0.170 0.147 0.102 0.088 0.0487 1.620 31.598 0.262 0.196 0.171 0.119 0.100 0.0578 1.768 34.476 0.282 0.211 0.185 0.129 0.108 0.0639 2.015 39.293 0.316 0.236 0.206 0.145 0.120 0.07110 2.250 43.873 0.348 0.259 0.228 0.160 0.132 0.07811 2.530 49.335 0.386 0.287 0.252 0.176 0.145 0.08612 2.765 53.916 0.419 0.309 0.275 0.191 0.157 0.09413 3.006 58.615 0.453 0.333 0.298 0.206 0.170 0.10314 3.283 64.019 0.489 0.359 0.324 0.223 0.183 0.11215 3.458 67.425 0.516 0.376 0.343 0.235 0.195 0.11816 3.792 73.944 0.558 0.406 0.373 0.255 0.212 0.12817 4.036 78.702 0.590 0.429 0.396 0.270 0.226 0.13618 4.262 83.107 0.620 0.450 0.417 0.284 0.239 0.14419 4.584 89.392 0.666 0.481 0.452 0.305 0.258 0.15520 4.801 93.620 0.692 0.501 0.471 0.318 0.267 0.16021 5.006 97.613 0.722 0.520 0.493 0.331 0.281 0.16822 5.298 103.311 0.759 0.546 0.521 0.348 0.297 0.17723 5.494 107.129 0.789 0.566 0.544 0.362 0.312 0.18324 5.765 112.416 0.824 0.591 0.570 0.378 0.325 0.19225 6.012 117.230 0.859 0.613 0.597 0.394 0.340 0.20126 6.277 122.400 0.892 0.635 0.622 0.409 0.356 0.20927 6.509 126.922 0.926 0.658 0.649 0.424 0.373 0.21628 6.771 132.033 0.964 0.680 0.678 0.441 0.391 0.22529 7.009 136.672 0.997 0.702 0.704 0.455 0.407 0.23330 7.247 141.313 1.033 0.724 0.733 0.472 0.422 0.24131 7.367 143.660 1.050 0.734 0.746 0.479 0.431 0.24532 7.521 146.656 1.076 0.750 0.767 0.488 0.442 0.25033 7.762 151.355 1.112 0.772 0.796 0.503 0.458 0.25934 7.861 153.293 1.128 0.781 0.809 0.510 0.466 0.26235 8.051 156.993 1.156 0.796 0.830 0.521 0.479 0.26736 8.214 160.165 1.189 0.813 0.855 0.533 0.495 0.27337 8.452 164.804 1.225 0.833 0.884 0.547 0.513 0.28138 8.620 168.094 1.260 0.851 0.911 0.558 0.530 0.28639 8.744 170.502 1.284 0.863 0.930 0.567 0.542 0.29140 8.795 171.501 1.299 0.871 0.942 0.572 0.548 0.29341 9.003 175.553 1.328 0.888 0.966 0.584 0.563 0.30042 9.159 178.608 1.360 0.903 0.991 0.594 0.579 0.30543 9.217 179.724 1.370 0.908 1.000 0.598 0.584 0.30644 9.310 181.545 1.392 0.918 1.016 0.605 0.594 0.30945 9.418 183.659 1.413 0.929 1.032 0.612 0.605 0.31346 9.500 185.244 1.428 0.937 1.044 0.618 0.613 0.31647 9.641 188.005 1.451 0.947 1.062 0.625 0.625 0.32048 9.720 189.532 1.465 0.954 1.074 0.630 0.633 0.32249 9.804 191.176 1.485 0.962 1.090 0.637 0.645 0.32550 9.909 193.231 1.510 0.973 1.109 0.644 0.659 0.329

123
Scan ID Manometer Load Max Mom Max Mom PT #3 PT #4 PT #5 PT #6w Near Far
in. h2o plf in. in. in. in. in. in.51 10.008 195.156 1.533 0.982 1.127 0.651 0.672 0.33352 10.114 197.223 1.561 0.995 1.150 0.659 0.687 0.33653 10.210 199.095 1.581 1.005 1.166 0.665 0.698 0.33954 10.252 199.914 1.591 1.009 1.174 0.668 0.704 0.34155 10.325 201.338 1.607 1.015 1.187 0.673 0.713 0.34356 10.379 202.391 1.622 1.023 1.200 0.678 0.721 0.34557 10.412 203.034 1.633 1.026 1.209 0.680 0.728 0.34758 10.517 205.082 1.648 1.034 1.222 0.686 0.736 0.34959 10.635 207.383 1.669 1.043 1.240 0.693 0.749 0.35260 10.776 210.132 1.706 1.056 1.271 0.703 0.771 0.35761 10.831 211.205 1.724 1.063 1.286 0.708 0.783 0.35962 10.900 212.550 1.749 1.072 1.306 0.714 0.798 0.36263 11.008 214.656 1.782 1.085 1.332 0.721 0.815 0.36564 11.123 216.899 1.817 1.097 1.360 0.730 0.837 0.36865 11.234 219.063 1.840 1.107 1.380 0.737 0.849 0.37266 11.325 220.838 1.866 1.115 1.402 0.743 0.866 0.37567 11.406 222.417 1.896 1.124 1.428 0.750 0.885 0.37868 11.520 224.640 1.923 1.133 1.452 0.756 0.902 0.38169 11.632 226.824 1.960 1.144 1.482 0.765 0.925 0.38470 11.725 228.638 1.989 1.153 1.508 0.770 0.943 0.38771 11.815 230.393 2.027 1.162 1.541 0.778 0.968 0.38972 11.870 231.465 2.056 1.169 1.564 0.782 0.984 0.39273 11.909 232.226 2.079 1.174 1.583 0.786 0.998 0.39374 12.005 234.098 2.130 1.185 1.624 0.794 1.027 0.39675 12.108 236.106 2.186 1.197 1.670 0.801 1.057 0.39976 12.216 238.212 2.228 1.206 1.705 0.807 1.081 0.40177 12.327 240.377 2.269 1.213 1.740 0.812 1.105 0.40378 12.418 242.151 2.313 1.219 1.777 0.817 1.132 0.40479 12.520 244.140 2.377 1.225 1.830 0.822 1.172 0.40580 12.626 246.207 2.453 1.230 1.892 0.828 1.218 0.40581 12.710 247.845 2.556 1.233 1.974 0.831 1.279 0.40382 12.755 248.723 2.656 1.232 2.051 0.830 1.337 0.39883 12.840 250.380 2.760 1.230 2.134 0.830 1.399 0.39384 12.698 247.611 3.238 1.176 2.546 0.791 1.735 0.34885 14.363 280.080 2.542 1.396 1.935 0.936 1.217 0.467
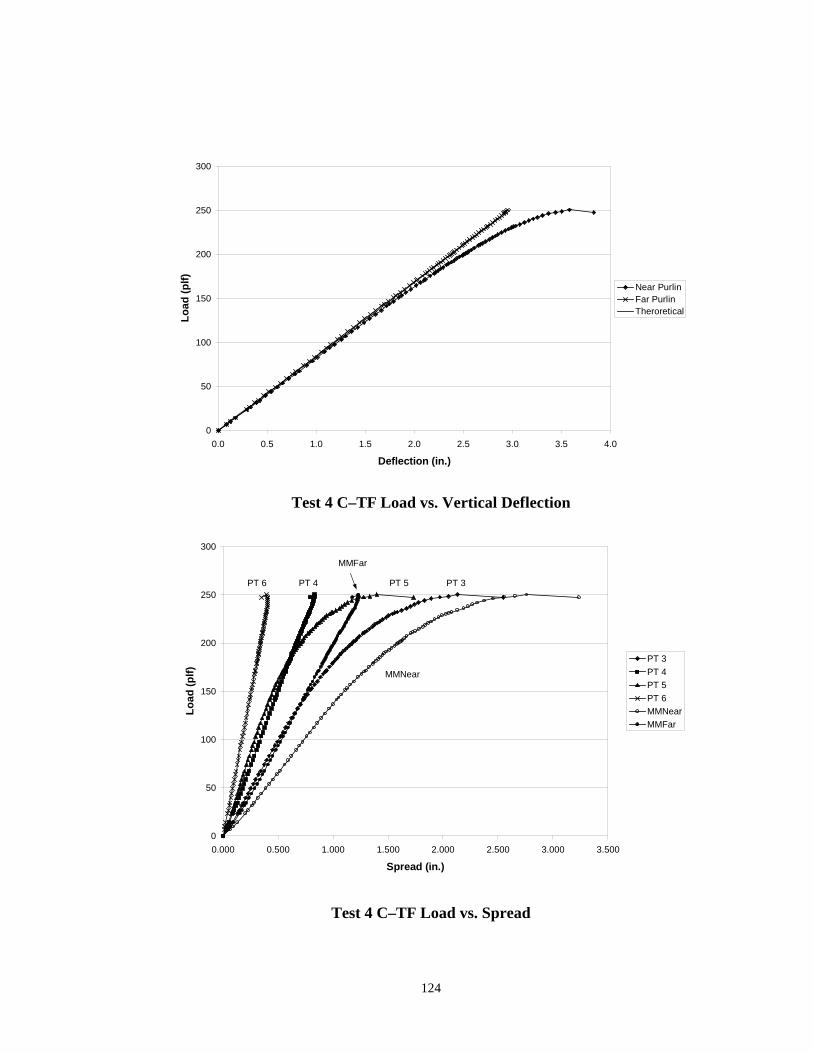
124
0
50
100
150
200
250
300
0.0 0.5 1.0 1.5 2.0 2.5 3.0 3.5 4.0
Deflection (in.)
Lo
ad (
plf
)
Near PurlinFar PurlinTheroretical
Test 4 C–TF Load vs. Vertical Deflection
0
50
100
150
200
250
300
0.000 0.500 1.000 1.500 2.000 2.500 3.000 3.500
Spread (in.)
Lo
ad (
plf
)
PT 3
PT 4PT 5
PT 6MMNearMMFar
MMNear
PT 3PT 6 PT 4 PT 5
MMFar
Test 4 C–TF Load vs. Spread

125
0
50
100
150
200
250
300
-400 -300 -200 -100 0 100 200 300 400 500
Strain (ue)
Lo
ad (
plf
) Position 1Position 2Position 3Position 4Position 5
Position 1 2 3 4 5
Test 4 C–TF Load vs. Strain Near Purlin Line
0
50
100
150
200
250
300
-300 -200 -100 0 100 200 300 400 500
Strain (ue)
Lo
ad (
plf
) Position 6Position 7Position 8Position 9position 10
6 7 8 9 10Position
Test 4 C–TF Load vs. Strain Far Purlin Line

126
APPENDIX E
I. P. TEST 1 Z–SS DATA

127
INFLECTION POINT INVESTIGATION TEST SUMMARY
TEST IDENTIFICATION: I. P. Test 1 Z-SSDATE: 3/17/99
TEST DESCRIPTION:Loading………………………………GravityPanel Type………………………… Standing Seam (R = 0.435)Span…………………………………2@30’-0"Purlin Spacing………………………5’ o.c. with 1’ deck overhangLateral Bracing………………………NoneAnti-roll Clips……………………… At the supports of both purlin linesWeb Stiffeners………………………NonePurlin Orientation……………………Top flanges opposedInsulation………………………….. Foam Blocks
FAILURE MODE:Positive moment failure of near purlin.
EXPERIMENTAL FAILURE LOAD:Pressure = 5.20 in. of water
Applied Line Loading = 104.78 plfWeight of Deck = 4.00 plfWeight of Purlin = 4.06 plfTotal Applied Load = 112.84 plf
Maximum (+) Moment = 81.78 kip in.Neg. Moment at Lap = 125.68 kip in.Shear at Lap = 1.9758 kips
PREDICTED FAILURE LOAD: (Fy= 69.6 ksi)Inflection Point As Bracepoint
Moment = R Fy Seff = 69.6(2.66)(0.435)= 80.53 kip-in.Predicted Line Load = 111.52 plf
Inflection Point Not As Bracepoint
Moment = R Fy Seff = 69.6(2.66)(0.435)= 80.53 kip-in.Predicted Line Load = 111.52 plf
Experimental/Predicted:Failure/Predicted = 112.84/111.52 = 1.012 I.P. BracedFailure/Predicted = 112.84/111.52 = 1.012 I.P. Not Braced
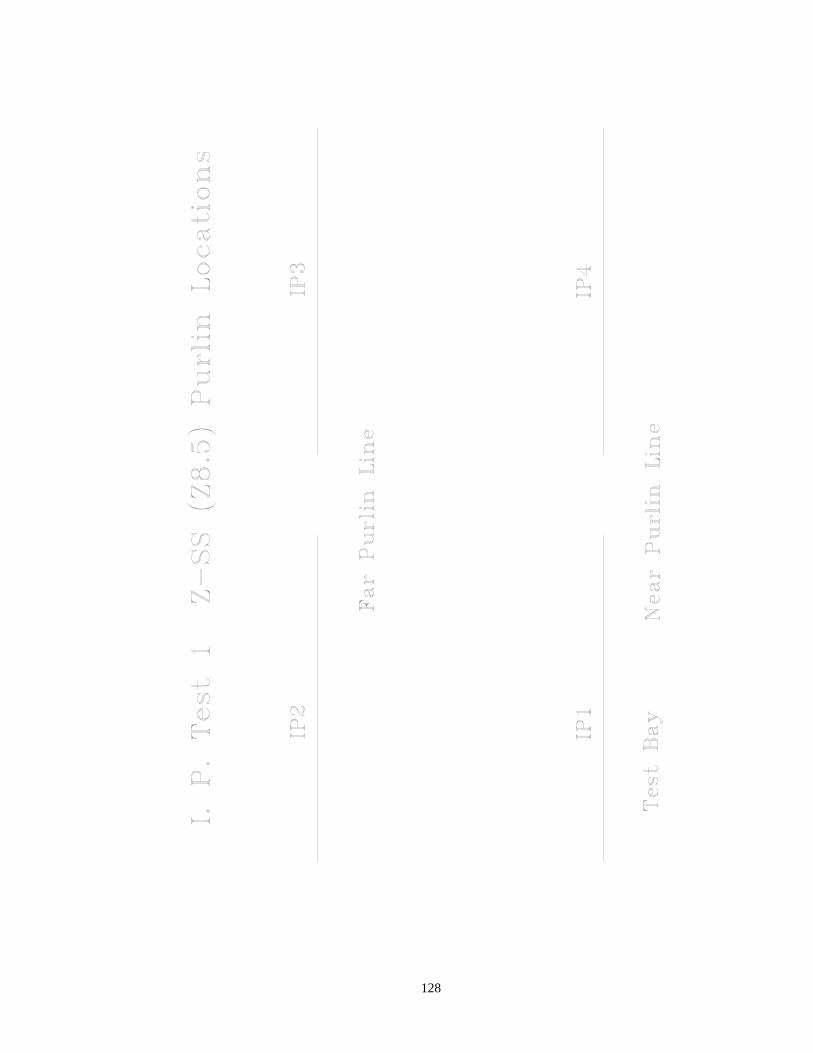
128

129
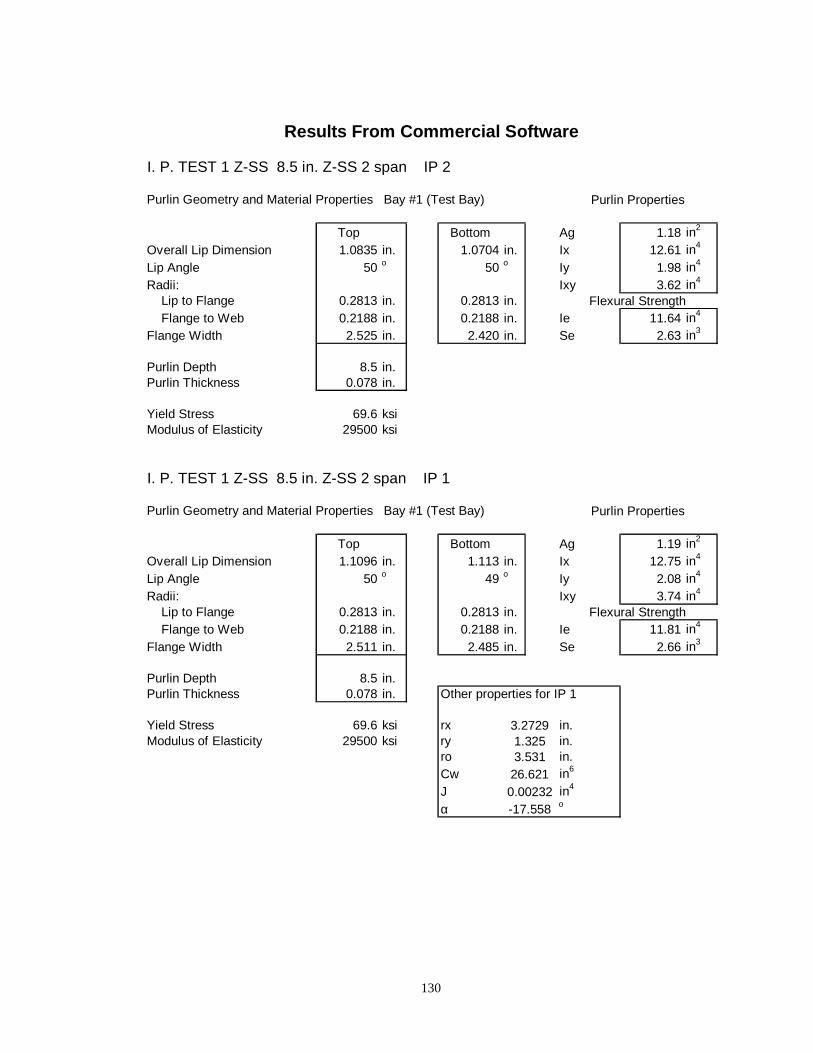
130
I. P. TEST 1 Z-SS 8.5 in. Z-SS 2 span IP 2
Purlin Geometry and Material Properties Bay #1 (Test Bay)
Top Bottom Ag 1.18 in2
Overall Lip Dimension 1.0835 in. 1.0704 in. Ix 12.61 in4
Lip Angle 50 o 50 o Iy 1.98 in4
Radii: Ixy 3.62 in4
Lip to Flange 0.2813 in. 0.2813 in. Flange to Web 0.2188 in. 0.2188 in. Ie 11.64 in4
Flange Width 2.525 in. 2.420 in. Se 2.63 in3
Purlin Depth 8.5 in.Purlin Thickness 0.078 in.
Yield Stress 69.6 ksiModulus of Elasticity 29500 ksi
I. P. TEST 1 Z-SS 8.5 in. Z-SS 2 span IP 1
Purlin Geometry and Material Properties Bay #1 (Test Bay)
Top Bottom Ag 1.19 in2
Overall Lip Dimension 1.1096 in. 1.113 in. Ix 12.75 in4
Lip Angle 50 o 49 o Iy 2.08 in4
Radii: Ixy 3.74 in4
Lip to Flange 0.2813 in. 0.2813 in. Flange to Web 0.2188 in. 0.2188 in. Ie 11.81 in4
Flange Width 2.511 in. 2.485 in. Se 2.66 in3
Purlin Depth 8.5 in.Purlin Thickness 0.078 in. Other properties for IP 1
Yield Stress 69.6 ksi rx in.Modulus of Elasticity 29500 ksi ry in.
ro in.Cw in6
J in4
α o
Purlin Properties
Flexural Strength
Results From Commercial Software
Purlin Properties
Flexural Strength
3.27291.3253.531
26.6210.00232-17.558

131
I. P. TEST 1 Z-SS 8.5 in. Z-SS 2 span IP 3
Purlin Geometry and Material Properties Bay #2 (End Bay)
Top Bottom Ag 1.18 in2
Overall Lip Dimension 1.0587 in. 1.1369 in. Ix 12.65 in4
Lip Angle 50 o 49 o Iy 2.01 in4
Radii: Ixy 3.65 in4
Lip to Flange 0.2813 in. 0.3813 in. Flange to Web 0.2188 in. 0.2188 in. Ie 11.68 in4
Flange Width 2.489 in. 2.450 in. Se 2.62 in3
Purlin Depth 8.5 in.Purlin Thickness 0.078 in.
Yield Stress 69.6 ksiModulus of Elasticity 29500 ksi
I. P. TEST 1 Z-SS 8.5 in. Z-SS 2 span IP 4
Purlin Geometry and Material Properties Bay #2 (End Bay)
Top Bottom Ag 1.19 in2
Overall Lip Dimension 1.09 in. 1.12 in. Ix 12.79 in4
Lip Angle 50 o 50 o Iy 2.11 in4
Radii: Ixy 3.77 in4
Lip to Flange 0.2813 in. 0.2813 in. Flange to Web 0.2188 in. 0.2188 in. Ie 11.82 in4
Flange Width 2.54 in. 2.501 in. Se 2.66 in3
Purlin Depth 8.5 in.Purlin Thickness 0.078 in.
Yield Stress 69.6 ksiModulus of Elasticity 29500 ksi
Predicted Through Fastened Capacity (ASD) From Commercial Software
91.5 lbs/ft x 1.67 = lbs/ft
Purlin Properties
Flexural Strength
Purlin Properties
Flexural Strength
152.8

132
T est Designation: I. P. T est # 1S pecimen Identification: IP T -1A
Coupon Number: T -1ADate: 4/7/99
Gage length (in.): 7.994T otal length (in.): 8.0
Length between shoulders (in.): 10.0T hickness (in.): 0.077
Width (in.): 1.501
T est S etup: T est Data:Procedure: T ensile T est .1% Offset Yield: 70100 psi
Range 1 Rate: 50000 ps i/min .2% Offset Yield: 71500 psiEnd Level: 55000 ps i .5 in/in Yield: 71500 psi
Range 2 Rate: 10000 psi/minEnd Level: 0.2 in/in Ulimate S trength: 79600 psi
Range 3 Rate: 25000 ps i/min Modulus of elasticity: 29.4 ksiEnd Level: S ample Break % E longation: 21%
T E NS ION T E S T OF MAT ER IAL S(In accordance with AS T M A370-95)
01000020000300004000050000600007000080000
0.0000 0.0010 0.0020 0.0030 0.0040 0.0050
S train (in/in)
Stre
ss (
psi
)
0
10000
20000
30000
40000
50000
60000
70000
80000
0.0000 0.0050 0.0100 0.0150 0.0200 0.0250 0.0300 0.0350 0.0400 0.0450 0.0500
S train (in/in)
Stre
ss (
psi
)
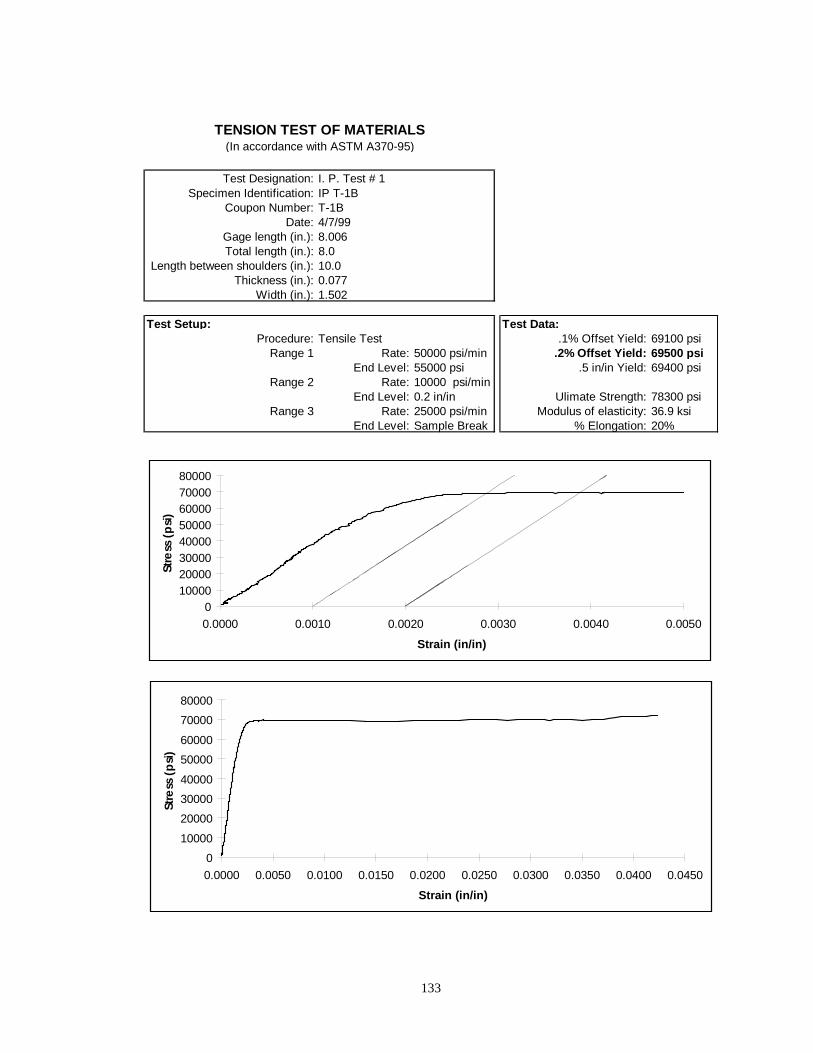
133
T est Designation: I. P. T est # 1S pecimen Identification: IP T -1B
Coupon Number: T -1BDate: 4/7/99
Gage length (in.): 8.006T otal length (in.): 8.0
Length between shoulders (in.): 10.0T hickness (in.): 0.077
Width (in.): 1.502
T est S etup: T est Data:Procedure: T ensile T est .1% Offset Yield: 69100 psi
Range 1 Rate: 50000 ps i/min .2% Offset Yield: 69500 psiEnd Level: 55000 ps i .5 in/in Yield: 69400 psi
Range 2 Rate: 10000 psi/minEnd Level: 0.2 in/in Ulimate S trength: 78300 psi
Range 3 Rate: 25000 ps i/min Modulus of elasticity: 36.9 ksiEnd Level: S ample Break % E longation: 20%
T E NS ION T E S T OF MAT ER IAL S(In accordance with AS T M A370-95)
01000020000300004000050000600007000080000
0.0000 0.0010 0.0020 0.0030 0.0040 0.0050
S train (in/in)
Stre
ss (
psi
)
0
10000
20000
30000
40000
50000
60000
70000
80000
0.0000 0.0050 0.0100 0.0150 0.0200 0.0250 0.0300 0.0350 0.0400 0.0450
S train (in/in)
Stre
ss (
psi
)

134
Standing Seam2@303’-0"1’-6"IP1100 plf
Test BayMax. (+) Moment = 6.043 k-ft
Ix = 12.75 in4 Moment at End of Lap = 9.282 k-ftAg = 1.19 in2 Shear at End of Lap = 1.751 kIy = 2.08 in4 Moment at Support = 12.028 k-ft
Shear at Support = 1.901 kMax Deflection = 1.886 in.
Inflection Point Located at 21.98 ft. from exterior Support.Max. (+) Moment located at 11.0 ft. from exterior SupportMax. Deflection Located at 12.525 ft. from exterior Support
Ix = 12.75 in4 Unbraced length (lu) between I. P. and Lap = 6.52 ft. = 78.2 in.Ag = 1.19 in2
Iy = 2.08 in4
Mmax = 9.282 k-ftMa = 1.922 k-ftMb = 4.112 k-ft
Ix = 25.5 in4 Mc = 6.567 k-ftAg = 2.38 in2
Iy = 4.16 in4 Cb = 1.782
End Bay Section Properties
Lap Section Properties
RESULTS FROM STIFFNESS MODEL
I. P. TEST 1 Z-SS
Deck TypeSpansTotal Lap Length
Test Bay Section Properties
Extension into Test BayPurlin DesignationLoad applied to Model
C b12.5 Mmax.
2.5 Mmax. 3 Ma. 4 Mb. 3 Mc.Mmax
Mmax Ma Mb Mc

135
Test ID: I. P. Test 1 Z-SS Michael R. Bryant3/17/99
Test Span, L = 30.0 ft Ix = 12.75 in.4
Scan ID Time Load Near Purlin Far Purlin Theoretical Manometerw Deflection (9dc) Deflection (7dc) Deflectionplf in. in. in. in. h2o
1 4:04:22.56 PM 0.00 0 0 0.000 0.02 4:04:32.56 PM 43.12 0.85 0.8 0.893 2.13 4:17:12.75 PM 63.67 1.3 1.2 1.319 3.24 4:21:50.75 PM 72.54 1.6 1.4 1.503 3.65 4:22:34.75 PM 82.62 1.8 1.6 1.712 4.16 4:23:16.75 PM 92.69 3.7 1.9 1.921 4.67 4:24:20.75 PM 101.15 4.7 2.1 2.096 5.08 4:26:28.75 PM 104.78 2.171 5.2
Scan ID Load Manometer Max Mom Max Mom PT #3 PT #4 PT #5 PT #6w Near farplf in. h2o in. in. in. in. in. in.
1 0.00 0.0 0 0 0.000 0.000 0.000 0.0002 43.12 2.1 -0.026 -0.06 -0.041 -0.054 -0.031 -0.0413 63.67 3.2 -0.026 -0.09 -0.056 -0.085 -0.042 -0.0644 72.54 3.6 -0.018 -0.65 -0.057 -0.096 -0.040 -0.0745 82.62 4.1 -0.001 -0.113 -0.049 -0.107 -0.031 -0.0816 92.69 4.6 0.991 -0.127 0.312 -0.149 0.186 -0.1227 101.15 5.0 0.682 -0.145 0.420 -0.163 0.274 -0.1398 104.78 5.2
Properties wd, Deck Weight d, Depth t, Thickness Top Flange Width
Units plf in. in. in.IP1 4.00 8.50 0.078 2.511
Ag, Area wo, Self Weight wts Set Fy
in2plf plf in3
ksi1.19 8.06 71.73 2.66 69.6
Notes: Opposed PurlinsStanding Seam PanelFoam Blocks
Bottom Flange Widthin.
2.485
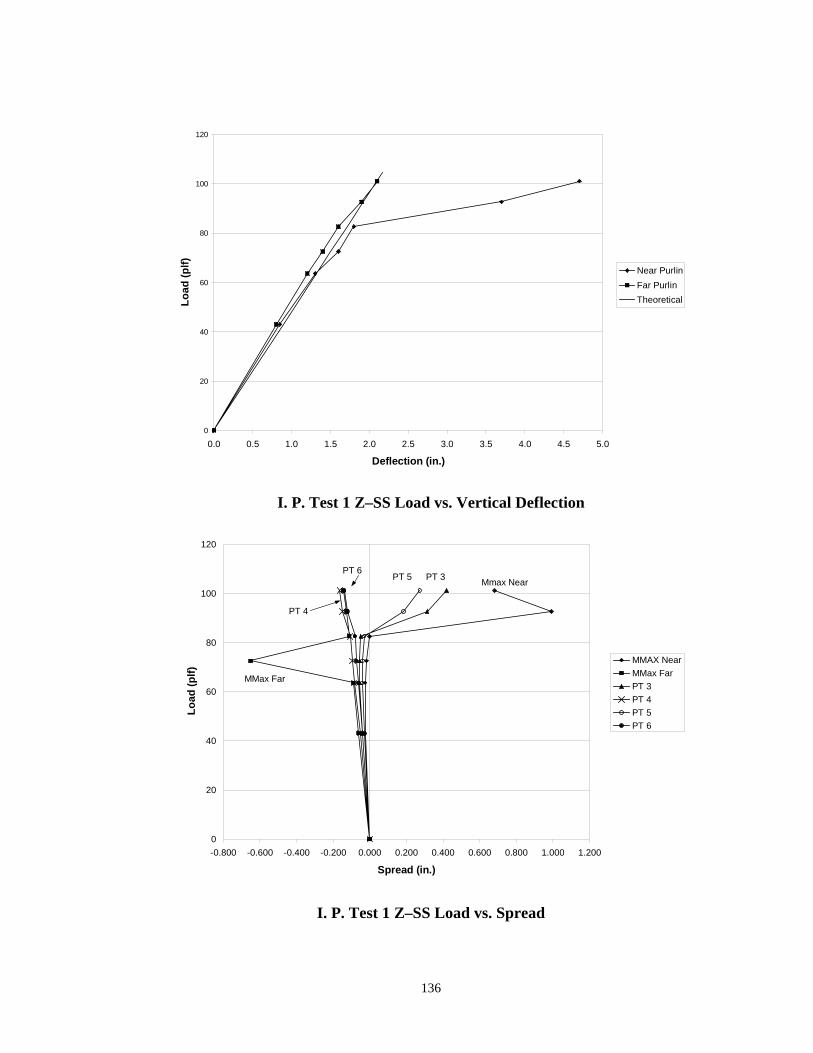
136
0
20
40
60
80
100
120
0.0 0.5 1.0 1.5 2.0 2.5 3.0 3.5 4.0 4.5 5.0
Deflection (in.)
Lo
ad (
plf
)
Near Purlin
Far Purlin
Theoretical
I. P. Test 1 Z–SS Load vs. Vertical Deflection
0
20
40
60
80
100
120
-0.800 -0.600 -0.400 -0.200 0.000 0.200 0.400 0.600 0.800 1.000 1.200
Spread (in.)
Lo
ad (
plf
)
MMAX Near
MMax FarPT 3
PT 4PT 5PT 6
Mmax Near
MMax Far
PT 3PT 5PT 6
PT 4
I. P. Test 1 Z–SS Load vs. Spread

137
APPENDIX F
I. P. TEST 2 Z–SS DATA

138
INFLECTION POINT INVESTIGATION TEST SUMMARY
TEST IDENTIFICATION: I. P. Test 2 Z-SSDATE: 3/18/99
TEST DESCRIPTION:Loading………………………………GravityPanel Type………………………… Standing Seam (R = 0.435)Span…………………………………2@30’-0"Purlin Spacing………………………5’ o.c. with 1’ deck overhangLateral Bracing………………………NoneAnti-roll Clips……………………… At the supports of both purlin linesWeb Stiffeners………………………NonePurlin Orientation……………………Top flanges opposedInsulation………………………….. Foam Blocks
FAILURE MODE:Positive moment failure of Near purlin.
EXPERIMENTAL FAILURE LOAD:Pressure = 5.10 in. of water
Applied Line Loading = 102.8 plfWeight of Deck = 4.00 plfWeight of Purlin = 4.02 plfTotal Applied Load = 110.82 plf
Maximum (+) Moment = 80.33 kip in.Neg. Moment at Lap = 123.53 kip in.Shear at Lap = 1.9405 kips
PREDICTED FAILURE LOAD: (Fy= 69.6 ksi)Inflection Point As Bracepoint
Moment = R Fy Seff = 69.6(2.62)(0.435)= 80.53 kip-in.Predicted Line Load = 111.49 plf
Inflection Point Not As Bracepoint
Moment = R Fy Seff = 69.6(2.62)(0.435)= 80.53 kip-in.Predicted Line Load = 111.49 plf
Experimental/Predicted:Failure/Predicted = 110.82/111.49 = 0.994 I.P. BracedFailure/Predicted = 110.82/111.49 = 0.994 I.P. Not Braced
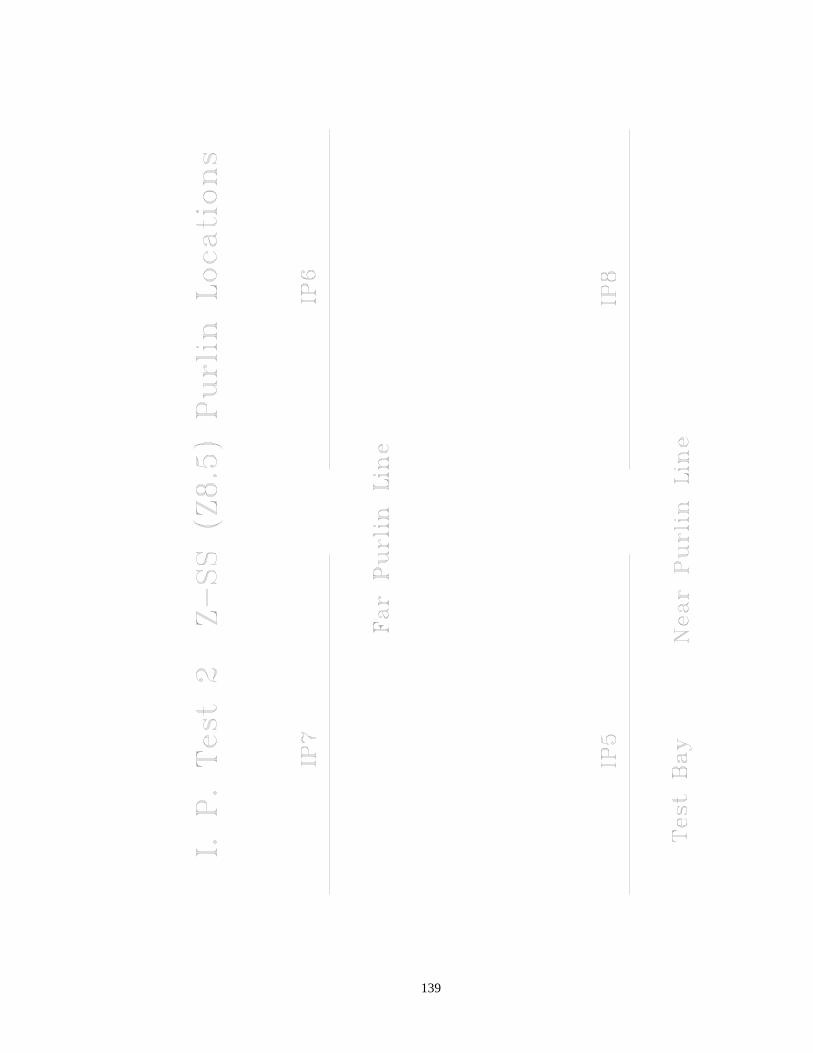
139

140

141
I. P. TEST 2 Z-SS 8.5 in. Z-SS 2 span IP 7
Purlin Geometry and Material Properties Bay #1 (Test Bay)
Top Bottom Ag 1.18 in2
Overall Lip Dimension 1.0613 in. 1.0229 in. Ix 12.62 in4
Lip Angle 50 o 49 o Iy 1.97 in4
Radii: Ixy 3.61 in4
Lip to Flange 0.2813 in. 0.2813 in. Flange to Web 0.2188 in. 0.2188 in. Ie 11.65 in4
Flange Width 2.496 in. 2.493 in. Se 2.62 in3
Purlin Depth 8.5 in.Purlin Thickness 0.078 in.
Yield Stress 69.6 ksiModulus of Elasticity 29500 ksi
I. P. TEST 2 Z-SS 8.5 in. Z-SS 2 span IP 5
Purlin Geometry and Material Properties Bay #1 (Test Bay)
Top Bottom Ag 1.18 in2
Overall Lip Dimension 1.1687 in. 1.1031 in. Ix 12.70 in4
Lip Angle 49 o 45 o Iy 2.13 in4
Radii: Ixy 3.78 in4
Lip to Flange 0.2813 in. 0.2813 in. Flange to Web 0.2188 in. 0.2188 in. Ie 11.84 in4
Flange Width 2.500 in. 2.510 in. Se 2.68 in3
Purlin Depth 8.5 in.Purlin Thickness 0.077 in. Other properties for IP 5
Yield Stress 69.6 ksi rx in.Modulus of Elasticity 29500 ksi ry in.
ro in.Cw in6
J in4
α o
27.8170.00242-17.831
Flexural Strength
3.27681.34513.5427
Purlin Properties
Flexural Strength
Results From Commercial Software
Purlin Properties

142
I. P. TEST 2 Z-SS 8.5 in. Z-SS 2 span IP 6
Purlin Geometry and Material Properties Bay #2 (End Bay)
Top Bottom Ag 1.17 in2
Overall Lip Dimension 1.0535 in. 1.0859 in. Ix 12.55 in4
Lip Angle 50 o 48 o Iy 1.93 in4
Radii: Ixy 3.57 in4
Lip to Flange 0.2813 in. 0.3813 in. Flange to Web 0.2188 in. 0.2188 in. Ie 11.70 in4
Flange Width 2.445 in. 2.455 in. Se 2.64 in3
Purlin Depth 8.5 in.Purlin Thickness 0.078 in.
Yield Stress 69.6 ksiModulus of Elasticity 29500 ksi
I. P. TEST 2 Z-SS 8.5 in. Z-SS 2 span IP 8
Purlin Geometry and Material Properties Bay #2 (End Bay)
Top Bottom Ag 1.18 in2
Overall Lip Dimension 1.0561 in. 1.1005 in. Ix 12.68 in4
Lip Angle 50 o 50 o Iy 2.02 in4
Radii: Ixy 3.67 in4
Lip to Flange 0.2813 in. 0.2813 in. Flange to Web 0.2188 in. 0.2188 in. Ie 11.70 in4
Flange Width 2.489 in. 2.503 in. Se 2.62 in3
Purlin Depth 8.5 in.Purlin Thickness 0.078 in.
Yield Stress 69.6 ksiModulus of Elasticity 29500 ksi
Predicted Through Fastened Capacity (ASD) From Commercial Software
88.0 lbs/ft x 1.67 = lbs/ft
Flexural Strength
Purlin Properties
Flexural Strength
147.0
Purlin Properties

143
T est Designation: I. P. T est # 2S pecimen Identification: IP T -2A
Coupon Number: T -2ADate: 4/7/99
Gage length (in.): 8.011T otal length (in.): 8.0
Length between shoulders (in.): 10.0T hickness (in.): 0.078
Width (in.): 1.501
T est S etup: T est Data:Procedure: T ensile T est .1% Offset Yield: 68000 psi
Range 1 Rate: 50000 ps i/min .2% Offset Yield: 69500 psiEnd Level: 55000 ps i .5 in/in Yield: 69500 psi
Range 2 Rate: 10000 psi/minEnd Level: 0.2 in/in Ulimate S trength: 78200 psi
Range 3 Rate: 25000 ps i/min Modulus of elasticity: 32.6 ksiEnd Level: S ample Break % E longation: 21%
T E NS ION T E S T OF MAT ER IAL S(In accordance with AS T M A370-95)
01000020000300004000050000600007000080000
0.0000 0.0010 0.0020 0.0030 0.0040 0.0050
S train (in/in)
Stre
ss (
psi
)
0
10000
20000
30000
40000
50000
60000
70000
80000
0.0000 0.0050 0.0100 0.0150 0.0200 0.0250 0.0300 0.0350 0.0400 0.0450 0.0500
S train (in/in)
Stre
ss (
psi
)

144
T est Designation: I. P. T est # 2S pecimen Identification: IP T -2B
Coupon Number: T -2BDate: 4/7/99
Gage length (in.): 8.001T otal length (in.): 8.0
Length between shoulders (in.): 10.0T hickness (in.): 0.077
Width (in.): 1.502
T est S etup: T est Data:Procedure: T ensile T est .1% Offset Yield: 67900 psi
Range 1 Rate: 50000 ps i/min .2% Offset Yield: 69600 psiEnd Level: 55000 ps i .5 in/in Yield: 68400 psi
Range 2 Rate: 10000 psi/minEnd Level: 0.2 in/in Ulimate S trength: 78700 psi
Range 3 Rate: 25000 ps i/min Modulus of elasticity: 40.2 ksiEnd Level: S ample Break % E longation: 21%
T E NS ION T E S T OF MAT ER IAL S(In accordance with AS T M A370-95)
01000020000300004000050000600007000080000
0.0000 0.0010 0.0020 0.0030 0.0040 0.0050
S train (in/in)
Stre
ss (
psi
)
0
10000
20000
30000
40000
50000
60000
70000
80000
0.0000 0.0050 0.0100 0.0150 0.0200 0.0250 0.0300 0.0350 0.0400 0.0450
S train (in/in)
Stre
ss (
psi
)

145
Standing Seam2@303’-0"1’-6"IP5100 plf
Test BayMax. (+) Moment = 6.043 k-ft
Ix = 12.7 in4 Moment at End of Lap = 9.282 k-ftAg = 1.18 in2 Shear at End of Lap = 1.751 kIy = 2.13 in4 Moment at Support = 12.028 k-ft
Shear at Support = 1.901 kMax Deflection = 1.886 in.
Inflection Point Located at 21.98 ft. from exterior Support.Max. (+) Moment located at 11.0 ft. from exterior SupportMax. Deflection Located at 12.525 ft. from exterior Support
Ix = 12.7 in4 Unbraced length (lu) between I. P. and Lap = 6.52 ft. = 78.2 in.Ag = 1.18 in2
Iy = 2.13 in4
Mmax = 9.282 k-ftMa = 1.922 k-ftMb = 4.112 k-ft
Ix = 25.4 in4 Mc = 6.567 k-ftAg = 2.36 in2
Iy = 4.26 in4 Cb = 1.782
End Bay Section Properties
Lap Section Properties
RESULTS FROM STIFFNESS MODEL
I. P. TEST 2 Z-SS
Deck TypeSpansTotal Lap Length
Test Bay Section Properties
Extension into Test BayPurlin DesignationLoad applied to Model
C b12.5 Mmax.
2.5 Mmax. 3 Ma. 4 Mb. 3 Mc.Mmax
Mmax Ma Mb Mc

146
Test ID: I. P. Test 2 Z-SS Michael R. Bryant3/18/99
Test Span, L = 30.0 ft Ix = 12.75 in.4
Scan ID Time Load Near Purlin Far Purlin Theoretical Manometerw Deflection (9dc) Deflection (7dc) Deflectionplf in. in. in. in. h2o
1 4:04:22.56 PM 0.000 0 0 0.000 0.02 4:04:32.56 PM 42.315 0.9 0.9 0.877 2.13 4:17:12.75 PM 61.256 1.4 1.25 1.269 3.04 4:21:50.75 PM 72.540 2.1 1.6 1.503 3.65 4:22:34.75 PM 82.615 3.15 2.05 1.712 4.16 4:23:16.75 PM 90.675 3.95 3.15 1.879 4.57 4:24:20.75 PM 98.735 5.4 4.05 2.046 4.98 4:26:28.75 PM 100.750 2.088 5.0
Scan ID Load Manometer Max Mom Max Mom PT #3 PT #4 PT #5 PT #6w Near farplf in. h2o in. in. in. in. in. in.
1 0.000 0.0 0 0 0.000 0.000 0.000 0.0002 42.315 2.1 -0.001 -0.003 0.007 -0.026 0.024 -0.0253 61.256 3.0 0.028 0.015 0.037 -0.036 0.069 -0.0314 72.540 3.6 0.209 0.165 0.129 -0.049 0.145 -0.0395 82.615 4.1 1.021 0.397 0.292 -0.062 0.242 -0.0596 90.675 4.5 1.379 0.47 0.397 -0.047 0.319 -0.0647 98.735 4.9 1.901 0.245 0.505 -0.049 0.387 -0.0718 100.750 5.0
Properties wd, Deck Weight d, Depth t, Thickness Top Flange Width
Units plf in. in. in.IP7 4.00 8.50 0.078 2.496
Ag, Area wo, Self Weight wts Set Fy
in2plf plf in3
ksi1.18 8.02 108.77 2.66 69.6
Notes: Opposed PurlinsStanding Seam PanelFoam Blocks
Bottom Flange Widthin.
2.493

147
0
20
40
60
80
100
120
0.0 1.0 2.0 3.0 4.0 5.0 6.0
Deflection (in.)
Lo
ad (
plf
)
Near Purlin
Far Purlin
Theoretical
I. P. Test 2 Z–SS Load vs. Vertical Deflection
0
20
40
60
80
100
120
-0.5 0.0 0.5 1.0 1.5 2.0
Spread (in.)
Lo
ad (
plf
)
MMax Near
MMax Far
PT 3
PT 4
PT 5
PT 6
MMax NearMMax Far
PT 3PT 5
PT 6
PT 4
I. P. Test 2 Z–SS Load vs. Spread

148
APPENDIX G
I. P. TEST 3 Z–TF DATA

149
INFLECTION POINT INVESTIGATION TEST SUMMARY
TEST IDENTIFICATION: I. P. Test 3 Z-TFDATE: 3/19/99
TEST DESCRIPTION:Loading………………………………GravityPanel Type……………………………Standing Seam (R = 0.435)Span………………………………… 2@30’-0"Purlin Spacing………………………5’ o.c. with 1’ deck overhangLateral Bracing………………………NoneAnti-roll Clips……………………… At the supports of both purlin linesWeb Stiffeners………………………NonePurlin Orientation……………………Top flanges opposedInsulation………………………….. None
FAILURE MODE:Combined Shear plus Bending at Face of Lap
EXPERIMENTAL FAILURE LOAD:Pressure = 8.00 in. of water
Applied Line Loading = 161.2 plfWeight of Deck = 4.00 plfWeight of Purlin = 4.02 plfTotal Applied Load = 169.22 plf
Maximum (+) Moment = 122.65 kip in.Neg. Moment at Lap = 188.49 kip in.Shear at Lap = 2.9631 kips
PREDICTED FAILURE LOAD: (Fy= 69.6 ksi)Inflection Point As BracepointCombined Shear + Bending:
Neg. Moment at Lap = 179.0 kip in.Shear at Lap = 2.90 kips
Predicted Line Load = 153.22 plfInflection Point Not As BracepointCombined Shear + Bending:
Neg. Moment at Lap = 162.10 kip in.Shear at Lap = 2.53 kips
Predicted Line Load = 139.52 plf
Experimental/Predicted: Failure/Predicted = 1.104 I.P. Braced Failure/Predicted = 1.213 I.P. Not Braced
169.22/153.22 =169.22/139.52 =

150

151

152
I. P. TEST 3 Z-TF 8.5 in. Z-TF 2 span IP 9
Purlin Geometry and Material Properties Bay #1 (Test Bay)
Top Bottom Ag 1.18 in2
Overall Lip Dimension 1.0835 in. 1.0704 in. Ix 12.61 in4
Lip Angle 50 o 50 o Iy 1.98 in4
Radii: Ixy 3.62 in4
Lip to Flange 0.2813 in. 0.2813 in. Flange to Web 0.2188 in. 0.2188 in. Ie 11.64 in4
Flange Width 2.525 in. 2.420 in. Se 2.63 in3
Purlin Depth 8.5 in.Purlin Thickness 0.078 in.
Yield Stress 69.6 ksiModulus of Elasticity 29500 ksi
I. P. TEST 3 Z-TF 8.5 in. Z-TF 2 span IP 10
Purlin Geometry and Material Properties Bay #1 (Test Bay)
Top Bottom Ag 1.19 in2
Overall Lip Dimension 1.1096 in. 1.113 in. Ix 12.75 in4
Lip Angle 50 o 49 o Iy 2.08 in4
Radii: Ixy 3.74 in4
Lip to Flange 0.2813 in. 0.2813 in. Flange to Web 0.2188 in. 0.2188 in. Ie 11.81 in4
Flange Width 2.511 in. 2.485 in. Se 2.66 in3
Purlin Depth 8.5 in.Purlin Thickness 0.078 in. Other properties for IP 10
Yield Stress 69.6 ksi rx in.Modulus of Elasticity 29500 ksi ry in.
ro in.Cw in6
J in4
α o
26.6210.00232-17.558
Flexural Strength
3.27291.3253.531
Purlin Properties
Flexural Strength
Results From Commercial Software
Purlin Properties
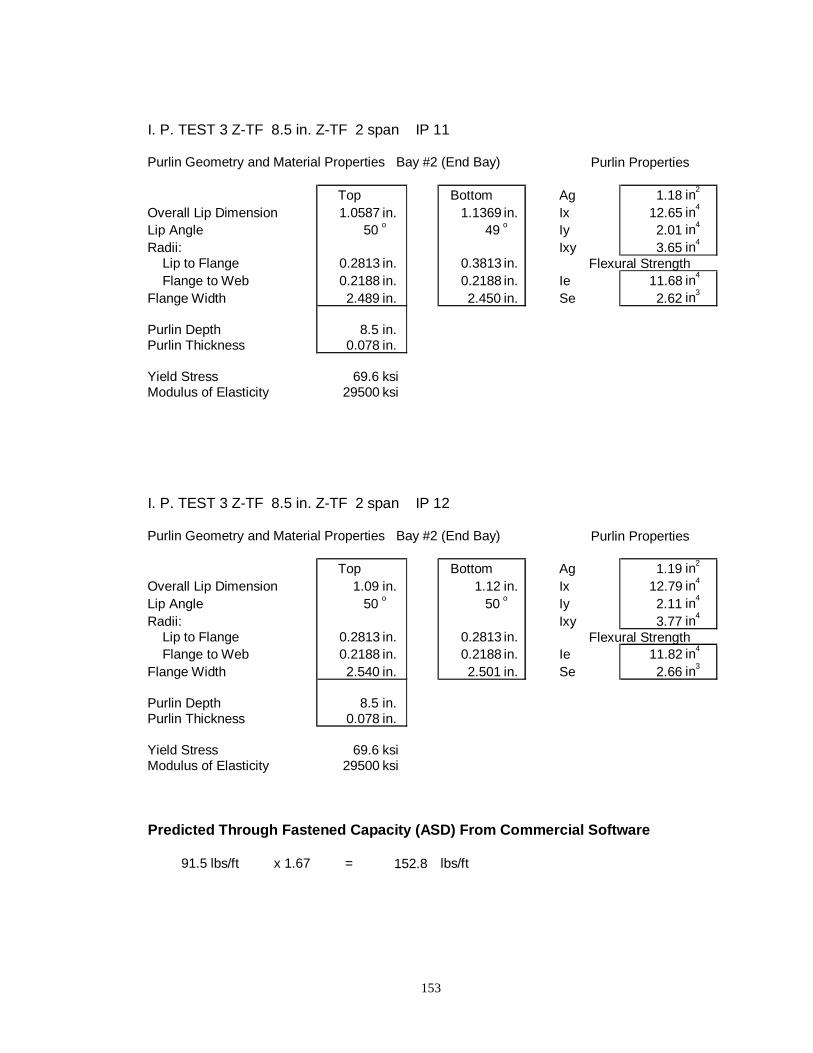
153
I. P. TEST 3 Z-TF 8.5 in. Z-TF 2 span IP 11
Purlin Geometry and Material Properties Bay #2 (End Bay)
Top Bottom Ag 1.18 in2
Overall Lip Dimension 1.0587 in. 1.1369 in. Ix 12.65 in4
Lip Angle 50 o 49 o Iy 2.01 in4
Radii: Ixy 3.65 in4
Lip to Flange 0.2813 in. 0.3813 in. Flange to Web 0.2188 in. 0.2188 in. Ie 11.68 in4
Flange Width 2.489 in. 2.450 in. Se 2.62 in3
Purlin Depth 8.5 in.Purlin Thickness 0.078 in.
Yield Stress 69.6 ksiModulus of Elasticity 29500 ksi
I. P. TEST 3 Z-TF 8.5 in. Z-TF 2 span IP 12
Purlin Geometry and Material Properties Bay #2 (End Bay)
Top Bottom Ag 1.19 in2
Overall Lip Dimension 1.09 in. 1.12 in. Ix 12.79 in4
Lip Angle 50 o 50 o Iy 2.11 in4
Radii: Ixy 3.77 in4
Lip to Flange 0.2813 in. 0.2813 in. Flange to Web 0.2188 in. 0.2188 in. Ie 11.82 in4
Flange Width 2.540 in. 2.501 in. Se 2.66 in3
Purlin Depth 8.5 in.Purlin Thickness 0.078 in.
Yield Stress 69.6 ksiModulus of Elasticity 29500 ksi
Predicted Through Fastened Capacity (ASD) From Commercial Software
91.5 lbs/ft x 1.67 = lbs/ft
Flexural Strength
Purlin Properties
Flexural Strength
152.8
Purlin Properties

154
ASSUMED BEHAVIOR FOR I. P. T ES T 3 Z-T F
T est Designation: I. P. T est # 2S pecimen Identification: IP T -2B
Coupon Number: T -2BDate: 4/7/99
Gage length (in.): 8.001T otal length (in.): 8.0
Length between shoulders (in.): 10.0T hickness (in.): 0.077
Width (in.): 1.502
T est Setup: T est Data:Procedure: T ensile T est .1% Offset Yield: 67900 psi
Range 1 Rate: 50000 psi/min .2% Offset Yield: 69600 ps iEnd Level: 55000 psi .5 in/in Yield: 68400 psi
Range 2 Rate: 10000 psi/minEnd Level: 0.2 in/in Ulimate S trength: 78700 psi
Range 3 Rate: 25000 psi/min Modulus of elasticity: 40.2 ksiEnd Level: S ample Break % E longation: 21%
T ENS ION T ES T OF MAT ER IAL S(In accordance with AS T M A370-95)
01000020000300004000050000600007000080000
0.0000 0.0010 0.0020 0.0030 0.0040 0.0050
S train (in/in)
Stre
ss (
psi
)
0
10000
20000
30000
40000
50000
60000
70000
80000
0.0000 0.0050 0.0100 0.0150 0.0200 0.0250 0.0300 0.0350 0.0400 0.0450
S train (in/in)
Stre
ss (
psi
)
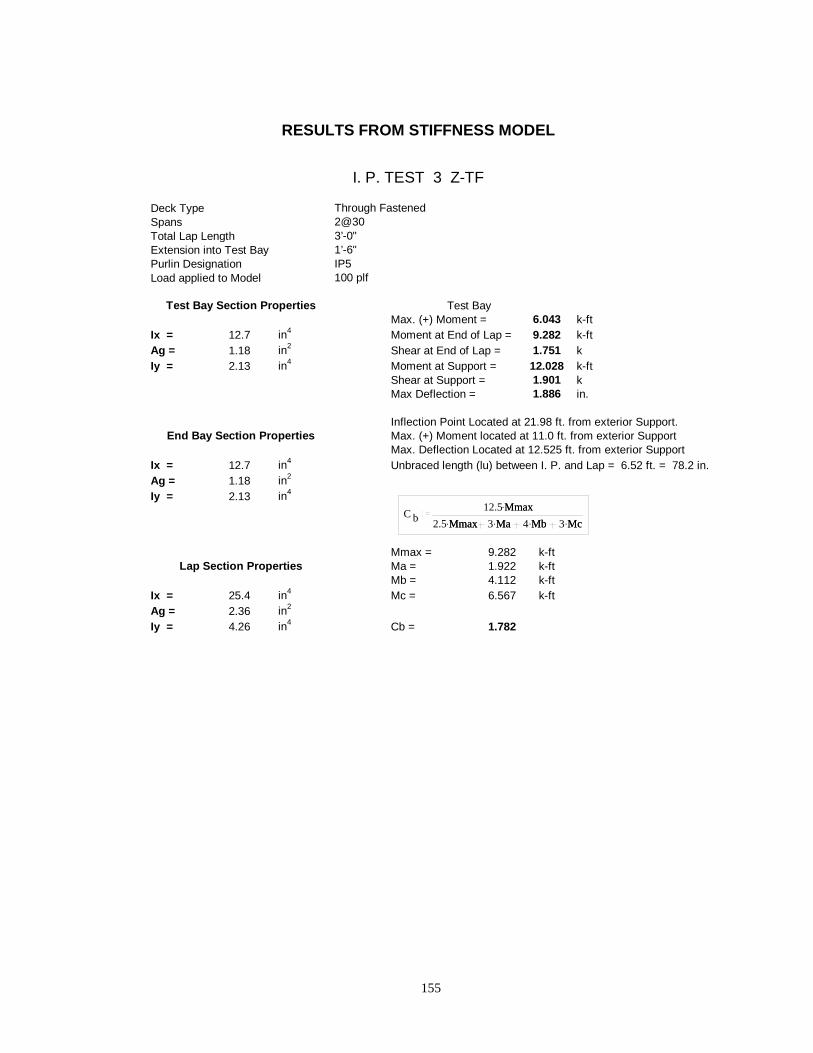
155
Through Fastened2@303’-0"1’-6"IP5100 plf
Test BayMax. (+) Moment = 6.043 k-ft
Ix = 12.7 in4 Moment at End of Lap = 9.282 k-ftAg = 1.18 in2 Shear at End of Lap = 1.751 kIy = 2.13 in4 Moment at Support = 12.028 k-ft
Shear at Support = 1.901 kMax Deflection = 1.886 in.
Inflection Point Located at 21.98 ft. from exterior Support.Max. (+) Moment located at 11.0 ft. from exterior SupportMax. Deflection Located at 12.525 ft. from exterior Support
Ix = 12.7 in4 Unbraced length (lu) between I. P. and Lap = 6.52 ft. = 78.2 in.Ag = 1.18 in2
Iy = 2.13 in4
Mmax = 9.282 k-ftMa = 1.922 k-ftMb = 4.112 k-ft
Ix = 25.4 in4 Mc = 6.567 k-ftAg = 2.36 in2
Iy = 4.26 in4 Cb = 1.782
End Bay Section Properties
Lap Section Properties
RESULTS FROM STIFFNESS MODEL
I. P. TEST 3 Z-TF
Deck TypeSpansTotal Lap Length
Test Bay Section Properties
Extension into Test BayPurlin DesignationLoad applied to Model
C b12.5 Mmax.
2.5 Mmax. 3 Ma. 4 Mb. 3 Mc.Mmax
Mmax Ma Mb Mc

156
Test ID: I. P. Test 3 Z-TF Michael R. Bryant3/19/99
Test Span, L = 30.0 ft Ix = 12.75 in.4
Scan ID Load Near Purlin Far Purlin Theoretical Manometerw Deflection (9dc) Deflection (7dc) Deflectionplf in. in. in. in. h2o
1 0.000 0 0 0.000 0.02 41.106 0.8 0.8 0.844 2.03 63.271 1.2 1.2 1.299 3.14 72.540 1.4 1.45 1.489 3.65 81.406 1.6 1.65 1.671 4.06 91.481 1.8 1.85 1.878 4.57 99.944 1.95 2.05 2.052 5.08 106.795 2.1 2.15 2.193 5.39 114.855 2.35 2.4 2.358 5.7
10 121.706 2.5 2.55 2.499 6.011 131.378 2.75 2.8 2.697 6.512 139.841 3 3.05 2.871 6.913 146.289 3.4 3.2 3.003 7.314 154.349 3.85 3.55 3.169 7.715 161.200 3.309 8.0
Scan ID Load Manometer Max Mom Max Mom PT #3 PT #4 PT #5 PT #6w Near farplf in. h2o in. in. in. in. in. in.
1 0.000 0.0 0 0 0.000 0.000 0.000 0.0002 41.106 2.0 0.005 0.038 -0.004 0.026 -0.004 0.0223 63.271 3.1 0.008 0.049 -0.007 0.033 -0.006 0.0314 72.540 3.6 0.01 0.054 -0.009 0.035 -0.008 0.0335 81.406 4.0 0.013 0.061 -0.012 0.036 -0.009 0.0366 91.481 4.5 0.017 0.068 -0.014 0.040 -0.010 0.0417 99.944 5.0 0.022 0.077 -0.015 0.047 -0.010 0.0498 106.795 5.3 0.029 0.087 -0.016 0.054 -0.010 0.0599 114.855 5.7 0.037 0.1 -0.015 0.064 -0.009 0.069
10 121.706 6.0 0.049 0.113 -0.013 0.075 -0.006 0.08111 131.378 6.5 0.063 0.135 0.002 0.094 0.012 0.10312 139.841 6.9 0.088 0.154 0.021 0.110 0.034 0.12113 146.289 7.3 0.127 0.182 0.074 0.133 0.101 0.14614 154.349 7.7 0.19 0.219 0.148 0.157 0.174 0.17115 161.200 8.0
Properties wd, Deck Weight d, Depth t, Thickness Top Flange Width
Units plf in. in. in.IP9 4.00 8.50 0.078 2.496
Ag, Area wo, Self Weight wts Set Fy
in2plf plf in3
ksi1.18 8.02 169.2238 2.66 69.6
Notes: Opposed PurlinsThrough Fastened Panel
Bottom Flange Width
2.493in.
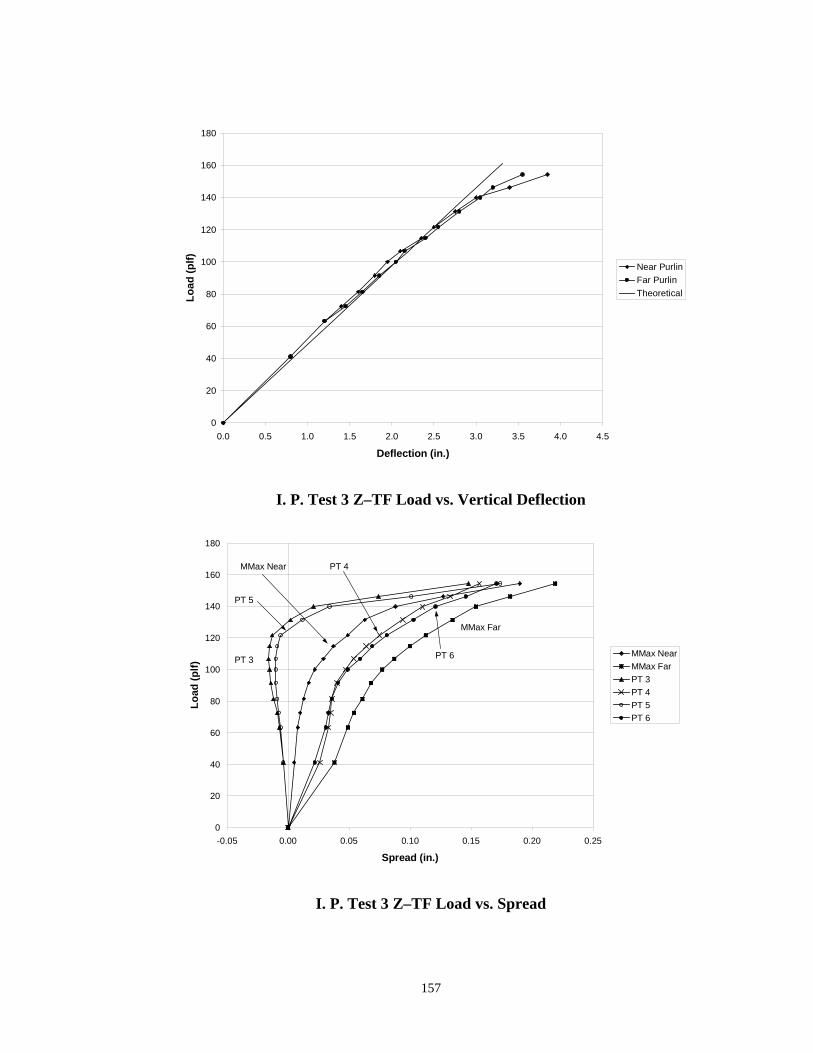
157
0
20
40
60
80
100
120
140
160
180
0.0 0.5 1.0 1.5 2.0 2.5 3.0 3.5 4.0 4.5
Deflection (in.)
Lo
ad (
plf
)
Near PurlinFar Purlin
Theoretical
I. P. Test 3 Z–TF Load vs. Vertical Deflection
0
20
40
60
80
100
120
140
160
180
-0.05 0.00 0.05 0.10 0.15 0.20 0.25
Spread (in.)
Lo
ad (
plf
)
MMax NearMMax FarPT 3PT 4PT 5PT 6
MMax Far
PT 3
PT 5
MMax Near PT 4
PT 6
I. P. Test 3 Z–TF Load vs. Spread

158
VITA
Michael R. Bryant was born in Woodlawn, Virginia on February 11, 1974. After
graduating from high school in 1992 he entered the engineering program at Virginia
Polytechnic Institute and State University. In 1997 he attained a Bachelor of Science
Degree in Civil Engineering and enrolled in the graduate program in the Civil
Engineering Department at Virginia Polytechnic Institute and State University,
Blacksburg, Virginia.
Related Documents