This content has been downloaded from IOPscience. Please scroll down to see the full text. Download details: IP Address: 211.138.121.36 This content was downloaded on 03/10/2013 at 11:50 Please note that terms and conditions apply. Investigation of GeV-scale electron acceleration in a gas-filled capillary discharge waveguide View the table of contents for this issue, or go to the journal homepage for more 2013 New J. Phys. 15 045024 (http://iopscience.iop.org/1367-2630/15/4/045024) Home Search Collections Journals About Contact us My IOPscience

Welcome message from author
This document is posted to help you gain knowledge. Please leave a comment to let me know what you think about it! Share it to your friends and learn new things together.
Transcript
This content has been downloaded from IOPscience. Please scroll down to see the full text.
Download details:
IP Address: 211.138.121.36
This content was downloaded on 03/10/2013 at 11:50
Please note that terms and conditions apply.
Investigation of GeV-scale electron acceleration in a gas-filled capillary discharge waveguide
View the table of contents for this issue, or go to the journal homepage for more
2013 New J. Phys. 15 045024
(http://iopscience.iop.org/1367-2630/15/4/045024)
Home Search Collections Journals About Contact us My IOPscience

Investigation of GeV-scale electron acceleration in agas-filled capillary discharge waveguide
P A Walker1, N Bourgeois1, W Rittershofer1, J Cowley1,N Kajumba2, A R Maier3, J Wenz2, C M Werle2, S Karsch2,F Gruner3, D R Symes4, P P Rajeev4, S J Hawkes4, O Chekhlov4,C J Hooker4, B Parry4, Y Tang4 and S M Hooker1,5
1 Department of Physics, University of Oxford, Clarendon Laboratory,Parks Road, Oxford OX1 3PU, UK2 Department of Physics, Ludwig-Maximilians-Universitat Munchen,D-85748 Garching, Germany3 University of Hamburg and Center for Free-Electron Laser Science (CFEL),Luruper Chaussee 149, 22761 Hamburg, Germany4 Central Laser Facility, Rutherford Appleton Laboratory, Didcot OX11 0QX,UKE-mail: [email protected]
New Journal of Physics 15 (2013) 045024 (17pp)Received 4 January 2013Published 26 April 2013Online at http://www.njp.org/doi:10.1088/1367-2630/15/4/045024
Abstract. The generation of GeV-scale electron beams in a gas-filled capillarydischarge waveguide with good reproducibility is discussed. Beams of electronswith energies above 900 MeV, and with root-mean-square divergences of3.5 mrad, are observed for a plasma density of 2.2 × 1018 cm−3 and a peak inputlaser power of 55 TW. The variation of the maximum electron energy withthe plasma density is measured and found to agree well with simple models.Injection and acceleration of electrons at the to date lowest plasma densityof 3.2 × 1017 cm−3 are reported. The energy spectra of the generated electronbeams exhibit good shot-to-shot reproducibility, with the observed variationsattributable to the measured shot-to-shot jitter of the laser parameters. Twomethods for correcting the effect of beam pointing variations on the measuredenergy spectrum are described.
5 Author to whom any correspondence should be addressed.
Content from this work may be used under the terms of the Creative Commons Attribution 3.0 licence.Any further distribution of this work must maintain attribution to the author(s) and the title of the work, journal
citation and DOI.
New Journal of Physics 15 (2013) 0450241367-2630/13/045024+17$33.00 © IOP Publishing Ltd and Deutsche Physikalische Gesellschaft

2
Contents
1. Introduction 22. Plasma accelerators driven in waveguides 33. Experimental setup 5
3.1. Measurement of the electron energy spectrum . . . . . . . . . . . . . . . . . . 74. Generated electron beams 9
4.1. Electron energy scaling . . . . . . . . . . . . . . . . . . . . . . . . . . . . . . 125. Conclusions 14Acknowledgments 14References 15
1. Introduction
As first recognized by Tajima and Dawson in 1979 [1], longitudinal plasma waves excited byintense laser pulses contain intense electric fields that are well suited to accelerating chargedparticles to relativistic energies. This concept was later extended to plasma waves driven byparticle beams [2]. For both laser- and beam-driven plasma accelerators, the accelerating electricfield is three or four orders of magnitude greater than can be achieved in conventional radio-frequency accelerators, allowing a corresponding reduction in the accelerator length.
Laser-driven plasma accelerators operate in several regimes, depending on the intensity ofthe driving laser pulse, the density of the plasma and the duration of the laser pulse relativeto the plasma period. A comprehensive review of the physics of these regimes has recentlybeen provided by Esarey et al [3]. In the experiments reported here, a single laser pulse witha duration less than the plasma period Tp = 2π/ωp excites a plasma wave via the action ofthe ponderomotive force; here ωp = (nee2/γ meε0)
1/2 is the angular plasma frequency, ne is theplasma density and γ is the relativistic factor of the quivering electrons. This force pushescharged particles away from regions of high spatial gradients in the pulse intensity and, as themass of the plasma ions greatly exceeds that of the plasma electrons, the ions can be consideredto remain essentially stationary while the electrons are pushed away from the region of thelaser pulse. The resulting charge separation sets up a plasma density wave—known as a plasmawakefield—which trails the laser pulse. The longitudinal electric fields within the plasma wavecan reach magnitudes of the order of the cold wave-breaking limit E0 = mecωp/e, which fortypical plasma densities of order ne ≈ 1018 cm−3 gives E0 ≈ 100 GeV m−1.
In early work on laser-driven plasma accelerators, the generated electron beams had a verybroad energy spectrum, but in 2004 three groups reported the generation of beams with quasi-monoenergetic energy spectra in the 100–200 MeV range. In that work, the target plasma wasformed by ionization of a gas jet by the driving laser [4, 5], or a plasma channel formed byadditional laser pulses [6]. In 2006 the energy of laser-accelerated electron beams was increasedto 1 GeV by channelling the driving laser pulse in the plasma channel formed in a capillarydischarge waveguide [7, 8], and subsequently electrons with GeV-scale energies were producedby laser-driven acceleration in the plasma channel [9–12] and in gas jets or gas cells [13–16].
In this paper, we discuss the results of experiments on electron acceleration in plasmachannels formed in capillary discharge waveguides. We present the results of a study of the
New Journal of Physics 15 (2013) 045024 (http://www.njp.org/)

3
dependence of the electron energy on the plasma density, and report GeV-scale electron energiesproduced by laser pulses with a peak power of P = 55 TW, which is double the laser poweremployed by Karsch et al [9] and Ibbotson et al [10, 11] and 40% of the laser power usedby Lu et al [12]. The shot-to-shot reproducibility of the electron beams is investigated andcompared with variations in the parameters of the driving laser pulse. We compare two methodsfor correcting the electron energy spectra recorded for generated electron beams that propagateat an angle to the spectrometer axis. Finally, we report on injection and acceleration of electronsat the lowest plasma densities reported to date, a result that is promising for future experimentswith greater energy gain per stage.
The paper is arranged as follows. In section 2, the benefits of plasma accelerators drivenin waveguides are introduced. Section 3 describes in detail the experimental arrangementemployed in this work, and the results are presented in section 4.
2. Plasma accelerators driven in waveguides
We first briefly discuss the operation of plasma accelerators driven within a waveguide structure.In a uniform plasma the phase velocity of a laser-driven plasma wave is close to, but
slightly less than, c since the laser pulse propagates with a group velocity vg < c. The smalldifference in the velocity of the accelerated electrons, which for relativistic energies is veryclose to c, and the velocity of the plasma wave causes the accelerated electron bunch to outrunthe plasma wave. The electron bunch moves from an accelerating phase to a decelerating oneafter the dephasing length Ld. For nonlinear plasma waves, i.e. wakefields driven by laser pulseswith a normalized vector potential a0 > 1, where a0 = eA/mec and A is the vector potential ofthe laser field, the dephasing length can be written [17] as Ld = (4/3)(ω2
0/ω3p)c
√a0. Since the
peak accelerating field E0 is proportional to ωp, the maximum energy gain per stage scalesas Wmax ∝ E0Ld ∝ 1/ω2
p ∝ 1/ne. For these reasons there is considerable interest in drivingplasma accelerators at lower plasma densities, and over longer distances, thereby yielding higherparticle energy gain per accelerator stage.
For low laser intensities, corresponding to a0 � 1, a linear wakefield is formed in whichthe relative amplitude of the plasma wave δne/ne � 1 and the wakefield is sinusoidal [3]. Forhigher values of a0, the wake becomes nonlinear and loses its simple sinusoidal form [3]. Atstill higher values of a0, the ‘blowout’ or ‘bubble’ regime is reached in which the laser pulseexpels essentially all the electrons from the axis, leaving an approximately spherical cavity withideal focusing and accelerating properties [18]. This regime is of particular current interest sinceelectrons from the target plasma can be self-injected at the back of the bubble, and subsequentlyaccelerated to high energy [19]. Reaching the bubble regime requires a0 > 2 and that the laserspot size w0 is properly matched to the plasma skin depth, i.e. w0 = wsf ≡ 2k−1
p√
a0. Here thespot size is defined for a laser pulse with a Gaussian transverse intensity profile of the formI (r) = I (0) exp
[−2(r/w0)
2]
in which r is the distance from the axis of propagation.To reach the high laser intensities needed to drive the bubble regime, it is necessary to focus
the laser pulse to a small spot size. However, this also means that the laser pulse will tend todiffract, limiting the distance for which the plasma wave has significant amplitude, and hencethe energy gained by particles trapped in the wake. The pulse will diffract significantly over adistance of the order of the Rayleigh range zR = πw2
0/λ, where λ is the laser wavelength [20].Extending the acceleration length beyond the limit set by diffraction requires that the laser
pulse be guided by some mechanism. In general, guiding can be achieved if the transverse
New Journal of Physics 15 (2013) 045024 (http://www.njp.org/)

4
refractive index is of the ‘step-index’ or ‘gradient-index’ type. Low-loss guiding of high-power laser pulses in step-index waveguides formed by a hollow-core capillary has beendemonstrated [21, 22] and the amplitude of plasma waves driven in these structures has beenmeasured [23]. Here we concentrate on gradient-index guiding; this can occur naturally, throughvariations of the relativistic motion of the plasma electrons, or by providing a plasma channelin which the density of the plasma varies with the transverse coordinate.
The refractive index of a plasma is given by η =[1 − (ω2
p/ω20)
]1/2≈ 1 − nee2/2γ meε0ω
20,
where the approximation holds if ω0 � ωp. Gradient refractive index guiding requires that thetransverse refractive index profile is peaked on the propagation axis [24]. A transverse refractiveindex profile of the correct form develops naturally through the transverse variation of theγ -factor of the plasma electrons oscillating in the driving laser field: since the laser intensityprofile is peaked on-axis, γ —and hence η—will also be peaked on-axis. This leads to relativisticself-focusing [25] for laser powers P > Pc ≡ 17.4(ωp/ω0)
2 GW. A relativistically self-focusedlaser pulse will drive a nonlinear plasma wave, and as such will experience longitudinal andtransverse variations of the plasma density; at the front of the laser pulse the transverse densityprofile tends to cancel the effect of relativistic self-focusing, and hence—in the absence of anexternal waveguide—the front of the pulse diffracts essentially freely [17, 25]. As discussedby Lu et al [17], in such cases the laser pulse can still be considered to be effectively self-guided if the rate at which the pulse loses energy to driving the plasma wave exceeds the rate atwhich energy is diffracted away. This leads to a condition for self-guiding of a0 > (ω0/ωp)
2/5;assuming that the pulse is self-focused to the matched self-focused spot size wsf, the conditionon the laser power for self-guiding becomes P > Pdiff
c = (1/8)(ω0/ωp)6/5 Pc. For the parameters
of interest in this work, Pdiffc > Pc and hence the laser power requirement for self-guiding is
significantly greater than that required for self-focusing alone.For laser powers below Pdiff
c , the bubble regime can be driven over long distances if thefront of the laser pulse is guided by a waveguide. It can be shown [17] that the conditions forreaching the bubble regime—i.e. a0 > 2 and w0 ≈ wsf—correspond to P > Pc; hence the backof the laser pulse will be focused by relativistic self-focusing and the transverse density profileof the bubble, while the front is guided only by the external waveguide.
In a plasma, a gradient refractive index waveguide is formed if the transverseplasma density profile has a minimum on-axis. Plasma channels of this type have beengenerated by several methods, including hydrodynamic expansion of a laser-producedspark [26, 27], discharge-ablated capillaries [28], z-pinch capillary discharges [29], open-geometry discharges [30] and gas-filled capillary discharges [31]. In this paper, we willdescribe experiments on electron acceleration in gas-filled capillary discharge waveguides.Waveguides of this type have been shown [31, 32] to guide laser pulses with peak intensitiesabove 1017 W cm−2 over distances up to 50 mm and have been used in several experimentson laser-driven plasma accelerators [7, 9–11, 33], including the generation of GeV electronbeams for the first time [7, 8]. The operation of these waveguides has been described indetail previously [34, 35]. Briefly, hydrogen gas flows into a capillary with a diameter of200–300 µm and tens of millimetres in length. A pulsed discharge, with a peak current of300–500 A and of approximately 200 ns half-period, flows through the capillary; this ionizesthe gas and establishes a plasma channel through thermal conduction of heat to the capillarywall.
New Journal of Physics 15 (2013) 045024 (http://www.njp.org/)

5
Figure 1. Schematic diagram of the experimental setup employed.
3. Experimental setup
The experiments described here were performed with the North beam of the Astra-Gemini laserusing a similar arrangement to earlier work [10], as shown in figure 1.
The Astra-Gemini laser is a dual-beam Ti:sapphire laser system and has been described indetail elsewhere [36]. The two beams, labelled North and South, are compressed in separatecompressors; owing to problems with the South compressor, for the experiments describedin this paper the amplified South beam was temporally compressed in the North compressor.This required the uncompressed beam to propagate through ≈1 m of air which could not befully shielded against air currents, and this may have increased the shot-to-shot jitter in the on-target beam pointing, which for this experiment was found to be 8 µrad. We note that pointingstabilization systems [37] can reduce this jitter to less than 3 µrad.
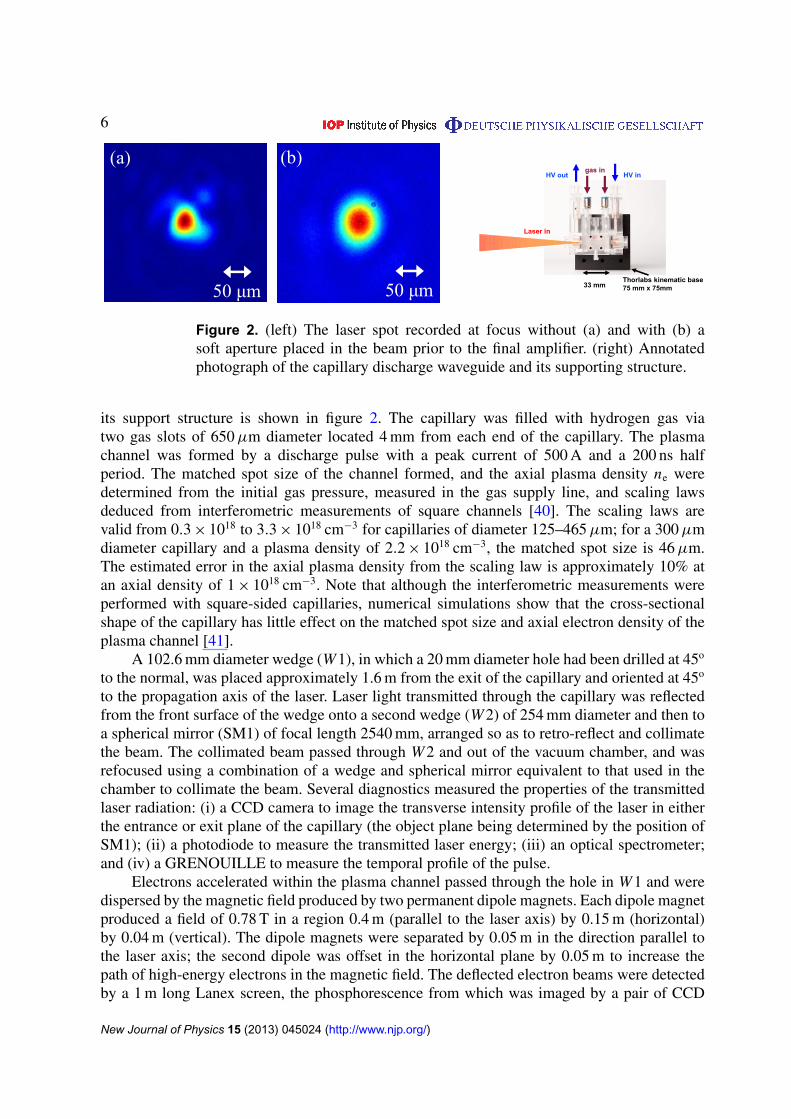
Laser pulses were focused on the entrance plane of the capillary waveguide by an off-axisparaboloid of f = 3 m focal length used at f/20. A soft aperture was placed in the beam, priorto the final laser amplifier, to improve the focal spot quality. As shown in figure 2, this increasedthe fraction of energy contained within the half-peak-intensity contour of the focal spot from 32to 38%, which may be compared with a fraction of 50% expected for an ideal Gaussian beam.Apodizing the beam limited the maximum on-target energy to 4.2 J, of which approximately(0.38/0.5) × 4.2 J = 3.2 J can be estimated to be contained within the lowest-order Gaussianmode. The soft aperture was used for all measurements reported in this paper; unless statedotherwise, the laser pulse energies and peak powers and intensities given in this paper are theestimated on-target energy contained within the lowest-order Gaussian mode. With the aperturein place the transverse intensity profile of the focal spot was measured to have a full-widthat half maximum (FWHM) of 41 µm at the entrance of the capillary. The temporal profile ofthe incident laser pulse was characterized with a GRENOUILLE [38] from which the FWHMduration of the pulses was determined to be τ = 55 fs. Assuming an effective laser pulse energyof 3.2 J, the maximum incident peak power, focal intensity and normalized vector potential wereP = 55 TW, I = 2.9 × 10¹⁸ W cm−2 and a0,in = 1.1, respectively.
For these experiments the capillary discharge waveguide employed 33 mm long, 300 µmdiameter capillaries laser machined into sapphire blocks [39]. An image of the capillary and
New Journal of Physics 15 (2013) 045024 (http://www.njp.org/)
6
Figure 2. (left) The laser spot recorded at focus without (a) and with (b) asoft aperture placed in the beam prior to the final amplifier. (right) Annotatedphotograph of the capillary discharge waveguide and its supporting structure.
its support structure is shown in figure 2. The capillary was filled with hydrogen gas viatwo gas slots of 650 µm diameter located 4 mm from each end of the capillary. The plasmachannel was formed by a discharge pulse with a peak current of 500 A and a 200 ns halfperiod. The matched spot size of the channel formed, and the axial plasma density ne weredetermined from the initial gas pressure, measured in the gas supply line, and scaling lawsdeduced from interferometric measurements of square channels [40]. The scaling laws arevalid from 0.3 × 10¹⁸ to 3.3 × 1018 cm−3 for capillaries of diameter 125–465 µm; for a 300 µmdiameter capillary and a plasma density of 2.2 × 1018 cm−3, the matched spot size is 46 µm.The estimated error in the axial plasma density from the scaling law is approximately 10% atan axial density of 1 × 1018 cm−3. Note that although the interferometric measurements wereperformed with square-sided capillaries, numerical simulations show that the cross-sectionalshape of the capillary has little effect on the matched spot size and axial electron density of theplasma channel [41].
A 102.6 mm diameter wedge (W 1), in which a 20 mm diameter hole had been drilled at 45o
to the normal, was placed approximately 1.6 m from the exit of the capillary and oriented at 45o
to the propagation axis of the laser. Laser light transmitted through the capillary was reflectedfrom the front surface of the wedge onto a second wedge (W 2) of 254 mm diameter and then toa spherical mirror (SM1) of focal length 2540 mm, arranged so as to retro-reflect and collimatethe beam. The collimated beam passed through W 2 and out of the vacuum chamber, and wasrefocused using a combination of a wedge and spherical mirror equivalent to that used in thechamber to collimate the beam. Several diagnostics measured the properties of the transmittedlaser radiation: (i) a CCD camera to image the transverse intensity profile of the laser in eitherthe entrance or exit plane of the capillary (the object plane being determined by the position ofSM1); (ii) a photodiode to measure the transmitted laser energy; (iii) an optical spectrometer;and (iv) a GRENOUILLE to measure the temporal profile of the pulse.
Electrons accelerated within the plasma channel passed through the hole in W 1 and weredispersed by the magnetic field produced by two permanent dipole magnets. Each dipole magnetproduced a field of 0.78 T in a region 0.4 m (parallel to the laser axis) by 0.15 m (horizontal)by 0.04 m (vertical). The dipole magnets were separated by 0.05 m in the direction parallel tothe laser axis; the second dipole was offset in the horizontal plane by 0.05 m to increase thepath of high-energy electrons in the magnetic field. The deflected electron beams were detectedby a 1 m long Lanex screen, the phosphorescence from which was imaged by a pair of CCD
New Journal of Physics 15 (2013) 045024 (http://www.njp.org/)

7
(a)
(b)
Figure 3. Sketch of the experimental setups of the electron spectrometer tocorrect for off-axis electron beam propagation using (a) the Pointing Lanexmethod and (b) the two-screen method.
cameras. Laser light and ambient light from the target area were prevented from entering thecameras objectives by bandpass interference filters with a centre wavelength of 550 nm and abandwidth of 50 nm.
3.1. Measurement of the electron energy spectrum
As illustrated in figure 3, two dual-screen systems were incorporated to overcome potentialerrors in the measurement of the electron energy arising from variations in the pointing ofthe generated electron beams. In the first method, shown in figure 3(a), W 1 could be replacedby a thin Lanex screen (the ‘Pointing Lanex’). The Pointing Lanex comprised a Lanex screen(Kodak, Intensifying Screen Regular) oriented with its back facing the incident electron beamand covered by a 11 µm thick Al foil to block the laser light. Phosphorescence from the frontof the Pointing Lanex was imaged by a CCD camera. Since the electron bunch is known tooriginate within a few µm of the centre of the exit plane of the capillary, measurement ofthe position of the electron bunch in the plane of the Pointing Lanex yields the position andpropagation vector of the beam as it enters the electron spectrometer. From this information,and the known field map of the dipole magnets, the energy calibration of the spectrometer canbe calculated for each laser shot.
Figure 3(b) shows an alternative arrangement for beam-pointing correction in which theelectron bunch position and propagation vector at the entrance of the spectrometer is deducedfrom the image of the dispersed electron beam recorded on two screens located after the dipolemagnets [42, 43]. This method also yields all the information needed to deduce the positionand propagation vector of the electron bunch as it enters the magnetic field, although differentprocedures are required for mono-energetic and broad-band electron spectra. A mono-energetic
New Journal of Physics 15 (2013) 045024 (http://www.njp.org/)
8
0 100 200 300 400 500 600 700 800 900 10000
1
2
3
4
5x 10⁵
dQ/d
E /
a.u.
Energy / MeV
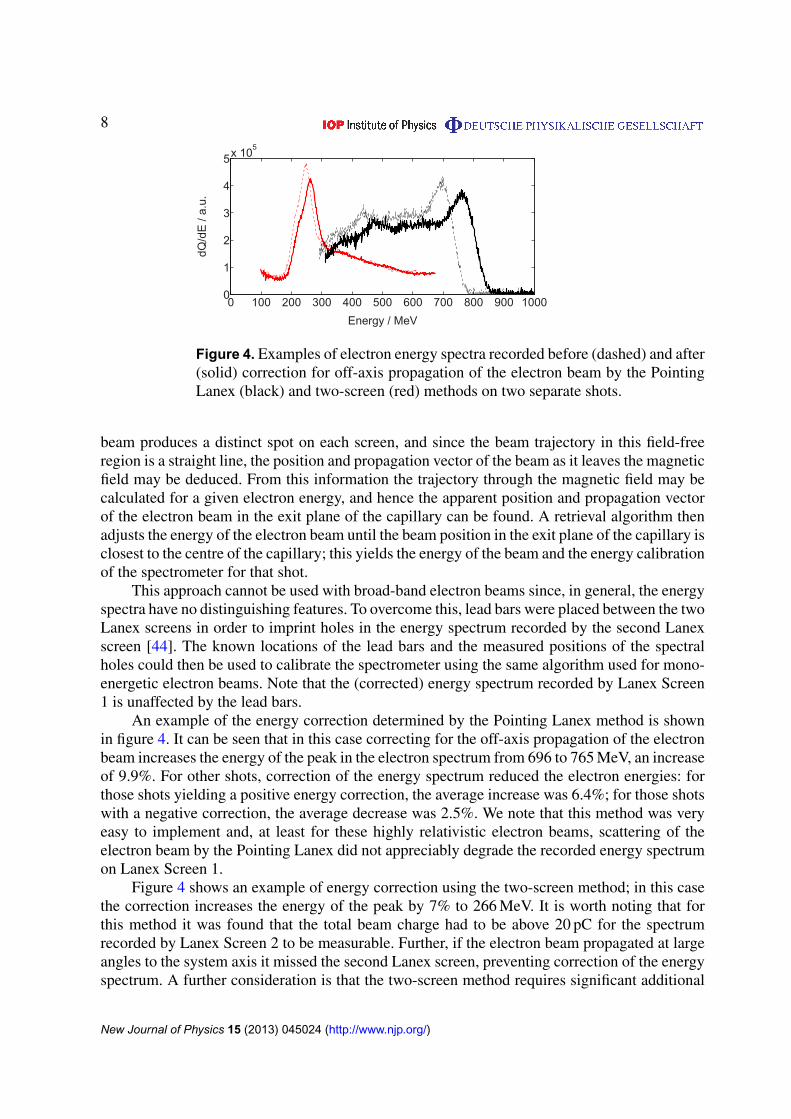
Figure 4. Examples of electron energy spectra recorded before (dashed) and after(solid) correction for off-axis propagation of the electron beam by the PointingLanex (black) and two-screen (red) methods on two separate shots.
beam produces a distinct spot on each screen, and since the beam trajectory in this field-freeregion is a straight line, the position and propagation vector of the beam as it leaves the magneticfield may be deduced. From this information the trajectory through the magnetic field may becalculated for a given electron energy, and hence the apparent position and propagation vectorof the electron beam in the exit plane of the capillary can be found. A retrieval algorithm thenadjusts the energy of the electron beam until the beam position in the exit plane of the capillary isclosest to the centre of the capillary; this yields the energy of the beam and the energy calibrationof the spectrometer for that shot.
This approach cannot be used with broad-band electron beams since, in general, the energyspectra have no distinguishing features. To overcome this, lead bars were placed between the twoLanex screens in order to imprint holes in the energy spectrum recorded by the second Lanexscreen [44]. The known locations of the lead bars and the measured positions of the spectralholes could then be used to calibrate the spectrometer using the same algorithm used for mono-energetic electron beams. Note that the (corrected) energy spectrum recorded by Lanex Screen1 is unaffected by the lead bars.
An example of the energy correction determined by the Pointing Lanex method is shownin figure 4. It can be seen that in this case correcting for the off-axis propagation of the electronbeam increases the energy of the peak in the electron spectrum from 696 to 765 MeV, an increaseof 9.9%. For other shots, correction of the energy spectrum reduced the electron energies: forthose shots yielding a positive energy correction, the average increase was 6.4%; for those shotswith a negative correction, the average decrease was 2.5%. We note that this method was veryeasy to implement and, at least for these highly relativistic electron beams, scattering of theelectron beam by the Pointing Lanex did not appreciably degrade the recorded energy spectrumon Lanex Screen 1.
Figure 4 shows an example of energy correction using the two-screen method; in this casethe correction increases the energy of the peak by 7% to 266 MeV. It is worth noting that forthis method it was found that the total beam charge had to be above 20 pC for the spectrumrecorded by Lanex Screen 2 to be measurable. Further, if the electron beam propagated at largeangles to the system axis it missed the second Lanex screen, preventing correction of the energyspectrum. A further consideration is that the two-screen method requires significant additional
New Journal of Physics 15 (2013) 045024 (http://www.njp.org/)

9
300 400 500 600 700 800 900 10000
1
2
3
4
5
x 105
Energy / MeV
dQ/d
E /
a.u.
Figure 5. A typical electron spectrum recorded on Lanex Screen 1. Theuncorrected spectrum (dashed) is corrected (solid) for off-axis electron beampointing, but not for variations of the energy or pointing of the incident laserpulse. For this shot the axial plasma density was set to 2.2 × 1018 cm−3, the laserpulse energy was 3.2 J, the maximum incident peak power and focal intensitywere P = 55 TW and I = 2.9 × 10¹⁸ W cm−2, respectively, and the laser wastimed to arrive within 10.1 ± 2.8 ns of the peak of the discharge current.
space—in our case approximately 1 × 1 m2—behind the dipole magnets, and hence overall thismethod is less convenient.
4. Generated electron beams
Electron energy spectra were recorded for a wide range of axial plasma densities, laser energies,and the delays τD between the onset of the discharge and the arrival of the laser. From thisinitial survey, the optimum conditions for electron beam generation were found to be an axialplasma density of 2.2 × 1018 cm−3 and the laser pulse timed to arrive at the plasma channelwithin (10.1 ± 2.8) ns of the peak of the discharge current. The laser pulse energy reachingthe capillary, contained within the lowest-order Gaussian beam, was 3.2 J, corresponding to amaximum incident peak power and focal intensity of P = 55 TW and I = 2.9 × 10¹⁸ W cm−2,respectively.
Figure 5 presents a typical electron energy spectrum recorded for these conditions, showingtwo distinct peaks at 512 and 826 MeV. Double-peaked spectra of this type were observed onmost shots. The mean peak energies and charges of these were obtained by fitting a doubleGaussian distribution to the measured spectra, and were found to be: for the lower-energypeak, (511 ± 77) MeV and (9.2 ± 3.4) pC; for the higher-energy peak, (768 ± 56) MeV and(10.5 ± 3.6) pC.
Dual-peak spectra of this form could arise either by trapping of electrons in two ‘buckets’of the plasma wave at different points along the length of the plasma channel, or by hybridacceleration of the type considered by Hidding et al [50] in which the first electron bunch drivesits own wakefield which can then accelerate a trailing electron bunch to a higher energy thanthe first bunch. Particle-in-cell simulations are being undertaken to elucidate the details of themechanisms responsible for electron trapping and acceleration in our experiments.
For the above-mentioned laser and plasma conditions, the root-mean-square (rms) variationof the beam pointing recorded by the Pointing Lanex was found to be 3.1 mrad. As summarized
New Journal of Physics 15 (2013) 045024 (http://www.njp.org/)

10
Table 1. Summary of measured electron beam divergence and beam pointingfluctuations for selected laser-driven plasma accelerators. The referenced papersare displayed in order of electron energy. For single-shot results and wherepointing results were not reported a dash is displayed.
Energy FWHM divergence rms pointingAuthors Method (MeV) (mrad) (mrad)
This paper } S 0991 3.5 3.1Leemans et al [7] } S 1000 1.6a –Kneip et al [13] Y S 0800 3.6b 4.0Ibbotson et al [10] } S 540 3.9 (h), 5.4 (v)b 4.6 (h), 2.4 (v)Gonsalves et al [45] }Y D 341 2.5 0.6Osterhoff et al [46] � S 200 2.1 1.4Pak et al [47] Y S 092 6.0 (h), 12.6 (v)c –Rechatin et al [48] Y C 72 5.0 –Schmid et al [49] Y D 19 7.3 –
Key: Y, gas jet; S, self-injection; �, gas cell; C, colliding-pulse injection; }, discharge capillarywaveguide; D, density-ramp injection.a rms result.b 1/e full-width result.c 1/
√e full-width result.
in table 1, this is similar to previous experiments employing capillary discharge [10], steady-state-flow gas cells [46] and gas jet targets [13], but large compared to the value of 0.57 mradobtained with an intra-waveguide gas jet to control the electron injection [45].
The divergence of the electron beams could be measured in both the vertical and horizontaldirections by the Pointing Lanex, and for the vertical direction by Lanex Screen 1 of the electronspectrometer. For the vertical direction, the two measurements were found to be in agreement.The divergences measured by the Pointing Lanex were σH = 3.6 mrad and σV = 3.4 mrad forthe horizontal and vertical planes, respectively, at a plasma density of ne = 2.2 × 1018 cm−3.Note that the laser was polarized in the horizontal direction; previous work has shown [51]that the divergence of the electron beam can be larger in the direction of the electric field ofthe driving laser as a result of interaction of the accelerating bunch with the tail of the laserpulse. For these conditions the radius of the plasma bubble is R ≈ 2c
√asf/ωp ≈ 20 µm; this is
not large compared to the length of the input laser pulse, cτ = 17 µm, and hence it might beexpected that the electron beams would have a larger divergence in the horizontal plane. Thatthis is not observed to be the case suggests that the laser pulse duration decreases during the longlaser–plasma interaction [52]; this conclusion is supported by the fact that for this density theduration of the transmitted laser pulse was measured by the GRENOUILLE to be approximately24 fs.
The reproducibility of the generated electron beams was studied by recording the electronenergy spectra for 36 consecutive shots with the same timing and initial gas pressure. Figure 6shows images of the Lanex Screen 1 for these shots, illustrating that high-energy electronbeams were generated on every laser shot with similar electron energy spectra. The spectrahave been corrected for variations in the electron beam pointing using the Pointing Lanex
New Journal of Physics 15 (2013) 045024 (http://www.njp.org/)

11
Figure 6. Electron spectra recorded on Lanex Screen 1 for 36 consecutive shots.The vertical axis corresponds to the beam divergence, as illustrated explicitly forthe spectrum shown at the top left. These images were corrected for variationsof the electron beam pointing but not for variations of the energy or pointingof the incident laser pulse. For these shots the axial plasma density was setto 2.2 × 1018 cm−3, the laser pulse energy was 3.2 J, the maximum incidentpeak power and focal intensity were P = 55 TW and I = 2.9 × 10¹⁸ W cm−2,respectively, and the laser was timed to arrive within 10.1 ± 2.8 ns of the peak ofthe discharge current.
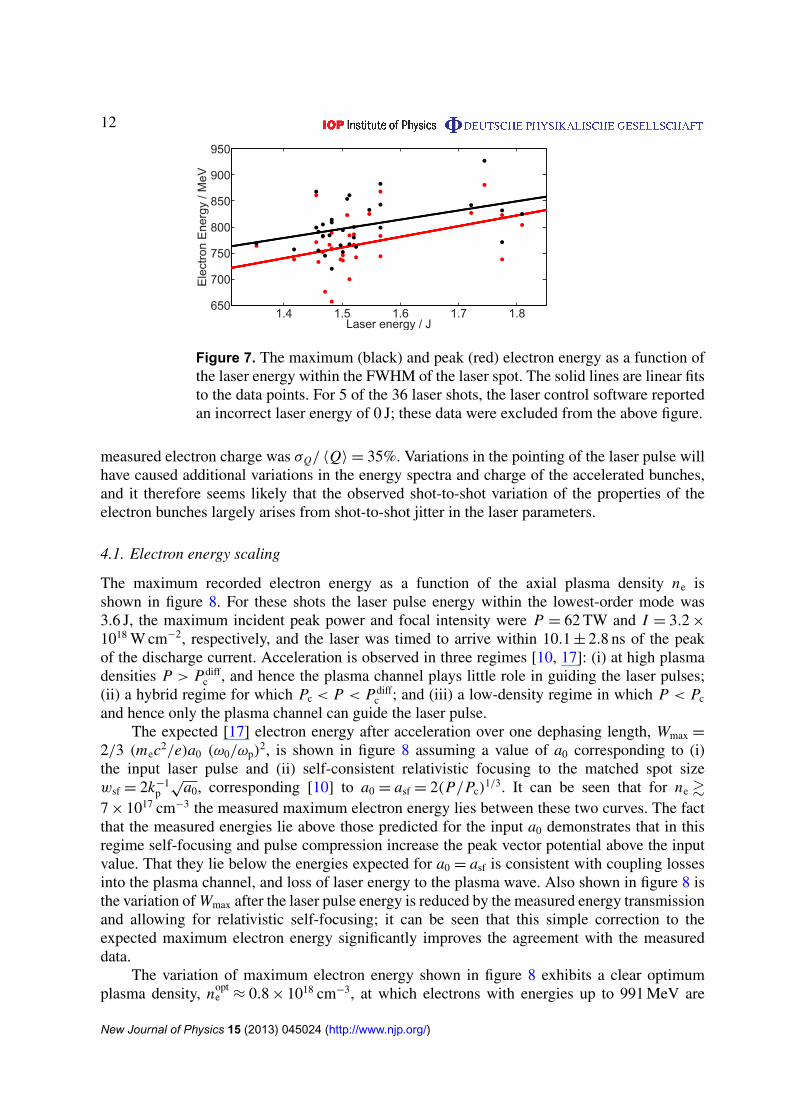
method described in section 3.1. However, the spectra have not been corrected for shot-to-shot jitter in the transverse position of the input laser focus, the rms variation of which wasmeasured to be 60% of the laser spot size; or in the laser pulse energy, which had an rmsvariation of 7.3%. Figure 7 shows the variation of the maximum and peak electron beam energyas a function of laser pulse energy for these 36 shots, showing that, as expected, the electronbeam energy increases with the laser pulse energy. A linear fit to the maximum energy datapoints yields dEelectron/dElaser = (176 ± 47) MeV J−1, and hence from the measured standarddeviation of the laser pulse energy, σElaser = 0.29 J, the variation in the maximum electron energyarising from jitter of the laser energy is expected to be approximately σElaserdEelectron/dElaser =
(50 ± 14) MeV. This is comparable to with the observed standard deviation of the maximumelectron energy σEelectron = 46 MeV. For the data shown in figure 6, the relative rms of the total
New Journal of Physics 15 (2013) 045024 (http://www.njp.org/)
12
1.4 1.5 1.6 1.7 1.8650
700
750
800
850
900
950
Laser energy / J
Ele
ctro
n E
nerg
y / M
eV
Figure 7. The maximum (black) and peak (red) electron energy as a function ofthe laser energy within the FWHM of the laser spot. The solid lines are linear fitsto the data points. For 5 of the 36 laser shots, the laser control software reportedan incorrect laser energy of 0 J; these data were excluded from the above figure.
measured electron charge was σQ/ 〈Q〉 = 35%. Variations in the pointing of the laser pulse willhave caused additional variations in the energy spectra and charge of the accelerated bunches,and it therefore seems likely that the observed shot-to-shot variation of the properties of theelectron bunches largely arises from shot-to-shot jitter in the laser parameters.
4.1. Electron energy scaling
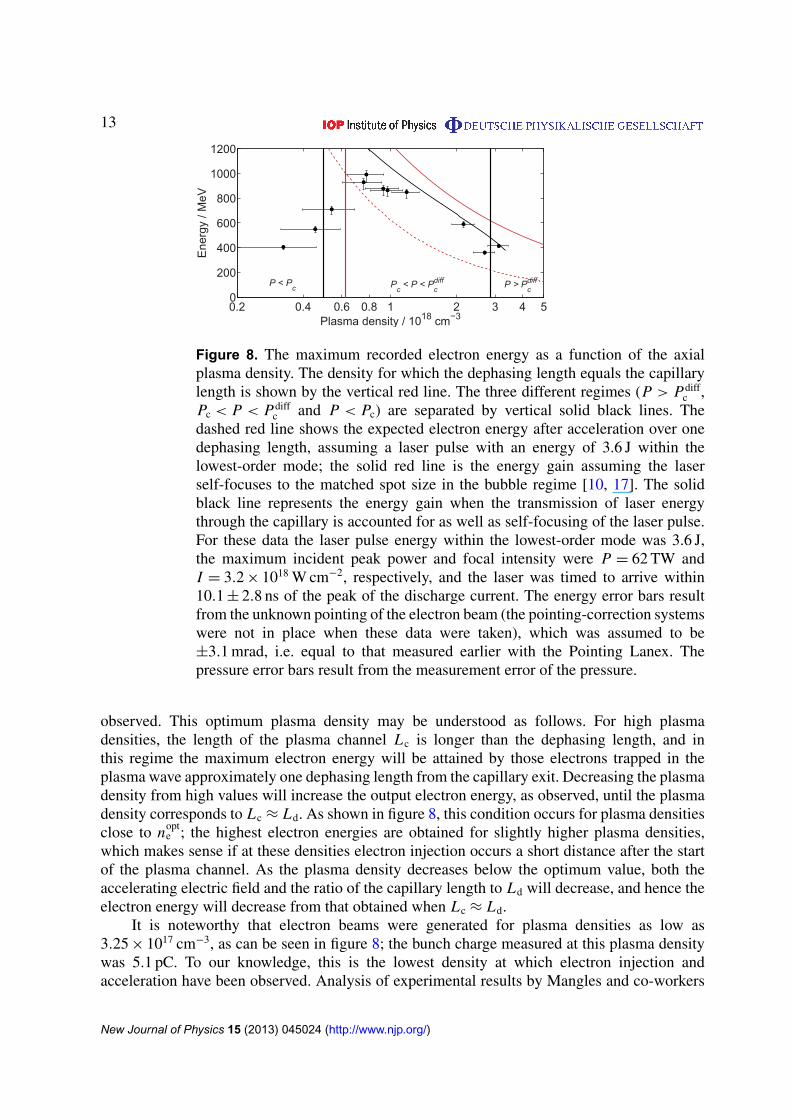
The maximum recorded electron energy as a function of the axial plasma density ne isshown in figure 8. For these shots the laser pulse energy within the lowest-order mode was3.6 J, the maximum incident peak power and focal intensity were P = 62 TW and I = 3.2 ×
1018 W cm−2, respectively, and the laser was timed to arrive within 10.1 ± 2.8 ns of the peakof the discharge current. Acceleration is observed in three regimes [10, 17]: (i) at high plasmadensities P > Pdiff
c , and hence the plasma channel plays little role in guiding the laser pulses;(ii) a hybrid regime for which Pc < P < Pdiff
c ; and (iii) a low-density regime in which P < Pc
and hence only the plasma channel can guide the laser pulse.The expected [17] electron energy after acceleration over one dephasing length, Wmax =
2/3 (mec2/e)a0 (ω0/ωp)2, is shown in figure 8 assuming a value of a0 corresponding to (i)
the input laser pulse and (ii) self-consistent relativistic focusing to the matched spot sizewsf = 2k−1
p√
a0, corresponding [10] to a0 = asf = 2(P/Pc)1/3. It can be seen that for ne &
7 × 1017 cm−3 the measured maximum electron energy lies between these two curves. The factthat the measured energies lie above those predicted for the input a0 demonstrates that in thisregime self-focusing and pulse compression increase the peak vector potential above the inputvalue. That they lie below the energies expected for a0 = asf is consistent with coupling lossesinto the plasma channel, and loss of laser energy to the plasma wave. Also shown in figure 8 isthe variation of Wmax after the laser pulse energy is reduced by the measured energy transmissionand allowing for relativistic self-focusing; it can be seen that this simple correction to theexpected maximum electron energy significantly improves the agreement with the measureddata.
The variation of maximum electron energy shown in figure 8 exhibits a clear optimumplasma density, nopt
e ≈ 0.8 × 1018 cm−3, at which electrons with energies up to 991 MeV are
New Journal of Physics 15 (2013) 045024 (http://www.njp.org/)
13
0.2 0.4 0.6 0.8 1 2 3 4 50
200
400
600
800
1000
1200
Plasma density / 1018 cm−3
Ene
rgy
/ MeV
P < Pc P
c < P < P
cdiff P > P
cdiff
Figure 8. The maximum recorded electron energy as a function of the axialplasma density. The density for which the dephasing length equals the capillarylength is shown by the vertical red line. The three different regimes (P > Pdiff
c ,Pc < P < Pdiff
c and P < Pc) are separated by vertical solid black lines. Thedashed red line shows the expected electron energy after acceleration over onedephasing length, assuming a laser pulse with an energy of 3.6 J within thelowest-order mode; the solid red line is the energy gain assuming the laserself-focuses to the matched spot size in the bubble regime [10, 17]. The solidblack line represents the energy gain when the transmission of laser energythrough the capillary is accounted for as well as self-focusing of the laser pulse.For these data the laser pulse energy within the lowest-order mode was 3.6 J,the maximum incident peak power and focal intensity were P = 62 TW andI = 3.2 × 10¹⁸ W cm−2, respectively, and the laser was timed to arrive within10.1 ± 2.8 ns of the peak of the discharge current. The energy error bars resultfrom the unknown pointing of the electron beam (the pointing-correction systemswere not in place when these data were taken), which was assumed to be±3.1 mrad, i.e. equal to that measured earlier with the Pointing Lanex. Thepressure error bars result from the measurement error of the pressure.
observed. This optimum plasma density may be understood as follows. For high plasmadensities, the length of the plasma channel Lc is longer than the dephasing length, and inthis regime the maximum electron energy will be attained by those electrons trapped in theplasma wave approximately one dephasing length from the capillary exit. Decreasing the plasmadensity from high values will increase the output electron energy, as observed, until the plasmadensity corresponds to Lc ≈ Ld. As shown in figure 8, this condition occurs for plasma densitiesclose to nopt
e ; the highest electron energies are obtained for slightly higher plasma densities,which makes sense if at these densities electron injection occurs a short distance after the startof the plasma channel. As the plasma density decreases below the optimum value, both theaccelerating electric field and the ratio of the capillary length to Ld will decrease, and hence theelectron energy will decrease from that obtained when Lc ≈ Ld.
It is noteworthy that electron beams were generated for plasma densities as low as3.25 × 1017 cm−3, as can be seen in figure 8; the bunch charge measured at this plasma densitywas 5.1 pC. To our knowledge, this is the lowest density at which electron injection andacceleration have been observed. Analysis of experimental results by Mangles and co-workers
New Journal of Physics 15 (2013) 045024 (http://www.njp.org/)
14
[53, 54] and theoretical calculations by Tsung et al [55] and Lu et al [17, 56] predict that thethreshold for self-injection is a0 > 3. Given the relatively low value of the normalized vectorpotential of the input pulse (a0,in = 1.1), it is apparent that self-injection could only occur inour experiment if the laser pulse experiences substantial self-focusing and pulse compression.However, at this low density self-focusing only increases the normalized vector potential toa0 ≈ 1.7 and laser pulse compression was measured to be of the order of 10%. An alternativeanalysis [57] of the threshold condition predicts that for our conditions the input laser pulseenergy would have to exceed 190 J for self-injection to occur. Hence it is clear that self-injectioncould not occur in our experiment at the lowest plasma densities for which electron beams wereobserved, and instead another mechanism, such as ionization injection [33, 47, 58], must playa role. Numerical simulations are in progress to seek insight into the mechanisms responsiblefor electron injection and the dynamics of acceleration over the long laser–plasma interactionlengths achieved in these experiments. Finally, we note that if for this lowest density the lengthof the plasma channel were properly matched to the dephasing length of 80 mm, electrons wouldbe accelerated to energies significantly above 1 GeV.
5. Conclusions
In conclusion, the Astra-Gemini laser was used to study electron acceleration in plasmachannels formed in a capillary discharge waveguide. Electron beams were generated underconditions corresponding to self-guiding, hybrid guiding and pure plasma channel guiding.At optimal conditions the average electron beam energy was above 900 MeV. The variationof the maximum electron beam energy with the plasma density was found to be in reasonableagreement with simple estimates of acceleration and deceleration in a plasma channel. Detailsof the mechanisms responsible for electron injection and acceleration over the long lengths oflaser–plasma possible in this experiment will be investigated in future work through particle-in-cell simulations.
The energy spectra of the generated electron beams were found to be reasonablyreproducible, with the observed shot-to-shot variations being attributable in large part tofluctuations in the properties of the driving laser pulses.
Two methods for correcting the effects on the measured energy spectrum of off-axiselectron beam propagation were demonstrated successfully, and for the conditions of thisexperiment yielded energy corrections of about 10%. Of the two methods, the use of a PointingLanex was found to be particularly convenient, and was found not to degrade the recordedenergy spectrum.
Acknowledgments
The authors thank M S Bloom, M J V Streeter, S Kneip, Z Najmudin and S P D Mangles fromImperial College, London for their assistance in setting up and calibrating shared diagnostics;and P Brummit, A Zayyani, D Rathbone, D Neville and D Rose from the Rutherford AppletonLaboratory for preparing the target chamber, and drive and gas systems. This work was madepossible by financial support from the UK Engineering and Physical Sciences Research Council(grant numbers EP/H011145/1, EP/G067791/1 and EP/F020120/1), the Leverhulme Trust andthe Munich-Centre for Advanced Photonics (MAP).
New Journal of Physics 15 (2013) 045024 (http://www.njp.org/)

15
References
[1] Tajima T and Dawson J M 1979 Laser electron-accelerator Phys. Rev. Lett. 43 267–70[2] Katsouleas T 1986 Physical mechanisms in the plasma wake-field accelerator Phys. Rev. A 33 2056–64[3] Esarey E, Schroeder C B and Leemans W P 2009 Physics of laser-driven plasma-based electron accelerators
Rev. Mod. Phys. 81 1229–85[4] Mangles S P D et al 2004 Monoenergetic beams of relativistic electrons from intense laser–plasma
interactions Nature 431 535–8[5] Faure J, Glinec Y, Pukhov A, Kiselev S, Gordienko S, Lefebvre E, Rousseau J P, Burgy F and Malka V 2004
A laser–plasma accelerator producing monoenergetic electron beams Nature 431 541–4[6] Geddes C G R, Toth C, van Tilborg J, Esarey E, Schroeder C B, Bruhwiler D, Nieter C, Cary J and
Leemans W P 2004 High-quality electron beams from a laser wakefield accelerator using plasma-channelguiding Nature 431 538–41
[7] Leemans W P, Nagler B, Gonsalves A J, Toth C S, Nakamura K, Geddes C G R, Esarey E, Schroeder C Band Hooker S M 2006 GeV electron beams from a centimetre-scale accelerator Nature Phys. 2 696–9
[8] Nakamura K, Nagler B, Toth Cs, Geddes C G R, Schroeder C B, Esarey E, Leemans W P, Gonsalves A J andHooker S M 2007 GeV electron beams from a centimeter-scale channel guided laser wakefield acceleratorPhys. Plasmas 14 056708
[9] Karsch S et al 2007 GeV-scale electron acceleration in a gas-filled capillary discharge waveguide New J.Phys. 9 415
[10] Ibbotson T P A et al 2010 Laser-wakefield acceleration of electron beams in a low density plasma channelPhys. Rev. Spec. Top. Accel. Beams 13 031301
[11] Ibbotson T P A et al 2010 Investigation of the role of plasma channels as waveguides for laser-wakefieldaccelerators New J. Phys. 12 045008
[12] Lu H et al 2011 Laser wakefield acceleration of electron beams beyond 1 GeV from an ablative capillarydischarge waveguide Appl. Phys. Lett. 99 091502
[13] Kneip S et al 2009 Near-GeV acceleration of electrons by a nonlinear plasma wave driven by a self-guidedlaser pulse Phys. Rev. Lett. 103 035002
[14] Mo M Z, Ali A, Fourmaux S, Lassonde P, Kieffer J C and Fedosejevs R 2012 Quasimonoenergetic electronbeams from laser wakefield acceleration in pure nitrogen Appl. Phys. Lett. 100 074101
[15] Liu J S et al 2011 All-optical cascaded laser wakefield accelerator using ionization-induced injection Phys.Rev. Lett. 107 035001
[16] Pollock B et al 2011 Demonstration of a narrow energy spread, ≈0.5 GeV electron beam from a two-stagelaser wakefield accelerator Phys. Rev. Lett. 107 045001
[17] Lu W, Tzoufras M, Joshi C, Tsung F S, Mori W B, Vieira J, Fonseca R A and Silva L O 2007 Generatingmulti-GeV electron bunches using single stage laser wakefield acceleration in a 3D nonlinear regime Phys.Rev. Spec. Top. Accel. Beams 10 061301
[18] Mori W B 1997 The physics of the nonlinear optics of plasmas at relativistic intensities for short-pulse lasersIEEE J. Quantum Electron. 33 1942–53
[19] Pukhov A and Meyer-ter-Vehn J 2002 Laser wake field acceleration: the highly nonlinear broken-wave regimeAppl. Phys. B 74 355–61
[20] Hooker S M and Webb C E 2010 Laser Physics (Oxford: Oxford University Press)[21] Dorchies F et al 1999 Monomode guiding of 1016 W cm−2 laser pulses over 100 Rayleigh lengths in hollow
capillary dielectric tubes Phys. Rev. Lett. 82 4655–8[22] Cros B, Courtois C, Matthieussent G, Di Bernardo A, Batani D, Andreev N and Kuznetsov S 2002
Eigenmodes for capillary tubes with dielectric walls and ultraintense laser pulse guiding Phys. Rev. E65 026405
[23] Wojda F et al 2009 Laser-driven plasma waves in capillary tubes Phys. Rev. E 80 066403[24] Sprangle P and Esarey E 1992 Interaction of ultrahigh laser fields with beams and plasmas Phys. Fluids B
4 2241–8
New Journal of Physics 15 (2013) 045024 (http://www.njp.org/)
16
[25] Esarey E, Sprangle P, Krall J and Ting A 1997 Self-focusing and guiding of short laser pulses in ionizinggases and plasmas IEEE J. Quantum Electron. 33 1879–914
[26] Durfee C G, Lynch J and Milchberg H M 1995 Development of a plasma waveguide for high-intensity laserpulses Phys. Rev. E 51 2368–89
[27] Volfbeyn P, Esarey E and Leemans W P 1999 Guiding of laser pulses in plasma channels created by theignitor-heater technique Phys. Plasmas 6 2269–77
[28] Zigler A, Greenberg B, Palhan T, Kaganovich D, Hubbard R F, Ting A, Jones T G and Sprangle P 2002Ablative and discharge capillaries for optical guiding and velocity control AIP Conf. Proc. 647 47–53
[29] Hosokai T et al 2006 Observation of strong correlation between quasimonoenergetic electron beam generationby laser wakefield and laser guiding inside a preplasma cavity Phys. Rev. E 73 036407
[30] Bendoyro R A, Onofrei R I, Sampaio J, Macedo R, Figueira G and Lopes N C 2008 Plasma channels forelectron accelerators using discharges in structured gas cells IEEE Trans. Plasma Sci. 36 1728–33
[31] Spence D J and Hooker S M 2001 Investigation of a hydrogen plasma waveguide Phys. Rev. E 63 015401[32] Butler A, Spence D J and Hooker S M 2002 Guiding of high-intensity laser pulses with a hydrogen-filled
capillary discharge waveguide Phys. Rev. Lett. 89 185003[33] Rowlands-Rees T P et al 2008 Laser-driven acceleration of electrons in a partially ionized plasma channel
Phys. Rev. Lett. 100 105005[34] Bobrova N A, Esaulov A A, Sakai J-I, Sasorov P V, Spence D J, Butler A, Hooker S M and Bulanov S V
2001 Simulations of a hydrogen-filled capillary discharge waveguide Phys. Rev. E 65 016407[35] Broks B H P, Garloff K and van der Mullen J J A M 2005 Nonlocal-thermal-equilibrium model of a pulsed
capillary discharge waveguide Phys. Rev. E 71 016401[36] Hooker C J et al 2006 The Astra Gemini project—a dual-beam petawatt Ti:sapphire laser system J. Physique
IV 133 673–7[37] Genoud G, Wojda F, Burza M, Persson A and Wahlstrom C-G 2011 Active control of the pointing of a
multi-terawatt laser Rev. Sci. Instrum. 82 033102[38] O’Shea P, Kimmel M, Gu X and Trebino R 2001 Highly simplified device for ultrashort-pulse measurement
Opt. Lett. 26 932–4[39] Jaroszynski D A et al 2006 Radiation sources based on laser-plasma interactions Phil. Trans. R. Soc. A
364 689–710[40] Gonsalves A J, Rowlands-Rees T P, Broks B H P, van der Mullen J J A M and Hooker S M 2007 Transverse
interferometry of a hydrogen-filled capillary discharge waveguide Phys. Rev. Lett. 98 025002[41] Broks B H P, Van Dijk W, van der Mullen J J A W, Gonsalves A J, Rowlands-Rees T P and Hooker S M
2007 Modeling of a square pulsed capillary discharge waveguide for interferometry measurements Phys.Plasmas 14 023501
[42] Blumenfeld I et al 2007 Energy doubling of 42 GeV electrons in a metre-scale plasma wakefield acceleratorNature 445 741–4
[43] Pollock B B et al 2009 Two-screen method for determining electron beam energy and deflection from laserwakefield acceleration. Proc. Particle Accelerator Conf. (Vancouver, Canada) pp 3035–7
[44] Clayton C E et al 2010 Self-guided laser wakefield acceleration beyond 1 GeV using ionization-inducedinjection Phys. Rev. Lett. 105 105003
[45] Gonsalves A J et al 2011 Tunable laser plasma accelerator based on longitudinal density tailoring NaturePhys. 7 862–6
[46] Osterhoff J et al 2008 Generation of stable, low-divergence electron beams by laser-wakefield acceleration ina steady-state-flow gas cell Phys. Rev. Lett. 101 085002
[47] Pak A, Marsh K A, Martins S F, Lu W, Mori W B and Joshi C 2010 Injection and trapping of tunnel-ionizedelectrons into laser-produced wakes Phys. Rev. Lett. 104 025003
[48] Rechatin C, Faure J, Lifschitz A, Davoine X, Lefebvre E and Malka V 2009 Quasi-monoenergetic electronbeams produced by colliding cross-polarized laser pulses in underdense plasmas New J. Phys. 11 013011
New Journal of Physics 15 (2013) 045024 (http://www.njp.org/)

17
[49] Schmid K, Buck A, Sears C M S, Mikhailova J M, Tautz R, Herrmann D, Geissler M, Krausz F andVeisz L 2010 Density-transition based electron injector for laser driven wakefield accelerators Phys. Rev.Spec. Top. Accel. Beams 13 091301
[50] Hidding B, Konigstein T, Osterholz J, Karsch S, Willi O and Pretzler G 2010 Monoenergetic energy doublingin a hybrid laser–plasma wakefield accelerator Phys. Rev. Lett. 104 195002
[51] Mangles S P D et al 2006 Laser-wakefield acceleration of monoenergetic electron beams in the first plasma-wave period Phys. Rev. Lett. 96 215001
[52] Schreiber J, Bellei C, Mangles S P D, Kamperidis C, Kneip S, Nagel S R, Palmer C A J, Rajeev P P,Streeter M J V and Najmudin Z 2010 Complete temporal characterization of asymmetric pulse compressionin a laser wakefield Phys. Rev. Lett. 105 235003
[53] Mangles S P D, Thomas A G R, Lundh O, Lindau F, Kaluza M C, Persson A, Wahlstrom C G, Krushelnick Kand Najmudin Z 2007 On the stability of laser wakefield electron accelerators in the monoenergetic regimePhys. Plasmas 14 056702
[54] Mangles S P D, Thomas A G R, Bellei C, Dangor A E, Kamperidis C, Kneip S, Nagel S R, Willingale L andNajmudin Z 2008 Self-guided wakefield experiments driven by petawatt-class ultrashort laser pulses IEEETrans. Plasma Sci. 36 1715–21
[55] Tsung F S, Ritesh Narang, Mori W B, Joshi C, Fonseca R A and Silva L O 2004 Near-GeV-energy laser-wakefield acceleration of self-injected electrons in a centimeter-scale plasma channel Phys. Rev. Lett.93 185002
[56] Lu W, Huang C, Zhou M, Tzoufras M, Tsung F S, Mori W B and Katsouleas T 2006 A nonlinear theory formultidimensional relativistic plasma wave wakefields Phys. Plasmas 13 056709
[57] Mangles S P D, Genoud G, Bloom M S, Burza M, Najmudin Z, Persson A, Svensson K, Thomas A G R andWahlstrom C-G 2012 Self-injection threshold in self-guided laser wakefield accelerators Phys. Rev. Spec.Top. Accel. Beams 15 011302
[58] McGuffey C et al 2010 Ionization induced trapping in a laser wakefield accelerator Phys. Rev. Lett.104 025004
New Journal of Physics 15 (2013) 045024 (http://www.njp.org/)
Related Documents


