This content has been downloaded from IOPscience. Please scroll down to see the full text. Download details: IP Address: 204.187.23.196 This content was downloaded on 18/10/2014 at 14:05 Please note that terms and conditions apply. Investigation of gas puff induced fluctuation suppression in ADITYA tokamak View the table of contents for this issue, or go to the journal homepage for more 2009 Plasma Phys. Control. Fusion 51 095010 (http://iopscience.iop.org/0741-3335/51/9/095010) Home Search Collections Journals About Contact us My IOPscience

Welcome message from author
This document is posted to help you gain knowledge. Please leave a comment to let me know what you think about it! Share it to your friends and learn new things together.
Transcript
This content has been downloaded from IOPscience. Please scroll down to see the full text.
Download details:
IP Address: 204.187.23.196
This content was downloaded on 18/10/2014 at 14:05
Please note that terms and conditions apply.
Investigation of gas puff induced fluctuation suppression in ADITYA tokamak
View the table of contents for this issue, or go to the journal homepage for more
2009 Plasma Phys. Control. Fusion 51 095010
(http://iopscience.iop.org/0741-3335/51/9/095010)
Home Search Collections Journals About Contact us My IOPscience
IOP PUBLISHING PLASMA PHYSICS AND CONTROLLED FUSION
Plasma Phys. Control. Fusion 51 (2009) 095010 (17pp) doi:10.1088/0741-3335/51/9/095010
Investigation of gas puff induced fluctuationsuppression in ADITYA tokamak
R Jha, A Sen, P K Kaw, P K Atrey, S B Bhatt, N Bisai, K Tahiliani,R L Tanna and the ADITYA Team
Institute for Plasma Research, Bhat, Gandhinagar 382428, India
E-mail: [email protected]
Received 18 February 2009, in final form 21 July 2009Published 13 August 2009Online at stacks.iop.org/PPCF/51/095010
AbstractAn experiment aimed at investigating the cause of fluctuation suppression bygas puffing in the edge and scrape-off layer plasma of the ADITYA tokamakis reported. The fluctuation suppression is accompanied by a flattening ofthe radial profiles of the floating potential, plasma density and electrostaticReynolds stress. Both the fluctuation suppression and the simultaneousreduction in particle flux occur throughout the observed region of the plasmaedge. The bolometer data also show an increase in the edge radiation from 20%to 40% of the input power during the gas puff. These results indicate a significantrole of edge cooling in the fluctuation suppression mechanism and are shownto be well explained in terms of a concomitant reduction in the growth rate ofthe interchange instability associated with the electron temperature gradient.
(Some figures in this article are in colour only in the electronic version)
1. Introduction
The study of edge fluctuations is an active area of research for fusion plasma devices andis motivated by the desire to gain a better understanding and ultimately a better control ofanomalous transport processes in order to achieve superior energy confinement. Over the pastseveral years a number of experimental scenarios that lead to improved confinement have beendiscovered. Perhaps the most prominent and dramatic one is the L–H transition phenomenontriggered by a sufficient level of auxiliary heating of the plasma. The mechanism underlyingthis transition to the H-mode, as widely understood today, is the creation of a transport barrierdue to an enhancement of the E × B flow shear near the plasma edge [1]. There is strongexperimental evidence to show that these plasma flows are driven by increased gradients of theelectrostatic Reynolds stress [2–7]. This observation is consistent with the notion that large-scale flows and small-scale turbulent fluctuations are closely interlinked and the confinement
0741-3335/09/095010+17$30.00 © 2009 IOP Publishing Ltd Printed in the UK 1
Plasma Phys. Control. Fusion 51 (2009) 095010 R Jha et al
improvement is caused when the small-scale fluctuations (represented by Reynolds stress)become a driver for the large-scale flows [8].
Another experimental scenario that has demonstrated successful suppression of anomaloustransport is by a radiative cooling of the plasma edge through external puffing of impurity gasessuch as neon and argon. Such a technique was attempted in early experiments on ISX-B andthe observed discharge mode, whose confinement scaling was seen to extend beyond the usualOhmic saturation limit, was termed as a Z-mode [9]. This experiment was subsequentlyrepeated on several other devices, namely, JFT-2M [10], ASDEX-U [11], TEXTOR [12, 13],D-IIID [14], TFTR [15], etc, and the resulting improved confinement was confirmed in allcases. The mechanism of fluctuation suppression and improved confinement with such anapproach is now understood to be through a suppression of the ion temperature gradient (ITG)instability brought about by a flattening of the ITG [14–16].
It is important to distinguish between improved confinements arising from increase inmean plasma density as opposed to other mechanisms including those discussed above. Forexample, puffing of the working gas has been a standard tool in tokamak experiments, forraising the plasma density and has led in the past to the discovery of the Alcator scaling.This improved confinement property due to raised mean density arises from a reduction inthe electron thermal conductivity throughout the plasma volume [17]. However, the improvedconfinement property that we observe in ADITYA is not related to such gas fuelling effects butarise from much smaller amounts of gas injection. It is similar in spirit to what was found onthe ASDEX tokamak where a limited amount of gas puffing from the divertor region, insteadof from the main plasma chamber, facilitated transition from a low confinement L-mode to ahigh confinement H-mode [18]. Limited gas fuelling has also been used for altering the type ofH-mode discharges and excessive gas fuelling can even quench the H-mode [19]. More recentexperiments on the COMPASS-D [20] and the MAST spherical tokamak [21] have furthershown that controlled fuelling at the inboard mid-plane facilitates L–H transition by loweringthe necessary power threshold. Askinazi et al [22] have carried out a comparison of threetechniques for achieving an ohmic H-mode, namely, electrode biasing, pellet injection and gaspuffing. They have argued that the improvement in confinement has a common origin in allof these cases, namely, the presence of a strongly inhomogeneous radial electric field insidethe last closed flux surface (LCFS). In this paper, we present our investigation of gas puffinduced fluctuation suppression, whose experimental characteristics are dissimilar to H-modecharacteristics but similar to those of the RI-mode [16].
In the ADITYA tokamak, we regularly inject short pulses of gas for the purpose of raisingthe plasma density [23, 24] and very often we observe that there is a concomitant suppressionof edge fluctuation. To the best of our knowledge, we have not come across a detailed studyof such suppression elsewhere, and therefore, the objective of this paper is to investigate anddiscuss the possible underlying mechanisms responsible for this experimental observation inthe ADITYA tokamak [23, 24]. For this purpose we examine the radial profiles of severalrelevant plasma parameters such as plasma density, electrostatic potential, particle flux andelectrostatic Reynolds stress that are measured in ADITYA using special configurations ofLangmuir probes. We find that during the gas puff there is a marked flattening of the floatingpotential, a decrease in the plasma density gradient and a reduction in the fluctuations of thefloating potential. These effects are spread over the edge as well as the scrape-off layer plasmaregion. The sharp gradient in the electrostatic Reynolds stress which is observed near the LCFSalso collapses during the gas puff. These effects are accompanied by almost a 50% reductionin the particle transport and a factor of two improvement in the global particle confinementtime. The transport reduction is not limited to a narrow radial range but is seen throughout theplasma edge. Also, following the gas puff, the total radiated power measured by a bolometer
2
Plasma Phys. Control. Fusion 51 (2009) 095010 R Jha et al
camera shows an increase in the edge radiation from 20% to 40% of the input power. Weexplain these results in terms of a reduction in the growth rate of the interchange instabilityassociated with the electron temperature gradient.
The rest of the paper is organized as follows. The gas puff experiment is describedin section 2, while Langmuir probe measurements of the mean plasma parameters andfluctuations along with a discussion of results are presented in section 3. In section 4we discuss the experimental evidence from ADITYA for radiation cooling of the edge andthe associated reduction in edge fluctuations. We also present a physical explanation ofthe suppression mechanism based on model calculations that suggest a suppression of theinterchange instability. A summary of our results and conclusions are provided in the finalsection of the paper.
2. Gas puff experiment
The present set of experiments were carried out on the ADITYA tokamak, which has a majorradius of 75 cm, a minor radius of 25 cm and a toroidal magnetic field of ∼0.72 T on theaxis. The typical discharge parameters were plasma current Ip ∼ 75 kA, the chord-averagedcentral density 〈ne〉 ∼ (1–2) × 1019 m−3 and central electron temperature Te0 ∼ 300 eV. Asmentioned earlier, in many past experimental shots on ADITYA, it has been found that anattempt to raise the plasma density by gas puff (GP) (or even molecular beam injection (MBI))has often brought about a concomitant suppression of fluctuations [23, 24]. These experimentswere conducted in ohmically heated plasmas. The fluctuation measurements carried out withan array of Langmuir probes further revealed that the poloidal correlation length increasedby 50% during both GP and MBI pulses. The probe configuration in those experiments,however, did not permit a detailed study of fluctuation suppression and transport reduction.We have therefore repeated the GP experiments with a new configuration of probes that allowsmeasurements of several turbulence related quantities.
The gas puff for this experiment was carried out using a piezo-electric valve (500 SCCMat 100 V). The valve is mounted on the bottom port and located 10 cm radially (on the bottomport) and 90◦ toroidally from the limiter. The amount of injected gas is controlled in such away that there is no significant change in the plasma current and its equilibrium position. Afterseveral tests the duration of valve opening was set at 1.7 ms. The calibration experimentyielded a pressure increase of 3 × 10⁻⁵ Torr in the vessel during the gas puff, which isequivalent to an addition of ≈1018 molecules of hydrogen gas. The gas molecules that getionized in the SOL cannot propagate into the main plasma but those that get ionized in theclosed field line region can propagate into the core through the pinch effect. We assumethat approximately 50% of the injected gas gets ionized in the SOL and hence about 1018
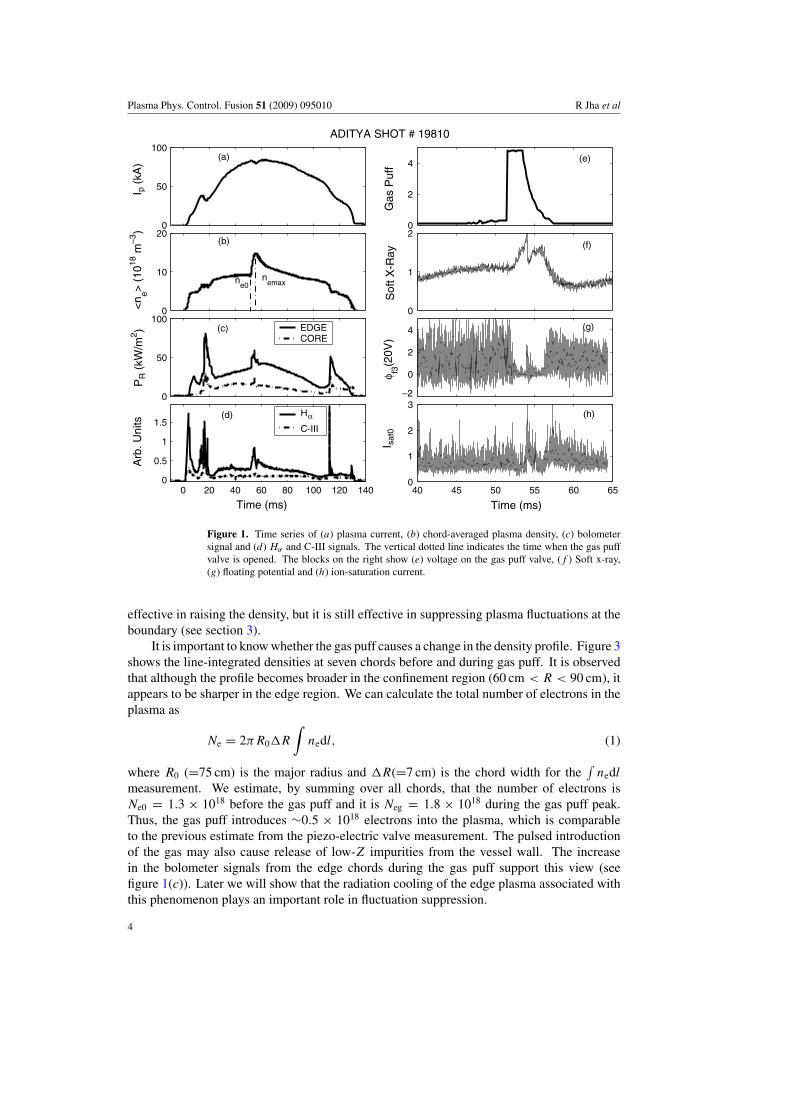
electrons enter deep into the core plasma as a result of the gas puff. Figure 1 shows thechanges seen in various diagnostic signals when a short gas puff is injected into the plasmaat the current flattop. The chord-averaged central plasma density shows a sharp rise from thebaseline density 〈ne0〉 to the peak value, 〈ne max〉, followed by a slower fall up to 〈ne0〉 (seefigure 1(b)).
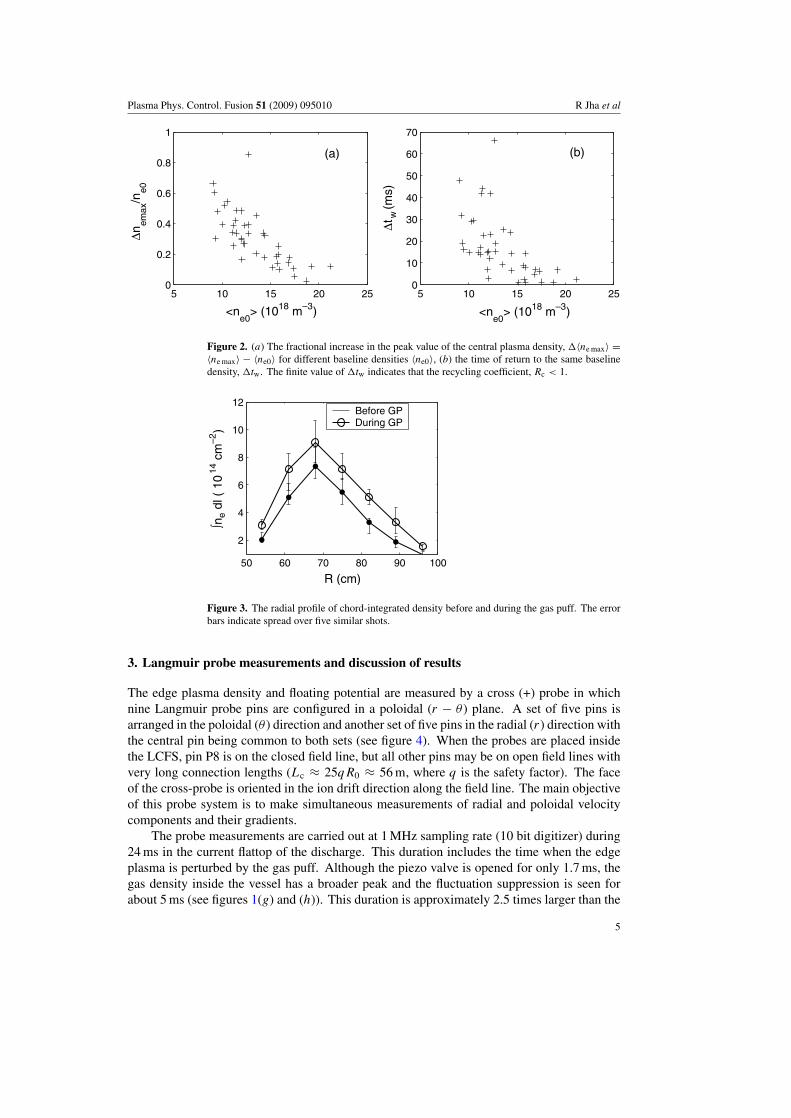
Figure 2 shows the fractional increase in the central plasma density to its peak valuefollowing the gas puff. The density increase is in the range 10–60%, and it is larger for asmaller baseline density, 〈ne0〉. After reaching the peak, the density falls back to the baselinein a time duration that varies from a few milliseconds to 70 ms (see figure 2(b)). The finitetime of fall indicates that the recycling coefficient is less than unity. The density would haveachieved a flattop only if the recycling coefficient were close to unity. Another important pointthat we notice is that at higher baseline densities, exceeding 1.5 × 10¹⁹ m−3, gas puff is not
3
Plasma Phys. Control. Fusion 51 (2009) 095010 R Jha et al
0
50
100I p
(kA
)ADITYA SHOT # 19810
0
10
20
<n e>
(10
18 m
–3)
0
50
100
PR (
kW/m
2 )
0 20 40 60 80 100 120 1400
0.5
1
1.5
Arb
. Uni
ts
Time (ms)
0
2
4
Gas
Puf
f
0
1
2
Sof
t X-R
ay–2
0
2
4
φ f3(2
0V)
40 45 50 55 60 650
1
2
3
I sat
0
Time (ms)
EDGECORE
Hα
C-III
ne0
nemax
(a)
(b)
(c)
(d)
(e)
(f)
(g)
(h)
Figure 1. Time series of (a) plasma current, (b) chord-averaged plasma density, (c) bolometersignal and (d) Hα and C-III signals. The vertical dotted line indicates the time when the gas puffvalve is opened. The blocks on the right show (e) voltage on the gas puff valve, (f ) Soft x-ray,(g) floating potential and (h) ion-saturation current.
effective in raising the density, but it is still effective in suppressing plasma fluctuations at theboundary (see section 3).
It is important to know whether the gas puff causes a change in the density profile. Figure 3shows the line-integrated densities at seven chords before and during gas puff. It is observedthat although the profile becomes broader in the confinement region (60 cm < R < 90 cm), itappears to be sharper in the edge region. We can calculate the total number of electrons in theplasma as
Ne = 2πR0�R
∫nedl, (1)
where R0 (=75 cm) is the major radius and �R(=7 cm) is the chord width for the∫
nedl
measurement. We estimate, by summing over all chords, that the number of electrons isNe0 = 1.3 × 10¹⁸ before the gas puff and it is Neg = 1.8 × 10¹⁸ during the gas puff peak.Thus, the gas puff introduces ∼0.5 × 10¹⁸ electrons into the plasma, which is comparableto the previous estimate from the piezo-electric valve measurement. The pulsed introductionof the gas may also cause release of low-Z impurities from the vessel wall. The increasein the bolometer signals from the edge chords during the gas puff support this view (seefigure 1(c)). Later we will show that the radiation cooling of the edge plasma associated withthis phenomenon plays an important role in fluctuation suppression.
4
Plasma Phys. Control. Fusion 51 (2009) 095010 R Jha et al
5 10 15 20 250
0.2
0.4
0.6
0.8
1
<ne0
> (1018 m–3)
∆nem
ax/n
e0
5 10 15 20 250
10
20
30
40
50
60
70
∆tw
(ms)
<ne0
> (1018 m–3)
(a) (b)
Figure 2. (a) The fractional increase in the peak value of the central plasma density, �〈ne max〉 =〈ne max〉 − 〈ne0〉 for different baseline densities 〈ne0〉, (b) the time of return to the same baselinedensity, �tw. The finite value of �tw indicates that the recycling coefficient, Rc < 1.
50 60 70 80 90 100
2
4
6
8
10
12
R (cm)
∫ne
dl (
10
14 c
m–2
)
Before GPDuring GP
Figure 3. The radial profile of chord-integrated density before and during the gas puff. The errorbars indicate spread over five similar shots.
3. Langmuir probe measurements and discussion of results
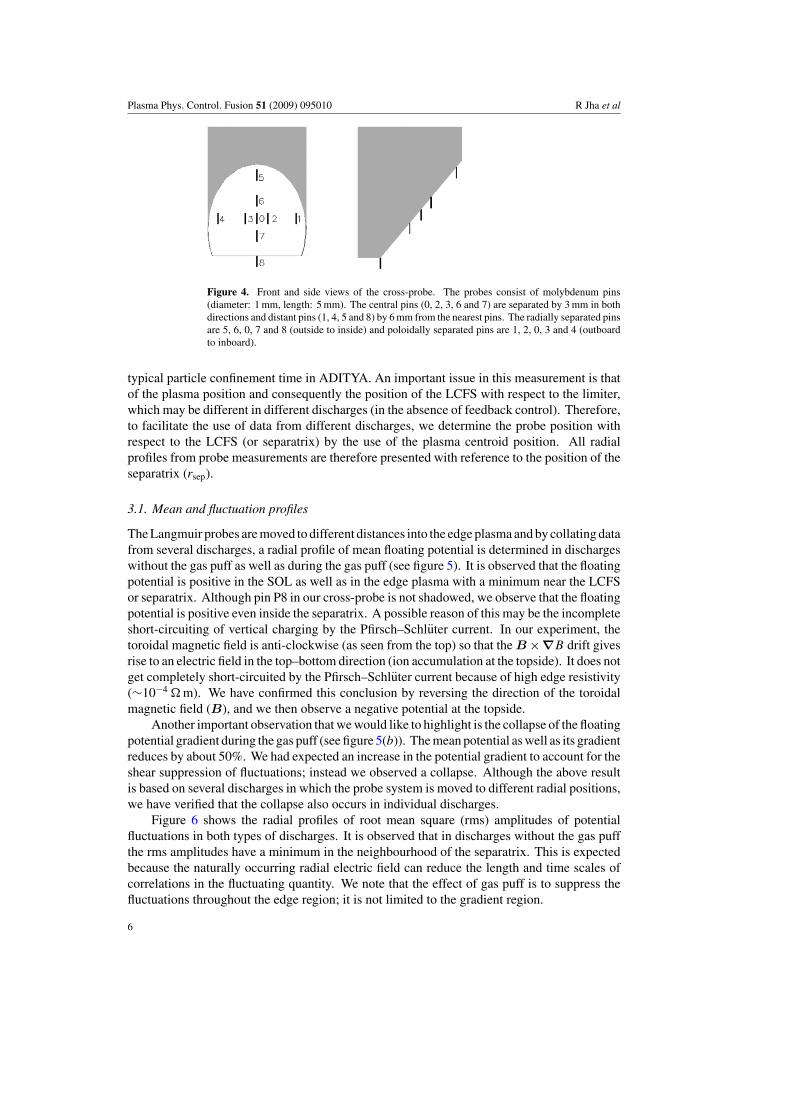
The edge plasma density and floating potential are measured by a cross (+) probe in whichnine Langmuir probe pins are configured in a poloidal (r − θ ) plane. A set of five pins isarranged in the poloidal (θ ) direction and another set of five pins in the radial (r) direction withthe central pin being common to both sets (see figure 4). When the probes are placed insidethe LCFS, pin P8 is on the closed field line, but all other pins may be on open field lines withvery long connection lengths (Lc ≈ 25qR0 ≈ 56 m, where q is the safety factor). The faceof the cross-probe is oriented in the ion drift direction along the field line. The main objectiveof this probe system is to make simultaneous measurements of radial and poloidal velocitycomponents and their gradients.
The probe measurements are carried out at 1 MHz sampling rate (10 bit digitizer) during24 ms in the current flattop of the discharge. This duration includes the time when the edgeplasma is perturbed by the gas puff. Although the piezo valve is opened for only 1.7 ms, thegas density inside the vessel has a broader peak and the fluctuation suppression is seen forabout 5 ms (see figures 1(g) and (h)). This duration is approximately 2.5 times larger than the
5
Plasma Phys. Control. Fusion 51 (2009) 095010 R Jha et al
Figure 4. Front and side views of the cross-probe. The probes consist of molybdenum pins(diameter: 1 mm, length: 5 mm). The central pins (0, 2, 3, 6 and 7) are separated by 3 mm in bothdirections and distant pins (1, 4, 5 and 8) by 6 mm from the nearest pins. The radially separated pinsare 5, 6, 0, 7 and 8 (outside to inside) and poloidally separated pins are 1, 2, 0, 3 and 4 (outboardto inboard).
typical particle confinement time in ADITYA. An important issue in this measurement is thatof the plasma position and consequently the position of the LCFS with respect to the limiter,which may be different in different discharges (in the absence of feedback control). Therefore,to facilitate the use of data from different discharges, we determine the probe position withrespect to the LCFS (or separatrix) by the use of the plasma centroid position. All radialprofiles from probe measurements are therefore presented with reference to the position of theseparatrix (rsep).
3.1. Mean and fluctuation profiles
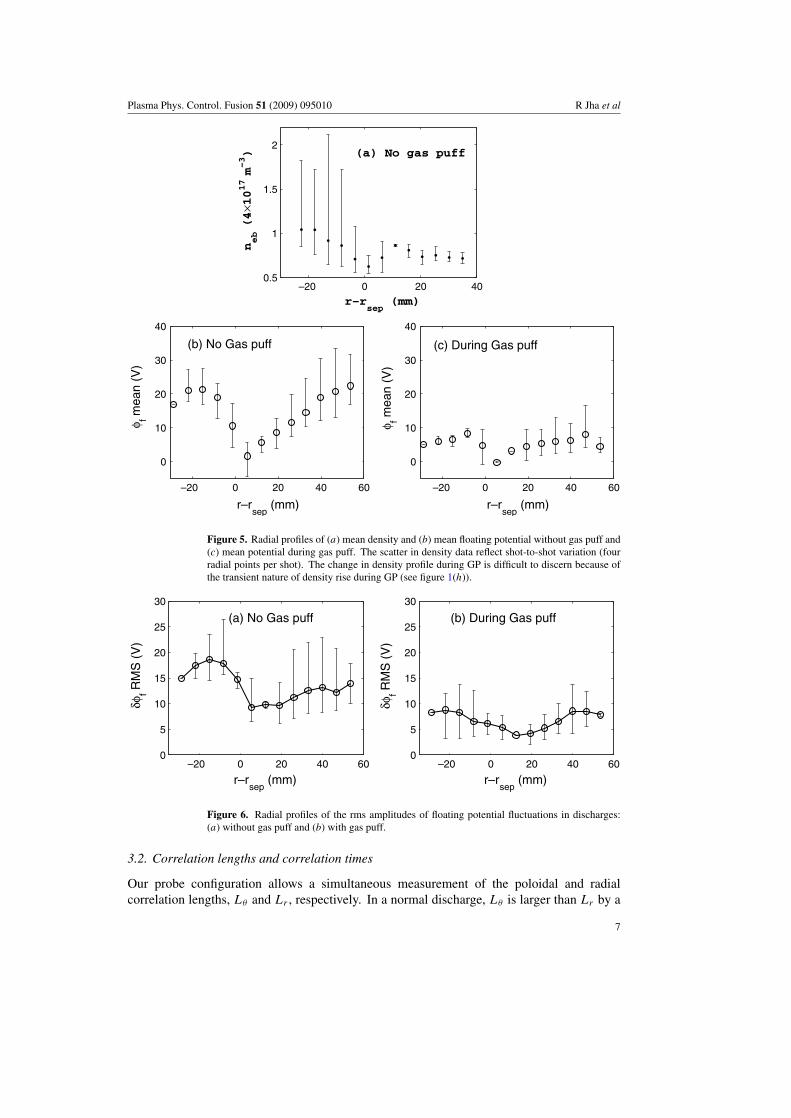
The Langmuir probes are moved to different distances into the edge plasma and by collating datafrom several discharges, a radial profile of mean floating potential is determined in dischargeswithout the gas puff as well as during the gas puff (see figure 5). It is observed that the floatingpotential is positive in the SOL as well as in the edge plasma with a minimum near the LCFSor separatrix. Although pin P8 in our cross-probe is not shadowed, we observe that the floatingpotential is positive even inside the separatrix. A possible reason of this may be the incompleteshort-circuiting of vertical charging by the Pfirsch–Schluter current. In our experiment, thetoroidal magnetic field is anti-clockwise (as seen from the top) so that the B × ∇B drift givesrise to an electric field in the top–bottom direction (ion accumulation at the topside). It does notget completely short-circuited by the Pfirsch–Schluter current because of high edge resistivity(∼10−4 � m). We have confirmed this conclusion by reversing the direction of the toroidalmagnetic field (B), and we then observe a negative potential at the topside.
Another important observation that we would like to highlight is the collapse of the floatingpotential gradient during the gas puff (see figure 5(b)). The mean potential as well as its gradientreduces by about 50%. We had expected an increase in the potential gradient to account for theshear suppression of fluctuations; instead we observed a collapse. Although the above resultis based on several discharges in which the probe system is moved to different radial positions,we have verified that the collapse also occurs in individual discharges.
Figure 6 shows the radial profiles of root mean square (rms) amplitudes of potentialfluctuations in both types of discharges. It is observed that in discharges without the gas puffthe rms amplitudes have a minimum in the neighbourhood of the separatrix. This is expectedbecause the naturally occurring radial electric field can reduce the length and time scales ofcorrelations in the fluctuating quantity. We note that the effect of gas puff is to suppress thefluctuations throughout the edge region; it is not limited to the gradient region.
6
Plasma Phys. Control. Fusion 51 (2009) 095010 R Jha et al
–20 0 20 400.5
1
1.5
2
r–rsep
(mm)
neb (4
×1017 m–3) (a) No gas puff
–20 0 20 40 60
0
10
20
30
40
r–rsep
(mm)
φ f mea
n (V
)
–20 0 20 40 60
0
10
20
30
40
r–rsep
(mm)
φ f mea
n (V
)
(b) No Gas puff (c) During Gas puff
Figure 5. Radial profiles of (a) mean density and (b) mean floating potential without gas puff and(c) mean potential during gas puff. The scatter in density data reflect shot-to-shot variation (fourradial points per shot). The change in density profile during GP is difficult to discern because ofthe transient nature of density rise during GP (see figure 1(h)).
–20 0 20 40 600
5
10
15
20
25
30
r–rsep
(mm)
δφf R
MS
(V
)
–20 0 20 40 600
5
10
15
20
25
30
r–rsep
(mm)
δφf R
MS
(V
)
(a) No Gas puff (b) During Gas puff
Figure 6. Radial profiles of the rms amplitudes of floating potential fluctuations in discharges:(a) without gas puff and (b) with gas puff.
3.2. Correlation lengths and correlation times
Our probe configuration allows a simultaneous measurement of the poloidal and radialcorrelation lengths, Lθ and Lr , respectively. In a normal discharge, Lθ is larger than Lr by a
7
Plasma Phys. Control. Fusion 51 (2009) 095010 R Jha et al
–20 0 20 400
10
20
30
40
50
Cor
rela
tion
time,
τ (
µs)
r–r sep (mm)
10 20 30 40 50
10
20
30
40
50
Lθ (mm)
Lr (
mm
)With gas puffW/o Gas puff
With Gas puffW/o Gas puff
(b) (a)
10–2
10–1
10–2
10–1
100
Frequency (MHz)
Auto Power (Norm.)
Electric Field
(c)
No GP
With GP
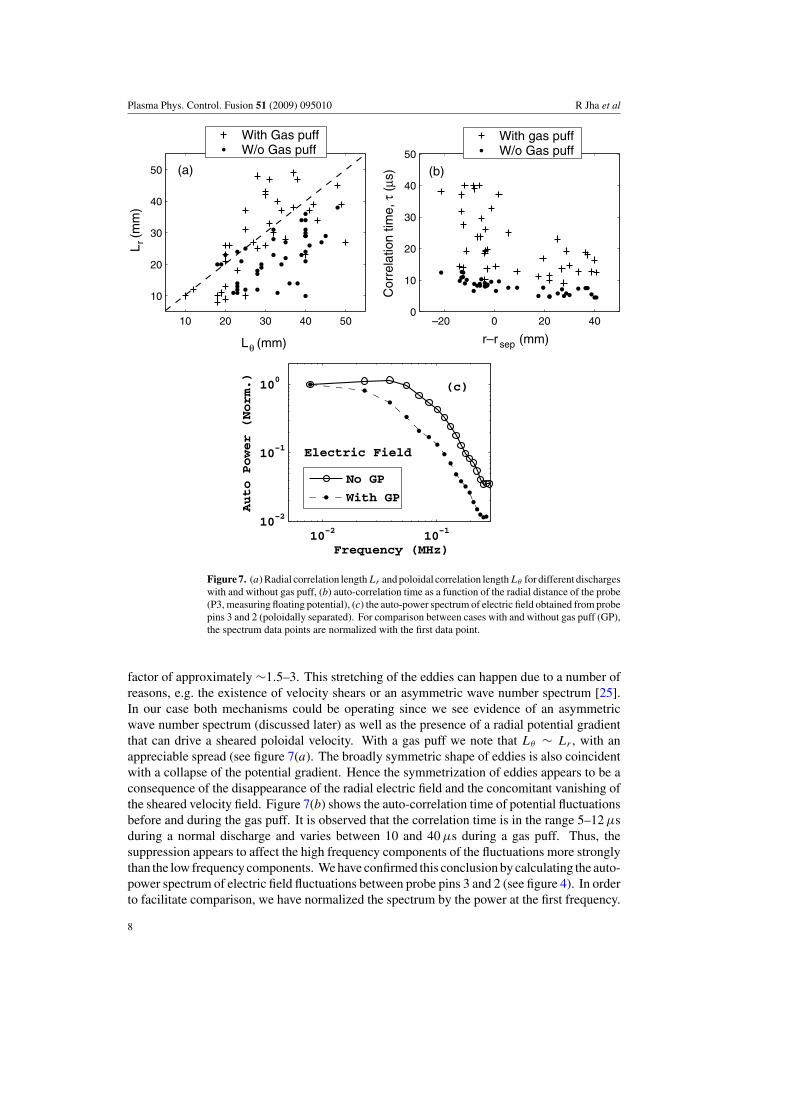
Figure 7. (a) Radial correlation lengthLr and poloidal correlation lengthLθ for different dischargeswith and without gas puff, (b) auto-correlation time as a function of the radial distance of the probe(P3, measuring floating potential), (c) the auto-power spectrum of electric field obtained from probepins 3 and 2 (poloidally separated). For comparison between cases with and without gas puff (GP),the spectrum data points are normalized with the first data point.
factor of approximately ∼1.5–3. This stretching of the eddies can happen due to a number ofreasons, e.g. the existence of velocity shears or an asymmetric wave number spectrum [25].In our case both mechanisms could be operating since we see evidence of an asymmetricwave number spectrum (discussed later) as well as the presence of a radial potential gradientthat can drive a sheared poloidal velocity. With a gas puff we note that Lθ ∼ Lr , with anappreciable spread (see figure 7(a). The broadly symmetric shape of eddies is also coincidentwith a collapse of the potential gradient. Hence the symmetrization of eddies appears to be aconsequence of the disappearance of the radial electric field and the concomitant vanishing ofthe sheared velocity field. Figure 7(b) shows the auto-correlation time of potential fluctuationsbefore and during the gas puff. It is observed that the correlation time is in the range 5–12 µsduring a normal discharge and varies between 10 and 40 µs during a gas puff. Thus, thesuppression appears to affect the high frequency components of the fluctuations more stronglythan the low frequency components. We have confirmed this conclusion by calculating the auto-power spectrum of electric field fluctuations between probe pins 3 and 2 (see figure 4). In orderto facilitate comparison, we have normalized the spectrum by the power at the first frequency.
8
Plasma Phys. Control. Fusion 51 (2009) 095010 R Jha et al
The result displayed in figure 7(c) clearly shows that the high frequency components (0.05–0.2 MHz) are reduced more strongly than the lower frequency (<0.05 MHz) components.
3.3. Reynolds stress profile
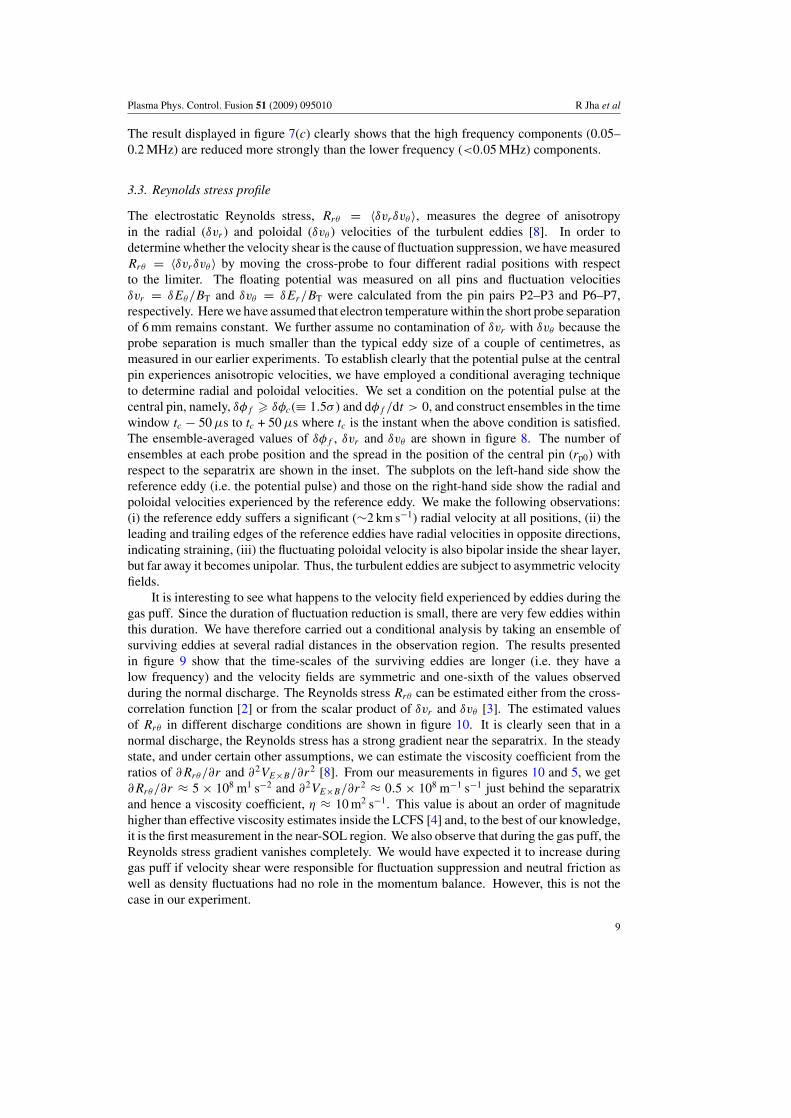
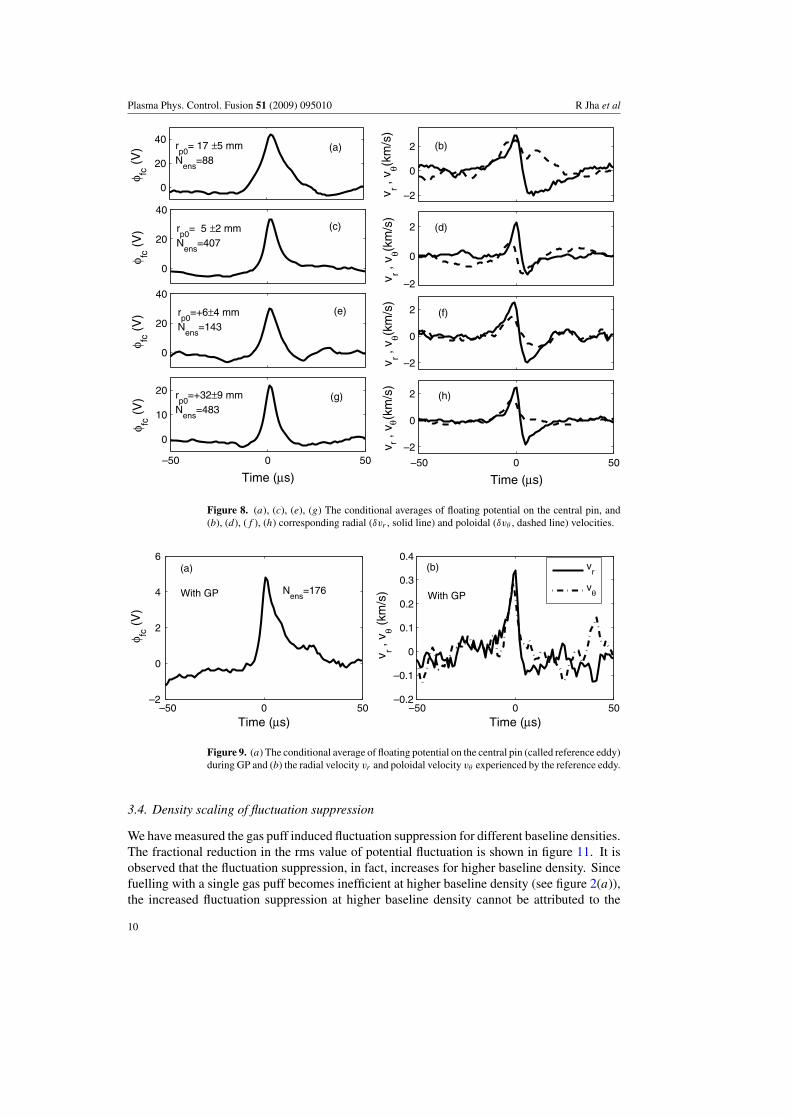
The electrostatic Reynolds stress, Rrθ = 〈δvrδvθ 〉, measures the degree of anisotropyin the radial (δvr ) and poloidal (δvθ ) velocities of the turbulent eddies [8]. In order todetermine whether the velocity shear is the cause of fluctuation suppression, we have measuredRrθ = 〈δvrδvθ 〉 by moving the cross-probe to four different radial positions with respectto the limiter. The floating potential was measured on all pins and fluctuation velocitiesδvr = δEθ/BT and δvθ = δEr/BT were calculated from the pin pairs P2–P3 and P6–P7,respectively. Here we have assumed that electron temperature within the short probe separationof 6 mm remains constant. We further assume no contamination of δvr with δvθ because theprobe separation is much smaller than the typical eddy size of a couple of centimetres, asmeasured in our earlier experiments. To establish clearly that the potential pulse at the centralpin experiences anisotropic velocities, we have employed a conditional averaging techniqueto determine radial and poloidal velocities. We set a condition on the potential pulse at thecentral pin, namely, δφf � δφc(≡ 1.5σ) and dφf /dt > 0, and construct ensembles in the timewindow tc − 50 µs to tc + 50 µs where tc is the instant when the above condition is satisfied.The ensemble-averaged values of δφf , δvr and δvθ are shown in figure 8. The number ofensembles at each probe position and the spread in the position of the central pin (rp0) withrespect to the separatrix are shown in the inset. The subplots on the left-hand side show thereference eddy (i.e. the potential pulse) and those on the right-hand side show the radial andpoloidal velocities experienced by the reference eddy. We make the following observations:(i) the reference eddy suffers a significant (∼2 km s−1) radial velocity at all positions, (ii) theleading and trailing edges of the reference eddies have radial velocities in opposite directions,indicating straining, (iii) the fluctuating poloidal velocity is also bipolar inside the shear layer,but far away it becomes unipolar. Thus, the turbulent eddies are subject to asymmetric velocityfields.
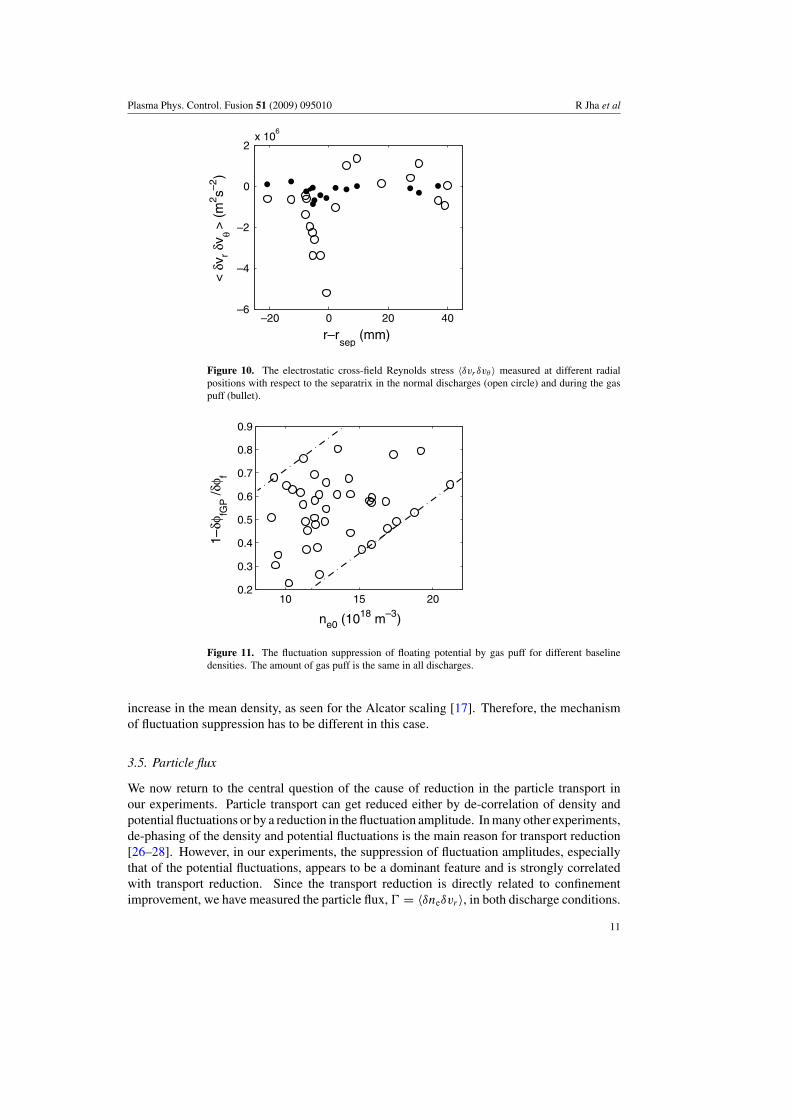
It is interesting to see what happens to the velocity field experienced by eddies during thegas puff. Since the duration of fluctuation reduction is small, there are very few eddies withinthis duration. We have therefore carried out a conditional analysis by taking an ensemble ofsurviving eddies at several radial distances in the observation region. The results presentedin figure 9 show that the time-scales of the surviving eddies are longer (i.e. they have alow frequency) and the velocity fields are symmetric and one-sixth of the values observedduring the normal discharge. The Reynolds stress Rrθ can be estimated either from the cross-correlation function [2] or from the scalar product of δvr and δvθ [3]. The estimated valuesof Rrθ in different discharge conditions are shown in figure 10. It is clearly seen that in anormal discharge, the Reynolds stress has a strong gradient near the separatrix. In the steadystate, and under certain other assumptions, we can estimate the viscosity coefficient from theratios of ∂Rrθ/∂r and ∂2VE×B/∂r2 [8]. From our measurements in figures 10 and 5, we get∂Rrθ/∂r ≈ 5 × 10⁸ m1 s−2 and ∂2VE×B/∂r2 ≈ 0.5 × 10⁸ m−1 s−1 just behind the separatrixand hence a viscosity coefficient, η ≈ 10 m2 s−1. This value is about an order of magnitudehigher than effective viscosity estimates inside the LCFS [4] and, to the best of our knowledge,it is the first measurement in the near-SOL region. We also observe that during the gas puff, theReynolds stress gradient vanishes completely. We would have expected it to increase duringgas puff if velocity shear were responsible for fluctuation suppression and neutral friction aswell as density fluctuations had no role in the momentum balance. However, this is not thecase in our experiment.
9
Plasma Phys. Control. Fusion 51 (2009) 095010 R Jha et al
0
20
40φ fc
(V
)
–2
0
2
v r , v θ(k
m/s
)
0
20
40
φ fc (
V)
–2
0
2
v r , v θ(k
m/s
)
0
20
40
φ fc (
V)
–2
0
2
v r , v θ(k
m/s
)
–50 0 50
0
10
20
φ fc (
V)
Time (µs)–50 0 50
–2
0
2v r ,
vθ(
km/s
)
Time (µs)
rp0
= 17 ±5 mmN
ens=88
rp0
= 5 ±2 mmN
ens=407
rp0
=+6±4 mmN
ens=143
rp0
=+32±9 mmN
ens=483
(a) (b)
(c) (d)
(e) (f)
(g) (h)
Figure 8. (a), (c), (e), (g) The conditional averages of floating potential on the central pin, and(b), (d), (f ), (h) corresponding radial (δvr , solid line) and poloidal (δvθ , dashed line) velocities.
–50 0 50–2
0
2
4
6
Time (µs)
φ fc (
V)
–50 0 50–0.2
–0.1
0
0.1
0.2
0.3
0.4
Time (µs)
v r , v θ (
km/s
)
v
r
vθ
(a)
With GPWith GP Nens
=176
(b)
Figure 9. (a) The conditional average of floating potential on the central pin (called reference eddy)during GP and (b) the radial velocity vr and poloidal velocity vθ experienced by the reference eddy.
3.4. Density scaling of fluctuation suppression
We have measured the gas puff induced fluctuation suppression for different baseline densities.The fractional reduction in the rms value of potential fluctuation is shown in figure 11. It isobserved that the fluctuation suppression, in fact, increases for higher baseline density. Sincefuelling with a single gas puff becomes inefficient at higher baseline density (see figure 2(a)),the increased fluctuation suppression at higher baseline density cannot be attributed to the
10
Plasma Phys. Control. Fusion 51 (2009) 095010 R Jha et al
–20 0 20 40–6
–4
–2
0
2x 10
6
r–rsep
(mm)
< δ
v r δv θ >
(m
2 s–2)
Figure 10. The electrostatic cross-field Reynolds stress 〈δvr δvθ 〉 measured at different radialpositions with respect to the separatrix in the normal discharges (open circle) and during the gaspuff (bullet).
10 15 200.2
0.3
0.4
0.5
0.6
0.7
0.8
0.9
ne0 (1018 m–3)
1–δφ
fGP /δ
φ f
Figure 11. The fluctuation suppression of floating potential by gas puff for different baselinedensities. The amount of gas puff is the same in all discharges.
increase in the mean density, as seen for the Alcator scaling [17]. Therefore, the mechanismof fluctuation suppression has to be different in this case.
3.5. Particle flux
We now return to the central question of the cause of reduction in the particle transport inour experiments. Particle transport can get reduced either by de-correlation of density andpotential fluctuations or by a reduction in the fluctuation amplitude. In many other experiments,de-phasing of the density and potential fluctuations is the main reason for transport reduction[26–28]. However, in our experiments, the suppression of fluctuation amplitudes, especiallythat of the potential fluctuations, appears to be a dominant feature and is strongly correlatedwith transport reduction. Since the transport reduction is directly related to confinementimprovement, we have measured the particle flux, � = 〈δneδvr〉, in both discharge conditions.
11
Plasma Phys. Control. Fusion 51 (2009) 095010 R Jha et al
–20 0 20 400
5
10
15x 10
19
r–rsep
(mm)
<δn
eδv
r> (m–2s–1)
(a)
–1.5 –1 –0.5 0 0.5 1x 10
19
0
5
10
15x 10
19
Local ∆ne/∆r (m–4)
<δn
eδ v
r> (m–2s–1)
(b)
–20 0 20 40–100
–50
0
50
100
150
r–rsep
(mm)
Local L n (mm) (c)
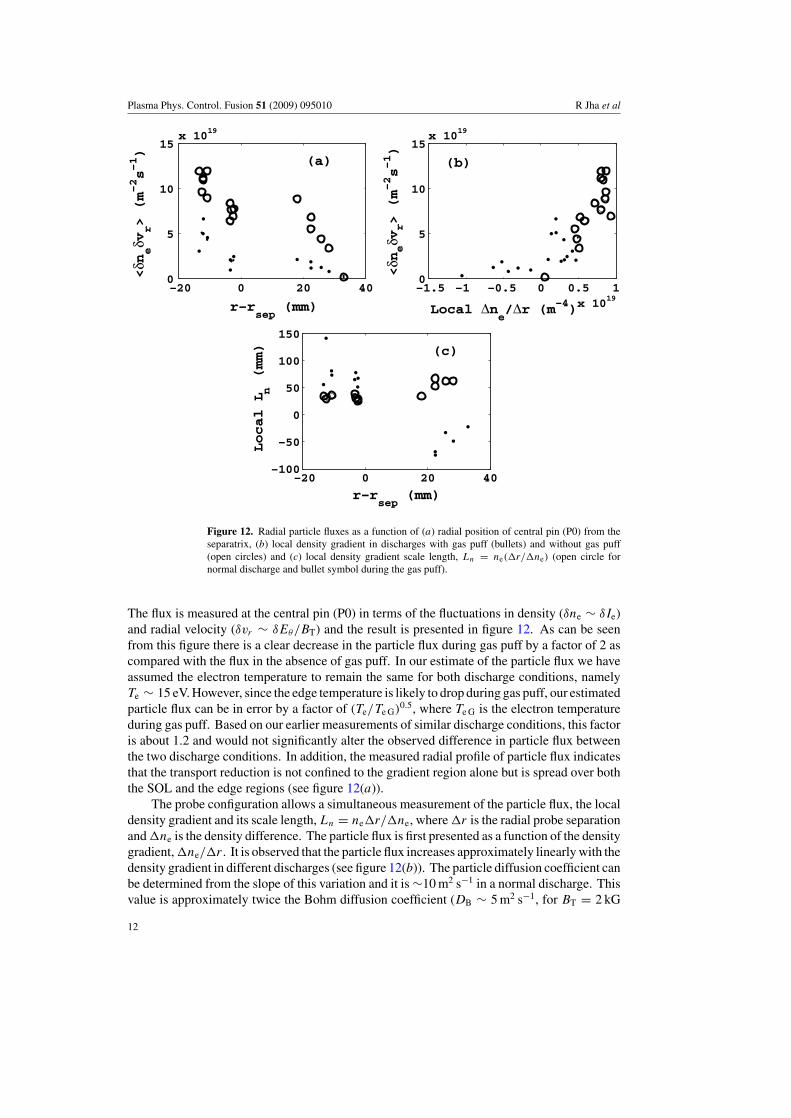
Figure 12. Radial particle fluxes as a function of (a) radial position of central pin (P0) from theseparatrix, (b) local density gradient in discharges with gas puff (bullets) and without gas puff(open circles) and (c) local density gradient scale length, Ln = ne(�r/�ne) (open circle fornormal discharge and bullet symbol during the gas puff).
The flux is measured at the central pin (P0) in terms of the fluctuations in density (δne ∼ δIe)and radial velocity (δvr ∼ δEθ/BT) and the result is presented in figure 12. As can be seenfrom this figure there is a clear decrease in the particle flux during gas puff by a factor of 2 ascompared with the flux in the absence of gas puff. In our estimate of the particle flux we haveassumed the electron temperature to remain the same for both discharge conditions, namelyTe ∼ 15 eV. However, since the edge temperature is likely to drop during gas puff, our estimatedparticle flux can be in error by a factor of (Te/Te G)0.5, where Te G is the electron temperatureduring gas puff. Based on our earlier measurements of similar discharge conditions, this factoris about 1.2 and would not significantly alter the observed difference in particle flux betweenthe two discharge conditions. In addition, the measured radial profile of particle flux indicatesthat the transport reduction is not confined to the gradient region alone but is spread over boththe SOL and the edge regions (see figure 12(a)).
The probe configuration allows a simultaneous measurement of the particle flux, the localdensity gradient and its scale length, Ln = ne�r/�ne, where �r is the radial probe separationand �ne is the density difference. The particle flux is first presented as a function of the densitygradient, �ne/�r . It is observed that the particle flux increases approximately linearly with thedensity gradient in different discharges (see figure 12(b)). The particle diffusion coefficient canbe determined from the slope of this variation and it is ∼10 m2 s−1 in a normal discharge. Thisvalue is approximately twice the Bohm diffusion coefficient (DB ∼ 5 m2 s−1, for BT = 2 kG
12
Plasma Phys. Control. Fusion 51 (2009) 095010 R Jha et al
and edge electron temperature ∼15 eV). It should be noted that particle diffusivity of theorder ∼10 m2 s−1 is not uncommon in the periphery of fusion plasma devices [12, 28, 29].The important observation here is the reduction in particle flux and diffusivity by about 50%because of the gas puff. Another important feature is that the diffusivity and the viscosity havenearly the same numerical value. This indicates that the same instability mechanism may beresponsible for the transport of both particles and momentum. The gradient scale lengths areimportant parameters that determine the growth rate of plasma instability. One such parameteris the local density gradient scale length, Ln, which we have measured in a normal discharge aswell as during the gas puff (see figure 12(c)). It is observed that Ln is in the range 20–50 mmduring a normal discharge, but it increases by several factors during the gas puff. Thus, the gaspuff causes a flattening of the local density gradient that may be expected when an additionaldensity source is introduced at the plasma edge.
3.6. Particle confinement
In order to determine the level of confinement improvement, we make an estimate of the particleconfinement time before the gas puff and that at the density peak following the gas puff. Theparticle content in a typical discharge at these two instants are estimated to be Ne = 1.3×10¹⁸
and 1.8 × 10¹⁸, respectively (see section 2 and figure 3). The particle confinement time insteady state can be estimated from the equation
τp = Ne
(dNe/dt)b, (2)
where (dNe/dt)b = 4π2aR0� ≈ 6.7� (in MKS units) is the particle loss rate across the plasmaboundary surface. It is implicitly assumed in the above equation that the particle loss fromthe boundary is being replenished by the same amount to maintain a certain constant density.Similarly, we have also ignored toroidal and poloidal variations in the particle flux. Ourmeasurements (see figure 12(a)) show that the particle fluxes (�) across the boundary surfaceare 1020 m−2 s−1 and 5 × 10¹⁹ m−2 s−1 before and during the gas puff, respectively. Thus, theestimated values of τp before and during the gas puff are ∼2 ms and 4–5 ms, respectively. Asimilar conclusion of confinement improvement can be made from estimates of τp from powerbalance considerations at the limiter [16]:
τp = γs〈ne〉V Teb
PLim, (3)
where γs is the electron energy sheath transmission factor, V is the plasma volume, Teb isthe electron temperature at the plasma boundary (LCFS) and PLim is the power falling on thelimiter. Since convection is the major mechanism of heat transfer to the limiter and by ignoringthe poloidal variation, we can write PLim = (5/2)AL�Teb, where AL is the limiter wet area.By making the reasonable assumption that γs, AL and V remain unchanged with and withoutgas puff, we get the relation
τp G
τp= �/�G
〈ne〉/〈ne G〉 , (4)
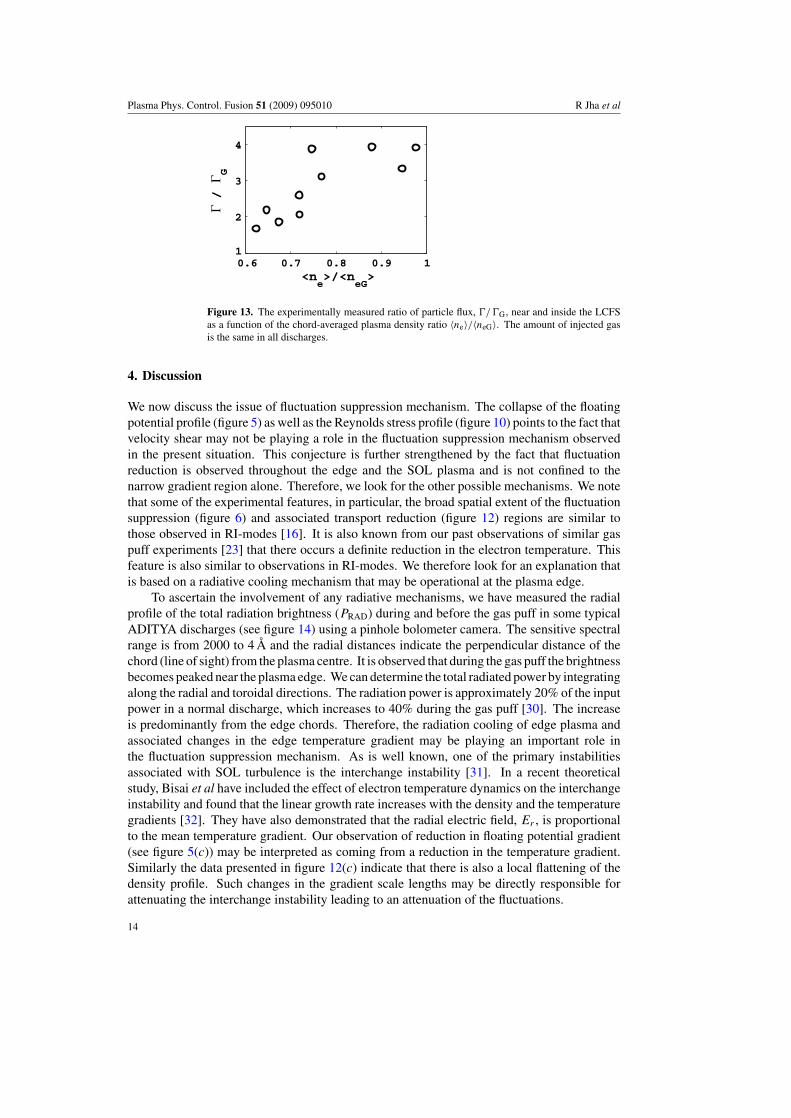
where the suffix ‘G’ indicates quantities during gas puff. Figure 13 shows measured valuesof �/�G and 〈ne〉/〈ne G〉 for those shots in which the probes are inside the LCFS. The meanconfinement improvement factor obtained from this plot is 〈τp G/τp〉 ∼ 4. Please note that iflower edge temperature during the gas puff is taken into account, as discussed in the previoussection, the estimated value of 〈τp G/τp〉 ∼ 3. We therefore believe that there is a definiteimprovement in the confinement.
13
Plasma Phys. Control. Fusion 51 (2009) 095010 R Jha et al
0.6 0.7 0.8 0.9 11
2
3
4
<ne>/<n
eG>
Γ /
Γ G
Figure 13. The experimentally measured ratio of particle flux, �/�G, near and inside the LCFSas a function of the chord-averaged plasma density ratio 〈ne〉/〈neG〉. The amount of injected gasis the same in all discharges.
4. Discussion
We now discuss the issue of fluctuation suppression mechanism. The collapse of the floatingpotential profile (figure 5) as well as the Reynolds stress profile (figure 10) points to the fact thatvelocity shear may not be playing a role in the fluctuation suppression mechanism observedin the present situation. This conjecture is further strengthened by the fact that fluctuationreduction is observed throughout the edge and the SOL plasma and is not confined to thenarrow gradient region alone. Therefore, we look for the other possible mechanisms. We notethat some of the experimental features, in particular, the broad spatial extent of the fluctuationsuppression (figure 6) and associated transport reduction (figure 12) regions are similar tothose observed in RI-modes [16]. It is also known from our past observations of similar gaspuff experiments [23] that there occurs a definite reduction in the electron temperature. Thisfeature is also similar to observations in RI-modes. We therefore look for an explanation thatis based on a radiative cooling mechanism that may be operational at the plasma edge.
To ascertain the involvement of any radiative mechanisms, we have measured the radialprofile of the total radiation brightness (PRAD) during and before the gas puff in some typicalADITYA discharges (see figure 14) using a pinhole bolometer camera. The sensitive spectralrange is from 2000 to 4 Å and the radial distances indicate the perpendicular distance of thechord (line of sight) from the plasma centre. It is observed that during the gas puff the brightnessbecomes peaked near the plasma edge. We can determine the total radiated power by integratingalong the radial and toroidal directions. The radiation power is approximately 20% of the inputpower in a normal discharge, which increases to 40% during the gas puff [30]. The increaseis predominantly from the edge chords. Therefore, the radiation cooling of edge plasma andassociated changes in the edge temperature gradient may be playing an important role inthe fluctuation suppression mechanism. As is well known, one of the primary instabilitiesassociated with SOL turbulence is the interchange instability [31]. In a recent theoreticalstudy, Bisai et al have included the effect of electron temperature dynamics on the interchangeinstability and found that the linear growth rate increases with the density and the temperaturegradients [32]. They have also demonstrated that the radial electric field, Er , is proportionalto the mean temperature gradient. Our observation of reduction in floating potential gradient(see figure 5(c)) may be interpreted as coming from a reduction in the temperature gradient.Similarly the data presented in figure 12(c) indicate that there is also a local flattening of thedensity profile. Such changes in the gradient scale lengths may be directly responsible forattenuating the interchange instability leading to an attenuation of the fluctuations.
14
Plasma Phys. Control. Fusion 51 (2009) 095010 R Jha et al
0 50 100 150 200 2500
1
2
3
4
5
6x 10
4
p (mm)
P RA
D (
Wm
–2)
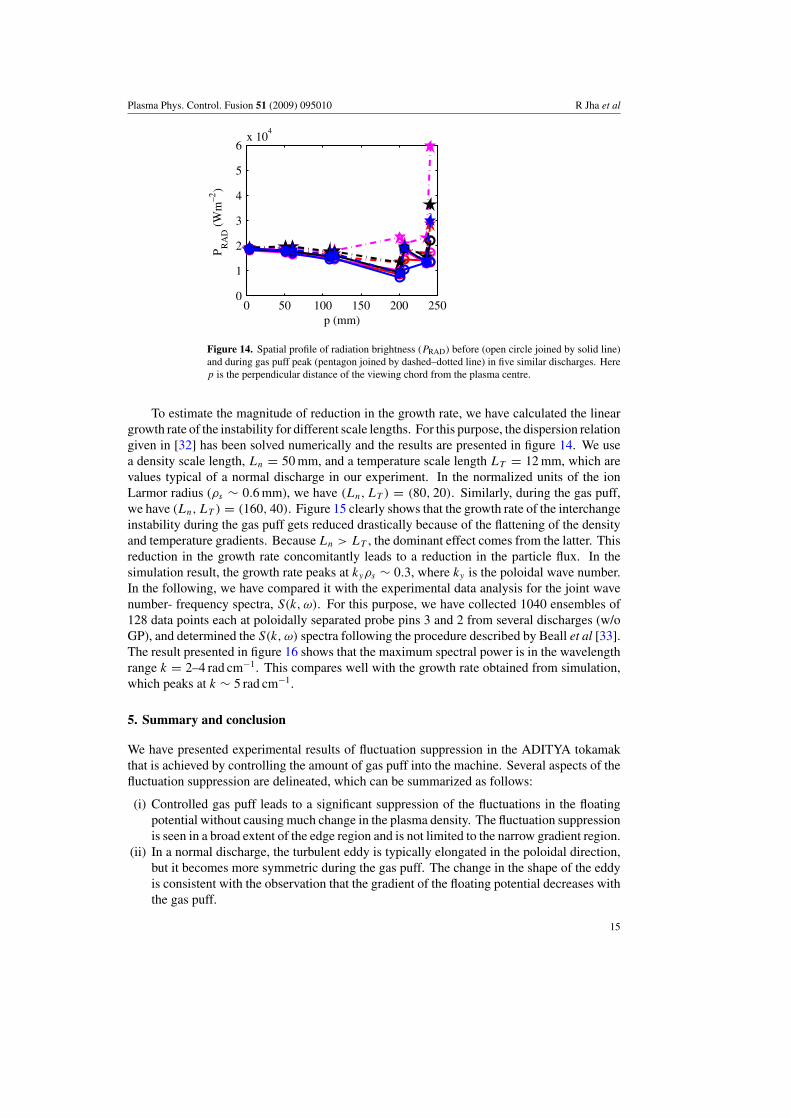
Figure 14. Spatial profile of radiation brightness (PRAD) before (open circle joined by solid line)and during gas puff peak (pentagon joined by dashed–dotted line) in five similar discharges. Herep is the perpendicular distance of the viewing chord from the plasma centre.
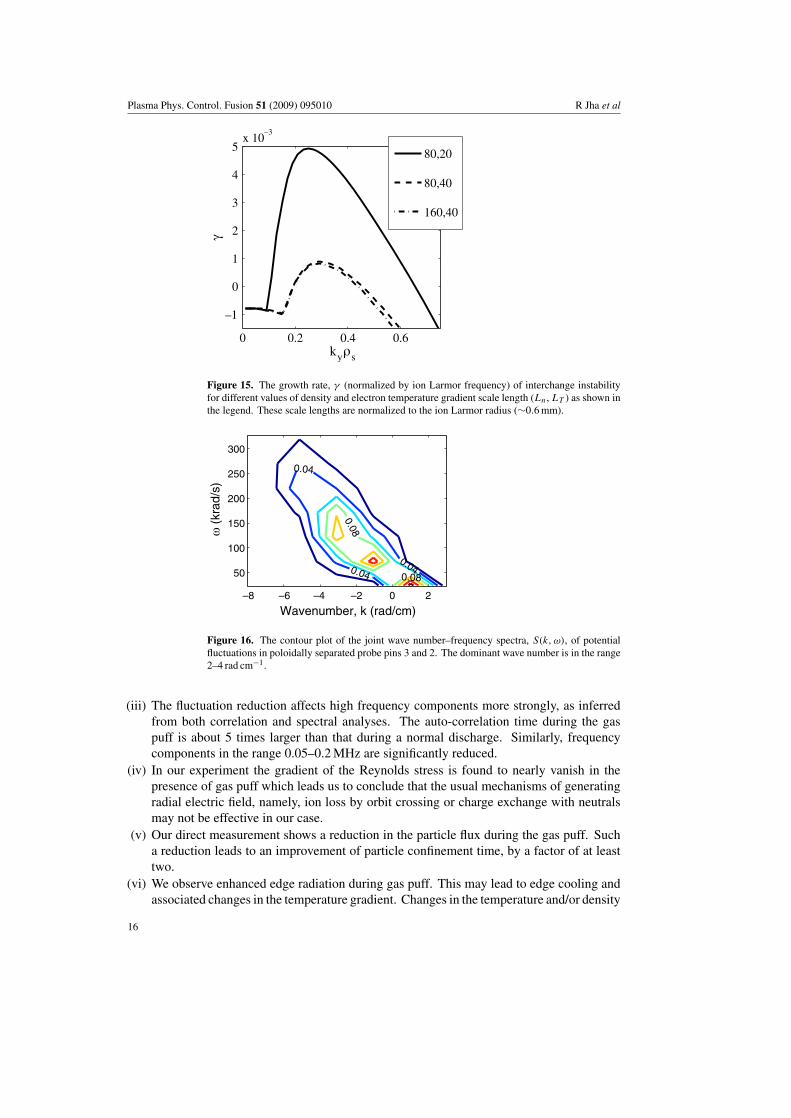
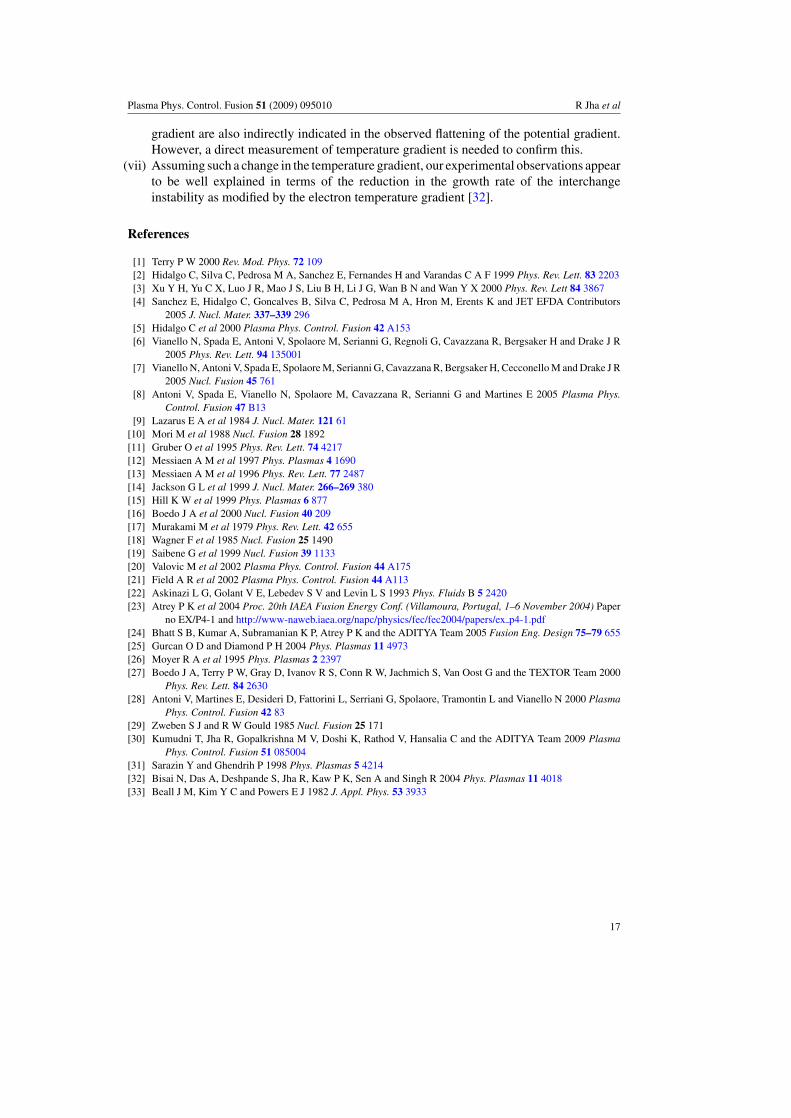
To estimate the magnitude of reduction in the growth rate, we have calculated the lineargrowth rate of the instability for different scale lengths. For this purpose, the dispersion relationgiven in [32] has been solved numerically and the results are presented in figure 14. We usea density scale length, Ln = 50 mm, and a temperature scale length LT = 12 mm, which arevalues typical of a normal discharge in our experiment. In the normalized units of the ionLarmor radius (ρs ∼ 0.6 mm), we have (Ln, LT ) = (80, 20). Similarly, during the gas puff,we have (Ln, LT ) = (160, 40). Figure 15 clearly shows that the growth rate of the interchangeinstability during the gas puff gets reduced drastically because of the flattening of the densityand temperature gradients. Because Ln > LT , the dominant effect comes from the latter. Thisreduction in the growth rate concomitantly leads to a reduction in the particle flux. In thesimulation result, the growth rate peaks at kyρs ∼ 0.3, where ky is the poloidal wave number.In the following, we have compared it with the experimental data analysis for the joint wavenumber- frequency spectra, S(k, ω). For this purpose, we have collected 1040 ensembles of128 data points each at poloidally separated probe pins 3 and 2 from several discharges (w/oGP), and determined the S(k, ω) spectra following the procedure described by Beall et al [33].The result presented in figure 16 shows that the maximum spectral power is in the wavelengthrange k = 2–4 rad cm−1. This compares well with the growth rate obtained from simulation,which peaks at k ∼ 5 rad cm−1.
5. Summary and conclusion
We have presented experimental results of fluctuation suppression in the ADITYA tokamakthat is achieved by controlling the amount of gas puff into the machine. Several aspects of thefluctuation suppression are delineated, which can be summarized as follows:
(i) Controlled gas puff leads to a significant suppression of the fluctuations in the floatingpotential without causing much change in the plasma density. The fluctuation suppressionis seen in a broad extent of the edge region and is not limited to the narrow gradient region.
(ii) In a normal discharge, the turbulent eddy is typically elongated in the poloidal direction,but it becomes more symmetric during the gas puff. The change in the shape of the eddyis consistent with the observation that the gradient of the floating potential decreases withthe gas puff.
15
Plasma Phys. Control. Fusion 51 (2009) 095010 R Jha et al
0 0.2 0.4 0.6
–1
0
1
2
3
4
5x 10
–3
kyρs
γ
80,20
80,40
160,40
Figure 15. The growth rate, γ (normalized by ion Larmor frequency) of interchange instabilityfor different values of density and electron temperature gradient scale length (Ln, LT ) as shown inthe legend. These scale lengths are normalized to the ion Larmor radius (∼0.6 mm).
0.04
0.04
0.040.08
0.08
Wavenumber, k (rad/cm)
ω (
krad
/s)
–8 –6 –4 –2 0 2
50
100
150
200
250
300
Figure 16. The contour plot of the joint wave number–frequency spectra, S(k, ω), of potentialfluctuations in poloidally separated probe pins 3 and 2. The dominant wave number is in the range2–4 rad cm−1.
(iii) The fluctuation reduction affects high frequency components more strongly, as inferredfrom both correlation and spectral analyses. The auto-correlation time during the gaspuff is about 5 times larger than that during a normal discharge. Similarly, frequencycomponents in the range 0.05–0.2 MHz are significantly reduced.
(iv) In our experiment the gradient of the Reynolds stress is found to nearly vanish in thepresence of gas puff which leads us to conclude that the usual mechanisms of generatingradial electric field, namely, ion loss by orbit crossing or charge exchange with neutralsmay not be effective in our case.
(v) Our direct measurement shows a reduction in the particle flux during the gas puff. Sucha reduction leads to an improvement of particle confinement time, by a factor of at leasttwo.
(vi) We observe enhanced edge radiation during gas puff. This may lead to edge cooling andassociated changes in the temperature gradient. Changes in the temperature and/or density
16
Plasma Phys. Control. Fusion 51 (2009) 095010 R Jha et al
gradient are also indirectly indicated in the observed flattening of the potential gradient.However, a direct measurement of temperature gradient is needed to confirm this.
(vii) Assuming such a change in the temperature gradient, our experimental observations appearto be well explained in terms of the reduction in the growth rate of the interchangeinstability as modified by the electron temperature gradient [32].
References
[1] Terry P W 2000 Rev. Mod. Phys. 72 109[2] Hidalgo C, Silva C, Pedrosa M A, Sanchez E, Fernandes H and Varandas C A F 1999 Phys. Rev. Lett. 83 2203[3] Xu Y H, Yu C X, Luo J R, Mao J S, Liu B H, Li J G, Wan B N and Wan Y X 2000 Phys. Rev. Lett 84 3867[4] Sanchez E, Hidalgo C, Goncalves B, Silva C, Pedrosa M A, Hron M, Erents K and JET EFDA Contributors
2005 J. Nucl. Mater. 337–339 296[5] Hidalgo C et al 2000 Plasma Phys. Control. Fusion 42 A153[6] Vianello N, Spada E, Antoni V, Spolaore M, Serianni G, Regnoli G, Cavazzana R, Bergsaker H and Drake J R
2005 Phys. Rev. Lett. 94 135001[7] Vianello N, Antoni V, Spada E, Spolaore M, Serianni G, Cavazzana R, Bergsaker H, Cecconello M and Drake J R
2005 Nucl. Fusion 45 761[8] Antoni V, Spada E, Vianello N, Spolaore M, Cavazzana R, Serianni G and Martines E 2005 Plasma Phys.
Control. Fusion 47 B13[9] Lazarus E A et al 1984 J. Nucl. Mater. 121 61
[10] Mori M et al 1988 Nucl. Fusion 28 1892[11] Gruber O et al 1995 Phys. Rev. Lett. 74 4217[12] Messiaen A M et al 1997 Phys. Plasmas 4 1690[13] Messiaen A M et al 1996 Phys. Rev. Lett. 77 2487[14] Jackson G L et al 1999 J. Nucl. Mater. 266–269 380[15] Hill K W et al 1999 Phys. Plasmas 6 877[16] Boedo J A et al 2000 Nucl. Fusion 40 209[17] Murakami M et al 1979 Phys. Rev. Lett. 42 655[18] Wagner F et al 1985 Nucl. Fusion 25 1490[19] Saibene G et al 1999 Nucl. Fusion 39 1133[20] Valovic M et al 2002 Plasma Phys. Control. Fusion 44 A175[21] Field A R et al 2002 Plasma Phys. Control. Fusion 44 A113[22] Askinazi L G, Golant V E, Lebedev S V and Levin L S 1993 Phys. Fluids B 5 2420[23] Atrey P K et al 2004 Proc. 20th IAEA Fusion Energy Conf. (Villamoura, Portugal, 1–6 November 2004) Paper
no EX/P4-1 and http://www-naweb.iaea.org/napc/physics/fec/fec2004/papers/ex p4-1.pdf[24] Bhatt S B, Kumar A, Subramanian K P, Atrey P K and the ADITYA Team 2005 Fusion Eng. Design 75–79 655[25] Gurcan O D and Diamond P H 2004 Phys. Plasmas 11 4973[26] Moyer R A et al 1995 Phys. Plasmas 2 2397[27] Boedo J A, Terry P W, Gray D, Ivanov R S, Conn R W, Jachmich S, Van Oost G and the TEXTOR Team 2000
Phys. Rev. Lett. 84 2630[28] Antoni V, Martines E, Desideri D, Fattorini L, Serriani G, Spolaore, Tramontin L and Vianello N 2000 Plasma
Phys. Control. Fusion 42 83[29] Zweben S J and R W Gould 1985 Nucl. Fusion 25 171[30] Kumudni T, Jha R, Gopalkrishna M V, Doshi K, Rathod V, Hansalia C and the ADITYA Team 2009 Plasma
Phys. Control. Fusion 51 085004[31] Sarazin Y and Ghendrih P 1998 Phys. Plasmas 5 4214[32] Bisai N, Das A, Deshpande S, Jha R, Kaw P K, Sen A and Singh R 2004 Phys. Plasmas 11 4018[33] Beall J M, Kim Y C and Powers E J 1982 J. Appl. Phys. 53 3933
17
Related Documents