http://jer.sagepub.com/ International Journal of Engine Research http://jer.sagepub.com/content/11/4/257 The online version of this article can be found at: DOI: 10.1243/14680874JER06409 2010 11: 257 International Journal of Engine Research S L Kokjohn and R D Reitz combustion using a variable pressure injection system Investigation of charge preparation strategies for controlled premixed charge compression ignition Published by: http://www.sagepublications.com On behalf of: Institution of Mechanical Engineers can be found at: International Journal of Engine Research Additional services and information for http://jer.sagepub.com/cgi/alerts Email Alerts: http://jer.sagepub.com/subscriptions Subscriptions: http://www.sagepub.com/journalsReprints.nav Reprints: http://www.sagepub.com/journalsPermissions.nav Permissions: http://jer.sagepub.com/content/11/4/257.refs.html Citations: What is This? - Aug 1, 2010 Version of Record >> by guest on October 11, 2013 jer.sagepub.com Downloaded from by guest on October 11, 2013 jer.sagepub.com Downloaded from by guest on October 11, 2013 jer.sagepub.com Downloaded from by guest on October 11, 2013 jer.sagepub.com Downloaded from by guest on October 11, 2013 jer.sagepub.com Downloaded from by guest on October 11, 2013 jer.sagepub.com Downloaded from by guest on October 11, 2013 jer.sagepub.com Downloaded from by guest on October 11, 2013 jer.sagepub.com Downloaded from by guest on October 11, 2013 jer.sagepub.com Downloaded from by guest on October 11, 2013 jer.sagepub.com Downloaded from by guest on October 11, 2013 jer.sagepub.com Downloaded from by guest on October 11, 2013 jer.sagepub.com Downloaded from by guest on October 11, 2013 jer.sagepub.com Downloaded from by guest on October 11, 2013 jer.sagepub.com Downloaded from by guest on October 11, 2013 jer.sagepub.com Downloaded from by guest on October 11, 2013 jer.sagepub.com Downloaded from by guest on October 11, 2013 jer.sagepub.com Downloaded from by guest on October 11, 2013 jer.sagepub.com Downloaded from by guest on October 11, 2013 jer.sagepub.com Downloaded from by guest on October 11, 2013 jer.sagepub.com Downloaded from by guest on October 11, 2013 jer.sagepub.com Downloaded from by guest on October 11, 2013 jer.sagepub.com Downloaded from by guest on October 11, 2013 jer.sagepub.com Downloaded from by guest on October 11, 2013 jer.sagepub.com Downloaded from by guest on October 11, 2013 jer.sagepub.com Downloaded from by guest on October 11, 2013 jer.sagepub.com Downloaded from by guest on October 11, 2013 jer.sagepub.com Downloaded from

Welcome message from author
This document is posted to help you gain knowledge. Please leave a comment to let me know what you think about it! Share it to your friends and learn new things together.
Transcript
http://jer.sagepub.com/International Journal of Engine Research
http://jer.sagepub.com/content/11/4/257The online version of this article can be found at:
DOI: 10.1243/14680874JER06409
2010 11: 257International Journal of Engine ResearchS L Kokjohn and R D Reitz
combustion using a variable pressure injection systemInvestigation of charge preparation strategies for controlled premixed charge compression ignition
Published by:
http://www.sagepublications.com
On behalf of:
Institution of Mechanical Engineers
can be found at:International Journal of Engine ResearchAdditional services and information for
http://jer.sagepub.com/cgi/alertsEmail Alerts:
http://jer.sagepub.com/subscriptionsSubscriptions:
http://www.sagepub.com/journalsReprints.navReprints:
http://www.sagepub.com/journalsPermissions.navPermissions:
http://jer.sagepub.com/content/11/4/257.refs.htmlCitations:
What is This?
- Aug 1, 2010Version of Record >>
by guest on October 11, 2013jer.sagepub.comDownloaded from by guest on October 11, 2013jer.sagepub.comDownloaded from by guest on October 11, 2013jer.sagepub.comDownloaded from by guest on October 11, 2013jer.sagepub.comDownloaded from by guest on October 11, 2013jer.sagepub.comDownloaded from by guest on October 11, 2013jer.sagepub.comDownloaded from by guest on October 11, 2013jer.sagepub.comDownloaded from by guest on October 11, 2013jer.sagepub.comDownloaded from by guest on October 11, 2013jer.sagepub.comDownloaded from by guest on October 11, 2013jer.sagepub.comDownloaded from by guest on October 11, 2013jer.sagepub.comDownloaded from by guest on October 11, 2013jer.sagepub.comDownloaded from by guest on October 11, 2013jer.sagepub.comDownloaded from by guest on October 11, 2013jer.sagepub.comDownloaded from by guest on October 11, 2013jer.sagepub.comDownloaded from by guest on October 11, 2013jer.sagepub.comDownloaded from by guest on October 11, 2013jer.sagepub.comDownloaded from by guest on October 11, 2013jer.sagepub.comDownloaded from by guest on October 11, 2013jer.sagepub.comDownloaded from by guest on October 11, 2013jer.sagepub.comDownloaded from by guest on October 11, 2013jer.sagepub.comDownloaded from by guest on October 11, 2013jer.sagepub.comDownloaded from by guest on October 11, 2013jer.sagepub.comDownloaded from by guest on October 11, 2013jer.sagepub.comDownloaded from by guest on October 11, 2013jer.sagepub.comDownloaded from by guest on October 11, 2013jer.sagepub.comDownloaded from by guest on October 11, 2013jer.sagepub.comDownloaded from
Investigation of charge preparation strategies forcontrolled premixed charge compression ignitioncombustion using a variable pressure injection systemS L Kokjohn and R D Reitz*
Department of Mechanical Engineering, The University of Wisconsin–Madison, Madison, Wisconsin, USA
The manuscript was accepted after revision for publication on 12 April 2010.
DOI: 10.1243/14680874JER06409
Abstract: This paper uses a multi-dimensional computational fluid dynamics (CFD) codecoupled with detailed chemistry, the KIVA-CHEMKIN code, to provide guidelines for solvingproblems with premixed combustion strategies, namely, lack of combustion phasing control,excessive pressure rise rate, and spray wall impingement due to early injections. A multipleinjection concept is used to control combustion phasing and reduce the rate of peak pressurerise. To address spray–wall impingement, an adaptive injection strategy (AIS) using two-injection pulses at different injection pressures is employed.
The combustion process considered is at a mid-load operating condition for the light-dutyengine of the present study (nominal indicated mean effective pressure (IMEP) of 5.5 bar andhigh speed, 2000 r/min) and the effects of first and second pulse injection pressure and timing,swirl ratio, and spray targeting are explored. The investigation showed that an optimized low-pressure early cycle injection combined with a high-pressure near top dead centre (TDC)injection allows combustion phasing to be well controlled while achieving premixed com-pression ignition (PCI)-like emissions levels. An improved solution was found with near-zeronitric oxides (NOx) and soot, a net indicated specific fuel consumption (ISFC) of only 175 g/kW h, and a peak pressure rise rate of ,8 bar/deg.
Keywords: injection pressure, LTC, PCCI, diesel engine, combustion modelling
1 INTRODUCTION
In recent years, many advanced combustion strategies
have been proposed in order to meet current and
future emissions mandates. Most of the current
strategies can be lumped into the category of low-
temperature premixed combustion. Premixed com-
bustion is achieved by extending the ignition delay
such that the injection event has completed prior to
the start of combustion. Furthermore, by ensuring low
local equivalence ratios or by significantly reducing the
oxygen concentration by using high levels of exhaust
gas recirculation (EGR), flame temperatures can be
significantly reduced. Lower combustion temperatures
result in nitric oxides (NOx) reduction owing to the
high temperature dependency of NO kinetics. In ad-
dition, utilizing long ignition delay allows adequate
time for mixing prior to the start of combustion; thus,
rich regions are reduced and soot formation is in-
hibited. Furthermore, Akihama et al. [1] have shown
that when combustion temperatures are significantly
reduced, the conversion of polycyclic aromatic hydro-
carbons (PAH) to soot does not occur. Therefore, even
if rich regions are present, low soot levels can still be
achieved.
Although premixed combustion strategies have
been shown to yield very low NOx and soot levels
[2–4], several problems must be solved before these
strategies can see widespread use. The first problem is
spray–wall impingement. Because a premixed charge
is required, fuel must be injected early in the cycle to
allow adequate time for mixing; however, early cycle
charge densities are often low, which can result in
very long liquid lengths and spray impingement on
the cylinder liner. Another problem that must be
*Corresponding author: Engine Research Center, Department of
Mechanical Engineering, The University of Wisconsin, Madison,
1500 Engineering Drive, Madison, Wisconsin 53706, USA.
email: [email protected]
257
JER06409 Int. J. Engine Res. Vol. 11
addressed is combustion phasing control. Because
the ignition delay must be extended to allow adequate
time for mixing, injection timing can no longer be
used to control combustion phasing. Therefore,
chemistry time-scales must also be extended so that
ignition does not occur prematurely. Furthermore,
some mechanism must be employed to reduce the
rapid heat release associated with premixed combus-
tion strategies. Because the combustion rate is no
longer limited by the mixing process, as in conven-
tional diesel combustion, the heat release can be
rapid and can result in excessive engine noise and
structural damage.
Many researchers have addressed the issue of
spray–wall impingement associated with premixed
charge compression ignition (PCCI) type strategies.
Kawaguchi [5] proposed an injector capable of
changing the cone angle depending on the piston
position in order to maintain optimal spray targeting
over a wide range of injection timings. Ra and Reitz
[6] performed a numerical evaluation of the variable
geometry spray (VGS) concept and found wall film
levels at the time of ignition were reduced from 25
per cent for a fixed geometry nozzle to below 5 per
cent for the VGS case. They also evaluated a more
practical two-pulse spray concept which had two
different fixed spray angles, i.e. a narrow angle for
the first pulse and a wider angle for the second pulse,
and found similar wall film levels as the VGS case.
Kohketsu et al. [7] developed an injection system
that altered the pressure of the spray midstream by
using a solenoid to switch between low- and high-
pressure common rails, allowing for the first part of
the injection to be at low pressure and the second
portion at high pressure. Sun and Reitz [8] showed
the advantages of using low-pressure injections with
a fixed spray angle as a means for reducing spray
wall impingement for early injected fuel and pro-
posed an adaptive injection strategy (AIS) concept
which allows the use of low-pressure injections for
fuel injected early in the cycle and high-pressure
injection of fuel injected late in the cycle.
Combustion phasing control of premixed com-
pression ignition engines has received much atten-
tion in recent years. Many parameters have been
investigated for control of premixed combustion
phasing. Sjoberg and Dec [9] have shown repeatable
control of an homogeneous charge compression
ignition (HCCI) engine by tuning the intake tem-
peratures and EGR rate. Koci [10] and Opat et al. [4]
have shown very promising results by using very
high levels of EGR (,67 per cent) in order to reduce
oxygen content and control combustion phasing in a
PCCI engine. However, the use of extremely high
EGR moves the combustion regime near the misfire
limit and makes fuel distribution extremely impor-
tant to ensure that the little oxygen in the combus-
tion chamber is appropriately utilized. Park and
Reitz [11] investigated the low emissions window in
an HCCI engine and found that combustion phasing
could be suitably controlled by using variable valve
actuation (VVA) rather than excessively high EGR
levels. However, they showed that the use of VVA or
reduced intake temperatures had little influence on
the peak cycle temperature, and that peak cycle
temperature was primarily a function of EGR level.
Thus, relatively high levels of EGR must still be
employed in order to limit thermal NOx formation.
Kawano et al. [12] also explored the use of VVA as a
means of premixed combustion phasing control.
They found that by utilizing a late intake valve
closure time, combustion could be phased near top
dead centre (TDC). Furthermore, utilizing high levels
of EGR and a high-pressure injection system, NOx
and soot emissions could be reduced dramatically
below those of conventional diesel combustion.
Hasegawa and Yanagihara [13] explained the
uniform bulky combustion system (UNIBUS), which
involves a dual injection strategy. An early injection,
well before TDC (BTDC), is used to create a
premixed charge. Engine parameters (intake gas
temperature, intake valve closure (IVC) timing, fuel
quantity, and injection timing) were set such that
high-temperature heat release did not occur prior to
the start of the second injection. The second
injection occurs after TDC (ATDC) and is used to
control the start of combustion of the premixed fuel;
thus, unlike very early injection PCCI and HCCI
concepts, combustion phasing can be directly con-
trolled by the injection timing of the second pulse.
The UNIBUS concept was able to achieve low NOx
and near-zero soot emissions.
For premixed combustion strategies to gain wide-
spread acceptance the rate of heat release must be
controlled. Through a computational study, Sun and
Reitz [14] and Sun [15] proposed a two-stage
combustion (TSC) concept as a means for extending
the operating range of HCCI combustion. The first
stage is HCCI-like combustion and the second stage
is diffusion combustion under low oxygen concen-
tration conditions. Note that in the work of Sun and
Reitz [14], Sun [15], and in the current paper, the
terminology ‘cool flame reaction’ describes the low-
temperature reaction associated with forming a pool
of hydrogen peroxide which will later be consumed
in the high-temperature reaction. ‘First stage com-
258 S L Kokjohn and R D Reitz
Int. J. Engine Res. Vol. 11 JER06409
bustion’ refers to high-temperature heat release of
an early injected or premixed fuel, and ‘second stage
combustion’ refers to combustion of a late injected
fuel. Computational work by Sun [15] showed that
optimized TSC could achieve NOx and soot levels at
the 2010 Environmental Protection Agency (EPA)
heavy-duty on-highway truck limits (0.1 and 0.01 g/
hp h of NOx and soot, respectively [16]) at 57 per
cent of full load while achieving a brake-specific fuel
consumption (BSFC) of close to 200 g/kW h. In an-
other computational study, Kokjohn and Reitz [17]
applied the TSC concept to a light-duty engine and
found that the rate of heat release and peak pres-
sure rise rate (PRR) could be controlled by the use of
optimized fuel splits, EGR, boost, and injection
timing.
Canova et al. [18] performed an experimental
investigation of a mixed-mode combustion strategy
similar to Sun’s TSC strategy in a 2.5 litre light-duty
engine. They used an external fuel atomizer to achieve
a homogeneous charge and a direct injection slightly
after TDC to extend the load limit of pure HCCI
combustion. At the 6.1 bar operating condition tested,
the mixed-mode combustion strategy showed simul-
taneous reduction in NOx and soot emissions com-
pared to conventional diesel combustion. Further-
more, cycle-to-cycle variability was found to be very
low, thus suggesting that mixed-mode combustion is a
stable operating strategy.
In a primarily computational study, Kokjohn et al.
[19] explored the combined use of VVA for combus-
tion phasing control and AIS (i.e. multiple injections
at different injection pressures) to reduce liner im-
pingement in an engine operating in PCCI mode. By
optimizing injection and operating parameters using
genetic algorithms (GAs), they were able to achieve
near-zero levels of NOx and net indicated specific
fuel consumption (ISFC) level of 185 g/kW h.
The main objective of the present study is to expand
on the optimization work of Kokjohn et al. [19] to
provide guidelines for solving problems with premixed
combustion strategies, namely, combustion phasing
control, excessive PRR, and spray–wall impingement
due to early injections. Operating conditions that will
simultaneously result in low noise, high efficiency, and
clean combustion are identified and investigated.
Additionally, trade-offs between noise, emissions, and
fuel consumption are examined.
2 ENGINE SPECIFICATIONS
The engine modelled in this study is a single-
cylinder version of the GM 1.9 litre engine with
specifications given in Table 1. This engine uses a
variable pressure pulse (VPP) injection system [19]
developed in the Diesel Emissions Reduction Con-
sortium (DERC) laboratory at the University of Wis-
consin-Madison’s Engine Research Center (ERC). The
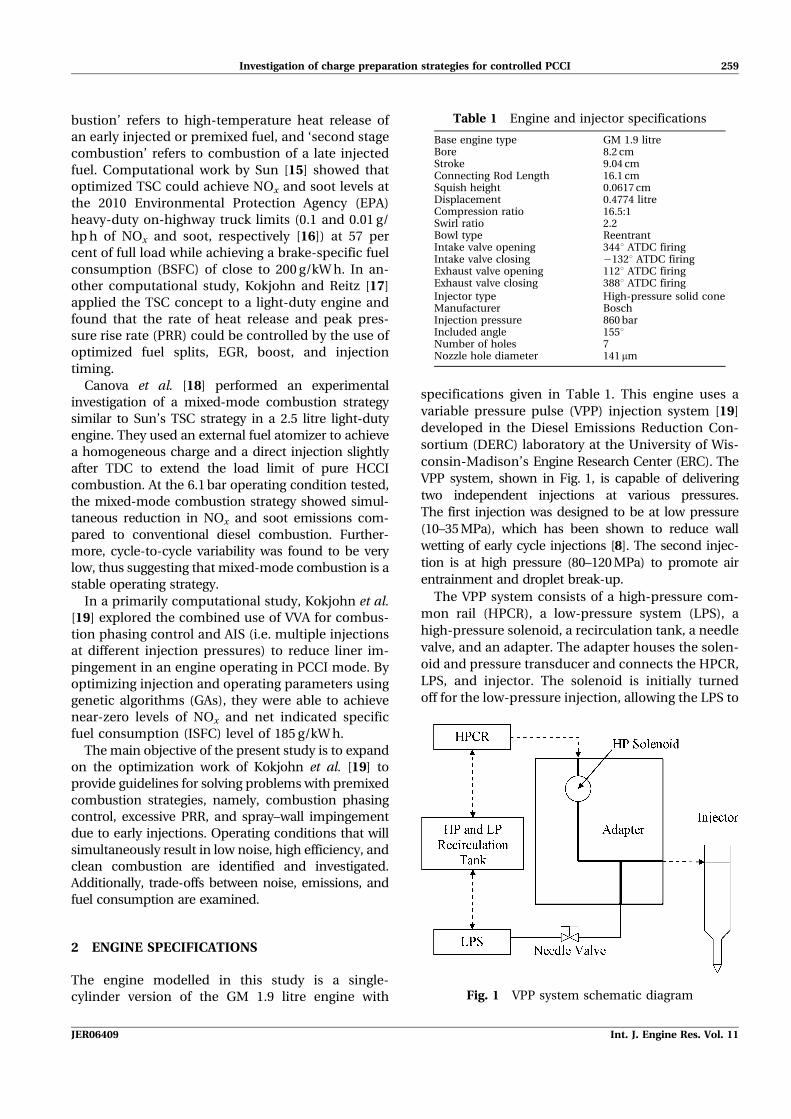
VPP system, shown in Fig. 1, is capable of delivering
two independent injections at various pressures.
The first injection was designed to be at low pressure
(10–35 MPa), which has been shown to reduce wall
wetting of early cycle injections [8]. The second injec-
tion is at high pressure (80–120 MPa) to promote air
entrainment and droplet break-up.
The VPP system consists of a high-pressure com-
mon rail (HPCR), a low-pressure system (LPS), a
high-pressure solenoid, a recirculation tank, a needle
valve, and an adapter. The adapter houses the solen-
oid and pressure transducer and connects the HPCR,
LPS, and injector. The solenoid is initially turned
off for the low-pressure injection, allowing the LPS to
Table 1 Engine and injector specifications
Base engine type GM 1.9 litreBore 8.2 cmStroke 9.04 cmConnecting Rod Length 16.1 cmSquish height 0.0617 cmDisplacement 0.4774 litreCompression ratio 16.5:1Swirl ratio 2.2Bowl type ReentrantIntake valve opening 344u ATDC firingIntake valve closing 2132u ATDC firingExhaust valve opening 112u ATDC firingExhaust valve closing 388u ATDC firing
Injector type High-pressure solid coneManufacturer BoschInjection pressure 860 barIncluded angle 155uNumber of holes 7Nozzle hole diameter 141mm
Fig. 1 VPP system schematic diagram
Investigation of charge preparation strategies for controlled PCCI 259
JER06409 Int. J. Engine Res. Vol. 11
control the pressure in the adapter. After the first
low-pressure injection, the solenoid opens, allowing
fuel from the HPCR to flow into the adapter. The
needle valve acts as a critical flow orifice, only
allowing a small amount of the fuel to pass into
the LPS. The resulting effect is a rapid increase of
pressure in the adapter. The second injection is
then fired, and the solenoid is turned to the off posi-
tion. The pressurized fuel bleeds through the needle
valve into the LPS.
3 COMPUTATIONAL MODEL
The computations were performed using the KIVA-
3v release 2 code [20] with improvements to many
physical and chemistry models developed at the ERC
[21–25]. The KIVA-3v code was coupled with the
CHEMKINTM II solver for detailed chemistry calcu-
lations. A 39-species and 131-reaction mechanism
for n-heptane [26] was used to simulate diesel fuel
chemistry. Soot was predicted using a two-step
phenomenological soot model [27] based on the
approach of Hiroyasu and Kadota [28]. The rate of
change of soot mass within a computational cell, _MM s,
is given by competition between formation, _MMsf , and
oxidation, _MM so, processes.
_MMs~ _MM sf{ _MMso ð1Þ
where the soot formation rate is given by the Arrhe-
nius expression
_MMsf~dMs
dt~Asf MC2H2
Pn expEsf
RT
� �ð2Þ
and the oxidation rate, RTotal, is given by the carbon
oxidation model of Nagle and Strickland-Constable
[29]. The oxidation rate considers two reaction sites
as described by Liu et al. [30], and
_MMso~dMso
dt~
6MWc
rsDsMsRTotal ð3Þ
Ms is the soot mass in the computational cell. The
soot density, rs, and soot particle diameter, Ds, were
taken as 2 g/cm3 and 0.025 micron, respectively.
The soot model used in the present study used
acetylene as an inception species, allowing coupling
of the soot model and chemistry solver through the
addition of 13 reactions involving acetylene. NOx
emissions are predicted using a reduced NO me-
chanism [15] consisting of four additional species
and 12 reactions. The reduced NO mechanism is
based on the Gas Research Institute (GRI) NO me-
chanism [31]. The reduced NO mechanism describ-
ed by Sun [15] is given by reactions (4) through
(15) below. Reactions (4) through (6) are the thermal
or extended Zeldovich NO pathways that dominate
at high temperatures [32]. Reactions 7 through 11
are low-temperature formation pathways and reac-
tions (12) through (15) represent the catalytic NO
formation cycle. The catalytic reaction pathways be-
come important when NO is recirculated into the
intake stream (i.e. EGR).
NzNOuN2zO ð4Þ
NzO2uNOzO ð5Þ
NzOHuNOzH ð6Þ
N2OzOuN2zO2 ð7Þ
N2OzOu2NO ð8Þ
N2OzHuN2zOH ð9Þ
N2OzOHuN2zHO2 ð10Þ
N2OzMuN2zOzM ð11Þ
HO2zNOuNO2zOH ð12Þ
NOzOzMuNO2zM ð13Þ
NO2zOuNOzO2 ð14Þ
NO2zHuNOzOH ð15Þ
As detailed chemistry calculations are often time
consuming, the adaptive multi-grid chemistry
(AMC) model of Shi et al. [33] was employed.
The current implementation of the CHEMKIN II
solver considers every grid cell as a well-stirred
reactor (WSR) and solves for the mass density of
each species in the continuity equation and the
260 S L Kokjohn and R D Reitz
Int. J. Engine Res. Vol. 11 JER06409
reaction source term in the energy equation. The
AMC model reduces the number of cells that need
to be computed by the chemistry solver by group-
ing cells with similar gas properties for chemis-
try calculations and remapping the results to the
original mesh. A brief overview of the mapping
and remapping procedures is given below. More
information can be found in the work of Shi et al.
[33, 34]. Cells are grouped based on the so-called
progress equivalence ratio [35], which is defined
by
w~2C#
{CO2zH#
{H2O
.2{z’C#
{CO2
O#{CO2{H2O{z’C#
{CO2
ð16Þ
In this equation, z’ defines the proportion of fuel
oxygen to fuel carbon, and for hydrocarbon fuels
without oxygen, as is the case in this work, z’ is
zero. The superscript # denotes the number of
atoms of each species present in each computa-
tional cell. The equivalence ratio is defined based
on complete combustion, but the products CO2
and H2O are excluded. For example, C#{CO2
is given
by
C#{CO2
~Xn species
i~1
xiNcellCið Þ{xCO2NcellCCO2
ð17Þ
where xi is the mole fraction of species i, Ncell is
the total number of moles in the cell, Ci is the num-
ber of carbon atoms in species i (e.g. CCO25 1).
The complete combustion products (i.e. stoichio-
metrically saturated species) are excluded from
the progress equivalence ratio calculation based
on the findings of Babajimopoulos et al. [35]. They
showed that the evolution of the progress equivalence
ratio excluding CO2 and H2O (i.e. as defined by equ-
ation (16)) better corresponded to the evolution of the
heat release than the kinetic equivalence ratio in-
cluding these stoichiometrically saturated species.
Therefore, they concluded that the progress equiva-
lence ratio (as defined by equation (16)) is the most
appropriate metric for identifying cells with similar
compositions.
During stratified combustion events, significant
gradients in mass fraction of species are present.
Therefore, it is not appropriate to group all cells with
similar progress equivalence ratios. A better solution
is to group cells with similar thermodynamic proper-
ties and species composition. Accordingly, a tem-
perature inhomogeneity, sT, was used as an indicator
for assessing the grouping region adaptively, where
sT~
ffiffiffiffiffiffiffiffiffiffiffiffiffiffiffiffiffiffiffiffiffiffiffiffiffiffiffiffiffiffiffiffiffiffiffiffiffiffi1
n{1
Xn
i~1
Ti{�TT� �2
vuut ð18Þ
�TT denotes the average in-cylinder temperature and Ti
is individual temperature of each of the n cells. Each
group of cells is then sent to the chemistry solver as a
single cell and species are redistributed back to the
cells in the original mesh, such that the gas properties
of each cell remapped from the group would be
comparable with those if the chemistry of each cell
was solved individually. By using the AMC model,
computational times can be reduced by more than a
factor of three while maintaining an accurate predic-
tion of the emissions results [34].
The spray model employed in this study uses the
Lagrangian-drop and Eulerian-fluid (LDEF) approach.
Because a detailed chemistry model is used, it is desir-
able to use a relatively coarse computational mesh;
however, severe grid size dependency has been ob-
served in LDEF spray models. This problem is most
severe in the near-nozzle region where the droplets are
very close together and occupy only small portions of
the Eulerian mesh. Abraham [36] showed that accurate
modelling of the near-nozzle region required grid
resolution on the order of the orifice diameter.
However, it is not feasible from a computational time
standpoint to solve engine problems on such a fine
mesh. Furthermore, a fundamental assumption of the
LDEF approach is that the volume fraction of droplets
in each cell is small, i.e. the void fraction is near one.
Thus, if the mesh size is overly refined (i.e. mesh size of
the order of the droplet size), this assumption may be
violated. In order to reduce the grid size dependency of
the LDEF spray model and allow accurate spray
simulation on a relatively coarse grid, the Gasjet model
of Abani et al. [22] is employed to model the relative
velocity between the droplets and gas phase in the
near-nozzle region. Their approach assumes that the
relative velocity between a droplet and the gas phase is
equal to that between the droplet and a turbulent gas
jet with the same mass and momentum as that of the
injected fuel. This approach imposes an axial compo-
nent for the gas phase velocity as a function of distance
from the nozzle, which is used in the droplet
acceleration equation given by
dU
dt~
3
8CD
rg
rlrdU{V gas
�� �� U{V gas
� �ð19Þ
where U is the droplet velocity vector, CD is the
droplet drag coefficient, which is a function of
Investigation of charge preparation strategies for controlled PCCI 261
JER06409 Int. J. Engine Res. Vol. 11
Reynolds number, rg and rl are the gas and liquid
phase densities, respectively, rd is the droplet
radius, and Vgas is the gas phase velocity vector
given as V gas~ Vx, Vy , Vz
� �, where Vy and Vz are
perpendicular to the spray axis and are obtained
from the Eulerian gas phase solution, and Vx, the
axial component of the gas phase velocity, is found
from gas-jet theory [37] as
Vx~ min Uinj,
3Uinjdnoz
ffiffiffiffiffiffiffiffiffiffiffiffiffiffiffiffiffiffiffirl
.rg
� rKentrx
2664
|1
1z 12r2= K 2entrx
2ð Þð Þ½ �2
( )ð20Þ
where Uinj is the injection velocity, dnoz is the nozzle
diameter, Kentr is a model constant taken to be 0.7
as suggested by Abani et al. [21], x is the position
downstream of the nozzle on the spray axis, and r is
the radial position.
Droplet break-up is modelled using the hybrid
Kelvin–Helmholtz (KH)–Rayleigh–Taylor (RT) model
described by Beale and Reitz [23]. The droplet collision
model is based on O’Rourke’s model; however, a radius
of influence method is used to determine the possible
collision partners to further reduce mesh dependency
[22]. In addition, the collision model was expanded by
Munnannur and Reitz [38] to include a more compre-
hensive range of collision outcomes. The current
implementation of the droplet collision model con-
siders bounce, coalescence, and both fragmenting and
non-fragmenting separations. Droplet interactions with
the wall are considered through a wall film submodel
[39, 40], which includes the effects associated with
splash, film spreading, and motion due to inertia.
The computational grid used in this study was a
51.4u sector mesh that represents a single nozzle hole
of the seven-hole Bosch injector used in the engine.
Abani et al. [21] and Shi et al. [34] have shown the
improved spray models used in this study yield
similar results on both fine and coarse grids. There-
fore, to reduce computational expense further, the
coarse grid of Fig. 2 was used for parameter sweeps
and the final solution was verified on the fine grid.
4 MODEL VALIDATION
To ensure the models were predictive, two sets of
model validation were performed. In the first part,
model predictions are compared to the single injec-
tion PCCI experiments of Opat et al. [4]. In the second
part, model predictions are compared to engine
experiments of Kokjohn et al. [19] using the VPP
injection system and a multiple injection strategy.
4.1 Single injection PCCI combustion validation
The engine experiments performed by Opat et al. [4]
used for computational model validation were con-
ducted using a single-injection PCCI approach at the
same operating condition as that investigated in the
present study (5.5 bar nominal indicated mean effec-
tive pressure (IMEP) and 2000 r/min). To achieve
PCCI combustion, Opat utilized an early injection to
attain adequate mixing prior to the start of combus-
tion and a high EGR rate (,67 per cent) to suppress in-
cylinder temperatures and extend the ignition delay.
Model validation was performed over a start-of-
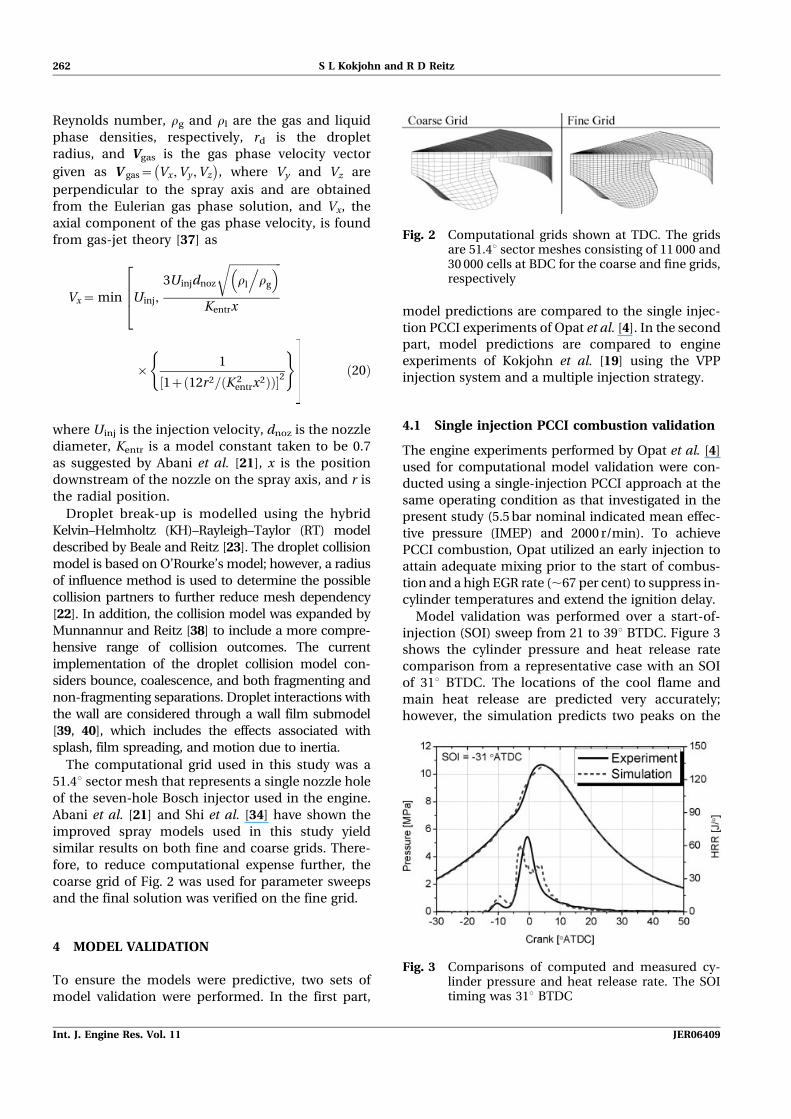
injection (SOI) sweep from 21 to 39u BTDC. Figure 3
shows the cylinder pressure and heat release rate
comparison from a representative case with an SOI
of 31u BTDC. The locations of the cool flame and
main heat release are predicted very accurately;
however, the simulation predicts two peaks on the
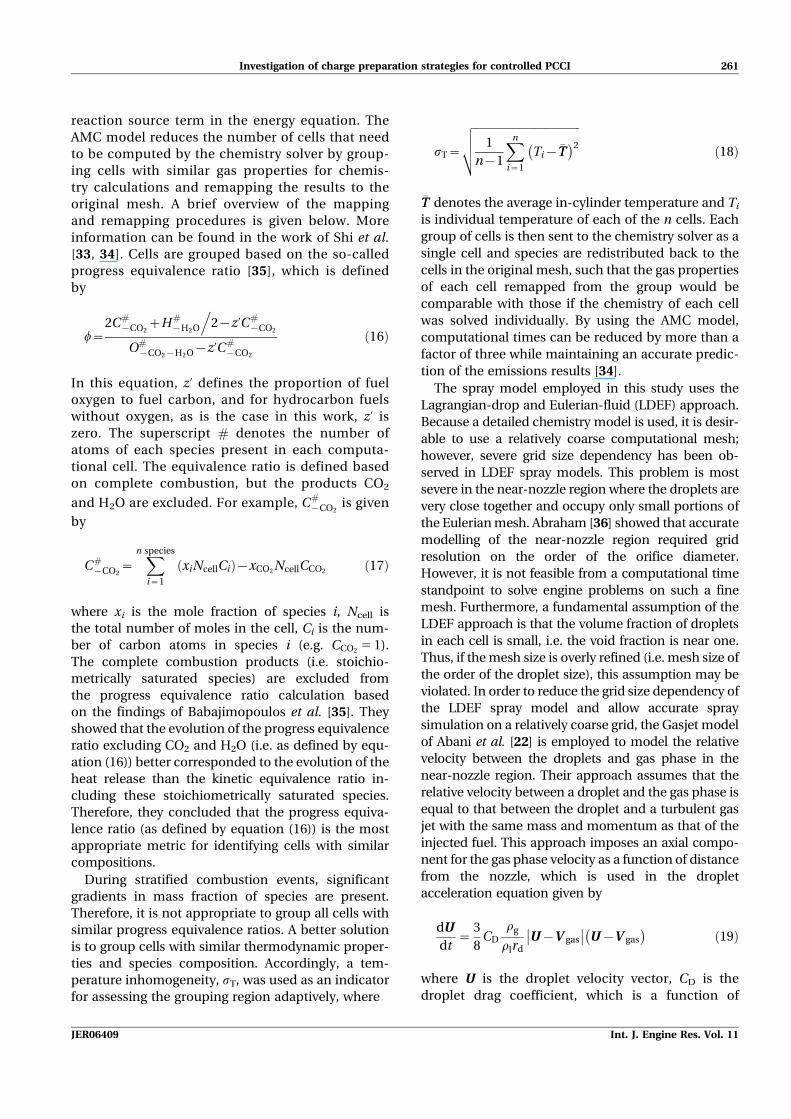
Fig. 2 Computational grids shown at TDC. The gridsare 51.4u sector meshes consisting of 11 000 and30 000 cells at BDC for the coarse and fine grids,respectively
Fig. 3 Comparisons of computed and measured cy-linder pressure and heat release rate. The SOItiming was 31u BTDC
262 S L Kokjohn and R D Reitz
Int. J. Engine Res. Vol. 11 JER06409
high-temperature heat release, which was not
observed in the experiments. It is thought that the
two-peak behaviour is due to competition for OH
radicals between the CO + OH R CO2 + H reaction
and other less exothermic reactions. That is, as OH
radicals are consumed by reactions other than the
CO + OH R CO2 + H reaction, the high-temperature
heat release slows down. Meanwhile, CO continues
to accumulate and is finally consumed when a
sufficient concentration of OH radicals is formed
through chain branching reactions. The two-peak
behaviour can be eliminated by adjusting the rates of
the competing reactions; however, the current n-
heptane mechanism generally performs better under
low-temperature combustion conditions than the
modified version (Y. Ra, 2008, personal communica-
tion). Additionally, the differences between the
measured and predicted cylinder pressure may be
because n-heptane is used to represent the kinetics
of diesel fuel. That is, some differences are expected
owing to the absence of the aromatic compounds
present in real diesel fuel. Although some differences
exist, the CFD predicted pressure traces are con-
sidered to be in acceptable agreement with the
measurements for the purposes of the present study.
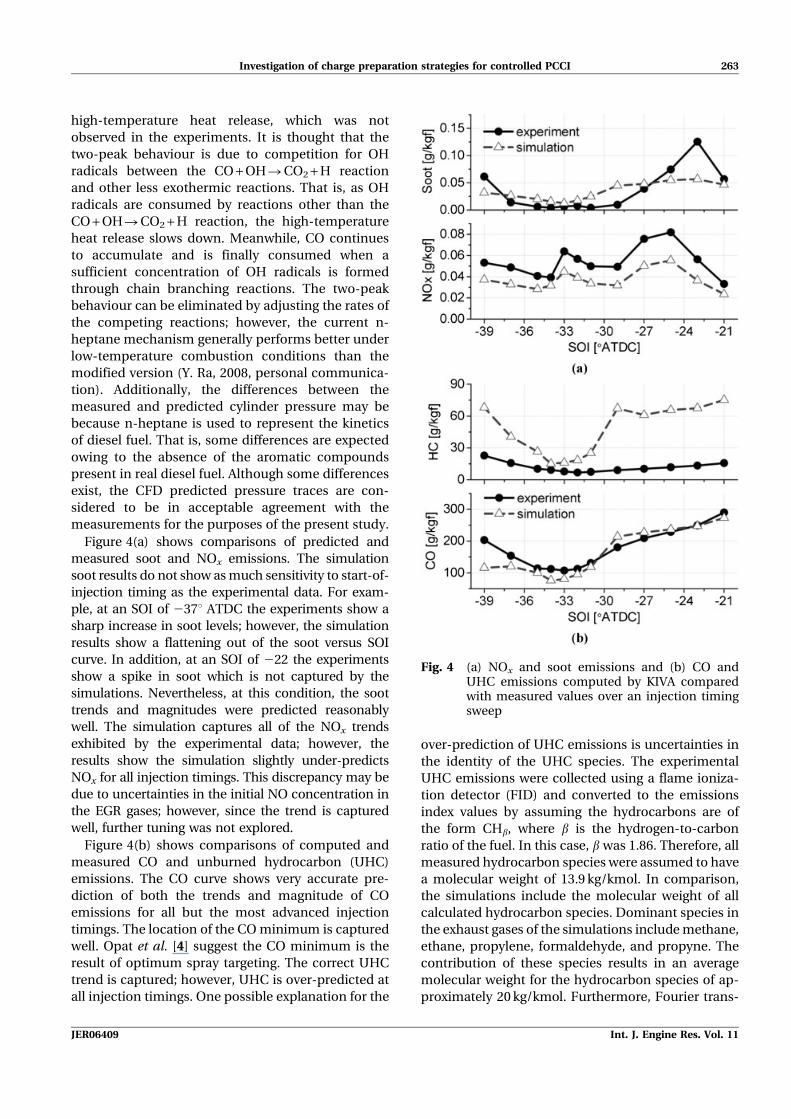
Figure 4(a) shows comparisons of predicted and
measured soot and NOx emissions. The simulation
soot results do not show as much sensitivity to start-of-
injection timing as the experimental data. For exam-
ple, at an SOI of 237u ATDC the experiments show a
sharp increase in soot levels; however, the simulation
results show a flattening out of the soot versus SOI
curve. In addition, at an SOI of 222 the experiments
show a spike in soot which is not captured by the
simulations. Nevertheless, at this condition, the soot
trends and magnitudes were predicted reasonably
well. The simulation captures all of the NOx trends
exhibited by the experimental data; however, the
results show the simulation slightly under-predicts
NOx for all injection timings. This discrepancy may be
due to uncertainties in the initial NO concentration in
the EGR gases; however, since the trend is captured
well, further tuning was not explored.
Figure 4(b) shows comparisons of computed and
measured CO and unburned hydrocarbon (UHC)
emissions. The CO curve shows very accurate pre-
diction of both the trends and magnitude of CO
emissions for all but the most advanced injection
timings. The location of the CO minimum is captured
well. Opat et al. [4] suggest the CO minimum is the
result of optimum spray targeting. The correct UHC
trend is captured; however, UHC is over-predicted at
all injection timings. One possible explanation for the
over-prediction of UHC emissions is uncertainties in
the identity of the UHC species. The experimental
UHC emissions were collected using a flame ioniza-
tion detector (FID) and converted to the emissions
index values by assuming the hydrocarbons are of
the form CHb, where b is the hydrogen-to-carbon
ratio of the fuel. In this case, b was 1.86. Therefore, all
measured hydrocarbon species were assumed to have
a molecular weight of 13.9 kg/kmol. In comparison,
the simulations include the molecular weight of all
calculated hydrocarbon species. Dominant species in
the exhaust gases of the simulations include methane,
ethane, propylene, formaldehyde, and propyne. The
contribution of these species results in an average
molecular weight for the hydrocarbon species of ap-
proximately 20 kg/kmol. Furthermore, Fourier trans-
Fig. 4 (a) NOx and soot emissions and (b) CO andUHC emissions computed by KIVA comparedwith measured values over an injection timingsweep
Investigation of charge preparation strategies for controlled PCCI 263
JER06409 Int. J. Engine Res. Vol. 11
form infrared spectroscopy (FTIR) measurements
performed by Koci [10] concluded that the dominant
hydrocarbon species in this condition are methane,
ethylene, and acetylene. These species all have mole-
cular weights greater than the assumed value of
13.9 kg/kmol; therefore, it seems reasonable to con-
clude that some of the over-prediction in hydro-
carbon emissions is due to uncertainties in the mole-
cular weight of UHC species.
In general, the comparisons between the simula-
tions and experiments show reasonable agreement.
However, it must be noted that representing the
multi-component kinetics of diesel fuel with a single
straight-chain hydrocarbon likely introduces inac-
curacies. However, numerous studies (e.g. Kong et
al. [27]) have shown that this approach is accep-
table for engineering approximations. Additionally,
in this work, the physical properties (for spray and
mixing processes) of the diesel fuel were represented
by tetradecane. Of course, the multi-component
vaporization of the diesel fuel used in the validation
experiments is not captured by this approach (i.e.
the distillation curve of diesel fuel is not repro-
duced). It is possible that the differences between
single- and multi-component vaporization result in
differences in the fuel distribution prior to and
during combustion. PCCI combustion has been
shown to be very sensitive to the mixture prepara-
tion details (e.g. Opat et al. [4]); therefore, the
simplified vaporization model should be borne
in mind when accessing the observed differences
between the simulations and experiments. However,
this approach has been used in numerous studies
and has been shown to yield acceptable results. For
example, Shuai et al. [41] compared model predicted
fuel distributions to fuel distributions acquired using
planar laser-induced fluorescence (PLIF) in an
optically accessible engine operating in a low-
temperature combustion mode. They showed that,
under low-temperature combustion conditions, the
spray models used in the current study accurately
reproduced the measured fuel distribution.
4.2 Split-injection validation using the VPPsystem
To ensure that the models are able to predict ade-
quately the emissions and performance characteristics
using the VPP system, the engine experiments of
Kokjohn et al. [19] – performed using multiple
injections at different injection pressures – were used
for further model validation. The engine was operated
at the condition of interest for the present study –
5.5 bar nominal IMEP (14.9 mg/stroke) and 2000 r/min.
However, to accommodate concurrent research pro-
jects at the ERC, the engine geometry for model
validation using the VPP system is slightly different
from the specifications given in Table 1. To highlight
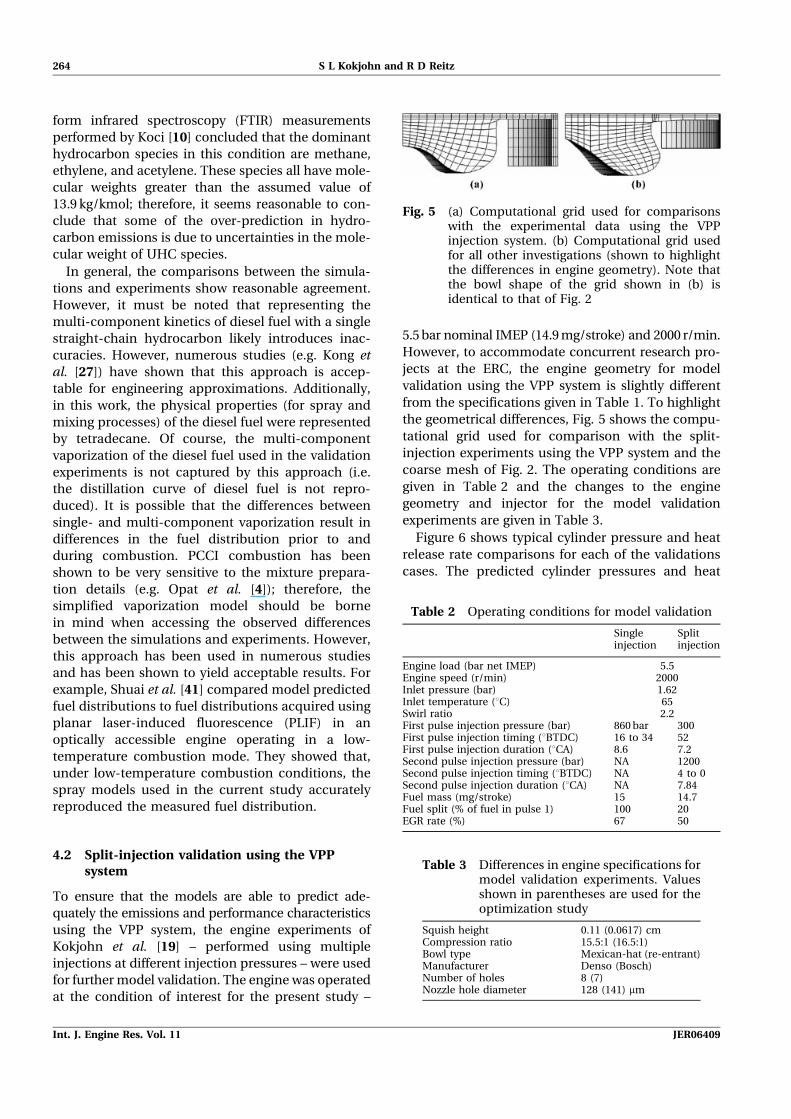
the geometrical differences, Fig. 5 shows the compu-
tational grid used for comparison with the split-
injection experiments using the VPP system and the
coarse mesh of Fig. 2. The operating conditions are
given in Table 2 and the changes to the engine
geometry and injector for the model validation
experiments are given in Table 3.
Figure 6 shows typical cylinder pressure and heat
release rate comparisons for each of the validations
cases. The predicted cylinder pressures and heat
Fig. 5 (a) Computational grid used for comparisonswith the experimental data using the VPPinjection system. (b) Computational grid usedfor all other investigations (shown to highlightthe differences in engine geometry). Note thatthe bowl shape of the grid shown in (b) isidentical to that of Fig. 2
Table 2 Operating conditions for model validation
Singleinjection
Splitinjection
Engine load (bar net IMEP) 5.5Engine speed (r/min) 2000Inlet pressure (bar) 1.62Inlet temperature (uC) 65Swirl ratio 2.2First pulse injection pressure (bar) 860 bar 300First pulse injection timing (uBTDC) 16 to 34 52First pulse injection duration (uCA) 8.6 7.2Second pulse injection pressure (bar) NA 1200Second pulse injection timing (uBTDC) NA 4 to 0Second pulse injection duration (uCA) NA 7.84Fuel mass (mg/stroke) 15 14.7Fuel split (% of fuel in pulse 1) 100 20EGR rate (%) 67 50
Table 3 Differences in engine specifications formodel validation experiments. Valuesshown in parentheses are used for theoptimization study
Squish height 0.11 (0.0617) cmCompression ratio 15.5:1 (16.5:1)Bowl type Mexican-hat (re-entrant)Manufacturer Denso (Bosch)Number of holes 8 (7)Nozzle hole diameter 128 (141) mm
264 S L Kokjohn and R D Reitz
Int. J. Engine Res. Vol. 11 JER06409
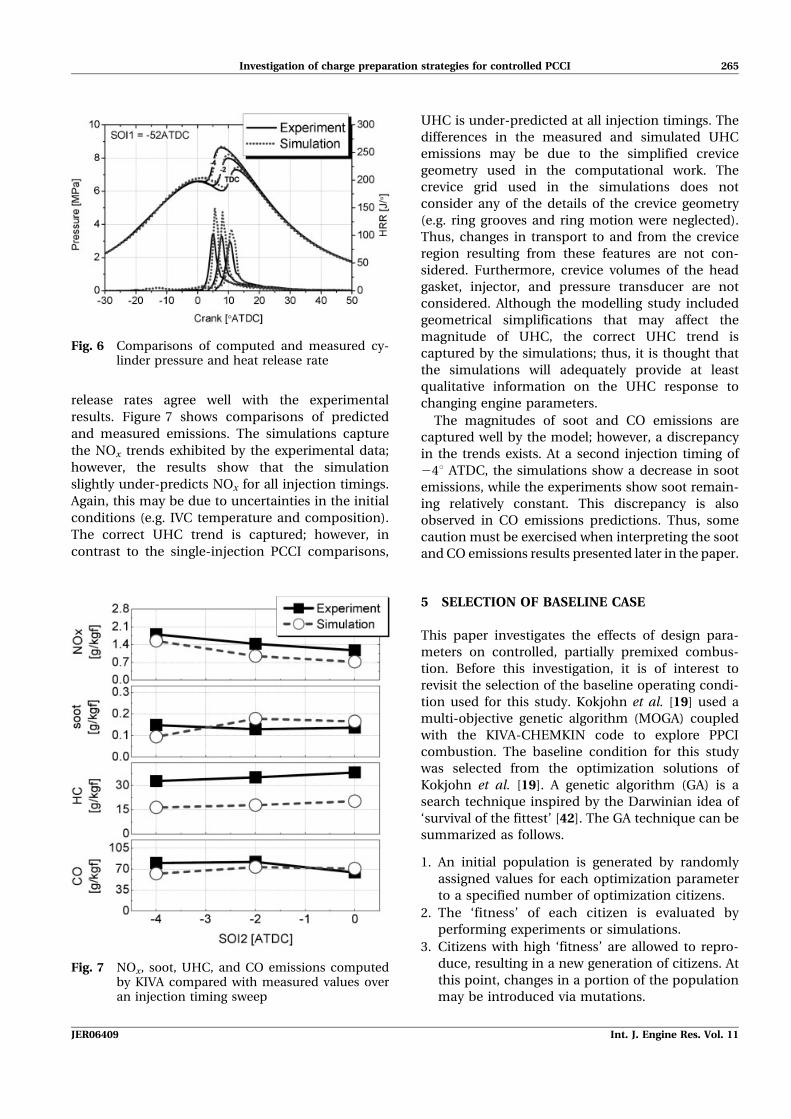
release rates agree well with the experimental
results. Figure 7 shows comparisons of predicted
and measured emissions. The simulations capture
the NOx trends exhibited by the experimental data;
however, the results show that the simulation
slightly under-predicts NOx for all injection timings.
Again, this may be due to uncertainties in the initial
conditions (e.g. IVC temperature and composition).
The correct UHC trend is captured; however, in
contrast to the single-injection PCCI comparisons,
UHC is under-predicted at all injection timings. The
differences in the measured and simulated UHC
emissions may be due to the simplified crevice
geometry used in the computational work. The
crevice grid used in the simulations does not
consider any of the details of the crevice geometry
(e.g. ring grooves and ring motion were neglected).
Thus, changes in transport to and from the crevice
region resulting from these features are not con-
sidered. Furthermore, crevice volumes of the head
gasket, injector, and pressure transducer are not
considered. Although the modelling study included
geometrical simplifications that may affect the
magnitude of UHC, the correct UHC trend is
captured by the simulations; thus, it is thought that
the simulations will adequately provide at least
qualitative information on the UHC response to
changing engine parameters.
The magnitudes of soot and CO emissions are
captured well by the model; however, a discrepancy
in the trends exists. At a second injection timing of
24u ATDC, the simulations show a decrease in soot
emissions, while the experiments show soot remain-
ing relatively constant. This discrepancy is also
observed in CO emissions predictions. Thus, some
caution must be exercised when interpreting the soot
and CO emissions results presented later in the paper.
5 SELECTION OF BASELINE CASE
This paper investigates the effects of design para-
meters on controlled, partially premixed combus-
tion. Before this investigation, it is of interest to
revisit the selection of the baseline operating condi-
tion used for this study. Kokjohn et al. [19] used a
multi-objective genetic algorithm (MOGA) coupled
with the KIVA-CHEMKIN code to explore PPCI
combustion. The baseline condition for this study
was selected from the optimization solutions of
Kokjohn et al. [19]. A genetic algorithm (GA) is a
search technique inspired by the Darwinian idea of
‘survival of the fittest’ [42]. The GA technique can be
summarized as follows.
1. An initial population is generated by randomly
assigned values for each optimization parameter
to a specified number of optimization citizens.
2. The ‘fitness’ of each citizen is evaluated by
performing experiments or simulations.
3. Citizens with high ‘fitness’ are allowed to repro-
duce, resulting in a new generation of citizens. At
this point, changes in a portion of the population
may be introduced via mutations.
Fig. 6 Comparisons of computed and measured cy-linder pressure and heat release rate
Fig. 7 NOx, soot, UHC, and CO emissions computedby KIVA compared with measured values overan injection timing sweep
Investigation of charge preparation strategies for controlled PCCI 265
JER06409 Int. J. Engine Res. Vol. 11
4. Successive generations are performed until the
goals of the optimization are attained.
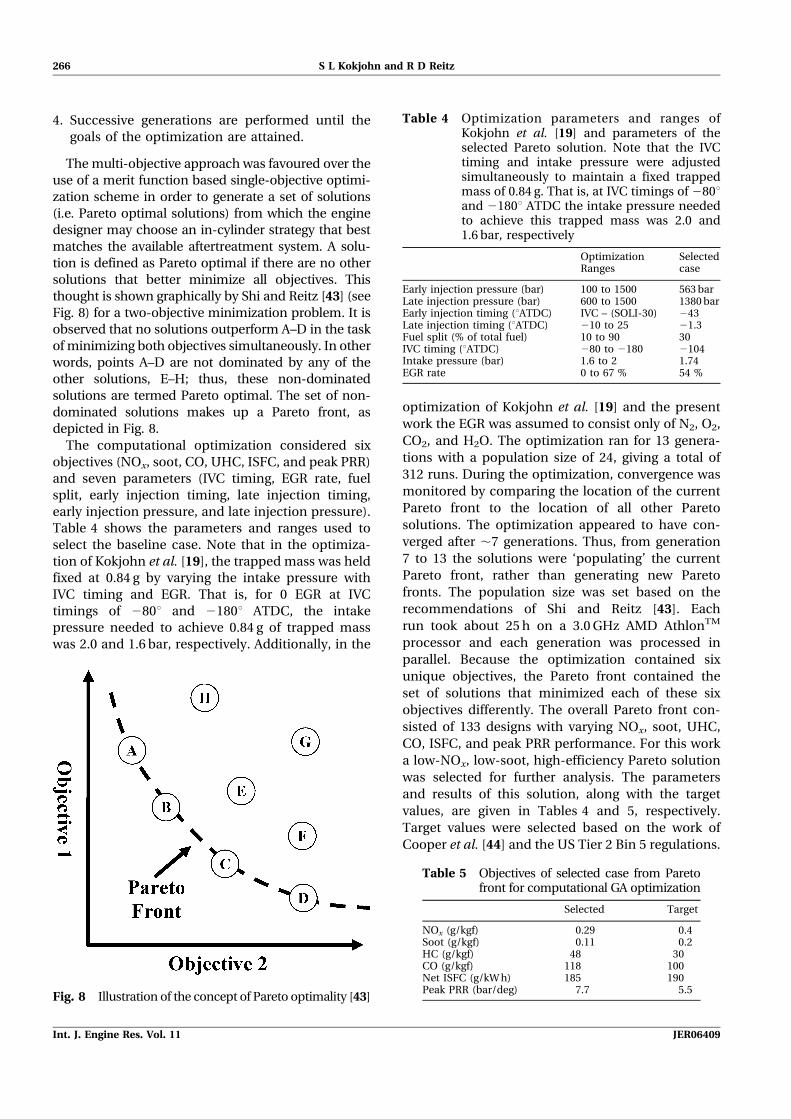
The multi-objective approach was favoured over the
use of a merit function based single-objective optimi-
zation scheme in order to generate a set of solutions
(i.e. Pareto optimal solutions) from which the engine
designer may choose an in-cylinder strategy that best
matches the available aftertreatment system. A solu-
tion is defined as Pareto optimal if there are no other
solutions that better minimize all objectives. This
thought is shown graphically by Shi and Reitz [43] (see
Fig. 8) for a two-objective minimization problem. It is
observed that no solutions outperform A–D in the task
of minimizing both objectives simultaneously. In other
words, points A–D are not dominated by any of the
other solutions, E–H; thus, these non-dominated
solutions are termed Pareto optimal. The set of non-
dominated solutions makes up a Pareto front, as
depicted in Fig. 8.
The computational optimization considered six
objectives (NOx, soot, CO, UHC, ISFC, and peak PRR)
and seven parameters (IVC timing, EGR rate, fuel
split, early injection timing, late injection timing,
early injection pressure, and late injection pressure).
Table 4 shows the parameters and ranges used to
select the baseline case. Note that in the optimiza-
tion of Kokjohn et al. [19], the trapped mass was held
fixed at 0.84 g by varying the intake pressure with
IVC timing and EGR. That is, for 0 EGR at IVC
timings of 280u and 2180u ATDC, the intake
pressure needed to achieve 0.84 g of trapped mass
was 2.0 and 1.6 bar, respectively. Additionally, in the
optimization of Kokjohn et al. [19] and the present
work the EGR was assumed to consist only of N2, O2,
CO2, and H2O. The optimization ran for 13 genera-
tions with a population size of 24, giving a total of
312 runs. During the optimization, convergence was
monitored by comparing the location of the current
Pareto front to the location of all other Pareto
solutions. The optimization appeared to have con-
verged after ,7 generations. Thus, from generation
7 to 13 the solutions were ‘populating’ the current
Pareto front, rather than generating new Pareto
fronts. The population size was set based on the
recommendations of Shi and Reitz [43]. Each
run took about 25 h on a 3.0 GHz AMD AthlonTM
processor and each generation was processed in
parallel. Because the optimization contained six
unique objectives, the Pareto front contained the
set of solutions that minimized each of these six
objectives differently. The overall Pareto front con-
sisted of 133 designs with varying NOx, soot, UHC,
CO, ISFC, and peak PRR performance. For this work
a low-NOx, low-soot, high-efficiency Pareto solution
was selected for further analysis. The parameters
and results of this solution, along with the target
values, are given in Tables 4 and 5, respectively.
Target values were selected based on the work of
Cooper et al. [44] and the US Tier 2 Bin 5 regulations.
Fig. 8 Illustration of the concept of Pareto optimality [43]
Table 4 Optimization parameters and ranges ofKokjohn et al. [19] and parameters of theselected Pareto solution. Note that the IVCtiming and intake pressure were adjustedsimultaneously to maintain a fixed trappedmass of 0.84 g. That is, at IVC timings of 280uand 2180u ATDC the intake pressure neededto achieve this trapped mass was 2.0 and1.6 bar, respectively
OptimizationRanges
Selectedcase
Early injection pressure (bar) 100 to 1500 563 barLate injection pressure (bar) 600 to 1500 1380 barEarly injection timing (uATDC) IVC – (SOLI-30) 243Late injection timing (uATDC) 210 to 25 21.3Fuel split (% of total fuel) 10 to 90 30IVC timing (uATDC) 280 to 2180 2104Intake pressure (bar) 1.6 to 2 1.74EGR rate 0 to 67 % 54 %
Table 5 Objectives of selected case from Paretofront for computational GA optimization
Selected Target
NOx (g/kgf) 0.29 0.4Soot (g/kgf) 0.11 0.2HC (g/kgf) 48 30CO (g/kgf) 118 100Net ISFC (g/kW h) 185 190Peak PRR (bar/deg) 7.7 5.5
266 S L Kokjohn and R D Reitz
Int. J. Engine Res. Vol. 11 JER06409
6 RESULTS AND DISCUSSION
The GA is an excellent tool for exploring the design
space. However, when many objectives and para-
meters are used, it is often difficult to interpret the
results, and in the interest of reduced computing
time, the Pareto front is left sparse. Consequently, to
understand the effects of influential design para-
meters and to see if further improvements can be
made to the Pareto solutions, the design space was
further explored through a parametric study. In this
work the effects of first and second pulse injection
pressure and timing, spray targeting, and swirl ratio
were investigated.
The following sections highlight the important
effects of each design parameter on emissions and
performance. Each sweep shows the effect of a single
parameter on emissions and performance with all
other parameters held fixed at the values given in
Table 4. By varying a single parameter, the effect of
each parameter on emissions and performance is
isolated. However, the weakness to this approach is
that interactions between variables, which may be
important for further reducing emissions and im-
proving performance, are not identified. This fact
should be kept in mind when interpreting the
results. Each section begins with a general discus-
sion of the effect of each design parameter, identifies
important aspects, and provides analysis of the root
cause of performance and emissions trends. The
final section combines the work of the computa-
tional optimization and parameter sweeps to choose
cases that best meet the target emissions and
performance characteristics.
6.1 First pulse injection pressure sweep
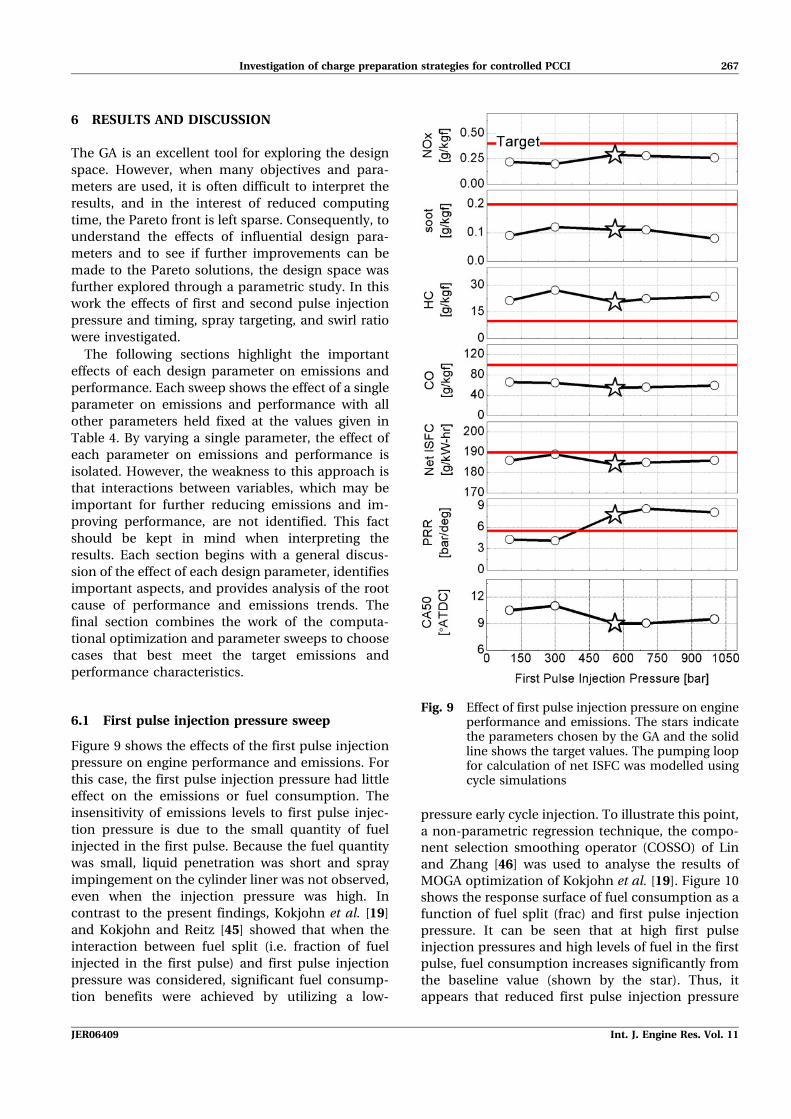
Figure 9 shows the effects of the first pulse injection
pressure on engine performance and emissions. For
this case, the first pulse injection pressure had little
effect on the emissions or fuel consumption. The
insensitivity of emissions levels to first pulse injec-
tion pressure is due to the small quantity of fuel
injected in the first pulse. Because the fuel quantity
was small, liquid penetration was short and spray
impingement on the cylinder liner was not observed,
even when the injection pressure was high. In
contrast to the present findings, Kokjohn et al. [19]
and Kokjohn and Reitz [45] showed that when the
interaction between fuel split (i.e. fraction of fuel
injected in the first pulse) and first pulse injection
pressure was considered, significant fuel consump-
tion benefits were achieved by utilizing a low-
pressure early cycle injection. To illustrate this point,
a non-parametric regression technique, the compo-
nent selection smoothing operator (COSSO) of Lin
and Zhang [46] was used to analyse the results of
MOGA optimization of Kokjohn et al. [19]. Figure 10
shows the response surface of fuel consumption as a
function of fuel split (frac) and first pulse injection
pressure. It can be seen that at high first pulse
injection pressures and high levels of fuel in the first
pulse, fuel consumption increases significantly from
the baseline value (shown by the star). Thus, it
appears that reduced first pulse injection pressure
Fig. 9 Effect of first pulse injection pressure on engineperformance and emissions. The stars indicatethe parameters chosen by the GA and the solidline shows the target values. The pumping loopfor calculation of net ISFC was modelled usingcycle simulations
Investigation of charge preparation strategies for controlled PCCI 267
JER06409 Int. J. Engine Res. Vol. 11
provides improved flexibility in the quantity of fuel
injected early in the cycle.
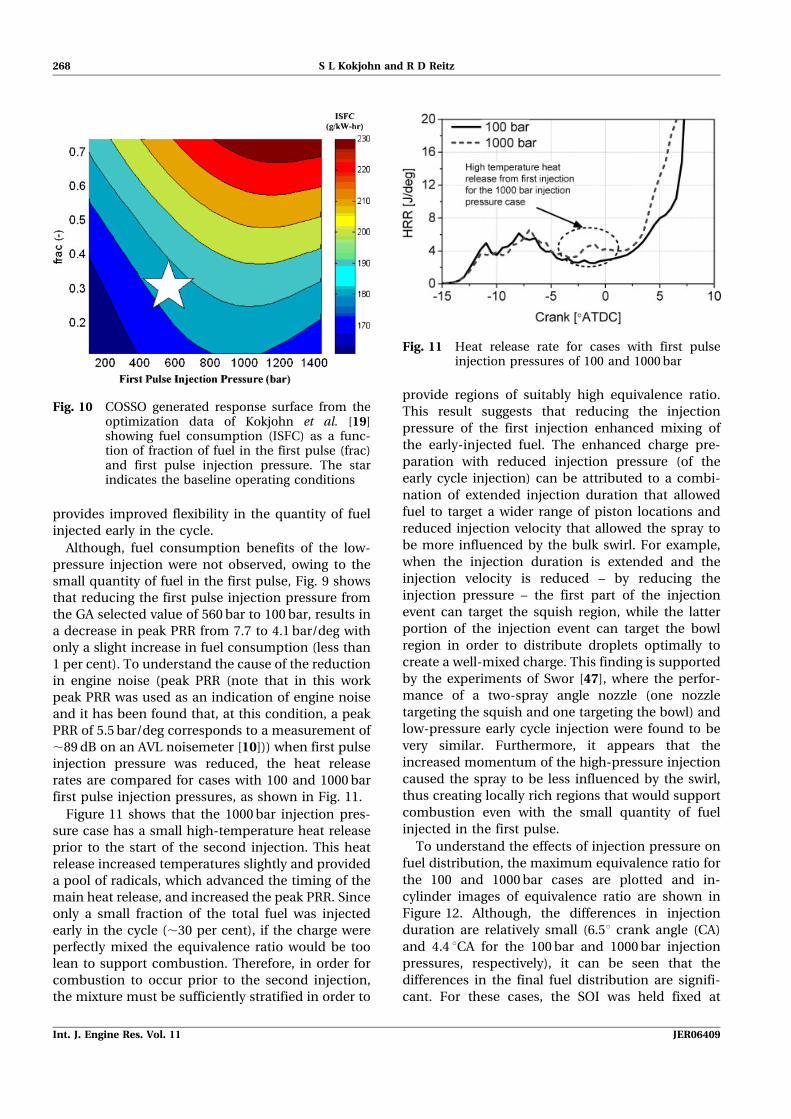
Although, fuel consumption benefits of the low-
pressure injection were not observed, owing to the
small quantity of fuel in the first pulse, Fig. 9 shows
that reducing the first pulse injection pressure from
the GA selected value of 560 bar to 100 bar, results in
a decrease in peak PRR from 7.7 to 4.1 bar/deg with
only a slight increase in fuel consumption (less than
1 per cent). To understand the cause of the reduction
in engine noise (peak PRR (note that in this work
peak PRR was used as an indication of engine noise
and it has been found that, at this condition, a peak
PRR of 5.5 bar/deg corresponds to a measurement of
,89 dB on an AVL noisemeter [10])) when first pulse
injection pressure was reduced, the heat release
rates are compared for cases with 100 and 1000 bar
first pulse injection pressures, as shown in Fig. 11.
Figure 11 shows that the 1000 bar injection pres-
sure case has a small high-temperature heat release
prior to the start of the second injection. This heat
release increased temperatures slightly and provided
a pool of radicals, which advanced the timing of the
main heat release, and increased the peak PRR. Since
only a small fraction of the total fuel was injected
early in the cycle (,30 per cent), if the charge were
perfectly mixed the equivalence ratio would be too
lean to support combustion. Therefore, in order for
combustion to occur prior to the second injection,
the mixture must be sufficiently stratified in order to
provide regions of suitably high equivalence ratio.
This result suggests that reducing the injection
pressure of the first injection enhanced mixing of
the early-injected fuel. The enhanced charge pre-
paration with reduced injection pressure (of the
early cycle injection) can be attributed to a combi-
nation of extended injection duration that allowed
fuel to target a wider range of piston locations and
reduced injection velocity that allowed the spray to
be more influenced by the bulk swirl. For example,
when the injection duration is extended and the
injection velocity is reduced – by reducing the
injection pressure – the first part of the injection
event can target the squish region, while the latter
portion of the injection event can target the bowl
region in order to distribute droplets optimally to
create a well-mixed charge. This finding is supported
by the experiments of Swor [47], where the perfor-
mance of a two-spray angle nozzle (one nozzle
targeting the squish and one targeting the bowl) and
low-pressure early cycle injection were found to be
very similar. Furthermore, it appears that the
increased momentum of the high-pressure injection
caused the spray to be less influenced by the swirl,
thus creating locally rich regions that would support
combustion even with the small quantity of fuel
injected in the first pulse.
To understand the effects of injection pressure on
fuel distribution, the maximum equivalence ratio for
the 100 and 1000 bar cases are plotted and in-
cylinder images of equivalence ratio are shown in
Figure 12. Although, the differences in injection
duration are relatively small (6.5u crank angle (CA)
and 4.4 uCA for the 100 bar and 1000 bar injection
pressures, respectively), it can be seen that the
differences in the final fuel distribution are signifi-
cant. For these cases, the SOI was held fixed at
Fig. 10 COSSO generated response surface from theoptimization data of Kokjohn et al. [19]showing fuel consumption (ISFC) as a func-tion of fraction of fuel in the first pulse (frac)and first pulse injection pressure. The starindicates the baseline operating conditions
Fig. 11 Heat release rate for cases with first pulseinjection pressures of 100 and 1000 bar
268 S L Kokjohn and R D Reitz
Int. J. Engine Res. Vol. 11 JER06409
43uBTDC; therefore, both cases initially target the
squish region. However, the reduced momentum
and increased injection duration of the low-pressure
injection allows the swirl to reduce the spray
penetration and promote a more uniform charge
that is primarily constrained to the bowl. In contrast,
the plot of maximum equivalence ratio shows that
the 1000 bar case has a significantly higher max-
imum equivalence ratio prior to the onset of
combustion. The in-cylinder images of the 1000 bar
case show that the richest region is located in the
squish area where fuel impinged on the piston
surface from the first injection. The images of the
100 bar case show a very uniformly mixed charge
(W, 0.4) from the bowl lip to the near-nozzle region.
The reduced equivalence ratio for the 100 bar case
caused a slight delay in the combustion phasing and
reduced the peak PRR. It should be noted, however,
that since the improvement in peak PRR came at the
expense of a slight increase in ISFC (due to slightly
delayed combustion phasing), reducing the injection
pressure from 563 to 100 bar represents a movement
along the current Pareto front rather than the
creation of a new Pareto front.
6.2 Second pulse injection pressure sweep
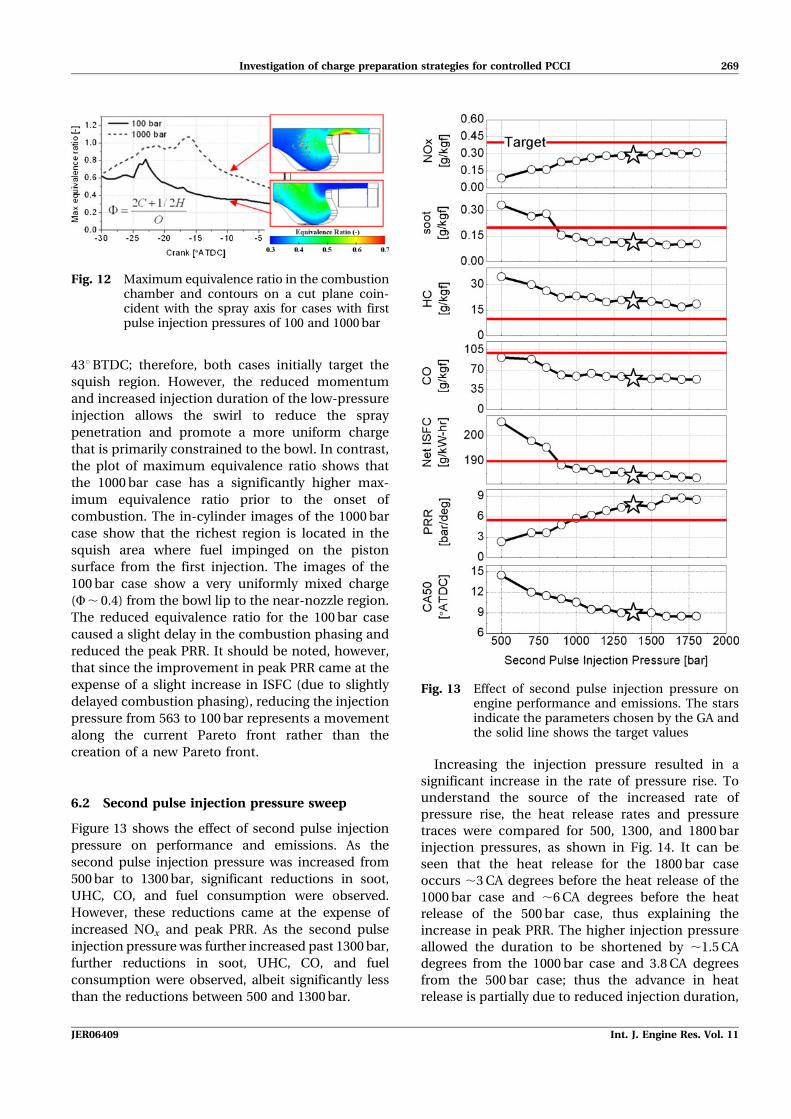
Figure 13 shows the effect of second pulse injection
pressure on performance and emissions. As the
second pulse injection pressure was increased from
500 bar to 1300 bar, significant reductions in soot,
UHC, CO, and fuel consumption were observed.
However, these reductions came at the expense of
increased NOx and peak PRR. As the second pulse
injection pressure was further increased past 1300 bar,
further reductions in soot, UHC, CO, and fuel
consumption were observed, albeit significantly less
than the reductions between 500 and 1300 bar.
Increasing the injection pressure resulted in a
significant increase in the rate of pressure rise. To
understand the source of the increased rate of
pressure rise, the heat release rates and pressure
traces were compared for 500, 1300, and 1800 bar
injection pressures, as shown in Fig. 14. It can be
seen that the heat release for the 1800 bar case
occurs ,3 CA degrees before the heat release of the
1000 bar case and ,6 CA degrees before the heat
release of the 500 bar case, thus explaining the
increase in peak PRR. The higher injection pressure
allowed the duration to be shortened by ,1.5 CA
degrees from the 1000 bar case and 3.8 CA degrees
from the 500 bar case; thus the advance in heat
release is partially due to reduced injection duration,
Fig. 12 Maximum equivalence ratio in the combustionchamber and contours on a cut plane coin-cident with the spray axis for cases with firstpulse injection pressures of 100 and 1000 bar
Fig. 13 Effect of second pulse injection pressure onengine performance and emissions. The starsindicate the parameters chosen by the GA andthe solid line shows the target values
Investigation of charge preparation strategies for controlled PCCI 269
JER06409 Int. J. Engine Res. Vol. 11
i.e. advanced end-of-injection. The remainder of the
increased peak pressure rise with increased injec-
tion pressure is likely to be due to enhanced fuel
preparation owing to smaller, easier to vaporize,
droplets created because of improved break-up from
higher injection velocity.
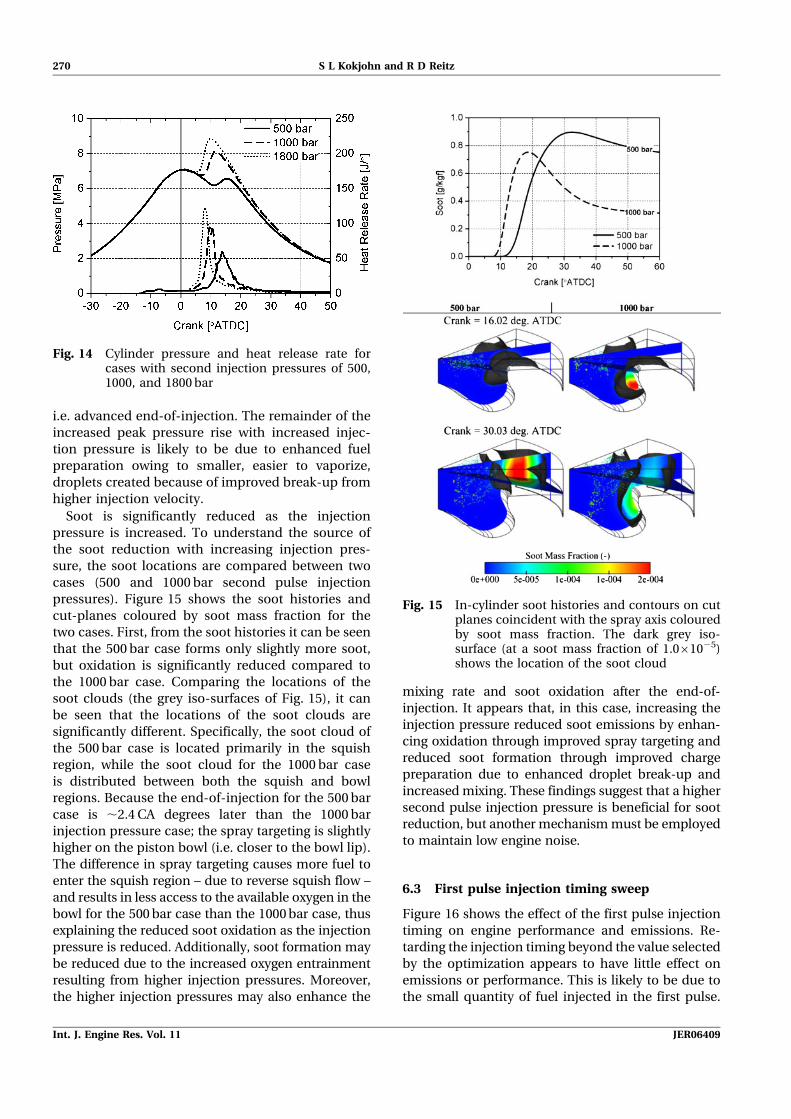
Soot is significantly reduced as the injection
pressure is increased. To understand the source of
the soot reduction with increasing injection pres-
sure, the soot locations are compared between two
cases (500 and 1000 bar second pulse injection
pressures). Figure 15 shows the soot histories and
cut-planes coloured by soot mass fraction for the
two cases. First, from the soot histories it can be seen
that the 500 bar case forms only slightly more soot,
but oxidation is significantly reduced compared to
the 1000 bar case. Comparing the locations of the
soot clouds (the grey iso-surfaces of Fig. 15), it can
be seen that the locations of the soot clouds are
significantly different. Specifically, the soot cloud of
the 500 bar case is located primarily in the squish
region, while the soot cloud for the 1000 bar case
is distributed between both the squish and bowl
regions. Because the end-of-injection for the 500 bar
case is ,2.4 CA degrees later than the 1000 bar
injection pressure case; the spray targeting is slightly
higher on the piston bowl (i.e. closer to the bowl lip).
The difference in spray targeting causes more fuel to
enter the squish region – due to reverse squish flow –
and results in less access to the available oxygen in the
bowl for the 500 bar case than the 1000 bar case, thus
explaining the reduced soot oxidation as the injection
pressure is reduced. Additionally, soot formation may
be reduced due to the increased oxygen entrainment
resulting from higher injection pressures. Moreover,
the higher injection pressures may also enhance the
mixing rate and soot oxidation after the end-of-
injection. It appears that, in this case, increasing the
injection pressure reduced soot emissions by enhan-
cing oxidation through improved spray targeting and
reduced soot formation through improved charge
preparation due to enhanced droplet break-up and
increased mixing. These findings suggest that a higher
second pulse injection pressure is beneficial for soot
reduction, but another mechanism must be employed
to maintain low engine noise.
6.3 First pulse injection timing sweep
Figure 16 shows the effect of the first pulse injection
timing on engine performance and emissions. Re-
tarding the injection timing beyond the value selected
by the optimization appears to have little effect on
emissions or performance. This is likely to be due to
the small quantity of fuel injected in the first pulse.
Fig. 14 Cylinder pressure and heat release rate forcases with second injection pressures of 500,1000, and 1800 bar
Fig. 15 In-cylinder soot histories and contours on cutplanes coincident with the spray axis colouredby soot mass fraction. The dark grey iso-surface (at a soot mass fraction of 1.061025)shows the location of the soot cloud
270 S L Kokjohn and R D Reitz
Int. J. Engine Res. Vol. 11 JER06409
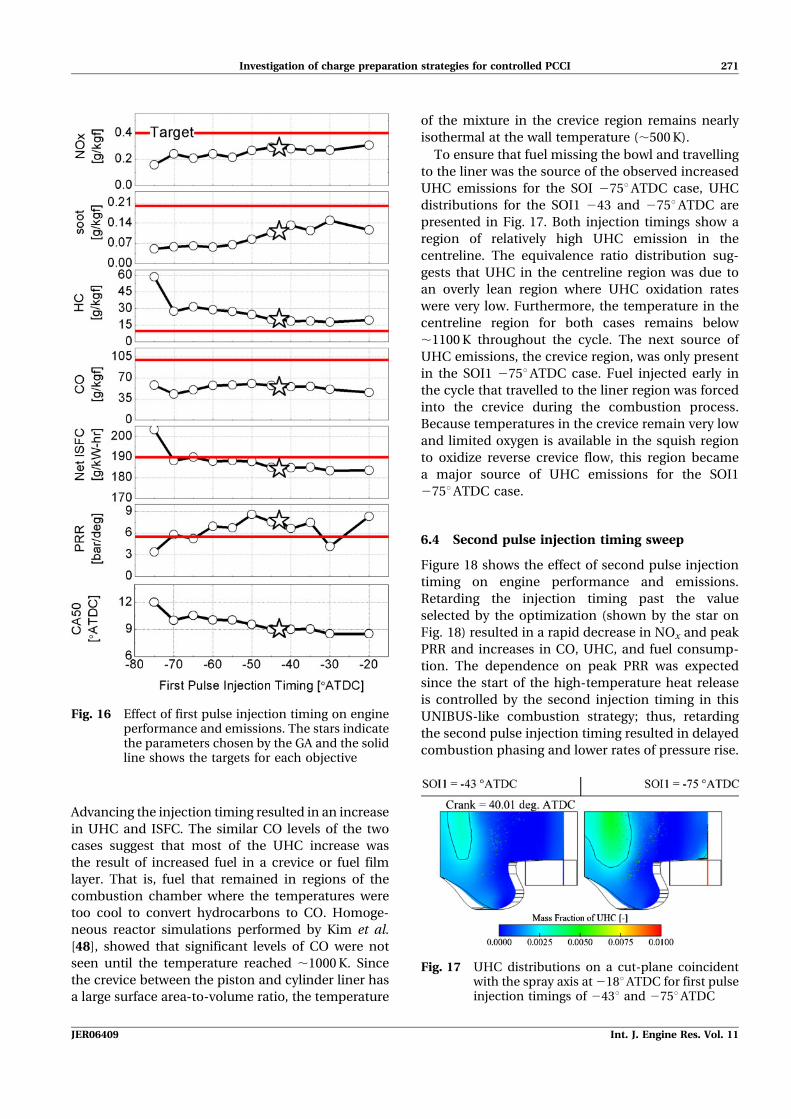
Advancing the injection timing resulted in an increase
in UHC and ISFC. The similar CO levels of the two
cases suggest that most of the UHC increase was
the result of increased fuel in a crevice or fuel film
layer. That is, fuel that remained in regions of the
combustion chamber where the temperatures were
too cool to convert hydrocarbons to CO. Homoge-
neous reactor simulations performed by Kim et al.
[48], showed that significant levels of CO were not
seen until the temperature reached ,1000 K. Since
the crevice between the piston and cylinder liner has
a large surface area-to-volume ratio, the temperature
of the mixture in the crevice region remains nearly
isothermal at the wall temperature (,500 K).
To ensure that fuel missing the bowl and travelling
to the liner was the source of the observed increased
UHC emissions for the SOI 275uATDC case, UHC
distributions for the SOI1 243 and 275uATDC are
presented in Fig. 17. Both injection timings show a
region of relatively high UHC emission in the
centreline. The equivalence ratio distribution sug-
gests that UHC in the centreline region was due to
an overly lean region where UHC oxidation rates
were very low. Furthermore, the temperature in the
centreline region for both cases remains below
,1100 K throughout the cycle. The next source of
UHC emissions, the crevice region, was only present
in the SOI1 275uATDC case. Fuel injected early in
the cycle that travelled to the liner region was forced
into the crevice during the combustion process.
Because temperatures in the crevice remain very low
and limited oxygen is available in the squish region
to oxidize reverse crevice flow, this region became
a major source of UHC emissions for the SOI1
275uATDC case.
6.4 Second pulse injection timing sweep
Figure 18 shows the effect of second pulse injection
timing on engine performance and emissions.
Retarding the injection timing past the value
selected by the optimization (shown by the star on
Fig. 18) resulted in a rapid decrease in NOx and peak
PRR and increases in CO, UHC, and fuel consump-
tion. The dependence on peak PRR was expected
since the start of the high-temperature heat release
is controlled by the second injection timing in this
UNIBUS-like combustion strategy; thus, retarding
the second pulse injection timing resulted in delayed
combustion phasing and lower rates of pressure rise.
Fig. 16 Effect of first pulse injection timing on engineperformance and emissions. The stars indicatethe parameters chosen by the GA and the solidline shows the targets for each objective
Fig. 17 UHC distributions on a cut-plane coincidentwith the spray axis at 218uATDC for first pulseinjection timings of 243u and 275uATDC
Investigation of charge preparation strategies for controlled PCCI 271
JER06409 Int. J. Engine Res. Vol. 11
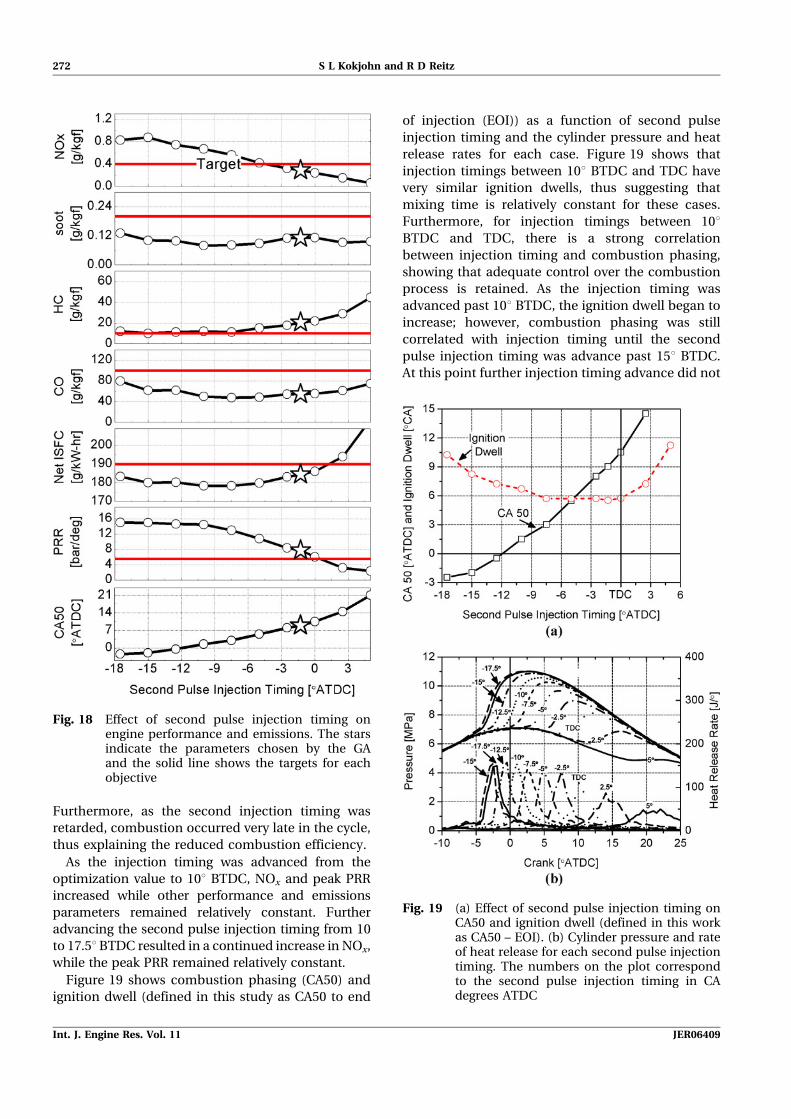
Furthermore, as the second injection timing was
retarded, combustion occurred very late in the cycle,
thus explaining the reduced combustion efficiency.
As the injection timing was advanced from the
optimization value to 10u BTDC, NOx and peak PRR
increased while other performance and emissions
parameters remained relatively constant. Further
advancing the second pulse injection timing from 10
to 17.5u BTDC resulted in a continued increase in NOx,
while the peak PRR remained relatively constant.
Figure 19 shows combustion phasing (CA50) and
ignition dwell (defined in this study as CA50 to end
of injection (EOI)) as a function of second pulse
injection timing and the cylinder pressure and heat
release rates for each case. Figure 19 shows that
injection timings between 10u BTDC and TDC have
very similar ignition dwells, thus suggesting that
mixing time is relatively constant for these cases.
Furthermore, for injection timings between 10uBTDC and TDC, there is a strong correlation
between injection timing and combustion phasing,
showing that adequate control over the combustion
process is retained. As the injection timing was
advanced past 10u BTDC, the ignition dwell began to
increase; however, combustion phasing was still
correlated with injection timing until the second
pulse injection timing was advance past 15u BTDC.
At this point further injection timing advance did not
Fig. 18 Effect of second pulse injection timing onengine performance and emissions. The starsindicate the parameters chosen by the GAand the solid line shows the targets for eachobjective
Fig. 19 (a) Effect of second pulse injection timing onCA50 and ignition dwell (defined in this workas CA50 – EOI). (b) Cylinder pressure and rateof heat release for each second pulse injectiontiming. The numbers on the plot correspondto the second pulse injection timing in CAdegrees ATDC
272 S L Kokjohn and R D Reitz
Int. J. Engine Res. Vol. 11 JER06409
significantly advance CA50, suggesting injection
timing and combustion phasing were decoupled.
This investigation suggests that near TDC second
pulse injections are capable of achieving low NOx
and acceptable PRR, while retaining significant
control over the phasing of the high-temperature
heat release. Thus, it appears the injection timing
selected by the MOGA optimization of Kokjohn et al.
[19] is a good choice for further work.
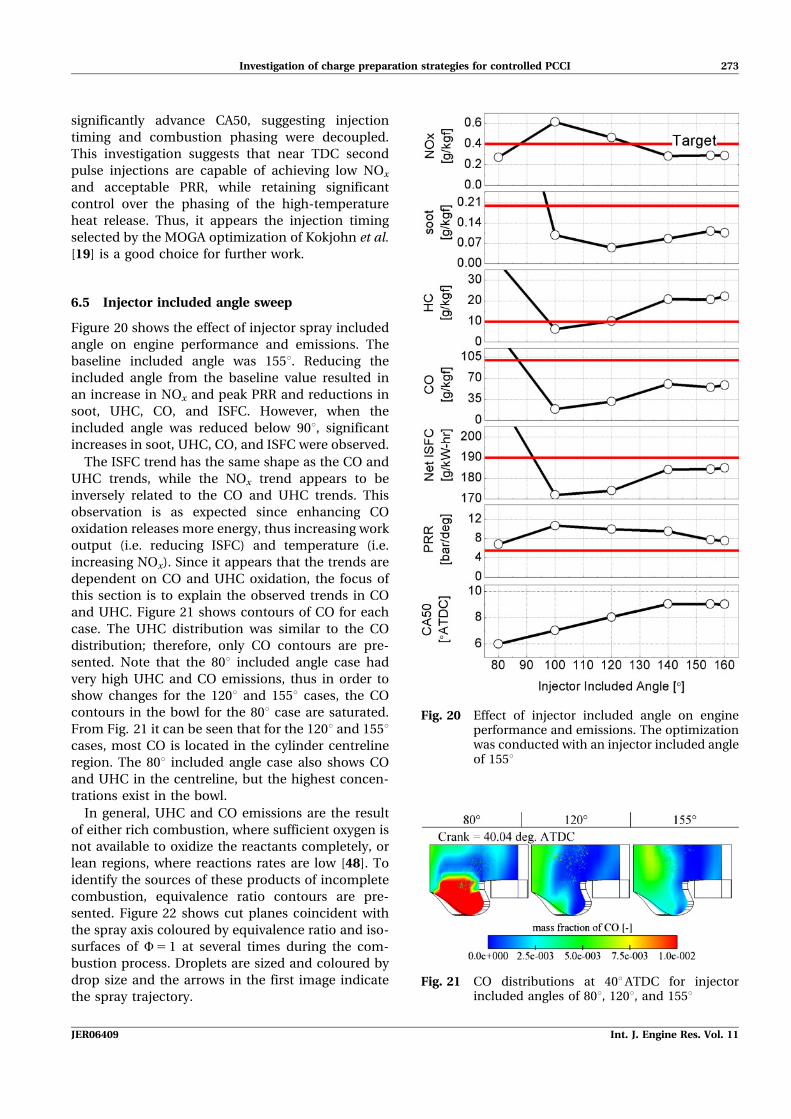
6.5 Injector included angle sweep
Figure 20 shows the effect of injector spray included
angle on engine performance and emissions. The
baseline included angle was 155u. Reducing the
included angle from the baseline value resulted in
an increase in NOx and peak PRR and reductions in
soot, UHC, CO, and ISFC. However, when the
included angle was reduced below 90u, significant
increases in soot, UHC, CO, and ISFC were observed.
The ISFC trend has the same shape as the CO and
UHC trends, while the NOx trend appears to be
inversely related to the CO and UHC trends. This
observation is as expected since enhancing CO
oxidation releases more energy, thus increasing work
output (i.e. reducing ISFC) and temperature (i.e.
increasing NOx). Since it appears that the trends are
dependent on CO and UHC oxidation, the focus of
this section is to explain the observed trends in CO
and UHC. Figure 21 shows contours of CO for each
case. The UHC distribution was similar to the CO
distribution; therefore, only CO contours are pre-
sented. Note that the 80u included angle case had
very high UHC and CO emissions, thus in order to
show changes for the 120u and 155u cases, the CO
contours in the bowl for the 80u case are saturated.
From Fig. 21 it can be seen that for the 120u and 155ucases, most CO is located in the cylinder centreline
region. The 80u included angle case also shows CO
and UHC in the centreline, but the highest concen-
trations exist in the bowl.
In general, UHC and CO emissions are the result
of either rich combustion, where sufficient oxygen is
not available to oxidize the reactants completely, or
lean regions, where reactions rates are low [48]. To
identify the sources of these products of incomplete
combustion, equivalence ratio contours are pre-
sented. Figure 22 shows cut planes coincident with
the spray axis coloured by equivalence ratio and iso-
surfaces of W5 1 at several times during the com-
bustion process. Droplets are sized and coloured by
drop size and the arrows in the first image indicate
the spray trajectory.
Fig. 20 Effect of injector included angle on engineperformance and emissions. The optimizationwas conducted with an injector included angleof 155u
Fig. 21 CO distributions at 40uATDC for injectorincluded angles of 80u, 120u, and 155u
Investigation of charge preparation strategies for controlled PCCI 273
JER06409 Int. J. Engine Res. Vol. 11
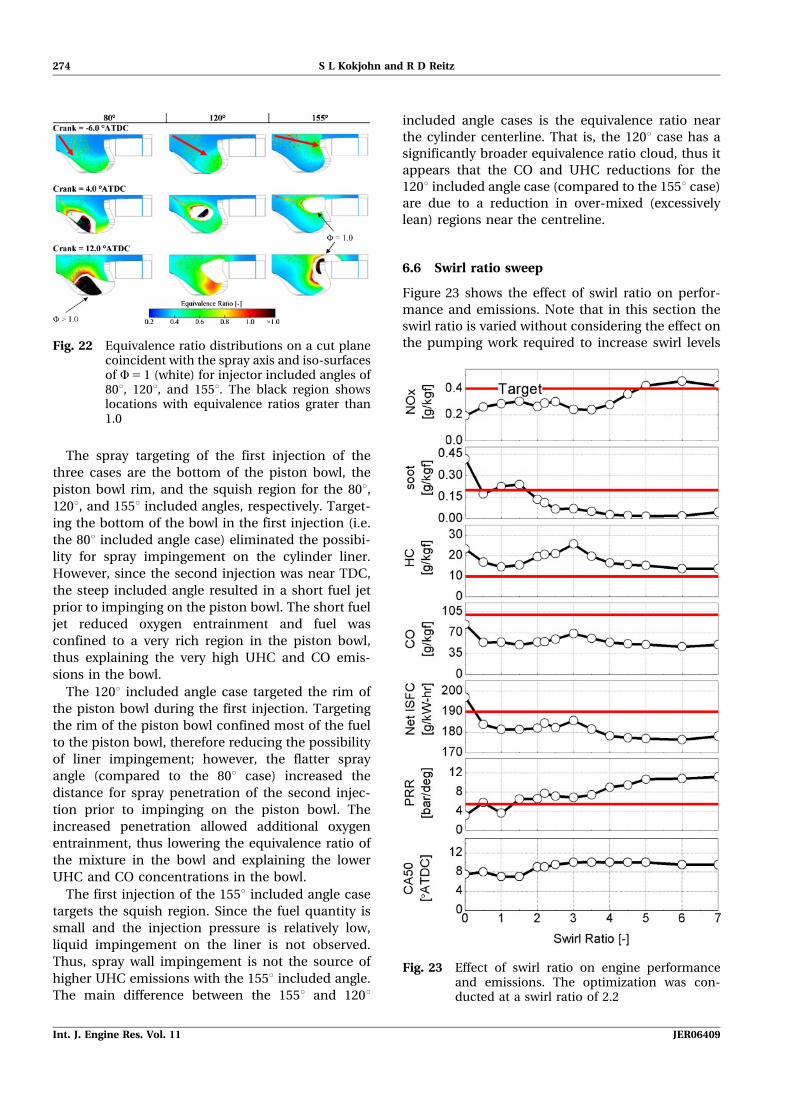
The spray targeting of the first injection of the
three cases are the bottom of the piston bowl, the
piston bowl rim, and the squish region for the 80u,120u, and 155u included angles, respectively. Target-
ing the bottom of the bowl in the first injection (i.e.
the 80u included angle case) eliminated the possibi-
lity for spray impingement on the cylinder liner.
However, since the second injection was near TDC,
the steep included angle resulted in a short fuel jet
prior to impinging on the piston bowl. The short fuel
jet reduced oxygen entrainment and fuel was
confined to a very rich region in the piston bowl,
thus explaining the very high UHC and CO emis-
sions in the bowl.
The 120u included angle case targeted the rim of
the piston bowl during the first injection. Targeting
the rim of the piston bowl confined most of the fuel
to the piston bowl, therefore reducing the possibility
of liner impingement; however, the flatter spray
angle (compared to the 80u case) increased the
distance for spray penetration of the second injec-
tion prior to impinging on the piston bowl. The
increased penetration allowed additional oxygen
entrainment, thus lowering the equivalence ratio of
the mixture in the bowl and explaining the lower
UHC and CO concentrations in the bowl.
The first injection of the 155u included angle case
targets the squish region. Since the fuel quantity is
small and the injection pressure is relatively low,
liquid impingement on the liner is not observed.
Thus, spray wall impingement is not the source of
higher UHC emissions with the 155u included angle.
The main difference between the 155u and 120u
included angle cases is the equivalence ratio near
the cylinder centerline. That is, the 120u case has a
significantly broader equivalence ratio cloud, thus it
appears that the CO and UHC reductions for the
120u included angle case (compared to the 155u case)
are due to a reduction in over-mixed (excessively
lean) regions near the centreline.
6.6 Swirl ratio sweep
Figure 23 shows the effect of swirl ratio on perfor-
mance and emissions. Note that in this section the
swirl ratio is varied without considering the effect on
the pumping work required to increase swirl levelsFig. 22 Equivalence ratio distributions on a cut planecoincident with the spray axis and iso-surfacesof W5 1 (white) for injector included angles of80u, 120u, and 155u. The black region showslocations with equivalence ratios grater than1.0
Fig. 23 Effect of swirl ratio on engine performanceand emissions. The optimization was con-ducted at a swirl ratio of 2.2
274 S L Kokjohn and R D Reitz
Int. J. Engine Res. Vol. 11 JER06409
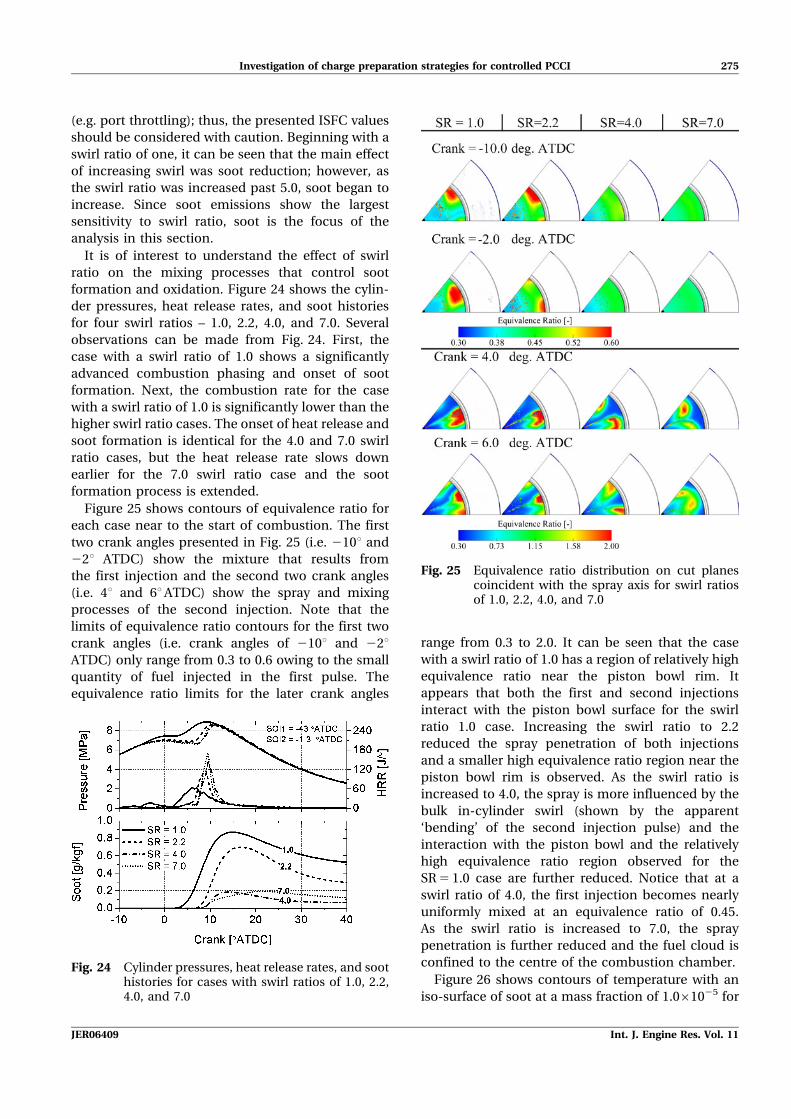
(e.g. port throttling); thus, the presented ISFC values
should be considered with caution. Beginning with a
swirl ratio of one, it can be seen that the main effect
of increasing swirl was soot reduction; however, as
the swirl ratio was increased past 5.0, soot began to
increase. Since soot emissions show the largest
sensitivity to swirl ratio, soot is the focus of the
analysis in this section.
It is of interest to understand the effect of swirl
ratio on the mixing processes that control soot
formation and oxidation. Figure 24 shows the cylin-
der pressures, heat release rates, and soot histories
for four swirl ratios – 1.0, 2.2, 4.0, and 7.0. Several
observations can be made from Fig. 24. First, the
case with a swirl ratio of 1.0 shows a significantly
advanced combustion phasing and onset of soot
formation. Next, the combustion rate for the case
with a swirl ratio of 1.0 is significantly lower than the
higher swirl ratio cases. The onset of heat release and
soot formation is identical for the 4.0 and 7.0 swirl
ratio cases, but the heat release rate slows down
earlier for the 7.0 swirl ratio case and the soot
formation process is extended.
Figure 25 shows contours of equivalence ratio for
each case near to the start of combustion. The first
two crank angles presented in Fig. 25 (i.e. 210u and
22u ATDC) show the mixture that results from
the first injection and the second two crank angles
(i.e. 4u and 6uATDC) show the spray and mixing
processes of the second injection. Note that the
limits of equivalence ratio contours for the first two
crank angles (i.e. crank angles of 210u and 22uATDC) only range from 0.3 to 0.6 owing to the small
quantity of fuel injected in the first pulse. The
equivalence ratio limits for the later crank angles
range from 0.3 to 2.0. It can be seen that the case
with a swirl ratio of 1.0 has a region of relatively high
equivalence ratio near the piston bowl rim. It
appears that both the first and second injections
interact with the piston bowl surface for the swirl
ratio 1.0 case. Increasing the swirl ratio to 2.2
reduced the spray penetration of both injections
and a smaller high equivalence ratio region near the
piston bowl rim is observed. As the swirl ratio is
increased to 4.0, the spray is more influenced by the
bulk in-cylinder swirl (shown by the apparent
‘bending’ of the second injection pulse) and the
interaction with the piston bowl and the relatively
high equivalence ratio region observed for the
SR 5 1.0 case are further reduced. Notice that at a
swirl ratio of 4.0, the first injection becomes nearly
uniformly mixed at an equivalence ratio of 0.45.
As the swirl ratio is increased to 7.0, the spray
penetration is further reduced and the fuel cloud is
confined to the centre of the combustion chamber.
Figure 26 shows contours of temperature with an
iso-surface of soot at a mass fraction of 1.061025 for
Fig. 24 Cylinder pressures, heat release rates, and soothistories for cases with swirl ratios of 1.0, 2.2,4.0, and 7.0
Fig. 25 Equivalence ratio distribution on cut planescoincident with the spray axis for swirl ratiosof 1.0, 2.2, 4.0, and 7.0
Investigation of charge preparation strategies for controlled PCCI 275
JER06409 Int. J. Engine Res. Vol. 11
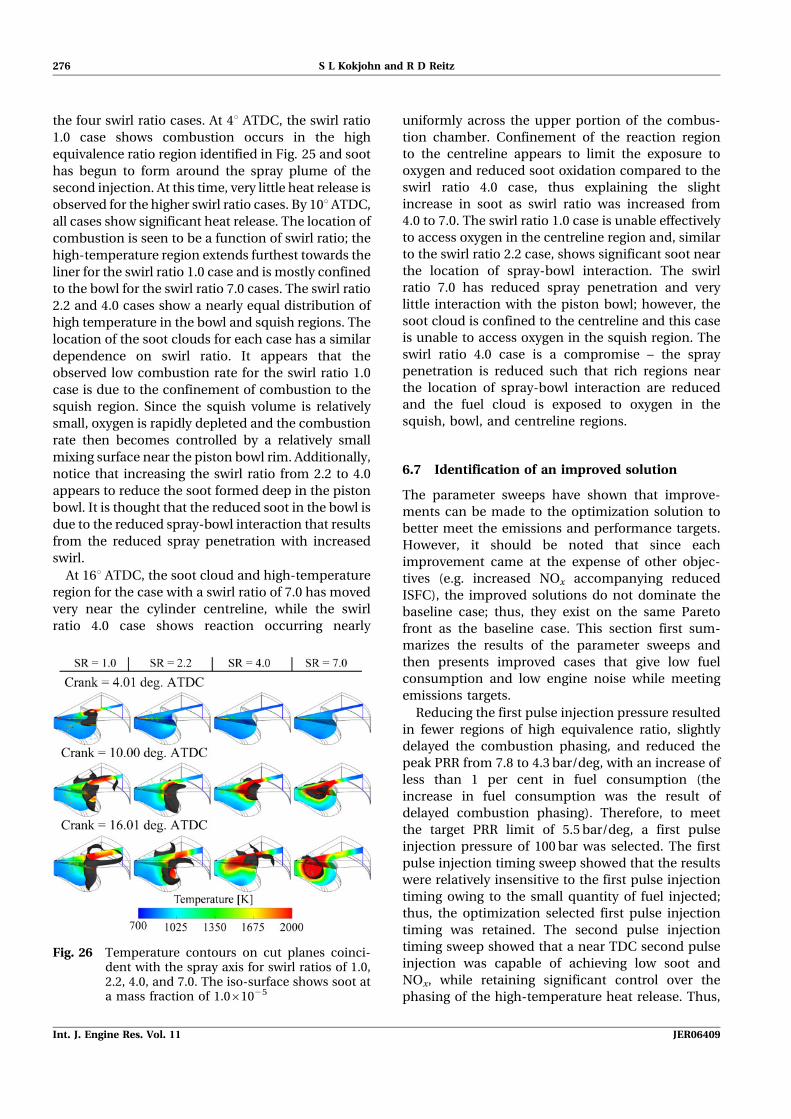
the four swirl ratio cases. At 4u ATDC, the swirl ratio
1.0 case shows combustion occurs in the high
equivalence ratio region identified in Fig. 25 and soot
has begun to form around the spray plume of the
second injection. At this time, very little heat release is
observed for the higher swirl ratio cases. By 10u ATDC,
all cases show significant heat release. The location of
combustion is seen to be a function of swirl ratio; the
high-temperature region extends furthest towards the
liner for the swirl ratio 1.0 case and is mostly confined
to the bowl for the swirl ratio 7.0 cases. The swirl ratio
2.2 and 4.0 cases show a nearly equal distribution of
high temperature in the bowl and squish regions. The
location of the soot clouds for each case has a similar
dependence on swirl ratio. It appears that the
observed low combustion rate for the swirl ratio 1.0
case is due to the confinement of combustion to the
squish region. Since the squish volume is relatively
small, oxygen is rapidly depleted and the combustion
rate then becomes controlled by a relatively small
mixing surface near the piston bowl rim. Additionally,
notice that increasing the swirl ratio from 2.2 to 4.0
appears to reduce the soot formed deep in the piston
bowl. It is thought that the reduced soot in the bowl is
due to the reduced spray-bowl interaction that results
from the reduced spray penetration with increased
swirl.
At 16u ATDC, the soot cloud and high-temperature
region for the case with a swirl ratio of 7.0 has moved
very near the cylinder centreline, while the swirl
ratio 4.0 case shows reaction occurring nearly
uniformly across the upper portion of the combus-
tion chamber. Confinement of the reaction region
to the centreline appears to limit the exposure to
oxygen and reduced soot oxidation compared to the
swirl ratio 4.0 case, thus explaining the slight
increase in soot as swirl ratio was increased from
4.0 to 7.0. The swirl ratio 1.0 case is unable effectively
to access oxygen in the centreline region and, similar
to the swirl ratio 2.2 case, shows significant soot near
the location of spray-bowl interaction. The swirl
ratio 7.0 has reduced spray penetration and very
little interaction with the piston bowl; however, the
soot cloud is confined to the centreline and this case
is unable to access oxygen in the squish region. The
swirl ratio 4.0 case is a compromise – the spray
penetration is reduced such that rich regions near
the location of spray-bowl interaction are reduced
and the fuel cloud is exposed to oxygen in the
squish, bowl, and centreline regions.
6.7 Identification of an improved solution
The parameter sweeps have shown that improve-
ments can be made to the optimization solution to
better meet the emissions and performance targets.
However, it should be noted that since each
improvement came at the expense of other objec-
tives (e.g. increased NOx accompanying reduced
ISFC), the improved solutions do not dominate the
baseline case; thus, they exist on the same Pareto
front as the baseline case. This section first sum-
marizes the results of the parameter sweeps and
then presents improved cases that give low fuel
consumption and low engine noise while meeting
emissions targets.
Reducing the first pulse injection pressure resulted
in fewer regions of high equivalence ratio, slightly
delayed the combustion phasing, and reduced the
peak PRR from 7.8 to 4.3 bar/deg, with an increase of
less than 1 per cent in fuel consumption (the
increase in fuel consumption was the result of
delayed combustion phasing). Therefore, to meet
the target PRR limit of 5.5 bar/deg, a first pulse
injection pressure of 100 bar was selected. The first
pulse injection timing sweep showed that the results
were relatively insensitive to the first pulse injection
timing owing to the small quantity of fuel injected;
thus, the optimization selected first pulse injection
timing was retained. The second pulse injection
timing sweep showed that a near TDC second pulse
injection was capable of achieving low soot and
NOx, while retaining significant control over the
phasing of the high-temperature heat release. Thus,
Fig. 26 Temperature contours on cut planes coinci-dent with the spray axis for swirl ratios of 1.0,2.2, 4.0, and 7.0. The iso-surface shows soot ata mass fraction of 1.061025
276 S L Kokjohn and R D Reitz
Int. J. Engine Res. Vol. 11 JER06409
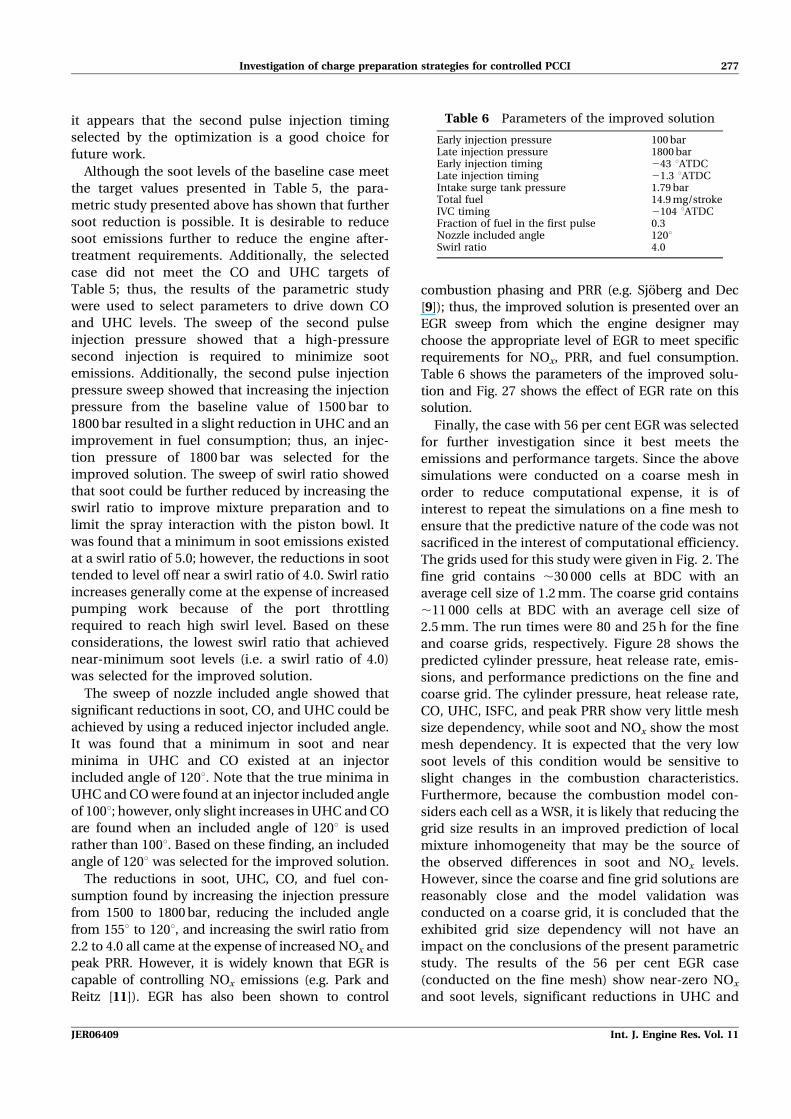
it appears that the second pulse injection timing
selected by the optimization is a good choice for
future work.
Although the soot levels of the baseline case meet
the target values presented in Table 5, the para-
metric study presented above has shown that further
soot reduction is possible. It is desirable to reduce
soot emissions further to reduce the engine after-
treatment requirements. Additionally, the selected
case did not meet the CO and UHC targets of
Table 5; thus, the results of the parametric study
were used to select parameters to drive down CO
and UHC levels. The sweep of the second pulse
injection pressure showed that a high-pressure
second injection is required to minimize soot
emissions. Additionally, the second pulse injection
pressure sweep showed that increasing the injection
pressure from the baseline value of 1500 bar to
1800 bar resulted in a slight reduction in UHC and an
improvement in fuel consumption; thus, an injec-
tion pressure of 1800 bar was selected for the
improved solution. The sweep of swirl ratio showed
that soot could be further reduced by increasing the
swirl ratio to improve mixture preparation and to
limit the spray interaction with the piston bowl. It
was found that a minimum in soot emissions existed
at a swirl ratio of 5.0; however, the reductions in soot
tended to level off near a swirl ratio of 4.0. Swirl ratio
increases generally come at the expense of increased
pumping work because of the port throttling
required to reach high swirl level. Based on these
considerations, the lowest swirl ratio that achieved
near-minimum soot levels (i.e. a swirl ratio of 4.0)
was selected for the improved solution.
The sweep of nozzle included angle showed that
significant reductions in soot, CO, and UHC could be
achieved by using a reduced injector included angle.
It was found that a minimum in soot and near
minima in UHC and CO existed at an injector
included angle of 120u. Note that the true minima in
UHC and CO were found at an injector included angle
of 100u; however, only slight increases in UHC and CO
are found when an included angle of 120u is used
rather than 100u. Based on these finding, an included
angle of 120u was selected for the improved solution.
The reductions in soot, UHC, CO, and fuel con-
sumption found by increasing the injection pressure
from 1500 to 1800 bar, reducing the included angle
from 155u to 120u, and increasing the swirl ratio from
2.2 to 4.0 all came at the expense of increased NOx and
peak PRR. However, it is widely known that EGR is
capable of controlling NOx emissions (e.g. Park and
Reitz [11]). EGR has also been shown to control
combustion phasing and PRR (e.g. Sjoberg and Dec
[9]); thus, the improved solution is presented over an
EGR sweep from which the engine designer may
choose the appropriate level of EGR to meet specific
requirements for NOx, PRR, and fuel consumption.
Table 6 shows the parameters of the improved solu-
tion and Fig. 27 shows the effect of EGR rate on this
solution.
Finally, the case with 56 per cent EGR was selected
for further investigation since it best meets the
emissions and performance targets. Since the above
simulations were conducted on a coarse mesh in
order to reduce computational expense, it is of
interest to repeat the simulations on a fine mesh to
ensure that the predictive nature of the code was not
sacrificed in the interest of computational efficiency.
The grids used for this study were given in Fig. 2. The
fine grid contains ,30 000 cells at BDC with an
average cell size of 1.2 mm. The coarse grid contains
,11 000 cells at BDC with an average cell size of
2.5 mm. The run times were 80 and 25 h for the fine
and coarse grids, respectively. Figure 28 shows the
predicted cylinder pressure, heat release rate, emis-
sions, and performance predictions on the fine and
coarse grid. The cylinder pressure, heat release rate,
CO, UHC, ISFC, and peak PRR show very little mesh
size dependency, while soot and NOx show the most
mesh dependency. It is expected that the very low
soot levels of this condition would be sensitive to
slight changes in the combustion characteristics.
Furthermore, because the combustion model con-
siders each cell as a WSR, it is likely that reducing the
grid size results in an improved prediction of local
mixture inhomogeneity that may be the source of
the observed differences in soot and NOx levels.
However, since the coarse and fine grid solutions are
reasonably close and the model validation was
conducted on a coarse grid, it is concluded that the
exhibited grid size dependency will not have an
impact on the conclusions of the present parametric
study. The results of the 56 per cent EGR case
(conducted on the fine mesh) show near-zero NOx
and soot levels, significant reductions in UHC and
Table 6 Parameters of the improved solution
Early injection pressure 100 barLate injection pressure 1800 barEarly injection timing 243 uATDCLate injection timing 21.3 uATDCIntake surge tank pressure 1.79 barTotal fuel 14.9 mg/strokeIVC timing 2104 uATDCFraction of fuel in the first pulse 0.3Nozzle included angle 120uSwirl ratio 4.0
Investigation of charge preparation strategies for controlled PCCI 277
JER06409 Int. J. Engine Res. Vol. 11
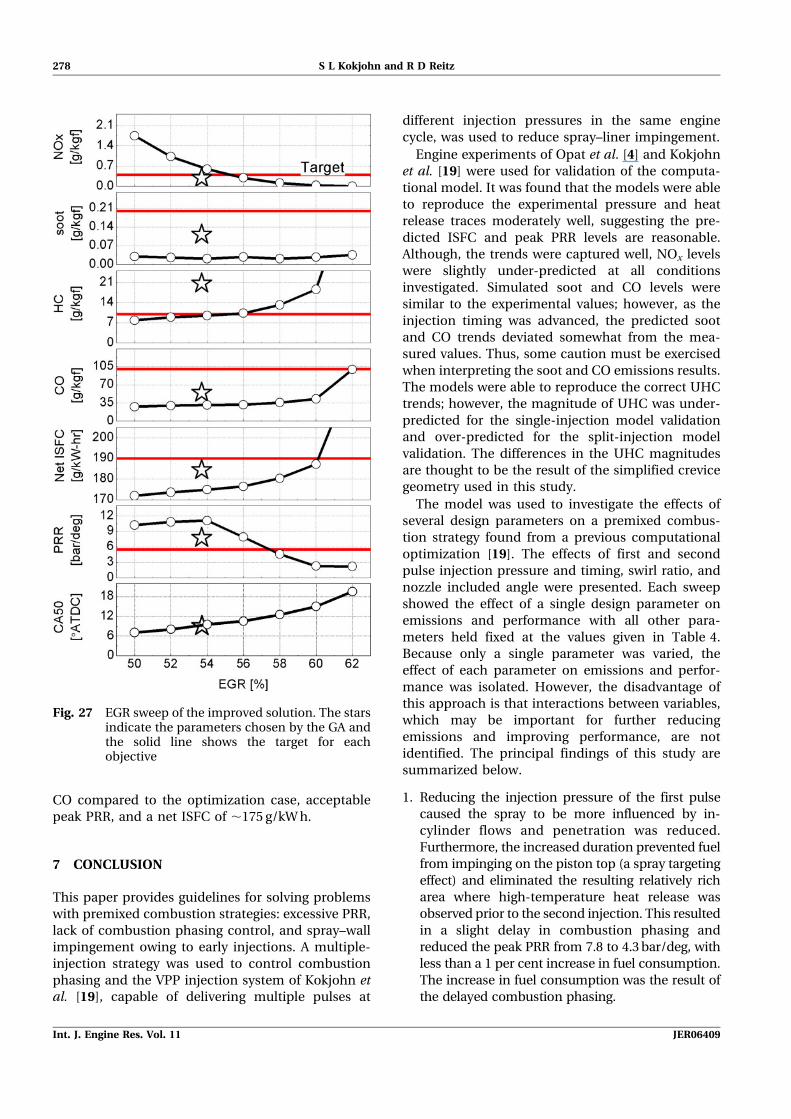
CO compared to the optimization case, acceptable
peak PRR, and a net ISFC of ,175 g/kW h.
7 CONCLUSION
This paper provides guidelines for solving problems
with premixed combustion strategies: excessive PRR,
lack of combustion phasing control, and spray–wall
impingement owing to early injections. A multiple-
injection strategy was used to control combustion
phasing and the VPP injection system of Kokjohn et
al. [19], capable of delivering multiple pulses at
different injection pressures in the same engine
cycle, was used to reduce spray–liner impingement.
Engine experiments of Opat et al. [4] and Kokjohn
et al. [19] were used for validation of the computa-
tional model. It was found that the models were able
to reproduce the experimental pressure and heat
release traces moderately well, suggesting the pre-
dicted ISFC and peak PRR levels are reasonable.
Although, the trends were captured well, NOx levels
were slightly under-predicted at all conditions
investigated. Simulated soot and CO levels were
similar to the experimental values; however, as the
injection timing was advanced, the predicted soot
and CO trends deviated somewhat from the mea-
sured values. Thus, some caution must be exercised
when interpreting the soot and CO emissions results.
The models were able to reproduce the correct UHC
trends; however, the magnitude of UHC was under-
predicted for the single-injection model validation
and over-predicted for the split-injection model
validation. The differences in the UHC magnitudes
are thought to be the result of the simplified crevice
geometry used in this study.
The model was used to investigate the effects of
several design parameters on a premixed combus-
tion strategy found from a previous computational
optimization [19]. The effects of first and second
pulse injection pressure and timing, swirl ratio, and
nozzle included angle were presented. Each sweep
showed the effect of a single design parameter on
emissions and performance with all other para-
meters held fixed at the values given in Table 4.
Because only a single parameter was varied, the
effect of each parameter on emissions and perfor-
mance was isolated. However, the disadvantage of
this approach is that interactions between variables,
which may be important for further reducing
emissions and improving performance, are not
identified. The principal findings of this study are
summarized below.
1. Reducing the injection pressure of the first pulse
caused the spray to be more influenced by in-
cylinder flows and penetration was reduced.
Furthermore, the increased duration prevented fuel
from impinging on the piston top (a spray targeting
effect) and eliminated the resulting relatively rich
area where high-temperature heat release was
observed prior to the second injection. This resulted
in a slight delay in combustion phasing and
reduced the peak PRR from 7.8 to 4.3 bar/deg, with
less than a 1 per cent increase in fuel consumption.
The increase in fuel consumption was the result of
the delayed combustion phasing.
Fig. 27 EGR sweep of the improved solution. The starsindicate the parameters chosen by the GA andthe solid line shows the target for eachobjective
278 S L Kokjohn and R D Reitz
Int. J. Engine Res. Vol. 11 JER06409
2. The injection timing sweeps showed that the use
of an optimized low-pressure early cycle injection
combined with a high-pressure near-TDC injec-
tion is capable of achieving near-zero NOx and
soot levels, while maintaining sufficient control
over the combustion phasing. It was found that as
the second pulse injection timing was advanced
beyond 15u BTDC, the injection and combustion
events become decoupled and controlling com-
bustion phasing might be a challenge.
3. Reducing the nozzle included angle from 155u to
120u resulted in significant reductions in soot, CO,
and UHC due to improved fuel distribution.
4. By increasing the swirl ratio from 2.2 to 4.0, the
soot cloud moves towards the centre of the bowl
and has increased exposure to oxygen. Further
increases in swirl ratio caused the soot cloud to be
trapped near the nozzle, where limited oxygen
was available, thus resulting in reduced soot
oxidation and increased soot emissions.
5. In general, the observed reductions in soot, UHC,
and CO came at the expense of increased NOx
and peak PRR for each of the parameter sweeps.
However, the EGR ratio sweep of the improved
solution showed that NOx and peak PRR were
easily controlled by increasing EGR. While EGR
was effective at controlling NOx and peak PRR, it
should be noted that these reductions came at the
expense of increased UHC and fuel consumption.
An improved solution was found with near-zero
NOx and soot, a net ISFC of only 175 g/kW h, and
a peak PRR of ,8 bar/deg. The solution’s operat-
ing parameters are presented in Table 6 and its
sensitivity to EGR rate is shown in Fig. 27.
ACKNOWLEDGEMENTS
Financial support from the US Department of Energy(DOE) HCCI contract # DE-FC04-02AL67612 and fromthe Engine Research Center’s Diesel Engine ResearchConsortium (DERC) member companies are gratefullyacknowledged. The authors would like to thank Thad-deus Swor and Chad Koci for their experimental data.
F Authors 2010
REFERENCES
1 Akihama, K., Takatori, Y., Inagaki, K., Sasaki, S.,and Dean, A. Mechanism of the smokeless rich
Fig. 28 Emissions and performance comparison of the improved solution using fine and coarsegrids
Investigation of charge preparation strategies for controlled PCCI 279
JER06409 Int. J. Engine Res. Vol. 11
diesel combustion by reducing temperature. SAETrans., J. Engines, 2001, 110(3), 648–662. SAE paper2001-01-0655.
2 Bression, G., Soleri, D., Savy, S., Dehoux, S.,Azoulay, D., Ben-Hadj Hamouda, H., Doradoux,L., Guerrassi, N., and Lawrence, N. A study ofmethods to lower HC and CO emissions in dieselHCCI. SAE Trans., J. Fuels Lubricants, 2008, 117(4),37–49. SAE paper 2008-01-0034.
3 Hardy, W. L. and Reitz, R. D. A study of the effects ofhigh EGR, high equivalence ratio, and mixing timeon emissions levels in a heavy-duty diesel engine forPCCI combustion. SAE paper 2006-01-0026, 2006.
4 Opat, R., Ra, Y., Gonzalez, M. A., Krieger, R., Reitz,R. D., Foster, D. E., Siewert, R., and Durrett, R.Investigation of mixing and temperature effects onHC/CO emissions for highly dilute low tempera-ture combustion in a light duty diesel engine. SAEpaper 2007-01-0193, 2007.
5 Kawaguchi, A. Compression ignition type engine.Patent no. 5626115, USA, 1997.
6 Ra, Y. and Reitz, R. D. The use of variable geometrysprays with low pressure injection for optimizationof diesel HCCI engine combustion. SAE Trans., J.Engines, 2005, 114(3), 331–341. SAE paper 2005-01-0148.
7 Kohketsu, S., Tanabe, K., and Mori, K. Flexiblecontrolled injection rate shape with next genera-tion common rail system for HD-DI diesel engines.SAE Trans., J. Fuels Lubricants, 2000, 109(4), 459–468.SAE paper 2000-01-0705.
8 Sun, Y. and Reitz, R. D. Adaptive injectionstrategies (AIS) for ultra-low emissions dieselengines. SAE paper 2008-01-0058, 2008.
9 Sjoberg, M. and Dec, J. Influence of fuel autoigni-tion reactivity on the high-load limits of HCCIengines. SAE Int. J. Engines, 2008, 1(1), 39–58. SAEpaper 2008-01-0054.
10 Koci, C. Multiple-event fuel injection and emissioninvestigations in a low temperature combustionregime using a small bore diesel engine. MastersThesis in Mechanical Engineering, University ofWisconsin–Madison, USA, 2008.
11 Park, S. W. and Reitz, R. D. Numerical study on thelow emission window of homogeneous chargecompression ignition diesel combustion. Combust.Sci. Technol., 2007, 179(11), 2279–2307.
12 Kawano, D., Suzuki, H., Ishii, H., Goto, Y., Odaka,M., Murata, Y., Kusaka, J., and Daisho, Y. Ignitionand combustion control of diesel HCCI. SAE paper2005-01-2132, 2005.
13 Hasegawa, R. and Yanagihara, H. HCCI combus-tion in DI diesel engine. SAE Trans., J. Engines,2003, 112, 1070–1077. SAE paper 2003-01-0745.
14 Sun, Y. and Reitz, R. D. Modeling diesel engineNOx and soot reduction with optimized two-stagecombustion. SAE Paper 2006-01-0027, 2006.
15 Sun, Y. Diesel combustion optimization and emis-sions reduction using adaptive injection strategies(AIS) with improved numerical models. PhD Thesis,University of Wisconsin–Madison, USA, 2007.
16 DieselNet. Emission standards, available fromhttp://www.dieselnet.com/standards, 2008.
17 Kokjohn, S. L. and Reitz, R. D. A computationalinvestigation of two-stage combustion in a light-duty diesel engine. SAE Int. J. Engines, 2008, 1(1),1083–1104. SAE paper 2008-01-2412.
18 Canova, M., Chiara, F., Cowgill, J., Midlan-Mohler, S., Guezennec, Y., and Rizzoni, G. Experi-mental characterization of mixed-mode HCCI/DIcombustion on a common rail diesel engine. SAEpaper 2007-24-0085, 2007.
19 Kokjohn, S. L., Swor, T. A., Andrie, M. J., andReitz, R. D. Experiments and modeling of adaptiveinjection strategies (AIS) in low emissions dieselengines. SAE paper 2009-01-0127, 2009.
20 Amsden, A. A. KIVA-3v, release 2, improvements toKIVA-3v, report LA-UR-99-915, Los Alamos Na-tional Laboratory, 1999.
21 Abani, N., Kokjohn, S. L., Park, S. W., Bergin, M.,Munnannur, A., Ning, W., Sun, Y., and Reitz, R. D.An improved spray model for reducing numericalparameters dependencies in diesel engine CFDsimulations. SAE paper 2008-01-0970, 2008.
22 Abani, N., Munnannur, A., and Reitz, R. D.Reduction of numerical parameter dependenciesin diesel spray models. J. Gas Turbines and Power,2008, 130(3), 032809.
23 Beale, J. C. and Reitz, R. D. Modeling sprayatomization with the Kelvin–Helmholtz/Rayleigh–Taylor hybrid model. Atomization and Sprays,1999, 9, 623–650.
24 Han, Z. and Reitz, R. D. Turbulence modeling ofinternal combustion engines using RNG k–e mod-els. Combust. Sci. Technol., 1995, 106, 267–295.
25 Ra, Y. and Reitz, R. D. The application of a multi-component droplet vaporization model to DIgasoline engines. Int. J. Engine Res., 2003, 4(3),193–218.
26 Ra, Y. and Reitz, R. D. A reduced chemical kineticmodel for IC engine combustion simulations withprimary reference fuels. Combust. Flame, 2008,155, 731–738.
27 Kong, S.-C., Sun, Y., and Reitz, R. D. Modelingdiesel spray flame lift-off, sooting tendency andNOx emissions using detailed chemistry withphenomenological soot model. J. Gas Turbinesand Power, 2007, 129, 245–251.
28 Hiroyasu, H. and Kadota, T. Models for combus-tion and formation of nitric oxide and soot in DIdiesel engines. SAE paper 760129, 1976.
29 Nagle, J. and Strickland-Constable, R. F. Oxida-tion of carbon between 1000–2000 C, In Proceed-ings of the Fifth Carbon Conference, vol. 1, 1962,p. 154.
30 Liu, Y., Tao, F., Foster, D. E., and Reitz, R. D.Application of a multiple-step phenomenologicalsoot model to HSDI diesel multiple injectionmodeling. SAE paper 2005-01-0924, 2005.
31 Frenklach, M., Bowman, T., Smith, G., andGardiner, B. GRI Mech 3.0, available from http://www.me.Berkeley.edu/gri-mech/.
280 S L Kokjohn and R D Reitz
Int. J. Engine Res. Vol. 11 JER06409
32 Turns, S. R. An introduction to combustion, 2000(McGraw Hill, New York).
33 Shi, Y., Hessel, R. P., and Reitz, R. D. An adaptivemulti-grid chemistry (AMC) model for efficientsimulation of HCCI and DI engine combustion.Combust. Theory and Modeling, 2008, 13(1), 83–104.
34 Shi, Y., Kokjohn, S. L., Ge Hai-Wen, and Reitz, R. D.Efficient multidimensional simulation of HCCI andDI engine combustion with detailed chemistry. SAEpaper 2009-01-0701, 2009.
35 Babajimopoulos, A., Assanis, D. N., Flowers, D. L.,Aceves, S. M., and Hessel, R. P. A fully coupledcomputational fluid dynamics and multi-zonemodel with detailed chemical kinetics for thesimulation of premixed charge compression igni-tion engines. Int. J. Engine Res., 2005, 6(5), 497–512.
36 Abraham, J. What is adequate resolution in thenumerical computation of transient jets. SAETrans., J. Engines, 1997, 106(3), 141–155. SAE paper970051.
37 Abraham, J. Entrainment characteristics of tran-sient gas jets, Numer. Heat Transfer, 1996, 30(4),347–364.
38 Munnannur, A. and Reitz, R. D. A comprehensivecollision model for multi-dimensional engine spraycomputations, Atomization and Sprays, 2009,19(7), 597–619.
39 O’Rourke, P. J. and Amsden, A. A. A particlenumerical model for wall film dynamics in port-injected engines. SAE Trans., J. Engines, 1996,105(3), 2000–2013. SAE paper 961961.
40 O’Rourke, P. J. and Amsden, A. A. A spray/wallinteraction submodel for the KIVA-3 wall filmmodel. SAE Trans., J. Engines, 2000, 109(3), 281–298. SAE paper 2000-01-0271.
41 Shuai, S., Abani, N., Park, S. W., Yoshikawa, T.,and Reitz, R. D. Simulating low temperature dieselcombustion with improved spray models. Int. J.Thermal Sci., 2009, 48, 1786–1799.
42 Senecal, P. K. Development of a methodology forinternal combustion engine design using multi-dimen-sional modeling with validation through experiments.PhD Thesis, University of Wisconsin–Madison, USA,2000.
43 Shi, Y. and Reitz, R. D. Assessment of optimizationmethodologies to study the effects of bowl geome-try, spray targeting and swirl ratio for a heavy-dutydiesel engine operated at high-load. SAE Int. J.Engines, 2008, 1(1), 537–557. SAE paper 2008-01-0949.
44 Cooper, B., Penny, I., Beasley, M., Greaney, A.,and Crump, J. Advanced diesel technology toachieve tier 2 bin 5 emissions compliance in USlight-duty diesel applications. SAE paper 2006-01-1145, 2006.
45 Kokjohn, S. L. and Reitz, R. D. A modeling study ofcharge preparation in an HCCI engine using avariable pressure pulse (VPP) injection system andoptimized PRF blends. In Proceedings of the 11thInternational Conference on Liquid atomizationand spray systems, Vail, Colorado, 27 July 27 2009.
46 Lin, Y. and Zhang, H. H. Component selection andsmoothing in smoothing spline analysis of variancemodels. Institute of Statistics Mimeo Series 2556,North Carolina State University, USA, 2003.
47 Swor, T. A. Experimental investigation of adap-tive injection strategies through low and high pre-ssure split injections. Masters Thesis, University ofWisconsin–Madison, USA, 2009.
48 Kim, D., Ekoto, I., Colban, W. F., and Miles, P. C.In-cylinder CO and UHC imaging in a light-dutydiesel engine during PPCI low-temperature com-bustion. SAE Int. J. Fuels Lubricants, 2008, 1(1),933–957. SAE paper 2008-01-1602.
APPENDIX
Definition of acronyms
AIS adaptive injection strategies
AMC adaptive multi-grid chemistry
ATDC after top dead centre
BSFC brake specific fuel consumption
BTDC before top dead centre
CA crank angle
CFD computational fluid dynamics
CO carbon monoxide
COSSO component selection smoothing
operator
DERC Diesel Emissions Reduction
Consortium
EGR exhaust gas recirculation
EOI end of injection
EPA Environmental Protection Agency
ERC Engine Research Center
FID flame ionization detector
FTIR Fourier transform infrared
spectroscopy
GA genetic algorithm
GRI Gas Research Institute
HCCI homogeneous charge compression
ignition
HPCR high-pressure common rail
IMEP indicated mean effective pressure
ISFC indicated specific fuel consumption
IVC intake valve closure
KH Kelvin–Helmholtz
LDEF Lagrangian drop–Eulerian fluid
LPS low-pressure system
MOGA multi-objective genetic algorithm
NOx nitric oxides
PAH polycyclic aromatic hydrocarbons
PLIF planar laser-induced fluorescence
PCCI premixed charge compression
ignition
PRR pressure rise rate
Investigation of charge preparation strategies for controlled PCCI 281
JER06409 Int. J. Engine Res. Vol. 11

RT Rayleigh–Taylor
SOI start of injection
TDC top dead centre
TSC two-stage combustion
UHC unburned hydrocarbon
UNIBUS uniform bulky combustion system
VGS variable geometry sprays
VPP variable pressure pulse
VVA variable valve actuation
WSR well-stirred reactor
282 S L Kokjohn and R D Reitz
Int. J. Engine Res. Vol. 11 JER06409
Related Documents