Investigation of a novel rolling contact fatigue/wear competitive life test machine faced to surface coating Jia-jie Kang a,b , Bin-shi Xu b , Hai-dou Wang a,b,n , Cheng-biao Wang a a School of Engineering and Technology, China University of Geosciences, Beijing 100083, China b National Key Lab for Remanufacturing, Academy of Armored Forces Engineering, Beijing 100072, China article info Article history: Received 28 February 2013 Received in revised form 13 May 2013 Accepted 22 May 2013 Available online 3 June 2013 Keywords: Rolling contact fatigue Slip-rolling Thermal spray coatings Acoustic emission abstract A novel rolling contact fatigue (RCF)/wear competitive life test machine based on double-roll mechanism was designed to investigate the RCF/wear failure mode and predict the competitive life regularity of surface coatings. The test machine was designed for variable slip ratio to simulate the complex service conditions. The failure can be monitored using signals which are acquired from acoustic emission (AE) of the contacting rollers. In the experimental studies, the typical morphologies of RCF damage such as pits, surface abrasion, and delamination were observed. The effectiveness of the AE signals used as a RCF failure monitoring tool was analyzed. The P–N and P–S–N plots were established to predict the life regularity of surface coatings. & 2013 Elsevier Ltd. All rights reserved. 1. Introduction Rolling contact fatigue (RCF) and wear are the most common failure modes of mechanical components and engineering struc- tural parts such as shafts, gears, cams, and rollers, etc. RCF and wear can cause a huge economic loss and restrict the service property of equipments. Wear is mainly in the form of surface material removal caused by plow and adhesion under slip contact condition. RCF often occurs on the surface of friction pairs under rolling contact condition. It is a persistent damage process which involves the crack initiation, crack propagation and crack induced fracture due to the generated shear stress in the superficial layer under the action of alternating load. RCF and wear are both subject to the surface material failure with a common characteristic of contact, friction, and surface accumulative damage. Thermal spraying as a kind of convenient and high efficient technology is often used to prepare surface coatings with high bonding strength and hardness for repairing the failure parts due to RCF and wear, which has attracted extensive attention of researchers in the field of tribology [1–3]. The wear-resistance and contact fatigue resistance properties are the key indicators to evaluate the quality and durability of the repairing coatings [4–6]. However, it should be noted that surface coatings have multicompo- nent composition and high irregular metastable structure, which endows surface coatings special characteristics-high free energy and multi-interface different from those of homogeneous materials. High free energy contributes to the improvement of the wear-resistance property, while multi-interface tends to induce the initiation of micro-cracks and reduce the RCF life. Therefore, the life evolution laws of surface coatings are nonlinear, which leads to the complexity of life prediction. Under the “slip-rolling” complex condition, the failure mode of surface coatings is determined by the competition between RCF and wear. Therefore, it has great scientific significance to research competitive life of surface coatings under “slip-rolling” mode which is close to real serving condition. A novel RCF/wear competitive life test machine was designed to simulate the real contact condition i.e. “slip-rolling” of surface coating. Acoustic emission (AE) technology was selected to moni- tor the failure of the surface coating, especially RCF failure. The energy and amplitude of acoustic emission signals can monitor sensitively the stress wave which is generated from the fracture of materials due to fatigue crack propagation [7–11]. Moreover, acoustic emission signals can prewarn the failure occurrence ahead of the commonly used vibration signals. This contributes to reduction of human attention and human error, and accurate determination of failure point as well. 2. RCF/wear competitive life test machine 2.1. Design criteria The novel RCF/wear competitive life test machine was designed to simulate the complex service condition and provide a reliable Contents lists available at SciVerse ScienceDirect journal homepage: www.elsevier.com/locate/triboint Tribology International 0301-679X/$ - see front matter & 2013 Elsevier Ltd. All rights reserved. http://dx.doi.org/10.1016/j.triboint.2013.05.015 n Corresponding author at: School of Engineering and Technology, China University of Geosciences, Beijing 100083, China. Tel.: +86 10 66718541; fax: +86 10 66717144. E-mail address: [email protected] (H.-d. Wang). Tribology International 66 (2013) 249–258

Welcome message from author
This document is posted to help you gain knowledge. Please leave a comment to let me know what you think about it! Share it to your friends and learn new things together.
Transcript
Tribology International 66 (2013) 249–258
Contents lists available at SciVerse ScienceDirect
Tribology International
0301-67http://d
n CorrUniversfax: +86
E-m
journal homepage: www.elsevier.com/locate/triboint
Investigation of a novel rolling contact fatigue/wear competitive lifetest machine faced to surface coating
Jia-jie Kang a,b, Bin-shi Xu b, Hai-dou Wang a,b,n, Cheng-biao Wang a
a School of Engineering and Technology, China University of Geosciences, Beijing 100083, Chinab National Key Lab for Remanufacturing, Academy of Armored Forces Engineering, Beijing 100072, China
a r t i c l e i n f o
Article history:Received 28 February 2013Received in revised form13 May 2013Accepted 22 May 2013Available online 3 June 2013
Keywords:Rolling contact fatigueSlip-rollingThermal spray coatingsAcoustic emission
9X/$ - see front matter & 2013 Elsevier Ltd. Ax.doi.org/10.1016/j.triboint.2013.05.015
esponding author at: School of Engineering aity of Geosciences, Beijing 100083, China. Tel.10 66717144.ail address: [email protected] (H.-d. W
a b s t r a c t
A novel rolling contact fatigue (RCF)/wear competitive life test machine based on double-roll mechanismwas designed to investigate the RCF/wear failure mode and predict the competitive life regularity ofsurface coatings. The test machine was designed for variable slip ratio to simulate the complex serviceconditions. The failure can be monitored using signals which are acquired from acoustic emission (AE) ofthe contacting rollers. In the experimental studies, the typical morphologies of RCF damage such as pits,surface abrasion, and delamination were observed. The effectiveness of the AE signals used as a RCFfailure monitoring tool was analyzed. The P–N and P–S–N plots were established to predict the liferegularity of surface coatings.
& 2013 Elsevier Ltd. All rights reserved.
1. Introduction
Rolling contact fatigue (RCF) and wear are the most commonfailure modes of mechanical components and engineering struc-tural parts such as shafts, gears, cams, and rollers, etc. RCF andwear can cause a huge economic loss and restrict the serviceproperty of equipments. Wear is mainly in the form of surfacematerial removal caused by plow and adhesion under slip contactcondition. RCF often occurs on the surface of friction pairs underrolling contact condition. It is a persistent damage process whichinvolves the crack initiation, crack propagation and crack inducedfracture due to the generated shear stress in the superficial layerunder the action of alternating load. RCF and wear are both subjectto the surface material failure with a common characteristic ofcontact, friction, and surface accumulative damage.
Thermal spraying as a kind of convenient and high efficienttechnology is often used to prepare surface coatings with highbonding strength and hardness for repairing the failure parts dueto RCF and wear, which has attracted extensive attention ofresearchers in the field of tribology [1–3]. The wear-resistance andcontact fatigue resistance properties are the key indicators toevaluate the quality and durability of the repairing coatings [4–6].However, it should be noted that surface coatings have multicompo-nent composition and high irregular metastable structure, which
ll rights reserved.
nd Technology, China: +86 10 66718541;
ang).
endows surface coatings special characteristics-high free energy andmulti-interface different from those of homogeneous materials. Highfree energy contributes to the improvement of the wear-resistanceproperty, while multi-interface tends to induce the initiation ofmicro-cracks and reduce the RCF life. Therefore, the life evolutionlaws of surface coatings are nonlinear, which leads to the complexityof life prediction. Under the “slip-rolling” complex condition, thefailure mode of surface coatings is determined by the competitionbetween RCF and wear. Therefore, it has great scientific significanceto research competitive life of surface coatings under “slip-rolling”mode which is close to real serving condition.
A novel RCF/wear competitive life test machine was designedto simulate the real contact condition i.e. “slip-rolling” of surfacecoating. Acoustic emission (AE) technology was selected to moni-tor the failure of the surface coating, especially RCF failure. Theenergy and amplitude of acoustic emission signals can monitorsensitively the stress wave which is generated from the fracture ofmaterials due to fatigue crack propagation [7–11]. Moreover,acoustic emission signals can prewarn the failure occurrenceahead of the commonly used vibration signals. This contributesto reduction of human attention and human error, and accuratedetermination of failure point as well.
2. RCF/wear competitive life test machine
2.1. Design criteria
The novel RCF/wear competitive life test machine was designedto simulate the complex service condition and provide a reliable
J. Kang et al. / Tribology International 66 (2013) 249–258250
test platform. It should meet the requirement of the followingcriteria [12]:
(a)
Fig.of strolle
The friction pairs contact with each other as a line contactmode to simulate the service condition of gears, rollers,and cams.
(b)
The test machine should have controllable drive device to runthe friction pairs to achieve any desired speed and realizeaccelerated life tests with high efficiency.(c)
The relative motion state between the friction pairs can switchconveniently among pure slip, slip-rolling, and pure rolling.(d)
The test machine should have reliable loading facility to give acontact pressure up to 2.6 GPa.(e)
The test machine should have sensitive system to monitorfailure process accurately, and realize automatic stop whendetermining failure point.Table 1Technical parameters of the test machine.
Technical parameters Values
2.2. Modules of the test machine
The test machine was designed in the form of modules. Fig. 1shows the schematic diagram of the test machine. The test machineconsists of a mechanical system and a measurement and controlsystem. The mechanical system includes roller assembly module,drive module, loading module, and lubrication module. The mea-surement and control system is composed of measurement moduleand data acquisition and processing module.
Table 1 shows the technical parameters of the test machine.The significant features of the test machine are as follows:
Loading range of test force 1.2–30 kN (relative error≤70.5%)Measurement range of friction torque 1–20 Nm (relative error≤71%)
(a) Rotational speed 5–2000 r/min(infinitive variable)Test time 1 s–9999 minMeasurement range of test revolution 0–999999999Measurement range of temperature −25–650 1CSlip ratio 0–100%Power of servo-actuator 5 kWThe test roller and standard roller are driven by respectiveservo-actuator to realize the accurate control of slip ratio(0–100%), where slip ratio is the ratio of velocity differencebetween test roller and standard roller to the velocity ofstandard roller. The rolling-slip contact condition can changeconveniently by adjust the slip ratio randomly
Torque output of servo-actuator 23 NmExternal dimensions 1690�960�1210 mm3
(b) The convex part of the test roller was designed to make themachine specific for testing surface coatings.
1. Schematic diagram of RCF/wear competitive life test machine. (1) Hydraulic pistonandard roller, (6) oil interceptor, (7) standard roller, (8) test roller, (9) main shaft ofr, and (13) hydraulic station.
(c)
, (2)test r
Hydraulic and lever loading device ensures the test machinecan load continuously without interruption. The loading valuecan be controlled by computer.
(d)
AE technique was introduced to make the test machineaccurately judge the failure point. The typical AE waveformsand frequency spectra of different stages in RCF process can beextracted to judge the RCF failure.(e)
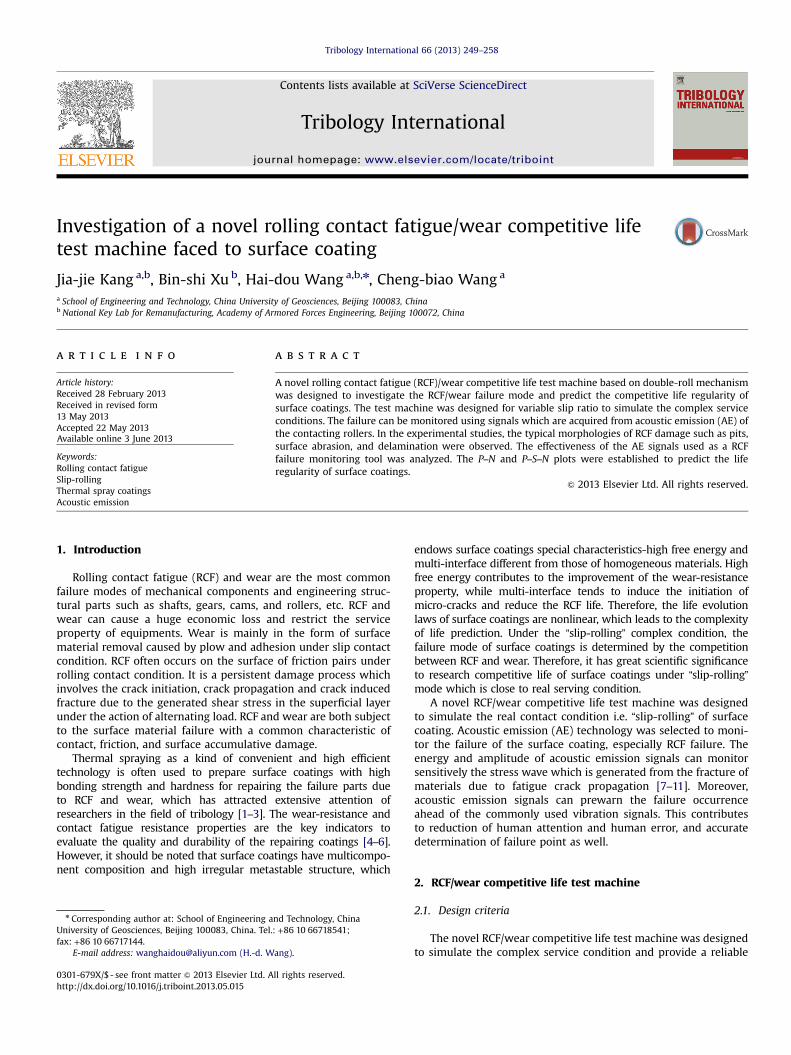
The test machine can realize automatic stop when the selectedparameter (energy of AE signal, friction torque, and test time)is over the pre-set value.2.2.1. Roller assembly moduleFig. 2 shows the schematic diagram of roller assembly module.
The roller assembly module of the test machine mainly includes atest roller and a standard roller. The test roller and standard rollerwere assembled on respective main shaft, and both locked by a nutwith the diameter of 35 mm. The main shaft of test roller was fixedon the working flat by a bearing block. The main shaft of standardroller was fixed on one side of the hydraulic and lever loadingdevice. The parallelism between the two main shafts is relativelyhigh to ensure the tight contact between the two rollers.
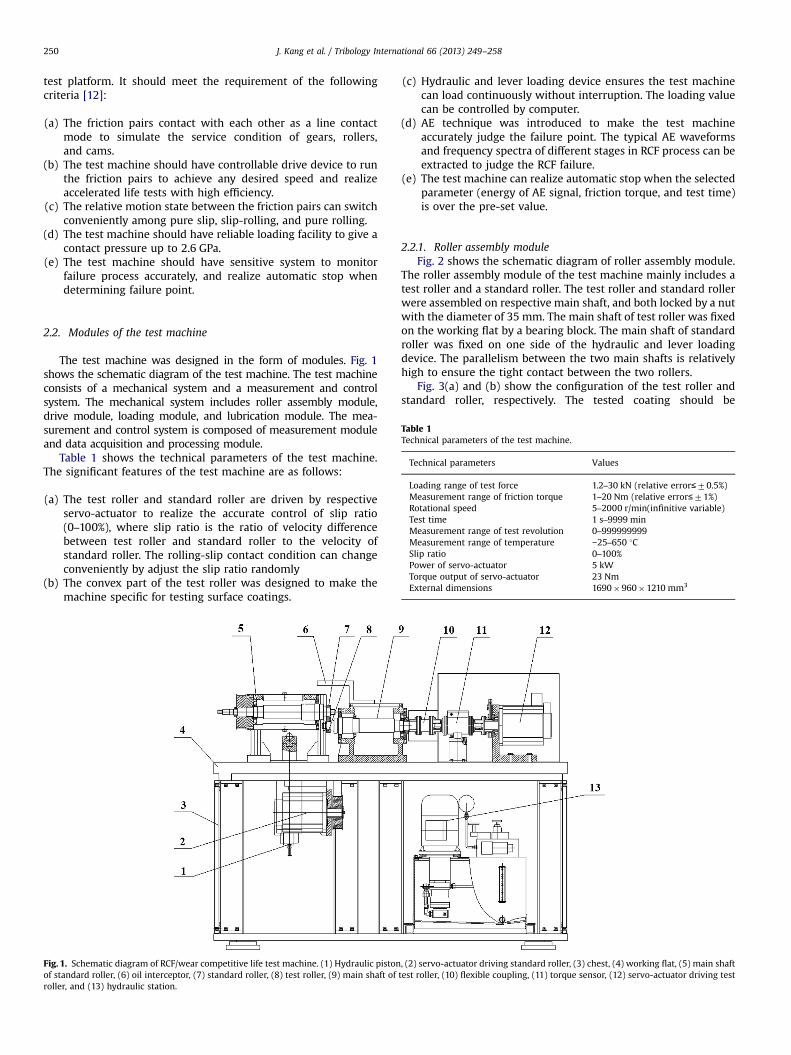
Fig. 3(a) and (b) show the configuration of the test roller andstandard roller, respectively. The tested coating should be
servo-actuator driving standard roller, (3) chest, (4) working flat, (5) main shaftoller, (10) flexible coupling, (11) torque sensor, (12) servo-actuator driving test
Fig. 2. Schematic diagram of roller assembly module. (1) Standard roller, and (2) test roller.
Fig. 3. Configuration of the rollers. (a) Test roller, and (b) standard roller.
Table 2Relationship between slip ratio and the relative motion state.
Slip ratio Slip ratio¼0% 0%oSlip ratioo100% Slip ratio¼100%
Relative motion state Pure rolling Slip+rolling Pure slip
J. Kang et al. / Tribology International 66 (2013) 249–258 251
prepared on the external circle surface. The design of convex partof the test roller makes it specific for surface coatings. The relativesmall area of coating on the convex part can weaken the negativeeffect of the elastic mismatch on the bonding strength oftenoccurring in lager area coating. The edge of convex part of thetest roller was beveled with the dimension of 0.5 mm to preventthe occurrence of stress concentration on the edge of the coating.The length of contact line between the rollers is 5 mm.
Supersonic plasma sprayed Al2O3/40%TiO2 composite ceramiccoating (AT40 coating) and quenched+low temperature temperedAISI 52100 steel were taken as an example to calculate the contactstress. Poisson's ratio and elastic modulus of the coating and steelwere 0.3 and 173 GPa, and 0.3 and 219 GPa, respectively. Themaximum contact stress can reach 2.6 GPa through calculating bythe Hertz equation when the applied load was 30 kN as maximum.The Hertz equation is shown below.
smax ¼ffiffiffiffiffiffiffiffiffiffiffiffiffiffiffiffiffiffiffiffiffiffiffiffiffiffiffiffiffiffiffiffiffiffiffiffiffiffiffiffiffiffiffiffiffiffiffiffiffiffiffiffiffiffi
F ∑ρ� �
πLð1−υ12=E1 þ 1−υ22=E2Þ
sð1Þ
where smax is the maximum contact stress; F is the load; L is thelength of the contact line; υ1 is the Poisson's ratio of the coasson'sratio of the standard rollerting prepared on the test roller; E1 is the
elastic modulus of the coating; υ2 is the Poi; E2 is the elasticmodulus of the standard roller; ρ is the principal curvature at thecontact area; Σρ is the sum of principal curvatures of test roller andstandard roller, which can be calculated according to Eq. (2).
∑ρ¼ 1R11
þ 1R12
þ 1R21
þ 1R22
ð2Þ
where R11 and R21, which are vertical to the rolling direction, arethe principal curvatures of the test roller and standard roller. R12and R22, which are along the rolling direction, are the principalcurvatures of the test roller and standard roller.
2.2.2. Drive moduleSlip ratio is the key index which indicates the relative motion
state between the test roller and standard roller. The relationshipbetween slip ratio and relative motion state is shown in Table 2.
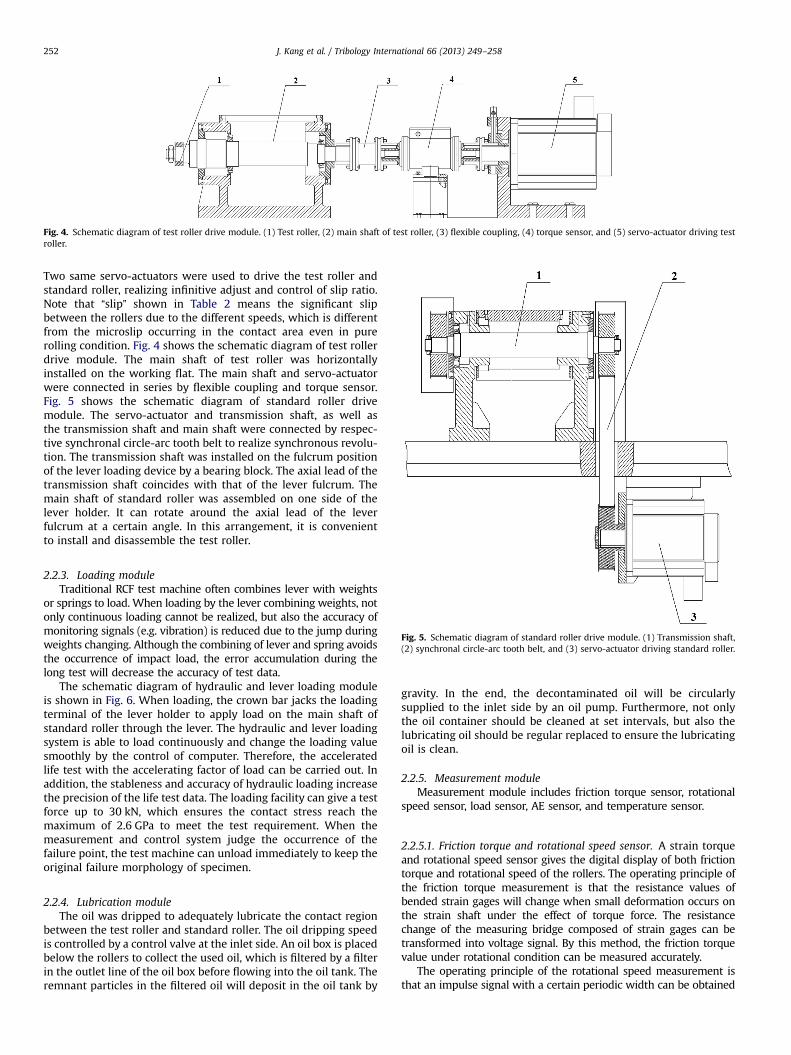
Fig. 4. Schematic diagram of test roller drive module. (1) Test roller, (2) main shaft of test roller, (3) flexible coupling, (4) torque sensor, and (5) servo-actuator driving testroller.
Fig. 5. Schematic diagram of standard roller drive module. (1) Transmission shaft,(2) synchronal circle-arc tooth belt, and (3) servo-actuator driving standard roller.
J. Kang et al. / Tribology International 66 (2013) 249–258252
Two same servo-actuators were used to drive the test roller andstandard roller, realizing infinitive adjust and control of slip ratio.Note that “slip” shown in Table 2 means the significant slipbetween the rollers due to the different speeds, which is differentfrom the microslip occurring in the contact area even in purerolling condition. Fig. 4 shows the schematic diagram of test rollerdrive module. The main shaft of test roller was horizontallyinstalled on the working flat. The main shaft and servo-actuatorwere connected in series by flexible coupling and torque sensor.Fig. 5 shows the schematic diagram of standard roller drivemodule. The servo-actuator and transmission shaft, as well asthe transmission shaft and main shaft were connected by respec-tive synchronal circle-arc tooth belt to realize synchronous revolu-tion. The transmission shaft was installed on the fulcrum positionof the lever loading device by a bearing block. The axial lead of thetransmission shaft coincides with that of the lever fulcrum. Themain shaft of standard roller was assembled on one side of thelever holder. It can rotate around the axial lead of the leverfulcrum at a certain angle. In this arrangement, it is convenientto install and disassemble the test roller.
2.2.3. Loading moduleTraditional RCF test machine often combines lever with weights
or springs to load. When loading by the lever combining weights, notonly continuous loading cannot be realized, but also the accuracy ofmonitoring signals (e.g. vibration) is reduced due to the jump duringweights changing. Although the combining of lever and spring avoidsthe occurrence of impact load, the error accumulation during thelong test will decrease the accuracy of test data.
The schematic diagram of hydraulic and lever loading moduleis shown in Fig. 6. When loading, the crown bar jacks the loadingterminal of the lever holder to apply load on the main shaft ofstandard roller through the lever. The hydraulic and lever loadingsystem is able to load continuously and change the loading valuesmoothly by the control of computer. Therefore, the acceleratedlife test with the accelerating factor of load can be carried out. Inaddition, the stableness and accuracy of hydraulic loading increasethe precision of the life test data. The loading facility can give a testforce up to 30 kN, which ensures the contact stress reach themaximum of 2.6 GPa to meet the test requirement. When themeasurement and control system judge the occurrence of thefailure point, the test machine can unload immediately to keep theoriginal failure morphology of specimen.
2.2.4. Lubrication moduleThe oil was dripped to adequately lubricate the contact region
between the test roller and standard roller. The oil dripping speedis controlled by a control valve at the inlet side. An oil box is placedbelow the rollers to collect the used oil, which is filtered by a filterin the outlet line of the oil box before flowing into the oil tank. Theremnant particles in the filtered oil will deposit in the oil tank by
gravity. In the end, the decontaminated oil will be circularlysupplied to the inlet side by an oil pump. Furthermore, not onlythe oil container should be cleaned at set intervals, but also thelubricating oil should be regular replaced to ensure the lubricatingoil is clean.
2.2.5. Measurement moduleMeasurement module includes friction torque sensor, rotational
speed sensor, load sensor, AE sensor, and temperature sensor.
2.2.5.1. Friction torque and rotational speed sensor. A strain torqueand rotational speed sensor gives the digital display of both frictiontorque and rotational speed of the rollers. The operating principle ofthe friction torque measurement is that the resistance values ofbended strain gages will change when small deformation occurs onthe strain shaft under the effect of torque force. The resistancechange of the measuring bridge composed of strain gages can betransformed into voltage signal. By this method, the friction torquevalue under rotational condition can be measured accurately.
The operating principle of the rotational speed measurement isthat an impulse signal with a certain periodic width can be obtained
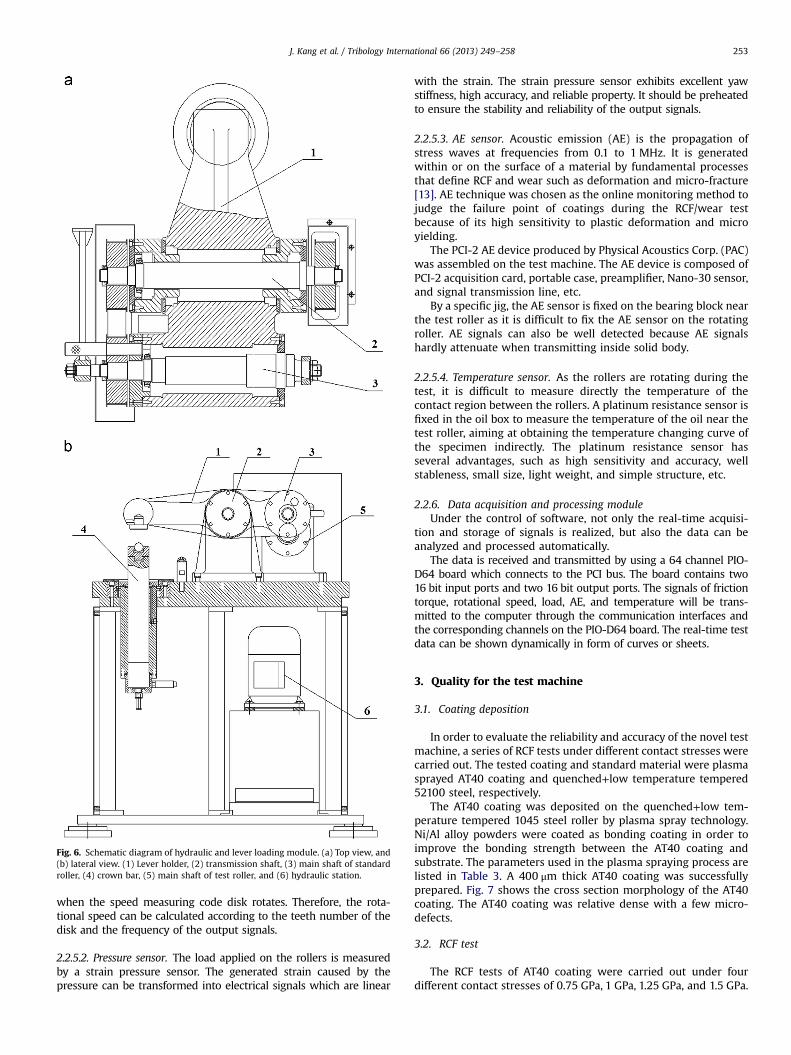
Fig. 6. Schematic diagram of hydraulic and lever loading module. (a) Top view, and(b) lateral view. (1) Lever holder, (2) transmission shaft, (3) main shaft of standardroller, (4) crown bar, (5) main shaft of test roller, and (6) hydraulic station.
J. Kang et al. / Tribology International 66 (2013) 249–258 253
when the speed measuring code disk rotates. Therefore, the rota-tional speed can be calculated according to the teeth number of thedisk and the frequency of the output signals.
2.2.5.2. Pressure sensor. The load applied on the rollers is measuredby a strain pressure sensor. The generated strain caused by thepressure can be transformed into electrical signals which are linear
with the strain. The strain pressure sensor exhibits excellent yawstiffness, high accuracy, and reliable property. It should be preheatedto ensure the stability and reliability of the output signals.
2.2.5.3. AE sensor. Acoustic emission (AE) is the propagation ofstress waves at frequencies from 0.1 to 1 MHz. It is generatedwithin or on the surface of a material by fundamental processesthat define RCF and wear such as deformation and micro-fracture[13]. AE technique was chosen as the online monitoring method tojudge the failure point of coatings during the RCF/wear testbecause of its high sensitivity to plastic deformation and microyielding.
The PCI-2 AE device produced by Physical Acoustics Corp. (PAC)was assembled on the test machine. The AE device is composed ofPCI-2 acquisition card, portable case, preamplifier, Nano-30 sensor,and signal transmission line, etc.
By a specific jig, the AE sensor is fixed on the bearing block nearthe test roller as it is difficult to fix the AE sensor on the rotatingroller. AE signals can also be well detected because AE signalshardly attenuate when transmitting inside solid body.
2.2.5.4. Temperature sensor. As the rollers are rotating during thetest, it is difficult to measure directly the temperature of thecontact region between the rollers. A platinum resistance sensor isfixed in the oil box to measure the temperature of the oil near thetest roller, aiming at obtaining the temperature changing curve ofthe specimen indirectly. The platinum resistance sensor hasseveral advantages, such as high sensitivity and accuracy, wellstableness, small size, light weight, and simple structure, etc.
2.2.6. Data acquisition and processing moduleUnder the control of software, not only the real-time acquisi-
tion and storage of signals is realized, but also the data can beanalyzed and processed automatically.
The data is received and transmitted by using a 64 channel PIO-D64 board which connects to the PCI bus. The board contains two16 bit input ports and two 16 bit output ports. The signals of frictiontorque, rotational speed, load, AE, and temperature will be trans-mitted to the computer through the communication interfaces andthe corresponding channels on the PIO-D64 board. The real-time testdata can be shown dynamically in form of curves or sheets.
3. Quality for the test machine
3.1. Coating deposition
In order to evaluate the reliability and accuracy of the novel testmachine, a series of RCF tests under different contact stresses werecarried out. The tested coating and standard material were plasmasprayed AT40 coating and quenched+low temperature tempered52100 steel, respectively.
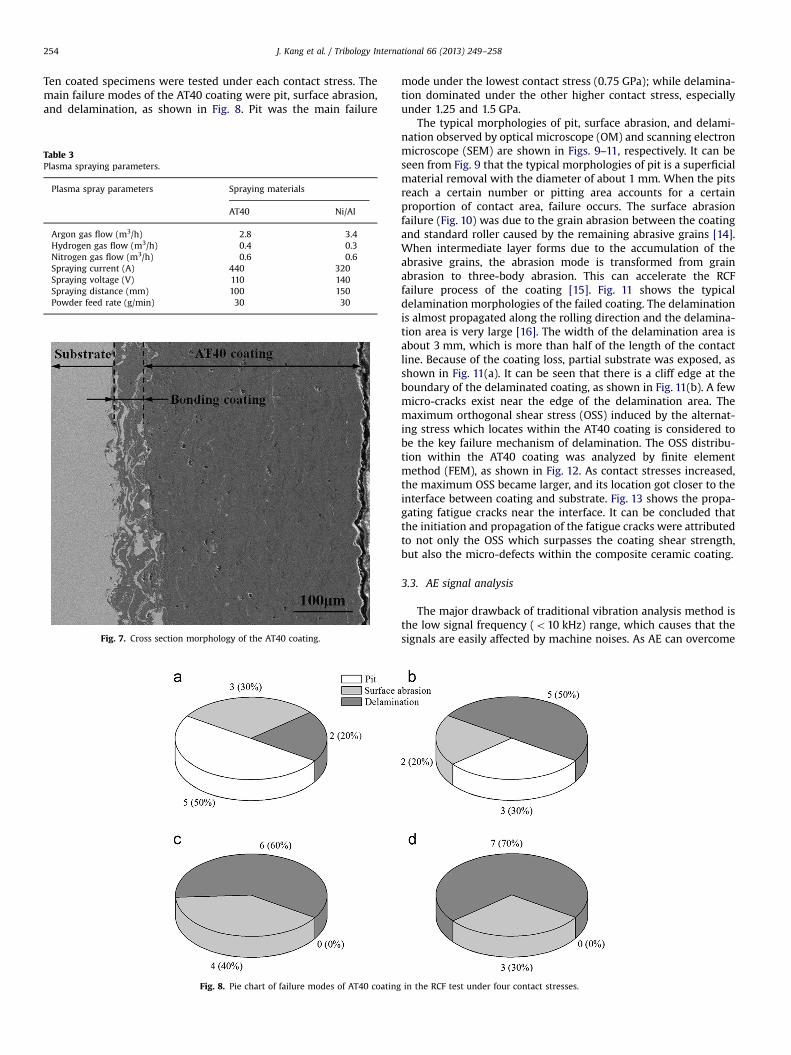
The AT40 coating was deposited on the quenched+low tem-perature tempered 1045 steel roller by plasma spray technology.Ni/Al alloy powders were coated as bonding coating in order toimprove the bonding strength between the AT40 coating andsubstrate. The parameters used in the plasma spraying process arelisted in Table 3. A 400 μm thick AT40 coating was successfullyprepared. Fig. 7 shows the cross section morphology of the AT40coating. The AT40 coating was relative dense with a few micro-defects.
3.2. RCF test
The RCF tests of AT40 coating were carried out under fourdifferent contact stresses of 0.75 GPa, 1 GPa, 1.25 GPa, and 1.5 GPa.
J. Kang et al. / Tribology International 66 (2013) 249–258254
Ten coated specimens were tested under each contact stress. Themain failure modes of the AT40 coating were pit, surface abrasion,and delamination, as shown in Fig. 8. Pit was the main failure
Table 3Plasma spraying parameters.
Plasma spray parameters Spraying materials
AT40 Ni/Al
Argon gas flow (m3/h) 2.8 3.4Hydrogen gas flow (m3/h) 0.4 0.3Nitrogen gas flow (m3/h) 0.6 0.6Spraying current (A) 440 320Spraying voltage (V) 110 140Spraying distance (mm) 100 150Powder feed rate (g/min) 30 30
Fig. 7. Cross section morphology of the AT40 coating.
Fig. 8. Pie chart of failure modes of AT40 coating
mode under the lowest contact stress (0.75 GPa); while delamina-tion dominated under the other higher contact stress, especiallyunder 1.25 and 1.5 GPa.
The typical morphologies of pit, surface abrasion, and delami-nation observed by optical microscope (OM) and scanning electronmicroscope (SEM) are shown in Figs. 9–11, respectively. It can beseen from Fig. 9 that the typical morphologies of pit is a superficialmaterial removal with the diameter of about 1 mm. When the pitsreach a certain number or pitting area accounts for a certainproportion of contact area, failure occurs. The surface abrasionfailure (Fig. 10) was due to the grain abrasion between the coatingand standard roller caused by the remaining abrasive grains [14].When intermediate layer forms due to the accumulation of theabrasive grains, the abrasion mode is transformed from grainabrasion to three-body abrasion. This can accelerate the RCFfailure process of the coating [15]. Fig. 11 shows the typicaldelamination morphologies of the failed coating. The delaminationis almost propagated along the rolling direction and the delamina-tion area is very large [16]. The width of the delamination area isabout 3 mm, which is more than half of the length of the contactline. Because of the coating loss, partial substrate was exposed, asshown in Fig. 11(a). It can be seen that there is a cliff edge at theboundary of the delaminated coating, as shown in Fig. 11(b). A fewmicro-cracks exist near the edge of the delamination area. Themaximum orthogonal shear stress (OSS) induced by the alternat-ing stress which locates within the AT40 coating is considered tobe the key failure mechanism of delamination. The OSS distribu-tion within the AT40 coating was analyzed by finite elementmethod (FEM), as shown in Fig. 12. As contact stresses increased,the maximum OSS became larger, and its location got closer to theinterface between coating and substrate. Fig. 13 shows the propa-gating fatigue cracks near the interface. It can be concluded thatthe initiation and propagation of the fatigue cracks were attributedto not only the OSS which surpasses the coating shear strength,but also the micro-defects within the composite ceramic coating.
3.3. AE signal analysis
The major drawback of traditional vibration analysis method isthe low signal frequency (o10 kHz) range, which causes that thesignals are easily affected by machine noises. As AE can overcome
in the RCF test under four contact stresses.
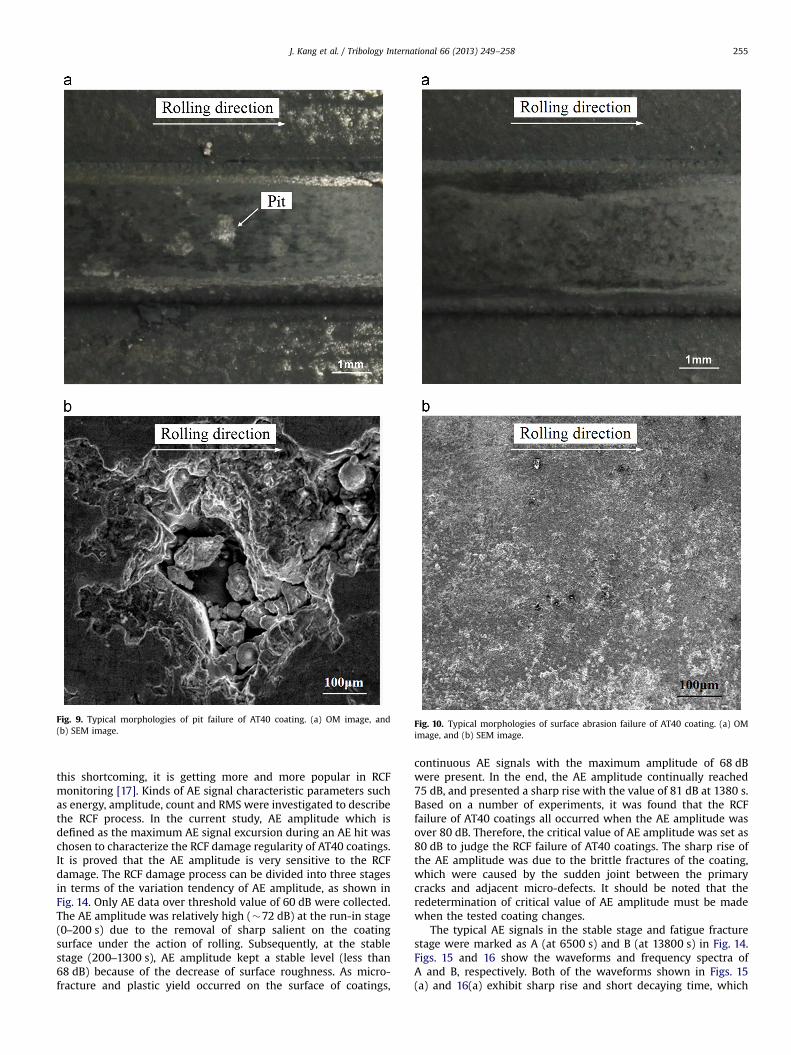
Fig. 9. Typical morphologies of pit failure of AT40 coating. (a) OM image, and(b) SEM image.
Fig. 10. Typical morphologies of surface abrasion failure of AT40 coating. (a) OMimage, and (b) SEM image.
J. Kang et al. / Tribology International 66 (2013) 249–258 255
this shortcoming, it is getting more and more popular in RCFmonitoring [17]. Kinds of AE signal characteristic parameters suchas energy, amplitude, count and RMS were investigated to describethe RCF process. In the current study, AE amplitude which isdefined as the maximum AE signal excursion during an AE hit waschosen to characterize the RCF damage regularity of AT40 coatings.It is proved that the AE amplitude is very sensitive to the RCFdamage. The RCF damage process can be divided into three stagesin terms of the variation tendency of AE amplitude, as shown inFig. 14. Only AE data over threshold value of 60 dB were collected.The AE amplitude was relatively high (�72 dB) at the run-in stage(0–200 s) due to the removal of sharp salient on the coatingsurface under the action of rolling. Subsequently, at the stablestage (200–1300 s), AE amplitude kept a stable level (less than68 dB) because of the decrease of surface roughness. As micro-fracture and plastic yield occurred on the surface of coatings,
continuous AE signals with the maximum amplitude of 68 dBwere present. In the end, the AE amplitude continually reached75 dB, and presented a sharp rise with the value of 81 dB at 1380 s.Based on a number of experiments, it was found that the RCFfailure of AT40 coatings all occurred when the AE amplitude wasover 80 dB. Therefore, the critical value of AE amplitude was set as80 dB to judge the RCF failure of AT40 coatings. The sharp rise ofthe AE amplitude was due to the brittle fractures of the coating,which were caused by the sudden joint between the primarycracks and adjacent micro-defects. It should be noted that theredetermination of critical value of AE amplitude must be madewhen the tested coating changes.
The typical AE signals in the stable stage and fatigue fracturestage were marked as A (at 6500 s) and B (at 13800 s) in Fig. 14.Figs. 15 and 16 show the waveforms and frequency spectra ofA and B, respectively. Both of the waveforms shown in Figs. 15(a) and 16(a) exhibit sharp rise and short decaying time, which
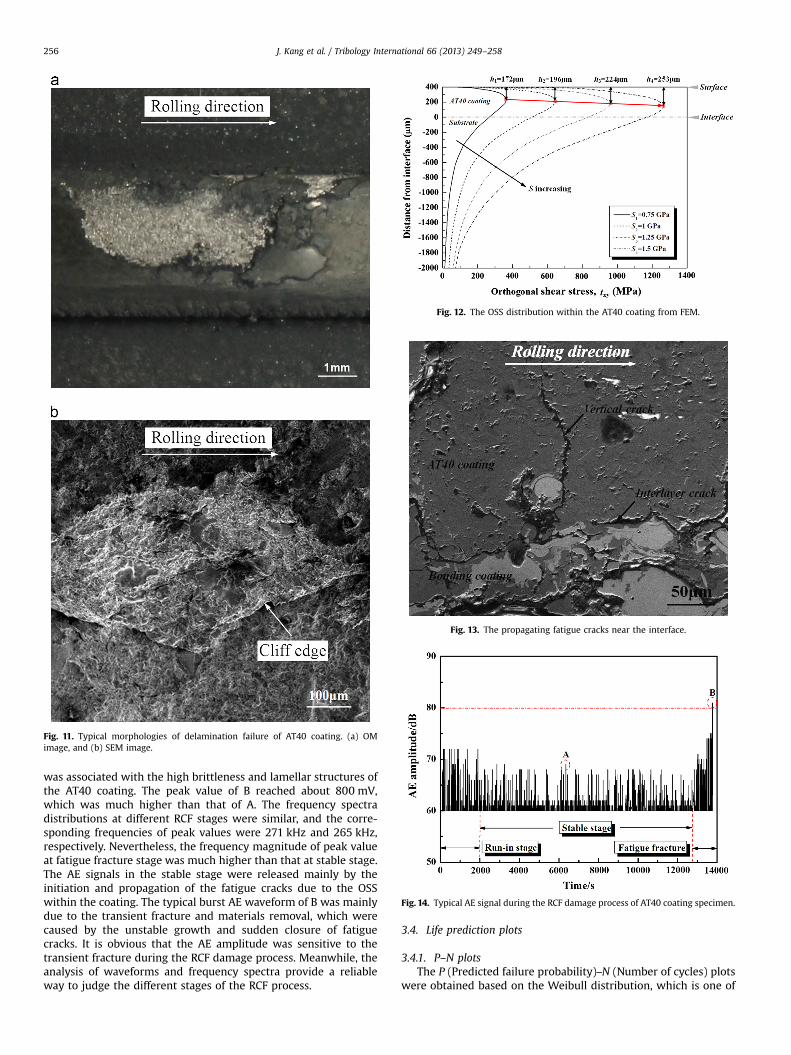
Fig. 11. Typical morphologies of delamination failure of AT40 coating. (a) OMimage, and (b) SEM image.
Fig. 12. The OSS distribution within the AT40 coating from FEM.
Fig. 13. The propagating fatigue cracks near the interface.
Fig. 14. Typical AE signal during the RCF damage process of AT40 coating specimen.
J. Kang et al. / Tribology International 66 (2013) 249–258256
was associated with the high brittleness and lamellar structures ofthe AT40 coating. The peak value of B reached about 800 mV,which was much higher than that of A. The frequency spectradistributions at different RCF stages were similar, and the corre-sponding frequencies of peak values were 271 kHz and 265 kHz,respectively. Nevertheless, the frequency magnitude of peak valueat fatigue fracture stage was much higher than that at stable stage.The AE signals in the stable stage were released mainly by theinitiation and propagation of the fatigue cracks due to the OSSwithin the coating. The typical burst AE waveform of B was mainlydue to the transient fracture and materials removal, which werecaused by the unstable growth and sudden closure of fatiguecracks. It is obvious that the AE amplitude was sensitive to thetransient fracture during the RCF damage process. Meanwhile, theanalysis of waveforms and frequency spectra provide a reliableway to judge the different stages of the RCF process.
3.4. Life prediction plots
3.4.1. P–N plotsThe P (Predicted failure probability)–N (Number of cycles) plots
were obtained based on the Weibull distribution, which is one of
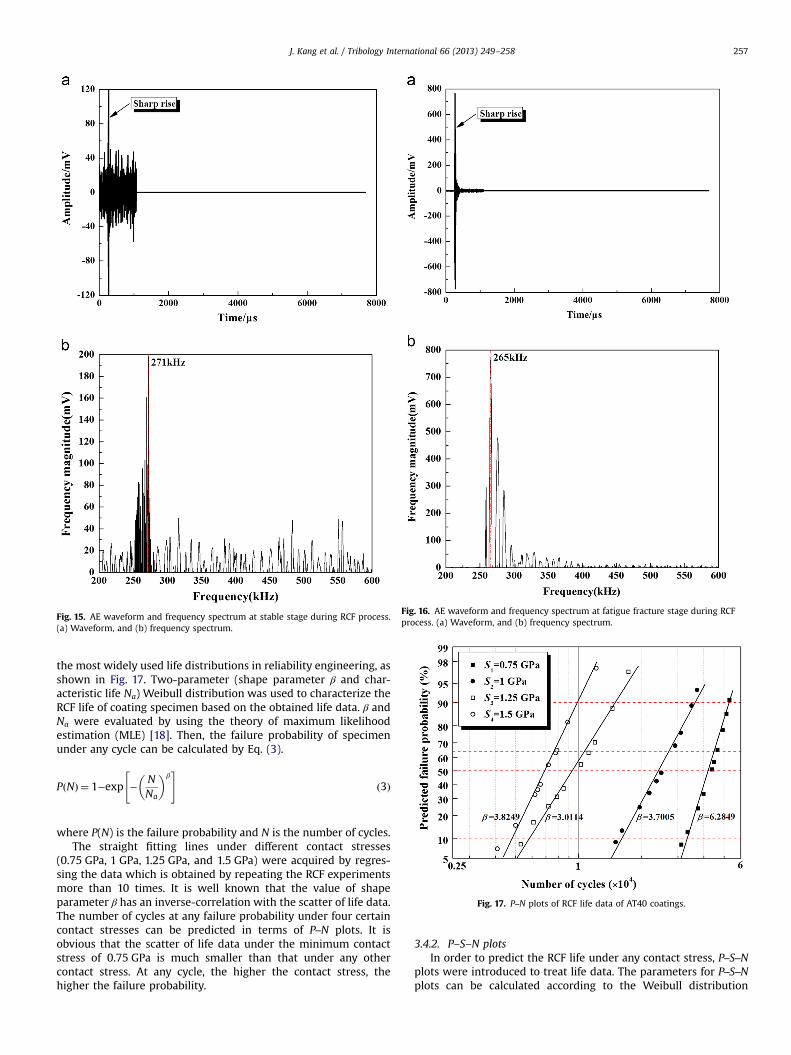
Fig. 15. AE waveform and frequency spectrum at stable stage during RCF process.(a) Waveform, and (b) frequency spectrum.
Fig. 16. AE waveform and frequency spectrum at fatigue fracture stage during RCFprocess. (a) Waveform, and (b) frequency spectrum.
Fig. 17. P–N plots of RCF life data of AT40 coatings.
J. Kang et al. / Tribology International 66 (2013) 249–258 257
the most widely used life distributions in reliability engineering, asshown in Fig. 17. Two-parameter (shape parameter β and char-acteristic life Na) Weibull distribution was used to characterize theRCF life of coating specimen based on the obtained life data. β andNa were evaluated by using the theory of maximum likelihoodestimation (MLE) [18]. Then, the failure probability of specimenunder any cycle can be calculated by Eq. (3).
PðNÞ ¼ 1−exp −NNa
� �β" #
ð3Þ
where P(N) is the failure probability and N is the number of cycles.The straight fitting lines under different contact stresses
(0.75 GPa, 1 GPa, 1.25 GPa, and 1.5 GPa) were acquired by regres-sing the data which is obtained by repeating the RCF experimentsmore than 10 times. It is well known that the value of shapeparameter β has an inverse-correlation with the scatter of life data.The number of cycles at any failure probability under four certaincontact stresses can be predicted in terms of P–N plots. It isobvious that the scatter of life data under the minimum contactstress of 0.75 GPa is much smaller than that under any othercontact stress. At any cycle, the higher the contact stress, thehigher the failure probability.
3.4.2. P–S–N plotsIn order to predict the RCF life under any contact stress, P–S–N
plots were introduced to treat life data. The parameters for P–S–Nplots can be calculated according to the Weibull distribution
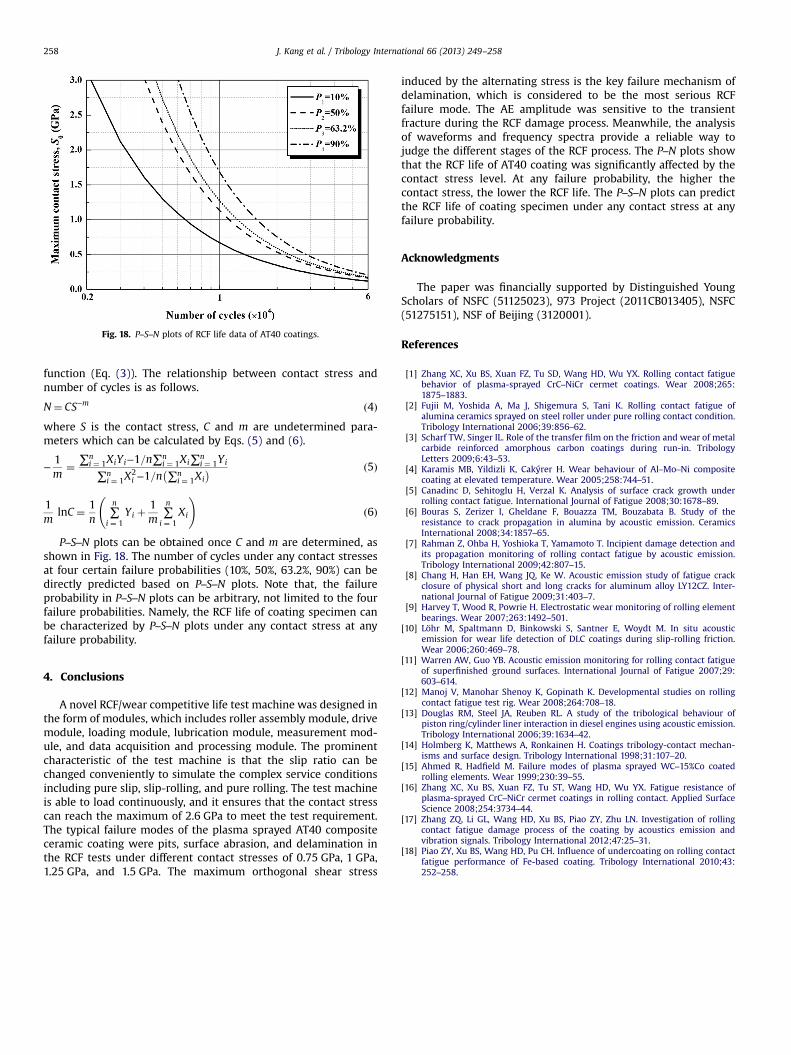
Fig. 18. P–S–N plots of RCF life data of AT40 coatings.
J. Kang et al. / Tribology International 66 (2013) 249–258258
function (Eq. (3)). The relationship between contact stress andnumber of cycles is as follows.
N¼ CS−m ð4Þwhere S is the contact stress, C and m are undetermined para-meters which can be calculated by Eqs. (5) and (6).
−1m
¼ ∑ni ¼ 1XiYi−1=n∑n
i ¼ 1Xi∑ni ¼ 1Yi
∑ni ¼ 1X
2i −1=n ∑n
i ¼ 1Xi� � ð5Þ
1m
lnC ¼ 1n
∑n
i ¼ 1Yi þ
1m
∑n
i ¼ 1Xi
!ð6Þ
P–S–N plots can be obtained once C and m are determined, asshown in Fig. 18. The number of cycles under any contact stressesat four certain failure probabilities (10%, 50%, 63.2%, 90%) can bedirectly predicted based on P–S–N plots. Note that, the failureprobability in P–S–N plots can be arbitrary, not limited to the fourfailure probabilities. Namely, the RCF life of coating specimen canbe characterized by P–S–N plots under any contact stress at anyfailure probability.
4. Conclusions
A novel RCF/wear competitive life test machine was designed inthe form of modules, which includes roller assembly module, drivemodule, loading module, lubrication module, measurement mod-ule, and data acquisition and processing module. The prominentcharacteristic of the test machine is that the slip ratio can bechanged conveniently to simulate the complex service conditionsincluding pure slip, slip-rolling, and pure rolling. The test machineis able to load continuously, and it ensures that the contact stresscan reach the maximum of 2.6 GPa to meet the test requirement.The typical failure modes of the plasma sprayed AT40 compositeceramic coating were pits, surface abrasion, and delamination inthe RCF tests under different contact stresses of 0.75 GPa, 1 GPa,1.25 GPa, and 1.5 GPa. The maximum orthogonal shear stress
induced by the alternating stress is the key failure mechanism ofdelamination, which is considered to be the most serious RCFfailure mode. The AE amplitude was sensitive to the transientfracture during the RCF damage process. Meanwhile, the analysisof waveforms and frequency spectra provide a reliable way tojudge the different stages of the RCF process. The P–N plots showthat the RCF life of AT40 coating was significantly affected by thecontact stress level. At any failure probability, the higher thecontact stress, the lower the RCF life. The P–S–N plots can predictthe RCF life of coating specimen under any contact stress at anyfailure probability.
Acknowledgments
The paper was financially supported by Distinguished YoungScholars of NSFC (51125023), 973 Project (2011CB013405), NSFC(51275151), NSF of Beijing (3120001).
References
[1] Zhang XC, Xu BS, Xuan FZ, Tu SD, Wang HD, Wu YX. Rolling contact fatiguebehavior of plasma-sprayed CrC–NiCr cermet coatings. Wear 2008;265:1875–1883.
[2] Fujii M, Yoshida A, Ma J, Shigemura S, Tani K. Rolling contact fatigue ofalumina ceramics sprayed on steel roller under pure rolling contact condition.Tribology International 2006;39:856–62.
[3] Scharf TW, Singer IL. Role of the transfer film on the friction and wear of metalcarbide reinforced amorphous carbon coatings during run-in. TribologyLetters 2009;6:43–53.
[4] Karamis MB, Yildizli K, Cakýrer H. Wear behaviour of Al–Mo–Ni compositecoating at elevated temperature. Wear 2005;258:744–51.
[5] Canadinc D, Sehitoglu H, Verzal K. Analysis of surface crack growth underrolling contact fatigue. International Journal of Fatigue 2008;30:1678–89.
[6] Bouras S, Zerizer I, Gheldane F, Bouazza TM, Bouzabata B. Study of theresistance to crack propagation in alumina by acoustic emission. CeramicsInternational 2008;34:1857–65.
[7] Rahman Z, Ohba H, Yoshioka T, Yamamoto T. Incipient damage detection andits propagation monitoring of rolling contact fatigue by acoustic emission.Tribology International 2009;42:807–15.
[8] Chang H, Han EH, Wang JQ, Ke W. Acoustic emission study of fatigue crackclosure of physical short and long cracks for aluminum alloy LY12CZ. Inter-national Journal of Fatigue 2009;31:403–7.
[9] Harvey T, Wood R, Powrie H. Electrostatic wear monitoring of rolling elementbearings. Wear 2007;263:1492–501.
[10] Löhr M, Spaltmann D, Binkowski S, Santner E, Woydt M. In situ acousticemission for wear life detection of DLC coatings during slip-rolling friction.Wear 2006;260:469–78.
[11] Warren AW, Guo YB. Acoustic emission monitoring for rolling contact fatigueof superfinished ground surfaces. International Journal of Fatigue 2007;29:603–614.
[12] Manoj V, Manohar Shenoy K, Gopinath K. Developmental studies on rollingcontact fatigue test rig. Wear 2008;264:708–18.
[13] Douglas RM, Steel JA, Reuben RL. A study of the tribological behaviour ofpiston ring/cylinder liner interaction in diesel engines using acoustic emission.Tribology International 2006;39:1634–42.
[14] Holmberg K, Matthews A, Ronkainen H. Coatings tribology-contact mechan-isms and surface design. Tribology International 1998;31:107–20.
[15] Ahmed R, Hadfield M. Failure modes of plasma sprayed WC–15%Co coatedrolling elements. Wear 1999;230:39–55.
[16] Zhang XC, Xu BS, Xuan FZ, Tu ST, Wang HD, Wu YX. Fatigue resistance ofplasma-sprayed CrC–NiCr cermet coatings in rolling contact. Applied SurfaceScience 2008;254:3734–44.
[17] Zhang ZQ, Li GL, Wang HD, Xu BS, Piao ZY, Zhu LN. Investigation of rollingcontact fatigue damage process of the coating by acoustics emission andvibration signals. Tribology International 2012;47:25–31.
[18] Piao ZY, Xu BS, Wang HD, Pu CH. Influence of undercoating on rolling contactfatigue performance of Fe-based coating. Tribology International 2010;43:252–258.
Related Documents