Investigation of a High–Power, High–Pressure Spark Gap Switch with High Repetition Rate Den Naturwissenschaftlichen Fakultäten der Friedrich–Alexander–Universität Erlangen–Nürnberg zur Erlangung des Doktorgrades vorgelegt von Hasibur Rahaman aus Indien

Welcome message from author
This document is posted to help you gain knowledge. Please leave a comment to let me know what you think about it! Share it to your friends and learn new things together.
Transcript

Investigation
of
a High–Power, High–Pressure Spark Gap Switch
with High Repetition Rate
Den Naturwissenschaftlichen Fakultäten
der Friedrich–Alexander–Universität Erlangen–Nürnberg
zur
Erlangung des Doktorgrades
vorgelegt von
Hasibur Rahaman
aus Indien

Als Dissertation genehmigt von den Naturwissenschaftlichen Fakultäten der Universität Erlangen–Nürnberg
Tag der mündlichen Prüfung: 12. 07. 2007
Vorsitzender der Promotionskommission: Prof. Dr. E. Bänsch
Erstberichterstatter: Prof. Dr. K. Frank
Zweitberichterstatter: Prof. Dr. J. Jacoby

I
Zusammenfassung
Im Rahmen dieser Arbeit wurden die Eigenschaften von Mikroplasmen als Schaltmedium in einem miniaturisierten Hochdruckfunkenschalter untersucht. Entsprechend dem universellen Zündspannungsgesetz von Paschen gibt es bei gasgefüllten Schaltsystemen prinzipiell zwei Möglichkeiten der Realisierung: Entweder bei niederigen Gasdrücken (p < 100 Pa, Elektrodenabständen d ~ einige mm und Schaltspannungen U < 30 kV) oder bei Gasdrücken von 105 Pa und höher bei theoretisch unbegrenzt hohen Schaltspannungen und Elektrodenabständen d << 1 mm. Das Thyratron, der Pseudofunkenschalter und das Ignitron sind Beispiele von Niederdruckschaltsystemen, die sog. Funkenstrecken (engl. Spark Gaps) gehören dagegen zu den Hochdruckschaltsystemen. Gasgefüllte Schalter werden grundsätzlich verwendet, wenn in einem Schaltkreis langsam gespeicherte Energie sehr schnell an eine Last überführt werden soll. Von der Physik unterscheiden sich beide Klassen dadurch, daß in Niederdruckschaltsystemen das Zeitverhalten des Plasmaaufbaus durch die Laufzeit der im anliegendem elektrischen Feld im Volumen erzeugten Elektronen über den Elektrodenabstand und die nachfolgend initiierten Sekundärelektronenprozeße bestimmt wird. Die untere Grenze der Schaltgeschwindigkeit liegt daher grundsätzlich im Bereich von einigen 10 ns. In Hochdruckschaltsystemen wird der zeitliche Plasmaaufbau im elektrischen Feld im wesentlichen durch Elektronenstoßionisation im Volumen bestimmt. Da die Teilchendichte nach oben nur technisch limitiert ist, können damit Schaltspannungen von bis zu Megavolt und bei sehr kleinen Elektrodenabständen entsprechende Schaltzeiten unter 100 ps erreicht werden. Die Wiederholfrequenz als weitere charakteristische Kenngröße von gasgefüllten Schaltsystemen wird grundsätzlich durch die dynamischen Prozesse der Wiederverfestigung des Gases limitiert. Daher lag der Schwerpunkt dieser Arbeit auf den physikalischen Untersuchungen von Hochdruckfunkenstrecken mit der Fähigkeit zu sehr hohen Repetitionsraten (bis zu Mhz) bei gleichzeitig schnellen Schaltzeiten im Picosekundenbereich, was physikalisch von einander (bedingt) abhängig ist. Für die untersuchte Hochdruckfunkenstrecke bedeutet dies, mit einen Gasdruck (z. B. in SF6) in der abgeschlossenen Elektrodenanordnung (d = 200 µm) von etwa 105 Pa und mehr zu arbeiten.
Die Funkenstrecke wurde im sogenannten „Free running mode“, d.h. ohne externe Triggerung betrieben, also im Selbstdurchbruch. Der Spannungszusammenbruch wurde nur durch eine Überspannung ausgelöst. Zusätzlich wurden nur nur innere Wiederverfestigungsprozesse wie Rekombination und Diffusion genutzt, d.h. es wurde z. B. kein Clippen des durchschwingenden Spannungspulses oder auch keine externe Kühlung des Systems verwendet. Neben experimentellen Untersuchungen wurde ein analytisches Modell verwendet, welches auf den bekannten Gasentladungscharakteristiken im Hochdruckfall basiert. Das Verständnis der wichtigsten Wiederverfestigungsmechanismen von Gasen spielt die entscheidende Rolle für das Erreichen der angestrebten hohen Repetitionsrate. Des weiteren konzentrierten sich die Untersuchungen auf eine Optimierung des Wirkungsgrades der Funkenstrecke. Die gespeicherte Energie soll möglichst klein sein bei vergleichsweise hoher transferierter Spitzenleistung. Ein wesentliches Kriterium für das Erreichen dieser gesteckten Ziele, ist die Auslegung des Schaltkreises. Dafür wurde eine neue, duale Energieversorgung für das pulsformende Netzwerk (PFN) entwickelt und eingesetzt. In einem solchen dualen Energieversorgungssystem arbeiten zwei

II
Spannungsversorgungen simultan. Eine der Spannungsversorgungen ist verantwortlich für die repetierende Pulsung der gezündeten Funkenstrecke. Diese Spannungsversorgung stellte aufgrund des vergleichsweise hohen Stromes von typischerweise 14-20 mA (d.c.) die Hauptenergieversorgung beim Betrieb der untersuchten Funkenstrecken. Die Spannung dieser Versorgung liegt mit 1-1,5 kV unterhalb der Zündspannung des Elektrodensystems. Die zweite Spannungsversorgung arbeitet bei einer höheren Spannung von 5-10 kV, die deutlich über der Durchbruchsspannung liegt, allerdings ist der von dieser Quelle gelieferte Strom mit etwa 0,5 mA (d.c.) wesentlich niedriger. Diese Spannungsversorgung ist für die erste Zündung und die Wiederzündung im Falle des Erlöschens der Entladung verantwortlich.
Ein weiterer wichtiger Aspekt bei allen Untersuchungen war die parallele laufende Fortentwicklung eines Simulationsprogramms, um den elektrischen Kreis und die Ladeparameter zu optimieren. Dafür wurde das kommerzielle Programm Pspice als Basis verwendet. Basierend auf den Parametern des elektrischen Kreises wurde damit ein resonantes Ladesystem modelliert und in eine experimentelle Anordnung übergeführt. Das Modell basiert auf den Entladeparametern, die die Dauer und das Abklingen des Plasmas bestimmen. Letzteres wurde durch Variation des Kreises und der Elektrodengeometrie optimiert.
Außerdem wurden diese vorhergenannten Betrachtungen mit den experimentellen Untersuchungen der Elektrodenmaterialien, der Gasart und des Gasdrucks korreliert. Bei der Wiederverfestigung des Gases, bei gleichzeitig an einer an den Elektroden angelegten Gleichspannung, kommt es zu einer transienten Entladung, der sogenannten Koronaentladung. Diese überlagerte Entladung führt zu einer signifikanten Reduktion der benötigten Totzeit zwischen den geschalteten Pulsen, entsprechend denen beim getriggerten Durchbruch einer Gasstrecke. Das Phänomen der Koronaentladung tritt nur für einen gewissen Druckbereich in elektronegativen Gasen wie Luft, SF6 oder ihren Mischungen mit anderen Gasen auf. Nach dem Abklingen des leitfähigen Kanals sammeln sich die übrig gebliebenen Ionen und bilden eine Raumladungszone um die beanspruchte Elektrode. Auf diese Weise schirmt die Raumladungszone den Rest des Gaps durch eine Absenkung des Feld außerhalb der Raumladungszone ab und unterbindet weitere Ionisation. Ein Durchbruch tritt nur auf, wenn das Feld der Raumladung selbst während des Ladevorganges einen kritischen Wert übersteigt. In SF6 beträgt dieses kritisches Feld bei Atmosphärendruck 89.6 kV/cm. Die Ergebnisse von Messungen und entsprechenden Simulationen wurden diskutiert, um die Wiederverfestigung des Arbeitsgases optimieren zu können. Dies erlaubte letztendlich die Pulsung des Plasmas in der Funkenstrecke mit der gewünschten hohen Wiederholrate.
Des weiteren wurde der Parameterbereich für die optimale Leistung der Funkenstrecke untersucht. Die Funkenstrecke selbst war dabei in das 50 Ω Transmissionskabel integriert. Die Rückwirkung durch das elektrische Feld auf das Plasma durch Reflexionen wegen einer Fehlanpassung der Impedanz wurde extrem verringert. Das optimierte Schaltermodul hatte eine Gesamtkapazität von 21 pF. Die geringe Kapazität hilft die während des Ladevorgangs gespeicherte Energie über der Funkenstrecke zu reduzieren. Die Elektrodenabstände wurden zwischen 200 und 300 µm eingestellt. Der untersuchte Druckbereich lag bei SF6 als Entladegas zwischen 1 und 1,5 bar. Die mittlere

III
Eingangsleistung für die Erzeugung dieser miniaturisierten Plasmen zwischen den Elektroden lag bei 12 bis 20 Watt.
Die gemessene Anstiegszeit der geschalteten Pulse im Transmissionskabel liegt damit bei unter 200 ps. Die Pulswiederholrate (PRR Pulse Repetition Rate) der Funkenplasmen übersteigt entsprechend 1 Mhz. Die Spitzenleistung der Pulse in der Transmissionskabellast liegt bei etwa 2 kW. Die Effizienz des Ladens und darauffolgenden Wiederladens der Funkenstrecke konnte auf Werte über 60 % gesteigert werden. Die gespeicherte Energie jedes geschalteten Pulses im Funkenschalter liegt im Bereich einiger Mikrojoules (typischerweise 6-8 µJ). Die Effizienz des Energietransfers durch die geschalteten Pulse in das Transmissionskabel erreicht damit 95 %. Zusätzlich zeigten die Elektrodenmaterialien Elkonit (CuW), Kupfer und Aluminium einen signifikanten Vorteil gegenüber anderen Elektroden wie z.B. Edelstahl und Graphit. Die Lebensdauer bei Verwendung dieser Elektroden übersteigt 109 Entladungen.
Zusammengefaßt läßt sich feststellen, daß derartige in miniaturisierten Funkenstrecken erzeugten Mikroplasmen es ermöglichen, das „State-of-the-Art“ Schaltverhalten mit Einfachheit, geringerer Größe, kleiner Eingangsleistung, hoher Effizient, bei parallel sehr hoher PRR und schneller Anstiegszeit zu vereinigen. Die experimentellen Ergebnisse, speziell die Pulswiederholrate, übersteigen die bisher bekannten Werte für schließende Hochdruckschaltsysteme. Es wurden zudem erstmals in miniaturisierter Geometrie die wichtigsten Durchbruchsphänomene in Gasen bei hohen Drücken (105 Pa und höher) experimentell untersucht und die entsprechende dielektrische Wiederverfestigung des Schaltplasmas optimiert.

IV

V
Abstract
The switching characteristics of micro plasmas in a miniaturized high pressure spark gap switch were under investigation. According to the universally accepted Paschen’s law for breakdown voltage between two electrodes, there are two principle possibilities for gas filled switch systems: either with low gas pressure (typically < 100 Pa, electrode gaps d ~ few mm and voltage potential < 30 kV) or with gas pressure of 105 Pa and more. Theoretically, they hold voltage potentials for unlimited period. Thyratron, pseudospark switch and ignitron are some examples of low pressure switch systems. In contrast, spark gap belongs to the high pressure switch systems. All gas filled switches are particularly used for transferring of accumulated energy over a relatively long time into very short pulses to a load. The physics of both classes differ by the fact that in low pressure switching, the temporal development of discharge plasmas is determined by the drift time of the electrons produced in the volume of the electrode gap and the associated secondary electron processes. The lower limit of the switching speed therefore lies in principle on the order of 10 ns. In high pressure switching, the temporal development of discharge plasmas is essentially determined by electron impact ionization of gases in the volume of the electrode gap. The gas density, although the device itself mechanically limits the pressure, can be very high. As a result, the voltage potential achieves up to megavolt in small electrode gap distances. The corresponding switching time reaches below 100 ps. An important characteristic of gas filled switch systems is the repetition frequency. The dynamic recovery processes of the gas, in principle, limit the repetition frequency. Therefore, the emphasis of this work was on physical investigations of the high pressure spark gap for a very high repetition rate and simultaneously maintaining their fast switching times in few hundred picoseconds range. The pressurized spark gap means the gas (e.g., SF6) employed for investigations in the enclosed electrode gap (d = 200 µm) arrangement was near 105 Pa and above.
The spark gap was operating in a free running mode i.e., without any external triggering in a self–breakdown mode. The breakdown was only initiated by overvoltage. In addition, the operation of the spark gap was subjected to a free voltage recovery processes such as recombination and diffusion and no external cooling of the system or any gas flow technique. Apart from experimental investigations, an analytical model based on common gas discharge characteristics at high pressure was utilized. The understanding of the most important recovery process in gases played a crucial role for achieving the desired operating frequency. A further intension of investigations was the optimization of the accumulated energy to be switched. The energy content should be as small as possible at a relatively maximum efficiency of the switching action for its delivery to the load. A substantial aspect for reaching these posed goals was the conceptualization of the circuit. For this concept, a novel dual–power supply scheme for a pulse forming network (PFN) was established. In the dual–power supply scheme, two voltage sources were operating simultaneously. One of the voltage sources was responsible for repetitive plasma pulses in the spark gap. This voltage supply was the main power supply for the spark gap operation since the average feeding current, typically 14–20 mA (d.c.), was relatively high. The applied voltage (~ 1–1.5 kV) of this power supply was below the threshold breakdown voltage of the electrode gap. The second power supply had a relatively higher applied voltage (~ 5–10 kV), which was above the threshold breakdown voltage of the spark gap
VI
electrodes. However, the average feeding current, typically less than 0.5 mA (d.c.), of this supply was substantially lower than the main power supply. This voltage source was responsible for the initial ignition as well as re–striking the spark gap when it misfired by the recharging voltage from the main power supply.
A further important aspect was the parallel execution of investigations by simulations in order to optimize electrical circuits and charging parameters. The commercial program named PSpice was exercised for this purpose. Based on the parameters of the electrical circuit, a resonant charging scheme was modeled and established for the experimental arrangement. Furthermore, this work was merged with a PSpice spark gap model pertaining to the essentiality for a rapid discharge of plasmas. The spark gap model was based on the discharge parameters, which determine the duration and decay of discharge plasmas. The discharge parameters were improved by variation of different circuit schemes and spark gap geometries.
We further extended the aforementioned studies and finally correlated them with the experimental investigations of electrode material, gas species and gas pressure for the optimized performance of the switching device. The recovery of the gas gap at the DC voltage stress, which produced transient plasmas, had utilized the so–called corona discharge phenomenon. The corona discharge significantly reduces the necessary dead time in between the switched pulses like that of a triggered breakdown in the gas gap. This discharge phenomenon occurs in electronegative gases such as air, SF6 or their mixture with other gases. After the decay of the conducting channel, the residual ions from the discharge accumulate and form a space charge region around the stressed electrode. In this manner, it can effectively shield the rest of the gap by lowering the electric field outside the space charge region and stops further ionization. Breakdown occurs only when the field by the space charge itself exceeds a critical value during the process of the charging. In SF6, this critical field value is 89.6 kV/cm at atmospheric pressure. The results from simulations and experimental investigations were exploited in order to be able to optimize the recovery of the working gas. Eventually, the switching action of the spark gap was plausible at the high repetition rate.
A range of parameters was examined for the optimum performance of the spark gap. The spark gap itself was integrated in a 50 Ω transmission line. The use of the transmission line throughout the circuit minimized the perturbation on discharge plasmas. The field stress on plasmas due to the reflection from the mismatch impedance was extremely minimized. The optimized design of the switch module, when connected in the circuit, had a total capacitance of 21 pF. This small capacitance assisted in reducing the accumulated energy across the spark gap for discharge plasmas. The electrode gap distances were adjusted between 200 and 300 µm. The examined pressure range of the SF6 gas was between 1 and 1.5 bars. The input average power for generating these miniaturized discharges within the electrode gap was amounted between 12 and 20 watts.
The measured rise time of the switched pulses in the transmission line was below 200 ps. The Pulse Repetition Rate (PRR) of spark plasmas exceeded 1 MHz. The peak power of the generated switched pulses in the transmission line load was about 2 kW. The efficiency of the charging and subsequent re–charging of the spark gap went beyond 60 %. The energy for each of the switched pulses in the spark gap was on the order of several

VII
microjoules (typically 6–8 µJ). The efficiency of energy transfer by the switched pulses in the transmission line exceeded 95 %. Additionally, elkonite (CuW), copper and aluminum manifested a significant advantage over other electrodes such as stainless steel and graphite. The lifetime of the spark gap employing these electrodes exceeded 109 impulses.
In essence, the switching behavior by such micro plasmas in the miniaturized spark gap enabled the state–of–the–art with simplicity, smaller volume, low input average power, high efficiency, very high PRR and extremely low rise time of the output current pulses. The experimental results especially the PRR exceed the up to now known values of the gas discharge switches. The most important breakdown phenomena of gases in a miniaturized geometry were worked out as the basis of this research study for the first time at the high pressure. In addition, the dielectric recovery of spark gap plasmas was optimized. The insight into our results will spur interest in many applications particularly in the repetitive pulsed power technology.

VIII

IX
TABLE OF CONTENTS
ZUSAMMENFASSUNG ...................................................................................................... I
ABSTRACT..........................................................................................................................V
CHAPTER 1: INTRODUCTION & MOTIVATION ...................................................................... 1
1.1 State of art ...................................................................................................... 2
1.2 Objectives....................................................................................................... 3
CHAPTER 2: BASICS OF GAS DISCHARGE.............................................................................. 5
2.1 Elementary processes related to ionization of gases ...................................... 5
2.1.1 Motion of electrons and ions.............................................................. 5
2.1.2 Mean free path and breakdown criteria.............................................. 6
2.2 Townsend criteria and Paschen’s law ............................................................ 9
2.2.1 Electron avalanche ............................................................................. 9
2.2.2 Secondary emission of electrons ...................................................... 10
2.2.3 Townsend mechanism in electronegative gases............................... 11
2.2.4 The Paschen curve............................................................................ 12
2.3 Streamer mechanism and spark criteria ....................................................... 14
2.3.1 Streamer criteria in electronegative gases ........................................ 15
2.4 Types of DC discharges ............................................................................... 17
2.4.1 Townsend discharge......................................................................... 18
2.4.2 Glow discharge................................................................................. 19
2.4.3 Arc discharge.................................................................................... 21
2.4.3.1 Spark discharge ................................................................. 22
2.4.4 Corona discharge.............................................................................. 23
CHAPTER 3: BREAKDOWN OF A HIGH PRESSURE SPARK GAP ............................................ 25
3.1 Fundamentals of a closing switch ................................................................ 25
3.1.1 Electrical breakdown in a gas gap.................................................... 27
3.1.2 Essential characteristics in SF6 gas discharge .................................. 29
3.1.2.1 Dielectric recovery properties ........................................... 31
3.1.2.2 Corona stabilization phenomenon..................................... 33
3.1.2.3 Limiting factor for corona inception ................................. 34
3.2 Different models for conducting channel resistance .................................... 35
3.2.1 Toepler’s model for time dependent resistance................................ 36
3.2.1.1 Rising slope of current pulse............................................. 38
3.2.2 Rompe and Weizel model with energy balance ............................... 39

X
3.2.3 Vlastos and Branginskii’s model due to a conducting channel
expansion.......................................................................................... 41
3.2.4 3t Law for resistive phase time by Sorensen and Ristic.................. 43
CHAPTER 4: EFFICIENCY OF A SPARK GAP OPERATION..................................................... 45
4.1 Charging strategy of a loss–free switch ....................................................... 45
4.2 Realistic switch model with losses for an open plasma gap ........................ 47
4.2.1 Single power supply scheme............................................................ 47
4.2.2 Dual–power supply scheme ............................................................. 51
4.2.3 Comparison of different circuit schemes ......................................... 54
4.3 DC resonant charging................................................................................... 56
4.4 Pulse forming network and impedance matching ........................................ 58
4.5 Switching efficiency for pulsed plasmas...................................................... 60
4.6 Overall efficiency for pulsed plasmas.......................................................... 61
CHAPTER 5: EXPERIMENTAL SET–UP................................................................................. 63
5.1 Design of a 50 Ω coaxial housing ................................................................ 63
5.1.1 Spark gap geometry and material consideration .............................. 64
5.1.2 Modified geometry........................................................................... 65
5.2 Circuit set–up for single power supply scheme ........................................... 66
5.2.1 Lay out of measurement techniques................................................. 66
5.3 Circuit set–up for dual–power supply scheme ............................................. 67
5.4 Set–up for optical measurements ................................................................. 68
CHAPTER 6: EQUIVALENT PSPICE MODEL FOR DISCHARGE PLASMA ............................... 71
6.1 Simulation of a normal plasma gap.............................................................. 73
6.1.1 Influence of overvoltage DC stress .................................................. 73
6.1.2 Study of geometrical parameters...................................................... 75
6.2 Simulation of an improved set–up parameter .............................................. 76
6.2.1 Influence of voltage and current source ........................................... 76
6.2.2 Study of an active current limiting source ....................................... 78
CHAPTER 7: EXPERIMENTAL RESULTS .............................................................................. 79
7.1 Operation bandwidth of electrode gap geometry ......................................... 79
7.2 Static breakdown voltage of the designed geometry.................................... 80
7.2.1 Measurement in different gases........................................................ 80
7.2.2 Measurement with electrode materials............................................. 81
7.3 Realized PRR of spark gap operation .......................................................... 82
7.3.1 Measurement in ambient air ............................................................. 82

XI
7.3.3 Measurement in SF6 gas ................................................................... 86
7.3.3.1 Limitations in single power supply scheme ...................... 86
7.3.3.2 Advantage of dual–power supply scheme......................... 87
7.3.3.3 Development of the improved set–up circuit .................... 88
7.3.3.4 Realized PRR in the improved set–up circuit ................... 90
7.4 Measurement of output current pulses ......................................................... 90
7.4.1 Rise time in single supply scheme ................................................... 91
7.4.2 Limitations of different circuit schemes........................................... 91
7.4.3 Outcome of the improved set–up circuit .......................................... 93
7.4.3.1 Geometrical effect ............................................................. 93
7.5 Efficiency measurement ............................................................................... 94
7.5.1 Charging efficiency in different circuit schemes ............................. 95
7.5.2 Switching efficiency in different circuit schemes ............................ 96
7.5.3 Charging and switching efficiencies in improved set–up circuit ..... 96
7.6 Measurement of breakdown voltage behavior ............................................. 97
7.6.1 Voltage recovery characteristic ........................................................ 98
7.6.2 Voltage pressure characteristic......................................................... 99
7.6.3 Field enhancement of electrode geometry ....................................... 99
7.6.4 Corona intensity oscillogram ......................................................... 100
7.7 Measurement of spectral lines.................................................................... 102
7.7.1 Time resolved measurement of F I lines ........................................ 103
7.8 Time integrated fast shutter pictures .......................................................... 104
7.9 Electrode erosion characteristic ................................................................. 105
CHAPTER 8: DISCUSSION ................................................................................................... 107
8.1 Rise time and stability of pulsed plasmas .................................................. 107
8.1.1 Dependence of gas type.................................................................. 108
8.1.2 Impact of pressure variation........................................................... 108
8.1.3 Geometrical dependency ................................................................ 109
8.2 PRR and stability of pulsed plasmas .......................................................... 111
8.2.1 Influence of gas type and gas mixture............................................ 111
8.2.2 Influence of gas pressure................................................................ 112
8.2.3 Effect of geometry.......................................................................... 113
8.2.4 Impact of electrode material........................................................... 114
8.3 Charging efficiency .................................................................................... 115
8.3.1 Single power supply scheme.......................................................... 115
8.3.2 Dual–power supply scheme ........................................................... 116
8.4 Leakage current in open plasma gap .......................................................... 116
XII
8.4.1 Outcome of different circuit schemes ............................................ 117
8.4.2 Efficiency in open plasma gap ....................................................... 119
8.5 Analysis of power consumption................................................................. 120
8.5.1 For different circuit schemes.......................................................... 121
8.5.2 For different geometry designs ...................................................... 121
8.6 Comparison of simulation and experimental results .................................. 122
8.6.1 The achievable PRR....................................................................... 123
8.6.2 Pulse shapes.................................................................................... 124
8.7 Why non–conventional spark gap switch................................................... 125
8.8 Lifetime of the spark gap ........................................................................... 127
8.8.1 Exploitation of spectroscopic data ................................................. 127
8.9 Overall assessment of measured results ..................................................... 127
CHAPTER 9: SUMMARY & OUTLOOK ............................................................................... 131
9.1 What we have achieved.............................................................................. 131
9.2 Outlook....................................................................................................... 132
REFERENCES................................................................................................................. 133
APPENDIX ........................................................................................................................... 143
Conversion units.................................................................................................. 143
Table A: List of energy loss and electron loss mechanisms ............................... 143
Table B: Primary interaction of electrons ........................................................... 143
Table C: Secondary Interaction of electrons ....................................................... 144
Table D: Physical constants for breakdown in gases .......................................... 145
Table E: Threshold energies for electron impact dissociation of SF6 into neutrals.
.................................................................................................................... 145
Table F: Library listing for subcircuit spark gap................................................. 146
Figure A: V–p characteristic of a corona stabilized switch. ............................... 147
Figure B: Temperature dependence of the relative cross section........................ 147
Figure C: Effective ionization coefficient for SF6. ............................................. 148
Figure D: Rate constant of electron attachment to SF6. ...................................... 148
PUBLICATIONS ................................................................................................................... 149
ACKNOWLEDGEMENTS ...................................................................................................... 151

Chapter 1: Introduction & motivation
1
Chapter 1: Introduction & motivation
The electrical breakdown of a neutral gas into a highly conducting ionized gas is an interesting physical phenomenon for many reasons. It occurs as a natural phenomenon in the case of lightning and as spark in the case of high–voltage circuits and transmission lines. The phenomenon in pulsed power is a relatively new technological field [Fro’93, Leh’97, Agee’98, Man’00, Jiu’00, Sch’04]. The fundamental purpose of all pulsed power systems is to convert a low power long–time (energy) input pulse into a high power short–time output pulse (see Figure 1-1). Plasma closing switches such as thyratrons, pseudosparks and spark gaps develop ionized gases to generate high power of few hundred megawatts or few gigawatts at the load [Thy’80, Fra’04, Age’98, Ver’04, Cla’92]. Thyratrons and pseudosparks are low-pressure gas discharge switches. Typically, the pressures they use are on the order of tens of pascals. Pressurized spark gaps are widely employed switches to generate output pulse waveforms with their rise times on the order of 100 ps.
Figure 1–1: Pulse power technique for short time output power.
In the simplest case, a spark gap consists of two electrodes, which are separated by an insulating gas. In a triggered spark gap, a third electrode for the initiation of a pre–discharge is integrated. When a suitable voltage is applied, a spark forms, drastically
Power Power
t t 1s 1µs
Energy=∫Pin .dt
Output Power
Input Power
Energy=∫Pout .dt
Pin
Pout

2
reducing the resistance of the gap. An electrical current then flows until the conducting path is disrupted or the energy is not enough to maintain the conducting channel. Nowadays spark gaps are extensively used as high voltage hold–off, high current conduction (or coulomb transport) and peak power-switching devices [Gun’91]. High-pressurized gases are useful in the operation of high power, high speed switches [Agee’98]. However, the rate of deionization and cooling of the gas limit the recovery time of such switches. Orders of magnitude advances are necessary over the hitherto progress in repetitive pulsed power technology. This research work examines distinct potential problems to be attempted in reducing the size and increasing the functionality of a compact repetitive pulsed power system based on the high–pressure spark gap.
1.1 State of art
High-pressure spark gaps operate over a broad range of voltage (up to megavolts) and current (up to mega amperes) with the attribution of simplicity, robustness, extremely low forward voltage drop and high voltage or current rise time [Mac’93, Macg’93, Sch’90]. To obtain the high PRR of their switching behavior, several possibilities exist like the use of gas flow techniques, sweeping voltage, corona stabilization, non–linear voltage pressure effect, high-pressure operation and employing low molecular and high thermal diffusive gases like hydrogen [Mor’91, Mor’92, Mac’95, Har’99]. For gases such as air, nitrogen, argon, oxygen, and SF6, typical recovery times are on the order of 10 ms [Mor’91, Mora’91]. Hydrogen gas with its high molecular speed and thermal diffusivity allows the recovery time to be an order of magnitude faster than the aforementioned gases or about 1 ms. Moran et al used a highly pressurized (~ 70 bars) hydrogen spark gap switch to obtain 100 µs recovery when it was undervolted by 50 % of the static breakdown voltage [Mor’92]. The lower breakdown voltage at the high PRR is attributed to the failure of the recovery of the neutral gas density or to the influence of remaining ionization from the previous discharge. A better technique, mentioned by Macgregor et al, of improving the PRR performance, was to design the spark gap by utilizing corona–stabilized breakdown [Mac’95, Mac’97, Har’99]. This work is appreciable but their experimental results illustrated the maximum achievable PRR of up to 10 kHz.
To increase the aforementioned PRR capability by two orders of magnitude was our interest. We had studied micro plasmas of a high power Fast Switching Device (FSD) based on high–pressure in small electrode gaps (typically ~80–400 µm). In spite of the wealth of information on electrical discharges in electrode gaps, typically of few millimeters to tens of centimeters, very little is known so far about discharges in such small gaps [Ale’99, Bön’03, Byk’04, Fro’93, Mee’40, Mee’53, Kha’90, Sch’90]. The reason for using micro plasmas in the small electrode gap is the requirement of low power to drive such discharge plasmas and the possibility to operate them at the high PRR for the switching purpose. The research work described herein was undertaken with the premise that the restriction of the PRR, so far known for spark gaps, could be improved by minor changes of spark parameters, which are difficult to control. To address this need, the operation of pulsed plasmas was concentrated on low charge or energy transfer rate. A prerequisite for the design and development of such a spark gap was to operate it by DC voltage stress along with a free voltage recovery process (no gas flow or external cooling).

Chapter 1: Introduction & motivation
3
1.2 Objectives
Disadvantages of commonplace spark gap devices are their high price, large space and limited operation at the high PRR. Their characteristic electrical capabilities are often available with either the fast rise time or the high PRR, but not available for all the desired applications. To overcome these drawbacks was our motivation to study new types of pulsed plasmas based on miniaturized discharges in the small electrode gaps. The characterizations of pulsed plasmas were separated in two time scales. The longer time scale, called the macroscopic scale, described the time between pulsed plasmas. The other time scale, called the microscopic time scale, described the processes of pulsed plasmas.
The chief goals in the macroscopic time scale were therefore:
• The achievable PRR of pulsed plasmas • The physical limitations to the maximum PRR • The dielectric recovery process of the plasma gap • The stability of the recovery process with varying parameters
The chief goals in the microscopic time scale were therefore:
• The re–breakdown voltage of the plasma gap • The rise time of the output pulse waveforms in the transmission line • The influence of pulsed plasmas on the output pulses • The physical behavior of the plasma gap after the re–breakdown voltage • The stability of the output pulses with varying parameters
The aforementioned features provide a clearer insight into the physical processes taking place in the discharge behavior of the electrode gaps. These consequences help in better comprehension of certain areas in plasma physics and can lead to the optimal solution of technological problems, which relates directly to the switching interest. The switching in pulsed power technology is an issue of special interest. Pulsed power has been pursued at varying levels for nearly three decades, yet there is substantial room for growth. The essential objective was to identify the particular areas of our interest where this technology could result in order of magnitude improvements in the state of art.

4

Chapter 2: Basics of gas discharge 5
Chapter 2: Basics of gas discharge
There are varieties of plasma applications at high operating pressure such as plasma closing switches (spark gap, trigatron), high-pressure micro–hollow cathode discharge (MHDC), capillary discharge, dielectric barrier discharge (DBD) and so on [Adl’00, Fle’02, San’00, San’03, Sch’90, Sch’00]. They operate near an atmospheric pressure and above. The physical processes involved in these applications are extremely varied, individually complex, typically involve several physical phenomena. The study of the present switching device aims at understanding the physical phenomena of discharge behavior in gases. Because of the scientific importance, we include here micro plasmas or channels in small electrode gaps as the basis for controlled spark discharges. In order to understand plasmas of such a switching device, it is indispensable to know at least basics of gas dynamics and particle kinetics. The practical importance of these theories lies in their application and hence in the following chapter we discuss discharge mechanisms in gases.
2.1 Elementary processes related to ionization of gases
In this section, we treat the theory of ionization of gases. Discharges are given special attention in the ensuing sections. The theoretical descriptions then lead to the choice of the discharge that we pursue thereafter. We wish to use electric discharge ionization as the breakdown principle.
2.1.1 Motion of electrons and ions
The motion of a charged particle is described by the equation of the form
frEQdt
rdm
rrrr
+= )(2
2
6 Chapter 2: Basics of gas discharge
m is the mass, Q is the charge, and rr
is the position of the particle. )(rErr
is the electric field
and fr
represents non electrical forces acting on the particle including magnetic field and
collisions.
The energy of the charged particle depends on its mass and velocity dv . The kinetic energy
of the charged particle due to the potential field V is given by
Vevm d =2
2
1
The energy Ve can be gained by moving the particle a distance 1r in the direction of the
field
∫=1
0
).(r
rdrEeVerrr
There are influences beside electric field, which affect charged particles such as generation, recombination, convection, diffusion are the most important [Appendix: Table A, B, C]. They are distributed over a region, which is bounded, by the electrodes and the wall confining the space. The primary ionizing process in the gas is ionization by collision between neutral gas molecules and free electrons which have been accelerated by the field and thus obtaining the necessary ionizing energy. Therefore, new electron ion pairs are formed in the electric field and by this cumulative process the number of electrons and ions grow very rapidly and electron avalanches are formed. To understand this cumulative process due to the electron molecule collision we need to know about the mean free path of the electron.
2.1.2 Mean free path and breakdown criteria
The mean free path is defined as the path length that a particle travels on average before colliding with one another [Bra’00].
mg
mn σ
λ1
=
where mσ is the effective cross section of the particle for collision.
2)2( gm rπσ =
gr is the gas kinetic radius of the particle. gr is not identical with the physical radius. At
low energies of less than eV130 it quickly increases, then slowly decreases with higher
energies as shown in Figure 2- 1. The gas density gn is obtained from the ideal gas law.
Tknp g= (2.1)

Chapter 2: Basics of gas discharge 7
where p is the pressure and k is the Boltzmann’s constant. The gas density is associated with the thermal energy of gas atoms.
The avalanche processes, that initiate electrical breakdown, depend on electron molecule collisions. In such case, the mean free path eλ of an electron is more important for
breakdown and plasma consideration than mλ .
eg
en σ
λ1
= ; 2ge rπσ =
eσ is the ionization cross section of a particle in the path of an electron. The ionization
cross section is smaller than the collision cross section, because peripheral collisions generally do not ionize. There is a difficulty to find the exact value of the collision cross section for the practical use. The cross sections for the SF6 gas are shown in Figure 2- 1. The datas are obtained from Kim et al. [Kim’00]. eλ for SF6 at an energy of 100 eV is
about 0.5 µm [Chr’00].
0 200 400 600 800 1000
0
2
4
6
8
1
10
100
Cro
ss s
ecti
on
(10
-20m
)
Energy (eV)
Mean
fre
e p
ath
(µ
m)
Figure 2- 1: Ionization cross section and mean free path of electrons in SF6 at 300 K and 1 bar. Datas are taken from Kim et al. [Kim’00].
Knowing the mean free path for an electron, the possibility of a gas discharge in a gap can be estimated. If the gap distance d is shorter than about 2λe, no avalanche can occur in the gap. For a glow discharge to develop, d must be greater than λe. In a large gap, λe can be used to estimate the breakdown voltage Vb, if the ionization potential Vi of the gas is known. The energy an electron gains between two collisions must be greater than Vi.
ie VE ⟩λ

8 Chapter 2: Basics of gas discharge
where E is the electric field. Figure 2- 2 shows an illustration of this equation. For a given gap, the breakdown voltage Vb can then be estimated by using
e
ib
dVV
λ≈
Figure 2- 3 shows graph of breakdown voltage calculated in this way.
Figure 2- 2: Electron energy that would be reached by an electron when accelerated by an applied field between collisions. It is assumed that the initial energy and the energy after a collision
are zero, and eλ = 0.5 µm. The
horizontal line shows the first ionization potential of SF6 [Chr’00]. Ionization would occur in a field of 2.86 X 10⁷ V/m.
Figure 2- 3: Breakdown voltage vs. gap
width for SF6 with an assumed eλ of
0.5 µm.
1 10 1000,1
1
10
100
Co
llis
ion
en
erg
y (
eV
)
E (106 V/m)
Vi(SF
6)
0 50 100 150 200 250 3000
2
4
6
8
10
Bre
ak
do
wn
vo
lta
ge
(k
V)
distance (µm)

Chapter 2: Basics of gas discharge 9
2.2 Townsend criteria and Paschen’s law
We describe here the processes responsible for the breakdown of the insulating gas in a planar electrode gap. A gas is normally a perfect insulator under normal condition, but some free electrons and ions are always present. These are atoms or molecules ionized by cosmic rays, for example [Kha’90]. The fact that ions and electrons are always available in the gas has great significance and consequences in many applications. Without free electrons, it would not be easy to produce a spark, or to ignite a discharge. The ensuing sections include the early work in the field of breakdown and discharges in gases by Townsend.
2.2.1 Electron avalanche
An avalanche denotes a process of multiplication of electrons in a series of impact ionization (Appendix: Table B). If one applies a high voltage to the electrodes, free electrons will accelerate and collide with molecules of gas. Hereby more electrons are released, which in turn will multiply, thus creating an avalanche. Based on this avalanche process, one of the pioneer work by Townsend is essentially a steady state experiment i.e. the current at any plane between the electrodes is constant in time. The current of electrons at the cathode by the external radiation source 0i increases with distance from the cathode
due to impact ionization of the background gas by the electrons. The growth of the electron current in an element of thickness dx is described by the steady state continuity equation
written as follows:
ei
e
d idx
div ξ=
2.2
where ei is the electron current, dv is the drift velocity of electrons and iξ is the
ionization rate ( the number of additional electrons produced per second by an electron as it moves in the background gas). The current ei is equal to dee vAqn , where en is the
electron density, eq is the electron charge, and A is the area of the discharge. The above
equation can be rewritten as
e
e idx
diα=
where idi v/ξα = is the ionization coefficient i.e. the number of electrons produced by an
electron as it travels a unit distance in the direction of the field. The coefficient α is called
Townsend’s first ionization coefficient. By integrating between 0=x (the cathode) and dx = (the anode), the solution to the above equation is
d
e eiiα
0=
10 Chapter 2: Basics of gas discharge
Since the ion current is zero at the anode ( dx = ), the external current in the circuit will be equal to the electron current ei evaluated at the anode. Therefore, we can rewrite the above
equation as
d
e eidiiα
0)( == 2.3
Townsend related the ionization coefficient α by an equation of the form [Mee’53,
Rot’95]
−=
−=
E
pBpA
E
pAVpA i expexpα 2.4
where A and B are relatively constants for a given gas over a range of fields and pressures and can be determined experimentally. The constant values are given in many literatures [Eng’94, Mee’53, Tip’91, Rai’97, Appendix: Table D].
2.2.2 Secondary emission of electrons
A number of secondary processes have been found, which play a larger role in accounting for the faster than exponential growth of the external current (equation 2.3). Consider an
electron starts at the cathode or in the space with de
α electrons producing at the anode. The
acceleration of positive ions, ( 1−de
α ) in the electric field, due to the impact collision of electrons and molecules, leads to emission of secondary electrons from the cathode. The release of secondary electrons in practice is due not only to the potential and the kinetic energy of the positive ions but also to other processes, like the arrival of photons, neutral and metastable particles [Appendix: Table C]. γ is the effective secondary emission
coefficient (third Townsend coefficient) defined as the probability of a secondary electron generation on the cathode. Therefore, the number of secondary electrons is equal to the
product of the number of positive ions ( 1−de
α ) reaching to the cathode andγ . The
secondary electrons ionize the gas in the same way, as do the primary electrons produce
and release more electrons in the gap space. The ( )1( −deαγ ) ions they produce on their
way reach to the cathode and release more electrons. These electrons produce further
( 22 )1( −deαγ ) ions at the cathode. This continues for infinite number of time. Summing
over all the electrons entering at the anode is
)1(1
......))1()1(1( 22
−−=+−+−+
d
dddd
e
eeee
α
αααα
γγγ
With initial current 0i , the above equation becomes
)1(1
0
−−=
d
d
e
eii
α
α
γ 2.5
This is well-known Townsend mechanism, which exhibits the growth of electrons created or the growth of current in the discharge medium. As long as the denominator of

Chapter 2: Basics of gas discharge 11
equation 2.5 is greater than zero, the current remains non-self–sustained. The condition for initiating a self-sustaining discharge is
1)1( =−deαγ Or
+=
γα
11lnd 2.6
This is Townsend criterion for breakdown. It implies that a finite value of current can be obtained for 00 =i . In other words, the discharge becomes self–sustained without
requirement of any external agent for liberating electrons at the cathode. The criterion should be taken more as a physical interpretation of the conditions in the gas than as derived mathematical criterion, since the theory as presented above is a steady state formulation, which has no provisions for transient events, such as breakdown. The obscure secondary emission depends on the cathode material and can be derived from the Paschen characteristic. A typical value of γ in electrical discharge ranges below 10-3 (Eng’94,
Rai’97, Appendix: Table D). Therefore, at the low values of d , 1<<de
αγ . The equation 2.5
becomes deii
α0= , and the plot of )/ln( 0ii versus d is linear, with a slope α . d
eαγ
increases with d . When it satisfies 1=de
αγ , i approaches infinity, and the breakdown
occurs at d .
2.2.3 Townsend mechanism in electronegative gases
The aforementioned Townsend criterion did not consider the crucial role of electron removal from the electrically stressed gases by electronegative species. The gases in which electron attachment occurs are electronegative gases. An attachment coefficient η can be
defined, analogous with α , as the number of attachments per electron unit drift in the
direction of the field. Under these conditions, the equation 2.5 of the current growth in a uniform field is as follows.
)1(1 )(
)(
0
−−
−
−−
−=
−
−
d
d
e
e
iiηα
ηα
ηα
αγ
ηα
η
ηα
α
The corresponding criterion for initiating self–sustaining discharge is
1)1( )( =−−
− dne α
ηα
αγ (2.7)
The Townsend criterion for breakdown equation 2.6 is modified to equation 2.7. For αη > ,
and for large gaps, the criterion is approximately
γ
ηα
+=
1
As γ is usually much smaller than unity, the equation can be reduced to ηα = . Both
coefficients are the function of pE / . Below ηα = , no self–sustaining discharge would be

12 Chapter 2: Basics of gas discharge
possible. The limiting value of pE / for this to happen is 118 V/(cm.torr) in SF6 [Kha’90,
Ped’84, Appendix: Figure C].
2.2.4 The Paschen curve
Since p/α is a unique function of pE / , and further, if one assumes that p/γ is also a
function of pE / , then we can represent a functional relationship between the electrode
separation and the voltage at which breakdown occurs. It implies that breakdown characteristics of a gap are a function of the product of the gas pressure p and gap length d .
The product dp is a measure of the number of collisions an electron makes by crossing the
gap. The pressure should be actually replaced by gas density, which is affected by the temperature as well as the pressure of the gas. Many other factors have an affect on the breakdown of the gap, such as radiation, particles (dust), electrode shape and surface irregularities. Paschen’s law reflects the Townsend breakdown mechanism in gases, that is, a cascading of secondary electrons in the gap. This fact was first observed experimentally by De La Rue and Muller, and was later extensively studied by Paschen [Sch’90]. Combining equations 2.4 & 2.6
+=
−
γ
11lnexp
E
pBdpA (2.8)
From the above equation, the breakdown voltage bV is obtained as
Cdp
dpBVb
+=
)ln( (2.9)
where
+
=
γ
11ln
lnA
C
Equation 2.9 is the Paschen law for planar electrodes. Typically, the Townsend’s mechanism and hence its extension, the Paschen’s law, apply at certain range of dp
product. Furthermore, modifications are necessary for highly electronegative gases because they recombine the secondary electrons very quickly. In general, the simple relation between bV and dp is sketched in Figure 2- 4. The breakdown voltage bV in equation 2.9
illustrates that at large dp value, i.e. a high-pressure insulation, bV increases because of too
many collisions (large gap or high-pressure). At low dp value, i.e., a vacuum insulation,
also bV increases because of too few collisions (small gap or low-pressure). Hence, there is
a minimum bV , whose value is found from 0)(/ =dpddVb ,
+=
γ
11ln
72.2)( min
Adp

Chapter 2: Basics of gas discharge 13
minmin )()( dpBVb =
Values of A and B are gas dependent coefficients. V
olt
ag
e
RHS
High pd
pdmin
Vmin
Vb
pd
Vacuum
insulation
High pressure
insulation
LHS
Low pd
Pressure. distance
Figure 2- 4: Paschen curve for arbitrary gas in plane parallel electrode discharge.
The limit of Paschen’s law
A number of experimental investigations have been conducted to confirm Paschen’s Law. The experimental results agreed well with equation 2.9 for values of dp up to a few
atmospheres. At higher pressures, additional effects due to irregularities in the cathode surface need to be taken into consideration. These irregularities cause field intensification leading to breakdown at voltages lower than those found from equation 2.9. On the other hand, in a small gap (~ 100 µm) when surface roughness becomes non–negligible, changing the pressure has a different influence than changing the distance. The discharge is not well understood at these distances [Bön’03, Jud’01]. It is stated that at these low separations, the surface quality of the electrode shape has great influence.
At large values of the product dp , an electron avalanche of critical size distorts the local
field by the space charges of electrons and positive ions. The space charge formation initiates the gas breakdown by a new mechanism, a “streamer”. The streamer process is explained in the next section. Under small dp values, the streamer breakdown mechanism
is replaced by the Townsend breakdown mechanism. Further decrease of dp value results
in vacuum breakdown. However, the dp limits for these mechanisms are not very sharp.

14 Chapter 2: Basics of gas discharge
2.3 Streamer mechanism and spark criteria
The Townsend theory accounts for the dependence of the breakdown voltage on gas density and electrode spacing. There is an experimental evidence, which appeared to be inconsistent with the Townsend mechanism [Mee’53]. In spark gaps, for example at atmospheric pressure with electrode spacing ~1 cm, the delay times were too short to have involved a series of successive avalanches produced by ions impinging on the cathode. The breakdown voltage in this case is independent on the cathode material, which is an evidence of qualitative difference from the Townsend breakdown. The mechanism of the electrical breakdown in this case is based on the concept of streamer– a thin ionized channel, fast growing between electrodes.
Neither the Townsend nor the streamer mechanisms alone can account for the behavior of the breakdown over the full range of pressures. The streamer mechanism neglects secondary electrons produced at the cathode and the Townsend mechanism neglects field distortion by space charge. A more realistic description of the breakdown process is a buildup of space charge in a sequence of avalanches until the field distortion precipitate collapse of the gap. This is accomplished when two conditions are met, applied field above a critical field, rcE and a critical distance, rcd in electrode gaps. The critical field in
ambient air is roughly mV /103 6× . The process of initialization of breakdown is illustrated
in Figure 2- 5 and Figure 2- 6. Loeb and Meek proposed the streamer theory of the spark for the positive streamer and independently by Raether for the negative streamer.
As long as the net charge is not sufficient to distort the field appreciably, the avalanche moves with the electron drift velocity appropriate to the applied field. The electron density developed in the avalanche incorporates both the drift and diffusion. As result, there is a spread of electron cloud behind, which is left with the trail of positive ions. When the electron avalanche head grows to a size such that the space charge distribution due to ions and electrons shield itself from the applied field, the propagation and growth of the avalanche change markedly, and the streamer phase follows. The condition necessary for streamer propagation are: the sufficient high energy photons must be created in the avalanche, the photons must be absorbed to produce sufficient electrons at the tip, the space charge field at the rear of the avalanche tip shall be sufficient enough to produce adequate secondary avalanche in the enhanced field. Van Veldhuizen mentioned a range for streamer velocity from 105 to 106 m/s [Vel02, Mor’97].

Chapter 2: Basics of gas discharge 15
Anode
Cathode
Anode
Cathode
A CB
Figure 2- 5: Distribution of electrons and positive ions in an electron avalanche of a negative streamer by Raether [Mee’60].
Figure 2- 6: Distribution of ions and electrons due to positive streamer by Meek and Loeb [Mee’60].
2.3.1 Streamer criteria in electronegative gases
The breakdown mechanism could not be easily established based on the mechanism of Townsend ionization in electronegative gases. Therefore, unlike equation 2.4, the effective ionization α coefficient for electronegative gases is given as [Ped’73, Ped’84, Ver’04]
26.3)(0277.0 −=p
E
p
α (2.10)
where ηαα −=
16 Chapter 2: Basics of gas discharge
Pederson modified the Meek’s equation for streamer mechanism to include the effect of electron attachment [Ped’67, Ped’70]. The critical avalanche length dx for a nonattaching gas is written as
kdx
x
=∫0
α
The constant k is 20 for air at an atmospheric pressure [Mee’60].
The conditions for streamer breakdown in SF6 are fulfilled if
kdxdx
xx
=−= ∫∫00
)( ηαα (2.11)
For a distance d of a uniform field
kd =α (2.12)
Rewriting equation 2.10 as
pkEpE −= βα ),( (2.13)
With the limiting value for SF6 for which 0=α is given by
torrcmVk
p
E./118
lim
==
β
Using equations 2.12 and 2.13, the breakdown voltage bV for a uniform field in SF6 is
given by [Ped’84]
dpp
EVdp
kkdEV sb
lim
0
+=+==
ββ (2.14)
Many authors measured the breakdown voltage against dp value and obtained a linear
relationship given by [Kar’72, Ped’73, Ped’84]
).
118380(
cmtorr
dpVb += (2.15)
Comparing equations 2.10, 2.13, 2.14 and 2.15
53.100 == Vk β
Evaluation of k is performed with experimental datas for ),( pEα and )( dpVb . Harrower
et al has used 12=k in calculation of critical volume for corona stabilized switches
[Ver’04]. In SF6 gas, the electric field has to be maintained at limEE ≥ in the streamer

Chapter 2: Basics of gas discharge 17
column in order to maintain conductivity while the streamer is propagating. This is not the case for air. Due to the lower attachment coefficient in air, electrons are not lost rapidly if limEE ≤ . For example, in air, the attachment time constant is ~100 ns at E = 10 kV/cm
and is similar to the propagation time of 100 ns. On the other hand, for SF6, the attachment time constant is ~0.06 ns at just near limE , which is the electric field in the streamer channel
[Mor’97]. Thus, the attachment dominates strongly the dynamics of streamer propagation in SF6 gas.
2.4 Types of DC discharges
In order to make gases electrically conducting, a sufficient number of charge carriers have to be generated. Although there are already, a certain number of charge carriers present at room temperature (typically, 106 electrons/m3 in atmospheric air) this number is by far too small to produce a measurable electrical conductivity. This small number of charge carriers is responsible for electric breakdown of the gas gap and depends on the process illustrated in Appendix: Table C. The circuit to which the voltage is applied is the one depicted in Figure 2- 7. When a voltage is applied to the circuit, the gap voltage gapV can be calculated
as
Cgap RIVV −= 0
where 0V is the applied voltage, CR is the ballast resistor (or load line), I is the circuit
current.
Figure 2- 7: A simple circuit for discharge
experiments. 0V : high voltage source,
CR : ballast resistor, gapR : spark gap
resistance, I : current meter.
Breakdown of the originally non–conducting gas establish a conducting path between the electrodes. Passing of electric current through the electrode gap leads to an array of phenomena known as gaseous discharge. In such gaseous discharge, a more or less electrically conducting plasma is generated, which consists of a mixture of electrons, ions, and neutral particles. The composition and distribution of plasma between the electrodes is a function of existing discharge mode and other discharge parameters. Figure 2- 8 shows schematically the various types of discharge in the electrode gap through the IV − characteristic of the circuit with a fixed voltage source 0V . After the breakdown, the current
I will take the value determined by the sum of the ballast and gap resistances gapC RR + .
The current increases and the gap voltage decreases along the load line. Depending on the IV − characteristic, the applied voltage V0 and the load line CR may cross the curve at

18 Chapter 2: Basics of gas discharge
several points. Then the discharge is not stable and changes randomly. Using higher ballast resistances, the load line becomes steeper.
Figure 2- 8: Voltage and current characteristics of the gas discharge [Rai’97, Rot’95].
2.4.1 Townsend discharge
The curve A to E is called the dark discharge (except corona discharge) because the discharge remains invisible to the eye. The region between A and B is the background ionization regime in which the voltage sweeps the ions and electrons created by cosmic rays and other background radiation. In the saturation regime of B and C, all of the ions and electrons produced by the background radiation are removed from the discharge. The region C to E is called the Townsend regime. In this regime, the discharge is self-sustained by applying the ignition potential igV to the electrode gap. The resistance CR is so high
that the circuit can supply only an extremely weak current. The electron and ion densities are negligible and the space charge is so small that the external field is not distorted. This voltage ensures the stationary reproduction of electrons ejected from the cathode and pulled to the anode. The current is usually between 10-10–10-5 Amp. The number of charges in the gap is to the greatest part determined by impact ionization. However, the discharge is dark because the ionization is so small that the gas emits no appreciable light.
The current range for the horizontal line C to E depends on the emission area, the surface area where field strength is similar on the electrode gap. The voltage across the electrodes begins to decrease after a certain current is reached at point E. The electrode surface with small area produces short range of current in the Townsend discharge. Then an appropriate choice of ballast resistance and voltage operation is difficult in the Townsend regime.

Chapter 2: Basics of gas discharge 19
2.4.2 Glow discharge
The main distinction of the glow discharge from the dark discharge lies in a non-uniform distribution of the potential difference applied across the electrode gap. The glow discharge can be divided into several sub–categories: subnormal, normal, and abnormal. The transition between the dark and glow discharge region corresponds to subnormal. There is no significant current change and the cathode thickness layer for the self–sustained discharge is higher than the normal regime.
Normal glow discharge
The segment of the IV − curve, F–G, corresponds to the so–called normal glow discharge. The remarkable property of the normal discharge is the current density at the cathode remains unchanged as the discharge current is varied. What changes is the area through which the current flows. When CR decreases (or increases), the luminous current spot on
the cathode surface contracts (or expands).
Figure 2- 9 shows a typical glow discharge region, which by itself is non-uniform in nature [Eng’94, Rai’95]. In a glow discharge, the cold cathode emits electrons due to secondary emission mostly by positive ion bombardment. The normal glow discharge unlike the Townsend or arc discharge is characterized by distinct region with large variation in the light intensity, plasma potential, electric field and distribution of various charge densities (electrons and ions) [Vit’87, Eng’94, Mee’53]. A distinctive feature of this discharge is a layer of large positive space charge at the cathode, with a strong field at the surface and considerable potential drop of a few hundreds of volts [Rai’97]. This region is known as the cathode fall. The cathode fall can be defined not by light emission but also by the characteristics of electric field distribution. The cathode fall with high electric field accelerates electrons to energies high enough to produce ionization and subsequent avalanche. If the inter electrode separation is large enough, an electrically neutral plasma region with fairly weak field is formed between the cathode layer and anode. Its relatively homogeneous part is called positive column. It is separated from the anode by the anode fall.
The distance from the cathode to characteristic points are dictated by the mean free
paths, eλ depending on the pressure i.e., 1−pe αλ . As the pressure increases, all the layers
become thinner and shift closer to the cathode. An elevated pressure causes the column to contract to the axis, while at low pressures the cross section of the tube is filled with the column in a diffuse manner. If the electrodes are moved closer at constant pressure, the positive column is shortened. As the electrodes come still closer, the column disappears, then the Faraday space and finally the negative glow vanishes. The cathode fall is vital for the glow discharge. If the distance is insufficient for the formation of the cathode layer, the glow discharge cannot be ignited.
The anode fall is defined as the voltage between the anode and the extrapolated value of the linear potential gradient of the positive column to the anode. The anode fall has a negative space charge due to electrons traveling from the positive column to the anode. The region has a higher electric field than the positive column and hence pulls electrons out of it. The

20 Chapter 2: Basics of gas discharge
multiplication of electrons is three orders of magnitude smaller than the number of electrons produced in the cathode layer. Consequently, the anode fall is much lower than the cathode fall. The voltage of the anode fall increases with increasing current, and decreases with increasing pressure.
Obstructed discharge
When the distance between inter electrode reduced below the cathode fall region, the discharge goes out unless the voltage is increased. This discharge is sometimes said to be obstructed. Roughly speaking, these conditions correspond to the left hand branch of the Paschen curve, where minVV > . The inter electrode separation is insufficient for normal
multiplication, so that voltage has to be raised in comparison with the normal value. If this is not possible, the discharge is extinguished.
Abnormal discharge
After no more free surface is left on the cathode during normal glow at point G (in Figure 2- 8), the current is increased by increasing the voltage. This extracts more electrons from unit surface area and hence the cathode current density must grow. This discharge is said to be abnormal. It corresponds to the climbing section G–H of the IV − curve. Typically, a cathode fall of several kilovolts and current densities of order 10–102 Amp/cm2 result in an intense heating of the cathode and transition to an arc discharge.
High-pressure glow discharge
At higher pressures, the discharge takes apparently different forms for different parts of the characteristic IV − curve. Corona discharges are equivalent in certain of their aspects to the Townsend discharges and spark may replace it depending on the circuit condition. The arc is still the ultimate form of discharge if the external circuit is capable of sustaining it. The means by which this state is reached in a gas at ~ 1 atm. is not always clear. The glow to arc transitions, and sparks as preliminary stages of the discharge has not yet been fully assessed.
If the gas pressure in a glow discharge is increased, the cathode current density increases as p
2, whilst the thickness of the cathode fall region decreases as 1/p. The energy transferred per unit volume of the cathode fall region thus increases as p
3. The cathode may be so strongly heated at high pressures that the glow may change to an arc with hot cathode spots and an arc positive column.

Chapter 2: Basics of gas discharge 21
Figure 2- 9: Glow discharge in a tube and the distribution of : (a) glow intensity, (b) potential ϕ , (c)
longitudinal field E , (d) electronic and ionic current densities ej and +j , 8e) charging densities
en and +n , and (f) space charge )( enne −= +ρ . [Rai’97]
2.4.3 Arc discharge
There are three typical features, which are characteristic for arcs and not found in other discharge modes: low cathode fall, relative high current density and high luminosity. The arc discharge is as a rule, self–sustaining, with a relatively low cathode potential of about 10 V, comparable to the ionization or excitation potential of atoms. This characteristic distinguishes the arc discharge from the glow discharge, in which the cathode fall is hundreds of volts. The small cathode fall results from cathode emission mechanisms that differ from those in the glow discharge. These mechanisms are capable of supplying a greater electron current from the cathode, nearly equal to the total discharge current. This factor eliminates the need for considerable amplification of the electron current, which is the function fulfilled by the high cathode fall in glow discharges. Arc cathode emits

22 Chapter 2: Basics of gas discharge
electrons as a result of thermionic, field electron, and thermionic field emission depending on the electrode material.
The arc discharge is characterized by large currents, 1–105 Amp, much greater than the typical currents of glow discharge, 10-4–10-1 Amp. The cathode current density is also greater than in glow discharges. It may be 100 Amp/cm2 and can go up to some tens of 106 Amp/cm2. Arc cathodes receive large amount of energy from the current and reach high temperature, either over the entire cathode area or just locally, usually for short time intervals. The cathodes suffer vaporization. The emission spectrum of the cathode region of a glow discharge coincides with the spectrum of the gas in which the discharge burns, but arc spectra show the lines of vapor of the electrode material. The luminosity of the arc column is very high compared to other discharge modes and finds many applications in the illumination field.
The dominating process responsible for ionization in the arc column is due to electron impact. The field strength in the arc column in the case of high-pressure arcs (typically p >10 kPa) is by far insufficient for an electron to accumulate enough kinetic energy over a
mean free path to make an ionizing collision.
ie VE ⟨⟨λ
In this inequality, it is assumed that the electron travels in the field direction, accumulating the maximum possible energy from the electric field. Charge carrier production in this situation must be accomplished by thermal ionization rather than field ionization. Electrons in the tail of the Maxwellian distribution possess sufficient energy for making ionizing collisions.
2.4.3.1 Spark discharge
The spark discharge occurs at voltage above the threshold breakdown level at a pressure of atmospheric and above [Mee’53, Rai’97]. The discharge is a rapid transient process such as lightning in a giant scale. A spark in a laboratory is a miniature lightning.
A streamer propagates at sufficient high voltage to the electrode and forms conducting path between the electrodes. If the current is low, conductivity will reduce and the discharge will extinguish. If the current is high enough it will heat the gas, decrease its density and increase its conductivity. The maximum growth of current depends on the pulse power circuit employed. The current can be many orders of magnitude higher than the corona. This type of discharge is called the spark. The major difference of the spark and streamer is that the plasma of the spark tends to go to thermal plasma, whereas in the streamer channel the gas remains close to the room temperature. Short discharges create spark, which in fact stop before they are completed into arcs. The sparks tend to develop from points of high field strength, i.e. tips. Such tips are destroyed by sparking. If the energy of the sparks is limited, the circuit or the plasma resistivity will round the tips and the conditioning of the gap is achieved. The violent spark will destroy the site of the high field strength or even destroy the electrodes.
Chapter 2: Basics of gas discharge 23
2.4.4 Corona discharge
In a uniform electric field, a gradual increase in voltage across a gap produces a breakdown of the gap in the form of a spark without any preliminary discharge. On the other hand, if the field is non–uniform, an increase in voltage will first cause a localized discharge in the gas to appear at points with the highest electric field intensity. This form of discharge is called a corona discharge. Corona is a phenomenon characteristic of Townsend dark discharge. The characteristics of corona discharges are the transitory, faintly luminous and audible, glows discerned in a discharge gap at voltages below the sparking value. The corona discharge occurs in the region of high electric field near sharp points, edges, or wires in certain gases of electronegative in nature. The corona discharges exist in several forms, depending on the polarity of the field and the electrode geometrical configurations.
Development of corona discharge
When the currents due to the dark discharge are small so that the field is very little distorted, the field at the cathode CE is quite close to the non-perturbed breakdown
field igE . As the current increases, the field CE deviates from igE more and more. As long
as the cathode fall region is greater than the inter electrode gap distance, igE retains the
same order of magnitude. The current density at which the field and discharge structure are considerably modified and which manifests the beginning of dark to glow transition of discharge is given within an order of magnitude, by the formula [Rai’97]
3
22
2 )(8
)(
)(8
)/)((
Lp
Vp
Lp
pEp
p
j igig
π
µ
π
µ ++=≈
j : current density, µ : mobility, p : pressure, igE : field strength, L : inter–electrode
distance.
The field must be inhomogeneous for a corona to develop, so that its strength is high enough to cause ionization near the stressed electrode but not near the counter electrode. The mechanism of multiplication of electrons is essentially dependent on the polarity of the electrode. If the stressed electrode is anode, secondary photo processes in the gas around the electrode ensure the reproduction of electrons. If the stressed electrode is cathode then avalanche multiplication takes place. The secondary process is the emission from the cathode and, possibly, photoionization in the bulk of the gas (see Appendix: Table C).
Negative Corona
At the onset type, the space at the cathode, where the field strength is high has the main electron avalanche occurring in the ionization zone. The primary electrons for the avalanche are the field emission from electrodes. This electron avalanche propagates through impact ionization of the gas molecules. At far way from the cathode, in electronegative gases, an electron finds itself in a very weak field. The multiplication of the avalanche is suppressed, and the current decays.

24 Chapter 2: Basics of gas discharge
The positive ions created due to electron avalanche at some distances from the cathode remain practically stationary and lead to a strong formation of positive space charge. This space charge formation rapidly increases the initial ionization. The electrons proceed out into the gap beyond the positive space charge. They transform into negative ions by attachment and thus build up a slow moving cloud of negative ion space charge. The positive ion movement in time increases its own strength with the increased applied field. This action, together with the influence of the negative ion space charge, reduces the effective field near the cathode. This leads to the discharge being quenched, if the field is not strong enough.
Positive Corona
The onset level exists in a small volume of space at anode where the field strength is sufficient to maintain the electron avalanche by ionization. The primary electrons for the avalanche are produced by negative ion detachment. At the head of the avalanche, the electron density grows to a critical size. Further electron and positive ions grows in space through photoionization. The net space charge due to these ionic species decreases the effective electric field of the gap (the detail is given in § 3.1.2.2, page 32). If the cathode is at far away, it does not participate in the multiplication because of the weak field. The action of the positive space charge together with the negative ion formation will quench the discharge if the field is not strong enough.
Leader mechanism
The excitation and recombination processes within the avalanche(s) supply photionizing quanta that trigger streamers. The growth of the corona eventually comes to a halt when the propagation conditions at the streamer tips cease to be fulfilled. Two major processes occur in the corona remnants. Firstly, a streamer channel, having received energy input during the corona propagation phase, expands thermally. Secondly, the positive and negative ions drift apart in the electrical field and form space charge filaments. Both processes become the origin of leader inception.
If a sufficient number of streamers fed their energy into a common one then the latter receives an energy input that causes thermal expansion and a corresponding reduction of the gas density. This in turn reduces the electric field. Ionization then restarts and creates a conducting channel, which becomes a leader section. The other mechanism is related to ion drift. Ions of different polarity drift apart and create space charge filaments, which locally enhance the field. This increases field distortion makes the process unstable and eventually produce a conducting channel, which forms the leader section.

Chapter 3: Breakdown of a high pressure spark gap
25
Chapter 3: Breakdown of a high pressure
spark gap
Experimental study of spark discharge in gaseous gap has a long history [Mee’40, Mee’53, Kha’90, Rai’97, Sch’90]. The basic knowledge over the past several years has been the systematic acquisition of the relevant fundamental process and development, and the resultant understanding of discharge phenomena and characteristics from basic principles. Our choice for the spark gap as the FSD is because of its spectacular performance in the recent times. Our study involves a self-breakdown gas gap with a configuration of two electrodes separated by an insulating gas medium. The electrical breakdown of the gas, brought about by various processes of ionization and other discharges in gaseous medium. In this chapter, we will discuss some of the basic physical processes, which considerably aided our understanding of gaseous dielectrics and their electrical insulation properties in breakdown processes. Some terminologies specific to switches and basic mechanisms responsible for the breakdown and re–breakdown of the electrode gap are described here. Apart from these, we discuss several theoretical models, which fared with many experimental datas. They consider the closure phase (‘resistive phase’ in spark gap terminology) of the switch as a function of time.
3.1 Fundamentals of a closing switch
Ionization processes in the inter–electrode space and the secondary electron emissions from the cathode cause rapid increase of the current. This rapid transformation of current produces a non–self–sustaining discharge to some form of self–sustaining discharge. This phenomenon is known as electrical breakdown. Electrical breakdown in a gas is a rapid sequence of irreversible events, which quickly lead to a transition of the gas from its ‘normal’ insulating state (conductivity ~ 10-14 Ω-1m-1) to high conducting state (e.g., over 14 orders of magnitude larger for the transition to an arc discharge). Gas filled spark gaps employ high or atmospheric pressure gases such as air, nitrogen, hydrogen and SF6. The voltage standoff capabilities of the switch are determined by the breakdown characteristics of the dielectric and the field emission characteristics of the separated electrodes. For high-pressure gas switches, breakdown of the bulk dielectric medium is usually close to but before the field emission from electrodes becomes a problem.

26 Chapter 3: Breakdown of a high pressure spark gap
One of the desirable operating characteristics such as voltage & current relationship pertinent to a closing switch is shown in Figure 3- 1 [Chr’87]. The efficient operation of the closing switch requires a gaseous medium with a large breakdown strength bV , extremely
small forward voltage drop or low conduction voltage FV , and a short formative time lag or
turn–on time ( bCf τττ −= ). The switch is initially opened (non–conducting) at time bττ < .
At this stage, the voltage bV applied between the electrodes of the spark gap is high in the
ambient temperature T . When the switch closes (start conducting) at time bττ = , the
voltage )(tV drops and the current )(ti increases. This is referred to be as the breakdown
phase or turn–on time or closure phase. The voltage FV across the two electrodes during
the conducting stage is much lower than bV depending on the degree of ionization. The gas
temperature is very high during this stage. It is highly desirable that such switches should close quickly and with a minimum energy loss. Christophorou has presented the efficiency
ffE of such a switch by [Chr’87]
2)/1( bFff VVE −=
To improve the efficiency of the switch, the breakdown voltage bV or the breakdown
strength must be large, the forward voltage drop, FV or resistivity of the switch gap during
conduction must be small, and fτ of very short duration.
Figure 3- 1: Voltage and current versus time in a spark gap closing switch [Chr’87].
A sufficient energy must be available to accelerate the charge carriers within the gap to establish and sustain ionization and conduction. When the resistance of conducting channel (s) becomes sufficiently low, the impedance of the switch begins to be dominated by the inductance of the physical arrangement (geometry) and the dimension of the conducting channel (s). This is referred to be as the inductive phase and can effect a major limitation on the rate of switch closure dtdI / . The switch voltage in the “on” state (forward drop) is important in determining overall switch efficiency. For most switches, complex kinetic processes rather than time determine the forward conduction voltage.

Chapter 3: Breakdown of a high pressure spark gap
27
In general, the formative time is determined by the pre–breakdown stage of the insulating gas, whereas dtdI / is determined by a number of factors including the dynamics of the final conducting state, the geometry of the switch, and possible external constraints. An appropriate selection of the gaseous medium is required for optimal performance of the spark gap with following properties:
Large hold–off voltage bV during open condition
• Large attachment rate constant )(εak or cross section )(εσ is required at
high E to prevent early breakdown and leakage current, where )(ε means a
function of energy.
• Strong electron attachment is required at low gas temperature, i.e., large )(εak
or )(εσ at low T (Figure 3- 4 and Appendix: Figure D).
Low forward voltage drop FV during conduction
• Conducting stage needs a high electron drift velocity dv at low E , means
maxima in conductivity.
• There should be no electron attachment at low E . That means negligible )(εak
or )(εσ at high temperature of the gas.
• This stage needs a large rate of ionization.
Short fτ during commutation
• A large change in effective ionization coefficient α is required with respect to change in E (Appendix: Figure C). The steeper the increase in change the
better it is, because the lower would be fτ and consequently, the faster the
transition to the arc.
3.1.1 Electrical breakdown in a gas gap
The recovery time generally refers to the time for the recovery of dielectric properties of the plasma gap so that the voltage can be reapplied to it at some rate ( dtdV / ). The
corresponding re–breakdown voltage is referred to be the recovery voltage. The recovery voltage of spark gaps that are operated at the high PRR has typically been below the DC holdoff voltage. Most plasma gaps require the concept of recombination and attachment of electrons in the recovery processes. The recovery processes are functions of the plasma kinetic characteristics of the conducting medium; i.e., charge density, mobility, temperature, recombination, attachment and other cross sections, mean free paths, externally applied fields, etc. Only after a finite delay, the recovery phase will progress to a

28 Chapter 3: Breakdown of a high pressure spark gap
point that a certain voltage can be withstood. This leads to the recovery characteristics that limit the PRR of the switch operation. If a certain rate of reapplication of voltage is exceeded, then there is a high probability that a conducting state will be reestablished.
In many cases, recombination and attachment may occur rapidly but the gas is then left in a highly heated state. Therefore, low gas density regions may persist (equation 2.1). It means the mean free path of stray charges is much higher and sudden reapplication of voltage may initiate an avalanche. Thus, the gas should not only be deionized but also be cooled and homogenized to allow full voltage recovery. This is the primary reason why gas flow is employed in many situations. Some switches may require little or no flow if the electrode gap geometry or operating conditions result in sufficient cooling and reduced energy deposition. At very high pressures, the recovery processes are such that the recovery time may decrease significantly because, in part, of intense cooling of the arc plasma.
Time history of breakdown behavior
The self-breakdown characteristics of a gas gap are dependent upon many parameters, including the duration, which the gap has been exposed to the applied voltage. The important time intervals associated with the pulsed charged spark gap are illustrated in Figure 3- 2 [Sch’90]:
1) The time required to raise the gap voltage to the self-breakdown voltage sbV is the
charging time Cτ .
2) The time lapse between the self–breakdown voltage sbV and the application of the
voltage ovV for the appearance of a suitably located initiatory electron in the
electrically stressed system is known as the statistical delay time sdτ .
3) The time interval after the statistical delay time to the onset of breakdown is related to streamer formation sfτ .
4) The time required for the gap closure through heating of the electrons is the column heating time chτ .
The performance of the spark gap involves several parameters that must be optimized for particular applications. Some of these parameters include the breakdown voltage for a given pressure and electrode spacing i.e. NE / , selection of a gas type, gas pressure, reduction of the resistive phase time or conducting channel formation time chτ , minimization of
electrode erosion for reliable operation and reduction of spark gap inductance for low rise time of the output pulse waveform. Two general operational categories require slightly different design approaches for a self-breakdown gas gap. For gas gaps that are required to operate at a relatively constant voltage without breaking down, until an overvoltage occurs, the Paschen curve is the criterion of operation. For gas gaps that are required to breakdown at a specific time/or voltage during a voltage transient, the spacing and geometry selection are the criteria of operation.

Chapter 3: Breakdown of a high pressure spark gap
29
Figure 3- 2: Illustration of pulsed charged and self-breakdown gas gap time scales [Sch’90].
The design objectives and goals of high power switches require a broad range of characteristics. These characteristics can be grouped into those relating to electrical capabilities of the switch and those relating to its physical, operational and other features. For instance, to carry high current or large amount of charge transfer, to withstand very high voltage, to provide very reliable and long life operation and precise triggering are reflected in the choice of specific design characteristics. Maintainability, ease of installation, weight and volume, and cost also dominate the choice of switches and determine their design. High current and large amount of charge transfer can be handled by forcing the discharge to move along the electrode surface, while reducing electrode erosion by spreading the arc heat over a large electrode area. Uniform field geometries can be made to be very durable and long-lived, but the low field enhancement introduces slower closure and usually unacceptable repeatability in terms of closure (jitter) time. The closure time of a point plane gap is fast, but with unacceptable voltage hold–off, which means a pre–breakdown behavior is very likely.
3.1.2 Essential characteristics in SF6 gas discharge
Of the four generic insulating media (solid, liquid, gas, and vacuum), specialized gases like SF6 or mixture of SF6 with nitrogen offer distinct advantages including a very high dielectric strength [Chr’90]. One of the reasons being these molecules have effective electron absorbents that rapidly attach electrons to form negative ions and are stable against detachment [Feh’70]. SF6 forms a stable system when an electron is added to the molecule or to its dissociative products to from negative ions. For such gases, the electron attachment coefficient is significant and the probability of negative ions formation is high enough. Detailed cross sections for attachment of SF6 are shown in Figure 3- 3. The plot illustrates a large range of cross sections energy for attachment.

30 Chapter 3: Breakdown of a high pressure spark gap
The negative ion species formed in SF6 favors the existence of resonance capture of electrons (Appendix: Figure D) [Edel’62].
−− →→+ 6*
66 )( SFSFSFe
The auto detachment lifetime of the (SF6-)* due to direct electron capture of low energy
electrons by SF6 is sufficiently great (~10 µs to 10 ms) [Feh’70]. This ion is efficiently stabilized depending on subsequent collisions with other neutrals usually under pressure conditions. There are several other resonant states, whose lifetime is so short that they are not observed in the mass spectrometer [Edel’62].
FnSFSF n )6()( *6 −+→ −− , 3,4,5=n ,2
These products are energy dependent of the captured electrons [Edel’62, Kli’79]. At very low energy (< 0.2 eV) of electrons, the principle negative ions are SF6
- and SF5-. The slight
high energy (> 0.2 eV) electrons favor SF5- (Figure 3- 4 and Appendix: Figure B). Further
high energy (<15 eV) electrons favor SF2- and F- (Figure 3- 4).
The concentration of negative ions in SF6 insulated systems is estimated to be ~104 cm-3 in ambient condition due to the background of cosmic and terrestrial radiation [Chr’90]. It seems that in electrically stressed electronegative gases the major source of breakdown, initiating free electron, is electron detachment from these negative ions. The detachment occurs with highest probability in the vicinity of positively stressed electrodes usually under non–uniform field conditions. The detachment process is mostly collisional.
eBABA ++→+−
eAB +→
The velocities of −A and B under field free conditions are too small for collisional
detachment. The shift in the velocity distribution of the negative ions to higher velocity under an applied field may result in significant collisional detachment. The negative species involving F-, SF5
-, and SF6- in SF6 with high electron energy and low cross sections of
formation has the highest electron detachment rate in the applied electric field (see Figure 3- 4).
Although secondary ionization processes are responsible for the breakdown phase (formative time), it depends on the particular secondary processes (Appendix: Table C). For example, if positive ion impact on the cathode is the most important mechanism of electron generation, fτ is inversely proportional to the positive ion drift speed and is of the order of
~ 10-5 s for a few centimeters of gap distance. In general, the long fτ (~10-1 to 10-7 s),
typical of gases under small overvoltages ( 2.1/ ≤sbVV ), can be accounted for by the
Townsend steady–state theory, while the short fτ (≤ 10-9 s), in high overvoltage
( 2.1/ ≥sbVV ) systems, may be accounted by several non–steady-state descriptions. In
particular, at moderate sbVV / of ~1.2, the streamer theory has had considerable success in
interpreting breakdown phenomena with short fτ .

Chapter 3: Breakdown of a high pressure spark gap
31
Figure 3- 3: Electron–SF6 cross sections vs. electron energy. Symbols are Qeffm –effective
momentum transfer; Qa (SF6-, SF5
-, SF4-, F2
-, F-) –electron attachment; Qvib –vibrational excitation; Qi
o –ionization; Qjx (j = 1,2,3) –electronic excitation. The datas are taken from Phelps et al [Phe’79].
3.1.2.1 Dielectric recovery properties
Many physical processes affect the dielectric properties of gases. These involve electrons, positive and negative ions, excited and unexcited atoms and molecules, and photon interactions with the gas and with the electrodes. The principle physical processes associated with the gas are listed in Appendix: Table B and Table C. The majority of these processes affect the dielectric behavior of the gas directly or indirectly by their effect on the number density and energy of the free electrons, which are present in the electrically stressed system. While electron impact ionization processes are non resonant and they extend over a wide energy range above threshold, electron attachment processes are inherently resonant processes occurring over limited energy ranges typically below ~ 20 eV (Figure 3- 4). The effect of electron attachment on the properties of gaseous dielectrics is profound.

32 Chapter 3: Breakdown of a high pressure spark gap
Figure 3- 4: Cross sections for the various attachment and detachment processes in SF6 leading to the indicated ions at room temperature. Sum (…..) suggests the total cross sections [Kli’79, Chr’00].
Knowledge on the physical processes (in Appendix: Table B and Table C) can be employed to select gaseous media with particular properties and to optimize their dielectric behavior. In the presence of an electron attaching gas, the free electrons may be effectively prevented from initiating breakdown by being attached to (captured by) the gas molecules forming negative ions. The total electron attachment cross sections for SF6 and for many other electronegative gas dielectrics are large only at low energies. Only these very low energy electrons can be removed efficiently from the dielectric by attachment. For a strongly electron attaching gas such as SF6 at atmospheric pressures, the mean capture time ≤ 10-11 s and the electron energy relaxation time ~ 10-12 s are very much shorter than the formative time [Chr’90]. Therefore, electrons are removed in the dielectric by attachment via the low energy tail of the electron energy distribution. The distribution itself relaxes quickly to its steady state by feeding the depleted low energy tail from the higher energies. The repetitive depletion of the low energy electrons does not alter the shape of the energy distribution from its steady one, but decreases the electron number density over the entire energy range.
As far as the primary electron molecule interactions are concerned, the dielectric mixture of two or more gases provide the best effective combination of electron attaching, ionizing (electron impact) and electron slowing down properties. Of practical significance are mixtures of the strongly electron attaching gases with abundant, and inexpensive buffer gases (e.g., nitrogen). The buffer gases scatter electrons into the energy range in which the electronegative gases capture electrons most efficiently.
The ability of a gaseous medium to switch large externally sustained currents is well suited for fast, high power repetitive closing switches in the pulsed power application. The principle advantages of these switches are rapid termination of discharge once the external
eV

Chapter 3: Breakdown of a high pressure spark gap
33
energy source is removed. Other advantages include low inductance, high power handling capacity, and good recovery characteristics (reusability).
In order to quench arcs, the insulating gas must capture charge carriers (electrons), absorb the electron energy and lower the arc temperature. The very high cross sectional area of SF6 molecules and the high electron affinity of fluorine atoms are the fundamental reasons that it is such an effective arc quenching gas. Beside this, SF6 gas has superior heat transfer properties compared to several other gases such as air [Kou’03]. These properties are the specific heat, the thermal conductivity due to convection and viscosity. These thermo–physical properties are responsible for a more effective and faster cooling of the arc column than that of other gases.
3.1.2.2 Corona stabilization phenomenon
The phenomenon of corona-stabilized breakdown occurs in highly non–uniform field geometries in electronegative gases [Har’99, Kou’99]. Under the application of a slowly rising or DC charging voltage, there is a gas pressure range where the breakdown is preceded by a corona discharge, which is confined to the stressed electrode (Appendix: Figure A). This discharge, which takes a finite time to develop, surrounds and shields the highly stressed electrode and inhibits premature breakdown. The space charge around the stressed electrode as shown in Figure 3- 5 literally decouples it from the plane electrode, allowing time for the gas in the inter–electrode volume to recombine (de–ionize) and to recover the neutral gas density. As the applied voltage increases, the electric field at the stressed electrode enhances. Accordingly, an increasing number of ions will move to the outer region and build up a space charge cloud, which reduces the electric field in front of the protrusion. Therefore, further ionization processes are stopped and thus an increased voltage level is needed to initiate the final breakdown. Breakdown can only occur when a sufficient space charge has been created to drift in the low field region. The critical field necessary for this to happen is 89.6 kV/cm at atmospheric pressure. The upper curve, indicating Vb in Figure 3- 6, is the recovery voltage at which this breakdown occurs. The process of space–charge formation, which is time dependent, therefore, allows voltage recovery to take place.
The corona inception or stabilization depends on many factors including gas type and gas pressure, gas mixture as well as field non–uniformity. Below the critical pressure Pc, the corona inception voltage Vcr and the Vb differ as shown in Figure 3- 6. Below the characteristic maximum pressure Pm, breakdown of the plasma gap increases with pressure. That means the voltage–pressure ( pV − ) characteristic curve has a positive trend. The
corona stabilization effect ceases at the higher pressure above Pc. There is a certain transition of the maximum breakdown voltage at Pm to the reduced breakdown voltage at Pc, which produces a negative dpdV / region of the breakdown voltage curve.
Characteristic pressures Pm and Pc roughly define the region of streamer and leader induced breakdown. Below Pm, the voltage collapse is due mainly to a streamer mechanism.

34 Chapter 3: Breakdown of a high pressure spark gap
Figure 3- 5: Space charge development and field distribution at the tip of a protrusion [Hin’00, Hin’01].
3.1.2.3 Limiting factor for corona inception
One of the factors that affect the process of corona stabilization in the operation of the high PRR switch is the critical volume [Har’99]. The critical volume Volcr is a region within the gas, close to the highly stressed electrode, where the presence of an electron will lead to an electron avalanche. Volcr attains a critical size for the corona inception. The critical region is bounded by two surfaces. According to Hinterholzer et al, a formation of positive space–charge ahead of the Volcr will occur if the velocity of the positive ions Vion exceeds the growth velocity of the critical volume vvol [Hin’01]. This is taken as a criterion for the space–charge formation and the corona–stabilization. The inner surface, close to the highly stressed electrode, is where an initiatory electron has just sufficient distance to accelerate and form an electron avalanche with a critical size. The outer surface is given by the boundary of 0=α . These two surfaces are determined by the geometry of the switch, the
applied voltage and the gas pressure. The inner boundary for the critical field can be calculated from the streamer criterion.
∫ −=d
drpBrEAK0
)..)(.(
where d is the distance from the highly stressed protrusions required to produce K=10.5 [Ped’84]. A & B are 27.8 kV-1 and 2460(bar cm)-1 respectively, p is the pressure & E(r) is the field in the direction of interest. The equation supports the fact that smaller the protrusion surface area, higher the E(r), which means a smaller radius for the critical volume. Therefore, the threshold voltage for the corona inception criterion is given by

Chapter 3: Breakdown of a high pressure spark gap
35
∫ −=crr
crcr drErEV0
).)((
Theoretically, at threshold voltage the “initiation volume” should reduce to a point on the axis of the protruded electrode. However, Hinterholzer et al have mentioned this critical voltage value of approximately 0.7 kV for streamer inception in SF6 [Hin’01]. Boeck separately has mentioned this critical voltage value of some hundred volts [Boe’03]. Apart from these, there is a limitation in the maximum pressure for the corona-inception below a certain critical pressure [Appendix: Figure A, Macg’93, Mac’95, Mac’97, Kou’03]. As the pressure increases, outer boundary moves closer to the highly stressed electrode. Hence, the critical volume due to the space charge has no significant effect on the corona stabilization (see Figure 3- 6). The increase of the electric field tends to breakdown the spark gap before the corona effect establishes over the protruded electrodes.
Figure 3- 6: Schematic illustration of the breakdown characteristics: Vb is the breakdown voltage, Vr
is the corona onset voltage, and Pm and Pc are the gas pressure corresponding to the maximum of the characteristic and critical pressure [Har’99].
3.2 Different models for conducting channel resistance
The gap breakdown time or the closure phase, bdt of a plasma gap is usually described as
the sum of three previously mentioned phases illustrated in Figure 3- 2. The closure phase is usually the channel heating time during which resistance of the plasma gap changes widely from several tens of megaohms to a few milliohms. Therefore, it is also referred to
V
P
Vcr
Vb
Pc Pm

36 Chapter 3: Breakdown of a high pressure spark gap
be as the resistive phase of the plasma gap. This phase decides the time dependent conductivity of the plasma gap and hence influence the rise time of the output pulse waveform at the load.
The most important factor in plasma closing switches is the dissipation of energy during the closure phase. The idea for including the time dependent resistive phase of the plasma gap lies not only for better comprehension of gas discharges but also in its application in the development of the pulsed plasmas for the FSD. The resistive phase determines how much energy is deposited in the gap gas medium and electrodes so that reducing and maintaining a small resistive phase time is important in repetitive self–breakdown gas gap. The resistance of the plasma gap is some function of the temporal development of several physical processes including the electron kinetic process. These processes are influenced by many factors, including the electric field and its distortion (enhancement) due to the electrode shape and the shape of the forming discharge, gas or dielectric species, etc. There are several reports on numerical evaluation of theoretical and empirical equations for time dependent resistance of spark model [Bra’58, Car’79, Eng’89, Mar’92, Rom’54, Toe’06, Vla’72 ]. Some of the important time dependent models of spark channel include Toepler’s, Rompe and Weizel, Vlastos, Branginskii, and Sorensen and Ristic model.
3.2.1 Toepler’s model for time dependent resistance
The time dependent arc resistance has been the subject of research by many investigators since the early 1900’s. Toepler proposed an empirical relation between the arc current and resistance of the plasma gap between electrodes [Toe’06]. His theory correlates the discharge parameters particularly the arc length and rising slopes for a given current waveform. We would like to show here the influence of the discharge parameters on the Toepler’s constant. His empirical formula attributes many research applications such as the high pressure GIS (gas insulation switchgear) and spark gaps [Bön’03, Dao’87, Sin’03, Ver’04].
The voltage )(tV across the spark gap changes rapidly during the electrical discharge. The
instantaneous resistance )(tR of the arc channel is given as
)(
)()(
ti
tVtR = 3.1
where )(ti is the current waveform. The current )(ti can be determined through
Townsend’s mechanism. The time dependent carrier n through a gap distance is given as
∫=dtv
o
d
ennα
α represents the number of ionized collisions produced by an electron as it travels a unit distance in the direction of the field with a drift velocity dv . Therefore, the current )(ti is
given as
Chapter 3: Breakdown of a high pressure spark gap
37
∫==dtv
dod
d
evenventiα
)( 3.2
Introducing this in equation 3.1
∫=
dtv
dodven
tVtR
α
)()( 3.3
The arcing voltage with the gap distance d is
∫=d
dxEtV0
)( 3.4
The drift velocity is proportional to electric field given as [Kha’90]
Evd µ= 3.5
Where µ is the mobility in the gas.
Using equations 3.4 – 3.5
∫=
dtv
o
d
een
dtR
αµ
)( Or d
een
tR
tv
o
d∫=
αµ
)(
1
Differentiating the above equation
dk
i
d
even
tRdt
d
T
tv
do
d
=∫
=
α
µ
)(
1
Integrating the above equation, the time dependent resistance is now
∫=
dti
dktR T)( 3.6
Where Tk is the Toepler's constant.
µα
1=Tk 3.7
The equation 3.6 describes the temporal dependence of spark gap resistance due to transient breakdown. The conductivity of the spark is equal to the flow of electric charge times a constant. Both constants α and µ are not only gas type and pressure dependent parameters
[Sin’03] but also they depend on applied voltage (i.e., NE / ) as well as ambient temperature [Chr’00]. Hence, in practice the Toepler’s constant varies in a manner
characteristic of the electrical discharge. Toepler’s constant varies from 3103.0 −× to 3108.0 −× Vs/cm [Toe’26, Vla’69]. There are also reported values of the constant varying
38 Chapter 3: Breakdown of a high pressure spark gap
from 3108.0 −× to 3108 −× Vs/cm [Osm’92]. In a GIS experiment with compressed SF6 –
nitrogen mixture, the constant value below to 4103.0 −× Vs/cm has been reported [Sin’03].
The Toepler’s law has been somehow useful in finding the slope of current rising pulses in some applications [Dao’87]. We show here, the empirical derivation for determining the rise time of a discharge current pulse at the load.
3.2.1.1 Rising slope of current pulse
The input charge across the spark gap for the breakdown voltage bV is bCV , where C is the
spark gap capacitance. Therefore, the time dependent charge across the spark gap during closing is
))(()()( tVVCdttitQ b −== ∫ 3.8
The time dependent discharge current )(ti can be obtained as
dt
tdVC
dt
tdQti
)()()( −== 3.9
Now, rewriting equation 3.1 and using equations 3.6 and 3.8
dt
tdV
tVV
dktitRtu
b
T )(
))(()()()(
−−==
After rearranging and integrating the above equation
∫ ∫ ∫ −=−
−=− dk
t
tVV
tdV
VtV
tdV
VtVVtV
tdV
Tbbbb )(
)(1
)(
)(1
))()((
)(
tdk
VtVVtV
T
b
b −=−−⇒ ))(ln())(ln(
This gives time dependent pulse voltage
tdk
V
b
T
b
e
VtV
+
=
1
)( Or bVtftV )()( = 3.10
where t
dk
V
T
b
e
tf
+
=
1
1)(
Equation 3.10 tells that the time dependent voltage at the time the switch closes, 0=t is
2)( bV
tV =

Chapter 3: Breakdown of a high pressure spark gap
39
Now, the instantaneous charge )(tQout due to the change of voltage )(tV is
bout VtCftCVtQ )()()( == 3.11
The discharge current due to this instantaneous charge using equations 3.2, 3.9, & 3.10 is
dk
tftfCV
tR
tV
dt
dQti
T
bout ))(1)((
)(
)()(
2 −=== 3.12
Using equation 3.7
dk
tftfCV
dt
tdfCV
T
b
b
))(1)(()( 2 −= Or
dk
tftfVb
dt
tdf
T
b ))(1)(()( −= 3.13
Differentiating equation 3.9
22
32 )())(1))((21()())(21()(
dk
tftftfCV
dt
tdf
dk
tfCV
dt
tdi
T
b
T
b −−=
−= 3.14
Differentiating again the above equation and equating to zero gives two roots of )(tf with
)(tf = 0.2113 and 0.7887 corresponds to maximum and minimum respectively [Gan’53].
Therefore, the maximum slope of the current rise time from equation 3.16 is
22
3
22
3
max
1.0~096.0)(
dk
CU
dk
CV
dt
tdi
T
b
T
b=
3.15
In our case, the breakdown voltage across the spark gap of 300 µm is more than 4 kV with the corresponding peak current of more than 30 A at the output impedance. Assuming the
rise time of 1 ns, the Toepler’s constant is less than 4101.2 −× Vs/cm through the system capacitance of 21 pF. However, at the high PRR, the measured breakdown voltage was 700–800 V with the peak current of around 6 Amp. The Toepler’s constant for the rise time
of these pulses below 200 ps was below 6102.5 −× Vs/cm.
3.2.2 Rompe and Weizel model with energy balance
An improvement of the Toepler’s law was suggested by Rompe and Weizel, which included the energy balance of the arc channel [Rom’54, Vla’ 72]. The theory assumes that the spark plasma homogeneously fill out a channel of radius r . The relationship between
the current i and electric field E in the discharge is
etEnrti ee )()( 2 µπ= 3.16

40 Chapter 3: Breakdown of a high pressure spark gap
where en is the electron concentration, eµ is the electron mobility, and e is the electronic
charge.
The power balance in the spark channel satisfy the relationship
dt
tdUtWtStEti
)()()()().( ++= 3.17
S is the radiated power, W is the thermal power and U is the internal energy of the discharge plasma.
Neglecting radiated and thermal power, we have
dt
dUEi =. 3.18
The internal energy includes ionization, vibration, rotation, and excitation, dissociation of molecules, translation energy of atoms, ions etc. Under short period of time and large electric field, Rompe and Weizel brought the equation closure by exclusive view of electron energy. Under further assumption in neglecting vibration, rotation etc, the internal energy of the spark channel is the sum of ionization and translation energy of electrons [Rom’54]
iee eVnrkTnrU22
2
3ππ += 3.19
Where, k is the boltzmann–constant and iV is the ionization energy.
Internal energy and conductivity both are proportional to electron concentration. They are
also proportional to temperature to some extent. Therefore, the conductivity σ was set
proportional to the internal energy.
Up
k
E
i R== σ 3.20
Where, Rk is the constant and p is the atmospheric pressure. This is the chief assumption
made by Rompe and Weizel that the coefficient of proportionality between the conductivity of the plasma in the channel and the internal energy of the discharge channel does not depend on time.
Using equations 3.16, 3.19 and 3.20, Rk is defined as
i
eR
eVkT
e
p
k
+
=
2
3
µ 3.21
Now, we can rewrite from equations 3.18 and 3.20 as

Chapter 3: Breakdown of a high pressure spark gap
41
dt
dUiEi ==
σ
2
. 3.22
Utilizing equation 3.26
dt
d
pkdt
d
pki
RR
22
/2
1
/
σσσ==
Through integration
∫= dtip
kR 22 2σ 3.23
Now, the resistance of the arc channel using equations 3.20 and 3.23 is given as
∫=
dttip
k
dtR
R )(2
)(2
3.24
The value of Rk is 0.5 to 1.0 atm.cm2/V2.sec. The equation has been derived from simple
and plausible model of the spark discharge. There is a similarity with Toepler’s resistance but not identical. The square of the conductivity is proportional to square of current.
3.2.3 Vlastos and Branginskii’s model due to a conducting channel expansion
Rompe and Weizel have suggested the resistance of the spark channel, given in equation 3.24, by assuming the energy used in changing the internal energy of the spark channel. Vlastos proposed that the conductivity of the plasma over the whole discharge gap stayed at some quasi–stationary value the moment of formation of the current–carrying channel and suggested that further changes in the channel resistance were due to the channel expansion only [Vla’72]. According to his theoretical model, the time dependent resistance of the conducting channel is given by
∫=
6.02 )()(
dtik
dtR
V
3.25
where Vk is a constant.
The assumption to obtain the above equation is that the channel plasma is single and fully ionized, the electron and ion temperatures of the ionized channel gas are equal. Furthermore, the formula assumes the time dependent resistance to be inversely proportional to the channel radius r . The experiments are made with thin exploding wires
[Vla’69, Vla’72]. Plotting the left hand side for resistance R against the right hand side of
known values gives a straight-line slope that determines the constant value.
42 Chapter 3: Breakdown of a high pressure spark gap
Branginskii showed that the resistive collapse of the spark gap discharge is governed by the radial expansion of a cylindrical shock wave, which rapidly increases the cross–sectional area of the conducting channel [Bra’58, Hus’99]. Initially, a comparatively narrow current carrying channel is formed in the gas, with high temperature and ionization. Joule heat is released in the channel, which leads to an increase in the pressure and an expansion of the conducting channel. The expansion channel acts like a piston on the remaining gas and produces a shock in the gas. This shock propagates in front of the original piston. The temperature in the vicinity of the shock is much higher than the gas at rest, and the temperature in the channel itself is many times higher than the shock. Consequently, the density of the gas in the channel is very low, and the boundary of the channel acts like a piston. In particular, his model assumes that the electrical conductivity remains constant during channel expansion. Hydrodynamic cooling associated with expansion, together with radiative cooling, are sufficient to keep the pressure, density and temperature of the conducting channel, and therefore its electrical conductivity, approximately constant. The physical processes are ionization of gas only in the channel accompanied by its broadening under the action of the pressure. This action determines the radius of the channel and the concentration of current through the channel.
The resistance of the expansion channel is represented like equation 3.25
)()(
2tr
dtR
πσ= 3.26
where )(tr is given by
∫
= dtIr
3/23
1
02
2 4
σξρπ 3.27
where ξ is related to the specific heat ratioγ ( Vp CC / ) of the gas,
( )
+
−+≅ 2
2
1
1
11 rrr
rK &&&
&γξ
Branginskii assumed for hydrogen, coefficient of resistance constant 9.0=K , 22.1=γ
and 5.4=ξ .
The value of ξ is considered same for different gases. The values for conductivity and
densities for different gases are given elsewhere [Mar’93]. The results from Branginskii rarely fit with experimental datas. The discrepancy between them is related with the assumption in the Branginskii model, which considers a constant conductivity. Practically, the electrical conductivity is a strong function of both the temperature and the density, as shown by Hussey et al in their report, in nitrogen gas [Hus’99].

Chapter 3: Breakdown of a high pressure spark gap
43
3.2.4 3
t Law for resistive phase time by Sorensen and Ristic
Martin proposed an empirical formula for the duration of the resistive phase, given by [Mar’92]
3/10
3/4
2/10 )/(88
ZER
ρρτ = ns 3.28
where ρ is the gas density and 0ρ is the density of air at NTP.
Sorensen and Ristic presented another empirical formula for the resistive phase time in gaseous nitrogen as [Sor’77]
3/10
2/144
ZE
pR =τ 3.29
where p is the pressure in atmosphere. In both case, 0Z is the impedance of the
transmission line in ohms and E is the electric field strength in 10 kV/cm.
The differences between equations 3.28 and 3.29 are the power of E and the numeric constant [Sor’77]. Martin did not mention the dependence of the spark–gap resistance on time albeit both equations gave approximately the same rise time for particular values of electric field. Sorensen and Ristic presented the resistance of the spark gap as a function of time in the following way
3
3/10
2/14102)(
××=
tZE
ptR 3.30
Substituting equation 3.29 in the above equation demonstrate that the resistance of the
spark gap conducting channel, )(tR decreases as 3/1−t in the following manner [Sch’90]
0
3
.23.0)( Zt
tR R
×=
τ 3.31
Equations 3.28 and 3.29 are important in estimating the resistive closure time of the spark gap, and particularly important in determining the electric field enhancement to obtain the desired closure time.

44

Chapter 4: Efficiency of a spark gap operation
45
Chapter 4: Efficiency of a spark gap operation
Conventional plasma-closing switches or spark gaps incur various losses in their repetitive operation such as power consumption in the resistive circuit elements and in the plasma gap. Immediately following the extinction of a discharge, the electrode gap stays enriched in residual charges. Whether these charges can keep the switch in conduction would depend on many factors particularly how quickly the discharge goes into the non-conducting state and the rate at which the voltage builds up across the electrode gap. Since pulsed plasmas generate an output power at the load, the over–all efficiency is an important consideration in the design of the charging circuit scheme and electrode gap geometry. For the sake of simplicity, an equivalent electrical model of the spark gap is introduced to study the physical behavior of pulsed plasmas depending on different circuit schemes in repetitive mode. This includes a resonant charging scheme, which improves the recovery time of the plasma gap tremendously.
4.1 Charging strategy of a loss–free switch
The charging circuit, as shown schematically in Figure 4- 1, consists of a voltage source, a charging element, a load, and a pulse-forming network (e.g., a capacitor). Since the charging circuit influences output characteristics of pulse waveforms at the high PRR, the design of the circuit and the choice of circuit components are of vital importance for the over all pulse operation and efficiency. The important considerations in the design of the circuit are:
• The same amount of energy must be stored for each output pulse waveform
• The charging element must isolate the power supply from the switch during the pulse and immediately after the pulse.
The isolation immediately after the pulse is necessary to allow the gaseous discharge to deionize and return to its non-conducting state. A constant voltage 0V is applied to the
closing switch through a charging resistance CR that limits the current and decouples the

46 Chapter 4: Efficiency of a spark gap operation
switch from the power supply. While the switch remains open, 0V charges the storage
capacitor C . When the voltage across the capacitor CV exceeds the threshold breakdown
voltage, the switch closes and the capacitor discharges through the load. The output load represented by LR is connected in series with C .
Figure 4- 1: A schematic of a charging circuit for a loss free switch.
The time development of voltage CV across the spark gap switch is given as [Sar’’89]
−−= )exp(10
τ
tVVC 4.1
where CRR LC )( +=τ is the time constant of the charging circuit. 0V is the feeding
voltage from the power supply.
If the switch closes at time T after the last firing, then the average output power assuming
a loss free switch is obtained as
220
2
)exp(12
1)(
2
1
−−==
τ
T
T
CV
T
tCVP C
out
where the repetition rate of the switch is T/1 . The average input power from the supply is
∫∫ −==T
O
T
O
in
t
RT
VdtI
T
VP
0
2
0
)exp(τ
Chapter 4: Efficiency of a spark gap operation
47
−−= )exp(1
2
τ
T
T
CVO 4.2
The charging efficiency chη is therefore given by
2
)exp(1
−−
==τ
η
T
P
P
in
out
ch 4.3
Thus, the efficiency of the transferred power at the load can never exceed 50 % for the closing switch.
4.2 Realistic switch model with losses for an open plasma gap
Following the discharge plasma, when the switch is still in the state of conduction, large current can flow through the electrode gap and the circuit. Unless the electrode gap goes into the non–conducting state, the capacitor is not charged again. It is to be noted that the charging current is always greater than the discharge current during the charging period, and the discharge current is always larger than the charging current during the discharge period. In order to ensure the recovery of the electrode gap, the discharge current must be less than the charging current. The simple theory discussed in the previous section is convenient for an ideal switch. However, for a real spark gap switch, there will be some discharge current or a leakage current through the electrode gap before re–breakdown. Therefore, it is better to include the resistance of the electrode gap or an open plasma gap due to flow of the leakage current through it and then to analyze the efficiency. In addition, we can neglect LR , since it is in series with CR and CL RR << .
4.2.1 Single power supply scheme
Figure 4- 2 illustrates an equivalent model of the real spark gap, corresponding to the case, when it is in the open state. Since only the charging process is considered, the output connection is not important and will be considered later. The open plasma gap during re–charging allows a pre–discharge current to flow through it and the circuit. Therefore, the open plasma gap can be represented as equivalent to a resistance dR . The physical
explanation of dR implicates the residual ionization from the previous pulsed discharge
plasma. The residual ionization in turn depends on the gas temperature and the voltage stress.
The feeding voltage from the power supply and the charging resistance determines the feeding current I . The feeding current in turn determines the voltage CV development
across the plasma gap in the manner
∫= dtIC
VC
1 4.4

48 Chapter 4: Efficiency of a spark gap operation
When the feeding current is high, the re–charging time of the plasma gap reduces. It should be noted that if the re–charging time is very small, the plasma gap does not recover completely and closes at smaller value of breakdown voltages. Consequently, the leakage current through the plasma gap increases and hence dR decreases. Therefore, the re–
charging time of the electrode gap is not only determined by CR , but is governed by the
collective resistance of CR and dR .
Figure 4- 2: Equivalent circuit model for a realistic spark gap switch. dR presents the resistance of
the open plasma gap.
The feeding current I under an open–circuit condition is
d
CC
R
V
dt
dVCI += 4.5
Also, COC RIVV −= 4.6
Substituting I in equation 4.5, it yields
CR
V
R
R
CR
V
dt
dV
C
O
d
C
C
CC ++−= )1( 4.7
The equation 4.7 has the form baydx
dy+= ,

Chapter 4: Efficiency of a spark gap operation
49
whose solution is )(1
beya
yax
o −=
This gives
+
+−
+
−=CR
V
R
R
CR
tA
R
R
CRV
C
O
d
C
C
d
C
C
C 1exp
1
4.8
where A is to be solved by the initial condition.
Assuming at 0=t , the voltage across the plasma gap, 0=CV and hence CR
VA
C
O−=
Therefore, the equation 4.8 becomes
−−= )exp(1
τ
tVV satC 4.9
where the saturated voltage satV is
dC
dO
satRR
RVV
+= 4.10
Due to the leakage current, the plasma gap resistance, dR can be determined as
sat
Csat
dVV
RVR
−=
0
4.11
The conventional way to determine the leakage current leakI through dR is
d
C
leakR
VI = 4.12
The time constant τ is defined as
CRR
RRCR
dC
dC
sat+
==τ 4.13
From equations 4.10 and 4.13
CVR
Vsat
C
=τ0
where satR is the effective resistance of the circuit. This resistance takes into account of
both CR and dR .

50 Chapter 4: Efficiency of a spark gap operation
Equation 4.11 illustrates that by increasing the feeding voltage 0V over the saturated
voltage satV , the resistance dR of the open plasma gap decreases. Therefore, the time
constant τ also decreases with the increase of the feeding voltage, and is manifested by the equation 4.13. This allows reducing the re–charging time of the open plasma gap.
The feeding current I for the plasma gap is
C
CO
R
VVI
−=
−−−=⇒ )exp(1
τ
t
R
V
R
VI
C
sat
C
O ,
The average input power for a continuous pulse train with time T between successive switch closures is
∫=T
O
in dttIT
VP
0
)(
−−+
−=
−−+−=
)exp(1
)exp(1)(
20
20
τ
τ
τ
T
T
VC
R
VVV
T
TR
VVVV
R
V
sat
C
sat
C
satO
satO
C
O
4.14
The average output power from the plasma gap, assuming no power is lost during switching, is given as
2
2Cout V
T
CP =
2
2 )exp(12
−−=
τ
TV
T
Csat 4.15
Therefore, the charging efficiency chη due to the repetitive closure of the plasma gap from
equations 4.14 and 4.15 is
−−+
−
−−
==
)exp(1
)exp(12
1
20
20
22
τ
τη
T
T
CV
R
VVV
T
T
CV
P
P
sat
C
sat
sat
in
out
ch or
Chapter 4: Efficiency of a spark gap operation
51
T
VCV
R
VVV
T
CV
P
P
Csat
C
sat
C
in
out
ch
+
−==
02
0
2
2
1
η 4.16
The first term in the denominator:
02
002
0 >+
=−
=dCC
sat
RR
V
R
VVVβ is always positive and hence
%50)exp(12
1
)exp(1)0(
)exp(12
1
2
2
2
<
−−<
−−+>
−−
=τ
τβ
τη
T
T
T
CV
TCV
sat
sat
ch 4.17
There will be an obvious disadvantage using the single power supply scheme. The value of the charging resistance, used for decoupling the power supply from the plasma gap, is very high. Despite this fact, a certain amount of feeding current (see equation 4.4) is necessary for the given PRR. This feeding current is produced at the cost of feeding voltage, which must exceed the threshold breakdown voltage of the spark gap. In this manner, the charging resistance consumes a significant amount of power. Decreasing the value of the charging resistance increases the feeding current for the given feeding voltage through the circuit and again consumes more power. At the high feeding current, the glow and arc probability in the plasma gap also increases. A different approach using a dual-power supply scheme is employed to reduce the feeding voltage below the threshold breakdown voltage of the spark gap. This allows us to decrease the value of the charging resistance to limit the feeding current besides decoupling the power supply and the plasma gap.
4.2.2 Dual–power supply scheme
It is possible in principle to use a dual-power supply scheme in our application. The equivalent model of this circuit scheme is shown in Figure 4- 3. For gas-filled switches, the initial breakdown voltage required to ignite the gap is significantly higher than re–breakdown voltages. This re–breakdown voltage across the plasma gap without initiating another spark can also referred to be as the recovery voltage. The higher voltage supply 1V
charges the plasma gap until self-breakdown voltage is attained. The reverse biased high voltage diode D protects the lower voltage supply 0V . The normal switch operation
has 0VVC < . The charging resistance 1R connected to 1V is nominally three orders of
magnitude higher than CR connected to 0V . The supply voltage 1V continually contributes a
negligible amount of current through the circuit. It behaves more like a pre-ionizer and intends to re–strike the plasma gap should the voltage CV exceed 0V . The lower voltage
supply for 0V is the high power supply, since it stimulates pulsed plasmas at the high PRR
during normal operation and the feeding current from this supply is an order of magnitude

52 Chapter 4: Efficiency of a spark gap operation
higher than that of the voltage supply for 1V . Of course, the recovery voltage of the
plasma gap is below 100 % at the high PRR.
The input current I through the circuit is
−+
−=
1
10
R
VV
R
VVI C
C
C
Substituting this value of current to equation 4.5, a first order differential equation is obtained.
++
++−=
CR
V
CR
VV
RRRCdt
dV
C
C
dC
C
1
10
1
1111
Solving this as earlier for the single power supply, the solution leads to
−−= )exp(1
τ
tVV satC
where
dC
C
sat
RRR
R
V
R
V
V111
1
1
10
++
+
= 4.18
and
dC RRR
C
111
1
++
=τ 4.19
The second term in both numerator and denominator of equation 4.18 is very small and hence can be neglected for simplicity. The equation for satV then become the same as that of
equation 4.10. Therefore, dR and leakI can be obtained in a similar manner as that of
equations 4.11 and 4.12 respectively.
From equations 4.18 and 4.19, we can write
CVR
V
R
Vsat
C
=
+ τ
1
10 4.20
Now, for the dual–power supply scheme
−−−=
−= )exp(100
0τ
t
R
V
R
V
R
VVI
C
sat
CC
C

Chapter 4: Efficiency of a spark gap operation
53
−−−=
−= )exp(1
11
1
1
11
τ
t
R
V
R
V
R
VVI satC
Figure 4- 3: Equivalent circuit model for the open plasma gap using the dual-power supply scheme.
The average input power is defined as
∫∫ +=TT
O
in dtIT
VdtI
T
VP
0
11
0
0
−−−
+++= 1)exp(1
1
10
1
21
20
τ
τ T
TR
V
R
VV
R
V
R
V
C
sat
C
−−+
+−+= )exp(12
1
10
1
21
20
τ
TV
T
C
R
V
R
VV
R
V
R
Vsat
C
sat
C
The average output power assuming the loss free switch is written as
−−== )exp(1
2
1
222
τ
TV
T
CV
T
CP satCout
The total charging efficiency chη in the case of dual–power supply scheme is given as

54 Chapter 4: Efficiency of a spark gap operation
−−+
+−+
−−
==
)exp(1
)exp(12
1
2
1
10
1
21
20
2
2
τ
τη
TV
T
C
R
V
R
VV
R
V
R
V
TV
T
C
P
P
sat
C
sat
C
sat
in
out
ch or
T
VCV
R
V
R
VV
R
V
R
V
T
CV
P
P
Csat
C
sat
C
C
in
out
ch
+
+−+
==
1
10
1
21
20
2
2
1
η 4.21
The first term in the denominator:
+−+=
1
10
1
21
20
R
V
R
VV
R
V
R
V
C
sat
C
β
+
++
+
−+=1
10
1
1
10
1
21
20
111 R
V
R
V
RRR
R
V
R
V
R
V
R
V
C
dC
C
C
( )
011
211
20
2
10 >++
++−=
RRRRRR
RVRVRVV
CdCd
Cd is always positive and hence
( )%50)exp(1
2
1
)exp(10
)exp(12
1
2
2
2
<
−−<
−−+>
−−
=τ
τβ
τη
T
TV
T
C
TV
T
C
sat
sat
ch 4.22
4.2.3 Comparison of different circuit schemes
Now one can compare the single and dual–power supply schemes. In the dual–power supply scheme, the maximum charging efficiency occurs, when 1V has the value
01 VRR
RV
dC
d
+= .
This equation is similar to equation 4.10, except that satV is replaced by 1V . At this
condition, the parameter β has a minimum value:
dC RR
V
+=
20β 4.23

Chapter 4: Efficiency of a spark gap operation
55
This is equivalent to that of the single power supply scheme. It means the use of the dual–power supply scheme does not improve the charging efficiency compared to the single power supply scheme. In the best case for the dual–power supply scheme, β can obtain:
d
C
C RRR
RR
V
++
=
1
1
20β 4.24
In this expression, the single and dual–power supply schemes can be equivalent:
gle
Cdual
C
dual
C RRR
RR sin
1
1 →+
4.25
which corresponds to parallel connection of CR and 1R , and implies CRR ⟩⟩1 .
The dual–power supply scheme has the lowest chη if 0V and CR used are similar to values
used in the single power supply scheme. The maximum chη of the dual–power supply
scheme becomes equal to that of the single power supply scheme (equation 4.25). chη of
the single power supply is limited by equation 4.17. If the resistance of the plasma gap becomes infinite i.e. a hypothetical situation ( ∞→dR ), then the charging efficiency is
maximum ( %50→chη ). An actual plasma gap will of course deviate from this ideal
condition at the high PRR. However, there is an advantage of using the dual–power supply scheme over the single power supply scheme in terms of the reduced 0V . It means 0V of
the main power supply in the dual–mode circuit scheme can be reduced below the threshold breakdown voltage of the dielectric gap.
Now comparing the single and dual–power supply schemes for a realistic plasma gap:
gle
C
dual
C RRsin<
dual
d
gle
d RR <sin (see equation 4.11)
gledual sinββ < (from equations 4.23 and 4.24)
Therefore, the charging efficiency in different power supply schemes is limited as follows:
%50sin ≤≤≤ switchideal
eff
dual
eff
gle
eff ηηη
Finally, the efficiency of the charging voltage across the plasma gap under DC voltage stress, employing resistive isolating element, does not exceed 50 %. Therefore, we explored a resonant charging scheme for further improvement in stimulating pulsed micro plasmas in the gas gap.

56 Chapter 4: Efficiency of a spark gap operation
4.3 DC resonant charging
In an inductive isolating element, the capacitor and inductor form a resonant circuit. The
current is sinusoidal through the charging loop. The time for half the cycle is LCπ .
During the positive cycle of the current, the capacitor acquires a voltage twice the supply voltage. During the negative cycle of the current, the voltage across the spark gap drops back to zero. Therefore, the energy transfer efficiency can be close to 100 %. The losses are resistive losses in the charging inductor.
The voltage build up for the resistive and resonant circuit can be given respectively by the following equations [Bis’98, Bis’01]:
)1()( /0
CRt
resistivecheVtV −=
[ ])cos(1)( 0 wtVtV resonant −= , where the frequency of oscillation, LC
w1
=
The rate of rise of the voltage, by using first order approximation, follows as
CR
V
CR
eV
dt
tdV
chch
CRt
resistivech
0/
0)(≅=
−
4.26
CL
tVtwVwtwV
dt
tdV resonant 0200 )sin(
)(=≅= 4.27
dt
dVdecreases with increase of resistor or inductor values.
Figure 4- 4 shows that for the resonant charging circuit, half of the time interval, cV
exceeds 0V . Adding a resistive element in series with the inductor, the oscillation is damped
at the voltage 0V .
The damped oscillation depends on the value of the resistance. The expression for the frequency of oscillation is then given as [Bro’90]
2
22
4
1
L
R
LCw −= with the exponential decay of
L
R
2=β
Chapter 4: Efficiency of a spark gap operation
57
time
V0
2V0
0
0
Vo
ltag
e (
VC)
Cu
rren
t (i
)
i0
time
ππππ (LC)1/2
Figure 4- 4: The oscillatory current and voltage across the capacitor in the resonant charging network. The capacitor acquires twice the supply voltage (
0V ) in the forward half cycle of the
current over a time LCπ .
For the power supply with a parallel capacitance at its output, the charging process begins with decaying oscillations. This occurs in both single and dual–power supply schemes with a resistive isolating element and no inductance in the circuit. For any PRR of the plasma gap switching, one can optimize the charging scheme by varying the value of inductance. A
high inductance reduces the frequency of oscillation ( 2/1~ −Lw ) and decreases the
charging time (equation 4.27). It means the current rippling in the circuit can be reduced and transient response of charging the test gap can be increased. For effective process, the charge–up time should be comparable with the recovery time of the plasma gap. If the inductance is too low then the decaying parameter β is large, and the charging process goes
without oscillations. As consequence, the charging efficiency is low over all the time. Figure 4- 5 illustrates this process for different values of charging resistances in series with the inductor. For certain time intervals, the charging efficiency chη exceeds 50 %.
Therefore, for a given L , the selection of an optimized charging resistance is important for
the resonant scheme.

58 Chapter 4: Efficiency of a spark gap operation
0 25 50 75 1000
500
1000
1500
2000
VC (
vo
lts
)
Time (µs)
Charging resistor
30 kΩΩΩΩ
50 kΩΩΩΩ
100 kΩΩΩΩ
V0
ηηηηch
> 50%
Figure 4- 5: Efficiency of the resonant charging circuit due to varying charging resistance. Other specifications:
0V =1000 volts, L = 1 Henry, C = 21 pF.
4.4 Pulse forming network and impedance matching
There are a number of important parameters in generating the voltage or current pulse through the load. For designing a spark gap device, some understandings of these parameters are a basic prerequisite. We have described already in previous sections about the efficient re–charging of the spark gap employing different circuit schemes. Here, we will be able to predict to a certain degree of how the energy storage section or the load must be optimized for the operation of the spark discharge.
The pulse generators store the electrical energy either in an electrostatic field or in a magnetic field and subsequently discharge a fraction or all of the stored energy into the load [Gla’65]. The two basic categories are:
1. Ones in which a fraction of stored electrical energy is discharged into the load during a pulse. These are referred to as hard tube systems. In general, the energy storage device for these systems is simply a capacitor.
2. The second category is one in which all the stored energy is transferred into the load with every pulse. These are line type systems, in which the energy is stored in a continuous or lumped element transmission line. Since the transmission line serves not only as the source of electrical energy during the pulse but also as the pulse-shaping element, it has become commonly known as Pulse Forming Network (PFN). There are essentially two classes of PFN: Voltage fed network in which the energy for the pulse is stored in the
electrostatic field in the amount of 2
2
1CCV . The other is current fed network in which the
energy is stored in the magnetic field in the amount of 2
2
1IL .

Chapter 4: Efficiency of a spark gap operation
59
PFN’s are widely used in many applications with distributed RC network instead of lumped. Generally, a coaxial geometry is used to get this PFN. A simple PFN generator is shown in Figure 4- 6.
The pulse width T is twice the time electromagnetic wave takes to travel the length of the transmission line. Mathematically, it can be defined as
C
LengthTrε=
2
where c is the speed of light in vacuum, Length is the length of the transmission line and
rε is dielectric constant of the material filled between the coaxial conductors of the line. If
the current limiting resistance, chR is much larger than the load impedance LR , then the
output voltage outV is given by
)/( 0ZRVRV LCLout +=
where CV is the charging voltage and 0Z is the characteristic impedance of the coaxial line.
If the line is matched to the load, i.e. 0ZRL = , then the voltage pulse at the load LR is a
rectangular pulse of amplitude 2/CV and duration T . This is the condition for the
maximum power transfer. Beside this, impedance matching is required for the maximum efficiency, pulse shape fidelity, minimum post discharge voltage stresses on the switch and PFN. The effect of mismatching the load produces a series of steps into the discharge. These steps are all of the same sign when 0ZRL > and alternate in sign when 0ZRL < . This
can be explained in terms of reflections caused at the terminals of the line by mismatching the load resistance. These pulses traverse the line to the open end in time 2/T and then are
completely reflected there, and travel back to the load end in a total time T , where they
appear as positive or negative steps depending on the mismatch ratio. The reflections continue in this way, with constantly diminishing amplitude, until all the energy initially stored in the PFN line dissipates at the load.

60 Chapter 4: Efficiency of a spark gap operation
(a) 0ZRL = (b) 0ZRL > (c) 0ZRL <
Figure 4- 6: Schematic and output waveforms with a simple pulse forming line.
4.5 Switching efficiency for pulsed plasmas
The switching efficiency is described as the ratio of the energy (or charge) transferred by micro discharges in the transmission line and the energy (or charge) accumulated before the breakdown voltage of the plasma gap.
The input charge accumulated across the plasma gap is given by
Cin VCQ =
Total charge transferred in the transmission line is given by
∫= dtiQ pout 4.28
pi is the output current pulse measured in the line impedance (i.e., the load).
Therefore, the switching efficiency swη is defined as
in
out
swQ
Q=η 4.29
Theoretically, a loss free plasma gap has the switching efficiency of 100 %. We studied the efficiency of transferred pulse charge content with different parameter settings. Eventually, optimized parameter settings are laid out for the maximum switching efficiency.

Chapter 4: Efficiency of a spark gap operation
61
4.6 Overall efficiency for pulsed plasmas
We already discussed about the efficiency of re–charging the open plasma gap i.e. the charging efficiency chη and the efficiency of the energy or the charge transfer in the
transmission line i.e. the switching efficiency swη . Then, the total efficiency η of the spark
gap operation is defined as the product of the charging efficiency and the switching efficiency.
swch ηηη =
The total efficiency can also be defined in another method. The customary definition of average power is the product of the output pulsed current and the re–breakdown voltage even though not necessarily occurring at the same time. Therefore, the average output power due to the repetition frequency, the PRR, of switched pulses is given as [Sch’90]
PRRtiVP pdpeakCavg ×××= 4.30
where peaki is the peak pulse current, pdt is the pulse duration for the peak current at its
70 % of maximum.
For the feeding voltage OV and the feeding current I from the power supply, the input
power is given by
IVP Oin ×= 4.31
Then the total efficiency can be defined as
in
avg
P
P=η 4.32
The most effective way of defining the total efficiency is from the integration of the output current pulse using the equation 4.28. The energy of the transferred charge content is expressed as
C
QE out
out
2
2
1=
Now the average output power is
PRREP outavg ×=
Taking account of the input power already defined in equation 4.31, the efficiency is described in the same way as that of the equation 4.32.
Although the overall efficiency of the spark gap is limited to the experimental conditions described in this chapter, it is intended to extend the investigation to determine the effect of other parameters such as electrode gap geometry, electrode material, gas type and gas pressure.

62

Chapter 5: Experimental set–up
63
Chapter 5: Experimental set–up
The principle operation of pulsed plasmas in the electrode gap can be explicable by referring the schematics of the circuit design, switch geometry including the set–up for various electrical and optical measurements. We have devoted a great deal of effort for the development of pulsed plasmas in a controlled manner at reduced power consumption. Several experiments are performed to explore the possible aspects within the physical and technical limitations to increase the frequency of these pulsed plasmas up to now known values to our knowledge. The detailed layout of the measurement techniques renders analysis of the physical mechanism easier that governs the behavior of pulsed plasmas.
5.1 Design of a 50 ΩΩΩΩ coaxial housing
A coaxial test chamber (metallic ground) is constructed with an integrated in–built electrode gap system as shown in Figure 5- 1. The test chamber is made of a coaxial structure to prevent any mismatching, ensuring minimum reflections, which could lead to uncorrupted pulse measurements. The coaxial structure also ensures a low inductance and containment of possible hazardous electromagnetic interference (EMI) radiation. The mathematical expression for designing the coaxial in–built electrode gap system with characteristic impedance of Zo is given by [Wad’91]
)ln(2
377
d
DZ
r
oεπ
= 5.1
Where rε is the relative permittivity of the medium such that the permittivity ε of the
medium is given by
rεεε 0= , )/(10854.8 120 mF
−×=ε for free space
D and d are the inner diameter of the coaxial chamber and outer diameter of the electrodes respectively.
64 Chapter 5: Experimental set–up
The 50 Ω coaxial chamber maintains an overall resolution in obtaining the fast output transient pulses across the impedance load. The left hand side of the coaxial chamber from the electrode gap constitutes the PFN length.
Figure 5- 1: Geometry of a 50 Ω coaxial spark gap design, geometry version I.
5.1.1 Spark gap geometry and material consideration
The electrodes of the in–built spark gap system as shown in Figure 5- 1 has a diameter of 10 mm. The electrode shapes are coplanar type in order to provide a homogeneous electric field for reproducible breakdown voltage values. The planar electrode also serves as a better coolant for sharing the discharge region through overall surface area. The electrodes were made of elkonite (Cu20/W80). The high melting temperature of the tungsten coupled with electrical conductivity of the copper produces better resistance to electrode erosion. Therefore, elkonite electrodes are widely employed in high power switches. Additionally, the material is easily machinable using tungsten carbide tools. The edges of the electrodes were machined to form a rogowski profile and the surfaces were sufficiently polished to achieve macroscopically the homogenous electric field in the gap space. These electrodes are adapted to tapered conductors of aluminum in order to maintain the 50 Ω matching throughout the chamber. The electrodes could be replaced after a long used or when desired. The adaptors used for matching two different end connectors, SHV (22SHV 50–0–3) and N–type (23N–50–0–3), with tapered conductors are constructed from commercially available brass material. The choice of the insulator is made for the high dielectric strength with a suitable dielectric constant to be consistent with the 50 Ω matching. The insulator is solid propylene with a relative permittivity of 2.3. This has low and uniform energy dissipation over a wide range of frequencies.
The coaxial chamber has two ports for optical view and gas inlet view. The left hand side electrode of the coaxial chamber is movable with a turn per millimeter in order to adjust the inter–electrode gap distance. The movable electrode is integrated to a high voltage SHV male adaptor. The right hand side of the coaxial chamber is fixed and is integrated to an N-type connector. The coaxial chamber is made of stainless steel and the designed structure can withstand a maximum pressure of 5 bars. The total length of the coaxial chamber is 158 mm. It has inner and outer diameter of 23 mm and 31 mm respectively. We refer this coaxial geometry of the spark gap to be the geometry version I, because it is the initial

Chapter 5: Experimental set–up
65
design for the investigation of pulsing micro plasmas. The coaxial chamber along with the SHV connector and the coaxial cable all together constitutes the total PFN length for the spark gap system. The length of the PFN incurred from the chamber design is 80 mm, which further extends to more than 40 mm due to the coaxial cable length and SHV connector. This produces approximately a capacitance of 12 pF with 1 pF per centimeter of the PFN length.
5.1.2 Modified geometry
The geometry version I is altered in order to reduce the PFN length and hence the geometry capacitance. The reduced geometry capacitance will lower the feeding current value for given re–breakdown voltages (see expression 4.4). This may probably prevent the power consumption with the optimized charging resistance. This new geometry is referred to be as the geometry version II. This modified geometry also aims at reducing surface areas of the electrodes in order to prevent spread of sparks on electrode surfaces. The control over the spread of spark channels between the electrodes may probably provide the stability of the electrical characteristics in particular the re–charging time and re–breakdown voltage of the plasma gap.
Figure 5- 2 shows the schematic of the geometry version II, which is an extended version of the geometry version I. The diameter of the electrodes in this geometry is reduced to 6.5 mm. The inner and outer diameter of the modified coaxial chamber retains similar to that of the geometry version I. The total length of the coaxial chamber for this geometry is 100 mm. In this manner, the reduced volume space of the geometry version II is a compact design of the spark gap. The shape of the insulator used here is different compared to the geometry version I to be consistent with the 50 Ω coaxial line. The connector at the high voltage line used for this geometry is a BNC type (23BNC–50–0–12). The geometry version II has the PFN length approximately half compared to the PFN length of the geometry version I. Different electrode materials are used in this geometry for the study of pulsed plasmas in the test gap such as copper, aluminum, graphite and stainless steel.
Figure 5- 2: 50 Ω coaxial chamber design of the modified geometry version II.

66 Chapter 5: Experimental set–up
5.2 Circuit set–up for single power supply scheme
In order to measure the rise time of output pulse waveforms down to a few hundreds of picoseconds, it is necessary to have circuits and measurement devices capable of handling transient pulses with frequency components in the ultra high frequency range [Wad’91]. Figure 5- 3 presents a typical arrangement of circuit connections and measurement techniques involved in the experiment. The gas inlet port with a KF (Kwik–Flange) flange allows vacuum creation inside the chamber and then refilling it with a particular gas type or gas mixtures at different pressures. The pressure inside the chamber is controlled and measured by two analogue pressure meters, placed just before the gas inlet port. The viewing port with a quartz window is integrated with the KF flange for the optical diagnostic. A mechanical oil pump has been used to evacuate the coaxial chamber to a
sufficiently low pressure below 2106 −× mmHg. Thermotron pressure gauge is used to check this vacuum pressure. The mentioned low pressure is much below the impurity of SF6 gas at 1 bar. SF6 gas from Linde product has a purity of 99.97 % (SF6 3.0).
Figure 5- 3: Experimental set–up for the detailed circuit and measurement techniques.
5.2.1 Lay out of measurement techniques
The electrode gap, in which pulsed plasmas, to be tested is arranged along the center conductor of the coaxial housing. Fixed spacers are used to set the gap distances from 40 µm up to a few 100 µm. The analogue pressure meter has a resolution of 0.25 bars. These parameter settings are sufficient for the qualitative understanding of the behavior of pulsed plasmas.

Chapter 5: Experimental set–up
67
The coaxial chamber connects the DC power supply (FUG: HCN800K-12 500) through the charging resistor. A high voltage probe (TEK; P6015A) with a bandwidth of 75 MHz measures the voltage across the electrode gap. It is inserted between the charging resistor and the coaxial transmission line. The position of the high voltage probe for the measurement is limited due to the mechanical construction of the chamber design (see Figure 5- 3). This probe is sensible enough in measuring re–breakdown voltages at the PRR of around 1 MHz. The right hand side of the test chamber goes directly to the oscilloscope through the attenuators and coaxial cable for measurement. The attenuators (SMA: m/f) have the bandwidth of 18 GHz. The total attenuation parameter is 60 dB, which corresponds to a division ratio of 1/1000. A 50 Ω coaxial cable (Suhner: Sucotest) load with 1.5 meters length is used with a bandwidth of 13 GHz. These probes have a large bandwidth, a compact size, low power dissipation and a minimum reflection. As a result, there is a minimum perturbation for the output pulse waveform in the transmission line. Two different oscilloscopes are used for the measurement of electrical signals. One with the 1 GHz bandwidth (TDS 684A) is used for the measurement of the re–charging voltage employing the high voltage probe. The other one with the 4 GHz bandwidth (TDS 7404B) is used for the measurement of output pulse waveforms at the 50 Ω cable impedance. A personnel computer (PC) was used to save all signals for post–processing by means of GPIB interfaces. A Network Analyzer (HP 8510C) with a frequency spectrum up to 26.5 GHz is employed to examine the bandwidth of the designed spark gap chamber. The device also allows us to check the bandwidth limitations of various probes and attenuators. An LCR meter (Escort ELC–13D) is used for the measurement of the system capacitance.
A high value of charging resistance (~ 230–500 kΩ) is used to decouple the power supply from the spark gap system. The applied voltage is maintained above re–breakdown voltages and obviously above the threshold breakdown of the gas gap. This allows a certain minimum current to operate pulsed plasmas at the high PRR.
5.3 Circuit set–up for dual–power supply scheme
The arrangement of the detailed circuit set–up using the dual–power supply scheme is shown in Figure 5- 4. The transmission line is used throughout for the circuit connections as that for the single power supply and therefore the effects of stray inductance and capacitance are minimized. The PFN is charged through two power supplies simultaneously. The feeding voltage (< 2.0 kV) of the main power supply (FUG: HCN800K-12 500) is mainly responsible for the operation of pulsed plasmas at the high PRR using the optimized charging resistance (typically tens of kiloohms) in series. The reverse biased high voltage diode, BY8408 (10 kV), is used in series with the main power supply to protect it from the high voltage power supply. The second power supply (FUG: HCN140-20 000) is kept at 6–10 kV above the threshold breakdown voltage to ignite the gas gap with a very high resistance (typically tens of megaohms) in series with it. Apart from this, it helps to re–ignite, if the plasma gap fails to re–breakdown due to the main power supply. The intention for employing high resistance is to dissipate negligible amount of power in the circuit from the high voltage power supply. The reduced feeding voltage from the main power supply employing the optimized resistance leads to a small power dissipation. As consequence, the efficiency will effectively increase during the repetitive charging of the plasma gap compared to that of the single power supply scheme.

68 Chapter 5: Experimental set–up
Figure 5- 4: The detailed circuit set–up using the dual–power supply system with the modified geometry version II.
5.4 Set–up for optical measurements
One obtains large information from the plasma diagnostic using optical spectroscopy, since this practically causes no effect to the examined object. The simplest optical procedure such as fast shutter camera with extremely short exposure time gives important information over the available plasma during different time intervals. The spectroscopic investigation by resolution of the emission lines permits a better characterization of the discharge plasma.
Monochromator (SPEX MODEL 1870)
The entire optical structure for the spectroscopic measurement is shown in Figure 5- 5. The spectrometer is 0.5 mtrs in length. The electrode gap is placed at the entrance of the slit. The light emission from the plasma is focused by a collimator to a grating element with grooves of 1200 lines per mm. This result, for half a meter of focal length, into a dispersion of 1.6 nm/mm or 16 Ao/mm. The usable spectrum of the monochromator covers the visible light along with adjacent ultraviolet (UV) and close infrared (IR) range. The monochromator has two exit slits. Both can be steered in its width through adjustable screw. The adjustable output slit is connected with a photomultiplier in order to represent individual lines for limited width with time resolved.
Photomultiplier tube (BURLE Electron Tubes, C31034A)
A photomultiplier tube (PMT) permits the recording of very weak light intensities. At the photocathode, the photons set electrons free, which are multiplied by dynodes with a
Chapter 5: Experimental set–up
69
system of dynodes of accelerated potentials. Due to the impact of electrons on the dynode surface produces secondary electrons. The number of electrons per photon hitting the cathode depends on the quantum efficiency of the electrode material, which is strongly the wavelength dependent. The maximum anode voltage can be applied up to 2.2 kV with maximally permissible average anode current of 100 nAmp. The cooling of the PMT is possible for an improvement of the signal to noise ratio by means of a Peltier element with a temperature of -22oC. The internal delay of the PMT because of subsequent hitting of electrons and their multiplications at the anode collector is 33 ns. The signal of the photomultiplier at the output gap of the monochromator makes no more spectral resolution. The width of the output exit slit from the monochromator produces the resolution for the temporal intensity process for an individual light wavelength. By means of standard lamps, the monochromator is calibrated so that by rotating the grating, the particular line of the desired wavelength is set correctly.
Figure 5- 5: The schematic experimental set up for spectroscopic investigation.
Short time Camera (PCO–Dicam)
Different optical procedures are possible in order to supplement and compare the spectroscopic results. For the qualitative description of fast variable plasma, the representation is suitable by means of short time photography. For a short exposure time of the camera, the entire course of the discharge process can be scanned. A CCD (Charged coupled device) camera coupled with an integrated image amplifier takes the short time photograph. The camera has the function for the short time catch of the discharge process in the electrode gap. The minimum exposure time is 5 ns. The pictures are read in and were stored by a bit map memory (Frame grabber) into a PC. Igniting the spark discharge and

70 Chapter 5: Experimental set–up
releasing the camera was operated via a common TTL pulse generator. The controller of the CCD camera has an inserted delay generator, in order to shift the triggering of the camera in relation to the discharge process. The CCD controller adjusts the exposure time. The delay time is noted at the oscilloscope together with the electrical measurements obtained from the switch. The pictures taken are spatially two–dimensional illustration. However, the representation of further parameters e.g. the wavelength of the light is no longer possible. In order to be able to assign the particular light emission from the plasma with spatially resolved spectral region using narrow band interference filters could be taken up.
Fiber Optic CCD Spectrometer
A miniature fiber optic spectrometer has enabled to record the time-integrated emission from the discharge plasma for the desired range of wavelength. An USB200 miniature spectrometer from Ocean Optics, Inc. has Sony ILX511–2048 element linear CCD array detector with an optical bench (Czerny–Turner) that fit into the palm of a hand. The spectrometer has a spectral resolution of less than 1.5 nm at FWHM. The grating employed has broad spectral range from 250 nm to 850 nm with 600 lines/mm blazed at 300 nm. The spectrometer has been calibrated with standard lamps and the resolution is found to be less than 0.3 nm. The integration time for the spectrometer varies from minimum of 3 milliseconds to 65 seconds. The optical emission from the discharge electrode gap is collected through an optical fiber, connected to the CCD spectrometer [Spe’00].

Chapter 6: Equivalent PSpice model
71
Chapter 6: Equivalent PSpice model for
discharge plasma
A numerical program is used for the time domain transient simulation of repetitive charging and discharging by the spark gap switch. The numerical program is an intusoft ICAP/4 containing IsPice version 4 [Int’04]. One of the breakthroughs by PSpice is the use of a variable time step for simulation. This advantage allows to model the operation of the spark gap related to dynamic effects of the switch at the high PRR.
The transient analysis computes the circuit response as a function of time over a user–specified time interval. A great number of numerical integration methods in general are used for time domain simulation such as Backward Euler, Trapezoidal, Simpson’s Rule, or other linear multi–step methods such as Gear method etc. Among these methods, the trapezoidal integration is one of the most popular ones in transient analysis, due to its merits of low distortion and stability. The default method in this program uses the trapezoidal integration for solving non–linear circuit equations. The other method, which the program uses for transient analysis, is the gear integration method. The trapezoidal integration produces faster result in less time for simulation accuracy (typically 0.01 percent). However, the gear method improves the stability and the accuracy of the simulations.
The transient analysis is controlled via some commands in the simulation option. A few of them are discussed here related to the operation of our spark gap device. The command RELTOL (relative error tolerance) is responsible for the simulation accuracy. It’s default value is 0.001 (i.e., 0.1 %). The use of the Gear integration method should be coupled with a increase in the RELTOL value. The command TRTOL (transient error tolerance) controls the convergence via local truncation error. Its default value is 7 for the fastest simulation. It is strongly advisable to use TRTOL of 1 and gear integration method for the generic spark gap in modeling of the switch (see Appendix: Table F). The other important commands are ABSTOL (absolute current error tolerance) and VNTOL (absolute voltage error). The typical values of ABSTOL and VNTOL are ~ 10-12 and ~ 10-6 respectively.
The aim of taking this simulation work is to develop the circuit and the spark gap model based on relevant physical phenomena, which would be capable of quantitative representation of the breakdown development, channel formation, and their significance to

72 Chapter 6: Equivalent PSpice model
various processes in the plasma gap. The parameters comprising the power supply, the charging resistor, the connecting transmission lines, the spark gap geometry and the 50 Ω scope impedance are numerically simulated. In the macroscopic scale, the simulation determines the parameters of circuit schemes such as charging resistor, capacitor or inductor. These parameters are mainly responsible for the charging time of re–breakdown voltages across the spark gap at the high PRR. These parameters also determine which stray elements (capacitance or inductance), discharge parameters (mismatch impedance) or measurement systems (adaptor, cable response) influence the output pulse waveform in the microscopic scale. However, in this program, the results of breakdown simulation with account of gas kinetic effects are absent. Therefore, the aforementioned estimates are only rudimentary approximations. We will find eventually that these estimates are sufficiently conclusive to be used as a starting point for controlling micro plasmas in an electrode gap. Of course, the detailed comparison with the measured quantities will constitute a posteriori verification of these estimates.
A schematic representation of the charging circuit and the spark gap model is shown in Figure 6- 1. The equivalent circuit coupled with the spark gap model simulates the PRR and pulse shapes due to re–breakdown voltages of the spark gap. At the high pressure, discharge modeling is in general not trivial because of a large number of gas discharge phenomena, which are involved during the pre–breakdown and breakdown phase. Since, it is not possible to take into account all the breakdown mechanisms in the simulation, so an over–simplified model of the spark gap is introduced. We take a single power supply scheme instead of the dual–power supply scheme since the model does not distinguish between different gases and its influence on the hold–off voltage. There is a generic spark gap available in the program. Once the re–breakdown voltage is set for the generic spark gap and the feeding voltage is applied to it, the mismatch impedance of the spark gap model determines relatively a dynamic situation of the plasma conducting channel. The dynamic situation of the spark gap is simulated in the microscopic time scale (typically several nanoseconds). This in turn decides the shape and amplitude of the output pulse waveform. In practical application, the operation of re–breakdown voltages is mainly governed by the main power supply. The second power supply assists only to re–ignite the spark gap, in case the main power supply misfires.
Between the nodes 2 and 6 in Figure 6- 1, an equivalent model of the spark gap is presented. The generic spark gap from the program is not sufficient alone because it does not represent the variation with dV/dt [Appendix: Table F, Int’04]. It represents a high voltage switch only with some advantages of the spark gap parameters like the inter–electrode gap capacitance, the minimum current to stop the discharge, breakdown voltages and so on. A series resistance, an inductance and a parallel capacitance are used in order to represent discharge parameters for pulsed plasmas. R2 represents the calculated impedance approximated from the experimental conducting channel of the spark discharge. L1 and C2 are the calculated inductance and capacitance respectively for the conducting channel. The complete spark gap system is treated as a composition of these plasma parameters and transmission lines (nodes 2 and 7). Later these parameters are chosen by successive approximation in order to obtain a good agreement with the experimental results.

Chapter 6: Equivalent PSpice model
73
3 4
SGSPARKGAP
7
R350
6
V2
2 3
TL1RG58C
R190k
21 2
C114p
4 5
R260.7
6 7
TL2RG58C5 6
L10.369n
3
3 6
6
6 63 33 6
C2.09p
7
V2x
1 11
V1
Figure 6- 1: Schematic P-Spice circuit and equivalent spark gap model. V1: voltage source, R1: charging resistor, C1: strays capacitance, TL1: PFN (~12 cm for the geometry version I and ~5 cm for the geometry version II), R2, L1, C2 are discharge parameters for 100 µm arc channel, TL2: impedance cable (1.5 mtrs), R3: oscilloscope impedance.
The nodes 2 and 3 are used for the simulation of the PFN length. The RG58C cable available in the program has been used for this purpose. In addition, the capacitance C1 at node 2 is used to represent the stray capacitance caused by the circuit connection, the probe connection, the charging resistance etc and the discharge capacitance of the electrode gap itself. R1 is the charging resistance connected to the main power supply V1. The RG58C cable on the right hand side is used for the simulation of the load impedance cable. This cable is connected to the 50 Ω input channel of an oscilloscope. In real experiment, coaxial transmission lines (e.g., RG58C, coaxial chamber, connectors etc.) with characteristic impedances of 50 Ω are used throughout the set–up before and after the gap. The dielectric material and length of the cable influence the waveform of pulsed plasmas because they are frequency sensitive for fast transient pulses.
6.1 Simulation of a normal plasma gap
The switching operation of the spark gap can be divided into two time scales: first, we have a time scale where the plasma gap is charged. This is the static situation where one conductor is charged. This time scale is referred to be the macroscopic scale. Next the plasma gap closes and almost instantaneously a spark channel forms. This is the dynamic situation where a current starts to run through the spark plasma and the load. The time scale needed to simulate this situation is referred to be the microscopic scale. Combining these simulations in both situations allow us to optimize many parameter settings, such as circuit and geometry parameters etc., influencing the PRR and physical limitations of the dielectric recovery processes.
6.1.1 Influence of overvoltage DC stress
Initially, we simulated the static situation or the circuit model in order to realize parameters, which are responsible for re–charging the plasma gap at the high PRR. The circuit model of

74 Chapter 6: Equivalent PSpice model
Figure 6- 1 is simplified for this purpose. Between the nodes 2 and 7, the transmission line parameters (RG58C) are replaced by their lumped values (capacitance) and the spark gap model is replaced by only the generic spark gap. In this manner, the simulated result for the operation of the spark gap does not affect the dynamic model for pulsed plasma formation. Secondly, the simulation program slows down or often stuck using the RG cable even at a RELTOL of 30 %. In Figure 6- 1, C1 is taken as 14 pF and the capacitance due to the PFN length is 12-14 pF. An extended circuit model of the spark gap in a simplified manner is shown in Figure 6- 2, which uses the single power supply scheme and is equivalent to the circuit of Figure 4- 2. The voltage source V0 feeds the spark gap through the charging resistance of 270 kΩ. The discharge free capacitance of the spark gap system, due to the PFN and stray capacitance (C1 in Figure 6- 1), is approximately 28pF (C2 in Figure 6- 2). The breakdown voltage of the generic spark gap is set at 650 V to simulate re–charging voltages in the macroscopic scale. The RELTOL for the simulation is set at 0.001. These re–charging voltages in practice depend on the gas type (e.g., SF6 has high re–breakdown voltages than air) and pressure variation (e.g., high pressure has high breakdown voltages).
The higher feeding voltage (~ 5.4 kV) in the simulation result shows decrease of the re–charging time for a particular set of parameters: switch geometry, charging circuit, gap distance, gas type and gas pressure. Two different feeding voltage values are employed to obtain a qualitative response of the re–charging time. The feeding voltage (V1) of 3.2 kV produces the re–charging time of ~ 2 µs. The re–charging time reduces below 1 µs at the feeding voltage of 5.4 kV. In this case, the power consumption in the charging resistance is high. An alternate method employing the dual–power supply scheme optimizes the feeding voltage and charging resistance to minimize the power consumption in the circuit (see § 4.2.2, page 49). We are not discussing this circuit scheme here simply because reducing the feeding voltage and charging resistance in the same ratio (3.2 kV or 5.4 kV/270 kΩ) will generate the PRR characteristic as that of Figure 6- 2. We have already discussed the detailed layout of the dual–power supply scheme in Chapter 4. Presently, we consider the geometrical effect on pulsed plasmas and verify whether they influence the PRR characteristic or not.
0 2 4 6 8 10
0
100
200
300
400
500
600
Bre
akd
ow
n v
olt
ag
es (
vo
lts)
Time (µs)
2 3
SGSPARKGAP
21
RC270k
2
C226p
1
V1
2 2 3
Load50
2
V3
Figure 6- 2: Variation of the PRR with feeding voltages using single power supply scheme. Solid line: V1 = 3.2 kV, dashed line: V1 = 5.4 kV. Test specifications: geometry version I.

Chapter 6: Equivalent PSpice model
75
6.1.2 Study of geometrical parameters
The pulse shape characteristics in the transmission line provide valuable information about the dynamic situations of pulsed plasmas. The intention for this is to study discharge parameters responsible for controlling the energy or the charge content of pulsed plasmas. The higher charge content in the decay tail of pulsed plasmas influences the recovery of the gas density, which plays a significant restriction on the rate of rise of recovery voltage and consequently limits the PRR. If the recovery time is slower than the re–charging time, the plasma gap remains closed and a DC like current is the consequence. Therefore, the parameters of the electrode gap geometry are optimized to reduce the charge content of pulsed plasmas while maintaining a relatively peak amplitude.
Figure 6- 3 displays the waveform of pulsed plasmas in the transmission line for two different geometries. The equivalent spark gap model is that of Figure 6- 1 between nodes 2 and 6. An inductance and capacitance of the plasma parameters determines the mismatching and these in turn depend on the plasma and spark gap geometry dimension. The simulated results are obtained at node 7 across the 50 Ω scope resistance. The pulses of the simulated results have been assumed for the same electrode gap distance and pressure with the conducting channel diameter of 100 µm. The PFN length for the geometry version I and the geometry version II are set at 12 cm and 5 cm respectively. The re–breakdown voltages for both geometries are set at 650 V. The electrode gap capacitances for two geometries vary because of the diameter variation of the electrodes. Therefore, the capacitance of the electrode gaps is changed in the generic spark gap. Other discharge parameters mainly R2, C2 & L1 values corresponding to the spark channel diameter remains the same. The control commands correspond to time step and RELTOL are set at 20 ps and 0.0005 respectively.
0 2 4 6 8 10 12
0
2
4
6
Cu
rren
t (A
mp
)
Time (ns)
Figure 6- 3: Pulse shapes from the spark gap for two different geometries. The breakdown voltage of the generic spark gap was set at 650 V. Solid line: geometry version I, dashed line: geometry version II. Test specifications: gap distance– 300 µm.

76 Chapter 6: Equivalent PSpice model
The geometry version I and the geometry version II have pulse durations of 1.7 ns and 816 ps respectively. The charge contents are 16.43 nC and 12.04 nC respectively. The tail of current pulses illustrates faster decay of pulsed plasmas for the geometry version II. The decay of the conducting channel in this geometry reaches to zero value in 1.5 ns before the geometry version I. This implies that the geometry version II furnishes faster dielectric recovery during and following arc-cooling process. It means the optimized design of the spark gap geometry is necessary to improve the dielectric recovery of the plasma gap. The rise time of the output current pulses for the geometry version I and version II is 109 ps and 68 ps respectively.
6.2 Simulation of an improved set–up parameter
In case of the voltage source, due to a parallel capacitance and a series resistance in the circuit, the decaying parameter β is large and the charging process goes without oscillation
(see § 4.3, page 56). As consequence, the charging process is slow over all the time and depends on circuit parameters such as charging resistances and capacitances. A better charging process for the plasma gap needs a negligible ripple in the current amplitude for our desired objectives. Hence, the practical need for the spark gap operation is the use of an active source of current limiting mode. This will allow maintaining the recovery time to be consistent with the desired PRR and independent of the charging resistance (equation 4.4).
6.2.1 Influence of voltage and current source
The feeding voltage and current are read from the power supply for testing the generation of pulsed plasmas in the test gap. The feeding current is similar as that of the calculated ratio of the feeding voltage to the charging resistance used in series with the power supply during experiment. After the switch closure, the feeding voltage from the power supply immediately re–charges the plasma gap. Since the output of the power supply charges the parallel capacitance of the plasma gap, the feeding voltage grows with decaying oscillation i.e. the charging voltage across the plasma gap is an over–damped electrical stress. It means DC power supply itself is not a regulated source for the feeding current or even for the feeding voltage. Simulation results illustrate this explicitly in Figure 6- 4. The influence of voltage and current source supplies on re–charging the plasma gap is different.
The feeding voltage of 1.6 kV is used for the spark gap ignition through the charging resistance of 90 kΩ. In practice, this is applicable to the dual–power supply scheme because this feeding voltage is much below the threshold breakdown voltage of the gap (see § 4.2.2, page 51). The calculated ratio of the feeding voltage and charging resistance is 16.7 mA. The current source of 16.7 mA presents superior performance in the recovery time of the plasma gap over the voltage source (1.6 kV). Figure 6- 4 illustrates a higher steepness in the rate of recovery voltage due to the current source compared to the voltage source. It means the source of an active current limitation greatly controls the recovery time of the plasma gap. Despite this fact, a minimum feeding voltage is needed for the re–breakdown of the plasma gap.
Chapter 6: Equivalent PSpice model
77
0 2 4 6 80
200
400
600B
reakd
ow
n v
olt
ag
e (
vo
lts)
Time (µs)
Figure 6- 4: PRR comparisons with different source supplies. The circuit used for this simulation is that of Figure 6-2. Solid line: feeding voltage source = 1.6 kV, dashed line: feeding current source = 16.7 mA. Test specifications: geometry version I, charging resistance– 90 kΩ.
The practical use of the active current limitation mode has been explored. Actually, the need of our technological solution is the low current ripple and rapid transient response, which is quite difficult in power circuit design. The Spice program has solved its possibility by using the same voltage sources in the dual–power supply scheme. An inductance of high value is used between the PFN and the charging resistance in the main power supply circuit. The use of the inductance has many advantages:
1. The high value of inductance reduces the frequency of oscillations for the feeding
current as 2/1~ −Lw , and the charge up time CL is very small for our spark gap
capacitance (see § 4-3, page 56). Accordingly, this maintains a very low current ripple or almost a constant feeding current at very high PRR (§ 6.2.2, page 78).
2. The constant flow of the feeding current (i.e., low ripple) maintains a constant feeding voltage after the charging resistor and before the inductor. Hence, the use of the inductor is the source of the feeding current and re–charges the plasma gap resonantly.
The high value of inductance decreases the decay factor β . Consequently, the transient
response across the electrode gap is rapid and comparable to the recovery time. The oscillating voltage or the re–breakdown voltage exceeds the feeding voltage for some time interval and hence the charging efficiency exceeds 50 % (see Figure 4- 5). Of course, the prerequisite condition for the achievable repetition rate is decided by as long as the charge up time is longer than the recovery time of the plasma gap.
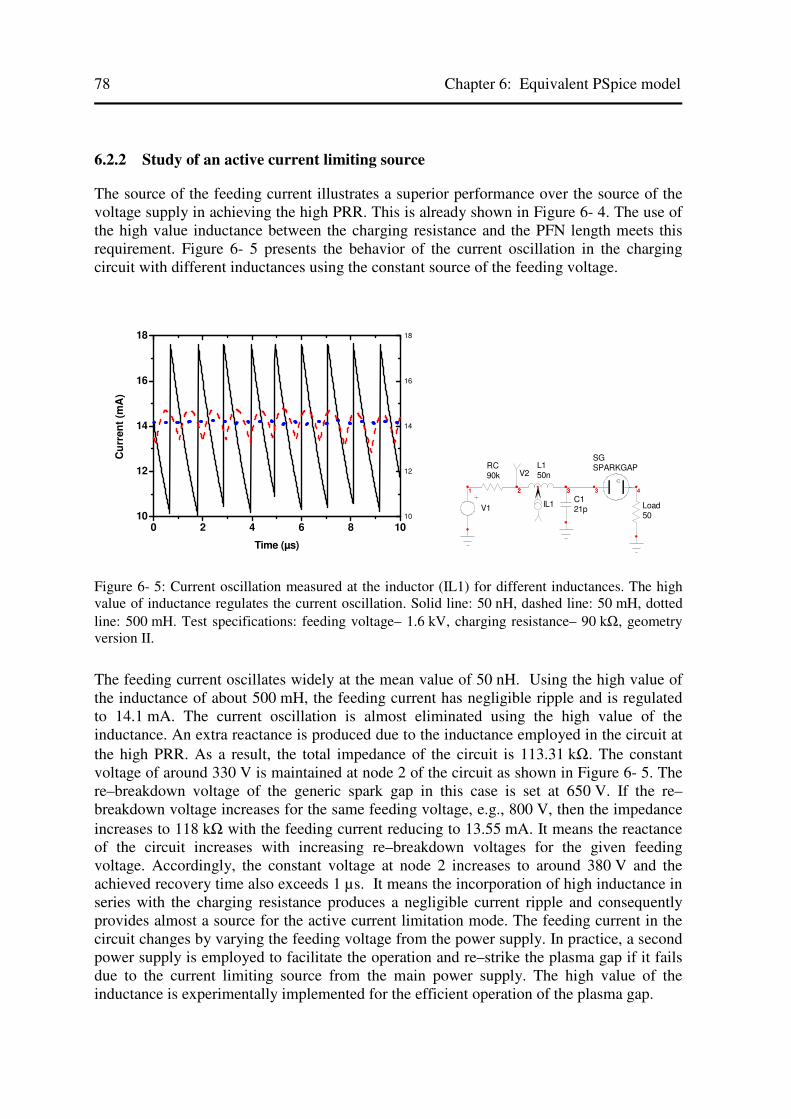
78 Chapter 6: Equivalent PSpice model
6.2.2 Study of an active current limiting source
The source of the feeding current illustrates a superior performance over the source of the voltage supply in achieving the high PRR. This is already shown in Figure 6- 4. The use of the high value inductance between the charging resistance and the PFN length meets this requirement. Figure 6- 5 presents the behavior of the current oscillation in the charging circuit with different inductances using the constant source of the feeding voltage.
0 2 4 6 8 1010
12
14
16
18
10
12
14
16
18
Cu
rren
t (m
A)
Time (µs)
3 4
SGSPARKGAP
21
RC90k
3
C121p
2 3
L150n
IL1
1
V1
3 3 4
Load50
2
V2
Figure 6- 5: Current oscillation measured at the inductor (IL1) for different inductances. The high value of inductance regulates the current oscillation. Solid line: 50 nH, dashed line: 50 mH, dotted line: 500 mH. Test specifications: feeding voltage– 1.6 kV, charging resistance– 90 kΩ, geometry version II.
The feeding current oscillates widely at the mean value of 50 nH. Using the high value of the inductance of about 500 mH, the feeding current has negligible ripple and is regulated to 14.1 mA. The current oscillation is almost eliminated using the high value of the inductance. An extra reactance is produced due to the inductance employed in the circuit at the high PRR. As a result, the total impedance of the circuit is 113.31 kΩ. The constant voltage of around 330 V is maintained at node 2 of the circuit as shown in Figure 6- 5. The re–breakdown voltage of the generic spark gap in this case is set at 650 V. If the re–breakdown voltage increases for the same feeding voltage, e.g., 800 V, then the impedance increases to 118 kΩ with the feeding current reducing to 13.55 mA. It means the reactance of the circuit increases with increasing re–breakdown voltages for the given feeding voltage. Accordingly, the constant voltage at node 2 increases to around 380 V and the achieved recovery time also exceeds 1 µs. It means the incorporation of high inductance in series with the charging resistance produces a negligible current ripple and consequently provides almost a source for the active current limitation mode. The feeding current in the circuit changes by varying the feeding voltage from the power supply. In practice, a second power supply is employed to facilitate the operation and re–strike the plasma gap if it fails due to the current limiting source from the main power supply. The high value of the inductance is experimentally implemented for the efficient operation of the plasma gap.

Chapter 7: Experimental results
79
Chapter 7: Experimental results
The qualitative description of the breakdown process, the simulation results and the experimental findings are suitable for eventual realization and predicting the observed phenomena of gas discharges in the electrode gap. Proper investigation must involve observations of the physical appearance of pulsed plasmas, particularly its current–potential relations with different circuit and geometry parameter settings. The discharge behavior must include the knowledge of gas nature and purity, variation with pressure, electrode gap distances and electrode properties etc. In addition, optical and spectroscopic characteristics cannot be ignored. The parameter settings and governing circumstances influencing pulsed plasmas in the electrode gap are presented in this chapter.
7.1 Operation bandwidth of electrode gap geometry
The coaxial housing of the electrode gap system was first tested for its bandwidth limitation using a Vector Network Analyzer (HP 8510C). BNC, N-type, SMA connectors or adaptors are compatible to this instrument. The coaxial chamber was integrated with the high voltage SHV and N-type connector at its opposite ends. Therefore, an adaptor was self-made with a SHV–female and BNC–male through the RG58C/U cable. The gap electrodes were connected inside the coaxial chamber. Sinusoidal electrical signal was generated from the measurement device itself in a wide frequency range. The signal was fed to the coaxial chamber to measure the insertion loss for the perspective of the designed geometry. Insertion loss means the decrease in transmitted signal power resulting from the insertion of the device in the transmission line. It is a combination of multiple sources of loss, which include dielectric loss, connector losses, impedance mismatch (reflections), conductor losses and radiation losses. The measured insertion loss over frequency is shown in Figure 7- 1. The use of the coaxial chamber guarantees the operation bandwidth from DC up to 11 GHz. That means the electrode gap geometry by itself provides an extremely minimized perturbation to pulsed plasmas in the transmission line.
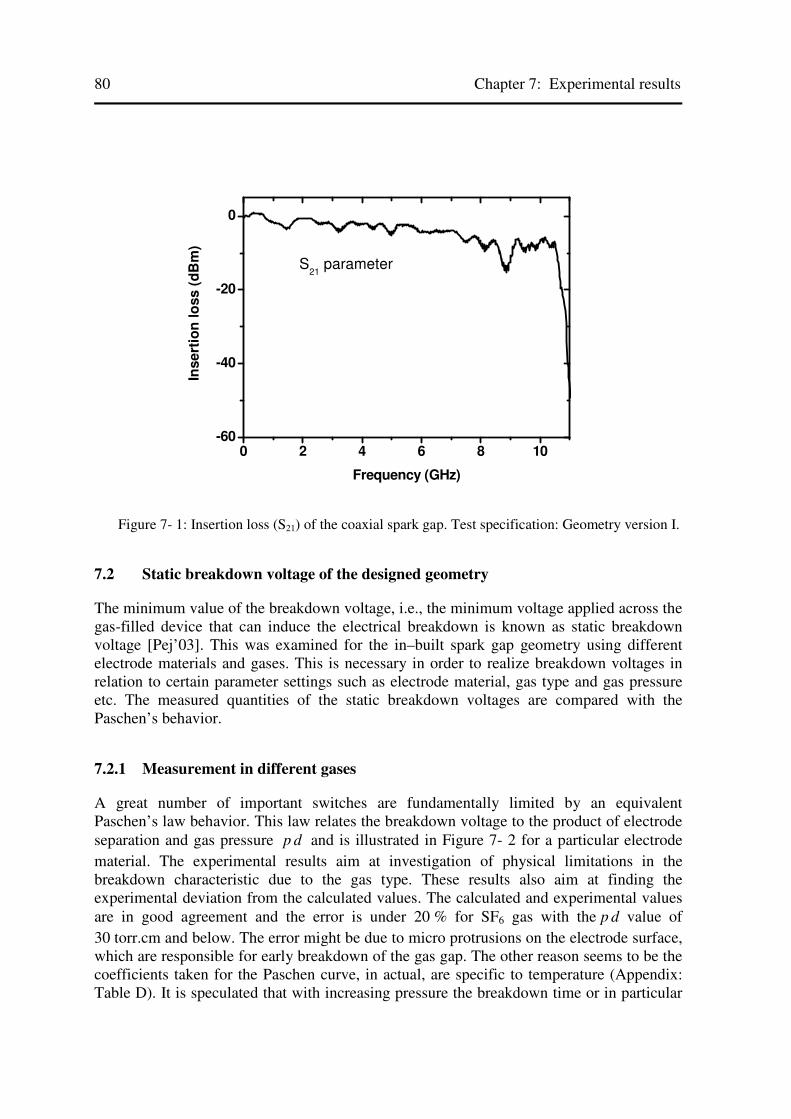
80 Chapter 7: Experimental results
0 2 4 6 8 10-60
-40
-20
0
Inse
rtio
n l
oss
(d
Bm
)
Frequency (GHz)
S21
parameter
Figure 7- 1: Insertion loss (S21) of the coaxial spark gap. Test specification: Geometry version I.
7.2 Static breakdown voltage of the designed geometry
The minimum value of the breakdown voltage, i.e., the minimum voltage applied across the gas-filled device that can induce the electrical breakdown is known as static breakdown voltage [Pej’03]. This was examined for the in–built spark gap geometry using different electrode materials and gases. This is necessary in order to realize breakdown voltages in relation to certain parameter settings such as electrode material, gas type and gas pressure etc. The measured quantities of the static breakdown voltages are compared with the Paschen’s behavior.
7.2.1 Measurement in different gases
A great number of important switches are fundamentally limited by an equivalent Paschen’s law behavior. This law relates the breakdown voltage to the product of electrode separation and gas pressure dp and is illustrated in Figure 7- 2 for a particular electrode
material. The experimental results aim at investigation of physical limitations in the breakdown characteristic due to the gas type. These results also aim at finding the experimental deviation from the calculated values. The calculated and experimental values are in good agreement and the error is under 20 % for SF6 gas with the dp value of
30 torr.cm and below. The error might be due to micro protrusions on the electrode surface, which are responsible for early breakdown of the gas gap. The other reason seems to be the coefficients taken for the Paschen curve, in actual, are specific to temperature (Appendix: Table D). It is speculated that with increasing pressure the breakdown time or in particular
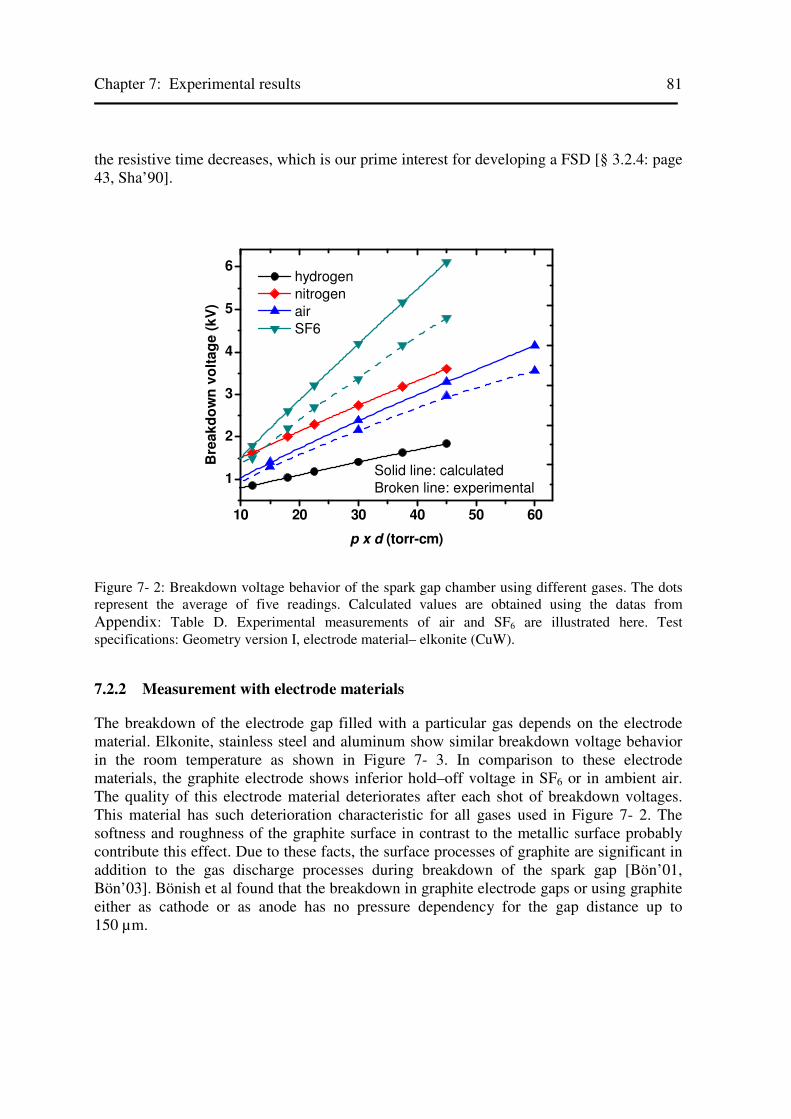
Chapter 7: Experimental results
81
the resistive time decreases, which is our prime interest for developing a FSD [§ 3.2.4: page 43, Sha’90].
10 20 30 40 50 60
1
2
3
4
5
6 hydrogen
nitrogen
air
SF6
Bre
ak
do
wn
vo
ltag
e (
kV
)
p x d (torr-cm)
Solid line: calculated
Broken line: experimental
Figure 7- 2: Breakdown voltage behavior of the spark gap chamber using different gases. The dots represent the average of five readings. Calculated values are obtained using the datas from Appendix: Table D. Experimental measurements of air and SF6 are illustrated here. Test specifications: Geometry version I, electrode material– elkonite (CuW).
7.2.2 Measurement with electrode materials
The breakdown of the electrode gap filled with a particular gas depends on the electrode material. Elkonite, stainless steel and aluminum show similar breakdown voltage behavior in the room temperature as shown in Figure 7- 3. In comparison to these electrode materials, the graphite electrode shows inferior hold–off voltage in SF6 or in ambient air. The quality of this electrode material deteriorates after each shot of breakdown voltages. This material has such deterioration characteristic for all gases used in Figure 7- 2. The softness and roughness of the graphite surface in contrast to the metallic surface probably contribute this effect. Due to these facts, the surface processes of graphite are significant in addition to the gas discharge processes during breakdown of the spark gap [Bön’01, Bön’03]. Bönish et al found that the breakdown in graphite electrode gaps or using graphite either as cathode or as anode has no pressure dependency for the gap distance up to 150 µm.

82 Chapter 7: Experimental results
0 10 20 30 40
1
2
3
4
5B
rea
kd
ow
n v
olt
ag
e (
kV
)
p x d (torr-cm)
SS
CuW
Graphite
Al
Figure 7- 3: Measured breakdown voltage behavior of the spark gap geometry for different materials. Test specifications: Geometry version I, gas type– SF6.
7.3 Realized PRR of spark gap operation
The discharge behavior depends on the characteristics of the plasma gap, of the insulating gas and of the dielectric stress. The circuit and geometry parameters are equally important to decide the discharge behavior. The first aim of this work was to study the influence of these parameters in relation to the PRR effects arising in pulsed plasmas. For this experiment, we operated the electrode gap system with DC voltage stress in combination with the unforced recovery voltage process.
7.3.1 Measurement in ambient air
The initial experiments on the plasma gap were performed in ambient air at an atmospheric pressure using a single power supply scheme. Figure 7- 4 shows the measured re–charging time at different feeding voltages for a typical gap distance of 200 µm and employing the charging resistance of 2 MΩ in series with the power supply. Figure 7- 4a presents the re–charging time of longer duration with a substantial statistical stability and is called the slow mode. The feeding voltage for this measurement is 1.52 kV. The higher feeding voltage at 1.82 kV as shown in Figure 7- 4b produces the dual mode, since it contains the re–charging time of both longer and shorter durations. The dual mode ceases with further increase of the feeding voltage. Finally, Figure 7- 4c shows the re–charging time of shorter duration only and is called the fast mode. Here, the feeding voltage is 2.23 kV. This mode has an explicit stability at the high PRR.

Chapter 7: Experimental results
83
0 50 100 150 2000.0
0.5
1.0
1.5
Bre
akd
ow
n v
olt
ag
e (
kV
)
Time (µs)
0 50 100 150 2000.0
0.5
1.0
1.5
Bre
ak
do
wn
vo
ltag
e (
kV
)
Time (µs)
(a) Slow mode: Feeding voltage 1.52 kV, Feeding current 0.25 mA
(b) Dual mode: Feeding voltage 1.82 kV, Feeding current 1.00 mA
0 25 50 75 1000.0
0.5
1.0
1.5
Bre
akd
ow
n v
olt
ag
e (
kV
)
Time (µs)
(c) Fast mode: Feeding voltage 2.23 kV,
Feeding current 2.00 mA
Figure 7- 4: Influence of the feeding voltage on the rate of recovery voltage for the spark gap operation in ambient air at atmospheric pressure. Test specifications: Geometry version I, electrode gap distance– 200 µm, charging resistance– 2 MΩ.
Figure 7- 5 presents the statistical histogram for the PRR of re–breakdown voltages in the dual–mode at the feeding voltage of 1.82 kV. This mode has a statistical spread in the PRR, which can be apparently separated into two distinct mean frequencies. For instance, Figure 7- 5 shows mean frequencies of 20 KHz and 50 KHz, which have some finite spread of the PRR at their mean values. In the following experiment, more than 60 measurements were noted to present the distribution of the PRR.

84 Chapter 7: Experimental results
0 20 40 60 800
5
10
15
Pro
ba
bil
ity s
tati
sti
cs
Pulse repetition rate (kHz)
Figure 7- 5: Statistical histogram of the dual mode in ambient air at atmospheric pressure. Test specifications: Geometry version I, gap distance– 200 µm, feeding voltage– 1.82 kV, charging resistance – 2 MΩ.
Figure 7- 6 presents the distribution of the measured PRR at different feeding voltages for a particular parameter setting. The parameter setting includes the electrode gap geometry, gap distance, gas type and pressure. The feeding voltage starts from the threshold breakdown of the electrode gap and it ends at the voltage value where the operation is physically limited by a continuous DC glow. Initially, at around 1.52 kV of the feeding voltage, the single mode appears with a negligible spread in the PRR. As the feeding voltage increases to a certain value, the dual mode appears. In this case, the distribution of re–charging time increases and hence re–breakdown voltages. We refer this stochastic behavior of re–breakdown voltages to be as the jitter. The jitter increases with the feeding voltage and attains a certain maximum value, e.g., at approximately 1.9 kV in Figure 7- 6. Then the jitter decreases with the further increase of the feeding voltage till the dual mode ceases to the fast mode. The jitter corresponding to the fast mode has again negligible spread in the PRR. Finally, the PRR of the fast mode increases with the feeding voltage until the continuous DC glow stops the recovery of the plasma gap. In this glow mode, the voltage drop across the spark gap is 200–300 V. The PRR is the maximum before DC glow transition. This impel us to limit the feeding voltage for the operation of pulsed plasmas in air. For the gap distance of 200 µm, the maximum limitation of the feeding voltage is around 2.4 kV. The re–breakdown voltages at the maximum PRR are approximately 800 V. The measured quantities of the PRR were realized for gap distances from 140 µm to 400 µm and are presented in Figure 7- 7 in ambient air at atmospheric pressure for several feeding current values.

Chapter 7: Experimental results
85
1.6 1.8 2.0 2.2
1.0
1.5
2.0
0
20
40
60
80
100B
rea
kd
ow
n v
olt
ag
e (
kV
)
Feeding voltage (kV)
PR
R (
KH
z)
Figure 7- 6: Influence of the feeding voltage on the PRR and re–breakdown voltage of the plasma gap in ambient air at atmospheric pressure. The dots present the mean value of several measurements corresponding to Figure 7- 5. Test specifications: Geometry version I, gap distance– 200 µm, charging resistance – 2 MΩ.
The influence of gap distances on the PRR for some specific feeding currents is presented in Figure 7- 7. The gap distances of 140 µm show the slow mode and fast mode corresponding to feeding currents of 0.25 mA and 2.00 mA respectively. There are dual modes in between, e.g., at 1.00 mA of the feeding current. The maximum feeding current, e.g. 2.00 mA, for this gap distance is limited by DC glow. At this feeding current, as the gap distance increases beyond 200 µm, the fast mode ceases to the dual mode. The achievable PRR then reduces compared to the gap distances of 140 to 200 µm. It can be said that at the given feeding current, smaller gap distances exhibit the higher PRR with an apparent stability (typically, <10 % of the mean PRR). The larger gap distances at the given feeding current establish unacceptable statistical variation, like the dual mode, along with the reduced PRR. The maximum PRR of 110 kHz has been realized in ambient air at atmospheric pressure for the electrode gap distance of 140 µm. However, the achievable PRR did not meet our desired objectives. Therefore, we explored the PRR with more electronegative gas than air viz. SF6.

86 Chapter 7: Experimental results
150 200 250 300 350 400
0
20
40
60
80
100
120
PR
R (
MH
z)
Gap distance (µm)
Feeding current
0.25 mA
1.00 mA
2.00 mA
2.25 mA
Figure 7- 7: Influence of gap distances on the PRR at given feeding currents in ambient air at atmospheric pressure. Test specifications: Geometry version I, gap distance– 200 µm, charging resistance– 2 MΩ.
7.3.3 Measurement in SF6 gas
In order to increase the PRR of re–breakdown voltages, beyond the realized value at atmospheric pressure in ambient air, SF6 gas has been used. The spark gap chamber was initially evacuated and then re–filled with SF6 gas. There are several advantages of using SF6 gas including higher dielectric strength (89 kV/cm) than other gases like air (30 kV/cm) at 1 bar. The most important property of SF6 gas is the self-quenching of DC glow or arc mode. It is reasonable to assume that after the discharge SF6 will deplete the ion population from the inter–electrode volume effectively and therefore can improve the voltage recovery characteristics better than other gases. In addition, it is possible in SF6 to feed a current much higher than that of in air, since the feeding current decides the re–charging time of the plasma gap (see equation 4.4).
7.3.3.1 Limitations in single power supply scheme
The use of SF6 has served to verify the feasibility of the desired PRR. Figure 7- 8 presents the variation of the PRR against feeding voltages in SF6 gas for various pressures. The detailed circuit for the measurement is already shown in Figure 5- 3. The charging resistance employed for these measurements is 270 kΩ. Unlike Figure 7- 6, in ambient air, the generation of pulsed plasmas exceeds 1 MHz of the PRR in SF6 at 1 bar. In the following, the feeding current is an order of magnitude higher than the maximum allowable feeding current in ambient air. The PRR decreases with increase of pressure for given feeding voltages. At the pressure of 1 bar, the PRR of 1.5 MHz needs the feeding voltage exceeding 6 kV. This PRR reduces at high pressures of 2 bars and 3 bars. Therefore, the

Chapter 7: Experimental results
87
feeding voltage is increased beyond 8 kV at these pressure ranges to increase the PRR. DC arc and glow occurs frequently at high feeding voltages but the self–quenching behavior of SF6 gas prevented them to continue for a long time (typically ~few microseconds). The achievable PRR at the feeding voltage of 12 kV was more than 3 MHz at 1 bar. However, two serious problems were encountered during these measurements:
1. The charging resistance was heated up due to the consumption of a lot of power. This effect had compelled us to operate the spark gap switch in burst mode of less than a minute.
2. DC glow and arc probability increased at high feeding voltages, which were not desirable in our study.
To reduce the effect of dissipation in the charging resistance, as well as DC glow and arc probability at the high PRR, an alternate charging circuit i.e., the dual-power supply scheme was employed.
4 6 8 10 120
1
2
3
PR
R (
MH
z)
Feeding voltage (kV)
Pressure
1 bar
2 bar
3 bar
Figure 7- 8: Influence of feeding voltages on the PRR in SF6 surroundings. Test specifications: Geometry version I, gap distance– 200 µm, charging resistance– 270 kΩ.
7.3.3.2 Advantage of dual–power supply scheme
The theoretical conception for the inclusion of the second power supply is already explained in Chapter 4 and the detailed experimental set–up is shown in Figure 5- 4. The dual-power supply scheme has the characteristic advantage of using the reduced feeding voltage below the threshold breakdown of the spark gap, which is not possible using the single power supply scheme. Figure 7- 9 presents the achieved PRR at reduced feeding voltage for two different electrode gap distances using the dual–power supply scheme.

88 Chapter 7: Experimental results
1.8 2.0 2.2 2.4 2.6 2.8
1.0
1.5
2.0
2.5
3.0P
RR
(M
Hz)
Feeding voltage (kV)
Gap distance
200 µm
300 µm
Figure 7- 9: The measured PRR using the dual–power supply scheme for different electrode gap distances in SF6 gas. Test specifications: Geometry version I, charging resistance– 90 kΩ. The illustrated feeding voltages are from the main power supply. The feeding voltage from the second power supply was 6 kV through the charging resistance of 20 MΩ.
The threshold breakdown voltages for the electrode gap distance of 200 µm and 300 µm are approximately 2.5 kV and 3.5 kV respectively in SF6 gas. The second power supply is responsible for this threshold ignition of the gas gap with a very small amount of power deposited in its circuit element. The feeding voltage from the main power supply to re–charge the plasma gap is below the threshold breakdown voltage of the gap. Here, e.g., the minimum feeding voltage from the main power supply is around 1.85 kV and 2.1 kV for the gap distance of 200 µm and 300 µm respectively. In these cases, the charging resistance of 90 kΩ is used in series with the main power supply. Below the mentioned feeding voltages, the spark gap often misfires and the PRR reduces below 1 MHz with a significant statistical variation in re–breakdown voltages.
7.3.3.3 Development of the improved set–up circuit
The improved set–up circuit in the PSpice simulation, using the high value of the inductance provided negligible ripple of the current through the circuit during the re–charging period as shown in Figure 6- 5. We implemented this circuit scheme to control the behavior of pulsed plasmas at the high PRR. Figure 7- 10 shows the measured results of re–charging voltages using the improved set–up circuit. The feeding voltage through the charging resistance of 90 kΩ from the main power supply to this plasma gap is 1.6 kV. The re–breakdown voltages with the solid line use the simple dual–power supply scheme as shown in Figure 5- 4. The measured feeding current (read from the power supply) is more than 17.5 mA. The dashed line presents the measured re–breakdown voltages using the improved set–up circuit. The feeding current in this case has reduced to 14.5 mA. The

Chapter 7: Experimental results
89
steepness in re–charging voltages has increased for the improved set–up circuit. The dotted line illustrates the constant voltage of approximately 420 V after the charging resistance and before the inductance used in the circuit. It means the feeding voltage is almost constant after the charging resistance (see node 2 in Figure 6- 5). The oscillation of voltage curves or re–breakdown voltages is measured only after the inductance or before the PFN of the electrode gap system. The inductor re–applies the feeding voltage across the plasma gap more likely in the resonant mode (§ 6.2, page 76). Therefore, the re–charging time decreases in the improved set–up circuit.
0 1 2 3 4 50
200
400
600
Bre
akd
ow
n v
olt
ag
e (
vo
lts)
Time (µs)
Figure 7- 10: Re–Breakdown voltages comparison using the dual–power supply scheme in SF6 gas for different circuit set–ups. The feeding voltage from the main power supply used here is 1.6 kV. Solid line: Re–breakdown voltages across the spark gap without the improved set–up. Dashed line: Recovery voltages across the spark gap with the improved set–up. Dotted line: Regulated voltage after the charging resistor and before the forming line of the spark gap with the improved set–up. Test specifications: Geometry version I, gap distance– 200 µm, charging resistance– 90 kΩ, inductance– 1 Henry. The feeding voltage from the second power supply was 6 kV through the charging resistance of 20 MΩ.
The measured PRR for two different circuit set–ups illustrates a remarkable variation using the same voltage source. The re–charging time of the plasma gap varies from 0.95 µs to above 1.3 µs without the improved set–up. The re–charging time with the improved set–up is more stable and varies between 0.82 µs to 0.86 µs. The minimum feeding voltage in the improved set–up circuit is 1.4 kV below which the plasma gap often misfires or do not re–breaks. The corresponding feeding current is below 13 mA. The re–breakdown voltages and the corresponding re–charging times exceed 1 kV and 1.0 µs respectively. In this case, the constant voltage after the charging resistance and before the inductance increases to approximately 450 V. The current through this circuit seems to be constant, unlike the single or dual–power supply schemes, which have high ripple or oscillation of currents.
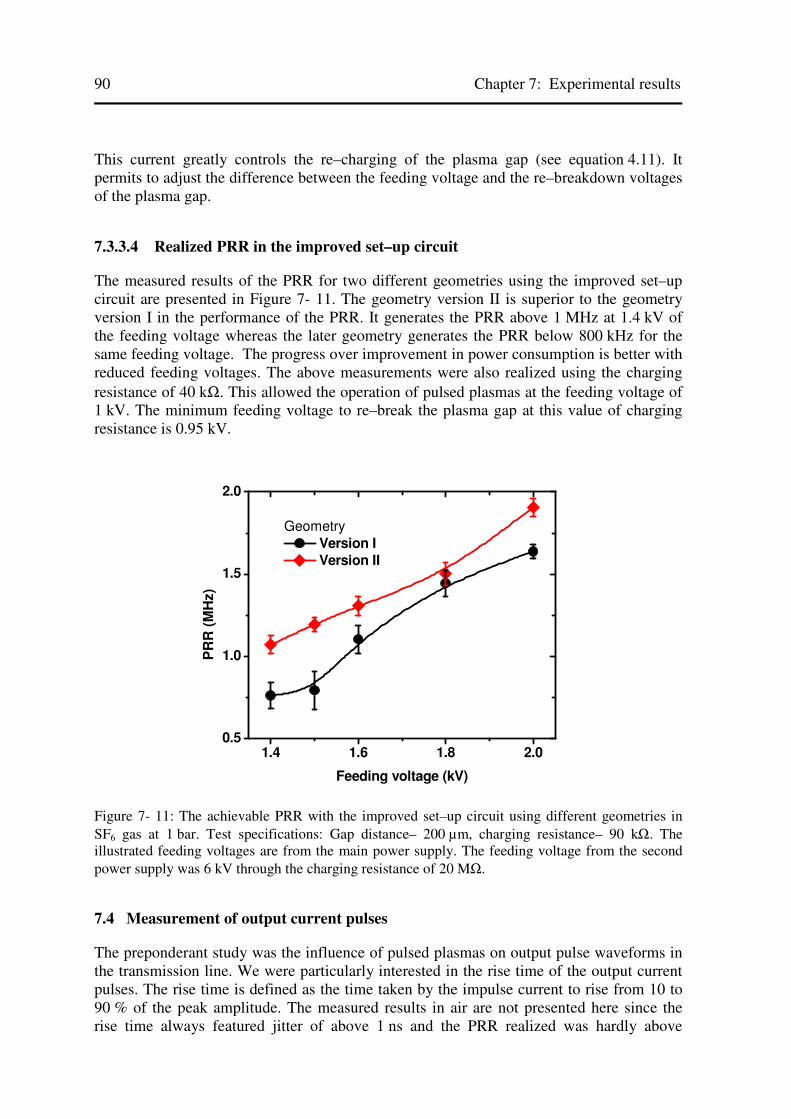
90 Chapter 7: Experimental results
This current greatly controls the re–charging of the plasma gap (see equation 4.11). It permits to adjust the difference between the feeding voltage and the re–breakdown voltages of the plasma gap.
7.3.3.4 Realized PRR in the improved set–up circuit
The measured results of the PRR for two different geometries using the improved set–up circuit are presented in Figure 7- 11. The geometry version II is superior to the geometry version I in the performance of the PRR. It generates the PRR above 1 MHz at 1.4 kV of the feeding voltage whereas the later geometry generates the PRR below 800 kHz for the same feeding voltage. The progress over improvement in power consumption is better with reduced feeding voltages. The above measurements were also realized using the charging resistance of 40 kΩ. This allowed the operation of pulsed plasmas at the feeding voltage of 1 kV. The minimum feeding voltage to re–break the plasma gap at this value of charging resistance is 0.95 kV.
1.4 1.6 1.8 2.00.5
1.0
1.5
2.0
PR
R (
MH
z)
Feeding voltage (kV)
Geometry
Version I
Version II
Figure 7- 11: The achievable PRR with the improved set–up circuit using different geometries in SF6 gas at 1 bar. Test specifications: Gap distance– 200 µm, charging resistance– 90 kΩ. The illustrated feeding voltages are from the main power supply. The feeding voltage from the second power supply was 6 kV through the charging resistance of 20 MΩ.
7.4 Measurement of output current pulses
The preponderant study was the influence of pulsed plasmas on output pulse waveforms in the transmission line. We were particularly interested in the rise time of the output current pulses. The rise time is defined as the time taken by the impulse current to rise from 10 to 90 % of the peak amplitude. The measured results in air are not presented here since the rise time always featured jitter of above 1 ns and the PRR realized was hardly above

Chapter 7: Experimental results
91
100 kHz. The measured quantities were obtained in SF6 for different circuit and geometry parameters.
7.4.1 Rise time in single supply scheme
Because of the stochastic nature of the plasma channel formation, the stability of switched pulses is significant for many applications. Figure 7- 12 shows the rise time of output current pulses corresponding to the parameter setting used in Figure 7- 8. The statistical variation of the rise time increases with increased pressure at all feeding voltages and so does the instability of re–breakdown voltages. At the feeding voltage below 5 kV, the statistical variation of the rise time is quite high (typically >1 ns). The smaller the rise time of output pulse waveforms, the more the improvement is pronounced. By increasing the feeding voltage, the rise time of current pulses and their stabilities are improved. However, at high feeding voltages the power consumption in the circuit increases due to high feeding currents. Hence, the dual-power supply scheme is employed to reduce feeding voltages below the threshold breakdown voltage of the gas gap. It is reasonably expected in dual–supply circuit scheme that optimized charging resistance will improve the rise time of current pulses.
4 6 8 10 120.0
0.5
1.0
1.5
2.0
2.5
Pressure variation
1 bar
2 bar
3 bar
Ris
e t
ime
(n
s)
Feeding voltage (kV)
Figure 7- 12: Influence of feeding voltages on the rise time in SF6 gas at different pressure using the single power supply scheme. Test specifications: Geometry version I, gap distance– 200 µm, charging resistance– 270 kΩ.
7.4.2 Limitations of different circuit schemes
Figure 7- 13 demonstrates the influence of different circuit set–ups on output current pulses in the transmission line. The feeding voltage of 2 kV through the charging resistance of 90 kΩ produces the feeding current of around 20 mA (read from the power supply). The

92 Chapter 7: Experimental results
second power supply is kept at 6 kV (V1) through the charging resistance of 20 MΩ. The solid line presents the measurement for one of the several shots. The second supply then shut off the power and pulse shapes were again measured for comparison. In this case, the dashed line shows the measurement. The recovery voltages for both current pulses were 580 V. Two important remarks can be expressed from these pulse shapes:
1. The efficiency of energy transfer i.e. the switching efficiency per switched pulses is 85 %, when the second supply was used in addition to the main power supply for the geometry capacitance of 42 pF. When the power shut off from the second supply, the switching efficiency reduced to 70 % for the geometry capacitance of 32 pF.
2. The re–breakdown voltage of 580 V in the single power supply scheme is obtained at the feeding voltage of around 7 kV through the charging resistance of 270 kΩ. This is the case, when the spark gap is not ignited by the second power supply. In case of the dual–power supply scheme, the feeding voltage from the main power supply can be reduced to 2 kV through the charging resistance of 90 kΩ.
0 2 4 60
2
4
6
Cu
rre
nt
(Am
p)
Time (ns)
Single supply
Dual supply
Figure 7- 13: Pulse waveforms with different circuit configurations in SF6 gas at 1 bar. The output charge of the discharge current pulses for the single supply scheme and the dual–supply scheme was 13.37 nC and 20.52 nC. Test specifications: Geometry version I, gap distance– 200 µm, charging resistance– 90 kΩ. The feeding voltage from the main power supply was 2 kV. The feeding voltage from the second power supply was 6 kV through the charging resistance of 20 MΩ. The second supply shut off the power during the operation for the single supply scheme.
There was a big disadvantage employing the dual–power supply scheme. The switching efficiency due to pulsed plasmas increases at the expense of system capacitance of the dual–power supply circuit. The system capacitance includes the stray capacitance due to the charging resistance and connections of the second power supply. This increases the energy

Chapter 7: Experimental results
93
capacity or the charge content of pulsed plasmas. In the same gap, this means a greater extension of the spark discharge or the plasma decay. Our objectives were to obtain relatively peak power with the low pulse charge content or small energy content. It means restricting pulsed plasmas at the low capacitance value. This was accomplished by using the improved–set up circuit and geometry version II.
7.4.3 Outcome of the improved set–up circuit
The rise time, measured for two different electrode gap geometries employing the improved set–up circuit, is shown in Figure 7- 14. The set of parameters in this case is similar compared to Figure 7- 11. The measurement presents a rise time of less than 300 ps. It manifests a significant improvement in the rise time and its stability over that of the single power supply scheme (see Figure 7- 12). The feeding voltage above 2.0 kV consumes more power in the circuit and hence is not included here. In addition, the occurrence of pulsed plasmas in the gap was constrained to a particular position on the electrode surfaces. As consequence, the probability of continuous DC glow or arcing was very high.
1.4 1.6 1.8 2.00
100
200
300
400
Ris
e t
ime (
ps)
Feeding voltage (kV)
Geometry
Version I
Version II
Figure 7- 14: The rise time of the output current pulses with improved circuit set–up for different geometries. Test specifications: Gap distance– 200 µm, charging resistance– 90 kΩ, SF6 gas at 1 bar. The illustrated feeding voltages are from the main power supply. The feeding voltage from the second power supply was 6 kV through the charging resistance of 20 MΩ.
7.4.3.1 Geometrical effect
The increased charge content of sparks slows down the decay of plasma channel (see Figure 7- 13). This influences adversely the recovery processes of the plasma gap, particularly the density of the neutral gas and the remnants of electrons and ions for the
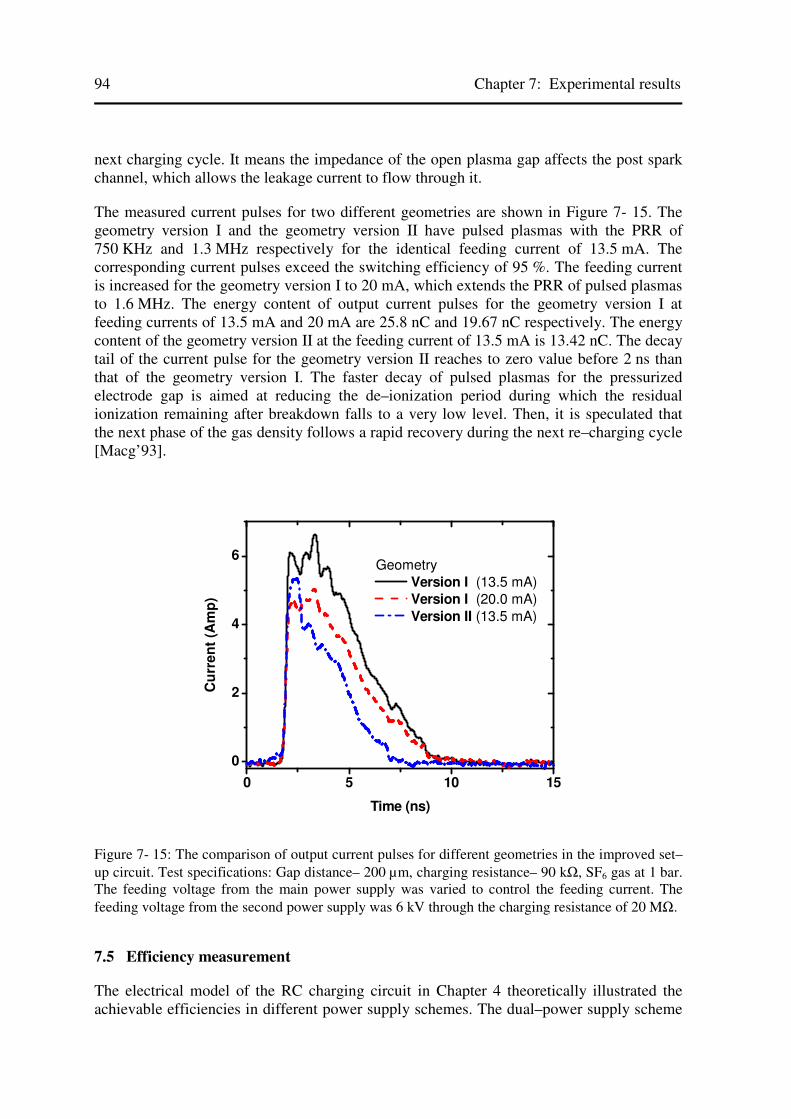
94 Chapter 7: Experimental results
next charging cycle. It means the impedance of the open plasma gap affects the post spark channel, which allows the leakage current to flow through it.
The measured current pulses for two different geometries are shown in Figure 7- 15. The geometry version I and the geometry version II have pulsed plasmas with the PRR of 750 KHz and 1.3 MHz respectively for the identical feeding current of 13.5 mA. The corresponding current pulses exceed the switching efficiency of 95 %. The feeding current is increased for the geometry version I to 20 mA, which extends the PRR of pulsed plasmas to 1.6 MHz. The energy content of output current pulses for the geometry version I at feeding currents of 13.5 mA and 20 mA are 25.8 nC and 19.67 nC respectively. The energy content of the geometry version II at the feeding current of 13.5 mA is 13.42 nC. The decay tail of the current pulse for the geometry version II reaches to zero value before 2 ns than that of the geometry version I. The faster decay of pulsed plasmas for the pressurized electrode gap is aimed at reducing the de–ionization period during which the residual ionization remaining after breakdown falls to a very low level. Then, it is speculated that the next phase of the gas density follows a rapid recovery during the next re–charging cycle [Macg’93].
0 5 10 15
0
2
4
6
Cu
rre
nt
(Am
p)
Time (ns)
Geometry
Version I (13.5 mA)
Version I (20.0 mA)
Version II (13.5 mA)
Figure 7- 15: The comparison of output current pulses for different geometries in the improved set–up circuit. Test specifications: Gap distance– 200 µm, charging resistance– 90 kΩ, SF6 gas at 1 bar. The feeding voltage from the main power supply was varied to control the feeding current. The feeding voltage from the second power supply was 6 kV through the charging resistance of 20 MΩ.
7.5 Efficiency measurement
The electrical model of the RC charging circuit in Chapter 4 theoretically illustrated the achievable efficiencies in different power supply schemes. The dual–power supply scheme

Chapter 7: Experimental results
95
is developed to improve the charging efficiency over that of the single power supply scheme. The study, of efficiency improvement, is important in the sense to develop optimized parameters for the operation of pulsed plasmas at the high PRR with low power consumption in the circuit as well as in the plasma gap. In this manner, it will serve our purpose to drive micro plasmas with relatively small power.
7.5.1 Charging efficiency in different circuit schemes
Figure 7- 16 exhibits the efficiency of charging the plasma gap in the case of single and dual–power supply schemes. The dual–power supply scheme has the higher charging efficiency than the single power supply scheme. The feeding voltage, for the single power supply scheme corresponding to the feeding current of 20 mA, is 5.5 kV. In this manner, it consumes a lot of power through its resistive element (≥ 270 kΩ). In the dual–power supply scheme, the feeding voltage for re–breakdown voltages of the plasma gap is achieved below the threshold breakdown voltage of the dielectric gap using the charging resistance of 90 kΩ. In this case, for instance, the feeding voltage corresponding to the feeding current of 20 mA is 2 kV. Due to this fact of reduced resistive element, the power consumption in the circuit is reduced by a factor of three.
15 20 25 300
5
10
15
20
Single supply, charging resistor 270 kΩΩΩΩ
Dual supply, charging resistor 90 kΩΩΩΩ
Ch
arg
ing
eff
icie
nc
y (
%)
Feeding current (mA)
Figure 7- 16: Charging efficiencies by repetitive pulsed plasmas for two different set–up circuits. Test specifications: Geometry version I, gap distance– 200 µm, SF6 at 1 bar. In dual–power supply scheme, the feeding voltage from the second power supply was 6 kV through the charging resistance of 20 MΩ.
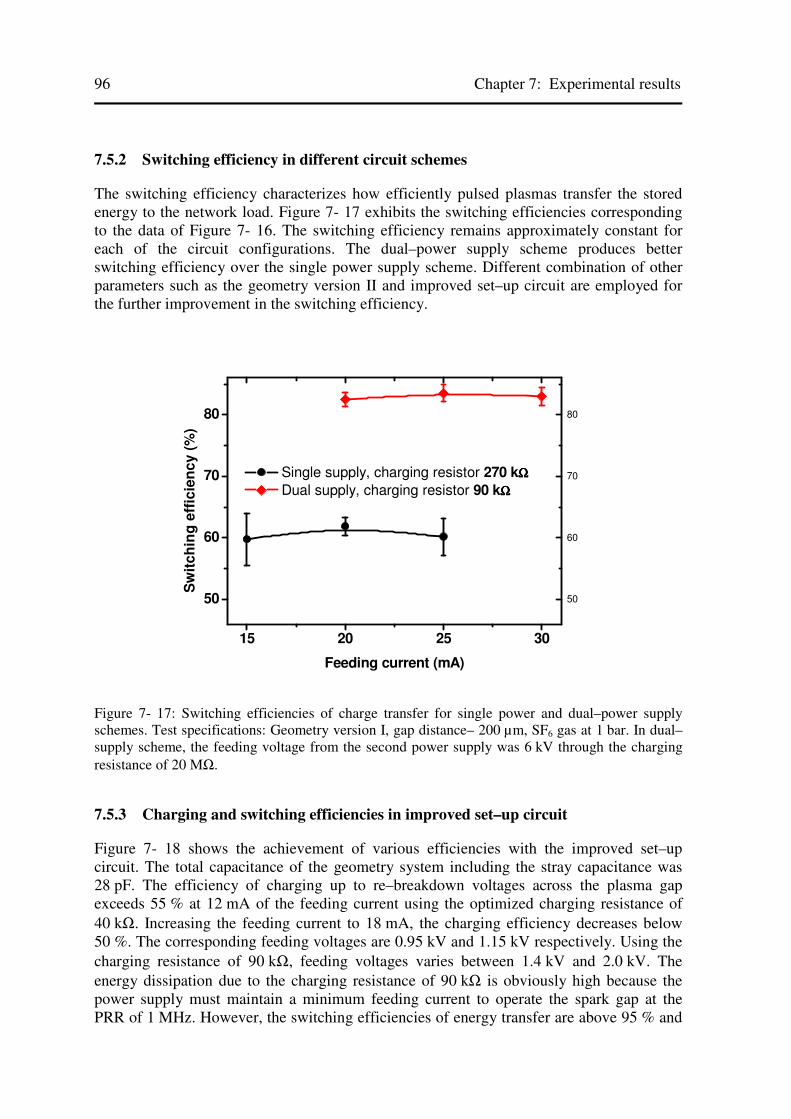
96 Chapter 7: Experimental results
7.5.2 Switching efficiency in different circuit schemes
The switching efficiency characterizes how efficiently pulsed plasmas transfer the stored energy to the network load. Figure 7- 17 exhibits the switching efficiencies corresponding to the data of Figure 7- 16. The switching efficiency remains approximately constant for each of the circuit configurations. The dual–power supply scheme produces better switching efficiency over the single power supply scheme. Different combination of other parameters such as the geometry version II and improved set–up circuit are employed for the further improvement in the switching efficiency.
15 20 25 30
50
60
70
80
50
60
70
80
Single supply, charging resistor 270 kΩΩΩΩ
Dual supply, charging resistor 90 kΩΩΩΩ
Sw
itc
hin
g e
ffic
ien
cy (
%)
Feeding current (mA)
Figure 7- 17: Switching efficiencies of charge transfer for single power and dual–power supply schemes. Test specifications: Geometry version I, gap distance– 200 µm, SF6 gas at 1 bar. In dual–supply scheme, the feeding voltage from the second power supply was 6 kV through the charging resistance of 20 MΩ.
7.5.3 Charging and switching efficiencies in improved set–up circuit
Figure 7- 18 shows the achievement of various efficiencies with the improved set–up circuit. The total capacitance of the geometry system including the stray capacitance was 28 pF. The efficiency of charging up to re–breakdown voltages across the plasma gap exceeds 55 % at 12 mA of the feeding current using the optimized charging resistance of 40 kΩ. Increasing the feeding current to 18 mA, the charging efficiency decreases below 50 %. The corresponding feeding voltages are 0.95 kV and 1.15 kV respectively. Using the charging resistance of 90 kΩ, feeding voltages varies between 1.4 kV and 2.0 kV. The energy dissipation due to the charging resistance of 90 kΩ is obviously high because the power supply must maintain a minimum feeding current to operate the spark gap at the PRR of 1 MHz. However, the switching efficiencies of energy transfer are above 95 % and

Chapter 7: Experimental results
97
approximately constant for the aforementioned feeding voltage ranges using charging resistances of 40 kΩ and 90 kΩ both. Below the feeding voltage of 0.95 kV, it was not possible to perceive the operation of pulsed plasmas at the controlled PRR. Since, the requirement of minimum feeding voltage for the repetitive operation of pulsed plasmas is 0.95 kV, reducing the charging resistance further, e.g. below 30 kΩ, increases the feeding current and consequently the power consumption in the circuit. Therefore, the optimized selection of the feeding voltage and charging resistance is necessary for the efficient charging. The experiments are also conducted for the gap distance of 300 µm. It displays a similar kind of behavior for pulsed plasmas. However, a continuous DC glow or arc probability appears at the earlier values of the feeding current for the gap distance of 200 µm compared to the gap distance of 300 µm. This is due to the constrained movement of sparks to particular positions on surface electrodes. The influence of gas pressure is also studied. The requirement of input power increases at high pressure for the operation of pulsed plasmas. However, the increase of the output power in the transmission line is not effective compared to the variation of the input power.
12 14 16 180
10
20
30
40
50
60
80
85
90
95
100
Charging resistor 90 kΩΩΩΩ
Ch
arg
ing
eff
icie
ncy (
%)
Feeding current (mA)
Charging resistor 40 kΩΩΩΩ
Sw
itch
ing
eff
icie
ncy (
%)
Figure 7- 18: Different efficiencies for the improved set–up circuit. Test specifications: Geometry version I, gap distance– 200 µm, SF6 gas at 1 bar. The feeding voltage from the second power supply was 6 kV through the charging resistance of 20 MΩ.
7.6 Measurement of breakdown voltage behavior
The operation of the spark gap in DC voltage stress is unlike that of the pulsed charged condition where it experiences a dead time between re–breakdown voltages. Therefore, the voltage recovery rate found under pulse charged conditions would not necessarily apply in situations where one employs DC voltage stress. One approach to repetitive operation with

98 Chapter 7: Experimental results
DC charged condition is to utilize the phenomenon of the corona stabilization [Mac’95, Kou’99, Kou’00, Ped’67]. In our study, the PRR of re–breakdown voltages exceeded 1 MHz. These re–breakdown voltages could be achieved using the corona stabilization at micro protrusions. Several experimental investigations were performed to realize this phenomenon.
7.6.1 Voltage recovery characteristic
In DC charged condition, the feeding voltage are applied resistively or resonantly to the electrode gap immediately after the switch closure. In such case, the electrode gap re–breaks at a much lower voltage than its initial breakdown voltage. This is illustrated in Figure 7- 19 for the improved set–up circuit. Initially, the feeding voltage from the second power supply is 6 kV through the charging resistance of 20 MΩ. The charging cycle due to this power supply has almost complete recovery voltages. This is followed by a number of incomplete charging cycles when superposed by the main power supply. The feeding voltage from the main power supply is 1 to 1.5 kV through the charging resistance of 40 to 90 kΩ. During incomplete cycles, the electrode gap closes at around 25 % of the initial breakdown voltage. The PRR of incomplete cycles exceeds 1 MHz. Although ion concentrations are not measured, it is reasonable to assume that a large population of ions could exist in the gas after switching and this will significantly affect the probability of discharge inception during the next re–charging voltage.
0 2 4 6 8 100
1
2
3
Bre
akd
ow
n v
olt
ag
e (
kV
)
Time (µs)
Figure 7- 19: The repetitive performance of re–breakdown voltages in DC voltage stress. The initial cycle of the charging voltage is obtained for the full recovery of the plasma gap. The following cycles are partially recovered attributing to the low recovery voltage and the high PRR. Test specifications: Geometry version I, gap distance– 200 µm, improved set–up, SF6 gas at 1 bar. The feeding voltage from the second power supply was 6 kV through the charging resistance of 20 MΩ.

Chapter 7: Experimental results
99
7.6.2 Voltage pressure characteristic
The measured non-linear pV − curve for the electrode gap under investigation is shown in
Figure 7- 20. There is a corona–like discharge in the plasma gap. In the presence of these coronae, physical breakdown of the gap does not take place in homogeneous fields as expected from the planar electrodes. We shall present some further experimental evidence to add credence to this conclusion. To characterize the pV − curve, the electrode gap
operates using the second power supply through the charging resistance of 20 MΩ. DC voltage is raised slowly for the ignition of the electrode gap with the increased pressure by a step of 0.25 bars. A series of re–breakdown voltages are noted for each pressure until the maximum pressure is limited by the mechanical construction of the geometry. Then the DC voltage is lowered with decreasing pressure and re–breakdown voltages are noted again. These tasks are performed 3–4 times and their average value is plotted in Figure 7- 20. Beyond the pressure of 1.5 bars, the breakdown voltage has a sudden transition. The corona shielding effect supposed to be ceased after 1.6 bars. These measured quantities show fairly good agreement with the one shown in Appendix: Figure A by Koutsoubis et al. [Kou’03].
0.5 1.0 1.5 2.0 2.5
2
3
4
Bre
ak
do
wn
vo
lta
ge
(k
V)
Pressure (bars)
Pure SF6
SF6 + N
2(20%)
SF6 + air(20%)
Cor
ona
ince
ptio
n
PC
Figure 7- 20: Measured voltage pressure characteristic of the spark gap in SF6 gas and its mixture with air and nitrogen. Test specifications: Geometry version I, gap distance– 200 µm, SF6 gas at 1 bar. The feeding voltage from the second power supply was increased through the charging resistance of 20 MΩ.
7.6.3 Field enhancement of electrode geometry
The electrodes were mechanically cleaned using the sandpaper. Then they were treated with acetone to remove loose particles. After these preparation, the electrode roughness or microprotrusions was approximately below 20 µm. The corona discharge in gases in the vicinity of these microprotrusions is subjected to intense, but not disruptive, electric fields. Figure 7- 21 shows the electric field distribution in the inter–electrode space of 200 µm

100 Chapter 7: Experimental results
with the applied voltage of 1 kV using finite element simulation of the field from Tricomp Field Precision program [Tri’00]. The edges of the electrodes are made rogowski profile to obtain macroscopically homogeneous field. Many micro pits and protrusions are created on the surface electrode of various sizes to examine the field effects.
The microprotrusions of 5 µm on the surface electrode produces a field enhancement of one order of magnitude. For the electrode separation of 300 µm, these micro protrusions produce the field enhancement by more than a factor of three. The micro protrusions with the high degree of field divergence are responsible for the corona inception [Har’99]. Taking the advantage of the corona stabilization, the ion population after the switching event can be reduced effectively to a level, which can extend the operation of repetitive spark gap into the megahertz regime.
Figure 7- 21: A simulation of field strength using Tricomp Field Precision program. The gap separation between the two electrodes is 200 µm.
7.6.4 Corona intensity oscillogram
The measurements of breakdown voltages and corresponding photomultiplier oscillographic records of spark discharges are shown in Figure 7- 22. In this case, the geometry version II is used for better view through the optical port. Due to the reduced electrodes diameter, pulsed plasmas are more concentrated within the optical window. Initially, the measurements are performed with the improved set–up circuit using only the second power supply with 6 kV through the charging resistance of 20 MΩ. The pre–breakdown activities are detected in the photomultiplier tube. The radiation intensities during the pre–breakdown period are shown in Figure 7- 22a and Figure 7- 22b. They demonstrate the time delay between the switch closure and the corona appearance of

Chapter 7: Experimental results
101
initiating the discharge, which varied considerably from shot to shot with fairly strong irradiation [Mac’85]. In Figure 7- 22b, the first appearance of the discharge corona is more than 70 ns before the breakdown of the electrode gap. The appearances of corona discharges were measured sometimes even without closing the switch gap [Har’99].
100 200 300 400
0
1
2
3
0
2
4
6
Bre
akd
ow
n v
olt
ag
e (
kV
)
Time (ns)
Inte
nsit
y (
a.u
)
0 100 200 300 400
0
1
2
3
0
2
4
6
Bre
akd
ow
n v
olt
ag
e (
kV
)
Time (ns)
Inte
nsit
y (
a.u
)
(a) Radiation inception (b) Early inception of radiation
0 100 200 300 400 500
0
200
400
600
800
0.00
0.05
0.10
0.15
0.20
0.25
Bre
akd
ow
n v
olt
ag
es
(V
olt
s)
Time (ns)
Inte
nsit
y (
a.u
)
0 2 40
200
400
600
800
0.000
0.005
0.010
0.015
Bre
ak
do
wn
vo
ltag
e (
Vo
lts
)
Time (µs)
In
ten
sit
y (
a.u
)
(c) Reduced radiation inception (d) Continuous radiation inception
Figure 7- 22: Radiation oscillograms for SF6 at 1 bar for different breakdown voltages. a and b correspond to re–breakdown voltages of the spark gap using the low power supply (6 kV through the charging resistance of 20 MΩ). Figure c and d correspond to re–breakdown voltages at the PRR of more than 1 MHz by using the main power supply in addition to the low power supply used in the measurement for figures a and b. Test specifications: Geometry version II, gap distance– 200 µm, improved set–up.
DC voltage of 1 kV (or 1.5 kV) from the main power supply through the charging resistance of 40 kΩ (or 90 kΩ) is superimposed with the aforementioned second power supply for the electrode gap operation. Then re–breakdown voltages reduce to around one-fourth (700–800 V) compared to breakdown voltages due to the second power supply only. These are shown in Figure 7- 22c and Figure 7- 22d. The corresponding radiation intensities are reduced to one–thirtieth. The related peak powers reduced to one–tenth. The duration of radiation intensities at 70 % percent of the peak amplitude is more or less similar (~ 25 ns) in both cases. At 10 % of the peak amplitude, their duration of intensities

102 Chapter 7: Experimental results
exceeds 100 ns. The re–charging voltages exceed 200 V, after the pulsed plasma although oscillations in the beginning, in 300 ns. Figure 7- 22c illustrates this phenomenon. The oscillations in re–charging voltages could be due to the presence of the discharge plasma after the switching event. Figure 7- 22d shows the presence of radiations always in the repetitive action of pulsed plasmas. The radiation is at peak during pulsed plasmas and is significantly small during the recovery process. This could be due to the development of space charge around the microprotrusions. The space charge shields the stressed electrode from the rest of the electrode gap during the recovery process.
7.7 Measurement of spectral lines
Time integrated spectroscopy experiments of pulsed plasmas are performed using the miniature spectrometer (§ 5.4, page 68). These plasmas are created in SF6 gas for the gap distance of 200 µm using the improved set–up circuit. Initially, the operation of the electrode gap is performed using only the low power supply as mentioned in the previous section. The recovery time due to this power supply is an order of milliseconds. Spectral lines are not apparent in this case. The reason being may be the limitation of the spectrometer with minimum integration time of 3 ms. Superimposing the feeding voltage of 1 kV from the main power supply increases the PRR of pulsed plasmas over 1 MHz. The corresponding recovery voltages decrease. In this case, the relative intensities of spectral lines are apparent and are shown in Figure 7- 23 between 350 nm and 750 nm. The emission spectrum is measured for two different electrode materials: elkonite and aluminum.
400 500 600 700
0
400
800
1200
Al I(
394.4
) Al I(
39
6.1
)
Em
issio
n i
nte
ns
ity (
a.
u.)
Wavelength (nm)
Electrode material
CuW
Al
F I
Cu I (
521
.8)
Figure 7- 23: Emission spectrum between 350 and 750 nm of spark discharges in SF6 gas at 1 bar. The spark gap operates at the PRR of re–breakdown voltages exceeding 1 MHz. The spectral resolution was less than 1.5 nm FWHM. Test specifications: Geometry version II, gap distance– l200 µm, improved set–up. The feeding voltage from the main power supply was 1 kV through the charging resistance 40 kΩ. The feeding voltage from the low power supply was 6 kV through the charging resistance of 20 MΩ.

Chapter 7: Experimental results
103
Between 600 nm and 750 nm, F I line dominates the emission spectrum. The relative intensities are exactly same as obtained by Blank et al while measuring absolute cross sections for fluorine 3p–3s line emissions between 600 nm and 800 nm [Bla’87]. The most intense and the prominent among all the emission lines is 685.6 nm (3p4D7/2→3s4P5/2). The elkonite or copper electrode material has a strong Cu I line at 521.8 nm. Pulsed plasmas in aluminum electrode produces strong Al I lines at 394.4 nm and 396.1 nm. The emission lines from the electrode materials, such as Cu II or Al II, are not observed.
7.7.1 Time resolved measurement of F I lines
The most prominent fluorine lines of the emission spectrum shown in Figure 7- 23, were 685.6 nm. Therefore, the temporal development of the radiation intensities is measured using the monochromator set for this particular emission line. Figure 7- 24 shows this emission line for two different breakdown voltages. Figure 7- 24a illustrates the recovery voltage due to the low power supply only. The duration of the emission intensity at 70 % of its maximum is below 3 ns and at 10 % of its maximum is more than 100 ns. Figure 7- 24b corresponds to the re–breakdown voltage at the PRR of 1 MHz using the main power supply in addition to the prevailed low power supply. Here, the emission peak intensity has reduced to one–fourth compared to the emission peak of the recovery voltage using the low power supply only. The duration of the emission intensity at 70 % and 10 % of its maximum value remains similar. There are more emission peaks with reduced amplitude. The number of these emission peaks varies from shot to shot. It means F I lines continue to exist during the recovery process.
0 50 100 150
0
1
2
3
0.0
0.1
0.2
0.3
0.4
Bre
akd
ow
n v
olt
ag
e (
kV
)
Time (ns)
In
ten
sit
y (
a.u
.)
685.6 nm
0 50 100 150
0.0
0.2
0.4
0.6
0.8
0.00
0.03
0.06
0.09
Bre
akd
ow
n v
olt
ag
e (
kV
)
Time (ns)
In
ten
sit
y (
a.u
.)
685.6 nm
(a) (b)
Figure 7- 24: Evolution of F I (685.6 nm) emission line in SF6 gas at 1 bar, for different breakdown voltages, in time. Figure 7- 24a displays the emission line for the breakdown voltage using only the low power supply. In this case, the feeding voltage was 6 kV through the charging resistance of 20 MΩ. Using in addition the main power supply of 1 kV through the charging resistance of 40 kΩ, Figure 7- 24b displays the emission line for re–breakdown voltages at 1 MHz of the PRR. Test specifications: Geometry version II, gap distance– 200 µm, improved set–up.

104 Chapter 7: Experimental results
7.8 Time integrated fast shutter pictures
Fast shutter pictures of the plasma development in the cathode–anode gap are captured by the CCD camera and are illustrated in Figure 7- 25. In fact, the intensity of pulsed plasmas at the PRR of 1 MHz is weak at an exposure time of 500 ns with the available device for the measurement. Additionally, pulsed plasmas moves on the surface of electrodes from pulse to pulse and are not constricted at a particular position between two electrodes. It is then more difficult to capture such spark channels especially for the short gap distances of 200–300 µm. Therefore, the PRR of the re–breakdown voltages is lowered to below 500 kHz and the exposure time of the camera is lengthened. The feeding voltage from the main power supply through the 90 kΩ charging resistance is 1.3 kV in this case. The corresponding feeding current is approximately 8 mA. In this way, it is possible to measure pulsed plasmas with the available device.
Figure 7- 25a shows the complete plasma channel between cathode and anode. Many times, the single spark channel with several branches or diffusive discharges at the respective electrodes is observed. Figure 7- 25b shows the discharge at the anode during the start of the recovery process. Many times the spread of the discharge appears at both electrodes without any channel connecting them. Figure 7- 25c and Figure 7- 25d present some of the many shots for the growth of the discharge during the recovery process. Figure 7- 25e shows the extended discharge, in space both in length along the axis and in lateral extent. The sequence of discharges from Figure 7- 25b to Figure 7- 25e presents the drift of the space charges in the electrode gap. This is the characteristic phenomenon of the corona stabilization.
Cathode Anode
(a) discharge1 discharge2 23ns 1.82µs t Picture (500ns)
(c) discharge1 discharge2 2.00µs
t 130ns Picture (1200ns)
300 µm
(b) discharge1 discharge2 1.60µs
t 65ns Picture (500ns)

Chapter 7: Experimental results
105
Figure 7- 25: Measurement by fast shutter pictures in the plasma gap. It illustrates the space charge formation for different moments on the time axis of the recovery voltage. Different gate times are presented in order to capture better pictures. The feeding voltage was 6 kV through the charging resistance of 20 MΩ. In addition, the feeding voltage from the main power supply was 1.3 kV through the charging resistance of 90 kΩ. Test specifications: Geometry version II, gap distance– 300 µm.
7.9 Electrode erosion characteristic
There are only one or two strong lines from the electrode material between 350–750 nm and that too from neutral atoms (see Figure 7- 23). It means material explosion is quite negligible compared to conventional spark gaps, where several techniques are employed to avoid the erosion of the electrode material and hence to increase their lifetime [Mac’00, Pet’80]. The major factor limiting the lifetime of conventional spark gaps is the evaporation of electrode materials at very high pulse current through the formation of cathode and anode spots [Hir’78, Rai’97, Pet’80]. In such cases, the emission spectrum of electrode material is apparent. In our investigation, the emission spectrum of mainly gas is apparent.
In SF6 gas discharge, regions of metal fluoride develop with time on electrode surfaces. This is due to the chemical reaction between the electrode material and fluorine produced in the discharge gap. Different electrode materials produce different chemical reaction rates with fluorine. This might be the reason why stainless steel builds up rapid metal fluoride (FeF2/FeF3) coated region and reduces the efficiency of the electron emission due to positive ion bombardment. The portion of the inside chamber exposed to the discharge gap also produces discoloration of the stainless steel. Even the optical window made of quartz placed at 2 cm from spark channels reacts with the fluorine after operation for some minutes. In such cases, the visibility of spark channels through the quartz window reduces. The limitation of the spark gap operation is not from the erosion of the electrode material but mainly due to the brittle compounds that can flake off the metal surface affecting breakdown voltages and jitter. Figure 7- 26 shows electrode compounds deposited on the surface of elkonite electrodes with operation time of typically exceeding 108 shots. A white dust compounds are formed over electrode surfaces. This might be due to the CuF2 compound. In addition, there is brown or dark brown color compound, which is possibly due to metallic oxide or metallic sulphides.
(d) discharge1 discharge2 1.93µs t 375ns Picture (1200ns)
(e) discharge1 discharge2 1.54µs t Picture (1200ns) 23ns

106 Chapter 7: Experimental results
(a) (b) (c)
Figure 7- 26: Flakes of metal compounds deposited on the electrode surfaces of elkonite. This appeared from the operation of the spark gap after half an hour in SF6 gas. Figure 7- 26a shows white color compound, a dust type, on the surface with pure SF6. When it is blown with air, the surface displays dark brownish color as shown by the second electrode surface in same Figure 7- 26a. Figure 7- 26b shows patches of black and dark brownish color on electrode surfaces for the mixture of SF6 with air (typically, <20%). Figure 7- 26c shows flakes of metal compounds or oxides in closure view of Figure 7- 26b, whose shapes and sizes vary from few tens of micrometers to a few hundreds of micrometers.
1 mm

Chapter 8: Discussion
107
Chapter 8: Discussion
Repetitive pulsing of micro plasmas will fill a rapidly expanding niche in the pulsed power technology. For this purpose, the present spark gap system performed admirably for its intended function as we have noticed in the previous chapter. Fortunately, this is an area where we achieved order of magnitude improvements successfully.
In the previous chapter, we presented many important measurement results like the rise time, the PRR and the corona assisted recovery process. In addition, we also presented the efficiency of charging the plasma gap and energy transfer by pulsed plasmas in the transmission line. What was important in our motive to take up this research work was to drive micro discharges with reduced power consumption in the circuit and the plasma gap. The feeding current through the resistive element is responsible for this power consumption. Despite this fact, the feeding current is important in the sense that it greatly controls the PRR of pulsed plasmas. The smaller the feeding current, the feeding voltage and higher the PRR, the improvement in pulsed plasmas for our goal will be a triumph. Eventually, we analyzed the operation of these plasmas depending on feeding power to provide a better understanding of various parameter settings for the optimal switching behavior. In the following chapter, we attempt to elucidate the availability of objectives through assumptions, results of numerical modeling and experimental investigations.
8.1 Rise time and stability of pulsed plasmas
Controlled pulsed plasmas illustrate the basis of the operation for the gas-filled spark gap. The measured rise time of pulsed plasmas in the transmission line are already presented in Figure 7- 12 and Figure 7- 14. Due to the fluctuation of the parameters α and γ with time,
the electrical re–breakdown does not occur for the same voltage in a series of experiments and consequently pulsed plasmas are stochastic in nature. We are able to control and reduce the stochastic nature of pulsed plasmas to a great extent. The reduced electric field ( pE / )
at the re–breakdown voltage determines the rise time (equation 3.28). The higher this electric field, the shorter will be the rise time of the output pulse waveform. The dielectric recovery of the plasma gap depends on several operating parameters such as gas type, gas pressure, electrode geometry design and so on. This dielectric recovery determines the re–breakdown voltage and so does the reduced electric field.

108 Chapter 8: Discussion
8.1.1 Dependence of gas type
The leading edge developments of switches and dielectric systems produce a major gain in the development of repetitive pulsed plasmas. The needed dielectric volume to form these pulsed plasmas is a limit of the system concerning size and weight. Pulsed forming dielectrics are necessary to have a high energy density, good PRR properties, less degradation and pulse-to-pulse reliability.
Hydrogen gas has the smallest density. Therefore, hydrogen is the preferred choice for applications where the rise–time is a predominant parameter [Pec’01, Fro’93]. Hydrogen’s low molecular weight allows a fast channel expansion, so that pulsed plasmas reduce turn–on time and gap losses [Kus’85]. Ambient air, nitrogen and hydrogen gas have high static breakdown voltages only at high pressures or dp values on the right branch of the Paschen
curve (see Figure 7- 2). In this context, the maximum pressure value is a limitation due to the mechanical construction of the spark gap device i.e. the maximum operating pressure in the coaxial chamber is 5 bars that it can withstand. The dielectric recovery of the aforementioned gases at tens of kHz is poor in the pressure range of 5 bars and below. This is assisted by lower breakdown voltages of the plasma gap or very often generates a continuous DC glow. The operation of the plasma gap in the ambient air produces high concentration of ozone (O3) especially at the high PRR and various nitrogen oxides (e.g. HNO2, HNO3). Apart from these, metal oxides (e.g. Cu2O/WO3 for elkonite electrodes) are formed due to repetitive sparks. Metal oxide build–up with time and affects the consistent behavior of rise time. The work functions of the surface change, which affect in its electron emission properties. The secondary emission described by Townsend’s coefficient γ
changes because now electrons and ions hit the surface atoms. A more dramatic effect can be expected i.e. the enrichment of metal oxide rise the breakdown voltage to a point in which the switch lock–on (short circuit) may occur with subsequent damage to the load or system. Inert gases being less reactive are supposed to produce the rise time with more consistent performance [Jud’01]. However, neither they have the properties of electron affinity like air to prevent premature breakdown nor they have high molecular speed and diffusivity like the hydrogen gas for faster cooling of the discharge plasma [Mor’91]. SF6 gas is the best candidate for the feasibility of pulsed plasmas at the high PRR. It has versatile properties including high hold–off voltage, strong quenching capability and better thermo-physical properties relative to other aforementioned gases.
8.1.2 Impact of pressure variation
High gas pressures and small gap spacing allow closer gas contact to metal surfaces and have the advantage of a shorter arc, which reduces resistance and inductance. As already mentioned, the gases like ambient air, nitrogen and hydrogen gases produce DC glow in the plasma gap for the PRR of tens of kilohertz even at the maximum working pressure of 5 bars. The PRR of the generated pulsed plasmas at 1 MHz is feasible only in SF6 gas at atmospheric pressure and above (see Figure 7- 8 to Figure 7- 11).
The rise time of output pulse waveforms very often increases along with more jittering behavior on increasing the pressure for given feeding voltages (see Figure 7- 12). This seems to be due to the stochastic behavior of re–breakdown voltages at the higher pressure.

Chapter 8: Discussion
109
It means the dielectric recovery of the plasma gap is not the problem. The cooling effect of the plasma gap is responsible for higher recovery voltages. The reduction effect in recovery voltages is due to the thermal effect or possibly by the effect of multiple spark channels occurring at the high PRR. At relatively higher feeding voltages, the re–breakdown voltages and consequently the PRR are stable in a single power supply scheme (see Figure 7- 6 and Figure 7- 8). The higher feeding voltages achieve this PRR at the expense of increased feeding currents. These currents increase the power consumption in the circuit via the charging resistance. However, employing the dual–power supply scheme has the advantage of the reduced feeding voltage and hence the feeding current employing the optimized charging resistance. An optimal circuit parameter setting is achieved employing the improved set–up scheme. Despite this fact, there is a limit on maximum pressure (~ 1.5-1.6 bars in SF6) after which the efficiency of the corona stabilization ceases (§ 3.1.2.3: page 33, Figure 7- 20).
8.1.3 Geometrical dependency
A uniform or quasi–uniform type electrode allows higher re–breakdown voltages. The gap spacing is chosen to be as small as possible to minimize the intrinsic inductance of the spark channel during the conduction phase, since the channel inductance limit the pulse rise–time. The channel inductance L for the gap length arcδ is given by
=
i
arcr
rL 00 ln
2π
µδ
where 0r is the inner radius of the coaxial chamber. ir is radius of the arc channel and 0µ is
the permeability in free space.
The rate of rise of the impulse voltage at load, dtdVL / is related to the electric field E by
L
EZ
dt
dV LL = 8.1
LZ is the load impedance of the transmission line. The uniform electric field is given by
arc
bVE
δ=
bV is the re–breakdown voltage (typically ~ 800 V) of the plasma gap. The achievable rate
of rise of the output pulse of 400 V for the gap distance of 300 µm is less than 1 ps.
From the transmission line point of view the impedance throughout the set–up has to be as constant as possible. The conducting channel of pulsed plasmas is optimized when the channel inductance per unit length is that of the transmission line. Maintaining the system impedance throughout eliminates the associated power loss and thus implicates an increase of output efficiency. For this above mentioned reason, the coaxial chamber with the integrated spark gap system was designed.

110 Chapter 8: Discussion
The propagation speed of electromagnetic (e.m) waves limits the timescale of the rise time of output pulsed waveforms in the insulating media. The rise time by the e.m waves from the spark gap breakdown is given by
µεδ arcrt =
ε and µ are permittivity and permeability of the medium respectively. For a gap distance
of 300 µm, this rise time is around 1 ps. The achievable rise time increases for the coaxial spark gap since the e.m waves have to re–establish between the inner and outer conductors [Hen’05, Leh’97]. Thus for the ultrafast switching, the inner diameter of the coaxial chamber must be chosen to be small and consistent with the 50 Ω design.
Lehr et al devised a biconical spark gap with quasi–constant impedance, which effectively reduces the inductance of the plasma gap [Leh’99]. The design geometry had both the tapered electrodes and coaxial chamber as shown in Figure 8- 1 (a). It was anticipated in this design to realize fast rise time by e.m waves. In a recent article by Hendriks et al, the electrodynamic simulation, using CST Microwave Studio, presented a rapid rising edge of the output waveform pulse in the biconical spark gap (Figure 8- 1 (b)) [Hen’06]. The rising edge of the waveform pulse is rapid compared to the non–tapered gap as ours, but up to the halfway to its final value. Then it rises slowly to its final value. It seemed the tapered system behaved like an over–damped system while the non–tapered system behaved like an under–damped system. The rise time to the final value was much better for the coplanar electrode gap.
(a) (b)
Figure 8- 1: (a) A biconical spark gap with quasi–constant impedance for optimal rise time by Lehr et al [Leh’97]. (b) Simulated output signals of different spark gap configurations by Hendriks et al [Hen’06].

Chapter 8: Discussion
111
8.2 PRR and stability of pulsed plasmas
Generally, the free voltage recovery process occurs in three distinct phases [Mor’91]. The first phase is the deionization of the ionized gases in the plasma channel following breakdown. The time duration of this phase is in the order of 10 µs. The second phase is the cooling of the neutral gas, which will provide the gas with its static or DC hold–off voltage. The time duration of this phase takes normally a few milliseconds. The third phase is the recovery of the ability to be overvolted. This phase is delayed by as long as several milliseconds and is attributed to the existence of residual electrons and ions in the gap [Mac’95]. The study of the PRR improvement is focused on a competent dielectric recovery process of the plasma gap. Different parameter settings are investigated for this purpose (see Figure 7- 11 and Figure 7- 18).
8.2.1 Influence of gas type and gas mixture
The dielectric recovery is dominated by the cooling time of the pulsed plasma channel. The recovery of the neutral gas density needs a finite time after the discharge [Mor’91, Ora’91]. The high molecular speed and thermal diffusivity of hydrogen gas allows the recovery time to be faster than other gases [Mor’91]. The strong thermo–physical properties of gases permit superior heat transfer and faster cooling of the plasma column. SF6 gas with very high density compared to other gases increases the heat capacity and improves turbulence. The higher attachment cross section of SF6 and its dissociative products (see Figure 3- 4) reduces the electron density, which results in decrease of the electrical conductivity of the plasma column far more rapidly and efficiently than other gases.
The mixture of SF6 with nitrogen was used in varied proportion to investigate pulsed plasmas in small electrode gaps. The idea of using SF6 mixing with nitrogen is for better insulation on the recovery process. The mixture combines the high dielectric field strength of SF6 with the high thermal conductivity and diffusive velocity of the light molecular gas such as nitrogen. Figure 8- 2 shows the effect of SF6 alone and its mixture with nitrogen on the PRR and the charging efficiency of the plasma gap for a range of feeding currents. Investigations of the high-pressure spark gap in circuit breakers and GIS (Gas Insulated Switchgear) have been successful in replacing large percentage of SF6 by nitrogen up to 95 % [Sin’03]. The operation of most of these devices is limited to a few shots per second. In our study, the amount of nitrogen with more than 20 % in SF6 produced often DC glow at the PRR of 1 MHz. However, the nitrogen amount of 20 % and below in SF6 generated efficient pulsed plasmas in the transmission line as that of SF6 gas alone.
When nitrogen (or air) is added to SF6 gas, the corona-generated space charge propagates faster and effectively shields the non–uniform electrode of the test gap more rapidly than SF6 gas alone. With increasing repetition rate, the dielectric recovery of the plasma gap becomes less efficient, since the space charge movement is a time dependant effect. Conversely, there is a lower limit of SF6 concentration, below which the electronegative behavior weakens to such a degree that the corona becomes unable to produce a stabilizing space charge. It means increasing concentrations beyond certain limit for nitrogen, which is apart from being lighter and more mobile than SF6 gas, contribute significantly to the production of photoelectrons and hence early breakdown of the electrode gap. Therefore,

112 Chapter 8: Discussion
we can say the dependence of the mixture’s dielectric recovery is determined by the SF6 gas concentration.
14 15 16 17 18 190
10
20
30
40
50
1.0
1.5
2.0
2.5
3.0
3.5
Only SF6
SF6 + 20% N2
Ch
arg
ing
eff
icie
nc
y (
%)
Feeding current (mA)
Pressure at 1.2 bars
PR
R (
MH
z)
Figure 8- 2: The influence of gas mixtures for the repetitive spark gap operation with improved set–up. Test specifications: Geometry version II, gap distance– 200 µm, electrode material– elkonite. The feeding voltage from the second power supply was 6 kV through the charging resistance of 20 MΩ. The illustrated feeding current was measured from the main power supply through the charging resistance of 40 kΩ.
8.2.2 Influence of gas pressure
Most of the published works on electrode gaps are based on the electrical stress of triggered mode or high overvoltage mode. Their switching performance is restricted up to few tens of kilohertz in gases like ambient air, nitrogen, hydrogen and so on [Mor’91, Mor’92, Mac’95]. The operation at very high-pressure (typically tens of bars) improves the PRR behavior due to the increased heat capacity, improved turbulent cooling, and reduced statistical time [Mor’91]. High-pressure hydrogen gas (typically several tens of atmospheres) allows the operation of a low loss spark gap switch with the recovery time by an order of magnitude faster than other gases [Mor’91]. Some of these factors may also be true for the DC voltage stress. Therefore, the essential requirement of the chamber design is to alleviate the constraint imposes by the stress of the high pressure. In order to overcome this pressure stress, a strong electronegative gas, particularly SF6, was employed at near atmospheric pressure due to many advantages including the simplicity of the chamber design. This design requires less attention for its leak tightness. Figure 8- 3 presents the response of the gas pressure on the PRR. In the pressure range between 1 and 1.5 bars, better performance in the efficiency of re–charging the plasma gap is observed compared to further higher pressures. The charging efficiency exceeds 60 % at times when the charging resistance of 40 kΩ is used. Despite this fact, the charging efficiency decreases significantly at the pressure of 2 bars (< 40 %).

Chapter 8: Discussion
113
The possible reason for the low charging efficiency at high pressure is due to high recovery voltages. The re–charging time for higher recovery voltages increases and accordingly, the PRR of pulsed plasmas decreases. In addition, high recovery voltages increase the energy input to the plasma gap and hence the time duration of decayed conducting plasmas. If the decay is not sufficient e.g., the failure of the neutral gas density by some amount, it increases the leakage current and hence reduce the resistance of the open plasma gap. Due to these facts, the dielectric recovery is poor and the plasma gap closes at low voltages for the next charging cycle. Sometimes the high recovery voltages and other times the low recovery voltages is a stochastic process. Additionally, the corona stabilization ceases beyond 1.6 bars as shown in Figure 7- 20 and in Appendix: Figure A. To obtain the desired PRR, the re–charging time has to be decreased. It can be done only at high feeding voltages (see Figure 7- 8 and Figure 7- 9). The feeding current increases at the expense of feeding voltages and in consequence, the power consumption in the circuit increases.
1.0 1.2 1.4 1.6 1.8 2.00
10
20
30
40
50
60
0.6
0.8
1.0
1.2
1.4
1.6
40 kΩΩΩΩ
Ch
arg
ing
eff
icie
nc
y (
%)
SF6 Pressure (bars)
90 kΩΩΩΩ P
RR
(M
Hz)
Figure 8- 3: Influence of pressure on the PRR for different charging resistances. The feeding voltage through charging resistance of 90 kΩ was 1.5 kV and through charging resistance of 40 kΩ was 1 kV for 1 and 1.5 bars. At 2 bars, minimum feeding voltages were 1.6 kV and 1.15 kV through charging resistances of 90 kΩ and 40 kΩ. Test specifications: Geometry version II, gap distance– 200 µm, electrode material– elkonite. The feeding voltage from the second power supply was 6 kV through the charging resistance of 20 MΩ.
8.2.3 Effect of geometry
It is of our interest to produce and control pulsed plasmas in the spark gap. The geometrical design of the spark gap plays a very significant role in alleviating the physical constraints of pulsed plasmas at the high PRR. For instance, the coplanar electrode type assists in reproducible pulsed plasmas in comparison to the point–plane gap [Kou’04]. The geometry version II is designed to reduce the electrode surface areas and consequently the spread of spark channels. This reduces the time between movements of plasma channels. Therefore,

114 Chapter 8: Discussion
this geometry seems more feasible for the reduced statistical variation of pulsed plasmas. The geometry has the added advantage of reduced system capacitance, which in turn reduces the input energy capacity of pulsed plasmas. The gap distance, for the PRR stability, is optimized between 200 µm and 300 µm. For the gap distances below 200 µm, spark channels are concentrated to particular positions on electrode surfaces. These conducting channels more likely induce the thermal heating of electrodes and increase the gas temperature. Therefore, lock–on activities (glow or arcing) increases for short gaps. For gap distances exceeding 300 µm, the cooling of pulsed plasmas is more effective in the increased volume space. This leads to the effective recovery of the neutral gas density and hence re–breakdown voltages are increasing. Finally, the energy capacity of pulsed plasmas increases. For the next charging cycle, the dielectric recovery is poor and hence re–breakdown voltages decrease. It means the stochastic breakdown processes increase in the gas gap, which is for obvious reason to be avoided for our desired objectives. Also, the excessive cooling of the plasma gap very often causes misfiring. One of the approaches to obtain stable re–breakdown voltages is to increase the feeding voltage from the main power supply (see Figure 7- 8). This increases the feeding current and consequently power consumption through the circuit element. In addition, the extended gap distances increase the mismatch impedance. This produces perturbations of the output impulses in the transmission line.
8.2.4 Impact of electrode material
A multitude of electrode materials are tested (Figure 7- 3). They have a profound effect on the quality of reproducible pulsed plasmas [Jud’01]. The metal electrodes with high heat capacity, melting points and good oxidation resistance tend to have better resistance to wear or erosion. These electrode materials allow better stability for the pulse reproducibility.
Elkonite is the copper–tungsten composite, which is commonly employed for the use of the electrode material where erosion from the spark is more concerned. The high melting temperature of the tungsten (3380oC) coupled with the electrical conductivity of the copper, which have low melting temperature (1083oC), achieves a better erosion performance than that of the copper alone. Aluminum electrode, which has the lowest melting point, 660oC, of the tested material displays good performance in the operation of our spark gap. This is in contrast to conventional spark gaps, where aluminum electrode material due to its high erosion rate is avoided [Kou’00]. Aluminum oxidizes very rapidly and hence a substantial insulating region of Al2O3 readily forms even before the start of the repetitive operation of pulsed plasmas [Mac’86]. Due to the discharge in SF6, the rate of the clean up of oxide layers through aluminum oxyfluoride (AlF2O) outweighs the rate of development of aluminum fluoride (AlF3) [Mac’86, Par’02]. Stainless steel with better physical properties than aluminum or copper, such as high melting temperature, hardness and resistance to erosion, was expected to have poor performance than elkonite, but better than aluminum or copper. However, lower electrical and thermal conductivities of stainless steel give rise to joules heat. A wide range of atomic, molecular, and ionic species is produced in the gas phase, when an electrical discharge occurs in SF6 (Figure 3- 3 and Appendix: Table E). The emission spectrum in Figure 7- 23 illustrated a high reaction rate for fluorine. Copper fluorination is a major process that forms CuF2 on the copper surface. The rapid build up of metal fluoride (FeF2 /FeF3) on the stainless steel reduces the efficiency of the electron

Chapter 8: Discussion
115
emission from the bombardment of positive ions. This seems to be the effect responsible for the performance decrease and frequent lock–on activities (glow or arcing) for stainless steel. The end of lifetime is very fast for this electrode material.
8.3 Charging efficiency
Theoretically, more than 50 % of the input power dissipates during charging of the open plasma gap, using non resonant circuit schemes. In following sections the efficiency of experimental results are compared with the calculated values in order to validate the analytical approach (§ 4.2.1, page 47, § 4.2.2, page 51) for the efficient operation of pulsed plasmas. We tried to provide the possible explanation of the poor charging efficiency and the experimental aspects of its improvement. We took into account the physical processes and their limitations for the plasma gap operation.
8.3.1 Single power supply scheme
We have theoretically explained the efficiency of the repetitive charging for the open plasma gap in the single power supply scheme (see equation 4.16). Using experimental datas, we have compared the theoretical and experimental results of charging efficiencies in Figure 8- 4. The discrepancies are more likely due to the physical limitation by the discharge gap. Immediately after the switched pulse, the electrode gap is still in the state of conduction and requires a finite time for the gas density to recover. Due to this fact, the plasma gap resistance decreases depending on the amount of conduction through the gas gap. The gap resistance in turn reduces the time constant of the circuit (see equation 4.13). The time constant for the theoretical curve is taken from experimental circuit parameters.
10 20 30 40 500
5
10
15
20
0
1
2
3
Theoretical
Experimental
Ch
arg
ing
eff
icie
ncy (
%)
Feeding current (mA)
PR
R (
MH
z)
Figure 8- 4: Influence of the feeding current on the PRR and charging efficiency using the single power supply scheme. Test specifications: Geometry version I, SF6 gas at 1 bar, gap distance– 200 µm, electrode material– elkonite.

116 Chapter 8: Discussion
The first term of the denominator ( Csat VVV −20 ) in equation 4.16 exceeds the numerator
term 2CV with overvoltage. In addition, the second term of the denominator increases
significantly because of the factor Csat VV over the factor 2CV in the numerator. As
consequence, the charging efficiency is hardly been more than 10 % at 1 MHz of the PRR for the single power supply scheme. At the feeding current of 50 mA, the charging efficiency decreases to below 2.5 %. The corresponding feeding voltage is 12 kV. Apart from these, a significant amount of leakage current flows through the gas gap during the recovery process at high feeding current or overvoltage.
8.3.2 Dual–power supply scheme
The first term of the denominator in equation 4.21 is very small due to the reduced 0V and
satV in the dual–power supply scheme. The factor Csat VV of the second term increases over 2
CV of the numerator term with increased feeding voltage, but their ratio is relatively small
compared to the single power supply scheme. As consequence, there is an improvement in the charging efficiency by a factor of three in the dual–power supply scheme. Figure 8- 5 presents the comparable charging efficiencies from theoretical and experimental results using the dual–power supply scheme. The feeding currents shown in the plot are noted from the main power supply readings. It is anticipated that further improvements in the charging efficiency would be achieved provided the feeding current from the main power supply is reduced and the corresponding feeding voltage is sufficient to carry the re–breakdown of the plasma gap at the PRR exceeding 1 MHz. The leakage current through the plasma gap is improved in this circuit scheme and a further improvement is recommended. In addition, we need a very small geometrical system capacitance to reduce the decay time of the pulsed plasma and consequently the recovery time of the plasma gap (see equation 4.4). All aforementioned qualities have been realized with the improved set–up circuit and the geometry version II.
8.4 Leakage current in open plasma gap
The density of neutral gas in the plasma gap is weakly established shortly after the discharge due to the remnants of ions and electrons. Accordingly, the recovery process of the plasma gap is poor and allows a finite leakage current to flow through it. The resistance
dR of the plasma gap decreases with increase of the overvoltage. The reduced
dR of the plasma gap means the increase in the leakage current through the plasma gap and
the circuit elements (equations 4.11 and 4.12). Therefore, it is very important in our study to reduce this leakage current and to improve the voltage recovery rate of the open plasma gap. In following sections, we emphasize on the leakage current and its improvement with varying parameters including the circuit and the spark gap geometry.
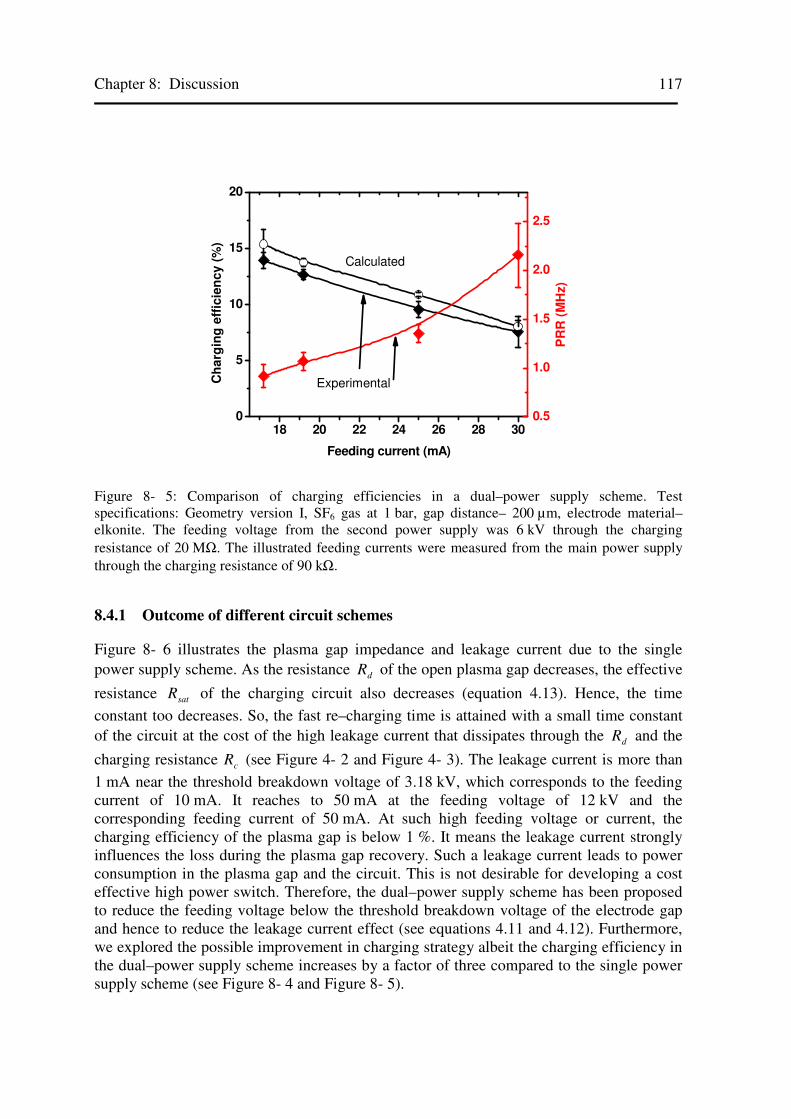
Chapter 8: Discussion
117
18 20 22 24 26 28 300
5
10
15
20
0.5
1.0
1.5
2.0
2.5
Calculated
ExperimentalCh
arg
ing
eff
icie
ncy (
%)
Feeding current (mA)
PR
R (
MH
z)
Figure 8- 5: Comparison of charging efficiencies in a dual–power supply scheme. Test specifications: Geometry version I, SF6 gas at 1 bar, gap distance– 200 µm, electrode material– elkonite. The feeding voltage from the second power supply was 6 kV through the charging resistance of 20 MΩ. The illustrated feeding currents were measured from the main power supply through the charging resistance of 90 kΩ.
8.4.1 Outcome of different circuit schemes
Figure 8- 6 illustrates the plasma gap impedance and leakage current due to the single power supply scheme. As the resistance dR of the open plasma gap decreases, the effective
resistance satR of the charging circuit also decreases (equation 4.13). Hence, the time
constant too decreases. So, the fast re–charging time is attained with a small time constant of the circuit at the cost of the high leakage current that dissipates through the dR and the
charging resistance cR (see Figure 4- 2 and Figure 4- 3). The leakage current is more than
1 mA near the threshold breakdown voltage of 3.18 kV, which corresponds to the feeding current of 10 mA. It reaches to 50 mA at the feeding voltage of 12 kV and the corresponding feeding current of 50 mA. At such high feeding voltage or current, the charging efficiency of the plasma gap is below 1 %. It means the leakage current strongly influences the loss during the plasma gap recovery. Such a leakage current leads to power consumption in the plasma gap and the circuit. This is not desirable for developing a cost effective high power switch. Therefore, the dual–power supply scheme has been proposed to reduce the feeding voltage below the threshold breakdown voltage of the electrode gap and hence to reduce the leakage current effect (see equations 4.11 and 4.12). Furthermore, we explored the possible improvement in charging strategy albeit the charging efficiency in the dual–power supply scheme increases by a factor of three compared to the single power supply scheme (see Figure 8- 4 and Figure 8- 5).
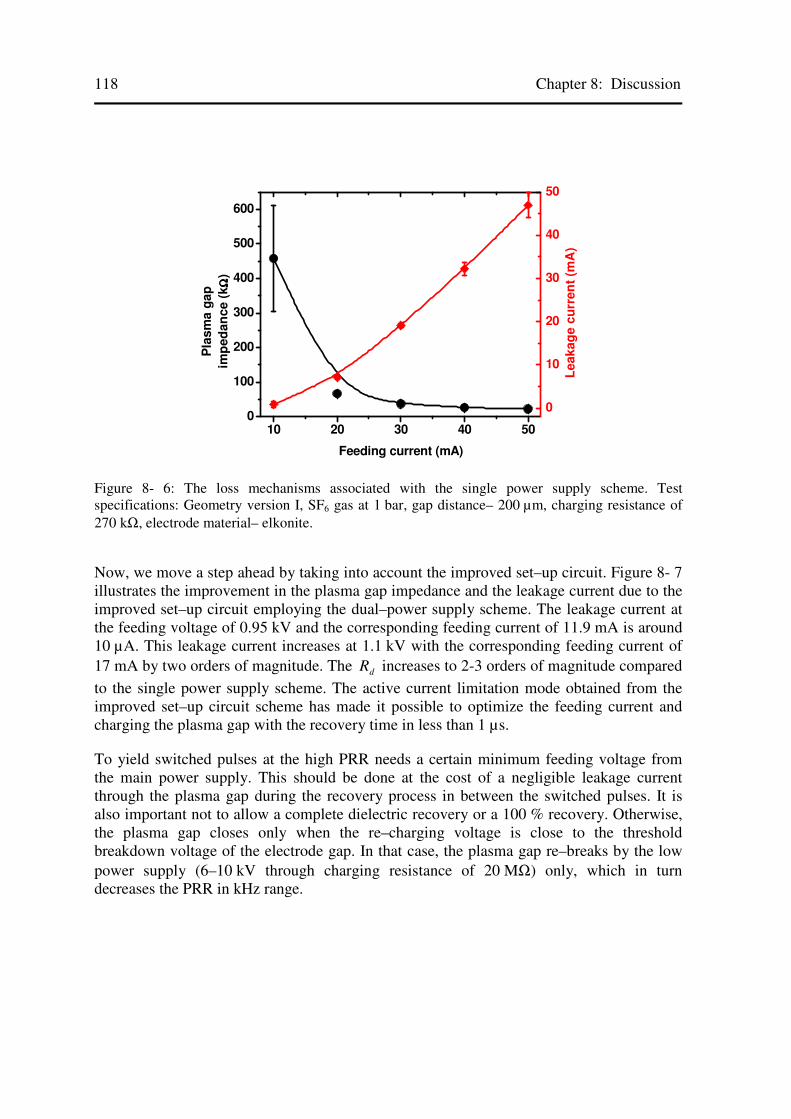
118 Chapter 8: Discussion
10 20 30 40 500
100
200
300
400
500
600
0
10
20
30
40
50P
lasm
a g
ap
imp
ed
an
ce (
kΩΩ ΩΩ
)
Feeding current (mA)
Leakag
e c
urr
en
t (m
A)
Figure 8- 6: The loss mechanisms associated with the single power supply scheme. Test specifications: Geometry version I, SF6 gas at 1 bar, gap distance– 200 µm, charging resistance of 270 kΩ, electrode material– elkonite.
Now, we move a step ahead by taking into account the improved set–up circuit. Figure 8- 7
illustrates the improvement in the plasma gap impedance and the leakage current due to the improved set–up circuit employing the dual–power supply scheme. The leakage current at the feeding voltage of 0.95 kV and the corresponding feeding current of 11.9 mA is around 10 µA. This leakage current increases at 1.1 kV with the corresponding feeding current of 17 mA by two orders of magnitude. The dR increases to 2-3 orders of magnitude compared
to the single power supply scheme. The active current limitation mode obtained from the improved set–up circuit scheme has made it possible to optimize the feeding current and charging the plasma gap with the recovery time in less than 1 µs.
To yield switched pulses at the high PRR needs a certain minimum feeding voltage from the main power supply. This should be done at the cost of a negligible leakage current through the plasma gap during the recovery process in between the switched pulses. It is also important not to allow a complete dielectric recovery or a 100 % recovery. Otherwise, the plasma gap closes only when the re–charging voltage is close to the threshold breakdown voltage of the electrode gap. In that case, the plasma gap re–breaks by the low power supply (6–10 kV through charging resistance of 20 MΩ) only, which in turn decreases the PRR in kHz range.

Chapter 8: Discussion
119
12 14 16 18
0
5
10
15
20
0
1
2
3
4P
lasm
a g
ap
imp
ed
an
ce (
MΩΩ ΩΩ
)
Feeding current (mA)
Leakag
e c
urr
en
t (m
A)
Figure 8- 7: The loss mechanisms associated with the improved set–up circuit scheme. Test specifications: Geometry version I, SF6 gas at 1 bar, charging resistance of 40 kΩ, gap distance– 200 µm, electrode material– elkonite. The feeding voltage from the second power supply circuit was 6 kV through the charging resistance of 20 MΩ.
8.4.2 Efficiency in open plasma gap
It is clear that one of the loss mechanisms in the open plasma gap during repetitive switching is caused by the leakage current. We studied this leakage current by using different circuit schemes. We cannot measure it directly but can express qualitatively in terms of efficiency of the open plasma gap as shown in Figure 8- 8. This efficiency is calculated from the total charge CCV accumulated by the re–charging voltage across the
plasma gap and the charge ( ∫ dtI leak ) that dissipates due to the leakage current during the
recovery time:
C
leakC
openCV
dtICV ∫−=η
The maximum value of the leakage current for the open plasma gap is included here to obtain a qualitative understanding of the improvement in the plasma gap recovery.

120 Chapter 8: Discussion
10 15 20 25 3040
50
60
70
80
90
100O
pen
pla
sm
a g
ap
eff
icie
ncy (
%)
Feeding current (mA)
Single supply, 270 kΩΩΩΩ
Dual supply, 40 kΩΩΩΩ
Dual supply, 40 kΩΩΩΩ, improved set-up
Figure 8- 8: Open plasma gap efficiencies for different circuit configurations at the PRR exceeding 1 MHz. Test specifications: Geometry version I, SF6 gas at 1 bar, gap distance– 200 µm, electrode material– elkonite. In dual–power supply scheme, the feeding voltage from the second power supply was 6 kV through the charging resistance of 20 MΩ.
The high leakage current in the single power supply scheme develops a poor efficiency of re–charging the open plasma gap (see Figure 7- 16). The dual–power supply scheme presents an improvement in the leakage losses over the single power supply scheme. Hence, the efficiency of re–charging the plasma gap in this case is higher than that of the single power supply scheme. The improved set–up circuit has negligible leakage current losses in a certain range of voltage and current parameters. In this circuit scheme, the efficiency of the open plasma gap touches close to 100 %. It seems the influence of remnants from pulsed plasmas reduces effectively or the neutral gas density in the region of plasma channels increases effectively during the recovery voltage process. The leakage current and hence the rate of recovery voltage improves further by the variation of electrode gap geometry.
8.5 Analysis of power consumption
Spark gaps provide a convenient switching mechanism for many high voltages (~several megavolts), high power applications. The use of spark gaps for single pulse and low PRR (~ 100 Hz) pulses is well established. The PRR is extendable up to two orders of magnitude, when switched pulses are intended for relatively lower re–breakdown voltages (~ tens of kilovolts). In contrast to these known breakdown voltages, we investigated the behavior of our pulsed plasmas for relatively small re–breakdown voltages below 1 kV in short gap distances to extend the intended PRR above 1 MHz. The realization of various losses in particular the power consumption in the circuit element and the plasma gap has allowed us to optimize different parameter settings for the efficient operation of the spark gap.

Chapter 8: Discussion
121
8.5.1 For different circuit schemes
In DC voltage stress, due to the parallel capacitance in the circuit, the charging process begins with decaying oscillation i.e. the charging process is an over damped one (§ 4.3, page 53). Hence, the efficiency of re–charging the plasma gap employing different power supply schemes and in particular, for the dual–power supply scheme stays below 25 %. Therefore, a high value of inductance is included in series with the charging resistance to provide a resonant charging. In doing so, the charging voltage across the plasma gap exceeds the feeding voltage for some interval of time (see Figure 4- 6). In addition, the current rippling in the circuit reduces and provides a rapid transient response in re–charging the plasma gap at the high PRR.
During the spark channel formation, the plasma column changes from being a dominant resistive loss to a relatively small resistive loss. The time required for this transformation determines the amount of energy expended in the switch relative to that being delivered to the load. The resistance of the plasma gap during the conduction is negligible compared to the load. The transfer of energy to the load is much larger than the energy deposited at the plasma gap in conventional switches. However, a practical plasma gap has always losses during the closure phase and conduction depending on the resistivity of the medium. In our experiment, the energy per output pulse is very small i.e. approximately 6 µJoules. Therefore, consumption of even 1 µJoule makes a difference of more than 10 % in the switching efficiency. The improved set–up circuit has better control over the feeding current, improves the system capacitance and hence the input energy. These facts are responsible for the increase of the switching efficiency (see Figure 6- 5, Figure 7- 15, Figure 7- 16 and Figure 7- 18). In addition, the plasma gap re–breaks at the resonant charging voltage. It seems the increase in the reduced electric field in the resonant charging decreases the rise time of output pulse waveforms and so does the expended energy during switching.
8.5.2 For different geometry designs
Increasing the system capacitance C of the electrode gap geometry increases the input energy and consequently the ionization in the gap. It means the same electrode gap with a greater extension of the discharge or the charge content of the output pulse waveform (see Figure 7- 15). Therefore, the next charging cycle has increased remnants of charge content from the previous pulsed plasma. As consequence, the recovery of the plasma gap for a given time (< 1 µs) is poor with a high leakage current and hence a low re–breakdown voltage. The low charge content of the geometry version II due to its small C reduces the decay time following the conducting spark channel. This in turn, cools effectively the plasma gap and improves the recovery of the neutral gas density for the next charging cycle. The experimental measurement of the charging efficiency achieved due to these facts is illustrated in Figure 8- 9.

122 Chapter 8: Discussion
15 20 25 30 35
20
30
40
50
60
Ch
arg
ing
eff
icie
ncy
(%
)
Feeding power (watts)
Version I, 40 KΩ
Version I, 90 kΩ
Version II, 40 kΩ
Version II, 90 kΩ
Figure 8- 9: Charging efficiency for different geometries with associated charging resistances using the improved set–up circuit scheme. Optimized charging resistance provided resonant charging. Test specifications: SF6 gas at 1 bar, gap distance– 300 µm, electrode material– elkonite. The feeding voltage from the second power supply was 6 kV through the charging resistance of 20 MΩ.
The decaying factor β in the improved set–up circuit is small (§ 4.4, page 53). The
charging process after the limiting resistor across the plasma gap is completely a resonant phenomenon i.e. the charging process is completely under–damped after the liming resistor (§ 6.2.1, page 73). This allows the feasibility to overcome the charging efficiency of 50 % compared to a non–resonant circuit. The input energy for the geometry version II reduces due to the reduced system capacitance of the spark gap device. The reduced remnants of ions from the discharge pulse in the plasma gap improve for the next charging voltage stress. It means the recovery time after the pulsed plasma reduces rapidly. Therefore, the resonant charging scheme is more effective for the geometry version II compared to the geometry version I in between the switched pulses. For practical application, we need a consistent behavior of re–breakdown voltages, which has been possible with the geometry version II. This improves the recovery process, which requires optimal feeding voltage and current (or power) for the repetitive operation at high frequency.
8.6 Comparison of simulation and experimental results
More information is acquired, when the numerical models are correlated with the experimental results. The Spice simulation of the plasma gap and the circuit model allowed us to determine parameters that limit the performance quality of the spark gap system device. In particular, it has significantly improved the re–charging process using the improved set–up circuit and discharge parameters. The discharge parameters particularly

Chapter 8: Discussion
123
the stray capacitance of the designed geometry is important to configure pulsed plasma characteristics.
8.6.1 The achievable PRR
The simulation results illustrated that the improved set–up circuit serves a great compromise between rapid transient response and low current ripple in the charging strategy for the plasma gap operation (see § 6.2.2, page 74). The results of simulation and experimental measurements for the improved set–up circuit are shown in Figure 8- 10. In this circuit, the feeding voltage through the charging resistance of 40 kΩ is 1.0 kV. During experimental operation of the plasma gap, the feeding current read from the power supply is 16 mA. In the simulated circuit, the charging resistance is 40 kΩ. The re–breakdown voltage for the generic spark gap is set at 750 V. A capacitive load of around 21 pF fits the experimental result. The simulated feeding current (IL1) is 16.1 mA. The constant voltage after the charging resistance (R1) at node 2 is 355 V. In experiment, this constant voltage is 360 V. For the aforementioned simulated feeding current and capacitance, the time required for re–breaking of the plasma gap at 730 V is 0.84 µs.
0 1 2 3 4 50
200
400
600
800
Bre
akd
ow
n v
olt
ag
e (
vo
lts)
Time (µs)
3
4
SGSPARKGAP
2
1
RC40k
3
V3
Load50
4
3
C121p
1
V1
2
3
L11
IL12
V2
3
3
Figure 8- 10: The PRR obtained from experimental and simulation results for the geometry version II using the improved set–up circuit. Solid and dotted line illustrate the experimental and simulation results respectively. Test specifications: Charging resistance– 40 kΩ, inductance– 1 Henry, SF6 gas at 1 bar, gap distance– 300 µm, electrode material– elkonite. The feeding voltage from the second power supply was 6 kV through the charging resistance of 20 MΩ.
These optimized circuit parameters allowed us to examine the losses associated with the circuit. For instance, 16 mA of the feeding current, corresponding to the feeding voltage of 1 kV, through the charging resistance of 40 kΩ produces a dissipative loss of 64 % (0.6 kV). However, the resonant charging scheme compensates this dissipative loss and

124 Chapter 8: Discussion
increases the charging efficiency exceeding 50 % (see § 4-4, page 53). In fact, the node 2 maintains a constant feeding voltage and hence the charging of the spark gap (at node 3) by this voltage source (at node 2) is a complete resonant phenomenon.
8.6.2 Pulse shapes
Figure 8- 11 represents output current pulse shapes due to pulsed plasmas in the transmission line to compare the experimental result with simulations. The equivalent spark gap model of Figure 6- 1 is used for this purpose. The impedance of the model is changed through rigorous alteration of the inductance and capacitance to fit with the experimental result. In the spark gap model, the inductance is 2.38 nH, while the capacitance retains the same as that of Figure 6- 1. The resistance (R2) of the spark gap model is 72 Ω. The overshoot of the decaying current pulse shown in the diagram is not the artifact but is due to the mismatch impedance of the plasma gap during its recovery phase.
0 2 4 6 8 10 12 14
0
1
2
3
4
5
6
Cu
rre
nt
(Am
p)
Time (ns)
Experiment
Simulation curve
across cable impedance
across scope impedance
Figure 8- 11: The experimental and simulation pulse shapes for the modified geometry version II. Test specifications: SF6 gas at 1 bar, gap distance– 300 µm, electrode material– elkonite. The feeding voltage from the second power supply was 6 kV through the charging resistance of 20 MΩ. In the circuit model, we used the current source of 15 mA.
The simulated pulses of the diagram are obtained across the 50 Ω coaxial cable impedance and across the 50 Ω scope impedance (see the circuit in Figure 6- 1). The experimental measurement is obtained using the scope of 1 GHz bandwidth. The Spice model has included the RG58C cable, available in the program, to be consistent with the transmission line in the experimental set–up. The pulse shape is different when measured before and after the cable impedance. In practical application, a shorter cable is recommended for the minimized perturbation of pulsed plasmas in the transmission line. We optimized several

Chapter 8: Discussion
125
discharge parameters in the simulation to compare pulse shapes. The variation of these parameters is due to the non–linearity of the plasma impedance during and following arc–cooling processes. The recovery of the plasma gap relies on basic mechanisms of the gas properties & pressure, which had not been possible to include in the simulation.
The simulation using PSpice program has proven indeed useful and yielded appreciable information for controlling spark plasmas in the electrode gap system. The validity of the PSpice model for different time scales involving charging and discharging of the spark gap system is demonstrated by comparing the measured quantities and the numerical results. A good agreement between them is presented.
8.7 Why non–conventional spark gap switch
In conventional pressurized spark gaps, the voltage is re–applied only after the gas in the inter–electrode volume cools to a level approaching its ambient temperature, thus allowing the gas density to return to its ambient value. This process limits the PRR and the corresponding recovery is near 100 % [Mac’93, Macg’93, Mac’95, Thy’88]. However, employing several techniques like forced gas flow, external cooling etc. the PRR can be increased to a maximum of two orders of magnitude. Therefore, the target PRR of 1 MHz seems impossible using the conventional spark gap with the unforced recovery process.
In DC charged conditions, the corona-stabilization compensates the dead time between switched pulses [Mac’95, Kou’00]. The corona discharge occurs near the microprotrusions more or less like a preionization. The space charge due to the corona discharge maintains a critical field at its inception value (see Figure 3- 6, Appendix: Figure A, Figure C). This space charge decouples the high voltage electrode from the rest of the gap permitting the gas density of the gap to recover. The temperature in the rest of the gap favors the formation of SF-
5 over SF6 for the low energy impact electrons (see: Figure B). The rate constant for electron attachment to SF6 at thermal or near thermal energies is independent of
temperature in the range from 300 to 1200 K and is quite high (typically 137105.2 −−× scm ) [Chr’00]. In addition, the mean value of low energy electrons favors the attachment rate constant of SF6 (Appendix: Figure D). The high-energy electrons produce electron impact dissociation of electronegative radicals such as SFx (x = 1-5) and F atoms (Appendix: Table E). Among them F has the highest cross section of attachment (Figure 3- 4). These facts boost the insulating characteristic of the dielectric recovery. The threshold energy of electrons for generating SFx
+ (x = 1-6) lies between 14.3 to 20.3 eV [Chr’00]. The energy input into the weak plasma of the corona discharge increases due to the increased voltage during the recovery time. Hence, the electrons in the space charge are heated in the recovery process. It seems during the gas breakdown, the electron attachment by SF6 molecules becomes inefficient and the electronegative properties of the background gas are no more an important feature. The benefit of the corona activity to the high PRR switching is that it inhibits the pre–breakdown in the gap until the re–charging voltage has reached a certain value. Therefore, the corona activity improves the time lag for the high PRR.
It is plausible that the high PRR is brought about by an approach to conditions such that the complete recovery of the neutral gas or cooling of the plasma gap is to be prevented. Otherwise, the spark gap will misfire and requires the ignition voltage of the threshold
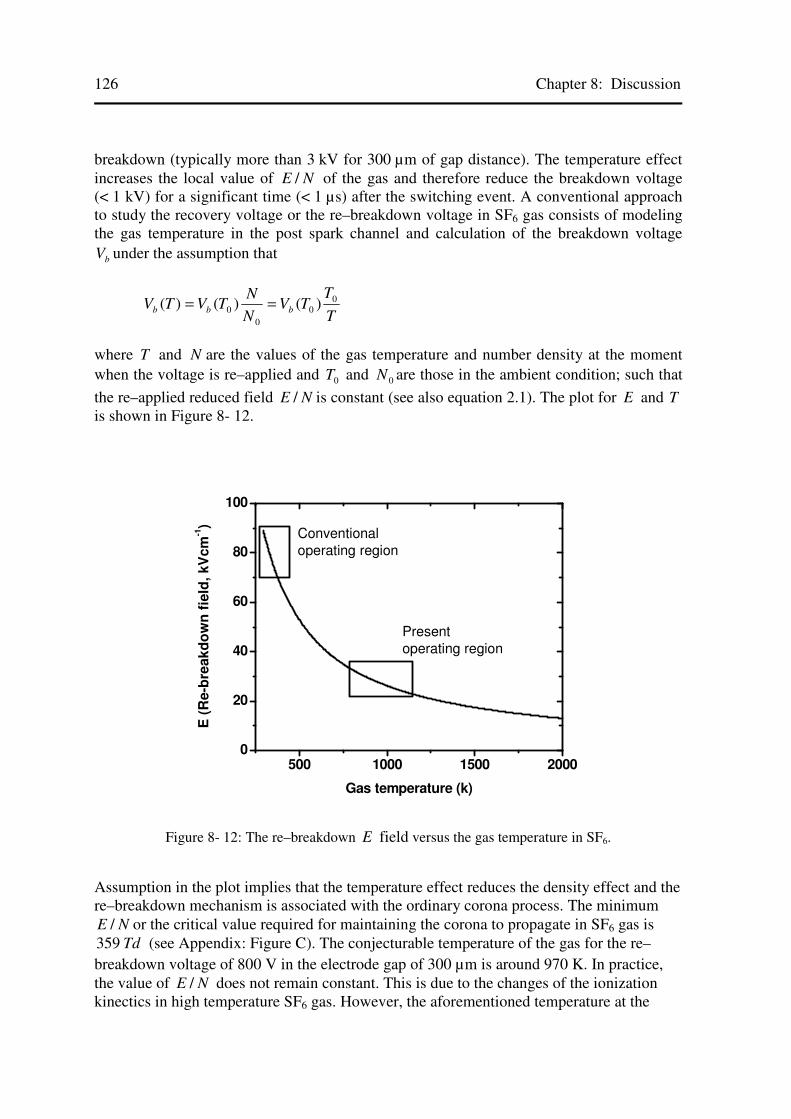
126 Chapter 8: Discussion
breakdown (typically more than 3 kV for 300 µm of gap distance). The temperature effect increases the local value of NE / of the gas and therefore reduce the breakdown voltage (< 1 kV) for a significant time (< 1 µs) after the switching event. A conventional approach to study the recovery voltage or the re–breakdown voltage in SF6 gas consists of modeling the gas temperature in the post spark channel and calculation of the breakdown voltage
bV under the assumption that
T
TTV
N
NTVTV bbb
00
0
0 )()()( ==
where T and N are the values of the gas temperature and number density at the moment when the voltage is re–applied and 0T and 0N are those in the ambient condition; such that
the re–applied reduced field NE / is constant (see also equation 2.1). The plot for E and T is shown in Figure 8- 12.
500 1000 1500 20000
20
40
60
80
100
E (
Re-b
reak
do
wn
fie
ld,
kV
cm
-1)
Gas temperature (k)
Present
operating region
Conventional
operating region
Figure 8- 12: The re–breakdown E field versus the gas temperature in SF6.
Assumption in the plot implies that the temperature effect reduces the density effect and the re–breakdown mechanism is associated with the ordinary corona process. The minimum
NE / or the critical value required for maintaining the corona to propagate in SF6 gas is Td359 (see Appendix: Figure C). The conjecturable temperature of the gas for the re–
breakdown voltage of 800 V in the electrode gap of 300 µm is around 970 K. In practice, the value of NE / does not remain constant. This is due to the changes of the ionization kinectics in high temperature SF6 gas. However, the aforementioned temperature at the

Chapter 8: Discussion
127
optimized operation is favorable enough to produce effective dielectric recovery (~30–40 %) of the plasma gap in less than 1 µs.
8.8 Lifetime of the spark gap
Figure 7- 23 has already displayed the optical emissions behavior. The emission lines due to the repetitive breakdown of the electrode gap between 600 nm and 750 nm are apparently F I lines. The discharge of SF6 gas is no longer chemically inert due to the atomic and molecular fluorine, which are extremely reactive. The reaction rate introduces lifetime–limiting parameters to the electrode erosion. Studied results of the spectral lines are explicable for reproducible discharges and particularly the lifetime limiting parameter of the spark gap switch.
8.8.1 Exploitation of spectroscopic data
The pulsed plasmas of electrode gaps are photographed and spectroscopically examined. Fluorine lines are abundant in the discharge processes due to the electron impact dissociation or dissociation from resonant capture of low energy electrons by SF6 molecule (Figure 7- 23,Appendix: Table E) [Tac’00, Tac’02, Bla’87]. The emission spectrum by Blanks et al for fluorine atoms is same as that of our measurement data in Figure 7- 23 in the span of 600–800 nm [Bla’87]. After the breakdown or during the after glow mode, the energetic electrons are most probably captured by the fluorine atoms itself since they have highest cross sections among the dissociative products of SF6 (Figure 3- 4). During the recovery voltage, at low leakage current (several 10’s of µA), thermal dissociation is negligible and the dissociation is only through electronic impact process (Appendix: Table E) [Mac’86]. The feeding current (>10 mA), applied for the PRR exceeding 1 MHz, is quite high by an order of magnitude three compared to the leakage current. The pulsed plasma current is much higher by an order of magnitude five. The electrode material is subjected to a very high average temperature due to these current pulses at the high PRR, with the development of various gas electrode compounds. These electrode compounds decrease the efficiency of electron emission and hence often do not fire the electrode gap. The surface condition of the electrodes deteriorates with time. The reaction rate may include gas deterioration, deteriorated gas–electrode reactions as well as pollution of the insulator surfaces from sparking debris and corona by–products. For some gas–electrode combination they can enhance erosion and very effectively limit the lifetime of the switch e.g., stainless steel operate for a very short time. The joule heating of the stainless steel increases due to its lower electrical conductivity and further enhanced by the low thermal conductivity. As consequence, the average temperature of the surface electrode rises. Hence, the increased reaction rate limits the lifetime of the electrode material.
8.9 Overall assessment of measured results
The direct measurement of the resistance of the conducting plasma is not an easy task due to the difficulty in measuring the voltage drop across the spark gap. The dynamic range (> 1 kV to < 10 V) of the voltage that must be measured during switching is large. This measurement is complicate and attributes its difficulty to inductive effect. The source of
128 Chapter 8: Discussion
this inductance is in the geometry of the electrode gap, in electrical connection to the voltage-measuring device, and in the pulsed plasma itself. High voltage probes are calibrated before measurements. Their bandwidth of 75 MHz is sufficient to measure re–breakdown voltages at 1 MHz of the PRR. The significant investigation related to our experiment is the rise time of output pulse waveforms. The output pulse waveforms are obtained by the fast coaxial probe with an impedance of 50 Ω terminated with 50 Ω. The measurements of pulse waveforms are limited by the bandwidth of measuring devices such as oscilloscopes, attenuators & impedance cable etc. The actual rise time riset of output
pulse waveforms is given by
22222
geocoattoscrisemeasured tttttt ++++=
where measuredt is the measured rise time from the oscilloscope. osct , attt , cat and geot are the
rise time limited by the oscilloscope (87.5 ps), attenuators (19.5 ps each), coaxial cable (30 ps) and spark gap geometry ( 32 ps) respectively. The lower risetime limit limt of the
whole measurement set–up can be estimated by
2222
lim geocoattosc ttttt +++=
This is approximately 128 ps for the complete setup.
Two different oscilloscopes are used for the measurement of the electrical behavior of pulsed plasmas. One oscilloscope of 1 GHz bandwith is used for the measurement of re–charging voltages in the macroscopic scale. A second oscilloscope of 4 GHz bandwidth is used for the rise time and pulse shape measurement in the microscopic scale. For reasons of time scale, the repetition rate of pulse shapes cannot be achieved directly. The readings from the power supply are caliberated with the oscilloscope and found to be in good agreement. We used Spice simulations for the determination of some parameter settings for the performance of pulsed plasmas. These circuit parameters include mainly the electrode gap geometry and circuit parameters.
The measurement of pressure is obtained with the analogue pressure meter. The minimum resolution is 0.25 bars and is sufficient for the qualitative understanding of the discharge behavior as a function of pressure variation. The measurement due to the fixed spacers (minimum of 40 µm) could make an error of less than 15 % for the gap distance of 300 µm. One of the significant error may be in the measurement of the stray capacitance due to its small value (~19–21 pF). Decreasing the capacitance (typically by 1–2 pF) will increase the switching efficiency exceeding 100 %, which is not possible. On the other hand, increasing the capacitance will increase the feeding current value for the given re–breakdown voltage, which will be inconsistent with the measured value of the experiment as well of the simulation result. It means the measured stray capacitance can have the maximum possible error of 5 %.
High pressure gas gaps, particularly spark gaps, are commonly found in pulsed power systems for fast and high peak power switching. These conventional spark gaps suffer from poor rate of rise of recovery voltage after switching and this usually restricts the PRR to a

Chapter 8: Discussion
129
few 100 Hz. Our work aimed at identifying the mechanisms responsible for voltage recovery in order to improve the PRR of pulsed plasmas and the system in which the spark gap is used. A novel facility, in particular the improved set–up circuit has been developed to study pulsed plasmas under repetitive operating conditions. It is the recovery of the gas density which plays the most significant role on the rate of rise of recovery voltage at the PRR which is our interest (~1 MHz). One approach to improve the recovery of the gas density is to utilize the phenomenon of the corona stabilization which has been found under highly divergent electric fields in strong electronegative gases and gas mixtures in certain pressure range (see Figure 3- 6). Measurements of the voltage recovery characteristics in the corona stabilized breakdown has shown that it is possible to operate this switch at the PRR far greater than those found with conventional switches. Under consideration of our findings, together with the aforementioned PRR, we were able to establish very reapeatable recovery in the spark gap.

130

Chapter 9: Summary & Outlook
131
Chapter 9: Summary & Outlook
The purpose of this dissertation was to investigate micro plasmas of a pressurized spark gap in a free running, DC voltage stress. We studied re–breakdown voltages in electrode gaps from 200 to 300 µm at a range of pressures in SF6 gas. The approximate range of the factor
dp (pressure times gap distance) was about 15–34 torr–cm. The PRR of output pulse
waveforms and its stability, as we have shown, depend on more factors than dp . Other
factors we examined were the electrode gap geometry, electrode material, gas type, gas pressure, gas mixture and the charging strategy of the spark gap. We examined in some depth of micro plasma-assisted processes concerning switching interest. Based on this, a model electrical circuit and a model spark gap were developed. These models and their simulation results had a good match with measured quantities. Eventually, we demonstrated the feasibility of the aim of our project.
9.1 What we have achieved
With a typical technique for pulsing micro plasmas of the spark gap, we have demonstrated a new method for generating sub–nanosecond electrical pulses at the high PRR in the transmission line. Up to now, the research work in the field of plasma closing switches is in the range of tens of kHz. Only recently due to the development of repetitive pulsed power technology, the increase of the PRR has gained a broader interest. To keep pace with the expanding technology, this is the right moment to present a worthwhile contribution with following features:
• In DC charged condition, the corona stabilization established the dielectric recovery of the open plasma gap.
• The stochastic behavior of recovery voltages is almost omitted and the rise time jitter of switched pulses is greatly reduced. The waveform of switched pulses presented a consistent behavior.
• The rise time of output current pulses in the transmission line reached below 200 ps. • The PRR of these current pulses exceeded 1 MHz. • The pulse widths of these current pulses were around 650–800 ps. • The charging efficiency to reach re–breakdown voltages across the spark gap
exceeded 60 %, and the efficiency of energy transfer by discharge plasmas in the transmission line exceeded 95 %. This generates an overall efficiency of the repetitive spark breakdown exceeding 55 %.

132 Chapter 9: Summary & Outlook
• The optimized charge transfer per pulse in the transmission line was ~13–14 nC and the corresponding energy was 6–7 µJ.
• The average output power in the transmission line was 6–8 watts with the peak power exceeding 2 kwatts.
• The current density and power density per switched pulses were ~ 7.6 X 10⁸ A/cm3 and 1.6 X 10⁹ watts/cm3.
• Discharges in the spark gap exploited an extremely small average input power of 12–20 watts.
• There was extremely low power consumption in the plasma gap. Therefore, the operation of this spark gap had less cooling problem and allowed to drive micro plasmas employing the free recovery process.
• The lifetime of spark gap electrodes exceeded 109 impulses. This limitation was due to the influence of electrode–fluorine reactions in discharge processes, which developed metal fluoride on electrode surfaces.
• The employed circuit elements for the spark gap operation had rendered a simple set–up.
9.2 Outlook
The accomplished work presents a contribution to a micro plasma research, and a first step towards developing a novel low cost, low volume, low weight, simple and compact device in the pursuit of a viable portable operation of the spark gap. We have shown, in the research work, that compact spark gap can be an appropriate base for the examination of micro plasmas. For the work that is further way, we suggest the following:
• It is now very convenient to replicate the spark gap design with more compact form. The present experience and know–how has accumulated so much knowledge, that it can help to avoid important design mistakes at the early stage for the fabrication of the spark gap. The design aims to reduce the capacitive load of the spark gap. This will definitely reduce the charge or energy transfer of output impulses.
• In the aforementioned manner, it is an obvious task to examine the parameters for reproducible pulsed plasmas. Of particular interests are the maximum amplitude and the minimum pulse width of output pulse waveforms in the transmission line.
• An important task for the future application is to show the feasibility of portable operation. One important and challenging step in the development of a portable spark gap will be the integration of a power source. Of course, the application of micro plasmas has the clear advantage of operation at comparatively low power.
• These repetition rates in combination with the rise time and the aforementioned peak power of output impulses cannot be attained by any alternate technology. Based on the results presented in this dissertation, further development of the high PRR is recommended. This can be achieved in principle by the operation of several spark gaps in parallel, each with a series resistance, to the same power supply/supplies.

References
133
References
[Abd’88] M. Abdel-salam, E.K. Stanek, “On the Calculation of Breakdown Voltages for Uniform Electric Fields in Compressed Air and SF6”, IEEE Trans. Industry App., Vol.24, pp 1025-1031, 1988
[Adl’00] F. Adler, S. Müller, “Formation and Decay Mechanisms of Excimer Molecules in Dielectric Barrier Discharges”, J. Appl. Phys. D: Appl. Phys, Vol. 33, pp. 1705 – 1715, 2000
[Age’98] F J. Agee, “Evolution of Pulse Shortening Research in Narrow Band, High Power Microwave Sources”, IEEE Trans. Plasma Sci. Vol 26, pp. 235-245, June 1998
[Agee’98] F J. Agee, C. E. Baum, W.D. Prather, J.M. Lehr, P. O’Loughlin, Jon S. H. Schoenberg, D.W. Scholfield, R.J. Torres, J.P. Hull, J.A. Gaudet “ Ultra-Wideband Transmitter Research”, IEEE Trans. Plasma Sci. Vol 26, pp. 860-873, June 1998
[Ale’99] N.L. Aleksandrov, E.M. Bazelyan, A. Yu Gorunov and I.V. Kochetov, “A Non–Thermal Mechanism of Spark Breakdown in Ar”, J. App. Phys. D: App. Phys, Vol. 32, pp. 2636 – 2644, 1999
[Arf’70] G. Arfken, “Mathematical Methods for Physicists”, 3rd edition, Miami University, Oxford, 1970
[Bec’68] A.H.W. Beck, H. Ahmed, “An Introduction to Physical Electronics”, Edward Arnold Ltd London, 1968
[Bis’98] D.J. Biswas, J.P. Nilaya and U.K. Chatterjee, “On the Recovery of a Spark Gap in a Fast Discharge Circuit”, Rev. Sci. Instrum., Vol. 69, pp. 4242–4244, 1998
[Bis’01] D.J. Biswas, J.P. Nilaya, “Diode–Less Operation of a Resonantly Charged Repetitive High Voltage Pulser Circuit”, Rev. Sci. Instrum., Vol. 65, pp. 2505–2507, 2001
[Bla’87] K.A. Blanks, A.E. Tabor, K. Becker, “Absolute Cross Sections for Fluorine 3p–3s Line Emissions Following Electron Impact on NF3, CF4, SF6”, J. Chem. Phys., Vol. 86, pp. 4871 – 4875, 1987
[Blan’87] K.A. Blanks, K. Becker, “Optical Emissions in the Wavelength Region 2000 –6000 A0 Produced by Electron Impact Dissociation of NF3, CF4 and SF6”, J. Phys. B: At. Mol. Phys., Vol. 20, pp. 6157–6163, 1987
[Boe’03] W. Boeck, “Solutions of Essential Problems of Gas Insulated Systems for Substations (GIS) and Lines (GIL)”, Pro. Of the 7th Int. Conf. on Properties and Appl. of Dielectric Materials, pp. 1–8, 2003

134 References
[Bön’03] S. Bönisch, W. Kalkner, and D. Pommerenke, “Modeling of Short-Gap ESD Under Consideration of Different Discharge Mechanisms”, IEEE Trans. Plasma Sci. Vol. 31, pp. 736-744, 2003
[Box’95] R. L. Boxman, P.J. Martin, D.M. sanders, “Handbook of Vacuum Arc Science and Technology”, Noyes Publication, New Jersey, U.S.A, 1995
[Boy’71] H.A. Boyd, G.C. Crichton, “Measurement of Ionization and Attachment Coefficients in SF6”, Proc. IEE, Vol. 118, pp. 1872-1877, 1971
[Bra’36] N.E. Bradbury, R.A. Nielsen, “Absolute Values of the Electron Mobility in Hydrogen”, Phys. Rev., Vol 49, pp 388 – 393, 1936
[Bra’58] S. I. Branginskii, “Theory of the Development of a Spark Channel”, Sov. Phy. JETP 6, S.1068 – 1074, 1958
[Bra’00] N.S.J. Braithwaite, “Introduction to Gas Discharges”, Plasma Source Sci. Tech, Vol. 9, pp – 517 – 527, 2000
[Bro’90] J.J. Brophy, “Basic Electronics for Scientists”, McGraw Hill, 5th edition, 1990
[Byk’04] N.M. Bykov, S.D. Korovin, Yu.D. Korolev, “Investigation of a High Pressure Spark Gap in the Regime of Sub-nanosecond Current Rise times”, 13th international symposium on high current electronics, Tomsk, pp. 119 – 122, 2004
[Cam’01] M. Camp, H. Garbe, D. Nitsch, “UWB and EMP Susceptibility of Modern Electronics”, Int. Sym. Electromagnetic compatibility, 2001
[Car’79] W.K. Cary, J. A. Mazzie, “Time–Resolved Resistance during Spark Gap Breakdown”, IEEE Trans. Electron Devices, Vol. ED–26, pp. 1422 – 1427, 1979
[Chr’87] L.G. Christophorou, D.L. McCorkle, S.R. Hunter, “Gas Mixtures for Spark Gap Closing Switches with Emphasis on Efficiency of Operation”, Gaseous Dielectrics, Vol. 5, pp. 381–388, 1987
[Chr’90] L.G. Christophorou, L.A. Pinnaduwage, “Basic physics of Gaseous Dielectrics”, IEEE Trans. on Elec. Ins., Vol. 25, pp. 55–74, 1990
[Chr’00] L.G. Christophorou, J.K. Olthoff, “Electron Interactions with SF6”, J. Phys. Chem., Vol. 29, pp. 267–330, 2000
[Cla’92] R.S. Clark, L.F. Rinehart, M.T. Buttram, J.F. Aurund, “Repetitive Ultrawidband Source Development at Sandia Labs”, 20th IEEE Power Modulator Conference, pp. 104 – 106, 1992
[Dao’87] B. Daout, H. Ryser, A. Germond, P. Zweiacker, “The Correlation of Rising Slope and Speed of Approach in ESD test”, Int. Zürich Symp. on EMC, Vol. 7, 1987
[Die’83] H. Dienemann, “Material Function of Sulphur Hexafluoride”, J. Phys. D: Appl. Phys., Vol. 16, pp. 1651 – 1671, 1983
[Ede’62] D. Edelson, J. E. Griffiths, K. B. McAfee, Jr., “Auto Detachment of Electrons in Sulphur Hexafluoride”, J. Chem. Phys., Vol. 37, pp. 917–918, 1962

References
135
[Eng’83] A.V. Engel, “Electric Plasmas: Their Nature and Uses”, Taylor & Francis Ltd, London, 1983
[Eng’89] T. G. Engel, A. L. Donaldson, M. Kristiansen, “The Pulsed Discharge Arc Resistance and its Functional Behavior”, IEEE Trans. Plasma Sci., Vol. 17, No. 2, S. 323–329, 1989
[Eng’94] A.V. Engel, “Ionized Gases”, American Institute of Physics, New York, 1994
[Eva’04] V. Evanof, S. Korenev, “Nanosecond Marx Pulse Generator with Semiconductor Switches”, 26th IEEE Power Modulator Conference, pp. 520–521, 2004
[Fel’65] P. Felsenthal, J. M. Proud, “Nanosecond–Pulse Breakdown in Gases”, Phys. Rev. Vol .139, S. A1796–A1804, 1965
[Feh’70] F. C. Fehsenfeld, “Electron Attachment to SF6”, J. Chem. Phys., Vol. 53, pp. 2000–2004, 1970
[Fle’49] R.C Fletcher, “Impulse Breakdown in the 10-9 Second Range at Atmospheric Pressure”, Physical Review, vol. 76, No. 10, Nov 1949
[Fle’02] P Flesch, M. Neiger, “Numerical Simulation of DC–High Pressure Discharge Lamps Including Electrodes”, J. Phys. D: Appl. Phys., Vol. 35, pp 1681-1694, 2002
[Fra’04] K. Frank, I. Petzenhauser, U. Blell, “Critical Assessment of Multistage Pseudospark Switches”, 26th IEEE Power Modulator Symposium, pp. 584 – 587, 2004
[Fro’93] C.A. Frost, T.H. Martin, P.E. Patterson, L.F. Rinehart, G.J. Rohwein, L.D. Roose, J.F. Aurant, M.T. Buttram, “Ultrafast Gas Switching Experiments”, 9th IEEE Pulsed Power Conference, pp. 491-494, 1993
[Fro’04] O. Frolov, K. Kolacek, V. Bohacek, J. Straus, J. Schmidt, V. Prunkner, “Gas Filled Laser Triggered Spark Gap”, Czech. J. Phys., Vol. 54, pp C309-C313, 2004
[Gan’53] B. Ganger, “Der Elektrische durschlag von Gasen”, Verlag Springer, Berlin 1953
[Gla’65] G.N. Glasoe, J.V. Lebacqz, “Pulse Generators”, Dover, New York, 1965
[Gun’91] M.A. Gundersen, “Gas Phase Pulse Power Switch”, IEEE Trans. Plasma Sci. Vol. 19, pp. 1123-1131, Dec 1991
[Gup’01] D.K. Gupta, P.I John, “Design and Construction of Double–Blumlein HV Pulse Power Supply”, Academy Proceedings in Engg. Sci., Vol. 26, Part 5, pp 475-484, Oct 2001
[Har’99] J.A. Harrower, S.J. Macgregor, F.A. Tuema, “The Influence of the Critical Volume on High Repetition Rate, Corona Stabilized Switching”, 12th IEEE Int. Pulsed Power Conf. pp 1162-1166, 1999
[Hen’05] J. Hendriks, S.B. van der Geer and G.J.H Brussaard, “Electrodynamic Simulations of a Phtoconductively Switched High Voltage Spark Gap”, J. Phys. D: App. Phys, Vol. 38, pp. 2798–2803, 2006

136 References
[Hen’06] J. Hendriks, S.B. van der Geer and G.J.H Brussaard, “Spark Gap Optimization by Electrodynamic Simulations”, J. Phys. D: App. Phys, Vol. 39, pp. 274–280, 2006
[Hey’06] A.E.D. Heylen, “Sparking Formula for Very High–Voltage Paschen Characteristics of Gases”, IEEE Trans. Elec. Insul. Magazine, Vol. 2, pp 25 – 35, 2006
[Hin’00] Th. Hinterholzer, W. Boeck, “Breakdown in SF6 Influenced by Corona–Stabilization”, Conference on Electrical Insulation and Dielectric Phenomena, Vol. 1, pp 413 – 16, 2000
[Hin’01] Th. Hinterholzer, W. Taschner, W. Boeck, “The Influence of Space–charge on the Breakdown in SF6”, Proceedings on Ninth International Symposium on Gaseous Dielectrics, 2001
[Hir’78] M.N. Hirsh, H.J. Oskam, “Gaseous Electronic”, Vol. 1, Electrical discharge, Academic press, 1978
[Hor’91] H. Hora, “Plasma at High Temperature Density”, Springer – Verlag, 1991
[Hua’03] J.S. Huang, D. Pommerenke, “Investigation of ESD Current and Induced Voltage from Different ESD Simulators”, Proceedings ESA, IEEE Joint Annual Meeting 2003
[Hus’99] T.W. Hussey, K.J. Davis, J.M. Lehr, “Dynamics of Nanosecond Spark-gap Channels”, Proceedings of the 12th IEEE Int. Pulsed Power Conference, S. 1171–1174, 1999
[Int’04] ICAP/4, Intusoft 2004 Ispice4 User’s Guide
[Iva’04] S.N. Ivanov, “Investigation of Mechanisms of Pulsed Electrical Breakdown of Highly Overvolted Gas Gaps on Sub-Nanosecond (<1 ns) Scale”, 13th International Symposium on High Current electronics, Tomsk, pp. 86 – 90, 2004
[Jiu’00] H. Jiu–Sheng, “The Test of Electromagnetic Field Radiated by Electrostatic Discharge (ESD) from the Real Charged Human Body in the Office”, 2nd Asia–Pacific Conference on Environment Electromagnetics, pp. 412–416, 2000
[Jud’01] M.D. Judd, “Contact Discharge as a Source of Sub–nanosecond High Voltage Pulses”, J. Phys. D: Appl. Phys., Vol. 34, pp. 2883 – 2893, 2001
[Kar’72] P.W. Karlsson, A. Pedersen, “Inherent Limitations in Uniform Field Discharge Data for SF6”, IEEE Trans. Power Apparatus and Systems, Vol. 91, pp. 1597-1601, 19672
[Kar’97] A.F. Kardo-Sysoev, S.V. Zazulin, V.M. Efanove, Y.S. Lelikov, “High Repetition Frequency Power Nanosecond Pulse Generation”, 11th IEEE International Pulsed Power Conference, pp. 420–424, 1997
[Kha’90] M. Khalifa, “High–Voltage Engineering”, New York, 1990

References
137
[Kim01] Kim Y.K., Irikura K.K., Rudd M.E., Zucker D.S., Zucker M.A., Coursey J.S., Olsen K.J., Wiersma G.G., “Electron Impact Ionization Cross Sections”, http://physics.nist.gov/PhysRefData/Ionization/
[Kli’79] L.E. Kline, D.K. Davies, C.L. Chen, P.J. Chantry, “Dielectric Properties for SF6 and SF6 Mixtures Predicted from Basic Data”, J. Appl. Phys., Vol. 50, pp 6790–6796, 1979
[Kou’99] J.M. Koustsoubis, S.J. Macgregor, “Triggered Switch Performance in SF6, Air, and an SF6/Air Mixture”, IEEE trans. Plasma Science, Vol. 27, pp 272-281, 1999
[Kou’00] J.M. Koustsoubis, S.J. Macgregor, “Electrode Erosion and Lifetime Performance of a High Repetition Rate, Triggered, Corona–Stabilized Switch in Air”, J. Phys. D: Appl. Phys., Vol. 33, pp 1093–1103, 2000
[Kou’03] J.M. Koustsoubis, S.J. Macgregor, “Effect of Gas Type on High Repetition Rate Performance of a Triggered, Corona Stabilised Swtich”, IEEE Trans. Dielectrics and Electrical Insulation, Vol. 10, pp 245–255, 2003
[Kus’85] M.J. Kushner, W.D. Kimura, and S.R. Byron, “Arc Resistance of Laser–Triggered Spark Gaps”, J. Appl. Phys., Vol. 58, pp 1744–1751, 1985
[Leh’97] J.M. Lehr, C.E. Baum, W.D. Prather and F.J. Agee, “Aspects of Ultrafast Spark Gap Switching for UWB HPM Generation”, 11th IEEE Int. Pulsed Power Con. pp. 1033-1041, 1997
[Leh’99] J.M. Lehr, C.E. Baum, W.D. Prather and F.J. Agee, “Fundamental Physical Considerations for Ultrafast Spark Gap Switching”, Ultra–Wideband, Short Pulse Electromagnetics 4, Plenum Publishers, New York, pp. 11-20, 1999
[Luc’01] J.R. Lucas, “Breakdown of Gaseous Insulation”, High Voltage Engineering, website: http://www.classictesla.com/download/breakdown_gi.pdf , 2001
[Mac’85] S.J. MacGregor, I.D. Chalmers, O. Farish, N. Ljumba, “The Streamer/Leader Transition in SF6 and SF6/Air Mixtures”, Proc. 8th Int. Conf. on Gas Discharges and their Applications, pp. 231–234, 1985
[Mac’86] S.J. Macgregor, G.A. Woosley, D.B. Ogle, O. Farish “The influence of Electrode Fluorine Reactions on Corona and Glow Discharge in SF6”, IEEE trans. Plasma Science, Vol. 14, pp 538-543, 1986
[Mac’93] S.J. Macgregor, S.M. Turnbull, F.A. Tuema, O. Farish “Increasing the PRF of High Pressure Spark Gas Switches”, 9th IEEE Int. Pulsed Power Conf. pp 929-933, 1993
[Macg’93] S.J. Macgregor, S.M. Turnbull, F.A. Tuema, O. Farish “The Application of the Paschen Deviation to the Operation of Repetitive High Pressure Gas Switches”, 9th IEEE Int. Pulsed Power Conf. pp 934-937, 1993
[Mac’95] S.J. Macgregor, S.M. Turnbull, F.A. Tuema, A.D.R. Phelps “Methods of Improving the Pulse Repetition Frequency of High Pressure Gas Switches”, 10th IEEE Int. Pulsed Power Conf. pp 249-254, 1995

138 References
[Mac’97] S.J. Macgregor, S.M. Turnbull, F.A. Tuema, O. Farish “Factors Affecting and Methods of Improving the Pulse Repetition Frequency of Pulse–Charged and DC–Charged High Pressure Gas Switch”, IEEE trans. Plasma Science, Vol. 25, pp 110-117, 1997
[Man’98] J. Mankowski, J. Dickens, and M. Kristiansen, “High Voltage Sub– Nanosecond Breakdown”, IEEE Trans. Plasma Sci. Vol. 26, pp. 874-881, June 1998
[Man’00] J. Mankowski, and M. Kristiansen, “A Review of Short Pulse Generator Technology”, IEEE Trans. Plasma Sci. Vol. 28, pp. 102-108, Feb 2000
[Mar’70] J.C Martin, “Nanosecond Pulse Technique”, AWRE Report SSWA/JCM/704/49, 1970
[Mar’92] J.C Martin, “Nanosecond Pulse Technique”, Proceedings of the IEEE, Vol. 80, No.6, S. 934 – 945, 1992
[Mar’93] T.H. Martin, J.F. Seamen, D.O. Jobe, “Energy Losses in Switches”, Proceedings of the 9th IEEE Int. Pulsed Power Conf., S. 463–470, 1993
[Mee’40] J.M. Meek, “Theory of Spark Discharge”, Phy. Rev., Vol. 57, pp. 722-728, 1940
[Mee’53] J.M. Meek, J.D. Craggs, “Electrical Breakdown of Gases”, Oxford University Press, 1953
[Mes’68] G. A. Mesyats, Yu. I. Bychkov, “Statistical Study of Nanosecond Breakdown Delay in Narrow Gas Gaps in Super High Electric Fields”, Sov. Phys. Tech. Phys. Vol. 12, No. 9, S. 1255–1260, 1968
[Mesy’69] G. A. Mesyats, Yu. I. Bychkov, A.I. Iskol’dskii, “Nanosecond Formation Time of Discharges in Short Air Gaps”, Sov. Phys. Tech. Phys. Vol. 13, No. 8, S. 1051–1055, 1969
[Mes’69] G. A. Mesyats, Yu. I. Bychkov, G. S. Korshunov, Yu. B. Yankelvich, “Spark Current and Voltage in Nanosecond Breakdown of a Gas Gap”, Sov. Phys. Tech. Phys. Vol. 14, No. 1, S. 49–53, 1969
[Mor’91] S.L. Moran, L.W. Hardesty, M.G. Grothaus, “Hydrogen Spark Gap for High Repetition Rates”, 8th IEEE Int. Pulsed Power Conf. pp 336-339, 1991
[Mora’91] S.L. Moran, L.W. Hardesty, “High–Repetition Rate Hydrogen Spark Gap”, IEEE Trans. Electron Device, Vol. 38, pp 726 – 730, 1991
[Mor’92] S.L. Moran, L.W. Hardesty, M.G. Grothaus, “Five Pulse, 10 GW, High Repetition Rate Hydrogen spark gap switch”, 20th Power Modulator Symposium, pp 376– 79, 1992
[Mor’97] R. Morrow, J.J. Lowke, “Streamer propagation in air”, J. Phys. D: Appl. Phys., Vol. 30, pp. 614 – 627, 1997
[Nie’89] L. Niemeyer, L. Ullrich, N. Wiegart, “The mechanism of Leader Breakdown in Electronegative Gases”, IEEE Trans. Electrical Insulation, Vol. 24, pp. 309 – 324, 1989

References
139
[New’37] M. Newman, “Short Time Lag of Spark Breakdown”, Phys. Rev. Vol. 52, S. 652–654, 1937
[Olt’62] J. K. Olthoff, R. J. Van Brunt, Y. Wang, R.L. Champion, L.D. Doverspike, “Collisional Electron Detachment and Decomposition Rates of SF6
-, SF5-, and
F- in SF6: Implications for Ion Transport and Electrical Discharges”, J. Chem. Phys., Vol. 91, pp. 2261–2268, 1989
[Osm’92] P. Osmokrovic, S. Krstic, “Influence of GIS Parameters on Toepler’s Constant”, IEEE Trans. on Electrical Insulation, Vol. 27, No. 2, S. 214–220, 1992
[Par’02] J. K. Parker, N. L. Garland, H.H. Nelson, “Kinetics of the Reaction Al + SF6 in the Temperature Range 499–813 K”, J. Chem. Phys., Vol. 106, pp. 307–311, 2002
[Pec’01] L. Pecastaing, J. Paillol, T. Reess, A. Gibert and P. Domens, “Design and Performance of High Voltage Pulse Generators for Ultra-Wideband Applications”, Meas. Sci. Technol. Vol 12, pp. 1718-1725, 2001
[Ped’67] A. Pedersen, “Calculation of Spark Breakdown or Corona Starting Voltages in Non–uniform Fields”, IEEE Trans. Power Apparatus and Systems, Vol. 86, pp. 200-206, 1967
[Ped’70] A. Pedersen, “Criteria for Spark Breakdown in Sulfur Hexafluoride”, IEEE Trans. Power Apparatus and Systems, Vol. 89, pp. 2043-2048, 1970
[Ped’73] A. Pedersen, P.W. Karlsson, E. Bregnsbo and T. Munk Nielsen, “Anomalous Breakdown in Uniform Field Gaps in SF6”, IEEE Transactions Paper T 73 448-8, New York, 1973
[Ped’75] A. Pedersen, “The effect of Surface Roughness on Breakdown in SF6”, IEEE Trans. Power Apparatus and Systems, Vol. 94, pp. 1749-1754, 1975
[Ped’84] A. Pedersen, “Formulation of the Streamer Breakdown Criteria and its Application to Strongly Electronegative Gases and Gas Mixture”, Archive für Electrotechnik, Vol. 67, pp. 395 – 402, 1984
[Pej’03] Momcilo.M. Pejovic, C.S. Milosavljevic, Milic.M. Pejovic, “The Estimation of Static Voltage for Gas Filled at Low Pressures Using Dynamic Method”, IEEE Trans. Plasma Sci. Vol. 31, pp. 776-781, Feb 2003
[Pet’80] R.A. Petr, T.R. Burkes, “Erosion of Spark Gap Electrodes”, IEEE Trans. Plasma Science, Vol. PS–8, pp 149–153, 1980
[Phe’88] A.V. Phelps, R.J. Van Brunt, “Electron transport, ionization, attachment, and dissociation coefficients in SF6 and its mixtures”, J. App. Phys., Vol. 64, pp. 4269–4277, 1988
[Rai’97] Y.P Raizer, “Gas Discharge Physics”, Springer–Verlag, 1st edition, 1997
[Rom’54] R. Rompe, W. Weizel, “ Über das Toeplersche Funkengestz”, Z. Physik 122, S. 636 – 639, 1954
[Rot’95] J.R. Roth, “Industrial Plasma Engineering”, Vol. 1, IOP Publishing Ltd, UK, 1995

140 References
[San’00] R.M. Sankaran, “High–Pressure Microdischarges as Microreactors for Material Applications”, Cal. Tech. Inst., phD thesis, May 2000
[San’03] R.M. Sankaran, K.P. Giapis “High Pressure Micro–Discharges in Etching and Deposition Applications”, J. Phys. D: App. Phys, Vol. 36, pp. 2914–2921, 2003
[San’04] H. Sanders, S. Glidden, “High Power Solid State Switch Module”, 26th IEEE Power Modulator Conference, pp. 563–566, 2004
[Sar’89] W.J. Sargeant, R.E. Doolinger, “High–Power Electronics”, 1st edition, TAB Books, U.S.A, 1989
[Sch’90] G. Schaefer, M. Kritiansen, A. Guenther, “Gas Discharge Closing Switches”, Volume 2, New York, Plenum Press, 1990
[Sch’00] K.H. Schoenbach, A.E. Habachi, M.M. Mosley, W. Shi, R. Stark, “Microhollow Cathode Discharge Excimer Lamps”, Physics of Plasma, Vol. 7, pp. 2186-2191, 2000
[Sch’04] E. Schamiloglu, “High Power Sources and Applications”, Preprint of paper presented at 2004 IEEE MTTS, Forth Worth, Texas
[Schm’04] J. Schmitz, M. Jung, G. Wollmann, “Ultra–wideband Pulse Sequence Enable Spectral variability of High–Power Microwave Sources”, 26th IEEE Power Modulator Conference, pp. 133–136, 2004
[Ser’01] P. Seriburi, D. Kercher and M. G. Allen, “An Experimental Study of Microfabricated Spark Gaps: Wear and Erosion Characteristic”, Journal of Micromechanics and Microengineering, Vol. 11, pp. 165–174, 2001
[Siglo] http://www.siglo-kinema.com
[Sin’03] S. Singha, M. J. Thomas, “Toepler’s Spark Law in a GIS with Compressed SF6–N2 Mixture”, IEEE Trans. on Dielectrics and Electrical Insulation, Vol. 10, No. 3, S. 498–505, 2003
[Smps] SMPS Technology Knowledge Base, “Energy Loss in Charging a Capacitor”, http://www.smpstech/charge.htm
[Sor’77] T.P. Sorensen, V.M. Ristic, “Rise Time and Time–Dependent Spark–Gap Resistance in Nitrogen and Helium”, J. App. Phys., Vol. 48, S. 114–117, 1977
[Spe’00] CCD Spectrometer, USB2000, Ocean Optics, America
[Tac’00] H. Tachikawa, “The Ionization Dynamics of SF6: a Full Dimensional Direct Ab Initio Dynamics Study”, J. Phys. B: At. Mo. Opt. Phys., Vol. 33, pp. 1725-1733, 2000
[Tac’02] H. Tachikawa, “Ab initio MO Calculations of Structures and Electronic States of SF6 and SF6
-”, J. Phys. B: At. Mo. Opt. Phys., Vol. 35, pp. 55-60, 2002
[Thy] EEV, Hydrogen Thyratron data sheets, English Electric Valve Company Ltd, London

References
141
[Thy’88] W. L. Thayer, V. C. H. Lo, A. K. Cousins, “Recovery of a High Pulse Rate Spark Gap Switch”, IEEE Conference Record of eighteenth Power Modulator Symposium, pp. 257–264, 1988
[Tip’91] P.A. Tipler, “Physics for Scientists and Engineers”, 3rd edition, Worth Publisher, 1991
[Toe’27] M. Toepler, “Zusammenhang Zwischen Funken, Büschellichtbogen und Bogen”, Archive für Elektrotechnik, Band 18, S. 563-566, 1927
[Toe’06] M. Toepler, “ Zur Kenntnis der Gesetze der Gleitfunkenbildung”, Annalen der Physik, Band 21, S. 193-222, 1906
[Toe’26] M. Toepler, “Neuer Weg zur Bestimmung der Funkenkonstanten, Einzelne Spannungsstöße mit Berechenbarem Gesamten Spannungsverlaufe”, Archiv für Elektrotechnik, Band 17, S. 61-70, 1926
[Tri’00] Finite–element software for electromagnetics, “Field Precision”, Tricomp series programs, Estat 4.0, 2000
[Tru’01] E.M. van Veldhuizen, W.R. Rutgers, “Pulsed Positive Corona Streamer Propagation and Branching”, J. Phys. D: App. Phys, Vol. 35, pp. 2169–2179, 2002
[Vel’02] D. Trunec, A Brablec and J Buchta, “Atmospheric Pressure Glow Discharge in Neon”, J. Phys. D: App. Phys, Vol. 34, pp. 1697 – 1699, 2001
[Vla’69] A. E. Vlastos, “Restrike Channel Resistance of Thin Exploding Wires”, J. App. Phys., Vol. 40, S. 4752-4760, 1969
[Vla’72] A. E. Vlastos, “The Resistance of Sparks”, J. Appl. Phys., Vol 43, S. 1987–1989, 1972
[Vit’87] I. Vitkovitsky, “High Power Switching”, Van Nostrand Reinhold Company, New York, 1987
[Ver’04] R. Verma, A. Shyam, S. Chaturvedi, R. Kumar, D. Lathi, P. Sarkar, V. Chaudhary, R. Shukla, K. Debnath, S. Sharma, J. Sonara, K. Shah, B. Adhikary, T. Jigna, J. Piyush, “Impulse Electromagnetic Interference Generator”, 26th IEEE Power Modulator Conference, pp. 543 – 546, 2004
[Wad’91] B. C. Wadell, “Transmission Line Design Handbook”, Artech House, Inc., Norwood, USA, 1991
[Wan’89] Y. Wang, R.L. Champion, L.D. Doverspike, J.K. Olthoff, R.J. Van Brunt, “Collisional Electron Detachment and Decomposition Cross Sections for SF6
-, SF5
-, and F- on SF6 and rare gas targets”, J. Chem. Phys., Vol. 91, pp. 2254–2260, 1989

142

Appendix
143
Appendix
Conversion units
Standard Temperature and Pressure
0oC = 273 K, 1 atm = 0.1013 MPa = 760 Torr (mmHg)
General
1 bar = 0.1 MPa.
1 Torr = 1.333 X 10⁻³ bar = 133.3 Pa.
1.013 bar = 760 Torr at any temperature = 1 atmosphere
1 bar.mm = 100 Pa.m = 75.0 torr.cm.
1 Td (Townsend) = 10-17 Vcm2
Table A: List of energy loss and electron loss mechanisms
Mechanism Comments Rate of electron
loss/energy loss
Elastic collisions Energy loss ~ 0 – 100 % Excitation of electronic states of atoms and molecules
Energy loss ~ 0 – 100 %
Excitation of molecular vibration and rotation
Energy loss ~ 0 – 100 %
Diffusion to walls Electron loss Linear to electron density Recombination (dissociative, radiative, ion–ion)
Electron loss Linear to electron density
Attachment to electronegative gas Electron loss Linear to electron density Transport to anode Electron loss Linear to electron density
Table B: Primary interaction of electrons
Representation Description
eABABe +→+
eABABe +→+ *
eBAABe ++⇒+
eBA ++⇒ *
eBAABe ++⇒+ −+
a) eABABe +→+ −*
eABAB +→ *)(
b) −+⇒ BA
Elastic electron scattering (direct)
Inelastic electron scattering (direct)
Dissociation by electron impact
Dissociation excitation by electron impact
Ion pair formation
Elastic (inelastic) electron scattering
Dissociative electron attachment

144 Appendix
c) energyAB +→ −
a) eABABe 2+→+ +
b) eBA 2++⇒ +
c) eBA 2* ++⇒ +
Parent negative ion formation
Ionization by electron impact
Dissociative ionization by electron impact
Dissociative ionization with fragment
excitation
Principle physical process [Chr’90]: )( *AAB represents an unexcited and )( ** AAB an
excited molecule (atom); the double arrow indicated that the reaction can produce a multiplicity of products. Photon interactions may follow interactions viz.
νhAABAAB +→ )()( **
For the parent negative ion −AB to be formed, the excess energy of the metastable *−AB ion must be removed in collision with other molecules (a much less likely way is radiative stabilization of *−AB )
Table C: Secondary Interaction of electrons
Representation Description
Photon–Molecule Interaction *
ABABh →+ν
eABABh +→+ +ν
eBA ++⇒ +
(*)BAABh +→+ν
eBABBABh +→+ −− )()(ν
BA +⇒ −
Photoabsorption
Photoionization
Dissociative photoionization
Photodissociation with(*)/without
excitation of the fragment (*)
Photodetachment
Negative ion photodissociation
Ion–Molecule (Atom) Interaction
CAABCAAB +→+−− )()(
eCAABCAAB ++→+−− )()(
eACABCCAAB +→+−− )()(
1≥→+ −−nCABCnAB n
1≥→+ ++nCABnCAB n
productsCCDAAB ⇒+−− )()(
productsCCDAAB ⇒+++ )()(
Ion conversion (charge transfer)
Collision detachment
Associative detachment
Cluster formation involving negative ions
Cluster formation involving positive ions
Negative ion–molecule (atom) reactions
Positive ion–molecule (atom) reactions
Electron–Ion and Negative Ion–Positive ion, Recombination reaction
)()( (*)(*) AABABe →+ ++
Electron–positive ion recombination with

Appendix
145
(*)BA +⇒
νhAAB +→ )(
eAeA 2+→+−
(*)ABBA →+ +−
(*)/ without excitation
Dissociative recombination with (*)/without excited fragment (s)
Radiative recombination
Detachment by electron impact
Negative ion–positive ion recombination with (*)/ without excitation
Interactions Involving Excited and Neutral Species
eCAABCAAB ++→+ +)()( **
eABBA +→+*
)()()()( ** εε ′+→+ eAABeAAB
productsCAAB ⇒+)(
Penning ionization
Associative ionization
εε >′ Super elastic collision
Chemical reaction involving neutral species
Principle physical process [Chr’90]: ),(* BAAB represents an unexcited and ),( *** BAAB
an exited species while ),( (*)(*)(*) BAAB represent species in either an excited or an
unexcited state; the double arrow indicates that the reaction can produce a multiplicity of products.
Table D: Physical constants for breakdown in gases
Gas B C γ Vmin (pd at Vmin) (Torr-cm)
Range of validity E/p (V/Torr.com)
H2 (0o) 127.0 -0.712 2.4 x 10⁻⁴ 273 (1.15) 5 – 130 N2 (20o) 257.5 -5.870 3.1 x 10⁻⁴ 251 (0.67) 12 – 342 Air (20o) 365.0 1.180 < 10-8 327 (0.567) 15 – 365 SF6 (20o) 1973 10.71 < 10-99 414 (0.6) 90 – 400 CO2 (20o) 223.0 -.9595 ~ 10-14 420 (0.51) 20 – 466 Few list of physical constants for Paschen’s curve with range of validity [Hey’06, Rai’97, Luc’01]
Table E: Threshold energies for electron impact dissociation of SF6 into neutrals.
Reaction Threshold energy (eV)
eFSFeSF ++→+ 56
eFSFeSF ++→+ 246
eFSFeSF ++→+ 246
eFSFeSF ++→+ 336
9.6 12.1
11.3
16

146 Appendix
eFFSFeSF +++→+ 236
eFSFeSF ++→+ 426
eFFSFeSF +++→+ 226 2
eFSFeSF ++→+ 226 2
eFSFeSF ++→+ 56
eFFSFeSF +++→+ 26 3
eFFSFeSF +++→+ 26 2
15.2
18.6
17.8
17.0 22.7
21.9
21.1
Table F: Library listing for subcircuit spark gap.
1 2 VTHRES=90 VARC=10 ISUS=500M RNEG=-0.5 LPL=130N RPL=2.5K CPAR=1P CARC=3P *Parameters: * VTHRES = VOLTAGE AT WHICH THE SPARKGAP STRIKES * VARC = VOLTAGE ACROSS THE SPARKGAP ONCE STRUCK * ISUS = CURRENT UNDER WHICH THE ARC IS STOPPED * RNEG = NEGATIVE RESISTANCE ONCE STRUCK * LPL = LEAD INDUCTANCE * RPL = FLUX LOSS ASSOCIATED WITH LPL * CPAR = GAP CAPACITANCE * CARC = ARC CAPACITANCE * * SINCE THE STRIKING IS VERY FAST, IT IS STRONGLY ADVISED * TO SET TRTOL TO 1 VIA: .OPTIONS TRTOL=1 and ITL4=1000. THIS WILL FORCE * IsSpice TO BE MORE VIGILANT IN THE VICINITY OF TRANSITIONS * ANOTHER OPTION IS TO TURN THE INTEGRATION METHOD TO GEAR * * Note: This version of the Intusoft Spark Gap model does NOT exhibit variations * with applied dV/dt.

Appendix
147
Figure A: V–p characteristic of a corona
stabilized switch.
The characteristic involves SF6 and three SF6/air mixtures (75 % SF6/25 % air, 50 % SF6/50 % air and 25% SF6/75 % air) for a main gap spacing of 10 mm, stressed electrode radius of 1 mm. Solid lines for all gases represent breakdown voltage levels; dashed lines represent corona onset levels. These plotted datas are taken from Koutsoubis et al [Kou’03].
Figure B: Temperature dependence
of the relative cross section.
The cross sections of SF5- ions
increase by low energy electron impact on SF6. [Chr’00]. The zero energy peak is very sensitive to temperature, has an activation energy of ~0.2 eV. The 0.38 eV peak is broad and insensitive to temperature variation.

148 Appendix
Figure C: Effective ionization coefficient for SF6.
Effective ionization coefficient for SF6, (α–η) =0 gives the critical value (E/N)cr for SF6. Datas are taken from Christophorou et al [Chr’00]. The dotted vertical line shows (E/N)cr =359.3 Td.
Figure D: Rate constant of electron attachment to SF6.
The rate constant of electron attachment to SF6 is presented as a function of the electron mean energy [Chr’00].
200 300 400 500-60
-40
-20
0
20
40
( α −
ηα
− η
α −
ηα
− η
)/N
(10
-18 c
m2 )
E/N (Td)
0.0 0.5 1.0 1.5 2.00.0
0.5
1.0
1.5
2.0
ka
tt( <
ε >
< ε
><
ε >
< ε
>)
(10
-7cm
3s
-1)
Mean electron energy < ε >< ε >< ε >< ε > (eV)

Publications 149
Publications
National Conference
1. Hasibur Rahaman, Jürgen Urban, Robert Stark, Jürgen Bohl, Klaus Frank, “ Behavior of repetition rates in a spark gap switch”, DPG Früjahrstagung Aachen 2003.
2. Hasibur Rahaman, Jürgen Urban, Geoff Staines, Robert Stark, Jürgen Bohl, Klaus Frank, “Investigations on high pressure sparks at very small electrode gap distance”, DPG Früjahrstagung Kiel 2004.
3. Hasibur Rahaman, Jürgen Urban, Geoff Staines, Robert Stark, Jürgen Bohl, Klaus Frank, “Characterization of a high repetition rate spark gap switch”, DPG Früjahrstagung Berlin 2005
4. Hasibur Rahaman, Byung–Joon Lee, Jürgen Urban, Robert Stark, Klaus Frank, “Switching characteristics of micro plasmas in a spark gap”, DPG Früjahrstagung Düsseldorf 2007
5. Byung–Joon Lee, Hasibur Rahaman, Jürgen Urban, Robert Stark, Klaus Frank, “Switching characteristics of micro plasmas in a spark gap”, DPG Früjahrstagung Düsseldorf 2007
International Conference
1. Hasibur Rahaman, Byung–Joon Lee, Jürgen Urban, Robert Stark, Klaus Frank, “Development of a miniature pressurized spark gap switch for high repetitive short transient pulses”, 3rd International Workshop on Microplasmas, May 9-11, 2006, Greifswald, Germany.
Scientific Journals
1. Hasibur Rahaman, Byung–Joon Lee, Isfried Petzenhauser, Jürgen Urban, Robert Stark, Klaus Frank, “Switching characteristics of micro plasmas in a planar electrode gap”, Applied Physics Letter, Vol. 90, 131505, 2007
2. Byung–Joon Lee, Hasibur Rahaman, Konstantinos P. Giapis, Isfried Petzenhauser, Klaus Frank, “Xenon Excimer emission from pulsed high pressure capillary micro discharges”, Applied Physics Letter, Vol. 90, 241502, 2007

150
Acknowledgements 151
Acknowledgements
I would not have been able to do my PhD work without the financial support sponsored by Diehl BGT Defence GmbH & Co. KG, Röthenbach and the valuable support of my supervisors and colleagues. I am indebted for all the support I received as well the wonderful time I spent at the physics department of the University of Erlangen. I would like to show my appreciation especially to:
• my supervisor, Prof. Dr. Klaus Frank. It is a great honor and pleasure to work with him and I am indebted to him for allowing me to work in his group. I feel thankful for the innovative research environment he has provided in the plasma physics group.
• Prof. Dr. J. Jacoby from the applied physics department of Frankfurt am Main University for the acceptance and referring my thesis. He has granted my work with an outstanding support and trust for which I am very grateful.
• my supervisors, Dr. Jürgen Urban and Dr. Robert Stark from Diehl BGT Defence GmbH & Co. KG, Röthenbach. They have been my mentor and this thesis embodies due to their assistance in exploring new ideas for the experiment.
• Dr. Jürgen Bohl from Diehl BGT Defence GmbH & Co. KG, Röthenbach. He has provided me the opportunity to carry this research work. I would like to thank other colleagues from Diehl BGT Defence GmbH & Co. KG, Röthenbach: Dr. Geoff
Staines who shared his knowledge of experience, and Dr. Victor. A. Kadetov for his valuable discussions and suggestions in my work.
• Prof. Yuri Korolev from Tomsk University and Prof. Dr. L. Biborosh from Romania. I express my deeply gratitude to them for valuable remarks and suggestions during their visit in Erlangen. I am grateful to Dr. H.K. Dwivedi and Dr. Rahul Verma from CEERI Pilani, India to boost my stay and my work in Erlangen.
• Klaus Streeb from the electronic workshop. I thank him for frequent discussion on the circuit theory and helped me with the electrical parts I needed for the experiment.
• Stephan Schreiter and Thomas Spona from the mechanical workshop. I thank them for their help in constructing the quality spark gap test chamber and other necessary mechanical parts that I needed for the experiment.
• my colleagues, Isfried Petzenhauzer and Byung–Joon Lee. They always provided nice surroundings and stood by my side to vent about all my problems.
• my colleagues, Dr. Marcus Iberler and Teske Christiansen for language corrections and cheering me up in writing the thesis.
• Finally, I want to thank my family for all their unselfish love and support throughout my work for encouraging me to stay here and finish what I’ve started.
Thank you all!

152

153
Resume
Name: Hasibur Rahaman
Date of birth: 10.07.1974
Place of birth: Durgapur
Parents: Sk.A. Hakim and B. Begum
Nationality: Indian
Languages: Bengali, Hindi, Urdu, English, German
Education
1979 – 1985: primary school, Durgapur, India
1986 – 1990: middle school and secondary, Purulia, India
1990 – 1992: High school, Purulia, India
1992 – 1997: B.Sc/M.Sc at the Faculty of Physics, A.M.U, Aligarh, India
1999 – 2000: Master of Technology (M.Tech) in Microwave Engg., Burdwan University,
India
Experience:
2000 – 2001: M. Tech thesis work with CEERI Pilani, CSIR, India
2001 – 2002: Project Assistant with CEERI Pilani, CSIR, India
Research positions:
Since March 2002: Ph.D with the Physics Department I of the University of Erlangen–
Nuremberg, stipend by Diehl BGT Defence GmbH & Co. KG, Röthenbach
Related Documents