Investigation into the Effect of Subcooling on the Kinetics of Hydrate Formation. Gwyn Ardeshir Mali 1,2 , Antonin Chapoy 2, 3* , Bahman Tohidi 2 1 Chevron North America Exploration & Production Company 2 Hydrates, Flow Assurance & Phase Equilibria Research Group, Institute of Petroleum Engineering, Heriot-Watt University, Edinburgh, Scotland, UK 3 Mines Paristech, CTP – Centre Thermodynamique des procédés, 35 rue St Honoré 77305 Fontainebleau, France Abstract A novel multi-test tube rocking cell unit has been used to generate large amounts of data to investigate the relationship between gas hydrate formation induction time and subcooling. The experiments included tests to determine the induction time for a natural gas and water system at a wide range of pressures and subcooling. Over 500 induction times were measured at pressure ranging from 2 to 17 MPa. The statistical analysis of the results shows that the commencement of hydrate growth is logarithmically related to subcooling, and that the scatter of the onset of hydrate growth is greater at higher subcooling. It was also shown that the induction time for hydrate growth was lower at higher pressures at similar levels of subcooling. Keywords: Gas hydrates, kinetics, induction time. * Corresponding author: E-mail: [email protected] brought to you by CORE View metadata, citation and similar papers at core.ac.uk provided by Heriot Watt Pure

Welcome message from author
This document is posted to help you gain knowledge. Please leave a comment to let me know what you think about it! Share it to your friends and learn new things together.
Transcript
Investigation into the Effect of Subcooling on the Kinetics of
Hydrate Formation.
Gwyn Ardeshir Mali1,2, Antonin Chapoy2, 3*, Bahman Tohidi2
1Chevron North America Exploration & Production Company
2Hydrates, Flow Assurance & Phase Equilibria Research Group, Institute of Petroleum Engineering, Heriot-Watt University, Edinburgh, Scotland, UK
3Mines Paristech, CTP – Centre Thermodynamique des procédés, 35 rue St Honoré 77305 Fontainebleau, France
Abstract
A novel multi-test tube rocking cell unit has been used to generate large amounts of data to
investigate the relationship between gas hydrate formation induction time and subcooling. The
experiments included tests to determine the induction time for a natural gas and water system at a
wide range of pressures and subcooling. Over 500 induction times were measured at pressure
ranging from 2 to 17 MPa. The statistical analysis of the results shows that the commencement of
hydrate growth is logarithmically related to subcooling, and that the scatter of the onset of hydrate
growth is greater at higher subcooling. It was also shown that the induction time for hydrate
growth was lower at higher pressures at similar levels of subcooling.
Keywords:
Gas hydrates, kinetics, induction time.
* Corresponding author: E-mail: [email protected]
brought to you by COREView metadata, citation and similar papers at core.ac.uk
provided by Heriot Watt Pure
I. Introduction
Gas hydrates or clathrate hydrates are ice like crystalline structures that are composed of hydrogen
bonded water molecules in cage like structures, which contain guest molecules that occupy the
cages, which stabilize the crystal structures [1]. In the petroleum industry, gas hydrates pose flow
assurance issues to oil and gas pipelines as they can form in natural gas systems at typical
temperatures and pressures encountered in many offshore and onshore pipelines. Clathrates of
natural gas are also naturally present in permafrost and in the ocean and have been investigated for
exploitation as an energy resource [2], or as a potential geohazard [3]. Other investigations have
looked into the use of hydrates as a medium for use in water desalination [4], natural gas
storage/transportation [5], and carbon dioxide capture and sequestration [6, 7].
The kinetics of hydrate nucleation and growth has been a subject of research that started in the
beginning of the 1960s [8]. The most significant contribution to the area of research has been by
Raj Bishnoi and his group, which was based on semi-batch continuous-state stirred reactors that
measured the molar consumption of guest molecules [9-14]. The kinetics work identified three
distinct regions; the first step called “dissolution” involves the dissolution of the gas with the guest
molecules across the vapor-liquid water interface into the aqueous phase. The next step called the
“induction period” involves a time period where the super-saturated aqueous phase has hydrate
crystal structures forming and decomposing until a stable hydrate nuclei are formed. The last step
is called “hydrate growth” where the previously formed nuclei grow, consuming the hydrate
forming gases and increase the turbidity of the test solution due to the presence of solid hydrate
crystals. The diffusion of hydrate formers to the aqueous phase is a key factor in the dissolution
and hydrate growth stages of hydrate formation kinetics, which is itself a function of the interfacial
area and mass transfer coefficient. Interfacial area and mass transfer coefficient are both strongly
dependent on degree of agitation and the equipment used, as such, experimental equipment and
operation impact the kinetic of hydrate formation, which makes it difficult to compare data
between different research groups. Bishnoi’s and several other groups [15-21] have subsequently
conducted experimental tests and generated empirical based models for hydrate growth kinetics,
all of which that have limitations to their use. An overview of the state of the art in hydrate kinetic
modelling is comprehensively described by Ribeiro and Lage (2008) [22].
The major limitation into the prediction of hydrate kinetics is the stochastic nature of nucleation
during the induction period, which requires large amounts of data to make any quantitative or
qualitative conclusions, and studies to investigate the stochastic behaviour in the open literature is
limited, particularly at high pressures. This study’s objective is to investigate the statistical
properties of the stochastic nature of gas hydrate induction. The investigation involves the
measurement of the hydrate induction time for a natural gas with water over a wide range of
pressures using a novel setup that enables the generation of large amounts of data.
II. Experimental
a. Experimental Materials
The composition of the multi-component gas mixture as measured by GC is given in Table 1.
Deionised water was used in all tests.
b. Equipment
A Multi Test Tube Rocking Cell (MTTRC) testing unit developed by Heriot Watt University was
used for the experiments. Schematics of the set-up used for the solubility study is shown in Figure
1.
The experimental set-up used consists of ten identical equilibrium cells, cryostat, rocking/pivot
mechanism, and temperature/pressure recording equipment controlled by a PC. The ten
equilibrium cells are (maximum effective volume of 10 ml), titanium cylindrical pressure vessel
with mixing ball. The cells are held into the same cooling/heating jacket, this jacket is mounted on
a horizontal pivot with associated stand for pneumatic controlled rocking through 180 degrees.
Rocking of the system, and the subsequent movement of the mixing ball within the equilibrium
cells, ensures adequate mixing of the cell fluids. For the tests reported here, the cell was rocked
through 180 degrees at a rate of 8 times per minute.
The rig has a working temperature range of 253.15 to 323.15 K, with a maximum operating
pressure of 40 MPa. System temperature is controlled by circulating coolant from a cryostat within
a jacket surrounding the cell. The cryostat is capable of maintaining the cell temperature stability
to within better than 0.05 ºC. To achieve good temperature stability, the jacket is insulated with
polystyrene board, while connecting pipe work is covered with plastic foam. The temperature is
measured and monitored by means of three PRTs (Platinum Resistance Thermometers) located
within the cooling jacket of the cell, which were calibrated regularly against a Prema 3040
precision thermometer. Cell temperature can be measured with an accuracy of 0.1 K. Ten pressure
transducer with an accuracy of 0.01 MPa were used to monitor pressure of each individual cells.
Temperatures and Pressures are monitored and recorded by the PC through an RS 232 serial port.
c. Procedures
For all tests, the cells were first cleaned and vacuumed at temperature well outside the predicted
hydrate stability (303.15 K). 5 ml of distilled water was then introduced into each test-tube cell
and pressurised with natural gas with the composition shown in Table 1 to the specified pressure.
The rocking system was then switched on, which rotates the cells 180° every 9 seconds. The
temperature of the thermostat bath is then set to the desired temperature. The pressure from each
test tube, and the coolant temperature in the jacket were measured and logged on a PC. Multiple
runs were conducted for each solution with heating of 303 K for at least 1 day to remove hydrate
history. The onset of hydrate formation is detected by monitoring the change in the pressure.
Tests were conducted at 6 different pressures of 1.72, 2.76, 6.21, 6.89, 10.34 and 17.24 MPa (250,
400, 900, 1000, 1500 and 2500 psia) with subcoolings from 3.2 K to 8.0 K (Figure 2). A total of
500 induction time run were carried out. The subcooling was calculated using our in-house
thermodynamic package [23-25], the model was previously validated for similar natural gases [26,
27]. The subcooling is defined at the difference in temperatures between the predicted three phase
equilibrium temperature (the temperature on the hydrate phase boundary) and the temperature of
hydrate onset, the set temperature. A typical run is shown in Figure 3 for three test tubes. In this
work the induction time is defined as the time difference between the time when the system reached
equilibrium at the set temperature and the time when hydrate forms (if hydrates form before
reaching the set temperature, the induction time is set to zero).
III. Results
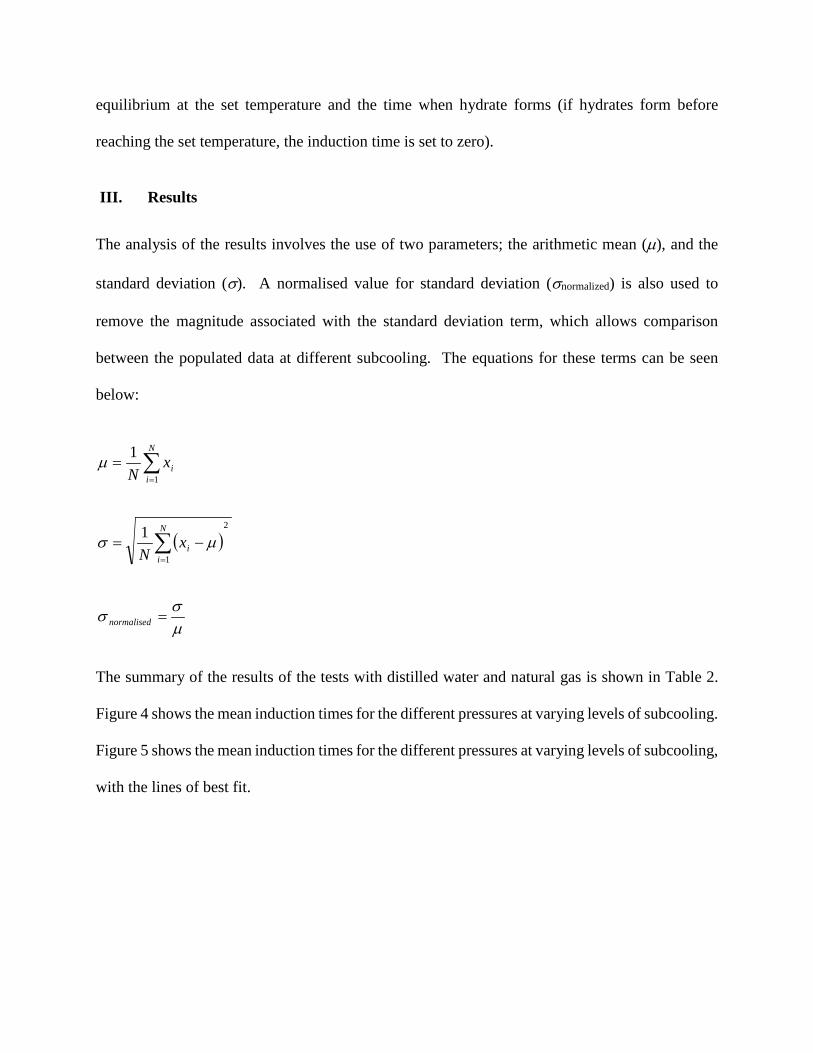
The analysis of the results involves the use of two parameters; the arithmetic mean (µ), and the
standard deviation (σ). A normalised value for standard deviation (σnormalized) is also used to
remove the magnitude associated with the standard deviation term, which allows comparison
between the populated data at different subcooling. The equations for these terms can be seen
below:
The summary of the results of the tests with distilled water and natural gas is shown in Table 2.
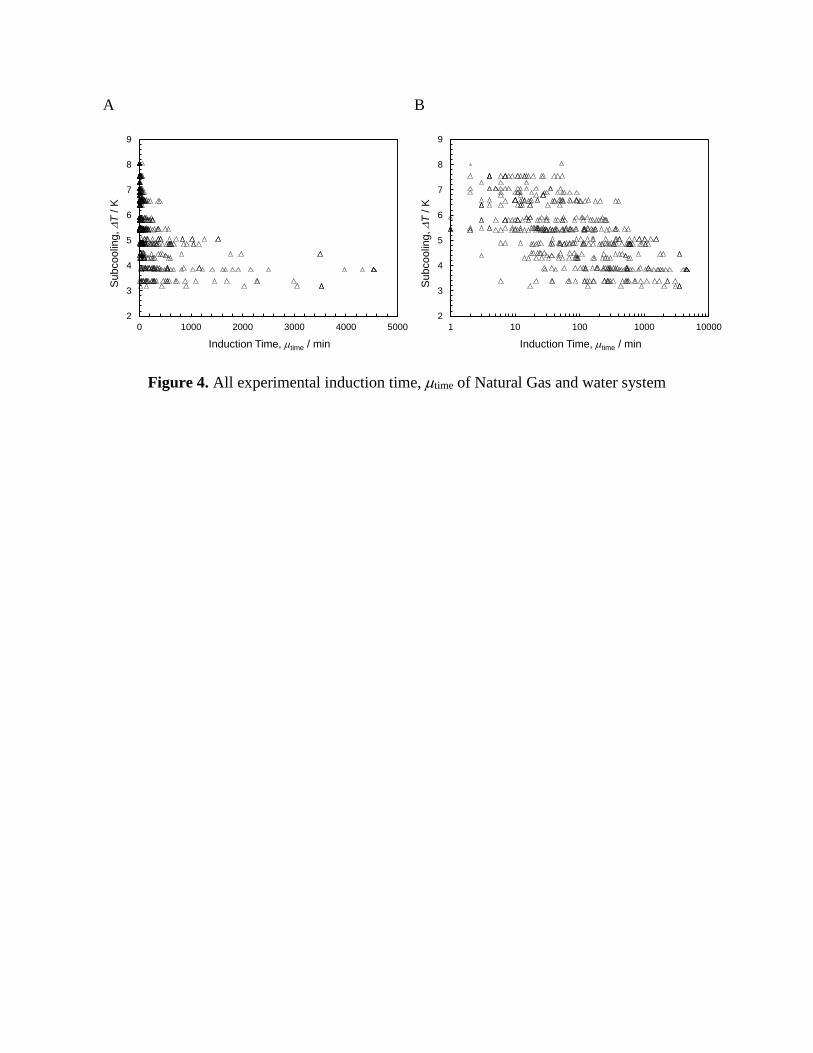
Figure 4 shows the mean induction times for the different pressures at varying levels of subcooling.
Figure 5 shows the mean induction times for the different pressures at varying levels of subcooling,
with the lines of best fit.
∑=
=N
iix
N 1
1µ
( )2
1
1 ∑=
−=N
iix
Nµσ
µσσ =normalised
IV. Discussion
a. Subcooling
The raw experimental data is presented in Figure 4 and the results show that the induction time for
the natural gas and water system tested is very stochastic, which is aligned with previously reported
experience by other researchers.
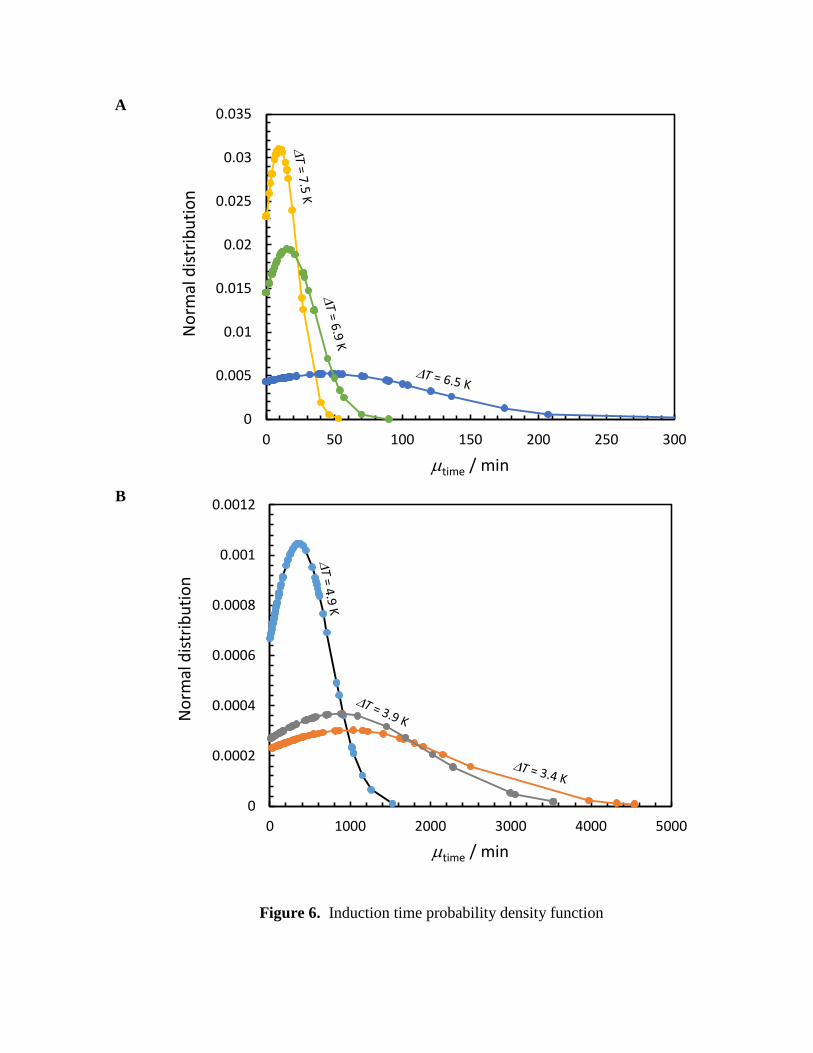
The cumulative distribution and the probability density curve of the data with similar subcooling
is presented in Figure 5 and Figure 6 respectively. The results demonstrate that the scatter in
induction time is higher at lower levels of subcooling than at higher levels of subcooling. Figure 7
shows data representing the 90%, 95% and 98% induction times (i.e. induction time when 90%,
95 % and 98 % of the samples have formed hydrates), for the three probability the induction clearly
follow an exponential behaviour with the subcooling. Figure 8 is a plot of the data with the addition
of the mean induction times for the tests with similar pressure, and figure 9 presents the lines of
best fit of the data. The results demonstrate that under the same pressures, induction time is
logarithmically related to subcooling.
b. Pressure
As seen in Figure 9, the mean values of induction time reduces as the subcooling increased due to
the greater thermodynamic driving force to form the hydrates. Although there is some scatter in
the data, it is also apparent that the hydrates also form quicker at lower pressures at the same level
of subcooling. The results show that there can be up to approximately 25 times increase in the
average induction time due to a change in pressure from 1.72 to 172 MPa at the same level of
subcooling.
To further explore the impact of pressure on induction time, figure 9 was created with the use of a
straight line equation (y=Aln(x) + B) with parallel lines (A constant) in a best fit relationship to
the data. Figure 11 is a plot of the data gathered from Figure 10 in relation to the intersect B as a
function of pressure. As can be seen there is a general trend with the intersect B increasing with
increasing pressure. This suggests that increasing pressure has a near linear effect of increasing
induction time. The exception to this data is the 6.21 MPa (900 psia) data set, which does not
follow the trend (blue on the figure). This may be attributable to experimental method, such as
the presence of nucleus forming particles in that test sample.
The results presented align with the findings of Arjmandi et al. (2005) [28] that demonstrated that
a change in pressure impacts induction time with similar subcooling. One of the conclusions of
the work was that the Gibbs free energy term or –G/RT should be used in comparing kinetic studies
at different pressure conditions.
Figure 11 shows the normalised standard deviation for the different pressures at varying levels of
subcooling. It is apparent from the data that the standard deviation (normalised) generally
increases with subcooling. The implication is that there is more reproducibility of measured
induction time and less stochasticity at higher subcooling, and less so at lower subcooling.
V. Conclusions
The nature of the tests carried out with the multi test tube rocking cell lends itself to the generation
of large volumes of data, enabling researchers to make statistical analyses and make meaningful
conclusions with a reasonable degree of certainty.
The results presented show that induction time is logarithmically related to subcooling for a natural
gas and distilled water system. The results also showed that an increase in pressure at the same
subcooling increases the average induction time, which is broadly in agreement with previously
published work [28]. Additionally, the results show that the scatter in induction time is smaller at
higher levels of subcooling.
The impact of pressure on induction time at similar subcooling is attributed to the relative
subcooling change not being equivalent to the relative driving force change. The result of this
conclusion is that the driving force term and not subcooling should be used for comparing kinetic
tests at different pressures.
References
[1] Sloan, E.D., Koh, C.A., “Clathrate Hydrates of Natural Gases, Third Edition”, CRC Press,
(2007).
[2] Makogon, Y.F., “Natural gas hydrates – A promising source of energy”, Journal of Natural Gas
Science and Engineering, volume 2, issue 1, pages 49-59 (2010).
[3] Maslin, M., Owen, M., Betts, R., Day, S., Jones, T. D., Ridgwell, A., “Gas hydrates: past and
future geohazard?”, Philosophical Transactions of the Royal Society A, volume 368, issue 1919
(2010).
[4] Sangwai, J.S., Patel, R. S., Mekala, P., Mech, D., Busch, M., “Desalination of Seawater using
Gas Hydrate Technology- Current Status and Future Direction”, Proceedings of Hydro 2013
Internationsl, IIT Madras, Chennai, 4-6 Dec (2013).
[5] Ahmadloo, F., Mali, G., Chapoy, A., Tohidi, B., “Gas Separation and Storage using Semi-
Clathrate Hydrates”, Proceedings of the 6th International Conference on Gas Hydrates (ICGH
2008), Vancouver, July 6-10 (2008).
[6] Linga, P., Adeyemo, A., Englezos, P., “Medium-Pressure Clathrate Hydrate/Membrane Hybrid
Process for Post combustion Capture of Carbon Dioxide”, Environ. Sci. Technol., 42, 315–320,
(2007).
[7] Castellani, B., Filipponi, M., Nicolini, A., Cotana, F., Rossi, F., “Carbon Dioxide Capture
Using Gas Hydrate Technology”, Journal of Energy and Power Engineering, 7, 883-890, (2013).
[8] Levkam, K., Ruoff, P., “Kinetics and mechanism of methane hydrate formation and
decomposition in liquid water Description of hysteresis”, Journal of Crystal Growth, 179, 618-624
(1997).
[9] Vysniauskas, A., and Bishnoi, P. R., “A kinetic study of methane hydrate formation,” Chem.
Eng. Sci., 38, 1061 (1983).
[10] Vysniauskas, A., and Bishnoi, P. R., “Kinetics of ethane hydrate formation,” Chem. Eng. Sci.,
40 (2), 299 (1985).
[11] Englezos, P., Kalogerakis, N., Dholabhai, P. D., and Bishnoi, P. R., “Kinetics of Formation
of Methane and Ethane Gas Hydrates,” Chem. Eng. Sci., 42, 2647 (1987).
[12] Natarajan, V., Bishnoi, P. R., and Kalogerakis, N., “Induction Phenomena in Gas Hydrate
Nucleation,” Chem. Eng. Sci., 49, 2075 (1994).
[13] Bishnoi, P. R., and Kalogerakis, N., "Induction Phenomena in Gas Hydrate Nucleation",
Chem. Eng. Sci.49, 2075-2087 (1994).
[14] Parent, J.S., and Bishnoi, P. R., " Investigations Into the Nucleation Behaviour of Natural
Gas Hydrates", Chemical Engineering Communications (CEC), 144, 51-64 (1996).
[15] Skovborg P., Rasmussen P., “A Mass Transport Limited Model for the Growth of Methane
and Ethane Gas Hydrates”, Chemical Engineering Science, 49(8):1131–1143 (1994).
[16] Mork M., Gudmundsson J.S., “Hydrate Formation Rate in a Continuous Stirred Tank Reactor:
Experimental Results and Bubble-to-Crystal Model”, in Proceedings of the Fourth International
Conference on Gas Hydrates, Yokohama, 813–818 (2002).
[17] Hashemi S., Macchi A., Servio P., “Dynamic Simulation of Gas Hydrate Formation in an
Agitated Three-Phase Slurry Reactor, in 2007 ECI Conference on The 12th International
Conference on Fluidization - New Horizons in Fluidization Engineering, Vancouver, pp. 329–336.
(2007).
[18] Hashemi S., Macchi A., Servio P.,“Gas Hydrate Growth Model in a Semibatch Stirred Tank
Reactor”, Industrial And Engineering Chemistry Research, 46, 5907–5912, (2007).
[19] Yousif, M. H., “The kinetics of hydrate formation”, SPE Paper 28479, presented at the 69th
Annual Technical Conference, New Orleans, 25-28 September (1994).
[20] Christiansen, R.L., Sloan, E. D., “A compact model for hydrate formation”, Proceedings of
the 74th GPA Annual Convention, San Antonio, Texas, 15-21 March (1995).
[21] Christiansen, R.L., Bansal, V., Sloan, E. D., “Avoiding Hydrates in the Petroleum Industry:
Kinetics of Formation”, SPE Paper 27994, University of Tulsa Centennial Petroleum Engineering
Symposium, Tulsa, 29-31 August, (1994).
[22] Ribeiro, C. P., Lage, P., “Modelling of hydrate formation kinetics: State-of-the-art and future
directions”, Chemical Engineering Science, 63(8), 2007-2034 (2008).
[23] Chapoy, A.; Haghighi, H.; Burgass, R.; Tohidi, B., On the phase behaviour of the (carbon
dioxide+ water) systems at low temperatures: experimental and modelling. The Journal of
Chemical Thermodynamics 2012, 47, 6-12.
[24] Chapoy, A.; Nazeri, M.; Kapateh, M.; Burgass, R.; Coquelet, C.; Tohidi, B., Effect of
impurities on thermophysical properties and phase behaviour of a CO 2-rich system in CCS.
International Journal of Greenhouse Gas Control 2013, 19, 92-100.
[25] Haghighi, H.; Chapoy, A.; Burgess, R.; Tohidi, B., Experimental and thermodynamic
modelling of systems containing water and ethylene glycol: Application to flow assurance and gas
processing. Fluid Phase Equilibria 2009, 276, (1), 24-30.
[26] Chapoy, A.; Tohidi, B. Hydrates in High Inhibitor Concentration Systems. GPA Res. Rep.
205 2010.
[27] Najibi, H.; Chapoy, A.; Tohidi, B. Methane/natural Gas Storage and Delivered Capacity for
Activated Carbons in Dry and Wet Conditions. Fuel 2008, 87 (May), 7–13.
[28] Arjmandi, M., Tohidi, B., Danesh, A., Todd, A. C., “Is Subcooling The Right Driving Force
For Testing Low Dosage Hydrate Inhibitors?” Chemical Engineering Science, 60, 1313-1321,
(2005)
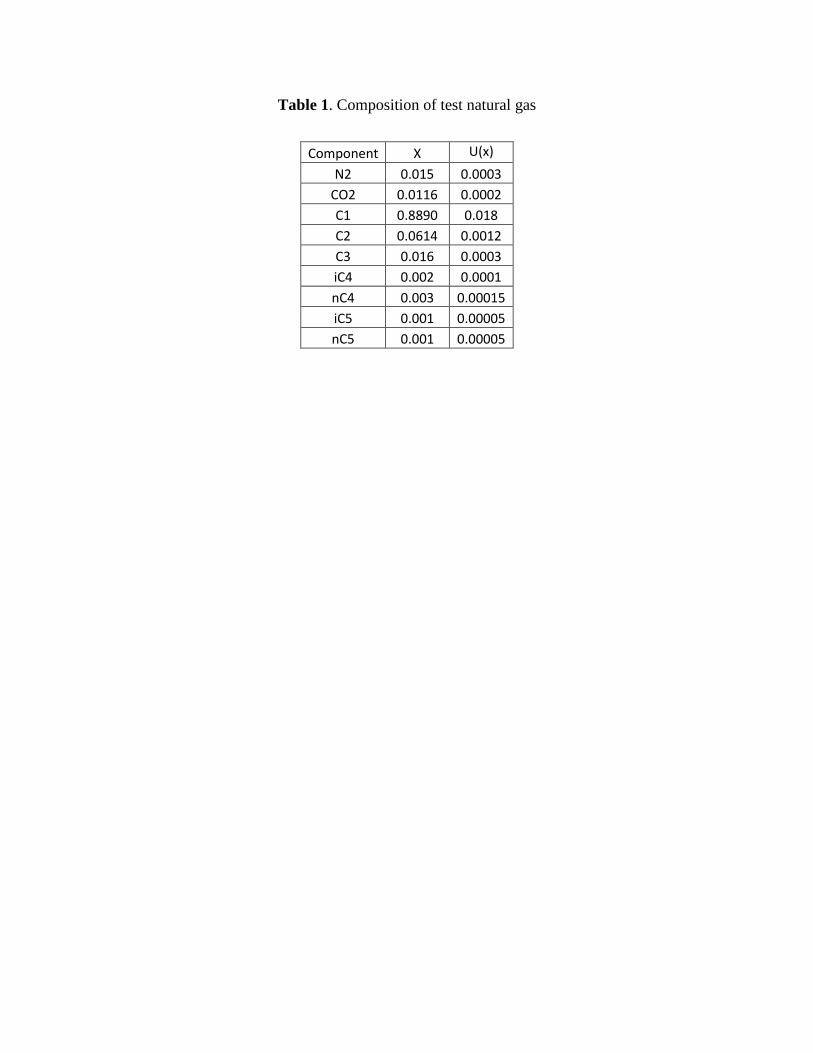
Table 1. Composition of test natural gas
Component X U(x) N2 0.015 0.0003
CO2 0.0116 0.0002 C1 0.8890 0.018 C2 0.0614 0.0012 C3 0.016 0.0003 iC4 0.002 0.0001 nC4 0.003 0.00015 iC5 0.001 0.00005 nC5 0.001 0.00005
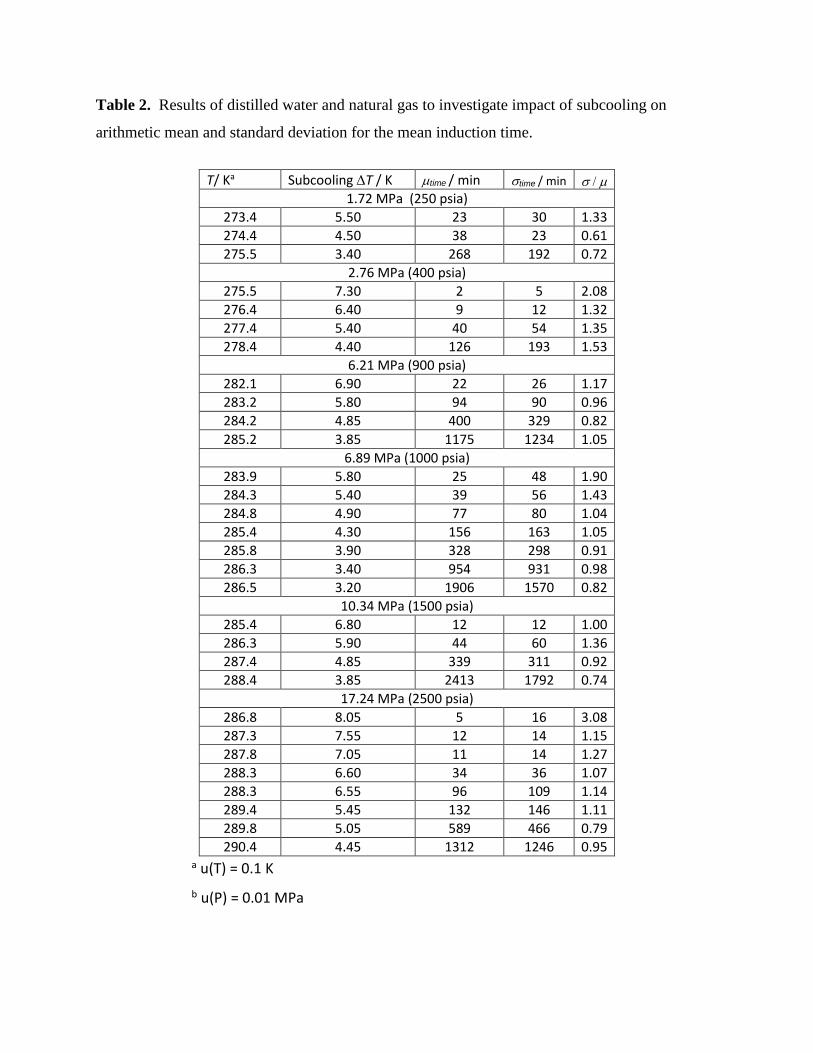
Table 2. Results of distilled water and natural gas to investigate impact of subcooling on
arithmetic mean and standard deviation for the mean induction time.
T/ Ka Subcooling ∆T / K µtime / min σtime / min σ / µ 1.72 MPa (250 psia)
273.4 5.50 23 30 1.33 274.4 4.50 38 23 0.61 275.5 3.40 268 192 0.72
2.76 MPa (400 psia) 275.5 7.30 2 5 2.08 276.4 6.40 9 12 1.32 277.4 5.40 40 54 1.35 278.4 4.40 126 193 1.53
6.21 MPa (900 psia) 282.1 6.90 22 26 1.17 283.2 5.80 94 90 0.96 284.2 4.85 400 329 0.82 285.2 3.85 1175 1234 1.05
6.89 MPa (1000 psia) 283.9 5.80 25 48 1.90 284.3 5.40 39 56 1.43 284.8 4.90 77 80 1.04 285.4 4.30 156 163 1.05 285.8 3.90 328 298 0.91 286.3 3.40 954 931 0.98 286.5 3.20 1906 1570 0.82
10.34 MPa (1500 psia) 285.4 6.80 12 12 1.00 286.3 5.90 44 60 1.36 287.4 4.85 339 311 0.92 288.4 3.85 2413 1792 0.74
17.24 MPa (2500 psia) 286.8 8.05 5 16 3.08 287.3 7.55 12 14 1.15 287.8 7.05 11 14 1.27 288.3 6.60 34 36 1.07 288.3 6.55 96 109 1.14 289.4 5.45 132 146 1.11 289.8 5.05 589 466 0.79 290.4 4.45 1312 1246 0.95
a u(T) = 0.1 K b u(P) = 0.01 MPa
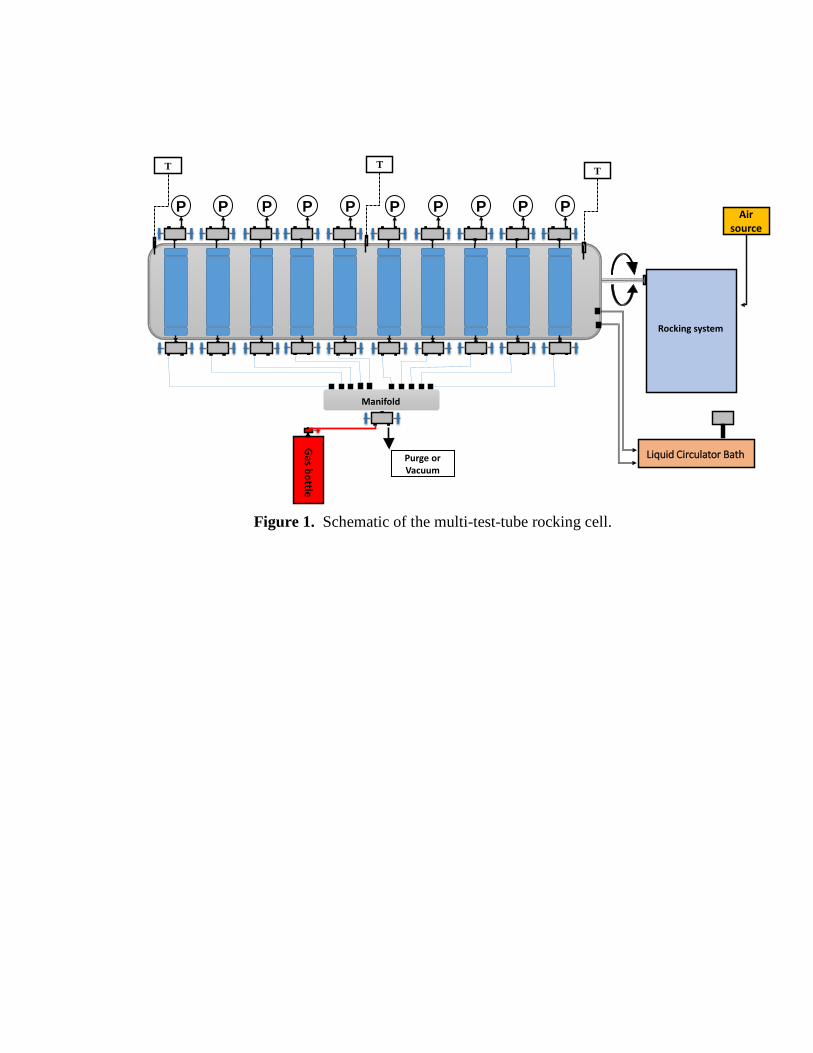
Figure 1. Schematic of the multi-test-tube rocking cell.
PP PPPPP PPP
Liquid Circulator Bath
Air source
Rocking system
TT T
Manifold
Purge or Vacuum
Gas bottle
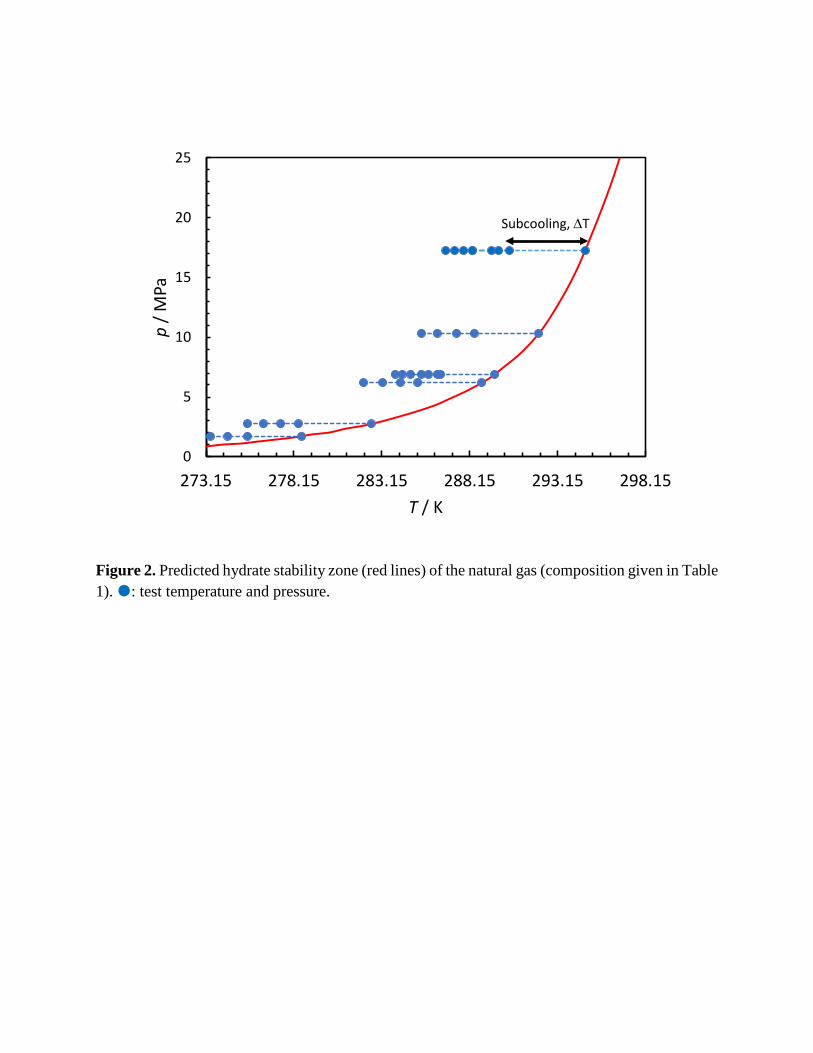
Figure 2. Predicted hydrate stability zone (red lines) of the natural gas (composition given in Table 1). : test temperature and pressure.
0
5
10
15
20
25
273.15 278.15 283.15 288.15 293.15 298.15
p/ M
Pa
T / K
Subcooling, ∆T
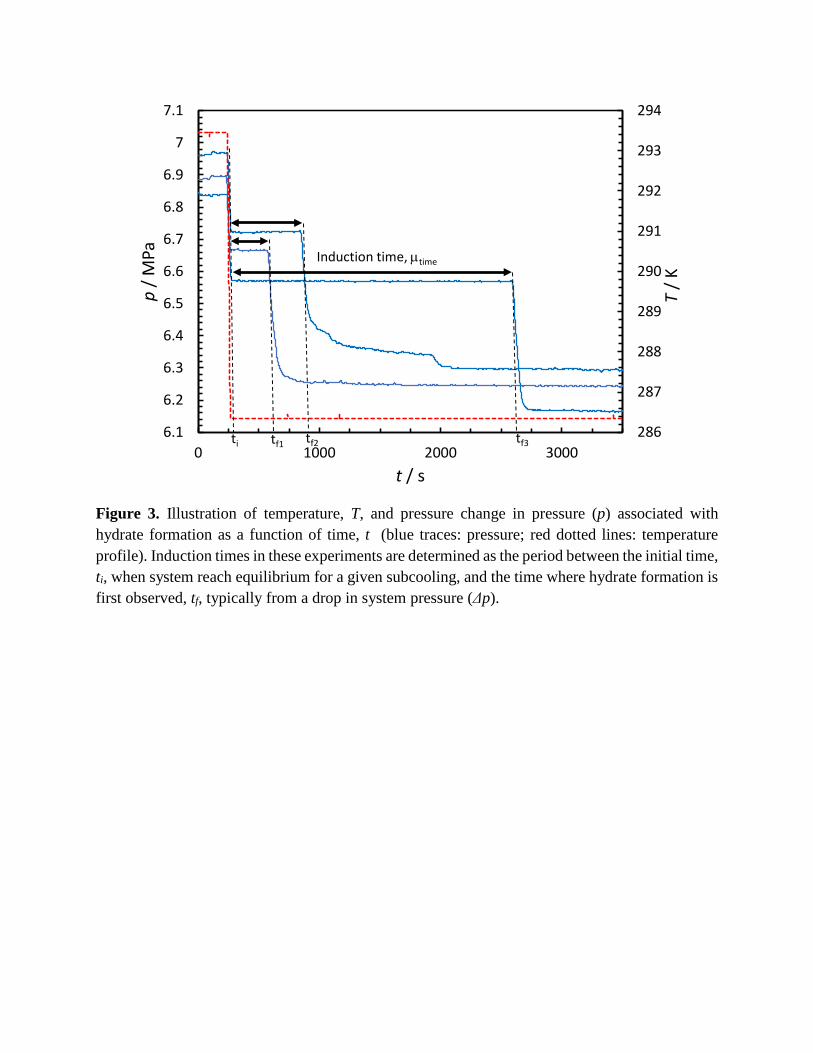
Figure 3. Illustration of temperature, T, and pressure change in pressure (p) associated with hydrate formation as a function of time, t (blue traces: pressure; red dotted lines: temperature profile). Induction times in these experiments are determined as the period between the initial time, ti, when system reach equilibrium for a given subcooling, and the time where hydrate formation is first observed, tf, typically from a drop in system pressure (Δp).
286
287
288
289
290
291
292
293
294
6.1
6.2
6.3
6.4
6.5
6.6
6.7
6.8
6.9
7
7.1
0 1000 2000 3000
T/ Kp/ M
Pa
t / s
Induction time, µtime
ti tf1 tf2 tf3
A B
Figure 4. All experimental induction time, µtime of Natural Gas and water system
2
3
4
5
6
7
8
9
0 1000 2000 3000 4000 5000
Sub
cool
ing,
∆T
/ K
Induction Time, µtime / min
2
3
4
5
6
7
8
9
1 10 100 1000 10000
Sub
cool
ing,
∆T
/ K
Induction Time, µtime / min
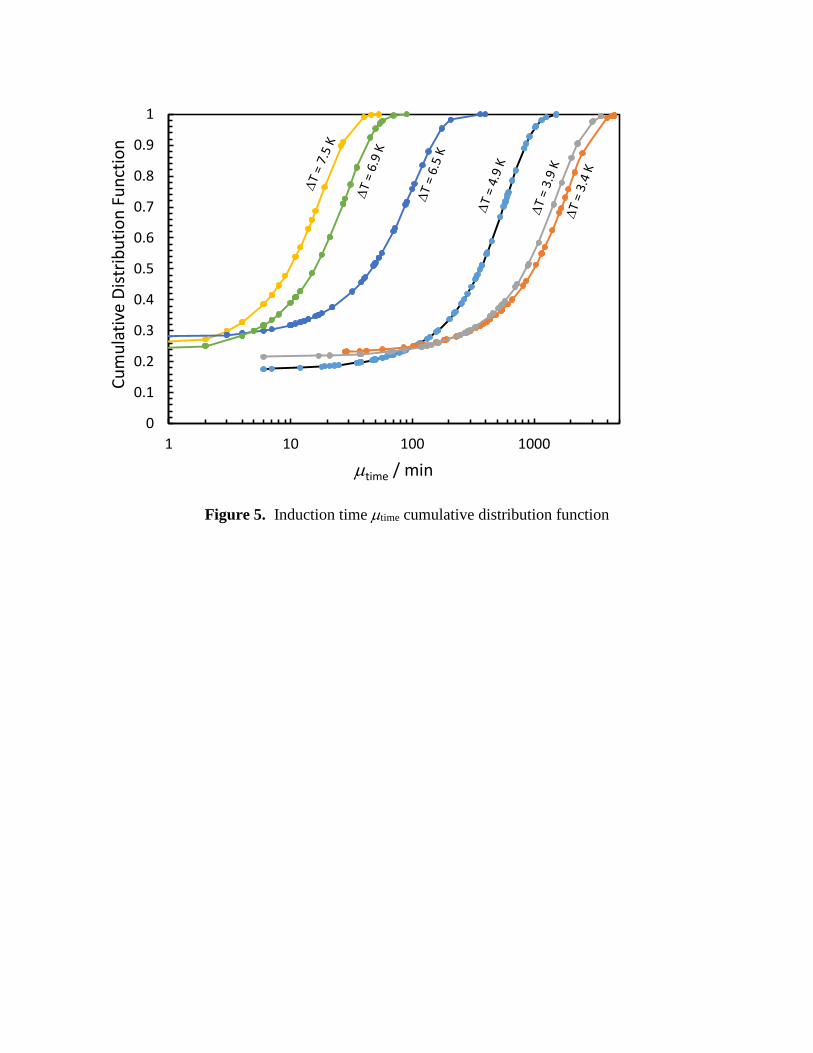
Figure 5. Induction time µtime cumulative distribution function
0
0.1
0.2
0.3
0.4
0.5
0.6
0.7
0.8
0.9
1
1 10 100 1000
Cum
ulat
ive
Dist
ribut
ion
Func
tion
µtime / min
A
B
Figure 6. Induction time probability density function
0
0.005
0.01
0.015
0.02
0.025
0.03
0.035
0 50 100 150 200 250 300
Nor
mal
dist
ribut
ion
µtime / min
0
0.0002
0.0004
0.0006
0.0008
0.001
0.0012
0 1000 2000 3000 4000 5000
Nor
mal
dist
ribut
ion
µtime / min
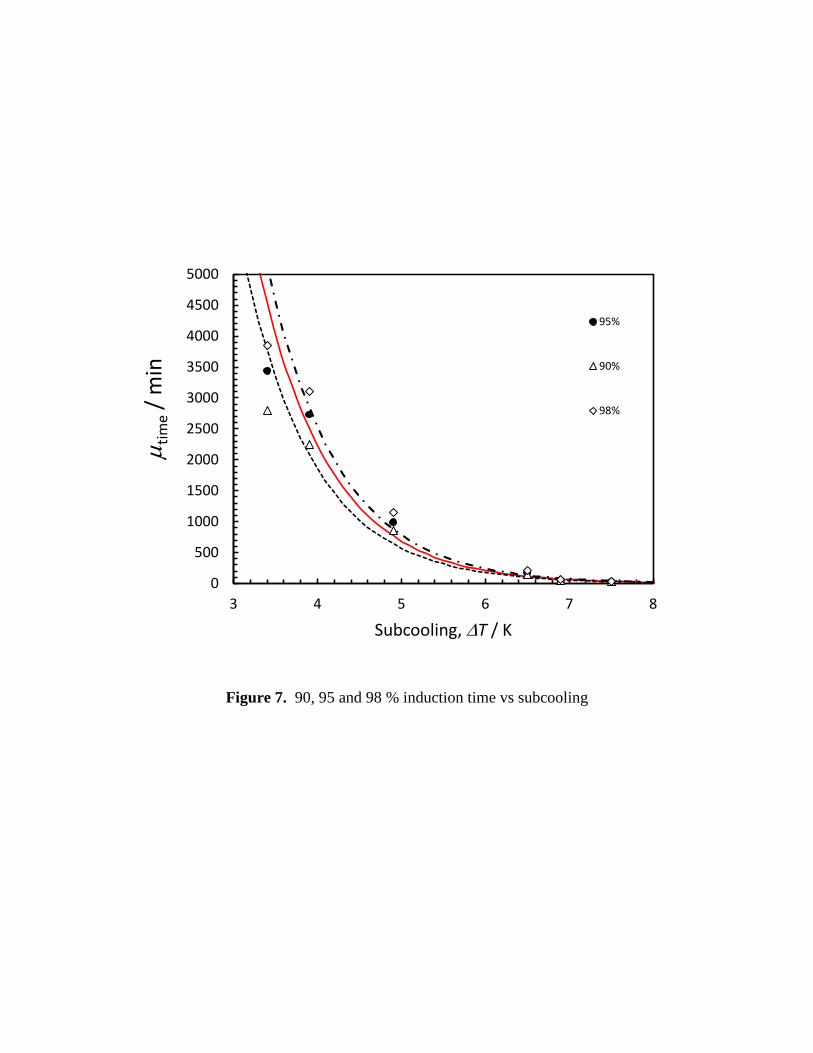
Figure 7. 90, 95 and 98 % induction time vs subcooling
0
500
1000
1500
2000
2500
3000
3500
4000
4500
5000
3 4 5 6 7 8
µ tim
e/ m
in
Subcooling, ∆T / K
95%
90%
98%
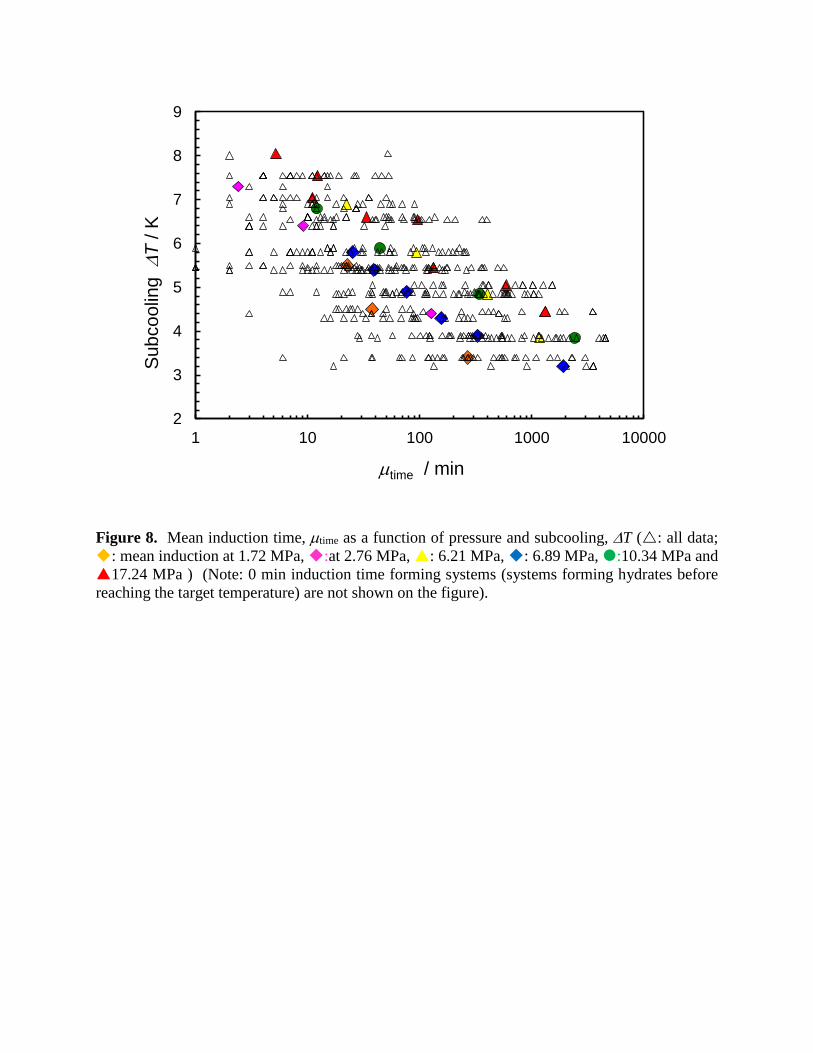
Figure 8. Mean induction time, µtime as a function of pressure and subcooling, ∆T (: all data; : mean induction at 1.72 MPa, :at 2.76 MPa, : 6.21 MPa, : 6.89 MPa, :10.34 MPa and 17.24 MPa ) (Note: 0 min induction time forming systems (systems forming hydrates before reaching the target temperature) are not shown on the figure).
2
3
4
5
6
7
8
9
1 10 100 1000 10000
Sub
cool
ing
∆T
/ K
µtime / min
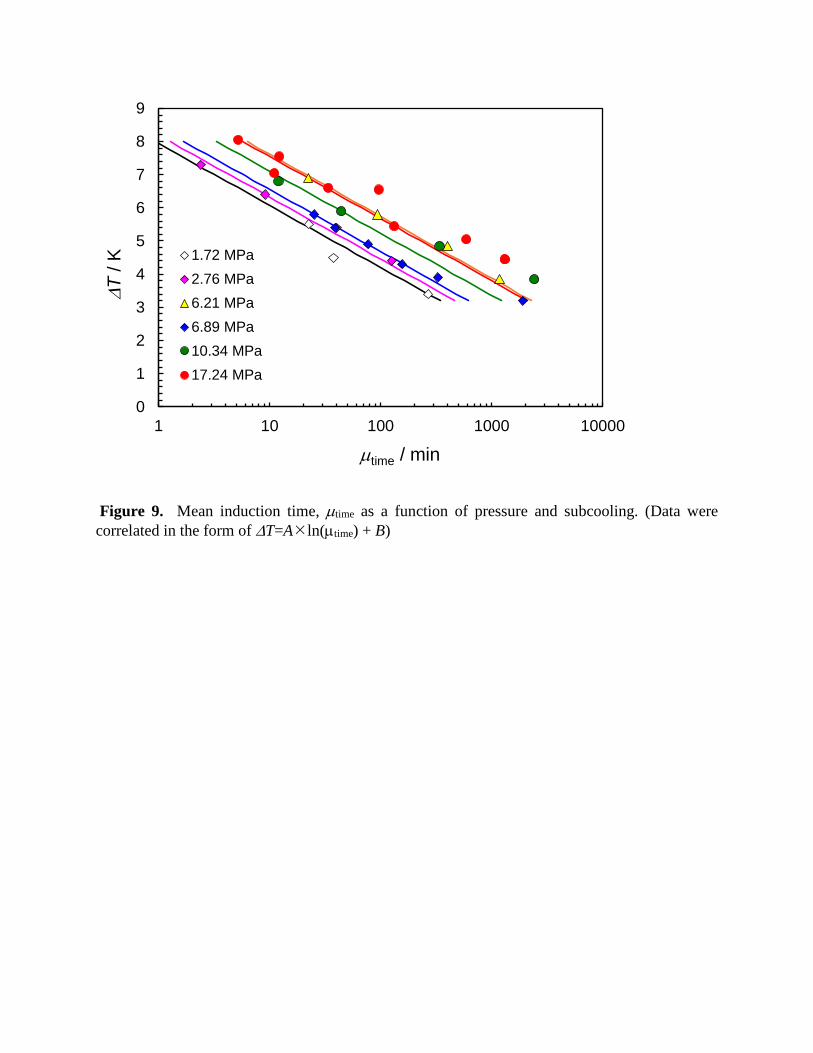
Figure 9. Mean induction time, µtime as a function of pressure and subcooling. (Data were correlated in the form of ∆T=Aln(µtime) + B)
0
1
2
3
4
5
6
7
8
9
1 10 100 1000 10000
∆T/ K
µtime / min
1.72 MPa2.76 MPa6.21 MPa6.89 MPa10.34 MPa17.24 MPa
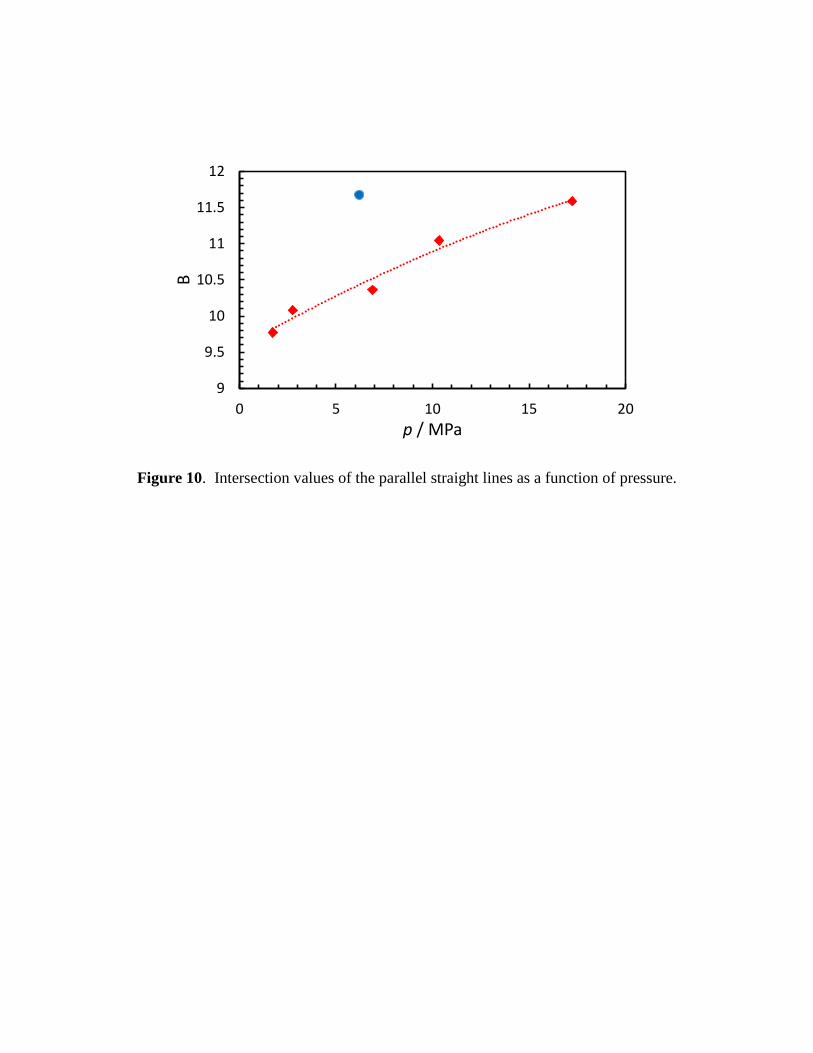
Figure 10. Intersection values of the parallel straight lines as a function of pressure.
9
9.5
10
10.5
11
11.5
12
0 5 10 15 20
B
p / MPa
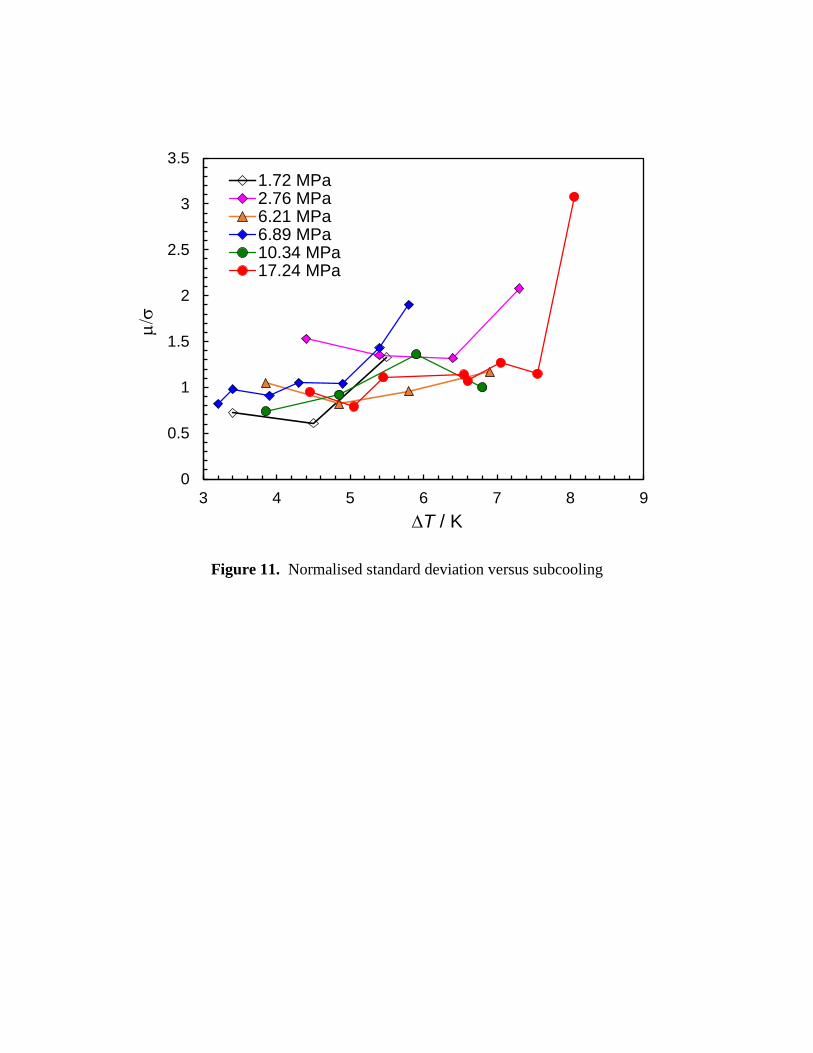
Figure 11. Normalised standard deviation versus subcooling
0
0.5
1
1.5
2
2.5
3
3.5
3 4 5 6 7 8 9
µ/σ
∆T / K
1.72 MPa2.76 MPa6.21 MPa6.89 MPa10.34 MPa17.24 MPa
Related Documents