1 Investigating the role of DA1 in growth control Jack James Dumenil A thesis submitted to the University of East Anglia in fulfilment of the Degree of Doctor of Philosophy John Innes Centre, Norwich, Norfolk September 2013 © This copy of the thesis has been supplied on condition that anyone who consults it is understood to recognise that its copyright rests with the author and that use of any information derived there from must be in accordance with current UK Copyright Law. In addition, any quotation or extract must include full attribution.

Welcome message from author
This document is posted to help you gain knowledge. Please leave a comment to let me know what you think about it! Share it to your friends and learn new things together.
Transcript
1
Investigating the role of DA1 in growth control
Jack James Dumenil
A thesis submitted to the University of East Anglia in fulfilment of the Degree of Doctor of Philosophy
John Innes Centre, Norwich, Norfolk
September 2013
© This copy of the thesis has been supplied on condition that anyone who consults it is understood to recognise that its copyright rests with the author and that use of any information derived there from must be in accordance with current UK Copyright Law. In addition, any quotation or extract must include full attribution.
2
Abstract
Increasing global demand for food is a major issue facing modern day agriculture. For
crops such as wheat and rice, where the seed constitutes the harvestable yield, the
engineering of larger seeds provides a possible strategy for yield improvement. A detailed
understanding of the growth of plant organs in general is paramount if such advances are
to be made. Utilising previously characterised regulators of plant organ growth, this thesis
explores the molecular mechanisms involved in the setting of final organ size.
This thesis capitalises on previous studies that have identified DA1 as a negative regulator
of organ growth; it explores the role of the DA1 protein and investigates its interactions
with other proteins. In vitro studies reveal that DA1 forms homo-‐ and hetero-‐multimeric
complexes with its sister protein DAR1 and in vitro and in yeast assays reveal interactions
between DA1 and the transcription factor TCP15 and the growth-‐regulating receptor-‐like
kinase TMK4.
In addition, biochemical assays described in this thesis identify an active ubiquitin
interacting motif (UIM) in the N-‐terminal region of DA1 and an ubiquitin-‐activated
metallopeptidase in its C-‐terminal region. Further studies reveal that, in addition to being
activated by the RING E3 ligases EOD1/BB and DA2, the DA1 peptidase is active towards
both EOD1/BB and DA2. In vitro and in vivo studies demonstrate that DA1 cleaves a
peptide fragment from the N-‐terminus of EOD1 and the C-‐terminus of DA2.
Finally, this thesis reports two genetic screens carried out in two separate Arabidopsis
mapping populations in order to identify novel regulators of organ growth. Analyses of
petal and seed phenotypes in the MAGIC RIL-‐type population and in a natural Swedish
population identify novel and a priori candidate genes for further characterisation.

3
List of Contents
LIST OF FIGURES 10
LIST OF TABLES 13
LIST OF SUPPLEMENTARY INFORMATION 14
ACKNOWLEDGEMENTS 16
CHAPTER 1 -‐ INTRODUCTION 17
1.1 -‐ Population growth and food production 17
1.2 – Organ formation in plants 17 1.2.1 – Plant organs display determinate growth characteristics 17 1.2.2 – Organ initiation and identity 18 1.2.3 – Organ polarity 20
1.3 – Organ growth is a multi-‐phase process 24 1.3.1 – Primordial formation from the shoot apical meristem 24 1.3.2 – Cell proliferation 25 1.3.3 – Cell expansion 28 1.3.3.1 – Endoreduplication-‐correlated cell expansion 29 1.3.3.1 – Biophysical regulation of cell expansion 29
1.3.4. – The transition phase: controlling the ‘stock’ of cells entering expansion 31
1.4 – Seed growth 32
1.5 – Coordinating cell division and expansion during organ growth 34 1.5.1 – Hormonal regulation of organ growth 34 1.5.2 – Evidence for additional long-‐range growth factors in organ development 36 1.5.3 – A compensation mechanism regulates final organ size 37 1.5.4 – Models to explain the compensatory mechanism 38 1.5.5 – Coordination of growth at the organ level 40
1.6 – Organ growth and the cell-‐cycle 43 1.6.1 – The cell-‐cycle: a brief overview 43 1.6.1.1 – The Mitotic cell-‐cycle 43 1.6.1.2 – Cell-‐cycle variations 44
4
1.6.2 – Regulating cell proliferation via the mitotic cell-‐cycle 45 1.6.3 – Regulating cell expansion via the endocycle 45
1.7 – The ubiquitin system 47 1.7.1 – Ubiquitin: a small peptide with multiple signalling roles 48 1.7.2 – E1 activating enzymes: ATP-‐dependent ubiquitin activation 50 1.7.3 – E2 conjugating enzymes: transferring ubiquitin to substrates 50 1.7.4 – E3 ligases: coordinating and specifying the ligation of ubiquitin to substrates 51 1.7.6 – Ubiquitin-‐like proteins also modulate protein function 54
CHAPTER 2 -‐ MATERIALS AND METHODS 57
2.1 – Reagents 57
2.2 – Recombinant DNA work 57 2.2.1 – Agarose gel electrophoresis 57 2.2.2 – PCR amplification of DNA 57 2.2.2.1 – High fidelity PCR amplification of DNA 57 2.2.2.2 – Colony PCR 58 2.2.2.3 – YeastAmp PCR 59 2.2.2.4 – Sequencing PCR reaction 59 2.2.2.5 – Site-‐directed mutagenesis of DNA 59 2.2.2.5 – Genotyping of transgenic plants 60
2.2.3 – DNA Purification 60 2.2.3.1 – DNA extraction from E.coli 60 2.2.3.2 – DNA extraction from PCR solutions and agarose gels 60 2.2.3.3 – DNA extraction from yeast 60 2.2.3.4 – DNA extraction from plants 61
2.2.4 – Subcloning 61 2.2.4.1 – Restriction digestion of DNA 61 2.2.4.2 – DNA ligation 61 2.2.4.3 –Klenow reaction 62
2.2.5 – Transforming bacteria 62 2.2.5.1 – Bacterial strains 62 2.2.5.2 – Preparation of electro-‐competent GV3101 A. tumefaciens 62 2.2.5.3 – Chemical transformation of bacteria 63 2.2.5.4 – Electro-‐transformation of bacteria 63 2.2.5.5 – Making plates 63
2.2.6 – Vectors 64 2.2.7 – Primers 64

5
2.3 – Plant growth 67 2.3.1 – Plant material 67 2.3.2 – Growth conditions 67 2.3.3 – Agrobacterium-‐mediated transformation of Arabidopsis 68 2.3.4 – Crossing plants 69 2.3.5 – Phenotyping plants 69 2.3.5.1 – Petal and seed area measurements 69 2.3.5.2 – Inflorescence stem height 69
2.4 – Brassinosteroid root growth assay 70
2.5 – In vitro protein biochemistry 70 2.5.1 – Western Blots 70 2.5.1.1 – Staining protein gels 71
2.5.2 – Co-‐Immunoprecipitation analysis 72 2.5.3 – UIM binding assays 73 2.5.4 – Ubiquitination assays 73 2.5.4.1 – DA1-‐ubiquitination assays and E3 cleavage assays 74 2.5.4.2 – Two-‐step EOD1 cleavage assay 75 2.5.4.3 – Assays using modified ubiquitin molecules 75
2.5.5 – De-‐ubiquitinase assay 75 2.5.6 – Bradford Assay 75
2.6 – Arabidopsis protoplast work 76 2.6.1 – Protoplast harvesting 76 2.6.2 – Protoplast Transformation 76 2.6.3 – Spit-‐YFP analysis in protoplasts 77 2.6.3 – EOD1 and DA2 cleavage assays 77
2.7 – Yeast-‐2-‐Hybrid screen 77 2.7.1 – Yeast strain and media 77 2.7.2 –Preliminary transformation 78 2.7.2.1 – Transformation protocol 78
2.7.3 – Library screen 79 2.7.3.1 – Selecting colonies 80 2.7.3.2 -‐ Drop testing 80
2.8 – MAGIC analysis 80
2.9 – GWAS analysis 81
6
CHAPTER 3 -‐ A STRUCTURAL ANALYSIS OF THE DA1 PROTEIN 82
3.1 Introduction 82 3.1.1 -‐ The Ubiquitin-‐Interacting Motif (UIM) 82 3.1.2 -‐ The LIM domain 84 3.1.3. – The C-‐terminal peptidase 86
3.2 – DA1 interacts with DA1 and DAR1 in vitro, in a LIM-‐independent manner 87 3.2.1 – Overexpressing DA1R358K-‐HA partially phenocopies da1-‐1 87 3.2.2 – FLAG-‐DA1 physically interacts with GST-‐DAR1 and GST-‐DA1 in vitro 89 3.2.3 – The LIM domain is not necessary for the DA1-‐DA1 interaction 91 3.2.4 – DA1 interacts with da1-‐1 in vitro 92 3.2.5 – DA1 family proteins contain a LIM-‐like domain 94
3.3 – Only one DA1 UIM domain binds mono-‐ubiquitin 95
3.4 – DA1 metallopeptidase is not active towards K48 or K63 poly-‐ubiquitin 100
3.5 -‐ Discussion 102
CHAPTER 4 -‐ A YEAST-‐2-‐HYBRID SCREEN FOR DA1 INTERACTING PROTEINS 104
4.1 Introduction 104 4.1.1 – Identifying physical interactors of DA1 104 4.1.2 – Yeast-‐2-‐Hybrid – An overview 105
4.2 – DA1 Yeast-‐2-‐Hybrid identifies 31 candidate interactors 107 4.2.1 – Experimental strategy 107 4.2.2 – Truncated DA1 was used to reduce false positives 108 4.2.3 – DA1 interacts with 31 candidate genes 108
4.3 – DA1 interacts with TCP15 111 4.3.1 – TCPs – An overview 111 4.3.1.1 – TCP biochemistry 111 4.3.1.2 – TCPs influence organ growth and development 111 4.3.1.3 – TCP15 influences organ growth and development 113 4.3.1.4 – TCP14 and TCP15 are implicated in pathogen response pathways 114
4.3.2 – DA1 physically interacts with TCP15 116 4.3.3 – DA1-‐TCP15 genetic interactions 116 4.3.3.1 – DA1 interacts with TCP14 and TCP15 to control stem height 117 4.3.3.2 – DA1 and TCP15 genetically interact to control petal area 119 4.3.3.3 – DA1 and TCP15 do not genetically interact to regulate seed area 120
7
4.3.3.4 -‐ Summary 120
4.4 – DA1 interacts with the C-‐terminal domain of the LRR-‐RLK, TMK4 121 4.4.1 – Leucine-‐rich repeat receptor-‐like kinases (LRR-‐RLKs) – an overview 121 4.4.1.1 – LRR-‐RLKs are involved in plant development and pathogen response 121 4.4.1.2 – da1-‐1 partially phenocopies bak1-‐4 in brassinosteroid response assays 122 4.4.1.3 – TMK4 (TRANSMEMBRANE KINASE 4) 123
4.4.2 – DA1 physically interacts with the C-‐terminal fragment of TMK4 125 4.4.3 – Cloning of full-‐length TMK4 127 4.4.4 – amiRNA TMK4 knockdown lines reveal developmental defects 127
4.5 -‐ Discussion 129 4.5.1 – DA1, TCP15 and the chloroplast: a role in retrograde signalling? 132
CHAPTER 5 -‐ DA1 IS AN UBIQUITIN-‐ACTIVATED PEPTIDASE 134
5.1 – Introduction 134 5.1.1 – E3 Ligases: a diverse group of proteins unified by functional similarity 134 5.1.2 – Regulation of E3 ligase activity 135 5.1.3 – Ubiquitin chains: a diversity of signalling modifications 138 5.1.4 – EOD1/BB and DA2 are RING E3 ligases 139
5.2 – DA1 interacts with EOD1 and DA2 140 5.2.1 – DA1 genetically interacts with EOD1 and DA2 to influence seed and petal size 140 5.2.1.1 – da1ko1 seeds and petals are significantly larger that Col-‐0 140 5.2.1.2 – DA1 genetically interacts with EOD1 and DA2 to influence seed and petal size 141
5.2.2 – DA1 physically interacts with EOD1 and DA2 148 5.2.2.1 – DA1 interacts with EOD1 and DA2 in vitro 148 5.2.2.2 – DA1 interacts with EOD1 and DA2 in vivo 148
5.3 –DA1 cleaves EOD1 and DA2 in a ubiquitin dependent manner 150 5.3.1 – DA2 is an active E3 ligase in vitro 150 5.3.2 – DA1 cleaves EOD1 in a ubiquitin-‐dependent manner 151 5.3.3 – EOD1 and DA2 (but not BBR) ubiquitinate DA1 in vitro 156 5.3.4 – Ubiquitinated DA1 is sufficient to specifically cleave EOD1 and DA2 158 5.3.4.1 – Ubiquitinated DA1 is sufficient to specifically cleave EOD1 and DA2 in vitro 158 5.3.4.2 – DA1 specifically cleaves EOD1 and DA2 in Arabidopsis protoplasts 160
5.4 – EOD1 and DA2 are ubiquitinated differently 162
5.6 – Discussion 165
8
5.6.1 – DA1 peptidase activity is activated by ubiquitination 167 5.6.2 – EOD1 and DA2 are modified by peptide cleavage 169 5.6.3 – DA1 cooperates with EOD1 and DA2 to influence final organ size 170
CHAPTER 6 -‐ GENETIC LINKAGE AND ASSOCIATION SCREENS FOR REGULATORS OF
PETAL AND SEED GROWTH 172
6.1 – General introduction 172
6.2 – Seed and petal phenotypes were investigated 174 6.2.1 – Petal and seed area 175 6.2.2 – Petal shape 176 6.2.3 – Variation in seed and petal size 177
6.3 – MAGIC analysis of seed size 177 6.3.1. – Transgressive segregation of seed size in the MAGIC lines 181 6.3.2 – No significant QTLs were identified for SE seed area 181 6.3.3 – 8 QTLs identified for mean seed area 182 6.3.4 – 21 a priori candidate genes identified in QTLs 184 6.3.5 – Bur-‐0 haplotype predicted to contribute to increase in seed area 186 6.3.6 – Candidate novel regulators of organ size 190 6.3.7 – Future work 192
6.4 – Genome wide association analysis of petal and seed growth 193 6.4.1 – Natural variation in seed and petal phenotypes 203 6.4.2 – A SNP at Ch4-‐9471419 associates with mean petal length 209 6.4.3 – A SNP at Chr1:6666179 associates with SE mean petal area. 212 6.4.4 – Future work 214
6.5 – Future perspectives 214
CHAPTER 7 -‐ GENERAL DISCUSSION 216
7.1 – DA1, EOD1 and DA2: molecular characterisation 216 7.1.1 – DA1: a ubiquitin activated peptidase 216 7.1.2 – EOD1 and DA2 are peptidase-‐regulated E3 ubiquitin ligases 220 7.1.3 – DA1, EOD1 and DA2: a novel enhancing regulatory loop 224
7.2 – DA1: regulating organ growth and development 225 7.2.1 – DA1: A role in organ growth and pathogen response pathways? 225 7.2.2 – DA1 and LRR-‐RLKs: regulation by internalisation? 226
9
7.2.2.1 – Models for DA1-‐dependent LRR-‐RLK regulation 227 7.2.2.2 – The developmental significance of a DA1-‐RLK interaction 230
7.2.3 – From DA1 to the cell cycle: linking via TCP transcription factors 232 7.2.3.1 – Unifying observations on the role of DA1 in organ growth 234
SUPPLEMENTARY INFORMATION 237
S1 – Supplementary Figures 237
S2 -‐ Supplementary Tables 250
ABBREVIATIONS 261
REFERENCES 262

10
List of Figures Figure 1.1 – Leaf initiation from the shoot apical meristem 19
Figure 1.2 – Organ polarity in the leaf 21
Figure 1.3 – Growth phases during organ development 23
Figure 1.4 – The mature Arabidopsis female gametophyte and the developing seed 32
Figure 1.5 – A model to explain the compensation effect 39
Figure 1.6 – Cell-‐autonomous and non-‐cell-‐autonomous coordination of organ growth 41
Figure 1.7 – The ubiquitin cascade 49
Figure 2.1 – Equation for DNA ligation reaction 62
Figure 3.1 – The DA1 protein family 83
Figure 3.2 – The LIM domain 85
Figure 3.3 – The DA1 R358K mutation is dominant negative towards DA1 and DAR1 87
Figure 3.4 – Models for explaining the da1-‐1 dominant negative phenotype 88
Figure 3.5 – FLAG-‐DA1 interacts with GST-‐ DA1, GST-‐DAR1 and GST-‐da1-‐1 in vitro 90
Figure 3.6 – The DA1 LIM domain is not necessary for DA1 homo-‐oligomerisation 92
Figure 3.7 – DA1 contains a cryptic LIM-‐like domain 93
Figure 3.8 – SMART alignment of DA1 and DAR1 UIM domains 96
Figure 3.9 – E. coli UIM expression constructs 97
Figure 3.10 – DA1 UIM2 binds mono-‐ubiquitin in vitro 98
Figure 3.11 – DA1 is not able to cleave K48-‐ and K63-‐ linked poly-‐ubiquitin in vitro 100
Figure 4.1 – The yeast-‐2-‐hybrid screen 105
Figure 4.2 – The TCP family of transcription factors 112
Figure 4.3 – In yeast drop-‐test: DA1 interacts with TCP15 in yeast 114
11
Figure 4.4 -‐ DA1 interacts with TCP15 in vitro 116
Figure 4.5 – TCP15 genetic interactions 117
Figure 4.6 – da1-‐1 seedlings have reduced sensitivity to epibrassinolide 121
Figure 4.7 – Protein sequence of AT3G23750 123
Figure 4.8 – In yeast drop-‐test: DA1 interacts with the C-‐terminus of TMK4 125
Figure 4.9 – DA1 interacts with TMK4 in vitro 125
Figure 4.10 – Preliminary evidence of developmental phenotypes of TMK4 amiRNA
knockdown lines
128
Figure 5.1 – Three different classes of E3 ligases 136
Figure 5.2 – Genetic interactions between DA1, EOD1 and DA2 144
Figure 5.3 – DA1 interacts with EOD1 and DA2 in vitro 147
Figure 5.4 – DA1 interacts with EOD1 and DA2 in vivo 149
Figure 5.5 – Arabidopsis DA2 is an active E3 ligase in vitro 151
Figure 5.6 – DA1 cleaves EOD1 in an ubiquitin-‐dependent manner 154
Figure 5.7 – EOD1 and DA2 ubiquitinate DA1 in vitro 157
Figure 5.8 – Ubiquitinated DA1 is sufficient to cleave EOD1 and DA2 in vitro 159
Figure 5.9 –DA1 cleaves EOD1 and DA2 in vivo 161
Figure 5.10 –EOD1 and DA2 auto-‐ubiquitination patterns 163
Figure 5.11 – Together, DA1 and EOD1 and DA2 collectively enhance their effect as
growth repressors
166
Figure 5.12 – DA1 may exist in a reciprocally enhancing feed-‐forward loop with EOD1
and DA2.
168
Figure 6.1 – Variation in seed area in the MAGIC population 180
Figure 6.2 – No QTL for SE mean seed area in the MAGIC population 182
Figure 6.3 – Eight QTL for mean seed area in the MAGIC population 183
12
Figure 6.4 – The predicted contribution of ML parents to the eight observed QTL 187
Figure 6.5 – Variation in petal area amongst the 19 MAGIC parent lines 188
Figure 6.6 – Bur-‐0 specific polymorphisms in candidate genes 191
Figure 6.7 – Phenotype-‐latitude correlations 195
Figure 6.8 – Phenotype distributions in the GWA mapping population 199
Figure 6.9 – Petal and seed phenotypes 202
Figure 6.10 – Genome-‐wide association of phenotype with SNP markers 204
Figure 7.1 – A model for the activation of the DA1 peptidase by coupled ubiquitination 217
Figure 7.2 – Models for the peptidase-‐mediated activation of EOD1 and DA2 221
Figure 7.3 – A Model for the peptidase-‐mediated modification of EOD1 substrate
specificity
223
Figure 7.4 – The UIM-‐cycle 229
Figure 7.5 – Two possible models for the DA1-‐E3 regulated ubiquitin-‐directed
internalisation of RLKs
231
Figure 7.6 – Possible models for the ubiquitin-‐ and peptidase-‐ mediated regulation of
RLKs by a DA1-‐E3 module
235
13
List of Tables
Table 2.1 – High Fidelity PCR protocol 58
Table 2.2 – Colony PCR protocol 58
Table 2.3 – YeastAmp PCR protocol 59
Table 2.4 – Sequencing PCR protocol 59
Table 2.5 – LB Formula 63
Table 2.6 – Vectors used in this thesis 64
Table 2.7 – Primers used in this thesis 65
Table 2.8 – Arabidopsis lines used in this thesis 67
Table 2.9 – Antibodies used in this thesis 72
Table 2.10 – Elution buffers 74
Table 2.11 – Ubiquitination assay protocol 74
Table 2.12 – Ubiquitination assay reaction buffer 74
Table 2.13 – Yeast Media 77
Table 2.14 – Materials for preliminary transformation 78
Table 2.15 – Materials for library transformation 79
Table 4.1 -‐ List of DA1-‐interacting proteins identified from the first round of the yeast-‐2-‐
hybrid screen.
109
Table 6.1 – MAGIC parent lines 178
Table 6.2 – Details of eight QTL for mean seed area 183
Table 6.3 – The QTL for mean seed area include 21 a priori regulators of organ growth 185
Table 6.4– Association interval around Chr4-‐9471419 210
Table 6.5 – Association interval around Chr1-‐6666179 213
14
List of Supplementary Information
S1 – Supplementary Figures
Figure S1 – Vector Maps 23
Figure S2 – Partial correlation analysis (Dan Maclean, unpublished) 244
Figure S3 – TCP22 influences organ growth 256
Figure S4 – The E3 ligase BIG BROTHER-‐RELATED (BBR) (At3g19910) is similar to EOD1 248
Figure S5 – Ubiquitinated DA1 is sufficient to cleave EOD1 and DA2 in vitro 249

15
S2 – Supplementary Tables
Table S1 – List of a priori growth regulators 250
Table S2 – List of accessions used in GWA studies 254
Table S3 – ClustalW colour codes 257
Table S4 – Chroma colour codes 258
Table S5 – De novo candidate gene list for MAGIC analysis 259

16
Acknowledgements
First and foremost I would like to thank my primary supervisor Professor Mike Bevan for all the
assistance that he has given me over the course of my PhD. I believe that Mike’s guidance over
the last four years, and in particular his demand for both a challenging appetite for progress
and a high degree of intellectual freedom, has enabled my work to progress as well as it has. I
would also like to thank my secondary supervisors Dr Phil Wigge and Dr Cyril Zipfel, whose
assistance has also been invaluable.
My deepest thanks also go to all members (past and present) of the Bevan Lab at the John
Innes Centre. To Mathilde Seguela for her essential guidance in my early days in the Lab and to
Fiona Corke, Caroline Smith, and Neil Mckenzie for their continued assistance with this work
and their encouragement throughout my PhD. I must also say a huge thank you to Joshua Ball
and Vladimir Chapman, whose efforts have been central to the progress of the GWA and
MAGIC analyses. I cannot forget Cindy Cooper; her media assistance, guidance, cakes and
smiles have ensured that I have thoroughly enjoyed my time in the Bevan Lab.
My thanks also go out to those who I have collaborated with, including Yunhai Li at the
Chinese Academy of Science, Justin Borevitz and Riyan Cheng at the Australian National
University, Canberra, and Andrei Kamenski at the University of York. In particular I would like
to thank Matt Box; not just for his assistance with the MAGIC and GWAs studies, but for all his
guidance and discussion, both scientific and not.
Most importantly: the family. I would like to say a massive thanks to all those who have put-‐up
with me and supported me through the ups and downs of the last few years, in particular to
Mum and Dad. Not forgetting Tim for his words of wisdom.
Finally, I would like to thank the BBSRC and BASF Plant Science who have funded my research.
I would like to express particular thanks to BASF whose interest in the DA1 project has been
central to developing my interest in the commercial side of science.

17
Chapter 1 -‐ Introduction
1.1 -‐ Population growth and food production
Global food production is constantly under pressure to keep up with demand from a rapidly
growing population. Over the course of human history, events such as the mechanisation of
farming during the agricultural revolution of the 17th-‐18th century, and more recently the
Green Revolution of the 1960s, have generated huge advances in productivity. The significant
improvements in irrigation, cultivars, fertilisers, and pesticides of the green revolution have
allowed agriculture to sustain the huge population increase of the last 40 years (Mitchell and
Sheehy, 2006). However, despite these advances, yield increases of key crops – such as rice
and wheat– have begun to plateau (Cassman, 1999), with yield potentials (the yield achieved
under optimal conditions, free of pathogens and pests) failing to improve over the past 30
years (Mitchell and Sheehy, 2006). The stagnation of the yield-‐potential increase suggests that
increasing crop productivity is paramount if the projected population growth is to be sustained.
For key food crops such as wheat, rice and maize, and potential fuel crops such as oilseeds,
where the seed constitutes the harvestable yield, the engineering of increased seed size and
seed number has significant potential benefits for food production and food security.
1.2 – Organ formation in plants
1.2.1 – Plant organs display determinate growth characteristics
Unlike animals, plants are unable to change location in response to environmental fluctuations
and as a consequence have evolved a high degree of developmental plasticity to maximise
fitness in different environments. Despite this plasticity, and the indeterminate nature of their
vegetative growth, organs such as seeds, petals and leaves are determinate in their
development. That is to say that they have a pre-‐determined size and shape. This is shown by
the uniformity of final size and morphology of organs within species, compared to that found
between species and between different varieties. In animal systems, organ development is also
determinate and although growth of simple organs, such as the Drosophila early embryo, can
be regulated by cell-‐counting mechanisms (Edgar et al., 1994), complex organs such as the
Drosophila wing are thought to be regulated by ‘size checkpoints’ that detect total organ size
rather than cell number (Dong et al., 2007). Current theories to explain how this determinate
18
development is achieved will be discussed in detail in section 1.5; however the following
sections will focus on the developmental processes that underpin organ growth.
It is important to note that, despite considerable similarities, the developmental processes
governing the growth of petals and leaves differ markedly from that of seeds. Therefore, in the
interest of clarity the bulk of general discussion of ‘organ development’ in this section will
refer to that of petals and leaves, and a separate section (section 1.4) will describe seed-‐
specific regulatory processes.
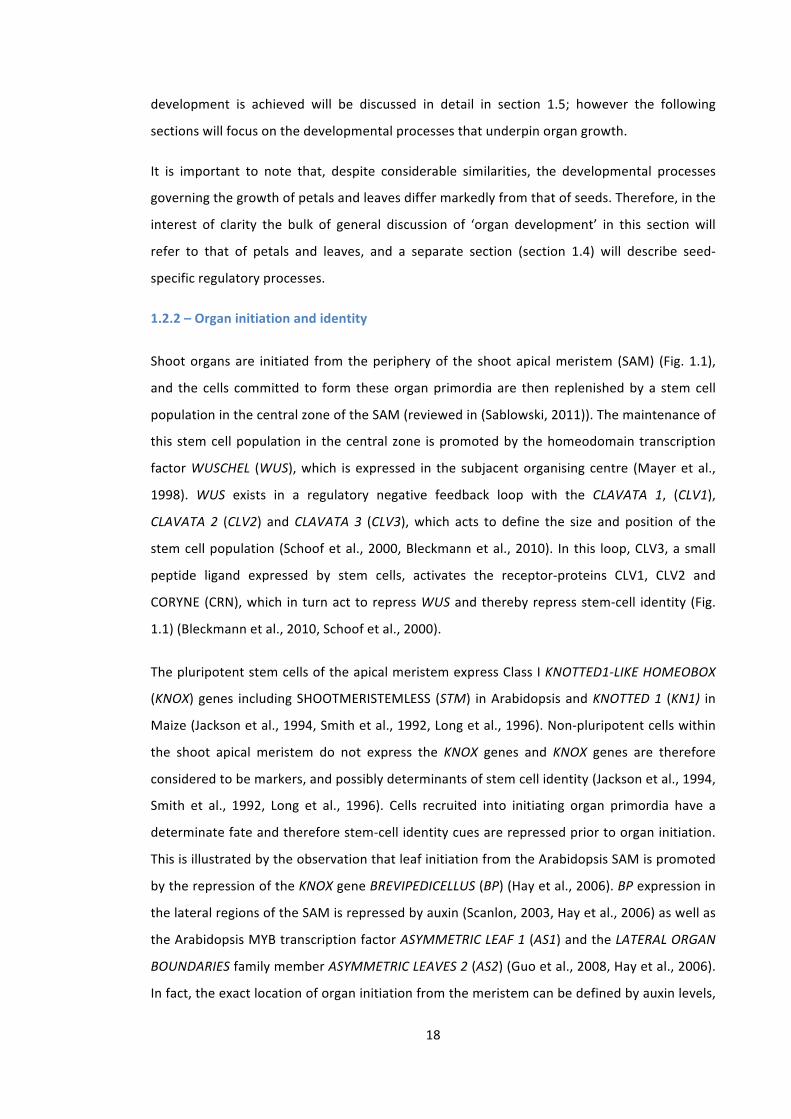
1.2.2 – Organ initiation and identity
Shoot organs are initiated from the periphery of the shoot apical meristem (SAM) (Fig. 1.1),
and the cells committed to form these organ primordia are then replenished by a stem cell
population in the central zone of the SAM (reviewed in (Sablowski, 2011)). The maintenance of
this stem cell population in the central zone is promoted by the homeodomain transcription
factor WUSCHEL (WUS), which is expressed in the subjacent organising centre (Mayer et al.,
1998). WUS exists in a regulatory negative feedback loop with the CLAVATA 1, (CLV1),
CLAVATA 2 (CLV2) and CLAVATA 3 (CLV3), which acts to define the size and position of the
stem cell population (Schoof et al., 2000, Bleckmann et al., 2010). In this loop, CLV3, a small
peptide ligand expressed by stem cells, activates the receptor-‐proteins CLV1, CLV2 and
CORYNE (CRN), which in turn act to repress WUS and thereby repress stem-‐cell identity (Fig.
1.1) (Bleckmann et al., 2010, Schoof et al., 2000).
The pluripotent stem cells of the apical meristem express Class I KNOTTED1-‐LIKE HOMEOBOX
(KNOX) genes including SHOOTMERISTEMLESS (STM) in Arabidopsis and KNOTTED 1 (KN1) in
Maize (Jackson et al., 1994, Smith et al., 1992, Long et al., 1996). Non-‐pluripotent cells within
the shoot apical meristem do not express the KNOX genes and KNOX genes are therefore
considered to be markers, and possibly determinants of stem cell identity (Jackson et al., 1994,
Smith et al., 1992, Long et al., 1996). Cells recruited into initiating organ primordia have a
determinate fate and therefore stem-‐cell identity cues are repressed prior to organ initiation.
This is illustrated by the observation that leaf initiation from the Arabidopsis SAM is promoted
by the repression of the KNOX gene BREVIPEDICELLUS (BP) (Hay et al., 2006). BP expression in
the lateral regions of the SAM is repressed by auxin (Scanlon, 2003, Hay et al., 2006) as well as
the Arabidopsis MYB transcription factor ASYMMETRIC LEAF 1 (AS1) and the LATERAL ORGAN
BOUNDARIES family member ASYMMETRIC LEAVES 2 (AS2) (Guo et al., 2008, Hay et al., 2006).
In fact, the exact location of organ initiation from the meristem can be defined by auxin levels,
19
with auxin maxima observed to form at the precise site of organ primordium formation, and
with evidence that exogenous application of auxin is sufficient to promote ectopic organ
initiation (Reinhardt et al., 2003).
B
A
CLV3
WUS
CLV1 CLV1
CLV2/CRN CLV2/CRN
Stem cells
Differentiation Differentiation
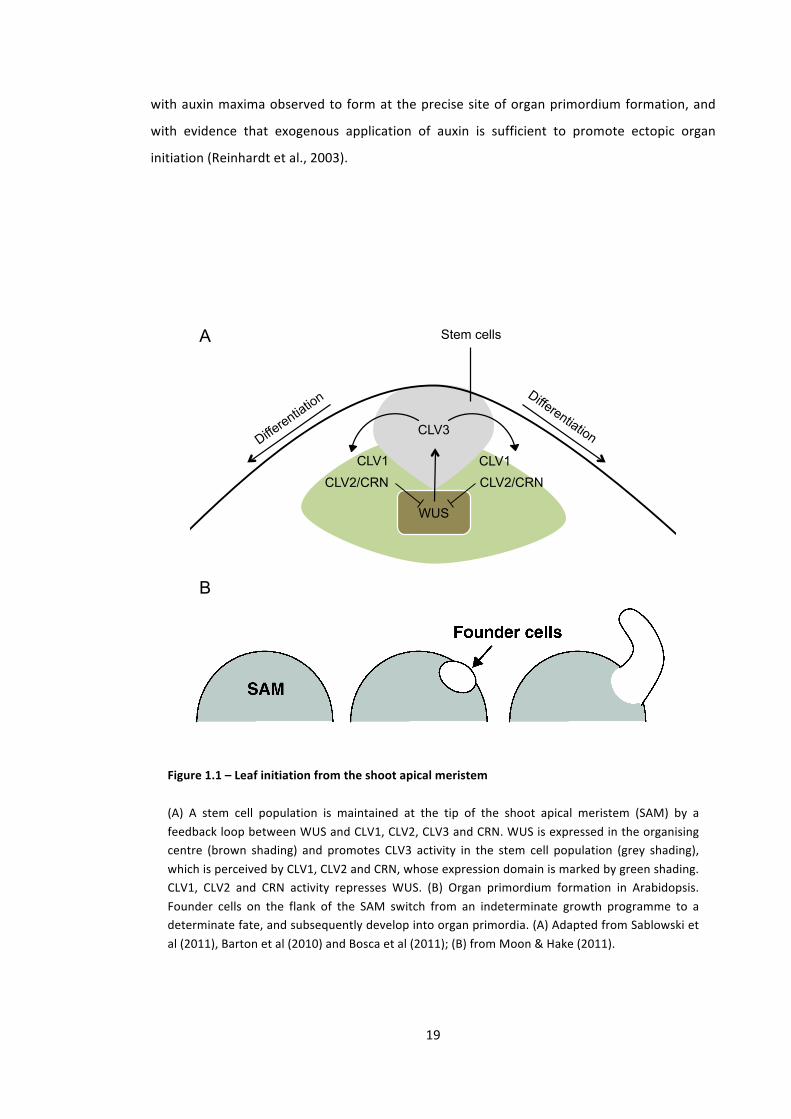
Figure 1.1 – Leaf initiation from the shoot apical meristem
(A) A stem cell population is maintained at the tip of the shoot apical meristem (SAM) by a feedback loop between WUS and CLV1, CLV2, CLV3 and CRN. WUS is expressed in the organising centre (brown shading) and promotes CLV3 activity in the stem cell population (grey shading), which is perceived by CLV1, CLV2 and CRN, whose expression domain is marked by green shading. CLV1, CLV2 and CRN activity represses WUS. (B) Organ primordium formation in Arabidopsis. Founder cells on the flank of the SAM switch from an indeterminate growth programme to a determinate fate, and subsequently develop into organ primordia. (A) Adapted from Sablowski et al (2011), Barton et al (2010) and Bosca et al (2011); (B) from Moon & Hake (2011).
20
The repression of KNOX genes in cells that go on to form organ primordia is thought to
represent a switch from indeterminate to determinate growth programmes (Moon and Hake,
2011). The formation and initiation of organ primordia also results in a change in identity of
founder cells; from a meristem identity to an organ-‐specific identity (e.g. petal, sepal, leaf
precursors). For example, the switch in cell-‐identity that occurs during sepal initiation results in
changes in cell proliferation rate, cell volume changes, heterogeneity in cell volumes, and
growth isotropy (Schiessl et al., 2012). These changes are in part mediated by the transcription
factor JAGGED (JAG) (Schiessl et al., 2012). Whereas the growth of wild-‐type sepal primordia
differs from that of the meristem in many ways (mentioned above), jag-‐1 sepal primordia do
not (Schiessl et al., 2012); suggesting that JAG is required for the timely establishment of
proper primordium identity (and therefore for appropriate primordium development).
Furthermore, as with plant growth in general, rather than being controlled by the autonomous
allocation of individual cellular identities, shoot organ development is controlled by the
interaction of different regions in relation to one another. This is highlighted by the
Arabidopsis floral-‐identity triple mutant -‐ apetala2 (ap2) apetala3 (ap3) agamous (ag), which
results in the conversion of floral organs to leaf-‐like organs (Bowman et al., 1991). The absence
of the respective floral identity genes in these plants results in a loss of floral identity in the
floral organs and their consequent reversion to ‘leaf-‐like’ organs (Bowman et al., 1991). While
these modified floral organs display many leaf-‐like characteristics, such as their overall
morphology, they remain a similar size to organs of the perianth (Bowman et al., 1991),
illustrating that the organ-‐intrinsic leaf-‐identity cues that result in a canonical leaf morphology
interact with the meristem signals that dictate final organ size.
1.2.3 – Organ polarity
Following initiation from the meristem, leaf development occurs on three polar axes (Fig. 1.2);
proximal-‐distal, adaxial-‐abaxial and medial-‐lateral (Moon and Hake, 2011), the establishment
of all of which are necessary for wild-‐type leaf form and function.
In the mature leaf, adaxial (dorsal) tissues are often distinct from abaxial (ventral) tissues, and
it is therefore important for adaxial-‐abaxial polarity to be accurately defined. For example, the
C4 grass, Paspalum dilatatum has a greater stomatal density and higher rates of CO2
assimilation in its abaxial surface relative to the adaxial surface (Soares et al., 2008).
Maintenance of adaxial-‐abaxial polarity is determined by the antagonistic interaction of
adaxially-‐expressed adaxial-‐identity promoting genes, and abaxially-‐expressed abaxial-‐identity
promoting genes. Adaxial-‐identity promoting genes include AS1, AS2 and the Class III HOMEO-‐
21
DOMAIN LEUCINE ZIPPER (HD-‐ZIPIII) family (Fu et al., 2007, Lin et al., 2003, Emery et al., 2003)
and abaxial-‐identity promoting genes include members of the KANADI (KAN) (Eshed et al.,
2001, Kerstetter et al., 2001) and YABBY (YAB) gene families (Eshed et al., 2004). The
antagonistic interaction between these two groups of genes serves to restrict their expression
to their respective compartments and thereby define an adaxial-‐abaxial boundary (reviewed in
Moon & Hake 2011).
Adaxial-abaxial
Proximal-distal Medial-lateral
In simple leaves the proximal-‐distal axis determines the blade-‐petiole (in dicots) and blade-‐
sheath (in monocots) organisation. The de-‐repression of KNOX genes in the petioles of the
blade on petiole (bop) mutant results in ectopic leaf blade tissue developing on the petiole (Ha
et al., 2004, Norberg et al., 2005). While KNOX genes are not normally expressed in developing
simple leaves, their expression is required for the lobed shape of compound leaves (Efroni et
al., 2010). Indeed a correlation has been observed between the expression of KNOX genes and
leaf complexity in such plants (Bharathan et al., 2002, Hareven et al., 1996) (reviewed in Efroni
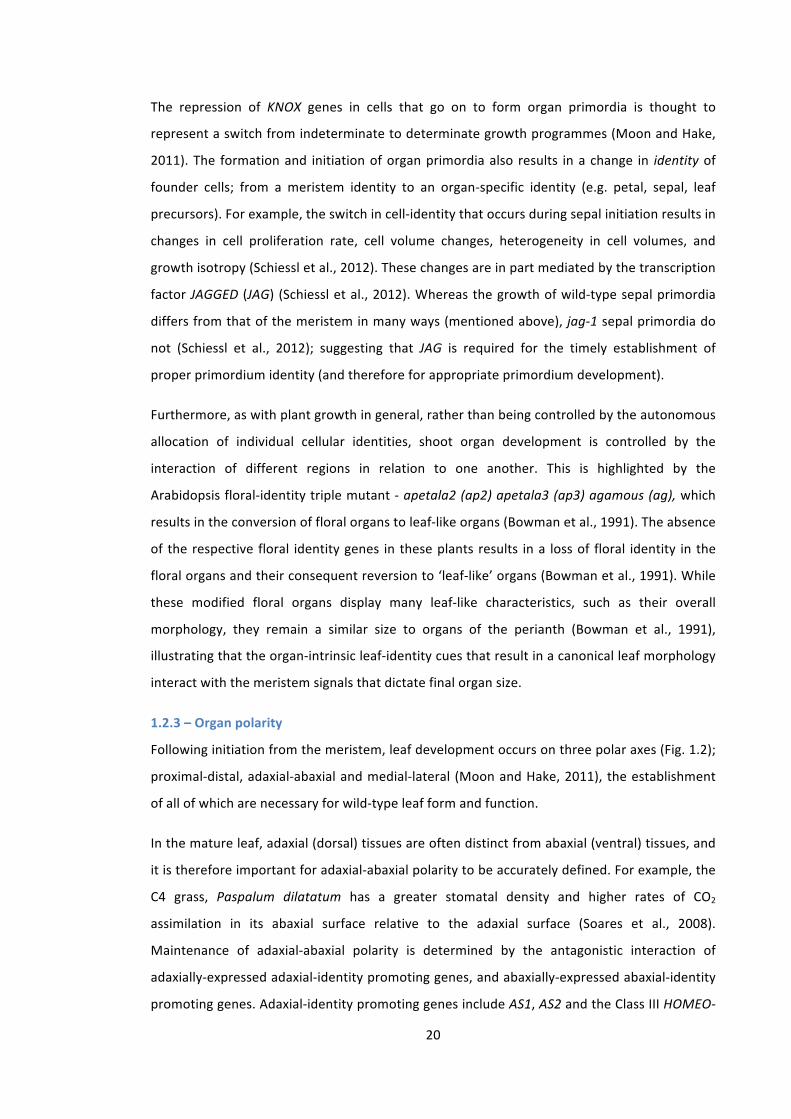
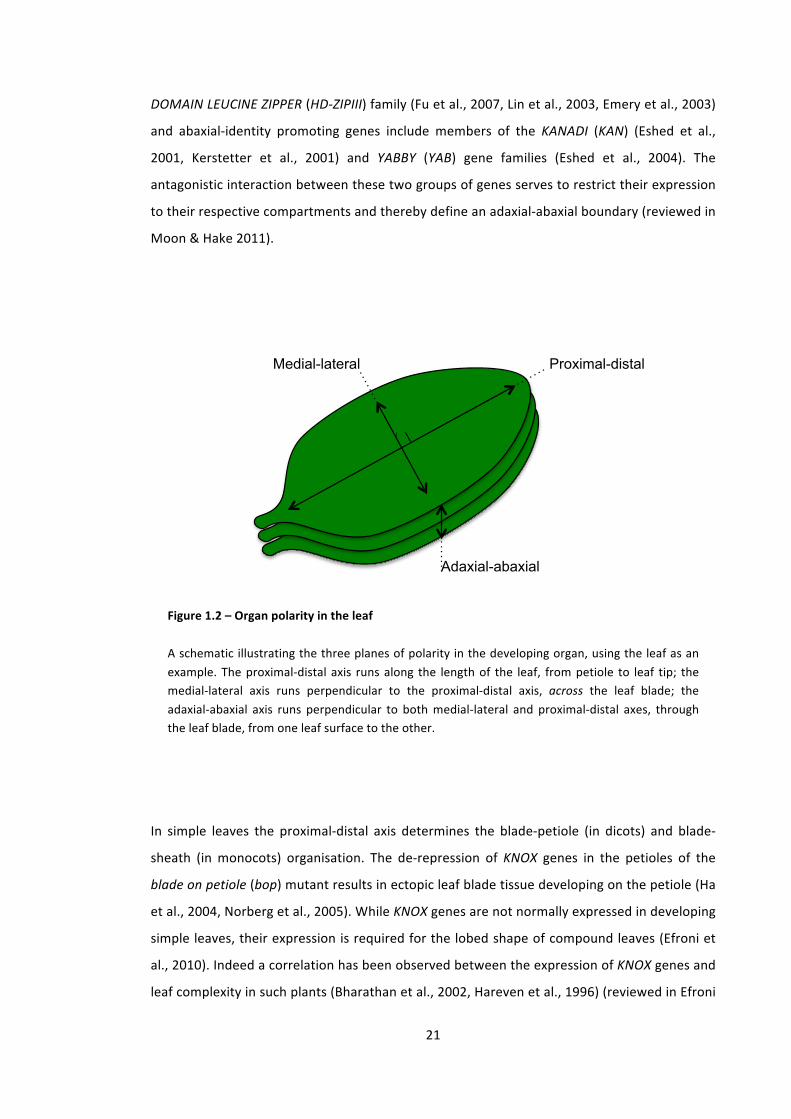
Figure 1.2 – Organ polarity in the leaf
A schematic illustrating the three planes of polarity in the developing organ, using the leaf as an example. The proximal-‐distal axis runs along the length of the leaf, from petiole to leaf tip; the medial-‐lateral axis runs perpendicular to the proximal-‐distal axis, across the leaf blade; the adaxial-‐abaxial axis runs perpendicular to both medial-‐lateral and proximal-‐distal axes, through the leaf blade, from one leaf surface to the other.
22
et al., 2010), and ectopic expression of maize KN1 has been shown to generate super-‐
compound leaves in tomato (Hareven et al., 1996).
Because the modifications to leaf shape along the medial-‐lateral axis often occur in concert
with modification along the proximal-‐distal axis, it is perhaps more useful to consider these
axes as interacting elements of overall leaf shape. Indeed, aspect ratio (length:width) has been
used as a metric for measuring the shape of both Arabidopsis leaves (Kieffer et al., 2011) and
petals (Abraham et al., 2013) in recent publications.
While aberrations in adaxial-‐abaxial polarity can result from mis-‐expression of tissue-‐identity
genes, aberrations in organ shape result from the mis-‐regulation of the two driving forces of
organ growth: cell proliferation and cell expansion (see section 1.3). Following initiation from
the meristem, organ growth is driven by a phase of cell proliferation – during which cells
mitotically divide and increase in number – and then a phase of cell expansion, wherein cells
exit mitosis and increase in volume (described in detail in section 1.3). The tissue specific mis-‐
regulation of cell proliferation and cell expansion along medial-‐lateral and proximal-‐distal axes
can affect overall organ shape.
As discussed in detail in section 1.3, cell proliferation in the developing organ is though to be
terminated by a basipetal cell-‐cycle arrest front, which causes cells to exit mitosis and
commence cell expansion (Nath et al., 2003). Mutants in the Antirrhinum TCP family
transcription factor CINCINNATA (CIN) have an altered pattern of cell-‐cycle arrest, whereby,
compared to wild-‐type leaves, the marginal tissue grows for longer (Nath et al., 2003). This
increase in growth in the leaf margins, results in wider leaves with a negative curvature (2003,
Nath et al., 2003).
Members of the Arabidopsis TCP family of transcription factors have also been shown to affect
leaf shape. Mutations in the Class I TCPs, TCP14 and TCP15, despite having a wild-‐type final
leaf size, have been shown (using a principal component analysis) to have significantly altered
shape components (Kieffer et al., 2011). These include an altered aspect ratio component of
leaf shape; revealing that in the tcp14/15 mutants there is a mis-‐regulation of growth along
the proximal-‐distal axis relative to growth along the medial-‐lateral axis (Kieffer et al., 2011).
More severe TCP-‐related leaf-‐shape phenotypes can be seen in JAW-‐D plants, which over-‐
express miR319a (a micro-‐RNA that down-‐regulates TCP2, TCP3, TCP4, TCP10, and TCP24)
(Palatnik et al., 2003). Leaves of JAW-‐D plants have significantly altered shape, with a
distinctive curled-‐phenotype (Palatnik et al., 2003).
23
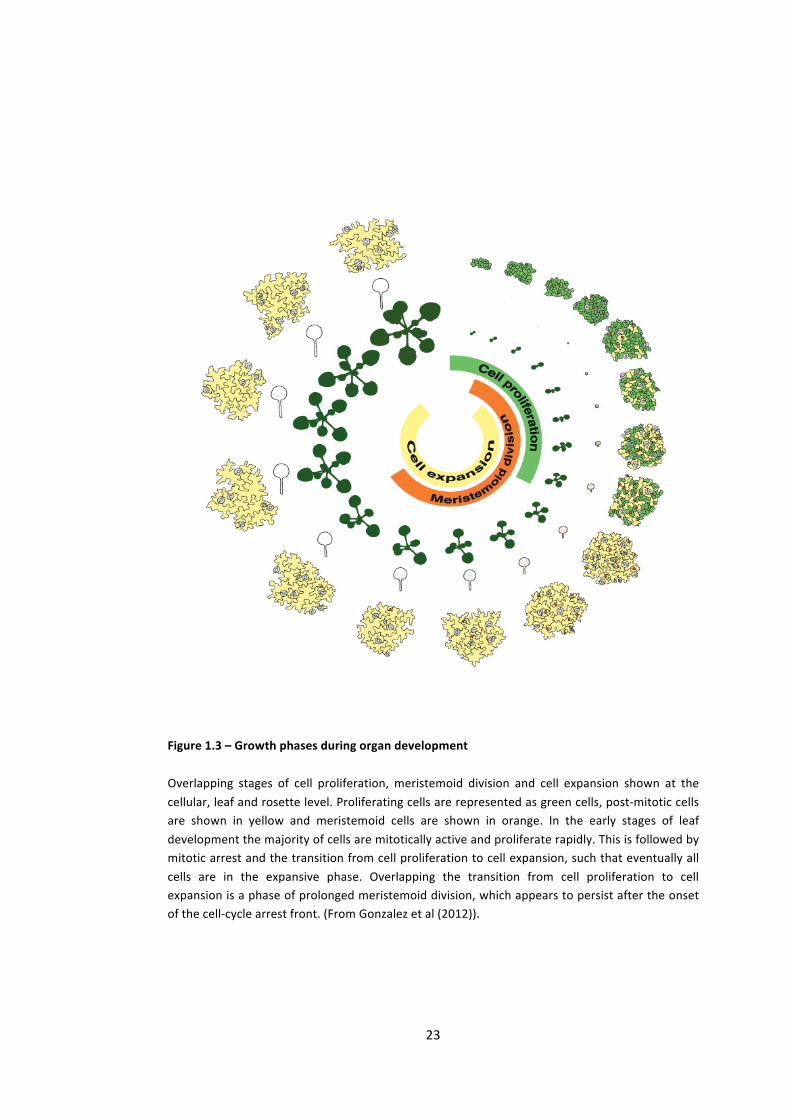
Figure 1.3 – Growth phases during organ development
Overlapping stages of cell proliferation, meristemoid division and cell expansion shown at the cellular, leaf and rosette level. Proliferating cells are represented as green cells, post-‐mitotic cells are shown in yellow and meristemoid cells are shown in orange. In the early stages of leaf development the majority of cells are mitotically active and proliferate rapidly. This is followed by mitotic arrest and the transition from cell proliferation to cell expansion, such that eventually all cells are in the expansive phase. Overlapping the transition from cell proliferation to cell expansion is a phase of prolonged meristemoid division, which appears to persist after the onset of the cell-‐cycle arrest front. (From Gonzalez et al (2012)).
24
1.3 – Organ growth is a multi-‐phase process
Leaf and petal growth can be generalised into two key cellular processes that occur in phases;
an initial period of cell proliferation, followed by a period cell expansion (Fig. 1.3) (Johnson and
Lenhard, 2011, Horiguchi et al., 2006a, Bögre et al., 2008). Following initiation from the SAM,
cells in the organ primordium divide during a period of cell proliferation, wherein rapid mitotic
divisions result in an increase in cell number (Johnson and Lenhard, 2011). This proliferative
phase of growth is terminated by a basipetal front of cell-‐cycle arrest (Nath et al., 2003,
Donnelly et al., 1999) that causes cells to exit the mitotic cell-‐cycle and initiate a phase of cell
expansion (Melaragno et al., 1993). In some organs – such as leaves – mitotic exit is concurrent
with entry to the endocycle (see Box 1.2) and subsequent endoreduplication.
The following sections (1.3.1 – 1.3.4) describe in detail the importance of organ initiation, cell
proliferation, cell expansion, and the transitory growth phase in establishing final organ size.
1.3.1 – Primordial formation from the shoot apical meristem
Organs such as leaves and petals are formed from primordia that initiate from the shoot SAM
(see section 1.2.2). When cell proliferation is accelerated in the SAM, such as caused by the
overexpression of Arabidopsis CDC27a (a subunit of the Anaphase Promoting Complex (APC))
in tobacco, the L1 zone forms with a larger complement of smaller cells (Rojas et al., 2009). As
a consequence, more (smaller) cells are recruited into the initiating organ primordia and the
resulting mature leaf is significantly larger than the wild-‐type (Rojas et al., 2009). In addition,
the exogenous application of auxin (dissolved in lanolin) to pin1 mutant SAMs has been shown
to be sufficient to induce ectopic organ initiation (Reinhardt et al., 2003). Interestingly, larger
droplets of lanolin resulted in the initiation of larger organ primordia from the SAM (Reinhardt
et al., 2003).
These data suggest that an increase in the number primordium founder cells can lead to an
increase in overall organ size. This is consistent with observations that the struwwelpeter (swp)
mutant in Arabidopsis, has reduced leaf area and cell number from the earliest stages of
development (Autran et al., 2002). The reduction in final leaf size and cell number is therefore
possibly due to fewer cells being recruited into the initiating leaf primordium (Autran et al.,
2002).
In addition to the influence of the size of the organ primordium, the rate of primordia initiation
may also have an impact on final organ size. This has been observed with klu mutants, which
show an interaction between an accelerated plastochron and a reduced final organ size
25
(Anastasiou et al., 2007), as well as in rice pla1 (plastochron 1) mutants, which have an
increased plastochron and smaller leaves (Miyoshi et al., 2004).
1.3.2 – Cell proliferation
The proliferative stage of organ growth occurs early in the development of the organ
(Andriankaja et al., 2012), and is responsible for determining the population of cells that will
enter the expansive phase. As the expansive phase contributes to the majority of organ size
increase, the rate and duration of cell proliferation in young organ primordia can significantly
influence final organ size. The rate of cell proliferation refers to the average number of mitotic
cycles per unit time during the proliferative phase; with an elevated proliferation rate
generating a larger population of cells in a fixed time interval. The proliferative phase
commences when primordia initiate from the SAM and it is terminated when cells exit the
mitotic cell cycle. The duration of cell proliferation therefore refers to the average duration of
mitotic activity within the developing organ.
Many genes have been shown to influence cell proliferation during organ formation; these
include genes that affect the rate of cell proliferation as well as genes that influence the
duration of cell proliferation (reviewed in (Breuninger and Lenhard, 2010)). Genes that
influence the rate of cell proliferation include the GIF1/2/3 (GRF-‐interacting factor) triplet. The
gif1/2/3 triple mutant has a reduction in final leaf size, which is concurrent with a reduction in
cell number (Lee et al., 2009). Kinematic analysis of growth revealed that this reduction in cell
number is due to a reduction in cell-‐proliferation rate rather than a temporal mis-‐regulation of
proliferation initiation and termination (Lee et al., 2009). Arabidopsis GIF proteins have been
shown to directly physically interact with the GROWTH-‐REGULATING FACTOR (GRF) family of
proteins, a relationship that is thought to reflect the fact that GRFs and GIFs are transcriptional
coactivators (Horiguchi et al., 2005, Kim et al., 2003). Similarly to the gif1/2/3 triple knockout
(Lee et al., 2009), the grf5 single mutant and the grf1/grf2/grf3 triple mutant have smaller
leaves with fewer cells (Horiguchi et al., 2005, Kim et al., 2003, Kim and Kende, 2004). Based
on the observed interactions between GRFs and GIFs (Horiguchi et al., 2005, Kim et al., 2003,
Kim and Kende, 2004), this reduction in leaf size is expected to be a consequence of a
reduction in the rate of cell proliferation during leaf development.
A similar effect is seen with sleepy1 (sly1) mutant plants, which are defective in an F-‐BOX E3
ligase subunit (see section 1.7.4 for details). In sly1 plants, leaf area is also reduced as
consequence of a reduction in cell proliferation rate (McGinnis et al., 2003, Achard et al., 2009).
The molecular basis of this phenotype is discussed in more detail in section 1.5.1.
26
In contrast to influencing the rate of cell proliferation, three genes, all with links to the
ubiquitin system, have been shown to negatively influence the duration of cell proliferation (Li
et al., 2008, Xia, 2013, Disch et al., 2006). Loss of function mutations in two RING E3 ligases,
BB/EOD1 and DA2, result in an increase in leaf area as a consequence of an increase in cell
number (Disch et al., 2006, Xia, 2013). Kinematic analysis of leaf growth in these mutants
reveals that the cell-‐proliferation rate is not increased; instead the duration of the proliferative
phase of organ growth is increased (Disch et al., 2006, Xia, 2013). E3 ligases are involved in the
post-‐translational modification of substrate proteins with ubiquitin (see section 1.7.4), which
can act as both an enhancing and a repressive signal (Mallery et al., 2002, Fang et al., 2000,
Stevenson et al., 2007). It is possible that DA2 and EOD1 repress organ growth through the
ubiquitin-‐directed proteolysis of factors that promote cell proliferation, or through the
ubiquitin-‐dependent activation of factors that promote cell expansion.
A similar phenotype is also seen with the dominant negative da1-‐1 allele of DA1, encoding a
UIM (ubiquitin interaction motif)-‐containing peptidase. da1-‐1 plants have enlarged leaves,
petals and seeds as a consequence of an extended duration of cell proliferation (Li et al., 2008).
In the case of da1-‐1, cells in the developing leaf were mitotically active for almost 50% longer
than in wild-‐type plants, resulting in a increased number of cells leading into the phase of
expansive cell growth (Li et al., 2008).
Although EOD1 and DA2 do not genetically interact, recent data has revealed a genetic
interaction between DA1 and both E3 ligases; EOD1 and DA2 (Li et al., 2008, Xia, 2013). This
interaction, and the link to the ubiquitin system held by all three genes, presents the possibility
that all these genes might influence cell proliferation through the same mechanism.
In contrast to the negative effect on the duration of proliferation exhibited by DA1, EOD1 and
DA2; KLUH (KLU) – a cytochrome P450 – has been revealed as a positive regulator of the
duration of cell proliferation in developing organs (Anastasiou et al., 2007). Klu-‐2 knockout
plants display reduced leaf, sepal and petal area (Anastasiou et al., 2007), and a reduction in
final seed size (Adamski et al., 2009). The reduction in lateral organ area does not coincide
with a reduction in cell size or cell proliferation rate, instead cells in klu-‐2 organs have a
reduced duration of cell proliferation during organ growth (Anastasiou et al., 2007).
Interestingly, in KLU/klu-‐2 chimeric plants KLU appears to function non-‐cell-‐autonomously;
influencing the development of neighbouring klu-‐2 tissues in chimeric organs and influencing
klu-‐2 organs in chimeric inflorescences (Eriksson et al., 2010). These observations are
reminiscent of data from the study of the developing Drosophila wing disc, which reveal the
27
coordinated growth of adjacent cell populations. In these studies, targeted inhibition of
growth in the anterior or posterior territory of the Drosophila wing disc resulted in a non-‐cell-‐
autonomous reduction in cell proliferation in the adjacent, unaffected territory (Mesquita et
al., 2010). This coordinated reduction in cell proliferation across the entire organ results in the
formation of well-‐proportioned wings despite growth inhibition in only one territory (Mesquita
et al., 2010). This is similar to the coordinated, well-‐proportioned morphology observed in
KLU/klu-‐2 chimeric petals, which occurs despite the absence of KLU in one petal region
(Eriksson et al., 2010). These data suggest that KLU might influence organ growth via a
diffusible signal molecule (Eriksson et al., 2010, Kazama et al., 2010); this is discussed in detail
in section 1.5.2.
Evidence that the basipetal arrest front (responsible for triggering exit from the proliferative
phase) persists at a fixed distance from the leaf blade base (Kazama et al., 2010) suggests that,
as well as the regulation of rate and duration of cell proliferation, regulation of the area of
mitotic competence within the developing leaf might also determine final organ size. For
example, an enlarged proliferative region in the developing leaves of the spatula (spt) mutant
is thought to contribute to an increase in final leaf size (Ichihashi et al., 2010). In spt leaves
(deficient in the SPT bHLH transcription factor), an increase in cell number with no change in
cell size suggests that mis-‐regulation of cell proliferation is responsible for the larger final leaf
size (Ichihashi et al., 2010). The fact that a size difference is only visible five days after sowing
(DAS), and not at 3 DAS (during the proliferative phase), suggests that the rate of proliferation
is in fact not altered (Ichihashi et al., 2010). Despite the lack of direct evidence that the
duration of proliferation is unaffected, evidence that the proliferative region of the leaf is
larger in spt plants supports the idea that SPT could influence the spatial regulation of
proliferative competence within the developing leaf. Based on this data, there are two
potential mechanisms of action of the spt mutant. Firstly, SPT could influence the range of a
purported diffusible growth signal, thereby extending the influence of a pro-‐proliferation
factor. Alternatively, it could adjust the sensitivity of all cells in the leaf to such a growth factor,
and therefore alter the growth factor’s active range (a more detailed discussion of these
concepts is presented in section 1.5).
As well as the uniform regulation of cell proliferation across the entire organ, some genes have
been revealed to control cell proliferation in a tissue-‐specific manner. For example, the zinc-‐
finger transcription factor, JAG, which has narrower and shorter petals and sepals than wild-‐
type plants, affects the duration of cell proliferation of certain, specific petal tissues (Dinneny
28
et al., 2004, Ohno et al., 2004). JAG appears to promote petal growth by maintaining the
mitotic competence of the distal regions of the petal (Dinneny et al., 2004), revealing a
differential regulation of cell proliferation along the proximal-‐distal axis. In a similar way, the
Antirrhinum CIN gene appears to regulate the duration of cell proliferation along the medial-‐
lateral axis, with leaf margins proliferating for longer in cin mutants (2003). Leaves of cin plants
are larger than the wild-‐type and, like jag petals, have an aberrant morphology (2003, Dinneny
et al., 2004, Ohno et al., 2004), revealing a role for tissue-‐specific regulation of cell
proliferation in the patterning of organs.
Additional tissue-‐specific regulation of cell proliferation in the developing organ can be seen
for meristemoid cells, which are guard cell precursors (Fig. 1.3). Meristemoid cells typically
undergo one to three rounds of asymmetric division before forming the guard mother cell
(GMC), which then undergoes one further symmetric division to form two guard cells
(Peterson et al., 2010). This means that a single meristemoid cell can generate up to three
pavement cells and two guard cells, and their population therefore makes a significant
contribution to overall leaf size. Importantly, regulation of meristemoid division appears to be
largely independent of the mechanisms controlling pavement cell proliferation (Andriankaja et
al., 2012), and therefore it is perhaps appropriate to consider meristemoid division as a
separate growth phase.
Only one example of the mis-‐regulation of meristemoid cell division is known for Arabidopsis:
PEAPOD (PPD). The ppd loss-‐of-‐function mutant has increased leaf lamina size and generates
curved leaves due to increased proliferation within the leaf blade (White, 2006). However,
unlike the da1-‐1 mutant or the gif1/2/3 triple mutant (Lee et al., 2009, Li et al., 2008), the
observed increase in proliferation is not a consequence of a general increase in proliferation,
but specifically a mis-‐regulation of meristemoid cell proliferation.
It is noteworthy that the absence of meristemoid cells in petals makes the petal a considerably
simpler organ for the study of growth and development.
1.3.3 – Cell expansion
During organ growth, cell expansion occurs through either an endoreduplication-‐correlated
mechanism, or an endoreduplication-‐independent mechanism. In the former system, cells
enter a modified cell-‐cycle called the endocycle (see Box 1.2), and every endocycle is
accompanied by a concurrent increase in cell volume. The latter system involves cell expansion
that is independent of the endocycle, and is primarily dependent on biophysical expansion.
29
1.3.3.1 – Endoreduplication-‐correlated cell expansion
Analysis of cell types from many different organisms -‐ from endoreduplicated plant cells to
multi-‐nucleate somatic syncytia in Caenorhabditis elegans – reveals a positive correlation
between cell size and ploidy, with larger cells having an increased DNA content (Sugimoto-‐
Shirasu and Roberts, 2003, Flemming et al., 2000, Nagl, 1976). The molecular basis of this
correlation is not well understood (Sugimoto-‐Shirasu and Roberts, 2003), however it is possible
that high ploidy is simply a requirement of increased cell size. It has been suggested that cell
division is a consequence of organ growth rather than a cause; i.e. a high density of nuclei is
needed to provide “information” (RNA and proteins) over suitable distances to the developing
organ (Mizukami, 2001). Based on this logic, it would follow that endoreduplication would be
necessary to sustain large cell sizes. This is supported by observations in crop plants such as
wheat and sugarcane, in which genome duplication events are associated with increased cell
size.
The endocycle (the cell-‐cycle that drives endoreduplication) is a modified cell-‐cycle in which
DNA replication is un-‐coupled from cytokinesis (see Box 1.2). For this reason, regulation of cell
expansion can also occur at the level of the cell-‐cycle. For example, a mutation in RPT2a, a
subunit of the 26S proteasome regulatory particle, has been shown to increase final leaf size as
a result of increased cell expansion and endoreplication (Sonoda et al., 2009). The 26S
proteasome plays a key role in the cell-‐cycle by rapidly degrading cell-‐cycle regulators and
ensuring a unidirectional progression through the cycle (see section 1.6 for a detailed
discussion of the cell-‐cycle). rpt2a mutants show elevated expression of G1-‐ and S-‐phase
specific factors and an uncoupling of the G2/M transition (see section 1.6), both of which act
to promote endoreplication (Sonoda et al., 2009). Additional genes, such as ARL (ARGOS-‐LIKE)
and ZINC FINGER HOMEODOMAIN5 (ZHD5), have been shown to increase leaf size by
influencing cell expansion (Hu et al., 2006, Hong et al., 2011). However, in these examples
there is no clear causative link to the mis-‐regulation of the cell-‐cycle.
1.3.3.1 – Biophysical regulation of cell expansion
The cell wall of plants exerts major constraints on cell expansion, and emerging evidence
shows that there is a complex interplay between the constraint of cell expansion by the cell
wall, and genes that control cell size.
A striking example of this is the transparent testa glabra 2 (ttg2) mutation, which causes a
biophysical constraint in one tissue type that results in an overall reduction in the size of the
entire organ (Garcia et al., 2005). TTG2 is a seed-‐coat expressed gene that is thought to
30
influence seed size through the integument-‐mediated physical restriction of endosperm
growth (Garcia et al., 2005). TTG2 is discussed in more detail in section 1.4. In addition to this
example, which documents the physical restriction of whole organs, there are also examples of
physical constraints acting on individual cells. These forces, which influence cells of the SAM
and the developing leaf primordium, have been shown to affect both leaf initiation and final
size. In tomato, the exogenous application of expansin – a cell wall loosening protein
(Sampedro and Cosgrove, 2005) – to the SAM causes ectopic primordia formation (Fleming et
al., 1999, Fleming et al., 1997). This is thought to occur through the loosening of the L1 layer of
the SAM, relaxing its physical constraint to the over-‐proliferation of subjacent cell layers and
allowing de novo leaf primordia to develop (Kessler and Sinha, 2004). In support of this work is
data demonstrating that, in addition to the exogenous application of expansins, the over-‐
expression of EXPANSIN 10 (EXP10) in Arabidopsis is sufficient to increase leaf size (Cho and
Cosgrove, 2000).
Work has also revealed that changes in the methyl-‐ester status of pectin polysaccharides in
the cell walls of the SAM contributes to organ primordia formation and phyllotaxis (Peaucelle
et al., 2008). This is thought to be due to the increased tissue elasticity that accompanies
demethylesterification (Peaucelle et al., 2011), and supports predictions that elastic domains
in the SAM form mechanical signals that promote organ initiation (Kierzkowski et al., 2012).
This regulatory effect of the SAM on overall plant growth can be seen through the
manipulation of the SAM in brassinosteroid insensitive1 (bri1) plants, which exhibit a dwarfed
phenotype as a consequence of defects in cell expansion (Clouse et al., 1996). Over-‐expression
of BRI1 in the L1 layer of the SAM of bri1 plants is sufficient to completely rescue the dwarfed
phenotype (Savaldi-‐Goldstein et al., 2007). In addition, targeted depletion of brassinosteroids
in the L1 layer of wild-‐type plants is sufficient to generate a dwarfed phenotype, revealing that
the SAM epidermis is able to both promote and restrict plant shoot growth (Savaldi-‐Goldstein
et al., 2007).
Finally, there is also evidence that cortical microtubule dynamics control organ growth and
development through a biophysical mechanism. The observation that the long and narrow leaf
phenotype of the angustifolia (an) mutant is due to the promotion of cell-‐expansion along the
apical-‐basal axis, and that this is concurrent with altered cortical microtubule arrangements,
suggests that the regulation of microtubules at the cellular level may influence overall organ
size (Kim et al., 2002). This link between individual cell growth and whole-‐organ development
31
is important, as it demonstrates that cell-‐autonomous mechanisms can provide considerable
control of overall growth (see section 1.5).
1.3.4. – The transition phase: controlling the ‘stock’ of cells entering expansion
For organs that undergo endocycle-‐correlated cell expansion, organ growth can be simplified
into an initial phase of cell proliferation followed by a phase of endocycle-‐driven cell expansion.
While these phases may overlap at the whole-‐organ level (i.e. at a specific time point during
organ formation some cells will be cycling through the mitotic cell cycle and others will be
cycling through the endocycle), individual cells can only either be mitotically cycling or
endocycling. As a consequence, cells undergo a decision-‐making process, with some factors
influencing them to remain proliferating, and others promoting the switch to the endocycle
(see section 1.6 for detailed review of this topic).
Genes such as DA1, EOD1, DA2, and KLU (Disch et al., 2006, Li et al., 2008, Xia, 2013,
Anastasiou et al., 2007) control the temporal dynamics of this decision and thereby alter the
timing of the switch to cell expansion. DA1 and EOD1 for example, both promote the onset of
cell expansion, and cells in which these genes are absent take longer to execute the decision to
enter the expansive phase (Li et al., 2008, Disch et al., 2006). Conversely, genes such as KLU
and CYCD3 appear to negatively regulate the onset of cell expansion (Adamski et al., 2009,
Anastasiou et al., 2007, Dewitte et al., 2007). This reveals the existence of antagonistic
signalling pathways, which possibly influence cell proliferation through the decision-‐making of
individual cells (to divide or to expand) during organ growth.
As discussed in section 1.3.2, the Antirrhinum CIN gene is also thought to increase the
sensitivity of cells to the basipetal arrest front (Nath et al., 2003). However in this example, the
effect is enhanced only in the leaf margins where CIN is most strongly expressed (Nath et al.,
2003), further highlighting the importance of cell-‐autonomous factors during the transition
phase.
Conversely, genes such as SPT regulate the spatial dynamics of the transition from cell
proliferation to cell expansion; influencing the distance of the arrest front from the leaf base
during the arrest front pausing phase (Ichihashi et al., 2010, Andriankaja et al., 2012, Kazama
et al., 2010). The re-‐location of the arrest front in the spt mutant could be due to either an
extension of the field of a mobile growth signal (see section 1.5.2 for a discussion), or the
increased sensitivity of leaf cells to this signal. In both models, the balance of factors
influencing proliferation and expansion would be influenced in the direction of cell
proliferation (along the apical-‐basal axis), and thus result in an enlarged proliferative region.
32
Typically, genes such as DA1 and EOD1 (Li et al., 2008, Disch et al., 2006) – whose mutants
result in enlarged organs – are considered to be negative regulators of the duration of cell
proliferation. However as this section highlights, ultimately, it is the molecular decision-‐making
of individual cells that will determine final organ size and therefore it is perhaps more accurate
to consider these genes as promoters of the transition to expansion, thereby considering the
role of these genes from a cell-‐centric viewpoint.
B" C"A"
Synergid cells
Central cell
Egg cell
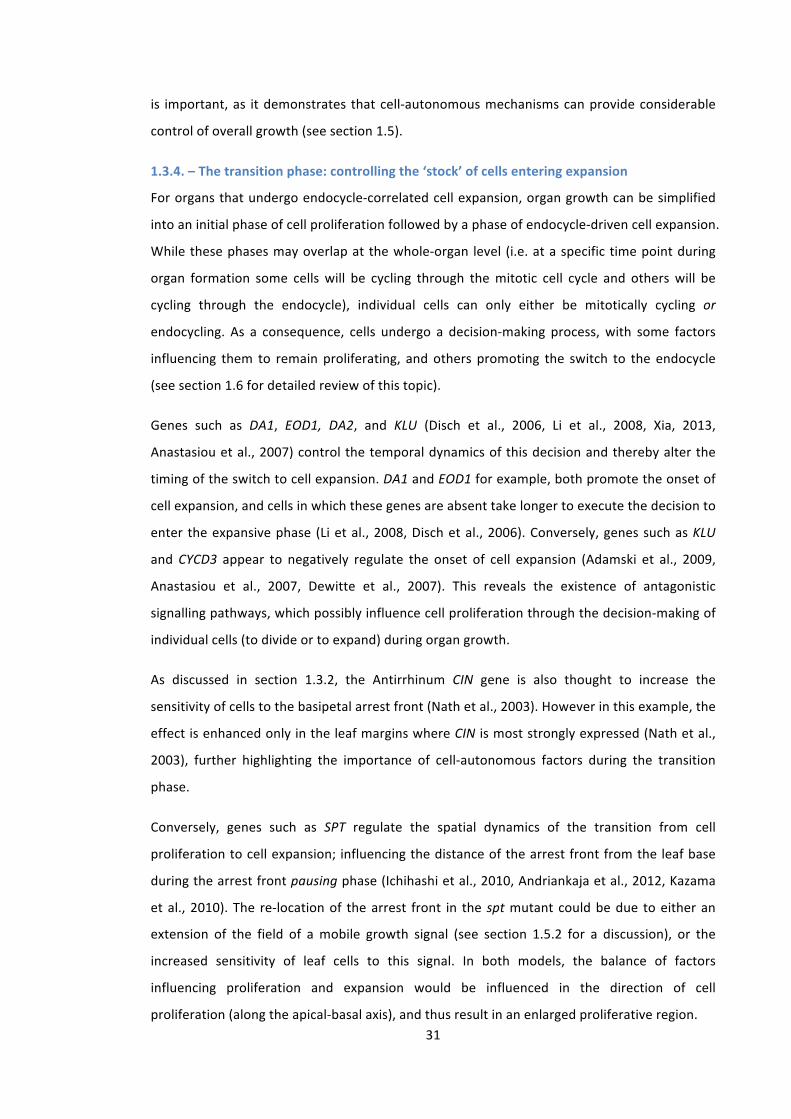
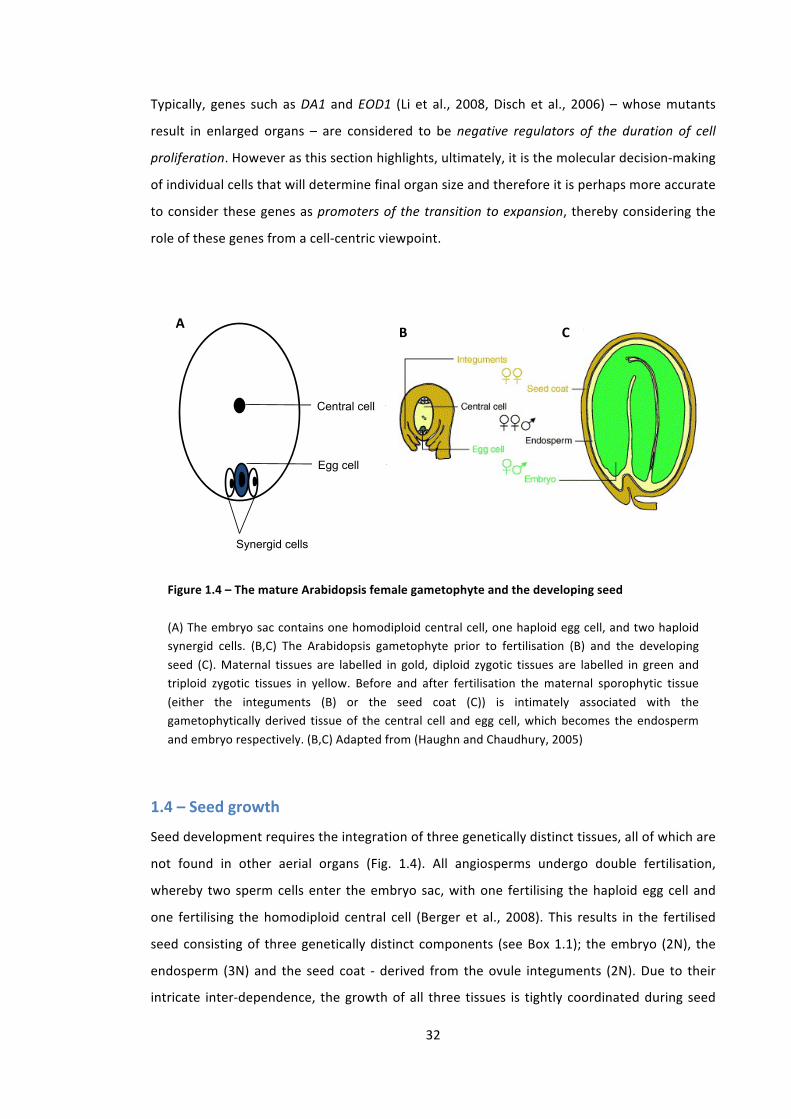
1.4 – Seed growth
Seed development requires the integration of three genetically distinct tissues, all of which are
not found in other aerial organs (Fig. 1.4). All angiosperms undergo double fertilisation,
whereby two sperm cells enter the embryo sac, with one fertilising the haploid egg cell and
one fertilising the homodiploid central cell (Berger et al., 2008). This results in the fertilised
seed consisting of three genetically distinct components (see Box 1.1); the embryo (2N), the
endosperm (3N) and the seed coat -‐ derived from the ovule integuments (2N). Due to their
intricate inter-‐dependence, the growth of all three tissues is tightly coordinated during seed
Figure 1.4 – The mature Arabidopsis female gametophyte and the developing seed
(A) The embryo sac contains one homodiploid central cell, one haploid egg cell, and two haploid synergid cells. (B,C) The Arabidopsis gametophyte prior to fertilisation (B) and the developing seed (C). Maternal tissues are labelled in gold, diploid zygotic tissues are labelled in green and triploid zygotic tissues in yellow. Before and after fertilisation the maternal sporophytic tissue (either the integuments (B) or the seed coat (C)) is intimately associated with the gametophytically derived tissue of the central cell and egg cell, which becomes the endosperm and embryo respectively. (B,C) Adapted from (Haughn and Chaudhury, 2005)
33
development. For example, the developing embryo relies on the provision of nutrients and
support from the endosperm (Hirner et al., 1998, Lopes and Larkins, 1993), and the endosperm
in turn depends on the accurate development of, and nutrient flow from the integuments
(Garcia et al., 2005, Lopes and Larkins, 1993). This interdependence can be seen through the
highly complex developmental regulation in the seed, whereby changes in an individual tissue
can have pleiotropic effects on the other tissues, as well as on seed size in general.
Maternal regulation of seed development can occur in different ways. One such mechanism is
the maternal regulation of seed nutrition, which occurs through the chalazal tissue.
Impairment to this tissue (the site of nutrient transport) in the Seg 1, 3, 6, and 7 barley
mutants has been shown to significantly reduce overall seed size (Felker et al., 1985). Maternal
regulation of seed development can also occur via the integuments, as illustrated by ttg2; a
mutation in an integument-‐expressed proanthocyanin synthesis gene. ttg2 plants produce
smaller and rounder seeds as a direct consequence of reduced cell elongation in the
integuments (Garcia et al., 2005). In these seeds, through either biophysical constraint, or
through proanthocyanin-‐mediated poisoning of the endosperm, the ttg2 integuments act to
restrict endosperm growth, thereby reducing final seed size (Garcia et al., 2005). Furthermore,
and highlighting the intricate relationship between all genetic compartments within the seed,
this reduction in endosperm restricts embryo growth (Garcia et al., 2005).
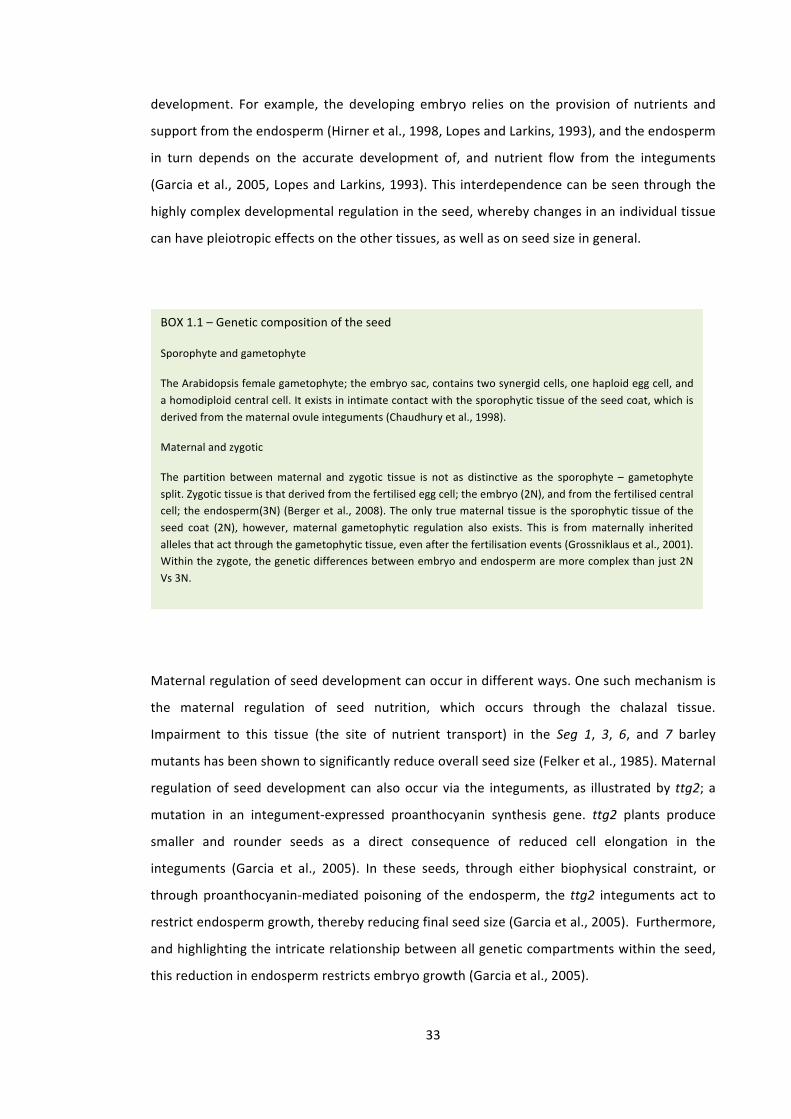
BOX 1.1 – Genetic composition of the seed
Sporophyte and gametophyte
The Arabidopsis female gametophyte; the embryo sac, contains two synergid cells, one haploid egg cell, and a homodiploid central cell. It exists in intimate contact with the sporophytic tissue of the seed coat, which is derived from the maternal ovule integuments (Chaudhury et al., 1998).
Maternal and zygotic
The partition between maternal and zygotic tissue is not as distinctive as the sporophyte – gametophyte split. Zygotic tissue is that derived from the fertilised egg cell; the embryo (2N), and from the fertilised central cell; the endosperm(3N) (Berger et al., 2008). The only true maternal tissue is the sporophytic tissue of the seed coat (2N), however, maternal gametophytic regulation also exists. This is from maternally inherited alleles that act through the gametophytic tissue, even after the fertilisation events (Grossniklaus et al., 2001). Within the zygote, the genetic differences between embryo and endosperm are more complex than just 2N Vs 3N.

34
Conversely, gametophytic regulation of sporophytic tissues can also occur. Autonomous
endosperm proliferation in the gametophytic multicopy suppressor of ira (msi1) mutant, leads
to the enlargement and partial differentiation of the integuments (Ingouff et al., 2006). It is not
clear whether this gametophytic effect on integument development is of a biophysical nature
or due to cross talk between the two compartments, however it clearly shows that the
development of the endosperm and the integuments are intricately linked. One further
example is the sporophytic recessive haiku (iku) mutation (Garcia et al., 2003), which, like msi1,
reduces integument development through a reduction in endosperm growth. However, unlike
the msi1 allele, the iku allele is zygotically expressed. This demonstrates that partitioning of
the developing seed into the gametophyte and the sporophyte, or maternal and zygotic tissue,
is probably not sufficient to understand the complexities, coordination, and compartmental
cross-‐talk involved in seed development.
1.5 – Coordinating cell division and expansion during organ growth
1.5.1 – Hormonal regulation of organ growth
Auxin, brassinosteroids, gibberellic acid and cytokinins are long-‐range signalling molecules that
have widespread effects in plant development and play a key role in regulating organ growth
(Johnson and Lenhard, 2011). As small signalling molecules, they have the potential to
coordinate the activities of large populations of cells throughout the developing plant, and as a
consequence aberrations in synthesis, perception and degradation of phytohormones often
results in systemic phenotypes.
Auxins have been shown to influence both cell expansion and cell proliferation (Chen et al.,
2001), and to be involved in regulating many developmental processes, including embryo
development, organ initiation, leaf vascular development and patterning, and root growth
(reviewed in Teale et al 2006). Auxins appear to influence leaf expansion via changes to the
cell wall and the plasma membrane (Overvoorde et al., 2005, Teale et al., 2006), suggesting
that auxin-‐dependent cell expansion changes are due to biophysical effects. Auxin-‐mediated
regulation of cell proliferation, however, is less well understood, although there is evidence
that auxin regulates the expression of several cell-‐cycle genes (reviewed in (Vanneste et al.,
2005)).
The effect of auxin on cell expansion in leaves can be seen by over-‐expressing Arabidopsis
AUXIN BINDING PROTEIN1 (ABP1) in tobacco. Over-‐expression of ABP1 is sufficient to promote
cell expansion, and generates leaves with larger cells (Jones et al., 1998). In addition, the
35
auxin-‐inducible gene, ARGOS has been revealed as a negative regulator of organ growth.
Unlike for ABP1, ARGOS over-‐expression primarily affects cell number; generating larger leaves
with more cells (Hu et al., 2003). This suggests that ARGOS promotes either the rate or
duration of cell proliferation in developing organs. Interestingly ARGOS appears to function
upstream of ANT and CYCD3, and its over-‐expression results in the prolonged expression of
ANT and CYCD3 (Hu et al., 2003). The role of CYCD3 in the maintenance of the mitotic cell cycle
(Dewitte et al., 2007) suggests that perhaps ARGOS influences organ growth via the auxin-‐
dependent promotion of the duration of cell proliferation.
A related gene, ARGOS-‐LIKE (ARL) also affects organ growth, but in response to
brassinosteroids. ARL is up-‐regulated by brassinosteroids, and demonstrates a role for
brassinosteroids in the setting of final organ size. Over-‐expression of ARL results in larger
leaves and cotyledons, a phenotype that is largely due to an increase in cell size; indicating
that ARL promotes cell expansion in the developing leaf (Hu et al., 2006). Brassinosteroids
have also been shown to affect organ development as part of systemic changes to cell
expansion rates. The bri (brassinosteroid insensitive1) and the dwf4 (dwarf4) mutants have
severe dwarfed phenotypes with smaller leaves, that are thicker and curled in bri1 plants
(Clouse et al., 1996, Azpiroz et al., 1998). Both BRI1 and DWF4 reduce organ size through
reduced cell expansion rates, an effect that can be reversed in bri1 plants by expressing wild-‐
type BRI1 in the L1 layer of the SAM (Savaldi-‐Goldstein et al., 2007), which suggests that
brassinosteroids might regulate organ size exclusively through altered expansion rates in the
SAM.
Much like in the case of auxin, cytokinins influence a wide variety of plant responses including
the pathogen response, apical dominance, organ development and vascular development
(reviewed in Choi and Hwang (2007)). The effect of cytokinins on organ growth can be seen in
the ahk2/ahk3/ahk4 mutant, which is defective for three cytokinin receptors. This mutant has
fewer leaves, which are smaller than wild-‐type leaves due to a reduction in cell number (cell
area is the same as the wild-‐type), indicating that cytokinins promote leaf growth via an
increase in cell proliferation (Higuchi et al., 2004, Nishimura et al., 2004). This is supported by
the observation that disruption of cytokinin metabolism has also been shown to affect petal
growth. Knock-‐down of two cytokinin oxidase/dehydrogenase (CKX) genes, CKX3 and CHX5
(responsible for catalysing the degradation of cytokinins) results in an increase in petal area
(Bartrina et al., 2011). The increase in petal area is a consequence of an increased number of
36
wild-‐type sized cells, revealing that the large organ phenotype is achieved through promotion
of cell proliferation in the developing petal (Bartrina et al., 2011).
The role of gibberellins in organ growth and development was revealed through the
identification of the DELLA proteins (Koornneef and Van der Veen, 1980), which are negative
regulators of gibberellin-‐dependent growth promotion (Hauvermale et al., 2012, Davière and
Achard, 2013, Dixit, 2013). DELLA knockout mutations increase leaf area through an increase in
cell number, which is a consequence of elevated cell expansion and proliferation rates (Achard
et al., 2009). As with brassinosteroids, constitutively desensitising plants to gibberellins results
in a systemic dwarf phenotype (Peng et al., 1997). DELLAs are destabilised by ubiquitin-‐
directed, proteasome-‐mediated degradation (Alvey and Harberd, 2005), and knockdown of
SLY1, an F-‐BOX subunit of the SCF E3 ubiquitin ligase (McGinnis et al., 2003) (see section 1.7.4
and 5.1.1) leads to a reduced leaf area as a result of decreased cell proliferation (Achard et al.,
2009). Interestingly, gibberellins have also been shown to affect cell expansion, with
overexpression of the gibberellin biosynthetic gene, GIBBERELLIN 20-‐OXIDASE1 (GA20OX)
increasing leaf area through increased cell size and cell number (Gonzalez et al., 2010).
Abscisic acid (ABA) is less well characterised as a regulator of growth and development,
however there is evidence that it might regulate organ growth through DA1 and DAR1 (Li et al.,
2008). DA1 expression is induced by ABA and da1-‐1 seedlings are partially insensitive to ABA-‐
inhibition, indicating that ABA might be involved in regulating the duration of cell proliferation
in the developing organ (Li et al., 2008).
1.5.2 – Evidence for additional long-‐range growth factors in organ development
The type of spatial coordination revealed by the compensation mechanism (described in
section 1.5.3) may be due to a diffusible, threshold-‐dependent, long-‐range growth-‐signal such
as Drosophila WINGLESS (WG), which is involved in coordinating Drosophila embryogenesis
(Zecca et al., 1996). In this system, a gradient of WG accumulates in cells surrounding the WG-‐
expressing cells, and cells in this field respond quantitatively; resulting in the differential
expression of additional growth factors (Zecca et al., 1996). Interestingly, the study of a
cytochrome p450 enzyme encoded by the KLU gene has provided evidence for a similar
diffusible signal in the regulation of Arabidopsis floral development. At the single organ level –
in the regulation of petals – KLU functions in a non-‐cell autonomous manner (Adamski et al.,
2009, Anastasiou et al., 2007); with the KLU genotype able to influence the development of
adjacent klu-‐2 tissues. Further work with KLU/klu-‐2 chimeric inflorescences has revealed that
KLU has an effect beyond individual flowers and can influence the development of klu-‐2
37
flowers in the same inflorescence (Eriksson et al., 2010). KLU cytochrome P450 is a member of
a large superfamily of genes involved the oxidation of many diverse substrates including
steroids and fatty acids (Pinot and Beisson, 2011); suggesting that KLU may be involved in the
synthesis or modification of a lipid or steroidal signal molecule. Indeed, in animal systems
cytochrome P450s are involved in the modification of retinoic acid (vitamin A), which is an
important morphogen during vertebrate embryonic development (Nebert and Russell, 2002).
Taken together, these data suggest that targets of KLU may be diffusible signalling molecules
involved in the coordination of cell proliferation in lateral organ growth. There is strong data to
support the role of a KLU-‐dependent signal in the long distance coordination of organ growth
(Adamski et al., 2009, Anastasiou et al., 2007, Eriksson et al., 2010), however there is little
direct evidence that a similar diffusible signal is responsible for coordinating the arrest front in
developing organs (see section 1.5.5).
1.5.3 – A compensation mechanism regulates final organ size
Sections 1.3.1 and 1.3.2 describe genes that mis-‐regulate cell proliferation or cell-‐expansion
and in doing so alter final organ size. Interestingly, there are also genes that mis-‐regulate cell
proliferation and cell expansion without influencing overall organ size. These genes reveal the
phenomenon of compensation, which is the ability of the developing organ to compensate for
fluctuations in cell number with changes cell size (and vice versa); such that final organ size
remains constant. For example, as discussed in section 1.3.2 and in a similar fashion to KLU,
CYCLIND3;1-‐3 are thought to positively regulate the duration of cell proliferation in developing
organs (Dewitte et al., 2007). However, whereas the reduction in cell number in klu-‐2 petals
results in an over-‐all reduction in petal size, the reduction in cell number in cycd3;1-‐3 leaves
does not affect leaf area (Dewitte et al., 2007). This is due to a compensatory increase in cell
expansion in cycd3;1-‐3 leaves that results in cells that are considerably larger that the wild
type (Dewitte et al., 2007). A similar compensatory effect can be seen when Arabidopsis AUXIN
BINDING-‐PROTEIN 1(ABP1) – involved in the promotion of auxin-‐mediated cell-‐expansion – is
over-‐expressed in tobacco (Jones et al., 1998). In this case, despite an increase in cell area,
there is an apparent reduction in cell number that causes the leaves to remain morphologically
identical to the wild-‐type (Jones et al., 1998). This compensation effect suggests that
developing organs possess an intrinsic ‘measure’ of organ size, and, that throughout their
growth they are able to access this pre-‐determined spatial information that sets the final size.
Investigation of the compensation mechanism by Ferjani et al (2007) revealed that there are
three distinct routes by which the developing leaf can compensate for a reduction in cell
38
proliferation. The first route involves the initiation of cell expansion during the proliferative
phase, as seen in KRP2 overexpressing lines (Ferjani et al., 2007). The second and third routes
involve post-‐mitotic compensation, where enhanced cell expansion follows the termination of
the proliferative phase (Ferjani et al., 2007). One route – that utilised by fugu2-‐1 mutants –
involves an elevated rate of post-‐mitotic cell expansion, and the other route – that utilised by
fugu5 mutants – involves an elevated duration of post mitotic cell expansion (Ferjani et al.,
2007).
1.5.4 – Models to explain the compensatory mechanism
A non-‐cell-‐autonomous model provides one explanation of why certain mutations affecting
cell proliferation are compensated, and why others lead to a change in final organ size. It
predicts that there are two classes of genes involved in organ size regulation; those involved in
spatial sensing (signal propagation, transduction and perception), and those that operate
outside of the sensing mechanism -‐ involved in performing core cellular activities only (such as
cell expansion and cell proliferation) (Fig. 1.5).
In this scenario genes involved in these core cellular processes would be independent of the
sensing mechanism and therefore any aberrant growth that resulted from mutations in these
core genes would be detected and compensated. Conversely, mutations in components of the
sensing mechanism would have effects that cannot be compensated, because the detection
and response mechanisms would themselves be aberrant. This can be explored by comparison
of the effect of da1-‐1 and cycd3;1-‐3 mutations. Both of these mutations alter the duration of
cell proliferation during organ formation, but only the cycd3;1-‐3 mutant is compensated (Li et
al., 2008, Dewitte et al., 2007). CYCD3;1-‐3 are key cell-‐cycle genes responsible for negatively
regulating the switch from the mitotic cell-‐cycle to the endocycle (Dewitte et al., 2007). In
cycd3;3 mutants, the absence of the negative influence of the CYCLIND3 genes causes cells to
be released early from the proliferative phase. However, perhaps because cycd3;3 cells are still
able to accurately sense their position in the developing organ, development is adjusted
according to the still correct spatial cues (resulting in increased expansion), and the pre-‐
determined final organ size is achieved.
The da1-‐1 large organ phenotype suggests that da1-‐1 cells have an increased sensitivity to a
potential proliferation-‐promoting signal. This would lead to proliferation at lower signal levels,
therefore a later exit from the proliferative phase and consequently an increased organ size.
According to this model, if DA1 were involved in the process of signal perception, the

39
Organ growth
Core%growth%drivers%
Size%sensing%mechanism%
Growth checkpoint
Growth feedback
da1-‐1 developing organ would be unable to detect the aberrant growth that results from the
da1-‐1 mutation. As a consequence, the developing organ would not undergo a compensatory
reduction in cell expansion.
This model predicts that genes with non-‐compensated mutations (such as DA1, BB/EOD1,
KLUH and SPT (Li et al., 2008, Disch et al., 2006, Anastasiou et al., 2007, Ichihashi et al., 2010))
are likely to be involved in responding to or regulating the size-‐sensing mechanism, and that
genes that are compensated (such as CYCD3;1-‐3, and CYCD2;1 (Qi and John, 2007, Dewitte et
al., 2007)) are involved in core developmental processes downstream of the sensing
mechanism.
Figure 1.5 – A model to explain the compensation effect
This model predicts that there are two groups of genes involved in organ growth: genes involved in a size-‐sensing mechanism and genes involved in downstream core growth processes. It predicts that spatial cues are received and transduced by a sensing machinery that in turn influences the activity of down-‐stream core growth drivers (which indirectly or directly influence organ growth). The model predicts that while mutation of core growth drivers might affect organ growth, accurate perception of aberrant growth by an intact size sensing mechanism would buffer against developmental abnormalities. Conversely, this model predicts that growth-‐altering mutations in elements of the size sensing machinery might also render the organ unable to perceive the consequent aberrant growth, and would therefore result in uncompensated abnormal growth.
40
1.5.5 – Coordination of growth at the organ level
Evidence of a compensation mechanism in the setting of final organ size (section 1.5.3)
suggests that throughout organ development, constituent cells can map their position relative
to the other cells in the organ. This allows cells to alter their growth such that a pre-‐
determined final organ size can be reached. This positional mapping could be achieved
through one of two systems: a non-‐cell-‐autonomous signal ‘field’ that generates spatial
information to constituent cells, or a cell-‐autonomous system in which individual progenitor
cells have a fixed growth potential such that they divide a certain number of times and then
expand to a fixed size (Fig. 1.6). It is also possible that a combination of both mechanisms
function during organ formation.
The cell-‐autonomous model (Fig. 1.6a) is based on observations that the growth potential of
certain structures can be pre-‐determined by pre-‐loading with a fixed amount of growth factor.
The maternal provision of CYCLINB mRNA to the Drosophila early embryo is one such example
(Edgar et al., 1994). The Drosophila early embryo is preloaded with a pool of maternal CYCLIN
B, which acts as a regulator of nuclear proliferation (Edgar et al., 1994). CYCLIN B is degraded
on the mitotic spindle and therefore levels fall with every nuclear division. This means that the
maternal ‘loading’ of the embryo is able to pre-‐determine exactly how many nuclear divisions
will occur regardless of their frequency; allowing the developing embryo to compensate for
any changes in the rate of cell division (Edgar et al., 1994) In this model, if nuclear division rate
was accelerated, although more nuclear divisions could occur per unit time, the growth factor
would run out after the pre-‐determined number of divisions and nuclear division would be
halted. It is tempting to speculate that this model extends to cellularised organs. In such a
system, initial progenitor cells might be ‘loaded’ with a cell-‐autonomous signal that accurately
regulates proliferation in a similar mitosis-‐dependent way to establish an intrinsic measure of
organ size.
Examples of an alternative (non-‐cell-‐autonomous) model (Fig. 1.6b) can also be found in
animal systems. In Drosophila, a gradient of either the mRNA or the protein of the
transcription factor BICOID, defines spatial boundaries in the developing embryo (Lipshitz,
2009), and it is thought that a similar system might be responsible for coordinating the
proliferation arrest front in Arabidopsis lateral organs (Lenhard, 2012). Evidence that the
arrest front is held at a fixed distance from the base of the leaf (Andriankaja et al., 2012,
Kazama et al., 2010) suggests that a proliferation promoting signal field, originating from the
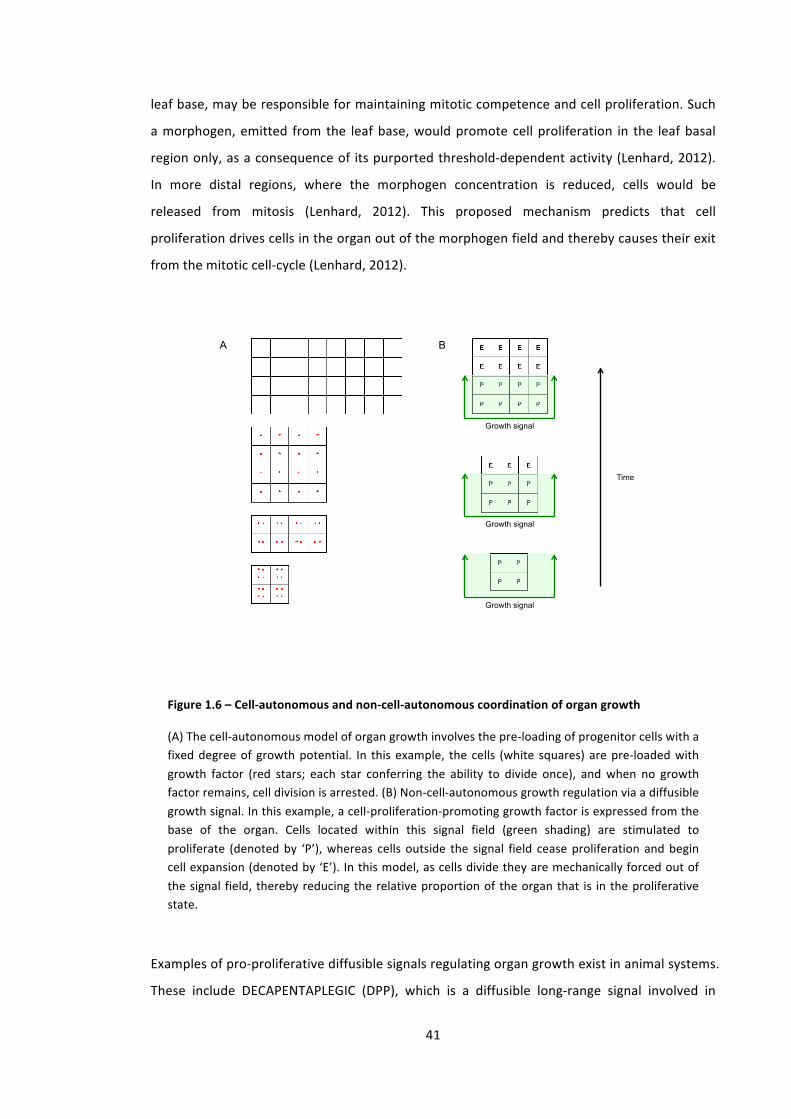
41
leaf base, may be responsible for maintaining mitotic competence and cell proliferation. Such
a morphogen, emitted from the leaf base, would promote cell proliferation in the leaf basal
region only, as a consequence of its purported threshold-‐dependent activity (Lenhard, 2012).
In more distal regions, where the morphogen concentration is reduced, cells would be
released from mitosis (Lenhard, 2012). This proposed mechanism predicts that cell
proliferation drives cells in the organ out of the morphogen field and thereby causes their exit
from the mitotic cell-‐cycle (Lenhard, 2012).
A B
Growth signal
Growth signal
Growth signal
Time
Examples of pro-‐proliferative diffusible signals regulating organ growth exist in animal systems.
These include DECAPENTAPLEGIC (DPP), which is a diffusible long-‐range signal involved in
Figure 1.6 – Cell-‐autonomous and non-‐cell-‐autonomous coordination of organ growth
(A) The cell-‐autonomous model of organ growth involves the pre-‐loading of progenitor cells with a fixed degree of growth potential. In this example, the cells (white squares) are pre-‐loaded with growth factor (red stars; each star conferring the ability to divide once), and when no growth factor remains, cell division is arrested. (B) Non-‐cell-‐autonomous growth regulation via a diffusible growth signal. In this example, a cell-‐proliferation-‐promoting growth factor is expressed from the base of the organ. Cells located within this signal field (green shading) are stimulated to proliferate (denoted by ‘P’), whereas cells outside the signal field cease proliferation and begin cell expansion (denoted by ‘E’). In this model, as cells divide they are mechanically forced out of the signal field, thereby reducing the relative proportion of the organ that is in the proliferative state.
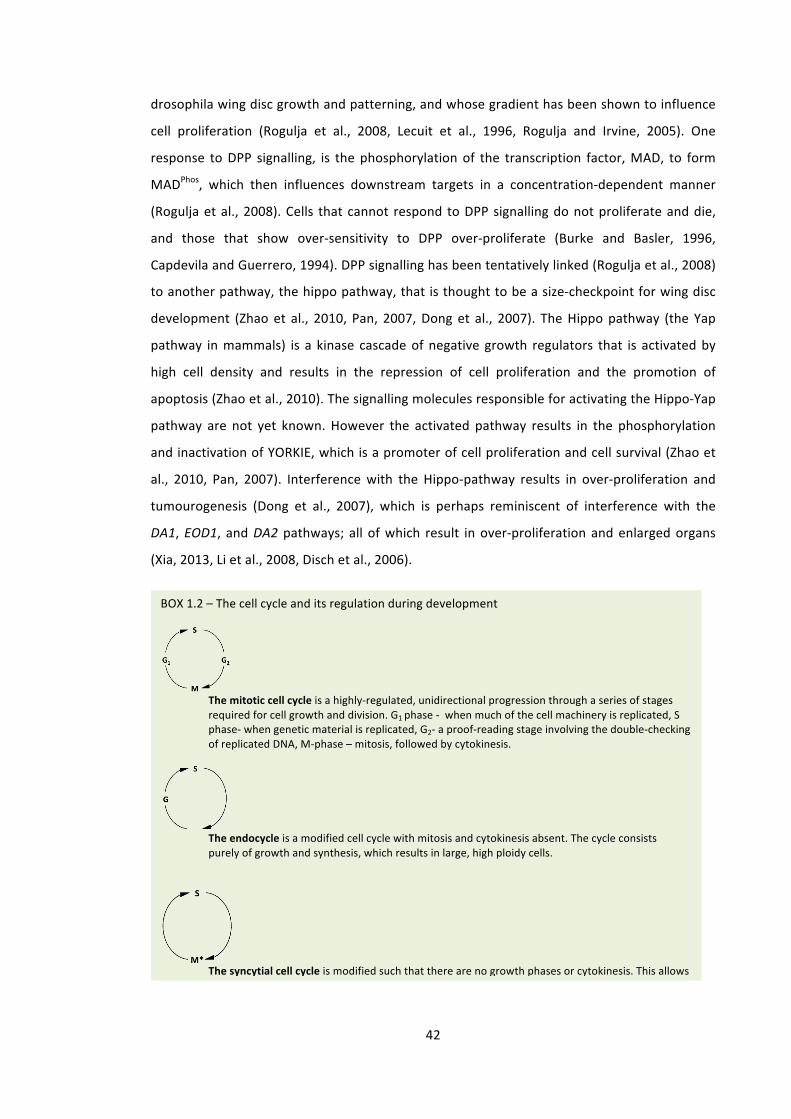
42
drosophila wing disc growth and patterning, and whose gradient has been shown to influence
cell proliferation (Rogulja et al., 2008, Lecuit et al., 1996, Rogulja and Irvine, 2005). One
response to DPP signalling, is the phosphorylation of the transcription factor, MAD, to form
MADPhos, which then influences downstream targets in a concentration-‐dependent manner
(Rogulja et al., 2008). Cells that cannot respond to DPP signalling do not proliferate and die,
and those that show over-‐sensitivity to DPP over-‐proliferate (Burke and Basler, 1996,
Capdevila and Guerrero, 1994). DPP signalling has been tentatively linked (Rogulja et al., 2008)
to another pathway, the hippo pathway, that is thought to be a size-‐checkpoint for wing disc
development (Zhao et al., 2010, Pan, 2007, Dong et al., 2007). The Hippo pathway (the Yap
pathway in mammals) is a kinase cascade of negative growth regulators that is activated by
high cell density and results in the repression of cell proliferation and the promotion of
apoptosis (Zhao et al., 2010). The signalling molecules responsible for activating the Hippo-‐Yap
pathway are not yet known. However the activated pathway results in the phosphorylation
and inactivation of YORKIE, which is a promoter of cell proliferation and cell survival (Zhao et
al., 2010, Pan, 2007). Interference with the Hippo-‐pathway results in over-‐proliferation and
tumourogenesis (Dong et al., 2007), which is perhaps reminiscent of interference with the
DA1, EOD1, and DA2 pathways; all of which result in over-‐proliferation and enlarged organs
(Xia, 2013, Li et al., 2008, Disch et al., 2006).
BOX 1.2 – The cell cycle and its regulation during development
The mitotic cell cycle is a highly-‐regulated, unidirectional progression through a series of stages required for cell growth and division. G1 phase -‐ when much of the cell machinery is replicated, S phase-‐ when genetic material is replicated, G2-‐ a proof-‐reading stage involving the double-‐checking of replicated DNA, M-‐phase – mitosis, followed by cytokinesis.
The endocycle is a modified cell cycle with mitosis and cytokinesis absent. The cycle consists purely of growth and synthesis, which results in large, high ploidy cells.
The syncytial cell cycle is modified such that there are no growth phases or cytokinesis. This allows the rapid accumulation of nuclei, and relies heavily on external transcription and translation.
43
1.6 – Organ growth and the cell-‐cycle
As discussed in section 1.3, organ growth is driven by a combination of cell proliferation and
cell expansion. Cell proliferation and endoreduplication-‐dependent cell expansion are both
processes that have the cell cycle as their core. In the leaf, proliferating cells progress through
the mitotic cell-‐cycle and expanding cells can progress through the endocycle, a modified cell-‐
cycle where mitosis and cytokinesis are absent (see Box 1.2). In both cases, the number of
cycles can affect the final size of the organ, and therefore mis-‐regulation of the rate or
duration of either the mitotic cell-‐cycle or the endocycle may influence final organ size.
1.6.1 – The cell-‐cycle: a brief overview
1.6.1.1 – The Mitotic cell-‐cycle
The cell-‐cycle is a cyclical, unidirectional progression through different growth stages. Mitotic
cells progress through a DNA synthesis phase (S-‐phase), which is preceded and proceeded by
two gap phases (G1-‐ and G2-‐phase respectively). G1-‐phase is required for the replication of cell
machinery in preparation for the DNA synthesis of S-‐phase, and G2-‐phase is required for
checking and proof-‐reading the DNA after replication. Following the completion of G1, S and
G2, cells then progress through the mitotic phase (M-‐phase), where cells divide through
cytokinesis. Cell-‐cycle checkpoints exist at the boundaries between these different phases to
ensure that the preceding phases have been completed and that there is no premature entry
into the next phase. Importantly, these checkpoints are unidirectional (i.e. cells can only
progress in one direction), which ensures that cells progress through the cell-‐cycle in the
correct order.
The accurate and timely progression of the cell-‐cycle is mediated by a family of
serine/threonine kinases, the CYCLIN DEPENDENT KINASES (CDKs), and their CYCLIN subunits,
which are required for CDK activity (van den Heuvel, 2005). The regulation of CDKs is tight and
multi-‐layered, and includes phosphorylation events (both activating and repressive), strict
control of protein expression and degradation, and regulation by CDK inhibitors (CKIs) (Dewitte
and Murray, 2003). Five classes of CDK (termed CDKA-‐E) (Joubes et al., 2000), and five classes
of cyclin (termed CYCLIN A, B, C, D and H) have been identified in plants (Dewitte and Murray,
2003). Cyclins, so named due to their periodic cyclical expression patterns, are the chief
regulatory influence on CDKs, and individual cyclins have roles at specific cell-‐cycle checkpoints.
For example, A-‐type cyclins regulate S-‐phase progression, B-‐type cyclins regulate the G2/M
transition, and D-‐type cyclins regulate the G1/S transition (Dewitte and Murray, 2003). Unlike
44
A-‐ and B-‐type cyclins, D-‐type cyclins do not have a cyclical pattern of abundance, and are
thought to be controlled by higher-‐order signalling in the regulation of cell division (Dewitte
and Murray, 2003). There are seven identified Arabidopsis CDK inhibitors with homology to
animal CKIs; these are termed ICK/KRP proteins (INHIBITOR OF CDK/KIP-‐RELATED PROTEIN)
and they inhibit CDK activity through their binding to CDK-‐CYCLIN complexes (Dewitte and
Murray, 2003, De Veylder et al., 2001). Four CKIs have also been characterised in Arabidopsis
belonging to the SIAMESE (SIM) and SIAMESE-‐RELATED (SMR) protein families (Churchman et
al., 2006).
Cell-‐cycle unidirectionality is maintained by ubiquitin-‐mediated degradation of cyclins, which
ensures that once a checkpoint is passed, components required for the previous stage are
destroyed (Dewitte and Murray, 2003). A-‐ and B-‐type cyclins are directed for destruction
through ubiquitination by the Anaphase Promoting Complex (APC), and D-‐type cyclins by an
SCF-‐type E3 ligase, (Dewitte and Murray, 2003). In addition to cyclins, CDK inhibitors are also
regulated by ubiquitin-‐dependent proteolysis; thereby de-‐repressing the respective CDK (King
et al., 1996).
1.6.1.2 – Cell-‐cycle variations
Excluding the meiotic cell cycle – where S-‐phase is followed by a modified M-‐phase, with two
rounds of chromosome segregation (van den Heuvel, 2005) – there are two significant
variations of the mitotic cell cycle; the endocycle and the syncytial cell-‐cycle.
Cells in the syncytial cell-‐cycle rapidly cycle between S-‐phase and a modified M-‐phase that
lacks cytokinesis. The absence of G1 and G2 permits rapid cycling, and the lack of cytokinesis
results in syncytial growth to produce multiple nuclei dividing without cellularisation. The lack
of G1 and G2 means that syncytial tissues are highly dependent on the extracellular provision of
DNA and protein, and their development is often governed by the nucleo-‐cytoplasmic ratio
(Edgar et al., 1986, Edgar and Datar, 1996). In plants the early stages of endosperm
development involves the syncytial cell cycle.
The endocycle consists of an S-‐phase followed by a single G-‐phase and no mitosis, resulting in
a doubling of ploidy level with each cycle (van den Heuvel, 2005). Down-‐regulation of the M-‐
phase components, CYCA1, CYCA2, CYCBs and CDKB have been reported in endocycling cells
(Dewitte and Murray, 2003). Work has also implicated CYCD3;1-‐3 in the maintenance of the
mitotic cell cycle (Dewitte et al., 2007), suggesting that CYCD3 acts as a mitotic cyclin that
drives cells from G2 to M, rather than allowing them to exit (to the endocycle) from G2 – S-‐
phase (Dewitte et al., 2007). Interestingly elevated levels of CYCD3 have been identified in
45
endoreduplicating tomato tissues (Joubes and Chevalier, 2000) , suggesting that CYCD3 may be
a general promoter of all cell cycles (mitotic and endocycles) as a consequence of a promotion
of the G1/S-‐phase transition (Dewitte et al., 2007).
1.6.2 – Regulating cell proliferation via the mitotic cell-‐cycle
As described in section 1.5.1, quadruple DELLA knockout plants exhibit an increased leaf area
due to an increased rate of cell proliferation (Achard et al., 2009). Further investigation of this
phenotype revealed that DELLAs promote the expression of several CKIs; KRP2, SIM1, SMR1,
SMR2 (Achard et al., 2009). As CKIs negatively regulate the progression of the cell-‐cycle, the
absence of DELLA activity in the quadruple DELLA knockout is therefore thought to drive an
increase cell-‐proliferation through a de-‐repression CKI-‐mediated cell-‐cycle inhibition. Over-‐
expression of the APC subunits, CDC27a and APC10 has also been shown to increase the rate
of cell proliferation in the developing leaf (Rojas et al., 2009, Eloy et al., 2011). As the APC is
required for mitotic progression, an increase in APC activity (through increased abundance of
its subunits), leads to an elevated mitotic rate.
As well as explaining observed increases in proliferation rate during organ growth,
manipulation of the cell-‐cycle machinery has also been shown to affect the duration of cell
proliferation during organ formation. As described in section 1.5.4, cyc3;1-‐3 triple knockout
leaves and petals have a reduced duration of cell proliferation (Dewitte et al., 2007). This has
led to a suggestion that CYCLIN D3s act as gatekeeper proteins, promoting the maintenance of
the mitotic cell-‐cycle and blocking entrance into the endocycle (Dewitte et al., 2007).
Consistent with this is the observation that the large organ-‐size phenotype of plants over-‐
expressing AINTEGUMENTA (ANT), is associated with increased CYCD3 expression (Mizukami
and Fischer, 2000). Over-‐expression of ANT – an AP2-‐domain transcription factor – results in
enlarged leaves with more cells, and conversely ant mutant leaves are smaller and have fewer
cell (Mizukami and Fischer, 2000). ANT over-‐expression causes an increased duration of cell
proliferation, which is consistent with the observed increase in CYCD3 expression, further
supporting a role for CYCD3 in the maintenance of mitotic competence (Mizukami and Fischer,
2000).
1.6.3 – Regulating cell expansion via the endocycle
As discussed in section 1.3.3, some mechanisms of cell expansion are accompanied by
endoreduplication (Sugimoto-‐Shirasu and Roberts, 2003). It is therefore possible that
regulation of the switch to, and the persistence of the endocycle will have a significant impact
on cell expansion in developing organs.
46
The switch from the mitotic cell-‐cycle to the endocycle may be governed by the antagonistic
influences of factors that promote mitosis and endocycling respectively. Because exit from the
mitotic cell cycle is a pre-‐requisite for entry to the endocycle, cell cycle regulators described in
section 1.6.2 that influence the duration of cell proliferation are also likely to be important in
determining the onset of the endocycle. The blurring of the boundaries between what is
negative regulation of the mitotic cell-‐cycle and promotion of the endocycle (and vice versa)
has made studies in this area difficult. For example, three recent papers disagree as to
whether the class I TCP, TCP15, is involved in the regulation of cell proliferation or cell
expansion (Kieffer et al., 2011, Li et al., 2012, Uberti-‐Manassero et al., 2012). Using
quantitative imaging, Kieffer et al report that TCP15 influences the expansion of the leaf blade
as a consequence of repressed cell proliferation in the developing leaf epidermis. Conversely,
Li et al (2012) suggest that TCP15 represses endoreduplication in trichomes and cotyledon cells.
This disagreement is consistent with the apparent context-‐dependent role of the class I TCPs
(Kieffer et al., 2011, Li et al., 2012, Uberti-‐Manassero et al., 2012), however it also likely
reflects the coupled nature of the mitotic cell-‐cycle and the endocycle. The mitotic cell-‐cycle
and the endocycle both have G-‐ and S-‐phases, and therefore factors that can promote either
of these shared phases might enhance both types of cell-‐cycle. It is also worthwhile
considering that TCP15-‐dependent growth factors are likely only a subset of the total
population of growth factors that influence the cell-‐cycle. As such, the precise effect of altered
TCP15 expression is likely to be dependent on the background (in terms of cell-‐cycle
regulation) of each treatment and tissue. Indeed, Li et al (2012) only reported six cell-‐cycle
regulators differentially regulated by TCP15 (Li et al., 2012).
Knockout of RPT2a, a 26S proteasome regulatory subunit (see section 1.3.3), increases the
duration of cell expansion and, as a consequence, increases leaf size through an increase in cell
size (Sonoda et al., 2009). Further investigation of this mutant revealed that the G1 regulator,
CYCD3;1 and the S-‐phase regulators, CDC6b, CDT1a, CDT1b, HISH4 and CYCA3;1, were up-‐
regulated in rpt2a-‐2 mutants (Sonoda et al., 2009). The number of cells in rpt2a-‐2 leaves
remains similar to the wild-‐type throughout development, suggesting that the increase in cell
size is a consequence of enhanced endocycling (rate or duration), but not due to a
consequence of early mitotic exit (Sonoda et al., 2009). As the endocycle consists only of a G-‐
phase and an S-‐phase, up-‐regulation of these G1-‐ and S-‐phase specific factors reflects the
increased persistence and/or up-‐regulation of the endocycle.
47
Recent work has pointed to chloroplast retrograde signalling promoting the onset of cell
expansion in the developing leaf (Andriankaja et al., 2012). This work showed that genes
involved in chloroplast differentiation were up-‐regulated prior to the appearance of the cell-‐
cycle arrest front, and that chemical inhibition of chloroplast differentiation blocked the cell-‐
cycle arrest front (Andriankaja et al., 2012). Chloroplast retrograde signalling in cultures of the
red algae, Cyanidioschyzon merolae activates CDKA and thereby initiates nuclear DNA
replication (Kobayashi et al., 2009). The reliance of nuclear DNA replication on chloroplast
differentiation shown by these studies may reflect a requirement for active plastids during S-‐
phase. The inhibition of cell proliferation by chloroplast differentiation can be uncoupled by
the addition of CDK inhibitors (aphidicolin or nalidixic acid), which permits chloroplast
differentiation without subsequent nuclear DNA replication (Kobayashi et al., 2009).
Arabidopsis CDKA levels are elevated in G1-‐ and S-‐phase (Dewitte and Murray, 2003) and thus
the up-‐regulation of CDKA in response to retrograde signalling is reminiscent of the up-‐
regulation of other G1-‐ and S-‐phase specific factors in the rpt2a-‐2 mutant, which has increased
endocycling and larger leaves (Sonoda et al., 2009).
1.7 – The ubiquitin system
The characterisation of the E3 ligases, DA2, EOD1 and SLY as bona fide regulators of organ
growth (McGinnis et al., 2003, Disch et al., 2006, Xia, 2013), as well as the identification of
other members of the ubiquitin pathway as growth regulators (Li et al., 2008, Rojas et al.,
2009), suggests that ubiquitination probably plays a key role in regulating organ growth, as in
most other biological processes. Furthermore, the importance of ubiquitin-‐dependent
proteolysis in the cell-‐cycle, a centrally important process at the heart of organ development
(section 1.6), further stresses the significance of ubiquitination in the establishment of final
organ size.
Ubiquitination is a reversible post-‐translation modification akin to phosphorylation, which
involves the ligation of ubiquitin (a short peptide molecule) to lysine residues on the surface of
substrate proteins (Hershko and Ciechanover, 1998). The ligation mechanism is a three-‐step
enzymatic process involving three classes of enzyme: E1-‐activating enzymes, E2-‐conjugating
enzymes and E3-‐ligases (Fig. 1.7). The ligation of ubiquitin can occur in variety of forms, from
single mono-‐ubiquitin molecules, to long-‐chain poly-‐ubiquitin molecules (Woelk et al., 2006,
Mallery et al., 2002, Disch et al., 2006, Petroski and Deshaies, 2003). Moreover, the inter-‐
molecular couplings and lengths of these chains can impart different signals, ranging from
enhancing modifications to labels for destruction (Mallery et al., 2002, Fang et al., 2000,
48
Stevenson et al., 2007). The following section describes the ubiquitination cascade and key
enzymatic steps, and explores the roles played by these enzymes in the regulation of organ
growth. Importantly, this section leverages the wealth of knowledge present in metazoan and
yeast ubiquitin-‐biology, and uses it to improve our understanding of the hitherto less
advanced field of plant ubiquitin-‐biology. Ubiquitination has a centrally important role in cell-‐
cycle regulation (Hershko and Ciechanover, 1998), which is a process at the core of both
cancer progression in animals (Vermeulen et al., 2003, Hartwell and Kastan, 1994) and organ
growth in plants (Inzé and De Veylder, 2006, Beemster et al., 2003).
1.7.1 – Ubiquitin: a small peptide with multiple signalling roles
Ubiquitin is a highly conserved 76 amino acid protein, whose structure is 100% conserved in
higher plants and differs by only three residues from animal ubiquitin (Callis et al., 1995). It is
expressed as an inactive precursor, as either an ubiquitin polymer, or fused to other peptide
sequences (Wiborg et al., 1985, Ozkaynak et al., 1987, Callis et al., 1995). Ubiquitin oligomers
are formed through the creation of an isopeptide linkage between a C-‐terminal glycine of
ubiquitin (Gly76) and a lysine residue on the substrate protein (Pickart and Fushman, 2004).
These can be single mono-‐ubiquitin moieties, such as those involved in the regulation of EPS15
(Woelk et al., 2006). They can also be long chain poly-‐ubiquitin signals, such as those seen on
BRCA2 and MDM2 in animals and EOD1 and DA2 in Arabidopsis (Mallery et al., 2002, Disch et
al., 2006, Xia, 2013, Fang et al., 2000).
Poly-‐ubiquitin chains can be formed through two distinct processes; an isopeptide linkage
between the C-‐terminal Gly76 and a lysine residue on the preceding ubiquitin (Pickart and
Fushman, 2004), or through head-‐to-‐tail ‘linear’ chains where the N-‐terminal Met1 is
conjugated to Gly76 through a peptide linkage (Kirisako et al., 2006). There are seven lysine
residues on ubiquitin (K6, K11, K27, K29, K31, K48 and K63), therefore seven possible (non-‐
linear) poly-‐ubiquitin architectures are available. All seven linkages have been identified in vivo
in yeast (Peng et al., 2003), and all but K6 and K27 have been identified in Arabidopsis (Saracco
et al., 2009). The different linkages are thought to confer different signals to the substrate
protein, with K48 linked chains generally associated with signalling proteasome-‐mediated
degradation (Jacobson et al., 2009), and other linkages thought to have a variety of functions
including enzyme activation (Mallery et al., 2002, Woelk et al., 2006). The structure and
function of poly-‐ubiquitin chains is discussed in detail in section 5.1.3.
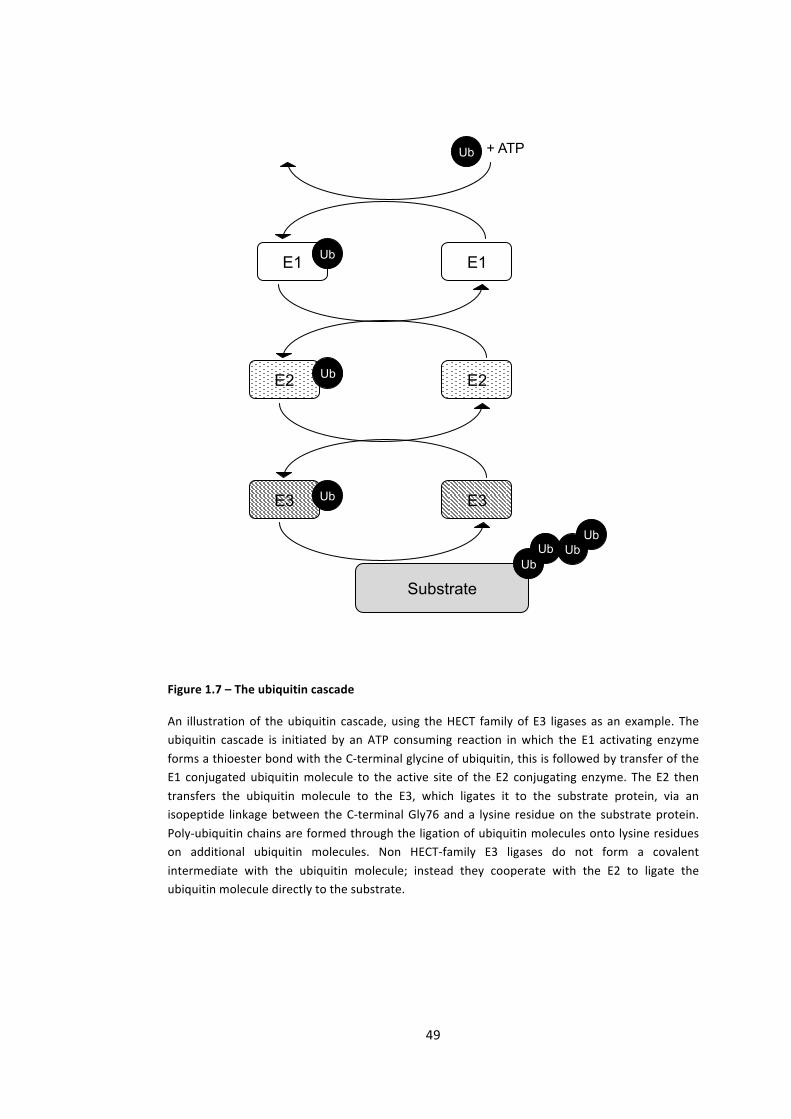
49
E1 E1
E2 E2
E3 E3
Ub
Ub
Ub
Substrate Ub
Ub Ub Ub
Ub + ATP
Figure 1.7 – The ubiquitin cascade
An illustration of the ubiquitin cascade, using the HECT family of E3 ligases as an example. The ubiquitin cascade is initiated by an ATP consuming reaction in which the E1 activating enzyme forms a thioester bond with the C-‐terminal glycine of ubiquitin, this is followed by transfer of the E1 conjugated ubiquitin molecule to the active site of the E2 conjugating enzyme. The E2 then transfers the ubiquitin molecule to the E3, which ligates it to the substrate protein, via an isopeptide linkage between the C-‐terminal Gly76 and a lysine residue on the substrate protein. Poly-‐ubiquitin chains are formed through the ligation of ubiquitin molecules onto lysine residues on additional ubiquitin molecules. Non HECT-‐family E3 ligases do not form a covalent intermediate with the ubiquitin molecule; instead they cooperate with the E2 to ligate the ubiquitin molecule directly to the substrate.
50
1.7.2 – E1 activating enzymes: ATP-‐dependent ubiquitin activation
As described above, the mechanism of ligating an ubiquitin molecule to its substrate is a three-‐
step process involving three classes of enzyme (Fig. 1.7). The first step in this process is the
conjugation of free ubiquitin to the E1 activating enzyme in an ATP-‐consuming step. This
reaction, via an ubiquitin-‐adenylate intermediate, results in the formation of a high energy
thiolester linkage between the ubiquitin and a catalytic cysteine residue on the E1 (Hatfield et
al., 1997, Hershko and Ciechanover, 1998).
The Arabidopsis genome encodes two E1 genes (UBA1 and UBA2) (Hatfield et al., 1997), one of
which has been shown to play a role in plant innate immunity and to have an organ-‐size
phenotype in certain genetic backgrounds (Goritschnig et al., 2007). A 15bp deletion in the C-‐
terminal region of Arabidopsis UBA1 (named mos5 (modifier of snc1 5)) was able to rescue the
dwarf phenotype of the npr1-‐1 snc1 double mutant, which has constitutively activated defence
responses (Goritschnig et al., 2007). Reduced plant growth is a characteristic defence
response and can be seen in various assays for pathogen challenge (Gómez‐Gómez et al.,
1999, Gómez-‐Gómez and Boller, 2000, Zipfel et al., 2006). This highlights an overlap between
plant development and the pathogen response, which is supported by observations that the
well characterised growth regulator, TCP14 (Kieffer et al., 2011) is also a central hub in the
plant immune system network (Mukhtar et al., 2011). Therefore, in addition to the mos5
phenotype implicating UBA1 in the defence response, it may reveal a potential link to core
developmental growth control.
1.7.3 – E2 conjugating enzymes: transferring ubiquitin to substrates
After activation of the ubiquitin monomer, the E1-‐thiolester-‐bound ubiquitin is transferred to
a thiol group on the active site cysteine of the E2 enzyme. In spite of there being only two E1
enzymes in Arabidopsis, the fact that only UBA1 has a pathogen response phenotype, suggests
that there may be some degree of selectivity in its downstream interactions with E2s
(Goritschnig et al., 2007). Indeed, data from animal systems demonstrates that the Human E1s,
UBA1 and UBE6, have different E2 binding preferences (Jin et al., 2007). This idea that the E1-‐
E2 interaction is to some extent specific, is supported by observations that UBA1 binds to E2
enzymes with a greater affinity when it is ubiquitinated (Haas et al., 1988, Ye and Rape, 2009).
This in turn suggests that the thiolester-‐ubiquitin status of the E1 might serve to recruit the E2
to the E1 (Ye and Rape, 2009). Perhaps in a similar fashion to the proposed recruitment of
UIM-‐containing proteins by E3-‐bound ubiquitin, in the process of coupled mono-‐ubiquitination
(Woelk et al., 2006).
51
The E2 conjugating step is the second tier of the ubiquitin cascade and E2 enzymes have a
significant influence on target protein specificity. This is reflected in the increased number of
E2s (relative to E1s); analysis of the Arabidopsis genome sequence predicted 37 E2s in 12
subfamilies (Vierstra, 1996, Sadanandom et al., 2012). E2 conjugating enzymes are responsible
for catalysing the transfer of ubiquitin to the substrate proteins, and E3 enzymes, although
often necessary, are typically only required to coordinate the E2-‐substrate interaction. Indeed,
although most E2s appear to be inactive without an E3, the Arabidopsis E2s, UBCE, UBC2 and
UBC8 have all been shown to ubiquitinate substrates in vitro in the absence of E3 enzymes
(Wiborg et al., 2008).
In animal systems, E2 enzymes have been shown to influence cell proliferation rate and cancer
progression. Over-‐expression of the human E2, UBCH10, the expression of which is elevated in
many primary tumours, results in an increase in cell proliferation (Okamoto et al., 2003). This
increase in cell proliferation is likely to be a direct consequence of UBCH10 being the
preferential binding partner of the APC E3 ligase (Summers et al., 2008), and therefore its
over-‐expression is likely to lead to accelerated mitotic cell-‐cycling. Indeed UBCH10 over-‐
expression was shown to be sufficient to promote APC-‐mediated degradation of securin, a key
anaphase inhibitor (Pellman and Christman, 2001, Summers et al., 2008).
1.7.4 – E3 ligases: coordinating and specifying the ligation of ubiquitin to substrates
E3 ligase enzymes are responsible for the final step of the ubiquitin cascade, where they
coordinate the E2-‐mediated ligation of ubiquitin to the target protein. Due to their role in
specifying the ligation of ubiquitin, there are large numbers of E3 genes; for example there are
1415 predicted in Arabidopsis (Mazzucotelli et al., 2006). E3 ligases are unified by their
biochemical function and not their structure or sequence. Whereas all E3 ligases act to
facilitate the ligation of E2-‐ubiquitin to the relevant target protein, their group as a whole
contains both monomeric and multimeric proteins of varying sequence divergence
(Mazzucotelli et al., 2006).
Despite their functional conservation, E3 ligases are an extremely diverse group of enzymes. In
terms of structure, there are two groups of E3 ligase; monomeric E3s, where E2-‐binding
domains and substrate binding domains are on the same polypeptide, and multimeric E3s.
Multimeric E3s consist of an E2-‐interacting module, and a target-‐specifying module joined by a
CUL (CULLIN) or CUL-‐like protein; (Mazzucotelli et al., 2006) (Fig. 5.1).
E3 ligases can also be split into two groups based on their E2-‐binding domains, characterised
by the presence of either a HECT (Homology to E6-‐AP C-‐Terminus) domain or a RING (Really
52
Interesting New Gene)/U-‐box domain. All HECT E3s, including UPL3 (UBIQUITIN PROTEIN
LIGASE 3) -‐ a regulator of trichome development (Downes et al., 2003), are monomeric E3s;
whereas RING E3s exist as both monomeric E3s and as subunits in multimeric modular E3
complexes (Mazzucotelli et al., 2006). Some RING E3s, such as EOD1 (Disch et al., 2006) and
the negative regulator of ABA signalling KEG (KEEP ON GOING) (Stone et al., 2006), as well as
the closely related PLANT U-‐BOX (PUB) E3s, including PUB12 and PUB13 (Lu et al., 2011), are
single polypeptide E3s. Whereas the RING protein atRBX1 (RING BOX PROTEIN1), the
knockdown of which causes severe developmental phenotypes such as poorly developed
leaves and loss of apical dominance (Lechner et al., 2002), is part of a multimeric E3 ligase.
RBX1 is the E2-‐binding subunit of SCF (SKP1-‐CULLIN-‐F-‐BOX), CUL3-‐BTB/POZ (CULLIN-‐3 – BRIC-‐
A-‐BRAC, TRAMTRACK and BROAD COMPLEX/POX VIRUS and ZINC FINGER), and CUL4-‐DDB1
(UV-‐DAMAGED DNA-‐BINDING PROTEIN1) E3 ligases; henceforth termed the cullin-‐ring ligases
(CRLs) (Mazzucotelli et al., 2006). All E3 ligases, except HECT E3s, simply act to coordinate the
ligation of the E2-‐conjugated ubiquitin to the substrate, without themselves covalently binding
the ubiquitin. HECT E3 ligases, however, form a thioester intermediate with the ubiquitin
molecule before ligation to the substrate.
As discussed in section 1.7.4, the activity of the human APC, a multimeric E3 ligase, can
influence the rate of cell proliferation through manipulating the spindle checkpoint arrest
(Okamoto et al., 2003, Summers et al., 2008). This is consistent with evidence that over-‐
expression of Arabidopsis CDC27a (an APC subunit) in tobacco is sufficient to increase cell
proliferation in the SAM (see section 1.3.1) (Rojas et al., 2009). The Arabidopsis APC has at
least 11 subunits (Capron et al., 2003, Gieffers et al., 2001) and a multitude of interacting
proteins (Fülöp et al., 2005), presenting multiple possibilities for manipulating cell-‐proliferation
rate. The molecular basis of the CDC27a overexpression-‐dependent increase in cell
proliferation is thought to be an increase in APC-‐mediated ubiquitin-‐directed degradation of
mitotic cyclins (Irniger et al., 1995), anaphase inhibitors (Pellman and Christman, 2001), and
regulators of DNA replication (Capron et al., 2003), which together accelerate the exit from M-‐
phase and increase the rate of cell proliferation.
Another example relating ubiquitination to growth in Arabidopsis is that of the F-‐BOX protein
SLY1 (see section 1.5.1). Its knockdown causes reduction in leaf area through a decrease in cell
proliferation rate (McGinnis et al., 2003, Dill et al., 2004). Unlike the APC, the targets of SLY1
are not at the level of the cell-‐cycle, instead they are DELLA proteins (Dill et al., 2004), which
are negative regulators of gibberellin-‐dependent growth promotion (Hauvermale et al., 2012,
53
Davière and Achard, 2013, Dixit, 2013). This indicates that E3 ligases mediate multiple
processes that influence growth.
Knockout mutations of two E3 ligases, EOD1/BB and DA2 (Disch et al., 2006, Xia, 2013), have
large-‐organ phenotypes, which are caused by a prolonged duration of cell proliferation during
organ formation. Despite their well-‐characterised organ size phenotypes, little is known about
their targets. As discussed in section 1.5.4, the observation that mutations in these genes are
not compensated for by decreased cell expansion might suggest that their substrates are
involved in spatial sensing during organ growth.
As well as those E3 ligases that have well characterised organ-‐size phenotypes (already
discussed in this section), there are also E3 ligases and complex components that are involved
in pathways linking organ growth and development. These include the RING E3 ligase, KEEP ON
GOING (KEG), which is a negative regulator of ABA signalling (Stone et al., 2006) and the F-‐BOX
proteins EBF1 and EBF2 (EIN3-‐BINDING F-‐BOX), which promote growth via repression of
ethylene action (Gagne et al., 2004); both of which are linked to phytohormone growth
responses. The F-‐BOX protein, UFO (UNUSUAL FLORAL ORGANS) is a regulator of meristem
development and floral organ identity in Arabidopsis (Levin and Meyerowitz, 1995), and due to
the intimate relationship between organ size, shape and identity (discussed in section 1.2.2),
its activities are also relevant to organ development in general.
Studies of cancer cell biology are much more advanced that those of plant development, and
as a consequence have identified many E3 ligases involved in the regulation of cell
proliferation (Nakayama and Nakayama, 2006). Despite significant differences between cancer
progression and the establishment of final organ size in plants, because they share the process
of cell proliferation, some degree of comparison is likely to be fruitful. Furthermore, as
regulation of the cell-‐cycle is centrally important for cell-‐proliferation control in both systems,
understanding the involvement of E3 ligases in the regulation of the cell-‐cycle in cancer
progression may shed valuable light on the role of ubiquitination in the control of final organ
size.
The F-‐BOX protein SKP2 is an oncogenic E3 ligase subunit in humans, and has been shown to
promote cell proliferation by targeting several CKIs for proteolytic degradation (Nakayama and
Nakayama, 2006). Although there are thought to be many targets of SKP2 (Nakayama and
Nakayama, 2006), its primary target is considered to be p27 (Sutterlüty et al., 1999), which is a
CKI involved in negatively regulating the G1-‐S-‐phase transition and whose over-‐expression
represses cell proliferation (Vlach et al., 1996). Conversely, the F-‐BOX E3 subunit FBW7 is a
54
tumour suppressor and acts to restrict cell proliferation through the negative regulation of
cell-‐cycle promoters including CYCLIN E (Nakayama and Nakayama, 2006, Tetzlaff et al., 2004).
CYCLIN E is a promoter of the G1-‐S-‐phase transition and therefore its ubiquitin-‐directed
degradation, mediated by FBW7, is thought to repress cell-‐cycling (Tetzlaff et al., 2004,
Nakayama and Nakayama, 2006).
These examples from mammalian cancer biology demonstrate the potential roles played by E3
ligases in the promotion and repression of cell proliferation through direct regulation of cell-‐
cycle promoters and repressors. Despite the fact that some mammalian E3 ligases and cell-‐
cycle regulators do not have homologs in higher plants, the overall close similarities in the
regulation of cell cycle progression, such as the common functions of proliferation promoting
cyclins and repressive CKIs (Dewitte and Murray, 2003), indicates that exploring these systems
may lead to the identification of new E3 ligases.
1.7.6 – Ubiquitin-‐like proteins also modulate protein function
In addition to ubiquitin, many organisms including higher plants encode ubiquitin-‐like proteins
(UBLs). Although their sequences are relatively diverse, with sequence similarity ranging from
~50% (RUB (RELATED TO UBIQUITIN)) to ~20% (mammalian AUT7) (Jentsch and Pyrowolakis,
2000, Schwartz and Hochstrasser, 2003), all UBLs share a similar tertiary structure known as
the ubiquitin fold (Miura and Hasegawa, 2010, Hochstrasser, 2009). All UBLs are also
conjugated in to their substrate in a similar way to ubiquitin; through an ɛ-‐amido linkage or
isopeptide bond between the C-‐terminal glycine of the UBL and a lysine on the target protein
(Miura and Hasegawa, 2010, Kerscher et al., 2006). In addition, all UBL conjugation pathways
also involve E1-‐like, E2-‐like and E3-‐like proteins in a conjugation cascade.
The UBL, HUB1, which is involved in yeast cell polarisation (Dittmar et al., 2002), and which has
also been identified in Arabidopsis (Downes and Vierstra, 2005), has a relatively poorly
understood conjugation cascade. SUMO (SMALL UBIQUITIN-‐RELATED MODIFIER) and RUB
have been relatively well characterised in animals and plants and use hetero-‐dimeric E1
complexes and specialist E2-‐conjugating enzymes (Miura and Hasegawa, 2010). SUMO and
RUB are activated by the hetero-‐dimeric E1 complexes SAE1-‐SAE2 (Castaño-‐Miquel et al.,
2013) and AXR1-‐ECR1/AXL1-‐ECR1 (Hotton et al., 2011) respectively. In addition SUMO and RUB
utilise the specialised E2-‐conjugating enzymes SCE1 and RCE1 respectively (Dharmasiri et al.,
2007, Miura and Hasegawa, 2010, Jentsch and Pyrowolakis, 2000). Specialist E3-‐ligase enzymes
are also required for ligating UBLs; SIZ1 and HPY2 are involved in sumoylation (Ishida et al.,
2009, Miura et al., 2010) and RBX1/ROC in rubylation (Miura and Hasegawa, 2010).
55
Although rubylation and sumoylation are the best-‐studied processes in plant UBL biology,
rubylation appears to be a significantly more restricted process as its only known substrates
are the cullin subunits of multimeric E3 ligases (Miura and Hasegawa, 2010). Here it plays a
significant role in the regulation of multimeric E3 activity and specificity (Duda et al., 2008,
Merlet et al., 2009). This is discussed in more detail in section 5.1.2. In contrast, sumoylation
has been shown to be involved in a variety of biological processes including phytohormone
signalling, cold-‐tolerance, meiosis, DNA damage responses and chloroplast development
(Miura et al., 2007, Budhiraja et al., 2009, Miura et al., 2009, Miura and Hasegawa, 2010).
Furthermore, sumoylation plays a role in regulating the transition from cell-‐proliferation to
cell-‐expansion, with the SUMO E3 ligase HIGH PLOIDY 2 (HPY2) characterised as a negative
regulator of the endocycle in Arabidopsis (Ishida et al., 2009). This study revealed that hpy2
mutants suffer premature mitotic exit and, as a consequence, have a dwarfed phenotype with
defective meristems (Ishida et al., 2009). In addition, the SUMO E3 ligase SIZ1 is involved in
regulating the salicylic-‐acid-‐mediated growth response, with siz1 mutants exhibiting a dwarfed
phenotype (Miura et al., 2010). This phenotype includes a reduced leaf area and reduced root
biomass, as a consequence of altered cell proliferation and cell expansion respectively (Miura
et al., 2010).
This chapter has reviewed the current state of knowledge surrounding the processes
governing organ formation and the setting of organ size in animals and plants. It has focused
on the contribution made by cell proliferation and cell expansion in the developing organ, and
detailed the identities and mechanisms of action of the key regulators of these processes.
Drawing on studies from animal systems, this chapter has explored possible models to explain
the apparent size-‐checkpoint system that is evidenced by the presence of a compensation
mechanism in plant organ development. It has also focused on the role played by the cell cycle
in the regulation of organ size, and in particular on how modification of the cell cycle can drive
changes in the rate and duration of both cell proliferation and cell expansion. The importance
of the process of ubiquitination in the cell-‐cycle and other organ-‐growth regulatory pathways
has also been explored and the enzymatic processes underpinning ubiquitination have been
discussed in detail.
This thesis focuses on the role played by DA1 in the regulation of organ size in Arabidopsis.
Chapter 3, the first results chapter, focuses on the structure of the DA1 protein and the role
played by its individual domains in DA1 biochemistry and DA1-‐dependent growth regulation.

56
Chapter 4 explores the DA1 interactome through a yeast-‐2-‐hybrid screen and seeks to link DA1
to upstream signalling events as well as to downstream regulation of the cell-‐cycle. Chapter 5
looks in detail at the DA1-‐EOD1 and DA1-‐DA2 interactions and explores the role played by DA1
in the regulation of growth through the Arabidopsis ubiquitin system. Complementing the
function analysis of DA1 in Chapters 3-‐5, Chapter 6 describes two large scale genetic analyses
conducted to screen for novel regulators of organ growth in Arabidopsis, as well as to
investigate whether natural variation at the DA1 locus is utilised as a growth regulator by
natural populations.
57
Chapter 2 -‐ Materials and Methods
2.1 – Reagents
General reagents used in this thesis were purchased from Merk Chemicals Ltd. (Nottingham,
UK), Sigma-‐Aldrich Company Ltd. (Gillingham UK), Melford Laboratories Ltd. (Ipswich, UK),
New England Biolabs UK Ltd. (Herts, UK), Qiagen Ltd. (Manchester, UK), Bio-‐Rad Laboratories
Ltd. (Herts, UK), and Santa Cruz Biotechnology Inc. (Texas, USA). Reagents used for ubiquitin
biochemistry were obtained from Boston Biochem Inc. (Massachusetts, USA).
2.2 – Recombinant DNA work
Some constructs described in this thesis were made by Neil McKenzie (Bevan Lab).
2.2.1 – Agarose gel electrophoresis
0.8% or 1% agarose gels were made by dissolving agarose in 1x TRIS-‐acetate-‐EDTA (TAE). The
agarose was mixed with TAE and heated in a microwave oven until boiling and dissolution of
the agarose. The solution was cooled at room temperature before being mixed with 0.005%
(v/v) ethidium bromide and poured into a custom gel tray. The gel was then left to set at room
temperature. When set, the gel was placed in a custom gel tank and immersed in 1% TAE.
Samples were mixed with 10X DNA loading buffer (0.25% (w/v) Bromophenol Blue, 0.01%
(w/v) SDS , 4% (w/v) glycerol, and 0.5 mM EDTA) and loaded in either 10μl or 20μl aliquots
onto the gel. Samples were run in parallel with 3μl of 1Kb DNA Ladder (New England BioLabs)
at 80-‐150V. Gels were analysed using an AlphaImager EP gel analyser (Alpha Innotech, USA).
2.2.2 – PCR amplification of DNA
All PCR protocols used dNTP solutions made from a 100mM dNTP stock solution consisting of
dATP, dGTP, dCTP, dTTP (Promega U1240). PCRs were carried out in either individual PCR
tubes (4titude 4TI-‐0790), strips of eight PCR tubes (4titude 4TI-‐0780) or 96 well PCR plates
(Fisher Scientific 11757533), and were run using the PTC200 PCR machine (MJ Research).
2.2.2.1 – High fidelity PCR amplification of DNA
High fidelity PCR was used to amplify cDNA in the cloning of whole gene coding sequences.
The cDNA used in this thesis was kindly provided by Mathilde Seguela. This protocol uses the
Phusion® High-‐Fidelity DNA Polymerase kit from New England BioLabs Ltd (M0530S). It is a
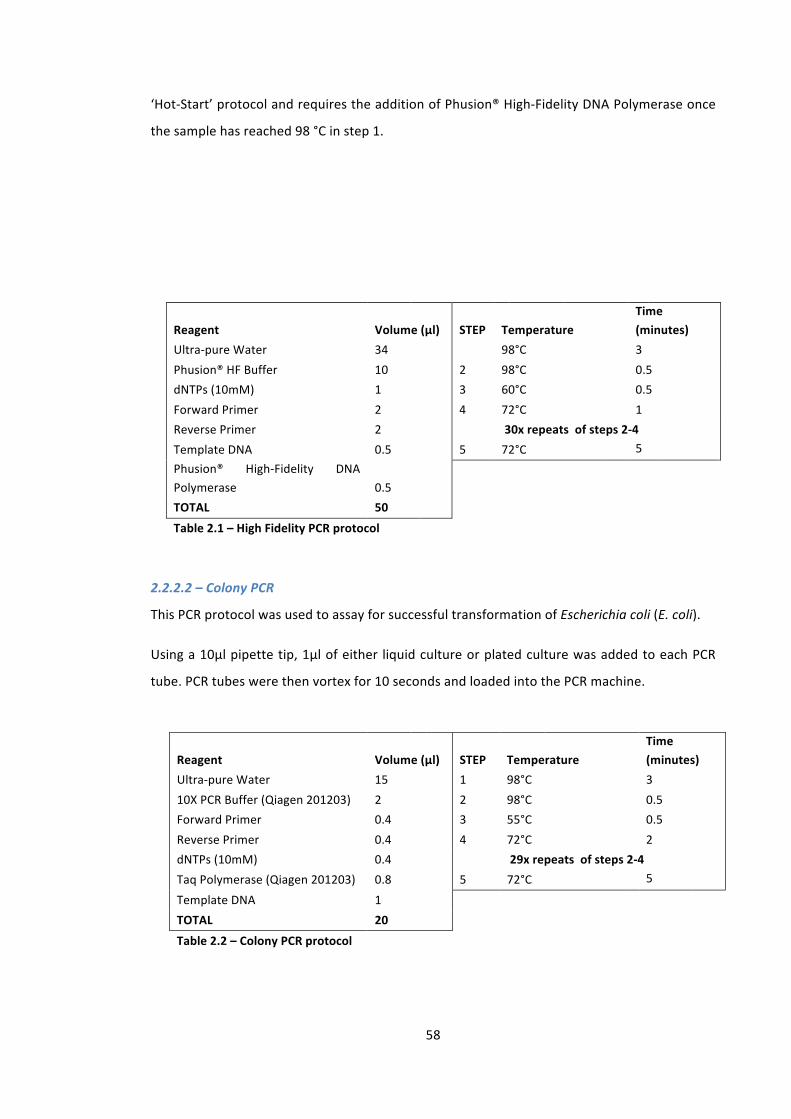
58
‘Hot-‐Start’ protocol and requires the addition of Phusion® High-‐Fidelity DNA Polymerase once
the sample has reached 98 °C in step 1.
2.2.2.2 – Colony PCR
This PCR protocol was used to assay for successful transformation of Escherichia coli (E. coli).
Using a 10μl pipette tip, 1μl of either liquid culture or plated culture was added to each PCR
tube. PCR tubes were then vortex for 10 seconds and loaded into the PCR machine.
Reagent Volume (μl) STEP Temperature Time (minutes)
Ultra-‐pure Water 15 1 98°C 3 10X PCR Buffer (Qiagen 201203) 2 2 98°C 0.5 Forward Primer 0.4 3 55°C 0.5 Reverse Primer 0.4 4 72°C 2 dNTPs (10mM) 0.4 29x repeats of steps 2-‐4
Taq Polymerase (Qiagen 201203) 0.8 5 72°C 5
Template DNA 1
TOTAL 20
Table 2.2 – Colony PCR protocol
Reagent Volume (μl) STEP Temperature Time (minutes)
Ultra-‐pure Water 34 1 98°C 3 Phusion® HF Buffer 10 2 98°C 0.5 dNTPs (10mM) 1 3 60°C 0.5 Forward Primer 2 4 72°C 1 Reverse Primer 2
30x repeats of steps 2-‐4
Template DNA 0.5 5 72°C 5 Phusion® High-‐Fidelity DNA Polymerase 0.5
TOTAL 50
Table 2.1 – High Fidelity PCR protocol
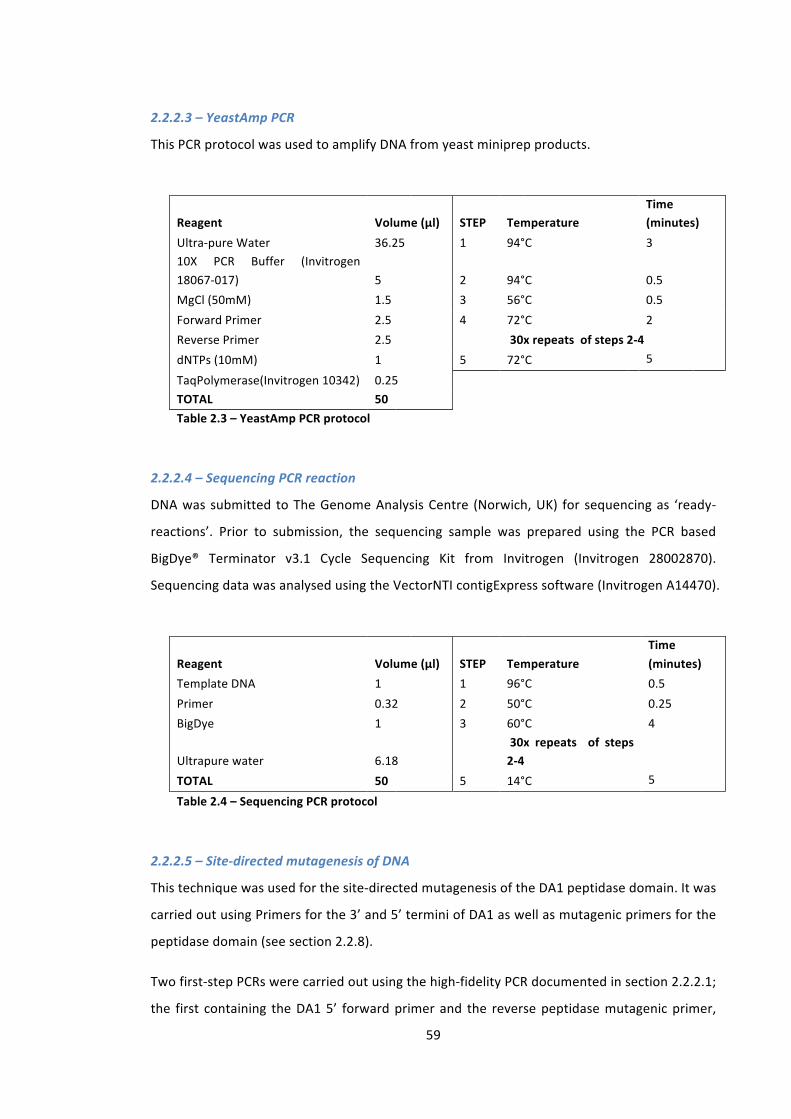
59
2.2.2.3 – YeastAmp PCR
This PCR protocol was used to amplify DNA from yeast miniprep products.
Reagent Volume (μl) STEP Temperature Time (minutes)
Ultra-‐pure Water 36.25 1 94°C 3 10X PCR Buffer (Invitrogen 18067-‐017) 5 2 94°C 0.5 MgCl (50mM) 1.5 3 56°C 0.5 Forward Primer 2.5 4 72°C 2 Reverse Primer 2.5 30x repeats of steps 2-‐4
dNTPs (10mM) 1 5 72°C 5
TaqPolymerase(Invitrogen 10342) 0.25
TOTAL 50
Table 2.3 – YeastAmp PCR protocol
2.2.2.4 – Sequencing PCR reaction
DNA was submitted to The Genome Analysis Centre (Norwich, UK) for sequencing as ‘ready-‐
reactions’. Prior to submission, the sequencing sample was prepared using the PCR based
BigDye® Terminator v3.1 Cycle Sequencing Kit from Invitrogen (Invitrogen 28002870).
Sequencing data was analysed using the VectorNTI contigExpress software (Invitrogen A14470).
Reagent Volume (μl) STEP Temperature Time (minutes)
Template DNA 1 1 96°C 0.5 Primer 0.32 2 50°C 0.25 BigDye 1 3 60°C 4
Ultrapure water 6.18 30x repeats of steps 2-‐4
TOTAL 50 5 14°C 5
Table 2.4 – Sequencing PCR protocol
2.2.2.5 – Site-‐directed mutagenesis of DNA
This technique was used for the site-‐directed mutagenesis of the DA1 peptidase domain. It was
carried out using Primers for the 3’ and 5’ termini of DA1 as well as mutagenic primers for the
peptidase domain (see section 2.2.8).
Two first-‐step PCRs were carried out using the high-‐fidelity PCR documented in section 2.2.2.1;
the first containing the DA1 5’ forward primer and the reverse peptidase mutagenic primer,
60
and the second containing the forward peptidase mutagenic primer and the DA1 3’terminus
reverse primer. PCR products from each reaction were purified using the PCR purification
technique described in section 2.3.3.2. A second high fidelity PCR reaction was carried out
using the products of both first-‐step PCRs and the DA1 5’ forward and 3’ reverse primers.
2.2.2.5 – Genotyping of transgenic plants
Using genomic DNA extracted from the appropriate plants (section 2.2.3.4) and the Colony PCR
protocol (2.2.2.2). PCRs using the T-‐DNA border primer (BP) and the right genomic primer (RP)
were used to detect the T-‐DNA insert, whereas PCRs using the left genomic primer (LP) and RP
were used to confirm no insertion. Homozygotes for the T-‐DNA insertion contained a BP-‐RP
PCR fragment only, heterozygotes contained both BP-‐RP and LP-‐RP PCR fragments, and wild-‐
type plants contained only LP-‐RP PCR fragments.
A similar technique was used to detect binary vector insertions in genomic DNA.
2.2.3 – DNA Purification
2.2.3.1 – DNA extraction from E.coli
Miniprep DNA extraction from E. coli was carried out using the Qiagen Spin Miniprep Kit
(Qiagen 27104), according to the manufacturer’s instructions. Samples were eluted in 30μl of
Qiagen Buffer EB.
Large quantities of DNA were extracted from E. coli using the Qiagen Plasmid Maxi Kit (Qiagen
12162), according to the manufacturer’s instructions. The DNA pellet was resuspended in
200μl in 1x ultrapure water.
2.2.3.2 – DNA extraction from PCR solutions and agarose gels
DNA was extracted from completed PCR reactions using the QIAquick PCR Purification Kit
(Qiagen 28104), according to the manufacturer’s instructions. Samples were eluted in 30μl
Qiagen Buffer EB.
Specific DNA fragments were extracted from completed PCR reactions and restriction digests
using the QIAquick Gel Extraction Kit (Qiagen Ltd 28704), according to the manufacturer’s
instructions. Samples were eluted in 30μl Qiagen Buffer EB.
2.2.3.3 – DNA extraction from yeast
DNA was extracted from yeast using the Qiagen Spin Miniprep Kit (Qiagen Ltd 27104) and a
modified protocol.
61
1.5ml of an overnight yeast culture (see section 2.7) was pelleted at 600x g for 2 minutes and
the supernatant discarded. 250μl Qiagen Buffer P1 (RNAase added) was mixed with 3μl
Zymolase (Zymo Research E1004) and added to the pelleted yeast. The pellet was resuspended
and incubated at 37 °C for one hour. Following incubation, the remainder or the Qiagen Spin
Miniprep Kit manufacturer’s protocol was followed (beginning with the addition of 250μl
Qiagen Buffer P2). Samples were eluted in 30μl Qiagen Buffer EB.
2.2.3.4 – DNA extraction from plants
A single leaf was placed in a 1.5ml eppendorf tube and ground with a disposable grinder in
150μl REB buffer (50mM TRIS-‐HCL pH8, 25mM EDTA, 250mM NaCl, 0.5% (w/v) SDS). 150μl
Phenol:Chlorophorm:Isoamyl alcohol (Sigma-‐Aldrich P3803) was added to each tube and
vortexed for 10 seconds, before centrifuging for 5minutes at 16 000x g. 130μl of the aqueous
phase was then transferred to a clean 1.5ml eppendorf tube, where the addition 110μl of
isopropanol was followed by centrifuging for 30 minutes at 16 000x g. The supernatant was
discarded, the pellet was washed with 50μl 70% ethanol, and the tube was centrifuged for a
further minute at 16 000x g. The ethanol supernatant was discarded and the pellet was left to
dry at room temperature for one hour, before being resuspended in 50μl of ultrapure water.
2.2.4 – Subcloning
2.2.4.1 – Restriction digestion of DNA
Restriction digests were carried out using restriction endonuclease enzymes purchased from
New England BioLabs (BamHI (R3136T/M), XhoI (R0146M), NotI (R3189M), SalI (R3138T/M),
NdeI (R0111S), NheI (R0131S), EcoRI (R0101S)) using the appropriate, designated buffers.
Restriction digests were carried out in a 20μl reaction volumes containing 1μl restriction
endonuclease, 2μl manufacturer’s reaction buffer and made up to 20μl with sample DNA or
ultrapure water. Restriction digests were carried out for two hours at 37°C.
2.2.4.2 – DNA ligation
DNA ligations were carried out using the LigaFast Rapid DNA Ligation System from Promega.
Reactions were carried out in a volume of 10μl, including 5μl 2x LigaFast Rapid Ligation Buffer
(Promega C671A) and 1μl T4 DNA ligase (Promega M1801). The amount of vector and insert
DNA was calculated using the following formula (from Promega) and the reaction volume was
made up to 10μl with nuclease-‐free water. Ligation reactions were incubated for 30 minutes at
room temperature.
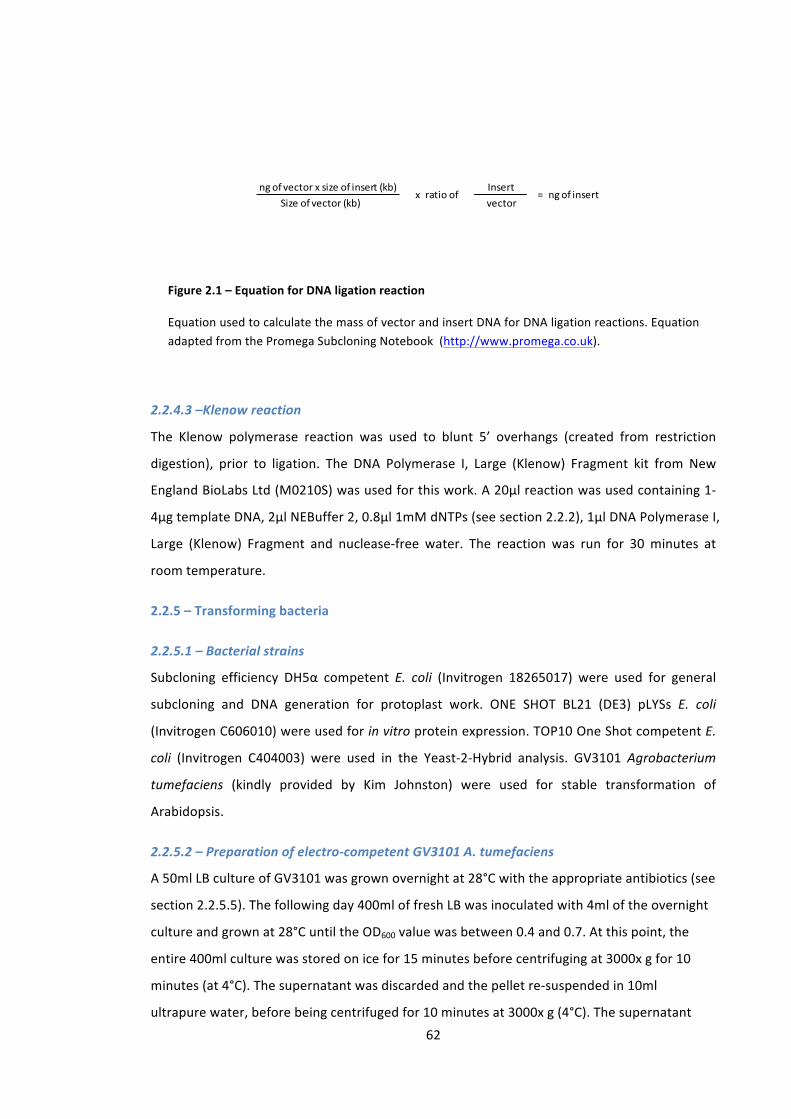
62
ngof vector x size of insert (kb) Size of vector (kb)
Insertx ratio of
vector= ng of insert
2.2.4.3 –Klenow reaction
The Klenow polymerase reaction was used to blunt 5’ overhangs (created from restriction
digestion), prior to ligation. The DNA Polymerase I, Large (Klenow) Fragment kit from New
England BioLabs Ltd (M0210S) was used for this work. A 20μl reaction was used containing 1-‐
4μg template DNA, 2μl NEBuffer 2, 0.8μl 1mM dNTPs (see section 2.2.2), 1μl DNA Polymerase I,
Large (Klenow) Fragment and nuclease-‐free water. The reaction was run for 30 minutes at
room temperature.
2.2.5 – Transforming bacteria
2.2.5.1 – Bacterial strains
Subcloning efficiency DH5α competent E. coli (Invitrogen 18265017) were used for general
subcloning and DNA generation for protoplast work. ONE SHOT BL21 (DE3) pLYSs E. coli
(Invitrogen C606010) were used for in vitro protein expression. TOP10 One Shot competent E.
coli (Invitrogen C404003) were used in the Yeast-‐2-‐Hybrid analysis. GV3101 Agrobacterium
tumefaciens (kindly provided by Kim Johnston) were used for stable transformation of
Arabidopsis.
2.2.5.2 – Preparation of electro-‐competent GV3101 A. tumefaciens
A 50ml LB culture of GV3101 was grown overnight at 28°C with the appropriate antibiotics (see
section 2.2.5.5). The following day 400ml of fresh LB was inoculated with 4ml of the overnight
culture and grown at 28°C until the OD600 value was between 0.4 and 0.7. At this point, the
entire 400ml culture was stored on ice for 15 minutes before centrifuging at 3000x g for 10
minutes (at 4°C). The supernatant was discarded and the pellet re-‐suspended in 10ml
ultrapure water, before being centrifuged for 10 minutes at 3000x g (4°C). The supernatant
Figure 2.1 – Equation for DNA ligation reaction
Equation used to calculate the mass of vector and insert DNA for DNA ligation reactions. Equation adapted from the Promega Subcloning Notebook (http://www.promega.co.uk).
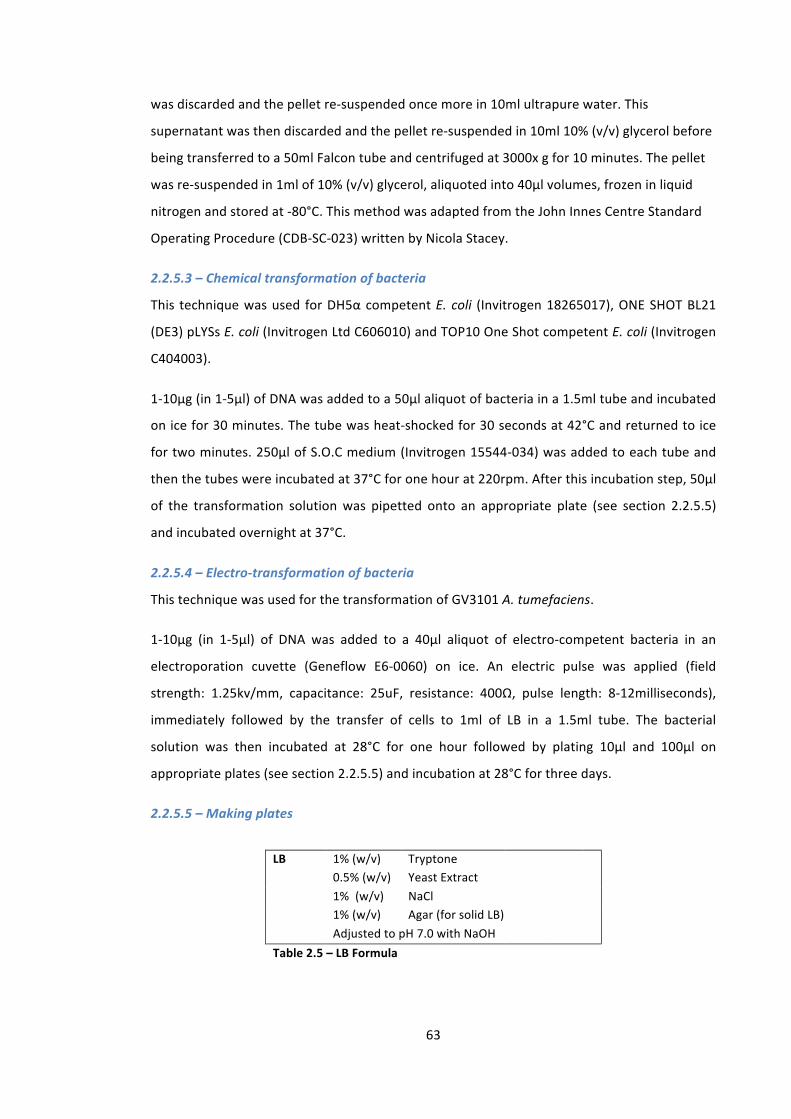
63
was discarded and the pellet re-‐suspended once more in 10ml ultrapure water. This
supernatant was then discarded and the pellet re-‐suspended in 10ml 10% (v/v) glycerol before
being transferred to a 50ml Falcon tube and centrifuged at 3000x g for 10 minutes. The pellet
was re-‐suspended in 1ml of 10% (v/v) glycerol, aliquoted into 40μl volumes, frozen in liquid
nitrogen and stored at -‐80°C. This method was adapted from the John Innes Centre Standard
Operating Procedure (CDB-‐SC-‐023) written by Nicola Stacey.
2.2.5.3 – Chemical transformation of bacteria
This technique was used for DH5α competent E. coli (Invitrogen 18265017), ONE SHOT BL21
(DE3) pLYSs E. coli (Invitrogen Ltd C606010) and TOP10 One Shot competent E. coli (Invitrogen
C404003).
1-‐10µg (in 1-‐5μl) of DNA was added to a 50μl aliquot of bacteria in a 1.5ml tube and incubated
on ice for 30 minutes. The tube was heat-‐shocked for 30 seconds at 42°C and returned to ice
for two minutes. 250μl of S.O.C medium (Invitrogen 15544-‐034) was added to each tube and
then the tubes were incubated at 37°C for one hour at 220rpm. After this incubation step, 50μl
of the transformation solution was pipetted onto an appropriate plate (see section 2.2.5.5)
and incubated overnight at 37°C.
2.2.5.4 – Electro-‐transformation of bacteria
This technique was used for the transformation of GV3101 A. tumefaciens.
1-‐10µg (in 1-‐5μl) of DNA was added to a 40μl aliquot of electro-‐competent bacteria in an
electroporation cuvette (Geneflow E6-‐0060) on ice. An electric pulse was applied (field
strength: 1.25kv/mm, capacitance: 25uF, resistance: 400Ω, pulse length: 8-‐12milliseconds),
immediately followed by the transfer of cells to 1ml of LB in a 1.5ml tube. The bacterial
solution was then incubated at 28°C for one hour followed by plating 10μl and 100μl on
appropriate plates (see section 2.2.5.5) and incubation at 28°C for three days.
2.2.5.5 – Making plates
LB 1% (w/v) Tryptone 0.5% (w/v) Yeast Extract 1% (w/v) NaCl 1% (w/v) Agar (for solid LB) Adjusted to pH 7.0 with NaOH Table 2.5 – LB Formula

64
100ml of LB agar (sufficient volume for three 90mm petri dishes) was melted in a microwave
and left to cool at room temperature. When cooled, relevant antibiotics were added to their
respective final concentrations (kanamycin 50µg.ml-‐1, ampicillin 100µg.ml-‐1, gentamycin
10µg.ml-‐1, spectinomycin 50µg.ml-‐1, carbenicillin 100µg.ml-‐1, rifampicin 25µg.ml-‐1) and plates
were poured. When making plates for A. tumefaciens, all antibiotics, with the exception of
rifampicin, were added at half the concentrations stated above.
2.2.6 – Vectors
The vectors used in this thesis are listed in the following table. Their vector maps can be seen
in (Fig.S1).
2.2.7 – Primers
All primers used in this thesis were purchased from either from Sigma Genosys (Sigma-‐Aldrich)
or Metabion International AG, Germany.
Vector Name Vector Type Vector Layout Reference pAM-‐GW-‐YFPc Binary Vector 35S-‐Gateway-‐YFPc Lefebvre et al, 2010
pAM-‐GW-‐YFPn Binary Vector 35S-‐Gateway-‐YFPn Lefebvre et al, 2010
pAM-‐YFPn-‐GW Binary Vector 35S-‐YFPn-‐Gateway-‐ Lefebvre et al, 2010
pAM-‐YFPc-‐GW Binary Vector 35S-‐YFPc-‐Gateway-‐ Lefebvre et al, 2010
pEarleyGate 201 Binary Vector 35S-‐HA tag-‐Gateway-‐ Earley et al, 2006
pw1211 Binary Vector 35S-‐Gateway-‐FLAG tag Phil Wigge, SLCU
pMDC32 Binary Vector 35S-‐Gateway-‐FLAG tag (Curtis and Grossniklaus, 2003)
pAmiR Binary Vector 35S-‐amiRNA (Schwab et al., 2006)
pGEX4T2 In vitro expression Ptac-‐GST-‐polylinker GE Life Science
pGEX4T1 In vitro expression Ptac-‐GST-‐polylinker GE Life Science
pET24a In vitro expression T7-‐polylinker-‐HIS Novagen
peTnT In vitro expression T7-‐FLAG-‐HA-‐polylinker-‐HIS Adapted from Novagem
Table 2.6 – Vectors used in this thesis
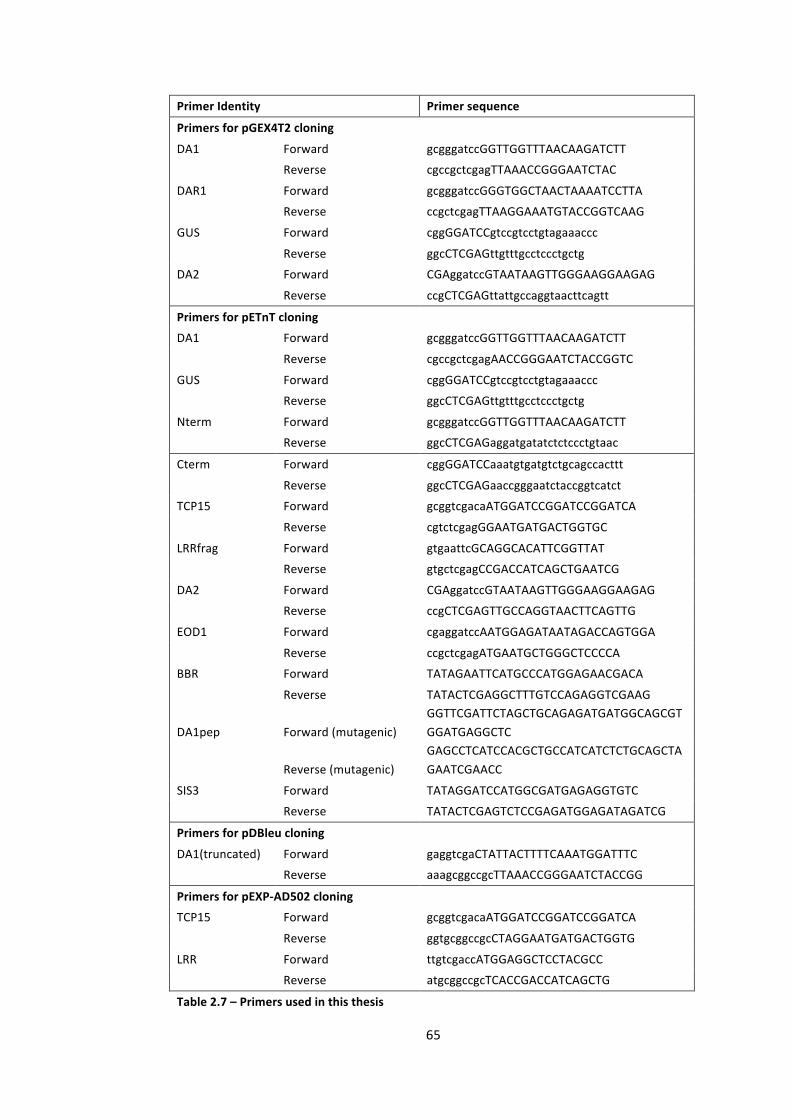
65
Primer Identity Primer sequence
Primers for pGEX4T2 cloning
DA1 Forward gcgggatccGGTTGGTTTAACAAGATCTT
Reverse cgccgctcgagTTAAACCGGGAATCTAC
DAR1 Forward gcgggatccGGGTGGCTAACTAAAATCCTTA
Reverse ccgctcgagTTAAGGAAATGTACCGGTCAAG
GUS Forward cggGGATCCgtccgtcctgtagaaaccc
Reverse ggcCTCGAGttgtttgcctccctgctg
DA2 Forward CGAggatccGTAATAAGTTGGGAAGGAAGAG
Reverse ccgCTCGAGttattgccaggtaacttcagtt
Primers for pETnT cloning
DA1 Forward gcgggatccGGTTGGTTTAACAAGATCTT
Reverse cgccgctcgagAACCGGGAATCTACCGGTC
GUS Forward cggGGATCCgtccgtcctgtagaaaccc
Reverse ggcCTCGAGttgtttgcctccctgctg
Nterm Forward gcgggatccGGTTGGTTTAACAAGATCTT
Reverse ggcCTCGAGaggatgatatctctccctgtaac
Cterm Forward cggGGATCCaaatgtgatgtctgcagccacttt
Reverse ggcCTCGAGaaccgggaatctaccggtcatct
TCP15 Forward gcggtcgacaATGGATCCGGATCCGGATCA
Reverse cgtctcgagGGAATGATGACTGGTGC
LRRfrag Forward gtgaattcGCAGGCACATTCGGTTAT
Reverse gtgctcgagCCGACCATCAGCTGAATCG
DA2 Forward CGAggatccGTAATAAGTTGGGAAGGAAGAG
Reverse ccgCTCGAGTTGCCAGGTAACTTCAGTTG
EOD1 Forward cgaggatccAATGGAGATAATAGACCAGTGGA
Reverse ccgctcgagATGAATGCTGGGCTCCCCA
BBR Forward TATAGAATTCATGCCCATGGAGAACGACA
Reverse TATACTCGAGGCTTTGTCCAGAGGTCGAAG
DA1pep Forward (mutagenic) GGTTCGATTCTAGCTGCAGAGATGATGGCAGCGTGGATGAGGCTC
Reverse (mutagenic) GAGCCTCATCCACGCTGCCATCATCTCTGCAGCTAGAATCGAACC
SIS3 Forward TATAGGATCCATGGCGATGAGAGGTGTC
Reverse TATACTCGAGTCTCCGAGATGGAGATAGATCG
Primers for pDBleu cloning
DA1(truncated) Forward gaggtcgaCTATTACTTTTCAAATGGATTTC
Reverse aaagcggccgcTTAAACCGGGAATCTACCGG
Primers for pEXP-‐AD502 cloning
TCP15 Forward gcggtcgacaATGGATCCGGATCCGGATCA
Reverse ggtgcggccgcCTAGGAATGATGACTGGTG
LRR Forward ttgtcgaccATGGAGGCTCCTACGCC
Reverse atgcggccgcTCACCGACCATCAGCTG
Table 2.7 – Primers used in this thesis

66
Primers for Sequencing
T7 Forward AATACGACTCACTATAGG
Reverse GCTAGTTATTGCTCAGCG
pDBleu Forward CAAGCTATACCAAGCATACAATC
Reverse ACCTCTGGCGAAGAAGTCCAAAGC
pEXP-‐AD502 Forward Tataacgcgtttggaatcact
Reverse Taaatttctggcaaggtagac
pAMIR Forward ATATAAGGAAGTTCATTTCATTTGGAG
Reverse Gagcctcgacatgttgtcgc
p35S Forward Tcgcaagacccttcctctatataagga
M13 Forward Gtaaaacgacggccag
Reverse Caggaaacagctatgac
Primers for pENTr cloning
DA1 Forward caccATGGGTTGGTTTAACAAGATC
Reverse (STOP) TTAAACCGGGAATCTACCGGTC
Reverse (NO STOP) AACCGGGAATCTACCGGTCATC
DA2 Forward caccATGGGTAATAAGTTGGGAAGGA
Reverse (STOP) ccgCTCGAGttattgccaggtaacttcagtt
Reverse (NO STOP) ccgCTCGAGTTGCCAGGTAACTTCAGTTG
EOD1 Forward caccATGAATGGAGATAATAGA
Reverse (STOP) TCAATGAATGCTGGGCTCC
Reverse (NO STOP) ATGAATGCTGGGCTCCCCA
BBR Forward caccATGCCCATGGAGAACGAC
Reverse (NO STOP) GCTTTGTCCAGAGGTCGAAG
Primers for plant genotyping
da1ko1 Salk_126092 LP AAGCCAGCTAAATATGATTGG
Salk_126092 RP AATCCGTTTGGAACTCGTTTG
tcp14 N108688 SMLP CGCTTCCACTTTTAGCCCTAATAACATA
N108688 SMRP TGTTTTTGTGTGTGTCTAATCTTGCTGAT
N108688 3’dSpm32 TACGAATAAGAGCGTCCATTTTAGAGTGA
tcp15 SALK_011491 LP AGAACCACGTAAGCCCATCTC
SALK_011491 RP CACCACTACTCCAAAACGGTG
eod1-‐2 SALK_045169 LP GAGCGATGCATCTCTAACCAC
SALK_045169 RP AGTAGGAACAGAAAGCAGGGG
da2-‐1 SALK_150003 LP AGATGATGAAGACGGTGTTGC
SALK_150003 RP AGCTCGGCCTACTCAGTATCC
dar1-‐1 SALK_067100 LP ATTTAGTCGAAGCCATGCATG
SALK_067100 RP TTACAAGGAGCAGCATCATCC
tcp22 Salk 027490 LP CGCATGAAGTACCAAGCTCTC
Salk 027490 RP AATGTGGTGCCTCAACCTATG
LBb1
GCGTGGACCGCTTGCTGCAACT
LBa1
TGGTTCACGTAGTGGGCCATCG
Table 2.7 – Primers used in this thesis

67
2.3 – Plant growth
2.3.1 – Plant material
All Arabidopsis lines used in this work were accessions, RILs, mutants or T-‐DNA insertion lines
of Arabidopsis thaliana (assistance with Arabidopsis work was kindly provided by Caroline
Smith and Fiona Corke from the Bevan Lab).
The lines used in Chapters 3-‐5 are listed in Table 2.8. T-‐DNA insertion lines were genotyped
using the DNA extraction protocol in section 2.2.3.4, the colony PCR protocol in section 2.2.2.2
and the primers listed in section 2.2.8.
The analysis described in Chapter 6 uses the Multiparent Advanced Generation Inter-‐Cross
(MAGIC) population described in Kover et al (2009), and a Swedish subset of the 1001
genomes project population (Weigel & Mott 2009). The MAGIC lines were kindly provided by
Phil Wigge at the Sainsbury Laboratory Cambridge University, Cambridge. The Swedish
accessions were kindly provided by Caroline Dean at the John Innes Centre, Norwich. The
identities of the Swedish accessions used in the GWAs analysis are listed in Table. S2.
Arabidopsis Line T-‐DNA/Mutation
Col-‐0 N/A
da1ko1 Salk_126092
tcp14 N108688
tcp15 SALK_011491
bak1-‐4 SALK_116202.39.60
eod1-‐2 SALK_045169
da2-‐1 SALK_150003
dar1-‐1 SALK_067100
tcp22 SALK_027490
da1-‐1 Mutant (Li et al 2009)
Table 2.8 – Arabidopsis lines used in this thesis
2.3.2 – Growth conditions
All mature Arabidopsis plants were grown in compost composing of eight parts peat-‐based
compost (Levington F2 soil, N150:P200: K200mg/L, pH=5.3-‐5.7) and one part grit.
For the GWAs analysis, five seeds of each accession were sown into randomised strips of five
P40 pots (five seeds per pot, 25 seeds per accession). Plants were stratified at 4°C for three
68
days and vernalised at for six weeks under 30µM white light (seedlings were thinned after one
week of vernalisation to leave one seedling per plot). After vernalisation plants were moved to
growth chambers until flowering (16h light / 8h dark cycle, 20°C day, 80% humidity, 170µM
white light). During growth, pots were moved (randomly) to different positions within the
growth chamber.
For the MAGIC analysis, plants were stratified for three days and vernalised for 4 weeks in
short days under 30µM white light. After vernalisation plants were moved to growth chambers
until flowering (16h light / 8h dark cycle, 21°C day/17°C night, 80% humidity, 170µM white
light).
For the phenotyping of plants in Chapters 3-‐5, seeds were sown in FP9 pots, stratified for three
days at 4°C and then moved directly to growth chambers (20°C, 16 hours light, 8 hours dark).
After one week of growth, seedlings were pricked out into randomly assigned positions in P24
trays and moved back into the same growth chamber.
For the Agrobacterium-‐mediated transformation of plants (see section 2.3.3), seeds were sown
in FP9 pots, stratified for three days at 4°C and then moved directly to glass-‐house conditions
(16h light / 8h dark cycle supplemented with 120 µmol m-‐2 s-‐1 fluorescent lighting, 21-‐23°C
day, 16°C night). After one week, 12 seedlings were transplanted to individual pots in P24 trays
and returned to the same glass-‐house conditions until inflorescence bolts emerged. For cross
pollination of Arabidopsis, a similar procedure was followed, except that individual seedlings
were pricked out into individual F7 pots.
2.3.3 – Agrobacterium-‐mediated transformation of Arabidopsis
10ml LB (with appropriate antibiotics (see section 2.2.5.5)) was inoculated with A. tumefaciens
and incubated at 28°C for 2 days at 200rpm. 1ml of this 10ml culture was used to inoculate a
new 400ml culture, which was then incubated overnight at 28°C and 200rpm.
The following day the culture was centrifuged for 10 minutes at 3000x g and the supernatant
discarded. The pellet was resuspended in 400ml transformation buffer (0.5xMS salts, 0.5g.l-‐1
MES, 5% sucrose, 300μl.l-‐1 Silwet L-‐77 (Lehle Seeds, Texas, USA VIS-‐01) and prepared plants
(see section2.3.2) were dipped into this solution for 30 seconds (with gentle agitation). After
dipping, plants were laid on their sides and covered with plastic to maintain humidity. Plants
were left overnight and then returned to an upright position and moved into the glasshouse
conditions described in section 2.3.2.

69
When ripe, seed was manually threshed. Threshed seed was sterilised by shaking 100μl of seed
in a 1.5ml tube containing 1ml sterilisation solution (50% (v/v) ethanol and 0.625% (w/v)
dichloroisocyanuric acid) for 18 minutes. Immediately afterwards, the sterilisation solution was
removed and seeds were washed with 3x 1ml 100% ethanol. Seeds were left to dry on sterile
filter paper. Once sterile, seeds were sown on GM plates (0.43% (w/v) Murashige and Skoog,
1% (w/v) sucrose, 0.01% (w/v) inositol, 10ppm (w/v) thiamine, 50ppm (w/v) pyridoxine,
50ppm (w/v) nicotinic acid, 0.05% (w/v) MES, 9% (w/v) agar, pH 5.7) with the appropriate final
concentration of antibiotic (spectinomycin-‐ 25μl.μl-‐1) and incubated at 20°C, in 24 hour light,
for 10-‐15 days. Transformed seedlings were selected based on their antibiotic resistance.
2.3.4 – Crossing plants
Maternal flowers (see section 2.3.2 for growth conditions) were selected before opening, and
the immature anthers were removed from all flowers of a single inflorescence, then a mature
paternal flower was introduced (using forceps) to the paternal flower and the paternal anther
was rubbed on the stigmatic surface of the maternal plant. The relevant inflorescence was
labelled seeds were harvested when ripe. Seedlings were grown in individual P40 pots (in
glass-‐house conditions documented in section 2.3.2) and genotyped as described in section
2.3.1.
2.3.5 – Phenotyping plants
2.3.5.1 – Petal and seed area measurements
Individual petals were harvested from the first flowers to form on each plant. These were then
stuck to a custom black perspex background using transparent adhesive tape. Petals were
scanned using a desktop scanner (Hewlett Packard Scanjet 4370) at a high resolution
(<3600dpi). Images were stored as black and white 8-‐bit images, and subjected to image
analysis using the ImageJ software (http://rsbweb.nih.gov/ij/) -‐ see Box 2.3.5.1 for details.
Seed area was measured using the same protocol, with the exception that seeds were
scattered in a petri dish and scanned against a white background.
2.3.5.2 – Inflorescence stem height
Inflorescence stem height was measured a 28 days after bolting (rather than after sowing) to
ensure that all plants were at a developmentally equivalent stage. The length of the stem was
measured from its base to its most distal tip, using a ruler.
70
2.4 – Brassinosteroid root growth assay
Seeds were sterilised using the protocol described in section 2.3.3 and then added to a 1.5ml
tube with 1ml sterile water. The tube was vortexed for 10 seconds, then wrapped in tin foil
and left at 4°C for seven days to stratify. 100mm square plates were made with modified ½ MS
(0.22% (w/v) Murashige and Skoog, 1% (w/v) sucrose, 0.8% (w/v) phytoagar, pH5.7) including
epibrassinolide (Sigma-‐Aldrich E1641) at the appropriate concentration. Seeds were placed on
to plates at a rate of ten per treatment per genotype (a total of 30 seeds per plate). Plates
were placed upright in a growth chamber (20°C, 16 hours light, 8 hours dark) for 9 days. Roots
were carefully unravelled, plates were scanned in a desktop scanner (Hewlett Packard Scanjet
4370), and root lengths calculated using ImageJ software (http://rsbweb.nih.gov/ij/). This
method was kindly provided by the Zipfel Group, The Sainsbury Lab, Norwich, UK.
2.5 – In vitro protein biochemistry
2.5.1 – Western Blots
20%, 12% or 4-‐20% precast SDS-‐polyacrylamide gels (RunBlue NXG02012, NXG01227,
NXG42027) were submerged in RunBlue SDS-‐TRIS-‐tricine run buffer (RunBlue NXB0500), in a
gel tank (Atto Japan AE6450) Samples were mixed with 2x Laemmli sample buffer (Bio-‐Rad Ltd
161-‐0737) placed in a heat block for 10 minutes at 96°C and then loaded into rinsed wells in
the gel in either 10μl or 20μl aliquots. The gels were run at 160V for 60 minutes along with a
Box 2.1 -‐ Instructions for ImageJ analysis
Open image in ImageJ and set threshold (Ctrl+Shift+T) such that all petals are completely red and most other structures are not. Select all petals with the “rectangular selection” tool and chose the analyse option (Analyze > Analyze Particles). In the dialog box set a size threshold to exclude smaller (non-‐petal) structures and large structures such as aggregations of petals. Do this by choosing a minimum value of half the mean petal size and a maximum value of twice the mean petal size (check by eye to ensure accuracy). Additionally, ensure that “Display results”, “Exclude on edges” and “Include holes” are enabled and click “OK”.
This protocol is adapted from the John Innes Centre standard operating procedure CDB-‐SC-‐022, written by Nicola Stacey.
71
3ul aliquot of PageRuler Plus Prestained Protein Ladder, 10 to 250kDa (Fermentas 26619). If
appropriate, gels were stained at this stage (see section 2.5.1.1).
Transfers were carried out using the Bio-‐Rad Mini Trans-‐Blot® Cell kit (Bio-‐Rad 170-‐3836). Gels
were removed from their glass casing and laid on top of a sponge (from Bio-‐Rad Mini Trans-‐
Blot® Cell kit), two pieces of chromatography paper (VWR WHAT3030-‐917) and a methanol-‐
washed PVDF membrane (Roche Diagnostics 03010040001). Air bubbles were removed from
between the gel and membrane and then two further pieces of Whatman paper and a sponge
were applied to the gel. This was enclosed in a gel holder cassette (from Bio-‐Rad Mini Trans-‐
Blot® Cell kit), submerged in transfer buffer (25mM TRIS, 192mM glycine, 10% (v/v) methanol)
and run at 90V for 70 minutes at 4°C.
Following the transfer the membrane was washed for 10 minutes in 50ml PBS (140mM NaCl,
2.7mM KCl, 10mM Na2HPO4, 1.8mM KH2PO4, pH 7.3) at room temperature, before being
agitated in 50ml blocking solution (5% (w/v) milk powder, 0.1% (v/v) Tween-‐20) for either one
hour at room temperature or overnight at 4°C. Primary antibodies were diluted to their
appropriate concentration (see Table 2.9) in blocking solution and incubated with the
membrane (10ml per membrane with gentle agitation) for one hour before five washes with
50ml PBST (140mM NaCl, 2.7mM KCl, 10mM Na2HPO4, 1.8mM KH2PO4, 0.1% (v/v) Tween-‐
20,pH 7.3) at room temperature. If secondary antibody was required, staining and washing
steps were repeated.
The washed membrane was held with forceps and carefully one corner was blotted onto blue-‐
roll to remove excess moisture. It was then laid in a petri dish and treated with peroxidise
substrate (SuperSignal West FEMTO Max. Sensitivity substrate (Fisher Scientific PN34095)) at a
rate of 800μl substrate per membrane. Membranes were left in this substrate for five minutes,
dried as before and placed in an X-‐ray cassette under a piece of X-‐ray film (Fuji Film X-‐RAY
18x24cm – (FujiFilm 497772RXNO)). X-‐ray films were developed using a Konica SRX-‐101 Table
Top X-‐ray film developer (Konica 106931659).
Subsequent to analysis, if required, membranes were washed in 50ml PBST and stained with
10ml Ponceau S solution (Sigma-‐Aldrich P7170) for 30 minutes, followed by a single wash in
50ml PBST and drying at room temperature.
2.5.1.1 – Staining protein gels
Protein gels were stained by agitation with InstantBlue Coomassie stain (Expedeon ISB1L) for
30 minutes at room temperature (20ml per gel).
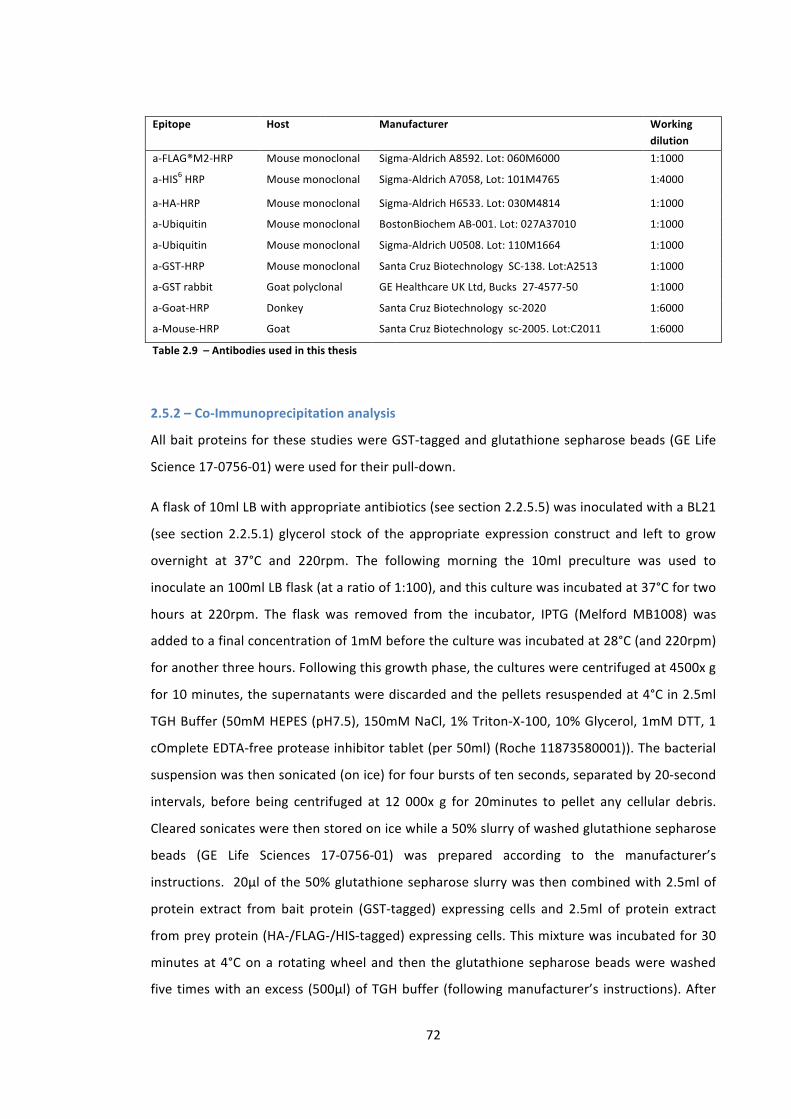
72
Epitope Host Manufacturer Working dilution
a-‐FLAG®M2-‐HRP Mouse monoclonal Sigma-‐Aldrich A8592. Lot: 060M6000 1:1000
a-‐HIS6 HRP Mouse monoclonal Sigma-‐Aldrich A7058, Lot: 101M4765 1:4000
a-‐HA-‐HRP Mouse monoclonal Sigma-‐Aldrich H6533. Lot: 030M4814 1:1000
a-‐Ubiquitin Mouse monoclonal BostonBiochem AB-‐001. Lot: 027A37010 1:1000
a-‐Ubiquitin Mouse monoclonal Sigma-‐Aldrich U0508. Lot: 110M1664 1:1000
a-‐GST-‐HRP Mouse monoclonal Santa Cruz Biotechnology SC-‐138. Lot:A2513 1:1000
a-‐GST rabbit Goat polyclonal GE Healthcare UK Ltd, Bucks 27-‐4577-‐50 1:1000
a-‐Goat-‐HRP Donkey Santa Cruz Biotechnology sc-‐2020 1:6000
a-‐Mouse-‐HRP Goat Santa Cruz Biotechnology sc-‐2005. Lot:C2011 1:6000
Table 2.9 – Antibodies used in this thesis
2.5.2 – Co-‐Immunoprecipitation analysis
All bait proteins for these studies were GST-‐tagged and glutathione sepharose beads (GE Life
Science 17-‐0756-‐01) were used for their pull-‐down.
A flask of 10ml LB with appropriate antibiotics (see section 2.2.5.5) was inoculated with a BL21
(see section 2.2.5.1) glycerol stock of the appropriate expression construct and left to grow
overnight at 37°C and 220rpm. The following morning the 10ml preculture was used to
inoculate an 100ml LB flask (at a ratio of 1:100), and this culture was incubated at 37°C for two
hours at 220rpm. The flask was removed from the incubator, IPTG (Melford MB1008) was
added to a final concentration of 1mM before the culture was incubated at 28°C (and 220rpm)
for another three hours. Following this growth phase, the cultures were centrifuged at 4500x g
for 10 minutes, the supernatants were discarded and the pellets resuspended at 4°C in 2.5ml
TGH Buffer (50mM HEPES (pH7.5), 150mM NaCl, 1% Triton-‐X-‐100, 10% Glycerol, 1mM DTT, 1
cOmplete EDTA-‐free protease inhibitor tablet (per 50ml) (Roche 11873580001)). The bacterial
suspension was then sonicated (on ice) for four bursts of ten seconds, separated by 20-‐second
intervals, before being centrifuged at 12 000x g for 20minutes to pellet any cellular debris.
Cleared sonicates were then stored on ice while a 50% slurry of washed glutathione sepharose
beads (GE Life Sciences 17-‐0756-‐01) was prepared according to the manufacturer’s
instructions. 20μl of the 50% glutathione sepharose slurry was then combined with 2.5ml of
protein extract from bait protein (GST-‐tagged) expressing cells and 2.5ml of protein extract
from prey protein (HA-‐/FLAG-‐/HIS-‐tagged) expressing cells. This mixture was incubated for 30
minutes at 4°C on a rotating wheel and then the glutathione sepharose beads were washed
five times with an excess (500μl) of TGH buffer (following manufacturer’s instructions). After
73
washing, proteins were eluted with 35μl GST-‐elution buffer (50mM TRIS-‐glycine (pH8.0),
10mM reduced glutathione) over 30 minutes at 4°C before being analysed by western blot
analysis (see section 2.5.1).
2.5.3 – UIM binding assays
Proteins in this assay were GST-‐tagged and glutathione sepharose beads (GE Life Sciences 17-‐
0756-‐01) were used for their purification.
Bacteria was grown, induced and lysed as described in section 2.5.2 and the cleared sonicate
was subjected to Bradford analysis to calculate protein content (see section 2.5.6). A volume of
sonicate containing 4mg of protein was added to 20μl 50% glutathione sepharose (prepared as
in section 2.5.2) and incubated on a rotating wheel at 4°C for 30 minutes. The beads were then
washed with 1ml of TGH buffer and then added to 10µg ubiquitin (Boston Biochem, USA-‐
U100) to a volume of 100μl (Fisher et al., 2003). This was followed by rotation for two hours at
4°C. The beads were washed four times with 1ml TGH buffer and then added directly to 50μl
2x Laemmli sample buffer (Bio-‐Rad Ltd 161-‐0737) followed by western blot analysis (see
section 2.5.1).
2.5.4 – Ubiquitination assays
Proteins used in this assay were either GST-‐tagged, FLAG-‐tagged, or HIS-‐tagged. Purification of
these proteins used glutathione sepharose beads (GE Life Sciences 17-‐0756-‐01), Anti-‐FLAG M2
Magnetic Beads (Sigma-‐Aldrich M8823), and Dynabeads His-‐Tag Isolation & Pulldown
(Invitrogen Ltd 101-‐04D) respectively.
Bacteria were grown, induced and lysed as described in section 2.5.2, apart from the pellets
being re-‐suspended in 5ml TGH buffer without DTT. Cleared sonicates were then incubated (by
rotation) with either 100µl of 50% glutathione sepharose slurry or 100μl of the appropriate
magnetic bead (all of which were prepared according to the respective manufacturer’s
instructions) for 30 minutes at 4°C. Beads were then washed twice with 1ml TGH buffer
(without DTT) and twice with 1ml modified TGH buffer (without cOmplete EDTA-‐free protease
inhibitor tablet, DTT and Triton-‐X-‐100). Proteins were eluted from beads by incubating (by
rotation) for 30 minutes at 4°C with 100µl elution buffer (see Table 2.10). Purified proteins
were assessed for protein content using Bradfords assay (see section 2.5.6) and were aliquoted
and frozen at -‐80°C.
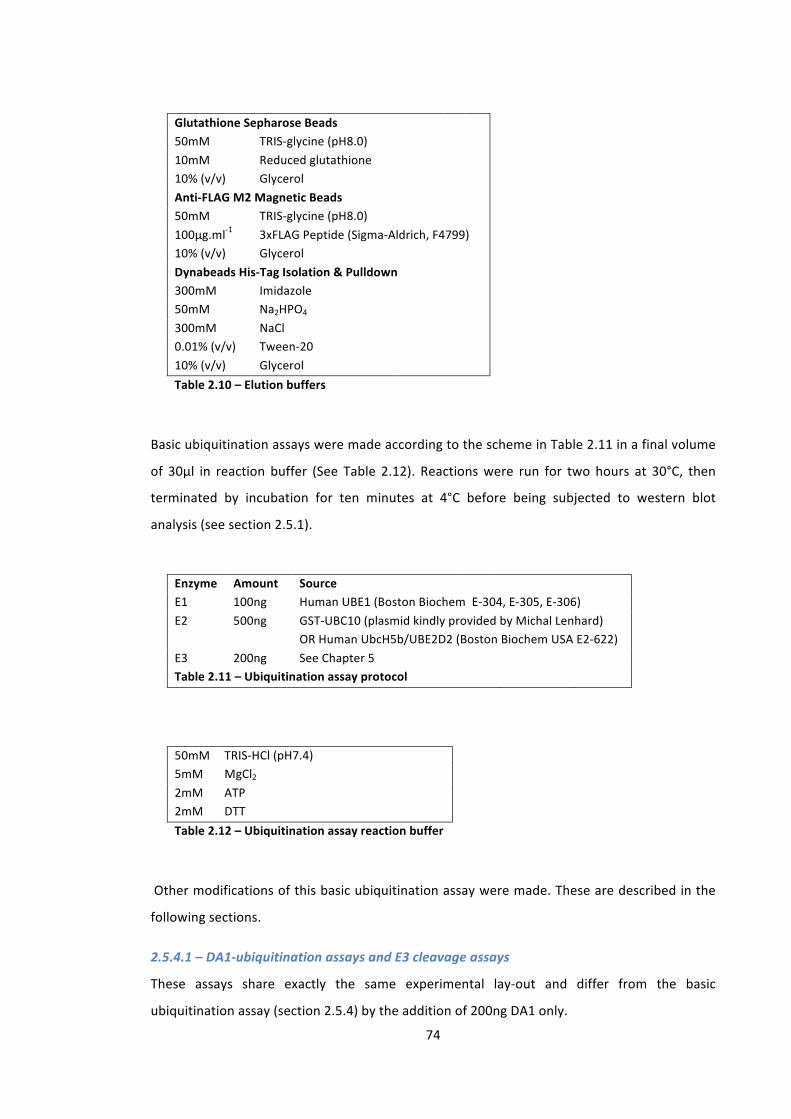
74
Glutathione Sepharose Beads 50mM TRIS-‐glycine (pH8.0) 10mM Reduced glutathione 10% (v/v) Glycerol Anti-‐FLAG M2 Magnetic Beads 50mM TRIS-‐glycine (pH8.0) 100µg.ml-‐1 3xFLAG Peptide (Sigma-‐Aldrich, F4799) 10% (v/v) Glycerol Dynabeads His-‐Tag Isolation & Pulldown 300mM Imidazole 50mM Na2HPO4 300mM NaCl 0.01% (v/v) Tween-‐20 10% (v/v) Glycerol Table 2.10 – Elution buffers
Basic ubiquitination assays were made according to the scheme in Table 2.11 in a final volume
of 30µl in reaction buffer (See Table 2.12). Reactions were run for two hours at 30°C, then
terminated by incubation for ten minutes at 4°C before being subjected to western blot
analysis (see section 2.5.1).
Enzyme Amount Source E1 100ng Human UBE1 (Boston Biochem E-‐304, E-‐305, E-‐306) E2 500ng GST-‐UBC10 (plasmid kindly provided by Michal Lenhard)
OR Human UbcH5b/UBE2D2 (Boston Biochem USA E2-‐622) E3 200ng See Chapter 5 Table 2.11 – Ubiquitination assay protocol
50mM TRIS-‐HCl (pH7.4) 5mM MgCl2 2mM ATP 2mM DTT Table 2.12 – Ubiquitination assay reaction buffer
Other modifications of this basic ubiquitination assay were made. These are described in the
following sections.
2.5.4.1 – DA1-‐ubiquitination assays and E3 cleavage assays
These assays share exactly the same experimental lay-‐out and differ from the basic
ubiquitination assay (section 2.5.4) by the addition of 200ng DA1 only.
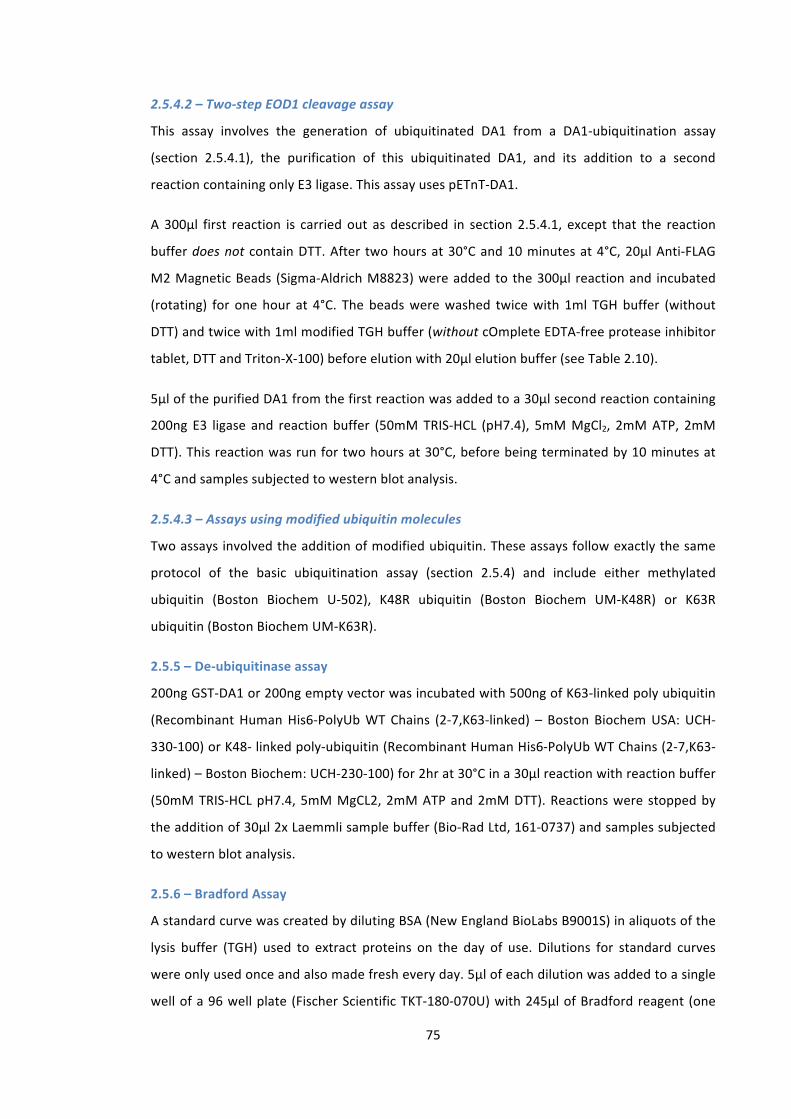
75
2.5.4.2 – Two-‐step EOD1 cleavage assay
This assay involves the generation of ubiquitinated DA1 from a DA1-‐ubiquitination assay
(section 2.5.4.1), the purification of this ubiquitinated DA1, and its addition to a second
reaction containing only E3 ligase. This assay uses pETnT-‐DA1.
A 300μl first reaction is carried out as described in section 2.5.4.1, except that the reaction
buffer does not contain DTT. After two hours at 30°C and 10 minutes at 4°C, 20µl Anti-‐FLAG
M2 Magnetic Beads (Sigma-‐Aldrich M8823) were added to the 300µl reaction and incubated
(rotating) for one hour at 4°C. The beads were washed twice with 1ml TGH buffer (without
DTT) and twice with 1ml modified TGH buffer (without cOmplete EDTA-‐free protease inhibitor
tablet, DTT and Triton-‐X-‐100) before elution with 20µl elution buffer (see Table 2.10).
5µl of the purified DA1 from the first reaction was added to a 30μl second reaction containing
200ng E3 ligase and reaction buffer (50mM TRIS-‐HCL (pH7.4), 5mM MgCl2, 2mM ATP, 2mM
DTT). This reaction was run for two hours at 30°C, before being terminated by 10 minutes at
4°C and samples subjected to western blot analysis.
2.5.4.3 – Assays using modified ubiquitin molecules
Two assays involved the addition of modified ubiquitin. These assays follow exactly the same
protocol of the basic ubiquitination assay (section 2.5.4) and include either methylated
ubiquitin (Boston Biochem U-‐502), K48R ubiquitin (Boston Biochem UM-‐K48R) or K63R
ubiquitin (Boston Biochem UM-‐K63R).
2.5.5 – De-‐ubiquitinase assay
200ng GST-‐DA1 or 200ng empty vector was incubated with 500ng of K63-‐linked poly ubiquitin
(Recombinant Human His6-‐PolyUb WT Chains (2-‐7,K63-‐linked) – Boston Biochem USA: UCH-‐
330-‐100) or K48-‐ linked poly-‐ubiquitin (Recombinant Human His6-‐PolyUb WT Chains (2-‐7,K63-‐
linked) – Boston Biochem: UCH-‐230-‐100) for 2hr at 30°C in a 30µl reaction with reaction buffer
(50mM TRIS-‐HCL pH7.4, 5mM MgCL2, 2mM ATP and 2mM DTT). Reactions were stopped by
the addition of 30µl 2x Laemmli sample buffer (Bio-‐Rad Ltd, 161-‐0737) and samples subjected
to western blot analysis.
2.5.6 – Bradford Assay
A standard curve was created by diluting BSA (New England BioLabs B9001S) in aliquots of the
lysis buffer (TGH) used to extract proteins on the day of use. Dilutions for standard curves
were only used once and also made fresh every day. 5µl of each dilution was added to a single
well of a 96 well plate (Fischer Scientific TKT-‐180-‐070U) with 245µl of Bradford reagent (one
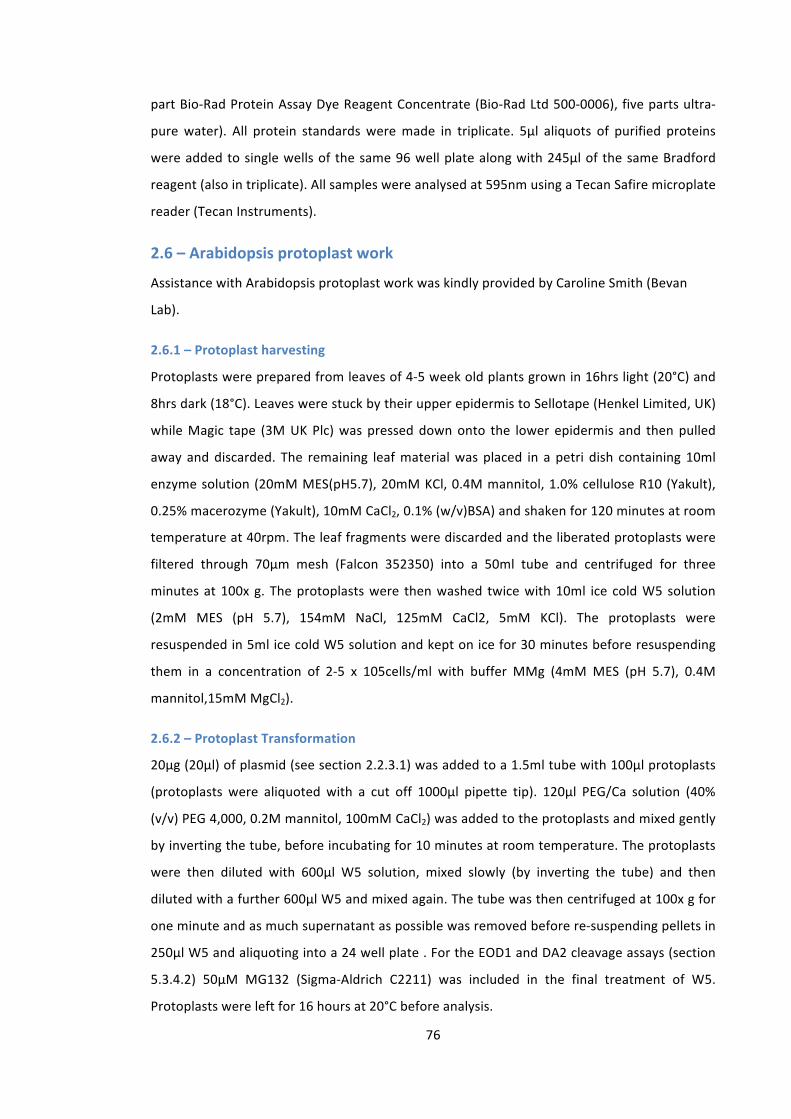
76
part Bio-‐Rad Protein Assay Dye Reagent Concentrate (Bio-‐Rad Ltd 500-‐0006), five parts ultra-‐
pure water). All protein standards were made in triplicate. 5µl aliquots of purified proteins
were added to single wells of the same 96 well plate along with 245µl of the same Bradford
reagent (also in triplicate). All samples were analysed at 595nm using a Tecan Safire microplate
reader (Tecan Instruments).
2.6 – Arabidopsis protoplast work
Assistance with Arabidopsis protoplast work was kindly provided by Caroline Smith (Bevan
Lab).
2.6.1 – Protoplast harvesting
Protoplasts were prepared from leaves of 4-‐5 week old plants grown in 16hrs light (20°C) and
8hrs dark (18°C). Leaves were stuck by their upper epidermis to Sellotape (Henkel Limited, UK)
while Magic tape (3M UK Plc) was pressed down onto the lower epidermis and then pulled
away and discarded. The remaining leaf material was placed in a petri dish containing 10ml
enzyme solution (20mM MES(pH5.7), 20mM KCl, 0.4M mannitol, 1.0% cellulose R10 (Yakult),
0.25% macerozyme (Yakult), 10mM CaCl2, 0.1% (w/v)BSA) and shaken for 120 minutes at room
temperature at 40rpm. The leaf fragments were discarded and the liberated protoplasts were
filtered through 70µm mesh (Falcon 352350) into a 50ml tube and centrifuged for three
minutes at 100x g. The protoplasts were then washed twice with 10ml ice cold W5 solution
(2mM MES (pH 5.7), 154mM NaCl, 125mM CaCl2, 5mM KCl). The protoplasts were
resuspended in 5ml ice cold W5 solution and kept on ice for 30 minutes before resuspending
them in a concentration of 2-‐5 x 10⁵cells/ml with buffer MMg (4mM MES (pH 5.7), 0.4M
mannitol,15mM MgCl2).
2.6.2 – Protoplast Transformation
20µg (20µl) of plasmid (see section 2.2.3.1) was added to a 1.5ml tube with 100μl protoplasts
(protoplasts were aliquoted with a cut off 1000µl pipette tip). 120µl PEG/Ca solution (40%
(v/v) PEG 4,000, 0.2M mannitol, 100mM CaCl2) was added to the protoplasts and mixed gently
by inverting the tube, before incubating for 10 minutes at room temperature. The protoplasts
were then diluted with 600µl W5 solution, mixed slowly (by inverting the tube) and then
diluted with a further 600µl W5 and mixed again. The tube was then centrifuged at 100x g for
one minute and as much supernatant as possible was removed before re-‐suspending pellets in
250µl W5 and aliquoting into a 24 well plate . For the EOD1 and DA2 cleavage assays (section
5.3.4.2) 50µM MG132 (Sigma-‐Aldrich C2211) was included in the final treatment of W5.
Protoplasts were left for 16 hours at 20°C before analysis.
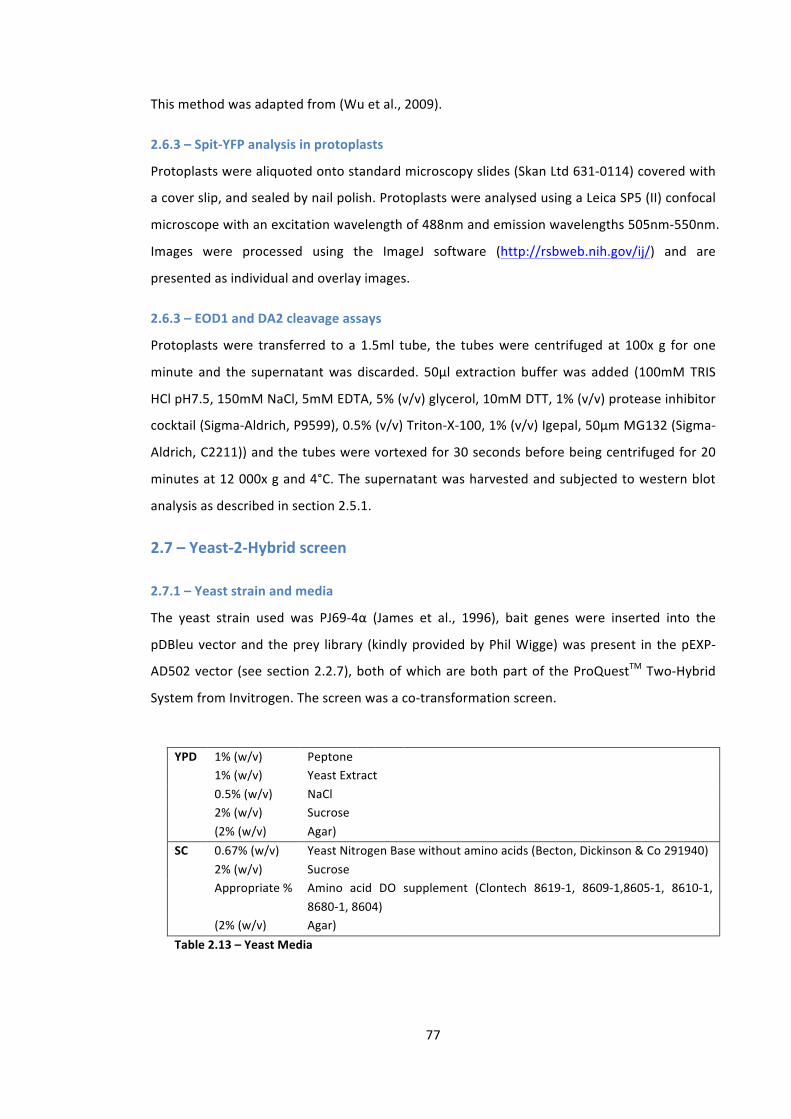
77
This method was adapted from (Wu et al., 2009).
2.6.3 – Spit-‐YFP analysis in protoplasts
Protoplasts were aliquoted onto standard microscopy slides (Skan Ltd 631-‐0114) covered with
a cover slip, and sealed by nail polish. Protoplasts were analysed using a Leica SP5 (II) confocal
microscope with an excitation wavelength of 488nm and emission wavelengths 505nm-‐550nm.
Images were processed using the ImageJ software (http://rsbweb.nih.gov/ij/) and are
presented as individual and overlay images.
2.6.3 – EOD1 and DA2 cleavage assays
Protoplasts were transferred to a 1.5ml tube, the tubes were centrifuged at 100x g for one
minute and the supernatant was discarded. 50µl extraction buffer was added (100mM TRIS
HCl pH7.5, 150mM NaCl, 5mM EDTA, 5% (v/v) glycerol, 10mM DTT, 1% (v/v) protease inhibitor
cocktail (Sigma-‐Aldrich, P9599), 0.5% (v/v) Triton-‐X-‐100, 1% (v/v) Igepal, 50µm MG132 (Sigma-‐
Aldrich, C2211)) and the tubes were vortexed for 30 seconds before being centrifuged for 20
minutes at 12 000x g and 4°C. The supernatant was harvested and subjected to western blot
analysis as described in section 2.5.1.
2.7 – Yeast-‐2-‐Hybrid screen
2.7.1 – Yeast strain and media
The yeast strain used was PJ69-‐4α (James et al., 1996), bait genes were inserted into the
pDBleu vector and the prey library (kindly provided by Phil Wigge) was present in the pEXP-‐
AD502 vector (see section 2.2.7), both of which are both part of the ProQuestTM Two-‐Hybrid
System from Invitrogen. The screen was a co-‐transformation screen.
YPD 1% (w/v) Peptone 1% (w/v) Yeast Extract 0.5% (w/v) NaCl 2% (w/v) Sucrose (2% (w/v) Agar) SC 0.67% (w/v) Yeast Nitrogen Base without amino acids (Becton, Dickinson & Co 291940) 2% (w/v) Sucrose Appropriate % Amino acid DO supplement (Clontech 8619-‐1, 8609-‐1,8605-‐1, 8610-‐1,
8680-‐1, 8604) (2% (w/v) Agar) Table 2.13 – Yeast Media
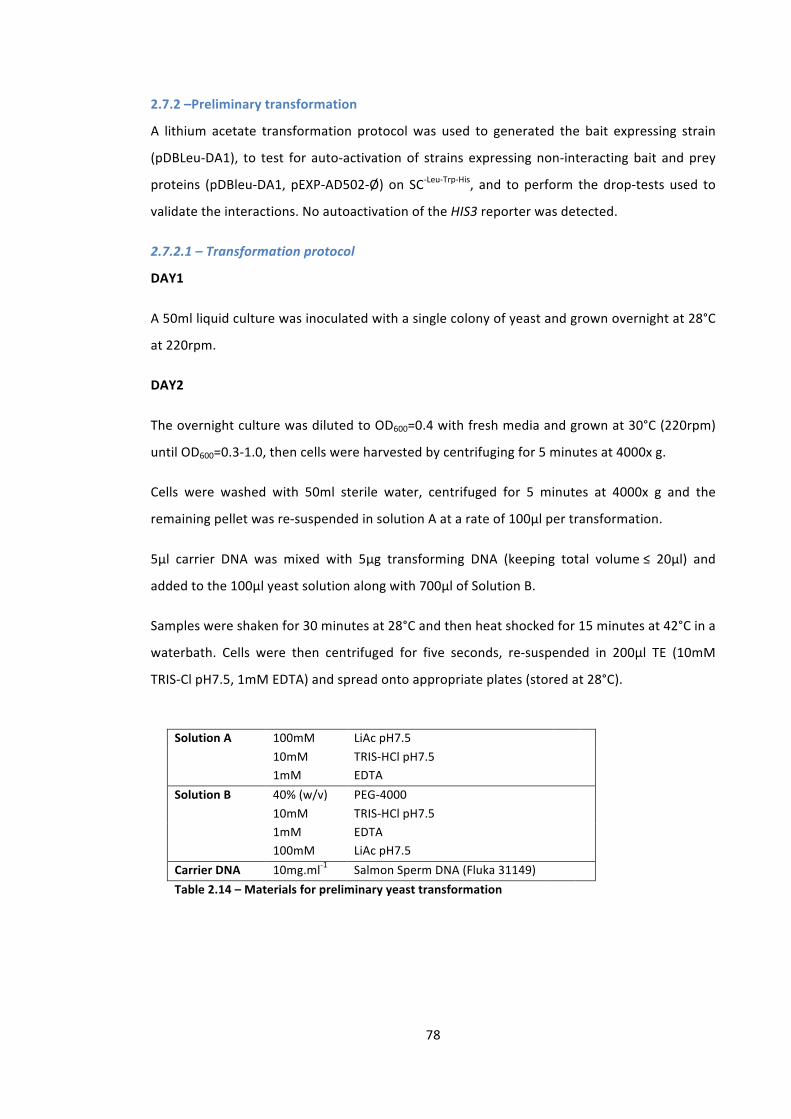
78
2.7.2 –Preliminary transformation
A lithium acetate transformation protocol was used to generated the bait expressing strain
(pDBLeu-‐DA1), to test for auto-‐activation of strains expressing non-‐interacting bait and prey
proteins (pDBleu-‐DA1, pEXP-‐AD502-‐Ø) on SC-‐Leu-‐Trp-‐His, and to perform the drop-‐tests used to
validate the interactions. No autoactivation of the HIS3 reporter was detected.
2.7.2.1 – Transformation protocol
DAY1
A 50ml liquid culture was inoculated with a single colony of yeast and grown overnight at 28°C
at 220rpm.
DAY2
The overnight culture was diluted to OD600=0.4 with fresh media and grown at 30°C (220rpm)
until OD600=0.3-‐1.0, then cells were harvested by centrifuging for 5 minutes at 4000x g.
Cells were washed with 50ml sterile water, centrifuged for 5 minutes at 4000x g and the
remaining pellet was re-‐suspended in solution A at a rate of 100µl per transformation.
5µl carrier DNA was mixed with 5µg transforming DNA (keeping total volume ≤ 20µl) and
added to the 100µl yeast solution along with 700µl of Solution B.
Samples were shaken for 30 minutes at 28°C and then heat shocked for 15 minutes at 42°C in a
waterbath. Cells were then centrifuged for five seconds, re-‐suspended in 200µl TE (10mM
TRIS-‐Cl pH7.5, 1mM EDTA) and spread onto appropriate plates (stored at 28°C).
Solution A 100mM LiAc pH7.5 10mM TRIS-‐HCl pH7.5 1mM EDTA Solution B 40% (w/v) PEG-‐4000 10mM TRIS-‐HCl pH7.5 1mM EDTA 100mM LiAc pH7.5 Carrier DNA 10mg.ml-‐1 Salmon Sperm DNA (Fluka 31149) Table 2.14 – Materials for preliminary yeast transformation
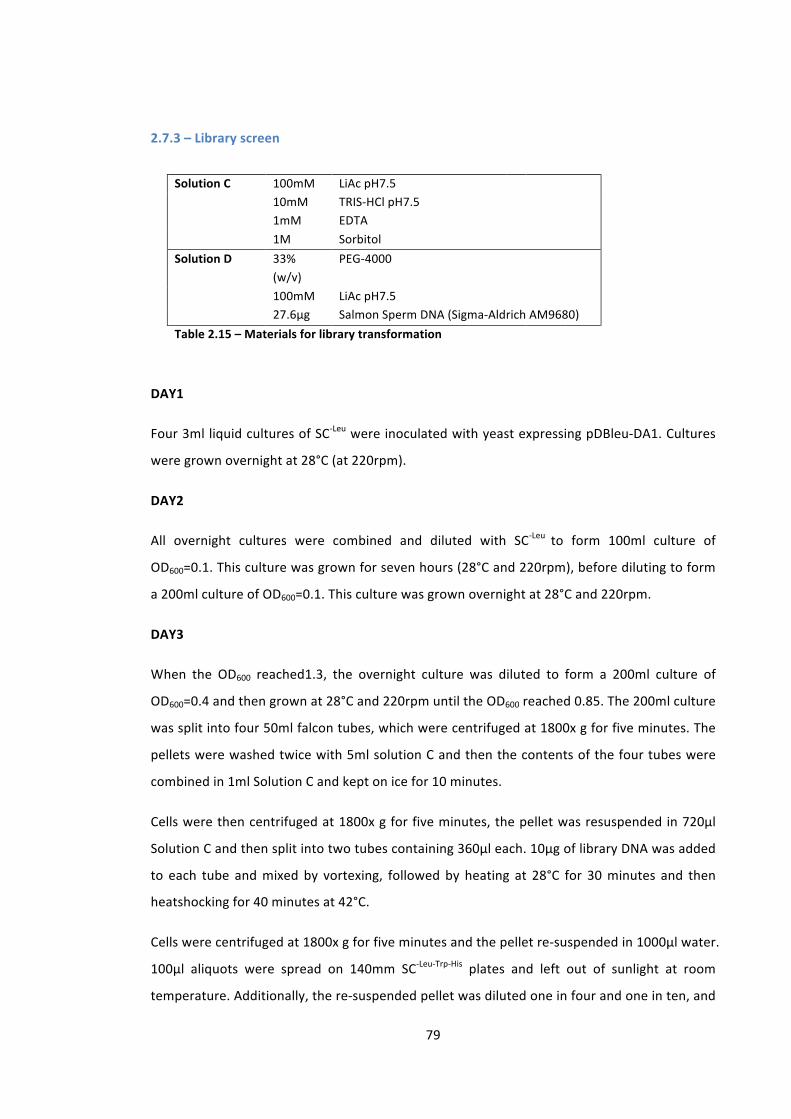
79
2.7.3 – Library screen
Solution C 100mM LiAc pH7.5 10mM TRIS-‐HCl pH7.5 1mM EDTA 1M Sorbitol Solution D 33%
(w/v) PEG-‐4000
100mM LiAc pH7.5 27.6µg Salmon Sperm DNA (Sigma-‐Aldrich AM9680) Table 2.15 – Materials for library transformation
DAY1
Four 3ml liquid cultures of SC-‐Leu were inoculated with yeast expressing pDBleu-‐DA1. Cultures
were grown overnight at 28°C (at 220rpm).
DAY2
All overnight cultures were combined and diluted with SC-‐Leu to form 100ml culture of
OD600=0.1. This culture was grown for seven hours (28°C and 220rpm), before diluting to form
a 200ml culture of OD600=0.1. This culture was grown overnight at 28°C and 220rpm.
DAY3
When the OD600 reached1.3, the overnight culture was diluted to form a 200ml culture of
OD600=0.4 and then grown at 28°C and 220rpm until the OD600 reached 0.85. The 200ml culture
was split into four 50ml falcon tubes, which were centrifuged at 1800x g for five minutes. The
pellets were washed twice with 5ml solution C and then the contents of the four tubes were
combined in 1ml Solution C and kept on ice for 10 minutes.
Cells were then centrifuged at 1800x g for five minutes, the pellet was resuspended in 720µl
Solution C and then split into two tubes containing 360µl each. 10µg of library DNA was added
to each tube and mixed by vortexing, followed by heating at 28°C for 30 minutes and then
heatshocking for 40 minutes at 42°C.
Cells were centrifuged at 1800x g for five minutes and the pellet re-‐suspended in 1000µl water.
100µl aliquots were spread on 140mm SC-‐Leu-‐Trp-‐His plates and left out of sunlight at room
temperature. Additionally, the re-‐suspended pellet was diluted one in four and one in ten, and
80
spread on SC-‐Leu-‐Trp plates in order to calculate transformational efficiency. Transformational
efficiency was 263,200 transformational events per screen. Two screens were carried out,
resulting in 526 400 transformational events in total.
2.7.3.1 – Selecting colonies
Colonies that grew on SC-‐Leu-‐Trp-‐His plates were used to inoculate 3ml SC-‐Leu-‐Trp-‐His liquid cultures,
which were then subjected to miniprep (section 2.2.3.3), PCR (section 2.2.2.3) and sequencing
(section 2.2.2.4) analyses. Sequenced colonies were screened for those with genes in-‐frame
with the GAL4 activation domain present in pEXP-‐AD502. Only these colonies were reported in
Chapter 4.
2.7.3.2 -‐ Drop testing
Candidate genes selected for further study were subject to drop testing. The respective pEXP-‐
AD502 prey constructs (isolated from colonies) were transformed into TOP10 One Shot
competent cells (Invitrogen C404003) and subjected to a further round of sequencing analysis
(section 2.2.2.4). Complete coding sequences, generated from cDNA (section 2.2.2.1) were
cloned into empty pEXP-‐AD502 vector (section 2.2) and re-‐transformed into yeast using the
protocol described in section 2.7.2.1. Transformed yeast were diluted and grown on SC-‐Leu-‐Trp,
SC-‐Leu-‐Trp-‐His, and SC-‐Leu-‐Trp-‐His-‐Ade plates and incubated at both room temperature and 28°C (data
presented in Chapter 4 is from growth at 28°C). Drop tests were repeated a total of four times.
2.8 – MAGIC analysis
The lines used in this study are described in section 2.3.1 and the growth conditions used are
described in section 2.3.2. Organs were phenotyped following the protocols documented in
section 2.3.5.
The MAGIC analysis was kindly performed in collaboration with Mathew Box at the Sainsbury
Laboratory Cambridge University, Cambridge. QTLs were identified using HAPPY: ‘a software
package for multipoint QTL mapping in genetically heterogeneous animals’ (Mott, 2000, Mott
et al., 2000). The genotype information used in the HAPPY analysis was from 1250 SNPs,
spaced roughly 100Kb apart (Kover et al., 2009, Mott et al., 2011). Genotype interrogation of
parental lines used publicly available sequence data (Gan et al., 2011) and the Rätsch lab
GBrowse platform (http://gbrowse.cbio.mskcc.org/gb/gbrowse/thaliana-‐19magic/).

81
2.9 – GWAS analysis
The accessions used in this study are listed in Table S2 and the growth conditions used are
described in section 2.3.2. Organs were phenotyped following the protocols documented in
section 2.3.5.
The genome wide association (GWA) analysis was performed in collaboration with Mathew
Box at the Sainsbury Laboratory Cambridge University, and Justin Borevitz and Riyan Cheng at
the Australian National University, Canberra, Australia. The analysis was carried out using the
QTLRel package (Cheng et al., 2011) and call_method_75_ TAIR9 SNP data (Horton et al., 2012).
Alleles with a frequency of less than 0.05 were excluded from the analysis.
82
Chapter 3 -‐ A Structural Analysis of the DA1 Protein
3.1 Introduction
The aim of the research conducted in this Chapter was to achieve a greater understanding of
DA1 function, beyond the preliminary observations of growth and developmental effects seen
in genetic studies (Li et al., 2008). The initial research demonstrated clearly that DA1 is a key
regulator of organ growth (Li et al., 2008), however it did not identify the mechanism through
which DA1 controls this growth. The work described in this Chapter uses the conserved
protein domains found in DA1 to uncover the biochemical functions of DA1, and thereby to
gain a deeper understanding of the mechanisms controlling growth in Arabidopsis. Moreover,
due to the extensive similarity in protein structure shared between DA1 and other DA1 family
members, progress made in this Chapter is likely to be relevant to the study of other family
members (Fig. 3.1). This work may therefore be of significant interest to research areas
including cold tolerance, pathogen response and the regulation of root meristem size (Yang et
al., 2010, Bi et al., 2011, Peng et al., 2013).
As illustrated in Fig. 3.1 DA1 is predicted to contain 4 identifiable protein domains: two UIM
domains, one LIM domain and a C-‐terminal metallopeptidase domain embedded in the highly
conserved C terminal region.
3.1.1 -‐ The Ubiquitin-‐Interacting Motif (UIM)
The UIM is a specific type of ubiquitin binding domain (UBD) made up of a short motif
containing the highly conserved sequence: Φ-‐x-‐x-‐Ala-‐x-‐x-‐x-‐Ser-‐x-‐x-‐Ac at its core (where Φ is a
large hydrophobic residue, and ‘Ac’ acidic residue) (Hofmann and Falquet, 2001). The UIM
moiety is thought to form an short alpha-‐helix, which is able to insert into protein folds and
bind ubiquitin (Hofmann and Falquet, 2001). Interestingly the ubiquitin binding capacity of
UIMs is not limited to one molecule per domain, with recent work illustrating that UIMs are
able to bind two ubiquitin molecules; one on either face of the helix (Harper and Schulman,
2006). Although a diverse variety of proteins contain UIMs, it is particularly pertinent to this
work that UIMs have been shown to be present in many proteins involved in the proteasomal
and lysosomal degradation pathway (Hofmann and Falquet, 2001).
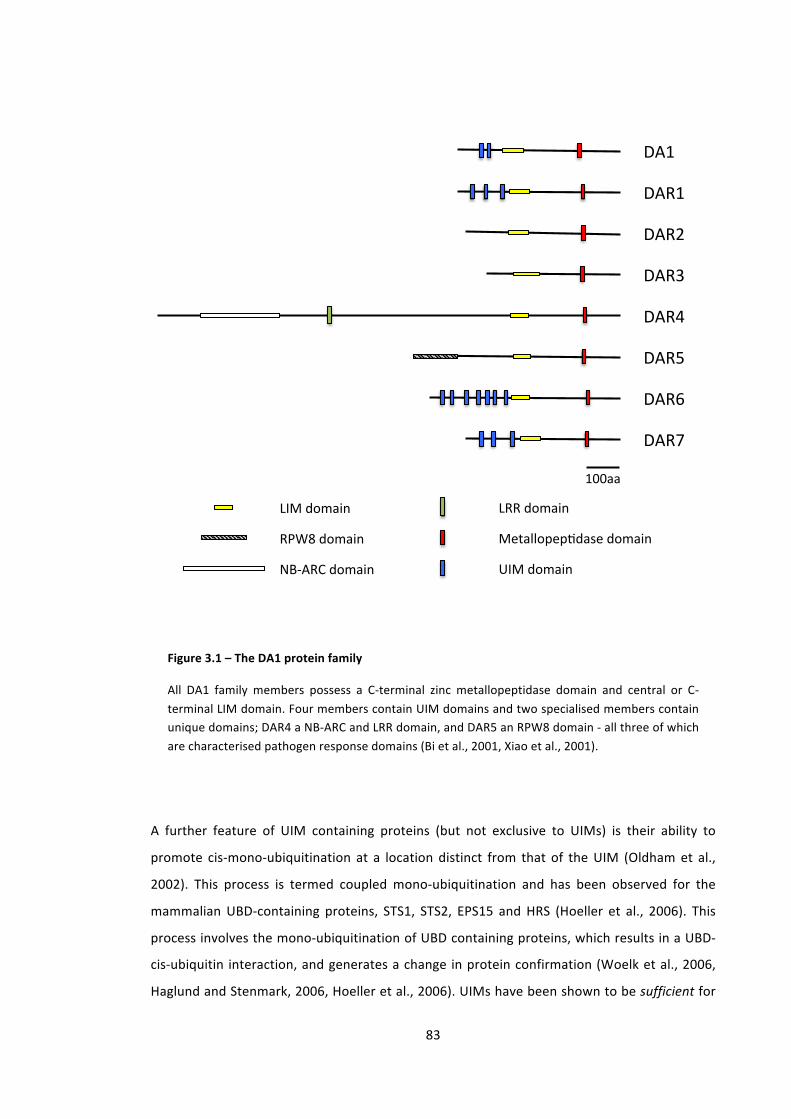
83
DA1$
DAR1$
DAR2$
DAR3$
DAR4$
DAR5$
$$DAR6$
DAR7$
100aa$
LIM$domain$
RPW8$domain$
NB1ARC$domain$
LRR$domain$
Metallopep8dase$domain$
UIM$domain$
A further feature of UIM containing proteins (but not exclusive to UIMs) is their ability to
promote cis-‐mono-‐ubiquitination at a location distinct from that of the UIM (Oldham et al.,
2002). This process is termed coupled mono-‐ubiquitination and has been observed for the
mammalian UBD-‐containing proteins, STS1, STS2, EPS15 and HRS (Hoeller et al., 2006). This
process involves the mono-‐ubiquitination of UBD containing proteins, which results in a UBD-‐
cis-‐ubiquitin interaction, and generates a change in protein confirmation (Woelk et al., 2006,
Haglund and Stenmark, 2006, Hoeller et al., 2006). UIMs have been shown to be sufficient for
Figure 3.1 – The DA1 protein family
All DA1 family members possess a C-‐terminal zinc metallopeptidase domain and central or C-‐terminal LIM domain. Four members contain UIM domains and two specialised members contain unique domains; DAR4 a NB-‐ARC and LRR domain, and DAR5 an RPW8 domain -‐ all three of which are characterised pathogen response domains (Bi et al., 2001, Xiao et al., 2001).
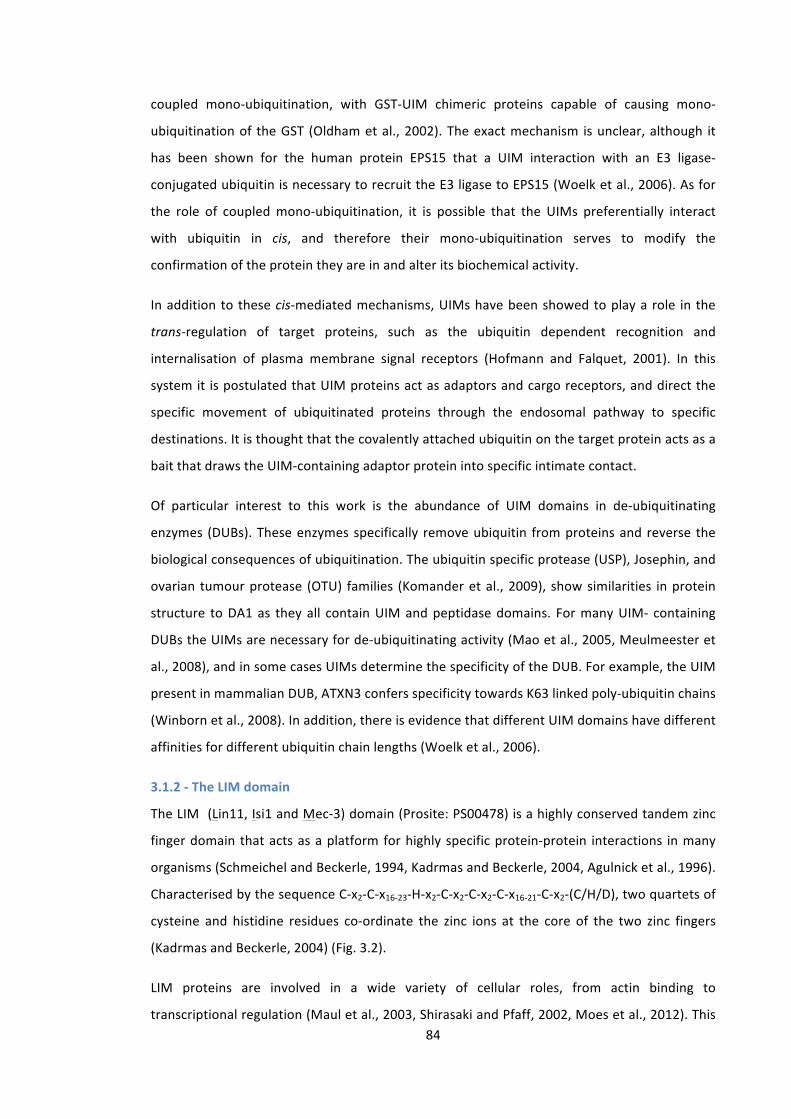
84
coupled mono-‐ubiquitination, with GST-‐UIM chimeric proteins capable of causing mono-‐
ubiquitination of the GST (Oldham et al., 2002). The exact mechanism is unclear, although it
has been shown for the human protein EPS15 that a UIM interaction with an E3 ligase-‐
conjugated ubiquitin is necessary to recruit the E3 ligase to EPS15 (Woelk et al., 2006). As for
the role of coupled mono-‐ubiquitination, it is possible that the UIMs preferentially interact
with ubiquitin in cis, and therefore their mono-‐ubiquitination serves to modify the
confirmation of the protein they are in and alter its biochemical activity.
In addition to these cis-‐mediated mechanisms, UIMs have been showed to play a role in the
trans-‐regulation of target proteins, such as the ubiquitin dependent recognition and
internalisation of plasma membrane signal receptors (Hofmann and Falquet, 2001). In this
system it is postulated that UIM proteins act as adaptors and cargo receptors, and direct the
specific movement of ubiquitinated proteins through the endosomal pathway to specific
destinations. It is thought that the covalently attached ubiquitin on the target protein acts as a
bait that draws the UIM-‐containing adaptor protein into specific intimate contact.
Of particular interest to this work is the abundance of UIM domains in de-‐ubiquitinating
enzymes (DUBs). These enzymes specifically remove ubiquitin from proteins and reverse the
biological consequences of ubiquitination. The ubiquitin specific protease (USP), Josephin, and
ovarian tumour protease (OTU) families (Komander et al., 2009), show similarities in protein
structure to DA1 as they all contain UIM and peptidase domains. For many UIM-‐ containing
DUBs the UIMs are necessary for de-‐ubiquitinating activity (Mao et al., 2005, Meulmeester et
al., 2008), and in some cases UIMs determine the specificity of the DUB. For example, the UIM
present in mammalian DUB, ATXN3 confers specificity towards K63 linked poly-‐ubiquitin chains
(Winborn et al., 2008). In addition, there is evidence that different UIM domains have different
affinities for different ubiquitin chain lengths (Woelk et al., 2006).
3.1.2 -‐ The LIM domain
The LIM (Lin11, Isi1 and Mec-‐3) domain (Prosite: PS00478) is a highly conserved tandem zinc
finger domain that acts as a platform for highly specific protein-‐protein interactions in many
organisms (Schmeichel and Beckerle, 1994, Kadrmas and Beckerle, 2004, Agulnick et al., 1996).
Characterised by the sequence C-‐x2-‐C-‐x16-‐23-‐H-‐x2-‐C-‐x2-‐C-‐x2-‐C-‐x16-‐21-‐C-‐x2-‐(C/H/D), two quartets of
cysteine and histidine residues co-‐ordinate the zinc ions at the core of the two zinc fingers
(Kadrmas and Beckerle, 2004) (Fig. 3.2).
LIM proteins are involved in a wide variety of cellular roles, from actin binding to
transcriptional regulation (Maul et al., 2003, Shirasaki and Pfaff, 2002, Moes et al., 2012). This
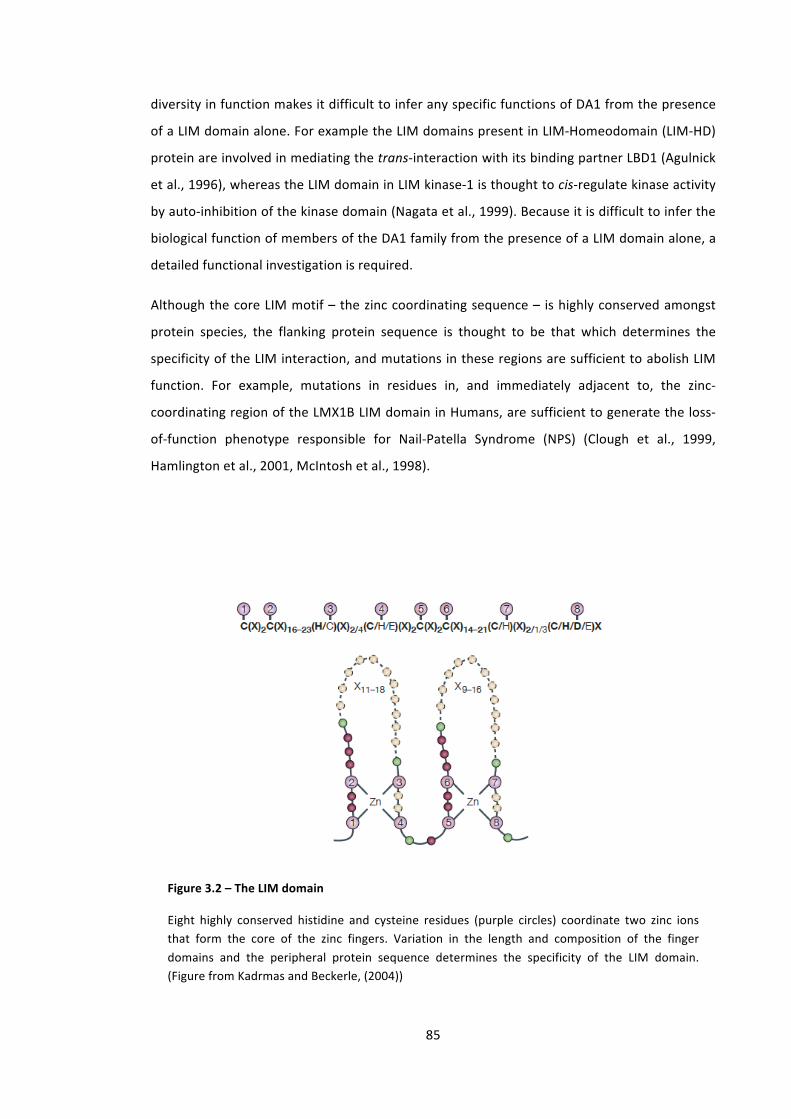
85
diversity in function makes it difficult to infer any specific functions of DA1 from the presence
of a LIM domain alone. For example the LIM domains present in LIM-‐Homeodomain (LIM-‐HD)
protein are involved in mediating the trans-‐interaction with its binding partner LBD1 (Agulnick
et al., 1996), whereas the LIM domain in LIM kinase-‐1 is thought to cis-‐regulate kinase activity
by auto-‐inhibition of the kinase domain (Nagata et al., 1999). Because it is difficult to infer the
biological function of members of the DA1 family from the presence of a LIM domain alone, a
detailed functional investigation is required.
Although the core LIM motif – the zinc coordinating sequence – is highly conserved amongst
protein species, the flanking protein sequence is thought to be that which determines the
specificity of the LIM interaction, and mutations in these regions are sufficient to abolish LIM
function. For example, mutations in residues in, and immediately adjacent to, the zinc-‐
coordinating region of the LMX1B LIM domain in Humans, are sufficient to generate the loss-‐
of-‐function phenotype responsible for Nail-‐Patella Syndrome (NPS) (Clough et al., 1999,
Hamlington et al., 2001, McIntosh et al., 1998).
Figure 3.2 – The LIM domain
Eight highly conserved histidine and cysteine residues (purple circles) coordinate two zinc ions that form the core of the zinc fingers. Variation in the length and composition of the finger domains and the peripheral protein sequence determines the specificity of the LIM domain. (Figure from Kadrmas and Beckerle, (2004))
86
3.1.3. – The C-‐terminal peptidase
The C-‐terminal region of DA1 is the most distinctive yet most enigmatic domain in the protein.
The published da1-‐1 mutation, with a single amino acid transition in the highly conserved C-‐
terminal region, is sufficient to generate a dominant negative-‐interfering growth phenotype (Li
et al., 2008). This indicates that conserved regions of the C-‐terminal domain are probably
essential for DA1 function.
The dominant negative nature of da1-‐1, and the functional redundancy between DA1 and
DAR1 (Li et al., 2008) suggest that the da1-‐1 phenotype may be a consequence of the non-‐
functional da1-‐1 protein forming a complex with a binding partner – for example DA1 or DAR1
– and forming a non-‐functional complex (Fig. 3.4a,b). This explanation would be similar to the
proposed mechanism for the dominant negative effects of the ERECTA ΔKinase mutant, where
the formation of a non-‐functional receptor heterodimer is thought to cause the observed
developmental phenotypes (Shpak et al., 2003). Therefore, one prediction to be tested is that
DA1 homo-‐ and hetero-‐oligomerises with DA1 and DAR1.
An alternative explanation for the observed dominant negative phenotype of the da1-‐1
mutant is that the non-‐functional da1-‐1 protein binds to its target protein and competes with
both DA1 and DAR1 for their common target protein (Fig. 3.4c,d). This form of substrate
competition is similar to that observed for the mammalian peptidase SPP (Schrul et al., 2010).
The C-‐terminal domain (Pfam:PF12315) is highly conserved amongst DA1 family members and
defines the DA1 family (Fig. 3.1). It has strong homology over a short region with members of
the higher-‐order peptidase MA clan (Pfam:CL0126), containing proteins from a wide diversity
organisms including archaea, bacteria, metazoans, fungi and plants (Pfam). Members of this
clan are defined by a neutral zinc metallopeptidase domain (PROSITE:PS00142), characterised
by an H-‐E-‐x-‐x-‐H motif (henceforth termed HExxH), where the two histidine residues coordinate
a zinc atom to form the active site of the peptidase (Matthews et al., 1972, Devault et al., 1988,
Jongeneel et al., 1989). The peptidase MA clan contains diverse proteins with a wide variety of
functions. For example, members of the WLM family (PF08325) have been shown to have de-‐
ubiquitination and de-‐sumoylation activities (Iyer et al., 2004, Su and Hochstrasser, 2010,
Mullen et al., 2010). Other clan members include virus expressed enhancin peptidases, whose
function is to facilitate infections (Wang and Granados, 1997, Lepore et al., 1996); reprolysin-‐
family snake venom endopeptidases (Fox and Serrano, 2005); and astacin, a crustacean
digestive enzyme (Bond and Beynon, 1995).
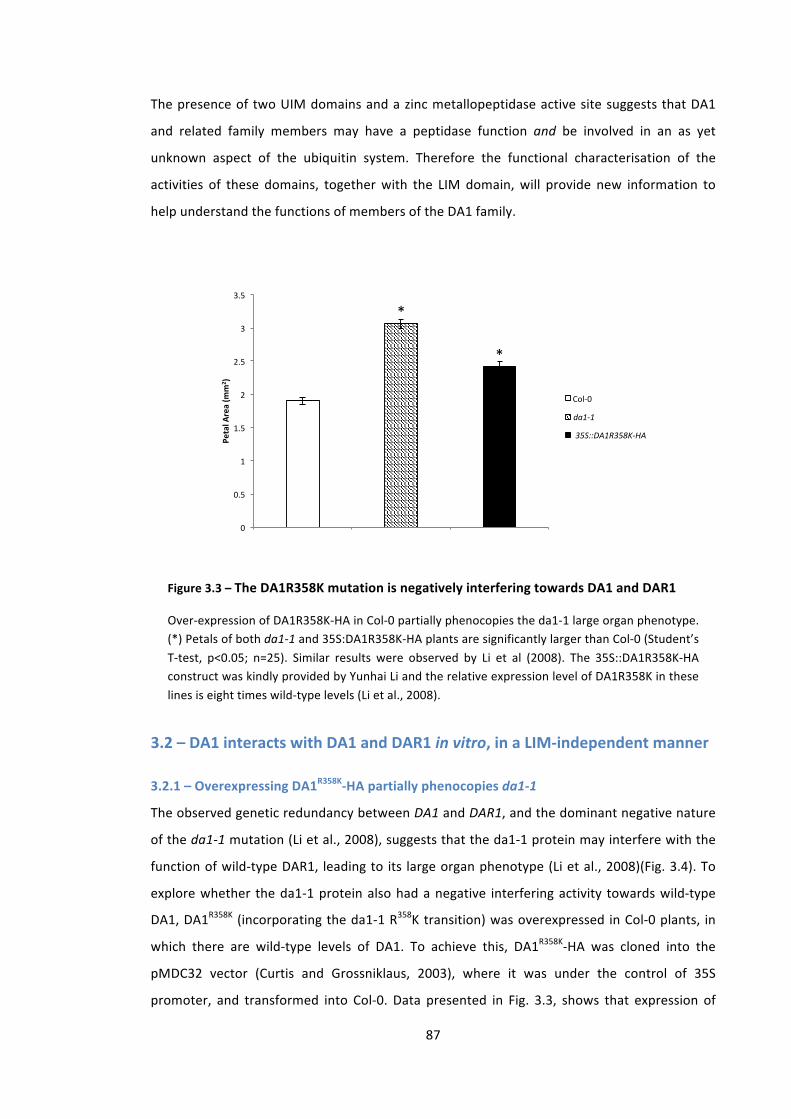
87
The presence of two UIM domains and a zinc metallopeptidase active site suggests that DA1
and related family members may have a peptidase function and be involved in an as yet
unknown aspect of the ubiquitin system. Therefore the functional characterisation of the
activities of these domains, together with the LIM domain, will provide new information to
help understand the functions of members of the DA1 family.
0"
0.5"
1"
1.5"
2"
2.5"
3"
3.5"
Col+0" da1+1" "35S::DA1R358K+HA"
Petal&A
rea&(m
m2 )&
Col+0"
da1$1%
%35S::DA1R358K$HA%
*"
*"
3.2 – DA1 interacts with DA1 and DAR1 in vitro, in a LIM-‐independent manner
3.2.1 – Overexpressing DA1R358K-‐HA partially phenocopies da1-‐1
The observed genetic redundancy between DA1 and DAR1, and the dominant negative nature
of the da1-‐1 mutation (Li et al., 2008), suggests that the da1-‐1 protein may interfere with the
function of wild-‐type DAR1, leading to its large organ phenotype (Li et al., 2008)(Fig. 3.4). To
explore whether the da1-‐1 protein also had a negative interfering activity towards wild-‐type
DA1, DA1R358K (incorporating the da1-‐1 R358K transition) was overexpressed in Col-‐0 plants, in
which there are wild-‐type levels of DA1. To achieve this, DA1R358K-‐HA was cloned into the
pMDC32 vector (Curtis and Grossniklaus, 2003), where it was under the control of 35S
promoter, and transformed into Col-‐0. Data presented in Fig. 3.3, shows that expression of
Figure 3.3 – The DA1R358K mutation is negatively interfering towards DA1 and DAR1
Over-‐expression of DA1R358K-‐HA in Col-‐0 partially phenocopies the da1-‐1 large organ phenotype. (*) Petals of both da1-‐1 and 35S:DA1R358K-‐HA plants are significantly larger than Col-‐0 (Student’s T-‐test, p<0.05; n=25). Similar results were observed by Li et al (2008). The 35S::DA1R358K-‐HA construct was kindly provided by Yunhai Li and the relative expression level of DA1R358K in these lines is eight times wild-‐type levels (Li et al., 2008).
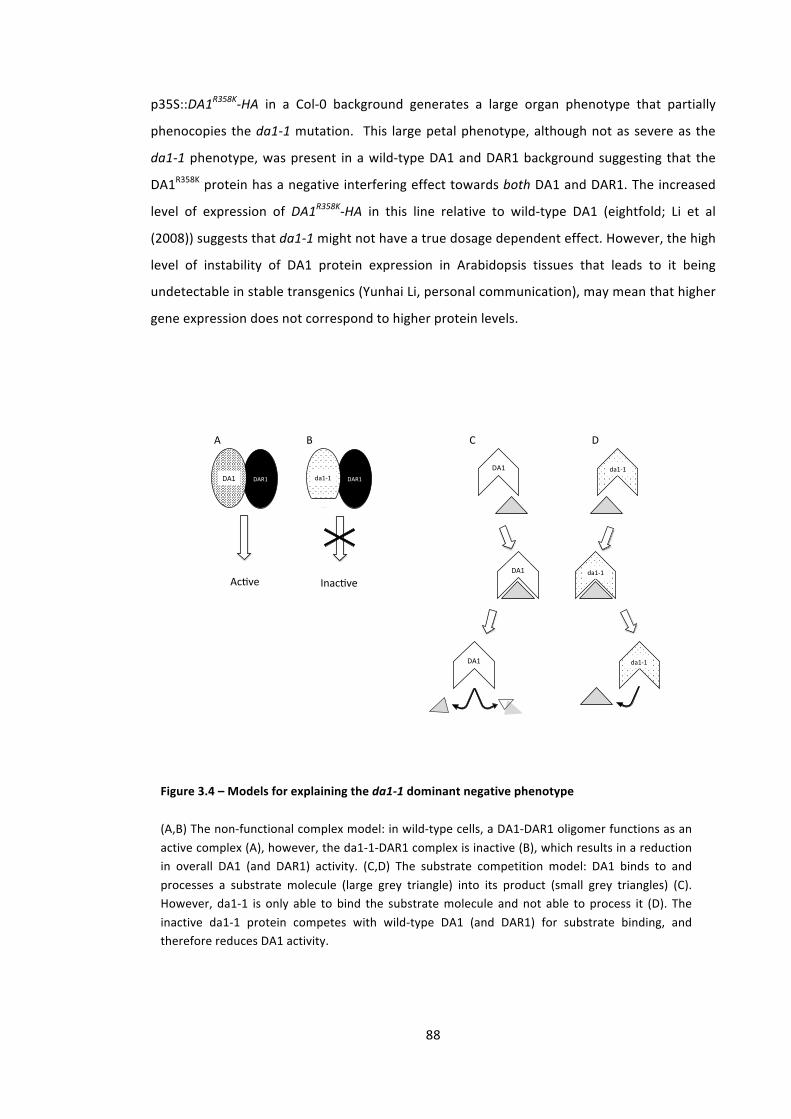
88
p35S::DA1R358K-‐HA in a Col-‐0 background generates a large organ phenotype that partially
phenocopies the da1-‐1 mutation. This large petal phenotype, although not as severe as the
da1-‐1 phenotype, was present in a wild-‐type DA1 and DAR1 background suggesting that the
DA1R358K protein has a negative interfering effect towards both DA1 and DAR1. The increased
level of expression of DA1R358K-‐HA in this line relative to wild-‐type DA1 (eightfold; Li et al
(2008)) suggests that da1-‐1 might not have a true dosage dependent effect. However, the high
level of instability of DA1 protein expression in Arabidopsis tissues that leads to it being
undetectable in stable transgenics (Yunhai Li, personal communication), may mean that higher
gene expression does not correspond to higher protein levels.
DAR1%DA1%
Ac've%
DAR1%da1,1%
Inac've%
A% B%
DA1%
DA1%
DA1%
C%
da1,1%
da1,1%
da1,1%
D%
Figure 3.4 – Models for explaining the da1-‐1 dominant negative phenotype
(A,B) The non-‐functional complex model: in wild-‐type cells, a DA1-‐DAR1 oligomer functions as an active complex (A), however, the da1-‐1-‐DAR1 complex is inactive (B), which results in a reduction in overall DA1 (and DAR1) activity. (C,D) The substrate competition model: DA1 binds to and processes a substrate molecule (large grey triangle) into its product (small grey triangles) (C). However, da1-‐1 is only able to bind the substrate molecule and not able to process it (D). The inactive da1-‐1 protein competes with wild-‐type DA1 (and DAR1) for substrate binding, and therefore reduces DA1 activity.

89
There are at least two possible explanations of the observed dominant negative phenotype of
da1-‐1 plants (Fig. 3.4). One is that DA1 and DAR1 interact physically as well as genetically, and
therefore the possibility of physical interactions between DA1 and both DA1 and DAR1 was
explored.
3.2.2 – FLAG-‐DA1 physically interacts with GST-‐DAR1 and GST-‐DA1 in vitro
There are several methods that can be used to investigate putative protein interactions; the
strengths and weaknesses of these methods are discussed in Box 3.1. In this experiment the
primary goal was to establish whether or not DA1 and DAR1 were able to directly interact.
Based on the observation that DA1 was undetectable in stable transgenic Arabidopsis lines
(Yunhai Li, personal communication), an in vitro approach was chosen.
In this in vitro system, recombinant GST-‐tagged bait proteins were incubated with
recombinant FLAG-‐tagged prey proteins before precipitation of GST-‐tagged bait proteins on
glutathione sepharose beads. The purified proteins were then eluted and subjected to SDS-‐
PAGE and immunoblot analysis. The ability of β-‐glucuronidase (GUS) to form a homo-‐tetramer
was utilised to design a positive control of GST-‐GUS vs FLAG-‐GUS. Two sets of negative
controls were also used; these were GST-‐GUS vs FLAG-‐prey, and GST-‐bait vs FLAG-‐GUS.
Box 3.1 – Methods of assaying for protein-‐protein interactions In vitro co-‐Immunoprecipitation (co-‐IP) This tests for direct physical interactions between proteins in the absence of species-‐specific proteins. The artificial nature of this system ensures that co-‐purifications are due to direct interaction between bait and prey and not intermediate adaptor proteins or higher order protein complexes. In planta co-‐Immunoprecipitation (co-‐IP) The endogenous conditions in this system give added confidence to the validity of any observed in vitro interaction. However this endogenous background allows for the formation of naturally occurring higher-‐order protein complexes and therefore does not allow one to infer direct bait-‐prey physical interactions. In planta bimolecular fluorescence complementation (BiFC) Unlike in planta co-‐IP experiments, due to the requirements for protein-‐protein proximity for positive BiFC results, this system gives more confidence that an observed interaction is a direct bait-‐prey interaction. It is however, still possible for positive results to be due to candidate proteins being in extremely close proximity through higher-‐order protein complexes and not through a direct physical interaction.
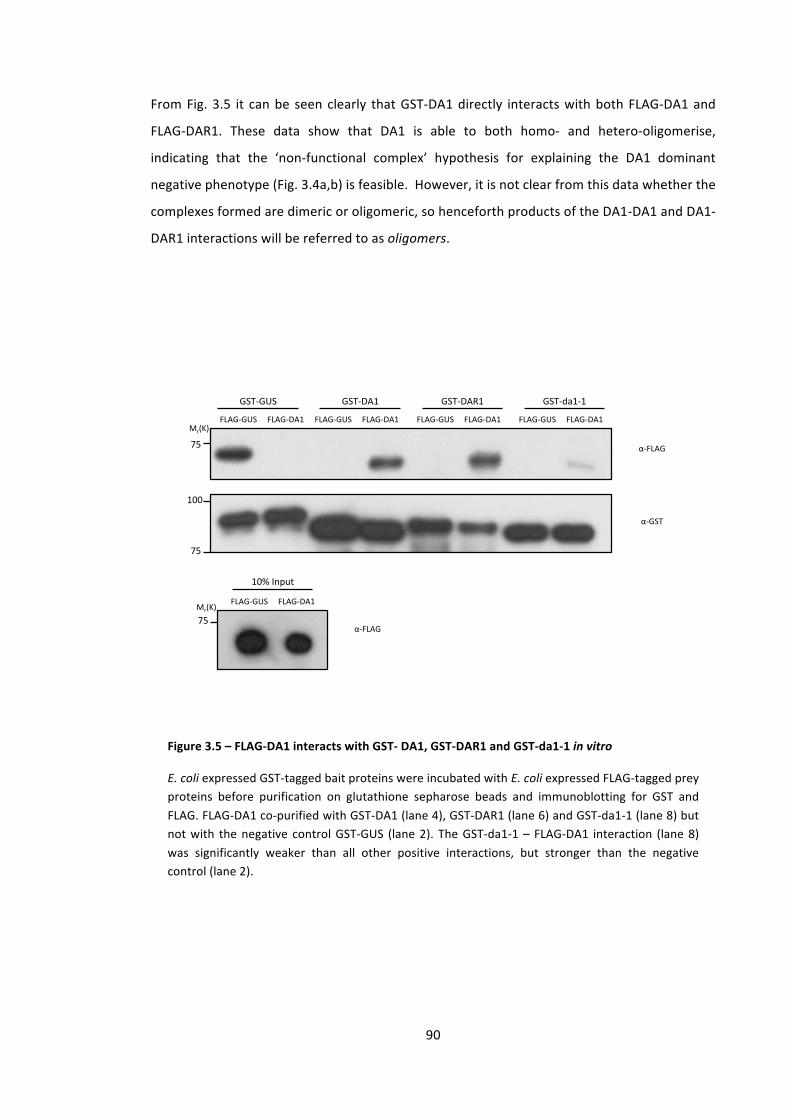
90
From Fig. 3.5 it can be seen clearly that GST-‐DA1 directly interacts with both FLAG-‐DA1 and
FLAG-‐DAR1. These data show that DA1 is able to both homo-‐ and hetero-‐oligomerise,
indicating that the ‘non-‐functional complex’ hypothesis for explaining the DA1 dominant
negative phenotype (Fig. 3.4a,b) is feasible. However, it is not clear from this data whether the
complexes formed are dimeric or oligomeric, so henceforth products of the DA1-‐DA1 and DA1-‐
DAR1 interactions will be referred to as oligomers.
GST$GUS& GST$DA1& GST$DAR1& GST$da1$1&FLAG$GUS&&&&&FLAG$DA1&
α$FLAG&
α$GST&
Mr(K)&
75&
75&
100&
75&Mr(K)&
α$FLAG&
10%&Input&
FLAG$GUS&&&&&FLAG$DA1& FLAG$GUS&&&&&FLAG$DA1& FLAG$GUS&&&&&FLAG$DA1&
FLAG$GUS&&&&&FLAG$DA1&
Figure 3.5 – FLAG-‐DA1 interacts with GST-‐ DA1, GST-‐DAR1 and GST-‐da1-‐1 in vitro
E. coli expressed GST-‐tagged bait proteins were incubated with E. coli expressed FLAG-‐tagged prey proteins before purification on glutathione sepharose beads and immunoblotting for GST and FLAG. FLAG-‐DA1 co-‐purified with GST-‐DA1 (lane 4), GST-‐DAR1 (lane 6) and GST-‐da1-‐1 (lane 8) but not with the negative control GST-‐GUS (lane 2). The GST-‐da1-‐1 – FLAG-‐DA1 interaction (lane 8) was significantly weaker than all other positive interactions, but stronger than the negative control (lane 2).
91
3.2.3 – The LIM domain is not necessary for the DA1-‐DA1 interaction
Due to its widely documented role in protein-‐protein interactions (reviewed in Kadrmas &
Beckerle (2004)), the LIM domain was a promising candidate region for mediating DA1
oligomerisation. To investigate this hypothesis, DA1 proteins with mutated LIM domains were
assayed in vitro for their ability to homo-‐oligomerise with wild-‐type DA1.
This work used the DA1lim8 mutant (originally designed by Yunhai Li), which incorporates four
Cys-‐Gly transitions into four of the eight zinc-‐coordinating positions of the LIM domain (C172,
C175, C199 and C202). This mutation was predicted to abrogate LIM function based on
evidence that individual amino acid changes at these positions are sufficient to interfere with
and abolish LIM function (Taira et al., 1994, Agulnick et al., 1996). Taira et al (1994) showed
that, by making a single Cys-‐Gly transition at the fourth zinc-‐coordinating position of both LIM
domains in the XLIM-‐1 protein, the negative regulatory capacity of the LIM domains were
abolished. They also showed that this effect is equivalent to deleting both entire LIM domains.
This observation is supported by Agulnick et al (1996), who showed that a Cys-‐Gly transition in
the equivalent position of both LIM domains in the LHX1 protein, almost completely abolishes
its ability to interact with its binding partner LBD1.
The experimental format for this work was similar to that used to investigate DA1-‐DAR1
oligomerisation in section 3.2.2. However, when designing this experiment it was important to
consider the hypothesised role the LIM might play in the interaction; whether the LIM domain
interacted with the LIM domain of its partner, or a different protein region. To ensure that the
assay was robust to the possibility of the LIM domain binding a non-‐LIM region of its partner,
lim8 mutations were included in both bait and prey constructs.
The data presented in Fig. 3.6 show that mutating the LIM domain in either one or both of the
interacting partners did not abolish their interaction. This suggests that the LIM domain is not
involved in mediating the DA1-‐DA1 oligomerisation event. This also indicates that the LIM
domain may have other roles; perhaps mediating interactions with other proteins or mediating
intramolecular interactions.
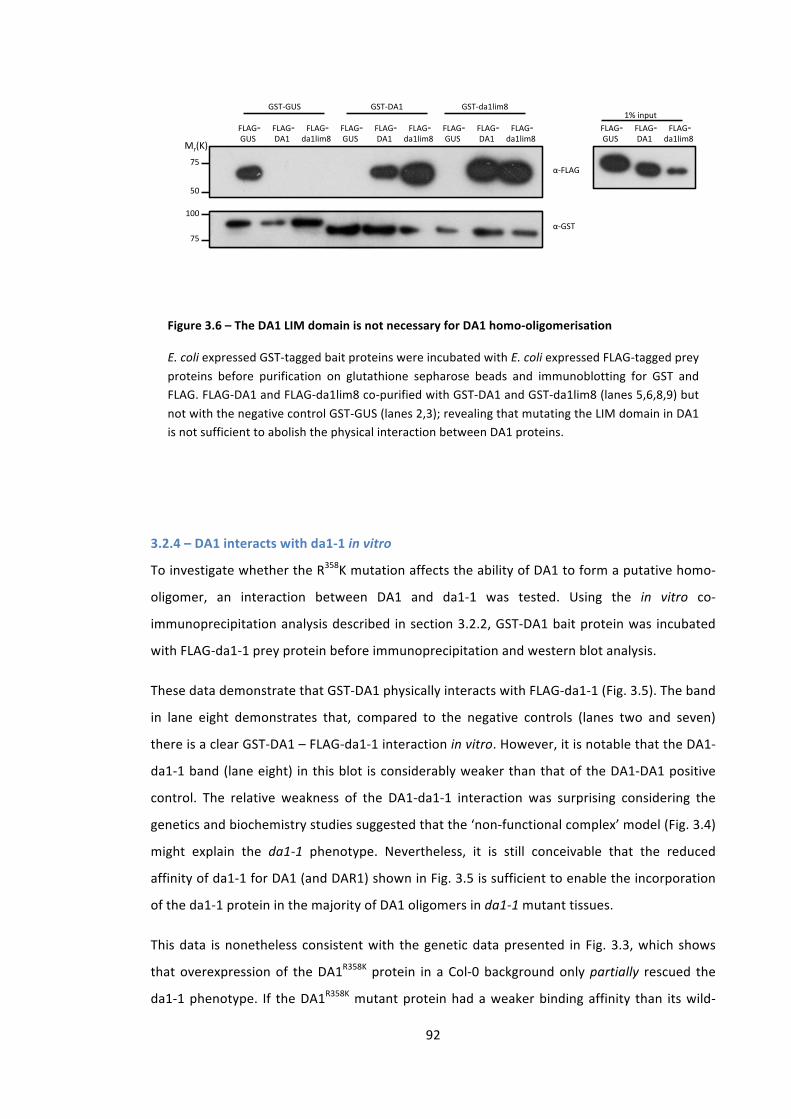
92
GST$GUS& GST$DA1& GST$da1lim8&
α$FLAG&
α$GST&
1%&input&
75&
50&
100&
75&
Mr(K)&
&FLAG$&GUS&&
&FLAG$&DA1&
&FLAG$&da1lim8&
&FLAG$&GUS&&
&FLAG$&DA1&
&FLAG$&da1lim8&
&FLAG$&GUS&&
&FLAG$&DA1&
&FLAG$&da1lim8&
&FLAG$&GUS&&
&FLAG$&DA1&
&FLAG$&da1lim8&
3.2.4 – DA1 interacts with da1-‐1 in vitro
To investigate whether the R358K mutation affects the ability of DA1 to form a putative homo-‐
oligomer, an interaction between DA1 and da1-‐1 was tested. Using the in vitro co-‐
immunoprecipitation analysis described in section 3.2.2, GST-‐DA1 bait protein was incubated
with FLAG-‐da1-‐1 prey protein before immunoprecipitation and western blot analysis.
These data demonstrate that GST-‐DA1 physically interacts with FLAG-‐da1-‐1 (Fig. 3.5). The band
in lane eight demonstrates that, compared to the negative controls (lanes two and seven)
there is a clear GST-‐DA1 – FLAG-‐da1-‐1 interaction in vitro. However, it is notable that the DA1-‐
da1-‐1 band (lane eight) in this blot is considerably weaker than that of the DA1-‐DA1 positive
control. The relative weakness of the DA1-‐da1-‐1 interaction was surprising considering the
genetics and biochemistry studies suggested that the ‘non-‐functional complex’ model (Fig. 3.4)
might explain the da1-‐1 phenotype. Nevertheless, it is still conceivable that the reduced
affinity of da1-‐1 for DA1 (and DAR1) shown in Fig. 3.5 is sufficient to enable the incorporation
of the da1-‐1 protein in the majority of DA1 oligomers in da1-‐1 mutant tissues.
This data is nonetheless consistent with the genetic data presented in Fig. 3.3, which shows
that overexpression of the DA1R358K protein in a Col-‐0 background only partially rescued the
da1-‐1 phenotype. If the DA1R358K mutant protein had a weaker binding affinity than its wild-‐
Figure 3.6 – The DA1 LIM domain is not necessary for DA1 homo-‐oligomerisation
E. coli expressed GST-‐tagged bait proteins were incubated with E. coli expressed FLAG-‐tagged prey proteins before purification on glutathione sepharose beads and immunoblotting for GST and FLAG. FLAG-‐DA1 and FLAG-‐da1lim8 co-‐purified with GST-‐DA1 and GST-‐da1lim8 (lanes 5,6,8,9) but not with the negative control GST-‐GUS (lanes 2,3); revealing that mutating the LIM domain in DA1 is not sufficient to abolish the physical interaction between DA1 proteins.
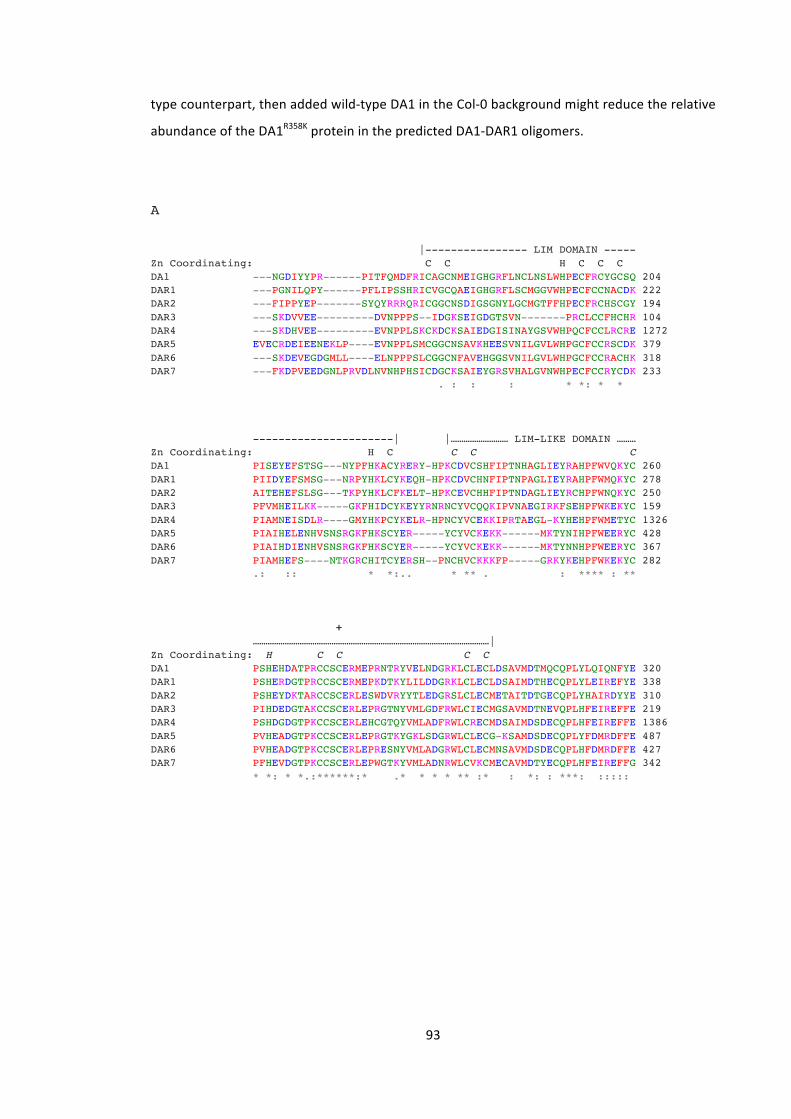
93
type counterpart, then added wild-‐type DA1 in the Col-‐0 background might reduce the relative
abundance of the DA1R358K protein in the predicted DA1-‐DAR1 oligomers.
A
|---------------- LIM DOMAIN ----- Zn Coordinating: C C H C C C DA1 ---NGDIYYPR------PITFQMDFRICAGCNMEIGHGRFLNCLNSLWHPECFRCYGCSQ 204 DAR1 ---PGNILQPY------PFLIPSSHRICVGCQAEIGHGRFLSCMGGVWHPECFCCNACDK 222 DAR2 ---FIPPYEP-------SYQYRRRQRICGGCNSDIGSGNYLGCMGTFFHPECFRCHSCGY 194 DAR3 ---SKDVVEE---------DVNPPPS--IDGKSEIGDGTSVN-------PRCLCCFHCHR 104 DAR4 ---SKDHVEE---------EVNPPLSKCKDCKSAIEDGISINAYGSVWHPQCFCCLRCRE 1272 DAR5 EVECRDEIEENEKLP----EVNPPLSMCGGCNSAVKHEESVNILGVLWHPGCFCCRSCDK 379 DAR6 ---SKDEVEGDGMLL----ELNPPPSLCGGCNFAVEHGGSVNILGVLWHPGCFCCRACHK 318 DAR7 ---FKDPVEEDGNLPRVDLNVNHPHSICDGCKSAIEYGRSVHALGVNWHPECFCCRYCDK 233 . : : : * *: * * ----------------------| |……………………… LIM-LIKE DOMAIN ……… Zn Coordinating: H C C C C DA1 PISEYEFSTSG---NYPFHKACYRERY-HPKCDVCSHFIPTNHAGLIEYRAHPFWVQKYC 260 DAR1 PIIDYEFSMSG---NRPYHKLCYKEQH-HPKCDVCHNFIPTNPAGLIEYRAHPFWMQKYC 278 DAR2 AITEHEFSLSG---TKPYHKLCFKELT-HPKCEVCHHFIPTNDAGLIEYRCHPFWNQKYC 250 DAR3 PFVMHEILKK-----GKFHIDCYKEYYRNRNCYVCQQKIPVNAEGIRKFSEHPFWKEKYC 159 DAR4 PIAMNEISDLR----GMYHKPCYKELR-HPNCYVCEKKIPRTAEGL-KYHEHPFWMETYC 1326 DAR5 PIAIHELENHVSNSRGKFHKSCYER-----YCYVCKEKK------MKTYNIHPFWEERYC 428 DAR6 PIAIHDIENHVSNSRGKFHKSCYER-----YCYVCKEKK------MKTYNNHPFWEERYC 367 DAR7 PIAMHEFS----NTKGRCHITCYERSH--PNCHVCKKKFP-----GRKYKEHPFWKEKYC 282 .: :: * *:.. * ** . : **** : ** + …………………………………………………………………………………………………| Zn Coordinating: H C C C C DA1 PSHEHDATPRCCSCERMEPRNTRYVELNDGRKLCLECLDSAVMDTMQCQPLYLQIQNFYE 320 DAR1 PSHERDGTPRCCSCERMEPKDTKYLILDDGRKLCLECLDSAIMDTHECQPLYLEIREFYE 338 DAR2 PSHEYDKTARCCSCERLESWDVRYYTLEDGRSLCLECMETAITDTGECQPLYHAIRDYYE 310 DAR3 PIHDEDGTAKCCSCERLEPRGTNYVMLGDFRWLCIECMGSAVMDTNEVQPLHFEIREFFE 219 DAR4 PSHDGDGTPKCCSCERLEHCGTQYVMLADFRWLCRECMDSAIMDSDECQPLHFEIREFFE 1386 DAR5 PVHEADGTPKCCSCERLEPRGTKYGKLSDGRWLCLECG-KSAMDSDECQPLYFDMRDFFE 487 DAR6 PVHEADGTPKCCSCERLEPRESNYVMLADGRWLCLECMNSAVMDSDECQPLHFDMRDFFE 427 DAR7 PFHEVDGTPKCCSCERLEPWGTKYVMLADNRWLCVKCMECAVMDTYECQPLHFEIREFFG 342 * *: * *.:******:* .* * * * ** :* : *: : ***: :::::
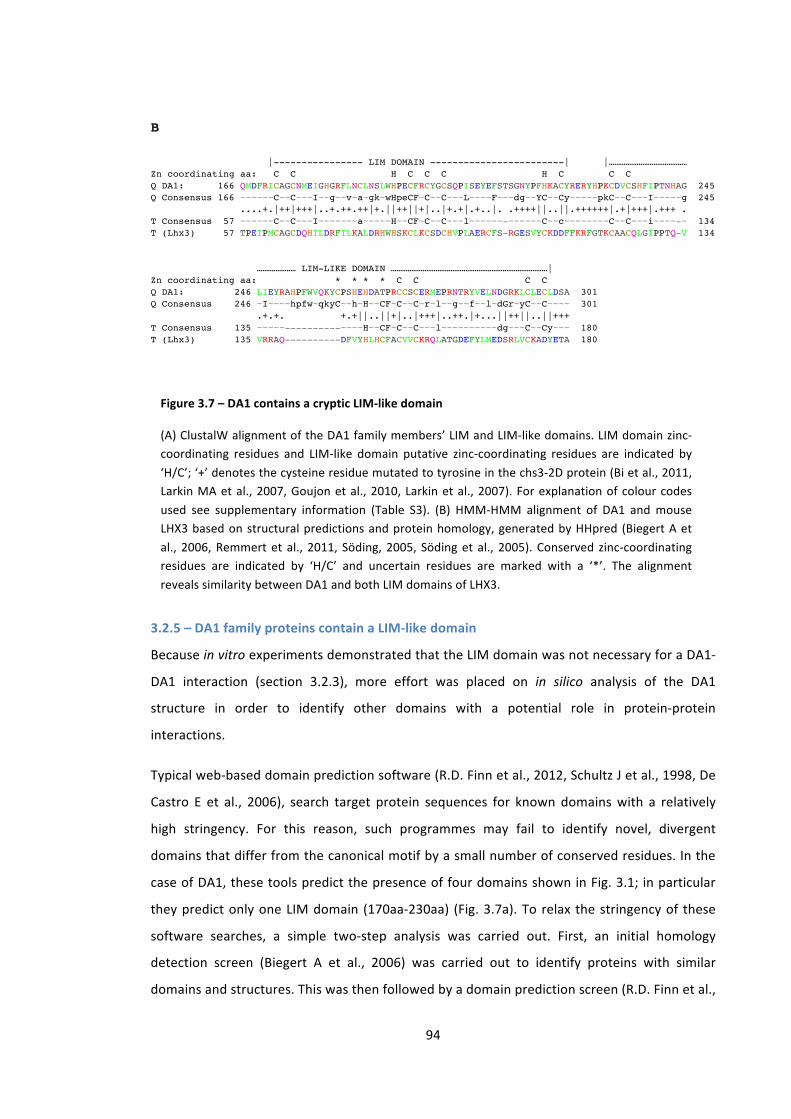
94
B |---------------- LIM DOMAIN ------------------------| |…………………………………… Zn coordinating aa: C C H C C C H C C C Q DA1: 166 QMDFRICAGCNMEIGHGRFLNCLNSLWHPECFRCYGCSQPISEYEFSTSGNYPFHKACYRERYHPKCDVCSHFIPTNHAG 245 Q Consensus 166 ~~~~~~C~~C~~~I~~g~~v~a~gk~wHpeCF~C~~C~~~L~~~~F~~~dg~~YC~~Cy~~~~~pkC~~C~~~I~~~~~g 245 ....+.|++|+++|..+.++.++|+.||++||+|..|+.+|.+..|. .++++||..||.++++++|.+|+++|.+++ . T Consensus 57 ~~~~~~C~~C~~~I~~~~~~~a~~~~~H~~CF~C~~C~~~l~~~~~~-~~~~~~C~~c~~~~~~~~C~~C~~~i~~~~-~ 134 T (Lhx3) 57 TPEIPMCAGCDQHILDRFILKALDRHWHSKCLKCSDCHVPLAERCFS-RGESVYCKDDFFKRFGTKCAACQLGIPPTQ-V 134 ………………… LIM-LIKE DOMAIN …………………………………………………………………………| Zn coordinating aa: * * * * C C C C Q DA1: 246 LIEYRAHPFWVQKYCPSHEHDATPRCCSCERMEPRNTRYVELNDGRKLCLECLDSA 301 Q Consensus 246 ~I~~~~hpfw~qkyC~~h~H~~CF~C~~C~r~l~~g~~f~~l~dGr~yC~~C~~~~ 301 .+.+. +.+||..||+|..|+++|..++.|+...||++||..||+++ T Consensus 135 ~~~~~----------~~~~H~~CF~C~~C~~~l~~~~~~~~~~dg~~~C~~Cy~~~ 180 T (Lhx3) 135 VRRAQ----------DFVYHLHCFACVVCKRQLATGDEFYLMEDSRLVCKADYETA 180
3.2.5 – DA1 family proteins contain a LIM-‐like domain
Because in vitro experiments demonstrated that the LIM domain was not necessary for a DA1-‐
DA1 interaction (section 3.2.3), more effort was placed on in silico analysis of the DA1
structure in order to identify other domains with a potential role in protein-‐protein
interactions.
Typical web-‐based domain prediction software (R.D. Finn et al., 2012, Schultz J et al., 1998, De
Castro E et al., 2006), search target protein sequences for known domains with a relatively
high stringency. For this reason, such programmes may fail to identify novel, divergent
domains that differ from the canonical motif by a small number of conserved residues. In the
case of DA1, these tools predict the presence of four domains shown in Fig. 3.1; in particular
they predict only one LIM domain (170aa-‐230aa) (Fig. 3.7a). To relax the stringency of these
software searches, a simple two-‐step analysis was carried out. First, an initial homology
detection screen (Biegert A et al., 2006) was carried out to identify proteins with similar
domains and structures. This was then followed by a domain prediction screen (R.D. Finn et al.,
Figure 3.7 – DA1 contains a cryptic LIM-‐like domain
(A) ClustalW alignment of the DA1 family members’ LIM and LIM-‐like domains. LIM domain zinc-‐coordinating residues and LIM-‐like domain putative zinc-‐coordinating residues are indicated by ‘H/C’; ‘+’ denotes the cysteine residue mutated to tyrosine in the chs3-‐2D protein (Bi et al., 2011, Larkin MA et al., 2007, Goujon et al., 2010, Larkin et al., 2007). For explanation of colour codes used see supplementary information (Table S3). (B) HMM-‐HMM alignment of DA1 and mouse LHX3 based on structural predictions and protein homology, generated by HHpred (Biegert A et al., 2006, Remmert et al., 2011, Söding, 2005, Söding et al., 2005). Conserved zinc-‐coordinating residues are indicated by ‘H/C’ and uncertain residues are marked with a ‘*’. The alignment reveals similarity between DA1 and both LIM domains of LHX3.
95
2012, Schultz J et al., 1998, De Castro E et al., 2006), which used these proteins as query
sequences. This strategy revealed that a large region of DA1 (167aa-‐303aa) had significant
structural similarities with a number of other proteins. In particular, the region 230aa-‐297aa
shared significant structural homology with the LIM domains of other proteins (including the
mouse LIM/homeobox protein LHX3 (Zhadanov et al., 1995)), as illustrated in Fig. 3.7b. This
new putative domain was termed the LIM-‐like domain.
The purported second pair of zinc coordinating amino acids in the LIM-‐like domain of DA1 was
not detected by classical domain prediction software (R.D. Finn et al., 2012, Schultz J et al.,
1998, De Castro E et al., 2006) because of significant sequence divergence from the canonical
LIM pattern. By considering a CxxH pairing at position 261aa-‐264aa, it was apparent that an
insertion in the first zinc finger domain and the inter-‐finger region causes the sequence to
deviate significantly from the LIM consensus pattern. This results in a finger length of 24aa and
an inter-‐finger region of 7aa (rather that 16-‐23aa and 2aa respectively). Currently it is not
known if these changes result in a functional domain or whether they abolish LIM function.
Observations from a recent publication on another member of the DA1 family, CHS3/DAR4,
suggest that this LIM-‐like domain is both functional and essential for DAR4 function (Bi et al.,
2011). They showed that a single Cys-‐Tyr transition at position 1340aa in the chs3-‐2D allele
has a dominant gain-‐of-‐function phenotype, with plants showing severe stunting, curled leaves,
constitutive expression of PATHOGENESIS-‐RELATED (PR) genes and accumulation of salicylic
acid. Fig. 3.7a shows that this cysteine residue is predicted to form the second zinc-‐
coordinating residue of the second zinc-‐finger in the LIM-‐like domain. The fact that this
mutation causes such a significant phenotype suggests that this LIM-‐like domain is indeed
functional. It is therefore possible that the LIM-‐like domain in DA1 plays an important role in
DA1 function, and that mutations in this domain in DA1 may also generate a dominant
negative phenotype. This opens up additional approaches to the structure-‐functional analysis
of DA1.
3.3 – Only one DA1 UIM domain binds mono-‐ubiquitin
Four members of the DA1 family contain predicted UIM domains (Fig3.1), but it is unclear
whether these are functional UIM domains or relics. For example in DAR1 (Fig. 3.8) inspection
of UIM2 shows that it lacks the highly conserved serine residue in the C-‐terminal section of the
domain. This divergence in sequence presents the possibility that the UIM is non-‐functional. In
order to determine whether the UIMs are indeed functional and to determine their role in

96
organ size control, a semi-‐quantitative in vitro ubiquitin-‐binding assay was conducted to test
the functionality of the UIM domains. This assay focussed exclusively on the DA1 UIMs.
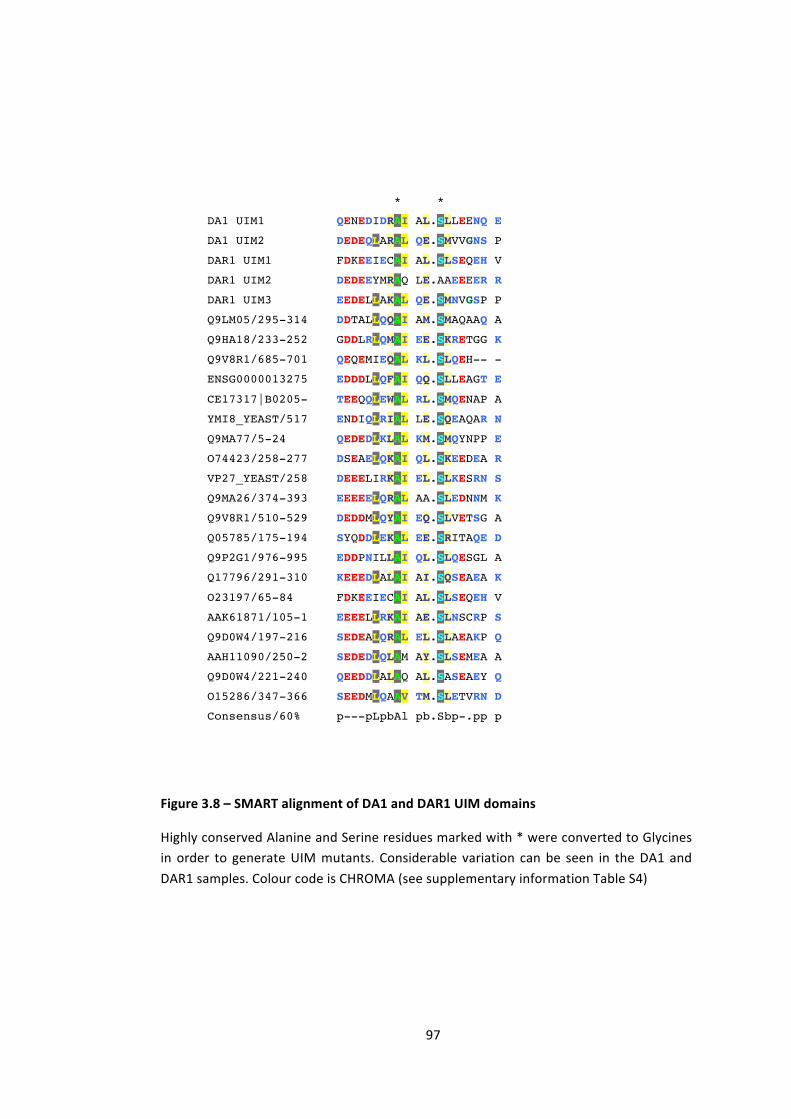
97
* *
DA1 UIM1 QENEDIDRAI AL.SLLEENQ E
DA1 UIM2 DEDEQLARAL QE.SMVVGNS P
DAR1 UIM1 FDKEEIECAI AL.SLSEQEH V
DAR1 UIM2 DEDEEYMRAQ LE.AAEEEER R
DAR1 UIM3 EEDELLAKAL QE.SMNVGSP P
Q9LM05/295-314 DDTALLQQAI AM.SMAQAAQ A
Q9HA18/233-252 GDDLRLQMAI EE.SKRETGG K
Q9V8R1/685-701 QEQEMIEQAL KL.SLQEH-- -
ENSG0000013275 EDDDLLQFAI QQ.SLLEAGT E
CE17317|B0205- TEEQQLEWAL RL.SMQENAP A
YMI8_YEAST/517 ENDIQLRIAL LE.SQEAQAR N
Q9MA77/5-24 QEDEDLKLAL KM.SMQYNPP E
O74423/258-277 DSEAELQKAI QL.SKEEDEA R
VP27_YEAST/258 DEEELIRKAI EL.SLKESRN S
Q9MA26/374-393 EEEEELQRAL AA.SLEDNNM K
Q9V8R1/510-529 DEDDMLQYAI EQ.SLVETSG A
Q05785/175-194 SYQDDLEKAL EE.SRITAQE D
Q9P2G1/976-995 EDDPNILLAI QL.SLQESGL A
Q17796/291-310 KEEEDLALAI AI.SQSEAEA K
O23197/65-84 FDKEEIECAI AL.SLSEQEH V
AAK61871/105-1 EEEELLRKAI AE.SLNSCRP S
Q9D0W4/197-216 SEDEALQRAL EL.SLAEAKP Q
AAH11090/250-2 SEDEDLQLAM AY.SLSEMEA A
Q9D0W4/221-240 QEEDDLALAQ AL.SASEAEY Q
O15286/347-366 SEEDMLQAAV TM.SLETVRN D
Consensus/60% p---pLpbAl pb.Sbp-.pp p
Figure 3.8 – SMART alignment of DA1 and DAR1 UIM domains
Highly conserved Alanine and Serine residues marked with * were converted to Glycines in order to generate UIM mutants. Considerable variation can be seen in the DA1 and DAR1 samples. Colour code is CHROMA (see supplementary information Table S4)
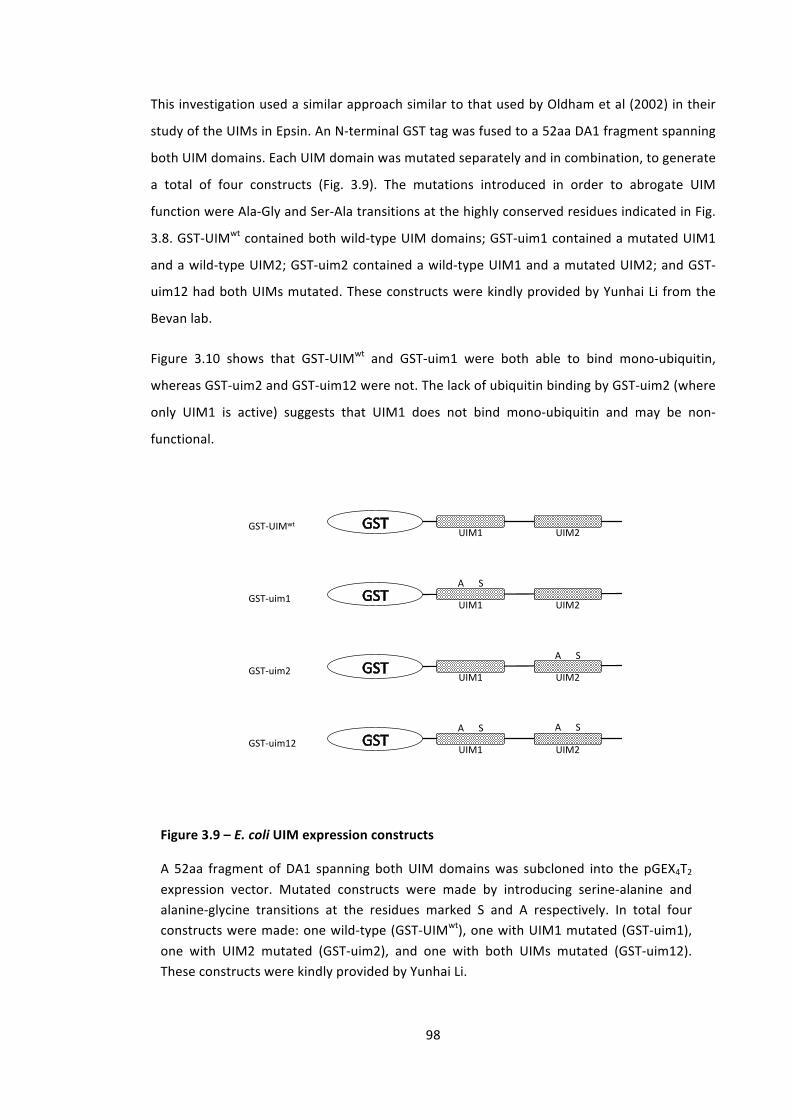
98
This investigation used a similar approach similar to that used by Oldham et al (2002) in their
study of the UIMs in Epsin. An N-‐terminal GST tag was fused to a 52aa DA1 fragment spanning
both UIM domains. Each UIM domain was mutated separately and in combination, to generate
a total of four constructs (Fig. 3.9). The mutations introduced in order to abrogate UIM
function were Ala-‐Gly and Ser-‐Ala transitions at the highly conserved residues indicated in Fig.
3.8. GST-‐UIMwt contained both wild-‐type UIM domains; GST-‐uim1 contained a mutated UIM1
and a wild-‐type UIM2; GST-‐uim2 contained a wild-‐type UIM1 and a mutated UIM2; and GST-‐
uim12 had both UIMs mutated. These constructs were kindly provided by Yunhai Li from the
Bevan lab.
Figure 3.10 shows that GST-‐UIMwt and GST-‐uim1 were both able to bind mono-‐ubiquitin,
whereas GST-‐uim2 and GST-‐uim12 were not. The lack of ubiquitin binding by GST-‐uim2 (where
only UIM1 is active) suggests that UIM1 does not bind mono-‐ubiquitin and may be non-‐
functional.
UIM1% UIM2%GST*UIMwt%
UIM1% UIM2%GST*uim1%
UIM1% UIM2%GST*uim2%
UIM1% UIM2%GST*uim12%
A%%%%%%S%
A%%%%%%S%
A%%%%%%S%A%%%%%%S%
Figure 3.9 – E. coli UIM expression constructs
A 52aa fragment of DA1 spanning both UIM domains was subcloned into the pGEX4T2 expression vector. Mutated constructs were made by introducing serine-‐alanine and alanine-‐glycine transitions at the residues marked S and A respectively. In total four constructs were made: one wild-‐type (GST-‐UIMwt), one with UIM1 mutated (GST-‐uim1), one with UIM2 mutated (GST-‐uim2), and one with both UIMs mutated (GST-‐uim12). These constructs were kindly provided by Yunhai Li.
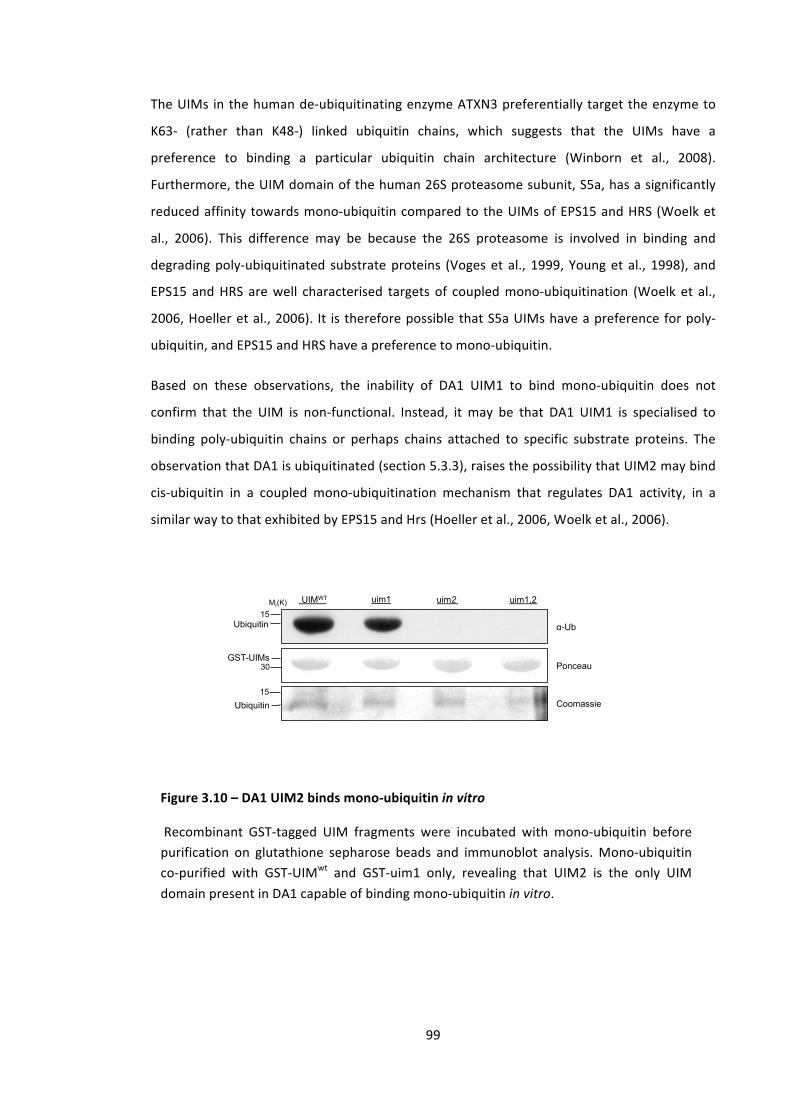
99
The UIMs in the human de-‐ubiquitinating enzyme ATXN3 preferentially target the enzyme to
K63-‐ (rather than K48-‐) linked ubiquitin chains, which suggests that the UIMs have a
preference to binding a particular ubiquitin chain architecture (Winborn et al., 2008).
Furthermore, the UIM domain of the human 26S proteasome subunit, S5a, has a significantly
reduced affinity towards mono-‐ubiquitin compared to the UIMs of EPS15 and HRS (Woelk et
al., 2006). This difference may be because the 26S proteasome is involved in binding and
degrading poly-‐ubiquitinated substrate proteins (Voges et al., 1999, Young et al., 1998), and
EPS15 and HRS are well characterised targets of coupled mono-‐ubiquitination (Woelk et al.,
2006, Hoeller et al., 2006). It is therefore possible that S5a UIMs have a preference for poly-‐
ubiquitin, and EPS15 and HRS have a preference to mono-‐ubiquitin.
Based on these observations, the inability of DA1 UIM1 to bind mono-‐ubiquitin does not
confirm that the UIM is non-‐functional. Instead, it may be that DA1 UIM1 is specialised to
binding poly-‐ubiquitin chains or perhaps chains attached to specific substrate proteins. The
observation that DA1 is ubiquitinated (section 5.3.3), raises the possibility that UIM2 may bind
cis-‐ubiquitin in a coupled mono-‐ubiquitination mechanism that regulates DA1 activity, in a
similar way to that exhibited by EPS15 and Hrs (Hoeller et al., 2006, Woelk et al., 2006).
α-Ub
Ponceau
Ubiquitin
uim2 uim1,2 UIMWT
30
Mr(K)
GST-UIMs
Coomassie
15
15
Ubiquitin
uim1
Figure 3.10 – DA1 UIM2 binds mono-‐ubiquitin in vitro
Recombinant GST-‐tagged UIM fragments were incubated with mono-‐ubiquitin before purification on glutathione sepharose beads and immunoblot analysis. Mono-‐ubiquitin co-‐purified with GST-‐UIMwt and GST-‐uim1 only, revealing that UIM2 is the only UIM domain present in DA1 capable of binding mono-‐ubiquitin in vitro.
100
3.4 – DA1 metallopeptidase is not active towards K48 or K63 poly-‐ubiquitin
The DA1 C-‐terminal peptidase domain belongs to the MA clan of peptidases that includes the
WLM family of proteins, which have been shown to be involved in de-‐sumoylation and de-‐
ubiquitination (Iyer et al., 2004, Su and Hochstrasser, 2010, Mullen et al., 2010). Because both
DA1 and WLM DUBs contain UIMs and a peptidase domain, it was hypothesised that DA1 was
a de-‐ubiquitinating enzyme. To test this hypothesis the ability of DA1 to hydrolyse poly-‐
ubiquitin was assayed in an in vitro system. Recombinant GST-‐DA1 was incubated with poly-‐
ubiquitin chains (a mixture of 2-‐7mers) for two hours at 30°C, before aliquots were run on SDS-‐
PAGE and subjected to western blot analysis. Because K48 and K63 linked ubiquitin chains are
the most abundant forms of poly-‐ubiquitin in nature (Peng et al., 2003, Saracco et al., 2009),
only poly-‐ubiquitin chains joined by these linkages were tested in this assay. Empty GST vector
(GST-‐Φ) was used as a negative control in this assay.
The western blots in Fig. 3.11 showed that DA1 had no de-‐ubiquitinating activity towards
either K63 and K48 linked ubiquitin in these experimental conditions. Although it remained a
possibility that DA1 possessed a de-‐ubiquitinating activity towards other poly-‐ubiquitin
structures, the identification of other substrates for the DA1 peptidase in Chapter 5 led to the
decision not to pursue this avenue of research.
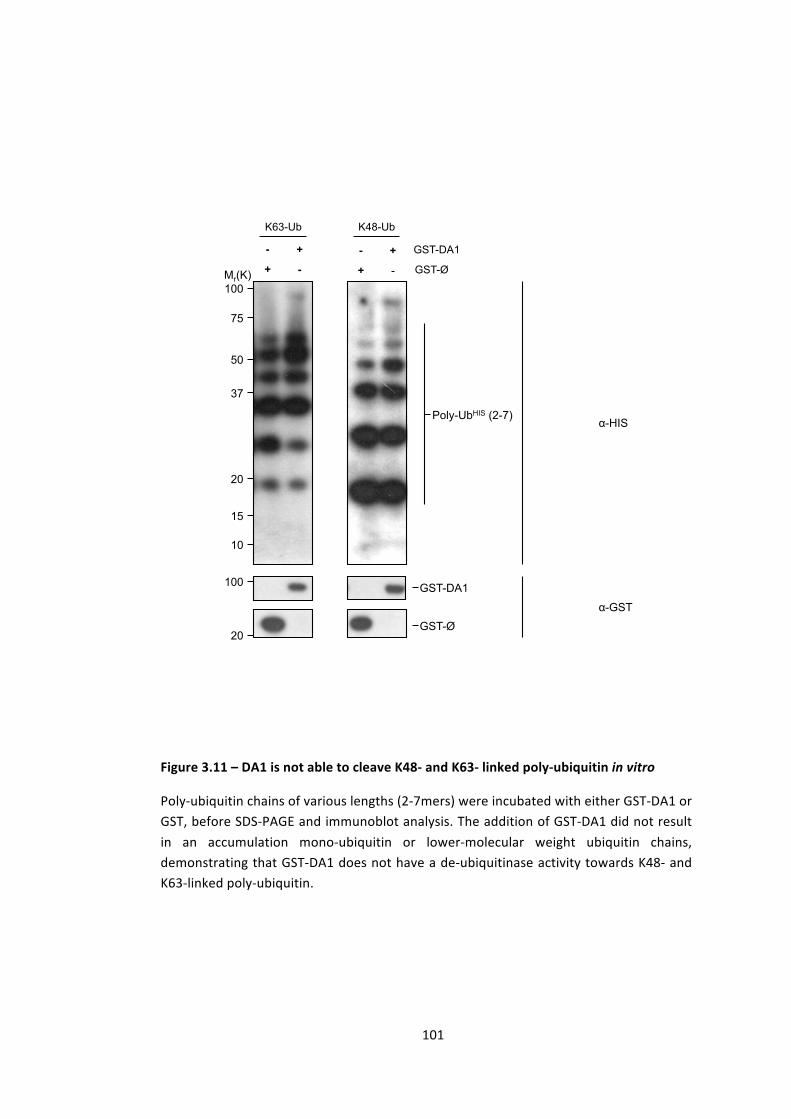
101
Mr(K)
α-GST
K48-Ub
α-HIS Poly-UbHIS (2-7)
GST-DA1
GST-Ø 20
100
10
15
20
37
50
75
100
K63-Ub
- + - +
+ - + -
GST-DA1
GST-Ø
Figure 3.11 – DA1 is not able to cleave K48-‐ and K63-‐ linked poly-‐ubiquitin in vitro
Poly-‐ubiquitin chains of various lengths (2-‐7mers) were incubated with either GST-‐DA1 or GST, before SDS-‐PAGE and immunoblot analysis. The addition of GST-‐DA1 did not result in an accumulation mono-‐ubiquitin or lower-‐molecular weight ubiquitin chains, demonstrating that GST-‐DA1 does not have a de-‐ubiquitinase activity towards K48-‐ and K63-‐linked poly-‐ubiquitin.

102
3.5 -‐ Discussion
The biochemical analyses reported in this chapter have improved our understanding of DA1
protein function, provided plausible explanations for its genetic interactions, and helped to
focus research on promising leads.
Based on predictions from da1-‐1 genetic interactions, it was shown that DA1 and DAR1
physically interact in vitro. This suggests that the active forms of these proteins may be hetero-‐
and homo-‐oligomeric complexes. The genetic analysis carried out by Li et al (2008) revealed
that DA1 and DAR1 redundantly influence the duration of cell proliferation in developing
organs. The analysis also showed that the da1-‐1 protein had a negative influence on the
activity of DAR1 (Li et al., 2008). Together these observations suggested that DA1 and DAR1
might be active in a multimeric complex, which is rendered non-‐functional with the inclusion
of the da1-‐1 protein. The evidence in section 3.2.2 that DA1 and DAR1 interact in vitro
supports the prediction that DA1 and DAR1 operate in a multimeric complex. In addition, the
in vitro observation that da1-‐1 binds both DA1 and DAR1 supports the prediction that da1-‐1 is
able to interact physically with wild-‐type DA1 and DAR1 in this multimeric complex.
By integrating this genetic and biochemical evidence it is possible to postulate that members
of the DA1 family may act together, as interchangeable subunits. For example, DA1 and DAR1
may form a complex whose functions are different from those of the respective homo-‐
oligomeric complexes. This idea is supported by the significant sequence similarity between
family members, and emerging evidence of different roles for the different family members (Bi
et al., 2011, Yang et al., 2010, Peng et al., 2013). This ability of different family members to
form into different complexes could serve to integrate different stimuli into a single
coordinated biological response.
The human muscle differentiation cofactors CRP1 and CRP2 are an example of LIM domain
containing proteins that form modular complexes (Chang et al., 2003). These proteins utilise
their dual LIM domains to bind different interacting partners; SRF at the N-‐terminal LIM and
GATA4/6 at the C-‐terminal LIM (Chang et al., 2003). The identification of the LIM-‐like domain
in DA1, and evidence of its significance in DAR4 (Yang et al., 2010), suggests that the dual LIM
and LIM-‐like domains in DA1 may act as a scaffold for modular complex formation, akin to that
seen for CRP1 and CRP2 (Chang et al., 2003). In support of this, the in vitro da1lim8 binding
studies show that the LIM domain is not required for the DA1-‐DA1 interaction, which suggests
that it has a role in the binding of other DA1 family members or putative substrates.
103
As the LIM domain is not required for DA1-‐DA1 interactions, it is possible that it may have a
role in either intramolecular interactions (perhaps associated with coupled mono-‐
ubiquitination and controlling peptidase activity) or in mediating interactions of DA1 with
other as yet unknown proteins. The well characterised role of LIM domains in mediating
protein-‐protein interactions (Schmeichel and Beckerle, 1994, Kadrmas and Beckerle, 2004,
Agulnick et al., 1996) and the evidence that the DA1-‐DA1 interaction is independent of LIM
function, suggests that the DA1 LIM domain could be utilised to identify de novo DA1
interacting partners. Such interactors could be upstream regulators of DA1, other components
of DA1 complexes, or the downstream targets of DA1 complex activity. To explore these
possibilities, a truncated version of DA1 containing the LIM and C-‐terminal domain was used in
Chapter 4 to identify binding partners in a yeast-‐2-‐hybrid screen.
Finally, evidence that DA1 has no de-‐ubiquitinating activity in vitro suggested that the putative
DA1 peptidase may have other substrates. This observation, together with the identification of
UIM2 as a functional ubiquitin-‐binding motif, has helped to focus functional analysis of DA1 on
the observed genetic interactions with the E3 ubiquitin ligases, EOD1/BB and DA2 (Li et al.,
2008, Disch et al., 2006, Xia, 2013). This is explored further in Chapter 5. The revelation that
DA1 is probably not a de-‐ubiquitinating enzyme suggests that it may have alternative roles
within the ubiquitin system. For example DA1 may act as an E3 ligase adaptor protein that may
recruit its cognate E3 ligase to a target. This is seen with the mammalian UIM-‐containing
protein RAP80, which recruits BRCA1 to double-‐strand breaks (Sobhian et al., 2007). An
alternative possibility is that the DA1 UIMs recruit a cognate E3 ligase by binding to its
ubiquitinated from and consequently initiate a coupled mono-‐ubiquitination reaction that
subsequently alters DA1 activity (Woelk et al., 2006, Komander et al., 2009). The role of the
putative DA1 peptidase activity in these mechanisms is not yet known, but it could involve the
modification of E3 behaviour, as is the case for the human E3 ligases, RNF13 and Parkin
(Burchell et al., 2012, Bocock et al., 2010).
104
Chapter 4 -‐ A yeast-‐2-‐hybrid screen for DA1 interacting proteins
4.1 Introduction
Current understanding of DA1 function has been obtained from knowledge of DA1 protein
structure, DA1 biochemistry (Chapter 3), genetic analysis of the da1-‐1 mutant (Li et al., 2008),
and two observed genetic interactions with EOD1/BB (Li et al., 2008) and MED25/PFT1 (Xu and
Li, 2011). Biochemical work has yielded significant insights into the relationship between DA1
and DAR1, as well as the role of DA1 in the ubiquitin system (Chapter 3). The observed genetic
interaction between DA1 and the E3 ligase EOD1 (Li et al., 2008) suggested DA1 might have a
role in the regulation of EOD1 (Chapter 5), which emphasises the potential significance and
promise of identifying DA1 interacting proteins for advancing the understanding of the
regulation of growth control. This is the subject of research described in this Chapter.
4.1.1 – Identifying physical interactors of DA1
To complement and extend the observations of a genetic interaction between DA1 and EOD1,
work in this Chapter focussed on identifying physical interactions between DA1 and other
proteins. The reasons for screening for physical interactors rather than genetic interactors are
as follows: first, growth and developmental phenotypes are often highly pleiotropic, and there
is considerable risk that enhancer and suppressor screens may identify non-‐related genes. For
example, the da1-‐1 enhancer EOD3 was recently shown to be independent of DA1 (Fang et al.,
2012). Second, a genetic interaction does not indicate biochemical or developmental
proximity; it can establish that the two genes in question may be in the same pathway, but not
that they function at the same step within that pathway. Therefore, depending on the
complexity of a pathway, a genetic interaction can be relatively uninformative, such as the
observed interaction between MED25/PFT1 and DA1 (Xu and Li, 2011).
In contrast, the identification of physical interactions between proteins provides the
foundations for a variety of informative biochemical and genetic experiments that can define,
in molecular detail, the cellular functions of the interaction and the partner proteins. A good
example of this power is the discovery, through a Y2H screen (see section 4.1.2), that the
Arabidopsis F-‐box protein AtFBS1 interacts with 14-‐3-‐3 proteins (Sepúlveda-‐García and Rocha-‐

105
Sosa, 2012). This observation has led to new hypotheses for the dimerization and auto-‐
ubiquitination of AtFBS1, which will undoubtedly be tested in the near future.
A further reason for screening for physical interactions is an interest in the significance of the
DA1 peptidase. The presence of this domain in DA1 suggests a role in the irreversible
modification of target proteins; a process known to play a critical role in regulating the uni-‐
directionality of the cell-‐cycle and cell proliferation in human cancer cells (Elledge, 1996,
Mason and Joyce, 2011). The irreversible nature of this modification indicates that potential
substrates of DA1 identified through interaction screens may be novel candidate regulators of
the progression of cell proliferation. Therefore such screens for DA1-‐interacting proteins form
a necessary part of our work towards understanding the control of organ and seed growth.
4.1.2 – Yeast-‐2-‐Hybrid – An overview
Two key methods are suitable for identifying the physical interactors of DA1: a Yeast-‐2-‐Hybrid
screen (henceforth Y2H) and an in planta co-‐immunoprecipitation screen. The latter involves
the immunopurification of epitope-‐tagged bait protein from transgenic plant tissue and the
subsequent proteomic identification of binding partners. This method relies on the stability of
the bait protein in planta, however as the DA1 protein is unstable in planta (Yunhai Li, personal
communication) this technique was unsuitable. For this reason a Y2H based experimental
strategy was used.
The Y2H screen, originally developed in the 1980s (Fields and Song, 1989), is a yeast-‐based
method for identifying physically interacting proteins. As illustrated in Fig. 4.1, the
transcriptional activation of a specific set of reporter genes is dependent upon the interaction
of both a bait and a prey protein. Using the Invitrogen Pro-‐QuestTM system, the coding
sequence of the bait protein (DA1) was fused in-‐frame to the DNA-‐binding domain of the GAL4
transcription factor (GAL4-‐DB), and a library of coding sequences of potential prey proteins
was fused to the activation domain of GAL4 (GAL4-‐AD). The prey library was generated from
cDNA from Arabidopsis inflorescences and kindly provided by Phil Wigge and Vinod Kumar at
the John Innes Centre, Norwich. The physical interaction of DA1 and its prey brings GAL4-‐DB
and GAL4-‐AD into close proximity such that a functional GAL4 transcription factor is
reconstituted, leading to activation of the reporter genes. In order to reduce the occurrence of
false-‐positives in the screen, two independent reporter genes were used in this screen. The
yeast strain used in this assay (PJ69-‐4α), had its HIS3 and ADE2 genes under the control of the
GAL4 transcription factor (see fig. 4.2) (James et al., 1996). These genes enable autotrophy for
histidine and adenine respectively, and therefore a bait and prey interaction is required for
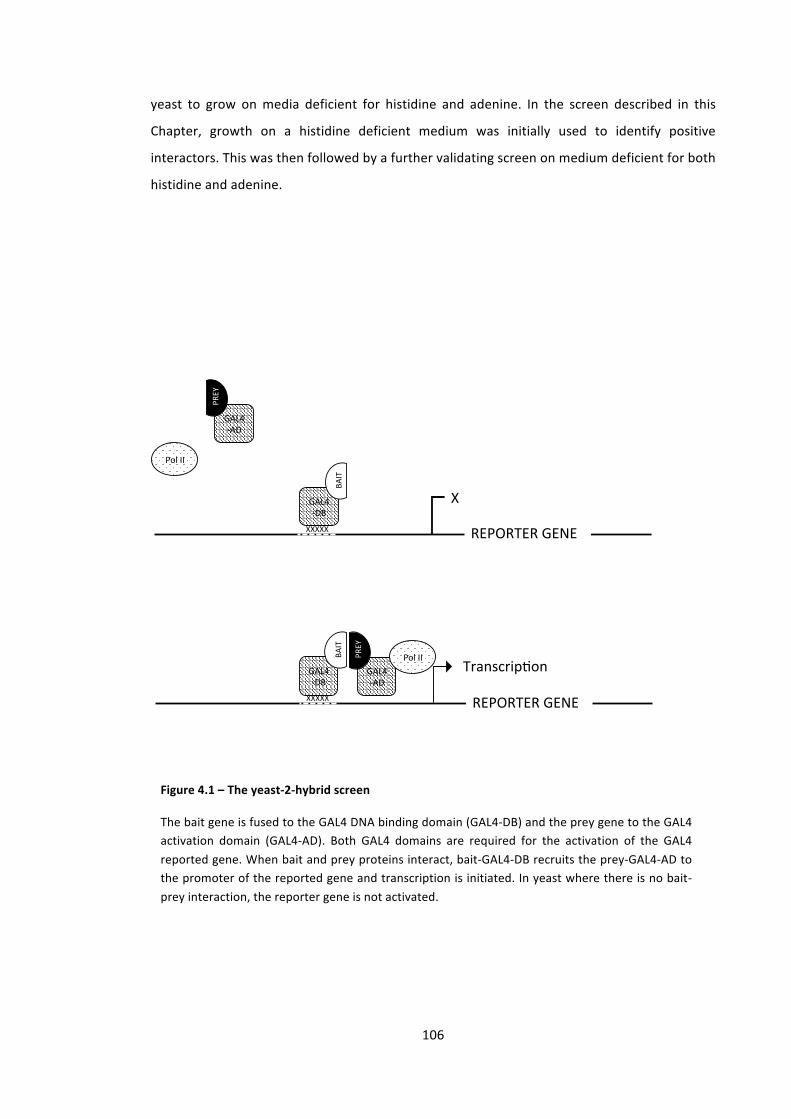
106
yeast to grow on media deficient for histidine and adenine. In the screen described in this
Chapter, growth on a histidine deficient medium was initially used to identify positive
interactors. This was then followed by a further validating screen on medium deficient for both
histidine and adenine.
GAL4%&DB%
BAIT%
GAL4&AD%
PREY%
GAL4%&DB%
BAIT%
REPORTER%GENE%
REPORTER%GENE%
GAL4&AD%
PREY%
Pol%II%
X
Pol%II%
Transcrip;on%
XXXXX%
XXXXX%
Figure 4.1 – The yeast-‐2-‐hybrid screen
The bait gene is fused to the GAL4 DNA binding domain (GAL4-‐DB) and the prey gene to the GAL4 activation domain (GAL4-‐AD). Both GAL4 domains are required for the activation of the GAL4 reported gene. When bait and prey proteins interact, bait-‐GAL4-‐DB recruits the prey-‐GAL4-‐AD to the promoter of the reported gene and transcription is initiated. In yeast where there is no bait-‐prey interaction, the reporter gene is not activated.
107
4.2 – DA1 Yeast-‐2-‐Hybrid identifies 31 candidate interactors
4.2.1 – Experimental strategy
The experiments were carried out in three steps:
1. A first-‐round screen was used to identify a pool of positive interactors. This was done by
initially selecting all colonies that were able to grow on SC-‐Leu-‐Trp-‐His medium (see Box
4.1). This pool of 117 primary transformants was then assessed – based on known
biochemical and developmental roles – for promising candidates.
2. Candidate interactors were taken forward for a second-‐round of Y2H to confirm the initial
interaction. This was done through a re-‐transformation of the yeast with both bait and
prey, followed by selection on SC-‐Leu-‐Trp-‐His-‐Ade medium (see Box 4.1). This added
confidence to the original interaction through the use of -‐Ade selection, which has a
background level two orders of magnitude lower than -‐His selection (James et al., 1996).
Negative controls consisting of empty vectors (GAL4-‐DB and GAL4-‐AD) were used to assay
for specific interactions.
3. Following this second round, remaining candidate interactors were cloned into bacterial
expression vectors and tested for interaction with DA1 in vitro. Only at his stage were
candidates taken forward for genetic analyses.
Box 4.1 – Yeast-‐2-‐hybrid selection genes
The PJ69-‐4a yeast strain used in this screen is deficient for LEU2 and TRP1, and has the HIS3 and ADE2 genes under the control of GAL4. The bait vector, pDBleu contains the LEU2 gene and the prey vector, pEXP-‐AD502 contains the TRP1 gene. Interaction of bait and prey constructs results in an active GAL4 protein and therefore the transcription of HIS3 and ADE2
LEU2 Confers ability to grow on SC-‐Leu media Selects for presence of bait construct (pDBleu)
TRP1 Confers ability to grow on SC-‐Trp media Selects for the prey construct (pEXP-‐AD-‐502)
GAL1-‐HIS3 Confers ability to grow on SC-‐His media Selecting for a bait:prey interaction
GAL2-‐ADE2 Confers ability to grow on SC-‐Ade media Selecting for a bait:prey interaction Stringent selection (two orders of magnitude less background than HIS3)
108
4.2.2 – Truncated DA1 was used to reduce false positives
As demonstrated in section 3.3, DA1 UIM2 interacts non-‐covalently with ubiquitin, and both
UIMs may have the potential to bind poly-‐ubiquitin. In order to reduce false positives arising
from non-‐specific binding between DA1 UIMs and endogenous yeast ubiquitin (free ubiquitin
and ubiquitinated proteins), a truncated DA1 bait protein was used in the Y-‐2-‐H screen. The
construct had the N-‐terminal 162aa removed, leaving both the LIM domain and the C-‐terminal
peptidase domain. The removal of such a large protein fragment had the potential to increase
the number of false negatives. However biochemical data suggesting the LIM and LIM-‐like
domains may be involved in binding non-‐DA1 family members (section 3.2) gave confidence
that this construct could identify candidate binding partners.
4.2.3 – DA1 interacts with 31 candidate genes
Adjusted to remove multiple colonies of the same clone, Fig. 4.1 displays identities of the in-‐
frame prey proteins that were fused to GAL4-‐AD in colonies that grew robustly on SC-‐Leu-‐Trp-‐
His medium. The table lists many genes that initially appear to be involved in growth and
development. UNFERTILISED EMBRYO SAC 16 (UNE16), and MATERNAL EFFECT EMBRYO
ARREST 14 (MEE14) both have published seed development phenotypes (Pagnussat et al.,
2005), and were considered to be potential candidates for further study. ARABIDOPSIS
THALIANA UBIQUITIN ACTIVATING ENZYME (ATUBA1) is also an interesting candidate, as it is
one of only two E1 activating enzymes in Arabidopsis and has a published pathogen-‐related
growth-‐response phenotype (Goritschnig et al., 2007). This is particularly interesting as it
shows biochemical and developmental overlap with DA1 – through the ubiquitin system, and
growth and development respectively.
The LOB DOMAIN-‐CONTAINING PROTEIN 41 (LBD41) was also of interest. This gene is related
to the LOB-‐domain containing protein, ASYMMETRIC LEAVES 2 (AS2), the knockout of which
causes leaf lobing, short petioles and the formation of leaflet-‐like structures (Semiarti et al.,
2001). AS2 is involved in the repression of KNOX gene expression in the lateral regions of the
SAM (Guo et al., 2008, Hay et al., 2006), and influences leaf development and the
establishment of adaxial-‐abaxial polarity (Semiarti et al., 2001, Xu et al., 2003, Lin et al., 2003).
Over-‐expression of the LBD41 homolog in Celosia cristata has been shown induce leaf lobing
and ectopic leaf blade formation on the petiole (Meng et al., 2010).
It is also noteworthy that 15 out of the 31 interacting proteins have a predicted chloroplast
localisation. These included genes involved in photosynthesis , such as PSAE-‐1 (Varotto et al.,
109
2000), FERREDOXIN 2 (Hanke et al., 2004) and two RUBISCO subunits (Spreitzer and Salvucci,
2002) as well as non-‐photosynthetic genes such as the transcription factor TCP15 (Uberti-‐
Manassero et al., 2012, Li et al., 2012, Kieffer et al., 2011) and the DNA binding storekeeper
protein-‐related gene AT4G00270.
Despite the potential interest of many of these genes, the candidates selected for further
characterisation were TCP15 and the Leucine Rich Repeat Receptor-‐Like Kinase (LRR-‐RLK)
TMK4. The decision to pursue TCP15 was largely based on observations from whole-‐proteome
screens of protein interactions relevant to plant pathology, which appeared to suggest an
interaction between DARs and the TCPs (Mukhtar et al., 2011). Furthermore, TCPs have a well-‐
described role in organ growth and development (Kieffer et al., 2011, Koyama et al., 2010, Li et
al., 2012, Steiner et al., 2012, Uberti-‐Manassero et al., 2012).
The decision to pursue TMK4 was based on observations that TMK4 is a promoter of organ
growth, through both cell proliferation and cell expansion, and has a reduced sensitivity to
auxin. Moreover, preliminary data showing a genetic interaction between da1-‐1 and the LRR-‐
RLK FLAGELLIN SENSITIVE2 (FLS2) (Cyril Zipfel, personal communication), and data from animal
systems implicating UIM containing proteins in the processing of LRR-‐RLKs (Marmor and
Yarden, 2004) suggested that TMK4 and DA1 may interact to influence organ growth and
development.
Additional reasons for pursuing TCP15 and TMK4 will be described in further detail in section
4.3 and section 4.4 respectively.
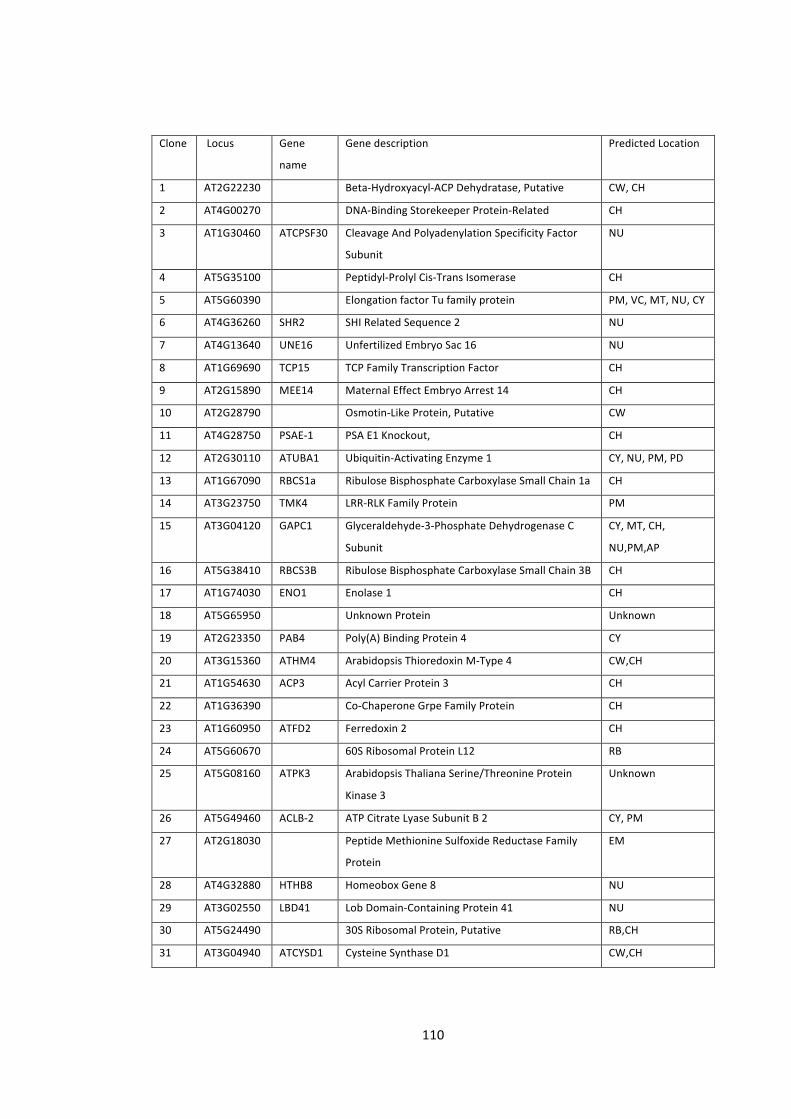
110
Clone Locus Gene
name
Gene description Predicted Location
1 AT2G22230 Beta-‐Hydroxyacyl-‐ACP Dehydratase, Putative CW, CH
2 AT4G00270 DNA-‐Binding Storekeeper Protein-‐Related CH
3 AT1G30460 ATCPSF30 Cleavage And Polyadenylation Specificity Factor
Subunit
NU
4 AT5G35100 Peptidyl-‐Prolyl Cis-‐Trans Isomerase CH
5 AT5G60390 Elongation factor Tu family protein PM, VC, MT, NU, CY
6 AT4G36260 SHR2 SHI Related Sequence 2 NU
7 AT4G13640 UNE16 Unfertilized Embryo Sac 16 NU
8 AT1G69690 TCP15 TCP Family Transcription Factor CH
9 AT2G15890 MEE14 Maternal Effect Embryo Arrest 14 CH
10 AT2G28790 Osmotin-‐Like Protein, Putative CW
11 AT4G28750 PSAE-‐1 PSA E1 Knockout, CH
12 AT2G30110 ATUBA1 Ubiquitin-‐Activating Enzyme 1 CY, NU, PM, PD
13 AT1G67090 RBCS1a Ribulose Bisphosphate Carboxylase Small Chain 1a CH
14 AT3G23750 TMK4 LRR-‐RLK Family Protein PM
15 AT3G04120 GAPC1 Glyceraldehyde-‐3-‐Phosphate Dehydrogenase C
Subunit
CY, MT, CH,
NU,PM,AP
16 AT5G38410 RBCS3B Ribulose Bisphosphate Carboxylase Small Chain 3B CH
17 AT1G74030 ENO1 Enolase 1 CH
18 AT5G65950 Unknown Protein Unknown
19 AT2G23350 PAB4 Poly(A) Binding Protein 4 CY
20 AT3G15360 ATHM4 Arabidopsis Thioredoxin M-‐Type 4 CW,CH
21 AT1G54630 ACP3 Acyl Carrier Protein 3 CH
22 AT1G36390 Co-‐Chaperone Grpe Family Protein CH
23 AT1G60950 ATFD2 Ferredoxin 2 CH
24 AT5G60670 60S Ribosomal Protein L12 RB
25 AT5G08160 ATPK3 Arabidopsis Thaliana Serine/Threonine Protein
Kinase 3
Unknown
26 AT5G49460 ACLB-‐2 ATP Citrate Lyase Subunit B 2 CY, PM
27 AT2G18030 Peptide Methionine Sulfoxide Reductase Family
Protein
EM
28 AT4G32880 HTHB8 Homeobox Gene 8 NU
29 AT3G02550 LBD41 Lob Domain-‐Containing Protein 41 NU
30 AT5G24490 30S Ribosomal Protein, Putative RB,CH
31 AT3G04940 ATCYSD1 Cysteine Synthase D1 CW,CH
111
4.3 – DA1 interacts with TCP15
4.3.1 – TCPs – An overview
4.3.1.1 – TCP biochemistry
TCPs are a family of transcription factors named after their first characterised members;
TEOSINTE BRANCHED 1 (TB1), CYCLOIDEA (CYC), and PROLIFERATING CELL FACTORS 1 and 2
(PCF1 and PCF2) (Cubas et al., 1999). They are characterised by the presence of an atypical
basic-‐Helix-‐Loop-‐Helix structure that is capable of DNA binding and protein-‐protein interaction
(Kosugi and Ohashi, 1997). The TCP family (of which there are 24 members in Arabidopsis)
forms two distinct groups with distinctive effects on growth: Class I TCPs, which are most
similar to PCF1 and PCF2; and Class II TCPs, which are more similar to CYC and TB1; Figure 4.2
shows the relationships between TCP family members defined by protein sequence similarities
across the TCP domain. TCPs have been shown to bind DNA as well as homo-‐and hetero-‐
dimerise (Viola et al., 2011, Kosugi and Ohashi, 2002, Masuda et al., 2008, Kosugi and Ohashi,
1997). Both classes of TCPs are thought to bind DNA through the basic region of their TCP
domain (Kosugi and Ohashi, 1997), and consensus sequences for both classes have been
described as GGNCCCAG and GTGGNCCC for class I and II respectively (Kosugi and Ohashi,
2002). The biochemistry of TCP protein-‐protein interactions, however, is less clear; the
presence of an ΦxxLL sequence (where Φ is an hydrophobic amino acid) in the second helix of
the TCP domain is thought to be a good candidate region based on its similarity to the LxxLL
motif shown to mediate the binding of transcriptional co-‐activators to nuclear receptors in
animals (Martín-‐Trillo and Cubas, 2010, Heery et al., 1997). However, the high level of
sequence conservation within the TCP domain and the large degree of diversity amongst
binding partners, suggests that – as with the LIM domain – binding specificity might be
determined by the sequences immediately adjacent to the TCP domain.
4.3.1.2 – TCPs influence organ growth and development
As a family, the TCPs are well characterised as regulators of growth and development. Family
members have been classified as class I, which are thought to promote growth and
Table 4.1 -‐ List of DA1-‐interacting proteins identified from the first round of the yeast-‐2-‐hybrid screen.
(CY=cytosol; CW=cell wall; NU=nucleus; CH=chloroplast; PM=plasma membrane; PD=plasmodesmata; MT=mitochondria; AP=apoplast; RB=ribosome; VC=vacuole; EM=endomembrane system).
.
112
development, and class II TCPs, which have been shown to repress growth and development.
Severe developmental defects in overexpression lines and a high-‐level of genetic redundancy
amongst class I TCPs, such as TCP15 and TCP20, means that developmental phenotypes have
been extremely hard to interpret (Hervé et al., 2009, Kieffer et al., 2011). For this reason, the
notion that class I TCPs promote growth and development needs to be taken with caution
(Martín-‐Trillo and Cubas, 2010). Conversely, class II TCPs have well documented growth and
developmental phenotypes. For example hyper-‐activation of TCP4, by fusing it to the C-‐
terminal activation domain of VP16 (Sadowski et al., 1988), results in a significant reduction in
leaf size, which is thought to be a consequence of a reduction of the duration of the growth
period (Sarvepalli and Nath, 2011). Moreover, enhanced expression of miR319a – a microRNA
known to down-‐regulate TCP2, TCP3, TCP4, TCP10, and TCP24 – results in a distinctive curled-‐
leaf phenotype (Palatnik et al., 2003), and the miR319a129 loss-‐of-‐function mutant shows floral
development defects such as significantly reduced sepal length (Nag et al., 2009). In addition,
Antirrhinum cin mutants show increased leaf area and curvature (Nath et al., 2003).
The mechanism through which mutations in class II TCPs cause these phenotypes is still
unclear, however some evidence points to the direct regulation of cell-‐cycle genes. For
example, TCP24 binds to the promoter regions of the pre-‐replication complex (pre-‐RC) control
factors CDT1a and CDT1b, and there is good evidence to suggest that this interaction reduces
expression of the genes (Masuda et al., 2008). The pre-‐RC genes are required for S phase
licensing, and therefore their repression is likely to result in slower S phase progression and
reduced cell proliferation. Similarly, there is evidence that suggests the class I TCPs TCP20 and
TCP15 activate the expression of the cell cycle effectors. These include: CYCA1;1, CYCB1;1,
CYCB1;2, CDC20, and CDKB2;1 (Li et al., 2005a, Kieffer et al., 2011).
TCPs have also been shown to influence SAM development, with gain of function (miR319-‐
resistant) TCP3-‐expressing plants unable to develop a functional SAM (Koyama et al., 2010a,
Koyama et al., 2007). It has been shown that TCP3 supresses the expression of the CUC (CUP
SHAPED COTELYDON) genes (Koyama et al., 2010a, Koyama et al., 2007), which have been
shown to promote SAM formation (Hibara et al., 2006, Aida et al., 1997). In particular, this
suppression of CUC genes is thought to be a consequence of the induced expression of AS1,
miR164, IAA3/SHY2 (INDOLE-‐3-‐ACETIC ACID3/SHORT HYPOCOTYL2) and SAUR (SMALL AUXIN
UP RNA), all of which appear to negatively regulate CUC expression (Koyama et al.).
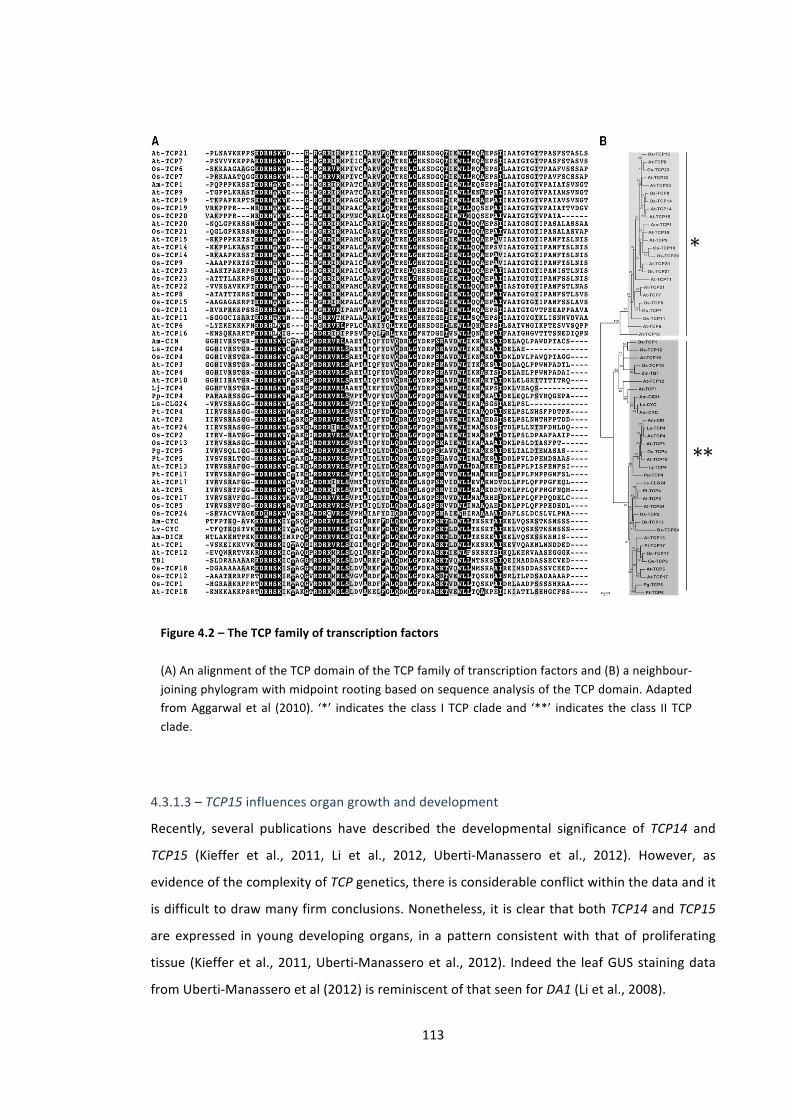
113
4.3.1.3 – TCP15 influences organ growth and development
Recently, several publications have described the developmental significance of TCP14 and
TCP15 (Kieffer et al., 2011, Li et al., 2012, Uberti-‐Manassero et al., 2012). However, as
evidence of the complexity of TCP genetics, there is considerable conflict within the data and it
is difficult to draw many firm conclusions. Nonetheless, it is clear that both TCP14 and TCP15
are expressed in young developing organs, in a pattern consistent with that of proliferating
tissue (Kieffer et al., 2011, Uberti-‐Manassero et al., 2012). Indeed the leaf GUS staining data
from Uberti-‐Manassero et al (2012) is reminiscent of that seen for DA1 (Li et al., 2008).
*
**
Figure 4.2 – The TCP family of transcription factors
(A) An alignment of the TCP domain of the TCP family of transcription factors and (B) a neighbour-‐joining phylogram with midpoint rooting based on sequence analysis of the TCP domain. Adapted from Aggarwal et al (2010). ‘*’ indicates the class I TCP clade and ‘**’ indicates the class II TCP clade.
.

114
Another point of agreement between Kieffer et al (2011), Li et al (2012), and Uberti-‐
Manassero et al (2012) is that the redundancy amongst the most closely related TCPs limits
the insight that can be gained from the use of single gene knock-‐out mutations. Using a double
knock-‐out approach, Kieffer et al (2011) report that the tcp14/tcp15 double mutant has
reduced internode length (resulting in a reduced inflorescence height), reduced pedicel length
and a quantitative effect on leaf blade expansion. The reduction in internode and pedicel
length appears to agree with the perceived role of TCP14 and TCP15 as class I TCPs, in the
promotion of growth and development. Another strategy used by Kieffer et al (2011), Li et al
(2012), and Uberti-‐Manassero et al (2012), in order to overcome the problem of redundancy,
was the fusion of EAR (SRDX) domains to the C-‐termini of the proteins, which turned them into
dominant transcriptional repressors (Hiratsu et al., 2003). However, taking into account the
evidence that TCP proteins form hetero-‐dimers with family and non-‐family members (Viola et
al., 2011, Kosugi and Ohashi, 2002, Masuda et al., 2008), the observed phenotypes are likely to
be significantly more complex than those resulting from single gene tcp knockouts. In addition
to leaf curling and leaf shape phenotypes, pTCP15:TCP15SDRX expressing plants had smaller
rosette leaves early on in development, which were made up of smaller cells (Uberti-‐
Manassero et al., 2012, Li et al., 2012). These data further support the notion that TCP15
promotes organ growth, and more specifically, also predict that it does so through increasing
the initial rate of cell expansion. This is supported by the observation that in
pTCP15:TCP15SDRX plants, cotyledon cell size is reduced (Li et al., 2012).
Surprisingly, and contradicting the pTCP15:TCP15SDRX data showing reduced growth (Uberti-‐
Manassero et al., 2012, Li et al., 2012), evidence from DEX-‐inducible over-‐expression of wild-‐
type TCP15 reveals a reduction in epidermal cell size and a reduction of high ploidy cells in
rosette leaves (Li et al., 2012). This, along with evidence that pTCP15:TCP15SDRX plants have
increased trichome branching (Li et al., 2012), suggested that TCP15 may also act to negatively
regulate cell size and endoreduplication.
4.3.1.4 – TCP14 and TCP15 are implicated in pathogen response pathways
Recently, two sets of evidence have linked TCP15 and its closest relative, TCP14, to pathogen
response pathways. Firstly, a partial correlation analysis of microarray data, carried out by Dan
Maclean in The Sainsbury Laboratory, identified DA1 as a hub in a network of interactions in
response to flg22 (the pathogen-‐associated molecular pattern (PAMP) for flagellin) (Fig. S2).
This network predicted a directional relationship from DA1 to TCP15, suggesting that DA1 was
upstream of TCP15.
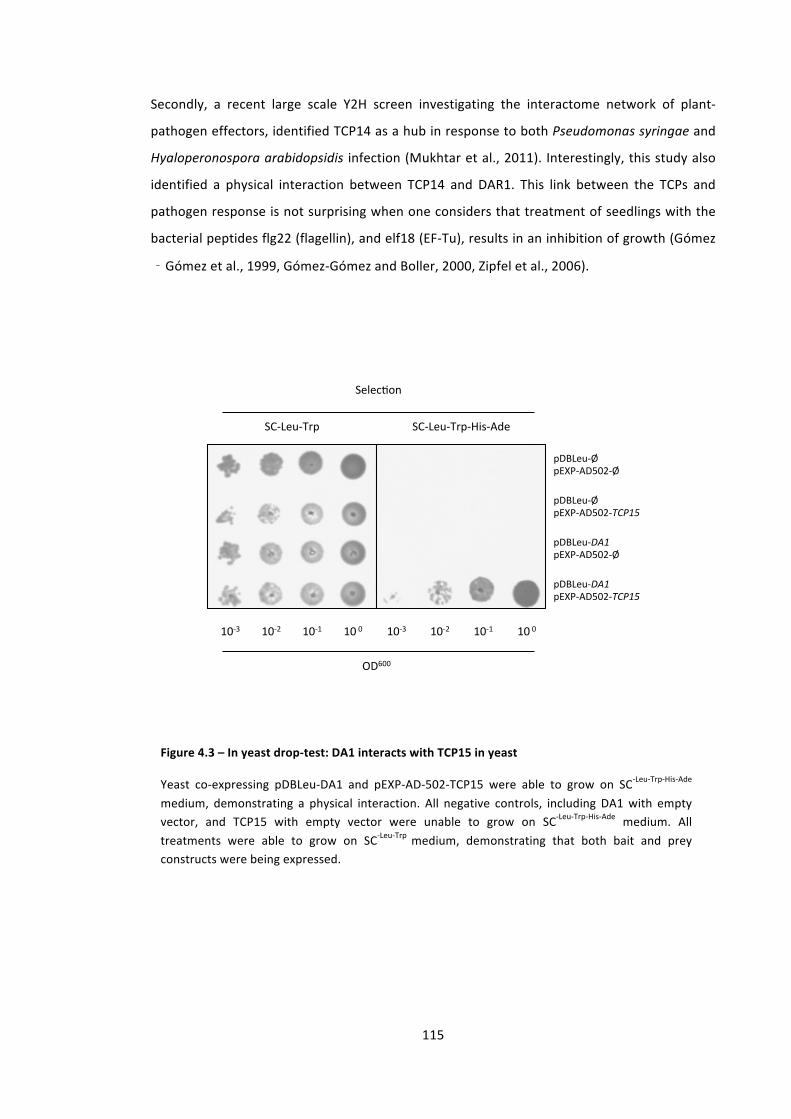
115
Secondly, a recent large scale Y2H screen investigating the interactome network of plant-‐
pathogen effectors, identified TCP14 as a hub in response to both Pseudomonas syringae and
Hyaloperonospora arabidopsidis infection (Mukhtar et al., 2011). Interestingly, this study also
identified a physical interaction between TCP14 and DAR1. This link between the TCPs and
pathogen response is not surprising when one considers that treatment of seedlings with the
bacterial peptides flg22 (flagellin), and elf18 (EF-‐Tu), results in an inhibition of growth (Gómez
‐Gómez et al., 1999, Gómez-‐Gómez and Boller, 2000, Zipfel et al., 2006).
pDBLeu'DA1(pEXP'AD502'TCP15(
pDBLeu'DA1(pEXP'AD502'Ø(
pDBLeu'Ø(pEXP'AD502'TCP15(
pDBLeu'Ø((pEXP'AD502'Ø(
SC'Leu'Trp( SC'Leu'Trp'His'Ade(
10(0(10'1(10'2(10'3( 10(0(10'1(10'2(10'3(
OD600(
Selec?on(
Figure 4.3 – In yeast drop-‐test: DA1 interacts with TCP15 in yeast
Yeast co-‐expressing pDBLeu-‐DA1 and pEXP-‐AD-‐502-‐TCP15 were able to grow on SC-‐Leu-‐Trp-‐His-‐Ade medium, demonstrating a physical interaction. All negative controls, including DA1 with empty vector, and TCP15 with empty vector were unable to grow on SC-‐Leu-‐Trp-‐His-‐Ade medium. All treatments were able to grow on SC-‐Leu-‐Trp medium, demonstrating that both bait and prey constructs were being expressed.

116
4.3.2 – DA1 physically interacts with TCP15
Sequencing of the interacting Y2H clone revealed that the full-‐length TCP15 sequence was
fused to the GAL4-‐AD fragment. To re-‐test the interaction in yeast, full length TCP15-‐GAL4-‐AD
was re-‐transformed into yeast and screened for an interaction with DA1. TCPs have been
shown to auto-‐activate in Y2H screens (Kosugi and Ohashi, 2002) and therefore ensure TCP15
auto-‐activation was not generating a false positive, a negative control of the TCP15 and an
empty bait vector was used. The drop test shown in Fig. 4.3 demonstrates a strong interaction
between DA1 and TCP15, and no interaction between any of the three negative controls.
Following this observation, TCP15 was cloned into the pETnT bacterial expression vector for in
vitro analysis. Following the procedure described in section 3.2.2; recombinant GST-‐tagged
bait proteins were incubated with recombinant FLAG-‐tagged prey proteins before
precipitation of GST-‐tagged bait proteins on glutathione sepharose beads. The purified
proteins were then eluted and subjected to SDS-‐PAGE and immunoblot analysis. The ability of
β-‐glucuronidase (GUS) to form a homo-‐tetramer was utilised to design a positive control of
GST-‐GUS vs FLAG-‐GUS. Two sets of negative controls were also used; these were GST-‐GUS vs
FLAG-‐TCP15, and GST-‐DA1 vs FLAG-‐GUS.
Fig. 4.6 shows that, in vitro, DA1 physically interacts with TCP15. This observation, combined
with the Y2H data suggested that the DA1-‐TCP15 relationship is a bona fide physical
interaction.
4.3.3 – DA1-‐TCP15 genetic interactions
Due to the large degree of redundancy among TCP family members, and in agreement with
recent publications (Kieffer et al., 2011, Li et al., 2012, Uberti-‐Manassero et al., 2012), very few
developmental phenotypes were visible with the single tcp15 knockout mutant. In order to
overcome this, double knockout lines were generated with the most closely related family
member of TCP15; TCP14 (Martín-‐Trillo and Cubas, 2010, Aggarwal et al., 2010). Using these
lines, and a triple knockout line incorporating the da1-‐1 mutation, plants were phenotyped for
petal size, seed size and inflorescence stem height.
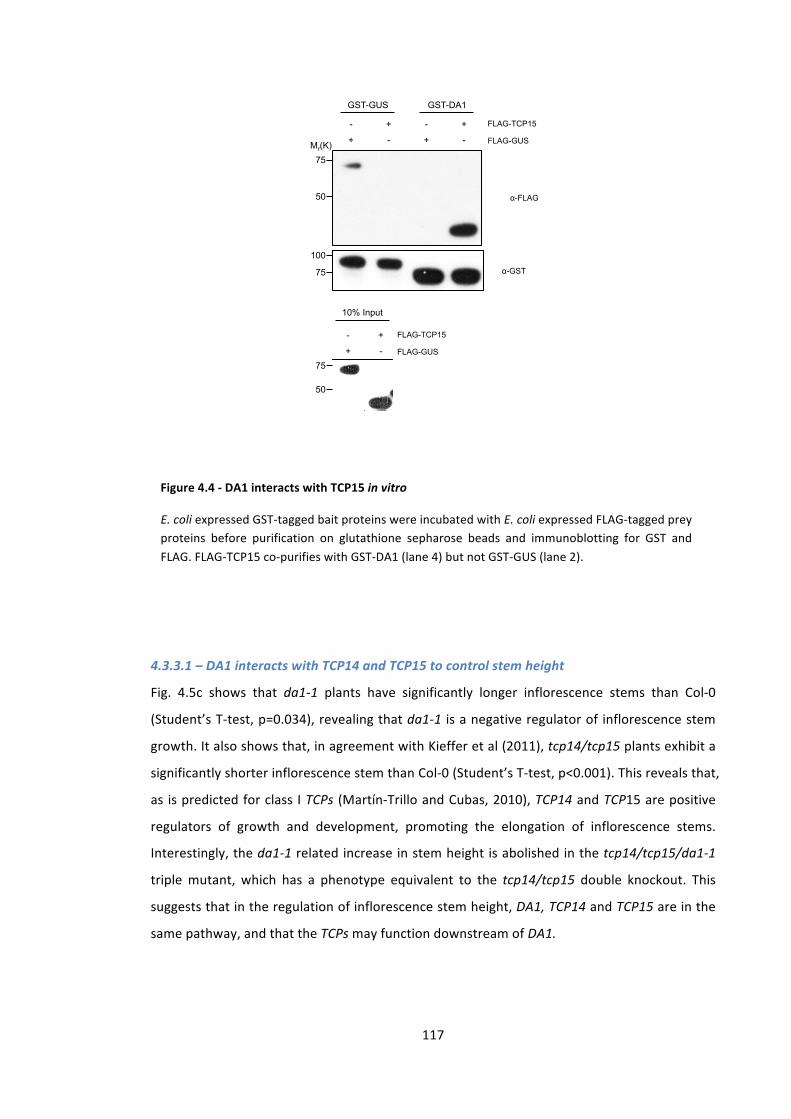
117
Mr(K) 75
50
100
75
75
50
GST-GUS GST-DA1
+ - + -
- + - + FLAG-TCP15
FLAG-GUS
α-FLAG
α-GST
10% Input
+ -
- + FLAG-TCP15
FLAG-GUS
4.3.3.1 – DA1 interacts with TCP14 and TCP15 to control stem height
Fig. 4.5c shows that da1-‐1 plants have significantly longer inflorescence stems than Col-‐0
(Student’s T-‐test, p=0.034), revealing that da1-‐1 is a negative regulator of inflorescence stem
growth. It also shows that, in agreement with Kieffer et al (2011), tcp14/tcp15 plants exhibit a
significantly shorter inflorescence stem than Col-‐0 (Student’s T-‐test, p<0.001). This reveals that,
as is predicted for class I TCPs (Martín-‐Trillo and Cubas, 2010), TCP14 and TCP15 are positive
regulators of growth and development, promoting the elongation of inflorescence stems.
Interestingly, the da1-‐1 related increase in stem height is abolished in the tcp14/tcp15/da1-‐1
triple mutant, which has a phenotype equivalent to the tcp14/tcp15 double knockout. This
suggests that in the regulation of inflorescence stem height, DA1, TCP14 and TCP15 are in the
same pathway, and that the TCPs may function downstream of DA1.
Figure 4.4 -‐ DA1 interacts with TCP15 in vitro
E. coli expressed GST-‐tagged bait proteins were incubated with E. coli expressed FLAG-‐tagged prey proteins before purification on glutathione sepharose beads and immunoblotting for GST and FLAG. FLAG-‐TCP15 co-‐purifies with GST-‐DA1 (lane 4) but not GST-‐GUS (lane 2).

118
0"
0.5"
1"
1.5"
2"
2.5"
3"
3.5"
4"
Petal&A
rea&(m
m2 )&
Col"
da1$1%
tcp14%
tcp15%
tcp14/15%
da1$1/tcp14/15%
*"
*"
*"
A"
0"
0.02"
0.04"
0.06"
0.08"
0.1"
0.12"
0.14"
0.16"
0.18"
Seed
$Area$(m
m2 )$
Col,0"
da1$1%
tcp14%
tcp15%
tcp14/15%
da1$1/tcp14/15%
*"
*"*"
*"
*"B"
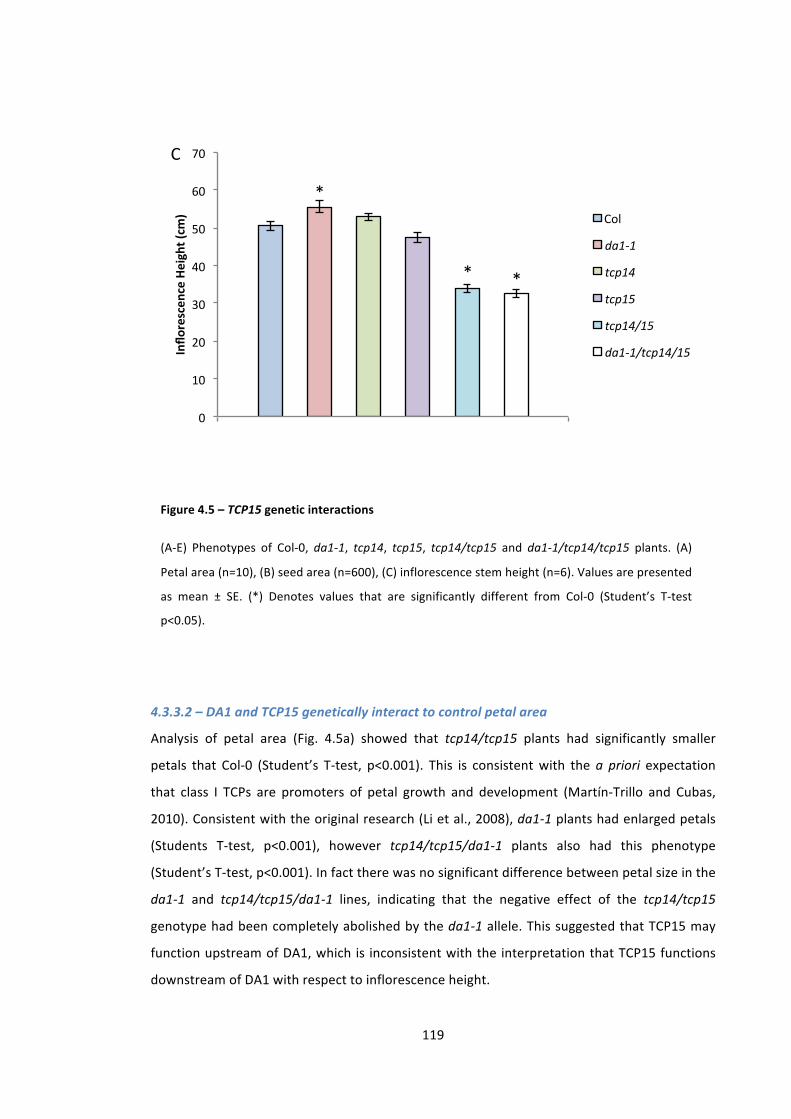
119
0"
10"
20"
30"
40"
50"
60"
70"
Inflo
rescen
ce)Height)(cm
)) Col"
da1$1%
tcp14%
tcp15%
tcp14/15%
da1$1/tcp14/15%
*"
*" *"
C"
4.3.3.2 – DA1 and TCP15 genetically interact to control petal area
Analysis of petal area (Fig. 4.5a) showed that tcp14/tcp15 plants had significantly smaller
petals that Col-‐0 (Student’s T-‐test, p<0.001). This is consistent with the a priori expectation
that class I TCPs are promoters of petal growth and development (Martín-‐Trillo and Cubas,
2010). Consistent with the original research (Li et al., 2008), da1-‐1 plants had enlarged petals
(Students T-‐test, p<0.001), however tcp14/tcp15/da1-‐1 plants also had this phenotype
(Student’s T-‐test, p<0.001). In fact there was no significant difference between petal size in the
da1-‐1 and tcp14/tcp15/da1-‐1 lines, indicating that the negative effect of the tcp14/tcp15
genotype had been completely abolished by the da1-‐1 allele. This suggested that TCP15 may
function upstream of DA1, which is inconsistent with the interpretation that TCP15 functions
downstream of DA1 with respect to inflorescence height.
Figure 4.5 – TCP15 genetic interactions
(A-‐E) Phenotypes of Col-‐0, da1-‐1, tcp14, tcp15, tcp14/tcp15 and da1-‐1/tcp14/tcp15 plants. (A)
Petal area (n=10), (B) seed area (n=600), (C) inflorescence stem height (n=6). Values are presented
as mean ± SE. (*) Denotes values that are significantly different from Col-‐0 (Student’s T-‐test
p<0.05).
120
Nonetheless, it is still possible that the data is consistent with TCP15 functioning downstream
of DA1 in determining petal area. The petal area increase in da1-‐1 lines is significantly greater
that the decrease observed in tcp14/tcp15 lines (Fig. 4.5a), suggesting the effect of DA1 is
stronger than that of TCP14/15. As DA1 may have multiple effects on growth through several
peptidase substrates (see Chapter 5), TCP14/TCP15 could be just be one of its targets. The
relatively small phenotypic effect of the tcp14/tcp15 mutation compared to the da1-‐1
phenotype is consistent with this interpretation.
4.3.3.3 – DA1 and TCP15 do not genetically interact to regulate seed area
As displayed in Fig. 4.5b, seed area for all genotypes (da1-‐1, tcp14, tcp15, tcp14/tcp15,
tcp14/tcp15/da1-‐1) was significantly different from that of Col-‐0 (Student’s T-‐test, p<0.001).
Consistent with published data (Li et al., 2008), da1-‐1 plants had larger seeds, and consistent
with section 4.3.3.2 and the notion that class I TCPs are promoters of growth and development,
tcp14/tcp15 plants had smaller seeds than Col-‐0. In agreement with petal data (section
4.3.3.2), tcp14/tcp15/da1-‐1 seed resembled da1-‐1 seed, with the effect of the tcp14/tcp15
genotype being completely abolished. However, interestingly the tcp14 and tcp15 single
knockouts had significantly enlarged seeds relative to Col-‐0, influencing seed size in the
opposite direction to the double knock-‐out.
This contradictory effect of the single and double tcp mutants may be due to the ability of the
TCPs to hetero-‐dimerise (Viola et al., 2011, Kosugi and Ohashi, 2002, Masuda et al., 2008). This
suggests that other binding partners may be involved with TCP14 and TCP15 in the regulation
of seed development. Furthermore the prospect that the TCPs are differentialy regulated
through their phosphorylatable residues (Martín-‐Trillo and Cubas, 2010) allows for the
possibility that hetero-‐complex members are differentialy regulated. A speculative model
exists to explain the observed phenotypes in which; TCP14, TCP15 and possible other as yet
unknown factors oligomerise to promote seed growth, and where the TCPs are also targets for
repressive phosphorylation. This leads to a possible model in which, when TCP14 and TCP15
are present in complexes, seed growth is promoted, but under tight control. In single tcp
knockout lines, less repressive phosphorylation is present and growth is accelerated, and in
tcp14/tcp15 double knockout lines, insufficient transcription factors are present to promote
growth, and growth is repressed.
4.3.3.4 -‐ Summary
With the exception of the tcp14 and tcp15 seed phenotype, these data collectively support a
role for TCP14 and TCP15 in the promotion of growth and development. However, in line with
121
recent work (Kieffer et al., 2011), these TCPs also appear to have contradictory tissue-‐specific
effects. They exhibited no genetic interaction to regulate seed area, and the observed genetic
interaction for petal size may be misleading, and possibly due to an epistatic interaction
between da1-‐1 and tcp14/tcp15. Despite this, a genetic interaction was observed between
DA1 and TCP14/15 in the regulation of inflorescence height. Previous work investigating the
relationship between TCP14 and TCP15, and SPINDLY (Steiner et al., 2012) highlights the
difficulty in observing genetic interactions with TCP family members. Genetic redundancy
amongst family members and lethality of gene over-‐expression resulted in Steiner et al (2012)
using tissue-‐specific overexpression of TCP14, in order to identify an interaction. This
publication supports section 4.3.3.2 in arguing that due to the complexities of TCP genetics,
and the fact that DA1 has other bona fide target proteins (Chapter 5), further biochemical and
functional evidence will be required to establish the biological significance of the interactions
between DA1 and TCP15.
4.4 – DA1 interacts with the C-‐terminal domain of the LRR-‐RLK, TMK4
4.4.1 – Leucine-‐rich repeat receptor-‐like kinases (LRR-‐RLKs) – an overview
Leucine-‐rich repeat receptor-‐like kinases (LRR-‐RLKs) are the largest sub-‐family of the receptor-‐
like kinase (RLK) family in Arabidopsis (Diévart and Clark, 2003). Of the 610 predicted RLKs, 216
are LRR-‐RLKs (Diévart and Clark, 2003). RLKs are defined as membrane spanning proteins with
C-‐terminal Ser/Thr kinases, and “versatile” N-‐terminal extra-‐cellular domains (Shiu and
Bleecker, 2003) and the LRR-‐RLKs are characterised by the presence of LRR motifs present in
their N-‐terminal domains (Diévart and Clark, 2003).
4.4.1.1 – LRR-‐RLKs are involved in plant development and pathogen response
The LRR-‐RLK family includes key regulators of growth and development such as CLAVATA1
(CLV1), BRASSINOSTEROID-‐INSENSITIVE1 (BRI1), ERECTA (ER) and TMK1-‐4 (Clark et al., 1997,
Clouse et al., 1996, Torii et al., 1996, Dai et al., 2013). CLV1, a regulator of shoot apical
meristem (SAM) size (Clark et al., 1997, Schoof et al., 2000), has recently been linked to DA1.
Work carried out by Yunhai Li at the Chinese Academy of Sciences in Beijing (personal
communication) has shown that the expression domain of WUSCHEL is greatly increased in
da1-‐1 mutants, akin to the effect in clv mutants (Schoof et al., 2000).
Also of relevance to this work is BRI1, a receptor in the brassinosteroid signalling pathway,
whose mutants show severe developmental defects including dwarfed stature and thickened
leaves (Clouse et al., 1996). BRI1 is activated by the binding of brassinosteroids to its extra-‐
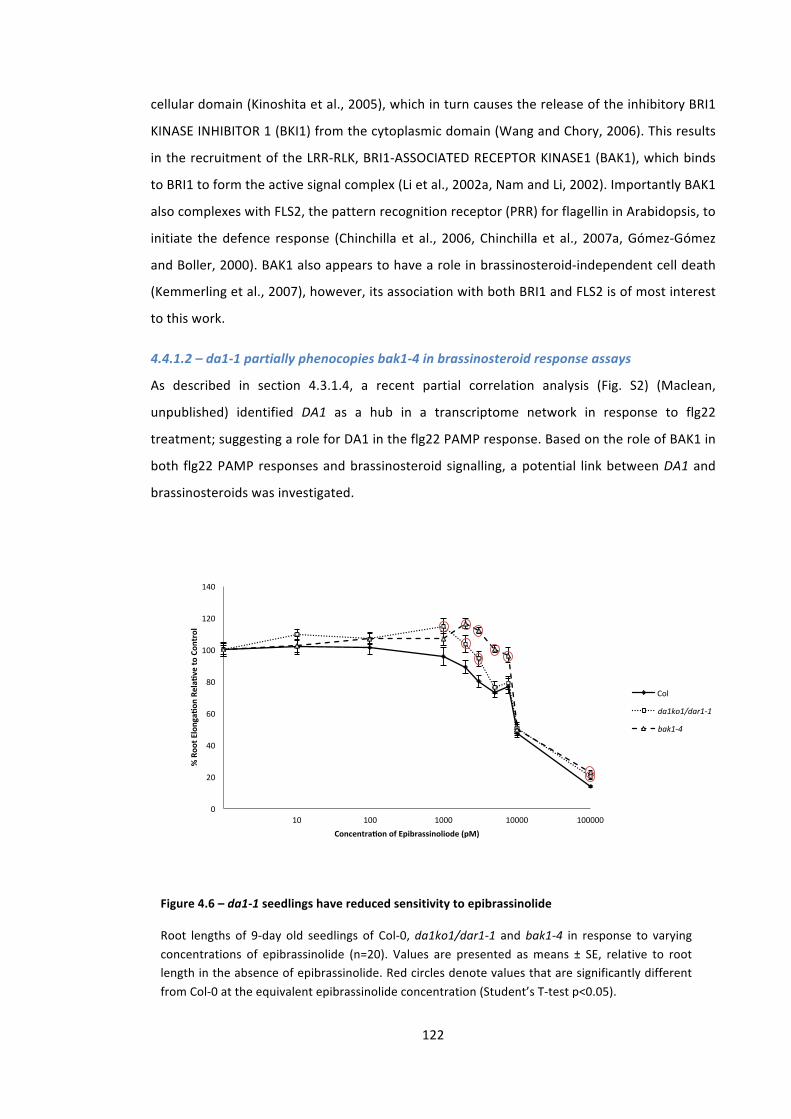
122
cellular domain (Kinoshita et al., 2005), which in turn causes the release of the inhibitory BRI1
KINASE INHIBITOR 1 (BKI1) from the cytoplasmic domain (Wang and Chory, 2006). This results
in the recruitment of the LRR-‐RLK, BRI1-‐ASSOCIATED RECEPTOR KINASE1 (BAK1), which binds
to BRI1 to form the active signal complex (Li et al., 2002a, Nam and Li, 2002). Importantly BAK1
also complexes with FLS2, the pattern recognition receptor (PRR) for flagellin in Arabidopsis, to
initiate the defence response (Chinchilla et al., 2006, Chinchilla et al., 2007a, Gómez-‐Gómez
and Boller, 2000). BAK1 also appears to have a role in brassinosteroid-‐independent cell death
(Kemmerling et al., 2007), however, its association with both BRI1 and FLS2 is of most interest
to this work.
4.4.1.2 – da1-‐1 partially phenocopies bak1-‐4 in brassinosteroid response assays
As described in section 4.3.1.4, a recent partial correlation analysis (Fig. S2) (Maclean,
unpublished) identified DA1 as a hub in a transcriptome network in response to flg22
treatment; suggesting a role for DA1 in the flg22 PAMP response. Based on the role of BAK1 in
both flg22 PAMP responses and brassinosteroid signalling, a potential link between DA1 and
brassinosteroids was investigated.
0"
20"
40"
60"
80"
100"
120"
140"
1" 10" 100" 1000" 10000" 100000"
%"Roo
t"Elonga+
on"Rela+
ve"to
"Con
trol"
Concentra+on"of"Epibrassinoliode"(pM)"
Col"
da1ko1/dar1(1)
bak1(4)
Figure 4.6 – da1-‐1 seedlings have reduced sensitivity to epibrassinolide
Root lengths of 9-‐day old seedlings of Col-‐0, da1ko1/dar1-‐1 and bak1-‐4 in response to varying concentrations of epibrassinolide (n=20). Values are presented as means ± SE, relative to root length in the absence of epibrassinolide. Red circles denote values that are significantly different from Col-‐0 at the equivalent epibrassinolide concentration (Student’s T-‐test p<0.05).
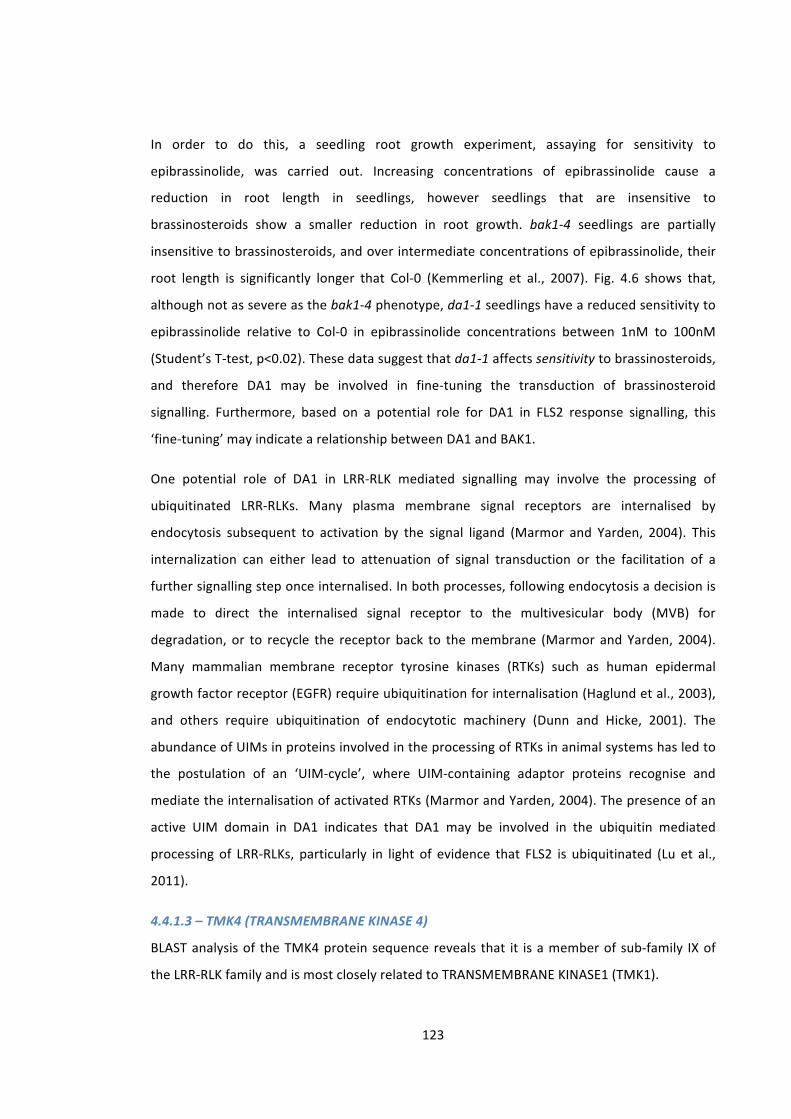
123
In order to do this, a seedling root growth experiment, assaying for sensitivity to
epibrassinolide, was carried out. Increasing concentrations of epibrassinolide cause a
reduction in root length in seedlings, however seedlings that are insensitive to
brassinosteroids show a smaller reduction in root growth. bak1-‐4 seedlings are partially
insensitive to brassinosteroids, and over intermediate concentrations of epibrassinolide, their
root length is significantly longer that Col-‐0 (Kemmerling et al., 2007). Fig. 4.6 shows that,
although not as severe as the bak1-‐4 phenotype, da1-‐1 seedlings have a reduced sensitivity to
epibrassinolide relative to Col-‐0 in epibrassinolide concentrations between 1nM to 100nM
(Student’s T-‐test, p<0.02). These data suggest that da1-‐1 affects sensitivity to brassinosteroids,
and therefore DA1 may be involved in fine-‐tuning the transduction of brassinosteroid
signalling. Furthermore, based on a potential role for DA1 in FLS2 response signalling, this
‘fine-‐tuning’ may indicate a relationship between DA1 and BAK1.
One potential role of DA1 in LRR-‐RLK mediated signalling may involve the processing of
ubiquitinated LRR-‐RLKs. Many plasma membrane signal receptors are internalised by
endocytosis subsequent to activation by the signal ligand (Marmor and Yarden, 2004). This
internalization can either lead to attenuation of signal transduction or the facilitation of a
further signalling step once internalised. In both processes, following endocytosis a decision is
made to direct the internalised signal receptor to the multivesicular body (MVB) for
degradation, or to recycle the receptor back to the membrane (Marmor and Yarden, 2004).
Many mammalian membrane receptor tyrosine kinases (RTKs) such as human epidermal
growth factor receptor (EGFR) require ubiquitination for internalisation (Haglund et al., 2003),
and others require ubiquitination of endocytotic machinery (Dunn and Hicke, 2001). The
abundance of UIMs in proteins involved in the processing of RTKs in animal systems has led to
the postulation of an ‘UIM-‐cycle’, where UIM-‐containing adaptor proteins recognise and
mediate the internalisation of activated RTKs (Marmor and Yarden, 2004). The presence of an
active UIM domain in DA1 indicates that DA1 may be involved in the ubiquitin mediated
processing of LRR-‐RLKs, particularly in light of evidence that FLS2 is ubiquitinated (Lu et al.,
2011).
4.4.1.3 – TMK4 (TRANSMEMBRANE KINASE 4)
BLAST analysis of the TMK4 protein sequence reveals that it is a member of sub-‐family IX of
the LRR-‐RLK family and is most closely related to TRANSMEMBRANE KINASE1 (TMK1).
124
1 MEAPTPLLLLVLLTTITFFTTSVADDQTAMLALAKSFNPPPSDWSSTTDFCKWSGVRCTG 60 61 GRVTTISLADKSLTGFIAPEISTLSELKSVSIQRNKLSGTIPSFAKLSSLQEIYMDENNF 120 121 VGVETGAFAGLTSLQILSLSDNNNITTWSFPSELVDSTSLTTIYLDNTNIAGVLPDIFDS 180 181 LASLQNLRLSYNNITGVLPPSLGKSSIQNLWINNQDLGMSGTIEVLSSMTSLSQAWLHKN 240 241 HFFGPIPDLSKSENLFDLQLRDNDLTGIVPPTLLTLASLKNISLDNNKFQGPLPLFSPEV 300 301 KVTIDHNVFCTTKAGQSCSPQVMTLLAVAGGLGYPSMLAESWQGDDACSGWAYVSCDSAG 360 361 KNVVTLNLGKHGFTGFISPAIANLTSLKSLYLNGNDLTGVIPKELTFMTSLQLIDVSNNN 420 TMD>> 421 LRGEIPKFPATVKFSYKPGNALLGTNGGDGSSPGTGGASGGPGGSSGGGGSKVGVIVGVI 480 481 VAVLVFLAILGFVVYKFVMKRKYGRFNRTDPEKVGKILVSDAVSNGGSGNGGYANGHGAN 540 KINASE DOMAIN>> 541 NFNALNSPSSGDNSDRFLLEGGSVTIPMEVLRQVTNNFSEDNILGRGGFGVVYAGELHDG 600 601 TKTAVKRMECAAMGNKGMSEFQAEIAVLTKVRHRHLVALLGYCVNGNERLLVYEYMPQGN 660 661 LGQHLFEWSELGYSPLTWKQRVSIALDVARGVEYLHSLAQQSFIHRDLKPSNILLGDDMR 720 |------------------------------------ 721 AKVADFGLVKNAPDGKYSVETRLAGTFGYLAPEYAATGRVTTKVDVYAFGVVLMEILTGR 780 --------Yeast-2-Hybrid Fragment (185aa)--------------------- 781 KALDDSLPDERSHLVTWFRRILINKENIPKALDQTLEADEETMESIYRVAELAGHCTARE 840 ------------------------------------------------------------ 841 PQQRPDMGHAVNVLGPLVEKWKPSCQEEEESFGIDVNMSLPQALQRWQNEGTSSSTMFHG 900 ----------------------------| 901 DFSYSQTQSSIPPKASGFPNTFDSADGR* 929
Figure 4.7 – Protein sequence of AT3G23750
The protein sequence of AT3G23750 (TMK4) with the transmembrane domain (TMD) marked in blue, the kinase domain marked in red, and the fragment identified in the DA1 Y2H marked with a superjacent dashed line (‘|-‐-‐-‐-‐|’).

125
TMK4 has recently been identified as a positive regulator of growth and development through
the study of combinational knockouts mutations with its most closely related proteins (Dai et
al., 2013). tmk1/tmk4 double mutants display reduced root and aerial organ size, and a dwarf-‐
like phenotype. All of these phenotypes are more severe in the tmk1/tmk3/tmk4 triple and
tmk1/tmk2/tmk3/tmk4 quadruple mutants (Dai et al., 2013). The reduced root length in these
mutants is primarily a consequence of reduced cell expansion, however the reduction in leaf
area is primarily a consequence of reduced cell proliferation (Dai et al., 2013). Dai et al (2013)
also demonstrated that tmk1/tmk4 mutants had reduced sensitivity to auxin (reminiscent of
da1-‐1 and bak1-‐4 to brassinosteroids), and that the tmk1/tmk3/tmk4 triple mutant is
insensitive to auxin.
Recent data also revealed that TMK4 may be involved in the flg22 PAMP response. flg22
treatment of Arabidopsis cell cultures resulted in the enrichment of TMK4 in lipid rafts with
FLS2 (Keinath et al., 2011).
4.4.2 – DA1 physically interacts with the C-‐terminal fragment of TMK4
Sequencing of the Y2H colony 14 (Table 4.1) revealed that the 185aa C-‐terminal fragment of
TMK4 (Fig.4.7) was fused in-‐frame to the GAL4-‐AD. The fragment extends from the extreme C-‐
terminus of TMK4 into the kinase domain (Fig. 4.7). Subsequent to identification of the
interacting colony containing a region of TMK4, the gene fragment was cloned and re-‐
transformed into yeast and a second-‐round screen was run. Fig. 4.11 shows the positive drop
test results, demonstrating that only yeast containing both pDBleu-‐DA1 and pEXPAD-‐502-‐
TMK4frag could grow on SC-‐Leu-‐Trp-‐His-‐Ade selective media.
Following confirmation of the interaction in yeast, the TMK4 C-‐terminal fragment was cloned
into the pETnT bacterial expression vector and expressed in E. coli as an N-‐terminal HA epitope
fusion protein for in vitro coIP analysis.
Following the procedure described in section 3.2.2; recombinant GST-‐tagged bait proteins
were incubated with recombinant HA-‐tagged prey proteins before precipitation of GST-‐tagged
bait proteins on glutathione sepharose beads. The purified proteins were then eluted and
subjected to SDS-‐PAGE and immunoblot analysis. The ability of DA1 to form a homo-‐oligomer
was utilised to design a positive control of GST-‐DA1 vs FLAG-‐DA1. Two sets of negative controls
were also used; these were GST-‐ Ø vs FLAG-‐TCP15, and GST-‐DA1 vs HA-‐ Ø. Fig. 4.9 shows that
GST-‐DA1 is able to pull down HA-‐DA1 (positive control) and the HA-‐tagged TMK4 C-‐terminal
fragment. GST alone did not pull-‐down the HA-‐tagged DA1 protein.

126
pDBLeu-DA1 pEXP-AD502-TMK4frag
pDBLeu-DA1 pEXP-AD502-ϕ
SC-Leu-Trp SC-Leu-Trp-His-Ade
OD600
Selection
10 0 10-1 10-2 10-3 10 0 10-1 10-2 10-3
GST-DA1 GST-Ø
HA-Ø
HA-DA1
HA-TMK4FRAG
α-HA
Ponceau
+ - - + - -
- + - - + - - - + - - +
Mr(K)
75
50
100
50
37
GST-DA1
GST-Ø
HA-DA1
HA-TMK4FRAG
Figure 4.8 – In yeast drop-‐test: DA1 interacts with the C-‐terminus of TMK4
Yeast co-‐expressing pDBLeu-‐DA1 and pEXP-‐AD-‐502-‐TMK4frag (C-‐terminal fragment of TMK4) were able to grow on SC-‐Leu-‐Trp-‐His-‐Ade medium, demonstrating a physical interaction. The negative control, DA1 with empty vector, was unable to grow on SC-‐Leu-‐Trp-‐His-‐Ade medium. Both treatments were able to grow on SC-‐Leu-‐Trp medium, demonstrating that both bait and prey constructs were being expressed.
Figure 4.9 – DA1 interacts with TMK4 in vitro
E. coli expressed GST-‐tagged bait proteins were incubated with E. coli expressed HA-‐tagged prey proteins before purification on glutathione sepharose beads and immunoblotting for HA. HA-‐TMK4FRAG co-‐purified with GST-‐DA1 (lane 3) but not with GST-‐Ø (lane 6).
127
4.4.3 – Cloning of full-‐length TMK4
Repeating the Y2H and in vitro interaction studies (section 4.4.2) with a full-‐length TMK4
protein would confirm that the observed interaction is not an artefact of the truncated protein.
PCR amplification of the 2.8 Kb coding sequence of TMK4 from cDNA was straightforward.
However upon subcloning the construct into E. coli, no intact full-‐length clones were recovered.
This may be because the cells were unable to tolerate the kinase domain of TMK4, perhaps
reflected in the fact that any full-‐length genes that were successfully cloned were extensively
mutated in the C-‐terminal kinase domain. Despite employing strategies involving two-‐step
cloning of the gene and the growth of E. coli at 28°C, no full-‐length non-‐mutated construct
could be stably maintained in E. coli.
An alternative strategy to validate the observed in yeast and in vitro interactions was to carry
out an in planta co-‐IP (see Box 3.1) with full-‐length protein. In order to achieve this, and
thereby avoid the problems with the accumulation of E. coli derived mutations in the kinase
domain, the genomic DNA was used and the gene was cloned with its intron intact.
Unfortunately TMK4 only has one intron, located downstream of the kinase active site. Despite
the absence of a bacterial promoter and the growth of bacteria at 28°C, the kinase domain still
accumulated mutations. This meant that despite occasionally successfully sub-‐cloning a full-‐
length intact gene into an entry vector (pDONR), the additional cloning steps into the
destination vector led to mutations in the kinase domain. For this reason, and due to progress
made in other areas, validation of the observed interaction with DA1 (section 4.4.2) was not
carried out with full-‐length protein.
4.4.4 – amiRNA TMK4 knockdown lines reveal developmental defects
For genetic analysis of TMK4, T-‐DNA insertion lines were acquired to assay for developmental
phenotypes and a putative genetic interaction with DA1. Unfortunately, at the time this work
was carried out no TMK insertion lines were publicly available. As a consequence an amiRNA
knockdown approach was taken.
An amiRNA construct was acquired from the Arabidopsis thaliana amiRNA library at Open
Biosystems (Thermo Scientific). The library was developed by Dr. Greg Hannon at Cold Spring
Harbour laboratories and the amiRNA design is based on work by Detlef Weigel at the Max
Planck Institute for Developmental Biology (Open_Biosystems). Based on this, the construct
was designed to be targeted specifically to TMK4 and none of its closest relatives (Schwab et
al., 2006).The amiRNA construct is expressed in a mi319a backbone, under the control of a 35S
promoter, in the pAmiR binary vector (see supplementary information Fig. S1).
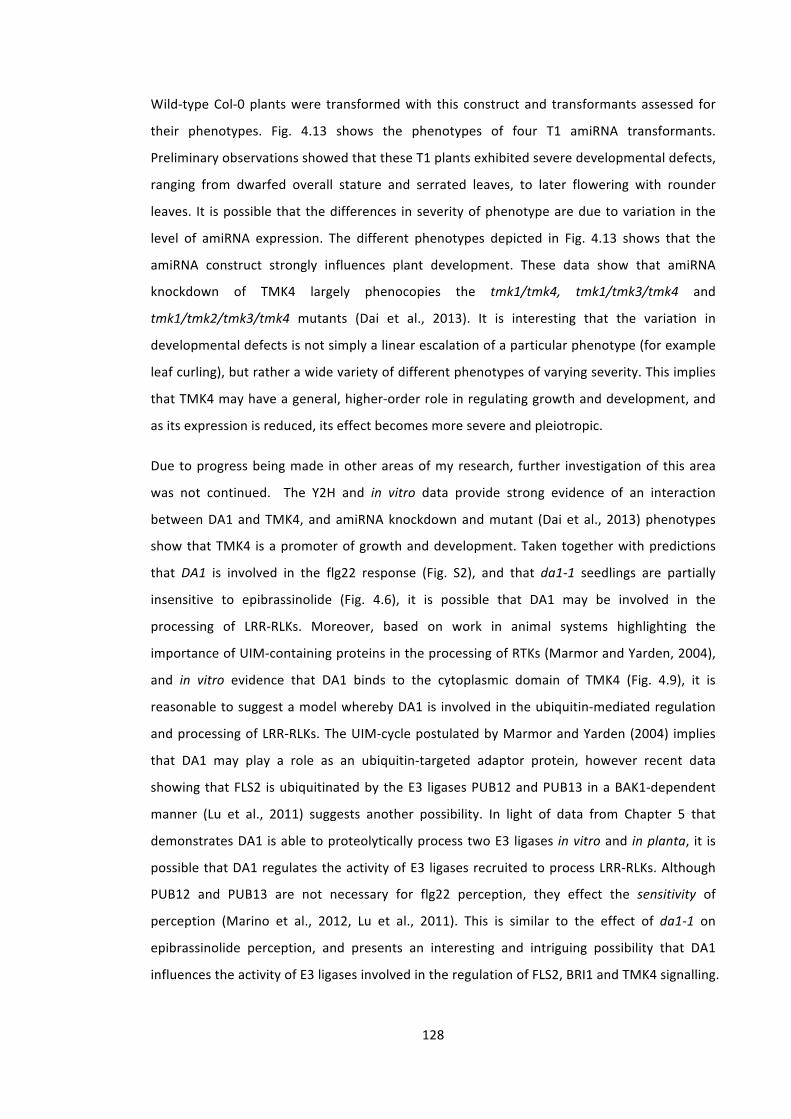
128
Wild-‐type Col-‐0 plants were transformed with this construct and transformants assessed for
their phenotypes. Fig. 4.13 shows the phenotypes of four T1 amiRNA transformants.
Preliminary observations showed that these T1 plants exhibited severe developmental defects,
ranging from dwarfed overall stature and serrated leaves, to later flowering with rounder
leaves. It is possible that the differences in severity of phenotype are due to variation in the
level of amiRNA expression. The different phenotypes depicted in Fig. 4.13 shows that the
amiRNA construct strongly influences plant development. These data show that amiRNA
knockdown of TMK4 largely phenocopies the tmk1/tmk4, tmk1/tmk3/tmk4 and
tmk1/tmk2/tmk3/tmk4 mutants (Dai et al., 2013). It is interesting that the variation in
developmental defects is not simply a linear escalation of a particular phenotype (for example
leaf curling), but rather a wide variety of different phenotypes of varying severity. This implies
that TMK4 may have a general, higher-‐order role in regulating growth and development, and
as its expression is reduced, its effect becomes more severe and pleiotropic.
Due to progress being made in other areas of my research, further investigation of this area
was not continued. The Y2H and in vitro data provide strong evidence of an interaction
between DA1 and TMK4, and amiRNA knockdown and mutant (Dai et al., 2013) phenotypes
show that TMK4 is a promoter of growth and development. Taken together with predictions
that DA1 is involved in the flg22 response (Fig. S2), and that da1-‐1 seedlings are partially
insensitive to epibrassinolide (Fig. 4.6), it is possible that DA1 may be involved in the
processing of LRR-‐RLKs. Moreover, based on work in animal systems highlighting the
importance of UIM-‐containing proteins in the processing of RTKs (Marmor and Yarden, 2004),
and in vitro evidence that DA1 binds to the cytoplasmic domain of TMK4 (Fig. 4.9), it is
reasonable to suggest a model whereby DA1 is involved in the ubiquitin-‐mediated regulation
and processing of LRR-‐RLKs. The UIM-‐cycle postulated by Marmor and Yarden (2004) implies
that DA1 may play a role as an ubiquitin-‐targeted adaptor protein, however recent data
showing that FLS2 is ubiquitinated by the E3 ligases PUB12 and PUB13 in a BAK1-‐dependent
manner (Lu et al., 2011) suggests another possibility. In light of data from Chapter 5 that
demonstrates DA1 is able to proteolytically process two E3 ligases in vitro and in planta, it is
possible that DA1 regulates the activity of E3 ligases recruited to process LRR-‐RLKs. Although
PUB12 and PUB13 are not necessary for flg22 perception, they effect the sensitivity of
perception (Marino et al., 2012, Lu et al., 2011). This is similar to the effect of da1-‐1 on
epibrassinolide perception, and presents an interesting and intriguing possibility that DA1
influences the activity of E3 ligases involved in the regulation of FLS2, BRI1 and TMK4 signalling.

129
4.5 -‐ Discussion
The Y2H screen described in this Chapter identified several interacting proteins that implicate
DA1 in growth and development and possibly pathogen responses (Table 4.1). Two interacting
proteins, TCP15 and TMK4, were selected for further study based on their potential links to
growth and development and the flagellin PAMP response. For TCP15; a clear role in the
regulation of cell proliferation and growth (Kieffer et al., 2011, Li et al., 2012, Uberti-‐
Manassero et al., 2012, Steiner et al., 2012) has recently been combined with data from TCP14
(Mukhtar et al., 2011) and transcriptomic analysis (Maclean, unpublished) that suggests a role
in the response to the bacterial elicitor flagellin. TMK4 has been demonstrated to negatively
regulate cell expansion (in roots) and cell proliferation (in leaves) (Dai et al., 2013) and has a
possible connection to FLS2 and the flagellin PAMP response (Keinath et al., 2011). Combined
with evidence that da1-‐1 partially phenocopies bak1-‐4 in response to epibrassinolide (section
Figure 4.10 – Preliminary evidence of developmental phenotypes of TMK4 amiRNA knockdown lines
Four T1 Col-‐0 lines expressing an AT3G23750 (TMK4) amiRNA knockdown construct. The plants exhibit a variety of developmental phenotypes including; dwarfed stature, and narrow and crinkly leaves. This figure presents preliminary data and contains only a subset of the transformants generated.
130
4.4.1.2), it may be that the LRR-‐RLK link provided by TMK4 can be extended to both FLS2 and
BRI1. Future experiments, based on improved knowledge of DA1 function, will include detailed
analyses of phenotypes and genetic interactions of the amiRNA lines and analysis of TMK4
protein levels, modifications and localization during organ growth.
Control of the cell cycle is fundamentally important for plant growth as it establishes the
numbers and sizes of cells that comprise a growing organ. The interaction between TCP15 and
DA1, and evidence that TCP15 directly regulates the expression of key cell-‐cycle genes (Kieffer
et al., 2011, Li et al., 2012), provides a promising link between DA1 function and the cell-‐cycle.
The da1-‐1 large organ phenotype is due to developing organs being mitotically active for
longer (Li et al., 2008). The interaction of DA1 with a transcription factor that has been shown
to repress cell proliferation in leaf and floral tissues (Kieffer et al., 2011) reveals a possible
mechanism for this phenotype. However, the often-‐contradictory phenotypes revealed from
genetic studies of TCP15 (Fig. 4.5) (Kieffer et al., 2011, Li et al., 2012, Uberti-‐Manassero et al.,
2012), have made it difficult to establish direct genetic evidence of a role of DA1 in TCP15
function. Speculatively, assuming that TCP15, as a canonical class I TCP, is a promoter of
growth, and that the dependence of its function on DA1 indicated by the partial correlation
analysis is correct, then a model can be proposed in which DA1 negatively regulates the
growth promoting activity of TCP15. This model is supported by data showing a genetic
interaction to regulate inflorescence stem height (section 4.3.3.1), but contradicted by data
from other sources that report a growth repressing activity of TCP15 (Kieffer et al., 2011).
Despite the uncertainty surrounding the details of the interaction, the observation that DAR1
has also been shown to interact with TCP14 (Mukhtar et al., 2011) supports the observed DA1-‐
TCP15 interaction, generating important insight that may allow us to explain certain aspects of
the da1-‐1 phenotype.
The observation that DA1 physically interacts with the cytoplasmic domain of TMK4, an LRR-‐
RLK, provides sufficient insight to be able to propose a tentative role for DA1 in LRR-‐RLK-‐
mediated regulation of growth and development. The ‘UIM-‐cycle’ model for the ubiquitin
dependent processing of RTKs in animal systems (Marmor and Yarden, 2004) predicts a role
for DA1 as an adaptor protein in the internalisation or recycling of LRR-‐RLKs. However,
evidence that the DA1 peptidase is active towards two E3 ligases (Chapter 5), and evidence
that FLS2 is ubiquitinated by PUB12 and PUB13 (Lu et al., 2011), suggests that DA1 may be
involved in the proteolytic regulation of E3 ligases involved in RLK-‐mediated signal
transduction. Indeed, the way that PUB12 and PUB13 affect the sensitivity of the flg22
131
response (Marino et al., 2012, Lu et al., 2011) is reminiscent of how DA1 affects sensitivity of
brassinosteroid perception (section 4.4.1.2). It is possible that ubiquitination of some LRR-‐RLKs
is required for their activity and that DA1 acts to recruit and regulate E3 ligases at the
cytoplasmic domain of the respective RLK. Due to the fact that BAK1 is involved in both the
flg22 and brassinosteroid responses, it is tempting to speculate that DA1 also interacts with
the C-‐terminal domain of BAK1.
Although it is possible that DA1 regulates TCP15 and TMK4 independently and at distinct
cellular locations, it is also possible that DA1 interacts with both proteins in the same location.
Evidence from animal systems reveals that the sterol regulatory element binding proteins
(SREBPs), ER-‐membrane bound transcription factors, are ‘activated’ by a proteolytic cleavage
event that liberates the DNA-‐binding domain from the membrane, before transition the
nucleus (Brown and Goldstein, 1997, Eberle et al., 2004). This example suggests a possible
mechanism of DA1 action, involving ligand binding of LRR-‐RLKs resulting in the RLK-‐proximal
ubiquitin-‐mediated regulation of TCP15 activity. This model, although very speculative, is
supported by strong evidence that TCP14 is a network hub in response to pathogen response
(Mukhtar et al., 2011), and that TCP15 interacts physically with the E3 ligase PUB14 (Dreze et
al., 2011). Detailed genetic analysis would help to dissect these interactions, but they may be
very complex due to substantial genetic redundancy of TCP genes.
The suggestion that DA1 may play a role in growth and development and the pathogen
response is supported by the identification of the E1-‐activating enzyme ATUBA1 in the Y2H
screen. A 15bp deletion in the C-‐terminal region of ATUBA1 (named mos5 (modifier of snc1 5))
was able to rescue the dwarf phenotype of the npr1-‐1 snc1 double mutant, which has
constitutively activated defence responses (Goritschnig et al., 2007). mos5 has enhanced
disease susceptibility, which suggests that ATUBA1 is involved in activating pathogen response
pathways (Goritschnig et al., 2007). The ability of mos5 to rescue the dwarf phenotype of the
npr1-‐1 snc1 double mutant suggests that ATUBA1 negatively regulates a growth control
pathway (Goritschnig et al., 2007); something that is well characterised in defence responses
(Gómez‐Gómez et al., 1999, Gómez-‐Gómez and Boller, 2000, Zipfel et al., 2006).
The regulation of a specific set of pathways by an E1-‐activating enzyme is surprising, seeing as
specificity in the ubiquitination cascade is considered to be determined by E3 enzymes
(Hershko and Ciechanover, 1998). Based on observations in Chapter 5, that reveal DA1
interacts with two E3 ligases, it is difficult to see how DA1 may also interact with an E1 enzyme.
One explanation would be if the E1, E2 and E3 enzymes form a temporary complex that

132
shuttles ubiquitin through the ubiquitin cascade to the substrate. Regardless of the
explanation, the identification of ATUBA1 as an interactor of DA1 unifies the ubiquitin system,
the pathogen response, and growth and development pathways; all pathways that DA1 has
been links to.
Other candidate DA1-‐interacting proteins from the Y2H screen include the Class III
homeodomain-‐leucine zipper (HD-‐Zip III) protein ATHB8 (HOMEOBOX GENE 8), which is part of
a small gene family shown to be involved in leaf development, meristem regulation, vascular
development and auxin transport (reviewed in (Prigge et al., 2005)). ATHB8 expression has
been shown to promote cell differentiation during vascular development (Baima et al., 2001)
and to be highly correlated with cell division in the developing vascular system (Kang and
Dengler, 2002). Consistent with its role in vascular development, there is also evidence that
ATHB8 expression is positively regulated by auxin (Baima et al., 1995, Mattsson et al., 2003). In
addition, there is evidence that ATHB8 antagonises the effect of REVOLUTA (REV), and
promotes meristem and floral organ development (Prigge et al., 2005). The fact that this
growth promoting transcription factor is auxin-‐responsive (Baima et al., 1995, Mattsson et al.,
2003), presents the possibility that it may operate in a similar pathway to TMK4, which is
involved in auxin sensing (Dai et al., 2013). It is therefore conceivable that any interaction
between DA1 and ATHB8, may be related to the DA1-‐TMK4 interaction.
Also identified in the first round of the Y2H screen was LOB DOMAIN-‐CONTROLING PROTEIN 41
(LBD41), related to the LOB-‐domain containing protein, ASYMMETRIC LEAVES 2 (AS2), which
affects leaf lobing, petiole length and the ectopic formation of leaflet-‐like structures (Semiarti
et al., 2001). The LBD41 homolog in Celosia cristata has also been shown induce leaf lobing
and ectopic leaf blade formation on the petiole (Meng et al., 2010). This is possibly due to a
similar repression of KNOX gene activity as that seen with AS2 (Guo et al., 2008, Hay et al.,
2006).
4.5.1 – DA1, TCP15 and the chloroplast: a role in retrograde signalling?
Finally, the abundance of chloroplast localised proteins in the Y2H screen (Table 4.1) suggests
that DA1 may function in the chloroplast. Recent work by Andriankaja et al (2012) revealed
that the cell proliferation arrest front appears to be induced by chloroplast retrograde
signalling. It was shown that genes involved in the synthesis of chlorophylls and hemes, whose
action is thought to promote retrograde signalling (Voigt et al., 2010), were up-‐regulated prior
to the onset of cell expansion (Andriankaja et al., 2012). It was also shown that the group of
133
genes that was differentially expressed during the transition from cell proliferation to
expansion was enriched in for genes also shown to be differentially regulated in response to
Norflurazon (NF), a chemical inhibitor of chloroplast differentiation (Andriankaja et al., 2012).
Moreover, the transition from cell proliferation to cell expansion in the leaf tip was inhibited
when NF was applied (Andriankaja et al., 2012), further supporting a role of chloroplast
retrograde signalling in the promotion of cell expansion in the developing leaf.
Although the precise details of chloroplast retrograde signal transduction remain unclear
(Nott et al., 2006, Leister, 2012, Caldana et al., 2012), reactive oxygen species (ROS),
tetrapyrrole biosynthesis and plastid gene expression are all thought to play a role in signal
initiation (Galvez‐Valdivieso and Mullineaux, 2010, Voigt et al., 2010). As the onset of the
cell-‐proliferation arrest front is delayed in da1-‐1 organs, it is possible that DA1 acts to promote
the onset of arrest and thereby accelerate the transition from proliferation to expansion
across the developing organ. It is possible that DA1 might promote this transition by
promoting chloroplast retrograde signalling. This hypothesis is supported by preliminary data
from the Y2H screen, which shows that DA1 interacts with 15 chloroplast localised proteins
including, FERREDOXIN 2 and PSAE-‐1 (Fig. 4.3), both of which are involved in linear
photophosphorylation (Allen, 2003, Nott et al., 2006). Interference with linear
photophosphorylation can induce the rapid accumulation of singlet oxygen (1O2), which is
thought to be involved in initiating retrograde signalling (Galvez‐Valdivieso and Mullineaux,
2010). This suggests that any DA1-‐mediated inhibition of either FERREDOXIN or PSAE-‐1 might
promote retrograde signalling and therefore promote the onset of the cell proliferation arrest
front. Additionally, because TCP15 is predicted to be localised to the chloroplast (Wagner and
Pfannschmidt, 2006), it is possible that DA1-‐TCP15 interactions might promote the expression
of chloroplast genes, and thereby activate retrograde signalling (Voigt et al., 2010).
Consistent with the possibility that DA1 promotes retrograde signalling through elevated ROS
levels, is evidence from microarray analyses that shows enhanced expression of FSD1 (IRON
SUPEROXIDE DISMUTASE 1) in da1-‐1 plants (Yunhai Li, personal communication). FSD1 is
involved in protecting chloroplasts from oxidative stress (Myouga et al., 2008) and is involved
in de-‐toxifying 1O2 by converting it to H2O2; the first of a two-‐step pathway resulting in H2O. It
may be, therefore, that DA1 negatively regulates FSD1; thereby promoting 1O2-‐induced
retrograde signalling and positively regulating the arrest front.
134
Chapter 5 -‐ DA1 is an ubiquitin-‐activated peptidase
5.1 – Introduction
This chapter identifies functions of the DA1 metallopeptidase domain and its role in the
processing and regulation of E3 ligases. Through a combination of genetics and biochemistry,
these experiments identify the E3 ligases EOD1 and DA2 as targets of DA1 peptidase activity,
and reveal a novel mechanism for the ubiquitin-‐dependent peptidase-‐mediated regulation of
E3 ligases.
5.1.1 – E3 Ligases: a diverse group of proteins unified by functional similarity
The final step in the ubiquitin cascade (see section 1.7) is the targeted transfer of E2-‐
conjugated ubiquitin molecules to substrate proteins. E3 ubiquitin ligases are responsible for
determining the specificity of this E2-‐mediated ubiquitin transfer; a centrally important
function consistent with the identification of 1415 E3 ubiquitin ligases in Arabidopsis
(Mazzucotelli et al., 2006). In the most general terms, an E3 ubiquitin ligase is an enzyme that
facilitates, directly or indirectly, the transfer of E2-‐conjugated ubiquitin molecules to a specific
substrate. However despite this functional conservation, E3 ligases are an exceptionally
diverse group of enzymes. According to their protein structures, there are two general groups
of E3 ligase: monomeric E3s, where E2-‐binding domains and substrate binding domains are on
the same polypeptide; and multimeric E3s, which consist of an E2-‐interacting module and a
target-‐specifying module joined by a CUL (CULLIN) or CUL-‐like protein (Mazzucotelli et al.,
2006) (Fig. 5.1).
E3 ligases can also be categorized according to their E2-‐binding domains. These are either a
HECT (Homology to E6-‐AP C-‐Terminus) domain or a RING (Really Interesting New Gene)/U-‐box
domain. All HECT E3s, including UPL3 (UBIQUITIN PROTEIN LIGASE 3) -‐ a regulator of trichome
development in Arabidopsis (Downes et al., 2003), are monomeric E3s; whereas RING E3s exist
as both monomeric E3s and as subunits in multimeric modular E3 complexes (Mazzucotelli et
al., 2006). Some RING E3s, such as BB/EOD1 (Disch et al., 2006) and the negative regulator of
ABA signalling KEG (KEEP ON GOING) (Stone et al., 2006), as well as the closely related PLANT
U-‐BOX (PUB) E3s, including PUB12 and PUB13 (Lu et al., 2011), are single polypeptide E3s. In
contrast the RING protein atRBX1 (RING BOX PROTEIN1), the knockdown of which causes
severe developmental phenotypes such as poorly developed leaves and loss of apical
135
dominance (Lechner et al., 2002), is part of a multimeric E3 ligase. RBX1 is the E2-‐binding
subunit of SCF (SKP1-‐CULLIN-‐F-‐BOX), CUL3-‐BTB/POZ (CULLIN-‐3 – BRIC-‐A-‐BRAC, TRAMTRACK
and BROAD COMPLEX/POX VIRUS and ZINC FINGER), and CUL4-‐DDB1 (UV-‐DAMAGED DNA-‐
BINDING PROTEIN1) E3 ligases; henceforth termed the cullin-‐ring ligases (CRLs) (Mazzucotelli
et al., 2006). All E3 ligases, except HECT E3s, coordinate the ligation of the E2-‐conjugated
ubiquitin to the substrate, without themselves covalently binding the ubiquitin. HECT E3
ligases, however, form a thioester intermediate with the ubiquitin molecule before transfer of
the ubiquitin moiety, by ligation, to the substrate (Hershko and Ciechanover, 1998).
The modular nature of multimeric E3 ligases and the diversity of their subunits generates a
large number of substrate specificities. Indeed, the most abundant E3 subgroup in Arabidopsis,
with 724 members, is that of the F-‐BOX proteins (Mazzucotelli et al., 2006). F-‐BOX proteins are
the substrate binding modules of the SCF-‐type E3 ligases, which determine the target
specificity of the multimeric E3s. They have been identified to play a role in many
developmental processes in Arabidopsis. For example, the F-‐BOX protein UNUSUAL FLORAL
ORGANS (UFO) is a regulator of floral development and meristem identity (Levin and
Meyerowitz, 1995); and SLEEPY1 (SLY1) is a positive regulator of gibberellin signalling (Dill et al.,
2004, McGinnis et al., 2003).
5.1.2 – Regulation of E3 ligase activity
Ubiquitination of a target protein often leads to its irreversible destruction by targeting to the
proteasome (Glickman and Ciechanover, 2002, Hochstrasser, 1996). In the cell cycle for
example, ubiquitin-‐mediated protein destruction ensures unidirectional cell-‐cycle progression.
Examples of this include the APC (anaphase promoting complex) mediated ubiquitination of A-‐
and B-‐type cyclins and the SCF-‐mediated ubiquitination of D-‐type cyclins (Dewitte and Murray,
2003). To enable these cellular decisions to be executed quickly and completely, pools of E3
ligase enzymes are often pre-‐existing and tightly regulated (Peters, 2006). For this reason E3
ligases are subject to a large amount of regulatory post-‐translational modification.
The activity and specificity of multimeric E3 ligases is dependent on the presence of all
required subunits, and mechanisms that interfere with, or enhance subunit assembly can act
as regulators of E3 ligase activity. In humans, the inhibitory CAND1 (CULLIN-‐ASSOCIATED AND
NEDDYLATION-‐DISSASSOCIATED) protein competes with the substrate recognition module (e.g.
DDB1) for the binding of the E2-‐binding module (CUL1/RBX), thus preventing complex
formation and repressing E3 function (Zheng et al., 2002). Conversely, there is also evidence
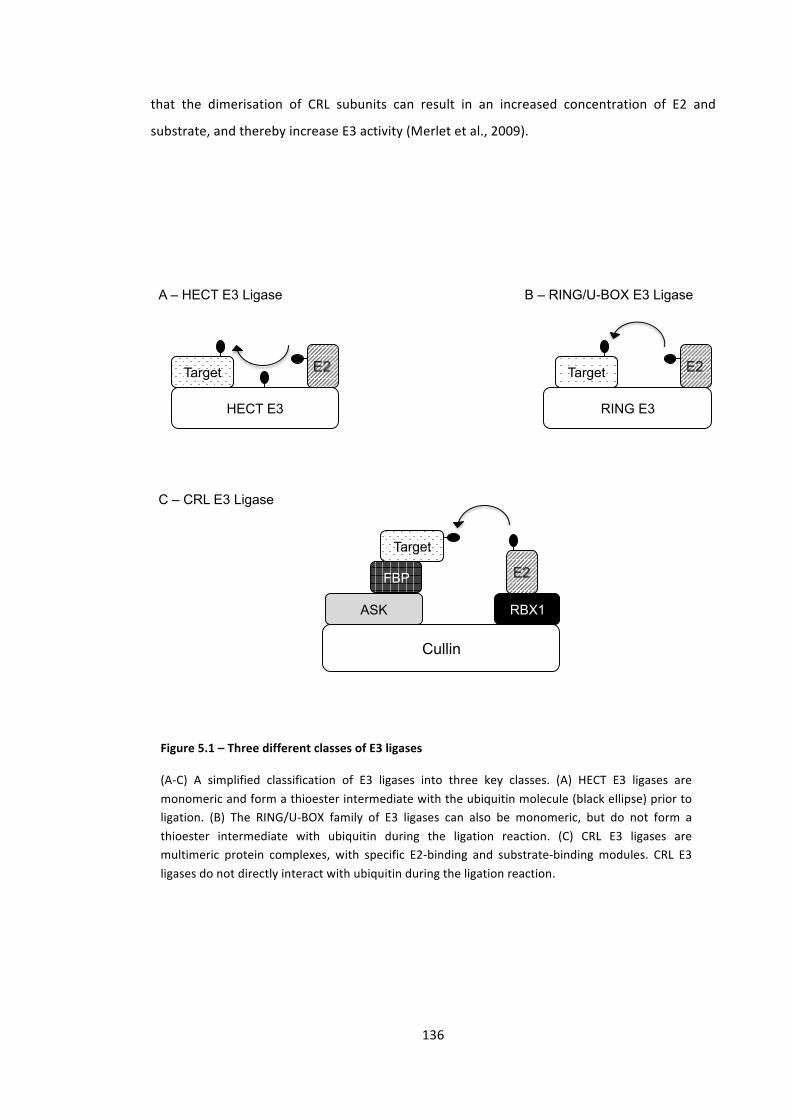
136
that the dimerisation of CRL subunits can result in an increased concentration of E2 and
substrate, and thereby increase E3 activity (Merlet et al., 2009).
HECT E3
Target
RING E3
Target
Cullin
RBX1 ASK
FBP
Target
A – HECT E3 Ligase B – RING/U-BOX E3 Ligase
C – CRL E3 Ligase
Figure 5.1 – Three different classes of E3 ligases
(A-‐C) A simplified classification of E3 ligases into three key classes. (A) HECT E3 ligases are monomeric and form a thioester intermediate with the ubiquitin molecule (black ellipse) prior to ligation. (B) The RING/U-‐BOX family of E3 ligases can also be monomeric, but do not form a thioester intermediate with ubiquitin during the ligation reaction. (C) CRL E3 ligases are multimeric protein complexes, with specific E2-‐binding and substrate-‐binding modules. CRL E3 ligases do not directly interact with ubiquitin during the ligation reaction.

137
In addition to regulating subunit availability, post-‐translational manipulation of protein
structure can also affect CRL activity. The ligation of the small ubiquitin related peptides
NEDD8 (in mammals) and RUB (in plants) to the CUL backbone of CRLs has been shown to be
sufficient to modify CUL tertiary structure and thereby alter its binding affinity to RBX1 (Duda
et al., 2008, Biedermann and Hellmann, 2011). This results in a more flexible E2-‐binding
module, reducing the distance from E2 to substrate, and enhancing E3 activity through the
facilitation of multiple catalytic geometries (Duda et al., 2008, Merlet et al., 2009).
Similarly to CRLs, monomeric E3s are also regulated by a combination of post-‐translational
modification and the availability of cognate substrate-‐binding adaptor proteins. For example,
and perhaps comparable to the neddylation of CRLs, poly-‐ubiquitination of monomeric E3s,
such as the auto-‐ubiquitination of the human BRCA1/BARD1 complex, has been shown to
stimulate E3 activity (Mallery et al., 2002). In contrast, poly-‐ubiquitination of the human RING
E3, MDM2 is a repressive signal, and the activity of this enzyme is regulated by the antagonism
of its auto-‐ubiquitination by the de-‐ubiquitinating activity of its cognate DUB; USP2a (Fang et
al., 2000, Stevenson et al., 2007). It has also been shown that post-‐translational modification
of the Human E3 ligase, PARKIN is sufficient to de-‐repress the enzyme and alter its specificity.
PARKIN exists in an auto-‐inhibitory state that can be released in vitro by the addition of N-‐
terminal epitope tags (Burchell et al., 2012), and can be converted from a mono-‐ubiquitin
ligase to a poly-‐ubiquitin ligase by an N-‐terminal truncation in vitro (Chew et al., 2012).
Together these data suggest that E3 ligases can contain auto-‐inhibitory domains, which may be
removed through cleavage of, or steric interference with the inhibitory region.
In addition to the steric activation of E3 ligases, there is also evidence that proteolytic
processing of E3s can cause their activation by re-‐localisation. The membrane localised Human
PA-‐TM-‐RING E3 ligase, RNF13, is cleaved at its trans-‐membrane domain, which releases the C-‐
terminal RING-‐containing domain to the cytoplasm (Bocock et al., 2010). This re-‐localisation
may be required to bring it into contact with its substrate, and therefore may be essential to
activate the enzyme.
For monomeric E3s, the availability of adaptor proteins also provides an additional level of
regulatory control. An extreme example of this is the human HECT E3 ligase, SMURF2, a
regulator of TGF-‐β endocytosis. Its cognate adaptor, SMAD7, acts as an additional E2 binding
site, increasing the affinity for the E2 and thereby enhancing its ligase activity (Ogunjimi et al.,
2005). Also, and comparable to the dependence on the availability of substrate-‐binding
modules in modular E3s, the yeast E3 ligase RSP5 requires an adaptor protein complex for
138
target specificity (Léon and Haguenauer-‐Tsapis, 2009). In this example three proteins – BSD2,
TRE1 and TRE2 – interact to target RSP5 to its substrate; SMF1 (Stimpson et al., 2006, Hettema
et al., 2004). Finally, highlighting the diverse regulatory roles carried out by adaptors, SMAD7’s
interaction with SMURF2 also causes the re-‐localisation of the E3 ligase from the nucleus to
the cytoplasm and plasma membrane (Kavsak et al., 2000), and disrupts its native
autoinhibitory conformation (Wiesner et al., 2007).
5.1.3 – Ubiquitin chains: a diversity of signalling modifications
Ubiquitin modifications occur in a variety of forms ranging from mono-‐ubiquitination to long-‐
chain poly-‐ubiquitination (Pickart and Fushman, 2004, Ikeda and Dikic, 2008, Kerscher et al.,
2006). Mono-‐ubiquitination is chiefly used as a reversible post-‐translational modification
similar to that of phosphorylation, and its role in coupled mono-‐ubiquitination is discussed in
more detail in section 3.1.1. This section will focus on the diversity in structure and function of
poly-‐ubiquitin chains.
Poly-‐ubiquitin chains are formed through the creation of an isopeptide linkage between the C-‐
terminal glycine of ubiquitin (Gly76) and a lysine residue on the preceding ubiquitin molecule
(Pickart and Fushman, 2004). There are seven lysines in ubiquitin -‐ K6, K11, K27, K29, K33, K48
and K63 – allowing for seven possible ubiquitin chain ‘architectures’. Five out of the seven
architectures have been detected in Arabidopsis in the following order of abundance: K48 >>
K63 > K11 >> K33 > K29 (Saracco et al., 2009). In yeast, all seven linkages have been detected
in the order of abundance: K48 > K63 & K11 >> K33, K27, K6 & (K29); with K29 linkages only
being detected on proteins also ubiquitinated at K33 (Peng et al., 2003). The identification of
all seven linkages in vivo suggests that all architectures are genuine signalling modifications.
Linear poly-‐ubiquitin chains – where a peptide linkage forms between the α-‐amino group of
Met1 of one ubiquitin and the α-‐carboxyl group of the C-‐terminal Gly76 of another (Rieser et
al., 2013) – have also been identified in animal systems. These chains are formed through the
linear ubiquitin chain assembly complex (LUBAC) (Kirisako et al., 2006), and are thought to be
non-‐degradative signals involved in the regulation of proteins such as TUMOUR NECROSIS
FACTOR RECEPTOR1 (TNFR1) (Rieser et al., 2013).
K48-‐linked poly-‐ubiquitin chains are generally accepted to be necessary for targeting proteins
to the proteasome-‐mediated degradation pathway (Hershko and Ciechanover, 1998, Jacobson
et al., 2009, Thrower et al., 2000), whereas other linkages are assumed to have non-‐
degradative signalling functions. K63 linked ubiquitin has been shown to be non-‐degradative
and necessary to regulate human pattern recognition receptor signalling (Kawai and Akira,
139
2010), as well as the activation of the CHK1 checkpoint kinase (Cheng et al., 2013b). The
biological function of the other ubiquitin linkages is less well understood, although there is
evidence that K29-‐ and K33-‐linked ubiquitin are negative regulators of the human kinases
NUAK1 and MARK1 (Al-‐Hakim et al., 2010). Interestingly, K29-‐linked ubiquitin has also been
shown to play a significant role, alongside K48-‐linked ubiquitin chains, in signalling the
proteasome-‐mediated destruction of DELLA proteins (Wang et al., 2009).
5.1.4 – EOD1/BB and DA2 are RING E3 ligases
EOD1/BB and DA2 are both RING-‐finger proteins that negatively influence the duration of
proliferative growth in Arabidopsis (Disch et al., 2006, Xia, 2013). Original research
demonstrated that EOD1 is an active E3 ligase in vitro and that it interacts with the E2
conjugating enzyme UBC10 (Disch et al., 2006).
eod1 null mutants have enlarged petals and sepals, and thicker stems than the wild-‐type; leaf
size is not increased in these null mutants, but is decreased in overexpression lines, indicating
that it acts as a negative regulator of growth (Disch et al., 2006). In the eod1 loss of function
mutant, the enlarged organs consist of an increased number of wild-‐type sized cells, which is a
consequence of a prolonged duration of cell proliferation (Disch et al., 2006). eod1 null
mutants also have enlarged gynoecia, which occasionally form multiple carpels (Disch et al.,
2006); they also have enlarged floral meristems, which sometimes results in the initiation of an
additional petal (Yunhai Li, personal communication). These phenotypes are strikingly similar
to those seen for da1-‐1. Moreover, in addition to sharing petal size, sepal size and stem
thickness phenotypes, both mutants negatively influence organ growth through the same
developmental mechanism-‐ a reduction in the duration of cell proliferation.
da2-‐1 leaves and petals are also enlarged relative to the wild-‐type, with the enlarged organs
consisting of an increased number of normally-‐sized cells (Xia, 2013). da2-‐1 seeds are heavier
that wild-‐type seeds, and have a size distribution that is different to the wild-‐type (more larger
seeds and fewer smaller seeds) (Xia, 2013). Interestingly, the increase in seed size is maternally
controlled and is a consequence of an increased duration of proliferation in the integuments
(Xia, 2013). This is analogous to the large-‐seed phenotype of da1-‐1 plants, which is also
maternally inherited. Collectively these data demonstrate that DA1, DA2 and EOD1 negatively
influence the duration of cell proliferation during organ growth. This is consistent with their
high expression levels in proliferating tissues (Xia, 2013, Li et al., 2008, Disch et al., 2006).
eod1-‐2 and da2-‐1 do not genetically interact with each other to control organ and seed size,
but they both have been shown to interact synergistically with da1-‐1 to influence organ
140
growth (Li et al., 2008, Xia, 2013). Taken together, the biochemical, cell-‐biological and
developmental similarities shared between DA1, and EOD1 and DA2 suggest that DA1 may
influence the activities of both E3 ligases to regulate organ growth. Due to the initial
characterisation being carried out with the da1-‐1 allele only, it is not possible to determine
whether the observed genetic interactions are with DA1 specifically, or whether they are with
the multimeric complex of DA1 family members with which the da1-‐1 mutation is predicted to
interfere. In order to elucidate this, it was important to initially determine genetic interactions
between da2-‐1 and eod1-‐2 , and the da1ko1 single loss of function mutant.
5.2 – DA1 interacts with EOD1 and DA2
DA1, DA2 and EOD1 are all negative regulators of growth as shown by the increased organ size
of loss of function mutations (Li et al., 2008, Xia, 2013, Disch et al., 2006). DA1 interacts
synergistically with both EOD1 and DA2 to further negatively influence growth (Li et al., 2008,
Xia, 2013), suggesting that they may work in a common mechanism in which one may enhance
the function of the other. The ability of DA1 to bind ubiquitin (section 3.3), and the fact that
EOD1 and DA2 encode E3 ligases, suggests that these synergic genetic interactions may result
from the respective proteins functioning together in a complex.
5.2.1 – DA1 genetically interacts with EOD1 and DA2 to influence seed and petal size
The original work that identified a genetic interaction between DA1 and the DA1-‐interacting E3
ligases, EOD1 and DA2 (termed DIEs) was performed with the dominant negative da1-‐1
mutant (Xia, 2013, Li et al., 2008). Work in section 3.2.2 identified that the dominant negative-‐
interfering effect of this allele is likely to be due to the physical interaction of DA1 and DAR1 in
an active complex. As such, it is possible that the DIEs interact with either DA1, DAR1 or both.
In order to investigate whether the genetic interaction is with DA1 specifically, a genetic
analysis of eod1-‐2 and da2-‐1 with da1ko1 (rather than with da1-‐1) was carried out.
5.2.1.1 – da1ko1 seeds and petals are significantly larger that Col-‐0
Seed and petal areas were measured using a high-‐resolution scanner and subsequent ImageJ
analysis (see section 2.3.5.1 for details).
For each genotype, 20 petals were collected and placed – intact – on transparent adhesive
tape and attached to a clean polished black background. Petal area was recorded using a high-‐
resolution scanner following a protocol adapted from (Herridge et al., 2011). Images were
141
scanned, and areas were calculated using the ImageJ image analysis software
(http://rsbweb.nih.gov/ij/links.html).
Seed areas were calculated using a similar method. However, due to their smaller size (relative
to the fixed resolution of the scanner) the number of seeds in the sample was increased to
n>100, and instead of adhering to tape, the seeds were scattered in a petri dish prior to
scanning.
This method permitted extremely accurate measurements and was much more precise than
previous seed-‐size analysis methods, which assessed differences in seed size through the
distribution of seed size (Li et al., 2008, Xia, 2013). Instead of looking at the percentages of
seeds in three or four different size categories, this method directly measured the area of
individual seeds. It was also automated and therefore allowed the high throughput analysis of
large datasets.
For these reasons, this analysis has revealed hitherto undetected phenotypes for da1ko1
single knockout seeds and petals. Fig. 5.2 shows that da1ko1 seeds (Student’s T-‐test, p=0.043)
and petals (Student’s T-‐test, p=0.019) are significantly larger than Col-‐0. This result
demonstrates that DA1 is not 100% redundant with DAR1, and suggests that some DA1
function is independent of DAR1. Taken with evidence from section 3.2.2 confirming that DA1
can homo-‐ and hetero-‐oligomerise, these data suggest that in some aspects of seed and petal
size regulation, DA1 might function as a homo-‐oligomer.
5.2.1.2 – DA1 genetically interacts with EOD1 and DA2 to influence seed and petal size
In agreement with observations from Dish et al (2006) and Xia et al (in press), Fig. 5.2b shows
that eod1-‐2 and da2-‐1 petals are significantly larger than Col-‐0 (Student’s T-‐test, P<0.005). The
data also show that da1ko1/eod1-‐2 and dako1/da2-‐1 petals are significantly larger than petals
of eod1-‐2 and da2-‐1 plants (Student’s T-‐test, P<0.001). Importantly, the increase in petal area
(relative to Col-‐0) in da1ko1/eod1-‐2 and dako1/da2-‐1 plants is significantly larger than that of
their constituent single mutations (Student’s T-‐test, p<0.002) (Fig. 5.2e). This shows that there
is a synergistic interaction between da1ko1 and eod1-‐2, and between da1ko1 and da2-‐1. This
data builds on earlier observations that the DIEs synergistically interact with the da1-‐1 allele,
and demonstrates that they interact with DA1 directly to set petal size.
eod1-‐2 was crossed with dar1 and da1ko1/dar1 plants in order to investigate whether EOD1
also genetically interacts with DAR1. The data displayed in Fig. 5.2c confirm that in addition to
142
interacting with da1ko1, eod1-‐2 interacts with the da1ko1/dar1 genotype. However, the data
also reveal that there is no synergistic interaction between dar1 and eod1-‐2. This shows that
EOD1 interacts specifically with DA1 to set petal size, and that the observed interaction with
da1-‐1 (Li et al., 2008) and da1ko1/dar1 is dependent on the presence of a da1 null allele.
Analysis of seed size phenotypes (Fig. 5.2) reveals that EOD1 and DA2 differentially regulate
the setting of seed and petal size. Unlike for petals, eod1-‐2 and da2-‐1 have no effect on seed
area. Interestingly, despite this lack of phenotype, the da1ko1/eod1-‐2 and da1ko1/da2-‐1
double mutants both have significantly larger seeds than the da1ko1 single knockouts.
Although not by definition a synergistic interaction, these data do appear to show that eod1-‐2
and da2-‐1 enhance the da1ko1 seed area phenotype.
One reason for the different influence of eod1-‐2 and da2-‐1 on seed and petal growth may be
the dramatically different development of these organs. In particular, compared to petals,
seeds contain multiple tissue types and are developmentally influenced by two genotypes (see
Box. 1.1). This developmental difference is supported by observations in Fig. 5e, which show
crosses of eod1-‐2 with dar1 and da1ko1/dar1 plants. These lines showed weak genetic
interactions between da1ko1 and eod1-‐2, and dar1 and eod1-‐2, and a much stronger
interaction between eod1-‐2 and the da1ko1/dar1 double-‐knockout genotype. This contrasted
with the petal data, which showed that almost all of the increase in petal area in the
da1ko1/dar1/eod1-‐2 triple mutant was due to the da1ko1/eod1-‐2 genotype. These
observations suggest that while EOD1 interacts specifically with DA1 to set petal size, it
interacts with both DA1 and DAR1 to set seed size. Based on observations that DA1 and DAR1
can homo-‐ and hetero-‐oligomerise in vitro (section 3.2.2), it is possible that EOD1 interacts
with a DA1 homo-‐complex to influence petal growth, and a DA1-‐DAR1 hetero-‐complex to
influence seed growth.
These data show that DA1 interacts synergistically with both EOD1 and DA2 in the setting of
petal size. The absence of epistasis indicates that although in the same overall petal-‐size
regulating pathway, the genes are not in a linear relationship, but rather they act together on a
common target or in a common pathway. Importantly, the observed synergism also reveals
that the interacting partners influence each other in a positive manner, suggesting that DA1
might enhance EOD1 and DA2 function, and vice versa (see Fig. 5.11).
There are two ways of explaining this synergistic, enhancing phenotype. Firstly, it is possible
that DA1 and the DIEs function in ‘parallel’ pathways acting on a common target and do not

143
themselves physically interact. In this model, the observed genetic interaction would result
from the downstream convergence of the two pathways, and the enhancing effect would be a
consequence of the interaction of downstream proteins. An alternative model involves DA1
and the DIEs operating at the same step in a pathway through a physical interaction that
enhances their collective function. These models were tested by determining if there were
physical interactions between DA1 the DIEs.
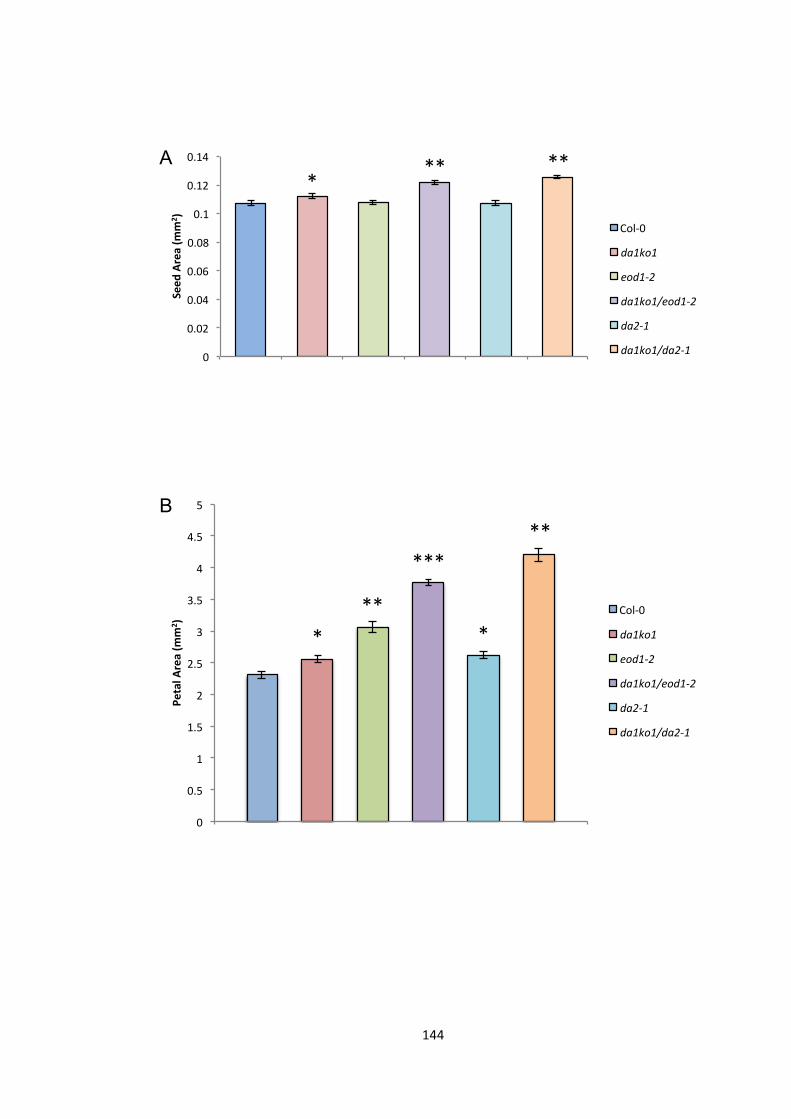
144
0"
0.02"
0.04"
0.06"
0.08"
0.1"
0.12"
0.14"
Col,0"
da1ko1"
eod1,2"
da1ko1/eod1,2"
da2,1"
da1ko1/da2,1"
Seed
$Area$(m
m2 )$
Col,0"
da1ko1&
eod1(2&
da1ko1/eod1(2&
da2(1&
da1ko1/da2(1&
*"**" **"A
0"
0.5"
1"
1.5"
2"
2.5"
3"
3.5"
4"
4.5"
5"
1"
Petal&A
rea&(m
m2 )& Col,0"
da1ko1&
eod1(2&
da1ko1/eod1(2&
da2(1&
da1ko1/da2(1&
*" *"**"
***"**"
B
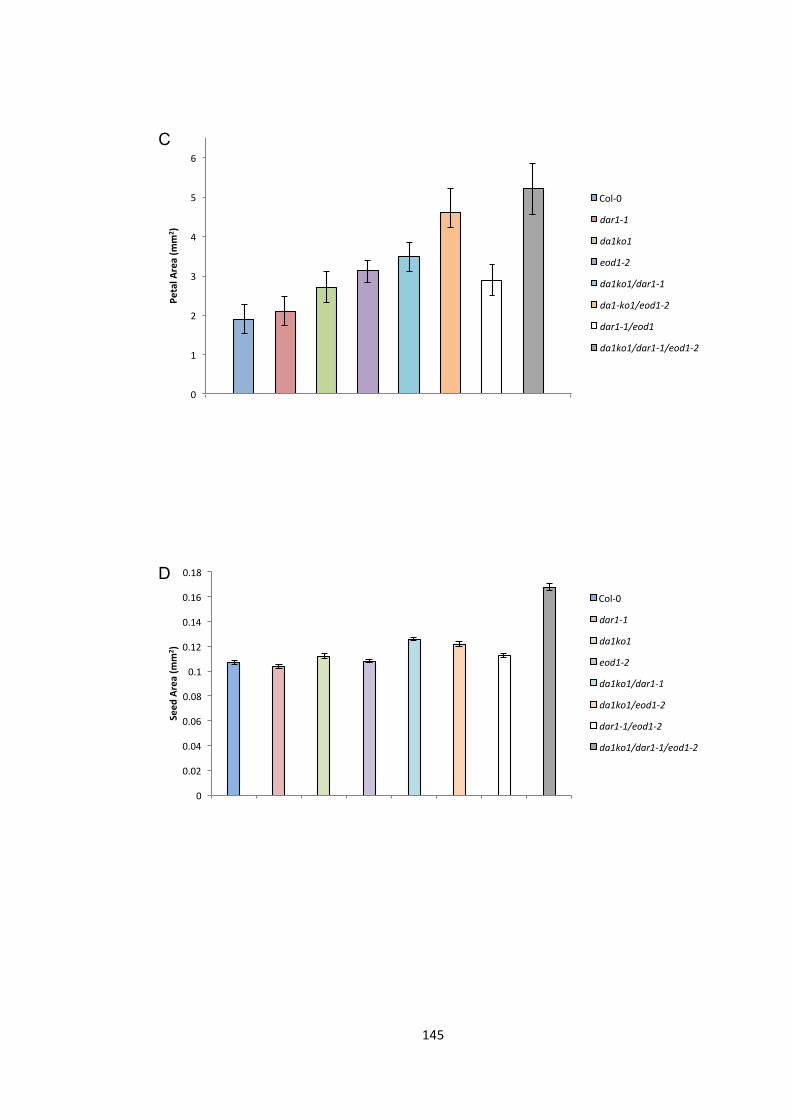
145
0"
1"
2"
3"
4"
5"
6"
1"
Petal&A
rea&(m
m2 )&
Col,0"
dar1%1&
da1ko1&
eod1%2&
da1ko1/dar1%1&
da1%ko1/eod1%2&
dar1%1/eod1&
da1ko1/dar1%1/eod1%2&
C
0"
0.02"
0.04"
0.06"
0.08"
0.1"
0.12"
0.14"
0.16"
0.18"
Col,0"
dar1,1"
da1ko1"
eod1,2"
da1ko1/dar1,1"
da1ko1/eod1,2"
dar1,1/eod1,2"
da1ko1/dar1,1/eod1,2"
Seed
$Area$(m
m2 )$
Col,0"
dar1%1&
da1ko1&
eod1%2&
da1ko1/dar1%1&
da1ko1/eod1%2&
dar1%1/eod1%2&
da1ko1/dar1%1/eod1%2&
D
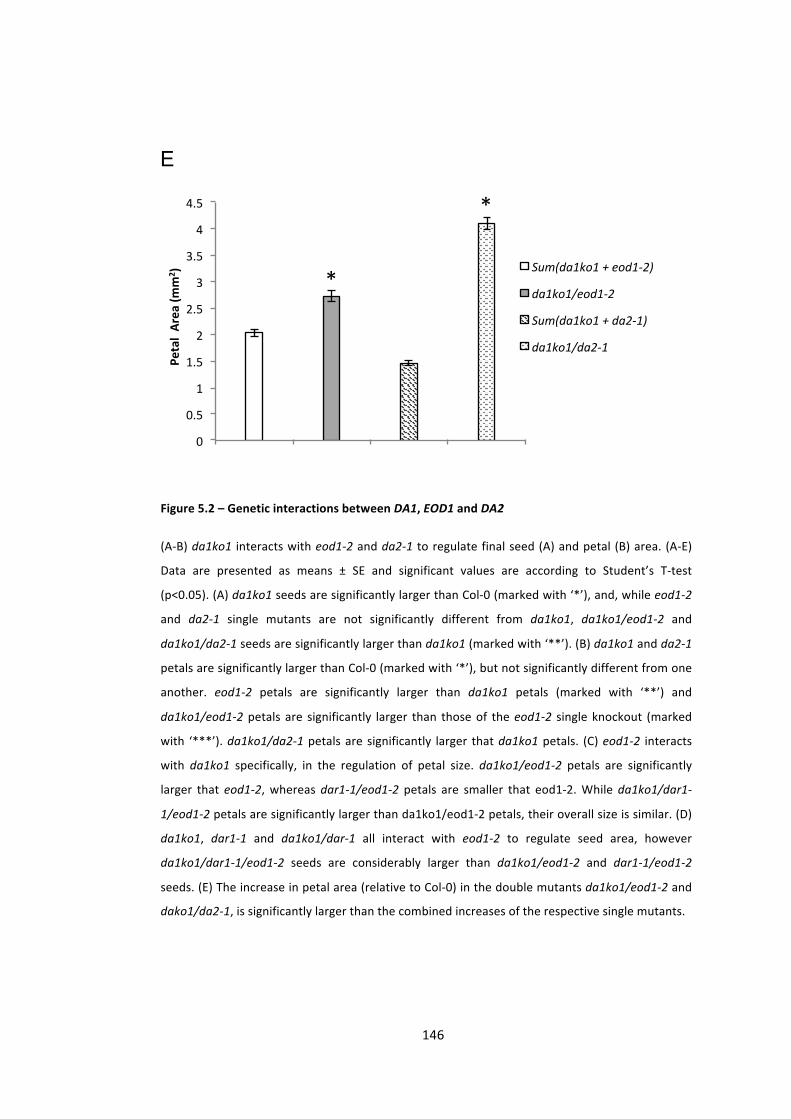
146
E
0"
0.5"
1"
1.5"
2"
2.5"
3"
3.5"
4"
4.5"
Su d Su d
Petal&&Area&(m
m2 )& Sum(da1ko1*+*eod1-2)*
da1ko1/eod1-2*
Sum(da1ko1*+*da2-1)*
da1ko1/da2-1*
*"
*"
Figure 5.2 – Genetic interactions between DA1, EOD1 and DA2
(A-‐B) da1ko1 interacts with eod1-‐2 and da2-‐1 to regulate final seed (A) and petal (B) area. (A-‐E)
Data are presented as means ± SE and significant values are according to Student’s T-‐test
(p<0.05). (A) da1ko1 seeds are significantly larger than Col-‐0 (marked with ‘*’), and, while eod1-‐2
and da2-‐1 single mutants are not significantly different from da1ko1, da1ko1/eod1-‐2 and
da1ko1/da2-‐1 seeds are significantly larger than da1ko1 (marked with ‘**’). (B) da1ko1 and da2-‐1
petals are significantly larger than Col-‐0 (marked with ‘*’), but not significantly different from one
another. eod1-‐2 petals are significantly larger than da1ko1 petals (marked with ‘**’) and
da1ko1/eod1-‐2 petals are significantly larger than those of the eod1-‐2 single knockout (marked
with ‘***’). da1ko1/da2-‐1 petals are significantly larger that da1ko1 petals. (C) eod1-‐2 interacts
with da1ko1 specifically, in the regulation of petal size. da1ko1/eod1-‐2 petals are significantly
larger that eod1-‐2, whereas dar1-‐1/eod1-‐2 petals are smaller that eod1-‐2. While da1ko1/dar1-‐
1/eod1-‐2 petals are significantly larger than da1ko1/eod1-‐2 petals, their overall size is similar. (D)
da1ko1, dar1-‐1 and da1ko1/dar-‐1 all interact with eod1-‐2 to regulate seed area, however
da1ko1/dar1-‐1/eod1-‐2 seeds are considerably larger than da1ko1/eod1-‐2 and dar1-‐1/eod1-‐2
seeds. (E) The increase in petal area (relative to Col-‐0) in the double mutants da1ko1/eod1-‐2 and
dako1/da2-‐1, is significantly larger than the combined increases of the respective single mutants.
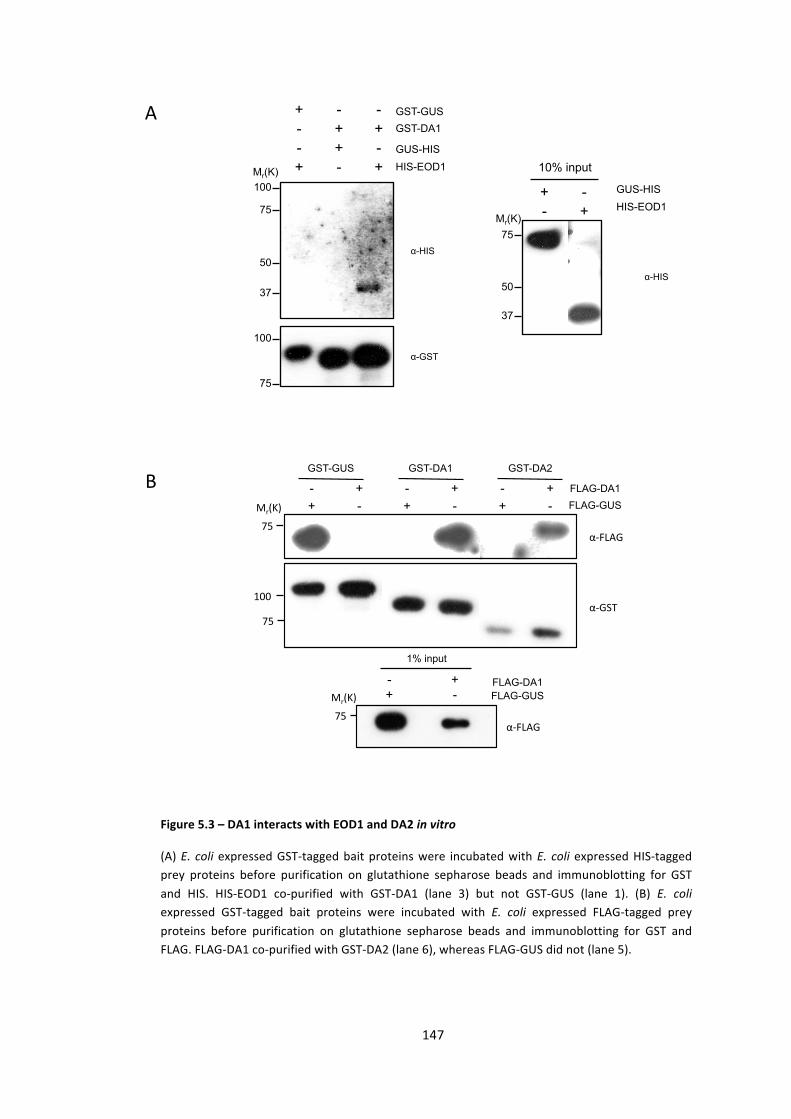
147
+ - +
GST-GUS
GUS-HIS HIS-EOD1
GST-DA1
100
- + + + - -
- + -
75
50
37
100
75
Mr(K)
α-HIS
α-GST
75
50
37
GUS-HIS HIS-EOD1 - +
+ -
10% input
Mr(K)
α-HIS
α"FLAG'
75'
GST-GUS GST-DA1 GST-DA2
+ - + - + - - + - + - + FLAG-DA1
FLAG-GUS
α"GST'
α"FLAG'
Mr(K)'
75'
100'
1% input
+ - - + FLAG-DA1
FLAG-GUS
75'
Mr(K)'
Figure 5.3 – DA1 interacts with EOD1 and DA2 in vitro
(A) E. coli expressed GST-‐tagged bait proteins were incubated with E. coli expressed HIS-‐tagged prey proteins before purification on glutathione sepharose beads and immunoblotting for GST and HIS. HIS-‐EOD1 co-‐purified with GST-‐DA1 (lane 3) but not GST-‐GUS (lane 1). (B) E. coli expressed GST-‐tagged bait proteins were incubated with E. coli expressed FLAG-‐tagged prey proteins before purification on glutathione sepharose beads and immunoblotting for GST and FLAG. FLAG-‐DA1 co-‐purified with GST-‐DA2 (lane 6), whereas FLAG-‐GUS did not (lane 5).
A
B
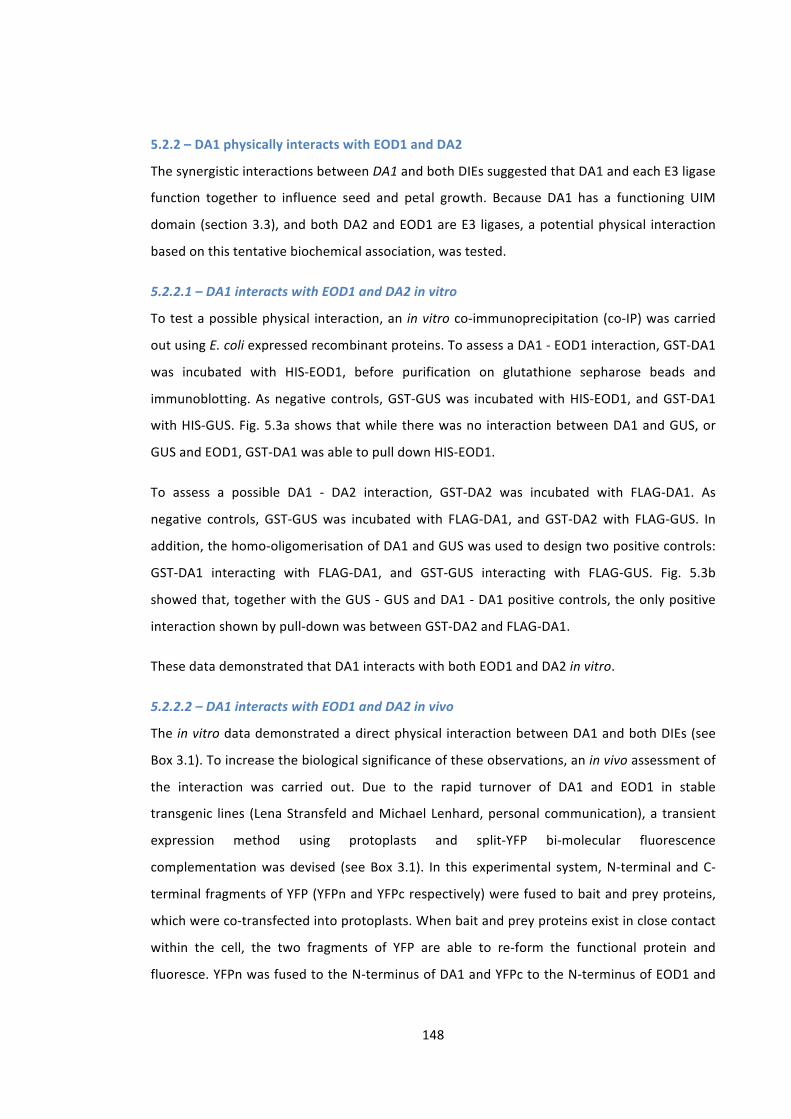
148
5.2.2 – DA1 physically interacts with EOD1 and DA2
The synergistic interactions between DA1 and both DIEs suggested that DA1 and each E3 ligase
function together to influence seed and petal growth. Because DA1 has a functioning UIM
domain (section 3.3), and both DA2 and EOD1 are E3 ligases, a potential physical interaction
based on this tentative biochemical association, was tested.
5.2.2.1 – DA1 interacts with EOD1 and DA2 in vitro
To test a possible physical interaction, an in vitro co-‐immunoprecipitation (co-‐IP) was carried
out using E. coli expressed recombinant proteins. To assess a DA1 -‐ EOD1 interaction, GST-‐DA1
was incubated with HIS-‐EOD1, before purification on glutathione sepharose beads and
immunoblotting. As negative controls, GST-‐GUS was incubated with HIS-‐EOD1, and GST-‐DA1
with HIS-‐GUS. Fig. 5.3a shows that while there was no interaction between DA1 and GUS, or
GUS and EOD1, GST-‐DA1 was able to pull down HIS-‐EOD1.
To assess a possible DA1 -‐ DA2 interaction, GST-‐DA2 was incubated with FLAG-‐DA1. As
negative controls, GST-‐GUS was incubated with FLAG-‐DA1, and GST-‐DA2 with FLAG-‐GUS. In
addition, the homo-‐oligomerisation of DA1 and GUS was used to design two positive controls:
GST-‐DA1 interacting with FLAG-‐DA1, and GST-‐GUS interacting with FLAG-‐GUS. Fig. 5.3b
showed that, together with the GUS -‐ GUS and DA1 -‐ DA1 positive controls, the only positive
interaction shown by pull-‐down was between GST-‐DA2 and FLAG-‐DA1.
These data demonstrated that DA1 interacts with both EOD1 and DA2 in vitro.
5.2.2.2 – DA1 interacts with EOD1 and DA2 in vivo
The in vitro data demonstrated a direct physical interaction between DA1 and both DIEs (see
Box 3.1). To increase the biological significance of these observations, an in vivo assessment of
the interaction was carried out. Due to the rapid turnover of DA1 and EOD1 in stable
transgenic lines (Lena Stransfeld and Michael Lenhard, personal communication), a transient
expression method using protoplasts and split-‐YFP bi-‐molecular fluorescence
complementation was devised (see Box 3.1). In this experimental system, N-‐terminal and C-‐
terminal fragments of YFP (YFPn and YFPc respectively) were fused to bait and prey proteins,
which were co-‐transfected into protoplasts. When bait and prey proteins exist in close contact
within the cell, the two fragments of YFP are able to re-‐form the functional protein and
fluoresce. YFPn was fused to the N-‐terminus of DA1 and YFPc to the N-‐terminus of EOD1 and
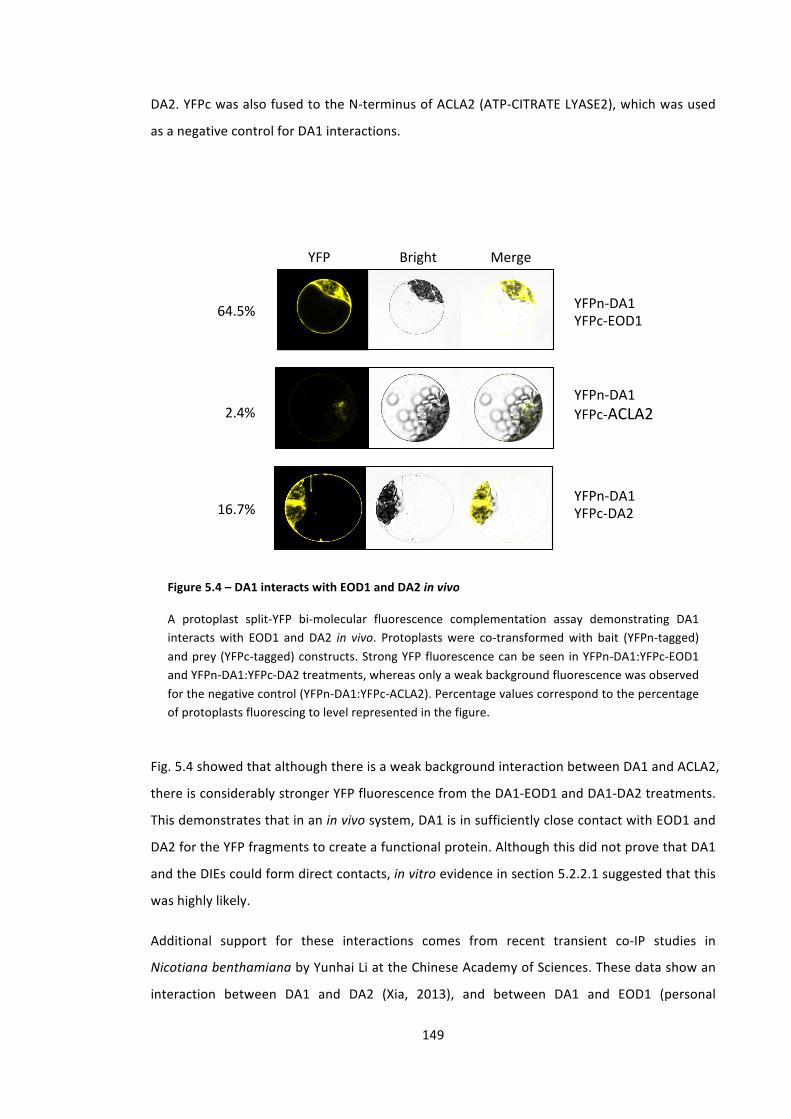
149
DA2. YFPc was also fused to the N-‐terminus of ACLA2 (ATP-‐CITRATE LYASE2), which was used
as a negative control for DA1 interactions.
YFP$ Bright$ Merge$
YFPn.DA1$YFPc.EOD1$
YFPn.DA1$YFPc.ACLA2$
YFPn.DA1$YFPc.DA2$
64.5%$
2.4%$
16.7%$
Fig. 5.4 showed that although there is a weak background interaction between DA1 and ACLA2,
there is considerably stronger YFP fluorescence from the DA1-‐EOD1 and DA1-‐DA2 treatments.
This demonstrates that in an in vivo system, DA1 is in sufficiently close contact with EOD1 and
DA2 for the YFP fragments to create a functional protein. Although this did not prove that DA1
and the DIEs could form direct contacts, in vitro evidence in section 5.2.2.1 suggested that this
was highly likely.
Additional support for these interactions comes from recent transient co-‐IP studies in
Nicotiana benthamiana by Yunhai Li at the Chinese Academy of Sciences. These data show an
interaction between DA1 and DA2 (Xia, 2013), and between DA1 and EOD1 (personal
Figure 5.4 – DA1 interacts with EOD1 and DA2 in vivo
A protoplast split-‐YFP bi-‐molecular fluorescence complementation assay demonstrating DA1 interacts with EOD1 and DA2 in vivo. Protoplasts were co-‐transformed with bait (YFPn-‐tagged) and prey (YFPc-‐tagged) constructs. Strong YFP fluorescence can be seen in YFPn-‐DA1:YFPc-‐EOD1 and YFPn-‐DA1:YFPc-‐DA2 treatments, whereas only a weak background fluorescence was observed for the negative control (YFPn-‐DA1:YFPc-‐ACLA2). Percentage values correspond to the percentage of protoplasts fluorescing to level represented in the figure.
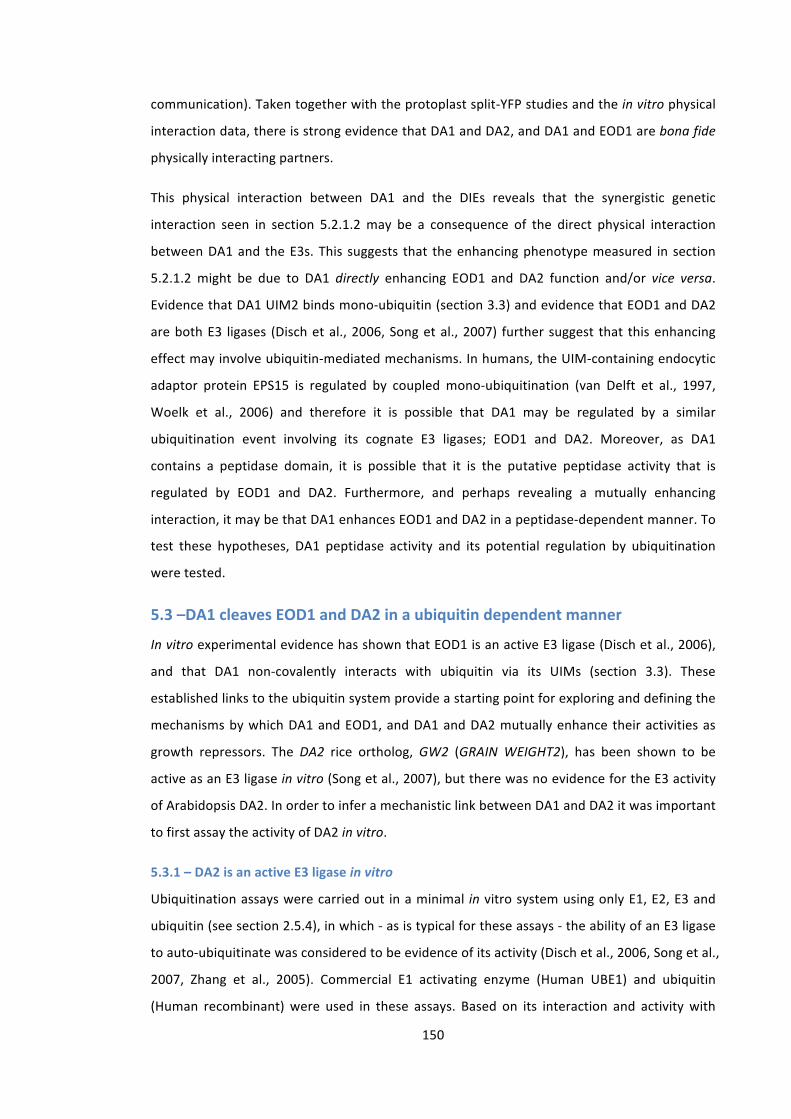
150
communication). Taken together with the protoplast split-‐YFP studies and the in vitro physical
interaction data, there is strong evidence that DA1 and DA2, and DA1 and EOD1 are bona fide
physically interacting partners.
This physical interaction between DA1 and the DIEs reveals that the synergistic genetic
interaction seen in section 5.2.1.2 may be a consequence of the direct physical interaction
between DA1 and the E3s. This suggests that the enhancing phenotype measured in section
5.2.1.2 might be due to DA1 directly enhancing EOD1 and DA2 function and/or vice versa.
Evidence that DA1 UIM2 binds mono-‐ubiquitin (section 3.3) and evidence that EOD1 and DA2
are both E3 ligases (Disch et al., 2006, Song et al., 2007) further suggest that this enhancing
effect may involve ubiquitin-‐mediated mechanisms. In humans, the UIM-‐containing endocytic
adaptor protein EPS15 is regulated by coupled mono-‐ubiquitination (van Delft et al., 1997,
Woelk et al., 2006) and therefore it is possible that DA1 may be regulated by a similar
ubiquitination event involving its cognate E3 ligases; EOD1 and DA2. Moreover, as DA1
contains a peptidase domain, it is possible that it is the putative peptidase activity that is
regulated by EOD1 and DA2. Furthermore, and perhaps revealing a mutually enhancing
interaction, it may be that DA1 enhances EOD1 and DA2 in a peptidase-‐dependent manner. To
test these hypotheses, DA1 peptidase activity and its potential regulation by ubiquitination
were tested.
5.3 –DA1 cleaves EOD1 and DA2 in a ubiquitin dependent manner
In vitro experimental evidence has shown that EOD1 is an active E3 ligase (Disch et al., 2006),
and that DA1 non-‐covalently interacts with ubiquitin via its UIMs (section 3.3). These
established links to the ubiquitin system provide a starting point for exploring and defining the
mechanisms by which DA1 and EOD1, and DA1 and DA2 mutually enhance their activities as
growth repressors. The DA2 rice ortholog, GW2 (GRAIN WEIGHT2), has been shown to be
active as an E3 ligase in vitro (Song et al., 2007), but there was no evidence for the E3 activity
of Arabidopsis DA2. In order to infer a mechanistic link between DA1 and DA2 it was important
to first assay the activity of DA2 in vitro.
5.3.1 – DA2 is an active E3 ligase in vitro
Ubiquitination assays were carried out in a minimal in vitro system using only E1, E2, E3 and
ubiquitin (see section 2.5.4), in which -‐ as is typical for these assays -‐ the ability of an E3 ligase
to auto-‐ubiquitinate was considered to be evidence of its activity (Disch et al., 2006, Song et al.,
2007, Zhang et al., 2005). Commercial E1 activating enzyme (Human UBE1) and ubiquitin
(Human recombinant) were used in these assays. Based on its interaction and activity with
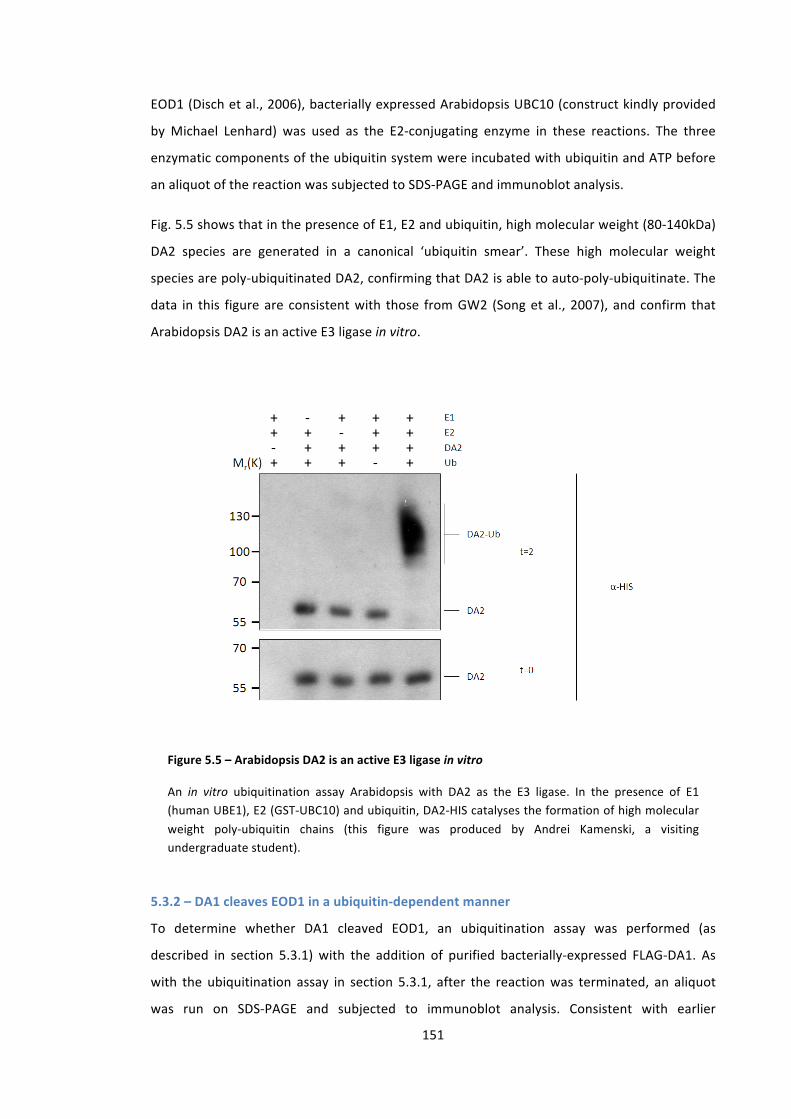
151
EOD1 (Disch et al., 2006), bacterially expressed Arabidopsis UBC10 (construct kindly provided
by Michael Lenhard) was used as the E2-‐conjugating enzyme in these reactions. The three
enzymatic components of the ubiquitin system were incubated with ubiquitin and ATP before
an aliquot of the reaction was subjected to SDS-‐PAGE and immunoblot analysis.
Fig. 5.5 shows that in the presence of E1, E2 and ubiquitin, high molecular weight (80-‐140kDa)
DA2 species are generated in a canonical ‘ubiquitin smear’. These high molecular weight
species are poly-‐ubiquitinated DA2, confirming that DA2 is able to auto-‐poly-‐ubiquitinate. The
data in this figure are consistent with those from GW2 (Song et al., 2007), and confirm that
Arabidopsis DA2 is an active E3 ligase in vitro.
5.3.2 – DA1 cleaves EOD1 in a ubiquitin-‐dependent manner
To determine whether DA1 cleaved EOD1, an ubiquitination assay was performed (as
described in section 5.3.1) with the addition of purified bacterially-‐expressed FLAG-‐DA1. As
with the ubiquitination assay in section 5.3.1, after the reaction was terminated, an aliquot
was run on SDS-‐PAGE and subjected to immunoblot analysis. Consistent with earlier
Figure 5.5 – Arabidopsis DA2 is an active E3 ligase in vitro
An in vitro ubiquitination assay Arabidopsis with DA2 as the E3 ligase. In the presence of E1 (human UBE1), E2 (GST-‐UBC10) and ubiquitin, DA2-‐HIS catalyses the formation of high molecular weight poly-‐ubiquitin chains (this figure was produced by Andrei Kamenski, a visiting undergraduate student).
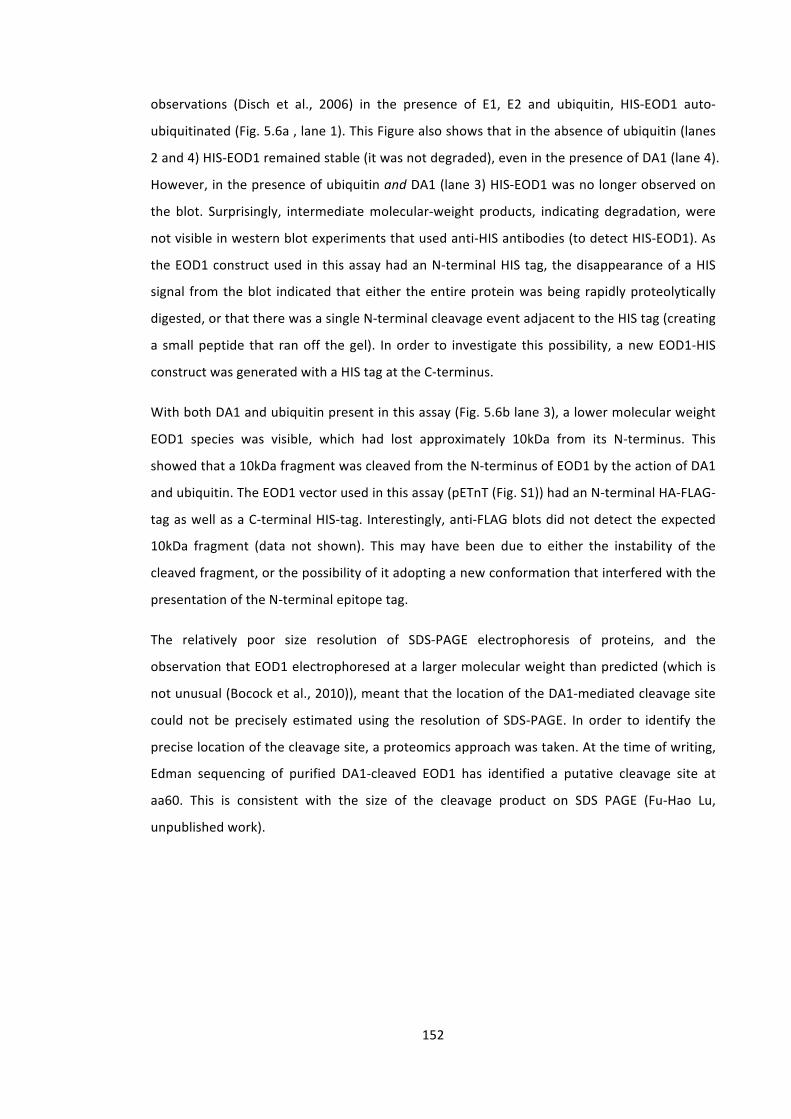
152
observations (Disch et al., 2006) in the presence of E1, E2 and ubiquitin, HIS-‐EOD1 auto-‐
ubiquitinated (Fig. 5.6a , lane 1). This Figure also shows that in the absence of ubiquitin (lanes
2 and 4) HIS-‐EOD1 remained stable (it was not degraded), even in the presence of DA1 (lane 4).
However, in the presence of ubiquitin and DA1 (lane 3) HIS-‐EOD1 was no longer observed on
the blot. Surprisingly, intermediate molecular-‐weight products, indicating degradation, were
not visible in western blot experiments that used anti-‐HIS antibodies (to detect HIS-‐EOD1). As
the EOD1 construct used in this assay had an N-‐terminal HIS tag, the disappearance of a HIS
signal from the blot indicated that either the entire protein was being rapidly proteolytically
digested, or that there was a single N-‐terminal cleavage event adjacent to the HIS tag (creating
a small peptide that ran off the gel). In order to investigate this possibility, a new EOD1-‐HIS
construct was generated with a HIS tag at the C-‐terminus.
With both DA1 and ubiquitin present in this assay (Fig. 5.6b lane 3), a lower molecular weight
EOD1 species was visible, which had lost approximately 10kDa from its N-‐terminus. This
showed that a 10kDa fragment was cleaved from the N-‐terminus of EOD1 by the action of DA1
and ubiquitin. The EOD1 vector used in this assay (pETnT (Fig. S1)) had an N-‐terminal HA-‐FLAG-‐
tag as well as a C-‐terminal HIS-‐tag. Interestingly, anti-‐FLAG blots did not detect the expected
10kDa fragment (data not shown). This may have been due to either the instability of the
cleaved fragment, or the possibility of it adopting a new conformation that interfered with the
presentation of the N-‐terminal epitope tag.
The relatively poor size resolution of SDS-‐PAGE electrophoresis of proteins, and the
observation that EOD1 electrophoresed at a larger molecular weight than predicted (which is
not unusual (Bocock et al., 2010)), meant that the location of the DA1-‐mediated cleavage site
could not be precisely estimated using the resolution of SDS-‐PAGE. In order to identify the
precise location of the cleavage site, a proteomics approach was taken. At the time of writing,
Edman sequencing of purified DA1-‐cleaved EOD1 has identified a putative cleavage site at
aa60. This is consistent with the size of the cleavage product on SDS PAGE (Fu-‐Hao Lu,
unpublished work).
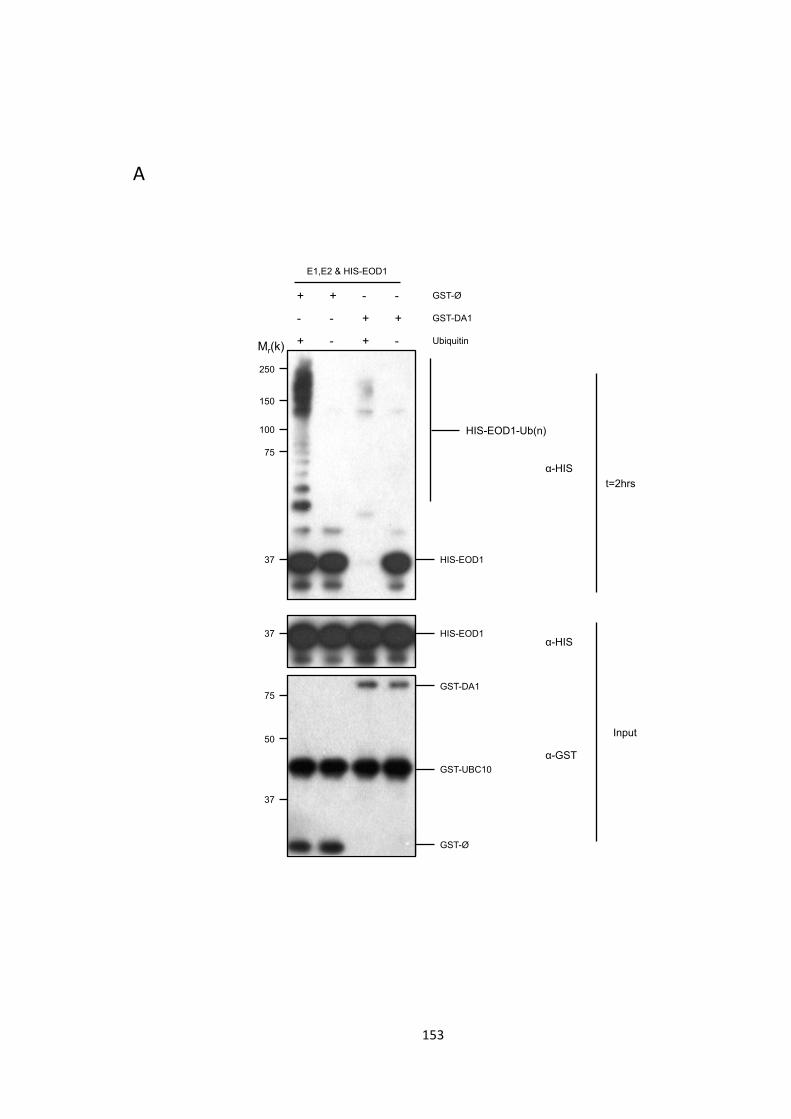
153
A
37
GST-Ø
HIS-EOD1
HIS-EOD1-Ub(n)
HIS-EOD1
GST-DA1
GST-UBC10
GST-Ø
α-HIS
α-HIS
α-GST
t=2hrs
Input
75
100
150
250
37
75
50
37
+ - + -
- - + +
+ + - -
GST-DA1
Ubiquitin
E1,E2 & HIS-EOD1
Mr(k)
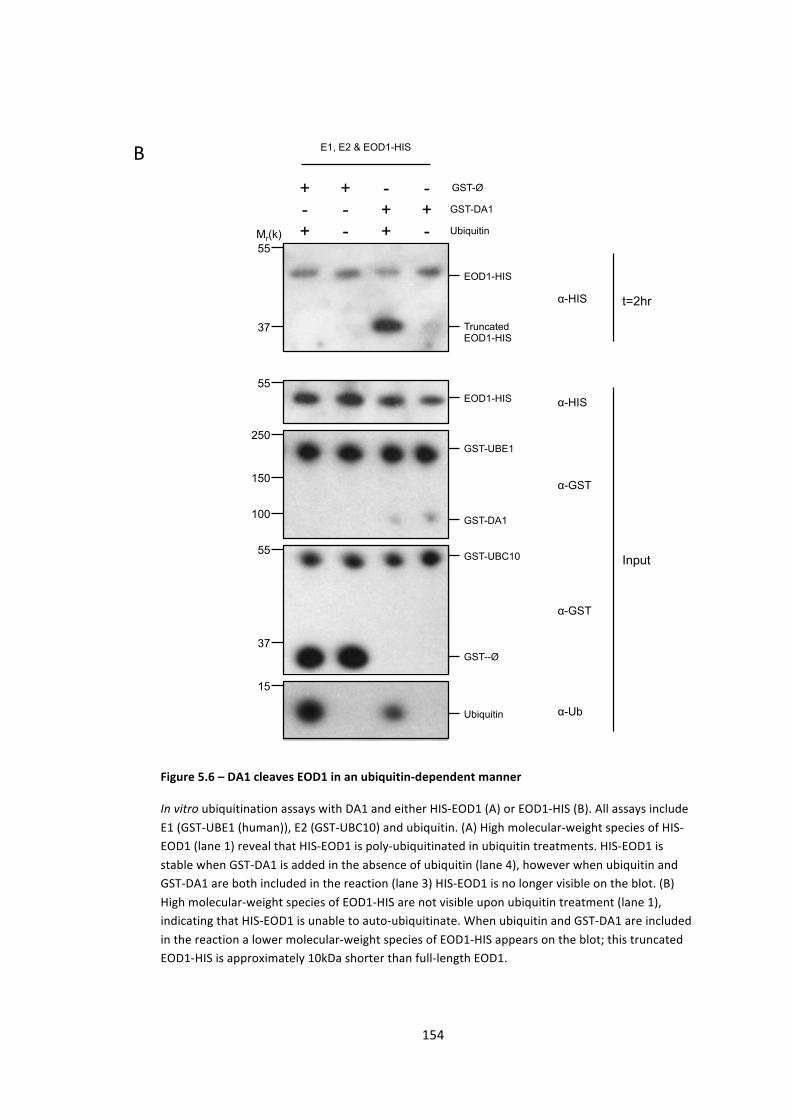
154
α-HIS
α-GST
α-GST
α-Ub
α-HIS t=2hr
EOD1-HIS
+ - + -
E1, E2 & EOD1-HIS
Input
Truncated EOD1-HIS
EOD1-HIS
GST-UBE1
GST-DA1
GST-UBC10
GST--Ø
Ubiquitin
55
37
55
250
100
150
55
37
15
- - + + + + - -
Ubiquitin
GST-DA1
Mr(k)
GST-Ø
Figure 5.6 – DA1 cleaves EOD1 in an ubiquitin-‐dependent manner
In vitro ubiquitination assays with DA1 and either HIS-‐EOD1 (A) or EOD1-‐HIS (B). All assays include E1 (GST-‐UBE1 (human)), E2 (GST-‐UBC10) and ubiquitin. (A) High molecular-‐weight species of HIS-‐EOD1 (lane 1) reveal that HIS-‐EOD1 is poly-‐ubiquitinated in ubiquitin treatments. HIS-‐EOD1 is stable when GST-‐DA1 is added in the absence of ubiquitin (lane 4), however when ubiquitin and GST-‐DA1 are both included in the reaction (lane 3) HIS-‐EOD1 is no longer visible on the blot. (B) High molecular-‐weight species of EOD1-‐HIS are not visible upon ubiquitin treatment (lane 1), indicating that HIS-‐EOD1 is unable to auto-‐ubiquitinate. When ubiquitin and GST-‐DA1 are included in the reaction a lower molecular-‐weight species of EOD1-‐HIS appears on the blot; this truncated EOD1-‐HIS is approximately 10kDa shorter than full-‐length EOD1.
B

155
As discussed in section 5.2, the synergistic (enhancing) genetic interactions between DA1 and
EOD1 predicted that DA1 may enhance the function of EOD1. It is therefore possible that the
DA1-‐ and Ubiquitin-‐mediated cleavage of EOD1 may increase the activity of EOD1 as a
negative regulator of growth. Current work is defining the specific cleavage site and the
activities of cleaved EOD1. Interestingly, there are some highly relevant examples of how the
activities of E3 ligases are controlled by protein cleavage. In the human RING E3 ligase PARKIN,
there is an auto-‐repressive N-‐terminal region that can be removed through cleavage (Burchell
et al., 2012, Chew et al., 2012). An alternative model involves proteolytic cleavage revealing or
removing a signal peptide, resulting in the spatial re-‐localisation of the protein in a mechanism
similar to that seen in the human PA-‐TM-‐RING E3 ligase RNF13 (Bocock et al., 2010) (see
section 5.1.2 for a detailed review of these examples).
Although HIS-‐EOD1 is an active E3 ligase, characterised by its ability to auto-‐ubiquitinate (Fig.
5.6a), FLAG-‐EOD1-‐HIS does not auto-‐ubiquitinate (Fig. 5.6b). While surprising, this observation
is similar to that of Burchell et al (2012) in their study of the E3 ligase PARKIN. They showed
that large N-‐terminal tags (FLAG, HA etc…) were sufficient to de-‐repress PARKIN auto-‐
ubiquitination, whereas the smaller HIS tag was unable to do so. In the case of EOD1, it
appears that either the converse is true (small N-‐terminal HIS tags permit E3 auto-‐
ubiquitination and large N-‐terminal FLAG-‐tags inhibit E3 auto-‐ubiquitination activity), or the
addition of a C-‐terminal HIS tag is sufficient to inhibit E3 auto-‐ubiquitination. To clarify this
issue, two new constructs (FLAG-‐EOD1 and EOD1-‐HIS) could be tested for auto-‐ubiquitination.
However, in the absence of this data, the observations from Fig. 5.6 are sufficient to provide
evidence that epitope-‐tags can alter EOD1 activity; perhaps through interfering with auto-‐
regulatory protein conformations. This would suggest that EOD1, in a similar way to PARKIN
(Burchell et al., 2012), may have an inhibitory protein conformation that is relieved by DA1-‐
mediated cleavage. The experiments reported here strongly support a role for peptidase-‐
mediated cleavage of EOD1 by DA1 as a mechanism for controlling its activity. A key question
is whether DA1-‐mediated cleavage increases its activity towards other substrates, and/or
changes substrate specificity.

156
Having established a promising mechanism by which DA1 and ubiquitin may modulate EOD1
activity, the genetic analysis in section 5.2.1 predicts an enhancing interaction in which the E3
ligases EOD1 and DA2 may also activate or enhance DA1 function. The observation that DA1
cleaved EOD1 in an ubiquitin-‐dependent manner suggested that DA1 may be activated by
EOD1-‐mediated ubiquitination. Therefore, the activity of the EOD1 and DA2 E3 ligases towards
DA1 was tested in vitro.
5.3.3 – EOD1 and DA2 (but not BBR) ubiquitinate DA1 in vitro
To test the hypothesis that the interactions of EOD1 and DA2 with DA1 may lead to DA1
ubiquitination, ubiquitination assays incorporating E1, E2, the E3 ligases HIS-‐EOD1 or DA2-‐HIS,
and FLAG-‐DA1 were performed. Aliquots of the reactions were subjected to SDS-‐PAGE and
immunoblot analysis to detect DA1 modifications. To test the specificity of DA1-‐E3 ligase
reactions, the E3 ligase BBR (BIG BROTHER RELATED, AT3G19910) was used as a negative
control. BBR is the most similar E3 ligase to EOD1 based on protein sequence (Fig. S4b), and is
an active E3 ligase in vitro (Fig. S4a).
Fig. 5.7 shows that in the presence of EOD1 and DA2 (lanes 5 and 6), DA1 is ubiquitinated. It
also clearly shows that BBR (lane 7) does not cause DA1 ubiquitination. This demonstrates that
DA1 is ubiquitinated by EOD1 and DA2 specifically, and that DA1 is not a non-‐specific target for
E3 ligases. Interestingly, the ubiquitination patterns catalysed by EOD1 and DA2 are noticeably
dissimilar. EOD1 catalyses the addition of approximately 3 to 6 ubiquitin molecules on DA1,
whereas DA2 catalyses the addition of only 1 to 3 ubiquitin molecules on DA1. It is unclear
whether these modifications are functionally distinct. The ubiquitin modifications could be
short chains linked to a single lysine residue, or could be single ubiquitin molecules linked to
several different DA1 lysine residues. The latter modifications are typical of ubiquitination
events that regulate protein activities (Woelk et al., 2006, Hoeller et al., 2006)).
Combined with the ubiquitin dependence of DA1 function seen in section 5.3.2, these data
suggest that DA1 cleavage of EOD1 could be activated by ubiquitination. To test this prediction
it was important to confirm that as well as being necessary for activation, DA1 ubiquitination
was sufficient to stimulate the activity of the peptidase. To do this, ubiquitinated DA1 was
purified and assayed for its activity in cleaving EOD1 and DA2.
157
- - - + + + +- - + - - - +- + - - - + - + - - - + - - + + + + + + +
EOD1 DA2 BBR Ub
DA1
α-GST
GST-DA1-Ub
GST-DA1
GST-DA1
α-HIS DA2-HIS
HIS -EOD1
BBR-HIS 75
50
100
37
100 150
t=2hrs
Input
Mr(K)
E1 & E2
Figure 5.7 – EOD1 and DA2 ubiquitinate DA1 in vitro
Ubiquitination reactions were run with E1 (UBE), E2 (UbcH5b), ubiquitin, GST-‐DA1 and either HIS-‐EOD1, DA2-‐HIS or BBR-‐HIS. Following EOD1 and DA2 treatments, high molecular-‐weight species of GST-‐DA1 are visible on the blot, revealing that GST-‐DA1 is ubiquitinated. Treatment with BRR does not result in ubiquitination of GST-‐DA1. This indicates that DA1 is not a general target of E3 ligase activity. A lower molecular weight band that co-‐purifies from E. coli with DA2-‐HIS can be seen in lanes 2 and 6. This is thought to be due to an ectopic translational event from an intragenic ATG (see section 5.3.4.1 for further discussion).
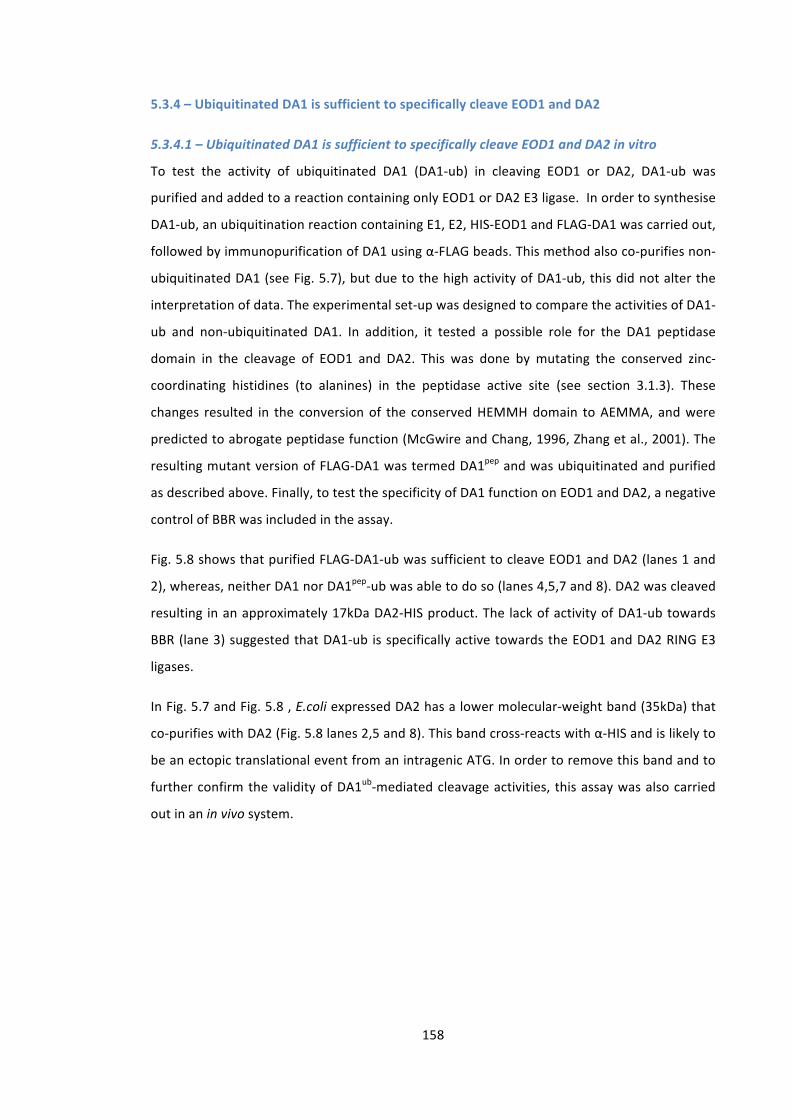
158
5.3.4 – Ubiquitinated DA1 is sufficient to specifically cleave EOD1 and DA2
5.3.4.1 – Ubiquitinated DA1 is sufficient to specifically cleave EOD1 and DA2 in vitro
To test the activity of ubiquitinated DA1 (DA1-‐ub) in cleaving EOD1 or DA2, DA1-‐ub was
purified and added to a reaction containing only EOD1 or DA2 E3 ligase. In order to synthesise
DA1-‐ub, an ubiquitination reaction containing E1, E2, HIS-‐EOD1 and FLAG-‐DA1 was carried out,
followed by immunopurification of DA1 using α-‐FLAG beads. This method also co-‐purifies non-‐
ubiquitinated DA1 (see Fig. 5.7), but due to the high activity of DA1-‐ub, this did not alter the
interpretation of data. The experimental set-‐up was designed to compare the activities of DA1-‐
ub and non-‐ubiquitinated DA1. In addition, it tested a possible role for the DA1 peptidase
domain in the cleavage of EOD1 and DA2. This was done by mutating the conserved zinc-‐
coordinating histidines (to alanines) in the peptidase active site (see section 3.1.3). These
changes resulted in the conversion of the conserved HEMMH domain to AEMMA, and were
predicted to abrogate peptidase function (McGwire and Chang, 1996, Zhang et al., 2001). The
resulting mutant version of FLAG-‐DA1 was termed DA1pep and was ubiquitinated and purified
as described above. Finally, to test the specificity of DA1 function on EOD1 and DA2, a negative
control of BBR was included in the assay.
Fig. 5.8 shows that purified FLAG-‐DA1-‐ub was sufficient to cleave EOD1 and DA2 (lanes 1 and
2), whereas, neither DA1 nor DA1pep-‐ub was able to do so (lanes 4,5,7 and 8). DA2 was cleaved
resulting in an approximately 17kDa DA2-‐HIS product. The lack of activity of DA1-‐ub towards
BBR (lane 3) suggested that DA1-‐ub is specifically active towards the EOD1 and DA2 RING E3
ligases.
In Fig. 5.7 and Fig. 5.8 , E.coli expressed DA2 has a lower molecular-‐weight band (35kDa) that
co-‐purifies with DA2 (Fig. 5.8 lanes 2,5 and 8). This band cross-‐reacts with α-‐HIS and is likely to
be an ectopic translational event from an intragenic ATG. In order to remove this band and to
further confirm the validity of DA1ub-‐mediated cleavage activities, this assay was also carried
out in an in vivo system.
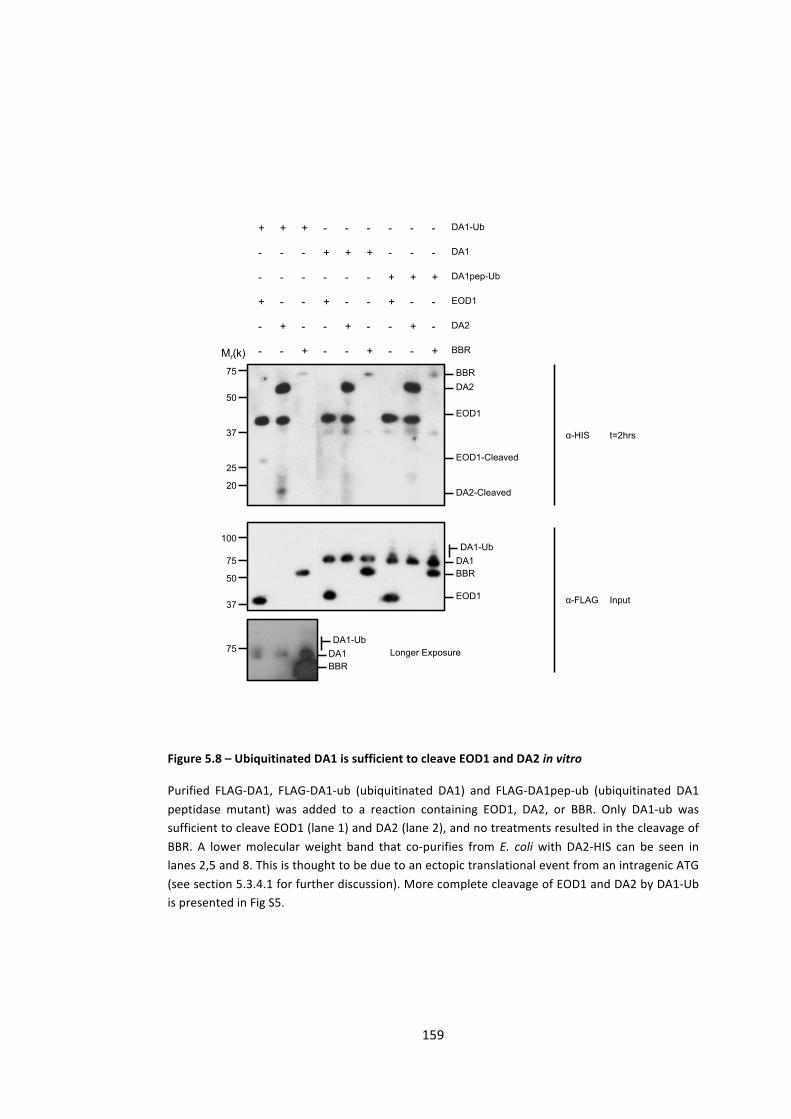
159
BBR DA2
EOD1
EOD1-Cleaved
DA2-Cleaved
α-HIS t=2hrs
α-FLAG Input
DA1 BBR
EOD1
DA1-Ub
DA1 BBR
DA1-Ub
+ + + - - - - - - DA1-Ub
- - - + + + - - - DA1
- - - - - - + + + DA1pep-Ub
+ - - + - - + - - EOD1
- + - - + - - + - DA2
- - + - - + - - + BBR
Longer Exposure
75
50
37
75
50
37
75
25
20
100
Mr(k)
Figure 5.8 – Ubiquitinated DA1 is sufficient to cleave EOD1 and DA2 in vitro
Purified FLAG-‐DA1, FLAG-‐DA1-‐ub (ubiquitinated DA1) and FLAG-‐DA1pep-‐ub (ubiquitinated DA1 peptidase mutant) was added to a reaction containing EOD1, DA2, or BBR. Only DA1-‐ub was sufficient to cleave EOD1 (lane 1) and DA2 (lane 2), and no treatments resulted in the cleavage of BBR. A lower molecular weight band that co-‐purifies from E. coli with DA2-‐HIS can be seen in lanes 2,5 and 8. This is thought to be due to an ectopic translational event from an intragenic ATG (see section 5.3.4.1 for further discussion). More complete cleavage of EOD1 and DA2 by DA1-‐Ub is presented in Fig S5.

160
5.3.4.2 – DA1 specifically cleaves EOD1 and DA2 in Arabidopsis protoplasts
Due to the instability of EOD1 in stable transgenic systems (Lena Stransfeld, personal
communication), transient expression systems were used for the in vivo investigation. Guided
by the success of expressing EOD1-‐YFP and DA2-‐YFP fusions in Arabidopsis mesophyll
protoplasts for BiFC analysis (section 5.2.2.2), a protoplast system was used to assess DA1-‐
dependent cleavage of EOD1 and DA2 in vivo.
To ensure that any observed cleavage of EOD1 and DA2 was dependent on added DA1
proteins, da1ko1/dar1 protoplasts that lacked DA1 and DAR1 protein were used in the PEG-‐
mediated co-‐transfection experiments. Protoplasts were transfected with HA-‐DA1 or HA-‐
DA1pep, and with C-‐terminal FLAG-‐tagged E3 ligases EOD1, DA2 or BBR. BBR was included as a
negative control to test the specificity of DA1 towards EOD1 and DA2. Fig. 5.10 shows that in
HA-‐DA1 transfected protoplasts, lower-‐molecular weight cleavage products of EOD1 (lane 1)
and DA2 (lane 3) are produced (as in in vitro experiments (Figure 5.8)). In contrast, these
cleavage products were not seen in DA1pep treatments (lanes 2 and 4). Fig. 5.10 also showed
that BBR was not cleaved by DA1 (lane 5), confirming that DA1 has specificity towards EOD1
and DA2.
In this experiment, all the E3 ligases were tagged with a C-‐terminal FLAG tag. Analysis of Fig.
5.10 reveals that, in contrast to the N-‐terminal cleavage of EOD1, DA2 was cleaved
approximately 20kDa from its C-‐terminus. The FLAG epitope tag is approximately 3kDa
suggesting that DA2 was cleaved approximately 17kDa from its C-‐terminus. However, as DA2
has an N-‐terminal RING domain and EOD1 has a C-‐terminal RING domain, both cleavage events
create proteins that contain an intact RING domain.
Taken together, the in vitro and in vivo data confirmed that DA1 is a functional peptidase that
is activated by ubiquitination mediated by the E3 ligases, EOD1 and DA2. Interestingly, the E3
ligases required for the activation of DA1 were those that are the targets of the peptidase. This
mutual dependence suggests a model in which EOD1 and DA2 activate the DA1 peptidase
through ubiquitination. This peptidase then cleaves the E3 ligases to create new truncated
proteins (Fig. 5.12). The observed synergistic genetic interactions (section 5.2.1) suggest that
these truncated E3 ligases have new or increased activities with respect to inhibiting cell
proliferation during organ formation (Disch et al., 2006, Xia, 2013, Song et al., 2007). Such a
novel feed-‐forward mechanism, whereby E3 ligases stimulate their activation through
ubiquitination of a cognate peptidase, is a previously un-‐described regulatory mechanism that
161
α"FLAG'
EOD1"FLAG'
BBR"FLAG'
DA2"FLAG'
HA"DA1'HA"DA1pep'
BBR"FLAG'
DA2"FLAG'
EOD1"FLAG'
EOD1"FLAG'Cleavage'Product'
DA2"FLAG'Cleavage'Product'
50'
37'
25'
50'
37'
25'
20'
Mr(K)'
Longer'exposure'
+' "'+'+' "'"'"' +'"'"' +'+'
α"HA'75'HA"DA1/HA"DA1pep'
BBR"FLAG'
DA2"FLAG'
Figure 5.9 –DA1 cleaves EOD1 and DA2 in vivo
Western blot from da1ko1/dar1-‐1 protoplasts co-‐transfected with either EOD1-‐FLAG, DA2-‐FLAG or BBR-‐FLAG, and one of either HA-‐DA1pep or HA-‐DA1. In HA-‐DA1 treatments EOD1-‐FLAG and DA2-‐FLAG are cleaved to reveal their truncated species (lanes 1 and 3, respectively). Longer exposure was required to visualise truncated DA2-‐FLAG. HA-‐DA1 treatments were not sufficient to cleave BBR-‐FLAG, suggesting specificity towards EOD1 and DA2. HA-‐DA1pep treatments were not sufficient to cleave EOD1-‐FLAG and DA2-‐FLAG, revealing that the DA1 peptidase is essential for their cleavage.
162
may have a more widespread role than just controlling E3 ligase activity in the regulation of
cell proliferation in Arabidopsis. Given that the activity of the Human E3 ligase PARKIN is
influenced by an N-‐terminal cleavage event (Chew et al., 2012), it is also possible that such a
mechanism may also be relevant for the control of E3 ligase activity in other organisms.
A peptidase-‐mediated activation of an E3 ligases would probably be an irreversible
modification, leading to increased and/or different activities of the E3. It is possible that the
observed auto-‐ubiquitination of the E3 ligases (Fig. 5.5 & 5.6) may also be an additional
mechanism for regulating E3 ligase activities. For example, this could be K48 linked poly-‐
ubiquitination leading to proteasome-‐ mediated degradation. The short half-‐lives of EOD1 and
DA2 in plant cells suggests a rapid turnover consistent with ubiquitin-‐directed proteasome-‐
mediated degradation. In order to investigate this, an in vitro study of EOD1 and DA2 auto-‐
ubiquitination was undertaken.
5.4 – EOD1 and DA2 are ubiquitinated differently
Understanding poly-‐ubiquitin chain architecture can reveal whether the chain is likely to be a
signal for proteasome-‐mediated destruction or to provide another function. The two most
common poly-‐ubiquitin chain linkage types are K48 and K63 (Saracco et al., 2009); K48 –linked
ubiquitin chains have a well-‐established role in targeting proteins for proteasome-‐ mediated
destruction (Hershko and Ciechanover, 1998, Jacobson et al., 2009, Thrower et al., 2000).
Conversely, there is no consensus as to the role of K63-‐linked ubiquitin chains, however there
is evidence that they are involved in enzyme activation (Cheng et al., 2013b) and receptor
signalling (Kawai and Akira, 2010).To identify the types of ubiquitin linkages created by DA2
and EOD1 auto-‐ubiquitination, ubiquitination assays (see section 5.3.1) were performed using
recombinant ubiquitin molecules with these K48 or K63 residues mutated to arginine.
Fig. 5.10a shows that in ubiquitination assays using wild-‐type and K63R ubiquitin (UbK63),
auto-‐ubiquitination of EOD1 resulted in a typical ‘ubiquitin smear’ (lanes 8 and 10). In contrast,
the use of K48R ubiquitin (UbK48) created only three EOD1-‐ubiquitin bands (lane 9). These
likely represent either a single triple-‐ubiquitin chain or three mono-‐ubiquitination events. To
distinguish between these possibilities, ubiquitination assays were performed using
methylated ubiquitin (Ub-‐Me), which has all lysine residues methylated and as a consequence
is unable to form ubiquitin polymers. Fig. 11b shows that when Ub-‐Me is used (lane 6), only
mono-‐ubiquitinated EOD1 is generated; revealing that EOD1 is ubiquitinated at one site only.
This indicated that the three ubiquitinated species of EOD1 in the UbK48 treatment in Fig. 11a
probably represented a single chain of three ubiquitin molecules.
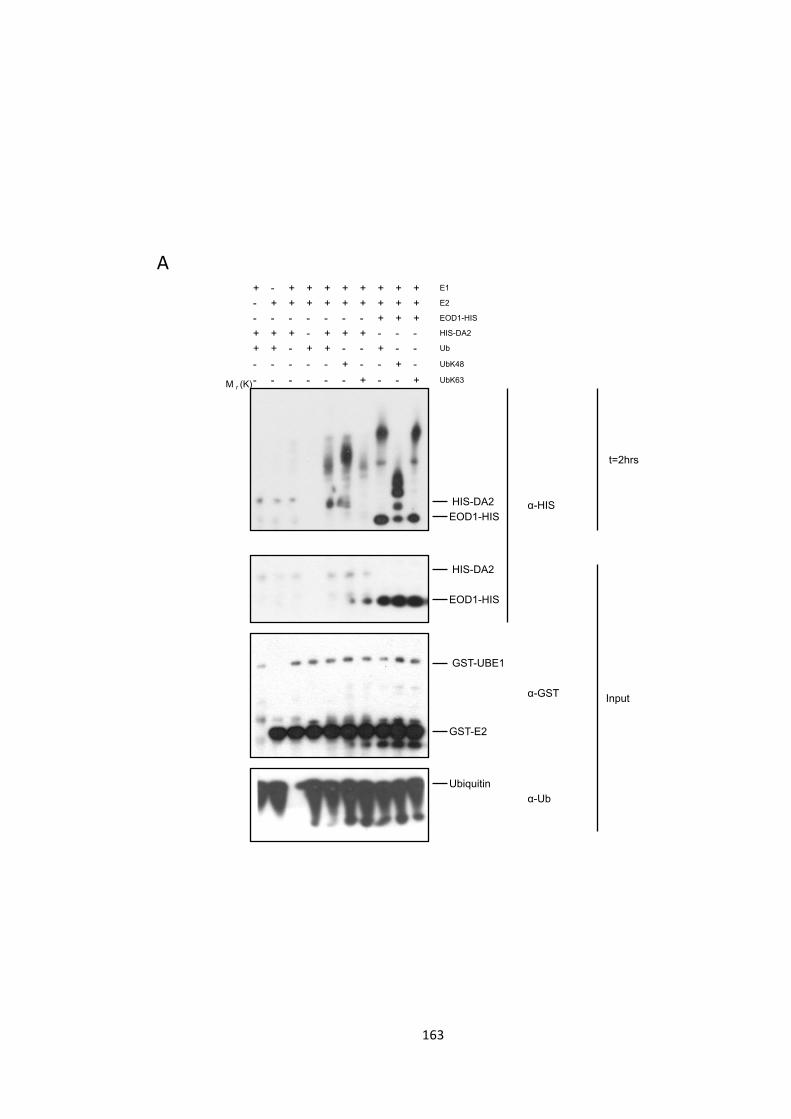
163
EOD1-HIS HIS-DA2
EOD1-HIS
HIS-DA2
GST-E2
GST-UBE1
Ubiquitin
α-HIS
α-GST
α-Ub
+ + - + + - - + - - Ub
+ + + - + + + - - - HIS-DA2
- - - - - - - + + + EOD1-HIS
- + + + + + + + + + E2
+ - + + + + + + + + E1
- - - - - + - - + - UbK48
- - - - - - + - - + UbK63 M r (K)
t=2hrs
Input
A
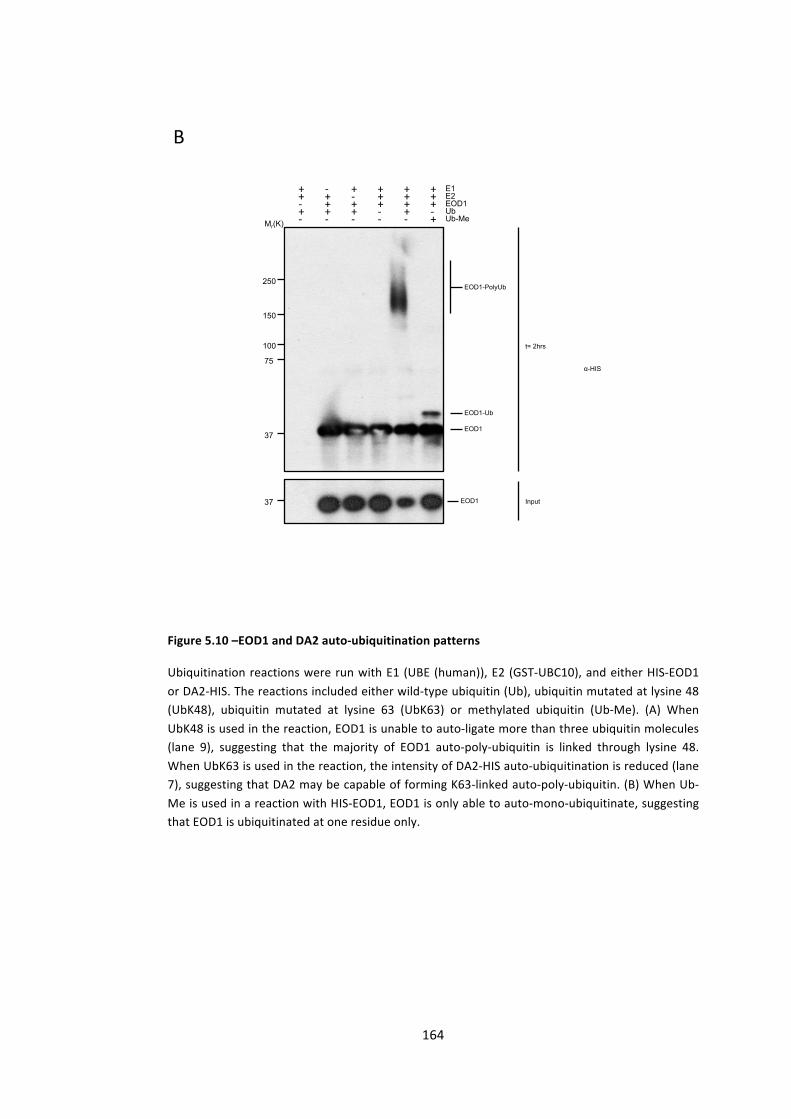
164
!" !" !" !" !" ++ + + !" + !"!" + + + + ++ + !" + + ++ !" + + + +
Ub-Me Ub EOD1 E2 E1
α-HIS
37
75
100
150
250
EOD1
EOD1-Ub
EOD1-PolyUb
37
Mr(K)
EOD1 Input
t= 2hrs
Figure 5.10 –EOD1 and DA2 auto-‐ubiquitination patterns
Ubiquitination reactions were run with E1 (UBE (human)), E2 (GST-‐UBC10), and either HIS-‐EOD1 or DA2-‐HIS. The reactions included either wild-‐type ubiquitin (Ub), ubiquitin mutated at lysine 48 (UbK48), ubiquitin mutated at lysine 63 (UbK63) or methylated ubiquitin (Ub-‐Me). (A) When UbK48 is used in the reaction, EOD1 is unable to auto-‐ligate more than three ubiquitin molecules (lane 9), suggesting that the majority of EOD1 auto-‐poly-‐ubiquitin is linked through lysine 48. When UbK63 is used in the reaction, the intensity of DA2-‐HIS auto-‐ubiquitination is reduced (lane 7), suggesting that DA2 may be capable of forming K63-‐linked auto-‐poly-‐ubiquitin. (B) When Ub-‐Me is used in a reaction with HIS-‐EOD1, EOD1 is only able to auto-‐mono-‐ubiquitinate, suggesting that EOD1 is ubiquitinated at one residue only.
B
165
These data showed that EOD1 auto-‐ubiquitination involves the formation of a K48-‐linked
ubiquitin chain that may target EOD1 for proteasome-‐mediated destruction (Thrower et al.,
2000). The analyses also showed that although the majority of the poly-‐ubiquitin chain is K48
linked, a short tri-‐ubiquitin chain is able to be formed through an alternative linkage. Currently
the significance of this observation is not known, however, the auto-‐ubiquitination of EOD1
with K48-‐linked poly-‐ubiquitin suggests a mechanism in which it promotes its own instability. It
is intriguing to speculate that DA1-‐mediated cleavage of EOD1 may influence its stability by
altering its auto-‐ubiquitination. This could be tested by investigating the nature of the auto-‐
poly-‐ubiquitin ligated by the cleaved version of EOD1.
In contrast to the data for EOD1 ubiquitination described above, UbK48 had no effect on DA2
auto-‐ubiquitination (Fig. 5.10 lane 6). This showed that unlike EOD1, DA2 does not auto-‐
catalyse K48-‐linked poly-‐ubiquitin chains. The assay also showed that UbK63 reduced the
degree of auto-‐ubiquitination (lane 7), suggesting that DA2 poly-‐ubiquitin chains can be part
K63-‐linked and part an alternative linkage. These observations imply that the suggested model
for EOD1 ‘stabilisation’ through interference with K48 chain formation, is not applicable to
DA2. It also suggests that, if DA1 is assumed to regulate both E3 ligases in the same fashion,
the model for activation of EOD1 through stabilisation (with regards to proteasome
degradation) is also unlikely to be valid.
The observation that EOD1 promotes its own instability through auto-‐ubiquitination suggests
that its abundance and functions are tightly regulated. This indicates that it may be involved in
regulating rapid, or time-‐bound cellular processes, and that its activity may be damaging if it is
not tightly controlled. This is consistent with the model of DA1-‐mediated protein cleavage of
EOD1, which is a one-‐way switch that drives the coordinated formation of EOD1 and DA2 E3
ligases that may have altered behaviours. Identifying putative targets of EOD1-‐ and DA2-‐
mediated ubiquitination, in addition to DA1, is therefore a high priority.
5.6 – Discussion
Research in this chapter has defined a novel mutually enhancing regulatory relationship
between two RING E3 ligases that control growth through independent pathways, and a
cognate specific peptidase that is predicted to alter their activity in a coordinated and uni-‐
directional manner. This is predicted to enhance and/or alter the activity of the E3s towards
unknown substrates that mediate cell proliferation and set final organ size. Fig. 5.12 is a
schematic representation of this regulatory system, where EOD1/DA2 activation of DA1 results
in their peptidase-‐mediated cleavage and the possible modification of their activity. The ‘feed-‐
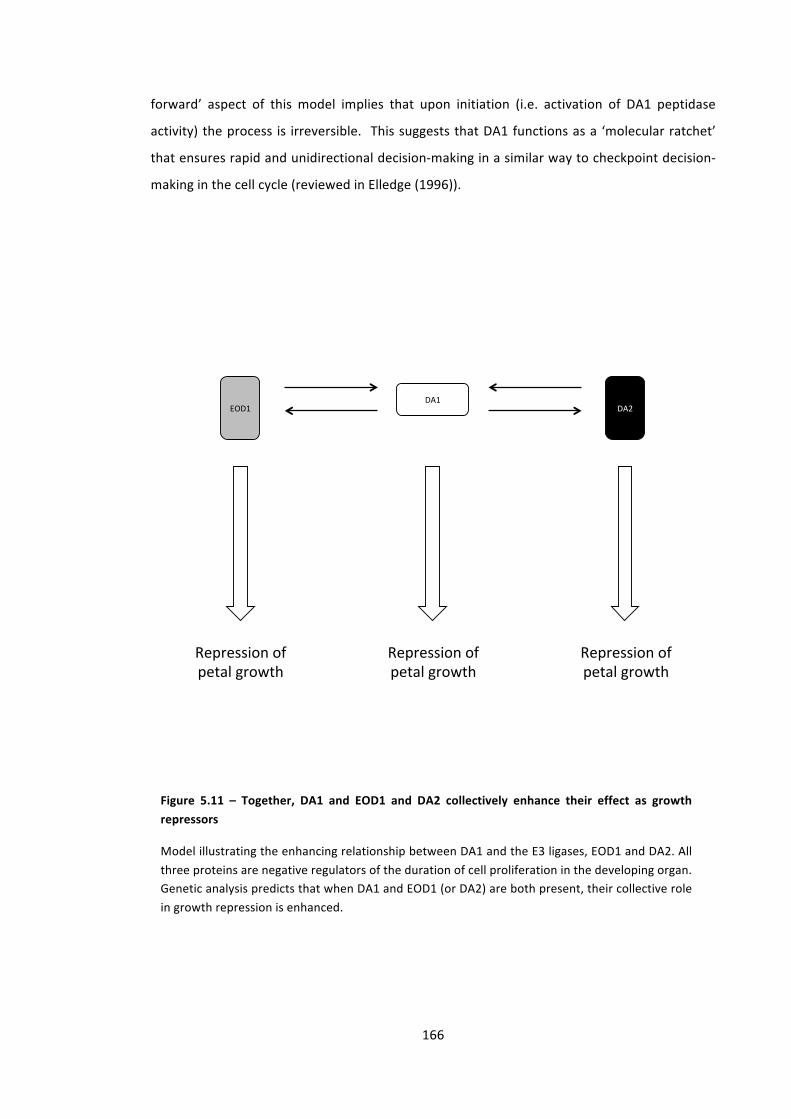
166
forward’ aspect of this model implies that upon initiation (i.e. activation of DA1 peptidase
activity) the process is irreversible. This suggests that DA1 functions as a ‘molecular ratchet’
that ensures rapid and unidirectional decision-‐making in a similar way to checkpoint decision-‐
making in the cell cycle (reviewed in Elledge (1996)).
DA1$EOD1$ DA2$
Repression$of$petal$growth$
Repression$of$petal$growth$
Repression$of$petal$growth$
Figure 5.11 – Together, DA1 and EOD1 and DA2 collectively enhance their effect as growth repressors
Model illustrating the enhancing relationship between DA1 and the E3 ligases, EOD1 and DA2. All three proteins are negative regulators of the duration of cell proliferation in the developing organ. Genetic analysis predicts that when DA1 and EOD1 (or DA2) are both present, their collective role in growth repression is enhanced.

167
5.6.1 – DA1 peptidase activity is activated by ubiquitination
Genetic analysis in section 5.2.1 predicted that EOD1 and DA2 act to enhance DA1 function.
This was confirmed by observations that ubiquitination of DA1 by EOD1 is sufficient to activate
the DA1 peptidase (section 5.3). The mechanism of activation is unclear, however the presence
of an active UIM domain in DA1 (section 3.3) suggests that it may be through a mechanism
similar to that of coupled mono-‐ubiquitination, such as in EPS15. The ubiquitination of EPS15 is
dependent on the interaction of the EPS15-‐UIM with a ubiquitinated E3 ligase (Woelk et al.,
2006). This suggests that ubiquitination of DA1 may involve the UIM targeting DA1 to the auto-‐
ubiquitinated EOD1/DA2.
The observation that non-‐ubiquitinated DA1 does not exhibit peptidase activity -‐ at least
towards EOD1 and DA2 -‐ suggested that the non-‐ubiquitinated form of DA1 exists in an auto-‐
repressive state. Studies of coupled mono-‐ubiquitination have led to the suggestion that UIM
binding to ubiquitin in cis can lead to major conformational changes (Hicke et al., 2005), which
could in turn alter the activity of the protein. It is therefore possible to speculate that UIM
interactions with cis-‐ubiquitin would be sufficient to activate the peptidase. Both EOD1 and
DA2 undergo long chain auto-‐poly-‐ubiquitination (Fig. 5.3.1-‐2), but they also coordinate the
ligation of short ubiquitin chains onto DA1. It is possible that this is due to geometric
constraints of the EOD1/DA2-‐UBC10 complex, but it is also feasible that the DA1 UIM
competes with the E3-‐E2 complex for binding of ubiquitin molecules on DA1, thereby
preventing chain elongation. Recent work in yeast has shown that the ubiquitin-‐binding
domain of VPS23 competes with the RSP5 E3 ligase for the binding of the mono-‐ubiquitin
present on the arrestin-‐related protein RIM8 (Herrador et al., 2013). The trans-‐interaction of
UBD and ubiquitin in this example is thought to be sufficient to repress poly-‐ubiquitination,
and presents the possibility that the short chains present on DA1 are a consequence of a cis-‐
interaction of UIM and ubiquitin.
Another potential cis-‐regulatory mechanism involves the DA1 LIM domain, which is present in
all members of the DA1 family, and in the same position relative to the conserved peptidase
domain. The LIM domain of LIM kinase-‐1 is proposed to have a cis-‐inhibitory activity towards
its kinase domain (Nagata et al., 1999), leading to the speculation that the
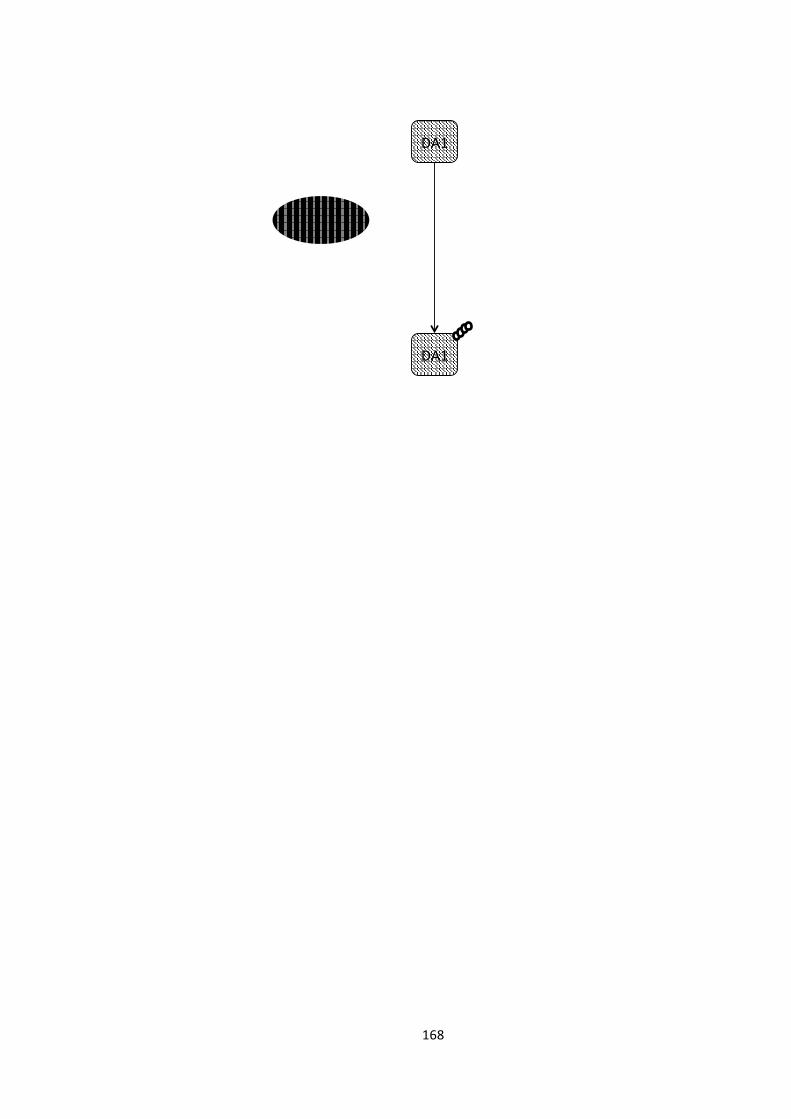
168
DA1$
DA1$
EOD1$ DA2$
EOD1$ DA2$cv$
Inac-ve$
Ac-ve$
Cleavage$Cleavage$
Ubiqui-na-on$
Altered$ac-vity$ Altered$ac-vity$
Figure 5.12 – DA1 may exist in a reciprocally enhancing feed-‐forward loop with EOD1 and DA2.
A model explaining the observed genetic, physical and biochemical interactions between DA1, and EOD1 and DA2. First, EOD1 and DA2 activate DA1 through an ubiquitination step. This is then followed by the peptidase-‐mediated cleavage of EOD1 and DA2 by ubiquitinated DA1, and the subsequent cleavage-‐dependent activation of the E3 ligases.
169
DA1 LIM (or LIM-‐like) domain has an analogous role with respect to its peptidase domain. It
may be that this inhibitory LIM-‐peptidase interaction is modulated by UIM interactions with
ubiquitin in cis. This is supported by evidence from section 3.2.3 that revealed that the LIM
domain is not involved in DA1-‐DA1 oligomerisation, and is therefore a good candidate for
interacting with the peptidase.
To test the sufficiency of DA1ub to cleave EOD1 and DA2 (section 5.3.4), DA1-‐ub was incubated
with EOD1 and DA2. DA1-‐ub was generated in an ubiquitination reaction using EOD1 only.
Therefore, despite the fact that EOD1 and DA2 have both been identified as bona fide targets
of the DA1 peptidase, it remains unclear whether DA2 can activate DA1 peptidase activity by
ubiquitination as well. The fact that DA2 can ubiquitinate DA1 and that BBR cannot (section
5.3.3), and that ubiquitination activates DA1, suggests that DA2 is indeed able to activate DA1.
5.6.2 – EOD1 and DA2 are modified by peptide cleavage
Based on the genetic analysis in section 5.2, it was predicted that DA1 might also enhance the
activities of EOD1 and DA2 (Fig. 5.12). Research described in Section 5.3 demonstrated that
DA1 specifically cleaves EOD1 and DA2, and therefore it is predicted that this cleavage
enhances the activities of these two DIEs. The mechanism by which DA1-‐ub-‐mediated cleavage
enhances E3 activity is currently not known. But some interesting examples of E3 ligase
regulation may be relevant. Studies of the human E3 ligase PARKIN have shown that the in
vitro removal of an inhibitory N-‐terminal fragment was sufficient to activate the auto-‐poly-‐
ubiquitination activity of PARKIN (Chew et al., 2012). Moreover, the addition of large N-‐
terminal epitope tags to PARKIN interfered with this inhibitory domain and de-‐repressed its
auto-‐ubiquitination activity (Burchell et al., 2012). Interestingly, the addition of a large N-‐
terminal epitope tag to EOD1, (together with a small C-‐terminal tag) appeared to repress E3
activity (Fig. 5.6b), suggesting that modification of EOD1 tertiary structure may also influence
EOD1 activity.
The observation that EOD1 and DA2 are able to auto-‐ubiquitinate and ubiquitinate DA1 prior
to their cleavage, suggested that DA1-‐mediated cleavage may alter their specificity rather than
their activity. This distinction can be illustrated by the neddylation and rubylation of CRL E3
ligases (see section 5.1.2), an event that changes CRL quaternary structure to create novel
catalytic geometries, which alter the specificity of the enzymes (Duda et al., 2008, Merlet et al.,
2009). EOD1 and DA2 are both cleaved at the opposite end of the protein to the RING domain,
and, as the RING domain mediates E2-‐binding, it is possible that the RING-‐distal ‘domain’ is
that which determines substrate specificity. Therefore it is conceivable that DA1-‐mediated
170
cleavage substantially alters the substrate-‐binding domain such that new catalytic geometries
are created. This modification could enhance E3 activity in the same way that neddylation
increases the activity of SCFβTRCP towards Iκbα (Read et al., 2000), and the activity of SCFskp2
towards p27kip1 (Morimoto et al., 2000, Podust et al., 2000). Alternatively, it could affect the
ubiquitin chain specificity of the E2-‐E3 complex, allowing it to alter the architecture of the
ligated chains in a similar way to the truncation of PARKIN that enables it to form poly-‐
ubiquitin chains (Chew et al., 2012).
An alternative explanation for the predicted enhancing/activating effects of DA1-‐ub mediated
cleavage of EOD1 and DA2 may be the disruption or revelation of a signal peptide that
determines the location of the E3 enzymes. For example, cleavage of the membrane integral
E3 ligase RNF13 revealed a putative nuclear localisation signal (Bocock et al., 2010) thought to
be responsible for previously observed nuclear localisation (Tranque et al., 1996). If RNF13
substrates are in the nucleus, a relocation event might lead to greater E3 activity without
modifying the enzyme biochemistry.
5.6.3 – DA1 cooperates with EOD1 and DA2 to influence final organ size
The experiments described in this chapter demonstrated genetic, physical and biochemical
interactions between DA1, EOD1 and DA2 in the regulation organ growth. They identified a
novel feed-‐forward loop involving the ubiquitin-‐activated, peptidase-‐mediated modification of
E3 ligases by a cognate peptidase.
Analysis of the growth responses of individual and combined mutants (see section 5.2.1)
provided clear evidence that in addition to their mechanistic interactions, DA1, EOD1 and DA2
also have functions that appear to be independent of each other. In da1ko1 plants, where
DA1-‐mediated controls do not function, EOD1 and DA2 were still able to partially supress the
double knockout petal phenotypes (da1ko1/eod1-‐2 or da1ko1/da2-‐1 respectively). This
suggests that they have also a DA1-‐independent role in setting organ size. This could be
through a basal activity of the full-‐length RING E3 ligases, or through modifications by other
activating peptidases. Similarly, in eod1-‐2 and da2-‐1 lines, the presence of DA1 was sufficient
to partially supress the large double knockout petal phenotypes; revealing that, despite the
absence of EOD1 and DA2, DA1 still influences growth, perhaps through activation by another
as-‐yet-‐unidentified ubiquitin ligase.
Taken together, these experiments and interpretations suggested that DA1, EOD1 and DA2 do
not function in simple linear pathways that converge to influence growth (Fig. 5.14a). A more

171
realistic model involves the coordinated activation of DA1 by a set of E3 ligases that control
linked cellular activities during cell proliferation (Fig. 5.14b). The identification of these DA1-‐
regulated E3 ligases, and other proteins, will be facilitated by identifying and assessing the DA1
cleavage site using bioinformatics and biochemistry.
172
Chapter 6 -‐ Genetic linkage and association screens for
regulators of petal and seed growth
6.1 – General introduction
This chapter was initiated as a complementary project to run alongside the DA1 functional
characterisation reported in Chapters 3 to 5. It was designed to identify novel genes involved
in the setting of seed and petal size, and through doing so, to develop our understanding of
the processes involved in organ growth and development, and their contribution to natural
variation in organ size in populations of Arabidopsis.
Mutant screens, such as those used to identify DA1 and EOD1 (Li et al., 2008, Disch et al.,
2006), are powerful tools for identifying genes of interest. However they use heavy doses of
mutagens that cause a narrow range of severe effects, such as the complete loss of gene
function. Natural genetic variation includes a wide variety of different alleles that have been
selected over millions of generations and provide both a different spectrum of mutants and
evidence for the biological role of the genetic variation in fitness and adaptation at the
population level. Such analyses can identify key regulatory nodes and genes that have been
selected by evolution. Therefore to complement and extend the analyses of induced mutations,
an investigation of natural variation in organ-‐size was undertaken. Natural variation allows you
to exploit a larger pool of variation not available in common laboratory strains. Because the
lines are genotyped and inbred you can also phenotype them repeatedly to see how the
environment interacts with your trait.
Two different strategies for investigating complex-‐traits such as final organ size exist in
Arabidopsis: population-‐based association studies, and family-‐based QTL mapping studies
(Mitchell-‐Olds, 2010). Population-‐based association studies take advantage of genetic variation
amongst natural populations of Arabidopsis, seeking out associations between phenotypes of
interest and genomic markers (Atwell et al., 2010). Alternatively, family-‐based linkage-‐
mapping studies look for genotype-‐phenotype associations amongst artificial inbred
populations originating from a small number of founding parent lines. Both strategies search
for statistically significant associations between phenotypes of interest and SNP genomic
markers.
173
Both techniques seek to uncover the genetic elements that underlie natural phenotypic
variation. This is done through the identification of statistical associations between a
phenotype of interest and an array of genomic SNP markers. The most highly associated
markers are then used to identify the causal genes based on their genetic linkage to the
marker. As such, the predictive power of these techniques is dependent on the linkage
disequilibrium (LD) within each mapping population. LD is the phenomenon that certain alleles
are non-‐randomly associated due to limited recombination events occurring between their loci
(Jorde, 2000). At linked loci, instead of finding a random combination of the constituent alleles,
there are linked “haplotype blocks” (Weigel, 2012). The amount of linkage disequilibrium in
the population – the length of these haplotype blocks – defines the maximal resolution of the
association analysis. If linkage disequilibrium is large, e.g. 10 Mb, then one can only be
confident that the causal variation is within 10 Mb of the associated marker SNP, whereas if
linkage disequilibrium is only 10Kb, then there is confidence that the causal variation is within
one of two genes of the marker SNP. Amongst other factors, linkage disequilibrium is affected
by the rate of recombination, and therefore the degree of intermixing within a population will
determine the resolution of an association analysis (Jorde, 2000).
Population-‐based association studies utilise highly recombined natural populations, and the
resulting short LD allows the identification of high-‐resolution QTLs (Mitchell-‐Olds, 2010,
Bergelson and Roux, 2010, Weigel, 2012, Kover and Mott, 2012). This is in contrast to family-‐
based mapping studies, which are often carried out with F5 or F6 progeny and therefore often
result in much broader QTLs (Mitchell-‐Olds, 2010, Bergelson and Roux, 2010, Kover et al.,
2009). Nonetheless, despite the greater mapping resolution achievable in population-‐based
studies, their predictive power can be reduced by population structure effects (Mitchell-‐Olds,
2010, Bergelson and Roux, 2010, Weigel, 2012, Kover and Mott, 2012). In this context,
population structure refers to genomic variation that is immortalised in accessions and yet has
no true linkage to the phenotypic variation being investigated (Mitchell-‐Olds, 2010). For
example -‐ distantly related, phenotypically divergent accessions will have significant genotypic
differences in many genomic locations; only some of which will contribute to the phenotype of
interest. This means that association analyses are likely to identify multiple false-‐positives.
Different strategies have been developed to reduce the effect of population structure;
including using mixed-‐model analyses (Kang et al., 2008) and the use of less-‐structured,
geographically confined population samples (Filiault and Maloof, 2012) that are likely to have a
limited number of founder types. Importantly, these corrective methods trade-‐off with the
power of the association study; with mixed-‐model analysis increasing the rate of false-‐
174
negatives (Mitchell-‐Olds, 2010), and the use of geographically confined populations reducing
the amount of genetic variation included in the study.
Despite this, population-‐based studies typically contain significantly more genotypic variation
than artificial mapping families, whose diversity is limited by the relatively small gene pool
held by the founding parental lines. Nonetheless, the genetic diversity found in artificial
mapping families can vary significantly depending on the number and diversity of parents
(Bergelson and Roux, 2010). Conventional bi-‐parental RIL populations, such as that which
recently identified ERECTA as a regulator of petal growth (Abraham et al., 2013), contain only
the genetic variation present in the two founding parents. In contrast, the multi-‐parental RIL-‐
type MAGIC population incorporates the genetic variation of 19 parent lines (Kover et al.,
2009).
The complementary strengths and weaknesses of both population-‐ and family-‐ based mapping
approaches enables powerful analyses to be achieved through a combinational approach; as
evidenced by recent work identifying regulators of flowering time (Brachi et al., 2010).
Following from these data, and in light of the general consensus that a combinational
approach is superior (Mitchell-‐Olds, 2010, Kover and Mott, 2012, Bergelson and Roux, 2010,
Weigel, 2012), studies described in this thesis have taken a dual approach to search for
regulators of seed and petal growth: a Genome Wide Association Study (GWAS), and a QTL
analysis of the MAGIC RIL-‐type population. Both strategies used large populations of
Arabidopsis (272 lines for the GWAS, 443 lines for the MAGIC analysis). The two test
populations did not overlap, and the study did not expect to find the same causal variation in
both populations. Instead, it aimed to maximise gene discovery through a combinatorial
approach, and to look for functional similarities amongst candidate genes from both screens.
This chapter describes the genes that have been identified as candidate regulators of organ
size. The details of the individual genetic analyses will be discussed in section 6.3 and 6.4
respectively.
6.2 – Seed and petal phenotypes were investigated
In line with the overall direction of this thesis, rather than focusing on any one specific organ
type, this chapter is interested in elucidating the mechanisms governing organ growth in
general. As a consequence, the genetic analyses described in this section are focused on two
key phenotypic areas: petal growth and seed growth.
175
Significant developmental differences between petals and seeds (reviewed in detail in Chapter
1) mean that many aspects of their development are regulated through independent pathways.
An extreme example of this is the maternal regulation of seed size through the ttg2
(transparent testa glabra2) mutation (see section 1.4), which relies on the interaction of the
integument and endosperm, tissues that are specific to seeds (Garcia et al., 2005). In addition
to these organ-‐specific growth pathways, genes that regulate core growth functions, such as
cell proliferation and cell expansion, are often involved in the setting the size of both organ
types. For example, DA1 and KLUH influence seed and petal growth, through manipulating the
duration of cell proliferation (Li et al., 2008, Adamski et al., 2009, Anastasiou et al., 2007). This
study uses two organ-‐types in order to broaden its scope; exploiting two distinct
developmental systems to maximise the identification of common and organ-‐specific
regulators.
The following sections describe the logic behind the selection of, and the methods used to
record the phenotypes chosen for this study.
6.2.1 – Petal and seed area
The manipulation of core developmental processes that drive organ growth, such as cell
proliferation and cell expansion (see section 1.3), will often result in organs of a wild-‐type
morphology, but an altered overall size. For example, regulators of cell proliferation – DA1,
KLU and EOD1 – all affect overall petal area without altering the shape of the organ
(Anastasiou et al., 2007, Disch et al., 2006, Li et al., 2008, Adamski et al., 2009). In addition, an
increase in organ size can be achieved in concert with significant morphological changes. This
is illustrated by the larger and rounder leaves found on da1-‐1 plants (Li et al., 2008), and the
larger more serrated leaves found in the rpt2a mutant, which has increased cell expansion
(Sonoda et al., 2009). In order to identify elements in core developmental pathways, involved
in the manipulation of overall organ size, plants were phenotyped for mean petal area and
mean seed area.
For each line, ten petals were collected from 5 individual plants (two per plant). The petals
were harvested from the first flowers per plant, to ensure developmental equivalence; once
harvested they were placed intact, on transparent adhesive tape and attached to a clean black
background. Petal area was recorded using a high-‐resolution scanning method following a
protocol adapted from (Herridge et al., 2011). Images were scanned, and areas were
calculated using the ImageJ image analysis software (see section 2.3.5.1), which allowed for a
high-‐throughput data input pipeline. To identify general growth regulators and cell-‐cycle genes
176
(instead of only petal-‐specific genes) petal area was not normalised to sepal area (Abraham et
al., 2013).
Seed areas were calculated using a similar method. Due to their smaller size (relative to the
fixed resolution of the scanner), the number of seeds in the sample were increased to n>60,
and instead of adhering to tape, the seeds were scattered in a petri dish prior to scanning.
For seed analysis, the ImageJ software was set to exclude aggregations of seed in the petri-‐
dish; such that only individual seed areas were recorded. As a fail-‐safe, and to ensure the
accuracy of the data, after each ImageJ measurement, a manual check of the scans was made
to ensure no seed aggregates had been measured.
6.2.2 – Petal shape
Organ size is intricately linked to organ shape (see section 1.2.2), and an increasing number of
genes, primarily characterised in Antirrhinum and Arabidopsis, have been identified that play a
significant role in influencing organ shape. Prolonged cell division in leaf meristemoid cells of
the Arabidopsis PEAPOD (PPD) mutant (White, 2006), and mis-‐regulation of the cell-‐cycle
arrest front in the Antirrhinum CINCINNATA (CIN) mutant (2003), both result in an increase in
leaf size and curvature; illustrating the intimate relationship between size and shape. Despite
this inter-‐relatedness, many genes appear to coordinate organ shape without affecting the
overall organ area. For example, although tcp14 and tcp15 mutants do not affect overall leaf
size, principle component analysis reveals that they cause significant changes to leaf shape and
aspect ratio (Kieffer et al., 2011).
Cell proliferation and cell expansion are the driving forces behind organ growth, however it is
the spatial coordination of these forces that determines final organ shape. Many factors are
thought to be involved in the setting of shape, including mobile morphogens such as the
proposed KLUH-‐dependent mobile growth factor (Adamski et al., 2009, Eriksson et al., 2010,
Kazama et al., 2010) and genes that exert biophysical constraints on the developing organ. For
example, ttg2 biophysically constrains the developing endosperm through the seed-‐coat
(Garcia et al., 2005), and angustifolia (an) mutants have a long and narrow leaf phenotype as a
result of altered cortical microtubule arrangements, which promote cell-‐expansion in the
apical-‐basal axis (Kim et al., 2002). These topics are reviewed in detail in Chapter 1.
This genetic analysis of petal shape is designed to identify any genes involved in the
coordination of petal growth.
177
In this analysis, three petal shape parameters were recorded: petal length, petal width and
petal shape (length/width). The primary measurements (length and width) were recorded
using the ImageJ software directly from the high-‐resolution petal scans described in section
6.2.1. Petal shape was calculated as a secondary measurement from the ratio of length/width
according to recent published work (Abraham et al., 2013).
6.2.3 – Variation in seed and petal size
Despite the indeterminate nature of vegetative plant growth, organs such as seeds, petals and
leaves display determinate growth (see section 1.2.1). The uniformity of final organ size and
morphology within species, compared to between species, demonstrates a high level of
developmental regulation. This regulation can be seen clearly in the ‘compensation’
mechanism that ensures uniformity in organ size in spite of changes in cell proliferation and
expansion (Dewitte et al., 2007, Ferjani et al., 2007, Jones et al., 1998). This not only implies
that the developing organ possesses an intrinsic knowledge of its pre-‐determined final size,
but that there are regulatory networks in place to buffer against aberrations in development.
Variation in the degree of uniformity of final organ size is likely to reflect differences in these
‘buffering’ regulatory networks, and in order to identify genes in these ‘buffering’ networks, a
genetic analysis of the variation in final organ size was carried out.
The phenotype used for these analyses was the standard error (SE) of the mean organ area
(for petal and seed respectively).
6.3 – MAGIC analysis of seed size
This MAGIC analysis was designed to investigate the regulation of seed and petal growth in
Arabidopsis. The project was initiated late on in my research schedule as a means to screen for,
and identify novel regulators of organ growth that could be subjected to further functional
study akin to that described for DA1 in Chapters 3-‐5. As a consequence of the late start, at the
time of writing only the seed data have been analysed.
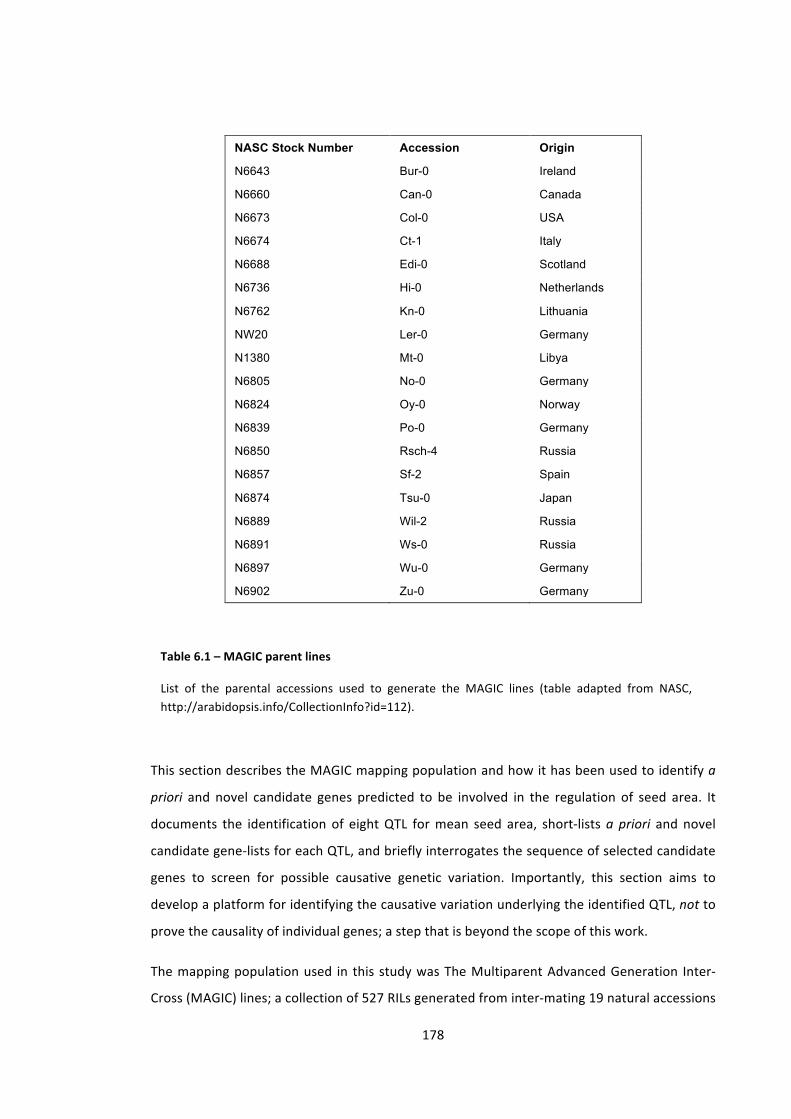
178
NASC Stock Number Accession Origin
N6643 Bur-0 Ireland
N6660 Can-0 Canada
N6673 Col-0 USA
N6674 Ct-1 Italy
N6688 Edi-0 Scotland
N6736 Hi-0 Netherlands
N6762 Kn-0 Lithuania
NW20 Ler-0 Germany
N1380 Mt-0 Libya
N6805 No-0 Germany
N6824 Oy-0 Norway
N6839 Po-0 Germany
N6850 Rsch-4 Russia
N6857 Sf-2 Spain
N6874 Tsu-0 Japan
N6889 Wil-2 Russia
N6891 Ws-0 Russia
N6897 Wu-0 Germany
N6902 Zu-0 Germany
This section describes the MAGIC mapping population and how it has been used to identify a
priori and novel candidate genes predicted to be involved in the regulation of seed area. It
documents the identification of eight QTL for mean seed area, short-‐lists a priori and novel
candidate gene-‐lists for each QTL, and briefly interrogates the sequence of selected candidate
genes to screen for possible causative genetic variation. Importantly, this section aims to
develop a platform for identifying the causative variation underlying the identified QTL, not to
prove the causality of individual genes; a step that is beyond the scope of this work.
The mapping population used in this study was The Multiparent Advanced Generation Inter-‐
Cross (MAGIC) lines; a collection of 527 RILs generated from inter-‐mating 19 natural accessions
Table 6.1 – MAGIC parent lines
List of the parental accessions used to generate the MAGIC lines (table adapted from NASC, http://arabidopsis.info/CollectionInfo?id=112).
179
(Kover et al., 2009), kindly provided by Phil Wigge at the Sainsbury Laboratory Cambridge
University, Cambridge. The 19 parents (Table 6.1) had been intercrossed for four generations
before being immortalised by six generations of backcrossing. This has resulted in 527 stable
homozygous lines, of which 452 were available for this study. Compared to conventional bi-‐
parental RIL populations, the presence of 19 parents incorporates increased allelic diversity
into the mapping population (Kover et al., 2009). In addition, the increased number of
recombination steps involved, improves the mapping resolution of the MAGIC population to as
little as 300Kb (Kover et al., 2009).
The final immortalised lines are unique mosaics of the 19 founder genomes, formed of a series
of haplotype blocks, each descended from one of the 19 parents. The location and ancestral
origin of these haplotype blocks can be mapped using genotype data available for each line
(Kover et al., 2009). The ability to probabilistically infer the mosaic structure of each ML allows
the prediction of parental contribution to each QTL. In addition, all 19 parental lines have
publicly available genome sequences (Gan et al., 2011), which allows the targeted
interrogation of parent-‐specific genome sequence data at predicted QTL loci.
The MAGIC analysis was performed in collaboration Mathew Box at the Sainsbury Laboratory
Cambridge University, Cambridge. The QTLs were identified using HAPPY: ‘a software package
for multipoint QTL mapping in genetically heterogeneous animals’ (Mott, 2000, Mott et al.,
2000). Using the collected phenotype values and pre-‐existing genotype data, this method
reconstructs ancestral haplotypes for each ML and subsequently tests for QTLs using linear
regression analysis (Mott et al., 2000). For this investigation, the genotype information used in
the HAPPY analysis was from 1250 SNPs, spaced roughly 100Kb apart (Kover et al., 2009, Mott
et al., 2011).
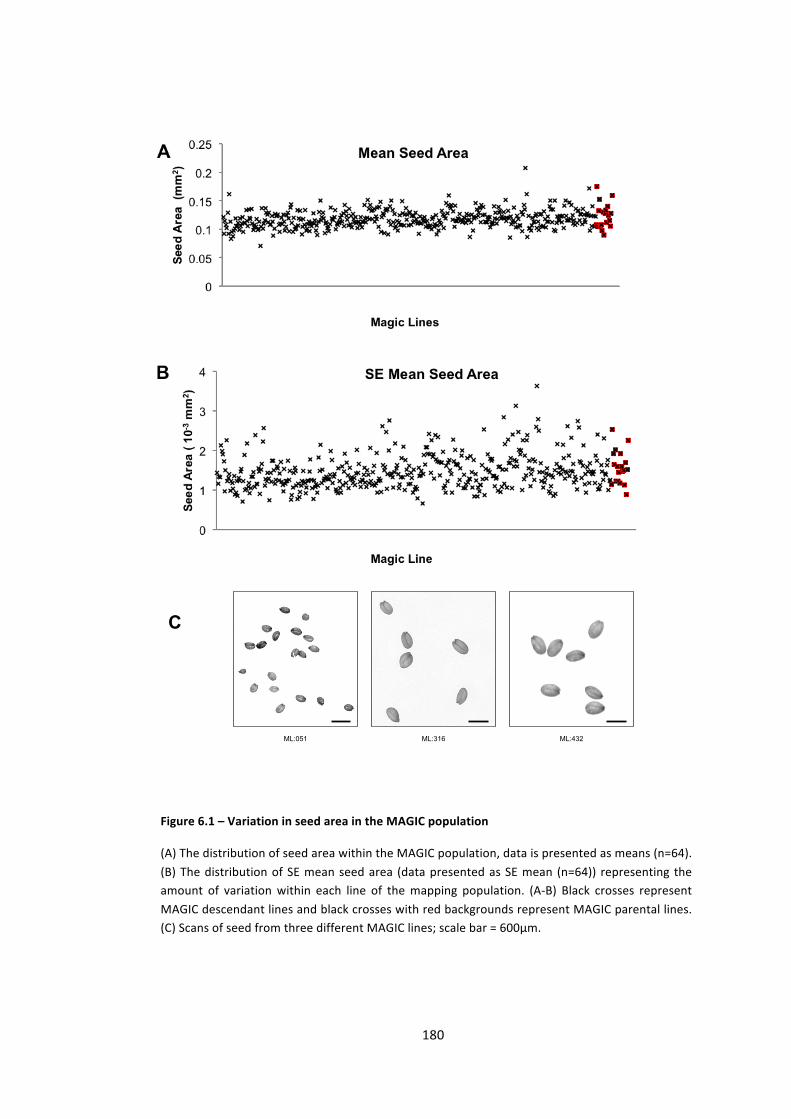
180
ML:051 ML:316 ML:432
Figure 6.1 – Variation in seed area in the MAGIC population
(A) The distribution of seed area within the MAGIC population, data is presented as means (n=64). (B) The distribution of SE mean seed area (data presented as SE mean (n=64)) representing the amount of variation within each line of the mapping population. (A-‐B) Black crosses represent MAGIC descendant lines and black crosses with red backgrounds represent MAGIC parental lines. (C) Scans of seed from three different MAGIC lines; scale bar = 600μm.
C
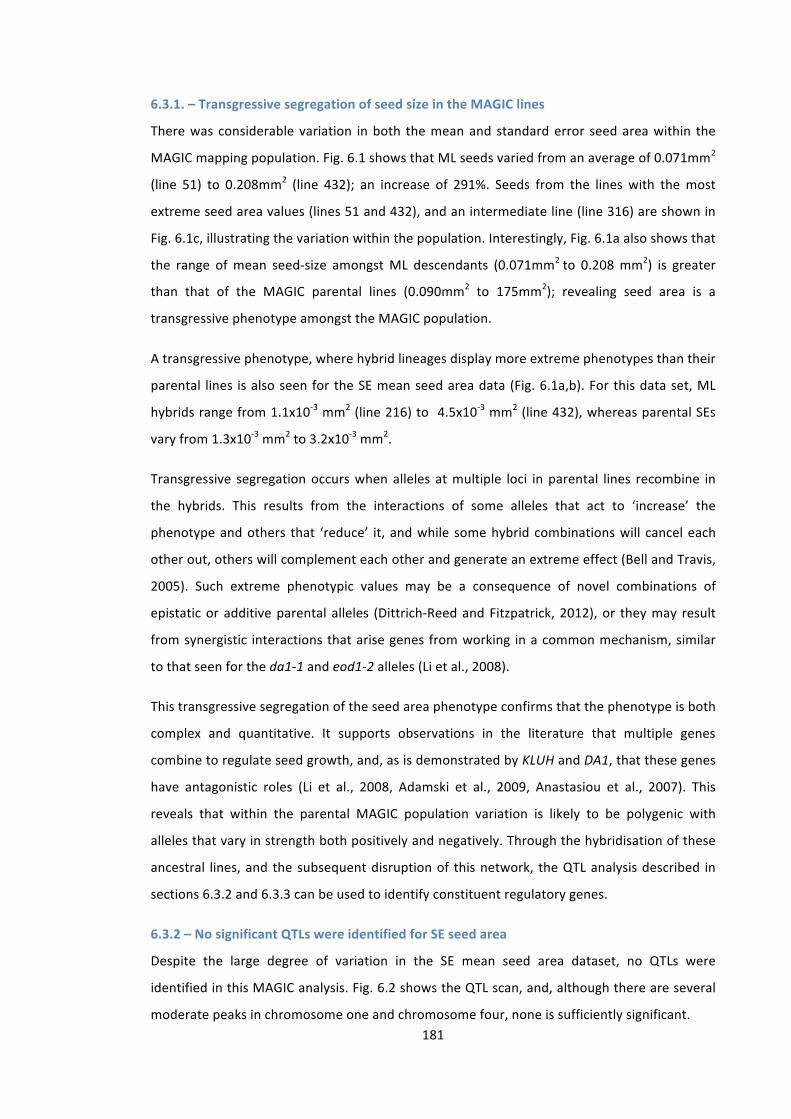
181
6.3.1. – Transgressive segregation of seed size in the MAGIC lines
There was considerable variation in both the mean and standard error seed area within the
MAGIC mapping population. Fig. 6.1 shows that ML seeds varied from an average of 0.071mm2
(line 51) to 0.208mm2 (line 432); an increase of 291%. Seeds from the lines with the most
extreme seed area values (lines 51 and 432), and an intermediate line (line 316) are shown in
Fig. 6.1c, illustrating the variation within the population. Interestingly, Fig. 6.1a also shows that
the range of mean seed-‐size amongst ML descendants (0.071mm2 to 0.208 mm2) is greater
than that of the MAGIC parental lines (0.090mm2 to 175mm2); revealing seed area is a
transgressive phenotype amongst the MAGIC population.
A transgressive phenotype, where hybrid lineages display more extreme phenotypes than their
parental lines is also seen for the SE mean seed area data (Fig. 6.1a,b). For this data set, ML
hybrids range from 1.1x10-‐3 mm2 (line 216) to 4.5x10-‐3 mm2 (line 432), whereas parental SEs
vary from 1.3x10-‐3 mm2 to 3.2x10-‐3 mm2.
Transgressive segregation occurs when alleles at multiple loci in parental lines recombine in
the hybrids. This results from the interactions of some alleles that act to ‘increase’ the
phenotype and others that ‘reduce’ it, and while some hybrid combinations will cancel each
other out, others will complement each other and generate an extreme effect (Bell and Travis,
2005). Such extreme phenotypic values may be a consequence of novel combinations of
epistatic or additive parental alleles (Dittrich-‐Reed and Fitzpatrick, 2012), or they may result
from synergistic interactions that arise genes from working in a common mechanism, similar
to that seen for the da1-‐1 and eod1-‐2 alleles (Li et al., 2008).
This transgressive segregation of the seed area phenotype confirms that the phenotype is both
complex and quantitative. It supports observations in the literature that multiple genes
combine to regulate seed growth, and, as is demonstrated by KLUH and DA1, that these genes
have antagonistic roles (Li et al., 2008, Adamski et al., 2009, Anastasiou et al., 2007). This
reveals that within the parental MAGIC population variation is likely to be polygenic with
alleles that vary in strength both positively and negatively. Through the hybridisation of these
ancestral lines, and the subsequent disruption of this network, the QTL analysis described in
sections 6.3.2 and 6.3.3 can be used to identify constituent regulatory genes.
6.3.2 – No significant QTLs were identified for SE seed area
Despite the large degree of variation in the SE mean seed area dataset, no QTLs were
identified in this MAGIC analysis. Fig. 6.2 shows the QTL scan, and, although there are several
moderate peaks in chromosome one and chromosome four, none is sufficiently significant.

182
6.3.3 – 8 QTLs identified for mean seed area
HAPPY analysis (Mott, 2000, Mott et al., 2000) of mean seed area in the MAGIC mapping
population revealed eight QTL for seed area, which had peaks that were significantly
associated with the phenotype to the 95% significance level. There is one QTL in chromosome
1, one QTL in chromosome 2 and six smaller QTL in chromosome 4 (Fig. 6.3). Table 6.2 shows
that QTL 1 and 2 (on chromosome 1 and chromosome 2 respectively) are considerably broader
that the remaining QTL; with QTL1 being ~5.3Mb and QTL8 only ~22Kb.
This difference in QTL size is reflected in the number of candidate genes underlying each QTL.
QTL1 and QTL2 (~5.3Mb and ~3.0Mb) cover 1410 and 742 genes respectively, and the 300Kb
either side of the peak SNP (Kover et al., 2009) for each QTL covers 172 and 150 genes
respectively. In contrast, the entirety of QTL8 covers only 4 genes. Although the large size of
QTL1 and QTL2 is not abnormal (Abraham et al., 2013, Kover et al., 2009), the considerably
narrower resolution of QTL 4,5,7 and 8 may be an artefact of a fragmented larger QTL.
Figure 6.2 – No QTL for SE mean seed area in the MAGIC population
Associations of SE mean seed area with genome position. The x-‐axis represents the full genome length of Arabidopsis, with the vertical bars denoting boundaries between chromosomes. The y-‐axis displays the associations of genotype markers at different positions on the genome with the phenotype. Associations are presented as logP values and grey bars represent genome-‐wide significance thresholds for p=0.5, p=0.1 and p=0.05. Significant associations are marked with gold stars. This genome scan reveals that there are no significant associations between genotype markers and the SE mean seed area phenotype.
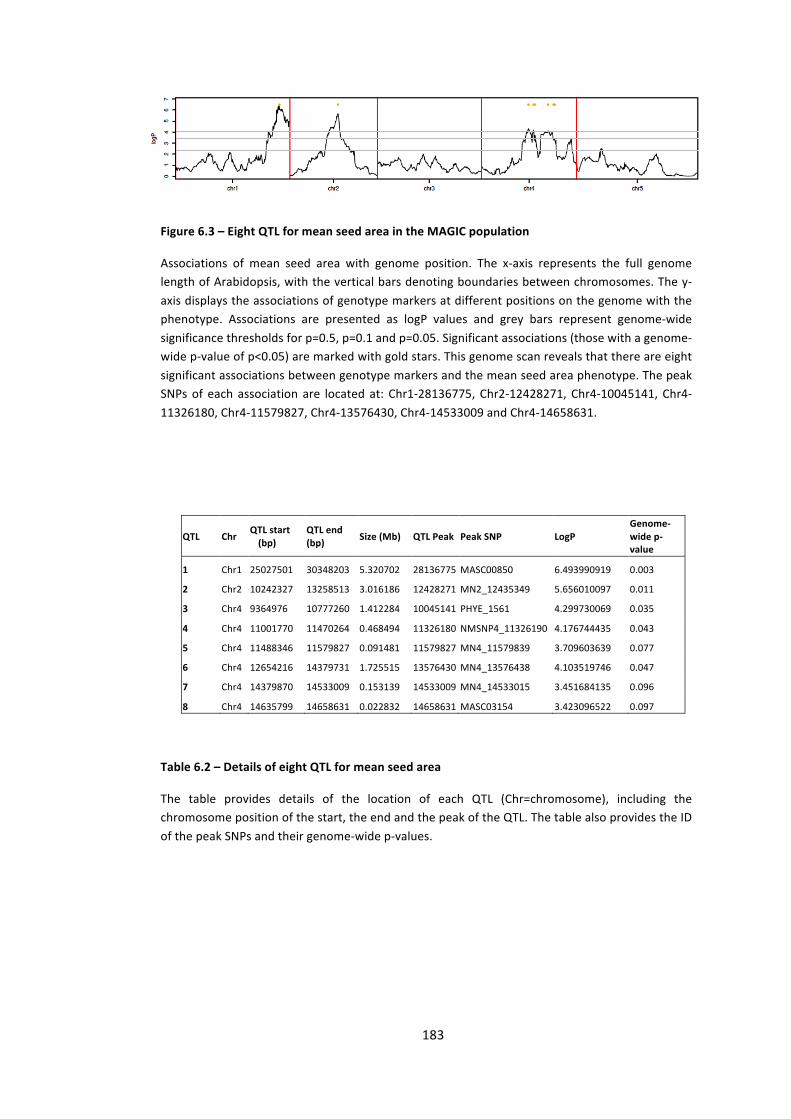
183
QTL Chr QTL start (bp)
QTL end (bp) Size (Mb) QTL Peak Peak SNP LogP
Genome-‐wide p-‐value
1 Chr1 25027501 30348203 5.320702 28136775 MASC00850 6.493990919 0.003
2 Chr2 10242327 13258513 3.016186 12428271 MN2_12435349 5.656010097 0.011
3 Chr4 9364976 10777260 1.412284 10045141 PHYE_1561 4.299730069 0.035
4 Chr4 11001770 11470264 0.468494 11326180 NMSNP4_11326190 4.176744435 0.043
5 Chr4 11488346 11579827 0.091481 11579827 MN4_11579839 3.709603639 0.077
6 Chr4 12654216 14379731 1.725515 13576430 MN4_13576438 4.103519746 0.047
7 Chr4 14379870 14533009 0.153139 14533009 MN4_14533015 3.451684135 0.096
8 Chr4 14635799 14658631 0.022832 14658631 MASC03154 3.423096522 0.097
Figure 6.3 – Eight QTL for mean seed area in the MAGIC population
Associations of mean seed area with genome position. The x-‐axis represents the full genome length of Arabidopsis, with the vertical bars denoting boundaries between chromosomes. The y-‐axis displays the associations of genotype markers at different positions on the genome with the phenotype. Associations are presented as logP values and grey bars represent genome-‐wide significance thresholds for p=0.5, p=0.1 and p=0.05. Significant associations (those with a genome-‐wide p-‐value of p<0.05) are marked with gold stars. This genome scan reveals that there are eight significant associations between genotype markers and the mean seed area phenotype. The peak SNPs of each association are located at: Chr1-‐28136775, Chr2-‐12428271, Chr4-‐10045141, Chr4-‐ 11326180, Chr4-‐11579827, Chr4-‐13576430, Chr4-‐14533009 and Chr4-‐14658631.
Table 6.2 – Details of eight QTL for mean seed area
The table provides details of the location of each QTL (Chr=chromosome), including the chromosome position of the start, the end and the peak of the QTL. The table also provides the ID of the peak SNPs and their genome-‐wide p-‐values.

184
6.3.4 – 21 a priori candidate genes identified in QTLs
Four of the eight QTL intervals (QTL 1,2,3 and 6) overlapped with genes known to be involved
in the regulation of organ growth. The presence of such a priori candidates in the QTL intervals
presents the possibility that these genes are responsible for the phenotypic variation observed
in the mapping population.
The a priori gene list (Table S1) is populated with genes that have published organ-‐growth
phenotypes, and is designed to be used as a tool for explaining observed phenotypic variation
with previously characterised genes. 21 members from this list are present in four of the QTL
intervals identified for seed area (Table 6.3), including six TCP transcription factors (TCPs
1,2,10,12,15 and 22), three CLAVATA related genes (CLV1, CLE8, CLE26) and the E3 ligase DA2.
Represented in these QTL are a priori genes involved in both core aspects of cell growth;
including DA2, a negative regulator of cell proliferation (Xia, 2013), and RPT2a, the negative
regulator of cell expansion (Sonoda et al., 2009).
The QTL intervals include characterised seed-‐specific growth regulators, such as SHB1 (SHORT
HYPOCOTYL UNDER BLUE1), which interacts with MINISEED3 and HAIKU2 to control seed
development (Zhou et al., 2009). However, they also include genes that only have
characterised phenotypes in leaves and petals, including the homeobox transcription factor,
ZHD5 (ZINC-‐FINGER HOMEODOMAIN 5), over-‐expression of which has been shown to increase
leaf area as a consequence of increased cell size (Hong et al., 2011). In addition, the regulator
of petal size and shape, ERECTA, is present in QTL2 (Abraham et al., 2013, Shpak et al., 2003).
The QTL intervals also include genes involved in phytohormone signalling, including the
ethylene response factor ERF6 (ETHYLENE ELEMENT BINDING FACTOR6), which is a negative
regulator of leaf growth (Dubois et al., 2013) and a positive regulator of jasmonate and
ethylene mediated pathogen defence (Moffat et al., 2012). Additionally, a member of the
gibberellin-‐signalling pathway, the gibberellic acid oxidase, GA20OX1, is present in QTL6.
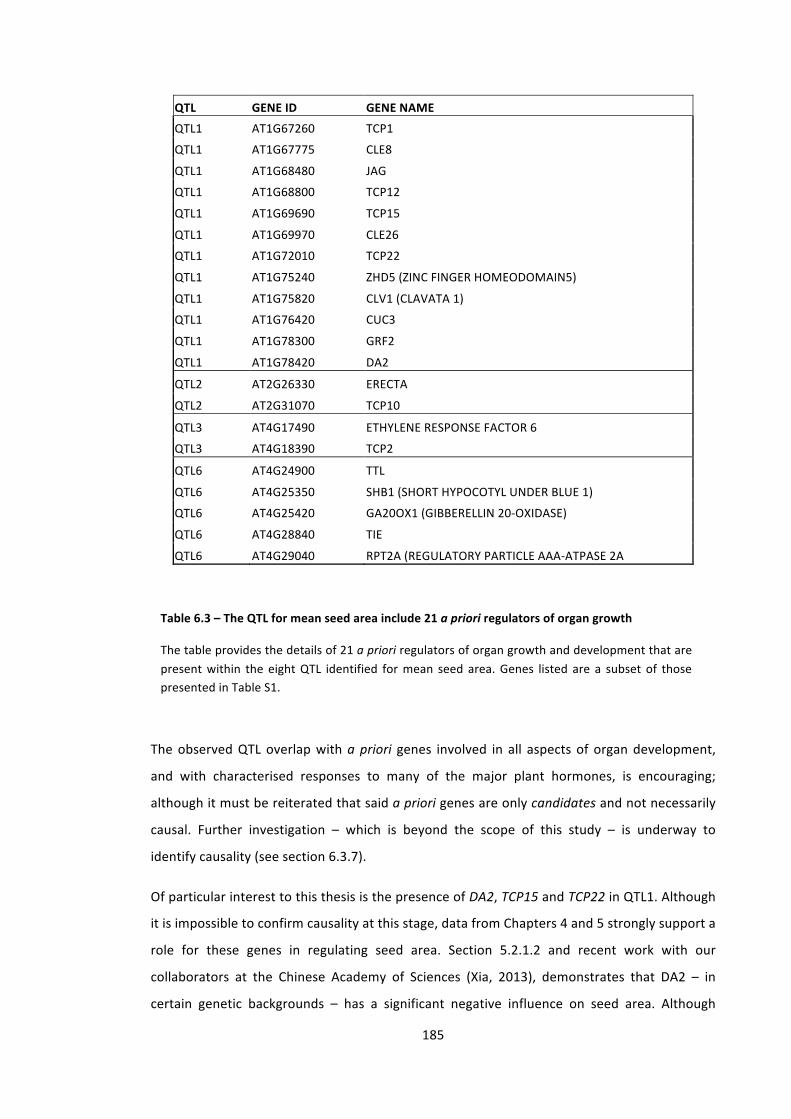
185
QTL GENE ID GENE NAME
QTL1 AT1G67260 TCP1
QTL1 AT1G67775 CLE8
QTL1 AT1G68480 JAG
QTL1 AT1G68800 TCP12
QTL1 AT1G69690 TCP15
QTL1 AT1G69970 CLE26
QTL1 AT1G72010 TCP22
QTL1 AT1G75240 ZHD5 (ZINC FINGER HOMEODOMAIN5)
QTL1 AT1G75820 CLV1 (CLAVATA 1)
QTL1 AT1G76420 CUC3
QTL1 AT1G78300 GRF2
QTL1 AT1G78420 DA2
QTL2 AT2G26330 ERECTA
QTL2 AT2G31070 TCP10
QTL3 AT4G17490 ETHYLENE RESPONSE FACTOR 6
QTL3 AT4G18390 TCP2
QTL6 AT4G24900 TTL
QTL6 AT4G25350 SHB1 (SHORT HYPOCOTYL UNDER BLUE 1)
QTL6 AT4G25420 GA20OX1 (GIBBERELLIN 20-‐OXIDASE)
QTL6 AT4G28840 TIE
QTL6 AT4G29040 RPT2A (REGULATORY PARTICLE AAA-‐ATPASE 2A
The observed QTL overlap with a priori genes involved in all aspects of organ development,
and with characterised responses to many of the major plant hormones, is encouraging;
although it must be reiterated that said a priori genes are only candidates and not necessarily
causal. Further investigation – which is beyond the scope of this study – is underway to
identify causality (see section 6.3.7).
Of particular interest to this thesis is the presence of DA2, TCP15 and TCP22 in QTL1. Although
it is impossible to confirm causality at this stage, data from Chapters 4 and 5 strongly support a
role for these genes in regulating seed area. Section 5.2.1.2 and recent work with our
collaborators at the Chinese Academy of Sciences (Xia, 2013), demonstrates that DA2 – in
certain genetic backgrounds – has a significant negative influence on seed area. Although
Table 6.3 – The QTL for mean seed area include 21 a priori regulators of organ growth
The table provides the details of 21 a priori regulators of organ growth and development that are present within the eight QTL identified for mean seed area. Genes listed are a subset of those presented in Table S1.

186
section 5.2.1.2 indicates that a da1 null allele is required for da2-‐1 to influence seed area, it is
possible that the genetic background of the MAGIC population is conducive to da2 acting
independently of a da1 null allele.
In addition, Chapter 4 has described in detail the role of TCP15 in growth and development,
and it is therefore particularly interesting to identify this gene in QTL1. However, TCP22 is also
of interest due recent work which has shown that, based on sequence analysis of the TCP
domain, TCP22 (and TCP14) are the most closely related family members to TCP15 (Aggarwal
et al., 2010). And as Fig. S3 documents, previous studies in the lab have characterised TCP22 as
a regulator of organ growth and development.
6.3.5 – Bur-‐0 haplotype predicted to contribute to increase in seed area
Fig. 6.4 shows boxplots of each parental line, representing the estimated contribution of their
haplotype to each QTL phenotype and the predicted direction of their contribution. One
particular parental haplotype – Bur-‐0 – is predicted contribute the largest increase in seed area
across all eight QTL. In some instances, such as QTL2 (Fig. 6.4b), other parental lines including
Edi-‐0, Kn-‐0 and Oy-‐0 also have a strong predicted contribution. However, for others, such as
QTL6 (Fig. 6.4f), the estimated Bur-‐0 haplotype influence is considerably larger than all other
parental lines.
Inspection of the variation in seed area amongst the parental lines (Fig. 6.7) reveals that Bur-‐0
has the largest seed of all parents. This strengthens the predictions in Fig. 6.4 that the Bur-‐0
haplotype is responsible for all eight QTL and suggests that the interrogation of the Bur-‐0
genotype at these intervals may yield insights as to the true causative variation. This genotype
interrogation is made possible by the sequencing of all parental lines (Gan et al., 2011) and the
availability of the sequence data through the Rätsch lab GBrowse
(http://gbrowse.cbio.mskcc.org/gb/gbrowse/thaliana-‐19magic/).
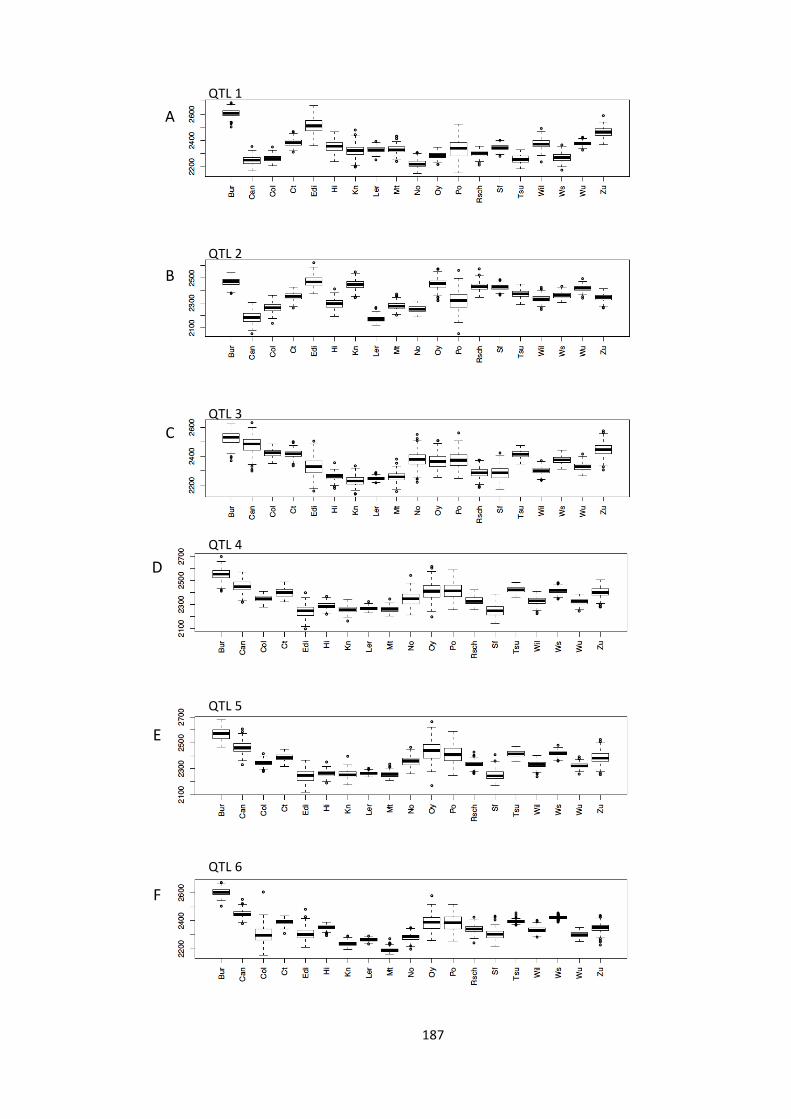
187
A"
B"
C"
D"
E"
F"
QTL 1
QTL 2
QTL 3
QTL 4
QTL 5
QTL 6
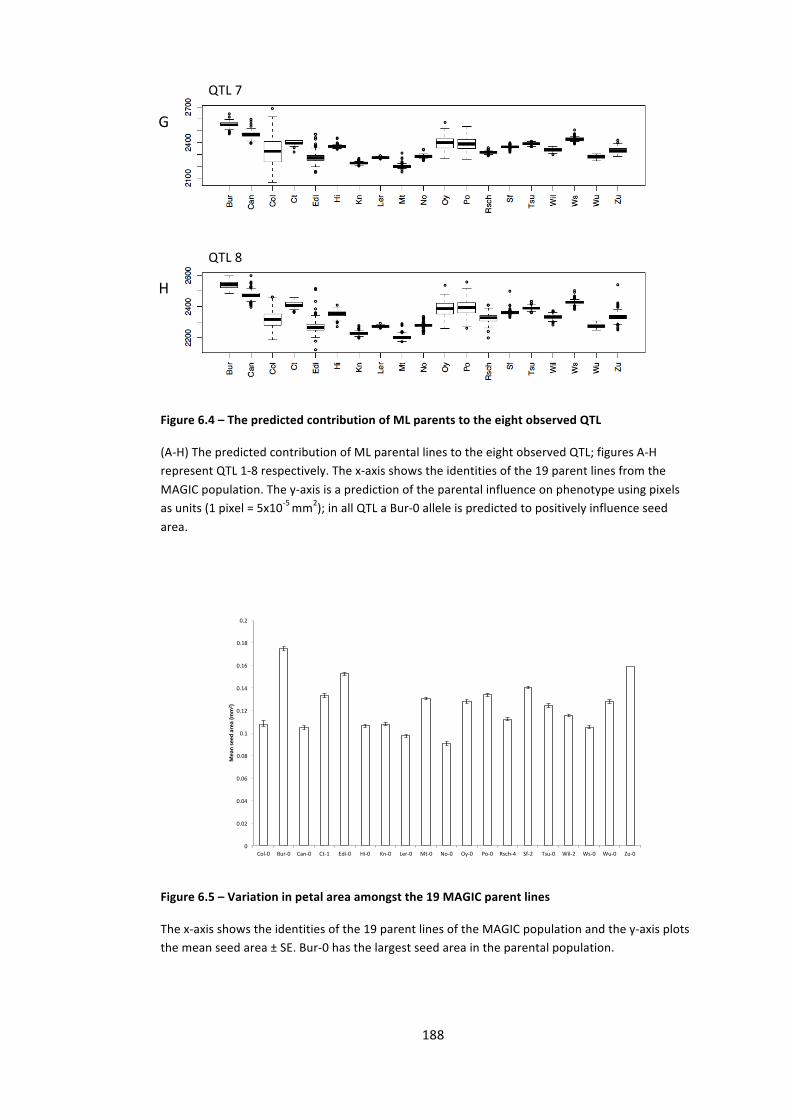
188
G"
H"
0"
0.02"
0.04"
0.06"
0.08"
0.1"
0.12"
0.14"
0.16"
0.18"
0.2"
Col,0" Bur,0" Can,0" Ct,1" Edi,0" Hi,0" Kn,0" Ler,0" Mt,0" No,0" Oy,0" Po,0" Rsch,4" Sf,2" Tsu,0" Wil,2" Ws,0" Wu,0" Zu,0"
Mean%seed
%area%(m
m2 )%
Figure 6.4 – The predicted contribution of ML parents to the eight observed QTL
(A-‐H) The predicted contribution of ML parental lines to the eight observed QTL; figures A-‐H represent QTL 1-‐8 respectively. The x-‐axis shows the identities of the 19 parent lines from the MAGIC population. The y-‐axis is a prediction of the parental influence on phenotype using pixels as units (1 pixel = 5x10-‐5 mm2); in all QTL a Bur-‐0 allele is predicted to positively influence seed area.
Figure 6.5 – Variation in petal area amongst the 19 MAGIC parent lines
The x-‐axis shows the identities of the 19 parent lines of the MAGIC population and the y-‐axis plots the mean seed area ± SE. Bur-‐0 has the largest seed area in the parental population.
QTL 7
QTL 8
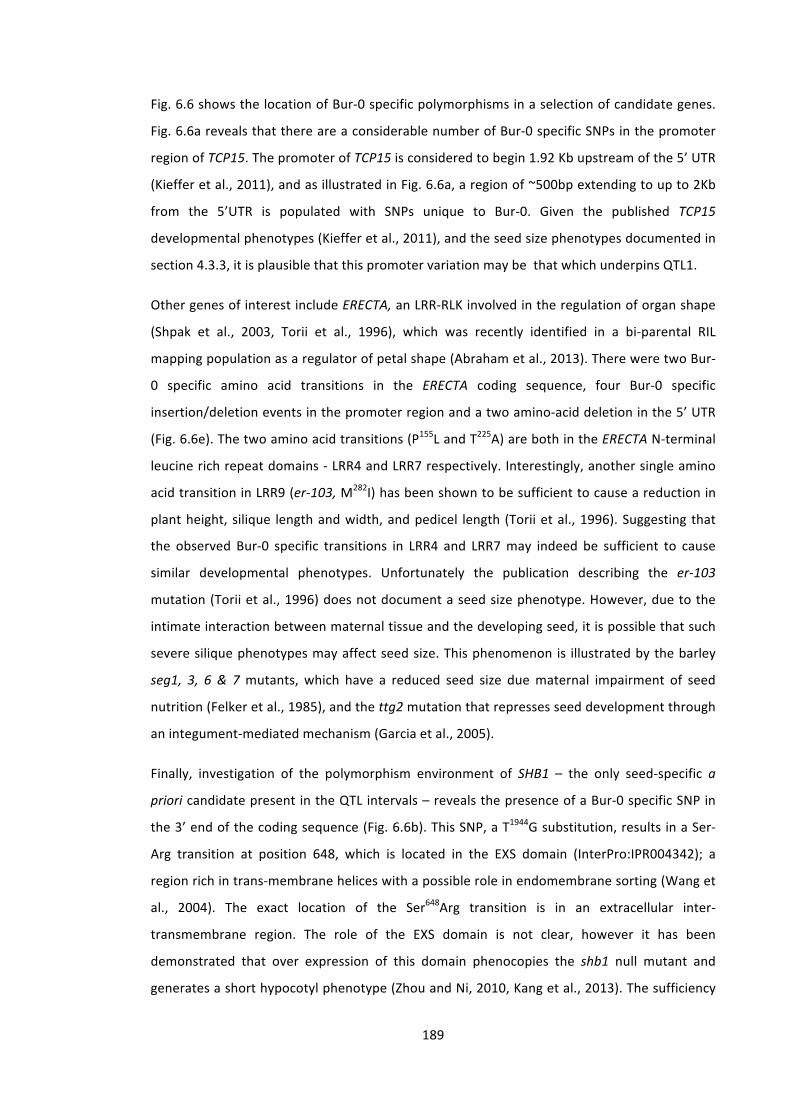
189
Fig. 6.6 shows the location of Bur-‐0 specific polymorphisms in a selection of candidate genes.
Fig. 6.6a reveals that there are a considerable number of Bur-‐0 specific SNPs in the promoter
region of TCP15. The promoter of TCP15 is considered to begin 1.92 Kb upstream of the 5’ UTR
(Kieffer et al., 2011), and as illustrated in Fig. 6.6a, a region of ~500bp extending to up to 2Kb
from the 5’UTR is populated with SNPs unique to Bur-‐0. Given the published TCP15
developmental phenotypes (Kieffer et al., 2011), and the seed size phenotypes documented in
section 4.3.3, it is plausible that this promoter variation may be that which underpins QTL1.
Other genes of interest include ERECTA, an LRR-‐RLK involved in the regulation of organ shape
(Shpak et al., 2003, Torii et al., 1996), which was recently identified in a bi-‐parental RIL
mapping population as a regulator of petal shape (Abraham et al., 2013). There were two Bur-‐
0 specific amino acid transitions in the ERECTA coding sequence, four Bur-‐0 specific
insertion/deletion events in the promoter region and a two amino-‐acid deletion in the 5’ UTR
(Fig. 6.6e). The two amino acid transitions (P155L and T225A) are both in the ERECTA N-‐terminal
leucine rich repeat domains -‐ LRR4 and LRR7 respectively. Interestingly, another single amino
acid transition in LRR9 (er-‐103, M282I) has been shown to be sufficient to cause a reduction in
plant height, silique length and width, and pedicel length (Torii et al., 1996). Suggesting that
the observed Bur-‐0 specific transitions in LRR4 and LRR7 may indeed be sufficient to cause
similar developmental phenotypes. Unfortunately the publication describing the er-‐103
mutation (Torii et al., 1996) does not document a seed size phenotype. However, due to the
intimate interaction between maternal tissue and the developing seed, it is possible that such
severe silique phenotypes may affect seed size. This phenomenon is illustrated by the barley
seg1, 3, 6 & 7 mutants, which have a reduced seed size due maternal impairment of seed
nutrition (Felker et al., 1985), and the ttg2 mutation that represses seed development through
an integument-‐mediated mechanism (Garcia et al., 2005).
Finally, investigation of the polymorphism environment of SHB1 – the only seed-‐specific a
priori candidate present in the QTL intervals – reveals the presence of a Bur-‐0 specific SNP in
the 3’ end of the coding sequence (Fig. 6.6b). This SNP, a T1944G substitution, results in a Ser-‐
Arg transition at position 648, which is located in the EXS domain (InterPro:IPR004342); a
region rich in trans-‐membrane helices with a possible role in endomembrane sorting (Wang et
al., 2004). The exact location of the Ser648Arg transition is in an extracellular inter-‐
transmembrane region. The role of the EXS domain is not clear, however it has been
demonstrated that over expression of this domain phenocopies the shb1 null mutant and
generates a short hypocotyl phenotype (Zhou and Ni, 2010, Kang et al., 2013). The sufficiency
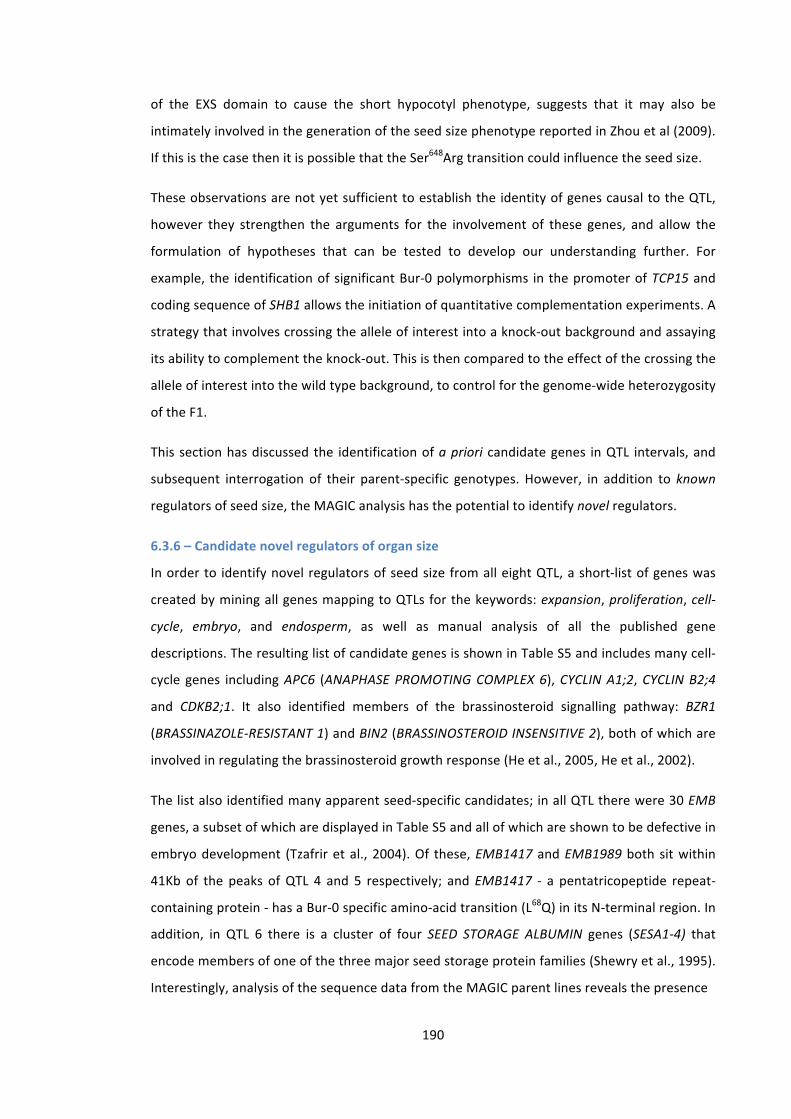
190
of the EXS domain to cause the short hypocotyl phenotype, suggests that it may also be
intimately involved in the generation of the seed size phenotype reported in Zhou et al (2009).
If this is the case then it is possible that the Ser648Arg transition could influence the seed size.
These observations are not yet sufficient to establish the identity of genes causal to the QTL,
however they strengthen the arguments for the involvement of these genes, and allow the
formulation of hypotheses that can be tested to develop our understanding further. For
example, the identification of significant Bur-‐0 polymorphisms in the promoter of TCP15 and
coding sequence of SHB1 allows the initiation of quantitative complementation experiments. A
strategy that involves crossing the allele of interest into a knock-‐out background and assaying
its ability to complement the knock-‐out. This is then compared to the effect of the crossing the
allele of interest into the wild type background, to control for the genome-‐wide heterozygosity
of the F1.
This section has discussed the identification of a priori candidate genes in QTL intervals, and
subsequent interrogation of their parent-‐specific genotypes. However, in addition to known
regulators of seed size, the MAGIC analysis has the potential to identify novel regulators.
6.3.6 – Candidate novel regulators of organ size
In order to identify novel regulators of seed size from all eight QTL, a short-‐list of genes was
created by mining all genes mapping to QTLs for the keywords: expansion, proliferation, cell-‐
cycle, embryo, and endosperm, as well as manual analysis of all the published gene
descriptions. The resulting list of candidate genes is shown in Table S5 and includes many cell-‐
cycle genes including APC6 (ANAPHASE PROMOTING COMPLEX 6), CYCLIN A1;2, CYCLIN B2;4
and CDKB2;1. It also identified members of the brassinosteroid signalling pathway: BZR1
(BRASSINAZOLE-‐RESISTANT 1) and BIN2 (BRASSINOSTEROID INSENSITIVE 2), both of which are
involved in regulating the brassinosteroid growth response (He et al., 2005, He et al., 2002).
The list also identified many apparent seed-‐specific candidates; in all QTL there were 30 EMB
genes, a subset of which are displayed in Table S5 and all of which are shown to be defective in
embryo development (Tzafrir et al., 2004). Of these, EMB1417 and EMB1989 both sit within
41Kb of the peaks of QTL 4 and 5 respectively; and EMB1417 -‐ a pentatricopeptide repeat-‐
containing protein -‐ has a Bur-‐0 specific amino-‐acid transition (L68Q) in its N-‐terminal region. In
addition, in QTL 6 there is a cluster of four SEED STORAGE ALBUMIN genes (SESA1-‐4) that
encode members of one of the three major seed storage protein families (Shewry et al., 1995).
Interestingly, analysis of the sequence data from the MAGIC parent lines reveals the presence
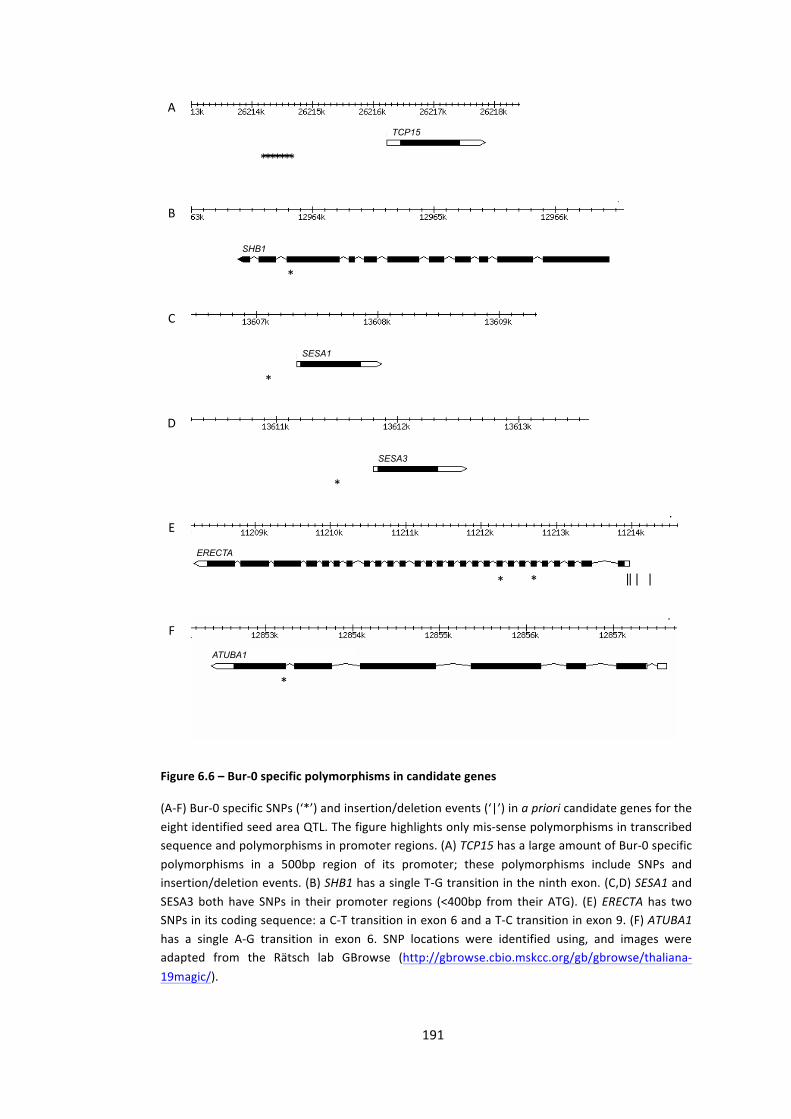
191
*"
SHB1
*"
SESA1
*"
SESA3
*"
ATUBA1
*" |"|"|" |"*"
ERECTA
A"
B"
C"
D"
E"
F"
*"*"*"*"*"*" *"
TCP15
Figure 6.6 – Bur-‐0 specific polymorphisms in candidate genes
(A-‐F) Bur-‐0 specific SNPs (‘*’) and insertion/deletion events (‘|’) in a priori candidate genes for the eight identified seed area QTL. The figure highlights only mis-‐sense polymorphisms in transcribed sequence and polymorphisms in promoter regions. (A) TCP15 has a large amount of Bur-‐0 specific polymorphisms in a 500bp region of its promoter; these polymorphisms include SNPs and insertion/deletion events. (B) SHB1 has a single T-‐G transition in the ninth exon. (C,D) SESA1 and SESA3 both have SNPs in their promoter regions (<400bp from their ATG). (E) ERECTA has two SNPs in its coding sequence: a C-‐T transition in exon 6 and a T-‐C transition in exon 9. (F) ATUBA1 has a single A-‐G transition in exon 6. SNP locations were identified using, and images were adapted from the Rätsch lab GBrowse (http://gbrowse.cbio.mskcc.org/gb/gbrowse/thaliana-‐19magic/).
192
of single Bur-‐0 specific SNPs in the promoter regions of SESA1 and SESA3 (Fig. 6.6c,d), which
are 31.25Kb and 35.75Kb from the peak SNP in QTL 6 respectively.
An ubiquitin pathway gene with a direct link to DA1 is also present in this list of potential novel
regulators. ATUBA1, one of the two Arabidopsis E1 activating enzymes, and a Y2H interactor
with DA1 (Chapter 4), is present in QTL2. This gene has been shown to play a role in plant
innate immunity and to have an organ size phenotype in certain genetic backgrounds
(Goritschnig et al., 2007). ATUBA1 has one Bur-‐0 specific SNP in the coding sequence, an A2656G
substitution, which results in a T886A transition in C-‐terminal region of the protein (Fig. 6.6f).
Interestingly, this amino-‐acid transition is within the ATUBA1 C-‐terminal fragment that was
pulled out by DA1 in the Y2H described in Chapter 4, and is 146 amino acids from the deletion
responsible for the mos5 phenotype described in (Goritschnig et al., 2007). Furthermore, the
transition is in position eight of the second ubiquitin-‐activating enzyme repeat (Interpro:
IPR000127, Pfam: PF02134), suggesting that the mutation could alter catalytic activity.
Modification of ATUBA1 function, as shown in the mos5 deletion, can have relatively specific
phenotypic effects. In the case of mos5, the mutation appears to effect only plant innate
immunity (including a growth response); suggesting a specific relationship with a subset of
Arabidopsis E2s. If this is indeed the case, then the Bur-‐0 specific T886A transition may also
specifically affect growth and development pathways, and is therefore a good candidate for
the causative genetic variation in QTL2.
6.3.7 – Future work
As discussed in section 6.3, this work was initiated with the intention of identifying shortlists of
a priori and de novo candidate genes, which could be tested in the future to determine their
role in the identified QTL. The MAGIC analysis has successfully identified a list of 21 a priori
candidates and 75 de novo candidates. Interrogation of the sequence of these genes in the
parental haplotypes predicted to underlie each QTL, has offered additional insight into the
likelihood of these genes being causal.
This not only provides a rich resource of candidate genes for further investigation, but the SNP
interrogation of parental haplotypes, and subsequent focus on genes with Bur-‐0 specific
polymorphisms allows the further refining of the candidate list. Unfortunately, due to time
constraints, and the nature of this work as a side-‐project, complete SNP interrogation of all
candidate genes has not been completed and an ultimate short-‐list of candidates has not yet
been populated. Nonetheless, sections 6.3.4 to 6.3.6 provide good support for the further
study of genes including: DA2, TCP15, TCP22, ERECTA, ATUBA1, SESA1, SESA3 and EMB1417.
193
Knockout lines will be acquired for these genes, and if knockout phenotypes exist, a strategy of
quantitative complementation will be undertaken to determine their role in their respective
QTL.
6.4 – Genome wide association analysis of petal and seed growth
This genome wide association (GWA) analysis was designed to investigate the regulation of
seed and petal growth in Arabidopsis. As with the MAGIC analysis, this project was initiated
late on in my research schedule as a means to screen for and identify novel regulators of organ
growth that could be subjected to further functional study. At the time of writing, the mapping
population had been genotyped, the genotype-‐phenotype associations had been analysed and
candidate genes had been identified. This chapter focuses on two putative associations only,
one for mean petal length and one for SE mean petal area (see section 6.2.3 for explanation).
It briefly documents the identification of these loci and the candidate genes therein, but does
not investigate the associations any further. Work to prove the causality of these candidate
genes is on-‐going and is not reported in this chapter.
The mapping population used in this investigation was made up of a subset of the 1001
genomes project (Weigel and Mott, 2009) consisting of 272 Swedish accessions kindly
provided by Caroline Dean at the John Innes Centre, Norwich (Table S2). This population was
being used at the John Innes Centre by Caroline Dean and Mathew Box to map genes involved
in the vernalisation response. During this work, variation in petal size was observed within the
population and therefore it was selected for this study of organ growth. Due to its confined
geographical distribution, this population is thought to have reduced population structure
effects and, as a consequence, a reduced frequency of false positives (Filiault and Maloof,
2012). Despite this mitigating measure, genetic diversity in Eurasian accessions of Arabidopsis
has been shown to follow a broad trend of “isolation by distance” (Platt et al., 2010). In order
to determine whether this isolation by distance might lead to population-‐structure effects
within this Swedish population, the effect of latitude on phenotype was investigated (Filiault
and Maloof, 2012). Figure 6.7 shows that there were negative correlations between latitude
and both mean petal area and mean petal length (Pearson’s r, p=0.006 and p=0.044,
respectively), and a positive correlation between latitude and mean seed area (Pearson’s r,
p<0.0001). For these reasons it was decided that a further corrective approach would be used
in this analysis (Cheng et al., unpublished).
The genome wide association analysis was kindly performed in collaboration with Caroline
Dean at the John Innes Centre, Norwich; Mathew Box at the Sainsbury Laboratory Cambridge

194
University, Cambridge; and Justin Borevitz and Riyan Cheng at the Australian National
University, Canberra, Australia. The analysis was carried out using the QTLRel package (Cheng
et al., 2011) and call_method_75_ TAIR9 SNP data (Horton et al., 2012). Alleles with a
frequency of less than 0.05 were excluded from the analysis.
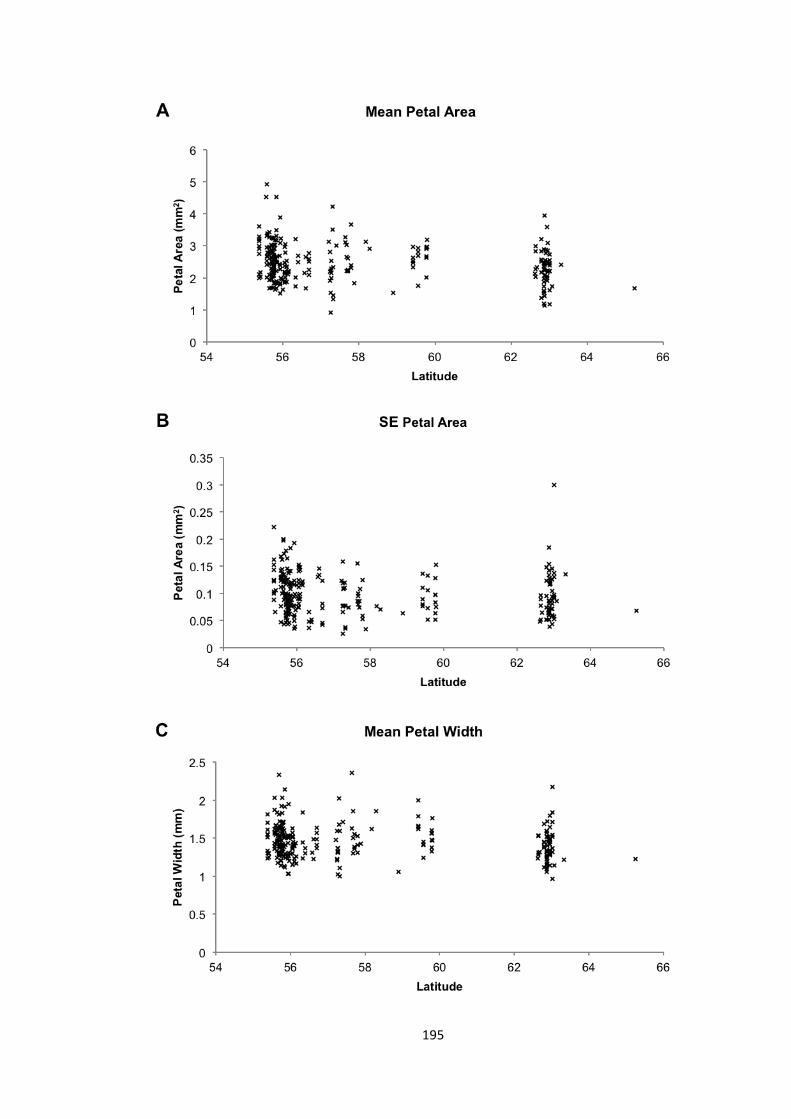
195
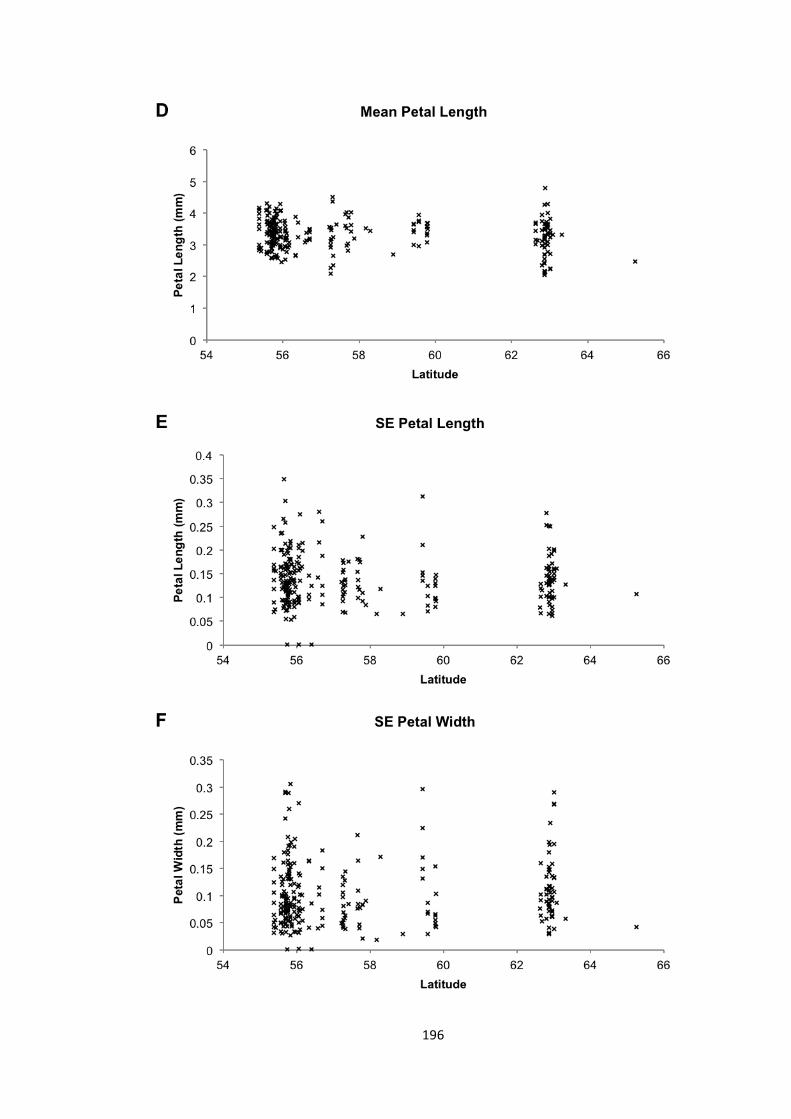
196
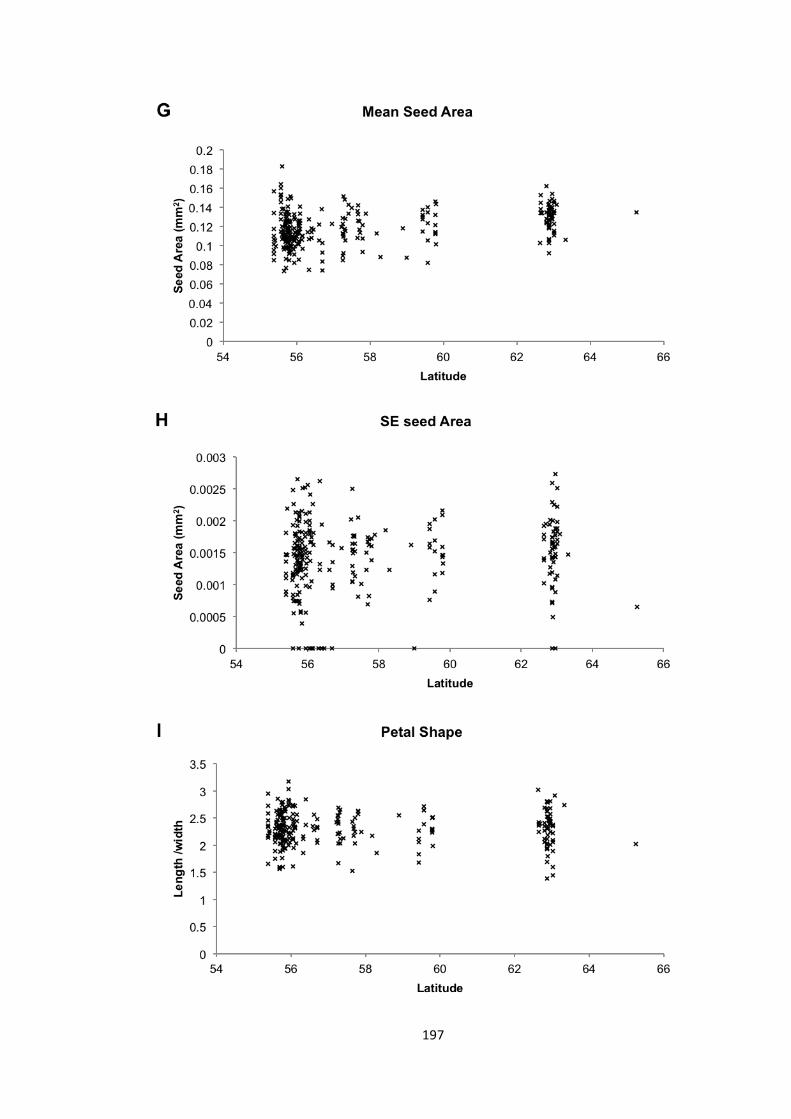
197
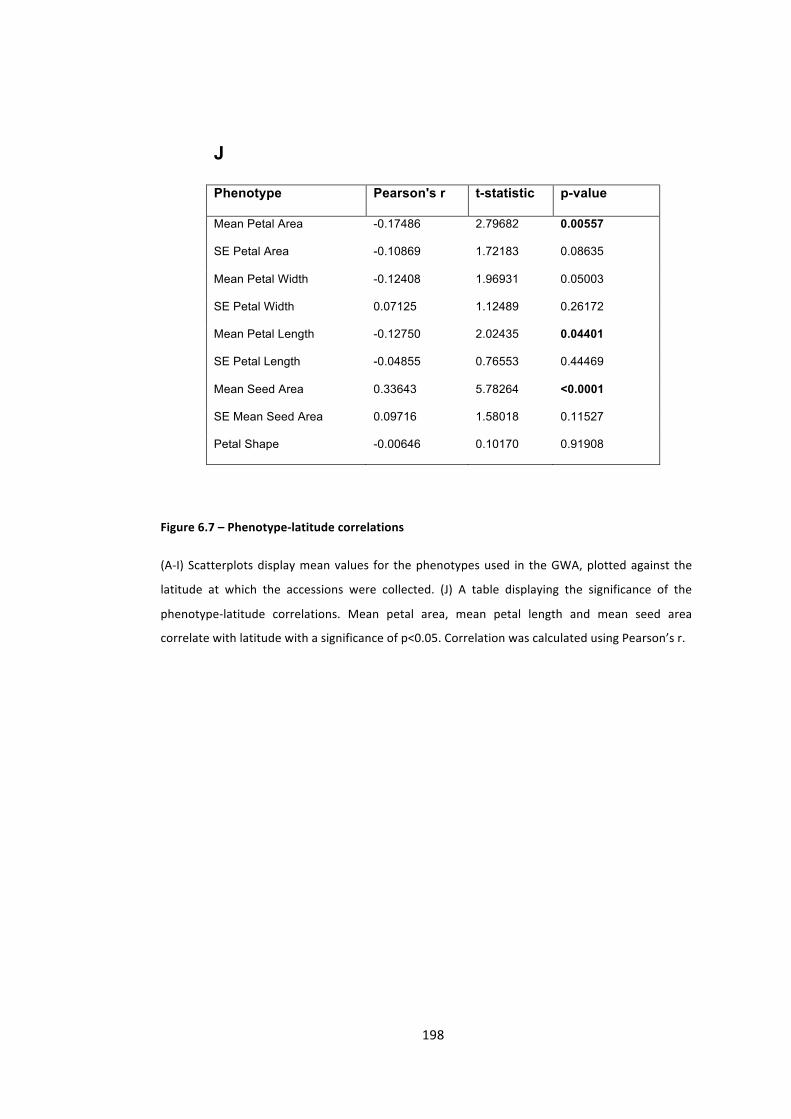
198
J
Phenotype Pearson's r t-statistic p-value
Mean Petal Area -0.17486 2.79682 0.00557
SE Petal Area -0.10869 1.72183 0.08635
Mean Petal Width -0.12408 1.96931 0.05003
SE Petal Width 0.07125 1.12489 0.26172
Mean Petal Length -0.12750 2.02435 0.04401
SE Petal Length -0.04855 0.76553 0.44469
Mean Seed Area 0.33643 5.78264 <0.0001
SE Mean Seed Area 0.09716 1.58018 0.11527
Petal Shape -0.00646 0.10170 0.91908
Figure 6.7 – Phenotype-‐latitude correlations
(A-‐I) Scatterplots display mean values for the phenotypes used in the GWA, plotted against the
latitude at which the accessions were collected. (J) A table displaying the significance of the
phenotype-‐latitude correlations. Mean petal area, mean petal length and mean seed area
correlate with latitude with a significance of p<0.05. Correlation was calculated using Pearson’s r.

199
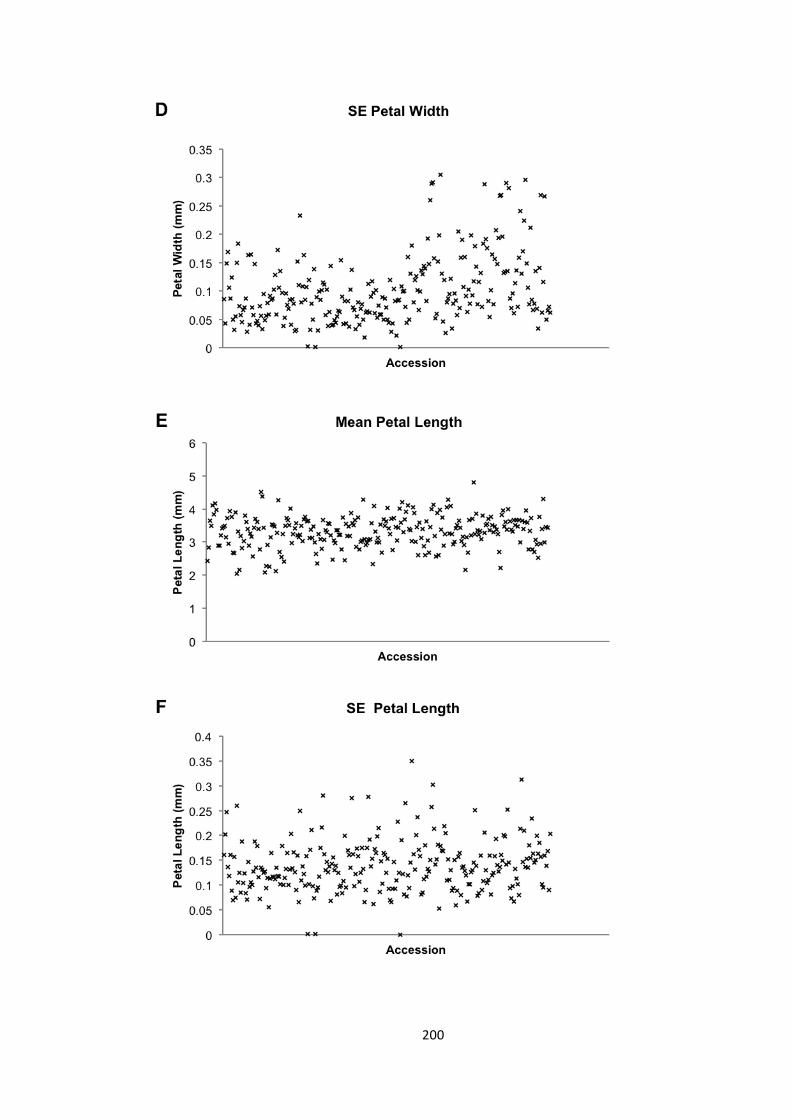
200
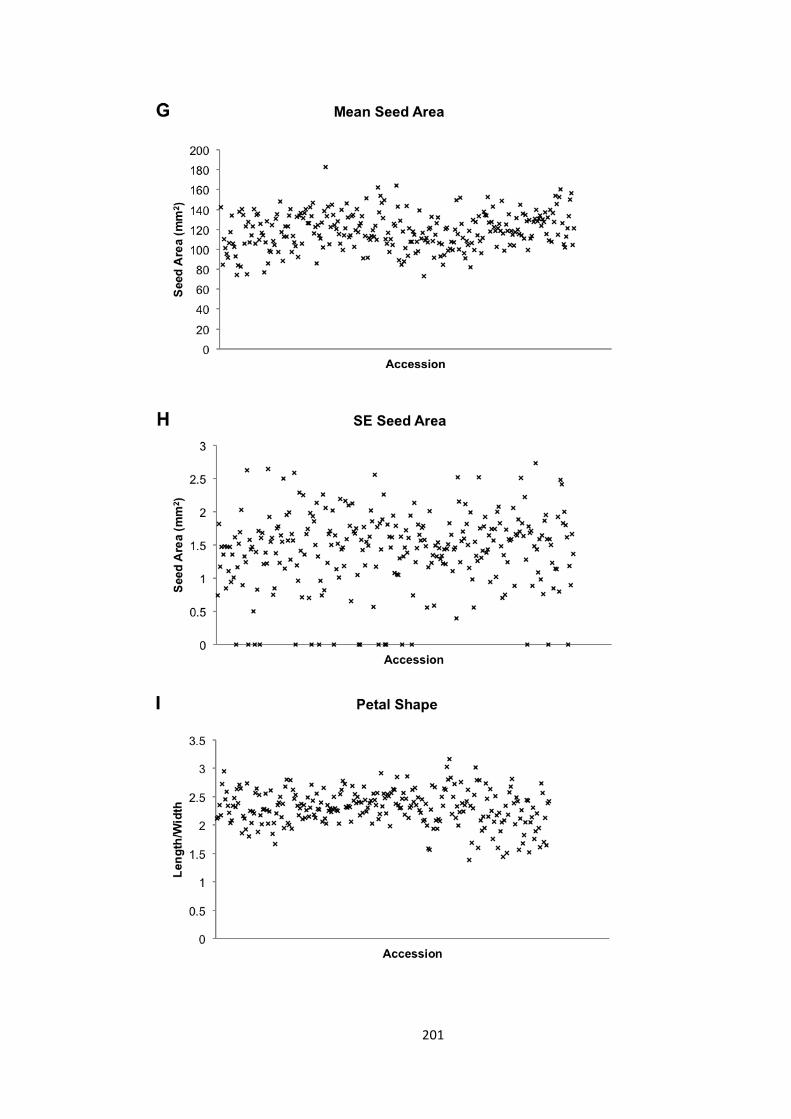
201
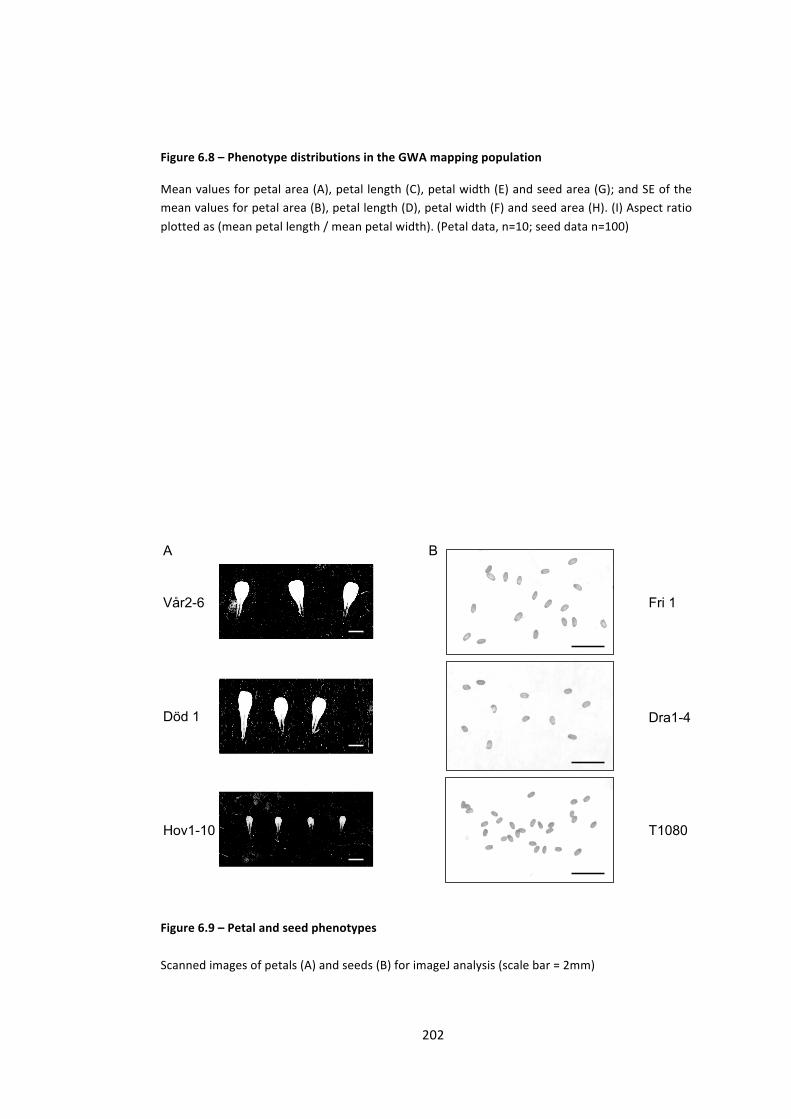
202
Vår2-6 Fri 1
Hov1-10 T1080
Död 1 Dra1-4
A B
Figure 6.8 – Phenotype distributions in the GWA mapping population
Mean values for petal area (A), petal length (C), petal width (E) and seed area (G); and SE of the mean values for petal area (B), petal length (D), petal width (F) and seed area (H). (I) Aspect ratio plotted as (mean petal length / mean petal width). (Petal data, n=10; seed data n=100)
Figure 6.9 – Petal and seed phenotypes
Scanned images of petals (A) and seeds (B) for imageJ analysis (scale bar = 2mm)
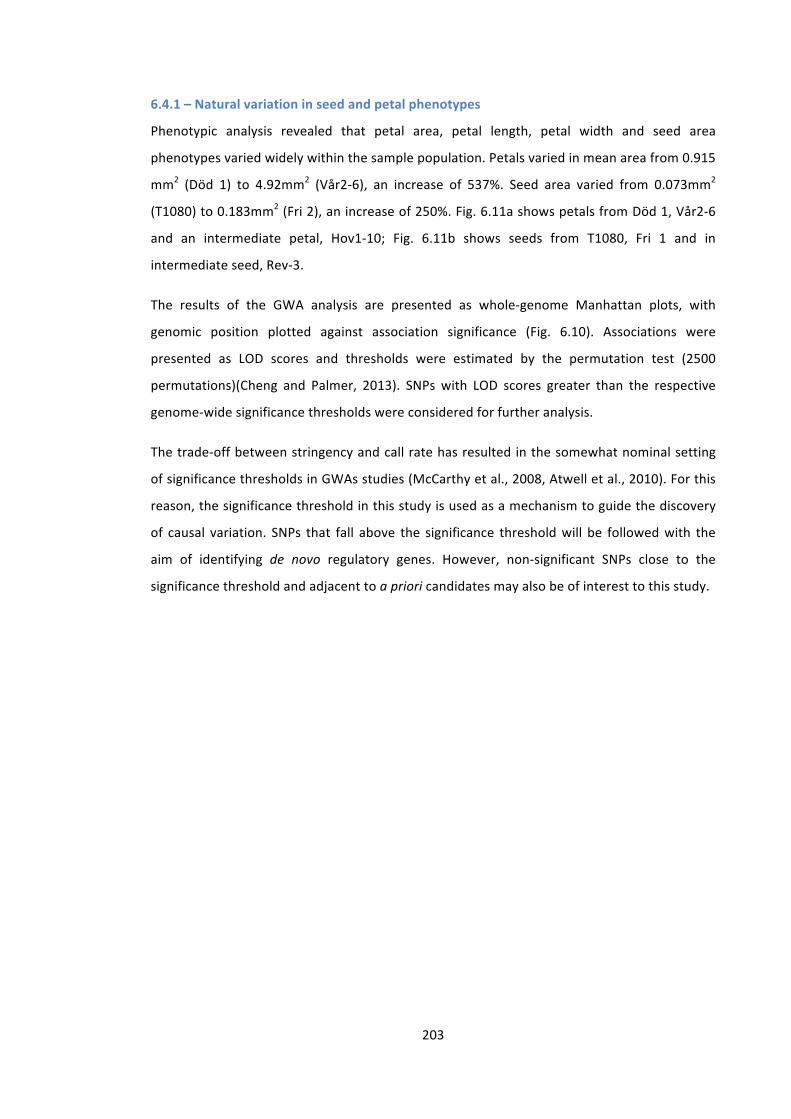
203
6.4.1 – Natural variation in seed and petal phenotypes
Phenotypic analysis revealed that petal area, petal length, petal width and seed area
phenotypes varied widely within the sample population. Petals varied in mean area from 0.915
mm2 (Död 1) to 4.92mm2 (Vår2-‐6), an increase of 537%. Seed area varied from 0.073mm2
(T1080) to 0.183mm2 (Fri 2), an increase of 250%. Fig. 6.11a shows petals from Död 1, Vår2-‐6
and an intermediate petal, Hov1-‐10; Fig. 6.11b shows seeds from T1080, Fri 1 and in
intermediate seed, Rev-‐3.
The results of the GWA analysis are presented as whole-‐genome Manhattan plots, with
genomic position plotted against association significance (Fig. 6.10). Associations were
presented as LOD scores and thresholds were estimated by the permutation test (2500
permutations)(Cheng and Palmer, 2013). SNPs with LOD scores greater than the respective
genome-‐wide significance thresholds were considered for further analysis.
The trade-‐off between stringency and call rate has resulted in the somewhat nominal setting
of significance thresholds in GWAs studies (McCarthy et al., 2008, Atwell et al., 2010). For this
reason, the significance threshold in this study is used as a mechanism to guide the discovery
of causal variation. SNPs that fall above the significance threshold will be followed with the
aim of identifying de novo regulatory genes. However, non-‐significant SNPs close to the
significance threshold and adjacent to a priori candidates may also be of interest to this study.
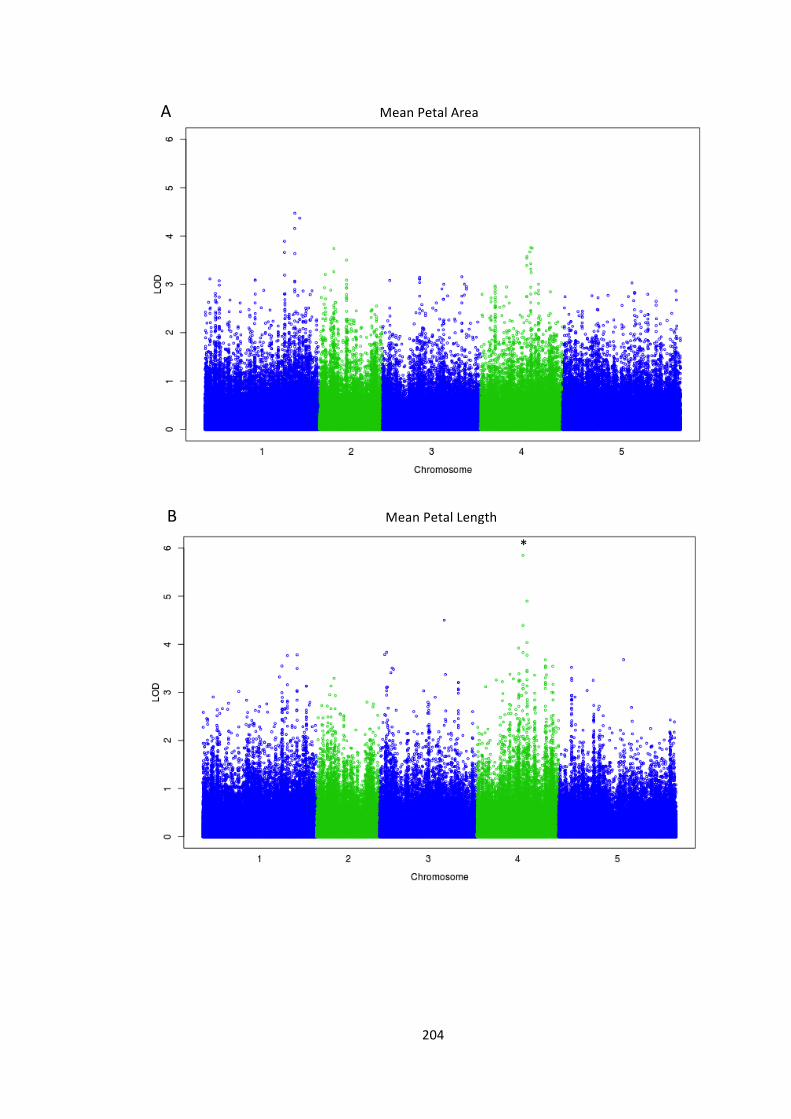
204
A Mean Petal Area
B Mean Petal Length
*

205
C Mean Petal Width
D Mean Seed Area
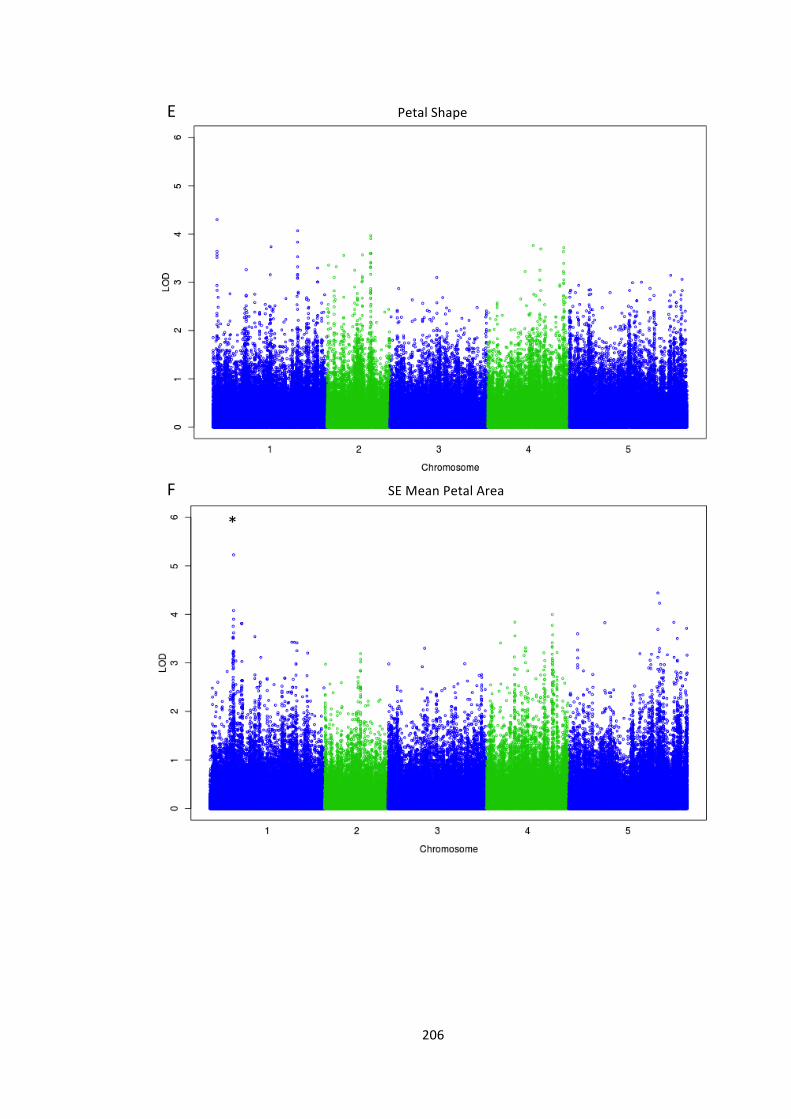
206
E Petal Shape
F SE Mean Petal Area
*
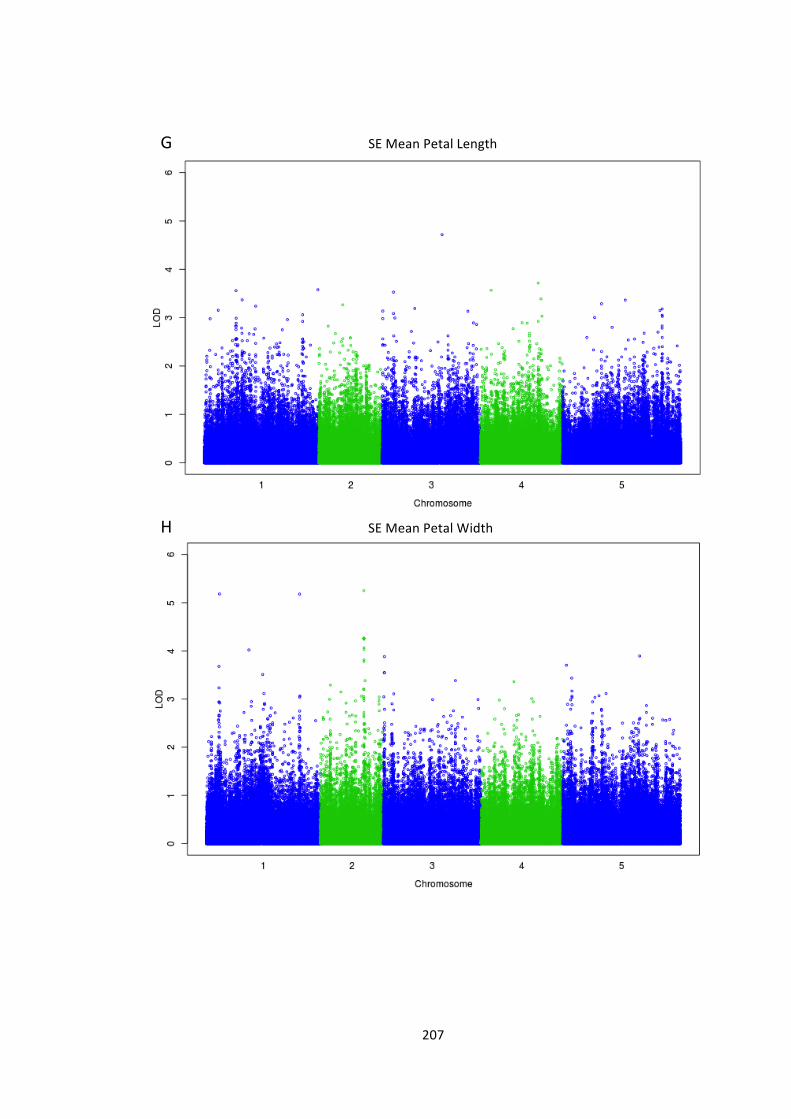
207
G SE Mean Petal Length
H SE Mean Petal Width
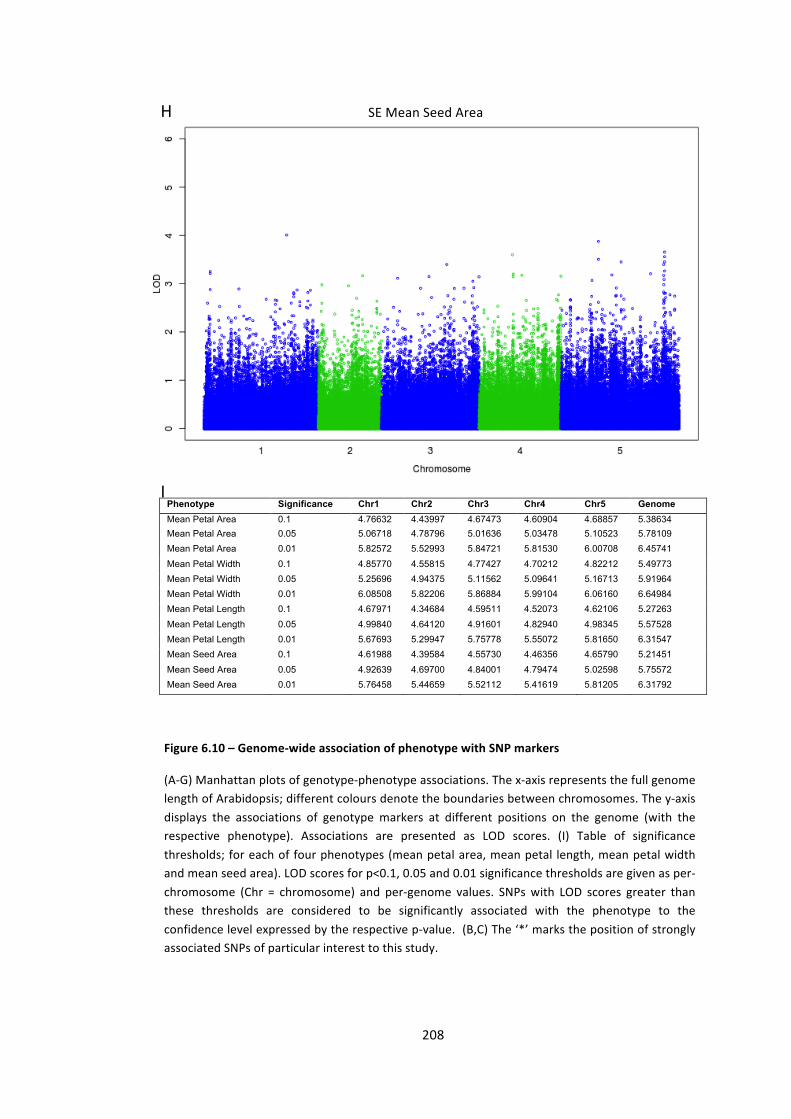
208
Phenotype Significance Chr1 Chr2 Chr3 Chr4 Chr5 Genome Mean Petal Area 0.1 4.76632 4.43997 4.67473 4.60904 4.68857 5.38634 Mean Petal Area 0.05 5.06718 4.78796 5.01636 5.03478 5.10523 5.78109 Mean Petal Area 0.01 5.82572 5.52993 5.84721 5.81530 6.00708 6.45741 Mean Petal Width 0.1 4.85770 4.55815 4.77427 4.70212 4.82212 5.49773 Mean Petal Width 0.05 5.25696 4.94375 5.11562 5.09641 5.16713 5.91964 Mean Petal Width 0.01 6.08508 5.82206 5.86884 5.99104 6.06160 6.64984 Mean Petal Length 0.1 4.67971 4.34684 4.59511 4.52073 4.62106 5.27263 Mean Petal Length 0.05 4.99840 4.64120 4.91601 4.82940 4.98345 5.57528 Mean Petal Length 0.01 5.67693 5.29947 5.75778 5.55072 5.81650 6.31547 Mean Seed Area 0.1 4.61988 4.39584 4.55730 4.46356 4.65790 5.21451 Mean Seed Area 0.05 4.92639 4.69700 4.84001 4.79474 5.02598 5.75572 Mean Seed Area 0.01 5.76458 5.44659 5.52112 5.41619 5.81205 6.31792
H SE Mean Seed Area
Figure 6.10 – Genome-‐wide association of phenotype with SNP markers
(A-‐G) Manhattan plots of genotype-‐phenotype associations. The x-‐axis represents the full genome length of Arabidopsis; different colours denote the boundaries between chromosomes. The y-‐axis displays the associations of genotype markers at different positions on the genome (with the respective phenotype). Associations are presented as LOD scores. (I) Table of significance thresholds; for each of four phenotypes (mean petal area, mean petal length, mean petal width and mean seed area). LOD scores for p<0.1, 0.05 and 0.01 significance thresholds are given as per-‐chromosome (Chr = chromosome) and per-‐genome values. SNPs with LOD scores greater than these thresholds are considered to be significantly associated with the phenotype to the confidence level expressed by the respective p-‐value. (B,C) The ‘*’ marks the position of strongly associated SNPs of particular interest to this study.
I
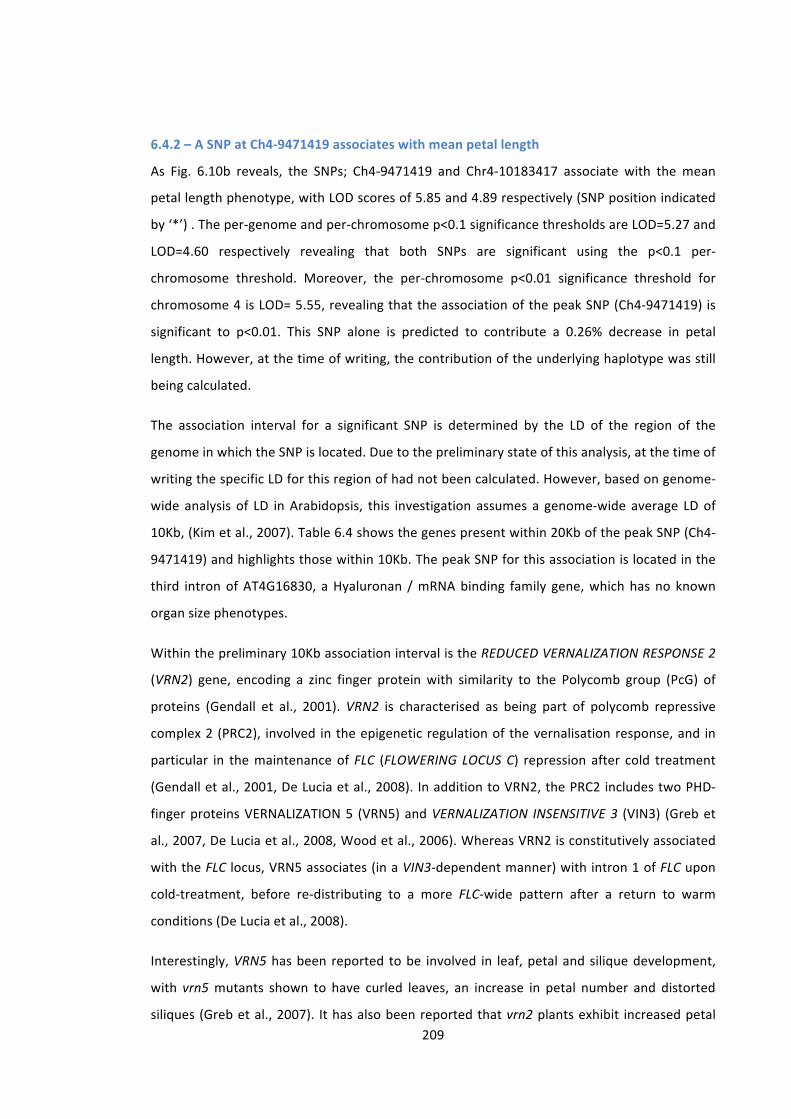
209
6.4.2 – A SNP at Ch4-‐9471419 associates with mean petal length
As Fig. 6.10b reveals, the SNPs; Ch4-‐9471419 and Chr4-‐10183417 associate with the mean
petal length phenotype, with LOD scores of 5.85 and 4.89 respectively (SNP position indicated
by ‘*’) . The per-‐genome and per-‐chromosome p<0.1 significance thresholds are LOD=5.27 and
LOD=4.60 respectively revealing that both SNPs are significant using the p<0.1 per-‐
chromosome threshold. Moreover, the per-‐chromosome p<0.01 significance threshold for
chromosome 4 is LOD= 5.55, revealing that the association of the peak SNP (Ch4-‐9471419) is
significant to p<0.01. This SNP alone is predicted to contribute a 0.26% decrease in petal
length. However, at the time of writing, the contribution of the underlying haplotype was still
being calculated.
The association interval for a significant SNP is determined by the LD of the region of the
genome in which the SNP is located. Due to the preliminary state of this analysis, at the time of
writing the specific LD for this region of had not been calculated. However, based on genome-‐
wide analysis of LD in Arabidopsis, this investigation assumes a genome-‐wide average LD of
10Kb, (Kim et al., 2007). Table 6.4 shows the genes present within 20Kb of the peak SNP (Ch4-‐
9471419) and highlights those within 10Kb. The peak SNP for this association is located in the
third intron of AT4G16830, a Hyaluronan / mRNA binding family gene, which has no known
organ size phenotypes.
Within the preliminary 10Kb association interval is the REDUCED VERNALIZATION RESPONSE 2
(VRN2) gene, encoding a zinc finger protein with similarity to the Polycomb group (PcG) of
proteins (Gendall et al., 2001). VRN2 is characterised as being part of polycomb repressive
complex 2 (PRC2), involved in the epigenetic regulation of the vernalisation response, and in
particular in the maintenance of FLC (FLOWERING LOCUS C) repression after cold treatment
(Gendall et al., 2001, De Lucia et al., 2008). In addition to VRN2, the PRC2 includes two PHD-‐
finger proteins VERNALIZATION 5 (VRN5) and VERNALIZATION INSENSITIVE 3 (VIN3) (Greb et
al., 2007, De Lucia et al., 2008, Wood et al., 2006). Whereas VRN2 is constitutively associated
with the FLC locus, VRN5 associates (in a VIN3-‐dependent manner) with intron 1 of FLC upon
cold-‐treatment, before re-‐distributing to a more FLC-‐wide pattern after a return to warm
conditions (De Lucia et al., 2008).
Interestingly, VRN5 has been reported to be involved in leaf, petal and silique development,
with vrn5 mutants shown to have curled leaves, an increase in petal number and distorted
siliques (Greb et al., 2007). It has also been reported that vrn2 plants exhibit increased petal
210
area and an increase in petal number compared to the wild-‐type (Caroline Dean, personal
communication). Both VRN2 and VRN5 are members of a polycomb group complex involved in
the epigenetic regulation of gene expression (Wood et al., 2006, Gendall et al., 2001, De Lucia
et al., 2008), and it is therefore possible that their influence on gene expression extends to
genes involved in petal development.
Gene
Distance from
Peak SNP (Kb) Gene Name
AT4G16780 -‐21491 ARABIDOPSIS THALIANA HOMEOBOX PROTEIN 2, ATHB-‐2
AT4G16790 -‐19000 Hydroxyproline-‐rich glycoprotein family protein
AT4G16800 -‐15492 ATP-‐dependent caseinolytic (Clp) protease/crotonase family protein
AT4G16807 -‐13064 Unknown protein
AT4G16810 -‐10358 VEFS-‐Box of polycomb protein
AT4G16820 -‐3080 PHOSPHOLIPASE A I BETA 2, PLA-‐I{BETA]2
AT4G16830 70 Hyaluronan / mRNA binding family protein
AT4G16835 2364 Tetratricopeptide repeat (TPR)-‐like superfamily protein
AT4G16840 3785 Unknown protein
AT4G16845 6591 REDUCED VERNALIZATION RESPONSE 2, VRN2
AT4G16850 9488 Unknown protein
AT4G16855 11019 Unknown protein
AT4G16860 20722 RECOGNITION OF PERONOSPORA PARASITICA 4, RPP4
In addition to regulating the vernalisation response, PcG proteins have been shown be
involved in seed development. They are known to play a role in the repression of genes
involved in promoting precocious endosperm proliferation and genes involved in the
promotion of proliferation of the embryo and endosperm after fertilisation (Bemer and
Table 6.4– Association interval around Chr4-‐9471419
List of genes within 20Kb of peak SNP Chr4-‐9471419; genes within 10Kb are in bold. Distances are calculated from middle of gene to peak SNP

211
Grossniklaus, 2012, Köhler and Makarevich, 2006, Grossniklaus et al., 2001). The PcG complex
involved in regulating seed growth consists of at least four proteins: MEDEA (MEA),
FERTILIZATION INDEPENDENT ENDOSPERM 2 (FIE), FERTILIZATION SEEDS 2 (FIS2) and
MULTICOPY SUPPRESSOR OF IRA 1-‐5 (MSI1-‐5) (Bemer and Grossniklaus, 2012, Köhler and
Makarevich, 2006, Luo et al., 1999, Ohad et al., 1999, Grossniklaus et al., 1998, Köhler et al.,
2003); with MEA and FIS2 also serving as subunits in the VRN2-‐PRC2 complex (Bemer and
Grossniklaus, 2012). In addition, MEA and FIS2 also form part of a PcG complex with CURLY-‐
LEAF (CLF)/SWINGER (SWN) and EMBRYONIC FLOWER 2 (EMF2) (Katz et al., 2004, Bemer and
Grossniklaus, 2012, Chanvivattana et al., 2004). Interestingly, CLF promotes the rates of cell
proliferation and cell expansion in in the developing leaf, with clf mutants exhibiting a curled-‐
leaf phenotype and a reduction in petal size in the second whorl (Kim et al., 1998a, Krizek et al.,
2006). CLF is also involved in the AGAMOUS-‐dependent repression of WUSCHEL (WUS) (Liu et
al., 2011), suggesting that it may be involved in the regulation of meristem size (Schoof et al.,
2000, Bleckmann et al., 2010), and as a consequence floral organ number (Schoof et al., 2000).
Interestingly, yeast-‐2-‐hybrid data reveals a physical interaction between the C5 domain of CLF
and the VEFS domain of VRN2 (Chanvivattana et al., 2004), suggesting that the VRN2 may be
able to influence petal number and size via interactions with CLF.
Further than 10Kb from the peak SNP (Ch4-‐9471419) are additional genes that have links to
organ growth and development, including ARABIDOPSIS THALIANA HOMEOBOX PROTEIN 2
(ATHB2), a Class II homeodomain-‐leucine zipper gene that is regulated by far-‐red light
(Carabelli et al., 1993, Morelli and Ruberti, 2002). Over-‐expression of ATHB2 results in longer
hypocotyls, smaller cotyledons and fewer, smaller leaves (Steindler et al., 1999, Schena et al.,
1993). The reduced cotyledon size is due to a reduction in cell expansion, whereas the
elongation of hypocotyls is due to increased cell expansion (Steindler et al., 1999). ATHB2 also
negatively regulates cell proliferation in the root (Steindler et al., 1999), revealing that it can
influence both cell expansion and cell proliferation. More recently, ATHB2 has been shown to
influence adaxial-‐abaxial polarity in the developing leaf (Bou-‐Torrent et al., 2012, Turchi et al.,
2013). Taken together, these data show that ATHB2 controls the development of leaves and
the setting of final leaf size in Arabidopsis. Due to the similarities that exist between leaf and
petal development (see Chapter 1), it is possible that ATHB2 may also influence petal size and
therefore be causal for the variation observed in this GWAs for petal length.
Additional candidate genes include the RPP5 (RECOGNITION OF PERONOSPORA PARASITICA 5)
cluster of seven (Toll Interleukin1 receptor-‐nucleotide binding-‐Leucine-‐rich-‐repeat) TIR-‐NBS-‐
212
LRR class resistance (R) genes (Yi and Richards, 2007) that are located 20Kb downstream of the
peak SNP. The closest of these genes to the peak SNP is RPP4, which like its ortholog, RPP5, is
essential for resistance to Peronospora parasitica (Van Der Biezen et al., 2002, Parker et al.,
1993). Also in the RPP5 cluster and within 30Kb of Ch4-‐9471419 is SUPRESSOR OF NPR1-‐1
(SNC1), a TIR-‐NBS-‐LRR R gene that promotes the expression of pathogenesis-‐related genes and
whose gain of function mutant has a dwarfed phenotype (Li et al., 2001, Zhang et al., 2003).
6.4.3 – A SNP at Chr1:6666179 associates with SE mean petal area.
The following section briefly describes data that suggest that an allele of DA1 might associate
with the phenotype – SE mean petal area. This section of the GWA study is still on-‐going,
therefore these data must be considered preliminary. Nonetheless, the data appear to confirm
predictions made in Chapter 1 that genetic variation at the DA1 locus might be involved in a
size-‐sensing mechanism during petal growth.
Fig. 6.10f shows a large peak in chromosome 1 (indicated by ‘*’ and the second largest peak in
the whole study), indicating a strong association between a region of chromosome 1 and the
SE mean petal area phenotype. The peak SNP (Chr1:6666179) has a LOD score of 5.23. At the
time of writing, the significance thresholds had not been calculated for this phenotype,
however the average per-‐chromosome p<0.10 and p<0.05 significance thresholds for
chromosome 1 for the four tested phenotypes are LOD=4.73 and LOD=5.06 respectively. These
values are encouraging as they suggest that the peak SNP (Chr1:6666179) associates with the
SE mean petal area phenotype with a significance of p<0.05. Currently, the influence of the
associating haplotype on this phenotype is unknown.
The peak SNP (Chr1:6666179) is located 150bp downstream of the 3’ UTR of DA1. Genes
within 20Kb of this SNP are shown in Table 6.5. Within 10Kb of the peak SNP are two genes of
interest: DA1 and ATGATL1 (GALACTURONOSYLTRANSFERASE-‐LIKE 1). AGATL1 is located 5Kb
from the peak SNP and encodes a galacturonosyltransferase involved in carbohydrate
metabolism (Shao et al., 2004). Loss of function of ATGATL1 results in a dwarfed phenotype
with smaller leaves and smaller floral organs, which is thought to be a consequence of cell wall
defects influencing cell expansion rates (Shao et al., 2004).
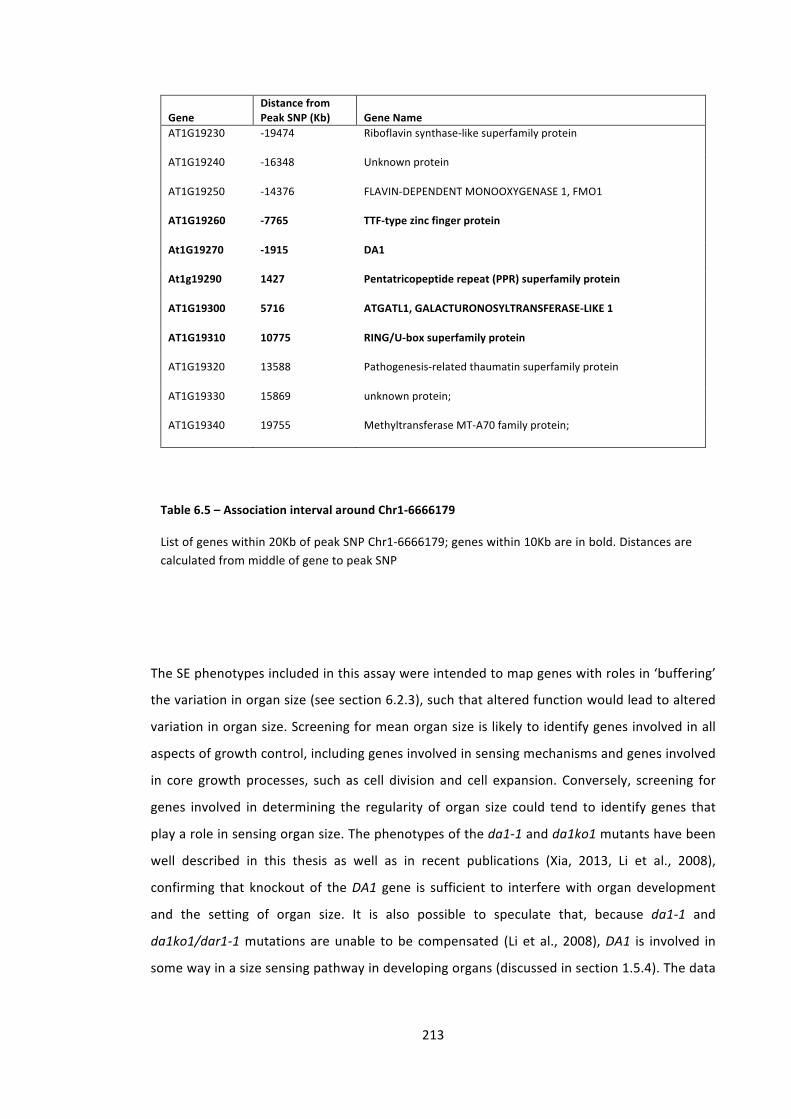
213
Gene Distance from Peak SNP (Kb) Gene Name
AT1G19230 -‐19474 Riboflavin synthase-‐like superfamily protein
AT1G19240 -‐16348 Unknown protein
AT1G19250 -‐14376 FLAVIN-‐DEPENDENT MONOOXYGENASE 1, FMO1
AT1G19260 -‐7765 TTF-‐type zinc finger protein
At1G19270 -‐1915 DA1
At1g19290 1427 Pentatricopeptide repeat (PPR) superfamily protein
AT1G19300 5716 ATGATL1, GALACTURONOSYLTRANSFERASE-‐LIKE 1
AT1G19310 10775 RING/U-‐box superfamily protein
AT1G19320 13588 Pathogenesis-‐related thaumatin superfamily protein
AT1G19330 15869 unknown protein;
AT1G19340 19755 Methyltransferase MT-‐A70 family protein;
The SE phenotypes included in this assay were intended to map genes with roles in ‘buffering’
the variation in organ size (see section 6.2.3), such that altered function would lead to altered
variation in organ size. Screening for mean organ size is likely to identify genes involved in all
aspects of growth control, including genes involved in sensing mechanisms and genes involved
in core growth processes, such as cell division and cell expansion. Conversely, screening for
genes involved in determining the regularity of organ size could tend to identify genes that
play a role in sensing organ size. The phenotypes of the da1-‐1 and da1ko1 mutants have been
well described in this thesis as well as in recent publications (Xia, 2013, Li et al., 2008),
confirming that knockout of the DA1 gene is sufficient to interfere with organ development
and the setting of organ size. It is also possible to speculate that, because da1-‐1 and
da1ko1/dar1-‐1 mutations are unable to be compensated (Li et al., 2008), DA1 is involved in
some way in a size sensing pathway in developing organs (discussed in section 1.5.4). The data
Table 6.5 – Association interval around Chr1-‐6666179
List of genes within 20Kb of peak SNP Chr1-‐6666179; genes within 10Kb are in bold. Distances are calculated from middle of gene to peak SNP
214
described in this section, which suggest that DA1 might be involved in controlling the
regularity of organ size in natural populations of Arabidopsis, supports these predictions.
Moreover, if indeed a DA1 allele is casual in this association, interrogation of the genomes of
the relevant accessions may uncover novel allelic variation in DA1. Such variation would permit
further genetic and biochemical investigation of DA1, and potentially yield new insights into
DA1 enzymology and interactomics. For these reasons, pursuing this line of research is a
priority.
6.4.4 – Future work
So far, this chapter documents the growth and phenotyping of a mapping population, the
investigation of phenotype-‐genotype associations, the identification of associations, and the
subsequent identification of possible candidate genes. This work will be immediately followed
by the analysis of knock-‐out mutations in candidate genes, as well as quantitative
complementation crosses of these alleles. Candidate genes include VRN2.
6.5 – Future perspectives
As set out in section 6.1, this chapter is a parallel, complementary project to the DA1
functional analysis reported in Chapters 3-‐5. The work in this chapter was commenced later
during my research programme and consequently some analyses are still underway. As
discussed in sections 6.3 and 6.4, the MAGIC and GWA analyses have generated several
promising leads around which future research efforts can be built.
The MAGIC analysis of seed phenotypes has identified 8 QTL for mean seed area, identifying a
list of candidate genes which include a priori growth regulators including DA2 and TCP15; both
of which are of wider relevance to this thesis (Chapters 4 and 5 respectively). The QTL also
include potential de novo candidates involved in many aspects of organ size control, including
the brassinosteroid response, the cell cycle and the regulation of seed development.
The GWA analysis has identified a genomic region in chromosome 4 that associates with
phenotypic variation in petal length and a region of chromosome 1 that associates with SE
petal area. The former region includes pathogen response and shade avoidance response
genes, both with links to the regulation of growth and development. Of particular interest is
the identification of VRN2 as a promising candidate and the observation that mutations in
other members of PRC2 can result in petal and seed growth phenotypes (Greb et al., 2007,
Chanvivattana et al., 2004, Kim et al., 1998a, Katz et al., 2004). The region of chromosome 1
that associates with SE petal area includes two genes with organ size phenotypes, AGATL1

215
(Shao et al., 2004) and DA1 (Li et al., 2008). The inability of cell expansion rates to compensate
for an increased duration of cell proliferation during organ growth in da1-‐1 mutants suggests
that DA1 may be involved in a size sensing mechanism in the developing organ. The
identification of DA1 as a candidate in the association with SE petal area, suggests that natural
variation at the DA1 locus has a role in regulating the uniformity of organ size in Arabidopsis
populations.
Future work will involve, as outlined in sections 6.3 and 6.4, determining the genotype
contribution to the phenotypic variation, which will help to understand the relative influence
of the variation at that particular locus. Future work will also test the influence of the
identified candidate genes (and their constituent SNPs) on the phenotypes in question.
Currently, work is underway to perform quantitative complementation crosses with the
candidate genes identified in this thesis.
The work in this chapter has established a platform for future gene discovery and provides lists
of candidate genes that may be important regulators of seed or petal development.
216
Chapter 7 -‐ General Discussion
The work documented in this thesis has shed light on two key areas of DA1 biology. Firstly, a
biochemical study of the DA1 protein has demonstrated that it is an ubiquitin-‐dependent
metallopeptidase, with a potentially enhancing activity towards the two E3 ligases, EOD1 and
DA2. Secondly, an investigation of DA1 interacting partners has revealed that DA1 has the
potential to function in several growth control pathways, which overlap both organ
development and pathogen response.
The biochemical analyses have revealed a novel regulatory feed-‐forward loop between two
RING E3 ligases and an interacting peptidase. This would be the first time that an ubiquitin-‐
activated peptidase has been shown to regulate the activity of an E3 ligase, and presents a
novel regulatory mechanism whose significance may extend as far as the field of human cancer
biology. In terms of higher plants however, the interactomic analysis in Chapter 4 suggests that
peptidase-‐mediated regulation by members of the DA1 family may play a role in both
pathogen-‐related and developmental growth regulation.
Finally, the identification of DA1 in a genome wide association analysis for variation in seed
and organ size has demonstrated that natural allelic variation in DA1 may contribute to fitness
and adaptation of populations in the natural landscape.
7.1 – DA1, EOD1 and DA2: molecular characterisation
7.1.1 – DA1: a ubiquitin activated peptidase
The biochemical analyses documented in Chapter 5 revealed that the predicted
metallopeptidase domain in DA1 is active towards EOD1 and DA2. Importantly, it also
demonstrates that its activity is dependent on the ubiquitination of DA1. This suggests that
native, full-‐length DA1 exists in an auto-‐repressive state, which is disrupted by the addition of
a short ubiquitin chain or several mono-‐ubiquitin molecules (Fig. 7.1).
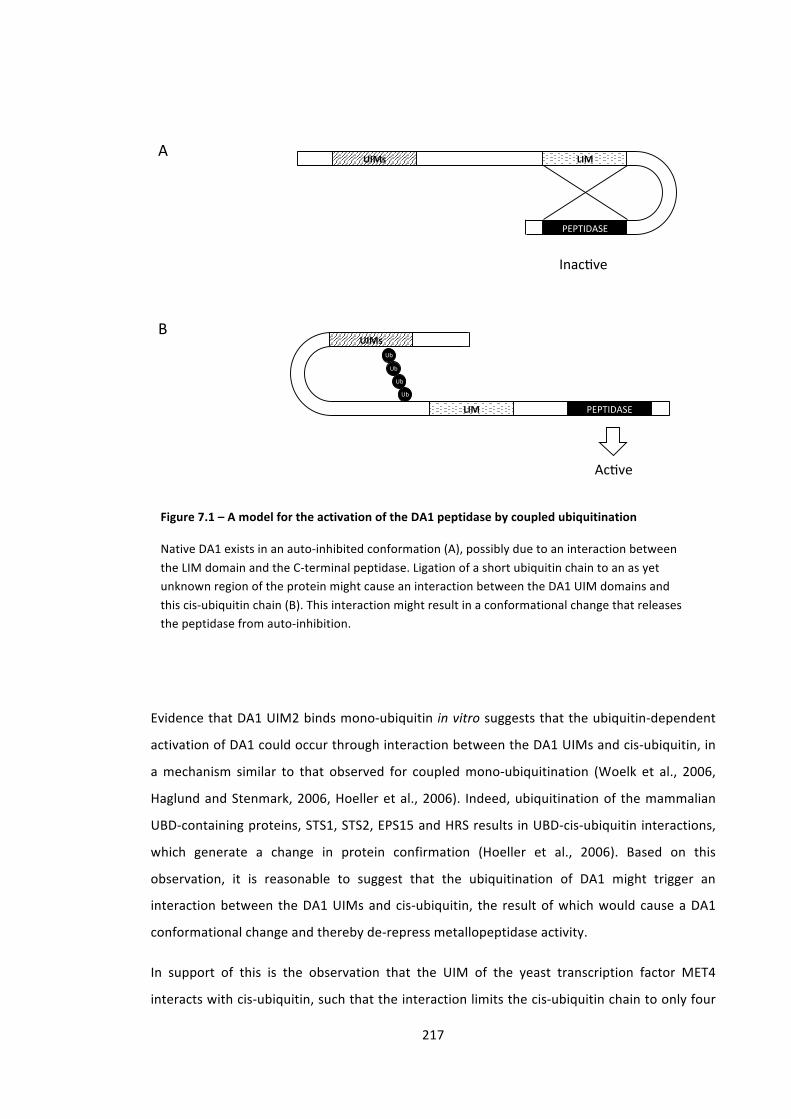
217
PEPTIDASE(
LIM$UIMs$A
PEPTIDASE(LIM$
UIMs$
Ub(
Ub(
Ub(
Ub(
B
Ac-ve(
Inac-ve(
Evidence that DA1 UIM2 binds mono-‐ubiquitin in vitro suggests that the ubiquitin-‐dependent
activation of DA1 could occur through interaction between the DA1 UIMs and cis-‐ubiquitin, in
a mechanism similar to that observed for coupled mono-‐ubiquitination (Woelk et al., 2006,
Haglund and Stenmark, 2006, Hoeller et al., 2006). Indeed, ubiquitination of the mammalian
UBD-‐containing proteins, STS1, STS2, EPS15 and HRS results in UBD-‐cis-‐ubiquitin interactions,
which generate a change in protein confirmation (Hoeller et al., 2006). Based on this
observation, it is reasonable to suggest that the ubiquitination of DA1 might trigger an
interaction between the DA1 UIMs and cis-‐ubiquitin, the result of which would cause a DA1
conformational change and thereby de-‐repress metallopeptidase activity.
In support of this is the observation that the UIM of the yeast transcription factor MET4
interacts with cis-‐ubiquitin, such that the interaction limits the cis-‐ubiquitin chain to only four
Figure 7.1 – A model for the activation of the DA1 peptidase by coupled ubiquitination
Native DA1 exists in an auto-‐inhibited conformation (A), possibly due to an interaction between the LIM domain and the C-‐terminal peptidase. Ligation of a short ubiquitin chain to an as yet unknown region of the protein might cause an interaction between the DA1 UIM domains and this cis-‐ubiquitin chain (B). This interaction might result in a conformational change that releases the peptidase from auto-‐inhibition.
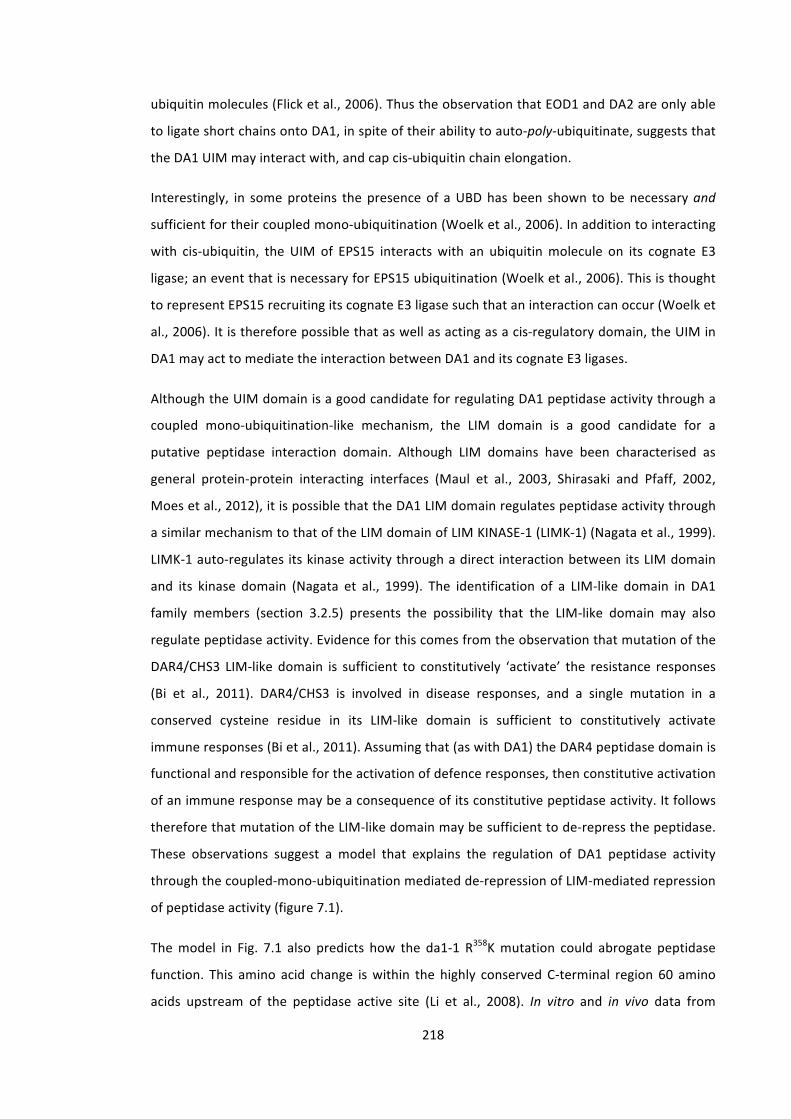
218
ubiquitin molecules (Flick et al., 2006). Thus the observation that EOD1 and DA2 are only able
to ligate short chains onto DA1, in spite of their ability to auto-‐poly-‐ubiquitinate, suggests that
the DA1 UIM may interact with, and cap cis-‐ubiquitin chain elongation.
Interestingly, in some proteins the presence of a UBD has been shown to be necessary and
sufficient for their coupled mono-‐ubiquitination (Woelk et al., 2006). In addition to interacting
with cis-‐ubiquitin, the UIM of EPS15 interacts with an ubiquitin molecule on its cognate E3
ligase; an event that is necessary for EPS15 ubiquitination (Woelk et al., 2006). This is thought
to represent EPS15 recruiting its cognate E3 ligase such that an interaction can occur (Woelk et
al., 2006). It is therefore possible that as well as acting as a cis-‐regulatory domain, the UIM in
DA1 may act to mediate the interaction between DA1 and its cognate E3 ligases.
Although the UIM domain is a good candidate for regulating DA1 peptidase activity through a
coupled mono-‐ubiquitination-‐like mechanism, the LIM domain is a good candidate for a
putative peptidase interaction domain. Although LIM domains have been characterised as
general protein-‐protein interacting interfaces (Maul et al., 2003, Shirasaki and Pfaff, 2002,
Moes et al., 2012), it is possible that the DA1 LIM domain regulates peptidase activity through
a similar mechanism to that of the LIM domain of LIM KINASE-‐1 (LIMK-‐1) (Nagata et al., 1999).
LIMK-‐1 auto-‐regulates its kinase activity through a direct interaction between its LIM domain
and its kinase domain (Nagata et al., 1999). The identification of a LIM-‐like domain in DA1
family members (section 3.2.5) presents the possibility that the LIM-‐like domain may also
regulate peptidase activity. Evidence for this comes from the observation that mutation of the
DAR4/CHS3 LIM-‐like domain is sufficient to constitutively ‘activate’ the resistance responses
(Bi et al., 2011). DAR4/CHS3 is involved in disease responses, and a single mutation in a
conserved cysteine residue in its LIM-‐like domain is sufficient to constitutively activate
immune responses (Bi et al., 2011). Assuming that (as with DA1) the DAR4 peptidase domain is
functional and responsible for the activation of defence responses, then constitutive activation
of an immune response may be a consequence of its constitutive peptidase activity. It follows
therefore that mutation of the LIM-‐like domain may be sufficient to de-‐repress the peptidase.
These observations suggest a model that explains the regulation of DA1 peptidase activity
through the coupled-‐mono-‐ubiquitination mediated de-‐repression of LIM-‐mediated repression
of peptidase activity (figure 7.1).
The model in Fig. 7.1 also predicts how the da1-‐1 R358K mutation could abrogate peptidase
function. This amino acid change is within the highly conserved C-‐terminal region 60 amino
acids upstream of the peptidase active site (Li et al., 2008). In vitro and in vivo data from

219
Chapter 5 revealed that mutation of the peptidase active site is sufficient to abolish DA1
peptidase activity towards EOD1 and DA2. It is therefore possible that the da1-‐1 mutation may
also reduce peptidase function. This can be readily tested by incorporating the da1-‐1 protein
into the in vitro and in vivo peptidase activity assays described in section 5.3.
The model also predicts that abrogation of LIM or LIM-‐like function may be sufficient to
constitutively activate the DA1 peptidase, and abrogation of UIM function may be able to
constitutively inactivate the peptidase. This could be directly tested using the in vitro and in
vivo peptidase activity assays (section 5.3) using the DA1uim12 mutant (full length DA1, with
both UIMs mutated) and the DA1lim8 mutant proteins. An alternate but not exclusive function
for the UIMs may be to recognise ubiquitinated E2 or EOD1, or both.
The demonstration that DA1 is an ubiquitin-‐dependent peptidase is important for
understanding the functions of other members of the DA1 family. It is also one of the first
examples of a well-‐characterised regulatory peptidase in plants and emphasises the significant
broader roles of peptidases in regulating diverse plant processes, such as the role of SOL1 (a
Zn-‐carboxypeptidase) in the regulation of meristem development (Casamitjana-‐Martınez et al.,
2003). All DA1 family members contain a LIM domain and a highly conserved C-‐terminal region
with a metallopeptidase active site (Fig. 3.1), with the LIM domain providing a postulated
auto-‐regulatory function. Regardless of the involvement of the LIM domain in peptidase
regulation, the demonstration in this thesis that the DA1 peptidase is active, suggests that all
other DA1 family members might function through their peptidase domains. So far DAR1 has
been characterised as a regulator of organ size (Li et al., 2008), DAR2 as a regulator of root
meristem size (Peng et al., 2013), and DAR4 as an R-‐protein and regulator of freezing tolerance
(Yang et al., 2010, Bi et al., 2011). Whether or not these proteins interact with their own E3
ligases, the insight developed in this thesis is likely to accelerate the understanding of the
molecular basis of their phenotypes and provide further information on a novel regulatory
mechanism.
Taking DAR4/CHS3 as an example, recent work concluded that the LIM domain may act as an
intra-‐molecular repressor of DAR4/CHS3 R-‐protein activity (Bi et al., 2011, Yang et al., 2010).
However, the lack of information regarding C-‐terminal peptidase function led to the
hypothesis that the LIM domain interacts with, and represses some aspect of N-‐terminal
protein function (Bi et al., 2011). Although this may indeed be the case, the identification of an
active peptidase in the C-‐terminus of DA1 leads to the prediction that the DAR4 peptidase is
220
also active and therefore may be a target of LIM-‐repression. This is directly testable using the
biochemical assays developed in this thesis.
This thesis presents, to the best of my knowledge, the first example of ubiquitin-‐dependent
peptidase activation. Due to the essentially irreversible nature of protein cleavage, peptidase
activity must be very stringently regulated. For example, caspases, proteases involved in
apoptosis in animal systems (Thornberry and Lazebnik, 1998), are proteolytically activated
(Mason and Joyce, 2011) as well as being targets of phosphorylation-‐mediated regulation
(Cardone et al., 1998). In plants, proteolysis and phosphorylation are also utilised as
mechanisms to regulate peptidase activity. For example, the activity of the 26S proteasome is
regulated by phosphorylation (Kurepa and Smalle, 2008, Lee et al., 2003, Umeda et al., 1997),
and the Arabidopsis CARBOXYPEPTIDASE Y (AtCPY) is activated through cleavage by the
cysteine protease VPEγ (VACUOLAR PROCESSING ENZYME-‐γ) (Rojo et al., 2004, Rojo et al.,
2003). These examples highlight the existence of both phosphorylation-‐ and peptidase-‐
mediated regulation of peptidase enzymes, however until this study there has been no
evidence of ubiquitin-‐mediated regulation of peptidases. Nevertheless, the concept of
ubiquitin-‐regulated enzyme activity is not new; for example poly-‐ubiquitin activation of the E3
ligase BRCA1 (Mallery et al., 2002), the K29/K33-‐linked ubiquitin-‐mediated regulation of the
NUAK1 kinase (Ikeda and Dikic, 2008, Al-‐Hakim et al., 2008) and the mono-‐ubiquitin
modification of the endocytic protein EPS15 (Woelk et al., 2006, Hoeller et al., 2006) have all
been reported.
7.1.2 – EOD1 and DA2 are peptidase-‐regulated E3 ubiquitin ligases
Genetic data presented in Chapter 5, revealing that DA1 synergistically interacts with EOD1
and DA2 to influence petal and seed size, shows an enhancing interaction, which suggests that
DA1 activity might enhance both EOD1 and DA2 functions. Biochemical data in Chapter 5 also
revealed that DA1 peptidase activity cleaves EOD1 and DA2. Taken together, these data
suggest that DA1 might increase the growth-‐repressive activities of these two E3 ligases
through a peptidase-‐mediated cleavage.
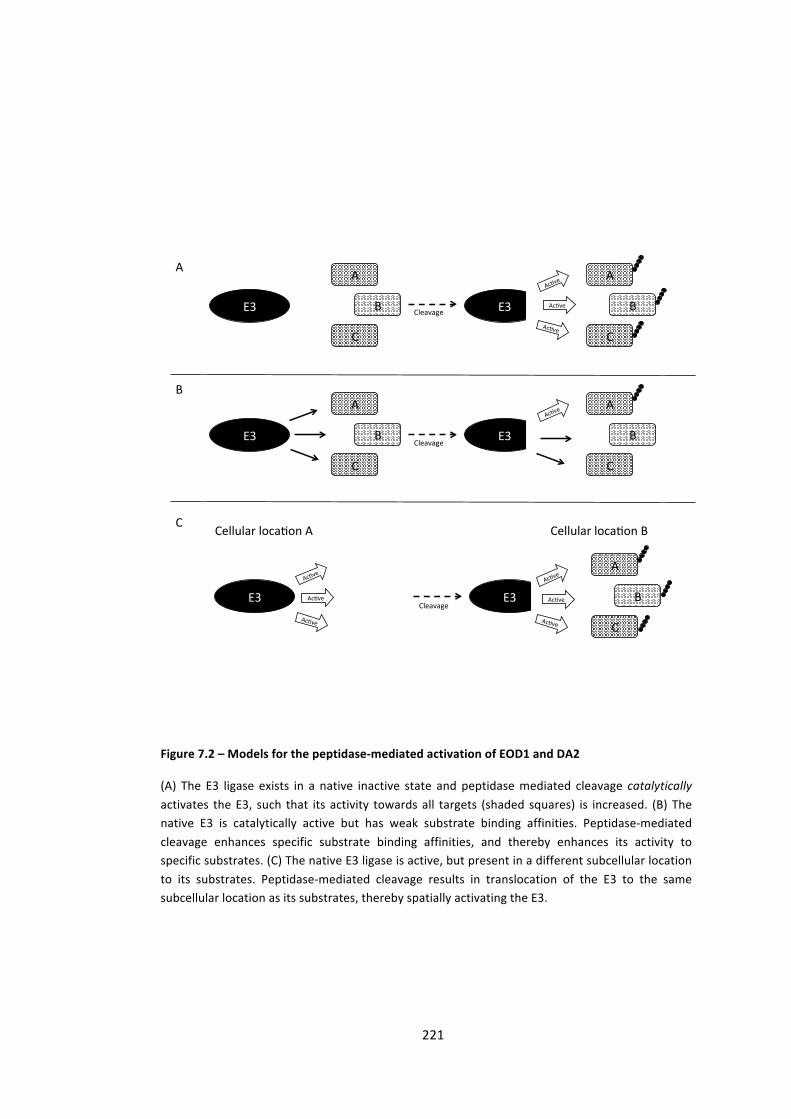
221
E3#
A#
B#
C#
E3#
A#
B#
C#
Ac(ve#
Ac(ve#
Ac(ve#
Cleavage#
E3#
A#
B#
C#
E3#
A#
B#
C#
Ac(ve#
Cleavage#
E3# E3#
A#
B#
C#
Ac(ve#
Ac(ve#
Ac(ve#
Ac(ve#
Ac(ve#
Ac(ve#
Cleavage#
Cellular#loca(on#A# Cellular#loca(on#B#
A#
B#
C#
Figure 7.2 – Models for the peptidase-‐mediated activation of EOD1 and DA2
(A) The E3 ligase exists in a native inactive state and peptidase mediated cleavage catalytically activates the E3, such that its activity towards all targets (shaded squares) is increased. (B) The native E3 is catalytically active but has weak substrate binding affinities. Peptidase-‐mediated cleavage enhances specific substrate binding affinities, and thereby enhances its activity to specific substrates. (C) The native E3 ligase is active, but present in a different subcellular location to its substrates. Peptidase-‐mediated cleavage results in translocation of the E3 to the same subcellular location as its substrates, thereby spatially activating the E3.
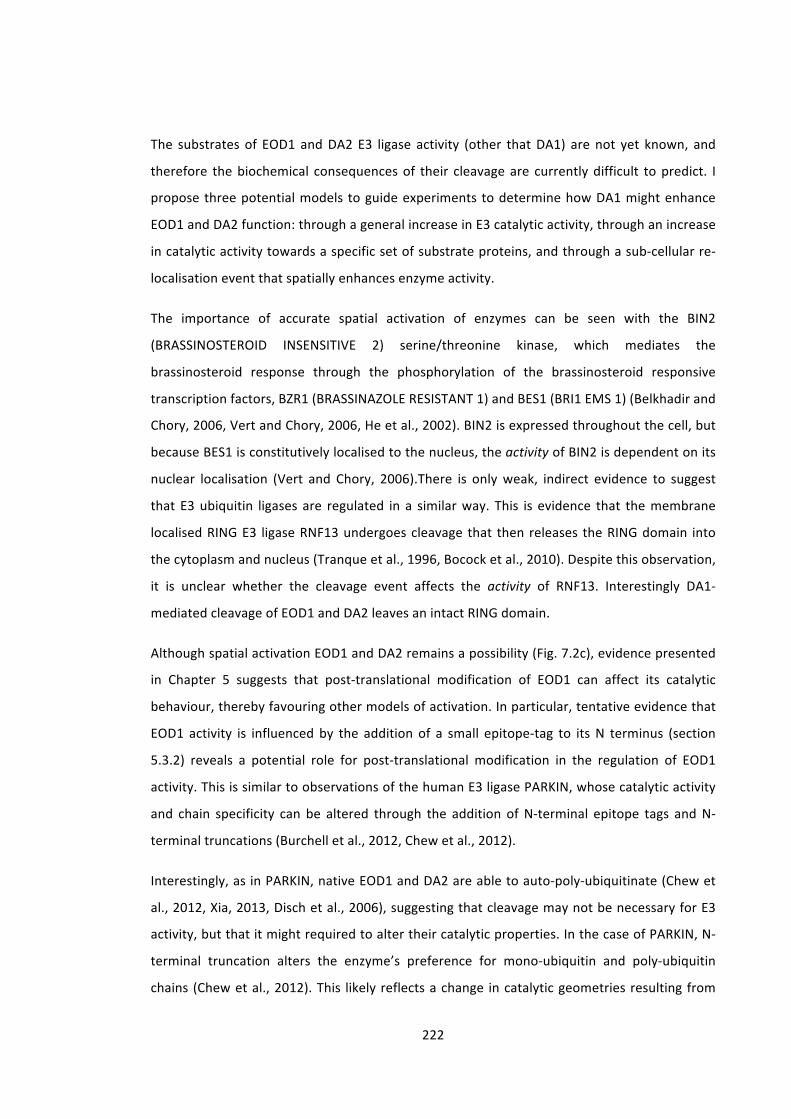
222
The substrates of EOD1 and DA2 E3 ligase activity (other that DA1) are not yet known, and
therefore the biochemical consequences of their cleavage are currently difficult to predict. I
propose three potential models to guide experiments to determine how DA1 might enhance
EOD1 and DA2 function: through a general increase in E3 catalytic activity, through an increase
in catalytic activity towards a specific set of substrate proteins, and through a sub-‐cellular re-‐
localisation event that spatially enhances enzyme activity.
The importance of accurate spatial activation of enzymes can be seen with the BIN2
(BRASSINOSTEROID INSENSITIVE 2) serine/threonine kinase, which mediates the
brassinosteroid response through the phosphorylation of the brassinosteroid responsive
transcription factors, BZR1 (BRASSINAZOLE RESISTANT 1) and BES1 (BRI1 EMS 1) (Belkhadir and
Chory, 2006, Vert and Chory, 2006, He et al., 2002). BIN2 is expressed throughout the cell, but
because BES1 is constitutively localised to the nucleus, the activity of BIN2 is dependent on its
nuclear localisation (Vert and Chory, 2006).There is only weak, indirect evidence to suggest
that E3 ubiquitin ligases are regulated in a similar way. This is evidence that the membrane
localised RING E3 ligase RNF13 undergoes cleavage that then releases the RING domain into
the cytoplasm and nucleus (Tranque et al., 1996, Bocock et al., 2010). Despite this observation,
it is unclear whether the cleavage event affects the activity of RNF13. Interestingly DA1-‐
mediated cleavage of EOD1 and DA2 leaves an intact RING domain.
Although spatial activation EOD1 and DA2 remains a possibility (Fig. 7.2c), evidence presented
in Chapter 5 suggests that post-‐translational modification of EOD1 can affect its catalytic
behaviour, thereby favouring other models of activation. In particular, tentative evidence that
EOD1 activity is influenced by the addition of a small epitope-‐tag to its N terminus (section
5.3.2) reveals a potential role for post-‐translational modification in the regulation of EOD1
activity. This is similar to observations of the human E3 ligase PARKIN, whose catalytic activity
and chain specificity can be altered through the addition of N-‐terminal epitope tags and N-‐
terminal truncations (Burchell et al., 2012, Chew et al., 2012).
Interestingly, as in PARKIN, native EOD1 and DA2 are able to auto-‐poly-‐ubiquitinate (Chew et
al., 2012, Xia, 2013, Disch et al., 2006), suggesting that cleavage may not be necessary for E3
activity, but that it might required to alter their catalytic properties. In the case of PARKIN, N-‐
terminal truncation alters the enzyme’s preference for mono-‐ubiquitin and poly-‐ubiquitin
chains (Chew et al., 2012). This likely reflects a change in catalytic geometries resulting from
223
the modification of the N-‐terminal substrate-‐binding domain. Both PARKIN and EOD1 have C-‐
terminal RING-‐domains (E2-‐binding domains), indicating that
RING%
Ub%
E2%
Substrate%
EOD1%
RING%
Ub%
E2%
Ub%
Substrate%
EOD1%Cleavage%
their N-‐terminal regions may be involved in substrate binding. Consequently, the cleavage of
EOD1 might trigger changes to the catalytic geometry of its active site and alter substrate or
chain specificity (Fig. 7.2b). Therefore it may be that DA1-‐mediated cleavage of EOD1 and DA2
alters their catalytic specificity (either substrate of chain-‐type) and not their general catalytic
activity (Fig. 7.3).
The observations that E3 ligases can be regulated by post-‐translational modification –
including this study – have implications across the field of biology and in particular in the study
of cancer biology. Many tumour suppressors and oncogenes are E3 ligases. These include the
RING E3, MDM2, which is a negative regulator of the central tumour suppressor gene p53
(Fang et al., 2000, Gottlieb and Oren, 1998), and the RING E3, BRCA1, which is involved in DNA
damage repair (Gowen et al., 1998) and is a key marker of ovarian and breast cancer (Futreal
et al., 1994, Miki et al., 1994). Other examples include the IAP (INHIBITOR OF APOPTOSIS)
protein, which is involved in the ubiquitin-‐dependent degradation of caspases (Scott et al.,
2005) as well as various components of the SCF complex, such as SKP2 and FBW7, which have
Figure 7.3 – A Model for the peptidase-‐mediated modification of EOD1 substrate specificity
It is possible that in EOD1’s native state, the C-‐terminal E2-‐binding RING domain is functional but the N-‐terminal substrate-‐binding domain is not. It is possible that peptidase-‐mediated cleavage of the N-‐terminus of EOD1 alters the substrate-‐binding domain such that the substrate can be accommodated. This would enable the E2 and the substrate to interact, and subsequently permit the ligation of the E2-‐conjugated ubiquitin to the substrate protein.
224
been implicated in lung cancer, and ovarian cancer, breast cancer, lymphoma and colorectal
cancer respectively (Nakayama and Nakayama, 2006).
Such is the prevalence of E3 ligases in the development of cancers, that various E3s have been
suggested as therapeutic targets of anti-‐cancer drugs (Sun, 2006, Sun, 2003). Identification of a
novel mechanism for the regulation of E3 ligases in plants may guide the discovery of a similar
mechanism in animal systems, and will ensure that all opportunities for manipulating E3 ligase
activity are understood.
7.1.3 – DA1, EOD1 and DA2: a novel enhancing regulatory loop
Together, these data reveal a novel enhancing regulatory loop involving the regulation of an E3
ligase through its interaction with an interacting peptidase enzyme. If both the E3 ligase and
peptidase components of this module activate one-‐another, then once initiated, the reciprocal
activation of peptidase and E3 would be likely to progress in an irreversible manner. This is a
novel switching mechanism that may act as a molecular ratchet that drives the unidirectional,
irreversible amplification of a signal (Fig. 5.13).
Similar peptidase-‐mediated reciprocally-‐activating enzyme loops, such as those proposed for
the DA1-‐EOD1 and DA1-‐DA2 examples described in this work, have been described in studies
of apoptosis in animal systems. Caspase-‐9, a member of the caspase family of cysteine
proteases involved in the apoptotic pathway, is involved in an activating feed-‐forward loop
with its sister caspase, caspase-‐3 (Budihardjo et al., 1999). Once cleaved from its inactive
procaspase state, caspase-‐9 cleaves procaspase-‐3, which, once active, cleaves more
procaspase-‐9 (Budihardjo et al., 1999). This cycle feeds forward to activate the entire pool of
caspase-‐9 and caspase-‐3, thereby irreversibly committing the animal cell towards apoptosis
(Budihardjo et al., 1999, Thornberry and Lazebnik, 1998). It is possible that the auto-‐activating
DA1-‐EOD1 module acts in a similar way to the capsase-‐9-‐caspase-‐3 module. This would predict
that under conditions that result in the interaction of EOD1 and DA1, an irreversible EOD1-‐ and
DA1-‐dependent signalling cascade is initiated.
More specifically, this work reveals a novel mechanism for the regulation of E3 ligases.
Previous work has revealed the regulation of E3 activity through a variety of mechanisms
including ubiquitination (Stevenson et al., 2007, Mallery et al., 2002), neddylation and
rubylation (Duda et al., 2008, Biedermann and Hellmann, 2011), binding-‐site competition
(Zheng et al., 2002), dimerization (Merlet et al., 2009) and artificial truncation (Chew et al.,
2012). To date, to my knowledge no one has demonstrated the in vivo cleavage of an E3 ligase
by a cognate peptidase enzyme.
225
In addition to the novelty of this regulatory mechanism, as well as its implications for other
studies in biology, this thesis has advanced our understanding of the role of EOD1, DA2 and
DA1 at the level of the developing organ (see section 7.2). Furthermore it has created
significant new insight into detailed molecular mechanisms that themselves provide a way to
investigate the wider cellular consequences of EOD1-‐, DA2-‐ and DA1-‐ mediated regulation. The
ability to constitutively activate EOD1 and DA2 enables one to screen for E3 substrate proteins
using a method similar to that used in (Emanuele et al., 2011). A promising approach to
identify substrates of E3 ligases by converting them to neddylating proteins (Zhuang et al.,
2012) could also be used. Furthermore, on-‐going work (Grant BB/K017225/1) to identify the
sequence specificity of DA1 cleavage has the potential to allow in silico screening for novel
DA1 targets.
Breakthroughs in understanding of the molecular relationship between DA1 and EOD1 (and
DA2) will also enable strategies for the improvement of yield in commercial crop varieties. The
knowledge that DA1 acts synergistically with both EOD1 and DA2 in the regulation of organ
size suggests that a combination of mutations will increase seed size and crop yield. As part of
this project a patent application was recently filed for the protection of DA1-‐DA2 technologies.
7.2 – DA1: regulating organ growth and development
7.2.1 – DA1: A role in organ growth and pathogen response pathways?
Recent work is beginning to reveal considerable overlap between the regulation of plant
growth and development and pathogen responses. A reduction in plant growth is a
stereotypical response to pathogen challenge, and many investigations of plant PAMP
(pathogen associated molecular patterns) responses utilise seedling growth response assays
(Gómez‐Gómez et al., 1999, Gómez-‐Gómez and Boller, 2000, Zipfel et al., 2006). Indeed the
challenge of Arabidopsis seedlings with the PAMPs, flg22 (flagellin), and elf18 (EF-‐Tu), results
in an inhibition of growth (Gómez‐Gómez et al., 1999, Gómez-‐Gómez and Boller, 2000, Zipfel
et al., 2006).
Further cross-‐talk between these two biological processes have been revealed by mutations in
pathogen-‐response related genes that have significantly altered growth and development
phenotypes. For example, the gain-‐of-‐function mutation in the plant resistance gene SNC1
(SUPRESSOR OF NPR1-‐1), which results in constitutive expression of pathogenesis-‐related (PR)
genes, also has a dwarfed phenotype (Li et al., 2001, Zhang et al., 2003). This overlap of growth
responses and innate immunity is further highlighted by the involvement of BAK1 (BRI1-‐
226
ASSOCIATED RECEPTOR KINASE 1) in both the brassinosteroid response and the FLS2 PAMP
response. bak1 knockout mutants have a reduced sensitivity to brassinosteroids and flg22
treatment, and have a semi-‐dwarfed phenotype (Chinchilla et al., 2007b, Li et al., 2002a). BAK1
has been shown to interact with both BRI1 (BRASSINOSTEROID INSESNITIVE 1) and FLS2 and
thereby facilitate brassinosteroid-‐ and flg22-‐responsive signalling respectively (Chinchilla et al.,
2007b, Li et al., 2002a, Nam and Li, 2002).
Whereas BAK1 provides an example of a gene involved in transducing both growth-‐related and
pathogen-‐related signals, the TCP family of transcription factors may be a common component
of growth and pathogen signalling pathways. As described in Chapter 4, members of the large
TCP family of transcription factors are well characterised regulators of growth and
development (Martín-‐Trillo and Cubas, 2010), with evidence that Class I TCPs bind directly to
the promoters of cell cycle genes (Li et al., 2012). However, a recent interactomic study also
identified TCP14 as a hub in response to Pseudomonas syringae and Hyaloperonospora
arabidopsidis infection (Mukhtar et al., 2011). In addition, the partial correlation analysis of
transcriptome data (Maclean, unpublished) documented in Fig. S2 identified DA1 as a hub in a
network of interactions in response to flg22, with TCP15 being a downstream target of DA1.
7.2.2 – DA1 and LRR-‐RLKs: regulation by internalisation?
Data from a partial correlation analysis (Maclean, unpublished) that accurately predicted an
interaction between DA1 and TCP15 (section 4.3) have implicated DA1 in the FLS2-‐mediated
PAMP response. Although there is no direct evidence yet of an interaction between DA1 and
FLS2, this thesis presents evidence of a link between DA1 and two LRR-‐RLKs, both of which
have connections to growth regulation and FLS2.
First, section 4.4.1.2 revealed that da1-‐1 seedlings have a reduced sensitivity to
epibrassinolide; partially phenocopying bak1 knockout seedlings. bak1 plants have a semi-‐
dwarfed phenotype and over-‐expression of BAK1 has been shown to increase leaf elongation
(Li et al., 2002a, Song et al., 2009), which demonstrates a role in the regulation of final organ
size. Various brassinosteroid-‐related genes have been implicated in the regulation of organ
growth, and in particular, in the mis-‐regulation of cell expansion (Azpiroz et al., 1998, Clouse et
al., 1996, Nakaya et al., 2002, Hu et al., 2006) and indeed the large leaf phenotype of BAK1
overexpressing plants is a consequence of enhanced cell expansion (Li et al., 2002a, Song et al.,
2009). While the bulk of these brassinosteroid-‐related organ-‐size changes are largely driven by
altered expansion rates (Azpiroz et al., 1998, Clouse et al., 1996, Li et al., 2002a, Song et al.,
2009), it has been reported that there are also concurrent changes in cell proliferation (Nakaya
227
et al., 2002). These data make it difficult to see a direct developmental link between the da1-‐1
phenotype and the brassinosteroid response because, whereas DA1 influences the timing of
the switch from cell-‐proliferation to cell-‐expansion (Li et al., 2008), brassinosteroids appear to
predominantly increase cell expansion (Kim and Wang, 2010, Johnson and Lenhard, 2011).
However, as discussed in Chapter 1, there are likely to be many signals acting simultaneously
on cells of the developing leaf, and their respective influences and effects on growth will
depend heavily on other signals at that precise time during organ formation. It is relevant to
note that CYCD3, considered to be a negative regulator of the switch from cell-‐proliferation to
cell-‐expansion (Dewitte et al., 2007), is also up-‐regulated in endoreduplicating expanding
tomato cells (Joubes and Chevalier, 2000).
DA1 has also been shown to physically interact with the cytoplasmic domain of the LRR-‐RLK,
TMK4 in a yeast-‐2-‐hybrid and an in vitro system. TMK4 was recently identified as a positive
regulator of growth and development, as it promotes cell expansion in the developing root
and cell proliferation in the developing leaf (Dai et al., 2013). It has also been shown to enrich
with FLS2 in lipid rafts after cell cultures were stimulated with flg22 (Keinath et al., 2011);
possibly reflecting a direct or indirect response to flg22. In addition to this tentative link with
flg22-‐responses, mutations in TMK4 have been shown to reduce sensitivity to auxin perception
(Dai et al., 2013). This is reminiscent of the reduced sensitivity of bak1 and da1-‐1 plants to
brassinosteroids (Li et al., 2002a), and of bak1 plants to flg22 (Chinchilla et al., 2007b).
7.2.2.1 – Models for DA1-‐dependent LRR-‐RLK regulation
In animal systems, it is well documented that RTKs (receptor tyrosine kinases) such as EGFR
(EPIDERMAL GROWTH FACTOR RECEPTOR) are ubiquitinated upon ligand binding, and that this
ubiquitination is sufficient for receptor internalisation and degradation (Haglund et al., 2003).
In plants, there is good evidence that FLS2, and tentative evidence that BRI1, BAK1 and EFR
(EF-‐Tu RECEPTOR) are ubiquitinated (Lu et al., 2011, Göhre et al., 2008). The ubiquitination of
FLS2 appears to negatively influence its stability (Göhre et al., 2008, Lu et al., 2011), but it is
unclear whether the ubiquitin ‘smears’ presented in Göhre et al (2008) and Lu et al (2011)
represent poly-‐ubiquitin chains or multiple mono-‐ubiquitination events, as was observed in
human EGFR (Haglund et al., 2003). If FLS2 is mono-‐ubiquitinated, it is possible that, as with
EGFR, the ubiquitination event serves to promote internalisation and either recycling to the
plasma membrane or degradation in the lysosome. In contrast, poly-‐ubiquitination suggests
ubiquitin-‐directed proteasome-‐mediated degradation. There is evidence that internalisation of
the BRI1-‐BAK1 complex is essential for signal propagation (Geldner et al., 2007, Karlova and de
228
Vries, 2006), and therefore it is possible that endocytosis of FLS2 leads to signal propagation,
as well as degradation (Robatzek et al., 2006).
The purported regulated internalisation of ubiquitinated, membrane-‐bound animal RTKs by
UIM-‐containing adaptor proteins is referred to as the UIM-‐cycle (Marmor and Yarden, 2004),
and it is possible that DA1 is involved in a similar cycle with plant LRR-‐RLKs (Fig. 7.4). The UIM-‐
cycle predicts that UIM-‐containing adaptor proteins bind to ubiquitinated RLKs resulting in
their internalisation and degradation or recycling to the plasma membrane (Marmor and
Yarden, 2004). Evidence that DA1 physically interacts with the cytoplasmic domain of TMK4
suggests that DA1 might act as an ubiquitin dependent adaptor protein, regulating this
internalisation and degradation/recycling of TMK4.
An alternative model incorporates the observed synergistic/enhancing interaction of DA1 with
EOD1 and DA2 (Fig. 7.5). This models predicts that DA1 promotes the EOD1-‐ or DA2-‐mediated
ubiquitination of TMK4, thereby triggering its internalisation and degradation, and the
subsequent attenuation of its signalling. In this model (Fig. 7.5) there are several potential
roles for the DA1 UIM domains. First, as with the UIM-‐cycle, the DA1 UIMs may recruit DA1 to
a pre-‐existing ubiquitin moiety on the RLK, thereby recruiting its cognate E3s to ligate a further
ubiquitin signal (Fig. 7.5a). This would be similar to the recruitment of BRCA1 to sites of DNA
damage by the UIM-‐containing protein RAP80, which binds pre-‐existing ubiquitin chains at
sites of DNA damage (Guzzo et al., 2012, Sobhian et al., 2007, Wang et al., 2007). Alternatively,
the UIMs may be involved in a coupled mono-‐ubiquitination-‐like mechanism, whereby the
UIMs recruit the cognate E3 to DA1, and also regulate peptidase activity via interactions with
cis-‐ubiquitin (Fig. 7.5b). A variation on this model is that, instead of ubiquitination of TMK4,
the function of the TMK4-‐DA1-‐EOD1 interaction is the peptidase-‐mediated processing of TMK4
by DA1 (Fig. 7.6). This could be similar to the peptidase-‐mediated cleavage of the membrane-‐
anchored mammalian
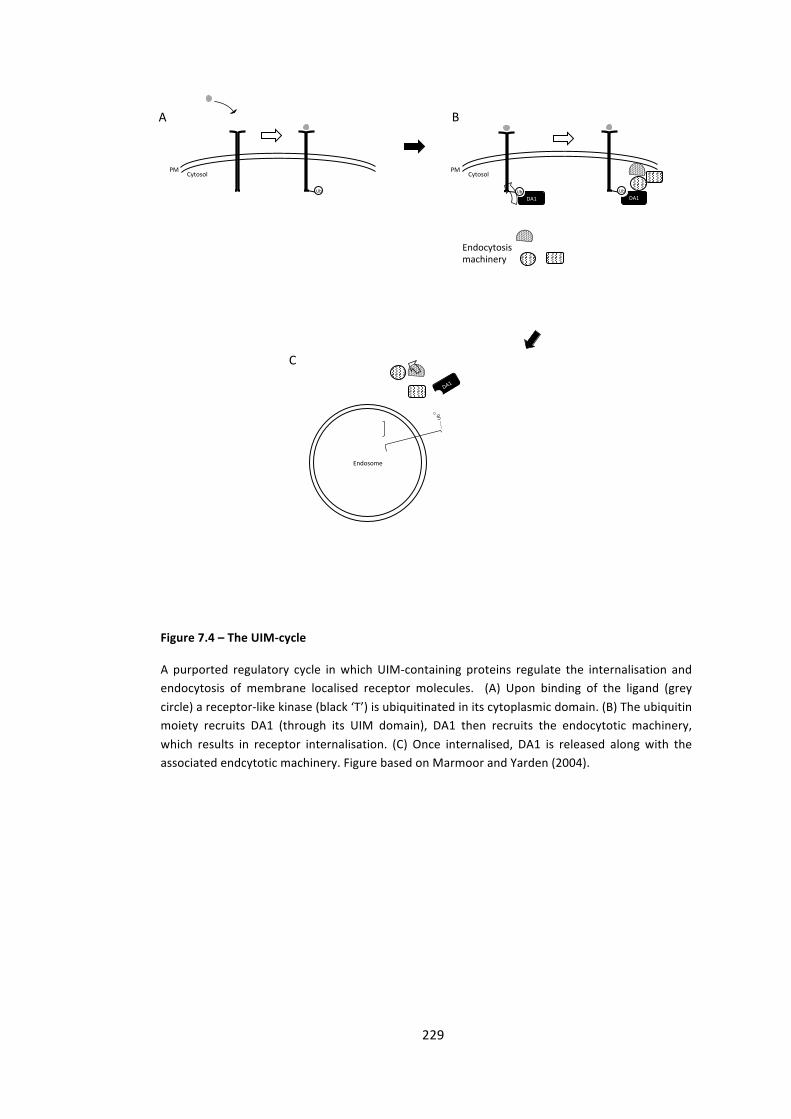
229
Ub#
DA1#Ub#
DA1#Ub#
Endocytosis#machinery#
PM#Cytosol# PM#
Cytosol#
Ub#
DA1#
Endosome#
A# B#
C#
Figure 7.4 – The UIM-‐cycle
A purported regulatory cycle in which UIM-‐containing proteins regulate the internalisation and endocytosis of membrane localised receptor molecules. (A) Upon binding of the ligand (grey circle) a receptor-‐like kinase (black ‘T’) is ubiquitinated in its cytoplasmic domain. (B) The ubiquitin moiety recruits DA1 (through its UIM domain), DA1 then recruits the endocytotic machinery, which results in receptor internalisation. (C) Once internalised, DA1 is released along with the associated endcytotic machinery. Figure based on Marmoor and Yarden (2004).
230
heparin-‐binding EGF-‐like growth factor (HB-‐EGFR) (Nanba et al., 2003). This cleavage event
results in the translocation of the HB-‐EGFR C-‐terminal fragment to the nucleus and the
subsequent export of the transcriptional repressor PZLF (promyelocytic leukaemia zinc finger),
which is a negative regulator of the cell cycle (Nanba et al., 2003).
This model also incorporates the observation that DA1 physically interacts with TMK4 as well
as DA2 and EOD1, which suggests that DA1 may be responsible for mediating an RLK – E3
interaction, leading to RLK ubiquitination by the E3 ligase, cleavage by DA1, or both. If EOD1
and DA2 are required to ubiquitinate TMK4, then DA1-‐mediated co-‐localisation of RLK and the
E3 ligases would activate the E3s only when directly bound to their substrate by DA1. In animal
systems there are examples of E3 activating enzymes, which localise to the targets of their
respective E3s in a similar manner. The RING E3, MDM2, which ubiquitinates and negatively
regulates the tumour suppressor p53, is stabilised (activated) by the de-‐ubiquitinating enzyme
HAUSP, which itself interacts with p53 (Stevenson et al., 2007, Li et al., 2002b). In a similar
system, SMAD7 both activates the human HECT E3 ligase, SMURF2, and relocates it from the
nucleus to the plasma membrane, which is the location of the SMURF2 target protein, TGF-‐β
(Wiesner et al., 2007, Ogunjimi et al., 2005, Kavsak et al., 2000).
The requirement for the suggested reciprocal activation in the DA1-‐E3 ligase module would
ensure that neither component could be active without interaction with each other. This
would safeguard against premature receptor internalisation and limit the signalling response
to tissues and developmental stages where both proteins are expressed. Furthermore, the
feed-‐forward nature of such a DA1-‐E3 module would suggest that subsequent E3 activity
would be all or nothing; preventing partial ubiquitination and ensuring complete receptor
internalisation. Experiments to test this model of DA1 function are possible using DA1-‐
interacting proteins identified by Y2H in Chapter 4. These experiments would include in vitro
assays for cleavage and ubiquitination.
7.2.2.2 – The developmental significance of a DA1-‐RLK interaction
Both models discussed in section 7.2.2.1 are supported by preliminary data that show that
DA1 and TMK4 antagonistically influence leaf growth. Whereas TMK4 has been shown to
increase leaf size through a promotion of cell proliferation (Dai et al., 2013), DA1 is known to
negatively influence the duration of this proliferative phase (Li et al., 2008). It is possible
therefore that DA1 is involved in the attenuation of TMK4 dependent growth promotion,
suggesting that da1-‐1/tmk1/tmk4 triple mutant leaves would phenocopy the da1-‐1 leaf.
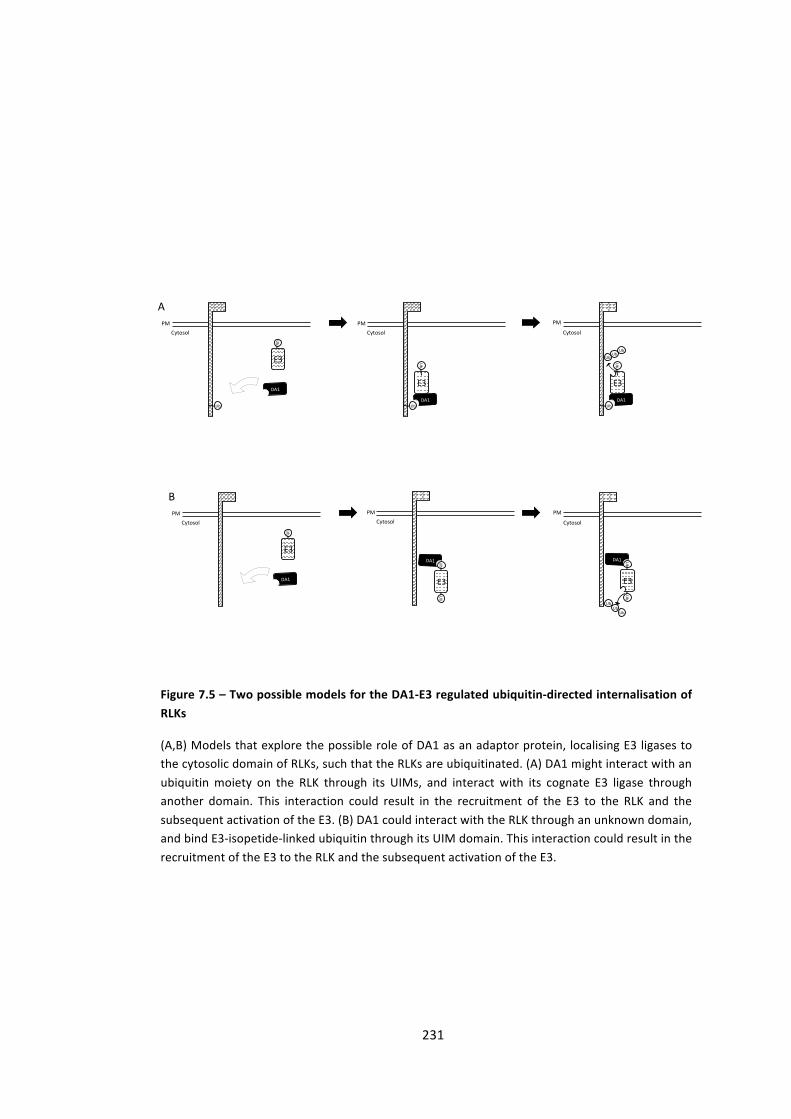
231
Ub#
DA1#
Ub#
E3#
DA1#Ub#
PM#Cytosol# PM#
Cytosol#A#
DA1#
E3#
Ub#
Ub#
DA1#
E3#
PM#Cytosol#
B#PM#
Cytosol#
DA1#Ub#
Ub#Ub#
Ub#
Cytosol#
E3#
Ub#
PM#
Cytosol#PM#
Ub#Ub#
Ub#
E3#
Ub#
Ub#
Ub#
DA1# Ub#
E3#
Figure 7.5 – Two possible models for the DA1-‐E3 regulated ubiquitin-‐directed internalisation of RLKs
(A,B) Models that explore the possible role of DA1 as an adaptor protein, localising E3 ligases to the cytosolic domain of RLKs, such that the RLKs are ubiquitinated. (A) DA1 might interact with an ubiquitin moiety on the RLK through its UIMs, and interact with its cognate E3 ligase through another domain. This interaction could result in the recruitment of the E3 to the RLK and the subsequent activation of the E3. (B) DA1 could interact with the RLK through an unknown domain, and bind E3-‐isopetide-‐linked ubiquitin through its UIM domain. This interaction could result in the recruitment of the E3 to the RLK and the subsequent activation of the E3.
232
Interestingly, as discussed in Chapter 1, the fact that the da1-‐1 large organ phenotype is not
complemented by a reduction in cell size suggests that DA1 may be part of a mechanism
involved in perception of a hypothetical diffusible growth signal (section 1.5.5). LRR-‐RLKs are
well characterised as signal receptor molecules and have been shown to transduce both
steroid (Clouse et al., 1996, Kinoshita et al., 2005) and peptide signals (Chinchilla et al., 2006,
Zipfel et al., 2006). The direct interaction of DA1 with TMK4, and its possible indirect links to
BAK1 and FLS2, suggest that DA1 may regulate the activity of an LRR-‐RLK involved in sensing
such a diffusible signal. Furthermore, proliferating cells in da1-‐1 organs appear have a reduced
sensitivity to the signals promoting the switch from proliferation to expansion. This is
supported by data presented in section 4.4.1.2, which show that both da1-‐1 and bak1-‐4
seedlings have reduced sensitivity to brassinosteroid perception. This is particularly interesting
considering BAK1 phosphorylation of PUB12/13 has been shown to be essential for an FLS2-‐
PUB13/14 interaction (Lu et al., 2011). In the flg22 response at least, this is consistent with
da1-‐1 phenocopying a knockout in a gene shown to be responsible for promoting the
ubiquitination of an LRR-‐RLK.
7.2.3 – From DA1 to the cell cycle: linking via TCP transcription factors
The da1-‐1 large organ phenotype is a consequence of a delayed exit from the mitotic cell-‐cycle,
suggesting that either directly or indirectly, DA1 may regulate cell-‐cycle progression. Prior to
the work documented in this thesis, the link between DA1 and the cell-‐cycle was unknown.
However, the interaction between DA1 and TCP15 (section 4.3) provides a potential link from
the da1-‐1 phenotype to the regulation of cell-‐cycle components via TCP14 and TCP15, which
are involved in regulating cell proliferation and cell expansion in developing tissues (Kieffer et
al., 2011, Li et al., 2012, Uberti-‐Manassero et al., 2012). However, the precise role of TCP15 in
the regulation of cell proliferation and expansion remains unclear, possibly due to its apparent
tissue-‐specific effects and the coupled nature of cell proliferation and cell expansion.
Nonetheless, the observation that organ growth is affected via a mis-‐regulation of
proliferation and expansion, suggests that, developmentally, TCP15 may work in the same
pathway as DA1 (Kieffer et al., 2011, Li et al., 2012, Uberti-‐Manassero et al., 2012). Indeed,
genetic interactions presented in sections 4.3.3.1 and 4.3.3.2 suggest that DA1 and TCP14/15
operate in the same pathway to regulate stem height and petal size.

233
DA1$
DA1$
E3$
PM$Cytosol$
B$PM$
Cytosol$ Cytosol$PM$
DA1$
DA1$
E3$
PM$Cytosol$
PM$Cytosol$ Cytosol$
PM$
Ub$Ub$
Ub$
E3$
DA1$
E3$
DA1$E3$
DA1$E3$
DA1$DA1$
A$
Figure 7.6 – Possible models for the ubiquitin-‐ and peptidase-‐ mediated regulation of RLKs by a DA1-‐E3 module
It is conceivable that the DA1-‐E3 module might regulate RLKs through an ubiquitin or peptidase-‐mediated mechanism. In both of these models DA1 would behave as an adaptor protein, targeting the E3 to the RLK, and upon interaction with the E3, DA1 and the E3 would reciprocally activate. (A) DA1 recruits the E3 to the RLK cytoplasmic domain. The E3-‐DA1 module reciprocally activates (not shown) and the active E3 ligase then ubiquitinates the cytoplasmic domain of the RLK. (B) DA1 recruits the E3 to the RLK cytoplasmic domain. The E3 activates the DA1 peptidase and the activated DA1 then cleaves the cytoplasmic domain of the RLK.
234
Recent work has also revealed several direct links between TCP15 and the cell cycle (Kieffer et
al., 2011, Li et al., 2012). It has been reported that TCP15 binds directly to the promoter of the
S-‐phase cyclin, CYCA2;3; as well as to the promoter of RBR1, which is a regulator of the
transition between proliferation and endocycling (Li et al., 2012, Magyar et al., 2012). In
addition, Li et al (2012) and Kieffer et al (2011) list a total of 12 cell-‐cycle regulators that are
differentially regulated in either knockout, overexpressing or –EAR domain fused TCP
backgrounds. Taken together with the physical and genetic interactions of DA1 and TCP15,
these data indicate the DA1 may function closely with the cell cycle machinery to regulate exit
from the mitotic cell-‐cycle.
Work in this thesis, as well as in three recent publications (Kieffer et al., 2011, Li et al., 2012,
Uberti-‐Manassero et al., 2012) has demonstrated that the effect of TCP15 on organ growth is
highly tissue specific, leading to apparently contradictory results and interpretations. This is
highlighted by data from Kieffer et al (2011), who show that while TCP14 and TCP15 promote
cell proliferation in the leaf, they both repress proliferation in the stem. For this reason it is not
easy to establish a specific developmental role for TCP15, and it is therefore difficult to predict
a directional mechanistic relationship between DA1 and TCP15. What is clear however is that
DA1 and TCP15 both affect the balance between cell proliferation and cell expansion, and that
TCP15 appears to directly regulate cell-‐cycle regulators. It is therefore reasonable to predict
that one of the routes by which DA1 influences the persistence of the mitotic cell-‐cycle may be
through the direct regulation of TCP15 activity. As is discussed in section 7.2.3.1, this may be
through a peptidase or ubiquitin-‐mediated mechanism, which can be directly tested.
7.2.3.1 – Unifying observations on the role of DA1 in organ growth
The biochemical and genetic analyses described in this thesis have described a novel
mechanism mediated by DA1 peptidase function that may regulate the activities of two E3
ubiquitin ligases involved in organ growth and seed size control. How DA1-‐mediated regulation
of E3 ligase activity influences organ growth has been explored using examples of two DA1-‐
interacting proteins, both of which have established roles in growth control. There is
preliminary data that DA1 also interacts with several other proteins (see Table 4.1) that have
established roles in growth and development. DA1-‐mediated E3 ligase activity may also
influence the activity of these proteins, perhaps suggesting a broad role for DA1 in
orchestrating leaf growth.
The identification of interactions between DA1 and four transcription factors known to
regulate organ development (LBD41, ASL1, TCP15 and ATHB8 (Prigge et al., 2005, Chalfun-‐
235
Junior et al., 2005, Uberti-‐Manassero et al., 2012, Li et al., 2012, Kieffer et al., 2011, Meng et
al., 2010)) suggests that DA1 influences organ growth through the regulation of a broad range
of transcription factors.
As discussed in section 5.6.3, DA1 appears to have an EOD1-‐ and DA2-‐ independent activity,
which suggests that the DA1 peptidase might be active towards some substrates in its native
state, or alternatively it could be activated by other E3 ligases. PUB12/13/14 are candidate E3
ligases for this role. PUB12 and PUB13 are the E3 ligases responsible for ubiquitination of FSL2
(Lu et al., 2011) and are involved influencing the sensitivity of flg22 perception (Marino et al.,
2012, Lu et al., 2011). Because there are indirect links between DA1 and the flg22 PAMP
response (discussed in section 4.4), as well as evidence that DA1 influences the sensitivity of
brassinosteroid perception, and because both flg22 and brassinosteroids are perceived (in
part) by BAK1 (Chinchilla et al., 2006, Chinchilla et al., 2007a, Gómez-‐Gómez and Boller, 2000,
Li et al., 2002a, Nam and Li, 2002), it is possible that PUB12 and PUB13, and BAK1 and DA1
function together to regulate flg22 and brassinosteroid perception. PUB14 may also be a
candidate DA1-‐activating E3 ligase due to its documented Y2H interaction with TCP15 (Dreze
et al., 2011).
It is currently an exciting time in the field of plant developmental biology, with the detailed
functional characterisation of known growth regulators occurring alongside the discovery of
new regulatory genes. The linkage and association screens reported in Chapter 6 aim to
continue this progress of gene discovery and, as described, have so far identified over 90
candidate genes for further study and characterisation.
In addition to identifying novel regulators of organ growth and development, these screens
may also have identified potentially novel allelic variation in a priori growth regulators, which
may be related to fitness and adaptation to growth in different environments. Of particular
interest to this work is the identification of DA1 as a candidate gene in a GWA study of natural
variation in SE mean petal area. It is hoped that continued investigation in this area may yield
insight into novel DA1 alleles, which in turn may feed into new functional analyses such as
those described in this thesis.

236

237
Supplementary Information
S1 – Supplementary Figures
pAM-35S-GW-YFPc7218 bp
RB
LB
''pA35S
RK2 ori
bla (AmpR CarbR)
ColE1 ori
pAnospat (BastaR)
Pnos
CmR(defect)
ccdB
YFP52 Rev
P35S Fw
T35SM primer
attR1
attR2
P35SS
YFP-c
pAM-35S-GW-YFPn7429 bp
RB
LB
YFP52 Rev
''pA35S
RK2 ori
bla (AmpR CarbR)
ColE1 ori
pAnospat (BastaR)Pnos
CmR(defect)
ccdB
YFP 51 Fw
P35S Fw
T35SM primer
attR1
attR2
P35SS
YFPn
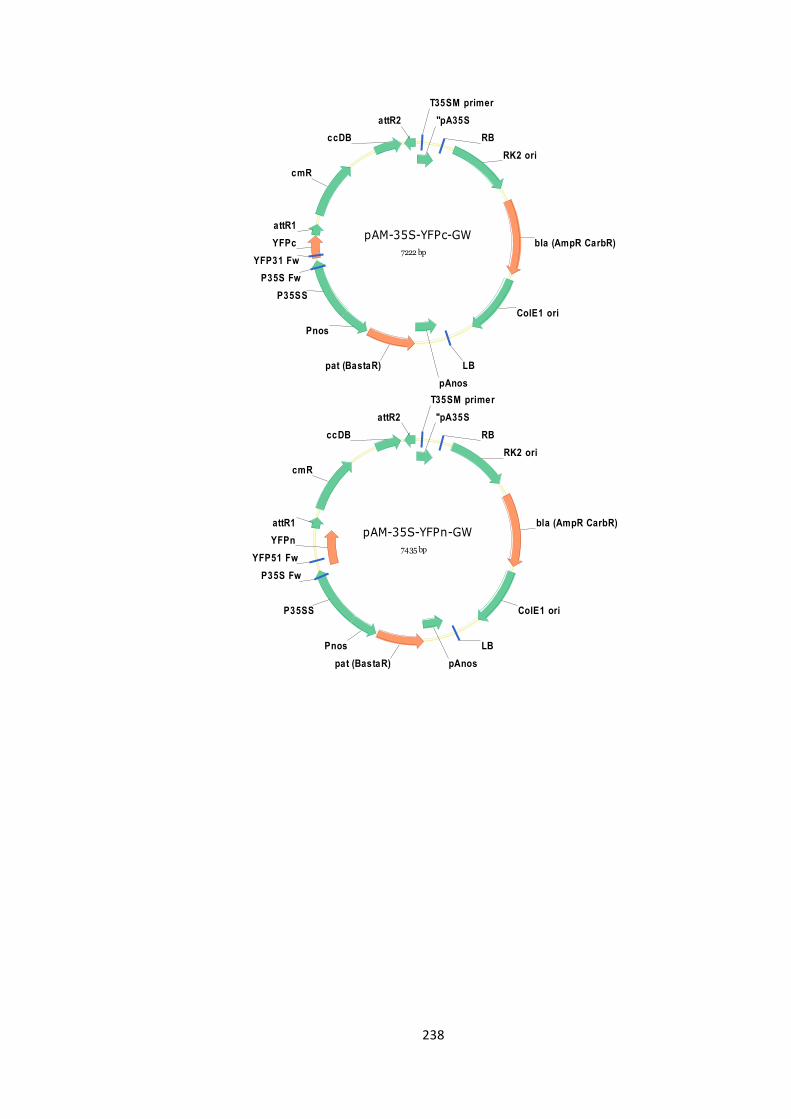
238
pAM-35S-YFPc-GW7222 bp
RB
bla (AmpR CarbR)
LB
YFPc
''pA35S
RK2 ori
ColE1 ori
pAnos
Pnos
P35SS
attR1
attR2
cmR
ccDB
YFP31 FwP35S Fw
T35SM primer
pat (BastaR)
pAM-35S-YFPn-GW7435 bp
RB
bla (AmpR CarbR)
LB
''pA35S
RK2 ori
ColE1 ori
pAnosPnos
P35SS
attR1
attR2
cmR
ccDB
P35S Fw
T35SM primer
YFP51 Fw
pat (BastaR)
YFPn
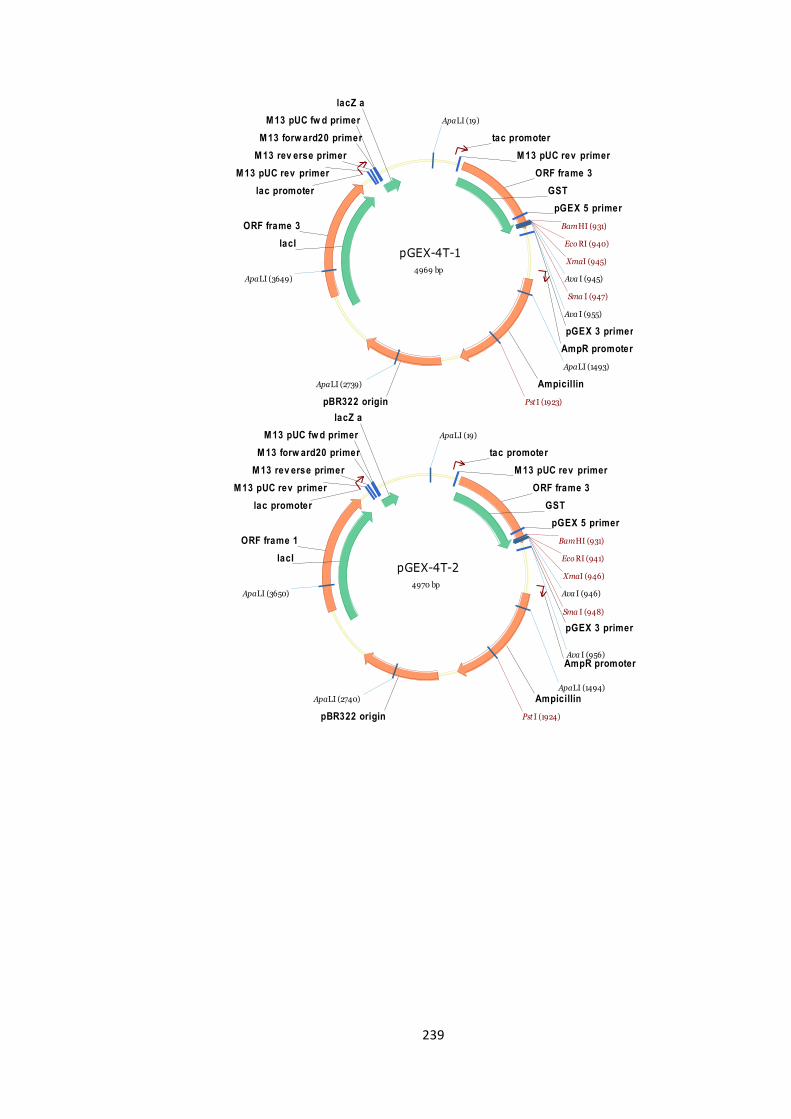
239
pGEX-4T-14969 bp
ORF frame 3
Ampicillin
ORF frame 3
M 13 pUC rev primer
GSTpGEX 5 primer
pGEX 3 primer
lacI
M 13 pUC rev primerM 13 rev erse primer
M 13 forw ard20 primerM 13 pUC fw d primer
lacZ a
tac promoter
AmpR promoter
lac promoter
pBR322 origin
BamHI (931)
EcoRI (940)
Pst I (1923)
Sma I (947)
XmaI (945)
Ava I (945)
Ava I (955)
ApaLI (19)
ApaLI (1493)
ApaLI (2739)
ApaLI (3649)
pGEX-4T-24970 bp
ORF frame 3
Ampicillin
ORF frame 1
M 13 pUC rev primer
GSTpGEX 5 primer
pGEX 3 primer
lacI
M 13 pUC rev primerM 13 rev erse primer
M 13 forw ard20 primerM 13 pUC fw d primer
lacZ a
tac promoter
AmpR promoter
lac promoter
pBR322 origin
BamHI (931)
EcoRI (941)
Pst I (1924)
Sma I (948)
XmaI (946)
Ava I (946)
Ava I (956)
ApaLI (19)
ApaLI (1494)ApaLI (2740)
ApaLI (3650)
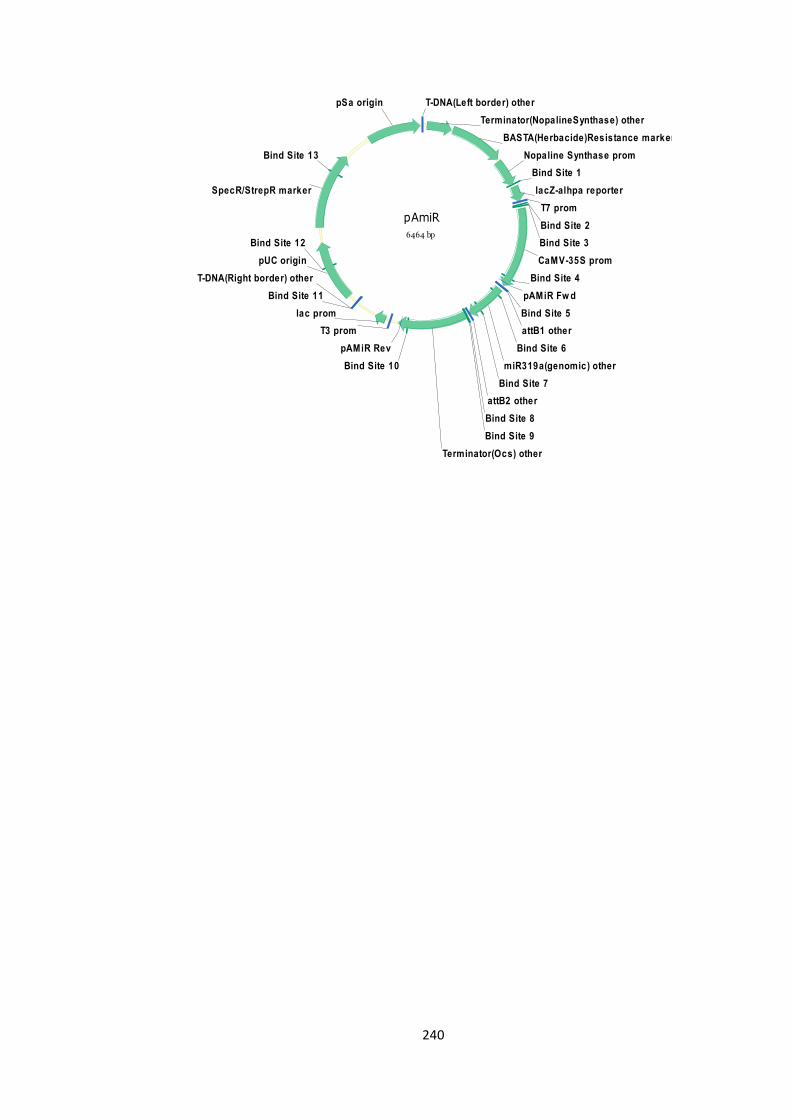
240
pAmiR6464 bp
Bind Site 1
Bind Site 2Bind Site 3
Bind Site 4
Bind Site 5
Bind Site 6
Bind Site 7
Bind Site 8Bind Site 9
Bind Site 10
Bind Site 11
Bind Site 12
Bind Site 13
T-DNA(Left border) otherTerminator(NopalineSynthase) other
BASTA(Herbacide)Resistance markerNopaline Synthase prom
lacZ-alhpa reporterT7 prom
CaMV-35S prom
attB1 other
miR319a(genomic) other
attB2 other
Terminator(Ocs) other
T3 promlac prom
T-DNA(Right border) otherpUC origin
SpecR/StrepR marker
pSa origin
pAMiR Fw d
pAMiR Rev

241
pET-24a5310 bp
KanR2
ORF frame 3
CDS
pGEX 3 primerROP
lacIpBRrevBam primer
lacO
T7 transl en RBSXpress fwd primer
T7 leaderT7 gene10 leader
6xHisT7 Terminal primer
T7 promoter
f1 origin
pBR322 origin
T7 terminator
BamHI (5109)
EcoR I (5115)
H indIII (5134)
NheI (5076)
NotI (5141)
Sa cI (5125)
Sa lI (5128)
XhoI (5149)
NdeI (5071)
pETnT5340 bp
ORF frame 3
KanR2
CDS
T7 Terminal primer
6xHis
lacO
pBRrev Bam primer
lacI
ROPpGEX 3 primer
FLAG
HA
T7 fw d primerT7 promoter
pBR322 origin
f1 origin
T7 terminator
BamHI (348)
EcoRI (354)
NdeI (274)
NheI (279)
Not I (371)
SalI (362)
XhoI (382)
Cla I (1794)
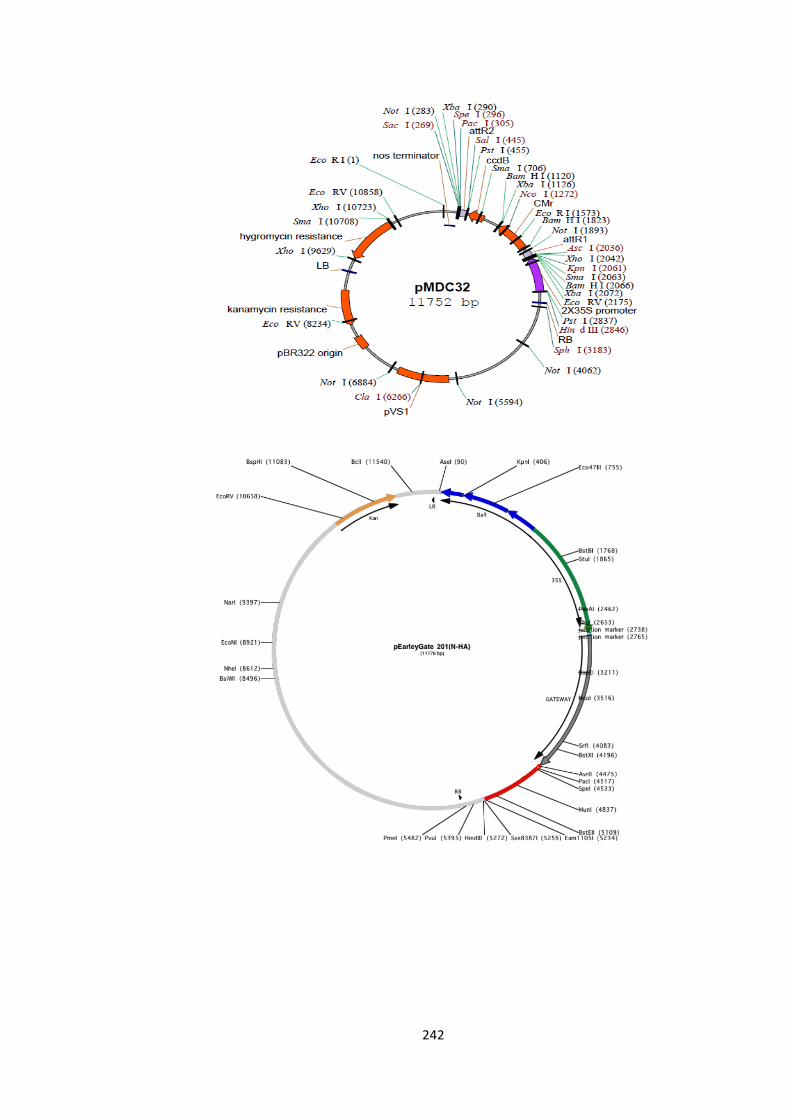
242

243
Figure S1 – Vector maps
Maps of all vectors used in this thesis, with the exception of pw1211, which does not have an
annotated map. Maps display key coding regions and vector identities are located in the
centre of each map. All maps were generated in Vector NTI (Invitrogen) with the
exception of the maps for pMDC32 and pEarleyGate201, which are adapted from
http://botserv1.uzh.ch/home/grossnik/curtisvector/pMDC32.pdf and
http://sites.bio.indiana.edu/~pikaardlab/pEarleyGate%20plasmid%20vectors%20copy/pl
asmid%20circular%20maps/pEarleyGate%20201(N-‐HA).pdf respectively.
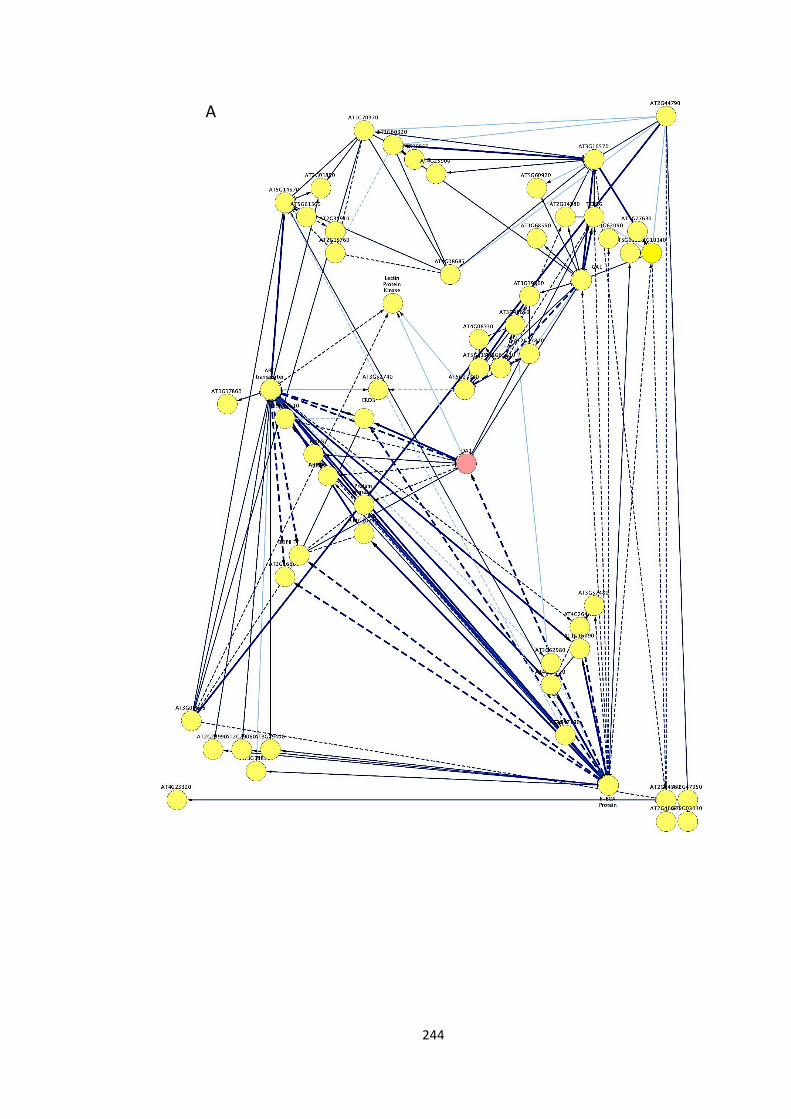
244
A
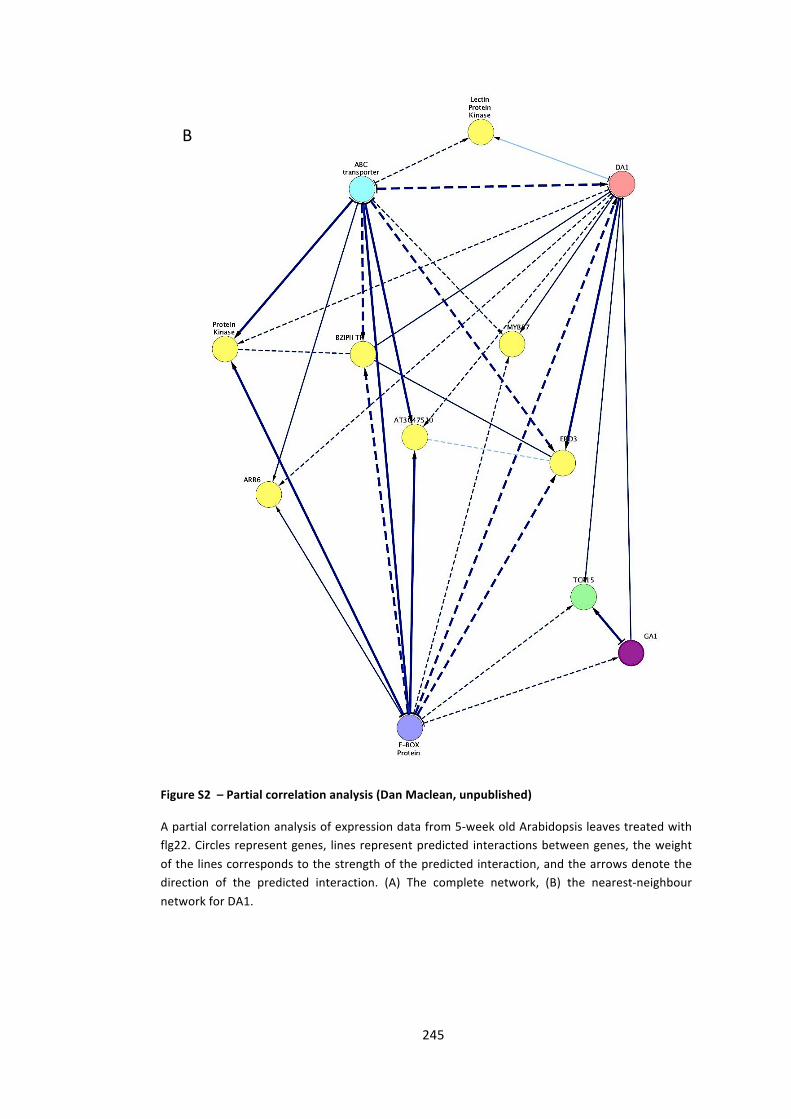
245
Figure S2 – Partial correlation analysis (Dan Maclean, unpublished)
A partial correlation analysis of expression data from 5-‐week old Arabidopsis leaves treated with flg22. Circles represent genes, lines represent predicted interactions between genes, the weight of the lines corresponds to the strength of the predicted interaction, and the arrows denote the direction of the predicted interaction. (A) The complete network, (B) the nearest-‐neighbour network for DA1.
This analysis was performed by Dan Maclean at the Sainsbury Laboratory, Norwich using AtGenExpress microarray data.
B
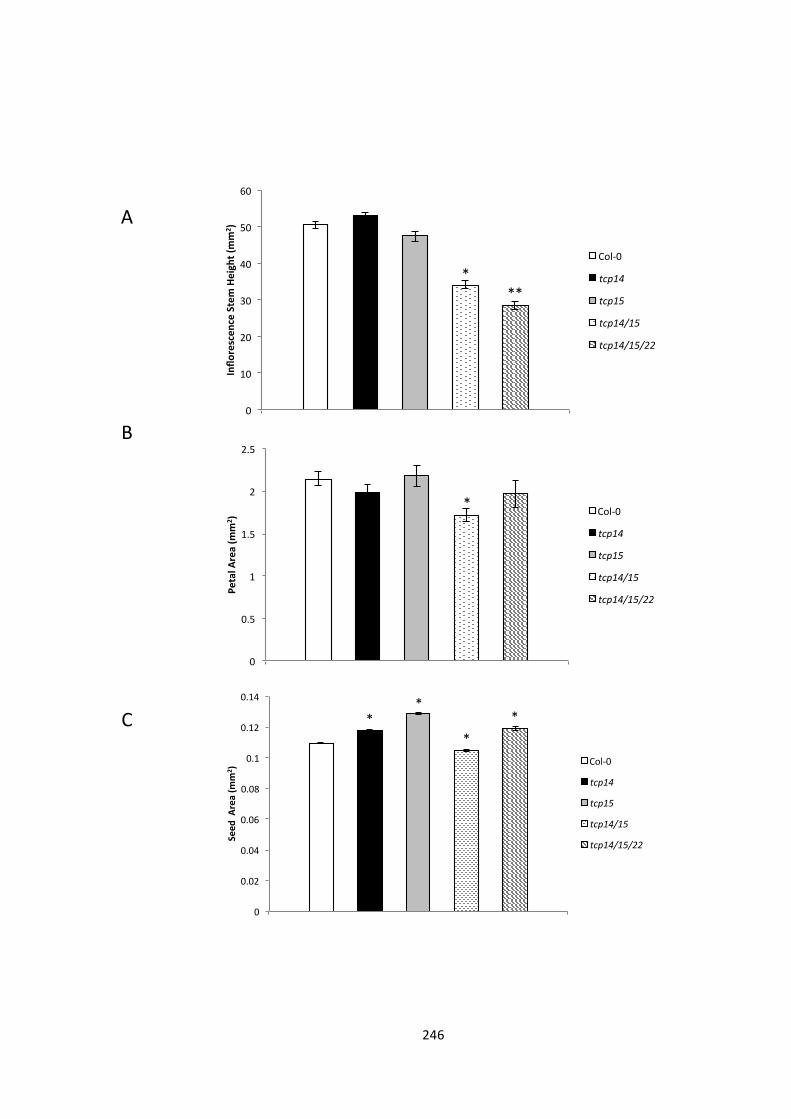
246
0"
10"
20"
30"
40"
50"
60"
Inflo
rescen
ce)Stem)Height)(mm
2 ))
Col,0"
tcp14&
tcp15&
tcp14/15&
tcp14/15/22&
*"**"
0"
0.5"
1"
1.5"
2"
2.5"
Petal&A
rea&(m
m2 )& Col*0"
tcp14&
tcp15&
tcp14/15&
tcp14/15/22&
*"
0"
0.02"
0.04"
0.06"
0.08"
0.1"
0.12"
0.14"
Seed
$$Area$(m
m2 )$ Col,0"
tcp14&
tcp15&
tcp14/15&
tcp14/15/22&
*"*"
*"*"
A
B
C
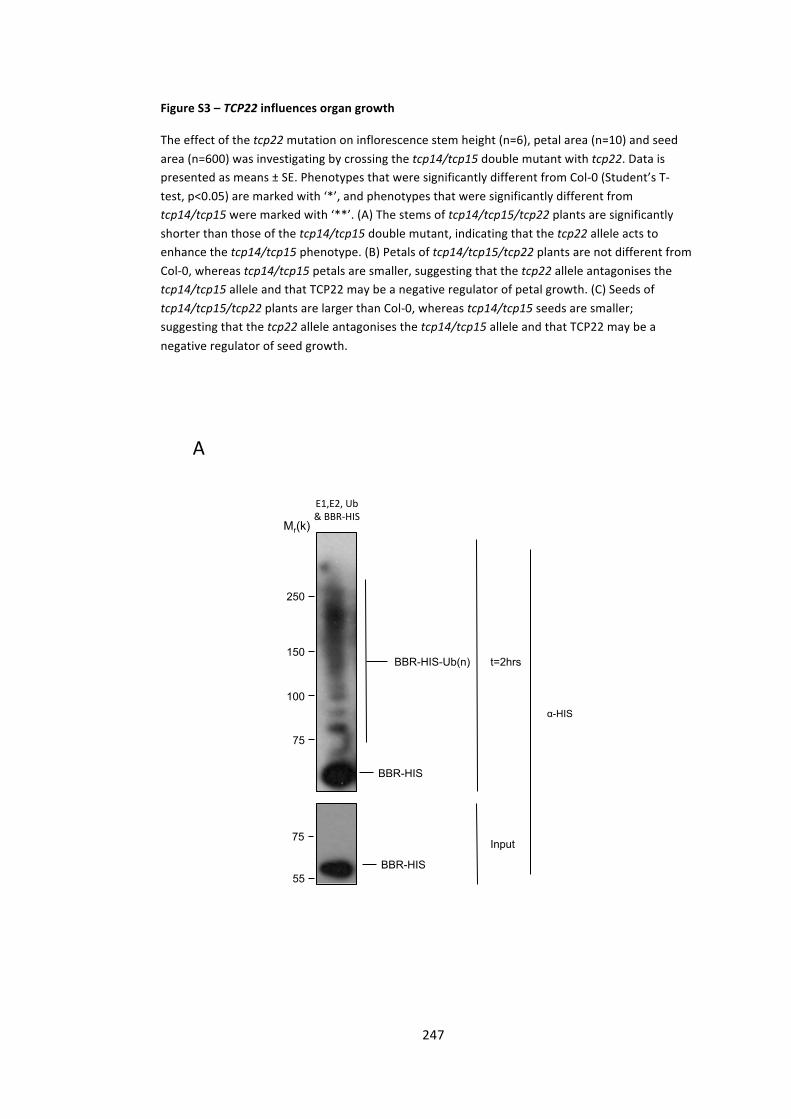
247
E1,E2,%Ub%&%BBR+HIS%%
BBR-HIS
BBR-HIS
BBR-HIS-Ub(n)
75
100
150
250
Mr(k)
55
75
t=2hrs
Input
α-HIS
Figure S3 – TCP22 influences organ growth
The effect of the tcp22 mutation on inflorescence stem height (n=6), petal area (n=10) and seed area (n=600) was investigating by crossing the tcp14/tcp15 double mutant with tcp22. Data is presented as means ± SE. Phenotypes that were significantly different from Col-‐0 (Student’s T-‐test, p<0.05) are marked with ‘*’, and phenotypes that were significantly different from tcp14/tcp15 were marked with ‘**’. (A) The stems of tcp14/tcp15/tcp22 plants are significantly shorter than those of the tcp14/tcp15 double mutant, indicating that the tcp22 allele acts to enhance the tcp14/tcp15 phenotype. (B) Petals of tcp14/tcp15/tcp22 plants are not different from Col-‐0, whereas tcp14/tcp15 petals are smaller, suggesting that the tcp22 allele antagonises the tcp14/tcp15 allele and that TCP22 may be a negative regulator of petal growth. (C) Seeds of tcp14/tcp15/tcp22 plants are larger than Col-‐0, whereas tcp14/tcp15 seeds are smaller; suggesting that the tcp22 allele antagonises the tcp14/tcp15 allele and that TCP22 may be a negative regulator of seed growth.
A
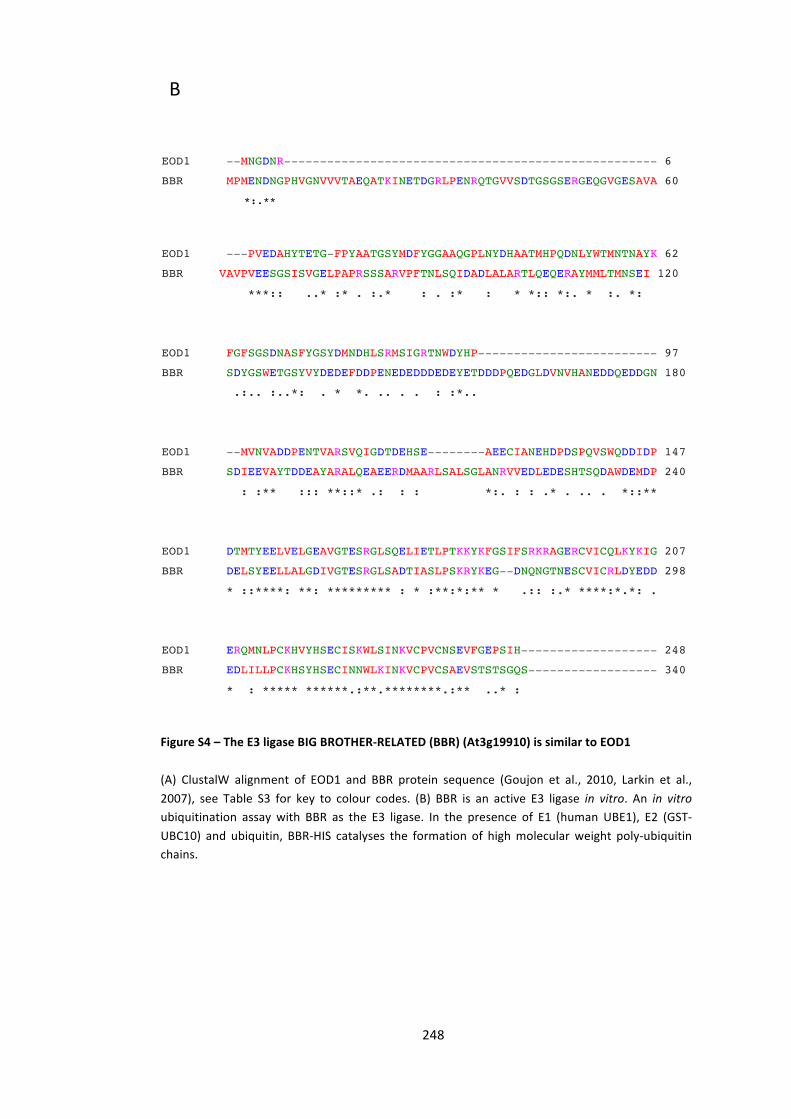
248
EOD1 --MNGDNR---------------------------------------------------- 6
BBR MPMENDNGPHVGNVVVTAEQATKINETDGRLPENRQTGVVSDTGSGSERGEQGVGESAVA 60
aaaaaaaaaa *:.**
EOD1 ---PVEDAHYTETG-FPYAATGSYMDFYGGAAQGPLNYDHAATMHPQDNLYWTMNTNAYK 62
BBR VAVPVEESGSISVGELPAPRSSSARVPFTNLSQIDADLALARTLQEQERAYMMLTMNSEI 120
aaaaaaaaaaaa***:: ..* :* . :.* : . :* : * *:: *:. * :. *:
EOD1 FGFSGSDNASFYGSYDMNDHLSRMSIGRTNWDYHP------------------------- 97
BBR SDYGSWETGSYVYDEDEFDDPENEDEDDDEDEYETDDDPQEDGLDVNVHANEDDQEDDGN 180
aaaaaaaaaa.:.. :..*: . * *. .. . . : :*..
EOD1 --MVNVADDPENTVARSVQIGDTDEHSE--------AEECIANEHDPDSPQVSWQDDIDP 147
BBR SDIEEVAYTDDEAYARALQEAEERDMAARLSALSGLANRVVEDLEDESHTSQDAWDEMDP 240
aaaaaaaaaaa: :** ::: **::* .: : : *:. : : .* . .. . *::**
EOD1 DTMTYEELVELGEAVGTESRGLSQELIETLPTKKYKFGSIFSRKRAGERCVICQLKYKIG 207
BBR DELSYEELLALGDIVGTESRGLSADTIASLPSKRYKEG--DNQNGTNESCVICRLDYEDD 298
aaaaaaaaa* ::****: **: ********* : * :**:*:** * .:: :.* ****:*.*: .
EOD1 ERQMNLPCKHVYHSECISKWLSINKVCPVCNSEVFGEPSIH------------------- 248
BBR EDLILLPCKHSYHSECINNWLKINKVCPVCSAEVSTSTSGQS------------------ 340
aaaaaaaaa* : ***** ******.:**.********.:** ..* :
Figure S4 – The E3 ligase BIG BROTHER-‐RELATED (BBR) (At3g19910) is similar to EOD1
(A) ClustalW alignment of EOD1 and BBR protein sequence (Goujon et al., 2010, Larkin et al., 2007), see Table S3 for key to colour codes. (B) BBR is an active E3 ligase in vitro. An in vitro ubiquitination assay with BBR as the E3 ligase. In the presence of E1 (human UBE1), E2 (GST-‐UBC10) and ubiquitin, BBR-‐HIS catalyses the formation of high molecular weight poly-‐ubiquitin chains.
B
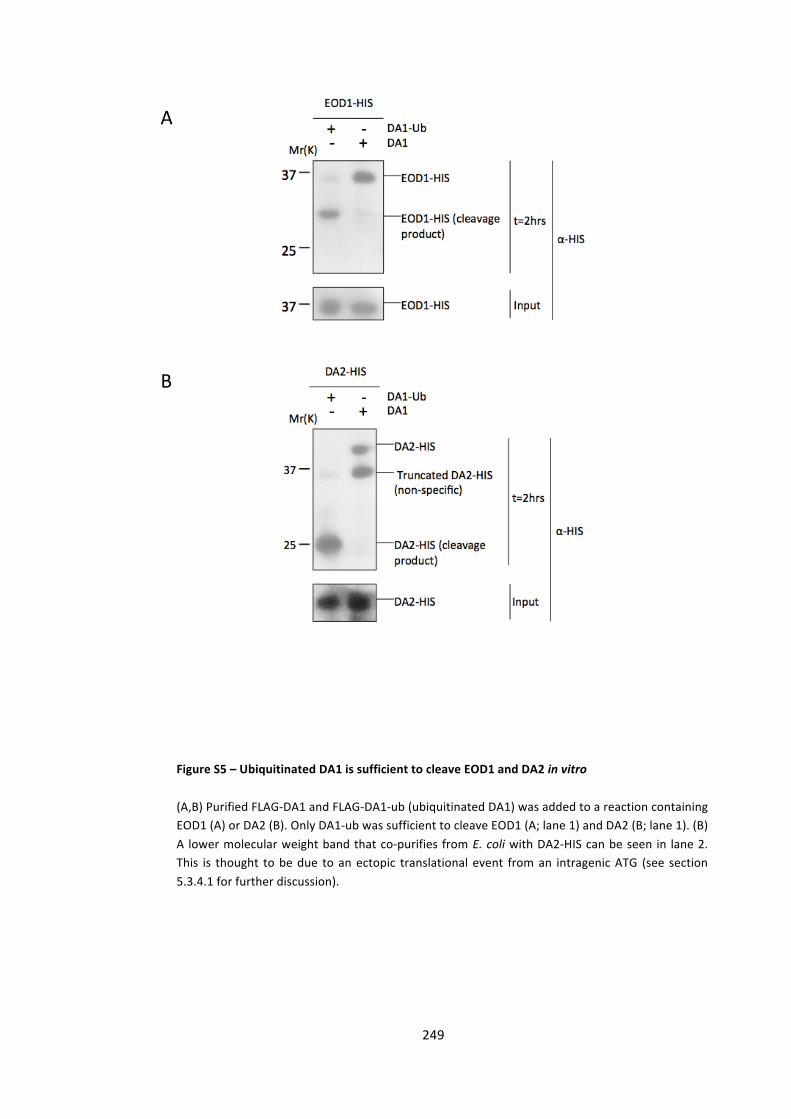
249
A
B
Figure S5 – Ubiquitinated DA1 is sufficient to cleave EOD1 and DA2 in vitro
(A,B) Purified FLAG-‐DA1 and FLAG-‐DA1-‐ub (ubiquitinated DA1) was added to a reaction containing EOD1 (A) or DA2 (B). Only DA1-‐ub was sufficient to cleave EOD1 (A; lane 1) and DA2 (B; lane 1). (B) A lower molecular weight band that co-‐purifies from E. coli with DA2-‐HIS can be seen in lane 2. This is thought to be due to an ectopic translational event from an intragenic ATG (see section 5.3.4.1 for further discussion).
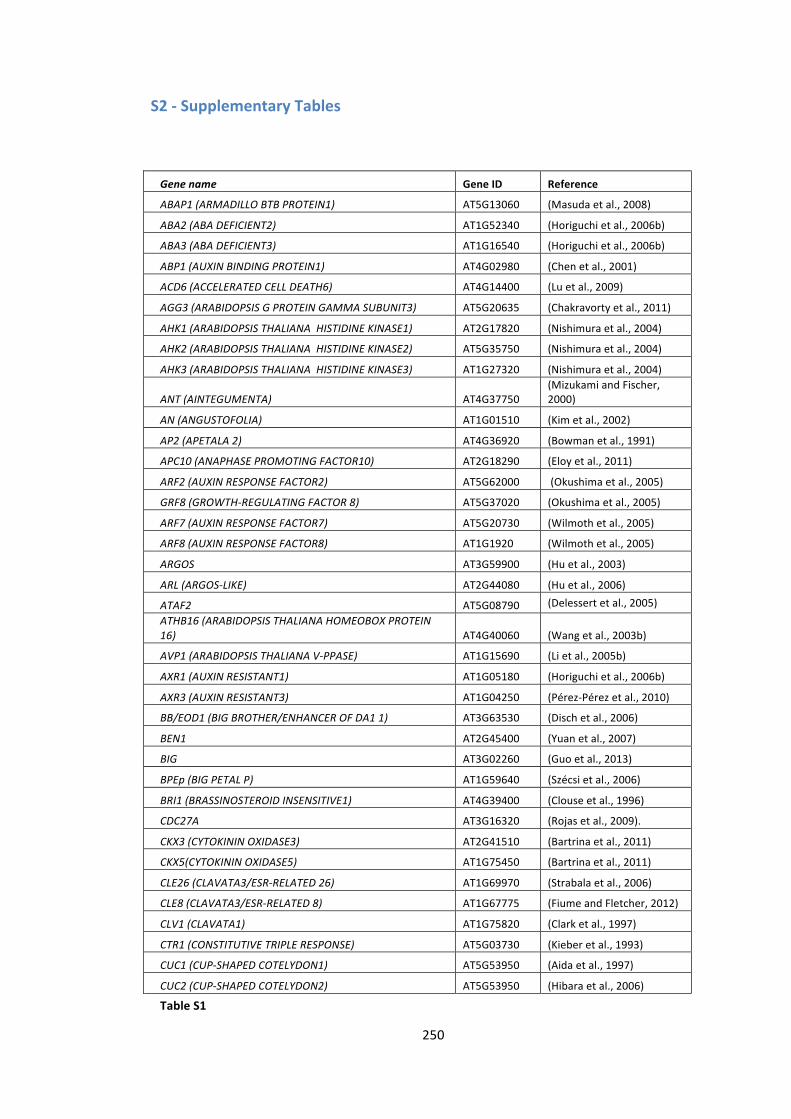
250
S2 -‐ Supplementary Tables
Gene name Gene ID Reference
ABAP1 (ARMADILLO BTB PROTEIN1) AT5G13060 (Masuda et al., 2008)
ABA2 (ABA DEFICIENT2) AT1G52340 (Horiguchi et al., 2006b)
ABA3 (ABA DEFICIENT3) AT1G16540 (Horiguchi et al., 2006b)
ABP1 (AUXIN BINDING PROTEIN1) AT4G02980 (Chen et al., 2001)
ACD6 (ACCELERATED CELL DEATH6) AT4G14400 (Lu et al., 2009)
AGG3 (ARABIDOPSIS G PROTEIN GAMMA SUBUNIT3) AT5G20635 (Chakravorty et al., 2011)
AHK1 (ARABIDOPSIS THALIANA HISTIDINE KINASE1) AT2G17820 (Nishimura et al., 2004)
AHK2 (ARABIDOPSIS THALIANA HISTIDINE KINASE2) AT5G35750 (Nishimura et al., 2004)
AHK3 (ARABIDOPSIS THALIANA HISTIDINE KINASE3) AT1G27320 (Nishimura et al., 2004)
ANT (AINTEGUMENTA) AT4G37750 (Mizukami and Fischer, 2000)
AN (ANGUSTOFOLIA) AT1G01510 (Kim et al., 2002)
AP2 (APETALA 2) AT4G36920 (Bowman et al., 1991)
APC10 (ANAPHASE PROMOTING FACTOR10) AT2G18290 (Eloy et al., 2011)
ARF2 (AUXIN RESPONSE FACTOR2) AT5G62000 (Okushima et al., 2005)
GRF8 (GROWTH-‐REGULATING FACTOR 8) AT5G37020 (Okushima et al., 2005)
ARF7 (AUXIN RESPONSE FACTOR7) AT5G20730 (Wilmoth et al., 2005)
ARF8 (AUXIN RESPONSE FACTOR8) AT1G1920 (Wilmoth et al., 2005)
ARGOS AT3G59900 (Hu et al., 2003)
ARL (ARGOS-‐LIKE) AT2G44080 (Hu et al., 2006)
ATAF2 AT5G08790
(Delessert et al., 2005) ATHB16 (ARABIDOPSIS THALIANA HOMEOBOX PROTEIN 16) AT4G40060 (Wang et al., 2003b)
AVP1 (ARABIDOPSIS THALIANA V-‐PPASE) AT1G15690 (Li et al., 2005b)
AXR1 (AUXIN RESISTANT1) AT1G05180 (Horiguchi et al., 2006b)
AXR3 (AUXIN RESISTANT3) AT1G04250 (Pérez-‐Pérez et al., 2010)
BB/EOD1 (BIG BROTHER/ENHANCER OF DA1 1) AT3G63530 (Disch et al., 2006)
BEN1 AT2G45400 (Yuan et al., 2007)
BIG AT3G02260 (Guo et al., 2013)
BPEp (BIG PETAL P) AT1G59640 (Szécsi et al., 2006)
BRI1 (BRASSINOSTEROID INSENSITIVE1) AT4G39400 (Clouse et al., 1996)
CDC27A AT3G16320 (Rojas et al., 2009).
CKX3 (CYTOKININ OXIDASE3) AT2G41510 (Bartrina et al., 2011)
CKX5(CYTOKININ OXIDASE5) AT1G75450 (Bartrina et al., 2011)
CLE26 (CLAVATA3/ESR-‐RELATED 26) AT1G69970 (Strabala et al., 2006)
CLE8 (CLAVATA3/ESR-‐RELATED 8) AT1G67775 (Fiume and Fletcher, 2012)
CLV1 (CLAVATA1) AT1G75820 (Clark et al., 1997)
CTR1 (CONSTITUTIVE TRIPLE RESPONSE) AT5G03730 (Kieber et al., 1993)
CUC1 (CUP-‐SHAPED COTELYDON1) AT5G53950 (Aida et al., 1997)
CUC2 (CUP-‐SHAPED COTELYDON2) AT5G53950 (Hibara et al., 2006)
Table S1
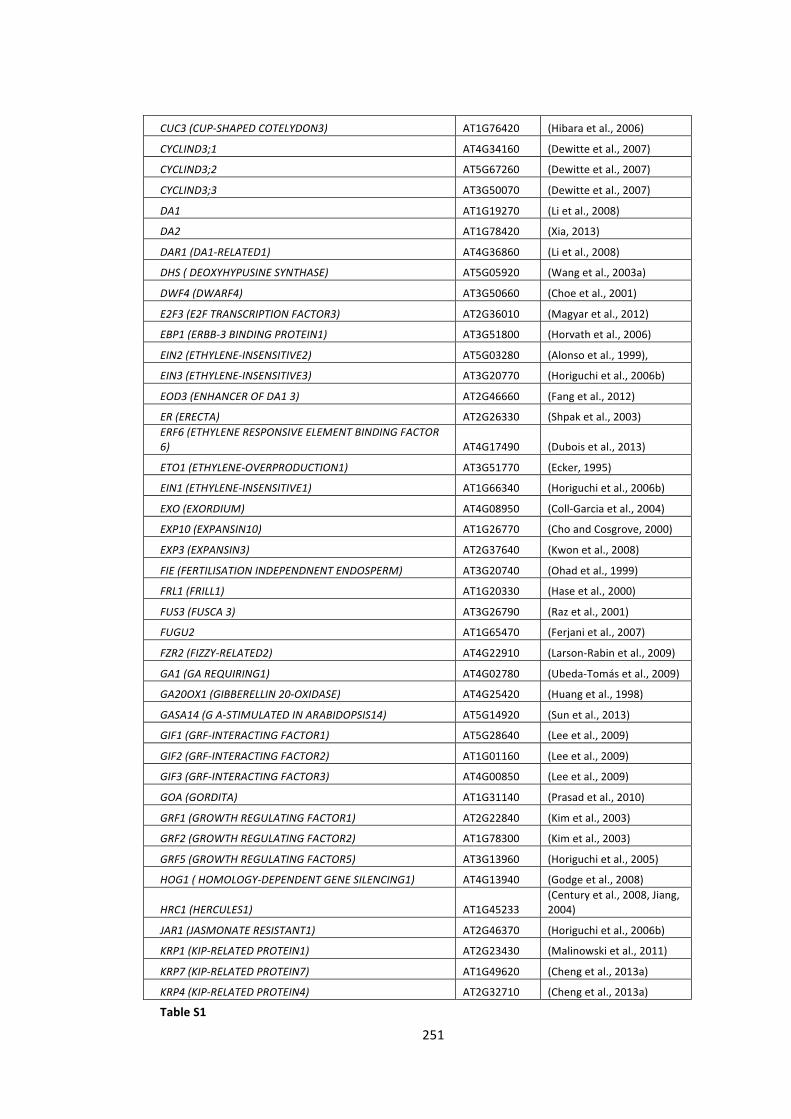
251
CUC3 (CUP-‐SHAPED COTELYDON3) AT1G76420 (Hibara et al., 2006)
CYCLIND3;1 AT4G34160 (Dewitte et al., 2007)
CYCLIND3;2 AT5G67260 (Dewitte et al., 2007)
CYCLIND3;3 AT3G50070 (Dewitte et al., 2007)
DA1 AT1G19270 (Li et al., 2008)
DA2 AT1G78420 (Xia, 2013)
DAR1 (DA1-‐RELATED1) AT4G36860 (Li et al., 2008)
DHS ( DEOXYHYPUSINE SYNTHASE) AT5G05920 (Wang et al., 2003a)
DWF4 (DWARF4) AT3G50660 (Choe et al., 2001)
E2F3 (E2F TRANSCRIPTION FACTOR3) AT2G36010 (Magyar et al., 2012)
EBP1 (ERBB-‐3 BINDING PROTEIN1) AT3G51800 (Horvath et al., 2006)
EIN2 (ETHYLENE-‐INSENSITIVE2) AT5G03280 (Alonso et al., 1999),
EIN3 (ETHYLENE-‐INSENSITIVE3) AT3G20770 (Horiguchi et al., 2006b)
EOD3 (ENHANCER OF DA1 3) AT2G46660 (Fang et al., 2012)
ER (ERECTA) AT2G26330 (Shpak et al., 2003) ERF6 (ETHYLENE RESPONSIVE ELEMENT BINDING FACTOR 6) AT4G17490 (Dubois et al., 2013)
ETO1 (ETHYLENE-‐OVERPRODUCTION1) AT3G51770 (Ecker, 1995)
EIN1 (ETHYLENE-‐INSENSITIVE1) AT1G66340 (Horiguchi et al., 2006b)
EXO (EXORDIUM) AT4G08950 (Coll-‐Garcia et al., 2004)
EXP10 (EXPANSIN10) AT1G26770 (Cho and Cosgrove, 2000)
EXP3 (EXPANSIN3) AT2G37640 (Kwon et al., 2008)
FIE (FERTILISATION INDEPENDNENT ENDOSPERM) AT3G20740 (Ohad et al., 1999)
FRL1 (FRILL1) AT1G20330 (Hase et al., 2000)
FUS3 (FUSCA 3) AT3G26790 (Raz et al., 2001)
FUGU2 AT1G65470 (Ferjani et al., 2007)
FZR2 (FIZZY-‐RELATED2) AT4G22910 (Larson-‐Rabin et al., 2009)
GA1 (GA REQUIRING1) AT4G02780 (Ubeda-‐Tomás et al., 2009)
GA20OX1 (GIBBERELLIN 20-‐OXIDASE) AT4G25420 (Huang et al., 1998)
GASA14 (G A-‐STIMULATED IN ARABIDOPSIS14) AT5G14920 (Sun et al., 2013)
GIF1 (GRF-‐INTERACTING FACTOR1) AT5G28640 (Lee et al., 2009)
GIF2 (GRF-‐INTERACTING FACTOR2) AT1G01160 (Lee et al., 2009)
GIF3 (GRF-‐INTERACTING FACTOR3) AT4G00850 (Lee et al., 2009)
GOA (GORDITA) AT1G31140 (Prasad et al., 2010)
GRF1 (GROWTH REGULATING FACTOR1) AT2G22840 (Kim et al., 2003)
GRF2 (GROWTH REGULATING FACTOR2) AT1G78300 (Kim et al., 2003)
GRF5 (GROWTH REGULATING FACTOR5) AT3G13960 (Horiguchi et al., 2005)
HOG1 ( HOMOLOGY-‐DEPENDENT GENE SILENCING1) AT4G13940 (Godge et al., 2008)
HRC1 (HERCULES1) AT1G45233 (Century et al., 2008, Jiang, 2004)
JAR1 (JASMONATE RESISTANT1) AT2G46370 (Horiguchi et al., 2006b)
KRP1 (KIP-‐RELATED PROTEIN1) AT2G23430 (Malinowski et al., 2011)
KRP7 (KIP-‐RELATED PROTEIN7) AT1G49620 (Cheng et al., 2013a)
KRP4 (KIP-‐RELATED PROTEIN4) AT2G32710 (Cheng et al., 2013a)
Table S1
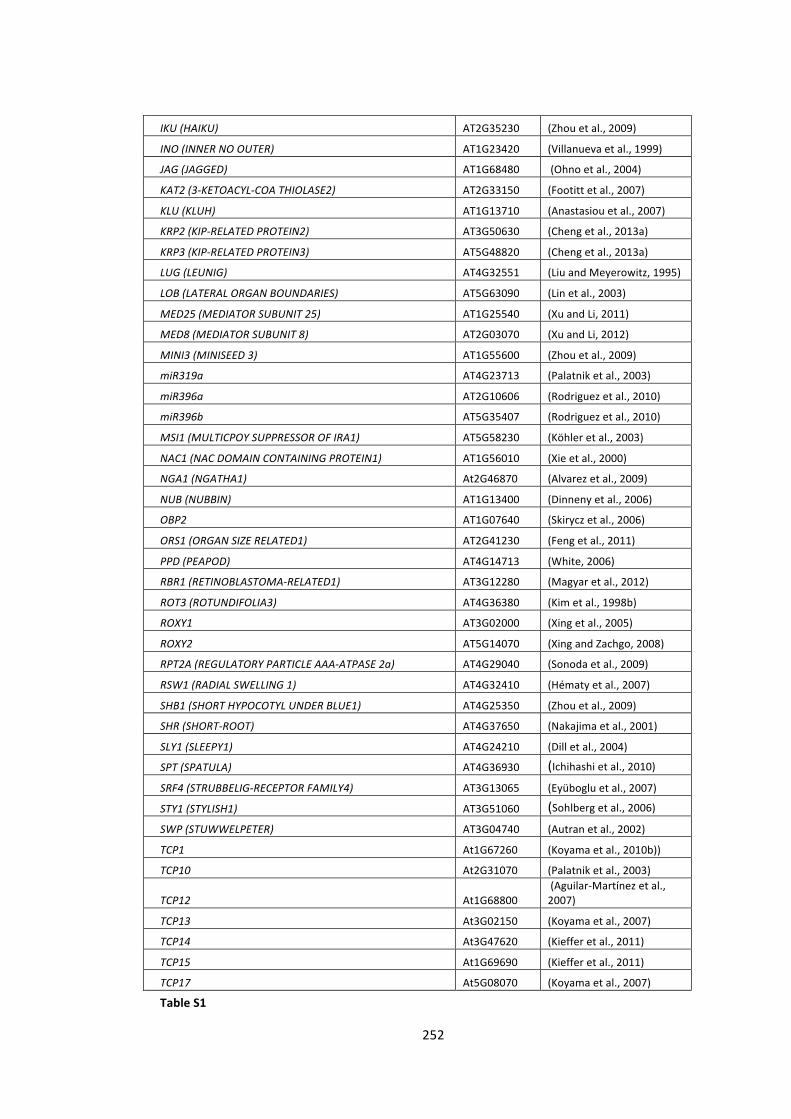
252
IKU (HAIKU) AT2G35230 (Zhou et al., 2009)
INO (INNER NO OUTER) AT1G23420 (Villanueva et al., 1999)
JAG (JAGGED) AT1G68480 (Ohno et al., 2004)
KAT2 (3-‐KETOACYL-‐COA THIOLASE2) AT2G33150 (Footitt et al., 2007)
KLU (KLUH) AT1G13710 (Anastasiou et al., 2007)
KRP2 (KIP-‐RELATED PROTEIN2) AT3G50630 (Cheng et al., 2013a)
KRP3 (KIP-‐RELATED PROTEIN3) AT5G48820 (Cheng et al., 2013a)
LUG (LEUNIG) AT4G32551 (Liu and Meyerowitz, 1995)
LOB (LATERAL ORGAN BOUNDARIES) AT5G63090 (Lin et al., 2003)
MED25 (MEDIATOR SUBUNIT 25) AT1G25540 (Xu and Li, 2011)
MED8 (MEDIATOR SUBUNIT 8) AT2G03070 (Xu and Li, 2012)
MINI3 (MINISEED 3) AT1G55600 (Zhou et al., 2009)
miR319a AT4G23713 (Palatnik et al., 2003)
miR396a AT2G10606 (Rodriguez et al., 2010)
miR396b AT5G35407 (Rodriguez et al., 2010)
MSI1 (MULTICPOY SUPPRESSOR OF IRA1) AT5G58230 (Köhler et al., 2003)
NAC1 (NAC DOMAIN CONTAINING PROTEIN1) AT1G56010 (Xie et al., 2000)
NGA1 (NGATHA1) At2G46870 (Alvarez et al., 2009)
NUB (NUBBIN) AT1G13400 (Dinneny et al., 2006)
OBP2 AT1G07640 (Skirycz et al., 2006)
ORS1 (ORGAN SIZE RELATED1) AT2G41230 (Feng et al., 2011)
PPD (PEAPOD) AT4G14713 (White, 2006)
RBR1 (RETINOBLASTOMA-‐RELATED1) AT3G12280 (Magyar et al., 2012)
ROT3 (ROTUNDIFOLIA3) AT4G36380 (Kim et al., 1998b)
ROXY1 AT3G02000 (Xing et al., 2005)
ROXY2 AT5G14070 (Xing and Zachgo, 2008)
RPT2A (REGULATORY PARTICLE AAA-‐ATPASE 2a) AT4G29040 (Sonoda et al., 2009)
RSW1 (RADIAL SWELLING 1) AT4G32410 (Hématy et al., 2007)
SHB1 (SHORT HYPOCOTYL UNDER BLUE1) AT4G25350 (Zhou et al., 2009)
SHR (SHORT-‐ROOT) AT4G37650 (Nakajima et al., 2001)
SLY1 (SLEEPY1) AT4G24210 (Dill et al., 2004)
SPT (SPATULA) AT4G36930 (Ichihashi et al., 2010) SRF4 (STRUBBELIG-‐RECEPTOR FAMILY4) AT3G13065 (Eyüboglu et al., 2007)
STY1 (STYLISH1) AT3G51060 (Sohlberg et al., 2006) SWP (STUWWELPETER) AT3G04740 (Autran et al., 2002)
TCP1 At1G67260 (Koyama et al., 2010b))
TCP10 At2G31070 (Palatnik et al., 2003)
TCP12 At1G68800 (Aguilar-‐Martínez et al., 2007)
TCP13 At3G02150 (Koyama et al., 2007)
TCP14 At3G47620 (Kieffer et al., 2011)
TCP15 At1G69690 (Kieffer et al., 2011)
TCP17 At5G08070 (Koyama et al., 2007)
Table S1
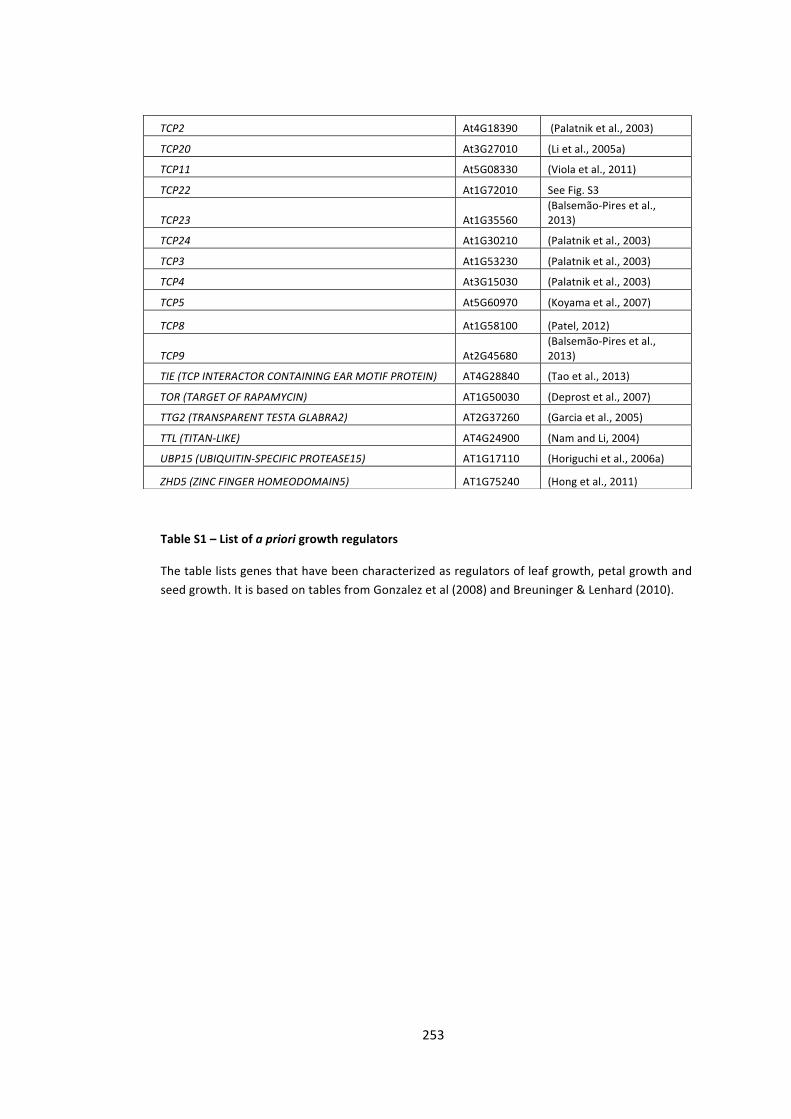
253
TCP2 At4G18390 (Palatnik et al., 2003)
TCP20 At3G27010 (Li et al., 2005a)
TCP11 At5G08330 (Viola et al., 2011)
TCP22 At1G72010 See Fig. S3
TCP23 At1G35560 (Balsemão-‐Pires et al., 2013)
TCP24 At1G30210 (Palatnik et al., 2003)
TCP3 At1G53230 (Palatnik et al., 2003)
TCP4 At3G15030 (Palatnik et al., 2003)
TCP5 At5G60970 (Koyama et al., 2007)
TCP8 At1G58100 (Patel, 2012)
TCP9 At2G45680 (Balsemão-‐Pires et al., 2013)
TIE (TCP INTERACTOR CONTAINING EAR MOTIF PROTEIN) AT4G28840 (Tao et al., 2013)
TOR (TARGET OF RAPAMYCIN) AT1G50030 (Deprost et al., 2007)
TTG2 (TRANSPARENT TESTA GLABRA2) AT2G37260 (Garcia et al., 2005)
TTL (TITAN-‐LIKE) AT4G24900 (Nam and Li, 2004)
UBP15 (UBIQUITIN-‐SPECIFIC PROTEASE15) AT1G17110 (Horiguchi et al., 2006a)
ZHD5 (ZINC FINGER HOMEODOMAIN5) AT1G75240 (Hong et al., 2011)
Table S1 – List of a priori growth regulators
The table lists genes that have been characterized as regulators of leaf growth, petal growth and seed growth. It is based on tables from Gonzalez et al (2008) and Breuninger & Lenhard (2010).
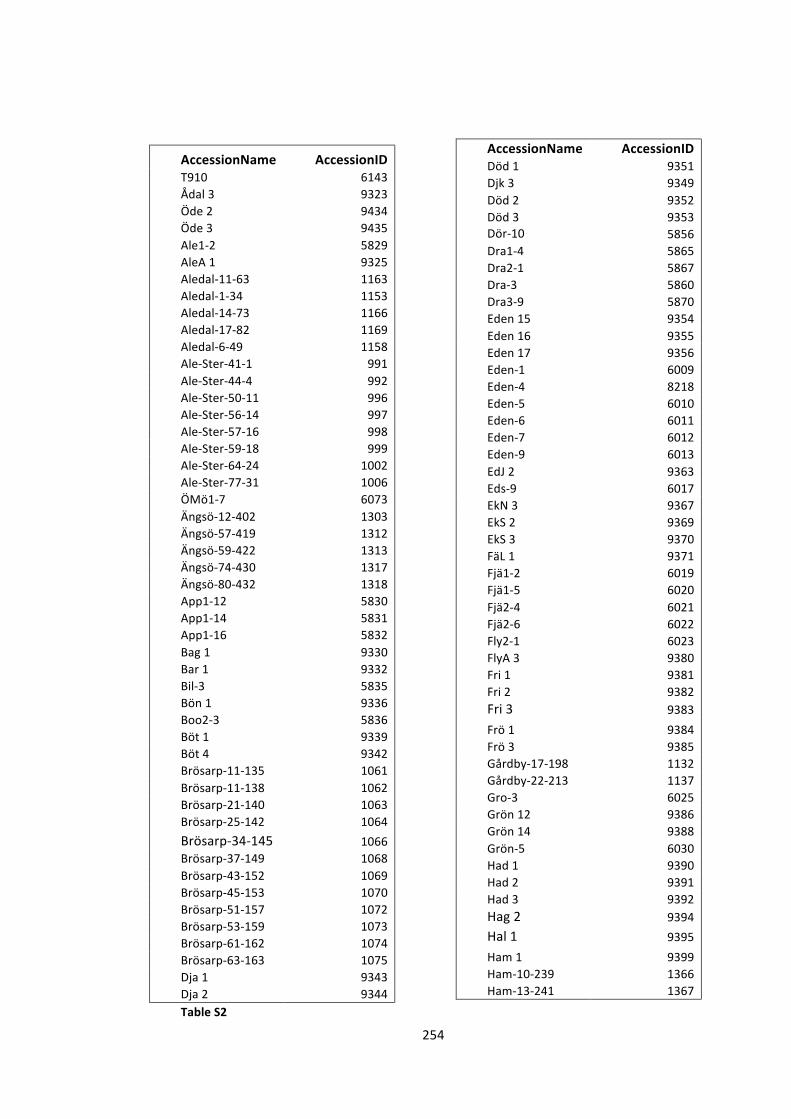
254
AccessionName AccessionID T910 6143 Ådal 3 9323 Öde 2 9434 Öde 3 9435 Ale1-‐2 5829 AleA 1 9325 Aledal-‐11-‐63 1163 Aledal-‐1-‐34 1153 Aledal-‐14-‐73 1166 Aledal-‐17-‐82 1169 Aledal-‐6-‐49 1158 Ale-‐Ster-‐41-‐1 991 Ale-‐Ster-‐44-‐4 992 Ale-‐Ster-‐50-‐11 996 Ale-‐Ster-‐56-‐14 997 Ale-‐Ster-‐57-‐16 998 Ale-‐Ster-‐59-‐18 999 Ale-‐Ster-‐64-‐24 1002 Ale-‐Ster-‐77-‐31 1006 ÖMö1-‐7 6073 Ängsö-‐12-‐402 1303 Ängsö-‐57-‐419 1312 Ängsö-‐59-‐422 1313 Ängsö-‐74-‐430 1317 Ängsö-‐80-‐432 1318 App1-‐12 5830 App1-‐14 5831 App1-‐16 5832 Bag 1 9330 Bar 1 9332 Bil-‐3 5835 Bön 1 9336 Boo2-‐3 5836 Böt 1 9339 Böt 4 9342 Brösarp-‐11-‐135 1061 Brösarp-‐11-‐138 1062 Brösarp-‐21-‐140 1063 Brösarp-‐25-‐142 1064 Brösarp-‐34-‐145 1066 Brösarp-‐37-‐149 1068 Brösarp-‐43-‐152 1069 Brösarp-‐45-‐153 1070 Brösarp-‐51-‐157 1072 Brösarp-‐53-‐159 1073 Brösarp-‐61-‐162 1074 Brösarp-‐63-‐163 1075 Dja 1 9343 Dja 2 9344 Table S2
AccessionName AccessionID Död 1 9351 Djk 3 9349 Död 2 9352 Död 3 9353 Dör-‐10 5856 Dra1-‐4 5865 Dra2-‐1 5867 Dra-‐3 5860 Dra3-‐9 5870 Eden 15 9354 Eden 16 9355 Eden 17 9356 Eden-‐1 6009 Eden-‐4 8218 Eden-‐5 6010 Eden-‐6 6011 Eden-‐7 6012 Eden-‐9 6013 EdJ 2 9363 Eds-‐9 6017 EkN 3 9367 EkS 2 9369 EkS 3 9370 FäL 1 9371 Fjä1-‐2 6019 Fjä1-‐5 6020 Fjä2-‐4 6021 Fjä2-‐6 6022 Fly2-‐1 6023 FlyA 3 9380 Fri 1 9381 Fri 2 9382 Fri 3 9383 Frö 1 9384 Frö 3 9385 Gårdby-‐17-‐198 1132 Gårdby-‐22-‐213 1137 Gro-‐3 6025 Grön 12 9386 Grön 14 9388 Grön-‐5 6030 Had 1 9390 Had 2 9391 Had 3 9392 Hag 2 9394 Hal 1 9395 Ham 1 9399 Ham-‐10-‐239 1366 Ham-‐13-‐241 1367
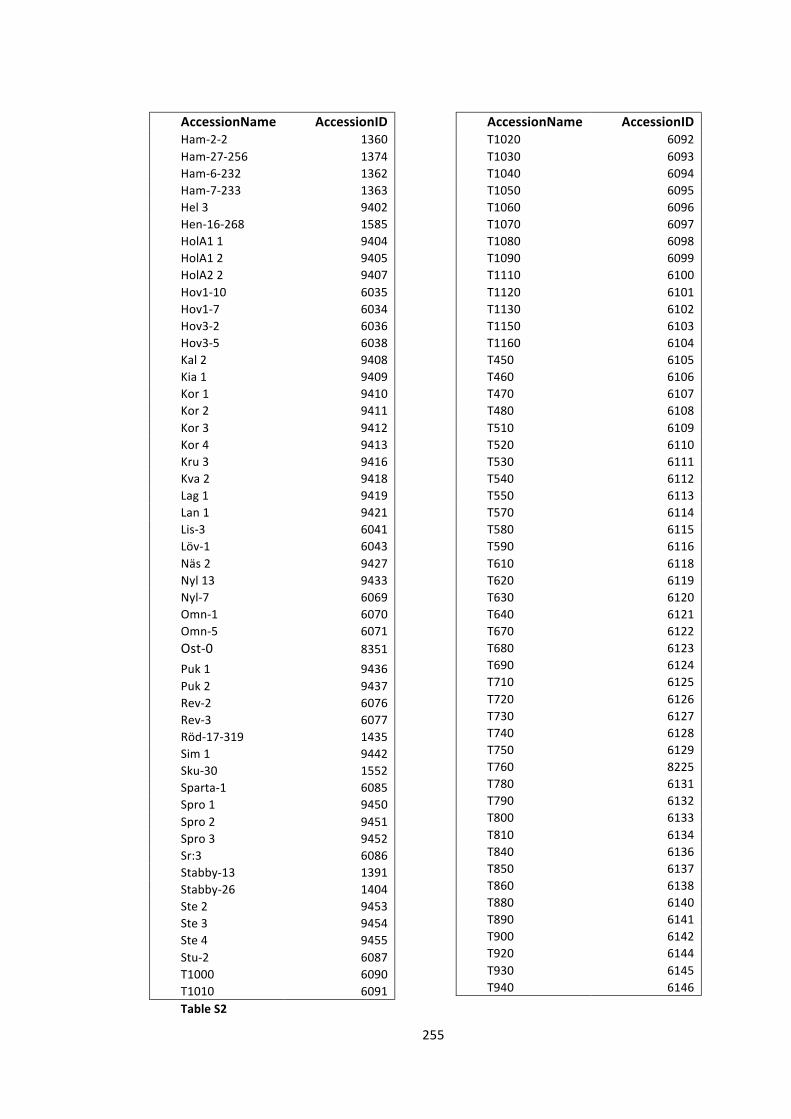
255
AccessionName AccessionID Ham-‐2-‐2 1360 Ham-‐27-‐256 1374 Ham-‐6-‐232 1362 Ham-‐7-‐233 1363 Hel 3 9402 Hen-‐16-‐268 1585 HolA1 1 9404 HolA1 2 9405 HolA2 2 9407 Hov1-‐10 6035 Hov1-‐7 6034 Hov3-‐2 6036 Hov3-‐5 6038 Kal 2 9408 Kia 1 9409 Kor 1 9410 Kor 2 9411 Kor 3 9412 Kor 4 9413 Kru 3 9416 Kva 2 9418 Lag 1 9419 Lan 1 9421 Lis-‐3 6041 Löv-‐1 6043 Näs 2 9427 Nyl 13 9433 Nyl-‐7 6069 Omn-‐1 6070 Omn-‐5 6071 Ost-‐0 8351 Puk 1 9436 Puk 2 9437 Rev-‐2 6076 Rev-‐3 6077 Röd-‐17-‐319 1435 Sim 1 9442 Sku-‐30 1552 Sparta-‐1 6085 Spro 1 9450 Spro 2 9451 Spro 3 9452 Sr:3 6086 Stabby-‐13 1391 Stabby-‐26 1404 Ste 2 9453 Ste 3 9454 Ste 4 9455 Stu-‐2 6087 T1000 6090 T1010 6091 Table S2
AccessionName AccessionID T1020 6092 T1030 6093 T1040 6094 T1050 6095 T1060 6096 T1070 6097 T1080 6098 T1090 6099 T1110 6100 T1120 6101 T1130 6102 T1150 6103 T1160 6104 T450 6105 T460 6106 T470 6107 T480 6108 T510 6109 T520 6110 T530 6111 T540 6112 T550 6113 T570 6114 T580 6115 T590 6116 T610 6118 T620 6119 T630 6120 T640 6121 T670 6122 T680 6123 T690 6124 T710 6125 T720 6126 T730 6127 T740 6128 T750 6129 T760 8225 T780 6131 T790 6132 T800 6133 T810 6134 T840 6136 T850 6137 T860 6138 T880 6140 T890 6141 T900 6142 T920 6144 T930 6145 T940 6146
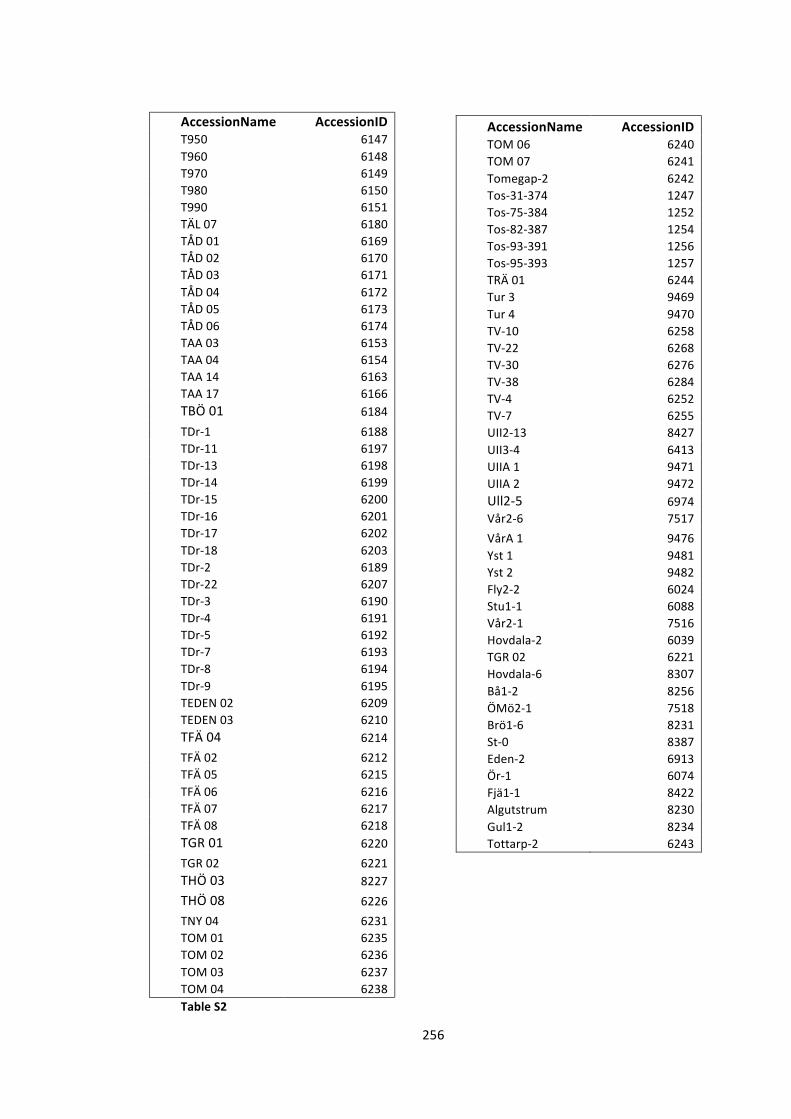
256
AccessionName AccessionID T950 6147 T960 6148 T970 6149 T980 6150 T990 6151 TÄL 07 6180 TÅD 01 6169 TÅD 02 6170 TÅD 03 6171 TÅD 04 6172 TÅD 05 6173 TÅD 06 6174 TAA 03 6153 TAA 04 6154 TAA 14 6163 TAA 17 6166 TBÖ 01 6184 TDr-‐1 6188 TDr-‐11 6197 TDr-‐13 6198 TDr-‐14 6199 TDr-‐15 6200 TDr-‐16 6201 TDr-‐17 6202 TDr-‐18 6203 TDr-‐2 6189 TDr-‐22 6207 TDr-‐3 6190 TDr-‐4 6191 TDr-‐5 6192 TDr-‐7 6193 TDr-‐8 6194 TDr-‐9 6195 TEDEN 02 6209 TEDEN 03 6210 TFÄ 04 6214 TFÄ 02 6212 TFÄ 05 6215 TFÄ 06 6216 TFÄ 07 6217 TFÄ 08 6218 TGR 01 6220 TGR 02 6221 THÖ 03 8227 THÖ 08 6226 TNY 04 6231 TOM 01 6235 TOM 02 6236 TOM 03 6237 TOM 04 6238 Table S2
AccessionName AccessionID TOM 06 6240 TOM 07 6241 Tomegap-‐2 6242 Tos-‐31-‐374 1247 Tos-‐75-‐384 1252 Tos-‐82-‐387 1254 Tos-‐93-‐391 1256 Tos-‐95-‐393 1257 TRÄ 01 6244 Tur 3 9469 Tur 4 9470 TV-‐10 6258 TV-‐22 6268 TV-‐30 6276 TV-‐38 6284 TV-‐4 6252 TV-‐7 6255 UII2-‐13 8427 UII3-‐4 6413 UIIA 1 9471 UIIA 2 9472 Ull2-‐5 6974 Vår2-‐6 7517 VårA 1 9476 Yst 1 9481 Yst 2 9482 Fly2-‐2 6024 Stu1-‐1 6088 Vår2-‐1 7516 Hovdala-‐2 6039 TGR 02 6221 Hovdala-‐6 8307 Bå1-‐2 8256 ÖMö2-‐1 7518 Brö1-‐6 8231 St-‐0 8387 Eden-‐2 6913 Ör-‐1 6074 Fjä1-‐1 8422 Algutstrum 8230 Gul1-‐2 8234 Tottarp-‐2 6243
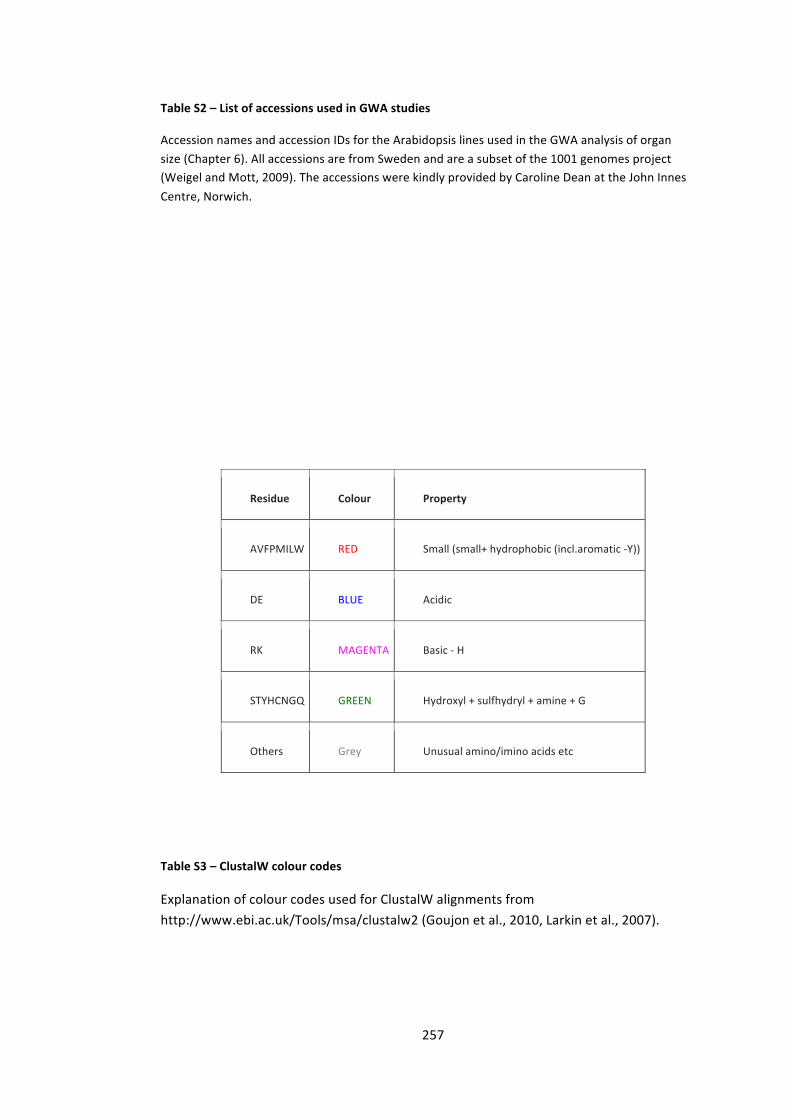
257
Residue Colour Property
AVFPMILW RED Small (small+ hydrophobic (incl.aromatic -‐Y))
DE BLUE Acidic
RK MAGENTA Basic -‐ H
STYHCNGQ GREEN Hydroxyl + sulfhydryl + amine + G
Others Grey Unusual amino/imino acids etc
Table S2 – List of accessions used in GWA studies
Accession names and accession IDs for the Arabidopsis lines used in the GWA analysis of organ size (Chapter 6). All accessions are from Sweden and are a subset of the 1001 genomes project (Weigel and Mott, 2009). The accessions were kindly provided by Caroline Dean at the John Innes Centre, Norwich.
Table S3 – ClustalW colour codes
Explanation of colour codes used for ClustalW alignments from http://www.ebi.ac.uk/Tools/msa/clustalw2 (Goujon et al., 2010, Larkin et al., 2007).
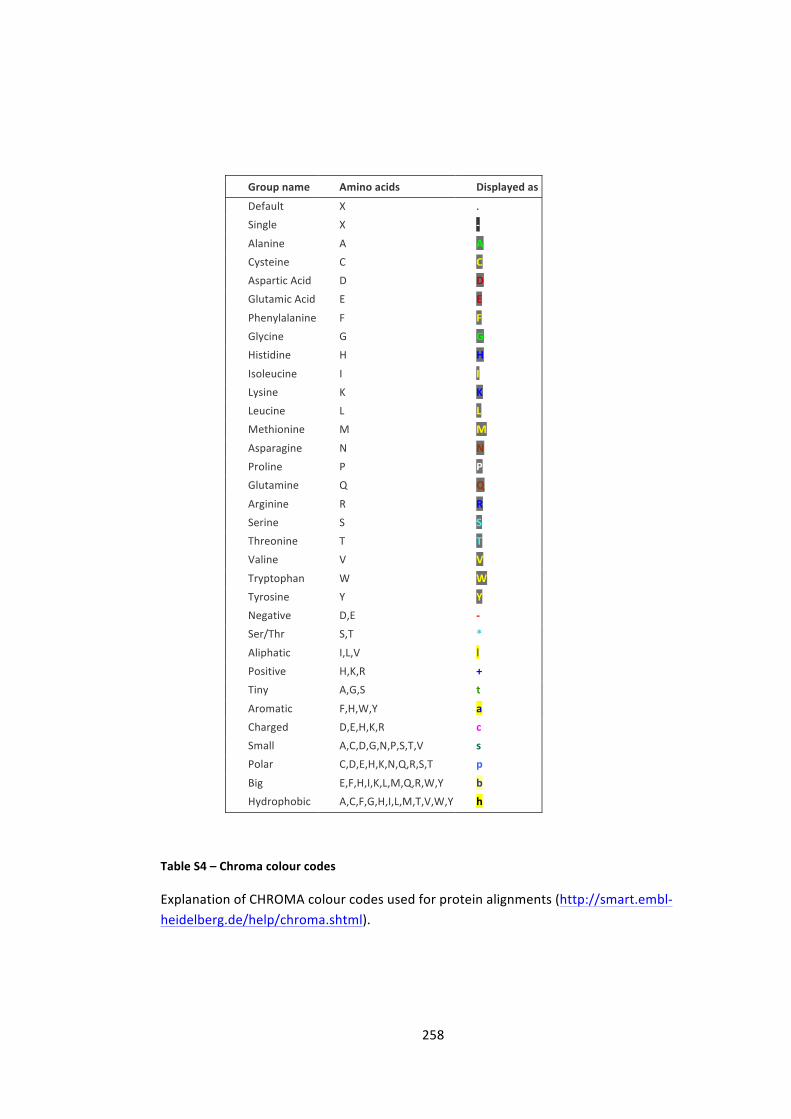
258
Group name Amino acids Displayed as
Default X . Single X -‐
Alanine A A Cysteine C C Aspartic Acid D D Glutamic Acid E E
Phenylalanine F F Glycine G G Histidine H H
Isoleucine I I Lysine K K Leucine L L Methionine M M
Asparagine N N Proline P P Glutamine Q Q
Arginine R R Serine S S Threonine T T Valine V V
Tryptophan W W Tyrosine Y Y Negative D,E -‐ Ser/Thr S,T *
Aliphatic I,L,V l Positive H,K,R + Tiny A,G,S t
Aromatic F,H,W,Y a Charged D,E,H,K,R c Small A,C,D,G,N,P,S,T,V s Polar C,D,E,H,K,N,Q,R,S,T p
Big E,F,H,I,K,L,M,Q,R,W,Y b Hydrophobic A,C,F,G,H,I,L,M,T,V,W,Y h
Table S4 – Chroma colour codes
Explanation of CHROMA colour codes used for protein alignments (http://smart.embl-‐heidelberg.de/help/chroma.shtml).
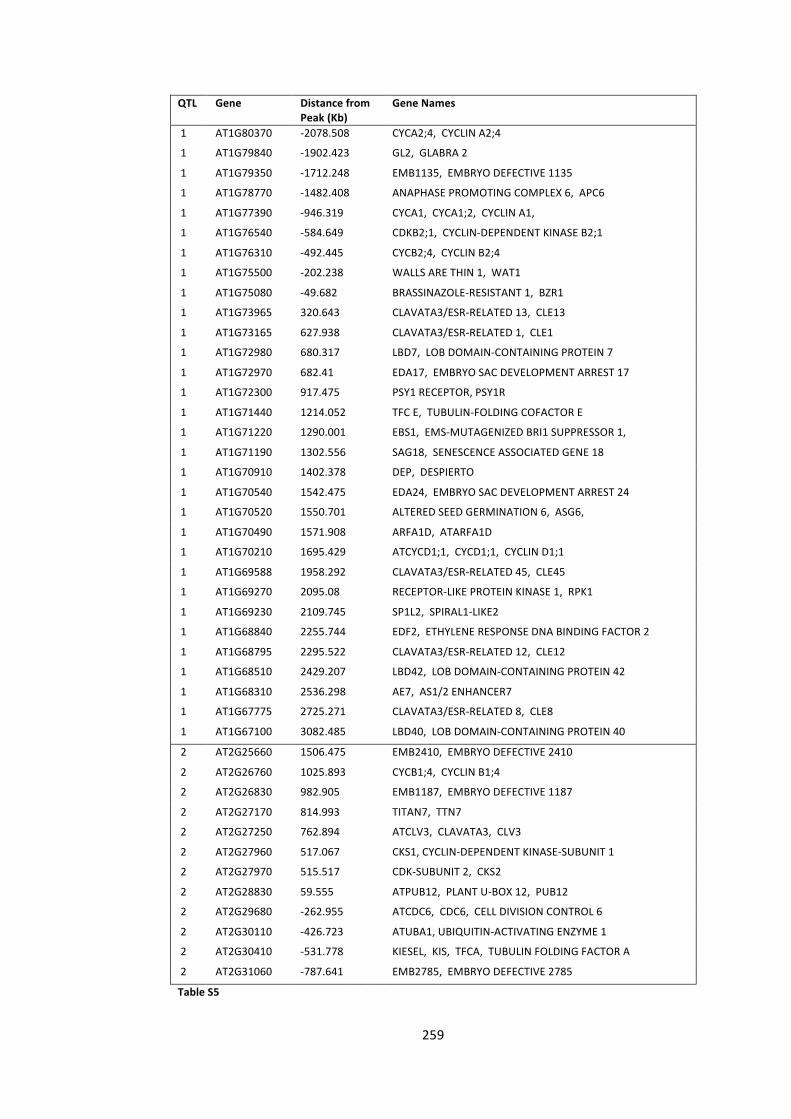
259
QTL Gene Distance from Peak (Kb)
Gene Names
1 AT1G80370 -‐2078.508 CYCA2;4, CYCLIN A2;4
1 AT1G79840 -‐1902.423 GL2, GLABRA 2
1 AT1G79350 -‐1712.248 EMB1135, EMBRYO DEFECTIVE 1135
1 AT1G78770 -‐1482.408 ANAPHASE PROMOTING COMPLEX 6, APC6
1 AT1G77390 -‐946.319 CYCA1, CYCA1;2, CYCLIN A1,
1 AT1G76540 -‐584.649 CDKB2;1, CYCLIN-‐DEPENDENT KINASE B2;1
1 AT1G76310 -‐492.445 CYCB2;4, CYCLIN B2;4
1 AT1G75500 -‐202.238 WALLS ARE THIN 1, WAT1
1 AT1G75080 -‐49.682 BRASSINAZOLE-‐RESISTANT 1, BZR1
1 AT1G73965 320.643 CLAVATA3/ESR-‐RELATED 13, CLE13
1 AT1G73165 627.938 CLAVATA3/ESR-‐RELATED 1, CLE1
1 AT1G72980 680.317 LBD7, LOB DOMAIN-‐CONTAINING PROTEIN 7
1 AT1G72970 682.41 EDA17, EMBRYO SAC DEVELOPMENT ARREST 17
1 AT1G72300 917.475 PSY1 RECEPTOR, PSY1R
1 AT1G71440 1214.052 TFC E, TUBULIN-‐FOLDING COFACTOR E
1 AT1G71220 1290.001 EBS1, EMS-‐MUTAGENIZED BRI1 SUPPRESSOR 1,
1 AT1G71190 1302.556 SAG18, SENESCENCE ASSOCIATED GENE 18
1 AT1G70910 1402.378 DEP, DESPIERTO
1 AT1G70540 1542.475 EDA24, EMBRYO SAC DEVELOPMENT ARREST 24
1 AT1G70520 1550.701 ALTERED SEED GERMINATION 6, ASG6,
1 AT1G70490 1571.908 ARFA1D, ATARFA1D
1 AT1G70210 1695.429 ATCYCD1;1, CYCD1;1, CYCLIN D1;1
1 AT1G69588 1958.292 CLAVATA3/ESR-‐RELATED 45, CLE45
1 AT1G69270 2095.08 RECEPTOR-‐LIKE PROTEIN KINASE 1, RPK1
1 AT1G69230 2109.745 SP1L2, SPIRAL1-‐LIKE2
1 AT1G68840 2255.744 EDF2, ETHYLENE RESPONSE DNA BINDING FACTOR 2
1 AT1G68795 2295.522 CLAVATA3/ESR-‐RELATED 12, CLE12
1 AT1G68510 2429.207 LBD42, LOB DOMAIN-‐CONTAINING PROTEIN 42
1 AT1G68310 2536.298 AE7, AS1/2 ENHANCER7
1 AT1G67775 2725.271 CLAVATA3/ESR-‐RELATED 8, CLE8
1 AT1G67100 3082.485 LBD40, LOB DOMAIN-‐CONTAINING PROTEIN 40
2 AT2G25660 1506.475 EMB2410, EMBRYO DEFECTIVE 2410
2 AT2G26760 1025.893 CYCB1;4, CYCLIN B1;4
2 AT2G26830 982.905 EMB1187, EMBRYO DEFECTIVE 1187
2 AT2G27170 814.993 TITAN7, TTN7
2 AT2G27250 762.894 ATCLV3, CLAVATA3, CLV3
2 AT2G27960 517.067 CKS1, CYCLIN-‐DEPENDENT KINASE-‐SUBUNIT 1
2 AT2G27970 515.517 CDK-‐SUBUNIT 2, CKS2
2 AT2G28830 59.555 ATPUB12, PLANT U-‐BOX 12, PUB12
2 AT2G29680 -‐262.955 ATCDC6, CDC6, CELL DIVISION CONTROL 6
2 AT2G30110 -‐426.723 ATUBA1, UBIQUITIN-‐ACTIVATING ENZYME 1
2 AT2G30410 -‐531.778 KIESEL, KIS, TFCA, TUBULIN FOLDING FACTOR A
2 AT2G31060 -‐787.641 EMB2785, EMBRYO DEFECTIVE 2785
Table S5
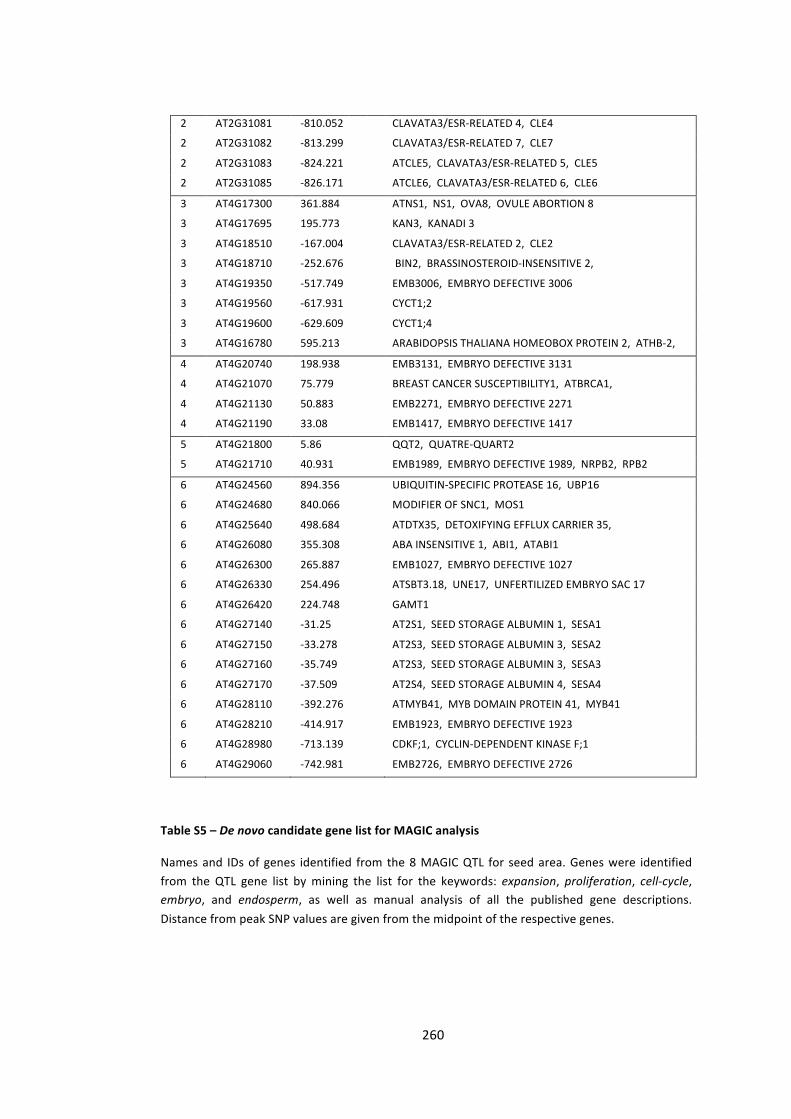
260
2 AT2G31081 -‐810.052 CLAVATA3/ESR-‐RELATED 4, CLE4
2 AT2G31082 -‐813.299 CLAVATA3/ESR-‐RELATED 7, CLE7
2 AT2G31083 -‐824.221 ATCLE5, CLAVATA3/ESR-‐RELATED 5, CLE5
2 AT2G31085 -‐826.171 ATCLE6, CLAVATA3/ESR-‐RELATED 6, CLE6
3 AT4G17300 361.884 ATNS1, NS1, OVA8, OVULE ABORTION 8
3 AT4G17695 195.773 KAN3, KANADI 3
3 AT4G18510 -‐167.004 CLAVATA3/ESR-‐RELATED 2, CLE2
3 AT4G18710 -‐252.676 BIN2, BRASSINOSTEROID-‐INSENSITIVE 2,
3 AT4G19350 -‐517.749 EMB3006, EMBRYO DEFECTIVE 3006
3 AT4G19560 -‐617.931 CYCT1;2
3 AT4G19600 -‐629.609 CYCT1;4
3 AT4G16780 595.213 ARABIDOPSIS THALIANA HOMEOBOX PROTEIN 2, ATHB-‐2,
4 AT4G20740 198.938 EMB3131, EMBRYO DEFECTIVE 3131
4 AT4G21070 75.779 BREAST CANCER SUSCEPTIBILITY1, ATBRCA1,
4 AT4G21130 50.883 EMB2271, EMBRYO DEFECTIVE 2271
4 AT4G21190 33.08 EMB1417, EMBRYO DEFECTIVE 1417
5 AT4G21800 5.86 QQT2, QUATRE-‐QUART2
5 AT4G21710 40.931 EMB1989, EMBRYO DEFECTIVE 1989, NRPB2, RPB2
6 AT4G24560 894.356 UBIQUITIN-‐SPECIFIC PROTEASE 16, UBP16
6 AT4G24680 840.066 MODIFIER OF SNC1, MOS1
6 AT4G25640 498.684 ATDTX35, DETOXIFYING EFFLUX CARRIER 35,
6 AT4G26080 355.308 ABA INSENSITIVE 1, ABI1, ATABI1
6 AT4G26300 265.887 EMB1027, EMBRYO DEFECTIVE 1027
6 AT4G26330 254.496 ATSBT3.18, UNE17, UNFERTILIZED EMBRYO SAC 17
6 AT4G26420 224.748 GAMT1
6 AT4G27140 -‐31.25 AT2S1, SEED STORAGE ALBUMIN 1, SESA1
6 AT4G27150 -‐33.278 AT2S3, SEED STORAGE ALBUMIN 3, SESA2
6 AT4G27160 -‐35.749 AT2S3, SEED STORAGE ALBUMIN 3, SESA3
6 AT4G27170 -‐37.509 AT2S4, SEED STORAGE ALBUMIN 4, SESA4
6 AT4G28110 -‐392.276 ATMYB41, MYB DOMAIN PROTEIN 41, MYB41
6 AT4G28210 -‐414.917 EMB1923, EMBRYO DEFECTIVE 1923
6 AT4G28980 -‐713.139 CDKF;1, CYCLIN-‐DEPENDENT KINASE F;1
6 AT4G29060 -‐742.981 EMB2726, EMBRYO DEFECTIVE 2726
Table S5 – De novo candidate gene list for MAGIC analysis
Names and IDs of genes identified from the 8 MAGIC QTL for seed area. Genes were identified from the QTL gene list by mining the list for the keywords: expansion, proliferation, cell-‐cycle, embryo, and endosperm, as well as manual analysis of all the published gene descriptions. Distance from peak SNP values are given from the midpoint of the respective genes.
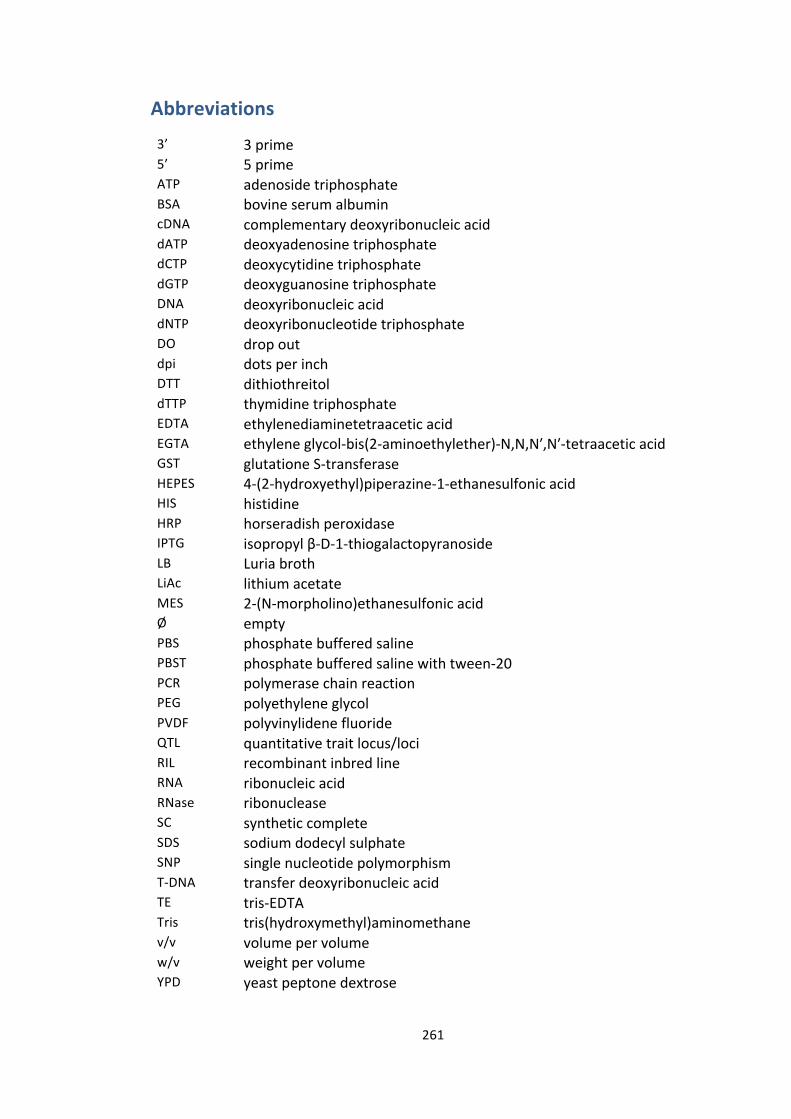
261
Abbreviations
3’ 3 prime 5’ 5 prime ATP adenoside triphosphate BSA bovine serum albumin cDNA complementary deoxyribonucleic acid dATP deoxyadenosine triphosphate dCTP deoxycytidine triphosphate dGTP deoxyguanosine triphosphate DNA deoxyribonucleic acid dNTP deoxyribonucleotide triphosphate DO drop out dpi dots per inch DTT dithiothreitol dTTP thymidine triphosphate EDTA ethylenediaminetetraacetic acid EGTA ethylene glycol-‐bis(2-‐aminoethylether)-‐N,N,Nʹ′,Nʹ′-‐tetraacetic acid GST glutatione S-‐transferase HEPES 4-‐(2-‐hydroxyethyl)piperazine-‐1-‐ethanesulfonic acid HIS histidine HRP horseradish peroxidase IPTG isopropyl β-‐D-‐1-‐thiogalactopyranoside LB Luria broth LiAc lithium acetate MES 2-‐(N-‐morpholino)ethanesulfonic acid Ø empty PBS phosphate buffered saline PBST phosphate buffered saline with tween-‐20 PCR polymerase chain reaction PEG polyethylene glycol PVDF polyvinylidene fluoride QTL quantitative trait locus/loci RIL recombinant inbred line RNA ribonucleic acid RNase ribonuclease SC synthetic complete SDS sodium dodecyl sulphate SNP single nucleotide polymorphism T-‐DNA transfer deoxyribonucleic acid TE tris-‐EDTA Tris tris(hydroxymethyl)aminomethane v/v volume per volume w/v weight per volume YPD yeast peptone dextrose
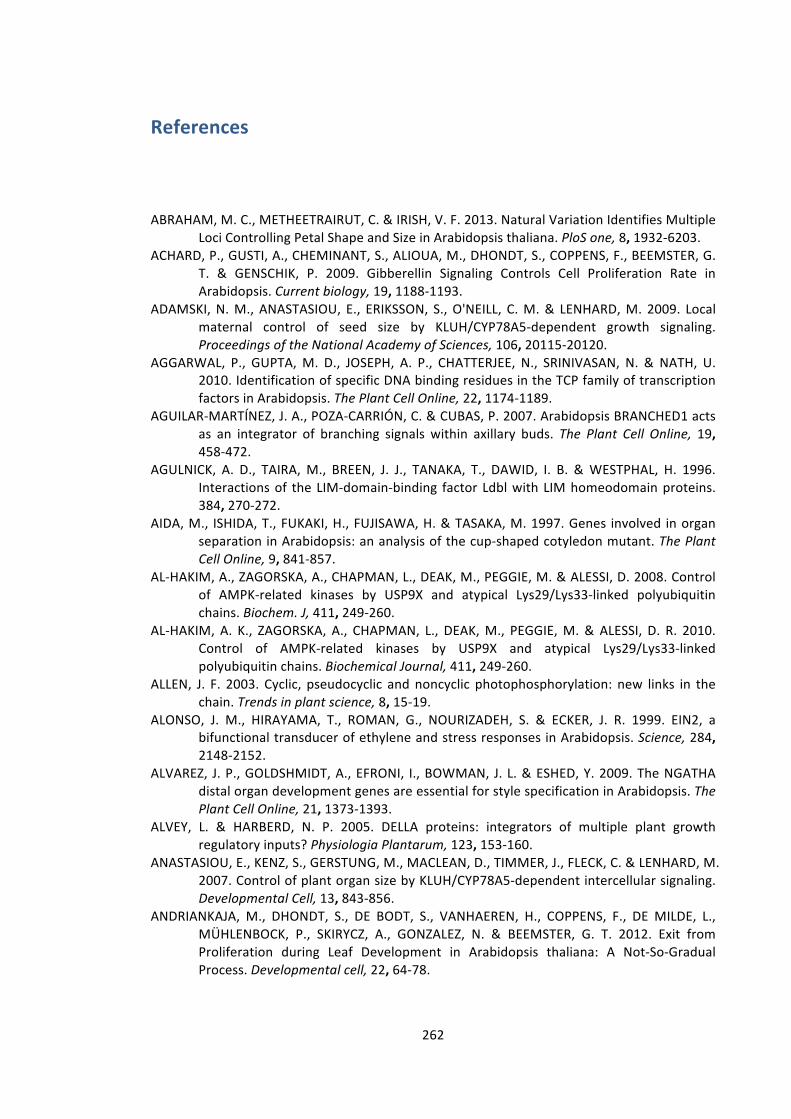
262
References
ABRAHAM, M. C., METHEETRAIRUT, C. & IRISH, V. F. 2013. Natural Variation Identifies Multiple
Loci Controlling Petal Shape and Size in Arabidopsis thaliana. PloS one, 8, 1932-‐6203. ACHARD, P., GUSTI, A., CHEMINANT, S., ALIOUA, M., DHONDT, S., COPPENS, F., BEEMSTER, G.
T. & GENSCHIK, P. 2009. Gibberellin Signaling Controls Cell Proliferation Rate in Arabidopsis. Current biology, 19, 1188-‐1193.
ADAMSKI, N. M., ANASTASIOU, E., ERIKSSON, S., O'NEILL, C. M. & LENHARD, M. 2009. Local maternal control of seed size by KLUH/CYP78A5-‐dependent growth signaling. Proceedings of the National Academy of Sciences, 106, 20115-‐20120.
AGGARWAL, P., GUPTA, M. D., JOSEPH, A. P., CHATTERJEE, N., SRINIVASAN, N. & NATH, U. 2010. Identification of specific DNA binding residues in the TCP family of transcription factors in Arabidopsis. The Plant Cell Online, 22, 1174-‐1189.
AGUILAR-‐MARTÍNEZ, J. A., POZA-‐CARRIÓN, C. & CUBAS, P. 2007. Arabidopsis BRANCHED1 acts as an integrator of branching signals within axillary buds. The Plant Cell Online, 19, 458-‐472.
AGULNICK, A. D., TAIRA, M., BREEN, J. J., TANAKA, T., DAWID, I. B. & WESTPHAL, H. 1996. Interactions of the LIM-‐domain-‐binding factor Ldbl with LIM homeodomain proteins. 384, 270-‐272.
AIDA, M., ISHIDA, T., FUKAKI, H., FUJISAWA, H. & TASAKA, M. 1997. Genes involved in organ separation in Arabidopsis: an analysis of the cup-‐shaped cotyledon mutant. The Plant Cell Online, 9, 841-‐857.
AL-‐HAKIM, A., ZAGORSKA, A., CHAPMAN, L., DEAK, M., PEGGIE, M. & ALESSI, D. 2008. Control of AMPK-‐related kinases by USP9X and atypical Lys29/Lys33-‐linked polyubiquitin chains. Biochem. J, 411, 249-‐260.
AL-‐HAKIM, A. K., ZAGORSKA, A., CHAPMAN, L., DEAK, M., PEGGIE, M. & ALESSI, D. R. 2010. Control of AMPK-‐related kinases by USP9X and atypical Lys29/Lys33-‐linked polyubiquitin chains. Biochemical Journal, 411, 249-‐260.
ALLEN, J. F. 2003. Cyclic, pseudocyclic and noncyclic photophosphorylation: new links in the chain. Trends in plant science, 8, 15-‐19.
ALONSO, J. M., HIRAYAMA, T., ROMAN, G., NOURIZADEH, S. & ECKER, J. R. 1999. EIN2, a bifunctional transducer of ethylene and stress responses in Arabidopsis. Science, 284, 2148-‐2152.
ALVAREZ, J. P., GOLDSHMIDT, A., EFRONI, I., BOWMAN, J. L. & ESHED, Y. 2009. The NGATHA distal organ development genes are essential for style specification in Arabidopsis. The Plant Cell Online, 21, 1373-‐1393.
ALVEY, L. & HARBERD, N. P. 2005. DELLA proteins: integrators of multiple plant growth regulatory inputs? Physiologia Plantarum, 123, 153-‐160.
ANASTASIOU, E., KENZ, S., GERSTUNG, M., MACLEAN, D., TIMMER, J., FLECK, C. & LENHARD, M. 2007. Control of plant organ size by KLUH/CYP78A5-‐dependent intercellular signaling. Developmental Cell, 13, 843-‐856.
ANDRIANKAJA, M., DHONDT, S., DE BODT, S., VANHAEREN, H., COPPENS, F., DE MILDE, L., MÜHLENBOCK, P., SKIRYCZ, A., GONZALEZ, N. & BEEMSTER, G. T. 2012. Exit from Proliferation during Leaf Development in Arabidopsis thaliana: A Not-‐So-‐Gradual Process. Developmental cell, 22, 64-‐78.

263
ATWELL, S., HUANG, Y. S., VILHJÁLMSSON, B. J., WILLEMS, G., HORTON, M., LI, Y., MENG, D., PLATT, A., TARONE, A. M. & HU, T. T. 2010. Genome-‐wide association study of 107 phenotypes in Arabidopsis thaliana inbred lines. Nature, 465, 627-‐631.
AUTRAN, D., JONAK, C., BELCRAM, K., BEEMSTER, G. T., KRONENBERGER, J., GRANDJEAN, O., INZÉ, D. & TRAAS, J. 2002. Cell numbers and leaf development in Arabidopsis: a functional analysis of the STRUWWELPETER gene. The EMBO Journal, 21, 6036-‐6049.
AZPIROZ, R., WU, Y., LOCASCIO, J. C. & FELDMANN, K. A. 1998. An Arabidopsis brassinosteroid-‐dependent mutant is blocked in cell elongation. The Plant Cell Online, 10, 219-‐230.
BAIMA, S., NOBILI, F., SESSA, G., LUCCHETTI, S., RUBERTI, I. & MORELLI, G. 1995. The expression of the Athb-‐8 homeobox gene is restricted to provascular cells in Arabidopsis thaliana. Development, 121, 4171-‐4182.
BAIMA, S., POSSENTI, M., MATTEUCCI, A., WISMAN, E., ALTAMURA, M. M., RUBERTI, I. & MORELLI, G. 2001. The Arabidopsis ATHB-‐8 HD-‐zip protein acts as a differentiation-‐promoting transcription factor of the vascular meristems. Plant Physiology, 126, 643-‐655.
BALSEMÃO-‐PIRES, E., ANDRADE, L. R. & SACHETTO-‐MARTINS, G. 2013. Functional study of TCP23 in Arabidopsis thaliana during plant development. Plant Physiology and Biochemistry, 67, 120-‐125.
BARTRINA, I., OTTO, E., STRNAD, M., WERNER, T. & SCHMÜLLING, T. 2011. Cytokinin regulates the activity of reproductive meristems, flower organ size, ovule formation, and thus seed yield in Arabidopsis thaliana. The Plant Cell Online, 23, 69-‐80.
BEEMSTER, G. T., FIORANI, F. & INZÉ, D. 2003. Cell cycle: the key to plant growth control? Trends in plant science, 8, 154-‐158.
BELKHADIR, Y. & CHORY, J. 2006. Brassinosteroid signaling: a paradigm for steroid hormone signaling from the cell surface. Science, 314, 1410-‐1411.
BELL, M. A. & TRAVIS, M. P. 2005. Hybridization, transgressive segregation, genetic covariation, and adaptive radiation. Trends in ecology & evolution, 20, 358-‐361.
BEMER, M. & GROSSNIKLAUS, U. 2012. Dynamic regulation of Polycomb group activity during plant development. Current opinion in plant biology, 15, 523-‐529.
BERGELSON, J. & ROUX, F. 2010. Towards identifying genes underlying ecologically relevant traits in Arabidopsis thaliana. Nature Reviews Genetics, 11, 867-‐879.
BERGER, F., HAMAMURA, Y., INGOUFF, M. & HIGASHIYAMA, T. 2008. Double fertilization-‐caught in the act. Trends in plant science, 13, 437-‐443.
BHARATHAN, G., GOLIBER, T. E., MOORE, C., KESSLER, S., PHAM, T. & SINHA, N. R. 2002. Homologies in leaf form inferred from KNOXI gene expression during development. Science, 296, 1858-‐1860.
BI, D., JOHNSON, K. C., ZHU, Z., HUANG, Y., CHEN, F., ZHANG, Y. & LI, X. 2011. Mutations in an atypical TIR-‐NB-‐LRR-‐LIM resistance protein confer autoimmunity. Frontiers in plant science, 2, 1-‐10.
BIEDERMANN, S. & HELLMANN, H. 2011. WD40 and CUL4-‐based E3 ligases: lubricating all aspects of life. Trends in plant science, 16, 38-‐46.
BIEGERT A, MAYER C, REMMERT M, SÖDING J & A, L. 2006. The MPI Toolkit for protein sequence analysis. Nucleic Acids Res, 34, 335-‐339.
BLECKMANN, A., WEIDTKAMP-‐PETERS, S., SEIDEL, C. A. & SIMON, R. 2010. Stem cell signaling in Arabidopsis requires CRN to localize CLV2 to the plasma membrane. Plant physiology, 152, 166-‐176.
BOCOCK, J. P., CARMICLE, S., SIRCAR, M. & ERICKSON, A. H. 2010. Trafficking and proteolytic processing of RNF13, a model PA-‐TM-‐�RING family endosomal membrane ubiquitin ligase. FEBS Journal, 278, 69-‐77.
BÖGRE, L., MAGYAR, Z. & LÓPEZ-‐JUEZ, E. 2008. New clues to organ size control in plants. Genome Biology, 9, 226-‐232.
264
BOND, J. S. & BEYNON, R. J. 1995. The astacin family of metalloendopeptidases. Protein Science, 4, 1247-‐1261.
BOU-‐TORRENT, J., SALLA-‐MARTRET, M., BRANDT, R., MUSIELAK, T., PALAUQUI, J.-‐C., MARTÍNEZ-‐GARCÍA, J. F. & WENKEL, S. 2012. ATHB4 and HAT3, two class II HD-‐ZIP transcription factors, control leaf development in Arabidopsis. Plant signaling & behavior, 7, 1382-‐1387.
BOWMAN, J. L., SMYTH, D. R. & MEYEROWITZ, E. M. 1991. Genetic interactions among floral homeotic genes of Arabidopsis. Development, 112, 1-‐20.
BRACHI, B., FAURE, N., HORTON, M., FLAHAUW, E., VAZQUEZ, A., NORDBORG, M., BERGELSON, J., CUGUEN, J. & ROUX, F. 2010. Linkage and association mapping of Arabidopsis thaliana flowering time in nature. PLoS Genetics, 6, e1000940.
BREUNINGER, H. & LENHARD, M. 2010. Chapter Seven-‐Control of Tissue and Organ Growth in Plants. Current topics in developmental biology, 91, 185-‐220.
BROWN, M. S. & GOLDSTEIN, J. L. 1997. The SREBP Pathway: Regulation Review of Cholesterol Metabolism by Proteolysis of a Membrane-‐Bound Transcription Factor. Cell, 89, 331-‐340.
BUDHIRAJA, R., HERMKES, R., MÜLLER, S., SCHMIDT, J., COLBY, T., PANIGRAHI, K., COUPLAND, G. & BACHMAIR, A. 2009. Substrates related to chromatin and to RNA-‐dependent processes are modified by Arabidopsis SUMO isoforms that differ in a conserved residue with influence on desumoylation. Plant physiology, 149, 1529-‐1540.
BUDIHARDJO, I., OLIVER, H., LUTTER, M., LUO, X. & WANG, X. 1999. Biochemical pathways of caspase activation during apoptosis. Annual review of cell and developmental biology, 15, 269-‐290.
BURCHELL, L., CHAUGULE, V. K. & WALDEN, H. 2012. Small, N-‐Terminal Tags Activate Parkin E3 Ubiquitin Ligase Activity by Disrupting Its Autoinhibited Conformation. PLoS ONE, 7, e34748.
BURKE, R. & BASLER, K. 1996. Dpp receptors are autonomously required for cell proliferation in the entire developing Drosophila wing. Development, 122, 2261-‐2269.
CALDANA, C., FERNIE, A. R., WILLMITZER, L. & STEINHAUSER, D. 2012. Unraveling retrograde signaling pathways: finding candidate signaling molecules via metabolomics and systems biology driven approaches. Frontiers in plant science, 3, 267.
CALLIS, J., CARPENTER, T., SUN, C.-‐W. & VIERSTRA, R. D. 1995. Structure and evolution of genes encoding polyubiquitin and ubiquitin-‐like proteins in Arabidopsis thaliana ecotype Columbia. Genetics, 139, 921-‐939.
CAPDEVILA, J. & GUERRERO, I. 1994. Targeted expression of the signaling molecule decapentaplegic induces pattern duplications and growth alterations in Drosophila wings. The EMBO journal, 13, 4459-‐4468.
CAPRON, A., ÖKRÉSZ, L. & GENSCHIK, P. 2003. First glance at the plant APC/C, a highly conserved ubiquitin–protein ligase. Trends in plant science, 8, 83-‐89.
CARABELLI, M., SESSA, G., BAIMA, S., MORELLI, G. & RUBERTI, I. 1993. The Arabidopsis Athb‐2 and‐4 genes are strongly induced by far‐red‐rich light. The Plant Journal, 4, 469-‐479.
CARDONE, M. H., ROY, N., STENNICKE, H. R., SALVESEN, G. S., FRANKE, T. F., STANBRIDGE, E., FRISCH, S. & REED, J. C. 1998. Regulation of cell death protease caspase-‐9 by phosphorylation. Science, 282, 1318-‐1321.
CASAMITJANA-‐MARTINEZ, E., HOFHUIS, H. F., XU, J., LIU, C.-‐M., HEIDSTRA, R. & SCHERES, B. 2003. Root-‐Specific CLE19 Overexpression and the sol1/2 Suppressors Implicate a CLV-‐like Pathway in the Control of Arabidopsis Root Meristem Maintenance. Current Biology, 13, 1435-‐1441.
265
CASSMAN, K. G. 1999. Ecological intensification of cereal production systems: Yield potential, soil quality, and precision agriculture. Proceedings of the National Academy of Sciences, 96, 5952-‐5959.
CASTAÑO-‐MIQUEL, L., SEGUÍ, J., MANRIQUE, S., TEIXEIRA, I., CARRETERO-‐PAULET, L., ATENCIO, F. & LOIS, L. M. 2013. Diversification of SUMO activating enzyme in Arabidopsis: implications in SUMO conjugation. Molecular plant, 6, 1646-‐1660.
CENTURY, K., REUBER, T. L. & RATCLIFFE, O. J. 2008. Regulating the regulators: the future prospects for transcription-‐factor-‐based agricultural biotechnology products. Plant Physiology, 147, 20-‐29.
CHAKRAVORTY, D., TRUSOV, Y., ZHANG, W., ACHARYA, B. R., SHEAHAN, M. B., MCCURDY, D. W., ASSMANN, S. M. & BOTELLA, J. R. 2011. An atypical heterotrimeric G‐protein γ‐ subunit is involved in guard cell K+‐ channel regulation and morphological development in Arabidopsis thaliana. The Plant Journal, 67, 840-‐851.
CHALFUN-‐JUNIOR, A., FRANKEN, J., MES, J. J., MARSCH-‐MARTINEZ, N., PEREIRA, A. & ANGENENT, G. C. 2005. ASYMMETRIC LEAVES2-‐LIKE1gene, a member of the AS2/LOB family, controls proximal–distal patterning in Arabidopsis petals. Plant molecular biology, 57, 559-‐575.
CHANG, D. F., BELAGULI, N. S., IYER, D., ROBERTS, W. B., WU, S.-‐P., DONG, X.-‐R., MARX, J. G., MOORE, M. S., BECKERLE, M. C. & MAJESKY, M. W. 2003. Cysteine-‐rich LIM-‐only proteins CRP1 and CRP2 are potent smooth muscle differentiation cofactors. Developmental cell, 4, 107-‐118.
CHANVIVATTANA, Y., BISHOPP, A., SCHUBERT, D., STOCK, C., MOON, Y.-‐H., SUNG, Z. R. & GOODRICH, J. 2004. Interaction of Polycomb-‐group proteins controlling flowering in Arabidopsis. Development, 131, 5263-‐5276.
CHEN, J.-‐G., ULLAH, H., YOUNG, J. C., SUSSMAN, M. R. & JONES, A. M. 2001. ABP1 is required for organized cell elongation and division in Arabidopsis embryogenesis. Genes & Development, 15, 902-‐911.
CHENG, R., ABNEY, M., PALMER, A. A. & SKOL, A. D. 2011. QTLRel: an R package for genome-‐wide association studies in which relatedness is a concern. BMC genetics, 12, 66.
CHENG, R. & PALMER, A. A. 2013. A Simulation Study of Permutation, Bootstrap, and Gene Dropping for Assessing Statistical Significance in the Case of Unequal Relatedness. Genetics, 193, 1015-‐1018.
CHENG, Y., CAO, L., WANG, S., LI, Y., SHI, X., LIU, H., LI, L., ZHANG, Z., FOWKE, L. C. & WANG, H. 2013a. Downregulation of multiple CDK inhibitor ICK/KRP genes upregulates the E2F pathway and increases cell proliferation, and organ and seed sizes in Arabidopsis. The Plant Journal, 75, 642-‐655.
CHENG, Y.-‐C., LIN, T.-‐Y. & SHIEH, S.-‐Y. 2013b. Candidate tumor suppressor BTG3 maintains genomic stability by promoting Lys63-‐linked ubiquitination and activation of the checkpoint kinase CHK1. Proceedings of the National Academy of Sciences, 110, 5993-‐5998.
CHEW, K. C. M., MATSUDA, N., SAISHO, K., LIM, G. G. Y., CHAI, C., TAN, H. M., TANAKA, K. & LIM, K. L. 2012. Parkin Mediates Apparent E2-‐Independent Monoubiquitination In Vitro and Contains an Intrinsic Activity That Catalyzes Polyubiquitination. PLoS ONE, 6, e19720.
CHINCHILLA, D., BAUER, Z., REGENASS, M., BOLLER, T. & FELIX, G. 2006. The Arabidopsis receptor kinase FLS2 binds flg22 and determines the specificity of flagellin perception. The Plant Cell Online, 18, 465-‐476.
CHINCHILLA, D., ZIPFEL, C., ROBATZEK, S., KEMMERLING, B., NÜRNBERGER, T., JONES, J. D., FELIX, G. & BOLLER, T. 2007a. A flagellin-‐induced complex of the receptor FLS2 and BAK1 initiates plant defence. Nature, 448, 497-‐500.
266
CHINCHILLA, D., ZIPFEL, C., ROBATZEK, S., KEMMERLING, B., NÜRNBERGER, T., JONES, J. D. G., FELIX, G. & BOLLER, T. 2007b. A flagellin-‐induced complex of the receptor FLS2 and BAK1 initiates plant defence. Nature, 448, 497-‐500.
CHO, H.-‐T. & COSGROVE, D. J. 2000. Altered expression of expansin modulates leaf growth and pedicel abscission in Arabidopsis thaliana. Proceedings of the National Academy of Sciences, 97, 9783-‐9788.
CHOE, S., FUJIOKA, S., NOGUCHI, T., TAKATSUTO, S., YOSHIDA, S. & FELDMANN, K. A. 2001. Overexpression of DWARF4 in the brassinosteroid biosynthetic pathway results in increased vegetative growth and seed yield in Arabidopsis. The Plant Journal, 26, 573-‐582.
CHURCHMAN, M. L., BROWN, M. L., KATO, N., KIRIK, V., HÜLSKAMP, M., INZÉ, D., DE VEYLDER, L., WALKER, J. D., ZHENG, Z. & OPPENHEIMER, D. G. 2006. SIAMESE, a plant-‐specific cell cycle regulator, controls endoreplication onset in Arabidopsis thaliana. The Plant Cell Online, 18, 3145-‐3157.
CLARK, S. E., WILLIAMS, R. W. & MEYEROWITZ, E. M. 1997. The CLAVATA1 gene encodes a putative receptor kinase that controls shoot and floral meristem size in Arabidopsis. Cell, 89, 575-‐585.
CLOUGH, M. V., HAMLINGTON, J. D. & MCINTOSH, I. 1999. Restricted distribution of loss‐of‐function mutations within the LMX1B genes of nail‐patella syndrome patients. Human mutation, 14, 459-‐465.
CLOUSE, S. D., LANGFORD, M. & MCMORRIS, T. C. 1996. A brassinosteroid-‐insensitive mutant in Arabidopsis thaliana exhibits multiple defects in growth and development. Plant Physiology, 111, 671-‐678.
COLL-‐GARCIA, D., MAZUCH, J., ALTMANN, T. & MÜSSIG, C. 2004. EXORDIUM regulates brassinosteroid-‐responsive genes. FEBS letters, 563, 82-‐86.
CUBAS, P., LAUTER, N., DOEBLEY, J. & COEN, E. 1999. The TCP domain: a motif found in proteins regulating plant growth and development. The Plant Journal, 18, 215-‐222.
CURTIS, M. D. & GROSSNIKLAUS, U. 2003. A gateway cloning vector set for high-‐throughput functional analysis of genes in planta. Plant Physiology, 133, 462-‐469.
DAI, N., WANG, W., PATTERSON, S. E. & BLEECKER, A. B. 2013. The TMK Subfamily of Receptor-‐Like Kinases in Arabidopsis Display an Essential Role in Growth and a Reduced Sensitivity to Auxin. PloS one, 8, e60990.
DAVIÈRE, J.-‐M. & ACHARD, P. 2013. Gibberellin signaling in plants. Development, 140, 1147-‐1151.
DE CASTRO E, SIGRIST CJA, GATTIKER A, BULLIARD V, LANGENDIJK-‐GENEVAUX PS, GASTEIGER E, BAIROCH A & N, H. 2006. ScanProsite: detection of PROSITE signature matches and ProRule-‐associated functional and structural residues in proteins. Nucleic Acids Res, 34, W362-‐W365.
DE LUCIA, F., CREVILLEN, P., JONES, A. M., GREB, T. & DEAN, C. 2008. A PHD-‐polycomb repressive complex 2 triggers the epigenetic silencing of FLC during vernalization. Proceedings of the National Academy of Sciences, 105, 16831-‐16836.
DE VEYLDER, L., BEECKMAN, T., BEEMSTER, G. T., KROLS, L., TERRAS, F., LANDRIEU, I., VAN DER SCHUEREN, E., MAES, S., NAUDTS, M. & INZÉ, D. 2001. Functional analysis of cyclin-‐dependent kinase inhibitors of Arabidopsis. The Plant Cell Online, 13, 1653-‐1668.
DELESSERT, C., KAZAN, K., WILSON, I. W., STRAETEN, D. V. D., MANNERS, J., DENNIS, E. S. & DOLFERUS, R. 2005. The transcription factor ATAF2 represses the expression of pathogenesis‐related genes in Arabidopsis. The Plant Journal, 43, 745-‐757.
DEPROST, D., YAO, L., SORMANI, R., MOREAU, M., LETERREUX, G., NICOLAÏ, M., BEDU, M., ROBAGLIA, C. & MEYER, C. 2007. The Arabidopsis TOR kinase links plant growth, yield, stress resistance and mRNA translation. EMBO reports, 8, 864-‐870.

267
DEVAULT, A., SALES, V., NAULT, C., BEAUMONT, A., ROQUES, B., CRINE, P. & BOILEAU, G. 1988. Exploration of the catalytic site of endopeptidase 24.11 by site-‐directed mutagenesis Histidine residues 583 and 587 are essential for catalysis. FEBS letters, 231, 54-‐58.
DEWITTE, W. & MURRAY, J. A. 2003. The plant cell cycle. Annual Review of Plant Biology, 54, 235-‐264.
DEWITTE, W., SCOFIELD, S., ALCASABAS, A. A., MAUGHAN, S. C., MENGES, M., BRAUN, N., COLLINS, C., NIEUWLAND, J., PRINSEN, E. & SUNDARESAN, V. 2007. Arabidopsis CYCD3 D-‐type cyclins link cell proliferation and endocycles and are rate-‐limiting for cytokinin responses. Proceedings of the National Academy of Sciences, 104, 14537.
DHARMASIRI, N., DHARMASIRI, S., WEIJERS, D., KARUNARATHNA, N., JURGENS, G. & ESTELLE, M. 2007. AXL and AXR1 have redundant functions in RUB conjugation and growth and development in Arabidopsis. The Plant Journal, 52, 114-‐123.
DIÉVART, A. & CLARK, S. E. 2003. Using mutant alleles to determine the structure and function of leucine-‐rich repeat receptor-‐like kinases. Current opinion in plant biology, 6, 507-‐516.
DILL, A., THOMAS, S. G., HU, J., STEBER, C. M. & SUN, T.-‐P. 2004. The Arabidopsis F-‐box protein SLEEPY1 targets gibberellin signaling repressors for gibberellin-‐induced degradation. The Plant Cell Online, 16, 1392-‐1405.
DINNENY, J. R., WEIGEL, D. & YANOFSKY, M. F. 2006. NUBBIN and JAGGED define stamen and carpel shape in Arabidopsis. Development, 133, 1645-‐1655.
DINNENY, J. R., YADEGARI, R., FISCHER, R. L., YANOFSKY, M. F. & WEIGEL, D. 2004. The role of JAGGED in shaping lateral organs. Development, 131, 1101-‐1110.
DISCH, S., ANASTASIOU, E., SHARMA, V. K., LAUX, T., FLETCHER, J. C. & LENHARD, M. 2006. The E3 ubiquitin ligase BIG BROTHER controls Arabidopsis organ size in a dosage-‐dependent manner. Current Biology, 16, 272-‐279.
DITTMAR, G. A., WILKINSON, C. R., JEDRZEJEWSKI, P. T. & FINLEY, D. 2002. Role of a ubiquitin-‐like modification in polarized morphogenesis. Science, 295, 2442-‐2446.
DITTRICH-‐REED, D. R. & FITZPATRICK, B. M. 2012. Transgressive Hybrids as Hopeful Monsters. Evolutionary Biology, 40, 310-‐315.
DIXIT, R. 2013. Plant Cytoskeleton: DELLA Connects Gibberellins to Microtubules. Current Biology, 23, 479-‐481.
DONG, J., FELDMANN, G., HUANG, J., WU, S., ZHANG, N., COMERFORD, S. A., GAYYED, M. F., ANDERS, R. A., MAITRA, A. & PAN, D. 2007. Elucidation of a Universal Size-‐Control Mechanism in Drosophila and Mammals. Cell, 130, 1120-‐1133.
DONNELLY, P. M., BONETTA, D., TSUKAYA, H., DENGLER, R. E. & DENGLER, N. G. 1999. Cell cycling and cell enlargement in developing leaves of Arabidopsis. Developmental Biology, 215, 407-‐419.
DOWNES, B. & VIERSTRA, R. 2005. Post-‐translational regulation in plants employing a diverse set of polypeptide tags. Biochemical Society Transactions, 33, 393-‐400.
DOWNES, B. P., STUPAR, R. M., GINGERICH, D. J. & VIERSTRA, R. D. 2003. The HECT ubiquitin‐protein ligase (UPL) family in Arabidopsis: UPL3 has a specific role in trichome development. The Plant Journal, 35, 729-‐742.
DREZE, M., CARVUNIS, A.-‐R., CHARLOTEAUX, B., GALLI, M., PEVZNER, S. J., TASAN, M., AHN, Y.-‐Y., BALUMURI, P., BARABÁSI, A.-‐L. & BAUTISTA, V. 2011. Evidence for network evolution in an Arabidopsis interactome map. Science, 333, 601-‐607.
DUBOIS, M., SKIRYCZ, A., CLAEYS, H., MALEUX, K., DHONDT, S., DE BODT, S., BOSSCHE, R. V., DE MILDE, L., YOSHIZUMI, T. & MATSUI, M. 2013. ETHYLENE RESPONSE FACTOR6 Acts as a Central Regulator of Leaf Growth under Water-‐Limiting Conditions in Arabidopsis. Plant physiology, 162, 319-‐332.
268
DUDA, D. M., BORG, L. A., SCOTT, D. C., HUNT, H. W., HAMMEL, M. & SCHULMAN, B. A. 2008. Structural insights into NEDD8 activation of cullin-‐RING ligases: conformational control of conjugation. Cell, 134, 995-‐1006.
DUNN, R. & HICKE, L. 2001. Multiple Roles for Rsp 5 p-‐dependent Ubiquitination at the Internalization Step of Endocytosis. Journal of Biological Chemistry, 276, 25974-‐25981.
EBERLE, D., HEGARTY, B., BOSSARD, P., FERRÉ, P. & FOUFELLE, F. 2004. SREBP transcription factors: master regulators of lipid homeostasis. Biochimie, 86, 839-‐848.
ECKER, J. R. 1995. The ethylene signal transduction pathway in plants. Science, 268, 667-‐675. EDGAR, B. A. & DATAR, S. A. 1996. Zygotic degradation of two maternal Cdc25 mRNAs
terminates Drosophila's early cell cycle program. Genes & Development, 10, 1966-‐1977. EDGAR, B. A., KIEHLE, C. P. & SCHUBIGER, G. 1986. Cell cycle control by the nucleo-‐cytoplasmic
ratio in early Drosophila development. Cell, 44, 365-‐372. EDGAR, B. A., SPRENGER, F., DURONIO, R. J., LEOPOLD, P. & O'FARRELL, P. H. 1994. Distinct
molecular mechanism regulate cell cycle timing at successive stages of Drosophila embryogenesis. Genes & Development, 8, 440-‐452.
EFRONI, I., ESHED, Y. & LIFSCHITZ, E. 2010. Morphogenesis of simple and compound leaves: a critical review. The Plant Cell Online, 22, 1019-‐1032.
ELLEDGE, S. J. 1996. Cell cycle checkpoints: preventing an identity crisis. Science, 274, 1664-‐1672.
ELOY, N. B., DE FREITAS LIMA, M., VAN DAMME, D., VANHAEREN, H., GONZALEZ, N., DE MILDE, L., HEMERLY, A. S., BEEMSTER, G. T., INZÉ, D. & FERREIRA, P. C. 2011. The APC/C subunit 10 plays an essential role in cell proliferation during leaf development. The Plant Journal, 68, 351-‐363.
EMANUELE, M. J., ELIA, A. E., XU, Q., THOMA, C. R., IZHAR, L., LENG, Y., GUO, A., CHEN, Y.-‐N., RUSH, J. & HSU, P. W.-‐C. 2011. Global identification of modular cullin-‐RING ligase substrates. Cell, 147, 459-‐474.
EMERY, J. F., FLOYD, S. K., ALVAREZ, J., ESHED, Y., HAWKER, N. P., IZHAKI, A., BAUM, S. F. & BOWMAN, J. L. 2003. Radial Patterning of Arabidopsis Shoots by Class III HD-‐ZIP and KANADI Genes. Current Biology, 13, 1768-‐1774.
ERIKSSON, S., STRANSFELD, L., ADAMSKI, N. M., BREUNINGER, H. & LENHARD, M. 2010. KLUH/CYP78A5-‐Dependent Growth Signaling Coordinates Floral Organ Growth in Arabidopsis. Current Biology, 20, 527-‐532.
ESHED, Y., BAUM, S. F., PEREA, J. V. & BOWMAN, J. L. 2001. Establishment of polarity in lateral organs of plants. Current Biology, 11, 1251-‐1260.
ESHED, Y., IZHAKI, A., BAUM, S. F., FLOYD, S. K. & BOWMAN, J. L. 2004. Asymmetric leaf development and blade expansion in Arabidopsis are mediated by KANADI and YABBY activities. Development, 131, 2997-‐3006.
EYÜBOGLU, B., PFISTER, K., HABERER, G., CHEVALIER, D., FUCHS, A., MAYER, K. & SCHNEITZ, K. 2007. Molecular characterisation of the STRUBBELIG-‐RECEPTOR FAMILY of genes encoding putative leucine-‐rich repeat receptor-‐like kinases in Arabidopsis thaliana. BMC plant biology, 7, 16.
FANG, S., JENSEN, J. P., LUDWIG, R. L., VOUSDEN, K. H. & WEISSMAN, A. M. 2000. Mdm2 is a RING finger-‐dependent ubiquitin protein ligase for itself and p53. Journal of Biological Chemistry, 275, 8945-‐8951.
FANG, W., WANG, Z., CUI, R., LI, J. & LI, Y. 2012. Maternal control of seed size by EOD3/CYP78A6 in Arabidopsis thaliana. The Plant Journal, 70, 929-‐939.
FELKER, F. C., PETERSON, D. M. & NELSON, O. E. 1985. Anatomy of immature grains of eight maternal effect shrunken endosperm barley mutants. American Journal of Botany, 72, 248-‐256.
269
FENG, G., QIN, Z., YAN, J., ZHANG, X. & HU, Y. 2011. Arabidopsis ORGAN SIZE RELATED1 regulates organ growth and final organ size in orchestration with ARGOS and ARL. New Phytologist, 191, 635-‐646.
FERJANI, A., HORIGUCHI, G., YANO, S. & TSUKAYA, H. 2007. Analysis of leaf development in fugu mutants of Arabidopsis reveals three compensation modes that modulate cell expansion in determinate organs. Plant physiology, 144, 988-‐999.
FIELDS, S. & SONG, O.-‐K. 1989. A novel genetic system to detect protein protein interactions. FILIAULT, D. L. & MALOOF, J. N. 2012. A genome-‐wide association study identifies variants
underlying the Arabidopsis thaliana shade avoidance response. PLoS genetics, 8, e1002589.
FISHER, R. D., WANG, B., ALAM, S. L., HIGGINSON, D. S., ROBINSON, H., SUNDQUIST, W. I. & HILL, C. P. 2003. Structure and ubiquitin binding of the ubiquitin-‐interacting motif. Journal of Biological Chemistry, 278, 28976-‐28984.
FIUME, E. & FLETCHER, J. C. 2012. Regulation of Arabidopsis embryo and endosperm development by the polypeptide signaling molecule CLE8. The Plant Cell Online, 24, 1000-‐1012.
FLEMING, A. J., CADERAS, D., WEHRLI, E., MCQUEEN-‐MASON, S. & KUHLEMEIER, C. 1999. Analysis of expansin-‐induced morphogenesis on the apical meristem of tomato. Planta, 208, 166-‐174.
FLEMING, A. J., MCQUEEN-‐MASON, S., MANDEL, T. & KUHLEMEIER, C. 1997. Induction of leaf primordia by the cell wall protein expansin. Science, 276, 1415-‐1418.
FLEMMING, A. J., SHEN, Z.-‐Z., CUNHA, A., EMMONS, S. W. & LEROI, A. M. 2000. Somatic polyploidization and cellular proliferation drive body size evolution in nematodes. Proceedings of the National Academy of Sciences, 97, 5285-‐5290.
FLICK, K., RAASI, S., ZHANG, H., YEN, J. L. & KAISER, P. 2006. A ubiquitin-‐interacting motif protects polyubiquitinated Met4 from degradation by the 26S proteasome. Nature cell biology, 8, 509-‐515.
FOOTITT, S., CORNAH, J. E., PRACHAROENWATTANA, I., BRYCE, J. H. & SMITH, S. M. 2007. The Arabidopsis 3-‐ketoacyl-‐CoA thiolase-‐2 (kat2-‐1) mutant exhibits increased flowering but reduced reproductive success. Journal of experimental botany, 58, 2959-‐2968.
FOX, J. W. & SERRANO, S. M. 2005. Structural considerations of the snake venom metalloproteinases, key members of the M12 reprolysin family of metalloproteinases. Toxicon, 45, 969-‐985.
FU, Y., XU, L., XU, B., YANG, L., LING, Q., WANG, H. & HUANG, H. 2007. Genetic interactions between leaf polarity-‐controlling genes and ASYMMETRIC LEAVES1 and 2 in Arabidopsis leaf patterning. Plant and cell physiology, 48, 724-‐735.
FÜLÖP, K., TARAYRE, S., KELEMEN, Z., HORVÁTH, G., KEVEI, Z., NIKOVICS, K., BAKÓ, L., BROWN, S., KONDOROSI, A. & KONDOROSI, E. 2005. Arabidopsis anaphase-‐promoting complexes: multiple activators and wide range of substrates might keep APC perpetually busy. Cell cycle, 4, 4084-‐4092.
FUTREAL, P. A., LIU, Q., SHATTUCK-‐EIDENS, D., COCHRAN, C., HARSHMAN, K., TAVTIGIAN, S., BENNETT, L. M., HAUGEN-‐STRANO, A., SWENSEN, J. & MIKI, Y. 1994. BRCA1 mutations in primary breast and ovarian carcinomas. Science, 266, 120-‐122.
GAGNE, J. M., SMALLE, J., GINGERICH, D. J., WALKER, J. M., YOO, S.-‐D., YANAGISAWA, S. & VIERSTRA, R. D. 2004. Arabidopsis EIN3-‐binding F-‐box 1 and 2 form ubiquitin-‐protein ligases that repress ethylene action and promote growth by directing EIN3 degradation. Proceedings of the National Academy of Sciences of the United States of America, 101, 6803-‐6808.
GALVEZ‐VALDIVIESO, G. & MULLINEAUX, P. M. 2010. The role of reactive oxygen species in signalling from chloroplasts to the nucleus. Physiologia Plantarum, 138, 430-‐439.
270
GAN, X., STEGLE, O., BEHR, J., STEFFEN, J. G., DREWE, P., HILDEBRAND, K. L., LYNGSOE, R., SCHULTHEISS, S. J., OSBORNE, E. J. & SREEDHARAN, V. T. 2011. Multiple reference genomes and transcriptomes for Arabidopsis thaliana. Nature, 477, 419-‐423.
GARCIA, D., GERALD, F., JONATHAN, N. & BERGER, F. 2005. Maternal control of integument cell elongation and zygotic control of endosperm growth are coordinated to determine seed size in Arabidopsis. The Plant Cell Online, 17, 52-‐60.
GARCIA, D., SAINGERY, V., CHAMBRIER, P., MAYER, U., JÜRGENS, G. & BERGER, F. 2003. Arabidopsis haiku mutants reveal new controls of seed size by endosperm. Plant physiology, 131, 1661-‐1670.
GELDNER, N., HYMAN, D. L., WANG, X., SCHUMACHER, K. & CHORY, J. 2007. Endosomal signaling of plant steroid receptor kinase BRI1. Genes & Development, 21, 1598-‐1602.
GENDALL, A. R., LEVY, Y. Y., WILSON, A. & DEAN, C. 2001. The VERNALIZATION 2 Gene Mediates the Epigenetic Regulation of Vernalization in Arabidopsis. Cell, 107, 525-‐535.
GIEFFERS, C., DUBE, P., HARRIS, J. R., STARK, H. & PETERS, J.-‐M. 2001. Three-‐dimensional structure of the anaphase-‐promoting complex. Molecular cell, 7, 907-‐913.
GLICKMAN, M. H. & CIECHANOVER, A. 2002. The ubiquitin-‐proteasome proteolytic pathway: destruction for the sake of construction. Physiological reviews, 82, 373-‐428.
GODGE, M. R., KUMAR, D. & KUMAR, P. P. 2008. Arabidopsis HOG1 gene and its petunia homolog PETCBP act as key regulators of yield parameters. Plant cell reports, 27, 1497-‐1507.
GÖHRE, V., SPALLEK, T., HÄWEKER, H., MERSMANN, S., MENTZEL, T., BOLLER, T., DE TORRES, M., MANSFIELD, J. W. & ROBATZEK, S. 2008. Plant pattern-‐recognition receptor FLS2 is directed for degradation by the bacterial ubiquitin ligase AvrPtoB. Current Biology, 18, 1824-‐1832.
GÓMEZ-‐GÓMEZ, L. & BOLLER, T. 2000. FLS2: an LRR receptor-‐like kinase involved in the perception of the bacterial elicitor flagellin in Arabidopsis. Molecular cell, 5, 1003-‐1011.
GÓMEZ‐GÓMEZ, L., FELIX, G. & BOLLER, T. 1999. A single locus determines sensitivity to bacterial flagellin in Arabidopsis thaliana. The Plant Journal, 18, 277-‐284.
GONZALEZ, N., DE BODT, S., SULPICE, R., JIKUMARU, Y., CHAE, E., DHONDT, S., VAN DAELE, T., DE MILDE, L., WEIGEL, D. & KAMIYA, Y. 2010. Increased leaf size: different means to an end. Plant Physiology, 153, 1261-‐1279.
GORITSCHNIG, S., ZHANG, Y. & LI, X. 2007. The ubiquitin pathway is required for innate immunity in Arabidopsis. The Plant Journal, 49, 540-‐551.
GOTTLIEB, T. M. & OREN, M. p53 and apoptosis. Seminars in cancer biology, 1998. Elsevier, 359-‐368.
GOUJON, M., MCWILLIAM, H., LI, W., VALENTIN, F., SQUIZZATO, S., PAERN, J. & LOPEZ, R. 2010. A new bioinformatics analysis tools framework at EMBL–EBI. Nucleic acids research, 38, W695-‐W699.
GOWEN, L. C., AVRUTSKAYA, A. V., LATOUR, A. M., KOLLER, B. H. & LEADON, S. A. 1998. BRCA1 required for transcription-‐coupled repair of oxidative DNA damage. Science, 281, 1009-‐1012.
GREB, T., MYLNE, J. S., CREVILLEN, P., GERALDO, N., AN, H., GENDALL, A. R. & DEAN, C. 2007. The PHD Finger Protein VRN5 Functions in the Epigenetic Silencing of Arabidopsis FLC. Current biology, 17, 73-‐78.
GROSSNIKLAUS, U., SPILLANE, C., PAGE, D. R. & KÖHLER, C. 2001. Genomic imprinting and seed development: endosperm formation with and without sex. Current opinion in plant biology, 4, 21-‐27.
GROSSNIKLAUS, U., VIELLE-‐CALZADA, J.-‐P., HOEPPNER, M. A. & GAGLIANO, W. B. 1998. Maternal control of embryogenesis by MEDEA, a polycomb group gene in Arabidopsis. Science, 280, 446-‐450.
271
GUO, M., THOMAS, J., COLLINS, G. & TIMMERMANS, M. C. 2008. Direct repression of KNOX loci by the ASYMMETRIC LEAVES1 complex of Arabidopsis. The Plant Cell Online, 20, 48-‐58.
GUO, X., LU, W., MA, Y., QIN, Q. & HOU, S. 2013. The BIG gene is required for auxin-‐mediated organ growth in Arabidopsis. Planta, 1-‐13.
GUZZO, C. M., BERNDSEN, C. E., ZHU, J., GUPTA, V., DATTA, A., GREENBERG, R. A., WOLBERGER, C. & MATUNIS, M. J. 2012. RNF4-‐dependent hybrid SUMO-‐ubiquitin chains are signals for RAP80 and thereby mediate the recruitment of BRCA1 to sites of DNA damage. Science signaling, 5, ra88.
HA, C. M., JUN, J. H., NAM, H. G. & FLETCHER, J. C. 2004. BLADE-‐ON-‐PETIOLE1 encodes a BTB/POZ domain protein required for leaf morphogenesis in Arabidopsis thaliana. Plant and cell physiology, 45, 1361-‐1370.
HAAS, A., BRIGHT, P. & JACKSON, V. 1988. Functional diversity among putative E2 isozymes in the mechanism of ubiquitin-‐histone ligation. Journal of Biological Chemistry, 263, 13268-‐13275.
HAGLUND, K., SIGISMUND, S., POLO, S., SZYMKIEWICZ, I., DI FIORE, P. P. & DIKIC, I. 2003. Multiple monoubiquitination of RTKs is sufficient for their endocytosis and degradation. Nature cell biology, 5, 461-‐466.
HAGLUND, K. & STENMARK, H. 2006. Working out coupled monoubiquitination. Nature cell biology, 8, 1218-‐1219.
HAMLINGTON, J. D., JONES, C. & MCINTOSH, I. 2001. Twenty‐two novel LMX1B mutations identified in nail patella syndrome (NPS) patients. Human mutation, 18, 458-‐458.
HANKE, G. T., KIMATA-‐ARIGA, Y., TANIGUCHI, I. & HASE, T. 2004. A post genomic characterization of Arabidopsis ferredoxins. Plant physiology, 134, 255-‐264.
HAREVEN, D., GUTFINGER, T., PARNIS, A., ESHED, Y. & LIFSCHITZ, E. 1996. The making of a compound leaf: genetic manipulation of leaf architecture in tomato. Cell, 84, 735-‐744.
HARPER, J. W. & SCHULMAN, B. A. 2006. Structural complexity in ubiquitin recognition. Cell, 124, 1133-‐1136.
HARTWELL, L. H. & KASTAN, M. B. 1994. Cell cycle control and cancer. Science, 266, 1821-‐1828. HASE, Y., TANAKA, A., BABA, T. & WATANABE, H. 2000. FRL1 is required for petal and sepal
development in Arabidopsis. The Plant Journal, 24, 21-‐32. HATFIELD, P. M., GOSINK, M. M., CARPENTER, T. B. & VIERSTRA, R. D. 1997. The ubiquitin‐
activating enzyme (E1) gene family in Arabidopsis thaliana. The Plant Journal, 11, 213-‐226.
HAUVERMALE, A. L., ARIIZUMI, T. & STEBER, C. M. 2012. Gibberellin signaling: a theme and variations on DELLA repression. Plant physiology, 160, 83-‐92.
HAY, A., BARKOULAS, M. & TSIANTIS, M. 2006. ASYMMETRIC LEAVES1 and auxin activities converge to repress BREVIPEDICELLUS expression and promote leaf development in Arabidopsis. Development, 133, 3955-‐3961.
HE, J.-‐X., GENDRON, J. M., SUN, Y., GAMPALA, S. S., GENDRON, N., SUN, C. Q. & WANG, Z.-‐Y. 2005. BZR1 is a transcriptional repressor with dual roles in brassinosteroid homeostasis and growth responses. Science Signaling, 307, 1634.
HE, J.-‐X., GENDRON, J. M., YANG, Y., LI, J. & WANG, Z.-‐Y. 2002. The GSK3-‐like kinase BIN2 phosphorylates and destabilizes BZR1, a positive regulator of the brassinosteroid signaling pathway in Arabidopsis. Proceedings of the National Academy of Sciences, 99, 10185-‐10190.
HEERY, D. M., KALKHOVEN, E., HOARE, S. & PARKER, M. G. 1997. A signature motif in transcriptional co-‐activators mediates binding to nuclear receptors. Nature, 387, 733-‐736.
HÉMATY, K., SADO, P.-‐E., VAN TUINEN, A., ROCHANGE, S., DESNOS, T., BALZERGUE, S., PELLETIER, S., RENOU, J.-‐P. & HÖFTE, H. 2007. A Receptor-‐like Kinase Mediates the
272
Response of Arabidopsis Cells to the Inhibition of Cellulose Synthesis. Current Biology, 17, 922-‐931.
HERRADOR, A., LEON, S., HAGUENAUER-‐TSAPIS, R. & VINCENT, O. 2013. A mechanism for protein monoubiquitination dependent on a trans-‐acting ubiquitin binding domain. Journal of Biological Chemistry, 288, 16206-‐16211.
HERRIDGE, R., DAY, R., BALDWIN, S. & MACKNIGHT, R. 2011. Rapid analysis of seed size in Arabidopsis for mutant and QTL discovery. Plant Methods, 7, 3.
HERSHKO, A. & CIECHANOVER, A. 1998. The ubiquitin system. Annual review of biochemistry, 67, 425-‐479.
HERVÉ, C., DABOS, P., BARDET, C., JAUNEAU, A., AURIAC, M. C., RAMBOER, A., LACOUT, F. & TREMOUSAYGUE, D. 2009. In vivo interference with AtTCP20 function induces severe plant growth alterations and deregulates the expression of many genes important for development. Plant physiology, 149, 1462-‐1477.
HETTEMA, E. H., VALDEZ-‐TAUBAS, J. & PELHAM, H. R. 2004. Bsd2 binds the ubiquitin ligase Rsp5 and mediates the ubiquitination of transmembrane proteins. The EMBO journal, 23, 1279-‐1288.
HIBARA, K.-‐I., KARIM, M. R., TAKADA, S., TAOKA, K.-‐I., FURUTANI, M., AIDA, M. & TASAKA, M. 2006. Arabidopsis CUP-‐SHAPED COTYLEDON3 regulates postembryonic shoot meristem and organ boundary formation. The Plant Cell Online, 18, 2946-‐2957.
HICKE, L., SCHUBERT, H. L. & HILL, C. P. 2005. Ubiquitin-‐binding domains. Nature Reviews Molecular Cell Biology, 6, 610-‐621.
HIGUCHI, M., PISCHKE, M. S., MÄHÖNEN, A. P., MIYAWAKI, K., HASHIMOTO, Y., SEKI, M., KOBAYASHI, M., SHINOZAKI, K., KATO, T. & TABATA, S. 2004. In planta functions of the Arabidopsis cytokinin receptor family. Proceedings of the National Academy of Sciences of the United States of America, 101, 8821-‐8826.
HIRATSU, K., MATSUI, K., KOYAMA, T. & OHME‐TAKAGI, M. 2003. Dominant repression of target genes by chimeric repressors that include the EAR motif, a repression domain, in Arabidopsis. The Plant Journal, 34, 733-‐739.
HIRNER, B., FISCHER, W. N., RENTSCH, D., KWART, M. & FROMMER, W. B. 1998. Developmental control of H+/amino acid permease gene expression during seed development of Arabidopsis. The Plant Journal, 14, 535-‐544.
HOCHSTRASSER, M. 1996. Ubiquitin-‐dependent protein degradation. Annual review of genetics, 30, 405-‐439.
HOCHSTRASSER, M. 2009. Origin and function of ubiquitin-‐like proteins. Nature, 458, 422-‐429. HOELLER, D., CROSETTO, N., BLAGOEV, B., RAIBORG, C., TIKKANEN, R., WAGNER, S.,
KOWANETZ, K., BREITLING, R., MANN, M. & STENMARK, H. 2006. Regulation of ubiquitin-‐binding proteins by monoubiquitination. Nature cell biology, 8, 163-‐169.
HOFMANN, K. & FALQUET, L. 2001. A ubiquitin-‐interacting motif conserved in components of the proteasomal and lysosomal protein degradation systems. Trends in Biochemical Sciences, 26, 347-‐350.
HONG, S.-‐Y., KIM, O.-‐K., KIM, S.-‐G., YANG, M.-‐S. & PARK, C.-‐M. 2011. Nuclear import and DNA binding of the ZHD5 transcription factor is modulated by a competitive peptide inhibitor in Arabidopsis. Journal of Biological Chemistry, 286, 1659-‐1668.
HORIGUCHI, G., FERJANI, A., FUJIKURA, U. & TSUKAYA, H. 2006a. Coordination of cell proliferation and cell expansion in the control of leaf size in Arabidopsis thaliana. Journal of plant research, 119, 37-‐42.
HORIGUCHI, G., FUJIKURA, U., FERJANI, A., ISHIKAWA, N. & TSUKAYA, H. 2006b. Large‐scale histological analysis of leaf mutants using two simple leaf observation methods: identification of novel genetic pathways governing the size and shape of leaves. The Plant Journal, 48, 638-‐644.
273
HORIGUCHI, G., KIM, G. T. & TSUKAYA, H. 2005. The transcription factor AtGRF5 and the transcription coactivator AN3 regulate cell proliferation in leaf primordia of Arabidopsis thaliana. The Plant Journal, 43, 68-‐78.
HORTON, M. W., HANCOCK, A. M., HUANG, Y. S., TOOMAJIAN, C., ATWELL, S., AUTON, A., MULIYATI, N. W., PLATT, A., SPERONE, F. G. & VILHJÁLMSSON, B. J. 2012. Genome-‐wide patterns of genetic variation in worldwide Arabidopsis thaliana accessions from the RegMap panel. Nature genetics, 44, 212-‐216.
HORVATH, B. M., MAGYAR, Z., ZHANG, Y., HAMBURGER, A. W., BAKO, L., VISSER, R. G., BACHEM, C. W. & BÖGRE, L. 2006. EBP1 regulates organ size through cell growth and proliferation in plants. The EMBO journal, 25, 4909-‐4920.
HOTTON, S. K., EIGENHEER, R. A., CASTRO, M. F., BOSTICK, M. & CALLIS, J. 2011. AXR1-‐ECR1 and AXL1-‐ECR1 heterodimeric RUB-‐activating enzymes diverge in function in Arabidopsis thaliana. Plant molecular biology, 75, 515-‐526.
HU, Y., POH, H. M. & CHUA, N. H. 2006. The Arabidopsis ARGOS‐LIKE gene regulates cell expansion during organ growth. The Plant Journal, 47, 1-‐9.
HU, Y., XIE, Q. & CHUA, N.-‐H. 2003. The Arabidopsis auxin-‐inducible gene ARGOS controls lateral organ size. The Plant Cell Online, 15, 1951-‐1961.
HUANG, S., RAMAN, A. S., REAM, J. E., FUJIWARA, H., CERNY, R. E. & BROWN, S. M. 1998. Overexpression of 20-‐oxidase confers a gibberellin-‐overproduction phenotype in Arabidopsis. Plant Physiology, 118, 773-‐781.
ICHIHASHI, Y., HORIGUCHI, G., GLEISSBERG, S. & TSUKAYA, H. 2010. The bHLH transcription factor SPATULA controls final leaf size in Arabidopsis thaliana. Plant and cell physiology, 51, 252-‐261.
IKEDA, F. & DIKIC, I. 2008. Atypical ubiquitin chains: new molecular signals. EMBO reports, 9, 536-‐542.
INGOUFF, M., JULLIEN, P. E. & BERGER, F. 2006. The female gametophyte and the endosperm control cell proliferation and differentiation of the seed coat in Arabidopsis. The Plant Cell Online, 18, 3491-‐3501.
INZÉ, D. & DE VEYLDER, L. 2006. Cell cycle regulation in plant development 1. Annu. Rev. Genet., 40, 77-‐105.
IRNIGER, S., PIATTI, S., MICHAELIS, C. & NASMYTH, K. 1995. Genes involved in sister chromatid separation are needed for B-‐type cyclin proteolysis in budding yeast. Cell, 81, 269-‐277.
ISHIDA, T., FUJIWARA, S., MIURA, K., STACEY, N., YOSHIMURA, M., SCHNEIDER, K., ADACHI, S., MINAMISAWA, K., UMEDA, M. & SUGIMOTO, K. 2009. SUMO E3 ligase HIGH PLOIDY2 regulates endocycle onset and meristem maintenance in Arabidopsis. The Plant Cell Online, 21, 2284-‐2297.
IYER, L. M., KOONIN, E. V. & ARAVIND, L. 2004. Report Novel Predicted Peptidases with a Potential Role in the Ubiquitin Signaling Pathway. Cell Cycle, 3, 1440-‐1450.
JACKSON, D., VEIT, B. & HAKE, S. 1994. Expression of maize KNOTTED1 related homeobox genes in the shoot apical meristem predicts patterns of morphogenesis in the vegetative shoot. Development, 120, 405-‐413.
JACOBSON, A. D., ZHANG, N.-‐Y., XU, P., HAN, K.-‐J., NOONE, S., PENG, J. & LIU, C.-‐W. 2009. The lysine 48 and lysine 63 ubiquitin conjugates are processed differently by the 26 S proteasome. Journal of Biological Chemistry, 284, 35485-‐35494.
JAMES, P., HALLADAY, J. & CRAIG, E. A. 1996. Genomic libraries and a host strain designed for highly efficient two-‐hybrid selection in yeast. Genetics, 144, 1425-‐1436.
JENTSCH, S. & PYROWOLAKIS, G. 2000. Ubiquitin and its kin: how close are the family ties? Trends in cell biology, 10, 335-‐342.
JIANG, C.-‐Z. 2004. Method for modifying plant biomass. Google Patents. JIN, J., LI, X., GYGI, S. P. & HARPER, J. W. 2007. Dual E1 activation systems for ubiquitin
differentially regulate E2 enzyme charging. Nature, 447, 1135-‐1138.
274
JOHNSON, K. & LENHARD, M. 2011. Genetic control of plant organ growth. New Phytologist, 191, 319-‐333.
JONES, A. M., IM, K. H., SAVKA, M. A., WU, M. J., DEWITT, N. G., SHILLITO, R. & BINNS, A. N. 1998. Auxin-‐dependent cell expansion mediated by overexpressed auxin-‐binding protein 1. Science, 282, 1114-‐1117.
JONGENEEL, C. V., BOUVIER, J. & BAIROCH, A. 1989. A unique signature identifies a family of zinc-‐dependent metallopeptidases. FEBS letters, 242, 211-‐214.
JORDE, L. 2000. Linkage disequilibrium and the search for complex disease genes. Genome research, 10, 1435-‐1444.
JOUBES, J. & CHEVALIER, C. 2000. Endoreduplication in higher plants. Plant Molecular Biology, 43, 735-‐745.
JOUBES, J., CHEVALIER, C., DUDITS, D., HEBERLE-‐BORS, E., INZÉ, D., UMEDA, M. & RENAUDIN, J.-‐P. 2000. CDK-‐related protein kinases in plants. Plant Molecular Biology, 43, 607-‐620.
KADRMAS, J. L. & BECKERLE, M. C. 2004. The LIM domain: from the cytoskeleton to the nucleus. Nature Reviews Molecular Cell Biology, 5, 920-‐931.
KANG, H. M., ZAITLEN, N. A., WADE, C. M., KIRBY, A., HECKERMAN, D., DALY, M. J. & ESKIN, E. 2008. Efficient control of population structure in model organism association mapping. Genetics, 178, 1709-‐1723.
KANG, J. & DENGLER, N. 2002. Cell cycling frequency and expression of the homeobox gene ATHB-‐8 during leaf vein development in Arabidopsis. Planta, 216, 212-‐219.
KANG, X., LI, W., ZHOU, Y. & NI, M. 2013. A WRKY Transcription Factor Recruits the SYG1-‐Like Protein SHB1 to Activate Gene Expression and Seed Cavity Enlargement. PLoS Genetics, 9, e1003347.
KARLOVA, R. & DE VRIES, S. C. 2006. Advances in understanding brassinosteroid signaling. Science's STKE, 2006, p.pe36.
KATZ, A., OLIVA, M., MOSQUNA, A., HAKIM, O. & OHAD, N. 2004. FIE and CURLY LEAF polycomb proteins interact in the regulation of homeobox gene expression during sporophyte development. The Plant Journal, 37, 707-‐719.
KAVSAK, P., RASMUSSEN, R. K., CAUSING, C. G., BONNI, S., ZHU, H., THOMSEN, G. H. & WRANA, J. L. 2000. Smad7 binds to Smurf2 to form an E3 ubiquitin ligase that targets the TGFβ receptor for degradation. Molecular cell, 6, 1365-‐1375.
KAWAI, T. & AKIRA, S. 2010. The role of pattern-‐recognition receptors in innate immunity: update on Toll-‐like receptors. Nature immunology, 11, 373-‐384.
KAZAMA, T., ICHIHASHI, Y., MURATA, S. & TSUKAYA, H. 2010. The mechanism of cell cycle arrest front progression explained by a KLUH/CYP78A5-‐dependent mobile growth factor in developing leaves of Arabidopsis thaliana. Plant and cell physiology, 51, 1046-‐1054.
KEINATH, N. F., KIERSZNIOWSKA, S., LOREK, J., BOURDAIS, G., KESSLER, S. A., ASANO, H., GROSSNIKLAUS, U., SCHULZE, W., ROBATZEK, S. & PANSTRUGA, R. 2011. PAMP-‐induced changes in plasma membrane compartmentalization reveal novel components of plant immunity. Journal of Biological Chemistry.
KEMMERLING, B., SCHWEDT, A., RODRIGUEZ, P., MAZZOTTA, S., FRANK, M., QAMAR, S. A., MENGISTE, T., BETSUYAKU, S., PARKER, J. E. & MÜSSIG, C. 2007. The BRI1-‐associated kinase 1, BAK1, has a brassinolide-‐independent role in plant cell-‐death control. Current Biology, 17, 1116-‐1122.
KERSCHER, O., FELBERBAUM, R. & HOCHSTRASSER, M. 2006. Modification of proteins by ubiquitin and ubiquitin-‐like proteins. Annu. Rev. Cell Dev. Biol., 22, 159-‐180.
KERSTETTER, R. A., BOLLMAN, K., TAYLOR, R. A., BOMBLIES, K. & POETHIG, R. S. 2001. KANADI regulates organ polarity in Arabidopsis. Nature, 411, 706-‐709.
KESSLER, S. & SINHA, N. 2004. Shaping up: the genetic control of leaf shape. Current opinion in plant biology, 7, 65-‐72.

275
KIEBER, J. J., ROTHENBERG, M., ROMAN, G., FELDMANN, K. A. & ECKER, J. R. 1993. CTR1, a negative regulator of the ethylene response pathway in arabidopsis, encodes a member of the Raf family of protein kinases. Cell, 72, 427-‐441.
KIEFFER, M., MASTER, V., WAITES, R. & DAVIES, B. 2011. TCP14 and TCP15 affect internode length and leaf shape in Arabidopsis. The Plant Journal, 68, 147-‐158.
KIERZKOWSKI, D., NAKAYAMA, N., ROUTIER-‐KIERZKOWSKA, A.-‐L., WEBER, A., BAYER, E., SCHORDERET, M., REINHARDT, D., KUHLEMEIER, C. & SMITH, R. S. 2012. Elastic domains regulate growth and organogenesis in the plant shoot apical meristem. Science Signaling, 335, 1096-‐1099.
KIM, G.-‐T., TSUKAYA, H. & UCHIMIYA, H. 1998a. The CURLY LEAF gene controls both division and elongation of cells during the expansion of the leaf blade in Arabidopsis thaliana. Planta, 206, 175-‐183.
KIM, G.-‐T., TSUKAYA, H. & UCHIMIYA, H. 1998b. The ROTUNDIFOLIA3 gene of Arabidopsis thalianaencodes a new member of the cytochrome P-‐450 family that is required for the regulated polar elongation of leaf cells. Genes & development, 12, 2381-‐2391.
KIM, G. T., SHODA, K., TSUGE, T., CHO, K. H., UCHIMIYA, H., YOKOYAMA, R., NISHITANI, K. & TSUKAYA, H. 2002. The ANGUSTIFOLIA gene of Arabidopsis, a plant CtBP gene, regulates leaf-‐cell expansion, the arrangement of cortical microtubules in leaf cells and expression of a gene involved in cell-‐wall formation. EMBO Journal, 21, 1267-‐1279.
KIM, J. H., CHOI, D. & KENDE, H. 2003. The AtGRF family of putative transcription factors is involved in leaf and cotyledon growth in Arabidopsis. The Plant Journal, 36, 94-‐104.
KIM, J. H. & KENDE, H. 2004. A transcriptional coactivator, AtGIF1, is involved in regulating leaf growth and morphology in Arabidopsis. Proceedings of the National Academy of Sciences of the United States of America, 101, 13374-‐13379.
KIM, S., PLAGNOL, V., HU, T. T., TOOMAJIAN, C., CLARK, R. M., OSSOWSKI, S., ECKER, J. R., WEIGEL, D. & NORDBORG, M. 2007. Recombination and linkage disequilibrium in Arabidopsis thaliana. Nature genetics, 39, 1151-‐1155.
KIM, T. & WANG, Z. Y. 2010. Brassinosteroid Signal Transduction from Receptor Kinases to Transcription Factors. Annual Review of Plant Biology, 61, 681-‐704.
KING, R. W., DESHAIES, R. J., PETERS, J.-‐M. & KIRSCHNER, M. W. 1996. How proteolysis drives the cell cycle. Science, 274, 1652-‐1659.
KINOSHITA, T., CAÑO-‐DELGADO, A., SETO, H., HIRANUMA, S., FUJIOKA, S., YOSHIDA, S. & CHORY, J. 2005. Binding of brassinosteroids to the extracellular domain of plant receptor kinase BRI1. Nature, 433, 167-‐171.
KIRISAKO, T., KAMEI, K., MURATA, S., KATO, M., FUKUMOTO, H., KANIE, M., SANO, S., TOKUNAGA, F., TANAKA, K. & IWAI, K. 2006. A ubiquitin ligase complex assembles linear polyubiquitin chains. The EMBO journal, 25, 4877-‐4887.
KOBAYASHI, Y., KANESAKI, Y., TANAKA, A., KUROIWA, H., KUROIWA, T. & TANAKA, K. 2009. Tetrapyrrole signal as a cell-‐cycle coordinator from organelle to nuclear DNA replication in plant cells. Proceedings of the National Academy of Sciences, 106, 803-‐807.
KÖHLER, C., HENNIG, L., BOUVERET, R., GHEYSELINCK, J., GROSSNIKLAUS, U. & GRUISSEM, W. 2003. Arabidopsis MSI1 is a component of the MEA/FIE Polycomb group complex and required for seed development. The EMBO journal, 22, 4804-‐4814.
KÖHLER, C. & MAKAREVICH, G. 2006. Epigenetic mechanisms governing seed development in plants. EMBO reports, 7, 1223-‐1227.
KOMANDER, D., CLAGUE, M. J. & URBE, S. 2009. Breaking the chains: structure and function of the deubiquitinases. Nature Reviews Molecular Cell Biology, 10, 550-‐563.
KOORNNEEF, M. & VAN DER VEEN, J. 1980. Induction and analysis of gibberellin sensitive mutants in Arabidopsis thaliana (L.) Heynh. Theoretical and Applied genetics, 58, 257-‐263.
276
KOSUGI, S. & OHASHI, Y. 1997. PCF1 and PCF2 specifically bind to cis elements in the rice proliferating cell nuclear antigen gene. The Plant Cell Online, 9, 1607-‐1619.
KOSUGI, S. & OHASHI, Y. 2002. DNA binding and dimerization specificity and potential targets for the TCP protein family. The Plant Journal, 30, 337-‐348.
KOVER, P. X. & MOTT, R. 2012. Mapping the genetic basis of ecologically and evolutionarily relevant traits in Arabidopsis thaliana. Current opinion in plant biology, 15, 212-‐217.
KOVER, P. X., VALDAR, W., TRAKALO, J., SCARCELLI, N., EHRENREICH, I. M., PURUGGANAN, M. D., DURRANT, C. & MOTT, R. 2009. A multiparent advanced generation inter-‐cross to fine-‐map quantitative traits in Arabidopsis thaliana. PLoS genetics, 5, e1000551.
KOYAMA, T., FURUTANI, M., TASAKA, M. & OHME-‐TAKAGI, M. 2007. TCP transcription factors control the morphology of shoot lateral organs via negative regulation of the expression of boundary-‐specific genes in Arabidopsis. The Plant Cell Online, 19, 473-‐484.
KOYAMA, T., MITSUDA, N., SEKI, M., SHINOZAKI, K. & OHME-‐TAKAGI, M. TCP Transcription Factors Regulate the Activities of ASYMMETRIC LEAVES1 and miR164, as Well as the Auxin Response, during Differentiation of Leaves in Arabidopsis. The Plant Cell Online, 22, 3574-‐3588.
KOYAMA, T., MITSUDA, N., SEKI, M., SHINOZAKI, K. & OHME-‐TAKAGI, M. 2010a. TCP Transcription Factors Regulate the Activities of ASYMMETRIC LEAVES1 and miR164, as Well as the Auxin Response, during Differentiation of Leaves in Arabidopsis. The Plant Cell Online, 22, 3574-‐3588.
KOYAMA, T., SATO, F. & OHME-‐TAKAGI, M. 2010b. A role of TCP1 in the longitudinal elongation of leaves in Arabidopsis. Bioscience, biotechnology, and biochemistry, 74, 2145-‐2147.
KRIZEK, B. A., LEWIS, M. W. & FLETCHER, J. C. 2006. RABBIT EARS is a second‐whorl repressor of AGAMOUS that maintains spatial boundaries in Arabidopsis flowers. The Plant Journal, 45, 369-‐383.
KUREPA, J. & SMALLE, J. A. 2008. Structure, function and regulation of plant proteasomes. Biochimie, 90, 324-‐335.
KWON, Y. R., LEE, H. J., KIM, K. H., HONG, S.-‐W., LEE, S. J. & LEE, H. 2008. Ectopic expression of Expansin3 or Expansinβ1 causes enhanced hormone and salt stress sensitivity in Arabidopsis. Biotechnology letters, 30, 1281-‐1288.
LARKIN, M., BLACKSHIELDS, G., BROWN, N., CHENNA, R., MCGETTIGAN, P. A., MCWILLIAM, H., VALENTIN, F., WALLACE, I. M., WILM, A. & LOPEZ, R. 2007. Clustal W and Clustal X version 2.0. Bioinformatics, 23, 2947-‐2948.
LARKIN MA, BLACKSHIELDS G, BROWN NP, CHENNA R, MCGETTIGAN PA, MCWILLIAM H, VALENTIN F, WALLACE IM, WILM A, LOPEZ R, THOMPSON JD, GIBSON TJ & DG, H. 2007. Clustal W adn Clustal X version 2.0. 23, 2947-‐2948.
LARSON-‐RABIN, Z., LI, Z., MASSON, P. H. & DAY, C. D. 2009. FZR2/CCS52A1 expression is a determinant of endoreduplication and cell expansion in Arabidopsis. Plant physiology, 149, 874-‐884.
LECHNER, E., XIE, D., GRAVA, S., PIGAGLIO, E., PLANCHAIS, S., MURRAY, J. A., PARMENTIER, Y., MUTTERER, J., DUBREUCQ, B. & SHEN, W.-‐H. 2002. The AtRbx1 protein is part of plant SCF complexes, and its down-‐regulation causes severe growth and developmental defects. Journal of Biological Chemistry, 277, 50069-‐50080.
LECUIT, T., BROOK, W. J., NG, M., CALLEJA, M., SUN, H. & COHEN, S. M. 1996. Two distinct mechanisms for long-‐range patterning by Decapentaplegic in the Drosophila wing. Nature, 381, 387-‐393.
LEE, B. H., KO, J.-‐H., LEE, S., LEE, Y., PAK, J.-‐H. & KIM, J. H. 2009. The Arabidopsis GRF-‐INTERACTING FACTOR gene family performs an overlapping function in determining
277
organ size as well as multiple developmental properties. Plant physiology, 151, 655-‐668.
LEE, S. S., CHO, H. S., YOON, G. M., AHN, J. W., KIM, H. H. & PAI, H. S. 2003. Interaction of NtCDPK1 calcium‐dependent protein kinase with NtRpn3 regulatory subunit of the 26S proteasome in Nicotiana tabacum. The Plant Journal, 33, 825-‐840.
LEISTER, D. 2012. Retrograde signaling in plants: from simple to complex scenarios. Frontiers in plant science, 3, 135.
LENHARD, M. 2012. All's Well that Ends Well: Arresting Cell Proliferation in Leaves. Developmental cell, 22, 9-‐11.
LÉON, S. & HAGUENAUER-‐TSAPIS, R. 2009. Ubiquitin ligase adaptors: regulators of ubiquitylation and endocytosis of plasma membrane proteins. Experimental cell research, 315, 1574-‐1583.
LEPORE, L. S., ROELVINK, P. R. & GRANADOS, R. R. 1996. Enhancin, the granulosis virus protein that facilitates nucleopolyhedrovirus (NPV) infections, is a metalloprotease. Journal of invertebrate pathology, 68, 131-‐140.
LEVIN, J. Z. & MEYEROWITZ, E. M. 1995. UFO: an Arabidopsis gene involved in both floral meristem and floral organ development. The Plant Cell Online, 7, 529-‐548.
LI, C., POTUSCHAK, T., COLÓN-‐CARMONA, A., GUTIÉRREZ, R. A. & DOERNER, P. 2005a. Arabidopsis TCP20 links regulation of growth and cell division control pathways. Proceedings of the National Academy of Sciences of the United States of America, 102, 12978-‐12983.
LI, J., WEN, J., LEASE, K. A., DOKE, J. T., TAX, F. E. & WALKER, J. C. 2002a. BAK1, an Arabidopsis LRR receptor-‐like protein kinase, interacts with BRI1 and modulates brassinosteroid signaling. Cell, 110, 213-‐222.
LI, J., YANG, H., PEER, W. A., RICHTER, G., BLAKESLEE, J., BANDYOPADHYAY, A., TITAPIWANTAKUN, B., UNDURRAGA, S., KHODAKOVSKAYA, M. & RICHARDS, E. L. 2005b. Arabidopsis H+-‐PPase AVP1 regulates auxin-‐mediated organ development. Science, 310, 121-‐125.
LI, M., CHEN, D., SHILOH, A., LUO, J., NIKOLAEV, A. Y., QIN, J. & GU, W. 2002b. Deubiquitination of p53 by HAUSP is an important pathway for p53 stabilization. Nature, 416, 648-‐653.
LI, X., CLARKE, J. D., ZHANG, Y. & DONG, X. 2001. Activation of an EDS1-‐mediated R-‐gene pathway in the snc1 mutant leads to constitutive, NPR1-‐independent pathogen resistance. Molecular plant-‐microbe interactions, 14, 1131-‐1139.
LI, Y., ZHENG, L., CORKE, F., SMITH, C. & BEVAN, M. W. 2008. Control of final seed and organ size by the DA1 gene family in Arabidopsis thaliana. Genes & Development, 22, 1331-‐1336.
LI, Z. Y., LI, B. & DONG, A. W. 2012. The Arabidopsis transcription factor AtTCP15 regulates endoreduplication by modulating expression of key cell-‐cycle genes. Molecular plant, 5, 270-‐280.
LIN, W.-‐C., SHUAI, B. & SPRINGER, P. S. 2003. The Arabidopsis LATERAL ORGAN BOUNDARIES–domain gene ASYMMETRIC LEAVES2 functions in the repression of KNOX gene expression and in adaxial-‐abaxial patterning. The Plant Cell Online, 15, 2241-‐2252.
LIPSHITZ, H. D. 2009. Follow the mRNA: a new model for Bicoid gradient formation. Nature Reviews Molecular Cell Biology, 10, 509-‐512.
LIU, X., KIM, Y. J., MÜLLER, R., YUMUL, R. E., LIU, C., PAN, Y., CAO, X., GOODRICH, J. & CHEN, X. 2011. AGAMOUS terminates floral stem cell maintenance in Arabidopsis by directly repressing WUSCHEL through recruitment of Polycomb Group proteins. The Plant Cell Online, 23, 3654-‐3670.
LIU, Z. & MEYEROWITZ, E. M. 1995. LEUNIG regulates AGAMOUS expression in Arabidopsis flowers. Development, 121, 975-‐991.
278
LONG, J. A., MOAN, E. I., MEDFORD, J. I. & BARTON, M. K. 1996. A member of the KNOTTED class of homeodomain proteins encoded by the STM gene of Arabidopsis. Nature, 379, 66-‐69.
LOPES, M. A. & LARKINS, B. A. 1993. Endosperm origin, development, and function. The Plant Cell, 5, 1383-‐1339.
LU, D., LIN, W., GAO, X., WU, S., CHENG, C., AVILA, J., HEESE, A., DEVARENNE, T. P., HE, P. & SHAN, L. 2011. Direct ubiquitination of pattern recognition receptor FLS2 attenuates plant innate immunity. Science Signaling, 332, 1439.
LU, H., SALIMIAN, S., GAMELIN, E., WANG, G., FEDOROWSKI, J., LACOURSE, W. & GREENBERG, J. T. 2009. Genetic analysis of acd6‐1 reveals complex defense networks and leads to identification of novel defense genes in Arabidopsis. The Plant Journal, 58, 401-‐412.
LUO, M., BILODEAU, P., KOLTUNOW, A., DENNIS, E. S., PEACOCK, W. J. & CHAUDHURY, A. M. 1999. Genes controlling fertilization-‐independent seed development in Arabidopsis thaliana. Proceedings of the National Academy of Sciences, 96, 296-‐301.
MACLEAN, D. Z., C unpublished. MAGYAR, Z., HORVÁTH, B., SAFINA KHAN, B. M., HENRIQUES, R., DE VEYLDER, L., BAKÓ, L.,
SCHERES, B. & BÖGRE, L. 2012. Arabidopsis E2FA stimulates proliferation and endocycle separately through RBR-‐bound and RBR-‐free complexes. The EMBO journal, 31, 1480-‐1493.
MALINOWSKI, R., KASPRZEWSKA, A. & FLEMING, A. J. 2011. Targeted manipulation of leaf form via local growth repression. The Plant Journal, 66, 941-‐952.
MALLERY, D. L., VANDENBERG, C. J. & HIOM, K. 2002. Activation of the E3 ligase function of the BRCA1/BARD1 complex by polyubiquitin chains. The EMBO Journal, 21, 6755-‐6762.
MAO, Y., SENIC-‐MATUGLIA, F., DI FIORE, P. P., POLO, S., HODSDON, M. E. & DE CAMILLI, P. 2005. Deubiquitinating function of ataxin-‐3: insights from the solution structure of the Josephin domain. Proceedings of the National Academy of Sciences of the United States of America, 102, 12700-‐12705.
MARINO, D., PEETERS, N. & RIVAS, S. 2012. Ubiquitination during plant immune signaling. Plant physiology, 160, 15-‐27.
MARMOR, M. D. & YARDEN, Y. 2004. Role of protein ubiquitylation in regulating endocytosis of receptor tyrosine kinases. Oncogene, 23, 2057-‐2070.
MARTÍN-‐TRILLO, M. & CUBAS, P. 2010. TCP genes: a family snapshot ten years later. Trends in plant science, 15, 31-‐39.
MASON, S. D. & JOYCE, J. A. 2011. Proteolytic networks in cancer. Trends in cell biology, 21, 228-‐237.
MASUDA, H. P., CABRAL, L. M., DE VEYLDER, L., TANURDZIC, M., DE ALMEIDA ENGLER, J., GEELEN, D., INZÉ, D., MARTIENSSEN, R. A., FERREIRA, P. C. & HEMERLY, A. S. 2008. ABAP1 is a novel plant Armadillo BTB protein involved in DNA replication and transcription. The EMBO journal, 27, 2746-‐2756.
MATTHEWS, B., COLMAN, P., JANSONIUS, J., TITANI, K., WALSH, K. & NEURATH, H. 1972. Structure of thermolysin. Nature, 238, 41-‐43.
MATTSSON, J., CKURSHUMOVA, W. & BERLETH, T. 2003. Auxin signaling in Arabidopsis leaf vascular development. Plant Physiology, 131, 1327-‐1339.
MAUL, R. S., SONG, Y., AMANN, K. J., GERBIN, S. C., POLLARD, T. D. & CHANG, D. D. 2003. EPLIN regulates actin dynamics by cross-‐linking and stabilizing filaments. The Journal of cell biology, 160, 399-‐407.
MAYER, K. F., SCHOOF, H., HAECKER, A., LENHARD, M., JÜRGENS, G. & LAUX, T. 1998. Role of WUSCHEL in Regulating Stem Cell Fate in the Arabidopsis Shoot Meristem. Cell, 95, 805-‐815.
279
MAZZUCOTELLI, E., BELLONI, S., MARONE, D., DE LEONARDIS, A., GUERRA, D., DI FONZO, N., CATTIVELLI, L. & MASTRANGELO, A. 2006. The E3 ubiquitin ligase gene family in plants: regulation by degradation. Current genomics, 7, 509-‐522.
MCCARTHY, M. I., ABECASIS, G. R., CARDON, L. R., GOLDSTEIN, D. B., LITTLE, J., IOANNIDIS, J. P. & HIRSCHHORN, J. N. 2008. Genome-‐wide association studies for complex traits: consensus, uncertainty and challenges. Nature Reviews Genetics, 9, 356-‐369.
MCGINNIS, K. M., THOMAS, S. G., SOULE, J. D., STRADER, L. C., ZALE, J. M., SUN, T.-‐P. & STEBER, C. M. 2003. The Arabidopsis SLEEPY1 gene encodes a putative F-‐box subunit of an SCF E3 ubiquitin ligase. The Plant Cell Online, 15, 1120-‐1130.
MCGWIRE, B. S. & CHANG, K.-‐P. 1996. Posttranslational Regulation of a Leishmania HEXXH Metalloprotease (gp63). The effects of site-‐specific mutagenesis of catalytic, zinc binding, N-‐glycosylation, and glycosyl phosphatidylinositol addition sites on N-‐terminal end cleavage, intracellular stability, and extracellular exit. Journal of Biological Chemistry, 271, 7903-‐7909.
MCINTOSH, I., DREYER, S. D., CLOUGH, M. V., DUNSTON, J. A., EYAID, W., ROIG, C. M., MONTGOMERY, T., ALA-‐MELLO, S., KAITILA, I. & WINTERPACHT, A. 1998. Mutation Analysis of LMX1B Gene in Nail-‐Patella Syndrome Patients. The American Journal of Human Genetics, 63, 1651-‐1658.
MELARAGNO, J. E., MEHROTRA, B. & COLEMAN, A. W. 1993. Relationship between endopolyploidy and cell size in epidermal tissue of Arabidopsis. The Plant Cell Online, 5, 1661-‐1668.
MENG, L.-‐S., SUN, X.-‐D., LI, F., LIU, H.-‐L., FENG, Z.-‐H. & ZHU, J. 2010. Modification of flowers and leaves in Cockscomb (Celosia cristata) ectopically expressing Arabidopsis ASYMMERTIC LEAVES2-‐LIKE38 (ASL38/LBD41) gene. Acta Physiologiae Plantarum, 32, 315-‐324.
MERLET, J., BURGER, J., GOMES, J.-‐E. & PINTARD, L. 2009. Regulation of cullin-‐RING E3 ubiquitin-‐ligases by neddylation and dimerization. Cellular and molecular life sciences, 66, 1924-‐1938.
MESQUITA, D., DEKANTY, A. & MILÁN, M. 2010. A dp53-‐dependent mechanism involved in coordinating tissue growth in Drosophila. PLoS biology, 8, e1000566.
MEULMEESTER, E., KUNZE, M., HSIAO, H. H., URLAUB, H. & MELCHIOR, F. 2008. Mechanism and consequences for paralog-‐specific sumoylation of ubiquitin-‐specific protease 25. Molecular cell, 30, 610-‐619.
MIKI, Y., SWENSEN, J., SHATTUCK-‐EIDENS, D., FUTREAL, P. A., HARSHMAN, K., TAVTIGIAN, S., LIU, Q., COCHRAN, C., BENNETT, L. M. & DING, W. 1994. A strong candidate for the breast and ovarian cancer susceptibility gene BRCA1. Science, 266, 66-‐71.
MITCHELL, P. L. & SHEEHY, J. E. 2006. Supercharging rice photosynthesis to increase yield. New Phytologist, 171, 688-‐693.
MITCHELL-‐OLDS, T. 2010. Complex-‐trait analysis in plants. Genome Biol, 11, 423. MIURA, K. & HASEGAWA, P. M. 2010. Sumoylation and other ubiquitin-‐like post-‐translational
modifications in plants. Trends in cell biology, 20, 223-‐232. MIURA, K., JIN, J. B., LEE, J., YOO, C. Y., STIRM, V., MIURA, T., ASHWORTH, E. N., BRESSAN, R. A.,
YUN, D.-‐J. & HASEGAWA, P. M. 2007. SIZ1-‐mediated sumoylation of ICE1 controls CBF3/DREB1A expression and freezing tolerance in Arabidopsis. The Plant Cell Online, 19, 1403-‐1414.
MIURA, K., LEE, J., JIN, J. B., YOO, C. Y., MIURA, T. & HASEGAWA, P. M. 2009. Sumoylation of ABI5 by the Arabidopsis SUMO E3 ligase SIZ1 negatively regulates abscisic acid signaling. Proceedings of the National Academy of Sciences, 106, 5418-‐5423.
MIURA, K., LEE, J., MIURA, T. & HASEGAWA, P. M. 2010. SIZ1 controls cell growth and plant development in Arabidopsis through salicylic acid. Plant and cell physiology, 51, 103-‐113.
280
MIYOSHI, K., AHN, B.-‐O., KAWAKATSU, T., ITO, Y., ITOH, J.-‐I., NAGATO, Y. & KURATA, N. 2004. PLASTOCHRON1, a timekeeper of leaf initiation in rice, encodes cytochrome P450. Proceedings of the National Academy of Sciences of the United States of America, 101, 875-‐880.
MIZUKAMI, Y. 2001. A matter of size: developmental control of organ size in plants. Current opinion in plant biology, 4, 533-‐539.
MIZUKAMI, Y. & FISCHER, R. L. 2000. Plant organ size control: AINTEGUMENTA regulates growth and cell numbers during organogenesis. Proceedings of the National Academy of Sciences, 97, 942-‐947.
MOES, D., GATTI, S., HOFFMANN, C., DIETERLE, M., MOREAU, F., NEUMANN, K., SCHUMACHER, M., DIEDERICH, M., GRILL, E. & SHEN, W.-‐H. 2012. A LIM Domain Protein from Tobacco Involved in Actin-‐Bundling and Histone Gene Transcription. Molecular Plant, 6, 483-‐502.
MOFFAT, C. S., INGLE, R. A., WATHUGALA, D. L., SAUNDERS, N. J., KNIGHT, H. & KNIGHT, M. R. 2012. ERF5 and ERF6 play redundant roles as positive regulators of JA/Et-‐mediated defense against Botrytis cinerea in Arabidopsis. PLoS One, 7, e35995.
MOON, J. & HAKE, S. 2011. How a leaf gets its shape. Current opinion in plant biology, 14, 24-‐30.
MORELLI, G. & RUBERTI, I. 2002. Light and shade in the photocontrol of Arabidopsis growth. Trends in plant science, 7, 399-‐404.
MORIMOTO, M., NISHIDA, T., HONDA, R. & YASUDA, H. 2000. Modification of Cullin-‐1 by Ubiquitin-‐like Protein Nedd8 Enhances the Activity of SCFskp2 toward p27 kip1. Biochemical and biophysical research communications, 270, 1093-‐1096.
MOTT, R. 2000. HAPPY: a software package for Multipoint QTL Mapping in Genetically Heterogeneous Animals [Online]. Available: http://www.well.ox.ac.uk/~rmott/happy.html.
MOTT, R., KOVER, P. X., CLARK, R., RAETSCH, G., TOOMAJIAN, C., STEGLE, O. & GAN, X. 2011. Association Analysis in Arabidopsis thaliana MAGIC recombinant inbred lines [Online]. Available: http://mus.well.ox.ac.uk/19genomes/magic.html.
MOTT, R., TALBOT, C. J., TURRI, M. G., COLLINS, A. C. & FLINT, J. 2000. A method for fine mapping quantitative trait loci in outbred animal stocks. Proceedings of the National Academy of Sciences, 97, 12649-‐12654.
MUKHTAR, M. S., CARVUNIS, A. R., DREZE, M., EPPLE, P., STEINBRENNER, J., MOORE, J., TASAN, M., GALLI, M., HAO, T. & NISHIMURA, M. T. 2011. Independently evolved virulence effectors converge onto hubs in a plant immune system network. Science, 333, 596-‐601.
MULLEN, J. R., CHEN, C.-‐F. & BRILL, S. J. 2010. Wss1 is a SUMO-‐dependent isopeptidase that interacts genetically with the Slx5-‐Slx8 SUMO-‐targeted ubiquitin ligase. Molecular and cellular biology, 30, 3737-‐3748.
MYOUGA, F., HOSODA, C., UMEZAWA, T., IIZUMI, H., KUROMORI, T., MOTOHASHI, R., SHONO, Y., NAGATA, N., IKEUCHI, M. & SHINOZAKI, K. 2008. A heterocomplex of iron superoxide dismutases defends chloroplast nucleoids against oxidative stress and is essential for chloroplast development in Arabidopsis. The Plant Cell Online, 20, 3148-‐3162.
NAG, A., KING, S. & JACK, T. 2009. miR319a targeting of TCP4 is critical for petal growth and development in Arabidopsis. Proceedings of the National Academy of Sciences, 106, 22534-‐22539.
NAGATA, K., OHASHI, K., YANG, N. & MIZUNO, K. 1999. The N-‐terminal LIM domain negatively regulates the kinase activity of LIM-‐kinase 1. Biochemical Journal, 343, 99-‐105.
NAGL, W. 1976. DNA endoreduplication and polyteny understood as evolutionary strategies. Nature, 261, 614-‐615.
281
NAKAJIMA, K., SENA, G., NAWY, T. & BENFEY, P. N. 2001. Intercellular movement of the putative transcription factor SHR in root patterning. Nature, 413, 307-‐311.
NAKAYA, M., TSUKAYA, H., MURAKAMI, N. & KATO, M. 2002. Brassinosteroids control the proliferation of leaf cells of Arabidopsis thaliana. Plant and cell physiology, 43, 239-‐244.
NAKAYAMA, K. I. & NAKAYAMA, K. 2006. Ubiquitin ligases: cell-‐cycle control and cancer. Nature Reviews Cancer, 6, 369-‐381.
NAM, K. H. & LI, J. 2002. BRI1/BAK1, a receptor kinase pair mediating brassinosteroid signaling. Cell, 110, 203-‐212.
NAM, K. H. & LI, J. 2004. The Arabidopsis transthyretin-‐like protein is a potential substrate of BRASSINOSTEROID-‐INSENSITIVE 1. The Plant Cell Online, 16, 2406-‐2417.
NANBA, D., MAMMOTO, A., HASHIMOTO, K. & HIGASHIYAMA, S. 2003. Proteolytic release of the carboxy-‐terminal fragment of proHB-‐EGF causes nuclear export of PLZF. The Journal of cell biology, 163, 489-‐502.
NATH, U., CRAWFORD, B. C., CARPENTER, R. & COEN, E. 2003. Genetic control of surface curvature. Science Signaling, 299, 1404-‐1407.
NEBERT, D. W. & RUSSELL, D. W. 2002. Clinical importance of the cytochromes P450. The Lancet, 360, 1155-‐1162.
NISHIMURA, C., OHASHI, Y., SATO, S., KATO, T., TABATA, S. & UEGUCHI, C. 2004. Histidine kinase homologs that act as cytokinin receptors possess overlapping functions in the regulation of shoot and root growth in Arabidopsis. The Plant Cell Online, 16, 1365-‐1377.
NORBERG, M., HOLMLUND, M. & NILSSON, O. 2005. The BLADE ON PETIOLE genes act redundantly to control the growth and development of lateral organs. Development, 132, 2203-‐2213.
NOTT, A., JUNG, H.-‐S., KOUSSEVITZKY, S. & CHORY, J. 2006. Plastid-‐to-‐nucleus retrograde signaling. Annu. Rev. Plant Biol., 57, 739-‐759.
OGUNJIMI, A. A., BRIANT, D. J., PECE-‐BARBARA, N., LE ROY, C., DI GUGLIELMO, G. M., KAVSAK, P., RASMUSSEN, R. K., SEET, B. T., SICHERI, F. & WRANA, J. L. 2005. Regulation of Smurf2 ubiquitin ligase activity by anchoring the E2 to the HECT domain. Molecular cell, 19, 297-‐308.
OHAD, N., YADEGARI, R., MARGOSSIAN, L., HANNON, M., MICHAELI, D., HARADA, J. J., GOLDBERG, R. B. & FISCHER, R. L. 1999. Mutations in FIE, a WD polycomb group gene, allow endosperm development without fertilization. The Plant Cell Online, 11, 407-‐415.
OHNO, C. K., REDDY, G. V., HEISLER, M. G. & MEYEROWITZ, E. M. 2004. The Arabidopsis JAGGED gene encodes a zinc finger protein that promotes leaf tissue development. Development, 131, 1111-‐1122.
OKAMOTO, Y., OZAKI, T., MIYAZAKI, K., AOYAMA, M., MIYAZAKI, M. & NAKAGAWARA, A. 2003. UbcH10 is the cancer-‐related E2 ubiquitin-‐conjugating enzyme. Cancer research, 63, 4167-‐4173.
OKUSHIMA, Y., MITINA, I., QUACH, H. L. & THEOLOGIS, A. 2005. AUXIN RESPONSE FACTOR 2 (ARF2): a pleiotropic developmental regulator. The Plant Journal, 43, 29-‐46.
OLDHAM, C. E., MOHNEY, R. P., MILLER, S. L. H., HANES, R. N. & O'BRYAN, J. P. 2002. The ubiquitin-‐interacting motifs target the endocytic adaptor protein epsin for ubiquitination. Current Biology, 12, 1112-‐1116.
OPEN_BIOSYSTEMS. Arabidopsis thaliana amiRNA Library [Online]. Available: http://www.biocat.com/bc/pdf/Arabidopsis_manual.pdf.
OVERVOORDE, P. J., OKUSHIMA, Y., ALONSO, J. M., CHAN, A., CHANG, C., ECKER, J. R., HUGHES, B., LIU, A., ONODERA, C. & QUACH, H. 2005. Functional genomic analysis of the AUXIN/INDOLE-‐3-‐ACETIC ACID gene family members in Arabidopsis thaliana. The Plant Cell Online, 17, 3282-‐3300.
282
OZKAYNAK, E., FINLEY, D., SOLOMON, M. & VARSHAVSKY, A. 1987. The yeast ubiquitin genes: a family of natural gene fusions. The EMBO journal, 6, 1429-‐1439.
PAGNUSSAT, G. C., YU, H.-‐J., NGO, Q. A., RAJANI, S., MAYALAGU, S., JOHNSON, C. S., CAPRON, A., XIE, L.-‐F., YE, D. & SUNDARESAN, V. 2005. Genetic and molecular identification of genes required for female gametophyte development and function in Arabidopsis. Development, 132, 603-‐614.
PALATNIK, J. F., ALLEN, E., WU, X., SCHOMMER, C., SCHWAB, R., CARRINGTON, J. C. & WEIGEL, D. 2003. Control of leaf morphogenesis by microRNAs. Nature, 425, 257-‐263.
PAN, D. 2007. Hippo signaling in organ size control. Genes & development, 21, 886-‐897. PARKER, J. E., SZABÒ, V., STASKAWICZ, B. J., LISTER, C., DEAN, C., DANIELS, M. J. & JONES, J. D.
1993. Phenotypic characterization and molecular mapping of the Arabidopsis thaliana locus RPP5, determining disease resistance to Peronospora parasitica. The Plant Journal, 4, 821-‐831.
PATEL, R. A. 2012. Characterisation of TCP genes in Arabidospis Thaliana. Doctoral, University of Toronto.
PEAUCELLE, A., BRAYBROOK, S. A., LE GUILLOU, L., BRON, E., KUHLEMEIER, C. & HÖFTE, H. 2011. Pectin-‐Induced Changes in Cell Wall Mechanics Underlie Organ Initiation in Arabidopsis. Current Biology, 21, 1720-‐1726.
PEAUCELLE, A., LOUVET, R., JOHANSEN, J. N., HÖFTE, H., LAUFS, P., PELLOUX, J. & MOUILLE, G. 2008. Arabidopsis Phyllotaxis Is Controlled by the Methyl-‐Esterification Status of Cell-‐Wall Pectins. Current Biology, 18, 1943-‐1948.
PELLMAN, D. & CHRISTMAN, M. F. 2001. Separase anxiety: dissolving the sister bond and more. Nature cell biology, 3, E207-‐E209.
PENG, J., CAROL, P., RICHARDS, D. E., KING, K. E., COWLING, R. J., MURPHY, G. P. & HARBERD, N. P. 1997. The Arabidopsis GAI gene defines a signaling pathway that negatively regulates gibberellin responses. Genes & Development, 11, 3194-‐3205.
PENG, J., SCHWARTZ, D., ELIAS, J. E., THOREEN, C. C., CHENG, D., MARSISCHKY, G., ROELOFS, J., FINLEY, D. & GYGI, S. P. 2003. A proteomics approach to understanding protein ubiquitination. Nature biotechnology, 21, 921-‐926.
PENG, Y., MA, W., CHEN, L., YANG, L., LI, S., ZHAO, H., ZHAO, Y., JIN, W., LI, N. & BEVAN, M. W. 2013. Control of Root Meristem Size by DA1-‐RELATED PROTEIN2 in Arabidopsis. Plant physiology, 161, 1542-‐1556.
PÉREZ-‐PÉREZ, J. M., CANDELA, H., ROBLES, P., LÓPEZ-‐TORREJÓN, G., DEL POZO, J. C. & MICOL, J. L. 2010. A role for AUXIN RESISTANT3 in the coordination of leaf growth. Plant and cell physiology, 51, 1661-‐1673.
PETERS, J.-‐M. 2006. The anaphase promoting complex/cyclosome: a machine designed to destroy. Nature Reviews Molecular Cell Biology, 7, 644-‐656.
PETERSON, K. M., RYCHEL, A. L. & TORII, K. U. 2010. Out of the mouths of plants: the molecular basis of the evolution and diversity of stomatal development. The Plant Cell Online, 22, 296-‐306.
PETROSKI, M. D. & DESHAIES, R. J. 2003. Context of multiubiquitin chain attachment influences the rate of Sic1 degradation. Molecular cell, 11, 1435-‐1444.
PICKART, C. M. & FUSHMAN, D. 2004. Polyubiquitin chains: polymeric protein signals. Current opinion in chemical biology, 8, 610-‐616.
PINOT, F. & BEISSON, F. 2011. Cytochrome P450 metabolizing fatty acids in plants: characterization and physiological roles. Febs Journal, 278, 195-‐205.
PLATT, A., HORTON, M., HUANG, Y. S., LI, Y., ANASTASIO, A. E., MULYATI, N. W., ÅGREN, J., BOSSDORF, O., BYERS, D. & DONOHUE, K. 2010. The scale of population structure in Arabidopsis thaliana. PLoS genetics, 6, e1000843.
PODUST, V. N., BROWNELL, J. E., GLADYSHEVA, T. B., LUO, R.-‐S., WANG, C., COGGINS, M. B., PIERCE, J. W., LIGHTCAP, E. S. & CHAU, V. 2000. A Nedd8 conjugation pathway is
283
essential for proteolytic targeting of p27Kip1 by ubiquitination. Proceedings of the National Academy of Sciences, 97, 4579-‐4584.
PRASAD, K., ZHANG, X., TOBÓN, E. & AMBROSE, B. A. 2010. The Arabidopsis B‐sister MADS‐box protein, GORDITA, represses fruit growth and contributes to integument development. The Plant Journal, 62, 203-‐214.
PRIGGE, M. J., OTSUGA, D., ALONSO, J. M., ECKER, J. R., DREWS, G. N. & CLARK, S. E. 2005. Class III homeodomain-‐leucine zipper gene family members have overlapping, antagonistic, and distinct roles in Arabidopsis development. The Plant Cell Online, 17, 61-‐76.
QI, R. & JOHN, P. C. L. 2007. Expression of genomic AtCYCD2; 1 in Arabidopsis induces cell division at smaller cell sizes: implications for the control of plant growth. Plant physiology, 144, 1587-‐1597.
R.D. FINN, J. MISTRY, J. TATE, P. COGGILL, A. HEGER, J.E. POLLINGTON, O.L. GAVIN, P. GUNESEKARAN, G. CERIC, K. FORSLUND, L. HOLM, E.L. SONNHAMMER, S.R. EDDY & BATEMAN, A. 2012. The Pfam protein families database. Nucleic Acids Res, 40.
RAZ, V., BERGERVOET, J. & KOORNNEEF, M. 2001. Sequential steps for developmental arrest in Arabidopsis seeds. Development, 128, 243-‐252.
READ, M. A., BROWNELL, J. E., GLADYSHEVA, T. B., HOTTELET, M., PARENT, L. A., COGGINS, M. B., PIERCE, J. W., PODUST, V. N., LUO, R.-‐S. & CHAU, V. 2000. Nedd8 modification of Cul-‐1 activates SCFβTrCP-‐dependent ubiquitination of IκBα. Molecular and cellular biology, 20, 2326-‐2333.
REINHARDT, D., PESCE, E.-‐R., STIEGER, P., MANDEL, T., BALTENSPERGER, K., BENNETT, M., TRAAS, J., FRIML, J. & KUHLEMEIER, C. 2003. Regulation of phyllotaxis by polar auxin transport. Nature, 426, 255-‐260.
REMMERT, M., BIEGERT, A., HAUSER, A. & SÖDING, J. 2011. HHblits: lightning-‐fast iterative protein sequence searching by HMM-‐HMM alignment. Nature methods, 9, 173-‐175.
RIESER, E., CORDIER, S. M. & WALCZAK, H. 2013. Linear ubiquitination: a newly discovered regulator of cell signalling. Trends in biochemical sciences, 38, 94-‐102.
ROBATZEK, S., CHINCHILLA, D. & BOLLER, T. 2006. Ligand-‐induced endocytosis of the pattern recognition receptor FLS2 in Arabidopsis. Genes & Development, 20, 537-‐542.
RODRIGUEZ, R. E., MECCHIA, M. A., DEBERNARDI, J. M., SCHOMMER, C., WEIGEL, D. & PALATNIK, J. F. 2010. Control of cell proliferation in Arabidopsis thaliana by microRNA miR396. Development, 137, 103-‐112.
ROGULJA, D. & IRVINE, K. D. 2005. Regulation of cell proliferation by a morphogen gradient. Cell, 123, 449-‐461.
ROGULJA, D., RAUSKOLB, C. & IRVINE, K. D. 2008. Morphogen control of wing growth through the Fat signaling pathway. Developmental cell, 15, 309-‐321.
ROJAS, C. A., ELOY, N. B., DE FREITAS LIMA, M., RODRIGUES, R. L., FRANCO, L. O., HIMANEN, K., BEEMSTER, G. T. S., HEMERLY, A. S. & FERREIRA, P. C. G. 2009. Overexpression of the Arabidopsis anaphase promoting complex subunit CDC27a increases growth rate and organ size. Plant Molecular Biology, 71, 307-‐318.
ROJO, E., MARTÍN, R., CARTER, C., ZOUHAR, J., PAN, S., PLOTNIKOVA, J., JIN, H., PANEQUE, M., SÁNCHEZ-‐SERRANO, J. J. & BAKER, B. 2004. VPEγ exhibits a caspase-‐like activity that contributes to defense against pathogens. Current Biology, 14, 1897-‐1906.
ROJO, E., ZOUHAR, J., CARTER, C., KOVALEVA, V. & RAIKHEL, N. V. 2003. A unique mechanism for protein processing and degradation in Arabidopsis thaliana. Proceedings of the National Academy of Sciences, 100, 7389-‐7394.
SABLOWSKI, R. 2011. Plant stem cell niches: from signalling to execution. Current opinion in plant biology, 14, 4-‐9.
SADANANDOM, A., BAILEY, M., EWAN, R., LEE, J. & NELIS, S. 2012. The ubiquitin–proteasome system: central modifier of plant signalling. New Phytologist, 196, 13-‐28.
284
SADOWSKI, I., MA, J., TRIEZENBERG, S. & PTASHNE, M. 1988. GAL4-‐VP16 is an unusually potent transcriptional activator. Nature, 335, 563-‐564.
SAMPEDRO, J. & COSGROVE, D. J. 2005. The expansin superfamily. Genome biology, 6, 242. SARACCO, S. A., HANSSON, M., SCALF, M., WALKER, J. M., SMITH, L. M. & VIERSTRA, R. D. 2009.
Tandem affinity purification and mass spectrometric analysis of ubiquitylated proteins in Arabidopsis. The Plant Journal, 59, 344-‐358.
SARVEPALLI, K. & NATH, U. 2011. Hyper‐activation of the TCP4 transcription factor in Arabidopsis thaliana accelerates multiple aspects of plant maturation. The Plant Journal, 67, 595-‐607.
SAVALDI-‐GOLDSTEIN, S., PETO, C. & CHORY, J. 2007. The epidermis both drives and restricts plant shoot growth. NATURE-‐LONDON-‐, 446, 199.
SCANLON, M. J. 2003. The polar auxin transport inhibitor N-‐1-‐naphthylphthalamic acid disrupts leaf initiation, KNOX protein regulation, and formation of leaf margins in maize. Plant Physiology, 133, 597-‐605.
SCHENA, M., LLOYD, A. & DAVIS, R. 1993. The HAT4 gene of Arabidopsis encodes a developmental regulator. Genes & development, 7, 367-‐379.
SCHIESSL, K., KAUSIKA, S., SOUTHAM, P., BUSH, M. & SABLOWSKI, R. 2012. JAGGED Controls Growth Anisotropy and Coordination between Cell Size and Cell Cycle during Plant Organogenesis. Current Biology, 22, 1739-‐1746.
SCHMEICHEL, K. L. & BECKERLE, M. C. 1994. The LIM domain is a modular protein-‐binding interface. Cell, 79, 211-‐219.
SCHOOF, H., LENHARD, M., HAECKER, A., MAYER, K. F., JÜRGENS, G. & LAUX, T. 2000. The Stem Cell Population of Arabidopsis Shoot Meristems Is Maintained by a Regulatory Loop between the CLAVATA and WUSCHEL Genes. Cell, 100, 635-‐644.
SCHRUL, B., KAPP, K., SINNING, I. & DOBBERSTEIN, B. 2010. Signal peptide peptidase (SPP) assembles with substrates and misfolded membrane proteins into distinct oligomeric complexes. Biochemical Journal, 427, 523-‐534.
SCHULTZ J, MILPETZ F, BORK P & CP, P. 1998. SMART, a simple modular architecture research tool: Identification of signaling domains. Proceedings of the National Academy of Sciences, 95, 5857-‐5864.
SCHWAB, R., OSSOWSKI, S., RIESTER, M., WARTHMANN, N. & WEIGEL, D. 2006. Highly specific gene silencing by artificial microRNAs in Arabidopsis. The Plant Cell Online, 18, 1121-‐1133.
SCHWARTZ, D. C. & HOCHSTRASSER, M. 2003. A superfamily of protein tags: ubiquitin, SUMO and related modifiers. Trends in biochemical sciences, 28, 321-‐328.
SCOTT, F. L., DENAULT, J.-‐B., RIEDL, S. J., SHIN, H., RENATUS, M. & SALVESEN, G. S. 2005. XIAP inhibits caspase-‐3 and-‐7 using two binding sites: evolutionarily conserved mechanism of IAPs. The EMBO journal, 24, 645-‐655.
SEMIARTI, E., UENO, Y., TSUKAYA, H., IWAKAWA, H., MACHIDA, C. & MACHIDA, Y. 2001. The ASYMMETRIC LEAVES2 gene of Arabidopsis thaliana regulates formation of a symmetric lamina, establishment of venation and repression of meristem-‐related homeobox genes in leaves. Development, 128, 1771-‐1783.
SEPÚLVEDA-‐GARCÍA, E. & ROCHA-‐SOSA, M. 2012. The Arabidopsis F-‐box protein AtFBS1 interacts with 14-‐3-‐3 proteins. Plant Science, 195, 36-‐47.
SHAO, M., ZHENG, H., HU, Y., LIU, D., JANG, J.-‐C., MA, H. & HUANG, H. 2004. The GAOLAOZHUANGREN1 gene encodes a putative glycosyltransferase that is critical for normal development and carbohydrate metabolism. Plant and cell physiology, 45, 1453-‐1460.
SHEWRY, P. R., NAPIER, J. A. & TATHAM, A. S. 1995. Seed storage proteins: structures and biosynthesis. The plant cell, 7, 945-‐956.
285
SHIRASAKI, R. & PFAFF, S. L. 2002. Transcriptional codes and the control of neuronal identity. Annual review of neuroscience, 25, 251-‐281.
SHIU, S.-‐H. & BLEECKER, A. B. 2003. Expansion of the receptor-‐like kinase/Pelle gene family and receptor-‐like proteins in Arabidopsis. Plant Physiology, 132, 530-‐543.
SHPAK, E. D., LAKEMAN, M. B. & TORII, K. U. 2003. Dominant-‐negative receptor uncovers redundancy in the Arabidopsis ERECTA leucine-‐rich repeat receptor–like kinase signaling pathway that regulates organ shape. The Plant Cell Online, 15, 1095-‐1110.
SKIRYCZ, A., REICHELT, M., BUROW, M., BIRKEMEYER, C., ROLCIK, J., KOPKA, J., ZANOR, M. I., GERSHENZON, J., STRNAD, M. & SZOPA, J. 2006. DOF transcription factor AtDof1. 1 (OBP2) is part of a regulatory network controlling glucosinolate biosynthesis in Arabidopsis. The Plant Journal, 47, 10-‐24.
SMITH, L. G., GREENE, B., VEIT, B. & HAKE, S. 1992. A dominant mutation in the maize homeobox gene, Knotted-‐1, causes its ectopic expression in leaf cells with altered fates. Development, 116, 21-‐30.
SOARES, A. S., DRISCOLL, S. P., OLMOS, E., HARBINSON, J., ARRABAÇA, M. C. & FOYER, C. H. 2008. Adaxial/abaxial specification in the regulation of photosynthesis and stomatal opening with respect to light orientation and growth with CO2 enrichment in the C4 species Paspalum dilatatum. New Phytologist, 177, 186-‐198.
SOBHIAN, B., SHAO, G., LILLI, D. R., CULHANE, A. C., MOREAU, L. A., XIA, B., LIVINGSTON, D. M. & GREENBERG, R. A. 2007. RAP80 targets BRCA1 to specific ubiquitin structures at DNA damage sites. Science, 316, 1198-‐1202.
SÖDING, J. 2005. Protein homology detection by HMM–HMM comparison. Bioinformatics, 21, 951-‐960.
SÖDING, J., BIEGERT, A. & LUPAS, A. N. 2005. The HHpred interactive server for protein homology detection and structure prediction. Nucleic acids research, 33, W244-‐W248.
SONG, L., SHI, Q.-‐M., YANG, X.-‐H., XU, Z.-‐H. & XUE, H.-‐W. 2009. Membrane steroid-‐binding protein 1 (MSBP1) negatively regulates brassinosteroid signaling by enhancing the endocytosis of BAK1. Cell research, 19, 864-‐876.
SONG, X. J., HUANG, W., SHI, M., ZHU, M. Z. & LIN, H. X. 2007. A QTL for rice grain width and weight encodes a previously unknown RING-‐type E3 ubiquitin ligase. Nature genetics, 39, 623-‐630.
SONODA, Y., SAKO, K., MAKI, Y., YAMAZAKI, N., YAMAMOTO, H., IKEDA, A. & YAMAGUCHI, J. 2009. Regulation of leaf organ size by the Arabidopsis RPT2a 19S proteasome subunit. The Plant Journal, 60, 68-‐78.
SPREITZER, R. J. & SALVUCCI, M. E. 2002. Rubisco: structure, regulatory interactions, and possibilities for a better enzyme. Annual review of plant biology, 53, 449-‐475.
STEINDLER, C., MATTEUCCI, A., SESSA, G., WEIMAR, T., OHGISHI, M., AOYAMA, T., MORELLI, G. & RUBERTI, I. 1999. Shade avoidance responses are mediated by the ATHB-‐2 HD-‐zip protein, a negative regulator of gene expression. Development, 126, 4235-‐4245.
STEINER, E., EFRONI, I., GOPALRAJ, M., SAATHOFF, K., TSENG, T. S., KIEFFER, M., ESHED, Y., OLSZEWSKI, N. & WEISS, D. 2012. The Arabidopsis O-‐Linked N-‐Acetylglucosamine Transferase SPINDLY Interacts with Class I TCPs to Facilitate Cytokinin Responses in Leaves and Flowers. The Plant Cell Online, 24, 96-‐108.
STEVENSON, L. F., SPARKS, A., ALLENDE-‐VEGA, N., XIRODIMAS, D. P., LANE, D. P. & SAVILLE, M. K. 2007. The deubiquitinating enzyme USP2a regulates the p53 pathway by targeting Mdm2. The EMBO journal, 26, 976-‐986.
STIMPSON, H. E., LEWIS, M. J. & PELHAM, H. R. 2006. Transferrin receptor-‐like proteins control the degradation of a yeast metal transporter. The EMBO journal, 25, 662-‐672.
STONE, S. L., WILLIAMS, L. A., FARMER, L. M., VIERSTRA, R. D. & CALLIS, J. 2006. KEEP ON GOING, a RING E3 ligase essential for Arabidopsis growth and development, is involved in abscisic acid signaling. The Plant Cell Online, 18, 3415-‐3428.
286
SU, D. & HOCHSTRASSER, M. 2010. A WLM protein with SUMO-‐directed protease activity. Molecular and cellular biology, 30, 3734-‐3736.
SUGIMOTO-‐SHIRASU, K. & ROBERTS, K. 2003. “Big it up”: endoreduplication and cell-‐size control in plants. Current opinion in plant biology, 6, 544-‐553.
SUMMERS, M. K., PAN, B., MUKHYALA, K. & JACKSON, P. K. 2008. The unique N terminus of the UbcH10 E2 enzyme controls the threshold for APC activation and enhances checkpoint regulation of the APC. Molecular cell, 31, 544-‐556.
SUN, S., WANG, H., YU, H., ZHONG, C., ZHANG, X., PENG, J. & WANG, X. 2013. GASA14 regulates leaf expansion and abiotic stress resistance by modulating reactive oxygen species accumulation. Journal of experimental botany, 64, 1637-‐1647.
SUN, Y. 2003. Targeting E3 ubiquitin ligases for cancer therapy. Cancer biology & therapy, 2, 623-‐629.
SUN, Y. 2006. E3 ubiquitin ligases as cancer targets and biomarkers. Neoplasia (New York, NY), 8, 645-‐654.
SUTTERLÜTY, H., CHATELAIN, E., MARTI, A., WIRBELAUER, C., SENFTEN, M., MÜLLER, U. & KREK, W. 1999. p45SKP2 promotes p27Kip1 degradation and induces S phase in quiescent cells. Nature Cell Biology, 1, 207-‐214.
SZÉCSI, J., JOLY, C., BORDJI, K., VARAUD, E., COCK, J. M., DUMAS, C. & BENDAHMANE, M. 2006. BIGPETALp, a bHLH transcription factor is involved in the control of Arabidopsis petal size. The EMBO journal, 25, 3912-‐3920.
TAIRA, M., OTANI, H., SAINT-‐JEANNET, J.-‐P. & DAWID, I. B. 1994. Role of the LIM class homeodomain protein Xlim-‐1 in neural and muscle induction by the Spemann organizer in Xenopus. Nature, 372, 677-‐679.
TAO, Q., GUO, D., WEI, B., ZHANG, F., PANG, C., JIANG, H., ZHANG, J., WEI, T., GU, H. & QU, L.-‐J. 2013. The TIE1 Transcriptional Repressor Links TCP Transcription Factors with TOPLESS/TOPLESS-‐RELATED Corepressors and Modulates Leaf Development in Arabidopsis. The Plant Cell Online, 25, 421-‐437.
TEALE, W. D., PAPONOV, I. A. & PALME, K. 2006. Auxin in action: signalling, transport and the control of plant growth and development. Nature Reviews Molecular Cell Biology, 7, 847-‐859.
TETZLAFF, M. T., YU, W., LI, M., ZHANG, P., FINEGOLD, M., MAHON, K., HARPER, J. W., SCHWARTZ, R. J. & ELLEDGE, S. J. 2004. Defective cardiovascular development and elevated cyclin E and Notch proteins in mice lacking the Fbw7 F-‐box protein. Proceedings of the National Academy of Sciences of the United States of America, 101, 3338-‐3345.
THORNBERRY, N. A. & LAZEBNIK, Y. 1998. Caspases: enemies within. Science, 281, 1312-‐1316. THROWER, J. S., HOFFMAN, L., RECHSTEINER, M. & PICKART, C. M. 2000. Recognition of the
polyubiquitin proteolytic signal. The EMBO journal, 19, 94-‐102. TORII, K. U., MITSUKAWA, N., OOSUMI, T., MATSUURA, Y., YOKOYAMA, R., WHITTIER, R. F. &
KOMEDA, Y. 1996. The Arabidopsis ERECTA gene encodes a putative receptor protein kinase with extracellular leucine-‐rich repeats. The Plant Cell Online, 8, 735-‐746.
TRANQUE, P., CROSSIN, K. L., CIRELLI, C., EDELMAN, G. M. & MAURO, V. P. 1996. Identification and characterization of a RING zinc finger gene (C-‐RZF) expressed in chicken embryo cells. Proceedings of the National Academy of Sciences, 93, 3105-‐3109.
TURCHI, L., CARABELLI, M., RUZZA, V., POSSENTI, M., SASSI, M., PEÑALOSA, A., SESSA, G., SALVI, S., FORTE, V. & MORELLI, G. 2013. Arabidopsis HD-‐Zip II transcription factors control apical embryo development and meristem function. Development, 140, 2118-‐2129.
TZAFRIR, I., PENA-‐MURALLA, R., DICKERMAN, A., BERG, M., ROGERS, R., HUTCHENS, S., SWEENEY, T. C., MCELVER, J., AUX, G. & PATTON, D. 2004. Identification of genes required for embryo development in Arabidopsis. Plant Physiology, 135, 1206-‐1220.
287
UBEDA-‐TOMÁS, S., FEDERICI, F., CASIMIRO, I., BEEMSTER, G. T., BHALERAO, R., SWARUP, R., DOERNER, P., HASELOFF, J. & BENNETT, M. J. 2009. Gibberellin Signaling in the Endodermis Controls Arabidopsis Root Meristem Size. Current Biology, 19, 1194-‐1199.
UBERTI-‐MANASSERO, N. G., LUCERO, L. E., VIOLA, I. L., VEGETTI, A. C. & GONZALEZ, D. H. 2012. The class I protein AtTCP15 modulates plant development through a pathway that overlaps with the one affected by CIN-‐like TCP proteins. Journal of Experimental Botany, 63, 809-‐823.
UMEDA, M., MANABE, Y. & UCHIMIYA, H. 1997. Phosphorylation of the C2 subunit of the proteasome in rice (Oryza sativa L.). FEBS letters, 403, 313-‐317.
VAN DELFT, S., GOVERS, R., STROUS, G. J., VERKLEIJ, A. J. & EN HENEGOUWEN, P. M. V. B. 1997. Epidermal growth factor induces ubiquitination of Eps15. Journal of Biological Chemistry, 272, 14013-‐14016.
VAN DEN HEUVEL, S. 2005. Cell-‐cycle regulation, WormBook. VAN DER BIEZEN, E. A., FREDDIE, C. T., KAHN, K. & JONES, J. D. 2002. Arabidopsis RPP4 is a
member of the RPP5 multigene family of TIR‐NB‐LRR genes and confers downy mildew resistance through multiple signalling components. The Plant Journal, 29, 439-‐451.
VANNESTE, S., MAES, L., DE SMET, I., HIMANEN, K., NAUDTS, M., INZE, D. & BEECKMAN, T. 2005. Auxin regulation of cell cycle and its role during lateral root initiation. Physiologia Plantarum, 123, 139-‐146.
VAROTTO, C., PESARESI, P., MEURER, J., OELMÜLLER, R., STEINER‐LANGE, S., SALAMINI, F. & LEISTER, D. 2000. Disruption of the Arabidopsis photosystem I gene psaE1 affects photosynthesis and impairs growth. The Plant Journal, 22, 115-‐124.
VERMEULEN, K., VAN BOCKSTAELE, D. R. & BERNEMAN, Z. N. 2003. The cell cycle: a review of regulation, deregulation and therapeutic targets in cancer. Cell proliferation, 36, 131-‐149.
VERT, G. & CHORY, J. 2006. Downstream nuclear events in brassinosteroid signalling. Nature, 441, 96-‐100.
VIERSTRA, R. D. 1996. Proteolysis in plants: mechanisms and functions. Plant molecular biology, 32, 275-‐302.
VILLANUEVA, J. M., BROADHVEST, J., HAUSER, B. A., MEISTER, R. J., SCHNEITZ, K. & GASSER, C. S. 1999. INNER NO OUTER regulates abaxial–adaxial patterning in Arabidopsis ovules. Genes & Development, 13, 3160-‐3196.
VIOLA, I., UBERTI, M. N., RIPOLL, R. & GONZALEZ, D. 2011. The Arabidopsis class I TCP transcription factor AtTCP11 is a developmental regulator with distinct DNA-‐binding properties due to the presence of a threonine residue at position 15 of the TCP domain. Biochem. J, 435, 143-‐155.
VLACH, J., HENNECKE, S., ALEVIZOPOULOS, K., CONTI, D. & AMATI, B. 1996. Growth arrest by the cyclin-‐dependent kinase inhibitor p27Kip1 is abrogated by c-‐Myc. The EMBO Journal, 15, 6595-‐6604.
VOGES, D., ZWICKL, P. & BAUMEISTER, W. 1999. The 26S proteasome: a molecular machine designed for controlled proteolysis. Annual review of biochemistry, 68, 1015-‐1068.
VOIGT, C., OSTER, U., BÖRNKE, F., JAHNS, P., DIETZ, K. J., LEISTER, D. & KLEINE, T. 2010. In‐depth analysis of the distinctive effects of norflurazon implies that tetrapyrrole biosynthesis, organellar gene expression and ABA cooperate in the GUN‐type of plastid signalling. Physiologia plantarum, 138, 503-‐519.
WAGNER, R. & PFANNSCHMIDT, T. 2006. Eukaryotic transcription factors in plastids—Bioinformatic assessment and implications for the evolution of gene expression machineries in plants. Gene, 381, 62-‐70.
288
WANG, B., MATSUOKA, S., BALLIF, B. A., ZHANG, D., SMOGORZEWSKA, A., GYGI, S. P. & ELLEDGE, S. J. 2007. Abraxas and RAP80 form a BRCA1 protein complex required for the DNA damage response. Science, 316, 1194-‐1198.
WANG, F., ZHU, D., HUANG, X., LI, S., GONG, Y., YAO, Q., FU, X., FAN, L.-‐M. & DENG, X. W. 2009. Biochemical insights on degradation of Arabidopsis DELLA proteins gained from a cell-‐free assay system. The Plant Cell Online, 21, 2378-‐2390.
WANG, P. & GRANADOS, R. R. 1997. An intestinal mucin is the target substrate for a baculovirus enhancin. Proceedings of the National Academy of Sciences, 94, 6977-‐6982.
WANG, T.-‐W., LU, L., ZHANG, C.-‐G., TAYLOR, C. & THOMPSON, J. E. 2003a. Pleiotropic effects of suppressing deoxyhypusine synthase expression in Arabidopsis thaliana. Plant molecular biology, 52, 1223-‐1235.
WANG, X. & CHORY, J. 2006. Brassinosteroids regulate dissociation of BKI1, a negative regulator of BRI1 signaling, from the plasma membrane. Science, 313, 1118-‐112.
WANG, Y., HENRIKSSON, E., SÖDERMAN, E., HENRIKSSON, K. N., SUNDBERG, E. & ENGSTRÖM, P. 2003b. The arabidopsis homeobox gene, ATHB16, regulates leaf development and the sensitivity to photoperiod in Arabidopsis. Developmental biology, 264, 228-‐239.
WANG, Y., RIBOT, C., REZZONICO, E. & POIRIER, Y. 2004. Structure and expression profile of the Arabidopsis PHO1 gene family indicates a broad role in inorganic phosphate homeostasis. Plant Physiology, 135, 400-‐411.
WEIGEL, D. 2012. Natural variation in Arabidopsis: from molecular genetics to ecological genomics. Plant physiology, 158, 2-‐22.
WEIGEL, D. & MOTT, R. 2009. The 1001 genomes project for Arabidopsis thaliana. Genome Biol, 10, 107.
WHITE, D. W. R. 2006. PEAPOD regulates lamina size and curvature in Arabidopsis. Proceedings of the National Academy of Sciences, 103, 13238-‐13243.
WIBORG, J., O'SHEA, C. & SKRIVER, K. 2008. Biochemical function of typical and variant Arabidopsis thaliana U-‐box E3 ubiquitin-‐protein ligases. Biochem. J, 413, 447-‐457.
WIBORG, O., PEDERSEN, M., WIND, A., BERGLUND, L., MARCKER, K. & VUUST, J. 1985. The human ubiquitin multigene family: some genes contain multiple directly repeated ubiquitin coding sequences. The EMBO journal, 4, 755-‐759.
WIESNER, S., OGUNJIMI, A. A., WANG, H.-‐R., ROTIN, D., SICHERI, F., WRANA, J. L. & FORMAN-‐KAY, J. D. 2007. Autoinhibition of the HECT-‐type ubiquitin ligase Smurf2 through its C2 domain. Cell, 130, 651-‐662.
WILMOTH, J. C., WANG, S., TIWARI, S. B., JOSHI, A. D., HAGEN, G., GUILFOYLE, T. J., ALONSO, J. M., ECKER, J. R. & REED, J. W. 2005. NPH4/ARF7 and ARF19 promote leaf expansion and auxin‐induced lateral root formation. The Plant Journal, 43, 118-‐130.
WINBORN, B. J., TRAVIS, S. M., TODI, S. V., SCAGLIONE, K. M., XU, P., WILLIAMS, A. J., COHEN, R. E., PENG, J. & PAULSON, H. L. 2008. The deubiquitinating enzyme ataxin-‐3, a polyglutamine disease protein, edits Lys63 linkages in mixed linkage ubiquitin chains. Journal of Biological Chemistry, 283, 26436-‐26443.
WOELK, T., OLDRINI, B., MASPERO, E., CONFALONIERI, S., CAVALLARO, E., DI FIORE, P. P. & POLO, S. 2006. Molecular mechanisms of coupled monoubiquitination. Nature cell biology, 8, 1246-‐1254.
WOOD, C. C., ROBERTSON, M., TANNER, G., PEACOCK, W. J., DENNIS, E. S. & HELLIWELL, C. A. 2006. The Arabidopsis thaliana vernalization response requires a polycomb-‐like protein complex that also includes VERNALIZATION INSENSITIVE 3. Proceedings of the National Academy of Sciences, 103, 14631-‐14636.
WU, F.-‐H., SHEN, S.-‐C., LEE, L.-‐Y., LEE, S.-‐H., CHAN, M.-‐T. & LIN, C.-‐S. 2009. Tape-‐Arabidopsis Sandwich-‐a simpler Arabidopsis protoplast isolation method. Plant Methods, 5, 16.
289
XIA, T. L., NA;DUMENIL, JACK; LI, JIE; BEVAN, MICHAEL W; LI, YUNHAI 2013. DA2, an E3 ubiquitin ligase, interacts with the ubiquitin receptor DA1 to control seed size in Arabidopsis thaliana. The plant cell, 25, 3347-‐3359.
XIE, Q., FRUGIS, G., COLGAN, D. & CHUA, N.-‐H. 2000. Arabidopsis NAC1 transduces auxin signal downstream of TIR1 to promote lateral root development. Genes & Development, 14, 3024-‐3036.
XING, S., ROSSO, M. G. & ZACHGO, S. 2005. ROXY1, a member of the plant glutaredoxin family, is required for petal development in Arabidopsis thaliana. Development, 132, 1555-‐1565.
XING, S. & ZACHGO, S. 2008. ROXY1 and ROXY2, two Arabidopsis glutaredoxin genes, are required for anther development. The Plant Journal, 53, 790-‐801.
XU, L., XU, Y., DONG, A., SUN, Y., PI, L., XU, Y. & HUANG, H. 2003. Novel as1 and as2 defects in leaf adaxial-‐abaxial polarity reveal the requirement for ASYMMETRIC LEAVES1 and 2 and ERECTA functions in specifying leaf adaxial identity. Development, 130, 4097-‐4107.
XU, R. & LI, Y. 2011. Control of final organ size by Mediator complex subunit 25 in Arabidopsis thaliana. Development, 138, 4545-‐4554.
XU, R. & LI, Y. 2012. The Mediator complex subunit 8 regulates organ size in Arabidopsis thaliana. Plant Signaling & Behavior, 7, 182-‐183.
YANG, H., SHI, Y., LIU, J., GUO, L., ZHANG, X. & YANG, S. 2010. A mutant CHS3 protein with TIR-‐NB-‐LRR-‐LIM domains modulates growth, cell death and freezing tolerance in a temperature-‐dependent manner in Arabidopsis. The Plant Journal, 63, 283-‐296.
YE, Y. & RAPE, M. 2009. Building ubiquitin chains: E2 enzymes at work. Nature reviews Molecular cell biology, 10, 755-‐764.
YI, H. & RICHARDS, E. J. 2007. A cluster of disease resistance genes in Arabidopsis is coordinately regulated by transcriptional activation and RNA silencing. The Plant Cell Online, 19, 2929-‐2939.
YOUNG, P., DEVERAUX, Q., BEAL, R. E., PICKART, C. M. & RECHSTEINER, M. 1998. Characterization of two polyubiquitin binding sites in the 26 S protease subunit 5a. Journal of Biological Chemistry, 273, 5461-‐5467.
YUAN, T., FUJIOKA, S., TAKATSUTO, S., MATSUMOTO, S., GOU, X., HE, K., RUSSELL, S. D. & LI, J. 2007. BEN1, a gene encoding a dihydroflavonol 4‐reductase (DFR)‐like protein, regulates the levels of brassinosteroids in Arabidopsis thaliana. The Plant Journal, 51, 220-‐233.
ZECCA, M., BASLER, K. & STRUHL, G. 1996. Direct and Long-‐Range Action of a Wingless Morphogen Gradient. Cell, 87, 833-‐844.
ZHADANOV, A. B., BERTUZZI, S., TAIRA, M., DAWID, I. B. & WESTPHAL, H. 1995. Expression pattern of the murine LIM class homeobox gene Lhx3 in subsets of neural and neuroendocrine tissues. Developmental dynamics, 202, 354-‐364.
ZHANG, H., HACKBARTH, C., CHANSKY, K. & CHAMBERS, H. 2001. A proteolytic transmembrane signaling pathway and resistance to beta-‐lactams in staphylococci. Science Signaling, 291, 1962-‐1965.
ZHANG, X., GARRETON, V. & CHUA, N.-‐H. 2005. The AIP2 E3 ligase acts as a novel negative regulator of ABA signaling by promoting ABI3 degradation. Genes & Development, 19, 1532-‐1543.
ZHANG, Y., GORITSCHNIG, S., DONG, X. & LI, X. 2003. A gain-‐of-‐function mutation in a plant disease resistance gene leads to constitutive activation of downstream signal transduction pathways in suppressor of npr1-‐1, constitutive 1. The Plant Cell Online, 15, 2636-‐2646.
ZHAO, B., LI, L., LEI, Q. & GUAN, K.-‐L. 2010. The Hippo–YAP pathway in organ size control and tumorigenesis: An updated version. Genes & development, 24, 862-‐874.
290
ZHENG, J., YANG, X., HARRELL, J. M., RYZHIKOV, S., SHIM, E.-‐H., LYKKE-‐ANDERSEN, K., WEI, N., SUN, H., KOBAYASHI, R. & ZHANG, H. 2002. CAND1 binds to unneddylated CUL1 and regulates the formation of SCF ubiquitin E3 ligase complex. Molecular cell, 10, 1519-‐1526.
ZHOU, Y. & NI, M. 2010. SHORT HYPOCOTYL UNDER BLUE1 truncations and mutations alter its association with a signaling protein complex in Arabidopsis. The Plant Cell Online, 22, 703-‐715.
ZHOU, Y., ZHANG, X., KANG, X., ZHAO, X., ZHANG, X. & NI, M. 2009. SHORT HYPOCOTYL UNDER BLUE1 associates with MINISEED3 and HAIKU2 promoters in vivo to regulate Arabidopsis seed development. The Plant Cell Online, 21, 106-‐117.
ZHUANG, M., GUAN, S., WANG, H., BURLINGAME, A. L. & WELLS, J. A. 2012. Substrates of IAP ubiquitin ligases identified with a designed orthogonal E3 ligase, the NEDDylator. Molecular cell, 49, 273-‐282.
ZIPFEL, C., KUNZE, G., CHINCHILLA, D., CANIARD, A., JONES, J. D., BOLLER, T. & FELIX, G. 2006. Perception of the Bacterial PAMP EF-‐Tu by the Receptor EFR Restricts Agrobacterium-‐Mediated Transformation. Cell, 125, 749-‐760.
Related Documents