Journal of the Foundation Year Network, Volume 1 (2018), pp. 113-125 © Copyright 2018. The author, Andrew Drummond, assigns to the Journal of the Foundation Year Network the right of first publication and to educational and non-profit institutions a non-exclusive licence to use this document for personal use and in courses of instruction provided that the article is used in full and this copyright statement is reproduced. Any other usage is prohibited without the express permission of the author. Investigating the Relationship between IELTS Scores and Receptive Vocabulary Size ANDREW DRUMMOND King’s College London This research investigates the relationship between IELTS scores and vocabulary size, using Nation and Belgar’s (2007) Vocabulary Size Test (VST). Correlations are stated between IELTS scores and mean estimated vocabulary size for a sample of 205 international foundation students; data which may be useful for streaming within such programmes. Mean and standard deviation vocabulary size scores are given for IELTS bands: there is a wide spread of scores within each 0.5 IELTS band, highlighting the weakness of an IELTS score as a predictor of this specific area of linguistic knowledge. A model is given for ‘mean’ students at each 0.5 band of IELTS, which estimates the number of unknown words s/he may encounter in a text written for educated native speakers, given the mean vocabulary size for that band. The pedagogical implications of these results are assessed. Introduction, Background and Rationale for Study Foundation programmes may have a component of international students who attend to com- plete a full foundation level qualification before commencing undergraduate study. Learning academic syntax and vocabulary may be required to prepare international students for full participation in English-medium education. Such international students normally approach UK- based HE institutions with an overall IELTS score (OIS) which is, essentially, a composite score from four language-skills tests: Reading, Writing, Speaking and Listening. The overall score is stated in 0.5 bands, along with scores for each component skill, with lower IELTS scores representing poorer performances on the constituent tests. IELTS.org (2015) considers IELTS 7.0 overall to be probably university ready but IELTS 6.5 overall students are, depending on the course and institution, often accepted for undergraduate and postgraduate studies. IELTS scores are used on foundation programmes to stream students into different levels of language ability assuming that relatively homogenous cohorts will result from this. A detailed picture of how diverse, or otherwise, linguistic competencies are among those with the same IELTS scores could inform whether this manner of streaming is the best practice for foundation programmes. Language input on foundation programmes may include input on grammar, vocabulary and discoursal features of texts, among other areas. Receptive knowledge of vocabulary – words successfully decoded when read – has been especially linked to success at reading (Nation and Anthony, 2016). Reading is often a primary mode of transmitting key course content, and it is

Welcome message from author
This document is posted to help you gain knowledge. Please leave a comment to let me know what you think about it! Share it to your friends and learn new things together.
Transcript
Journal of the Foundation Year Network, Volume 1 (2018), pp. 113-125
© Copyright 2018. The author, Andrew Drummond, assigns to the Journal of the Foundation Year Network the right of first publication and to educational and non-profit institutions a non-exclusive licence to use this document for personal use and in courses of instruction provided that the article is used in full and this copyright statement is reproduced. Any other usage is prohibited without the express permission of the author.
Investigating the Relationship between IELTS Scores and Receptive Vocabulary Size
ANDREW DRUMMOND King’s College London
This research investigates the relationship between IELTS scores and vocabulary size, using Nation and Belgar’s (2007) Vocabulary Size Test (VST). Correlations are stated between IELTS scores and mean estimated vocabulary size for a sample of 205 international foundation students; data which may be useful for streaming within such programmes. Mean and standard deviation vocabulary size scores are given for IELTS bands: there is a wide spread of scores within each 0.5 IELTS band, highlighting the weakness of an IELTS score as a predictor of this specific area of linguistic knowledge. A model is given for ‘mean’ students at each 0.5 band of IELTS, which estimates the number of unknown words s/he may encounter in a text written for educated native speakers, given the mean vocabulary size for that band. The pedagogical implications of these results are assessed.
Introduction, Background and Rationale for Study Foundation programmes may have a component of international students who attend to com-plete a full foundation level qualification before commencing undergraduate study. Learning academic syntax and vocabulary may be required to prepare international students for full participation in English-medium education. Such international students normally approach UK-based HE institutions with an overall IELTS score (OIS) which is, essentially, a composite score from four language-skills tests: Reading, Writing, Speaking and Listening. The overall score is stated in 0.5 bands, along with scores for each component skill, with lower IELTS scores representing poorer performances on the constituent tests. IELTS.org (2015) considers IELTS 7.0 overall to be probably university ready but IELTS 6.5 overall students are, depending on the course and institution, often accepted for undergraduate and postgraduate studies. IELTS scores are used on foundation programmes to stream students into different levels of language ability assuming that relatively homogenous cohorts will result from this. A detailed picture of how diverse, or otherwise, linguistic competencies are among those with the same IELTS scores could inform whether this manner of streaming is the best practice for foundation programmes.
Language input on foundation programmes may include input on grammar, vocabulary and discoursal features of texts, among other areas. Receptive knowledge of vocabulary – words successfully decoded when read – has been especially linked to success at reading (Nation and Anthony, 2016). Reading is often a primary mode of transmitting key course content, and it is
114 Journal of the Foundation Year Network
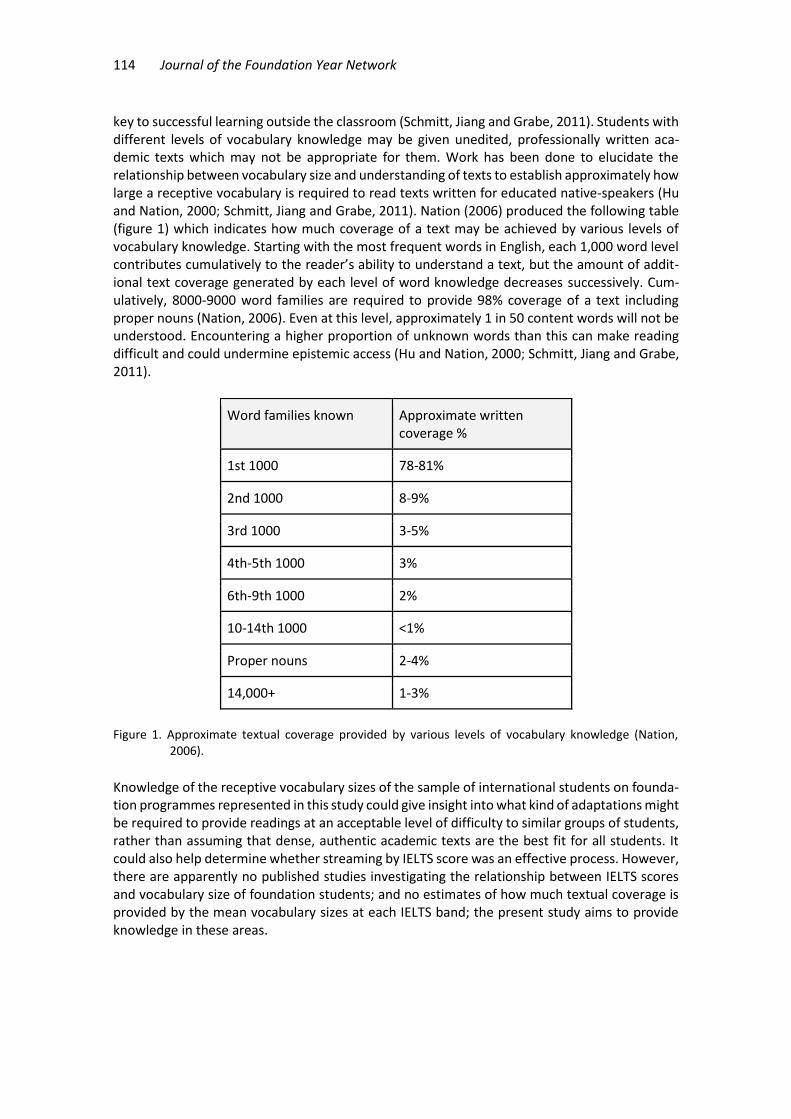
key to successful learning outside the classroom (Schmitt, Jiang and Grabe, 2011). Students with different levels of vocabulary knowledge may be given unedited, professionally written aca-demic texts which may not be appropriate for them. Work has been done to elucidate the relationship between vocabulary size and understanding of texts to establish approximately how large a receptive vocabulary is required to read texts written for educated native-speakers (Hu and Nation, 2000; Schmitt, Jiang and Grabe, 2011). Nation (2006) produced the following table (figure 1) which indicates how much coverage of a text may be achieved by various levels of vocabulary knowledge. Starting with the most frequent words in English, each 1,000 word level contributes cumulatively to the reader’s ability to understand a text, but the amount of addit-ional text coverage generated by each level of word knowledge decreases successively. Cum-ulatively, 8000-9000 word families are required to provide 98% coverage of a text including proper nouns (Nation, 2006). Even at this level, approximately 1 in 50 content words will not be understood. Encountering a higher proportion of unknown words than this can make reading difficult and could undermine epistemic access (Hu and Nation, 2000; Schmitt, Jiang and Grabe, 2011).
Word families known Approximate written coverage %
1st 1000 78-81%
2nd 1000 8-9%
3rd 1000 3-5%
4th-5th 1000 3%
6th-9th 1000 2%
10-14th 1000 <1%
Proper nouns 2-4%
14,000+ 1-3%
Figure 1. Approximate textual coverage provided by various levels of vocabulary knowledge (Nation,
2006).
Knowledge of the receptive vocabulary sizes of the sample of international students on founda-tion programmes represented in this study could give insight into what kind of adaptations might be required to provide readings at an acceptable level of difficulty to similar groups of students, rather than assuming that dense, authentic academic texts are the best fit for all students. It could also help determine whether streaming by IELTS score was an effective process. However, there are apparently no published studies investigating the relationship between IELTS scores and vocabulary size of foundation students; and no estimates of how much textual coverage is provided by the mean vocabulary sizes at each IELTS band; the present study aims to provide knowledge in these areas.
Andrew Drummond 115
Research Questions
1. For a cohort of international foundation students, which aspect of their IELTS scores (overall; one of the four skills; combinations of two skills) most closely correlates with their estimated vocabulary size?
2. How effective is an IELTS score at predicting vocabulary size? 3. Are there statistically significant differences in mean vocabulary size test results
between 0.5 IELTS bands and/or whole bands? 4. According to the test data, how many unknown words would an average student at each
0.5 IELTS band encounter when reading an academic text?
Literature Review Measuring receptive vocabulary size is typically done by administering a vocabulary test and such an instrument is used in the present study. Various tests aiming to do this have been developed, including the Vocabulary Levels Test (VLT) (Nation, 1990; Schmitt, Schmitt and Clapham, 2001), the Vocabulary Size Test (VST) (Nation and Belgar, 2007), and X_Lex (Meara and Milton, 2003) and Y_Lex (Meara and Miralpeix, 2006). The VLT tests participants’ knowledge of words at various levels of frequency: 2000, 3000, 5000 and 10000; as well testing knowledge of the Academic Word List (Coxhead, 2000). It follows a form-recognition matching format requiring students to demonstrate some knowledge of a word’s meaning in order select the correct answer. The VLT has been used widely for diagnostic purposes and to develop profiles of vocabulary knowledge at different points in the educational journey (Schmitt, 2010:198). Unlike the VST, it cannot be used so effectively to generate an overall of estimate of a student’s vocabulary size because it only samples from 4 levels of word frequency. Whilst X and Y_Lex do aim to produce such an estimate, when combined they only sample from ten frequency bands compared with the VST’s 14 bands. In addition, the VST provides a meaning-based assessment in the form of multiple choice questions rather than asking students to indicate whether they know words with ‘yes’ or ‘no’ responses. Space permitting, a much fuller exploration of the merits of each test could be given, but the VST offers the fullest description of a student’s lexical knowledge and, therefore, suits the present purpose most adequately.
In the VST, items appear in short example sentences with students required to select an appropriate synonym from four choices (Nation and Beglar, 2007). Each of the 14 levels of the test is essentially a 10-word ‘sample’ of an entire 1000 word frequency band. In other words, the first ten words in the test represent the most common 1000 word families in English (1k level), the second group of ten words, represent the second most common 1000 words families (2k level), and so on, up to the 14k level. Overall vocabulary size is estimated by multiplying the test score by 100 to give an approximation of word families known. For example, a score of 85 equates to an estimate of 8500 (85x100) word families known.
Some initial research shows that the VST has a high degree of validity. Belgar (2010) found that when analysing the VST according to the Rasch model, the level of difficulty reliably rose in the manner anticipated: scores progressively decrease as the questions test knowledge of progressively less frequent words. However, the multiple choice format of the test has been criticised for giving an inflated estimate of students’ vocabulary knowledge (Stewart, 2014). In the case of a 4-option, 140-question test, a student may receive an estimated vocabulary size of 3500 by simply guessing all of the questions. To counter this, Zhang (2013) explored the effect of including an ‘I don’t know option’ in the test to reduce the prevalence of guessing. It was found that adding this option reduced guessing to an extent, but when this option was combined
116 Journal of the Foundation Year Network
with deducting points for wrong answers, guessing was reduced even further. According to Zhang (2013), the decision on whether to include both safeguards should be influenced by whether credit is to be given for partial knowledge of a word. For the purpose of this research, we opted to include the ‘I don’t know option’ but not to penalise for wrong answers. This choice represents a balance between attempting to limit score inflation from correct guessing and allowing some credit for partial knowledge when the test-taker is reasonably sure.
There have been a number of studies stating statistical correlations between scores from vocabulary tests and component skills such as reading, writing and listening. Stæhr (2008) found vocabulary size correlated most strongly with reading (.83) followed by writing (.73) and listening (.69). Laufer (1992) also found significant correlations between scores on reading tests and vocabulary test, reporting correlations of .5 and .75. The variation in strength of the correlations in these two studies may indicate that the design of the instruments and characteristics of participants can have a considerable impact on the results. In addition, vocabulary scores have been correlated with other aspects of academic competence. For example, Masrai and Milton (2018) found a strong correlation between receptive vocabulary knowledge and GPA scores. Belgar (2010:110) found that performance on the VST corresponded to participant grouping on the basis of TOEFL scores; the higher TOEFL scores equated to higher scores in VST and vice-versa. Generally speaking, these studies serve to underlie the importance of receptive vocabulary to a range of academic skills and high-stakes assessments.
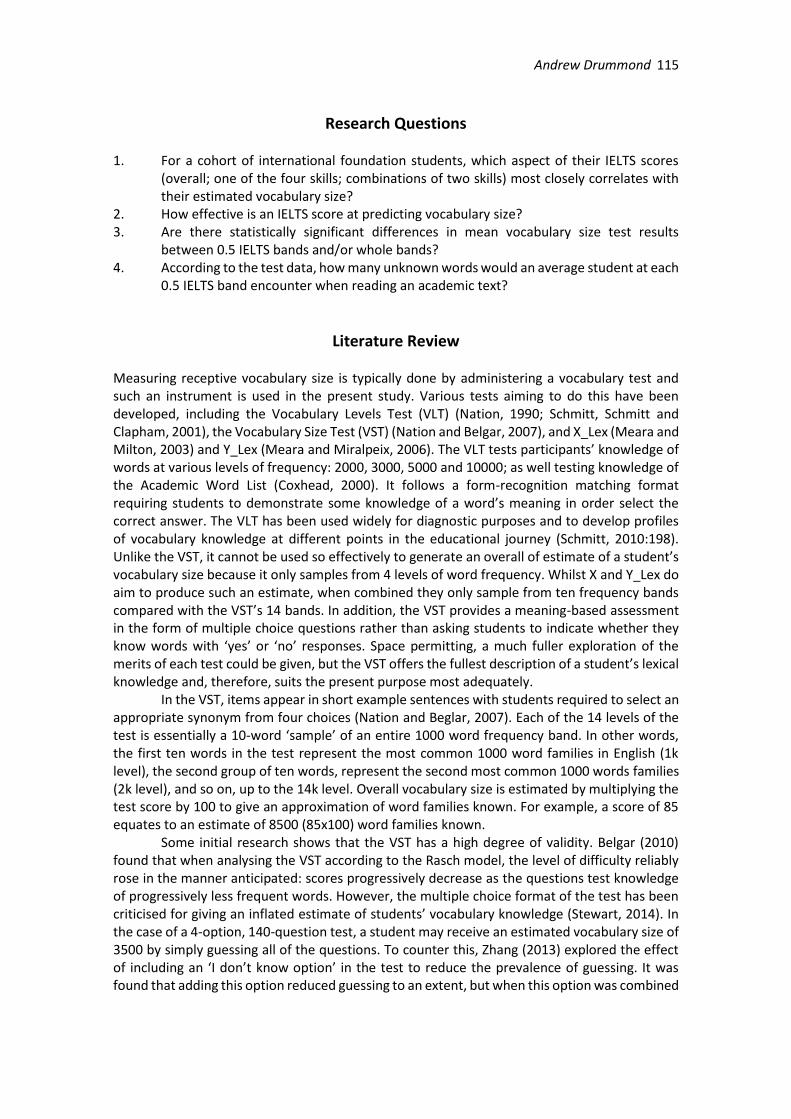
Milton et al. (2010) conducted a study investigating the relationship between receptive orthographic and phonological vocabulary size and IELTS scores and, as such, it is apparently the most similar study to the present one. The sample size (n=30) was much smaller than the present study and X Lex, their vocabulary testing instrument, only measures a maximum of 5,000 lemmas; that is, a smaller kind of word family consisting of the head word and the word’s inflected forms (e.g. walk, walks, walked). Their findings are stated here and will be compared directly to those in the present study. They found that vocabulary size correlated most strongly with IELTS writing score (.76), and that stronger correlations occurred for the orthographic skills (reading and writing) than for the phonological (speaking and listening).
read listen write speak overall
X_lex .70 .48 .76 .35** .68
Figure 2. Spearman correlations between IELTS scores and X_Lex test results (Milton et al., 2010).
Meara and Milton (2003) used X_Lex to estimate vocabulary size at Common European
Framework of Reference for Language levels (CEFR). They found that B2 learners knew between 3250-3750 lemmas and C2 levels (the highest level) knew between 4500-5000. It is possible that 5000 word estimate may be too low, however, since this represents the maximum score on the test. To a lesser extent, the VST can produce constrained estimates for higher level learners. For example, students scoring 25% at the 14k level (the highest level) are likely to have known some words at the 14k+ levels, had these levels been included. In a later study, Milton and Alexiou (2009) calculated vocabulary size for three languages at various CEFR levels and noted that vocabulary scores increased progressively at each band of the CEFR framework in each language. They (2009:201) carried out ANOVA and Tukey tests and found statistically significant differences for the mean vocabulary test scores at each CEFR level for Greek and Spanish learners; this result indicates that CEFR levels effectively equate to different populations with regard to vocabulary size in so far as their receptive vocabulary knowledge is concerned.
Andrew Drummond 117
Sample Information and Procedure During the 2017-18 year of the King’s College London International Foundation Programme, an online version of the VST was presented to the entire cohort of students at the beginning of their second term of study. Ethical clearance was granted for this study. Google forms was used to create an electronic version of the VST, and this was used to collect data on first language, IELTS scores and the date of their most recent IELTS test. There were 205 valid responses to the test. Of these, 75 identified as Mandarin speakers, 37 as Arabic (including 14 bilinguals) and 26 Turkish speakers. Their ages ranged from 17 to 22 (mean 18.7). Some responses were deleted due to ambiguous or multiple IELTS scores being listed by individuals. Their IELTS test had been taken as follows: 1-6 months ago, 20%; 7-12 months ago, 53.7%; 12+ months, 26.3%. The spread of these test dates is not ideal since vocabulary learning is likely to continue after the test, but the sample is likely to be representative of international students on foundation programmes in term two. This cohort includes a significant proportion of bilingual or multilingual students and students educated with English as the language of instruction. 81 participants (40%) indicated that English had been the language most often spoken by their teachers at school and a further 13 (6%) stated English and been part of bilingual instruction. 21 students indicated that English was one of the languages used in their home and seven students used English exclusively in the home. Anecdotally, private school attendance seems to have been relatively common among this cohort, especially for the non-Chinese part of the sample. The high proportion of those exposed to English-medium education in this sample may lead to higher aggregate VST scores and/or higher aggregate IELTS scores than for other cohorts.
Students were asked to sit the test in class time with an internet-enabled device. In this version of the test, the first ten levels were set as mandatory (1k-10k), whereas, at levels 11k-14k, students were able to skip questions. The purpose of this was to discourage guessing during the later, more difficult part of the test. The prelims to the test discouraged guessing and students were required to indicate understanding of this principle. Students’ responses are automatically transferred to a Google Sheets document which allowed the data to be analysed. The data was analysed with two statistics software packages: SPSS and JASP. The results from these analyses are stated below.
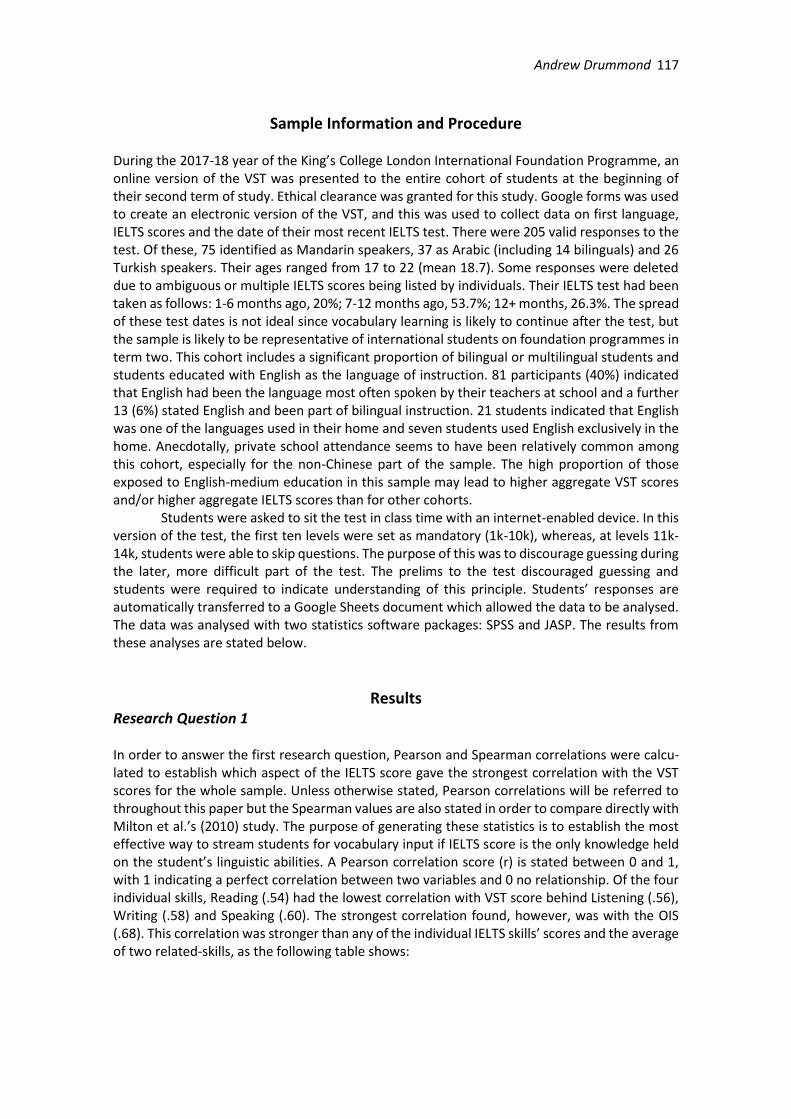
Results Research Question 1 In order to answer the first research question, Pearson and Spearman correlations were calcu-lated to establish which aspect of the IELTS score gave the strongest correlation with the VST scores for the whole sample. Unless otherwise stated, Pearson correlations will be referred to throughout this paper but the Spearman values are also stated in order to compare directly with Milton et al.’s (2010) study. The purpose of generating these statistics is to establish the most effective way to stream students for vocabulary input if IELTS score is the only knowledge held on the student’s linguistic abilities. A Pearson correlation score (r) is stated between 0 and 1, with 1 indicating a perfect correlation between two variables and 0 no relationship. Of the four individual skills, Reading (.54) had the lowest correlation with VST score behind Listening (.56), Writing (.58) and Speaking (.60). The strongest correlation found, however, was with the OIS (.68). This correlation was stronger than any of the individual IELTS skills’ scores and the average of two related-skills, as the following table shows:
118 Journal of the Foundation Year Network
Overall (OIS)
Listen+ Write
Read+ Write
Speak Listen+ Read
Write Listen Read
Pearson r=.68 r=.65 r=.64 r=.60 r=.60 r=.58 r=.56 r=.54
Spearman rho=.68 rho=.65 rho=.62 rho=.62 rho=.59 rho=.58 rho=.56 rho=.53
Sig. p<0.01 p<0.01 p<0.01 p<0.01 p<0.01 p<0.01 p<0.01 p<0.01 Figure 3. Pearson Correlations for VST scores and IELTS scores; individual components and combination.
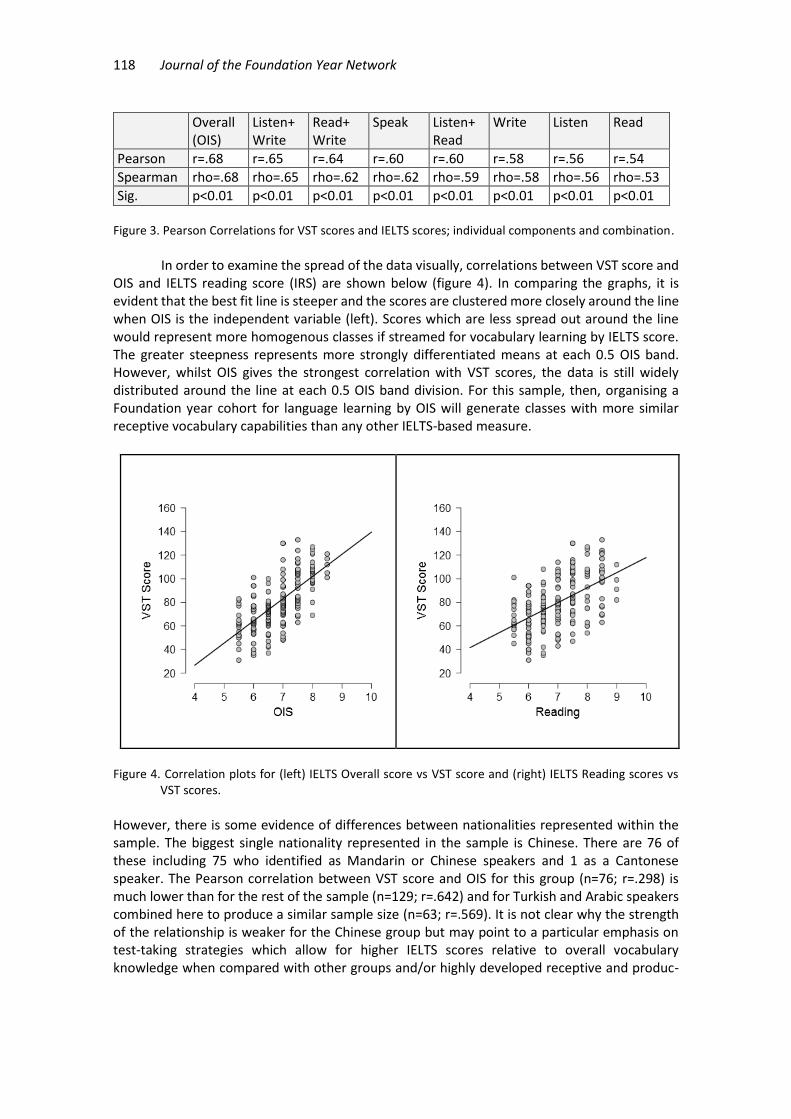
In order to examine the spread of the data visually, correlations between VST score and
OIS and IELTS reading score (IRS) are shown below (figure 4). In comparing the graphs, it is evident that the best fit line is steeper and the scores are clustered more closely around the line when OIS is the independent variable (left). Scores which are less spread out around the line would represent more homogenous classes if streamed for vocabulary learning by IELTS score. The greater steepness represents more strongly differentiated means at each 0.5 OIS band. However, whilst OIS gives the strongest correlation with VST scores, the data is still widely distributed around the line at each 0.5 OIS band division. For this sample, then, organising a Foundation year cohort for language learning by OIS will generate classes with more similar receptive vocabulary capabilities than any other IELTS-based measure.
Figure 4. Correlation plots for (left) IELTS Overall score vs VST score and (right) IELTS Reading scores vs
VST scores.
However, there is some evidence of differences between nationalities represented within the sample. The biggest single nationality represented in the sample is Chinese. There are 76 of these including 75 who identified as Mandarin or Chinese speakers and 1 as a Cantonese speaker. The Pearson correlation between VST score and OIS for this group (n=76; r=.298) is much lower than for the rest of the sample (n=129; r=.642) and for Turkish and Arabic speakers combined here to produce a similar sample size (n=63; r=.569). It is not clear why the strength of the relationship is weaker for the Chinese group but may point to a particular emphasis on test-taking strategies which allow for higher IELTS scores relative to overall vocabulary knowledge when compared with other groups and/or highly developed receptive and produc-
Andrew Drummond 119
tive knowledge of syntax relative to vocabulary knowledge. Additional research in this area could be relevant.
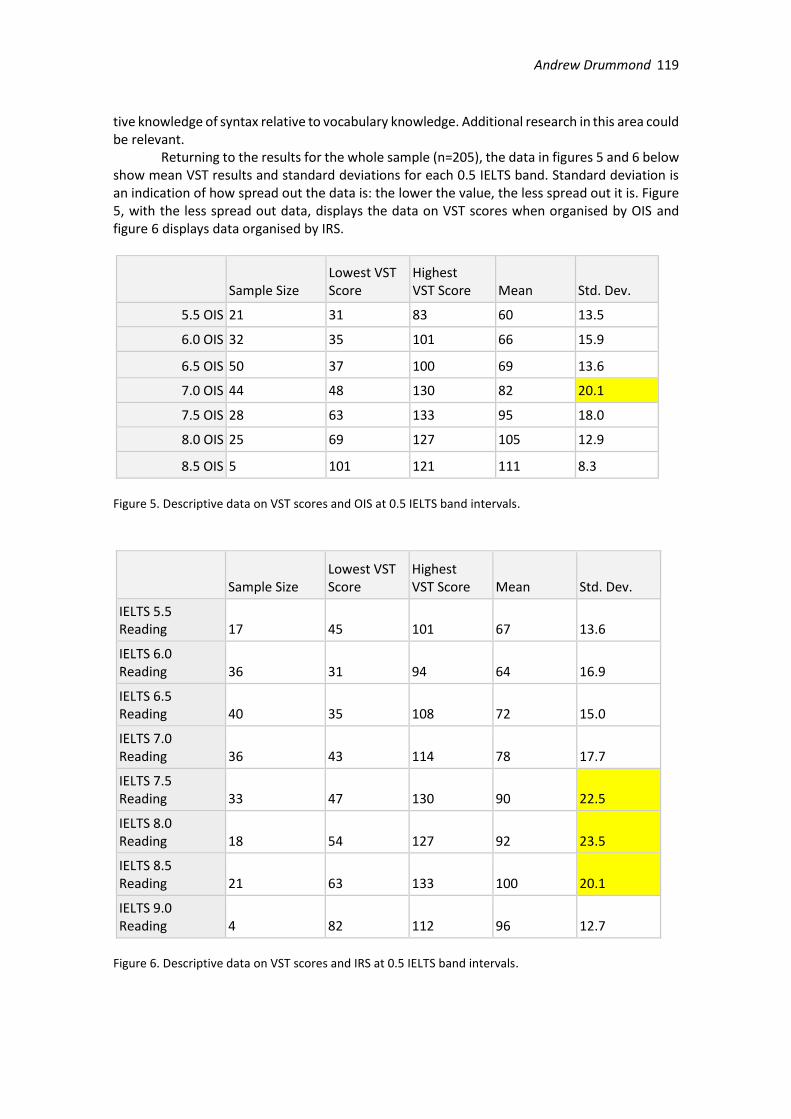
Returning to the results for the whole sample (n=205), the data in figures 5 and 6 below show mean VST results and standard deviations for each 0.5 IELTS band. Standard deviation is an indication of how spread out the data is: the lower the value, the less spread out it is. Figure 5, with the less spread out data, displays the data on VST scores when organised by OIS and figure 6 displays data organised by IRS.
Sample Size Lowest VST Score
Highest VST Score Mean Std. Dev.
5.5 OIS 21 31 83 60 13.5
6.0 OIS 32 35 101 66 15.9
6.5 OIS 50 37 100 69 13.6
7.0 OIS 44 48 130 82 20.1
7.5 OIS 28 63 133 95 18.0
8.0 OIS 25 69 127 105 12.9
8.5 OIS 5 101 121 111 8.3
Figure 5. Descriptive data on VST scores and OIS at 0.5 IELTS band intervals.
Sample Size Lowest VST Score
Highest VST Score Mean Std. Dev.
IELTS 5.5 Reading 17 45 101 67 13.6
IELTS 6.0 Reading 36 31 94 64 16.9
IELTS 6.5 Reading 40 35 108 72 15.0
IELTS 7.0 Reading 36 43 114 78 17.7
IELTS 7.5 Reading 33 47 130 90 22.5
IELTS 8.0 Reading 18 54 127 92 23.5
IELTS 8.5 Reading 21 63 133 100 20.1
IELTS 9.0 Reading 4 82 112 96 12.7
Figure 6. Descriptive data on VST scores and IRS at 0.5 IELTS band intervals.
120 Journal of the Foundation Year Network
The shaded cells are those with a standard deviation of above 20. In the case of OIS-based organisation, there is only one standard deviation score above 20 but for the IRS-based organ-isation, there are 3. In fact, all of the standard deviation scores for the OIS-based organisation, except one, are lower than for the IRS-based, indicating again that OIS is the most effective way to stream this sample if similar levels of receptive vocabulary knowledge are required for pedagogical purposes.
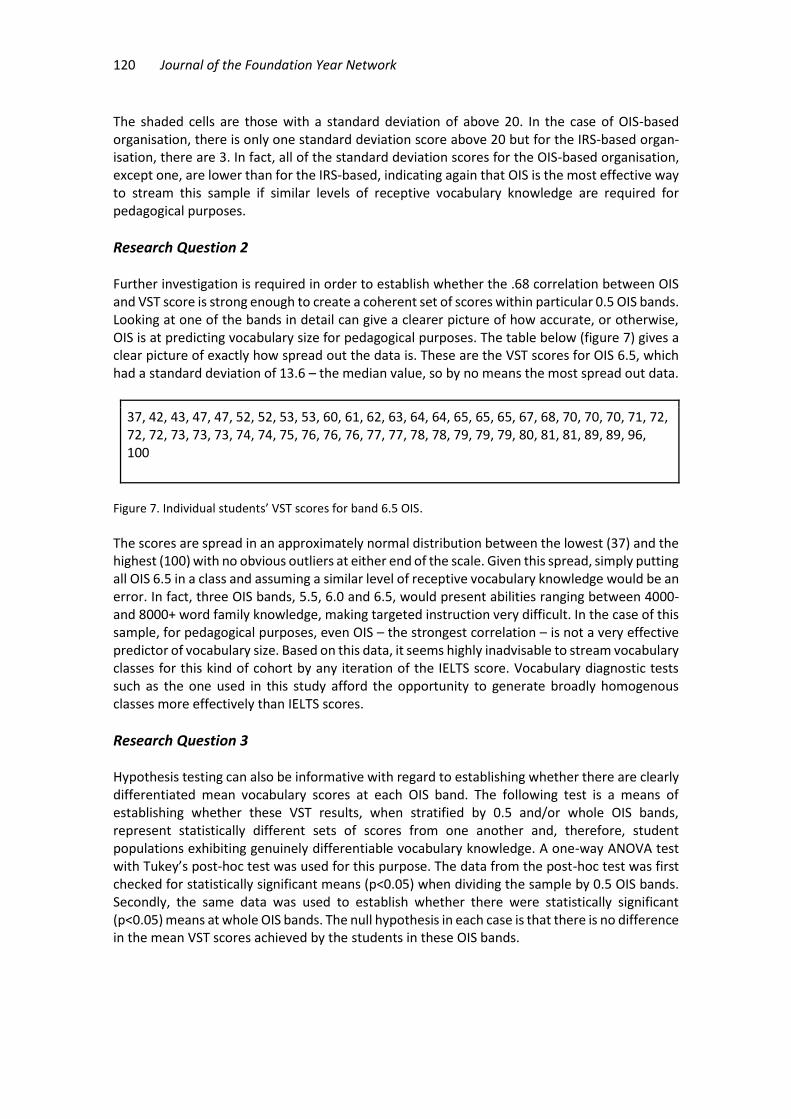
Research Question 2 Further investigation is required in order to establish whether the .68 correlation between OIS and VST score is strong enough to create a coherent set of scores within particular 0.5 OIS bands. Looking at one of the bands in detail can give a clearer picture of how accurate, or otherwise, OIS is at predicting vocabulary size for pedagogical purposes. The table below (figure 7) gives a clear picture of exactly how spread out the data is. These are the VST scores for OIS 6.5, which had a standard deviation of 13.6 – the median value, so by no means the most spread out data.
37, 42, 43, 47, 47, 52, 52, 53, 53, 60, 61, 62, 63, 64, 64, 65, 65, 65, 67, 68, 70, 70, 70, 71, 72, 72, 72, 73, 73, 73, 74, 74, 75, 76, 76, 76, 77, 77, 78, 78, 79, 79, 79, 80, 81, 81, 89, 89, 96, 100
Figure 7. Individual students’ VST scores for band 6.5 OIS.
The scores are spread in an approximately normal distribution between the lowest (37) and the highest (100) with no obvious outliers at either end of the scale. Given this spread, simply putting all OIS 6.5 in a class and assuming a similar level of receptive vocabulary knowledge would be an error. In fact, three OIS bands, 5.5, 6.0 and 6.5, would present abilities ranging between 4000- and 8000+ word family knowledge, making targeted instruction very difficult. In the case of this sample, for pedagogical purposes, even OIS – the strongest correlation – is not a very effective predictor of vocabulary size. Based on this data, it seems highly inadvisable to stream vocabulary classes for this kind of cohort by any iteration of the IELTS score. Vocabulary diagnostic tests such as the one used in this study afford the opportunity to generate broadly homogenous classes more effectively than IELTS scores.
Research Question 3 Hypothesis testing can also be informative with regard to establishing whether there are clearly differentiated mean vocabulary scores at each OIS band. The following test is a means of establishing whether these VST results, when stratified by 0.5 and/or whole OIS bands, represent statistically different sets of scores from one another and, therefore, student populations exhibiting genuinely differentiable vocabulary knowledge. A one-way ANOVA test with Tukey’s post-hoc test was used for this purpose. The data from the post-hoc test was first checked for statistically significant means (p<0.05) when dividing the sample by 0.5 OIS bands. Secondly, the same data was used to establish whether there were statistically significant (p<0.05) means at whole OIS bands. The null hypothesis in each case is that there is no difference in the mean VST scores achieved by the students in these OIS bands.
Andrew Drummond 121
0.5 OIS BANDS P Value
5.5 to 6.0 p= .737
6.0 to 6.5 p= .985
6.5 to 7.0 p= .004
7.0 to 7.5 p= .015
7.5 to 8.0 p= .266
8.0 to 8.5 p= .981
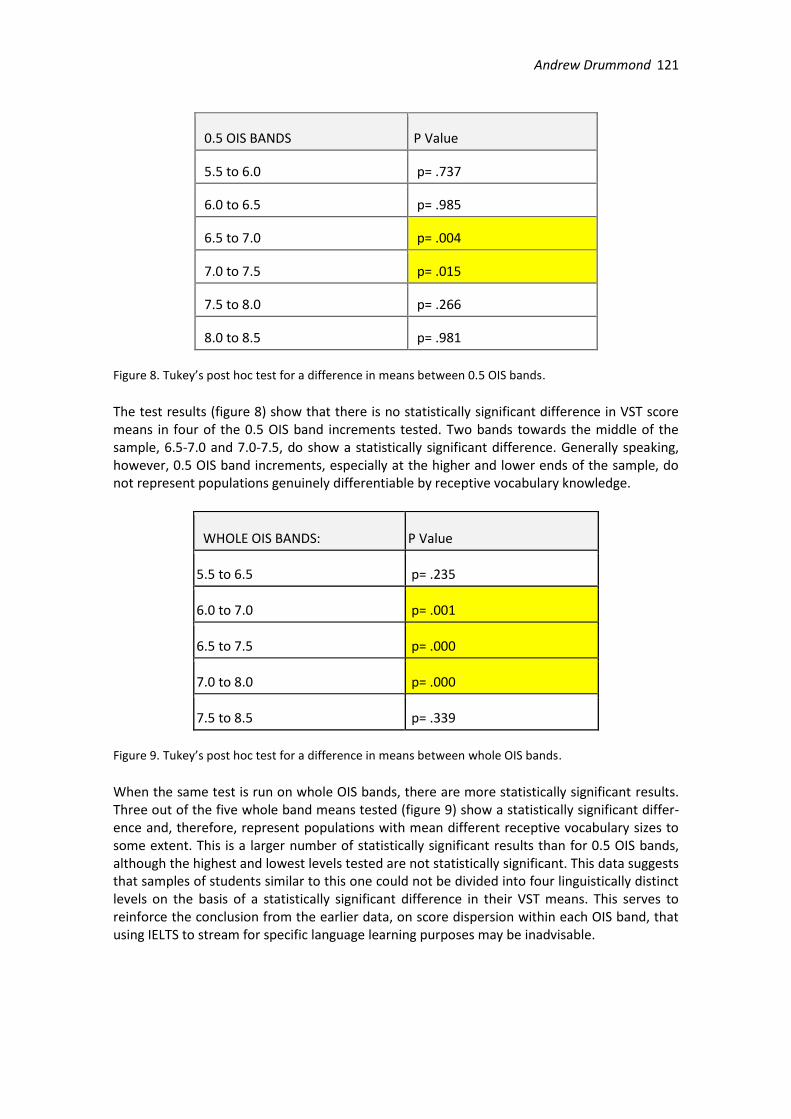
Figure 8. Tukey’s post hoc test for a difference in means between 0.5 OIS bands.
The test results (figure 8) show that there is no statistically significant difference in VST score means in four of the 0.5 OIS band increments tested. Two bands towards the middle of the sample, 6.5-7.0 and 7.0-7.5, do show a statistically significant difference. Generally speaking, however, 0.5 OIS band increments, especially at the higher and lower ends of the sample, do not represent populations genuinely differentiable by receptive vocabulary knowledge.
WHOLE OIS BANDS: P Value
5.5 to 6.5 p= .235
6.0 to 7.0 p= .001
6.5 to 7.5 p= .000
7.0 to 8.0 p= .000
7.5 to 8.5 p= .339
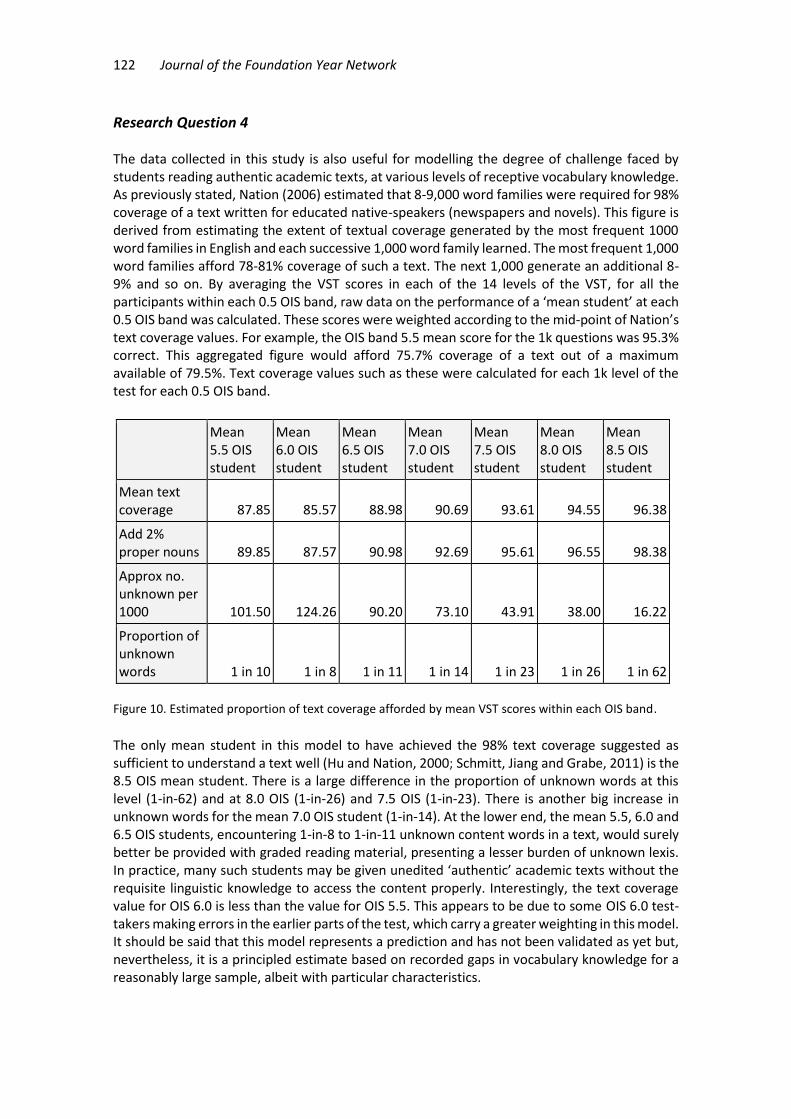
Figure 9. Tukey’s post hoc test for a difference in means between whole OIS bands.
When the same test is run on whole OIS bands, there are more statistically significant results. Three out of the five whole band means tested (figure 9) show a statistically significant differ-ence and, therefore, represent populations with mean different receptive vocabulary sizes to some extent. This is a larger number of statistically significant results than for 0.5 OIS bands, although the highest and lowest levels tested are not statistically significant. This data suggests that samples of students similar to this one could not be divided into four linguistically distinct levels on the basis of a statistically significant difference in their VST means. This serves to reinforce the conclusion from the earlier data, on score dispersion within each OIS band, that using IELTS to stream for specific language learning purposes may be inadvisable.
122 Journal of the Foundation Year Network
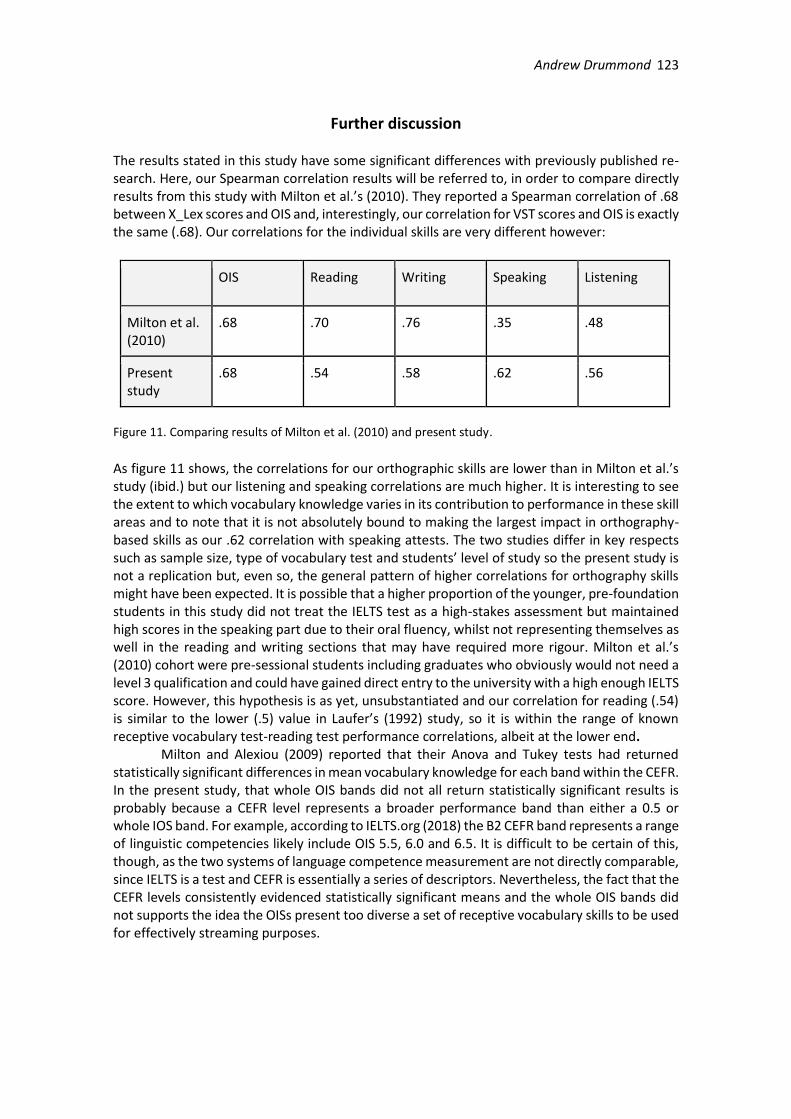
Research Question 4 The data collected in this study is also useful for modelling the degree of challenge faced by students reading authentic academic texts, at various levels of receptive vocabulary knowledge. As previously stated, Nation (2006) estimated that 8-9,000 word families were required for 98% coverage of a text written for educated native-speakers (newspapers and novels). This figure is derived from estimating the extent of textual coverage generated by the most frequent 1000 word families in English and each successive 1,000 word family learned. The most frequent 1,000 word families afford 78-81% coverage of such a text. The next 1,000 generate an additional 8-9% and so on. By averaging the VST scores in each of the 14 levels of the VST, for all the participants within each 0.5 OIS band, raw data on the performance of a ‘mean student’ at each 0.5 OIS band was calculated. These scores were weighted according to the mid-point of Nation’s text coverage values. For example, the OIS band 5.5 mean score for the 1k questions was 95.3% correct. This aggregated figure would afford 75.7% coverage of a text out of a maximum available of 79.5%. Text coverage values such as these were calculated for each 1k level of the test for each 0.5 OIS band.
Mean 5.5 OIS student
Mean 6.0 OIS student
Mean 6.5 OIS student
Mean 7.0 OIS student
Mean 7.5 OIS student
Mean 8.0 OIS student
Mean 8.5 OIS student
Mean text coverage 87.85 85.57 88.98 90.69 93.61 94.55 96.38
Add 2% proper nouns 89.85 87.57 90.98 92.69 95.61 96.55 98.38
Approx no. unknown per 1000 101.50 124.26 90.20 73.10 43.91 38.00 16.22
Proportion of unknown words 1 in 10 1 in 8 1 in 11 1 in 14 1 in 23 1 in 26 1 in 62
Figure 10. Estimated proportion of text coverage afforded by mean VST scores within each OIS band.
The only mean student in this model to have achieved the 98% text coverage suggested as sufficient to understand a text well (Hu and Nation, 2000; Schmitt, Jiang and Grabe, 2011) is the 8.5 OIS mean student. There is a large difference in the proportion of unknown words at this level (1-in-62) and at 8.0 OIS (1-in-26) and 7.5 OIS (1-in-23). There is another big increase in unknown words for the mean 7.0 OIS student (1-in-14). At the lower end, the mean 5.5, 6.0 and 6.5 OIS students, encountering 1-in-8 to 1-in-11 unknown content words in a text, would surely better be provided with graded reading material, presenting a lesser burden of unknown lexis. In practice, many such students may be given unedited ‘authentic’ academic texts without the requisite linguistic knowledge to access the content properly. Interestingly, the text coverage value for OIS 6.0 is less than the value for OIS 5.5. This appears to be due to some OIS 6.0 test-takers making errors in the earlier parts of the test, which carry a greater weighting in this model. It should be said that this model represents a prediction and has not been validated as yet but, nevertheless, it is a principled estimate based on recorded gaps in vocabulary knowledge for a reasonably large sample, albeit with particular characteristics.
Andrew Drummond 123
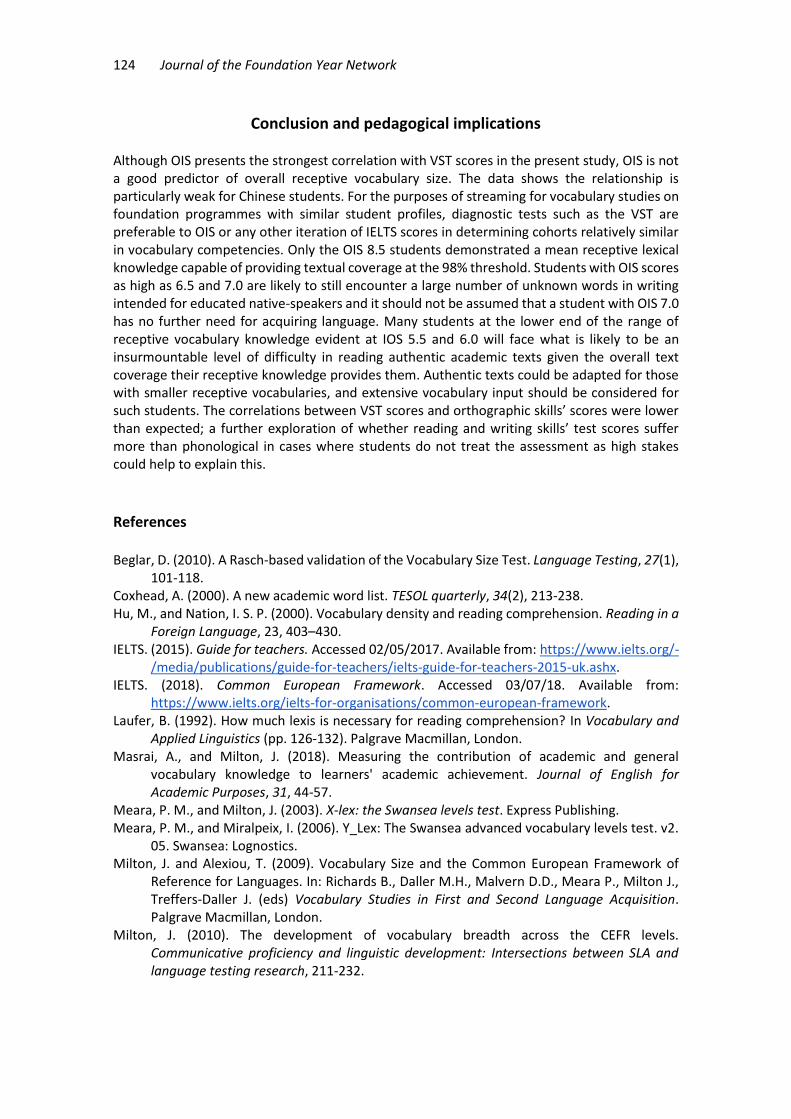
Further discussion The results stated in this study have some significant differences with previously published re-search. Here, our Spearman correlation results will be referred to, in order to compare directly results from this study with Milton et al.’s (2010). They reported a Spearman correlation of .68 between X_Lex scores and OIS and, interestingly, our correlation for VST scores and OIS is exactly the same (.68). Our correlations for the individual skills are very different however:
OIS Reading Writing Speaking Listening
Milton et al. (2010)
.68 .70 .76 .35 .48
Present study
.68 .54 .58 .62 .56
Figure 11. Comparing results of Milton et al. (2010) and present study.
As figure 11 shows, the correlations for our orthographic skills are lower than in Milton et al.’s study (ibid.) but our listening and speaking correlations are much higher. It is interesting to see the extent to which vocabulary knowledge varies in its contribution to performance in these skill areas and to note that it is not absolutely bound to making the largest impact in orthography-based skills as our .62 correlation with speaking attests. The two studies differ in key respects such as sample size, type of vocabulary test and students’ level of study so the present study is not a replication but, even so, the general pattern of higher correlations for orthography skills might have been expected. It is possible that a higher proportion of the younger, pre-foundation students in this study did not treat the IELTS test as a high-stakes assessment but maintained high scores in the speaking part due to their oral fluency, whilst not representing themselves as well in the reading and writing sections that may have required more rigour. Milton et al.’s (2010) cohort were pre-sessional students including graduates who obviously would not need a level 3 qualification and could have gained direct entry to the university with a high enough IELTS score. However, this hypothesis is as yet, unsubstantiated and our correlation for reading (.54) is similar to the lower (.5) value in Laufer’s (1992) study, so it is within the range of known receptive vocabulary test-reading test performance correlations, albeit at the lower end.
Milton and Alexiou (2009) reported that their Anova and Tukey tests had returned statistically significant differences in mean vocabulary knowledge for each band within the CEFR. In the present study, that whole OIS bands did not all return statistically significant results is probably because a CEFR level represents a broader performance band than either a 0.5 or whole IOS band. For example, according to IELTS.org (2018) the B2 CEFR band represents a range of linguistic competencies likely include OIS 5.5, 6.0 and 6.5. It is difficult to be certain of this, though, as the two systems of language competence measurement are not directly comparable, since IELTS is a test and CEFR is essentially a series of descriptors. Nevertheless, the fact that the CEFR levels consistently evidenced statistically significant means and the whole OIS bands did not supports the idea the OISs present too diverse a set of receptive vocabulary skills to be used for effectively streaming purposes.
124 Journal of the Foundation Year Network
Conclusion and pedagogical implications Although OIS presents the strongest correlation with VST scores in the present study, OIS is not a good predictor of overall receptive vocabulary size. The data shows the relationship is particularly weak for Chinese students. For the purposes of streaming for vocabulary studies on foundation programmes with similar student profiles, diagnostic tests such as the VST are preferable to OIS or any other iteration of IELTS scores in determining cohorts relatively similar in vocabulary competencies. Only the OIS 8.5 students demonstrated a mean receptive lexical knowledge capable of providing textual coverage at the 98% threshold. Students with OIS scores as high as 6.5 and 7.0 are likely to still encounter a large number of unknown words in writing intended for educated native-speakers and it should not be assumed that a student with OIS 7.0 has no further need for acquiring language. Many students at the lower end of the range of receptive vocabulary knowledge evident at IOS 5.5 and 6.0 will face what is likely to be an insurmountable level of difficulty in reading authentic academic texts given the overall text coverage their receptive knowledge provides them. Authentic texts could be adapted for those with smaller receptive vocabularies, and extensive vocabulary input should be considered for such students. The correlations between VST scores and orthographic skills’ scores were lower than expected; a further exploration of whether reading and writing skills’ test scores suffer more than phonological in cases where students do not treat the assessment as high stakes could help to explain this.
References Beglar, D. (2010). A Rasch-based validation of the Vocabulary Size Test. Language Testing, 27(1),
101-118. Coxhead, A. (2000). A new academic word list. TESOL quarterly, 34(2), 213-238. Hu, M., and Nation, I. S. P. (2000). Vocabulary density and reading comprehension. Reading in a
Foreign Language, 23, 403–430. IELTS. (2015). Guide for teachers. Accessed 02/05/2017. Available from: https://www.ielts.org/-
/media/publications/guide-for-teachers/ielts-guide-for-teachers-2015-uk.ashx. IELTS. (2018). Common European Framework. Accessed 03/07/18. Available from:
https://www.ielts.org/ielts-for-organisations/common-european-framework. Laufer, B. (1992). How much lexis is necessary for reading comprehension? In Vocabulary and
Applied Linguistics (pp. 126-132). Palgrave Macmillan, London. Masrai, A., and Milton, J. (2018). Measuring the contribution of academic and general
vocabulary knowledge to learners' academic achievement. Journal of English for Academic Purposes, 31, 44-57.
Meara, P. M., and Milton, J. (2003). X-lex: the Swansea levels test. Express Publishing. Meara, P. M., and Miralpeix, I. (2006). Y_Lex: The Swansea advanced vocabulary levels test. v2.
05. Swansea: Lognostics. Milton, J. and Alexiou, T. (2009). Vocabulary Size and the Common European Framework of
Reference for Languages. In: Richards B., Daller M.H., Malvern D.D., Meara P., Milton J., Treffers-Daller J. (eds) Vocabulary Studies in First and Second Language Acquisition. Palgrave Macmillan, London.
Milton, J. (2010). The development of vocabulary breadth across the CEFR levels. Communicative proficiency and linguistic development: Intersections between SLA and language testing research, 211-232.
Andrew Drummond 125
Milton, J., Wade, J., and Hopkins, N. (2010). Aural word recognition and oral competence in English as a foreign language. Insights into non-native vocabulary teaching and learning, 83-98.
Nation, I. S. P. (1990). Teaching and Learning Vocabulary. New York: Newbury House. Nation, I. S. P. (2006). How large a vocabulary is needed for reading and listening?. Canadian
Modern Language Review, 63(1), 59-82. Nation, I. S. P., and Belgar, D. (2007). A vocabulary size test. The Language Teacher, 31(7), 9-13. Nation, I. S. P., and Anthony, L. (2016). Measuring Vocabulary Size. In E. Hinkel (ed), Handbook
of Research in Second Language Teaching and Learning, Volume III. New York: Routledge. Schmitt, N., Schmitt, D., and Clapham, C. (2001). Developing and exploring the behaviour of two
new versions of the Vocabulary Levels Test. Language Testing, 18(1), 55-88. Schmitt, N. (2010). Researching vocabulary. Basingstoke, England: Palgrave Macmillan. Schmitt, N., Jiang, X., and Grabe, W. (2011). The percentage of words known in a text and reading
comprehension. The Modern Language Journal, 95(1), 26-43. Stæhr, L. S. (2008). Vocabulary size and the skills of listening, reading and writing. Language
Learning Journal, 36, 139–152. Stewart, J. (2014). Do multiple-choice options inflate estimates of vocabulary size on the VST?
Language Assessment Quarterly, 11(3), 271-282. Zhang, X. (2013). The I don't know option in the Vocabulary Size Test. TESOL Quarterly, 47(4),
790-811.
About the Author Andrew Drummond is an English for Academic Purposes teacher at King's College London. He has previously taught in South Africa, Hungary and Macedonia (FYROM). His research interests include academic vocabulary, the link between vocabulary knowledge and assessment and the link between vocabulary knowledge and reading skills. Andrew can be contacted at [email protected] and @drummondandrew on Twitter. There is a video present-ation of the paper on his YouTube channel: https://goo.gl/jJW8nk.

126 Journal of the Foundation Year Network
Related Documents