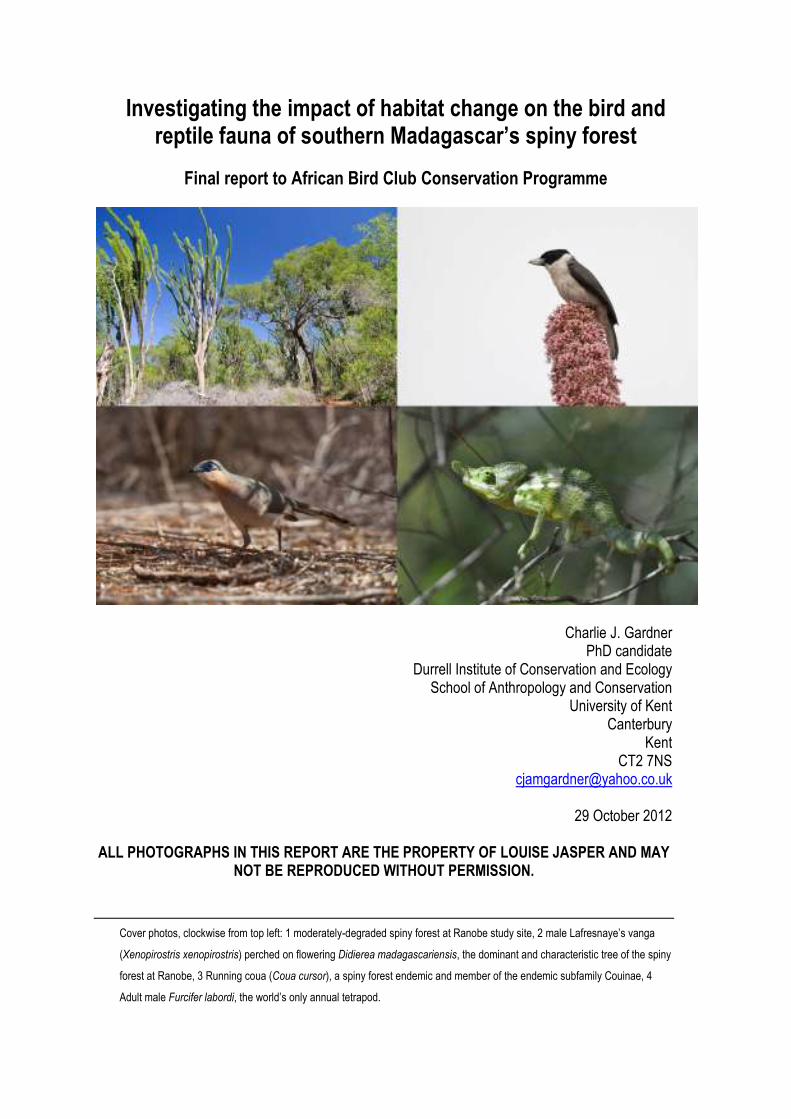
Investigating the impact of habitat change on the bird and reptile fauna of southern Madagascar’s spiny forest Final report to African Bird Club Conservation Programme Charlie J. Gardner PhD candidate Durrell Institute of Conservation and Ecology School of Anthropology and Conservation University of Kent Canterbury Kent CT2 7NS [email protected] 29 October 2012 ALL PHOTOGRAPHS IN THIS REPORT ARE THE PROPERTY OF LOUISE JASPER AND MAY NOT BE REPRODUCED WITHOUT PERMISSION. Cover photos, clockwise from top left: 1 moderately-degraded spiny forest at Ranobe study site, 2 male Lafresnaye’s vanga (Xenopirostris xenopirostris) perched on flowering Didierea madagascariensis, the dominant and characteristic tree of the spiny forest at Ranobe, 3 Running coua (Coua cursor), a spiny forest endemic and member of the endemic subfamily Couinae, 4 Adult male Furcifer labordi, the world’s only annual tetrapod.

Welcome message from author
This document is posted to help you gain knowledge. Please leave a comment to let me know what you think about it! Share it to your friends and learn new things together.
Transcript
Investigating the impact of habitat change on the bird and reptile fauna of southern Madagascar’s spiny forest
Final report to African Bird Club Conservation Programme
Charlie J. Gardner PhD candidate
Durrell Institute of Conservation and Ecology School of Anthropology and Conservation
University of Kent Canterbury
Kent CT2 7NS
29 October 2012
ALL PHOTOGRAPHS IN THIS REPORT ARE THE PROPERTY OF LOUISE JASPER AND MAY NOT BE REPRODUCED WITHOUT PERMISSION.
Cover photos, clockwise from top left: 1 moderately-degraded spiny forest at Ranobe study site, 2 male Lafresnaye’s vanga
(Xenopirostris xenopirostris) perched on flowering Didierea madagascariensis, the dominant and characteristic tree of the spiny
forest at Ranobe, 3 Running coua (Coua cursor), a spiny forest endemic and member of the endemic subfamily Couinae, 4
Adult male Furcifer labordi, the world’s only annual tetrapod.

Expedition members Charlie Gardner Principal investigator Louise Jasper Research assistant (birds and reptiles) Julio-Josepha Duchene Research assistant (reptiles) Eonintsoa Research assistant (reptiles) Toto Local guide (Site 1) Alexis Local guide (Site 1) Rekamo Local guide (Site 2) Milison Justin Local guide (Site 2) Jean-Paul Local guide (Site 3) Sambiasy Local guide (Site 3) Mameno Cook (Sites 1 & 2) Saholy Cook (Site 3)
Fig 1: Expedition members at Site 2, from left to right: Charlie Gardner, Eonintsoa, Julio Josepha Duchene, Louise Jasper. Front row: Milison Justin, Rekamo
Background Madagascar is recognised as the world’s number one conservation priority, possessing unparalleled levels of diversity and endemism, coupled with high rates of forest loss. While the avifauna of the country is relatively impoverished with only 209 breeding species, a full 52% of these are endemic (Goodman & Hawkins 2008), giving Madagascar the highest proportion of endemic bird species of any major landmass in the world (Hawkins & Goodman 2003). Three families are endemic (the Mesitornithidae, Brachypteraciidae and Bernieridae), while the Leptosomatidae and Vangidae are near-endemic, both having a single species occurring on the nearby Comoros islands. In addition the Couinae and Philepittinae are endemic subfamilies. The spiny forest ecoregion of southern and southwestern Madagascar has been classified as an Endemic Bird Area (Stattersfield et al. 1998) on the basis of ten locally endemic species. These forests also suffer the fastest rates of forest loss in the country (Conservation

International et al. 2007), and were until recently the least represented ecoregion within the national protected area system (Fenn 2003). In 2003 the President of Madagascar declared his government’s intention to triple the protected area coverage of the country (Mittermeier et al. 2005). Known as the ‘Durban Vision’, this process involves the establishment of a new generation of protected areas (PAs), most of which will be co-managed by local community associations and will contain substantial areas of sustainable use zones (Raik 2007). The objectives of the expanded Madagascar Protected Area System (SAPM) are to a) conserve biodiversity, b) conserve the country’s cultural heritage (which is tightly linked to remaining forests, see Gardner et al. 2008), and c) contribute to sustainable rural development (Durban Vision Group 2006). Little is known, however, about the capacity of Madagascar’s forests to sustainably meet local development needs (in terms of extractive natural resource use) while simultaneously maintaining biodiversity (Gardner 2009, Irwin et al. 2010), and research is required to investigate the impacts of forest use on biodiversity if new protected areas are to successfully meet the objectives of multiple stakeholders. I propose to implement such a research programme in the newly established protected area of PK32-Ranobe on Madagascar’s southwest coast. The PK32-Ranobe protected area forms part of the Mikea Forest Important Bird Area (ZICOMA 1999), and is recognised as the single most important site for biodiversity conservation within the spiny forest ecoregion of southern Madagascar – it contains more species of birds, mammals and reptiles than any other existing or proposed protected area in the south. Eight lemur species have been recorded (Gardner et al. 2009a), as well as 130 species of birds (Gardner et al. 2009b), of which the most important are the subdesert mesite (Monias benschi) and the long-tailed ground-roller (Uratelornis chimaera). Both the species belong to monotypic genera of endemic families (the Mesitornithidae and Brachypteraciidae respectively), and both are restricted to a thin band of coastal sands on Madagascar’s southwest coast (Seddon et al. 2000); as a result, I estimate the PK32-Protected area to contain approximately 30% of the global population of these two globally Vulnerable (IUCN 2008) species. In addition, a further six locally endemic birds have been recorded within the PA - running coua, Coua cursor; Lafresnaye’s vanga, Xenopirostris xenopirostris; littoral rock thrush, Monticola imerinus; subdesert brush-warbler, Nesillas lantzii, Thamnornis warbler, Thamnornis chloropetoides; Archbold’s newtonia, Newtonia archboldi (Gardner et al. 2009b). The existence of so many locally endemic, and taxonomically distinctive, bird species has lead the BirdLife/ZICOMA project to declare that, in terms of preserving the “genetic diversity of birds, the Mikea Forest [of which PK32-Ranobe forms the southern 30%] will be considered a supreme priority in Africa” (ZICOMA 1999). While the importance of the PK32-Ranobe protected area for the conservation of biodiversity (and particularly birds) is clear, the area is also highly threatened by slash-and-burn maize cultivation, uncontrolled fires and in particular the production of charcoal (it supplies the majority of charcoal used in the regional capital of Toliara). An estimated 90,000 people live either within or immediately adjacent to the protected area and depend largely on its natural resources for their subsistence and household income, and it is therefore critical to find ways of reconciling such forest use with the conservation of the site’s globally important biodiversity. The protected area, which received temporary protection status in December 2008, is co-managed by WWF and an association of local communities known as MITOIMAFI, and much of its surface area is designated as a sustainable use zone of one type or another. The result is that much of the PA’s forests will continue to be used by local communities to satisfy their

subsistence needs, yet nothing is known about how such use will impact the unique biodiversity of the area (Gardner 2009).
Expedition rationale and summary details In order to fill our knowledge gaps on the impacts of forest use and associated habitat change on the faunal biodiversity of the spiny forest, I carried out bird and reptile surveys at three sites across a gradient of land-use intensity at Ranobe, a site on the western limits of the PK32-Ranobe protected area (Fig 2).
Fig 2: Satellite image of the PK32-Ranobe new protected area, between the Fiherenana and Manombo rivers (to the south and north respectively), showing location of three study sites. The three study sites were approximately equidistant from the village of Ranobe, and selected to represent the range of anthropogenic impacts that characterise the vegetation of the western half of the protected area (Fig 3). Site 1 was the least disturbed, having suffered charcoal production since around 2007, while Site 2 had been exploited for at least 15 years and is a site of production for large numbers of people from outside the Ranobe area (WWF, unpublished data), resulting in a higher density of producers. Site 3 is a site that currently lies outside the forest edge but had been forested prior to 2001; following clearance and agricultural production for 2 to 3 years, these areas have been regenerating naturally since 2004. Each site was situated within forest thought to have been relatively homogeneous prior to disturbance suffered within the last twenty years. Summary details of the three surveys are provided in Table 1.

Table 1: Location, survey dates and habitat description of three survey sites at Ranobe. Site Coordinates Disturbance
history Habitat description Dates
surveyed
Site 1 23°01.915S 043°37.402E
Low level disturbance (charcoal)
Relatively closed canopy dominated by Didierea madagascariensis and hardwood trees, with no understorey shrub layer. Some charcoal production resulting in small openings, but canopy generally unbroken. Thick leaf litter layer.
20.02-04.03.2010
Site 2 23°00.866S 043°37.472E
Moderate disturbance (charcoal)
Broken canopy dominated by Didierea madagascariensis, with hardwood trees largely absent. Small openings are frequent and possess a dense shrub layer of regenerating stumps. Characterised by piles of dead branches and bark left over from charcoal production. Thin leaf litter layer.
29.01-09.02.2010
Site 3 23°00.895S 043°35.964E (camp) 23°0'46.87"S 43°35'37.09"E (field)
High disturbance (slash and burn)
Dense shrub layer (height of 1-2m) of regenerating stumps dominated by Cedrelopsis grevei and Fernandoa madagascariensis, with no litter layer. Relict individual trees and small forest patches (< 1ha) occur within a mosaic pattern.
12.03-24.03.2010
Fig 3: Representative habitats at three study sites in Ranobe. Clockwise from top left: 1 & 2 low-level disturbance as a result of charcoal production, although the impacts of charcoal production (dead branches, clearings) are evident, the density of trees remains high (Site 1). 3 moderate-level disturbance as a result of charcoal production, with few canopy trees and a dense shrub layer of regenerating stumps (Site 2). 4 High-level disturbance following slash-and-burn cultivation. Abandoned fields are dotted with regenerating stumps and shrubs, with relict forest patches in the background (Site 3).

Methodology Bird data collection We established 48 census stations at each site, and used the point count method (Bibby et al., 1996) to estimate bird relative abundance. Because of the impenetrable nature of the vegetation at sites 1 and 2, access into the forest interior was limited to existing ox-cart tracks. Census stations were therefore placed on a stratified random grid pattern along these tracks: all stations were placed at a perpendicular distance of 75m from a track (following Jones et al., 1995) and were therefore approximately equidistant from these openings, thereby minimising edge effects. All stations were at least 150m apart to minimise the risk of double-counting. Each census station was surveyed for fifteen minutes (following a settling period of four minutes following the observers’ arrival at the census station), during which all visual and auditory contacts within 50m of the census station were recorded. All point count surveys were carried out by the same two observers (CJG & LDJ) to reduce detection and identification biases. Both observers were experienced with the avifauna of the region, had good knowledge of bird calls, and undertook distance estimation training before the start of data collection. All distances were estimated by the same individuals in order to minimise observer bias. To reduce time-of-day and weather-related effects, all surveys were carried out between 06.00 and 08.00, and no surveys were carried out on rainy or windy days. The majority of contacts were auditory, and it was therefore not possible to accurately estimate group sizes of social species. All contacts were therefore counted as a single contact whether it involved an individual or a group. We recorded the number of separate contacts of a given species within each point count, so long as we could be sure that this did not represent a double counting of the same individual(s). Contacts with juvenile birds were not recorded in order to reduce seasonality effects.
Reptile data collection We calculated the relative abundance of reptiles using two methods; pit-fall traps and area-constrained refuge searches (transects). For pitfall trapping we followed a standard protocol widely utilised in Madagascar: traps consisted of plastic buckets (270 mm deep, 290 mm internal diameter at top, 220 mm internal diameter at base) buried in the ground with the rim level with the surface. Three drainage holes were drilled in the bottom of each bucket, and handles were removed. Buckets were connected by a drift fence 50 cm high, passing directly over the centre of each bucket, consisting of plastic sheeting supported by wooden stakes; the bottom 5 cm of the fence was buried in the ground and covered with leaf litter to prevent animals passing underneath (Fig 4). At each site we established three trap lines in areas selected for their representativity of the site: two lines were 90 m long and consisted of 10 buckets, while the third line was 100 m long and consisted of 11 buckets. All trap lines were established in the morning and left open for 13 nights, for a total of 403 trap-nights per site. Traps were checked at 07.00 and 16.00 each day. All captured animals were marked on the hind leg or ventral surface with nail varnish and released at the site of capture; recaptured animals and juveniles were not included in data analysis.

Figure 4: Local guide Sambiasy checking the integrity of a pitfall trap line at Site 3; this picture illustrates the plastic drift fence erected between sunken bucket traps. We also established 38 transects at each site along which we conducted active refuge searches. Each transect consisted of a 50 m rope erected adjacent to forest tracks using a stratified random grid pattern. Each transect ran perpendicular to a track and had a starting point 10m away from the track to minimise edge effects. Each transect was established 24 hrs prior to surveying to minimise disturbance effects. Two observers moved slowly along each transect and searched for reptiles within 2m on either side of the central transect line, scanning the trunks and branches of trees, searching within tree holes, under bark, in the leaf litter and under dead branches. All reptiles initially observed within 2 m of the central transect line were recorded. At each site 22 transects were surveyed from 08.00 – 10.00 and 16 from 15.00-17.00. All transects were carried out on days without cloud cover to minimise variation in weather-related detectability.
Results Bird survey We recorded 53 species in point counts at the three sites, of which 35 were recorded at Site 1, 43 at Site 2, and 37 at Site 3. A further four species were observed outside of point counts, and an additional seven, six and seven species were observed at Site 1, Site 2 and Site 3 respectively outside of formal data collection. Within point counts, 24 species (45.3%) were recorded at all sites, one species (1.9%) was restricted to Site 1, six species (11.3%) were restricted to Site 2, and seven (13.2%) species were restricted to Site 3: 16 species (30.2%) were recorded only in forest habitats (Site 1 and Site 2). Observed patterns of species relative frequency differed significantly from random for 30 species (56.7%): of these, four species (Monias benschi, Cuculus rochii, Hypsipetes madagascariensis and Dicrurus forficatus) showed a preference for low-degradation habitat, three species (Accipiter francesii, Coracopsis nigra and Ploceus sakalava) showed a

preference for medium-degradation habitat, and 10 species (Falco concolor, Numida meleagris, Turnix nigricollis, Oena capensis, Agapornis cana, Mirafra hova, Cisticola cherina, Xenopirostris xenopirostris, Acridotheres tristis and Foudia madagascariensis) showed a preference for highly-degraded habitat. Fourteen species (Streptopelia picturata, Coracopsis nigra, C. vasa, Coua ruficeps olivaceiceps, C. cristata, Thamnornis chloropetoides, Newtonia brunneicauda, N. archboldi, Neomixis tenella, N. striatigula, Nectarinia souimanga, Vanga curvirostris, Falculea palliata and Leptopterus viridis) showed a significant preference for forest habitat of either low- or medium-intensity degradation. Table 2 presents the relative frequency (defined as proportion of counts in which species was observed) and relative abundance (mean number of contacts per count) of all bird species recorded during the study, as well as those observed at Ranobe during the course of the expedition but not recorded during formal data collection. Chi-squared contingency tables were used to test whether the observed patters of relative frequency differed significantly from random. Table 2: Relative frequency and relative abundance of 53 bird species recorded at three survey sites in Ranobe. P = observed at site but not recorded within point counts.
Site 1 – Low intensity Site 2 – Medium intensity Site 3 – High intensity Species
Relative frequency (no.
counts)
Relative abundance
(no. contacts)
Relative frequency (no.
counts)
Relative abundance
(no. contacts)
Relative frequency (no. counts)
Relative abundance
(no. contacts)
Chi-sq
Aviceda madagascariensis
P P 0.04 (2) 0.04 (2) 4.06 (NS)
Milvus aegyptius P P P P -
Polyboroides radiatus
0.04 (2) 0.04 (2) 0.02 (1) 0.02 (1) P P 2.04 (NS)
Accipiter francesii P P 0.08 (4) 0.08 (4) 8.23 (p<0.05)
Buteo brachypterus P P 0.04 (2) 0.04 (2) 4.06 (NS)
Falco newtoni 0.10 (5) 0.10 (5) 0.08 (4) 0.08 (4) 0.23 (11) 0.23 (11) 4.99 (NS)
Falco zoniventris 0.04 (2) 0.04 (2) 4.06 (NS)
Falco concolor P P 0.17 (8) 0.17 (8) 16.94 (p<0.01)
Falco peregrinus 0.02 (1) 0.02 (1) 2.01 (NS)
Numida meleagris 0.13 (6) 0.13 (6) 12.52 (p<0.01)
Monias benschi 0.17 (8) 0.17 (8) 0.04 (2) 0.04 (2) 0.04 (2) 0.04 (2) 6.55 (p<0.05)
Turnix nigricollis 0.10 (5) 0.10 (5) 0.60 (29) 0.65 (31) 55.52 (p<0.01)
Streptopelia picturata 0.35 (17) 0.44 (21) 0.44 (21) 0.48 (23) 0.10 (5) 0.10 (5) 13.79 (p<0.01)
Oena capensis 0.50 (24) 0.69 (33) 0.21 (10) 0.29 (14) 0.88 (42) 1.77 (85) 43.02 (p<0.01)
Treron australis 0.04 (2) 0.04 (2) 4.06 (NS)
Coracopsis vasa 0.17 (8) 0.17 (8) 0.17 (8) 0.17 (8) 9.00 (p<0.05)
Coracopsis nigra 0.10 (5) 0.10 (5) 0.25 (12) 0.25 (12) 14.54 (p<0.01)
Agapornis cana 0.13 (6) 0.13 (6) 0.13 (6) 0.13 (6) 0.38 (18) 0.40 (19) 12.13 (p<0.01)
Cuculus rochii 0.31 (15) 0.35 (17) 0.15 (7) 0.19 (9) 0.06 (3) 0.06 (3) 10.84 (p<0.01)
Coua cursor 0.15 (7) 0.17 (8) 0.04 (2) 0.04 (2) 0.06 (3) 0.06 (3) 3.82 (NS)
Coua ruficeps olivaceiceps
0.21 (10) 0.23 (11) 0.29 (14) 0.29 (14) P P 15.60 (p<0.01)
Coua cristata 0.65 (31) 1.15 (55) 0.56 (27) 0.67 (32) (0.40 (19) 0.46 (22) 6.25 (p<0.05)
Centropus toulou 0.46 (22) 0.52 (25) 0.46 (22) 0.63 (30) 0.65 (31) 0.81 (39) 4.46 (NS)
Caprimulgus madagascariensis
0.02 (1) 0.02 (1) P P P P 2.01 (NS)
Apus melba P P 0.02 (1) 0.02 (1) 2.01 (NS)
Apus barbatus 0.02 (1) 0.02 (1) 0.04 (2) 0.04 (2) 2.04 (NS)
Merops superciliosus 0.23 (11) 0.23 (11) 0.21 (10) 0.23 (11) 0.38 (18) 0.42 (20) 4.01 (NS)
Eurystomus 0.02 (1) 0.02 (1) 2.01 (NS)

glaucurus
Uratelornis chimaera P P P P P P -
Leptosomus discolor P P -
Upupa marginata 0.29 (14) 0.33 (16) 0.19 (9) 0.29 (14) 0.25 (12) 0.27 (13) 1.43 (NS)
Mirafra hova 0.13 (6) 0.15 (7) 12.52 (p<0.01)
Phedina borbonica 0.02 (1) 0.02 (1) 0.02 (1) 0.02 (1) 1.01 (NS)
Hirundo rustica P P P P -
Thamnornis chloropetoides
0.15 (7) 0.15 (7) 0.13 (6) 0.13 (6) 7.27 (p<0.05)
Hypsipetes madagascariensis
0.48 (23) 0.56 (27) 0.10 (5) 0.10 (5) 0.27 (13) 0.27 (13) 16.64 (p<0.01)
Copsychus albospecularis
0.58 (28) 0.75 (36) 0.56 (27) 0.69 (33) 0.42 (20) 0.46 (22) 3.17 (NS)
Nesillas lantzii 0.06 (3) 0.06 (3) 0.02 (1) 0.02 (1) 3.60 (NS)
Newtonia brunneicauda
1.00 (48) 2.29 (110) 0.96 (46) 2.25 (108) 0.44 (21) 0.65 (31) 58.64 (p<0.01)
Newtonia archboldi 0.52 (25) 0.75 (36) 0.35 (17) 0.48 (23) 0.17 (8) 0.17 (8) 13.30 (p<0.01)
Cisticola cherina 0.88 (42) 1.54 (74) 118.59 (p<0.01)
Neomixis tenella 0.83 (40) 1.08 (52) 0.81 (39) 1.13 (54) 0.65 (31) 0.71 (34) 5.62 (NS)
Neomixis striatigula 0.58 (28) 0.83 (40) 0.81 (39) 1.23 (59) 0.29 (14) 0.33 (16) 26.58 (p<0.01)
Terpsiphone mutata 0.52 (25) 0.60 (29) 0.65 (31) 0.79 (38) 0.25 (12) 0.31 (15) 15.77 (p<0.01)
Nectarinia souimanga
0.96 (46) 2.13 (102) 1.00 (48) 2.17 (104) 0.73 (35) 0.98 (47) 21.88 (p<0.01)
Nectarinia notata P P 0.08 (4) 0.10 (5) 0.02 (1) 0.02 (1) 5.39 (NS)
Calicalicus madagascariensis
0.02 (1) 0.02 (1) 2.01 (NS)
Vanga curvirostris 0.48 (23) 0.54 (26) 0.29 (14) 0.29 (14) 0.04 (2) 0.04 (2) 23.42 (p<0.01)
Xenopirostris xenopirostris
P P 0.02 (1) 0.02 (1) 0.15 (7) 0.15 (7) 11.38 (p<0.01)
Falculea palliata 0.19 (9) 0.19 (9) 0.19 (9) 0.23 (11) 10.29 (p<0.01)
Leptopterus viridis 0.08 (4) 0.08 (4) 0.15 (7) 0.15 (7) 7.28 (p<0.05)
Leptopterus chabert 0.13 (6) 0.13 (6) 0.10 (5) 0.10 (5) 0.21 (10) 0.21 (10) 2.34 (NS)
Dicrurus forficatus 0.92 (44) 1.67 (80) 0.69 (33) 0.92 (44) 0.73 (35) 0.94 (45) 8.28 (p<0.05)
Acridotheres tristis 0.02 (1) 0.02 (1) 0.58 (28) 0.98 (47) 65.37 (p<0.01)
Corvus albus 0.04 (2) 0.04 (2) 4.06 (NS)
Ploceus sakalava 0.02 (1) 0.02 (1) 0.44 (21) 0.44 (21) 0.15 (7) 0.17 (8) 27.29 (p<0.01)
Foudia madagascariensis
0.02 (1) 0.02 (1) 0.10 (5) 0.10 (5) 1.00 (48) 3.60 (173) 120.71 (p<0.01)
Reptile survey We recorded 32 species of reptile, of which 27 were recorded at S1 and S2, and 15 species at S3. Twenty-two species were observed during transects, and 27 were captured in pit-fall traps. Table 3 presents the number of captures/observations, capture rate (captures/trap night) and density of all observed reptile species.
Table 3: Number of captures/observations, capture rate from pitfall traps (captures/trap night) and density estimates generated from refuge searches of 32 reptile species at three sites in Ranobe. Site 1 –
Low intensity
Site 2 – Medium intensity
Site 3 – High intensity
Capture rate – traps
Density (ha) - transects
Capture rate - traps
Density (ha) - transects
Capture rate – traps
Density (ha) – transects
Scincidae

Trachylepis elegans 15 (0.037) 15 (19.73) 20 (0.050) 16 (21.05) 8 (0.020) 10 (13.16)
Trachylepis aureopunctatus
1 (0.002) 1 (1.32) 4 (0.010) 2 (2.63) 1 (0.002)
Madascincus cf. igneocaudatus
6 (0.015) 15 (0.037)
Amphiglossus ornaticeps 2 (0.005) 1 (1.32) 5 (0.012)
Voeltzkowia petiti 3 (0.007) 11 (0.027)
Voeltzkowia rubrocauda 7 (0.017) 2 (0.005)
Pygomeles braconnieri 2 (0.005) 5 (0.012)
Gerrhosauridae
Tracheloptychus petersi 2 (0.005) 7 (9.21) 9 (0.022) 11 (14.47) 1 (0.002)
Zonosaurus quadrilineatus
6 (0.015) 3 (3.95) 4 (0.010) 4 (5.26) 1 (0.002) 1 (1.32)
Zonosaurus karsteni 1 (0.002) 1 (0.002)
Iguanidae
Chalarodon madagascariensis
53 (0.132) 25 (32.90) 16 (0.040) 23 (30.26) 19 (0.047) 10 (13.16)
Oplurus cyclurus 1 (0.002) 21 (27.63) 1 (0.002) 8 (10.52) 1 (0.002)
Gekkonidae
Geckolepis cf. polylepis 19 (25.0) 5 (0.012) 8 (10.52)
Blaesodactylus sakalava 3 (3.95) 1 (0.002) 1 (1.32)
Hemidactylus mercatorius
6 (7.89) 6 (7.90) 1 (0.002) 4 (5.26)
Lygodactylus tuberosus 1 (0.002) 63 (82.90)
Lygodactylus verticillatus 12 (15.79) 3 (3.95)
Paroedura androyensis 1 (0.002) 2 (0.005) 1 (1.32)
Paroedura picta 8 (0.020) 3 (0.007) 1 (1.32) 21 (0.052)
Phelsuma mutabilis 14 (18.42) 9 (11.84) 2 (2.63)
Chamaeleonidae
Furcifer verrucosus 3 (0.007) 4 (5.26) 1 (0.002) 1 (1.32)
Lamprophiidae
Dromicodryas bernieri 1 (1.32) 1 (1.32) 1 (1.32)
Heteroliodon occipitalis 2 (0.005) 4 (0.010)
Ithycyphus oursi 1 (1.32)
Liophidium chabaudi 5 (0.012) 4 (0.010) 3 (0.007)
Leioheterodon geayi 2 (0.005)
Madagascarophis meridionalis
1 (0.002)
Madagascarophis ocellatus
1 (0.002) 2 (2.63)
Mimophis mahfalensis 1 (0.002) 5 (6.57) 1 (0.002) 7 (9.21) 1 (0.002) 6 (7.90)
Typhlopidae
Typhlops arenarius 4 (0.010) 13 (0.032)
Typhlops decorsei 1 (0.002)
Testudinidae
Pyxis arachnoides 1 (1.32)
Discussion The results of the survey are intended for publication in a peer-reviewed journal and will not be discussed in detail here. In brief, however, two important patterns emerge from the data:
o Moderate levels of degradation can lead to an increase in bird species richness over lightly degraded areas; this is due to an influx of non-forest species while all forest specialists are retained.
o This increase in richness masks a community turnover from forest specialists to non forest specialists, and from endemics to non-endemics, with increasing degradation intensity.
o Forest-dependent birds, including the species endemic to the spiny forest ecoregion, appear more tolerant of degradation than has been reported in the literature, and were recorded even at heavily degraded sites (Site 3). This suggests that new multiple-use protected areas within the spiny forest ecoregion may maintain their bird and reptile diversity within heavily-utilised zones.
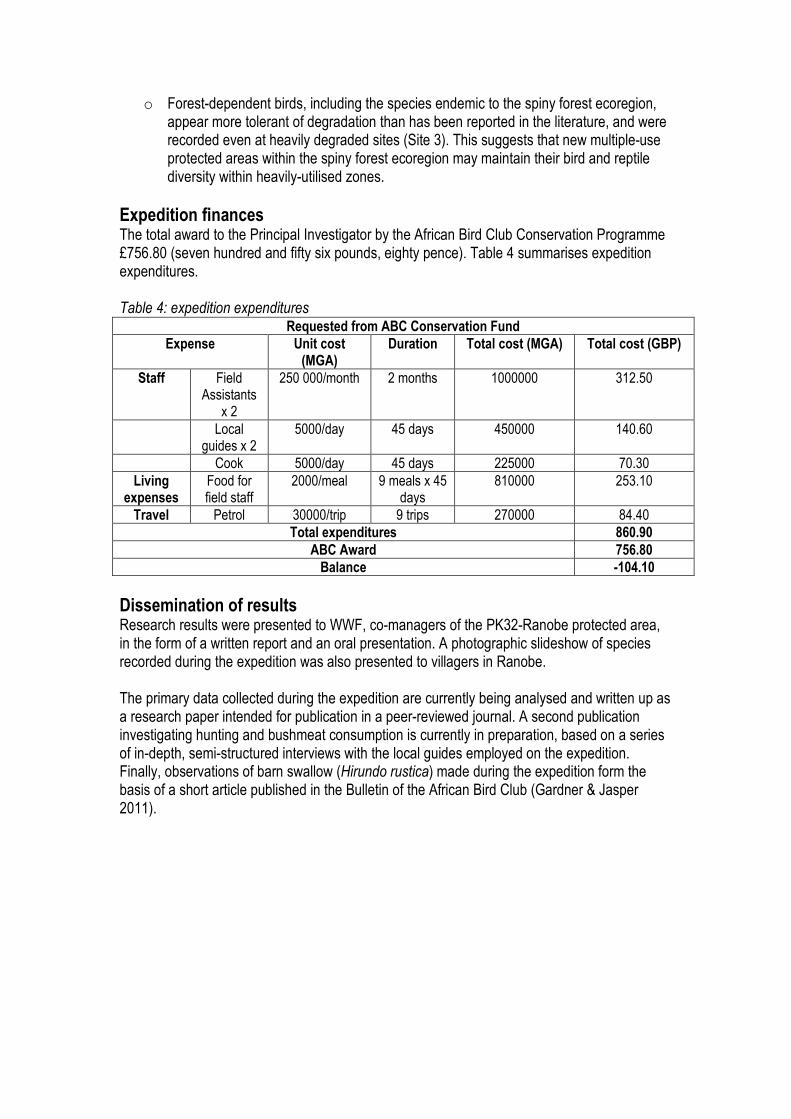
Expedition finances The total award to the Principal Investigator by the African Bird Club Conservation Programme £756.80 (seven hundred and fifty six pounds, eighty pence). Table 4 summarises expedition expenditures. Table 4: expedition expenditures
Requested from ABC Conservation Fund
Expense Unit cost (MGA)
Duration Total cost (MGA) Total cost (GBP)
Staff Field Assistants
x 2
250 000/month 2 months 1000000 312.50
Local guides x 2
5000/day 45 days 450000 140.60
Cook 5000/day 45 days 225000 70.30
Living expenses
Food for field staff
2000/meal 9 meals x 45 days
810000 253.10
Travel Petrol 30000/trip 9 trips 270000 84.40
Total expenditures 860.90
ABC Award 756.80
Balance -104.10
Dissemination of results Research results were presented to WWF, co-managers of the PK32-Ranobe protected area, in the form of a written report and an oral presentation. A photographic slideshow of species recorded during the expedition was also presented to villagers in Ranobe. The primary data collected during the expedition are currently being analysed and written up as a research paper intended for publication in a peer-reviewed journal. A second publication investigating hunting and bushmeat consumption is currently in preparation, based on a series of in-depth, semi-structured interviews with the local guides employed on the expedition. Finally, observations of barn swallow (Hirundo rustica) made during the expedition form the basis of a short article published in the Bulletin of the African Bird Club (Gardner & Jasper 2011).

References Bibby, C., Jones, M. & Marsden, S. 1998. Expedition Field Techniques: Bird Surveys. Expedition Advisory Centre, Royal Geographic Society, London. Conservation International, IRG, Ministère de L’Environnement, des Eaux et Forêts and USAID
2007. Madagascar: Changement de la couverture des forêts naturelles circa 1990-2000-2005. Conservation International, Washington, D.C.
Durban Vision Group 2006. Système d’aires protégées malagasy : orientations générales sur
les catégories et les types de gouvernance. Durban Vision Group orientation document, July 2006, Antananarivo, Madagascar.
Fenn, M. D. 2003. The Spiny Forest Ecoregion. In: Goodman, S. M. & Benstead, J. P. (eds.),
The Natural History of Madagascar, pp 1525-1529. The University of Chicago Press, Chicago.
Gardner, C.J. 2009. A review of the impacts of anthropogenic habitat change on terrestrial
biodiversity in Madagascar: Implications for the design and management of new protected areas. Malagasy Nature 2: 2-29.
Gardner, C.J. and Jasper, L. 2011. Status of Barn Swallow Hirundo rustica in south-west
Madagascar. Bulletin of the African Bird Club 18(2): 207-210. Gardner, C. J., Ferguson, B., Rebara, F., & Ratsifandrihamanana, A. N. 2008. Integrating
traditional values and management regimes into Madagascar’s expanded protected area system: the case of Ankodida. In: J-M. Mallarach (ed.) Protected Landscapes and Cultural and Spiritual Values, pp. 92-103. IUCN, GTZ and Obra Social de Caixa Catalunya. Kasparek Verlag, Heidelberg.
Gardner, C.J., Fanning, E., Thomas, H. & Kidney, D. 2009a The lemur diversity of the
Fiherenana-Manombo Complex, southwest Madagascar. Madagascar Conservation and Development 4(1): 38-43.
Gardner, C.J., Kidney, D. & Thomas, H. 2009b. First comprehensive avifaunal survey of PK32-
Ranobe, a new protected area in south-west Madagascar. Phelsuma 17: 20-39. Goodman, S.M. & Hawkins A.F.A. 2008. Les oiseaux. In: Goodman, S.M. (ed.) Paysages
Naturels et Biodiversité de Madagascar, pp. 383- 434. Muséum National d’Histoire Naturelle, Paris.
Hawkins, F. & Goodman S. 2003. Introduction to the Birds. In: Goodman, S. M. & Benstead, J.
P. (eds.), The Natural History of Madagascar, pp 1019-1044. The University of Chicago Press, Chicago.
Irwin, M.T., Wright, P.C., Birkinshaw, C., Fisher, B., Gardner, C.J., Glos, J., Goodman, S.M.,
Loiselle, P., Rabeson, P., Raharison, J.-L., Raherilalao, M.J., Rakotondravony, D., Raselimanana, A., Ratsimbazafy, J., Sparks, J., Wilmé, L. & Ganzhorn, J.U. 2010. Patterns of species change in anthropogenically disturbed habitats of Madagascar. Biological Conservation 143(10): 2351-2362.

IUCN 2008. IUCN Red List of Threatened Species. IUCN Species Survival Commission, Gland,
Switzerland. Jones, M.J., Linsley, M.D., Marsden, S.J., 1995. Population sizes, status and habitat
associations of the restricted-range bird species of Sumba, Indonesia. Bird Conservation International 5: 21-52.
Mittermeier, R.A., Hawkins, A.F.A., Rajaobelina, S. & Langrand, O. 2005 Wilderness
Conservation in a Wilderness Hotspot. International Journal of Wilderness 11(3): 42-45.
Raik, D. 2007. Forest management in Madagascar: An historical overview. Madagascar
Conservation and Development 2: 5-10. Seddon, N., Tobias, J., Yount, J. W., Ramanampamonjy, J. R., Butchart, S. &
Randrianizahana, H. 2000. Conservation Issues and Priorities in the Mikea Forest of South-west Madagascar. Oryx 34 (4): 287-304.
Stattersfield, A., Crosby, M., Long, A. & Wege, D. 1998. Global Directory of Endemic Bird Areas, BirdLife International. BirdLife International, Cambridge, UK. ZICOMA 1999. Les Zones d’Importance pour la Conservation des Oiseaux à Madagascar. Projet ZICOMA, Antananarivo, Madagascar.

Appendix A: selected birds
Fig 5: Juvenile banded kestrel, Falco zoniventris. Endemic to Madagascar
Fig 6: Subdesert mesite, Monias benschi. A Vulnerable spiny forest endemic and member of the endemic family Mesitornithidae.

Fig 7: Crested coua, Coua cristata
Fig 8: Running coua, Coua cursor. A spiny forest endemic and member of the endemic subfamily Couinae.

Fig 9: Male Lafresnaye’s vanga, Xenopirostris xenopirostris. A member of the near-endemic family Vangidae and a spiny forest endemic.
Fig 10: Long-tailed ground-roller, Uratelornis chimaera. Endemic to the spiny forest and representative of the endemic family Brachypteraciidae.

Fig 11: Thamnornis, Thamnornis chloropetoides. A spiny forest endemic and member of the recently recognised endemic family Bernieridae.
Fig 12: Archbold’s newtonia, Newtonia archboldi. A spiny forest endemic only recently recognised as belonging to the near-endemic family Vangidae.
Related Documents