Investigating the effects of scale in MRF texture classification Scott Blunsden 1 , Louis Atallah 2 1 School of Informatics, University of Edinburgh, [email protected] 2 The British University in Dubai/ University of Edinburgh, PO Box 502216, Dubai, UAE, [email protected] Keywords:Texture, Classification, Scale, MRF Abstract This work sheds the light on an important problem that faces real-world texture classification. That of incorporating textural information present at several scales and the robustness of classifiers to viewing distance and zooming. A Markov Random field framework is considered and the Varma-Zisserman classifier [16] (VZ classifier) is used as a starting point due to its high rates of classification on some difficult datasets (the CUReT dataset for example). A region selector (the scale-saliency algorithm by Kadir and Brady [5]) is incorporated in the VZ classifier to select ‘salient’ or significant areas in an image and use them for texture classification. The performance of this method on several datasets is discussed and analysed (namely the CUReT and the Brodatz datasets). The VZ classifier is then updated to include multiscale information and use that for classification, which improves the performance of the VZ classifier for the CUReT dataset but shows lower classification rates for the Brodatz dataset. The reasons relating to the type of textures present in each dataset are discussed. Finally, a discussion of real-world data classification is given with a summary and future directions. 1 Introduction The use of Markov Random Field (MRF) models within texture research has been increasing in popularity throughout recent years. An MRF model is based upon the assumption that a pixel’s intensity distribution is conditionally dependent upon only the local neighbourhood, and independent of the rest of the image. A non parametric MRF seeks to capture and represent local neighbourhood statistics without using a specific local parametric image model. Varma and Zisserman [15, 16] use non parametric MRF models to incorporate local neighbourhood properties for the purpose of texture classification. Due to the very good rates of classification obtained by their method (abbreviated as the VZ classifier), it is used as a benchmark for comparison with the methods developed in this work. Texture Synthesis is also an area where MRF approaches have been proven to work well, as demonstrated by Efros and Leung [4], Paget and Longstaff [11] and Zalensy and Van Gool [17]. Within this work a novel way of automatically determining scale selection within the MRF classification framework is proposed. Here a region selector at various different scales is used to identify salient areas of the texture (in this case using Kadir and Brady’s scale saliency algorithm [5]). Selected areas are then clustered and used to give a texture description, this classifier is developed in section 4. The effects of boosting (or zooming neighbourhoods at different scales) is then proposed as a way to improve the performance of the classifier. Finally a classifier is developed (in section 4.2) to include multiscale information without using region selection. This classifier displayed improved recognition classification performance upon the CUReT data set compared to the standard VZ classifier. A summary and discussion of the work is given along with directions for future work (section 5). 1.1 Why scale is important Within this paper the effects of scale upon the VZ classification are investigated. Scale refers to the resolution at which a texture is imaged. The experiments conducted by both Varma and Zisserman [16] and Hayman [3] have shown that in most cases, to classify textures spanning several scales, the VZ classifier performs well if explicitly trained on samples over several scales, otherwise a drop in performance is observed. Lazebnik et al. [14] also report a drop in performance when using their own database in both training and testing in conjunction with the VZ classifier. The authors (in [14]) also show the dependence of the VZ classifier on requiring a large number of training images to generate good texture models, raising many questions which motivated this work. An important issue is the effect of neighbourhood size (or scale in which features are considered) on the VZ classifier (section 4). 2 VZ Classifier - A Review In this section, the VZ classifier [15, 16] is introduced briefly as it forms the basis of subsequent investigation which is presented in the following sections. The assumption behind this method (and most MRF methods) is that texture can be represented using local descriptors. The model assumes that a pixel is conditional upon only its neighbourhood and is independent of the rest of the image (as shown in equation 1). p(I (x c |I (x), ∀x = x c )= p(I (x c )|I (x),x ∈N (x c )) (1) Where x is the neighbourhood region and x c is the centre pixel. I is the current image. N (x c ) consists of all the sites included in the neighbourhood of x c .

Welcome message from author
This document is posted to help you gain knowledge. Please leave a comment to let me know what you think about it! Share it to your friends and learn new things together.
Transcript
Investigating the effects of scale in MRF texture classification
Scott Blunsden1, Louis Atallah2
1 School of Informatics, University of Edinburgh, [email protected] The British University in Dubai/ University of Edinburgh, PO Box 502216, Dubai, UAE, [email protected]
Keywords:Texture, Classification, Scale, MRF
Abstract
This work sheds the light on an important problem thatfaces real-world texture classification. That of incorporatingtextural information present at severalscales and therobustness of classifiers to viewing distance and zooming.A Markov Random field framework is considered and theVarma-Zisserman classifier [16] (VZ classifier) is used as astarting point due to its high rates of classification on somedifficult datasets (the CUReT dataset for example). A regionselector (the scale-saliency algorithm by Kadir and Brady[5]) is incorporated in the VZ classifier to select ‘salient’or significant areas in an image and use them for textureclassification. The performance of this method on severaldatasets is discussed and analysed (namely the CUReT andthe Brodatz datasets). The VZ classifier is then updated toinclude multiscale information and use that for classification,which improves the performance of the VZ classifier for theCUReT dataset but shows lower classification rates for theBrodatz dataset. The reasons relating to the type of texturespresent in each dataset are discussed. Finally, a discussionof real-world data classification is given with a summary andfuture directions.
1 Introduction
The use of Markov Random Field (MRF) models withintexture research has been increasing in popularity throughoutrecent years. An MRF model is based upon the assumptionthat a pixel’s intensity distribution is conditionally dependentupon only the local neighbourhood, and independent of therest of the image. A non parametric MRF seeks to captureand represent local neighbourhood statistics without using aspecific local parametric image model. Varma and Zisserman[15, 16] use non parametric MRF models to incorporatelocal neighbourhood properties for the purpose of textureclassification. Due to the very good rates of classificationobtained by their method (abbreviated as the VZ classifier),it is used as a benchmark for comparison with the methodsdeveloped in this work. Texture Synthesis is also an areawhere MRF approaches have been proven to work well, asdemonstrated by Efros and Leung [4], Paget and Longstaff[11] and Zalensy and Van Gool [17].
Within this work a novel way of automatically determining
scale selection within the MRF classification framework isproposed. Here a region selector at various different scales isused to identify salient areas of the texture (in this case usingKadir and Brady’s scale saliency algorithm [5]). Selected areasare then clustered and used to give a texture description, thisclassifier is developed in section 4. The effects of boosting (orzooming neighbourhoods at different scales) is then proposedas a way to improve the performance of the classifier. Finallya classifier is developed (in section 4.2) to include multiscaleinformation without using region selection. This classifierdisplayed improved recognition classification performanceupon the CUReT data set compared to the standard VZclassifier. A summary and discussion of the work is givenalong with directions for future work (section 5).
1.1 Why scale is important
Within this paper the effects of scale upon the VZ classificationare investigated. Scale refers to the resolution at which atexture is imaged. The experiments conducted by both Varmaand Zisserman [16] and Hayman [3] have shown that in mostcases, to classify textures spanning several scales, the VZclassifier performs well if explicitly trained on samples overseveral scales, otherwise a drop in performance is observed.Lazebnik et al. [14] also report a drop in performancewhen using their own database in both training and testingin conjunction with the VZ classifier. The authors (in [14])also show the dependence of the VZ classifier on requiringa large number of training images to generate good texturemodels, raising many questions which motivated this work. Animportant issue is the effect of neighbourhood size (or scale inwhich features are considered) on the VZ classifier (section 4).
2 VZ Classifier - A Review
In this section, the VZ classifier [15, 16] is introduced brieflyas it forms the basis of subsequent investigation which ispresented in the following sections. The assumption behindthis method (and most MRF methods) is that texture can berepresented using local descriptors. The model assumes thata pixel is conditional upon only its neighbourhood and isindependent of the rest of the image (as shown in equation 1).
p(I(xc|I(x),∀x 6= xc) = p(I(xc)|I(x), x ∈ N (xc)) (1)
Wherex is the neighbourhood region andxc is the centre pixel.I is the current image.N (xc) consists of all the sites includedin the neighbourhood ofxc.
The VZ classifier identifies these local descriptors by extractingfixed sized local neighbourhood regions taken from the imagesthemselves. These neighbourhood descriptors are clusteredusing the k-means [2] algorithm, thus producing a set ofrepresentativetextonsper texture class. These textons arerecorded in a texton dictionary which records all of the clustercentres (textons) for all samples within the dataset. To build arepresentation of anew texture, the texton dictionary is usedto label images. For each neighbourhood within an imagethe closest texton in the dictionary is identified (closeness isdefined in terms of Euclidean distance, using the intensityvalues). Once this labelling is complete, a probability densityfunction (pdf) is built by forming a normalised histogram of thelabelled pixels. To classify a texture as belonging to a certainclass, theχ2 [12] is used as a dissimilarity measure within anearest neighbour classifier. Although other classifiers haveshown some improvement in classification accuracy (Haymanet al.[3] used support vector machines as their classificationmethod), the nearest neighbour classification scheme is usedin this work in order to directly compare results with those ofthe original VZ classifier presented in [16]. Three versions ofthe VZ classifier will be used in this work: ‘Joint’ refers tousing the central pixel as part of its neighbourhood for textondictionary formation, ‘Neighbourhood’ refers to excluding itfrom the neighbourhood area when forming the dictionary and‘MRF’ refers to each texton representing a histogram of thecentral pixels intensity distribution.
3 Datasets
To measure the performance of the classifier, the CUReT [7]dataset is used. This dataset contains 61 different textureswhich are imaged at differing and regular viewpoints andillumination. Each class contains a total of 92 texture imageswhich are used by the classifier. This set was divided in half,with half used for training and the other half used for testing(a few examples are given in figure 1). Examples were firstconverted to greyscale before use so that classification wasbased upon the textural features and not the colour distributionsof the samples.
Although the CUReT dataset provides many images of naturaltextures, regular and synthetic texture types are not so wellrepresented. This was the motivation behind using anotherdataset. The Brodatz dataset [1] is well known throughoutcomputer vision literature, and provides several patterned andsynthetic textures. This dataset is a collection of single highresolution images, where each image represents a single class,as such there is no intra class illumination or orientationvariation within the dataset1. To generate a usable dataset fromthe collection, images were partitioned into 16 non overlappingimage windows. These 16 image segments are then dividedwith half forming the training set and half forming the testing
1Brodatz textures were those used in Randen [13], and are publiclyavailable from his website at http://www.ux.his.no/ tranden/
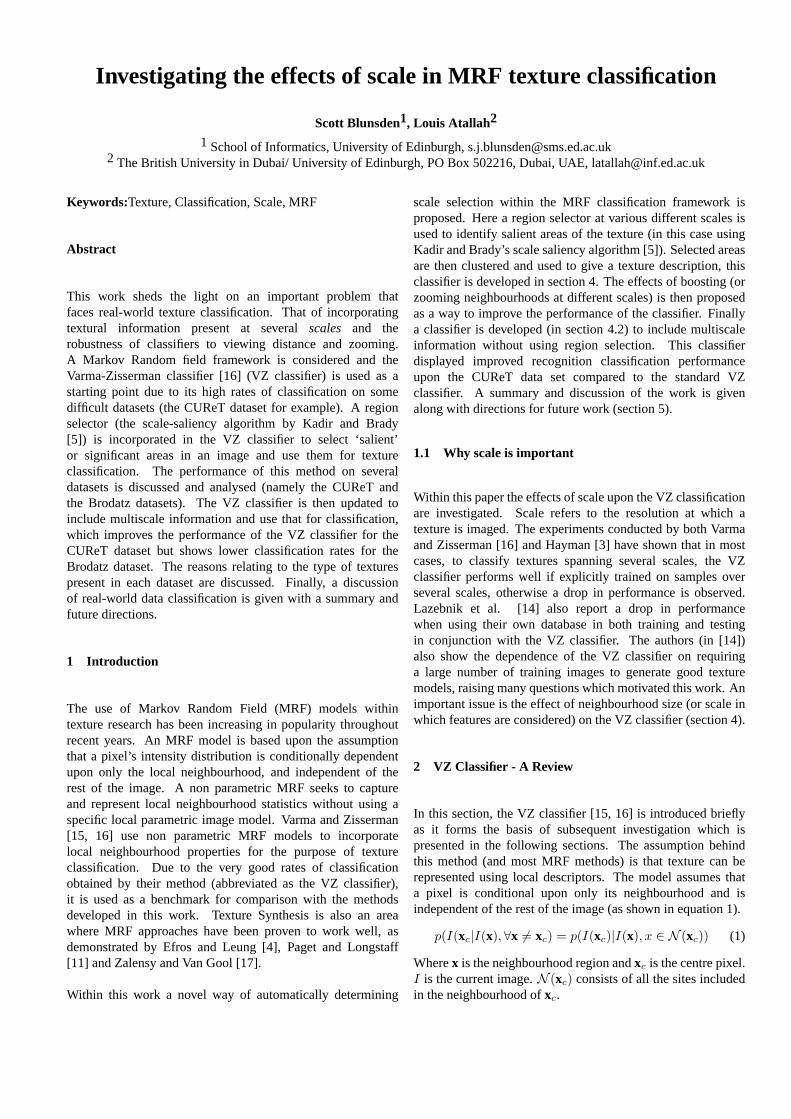
Figure 1: Variations within images in the CUReT dataset fromthe imaging conditions. The top row shows images fromthe same texture class that look different due to variations inlighting and orientation conditions. The bottom row displaystextures that look similar although they are from differentclasses. The CUReT dataset displays high intra class variabilityand some similarities between different texture classes whichmakes classification a challenging problem.
set. Some examples are given in figure 2. All images are ingreyscale.
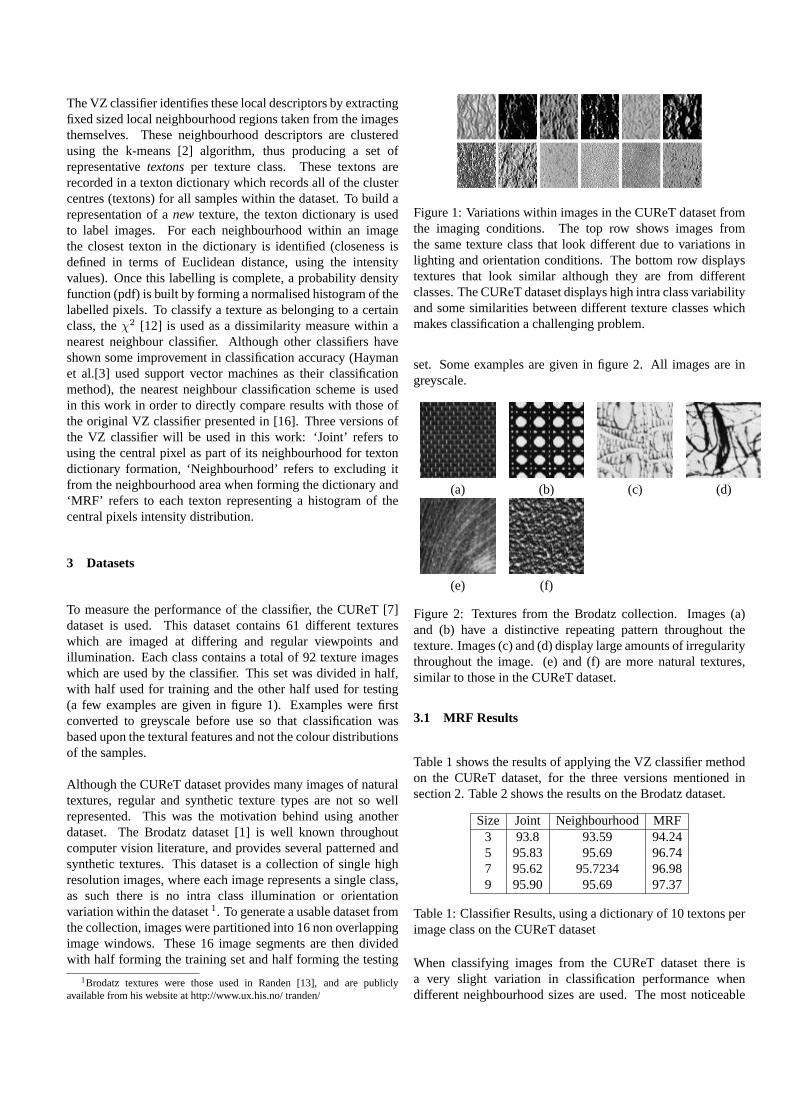
(a) (b) (c) (d)
(e) (f)
Figure 2: Textures from the Brodatz collection. Images (a)and (b) have a distinctive repeating pattern throughout thetexture. Images (c) and (d) display large amounts of irregularitythroughout the image. (e) and (f) are more natural textures,similar to those in the CUReT dataset.
3.1 MRF Results
Table 1 shows the results of applying the VZ classifier methodon the CUReT dataset, for the three versions mentioned insection 2. Table 2 shows the results on the Brodatz dataset.
Size Joint Neighbourhood MRF3 93.8 93.59 94.245 95.83 95.69 96.747 95.62 95.7234 96.989 95.90 95.69 97.37
Table 1: Classifier Results, using a dictionary of 10 textons perimage class on the CUReT dataset
When classifying images from the CUReT dataset there isa very slight variation in classification performance whendifferent neighbourhood sizes are used. The most noticeable
Size Joint Neighbourhood MRF3 86.71 85.47 86.915 88.29 86.26 88.837 88.51 88.85 88.969 87.743 87.839 87.934
Table 2: Classifier Results for the Brodatz data set, using adictionary of 10 textons per image class
result is that using3 × 3 neighbourhood sizes producessignificantly worse performance than any other size forboth datasets. Other neighbourhood sizes show very littlevariation (less than 1% difference in performance acrossneighbourhood sizes 5,7 and 9). In the case of the Brodatzdataset neighbourhood size7× 7 clearly outperforms all otherneighbourhood sizes by a margin of around 1%.
4 Incorporating Scale in the VZ classifier
As given in [15, 16], the VZ classifier uses a pre-determinedand fixed neighbourhood size (scale) for texton dictionarygeneration. The following section investigates the effectsof incorporating multiscalar information within the classifier.In section 4.1.1, region selectors are used to locate salientareas within an image at different scales and use them forclassification. Section 4.2 uses multiscalar information directlyin the VZ classifier without going through region selection.
4.1 Region Selection
Region selectors provide an attractive proposition withintexture modelling. The hope is that by extracting interesting(as deemed by a region selector) areas of the texture, adescriptive multiscalar model can be built. By only extractinga subset of the features present in an image it is hoped that thefocus would be on those features which describe the texturewell. Among methods that can be used to select salient (ormost informative) regions in an image, the scale-saliencymethod of Kadir and Brady [5] has proved to perform well andwill be used in the following section.
4.1.1 Scale Saliency
The scale saliency approach of Kadir and Brady [5, 6]provides a region selector which is capable of selectingsalient areas and providing the scale at which they are mostsalient. Thus salient areas can be selected at several scales,providing multiresolutional textural features. Scale saliencyworks by identifying regions where the entropy of the localregions intensity distribution is highest (and therefore themost unpredictable) and combines this with an intra scale
measure to determine the scale at which the region is mostunpredictable. In order to compare all scale sizes present in animage, only those pixel locations which are withinmaxscale
2pixels of the image edge are considered. Wheremaxscale isthe maximum neighbourhood size (scale) considered by thealgorithm. This ensures there are as many neighbourhoods atthe maximum scale as there are at the minimum scale and soan unbiased intra scalar comparison is possible.
(a) (b)
(c) (d)
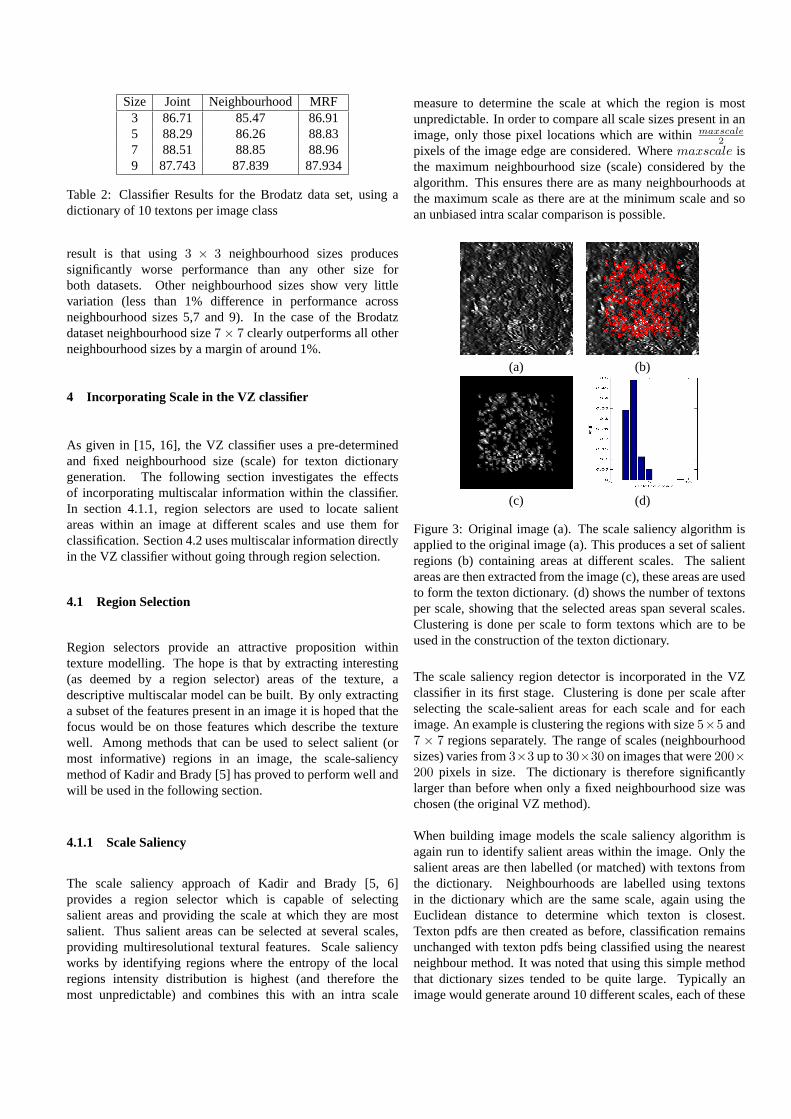
Figure 3: Original image (a). The scale saliency algorithm isapplied to the original image (a). This produces a set of salientregions (b) containing areas at different scales. The salientareas are then extracted from the image (c), these areas are usedto form the texton dictionary. (d) shows the number of textonsper scale, showing that the selected areas span several scales.Clustering is done per scale to form textons which are to beused in the construction of the texton dictionary.
The scale saliency region detector is incorporated in the VZclassifier in its first stage. Clustering is done per scale afterselecting the scale-salient areas for each scale and for eachimage. An example is clustering the regions with size5×5 and7 × 7 regions separately. The range of scales (neighbourhoodsizes) varies from3×3 up to30×30 on images that were200×200 pixels in size. The dictionary is therefore significantlylarger than before when only a fixed neighbourhood size waschosen (the original VZ method).
When building image models the scale saliency algorithm isagain run to identify salient areas within the image. Only thesalient areas are then labelled (or matched) with textons fromthe dictionary. Neighbourhoods are labelled using textonsin the dictionary which are the same scale, again using theEuclidean distance to determine which texton is closest.Texton pdfs are then created as before, classification remainsunchanged with texton pdfs being classified using the nearestneighbour method. It was noted that using this simple methodthat dictionary sizes tended to be quite large. Typically animage would generate around 10 different scales, each of these
scales would generateK cluster centres so the dictionary sizewould beK × 10 × numclasses, wherenumclasses is thenumber of texture classes (or image types) to classify.
A problem that region selection could face while selectingtextural features at multiple scales is that some textural featureswhich describe a certain type of texture (grass for example)could appear at different scales (due to the distance of theobject from the camera). The algorithm described aboveclusters the features per scale and fails to realise that we areactually considering the same textural feature. A way ofovercoming this is to boost (expand or contract) the scale-salient regions selected to a standard scale. These regionsare then clustered together and entered into the global textondictionary. To build the texton pdf, neighbourhood regions areextracted using the saliency algorithm. These regions are thenboosted to the standard size and labelled by finding the closestmatch contained within the texton dictionary. The other stepsof the algorithm remain unchanged.
4.1.2 Results
Table 3 shows the results of incorporating scale-saliency in theVZ classifier, then using boosting to standardise the selectedareas and classify the images in the dataset. By boostingthe extracted regions to a specified size the classificationperformance shows a notable improvement of around 10% forthe CUReT dataset and 4% for the Brodatz dataset (comparedto just using the scale-saliency selected areas withoutboosting). Even though boosting improves the performanceof the scale-saliency VZ classifier, the classification rate issignificantly below that of the MRF classifier (original VZclassifier) which does not use a region selector, given in tables1 and 2.
CUReT BrodatzScale-saliency VZ 75.44% 78.38%
Boosted scale-saliency VZ85.996% 82.207%
Table 3: Results using the scale saliency classifier and theboosted scale saliency classifier. Results are the percentage ofcorrectly classified textures.
4.1.3 Issues with Region Selection
Many region selectors are developed with specific imageprocessing applications, such as object recognition or trackingin mind. Those areas which are deemed important for the taskare retained whilst others are ignored. In this particular casethose areas which are ignored do contain information whichis important for texture modelling and classification using theapproach described here. The authors have also experimentedwith other scale based region selectors including Lowe’s SIFT
descriptors [9] which also proved to be unsuitable for usewithin this framework as many textures are uniform and sofor many classes of texture few regions are selected leading topoor texture models.
4.2 Multiscale Classification in the VZ Classifier
Although the previous section presented a classifier whichincorporated multiscale information, this information wasrestricted to only the areas which were deemed to be ofinterest by the scale saliency algorithm. However, thelower classification rates suggest that some of the texturalinformation which was used by the original VZ classifier wasmissed by scale-saliency region selection.
In order to allow the VZ classifier to incorporate all theinformation available across multiple scales, the original VZclassifier (without automatic region detection) was adapted inthe following way. For dictionary construction, textons wereconsidered at multiple scales (3,5,7 and 9) using the originalVZ method to cluster the useful textons per scale. Throughoutthis experiment the same dictionaries used to generate theresults reported in section 3.1 are used to allow a directcomparison between methods. The clustering at multiple scalesgives a single global texton dictionary which includes textonsover four different neighbourhood scales (3,5,7 and 9). Ideallyall possible scales should be used to to build a true multi-scalemodel. However, only these four scales were selected sinceboth the results of table 2 and those obtained by Varma andZisserman proved that increasing neighbourhood sizes beyonda certain level does not have to lead to an improvement inclassification. In some datasets, such as the Brodatz dataset,increasing the neighbourhood size more than7 × 7 led to adeterioration in classification rates (table 2). Computationallimitations particularly in regards to storage space also prohibitconsidering a very large number of scales.
Each image (from the test set) is labelled by finding the closesttexton to the neighbourhood. This process is carried out forthe different scales contained in the dictionary. This representseach image as an×m matrix wheren is the number of textonsin the dictionary andm is the number of scales. The imageis labelledm times using different scales to create a matrixrepresentation of the texture image, in this case the models aremade up of 4 by 610 matrix as we use four different scales anda dictionary of 610 textons. To compare the texture models theχ2 dissimilarity measure is again used over all elements in thematrix within a nearest neighbour classifier.
When using the multiscale representation with a dictionary of610 textons for each scale (10 per texture class), the multiscaleVZ method achieves a 96.33% which provides an improvementover the VZ classifier with a single scale (using only the jointand neighbourhood representations in figure 1) which gave anaccuracy of 95.83%. The MRF version was not used due to
Curet Brodatz96.33% 85.73%
Table 4: Multi scale results
computational requirements.)
When incorporating all scales into the model, results are vastlyimproved compared to the case of using region selectors. In thecase of the CUReT dataset the improvement in results can beattributed to there being no particular ‘optimal’ window sizeto use when using the VZ classifier (see table 1). Thereforethe combination of many similarly performing neighbourhoodsizes leads to an improvement in classification performance. Inthe case of the Brodatz dataset the7× 7 window size performssignificantly better than any other neighbourhood size. Herethe combining of scales does not produce the best performancedue to the variation across scales and the clear identification ofan ‘optimal’ neighbourhood size.
4.3 Local Descriptor Limitations
A more general version of the problem exists, even if allneighbourhoods within an image are considered (as in theoriginal and multi-scale classifiers), it is not possible to capturethe spacial arrangement and positioning of textons. If thereexist two different classes of texture which differ on only thespacial arrangement of textons then using only local descriptorsthe classifier will be unable to distinguish between them. Therelatively high classification rates for both the Brodatz andthe CUReT datasets indicate that most of the texture classescontained within these datasets are not differentiated by spacialfeatures alone.
4.4 Real World Data
This section considers the impact of zooming level variationsupon texture which are present in real world data sets. Byaltering the zooming level at which a texture is imaged,new features will become visible (see for example figure 4).Previous methods [8, 9, 5, 6] did not incorporate this type ofinformation into their definition of scale. Here the effects ofclassification upon this type of data are investigated.
Hayman et al.[3] created the KTHTIPS [10] dataset whichcontains 10 textures from the CUReT dataset where additionalzoomed information is available. In this work, a similarapproach to that presented in [3] is followed where the classifieris trained upon textures from the CUReT dataset and imagesfrom the KTH TIPS dataset are used as the test set, theseresults are shown in figure 5.
All methods performed poorly when training upon CUReT andtesting upon the KTHTIPS dataset. The best classification
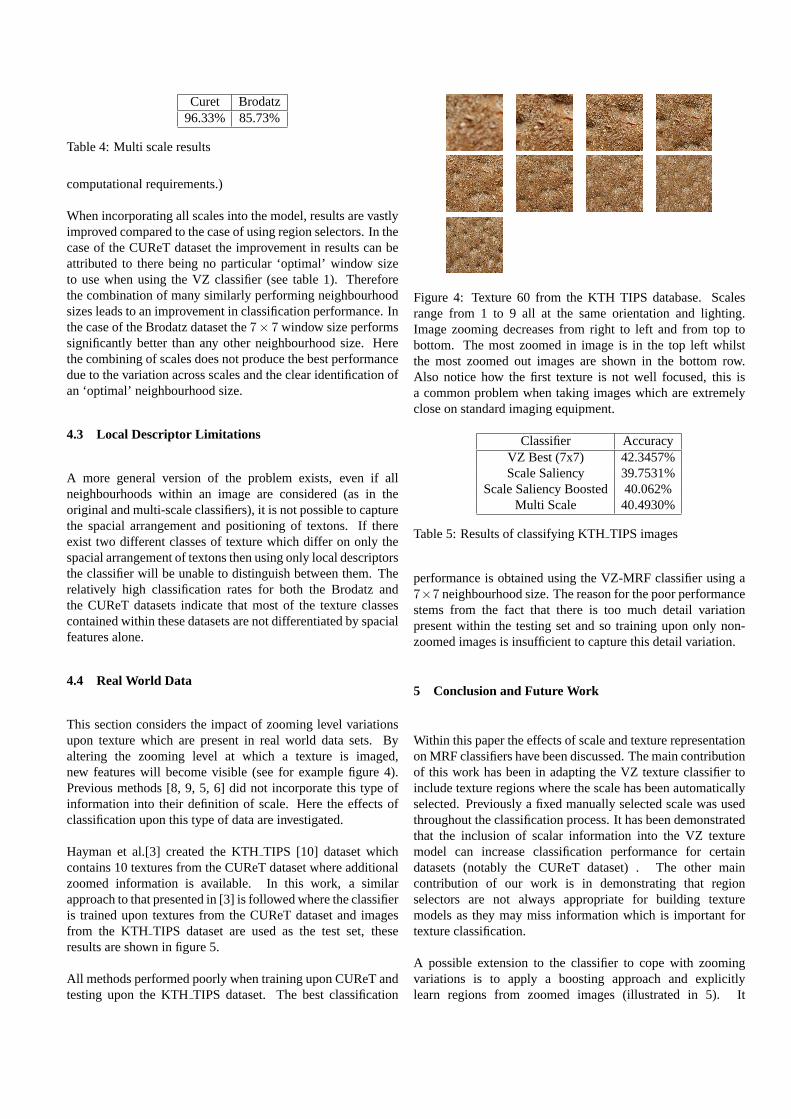
Figure 4: Texture 60 from the KTH TIPS database. Scalesrange from 1 to 9 all at the same orientation and lighting.Image zooming decreases from right to left and from top tobottom. The most zoomed in image is in the top left whilstthe most zoomed out images are shown in the bottom row.Also notice how the first texture is not well focused, this isa common problem when taking images which are extremelyclose on standard imaging equipment.
Classifier AccuracyVZ Best (7x7) 42.3457%Scale Saliency 39.7531%
Scale Saliency Boosted 40.062%Multi Scale 40.4930%
Table 5: Results of classifying KTHTIPS images
performance is obtained using the VZ-MRF classifier using a7×7 neighbourhood size. The reason for the poor performancestems from the fact that there is too much detail variationpresent within the testing set and so training upon only non-zoomed images is insufficient to capture this detail variation.
5 Conclusion and Future Work
Within this paper the effects of scale and texture representationon MRF classifiers have been discussed. The main contributionof this work has been in adapting the VZ texture classifier toinclude texture regions where the scale has been automaticallyselected. Previously a fixed manually selected scale was usedthroughout the classification process. It has been demonstratedthat the inclusion of scalar information into the VZ texturemodel can increase classification performance for certaindatasets (notably the CUReT dataset) . The other maincontribution of our work is in demonstrating that regionselectors are not always appropriate for building texturemodels as they may miss information which is important fortexture classification.
A possible extension to the classifier to cope with zoomingvariations is to apply a boosting approach and explicitlylearn regions from zoomed images (illustrated in 5). It
would be hoped that zoomed information could be accuratelyrepresented in this way and an improvement in performancecould be gained similar to that observed when boosting wasincorporated into the scale saliency classifier (see figure 3),given that no significant aliasing effects are introduced due toboosting.
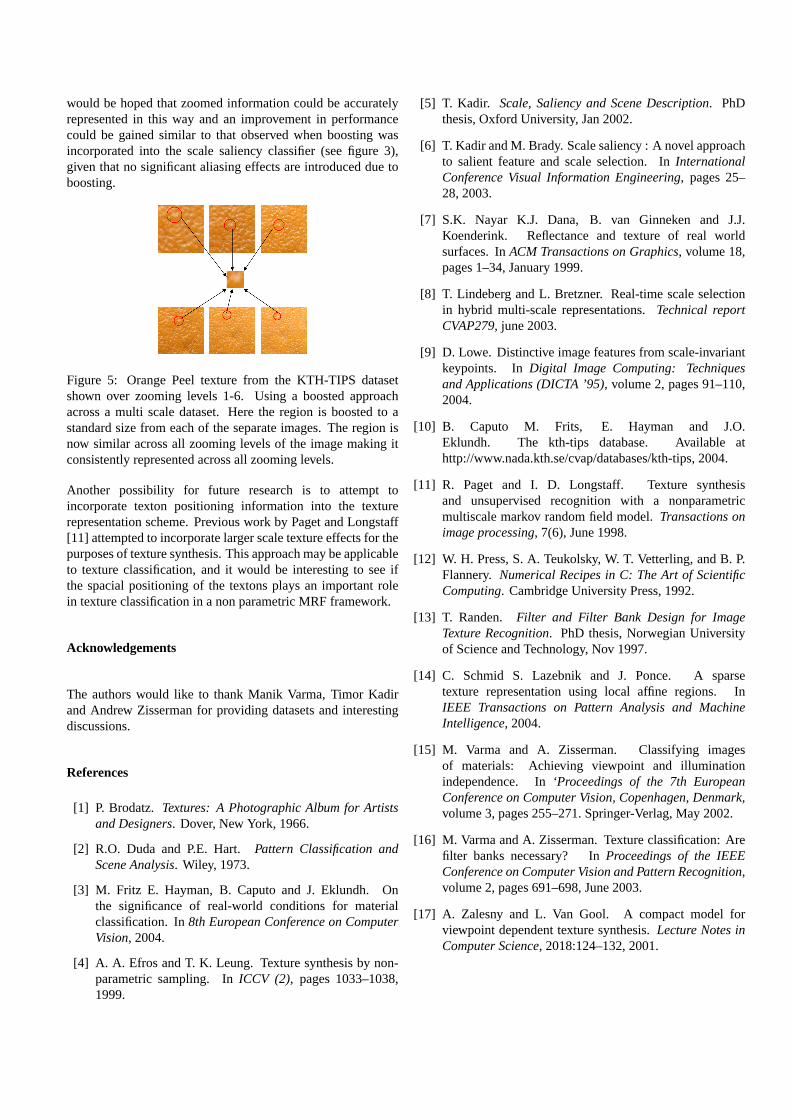
Figure 5: Orange Peel texture from the KTH-TIPS datasetshown over zooming levels 1-6. Using a boosted approachacross a multi scale dataset. Here the region is boosted to astandard size from each of the separate images. The region isnow similar across all zooming levels of the image making itconsistently represented across all zooming levels.
Another possibility for future research is to attempt toincorporate texton positioning information into the texturerepresentation scheme. Previous work by Paget and Longstaff[11] attempted to incorporate larger scale texture effects for thepurposes of texture synthesis. This approach may be applicableto texture classification, and it would be interesting to see ifthe spacial positioning of the textons plays an important rolein texture classification in a non parametric MRF framework.
Acknowledgements
The authors would like to thank Manik Varma, Timor Kadirand Andrew Zisserman for providing datasets and interestingdiscussions.
References
[1] P. Brodatz. Textures: A Photographic Album for Artistsand Designers. Dover, New York, 1966.
[2] R.O. Duda and P.E. Hart.Pattern Classification andScene Analysis. Wiley, 1973.
[3] M. Fritz E. Hayman, B. Caputo and J. Eklundh. Onthe significance of real-world conditions for materialclassification. In8th European Conference on ComputerVision, 2004.
[4] A. A. Efros and T. K. Leung. Texture synthesis by non-parametric sampling. InICCV (2), pages 1033–1038,1999.
[5] T. Kadir. Scale, Saliency and Scene Description. PhDthesis, Oxford University, Jan 2002.
[6] T. Kadir and M. Brady. Scale saliency : A novel approachto salient feature and scale selection. InInternationalConference Visual Information Engineering, pages 25–28, 2003.
[7] S.K. Nayar K.J. Dana, B. van Ginneken and J.J.Koenderink. Reflectance and texture of real worldsurfaces. InACM Transactions on Graphics, volume 18,pages 1–34, January 1999.
[8] T. Lindeberg and L. Bretzner. Real-time scale selectionin hybrid multi-scale representations.Technical reportCVAP279, june 2003.
[9] D. Lowe. Distinctive image features from scale-invariantkeypoints. InDigital Image Computing: Techniquesand Applications (DICTA ’95), volume 2, pages 91–110,2004.
[10] B. Caputo M. Frits, E. Hayman and J.O.Eklundh. The kth-tips database. Available athttp://www.nada.kth.se/cvap/databases/kth-tips, 2004.
[11] R. Paget and I. D. Longstaff. Texture synthesisand unsupervised recognition with a nonparametricmultiscale markov random field model.Transactions onimage processing, 7(6), June 1998.
[12] W. H. Press, S. A. Teukolsky, W. T. Vetterling, and B. P.Flannery. Numerical Recipes in C: The Art of ScientificComputing. Cambridge University Press, 1992.
[13] T. Randen. Filter and Filter Bank Design for ImageTexture Recognition. PhD thesis, Norwegian Universityof Science and Technology, Nov 1997.
[14] C. Schmid S. Lazebnik and J. Ponce. A sparsetexture representation using local affine regions. InIEEE Transactions on Pattern Analysis and MachineIntelligence, 2004.
[15] M. Varma and A. Zisserman. Classifying imagesof materials: Achieving viewpoint and illuminationindependence. In‘Proceedings of the 7th EuropeanConference on Computer Vision, Copenhagen, Denmark,volume 3, pages 255–271. Springer-Verlag, May 2002.
[16] M. Varma and A. Zisserman. Texture classification: Arefilter banks necessary? InProceedings of the IEEEConference on Computer Vision and Pattern Recognition,volume 2, pages 691–698, June 2003.
[17] A. Zalesny and L. Van Gool. A compact model forviewpoint dependent texture synthesis.Lecture Notes inComputer Science, 2018:124–132, 2001.
Related Documents


