Investigating the effects of Chromosome 21 genes on pathological angiogenesis MARIANNE BAKER Thesis submitted for the Degree of Doctor of Philosophy University of London June 2012 Adhesion and Angiogenesis Laboratory Centre for Tumour Biology Barts Cancer Institute – A CR-UK Centre of Excellence Queen Mary University of London Charterhouse Square London, EC1M 6BQ United Kingdom

Welcome message from author
This document is posted to help you gain knowledge. Please leave a comment to let me know what you think about it! Share it to your friends and learn new things together.
Transcript

Investigating the effects of
Chromosome 21 genes on pathological
angiogenesis
MARIANNE BAKER
Thesis submitted for the Degree of Doctor of Philosophy
University of London
June 2012
Adhesion and Angiogenesis Laboratory
Centre for Tumour Biology
Barts Cancer Institute – A CR-UK Centre of Excellence
Queen Mary University of London
Charterhouse Square
London, EC1M 6BQ
United Kingdom

DECLARATION OF AUTHORSHIP
I, Marianne Baker, confirm that the work presented in this thesis is my own and the
work of other persons has been properly cited and acknowledged.
Signed:
COPYRIGHT NOTICE
The copyright of this thesis rests with the author and no quotation from it or
information derived from it may be published without the prior written consent of the
author.
- 1 -
TABLE OF CONTENTS DECLARATION OF AUTHORSHIP........................................................................ COPYRIGHT NOTICE .............................................................................................. TABLE OF CONTENTS............................................................................................. LIST OF FIGURES ..................................................................................................... LIST OF TABLES ....................................................................................................... ABSTRACT ..................................................................................................................
CHAPTER 1 INTRODUCTION ..................................................... - 10 - 1.1 Cancer ................................................................................................ - 10 -
1.1.1 Cancer growth and angiogenesis .......................................................... - 10 - 1.2 Blood vessel morphology .................................................................. - 13 -
1.2.1 Cellular components............................................................................. - 15 - 1.2.1.1 Endothelial cells ....................................................................................... - 15 - 1.2.1.2 Pericytes ................................................................................................... - 16 -
1.3 The process of angiogenesis .............................................................. - 17 - 1.4 Hypoxia and angiogenesis ................................................................. - 22 - 1.5 Growth factors and their receptors .................................................... - 25 -
1.5.1 VEGF ................................................................................................... - 25 - 1.5.1.1 VEGF receptor 2 ...................................................................................... - 27 -
1.5.2 Fibroblast growth factor ....................................................................... - 30 - 1.5.3 Platelet derived growth factor .............................................................. - 31 - 1.5.4 Integrins................................................................................................ - 32 - 1.5.5 Anti-angiogenic therapy ....................................................................... - 34 -
1.5.5.1 Vascular normalisation ............................................................................ - 37 - 1.6 Endothelial cell-cell adhesion ........................................................... - 40 - 1.7 Adherens junctions ............................................................................ - 44 -
1.7.1 Vascular endothelial cadherin (VECAD) ............................................ - 44 - 1.7.2 Catenins ................................................................................................ - 49 -
1.8 Tight junctions ................................................................................... - 50 - 1.8.1 Occludin ............................................................................................... - 53 - 1.8.2 JAMs .................................................................................................... - 54 - 1.8.3 TJ plaque proteins ................................................................................ - 56 - 1.8.4 Claudins ............................................................................................... - 58 -
1.8.4.1 Claudins in human disease ....................................................................... - 61 - 1.8.4.1.1 Claudins and cancer.......................................................................... - 62 - 1.8.4.1.2 Claudins and therapy ........................................................................ - 64 -
1.8.4.2 Endothelial claudins ................................................................................. - 65 - 1.8.4.3 Claudin14 ................................................................................................. - 66 -
1.9 Studying angiogenic regulators ......................................................... - 67 - 1.9.1 Down’s Syndrome and cancer ............................................................. - 67 - 1.9.2 DS Mouse Models ................................................................................ - 70 -
1.9.2.1 The Tc1 Mouse.......................................................................................... - 72 - 1.10 SUMMARY .................................................................................... - 76 - 1.11 HYPOTHESIS ................................................................................. - 77 - 1.12 RESEARCH AIMS ......................................................................... - 77 -
CHAPTER 2 MATERIALS AND METHODS ............................. - 78 - 2.1 Antibodies and reagents .................................................................... - 78 - 2.2 Mice ................................................................................................... - 80 -
2.2.1 Genotyping mice by PCR analysis ....................................................... - 80 - 2.2.1.1 Tc1 ............................................................................................................ - 80 -
1 1 2 5 7 8
- 2 -
2.2.1.2 Claudin14 ................................................................................................. - 82 - 2.3 Tissue culture media and solutions ................................................... - 84 -
2.3.1 Endothelial cell medium ...................................................................... - 84 - 2.3.2 Aortic ring medium .............................................................................. - 84 - 2.3.3 Tumour cell growth medium ................................................................ - 84 -
2.4 Cell culture ........................................................................................ - 85 - 2.4.1 Tumour cells......................................................................................... - 85 - 2.4.2 Primary endothelial cells ...................................................................... - 85 -
2.4.2.1 Coating tissue culture flasks ..................................................................... - 85 - 2.4.2.2 Isolation of primary endothelial cells from mouse lungs ......................... - 86 - 2.4.2.3 Cell sorting ............................................................................................... - 87 - 2.4.2.4 Passaging ................................................................................................. - 88 -
2.5 Dunn Chamber chemotaxis assay...................................................... - 89 - 2.6 Aortic ring assay ................................................................................ - 91 -
2.6.1 RNA interference in aortic rings ex vivo .............................................. - 92 - 2.7 Immunofluorescence ......................................................................... - 93 -
2.7.1 Whole tissue sections ........................................................................... - 93 - 2.7.1.1 FFPE sections........................................................................................... - 93 - 2.7.1.2 Cryosections ............................................................................................. - 94 -
2.7.2 Immunofluorescence staining of aortic rings ....................................... - 95 - 2.7.2.1 Ex vivo EdU proliferation assay ............................................................... - 95 -
2.7.3 Primary endothelial cells ...................................................................... - 96 - 2.7.3.1 VEGFR2 immunofluorescence.................................................................. - 96 - 2.7.3.2 In vitro proliferation assay ....................................................................... - 97 - 2.7.3.3 TUNEL apoptosis assay in vitro ............................................................... - 98 -
2.8 Transient siRNA transfection of primary endothelial cells in vitro .. - 99 - 2.9 Flow cytometric analysis of cell surface receptor levels................. - 100 - 2.10 Western blot analysis..................................................................... - 101 -
2.10.1 Cell lysis ........................................................................................... - 101 - 2.10.2 Protein assessment ........................................................................... - 101 - 2.10.3 SDS-PAGE ....................................................................................... - 101 -
2.10.3.1 NuPAGE system .................................................................................... - 102 - 2.10.4 Blotting ............................................................................................. - 103 - 2.10.5 Probing ............................................................................................. - 103 - 2.10.6 Densitometry .................................................................................... - 104 -
2.11 Reverse transcription PCR ............................................................ - 105 - 2.11.1 Confirmation of siRNA-mediated knockdown in WT and Tc1 cells . - 105 - 2.11.2 Assessment of claudin mRNA levels ............................................... - 105 -
2.11.2.1 RNA extraction ..................................................................................... - 105 - 2.11.2.2 Reverse transcription ............................................................................ - 106 - 2.11.2.3 Quantitative PCR .................................................................................. - 106 -
2.12 Syngeneic tumour growth assay .................................................... - 107 - 2.12.1 Injection of cells ............................................................................... - 107 - 2.12.2 Tumour growth and bioluminescence .............................................. - 108 - 2.12.3 Ante-mortem processing .................................................................. - 108 -
2.12.3.1 Pimonidazole hypoxyprobe assay ......................................................... - 109 - 2.12.3.2 Hoechst leakage assay .......................................................................... - 109 -
2.12.4 Assessment of hypoxia in tumours .................................................. - 110 - 2.12.5 Blood vessel quantitation ................................................................. - 110 - 2.12.6 Assessment of Hoechst delivery into tumours ................................. - 112 - 2.12.7 Quantification of cellular proliferation in tumours .......................... - 114 -
- 3 -

2.13 Subcutaneous sponge assay ........................................................... - 114 - 2.14 ........................................................................................................... - 116 - 2.15 Statistical Analysis ........................................................................ - 116 - 2.16 Home Office regulations ............................................................... - 116 -
CHAPTER 3 IDENTIFICATION OF NOVEL REGULATORS OF ANGIOGENESIS USING THE TC1 MOUSE MODEL OF DOWN’S
SYNDROME........................................................................................ - 117 -
3.1 RESULTS ........................................................................................ - 117 - 3.1.1 Tumour growth is reduced in Tc1 mice ............................................. - 117 - 3.1.2 Pathological angiogenesis is attenuated in Tc1 mice ......................... - 119 - 3.1.3 VEGF-induced angiogenic responses are impaired in Tc1 mice ....... - 121 - 3.1.4 Surface levels of VEGFR2 are higher in Tc1 endothelial cells ......... - 125 - 3.1.5 Endothelial-specific and angiogenesis-regulating Hsa21 candidate genes .. - 127 - 3.1.6 Knockdown of endothelial cell-specific and angiogenesis-modulating candidate genes can rescue the Tc1 phenotype. ............................................. - 128 -
3.2 DISCUSSION ................................................................................. - 132 - 3.3 FUTURE PERSPECTIVE .............................................................. - 139 -
3.3.1 Hsa21 microRNAs ............................................................................. - 140 -
CHAPTER 4 ELUCIDATING THE ROLE OF CLAUDIN14 IN ANGIOGENESIS .............................................................................. - 142 -
4.1 RESULTS ........................................................................................ - 143 - 4.1.1 Claudin14 depletion affects endothelial junctions and basement membrane organisation in B16F10 tumours .................................................................... - 143 - 4.1.2 Claudin14 levels affect tumour blood vessel leakage ........................ - 149 - 4.1.3 Claudin14 heterozygosity decreases tumour hypoxia without affecting tumour size ..................................................................................................... - 151 - 4.1.4 Claudin14 heterozygosity affects the proportion of lumenated tumour blood vessels .................................................................................................. - 156 - 4.1.5 Supporting cell association is affected by partial loss of Claudin14 . - 159 - 4.1.6 Claudin14 heterozygosity increases endothelial cell proliferation in vivo, ex vivo and in vitro ......................................................................................... - 161 - 4.1.7 Transient depletion of Cldn14 mimics Cldn14-heterozygous angiogenic phenotypes ..................................................................................................... - 169 -
4.2 DISCUSSION ................................................................................. - 176 - 4.2.1 Cldn14, cell-cell contacts and the basement membrane .................... - 181 - 4.2.2 Cldn14 and tumour oxygenation ........................................................ - 182 - 4.2.3 Cldn14 and pericytes .......................................................................... - 183 - 4.2.4 Cldn14, the VEGF response and proliferation ................................... - 184 - 4.2.5 Cldn14 and other cell surface molecules ........................................... - 186 - 4.2.6 Cldn14 and tumour growth ................................................................ - 187 - 4.2.7 Cldn14 knockdown ............................................................................ - 188 - 4.2.8 Cldn14-heterozygous vs. Cldn14-null phenotypes ............................ - 189 - 4.2.9 Cldn14 in non-endothelial cell types.................................................. - 190 -
4.3 FUTURE PERSPECTIVE .............................................................. - 193 - 4.3.1 Cldn14 and metastasis ........................................................................ - 197 - 4.3.2 Targeting Cldn14 and disease control ................................................ - 198 -
CHAPTER 5 CONCLUDING REMARKS ................................. - 202 - - 4 -
CHAPTER 6 REFERENCES ........................................................ - 205 -
CHAPTER 7 APPENDICES ......................................................... - 219 - 7.1 Abbreviations .................................................................................. - 219 - 7.2 Hsa21 Gene list .................................................................................... 222 7.3 Publications .......................................................................................... 224
LIST OF FIGURES
Figure 1.1 The evolving hallmarks of solid cancers ................................................ - 12 - Figure 1.2 Capillary morphology ............................................................................. - 14 - Figure 1.3 The balance between pro- and anti-angiogenic factors: the “angiogenic
switch”.............................................................................................................. - 20 - Figure 1.4 Stages of sprouting angiogenesis ............................................................ - 21 - Figure 1.5 Regulation of HIF-1α activity according to oxygen availability. ........... - 24 - Figure 1.6 Signalling from VEGFR2 ....................................................................... - 29 - Figure 1.7 Types of anti-angiogenic therapies targeting VEGF .............................. - 36 - Figure 1.8 Tumour vasculature abnormalities and the phenomenon of vascular
normalisaiton .................................................................................................... - 38 - Figure 1.9 Endothelial cell-cell junctions ................................................................ - 43 - Figure 1.10 VE-cadherin and VEGFR2 ................................................................... - 48 - Figure 1.11 Tight junction functions and downstream signalling ........................... - 52 - Figure 1.12 Claudin protein structure, function and posttranslational modifications . - 60
- Figure 1.13 Cancer incidence in human DS and non-DS populations. .................... - 69 - Figure 1.14 Human chromosome 21, mouse orthologs and the Tc1 mouse Hsa21
fragment. .......................................................................................................... - 73 - Figure 2.1 RNA sample integrity ........................................................................... - 106 - Figure 2.2 Thresholding confocal image stacks in ImageJ .................................... - 112 - Figure 2.3 Measurement of pixel intensity in a confocal image stack in ImageJ .. - 113 - Figure 3.1 Tumour size is reduced in Tc1 mice. .................................................... - 118 - Figure 3.2 Pathological angiogenesis is attenuated in Tc1 mice. .......................... - 120 - Figure 3.3 VEGF-induced neoangiogenesis is impaired in Tc1 mice. .................. - 122 - Figure 3.4 VEGF-stimulated microvessel outgrowth is reduced in Tc1 aortic rings....... -
123 - Figure 3.5 Tc1 pMLEC show no increase in ERK phosphorylation upon VEGF
treatment. ........................................................................................................ - 124 - Figure 3.6 Surface levels of VEGFR2 are consistently higher in Tc1 pMLEC than in
WT.................................................................................................................. - 126 -
- 5 -
Figure 3.7 Human-specific siRNA transfection can restore the angiogenic potential of Tc1 aortic rings (reducing gene dosage from 3 to 2). .................................... - 129 -
Figure 3.8 Mouse-specific siRNA transfection can restore the angiogenic potential of Tc1 aortic rings (reducing gene dosage from 3 to 1). .................................... - 131 -
Figure 4.1 Statistics and genotyping of Cldn14 mouse colonies ........................... - 145 - Figure 4.2 Cldn5 mRNA levels do not differ in brain or kidney between Cldn14
genotypes ....................................................................................................... - 146 - Figure 4.3 ZO-1 staining appears disrupted in tumour blood vessels from Cldn14-het
mice ................................................................................................................ - 147 - Figure 4.4 Tumour blood vessels display a greater laminin basement membrane
“shoreline effect” in Cldn14-het mice............................................................ - 148 - Figure 4.5 Stromal Cldn14 heterozygosity increases tumour blood vessel leakage. - 150
- Figure 4.6 Stromal heterozygosity for Cldn14 decreases tumour hypoxia. ........... - 153 - Figure 4.7 Tumours grown in Cldn14-Heterozygous mice have increased
bioluminescence signal. ................................................................................. - 154 - Figure 4.8 Stromal Cldn14 levels have no effect on subcutaneous tumour growth. - 155
- Figure 4.9 More non-lumenated vessels are present in Cldn14-heterozygous tumour
sections. .......................................................................................................... - 157 - Figure 4.10 Cldn14 heterozygosity increases the total number of blood vessels in
B16F10 tumours but does not affect blood vessel density in unchallenged skin..... - 158 -
Figure 4.11 Supporting cell association with tumour vessels is decreased in tumour blood vessels of Cldn14-heterozygous mice. ................................................. - 160 -
Figure 4.12 Tumour endothelial cells proliferate more in Cldn14-het B1610 tumours. . - 163 -
Figure 4.13 Heterozygosity for Cldn14 increases VEGF-induced microvessel numbers and length. ...................................................................................................... - 164 -
Figure 4.14 Cldn14 gene copy number affects endothelial cell proliferation in ex vivo aortic ring assays. ........................................................................................... - 165 -
Figure 4.15 Cldn14 heterozygous cells proliferate more in response to VEGF stimulation ...................................................................................................... - 166 -
Figure 4.16 Cldn14 gene copy number can affect primary endothelial cell behaviour in 2D culture. ...................................................................................................... - 167 -
Figure 4.17 Cldn14-heterozygous cells in culture divide more frequently with no effect on cell death. .................................................................................................. - 168 -
Figure 4.18 Cldn14 levels were reduced by approximately 50% 72 hours post-transfection. .................................................................................................... - 171 -
Figure 4.19 Knockdown of Cldn14 in wild-type aortic rings embedded in collagen increases microvessel sprout number and length. .......................................... - 172 -
Figure 4.20 Knockdown of Cldn14 in wild-type mixed background aortic rings increases endothelial cell proliferation........................................................... - 173 -
- 6 -
Figure 4.21 Knockdown of Cldn14 increases primary endothelial cell proliferation in 2D culture. ...................................................................................................... - 174 -
Figure 4.22 Cldn14 knockdown has no effect on pMLEC apoptosis in 2D culture. - 175 -
Figure 4.23 Possible influences of claudin14 in angiogenic processes and open questions ......................................................................................................... - 180 -
LIST OF TABLES
Table 1.1 Binding specificity of endothelial integrin heterodimers ......................... - 32 - Table 1.2 Claudin protein expression in different cancer types. .............................. - 63 - Table 1.3 Genes within deleted regions of the Hsa21 sequence in Tc1 mice. ......... - 74 - Table 1.4 Genes located in possible duplicated regions of the Tc1 Hsa21 fragment. - 74
- Table 2.1 Primary antibodies. .................................................................................. - 78 - Table 2.2 Alexa Fluor® IgG-bound fluorochromes used for immunofluorescence
staining. ............................................................................................................ - 79 - Table 2.3 Horseradish peroxidase-conjugated IgG antibodies used for Western
Blotting. ............................................................................................................ - 79 - Table 2.4 Tc1 genotyping and PCR programme. ..................................................... - 81 - Table 2.5 Cldn14 genotyping and PCR programme. ............................................... - 83 -
- 7 -
ABSTRACT
Patients with trisomy of chromosome 21, known as Down’s syndrome (DS), have a
lower incidence of solid tumours than unaffected age-matched individuals. However,
the cellular and molecular basis for this observation is not well understood. We
hypothesised that a direct link between Down’s syndrome and angiogenesis exists,
whereby the overexpression of human chromosome 21 (Hsa21) genes causes the
repression of angiogenesis (gene dosage effects) resulting in the inhibition of solid
tumour growth.
In this project we investigated the angiogenic phenotype of an animal model of Down’s
syndrome, the Tc1 mouse, which contains a large freely segregating fragment of Hsa21
containing over 200 human genes. We found that the growth of both B16F0 melanoma
and Lewis Lung Carcinoma cells was impaired in Tc1 mice. Tumour vascularity also
was reduced. This is supportive of the epidemiological data from the human DS
population and supports the hypothesis that Hsa21 contains anti-angiogenic genes.
Candidate genes were selected due to their endothelial specificity or likelihood to
function in angiogenesis based on functional data or similarity to other proteins. Ex vivo
RNAi assays were used to examine their roles in angiogenesis. We have found that
reducing the expression of human Adamts1, Erg, Jamb or Pttg1ip in Tc1 tissue can
restore its angiogenic potential, suggesting that the dosage of these genes (i.e. 3 copies
instead of 2) can inhibit angiogenesis.
Following from this study we also examined the role of selected adhesion related genes
found on chromosome 21 in angiogenesis. Cldn14 encodes the tight junction molecule
Claudin14 but its role in angiogenesis was unknown. We found that partial, but not
- 8 -

complete, depletion of Cldn14 can increase the proportion of non-lumenated tumour
blood vessels; decrease supporting cell association with tumour vessels; and increase
endothelial cell proliferation in vivo, ex vivo and in vitro.
Taken together this series of experiments has identified novel regulators of angiogenesis
and has demonstrated the gene dosage effects of a subset of Hsa21 genes on angiogenic
processes.
- 9 -

CHAPTER 1 INTRODUCTION
1.1 Cancer
Cancer is a leading cause of mortality worldwide and the second most common cause of
death in England and Wales. It is set to become even more significant as populations
age; while medical care in general continues to improve, the proportion of the population
suffering from diseases of old age increases, placing more burden on these areas of care
and treatment. It is predicted that by 2050, 21% of the world’s population will be over
60 years of age, with the figure nearing 35% in more developed regions (Ferlay et al.
2010). In order to develop more effective cancer treatments, we must improve our
understanding of cancer biology and progression.
1.1.1 Cancer growth and angiogenesis
Several conditions are now known to be necessary for malignancy to take hold; for cells
to grow and become cancerous, they must evade all control mechanisms that normally
maintain the cells of multicellular organisms. In solid tumours, these conditions could
be simplified as: the induction of angiogenesis (growth of blood vessels); resisting
programmed cell death; evasion of growth suppression; sustaining cell division
signalling and replicative capabilities; and the activation of cell invasion into
surrounding tissue and eventual metastasis. Emerging hallmarks of some (and perhaps
all) tumours include the avoidance of immune cell detection and destruction and
establishing tumour-promoting inflammation (Figure 1.1). Further conditions are being
described and the detailed mechanisms behind those already established are still being
studied further (Hanahan and Weinberg 2011). It has become apparent that it is not only
tumour cells themselves that drive and maintain cancer, but also the cells and
components surrounding them; termed the tumour microenvironment or stroma (defined
as cells and connective tissue providing a framework for an organ or tissue). Tumour - 10 -
blood vessels and the cells that comprise them are part of the stroma and now recognised
as integral players in tumour development and growth (Tlsty and Coussens 2006). Also
in the stroma are inflammatory components (immune cells such as macrophages), the
extracellular matrix (ECM), fibroblasts and lymphatic vessels. In this thesis, “stroma”
will refer to all “non-tumour cell” components, which includes the blood vessels. The
role of the stroma in cancer development is discussed in detail by Tlsty and Coussens,
2006.
The induction of angiogenesis is the main area of investigation in this thesis and will
therefore be discussed in the greatest detail. Solid tumours, like any organ in the body,
need a vasculature in order to survive. Tumour blood vessels deliver the oxygen and
nutrients required to maintain growth and also dispose of the waste products of
metabolism and respiration to prevent toxicity (Nishida et al. 2006, O'Reilly 2007, Sund
et al. 2005, Weinberg 2007). Without vasculature, tumours cannot grow beyond 2-4
mm3 due to the limited distance over which oxygen can diffuse from blood vessels to
tumour cells; approximately 145 µm (Bertout et al. 2008). Hypoxia (less than 0.2% O2,
where tissues are normally 2-9% O2 (Bertout et al. 2008)) is a major driving force behind
the growth of new blood vessels into the tumour environment (explored further in 1.4)
(Adams and Alitalo 2007, Bertout et al. 2008, Weinberg 2007). Since tumour growth is
unregulated (in contrast to normal developmental processes), tumours must adapt and
acquire the ability to attract blood vessels (Nishida et al. 2006). Vessel density within
tumours has been found to correlate with tumour progression, since the greater the
angiogenic potential of the tumour, the faster its growth (Hanahan and Weinberg 2000,
Weinberg 2007). Dissecting the cellular and molecular basis of tumour angiogenesis not
only enables us to understand these processes better but may also offer opportunities to
control cancer growth and spread.
- 11 -
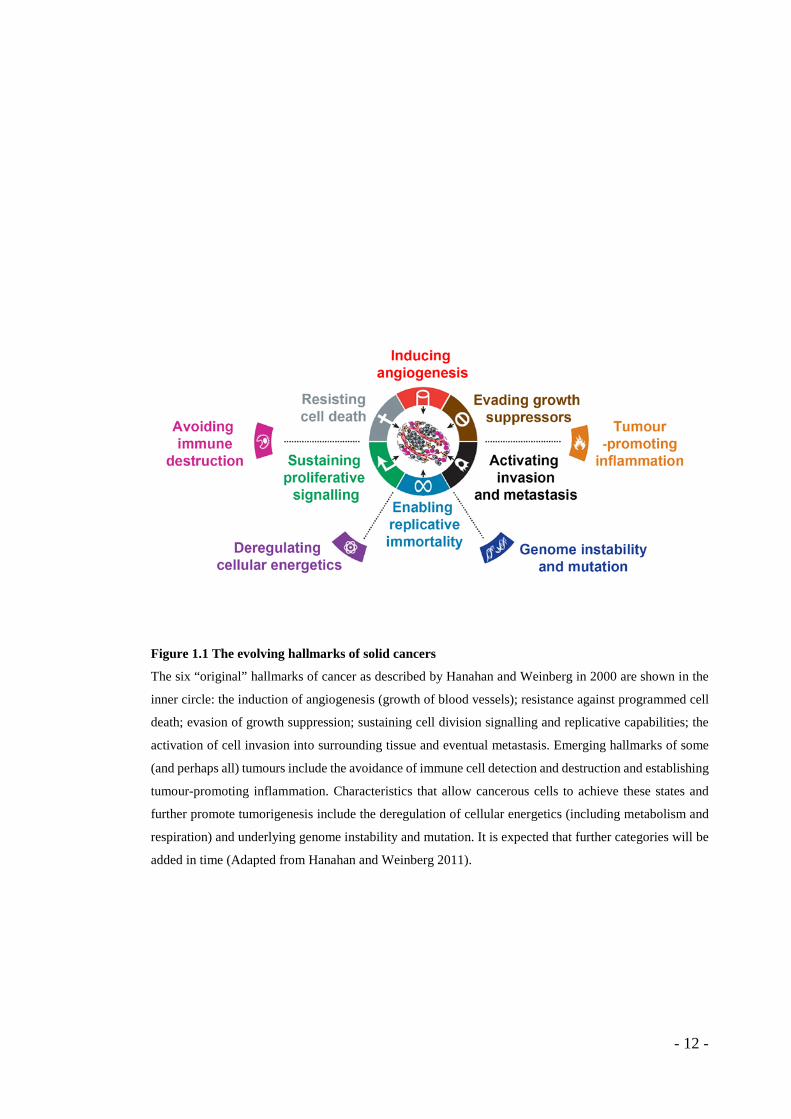
Figure 1.1 The evolving hallmarks of solid cancers
The six “original” hallmarks of cancer as described by Hanahan and Weinberg in 2000 are shown in the
inner circle: the induction of angiogenesis (growth of blood vessels); resistance against programmed cell
death; evasion of growth suppression; sustaining cell division signalling and replicative capabilities; the
activation of cell invasion into surrounding tissue and eventual metastasis. Emerging hallmarks of some
(and perhaps all) tumours include the avoidance of immune cell detection and destruction and establishing
tumour-promoting inflammation. Characteristics that allow cancerous cells to achieve these states and
further promote tumorigenesis include the deregulation of cellular energetics (including metabolism and
respiration) and underlying genome instability and mutation. It is expected that further categories will be
added in time (Adapted from Hanahan and Weinberg 2011).
- 12 -
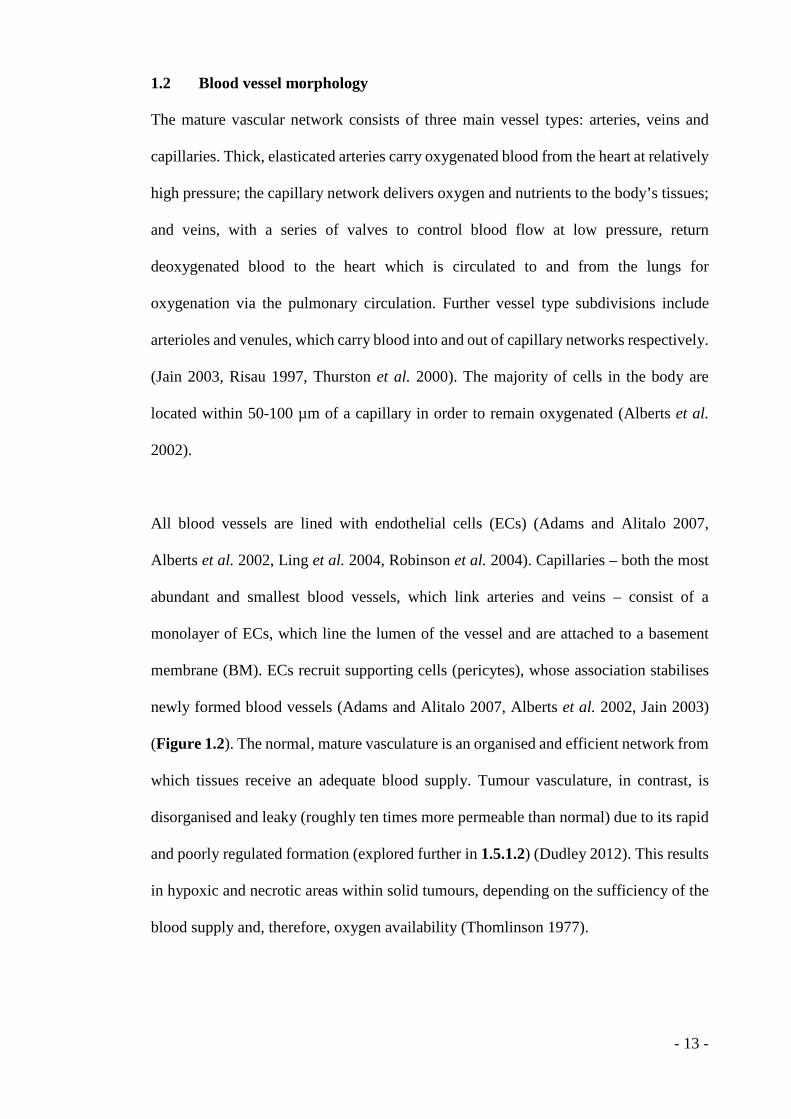
1.2 Blood vessel morphology
The mature vascular network consists of three main vessel types: arteries, veins and
capillaries. Thick, elasticated arteries carry oxygenated blood from the heart at relatively
high pressure; the capillary network delivers oxygen and nutrients to the body’s tissues;
and veins, with a series of valves to control blood flow at low pressure, return
deoxygenated blood to the heart which is circulated to and from the lungs for
oxygenation via the pulmonary circulation. Further vessel type subdivisions include
arterioles and venules, which carry blood into and out of capillary networks respectively.
(Jain 2003, Risau 1997, Thurston et al. 2000). The majority of cells in the body are
located within 50-100 µm of a capillary in order to remain oxygenated (Alberts et al.
2002).
All blood vessels are lined with endothelial cells (ECs) (Adams and Alitalo 2007,
Alberts et al. 2002, Ling et al. 2004, Robinson et al. 2004). Capillaries – both the most
abundant and smallest blood vessels, which link arteries and veins – consist of a
monolayer of ECs, which line the lumen of the vessel and are attached to a basement
membrane (BM). ECs recruit supporting cells (pericytes), whose association stabilises
newly formed blood vessels (Adams and Alitalo 2007, Alberts et al. 2002, Jain 2003)
(Figure 1.2). The normal, mature vasculature is an organised and efficient network from
which tissues receive an adequate blood supply. Tumour vasculature, in contrast, is
disorganised and leaky (roughly ten times more permeable than normal) due to its rapid
and poorly regulated formation (explored further in 1.5.1.2) (Dudley 2012). This results
in hypoxic and necrotic areas within solid tumours, depending on the sufficiency of the
blood supply and, therefore, oxygen availability (Thomlinson 1977).
- 13 -
Figure 1.2 Capillary morphology
A simplified depiction of a capillary type blood vessel. The endothelial cell monolayer lining the capillary
lumen is associated with sparse supporting cells (pericytes). These cells are in contact with their basement
membranes (BM) and in turn surrounded by the extracellular matrix (ECM).
- 14 -
1.2.1 Cellular components
There are two main blood vessel cell types that are of particular interest in this study:
endothelial cells, which line blood vessels, and their supporting cells, typically referred
to as pericytes.
1.2.1.1 Endothelial cells
The endothelial cell (EC) is the specialised cell type that lines all blood vessels. As the
intermediary between the blood and surrounding tissues, the endothelial layer controls
the movement of molecules and cells between the two compartments. They are sensitive
to blood flow and interstitial pressure, responding to and regulating vessel morphology
accordingly. In vessels in vivo they are polarised cells with an apical side (facing the
vessel lumen) and a basal side (attached to a basement membrane and supporting cells)
(Carmeliet and Jain 2000, Jain 2003). The BM in which blood vessel endothelial and
supporting cells are embedded is a specialised, dense form of ECM that is mainly
comprised of laminins, nidogens, collagen IV and perlecan. The BM contributes to blood
vessel function through organising ECs and providing mechanical support (Eming and
Hubbell 2011, LeBleu et al. 2007). Indeed, deletion of some BM components has been
found to cause blood vessel leakage (Abraham et al. 2008, Eming and Hubbell 2011).
The precise characteristics of ECs, including their arrangement in the vessel wall, cell-
cell adhesive properties and degree of polarisation can vary depending on the vessel
type, tissue location and quality of blood flow; for example in the brain, endothelial cells
forming the blood-brain-barrier (BBB), which must be highly selective in terms of the
volume and type of substances allowed to pass through from the blood to the brain
tissues, are adhered strongly together and regularly arranged, creating an extremely low-
permeability barrier almost epithelial in nature (Nitta et al. 2003, Rubin et al. 1991).
Endothelial cells in the BBB are highly specialised for their function, as are ECs in other
- 15 -
situations, such as the postcapillary venules and collecting venules (connecting
capillaries to veins) with looser EC connections, which allow for immune cell interaction
and leak blood plasma during inflammation (Thurston et al. 2000). ECs change their
morphology and migratory properties in vitro depending on their confluence. While ECs
in sparse cultures have a more motile fibroblast-like phenotype, in confluent cultures
they have a characteristic cobblestone appearance (Lampugnani et al. 2002).
1.2.1.2 Pericytes
ECs recruit pericytes, also known as vascular mural cells, to maturing blood vessels in
order to stabilise the vessel structure (Hall 2006). Pericytes are found to cover capillaries
sparsely, in postcapillary venules more densely and are formed in multiple layers around
larger arterial vessels, where they are referred to instead as vascular smooth muscle cells
(vSMCs) (Bergers and Song 2005, Jain 2003, Thurston et al. 2000). They are
characterised by an extended morphology with finger-like protrusions that contact
multiple endothelial cells through gaps in the basement membrane (Hall 2006),
communicating with ECs both directly by cell-cell contact (discussed further in 1.7.1
and 1.8) and indirectly via extracellular signalling, although the details of these
interactions are not yet well-described. They are also bound to the basement membrane,
which is rich in fibronectin and synthesised by pericytes and ECs together (Armulik et
al. 2005, Mandarino et al. 1993, Gerhardt and Bersholtz 2003).
The exact cellular progenitors of these cells are not known for certain and it depends on
the tissue as to which cells may differentiate into pericytes. Like ECs, pericytes have
specialised functions in different contexts. A specific marker of differentiation for all
pericytes has not yet been found, though commonly used markers include α-smooth
muscle actin (α-SMA), NG2 (a chondroitin sulphate proteoglycan marker expressed by
- 16 -
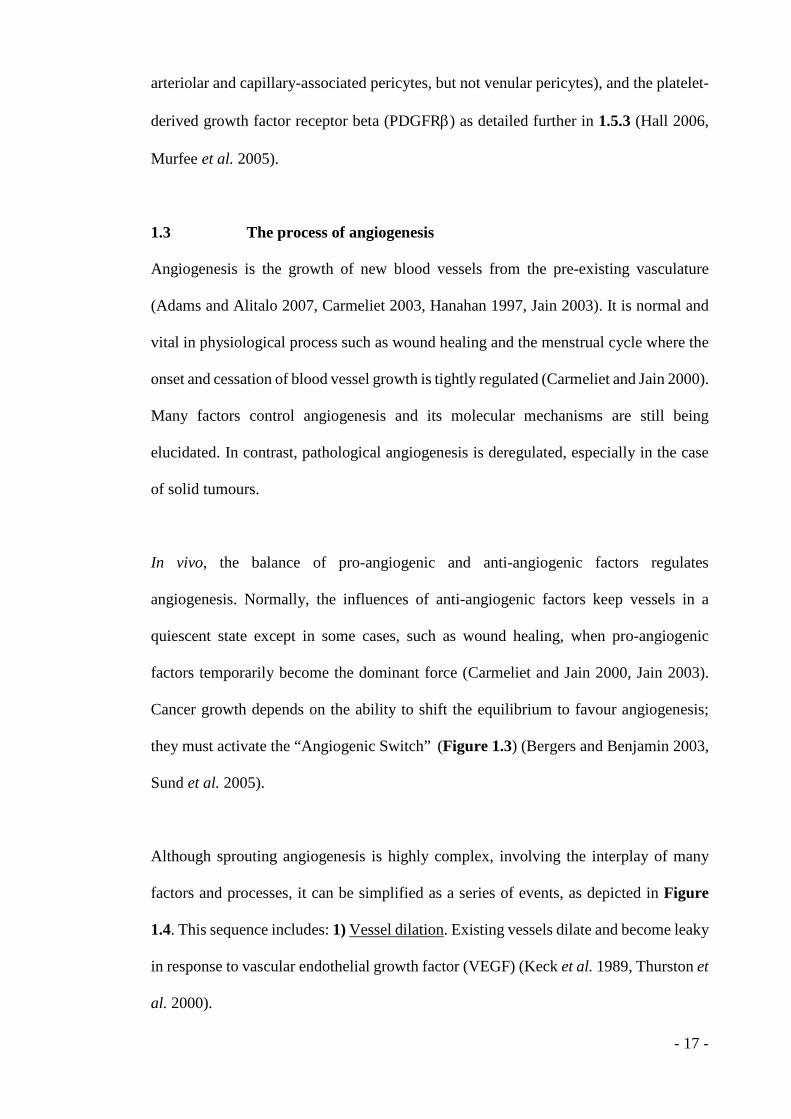
arteriolar and capillary-associated pericytes, but not venular pericytes), and the platelet-
derived growth factor receptor beta (PDGFRβ) as detailed further in 1.5.3 (Hall 2006,
Murfee et al. 2005).
1.3 The process of angiogenesis
Angiogenesis is the growth of new blood vessels from the pre-existing vasculature
(Adams and Alitalo 2007, Carmeliet 2003, Hanahan 1997, Jain 2003). It is normal and
vital in physiological process such as wound healing and the menstrual cycle where the
onset and cessation of blood vessel growth is tightly regulated (Carmeliet and Jain 2000).
Many factors control angiogenesis and its molecular mechanisms are still being
elucidated. In contrast, pathological angiogenesis is deregulated, especially in the case
of solid tumours.
In vivo, the balance of pro-angiogenic and anti-angiogenic factors regulates
angiogenesis. Normally, the influences of anti-angiogenic factors keep vessels in a
quiescent state except in some cases, such as wound healing, when pro-angiogenic
factors temporarily become the dominant force (Carmeliet and Jain 2000, Jain 2003).
Cancer growth depends on the ability to shift the equilibrium to favour angiogenesis;
they must activate the “Angiogenic Switch” (Figure 1.3) (Bergers and Benjamin 2003,
Sund et al. 2005).
Although sprouting angiogenesis is highly complex, involving the interplay of many
factors and processes, it can be simplified as a series of events, as depicted in Figure
1.4. This sequence includes: 1) Vessel dilation. Existing vessels dilate and become leaky
in response to vascular endothelial growth factor (VEGF) (Keck et al. 1989, Thurston et
al. 2000).
- 17 -
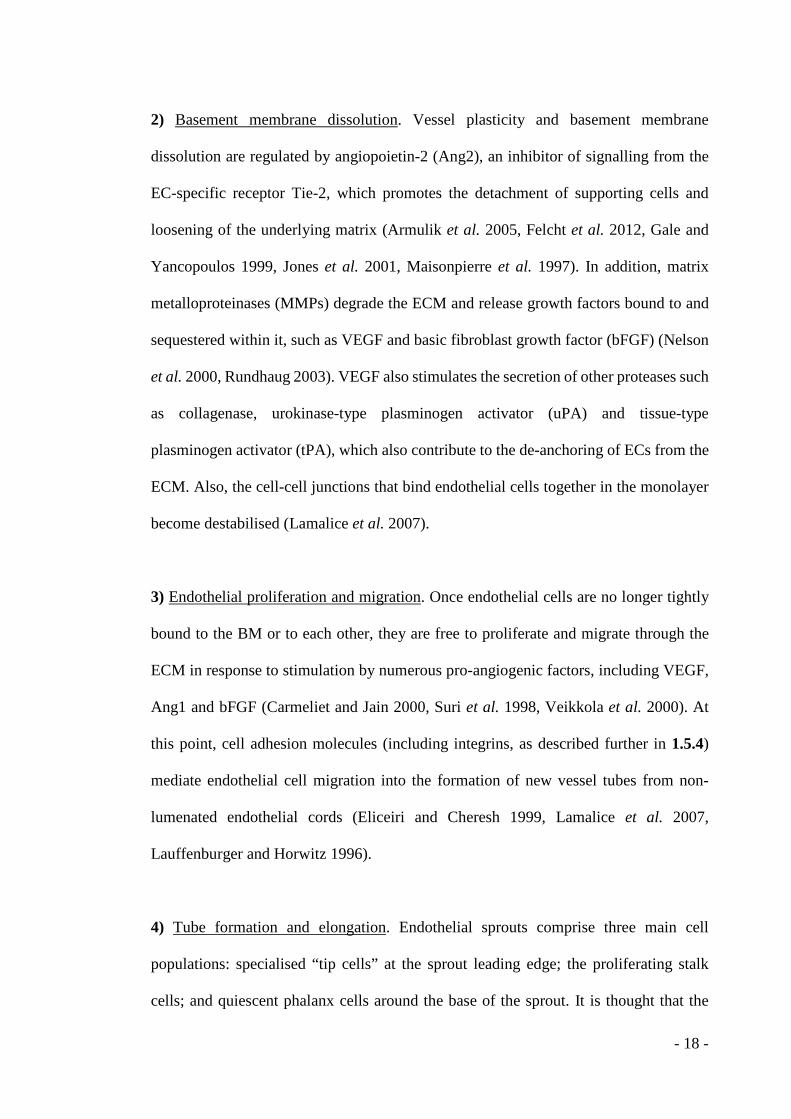
2) Basement membrane dissolution. Vessel plasticity and basement membrane
dissolution are regulated by angiopoietin-2 (Ang2), an inhibitor of signalling from the
EC-specific receptor Tie-2, which promotes the detachment of supporting cells and
loosening of the underlying matrix (Armulik et al. 2005, Felcht et al. 2012, Gale and
Yancopoulos 1999, Jones et al. 2001, Maisonpierre et al. 1997). In addition, matrix
metalloproteinases (MMPs) degrade the ECM and release growth factors bound to and
sequestered within it, such as VEGF and basic fibroblast growth factor (bFGF) (Nelson
et al. 2000, Rundhaug 2003). VEGF also stimulates the secretion of other proteases such
as collagenase, urokinase-type plasminogen activator (uPA) and tissue-type
plasminogen activator (tPA), which also contribute to the de-anchoring of ECs from the
ECM. Also, the cell-cell junctions that bind endothelial cells together in the monolayer
become destabilised (Lamalice et al. 2007).
3) Endothelial proliferation and migration. Once endothelial cells are no longer tightly
bound to the BM or to each other, they are free to proliferate and migrate through the
ECM in response to stimulation by numerous pro-angiogenic factors, including VEGF,
Ang1 and bFGF (Carmeliet and Jain 2000, Suri et al. 1998, Veikkola et al. 2000). At
this point, cell adhesion molecules (including integrins, as described further in 1.5.4)
mediate endothelial cell migration into the formation of new vessel tubes from non-
lumenated endothelial cords (Eliceiri and Cheresh 1999, Lamalice et al. 2007,
Lauffenburger and Horwitz 1996).
4) Tube formation and elongation. Endothelial sprouts comprise three main cell
populations: specialised “tip cells” at the sprout leading edge; the proliferating stalk
cells; and quiescent phalanx cells around the base of the sprout. It is thought that the
- 18 -
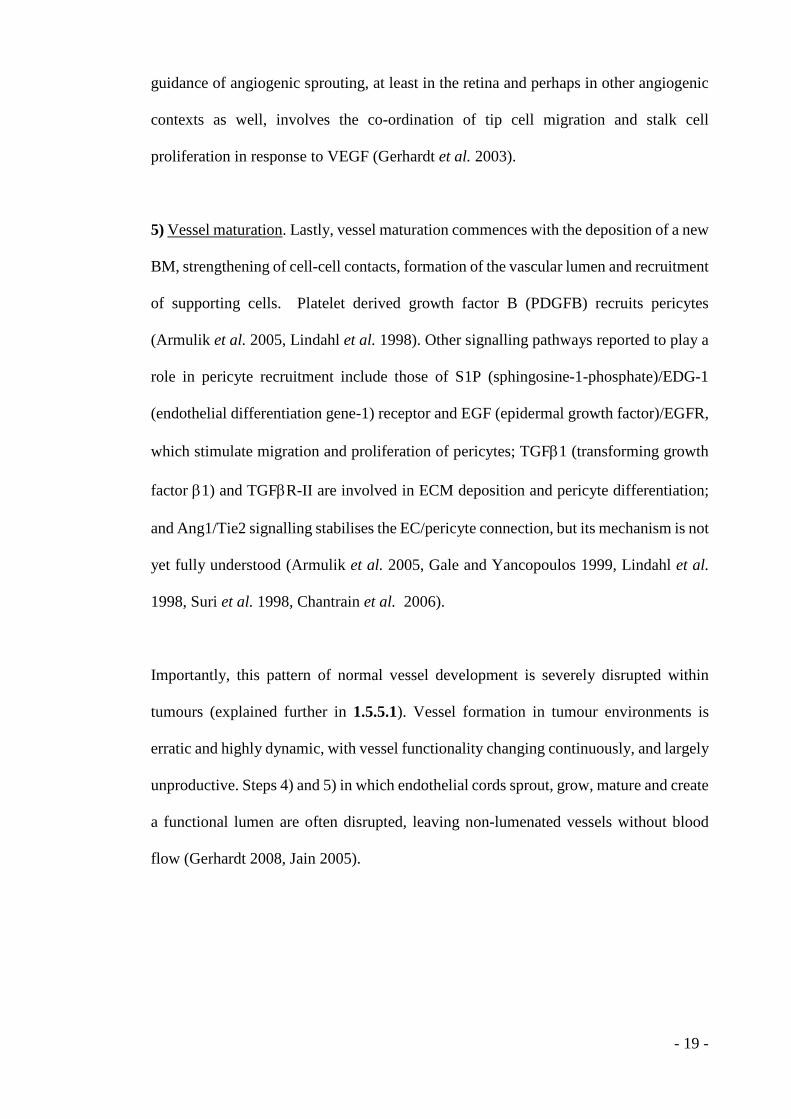
guidance of angiogenic sprouting, at least in the retina and perhaps in other angiogenic
contexts as well, involves the co-ordination of tip cell migration and stalk cell
proliferation in response to VEGF (Gerhardt et al. 2003).
5) Vessel maturation. Lastly, vessel maturation commences with the deposition of a new
BM, strengthening of cell-cell contacts, formation of the vascular lumen and recruitment
of supporting cells. Platelet derived growth factor B (PDGFB) recruits pericytes
(Armulik et al. 2005, Lindahl et al. 1998). Other signalling pathways reported to play a
role in pericyte recruitment include those of S1P (sphingosine-1-phosphate)/EDG-1
(endothelial differentiation gene-1) receptor and EGF (epidermal growth factor)/EGFR,
which stimulate migration and proliferation of pericytes; TGFβ1 (transforming growth
factor β1) and TGFβR-II are involved in ECM deposition and pericyte differentiation;
and Ang1/Tie2 signalling stabilises the EC/pericyte connection, but its mechanism is not
yet fully understood (Armulik et al. 2005, Gale and Yancopoulos 1999, Lindahl et al.
1998, Suri et al. 1998, Chantrain et al. 2006).
Importantly, this pattern of normal vessel development is severely disrupted within
tumours (explained further in 1.5.5.1). Vessel formation in tumour environments is
erratic and highly dynamic, with vessel functionality changing continuously, and largely
unproductive. Steps 4) and 5) in which endothelial cords sprout, grow, mature and create
a functional lumen are often disrupted, leaving non-lumenated vessels without blood
flow (Gerhardt 2008, Jain 2005).
- 19 -
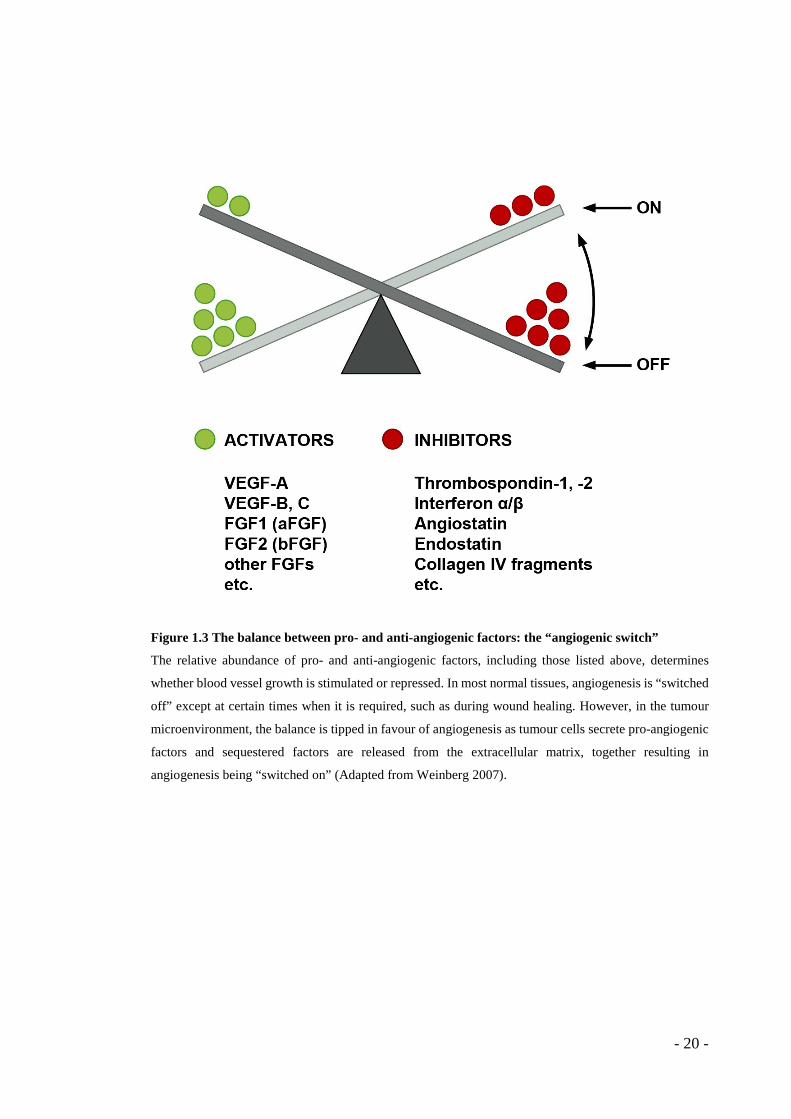
Figure 1.3 The balance between pro- and anti-angiogenic factors: the “angiogenic switch”
The relative abundance of pro- and anti-angiogenic factors, including those listed above, determines
whether blood vessel growth is stimulated or repressed. In most normal tissues, angiogenesis is “switched
off” except at certain times when it is required, such as during wound healing. However, in the tumour
microenvironment, the balance is tipped in favour of angiogenesis as tumour cells secrete pro-angiogenic
factors and sequestered factors are released from the extracellular matrix, together resulting in
angiogenesis being “switched on” (Adapted from Weinberg 2007).
- 20 -
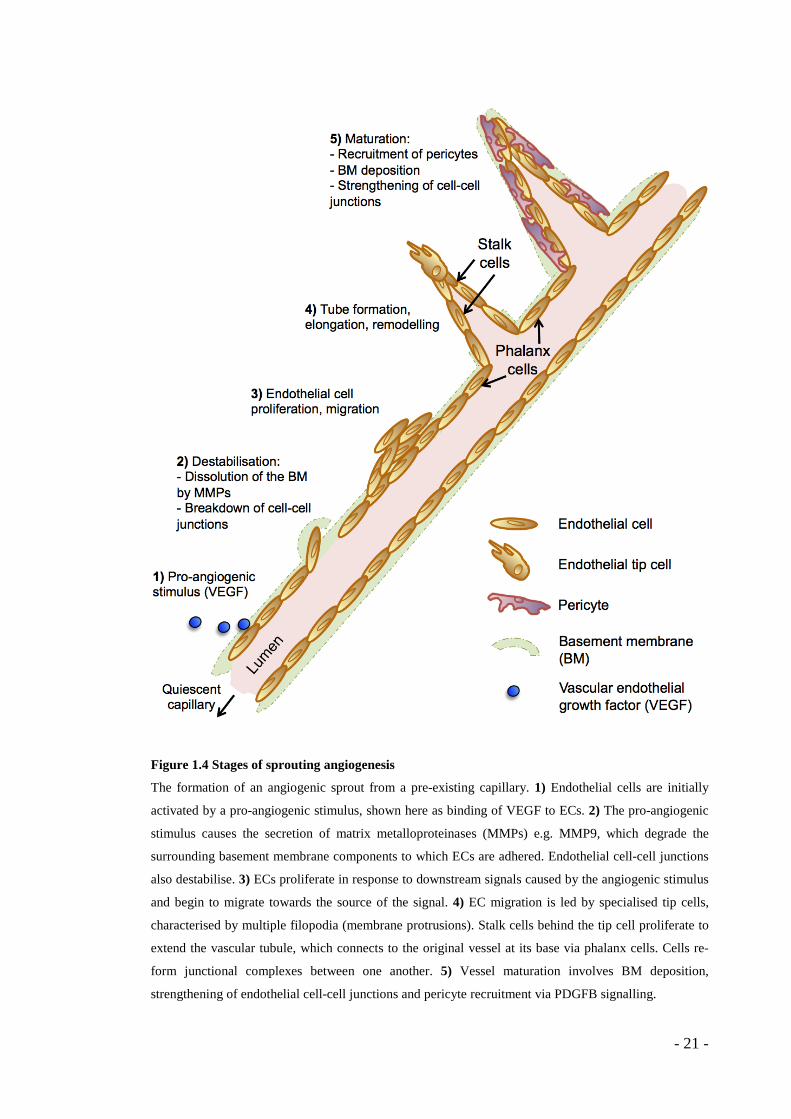
Figure 1.4 Stages of sprouting angiogenesis
The formation of an angiogenic sprout from a pre-existing capillary. 1) Endothelial cells are initially
activated by a pro-angiogenic stimulus, shown here as binding of VEGF to ECs. 2) The pro-angiogenic
stimulus causes the secretion of matrix metalloproteinases (MMPs) e.g. MMP9, which degrade the
surrounding basement membrane components to which ECs are adhered. Endothelial cell-cell junctions
also destabilise. 3) ECs proliferate in response to downstream signals caused by the angiogenic stimulus
and begin to migrate towards the source of the signal. 4) EC migration is led by specialised tip cells,
characterised by multiple filopodia (membrane protrusions). Stalk cells behind the tip cell proliferate to
extend the vascular tubule, which connects to the original vessel at its base via phalanx cells. Cells re-
form junctional complexes between one another. 5) Vessel maturation involves BM deposition,
strengthening of endothelial cell-cell junctions and pericyte recruitment via PDGFB signalling.
- 21 -
1.4 Hypoxia and angiogenesis
Tumours are heterogeneous, rapidly expanding cellular masses with high demands on
oxygen and nutrient supplies. Many areas within tumours experience localised hypoxia,
which can drive the development of new blood vessels into the tumour mass
(Thomlinson 1977). However, these vessels are poorly formed, far more leaky and
inefficient than the normal vasculature, and therefore further contribute to the poor
oxygenation of tumours (Konerding et al. 1999). Hypoxia is also a significant element
of tumour biology because of its propensity both to protect tumour cells from
radiotherapy, chemotherapy and the immune system (Bertout et al. 2008, Chouaib et al.
2012, Thomlinson 1977), and, as more recently described, to stimulate tumour
metastasis (Branco-Price et al. 2012).
The action of Hypoxia-Inducible Factor-1α (HIF-1α) is a major cellular “oxygen-
sensing” mechanism (Bertout et al. 2008, Nishida et al. 2006, Yoo et al. 2006). The
HIFs play a variety of roles in different cell types, including epithetlial to mesenchymal
transition (EMT), thought to be important in carcinogenesis Shiren et al. 2009, Yang et
al. 2008). Continuing with particular focus on the stimulation of pro-angiogenic
signalling by hypoxia, under normoxic conditions, proline hydroxylase enzymes
containing prolyl hydroxylase domains (PHDs) add oxygen to proline residues within
HIF-1α. The hydroxyprolines allow recognition and polyubiquitination of HIF-1α by the
tumour suppressor E3 ubiquitin ligase VHL (von Hippel-Lindau). This marks HIF-1α
for degradation by the 26S proteasome, preventing it from dimerising with its partner
HIF-1β and transcribing pro-angiogenic target genes (Bertout et al. 2008).
However, under hypoxic conditions, HIF-1α does not display hydroxyprolines and VHL
does not ubiquitinate it, leaving it free to dimerise with HIF-1β and bind to HRE
- 22 -

(hypoxia response element) sequences in the promoters of pro-angiogenic genes such as
VEGF and PDGFB, activating their transcription (Figure 1.5) (Bertout et al. 2008). The
resulting pro-angiogenic factors expressed then induce the proliferation and migration
of ECs, allowing increased vascularisation of the hypoxic tissue; a positive angiogenic
process following such events as ischaemic trauma and stroke, but also supporting
pathological conditions such as solid tumour growth.
- 23 -
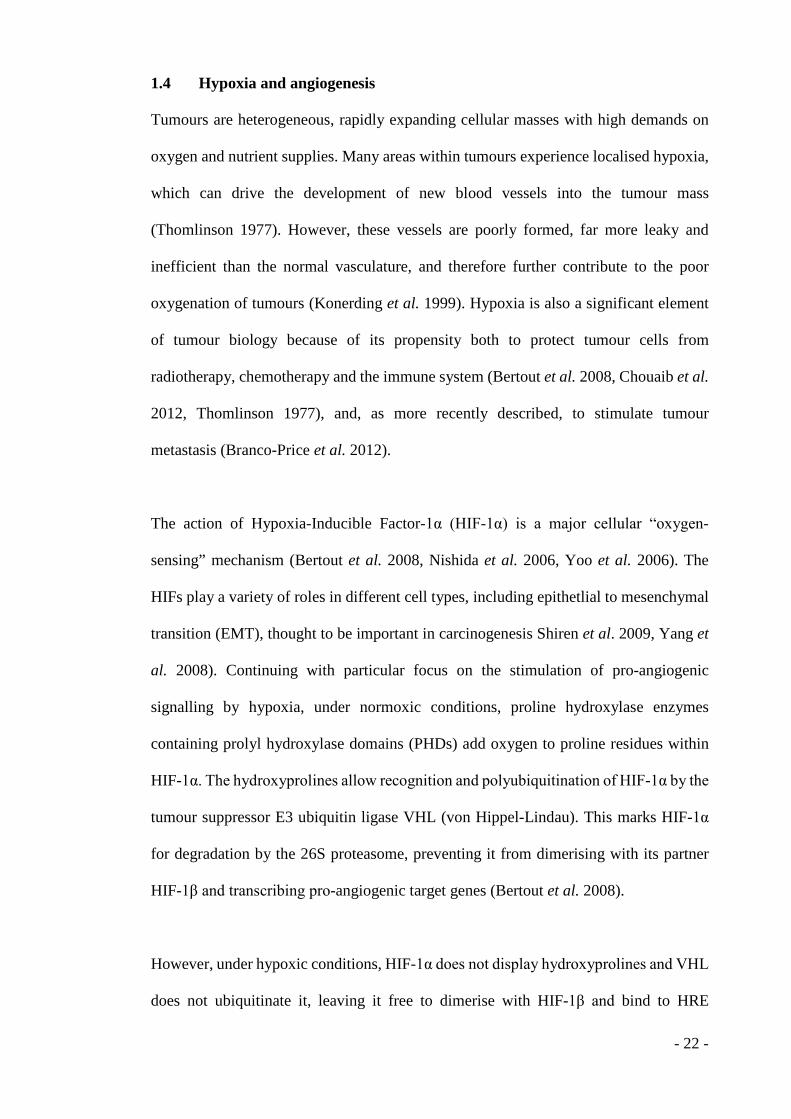
Figure 1.5 Regulation of HIF-1α activity according to oxygen availability.
Under hypoxic conditions the half-life and therefore abundance of HIF-1α is increased and it is free to
dimerise with HIF-1β in the nucleus to form an active heterodimeric transcription factor. The HIF complex
activates pro-angiogenic genes (including vascular endothelial growth factor; VEGF) via binding to
promoter hypoxia response elements (HREs). In normoxic conditions, however, the hydroxylation of HIF-
1α proline residues by proline hydroxylase domain enzymes (PHD proteins) leads to its ubiquitination
(attachment of ubiquitin, Ubi) by the pVHL (von Hippel-Lindau protein) complex and degradation by the
26S proteasome (Adapted from Weinberg 2007).
- 24 -
1.5 Growth factors and their receptors
Angiogenesis is regulated by a variety of molecules including growth factors, their
receptors and adhesion molecules. A major route by which tumours stimulate
angiogenesis is through production of the potent pro-angiogenic factor VEGF, by both
tumour and stromal cells including macrophages, fibroblasts and endothelial cells
(Neufeld et al. 1999, Kiriakidis et al. 2002, Ito et al. 2007, da Silva et al. 2010). Other
notable pro-angiogenic factors with surface receptors on vascular cells include: the
angiopoietins, angiogenin, basic fibroblast growth factor (bFGF), platelet-derived
growth factor (PDGF), and transforming growth factor β (TGFβ) (Adams and Alitalo
2007, Carlson et al. 2001, Karsan et al. 1997, ten Dijke and Arthur 2007).
1.5.1 VEGF
The VEGF protein family consists of 7 members: VEGFs A-E and PlGF (placenta
growth factor). VEGF isoforms -A, -B, -C and -E act on blood vessels via VEGFR-1
(Flt1) and/or VEGFR-2, whereas VEGF-C and VEGF-D influence lymphangiogenesis
through VEGF receptor 3 (VEGFR-3), which is also expressed in the tumour vasculature
(Robinson and Stringer 2001, Roy et al. 2006). VEGF-A, located on human chromosome
6q21.3 (mouse chromosome 17C), was originally designated vascular permeability
factor (VPF) for its ability to increase vessel permeability markedly (Keck et al. 1989).
It is produced by several cell types including macrophages, keratinocytes, pancreatic
cells, hepatocytes, vSMCs, embryonic fibroblasts and tumour cells, and promotes
endothelial proliferation, migration, survival, differentiation, vessel tube formation,
permeability and maintenance (Carmeliet 2005, Ferrara et al. 2003, Yancopoulos et al.
2000). Henceforth, given its pivotal role in angiogenesis and tumour growth and being
a focus of this study, “VEGF” will refer specifically to VEGF-A.
- 25 -
VEGF mRNA is alternatively spliced to give at least 6 variants in humans, named for
their translated amino acid length: 121, 145, 165, 183, 189 and 206, of which VEGF165
is the most studied and known as VEGF164 in mice, since all the murine isoforms are one
amino acid shorter than their human orthologs (Robinson and Stringer 2001). VEGF165
could also be considered the vital VEGF isoform, since it is only the exclusively
VEGF164-expressing transgenic mouse, and no other single variant-expression model,
that develops normally (Eming and Hubbell 2011, Neufeld et al. 1999, Robinson and
Stringer 2001). Demonstrating the vital function of VEGF, deletion of only one allele
results in embryonic lethality at E11-12 due to aberrant vascular development (Ferrara
et al. 1996), while total deletion causes earlier (E9) lethality due to more severe defects
(Carmeliet et al. 1999). VEGF is regulated in several ways: at the transcriptional
(including via HIF-1α as described in 1.4), post-transcriptional, translational and post-
translational levels.
Post-transcriptionally, the half-life of VEGF mRNA is only around one hour due to the
presence of AU-rich elements (AREs) in its 3’ UTR, which mark it for degradation.
However, under hypoxic conditions, an RNA-binding protein called HuR (human
protein R) binds to the AREs, stabilising the mRNA to extend its half-life, causing an
increase in VEGF levels (Nabors et al. 2001, Kurosu et al. 2011). In addition to hypoxia,
VEGF expression is also regulated by other growth factors, cytokines secreted by
immune cells, hormonal signalling and cellular stresses (Eming and Hubbell 2011). It
has been shown that the overexpression of HuR allows enhanced tumour growth and
that HuR deletion results in decreased growth, assumed to be due to VEGF mRNA
stabilisation (Yoo et al. 2006). At the translational level, Myc binds to Vegf mRNA and
upregulates translation initiation by approximately ten-fold (Yoo et al. 2006). Since Myc
activating mutations are common in tumours, this may be a common route by which
- 26 -
tumours overproduce VEGF and indeed, expression of VEGF family members was
observed immunohistochemically in approximately 50 % of human cancers investigated
in 1998 (Nishida et al. 2006).
Post-translationally, the bioavailability of VEGF is limited by its binding to the ECM.
The isoforms VEGF165 and VEGF189 bind heparin in the ECM, whereas VEGF121
diffuses freely (Robinson and Stringer 2001). VEGF165 is also cleaved by MMPs, which
are secreted both by ECs and tumour-associated macrophages (TAMs). This generates
two bioactive N-terminal fragments, VEGF11-110 and 111-165, of which the C-terminal
fragment has been found to be critical for binding to the ECM and to cognate receptors,
and for mediating EC adhesion and survival. It has been shown that MMP inhibitors can
attenuate pathological angiogenesis, showing that release of GFs from the ECM is a key
part of angiogenic sprouting (Eming and Hubbell 2011, Kowanetz and Ferrara 2006,
Tlsty and Coussens 2006).
1.5.1.1 VEGF receptor 2
The VEGF family members bind to their cognate receptors, VEGF receptors (VEGFR)
1, 2, and 3 to exert their biological effects. These receptors are transmembrane tyrosine
kinases for which the binding of their ligands to their extracellular domain induces
dimerisation and autophosphorylation of their intracellular domain and subsequent
activation of downstream signalling cascades (reviewed by Olsson et al. 2006, and
Shibuya 2006). Although VEGF-A interacts with both VEGFR1 and VEGFR2, its pro-
angiogenic effects are mediated mainly by binding to VEGFR2 (in mice: foetal liver
kinase 1 [Flk-1], also kinase-insert domain containing receptor [KDR] in humans), a
tyrosine kinase receptor (RTK) found almost exclusively on ECs (Ferrara et al. 2003,
Robinson and Stringer 2001, Roy et al. 2006, Shibuya 2006, Waltenberger et al. 1994).
- 27 -
Downstream pathways include proliferative and anti-apoptotic signalling via
phospholipase C-γ (PLCγ), increasing the concentration of intracellular Ca2+, and
stimulation of protein kinase C (PKC). Activation of the mitogen-activated protein
kinase/extracellular signal-regulated kinase (MAPK/ERK) cascade follows, which
continues after clathrin-dependent receptor internalisation (Ewan et al. 2006, Takahashi
et al. 2001). VEGFR2 is also recycled to the cell surface, or can continue in the
endocytosis pathway to degradation in the lysosome (Ewan et al. 2006). Thus, VEGFR2
trafficking and its subcellular localisation is thought to be an integral part of the
regulation of VEGF signalling (as reviewed by Horowitz and Seerapu 2012) (Figure
1.6). Survival signals are mediated via the kinase Akt, as well as the stimulation of
migration via phosphatidylinositol-3-kinase (PI3K) and the small GTPases Rho and Rac
(Matsumoto and Mugishima 2006).
The importance of VEGFR2 is demonstrated by the Flk-1 knockout mouse, which shows
an embryonic lethal phenotype between E8.5 and E9.5 due to vasculogenic defects and
severely impaired development of endothelial and haematopoietic cells (Shalaby et al.
1995). VEGFR2 also acts with the co-receptor Neuropilin-1 (NP-1), which appears to
be necessary for VEGFR2 internalisation (Horowitz and Seerapu 2012). Indeed, the NP-
1-null genotype is also embryonic lethal, illustrating its requirement in blood vessel
development (Neufeld et al. 2002, Robinson and Stringer 2001). VEGFR2 over-
expression in colorectal cancer is also considered an independent prognostic factor,
further demonstrating the relevance of angiogenic signalling in solid tumour progression
(Eppenberger et al. 2010).
- 28 -
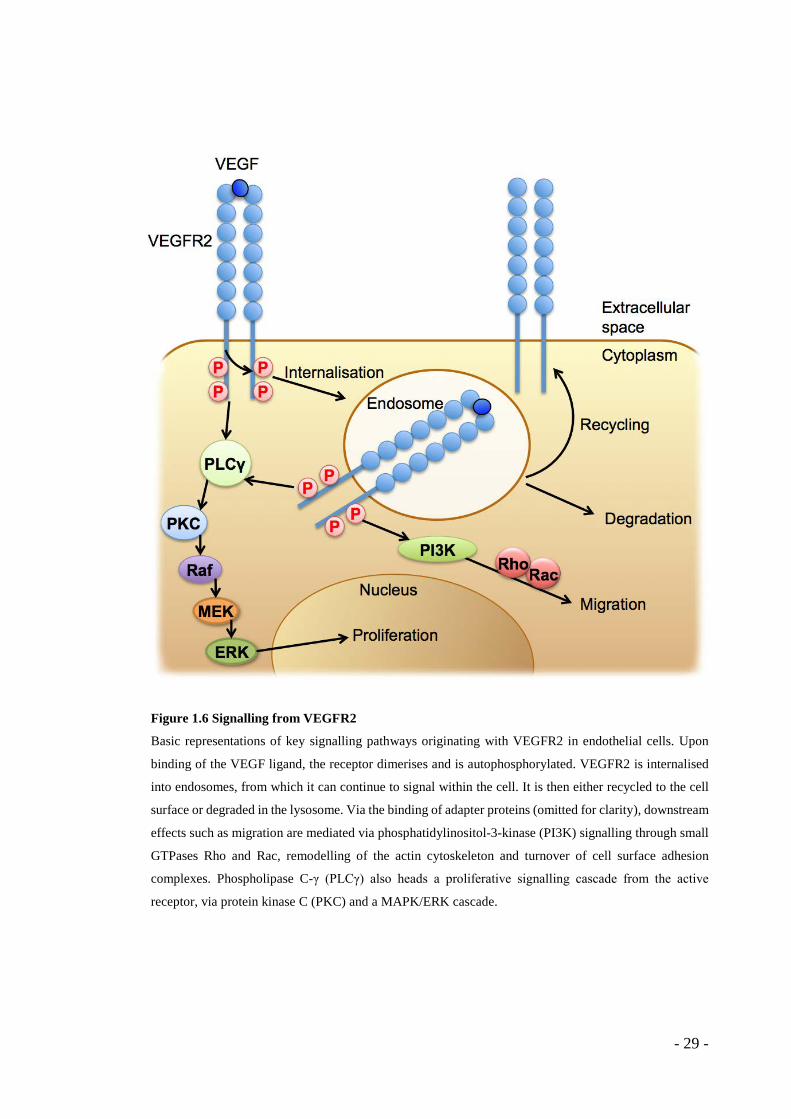
Figure 1.6 Signalling from VEGFR2
Basic representations of key signalling pathways originating with VEGFR2 in endothelial cells. Upon
binding of the VEGF ligand, the receptor dimerises and is autophosphorylated. VEGFR2 is internalised
into endosomes, from which it can continue to signal within the cell. It is then either recycled to the cell
surface or degraded in the lysosome. Via the binding of adapter proteins (omitted for clarity), downstream
effects such as migration are mediated via phosphatidylinositol-3-kinase (PI3K) signalling through small
GTPases Rho and Rac, remodelling of the actin cytoskeleton and turnover of cell surface adhesion
complexes. Phospholipase C-γ (PLCγ) also heads a proliferative signalling cascade from the active
receptor, via protein kinase C (PKC) and a MAPK/ERK cascade.
- 29 -
1.5.2 Fibroblast growth factor
FGFs are pleiotropic factors that exert their effects upon several different cell types,
including endothelial cells. FGFs contribute to embryonic development, wound healing
and tissue homeostasis in the adult, and angiogenic processes (Böttcher and Niehrs 2005,
Dailey et al. 2005, Ornitz and Itoh 2001). There are 22 known human FGFs, of which
FGF-1 (or acid FGF) and FGF-2 (or basic FGF, bFGF) have been particularly well
studied and are expressed almost ubiquitously in both humans and mice (Dailey et al.
2005). However, the FGFs could be considered non-essential players in angiogenic
processes (compared to VEGFs), since the FGF-1/2 double knockout mouse exhibits a
relatively mild phenotype, with only minor neuronal and haematopoietic changes,
compared to the lethal phenotypes of VEGF and VEGFR knockouts (Miller DL et al.
2000).
FGF ligands bind to the FGF receptors (FGFR1-4 and their derived isoforms, which can
each bind different FGFs), with the complex in turn binding heparin or heparan sulphate
proteoglycan (HSPG), abundant extracellular molecules, via one of the three
extracellular Ig-like loop domains of the receptor. This interaction is required for signal
transduction (Ornitz and Itoh 2001). Downstream signalling can influence proliferation,
migration, survival and differentiation in a number of cell types (Dailey et al. 2005).
bFGF can also elicit the same sequence of angiogenic responses in ECs as VEGF, but it
is far less specific (Ornitz and Itoh 2001). VEGF also elicits a stronger anti-apoptotic
signal in microvascular endothelial cells than bFGF (Gupta et al. 1999).
- 30 -
1.5.3 Platelet derived growth factor
There are several PDGF isoforms: PDGFA, -AB, -C, -D and PDGFB, and three cognate
receptor isoforms to which they bind: PDGFRα, -αβ and PDGFRβ. PDGFB/PDGFRβ-
stimulated pericyte recruitement is of particular interest in this study, in relation to
sprouting angiogenesis. PDGFB is released from ECs (of arterioles and capillaries, but
not venules - mainly by endothelial tip cells in healthy tissue, but more heterogeneously
by tumour microvessels (Gerhardt and Bertsholtz 2003) and can bind to proteoglycans
in the ECM until released by MMPs, similar to VEGF (Kurup et al. 2006). Free PDGFB
facilitates the recruitment of pericytes to stabilise new vessels via binding to its receptor
PDGFRβ on pericytes, stimulates the mesenchymal cells to migrate towards local
endothelial cells and form cell-cell contacts (Adams and Alitalo 2007, Hall 2006, Homsi
and Daud 2007, Thurston et al. 2000, Gerhardt and Bertsholtz 2003), as described in
1.2.1.2.
Both PDGFB-null and PDGFRβ-null mice have embryonic lethal phenotypes involving
severe pericyte deficit, demonstrating the requirement both for the supporting cells
themselves and the major signalling pathway that recruits them to maturing blood
vessels (Lindahl et al. 1997, Soriano 1994). The vital role of PDGFRβ is also
demonstrated by the injection of PDGFRβ blocking antibodies in neonatal mice, which
completely prevented pericyte recruitment to retinal vessels and severely impaired
development of the network (Uemura et al. 2002).
- 31 -
1.5.4 Integrins
Endothelial cells adhere to the surrounding ECM via cell surface molecules including,
in particular, the integrins. Integrins are transmembrane heterodimeric receptors
composed of one α and one β subunit, of which β is smaller. The combinations of
subunits dictate the ECM component binding specificity of the cell surface complex
(Table 1.1). Integrins are not restricted to endothelial cells, though some are cell type-
specific, for example, integrin β2 is found only on leukocytes. Endothelial integrin
dimers include α1β1, α2β1, α3β1, α4β1, α5β1, α6β1, αvβ3 and αvβ5, with α7β1 and
α8β1 found on pericytes, and several β1 dimers expressed by both cell types (Abraham
et al. 2008, Silva et al. 2008, Stupack and Cheresh 2002).
ECM component Binding integrin heterodimers
Laminin α3β1, α6β1. α6β4
Collagen α1β1, α2β1
RGD peptide motif (FG, FN, vWF, VN)
α5β1, αvβ3, αvβ5
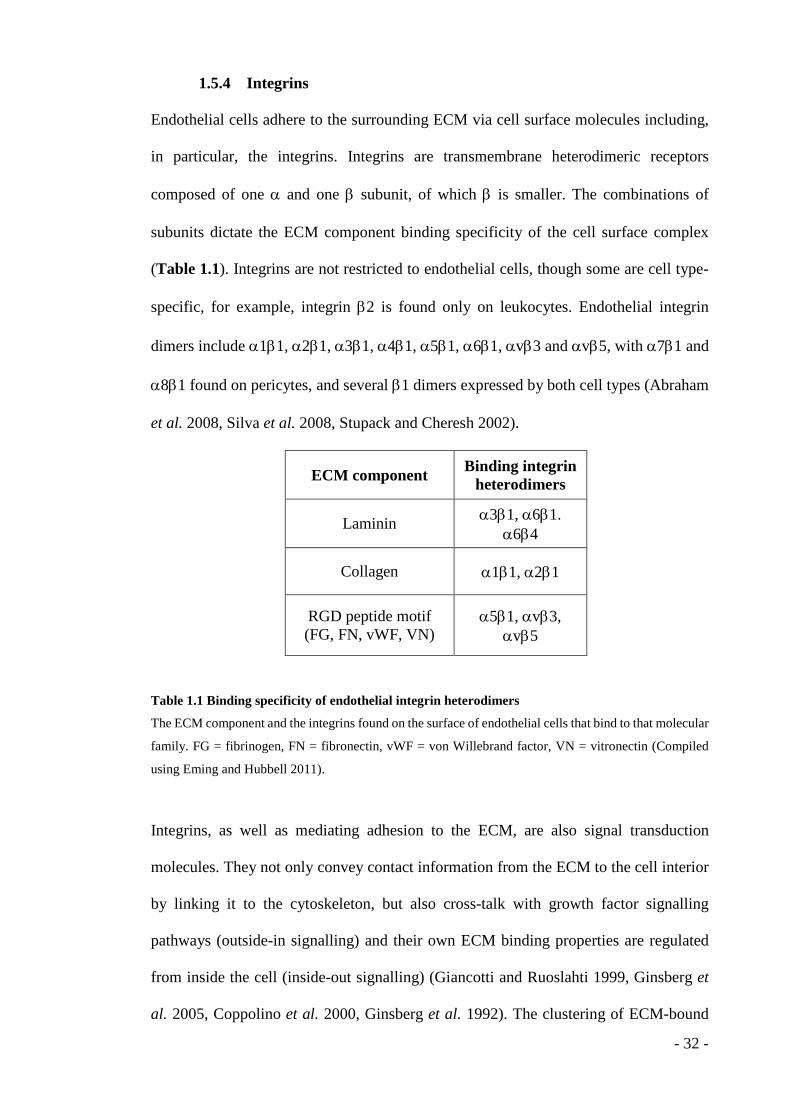
Table 1.1 Binding specificity of endothelial integrin heterodimers
The ECM component and the integrins found on the surface of endothelial cells that bind to that molecular
family. FG = fibrinogen, FN = fibronectin, vWF = von Willebrand factor, VN = vitronectin (Compiled
using Eming and Hubbell 2011).
Integrins, as well as mediating adhesion to the ECM, are also signal transduction
molecules. They not only convey contact information from the ECM to the cell interior
by linking it to the cytoskeleton, but also cross-talk with growth factor signalling
pathways (outside-in signalling) and their own ECM binding properties are regulated
from inside the cell (inside-out signalling) (Giancotti and Ruoslahti 1999, Ginsberg et
al. 2005, Coppolino et al. 2000, Ginsberg et al. 1992). The clustering of ECM-bound
- 32 -
integrins and their cytoplasmic binding partners at the membrane and recruitment of the
key downstream signalling protein focal adhesion kinase (FAK) is termed formation of
a focal contact. Focal contacts connect actin cytoskeleton stress fibres within the cell to
the ECM in focal adhesion complexes (Geiger and Bershadsky 2001, Yamada 1997).
The full range of integrin functions, however, is not yet fully understood, as evidenced
by apparently conflicting results from blocking antibody and knockout mouse model
studies. It was thought that a simple relationship between integrins and pro-angiogenesis
would exist and this idea is supported by some integrin-inhibition studies. For example,
a small molecule dual inhibitor of αvβ3 and αvβ5 (LM609) decreased tumour growth
in vivo and angiogenesis in the chick chorioallantoic membrane assay (Kumar et al.
2001). Additionally, administration of an anti-αvβ3 antibody, Vitaxin, to a small cohort
of late-stage cancer patients in the clinic gave positive results (Gutheil et al. 2000).
However, the assumption that integrins are only pro-angiogenic does not hold true. For
example, in mice lacking β3 or both β3 and β5 integrins, tumour growth and
vascularisation were in fact enhanced, which was found to be mediated by increased
VEGFR2 expression (Reynolds et al. 2004, Reynolds et al. 2002). Subsequently, VEGF-
induced blood vessel permeability was enhanced in β3-null mice, and use of the anti-
VEGFR2 antibody DC101 abrogated this phenotype (Reynolds et al. 2002, Robinson et
al. 2009). Similarly, endothelial cell-specific deletion of α6 integrin using a Tie-1 Cre
recombinase model also increased tumour growth and vascularisation, and VEGF-
stimulated angiogenesis, concurrent with VEGFR2 upregulation (Germain et al. 2009).
Recently, α2β1 integrin was also found to promote EC quiescence (Cailleteau et al.
2010).
- 33 -
Most strikingly, when the dosage of RGD ligand-mimetic αvβ3 and αvβ5 inhibitor
drugs in clinical trials was examined in detail, it was found that low doses could actually
stimulate tumour growth and angiogenesis (Reynolds et al. 2009). Together these
apparently conflicting results show that our knowledge of integrin modes of action in
ECs and angiogenesis, especially in pathological contexts, is still lacking. Further
examination of the molecular interactions between blood vessel cells and their
environment, and with each other, is required to inform the development of more
effective therapies.
1.5.5 Anti-angiogenic therapy
The rationale behind anti-angiogenic therapy is that severing the tumour’s blood supply
by removing angiogenic stimuli and promoting tumour EC death should starve the
tumour and perhaps reduce metastasis by removing the conduit for tumour cells to enter
the blood stream and travel to new niches (Cheresh 1998, Fidler and Ellis 1994).
Initially, “first generation” therapies focused on VEGF signalling, being a dominant pro-
angiogenic force in tumour growth (as discussed in 1.5.1) and some of these strategies
are depicted in Figure 1.7. For example, the humanised monoclonal anti-VEGF
antibody bevacizumab (or Avastin®, produced by Genentech) was the first drug of its
kind to be approved by the US Food and Drug Administration (FDA) and is now
administered as monotherapy to non-responding glioblastoma patients (Shih and
Lindley 2006). However, in most cases bevacizumab is not beneficial when
administered alone and serious side effects have also been noted, due to off-target
damage to healthy tissue (Chen and Cleck 2009, Loges et al. 2010).
“Second generation” broad-spectrum receptor tyrosine kinase inhibitors (RTKIs)
targeting VEGFR2 and other RTKs such as FGFR, EGFR and PDGFR have also been
- 34 -
developed. These include sunitinib and sorafenib, which are also approved in some
advanced cases of renal cell, gastro-intestinal and hepatocellular cancers as
monotherapy, presumed to be more effective than first generation strategies due to their
multi-target mechanisms (Gotink and Verheul 2010, Homsi and Daud 2007). However,
in most cases such therapies have been limited to extending survival only for several
months (Loges et al. 2010, O'Reilly 2007).
The original assumptions behind anti-angiogenic therapy have been challenged by pre-
clinical and clinical results, so it is now acknowledged that targeting only one factor is
not enough; the use of anti-angiogenic agents alone has proved insufficiently
efficacious. It has been reported that improved blood flow and normalisation of
interstitial pressure can lead to deeper, more efficient drug delivery and indeed,
bevacizumab is approved for administration to metastatic colorectal, selected non-small
cell lung and metastatic renal cell cancer patients, in combination with cytotoxic or
cytokine therapy (Carmeliet and Jain 2011). Combination therapies are being tested and
approved more frequently but require extensive evaluation for safety.
Most recently, “third generation” strategies are emerging, involving other concepts in
tumour biology: targeting myeloid cells (e.g. TAMs) in the immune compartment;
promoting non-productive angiogenesis; blocking neuropilin (Nrp) receptors both to
synergistically enhance anti-VEGF targeting and as an anti-lymphatic treatment; and
finally, through vessel normalisation, which is explained further in 1.5.5.1 below and
demonstrated in Figure 1.8 (Loges et al. 2010).
- 35 -
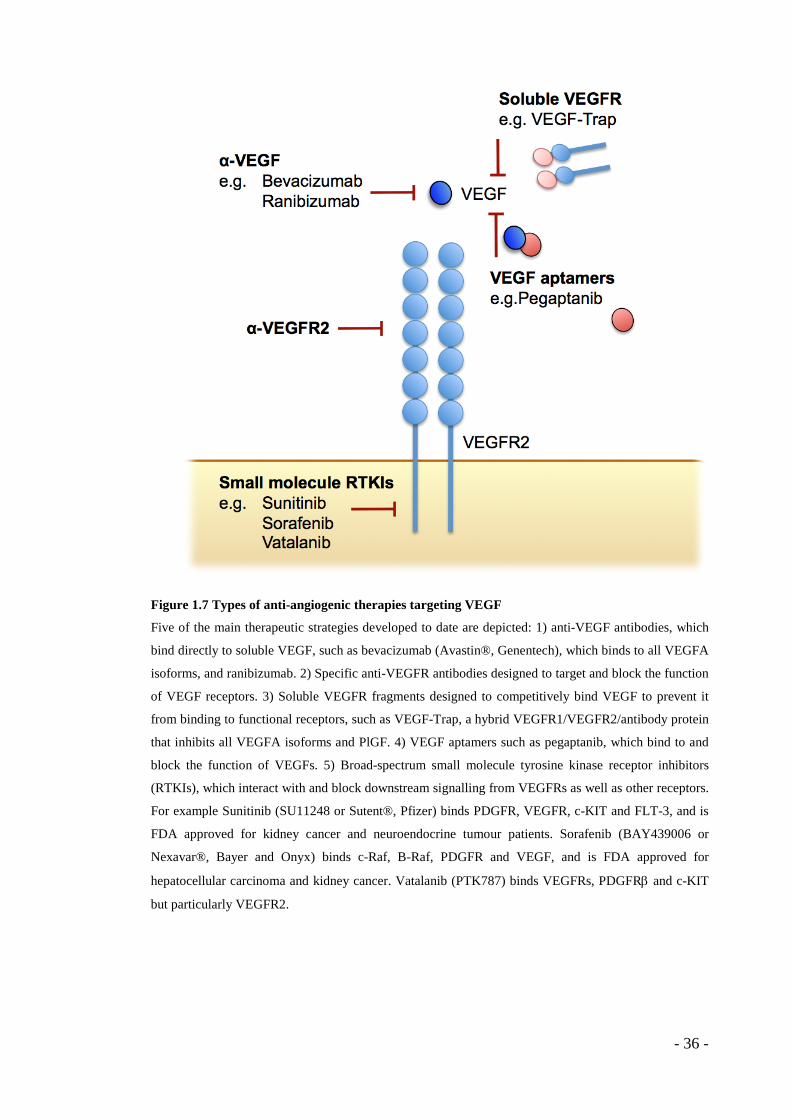
Figure 1.7 Types of anti-angiogenic therapies targeting VEGF
Five of the main therapeutic strategies developed to date are depicted: 1) anti-VEGF antibodies, which
bind directly to soluble VEGF, such as bevacizumab (Avastin®, Genentech), which binds to all VEGFA
isoforms, and ranibizumab. 2) Specific anti-VEGFR antibodies designed to target and block the function
of VEGF receptors. 3) Soluble VEGFR fragments designed to competitively bind VEGF to prevent it
from binding to functional receptors, such as VEGF-Trap, a hybrid VEGFR1/VEGFR2/antibody protein
that inhibits all VEGFA isoforms and PlGF. 4) VEGF aptamers such as pegaptanib, which bind to and
block the function of VEGFs. 5) Broad-spectrum small molecule tyrosine kinase receptor inhibitors
(RTKIs), which interact with and block downstream signalling from VEGFRs as well as other receptors.
For example Sunitinib (SU11248 or Sutent®, Pfizer) binds PDGFR, VEGFR, c-KIT and FLT-3, and is
FDA approved for kidney cancer and neuroendocrine tumour patients. Sorafenib (BAY439006 or
Nexavar®, Bayer and Onyx) binds c-Raf, B-Raf, PDGFR and VEGF, and is FDA approved for
hepatocellular carcinoma and kidney cancer. Vatalanib (PTK787) binds VEGFRs, PDGFRβ and c-KIT
but particularly VEGFR2.
- 36 -
1.5.5.1 Vascular normalisation
Since endothelial cells are non-neoplastic cells they were thought to be less likely than
tumour cells to develop resistance to therapy, but the development of resistance has in
fact been observed, whereby angiogenesis is stimulated via alternative pathways
including PlGF, Ang-1 and FGF signalling (Loges et al. 2010). In addition, the
promotion of metastasis as a result of such treatments has been observed but this effect
is still in debate due to conflicting data (Carmeliet and Jain 2011, Pàez-Ribes et al. 2009,
Singh et al. 2012). Despite these findings, anti-angiogenic therapy is still an attractive
anti-cancer strategy, in part due to a phenomenon first described in the 70s termed
“vessel normalisation” (Figure 1.8), which serves to decrease hypoxia and metastasis
and could improve drug delivery and efficacy (Carmeliet and Jain 2011, Serve and
Hellmann 1972).
Importantly, while tumour ECs are non-neoplastic, the tumour vasculature is
nevertheless unlike the normal vasculature. Tumour vessels themselves are more leaky
than normal vessels, chaotic and tortuous in their organisation, and extremely
heterogeneous (Dudley 2012, Tlsty and Coussens 2006). Tumour ECs often display little
to no polarity, are poorly differentiated and loosely associated with the BM and with
each other, and form multi-layers with gaps between cells. Tumour vessels are also often
“mosaic”, with EC-mimicking tumour cells and other cell type progenitors incorporating
into the vessel wall (Wang et al. 2010). In some cases, ECs are absent from sections of
vessels, with BM-only “string vessels” remaining (Carmeliet and Jain 2011, Dudley
2012, Yuan et al. 2012). Other vessel wall abnormalities include variable (but often
poor) de-differentiated pericyte coverage, and the generation of an unstable thicker BM
as well as, due to high turnover rates, “naked” EC channels completely devoid of BM
(Carmeliet and Jain 2011).
- 37 -
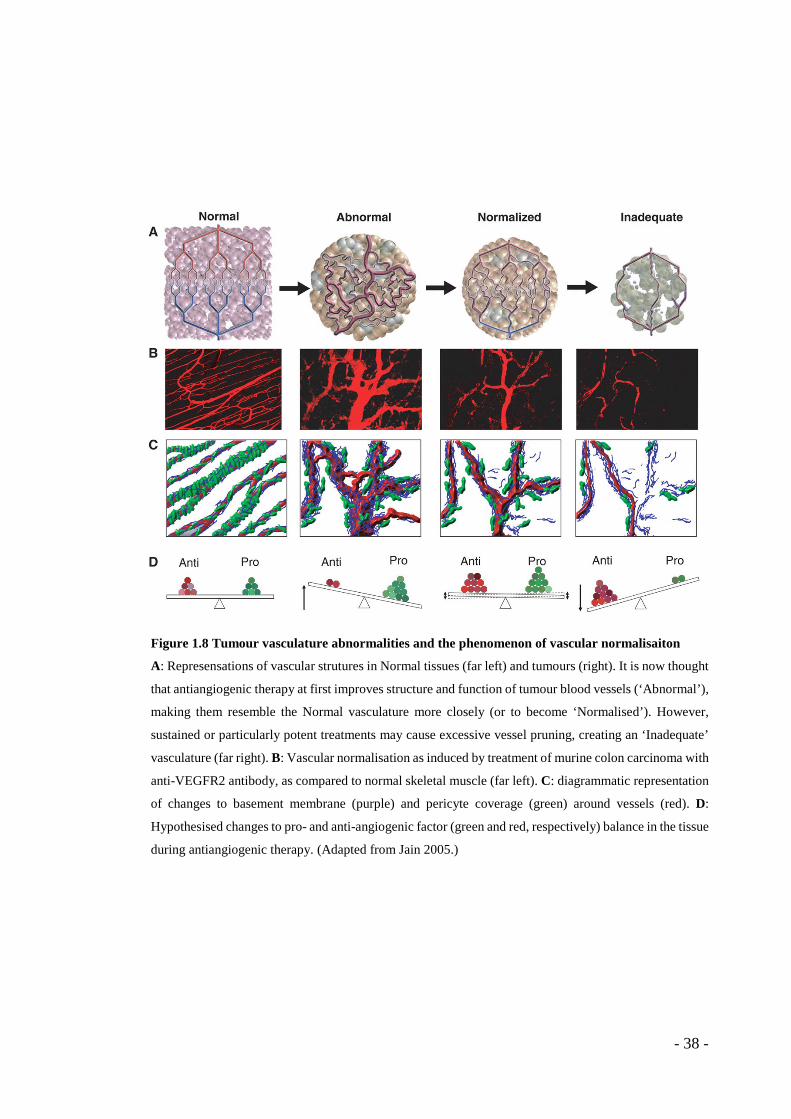
Figure 1.8 Tumour vasculature abnormalities and the phenomenon of vascular normalisaiton
A: Represensations of vascular strutures in Normal tissues (far left) and tumours (right). It is now thought
that antiangiogenic therapy at first improves structure and function of tumour blood vessels (‘Abnormal’),
making them resemble the Normal vasculature more closely (or to become ‘Normalised’). However,
sustained or particularly potent treatments may cause excessive vessel pruning, creating an ‘Inadequate’
vasculature (far right). B: Vascular normalisation as induced by treatment of murine colon carcinoma with
anti-VEGFR2 antibody, as compared to normal skeletal muscle (far left). C: diagrammatic representation
of changes to basement membrane (purple) and pericyte coverage (green) around vessels (red). D:
Hypothesised changes to pro- and anti-angiogenic factor (green and red, respectively) balance in the tissue
during antiangiogenic therapy. (Adapted from Jain 2005.)
- 38 -
Together the abnormalities of tumour vessels contribute to the inefficient function of the
tumour vasculature, including heterogeneous blood flow, poor tumour perfusion and
restricted immune access, which in turn promotes hypoxia, further non-productive
angiogenesis and vascular remodelling in a positive but futile feedback loop.
Consequently, metastasis can become more likely as tumour cells have a low-resistance
barrier to intravasation.
Attempts to restore the angiogenic “balance” (a more anti-angiogenic state, as shown in
Figure 1.3) in preclinical models, for example by decreasing VEGF availability or
manipulating the HIF-1α pathway, have shown that a transient vessel normalisation
window presents itself in which tumour perfusion, oxygenation and drug delivery are
increased. The promotion of vessel maturation (improving vessel quality and function
rather than vessel pruning and blockade) is another aspect of normalisation. This can
involve the stimulation of pericyte coverage and tightening EC contacts via blocking the
pro-angiogenic factor Ang-2. In addition, blocking PlGF appears to promote the M1
phenotype of tumour-associated macrophages or TAMs (where the M2 phenotype is pro-
angiogenic) and create a more uniform tumour vasculature (Bouzin and Feron 2007,
Carmeliet and Jain 2011).
Clinically, collection and analysis of data can prove difficult, since imaging technology
is limited and monitoring during treatment is typically infrequent. However, some
normalisation has been observed in small patient trials and human tumour samples. It is
hypothesised and supported by some data that increased tumour cell proliferation around
normalised vessels can sensitise them to cytotoxic chemotherapy, and that decreased
hypoxia due to improved blood flow and oxygen delivery can increase the efficacy of
- 39 -
radiotherapy (Bertout et al. 2008, Carmeliet and Jain 2011). Normalisation also
improves immune cell infiltration into tumours, assisting immunotherapy strategies.
Anti-angiogenic strategies have not only focused on VEGF (and other pro-angiogenic
growth factors) and vascular normalisation, but also on cell adhesion molecules such as
integrins; the examples of Cilengitide (Merck), which binds to and inhibits αv integrins
(Reynolds et al. 2009), and Vitaxin, which is a blocking antibody for αvβ3 integrins,
were introduced in 1.5.4. In addition, histone deacetylase (HDAC) inhibitors have been
targeted in an attempt to modulate HIF-1α activity and downstream angiogenic
responses, as described in 1.4, and have been successful in preclinical models and early
clinical trials (Ellis et al. 2009). MMPs have also been targeted with limited success but
may be more effective as combination therapy (Zucker et al. 2000). It is likely that many
viable anti-angiogenic therapeutic strategies are yet to be discovered and improving our
understanding of the molecular players in tumour angiogenesis will surely reveal new
targets.
1.6 Endothelial cell-cell adhesion
The endothelial cell-cell junctions include both tight junctions (TJs) and adherens
junctions (AJs), which are depicted in Figure 1.9 with their associated cell surface
molecules and cytoplasmic binding partners. For multicellular organisms to function,
individual cells must adhere to each other as well as their environment in order to form
functioning tissues and barriers between bodily compartments and the outside world.
The endothelial barriers of blood vessels are semi-permeable to allow the controlled
release of fluids, solutes, proteins and immune cells. Transcellular permeability
describes the movement of solutes through cells via vesicular transport, whereas
paracellular permeability involves the control of the spaces between cells. The integrity
- 40 -
of the endothelial cell barriers in different parts of the vascular system is determined by
how robustly ECs are adhered to one other via cell-cell junctions and their temporary
breakdown is required for endothelial cell division, migration and formation of new
blood vessels during angiogenesis, with cell contacts re-established during maturation
(Lampugnani et al. 2002). The rapid formation and constant remodelling of tumour
vessels leads to abnormalities in vessel permeability, lumen formation, supporting cell
association, and overall functionality, as described in 1.5.1.2, with endothelial cells
poorly adhered to one another.
AJs are ubiquitous in the vascular system, while TJs are thought to be more restricted to
certain endothelial layers such as the blood-brain barrier (BBB) where TJs are especially
abundant, with fewer well-developed TJs in other vessels such as microcapillaries
(Willis et al. 2007). The space between adjacent cell membranes at an AJ is 3 nm on
average, compared to the 1 nm TJ average where membrane proximity is very high
(Yuan and Rigor 2010). Together these cell-cell junctions regulate endothelial
paracellular permeability (Bazzoni and Dejana 2004). While comprising different
components, AJs and TJs both contain specialised transmembrane proteins, which bind
cytoplasmic adapter proteins. Together they mediate contact inhibition of cellular
proliferation, with downstream signalling altering gene transcription, and also maintain
cellular polarity (Bazzoni and Dejana 2004). The characteristic transmembrane elements
of AJs are cadherins, specifically vascular endothelial cadherin (VECAD) in endothelial
cells. Cadherins bind catenin proteins in the cytoplasm, which contact and connect AJs
to the cytoskeleton. AJs prompt the formation of TJs, but are not necessary for their
maintenance (Hartsock and Nelson 2008). Occludin and claudins form the TJ
“backbone”, also known as strands, and they in turn associate with other transmembrane
proteins such as the junctional adhesion molecules (JAMs), together regulating
- 41 -
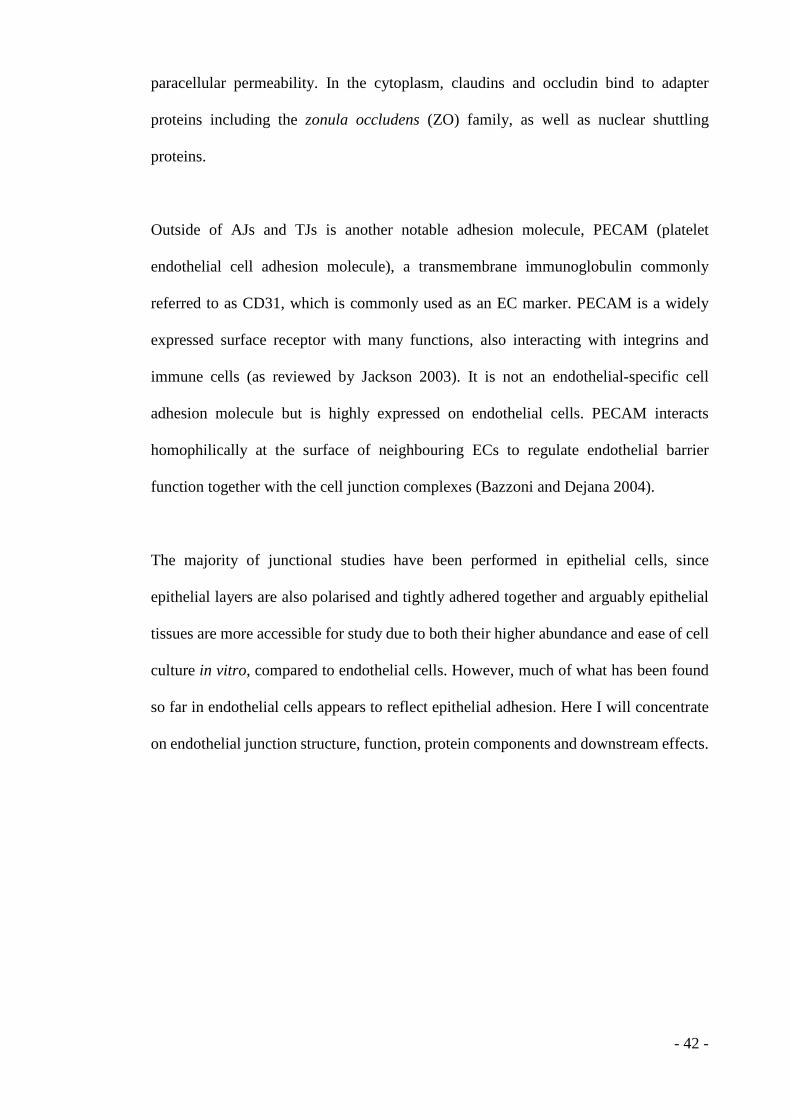
paracellular permeability. In the cytoplasm, claudins and occludin bind to adapter
proteins including the zonula occludens (ZO) family, as well as nuclear shuttling
proteins.
Outside of AJs and TJs is another notable adhesion molecule, PECAM (platelet
endothelial cell adhesion molecule), a transmembrane immunoglobulin commonly
referred to as CD31, which is commonly used as an EC marker. PECAM is a widely
expressed surface receptor with many functions, also interacting with integrins and
immune cells (as reviewed by Jackson 2003). It is not an endothelial-specific cell
adhesion molecule but is highly expressed on endothelial cells. PECAM interacts
homophilically at the surface of neighbouring ECs to regulate endothelial barrier
function together with the cell junction complexes (Bazzoni and Dejana 2004).
The majority of junctional studies have been performed in epithelial cells, since
epithelial layers are also polarised and tightly adhered together and arguably epithelial
tissues are more accessible for study due to both their higher abundance and ease of cell
culture in vitro, compared to endothelial cells. However, much of what has been found
so far in endothelial cells appears to reflect epithelial adhesion. Here I will concentrate
on endothelial junction structure, function, protein components and downstream effects.
- 42 -
Figure 1.9 Endothelial cell-cell junctions
Cartoon of two contacting endothelial cells and one pericyte with major junctional molecules indicated.
Tight junctions include: claudins and occludin, JAMs (junctional adhesion molecules), and ESAM
(endothelial cell selective adhesion molecule). Downstream zonula occludens (ZO) adapter proteins are
shown linking TJs to the cytoskeleton. Adherens junctions include: VECAD (vascular endothelial
cadherin), shown bound to catenins p120, γ-catenin and β-catenin, linked to the cytoskeleton. PECAM
(platelet endothelial cell adhesion molecules) also adheres endothelial cells to one another via homophilic
interaction and is commonly used as an endothelial cell marker. NCAD (neuronal cadherin) is thought to
be involved in endothelial-pericyte interactions in the form of NCAD/β-Catenin adherens junctions
(Gerhardt and Bersholtz 2003). The polarity of the cells is indicated, with the cell apices facing inwards
towards the lumen and basal sides contacting the basement membrane (BM). (Adapted from Dejana 2004).
- 43 -
1.7 Adherens junctions
The patterning of adherens junctions (AJs) on endothelial cells varies between tissues
and this correlates with the level of vascular permeability in that tissue. For example,
AJs in the BBB are typically located at basolateral surfaces of ECs, where they maintain
a tight barrier structure. In contrast, AJs in microcapillaries are more diffusely
distributed around the cell and this correlates with a more permeable barrier type
(Bazzoni and Dejana 2004).
1.7.1 Vascular endothelial cadherin (VECAD)
VECAD is the major transmembrane protein found in endothelial AJs. The extracellular
domain, containing five extracellular cadherin (EC) domains, interacts homotypically
with VECAD proteins on the surface of adjacent cells. The interaction of VECAD
cytoplasmic tails with catenin binding partners and their associated proteins is
collectively referred to as the cytoplasmic cell adhesion complex (CCC). The CCC as a
whole is required for stable AJ formation and maintenance, and for the regulation of
endothelial morphology and paracellular permeability (Corada et al. 2002).
Members of the “classical” or Type I subset of the cadherin family of proteins were
named for the cell type in which they were found: epithelial cadherin (ECAD or E-
Cadherin) neural cadherin (NCAD or N-Cadherin) and placental cadherin (PCAD or P-
Cadherin). VE-cadherin is a Type II cadherin, distinguished by the lack of an HAV
cadherin binding motif present in the Type I cadherins (Vestweber 2008). Both VECAD
and NCAD are expressed by endothelial cells, with NCAD thought to mediate pericyte-
endothelial interaction at sites of contact via NCAD/β-Catenin AJs (Gerhardt and
Bersholtz 2003). All cadherins have a single pass transmembrane structure with cadherin
repeats in the extracellular domain, which require calcium ions (Ca2+) for cell adhesion
- 44 -
complex function (Braga et al. 1999, Gumbiner 2005, Wheelock and Johnson 2003).
Ion-bound VECAD monomers interact laterally together at the cell surface and
homotypically via the extracellular domain to contact neighbouring ECs. Multiple
functions have been described for VECAD, not limited to its cell-cell adhesion role, but
extending to the regulation of VEGFR2 signalling and directing the transcription of
other endothelial proteins (Bazzoni and Dejana 2004, Carmeliet et al. 1999, Christofori
2003, Lampugnani et al. 2006). VECAD controls vascular permeability dynamically via
three main mechanisms: 1) phosphorylation (as well as that of its catenin binding
partners), 2) internalisation and 3) cleavage (Dejana 2004).
VECAD is phosphorylated at five known tyrosine sites and one serine site (reviewed in
Dejana et al. 2008). The extent of tyrosine phosphorylation was found to correlate
inversely with cell density in culture, although the significance of VECAD
phosphorylation in vivo is not yet fully understood (Dejana et al. 2008, Lampugnani and
Dejana 1997). In addition, tyrosine phosphorylation was also found to inhibit p120 and
β-catenin binding, maintaining ECs in a mesenchymal migratory state (Potter et al.
2005). Rac-mediated serine phosphorylation of VECAD also leads to its clathrin-
dependent internalisation and subsequent degradation, which increases permeability
(Horowitz and Seerapu 2012). This cascade was found to be triggered by VEGF-
mediated activation of Src, which phosphorylates a Rac-activating protein, VAV2. This
VECAD internalisation was also found to be inhibited by p120 binding (Xiao et al.
2005). Cell morphology and motility is also controlled via p120 catenin, which interacts
with the small Rho GTPase proteins Rho, Rac (as indicated downstream of VEGFR2 in
Figure 1.6) and cdc42 that together regulate the different structures that compose the
cytoskeleton (Braga 2002, Lampugnani et al. 2002, Perez-Moreno and Fuchs 2006).
- 45 -
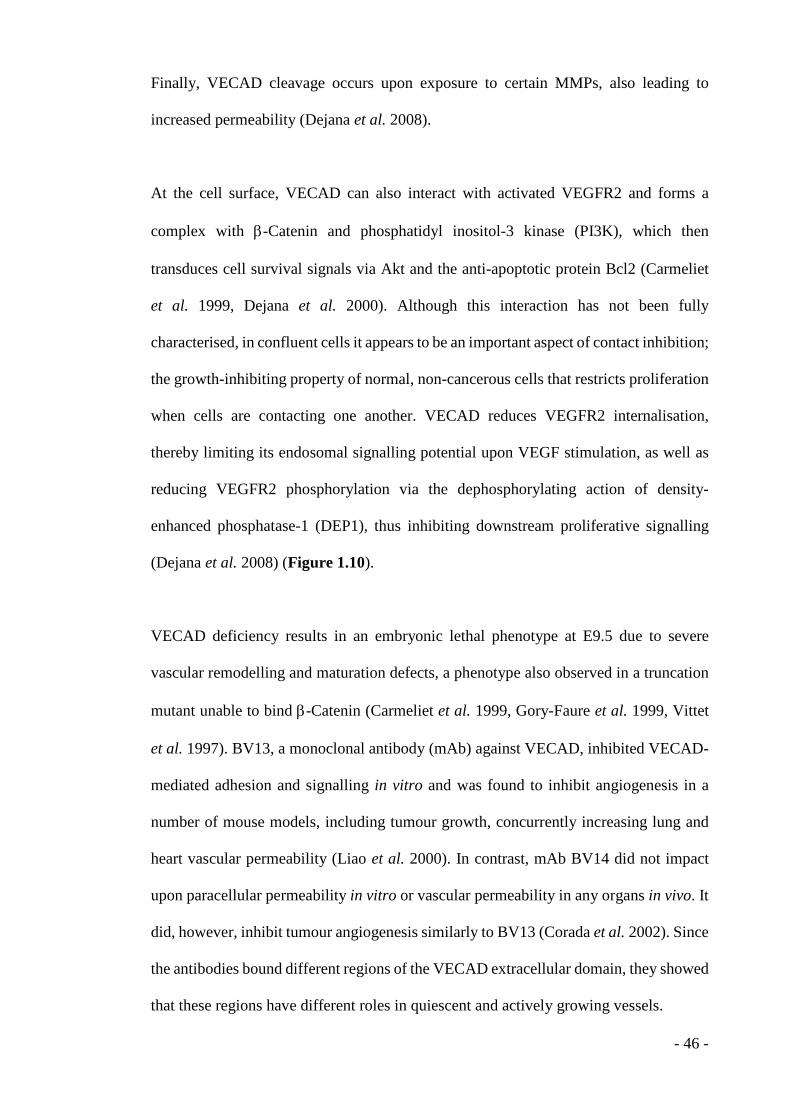
Finally, VECAD cleavage occurs upon exposure to certain MMPs, also leading to
increased permeability (Dejana et al. 2008).
At the cell surface, VECAD can also interact with activated VEGFR2 and forms a
complex with β-Catenin and phosphatidyl inositol-3 kinase (PI3K), which then
transduces cell survival signals via Akt and the anti-apoptotic protein Bcl2 (Carmeliet
et al. 1999, Dejana et al. 2000). Although this interaction has not been fully
characterised, in confluent cells it appears to be an important aspect of contact inhibition;
the growth-inhibiting property of normal, non-cancerous cells that restricts proliferation
when cells are contacting one another. VECAD reduces VEGFR2 internalisation,
thereby limiting its endosomal signalling potential upon VEGF stimulation, as well as
reducing VEGFR2 phosphorylation via the dephosphorylating action of density-
enhanced phosphatase-1 (DEP1), thus inhibiting downstream proliferative signalling
(Dejana et al. 2008) (Figure 1.10).
VECAD deficiency results in an embryonic lethal phenotype at E9.5 due to severe
vascular remodelling and maturation defects, a phenotype also observed in a truncation
mutant unable to bind β-Catenin (Carmeliet et al. 1999, Gory-Faure et al. 1999, Vittet
et al. 1997). BV13, a monoclonal antibody (mAb) against VECAD, inhibited VECAD-
mediated adhesion and signalling in vitro and was found to inhibit angiogenesis in a
number of mouse models, including tumour growth, concurrently increasing lung and
heart vascular permeability (Liao et al. 2000). In contrast, mAb BV14 did not impact
upon paracellular permeability in vitro or vascular permeability in any organs in vivo. It
did, however, inhibit tumour angiogenesis similarly to BV13 (Corada et al. 2002). Since
the antibodies bound different regions of the VECAD extracellular domain, they showed
that these regions have different roles in quiescent and actively growing vessels.
- 46 -

Considering these interactions together, the molecular complexity of EC permeability
becomes apparent. These activities of VECAD have been shown to be crucial in the
regulation of permeability, but they do not perform this function alone.
- 47 -
Figure 1.10 VE-cadherin and VEGFR2
Association of activated VEGFR2 with VECAD, p120 and β-catenin at the endothelial cell surface
activates cell survival pathways via phosphatidylinositol-3-kinase (PI3K), Akt and Bcl-2. This association
also blocks VEGFR2 internalisation into the endosomal compartment and decreases receptor
phosphorylation via the phosphatase activity of density-enhanced phosphatase-1 (DEP1) (Dejana et al.
2008, Lampugnani et al. 2006). Thus, the AJ protein VECAD attenuates VEGF proliferative signalling
from VEGFR2, PLCγ and MAP kinases, as shown in Figure 1.6.
- 48 -
1.7.2 Catenins
VECAD effects on endothelial cell behaviour are also mediated by its binding to catenin
proteins in the cytoplasm, which itself is modulated by catenin phosphorylation. The
membrane-proximal regions of the VECAD cytoplasmic tail also interact with p120-
catenin and thus lateral clustering of cadherins in the membrane occurs as the contact
matures (Perez-Moreno and Fuchs 2006).
The distal portion of the VECAD cytoplasmic tail binds β-catenin or γ-catenin (also
known as plakoglobin), which in turn contact α-catenin, thought to link the junctional
complex with the actin cytoskeleton (Bienz 2005, Carmeliet et al. 1999, Dejana et al.
2008, Gumbiner 2005). Catenin proteins, β-catenin in particular, are known for their
ability to translocate to the nucleus and modulate transcription of genes involved in
proliferation via interaction with transcription factors such as the TCF/lef family (Bienz
2005, Perez-Moreno and Fuchs 2006). Sequestration of catenins at the cell membrane
allows the regulation of gene transcription by cell-cell contacts. Traditionally α-catenin
has been described as the link between the actin cytoskeleton and β-catenin-VECAD.
However, it may act instead in a “switch” manner, existing either as monomers or
homodimers, the former binding β-catenin and the latter binding actin filaments (Drees
et al. 2005). Phosphorylation and subcellular localisation of the α-catenin pool are also
proposed as regulatory mechanisms in the linkage of AJs to the actin cytoskeleton
(Burks and Agazie 2006).
- 49 -
1.8 Tight junctions
Tight junctions (TJs) are close protein complex interactions that completely close the
intercellular space at “kissing points” between adjacent cell membranes, which are
visible as “strands” under freeze-fracture electron microscopy (Tsukita et al. 2001). Like
AJs, the degree of TJ formation and maintenance differs between endothelial tissues.
For example, in the BBB, TJs are dense and regimented in their structure to create a
minimally permeable and highly selective barrier, but even within this tissue different
areas exhibit varied junctional composition and structure (Willis et al. 2007). In contrast,
TJs are less frequent and more loosely structured in microcapillaries to allow greater
permeability (Bazzoni and Dejana 2004, Risau Werner 1998, Thurston et al. 2000).
Tight junctions have also been reported to play a role in pericyte-EC contacts (depicted
in Figure 1.9), along with NCAD-based AJs and gap junctions (pore-like connections
between adjacent cell membranes), although the characteristics of these EC-pericyte
tight junctions are not well described (Gerhardt and Bersholtz 2003).
TJs are composed of transmembrane proteins: claudins, occludin and junctional
adhesion molecules (JAMs), and other proteins interacting both laterally in the
membrane and as ‘plaque’ complexes in the cytoplasm (González-Mariscal et al. 2003,
Nitta et al. 2003, Saitou et al. 2000, Sasaki et al. 2003, Tsukita et al. 2001). The TJ
protein families, including occludin, JAMs and claudins, have some endothelial cell-
specific members such as vascular endothelial junctional adhesion molecule (VE-JAM,
also known as JAM-B or JAM2), and endothelial cell-enriched molecules like Claudin5
(Aurrand-Lions Michel et al. 2001, Morita et al. 1999). Tight junction functions,
component proteins, and some downstream signalling effects are depicted in Figure
1.11.
- 50 -
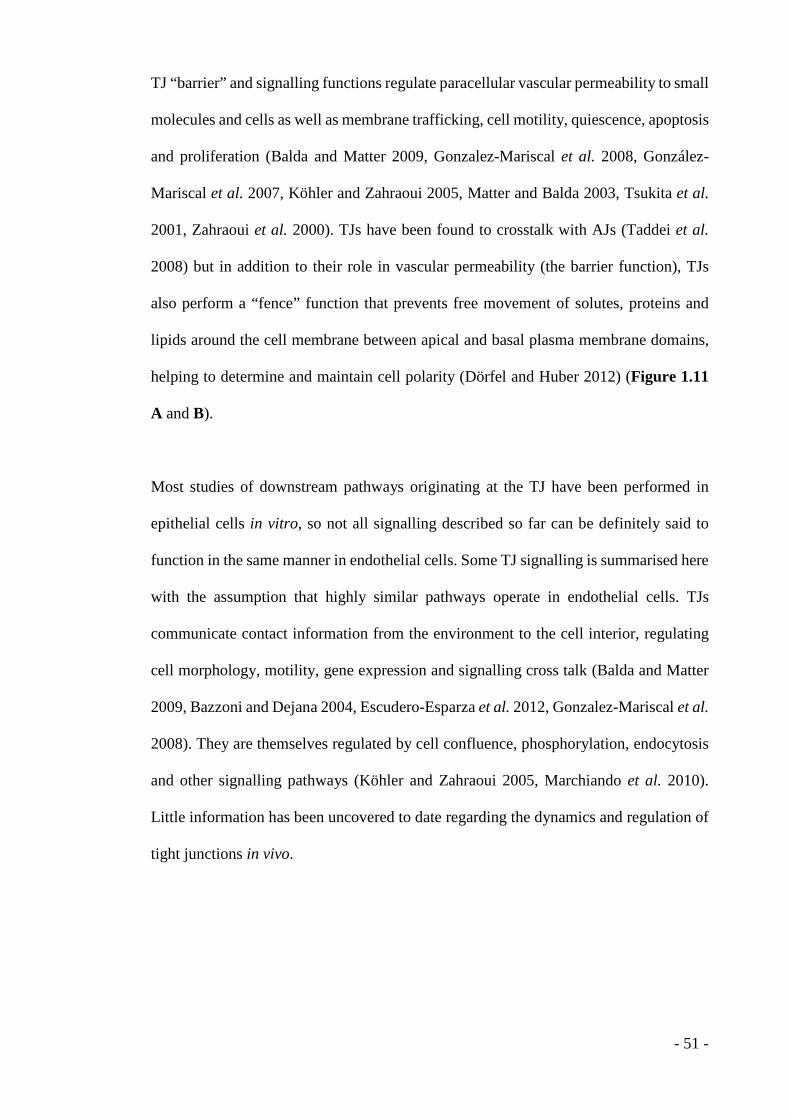
TJ “barrier” and signalling functions regulate paracellular vascular permeability to small
molecules and cells as well as membrane trafficking, cell motility, quiescence, apoptosis
and proliferation (Balda and Matter 2009, Gonzalez-Mariscal et al. 2008, González-
Mariscal et al. 2007, Köhler and Zahraoui 2005, Matter and Balda 2003, Tsukita et al.
2001, Zahraoui et al. 2000). TJs have been found to crosstalk with AJs (Taddei et al.
2008) but in addition to their role in vascular permeability (the barrier function), TJs
also perform a “fence” function that prevents free movement of solutes, proteins and
lipids around the cell membrane between apical and basal plasma membrane domains,
helping to determine and maintain cell polarity (Dörfel and Huber 2012) (Figure 1.11
A and B).
Most studies of downstream pathways originating at the TJ have been performed in
epithelial cells in vitro, so not all signalling described so far can be definitely said to
function in the same manner in endothelial cells. Some TJ signalling is summarised here
with the assumption that highly similar pathways operate in endothelial cells. TJs
communicate contact information from the environment to the cell interior, regulating
cell morphology, motility, gene expression and signalling cross talk (Balda and Matter
2009, Bazzoni and Dejana 2004, Escudero-Esparza et al. 2012, Gonzalez-Mariscal et al.
2008). They are themselves regulated by cell confluence, phosphorylation, endocytosis
and other signalling pathways (Köhler and Zahraoui 2005, Marchiando et al. 2010).
Little information has been uncovered to date regarding the dynamics and regulation of
tight junctions in vivo.
- 51 -
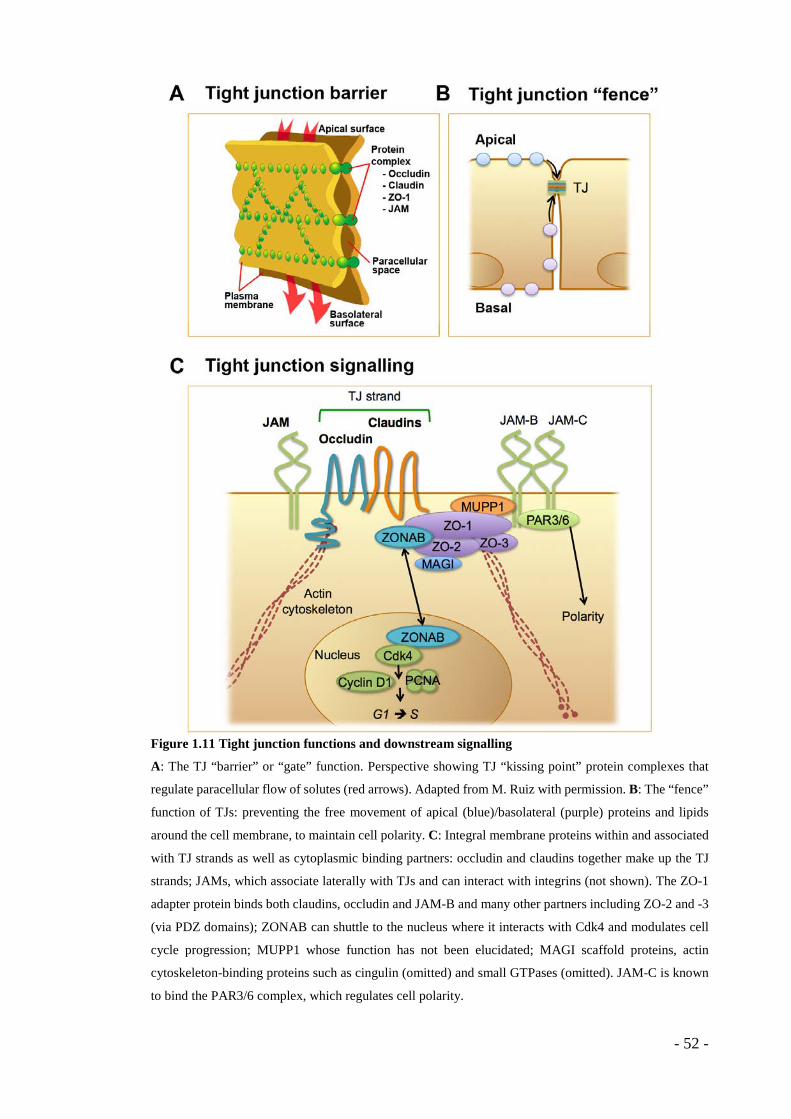
Figure 1.11 Tight junction functions and downstream signalling
A: The TJ “barrier” or “gate” function. Perspective showing TJ “kissing point” protein complexes that
regulate paracellular flow of solutes (red arrows). Adapted from M. Ruiz with permission. B: The “fence”
function of TJs: preventing the free movement of apical (blue)/basolateral (purple) proteins and lipids
around the cell membrane, to maintain cell polarity. C: Integral membrane proteins within and associated
with TJ strands as well as cytoplasmic binding partners: occludin and claudins together make up the TJ
strands; JAMs, which associate laterally with TJs and can interact with integrins (not shown). The ZO-1
adapter protein binds both claudins, occludin and JAM-B and many other partners including ZO-2 and -3
(via PDZ domains); ZONAB can shuttle to the nucleus where it interacts with Cdk4 and modulates cell
cycle progression; MUPP1 whose function has not been elucidated; MAGI scaffold proteins, actin
cytoskeleton-binding proteins such as cingulin (omitted) and small GTPases (omitted). JAM-C is known
to bind the PAR3/6 complex, which regulates cell polarity.
- 52 -
1.8.1 Occludin
Occludin is a tetraspanin (a protein containing four transmembrane domains) with a long
C-terminal cytoplasmic domain and was the first component of TJs to be discovered in
1993 (Furuse et al. 1993). In the TJ strands, occludin interacts with claudins and JAMs
via its second extracellular loop (EL). Occludin is expressed by both epithelial and
endothelial cells and some results have suggested that occludin membrane distribution
and expression levels, which are high in the brain but undetectable in some other tissues,
facilitate its modulation of TJ-mediated permeability (Hirase et al. 1997). Occludin has
been placed in a small family of proteins, the TAMPs (tight junction-associated
MARVEL [MAL and related proteins for vesicle trafficking and membrane link]
proteins) together with tricellulin (or MarvelD2) and MarvelD3. TAMPs share the two
ELs plus one intracellular loop-structure and appear to have similar functions, indicating
some possible redundancy as well as some unique functions that cannot be compensated
for (Dörfel and Huber 2012, Raleigh et al. 2010). Occludin knockout mice, however,
are viable and gut junctions were found to assemble normally, although other organs
displayed histological abnormalities, male mice are infertile and pups do not grow
normally after birth (Saitou et al. 2000). This variety of phenotypes suggests a complex
function and requirement for occludin, which is not yet fully characterised.
Recently, phosphorylation has been investigated as a regulatory mechanism of occludin
functions (as reviewed by Dörfel and Huber 2012). Hypoxia-induced tyrosine
phosphorylation of occludin by Src was shown to prevent interaction with the ZO-1
adapter protein at junction sites (Elias et al. 2009). VEGF-induced phosphorylation of
occludin at Ser-490 was also shown to be vital for its ubiquitination and subsequent
internalisation, also resulting in increased vascular permeability (Horowitz and Seerapu
2012, Murakami et al. 2009). Conversely, protein kinase C-ζ (PKCζ)-mediated
- 53 -
threonine phosphorylation of occludin is required for its localisation to epithelial TJs
(Jain S et al. 2011).
1.8.2 JAMs
JAMs are associated laterally with TJ strand proteins, though not constituents of the
strands themselves, and appear to be important in TJ formation as well as the adhesion
and transendothelial migration (diapedesis) of leukocyte immune cells (Bazzoni
Gianfranco 2003). As members of the immunoglobulin (Ig) protein superfamily, JAMs
are single-pass transmembrane proteins with extracellular Ig domains. The
nomenclature of the three family members is often unclear: JAM-A was the first member
described, originally termed JAM and sometimes referred to as JAM-1; JAM-B is also
known as VE-JAM, and JAM-2 in humans, but JAM-3 in mice; and JAM-C is known
as JAM-3 in humans but also as JAM-2 both in humans and mice (Bazzoni Gianfranco
2003).
JAM-A is not an endothelial-specific molecule as it is found in platelets, epithelial and
immune cells as well as ECs (Aurrand-Lions Michel et al. 2001, Bazzoni Gianfranco
2003). JAM-B, the least studied of the group, is specific to vascular endothelial cells,
hence its VE-JAM alternative nomenclature (Aurrand-Lions M. et al. 2002, Bazzoni
Gianfranco 2003). JAM-C is expressed in both lymphatic and venule endothelial cells
and was found to localise to junctions via the ZO-1 adapter protein (Aurrand-Lions
Michel et al. 2001). It was shown to mediate the transendothelial migration of leukocytes
via interaction with the leukocyte receptor integrin αΜβ2, together with JAM-B
(Johnson-Léger et al. 2002, Lamagna et al. 2005b). JAM-C/JAM-B also contacts PAR3
directly, which, in concert with AJ downstream signalling, regulates cell polarity (Ebnet
- 54 -
et al. 2003). Interaction of the integrin αvβ3 with JAM-C was recently shown to regulate
permeability in a GTPase-dependent manner (Li et al. 2009).
JAM-A deficient mice are viable but display abnormal leukocyte transmigration
(Woodfin et al. 2007). JAM-B knockout mice are also viable and show defective
haematopoietic stem cell maintenance in the bone marrow, with the authors concluding
that this may be due to altered interactions with the bone marrow stroma (Arcangeli et
al. 2011). JAM-B was also found to be essential for muscle fibre formation in a study
using JAM-B-/- zebrafish (Powell and Wright 2011). JAM-C knockout mice exhibit
defective motor function due to abnormal myelin sheath coverage (Scheiermann et al.
2007). Knockdown of JAM-C in ECs decreased permeability and was concurrent with
increased VECAD adhesion (Orlova et al. 2006). Finally, knockout of the JAM-like
molecule ESAM also increased VEGF-stimulated vascular permeability (Wegmann et
al. 2006), though ESAM was not found to interact with PAR3 in the control of polarity
(Ebnet et al. 2003).
As with VECAD, the JAMs have presented as promising targets for vascular-modulating
therapy. In mice, anti-JAM-C antibody therapy was found to inhibit the growth of
tumours in vivo (with no effect on normal kidney). This encouraging result was
accompanied by a decrease in tumour-associated macrophage (TAM) numbers,
inhibited retinal neovascularisation following hypoxia and completely ablated
microvessel sprouting from explanted aortic rings ex vivo (Lamagna et al. 2005a).
- 55 -
1.8.3 TJ plaque proteins
The integral membrane proteins of TJs interact via PDZ domains with plaque proteins
in the cytoplasm, linking them to the JAMs and further binding partners. The zonula
occludens (ZO) proteins ZO-1, ZO-2 and ZO-3 are scaffolding/adapter molecules that
interact directly with occludin and claudins at TJs as well as with AJs and the
cytoskeleton. They are of the membrane associated guanylate kinase homologue
(MAGUK) family, containing PDZ and SH3 protein-protein interaction domains as well
as a guanylate kinase (GK) module (González-Mariscal et al. 2000). ZO proteins also
appear to contain both nuclear localisation and nuclear export signals (NLS/NES)
though their potential roles in EC transcriptional modulation are unclear (Gonzalez-
Mariscal et al. 2008, González-Mariscal et al. 2003). ZO-1 and ZO-3 also directly bind
F-actin, thus linking TJs to the cytoskeleton (González-Mariscal et al. 2000). ZO-1
expression is regulated by cell density, as demonstrated by the finding that ZO-1 levels
are elevated proportionally in MDCK cells with increasing confluence (Balda and
Matter 2000). It has also been reported that VEGF can regulate ZO-1 expression, though
the effect depends on the particular endothelial cell type (Ghassemifar et al. 2006).
Demonstrating its pivotal role in TJs and vessel wall integrity, the ZO-1 knockout
phenotype is embryonic lethal, partly due to yolk sac angiogenic defects (Katsuno et al.
2008).
The Y-box transcription factor ZONAB (ZO-1-associated nucleic acid binding protein)
binds the ZO-1 SH3 domain and can shuttle to the nucleus, interacting with Cdk4 to
induce cell cycle progression from G1 to S phase via transcriptional upregulation of
Cyclin D1 and PCNA in sparsely-cultured cells, as depicted in Figure 1.11 C (Balda
and Matter 2009, Dejana 2004, González-Mariscal et al. 2007, Sourisseau et al. 2006,
Tsapara et al. 2006). In a similar manner to VECAD and β-catenin, the sequestration of
- 56 -
ZONAB at the TJ membrane complex by ZO-1 thus allows TJs to regulate cellular
proliferation. In low density, proliferating cells, ZO-1 levels are low and ZONAB is
largely localised to the nucleus. Conversely, in confluent cells, ZO-1 expression is high,
with ZONAB bound at TJs, limiting the nuclear ZONAB pool available for the
promotion of transcription (González-Mariscal et al. 2007, Tsapara et al. 2006).
Other TJ-associated MAGUK proteins include the scaffolding MAGI proteins
(MAGUK with inverted orientation), PAR-3 and -6 (partitioning defective), and MUPP1
(multi-PDZ-domain protein). PAR proteins are known to mediate cell polarity,
particularly during embryonic development, and MUPP1 appears to interact directly
with claudin-1 and JAMs via its PDZ domains; perhaps acting as a scaffold in a similar
manner to ZO-1, though its precise function is not known (González-Mariscal et al.
2003, Hamazaki et al. 2002). Little has been confirmed regarding the downstream
actions of TJ plaque constituents in ECs specifically.
- 57 -
1.8.4 Claudins
At TJs where cell membranes come into close contact, claudins are a major component
of the cell-cell contact strands and are known to be vital for TJ formation and
maintenance. The claudin strands perform the fence function of TJs, as shown in Figure
1.11 B (Hartsock and Nelson 2008, Tsukita et al. 2001). Claudins recruit occludin to the
junctional complex and bind the plaque proteins via their PDZ domains. There are 24
known claudin (Cldn) proteins in the mammalian family, with humans possessing 23
(lacking Cldn13) and mice coding for all 24 (Hewitt et al. 2006, Lal-Nag and Morin
2009). They are tetraspan membrane proteins, with intracellular N- and C-termini
(Figure 1.13). The intracellular loops undergo post-translational modifications such as
phosphorylation and palmitoylation, which is required for their localisation at the
membrane, and they can also be regulated by endocytic internalisation (Lal-Nag and
Morin 2009, Morin 2005, Van Itallie et al. 2005). While structured similarly to the
TAMPs, except for shorter N- and C-termini, they are not similar in sequence and
therefore not of the same protein family (Dörfel and Huber 2012).
The expression patterns and functions of many claudin family members remain poorly
characterised but claudin expression is known to be tissue-specific. However, most
tissues express multiple members of the family, suggesting some functional redundancy
and a capacity for tissue-specific functional consequences of heteropolymerisation,
since variable amino acid composition of the extracellular loops (ELs) allows
combinations of claudins to create paracellular selectivity for differently charged ions
(González-Mariscal et al. 2007, Tsukita et al. 2001).
Knockout mouse models have demonstrated the significant and diverse roles of claudins
in vivo. For example, Cldn1-/- mice do not survive long after birth due to dehydration,
- 58 -
with the lack of Cldn1 severely destabilising the epidermal barrier leading to severe
water loss (Furuse et al. 2002). Cldn11-/- male mice are sterile and both Cldn11-/- and
Cldn14-/- mice exhibit deafness, though due to different cellular malfunctions in the ear
(Ben-Yosef et al. 2003, Gow et al. 2004). Loss of Cldn11 abolishes TJs normally found
in the basal cells of the stria vascularis in the cochlear duct of the inner ear, while Cldn14
loss causes the rapid degeneration of outer hair cells in the cochlea as well as slower
degeneration of inner hair cells, both leading to hearing loss. However, while TJs were
lost in the Cldn11 knockout, strands were still visible in the Cldn14-/- animals, showing
that the effects of its loss were functional and not structural. Finally, the Cldn19-/- mouse
exhibited behavioural defects due to impaired nervous impulse conduction, which
showed that TJs are vital to Schwann cell insulation of nerve fibres (Miyamoto et al.
2005).
Considering that claudins are a large protein family, expressed in a range of cell types
with apparently pleiotropic actions as further discussed below, it has now become clear
that their function is not limited to the traditional barrier/fence role of TJs. The diversity
of claudins compared to other junctional proteins suggests that they are likely
responsible for the striking range of EC barrier types in different tissues, and other
claudin functions may exist that are yet to be defined.
- 59 -
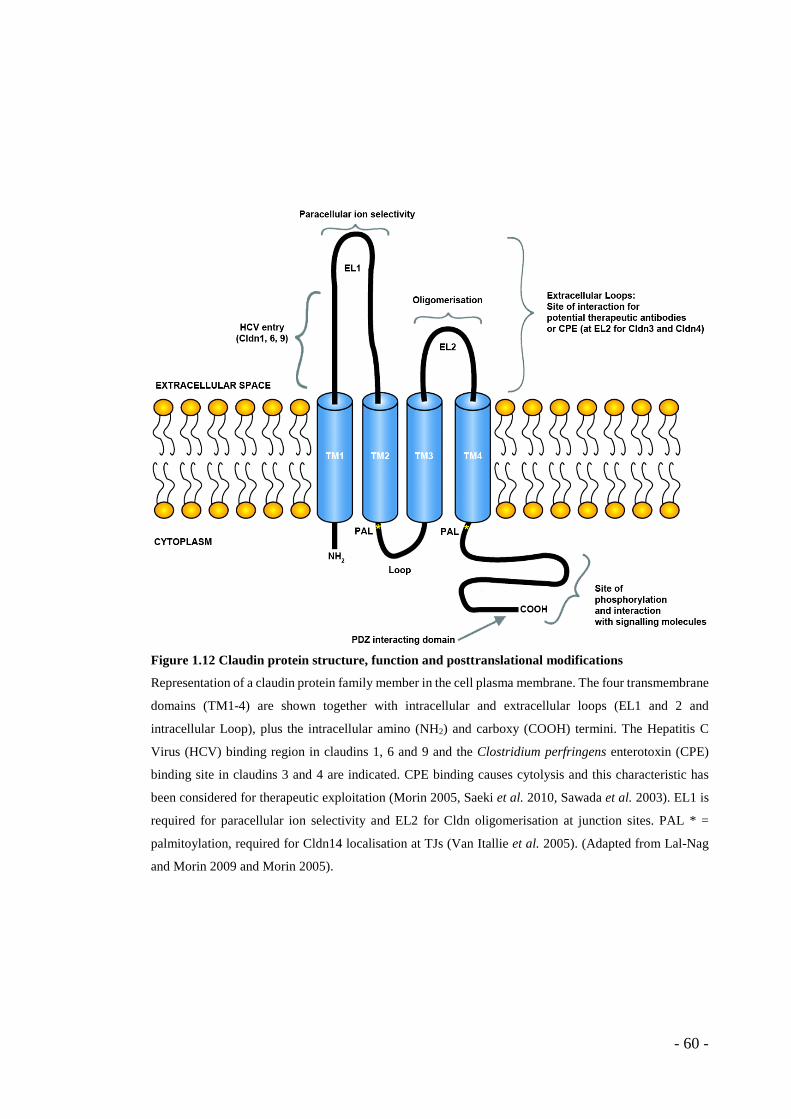
Figure 1.12 Claudin protein structure, function and posttranslational modifications
Representation of a claudin protein family member in the cell plasma membrane. The four transmembrane
domains (TM1-4) are shown together with intracellular and extracellular loops (EL1 and 2 and
intracellular Loop), plus the intracellular amino (NH2) and carboxy (COOH) termini. The Hepatitis C
Virus (HCV) binding region in claudins 1, 6 and 9 and the Clostridium perfringens enterotoxin (CPE)
binding site in claudins 3 and 4 are indicated. CPE binding causes cytolysis and this characteristic has
been considered for therapeutic exploitation (Morin 2005, Saeki et al. 2010, Sawada et al. 2003). EL1 is
required for paracellular ion selectivity and EL2 for Cldn oligomerisation at junction sites. PAL * =
palmitoylation, required for Cldn14 localisation at TJs (Van Itallie et al. 2005). (Adapted from Lal-Nag
and Morin 2009 and Morin 2005).
- 60 -
1.8.4.1 Claudins in human disease
Several claudins have been implicated in diseases affecting humans. These include
mutations in the claudin genes themselves, changes in expression, and interaction of
normally functioning proteins with pathogens.
Mutations in Cldn19 have been found to cause ocular diseases including myopia (Lal-
Nag and Morin 2009). Cldn16 mutation can result in a rare autosomal recessive
calcium/magnesium wasting disorder, FHHNC, with Cldn19 mutations also causing
similar symptoms in some cases (Hampson et al. 2008, Lal-Nag and Morin 2009).
Cldn14 is essential for correct functioning of the organ of Corti in the inner ear and
mutation at the DFNB29 locus causes autosomal recessive non-syndromic hearing loss
(Wilcox et al. 2001). A Cldn1 mutation has also been found to cause atopic dermatitis
and an extremely rare ichthyosis syndrome, NISCH, with fewer than ten patients
recorded to date (De Benedetto et al. 2011, Feldmeyer et al. 2006). In terms of changes
to expression levels, elevated expression of Cldn1 and -5 was noted in the peripheral
blood leukocytes of multiple sclerosis (MS) patients, as well as overexpression of Cldn1
in Type 1 diabetes samples (Mandel et al. 2011). Also, in the inflammatory bowel
condition Crohn’s disease, Cldn5 and -8 were downregulated whereas Cldn2 expression
was greatly increased (Zeissig et al. 2007).
Claudin extracellular loops are known to participate in pathogenic bacterial behaviour,
including binding of the Clostridium perfringens enterotoxin (CPE) to Cldn3 and Cldn4
first extracellular loops (EL1), as noted in Figure 1.12 (Lal-Nag and Morin 2009,
Sawada et al. 2003). Some viruses also interact with claudin proteins, including hepatitis
C (HCV), which binds Cldn1, -6 and -9 EL1 (Lal-Nag and Morin 2009) and HIV, which
has been shown to bind to Cldn7 (Zheng et al. 2005).
- 61 -
1.8.4.1.1 Claudins and cancer
The breakdown of cell-cell junctions is an integral step in tumorigenesis, as cells
depolarise and dedifferentiate, disrupting the organised tissue format to give way to the
proliferative, migratory tumour phenotype. Approximately 85% of cancers are epithelial
in origin so many expression studies have used carcinomas specifically (Saeki et al.
2010). Both over- and under-expression of claudins has been noted in cancer samples,
indicating that different proteins in the family may play very different roles. Some
claudin protein expression findings are summarised in Table 1.2. Of particular note is
that “claudin-low” is a rare breast cancer subtype that was classified in 2007, with a poor
prognosis compared to other subtypes (Prat et al. 2010). The subtype is characterised by
low expression of claudins 3, 4 and 7, as well as occludin, E-cadherin and cingulin, and
overexpression of certain immune response genes, which may indicate elevated immune
cell involvement (Eroles et al. 2012).
Claudin expression appears to correlate with tumour invasiveness in some cases, for
example: Cldn4 overexpression is associated with more invasive pancreatic neoplasms
(Tsutsumi et al. 2011), but Cldn11 silencing and Cldn6, 7 or 9 overexpression is
correlated with the invasive function of gastric cancer cell lines (Agarwal et al. 2009,
Zavala-Zendejas et al. 2011). Cldns 1 and 4 were also found to be upregulated in
metastasis (Singh et al. 2010). Cldn3 and Cldn4 expression in ovarian cells appears to
confer increased invasive, motile and survival properties (Agarwal et al. 2005). As well
as differences in expression, abnormal claudin subcellular localisation has been noted,
for example the nuclear localisation of Cldn1 in colon carcinoma and associated
metastases (Singh et al. 2010, Zavala-Zendejas et al. 2011). However, claudin
expression does not always have prognostic significance, for example, in non-small cell
- 62 -
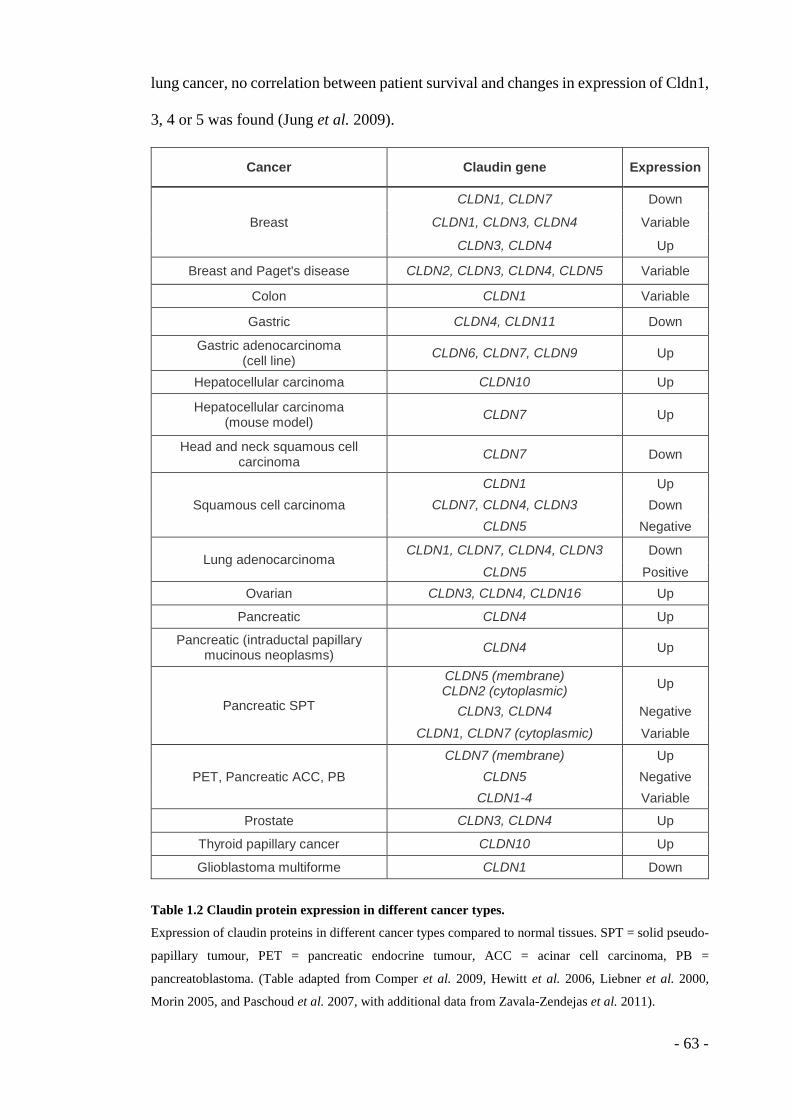
lung cancer, no correlation between patient survival and changes in expression of Cldn1,
3, 4 or 5 was found (Jung et al. 2009).
Cancer Claudin gene Expression
Breast
CLDN1, CLDN7 Down
CLDN1, CLDN3, CLDN4 Variable
CLDN3, CLDN4 Up
Breast and Paget's disease CLDN2, CLDN3, CLDN4, CLDN5 Variable
Colon CLDN1 Variable
Gastric CLDN4, CLDN11 Down
Gastric adenocarcinoma (cell line) CLDN6, CLDN7, CLDN9 Up
Hepatocellular carcinoma CLDN10 Up
Hepatocellular carcinoma (mouse model) CLDN7 Up
Head and neck squamous cell carcinoma CLDN7 Down
Squamous cell carcinoma CLDN1 Up
CLDN7, CLDN4, CLDN3 Down CLDN5 Negative
Lung adenocarcinoma CLDN1, CLDN7, CLDN4, CLDN3 Down
CLDN5 Positive Ovarian CLDN3, CLDN4, CLDN16 Up
Pancreatic CLDN4 Up
Pancreatic (intraductal papillary mucinous neoplasms) CLDN4 Up
Pancreatic SPT
CLDN5 (membrane) CLDN2 (cytoplasmic) Up
CLDN3, CLDN4 Negative CLDN1, CLDN7 (cytoplasmic) Variable
PET, Pancreatic ACC, PB CLDN7 (membrane) Up
CLDN5 Negative CLDN1-4 Variable
Prostate CLDN3, CLDN4 Up
Thyroid papillary cancer CLDN10 Up
Glioblastoma multiforme CLDN1 Down
Table 1.2 Claudin protein expression in different cancer types.
Expression of claudin proteins in different cancer types compared to normal tissues. SPT = solid pseudo-
papillary tumour, PET = pancreatic endocrine tumour, ACC = acinar cell carcinoma, PB =
pancreatoblastoma. (Table adapted from Comper et al. 2009, Hewitt et al. 2006, Liebner et al. 2000,
Morin 2005, and Paschoud et al. 2007, with additional data from Zavala-Zendejas et al. 2011).
- 63 -
1.8.4.1.2 Claudins and therapy
Our understanding of the claudin protein family is still relatively limited but what has
been uncovered so far presents claudins as potentially useful in human medicine; in
diagnosis, prognosis and treatment. The possibility of targeting claudins therapeutically
has been explored recently. The localisation of claudin proteins at the cell surface, as
well as their known small-molecule binding capabilities presents them as a potential
drug target. For example, the Clostridium perfringens enterotoxin (CPE) C-terminal
fragment (C-CPE) has been used as a carrier molecule, both for vaccination and
cytotoxic therapy. The CPE protein binds Cldn3 and Cldn4 and thus delivers the attached
drug molecule into the cell (Lo et al. 2012, Morin 2005, Saeki et al. 2010, Suzuki et al.
2012). The claudin extracellular loops (Figure 1.12) also present the opportunity to
develop blocking antibodies.
In particular, the tissue-specific expression patterns of claudins mean that drugs could
possibly be targeted efficiently to desired organs and tissues with minimal off-target
effects. Also, targeting specificity may be further aided by the fact that claudin
extracellular domains in normal tissues are less exposed due to their participation in
mature TJs, compared to cells with a more migratory phenotype and disrupted junctions
(such as tumour blood vessel ECs) where claudin extracellular loops may be unobscured
and therefore more effectively bound by targeting molecules (Saeki et al. 2010). This
same location-specific expression quality may allow claudins to be used as diagnostic
or prognostic molecular biomarkers in some situations, due to the altered claudin
expression in some cancers as illustrated by Table 1.2. Tumour-specific drug targeting
may be feasible following in-depth clinical studies to thoroughly characterise claudin
expression changes in different tumours and use of these data to inform therapeutic
decisions.
- 64 -
1.8.4.2 Endothelial claudins
Cldn5 is typically thought to be the major endothelial claudin protein, but its expression
has now also been noted in rat pancreatic acinar cells, stomach and gut epithelia, and in
human immune cells (Mandel et al. 2011, Morita et al. 1999, Rahner et al. 2001). Cldn5
is known to be vital in maintaining the integrity of the endothelial BBB, since knockout
mice display size-selective loosening of the barrier (Nitta et al. 2003). Cldn5 expression
appears to be dependent on the adhesion of endothelial cells to the ECM via β1-integrin,
and is controlled by adherens junctions via VECAD, FoxO1 and β-catenin
transcriptional regulation (Gavard and Gutkind 2008, Osada et al. 2011, Taddei et al.
2008). Its expression also lowered in hypoxic conditions, along with Cldns 1 and 3 and
occludin (Koto et al. 2007), and regulated by the ETS-family transcription factor ERG
(Yuan et al. 2011). Internalisation of Cldn5, together with occludin, has also been
reported in brain ECs during inflammatory stimulation of TJ remodelling (Stamatovic
et al. 2009). Cldn5 overexpression also correlated with aggressive ovarian cancer
(Turunen et al. 2009).
Other claudins found in endothelial cell lines and human tissue samples have included
Cldn1, -3, -10, -12, -15, -17, -19, -20, -22 and -23 (Brown et al. 2007, Glienke et al.
2000, Gonzalez-Mariscal et al. 2008, Ohtsuki et al. 2008). Cldn11 was found to be
enriched in human corpus cavernosum ECs (HCCEC) compared to arterial and umbilical
vein cells (HCAEC and HUVEC respectively), and hypothesised to be important in the
haemodynamic properties of penile blood vessels (Wessells et al. 2009). Most
expression studies have been performed in vitro and the tissue-specificity of claudins in
vivo is not well characterised at present. It is therefore likely that more information will
emerge in the coming years as detection techniques are improved.
- 65 -
1.8.4.3 Claudin14
In my studies I have focussed on one particular claudin, namely Cldn14. Cldn14 protein
is 239 amino acids in length in both mouse and human, with 93.3% identity between the
two species, and it is expressed in both epithelial and endothelial cell layers. Cldn14 was
also found to participate in an unusual TJ/AJ hybrid junctional structure in inner ear cells
(Nunes et al. 2006). Most recently it has been suggested as a regulator of calcium ion
transport in the kidney (Gong et al. 2012). Mutations in the CLDN14 gene have primarily
been identified as a key cause of human autosomal recessive deafness, and the hair cells
layers in the murine ear were found to degenerate in a knockout model, as described in
1.8.4.1 (Belguith et al. 2009, Ben-Yosef et al. 2003).
Cldn14 was found to be upregulated in microvascular endothelial cell (MVEC) tubules
in vitro, but not in proliferating sub-confluent monolayers of these cells (Glienke et al.
2000). Overexpression of Cldn14 was found to elicit a change in nuclear shape and cell
morphology in kidney epithelial cells, while Cldn17 overexpression was not seen to have
an effect (Hu et al. 2006). Palmitoylation of Cldn14 was found to be required for its
localisation at tight junctions in MDCK cells, with mutants localising less efficiently,
which correlated with decreased TJ barrier function (Van Itallie et al. 2005).
Relatively little so far has been discovered regarding the functions of Cldn14 in different
tissues but together these studies suggest a possible role for this molecule in angiogenic
processes, given that it has been identified in endothelial cell types in different
morphological states (Glienke et al. 2000). However, its precise functions in vivo,
including any role in tumour blood vessels, have not been described.
- 66 -
1.9 Studying angiogenic regulators
In order to study the molecular basis of angiogenesis in detail, a process about which
much still remains to be understood, model systems are required. Mouse models provide
a whole organism system in which tumour biology can be studied. The use of murine
models (while expensive and, by necessity, highly regulated) allows us to observe the
effects of particular targeted genetic changes on cancer development and pathological
angiogenesis in part due to the relative ease of genetic manipulation in mice and their
closer genetic relationship to human beings than zebrafish or fruit flies, for example. In
this study we began by using a mouse model of a human genetic condition, Down’s
Syndrome, to further our knowledge of molecular regulators of angiogenesis in cancer.
1.9.1 Down’s Syndrome and cancer
One of the few viable human aneuploidies (abnormal chromosome number) is trisomy
21; having 3 copies instead of 2 of human chromosome (Hsa) 21, which occurs at the
frequency of approximately 1/750 live births. With more than 80 clinically recognised
phenotypes, some of which are common to all cases while some are not, the condition
is collectively referred to as Down’s Syndrome (DS) (Reeves 2006). Features include:
mental retardation from a mild to moderate degree; abnormal craniofacial bone
structure; diminished stature; significant hearing loss in 90 % of cases (OMIM);
development of Alzheimer’s (senile plaques and neurofibrillary tangles) by the fourth
decade; heart defects in ~ 40% of patients (O'Doherty et al. 2005, Reeves 2006);
weakened immune system and increased risk of developing Leukaemia (Miller 2005,
O'Doherty et al. 2005, Reeves 2006). However, this risk lowers with age and the chance
of developing a second malignancy is significantly reduced (Hasle et al. 2000). It has
also been confirmed, using both epidemiological data from humans and studies of DS
mouse models, that solid tumour incidence is decreased in DS individuals (Hasle 2001,
- 67 -

Satgé and Bénard 2008, Satgé and Vekemans 2011, Threadgill 2008, Zorick et al. 2001).
DS children and adults are at lower risk of developing solid tumours, with some
exceptions (such as retinoblastoma) as shown in Figure 1.13 (Hasle 2001, Sund et al.
2005). A woman living to age 90 has a one in eight chance of developing breast cancer
and around 54,000 women die from the disease each year in the UK and USA alone. It
is, however, the rarest of solid tumours in DS individuals with mortality due to only lung
and colon cancers higher in the general population.
It appears that trisomy 21 somehow protects against the growth of some solid tumours
and there are several theories as to why this may be. Environmental factors have been
acknowledged, such as the lower prevalence of smoking in the DS population, healthier
eating habits and decreased sexual activity. Accurate measures of the decrease in
incidence for different tumour types have been difficult to obtain, given the low
frequency of malignancy in DS. Different studies have reported that digestive tract
tumours, for example, are less common, while others have reported close to the expected
incidence in the DS population (Satgé et al. 1998, Satgé et al. 2006, Scholl et al. 1982).
For those malignancies that can confidently be said to be underrepresented in the DS
population, it is reasonable to speculate that pathological angiogenesis may also be
impaired in the context of DS since most tumours, when they do arise, only grow to a
small size (Sussan et al. 2008). It is possible that the extra genes present in trisomic
stromal cells cause a net anti-angiogenic effect, restricting tumour growth as a result.
Our aim is to discover which Hsa21 genes are responsible for this potential anti-
angiogenic effect.
- 68 -
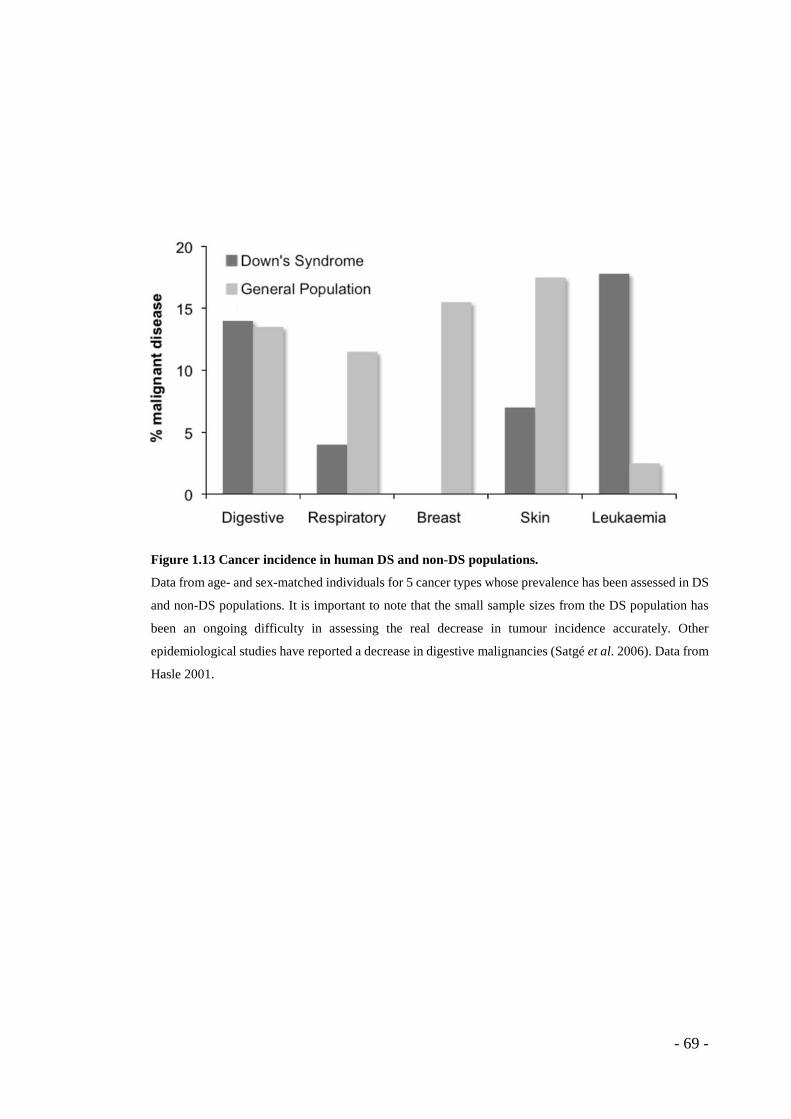
Figure 1.13 Cancer incidence in human DS and non-DS populations.
Data from age- and sex-matched individuals for 5 cancer types whose prevalence has been assessed in DS
and non-DS populations. It is important to note that the small sample sizes from the DS population has
been an ongoing difficulty in assessing the real decrease in tumour incidence accurately. Other
epidemiological studies have reported a decrease in digestive malignancies (Satgé et al. 2006). Data from
Hasle 2001.
- 69 -
1.9.2 DS Mouse Models
The genes of Hsa21 have orthologs found mainly on mouse chromosome (Mmu) 16 but
also on Mmu10 and 17 (Miller 2005, O'Doherty et al. 2005, Reeves 2006). To study the
effects of trisomy 21, several mouse models have been created (Figure 1.15). Mmu16
trisomy is lethal and equivalent to partial trisomy of Hsa3, 16, 21 and 22 and so was
never a viable model (O'Doherty et al. 2005).
Ts65Dn mice with partial trisomy of Mmu16 (equivalent to triplication of approximately
50% of Hsa21 genes) and effects on CNS function and facial development were created
in 1990 at The Jackson Laboratories (Miller 2005, Threadgill 2008). Saran et al. (2003)
carried out microarray analysis of Ts65Dn cerebellar gene expression. They concluded
that the genetic background of the mice had significant effects on the trisomic expression
profile (Saran et al. 2003).
Sago et al. (1998) created the Ts1Cje model with partial trisomy of Mmu16
corresponding to Hsa21q22.1-22.3 (Sago et al. 1998). Shinohara et al. (2001) attempted
to create mice containing Hsa21 with limited success, but the chimaeric mice with
varying levels of mosaicism did recapitulate some DS phenotypes (Shinohara et al.
2001). Olson et al. (2004) created mouse lines trisomic and monosomic for 33 Hsa21
orthologs, named Ts1Rhr and Ms1Rhr respectively (Sussan et al. 2008, Threadgill
2008).
Sussan et al. (2008) investigated the influence of DS on solid tumour growth by crossing
Ts65Dn, Ts1Rhr and Ms1Rhr mice with the APCMin mouse model of colorectal cancer
and comparing actual and expected tumour incidence. The Ts65Dn and Ts1RhR
- 70 -
progeny developed fewer tumours than the expected frequency while Ms1Rhr progeny
developed more, confirming the influence of gene dosage.
A recent study by Baek et al. also used the Ts65Dn model and a Dscr1 transgenic mouse
to examine the role of Dscr1 in pathological angiogenesis. They concluded that an extra
copy of Dscr1 is sufficient to inhibit angiogenesis and tumour growth in DS and that
DSCR1 and DYRK1A, via the calcineurin-NFAT pathway, mediate this effect (Baek et
al. 2009). However, on crossing Ts65Dn with Dscr1-/+ mice, tumour blood vessel
density increased only very slightly and tumour growth was about 50% of euploid
control size, showing that other factors are clearly at play.
O’Doherty et al. (2005) attempted the generation of trans-chromosomic mice again and
generated a trans-species aneuploid mouse line with stable transmission of a freely-
segregating Hsa21 fragment containing most of the coding regions, which they named
Tc1 (O'Doherty et al. 2005).
- 71 -
1.9.2.1 The Tc1 Mouse
The Tc1 mouse was the most accurate representation of human DS at the time of writing
and took 12 years to develop (Reeves 2006). It carries a large fragment (~92 %) of Hsa21
resulting in effective partial trisomy of Mmu16, 17 and 10 (Miller 2005, Reeves 2006).
Included on the fragment are 242/298 Hsa21 coding genes (56 missing, see Table 1.3)
and 24/29 non-coding RNAs (five missing), six being miRNAs (personal
communication from T. Broughton and V Tybulewicz). The mice were generated by
taking human chromosomes from fibroblasts, injecting them into mouse embryonic stem
cells (ESCs) and introducing the ESCs into early mouse embryos, which were then
implanted in surrogate mothers (Miller 2005, O'Doherty et al. 2005).
Tc1 mice show many phenotypic similarities with human DS; learning disabilities in
terms of decreased spatial learning and memory (defective long-term potentiation, a
form of synaptic plasticity also altered in the Ts65Dn mouse); lower cerebellar granule
cell density (where total reduction in brain volume is seen in human DS); a tendency
towards hyperactivity; heart defects in approximately 64 % of mice; smaller mandibles
in most cases and defective T lymphocyte activation (also seen in DS) (Miller 2005,
O'Doherty et al. 2005, Reeves 2006). With over 80% of Hsa21 genes and their
accompanying regulatory elements represented in the Tc1 mice, it is a comprehensive
model of human Down’s Syndrome, as evidenced by these shared phenotypes (Figure
1.14).
- 72 -
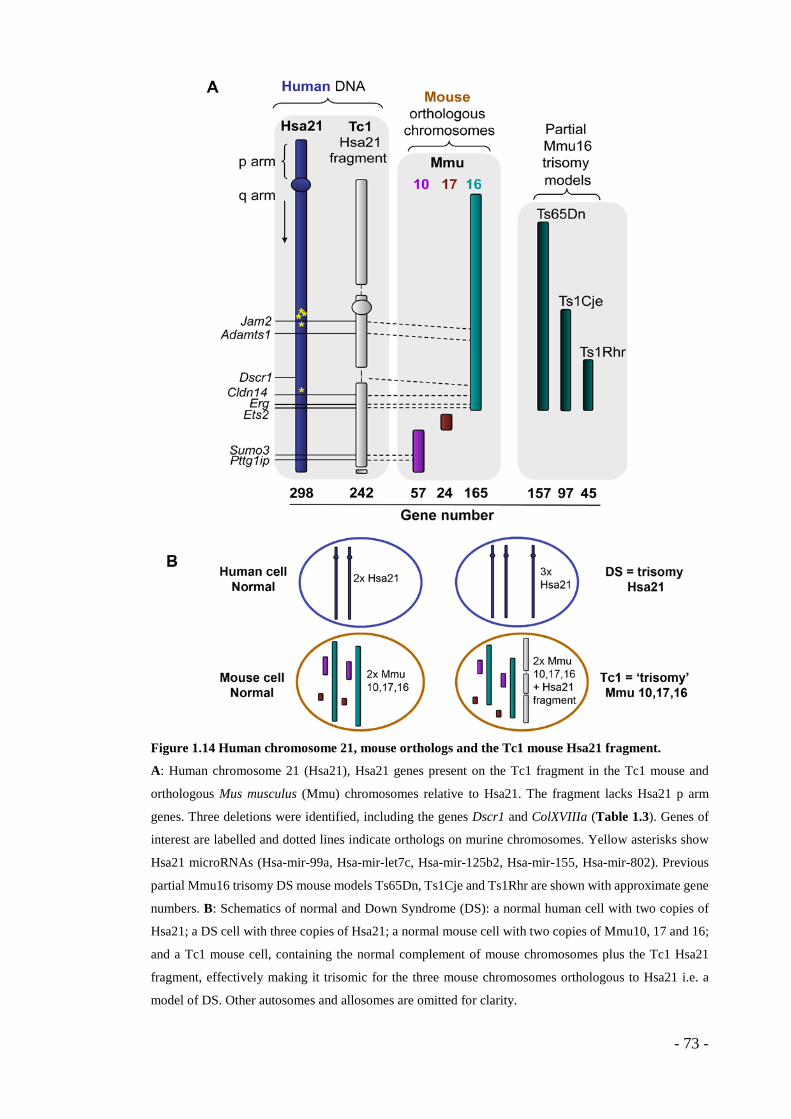
Figure 1.14 Human chromosome 21, mouse orthologs and the Tc1 mouse Hsa21 fragment.
A: Human chromosome 21 (Hsa21), Hsa21 genes present on the Tc1 fragment in the Tc1 mouse and
orthologous Mus musculus (Mmu) chromosomes relative to Hsa21. The fragment lacks Hsa21 p arm
genes. Three deletions were identified, including the genes Dscr1 and ColXVIIIa (Table 1.3). Genes of
interest are labelled and dotted lines indicate orthologs on murine chromosomes. Yellow asterisks show
Hsa21 microRNAs (Hsa-mir-99a, Hsa-mir-let7c, Hsa-mir-125b2, Hsa-mir-155, Hsa-mir-802). Previous
partial Mmu16 trisomy DS mouse models Ts65Dn, Ts1Cje and Ts1Rhr are shown with approximate gene
numbers. B: Schematics of normal and Down Syndrome (DS): a normal human cell with two copies of
Hsa21; a DS cell with three copies of Hsa21; a normal mouse cell with two copies of Mmu10, 17 and 16;
and a Tc1 mouse cell, containing the normal complement of mouse chromosomes plus the Tc1 Hsa21
fragment, effectively making it trisomic for the three mouse chromosomes orthologous to Hsa21 i.e. a
model of DS. Other autosomes and allosomes are omitted for clarity.
- 73 -
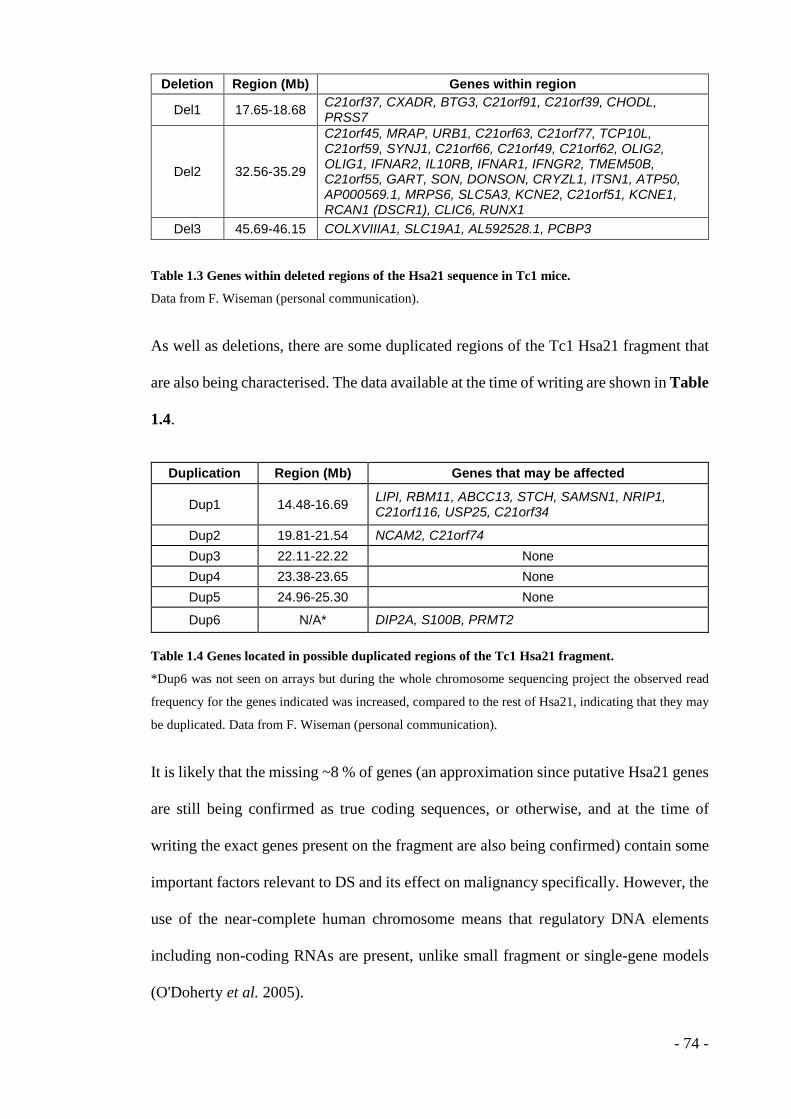
Deletion Region (Mb) Genes within region
Del1 17.65-18.68 C21orf37, CXADR, BTG3, C21orf91, C21orf39, CHODL, PRSS7
Del2 32.56-35.29
C21orf45, MRAP, URB1, C21orf63, C21orf77, TCP10L, C21orf59, SYNJ1, C21orf66, C21orf49, C21orf62, OLIG2, OLIG1, IFNAR2, IL10RB, IFNAR1, IFNGR2, TMEM50B, C21orf55, GART, SON, DONSON, CRYZL1, ITSN1, ATP50, AP000569.1, MRPS6, SLC5A3, KCNE2, C21orf51, KCNE1, RCAN1 (DSCR1), CLIC6, RUNX1
Del3 45.69-46.15 COLXVIIIA1, SLC19A1, AL592528.1, PCBP3 Table 1.3 Genes within deleted regions of the Hsa21 sequence in Tc1 mice.
Data from F. Wiseman (personal communication).
As well as deletions, there are some duplicated regions of the Tc1 Hsa21 fragment that
are also being characterised. The data available at the time of writing are shown in Table
1.4.
Duplication Region (Mb) Genes that may be affected
Dup1 14.48-16.69 LIPI, RBM11, ABCC13, STCH, SAMSN1, NRIP1, C21orf116, USP25, C21orf34
Dup2 19.81-21.54 NCAM2, C21orf74 Dup3 22.11-22.22 None Dup4 23.38-23.65 None Dup5 24.96-25.30 None
Dup6 N/A* DIP2A, S100B, PRMT2 Table 1.4 Genes located in possible duplicated regions of the Tc1 Hsa21 fragment.
*Dup6 was not seen on arrays but during the whole chromosome sequencing project the observed read
frequency for the genes indicated was increased, compared to the rest of Hsa21, indicating that they may
be duplicated. Data from F. Wiseman (personal communication).
It is likely that the missing ~8 % of genes (an approximation since putative Hsa21 genes
are still being confirmed as true coding sequences, or otherwise, and at the time of
writing the exact genes present on the fragment are also being confirmed) contain some
important factors relevant to DS and its effect on malignancy specifically. However, the
use of the near-complete human chromosome means that regulatory DNA elements
including non-coding RNAs are present, unlike small fragment or single-gene models
(O'Doherty et al. 2005).
- 74 -
A study by Wilson et al. has shown that expression of genes from the human
chromosome within mouse cells is determined by the DNA sequence, not the host cell
environment; that is, mouse-encoded transcription machinery (TFs, RNA polymerase,
epigenetic modifiers) binds in the same fashion as human transcription machinery binds
to the sequences in human cells. Thus, it appears that DNA has species-specific
directions for how it is to be transcribed (known as cis-direction rather than trans-
direction). They found that the expression profile from Hsa21 in Tc1 hepatocytes
matches the profile of Hsa21 expression in human liver tissue, not that of the orthologous
mouse chromosomes in murine liver tissue (Wilson et al. 2008). In addition, Kahlem et
al. confirmed that increased gene dosage in the Ts65Dn model led to approximately 50%
stable upregulation of transcripts in almost all cases, with only a small number of gene
transcript levels unaffected by the extra copy, this subset seeming to be under tissue-
specific or other modes of control (Kahlem et al. 2004).
Up to 50 % of cells lose the human chromosome fragment during development resulting
in variable mosaicism, which is also seen in humans with DS. Analysis of the model by
O’Doherty et al. showed roughly 65 % of brain nuclei and 50 % of spleen nuclei were
positive for the Hsa21 fragment (Miller 2005, O'Doherty et al. 2005). The mosaicism
varies between tissues and individual mice, which may complicate interpretation of
results. Nevertheless the Tc1 mouse provides proof-of-principle that mouse models of
whole Hsa aneuploidies can be created and it is a valuable tool for characterising the
effects of trisomy 21.
- 75 -
1.10 SUMMARY
Pathological angiogenesis is an integral part of solid tumour growth and progression, in
which the normal regulators of angiogenesis are disrupted and the delicate balance
maintaining endothelial cell quiescence is shifted in favour of new vessel growth.
Endothelial cell signalling, response to the environment and cell-cell adhesion are key
processes in angiogenesis; in order to study these on a cellular and molecular level, we
require in vivo models and in this thesis we have started with a model of Down’s
Syndrome, the Tc1 mouse. This model allows us to observe the effects of increased gene
dosage of human chromosome 21 genes, not in tumour cells but in the stroma, on tumour
growth and endothelial cell function in tumour angiogenesis.
- 76 -

1.11 HYPOTHESIS
Since individuals with Down’s Syndrome have a decreased incidence of solid tumours,
impaired angiogenesis may be responsible. If so, the extra copy of Hsa21 is likely to
contain anti-angiogenic genes, some of which may not have been linked previously to
this process.
1.12 RESEARCH AIMS
The aims of this project are:
1. Investigate whether the presence of additional human chromosome (Hsa21) genes in
a mouse model of Down’s Syndrome (the Tc1 mouse) affects tumour angiogenesis and
tumour growth.
2. Identify gene dosage effects of candidate endothelial cell-specific and angiogenesis-
modulating genes on the angiogenic response ex vivo.
3. Elucidate gene dosage effects of the non-endothelial cell-specific Hsa21 gene
Claudin-14 on tumour growth and angiogenesis in vivo.
- 77 -
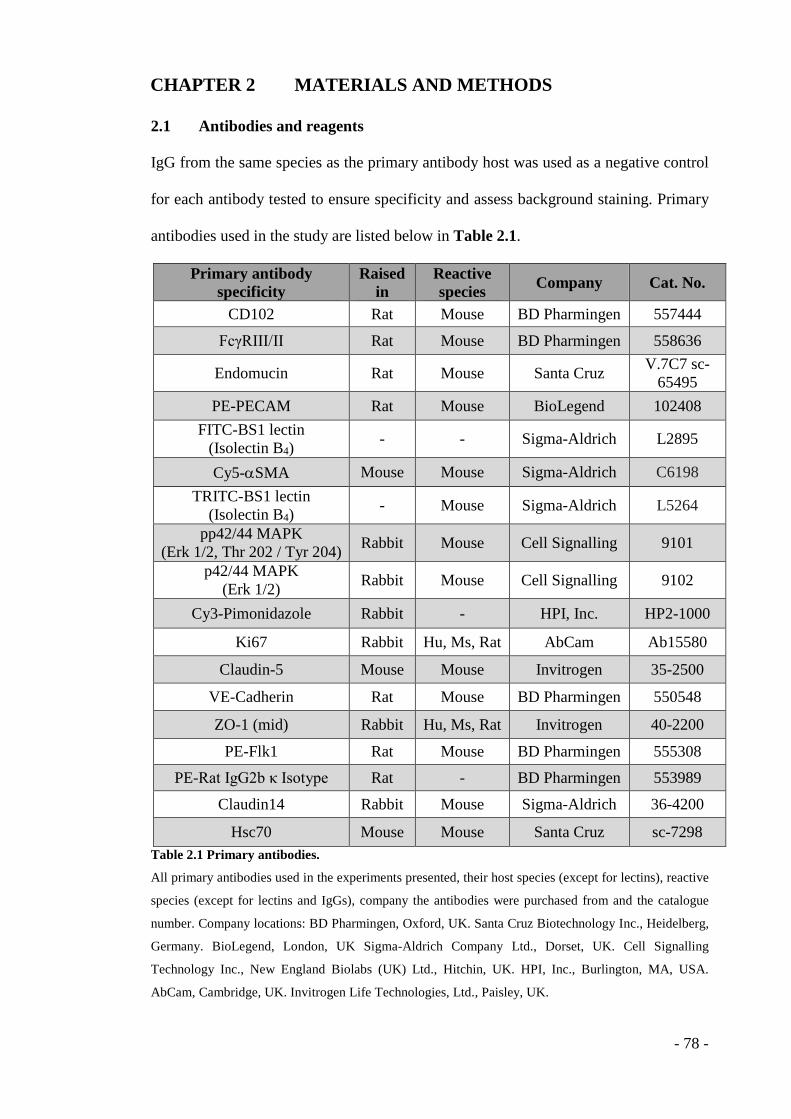
CHAPTER 2 MATERIALS AND METHODS
2.1 Antibodies and reagents
IgG from the same species as the primary antibody host was used as a negative control
for each antibody tested to ensure specificity and assess background staining. Primary
antibodies used in the study are listed below in Table 2.1.
Primary antibody specificity
Raised in
Reactive species Company Cat. No.
CD102 Rat Mouse BD Pharmingen 557444
FcγRIII/II Rat Mouse BD Pharmingen 558636
Endomucin Rat Mouse Santa Cruz V.7C7 sc-65495
PE-PECAM Rat Mouse BioLegend 102408 FITC-BS1 lectin
(Isolectin B4) - - Sigma-Aldrich L2895
Cy5-αSMA Mouse Mouse Sigma-Aldrich C6198 TRITC-BS1 lectin
(Isolectin B4) - Mouse Sigma-Aldrich L5264
pp42/44 MAPK (Erk 1/2, Thr 202 / Tyr 204) Rabbit Mouse Cell Signalling 9101
p42/44 MAPK (Erk 1/2) Rabbit Mouse Cell Signalling 9102
Cy3-Pimonidazole Rabbit - HPI, Inc. HP2-1000
Ki67 Rabbit Hu, Ms, Rat AbCam Ab15580
Claudin-5 Mouse Mouse Invitrogen 35-2500
VE-Cadherin Rat Mouse BD Pharmingen 550548
ZO-1 (mid) Rabbit Hu, Ms, Rat Invitrogen 40-2200
PE-Flk1 Rat Mouse BD Pharmingen 555308 PE-Rat IgG2b κ Isotype Rat - BD Pharmingen 553989
Claudin14 Rabbit Mouse Sigma-Aldrich 36-4200
Hsc70 Mouse Mouse Santa Cruz sc-7298 Table 2.1 Primary antibodies.
All primary antibodies used in the experiments presented, their host species (except for lectins), reactive
species (except for lectins and IgGs), company the antibodies were purchased from and the catalogue
number. Company locations: BD Pharmingen, Oxford, UK. Santa Cruz Biotechnology Inc., Heidelberg,
Germany. BioLegend, London, UK Sigma-Aldrich Company Ltd., Dorset, UK. Cell Signalling
Technology Inc., New England Biolabs (UK) Ltd., Hitchin, UK. HPI, Inc., Burlington, MA, USA.
AbCam, Cambridge, UK. Invitrogen Life Technologies, Ltd., Paisley, UK.
- 78 -
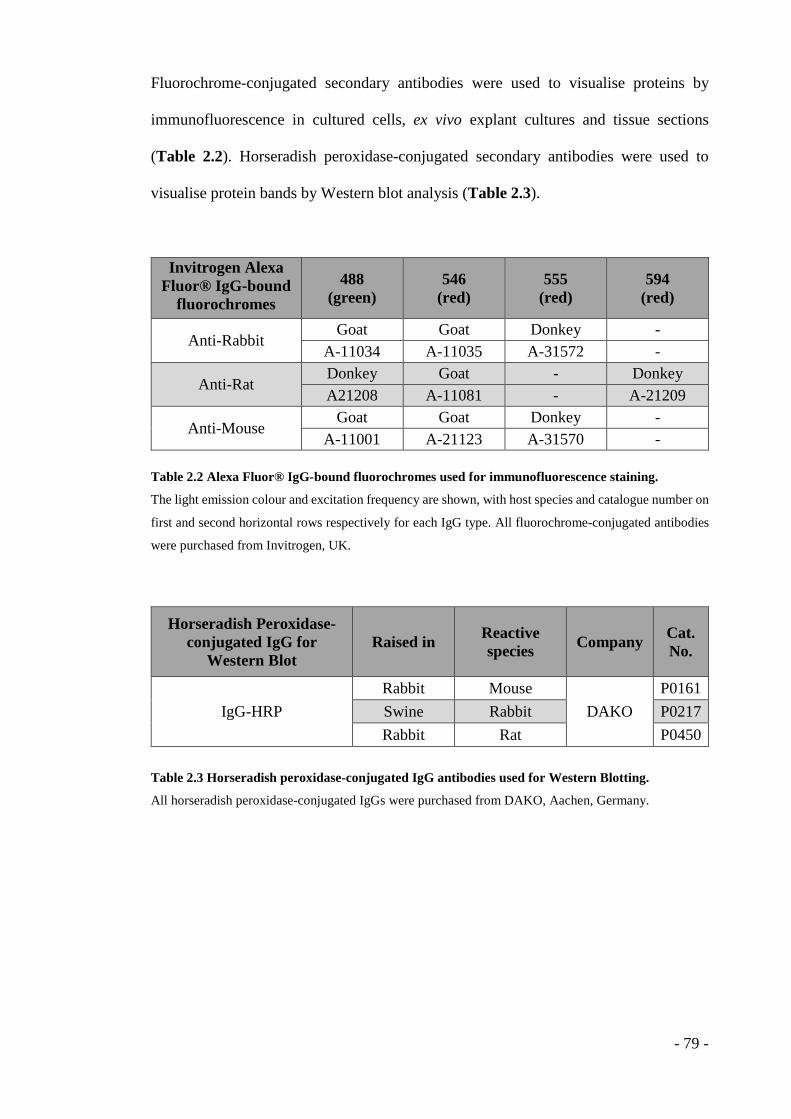
Fluorochrome-conjugated secondary antibodies were used to visualise proteins by
immunofluorescence in cultured cells, ex vivo explant cultures and tissue sections
(Table 2.2). Horseradish peroxidase-conjugated secondary antibodies were used to
visualise protein bands by Western blot analysis (Table 2.3).
Invitrogen Alexa Fluor® IgG-bound
fluorochromes 488
(green) 546
(red) 555
(red) 594
(red)
Anti-Rabbit Goat Goat Donkey -
A-11034 A-11035 A-31572 -
Anti-Rat Donkey Goat - Donkey A21208 A-11081 - A-21209
Anti-Mouse Goat Goat Donkey -
A-11001 A-21123 A-31570 - Table 2.2 Alexa Fluor® IgG-bound fluorochromes used for immunofluorescence staining.
The light emission colour and excitation frequency are shown, with host species and catalogue number on
first and second horizontal rows respectively for each IgG type. All fluorochrome-conjugated antibodies
were purchased from Invitrogen, UK.
Horseradish Peroxidase-conjugated IgG for
Western Blot Raised in Reactive
species Company Cat. No.
IgG-HRP Rabbit Mouse
DAKO P0161
Swine Rabbit P0217 Rabbit Rat P0450
Table 2.3 Horseradish peroxidase-conjugated IgG antibodies used for Western Blotting.
All horseradish peroxidase-conjugated IgGs were purchased from DAKO, Aachen, Germany.
- 79 -
2.2 Mice
The Tc1 mice were created by V. Tybulewicz and L. Fisher (National Institute for
Medical Research, London and University College London respectively) (O'Doherty et
al. 2005). Mice, initially for experiments only and later for separate colony generation,
were provided by the National Institute for Medical Research, and maintained by
crossing female F1 progeny with C57bl6/129 mixed background males.
Claudin14 knockout (null) mouse pairs were kindly donated by T. Ben-Yosef (Technion,
Israel) (Ben-Yosef et al. 2003). Cldn14 null mice crossed with wild-type pure C57
animals purchased from Charles River Laboratories International, Inc. to create Cldn14-
heterozygous progeny. Cldn14-het animals were crossed together to produce all three
genotypes and finally colonies of wild-type, Cldn14-het and Cldn14-null animals were
generated.
2.2.1 Genotyping mice by PCR analysis
DNA samples extracted from ear/tail snips were individually analysed by PCR in order
to confirm the genotypes of experimental animals.
2.2.1.1 Tc1
Tc1 mouse ear/tail snips were first digested in 500 µl Tail buffer (0.1 M Tris-HCl pH
8.5, 0.2% SDS, 5 mM EDTA, 0.2 M NaCl) supplemented with Proteinase K (0.1 mg/ml,
Roche, Lewes, UK) at 55 °C overnight. 400 µl of isopropanol was added to precipitate
DNA. Samples were centrifuged at full speed (10,000 g) for 10 minutes, the supernatant
aspirated and DNA pellets washed with 500 µl 70% ethanol. Samples were spun at
10,000 g for 6 minutes then the supernatant was aspirated and pellets air-dried at room
temperature overnight or for 1-2 hours at 72 °C. DNA was resuspended in 50-100 µl TE - 80 -
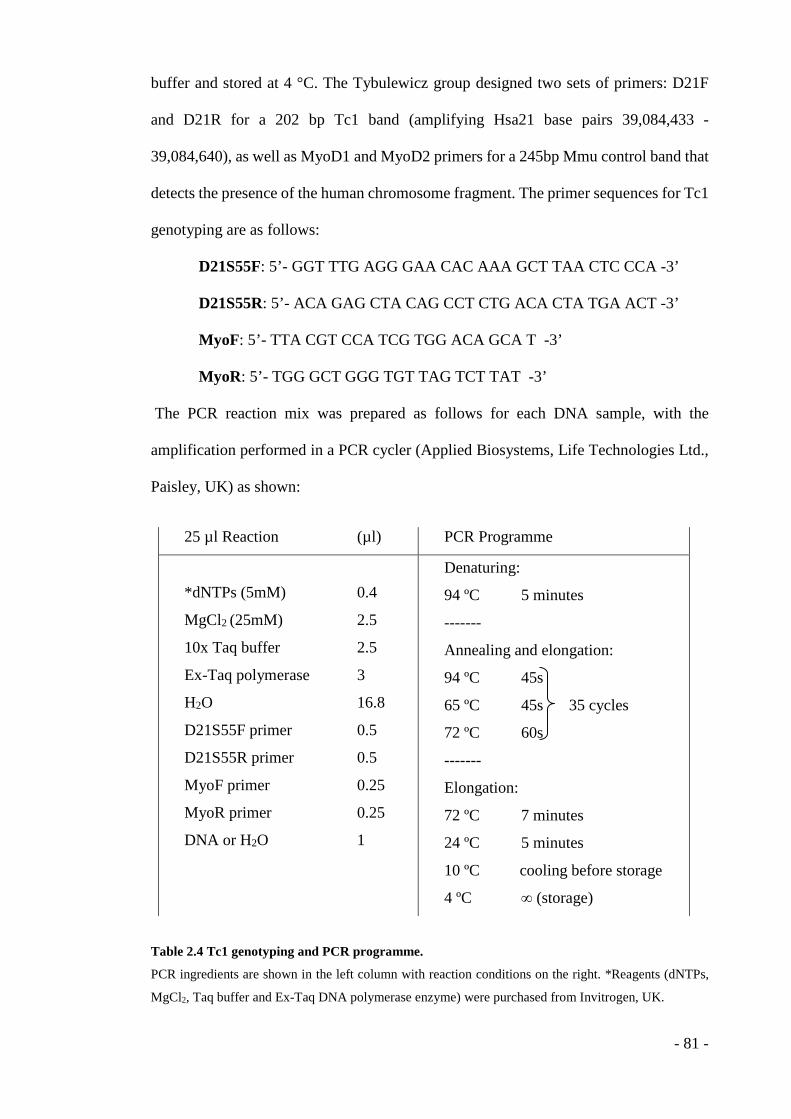
buffer and stored at 4 °C. The Tybulewicz group designed two sets of primers: D21F
and D21R for a 202 bp Tc1 band (amplifying Hsa21 base pairs 39,084,433 -
39,084,640), as well as MyoD1 and MyoD2 primers for a 245bp Mmu control band that
detects the presence of the human chromosome fragment. The primer sequences for Tc1
genotyping are as follows:
D21S55F: 5’- GGT TTG AGG GAA CAC AAA GCT TAA CTC CCA -3’
D21S55R: 5’- ACA GAG CTA CAG CCT CTG ACA CTA TGA ACT -3’
MyoF: 5’- TTA CGT CCA TCG TGG ACA GCA T -3’
MyoR: 5’- TGG GCT GGG TGT TAG TCT TAT -3’
The PCR reaction mix was prepared as follows for each DNA sample, with the
amplification performed in a PCR cycler (Applied Biosystems, Life Technologies Ltd.,
Paisley, UK) as shown:
Table 2.4 Tc1 genotyping and PCR programme.
PCR ingredients are shown in the left column with reaction conditions on the right. *Reagents (dNTPs,
MgCl2, Taq buffer and Ex-Taq DNA polymerase enzyme) were purchased from Invitrogen, UK.
25 µl Reaction (µl) PCR Programme
*dNTPs (5mM) 0.4
MgCl2 (25mM) 2.5
10x Taq buffer 2.5
Ex-Taq polymerase 3
H2O 16.8
D21S55F primer 0.5
D21S55R primer 0.5
MyoF primer 0.25
MyoR primer 0.25
DNA or H2O 1
Denaturing:
94 ºC 5 minutes
-------
Annealing and elongation:
94 ºC 45s
65 ºC 45s 35 cycles
72 ºC 60s
-------
Elongation:
72 ºC 7 minutes
24 ºC 5 minutes
10 ºC cooling before storage
4 ºC ∞ (storage)
- 81 -
PCR products were evaluated by agarose gel electrophoresis. 1.8% agarose gels were
prepared by dissolving 1.8% w/v agarose powder (Gibco, Invitrogen, Paisley, UK) in
TBE buffer (89 mM Tris Base, 89 mM boric acid, 2mM EDTA, pH 8.3). The solution
was heated in a microwave for 4 minutes, swirling the flask to mix at 1-minute intervals,
then allowed to cool to 50 °C before 4 µl 10 mg/ml ethidium bromide (Sigma) was
added. The gel was then poured into a gel tank (Scotlab-Anachem, Luton, UK) and lane
combs inserted to create wells for loading the PCR products. Once cooled, the combs
were removed carefully and the tank filled with TBE buffer. 20 µl PCR product was
loaded into each individual well of the gel and 10 µl Hyperladder I DNA ladder (BioLine
Reagents Ltd., London, UK) was run alongside to determine the correct band size for
the PCR products. Gels were run at 100 V to separate the samples and stopped when the
loading dye reached the end of the gel. PCR product and molecular weight marker bands
were visualised under UV light using LabWorks software and UV Camera.
2.2.1.2 Claudin14
Cldn14 colony ear/tail snips were digested in 100 µl Tail buffer with Proteinase K at 55
°C overnight and the DNA precipitated by adding 100 µl isopropanol. Samples were
spun at full speed, the supernatant aspirated and the DNA pellets left to dry either at
room temperature overnight or at 55 °C for 1-3 hours. DNA was then resuspended in
100 µl TE buffer ready for analysis. Two separate PCR reactions were run for each
sample, to identify wild-type Cldn14 (Reaction 1: 380 bp WT band, amplifying Mmu
16 base pairs 93,919,129-93,919,506) and null Cldn14 (Reaction 2: 275 bp mutant band)
alleles (Figure 3.9), using three primers as follows:
- 82 -
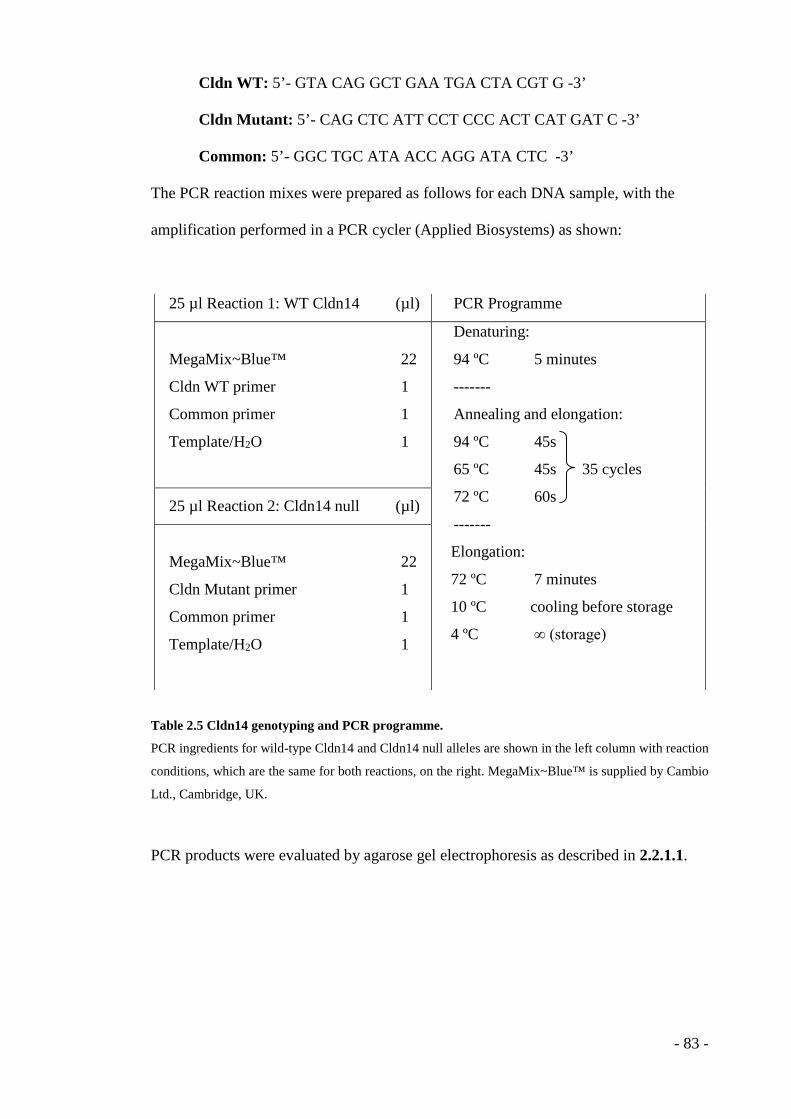
Cldn WT: 5’- GTA CAG GCT GAA TGA CTA CGT G -3’
Cldn Mutant: 5’- CAG CTC ATT CCT CCC ACT CAT GAT C -3’
Common: 5’- GGC TGC ATA ACC AGG ATA CTC -3’
The PCR reaction mixes were prepared as follows for each DNA sample, with the
amplification performed in a PCR cycler (Applied Biosystems) as shown:
25 µl Reaction 1: WT Cldn14 (µl) PCR Programme
MegaMix~Blue™ 22
Cldn WT primer 1
Common primer 1
Template/H2O 1
Denaturing:
94 ºC 5 minutes
-------
Annealing and elongation:
94 ºC 45s
65 ºC 45s 35 cycles
72 ºC 60s
-------
Elongation:
72 ºC 7 minutes
10 ºC cooling before storage
4 ºC ∞ (storage)
25 µl Reaction 2: Cldn14 null (µl)
MegaMix~Blue™ 22
Cldn Mutant primer 1
Common primer 1
Template/H2O 1
Table 2.5 Cldn14 genotyping and PCR programme.
PCR ingredients for wild-type Cldn14 and Cldn14 null alleles are shown in the left column with reaction
conditions, which are the same for both reactions, on the right. MegaMix~Blue™ is supplied by Cambio
Ltd., Cambridge, UK.
PCR products were evaluated by agarose gel electrophoresis as described in 2.2.1.1.
- 83 -
2.3 Tissue culture media and solutions
All centrifugation steps during tissue culture were performed using an Eppendorf 5810
centrifuge and A-4-62 rotor (Eppendorf UK Limited, Stevenage, UK).
2.3.1 Endothelial cell medium
Primary mouse lung endothelial cells were fed using MLEC medium: a 1:1 mixture of
HAMS F-12 (Gibco): 1 g/L glucose DMEM (Gibco), 20% v/v FBS (EU-approved heat-
inactivated foetal bovine serum (PAA Laboratories, GE Healthcare, Yeovil, UK), 100
mg L-1 heparin (Heparin sodium salt, from porcine intestinal mucosa, Sigma), 1% v/v
glutamine (GlutaMAX™ 100x, Gibco), 1% v/v Penicillin/Streptomycin (Gibco), 1
bottle Endothelial Growth Supplement (AbD Serotec, Oxford, UK) per litre of medium.
Medium to be replaced every 3-4 days or when required was aspirated, cell layers
washed with sterile PBS and new medium warmed to 37 °C added to the flask.
2.3.2 Aortic ring medium
Aortic ring explants embedded in a collagen matrix in 96-well plates (as in 2.6) were fed
with 150 µl OPTI-MEM® (Gibco) + 2.5% FBS (PAA Laboratories) ± 30 ng/ml VEGF
(produced in-house). In early experiments with the Tc1 mice, feeding medium was based
on DMEM but later changed to OPTI-MEM® following further optimisation (as
performed by S. D. Robinson; data not shown).
2.3.3 Tumour cell growth medium
Both B16F10 melanoma and Lewis Lung carcinoma (LLC) tumour cells were grown in
DMEM + 4 g/L glucose (Gibco) supplemented with 10% v/v FBS (PAA Laboratories)
and 1% v/v Penicillin/Streptomycin (Gibco).
- 84 -
2.4 Cell culture
2.4.1 Tumour cells
B16F10 melanoma and LLC tumour cells were grown in T175 tissue culture flasks (BD
Falcon, Oxford, UK) and passaged when 90% confluent. For B16F10 cells, growth
medium was aspirated and discarded. The cell layer was then washed with sterile PBS
and cells detached by adding 5 ml trypsin and incubating at 37 °C until cells had fully
detached from the tissue culture plastic surface. After cell detachment, 10 ml tumour
cell growth medium (2.3.3) was added to neutralise the trypsin and the suspended cells
transferred to a 50 ml falcon tube (BD Falcon). Cells were spun down at 1,200 rpm for
3 minutes, the supernatant aspirated and cells resuspended in 20 ml growth medium. 1-
5 ml (depending on the desired level of confluence after passaging) of resuspended cells
was transferred to a fresh T175 flask containing 25 ml fresh pre-warmed growth medium
and flasks were returned to the incubator at 37 °C and 8% CO2. For LLC cells, which
grow both in suspension and as an adherent layer, the growth medium was aspirated and
transferred to a 50 ml falcon tube. The adherent layer was then washed carefully with
sterile PBS then cells were trypsinised as described above and transferred to a separate
50 ml falcon tube. Both supernatant and trypsinised adherent cells were spun down at
1,200 rpm for 3 minutes and cell pellets each resuspended in 20 ml growth medium. 0.5-
5 ml of each cell suspension was added to a new T175 flask containing 25 ml pre-
warmed growth medium and flasks returned to the incubator.
2.4.2 Primary endothelial cells
2.4.2.1 Coating tissue culture flasks
T75 tissue culture flasks were pre-coated with coating solution to prepare the surface for
endothelial cells to adhere using the following solution: 10 ml 0.1% gelatin (Porcine
skin – 300 bloom, Sigma), 100 µl collagen (5005-B, 3 mg/ml, Advanced Biomatrix,
- 85 -
Sandiego, CA, USA), 100 µl 1 mg/ml human plasma fibronectin (Calbiochem, Merck
Millipore, Germany). Flasks were incubated at 37 °C and 8% CO2 with the coating
medium for 2-3 hours, or at 4 °C overnight. Since the coating medium is not neutral pH,
immediately prior to seeding endothelial cells the coating solution was aspirated off,
with as much as possible removed so as not to significantly alter the pH of the growth
medium.
2.4.2.2 Isolation of primary endothelial cells from mouse lungs
6- to 9-week old mice were killed by cervical dislocation and sprayed with 70% ethanol.
Lungs were dissected out in a sterile environment using sterilised instruments and stored
in OPTI-MEM® medium on ice prior to endothelial cell isolation. Lungs were then
rinsed in ethanol followed by one wash in MLEC medium. 0.1% w/v Type I Collagenase
(Gibco) for digestion of mouse lung tissue was prepared as follows: the collagenase was
first made dissolved in DPBS + CaCl2 + MgCl2 (Gibco) at 2x the desired final
concentration (0.2% w/v), incubated at 37 ºC for 1 hour to auto-digest and then diluted
1:2 with DPBS + CaCl2 + MgCl2 prior to use. Lungs were minced with scalpels and
transferred to 15 ml tubes containing approximately 10 ml 0.1 % w/v Type I Collagenase
for every 3 sets of lungs. The tubes were incubated at 37 ºC for 30 minutes with
occasional agitation until sufficiently digested (indicated by sinking of tissue).
MLEC medium was added to inhibit collagenase activity and cell/tissue clumps were
separated into a single-cell suspension by syringing up and down with a 21 gauge needle
and syringe, which was followed by passage through a cell strainer of 70 μm pore size
(BD Falcon). The strainer was then rinsed with 6 ml MLEC medium. Cells were then
spun down at 1,200 rpm for 3 minutes, the supernatant was removed and the cell pellet
resuspended in 10 ml medium to create a cell suspension. Cells were plated (in pre-
- 86 -
coated T75 flasks for every 3-4 sets of lungs) and incubated at 37 °C/8% CO2
Approximately 5 hours later the flask was gently agitated to remove red blood cells
layered on the bottom of the flask, and half the medium was removed and replaced with
fresh MLEC. The following morning, the medium still containing a high proportion of
erythrocytes was aspirated and the adhered cells washed with PBS 4-5 times or until the
wash remained clear, before adding fresh MLEC medium.
2.4.2.3 Cell sorting
To isolate endothelial cells from the heterogeneous population obtained by the initial
extraction method, sorting was carried out using antibody-conjugated magnetic beads
(Dynal, Invitrogen): typically, the day after the cell preparation, a negative sort was
performed to remove macrophages. A positive sort for endothelial cells was then carried
out 2-4 days later, depending on the number and size of endothelial colonies in each
preparation.
Cells were first incubated at 4 °C in MLEC for 20 minutes to prevent internalisation of
surface proteins. The MLEC medium was removed, cells washed with PBS, and rat α-
mouse primary antibody (either to the macrophage marker FcγRII/III (BD Pharmingen)
for negative sorts, or the endothelial marker CD102 (BD Pharmingen) for positive sorts)
diluted in PBS was then added and the cells incubated at 4 °C for 30 minutes. After
washing once with PBS to remove unbound antibodies in solution, magnetic beads
conjugated to sheep α-rat secondary antibody were added and cells incubated for a
further 30 minutes at 4 °C with occasional agitation. Cells were washed 3x with PBS
before trypsinisation for 1 minute at 37 °C. Medium was added to neutralise the trypsin
and the suspension was transferred to a tube which was kept in a magnetic holder for ≥5
- 87 -
minutes to allow cells with beads attached to be held to the wall of the tube. Movement
of the tube in the next step was avoided to prevent detachment of beads.
Negative sort: beads attach to macrophages and adhere these cells to the tube. Medium
was carefully removed and transferred to a pre-coated flask to allow EC adhesion.
Negative sorts were typically performed 1-2 days after initial cell isolation.
Positive sort: beads attach to endothelial cells and adhere to the tube so medium
containing other cell types was aspirated and discarded. Tubes were carefully washed
with fresh MLEC medium to resuspend ECs attached to beads and cells were then
transferred to a pre-coated flask. Typically 2-3 positive sorts were performed on EC
cultures before their use in experiments. EC preparations were shown to be
approximately 95% pure for endothelial cells by FACS analysis (as described in da Silva
et al. 2010).
2.4.2.4 Passaging
Primary endothelial cell colonies were monitored closely and only passaged when large
enough cobblestone colony areas had grown, so as not to seed EC populations too
sparsely. MLEC medium was aspirated and the cell layer washed with sterile PBS. Cells
were detached by incubating T75 flasks with 500 µl trypsin at 37 °C for 1-5 minutes.
Flasks were washed with 10 ml medium and suspended cells transferred to 15 ml falcon
tubes (BD Falcon) then spun down at 1,200 rpm for 3 minutes. The supernatant was
aspirated, cell pellets carefully resuspended in 12 ml medium and transferred to a new
pre-coated flask (2.4.2.1). Flasks were returned to the incubator at 37 °C and 8% CO2.
EC preps were routinely used up to passage 5.
- 88 -
2.5 Dunn Chamber chemotaxis assay
Dunn Chamber assays were performed in collaboration with M. Parsons (Randall Cell
Division of Cell and Molecular Biophysics, Kings College London) (King et al. 2011,
Zicha et al. 1997). Primary endothelial cells grown in culture as described in 2.4.2 were
seeded on 22mm x 25mm x 0.17 mm glass coverslips (Hawksley Scientific, Sussex, UK)
cleaned with 70% ethanol and dried in a sterile environment and pre-coated in 6-well
plates. Cells were seeded at a density of 10,000, 20,000 and 30,000 cells per well, and
serum-starved in OptiMEM® overnight. Coverslips chosen for imaging had single
endothelial cells adhered in sufficient numbers and in good health, but not so confluent
as to be forming larger colonies. A range of densities are used to ensure sufficient
coverslip numbers for analysis, since endothelial cells grow poorly in sparse cultures but
must not be over-confluent for the assay, and primary cell growth rates can vary between
preparations.
Coverslips were then sealed to glass slides containing consecutive circular chambers
(Hawksley Chemotaxis Dunn counting chamber, DC100) as follows: both slide
chambers were first rinsed with serum-free OptiMEM® to coat the chambers’
hydrophobic surfaces and aid assembly of the chamber. Both chambers were then filled
to overflowing with OptiMEM® supplemented with 25mM HEPES to buffer against
changes to ambient CO2 levels. A coverslip as prepared above was taken and inverted
over the slide leaving a small gap at the edge of the outer chamber only large enough to
insert a 200 µl pipette tip. The coverslip was dried thoroughly with tissue whilst being
held in place to remove as much liquid as possible. Three edges were sealed with wax
(1:1:1 mixture of beeswax (Fluka, Sigma-Aldrich), paraffin wax (Sigma-Aldrich) and
petroleum jelly (Vaseline™); melted together in a glass beaker on a heat block at 70
°C) using a paintbrush to leave an accessible gap. The slide was then tilted and the outer
- 89 -
chamber medium removed with tissue by capillary action. The outer chamber was rinsed
slowly once with chemoattractant medium (OptiMEM® supplemented with 100 ng/ml
VEGF), avoiding air bubbles, and drained again with tissue. The outer chamber was then
refilled with chemoattractant medium to create a migration-stimulating growth factor
gradient. Any excess medium was carefully dried from the slide. The final coverslip
edge was then sealed with wax.
Assembled slides were placed on a Zeiss Axiovert 100 inverted microscope within a
perspex environmental chamber (Solent Scientific, Segensworth, UK) heated to 37 °C.
Several fields were selected for overnight image capture at intervals of 10 minutes over
16 hours. Images were acquired by phase contrast imaging using a 10x N-Achroplan
Phase contrast objective (numerical aperture 0.25). Cell images were collected using a
Sensicam (PCO Cook, Indianapolis, IN, US) charge coupled device (CCD) camera.
Chamber assembly and imaging were performed by M. Parsons at KCL.
Movie files were then imported into Andor IQ acquisition software (Andor Bioimaging,
Belfast, Northern Ireland) to obtain individual cell track data from each movie. Resulting
cel files were then analysed in Mathematica™ software (v6, Wolfram Research,
Oxfordshire, UK) using the Dunn chamber Notebook (written by Prof. Graham Dunn,
Kings College London). Instances of apparent cell division and cell death were also
quantified visually from the movie files.
- 90 -
2.6 Aortic ring assay
For more a more detailed analysis of aortic ring assay protocols, please see Baker et al.
2012 (attached in Appendix 7.3).
Briefly, in a sterile tissue culture hood, thoracic aortas were removed from 6- to 24-week
old mice following cervical dislocation and were transferred to OPTI-MEM® medium
(Invitrogen). Extraneous fat, blood and other tissue were removed and aortae were then
transferred to fresh medium. Aortae were sliced transversely into rings approximately
0.5 mm in width, visualised using a dissecting microscope. All rings from individual
aortae were then placed in OPTI-MEM® in a 10 cm culture dish to be serum-starved
overnight in an incubator at 37 ºC/8% CO2.
Sterile water was added to sterile 10x DMEM (Gibco) and the mix chilled on ice for
approximately 5 minutes. Collagen (type 1 rat tail, Millipore) was added to the chilled
water/DMEM to a final concentration of 1.1-1.2 mg ml-1 and mixed, with the final
concentration of the DMEM at 1x. The mix was kept on ice to prevent polymerisation.
Each ring was then transferred to 50 µl of unpolymerised rat-tail collagen + 10x DMEM;
one per well of a 96-well plate. Plates were incubated for one hour at 37 °C to allow
polymerisation.
Plates were then allowed to return to room temperature and 150 μl of growth medium
(as in 2.3.2) or equivalent volume PBS for no treatment) was added per well and the
plate returned to the incubator. The aortic rings were fed every 3-4 days by removing
120 μl medium from each well and adding 150 μl fresh medium. Endothelial sprouts
were counted at 5-11 days by live microscopy, focusing up and down through all planes
- 91 -
of the explant culture, counting each sprout emerging from the aortic ring and each
branching sprout.
2.6.1 RNA interference in aortic rings ex vivo
Aortae were isolated as described previously and cut. A maximum of 24 rings were
transferred to one well of a 24-well plate containing OPTI-MEM®. Mixtures A and B
for Oligofectamine™ (Invitrogen) transfection were prepared and left to stand for 5
minutes:
A: 2.5 µl 40 µM siRNA + 182.5 µl OPTI-MEM®
B: 3 µl Oligofectamine + 12 µl OPTI-MEM®
Solutions A and B were mixed together and left to stand for 20 minutes. Culture medium
was removed from rings and replaced with 800 µl OPTI-MEM® + 200 µl transfection
mixture per well. Rings were left at 37 ºC/8 % CO2 in the medium + siRNA overnight
and embedded in collagen the next day, fed and counted at 5-11 days as described in
2.6.
SMARTpool siRNA sets were ordered from Dharmacon Inc., Chicago, IL, USA. For
additional siRNAs used in the Tc1 study (section 3.6), please see Reynolds et al. 2010,
included in Appendix 7.3.
Mouse CLDN14 siRNA pool (Dharmacon):
1: GUG CAC ACG CUG CGC CAA A 2: GGA GCU ACC ACC ACG GCU A
3: GGU ACA GGC UGA AUG ACU A 4: GGA UGG AAU GUG UGU GGC A
- 92 -
2.7 Immunofluorescence
2.7.1 Whole tissue sections
2.7.1.1 FFPE sections
8 µm sections were cut from FFPE tumour blocks and mounted onto glass slides. Prior
to staining, sections were first deparaffinised and hydrated by immersion in a series of
solutions, as follows:
Excess water was blotted from around rehydrated sections and the tissue area defined
with a pap-pen (ImmEdge™, Vector Laboratories Ltd., Peterborough, UK). For antigen
retrieval, sections were boiled in citrate buffer (0.294% w/v Tri-Sodium citrate (Fisher)
in ddH2O, adjusted to pH 6 with acetic acid) for 10 + 10 minutes. Sections were then
allowed to cool to room temperature for 10 minutes (aided by addition of ddH2O to the
boiling container) and rinsed twice with PBS before blocking for 30 minutes at 37 °C
with blocking buffer (2 % v/v Goat serum, 1 % w/v BSA, 0.1 % v/v Triton X-100 in PBS).
For analysis of blood vessels, sections were then incubated overnight at 4 °C with
primary α-endomucin antibody diluted 1:500 in blocking buffer to identify endothelial
cells. Sections were washed three times with PBS before incubation for 1 hour at room
temperature with 1:200 Alexa Fluor secondary antibody in blocking buffer. After three
further PBS washes, slides were rinsed once with ddH2O and coverslips mounted with
ProLong® Gold Antifade with DAPI (Invitrogen, cat. no. P36930).
1: 1st xylene solution 5 minutes 6: 2nd 80 % ethanol 3 minutes
2: 2nd xylene solution 5 minutes 7: 70 % ethanol 3 minutes
3: 1st 100 % ethanol 3 minutes 8: 50 % ethanol 3 minutes
4: 2nd 100 % ethanol 3 minutes 9: distilled water
5: 1st 80 % ethanol 3 minutes
- 93 -
To visualise supporting cell coverage of blood vessels in tumour sections, 8 µm FFPE
tumour sections were treated as above, with the exception that 1:500 mouse anti-mouse
Cy5-conjugated αSMA antibody (Sigma) was added to the secondary antibody
incubation step. Following mounting of slides, pericyte coverage of blood vessels was
quantified by live microscopy: the total number of endomucin-positive blood vessels per
unit tumour area and the number of endomucin-positive blood vessels with associated
αSMA-positive cells was counted and the percentage αSMA/endomucin blood vessels
calculated.
2.7.1.2 Cryosections
Staining for the junctional molecule ZO-1, the basement membrane protein laminin and
the endothelial marker PECAM in 8 µm tumour cryosections: sections were air dried at
room temperature, rehydrated in PBS for 10 minutes, fixed in -20 °C methanol for 10
minutes, and then blocked (5% w/v BSA, 0.1% Triton X-100 in PBS) for 45 minutes at
room temperature or overnight at 4 ºC. After three 5-minute washes in PBS, sections
were incubated with primary antibody (ZO-1 or laminin 1:100 in blocking buffer) for 2
hours at room temperature. After three 5-minute washes in PBS, sections were incubated
with anti-rabbit Alexa 488 secondary antibody diluted 1:200 in blocking buffer for 1
hour at room temperature, and PE-PECAM was diluted to 1:500. After three 5 minute
washes in PBS, sections were washed briefly with distilled water and mounted with
ProLong® Gold Antifade with DAPI (Invitrogen). Fluorescent images of sections were
acquired using a Zeiss Axioplan microscope and Axiovision software multidimensional
acquisition settings.
- 94 -
2.7.2 Immunofluorescence staining of aortic rings
To quantify and image aortic rings at the end of the ex vivo assay, whole explant cultures
were stained with the endothelial cell-specific Bandeiraea simplicifolia (BS1) lectin
conjugated to fluorescein isothiocyanate (FITC).
To fix aortic rings in 96-well plates, the growth medium was removed and wells were
washed three times in PBS. 50 µl 4% PFA was added to each well chosen for staining
and left for 15 minutes at room temperature before a further three PBS washes. 50 µl
1:1000 BS1-lectin in PBS was added per well and plates incubated at 4 °C overnight.
Wells were then washed a final three times with PBS before removing the cultures
carefully from the wells to mount on slides (up to 6 explants per slide) using ProLong®
Gold Antifade with DAPI (Invitrogen). Fluorescent images were acquired using a Zeiss
Axioplan microscope and Axiovision software multidimensional acquisition settings.
2.7.2.1 Ex vivo EdU proliferation assay
The ClickIT® EdU Proliferation Assay (Invitrogen), which employs a BrdU-like
molecule capable of incorporating into DNA to assess DNA synthesis and therefore
cellular proliferation, was modified for use in the ex vivo aortic ring assay (see also Baker
et al. 2012 for details, attached in Appendix 7.3). Briefly, aortic rings embedded in a
collagen matrix as described in 2.6 were serum-starved and treated with 10 µM EdU for
2 hours prior to fixation as described below in 2.7.3.3 and Baker et al. Following fixation
in 4% formaldehyde, EdU detection was performed as according to the manufacturer’s
protocol, using reduced reagent volumes (50 µl per well) as well as increased washing
frequency and duration to remove as much background signal as possible, since the
collagen matrix picks up some of the green fluorescent reagent provided with the kit.
Rings were co-stained with TRITC-conjugated BS1-lectin (Sigma), carefully removed - 95 -
from the 96-well plate and mounted on glass slides with ProLong® Gold Antifade with
DAPI (Invitrogen) following EdU detection. Fluorescent images were acquired using a
Zeiss Axioplan microscope and Axiovision software multidimensional acquisition
settings. Proliferation was quantified by counting EdU-positive proliferating cell nuclei
and total nuclei in BS1 lectin-positive endothelial microvessel sprouts during live
imaging, with the percentage of proliferating cells recorded.
2.7.3 Primary endothelial cells
2.7.3.1 VEGFR2 immunofluorescence
Primary endothelial cells were seeded onto coverslips and allowed to attach and grow
for 24 h in full endothelial cell growth medium. The cells were serum-starved in OPTI-
MEM® overnight and half were stimulated for 10 min with 30 ng/ml VEGF while the
remainder were used as controls (supplemented with an equal volume of PBS). After
VEGF- stimulation the cells were rinsed three times with PBS and fixed in 4%
paraformaldehyde for 5 minutes. Free aldehydes were quenched with 50 mM NH4Cl in
PBS for 10 minutes. Fixed cells were then permeabilised in PBS containing 0.1 % Triton
X-100 with 2 % w/v BSA for 15 minutes then incubated at room temperature for 1 hour
with rabbit anti-human phospho-VEGFR2 antibody (Cell Signaling Technology) diluted
at 1:100 in PBS with 0.1% Triton X-100. Cells were rinsed and incubated with donkey
anti-rabbit secondary antibody conjugated to Alexa-488 (Invitrogen), diluted at 1:1000
for 30 min. Cells were washed three times in PBS and once in water and then mounted
with ProLong® Gold Antifade with DAPI (Invitrogen). Images were acquired using a
Zeiss LSM 510 confocal microscope.
- 96 -
2.7.3.2 In vitro proliferation assay
For the labelling of proliferating primary endothelial cells in vitro, the ClickIT® EdU
Proliferation Assay (Invitrogen) was used in a similar manner to that described for aortic
rings in 2.7.2.1. The 10 mM EdU reagent stock was diluted to create a 2x stock at 20
µM; typically, 80 µl of 2x stock was added to 40 ml proliferation assay medium (see
below). Cells were seeded on pre-coated coverslips in 6-well tissue culture plates 24
hours before the assay and were tested at 50-60% confluence.
Two hours prior to addition of the EdU reagent, half of the cell growth medium was
replaced with starvation medium (1:1 F12:DMEM medium, 1% v/v FBS, 1 mg ml-1
Heparin, 1:100 Penicillin/Streptomycin, without EdU) to serum-starve the cells. Two
hours later, half of the starvation medium was removed and replaced with starvation
medium containing EdU to provide 1x (10 µM) EdU in the wells (1:1 F12:DMEM
medium, 1% v/v FBS, 1 mg ml-1 Heparin, 1:100 Penicillin/Streptomycin, with EdU).
Cells were also supplemented with 30 ng/ml VEGF or PBS as a control. EdU
incorporation was allowed to proceed for 1.5 hours before plates were placed on ice, the
medium removed, coverslips washed with PBS and 4% formaldehyde fixative added.
Plates were incubated with fixative at room temperature for 15 minutes before washing
in PBS three times.
The EdU detection protocol was performed according to the manufacturer’s instructions
(Invitrogen), only with all reagent volumes reduced by a factor of 10, for example 50 µl
incubation reagent was used per well instead of the suggested 500 during the staining
protocol. Explants were mounted on glass slides with ProLong Gold™ Antifade with
DAPI and images were acquired using a Zeiss Axioplan microscope and Axiovision
software multidimensional acquisition settings. The percentage of proliferating (EdU-
- 97 -
positive) cells was calculated by counting total DAPI-positive nuclei per field and then
total EdU-positive nuclei in the same field.
Assessment of proliferation in siRNA-transfected cells (as in 2.8) was carried out as
above except that cells were seeded on pre-coated 15 mm coverslips in 10 cm tissue
culture plates (BD Falcon) and allowed to adhere overnight as detailed above, before
moving coverslips to 6-well plates and following the protocol as previously described.
2.7.3.3 TUNEL apoptosis assay in vitro
The Invitrogen ClickIT® TUNEL Apoptosis Assay was used to quantify TUNEL-
positive (apoptotic) primary endothelial cells transfected with siRNA as described in
2.8. Transfected cells were seeded on pre-coated 15 mm coverslips in 10 cm tissue
culture plates (BD Falcon) and allowed to adhere overnight. Coverslips were transferred
to 6-well tissue culture plates containing starvation medium for 1.5 hours. 30 ng/ml
VEGF or PBS as a control was added to the wells to stimulate cells for 1.5 hours. Plates
were then placed on ice, the medium removed and coverslips washed with PBS, then
fixed with 4 % paraformaldehyde for 15 minutes at room temperature. Following three
PBS washes to remove fixative, coverslips were processed with the TUNEL staining
protocol provided by the manufacturers. As in 2.7.2.1, reagent volumes were reduced
10 x.
Coverslips were mounted with ProLong Gold™ Antifade with DAPI and fluorescent
images were acquired using a Zeiss Axioplan microscope and Axiovision software
multidimensional acquisition settings. The percentage of apoptotic (TUNEL-positive)
cells was calculated by counting total DAPI-positive nuclei per field and then total
TUNEL-positive nuclei in the same field.
- 98 -
2.8 Transient siRNA transfection of primary endothelial cells in vitro
Primary endothelial cells to be transfected were grown to 70-90% confluence in T175
tissue culture flasks (or containing approximately 3 million cells). An AMAXA
Nucleofector™ 2b Device (Lonza, Basel, Switzerland) was sterilised and transferred to
the sterile tissue culture hood then set to programme T-27 for endothelial cells. To
prepare for transfection, 40 µM siRNA pool stocks were thawed on ice and 3 µl of
siRNA stock (3 µg siRNA) was transferred to an appropriately labelled 1.5 ml
Eppendorf tube.
Cells were trypsinised and resuspended in 30 ml MLEC medium. Cells were counted
and 1 million cells for each transfection reaction aliquoted to 15 ml tubes (for example,
where 6 transfections using the same siRNA pool were required, 6 million cells were
transferred). Cells were spun down at 1,200 rpm for 3 minutes and medium carefully
aspirated, with as much as possible removed from the cell pellet using a p1000 Gilson
pipette tip after initial aspiration.
For transfection, the cell pellet was carefully resuspended in 100 µl endothelial cell
transfection buffer provided with the AMAXA kit (or 600 µl for 6 million cells) and 100
µl resuspended cells was transferred to the appropriate Eppendorf containing the siRNA.
The cell/siRNA suspension was then transferred to an AMAXA plastic cuvette using the
provided pipettes to ensure no air bubbles were formed, placed in the Nucleofector and
transfected using the set programme. The cuvette was immediately removed from the
machine and the transfected cell suspension transferred to a pre-coated 10 cm tissue
culture plate containing 15 mm coverslips and 5 ml MLEC medium. Cells were returned
to the incubator at 37 °C and 8% CO2 and allowed to recover overnight.
- 99 -
2.9 Flow cytometric analysis of cell surface receptor levels
Primary endothelial cells were seeded in individual wells of a 24 well plate (3 x 10⁵ per
well), cultured overnight, and stimulated the following day with 30 ng/ml VEGF.
Stimulation was ceased by placing cells on ice, followed by rinsing with ice-cold
DMEM. Cells were kept on ice for the subsequent steps. To dissociate GF/receptor
interactions, cells were treated for 10 minutes with cold acidified E4 medium (pH 4)
supplemented with 1% BSA and washed in FACS buffer (2% FBS in PBS). Cells were
stained with PE-conjugated rat α-mouse VEGFR2 antibody (1/50, BD Pharmingen) or
with a corresponding isotype control (PE-conjugated rat α-mouse IgG, BD Pharmingen)
in FACS buffer for 45 minutes. Cells were then washed three times and detached from
the well by incubating with 5 mM EDTA in PBS and scraping. Surface antibody binding
was analysed by flow cytometry using a FACScalibur® flow cytometer (Becton
Dickinson, Oxford, UK) and Cellquest Pro software. The geomean fluorescence
intensity of the population was measured to determine the percentage of receptor
remaining at the plasma membrane over time.
- 100 -
2.10 Western blot analysis
2.10.1 Cell lysis
Primary endothelial cells grown in pre-coated culture plates to comparable confluence
were incubated on ice for 10 minutes and scraped into RIPA buffer (2% Triton X-100,
2% sodium deoxycholate (Sigma), 0.2% SDS, 316 mM NaCl, 20 mM Tris-base pH 7.3,
2 mM EGTA (BDH Laboratory Supplies, UK), 2 mM sodium orthovanadate (Sigma), 10
mM NaF (Sigma), 1 mM PMSF (Sigma). Lysate was transferred to an eppendorf and
spun in a benchtop microcentrifuge (Eppendorf) at 20,000 g for 10 minutes at 4°C. The
supernatant was removed and transferred to a fresh eppendorf, discarding the pellet.
2.10.2 Protein assessment
BSA standards of known concentrations: 0, 0.1, 0.2, 0.4, 0.8, 1.2, 1.6 and 2.0 mg/ml
were prepared by serial dilution in RIPA buffer. 5 µl of cell lysates and duplicate
standard samples were transferred to a 96-well plate. The DC-Biorad Protein Assay Kit
was used according to manufacturer’s instructions: 1 ml Reagent A was supplemented
with Reagent S and 25 µl of this solution was added to each protein sample. 200 µl
Reagent B was then added to each well and the plate incubated for 15 minutes at room
temperature. A spectrophotometer (LabTech International LDT, East Sussex, UK) was
used to read sample absorbance at 650 nm, to determine protein concentration by
comparison with the BSA standards. A standard curve was created in Excel (Microsoft)
and the equation of the line used to find the protein concentrations of the test samples.
2.10.3 SDS-PAGE
Polyacrylamide gel electrophoresis (PAGE) was performed using the Novex gel
apparatus Xcell IITM Mini-Cell (Novex Electrophoreses GmbH, Invitrogen). Gel
cassettes were prepared prior to loading by pouring the running gel (10 ml prepared per - 101 -

8 % gel: 2.7 ml 30 % Protogel Acrylamide, 2.5 ml v/v Protogel 4x Resolving buffer, 4.7
ml v/v H2O + 100 μl fresh 10 % w/v APS + 6 μl TEMED) into an empty cassette
(Invitrogen), overlaying with distilled water and leaving the gel to polymerise for 30
minutes. The distilled water was then removed and replaced with stacking gel (2ml
prepared per gel: 330 μl 35% Protogel Acrylamide, 500 μl Protogel Stacking buffer,
1.15 μl H2O, 20 μl APS, 2 μl TEMED), into which a lane comb was carefully inserted
and the gel left to polymerise for a further 30 minutes. The lane comb was then removed
and the gel tank apparatus assembled, with the addition of running buffer (see 2.1). Cell
lysates of equal concentration were added to 5 % volume 5x sodium dodecyl sulphate
(SDS) loading buffer (10 % w/v SDS, 20 % w/v glycerol, 312.5 mM Tris pH6.8, 10 %
w/v 2-ME, few crystals bromophenol blue). Samples were boiled at 100 °C for 5 minutes
prior to loading. Gel wells were washed with running buffer and samples loaded into the
wells. Rainbow Marker (GE Healthcare) was used for molecular weight determination
and loaded gels were run in running buffer at 200 volts (V) for approximately 20 minutes
to run samples through the stacking gel, then at 125V to run samples to the end of the
gel.
2.10.3.1 NuPAGE system
Detection of Cldn14 was achieved using a modified Western Blot protocol from that
described in 2.9.3, employing instead the Invitrogen NuPAGE system as optimised by
myself and S. D. Robinson. Samples were prepared after determination of protein
concentration and aliquoting volumes containing 15-20 µg protein by addition of 4x
NuPAGE LDS Sample Buffer and 10x NuPAGE Sample Reducing Agent each to a final
concentration of 1x. Samples were then heated to 100 °C for 5 minutes prior to loading.
- 102 -
Running cassettes were assembled 1 mm x 12-well pre-cast 12% Bis-Tris gradient
polyacrylamide gels (Invitrogen). Samples were loaded into the wells along with
Rainbow Marker (GE Healthcare). The cassette was assembled as detailed above using
different buffer solutions to allow proper separation of proteins in the gradient gel; 1
litre 1x MES-SDS buffer was prepared by diluting Invitrogen NuPAGE 10x stock with
H2O and 200 ml was removed, to which 500 µl NuPAGE antioxidant was added in order
to keep protein samples denatured within the gel. The outer chamber of the cassette was
filled with the remaining 800 ml 1x MES-SDS buffer and the inner chamber was filled
with the 200 ml buffer + antioxidant. Gels were run at 120 V for 2 hours at 4 °C to
separate samples sufficiently before proceeding to the transfer step.
2.10.4 Blotting
Separated proteins were transferred from the gel to Hybond ECL™ nitrocellulose
membrane (Amersham Life Science) using the Novex Xcell II™ Mini-Cell transfer
module. Before setting up the transfer, the membrane, sponges and 3MM Whatmann
paper were placed in transfer buffer (12 mM Tris, 96 mM Glycine, MeOH pH 8.3, in
H2O) for pH equilibration. The cassette was assembled and transfer carried out at 30V
for 1 hour.
For NuPAGE gels, transfer to nitrocellulose membranes was set up and run as described
above except that 20x NuPAGE Transfer Buffer was diluted to 1 x with H2O and used
to run the transfer at 30V for 2 hours also at 4 °C.
2.10.5 Probing
Membranes were blocked for 1 hour in 5 % w/v Marvel™ skimmed milk powder in
PBS, washed 3x 5 minutes in 0.1 % PBS-Tween then incubated with primary rabbit anti-
- 103 -
mouse phospho- or total-ERK antibody diluted 1:100 in blocking solution at 4 °C
overnight. A further 3 5-minute washes in PBS-Tween were followed by incubation with
HRP-conjugated secondary antibody with agitation for one hour at room temperature.
After 3x 5-minute washes with PBS-T, excess liquid was removed and signal detected
with the ECL Western Blot Detection reagents (GE Healthcare, Amersham). Bands were
visualised using Hyperfilm ECL (Amersham) and a Konica SRX-101A developer. To
re-probe, blots were stripped by incubation at room temperature in Re-Blot Plus Mild
Solution 10x (Millipore) diluted 1:10 in ddH2O, with agitation, for 5-10 minutes. Strip
buffer was rinsed off with water and blots re-blocked before primary antibody incubation
or stored in PBS at 4 °C.
From NuPAGE gels, following transfer to the membrane, blots were blocked for 1 hour
in 5% Marvel milk in PBS and then incubated overnight at 4 °C with primary rabbit anti-
mouse Cldn14 antibody (Sigma) diluted 1:100 in 5% BSA in PBS with 0.1% Tween-20.
Following three 15-minute washes in PBS with 0.1% Tween-20, blots were incubated
with 1:200 secondary anti-rabbit HRP antibody for 1 hour at room temperature. Blots
were then developed as described above, stripped and reprobed for Hsc70 as a loading
control.
2.10.6 Densitometry
Densitometry was performed on scanned film images using ImageJ. Lanes were defined
and bands selected then the areas of the peaks measured. Results were normalised to
corresponding total protein values for ERK or to Hsc70 loading control band values for
Cldn14.
- 104 -
2.11 Reverse transcription PCR
2.11.1 Confirmation of siRNA-mediated knockdown in WT and Tc1 cells
The RTPCR method used to confirm expression and RNAi knockdown of mouse and
human target genes in wild-type and Tc1 cells is shown in Reynolds et al. 2010
Supplementary Information (Appendix 7.3). Briefly, primary lung endothelial cells
isolated from wild-type and Tc1 mouse lungs were grown to 60-70% confluence. RNA
was extracted using either the Trizol method (according to the manufacturer’s
instructions) (Invitrogen, UK) or the QIAGEN RNeasy mini kit (QIAGEN, Crawley,
UK). cDNA was synthesised from equal concentrations of RNA isolated from both
genotypes (Superscript III RT kit, Invitrogen). Primer sequences and cycling conditions
are detailed in the Supplementary Information (Appendix 7.3). PCR products were run
on a 1.8% agarose gel and the bands were visualised under UV light.
2.11.2 Assessment of claudin mRNA levels
A different method for RNA extraction and detection of claudin mRNAs was optimised
by D. Lees, as described below.
2.11.2.1 RNA extraction
Organs were harvested from WT, Cldn14-het and Cldn14-null mice and snap-frozen in
liquid N2 then stored at -80 °C. Samples were weighed and ground to powder in liquid
N2 using a pestle and mortar. Powdered samples were halved and transferred to 1.5 ml
tubes. The sample for RNA extraction was homogenised with a 1 ml pipette, then a 20
G x 1 1/2 in needle and 3 ml syringe. Samples were spun for 3 minutes at 13,000 g and
the supernatant collected, frozen on dry ice and stored at -80 °C.
The Qiagen RNeasy mini kit, with a DNaseI digestion step, was used to extract RNA
from the tissue supernatants, according to the manufacturer’s instructions. Samples were
- 105 -
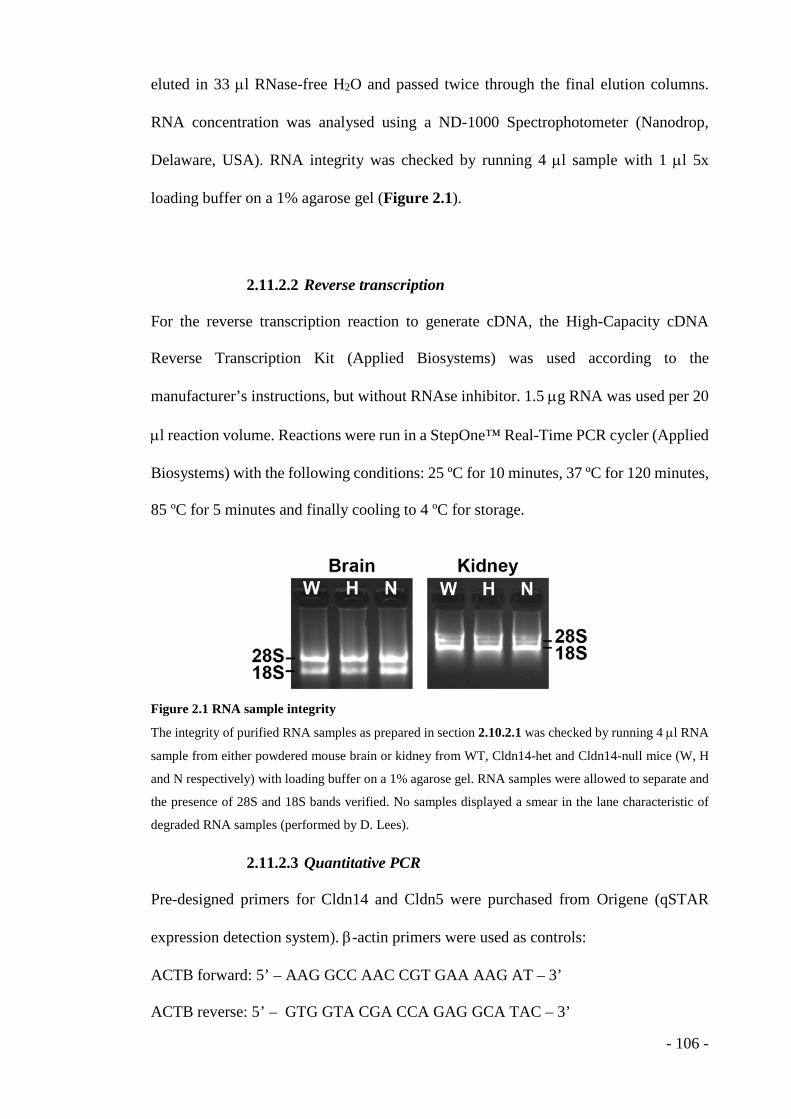
eluted in 33 µl RNase-free H2O and passed twice through the final elution columns.
RNA concentration was analysed using a ND-1000 Spectrophotometer (Nanodrop,
Delaware, USA). RNA integrity was checked by running 4 µl sample with 1 µl 5x
loading buffer on a 1% agarose gel (Figure 2.1).
2.11.2.2 Reverse transcription
For the reverse transcription reaction to generate cDNA, the High-Capacity cDNA
Reverse Transcription Kit (Applied Biosystems) was used according to the
manufacturer’s instructions, but without RNAse inhibitor. 1.5 µg RNA was used per 20
µl reaction volume. Reactions were run in a StepOne™ Real-Time PCR cycler (Applied
Biosystems) with the following conditions: 25 ºC for 10 minutes, 37 ºC for 120 minutes,
85 ºC for 5 minutes and finally cooling to 4 ºC for storage.
Figure 2.1 RNA sample integrity
The integrity of purified RNA samples as prepared in section 2.10.2.1 was checked by running 4 µl RNA
sample from either powdered mouse brain or kidney from WT, Cldn14-het and Cldn14-null mice (W, H
and N respectively) with loading buffer on a 1% agarose gel. RNA samples were allowed to separate and
the presence of 28S and 18S bands verified. No samples displayed a smear in the lane characteristic of
degraded RNA samples (performed by D. Lees).
2.11.2.3 Quantitative PCR
Pre-designed primers for Cldn14 and Cldn5 were purchased from Origene (qSTAR
expression detection system). β-actin primers were used as controls:
ACTB forward: 5’ – AAG GCC AAC CGT GAA AAG AT – 3’
ACTB reverse: 5’ – GTG GTA CGA CCA GAG GCA TAC – 3’
- 106 -
Reactions were performed with the SYBR Green PCR master mix (Applied Biosystems)
in optical qPCR plates. A 40 ng to 0.625 ng standard curve was set up using sequential
2x dilutions of cDNA. To amplify Cldn cDNA: 0.8 µl primers were used, as
recommended by Origene, with 100 ng cDNA. 1 µl (50 nM) ACTB primers were used
with 10 ng cDNA. Reactions were run in a StepOne RTPCR cycler (Applied
Biosystems). Relative Cldn message quantities (r) were calculated using the following
formula, which includes the efficiency of each gene amplification:
Efficiency = 10^-(1/slope)
r = [e(target)ΔCt (control-sample)] / [e(reference)ΔCt(control-sample)]
2.12 Syngeneic tumour growth assay
2.12.1 Injection of cells
B16F0 (a low metastatic variant of the B16 melanoma cell line) and Lewis Lung
Carcinoma (LLC) were grown and described in 2.4.1 with medium specified in 2.3.3
and were trypsinised for counting using a Millipore Scepter 2.0 Handheld Automated
Cell Counter, which provides the concentration of cells present in the sampled
suspension. The appropriate volume of tumour cell suspension was then transferred to a
fresh tube, spun down at 1,200 rpm for 3 minutes and resuspended in sterile PBS ready
for injection: 1×10⁶ B16F0 or 0.5×10⁶ LLC cells per 100 µl of PBS. A mixture of LLC
cells growing both in suspension and adhered (as described in 2.4.1) was used for
injections. Mice were prepared for tumour cell injections one day prior to the start of
tumour growth experiments by shaving along the flank with electric clippers. A single
subcutaneous injection of 100 µl of PBS containing either 1×10⁶ B16F0 or 0.5×10⁶ LLC
cells was given on day 0. Tumours were allowed to grow for 10 (B16) or 12 days (LLC)
then excised and photographed following cervical dislocation of the mice.
- 107 -
2.12.2 Tumour growth and bioluminescence
The tumour dimensions were measured with electronic callipers (including length and
width measurements every two days for growth kinetics). For bioluminescence
measurements, luciferase-tagged cell lines were used (as described in Salako et al.
2011). From day 3 post-inoculation and every 2-3 days thereafter, mice were injected
with 200 µl Luciferin (Caliper Lifesciences D-Luciferin Firefly, Potassium salt 1.0 g
diluted to 15 mg ml-1 in PBS + CaCl2 + MgCl2 (Gibco)) intra-peritoneally and imaged
in a VivoVision® IVIS® scanner (Xenogen, Caliper Lifesciences) after 10 minutes
whilst under light anaesthetic (isofluorane). Photon emission data were analysed using
Living Image V3.2 software. The luciferase expressed by the tumour cells is able to
oxidise luciferin taken up by the tumour cells so long as sufficient oxygen is available,
which releases photons that can be detected by the camera. Bioluminescence is not a
measure of tumour mass or size but a combination of tumour oxygenation and metabolic
activity.
At the end of the experiment, mice were killed by cervical dislocation. Tumours were
dissected out, measured in 3 dimensions then bisected and either: (1) snap-frozen by
embedding in OCT (Fisher Scientific, Loughborough, UK) and freezing in liquid N2-
cooled isopentane or (2) fixed in 4 % formaldehyde in PBS for histological analysis; 24
hours post-fixation, formaldehyde was replaced with 70% ethanol and tumours were
then arranged in cassettes to be embedded in paraffin.
2.12.3 Ante-mortem processing
In some experiments ante-mortem procedures were carried out prior to tumour
harvesting as described below.
- 108 -
2.12.3.1 Pimonidazole hypoxyprobe assay
The Pimonidazole hypoxyprobe was used to assess hypoxia in tumours. Pimonidazole
binds thiol-containing proteins specific to hypoxic cells and can be visualised with a
commercially-available antibody (Varia et al. 1998,). This reagent has been optimised
extensively for use in vivo (Rosenberger et al. 2009) Tumour-bearing mice were given
intravenous injections via the tail vein of 60 mg/kg pimonidazole hydrochloride
(Hypoxyprobe™-1 HPI, Inc., diluted in ddH2O to a final concentration of 10 mg/ml) 1
hour prior to sacrifice. Tumours were processed immediately after cervical dislocation
by snap-freezing. 8 µm cryosections were thawed, rehydrated and fixed for 10 minutes
in -20 °C acetone. Sections were washed once in PBS and incubated with antibodies
diluted in PBS (1:10 anti-pimonidazole Cy3-conjugated antibody and 1:500 PE-
PECAM) overnight, then washed three times with PBS and mounted with ProLong
Gold™ Antifade with DAPI (Invitrogen). Fluorescent images were acquired using a
Zeiss Axioplan microscope and Axiovision software multidimensional acquisition
settings.
2.12.3.2 Hoechst leakage assay
10 minutes prior to sacrifice, tumour-bearing mice were injected with 100 µl PE-
PECAM antibody (undiluted, BD Pharmingen) to label blood vessels with active blood
flow. Hoechst dye (Sigma bisBenzimide H33342 trihydrochloride, B2261) was prepared
at 4 µg/ml final concentration by dilution in H2O, following resuspension and storage of
the product at 10 µg/ml. 1 minute before sacrifice, the same mice were injected with 100
µl Hoeschst dye to label cell nuclei. Tumours were processed immediately after cervical
dislocation. Thick (100 µm) sections of frozen tumour samples were thawed, rehydrated
- 109 -
and fixed for 10 minutes in -20 °C methanol then mounted with ProLong Gold™
Antifade without DAPI (Invitrogen, cat. no. P36930).
2.12.4 Assessment of hypoxia in tumours
To convert pimonidazole staining to an “hypoxic index” a 4x5 grid was used to divide
images of pimonidazole-immunostained tumour sections into 20 sectors. The distance
from several PECAM-positive blood vessels per sector (at least 5 sectors per image) to
the closest pimonidazole-positive (hypoxic) areas were measured in Adobe Photoshop
CS5. The inverse values of these distances were taken and averaged to give the hypoxic
index.
2.12.5 Blood vessel quantitation
Immunofluorescence images of endomucin-immunostained sections were captured
using an epifluorescence microscope (Carl Zeiss, Jena, Germany) equipped with a Zeiss
AxioCam MRc 5 digital camera (Carl Zeiss Ltd., Welwyn Garden City, UK) and
AxioVision V4.8.1.0 software (Carl Zeiss Imaging Studios). The mean number of
endomucin//PECAM-positive blood vessels present in entire tissue sections was counted
and divided by the area of the section to determine blood vessel density. Whole tumour
sections are used in order to avoid selection bias due to choosing individual fields, and
multiple tumours are counted to collect a high number of data points that should
represent the actual vessel density of the tumours. It is also thought that this method
should avoid methodological problems such as collapsing vessels during the sectioning
process. Mid-sections are counted to avoid the more variable vessel densities found at
the tumour extremities. After confirming that counts correlated well with those made by
more experienced lab members, all counts were performed by myself, to avoid
differences due to changing observers. “Lumenated” (vessels showing clear lumens
- 110 -
within endomucin-positive endothelial walls, indicating vessels likely to carry blood
flow) and “non-lumenated” (endomucin-positive structures without clear lumens
indicating blind vessel ends, poorly-formed or collapsing/regressing vessels) vessels
were identified by eye, following guidance from Prof. Hodivala-Dilke, and counted
across whole tumour midsections in the same manner as the total vessel counts. Results
are given as the number of vessels per mm2 of section. All counts were carried out in a
double blind fashion.
Unchallenged skin was also taken from mice, fixed and embedded in paraffin in the
same way as tumour samples, and immunostained for endomucin. Blood vessel density
was also quantified in this unchallenged tissue to confirm that any observed effects on
blood vessels in tumours were due to pathological angiogenesis.
- 111 -
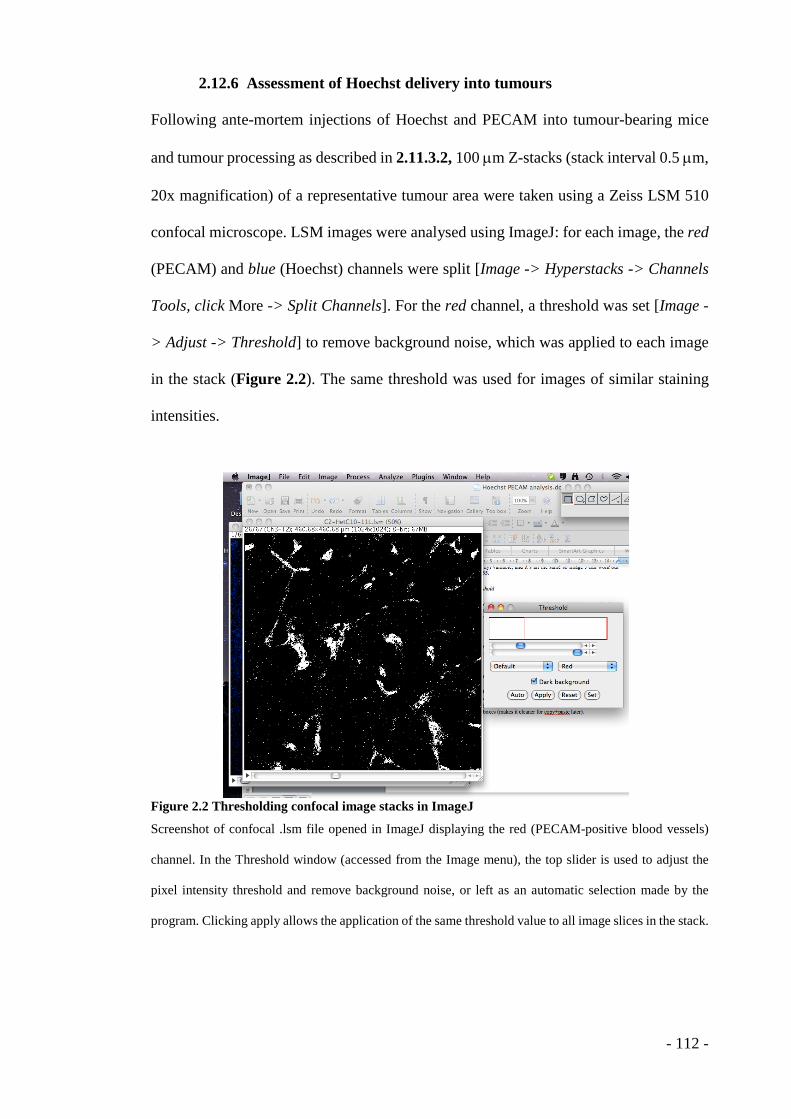
2.12.6 Assessment of Hoechst delivery into tumours
Following ante-mortem injections of Hoechst and PECAM into tumour-bearing mice
and tumour processing as described in 2.11.3.2, 100 µm Z-stacks (stack interval 0.5 µm,
20x magnification) of a representative tumour area were taken using a Zeiss LSM 510
confocal microscope. LSM images were analysed using ImageJ: for each image, the red
(PECAM) and blue (Hoechst) channels were split [Image -> Hyperstacks -> Channels
Tools, click More -> Split Channels]. For the red channel, a threshold was set [Image -
> Adjust -> Threshold] to remove background noise, which was applied to each image
in the stack (Figure 2.2). The same threshold was used for images of similar staining
intensities.
Figure 2.2 Thresholding confocal image stacks in ImageJ
Screenshot of confocal .lsm file opened in ImageJ displaying the red (PECAM-positive blood vessels)
channel. In the Threshold window (accessed from the Image menu), the top slider is used to adjust the
pixel intensity threshold and remove background noise, or left as an automatic selection made by the
program. Clicking apply allows the application of the same threshold value to all image slices in the stack.
- 112 -
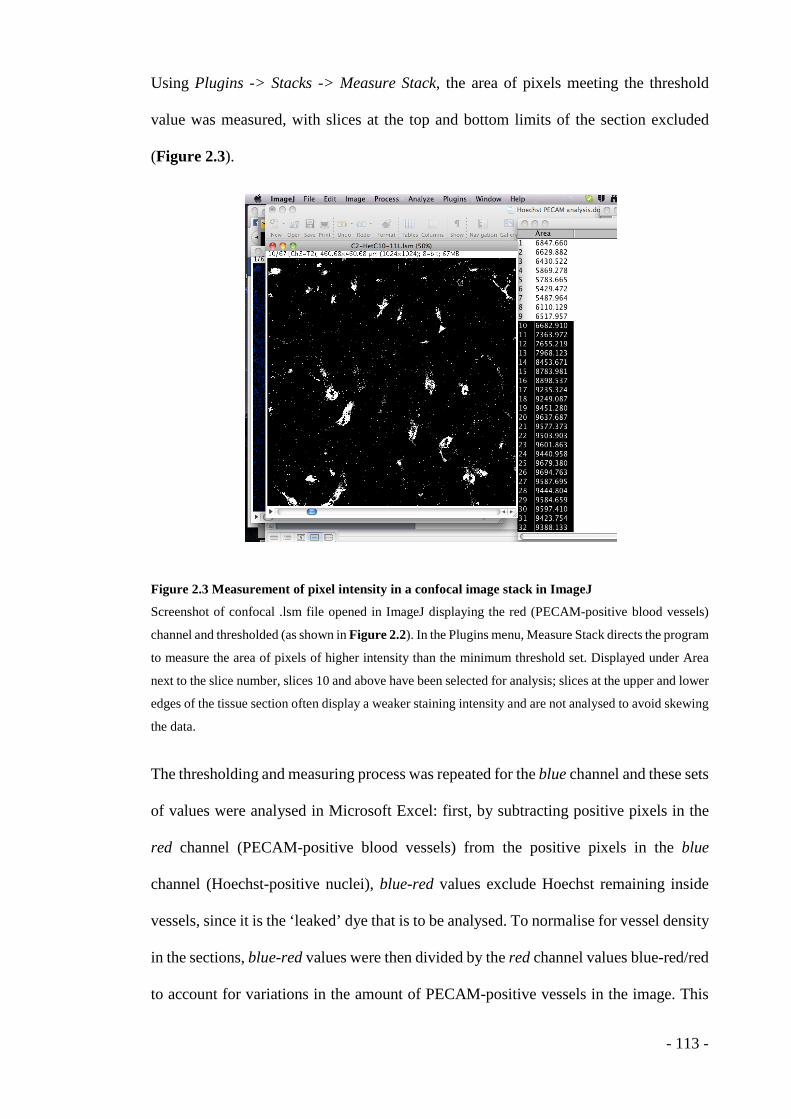
Using Plugins -> Stacks -> Measure Stack, the area of pixels meeting the threshold
value was measured, with slices at the top and bottom limits of the section excluded
(Figure 2.3).
Figure 2.3 Measurement of pixel intensity in a confocal image stack in ImageJ
Screenshot of confocal .lsm file opened in ImageJ displaying the red (PECAM-positive blood vessels)
channel and thresholded (as shown in Figure 2.2). In the Plugins menu, Measure Stack directs the program
to measure the area of pixels of higher intensity than the minimum threshold set. Displayed under Area
next to the slice number, slices 10 and above have been selected for analysis; slices at the upper and lower
edges of the tissue section often display a weaker staining intensity and are not analysed to avoid skewing
the data.
The thresholding and measuring process was repeated for the blue channel and these sets
of values were analysed in Microsoft Excel: first, by subtracting positive pixels in the
red channel (PECAM-positive blood vessels) from the positive pixels in the blue
channel (Hoechst-positive nuclei), blue-red values exclude Hoechst remaining inside
vessels, since it is the ‘leaked’ dye that is to be analysed. To normalise for vessel density
in the sections, blue-red values were then divided by the red channel values blue-red/red
to account for variations in the amount of PECAM-positive vessels in the image. This
- 113 -
calculation produced relative intensity values, which were analysed for mean and
standard error to visualise results.
2.12.7 Quantification of cellular proliferation in tumours
Proliferation of both tumour and endothelial cells was quantified in tumour sections by
immunostaining for the proliferation marker Ki67. Cryosections were thawed and
rehydrated with PBS. Sections were then fixed with -20 °C acetone for 10 minutes,
permeabilised with 0.5% v/v NP40 in PBS for 10 minutes and washed once with 0.1%
Triton X-100 in PBS. Sections were blocked (1% w/v BSA, 0.1% Triton X-100 in PBS)
for 45 minutes at room temperature and then incubated with rabbit anti-Ki67 antibody
(1:100 in wash buffer) overnight at 4 °C. Slides were washed three times with wash
buffer as above then incubated with secondary anti-rabbit Alexa Fluor 488 antibody
(1:200) and PE-PECAM (1:500) for 1 hour at room temperature. Following three final
washes and one H2O wash, slides were mounted with ProLong Gold™ with Antifade
and DAPI (Invitrogen). Fluorescent images were acquired using a Zeiss Axioplan
microscope and Axiovision software multidimensional acquisition settings.
Counting PECAM-negative nuclei and the number of those nuclei that were also Ki67-
positive across several fields allowed quantification of tumour cell proliferation. To
quantify endothelial cell proliferation in the same fields, the PECAM-positive cell nuclei
were counted as well as the number of those that were Ki67 positive.
2.13 Subcutaneous sponge assay
This in vivo assay for growth factor-induced angiogenesis was based on a technique
developed in rats (Andrade et al. 1987). Sterile polyether sponge cylinders were cut from
sponges (Caligen Foam Ltd. Sample 611-7 polyether grade XE1700V 16 kg/m3) first
- 114 -

with a large heavy-duty hole-punch (5 mm hole size) and further cut into 8 mm - 1 cm
length cylinders. The sponge cylinders were autoclaved at 121 °C.
Day 0: sponge implantation. Mice received a subcutaneous injection of
Vetergesic/Rymadil prior to anaesthesia with fluothane and the abdomen was shaved
with electric clippers. A small subcutaneous incision was made in the abdomen and the
sterile sponge inserted with a sterile trocar. The incision was closed using vet-bond
surgical glue or sterile wound clips. The same procedure was repeated for the opposite
flank.
Day 1: injection of the test reagents. Reagents were injected through the skin directly
into the sponges following a similar timetable to the example: Day 1, Day 4, Day 6, Day
8 and Day 11. Sponges were injected with 10 ng ml-1 VEGF in 100 µl of PBS (shown
previously to be the maximum effective dose, as in Hodivala-Dilke et al. 1999) or PBS
only as control.
Day 13: harvesting. At the end of the experiment, all animals were killed by cervical
dislocation. Sponges were excised rapidly with underlying connective tissue/fat
removed from each sponge. Each sponge was cut in half with a scalpel and fixed in 10
% formalin solution overnight and immersed in 70 % ethanol the next day. Samples
were then paraffin-embedded for immunohistochemical staining to identify endomucin-
positive blood vessels infiltrating the sponges. Blood vessel numbers across whole
cross-sections of the immunostained sponge were counted and divided by the total area
of the sponge section to give blood vessel densities.
- 115 -
2.14
2.15 Statistical Analysis
P values were obtained using the Student’s paired T-test and values of P < 0.05 were
considered statistically significant.
2.16 Home Office regulations
All animals were housed and used in experiments according to UK Home Office
regulations; all experiments were performed in accordance with our laboratory’s Project
Licence and all individuals involved held valid Personal Licences. Animal wellbeing
was monitored daily by the resident qualified technicians and experimental animals by
myself additionally. Animals were humanely killed by experienced qualified technicians
and any animals that fell sick during experiments were treated appropriately or killed if
required.
- 116 -
CHAPTER 3 IDENTIFICATION OF NOVEL REGULATORS
OF ANGIOGENESIS USING THE TC1 MOUSE MODEL OF
DOWN’S SYNDROME
The Tc1 model of Down’s syndrome gave us an opportunity to investigate the possible
effects of stromal trisomy for Hsa21 genes on tumour growth. Injectable tumour models
were used to dissect the role of trisomic Hsa21 genes within the stromal compartment
from the tumour cell compartment.
3.1 RESULTS
3.1.1 Tumour growth is reduced in Tc1 mice
To examine whether the Tc1 mice could recapitulate the epidemiological observation of
reduced tumour growth in DS patients, 1x10⁶ B16F0 melanoma or 0.5x10⁶ Lewis Lung
Carcinoma mouse cells were injected subcutaneously into age and sex-matched Tc1 and
wild-type (WT) control mice. B16F0 and LLC tumours were grown for 10 or 12 days
respectively. Mice were killed and tumour size assessed. Results showed that syngeneic
tumour growth in Tc1 mice is decreased significantly when compared to WT mice (P <
0.05) (Figure 3.1).
- 117 -
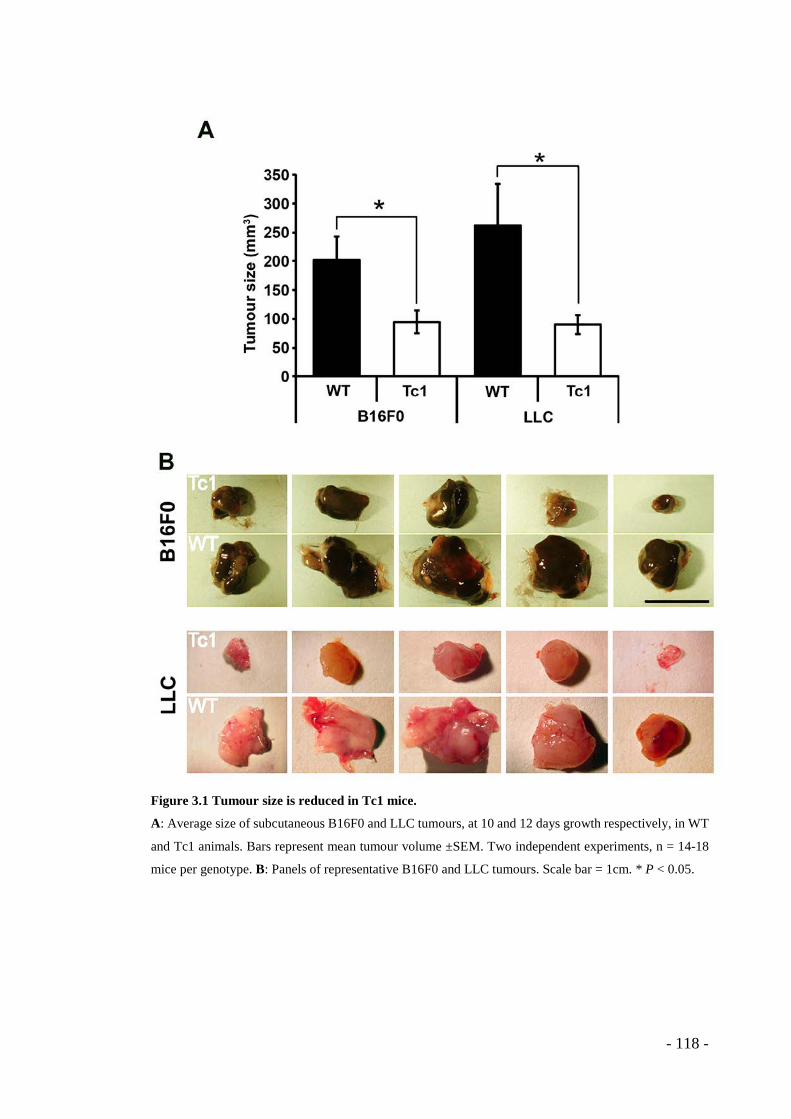
Figure 3.1 Tumour size is reduced in Tc1 mice.
A: Average size of subcutaneous B16F0 and LLC tumours, at 10 and 12 days growth respectively, in WT
and Tc1 animals. Bars represent mean tumour volume ±SEM. Two independent experiments, n = 14-18
mice per genotype. B: Panels of representative B16F0 and LLC tumours. Scale bar = 1cm. * P < 0.05.
- 118 -
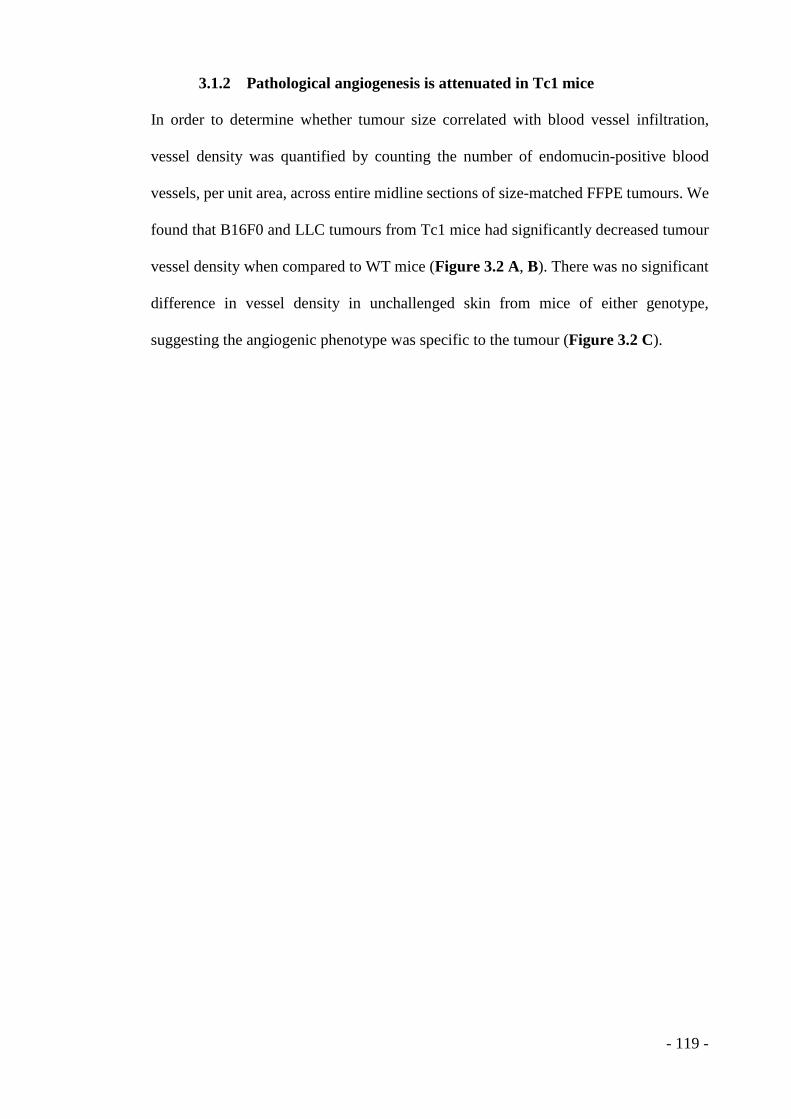
3.1.2 Pathological angiogenesis is attenuated in Tc1 mice
In order to determine whether tumour size correlated with blood vessel infiltration,
vessel density was quantified by counting the number of endomucin-positive blood
vessels, per unit area, across entire midline sections of size-matched FFPE tumours. We
found that B16F0 and LLC tumours from Tc1 mice had significantly decreased tumour
vessel density when compared to WT mice (Figure 3.2 A, B). There was no significant
difference in vessel density in unchallenged skin from mice of either genotype,
suggesting the angiogenic phenotype was specific to the tumour (Figure 3.2 C).
- 119 -
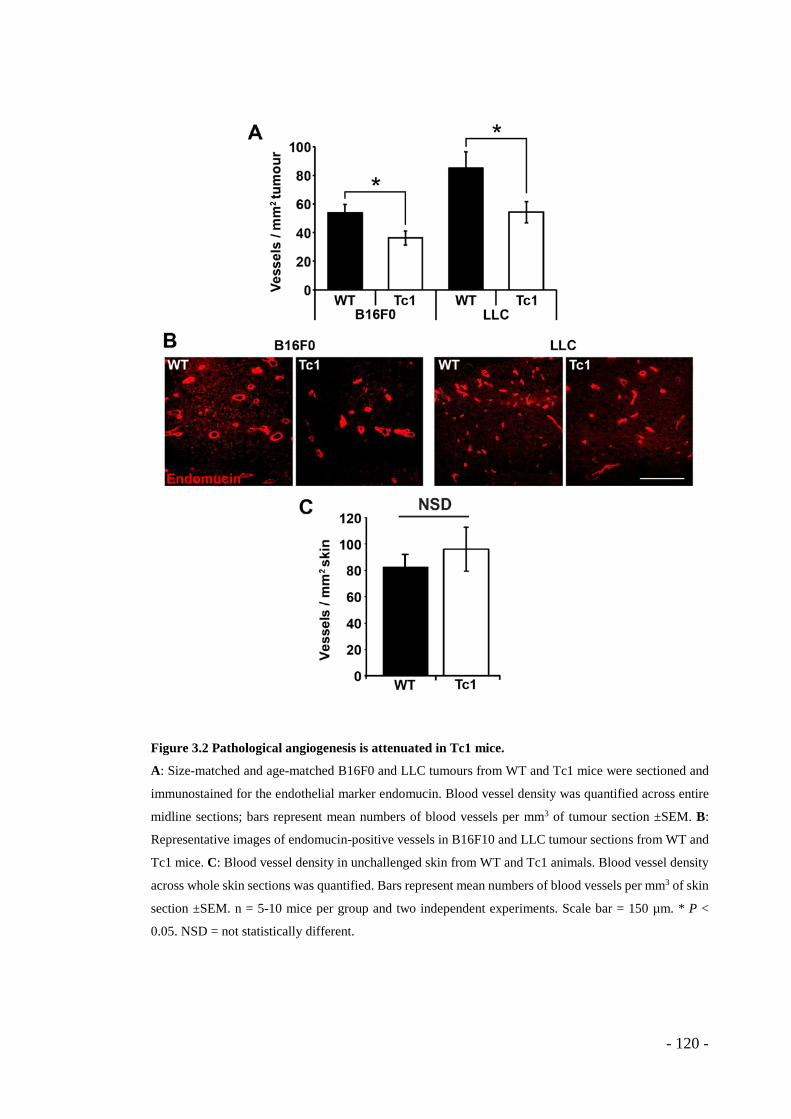
Figure 3.2 Pathological angiogenesis is attenuated in Tc1 mice.
A: Size-matched and age-matched B16F0 and LLC tumours from WT and Tc1 mice were sectioned and
immunostained for the endothelial marker endomucin. Blood vessel density was quantified across entire
midline sections; bars represent mean numbers of blood vessels per mm3 of tumour section ±SEM. B:
Representative images of endomucin-positive vessels in B16F10 and LLC tumour sections from WT and
Tc1 mice. C: Blood vessel density in unchallenged skin from WT and Tc1 animals. Blood vessel density
across whole skin sections was quantified. Bars represent mean numbers of blood vessels per mm3 of skin
section ±SEM. n = 5-10 mice per group and two independent experiments. Scale bar = 150 µm. * P <
0.05. NSD = not statistically different.
- 120 -
3.1.3 VEGF-induced angiogenic responses are impaired in Tc1 mice
Given that VEGF is a potent proangiogenic factor, we next sought to examine VEGF-
stimulated angiogenic responses using three independent assays. Firstly, sponges were
implanted subcutaneously in the flanks of Tc1 and WT mice and injected with VEGF
(or PBS as a control) over 14 days; this method has been shown previously to encourage
blood vessel growth in vivo (Andrade et al. 1987). Sponges were excised, fixed and
sectioned for immunostaining. Endomucin-positive blood vessel density was quantified
histologically over whole sponge sections for each genotype and it was found that VEGF
stimulated an angiogenic response in WT but not Tc1 mice (Figure 3.3). This result
provided in vivo evidence that VEGF-stimulated responses were impaired in Tc1 mice.
Secondly, we used an ex vivo method to examine VEGF stimulation in this model (Baker
et al. 2012). Tc1 and WT aortic rings were embedded in collagen and fed with medium
supplemented with either PBS or VEGF. The numbers of emerging microvessels were
counted and results showed that, while WT rings showed a significant increase in
sprouting upon VEGF stimulation, no significant difference was observed for Tc1 aortic
rings after VEGF stimulation (Figure 3.4). These data corroborated our in vivo findings.
Thirdly, we examined the effect of extra Hsa21 gene copies on VEGF-stimulated
downstream signalling in vitro. Primary endothelial cells (pMLEC) were extracted and
cultured from Tc1 and WT mouse lungs. Endothelial cells were stimulated with VEGF,
or PBS as a control, lysed and proteins were analysed by Western blotting. Results
showed that VEGF-stimulated ERK phosphorylation was increased in WT but not Tc1
pMLEC, suggesting that signalling downstream of VEGF is impaired by the presence
of additional Hsa21 gene copies (Figure 3.5).
- 121 -
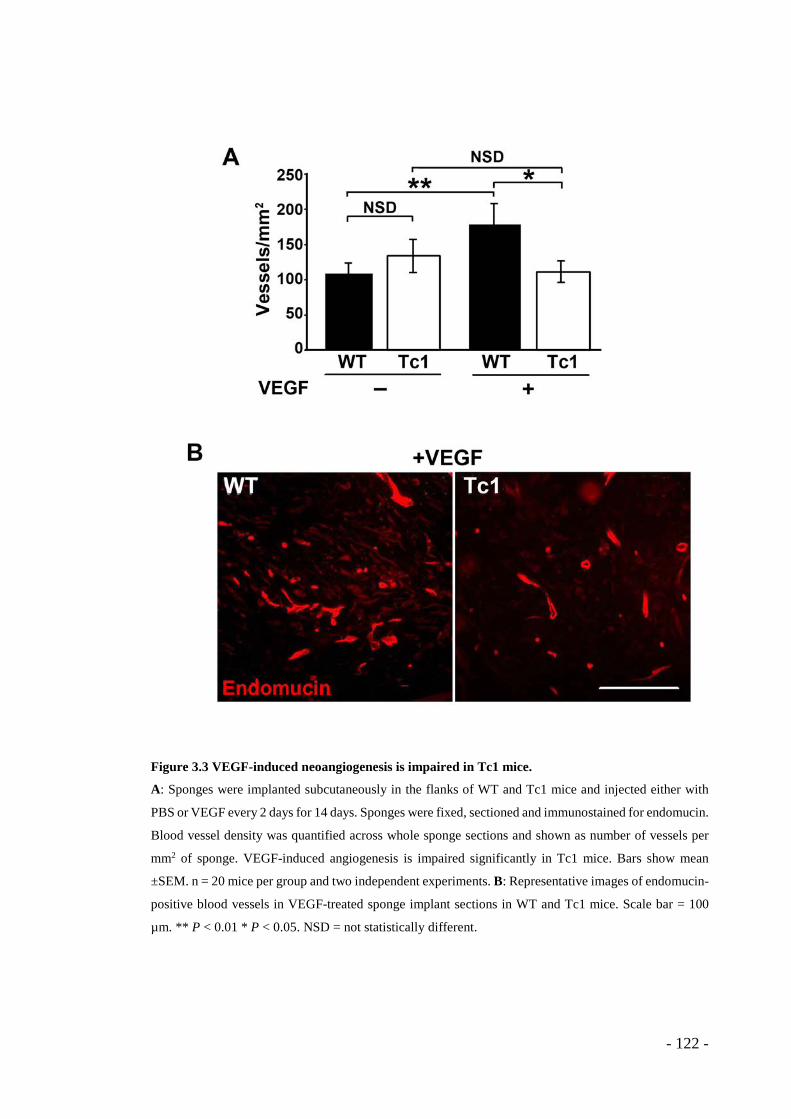
Figure 3.3 VEGF-induced neoangiogenesis is impaired in Tc1 mice.
A: Sponges were implanted subcutaneously in the flanks of WT and Tc1 mice and injected either with
PBS or VEGF every 2 days for 14 days. Sponges were fixed, sectioned and immunostained for endomucin.
Blood vessel density was quantified across whole sponge sections and shown as number of vessels per
mm2 of sponge. VEGF-induced angiogenesis is impaired significantly in Tc1 mice. Bars show mean
±SEM. n = 20 mice per group and two independent experiments. B: Representative images of endomucin-
positive blood vessels in VEGF-treated sponge implant sections in WT and Tc1 mice. Scale bar = 100
µm. ** P < 0.01 * P < 0.05. NSD = not statistically different.
- 122 -
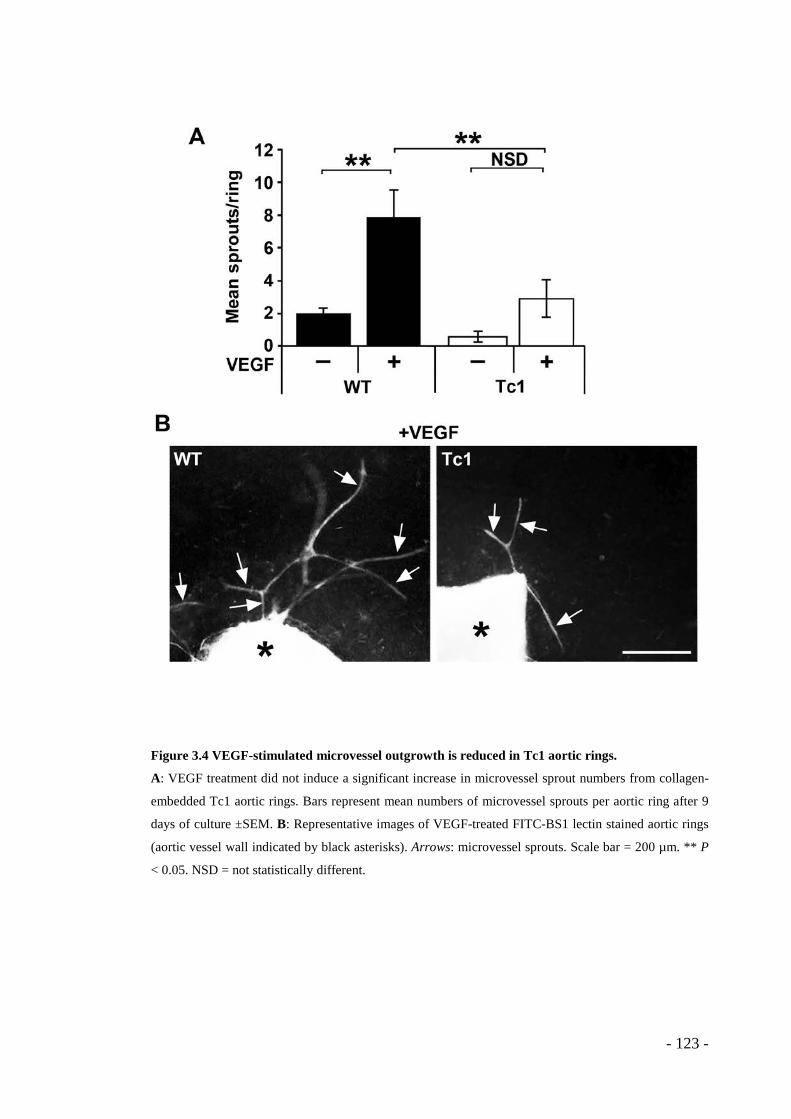
Figure 3.4 VEGF-stimulated microvessel outgrowth is reduced in Tc1 aortic rings.
A: VEGF treatment did not induce a significant increase in microvessel sprout numbers from collagen-
embedded Tc1 aortic rings. Bars represent mean numbers of microvessel sprouts per aortic ring after 9
days of culture ±SEM. B: Representative images of VEGF-treated FITC-BS1 lectin stained aortic rings
(aortic vessel wall indicated by black asterisks). Arrows: microvessel sprouts. Scale bar = 200 µm. ** P
< 0.05. NSD = not statistically different.
- 123 -
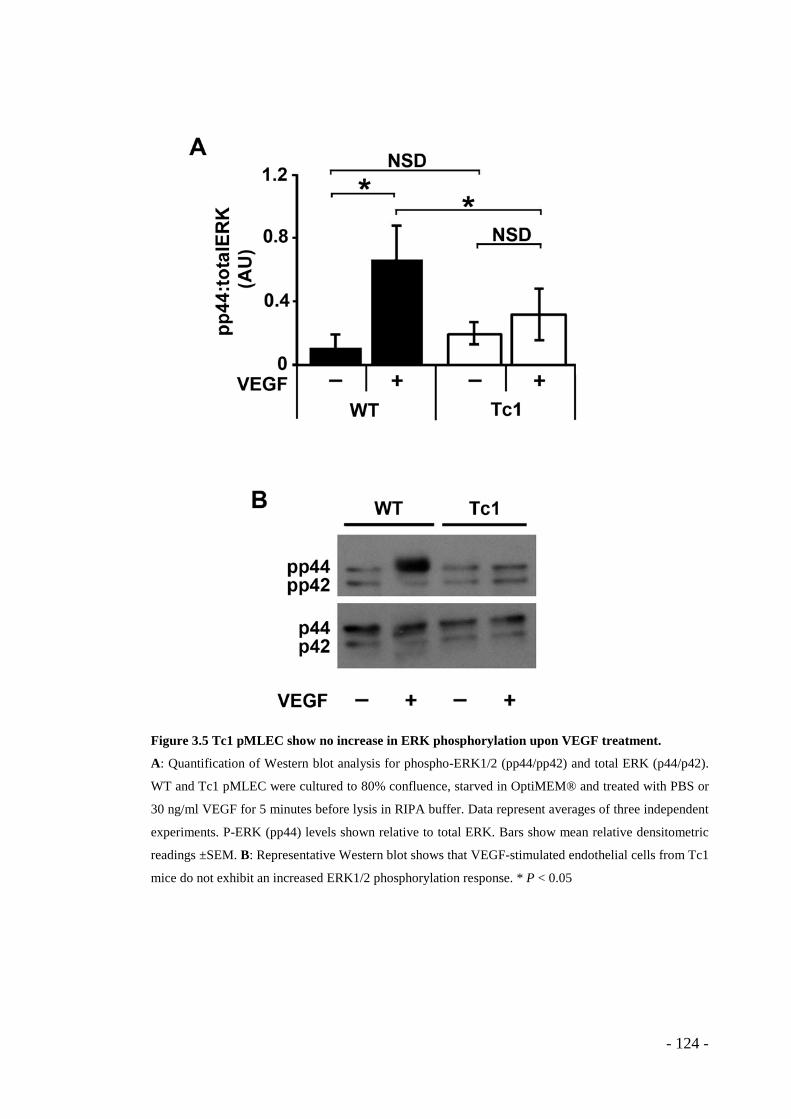
Figure 3.5 Tc1 pMLEC show no increase in ERK phosphorylation upon VEGF treatment.
A: Quantification of Western blot analysis for phospho-ERK1/2 (pp44/pp42) and total ERK (p44/p42).
WT and Tc1 pMLEC were cultured to 80% confluence, starved in OptiMEM® and treated with PBS or
30 ng/ml VEGF for 5 minutes before lysis in RIPA buffer. Data represent averages of three independent
experiments. P-ERK (pp44) levels shown relative to total ERK. Bars show mean relative densitometric
readings ±SEM. B: Representative Western blot shows that VEGF-stimulated endothelial cells from Tc1
mice do not exhibit an increased ERK1/2 phosphorylation response. * P < 0.05
- 124 -
3.1.4 Surface levels of VEGFR2 are higher in Tc1 endothelial cells
To investigate the reason for the defect in VEGF-induced downstream signalling,
surface levels of VEGFR2 on Tc1 and WT primary endothelial cells were assessed by
flow cytometry following VEGF stimulation for 0, 5, 15 and 30 minutes. We
hypothesised that reduced VEGF-stimulated responses may correlate with decreased
VEGFR2 expression. Total VEGFR2 protein levels were also analysed by L. Reynolds
and no significant difference was found between the genotypes (Reynolds et al. 2010).
Surprisingly, we found that surface receptor levels were significantly higher in Tc1 cells
at all timepoints (Figure 3.6 A). Surface VEGF receptor data is presented here as mean
fluorescence measured in the different cell types over time, rather than relative
fluorescence normalised to time zero (no VEGF stimulation), because the latter method
would obscure the differences between the genotypes. While the relative surface
receptor levels appear similar over time, these data show that surface levels are
consistently higher in Tc1 cells, despite no difference in total VEGFR2 protein levels
(Reynolds et al. 2010, Supplementary information). The aberrant subcellular
localisation of VEGFR2 was not observed in all cells, likely due to mosaicism for the
Hsa21 fragment within populations of Tc1 cells isolated and grown in culture.
Recent work has described that VEGF signalling is prolonged by the internalisation of
phosphorylated VEGFR2. WT and Tc1 pMLEC were stimulated with VEGF for 5
minutes before fixation and incubation with anti-VEGFR2 antibody. It was observed
that upon VEGF stimulation VEGFR2 was internalised as expected in WT cells, but the
receptor appeared to accumulate at the cell surface rather than in the cytoplasm in many
Tc1 cells (Figure 3.6 B). This suggested that the presence of additional Hsa21 genes
could block the internalisation of VEGFR2 and that this correlates with reduced VEGF-
induced signalling.
- 125 -
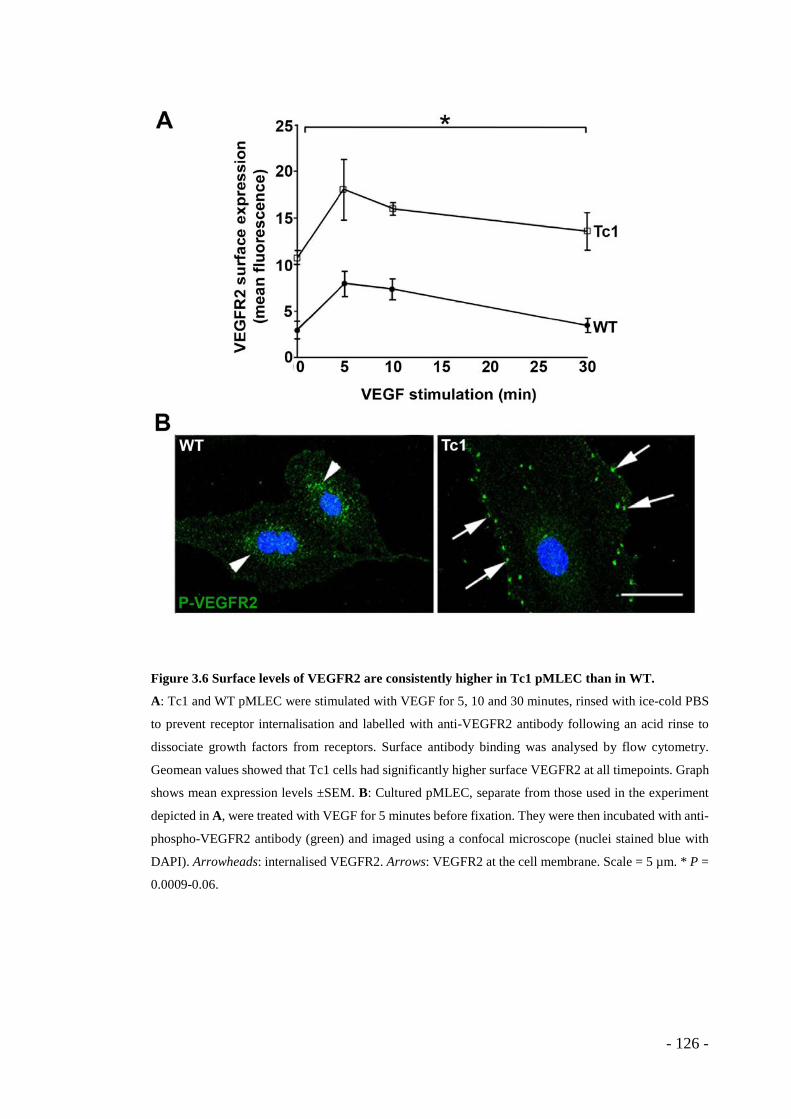
Figure 3.6 Surface levels of VEGFR2 are consistently higher in Tc1 pMLEC than in WT.
A: Tc1 and WT pMLEC were stimulated with VEGF for 5, 10 and 30 minutes, rinsed with ice-cold PBS
to prevent receptor internalisation and labelled with anti-VEGFR2 antibody following an acid rinse to
dissociate growth factors from receptors. Surface antibody binding was analysed by flow cytometry.
Geomean values showed that Tc1 cells had significantly higher surface VEGFR2 at all timepoints. Graph
shows mean expression levels ±SEM. B: Cultured pMLEC, separate from those used in the experiment
depicted in A, were treated with VEGF for 5 minutes before fixation. They were then incubated with anti-
phospho-VEGFR2 antibody (green) and imaged using a confocal microscope (nuclei stained blue with
DAPI). Arrowheads: internalised VEGFR2. Arrows: VEGFR2 at the cell membrane. Scale = 5 µm. * P =
0.0009-0.06.
- 126 -
3.1.5 Endothelial-specific and angiogenesis-regulating Hsa21 candidate
genes
We wished to discover which genes on Hsa21 contribute to the tumour-repressing
phenotype of DS. To this end we employed bioinformatic techniques to identify
candidate genes to investigate further in silico, in vitro and in vivo. In collaboration with
the Bicknell lab (University of Birmingham) endothelial-specific or -enriched genes on
the Tc1 Hsa21 fragment were identified in silico (the full gene list is presented in
Appendix 7.2). Five genes were chosen for further study as listed below. Erg (v-ets
avian erythroblastosis virus E26 oncogene related) is an endothelial cell-specific ETS-
family transcription factor involved in angiogenesis and endothelial cell survival via its
transactivation of the VE-Cadherin promoter (Birdsey et al. 2008). Ets2 (v-ets avian
erythroblastosis virus E26 oncogene homolog 2) is a transcription factor shown to be
involved in tumorigenesis and the reduction of tumour incidence in the Ts65Dn/APCMin
mouse model of DS and other models (Sussan et al. 2008, Wolvetang et al. 2003). Ets2
has not previously been implicated in angiogenesis. Pttg1ip (pituitary tumour-
transforming 1 interacting protein) is a transcription factor that facilitates transcription
of bFGF. It was identified as highly endothelial cell-enriched in the EST results. Pttg1ip
is a designated proto-oncogene in breast and thyroid cancer but not previously
implicated in angiogenesis (Chien and Pei 2000, Read et al. 2011). Jam-b is an
endothelial cell-specific tight junction adhesion molecule present in tight junctions, also
described in section 1.8.2 (Aurrand-Lions Michel et al. 2001). Adamts1 is a disintegrin
and metalloproteinase with thrombospondin motifs. It is known to inhibit angiogenesis
via binding to VEGF165 (Lee et al. 2006, Liu et al. 2006, Luque et al. 2003). It has also
been shown to inhibit tumour growth and expression is often downregulated in breast,
pancreas and liver cancer (Liu et al. 2006, Porter et al. 2005).
- 127 -
3.1.6 Knockdown of endothelial cell-specific and angiogenesis-modulating
candidate genes can rescue the Tc1 phenotype.
Since the Tc1 model possessed both the human Hsa21 fragment and mouse
chromosomes orthologous to Hsa21 (Mmu10, 16 and 17) we had the opportunity to use
species-specific siRNA to deplete either the human or mouse candidate genes and test
the effect of reducing gene dosage from 3 to 2 and from 3 to 1. To assess gene dosage
effects of the extra gene copies present on the Hsa21 fragment in Tc1 mice, we knocked
down the human transcripts of each of the genes described in 3.5 in Tc1 aortic rings,
effectively reducing the copy number from 3 to 2. Knockdown of candidate genes in
cultured primary endothelial cells was confirmed by RT-PCR by A. Watson and L.
Reynolds and is shown in the figures here. Knockdown of all genes except for Ets2 in
Tc1 aortic rings reversed the VEGF-stimulated microvessel-sprouting defect in aortic
ring assays suggesting that vascular Ets2 is not involved in the Tc1 impaired
microvessel-sprouting phenotype (Figure 3.7). To examine further the dosage effects of
these genes, Tc1 aortic rings were transfected with siRNAs designed to target mouse
transcripts specifically, effectively reducing their copy number from 3 to 1 (Figure 3.8).
The VEGF-stimulated angiogenic defect in aortic ring assays was reversed when Erg,
Adamts1, Jam-b and Pttg1ip were knocked down. However, knockdown of mouse Erg
transcripts had no effect. This suggests that two copies of Erg are required for wild-type
angiogenic responses.
Taken together, these results confirm that one extra copy of the candidate genes on
Hsa21 can provide an anti-angiogenic effect. They also show that manipulating the
dosage of particular genes can restore defective angiogenic phenotypes to wild-type
levels.
- 128 -
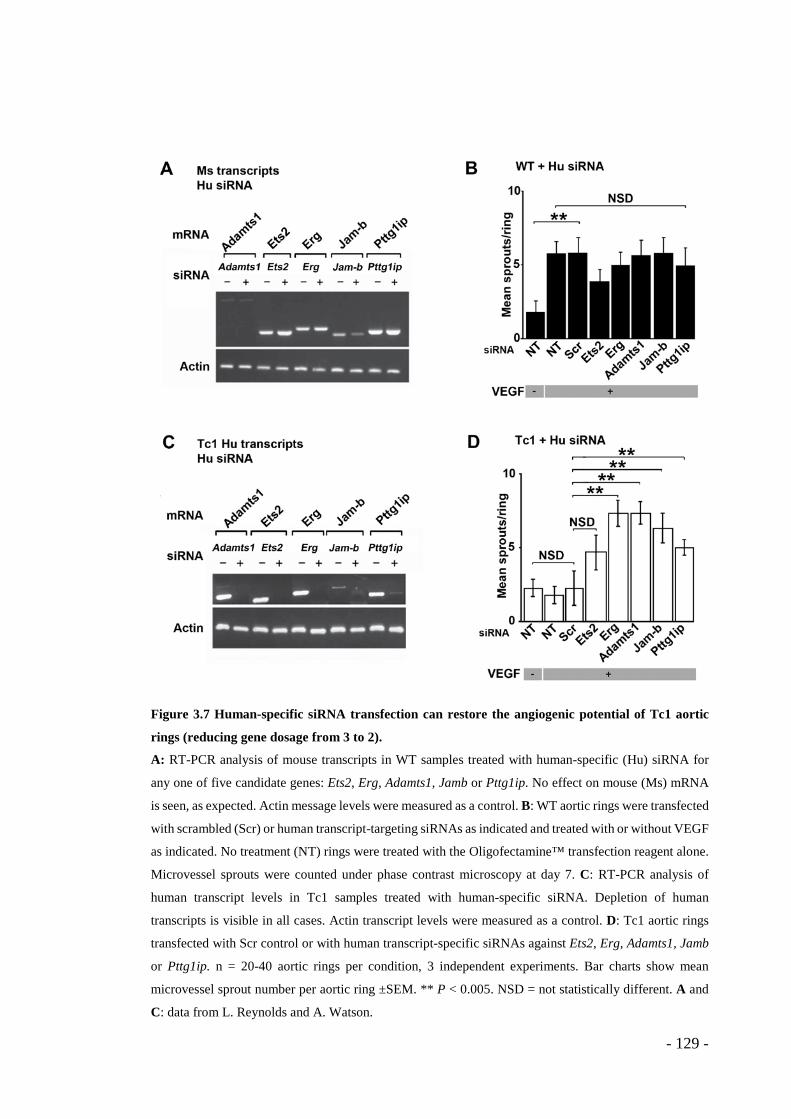
Figure 3.7 Human-specific siRNA transfection can restore the angiogenic potential of Tc1 aortic
rings (reducing gene dosage from 3 to 2).
A: RT-PCR analysis of mouse transcripts in WT samples treated with human-specific (Hu) siRNA for
any one of five candidate genes: Ets2, Erg, Adamts1, Jamb or Pttg1ip. No effect on mouse (Ms) mRNA
is seen, as expected. Actin message levels were measured as a control. B: WT aortic rings were transfected
with scrambled (Scr) or human transcript-targeting siRNAs as indicated and treated with or without VEGF
as indicated. No treatment (NT) rings were treated with the Oligofectamine™ transfection reagent alone.
Microvessel sprouts were counted under phase contrast microscopy at day 7. C: RT-PCR analysis of
human transcript levels in Tc1 samples treated with human-specific siRNA. Depletion of human
transcripts is visible in all cases. Actin transcript levels were measured as a control. D: Tc1 aortic rings
transfected with Scr control or with human transcript-specific siRNAs against Ets2, Erg, Adamts1, Jamb
or Pttg1ip. n = 20-40 aortic rings per condition, 3 independent experiments. Bar charts show mean
microvessel sprout number per aortic ring ±SEM. ** P < 0.005. NSD = not statistically different. A and
C: data from L. Reynolds and A. Watson.
- 129 -

- 130 -
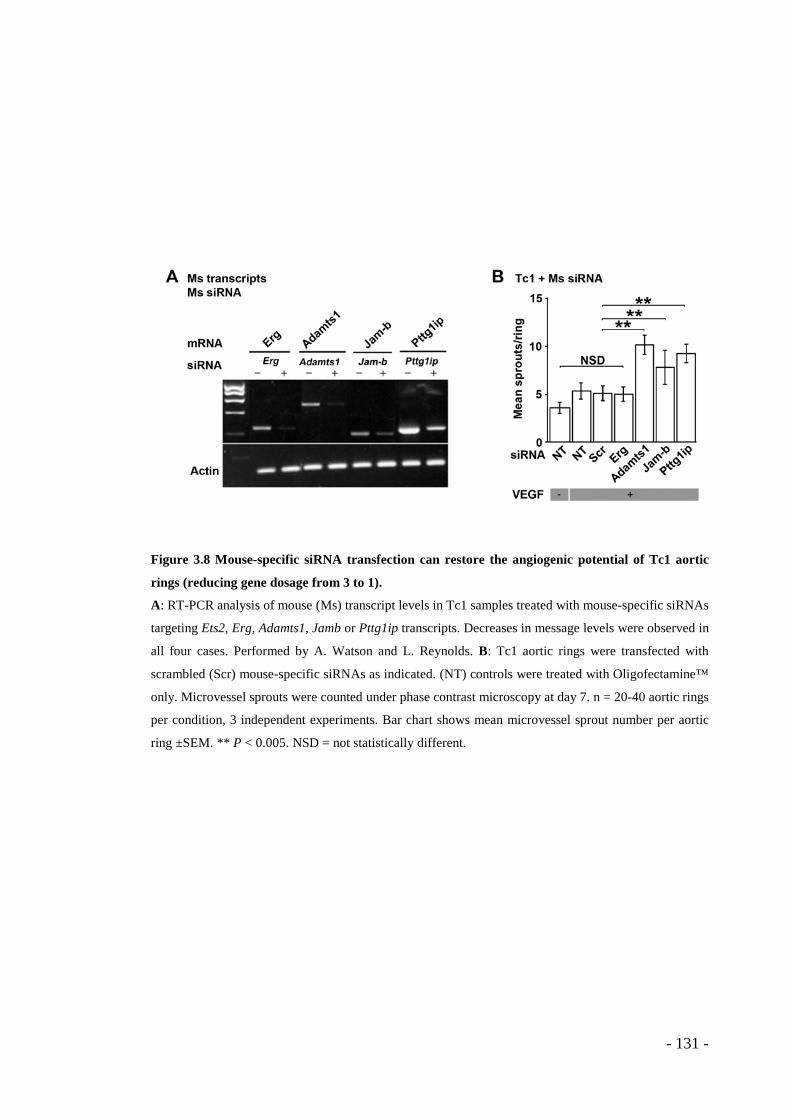
Figure 3.8 Mouse-specific siRNA transfection can restore the angiogenic potential of Tc1 aortic
rings (reducing gene dosage from 3 to 1).
A: RT-PCR analysis of mouse (Ms) transcript levels in Tc1 samples treated with mouse-specific siRNAs
targeting Ets2, Erg, Adamts1, Jamb or Pttg1ip transcripts. Decreases in message levels were observed in
all four cases. Performed by A. Watson and L. Reynolds. B: Tc1 aortic rings were transfected with
scrambled (Scr) mouse-specific siRNAs as indicated. (NT) controls were treated with Oligofectamine™
only. Microvessel sprouts were counted under phase contrast microscopy at day 7. n = 20-40 aortic rings
per condition, 3 independent experiments. Bar chart shows mean microvessel sprout number per aortic
ring ±SEM. ** P < 0.005. NSD = not statistically different.
- 131 -
3.2 DISCUSSION
Down’s syndrome is caused by trisomy of human chromosome 21 (Hsa21) and DS
individuals are reported to have a decreased incidence of several solid tumour types,
which suggests that the dose of Hsa21 genes may affect cancer initiation and growth.
Here we demonstrate, using the Tc1 model of Down’s syndrome, that an extra copy of
Hsa21 can reduce tumour angiogenesis and that this may be part of the reason why DS
individuals are protected from many solid tumour types.
This notion was first tested in mouse models by Sussan et al., who crossed mouse models
of Down’s syndrome (Ts65Dn, Ts1Rhr and Ms1Rhr) with the APCMin mouse model of
colorectal cancer to compare tumour incidence. The Ts65Dn and Ts1Rhr mice have
extra copies of approximately 100 and 33 genes on Mmu16, respectively, whereas
Ms1Rhr has only one copy of the same genes triplicated in Ts1Rhr. The trisomic
Ts65Dn/APCMin and Ts1Rhr/APCMin mice developed fewer tumours than expected
while monosomic Ms1Rhr/APCMin progeny developed more, confirming the influence
of gene dosage and suggesting that Hsa21 orthologs do have an anti-tumour protective
effect. They identified that mutation of Ets2 in a trisomy/APCMin model, effectively
reducing its copy number from 3 to 2, could significantly increase tumour incidence
when compared to trisomic APCMin mice with 3 functional copies of Ets2. This study
therefore provided proof of principle that extra copies of Hsa21 genes could affect
tumour growth (Sussan et al. 2008).
However, the limitation of this report is that all mouse cells, including those in the
tumour cell compartment, had their gene dosage altered and therefore the authors were
not able to dissect the role of trisomy in the tumour cell compartment from the stromal
compartment. Our studies in the Tc1 mice provide a significant advance over this work,
- 132 -
since the use of injectable tumour models lacking Hsa21 trisomy meant we could
examine the effects of Hsa21 trisomy in the stroma alone. Our results indicate that
aneuploidy in stromal cells directly affects pathological angiogenesis and, as a
consequence, tumour growth. We have concluded that trisomy for Hsa21 genes in the
tumour stroma (including vascular endothelial cells) is sufficient to repress pathological
angiogenesis.
Another study by Baek et al. tested the effect of increased Hsa21 gene dosage on tumour
growth. They confirmed a reduction in tumour growth in Ts65Dn mice and focussed on
the overexpression of one gene that is triplicated in the model: Dscr1. They went on to
create Dscr1 transgenic mice with 3 copies of Dscr1 on an otherwise normal gene dosage
background, finding a 2.4-fold increase in DSCR1 expression. This increase is
considerably higher than the 1.5-fold increase expected for one extra gene copy. Tumour
growth and angiogenesis were reduced in these mice as compared to wild-type controls
with only 2 copies of Dscr1, confirming that DSCR1 has an anti-angiogenic effect.
However, when Ts65Dn Dscr1+/- were generated (mice trisomic for approximately 103
genes but with normal Dscr1 copy number), tumour growth and angiogenesis was only
increased to approximately half the wild-type level when compared to the Ts65Dn
Dscr1+/+ controls, suggesting that the remaining anti-tumour effect in Ts65Dn mice is
mediated by genes other than Dscr1 (Baek et al. 2009). Furthermore, DSCR1 has been
known for some time to negatively regulate VEGF signalling and angiogenesis via the
calcineurin/NFAT signalling pathway, with the effect characterised extensively in 2004
by several groups (Hesser et al. 2004, Iizuka et al. 2004, Minami et al. 2004, Yao and
Duh 2004).
- 133 -
We confirmed that tumour size was reduced in Tc1 mice, and that this correlated with
reduced blood vessel density in Tc1 tumours. The effect was shown to be independent
of co-option (use of pre-existing vessels by tumour cells) using a longer-term tumour
growth experiment that showed consistently smaller Tc1 tumours over time (Reynolds
et al. 2010). We also found that responses of Tc1 tissues to VEGF stimulation, both in
vivo and ex vivo, were impaired. So far we have seen that this effect is limited to VEGF-
A responses; Tc1 endothelial cells did not activate downstream MAPK signalling in
response to VEGF, whereas signalling initiated by bFGF was comparable in both WT
and Tc1 cells (Reynolds et al. 2010). The cause of the specific VEGF-stimulated
phenotype has not yet been confirmed, though possible contributors include two
observed phenomena: the overexpression of ADAMTS-1, a VEGF-sequestering
secreted fragment protein discussed further below, and the possible defective VEGF
receptor internalisation observed in Tc1 cells.
Since the Tc1 mouse does not contain an extra copy of Dscr1, our results indicate that
Dscr1 is not the only significant player in trisomy 21-mediated repression of
angiogenesis. Our study is also more novel in that, while Dyrk1a/Dscr1-calceneurin-
NFAT signalling has already been shown to regulate VEGF-induced angiogenesis, we
identified several other genes that had not yet been implicated in angiogenic processes.
We have provided a significant advance over the DSCR1 study by identifying novel and
more therapeutically relevant angiogenesis regulators. Dscr1 is thought to be involved
in a wide range of pathologies including Alzheimer’s disease and auto-immune
conditions (comprehensively reviewed in Harris et al. 2005), so it may not be a
favourable choice for anti-angiogenic therapy.
- 134 -
Regarding which elements of the stroma are the main effectors of the reduced tumour
growth in Tc1 mice, it has not been fully confirmed that the phenotype is entirely
mediated by vascular endothelial cells. However, it was found that immune cell
infiltration into tumours did not differ between the genotypes and no significant decrease
in tumour size was observed when transplanting Tc1 bone marrow into wild-type
tumour-burdened mice, although Hsa21-positive cells were identified in the tumour
stroma (Reynolds et al. 2010). Therefore neither differences in immune cell behaviour
nor recruitment of cells from the bone marrow to the tumour vasculature are likely to be
responsible for the Tc1 angiogenic phenotype.
Of the phenotypes observed, the impaired response to VEGF stimulation was
particularly interesting. Two explanations for this are discussed here: the increased
expression of ADAMTS-1 (due to its presence on the Tc1 Hsa21 fragment) and the
altered VEGFR2 trafficking phenotype observed in Tc1 endothelial cells.
ADAMTS-1 has been shown previously to inhibit tumour growth and its expression is
often downregulated in breast, pancreatic and liver cancer, but contrarily upregulated in
aggressive metastatic disease (Liu et al. 2006, Porter et al. 2005). The full-length 110
kDa ADAMTS-1 zymogen requires processing to become an 87 kDa active
metalloproteinase enzyme, which binds to and cleaves ECM proteins such as versican
and aggrecan in a Zn2+-dependent fashion (Liu et al. 2006, Luque et al. 2003, Porter et
al. 2005). The 87kDa fragment binds to the heparin-binding domain of VEGF165 via its
C-terminal TSP motifs, sequestering the growth factor in the ECM, thereby preventing
VEGFR2 autophosphorylation and downstream signalling, which has been shown to
inhibit EC proliferation (Iruela-Arispe et al. 2004, Liu et al. 2006, Luque et al. 2003,
Porter et al. 2005, Shindo et al. 2000, Xu et al. 2006). VEGF signalling has even been
- 135 -
found to activate expression of ADAMTS-1 in a PKC-dependent manner, suggesting
that ADAMTS-1 is important in the attenuation of angiogenic responses (Xu et al.
2006). In support of this finding, ADAMTS-1 null mice display defective wound healing
and overactive vascularisation (Lee et al. 2006, Shindo et al. 2000). Interestingly, Satgé
and Bénard also examined the effects of ECM produced by fibroblasts trisomic for
Hsa21 on the growth of the MDA-MB 431 breast cancer cell line and neuroblastoma
cell lines (an uncommon neoplasm in DS individuals), compared with ECM from
euploid fibroblasts. The result was a decrease in tumour cell growth of approximately
30% (Satgé and Bénard 2008). This suggests that the ECM secreted by fibroblasts with
an extra copy of Hsa21 creates an unfavourable environment for tumour growth. Since
ADAMTS-1 is a secreted component of the ECM and we have verified its expression at
the mRNA level in Tc1 primary endothelial cells, its effect could be significant.
Furthermore, ADAMTS-1-/+ aortic rings were found to sprout significantly more in
response to VEGF when compared to wild-type controls (Reynolds et al. 2010). The
anti-angiogenic potential of the 87 kDa ADAMTS-1 fragment has been reported to be
greater than both endostatin and TSP-1 on a molar basis, which are known endogenous
angiogenesis inhibitors (Luque et al. 2003, Porter et al. 2005, Xu et al. 2006). It is
therefore a strong candidate for mediating some, if not the majority, of the observed anti-
tumour effects seen in DS. Endostatin is commonly cited as a major anti-angiogenic
factor in DS with reference to a study by Sund et al., which showed that its
overexpression in transgenic mice was sufficient to inhibit tumour growth (Sund et al.
2005). However, endostatin is not triplicated in Tc1 mice and so cannot be solely
responsible for the anti-tumour DS phenotype.
- 136 -
It was unexpected to find that the individual knockdown of four of the five chosen
candidate genes (Erg, Pttg1ip, Adamts1 and Jamb) successfully restored Tc1 aortic ring
microvessel sprouting to normal levels. Approximately 200 genes are present on the Tc1
Hsa21 fragment and, assuming proportional overexpression of all or most of those
genes, it was not expected that knocking down a single candidate gene would fully
restore Tc1 VEGF-stimulated responses. This would be more accurately described as
“mRNA dosage”, since the reduction is via RNAi and not genetic ablation, but “gene
dosage” is used to describe the concept more simply, since we could not measure the
level of each mRNA in every aortic ring. Unfortunately, knockdown at the protein level
could not be confirmed in all cases due to limited antibody availability and performance.
However, reduced protein levels of human ADAMTS1, mouse JAM-B, mouse ERG,
mouse PTTG1IP and mouse ADAMTS1 were confirmed in Tc1 primary endothelial
cells (Reynolds et al. 2010, Supplementary information). Ideally, RNA and protein
levels would be assessed in siRNA-treated aortic rings and not only in cultured
endothelial cells.
The candidate genes (Erg, Ets2, Pttg1ip, Jamb and Adamts1, as introduced in 3.1.5)
were chosen based on their known functions as well as their increased expression in
endothelial cells. No explanation has been settled upon for the high rate of rescue success
upon knockdown of these individual candidate genes in the Tc1 aortic ring assay.
Ingenuity® Pathway Analysis was performed to investigate whether the current
published knowledge base could indicate that all four gene products function in a
common signalling pathway upstream of ERK, which could explain the similar
restorative effects of targeting the genes individually by RNAi in aortic rings.
Unfortunately, while some signalling functions were shared by subsets of the genes, no
single pathway was found to involve all of them together, therefore this hypothesis was
- 137 -
incorrect. However, it may be that such links have not yet been reported and future
studies may link these genes in a common pathway.
It is possible that the ex vivo aortic ring assay is not sufficiently sensitive to reveal
subtleties that would more accurately reflect the contributions of these different genes
to the VEGF-insensitive Tc1 phenotype. It may be that instead of knockdown ex vivo,
reducing gene copy numbers by genetic ablation, with other genes still over-represented,
would present the most influential candidates in tumour growth and angiogenesis in vivo.
The effects of single gene targeting certainly were not due to siRNA transfection alone,
since non-transfected and scrambled controls as well as Ets2 knockdown had no effect.
Considering the results presented in Figure 3.7 and the Sussan et al. study (discussed
further in 4.1), in which loss of Ets2 is shown to increase tumour incidence in the gut,
together, our results imply that the cancer-specific role of Ets2 is in the tumour cell
compartment and not the stroma. In our study, targeting the human Ets2 in Tc1 aortic
rings failed to restore the VEGF response, suggesting that Ets2 does not play a role in
the Tc1 angiogenic phenotype. It is also possible, however, that the human Ets2 protein
is non-functional in mouse tissue, but this still suggests that Ets2 is not important in the
repression of angiogenesis and tumour growth in the Tc1 mice.
In further Tc1 experiments, we decreased dosage of one of our candidates, Jam-b, alone:
both through the use of Jam-b heterozygous mice and a function-blocking antibody to
assess the anti-angiogenic potential of this tight junction molecule. We found that
targeting this protein alone, either post-translationally or through gene dosage,
significantly increased tumour growth and angiogenesis to levels comparable with the
wild-type situation (Reynolds et al. 2010).
- 138 -
Together the studies of angiogenesis and tumour growth in Down’s syndrome and the
Tc1 mouse prove that the addition of many extra gene copies induces, as expected, a
complex phenotype and the roles of individual genes are still being investigated. Our
results have confirmed that the overexpression of Hsa21 genes negatively affects tumour
growth and angiogenesis and highlighted genes not previously implicated in the
regulation of angiogenesis.
3.3 FUTURE PERSPECTIVE
Work is ongoing in the laboratory to examine the regulation of VEGFR2 internalisation
in Tc1 cells. To further characterise the nature of the possible VEGFR2 trafficking defect
in Tc1 endothelial cells, flow cytometric assessment of surface receptor levels, confocal
microscopy to observe receptor subcellular localisation and assessment of ERK
phosphorylation may be repeated using Dynasore™ (an inhibitor of dynamin-dependent
vesicle formation: Macia et al. 2006) in wild-type cells. If blocking receptor
internalisation upon VEGF stimulation elicits phenotypes reflecting those seen in Tc1
cells, including membrane-proximate receptor aggregation and decreased downstream
ERK phosphorylation, it would suggest that defective receptor internalisation may be
responsible for the VEGF insensitivity in Tc1 cells. The vesicular recycling inhibitor
Primaquine™ could also be used to block recycling of internalised vesicles back to the
cell membrane in WT endothelial cells stimulated with VEGF, to examine further the
effects of restricting VEGFR2 trafficking.
It would be ideal to be able to track the movement of the receptor during VEGF
stimulation in real-time using fluorescent tags and timelapse microscopy. This would
give a more accurate picture of receptor trafficking and changes to the internal receptor
- 139 -
pool over time, as compared to snapshots. Additional staining of endosomal markers
such as EEA1 would also enable further scrutiny of the internal trafficking pathways of
VEGFR2 in Tc1 and wild-type cells.
VE-Cadherin (VECAD) may also be involved in the Tc1 phenotype, considering that
VECAD inhibits VEGFR2 internalisation through direct interaction (as shown in Figure
1.10), and that receptor internalisation is mainly clathrin-dependent (Lampugnani et al.
2006). Further immunostaining studies of VECAD in Tc1 endothelial cells could be
performed to identify differences in the VEGFR2/VECAD signalling complexes
visually. It may be that VECAD association with activated VEGFR2 is increased, thus
inhibiting internalisation of the receptor. Birdsey et al. showed that ERG (also an Hsa21
gene present in Tc1 mice) promotes VECAD expression (Birdsey et al. 2008). Thus,
ERG overexpression in Tc1 cells may lead to increased VECAD levels and inhibition
of VEGFR2 internalisation as described above.
3.3.1 Hsa21 microRNAs
One area of interest that has as yet not been explored at all is the role of Hsa21
microRNAs (miRs) in DS phenotypes. Five miRs have been identified on the Hsa21
fragment (Hsa-mir-99a, Hsa-let-7c, Hsa-mir-125b-2, Hsa-mir-155 and Hsa-mir-802), as
indicated in Figure 1.14, and if these are overexpressed in Tc1 stromal cells (including
endothelial cells), they may have a significant impact on protein levels, secreted factors,
signalling pathways, proliferation, migration and other cell functions. All five miRs have
been shown to be overexpressed in human DS tissue samples (Kuhn et al. 2008) and
have murine equivalents on Mmu16 with very high sequence similarity. While none
have so far been shown to be endothelial-specific, not all are well studied. Other
endothelial-specific and angiogenesis-regulating miRs have recently been characterised,
for example Hsa-miR-126, which increases vascular integrity (Wang and Olson 2009). - 140 -

Therefore, in future studies, investigations of the roles of Hsa21 miRNAs in tumour
angiogenic processes would be of interest.
- 141 -
CHAPTER 4 ELUCIDATING THE ROLE OF CLAUDIN14 IN
ANGIOGENESIS
Following the unexpected result of restoring angiogenic potential in Tc1 aortic rings by
knocking down four different genes independently, I selected further genes from the
Hsa21 gene list; not endothelial-specific genes, but possible players in the tumour-
repressing aspect of DS with potential roles in angiogenesis, based on their known
functions. The genes identified in the Tc1 project were studied further by L. Reynolds.
There are three claudin genes on Hsa21, whose protein products are cell-cell adhesion
molecules found in tight junctions (as described in 1.8 and 1.8.4): Cldn8, Cldn17 and
Cldn14. Of these three, the previously published data suggested Cldn14 may participate
in the regulation of angiogenesis, and a knockout mouse model has been generated (Ben-
Yosef et al. 2003). Preliminary RNAi experiments in Tc1 and WT aortic rings using
siRNA pools directed against Cldn14 and other chosen genes (not shown) suggested that
Cldn14 levels might affect the angiogenic reponse to VEGF. Consequently, the
following results describe our study of the requirement for Cldn14 in angiogenic
processes.
Cldn14 is a component of tight junctions and possible mediator of vascular permeability.
Its potential involvement in angiogenesis is highlighted by a study that demonstrated it
is overexpressed in microvascular endothelial cells (MVEC) grown on Matrigel in 2D
forming tubes, compared to proliferating subconfluent monolayers (Glienke et al. 2000).
Little other functional data have been collected for Cldn14, other than that
overexpression led to a change in nuclear shape, decreased membrane protrusions, and
stimulated apoptosis in human embryonic kidney (HEK) cells (Hu 2009, Hu Y et al.
- 142 -
2006). It has also been described in the regulation of kidney tubule permeability, as
described in 1.8.4.3.
4.1 RESULTS
To test the requirement of Cldn14 in angiogenic processes in vivo, I moved from the
Tc1/WT aortic ring siRNA method to a Cldn14 genetic ablation mouse model. Cldn14-
heterozygous (Cldn14-het) mice were inter-crossed to produce wild-type (WT), Cldn14-
het and Cldn-14 null progeny. No effects on Mendelian ratios or male:female ratios were
observed in litters (Figure 4.1 A and B). Over 400 mice were generated and genotyped
in this manner during this project, with an example result shown in Figure 4.1 C. RT-
PCR analysis confirmed that Cldn14 transcript levels in Cldn14-het organs were
approximately half those detected in WT mice, with undetectable levels in Cldn14-nulls
(Figure 4.1 D). Considering the known role of Cldn5 in the regulation of endothelial
tight junctions, we looked for evidence of Cldn5 upregulation as a possible
compensatory mechanism in the Cldn14-ablated mice. However, RT-PCR analysis of
mRNA levels in kidney and brain showed no differences in Cldn5 levels between the
genotypes (Figure 4.2), although there may be as yet unconfirmed differences in tumour
blood vessel endothelial cells.
4.1.1 Claudin14 depletion affects endothelial junctions and basement
membrane organisation in B16F10 tumours
Given that Cldn14 is a tight junction protein, we first asked whether deletion of Cldn14
could affect endothelial cell-cell junctions and blood vessel leakage in tumours. Firstly,
WT, Cldn14-het and Cldn14-null mice were injected subcutaneously with 0.5x10⁶
B16F10 melanoma cells. At 10 days post tumour cell inoculation the tumours were snap-
frozen and cryosections were immunostained for the tight junction adapter protein ZO-
- 143 -

1 and for the endothelial cell marker PECAM to identify blood vessels. While clear,
continuous junctional staining was observed for ZO-1 in sections from WT and Cldn14-
null tumours, a more discontinuous pattern was observed frequently in Cldn14-het
sections (Figure 4.3). This suggests that ZO-1 localisation to endothelial tight junctions
may be affected by partial loss of Cldn14.
Loss or disruption of endothelial cell-cell junctions could reasonably be associated with
destabilisation of the blood vessels in Cldn14-heterozygous tumour blood vessels.
Vessel destabilisation is associated with changes in the endothelial basement membrane.
Therefore we also asked whether the basement membrane was affected by changes in
stromal Cldn14 levels. B16F10 tumour sections were immunostained for laminin and
the degree of “shorelining” (laminin-positive areas radiating from PECAM-positive
vessels at varying distances) was observed. Although the pattern of laminin staining
appeared similar in WT and Cldn14-null blood vessels, i.e. closely associated with the
PECAM-positive endothelium in both cases, a higher degree of laminin “shorelining”
was observed in sections from Cldn14-het tumours; the laminin staining often appeared
to extend away from the vessels for a greater distance (Figure 4.4). This suggested that
the organisation of the laminin within the basement membrane may be affected by partial
loss of Cldn14. Together these results indicated that two key features of vessel
stabilisation: cell-cell junctions and basement membrane organisation are altered in
Cldn14-het, but not Cldn14-null, tumour blood vessels.
- 144 -
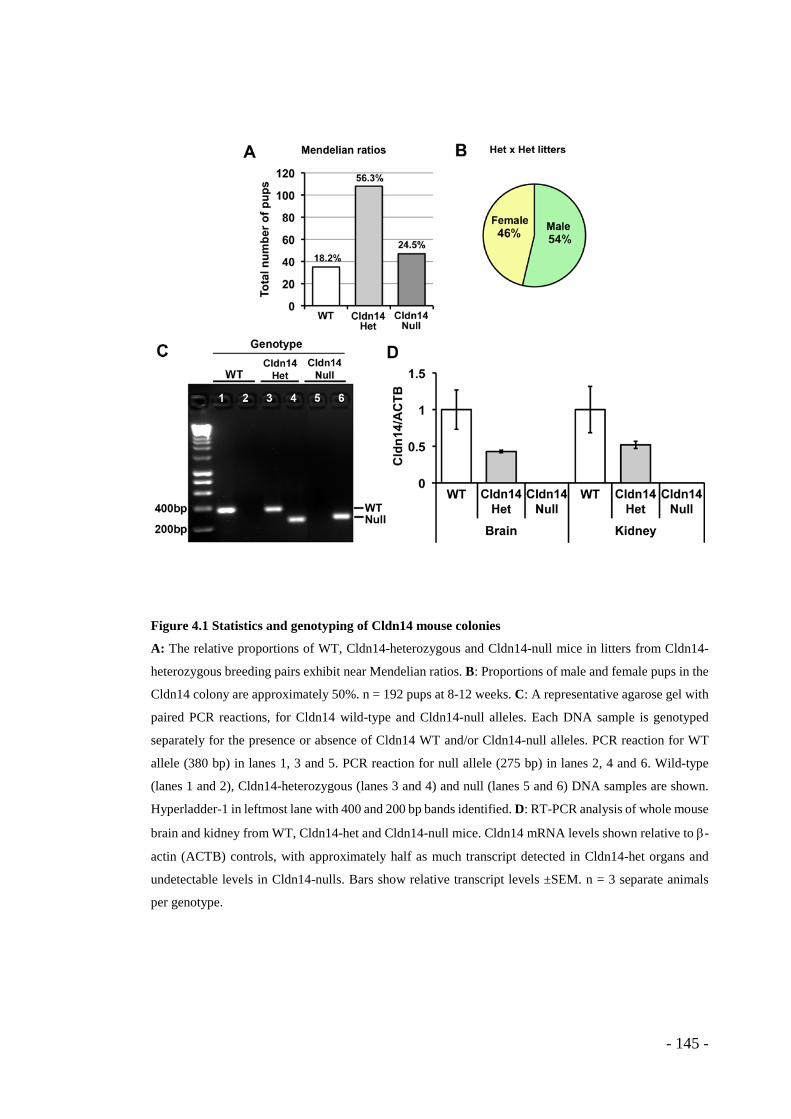
Figure 4.1 Statistics and genotyping of Cldn14 mouse colonies
A: The relative proportions of WT, Cldn14-heterozygous and Cldn14-null mice in litters from Cldn14-
heterozygous breeding pairs exhibit near Mendelian ratios. B: Proportions of male and female pups in the
Cldn14 colony are approximately 50%. n = 192 pups at 8-12 weeks. C: A representative agarose gel with
paired PCR reactions, for Cldn14 wild-type and Cldn14-null alleles. Each DNA sample is genotyped
separately for the presence or absence of Cldn14 WT and/or Cldn14-null alleles. PCR reaction for WT
allele (380 bp) in lanes 1, 3 and 5. PCR reaction for null allele (275 bp) in lanes 2, 4 and 6. Wild-type
(lanes 1 and 2), Cldn14-heterozygous (lanes 3 and 4) and null (lanes 5 and 6) DNA samples are shown.
Hyperladder-1 in leftmost lane with 400 and 200 bp bands identified. D: RT-PCR analysis of whole mouse
brain and kidney from WT, Cldn14-het and Cldn14-null mice. Cldn14 mRNA levels shown relative to β-
actin (ACTB) controls, with approximately half as much transcript detected in Cldn14-het organs and
undetectable levels in Cldn14-nulls. Bars show relative transcript levels ±SEM. n = 3 separate animals
per genotype.
- 145 -
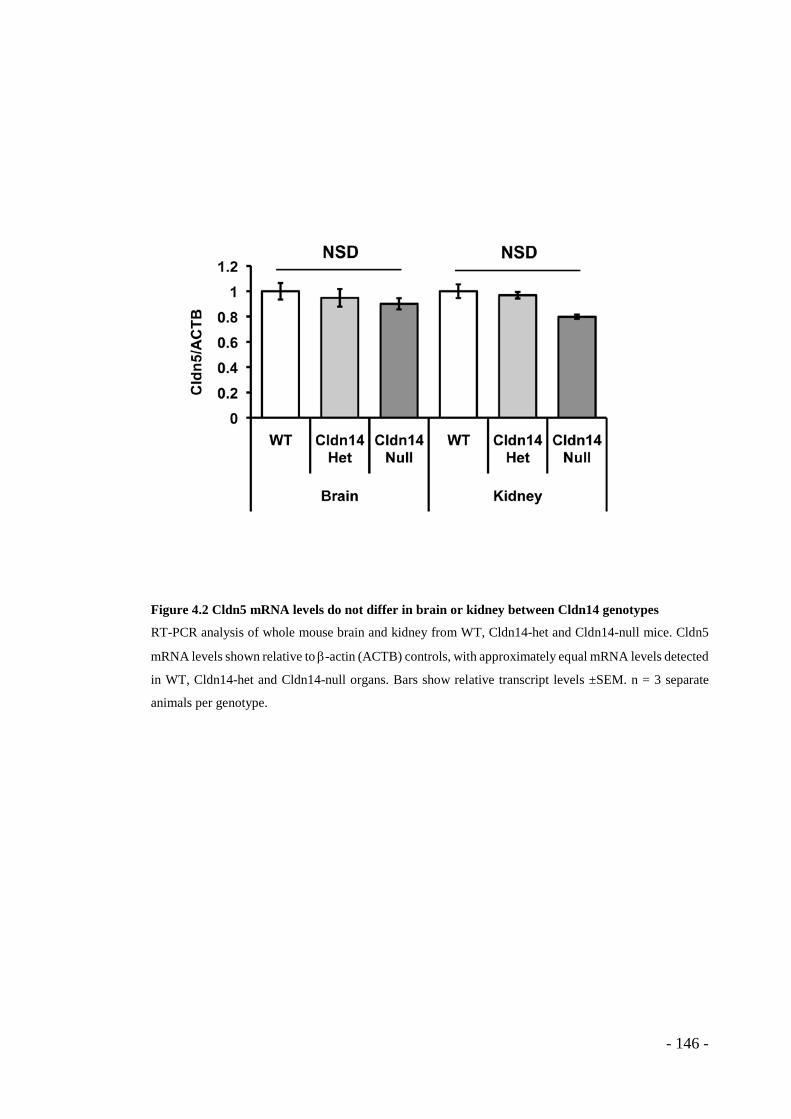
Figure 4.2 Cldn5 mRNA levels do not differ in brain or kidney between Cldn14 genotypes
RT-PCR analysis of whole mouse brain and kidney from WT, Cldn14-het and Cldn14-null mice. Cldn5
mRNA levels shown relative to β-actin (ACTB) controls, with approximately equal mRNA levels detected
in WT, Cldn14-het and Cldn14-null organs. Bars show relative transcript levels ±SEM. n = 3 separate
animals per genotype.
- 146 -
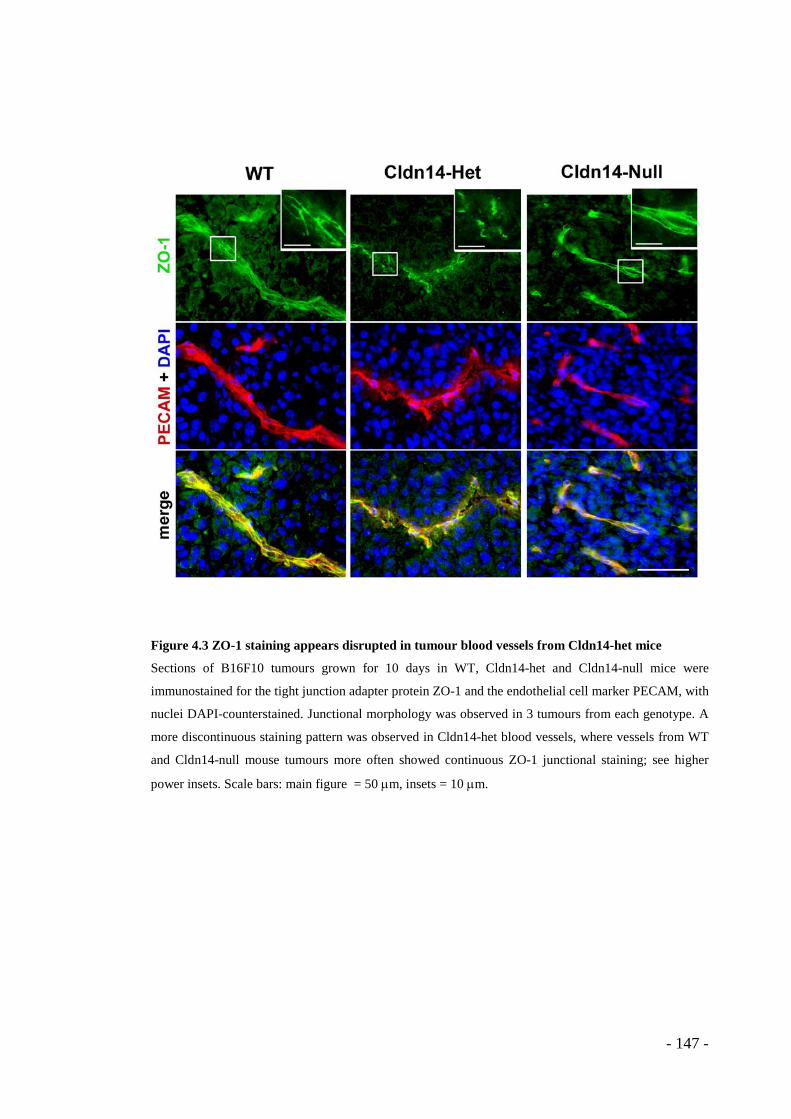
Figure 4.3 ZO-1 staining appears disrupted in tumour blood vessels from Cldn14-het mice
Sections of B16F10 tumours grown for 10 days in WT, Cldn14-het and Cldn14-null mice were
immunostained for the tight junction adapter protein ZO-1 and the endothelial cell marker PECAM, with
nuclei DAPI-counterstained. Junctional morphology was observed in 3 tumours from each genotype. A
more discontinuous staining pattern was observed in Cldn14-het blood vessels, where vessels from WT
and Cldn14-null mouse tumours more often showed continuous ZO-1 junctional staining; see higher
power insets. Scale bars: main figure = 50 µm, insets = 10 µm.
- 147 -
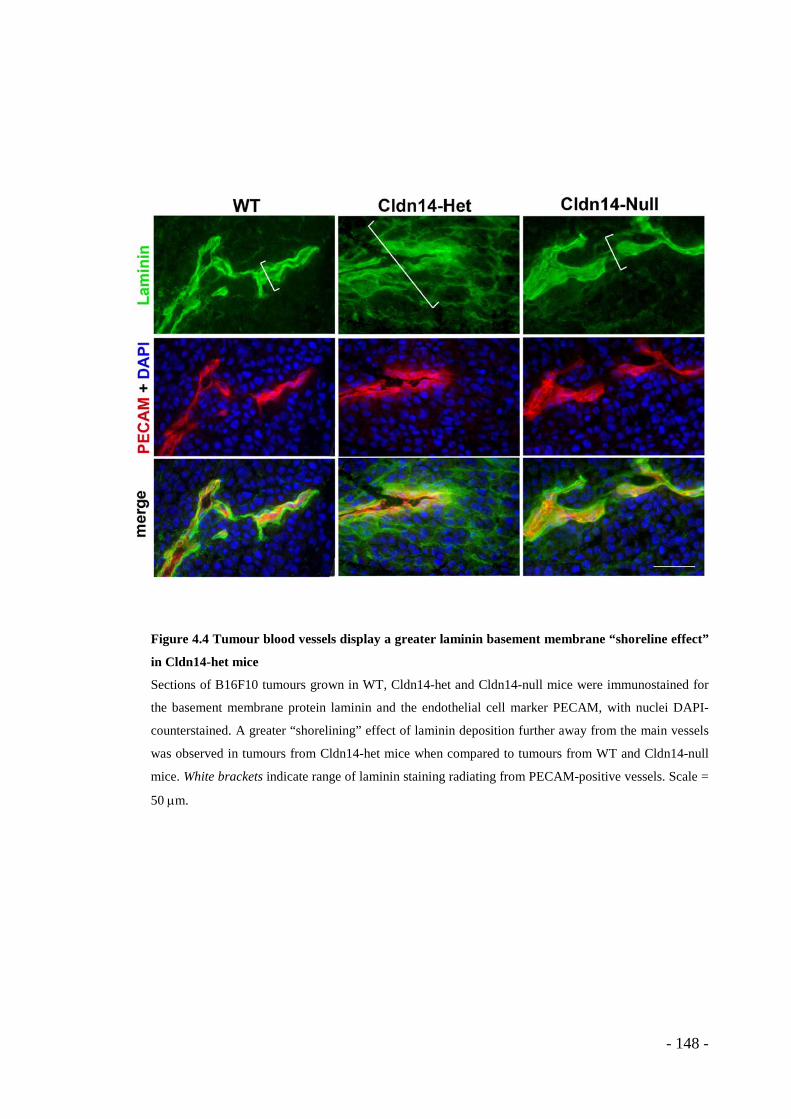
Figure 4.4 Tumour blood vessels display a greater laminin basement membrane “shoreline effect”
in Cldn14-het mice
Sections of B16F10 tumours grown in WT, Cldn14-het and Cldn14-null mice were immunostained for
the basement membrane protein laminin and the endothelial cell marker PECAM, with nuclei DAPI-
counterstained. A greater “shorelining” effect of laminin deposition further away from the main vessels
was observed in tumours from Cldn14-het mice when compared to tumours from WT and Cldn14-null
mice. White brackets indicate range of laminin staining radiating from PECAM-positive vessels. Scale =
50 µm.
- 148 -
4.1.2 Claudin14 levels affect tumour blood vessel leakage
Considering the possible destabilisation of junctions and the basement membrane in
tumour blood vessels from Cldn14-het animals, we next asked whether this would affect
vascular permeability in tumours. Cohorts of both B16F10 and Lewis lung carcinoma
(LLC) tumour-bearing mice of each genotype were selected to receive end-point
intravenous injections of phycoerythrin-labelled anti-PECAM (PE-PECAM) antibody
and Hoechst dye. These injections allowed visualisation of functional tumour blood
vessels and assessment of vessel leakage, in terms of vessel-proximate Hoechst-positive
nuclei, respectively. Once again no consistent differences in leakage were observed
between WT and Cldn14-null mice, but a significant increase was observed in the
Cldn14-heterozygous mice (Figure 4.5), suggesting that partial loss of Cldn14 can
enhance blood vessel leakage in B16F10 and LLC tumours.
- 149 -
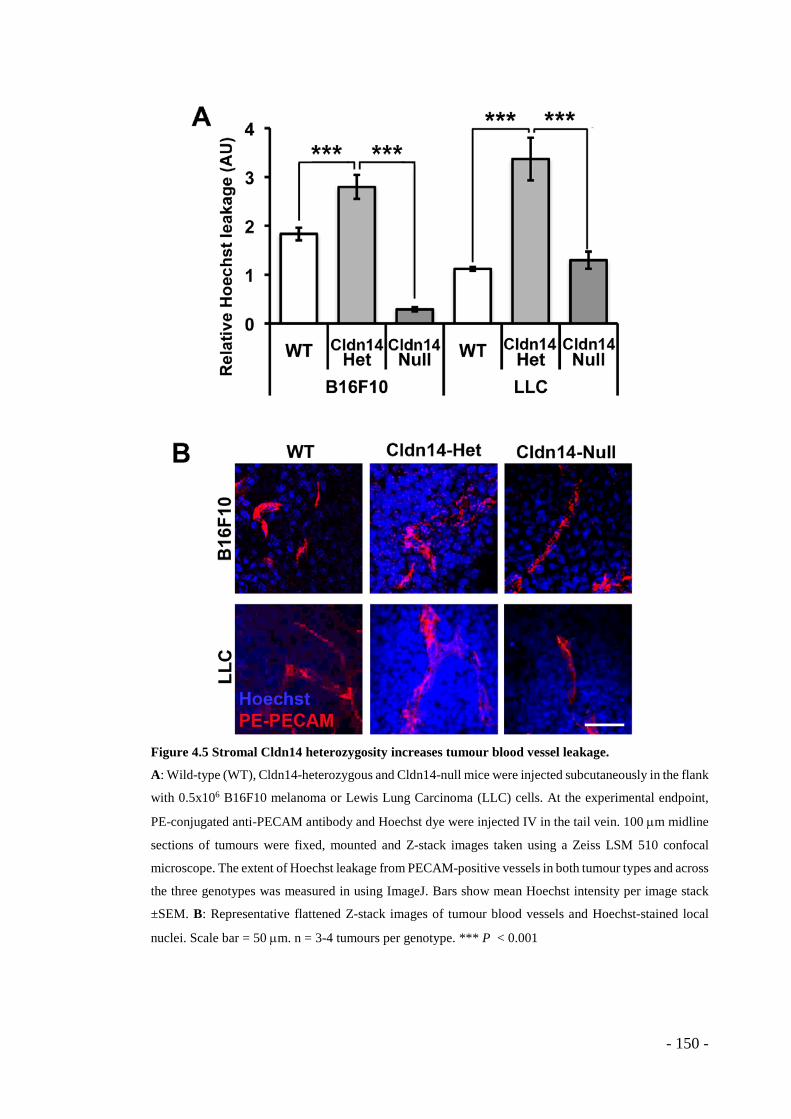
Figure 4.5 Stromal Cldn14 heterozygosity increases tumour blood vessel leakage.
A: Wild-type (WT), Cldn14-heterozygous and Cldn14-null mice were injected subcutaneously in the flank
with 0.5x10⁶ B16F10 melanoma or Lewis Lung Carcinoma (LLC) cells. At the experimental endpoint,
PE-conjugated anti-PECAM antibody and Hoechst dye were injected IV in the tail vein. 100 µm midline
sections of tumours were fixed, mounted and Z-stack images taken using a Zeiss LSM 510 confocal
microscope. The extent of Hoechst leakage from PECAM-positive vessels in both tumour types and across
the three genotypes was measured in using ImageJ. Bars show mean Hoechst intensity per image stack
±SEM. B: Representative flattened Z-stack images of tumour blood vessels and Hoechst-stained local
nuclei. Scale bar = 50 µm. n = 3-4 tumours per genotype. *** P < 0.001
- 150 -
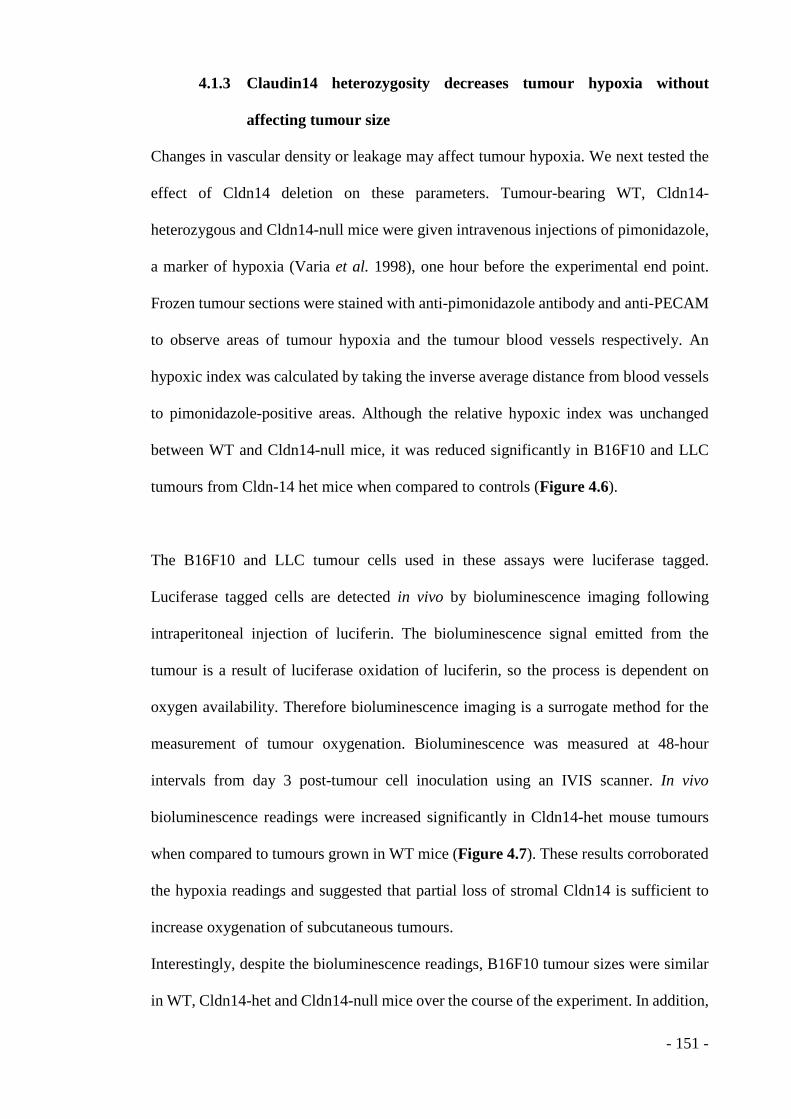
4.1.3 Claudin14 heterozygosity decreases tumour hypoxia without
affecting tumour size
Changes in vascular density or leakage may affect tumour hypoxia. We next tested the
effect of Cldn14 deletion on these parameters. Tumour-bearing WT, Cldn14-
heterozygous and Cldn14-null mice were given intravenous injections of pimonidazole,
a marker of hypoxia (Varia et al. 1998), one hour before the experimental end point.
Frozen tumour sections were stained with anti-pimonidazole antibody and anti-PECAM
to observe areas of tumour hypoxia and the tumour blood vessels respectively. An
hypoxic index was calculated by taking the inverse average distance from blood vessels
to pimonidazole-positive areas. Although the relative hypoxic index was unchanged
between WT and Cldn14-null mice, it was reduced significantly in B16F10 and LLC
tumours from Cldn-14 het mice when compared to controls (Figure 4.6).
The B16F10 and LLC tumour cells used in these assays were luciferase tagged.
Luciferase tagged cells are detected in vivo by bioluminescence imaging following
intraperitoneal injection of luciferin. The bioluminescence signal emitted from the
tumour is a result of luciferase oxidation of luciferin, so the process is dependent on
oxygen availability. Therefore bioluminescence imaging is a surrogate method for the
measurement of tumour oxygenation. Bioluminescence was measured at 48-hour
intervals from day 3 post-tumour cell inoculation using an IVIS scanner. In vivo
bioluminescence readings were increased significantly in Cldn14-het mouse tumours
when compared to tumours grown in WT mice (Figure 4.7). These results corroborated
the hypoxia readings and suggested that partial loss of stromal Cldn14 is sufficient to
increase oxygenation of subcutaneous tumours.
Interestingly, despite the bioluminescence readings, B16F10 tumour sizes were similar
in WT, Cldn14-het and Cldn14-null mice over the course of the experiment. In addition,
- 151 -
no difference in LLC tumour growth was observed between the genotypes either (Figure
4.8). Together the results demonstrate that the decrease in tumour hypoxia in Cldn14-
het mice does not correlate with a change in tumour growth.
- 152 -
Figure 4.6 Stromal heterozygosity for Cldn14 decreases tumour hypoxia.
A: Wild-type, Cldn14-heterozygous and Cldn14-null mice were injected subcutaneously in the flank with
0.5x10⁶ luciferase expressing B16F10 melanoma or Lewis Lung Carcinoma (LLC) cells. At the
experimental endpoint, pimonidazole was injected IV in the tail vein prior to sacrifice. Midline sections
of bisected and immediately snap-frozen tumours were fixed, immunostained with an anti-pimonidazole
antibody and PE-conjugated anti-PECAM antibody to identify blood vessels. The proximity of hypoxic
areas to tumour blood vessels was quantified and the inverse of these values are plotted as Hypoxic index.
Bars show mean ±SEM. B: Representative images of pimonidazole-positive tumour areas (rare in tumours
from heterozygous mice). n = 3 - 5 mice per genotype. Scale bar = 200 µm. * p < 0.05 ** p < 0.01 *** p
< 0.001.
- 153 -
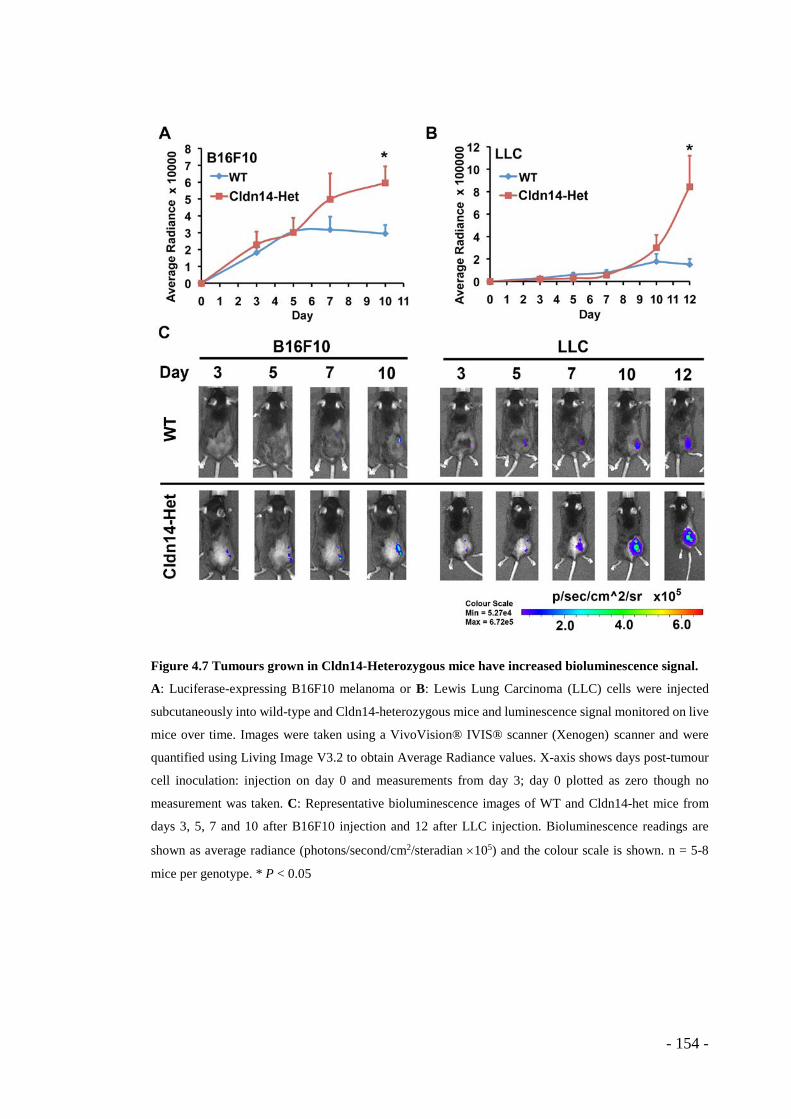
Figure 4.7 Tumours grown in Cldn14-Heterozygous mice have increased bioluminescence signal.
A: Luciferase-expressing B16F10 melanoma or B: Lewis Lung Carcinoma (LLC) cells were injected
subcutaneously into wild-type and Cldn14-heterozygous mice and luminescence signal monitored on live
mice over time. Images were taken using a VivoVision® IVIS® scanner (Xenogen) scanner and were
quantified using Living Image V3.2 to obtain Average Radiance values. X-axis shows days post-tumour
cell inoculation: injection on day 0 and measurements from day 3; day 0 plotted as zero though no
measurement was taken. C: Representative bioluminescence images of WT and Cldn14-het mice from
days 3, 5, 7 and 10 after B16F10 injection and 12 after LLC injection. Bioluminescence readings are
shown as average radiance (photons/second/cm2/steradian ×105) and the colour scale is shown. n = 5-8
mice per genotype. * P < 0.05
- 154 -
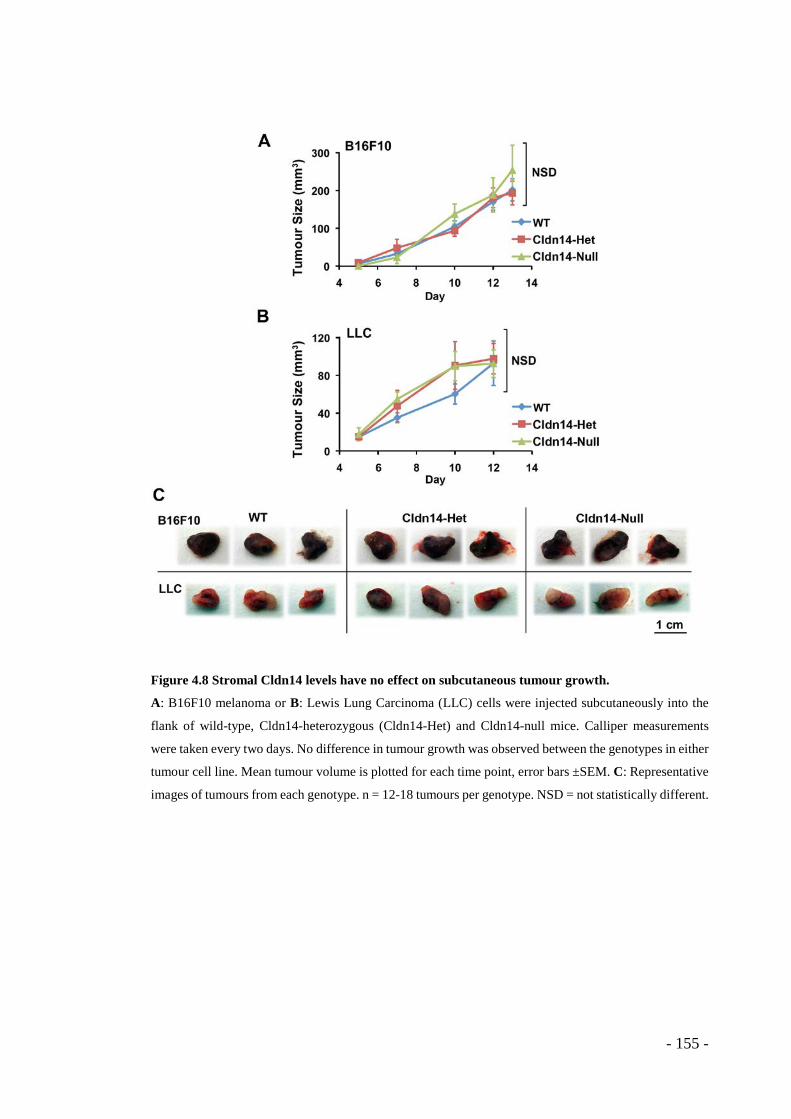
Figure 4.8 Stromal Cldn14 levels have no effect on subcutaneous tumour growth.
A: B16F10 melanoma or B: Lewis Lung Carcinoma (LLC) cells were injected subcutaneously into the
flank of wild-type, Cldn14-heterozygous (Cldn14-Het) and Cldn14-null mice. Calliper measurements
were taken every two days. No difference in tumour growth was observed between the genotypes in either
tumour cell line. Mean tumour volume is plotted for each time point, error bars ±SEM. C: Representative
images of tumours from each genotype. n = 12-18 tumours per genotype. NSD = not statistically different.
- 155 -

4.1.4 Claudin14 heterozygosity affects the proportion of lumenated
tumour blood vessels
Since Cldn14 deficiency did not appear to affect tumour size, but tumour hypoxia
appeared to be altered, we next sought to examine the blood vessels within these
tumours. Tumour blood vessels are dynamic structures that go through phases of lumen
formation when they are likely to be functional. Lumenated and non-lumenated blood
vessel numbers were counted across whole midline tumour sections and results are
shown in Figure 4.9 B as percentage of non-lumenated (or less likely to be functional)
blood vessels. However, when lumenated (more likely to be functional) vessels per mm2
of tumour section is analysed, no significant difference in vessel density is seen between
any of the genotypes in either B16F10 or LLC tumours (Figure 4.9 C).
In contrast, when both lumenated and non-lumenated vessels were counted together, the
total number of blood vessels was found to be elevated in B16F10 tumours grown in
Cldn14-het mice (Figure 4.10 A), but was unchanged in LLC tumours (Figure 4.10 B,
C). To examine the effect of Cldn14 depletion on blood vessel density in non-tumour
tissue, we next counted blood vessel density in unchallenged skin from WT, Cldn14-het
and Cldn14-null. Results showed that there were no significant differences in vascular
density in the skin between the genotypes (Figure 4.10 C).
- 156 -
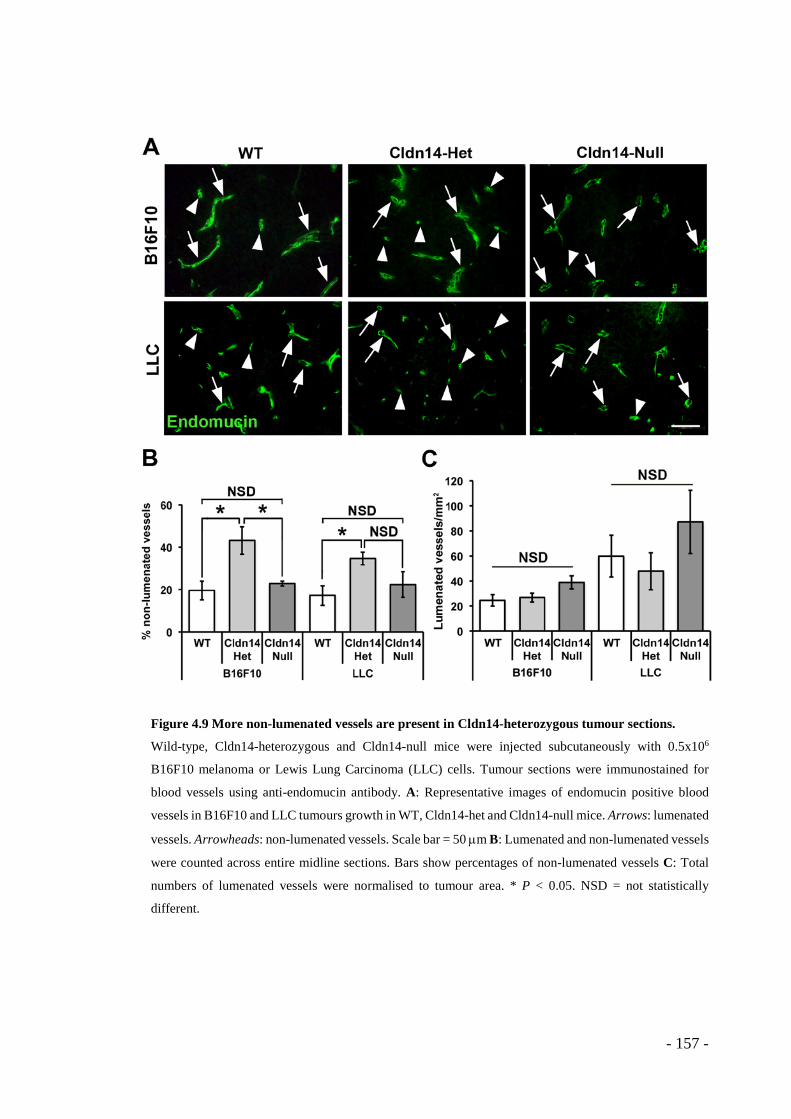
Figure 4.9 More non-lumenated vessels are present in Cldn14-heterozygous tumour sections.
Wild-type, Cldn14-heterozygous and Cldn14-null mice were injected subcutaneously with 0.5x10⁶
B16F10 melanoma or Lewis Lung Carcinoma (LLC) cells. Tumour sections were immunostained for
blood vessels using anti-endomucin antibody. A: Representative images of endomucin positive blood
vessels in B16F10 and LLC tumours growth in WT, Cldn14-het and Cldn14-null mice. Arrows: lumenated
vessels. Arrowheads: non-lumenated vessels. Scale bar = 50 µm B: Lumenated and non-lumenated vessels
were counted across entire midline sections. Bars show percentages of non-lumenated vessels C: Total
numbers of lumenated vessels were normalised to tumour area. * P < 0.05. NSD = not statistically
different.
- 157 -
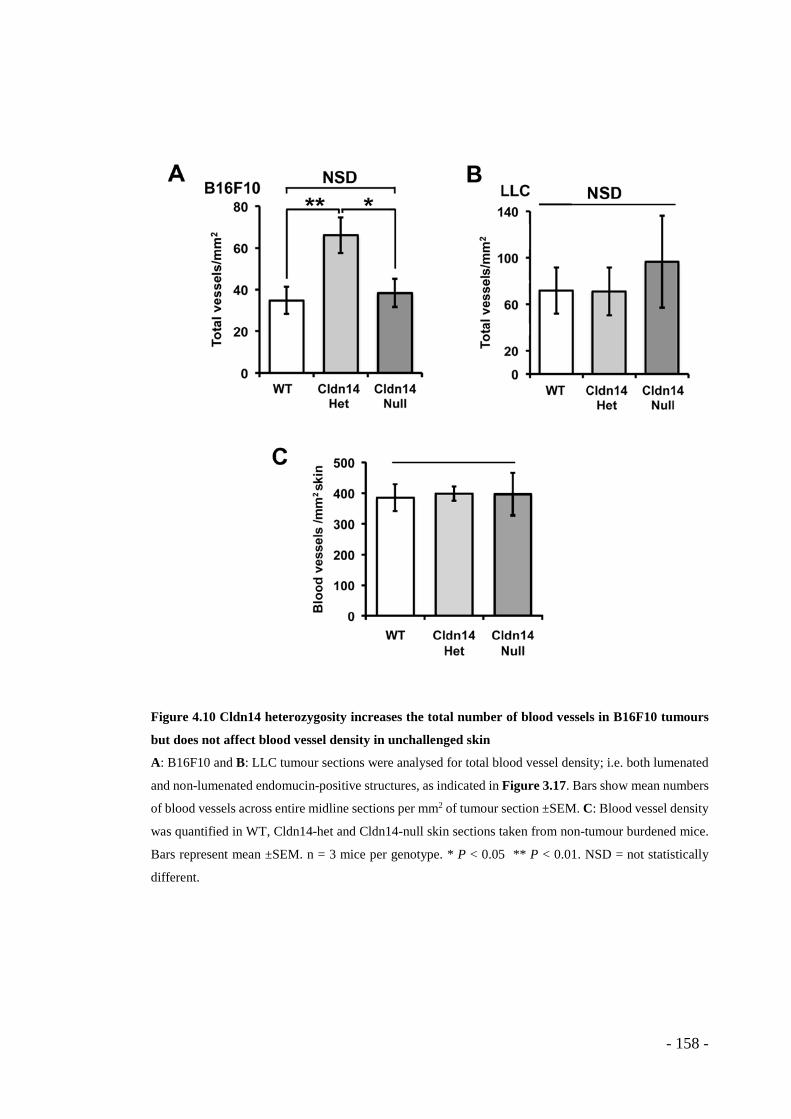
Figure 4.10 Cldn14 heterozygosity increases the total number of blood vessels in B16F10 tumours
but does not affect blood vessel density in unchallenged skin
A: B16F10 and B: LLC tumour sections were analysed for total blood vessel density; i.e. both lumenated
and non-lumenated endomucin-positive structures, as indicated in Figure 3.17. Bars show mean numbers
of blood vessels across entire midline sections per mm2 of tumour section ±SEM. C: Blood vessel density
was quantified in WT, Cldn14-het and Cldn14-null skin sections taken from non-tumour burdened mice.
Bars represent mean ±SEM. n = 3 mice per genotype. * P < 0.05 ** P < 0.01. NSD = not statistically
different.
- 158 -
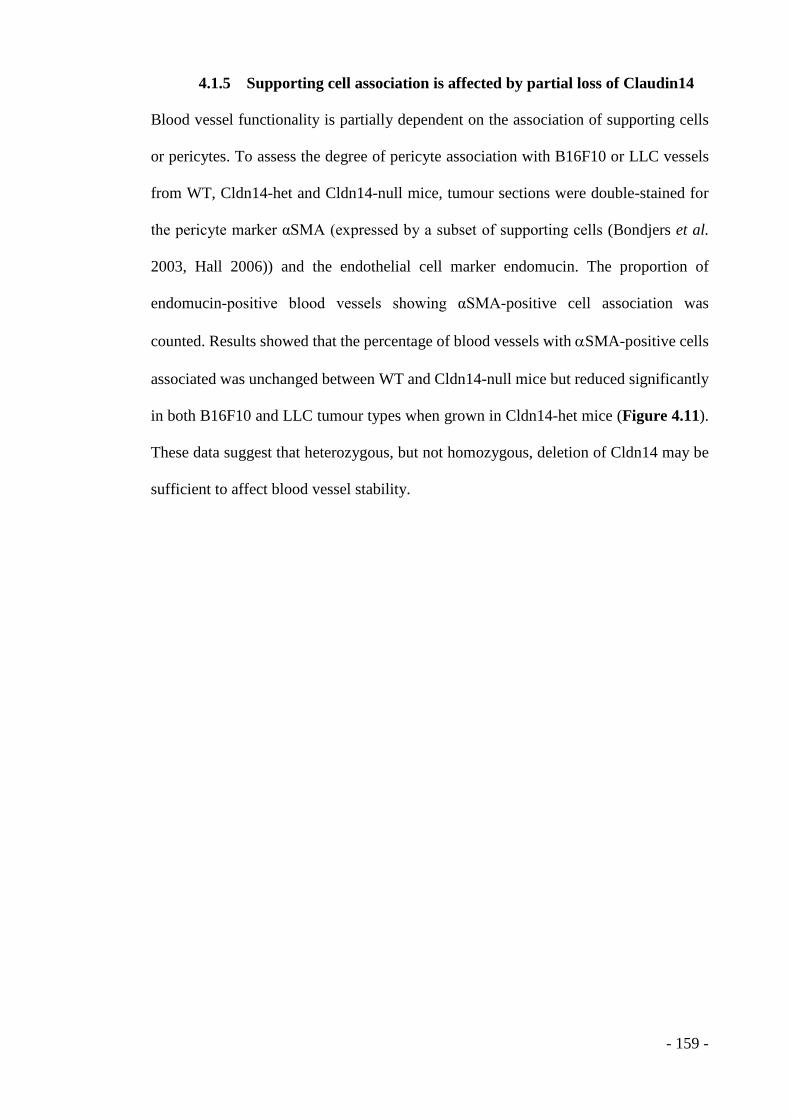
4.1.5 Supporting cell association is affected by partial loss of Claudin14
Blood vessel functionality is partially dependent on the association of supporting cells
or pericytes. To assess the degree of pericyte association with B16F10 or LLC vessels
from WT, Cldn14-het and Cldn14-null mice, tumour sections were double-stained for
the pericyte marker αSMA (expressed by a subset of supporting cells (Bondjers et al.
2003, Hall 2006)) and the endothelial cell marker endomucin. The proportion of
endomucin-positive blood vessels showing αSMA-positive cell association was
counted. Results showed that the percentage of blood vessels with αSMA-positive cells
associated was unchanged between WT and Cldn14-null mice but reduced significantly
in both B16F10 and LLC tumour types when grown in Cldn14-het mice (Figure 4.11).
These data suggest that heterozygous, but not homozygous, deletion of Cldn14 may be
sufficient to affect blood vessel stability.
- 159 -
Figure 4.11 Supporting cell association with tumour vessels is decreased in tumour blood vessels of
Cldn14-heterozygous mice.
A: Wild-type, Cldn14-heterozygous and Cldn14-null mice were injected subcutaneously with 0.5x10⁶
luciferase expressing B16F10 melanoma or Lewis Lung Carcinoma (LLC) cells. Tumour sections were
immunostained with anti-endomucin and αSMA antibodies to visualise endothelial cells and supporting
cells. The percentage of αSMA+ vessels was quantified across ≥5 fields per section. Bars show means
±SEM. B: Representative images of sections from each tumour type. Arrowheads: blood vessels with
associated αSMA+ supporting cells. Arrows: blood vessels lacking association of αSMA+ cells. n = 7-22
tumours per genotype. Scale bar = 50 µm. * p < 0.05 ** p < 0.01.
- 160 -
4.1.6 Claudin14 heterozygosity increases endothelial cell proliferation in
vivo, ex vivo and in vitro
To test whether the increase in tumour blood vessel density in Cldn14-het mice
correlated with a change in endothelial proliferation, tumour sections from WT, Cldn14-
het and Cln14-null mice were stained for the proliferation marker Ki67. A significant
increase in numbers of proliferating endothelial cells was found in tumours grown in
Cldn14-het mice but no differences between WT and Cldn14-nulls were observed. No
significant changes in cellular proliferation were observed in the tumour cell
compartment (Figure 4.12).
To examine further the effect of Cldn14 heterozygosity on growth factor-specific
angiogenic responses ex vivo, the aortic ring assay was employed (Baker et al. 2012).
WT, Cldn14-het and Cldn14-null aortic rings were embedded in collagen and treated
with either PBS or VEGF. In the absence of VEGF, microvessel sprouting was barely
detectable and unchanged between the genotypes. The level of VEGF-stimulated
microvessel sprouting in WT and Cldn14-null aortic ring cultures was similar. In
contrast, VEGF-stimulated aortic ring sprouting was enhanced significantly in Cldn14-
het aortic rings when compared with WT and Cldn14-nulls (Figure 4.13 A, C). In
addition, the resulting mean sprout length was enhanced in Cldn14-het aortic rings
(Figure 4.13 B, C).
Similar to my findings in vivo, endothelial cell proliferation in ex vivo aortic ring assays,
as indicated by EdU incorporation into cellular DNA, was also found to be elevated in
Cldn14-het aortic ring BS1 lectin-positive microvessel sprouts when compared with WT
and Cldn14-null aortic rings (Figure 4.14). Furthermore, cells isolated and cultured
from WT, Cldn14-het and Cdn14-null mice were tested for their proliferative capacity
- 161 -
with and without VEGF stimulation, using EdU incorporation as a marker. EdU
incorporation was unchanged between WT and Cldn14-null endothelial cells but
increased in Cldn14-het endothelial cells when compared to controls (Figure 4.15).
Changes in angiogenesis may relate not only to altered proliferation but also to changes
in endothelial cell migration. To examine this, pMLEC were plated on Dunn chamber
slides in a VEGF gradient and were observed over 16 hours to record their VEGF-
stimulated migratory capabilities. Analysis of cell tracks revealed a small but
statistically significant decrease in the speed and persistence of cell movement in
Cldn14-null cells compared to both WT and Cldn14-het cells, though we speculate that
this very small difference is unlikely to be biologically significant (Figure 4.16).
Interestingly, careful observations of the cell migration movies revealed that Cldn14-het
cells divided at a higher rate than WT or Cldn14-null endothelial cells, but no significant
differences in the numbers of apparent cell deaths were observed (Figure 4.17).
- 162 -
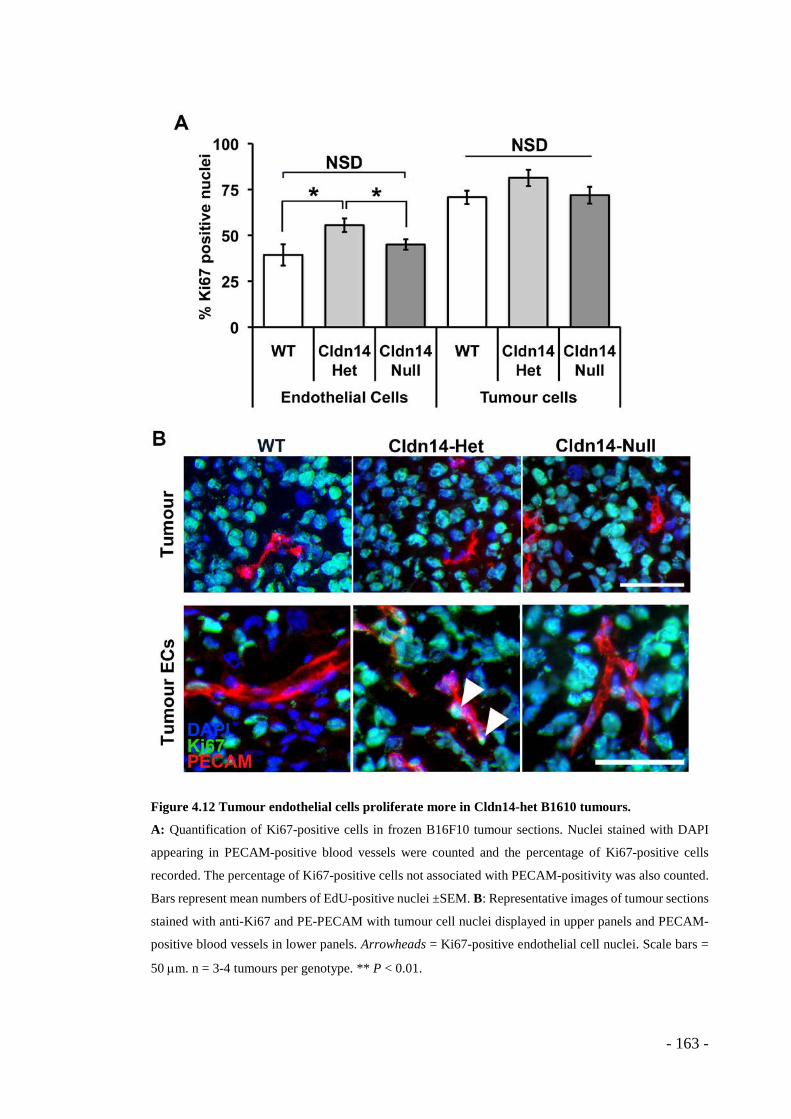
Figure 4.12 Tumour endothelial cells proliferate more in Cldn14-het B1610 tumours.
A: Quantification of Ki67-positive cells in frozen B16F10 tumour sections. Nuclei stained with DAPI
appearing in PECAM-positive blood vessels were counted and the percentage of Ki67-positive cells
recorded. The percentage of Ki67-positive cells not associated with PECAM-positivity was also counted.
Bars represent mean numbers of EdU-positive nuclei ±SEM. B: Representative images of tumour sections
stained with anti-Ki67 and PE-PECAM with tumour cell nuclei displayed in upper panels and PECAM-
positive blood vessels in lower panels. Arrowheads = Ki67-positive endothelial cell nuclei. Scale bars =
50 µm. n = 3-4 tumours per genotype. ** P < 0.01.
- 163 -
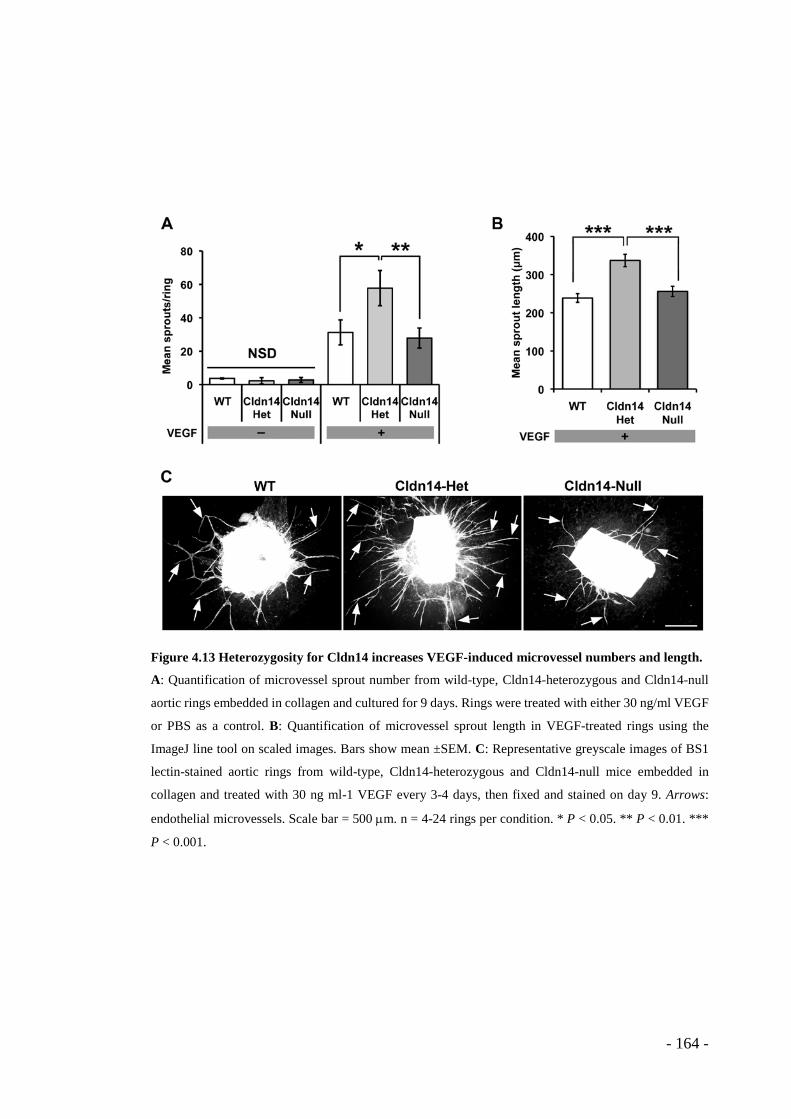
Figure 4.13 Heterozygosity for Cldn14 increases VEGF-induced microvessel numbers and length.
A: Quantification of microvessel sprout number from wild-type, Cldn14-heterozygous and Cldn14-null
aortic rings embedded in collagen and cultured for 9 days. Rings were treated with either 30 ng/ml VEGF
or PBS as a control. B: Quantification of microvessel sprout length in VEGF-treated rings using the
ImageJ line tool on scaled images. Bars show mean ±SEM. C: Representative greyscale images of BS1
lectin-stained aortic rings from wild-type, Cldn14-heterozygous and Cldn14-null mice embedded in
collagen and treated with 30 ng ml-1 VEGF every 3-4 days, then fixed and stained on day 9. Arrows:
endothelial microvessels. Scale bar = 500 µm. n = 4-24 rings per condition. * P < 0.05. ** P < 0.01. ***
P < 0.001.
- 164 -
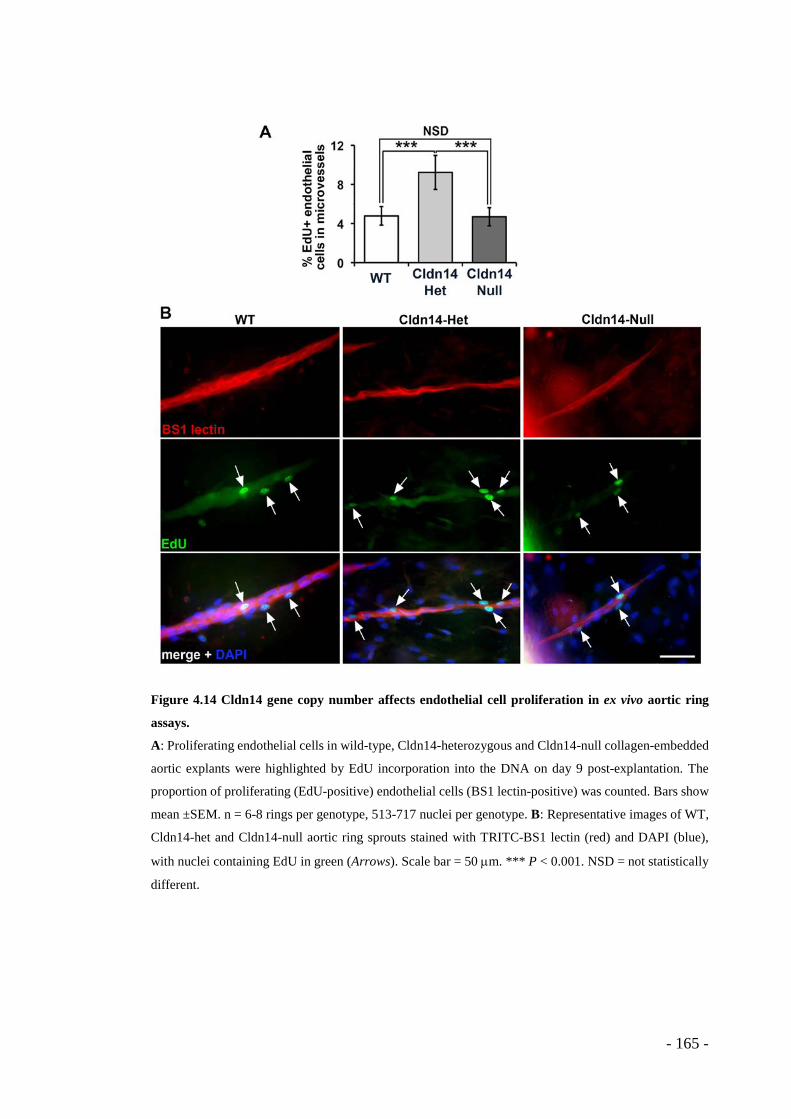
Figure 4.14 Cldn14 gene copy number affects endothelial cell proliferation in ex vivo aortic ring
assays.
A: Proliferating endothelial cells in wild-type, Cldn14-heterozygous and Cldn14-null collagen-embedded
aortic explants were highlighted by EdU incorporation into the DNA on day 9 post-explantation. The
proportion of proliferating (EdU-positive) endothelial cells (BS1 lectin-positive) was counted. Bars show
mean ±SEM. n = 6-8 rings per genotype, 513-717 nuclei per genotype. B: Representative images of WT,
Cldn14-het and Cldn14-null aortic ring sprouts stained with TRITC-BS1 lectin (red) and DAPI (blue),
with nuclei containing EdU in green (Arrows). Scale bar = 50 µm. *** P < 0.001. NSD = not statistically
different.
- 165 -
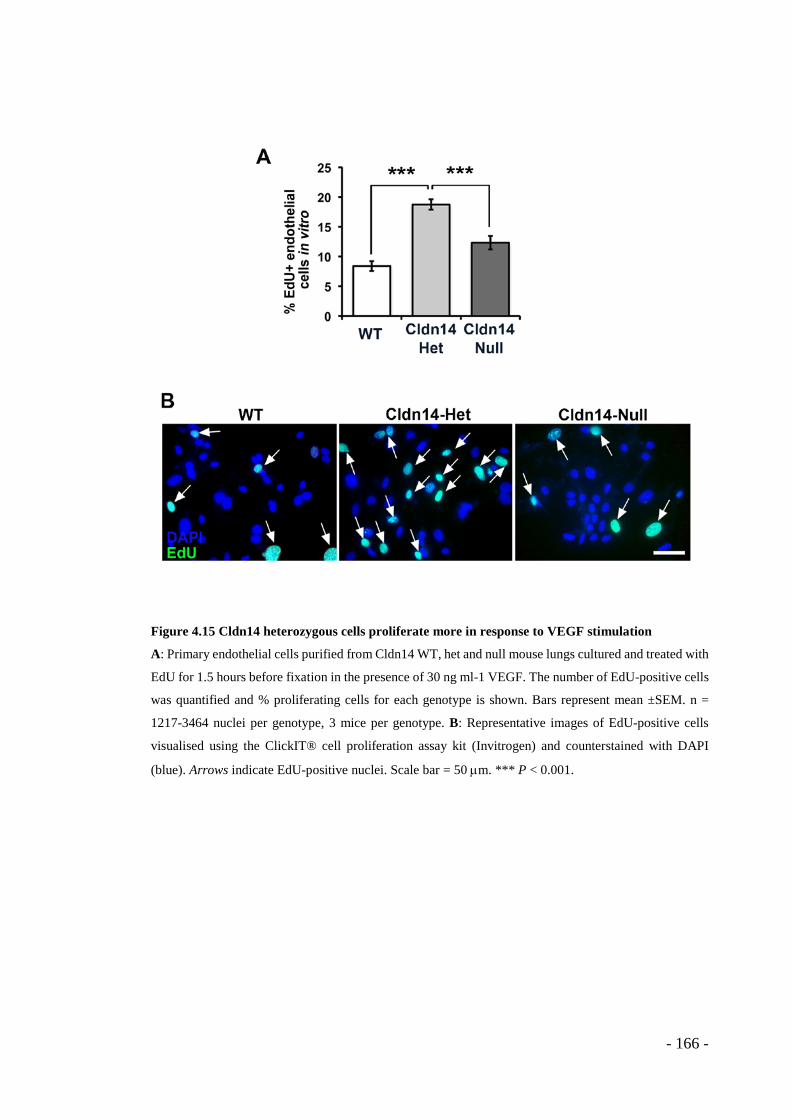
Figure 4.15 Cldn14 heterozygous cells proliferate more in response to VEGF stimulation
A: Primary endothelial cells purified from Cldn14 WT, het and null mouse lungs cultured and treated with
EdU for 1.5 hours before fixation in the presence of 30 ng ml-1 VEGF. The number of EdU-positive cells
was quantified and % proliferating cells for each genotype is shown. Bars represent mean ±SEM. n =
1217-3464 nuclei per genotype, 3 mice per genotype. B: Representative images of EdU-positive cells
visualised using the ClickIT® cell proliferation assay kit (Invitrogen) and counterstained with DAPI
(blue). Arrows indicate EdU-positive nuclei. Scale bar = 50 µm. *** P < 0.001.
- 166 -
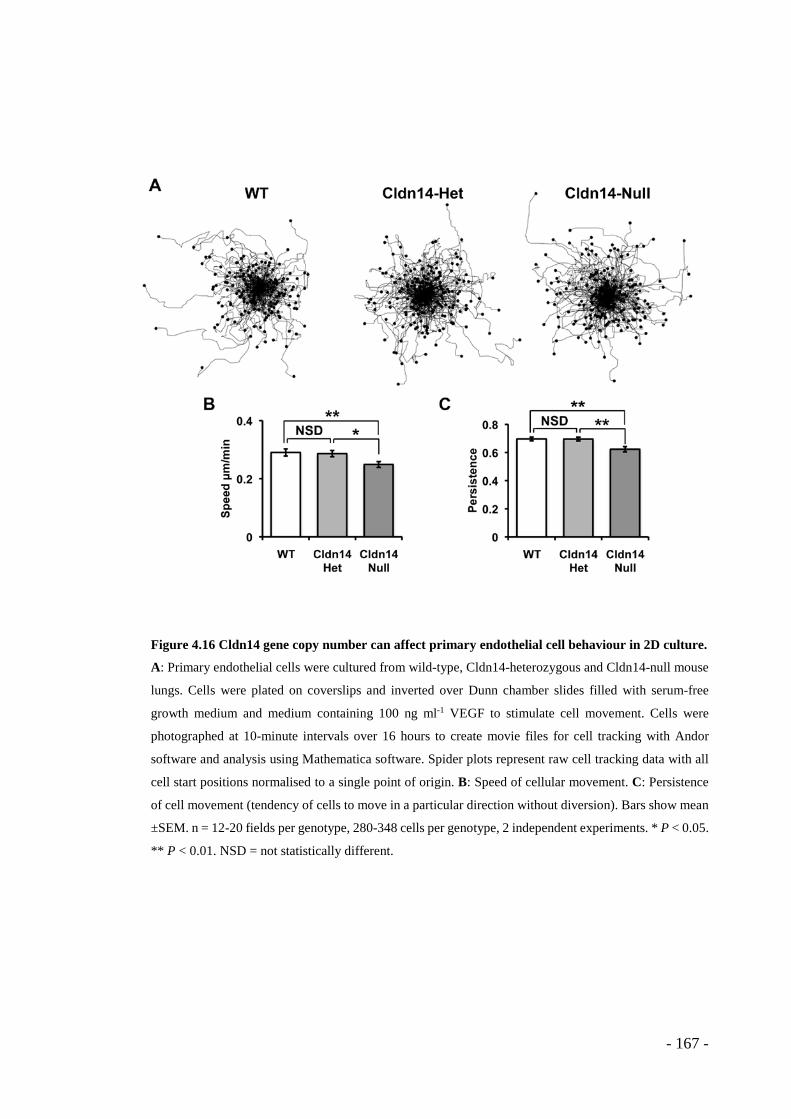
Figure 4.16 Cldn14 gene copy number can affect primary endothelial cell behaviour in 2D culture.
A: Primary endothelial cells were cultured from wild-type, Cldn14-heterozygous and Cldn14-null mouse
lungs. Cells were plated on coverslips and inverted over Dunn chamber slides filled with serum-free
growth medium and medium containing 100 ng ml-1 VEGF to stimulate cell movement. Cells were
photographed at 10-minute intervals over 16 hours to create movie files for cell tracking with Andor
software and analysis using Mathematica software. Spider plots represent raw cell tracking data with all
cell start positions normalised to a single point of origin. B: Speed of cellular movement. C: Persistence
of cell movement (tendency of cells to move in a particular direction without diversion). Bars show mean
±SEM. n = 12-20 fields per genotype, 280-348 cells per genotype, 2 independent experiments. * P < 0.05.
** P < 0.01. NSD = not statistically different.
- 167 -
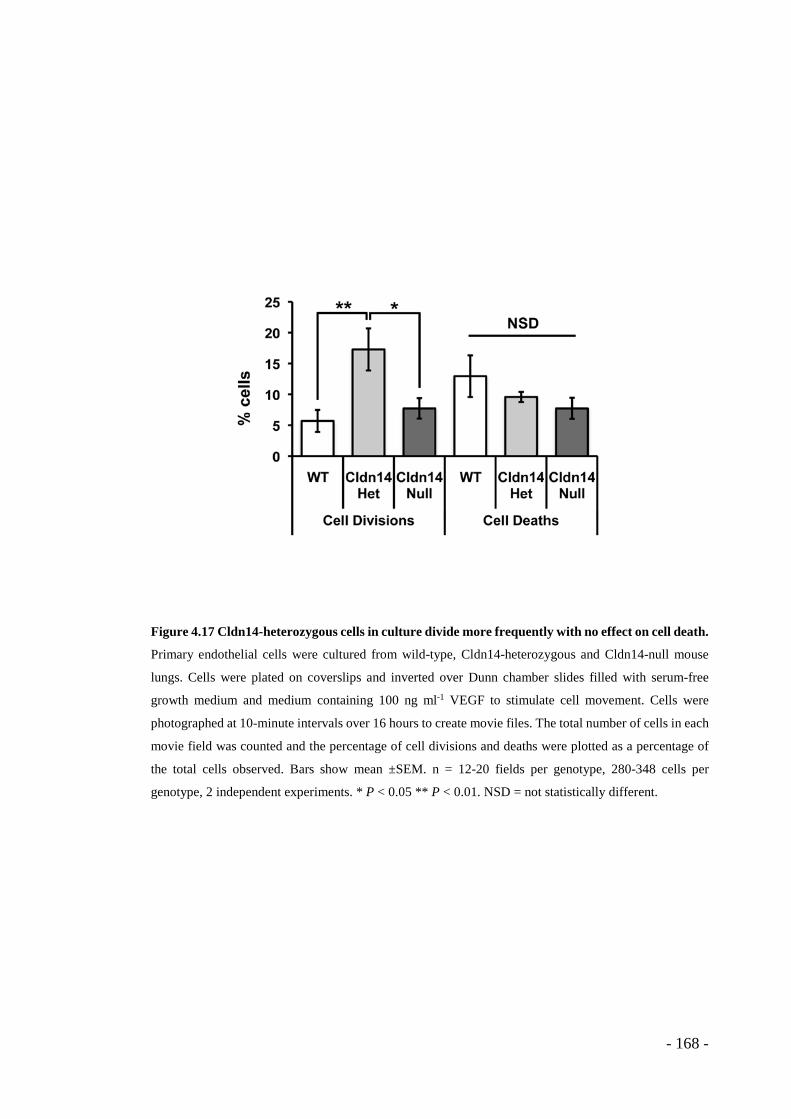
Figure 4.17 Cldn14-heterozygous cells in culture divide more frequently with no effect on cell death.
Primary endothelial cells were cultured from wild-type, Cldn14-heterozygous and Cldn14-null mouse
lungs. Cells were plated on coverslips and inverted over Dunn chamber slides filled with serum-free
growth medium and medium containing 100 ng ml-1 VEGF to stimulate cell movement. Cells were
photographed at 10-minute intervals over 16 hours to create movie files. The total number of cells in each
movie field was counted and the percentage of cell divisions and deaths were plotted as a percentage of
the total cells observed. Bars show mean ±SEM. n = 12-20 fields per genotype, 280-348 cells per
genotype, 2 independent experiments. * P < 0.05 ** P < 0.01. NSD = not statistically different.
- 168 -
4.1.7 Transient depletion of Cldn14 mimics Cldn14-heterozygous
angiogenic phenotypes
In addition to observing the effect of manipulation of Cldn14 gene copy number on
angiogenic responses, temporary gene knockdown was also tested using RNAi. Wild-
type aortic rings were transfected using Oligofectamine™ with the mouse Cldn14-
targeting siRNA pool (Dharmacon) or scrambled non-targeting control siRNA. The
degree of Cldn14 depletion was confirmed to be approximately 50% in each case
(though levels are likely to vary cell by cell) by Western blot analysis, suggesting that
the RNAi results may correlate with those from Cldn14-heterozygous aortic rings and
primary cells (Figure 4.18). siRNA-treated rings were embedded in collagen and given
VEGF to stimulate microvessel outgrowth, which was quantified after 9 days of culture.
In the absence of VEGF there was no significant difference in microvessel outgrowth
between scrambled or Cldn14 siRNA-treated aortic rings. VEGF significantly enhanced
microvessel sprouting in scrambled siRNA-transfected rings. Moreover, a significant
increase in VEGF-induced microvessel sprouting was observed in Cldn14-depleted
rings compared to those transfected with scrambled control siRNA (Figure 4.19 A).
Microvessel length, as in Cldn14-heterozygous explants, was also found to be
significantly greater in Cldn14 siRNA-transfected rings (Figure 4.19 B).
In addition, proliferation assays performed on scrambled and Cldn14 siRNA-treated
aortic ring cultures revealed an increase in the number of proliferating cells upon Cldn14
knockdown (Figure 4.20). To further validate our previous results, primary endothelial
cells cultured from mouse lungs were also transfected with siRNAs against Cldn14 and
examined for proliferation and apoptotic profiles using EdU incorporation and TUNEL
expression respectively. Cldn14-depletion induced an increase in cellular proliferation
when compared with Scr siRNA-transfected controls even in the absence of VEGF.
- 169 -
VEGF stimulation induced an increase in proliferation of Scr siRNA treated cells and
this was further enhanced in Cldn14 siRNA-transfected cells (Figure 4.21). In contrast,
no effect on apoptosis was observed (Figure 4.22).
Together these results reveal a novel role for Claudin 14 in regulating endothelial cell
and microvessel behaviours in vitro, ex vivo and in vivo and suggest that partial loss of
Cldn14 in the stroma can enhance some angiogenic responses.
- 170 -
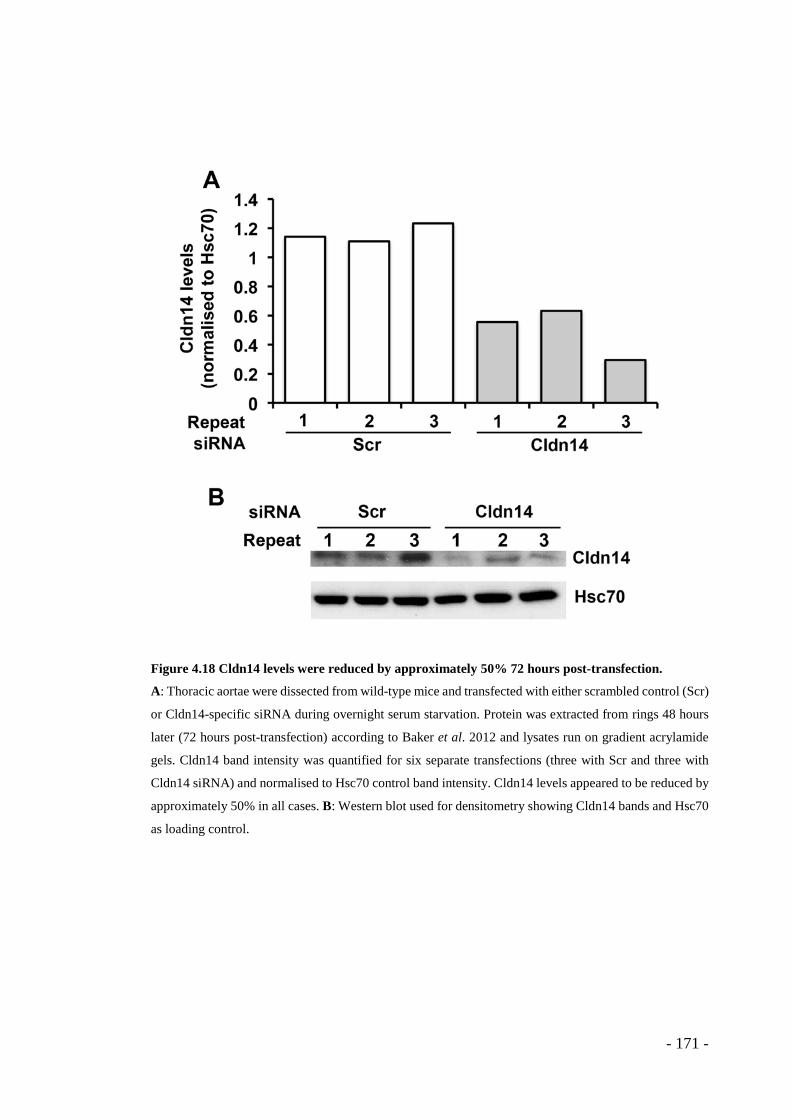
Figure 4.18 Cldn14 levels were reduced by approximately 50% 72 hours post-transfection.
A: Thoracic aortae were dissected from wild-type mice and transfected with either scrambled control (Scr)
or Cldn14-specific siRNA during overnight serum starvation. Protein was extracted from rings 48 hours
later (72 hours post-transfection) according to Baker et al. 2012 and lysates run on gradient acrylamide
gels. Cldn14 band intensity was quantified for six separate transfections (three with Scr and three with
Cldn14 siRNA) and normalised to Hsc70 control band intensity. Cldn14 levels appeared to be reduced by
approximately 50% in all cases. B: Western blot used for densitometry showing Cldn14 bands and Hsc70
as loading control.
- 171 -
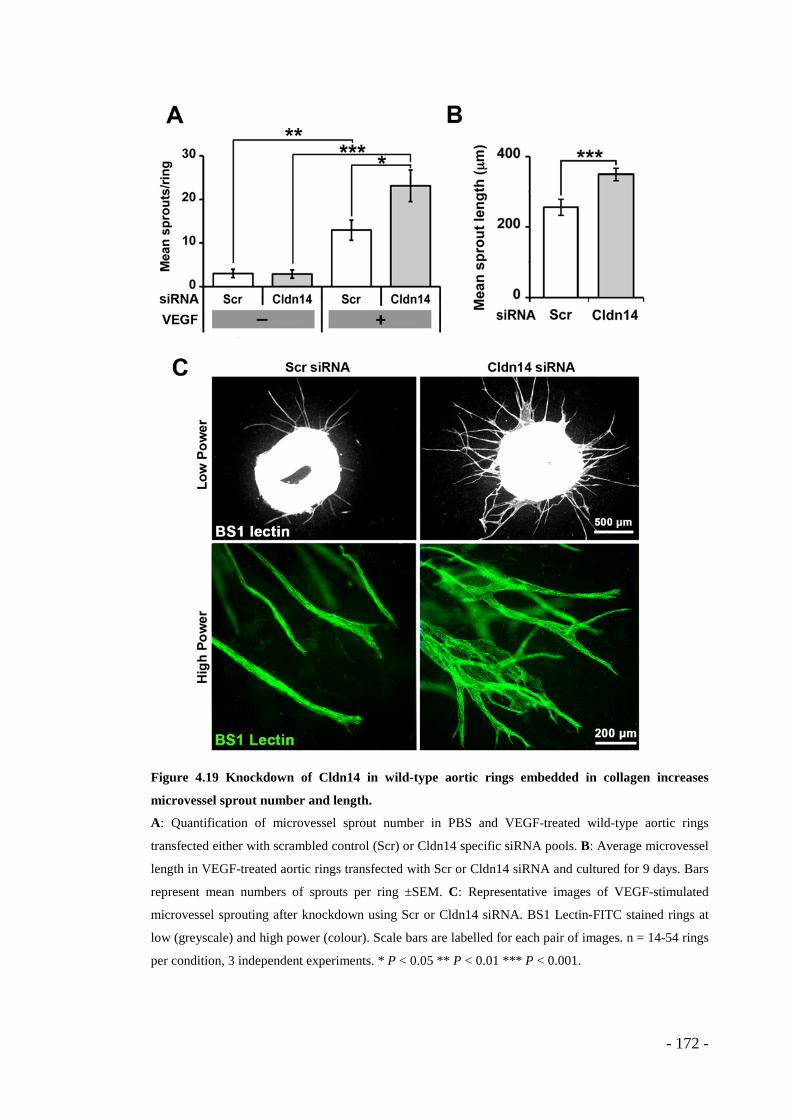
Figure 4.19 Knockdown of Cldn14 in wild-type aortic rings embedded in collagen increases
microvessel sprout number and length.
A: Quantification of microvessel sprout number in PBS and VEGF-treated wild-type aortic rings
transfected either with scrambled control (Scr) or Cldn14 specific siRNA pools. B: Average microvessel
length in VEGF-treated aortic rings transfected with Scr or Cldn14 siRNA and cultured for 9 days. Bars
represent mean numbers of sprouts per ring ±SEM. C: Representative images of VEGF-stimulated
microvessel sprouting after knockdown using Scr or Cldn14 siRNA. BS1 Lectin-FITC stained rings at
low (greyscale) and high power (colour). Scale bars are labelled for each pair of images. n = 14-54 rings
per condition, 3 independent experiments. * P < 0.05 ** P < 0.01 *** P < 0.001.
- 172 -
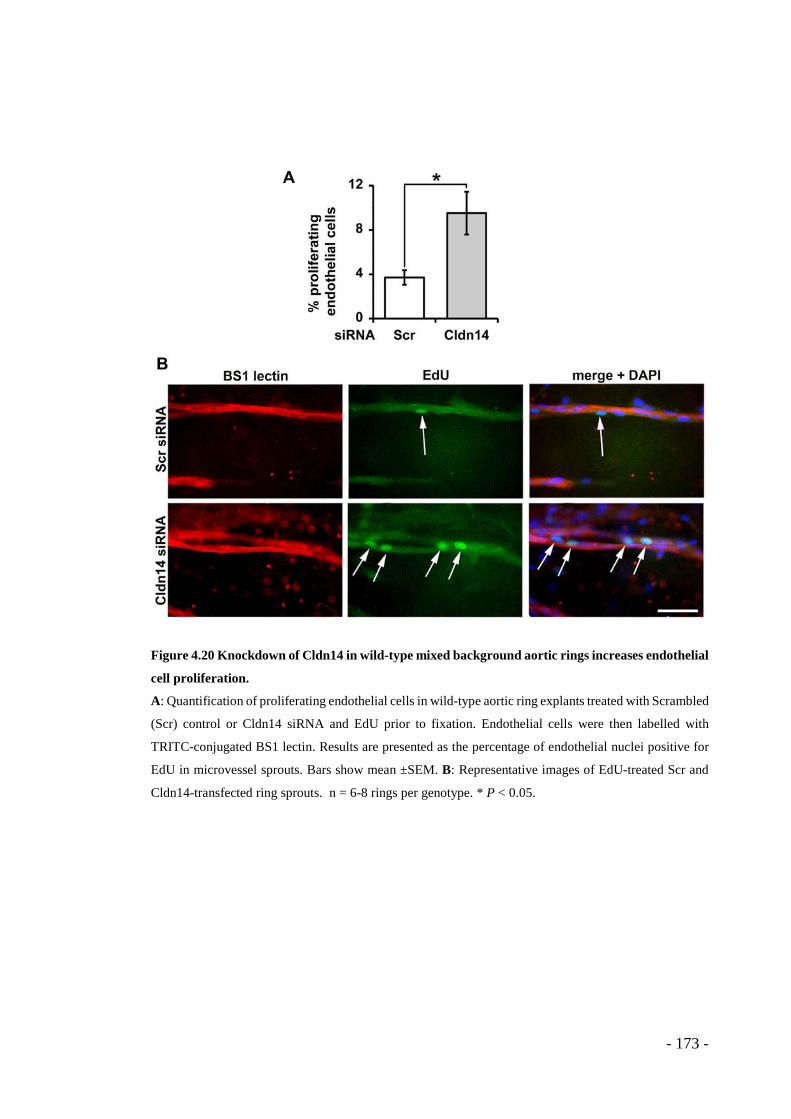
Figure 4.20 Knockdown of Cldn14 in wild-type mixed background aortic rings increases endothelial
cell proliferation.
A: Quantification of proliferating endothelial cells in wild-type aortic ring explants treated with Scrambled
(Scr) control or Cldn14 siRNA and EdU prior to fixation. Endothelial cells were then labelled with
TRITC-conjugated BS1 lectin. Results are presented as the percentage of endothelial nuclei positive for
EdU in microvessel sprouts. Bars show mean ±SEM. B: Representative images of EdU-treated Scr and
Cldn14-transfected ring sprouts. n = 6-8 rings per genotype. * P < 0.05.
- 173 -
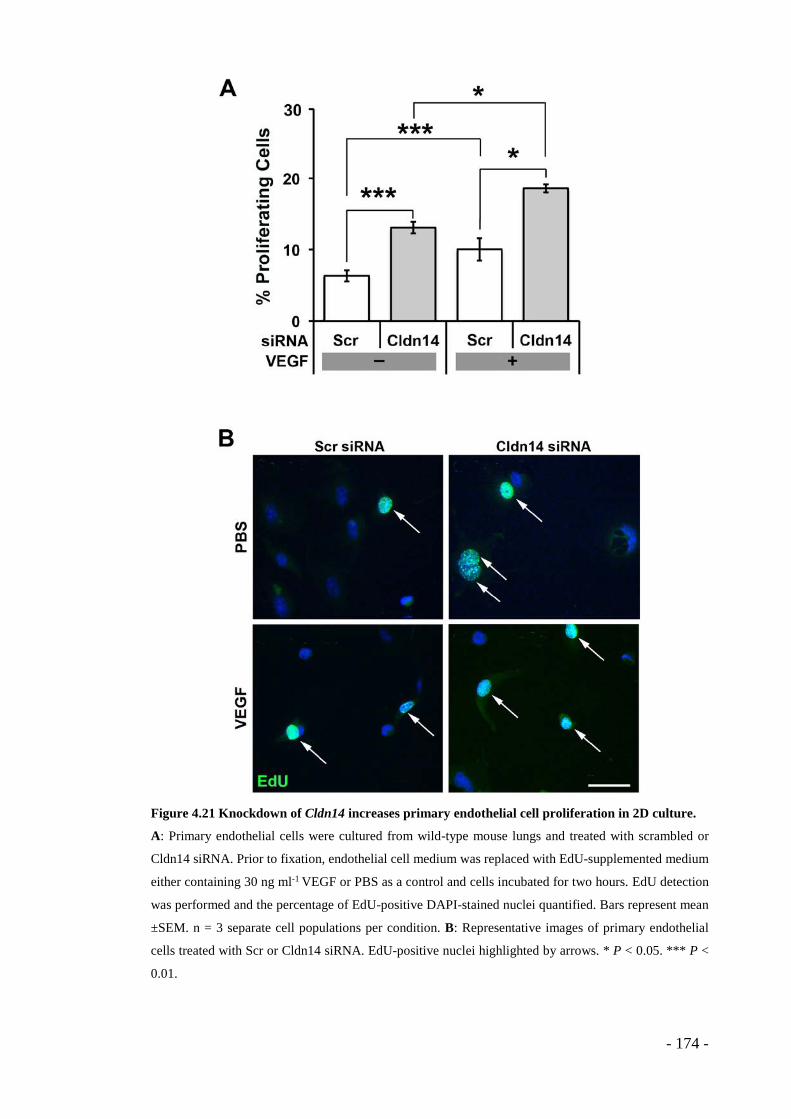
Figure 4.21 Knockdown of Cldn14 increases primary endothelial cell proliferation in 2D culture.
A: Primary endothelial cells were cultured from wild-type mouse lungs and treated with scrambled or
Cldn14 siRNA. Prior to fixation, endothelial cell medium was replaced with EdU-supplemented medium
either containing 30 ng ml-1 VEGF or PBS as a control and cells incubated for two hours. EdU detection
was performed and the percentage of EdU-positive DAPI-stained nuclei quantified. Bars represent mean
±SEM. n = 3 separate cell populations per condition. B: Representative images of primary endothelial
cells treated with Scr or Cldn14 siRNA. EdU-positive nuclei highlighted by arrows. * P < 0.05. *** P <
0.01.
- 174 -
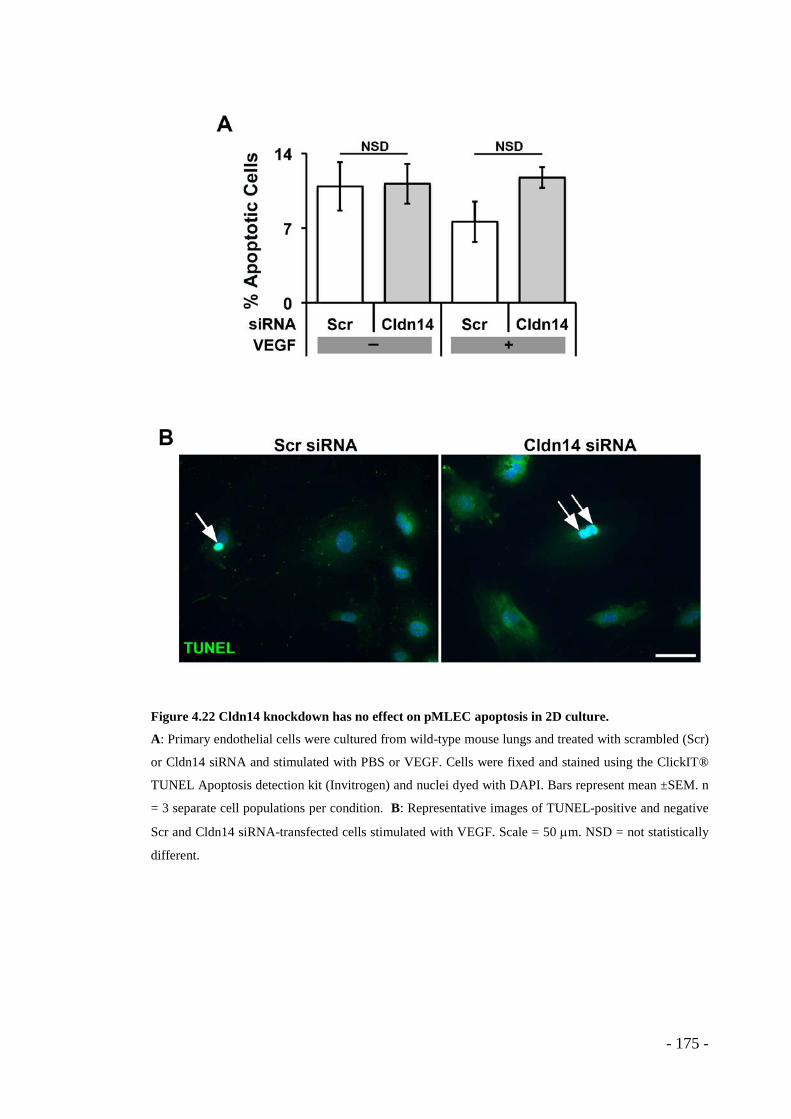
Figure 4.22 Cldn14 knockdown has no effect on pMLEC apoptosis in 2D culture.
A: Primary endothelial cells were cultured from wild-type mouse lungs and treated with scrambled (Scr)
or Cldn14 siRNA and stimulated with PBS or VEGF. Cells were fixed and stained using the ClickIT®
TUNEL Apoptosis detection kit (Invitrogen) and nuclei dyed with DAPI. Bars represent mean ±SEM. n
= 3 separate cell populations per condition. B: Representative images of TUNEL-positive and negative
Scr and Cldn14 siRNA-transfected cells stimulated with VEGF. Scale = 50 µm. NSD = not statistically
different.
- 175 -
4.2 DISCUSSION
The Claudin family of proteins are not yet fully characterised and their study is a
relatively nascent field with many open questions. Their role in cell adhesion as
components of tight junctions is established, but there may be other Claudin functions
that are still to be defined. This study implicates Claudin14 in endothelial cell functions
and angiogenesis in vivo, which has not been shown previously.
There are three CLDN genes present on the Hsa21 fragment in Tc1 mice, whose protein
products are components of cell-cell tight junctions (as detailed in 1.8.4): CLDN8,
CLDN14 and CLDN17. Cldn8 is thought to be involved in kidney nephron permeability
(Li et al. 2004). Little is known about Cldn17, but a recent study suggested it might
regulate paracellular uptake of anions in kidney nephrons (Krug et al. 2012). Cldn14
also is not well-studied but mutation of the gene is known to cause human non-
syndromic autosomal recessive deafness (Arican et al. 2005, Bashir et al. 2010, Belguith
et al. 2009, Lee et al. 2012, Nunes et al. 2006, Uyguner et al. 2003, Wilcox et al. 2001).
This human phenotype is recapitulated in the Cldn14-null mouse, which is also deaf
(Ben-Yosef et al. 2003). Cldn14 has also been implicated in kidney functions (Gong et
al. 2012, Kirk et al. 2010, Thorleifsson et al. 2009). In vitro, Cldn14 was found to elicit
a change in nuclear shape and decreased cell membrane protrusions, in addition to
increasing apoptosis, when overexpressed in human embryonic kidney cells, while
Cldn17 had no effect (Hu et al. 2006, Hu et al. 2010). With respect to angiogenesis, so
far only one study has presented evidence for a role for Cldn14. Glienke et al. detected
higher levels of Cldn14 transcript in endothelial cells cultured on Matrigel with a more
differentiated (tubular) phenotype, compared to proliferating subconfluent monolayers
(Glienke et al. 2000).
- 176 -
These data and preliminary experiments, together with the results of altering JAM-B
gene dosage and blocking its function, informed the decision to study Cldn14, another
tight junction protein, and its potential angiogenic roles. Additionally, one study pointed
out that while Cldn5 is endothelial “specific”, its function might not be particularly
influential outside of the BBB, the situation in which it has been most thoroughly
characterised (Fontijn et al. 2006). However, some data suggest otherwise, reporting
Cldn5 expression in certain epithelia (Escudero-Esparza et al. 2012) and immune cells,
as discussed further below (4.2.2). The study investigated barrier properties of primary
vascular endothelial cell layers both over- and under-expressing Cldn5 in vitro, finding
that barrier function was enhanced with Cldn5 overexpression (but unaffected by
silencing) but no effects on immune cell transmigration were found. In addition, that the
Cldn5-/- mouse only displays vascular defects in terms of a size-selective loosening of
the BBB also suggests that junctions in other endothelial barriers may rely on other
claudin family members (Nitta et al. 2003). These results suggest that other proteins,
likely other Cldn family members, can regulate endothelial barrier functions in non-BBB
endothelial cell layers. Nitta et al. confirmed the expression of Cldn12 in brain
endothelial cells, for example. The limited data available for Cldn14 function in
endothelial cells and angiogenesis presented it as a favourable candidate to study in this
context.
Cldn14 has previously been found to be upregulated in endothelial cells arranged in
organised tubular structures in vitro when compared to cells in 2D culture (Glienke et
al. 2000). This result is expected since tight junctions are cell-cell contacts. Here I have
presented findings from the manipulation of Cldn14 gene dosage in vivo, ex vivo and in
vitro, showing that Claudin14 heterozygosity can influence angiogenic processes.
- 177 -
I have found that reduction of Cldn14 gene copy number from 2 to 1 affects the
localisation of the TJ plaque protein ZO1 to endothelial junctions, destabilises the
tumour blood vessel basement membrane, increases small molecule leakage from
tumour blood vessels, increases tumour oxygenation, decreases the proportion of
lumenated blood vessels within tumours, decreases pericyte association with tumour
blood vessels, and increases endothelial cell proliferation. Together my results have
clearly demonstrated that Claudin14 gene dosage can affect angiogenesis, altering the
barrier properties of vascular endothelia in tumours, and interestingly, without affecting
tumour growth.
Relatively few high-quality reagents are available for Claudin proteins, since their
antigenicity is reported to be low (Saeki et al. 2010). The lack of a reliable antibody
against Claudin14 in this study was a major limitation; a very small aliquot of antibody
developed by T. Ben-Yosef and colleagues was kindly provided early in the study, but
was insufficient to carry out all assessments of protein levels that were planned.
Commercially-available antibodies could not be optimised for Western blotting or
immunofluorescence, meaning protein levels could not be confirmed in the genetic
models, or in all RNAi experiments, which would have been ideal.
We confirmed that Cldn14 message levels were decreased in proportion with the gene
dosage. Approximately 50% reduction in Cldn14 mRNA was found in Cldn14-
heterozygous kidney and brain, compared to wild-type samples, and transcript was
undetectable in Cldn14-null samples. Unfortunately this was not confirmed at the
protein level, which would ideally be examined in vivo, as mentioned above. Thus, we
have assumed that approximately half the protein product is present in the Cldn14-
heterozygous mice. Optimisation of the RTPCR detection protocol was achieved only
- 178 -
at the very end of the project so could not be shown for all experiments carried out
previously, though RNA was extracted each time for this purpose. Analysis of Cldn14
levels in primary endothelial cells of each genotype was planned but could not be
performed due to restrictions on time, mouse availability and primary endothelial cell
culture.
A diagram depicting the major results of this Claudin14 study, along with previously
established phenomena relevant to these results, is presented on the following page
(Figure 4.23). Questions arising from these observations are detailed and discussed
below.
- 179 -
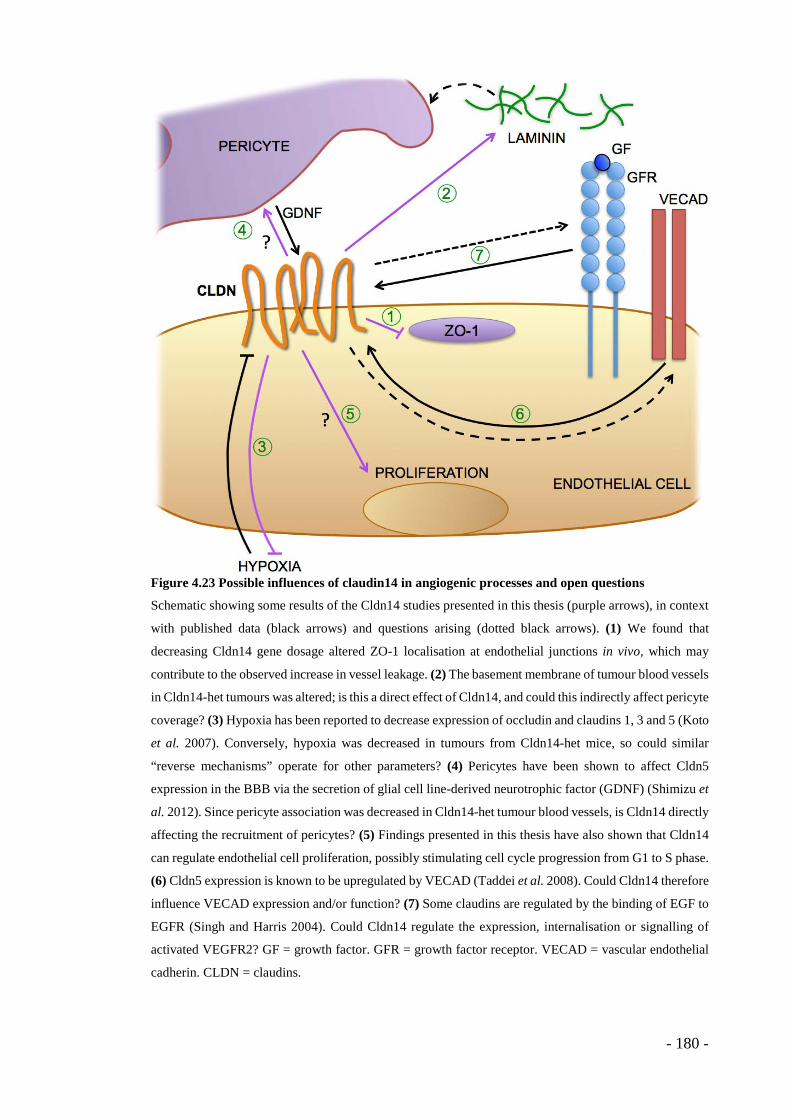
Figure 4.23 Possible influences of claudin14 in angiogenic processes and open questions
Schematic showing some results of the Cldn14 studies presented in this thesis (purple arrows), in context
with published data (black arrows) and questions arising (dotted black arrows). (1) We found that
decreasing Cldn14 gene dosage altered ZO-1 localisation at endothelial junctions in vivo, which may
contribute to the observed increase in vessel leakage. (2) The basement membrane of tumour blood vessels
in Cldn14-het tumours was altered; is this a direct effect of Cldn14, and could this indirectly affect pericyte
coverage? (3) Hypoxia has been reported to decrease expression of occludin and claudins 1, 3 and 5 (Koto
et al. 2007). Conversely, hypoxia was decreased in tumours from Cldn14-het mice, so could similar
“reverse mechanisms” operate for other parameters? (4) Pericytes have been shown to affect Cldn5
expression in the BBB via the secretion of glial cell line-derived neurotrophic factor (GDNF) (Shimizu et
al. 2012). Since pericyte association was decreased in Cldn14-het tumour blood vessels, is Cldn14 directly
affecting the recruitment of pericytes? (5) Findings presented in this thesis have also shown that Cldn14
can regulate endothelial cell proliferation, possibly stimulating cell cycle progression from G1 to S phase.
(6) Cldn5 expression is known to be upregulated by VECAD (Taddei et al. 2008). Could Cldn14 therefore
influence VECAD expression and/or function? (7) Some claudins are regulated by the binding of EGF to
EGFR (Singh and Harris 2004). Could Cldn14 regulate the expression, internalisation or signalling of
activated VEGFR2? GF = growth factor. GFR = growth factor receptor. VECAD = vascular endothelial
cadherin. CLDN = claudins.
- 180 -
4.2.1 Cldn14, cell-cell contacts and the basement membrane
It may be that, with lateral cell connections affected by Cldn14 heterozygosity or knock-
down, cell contact with the ECM may compensate, or also be negatively affected; a
similar phenomenon is reported by Delom et al., who found that Hsa21
transchromosomic fibroblasts exhibited defective migration and adhesion, thus showing
that overexpression of Hsa21 genes can affect cellular adhesion to the ECM (Delom et
al. 2009). Therefore, as an Hsa21 gene, the abundance of Cldn14 in cells contacting the
ECM may affect their adhesive properties (indicated in Figure 4.23). In addition, Cldn5
expression in brain endothelial cells was found to be regulated by β1 integrin binding to
the ECM (Osada et al. 2011), so it is possible that Cldns may in turn regulate integrin
expression and adhesion of ECs to the matrix, including laminin binding (Figure 4.23).
Eming and Hubbell summarised the effects of the deletion of various basement
membrane components on vascular integrity, with the loss of most components leading
to increased vessel leakiness (Eming and Hubbell 2011). Indeed, the delivery of the
small molecule Hoechst dye to tumour vessel-proximate nuclei was enhanced in Cldn14-
het mice, which may be a direct result of TJ destabilisation due to Cldn14 loss or as an
indirect result via alteration of the basement membrane. This suggests that partial loss
of Cldn14 alters the barrier function of tumour endothelium. Similarly, while loss of
Cldn5 increases leakage through the BBB, which ultimately kills Cldn5-null pups within
10 days after birth, the integrity of the cell layer itself is maintained (Nitta et al. 2003).
In addition to the observed effects on vessel permeability to the small molecule Hoechst
dye and disruption of the endothelial layer and basement membrane, we observed a
decreased proportion of lumenated blood vessels in tumours taken from Cldn14-
heterozygous mice. While there was an overall increase in endomucin-positive vessels
- 181 -
in Cldn14-het tumour sections, clearly lumenated vessels in particular were less
common than in tumours from wild-type or Cldn14-null mice. This suggests that, while
Cldn14 depletion may enhance angiogenic responses, the resulting vessels may not be
fully functional. Greater numbers of unlumenated vessels may result in reduced flow
through these vessels. This is apparently over-compensated for by the lumenated vessels,
which appear leakier (as demonstrated by the Hoechst assay) and able to deliver more
oxygen, thus decreasing hypoxia in Cldn14-het tumours. As described in 2.12.5, the use
of multiple tumours and whole midline sections (as opposed to a selection of fields and
tumour extremities) should have allowed the data collection to overcome the influences
of artefacts from sectioning and looking at individual planes.
4.2.2 Cldn14 and tumour oxygenation
As well as improved small molecule diffusion from tumour blood vessels in Cldn14-het
mice, oxygenation was also apparently increased. We showed that Cldn14-het tumours
had decreased hypoxic areas, detected using the Pimonidazole hypoxyprobe, and greater
bioluminescence readings from luciferase-tagged tumour cells in Cldn14-het mice when
compared to wild-type controls. Since luciferase can only perform the bioluminescent
reaction with injected luciferin in the presence of oxygen, this suggests improved
delivery of oxygenated blood to the tumour and consequently an increase in oxygen-
dependent metabolism, despite the apparent increase in vessel leakage. Unfortunately,
bioluminescence experiments could not be carried out with the addition of Cldn14-null
cohorts due to limited mouse availability. Similar to Cldn5 deletion (Nitta et al. 2005),
the observed effect may be due to a size-selective modification of the barrier function,
in which small molecules are freer to exit the vessel, without severe effects on flow. This
could be confirmed with the use of varied molecular weight tracers and monitoring their
- 182 -
movement across Cldn14-depleted endothelial barriers, and flow could be monitored by
ultrasound in vivo.
The lack of significant difference in hypoxia and total blood vessel numbers between
Cldn14-WT and Cldn14-het LLC tumours may be due to the different pro-angiogenic
secretory profile of the cell line, for example compared to the B16F10 melanoma line;
LLC tumours produce far less placenta growth factor (PlGF), another VEGF family
member as introduced in 1.5.1 and 1.5.5.1 (Zhang et al. 2008). This suggests that the
effects of Cldn14 gene dosage, upon tumour hypoxia in particular, may be dependent on
growth factors other than VEGF, such as PlGF. Future experiments testing the direct
response to PlGF may clarify this detail.
Decreased tumour hypoxia due to Cldn14 depletion in the stroma may also have
implications for cancer progression and therapy. Given that hypoxia is known to
destabilise vessels via the inhibition of adhesion molecules and may stimulate metastasis
as a result, a transient reduction in tumour hypoxia, similar to that observed when Cldn14
was depleted, would be favourable to avoid these negative effects (Brockton et al. 2012,
Koto et al. 2007, Yuan et al. 2012). Conversely, hypoxia was found to decrease the
expression of claudins 1, 3 and 5 (Koto et al. 2007), and, considering this finding
together with our data, a hypothesised two-way regulatory system between claudins and
hypoxia is depicted in Figure 4.23.
4.2.3 Cldn14 and pericytes
As well as alterations to the endothelial component of tumour vessels, decreased pericyte
coverage was also observed in Cldn14-het tumour sections, using α-smooth muscle actin
as a supporting cell marker. This interesting result is difficult to interpret, given the lack
- 183 -
of detailed knowledge of pericyte-endothelial cell interactions at present. It may indicate
a greater number of immature tumour blood vessels in Cldn14-het tumours, or
restrictions on blood vessel maturation. The decreased pericyte coverage of tumour
blood vessels in Cldn14-het mice is intriguing and may indicate that EC-pericyte tight
junctions involve Cldn14, although other claudins are almost certainly involved, given
the absence of the phenotype in Cldn14-null mice. Pericyte-endothelial cell signalling is
not yet well understood, but recently pericytes have been found to regulate Cldn5
expression in blood-brain barrier endothelial cells via secretion of growth factors
(Shimizu et al. 2012). Therefore it may be that feedback loops exist between the two
cell types, and that the levels of TJ proteins can also influence pericyte recruitment
(Figure 4.23).
Examining the expression of adhesion molecules such as NCAD, EC-pericyte and
pericyte-ECM integrins and other adhesive proteins in Cldn14-WT, heterozygous and
null cells and in vivo may also help to illuminate the reason for limited pericyte
association in Cldn14-het tumours. Interestingly, pericytes in human skin were found to
secrete laminin and to compensate for differentiating cells that ceased to produce it
(Paquet-Fifield et al. 2009). This indicates that the basement membrane differences
around tumour blood vessels in Cldn14-het mice may not be a cause, but rather a result,
of decreased pericyte association (since endothelial cells and pericytes share the matrix
in between them).
4.2.4 Cldn14, the VEGF response and proliferation
In three systems (primary endothelial cells in vitro, aortic rings ex vivo and tumour
endotheial cells in vivo), I have found that heterozygosity for Cldn14 can increase
endothelial cell proliferation (Figure 4.23). While it is known that tight junctions can
- 184 -
regulate proliferation (Balda and Matter 2009, González-Mariscal et al. 2007), Cldn14
in particular has not yet been implicated in the process prior to this study. Experiments
that could address the mechanistic basis of this effect are discussed in section 4.3.
Despite increased tumour oxygenation and reduced hypoxia in tumours from Cldn14-
het mice, only a statistically insignificant trend in tumour cell proliferation was
observed, using Ki67 as a marker of cellular proliferation. However, a significantly
higher number of PECAM-positive endothelial cells were Ki67-positive in Cldn14-het
tumours compared to controls. In addition, in the ex vivo aortic ring assay, VEGF-
induced endothelial microvessel sprouting was significantly increased in Cldn14-het
aortic rings, compared to controls. This was found to correlate with an increase in
endothelial cell proliferation in Cldn14-het aortic ring explants, which could entirely
explain the increased microvessel sprout length and numbers. Further confirming the
effect of Cldn14-depletion on endothelial cell proliferation, Cldn14-heterozygous
primary mouse lung ECs grown in culture exhibited higher proliferation rates than
Cldn14-WT or Cldn14-null cells. This effect was seen regardless of whether VEGF was
present or not, though proliferation was significantly increased upon VEGF stimulation,
compared to PBS-only controls. This baseline increase in EC proliferation may be
related to in vitro culture; perhaps a specific reaction to the collagen/fibronectin tissue
culture surface as a result of changes to Cldn14-het EC adhesive properties.
The increase in aortic microvessel sprout number and length ex vivo may be particularly
related to the phalanx cells, which form more tight junctions than the proliferating stalk
and migrating tip cells (Warren and Iruela-Arispe 2010). Decreased TJ molecule
abundance in quiescent phalanx cells may promote a more proliferative stalk cell
phenotype, encourage nascent vessel sprouting and inhibit vessel maturation, which may
- 185 -
also be reflected in the tumour blood vessel phenotypes, including the loss of αSMA-
positive cell association. While increased proliferation could be the sole reason for
increased microvessel sprouting ex vivo in Cldn14-het aortic rings, there may be other
facets to this response. Monitoring VEGFR2 levels before and during VEGF stimulation
in primary ECs may provide insight into the increased VEGF responses seen in Cldn14-
herozygous cells and tissues.
Although we performed Dunn chamber chemotaxis assays, which again confirmed
increased proliferative capacity of Cldn14-het endothelial cells, the migratory results
were unlikely to be biologically significant given the very small differences observed.
In addition, daughter cells were tracked in the experiment; while advice was taken to
suspend tracking for dividing cells and resume when daughter cells appeared to have
separated and started moving independently, these data may have obscured real
differences between the genotypes, due to the changes in speed and directional
movement inherent in cytokinesis. It is also difficult to perform the Dunn Chamber assay
effectively with primary endothelial cells, since they do not react well to being seeded
sparsely, and were often dying before the experiment could be performed.
4.2.5 Cldn14 and other cell surface molecules
Considering the effect on VEGFR2 subcellular localisation in Tc1 cells, the VECAD
regulation of VEGFR2 internalisation, crosstalk between TJs and AJs, and the fact that
TJs are also regulated by endocytosis (Gavard and Gutkind 2008, Taddei et al. 2008), it
would be of interest to discover whether there are any effects of manipulating Cldn14
gene copy number on endocytic processes, which may also contribute to growth factor
sensitivity when Cldn14 gene dosage is altered. Since VECAD can increase the
- 186 -
expression of Cldn5 (Taddei et al. 2008), it is possible that Cldn14 could affect VECAD
function in the opposite direction (Figure 4.23).
To understand the effects of manipulating TJ molecules like Cldn14, challenging the
ideas of directional molecular effects may be required; it was thought that VEGFR2
regulated β3 integrin in a unidirectional manner, however it was later shown that β3
integrin could also regulate VEGFR2 (Reynolds et al. 2002, Robinson et al. 2009, Tsou
and Isik 2001). Similarly, while the binding of EGF to EGFR has been shown to affect
claudins (Singh and Harris 2004), could it be that manipulating claudins impacts on other
growth factor receptors, for example Cldn14 affecting VEGFR2 (as shown in Figure
4.23)? These questions and experiments addressing them could begin to unravel the
mechanism of Cldn14-heterozygosity affecting endothelial cell proliferation and
angiogenic processes more widely.
4.2.6 Cldn14 and tumour growth
Despite the changes to endothelial cell layer properties that I have reported in tumours
from Cldn14-het mice, no differences in tumour growth were observed in Cldn14-het or
Cldn14-null mice, compared to wild-type controls. While initially surprising, this may
reflect more of a difference in tumour “quality” (parameters such as metabolic and
stromal cell proportions) than the tumour’s ability to simply get bigger. It is now
accepted that overall tumour size alone, which does not account for tumour
heterogeneity, is not a sufficient measure of cancer progression, tumour grade or
treatment efficacy (Choi et al. 2007, Kenny et al. 2010, Wieder et al. 2005). The use of
PET scanning to assess tumour activity in terms of metabolism, in addition to MRI/CT
scanning to image the tumour bulk, has become more common in order to evaluate
whether treatments are benefiting the patient or not, in a shorter time scale than has been
- 187 -
possible previously. Tumour size may not vary significantly in these short intervals but
active mass may decrease visibly, indicating effective treatment. New technologies such
as Magnetic Resonance Spectroscopy (MRS) are being developed to monitor tumour
quality, the behaviour and metabolism of its inner microenvironment, as a result (Lodi
and Ronen 2011).
Alternatively, it may be that the duration of this tumour assay was not sufficient to reveal
differences in tumour size resulting from the changes to blood vessels caused by Cldn14
depletion. Longer term assays may in fact show a decreased rate of tumour growth, a
growth plateau or even regression in Cldn14-het and/or null mice. Unfortunately
restrictions on tumour size and limited animal numbers did not permit such experiments.
4.2.7 Cldn14 knockdown
Knockdown experiment results corroborate those from the genetic ablation experiments,
particularly differences between WT and Cldn14-het in terms of increased proliferation
upon Cldn14 depletion. One successful Western Blot analysis of Cldn14 knockdown
using a Sigma antibody is presented, but unfortunately could not be replicated for further
experiments, despite collection of protein and RNA in parallel for all proliferation,
TUNEL and aortic ring procedures. This means we cannot be sure of the efficiency of
knockdown in all cases, which is likely, for example, to differ between cell types within
the aortic ring explants. However, the replication of results from the genetic ablation
experiments suggests that knockdown – probably partial rather than to a high degree –
was occurring, since results between knockdown experiments were also repeatable.
Transient knockdown is also likely to identify changes that more closely mimic the
potential effects of targeting Cldn14 with drugs and thus provides some benefit over
genetic ablation studies where genetic or molecular compensation occurs.
- 188 -
4.2.8 Cldn14-heterozygous vs. Cldn14-null phenotypes
An intriguing aspect of the Cldn14 study is the near-exact recapitulation of Cldn14-WT
phenotypes in Cldn14-nulls; most results have shown a distinct phenotype in Cldn14-
het mice, in contrast to little to no effect in the Cldn14-nulls. This lack of angiogenic
phenotypes is assumed to be due to compensation, although one candidate, Cldn5, was
not found to be upregulated in kidney or brain at the transcript level. However, these are
both non-tumour contexts and the protein levels may differ in the tumour blood vessels
and further investigations would be required to clarify this point.
Cldn14 is unlikely to be fully compensated for in the heterozygous state, or entirely
absent, given the phenotypes observed that are significantly different from both the wild-
type and Cldn14-null mice. Manipulation of Cldn14 gene dosage did not appear to
impact upon Cldn5 expression, since no significant differences, at least at the transcript
level, were found between the genotypes.
It may be that other endothelial claudins such as Cldn12 redistribute in order to
counteract the absence of Cldn14, while this does not occur in the heterozygous state.
Importantly, the deletion is organism-wide and permanent. Other compensation
mechanisms have been noted in other knockout models, a particularly relevant example
being that of compensation for the loss of FAK in adult mouse ECs by the related kinase
Pyk2 (Weis et al. 2008). Compensation may also occur through non-related molecules.
For example, VEGFR2 compensates for the loss of β3 integrin in β3-null mice
(Reynolds et al. 2002). It is possible that Cldn14 deletion is compensated for by other
non-claudin family molecules. For example, VECAD is known to affect Cldn5
expression and VEGFR2 signalling, as indicated in Figure 4.23 (Carmeliet et al. 1999,
Taddei et al. 2008), so could VEGFR2 or VECAD be involved in compensating for
- 189 -
Cldn14 loss? Monitoring their expression and subcellular localisation in Cldn14-
heterozygous, wild-type and Cldn14-null cells could begin to answer this question.
The Cldn14-null mice are viable and show no distinctive phenotypes apart from their
characterised deafness, the onset of which occurs approximately 2-3 weeks after birth
and does not occur in Cldn14-het littermates (Ben-Yosef et al. 2003). These data suggest
that Cldn14 is not essential for survival. Inducible genetic ablation is sometimes
favoured over constitutive deletion, so that temporally controlled acute deletion can be
achieved when compensation for the deleted gene has not occurred during development,
and to avoid lethality due to deletion where this occurs.
Cre-lox systems could be employed to reveal different functions of Cldn14 from those
seen in total knockouts. Driving expression of the Cre recombinase with an endothelial
cell-specific promoter such as PDGFB or Tie-1 would allow the deletion of Cldn14 in
endothelial cells, which could dissect out endothelial-specific roles of Cldn14 from any
functions it performs in other cell types. Combining such strategies with an inducible
Cre system, for example the CreERT, which becomes functional upon treatment with
tamoxifen, would also allow temporal regulation of the deletion (Tavora et al. 2010). In
this case, Cldn14 targeting as a therapeutic strategy could be tested in a more relevant
fashion, using temporary gene deletion in the disease situation alone rather than from
birth.
4.2.9 Cldn14 in non-endothelial cell types
Considering the range of cell types involved in tumour growth, it is clear from our results
that Cldn14 expression levels can affect endothelial cell behaviour and EC interactions
in the tumour types tested, resulting in changes not to tumour size but tumour quality.
- 190 -
The malignant cells did not mediate these effects because an injectable model was used;
Cldn14 was not depleted in the tumour cells themselves, thus our studies have dissected
the requirement for Cldn14 within the stromal compartment. The use of spontaneous
tumour models would enable us to further investigate whether Cldn14 levels in the
cancer cells themselves, as well as in the stroma, also affect angiogenic processes. For
example: 1) the RIP-Tag pancreatic cancer model, in which expression of the simian
virus 40 (SV40) large-T antigen is driven by the rat insulin II promoter specific for
pancreatic β-cells, causing pancreatic adenomas (Hanahan 1985). 2) The APCMin colon
cancer model, in which mutation of the adenomatous polyposis coli gene causes multiple
intestinal neoplasia (Moser et al. 1990). 3) The MMTV-PyMT breast cancer model, in
which expression of the polyoma middle-T antigen is driven by the mouse mammary
tumour virus promoter, causing breast cancer-like disease (Guy et al. 1992). Considering
that the “claudin-low” breast cancer subtype (described in 1.8.4.1.1) is still being
characterised, use of the MMTV breast cancer model may be particularly informative.
The levels of many claudin family members are altered in human tumours, as
summarised in Table 1.2, so Cldn14 may well be an important player in the tumour cell
compartment.
Although not specific to endothelial cells, since epithelial cells from the host are not
components of the tumour stroma in the models that we have used, it is unlikely that
epithelial components significantly influenced the results in our Cldn14 knockout study
presented in this thesis.
An interesting consideration is the expansion of claudin protein roles beyond what is
currently known; specifically regarding their functions outside of cell adhesion and the
- 191 -
tight junctions. These questions are now being asked and, while little data have been
collected so far, it seems that wider roles for claudins may well exist.
It is not yet known whether Cldn14 in particular has any role in immune cell types, and
tumours do influence and attract other non-neoplastic cells including inflammatory cells
such as tumour-associated macrophages (TAMs) and leukocytes (Thurston et al. 2000,
Tlsty and Coussens 2006, Weinberg 2007). Interestingly, some reports of claudin
expression and function in immune cells are starting to emerge. Mandel et al. studied TJ
protein expression in circulating white blood cells from multiple sclerosis (MS) and type
1 diabetes patients, finding that expression of Cldn1 and Cldn5 increased in immune
cells from MS patients, with Cldn1 also elevated in diabetes patients’ cells (Mandel et
al. 2011). In MS, immune cells move through the BBB into the brain, which causes
inflammation. In addition, Van den Bossche et al. detected claudins 1, 2 and 11 in
alternative differentiation states of macrophages, with Cldn2 particularly associated with
TAMs in mice (Van den Bossche et al. 2012). JAMs are known to be important in
monocyte, lymphocyte and leukocyte transmigration through endothelial cell layers
(Imhof and Aurrand-Lions 2004, Johnson-Léger et al. 2002, Lamagna et al. 2005b), so
the expression of claudins by immune cells suggests they may be involved in immune
cell infiltration into tissues and the inflammatory response, which is now known to be a
central aspect of the tumour environment (Tlsty and Coussens 2006). Further to this,
decreased Cldn5 expression has been observed in the pulmonary (lung) endothelium and
the BBB during HIV infection in human and mouse (András et al. 2011, Li et al. 2012).
In the lung, this correlated with increased macrophage infiltration into the lungs.
These preliminary data, together with the work presented in this thesis, make it tempting
to speculate that reduction of Cldn14 levels in the tumour endothelium could stimulate
- 192 -
increased macrophage infiltration into the tumour stroma, and/or have effects on other
members of the immune cell compartment. To test this, macrophage recruitment could
be observed by staining for the macrophage marker FcγRII/III in tumour sections from
wild-type and Cldn14-depleted mice, and markers for other immune cell types could be
used in a similar fashion.
4.3 FUTURE PERSPECTIVE
In the tumour context, disruption of ZO-1 staining patterns in tumour blood vessels was
observed in Cldn14-heterozygous mice, suggesting that partial loss of Cldn14 may affect
the localisation of ZO-1 at tight junctions. Though not a direct measure of endothelial
TJ-mediated barrier integrity, further experiments could be performed to test this.
Firstly, transmission electron microscopy (TEM) can be carried out to view any TJ
disruption caused by the depletion of Cldn14. An informative further assessment of
barrier function in endothelial cell layers is the measurement of transendothelial
electrical resistance (TEER or TER), which could be performed in order to assess the
effect of Cldn14 gene depletion and knockdown on the barrier integrity of confluent
endothelial monolayers. The expression of Cldn14, along with that of Cldn5 and other
endothelial claudins, would ideally be monitored over time as the confluence of wild-
type, Cldn14-heterozygous and Cldn14-siRNA transfected cell cultures increased, since
Cldn5 expression increases with cell confluence (Osada et al. 2011). Unfortunately,
VECAD staining was not fully optimised and limited time meant that VECAD
expression and localisation in tumour blood vessels could not be analysed.
Disrupted tumour blood vessel basement membranes (specifically surrounding laminin
deposition) were also observed in Cldn14-heterozygous mice. This indicates that cross-
talk between Cldn14 and cell-matrix adhesion molecules may occur, since adhesion
- 193 -
molecules also conduct inside-out signalling that affects the ECM (Ginsberg et al. 1992).
Given the interactions of tight junctions with adherens junctions via occludin and
cytoplasmic proteins, and cross-talk with integrin signalling via JAMs, it would be
interesting to perform adhesion assays, to find out if Cldn14-depleted cells have altered
ECM adhesion properties.
The comparison of lumenated vs. non-lumenated vessels in the tumour sections hints
that there may be differences in blood vessel functionality between the Cldn14
genotypes. To confirm this more precisely and less subjectively, injections of FITC-
dextran of differing molecular weights could be performed to observe both vessel
perfusion in the tumours and the degree of leakage from vessels. It is also possible to
analyse vascular diameters, branch point numbers and vessel tortuosity with the
appropriate software. These data would give more information on the differences in
tumour vessel functionality in Cldn14-het tumours, compared to controls.
Given the disrupted BM and pericyte dissociation results, plating Cldn14-depleted cells
on various ECM substrates such as collagen, fibronectin, and vitronectin may indicate
other cell surface proteins involved in adhesion that are linked to Cldn14 function.
Further to adhesion studies, integrin profiling (for both ECs and pericytes) would reveal
any significant changes to integrin expression, such as β1 integrin, which is involved in
laminin and collagen binding.
In addition to testing the permeability and functionality of tumour blood vessels, it would
be informative to test normal blood vessels as well, for example using the Miles assay.
In this assay, intravenous injections of Evans Blue dye are followed by intradermal
injections of VEGF or PBS as a control. The leakage of dye into the skin tissue is then
- 194 -
quantified as a measure of VEGF-induced vascular permeability (Robinson et al. 2004).
Characterising the effects of Cldn14 dosage on vascular permeability outside of the
tumour would be helpful in assessing further both the function of Cldn14 in the normal
vasculature, and the suitability of TJ molecules such as Cldn14 as therapeutic targets.
As well as quantifying tumour hypoxia, the VEGF-dependent retinopathy of prematurity
(ROP) assay could be performed in further studies to study the effects of hypoxia on
bloosd vessel growth in non-tumour tissue (Aiello et al. 1995). In this assay, newborn
mice are exposed to hypoxic conditions for 5 days and then normal air for 5 days, which
stimulates the production of VEGF and neoangiogenesis in the retina. The development
and quality of the new hypoxia-induced vascular network can be visualised and assessed
in several ways; for example retinal vessels are ideal for close observation of tip cell
morphology, which has not yet been studied in the Cldn14 model. Vascular spread,
branchpoint frequency, vessel thickness and supporting cell association can also be
measured. This assay may reveal further effects of Cldn14 abundance on vascular
responses to hypoxia, through the analysis of normoxic and hypoxic retinal vasculature
(as in da Silva et al. 2010).
Further to ex vivo aortic ring assay studies of growth factor-induced angiogenesis, the in
vivo subcutaneous sponge assay for VEGF-induced neoangiogenesis would also be
appropriate to perform with the Cldn14 mice. Since we observed changes to VEGF-
stimulated responses ex vivo and in vitro, this assay could be used to test these responses
in vivo, free of the influences of tumour cells, which secrete multiple factors and recruit
immune cells and fibroblasts that also affect the tumour vasculature. It would also be
interesting to look at different pro-angiogenic growth factors, such as bFGF and PlGF,
to find out whether altered angiogenic responses in Cldn14-heterozygous animals are
- 195 -
most reliant on the VEGF signalling pathway or not. Such experiments would identify
the precise responses to individual growth factors in vivo when Cldn14 gene dosage is
varied.
As well as looking at how endothelial cells with differing Cldn14 gene dosage respond
to VEGF and adhere to the ECM, it would also be interesting to look more closely at
how they migrate. Rather than performing Dunn Chamber assays, it may be more
revealing to assess Rho/Rac small GTPase expression levels, activity, and localisation,
to assess possible effects of Cldn14 depletion on the actin cytoskeleton and cell motility,
given their involvement in linking both AJs and TJs to the cytoskeleton (Bazzoni and
Dejana 2004, Hartsock and Nelson 2008, Wallez and Huber 2008).
To understand the molecular regulation of proliferation by Cldn14, Western Blot
assessment of downstream signalling was attempted. Unfortunately, problems with
primary endothelial cell culture (including limited mouse numbers, contamination in the
tissue culture suite and of purchased reagents, all preps of one or more genotypes dying
before protein could be extracted and low protein yields) did not allow for analysis of
any blots probed. Interrogation of downstream signalling in the endothelial cells of
different genotypes was planned, by probing for molecules (and their phosophorylated
forms where appropriate) such as beta-catenin, VECAD, ERK and Akt. It was also
hoped that VEGFR2 levels could be monitored, but sufficient protein was not obtained
from primary cell cultures. For a more far-reaching analysis of the downstream effects
of Cldn14 gene dosage changes, protein arrays testing for the levels of many signalling
proteins at once can inform further research decisions.
- 196 -
In addition to analyses of downstream signalling in whole cell lysates, further
investigation could include the use of fractionation studies to assess the proportions of
proteins with nuclear localisation signals in the nucleus or cytoplasm upon VEGF
stimulation. For example, if the concentration of ZONAB were enhanced in the nuclear
fraction of Cldn14-heterozygous cells, this would indicate greater freedom to move from
the TJ to the nucleus and promote G1 to S phase transition.
To examine the impact of Cldn14 depletion on interactions between the molecules
known to influence proliferation, immunoprecipitation of ZONAB or Cdk4 and probing
for the opposite binding partner may indicate increased ZONAB/Cdk4 interaction,
further demonstrating a role for Cldn14 in sequestering ZONAB at the TJ and limiting
cellular proliferation. These experiments could be combined with immunofluorescence
in vitro and possibly in vivo, along with probing for other TJ molecules, to observe
effects of Cldn14 levels on their expression and localisation. In addition, Cldn14-WT,
Cldn14-het and Cldn14-null endothelial cells could be treated with propidium iodide to
measure DNA content and sorted with a flow cytometer to observe the proportions of
cells in different phases of the cell cycle. An increase in the number of Cldn14-het cells
in S phase compared to the other genotypes would further support a role for
ZONAB/Cdk4 in the regulation of EC proliferation by Cldn14.
4.3.1 Cldn14 and metastasis
Though beyond the scope of this study, these phenotypes may also have effects on
metastatic processes. The decreased integrity of the endothelial cell layer may create a
tumour environment more conducive to intravasation at primary tumour sites. This
hypothesis is supported by results seen in other models where cell-cell adhesion
molecule levels or function have been affected. In addition, pericyte coverage is known
- 197 -
to affect metastasis (Cooke et al. 2012, Xian et al. 2006). Considering the reduced
supporting cell coverage observed in heterozygous tumours, increased metastasis may
result. Additionally, the expression levels of claudins 1, 3 and 4 were found to correlate
with different metastatic potentials of ovarian and colon cancer (Agarwal et al. 2005,
Singh et al. 2010). Our in vivo lines of investigation have not yet considered the impact
of Cldn14 manipulation outside of the primary tumour site; therefore further work
should also examine metastasis in Cldn14-depleted mice. Considering the apparent
destabilisation of endothelial junctions, it is reasonable to postulate that tumour cell
intravasation into blood vessels at the primary site may be promoted. Also, since Cldn14
is not endothelial-specific, there may be effects on metastatic niches.
Experimental metastasis studies could be performed to find out which stages of
metastasis might be affected by changes to Cldn14 gene dosage. The ability of tumour
cells to “home in” on potential metastatic niches can be assessed by injecting tumour
cells and looking only a few hours later at tumour cell presence in metastatic sites, such
as the lung. Extravasation at the metastatic site could well be affected by alterations to
endothelial cell adhesion molecules; so increased metastases in Cldn14-het animals
might be expected. However, if loss of Cldn14 actually impairs the ability of tumour
cells to bind to the endothelium whilst circulating in the blood stream, even if
intravasation is increased, metastatic growth may remain unaffected.
4.3.2 Targeting Cldn14 and disease control
Our studies may have therapeutic implications in future when further research has
increased our understanding of claudin roles in cancer. We have shown that greater
effects can occur upon partial depletion of a cell-cell adhesion molecule than total
knockout of the gene, which is more relevant to the therapeutic situation where total
- 198 -
ablation is unlikely to be achieved. In addition, since mutations in Cldn14 causing
autosomal recessive deafness are known in humans, these findings may be of relevance
to such individuals, as it is possible they are more susceptible to angiogenic defects
(Wilcox et al. 2001).
It has been found that decreased pericyte coverage can increase sensitivity to Avastin,
the anti-VEGF-A antibody (Benjamin et al. 1999). Thus, the partial reduction of Cldn14
expression may sensitise tumour vasculature to Avastin 1.5.1.2 (Serve and Hellmann
1972). Conversely, VEGF is known to stimulate the delocalisation of occludin from
endothelial tight junctions and the VEGF inhibitor pegaptanib was found to return TJ
molecules to the plasma membrane, suggesting that anti-angiogenic therapies can also
influence endothelial cell-cell contacts in tumours (Bazzoni and Dejana 2004, Deissler
et al. 2011). If anti-VEGF therapy stimulates claudin presentation at the cell surface, this
may present an opportunity to utilise the Clostridium perfringens enterotoxin (CPE)
claudin extracellular loop binding capacity (shown in Figure 1.13 and 1.8.4.1.1) to
deliver cytotoxic therapy to endothelial cells, and prune back the tumour vasculature.
It is now accepted that combination therapy in cancer, particularly where anti-
angiogenics are concerned, is more likely to be effective than targeting one pathway or
molecule alone. Such strategies are designed to avoid compensation and the
development of resistance. Recently dual RTK inhibitors for VEGFR2 and PDGFR
targeting endothelial cells and pericytes respectively have been trialled, for example in
the particularly aggressive pancreatic neuroendocrine tumours (Delbaldo et al. 2012).
This combination doubled progression-free survival and showed that targeting the
tumour stroma can be an effective strategy. Thus, we speculate that a combination of
- 199 -
anti-adhesion molecule therapy with traditional anti-angiogenic drugs may serve to
improve delivery of cytotoxic therapy to the tumour bulk.
It may be that advances could permit the development of gene-specific targeting
constructs, which could target Cldn14 or other TJ molecules. If this could be achieved
in the tumour environment alone, oxygenation of the tumour could be increased,
stimulating tumour cell proliferation and possibly sensitising cells to chemotherapeutic
drugs and radiotherapy treatment (Bertout et al. 2008, Thomlinson 1977), although the
notion of enhancing angiogenesis to treat cancer is obviously controversial. This could
be tested in vivo, for example via the development of shRNA lentiviral vectors, and
injecting the virus into tumours to observe the effects on parameters such as blood vessel
functionality, tumour perfusion, hypoxia, tumour growth and metastasis. This
knockdown approach could also be combined with chemotherapy or targeted drugs
against pro-angiogenic molecules, to see if combination therapy conferred further anti-
tumour benefit.
Alternatively, lentiviral vectors could be used to overexpress Cldn14, if overexpression
were found to efficiently decrease endothelial cell proliferation and improve vessel
maturity by creating more robust cell-cell contacts. Some straightforward experiments
could be performed to find out if overexpression of Cldn14 would have the opposite
effect to Cldn14 deletion or depletion. For example, overexpression of Cldn14 in
pMLEC would be expected to decrease proliferation. In a longer-term study lentiviral
particles containing the Cldn14 expression construct (kindly provided by Hu et al.,
2006) could be created to infect aortic rings and also be injected into tumour sites so see
if endothelial cell proliferation and angiogenesis is decreased and, in the case of aortic
explants, if microvessel sprout number and length would be inhibited below wild-type
- 200 -

levels. Although these experiments were planned, time restrictions meant that they were
not performed.
- 201 -
CHAPTER 5 CONCLUDING REMARKS
My studies have focussed on how gene “dosage”, rather than a simple presence or
absence, can mediate effects in tumour angiogenesis. Indeed, many genes are regulated
by their level of expression and not a simple binary on/off mechanism. For example,
gene dosage effects have been observed for other molecules such as BMPER (bone
morphogenic protein endothelial cell-precursor-derived regulator) and crossveinless2
(the Drosophila ortholog of BMPER); this ECM protein has been found to be a dose-
dependent EC activator, which activates ERK signalling (Heinke et al. 2008, Serpe et
al. 2008). Using a combination of genetically manipulated mouse models, which have
changes in gene dosage, and injectable tumour models in which gene dosage levels are
unchanged in the tumour cells, we have dissected the effects of stromal gene dosage on
tumour angiogenesis and tumour growth.
We first used the Tc1 mouse model of Down’s syndrome with elevated gene dosage of
a large proportion of Hsa21 genes, and then a genetic ablation of claudin14 mouse model
in which gene dosage was reduced by half in heterozygous and completely absent in
nulls. Using both of these models we have discovered novel angiogenic regulators, and
concluded that increased gene dosage of some Hsa21 genes can affect pathological
angiogenesis, and therefore may contribute to the tumour protection phenotype observed
in the Down’s syndrome population. I have also shown that Cldn14 is involved in
angiogenesis in vivo, which was not previously known.
This study has demonstrated gene dosage effects of chromosome 21 genes on angiogenic
processes. Extra copies of human chromosome 21 genes in the stroma are sufficient to
decrease tumour size via the inhibition of angiogenesis. Furthermore, blocking
- 202 -

individual Hsa21 genes to restore the normal copy number and reduce gene dosage can
restore normal angiogenic responses.
This study also reveals novel functions for Claudin14, which has not been shown to be
involved in angiogenic processes in vivo previously. Depletion but not total ablation of
claudin14 alone, a chromosome 21 gene, increases small molecule delivery to tumour
cells, decreases hypoxia and supporting cell coverage, and affects endothelial cell
proliferation but not tumour size.
- 203 -

ACKNOWLEDGEMENTS
I dedicate this work to Sarah Jessica Bough, who tragically was denied the opportunity
to finish her own PhD, and she is greatly missed.
Cancer Research UK generously funded the majority of my project and Barts Cancer
Institute, including the director Prof. Nicholas Lemoine, kindly allowed me to work in
their laboratories.
I would like to thank my supervisors, Professor Kairbaan Hodivala-Dilke and
Professor Ian Hart, for giving me support and advice throughout my time in the
department, without which none of this would have been possible.
I would also like to thank the rest of our group: in particular Stephen Robinson for
both his professional and personal support during the most difficult times; Louise
Reynolds and Delphine Lees for imparting so much technical wisdom and lending
helping hands so often; Tanguy Lechertier for his ever-present friendship; and all
members of our lab, past and present (Sílvia Batista, Bernardo Tavora, Annika
Alexopoulou, Isabelle Fernandez, Dylan Jones, Rita Silva, Mitchel Germaine, Andrew
Reynolds and Antoine Ramjaun), and the rest of Tumour Biology, for their help and
kindness over the last four years.
The hard work of Garry Saunders, Julie Holdsworth, Bruce Williams, Hagen Schmidt,
Julie Andow, Colin Wren, Colin Pegrum and all of the animal unit staff in their
dedicated animal husbandry work is greatly appreciated.
Thanks to Victor Tybulewicz and Elizabeth Fisher for setting up the Tc1 collaboration
and to Amy Slender, Eva Elola and Frances Wiseman for their assistance. For giving
up some time to help with technical issues, thanks to James Moffatt and C. Headley.
I am grateful to my parents and all of my friends, particularly Martin Robbins and
Jessica Brown, for their continued encouragement and support.
- 204 -
CHAPTER 6 REFERENCES
Abraham S, Kogata N, Fassler R, Adams RH. Integrin beta1 subunit controls mural cell adhesion, spreading, and blood vessel wall stability. Circ Res. 2008. 102(5):562-570.
Adams RH, Alitalo K. Molecular regulation of angiogenesis and lymphangiogenesis. Nat Rev Mol Cell Biol. 2007. 8(6):464-478.
Agarwal R, D'Souza T, Morin PJ. Claudin-3 and Claudin-4 Expression in Ovarian Epithelial Cells Enhances Invasion and Is Associated with Increased Matrix Metalloproteinase-2 Activity. Cancer Res. 2005. 65(16):7378-7385.
Agarwal R, Mori Y, Cheng Y, Jin Z, Olaru AV, Hamilton JP, et al. Silencing of Claudin-11 Is Associated with Increased Invasiveness of Gastric Cancer Cells. PLoS ONE. 2009. 4(11):e8002.
Aiello LP, Pierce EA, Foley ED, Takagi H, Chen H, Riddle L, et al. Suppression of retinal neovascularization in vivo by inhibition of vascular endothelial growth factor (VEGF) using soluble VEGF-receptor chimeric proteins. PNAS 1995. 92(23):10457-10461.
Alberts B, Johnson A, Lewis J, Raff M, Roberts K, Walter P. Molecular Biology of the Cell. 4 ed. New York: Garland Science; 2002.
Andrade SP, Fan TP, Lewis GP. Quantitative in-vivo studies on angiogenesis in a rat sponge model. Br J Exp Pathol. 1987. 68(6):755-766.
András IE, Toborek M, Turksen K. HIV-1-Induced Alterations of Claudin-5 Expression at the Blood–Brain Barrier Level. Methods Mol Biol. 2011. (762):355-370.
Arcangeli M-L, Frontera V, Bardin F, Obrados E, Adams S, Chabannon C, et al. JAM-B regulates maintenance of hematopoietic stem cells in the bone marrow. Blood. 2011. 118(17):4609-4619.
Arican ST, Incesulu A, Inceoglu B, Tekin M. Alterations in the GJB3 and CLDN14 genes in families with nonsyndromic sensorineural hearing loss. Genet Couns. 2005. 16(3):309-311.
Armulik A, Abramsson A, Betsholtz C. Endothelial/Pericyte Interactions. Circ Res. 2005. 97(6):512-523. Aurrand-Lions M, Johnson-Leger C, Wong C, Du Pasquier L, Imhof BA. Heterogeneity of endothelial
junctions is reflected by differential expression and specific subcellular localization of the three JAM family members. Blood. 2001. 98(13):3699-3707.
Aurrand-Lions M, Johnson-Leger C, Lamagna C, Ozaki H, Kita T, Imhof BA. Junctional Adhesion Molecules and Interendothelial Junctions. Cells Tissues Organs. 2002. 172(3):152-160.
Baek KH, Zaslavsky A, Lynch RC, Britt C, Okada Y, Siarey RJ, et al. Down's syndrome suppression of tumour growth and the role of the calcineurin inhibitor DSCR1. Nature. 2009. 459(7250):1126-1130.
Baker M, Robinson SD, Lechertier T, Barber PR, Tavora B, D'Amico G, et al. Use of the mouse aortic ring assay to study angiogenesis. Nat Protocols. 2012. 7(1):89-104.
Balda MS, Matter K. Transmembrane proteins of tight junctions. Semin Cell Dev Biol. 2000. 11(4):281-289.
Balda MS, Matter K. Tight junctions and the regulation of gene expression. Biochim Biophys Acta. 2009. 1788(4):761-767.
Bashir R, Fatima A, Naz S. Mutations in CLDN14 are associated with different hearing thresholds. J Hum Genet. 2010. 55(11):767-770.
Bazzoni G. The JAM family of junctional adhesion molecules. Curr Opin Cell Biol. 2003. 15(5):525-530. Bazzoni G, Dejana E. Endothelial Cell-to-Cell Junctions: Molecular Organization and Role in Vascular
Homeostasis. Physiol Rev. 2004. 84(3):869-901. Belguith H, Tlili A, Dhouib H, Ben Rebeh I, Lahmar I, Charfeddine I, et al. Mutation in gap and tight
junctions in patients with non-syndromic hearing loss. Biochem Biophys Res Commun. 2009. 385(1):1-5. Ben-Yosef T, Belyantseva IA, Saunders TL, Hughes ED, Kawamoto K, Van Itallie CM, et al. Claudin 14
knockout mice, a model for autosomal recessive deafness DFNB29, are deaf due to cochlear hair cell degeneration. Hum Mol Genet. 2003. 12(16):2049-2061.
Benjamin LE, Golijanin D, Itin A, Pode D, Keshet E. Selective ablation of immature blood vessels in established human tumors follows vascular endothelial growth factor withdrawal. J Clin Invest. 1999. 103(2):159-165.
Bergers G, Benjamin LE. Tumorigenesis and the angiogenic switch. Nat Rev Cancer. 2003. 3(6):401-410.
- 205 -

Bergers G, Song S. The role of pericytes in blood-vessel formation and maintenance. Neuro-Oncology. 2005. 7(4):452-464.
Bertout JA, Patel SA, Simon MC. The impact of O2 availability on human cancer. Nat Rev Cancer. 2008. 8(12):967-975.
Bienz M. β-Catenin: A Pivot between Cell Adhesion and Wnt Signalling. Curr Biol. 2005. 15(2):64-67. Birdsey GM, Dryden NH, Amsellem V, Gebhardt F, Sahnan K, Haskard DO, et al. Transcription factor Erg
regulates angiogenesis and endothelial apoptosis through VE-cadherin. Blood. 2008. 111(7):3498-3506. Bondjers C, Kalen M, Hellstrom M, Scheidl SJ, Abramsson A, Renner O, et al. Transcription profiling of
platelet-derived growth factor-B-deficient mouse embryos identifies RGS5 as a novel marker for pericytes and vascular smooth muscle cells. Am J Patholol. 2003. 162(3):721-729.
Böttcher RT, Niehrs C. Fibroblast Growth Factor Signaling during Early Vertebrate Development. Endocr Rev. 2005. 26(1):63-77.
Bouzin C, Feron O. Targeting tumor stroma and exploiting mature tumor vasculature to improve anti-cancer drug delivery. Drug Resistance Updates. 2007. 10(3):109-120.
Braga VMM, Del Maschio A, Machesky L, Dejana E. Regulation of Cadherin Function by Rho and Rac: Modulation by Junction Maturation and Cellular Context. Mol Biol Cell. 1999. 10(1):9-22.
Braga VMM. Cell-cell adhesion and signalling. Curr Opin Cell Biol. 2002. 14(5):546-556. Branco-Price C, Zhang N, Schnelle M, Evans C, Katschinski DM, Liao D, et al. Endothelial Cell HIF-1α
and HIF-2α Differentially Regulate Metastatic Success. Cancer cell. 2012. 21(1):52-65. Brockton NT, Klimowicz AC, Bose P, Petrillo SK, Konno M, Rudmik L, et al. High stromal carbonic
anhydrase IX expression is associated with nodal metastasis and decreased survival in patients with surgically-treated oral cavity squamous cell carcinoma. Oral Oncol. 2012. (0).
Brown RC, Morris AP, O'Neil RG. Tight junction protein expression and barrier properties of immortalized mouse brain microvessel endothelial cells. Brain Res. 2007. 1130(0):17-30.
Burks J, Agazie YM. Modulation of α-catenin Tyr phosphorylation by SHP2 positively effects cell transformation induced by the constitutively active FGFR3. Oncogene. 2006 25(54):7166-7179
Cailleteau L, Estrach S, Thyss R, Boyer L, Doye A, Domange B, et al. α2β1 integrin controls association of Rac with the membrane and triggers quiescence of endothelial cells. J Cell Sci. 2010. 123(14):2491-2501.
Carlson TR, Feng Y, Maisonpierre PC, Mrksich M, Morla AO. Direct cell adhesion to the angiopoietins mediated by integrins. J Biol Chem. 2001. 276(28):26516-26525.
Carmeliet P, Lampugnani MG, Moons L, Breviario F, Compernolle V, Bono F, et al. Targeted deficiency or cytosolic truncation of the VE-cadherin gene in mice impairs VEGF-mediated endothelial survival and angiogenesis. Cell. 1999. 98(2):147-157.
Carmeliet P, Jain RK. Angiogenesis in cancer and other diseases. Nature. 2000. 407(6801):249-257. Carmeliet P. Angiogenesis in health and disease. Nat Med. 2003. 9(6):653-660. Carmeliet P. VEGF as a key mediator of angiogenesis in cancer. Oncology. 2005. 69 Suppl 3:4-10. Carmeliet P, Jain RK. Principles and mechanisms of vessel normalization for cancer and other angiogenic
diseases. Nat Rev Drug Discov. 2011. 10(6):417-427. Chantrain CF, Henriet P, Jodele S, Emonard H, Feron O, Courtoy PJ et al. Mechanisms of pericyte
recruitment in tumour angiogenesis: A new role for metalloproteinases. Eur J Cancer. 2006. 42:310-318 Chen HX, Cleck JN. Adverse effects of anticancer agents that target the VEGF pathway. Nat Rev Clin
Oncol. 2009. 6(8):465-477. Cheresh DA. Death to a blood vessel, death to a tumor. Nat Med. 1998. 4(4):395-396. Chien W, Pei L. A Novel Binding Factor Facilitates Nuclear Translocation and Transcriptional Activation
Function of the Pituitary Tumor-transforming Gene Product. J Biol Chem. 2000. 275(25):19422-19427. Choi H, Charnsangavej C, Faria SC, Macapinlac HA, Burgess MA, Patel SR, et al. Correlation of Computed
Tomography and Positron Emission Tomography in Patients With Metastatic Gastrointestinal Stromal Tumor Treated at a Single Institution With Imatinib Mesylate: Proposal of New Computed Tomography Response Criteria. J Clin Oncol. 2007. 25(13):1753-1759.
Chouaib S, Messai Y, Couve S, Escudier B, Hasmim M, Noman MZ. Hypoxia promotes tumor growth in linking angiogenesis to immune escape. Front Immunol. 2012. 3(21):1-10.
- 206 -
Christofori G. Changing neighbours, changing behaviour: cell adhesion molecule-mediated signalling during tumour progression. EMBO J. 2003. 22(10):2318-2323.
Comper F, Antonello D, Beghelli S, Gobbo S, Montagna L, Pederzoli P, et al. Expression pattern of claudins 5 and 7 distinguishes solid-pseudopapillary from pancreatoblastoma, acinar cell and endocrine tumors of the pancreas. Am J Surg Pathol. 2009. 33(5):768-774.
Cooke VG, LeBleu VS, Keskin D, Khan Z, O'Connell JT, Teng Y, et al. Pericyte Depletion Results in Hypoxia-Associated Epithelial-to-Mesenchymal Transition and Metastasis Mediated by Met Signaling Pathway. Cancer cell. 2012. 21(1):66-81.
Corada M, Zanetta L, Orsenigo F, Breviario F, Lampugnani MG, Bernasconi S, et al. A monoclonal antibody to vascular endothelial-cadherin inhibits tumor angiogenesis without side effects on endothelial permeability. Blood. 2002. 100(3):905-911.
da Silva RG, Tavora B, Robinson SD, Reynolds LE, Szekeres C, Lamar J, et al. Endothelial α3β1-Integrin Represses Pathological Angiogenesis and Sustains Endothelial-VEGF. Am J Pathol. 2010. 177(3):1534-1548.
Dailey L, Ambrosetti D, Mansukhani A, Basilico C. Mechanisms underlying differential responses to FGF signaling. Cytokine & Growth F R. 2005. 16(2):233-247.
De Benedetto A, Rafaels NM, McGirt LY, Ivanov AI, Georas SN, Cheadle C, et al. Tight junction defects in patients with atopic dermatitis. J Allergy Clin Immun. 2011. 127(3):773-786.e777.
Deissler HL, Deissler H, Lang GE. Inhibition of vascular endothelial growth factor (VEGF) is sufficient to completely restore barrier malfunction induced by growth factors in microvascular retinal endothelial cells. Br J Ophthalmol. 2011. 95(8):1151-1156.
Dejana E, Lampugnani MG, Martinez-Estrada O, Bazzoni G. The molecular organization of endothelial junctions and their functional role in vascular morphogenesis and permeability. Int J Dev Biol. 2000. 44(6):743-748.
Dejana E. Endothelial cell-cell junctions: happy together. Nat Rev Mol Cell Biol. 2004. 5(4):261-270. Dejana E, Orsenigo F, Lampugnani MG. The role of adherens junctions and VE-cadherin in the control of
vascular permeability. J Cell Sci. 2008. 121(13):2115-2122. Delbaldo C, Faivre S, Dreyer C, Raymond E. Sunitinib in advanced pancreatic neuroendocrine tumors:
latest evidence and clinical potential. Therapeutic Advances in Medical Oncology. 2012. 4(1):9-18. Delom F, Burt E, Hoischen A, Veltman J, Groet J, Cotter F, et al. Transchromosomic cell model of Down
syndrome shows aberrant migration, adhesion and proteome response to extracellular matrix. Proteome Science. 2009. 7(1):31.
Dörfel MJ, Huber O. Modulation of tight junction structure and function by kinases and phosphatases targeting occludin. J Biomed Biotechnol. 2012. 2012(807356):1-14.
Drees F, Pokutta S, Yamada S, Nelson WJ, Weis WI. α-Catenin Is a Molecular Switch that Binds E-Cadherin-β-Catenin and Regulates Actin-Filament Assembly. Cell. 2005. 123(5):903-915.
Dudley AC. Tumor endothelial cells. Cold Spring Harb Perspect Med. 2012. 2(3):1-18. Ebnet K, Aurrand-Lions M, Kuhn A, Kiefer F, Butz S, Zander K, et al. The junctional adhesion molecule
(JAM) family members JAM-2 and JAM-3 associate with the cell polarity protein PAR-3: a possible role for JAMs in endothelial cell polarity. J Cell Sci. 2003. 116(19):3879-3891.
Elias BC, Suzuki T, Seth A, Giorgianni F, Kale G, Shen L, et al. Phosphorylation of Tyr-398 and Tyr-402 in Occludin Prevents Its Interaction with ZO-1 and Destabilizes Its Assembly at the Tight Junctions. J Biol Chem. 2009. 284(3):1559-1569.
Eliceiri BP, Cheresh DA. The role of alphav integrins during angiogenesis: insights into potential mechanisms of action and clinical development. J Clin Invest. 1999. 103(9):1227-1230.
Ellis L, Hammers H, Pili R. Targeting tumor angiogenesis with histone deacetylase inhibitors. Cancer letters. 2009. 280(2):145-153.
Eming SA, Hubbell JA. Extracellular matrix in angiogenesis: dynamic structures with translational potential. Exp Dermatol. 2011. 20(7):605-613.
Eppenberger M, Zlobec I, Baumhoer D, Terracciano L, Lugli A. Role of the VEGF ligand to receptor ratio in the progression of mismatch repair-proficient colorectal cancer. BMC Cancer. 2010. 10(1):93.
Eroles P, Bosch A, Alejandro Pérez-Fidalgo J, Lluch A. Molecular biology in breast cancer: Intrinsic subtypes and signaling pathways. Cancer Treat Rev. 2012. 38(6):698-707.
- 207 -
Escudero-Esparza A, Jiang W, Martin T. Claudin-5 is involved in breast cancer cell motility through the N-WASP and ROCK signalling pathways. J Exp Clin Cancer Res 2012. 31(1):43.
Ewan LC, Jopling HM, Jia H, Mittar S, Bagherzadeh A, Howell GJ, et al. Intrinsic Tyrosine Kinase Activity is Required for Vascular Endothelial Growth Factor Receptor 2 Ubiquitination, Sorting and Degradation in Endothelial Cells. Traffic. 2006. 7(9):1270-1282.
Felcht M, Luck R, Schering A, Seidel P, Srivastava K, Hu J, et al. Angiopoietin-2 differentially regulates angiogenesis through TIE2 and integrin signaling. J Clin Invest. 2012. 122(6):1991-2005.
Feldmeyer L, Huber M, Fellmann F, Beckmann JS, Frenk E, Hohl D. Confirmation of the origin of NISCH syndrome. Hum Mutat. 2006. 27(5):408-410.
Ferlay J, Shin H-R, Bray F, Forman D, Mathers C, Parkin DM. Estimates of worldwide burden of cancer in 2008: GLOBOCAN 2008. Int J Cancer. 2010. 127(12):2893-2917.
Ferrara N, Carver-Moore K, Chen H, Dowd M, Lu L, O'Shea KS, et al. Heterozygous embryonic lethality induced by targeted inactivation of the VEGF gene. Nature. 1996. 380(6573):439-442.
Ferrara N, Gerber H, LeCouter J. The biology of VEGF and its receptors. Nat Med. 2003. 9(6):669-676. Fidler IJ, Ellis LM. The implications of angiogenesis for the biology and therapy of cancer metastasis. Cell.
1994. 79(2):185-188. Fontijn RD, Rohlena J, van Marle J, Pannekoek H, Horrevoets AJG. Limited contribution of claudin-5-
dependent tight junction strands to endothelial barrier function. Eur J Cell Biol. 2006. 85(11):1131-1144. Furuse M, Hirase T, Itoh M, Nagafuchi A, Yonemura S, Tsukita S. Occludin: a novel integral membrane
protein localizing at tight junctions. J Cell Biol. 1993. 123(6):1777-1788. Furuse M, Hata M, Furuse K, Yoshida Y, Haratake A, Sugitani Y, et al. Claudin-based tight junctions are
crucial for the mammalian epidermal barrier. J Cell Biol. 2002. 156(6):1099-1111. Gale NW, Yancopoulos GD. Growth factors acting via endothelial cell-specific receptor tyrosine kinases:
VEGFs, Angiopoietins, and ephrins in vascular development. Gene Dev. 1999. 13(9):1055-1066. Gavard J, Gutkind JS. VE-cadherin and claudin-5: it takes two to tango. Nat Cell Biol. 2008. 10(8):883-
885. Geiger B, Bershadsky A. Assembly and mechanosensory function of focal contacts. Curr Opin Cell Biol.
2001. 13(5):584-592. Gerhardt H. VEGF and endothelial guidance in angiogenic sprouting. Oncogene. 2008. 4(4):241-246 Gerhardt H, Bersholtz C. Endothelial-pericyte interactions in angiogenesis. Cell Tissue Res. 2003. 314:15-
23 Gerhardt H, Golding M, Fruttiger M, Ruhrberg C, Lundkvist A, Abramsson A, et al. VEGF guides
angiogenic sprouting utilizing endothelial tip cell filopodia. J Cell Biol. 2003. 161(6):1163-1177. Germain M, De Arcangelis A, Robinson SD, Baker M, Tavora B, D'Amico G, et al. Genetic ablation of the
alpha 6-integrin subunit in Tie1Cre mice enhances tumour angiogenesis. J Pathol. 2009. 220(3):370-381. Ghassemifar R, Lai C-M, Rakoczy P. VEGF differentially regulates transcription and translation of ZO-
1α+ and ZO-1α− and mediates trans-epithelial resistance in cultured endothelial and epithelial cells. Cell Tissue Res. 2006. 323(1):117-125.
Giancotti FG, Ruoslahti E. Integrin signaling. Science. 1999. 285(5430):1028-1032. Ginsberg MH, Du X, Plow EF. Inside-out integrin signalling. Curr Opin Cell Biol. 1992. 4(5):766-771. Ginsberg MH, Partridge A, Shattil SJ. Integrin regulation. Curr Opin Cell Biol. 2005. 17(5):509-516. Glienke J, Schmitt AO, Pilarsky C, Hinzmann B, Weiss B, Rosenthal A, et al. Differential gene expression
by endothelial cells in distinct angiogenic states. Eur J Biochem. 2000. 267(9):2820-2830. Gong Y, Renigunta V, Himmerkus N, Zhang J, Renigunta A, Bleich M, et al. Claudin-14 regulates renal
Ca++ transport in response to CaSR signalling via a novel microRNA pathway. EMBO J. 2012. 31(8):1999-2012.
Gonzalez-Mariscal L, Tapia R, Chamorro D. Crosstalk of tight junction components with signaling pathways. Biochim Biophys Acta. 2008. 1778(3):729-756.
González-Mariscal L, Betanzos A, Ávila-Flores A. MAGUK proteins: structure and role in the tight junction. Semin Cell Dev Biol. 2000. 11(4):315-324.
González-Mariscal L, Betanzos A, Nava P, Jaramillo BE. Tight junction proteins. Prog Biophys Mol Bio. 2003. 81(1):1-44.
- 208 -
González-Mariscal L, Lechuga S, Garay E. Role of tight junctions in cell proliferation and cancer. Prog Histochem Cytoc. 2007. 42(1):1-57.
Gory-Faure S, Prandini MH, Pointu H, Roullot V, Pignot-Paintrand I, Vernet M, et al. Role of vascular endothelial-cadherin in vascular morphogenesis. Development. 1999. 126(10):2093-2102.
Gotink K, Verheul H. Anti-angiogenic tyrosine kinase inhibitors: what is their mechanism of action? Angiogenesis. 2010. 13(1):1-14.
Gow A, Davies C, Southwood CM, Frolenkov G, Chrustowski M, Ng L, et al. Deafness in Claudin 11-Null Mice Reveals the Critical Contribution of Basal Cell Tight Junctions to Stria Vascularis Function. J Neurosci. 2004. 24(32):7051-7062.
Gumbiner BM. Regulation of cadherin-mediated adhesion in morphogenesis. Nat Rev Mol Cell Biol. 2005. 6(8):622-634.
Gupta K, Kshirsagar S, Li W, Gui L, Ramakrishnan S, Gupta P, et al. VEGF prevents apoptosis of human microvascular endothelial cells via opposing effects on MAPK/ERK and SAPK/JNK signaling. Exp Cell Res. 1999. 247(2):495-504.
Gutheil JC, Campbell TN, Pierce PR, Watkins JD, Huse WD, Bodkin DJ, et al. Targeted antiangiogenic therapy for cancer using Vitaxin: a humanized monoclonal antibody to the integrin alphavbeta3. Clin Cancer Res. 2000. 6(8):3056-3061.
Guy CT, Cardiff RD, Muller WJ. Induction of mammary tumors by expression of polyomavirus middle T oncogene: a transgenic mouse model for metastatic disease. Mol Cell Biol. 1992. 12(3):954-961.
Hall AP. Review of the Pericyte during Angiogenesis and its Role in Cancer and Diabetic Retinopathy. Toxicol Pathol. 2006. 34(6):763-775.
Hamazaki Y, Itoh M, Sasaki H, Furuse M, Tsukita S. Multi-PDZ Domain Protein 1 (MUPP1) Is Concentrated at Tight Junctions through Its Possible Interaction with Claudin-1 and Junctional Adhesion Molecule. J Biol Chem. 2002. 277(1):455-461.
Hampson G, Konrad M, Scoble J. Familial hypomagnesaemia with hypercalciuria and nephrocalcinosis (FHHNC): Compound heterozygous mutation in the claudin 16 (CLDN16) gene. BMC Nephrology. 2008. 9(1):12.
Hanahan D. Heritable formation of pancreatic beta-cell tumours in transgenic mice expressing recombinant insulin/simian virus 40 oncogenes. Nature. 1985. 315(6015):115-122.
Hanahan D. Signaling vascular morphogenesis and maintenance. Science. 1997. 277(5322):48-50. Hanahan D, Weinberg RA. The hallmarks of cancer. Cell. 2000. 100(1):57-70. Hanahan D, Weinberg RA. Hallmarks of cancer: the next generation. Cell. 2011. 144(5):646-674. Harris C, Ermak G, Davies K. Multiple roles of the DSCR1 (Adapt78 or RCAN1) gene and its protein
product Calcipressin 1 (or RCAN1) in disease. Cell Mol Life Sci. 2005. 62(21):2477-2486. Hartsock A, Nelson WJ. Adherens and tight junctions: structure, function and connections to the actin
cytoskeleton. Biochim Biophys Acta. 2008. 1778(3):660-669. Hasle H. Pattern of malignant disorders in individuals with Down's syndrome. Lancet Oncol. 2001.
2(7):429-436. Hasle H, Clemmensen IH, Mikkelsen M. Risks of leukaemia and solid tumours in individuals with Down's
syndrome. Lancet. 2000. 355(9199):165-169 Heinke J, Wehofsits L, Zhou Q, Zoeller C, Baar K-M, Helbing T, et al. BMPER Is an Endothelial Cell
Regulator and Controls Bone Morphogenetic Protein-4 Dependent Angiogenesis. Circ Res. 2008. 103(8):804-812.
Hesser BA, Liang XH, Camenisch G, Yang S, Lewin DA, Scheller R, et al. Down syndrome critical region protein 1 (DSCR1), a novel VEGF target gene that regulates expression of inflammatory markers on activated endothelial cells. Blood. 2004. 104(1):149-158.
Hewitt KJ, Agarwal R, Morin PJ. The claudin gene family: expression in normal and neoplastic tissues. BMC Cancer. 2006. 6(186):1-8.
Hirase T, Staddon JM, Saitou M, Ando-Akatsuka Y, Itoh M, Furuse M, et al. Occludin as a possible determinant of tight junction permeability in endothelial cells. J Cell Sci. 1997. 110(14):1603-1613.
Hodivala-Dilke KM, McHugh KP, Tsakiris DA, Rayburn H, Crowley D, Ullman-Cullere M, et al. Beta3-integrin-deficient mice are a model for Glanzmann thrombasthenia showing placental defects and reduced survival. J Clin Invest. 1999. 103(2):229-238.
- 209 -
Homsi J, Daud AI. Spectrum of activity and mechanism of action of VEGF/PDGF inhibitors. Cancer Control. 2007. 14(3):285-294.
Horowitz A, Seerapu HR. Regulation of VEGF signaling by membrane traffic. Cell Signal. 2012. (Epub ahead of print).
Hu. Incidences of micro-deletion/duplication 22q11.2 detected by multiplex ligation-dependent probe amplification in patients with congenital cardiac disease who are scheduled for cardiac surgery. Cardiol Young. 2009. 19(2):179-184.
Hu Y, Warnatz HJ, Vanhecke D, Wagner F, Fiebitz A, Thamm S, et al. Cell array-based intracellular localization screening reveals novel functional features of human chromosome 21 proteins. BMC Genomics. 2006. 7:155.
Hu Y, Lehrach H, Janitz M. Apoptosis screening of human chromosome 21 proteins reveals novel cell death regulators. Mol Biol Rep. 2010. 37(7):3381-3387.
Iizuka M, Abe M, Shiiba K, Sasaki I, Sato Y. Down Syndrome Candidate Region 1,a Downstream Target of VEGF, Participa tes in Endothelial Cell Migration and Angiogenesis. J Vasc Res. 2004. 41(4):334-344.
Imhof BA, Aurrand-Lions M. Adhesion mechanisms regulating the migration of monocytes. Nat Rev Immunol. 2004. 4(6):432-444.
Iruela-Arispe ML, Luque A, Lee N. Thrombospondin modules and angiogenesis. Int J Biochem Cell Biol. 2004. 36(6):1070-1078.
Ito T-K, Ishii G, Chiba H, Ochiai A. The VEGF angiogenic switch of fibroblasts is regulated by MMP-7 from cancer cells. Oncogene. 2007. 26(51):7194-7203
Jackson DE. The unfolding tale of PECAM-1. FEBS letters. 2003. 540(1):7-14. Jain RK. Molecular regulation of vessel maturation. Nat Med. 2003. 9(6):685-693. Jain S, Suzuki T, Seth A, Samak G, Rao R. Protein kinase Cζ phosphorylates occludin and promotes
assembly of epithelial tight junctions. Biochem J. 2011. 437:289-299. Johnson-Léger CA, Aurrand-Lions M, Beltraminelli N, Fasel N, Imhof BA. Junctional adhesion molecule-
2 (JAM-2) promotes lymphocyte transendothelial migration. Blood. 2002. 100(7):2479-2486. Jones N, Iljin K, Dumont DJ, Alitalo K. Tie receptors: new modulators of angiogenic and lymphangiogenic
responses. Nat Rev Mol Cell Biol. 2001. 2(4):257-267. Jung JH, Jung CK, Choi HJ, Jun KH, Yoo J, Kang SJ, et al. Diagnostic utility of expression of claudins in
non-small cell lung cancer: Different expression profiles in squamous cell carcinomas and adenocarcinomas. Pathol Res Pract. 2009. 205(6):409-416.
Kahlem P, Sultan M, Herwig R, Steinfath M, Balzereit D, Eppens B, et al. Transcript Level Alterations Reflect Gene Dosage Effects Across Multiple Tissues in a Mouse Model of Down Syndrome. Genome Res. 2004. 14(7):1258-1267.
Karsan A, Yee E, Poirier GG, Zhou P, Craig R, Harlan JM. Fibroblast growth factor-2 inhibits endothelial cell apoptosis by Bcl-2-dependent and independent mechanisms. Am J Pathol. 1997. 151(6):1775-1784.
Katsuno T, Umeda K, Matsui T, Hata M, Tamura A, Itoh M, et al. Deficiency of Zonula Occludens-1 Causes Embryonic Lethal Phenotype Associated with Defected Yolk Sac Angiogenesis and Apoptosis of Embryonic Cells. Mol Biol Cell. 2008. 19(6):2465-2475.
Keck P, Hauser S, Krivi G, Sanzo K, Warren T, Feder J, et al. Vascular permeability factor, an endothelial cell mitogen related to PDGF. Science. 1989. 246(4935):1309-1312.
Kenny LM, Contractor KB, Hinz R, Stebbing J, Palmieri C, Jiang J, et al. Reproducibility of [11C]Choline-Positron Emission Tomography and Effect of Trastuzumab. Clin Cancer Res. 2010. 16(16):4236-4245.
King SJ, Worth DC, Scales TME, Monypenny J, Jones GE, Parsons M. β1 integrins regulate fibroblast chemotaxis through control of N-WASP stability. EMBO J. 2011. 30(9):1705-1718.
Kirk A, Campbell S, Bass P, Mason J, Collins J. Differential expression of claudin tight junction proteins in the human cortical nephron. Nephrol Dial Transplant. 2010. 25(7):2107-2119.
Köhler K, Zahraoui A. Tight junction: a co-ordinator of cell signalling and membrane trafficking. Biol Cell. 2005. 97(8):659-665.
Konerding MA, Malkusch W, Klapthor B, Ackern Cv, Fait E, Hill SA, et al. Evidence for characteristic vascular patterns in solid tumours: quantitative studies using corrosion casts. Br J Cancer. 1999. 80(5-6):724-732.
- 210 -
Koto T, Takubo K, Ishida S, Shinoda H, Inoue M, Tsubota K, et al. Hypoxia Disrupts the Barrier Function of Neural Blood Vessels through Changes in the Expression of Claudin-5 in Endothelial Cells. Am J Path. 2007. 170(4):1389-1397.
Kowanetz M, Ferrara N. Vascular endothelial growth factor signaling pathways: therapeutic perspective. Clin Cancer Res. 2006. 12(17):5018-5022.
Krug S, Günzel D, Conrad M, Rosenthal R, Fromm A, Amasheh S, et al. Claudin-17 forms tight junction channels with distinct anion selectivity. Cell Mol Life Sci. 2012. Online First™(09 March 2012):1-14.
Kuhn DE, Nuovo GJ, Martin MM, Malana GE, Pleister AP, Jiang J, et al. Human chromosome 21-derived miRNAs are overexpressed in down syndrome brains and hearts. Biochem Biophys Res Commun. 2008. 370(3):473-477.
Kumar CC, Malkowski M, Yin Z, Tanghetti E, Yaremko B, Nechuta T, et al. Inhibition of Angiogenesis and Tumor Growth by SCH221153, a Dual αvβ3 and αvβ5 Integrin Receptor Antagonist. Cancer Res. 2001. 61(5):2232-2238.
Kurosu T, Ohga N, Hida Y, Maishi N, Akiyama K. Kakuguchi W, et al. HuR keeps an angiogenic switch on by stabilising mRNA of VEGF and COX-2 in tumour endothelium. Br J Cancer. 2011. 104(5):819-829
Kurup S, Abramsson A, Li JP, Lindahl U, Kjellen L, Bersholtz C et al. Heparan sulphate requirement in platelet-derived growth factor B-mediated pericyte recruitment. Biochem Soc Trans. 2006. 34(3):454-455
Lal-Nag M, Morin P. The claudins. Genome Biol. 2009. 10(8):235. Lamagna C, Hodivala-Dilke KM, Imhof BA, Aurrand-Lions M. Antibody against Junctional Adhesion
Molecule-C Inhibits Angiogenesis and Tumor Growth. Cancer Res. 2005a. 65(13):5703-5710. Lamagna C, Meda P, Mandicourt G, Brown J, Gilbert RJC, Jones EY, et al. Dual Interaction of JAM-C
with JAM-B and αMβ2 Integrin: Function in Junctional Complexes and Leukocyte Adhesion. Mol Biol Cell. 2005b. 16(10):4992-5003.
Lamalice L, Le Boeuf F, Huot J. Endothelial Cell Migration During Angiogenesis. Circ Res. 2007. 100(6):782-794.
Lampugnani MG, Dejana E. Interendothelial junctions: structure, signalling and functional roles. Curr Opin Cell Biol. 1997. 9(5):674-682.
Lampugnani MG, Zanetti A, Breviario F, Balconi G, Orsenigo F, Corada M, et al. VE-Cadherin Regulates Endothelial Actin Activating Rac and Increasing Membrane Association of Tiam. Mol Biol Cell. 2002. 13(4):1175-1189.
Lampugnani MG, Orsenigo F, Gagliani MC, Tacchetti C, Dejana E. Vascular endothelial cadherin controls VEGFR-2 internalization and signaling from intracellular compartments. J Cell Biol. 2006. 174(4):593-604.
Lauffenburger DA, Horwitz AF. Cell Migration: A Physically Integrated Molecular Process. Cell. 1996. 84(3):359-369.
LeBleu VS, MacDonald B, Kalluri R. Structure and Function of Basement Membranes. Exp Biol Med. 2007. 232(9):1121-1129.
Lee K, Ansar M, Andrade PB, Khan B, Santos-Cortez RL, Ahmad W, et al. Novel CLDN14 mutations in Pakistani families with autosomal recessive non-syndromic hearing loss. Am J Med Genet A. 2012. 158A(2):315-321.
Lee NV, Sato M, Annis DS, Loo JA, Wu L, Mosher DF, et al. ADAMTS1 mediates the release of antiangiogenic polypeptides from TSP1 and 2. EMBO J. 2006. 25(22):5270-5283.
Li H, Singh S, Gorantla S, Potula R, Persidsky Y, Poluektova L, et al. Dysregulation of Claudin-5 in HIV-induced Interstitial Pneumonitis and Lung Vascular Injury: Protective Role of PPAR-γ. Am J Resp Crit Care. 2012. (Epub ahead of print).
Li WY, Huey CL, Yu ASL. Expression of claudin-7 and -8 along the mouse nephron. Am J Physiol-Renal. 2004. 286(6):1063-1071.
Li X, Stankovic M, Lee BP-L, Aurrand-Lions M, Hahn CN, Lu Y, et al. JAM-C Induces Endothelial Cell Permeability Through Its Association and Regulation of β3 Integrins. Arterioscler Thromb Vasc Biol. 2009. 29(8):1200-1206.
Liao F, Li Y, O'Connor W, Zanetta L, Bassi R, Santiago A, et al. Monoclonal Antibody to Vascular Endothelial-cadherin Is a Potent Inhibitor of Angiogenesis, Tumor Growth, and Metastasis. Cancer Res. 2000. 60(24):6805-6810.
- 211 -
Liebner S, Fischmann A, Rascher G, Duffner F, Grote EH, Kalbacher H, et al. Claudin-1 and claudin-5 expression and tight junction morphology are altered in blood vessels of human glioblastoma multiforme. Acta Neuropathol. 2000. 100(3):323-331.
Lindahl P, Johansson BR, Levéen P, Betsholtz C. Pericyte Loss and Microaneurysm Formation in PDGF-B-Deficient Mice. Science. 1997. 277(5323):242-245.
Lindahl P, Hellström M, Kalén M, Betsholtz C. Endothelial-perivascular cell signaling in vascular development: lessons from knockout mice. Curr Opin in Lipidol. 1998. 9(5):407-411.
Ling Q, Jacovina AT, Deora A, Febbraio M, Simantov R, Silverstein RL, et al. Annexin II regulates fibrin homeostasis and neoangiogenesis in vivo. J Clin Invest. 2004. 113(1):38-48.
Liu YJ, Xu Y, Yu Q. Full-length ADAMTS-1 and the ADAMTS-1 fragments display pro- and antimetastatic activity, respectively. Oncogene. 2006. 25(17):2452-2467.
Lo D, Ling J, Holly Eckelhoefer A. M cell targeting by a Claudin 4 targeting peptide can enhance mucosal IgA responses. BMC Biotechnology. 2012. 12(1):7.
Lodi A, Ronen SM. Magnetic Resonance Spectroscopy Detectable Metabolomic Fingerprint of Response to Antineoplastic Treatment. PLoS ONE. 2011. 6(10):e26155.
Loges S, Schmidt T, Carmeliet P. Mechanisms of resistance to anti-angiogenic therapy and development of third-generation anti-angiogenic drug candidates. Genes Cancer. 2010. 1(1):12-25.
Luque A, Carpizo DR, Iruela-Arispe ML. ADAMTS1/METH1 inhibits endothelial cell proliferation by direct binding and sequestration of VEGF165. J Biol Chem. 2003. 278(26):23656-23665.
Macia E, Ehrlich M, Massol R, Boucrot E, Brunner C, Kirchhausen T. Dynasore, a cell-permeable inhibitor of dynamin. Dev Cell. 2006. 10(6):839-850.
Maisonpierre PC, Suri C, Jones PF, Bartunkova S, Wiegand SJ, Radziejewski C, et al. Angiopoietin-2, a Natural Antagonist for Tie2 That Disrupts in vivo Angiogenesis. Science. 1997. 277(5322):55-60.
Mandarino LJ, Sundarraj N, Finlayson J, Hassell JR. Regulation of Fibronectin and Laminin Synthesis by Retinal Capillary Endothelial Cells and Pericytes In Vitro. Exp Eye Res. 1993. 57(5):609-621.
Mandel I, Paperna T, Glass-Marmor L, Volkowich A, Badarny S, Schwartz I, et al. Tight junction proteins expression and modulation in immune cells and multiple sclerosis. J Cell Mol Med. 2011. 16(4):765-775.
Marchiando AM, Shen L, Graham WV, Weber CR, Schwarz BT, Austin JR, et al. Caveolin-1-dependent occludin endocytosis is required for TNF-induced tight junction regulation in vivo. J Cell Biol. 2010. 189(1):111-126.
Matsumoto T, Mugishima H. Signal transduction via vascular endothelial growth factor (VEGF) receptors and their roles in atherogenesis. J Atheroscler Thromb. 2006. 13(3):130-135.
Matter K, Balda MS. Signalling to and from tight junctions. Nat Rev Mol Cell Biol. 2003. 4(3):225-236. Miller DL, Ortega S, Bashayan O, Basch R, Basilico C. Compensation by Fibroblast Growth Factor 1
(FGF1) Does Not Account for the Mild Phenotypic Defects Observed in FGF2 Null Mice. Mol Cell Biol. 2000. 20(6):2260-2268.
Miller G. Mouse with human chromosome should boost Down syndrome research. Science. 2005. 309(5743):1975.
Minami T, Horiuchi K, Miura M, Abid MR, Takabe W, Noguchi N, et al. Vascular endothelial growth factor- and thrombin-induced termination factor, Down syndrome critical region-1, attenuates endothelial cell proliferation and angiogenesis. J Biol Chem. 2004. 279(48):50537-50554.
Miyamoto T, Morita K, Takemoto D, Takeuchi K, Kitano Y, Miyakawa T, et al. Tight junctions in Schwann cells of peripheral myelinated axons. J Cell Biol. 2005. 169(3):527-538.
Morin PJ. Claudin proteins in human cancer: promising new targets for diagnosis and therapy. Cancer Res. 2005. 65(21):9603-9606.
Morita K, Sasaki H, Furuse M, Tsukita S. Endothelial Claudin: Claudin-5/Tmvcf Constitutes Tight Junction Strands in Endothelial Cells J Cell Biol. 1999. 147(1):185-194.
Moser AR, Pitot HC, Dove WF. A dominant mutation that predisposes to multiple intestinal neoplasia in the mouse. Science. 1990. 247(4940):322-324.
Murakami T, Felinski EA, Antonetti DA. Occludin Phosphorylation and Ubiquitination Regulate Tight Junction Trafficking and Vascular Endothelial Growth Factor-induced Permeability. J Biol Chem. 2009. 284(31):21036-21046.
- 212 -
Murfee WL, Skalak TC, Peirce SM. Differential arterial/venous expression of NG2 proteoglycan in perivascular cells along microvessels: identifying a venule-specific phenotype. Microcirculation. 2005. 12(2):151-160.
Nabors LB, Gillespie GY, Harkins L, King PH. HuR, a RNA Stability Factor, Is Expressed in Malignant Brain Tumors and Binds to Adenine- and Uridine-rich Elements within the 3′ Untranslated Regions of Cytokine and Angiogenic Factor mRNAs. Cancer Res. 2001 61(5):2154-2161
Nelson AR, Fingleton B, Rothenberg ML, Matrisian LM. Matrix Metalloproteinases: Biologic Activity and Clinical Implications. J Clin Oncol. 2000. 18(5):1135.
Neufeld G, Cohen T, Gengrinovitch S, Poltorak Z. Vascular endothelial growth factor (VEGF) and its receptors. Faseb J. 1999. 13(1):9-22.
Neufeld G, Kessler O, Herzog Y. The interaction of Neuropilin-1 and Neuropilin-2 with tyrosine-kinase receptors for VEGF. Adv Exp Med Biol. 2002. 515:81-90.
Nishida N, Yano H, Nishida T, Kamura T, Kojiro M. Angiogenesis in cancer. Vasc Health Risk Manag. 2006. 2(3):213-219.
Nitta T, Hata M, Gotoh S, Seo Y, Sasaki H, Hashimoto N, et al. Size-selective loosening of the blood-brain barrier in claudin-5-deficient mice. J Cell Biol. 2003. 161(3):653-660.
Nunes FD, Lopez LN, Lin HW, Davies C, Azevedo RB, Gow A, et al. Distinct subdomain organization and molecular composition of a tight junction with adherens junction features. J Cell Sci. 2006. 119(23):4819-4827.
O'Doherty A, Ruf S, Mulligan C, Hildreth V, Errington ML, Cooke S, et al. An aneuploid mouse strain carrying human chromosome 21 with Down syndrome phenotypes. Science. 2005. 309(5743):2033-2037.
O'Reilly MS. Antiangiogenesis and vascular endothelial growth factor/vascular endothelial growth factor receptor targeting as part of a combined-modality approach to the treatment of cancer. Int J Radiat Oncol Biol Phys. 2007. 69(2 Suppl):S64-66.
Ohtsuki S, Yamaguchi H, Katsukura Y, Asashima T, Terasaki T. mRNA expression levels of tight junction protein genes in mouse brain capillary endothelial cells highly purified by magnetic cell sorting. J Neurochem. 2008. 104(1):147-154.
Olsson AK, Dimberg A, Kreuger J, Claesson-Welsh L. VEGF receptor signalling - in control of vascular function. Nat Rev Mol Cell Biol. 2006. 7(5):359-371.
OMIM. Online Mendelian Inheritance in Man, OMIM (TM). McKusick-Nathans Institute of Genetic Medicine, Johns Hopkins University (Baltimore, MD), National Center for Biotechnology Information, National Library of Medicine (Bethesda, MD); Available from: http://www.ncbi.nlm.nih.gov/omim/
Orlova VV, Economopoulou M, Lupu F, Santoso S, Chavakis T. Junctional adhesion molecule-C regulates vascular endothelial permeability by modulating VE-cadherin-mediated cell-cell contacts. J Exp Med. 2006. 203(12):2703-2714.
Ornitz D, Itoh N. Fibroblast growth factors. Genome Biol. 2001. 2(3):3001-3012. Osada T, Gu Y-H, Kanazawa M, Tsubota Y, Hawkins BT, Spatz M, et al. Interendothelial claudin-5
expression depends on cerebral endothelial cell-matrix adhesion by β1-integrins. J Cereb Blood Flow Metab. 2011. 31(10):1972-1985.
Pàez-Ribes M, Allen E, Hudock J, Takeda T, Okuyama H, Viñals F, et al. Antiangiogenic Therapy Elicits Malignant Progression of Tumors to Increased Local Invasion and Distant Metastasis. Cancer cell. 2009. 15(3):220-231.
Paquet-Fifield S, Schlüter H, Li A, Aitken T, Gangatirkar P, Blashki D, et al. A role for pericytes as microenvironmental regulators of human skin tissue regeneration. J Clin Invest. 2009. 119(9):2795-2806.
Paschoud S, Bongiovanni M, Pache JC, Citi S. Claudin-1 and claudin-5 expression patterns differentiate lung squamous cell carcinomas from adenocarcinomas. Mod Pathol. 2007. 20(9):947-954.
Perez-Moreno M, Fuchs E. Catenins: Keeping Cells from Getting Their Signals Crossed. Dev Cell. 2006. 11(5):601-612.
Porter S, Clark IM, Kevorkian L, Edwards DR. The ADAMTS metalloproteinases. Biochem J. 2005. 386(Pt 1):15-27.
Potter MD, Barbero S, Cheresh DA. Tyrosine phosphorylation of VE-cadherin prevents binding of p120- and beta-catenin and maintains the cellular mesenchymal state. J Biol Chem. 2005. 280(36):31906-31912.
Powell GT, Wright GJ. Jamb and Jamc Are Essential for Vertebrate Myocyte Fusion. PLoS Biol. 2011. 9(12):e1001216.
- 213 -
Prat A, Parker J, Karginova O, Fan C, Livasy C, Herschkowitz J, et al. Phenotypic and molecular characterization of the claudin-low intrinsic subtype of breast cancer. Breast Cancer Res. 2010. 12(5):R68.
Rahner C, Mitic LL, Anderson JM. Heterogeneity in expression and subcellular localization of claudins 2, 3, 4, and 5 in the rat liver, pancreas, and gut. Gastroenterology. 2001. 120(2):411-422.
Raleigh DR, Marchiando AM, Zhang Y, Shen L, Sasaki H, Wang Y, et al. Tight Junction-associated MARVEL Proteins MarvelD3, Tricellulin, and Occludin Have Distinct but Overlapping Functions. Mol Biol Cell. 2010. 21(7):1200-1213.
Read ML, Lewy GD, Fong JCW, Sharma N, Seed RI, Smith VE, et al. Proto-oncogene PBF/PTTG1IP Regulates Thyroid Cell Growth and Represses Radioiodide Treatment. Cancer Res. 2011. 71(19):6153-6164.
Reeves RH. Down syndrome mouse models are looking up. Trends Mol Med. 2006. 12(6):237-240. Reynolds AR, Reynolds LE, Nagel TE, Lively JC, Robinson SD, Hicklin DJ, et al. Elevated Flk1 (vascular
endothelial growth factor receptor 2) signaling mediates enhanced angiogenesis in beta3-integrin-deficient mice. Cancer Res. 2004. 64(23):8643-8650.
Reynolds AR, Hart IR, Watson AR, Welti JC, Silva RG, Robinson SD, et al. Stimulation of tumor growth and angiogenesis by low concentrations of RGD-mimetic integrin inhibitors. Nat Med. 2009. 15(4):392-400.
Reynolds LE, Wyder L, Lively JC, Taverna D, Robinson SD, Huang X, et al. Enhanced pathological angiogenesis in mice lacking beta3 integrin or beta3 and beta5 integrins. Nat Med. 2002. 8(1):27-34.
Reynolds LE, Watson AR, Baker M, Jones TA, D'Amico G, Robinson SD, et al. Tumour angiogenesis is reduced in the Tc1 mouse model of Down's syndrome. Nature. 2010. 465(7299):813-817.
Risau W. Mechanisms of angiogenesis. Nature. 1997. 386(6626):671-674. Risau W. Development and differentiation of endothelium. Kidney Int. 1998. 54(S67):S3-S6. Robinson CJ, Stringer SE. The splice variants of vascular endothelial growth factor (VEGF) and their
receptors. J Cell Sci. 2001. 114(Pt 5):853-865. Robinson SD, Reynolds LE, Wyder L, Hicklin DJ, Hodivala-Dilke KM. Beta3-integrin regulates vascular
endothelial growth factor-A-dependent permeability. Arterioscler Thromb Vasc Biol. 2004. 24(11):2108-2114.
Robinson SD, Reynolds LE, Kostourou V, Reynolds AR, da Silva RG, Tavora B, et al. Alphav beta3 integrin limits the contribution of neuropilin-1 to vascular endothelial growth factor-induced angiogenesis. J Biol Chem. 2009. 284(49):33966-33981.
Rosenberger C, Rosen S, Paliege A, Heyman SN. Pimonidazole Adduct Immunohistochemistry in the Rat Kidney: Detection of Tissue Hypoxia. Meth Mol Biol. 2009. 466(1): 161-174
Roy H, Bhardwaj S, Ylä-Herttuala S. Biology of vascular endothelial growth factors. FEBS letters. 2006. 580(12):2879-2887.
Rubin LL, Hall DE, Porter S, Barbu K, Cannon C, Horner HC, et al. A cell culture model of the blood-brain barrier. J Cell Biol. 1991. 115(6):1725-1735.
Rundhaug JE. Matrix Metalloproteinases, Angiogenesis, and Cancer. Clin Cancer Res. 2003. 9(2):551-554. Saeki R, Kondoh M, Kakutani H, Matsuhisa K, Takahashi A, Suzuki H, et al. A Claudin-Targeting
Molecule as an Inhibitor of Tumor Metastasis. J Pharmacol Exp Ther. 2010. 334(2):576-582. Sago H, Carlson EJ, Smith DJ, Kilbridge J, Rubin EM, Mobley WC, et al. Ts1Cje, a partial trisomy 16
mouse model for Down syndrome, exhibits learning and behavioral abnormalities. PNAS. 1998. 95(11):6256-6261.
Saitou M, Furuse M, Sasaki H, Schulzke Jr-D, Fromm M, Takano H, et al. Complex Phenotype of Mice Lacking Occludin, a Component of Tight Junction Strands. Mol Biol Cell. 2000. 11(12):4131-4142.
Salako MA, Kulbe H, Ingemarsdotter CK, Pirlo KJ, Williams SL, Lockley M, et al. Inhibition of the Inflammatory Cytokine TNF-α Increases Adenovirus Activity in Ovarian Cancer via Modulation of cIAP1/2 Expression. Mol Ther. 2011. 19(3):490-499.
Saran NG, Pletcher MT, Natale JE, Cheng Y, Reeves RH. Global disruption of the cerebellar transcriptome in a Down syndrome mouse model. Hum Mol Genet. 2003. 12(16):2013-2019.
Sasaki H, Matsui C, Furuse K, Mimori-Kiyosue Y, Furuse M, Tsukita S. Dynamic behavior of paired claudin strands within apposing plasma membranes. PNAS. 2003. 100(7):3971-3976.
- 214 -
Satgé D, Sommelet D, Geneix A, Nishi M, Malet P, Vekemans M. A tumor profile in Down syndrome. Am J Med Genet. 1998. 78(3):207-216.
Satgé D, Sasco A, Vekemans M, Portal M-L, Fléjou J-F. Aspects of Digestive Tract Tumors in Down Syndrome: A Literature Review. Digestive Diseases and Sciences. 2006. 51(11):2053-2061.
Satgé D, Bénard J. Carcinogenesis in Down syndrome: What can be learned from trisomy 21? Semin Cancer Biol. 2008. 18(5):365-371.
Satgé D, Vekemans M. Down syndrome patients are less likely to develop some (but not all) malignant solid tumours. Clin Genet. 2011. 79(3):289-290.
Sawada N, Murata M, Kikuchi K, Osanai M, Tobioka H, Kojima T, et al. Tight junctions and human diseases. Med Electron Microsc. 2003. 36(3):147-156.
Scheiermann C, Meda P, Aurrand-Lions M, Madani R, Yiangou Y, Coffey P, et al. Expression and Function of Junctional Adhesion Molecule-C in Myelinated Peripheral Nerves. Science. 2007. 318(5855):1472-1475.
Scholl T, Stein Z, Hansen H. Leukemia and other cancers, anomalies and infections as causes of death in Down's syndrome in the United States during 1976. Dev Med Child Neurol. 1982. 24(6):817-829.
Serpe M, Umulis D, Ralston A, Chen J, Olson DJ, Avanesov A, et al. The BMP-Binding Protein Crossveinless 2 Is a Short-Range, Concentration-Dependent, Biphasic Modulator of BMP Signaling in Drosophila. Dev Cell. 2008. 14(6):940-953.
Serve AWL, Hellmann K. Metastases and the Normalization of Tumour Blood Vessels by ICRF 159: A New Type of Drug Action. BMJ. 1972. 1(5800):597-601.
Shalaby F, Rossant J, Yamaguchi TP, Gertsenstein M, Wu X-F, Breitman ML, et al. Failure of blood-island formation and vasculogenesis in Flk-1-deficient mice. Nature. 1995. 376(6535):62-66.
Shibuya M. Differential roles of vascular endothelial growth factor receptor-1 and receptor-2 in angiogenesis. J Biochem Mol Biol. 2006. 39(5):469-478.
Shih T, Lindley C. Bevacizumab: An angiogenesis inhibitor for the treatment of solid malignancies. Clin Ther. 2006. 28(11):1779-1802.
Shimizu F, Sano Y, Saito K, Abe M-a, Maeda T, Haruki H, et al. Pericyte-derived Glial Cell Line-derived Neurotrophic Factor Increase the Expression of Claudin-5 in the Blood–brain Barrier and the Blood-nerve Barrier. Neurochem Res. 2012. 37(2):401-409.
Shindo T, Kurihara H, Kuno K, Yokoyama H, Wada T, Kurihara Y, et al. ADAMTS-1: a metalloproteinase-disintegrin essential for normal growth, fertility, and organ morphology and function. J Clin Invest. 2000. 105(10):1345-1352.
Shinohara T, Tomizuka K, Miyabara S, Takehara S, Kazuki Y, Inoue J, et al. Mice containing a human chromosome 21 model behavioral impairment and cardiac anomalies of Down's syndrome. Hum Mol Genet. 2001. 10(11):1163-1175.
Shiren S, Xiaoxuan N, Yanqi Z, Yuanyuan L, Yongzhan N, Shuang H et al. Hypoxia-inducible factor-1α induces Twist expression in tubular epithelial cells subjected to hypoxia, leading to epithelial-to-mesenchymal transition. Kidney Int. 2009. 75(12):1278-1287
Silva R, D'Amico G, Hodivala-Dilke KM, Reynolds LE. Integrins: the keys to unlocking angiogenesis. Arterioscler Thromb Vasc Biol. 2008. 28(10):1703-1713.
Singh AB, Harris RC. Epidermal Growth Factor Receptor Activation Differentially Regulates Claudin Expression and Enhances Transepithelial Resistance in Madin-Darby Canine Kidney Cells. J Biol Chem. 2004. 279(5):3543-3552.
Singh AB, Sharma A, Dhawan P. Claudin family of proteins and cancer: an overview. J Oncol. 2010. 2010:541957.
Singh M, Couto SS, Forrest WF, Lima A, Cheng JH, Molina R, et al. Anti-VEGF antibody therapy does not promote metastasis in genetically engineered mouse tumor models. J Pathol. 2012. (Epub ahead of print).
Soriano P. Abnormal kidney development and hematological disorders in PDGF beta-receptor mutant mice. Gene Dev. 1994. 8(16):1888-1896.
Sourisseau T, Georgiadis A, Tsapara A, Ali RR, Pestell R, Matter K, et al. Regulation of PCNA and Cyclin D1 Expression and Epithelial Morphogenesis by the ZO-1-Regulated Transcription Factor ZONAB/DbpA. Mol Cell Biol. 2006. 26(6):2387-2398.
- 215 -
Stamatovic SM, Keep RF, Wang MM, Jankovic I, Andjelkovic AV. Caveolae-mediated Internalization of Occludin and Claudin-5 during CCL2-induced Tight Junction Remodeling in Brain Endothelial Cells. J Biol Chem. 2009. 284(28):19053-19066.
Stupack DG, Cheresh DA. Get a ligand, get a life: integrins, signaling and cell survival. J Cell Sci. 2002. 115(Pt 19):3729-3738.
Sund M, Hamano Y, Sugimoto H, Sudhakar A, Soubasakos M, Yerramalla U, et al. Function of endogenous inhibitors of angiogenesis as endothelium-specific tumor suppressors. PNAS. 2005. 102(8):2934-2939.
Suri C, McClain J, Thurston G, McDonald DM, Zhou H, Oldmixon EH, et al. Increased Vascularization in Mice Overexpressing Angiopoietin-1. Science. 1998. 282(5388):468-471.
Sussan TE, Yang A, Li F, Ostrowski MC, Reeves RH. Trisomy represses Apc(Min)-mediated tumours in mouse models of Down's syndrome. Nature. 2008. 451(7174):73-75.
Suzuki H, Kondoh M, Kakutani H, Yamane S, Uchida H, Hamakubo T, et al. The application of an alanine-substituted mutant of the C-terminal fragment of Clostridium perfringens enterotoxin as a mucosal vaccine in mice. Biomaterials. 2012. 33(1):317-324.
Taddei A, Giampietro C, Conti A, Orsenigo F, Breviario F, Pirazzoli V, et al. Endothelial adherens junctions control tight junctions by VE-cadherin-mediated upregulation of claudin-5. Nat Cell Biol. 2008. 10(8):923-934.
Takahashi T, Yamaguchi S, Chida K, Shibuya M. A single autophosphorylation site on KDR/Flk-1 is essential for VEGF-A-dependent activation of PLC-γ and DNA synthesis in vascular endothelial cells. EMBO J. 2001. 20(11):2768-2778.
Tavora B, Batista S, Reynolds LE, Jadeja S, Robinson SD, Kostourou V, et al. Endothelial FAK is required for tumour angiogenesis. EMBO Mol Med. 2010. 2(12):516-528.
ten Dijke P, Arthur HM. Extracellular control of TGFbeta signalling in vascular development and disease. Nat Rev Mol Cell Biol. 2007. 8(11):857-869.
Thomlinson RH. Hypoxia and tumours. Journal of Clinical Pathology. 1977. s3-11(1):105-113. Thorleifsson G, Holm H, Edvardsson V, Walters GB, Styrkarsdottir U, Gudbjartsson DF, et al. Sequence
variants in the CLDN14 gene associate with kidney stones and bone mineral density. Nat Genet. 2009. 41(8):926-930.
Threadgill DW. Down's syndrome: paradox of a tumour repressor. Nature. 2008. 451(7174):21-22. Thurston G, Baluk P, Mcdonald DM. Determinants of Endothelial Cell Phenotype in Venules.
Microcirculation. 2000. 7(1):67-80. Tlsty TD, Coussens LM. Tumor stroma and regulation of cancer development. Annu Rev Pathol. 2006.
1:119-150. Tsapara A, Matter K, Balda MS. The Heat-Shock Protein Apg-2 Binds to the Tight Junction Protein ZO-1
and Regulates Transcriptional Activity of ZONAB. Mol Biol Cell. 2006. 17(3):1322-1330. Tsou R, Isik FF. Integrin activation is required for VEGF and FGF receptor protein presence on human
microvascular endothelial cells. Mol Cell Biochem. 2001. 224(1):81-89. Tsukita S, Furuse M, Itoh M. Multifunctional strands in tight junctions. Nat Rev Mol Cell Biol. 2001.
2(4):285-293. Tsutsumi K, Sato N, Tanabe R, Mizumoto K, Morimatsu K, Kayashima T, et al. Claudin-4 Expression
Predicts Survival in Pancreatic Ductal Adenocarcinoma. Ann Surg Oncol. 2011.1-9. Turunen M, Talvensaari-Mattila A, Soini Y, Santala M. Claudin-5 Overexpression Correlates with
Aggressive Behavior in Serous Ovarian Adenocarcinoma. Anticancer Res. 2009. 29(12):5185-5189. Uemura A, Ogawa M, Hirashima M, Fujiwara T, Koyama S, Takagi H et al. Recombinant angiopoietin-1
restores higher-order architecture of growing blood vessels in mice in the absence of mural cells. J Clin Invest. 2002. 110(11):1619-1628
Uyguner O, Emiroglu M, Uzumcu A, Hafiz G, Ghanbari A, Baserer N, et al. Frequencies of gap- and tight-junction mutations in Turkish families with autosomal-recessive non-syndromic hearing loss. Clin Genet. 2003. 64(1):65-69.
Van den Bossche J, Laoui D, Morias Y, Movahedi K, Raes G, De Baetselier P, et al. Claudin-1, Claudin-2 and Claudin-11 Genes Differentially Associate with Distinct Types of Anti-inflammatory Macrophages In vitro and with Parasite- and Tumour-elicited Macrophages In vivo. Scand J Immunol. 2012. 75(6):588-598.
- 216 -
Van Itallie CM, Gambling TM, Carson JL, Anderson JM. Palmitoylation of claudins is required for efficient tight-junction localization. J Cell Sci. 2005. 118(Pt 7):1427-1436.
Varia MA, Calkins-Adams DP, Rinker LH, Kennedy AS, Novotny DB, Fowler Jr WC, et al. Pimonidazole: A Novel Hypoxia Marker for Complementary Study of Tumor Hypoxia and Cell Proliferation in Cervical Carcinoma. Gynecol Oncol. 1998. 71(2):270-277.
Veikkola T, Karkkainen M, Claesson-Welsh L, Alitalo K. Regulation of Angiogenesis via Vascular Endothelial Growth Factor Receptors. Cancer Res. 2000. 60(2):203-212.
Vestweber D. VE-Cadherin: The Major Endothelial Adhesion Molecule Controlling Cellular Junctions. Arterioscler Thromb Vasc Biol. 2008. 28:223-232
Vittet D, Buchou T, Schweitzer A, Dejana E, Huber P. Targeted null-mutation in the vascular endothelial–cadherin gene impairs the organization of vascular-like structures in embryoid bodies. PNAS 1997. 94(12):6273-6278.
Wallez Y, Huber P. Endothelial adherens and tight junctions in vascular homeostasis, inflammation and angiogenesis. BBA-Biomembranes. 2008. 1778(3):794-809.
Waltenberger J, Claesson-Welsh L, Siegbahn A, Shibuya M, Heldin CH. Different signal transduction properties of KDR and Flt1, two receptors for vascular endothelial growth factor. J Biol Chem. 1994. 269(43):26988-26995.
Wang R, Chadalavada K, Wilshire J, Kowalik U, Hovinga KE, Geber A, et al. Glioblastoma stem-like cells give rise to tumour endothelium. Nature. 2010. 468(7325):829-833.
Wang S, Olson EN. AngiomiRs--key regulators of angiogenesis. Curr Opin Genet Dev. 2009. 19(3):205-211.
Warren CM, Iruela-Arispe ML. Signaling circuitry in vascular morphogenesis. Curr Opin Hematol. 2010. 17(3):213-218.
Wegmann F, Petri Br, Khandoga AG, Moser C, Khandoga A, Volkery S, et al. ESAM supports neutrophil extravasation, activation of Rho, and VEGF-induced vascular permeability. J Exp Med. 2006. 203(7):1671-1677.
Weinberg R. The Biology of Cancer. New York: Garland Science; 2007. Weis SM, Lim S, Lutu-Fuga KM, Barnes LA, Chen XL, Göhert JR, et al. Compensatory role for Pyk2
during angiogenesis in adult mice lacking endothelial cell FAK. J Cell Biol. 2008. 181(1):43-50. Wessells H, Sullivan CJ, Tsubota Y, Engel KL, Kim B, Olson NE, et al. Transcriptional profiling of human
cavernosal endothelial cells reveals distinctive cell adhesion phenotype and role for claudin 11 in vascular barrier function. Physiol Genomics. 2009. 39(2):100-108.
Wheelock MJ, Johnson KR. Cadherin-mediated cellular signaling. Curr Opin Cell Biol. 2003. 15(5):509-514.
Wieder HA, Beer AJ, Lordick F, Ott K, Fischer M, Rummeny EJ, et al. Comparison of Changes in Tumor Metabolic Activity and Tumor Size During Chemotherapy of Adenocarcinomas of the Esophagogastric Junction. J Nucl Med. 2005. 46(12):2029-2034.
Wilcox ER, Burton QL, Naz S, Riazuddin S, Smith TN, Ploplis B, et al. Mutations in the Gene Encoding Tight Junction Claudin-14 Cause Autosomal Recessive Deafness DFNB29. Cell. 2001. 104(1):165-172.
Willis CL, Garwood CJ, Ray DE. A size selective vascular barrier in the rat area postrema formed by perivascular macrophages and the extracellular matrix. Neuroscience. 2007. 150(2):498-509.
Wilson MD, Barbosa-Morais NL, Schmidt D, Conboy CM, Vanes L, Tybulewicz VL, et al. Species-specific transcription in mice carrying human chromosome 21. Science. 2008. 322(5900):434-438.
Wolvetang EJ, Wilson TJ, Sanij E, Busciglio J, Hatzistavrou T, Seth A, et al. ETS2 overexpression in transgenic models and in Down syndrome predisposes to apoptosis via the p53 pathway. Hum Mol Genet. 2003. 12(3):247-255.
Woodfin A, Reichel CA, Khandoga A, Corada M, Voisin M-B, Scheiermann C, et al. JAM-A mediates neutrophil transmigration in a stimulus-specific manner in vivo: evidence for sequential roles for JAM-A and PECAM-1 in neutrophil transmigration. Blood. 2007. 110(6):1848-1856.
Xian X, Håkansson J, Ståhlberg A, Lindblom P, Betsholtz C, Gerhardt H, et al. Pericytes limit tumor cell metastasis. J Clin Invest. 2006. 116(3):642-651.
Xiao K, Garner J, Buckley KM, Vincent PA, Chiasson CM, Dejana E, et al. p120-Catenin Regulates Clathrin-dependent Endocytosis of VE-Cadherin. Mol Biol Cell. 2005. 16(11):5141-5151.
- 217 -
Xu Z, Yu Y, Duh EJ. Vascular Endothelial Growth Factor Upregulates Expression of ADAMTS1 in Endothelial Cells through Protein Kinase C Signaling. Invest Ophth Vis Sci. 2006. 47(9):4059-4066.
Yamada KM. Integrin signaling. Matrix Biol. 1997. 16(4):137-141. Yancopoulos GD, Davis S, Gale NW, Rudge JS, Wiegand SJ, Holash J. Vascular-specific growth factors
and blood vessel formation. Nature. 2000. 407(6801):242-248. Yang MH, Wu MZ, Chiou SH, Chen PM, Chang SY et al. Direct regulation of TWIST by HIF-1α promotes
metastasis. Nat Cell Biol. 2008. 10(3):295-305 Yao Y-G, Duh EJ. VEGF selectively induces Down syndrome critical region 1 gene expression in
endothelial cells: a mechanism for feedback regulation of angiogenesis? Biochem Bioph Res Co. 2004. 321(3):648-656.
Yoo PS, Mulkeen AL, Cha CH. Post-transcriptional regulation of vascular endothelial growth factor: implications for tumor angiogenesis. World J Gastroenterol. 2006. 12(31):4937-4942.
Yuan L, Le Bras A, Sacharidou A, Itagaki K, Zhan Y, Kondo M, et al. ETS-related Gene (ERG) Controls Endothelial Cell Permeability via Transcriptional Regulation of the Claudin 5 (CLDN5) Gene. J Biol Chem. 2011. 287(9):6582-6591.
Yuan SY, Rigor RR. Regulation of Endothelial Barrier Function. San Rafael (CA): Morgan & Claypool Life Sciences; 2010.
Yuan X, Qin L, Xiao-Yu L, Qiu-Ya Y, Wei-Wei X, Gao-Lin L. Short-term anti-vascular endothelial growth factor treatment elicits vasculogenic mimicry formation of tumors to accelerate metastasis. J Exp Clin Cancer Res. 2012. 31(1):16.
Zahraoui A, Louvard D, Galli T. Tight junction, a platform for trafficking and signaling protein complexes. J Cell Biol. 2000. 151(5):F31-36.
Zavala-Zendejas VE, Torres-Martinez AC, Salas-Morales B, Fortoul TI, Montaño LF, Rendon-Huerta EP. Claudin-6, 7, or 9 Overexpression in the Human Gastric Adenocarcinoma Cell Line AGS Increases Its Invasiveness, Migration, and Proliferation Rate. Cancer Invest. 2011. 29(1):1-11.
Zeissig S, Bürgel N, Günzel D, Richter J, Mankertz J, Wahnschaffe U, et al. Changes in expression and distribution of claudin 2, 5 and 8 lead to discontinuous tight junctions and barrier dysfunction in active Crohn's disease. Gut. 2007. 56(1):61-72.
Zhang Z, Ramirez NE, Yankeelov TE, Li Zi, Ford LE, Qi Y, et al. α2β1 integrin expression in the tumor microenvironment enhances tumor angiogenesis in a tumor cell-specific manner. Blood. 2008. 111(4):1980-1988.
Zheng J, Xie Y, Campbell R, Song J, Massachi S, Razi M, et al. Involvement of claudin-7 in HIV infection of CD4(-) cells. Retrovirology. 2005. 2(1):79.
Zicha D, Dunn G, Jones G, Pollard J, Walker JM. Analyzing Chemotaxis Using the Dunn Direct-Viewing Chamber. Basic Cell Culture Protocols. In: Walker JM, editor.: Humana Press; 1997. p. 449-457.
Zorick TS, Mustacchi Z, Bando SY, Zatz M, Moreira-Filho CA, Olsen B, et al. High serum endostatin levels in Down syndrome: implications for improved treatment and prevention of solid tumours. Eur J Hum Genet. 2001. 9(11):811-814.
Zucker S, Cao J, Chen WT. Critical appraisal of the use of matrix metalloproteinase inhibitors in cancer treatment. Oncogene. 2000. 19(56):6642-6650.
- 218 -
CHAPTER 7 APPENDICES
7.1 Abbreviations
αCat – alpha catenin
βCat – beta catenin
A
Adamts1 – A disintegrin and metalloprotease
with thrombospondin motifs 1
AJ – adherens junction
Akt – also Protein kinase B (PKB)
APCMin – Adenomatous Polyposis Coli
multiple intestinal neoplasia mutated
B
BBB – blood-brain barrier
bFGF – basic fibroblast growth factor
BM – basement membrane
BS1 lectin – Bandeiraea simplicifolia lectin
BSA – bovine serum albumin
C
CCC – cytoplasmic cell adhesion complex
Cdk – cyclin-dependent kinase
cDNA – complementary DNA
Cldn – claudin
CPE – Clostridium perfringens enterotoxin
D
DAPI – 4',6-diamidino-2-phenylindole
DMEM – Dulbecco’s modified Eagle’s
medium
DS – Down’s Syndrome
DSCR1 – Down’s Syndrome critical region 1
DYRK1A – Dual specificity tyrosine-
phosphorylation-regulated kinase 1A
E
EC – Endothelial cell
ECM – extracellular matrix
EDTA – ethylenediaminetetraacetic acid
EGFR – epidermal growth factor receptor
EL1/2 – extracellular loop 1/2
Erg – v-ets avian erythroblastosis virus E26
oncogene related
ERK – extracellular signal-regulated kinase
ESAM – endothelial cell-selective adhesion
molecule
Ets2 – v-ets avian erythroblastosis virus E26
oncogene homolog 2
F
FACS – fluorescence-activated cell sorting
FAK – focal adhesion kinase
FCS – foetal calf serum
FFPE – formalin-fixed paraffin-embedded
FGFR – fibroblast growth factor receptor
FHHNC – Familial hypomagnesaemia with
hypercalciuria and nephrocalcinosis
FITC – fluorescein isothiocyanate
Flk1 – foetal liver kinase 1 (VEGFR2)
Flt1 – FMS-like tyrosine kinase 1
FN – fibronectin
G
GF – growth factor
GTPase – guanosine triphosphatase
H
HCl – hydrochloric acid
HCV – hepatitis C virus
HEPES – 4-(2-hydroxyethyl)-1-
piperazineethanesulfonic acid
HEK – human embryonic kidney
HIF – hypoxia inducible factor
HIV – human immunodeficiency virus
HRP – horseradish peroxidase
Hsa21 – Human chromosome 21
Hsc – heat shock cognate
HUVEC – human umbilical vein endothelial
cells
J
JAM – junctional adhesion molecule
K
KDR – kinase insert domain receptor
(VEGFR2)
- 219 -
L
LLC – Lewis lung carcinoma
LSM – laser scanning microscope
M
mAb – monoclonal antibody
MAPK – mitogen-activated protein kinase
MARVEL – MAL and related proteins for
vesicle trafficking and membrane link
MDCK – Madin Darby canine kidney cells
MEK – MAPK kinase (MAPKK)
miRNA – microRNA
MLEC – mouse lung endothelial cells
MMP – matrix metalloprotease
Mmu – Mus musculus chromosome
MRI – magnetic resonance imaging
MS – multiple sclerosis
MUPP – multiple PDZ domain containing
protein
N
NaCl – sodium chloride
NCAD – neural cadherin
NES – nuclear export signal
NFAT – Nuclear factor of activated T-cells
NISCH - Neonatal ichthyosis and sclerosing
cholangitis
NLS – nuclear localisation signal
NSD – not statistically different/no significant
difference
NT – no treatment
O
OCT – optimal cutting temperature embedding
medium
OMIM – Online Mendelian Inheritance In Man
P
PAL – palmitoyl
PAR – partitioning-defective
PAGE – polyacrylamide gel electrophoresis
PBS – phosphate-buffered saline
PCNA – proliferating cell nuclear antigen
PCR – polymerase chain reaction
PDGFB - platelet-derived growth factor B
PDGFRβ - platelet-derived growth factor
receptor beta
PDZ domain – from the 3 proteins: post
synaptic density protein (PSD95), Drosophila
disc large tumour suppressor (Dlg1), and
zonula occludens-1 protein (ZO-1)
PE – phycoerythrin
PECAM – platelet endothelial cell adhesion
molecule
PET – positron emission tomography
PFA – paraformaldehyde
PI3K – phosphatidylinositol-3-kinase
PKC – protein kinase C
PLCγ – phospholipase C gamma
PlGF – placenta growth factor
pMLEC – primary mouse lung endothelial cells
PMSF – phenylmethanesulfonylfluoride
Pttg1ip – pituitary tumour-transforming 1
interacting protein
R
RGD – Arginine-Glycine-Aspartate (amino
acid motif)
RIPA – radioimmunoprecipitation assay buffer
RISC – RNA-induced silencing complex
RNA – ribonucleic acid
RNAi – RNA interference
RNase – ribonuclease
RTK – tyrosine kinase receptor
RTKI – tyrosine kinase receptor inhibitor
S
Scr – scrambled
SEM – standard error of the mean
SH3 – Src homology 3 domain
siRNA – small interfering RNA
SMA – smooth muscle actin
Sumo3 – small ubiquitin-like modifier 3
T 220
TAM – tumour-associated macrophage
TAMPs – tight junction associated MARVEL proteins
TBE – Tris/Borate/EDTA
TEMED – tetramethylethylenediamine
TGFβ - transforming growth factor beta
TM – transmembrane
TJ – tight junction
TRITC – tetramethyl rhodamine isothiocyanate
TSP – thrombospondin
TUNEL – terminal deoxynucleotidyl transferase dUTP nick end labelling
U
UV – ultraviolet
V
VE-Cadherin/VECAD – vascular endothelial cadherin
VE-JAM – vascular endothelial junctional adhesion molecule (JAMB)
VEGF – vascular endothelial growth factor
VEGFR1/2/3 – vascular endothelial growth factor 1/2/3
VN – vitronectin
vSMC – vascular smooth muscle cell
vWF – von Willebrand factor
W
WT – wild-type
Z
ZO1 – zonula occludens 1
ZONAB – ZO-1 associated nucleic acid binding protein
221
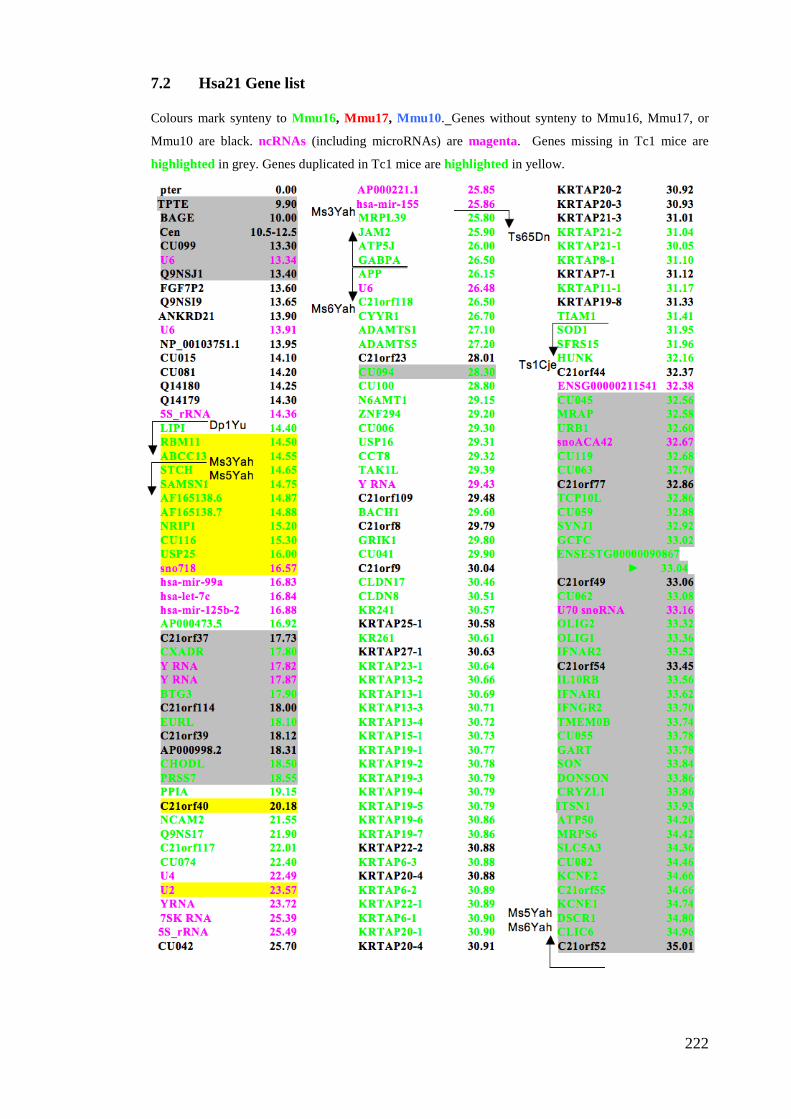
7.2 Hsa21 Gene list
Colours mark synteny to Mmu16, Mmu17, Mmu10. Genes without synteny to Mmu16, Mmu17, or
Mmu10 are black. ncRNAs (including microRNAs) are magenta. Genes missing in Tc1 mice are
highlighted in grey. Genes duplicated in Tc1 mice are highlighted in yellow.
222
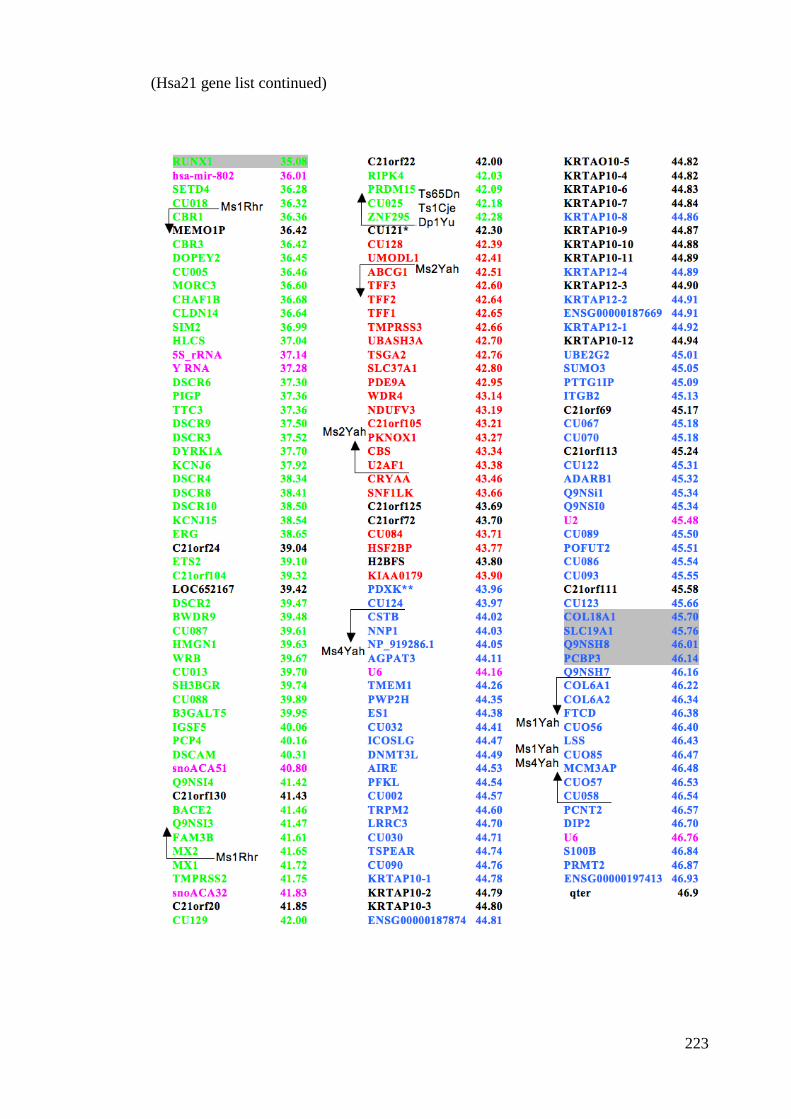
(Hsa21 gene list continued)
223
7.3 Publications
Two publications relating to my study are attached:
Reynolds L. E. et al. Tumour angiogenesis is reduced in the Tc1 mouse model of Down’s
syndrome. Nature (2010) 465, 813–817
Supplementary information:
http://www.nature.com/nature/journal/v465/n7299/abs/nature09106.html?lang=en#/su
pplementary-information
Baker M. et al. Use of the mouse aortic ring assay to study angiogenesis. Nature Protocols (2012) 7, 89–104
Supplementary information:
http://www.nature.com/nprot/journal/v7/n1/abs/nprot.2011.435.html#/supplementary-
information
Updated, 2015:
A further publication is available in the open-access journal PLOS ONE:
Baker M. et al. Stromal Claudin14-Heterozygosity, but Not Deletion, Increases
Tumour Blood Leakage without Affecting Tumour Growth (2013) DOI:
10.1371/journal.pone.0062516
http://journals.plos.org/plosone/article?id=10.1371/journal.pone.0062516
224
Related Documents