i INVESTIGATING THE EFFECTIVENESS OF PROBLEM-BASED LEARNING IN THE FURTHER MATHEMATICS CLASSROOMS by ALFRED OLUFEMI FATADE Submitted in accordance with the requirements for the degree of DOCTOR OF PHILOSOPHY IN MATHEMATICS, SCIENCE AND TECHNOLOGY EDUCATION - WITH SPECIALISATION IN MATHEMATICS EDUCATION at the UNIVERSITY OF SOUTH AFRICA PROMOTER: PROF. L. D. MOGARI JOINT PROMOTER: PROF. A. A. ARIGBABU NOVEMBER 2012

Welcome message from author
This document is posted to help you gain knowledge. Please leave a comment to let me know what you think about it! Share it to your friends and learn new things together.
Transcript

i
INVESTIGATING THE EFFECTIVENESS OF PROBLEM-BASED LEARNING IN
THE FURTHER MATHEMATICS CLASSROOMS
by
ALFRED OLUFEMI FATADE
Submitted in accordance with the requirements
for the degree of
DOCTOR OF PHILOSOPHY
IN MATHEMATICS, SCIENCE AND TECHNOLOGY EDUCATION
- WITH SPECIALISATION IN MATHEMATICS EDUCATION
at the
UNIVERSITY OF SOUTH AFRICA
PROMOTER: PROF. L. D. MOGARI
JOINT PROMOTER: PROF. A. A. ARIGBABU
NOVEMBER 2012
ii
ABSTRACT The study investigated the effectiveness of Problem-based learning (PBL) in the Further
Mathematics classrooms in Nigeria within the blueprint of pre-test-post-test non-equivalent
control group quasi-experimental design. The target population consisted of all Further
Mathematics students in the Senior Secondary School year one in Ijebu division of Ogun
State, Nigeria. Using purposive and simple random sampling techniques, two schools were
selected from eight schools that were taking Further Mathematics. One school was randomly
assigned as the experimental while the other as the control school. Intact classes were used
and in all, 96 students participated in the study (42 in the experimental group taught by the
researcher with the PBL and 54 in the control group taught by the regular Further
Mathematics teacher using the Traditional Method (TM)).
Four research questions and four research hypotheses were raised, answered, and tested in the
study. Four research instruments namely pre-test manipulated at two levels: Researcher-
Designed Test (RDT) (r = 0.87) and Teacher- Made Test (TMT) (r = 0.88); post-test
manipulated at two levels: RDT and TMT; pre-treatment survey of Students Beliefs about
Further Mathematics Questionnaire (SBFMQ) (r = 0.86); and post-treatment survey of
SBFMQ were developed for the study. The study lasted thirteen weeks (three weeks for pilot
study and ten weeks for main study) and data collected were analysed using Mean, Standard
deviation, Independent Samples t-test statistic, and Analysis of Variance.
Results showed that there were statistically significant differences in the mean post-test
achievement scores on TMT (t=-3.58, p<0.05), mean post-test achievement scores on RDT
(t=-5.92, p<0.05) and mean post-treatment scores on SBFMQ (t=-6.22, p<0.05) between
students exposed to the PBL and those exposed to the TM, all in favour of the PBL group.
Results also revealed that there was statistically significant difference in the post-test
achievement scores on TMT at knowledge (t= -23.97, p<0.05) and application (t= -11.41,
p<0.05) but not at comprehension (t= -0.50, p>0.05, ns) levels of cognition between students
exposed to the PBL and the TM.
Based on the results, the study recommended that the PBL should be adopted as alternative
instructional strategy to the TM in enhancing meaningful learning in Further Mathematics

iii
classrooms and efforts should be made to integrate the philosophy of PBL into the pre-service
teachers’ curriculum at the teacher-preparation institutions in Nigeria.

iv
DECLARATION
I declare that ‘Investigating the effectiveness of problem-based learning in Further
Mathematics classrooms’ is my own work and that all the sources that I have used or
quoted have been acknowledged by means of complete references
SIGNATURE DATE
Revd A. O. Fatade
30th November, 2012

v
ACKNOWLEDGEMENTS
I sincerely give all honour and praises to the eternal God, rock of ages, immortal,
invisible and the only wise God for strengthening and sustaining me to complete this
programme successfully.
I express my appreciation to my dear late Promoter, Prof. Lovemore J. Nyaumwe who
passed on to glory in June 2012. His sense of duty and devotion, thoroughness in
painstakingly going through the thesis word-by-word, page by page and chapter by
chapter is highly commendable. May the Lord in His infinite mercy comfort, soothing,
provide and support the wife and children he left behind and may his soul find peace in
the bossom of the Lord Almighty.
I acknowledge the timely intervention of Prof. David Mogari who stood in the gap
created by the demise of Prof. Nyaumwe and despite his tight schedule found it
worthwhile to help me out of the lock-jam. May the God of Heaven and Earth reward
him abundantly, Amen.
I also appreciate the efforts and sacrifice of my Joint Promoter, Prof. Abayomi A.
Arigbabu, Dean College of Science and Information Technology (TASUED) who is
resident here in Nigeria. His unflinching support cognitively and encouragement saw this
research work to a logical end. I cannot forget the positive role played by, Prof. Harrison
Atagana, Director of ISTE, Prof. D.C.J. Wessels (my second promoter), Prof. Jeanne
Kriek, both of ISTE, Dr M. Kolawole Onasanya, and Dr. Adeneye O. A. Awofala of
University of Lagos, Nigeria.
I want to acknowledge with thanks the various roles played by the following
personalities in Pretoria that will remain permanently engraved in my memory: Bukky
Ojo, Segun Ajigini, The Aregbesolas, Segun Adeyefa, Faleye, Maggi Mokolabi, Dapo
Adewunmi, Prof. Meschach B. Ogunniyi and a host of others
I express my heartfelt and sincere appreciation to my dearest wife and loving children
for their absolute understanding, good and moral behaviour and endurance while I was
far away in Pretoria. My wife took charge of the church, my role at Scripture Union,
nuclear and extended family apart from her own job. I appreciate it all.
vi
I thank all my brothers and sisters including Tunde Lemo, Deputy Governor (Operations)
Central Bank of Nigeria, Reuben Sogaolu, Wale Oludiya, Idowu Olaogun, Olalere
Abass, Olumuyiwa Alaba, Emmanuel Oyekanlu and a host of others for their spiritual
and moral support.
I am more than grateful to the management of Tai Solarin University of Education under
the good leadership of the then Vice-Chancellor, Prof. Olukayode O. Oyesiku for
granting me the approval to spend six months out of my accumulated leave for my
programme in South Africa. I cannot forget to appreciate the moral support given to me
by Prof. Segun Awonusi, my new Vice-Chancellor and the management team. God bless
you all.
To my colleagues in the Department of Mathematics and College of Science and
Information Technology, Mr, Dele Sogbesan for the language editing, and University in
general, I thank you all.

vii
DEDICATION
To my creator, the all-knowing GOD, the unchangeable changer, the unmovable mover,
unshakeable shaker, who preserved and sustained my life and the entire household in
actualizing my lifelong dream.

viii
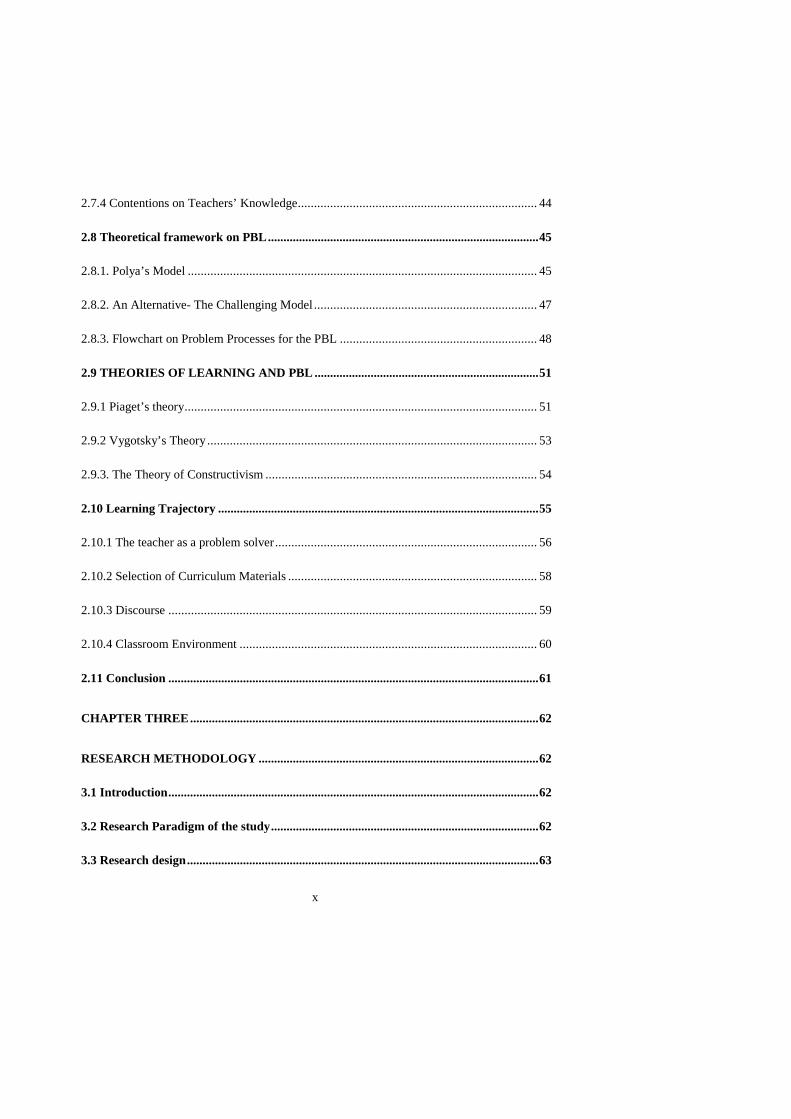
TABLE OF CONTENTS
ABSTRACT ............................................................................................................................. II
DECLARATION.................................................................................................................... IV
ACKNOWLEDGEMENTS .................................................................................................... V
DEDICATION....................................................................................................................... VII
TABLE OF CONTENTS ................................................................................................... VIII
LIST OF TABLES ............................................................................................................. XVII
LIST OF FIGURES ............................................................................................................ XIX
CHAPTER ONE ....................................................................................................................... 1
INTRODUCTION..................................................................................................................... 1
1.1 Background ......................................................................................................................... 1
1.1.1 Nature of Further Mathematics ...................................................................................... 9
1.1.2.1 Content of the New Senior Secondary (SS) Further Mathematics Curriculum ... 10
1.1.3 Categorising Mathematics Teaching Approaches ......................................................... 12
1.1.4 Context of PBL Further Mathematics Classroom Practice ............................................ 15
1.1.5 Bloom Taxonomy versus TIMSS Taxonomy ............................................................... 19
1.2 Problem Statement............................................................................................................ 20
ix
1.3 Motivation for the study ................................................................................................... 21
1.4 Aims of the study ............................................................................................................... 22
1.5 Research questions ............................................................................................................ 23
1.6 Research hypotheses ......................................................................................................... 23
1.7 Significance of the study ................................................................................................... 24
1.8 Scope and limitation of the study .................................................................................... 25
1.9 Definition of terms ............................................................................................................ 25
1.10 Structure of the thesis ..................................................................................................... 25
CHAPTER TWO .................................................................................................................... 28
LITERATURE REVIEW ...................................................................................................... 28
2.1 Introduction ....................................................................................................................... 28
2.2 Conceptual analysis of PBL ............................................................................................. 28
2.3 Students’ mathematical beliefs and achievements ......................................................... 31
2.4 Differences between PBL and PROBLEM-SOLVING ................................................. 32
2.5 Case studies on successful stories of PBL ....................................................................... 34
2.6 Advantages and challenges of PBL ................................................................................. 36
2.7 Pedagogical discourse ....................................................................................................... 38
2.7.1 Different Components of Mathematics Teachers’ Knowledge ..................................... 39
2.7.2 Shulman’s Submissions on Teachers’ Knowledge ....................................................... 41
2.7.3 Submissions of Ball and Associates on Teachers’ Knowledge ..................................... 43
x
2.7.4 Contentions on Teachers’ Knowledge .......................................................................... 44
2.8 Theoretical framework on PBL ....................................................................................... 45
2.8.1. Polya’s Model ............................................................................................................ 45
2.8.2. An Alternative- The Challenging Model ..................................................................... 47
2.8.3. Flowchart on Problem Processes for the PBL ............................................................. 48
2.9 THEORIES OF LEARNING AND PBL ........................................................................ 51
2.9.1 Piaget’s theory ............................................................................................................. 51
2.9.2 Vygotsky’s Theory ...................................................................................................... 53
2.9.3. The Theory of Constructivism .................................................................................... 54
2.10 Learning Trajectory ....................................................................................................... 55
2.10.1 The teacher as a problem solver ................................................................................. 56
2.10.2 Selection of Curriculum Materials ............................................................................. 58
2.10.3 Discourse .................................................................................................................. 59
2.10.4 Classroom Environment ............................................................................................ 60
2.11 Conclusion ....................................................................................................................... 61
CHAPTER THREE ................................................................................................................ 62
RESEARCH METHODOLOGY .......................................................................................... 62
3.1 Introduction ....................................................................................................................... 62
3.2 Research Paradigm of the study ...................................................................................... 62
3.3 Research design ................................................................................................................. 63

xi
3.4 Sources of data .................................................................................................................. 66
3.4.1 Population ................................................................................................................... 66
3.4.2 Sample and sampling method ...................................................................................... 67
3.5 The research instruments ................................................................................................. 68
3.5.1 Researcher- Designed Test (RDT) ............................................................................... 69
3.5.2 Teacher-Made Test (TMT) ....................................................................................... 70
3.5.3 Students’ Beliefs about Further Mathematics Questionnaire (SBFMQ) ...................... 74
3.6 Procedure for data collection ........................................................................................... 75
3.7 Validity and reliability of research instruments ............................................................ 80
3.7.1 Content validity of the RDT and TMT ......................................................................... 80
3.7.2 Construct validity of SBFMQ ...................................................................................... 82
3.7.3 Reliability of RDT, TMT and SBFMQ ........................................................................ 82
3.8 Data analysis and interpretation ..................................................................................... 86
3.9 Limitations of the study .................................................................................................... 87
CHAPTER FOUR ................................................................................................................... 88
PRESENTATION OF RESULTS ......................................................................................... 88
4.1. Introduction ...................................................................................................................... 88
4.2. Results of Students in the TMT, RDT and SBFMQ before the Intervention ............ 89
4.2.1.1 Analysis of students’ detailed workings on the TMT pre-test .................................... 90
4.2.2. Results of Students in the RDT before the Intervention ............................................... 93

xii
4.2.3. Pre-treatment Questionnaire ....................................................................................... 98
4.3. Results of Students in the TMT, RDT and SBFMQ after the Intervention ............. 102
Figure 4.3b. Script of experimental group student for question four on post-test TMT ........ 105
4.3.2. Results of Students in the RDT after the Intervention ............................................... 105
4.3.3. Post-treatment questionnaire ..................................................................................... 108
4.4 Impact of the intervention on achievements in and beliefs about Further
Mathematics ................................................................................................................... 112
4.4.1a Research question one ............................................................................................. 113
4.4.1b Research hypothesis one .......................................................................................... 113
4.4.2a. Research question two ............................................................................................ 114
4.4.2b. Research hypothesis two ......................................................................................... 115
4.4.3a. Research question three .......................................................................................... 116
4.4.3b. Research hypothesis three ....................................................................................... 116
4.5. Analysis of post-test TMT scores (Segregated into the Lower-order Cognitive
Domain of Bloom taxonomy) ........................................................................................ 117
4.5.1. TMT post-test scores in the knowledge domain of Bloom’s Taxonomy .................... 118
4.5.2. TMT Post-test scores in the comprehension domain of Bloom’s Taxonomy ............. 119
4.5.3. TMT post-test scores in the application domain of Bloom’s Taxonomy .................... 120
4.6 Impact of the intervention on the lower-order cognitive domain of Bloom’s
Taxonomy in the TMT post-test ................................................................................... 121
4.6.1a Research question four ............................................................................................. 121
4.6.1b Research hypothesis four ......................................................................................... 122

xiii
4.7. Summary of the chapter ................................................................................................ 124
CHAPTER FIVE .................................................................................................................. 126
SUMMARY OF THE STUDY, DISCUSSION, CONCLUSION AND
RECOMMENDATIONS ...................................................................................................... 126
5.1 Introduction ..................................................................................................................... 126
5.2 Summary of the study ..................................................................................................... 126
5.3 Discussion of results ........................................................................................................ 127
5.3.1a Research question one ............................................................................................. 127
5.3.1b Research hypothesis one .......................................................................................... 127
5.3.2a Research question two ............................................................................................. 128
5.3.2b Research hypothesis two .......................................................................................... 128
5.3.3a Research question three ........................................................................................... 130
5.3.3b Research hypothesis three ........................................................................................ 130
5.3.4a Research question four ............................................................................................. 132
5.3.4b Research hypothesis four ......................................................................................... 132
5.4. Implications of the findings ........................................................................................... 133
5.7 Suggestions for further studies ...................................................................................... 136
REFERENCES ...................................................................................................................... 137
APPENDICES ....................................................................................................................... 164
Teaching specific topics in Senior Secondary year one further mathematics class ........ 171

xiv
Teaching of Indices and Logarithms using Traditional Method .......................................... 171
Teaching of Indices and Logarithms using PBL Approach ................................................. 173
Teaching of Algebraic Equations using Traditional Method ............................................... 174
Teaching of Algebraic Equations using PBL Approach ...................................................... 175
xv
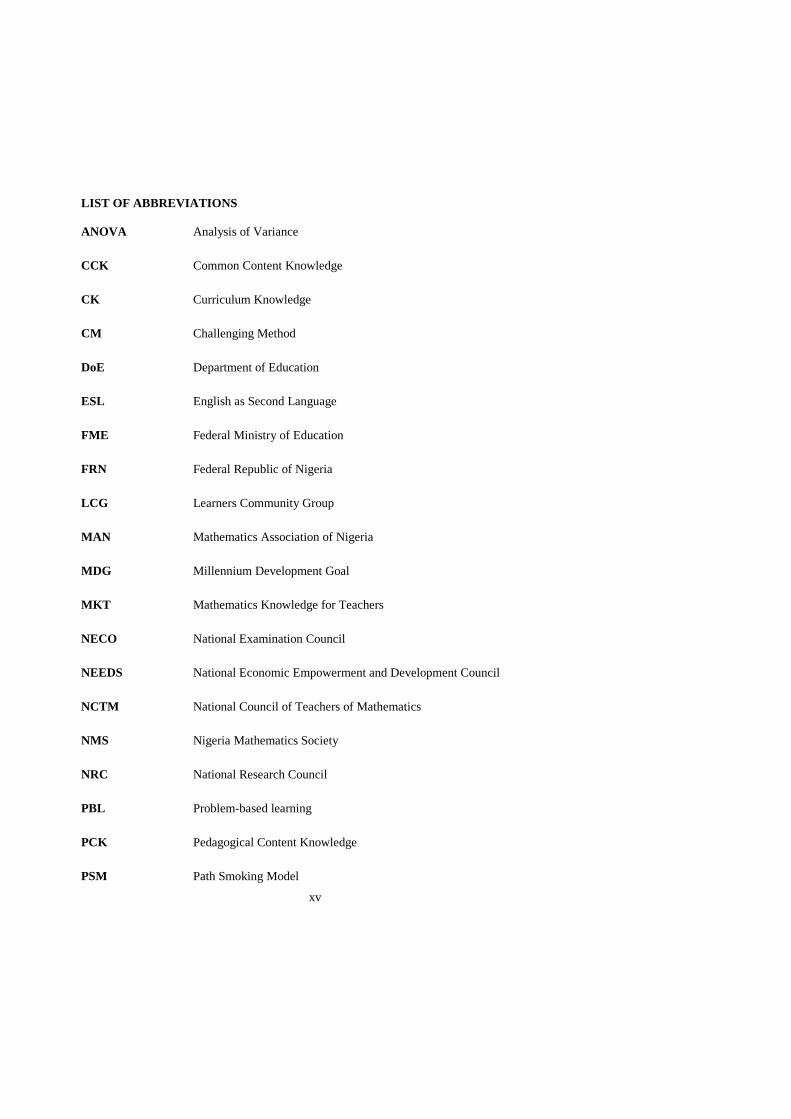
LIST OF ABBREVIATIONS ANOVA Analysis of Variance
CCK Common Content Knowledge
CK Curriculum Knowledge
CM Challenging Method
DoE Department of Education
ESL English as Second Language
FME Federal Ministry of Education
FRN Federal Republic of Nigeria
LCG Learners Community Group
MAN Mathematics Association of Nigeria
MDG Millennium Development Goal
MKT Mathematics Knowledge for Teachers
NECO National Examination Council
NEEDS National Economic Empowerment and Development Council
NCTM National Council of Teachers of Mathematics
NMS Nigeria Mathematics Society
NRC National Research Council
PBL Problem-based learning
PCK Pedagogical Content Knowledge
PSM Path Smoking Model

xvi
RDT Researcher Designed Test
RME Realistic Mathematics Education
SBFMQ Students Beliefs about Further Mathematics
SCK Subject Content Knowledge
SPAIN Successful-Pictoria-Algorithms-Illgebraic-Numeric
SS Senior Secondary
STAN Science Teachers Association of Nigeria
TIMMS Third International Mathematics and Science Study
TM Traditional Method
TMT Teacher Made Test
UBEP Universal Basic Education Programme
UTME Unified Tertiary Matriculation Examination
WAEC West African Examination Council
WASSCE West African Senior School Certificate Examination
xvii
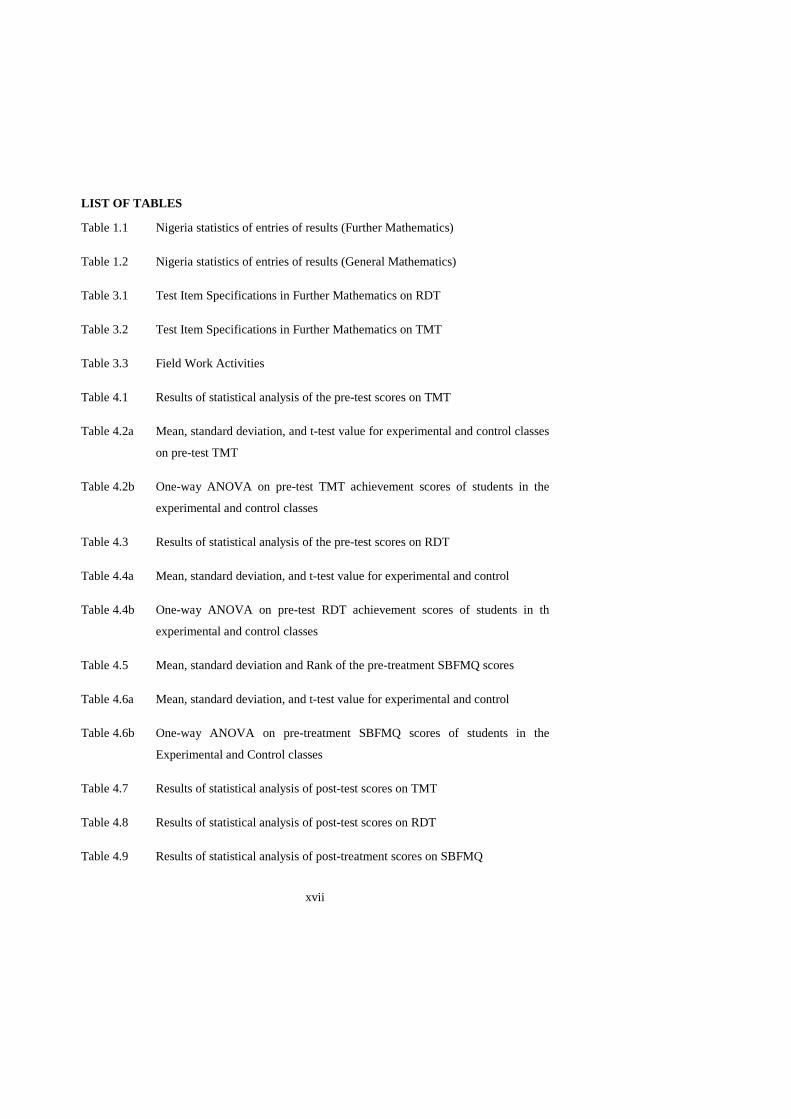
LIST OF TABLES
Table 1.1 Nigeria statistics of entries of results (Further Mathematics)
Table 1.2 Nigeria statistics of entries of results (General Mathematics)
Table 3.1 Test Item Specifications in Further Mathematics on RDT
Table 3.2 Test Item Specifications in Further Mathematics on TMT
Table 3.3 Field Work Activities
Table 4.1 Results of statistical analysis of the pre-test scores on TMT
Table 4.2a Mean, standard deviation, and t-test value for experimental and control classes
on pre-test TMT
Table 4.2b One-way ANOVA on pre-test TMT achievement scores of students in the
experimental and control classes
Table 4.3 Results of statistical analysis of the pre-test scores on RDT
Table 4.4a Mean, standard deviation, and t-test value for experimental and control
Table 4.4b One-way ANOVA on pre-test RDT achievement scores of students in th
experimental and control classes
Table 4.5 Mean, standard deviation and Rank of the pre-treatment SBFMQ scores
Table 4.6a Mean, standard deviation, and t-test value for experimental and control
Table 4.6b One-way ANOVA on pre-treatment SBFMQ scores of students in the
Experimental and Control classes
Table 4.7 Results of statistical analysis of post-test scores on TMT
Table 4.8 Results of statistical analysis of post-test scores on RDT
Table 4.9 Results of statistical analysis of post-treatment scores on SBFMQ
xviii
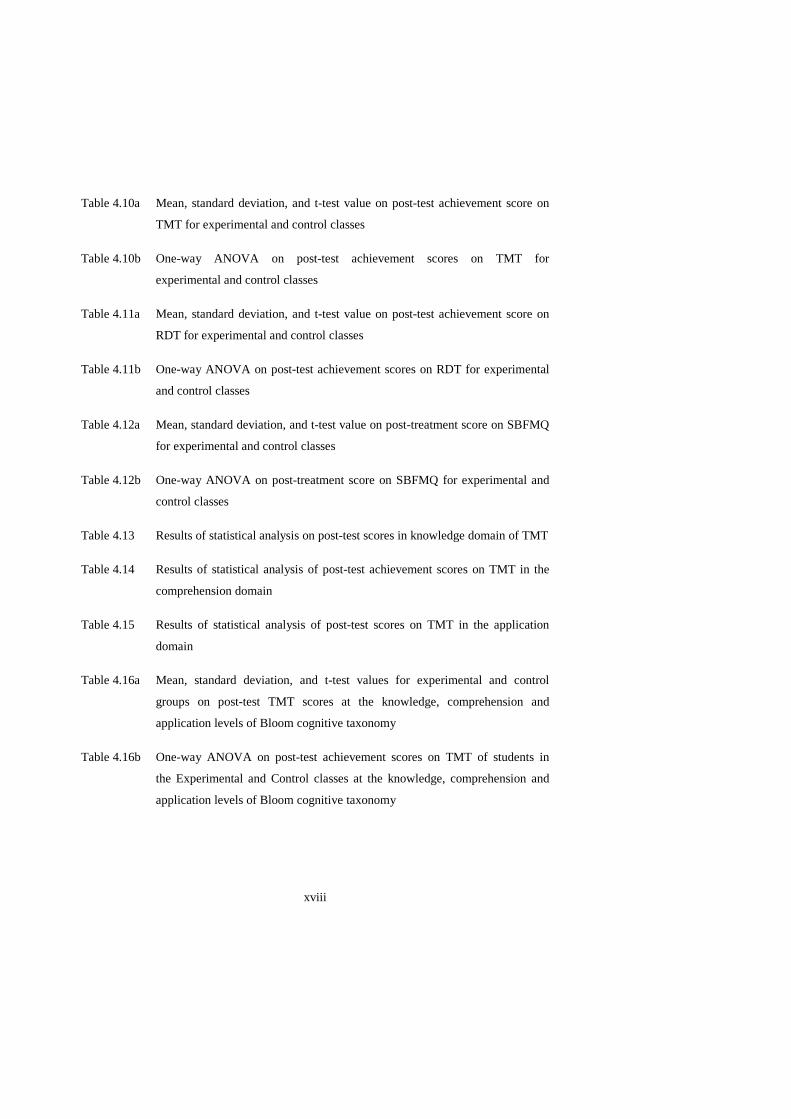
Table 4.10a Mean, standard deviation, and t-test value on post-test achievement score on
TMT for experimental and control classes
Table 4.10b One-way ANOVA on post-test achievement scores on TMT for
experimental and control classes
Table 4.11a Mean, standard deviation, and t-test value on post-test achievement score on
RDT for experimental and control classes
Table 4.11b One-way ANOVA on post-test achievement scores on RDT for experimental
and control classes
Table 4.12a Mean, standard deviation, and t-test value on post-treatment score on SBFMQ
for experimental and control classes
Table 4.12b One-way ANOVA on post-treatment score on SBFMQ for experimental and
control classes
Table 4.13 Results of statistical analysis on post-test scores in knowledge domain of TMT
Table 4.14 Results of statistical analysis of post-test achievement scores on TMT in the
comprehension domain
Table 4.15 Results of statistical analysis of post-test scores on TMT in the application
domain
Table 4.16a Mean, standard deviation, and t-test values for experimental and control
groups on post-test TMT scores at the knowledge, comprehension and
application levels of Bloom cognitive taxonomy
Table 4.16b One-way ANOVA on post-test achievement scores on TMT of students in
the Experimental and Control classes at the knowledge, comprehension and
application levels of Bloom cognitive taxonomy

xix
LIST OF FIGURES
Figure 2.1 The iterative nature of flowchart construction
Figure 2.2 Projectile Path
Figure 4.1a Script of control group student for question one on pre-test TMT
Figure 4.1b Script of experimental group student for question one on pre-test TMT
Figure 4.2a Script of control group student for question three on pre-test RDT
Figure 4.2b Script of experimental group student for question three on pre-test RDT
Figure 4.3a Script of control group student for question four on post-test TMT
Figure 4.3b Script of experimental group student for question four on post-test TMT
Figure 4.4a Script of control group student for question one on post-test RDT
Figure 4.4b Script of experimental group student for question one on post-test RDT

1
CHAPTER ONE
INTRODUCTION
In this chapter the introduction, orientation and background to the study are discussed. In
addition, the motivation, problem statement, research questions, hypotheses, significance of
the study and the aims of the study are clearly stated. Statistics of student entries and results
at the West African Senior School Certificate Examination (WASSCE) in Mathematics and
Further Mathematics over a period of (1991-2010) and (1996-2010) respectively are included
to reflect students’ performance in Mathematics and Further Mathematics. The curriculum
goals and expectations, examination format and duration were all explained in this chapter.
1.1 Background
Much of the failure in school Mathematics is associated with a tradition of teaching that is
inappropriate to the way most students learn (National Research Council (NRC), 1989). The
ineffective teaching and learning of Mathematics due to the traditional method of teaching
that has dominated the classroom worldwide has been associated with the dismal
performances of students in Mathematics (Van de Walle, 2007; Kifer in Dossey, McCrone,
Giordano & Weir, 2002). Traditional methods of teaching Mathematics have been found to
be very defective and full of many inadequacies that do not allow students to actively
construct their own mathematical knowledge (Tall, 1991; Mji, 2003). It has adversely
affected effective learning at the different levels of education. Education is facing many
challenges in terms of student performance particularly in the physical sciences (DoE, 2006).
The introduction of new topics to the Mathematics curriculum and topics that teachers
perceive as difficult to teach are part of the challenges (DoE, 2006).
The performances of students in Mathematics at both internal and external examinations have
remained low in many countries (Van de Walt & Maree, 2007) including Nigeria. In Lesotho,
at the Junior Certificate (J. C.) and the Cambridge Overseas School Certificate (COSC)
levels, the number of students that obtained grades A through C in Mathematics were less
than 10% (MOET, 2003). The Southern African Consortium for Monitoring Educational
Quality (SACMEQ) Survey of sixth grade primary school students’ performance in Reading
and Mathematics conducted across 15 South and East African countries indicated that
2
Lesotho’s mean score for Mathematics was below the SACMEQ average (Ratsatsi, 2005). In
Namibia, the low performance of students raises national concern amongst curriculum
developers, policy makers and even politicians each year. In the Primary and Secondary
schools in the northern regions of Namibia, teacher shortages persisted especially in
Mathematics, Science and English which made the level of teaching in these subjects very
poor (Beukes, Visagie, & Kasanda, 2007). In South Africa, when apartheid ended,
Mathematics was not offered and taken by learners in all schools. It was taught as an abstract,
meaningless subject, only to be memorised (Khuzwayo, 2005). In Nigeria, 23.5% of the total
number of candidates that sat for the Senior School Certificate Examination obtained a credit
pass in Mathematics and English Language at the West African Senior School Certificate
Examination (WASSCE) in 2008 while 25.99% obtained it in 2009. In May/June 2011,
540,250 candidates representing 38.2% of the 1,587,630 that sat for the examination,
obtained credits and above in Mathematics (The Guardian Nigeria Newspaper, 2011). Thus,
61.8% of the candidates failed the Mathematics examination.
The observed annual poor performance of students in Mathematics at these external
examinations necessitates the concern of everyone who works in the mathematical sciences to
find lasting solutions to this dilemma. Research-based strategies for helping students come to
know Mathematics and be confident in their ability to do the subject are on daily increase
(Sungur & Tekkaya, 2006) and the need for teachers to shift from traditional method of
teaching to a learner-centred approach is inevitable (NCTM, 2005). The recognition of the
need for reform in Mathematics curriculum and instruction is broad and deep, ranging from
professional organizations to government agencies. Currently, the dominant method of
teaching Mathematics involves the rote learning of algorithms for solving a limited range of
exercises (Van de Walle, 2007). The textbooks that nurture this method are repetitive and
uninspiring in their content and the students who are its victims are generally unable to
transfer their skills from the textbook exercises to problems of the real world.
Enormous reactions (Hestenes, Wells & Swackhamer, 1995) emanated from the above
approach of teaching Mathematics and the reaction focuses attention on its major
weaknesses, urging the development of relevance, application, modeling and problem
solving. Some of the weaknesses of the traditional method are that teachers’ focus is
primarily on getting answers. Students depend on the teacher to determine the validity of

3
their answers. Learners with this background are of the view that Mathematics is a series of
arbitrary rules, emanating from the teacher. These follow-the-rules, computation-dominated,
answer-oriented view of Mathematics is a gross distortion of what Mathematics is really
about (Van de Walle, 2007). The approach cannot be exciting to the learners. Few learners
are good at learning rules and strive to obtain good grades but are not necessarily the thinkers
in the classroom. The traditional system rewards the learning of rules but offers little
opportunity actually to do Mathematics.
According to Hiebert & Stigler (2004), one factor that is found in international studies which
characterizes higher performing countries is the use of cognitively demanding tasks and
having students engage in critical thinking and reasoning. Clarke (1997) remarked that the
call for reform draws its impetus from two main areas: (i) the changing needs of citizens for
effective participation in an increasingly technological and global society, and (ii) increased
research knowledge about the teaching and learning of Mathematics. Curriculum reforms
have been taking place in various countries across the world; countries like Australia, China,
Singapore, United States and United Kingdom are known to have altered their systems of
education (Huang, 2004).
In Nigeria, the federal government reform in education, the need to attain the Millennium
Development Goals (MDGs), and the critical targets of the National Economic
Empowerment and Development Strategy (NEEDS) provided the needed impetus to review
and re-align the existing curricula for senior secondary school to fit into the reform
programme (NERDC, 2008). The Nigerian Educational Research and Development Council
(NERDC), on the directive of the National Council on Education carried out the overhauling
of the existing curricula and Mathematics became one of the five cross-cutting core subjects
while Further Mathematics became a core subject in the Science/Mathematics field of study.
One unique thing about the current curriculum reform in Nigeria is the advocacy for a
learner-centred approach to instruction in schools.
The Professional Standards for Teaching Mathematics assert that teachers must shift from a
teacher-centred to a child-centred approach in their instruction (Van de Walle, 2007). The
path towards the shift and reform is the adoption of modern methods of teaching whose focus
is on students sharpening their problem-solving abilities, as well as their abilities to reason,

4
communicate, connect ideas, and shift among representations of mathematical concepts and
ideas (Dossey et al., 2002). Adler (1997) described participatory-inquiry approach as one of
the alternative modern methods to the traditional method of teaching. Participatory-inquiry is
a structured learner-centred strategy in which multiple perspectives are sought through a
process of group inquiry within the context of helping learners organise their thinking in
solving problems. Clarke (2004) described another modern method of teaching and called it
Kikan-Shido, meaning, “walking between desks instruction” in Japanese. Kikan-Shido is a
classroom strategy that organizes Mathematics instructions around problem solving activities
and affords students more opportunities to think critically, present their creative ideas and
communicate with peers mathematically (Hiebert, Carpenter, Fennema, Fuson, Human,
Murray, Olivier, & Weane, 1996). Problem-based learning (PBL) possesses some of the
features in the participatory-inquiry and walking between desks instruction approaches as
discussed by both Adler and Clarke and in addition has the learning trajectory that made it
unique among other modern methods (Kyeong Ha, 2003).
The erroneous belief in traditional approaches is that everybody can teach using pre-
determined chalk & talk methods. Teachers who attended teachers’ preparation institutions
can only understand teaching methods and teaching as a complex endeavour. Teachers’
personal beliefs and theories about Mathematics and the teaching and learning of
Mathematics are widely considered to play a central role in their teaching practices (Handal
& Herrington, 2003). Beliefs are seen as what participants provided as suitable responses to
open ‘I believe’ statements (Perry, Way, & Southwell, 2005). Literature on beliefs revealed
an area of considerable complexity (McLeod, 1992), that results in disagreement over
whether beliefs are expressions of knowledge or opinions and whether beliefs belong to the
cognitive or to the affective domain (Schuck & Grootenber, 2004). Beliefs play a very
important role in cognitive process especially in the domain of learning and knowing
particularly in Mathematics (De Corte & Opt Eynde, 2003). Schoenfeld (1983) states that
beliefs system drives the students’ behaviour in solving Mathematics problems. Mason
(2003) noted that students could fail when they were needed to elaborate on the nature of the
Mathematics discipline regardless that they were good in procedural Mathematics
understanding. The beliefs students’ holds about Mathematics are important factors in the
learning process. Researchers have noted that students’ beliefs affect their ability to learn
Mathematics (McLeod, 1992). The NCTM (2000) emphasized the need to help students learn

5
to value Mathematics and develop self-confidence in doing Mathematics. For example, if
students are often frustrated when they attempt to solve story problems they are likely to
believe that they cannot solve story problems, and they will carry this belief through many
years of schooling. These students may not even attempt to solve story problems when they
encounter them on class tests or standardized examination. Students who are not provided
opportunities to experience Mathematics outside the classroom may believe that Mathematics
is unimportant and will be bored and disinterested in the class.
These students are likely to pay less attention in class, which may severely hamper their
learning. Some students believe that Mathematics is about techniques for solving those
mysterious equations or other obscure problems. They believe Mathematics is about
memorizing techniques and formulas (Dossey et al., 2002). Mathematics is perceived by
other students as useful in routine tasks, such as doing simple calculations at the store,
balancing a checkbook, or measuring a room to fit a carpet. Others believe they cannot learn
Mathematics, while some believe that they can. Teacher’s beliefs in students’ ability affect
the student’s beliefs. Kenny & Silver (1997) showed that teacher conceptions about students
influence the ways in which they interact with those students. The question is: Which one
comes first: how to teach or what to teach? This is a predicament, because it is a question
about teacher’s knowledge, which is instrumental for effective learning. Shulman (1987) has
formulated seven types of teacher’s knowledge of which ‘subject content knowledge’ is one.
Researchers like Brown & Borko (1992), Hallam & Ireson (2005) have established that the
others, like general pedagogical knowledge, curriculum knowledge, pedagogical content
knowledge, knowledge of learners and their characteristics are some of the attributes
expected of a teacher in an ideal PBL classroom. Others include knowledge of educational
contexts, knowledge of educational ends, purposes, values and their philosophical and
historical grounds.
However, Shulman (1986) distinguished among three categories of content knowledge,
namely subject matter knowledge, pedagogical content knowledge, and curricular knowledge,
and concluded that the three are inseparable for effective teaching. Other studies like
(Wilson’s in Szetela & Nicol, 1992) confirmed the impact of teachers’ content knowledge on
student learning. Gagné (1987) summarised the finding of a research to identify those
teachers’ behaviours and strategies most likely to lead to achievement gains among students.

6
The findings have been much more closely connected with the management of classrooms
than with the subtleties of content pedagogy. That is, the effective teaching principles deal
with making classrooms places where students can attend to instructional tasks, orient
themselves toward learning with a minimum of distraction and disruption and receive a fair
and adequate opportunity to learn. Prawat (1992) corroborated the above and added that
across several teacher effectiveness studies, consistent relationships emerged. Teachers who
were more effective in producing gains in student achievement were organised, minimised
student disruptions by monitoring behaviour, and enforced rules in a consistent manner.
Effective teachers programmed their instruction to ensure success. They proceeded through
the material in small, quickly grasped steps and carefully asked questions that engendered
short correct answers. Azuma in Prawat (1992) terms this approach, predominant in
American education, the “quick and snappy” method of conducting lessons. He contrasts it
with lessons in Japan, which he characterizes as “sticky and probing”. Rather than moving
briskly, Japanese teachers linger over topics encouraging students to examine important
concepts from a variety of perspectives (Azuma in Prawat, 1992).
Research on educational effectiveness often investigates the importance of what is going on
in the classroom with respect to cognitive and non-cognitive outcomes. Factors such as the
quality of teaching, time on task, opportunity to learn (content covered), effective learning
time, classroom management, classroom climate, and relationships within the classroom have
not only often been included as promising explanatory variables in models about learning and
educational effectiveness, but their relevance has also regularly been much in educational
effectiveness research (Opdenaker, 2006). This is in agreement with NCTM principles and
standards on reform and shift. Educational researchers like Sungur & Tekkaya (2006),
Hallam & Ireson (2005) seem to agree with the idea that, among other factors, the teacher ’s
teaching style has some impact on student learning and the perceptions students develop
about science learning and the work of scientists. In particular, Sungur & Tekkaya (2006)
advocated the use of PBL as an instructional strategy to enhance students’ performance in
both the cognitive and non-cognitive outcomes.
Efforts have been concentrated on students’ performances in Mathematics for some years;
there is however little or no research carried out on the effectiveness of PBL in Further
Mathematics in Nigeria. The PBL is one of the modern methods of teaching that allows each

7
learner to construct his/her own schema. The PBL Mathematics classroom focuses on
problem-solving and conceptual understanding rather than on computational drill. It also
promotes students’ confidence in their own mathematical abilities (Schifter & Fosnot, 1993).
The PBL classroom is no longer dominated by the fetish of the “one right way”- the teachers’
way, the textbooks’ way- to solve a problem but has become a community where members
explore Mathematics problems together. A Problem-based learning classroom is one that
could be called learners’ community classroom. In this community, learners engage in
discourse, dialogue and work in groups. Opportunity is given to each member of the
community to express his/her ideas during the lesson. The teacher gives open-ended
questions and tasks that allow multiple entries to solving the problems. Teachers in a PBL
classroom do not appear to possess solutions to problems. Evidence suggests that the high
attrition rate in most physical science subjects and concomitant poor performance in the
subjects at the senior secondary school level could be reduced to the barest minimum with the
implementation of the PBL (Abraham, Ramnarayan, Bincy, Indira, Girija, Suvarna, Devi,
Lakshminarayana, Mamot, Jamil, & Haripin, (2012).; Burch, Sikakana, Yeld, Seggie &
Schmidt, 2007).
This study is against the backdrop of increased high annual percentage of students that fail
Mathematics and Further Mathematics (see section 1.9) in Nigeria at the West African Senior
School Certificate Examination (WASSCE). Many factors could have being responsible for
the students high failure rate in these subjects such as parents, students, teachers, government,
among others. The researcher however sought to examine teachers’ method of approach in
the Further Mathematics classroom. Table 1.1 illustrates the awful performance of candidates
in the West African Senior School Certificate Examination in Further Mathematics over a
period of 15 years.

8
Table 1.1. Nigeria statistics of entries & results (Further-Mathematics) YEAR TOTAL
ENTRIES NO PRESENT FOR EXAM.
NO. WITH CREDIT & ABOVE (%)
NO. FAILED(%)
1996 8758 6884 1578 (22.9) 5306 (77.1) 1997 10594 8618 1339 (15.5) 7279 (84.5) 1998 10571 8128 1290 (15.9) 6838 (84.1) 1999 12481 9684 2230 (23.0) 7454 (77.0) 2000 9292 7431 1724 (23.2) 5707 (76.8) 2001 37060 21978 2910 (13.2) 19068 (86.8) 2002 41852 22797 3926 (17.2) 18871 (82.8) 2003 30768 18520 3336 (18.1) 15194 (81.9) 2004 2005 2006 2007 2008 2009 2010
18618 29998 35208 40115 41699 44719 43543
12385 24385 28733 33021 35155 38233 37502
3518 (28.4) 7212 (29.6) 12552 (43.7) 9750 (29.5) 13293 (37.8) 11952 (31.3) 13829 (36.9)
8867 (71.6) 17173 (70.4) 16181 (56.3) 23271 (70.5) 21862 (62.2) 26281 (68.7) 23673 (73.1)
Source: Test Development Division West African Examinations Council (WAEC, 2011), Yaba, Lagos.
This appalling performance of candidates in externally conducted examination is not
restricted only to Further Mathematics as evidence suggests a dismal performance of
candidates in the West African Senior School Certificate Examination in Mathematics over a
period of 20 years (1991-2010) as indicated in Table 1.2 below.
9
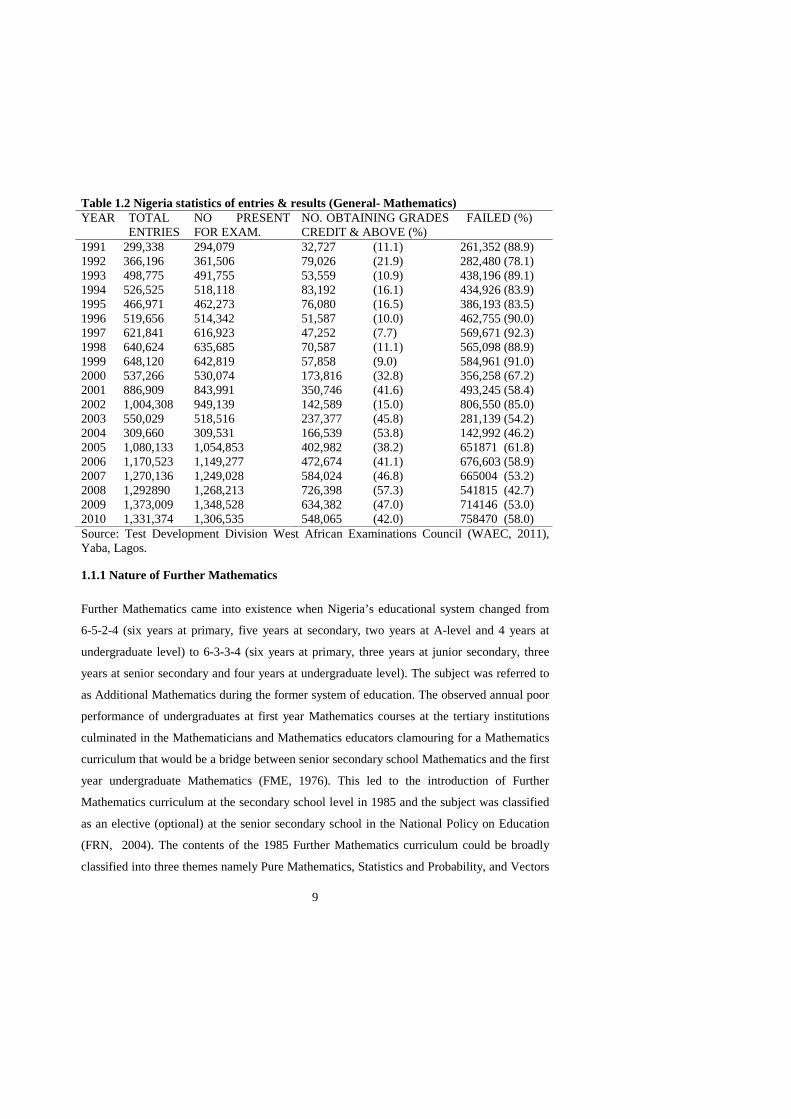
Table 1.2 Nigeria statistics of entries & results (General- Mathematics) YEAR TOTAL
ENTRIES NO PRESENT FOR EXAM.
NO. OBTAINING GRADES CREDIT & ABOVE (%)
FAILED (%)
1991 299,338 294,079 32,727 (11.1) 261,352 (88.9) 1992 366,196 361,506 79,026 (21.9) 282,480 (78.1) 1993 498,775 491,755 53,559 (10.9) 438,196 (89.1) 1994 526,525 518,118 83,192 (16.1) 434,926 (83.9) 1995 466,971 462,273 76,080 (16.5) 386,193 (83.5) 1996 519,656 514,342 51,587 (10.0) 462,755 (90.0) 1997 621,841 616,923 47,252 (7.7) 569,671 (92.3) 1998 640,624 635,685 70,587 (11.1) 565,098 (88.9) 1999 648,120 642,819 57,858 (9.0) 584,961 (91.0) 2000 537,266 530,074 173,816 (32.8) 356,258 (67.2) 2001 886,909 843,991 350,746 (41.6) 493,245 (58.4) 2002 1,004,308 949,139 142,589 (15.0) 806,550 (85.0) 2003 550,029 518,516 237,377 (45.8) 281,139 (54.2) 2004 2005 2006 2007 2008 2009 2010
309,660 1,080,133 1,170,523 1,270,136 1,292890 1,373,009 1,331,374
309,531 1,054,853 1,149,277 1,249,028 1,268,213 1,348,528 1,306,535
166,539 (53.8) 402,982 (38.2) 472,674 (41.1) 584,024 (46.8) 726,398 (57.3) 634,382 (47.0) 548,065 (42.0)
142,992 (46.2) 651871 (61.8) 676,603 (58.9) 665004 (53.2) 541815 (42.7) 714146 (53.0) 758470 (58.0)
Source: Test Development Division West African Examinations Council (WAEC, 2011), Yaba, Lagos.
1.1.1 Nature of Further Mathematics
Further Mathematics came into existence when Nigeria’s educational system changed from
6-5-2-4 (six years at primary, five years at secondary, two years at A-level and 4 years at
undergraduate level) to 6-3-3-4 (six years at primary, three years at junior secondary, three
years at senior secondary and four years at undergraduate level). The subject was referred to
as Additional Mathematics during the former system of education. The observed annual poor
performance of undergraduates at first year Mathematics courses at the tertiary institutions
culminated in the Mathematicians and Mathematics educators clamouring for a Mathematics
curriculum that would be a bridge between senior secondary school Mathematics and the first
year undergraduate Mathematics (FME, 1976). This led to the introduction of Further
Mathematics curriculum at the secondary school level in 1985 and the subject was classified
as an elective (optional) at the senior secondary school in the National Policy on Education
(FRN, 2004). The contents of the 1985 Further Mathematics curriculum could be broadly
classified into three themes namely Pure Mathematics, Statistics and Probability, and Vectors
10
and Mechanics. This curriculum was in use in the country for over two and a half decades
without any meaningful review. The new Senior Secondary School Further Mathematics
curriculum whose implementation started in September 2011 with the first set of graduates
from the nine-year Basic Education Curriculum was a product of the reform initiatives of the
Federal Government of Nigeria under the auspices of the Nigerian Educational Research and
Development Council. This think tank of the Nigeria education carefully reviewed and re-
aligned the old Further Mathematics curriculum with inputs from the teachers in the field to
fit into the current education reform in the country. This new curriculum was planned to
enable Senior Secondary School graduates cope with first year undergraduate Mathematics
and Mathematics related courses. Unfortunately, students’ enrolment in the subject has been
very poor (cf. Tables 1.1 and 1.2).
1.1.2.1 Content of the New Senior Secondary (SS) Further Mathematics Curriculum
The years at the Senior Secondary School are from SS year one to SS year three. The new
curriculum which is spiral in nature was prepared to ensure continuity and flow of themes,
topics and experiences from Senior Secondary year one to Senior Secondary year three. The
new curriculum reflects depth, appropriateness, and interrelatedness of the curricula contents.
The new curriculum pays particular attention to the achievement of the Millennium
Development Goals (MDGs) and the critical elements of the National Economic
Empowerment and Development Strategies (NEEDS). The new curriculum represents the
total experiences to which all learners must be exposed; the contents, performance objectives,
activities for both teachers and learners, teaching and learning materials and evaluation guide
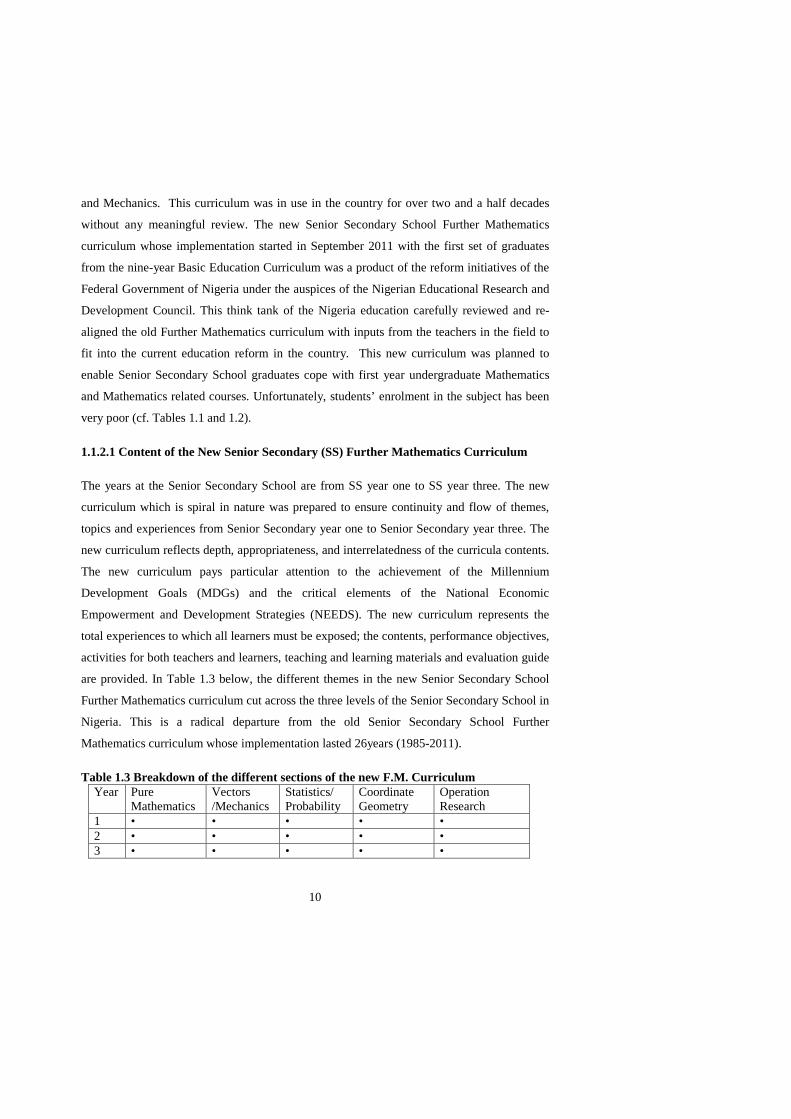
are provided. In Table 1.3 below, the different themes in the new Senior Secondary School
Further Mathematics curriculum cut across the three levels of the Senior Secondary School in
Nigeria. This is a radical departure from the old Senior Secondary School Further
Mathematics curriculum whose implementation lasted 26years (1985-2011).
Table 1.3 Breakdown of the different sections of the new F.M. Curriculum Year Pure
Mathematics Vectors /Mechanics
Statistics/ Probability
Coordinate Geometry
Operation Research
1 • • • • • 2 • • • • • 3 • • • • •

11
1.1.2.2 Further Mathematics Examination Format for years 2008-2012
The examination comprised two papers, both of which must be taken.
PAPER 1: (Objective) - 1hr 30minutes (50 marks)
This usually contains forty multiple-choice questions, testing the areas common to the two
alternatives of the syllabus, made up of twenty-four from Pure Mathematics, eight from
Statistics and Probability and eight from Vectors and Mechanics. Candidates are expected to
attempt all the questions.
PAPER 2: (Essay) – 2hrs 30 minutes (100 marks)
This consists of two sections – (A and B).
SECTION A (48 MARKS) – Consists of eight compulsory questions that are elementary in
type, drawn from the areas common to both alternatives as for Paper 1 with four questions
drawn from Pure Mathematics, two from Statistics and Probability and two from Vectors and
Mechanics.
SECTION B (52 marks) - Consists of ten questions of greater length and difficulty,
consisting of three parts as follows.
PART I (PURE MATHEMATICS) -Four questions with two drawn from the
common areas of the syllabus and one from each of the alternatives X and Y.
PART II (STATISTICS AND PROBABILITY) – Four questions with two drawn
from common areas of the syllabus and one from alternative X.
PART III (VECTORS AND MECHANICS) – Three questions with two drawn from
common areas of the syllabus and one from alternative X.
Candidates are expected to answer any four questions with at least one from each part..
Legend: Alternative X questions shall be for candidates in Nigeria since the topics therein are
peculiar to Nigeria, while Alternative Y shall be for candidates in Ghana since the topics
therein are peculiar to Ghana,
12
(Extracted from the West African Examinations Council Regulations and Syllabuses for the
West African Senior School Certificate Examination (WASSCE, 2008 - 2012).
1.1.3 Categorising Mathematics Teaching Approaches
Although there are many teaching approaches known to educators and a plethora of new
scholarly articles on the subject, efforts are continually being made in this regard with the
hope of further enhancing students’ understanding and knowledge. This notwithstanding, the
various approaches could be categorised as teacher-centred, student-centred or subject-
centred.
1.1.3.1 Teacher – centred approach
The ‘traditional instructional mode’ is characterised by teacher-centred instruction where the
teacher is supposed mainly to explain procedures and give directions. Teacher-centred
focuses on teachers efforts in the classroom system. The curriculum, teaching and learning
process radiates around the teacher who uses force, commands, threats, shame and attacks
against the personal status of an individual. He remains rigid or inflexible and fails to admit
and recognise the psychological inevitability of individual differences. The teacher-
dominated class involves force or threats of force or of some other form of the expenditure of
energy against the learners. The dominative teacher behaviour however, does not allow him
to utilise new data, new information and new experience. She/he puts on an expression of
resistance to change. He is autocratic and dictatorial. Since learners are not carried along and
does not consider the varying abilities, interests, learning styles and readiness of the students,
she/he cannot achieve the desired learning outcome. The teacher is supposed mainly to
explain procedures and give directions while the students are expected to listen and
remember what the teacher says (Van de Walle, 2007).
The students are rarely allowed to explain their thoughts and reach a consensus on
mathematical ideas (Silver & Smith, 1996). Social interaction and communication among
classmates are not important to the teacher. The teacher is expected to take responsibility for
emphasising and preparing the Mathematics content, but not for making students’
experiences and reasoning about the content visible in a way that enables them to take
responsibility for their learning process (Hansson, 2010). Mok & Morris (2001) argue:
"...these descriptions fail to capture many salient features of pedagogy". Mok (2003) showed
13
in a later study that teacher-centred instruction in East Asian regions was characterised by a
conscious teacher intervention together with students active thinking moments. This is
however not the case from Nigeria experience. The teacher-centred approach, which is not
different from the traditional method of teaching known to be more prominent at both
primary and secondary levels of education and lecture method that is predominantly used at
tertiary institutions make students to be passive in the class (Mji, 2003). Students dislike for
Further Mathematics and attrition of students in the Further Mathematics classroom could be
gleaned from the total number of entries and the actual number of students that wrote the
Senior School Certificate Examination each year (cf. Tables 1.1 & 1.2).
1.1.3.2 Learner – centred approach
The learner-centred approach is also known as activity curriculum. Activity curriculum
consists of things to be done and not things to be known. In learner-centred or activity
curriculum, interest is focused on the growth of the learner through visible active experience.
Elements of this design are structured with the learners’ felt needs and interests in mind.
Learner-centred approach fixes the learner as the starting point, the centre and the end
(Hansson, 2010). The development and the growth of the learner is the ideal measure of
education. To the growth of the learner, all studies are subservient. They are valued
instruments as they serve the growth needs of the learner. Personality or character of the
learner is more than subject matter. Self-actualization of the individual learner is the desired
goal. The learner determines both the quality and quantity of the learning. Literature (NCTM,
2000) supports teachers’ shift to this approach as the idea that students construct their own
knowledge has been replaced by the idea that students should be responsible for their own
learning. This is one of the main attributes of the PBL approach.
For the teacher using this design, she/he is of the integrative behaviour, which is consistent
with the concept of growth and learning. The teacher behaviour makes the most of individual
learner differences, and advances the psychological processes of differentiation. She/he is
flexible, adaptive and scientific in his approach. The teacher behaviour is democratic. Her/his
indirect teaching approach consists of soliciting the opinions or ideas of learners, applying or
enlarging on those opinions or ideas, praising or encouraging the participation of students, or
clarifying and accepting their feelings. Educators have long recognised the critical need for
restructuring the teaching and learning processes and for helping students to become

14
independent thinkers, to explore complex problems, and to apply what they have learnt in
real-life situations (Jonassen, 1994).
1.1.3.3 Subject – centred approach
Curriculum could be organised in a way that focuses on the subject matter areas or fields and
it is referred to as ‘Subject-centred Curriculum’. In the subject-centred curriculum, the
subject matter furnishes the end and it determines methods. The teachers’ emphasis is on the
logical subdivisions of the subject matter. Problems of instruction are problems of procuring
texts giving logical parts and sequences and of presenting these portions in class in a similar,
definite and graded manner. The researcher is of the opinion that this approach on its own
could not bring about effective teaching and learning of Further Mathematics except other
components such as subject content and pedagogical content knowledge are taken into
consideration. This is in line with Shulman (1986) and Ball (2000) submissions that
possession of high subject content knowledge, pedagogical content knowledge and curricula
knowledge characterise an effective teacher. Several studies have attempted to assess the
mathematical competence of mathematics teachers (Harbour-Peters, 1991). The results have
consistently shown that Mathematics teachers do not have knowledge of Mathematics
expected as a prerequisite to effective teaching. In particular, Obioma (1992) investigated
how senior secondary Mathematics teachers assessed the difficulty levels of the Further
Mathematics contents. Construction, geometric proofs, locus, computers, analysis, vector
geometry and correlations were assessed as difficult to teach by the senior secondary school
teachers. This is worrisome, because construction, geometric proofs and locus are also
examined in the General Mathematics curriculum that is substantially lighter in content. This
approach requires the teacher’s ability to move from the world of life into the world of
symbols and moving within the world of symbols according to Freudenthal (1991) definitions
of horizontal and vertical mathematisation is that the teacher adopting this approach focuses
only on how the curricula contents will be covered within the stipulated time. PBL requires
more than this from the teacher for students to have thorough understanding.

15
1.1.4 Context of PBL Further Mathematics Classroom Practice
Generally, the situation in a PBL Mathematics classroom depicts what happens in a Further
Mathematics classroom. The discussion in this section is on the expected practices in a PBL
Further Mathematics classroom.
1.1.4.1 Further Mathematics Classroom Practice
According to Whitcomb, Borko, & Linston (2008), instructional practices in classroom
discourse include asking questions or posing problems to begin a discussion, monitoring
student participation during discussion and keeping the discussion on track. The researcher
queried and asked, "Are these instructional practices observed in Mathematics and Further
Mathematics classrooms in Nigeria? Presently, the answer is no. The present classroom
teaching was void of the above instructional practices. The researcher adopted the listed
instructional practices as outlined by Whitcomb et al. (2008) during the intervention period at
the experimental class. The traditional classroom teaching was used at the control schools.
Mathematics education has moved beyond series of arguments between the constructivists
and those that engage in didactic teaching (dichotomized thinking) to a broader appreciation
of the varied and complex roles in which effective teachers of Mathematics need to engage
(Lobato, Clarke, & Ellis, 2005). Boaler (2008) remarked that effective teaching of
Mathematics does not only involve the precise presentation of knowledge, it also involves
changing the ways children think, building on their current understandings, and addressing
any prior misconceptions. He concluded that one of the main contributions of the field of
Mathematics education research has been the development of an extensive knowledge base
documenting learners’ common conceptions and misconceptions in different Mathematics
domains.
Teacher-centred instruction which is generally understood to mean a teacher presenting
methods to students who watch, listen and then practice the methods is ill-favoured to experts
in Mathematics education and hence an unhealthy development to the learning of
Mathematics. The experts in Mathematics education now advocate student-centred
instruction, although this has received more varied definitions, generally implies an approach
in which learners are given opportunities to offer their own ideas and to become actively
involved in their learning (Sungur & Tekkaya, 2006). The use of learners’ community at the

16
experimental school during the intervention period by the researcher was a follow up to this
development.
The practices and atmosphere in the PBL Further Mathematics classroom focuses on
instructional responsibility both from knowledge generation and for how this responsibility
would end in instructional practice (Hansson, 2010). In the context of Mathematics classroom
practice, the construction of Mathematics knowledge lies with both students and teachers.
Teacher responsibility embraces both form of content that expresses how the Mathematics
instruction takes its responsibility for students’ Mathematics knowledge construction. For the
expected students’ communication and thinking to take place in the classroom, teachers have
the responsibility to arrange the instructional practice.
The mark of a brilliant teacher is not to make teaching brilliant but makes teaching to the
learners wonderfully simple. A lesson, for example, is not taught until it is learned; it cannot
be understood until the learners are actively involved in the teaching and learning process.
Researchers concluded that teachers in Mathematics education have tremendous authority,
and that this authority may have an impact on how students interact with the teacher and how
they approach Mathematics (Amit & Fried, 2005; Fried & Amit, 2003). They suggested that
teachers should use their authority to link together the private domain, which is distinguished
by reflections and deliberations, and the public domain, which is more distinguished by
precise use of standard notations and representations. Mok, Cai, & Fong Fung (2008) opined
that instructional responsibility should provide sufficient support for students’ mathematical
explorations, but not so much support that the teacher takes over the process of thinking from
the students. Mok et al. (2008) argued that the opportunity for learning depends significantly
on the nature of interaction generated in the classroom.
Results from Moschkovich (2002), Clarke & Xu (2008), Shayer & Adhamu (2007) among
others indicate that teachers need to take responsibility both for emphasising and preparing
the Mathematics content and for making students experiences and reasoning about the
content visible in a way that enables students to take responsibility for their process. The
context of classroom practise could not be classified as student-centred if a dimension of
instructional responsibility on how teachers deliver valid conditions for students’
Mathematics knowledge construction is lacking. It could also be misleading to characterise

17
classroom practise as teacher -centred if focus is not placed on the way teachers are initiating
students to construct their own knowledge. It is sufficed to state that instructional
responsibility could be present in both the teacher-and the student-centred instructional
modes (Hansson, 2010).
1.1.4.2 Didactical Analysis
The expected practices of a PBL Further Mathematics teacher could best be seen if it is
included in the curriculum of the pre-service teachers at the teacher-preparation institutions.
However, in-service teachers are at best introduced to these practices through long vacation
collaboration group teachings. They could also be made to watch video tapes of classroom
teachings as practised in Japan. The design of pre-service teacher training courses should be
based on a conceptualisation of the activities that the teacher has to do in order to promote
students’ learning and of the knowledge that is necessary to perform those activities. The
structuring of a cycle of these activities is called a Didactical analysis (Gómez & Rico, 2002).
Didactical analysis allows the teacher to examine and describe the complexity and multiple
meanings of the subject matter, and to design, select, implement and assess teaching/learning
activities. It is organised around four major areas: subject matter, cognitive, instruction and
performance. Identification of students’ knowledge for the subject matter and description of
the mathematical content from the viewpoint of its teaching and learning in school constitutes
the Didactical analysis cycle.
The subject matter analysis is a procedure that allows the pre-service teacher to identify and
organise the multiple meanings of a mathematical topic. This is based according to (Gómez et
al., 2006) on three aspects of any given topic such as its representations, conceptual structure
and phenomenology. The information from the subject matter and cognitive analysis allows
the teacher to carry out an instruction analysis: the analysis, comparison and selection of the
tasks that can be used in the design of the teaching and learning activities that will compose
the instruction in the class. In the performance analysis, the teacher observes, describes and
analyses students’ performance in order to produce better descriptions of their current
knowledge and review the planning in order to start a new cycle. Researchers like Brousseau
(1997) have earlier contributed to the current issues on expectations of a PBL teacher in a
Further Mathematics classroom. He qualifies PBL as not only learner-centred but also
problem-centred. He argued that the rules and the interaction in Mathematics -learning

18
environment come up in the didactic situation. He referred to this as the silent actor
(Hansson, 2010).
Brousseau propounded his theory of didactic situation to explain the interaction in a learning
environment involving some mathematics. According to Brousseau (1986, 1997) the social
axis represents the negotiation between teachers and the students. The didactical axis gives
the rules that regulate the interaction between actors in the learning context in terms of
responsibility of students and the teacher as it affects what they could, should or should not
do regarding mathematical knowledge. The adidactical axis explains the interaction between
students’ learning and subject-content. The teacher does not reveal to the students their
intention concerning the knowledge they have to construct. Students take on responsibility to
learn as teachers do not have the power to make the students learn in didactical situation. It is
however expected of the teacher to offer the conditions for the students to access the
knowledge. The teacher is therefore not absent as he has to ascertain that the students
understand the task they have to solve and what is expected in the situation. The teacher
interacts with both the students and the system constructed by the students and the learning
environment.
A teacher cannot enlighten the learners if the teacher is ignorant and could also not lift the
learners higher than himself. It is therefore important that the teacher-education period
should adequately equip the pre-service teacher to make a well-informed teacher. Nyaumwe
(2004) challenged teacher preparation institutions to design a pedagogy course that will
facilitate pre-service teachers to employ constructivist methods for teaching difficult concepts
in Further Mathematics. The real authority any teacher hearkens to is the authority of both the
contents and the pedagogy. Coupled with these is the knowledge of human behaviour and
learning. The true teacher should seek after knowledge about the local community and the
world outside and he has to stand foursquare for truth and knowledge. The didactical analysis
reasonably describes the expected practices in a PBL Further Mathematics classroom.
Although numerous studies on PBL emphasise giving ill-structured problems to students
(Speaking of Teaching, 2001; Chin& Chia, 2006; Karakas, 2008; Mahendru & Mahindru,
2011) none of these studies investigated the effects of PBL on students’
achievement/performance in the subject domain along the level of either Bloom or TIMSS
taxonomies.
19
1.1.5 Bloom Taxonomy versus TIMSS Taxonomy
In 1948, a committee of colleges led by Benjamin Bloom started the enquiry into the
classification of educational goals and objectives into three domains: Cognitive (mental
skills), Affective (growth in feelings or emotional areas-attitude); and Psychomotor (manual
or physical skills-skills) and completed their work in 1956. Although Bloom and his
associates worked on the three domains, much emphasis was given to the cognitive domain.
The resulting classification in the cognitive domain is now commonly referred to as Bloom’
Taxonomy of the Cognitive Domain. In Bloom taxonomy of the cognitive domain,
educational objectives can be arranged in a hierarchy starting from the simplest behaviour or
skill to the most complex and this provides a useful structure with which to categorise and
analyse test items (Simkin & Kuechler, 2005). The six levels in Bloom cognitive taxonomy
include: knowledge, comprehension, application, analysis, synthesis, and evaluation. The
Bloom taxonomy of the cognitive domain has undergone revision (Anderson & Krathwohl,
2001) and the revised version of Bloom’s taxonomy validated the original by mapping six
well researched cognitive processes to a set of knowledge levels derived directly from the
original taxonomy (Simkin & Kuechler, 2005).
One other taxonomy closely related to the Bloom taxonomy of the cognitive domain is the
TIMSS taxonomy. The TIMSS taxonomy outlines the skills and abilities associated with the
cognitive dimension. The cognitive dimension is divided into three domains based on what
students have to know and do when confronting the various items developed for the TIMSS
assessment. The first domain, knowing, covers facts, procedures, and concepts students need
to know, while the second domain, applying, focuses on the ability of the student to apply
knowledge and conceptual understanding in a problem situation. The third domain,
reasoning, goes beyond the solution of routine problems to encompass unfamiliar situations,
complex contexts, and multi-step problems (TIMSS, 2007). The three cognitive dimensions
in TIMSS taxonomy can be derived from the original Bloom’s taxonomy of the cognitive
domain. The first domain, knowing relates to the knowledge and comprehension domains in
the Bloom’s cognitive taxonomy. The second domain, applying relates to the application
domain while the third domain in TIMSS taxonomy relates to the analysis, synthesis, and
evaluation domains of Bloom’s cognitive taxonomy. The first three domains in the Bloom
20
cognitive taxonomy are termed the lower-order cognitive domains while the last three
domains are collectively referred to as the higher-order cognitive domains.
However, the Bloom’s cognitive taxonomy is chosen in this study for several reasons: First, it
is the most widely known (Simkin & Kuechler, 2005) and therefore, the most accessible to
senior secondary school students in Nigeria. Second, it is used in more prior (Simkin &
Kuechler, 2005) and current studies (Awofala, Fatade & Ola-Oluwa, 2012) than any other
taxonomy and this enables this work to be more easily compared to prior work. Third,
Bloom’s taxonomy is regarded as a stricter hierarchy than any other taxonomy (Krathworhl,
2002) with less overlap between levels. Finally, a hierarchical taxonomy has significant
benefits when proposing a domain-specific operationalisation for creating examinations
because each question that requires specific evidence of achievement is more precisely traced
to a specific level of understanding (Simkin & Kuechler, 2005). This study foreclosed the use
of TIMSS taxonomy because Nigeria is yet to join the leagues of nation participating in
TIMSS study. In this study, students were assessed using the TMT and the RDT. The TMT
reflected the true state of the test being conducted in a normal classroom setting in Nigeria
and senior secondary school students are expected to be well grounded on the lower-order
cognitive domain of the Bloom’s taxonomy whereas students are expected to display prowess
on the higher-order cognitive domain of the Bloom’s taxonomy at the tertiary levels in
Nigeria. The RDT was used in this study to assess students’ higher-order cognitive domain of
the Blooms’ taxonomy.
1.2 Problem Statement
The relatively low enrolment and general poor performance of students in Further
Mathematics at the Senior School Certificate Examinations in Nigeria are indications of and
invitation to serious future problems in producing skilled and knowledgeable engineers and
scientists in the country. Teachers’ poor method of teaching as earlier stated has been
identified as one of the major factors responsible for students’ low enrolment and poor
performances in Further Mathematics. The search for an enduring, appropriate and effective
method of teaching Further Mathematics is yet to be fruitful, and this constitutes a major
problem. This study therefore, seeks to investigate the effectiveness of PBL in Further
Mathematics in senior secondary school year one in Ogun State in Nigeria.
21
1.3 Motivation for the study
The problems of ineffective teaching and learning of Further Mathematics in Nigerian
secondary schools have eaten deep to the very foundation of the nation’s technological
growth and need urgent surgical operation. The current state of malaise in Mathematics and
Further Mathematics has to be discontinued; otherwise, the nation’s technological
development would be greatly impeded (Azuka, 2003). No doubt, Further Mathematics has
been engulfed in a web of implementation problems. Students are not interested in the subject
and most of the few qualified Mathematics graduate teachers are not willing to teach the
subject. Mathematics is the queen and bedrock of all the sciences and is the major pillar on
which the technological development of any nation rests (Fatade, Wessels & Arigbabu,
2011). If the pillar is adequately fortified, there will not be any collapse. Azuka (2003:20)
questioned:
Where lays the hope of our economic and technological development? How can Nigeria effectively realize her vision of economic and technological development, if the situation is not improved upon?
Nation building and economic growth is highly dependent on an efficient and effectively
improved technology. Nigeria being conscious of this fact stipulates in her National Policy
on Education (FRN, 2004) that admission into the Universities shall be in 60:40 in favour of
the sciences and 70:30 into the Polytechnics and Colleges of Technology in favour of the
Sciences and Technical and Vocational. Government projection could not be achieved as
many prospective science students failed to secure admission into Tertiary Institutions due to
their poor performances especially in Mathematics at the Unified Tertiary Matriculation
Examination (UTME). The Government is worried at the development as more liberal Arts
students find it easier to pass the UTME. Many students do not register for Further
Mathematics or attempt to attend the classes during their Senior Secondary School. Further
Mathematics topics are however included at the Mathematics questions that students have to
take at the UTME. The Government needs to urgently address the issue if the country aims at
economic and technological development.
The inexhaustible number of problems plaguing the different levels of education in Nigeria
with particular reference to teaching and learning of Further Mathematics at the senior
secondary school level should not be seen as an incurable ailment. The healing process will
Comment [T1]: Any difference between NPE 2004 and NERDC 2004. Consitency, pls

22
however be gradual and has to commence from the source. The source is no other place than
the very starting point of introducing Further Mathematics to students at the senior secondary
school and using effective instructional methods such as the PBL that can nurture students’
inquiry during lessons. Dalton (1985) opined that if we hope to prepare children to meet the
demands of tomorrow, we must not spoon-feed them with facts and instructions. It is an
invitation to mental unemployment. Children must learn to think for themselves, innovate,
create, and imagine alternative ways to get to the same goal, to seek and solve problems.
Mathematics is the key to open doors of opportunity as it is a critical filter to a variety of
prestigious career options. No longer just the language of science, mathematics now
contributes in direct and fundamental ways to business, finance, health and defence. For
students, it opens doors to careers. For citizens, it enables informed decisions. For nations, it
provides knowledge to compete in a technological and information driven economy. To
participate fully in the world of the future no nation can afford to lag behind in tapping the
power of mathematics (NRC, 1989). The importance of Further Mathematics could then be
better imagined. Teachers’ method of delivery apart from subject content at all levels of
education in Nigeria has been identified to be deficient and inadequate (FME, 2002). The
need to identify and adopt an efficient and pragmatic method of teaching that is learner-
centred is inevitable in the nation’s quest to increase students’ credit pass rate in Mathematics
and Further Mathematics at WASSCE.
Considering the scenario painted above, the need for research into the teaching and learning
of Further Mathematics is imperative. Hence, the present study focused on the effectiveness
of PBL in the Further Mathematics classroom.
1.4 Aims of the study
The researcher carried out this study to find out whether the use of the PBL approach in the
Further Mathematics classroom would have any significant effect on students’ general
achievement.
Specifically, the aims of the study were:
A. To investigate the effect of PBL approach on students’ achievements in Further
Mathematics.
23
B. To examine the impact of PBL approach on students’ beliefs about Further
Mathematics.
C. To determine the effectiveness of PBL approach on students’ achievement in TMT in
Further Mathematics along the lower-order cognitive level of Bloom’s taxonomy.
1.5 Research questions
The study provided Yes/No answers to the following research questions:
(i) Will there be any significant difference in the post-test achievement scores on
TMT between students exposed to the PBL and those exposed to the TM?
(ii) Will there be any significant difference between the post-test achievement
scores on RDT between students exposed to the PBL and those exposed to the
TM?
(iii) Will there be any significant difference in the post-treatment scores on
SBFMQ between students exposed to the PBL and those exposed to the TM?
(iv) Will there be any significant difference between the students’ achievement
scores in TMT post-test disaggregated into knowledge, comprehension and
application levels of cognition of Bloom’s taxonomy after being exposed to
the PBL and the TM?
1.6 Research hypotheses
The following null hypotheses were stated and tested at .05 level of significance in the study
Ho1: There is no significant difference in the post-test achievement scores on TMT between
students exposed to the PBL and those exposed to the TM.
Ho2: There is no significant difference in the post-test achievement scores on RDT between
students exposed to the PBL and those exposed to the TM.
Ho3: There is no significant difference in the post-treatment scores on SBFMQ between
students exposed to the PBL and those exposed to the TM.

24
Ho4: There is no significant difference between the students’ achievement scores in TMT post-
test disaggregated into knowledge, comprehension and application levels of cognition of
Bloom’s taxonomy after being exposed to the PBL and the TM.
1.7 Significance of the study
The Nigerian Government has invested huge amounts of money on the training of Primary
and Secondary school teachers on pedagogical content knowledge through National Teachers
Institute in collaboration with the office of the Millennium Development Goals. The
continuous training has not improved students’ performance at WASSCE. The need to try
other modern methods of teaching should be a welcome idea.
PBL approach offers teachers an opportunity to continue learning mathematics from outside
and within their practice. The findings and the results of this study have both educational and
research implications in the Nigerian education context. The effectiveness of PBL in this
study lies in the fact that it stimulates students’ level and ways of thinking. The method
allows students to make decisions of their own. It helps students to develop their ability to
frame and ask questions. PBL method makes students to be bold and convinced when a
solution is appropriate or not. It agitates the minds of the students via their experience to be
able to defend their discoveries; hence, the method stimulates their reasoning capability. The
method encourages discussion between and among the students. It promotes interpersonal
relationships among the students.
Head teachers of Primary schools, Principals, Classroom teachers of Secondary schools and
Ministry of Education officials might benefit from the findings of this study. They are all
regarded as contributors to the making of educational policies at one stage or the other.
Students annual poor performances in Mathematics and Further Mathematics at all the
external examinations in Nigeria is a national concern among curriculum developers, policy
makers, parents, teacher preparation institutions and the Government. It is the Government’s
responsibility through its agencies to recommend and provide enabling environment for the
implementation of any new method of teaching in all the schools.
The study is therefore significant in the sense that its findings might provide essential
baseline information and necessary ingredients to help address the problem of students’

25
attrition in Further Mathematics classroom. It could, indeed, be regarded as a contribution to
knowledge and as a way of assisting the Government of Nigeria to find a lasting solution to
the malaise of poor performance in Further Mathematics that has eaten deep into the very
foundation of Nigeria’s technological growth.
1.8 Scope and limitation of the study
The Federal Republic of Nigeria is made up of 36 states, which could be further categorized
into six geo-political zones, namely, North-West, North-East, North-Central, South-West,
South-East and South-South. The present study was limited to Ogun State in the South West
geo-political zone. Western education came to Nigeria through Ogun State in 1843. Ogun
State is thus classified as one of the educationally advantaged States in the country, and it has
become a reference point to other states in the area of education. It would have been ideal for
the study to cover the four divisions of the state but factors such as time, distance and the
need for the researcher to personally, handle the experimental class led to the decision to limit
the study to one State. The proximity of the researcher to the control and experimental
schools enhanced the administration of research instruments and, indeed, the feasibility of the
entire research.
1.9 Definition of terms
Effectiveness: is the capability of producing a desired result.
Problem-Based Learning (PBL): The PBL is one of the modern methods of teaching that
allows each learner to construct his/her own schema
Further Mathematics (FM): This is one of the subjects that students register for at the
Senior Secondary Schools, though it is classified as optional. Further Mathematics is different
from Mathematics in that the former encompasses the latter in addition to some rudiments of
tertiary mathematics such as calculus, matrices, vectors and mechanics.
1.10 Structure of the thesis
CHAPTER ONE: INTRODUCTION
In this chapter the introduction, orientation and background to the study are discussed. In
addition, the motivation, problem statement, research questions, research hypotheses,
26
significance of the study and the aims of the study are clearly stated. Statistics of student
entries and results at the West African Senior School Certificate Examination (WASSCE) in
Mathematics and Further Mathematics over a period 20 and 15 years are respectively
included to reflect the students’ performance in Mathematics and Further Mathematics. The
curriculum goals and expectations, examination format and duration are all explained in this
chapter.
CHAPTER TWO: LITERATURE REVIEW
In this chapter, the conceptual analysis of PBL is explained. The students’ mathematical
beliefs and achievements, differences between PBL and Problem-solving are discussed. Some
case studies on successful stories, advantages and challenges of the PBL are highlighted.
Pedagogical discourse on Subject-Content Knowledge (SCK), Pedagogical-Content
Knowledge (PCK) and Curricula-Knowledge (CK) are thoroughly explained. The teaching of
some specific topics in Senior Secondary School year one Further Mathematics curriculum is
demonstrated using the PBL and the TM. Lastly, Learning Trajectory and its criteria are
discussed.
CHAPTER THREE: RESEARCH METHODOLOGY
This section describes the methodology followed in addressing the research questions and
hypotheses. In this section, the research methodology/ paradigm, research design, population
and sample, the research instruments, procedure for data collection, data analysis and
interpretation, limitations of the study, and validity and reliability are discussed.
CHAPTER FOUR: PRESENTATION OF RESULTS
In the preceding chapter, the research methodology employed in the study was explained.
This chapter presents the results obtained in the main study in order to answer the research
questions that guided this study as stated in chapter one. The raw data from the field for pre-
and post- tests in both the experimental and control classes are analysed and summarised
using descriptive statistics of tables. Other relevant descriptive statistical tools such as the
mean and standard deviation obtained in the tests (TMT and RDT) and questionnaire
(SBFMQ) were used in the study. However, the summary of the results concludes the
chapter.

27
CHAPTER FIVE: SUMMARY OF THE STUDY, DISCUSSION, CONCLUSSION AND
RECOMMENDATIONS
The summary of major findings of the study is given in this chapter. Based on this,
suggestions and recommendations are made. The chapter concludes with suggestions for
future research in problem-based learning.
28
CHAPTER TWO
LITERATURE REVIEW
2.1 Introduction
In this chapter, the conceptual analysis of PBL is explained. Students’ mathematical beliefs
and achievements, differences between PBL and Problem-solving are discussed. Some case
studies on successful stories, advantages and challenges of PBL are highlighted. Pedagogical
discourse on Subject-Content Knowledge (SCK), Pedagogical-Content Knowledge (PCK)
and Curricula-Knowledge (CK) are thoroughly explained. The teaching of some specific
topics in the Senior Secondary School year one Further Mathematics curriculum is
demonstrated using PBL and TM. Lastly, the Learning Trajectory and its criteria are
discussed.
2.2 Conceptual analysis of PBL
There does not exist presently a universally accepted definition of PBL as researchers ascribe
varieties of definitions and meanings to it. For example, Simon & Schifter (1991) describe
PBL as an alternative pedagogy, a new paradigm of mathematics instruction, long in
gestation which has begun to find the support necessary to contest the old traditional method
of instruction. PBL is also a classroom strategy that organizes mathematics instructions
around problem solving activities and affords students more opportunities to think critically,
present their creative ideas and communicate with peers mathematically (Krulic & Rudnick,
1999; Hiebert et al., 1996, 1997; Kyeong Ha, 2003). Major (2001) defined PBL as an
educational approach in which complex problems serve as the context and the stimulus for
learning. The common denominator to the varieties of PBL definitions is that students
actively construct their own knowledge of mathematics. The current study adopts this notion
of PBL.
Problem-Based Learning (PBL) was first established as part of the education of physicians in
medical school at McMaster University, Hamilton, Ontario, Canada in the 1960s. Developed
by Howard Barrows, this strategy has grown into an instructional approach, which is finding
success in elementary through high school throughout the state of Illinois Mathematics and
Science Academy and beyond. PBL was originally developed out of the perceived need to

29
produce graduates who were prepared to deal with the information explosion, and who could
think critically and solve complex problems (Major, 2001). PBL is rooted in Dewey’s
“learning by doing and experiencing” principle (Dewey, 1938 in Hiebert et al., 1996). Dewey
advocated engaging the learner in everyday problems to facilitate learning. Hiebert et al.
(1996) proposed alternative principle by building on John Dewey’s idea of “reflective
inquiry” that curriculum and instruction be guided by the basic principle that students
problematize their subjects.
Smith (1997) described Hiebert et al. submission as a relatively narrow view of school
mathematics content. He remarked that while they are correct to argue that topics
traditionally taught in routine and uninteresting ways can be problematized, their implicit
view of content is inconsistent with the problematizing process itself. He stated further that if
students are encouraged to engage in that process seriously and articulate what they find
interesting and problematic, and do not expect to be assigned problems to solve, their
interests would inevitably lead them to ponder a much richer and wider range of
mathematical ideas. Problematizing, according to Hiebert et al. (1996) if pursued seriously,
will burst the boundaries of the traditional school mathematics curriculum. To problematize
is to “wonder why things are, to inquire, to search for solutions, and to resolve incongruities”.
When students problematize mathematics, they become “engaged in genuine problem
solving” and find, present and discuss “alternative solution methods”. Whether tasks become
“problematic” and engaging, there emphasis depends more on how teachers and students treat
them than on their source e.g. ‘‘real–life situations”. Hiebert et al. (1996) admitted that the
principle in mathematics fits under the umbrella of problem solving, but their own
interpretation differs from many problem-solving approaches.
Educational and Professional schools also began to feel many of the same needs as medical
schools, so they began to adopt the approach as well, although in different forms, such as
hybrid PBL, and traditional curricula and course-by course models; again the approach
spread to institutions around the world (Boud & Feletti, 1991). A search for a change from
the traditional method of teaching resulted in the National Council of Teachers of
Mathematics (NCTM) adopting a veritable pragmatic alternative method for effective
teaching and learning of mathematics, which incorporates the characteristics of PBL (NCTM,
2000). PBL is an active learning approach which enables students to become aware of and
30
determine his/her problem solving ability and learning needs, to learn how to learn, to be able
to make knowledge operative and to perform group works “in the face of real life problems”
(Akinoglu &Tandogan, 2007). Hence, the current study sought to determine its effectiveness
in the learning of Further Mathematics in Nigeria.
Literature reveals that studies have focused on the use of PBL model in primary education,
secondary and post-secondary education by the 1980s (Duch, Gallagher, Kaptan, &
Korkmaz, in Akinoglu & Tandogan, 2007). In the current study, PBL was used in secondary
school education. The PBL approach is a learning model which centres on students, develops
active learning, problem-solving skills and field knowledge, and is based on understanding
and problem-solving (Major, 2001). The PBL model turns the student from a passive
information recipient to an active, free self-learner and problem solver, and it slides the
emphasis of educational programme from teaching to learning. This model enables students
to learn new knowledge by facing him/her with the problems to be solved, instead of
burdened contents (Ndlovu, 2008). The PBL teaching approach is at present not in vogue in
the Nigerian educational system. Teachers in Nigeria, as in other countries in the world hold
beliefs that the traditional method of teaching is ineffective and highly unproductive
(Awodeyi, 2003) in teaching curricular contents. The students are exposed to the curriculum
that is more theoretical than practical (Azuka, 2003) thereby resulting into teachers adopting
instructional strategies that are largely traditional. Most times students find themselves
memorising mathematics formulae for passing examinations. Students do not immediately
realize the applications of what they are taught and find it difficult to conceptualise the topics
being taught, not to talk of the applications (Mji, 2003).
An enabling environment for the implementation of the PBL approach is yet to be put on
ground by Government and stakeholders in the Nigerian education. . This might be due,
among other reasons, to acute shortage of teaching facilities, textbooks written with PBL
focus, orientation, and teachers that are trained in the PBL pedagogical approach.
Government has made some efforts to address the problem of ineffective teaching methods
being used in our classrooms. One of such efforts is the Second Primary Education Project
(PEP II) and Teaching and Learning Studies. Under PEP II, the Universal Basic Education
Programme (UBEP) carried out a number of activities across the country to improve the
quality of teaching and learning in primary schools. Two types of research activities were
31
undertaken that would contribute to improvement in the content and management of teacher
education and training. These are; (a) national surveys of teachers and teacher education
programme, and (b) action research and development activities in classrooms and across
school clusters (UBEC, 2002). Participatory method of approach was planned for the use of
the project. PBL, however accommodates this method and still possesses other features that
can enhance effective teaching and learning of Further Mathematics.
2.3 Students’ mathematical beliefs and achievements
Research on beliefs dates a long way back. Beliefs are paramount, given that they can
generate psychological domains of behaviour. In the same way, belief about Mathematics can
determine how one chooses to mentally construct the whole idea of Mathematics. Beliefs are
personal principles, constructed from experience that an individual employs often
unconsciously to interpret new experiences and information and to guide action (Pajares,
1992). Cobb (1986) defined beliefs as an individual personal assumption about the nature of
reality. The importance of beliefs in the life of a student is stressed again because these
assumptions constitute the goal-oriented activity. Beliefs play a significant role in directing
human’s perceptions and behaviour. In learning environments, students’ belief might
propagate the idea for achievements and smoothness of learning. The current study focused
on the impact of PBL on learners’ beliefs. In the Mathematics learning process, students’
beliefs about the nature of Mathematics and factors related to the learning are two
components that always concern Mathematics educators. Fennema & Sherman (1978)
reported that middle school and high school students who achieved higher scores on tests of
mathematical achievement perceived Mathematics to be more useful than lower-achieving
students did. Schreiber (2000) studied attributions associated with successful achievement
and found that the more a student believed that success in Mathematics was caused by natural
ability, the higher the test score.
Several researchers (Amarto & Watson, 2003; Chick, 2002; Morris, 2001) have reported that
pre-service teachers do not always have the conceptual understanding of the mathematics
content they will be expected to teach. Alridge & Bobis (2001) reported a change in beliefs
about Mathematics towards a more utilitarian and problem solving perspective because of a
university education programme. Schuck and Grootenboer (2004) stated that research ‘on the
beliefs of student teachers has found that prospective primary school teachers generally hold
32
beliefs about mathematics that prevent them from teaching mathematics that empower
children’. House (2006) conducted a study to compare the relationship of mathematics beliefs
and achievement of elementary school students in Japan and the United States based on the
Third International Mathematics and Science Study (TIMSS). The study revealed that
students in Japan scored above the International averages.
Chen & Zimmerman (2007) compared the mathematical beliefs between American and
Taiwanese and found that the Taiwanese students surpassed the American students in
mathematics achievement. Their result supported the TIMSS (1995) report on the
International comparison of the two countries. Chen and Zimmerman (2007) concluded that
there were more similarities in mathematics beliefs regarding mathematical competence of
Taiwanese and American students. The results of the study showed that students from both
countries have undistinguishable beliefs in the difficulty level of mathematics questions
especially the easy and difficult mathematics items. De Corte & Op’t Eynde (2003)
conducted a research on mathematics beliefs among Belgium secondary school students and
the findings showed that most students believed that mathematics was an interesting
discipline to be learnt. They also found that there was a significant difference among students
in terms of their mathematics ability.
2.4 Differences between PBL and PROBLEM-SOLVING
PBL as the name connotes starts with a problem to be solved and students working in a PBL
environment must become skilled in problem solving, creative thinking and critical thinking
(Kyeong Ha, 2003). One way to widen students’ perspectives and to encourage deep learning
is to stimulate class discussion face to face. Effective discussions have the potential to guide
and motivate students, and provide a safe and conducive environment for learning and
communication exchange. An opening question that encourages higher order thinking will set
the tone for the rest of the discussion. The richest discussions are those that open up
participants’ minds to many possibilities rather than close them down to a right or wrong
answer. These are some of the attributes of PBL. Mathematics is to be taught through
problem solving and problem-based tasks or activities are the vehicles by which the desired
curriculum is developed (Van de Walle, 2007). The learning is an outcome of the problem-
solving process. Hence, the interest in this study was to determine whether PBL could
improve the students’ problem solving performance.
33
Problem solving is not a spectator sport, nor is it necessarily the matching of acquired
knowledge to new situations but a searching for a solution by actions that seem appropriate
(Simmons, 1993). Problem solving, according to Blum et al (1989) simply refers to the entire
process of dealing with a problem, pure or applied in attempting to solve it. In mathematics
education, problem solving is considered in two ways, (i) as an object of research on issues
such as; how is problem solving related to other aspects of thinking mathematically. (ii) In
relation to mathematics instruction, where issues concerning the inclusion and
implementation of problem solving in mathematics curricula addressed. Applied problems
which can also be referred to as, a real problem situation has to be simplified, idealised,
structured and be made more precise by the solver according to his/her interest.
Wigley (1992) described two models for teaching and learning that were used in the
classroom in his article titled ‘Models for Mathematics Teaching’. One was called The Path
Smoking Model (PSM) and the other was called an Alternative-the Challenging Model (CM).
While the PSM ensures that, the syllabus is covered quickly and its teachers use it to help
students achieve success in public examinations; the CM asserts that the understanding of the
Mathematics is more important than examination success. The CM allows students build on
their understanding of Mathematics through discussions and strategic problem solving. In
CM teachers’ role is not to teach but to support and present initial challenges for the students
to build on their mathematical knowledge. Realistic Mathematics Education and Diagnostic
teaching are two approaches to teaching and learning that made use of the Challenging Model
features. These two approaches allow students to understand mathematics for themselves
through problem solving and allow teachers to take a step back and observe the learning
process.
In summary, the PBL is a classroom strategy that organizes mathematics instructions around
problem solving activities and affords students more opportunities to think critically, present
their creative ideas and communicate with peers mathematically. Problem solving, according
to Blum et al. (1989) simply refers to the entire process of dealing with a problem, pure or
applied in attempting to solve it. However, RME is one of the approaches to teaching and
learning that allows students to understand mathematics for themselves through problem
solving and allows teachers to take a step back and observe the learning process.

34
2.5 Case studies on successful stories of PBL
The researcher investigated from literature the extent to which problem-based learning
approach has been used in the teaching of mathematics to students at various levels of
education. Considerable literature on PBL dates in the nineties. For example, Gallagher,
Stepian, Sher & Workman (1995) study on PBL in science classrooms found that PBL
creates an environment in which students (a) participate actively in the learning process, (b)
take responsibility for their own learning, and (c) become better learners in terms of time-
management skills and ability to define topics, access different resources, and evaluate the
validity of these resources. Krynock & Robb (1996) corroborated the findings of Gallagher et
al. (1995) in a study ‘Is PBL a problem for your curriculum?’ In a comparison of PBL with
TM, Krynock & Robb (1999) noted that in PBL student activity is the norm with students
working in groups, confering with others, doing labs, creating physical displays, or consulting
resources outside the classroom. They noted further that PBL enables students to solve real
problems about their world with accurate, logical, and creative solutions using skills that
connect to different subject areas. In a paper presented by Achilles & Hoover (1996) titled
‘Exploring PBL in Grades 6-12’, submitted that PBL appears to improve critical thinking,
communication, mutual respect, teamwork, and inter-personal skills and increases students’
interest in a course. Gordon, Rogers, Comfort, Gavula, & McGee (2001), West (1992),
Savoie & Hughes (1994) and McBroom & McBroom (2001) also supported these views.
Ward (2007) looked at issues involved in developing and implementing an effective student-
centred, problem-based mathematics-learning environment for English Second Language
(ESL) students. He used a case study approach to describe the evolution (development,
implementation, evaluation) along ‘constructivist lines’ of a mathematics learning-
environment within the foundation year of what could be termed, a selective Arab University.
He used SPAIN (Successful-Pictorial-Algorithmic-‘Illgebraic’-Numeric) to determine a
student’s problem-solving veracity and preference. Although not a conclusive method he
remarked, SPAIN allows us to identify students with limited problem-solving strategies and
also students who are gifted-and talented in this respect. Students in this procedure are guided
through what is initially a relatively simple problem that increases in complexity.
Sungur & Tekkaya (2006) of the Middle East Technical University, Turkey used Motivated
Strategies for Learning Questionnaire to investigate the effectiveness of problem-based
35
learning and traditional instructional approaches on various facets of students’ self-regulated
learning, including motivation and learning strategies. Results revealed that PBL students had
higher levels of intrinsic goal orientation, task value, use of elaboration learning strategies,
critical thinking, meta-cognitive self-regulation, effort regulation, and peer learning compared
with control group students. Iroegbu (1998) in a study of Problem-based learning, numerical
ability and gender as determinants of achievement in line graphing skills in Nigerian Senior
Secondary School Physics found that PBL was more effective than TM in facilitating
students’ achievement. Hoffman & Ritchie (1997) affirmed that PBL could promote transfer
of knowledge and skills gained in the school to daily life. It is against this background the
current study is pursued with a view to determining whether PBL can enhance learning and
change students’ beliefs.
Şahin (2009) investigated the correlations of PBL and traditional students’ course grades,
expectations and beliefs about physics and selected student variables in an introductory
physics course in engineering faculty. PBL and traditional groups were found to be no
different in their responses to the Maryland Physics Expectations Survey (MPEX) and in
their physics grades. In addition, students who showed effort and studied hard tended to
obtain higher physics grades. Şahin (2009) in a pretest-posttest quasi-experimental study of
the effect of instructional strategy manipulated at two levels; modular-based active learning
(problem-based learning [PBL]) method and traditional lecture method on university
students’ expectations and beliefs in a calculus-based introductory physics course measured
with the Maryland Physics Expectations (MPEX) survey revealed that average favourable
scores of both groups on the MPEX survey were substantially lower than that of experts and
that of other university students reported in the literature. He maintained that students’
favourable scores on the MPEX survey dropped significantly after one semester of instruction
and both PBL and traditional groups displayed similar degree of ‘expert’ beliefs. He
concluded that university students’ expectations and beliefs about physics and physics
learning deteriorated as a result of one semester of instruction whether in PBL or traditional
context.
Albanese & Mitchell (1993) concluded that problem-based instructional approaches were less
effective in teaching basic science content (as measured by Part I of the National Board of
Medical Examiners exam), whereas Vernon & Blake (1993) reported that PBL approaches

36
were more effective in generating student interest, sustaining motivation, and preparing
students for clinical interactions with patients. Mixed results were also observed in the studies
by Moust, Van Berkel & Schmidt (2005) and Prince (2004) in which the latter maintained
that it is difficult to conclude if it is better or worse than traditional curricula, and that ‘it is
generally accepted …that PBL produces positive student attitudes’ (p. 228) whereas the
former concluded that PBL has a positive effect on the process of learning as well as on
learning outcomes. According to Major & Palmer (2001) students in PBL courses often
report greater satisfaction with their experiences than non-PBL students whereas Beers
(2005) demonstrated no advantage in the use of PBL over more traditional approaches.
2.6 Advantages and challenges of PBL
The modes of instruction and education have undergone significant changes with the passage
of time. PBL is one of such novel modes of imparting knowledge to the aspiring students.
Teaching and learning are no longer limited to classroom sessions where one person takes the
centre stage to deliver knowledge and a group of students remain at the receiving end. The
present day education has expanded its wings to more practical methods of teaching wherein
students are allowed to experiment and explore beyond the instructor led knowledge. PBL is
one such way of teaching students where they use their prior knowledge to solve problems
and learn new things in the process. PBL is more likely to motivate and excite the students to
learn, wherein they need to play an active role in analyzing things for a given assignment.
PBL enhances the problem solving skills of the students as opposed to providing only
theoretical knowledge. Learning, therefore, goes beyond bookish knowledge and helps the
students face and see through practical problems. PBL allows students to use prior knowledge
to solve new problems and ensures deeper understanding. Learning is enhanced when new
information is presented through a meaningful context and comes in conflict with the existing
knowledge. PBL demands a collaborative approach towards problem solving, thus, creating
an environment in which the students learn to see various approaches to solve one problem
through group interactions. This makes the team members’ responsible for each other and not
just for one's own self. PBL demands a unique relation between the students and the teacher.
This, in turn, allows the students to partially determine their course of action with the help of
the teacher, making learning more interesting, engaging and activity based.

37
Across the nations, according to Science Teachers Association of Nigeria (STAN) (1992),
some of the identified teacher-related causes of ineffective teaching of Mathematics and
Further Mathematics, apart from the teaching method adopted, are low morale of teachers
because of the low ranking of the teaching profession, poor preparation of teachers and lack
of motivation of many mathematics teachers. Others are inadequate knowledge of the subject
matter, lack of skills/competence required for teaching, lack of skills of improvisation and
shortage of qualified mathematics graduate teachers. These factors are underpins that are
likely to jeopardize the positive effects of any alternative method of teaching adopted by
teachers in place of the ineffective traditional method that has been discussed earlier.
Several researchers like Adler (1997), Franco, Sztajn, & Ortigao (2007) among others, for
reasons best known to them, avoided the use of the name problem-based learning. Other
names used by them like participatory-inquiry approach, collaborative/cooperative learner-
centred describes nothing else than problem-based learning approach. This is one of the
major problems even among mathematics educators. The principals of schools where
problem-based learning approach was to be implemented had to be motivated in terms of
having job satisfaction and be convinced well of its suitability before giving approval for its
implementation.
Some of the reasons given by the school principals against the use of Problem-based learning
were that the method prevented teachers to cover all the topics in the scheme for a specified
term and the allocation of just two periods per week on the school timetable. Others were that
teachers had to be motivated and had job satisfaction, otherwise the approach could be
handled haphazardly, and the fear of the school management and the parents on how well the
students performed in standardised tests. The paucity of qualified mathematics graduate
teachers was a major concern to the school management, placing further mathematics periods
in the afternoon when most of the teachers seemed to have exhausted themselves and non-
periodical review of mathematics curricula at the teacher preparation institutions.
Akinoglu & Tandogan (2007:74) remarked that the following points might militate against
effective implementation or non-adoption of problem-based learning approach in the school
system that cut across all levels of education:
(i) It could be difficult for teachers to change their teaching styles.

38
(ii) It could take more time for students to solve problematic situations when these
situations are firstly presented in the class.
(iii) Groups or individuals may finish their works earlier or later.
(iv) Problem-based learning requires rich material and research.
(v) It is difficult to implement Problem-based learning model in all the classes. It is
fruitful to use this strategy with students who could not fully understand the value
or scope of the problems with social content.
Resistance against the adoption of problem-based learning includes the time and energy
involved in terms of the teacher who faces an examination-driven mathematics curriculum.
Others are the culture of a traditional classroom that reflects the culture of the traditional
society where most learners come from, the need or cost of material resources and the
challenges involved in changing the classroom environment from a transmission of
knowledge to an argumentative and discursive-based method of instruction Akinoglu &
Tandogan (2007).
2.7 Pedagogical discourse
The South African National Curriculum Statement Grade R-9 and the submissions of Van der
Walt & Maree (2007) seem to have adopted Shulman’s (1987) theory of constituents for an
effective teaching and learning because the seven different roles expected from a learning
facilitator are almost identical to Shulman’s categorisation of the knowledge base. Ball, Bass,
Sleep, & Thames in Kotsopoulos & Lavigne (2008) proposed a framework that describes the
knowledge associated with mathematics knowledge for teaching (MKT). The framework
consists of four “distinct domains” (Ball, Bass, Sleep & Thames in Kotsopolous & Lavigne
2008): common content knowledge (CCK)-the mathematical knowledge of the school
curriculum; specialised content knowledge (SCK)- the mathematical knowledge that teachers
use in teaching that goes beyond the Mathematics of the curriculum itself. Others are
knowledge of students and content (KSC) - the intersection of knowledge about students and
knowledge about Mathematics; and knowledge of teaching and content (KTC) -intersection
of knowledge about teaching and knowledge about Mathematics. Three bodies of literature
39
inform this study (i.e. Shulman, 1986, 1987; Van der Walt & Maree, 2007; Kotsopoulos &
Lavigne, 2008).
The studies by Shulman (1986, 1987); Van der Walt & Maree (2007); Kotsopoulos &
Lavigne (2008) centred generally on how effective teaching and learning of Mathematics
could be achieved. The current study investigated the effectiveness of PBL. Divergent views
were expressed on the pertinent question of “which one comes first, how to teach or what to
teach”? It is a predicament, because it is a question about teacher’s knowledge. The common
belief in the society is that if a teacher knows Mathematics very well, he or she is the best
person to teach Mathematics, nevertheless, what about “knowing to teach Mathematics?”
Fennema & Franke (1992) determined the components of Mathematics teachers’ knowledge
as knowledge of Mathematics – content knowledge consisting of the nature of Mathematics
and the mental organisation of teacher knowledge; knowledge of mathematical
representations; knowledge of students, that is, knowledge of the students’ cognition and
knowledge of teaching and decision-making. The argument here is that all these forms of
knowledge are essential in the derivation of beliefs about PBL as a mode of learning.
2.7.1 Different Components of Mathematics Teachers’ Knowledge
The first component of Mathematics teachers’ knowledge refers to teachers having
conceptual understanding of Mathematics. Fennema & Franke (1992) argue that if a teacher
has a conceptual understanding of Mathematics, this will influence classroom instruction in a
positive way; it is therefore important for teachers to have Mathematics knowledge. They
also emphasise the importance of knowledge of mathematical representations, because
Mathematics is perceived as a composition of a large set of highly related abstractions. They
state that if teachers do not know how to translate those abstractions into a form that enables
learners to relate Mathematics to what they already know, the students would not learn with
understanding. It is for this reason this study determined the PBL’s potential to recognize
what the students already know and the extent to which PBL can enable learning with
understanding. Knowledge of students’ cognitions is seen as one of the important
components of teacher knowledge, because, according to Fennema & Franke (1992), learning
is based on what happens in the classroom, and not only on what students do, but on the
40
learning environment is important for learning. “Knowledge of teaching and decision
making” is the last component of teacher knowledge.
Teachers’ beliefs, knowledge, judgments, and thoughts have an effect on the decisions they
make which influence their plans and actions in the classroom. In what Kotsopoulos &
Lavigne (2008:18) referred to as shaping this research is the growing body of scholarship
known as “mathematics for teaching”. According to them, this scholarship suggests that there
is a complex interrelated and multi-faceted core knowledge required for teaching
Mathematics that ought to inform how Mathematics teacher education is conceived of and
how ongoing professional development amongst teachers occurs. However, Ball (2000)
suggested that to improve teachers’ sense of what content knowledge matters in teaching,
teachers would need to identify core activities of teaching, such as figuring out what students
know; choosing and managing representations of ideas; appraising, selecting, and modifying
textbooks. She said further that teachers should decide among alternative courses of action,
and analyse the subject matter knowledge and insight entailed in these activities.
Researchers that theorize about Mathematics for teaching seem to have agreed on the need
for teachers to possess enough subject content knowledge in such a way as to be able to know
how to use Mathematics to develop students’ understanding (Adler, & Davis, 2006; Ball &
Bass, 2001; Davis & Simmt, 2006). This is in agreement with the momentum for reform in
Mathematics education that started in the early 1980s. Mathematics educators were
responding to a “back to basics” movement, which culminated in problem solving becoming
an important strand in the Mathematics curriculum (Van de Walle, 2007). The researcher
however observed from NCTM (2000) that the emphasis of the reform is also on pedagogical
content knowledge (PCK) and not only on the subject content knowledge (SCK). In Shulman
(1986:4) reactions to what he referred to as infamous aphorism, words that have plagued
members of the teaching profession for nearly a century of George Bernard Shaw’s “He who
can, does, He who cannot teaches” described the statement as a calamitous insult to the
teaching profession, yet one readily repeated even by teachers. This saying is in line with
what PBL prescribes.
41
2.7.2 Shulman’s Submissions on Teachers’ Knowledge
Inquiries into conceptions of teacher knowledge with the tests for teachers that were used in
the USA during the last century at both State and country levels according to Shulman (1986)
reveal that the idea of testing teacher competence in subject matter and pedagogical skill has
been in existence before the 1980 era of educational reform. Comparatively, the emphasis on
the subject matter to be taught in today’s standards stands in sharp contrast to the emerging
policies of the 1980s. The evaluation of teachers emphasizes the assessment of capacity to
teach. The assessment is usually claimed to rest on a “research-based” conception of teacher
effectiveness. Where did the subject matter go? What happened to the content? Perhaps Shaw
was correct as he accurately anticipated the standards for teaching in 1985: He who knows,
does. He who cannot teaches (Shulman 1986:4). The absence of focus on subject matter
among the various research paradigms for the study of teaching was referred to by Shulman
(1986) and his colleagues as the “missing paradigm” problem. Shulman (1986) submitted that
for effective teaching and learning to be achieved, teachers must reflect an understanding that
both content and process are needed by teaching professionals, and within the content, we
must include knowledge of the structures of one’s subject, pedagogical knowledge of the
general and specific topics of the domain, and specialised curricular knowledge.
Shulman’s submission was reflected in the South Africa policy statement, the National
Curriculum Assessment. The South African National Curriculum Statement Grade R- 9
(Department of Education, 2002) for the learning area Mathematics stresses the importance
of problem-solving, reasoning, communication and critical thinking. The National Education
Policy Act (DoE,1996) requires a learning facilitator to play seven different roles, that is,
learning mediator, Interpreter and designer of learning programs and materials, Leader,
Administrator and Manager; Scholar, Researcher and lifelong learner; Community,
citizenship and pastoral role; Assessor; and Learning area specialists (DoE, 2003). Some of
these roles directly imply meta-cognition. As a facilitator of learning, assessor and subject
specialist, according to Van der Walt & Maree (2007), should have a thorough knowledge of
his/her subject, teaching principles, strategies, methods, skills and education media as
applicable to South African conditions. Facilitators should also be able to monitor and fairly
evaluate learners’ progress, their knowledge, insight and views on teaching strategies and
42
learning so that these factors can be utilised during the design and implementation of learning
curricular.
Shulman (1987) outlined the categories of knowledge that underlie the teacher understanding
needed to promote comprehension among students: content knowledge, general pedagogical
knowledge; curriculum knowledge; pedagogical content knowledge; knowledge of learners
and their characteristics; knowledge of educational contexts; and knowledge of educational
ends, purposes, and values. Shulman (1987) pioneered the call for focusing the reform shift to
the pedagogical content knowledge, when he remarked that:
Among the seven stated categories of the knowledge base, pedagogical
content knowledge is of special interest because it identifies the distinctive
bodies of knowledge for teaching. It represents the blending of content and
pedagogy into an understanding of how particular topics, problems, or
issues are organised, represented and adapted to the diverse interests and
abilities of learners, and presented for instruction. Pedagogical content is
the category most likely to distinguish the understanding of the content
specialist from that of the pedagogue (p.8)
This was corroborated by Principles and Standards of NCTM (2000) and An, Kulm, & Wu
(2004). According to them, pedagogical content knowledge has three components:
knowledge of content, knowledge of curriculum, and knowledge of teaching. They
acknowledged knowledge of teaching and accepted it as the core component of pedagogical
content. Grouws & Schultz (1996) stated that pedagogical content knowledge includes, but is
not limited to, useful representations, unifying ideas, clarifying examples and counter
examples, helpful analogies, important relationships, and connections among ideas. The
different views as expressed by researchers in mathematics education and related discipline
seem to centre on the three categories of content knowledge analysed by Shulman (1986).
Shulman (1986) categorised content knowledge into three: subject content knowledge,
pedagogical content knowledge, and curricular knowledge and submitted that the three are
inseparable. The holistic approach to teacher effectiveness in the classroom is the possession
of the three categories stated by Shulman. The current study asserted that successful use of
PBL was somehow espoused by the three categories of knowledge.

43
2.7.3 Submissions of Ball and Associates on Teachers’ Knowledge
Comparing the studies of (Ball, Bass, Sleep, & Thames in Kotsopolous & Lavigne, 2008) to
Shulman (1986), knowledge of students and contents were not clearly stated by Shulman,
perhaps was assumed to have been embedded in pedagogical content knowledge, but was
explicitly addressed by Ball et al. KSC is of high significance in a PBL classroom. It
conforms with the NCTM’s (2000) principles and standards that adopted Problem-based
learning as an alternative method of teaching to the ineffective traditional method of teaching.
Ball (1989) found that teachers’ with advanced degrees in Mathematics or to use Ball et al
(2005) domains, high SCK, may alternate student interest for content integrity in making
choices about subject matter which might not result into effective teaching of Mathematics
and Further Mathematics. Ball (1989) further claimed that teachers without sufficient SCK
(or other domains) are able to learn both pedagogy and content and become effective teachers
of Mathematics, hence supporting the Mathematics for teaching movement.
The researcher is in agreement with Ball’s (1989) submission that possession of only higher
degrees in mathematics or any related field will not necessarily result in effective teaching of
mathematics and Further Mathematics. The researcher also agrees with Ball’s (2000)
submission that there exists little empirical evidence to link teachers’ content knowledge to
their students’ learning and that what is being measured as “content knowledge” (often
teachers’ course attainment) is a poor proxy for subject matter understanding. Fatade (1998)
found that teachers with low SCK and no PCK, and Mathematics graduate teachers with
either third class or ordinary pass at the honours degree level had difficulties teaching
difficult concepts in Further Mathematics. Teachers’ in this category often omit such difficult
topics like conic sections, dynamics and vectors. This in essence correlates with the Chief
Examiners’ Report of West African Examinations Council (WAEC, 2007) from marks and
attendance sheets that some questions at the West African Senior School Certificate
Examination (WASSCE) are no-go areas for students, an indication that the topics from
which the questions were set were either not taught or sparingly taught by teachers. The
above scenario reveals a classroom where modern methods of teaching like PBL is non-
existent and could probably be responsible for student poor performances at both internal and
external examinations. This study relied on Shulman’s (1986) submissions that teachers’
possession of high subject content, pedagogical content and curricula knowledge determined
44
who an effective teacher is. A PBL teacher is expected to possess all these components of an
effective teacher. It is on this premise that the researcher investigated the effectiveness of
PBL in Further Mathematics classrooms.
2.7.4 Contentions on Teachers’ Knowledge
According to Turnuklu & Yesildere’s (2007) findings’, having a deep understanding of
mathematical knowledge was necessary but not sufficient to teach Mathematics. The findings
pointed out that the degree of association between knowledge of Mathematics and knowledge
of Mathematics teaching was low. Shulman (1986) could be said to be right with the
teachers’ possession of adequate subject content knowledge, pedagogical content knowledge
and curricular knowledge that will result in teachers’ effectiveness in the teaching of
Mathematics. The importance of pedagogical content knowledge (PCK) for Mathematics
teachers has been well documented (Ball, 2000; Langrall, Thornton, Jones, & Malone in
Turnuklu & Yesildere, 2007). Lampert (1990) and Marks (1990) also documented the
importance of enacting PCK for pre-service Mathematics teachers’ teaching practice. PCK
significance notwithstanding cannot be solely associated with effective teaching without the
contributions of SCK and curricular knowledge.
Apart from the different domains and categories of knowledge base which teachers exhibit
some other attributes, bring about either effectiveness or ineffectiveness in the teaching and
learning of Mathematics. Hestenes & Swackhamer (1995) concluded the findings of their
study with the remark that the effectiveness of physics instruction depends heavily on the
pedagogical expertise of the teacher. Opdenakker & Damme (2006) found that good class
management skills seemed to have a positive effect on the quality of the relationship between
teacher and class, and because of this, also (a small effect) on the learning climate in the
class. They also found that the lower the job satisfaction of the teacher is, the stronger the
relationship between the cognitive level of the class and the amount of instructional support a
class receives. Teachers with a high level of job satisfaction (who have the feeling that they
can mean a lot to their students and that they can make a difference in the learning of
students) are willing to invest a lot of energy and effort (instructional support) into their
classes across the ability range contrary to teachers with a low job satisfaction. Research on
effective teaching within the teacher ‘artistry’ tradition, stresses the importance of a good and
45
vital relationship between teacher and students (Harris, 1998). Research on teaching and
teacher education (within the tradition of teacher thinking) and research on teacher change
emphasize the importance of instructional-support, beliefs, thoughts-judgments, knowledge
and attitudes and theories of teachers for teaching practice (Clark & Peterson, 1986; Pajares,
1992 & Shuell, 1996). Teachers’ that are creative and innovative with varying teaching skills
if well catered for will be very effective in the Further Mathematics classroom.
2.8 Theoretical framework on PBL
2.8.1. Polya’s Model
Polya’s (1957) Problem Solving Model consists of four phases; understanding the problem,
devising a plan, carrying out the plan and looking back. According to Polya (1957), the
problem solver must understand the problem first, then move ahead to devise a workable
plan, proceed to carry out the plan and look back, which implies checking the solution and
solution process. The model is illustrated by the following examples:
A rectangular plaque is being engraved on expensive gold metal. Because of
its cost, only 400cm2 of material can be used. A border of 2cm at the top, at
the bottom and on the left side is required. On the right-hand side the border
is to be 4cm to allow for appropriate designs. What dimensions should be
chosen for the piece of gold metal to allow for the maximum rectangular area
for the engraved message?
(Adapted from Haigh, 1986:598)
The steps taken to solve this problem are described by using Polya’s techniques.
1. Understanding the problem
The description of the problem allows the construction of a model or diagram for
problem clarification. Symbolic models such as ‘w’ to represent the width and l to
represent the length. The borders at the top and bottom are each 2cm, the length of the
printed matter is l - 4 and the width of the printed message would be w - 6.
46
2. Devising a plan
(i) Formulate appropriate equations as indicated, equation (1) wl = 400 for area
of the entire gold sheet and equation (2) A = wl which implies (l – 4) (w – 6)
for area of the printed message
(ii) Replacing l by 400/w from equation (1) and equation (2) could be changed to
express A as a function of the variable w alone giving A = (400/w – 4) (w – 6)
(iii) Differentiating A with respect to w → dA/dw = 2400w-2 – 4 (say equation 3)
and equating the derivative to zero enables stationary points to be obtained.
We recognise from the discussion that w must be greater than 6 and l must be
greater than 4. From the relation, l = 400/w, we determine that when l = 4, w =
100, hence the value of w must be between 6 and 100. Substituting values of
the stationary points ‘w’, which is ±10√6 in equation (1) gives the values of l.
The positive value of w, which is equal to 10√6, is taken because the width
cannot be negative. The second derivative of equation (3) i.e. d2A/dw2 = -
4800/w3 but the sign of the second derivative at w = 10√6 is negative which is
the condition for maximum area. Hence, w = 10√6 maximises the area.
3. Carrying out the plan
(i) The different values of w could be used to compute the area.
A BASIC program that evaluates the area could be written for values of w
from 6 to 100 in increments of 4
10 PRINT ‘‘WIDTH’’, TAB (10). ‘‘LENGTH’’, TAB (25), ‘‘AREA’’
20 FOR W = 6 TO 100 STEP 4
30 L = 400/w
40 A = (L – 4) * (W – 6)
50 PRINT W; TAB (10); L; TAB (25); A
47
60 NEXT W
70 END.
(ii) Analyze the result
The program could be run and the values of w where the Area appears to be
the greatest noted.
4. Looking back
The result could be determined by using calculus as demonstrated under devising a
plan. It could also be determined through graphing as equation 2 expresses A as a
function of w alone. These results could be used to solve other problems such as:
(a) A farmer has 100m of metal railing with which to form two adjacent sides of a
rectangular enclosure, the other two sides being two existing walls of the yard, meeting at
right angles. Establish a model that could be used to obtain dimensions needed for maximum
possible area.
(b) A rectangular sheet of metal is constructed in such a way that its dimensions are 8cm by
5cm. Equal squares of side x cm are removed from each corner, and the edges are then turned
up to make an open box of volume Vcm3. Show that V = 40x – 26x2 + 4x3, find the maximum
possible volume, and the corresponding value of x.
2.8.2. An Alternative- The Challenging Model
This was one of the two models for teaching and learning described by Wigley (1992). The
features of the model are presented procedurally below:
Step 1: The teacher presents a challenging context or problem and gives students time to
work on it and make conjectures about methods or results. The teacher might often have an
aspect of the syllabus in mind, but this may not be declared to the students at this stage.
Step 2: A variety of ways that help to deal with the situation is established from the students’
working.

48
Step 3: Strategies, which evolve, are applied to a variety of problems testing special cases,
looking at related problems or extending the range of applications, developing some fluency
in processes.
Step 4: A variety of techniques is used to help students to review their work, and to identify
more clearly what they have learned, how it connects together and how it relates to other
knowledge.
Other Problem-solving processes that could be adopted in the PBL class include Lester’s
(1980) model of six stages: Problem awareness, Problem comprehensiveness, Goal analysis,
Plan development, Plan implementation and Solution evaluation. Rohr’s model of eight
phases: Focusing of perceptual process producing certainty in the understanding of the
problem, Analysis of the problem; exploration and primary processing; breaking the
concentration on old patterns and ideas, Building of anticipation patterns through
representation of problem elements, Substitution of meanings; field displacements; and
transformation of problem elements, Construction of representations for problem elements
through curtailment, contradiction, and negation, Abstraction of principles to obtain symbolic
structural properties, Projection of principles in the problem and simultaneous identification
of the elements of the problem and Formation and amplification of new generalisations of the
entire situation. Based on the researcher’s understanding of all these problem-solving
processes, a new model for this study is proposed in figure 2.1.
2.8.3. Flowchart on Problem Processes for the PBL
The flowchart on problem solving processes consists of six phases; Arrangement of students
into heterogeneous ability groups, Identify the problem, Make assumption, Formulate a
model, Use the model and evaluate the model. These could be classified into two major
groups namely: Arrangement of students into heterogeneous ability groups and Adoption of
Problem-solving process. The iterative nature of flowchart construction is as illustrated in
figure 2.1.
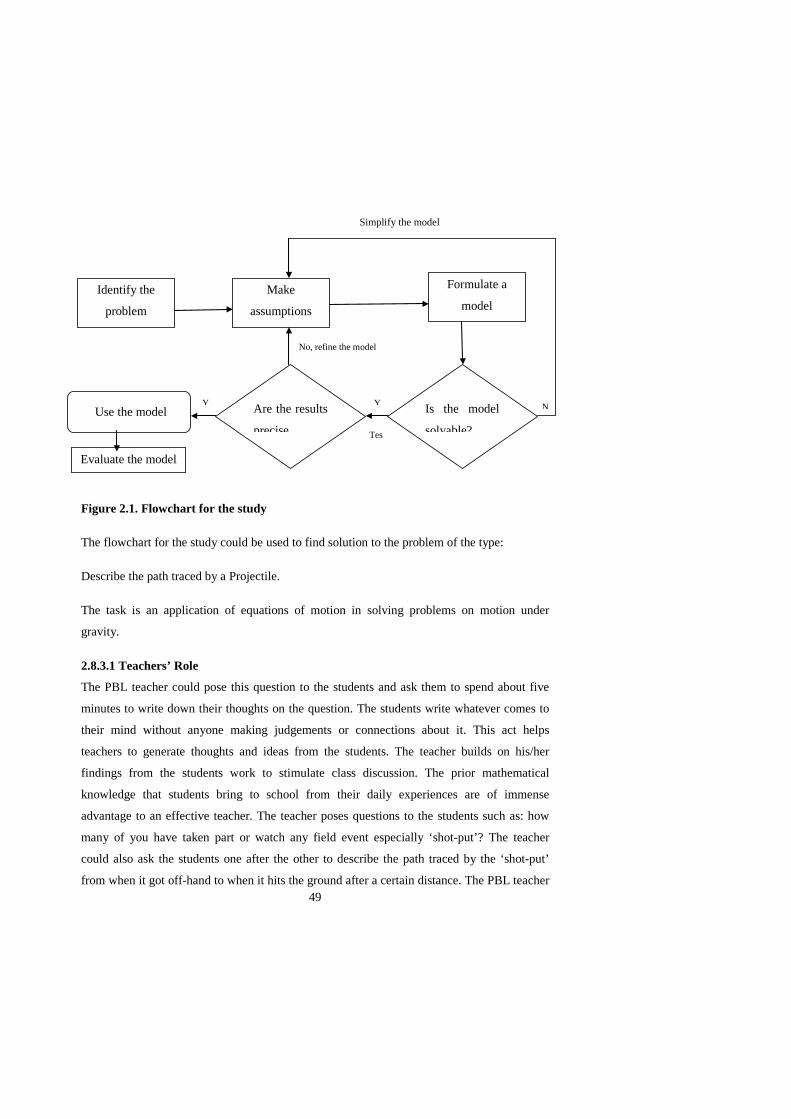
49
Figure 2.1. Flowchart for the study
The flowchart for the study could be used to find solution to the problem of the type:
Describe the path traced by a Projectile.
The task is an application of equations of motion in solving problems on motion under
gravity.
2.8.3.1 Teachers’ Role
The PBL teacher could pose this question to the students and ask them to spend about five
minutes to write down their thoughts on the question. The students write whatever comes to
their mind without anyone making judgements or connections about it. This act helps
teachers to generate thoughts and ideas from the students. The teacher builds on his/her
findings from the students work to stimulate class discussion. The prior mathematical
knowledge that students bring to school from their daily experiences are of immense
advantage to an effective teacher. The teacher poses questions to the students such as: how
many of you have taken part or watch any field event especially ‘shot-put’? The teacher
could also ask the students one after the other to describe the path traced by the ‘shot-put’
from when it got off-hand to when it hits the ground after a certain distance. The PBL teacher
Identify the
problem
Make
assumptions
Formulate a
model
Use the model Are the results
precise
Is the model
solvable?
Y Y N
Tes
No, refine the model
Simplify the model
Evaluate the model

50
gives guidance and allows students refine (if necessary) on their mates responses. The teacher
should ensure through probing questions that students are familiar with pre-requisites topics
like equations of motion and Newton’s laws of motion. Details of the rough sketch should be
clearly explained to the students.
Figure 2.2 Projectile Path
The students are allowed to mention the shape that Figure 2.2 resembles. The ‘path’ traced by
the projectile is obtained graphically or analytically. Equations of motion with acceleration
‘g’ is used to determine the height, range, time of flight, total time of flight for vertical and
horizontal projection only. When all the above variables are substituted in the appropriate
equation of motion, it becomes y = ax – bx2 where letters a and b are arbitrary constants. It
could be observed that the integration of different segments of Mathematics such as
Trigonometry come into play. The trigonometrically identities like Sin 2Ѳ = 2SinѲCosѲ
assist the students’ to obtain the horizontal range and show that it is a maximum. The
emerging equation is a quadratic equation with a parabolic shape. Extension of this exercise
can be a link to introduce the ‘Parabola’ in the conic section whose eccentricity equals one.
2.8.3.2 Learners’ Role
The students’ exposure like those that had witnessed the take off of an aeroplane, flight of a
bird and throwing of a javelin are good entry points to understand and actively participate in
y
x
V
h
θ

51
the discussion on the problem posed by the teacher. The learners could easily recognise and
identify the shape and nature of a linear and quadratic form of equation. They are to use this
prior knowledge in describing the path traced by a projectile. They are also to examine the
equations of motion, apply them to Fig 2.2 and obtain the quadratic equation. Different
techniques for solving Further Mathematics problems in a PBL classroom are still highly
dependent on the general nature of problem solving as propounded by Polya (1957). The
linkage of this topic to the Parabola under the conic section motivates students to find out
more facts on their own about the applications of this concept. Parabola, in Mathematics,
plane curve, one of the conic sections, formed by the intersection of a cone with a plane
parallel to a straight line on the slanting surface of the cone. Each point, called the focus, and
a fixed straight line, known as the Directrix. The parabola is symmetrical about a line passing
through the focus and perpendicular to the Directrix. For a parabola symmetric about the x-
axis and with its vertex at the origin, the mathematical equation is y2 = 4ax where 4a is called
the Latus rectum or the focal chord, the line that is parallel to y-axis and passes through the
focus (Fatade, Arigbabu, & Wessels, 2011).
2.9 THEORIES OF LEARNING AND PBL
For quite some time now, the teaching and learning of Mathematics has been a subject of
study by researchers, theorists and others alike. The reasons for this keen interest are not only
far-fetched but also very glaring. In the first instance, Mathematics is the backbone of any
technological development. Furthermore, it is a core subject, which is offered by all students.
The purpose of this section is to review and give an x-ray of how PBL fits into the theories of
learning proposed by Piaget and Vygotsky. It also reviews the theory of constructivism in
relation to the PBL.
2.9.1 Piaget’s theory
Jean Piaget, a Swiss psychologist and one of the most prominent developmental psychology
researchers during the 20th century, had an early career in science and later became interested
in the development of children. His research methodology is described as quasi-clinical,
primarily one-to-one interviews and direct observation in classrooms. He also studied
epistemology (the study of how knowledge is acquired), and regarded the child’s incorrect
responses to be as important as the correct ones (Ashlock, Johnson, Wilson & Jones 1979).

52
Among Piaget’s major contributions was his theory that children pass through distinct stages
of mental and emotional development. These stages; sensori-motor, pre-operations, concrete
operations, and formal operations represent distinctive differences in the qualitative thinking
abilities (Ashlock et al, 1979). Piaget discovered from his investigations of knowledge
growth that he could learn a great deal about knowledge and its development from careful
observation of those who were just beginning to develop and organise their intelligence
(Shulman, 1987).
Education in Piaget’s view merely refines the child’s cognitive skills that have already
emerged. Piaget also views the teacher as a facilitator and guide, not a director, who provides
support for children to explore their world and discover knowledge (Santrock, 2005). More
so, Piaget opposed teaching methods that treat children as passive receptacles (Byrnes, 2003).
This view is one of the tenets of PBL in which the teacher becomes a facilitator rather than
being a dispenser of repository knowledge and learners are given the opportunity to explore
the world around them and make meaningful contributions to learning thereby making
learning learner-centred. Piaget introduced the concept of reflective abstraction to describe
the construction of logico-mathematical structures by an individual during the course of
cognitive development (Tall, 1991). In PBL, leaners are free to interact with one another and
the learning materials to foster the development of problem solving skills and a minimum
dose of abstract thinking through reflection is involved. In Piaget’s theory reflective
abstraction has no absolute beginning but is present at the very earliest stages in the
coordination of sensori-motor structure. More so, reflective abstractions continue up through
higher Mathematics to the extent that the entire history of the development of Mathematics
from antiquity to the present day may be considered as an example of the process of
reflective abstraction (Tall, 1991).
The educational implication from Piaget’s work and its use in the PBL classroom is that
children learn best from concrete activities. If implemented in schools, the use of concrete
objects significantly alters the role of the teacher and the nature of the learning environment.
The teacher thereafter becomes less of an expositor and more of a facilitator that promotes
and guides children’s learning rather than teach everything directly (Santrock, 2005). This is
one of the hallmarks of PBL. Piaget emphasised the important role that student-to-student
interaction plays in both the rate and the quality at which intelligence develops. In the PBL
53
classroom, learners are given the opportunity to interact with one another and this could serve
as a springboard for exchanging, discussing, and evaluating one’s own ideas and the ideas of
others thereby making leraners to be more critical of self and others. Piaget posited that the
opportunity to exchange, discuss, and evaluate one’s own ideas and the ideas of others
promotes in children a more critical and realistic view of self and others (“decent ration”).
The educational implication of Piaget’s view in PBL Mathematics classroom is that, students
learn best by making discoveries, reflecting on them, and discussing them, rather than blindly
imitating the Mathematics teacher or doing things by rote which blocks meaningful learning.
2.9.2 Vygotsky’s Theory
Another developmental theory that focuses on children’s cognition is Vygotsky’s theory.
Like Piaget, Vygotsky emphasised that children actively construct their knowledge and
understanding. In Piaget’s theory, children develop ways of thinking and understanding by
their actions and interactions with the physical world. In Vygotsky’s theory, children are
more often described as social beings than in Piaget’s theory. Children develop their ways of
thinking and understanding primarily through social interaction. Their cognitive development
depends on the tools provided by society, and their minds are shaped by the cultural context
in which they live (Santrock, 2005). In the PBL classroom, learners engage in social
interaction and discourse and Mathematics as an object of learning is made more meaningful
when learners are given minimum level of support and guidance. Zone of Proximal
Development (ZPD) is Vygotsky’s term for the range of tasks that are too difficult for the
child to master alone but that can be learned with guidance and assistance of adults or more
children that are skilled. He also defined ZPD as the place where new external ideas are
accessible to the learner with those ideas already developed. Thus, the lower limit of the ZPD
is the level of skill reached by the child working independently. It is also referred to as
spontaneous concepts, that is, ideas developed within. The upper limit is the level of
assistance of an able instructor that is called scientific concepts, that is, ideas external to the
learner. Closely linked to the idea of the ZPD is the concept of scaffolding. Scaffolding
means changing the level of support (Van de Walle, 2007). In the PBL classroom, scaffolding
is a major ingredient to facilitate meaningful learning in which the teacher guages the level of
support being offered to the learners. The level of support given is gauged by the level of
difficulty of the problem. If the problem is too simple, the zone is so small that the problem is

54
not a problem any more and the scaffolding may be unnecessary thus very little learning has
occurred and this may lead to leaners’ disinterest. On the other hand, if the problem is too
cognitively challenging the zone is simply too big for the learner to bridge even with the help
of their peers’ and teacher scaffolding. The learner looses interest and motivation, thus
terminating the learning opportunity.
The Vygosky theory sees learners as a social being while the Piaget theory focuses on leaners
as a cognitive being and the integration of these two theories form the bedrock of the theory
of constructivism.
2.9.3. The Theory of Constructivism
Constructivism is a theory about how we learn. It also suggests that children must be active
participants in the development of their own understanding. If the assertion is true, it follows
that it is how all learning takes place regardless of how we teach (Van de Walle, 2007). From
a constructivist perspective, some principles to follow when teaching Mathematics include:
(i) making Mathematics realistic and interesting, (ii) considering students prior knowledge,
(iii) making the Mathematics curriculum socially interactive (Middleton & Goepfert, 1996).
Constructivist teaching, however emphasise that children have to build their own scientific
knowledge and understanding. At each step in science learning, they need to interpret new
knowledge in the context of what they already understand. Rather than putting formed
knowledge into children’s minds, in the constructivist approach, teachers help children
construct scientifically valid interpretations of the world and guide them in altering their
scientific misconceptions (Martins, Sexton, Franklin, & Gerlovich, 2005).
Some constructivist researchers such as Von Glassesfeld (1990), Sahu (1983) and Kaput
(1992) have investigated the processes by which students modify their cognitive
representations as they create external representations and use conventional symbols to
express their thinking. Given that Mathematics educators almost universally accept that
learning is a constructive process, it is doubtful if any take the representational view literally
and believe that learning is a process of immaculate perception (Cobb, Yackel, & Wood,
1992). However, as Ernest (1991) observed, the term constructivism itself covers panoply of
theoretical positions. Some of these appear to be eclectic positions with researchers
attempting to combine the notion of learning as active construction with aspects of the
55
representational view. According to Cobb et al (1992) learning is described as a process in
which students actively construct mathematical knowledge as they strive to make sense of
their worlds. On the other hand, learning can in practice be treated as a process of
apprehending or recognising mathematical relationships presented in instructional
representations. These two characterisations of mathematical learning reflect differences in
the emphasis given to the students and to the teachers’ inter-presentations of instructional
representations. The view of learning as active construction implies that students build on and
modify their current ways of knowing mathematical concepts. In the PBL classroom, learners
are given the opprotunuty to construct their own knowledge of Mathematics through
schematization of the learning process in which previously learned knowledge serves as
precursors and anchors to the new knowledge. In constructivism collaboration is emphasised
(Adler, 1997) and this form the basis of PBL. PBL classroom allows learners to
collaboratively engage in decision making regarding the solution to a problem at hand with
learners not loosing their autonomy and control. In constuctivism knowledge gained is
relatively permanent (Adler, 1997) and PBL relies on the heuristics of problem solving in
developing and consolidating knowledge in learners. When students make public conjectures
and reason with others about Mathematics, ideas and knowledge are developed
collaboratively, revealing Mathematics as constructed by human beings within an intellectual
community (Ball, 2000).
2.10 Learning Trajectory
Children learning of Mathematics followed natural developmental progressions and
development. They learn mathematical ideas and skills in their own way. When teachers
understand these developmental progressions and sequence activities based on them, enriched
mathematical learning and environment that are developmentally appropriate and effective
could be built (Clement & Sarama, 2010). The aforementioned developmental paths are a
main component of a learning trajectory. Questions such as: what objectives should we
establish? , Where do we start? How do we know where to go next? and how do we get
there? could be answered by the learning trajectories. Clements and Sarama (2004) asserted
that learning trajectories have three parts: (a) a mathematical goal. These are the clusters of
concepts and skills that are mathematically central and coherent, consistent with childrens’

56
thinking and generative of future learning (b) a developmental path along which children
develop to reach that goal.
This describes a typical path children follow in developing understanding and skill about a
mathematical topic. Effective teachers attempt to follow the situation from the child’s point
of view, and also consider (c) the instructional tasks, and their own actions from the child’s
point of view. These instructional tasks are referred to as the paths of teaching. It consists of a
set of instructional tasks, matched to each of the children’s level of thinking in the
developmental progression. PBL teachers are to use the tasks to promote children’s growth
from one level to the next. Van den Heuvel-Panhuizen (2000) discussed the criterion for
learning trajectory. Learning trajectories describe the goals of learning, the thinking and
learning processes of children at various levels and the learning activities in which they might
engage.
The different roles played by each of the learning trajectories in a PBL classroom can
facilitate developmental and appropriate teaching and learning for all children. Teaching with
a PBL approach differs completely from all other methods of teaching. Some intriguing
variables do manifest in a PBL classroom environment that are not addressed by other
approaches. The learning trajectory comprehensively describes what a PBL environment
looks like. A PBL classroom looks different from a traditional teacher-centred classroom
because teachers talk less but engage students more in the act of problem solving. Whether
gathering information or drawing conclusions, students work in groups, confer with others,
do labs, create physical displays, or consult resources outside the classroom (Krynock &
Robb, 1999). The teacher as a problem solver, selection of curriculum materials, discourse,
classroom culture and beliefs and mind set of teachers constitute the different learning
trajectory.
2.10.1 The teacher as a problem solver
The researcher reviewed the two models for teaching and learning that were used in the
mathematics classroom as described by Wigley (1992). The first one was called ‘The Path
Smoothing Model’ (PSM) while the second one was called ‘Alternative the Challenging
Model’ (ACM). In the Path Smoothing Model, the teacher or text states the kind of problem
on which the class will be working; students are led through a method for tackling the

57
problem, students work on exercises to practice the methods given aimed at involving
learners more actively and finally the revision. The perceived strengths of this model are that
the school syllabus could be quickly covered and help students to achieve success in public
examinations. However, the NCTM (2000) reforms felt strongly that it is the understanding
of the Mathematics that is more important than examination success. The researcher is of the
opinion that this Path Smoothing Model method is teacher-centred that has been found to be
in-effective (cf.1.1:1).
The challenging model from the literal meaning allows students to build on their
understanding of mathematics through discussions and strategic problem solving. In the
challenging model, the teacher presents a challenging context or problem and gives students
time to work on it and make conjectures about methods or results. The aspect the teacher
often has in mind may not be declared to the students at this stage. From the students’
working, a variety of ways that help to deal with the situation is established. Strategies, which
evolve, are applied to a variety of problems: testing special cases, looking at related problems
or extending the range of applications, developing some fluency in processes. A variety of
techniques is used to help students to review their work, identify more clearly what they have
learned and how it relates to other knowledge. In this model teachers role is not to teach but
to support and present initial challenges for the students to build on their basic mathematical
knowledge.
The Alternative Challenging model was made use of by (Freudenthal, 1991) in Netherlands.
The two teaching and learning approaches adopted by Freudenthal were (i) Realistic
Mathematics Education and (ii) Diagnostic teaching. These two approaches allow students to
understand Mathematics for themselves through problem solving and allow teachers to take a
step back and observe the learning process. Many misconceptions can be exposed through
problem solving activities as teachers are provided with the opportunity to observe the way in
which students solve and approach different problems. There is no better way for teachers to
check if a student understands a process of knowledge than to see if the students can use the
understanding in solving a problem (Fisher, 1990). Diagnostic teaching expose and work on
students’ misconceptions in order to help students see that what they believe to be true cannot
be applied to all questions so in turn must be incorrect.

58
2.10.2 Selection of Curriculum Materials
Wood, Cobb, & Yackel (1990) identified the provision of innovative curriculum materials.
The opportunity for teachers’ to reflect on students’ work with these materials as major
factors in finding that their previous practice was problematic was emphasized. One of the
most critical decisions that confront Mathematics teachers is the selection of a Mathematics
curriculum. The situation varies from one country to another. The Federal Government of
Nigeria centrally produces the curriculum, for example, the NERDC produces this document
in Nigeria on behalf of the government. This might not be the case in the United States of
America. Most teachers rely on curriculum materials as their primary tool for teaching
(Grouws, Smith, & Sztain, 2004). The likelihood that teachers skip some topics that are not
included in the curriculum materials they use is very high and students do not learn it as was
revealed by Marks and Attendance sheets (WAEC, 2007). Other scholars argued that how
material is presented in the curricula, that is, the pedagogical approach through which
students are expected to learn the content is also of equal importance to what topics are
covered.
Content analysts typically compare selected curriculum materials against a set of external
criteria to determine if important topics, concepts and skills are covered and that sequencing
is sensible. Analyses in the United States typically use standards, frameworks or other
countries curricula as their external criteria (NRC, 2004). Most curricula (standards-based
and conventional) intend for students to learn concepts, skills, applications, and problem
solving and efficient procedures. They differ, however with regard to the order and manner in
which these elements are presented, the balance that is struck among different elements and
organizational style.
Conventional curricula tend to rely on direct explication of the to-be-learned material as well
as careful sequencing and the accumulation of lower-level skills before presenting students
with the opportunity to engage in higher-order thinking, reasoning and problem solving with
these skills. Standards-based material on the other hand rarely explicate concepts for students,
rather, they rely on students’ engagement with well-designed tasks to expose them to the
concepts. Its features are thereafter explored by students; the curriculum and teacher step in
to apply definitions, standard labels and standard procedural techniques. Research suggests
59
that curricula tasks that focus on specified skills and procedures are less challenging for
teachers to learn to implement well than are curricula tasks that demand students to think;
reason and problem solve (Stein, Grover, & Henningsen, 1996).
2.10.3 Discourse
Another component of PBL that facilitates mathematical thinking of students in the
classroom is known as discourse, that is, teachers’ ability to create an environment that makes
students forget Mathematics anxiety. According to Reys & Long (1995), the discourse of a
classroom, that is, the ways of representing, thinking, talking, agreeing and disagreeing – is
central to what students learn about Mathematics as a domain of human inquiry with
characteristic ways of knowing. Discourse is both the way ideas are exchanged and what the
ideas entail. Students must talk with one another as well as in response to the teacher. When
the teacher talks most, the flow of ideas and knowledge is primarily from teacher to student.
In relation to mathematical discourse, the teacher’s role is to translate what is being said into
academic discourse, to help frame discussion, pose questions, suggest real-life connections,
probe arguments and ask for evidence.
The language practices of the classroom (educational discourse) must ‘scaffold’ students’
entry into mathematical discourse (Adler, 1997). When students make public conjectures and
reason with others about Mathematics, ideas and knowledge are developed collaboratively,
revealing Mathematics as constructed by human beings within an intellectual community.
King in Rosenshine & Meister (1992) reported that after hearing a lecture, students met in
small groups and practiced generating questions about the lecture.
Students in Schoenfeld’s (1985) study had opportunities to participate in small group
mathematical problem solving. He sequenced the problems he presented to his students when
teaching mathematical problem solving. He first gave students problems that they were
incapable of solving on their own; this provided the motivation for learning the strategy he
planned to introduce. He suggests that small-group work facilitates the learning process in
four ways. It provides support and assistance as students actively engage in problem solving
and group decision making, facilitates the articulation of knowledge and reasoning as
students justify group members reasons for choosing alternative solutions. Others are that
students receive practice in collaboration, a skill required in real-life problem solving and
60
students who are insecure about their abilities to solve problems have the opportunity to see
more capable peers struggle over difficult problems (Rosenshine & Meister, 1992). The
above scenario aptly distinguishes PBL environment from any other method of teaching for
effective students’ learning. According to Wheijen (2005), the development of the
constructivist view of learning in recent years has resulted in modifications of teaching
design in many science classes.
2.10.4 Classroom Environment
A PBL classroom environment seems to be an antidote to students’ truancy and disruptive
behaviour. According to Sungur & Tekkaya (2006) education research reveals that beliefs
and cognition that enable students to be independent learners are related highly to academic
learning. The viewpoint has led to an increased emphasis on how classroom context and other
contextual factors shape and influence student learning and motivation. Educators, therefore
focus their attention on students’ strategic efforts to manage achievement through specific
beliefs and processes. According to Zimmerman in Sungur & Tekkaya (2006), those self-
regulatory processes and beliefs had been the focus of systematic research. Constructivist
teaching seemed to have guided the students towards coherent perceptions of constructivism
including beliefs about effective learning and teaching strategies, epistemological beliefs
about science knowledge, and perspectives on learning goals.
The outcomes of the constructivist teaching in developing students’ perspectives on how to
learn and what to achieve as observed by Wheijen (2005) were in agreement with the studies
of Elby (1999). No single theory is comprehensive enough to explain learning and, at the
same time, reliably predict the best way to select and organise content and choose a teaching
strategy. Few theories address such vital aspects of learning as affective behaviour and
classroom climate. The belief of behaviourists and cognitivists on learning seems to have
some variations. The common behaviourist’s definition of learning is that it is any change in
behaviour (Green, 1968) or “the relatively permanent modification of behaviour as the result
of experience” (Magee, 1971:71). This definition suggests that teachers should induce certain
behaviours in students; when these behaviours are demonstrated, we can assume learning has
taken place. On the contrary the position of cognitivists is that learning is not merely a
change in behaviour.
61
The cognitivists’ view behaviours as mere indicators of learning; learning itself is an internal
process that takes place somewhere between the stimulus and the response. Certain
behaviours might imply that learning has taken place, it may also have occurred when no
overt behaviour change can be detected (Green, 1968:56). Teachers that have negative beliefs
and mind set towards the workability of PBL will necessarily not implement or see any
positive impact that PBL has in students’ proper understanding of mathematical concepts.
2.11 Conclusion
The conceptual analysis and theoretical framework of PBL had been discussed. The case
studies that focused mainly on the first year undergraduate Mathematics courses as the origin
of PBL were from a tertiary institution. Further Mathematics is not standing alone as a course
or subject at tertiary level but it is embedded in the Mathematics courses. Its linkage with the
secondary school level is because most of the Mathematics courses at the first year
undergraduate level are contained in Senior Secondary School Further Mathematics
curriculum for classes 1 to 3 in Nigeria. It is because of this reason that Further Mathematics
is referred to as the bridge between Mathematics offered at secondary school and
Mathematics courses at the first year undergraduate level at the tertiary level. The alternative
methods to the Traditional method of which PBL is significantly one as could be seen in the
conclusion foster on students’ understanding of Mathematics rather than the traditional
method that is preoccupied with examination success and syllabus coverage. It should be
noted however, that a student with proper understanding of any mathematical topic or
concept would necessarily do well in any examination.
62
CHAPTER THREE
RESEARCH METHODOLOGY
3.1 Introduction
This chapter describes the methodology followed in addressing the research questions put
forward to seek possible solutions to the problems identified in chapter one. In this section,
research methodology/ paradigm, research design, population and sample, the research
instruments, procedure for data collection, data analysis and interpretation, limitations of the
study, and validity and reliability are discussed.
3.2 Research Paradigm of the study
This study relied on the theory of evaluation research, which narrowly suggests the use of
scientific methods to measure the implementation and outcomes of programs for decision-
making purposes (Rutman, 1984). Evaluation research in a more widely accepted definition is
the systematic application of social research procedures for assessing the conceptualization,
design, implementation, and utility of social intervention programs (Rossi & Freeman, 1993).
A much broader definition is offered by Scriven (1991), who suggests that evaluation
research is the process of determining the merit, worth and value of things. In this study, an
evaluation research model involving seven sequential steps developed by Paulsen & Dailey
(2002) was adopted. The steps are as follows: (i) what are the purpose and goals of the
programme? (ii) what evaluation research questions do I need to answer? (iii) what type of
design will give me the data that I need? (iv) what tools will give me the data I need? (v) how
do I collect the data? (vi) how do I analyse the data and make the findings useful? (vii)
reporting the evaluation findings.
This study was informed by the poor performance and high attrition rate of students in both
internal and external examinations in FM in Nigeria. The Chief Examiners’ Report (WAEC,
2007) indicated that students’ poor performance in FM is partly related to teachers’
continuous use of the TM. This study decided to implement a PBL strategy, which involved
students collaboratively working together in groups, each group being engaged in dialogue by
other groups using problem solving processes in which learning was not restricted to the
classroom. This intervention was different from the evaluation strategy that focused on
teachers being dispensers of knowledge while students were passive recipients (Mji, 2003) in

63
that it is a derivation of the theory of constructivism, which allows students active
construction of their own mathematical meanings of the world (Cobb, Yackel, & Wood,
1992). The study evaluated the effects of PBL on students’ achievement in and beliefs about
FM within a quasi-experimental design in which students were matched before hand, or after
the fact, using statistical methods (i.e students with similar characteristics were placed in PBL
and TM conditions so that any differences between the treatments could be attributable to
treatment effects and not to differences between the groups themselves). The study offered a
reasonable solution for researchers that could not randomly assign students to different
treatments, but still desired some degree of control so that they could make statistical
statements about their findings.
3.3 Research design
The model of inquiry adopted for this study was a quantitative method described as a
systematic empirical investigation of social phenomena via statistical, mathematical or
computational techniques (Creswell & Plano Clark, 2011) within the blueprint of quasi-
experimental design using pretest-posttest non-equivalent control groups (Bell, 2008). The
quasi-experimental design allows identification of variables (Blaxter, Hughes & Tight, 1996)
in the study. The quasi-independent variable-instructional strategy was manipulated at two
levels (PBL & TM) and answering the research questions for the study required data that
allowed assessment of the extent to which the PBL and TM influence students’ achievements
in and beliefs about Further Mathematics. This study relied on interval (scores on Students’
Beliefs about Further Mathematics Questionnaire) and ratio (scores on Researcher-Designed
Test and Teacher-Made Test) data as the strongest form of quantification (Okpala, Onocha, &
Oyedeji, 1993). In this study, participants did not have control over which group (control or
experimental) they belonged to or of receiving or not receiving the treatment based on quasi-
experimental design.
One inherent advantage of this design is that it is typically easier to set up than true
experimental designs (Shadish, Cook, & Campbell, 2002) but lacks randomisation of subjects
to treatment conditions (Bell, 2008). Adopting quasi-experimental design in this study
allowed the investigation of intact groups in real classroom settings since it was not necessary
to randomly assemble students for any intervention during the school hours so as not to create
artificial conditions. Students in control and experimental groups participated in the study in

64
their natural classroom conditions. Additionally, using quasi-experimental designs minimises
threats to external validity (Shadish, Cook, & Campbell, 2002) as natural environments do
not suffer the same problems of artificiality as compared to a well-controlled laboratory
setting (McKnight, Magid, Murphy, & McKnight, 2000). However, quasi-experimental
designs may be weak in controlling for threats to internal validity (Robson, Shannon,
Goldenhar, & Hale, 2001). External validity refers to how well the results of a study can be
generalized to the population from which a sample was selected (Wimmer & Dominic, 2000).
Internal validity refers to how well a study is able to control the variables that create possible
(plausible) but incorrect explanations of results.
Threats to external validity include effects of selection, effects of setting, effects of history,
and effects of testing (Wimmer & Dominic, 2000). The effects of selection were controlled in
this study using homogeneous samples. Students in both the control and experimental groups
were similar in terms of age (the mean age of students in the control group was 15.3 years
while that of the experimental group was 15.4 years, meaning that students in both groups fell
into Piaget’s formal operational stage). This is a stage where children develop abstract
thought and can easily conserve and think logically in their mind. In addition, students in
both groups had exposure to the same national curriculum for Further Mathematics (FME,
1985) and displayed similar cognitive abilities based on pre-tests scores. The National
Curriculum for Further Mathematics and the National Policy on Education of Nigeria
stipulated that the transiting students from Junior Secondary School year three (an equivalent
of Grade nine) into Senior Secondary School year one (an equivalent of Grade 10) must
obtain credit passes in English, Mathematics, Basic Science, Basic Technology and any other
two subjects. Thus, credit passes in six subjects served as a baseline for all entrants into
Senior Secondary School year one science. In this study, students in both groups fulfilled this
condition.
History as a potential threat to external validity was controlled in this study in that students in
both the control and experimental groups were pretested on the same day and within the same
period and the posttest was equally administered on the same day (last day of the
intervention) and within the same period. The present study was conducted in Ijebu Ode
Local Government in Ijebu Division of Ogun State, Nigeria. Conducting the study in one
location controlled for the effects of setting. Lastly, the three months time lag between the

65
administration of the pretest and the posttest in this study ruled out the effects of testing in
that test items in the pre-test instruments were re-shuffled to make the post-test instruments in
order to reduce familiarity. Threats to internal validity such as history, maturation, statistical
regression, selection, experimental mortality, testing, instrumentation and design
contamination (Wimmer & Dominic, 2000) were controlled in this study as follows. First,
there was no review of the National Curriculum of FM and there was no nationwide strike
that could have brought about any change in the dependent variables of achievements in FM
(RDT & TMT) and beliefs about FM (SBFMQ). Thus, both the experimental and control
groups experienced the same stable environment in the education sector throughout the
treatment period thereby ruling out the effects of history. Second, there was no visible
vacation/coaching classes for students outside the normal school schedules such as during the
holidays that could have led to the acquisition of any academic knowledge to the advantage
of any of the students in either groups. The students in both groups having been brought up
within the same society passed through similar social, cultural and physiological development
that could have affected the dependent variables thus controlling any possible effects of
maturation.
Third, students in both groups were from low income families thus ruling out the effects of
statistical regression. The demographic section of the questionnaire filled by students
reflected this (See Appendix 1). Fourth, students did not have the opportunity to choose
which of the groups to belong to (experimental or control), which could have affected the
dependent variables of achievements in FM and beliefs about FM. The schools that were
selected for the study gave their students opportunity to participate in the study considering
the fact that they were of similar characteristics in terms of age, exposure to national
curriculum, class, criteria for placement, and language.
Fifth, no attrition of students in both groups during the treatments was recorded. Attendance
showed that no student dropped out in both the control and experimental schools during the
period of the study. This ruled out the effects of experimental mortality. Sixth, the time lag of
three months between pre-tests and post-tests was adequate in ruling out the effects of testing
in the study. More so, the test-items were re-shuffled in order to prevent hallo-effect that
could result from familiarity with pre- test instrument into the post-test instrument. Seventh,
the measurement methods of Teacher Made Test (TMT), Researcher Designed Test (RDT)

66
and Students’ Beliefs about Further Mathematics Questionnaire (SBFMQ) did not change
during the study as both groups supplied information on the same instruments. This
controlled the threat of instrumentation in the study. Lastly, both the control and experimental
groups were far apart from each other thus preventing interaction of students from both
groups and the teachers at the control school had no information about the school used for the
experimental. More so, either group had no reason to want to make the study succeed or fail
thereby ruling out the probable effects of design contamination in the study.
3.4 Sources of data
Sources of data are usually classified into two main categories: (a) Primary sources and (b)
Secondary sources (Taylor-Powell & Steele, 1996). Primary sources lead to the collection of
primary data - data collected for the first time and common methods of primary data
collection include questionnaire and test whereas secondary sources give information about
secondary data - those data, which have already been collected and analysed by someone
else. This study relied on tests (RDT and TMT).and questionnaire (SBFMQ) in the
generation of quantitative primary data for the study.
3.4.1 Population
The study was conducted in the Ijebu division of Ogun State of Nigeria. The division is made
up of six out of twenty Local Government areas constituting Ogun State. The local
governments are Ijebu East; Ijebu North; Ijebu North East; Ijebu Ode; Odogbolu and Ogun
Waterside. Ijebu division, which is, populated predominantly by Ijebu tribe, has a population
of about 816,681 out of the recorded figure of 3,751,140 for the State (NPC, 2006). In the
education sector, there are many primary and secondary schools owned by individuals and
missionaries apart from the public ones owned by the government. For the purpose of this
study, the government owned public secondary schools were considered as all others did not
allow any interference in the administration of their schools. Only Ijebu-Ode Local
Government out of the existing six local governments in the division was considered for the
study based on the following criteria: proximity to the base of the researcher, the researcher’s
familiarity with the geographical terrain, and accessibility to information at the Zonal
Ministry of Education.
67
The 319 Senior Secondary School (SSS1) year one science students (an equivalent of
Grade10) taking Further Mathematics at the 30 senior secondary schools in Ijebu-Ode Local
Government of the Ijebu division of Ogun state constituted the target population. As
stipulated in the National Curriculum for Senior Secondary Schools for Further Mathematics
(FME, 1985), Further Mathematics is meant for potential Mathematicians, Engineers and
Scientists. Consequently, all schools that have qualified graduate mathematics teachers are
expected to offer the subject to cater for science students’ interest. Among the 30 schools in
the local government, eight were found to be offering Further Mathematics. This is due to
paucity of qualified graduate Mathematics teachers.
A breakdown of the 319 total number of students taking Further Mathematics at the eight
schools coded A - H is given in which (School A has 42 students, B has 54, C has 34, D has
35, E has 41, F has 35, G has 30 and H has 48). This population was considered for the study
because of the following reasons: (i) This was the class where Further Mathematics
instruction begins in Nigerian Senior Secondary Schools. (ii) These groups of students were
not preparing for any immediate external examination (unlike the Senior Secondary School
year three students); hence, the schools were willing to allow them to participate in the study.
(iii) The researcher was of the opinion that this level of students was mature enough to
express their opinions about beliefs toward Further Mathematics.
3.4.2 Sample and sampling method
In selecting schools to participate in the study, purposive sampling and simple random
sampling techniques were used. Purposive sampling relies on the judgment of the researcher
when it comes to selecting the units using certain criteria (Mulder, 1989). One of the criteria
of purposive sampling technique was based on the few number of schools offering Further
Mathematics and was considered appropriate for the study. More so, graduate teachers from
other disciplines like Physics and Economics were found teaching FM in four schools at the
time the study was conducted. Thus, the following criteria were used in selecting the schools
that participated in the study. The schools were to (i) have qualified graduate Mathematics
teachers who had been teaching in the school for at least three years. The three years
minimum was the researcher’s decision to ensure some degree of teachers’ cognate
experience (ii) have been presenting candidates in the West African Senior School Certificate
68
Examination (WASSCE) for at least four years consistently. The minimum of four years was
the researcher’s decision to ascertain that the schools have been presenting candidates in FM
at external examination. (iii) had principal and Mathematics teachers who were willing to
cooperate and participate in the study and (iv) were public government owned secondary
schools.
Thus, four out of the eight schools emerged based on the foregoing criteria. Simple random
sampling technique was used in selecting schools for the pilot and the main study (see section
3.5.2). This involved writing the initials of each of the four schools on different pieces of
paper and each was squeezed into a bolus on the floor. The decision was that, the first two
boluses that were handpicked were tagged schools for the pilot study whereas the remaining
two went for the main study. A young lady was asked to handpick two boluses at a time.
Thus, two schools emerged for the pilot study and the remaining two schools for the main
study. However, in the two schools for the pilot study, one was randomly assigned as the
control group and the other as the experimental group using a flip of a coin with the rule that
when a head appeared, the first handpicked bolus went for the experimental whereas when a
tail appeared the first handpicked bolus went for the control. The same procedure was
adopted in the selection of experimental and control schools for the main study. This was to
reduce bias. Furtherance to the emergence of experimental and control schools for the study,
trips were made to the selected schools and their (Principals, Further Mathematics teachers,
and Students) cooperation solicited for the smooth conduct of the study. In all, 96 students
participated in the main study. This consisted of 42 in the experimental group and 54 in the
control group.
3.5 The research instruments
The data needed in this study were gathered using the research instrument of tests and
questionnaire before and after treatment conditions enacted by the researcher and the
participating teachers. Three instruments were used in the study: Researcher-Designed Test
(RDT), Teacher-Made Test (TMT), and Students’ Beliefs about Further Mathematics
Questionnaire (SBFMQ). Details about the instruments, adequacy and relevance are
described below.
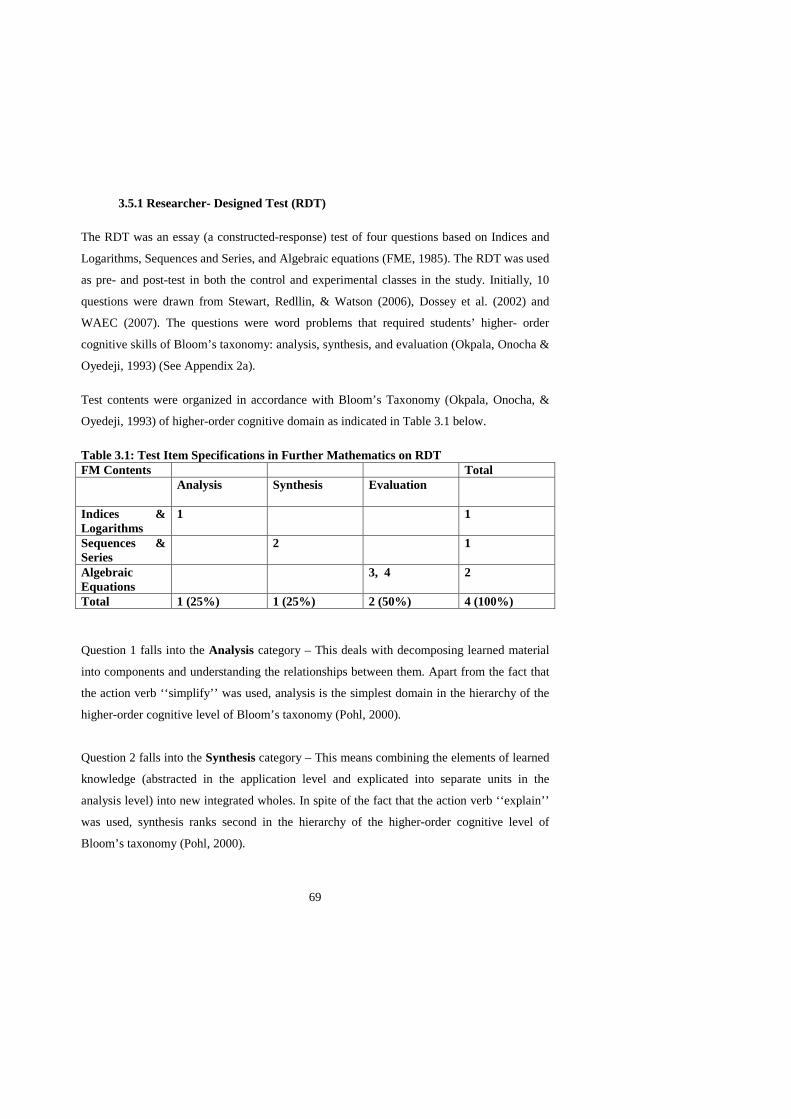
69
3.5.1 Researcher- Designed Test (RDT)
The RDT was an essay (a constructed-response) test of four questions based on Indices and
Logarithms, Sequences and Series, and Algebraic equations (FME, 1985). The RDT was used
as pre- and post-test in both the control and experimental classes in the study. Initially, 10
questions were drawn from Stewart, Redllin, & Watson (2006), Dossey et al. (2002) and
WAEC (2007). The questions were word problems that required students’ higher- order
cognitive skills of Bloom’s taxonomy: analysis, synthesis, and evaluation (Okpala, Onocha &
Oyedeji, 1993) (See Appendix 2a).
Test contents were organized in accordance with Bloom’s Taxonomy (Okpala, Onocha, &
Oyedeji, 1993) of higher-order cognitive domain as indicated in Table 3.1 below.
Table 3.1: Test Item Specifications in Further Mathematics on RDT FM Contents Total
Analysis Synthesis Evaluation
Indices & Logarithms
1 1
Sequences & Series
2 1
Algebraic Equations
3, 4 2
Total 1 (25%) 1 (25%) 2 (50%) 4 (100%)
Question 1 falls into the Analysis category – This deals with decomposing learned material
into components and understanding the relationships between them. Apart from the fact that
the action verb ‘‘simplify’’ was used, analysis is the simplest domain in the hierarchy of the
higher-order cognitive level of Bloom’s taxonomy (Pohl, 2000).
Question 2 falls into the Synthesis category – This means combining the elements of learned
knowledge (abstracted in the application level and explicated into separate units in the
analysis level) into new integrated wholes. In spite of the fact that the action verb ‘‘explain’’
was used, synthesis ranks second in the hierarchy of the higher-order cognitive level of
Bloom’s taxonomy (Pohl, 2000).

70
Questions 3 and 4 fall into the Evaluation category –This connotes making judgments about
the value or worth of learned information. These questions fall into this category because the
action verb ‘‘evaluate’’ was used and evaluation is the most complex domain in the Bloom’s
cognitive taxonomy (Pohl, 2000). The placement of test items in the RDT follows the dictum
of simple to complex.
The RDT might be considered as a performance test in that it assessed how well students
used foundational knowledge to perform complex tasks under more or less realistic
conditions. Apart from the fact that the RDT contained ill-structured tasks which favoured
PBL for the study (Sungur & Tekkaya, 2006), the instrument was considered advantageous in
ascertaining students’ background knowledge (used as pre-test) in FM before treatment and
in detecting the level of knowledge gained (used as post-test after questions re-arrangement)
in FM after treatment.
One other advantage of the RDT was that the test items contained multiple solutions
(Educational Testing Service, 2011), synonymous with real-world problems which called for
critical thinking (Paul & Elder, 2006) on the part of the students. Critical thinking is the
process of thinking that questions assumptions and scrutinises viable facts to assess why they
hold. This is in tandem with the constructivist approaches to setting of ‘open-ended
questions’ as against the traditional way of setting questions that favour one pre-determined
correct answer. Conversely, this inherent advantage of the RDT could also constitute a
disadvantage as the multiple solutions made the RDT more difficult for students to solve,
more tasking and time consuming for the researcher to grade. This potential disadvantage was
reduced through the TMT, which followed the traditional way of setting essay questions
(which both teachers and students were used to) that favoured one direct answer. Below is the
full description of the TMT purposely used as pre- and post-test in the study.
3.5.2 Teacher-Made Test (TMT)
The TMT (used as pre- and post-test in both the control and experimental classes in this
study) was an essay test of 10 questions based on the course contents for the study reflecting
the cognitive level of Bloom’s taxonomy. The contents selected include Indices and
Logarithms, Algebraic Equations, and Series and Sequences (See Appendix 3a). These were
chosen from the first term work of the Senior Secondary School year one Further

71
Mathematics curriculum (FME, 1985). The Mathematics studied at the Junior Secondary
School served as pre-requisite for the selected topics. Unlike the RDT, which was developed
by the researcher, the TMT with initial items of 60 questions (20 questions each) was set by
three FM teachers from schools different from the ones selected for the study based on the
instruction of the researcher, were drawn from (Tuttuh-Adegun, Sivasubranmaniam &
Adegoke, 2002). Test contents were organized in accordance with Bloom’s Taxonomy
(Okpala, Onocha, & Oyedeji, 1993) of cognitive domain as indicated in Table 3.2 below.
Table 3.2: Test Item Specifications in Further Mathematics on TMT FM Contents
Cognitive Levels Total
K C AP A S E Indices & Logarithms
5 6 - 3 - 1 4
Sequences & Series
8, 9,10 - 7 - - - 4
Algebraic Equations
- 4 2 - - - 2
Total 4 (40%) 2 (20%) 2 (20%) 1 (10%) - 1 (10%) 10 (100%)
K-Knowledge, C- Comprehension, AP- Application, A- Analysis, S- Synthesis and E- Evaluation Along the cognitive levels of Bloom’s taxonomy
The descriptions of K, C, AP, A, S and E below follow from Simkin and Kuechler (2005).
Questions 5, 8, 9, and 10 fall into the Knowledge category - This deals with rote memory;
recognition without (necessarily having) the ability to apply learned knowledge, because
action verb ‘‘find’’ was used.
Questions 6 and 4 fall into the Comprehension category – This connotes information that
has been assimilated into students’ frame of reference, because action verb ‘‘express’’ was
used.
Questions 2 and 7 fall into the Application category – This deals with abstracts from learned
material to solve new (analogous) situations, because action verbs ‘‘solve and calculate’’
were used.

72
Question 3 falls into the Analysis category – This deals with decomposing learned material
into components and understanding the relationships between them, because action verb
‘‘simplify’’ was used.
Question 1 falls into the Evaluation category – This deals with making judgments about the
value or worth of learned information, because action verb ‘‘evaluate’’ was used. While the
items on the TMT as contained in the Table 3.2 were used in the piloting, significant changes
were effected in the arrangement of these items following the test construction theory that
emphasises the hierarchical nature of the Bloom cognitive taxonomy (Simkin & Kuechler,
2005) during the main study. Details about the re-organisation of the test items used for the
main study can be gleaned from the last paragraph of this section.
The request made by the researcher to the participating teachers to set questions for the TMT
is not new. Researchers (Notar, Zeulke, Wilson, & Yunker, 2004; Kadivar, Nejad, &
Emamzade, 2005) have used TMT in assessing students’ achievements and grade point
average (GPA). In general, teacher-made, or teacher-chosen, content-specific tests are
templates for awarding course grades resulting in the computation of GPA which is often
considered a standard of accountability (Notar, Zeulke, Wilson, & Yunker, 2004). Apart from
the fact that these teachers have been teaching and setting questions internally for students
taking FM, which made them knowledgeable in setting questions, both the State and Federal
Ministries of Education in Nigeria rely on experienced and practicing teachers in setting
examination questions for students in various school subjects including FM.
More so, external examination bodies like WAEC and National Examination Council
(NECO) at all times invite experienced and practicing graduate teachers to set questions on
all subjects, including FM, into their question banks. It is from such question banks that the
final selection of items for any particular examination is taken. In this study, the 60 items for
TMT went through various stages of validation (Kimberlin & Winterstein, 2008). Thus, the
harmonisation of the final items on the TMT resulted from a combination of experts’ advice
and recommendations as explained in (cf.3.5.2). The TMT was considered suitable for data
collection in the study because it addressed one of the aims of the study, which centred on
determining the effectiveness of PBL approach on students’ achievement in Further
Mathematics along the cognitive lower-level (Knowledge, Comprehension & Application) of
73
Bloom’s taxonomy. Apart from ease of construction by the teachers, the TMT was
considered advantageous in terms of efficiency thereby enabling the teachers to ask many
questions in a short period.
The TMT also allowed speedy assessment of what might be called foundational knowledge
as against the higher-order skills enacted in the RDT. The foundational knowledge refers to
the basic information and cognitive skills (comprehension and application) that students need
in order to do such high-level tasks as solved problems and create products (Stiggins, 1994).
One disadvantage of the TMT was that it reflected the lowest level of Bloom’s cognitive
taxonomy (verbatim knowledge) as a result, students focused on verbatim memorization
rather than on meaningful learning championed in the RDT. Another disadvantage of the
TMT was that one only got some indication of what students knew, the test exposed nothing
about what students could do with the knowledge. This shortcoming was among other factors
that led to the development of the RDT.
The suitability and relevancy of the RDT and TMT were checked in the piloting using two
public co-educational senior secondary schools in the local government area of the study. The
schools used in the piloting were distantly located from each other and also distantly located
from the main study schools in order to prevent any possible interaction between the students
of the pilot and main studies. In general, the purpose of piloting is to provide enough data to
support recommendations for change and inform on-going developments or next phases of
the work. Specifically in this study, the piloting was informed by the need to further validate
the instruments used for the main study, and more importantly to serve as try-out sessions for
the PBL. It was also carried out to test run the whole study with the consciousness of
identifying problem areas in the design to enable the researcher make necessary amendments
before the commencement of the main study. Results of the piloting showed that (i) there was
a significant difference in the post-test achievement score of the experimental and control
classes with respect to RDT and TMT in favour of the experimental class. The latter
suggested the efficacy of the PBL in improving students’ achievements in FM.
During the piloting, no attempt was made to reorganise the test items on the RDT and TMT
when administered as post-tests. This might have introduced a hallo-effect in the students’
scores on the post-tests (Pike, 1999). Reducing this effect and coupled with the hierarchical
74
nature of the Bloom’s cognitive taxonomy (Simkin & Kuechler, 2005) necessitated the
reorganisation of the test items on RDT and TMT when used in the main study. Thus, Tables
3.1 and 3.2 were not sacrosanct. For instance, in TMT, changes were effected in the
numbering of items 1, 2 and 3 to mean items 10, 8 and 9 respectively. While items 6 and 7
maintained their positions in Table 3.2 and items 4, 5, 8, 9 and 10 were renamed as items 5,
4, 3, 2 and 1 respectively. In the case of the RDT, items 1 and 4 maintained their positions
whereas items 2 and 3 were swapped.
3.5.3 Students’ Beliefs about Further Mathematics Questionnaire (SBFMQ)
The Students’ Beliefs about Further Mathematics Questionnaire consisted of 28 Likert-type
items, anchored on Strongly Agree, Agree, Disagree or Strongly Disagree, to which the
students were asked to respond (See Appendix 4). The SBFMQ was purposely used in this
study as pre- and post- test in both the experimental and control classes. It was developed by
modifying the 18-items on beliefs about mathematics survey developed by Perry, Vistro-Yu,
Howard, Wong, & Fong (2002); and then adding ten other beliefs items constructed by the
researcher to make 28 items. The survey items by Perry et al. (2002) were modified by
replacing Mathematics with Further Mathematics and constructing 10 other beliefs items in
relation to the nature of Further Mathematics, its teaching and the theoretical underpinning of
the Further Mathematics curriculum (Harbour-Peters, 1990, 1991). The suitability of the
newly developed SBFMQ rested on the fact that it enabled the researcher to examine the
impact of PBL approach on students’ beliefs about Further Mathematics. This was one of the
aims of the study. One advantage of the SBFMQ was that it provided an overview of
commonly espoused students’ beliefs since it was based on statements summarizing modern
approaches to Further Mathematics learning and teaching.
As done with the RDT and TMT, the SBFMQ was administered before and after the
intervention in the experimental and control classes in a piloting with the purpose earlier
identified for RDT and TMT (see section 3.5.1 & 3.5.2). Results showed that there was a
significant difference in the SBFMQ score after the intervention between the experimental
and control classes. The SBFMQ together with other research instruments (RDT & TMT) in
the study were considered adequate based on piloting results, which showed no ambiguities.

75
3.6 Procedure for data collection
The collection of data for the study started on 16/10/2008 and ended on 12/01/2009 thus
covering a period of three months. The breakdown of the activities during the period is
presented in Table 3.2 and the procedures taken in the administration of the SBFMQ, TMT,
and RDT as pre-tests and post-tests before and after treatment conditions in both the
experimental and control classes and the differences in the treatments of experimental and
control groups are described below.
Table 3.3: Field Work Activities Week Activities 1 Selection of schools; categorization of schools into experimental and
control groups; selection and sensitization of participating teachers 2 Administration of pre-test (TMT & RDT) in that order on both
experimental and control groups. The SBFMQ was administered before the intervention at both experimental and control groups
3, 4, 5, 6, 7, 8, 9
Implementation of the instructional lesson plans on Further Mathematics contents selected for the study: instructional lesson plan using PBL in the experimental group and instructional lesson plan based on Traditional Method in the control group. The topics considered include Indices and Logarithms, Algebraic Equations, Series and Sequences.
10 Administration of post-test (TMT & RDT) in that order on both experimental and control groups. The SBFMQ was administered after the intervention at both experimental and control groups.
Prior to the commencement of teaching in the third week of the study (28/10/2008) in the
experimental and control classes, students were pre-tested on the TMT, and RDT in that order
in the second week (21/10/2008) of the study. The essence of the pre-test was to ascertain the
background knowledge of the participants in both the experimental and control classes before
entering into the experiment/instruction period. The attention of the regular mathematics
graduate teacher in the control school was sought after the management of the school had
given approval for the study to be conducted in the school. The details of the study were
neither made known to him nor fully discussed with the school management as the study was
presented to the duo as if the exercise was meant for the school alone. This was to prevent
any form of bias and influence on the part of the teacher in the course of his teaching.

76
The participating teacher in the control school unlike his counterparts at the experimental
school was not trained on the PBL approach but the researcher paid unscheduled visits to the
control school during the school hours and this afforded the researcher the opportunity to
observe the teacher while teaching. However, no attempt was made to discuss the classroom
interaction pattern that prevailed between the teacher and the students in the classroom. The
regular teacher in the control group taught the students with the traditional method following
the already prepared instructional plan within the context of the contents selected for the
study. The teacher covered the topics related to the Indices and Logarithms, Algebraic
Equations, and Series and Sequences. The instructional lesson plan in the control school
differed only from that of the experimental school in the area of presentation. The
presentation in the control school followed the routine traditional activities against the
flowchart of problem solving process enacted in the experimental school. The traditional
mathematics instruction involved lessons with lecture and questioning methods to teach the
concepts related to indices and logarithms, algebraic equations, and series and sequences. The
students studied the approved mathematics textbooks on their own before the class hour. The
teacher structured the entire class as a unit, wrote notes on the chalkboard about definitions of
concepts related to indices and logarithms, algebraic equations and sequences and series. The
teacher worked examples on the chalkboard about indices and logarithms, algebraic equations
and sequences and series, and, after his explanation, students discussed the concepts and
examples with teacher-directed questions. For the majority of instructional time in the control
school, students received instruction and engaged in discussions stemming from the teacher’s
explanations and questions. Thus, teaching in the control school was largely teacher-
dominated and learning confined to the classroom. The classroom instruction in the control
class was two periods of 40 minutes each per week in the afternoon on Tuesdays and
Thursdays. The afternoon periods on these two days were uniform across the schools offering
FM in the local government area of the study. The regular teacher ended teaching in the
control class on 08-01-2009 while the post tests (TMT & RDT) and the SBFMQ were
administered on the control class after the intervention on 12-01-2009.
The researcher sought the consent of the management of the experimental school and an
approval was given to conduct the study in the school. The nature and purpose of the
research were then explained to the four teachers who showed willingness and readiness to
participate in the study. The highlight of the weekly activities that would be carried out and

77
the extent of their involvement were discussed with them. The teachers were given
comprehensive orientation on the principle behind the PBL as an instructional strategy and
content areas for the study discussed. They were free to ask questions and offer suggestions
on how best this modern approach could successfully be implemented in the school. The
teachers were given comprehensive orientation on the principle of PBL in other to expose
them to the nitty-gritty of the PBL so that they could adopt the strategy on their own if found
effective after the exit of the researcher. Because the PBL was a novel approach for
participating teachers in the experimental group, the researcher taught students in the
experimental group in order to ensure fidelity of treatment. The researcher acted as both a
teacher and a researcher in the experimental class based on the following reasons: Although
many teachers are aware of problem solving, few teachers understand the difference between
a traditional approach and problem-based approach. For those teachers who understand what
problem-based approach entails, the majority are neither sure of how to implement this
approach in their classrooms nor are they interested in even to try it (due to their own valid
reasons).
Prior to the actual implementations of the PBL in the experimental classroom, the researcher
in collaboration with the four participating mathematics graduate teachers grouped the 42
Further Mathematics students heterogeneously based on their performances at the JSS year 3
final examinations. The class was referred to by the researcher as Learners’ Community
Group (LCG) that consisted of six groups of seven students each. The sitting arrangement
was re-constituted in a semi circular form that made it possible for the researcher to walk
across the groups. The groups were coded as LCG A, B, C, R, P, and Q. The students were
asked to construct nametags that were used as a form of identification. The students coded
numbers were LCGA 01-07, LCGB 01-07, LCGC 01-07, LCGR 01-07, LCGP 01-07 and
LCGQ 01-07. The coded number for the students was used for ‘blind’ assessment.
The seats were arranged for all students in the experimental class to face the chalkboard. Files
were provided with working sheets. Shipboard, cello tape, markers of different colours and
exercise books were given to the participating teachers to note their remarks and
observations. Two periods of forty minutes each were allocated to the teaching of Further
Mathematics in a week. The periods were usually in the afternoon on Tuesdays and
Thursdays as dictated by the Zonal Ministry of Education in Ijebu Ode Local Government

78
Area. Thus, the researcher had no control on the placement of FM in the afternoon on the
school timetable. The rigidity of the timetable did not allow the researcher to create more
instructional time in the teaching of the contents in the experimental class and more
importantly, the school authority in compliance with the State Government’s directives did
not allow any extension of classroom activities beyond the closing time. This precluded any
intruder in the PBL classroom from creating an unusual atmosphere.
Four mathematics graduate teachers at the experimental school watched the researcher
leading discussions in the Further Mathematics classroom using PBL in a scaffolding manner
to suit the already prepared instructional lesson plan. The instructional plan consisted of
Introduction, Objectives, Content, Presentation, Evaluation and Conclusion. In the
experimental class, the PBL group process adopted consisted of five phases namely (i)
identify the problem (ii) make assumptions (iii) formulate a model (iv) use the model and (v)
evaluate the model. In the first contact period of the third week (28-10-2008) in the PBL
class, students were given orientation on the PBL and its associated problem-solving
processes. This was followed by a diagnostic test (a feature of PBL) on indices in which
students were to investigate the correctness of the given equations: (i) 22 x 33 = 66? (ii) (23)4 =
27; 64; 212; 163? (Pick the correct answers). Students were left to ruminate on the given tasks
individually and in groups following the identified problem-solving processes while the
teacher acted as a facilitator. One member each from the first three groups (LCG A, B & C)
was selected by the teacher to make presentations on the chalkboard while other members of
the learners’ community group critiqued the presentations and this triggered off dialogue in
the classroom. Thus, mixed feelings ensued among members of the learners’ community
group as some were in favour that the equality holds for the first equation, some were against
this stand and obtained 65 as the solution while others were indifferent. In reaching consensus
among the three opposing groups, the rsearcher interjected by calling the students attention to
simplify the value on the right hand side of the equation and see whether it corresponded to
the simplified value on the left hand side. This made the three opposing groups to retract
from their decisions and agreed that the equality did not hold and stemming from the
researcher’s questions, a member of the class stated that the law of indices could not be
applied to the given equation because the given numbers were not of the same base.

79
The entire class was in agreement with the final submission while another member of the
class gave a brisk overview of the laws of indices. In the second given equation, students
engaged in individual and group investigations of the task following the identified problem-
solving processes and the same procedure as described above took place in arriving at final
answers while the researcher acted as a facilitator. A similar procedure was adopted in
teaching topics related to the logarithms in the fourth week, algebraic equations in the fifth
and sixth weeks and sequences and series in the seventh, eighth and ninth weeks of the study.
In each of the topics taught students were given ill-structured tasks as homework that
demanded their visiting the libraries, and surfing the net in preparation for presentation in the
next contact period. An example of ill-structured task in algebraic equation is given:
The fish population in a certain lake rises and falls according to the formula: F=1000(30+17t
-t2). F is the number of fish at time t, where t is measured in years since Jan 1, 2002, when the
fish population was first estimated.
(a) On what day will the fish population again be the same as on Jan 1, 2002?
(b) By what date will all the fish in the lake have died?
(Stewart, Redllin, & Watson, 2006)
Another example of an ill-structured task on sequences and series is also given:
On graduation day, 1000 seniors line up outside the school. As they enter the school, they
pass the school lockers, aptly numbered 1 to 1000. The first student opens all of the lockers.
The second student closes every other locker beginning with the second locker. The third
student changes the status of every third locker beginning with every third one (if opened, the
student closes it, if closed, the student opens it). The fourth student changes the status of
every fourth locker, and so on. Which lockers remain open after all 1000 students entered the
school? (Dossey et al., 2002)
After each day’s work, the researcher met with the participating teachers and allowed them to
share their experiences. Their notebooks used for comments during the intervention periods
were collected and fully discussed with them. The treatment in the experimental class ended
on 08-01-2009 while the posttests (TMT, RDT) and the SBFMQ were administered on the

80
experimental class after the intervention on 12-01-2009. The post-tests were the modified
form of the pre-tests administered in the experimental class prior to the treatments in both the
control and experimental classes. The modification was carried out in the area of test-items
re-organisation in order to prevent hallo-effect that could result from familiarity of pre-and
post-test instruments.
3.7 Validity and reliability of research instruments
Validity is often defined as the extent to which an instrument measures what it purports to
measure. Validity requires that an instrument is reliable, but an instrument can be reliable
without being valid (Kimberlin & Winterstein, 2008). Validity is about relationships between
changes and differences in the seen and unseen. Reliability is about the consistency of that
relationship across situations when there has been little or no change (McKnight, C., Magid,
Murphy, & McKnight, M., 2000). Determination of the reliability of measures of SBFMQ,
TMT, and RDT was important because it allowed for generalization of the results obtained by
the measure, and without reliability, validity cannot be established (Nunnally & Bernstein,
1994). Validity allows proper refinement of outcome measures (Smith & McCarthy, 1995).
Validity can vary depending on the purpose of a test, therefore various forms of validity exist
(Kimberlin & Winterstein, 2008). In this study, content validity was looked into as it was
found to be most appropriate for the RDT and TMT whereas, construct validity was found
suitable for the SBFMQ (Mulder, 1989). Content validity relates to how well the test
succeeds in covering the field with which the test is concerned (Kimberlin & Winterstein,
2008). Construct validity is a judgment based on the accumulation of evidence from
numerous studies using a specific measuring instrument (Kimberlin & Winterstein, 2008).
The content validity of the RDT and TMT and construct validity of the SBFMQ are
explained in the next section.
3.7.1 Content validity of the RDT and TMT
Two Mathematics educators in the tertiary institution subjected the questions to face and
content validity in terms of (i) language clarity to the target audience, (ii) relevance to the
aims of the study, and (iii) coverage of the topics chosen for the study. Consequently, the
initial 10 questions on the RDT were reduced to four (questions 2, 5, 6, 7, 8 & 10 were
81
eliminated). The four questions (1, 3, 4 & 9) were further subjected to scrutiny by the Joint
Promoter who made some amendments to question three and finally the four questions
constituting the RDT were approved by the Promoter.
Three Further Mathematics teachers at the two schools selected for the study were asked to
prepare 20 essay questions (in Further Mathematics) each based on the course content for the
study. The set of questions were then given to Mathematics graduate teachers in other schools
different from the sampled schools for their critique. Based on their advice seventeen of the
questions, which featured in the selection of one or more of the graduate teachers, were taken.
These were then given to two Mathematics educators in the tertiary institution following the
procedure described for RDT above. Their recommendations led to further pruning of the
questions to ten (questions 1, 2, 3, 6, 7, 9, 11, 14, 15, & 16) The 10 questions formed the
TMT. Combining two different tests (RDT and TMT) not only provides for crosschecks and
increased validity but also provides a way to methodologically triangulate (Taylor-Powell &
Steele, 1996). One way to increase the validity, strength, and interpretative potential of a
study, decrease investigator biases, and provide multiple perspectives is to use methods
involving triangulation (Denzin, 1970).
In particular, six investigators (One teacher in the control school, four teachers in the
experimental school and the researcher) handled the study, so that meant the use of
investigator triangulation. However, the study adopted the methodologic triangulation in the
area of students’ achievement in Further Mathematics. Two different tests (RDT and TMT)
were used to source data on achievement and these allowed the researcher to weigh the two
tests in an attempt to decrease the deficiencies and biases that could stem from any single
test. The presence of theoretical triangulation could be seen in the area of multiple research
questions set for the study and addressing the same phenomenon. In essence, research
questions i & iii, ii & iv were related and addressed the impact of PBL on students’
achievement in Further Mathematics. The benefits inherent in data sources triangulation with
particular attention to time triangulation were maximized in the study. Specifically, data were
collected on students’ achievements in FM and beliefs about FM before and after treatments.
The collection of data at different times was to determine if similar findings occurred
(Kimchi, Polivka, & Stevenson, 1991). The study also relied on data –analysis triangulation
in the area of selection of data for the validation of instruments. In particular, different

82
statistical techniques (Cronbach alpha, Factor analysis using Principal Components Analysis,
Discrimination Power and Difficulty Index) were used in validating data collected in the pilot
testing of instruments as well as in the study.
3.7.2 Construct validity of SBFMQ
The SBFMQ was used as a questionnaire and considered appropriate for this study because of
its ‘‘versatility, efficiency and generalisabilty’’ (McMillan, 2004). The versatility of a
questionnaire lies in its ability to address a wide range of problems or questions, especially
when the purpose is to describe the beliefs, attitudes and perspectives of the respondents. Its
limitation, according to Mertler & Charles (2005), is that it does not allow the researcher to
probe further as would be possible in an interview. In this study, the 18-item beliefs survey
developed by Perry et al (2002) was adapted. This survey had been widely used in previous
research in Australia (Perry, Way, Southwell, White, & Pattison, 2005; Perry, Howard, &
Tracey, 1999; Perry, Howard, & Conroy, 1996). Two mathematics educators in the tertiary
institution checked the adequacy, appropriateness and suitability of the survey items to the
Nigerian sample. The survey items were considered appropriate and suitable but inadequate.
This led to the construction of 10 other beliefs items in relation to the nature of Further
Mathematics, its teaching and the theoretical underpinning of the Further Mathematics
curriculum (Harbour-Peters, 1990, 1991). These items were also scrutinised by the two
mathematics educators and minor amendments were effected. Thereafter, the 28-item
constituting the SBFMQ was given to the Joint Promoter for comments who found the items
acceptable. Finally, the SBFMQ was approved by the Promoter with no amendment.
3.7.3 Reliability of RDT, TMT and SBFMQ
Reliability refers in general to the extent to which independent administration of the same
instrument (or highly similar instruments) consistently yields the same (or similar) results
under comparable conditions (De Vos, 2002). The RDT, TMT and SBFMQ were pilot tested
in a school different from the study schools but whose sample shared similar characteristics
(age, class level and exposure to the same curriculum) with the study schools. The results of
the students were used for item analysis. Both discrimination index and item difficulty were
calculated purposely for (i) evaluating the quality of the items and of the test as a whole and
(ii) revising and improving both items and the test as a whole (Gronlund & Linn, 1990;

83
Matlock-Hetzel, 1997; Pedhazur & Schemlkin, 1991). The discrimination index, D, is the
number of students in the upper group who answered the item correctly minus the number of
students in the lower group who answered the item correctly, divided by the total number of
students in the two groups. The higher the discrimination index, the better the item because
such a value indicates that the item discriminates in favour of the upper group, which should
get more items correct. As a rule of thumb, in terms of discrimination index, 0.40 and greater
are very good items, 0.30 to 0.39 are reasonably good but possibly subject to improvement,
0.20 to 0.29 are marginal items and need some revision, below 0.19 are considered poor
items and need major revision or should be eliminated (Ebel & Frisbie, 1986).
Item difficulty is simply the percentage of students taking the test who answered the item
correctly. The larger the percentage getting an item right, the easier the item. The higher the
difficulty index, the easier the item is understood to be. The lower the difficulty index, the
more difficult the item is understood to be. To compute the item difficulty, divide the number
of students answering the item correctly by the total number of students answering the item.
The proportion for the item is usually denoted as p and is called item difficulty (Crocker &
Algina, 1986). The implication of a p value is that the difficulty is a characteristic of both the
item and the sample taking the test. One motivation for item and test analysis in this study is
that an item's difficulty and index assisted the researcher in determining what was wrong with
individual items. Item and test analysis provided empirical data about how individual items
and whole tests performed in real test situations.
Each of the four questions in the RDT showed a discrimination index of more than 0.40 and
item difficulty of 0.40 – 0.60. This supports the views of Ebel (1979) about the
appropriateness of values. Cronbach alpha computed to determine the internal consistency
and reliability of the test was 0.87. Thus, the four questions constituting the RDT were
considered reliable and of moderate difficulty level. Each item on the RDT instrument
attracted a score of 25marks. This gave a total of 100marks. Hence, a maximum score that
could be obtained was 100marks.
The students’ pre-test scores on the RDT in the experimental school were further used for
item analysis. Cronbach alpha computed to determine the internal consistency and reliability
of the test was 0.85. Appendix 5 shows the difficulty and discrimination index for each item

84
on the RDT. In Appendix 5, the mean of item difficulty (0.54) agreed with the submission of
Brown (1996) and the ranges of item difficulty (from 0.25 to 0.86) and the discrimination
index (from 0.42 to 0.64) also concurred with Ebel (1979), for those 4 items as a whole
satisfied the criteria to serve as a complete set of a RDT.
For the TMT, each of the ten questions showed discrimination index of more than 0.40 and
item difficulty of 0.40-0.60 thus, similar to suggestions as noted by Ebel (1979). Cronbach
alpha was computed (using SPSS version 15) to determine the internal consistency and
reliability of the test and a value of 0.88 was obtained. The ten questions then constituted the
TMT. Each item on the TMT instrument attracted a score of 10 marks. This gave 100 marks.
Hence, a maximum score that could be obtained was 100marks. Items on the TMT, when
classified based on Bloom’s cognitive taxonomy covered five out of the six cognitive levels
namely knowledge, comprehension, application, analysis, and evaluation. As indicated in
Table 3.2, the items were more for the lower-order cognitive domain based on random
selection of items that eventually constituted the TMT. However, the scores of 40 students
on the TMT when administered as pre-test in the experimental school were further used for
item analysis. Cronbach alpha computed to determine the internal consistency and reliability
of the test was 0.86. Appendix 6 shows the item difficulty and discrimination index for the
TMT. Appendix 6 shows the mean of item difficulty as 0.61 and the ranges of item difficulty
from 0.25 to 0.88 and discrimination index from 0.44 to 0.67 which agreed with the views of
Ebel (1979), for those 10 items as a whole satisfied the criteria to serve as a complete set of a
TMT.
For the SBFMQ, Cronbach alpha computed showed a reliability coefficient of 0.86. In
addition, the SBFMQ before intervention scores of 40 students in the control school were
subjected to factor analysis using Principal Components Analysis with the factor loadings
shown in Appendix 5 based on an Oblimin three factor resolution. In running the factor
analysis, the researcher observed the following criteria for determining the number of factors.
First, consideration was given to the option of retaining those factors whose meaning was
comprehensible. Second, the Kaiser rule (Kaiser, 1960), which suggests five factors and
ascertains that all components with eigenvalues under 1.0 be dropped was observed. The
method is not recommended when used as the sole cut-off criterion for estimating the number
of factors as it tends to over extract factors (Gorsuch, 1983).

85
Third, the variance explained criterion was observed. This involves keeping enough factors to
account for 90% (sometimes 80%) of variation, and where the goal of parsimony is
emphasised the criterion could be as low as 50% (Ebel, 1979). Fourth, the Scree test, which
suggests two factors, was plotted. The Cattel Scree test plots the components as the X-axis
and the corresponding eigenvalues as the Y-axis. As one moves to the right, toward later
components, the eigenvalues drop (Cattel, 1966). When the drop ceases and the curve makes
an elbow toward less steep decline, Cattel's Scree test says to drop all further components
after the one starting the elbow (Gorsuch, 1983). This has been criticized for being amenable
to researcher-controlled fudging. That is, picking the elbow can be subjective (Kaiser, 1960).
In this study, a five- factor solution was initially obtained. This was considered not good
enough as one of the components had just two items. A four-factor solution was thus
computed but this was also jettisoned because one of the factors with only three items had
low internal consistency reliability (0.23). However, an examination of the Scree plot of
eigenvalues gave an indication suggestive of three-factor solution. The three-factor solution
was thus computed and this was found not only meaningful but had non-overlapping
interpretable structures. That is, items did not load on more than one structure.
There are two rotation methods in factor analysis namely orthogonal and oblique
(Bartholomew, Steele, Galbraith, & Moustaki, 2008). Varimax rotation is an orthogonal
rotation of the factor axes to maximize the variance of the squared loadings of a factor
(column) on all the variables (rows) in a factor matrix, which has the effect of differentiating
the original variables by extracted factor. A varimax solution yields results that make it easy
to identify each variable with a single factor and it is the most common rotation option. The
direct oblimin rotation is the standard method when one wishes a non-orthogonal (oblique
solution) - that is, one in which the factors are allowed to be correlated (Bartholomew, Steele,
Galbraith, & Moustaki, 2008). This resulted in higher eigenvalues but diminished
interpretability of the factors. However, the researcher wished a non-orthogonal solution and
so, adopted the direct oblimin rotation.
In Appendix 4, Factor 1 is composed of 15 items (5, 6, 7, 8, 12, 13, 15, 16, 18, 21, 22, 23, 24,
25, and 26) reflecting students’ cognitive beliefs about the teaching and learning of Further
Mathematics. Factor 2 contained seven items (1, 2, 4, 10, 17, 20 and 27) and reflected
students’ beliefs about the nature and importance of Further Mathematics. Factor 3 was made

86
up of six items (3, 9, 11, 14, 19 and 28) and showed students’ beliefs about aesthetic value
and teachers’ behaviour in Further Mathematics. The three interpretable factors accounted for
42% of the item variance. The three identified factors were clearly different and non-
overlapping. This indicated that it was possible for a student to hold both beliefs
simultaneously. Cronbach alpha computed to determine the internal consistency and
reliability of the SBFMQ was 0.7.
3.8 Data analysis and interpretation
The quantitative data collected using the TMT, RDT and SBFMQ were analysed using the
means and standard deviations, which are important precursor to conducting inferential
statistical analysis of the t-test. This study tested differences in students’ achievements in
TMT, RDT and students’ responses in SBFMQ before and after treatment conditions in both
the experimental and control classes and no attempt was made to test relationships. Thus, this
foreclosed the adoption of correlation statistic. The t-test statistic was adopted in the study
partly because two groups were involved and more importantly, the statistic is considered
more robust when comparing differences of two means. Analysis of variance (ANOVA) was
also considered appropriate in this study to test the null hypotheses and since it generalizes
the t-test value. Thus, a one-way ANOVA was adopted to corroborate results obtained using
the t-test and also to prove the relation F = t2.
Independent Samples t-test was used to analyse the pre-test and post- test performances of the
control and experimental groups for SBFMQ, TMT and RDT. An alpha level of 0.05 was
used for all statistical tests. Hill & Lewicki (2007) stated that the following assumptions
could be used when independent samples t-test is adopted:
• Each of the two samples being compared should follow a normal distribution which
can be tested using a normality test, such as the Shapiro-Wilk or Kolmogorov–
Smirnov test, or it can be assessed graphically using a normal quantile plot.
• If using student original definition of the t-test, the two populations being compared
should have the same variance (testable using F test, Levene's test, Bartlett's test, or
the Brown–Forsythe test; or assessable graphically using a Q-Q plot).
• The data used to carry out the test should be sampled independently from the two
populations being compared.

87
By the central limit theorem, means of samples from a population with finite variance
approach a normal distribution regardless of the distribution of the population (Hill &
Lewicki, 2007). Rules of thumb say that the sample means are normally distributed as long as
the sample size is at least 20 or 30 and for a t-test to be valid on a sample of smaller size, the
population distribution would have to be approximately normal (Hill & Lewicki, 2007). This
was a necessary condition in this study.
However, the analysis of the study data using Shapiro-Wilk test often considered more
efficient than the Kolmogorov-Smirnov test revealed that the quantitative data collected in
respect of the RDT, TMT and SBFMQ separately significantly deviated from a normal
distribution. This is because the significant value of the Shapiro-Wilk test for each of RDT,
TMT and SBFMQ was below 0.05. Moreover, literature suggests that the t-test is invalid for
small samples from non-normal distributions, but it is valid for large samples (N>30) from
non-normal distributions (Hill & Lewicki, 2007). Based on the latter, the study sample was
96 hence, the justification for the adoption of the t-test statistic.
3.9 Limitations of the study
The limitations in this study are as stated below:
• This study relied on the purposive sampling technique in choosing schools that
participated in the study. This was due to the few numbers of students taking
Further Mathematics consequent upon paucity of qualified graduate
mathematics teachers in the study area and generally in Nigeria. This non-
probability sampling is often criticised for being subjective to researcher’s
manipulation, thus making generalisation of findings impractical (Hill &
Lewicki, 2007). This is seen as a potential weakness of this study.
• The ability to address a wide range of problems or questions, especially when
the purpose is to describe the beliefs, attitudes and perspectives of the
respondents is one of the strengths of a questionnaire. It does not however,
allow the researcher to probe further as would have been possible in an
interview (Mertler & Charles, 2005).

88
CHAPTER FOUR
PRESENTATION OF RESULTS
4.1. Introduction
This chapter presents results obtained in the main study in order to answer the research
questions that guided this study. The raw data from the field for pre- and post- tests in both
the experimental and control classes were analysed and summarised using descriptive
statistics. Other relevant descriptive statistical tools such as the mean and standard deviation
obtained in the tests (TMT and RDT) and questionnaire (SBFMQ) were used in the study.
The latter statistical tools especially the mean was used because it is the best-known and most
commonly used measure of central location and its precise meaning is easily explained. More
so, the mean is in fact the centre of gravity of the observations. The observations in this study
were the raw scores associated with the TMT, RDT, and SBFMQ. The standard deviation
reflects the distances of all the individual student’s scores in TMT, RDT, and SBFMQ from
the mean. The greater the standard deviation is, the further on average, the scores lie from the
mean and vice-versa. The statistical tools assisted in comparing the performance of the
experimental (PBL) and control (TM) classes with the intention of deciding whether or not
the intervention improved students’ achievements in Further Mathematics. Samples of
students’ self-written work in both the experimental and control classes were used to support
claims made from means and standard deviations.
The analysis of students’ responses to the questionnaire enabled the researcher to deduce how
the intervention influenced students’ beliefs about Further Mathematics in general. An
independent t-test was used to determine whether the mean scores obtained by the two classes
were statistically significant thus confirming or rejecting the stated research hypotheses. The
adoption of both the independent samples t-test and Analysis of variance (ANOVA) were
hinged on verifying the consistency of conclusions made from any of the statistics. The t-test
statistic was adopted in this study partly because two groups were involved and more
importantly, the statistic is considered more robust when comparing differences of two means
(Hill & Lewicki, 2007). ANOVA was also considered appropriate in this study because it
provides a statistical test of whether or not the means of several groups are all equal, and

89
therefore generalizes the t-test to more than two groups (Hill & Lewicki, 2007). One-way
ANOVA was used to test the null hypotheses and test for differences in learning outcomes
(achievement in Further Mathematics and beliefs about Further Mathematics) between the
experimental and control classes. Since there were only two group means to compare, the t-
test and the ANOVA F-test must be equivalent; the relation between ANOVA and the t-test is
given by F = t2. An attempt was made to prove this relationship in the study with attention
given to the interpretations of p values generated from the statistical tests. The p value is a
probability, with a value ranging from zero to one, and all statistical tests in the study were
carried out using two-tailed p values. However, the summary of the results concludes the
chapter.
4.2. Results of Students in the TMT, RDT and SBFMQ before the Intervention
The pre-test was an instrument to measure the background knowledge of the participants
before the intervention. In the present study the pre-test was manipulated at two levels: TMT
and RDT. The essence of the pre-tests was to ascertain the prior or background knowledge of
the students in the Further Mathematics topics selected for the study (cf. 3.5.1 & 3.5.2) in
both the control and experimental classes before the intervention. A pre-treatment
questionnaire, SBFMQ (cf. 3.5.3) gave a preview of students’ already acquired beliefs about
Further Mathematics. In this section attempt is made to discuss the TMT pre-test, RDT pre-
test, and SBFMQ pre-treatment questionnaire results of students in the control and
experimental groups.
4.2.1. Results of Students in the TMT before the Intervention
The TMT pre-test consisted of 10 constructed-response items (See Appendix 3a). Each of
the 10 items attracted a maximum score of 10 (since the items were of moderate difficulty cf.
3.9.3) and a total score obtainable by any of the students was 100%. The TMT pre-test raw
scores for the control and experimental classes were analysed, summarised, and interpreted
using the means and standard deviations.
Table 4.1 below shows the results of statistical analysis of theTMT pre-test scores in both the
experimental and control classes with no attempt to compare the means since the
participating schools were of comparable characteristics. The mean of the pre-test
achievement on the TMT for the experimental class was M=30.90 while that of the control
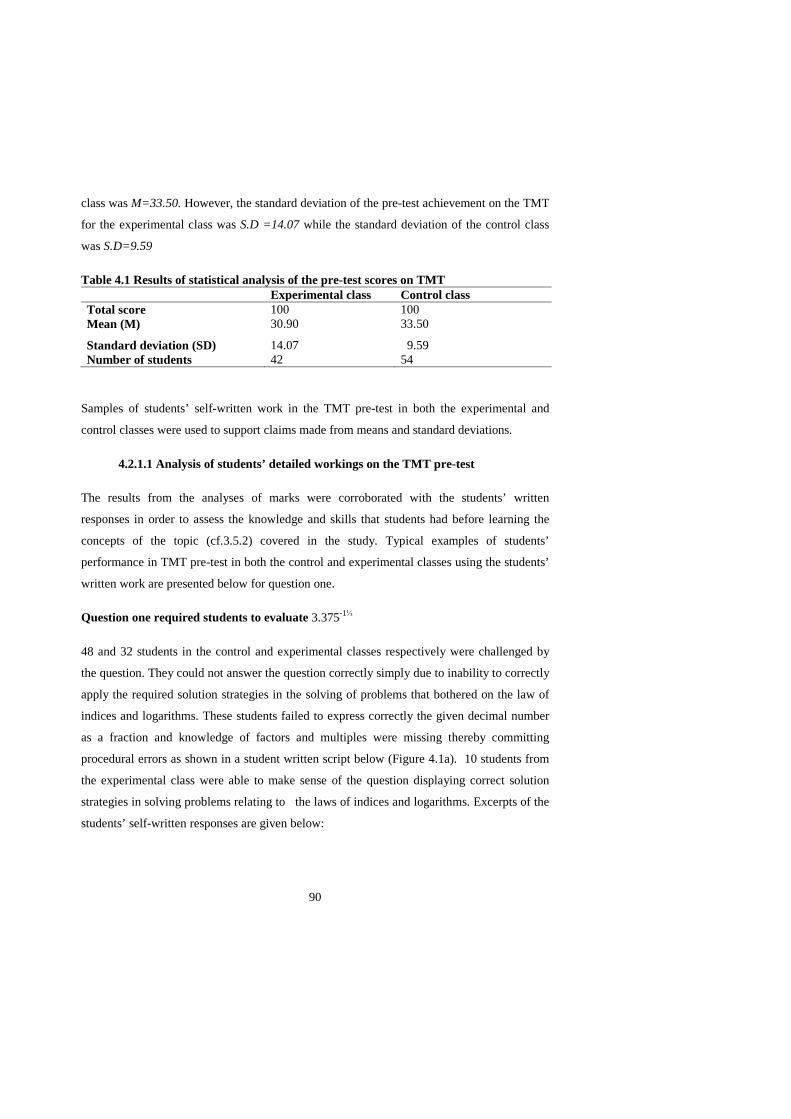
90
class was M=33.50. However, the standard deviation of the pre-test achievement on the TMT
for the experimental class was S.D =14.07 while the standard deviation of the control class
was S.D=9.59
Table 4.1 Results of statistical analysis of the pre-test scores on TMT Experimental class Control class Total score 100 100 Mean (M) 30.90 33.50
Standard deviation (SD) 14.07 9.59 Number of students 42 54
Samples of students’ self-written work in the TMT pre-test in both the experimental and
control classes were used to support claims made from means and standard deviations.
4.2.1.1 Analysis of students’ detailed workings on the TMT pre-test
The results from the analyses of marks were corroborated with the students’ written
responses in order to assess the knowledge and skills that students had before learning the
concepts of the topic (cf.3.5.2) covered in the study. Typical examples of students’
performance in TMT pre-test in both the control and experimental classes using the students’
written work are presented below for question one.
Question one required students to evaluate 3.375-1⅓
48 and 32 students in the control and experimental classes respectively were challenged by
the question. They could not answer the question correctly simply due to inability to correctly
apply the required solution strategies in the solving of problems that bothered on the law of
indices and logarithms. These students failed to express correctly the given decimal number
as a fraction and knowledge of factors and multiples were missing thereby committing
procedural errors as shown in a student written script below (Figure 4.1a). 10 students from
the experimental class were able to make sense of the question displaying correct solution
strategies in solving problems relating to the laws of indices and logarithms. Excerpts of the
students’ self-written responses are given below:

91
Figure 4.1a. Script of control group student for question one on pre-test TMT
This script shows a student could evaluate a given power that has a decimal as a base and a
negative fraction as an exponent.The student attempted to convert a decimal into an ordinary
fraction by dividing by 1000 then went back to the original form. Surprisingly, the student
put two-thirds as the answer without showing any workings. The student might have gotten
the correct answer using scientific calculator or spied the answer from another student. A
close juxtaposition of the original question with the one written on the script (as in Fig 4.1a)
revealed that the student miscopied the question and thus committed an error of omission (the
index -⅓ was written instead of -1⅓).
Figure 4.1b. Script of experimental group student for question one on pre-test TMT
The experimental student copied the question correctly but failed in line two in the attempt to
transform the mixed fraction index (-1⅓) to an improper fraction index (-4/3). Instead of -
4/3, the student wrote 4/3 as seen in Figure 4.1b above. This set the stage for the application

92
of the laws of indices, which the student correctly carried out in line 3 (the student thus
recovered the missing sign in line 2). In the final stage, the student jumped into an incorrect
answer. However, it could be deduced from the students’ sampled scripts regarding the
topics on Indices and Logarithms is that there were students in both the experimental and
control classes who struggled with the evaluation of powers that have a decimal as a base and
a negative fraction as an index/exponent and hence they committed procedural errors in the
TMT pre-test. Overall, the students’ performance in both the experimental and control classes
in the remaining topics selected for the study was not encouraging due to their inability to
implement correct solution strategies in answering questions relating to algebraic equations,
series and sequences.
Having done with the qualitative analysis of students’ written scripts, the stage was set for
quantitative analysis of the TMT pre-test achievement scores of students in both the
experimental and control classes leaning on the results of the means and standard deviations.
The means and standard deviations are measures of central tendency and in fact important
precursors to conducting inferential statistical analysis of the t-test, which is the most robust
statistic when dealing with significance difference of two group means. In the sequel, the t-
test was used to determine whether or not there was a significant difference between the TMT
pre-test mean scores of students exposed to the PBL and those exposed to the TM.
Table 4.2a. Means, standard deviations, and t-test value for Experimental and Control classes on pre-test TMT N M SD t p Experimental 42 30.90 14.07 1.07 .286 Control 54 33.50 9.59
Based on the means and standard deviations from Section 4.2.1, which were reproduced
above in Table 4.2a, one notices that the mean of the experimental class was lower while its
standard deviation was higher than that of the control class. The mean difference of 2.60
between the control and experimental classes in the pre-test TMT was however not
significant (t=1.07, p=.286) as indicated by the t-test results in Table 4.2a. As observed in the
table above, the two-tail p value was 0.286 meaning that random sampling from identical
populations would lead to a difference smaller than was observed in 71.4% of experiments
and larger than was observed in 28.6% of experiments. Thus, based on the t-test analysis,
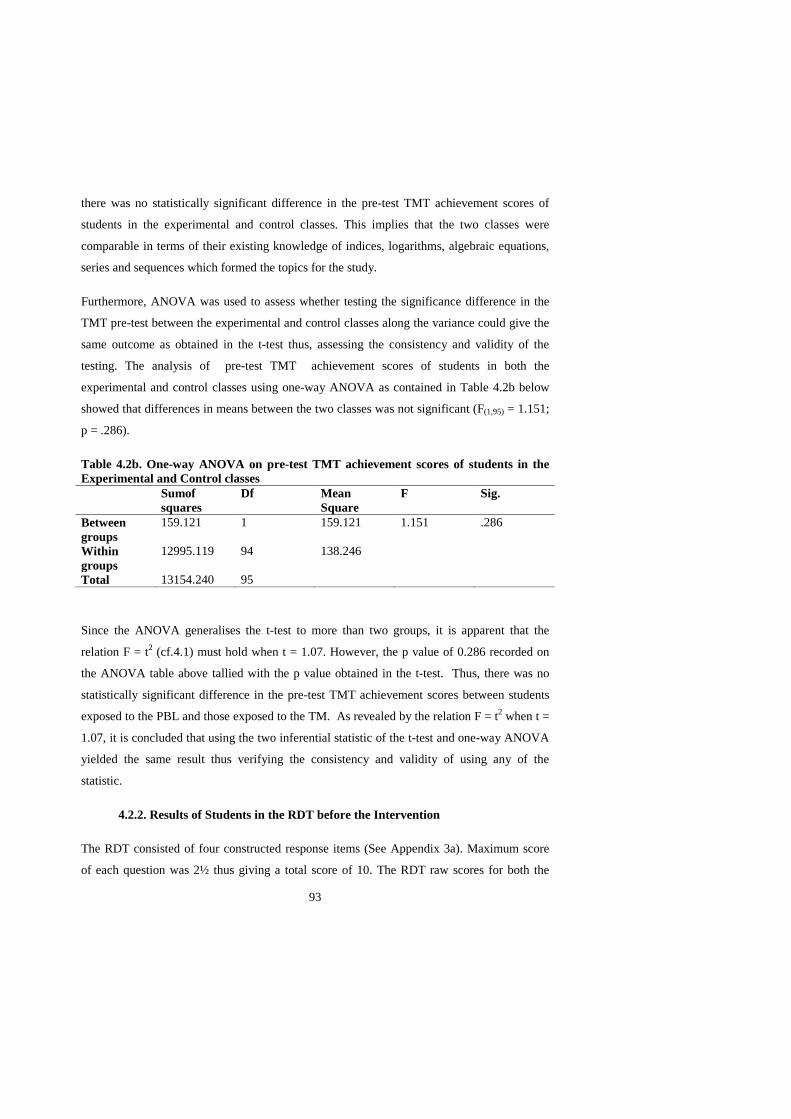
93
there was no statistically significant difference in the pre-test TMT achievement scores of
students in the experimental and control classes. This implies that the two classes were
comparable in terms of their existing knowledge of indices, logarithms, algebraic equations,
series and sequences which formed the topics for the study.
Furthermore, ANOVA was used to assess whether testing the significance difference in the
TMT pre-test between the experimental and control classes along the variance could give the
same outcome as obtained in the t-test thus, assessing the consistency and validity of the
testing. The analysis of pre-test TMT achievement scores of students in both the
experimental and control classes using one-way ANOVA as contained in Table 4.2b below
showed that differences in means between the two classes was not significant (F(1,95) = 1.151;
p = .286).
Table 4.2b. One-way ANOVA on pre-test TMT achievement scores of students in the Experimental and Control classes Sumof
squares Df Mean
Square F Sig.
Between groups
159.121 1 159.121 1.151 .286
Within groups
12995.119 94 138.246
Total 13154.240 95
Since the ANOVA generalises the t-test to more than two groups, it is apparent that the
relation F = t2 (cf.4.1) must hold when t = 1.07. However, the p value of 0.286 recorded on
the ANOVA table above tallied with the p value obtained in the t-test. Thus, there was no
statistically significant difference in the pre-test TMT achievement scores between students
exposed to the PBL and those exposed to the TM. As revealed by the relation F = t2 when t =
1.07, it is concluded that using the two inferential statistic of the t-test and one-way ANOVA
yielded the same result thus verifying the consistency and validity of using any of the
statistic.
4.2.2. Results of Students in the RDT before the Intervention
The RDT consisted of four constructed response items (See Appendix 3a). Maximum score
of each question was 2½ thus giving a total score of 10. The RDT raw scores for both the

94
control and experimental classes were analysed, summarised, and interpreted using the means
and standard deviations. Table 4.3 below shows the results of the statistical analysis of the
RDT scores in both the experimental and control classes. The mean of the pre-test
achievement on the RDT for the experimental class was M=1.05 with S.D = 0.75 while that
of the control class was M=1.06 with S.D=0.72 and this meant qualitatively that the
performance of students in both classes were almost at par. The lean difference in mean
scores between the experimental and control classes in the pre-test achievement on the RDT
reinforced our initial position on the comparability of the two classes. Thus, both classes
possessed equal prior knowledge on the Further Mathematics topics earmarked for the study.
Table 4.3 Results of statistical analysis of the pre-test scores on the RDT Experimental class Control class Total score 10 10 Mean (M) 1.05 1.06
Standard deviation (SD) 0.75 0.72 Number of students 42 54
Nevertheless, an attempt was made to analyse samples of the students’ self-written work in
the pre-test on the RDT in both the experimental and control classes.
4.2.2.1. Analysis of students’ detailed workings on the pre-test RDT
The students’ written responses were analysed in order to assess the knowledge and skills that
students had before learning the concepts of the topics (cf. 3.5.2) covered in this study.
Typical examples of the students’ performance in the pre-test RDT in both the control and
experimental classes using the students’ written work are displayed below for question three.
Question three stated that Some Biologists model the number of species ‘S’ in a fixed area
A (such as an island) by the Species-Area relationship: log S = logC + klogA, where c and k
are positive constants that depend on the type of species and habitat.
(a) Simplify the equation for S
(b) Use part (a) to show that if k =3, then doubling the area increases the number of
species eightfold.
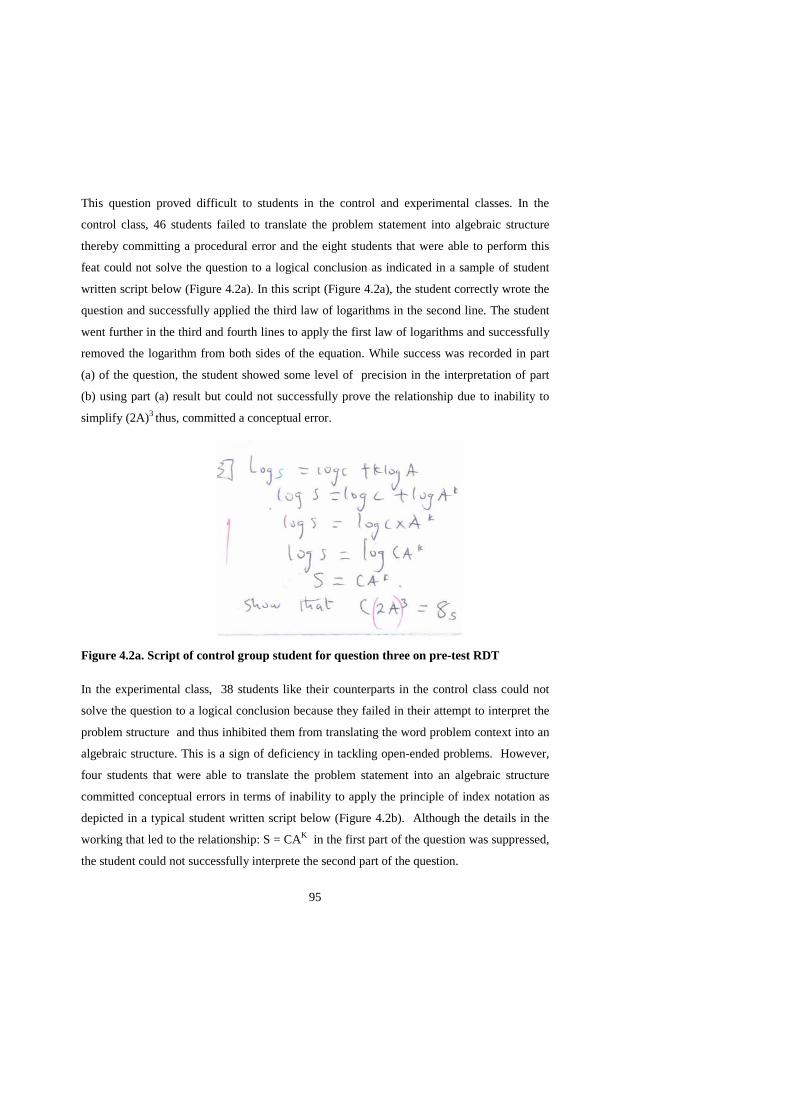
95
This question proved difficult to students in the control and experimental classes. In the
control class, 46 students failed to translate the problem statement into algebraic structure
thereby committing a procedural error and the eight students that were able to perform this
feat could not solve the question to a logical conclusion as indicated in a sample of student
written script below (Figure 4.2a). In this script (Figure 4.2a), the student correctly wrote the
question and successfully applied the third law of logarithms in the second line. The student
went further in the third and fourth lines to apply the first law of logarithms and successfully
removed the logarithm from both sides of the equation. While success was recorded in part
(a) of the question, the student showed some level of precision in the interpretation of part
(b) using part (a) result but could not successfully prove the relationship due to inability to
simplify (2A)3 thus, committed a conceptual error.
Figure 4.2a. Script of control group student for question three on pre-test RDT
In the experimental class, 38 students like their counterparts in the control class could not
solve the question to a logical conclusion because they failed in their attempt to interpret the
problem structure and thus inhibited them from translating the word problem context into an
algebraic structure. This is a sign of deficiency in tackling open-ended problems. However,
four students that were able to translate the problem statement into an algebraic structure
committed conceptual errors in terms of inability to apply the principle of index notation as
depicted in a typical student written script below (Figure 4.2b). Although the details in the
working that led to the relationship: S = CAK in the first part of the question was suppressed,
the student could not successfully interprete the second part of the question.
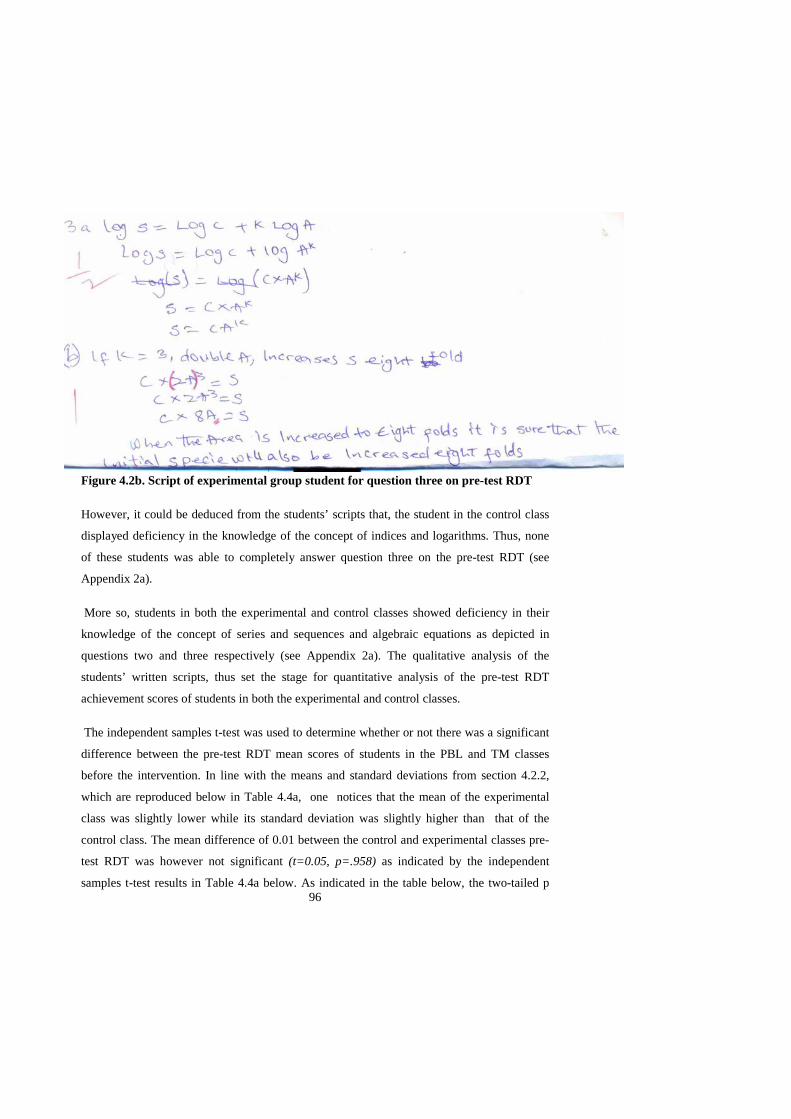
96
Figure 4.2b. Script of experimental group student for question three on pre-test RDT
However, it could be deduced from the students’ scripts that, the student in the control class
displayed deficiency in the knowledge of the concept of indices and logarithms. Thus, none
of these students was able to completely answer question three on the pre-test RDT (see
Appendix 2a).
More so, students in both the experimental and control classes showed deficiency in their
knowledge of the concept of series and sequences and algebraic equations as depicted in
questions two and three respectively (see Appendix 2a). The qualitative analysis of the
students’ written scripts, thus set the stage for quantitative analysis of the pre-test RDT
achievement scores of students in both the experimental and control classes.
The independent samples t-test was used to determine whether or not there was a significant
difference between the pre-test RDT mean scores of students in the PBL and TM classes
before the intervention. In line with the means and standard deviations from section 4.2.2,
which are reproduced below in Table 4.4a, one notices that the mean of the experimental
class was slightly lower while its standard deviation was slightly higher than that of the
control class. The mean difference of 0.01 between the control and experimental classes pre-
test RDT was however not significant (t=0.05, p=.958) as indicated by the independent
samples t-test results in Table 4.4a below. As indicated in the table below, the two-tailed p
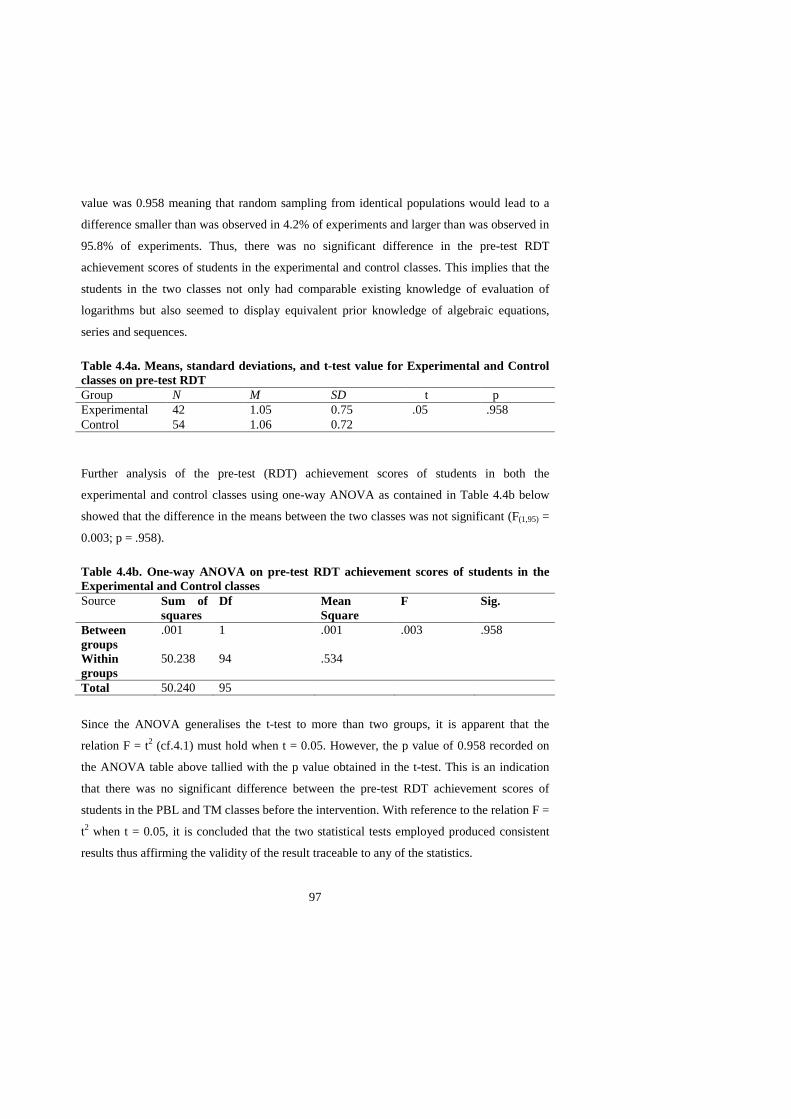
97
value was 0.958 meaning that random sampling from identical populations would lead to a
difference smaller than was observed in 4.2% of experiments and larger than was observed in
95.8% of experiments. Thus, there was no significant difference in the pre-test RDT
achievement scores of students in the experimental and control classes. This implies that the
students in the two classes not only had comparable existing knowledge of evaluation of
logarithms but also seemed to display equivalent prior knowledge of algebraic equations,
series and sequences.
Table 4.4a. Means, standard deviations, and t-test value for Experimental and Control classes on pre-test RDT Group N M SD t p Experimental 42 1.05 0.75 .05
.958
Control 54 1.06 0.72
Further analysis of the pre-test (RDT) achievement scores of students in both the
experimental and control classes using one-way ANOVA as contained in Table 4.4b below
showed that the difference in the means between the two classes was not significant (F(1,95) =
0.003; p = .958).
Table 4.4b. One-way ANOVA on pre-test RDT achievement scores of students in the Experimental and Control classes Source Sum of
squares Df Mean
Square F Sig.
Between groups
.001 1 .001 .003 .958
Within groups
50.238 94 .534
Total 50.240 95
Since the ANOVA generalises the t-test to more than two groups, it is apparent that the
relation F = t2 (cf.4.1) must hold when t = 0.05. However, the p value of 0.958 recorded on
the ANOVA table above tallied with the p value obtained in the t-test. This is an indication
that there was no significant difference between the pre-test RDT achievement scores of
students in the PBL and TM classes before the intervention. With reference to the relation F =
t2 when t = 0.05, it is concluded that the two statistical tests employed produced consistent
results thus affirming the validity of the result traceable to any of the statistics.

98
4.2.3. Pre-treatment Questionnaire
The pre-treatment questionnaire on beliefs tagged SBFMQ consisted of 28 statements
anchored on a four-point Likert scale of strongly agree, agree, disagree, and strongly disagree
to which students were asked to respond (See Appendix 4 and cf. 3.5.3). The SBFMQ
defined in Chapter two (cf. 2.3) of this study gave a three-factor solution determined from
factor analysis using principal components analysis with an oblique rotation. The choice of
the four-point Likert scale as against to the five-point was hinged on the fact that having a
neutral point (in this case undecided) attracts respondents who actually slightly lean toward a
favourable or unfavourable response. Bearing in mind that the reason for neutral is not to
coerce respondents on the available choices for those who don’t want any of strongly agree,
agree, disagree, and strongly disagree will choose undecided, nevertheless, three reasons
could be adduced for not using a neutral point in this study. First, analyses on questionnaire
(SBFMQ) are averaged or summed across items. Having four response options or five will
not matter when one takes the average. Second, responses on the SBFMQ are not terribly
valuable by themselves. One needs to compare the scores to something meaningful. Third, in
general the effects of usable or unusable applications tend to outweigh the much smaller
effects of scale points, labels, scale directions, neutral responses and poorly written
questions.
The SBFMQ has no zero point and maximum score obtainable in the Likert scale was four
while the least score that could be obtained by a student on any one item of the questionnaire
was one. The SBFMQ scores for both the control and experimental classes were analysed,
summarised, and interpreted using the means and standard deviations. Table 4.5 below shows
the results of statistical analysis of SBFMQ pre-treatment scores according to themes
determined from factor analysis using principal components analysis based on an oblimin
three-factor resolution (cf. 3.9.3) in both the experimental and control classes. In theme one
that centred on cognitive beliefs about the teaching and learning of Further Mathematics, the
control class students recorded a higher mean score (M = 3.13) but lower standard deviation
(S.D = 0.95) when compared with the experimental class students’ mean score (M = 2.85)
and standard deviation (S.D = 0.98). Similarly, in theme two which summarised the beliefs
about the nature and importance of Further Mathematics, students in the control class
recorded a higher mean score (M = 2.20) and standard deviation (S.D = 1.11) than the

99
students’ mean score (M =1.98) and standard deviation (S.D = 1.01) in the experimental
class. This trend was also recorded with theme three that centred on beliefs about aesthetic
value and teachers’ behaviour in Further Mathematics. The mean score (M = 2.84) and
standard deviation (S.D =1.06) of the control class were higher than the mean score (M =
2.49) and standard deviation (S.D = 1.04) of the experimental class. The grand-overall mean
of the pre-treatment score on the SBFMQ for the experimental class (M=2.56) was lower
than the mean of the control class (M=2.83). However, the two classes were almost holding
similar beliefs about Further Mathematics prior to the intervention but this needed further
investigation. The high standard deviation (S.D =.45) recorded by students in the
experimental class showed that students’ scores in the experimental class were spread away
from the mean while the low standard deviation (S.D=.37) recorded by the control class
students on the SBFMQ showed that their scores clustered around the mean.
Table 4.5 Mean, Standard Deviation and Rank of the pre-treatment SBFMQ scores Control class (n = 54) Experimental class
(n = 42) Beliefs Statements Mean
( ) SD Rank Mean
( ) SD Rank
Theme 1: cognitive beliefs about the teaching and learning of Further Mathematics 5: Right answers are much more important in Further Mathematics than the ways in which you get them
3.72 .71 3 2.95 1.17 8
6: Further Mathematics knowledge is the result of the learner interpreting and organizing the information gained from experiences
2.67 1.10 13 3.57 .77 2
7: Being able to build on other students’ ideas makes extensions of FM real
1.70 1.04 15 2.00 .94 13.5
8: Students are rational decision makers capable of determining for themselves what is right and wrong
2.96 1.10 10 2.90 1.08 10
12: Students should be allowed to use any method known to them in solving FM problems
2.98 1.12 9 2.93 1.05 9
13: Young students are capable of much higher levels of mathematical thought than has been suggested traditionally
3.04 1.08 8 2.62 1.08 11
15: Being able to memorize facts is critical in Further Mathematics learning
2.80 1.23 12 2.00 1.33 13.5
16: Further Mathematics learning is enhanced by activities which build upon
2.94 1.11 11 2.50 1.13 12
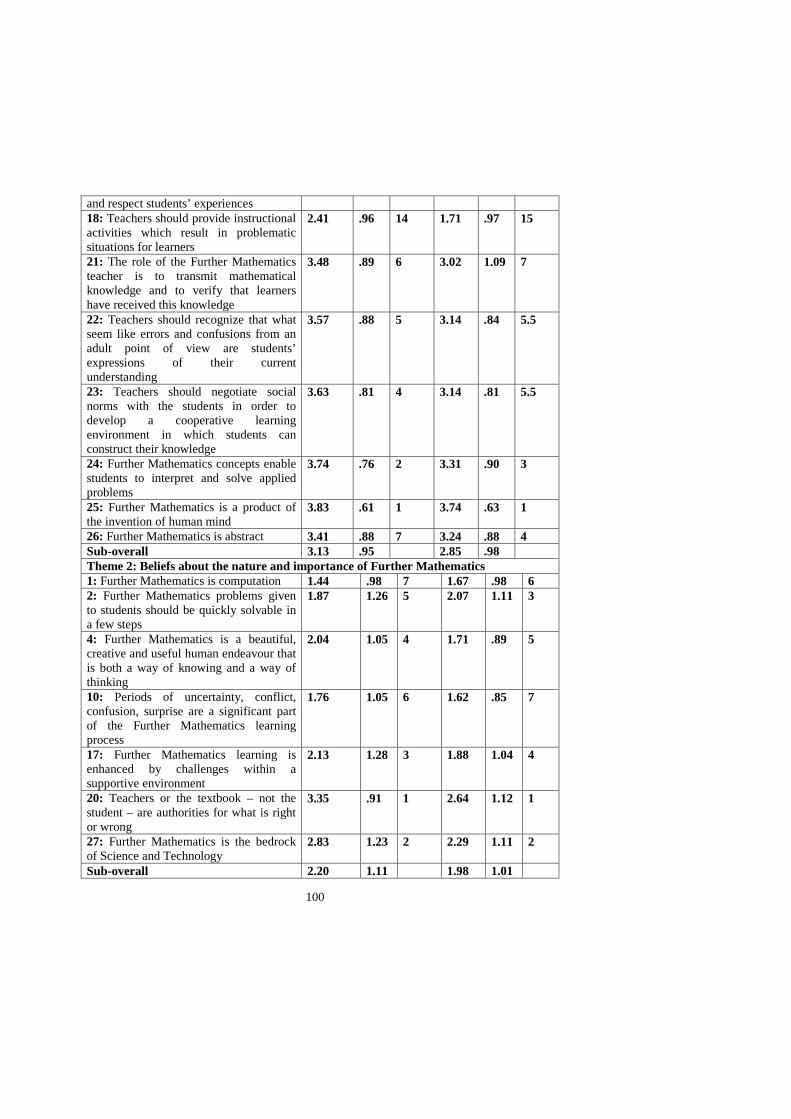
100
and respect students’ experiences 18: Teachers should provide instructional activities which result in problematic situations for learners
2.41 .96 14 1.71 .97 15
21: The role of the Further Mathematics teacher is to transmit mathematical knowledge and to verify that learners have received this knowledge
3.48 .89 6 3.02 1.09 7
22: Teachers should recognize that what seem like errors and confusions from an adult point of view are students’ expressions of their current understanding
3.57 .88 5 3.14 .84 5.5
23: Teachers should negotiate social norms with the students in order to develop a cooperative learning environment in which students can construct their knowledge
3.63 .81 4 3.14 .81 5.5
24: Further Mathematics concepts enable students to interpret and solve applied problems
3.74 .76 2 3.31 .90 3
25: Further Mathematics is a product of the invention of human mind
3.83 .61 1 3.74 .63 1
26: Further Mathematics is abstract 3.41 .88 7 3.24 .88 4 Sub-overall 3.13 .95 2.85 .98 Theme 2: Beliefs about the nature and importance of Further Mathematics 1: Further Mathematics is computation 1.44 .98 7 1.67 .98 6 2: Further Mathematics problems given to students should be quickly solvable in a few steps
1.87 1.26 5 2.07 1.11 3
4: Further Mathematics is a beautiful, creative and useful human endeavour that is both a way of knowing and a way of thinking
2.04 1.05 4 1.71 .89 5
10: Periods of uncertainty, conflict, confusion, surprise are a significant part of the Further Mathematics learning process
1.76 1.05 6 1.62 .85 7
17: Further Mathematics learning is enhanced by challenges within a supportive environment
2.13 1.28 3 1.88 1.04 4
20: Teachers or the textbook – not the student – are authorities for what is right or wrong
3.35 .91 1 2.64 1.12 1
27: Further Mathematics is the bedrock of Science and Technology
2.83 1.23 2 2.29 1.11 2
Sub-overall 2.20 1.11 1.98 1.01
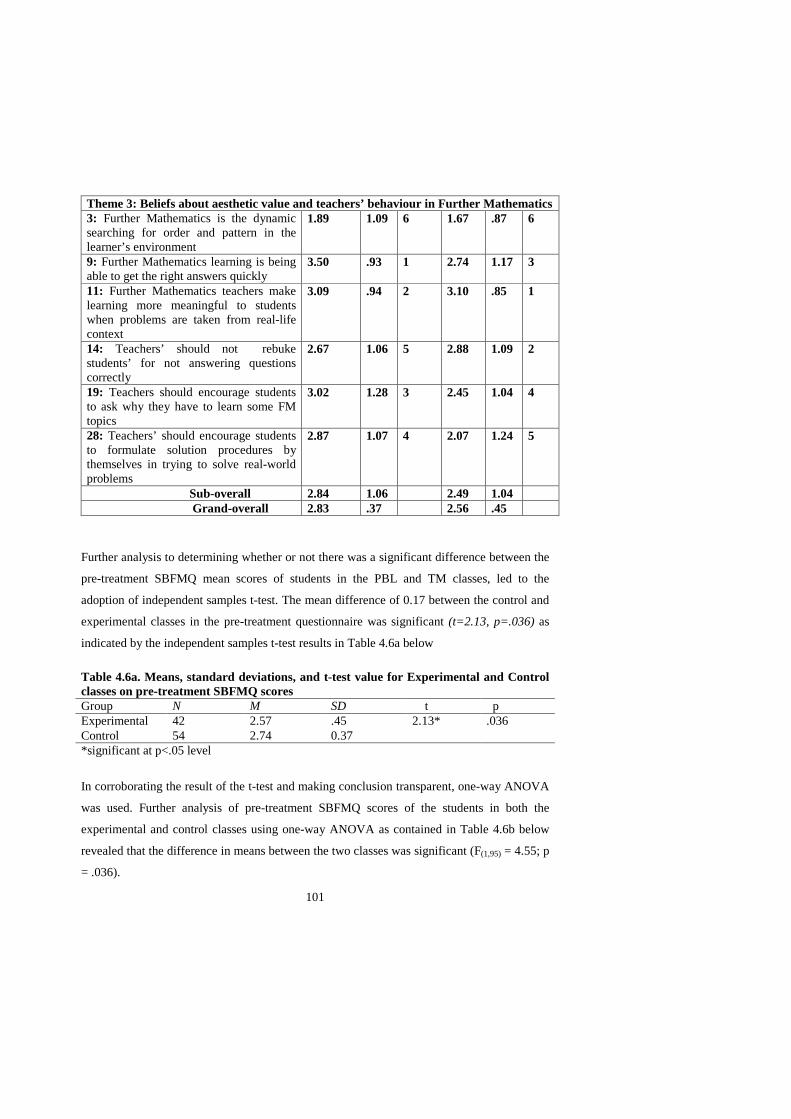
101
Theme 3: Beliefs about aesthetic value and teachers’ behaviour in Further Mathematics 3: Further Mathematics is the dynamic searching for order and pattern in the learner’s environment
1.89 1.09 6 1.67 .87 6
9: Further Mathematics learning is being able to get the right answers quickly
3.50 .93 1 2.74 1.17 3
11: Further Mathematics teachers make learning more meaningful to students when problems are taken from real-life context
3.09 .94 2 3.10 .85 1
14: Teachers’ should not rebuke students’ for not answering questions correctly
2.67 1.06 5 2.88 1.09 2
19: Teachers should encourage students to ask why they have to learn some FM topics
3.02 1.28 3 2.45 1.04 4
28: Teachers’ should encourage students to formulate solution procedures by themselves in trying to solve real-world problems
2.87 1.07 4 2.07 1.24 5
Sub-overall 2.84 1.06 2.49 1.04 Grand-overall 2.83 .37 2.56 .45
Further analysis to determining whether or not there was a significant difference between the
pre-treatment SBFMQ mean scores of students in the PBL and TM classes, led to the
adoption of independent samples t-test. The mean difference of 0.17 between the control and
experimental classes in the pre-treatment questionnaire was significant (t=2.13, p=.036) as
indicated by the independent samples t-test results in Table 4.6a below
Table 4.6a. Means, standard deviations, and t-test value for Experimental and Control classes on pre-treatment SBFMQ scores Group N M SD t p Experimental 42 2.57 .45 2.13* .036 Control 54 2.74 0.37 *significant at p<.05 level
In corroborating the result of the t-test and making conclusion transparent, one-way ANOVA
was used. Further analysis of pre-treatment SBFMQ scores of the students in both the
experimental and control classes using one-way ANOVA as contained in Table 4.6b below
revealed that the difference in means between the two classes was significant (F(1,95) = 4.55; p
= .036).
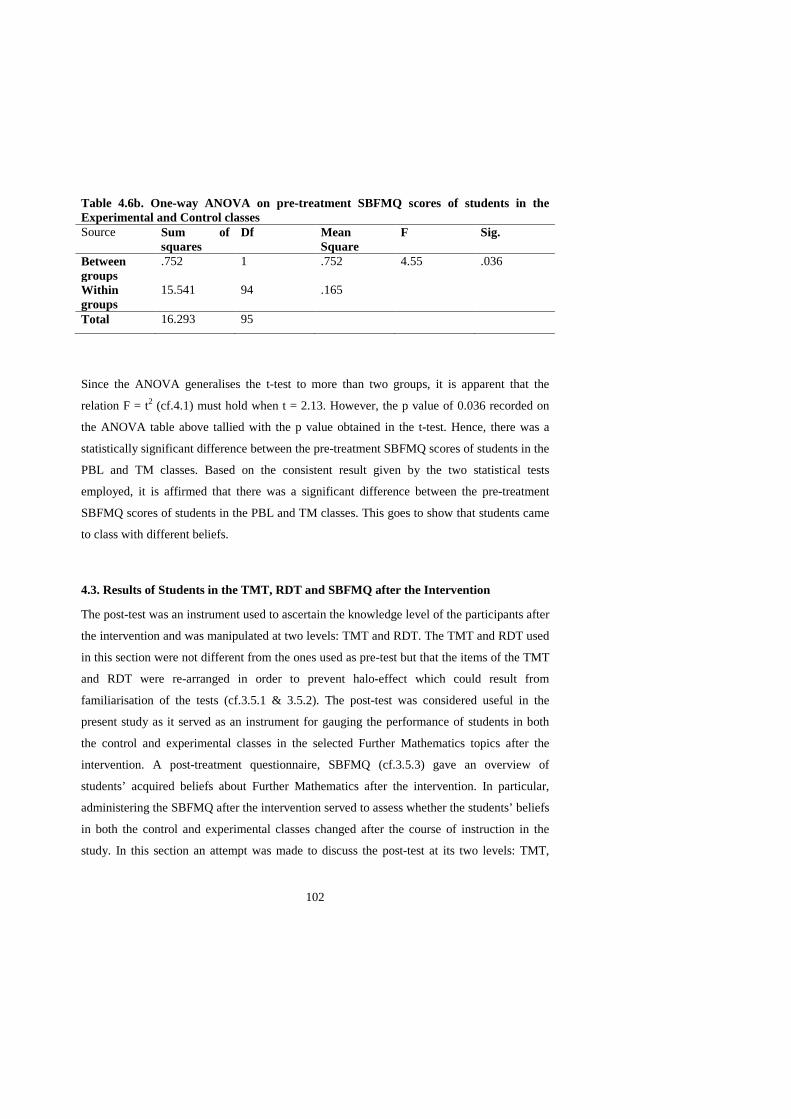
102
Table 4.6b. One-way ANOVA on pre-treatment SBFMQ scores of students in the Experimental and Control classes Source Sum of
squares Df Mean
Square F Sig.
Between groups
.752 1 .752 4.55 .036
Within groups
15.541 94 .165
Total 16.293 95
Since the ANOVA generalises the t-test to more than two groups, it is apparent that the
relation F = t2 (cf.4.1) must hold when t = 2.13. However, the p value of 0.036 recorded on
the ANOVA table above tallied with the p value obtained in the t-test. Hence, there was a
statistically significant difference between the pre-treatment SBFMQ scores of students in the
PBL and TM classes. Based on the consistent result given by the two statistical tests
employed, it is affirmed that there was a significant difference between the pre-treatment
SBFMQ scores of students in the PBL and TM classes. This goes to show that students came
to class with different beliefs.
4.3. Results of Students in the TMT, RDT and SBFMQ after the Intervention
The post-test was an instrument used to ascertain the knowledge level of the participants after
the intervention and was manipulated at two levels: TMT and RDT. The TMT and RDT used
in this section were not different from the ones used as pre-test but that the items of the TMT
and RDT were re-arranged in order to prevent halo-effect which could result from
familiarisation of the tests (cf.3.5.1 & 3.5.2). The post-test was considered useful in the
present study as it served as an instrument for gauging the performance of students in both
the control and experimental classes in the selected Further Mathematics topics after the
intervention. A post-treatment questionnaire, SBFMQ (cf.3.5.3) gave an overview of
students’ acquired beliefs about Further Mathematics after the intervention. In particular,
administering the SBFMQ after the intervention served to assess whether the students’ beliefs
in both the control and experimental classes changed after the course of instruction in the
study. In this section an attempt was made to discuss the post-test at its two levels: TMT,

103
RDT and the post-treatment questionnaire, SBFMQ of students in the control and
experimental classes and their associated research questions.
4.3.1. Results of Students in the TMT after the Intervention
The TMT post-test like the TMT pre-test consisted of 10 constructed response items (See
Appendix 3b). The maximum score for each question on the post-test TMT was 10 thus
giving a total score of 100. The TMT post-test scores from the field for both the control and
experimental classes were analysed, summarised, and interpreted using the means and
standard deviations. Table 4.7 below shows the results of the statistical analysis of post-test
TMT scores in both the experimental and control classes. The mean of the post-test
achievement on the TMT for the experimental class (M=43.79) was higher than the mean of
the control class (M=34.96). This connotes that students in the experimental class exposed to
the PBL recorded better performance on the post-test TMT than did the students in the
control class taught using the traditional method. This is in line with the submission that the
PBL might have improved the performance of the experimental students. The standard
deviation of the post-test achievement on the TMT for the experimental class (S.D =14.46)
was higher than the standard deviation of the control class (S.D=9.62). This is an indication
that students scores in the experimental class did not cluster around the mean even though
their overall performance has improved better than their counterparts in the control group
(also see section 4.3.1.1).
Table 4.7 Results of statistical analysis of post-test scores on TMT Experimental class Control class Total score 100 100 Mean (M) 43.79 34.96
Standard deviation (SD) 14.46 9.62 Number of students 42 54
The mean marks obtained by the students in the post-test TMT in the experimental and
control classes, showed that the marks obtained by the students in the experimental class
were better than the marks obtained by students in the control class. Evidently, the mean gain
(12.89) in the experimental class on the post-test TMT was far above the mean gain (1.46)
recorded in the control class. Nevertheless, an attempt was made to analyse samples of the

104
students’ self-written work in the post-test on the TMT in both the experimental and control
classes.
4.3.1.1. Analysis of students’ detailed workings on the post-test TMT
The students’ written responses were analysed in order to assess the knowledge and skills that
students gained after learning the concepts of the topics covered in this study with either the
PBL or TM. Typical examples of students’ performance in the post-test TMT in both the
control and experimental classes using students’ written work are displayed below for
question four.
Question four required students to Express y in terms of x if ½log2(y+3) = 2x
In the control class, 45 students failed to apply the relevant laws of logarithms and change of
base in solving the question as depicted in a typical student written script Figure 4.3a below.
This showed that the control students learnt little even after they had been exposed to the
traditional instruction in Further Mathematics by their regular teacher. More so, 40 students
of the control group found it difficult to transform the logarithm problem into indicial
equation and finally making y the subject of the formula (literal equation). As shown in the
script below, the student showed low understanding of the concepts of the number, base, and
the power. Instead of raising (y+3) to the power of ½, the student raised base 2 to power ½
thus, committed a procedural error.
Figure 4.3a. Script of control group student for question four on post-test TMT
In the experimental class, 10 students were able to solve the given problem (question four) as
indicated in the specimen of a student’s written script shown in Figure 4.3b below. Others
found it very difficult to tackle the given problem like their counterparts in the control class
after they had been exposed to the PBL. As shown in the sampled script below, the student

105
displayed a high level of mastery of the concepts of indices, indicial equations and logarithms
after being exposed to instruction in the PBL, in that the student got the maximum marks
without committing any error either procedural or conceptual. The demonstration of prowess
in solving questions on indices, logarithms, algebraic equations, series and sequences by 10
students in the experimental class was not surprising in that the PBL as a learner-centred,
minds-on, problem-centred strategy has been linked to sharpening students’ problem-solving
abilities, as well as their abilities to reason, communicate, connect ideas, and shift among
representations of mathematical concepts and ideas (Van der Walle, 2007). In general, the
students’ performance in the PBL class after intervention was better in comparison with the
performance of the students in the control class.
Figure 4.3b. Script of experimental group student for question four on post-test TMT
4.3.2. Results of Students in the RDT after the Intervention
The post-test RDT like the pre-test RDT consisted of four constructed response items (See
Appendix 3b). The maximum score for each question on the post-test RDT was 2½ thus
giving a total score of 10. The post-test RDT scores for both the control and experimental
classes were analysed, summarised, and interpreted using the means and standard deviations.
Table 4.8 below shows the results of the statistical analysis of post-test RDT scores in both
the experimental and control classes. The post-test RDT achievement mean score for the
experimental class (M=2.43) was higher than the mean score of the control class (M=1.34).
This is an indication that students in the experimental class when compared with their
counterparts in the control class performed better after the intervention in the post-test RDT.

106
The standard deviation of the post-test RDT achievement for the experimental class (S.D
=1.07) was also higher than the standard deviation of the control class (S.D=0.72).
In the post-experimental class only eight students obtained raw scores well above the mean
marks of 2.43 while the remaining 34 students obtained raw scores below the mean marks.
In the post-control class, 35 students obtained raw scores well above the mean marks of 1.34
while the remaining 19 students obtained raw scores well below the mean marks. Hence, less
than 20% of the students in the experimental class obtained raw scores well above their class
mean mark while more than 60% of the students in the control class recorded raw scores well
above their class mean mark.
Table 4.8 Results of statistical analysis of post-test scores on RDT Experimental class Control class Total score 10 10 Mean (M) 2.43 1.34
Standard deviation (SD) 1.07 0.72 Number of students 42 54
A comparison of the mean marks obtained by the students in the post-test RDT in the
experimental and control classes, showed that the marks obtained by the students in the
experimental class were higher than the marks obtained by students in the control class but
this needs further investigation. The mean gain (1.38) in the experimental class was above the
mean gain (0.28) recorded in the control class. The performance of the experimental students
in both the pre- and post-RDT showed that less than 40% and 20% of the students
respectively recorded raw scores above the mean marks in the pre- and post-tests. Similarly,
less than 40% and more than 60% of the control students obtained raw scores above the
mean marks in both the pre- and post-RDT respectively. Yet, an attempt was made to analyse
samples of the students’ self-written work in the post-test on the RDT in both the
experimental and control classes.
4.3.2.1. Analysis of students’ detailed workings on the post-test RDT
Results from the analyses of marks were supported with the students’ written responses in
order to assess the knowledge and skills that students gained after learning the concepts of the
topics covered in this study with either the PBL or TM. Typical examples of the students’

107
performance in the post-test RDT in both the control and experimental classes using the
students’ written work are displayed below for question one.
Question one stated that: Some Biologists model the number of species ‘S’ in a fixed area
A (such as an island) by the Species-Area relationship: log S = logC + klogA, where c and k
are positive constants that depend on the type of species and habitat.
(a) Simplify the equation for S
(b) Use part (a) to show that if k =3, then doubling the area increases the number of
species eightfold.
The total score for this question was 2½ in each of the control and experimental classes. In
the control class, 35 (65 %) of the students were able to transform the word problem context
in the given question to a mathematical representation as shown in the first part of the typical
specimen of a student’s written script in Figure 4.4a below. Although these students
demonstrated prowess in transforming the word problem context into a mathematical
representation coupled with correct application of laws of logarithms after being taught with
the traditional method, however, none of the students earned the maximum marks earmarked
for this question simply because they failed in their attempt to substitute correctly the given
values as seen in a student written script below (Fig. 4.4a).
Figure 4.4a. Script of control group student for question one on post-test RDT
In the experimental class, eight students got the maximum marks allocated to this question as
illustrated by a specimen of a student’s written script in Figure 4.4b below. This is not too
encouraging but judging by the advantages inherent in the use of PBL in classrooms. In PBL,
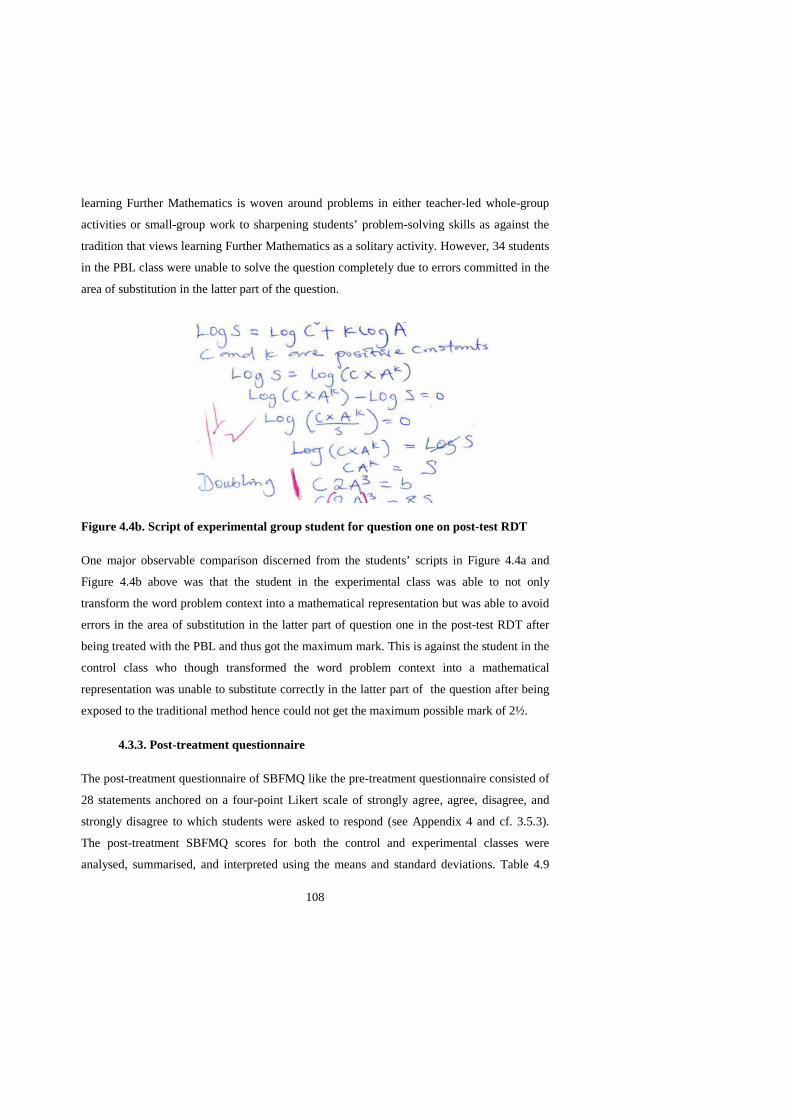
108
learning Further Mathematics is woven around problems in either teacher-led whole-group
activities or small-group work to sharpening students’ problem-solving skills as against the
tradition that views learning Further Mathematics as a solitary activity. However, 34 students
in the PBL class were unable to solve the question completely due to errors committed in the
area of substitution in the latter part of the question.
Figure 4.4b. Script of experimental group student for question one on post-test RDT
One major observable comparison discerned from the students’ scripts in Figure 4.4a and
Figure 4.4b above was that the student in the experimental class was able to not only
transform the word problem context into a mathematical representation but was able to avoid
errors in the area of substitution in the latter part of question one in the post-test RDT after
being treated with the PBL and thus got the maximum mark. This is against the student in the
control class who though transformed the word problem context into a mathematical
representation was unable to substitute correctly in the latter part of the question after being
exposed to the traditional method hence could not get the maximum possible mark of 2½.
4.3.3. Post-treatment questionnaire
The post-treatment questionnaire of SBFMQ like the pre-treatment questionnaire consisted of
28 statements anchored on a four-point Likert scale of strongly agree, agree, disagree, and
strongly disagree to which students were asked to respond (see Appendix 4 and cf. 3.5.3).
The post-treatment SBFMQ scores for both the control and experimental classes were
analysed, summarised, and interpreted using the means and standard deviations. Table 4.9

109
below shows the results of statistical analysis of post-treatment scores on the SBFMQ
according to the themes determined from factor analysis using principal components analysis
based on an oblimin three-factor resolution (cf. 3.9.3) in both the experimental and control
classes. In theme one, the experimental class pooled a higher mean score (M = 3.64) and a
lower standard deviation (S.D = 0.58) than the mean score (M = 3.46) and standard deviation
(S.D = 0.82) recorded by the control class, a trend visible also in theme two. The mean score
(M = 3.40) recorded by the experimental class in theme two was higher than the mean score
(M = 2.00) obtained by the control class. Similarly, the standard deviation (S.D = 0.80)
recorded by the experimental class in theme two was lower than the standard deviation (S.D
= 1.18) recorded by the control class.
With respect to theme three, the control class obtained a mean score (M = 2.87) lower than
the mean score (M = 3.38) recorded by the experimental class. In addition, the standard
deviation (S.D = 0.82) obtained in theme three by the experimental class was lower than the
standard deviation (S.D = 1.15) recorded by the control class. Concisely, the lower standard
deviation recorded in each of the three themes by the experimental class showed that the
scores obtained by the students in each theme clustered around the mean. The higher
standard deviation obtained in each of the three themes by the control class was an indication
that students in this class obtained scores in each theme that were spread away from the
mean. Overall, the post-treatment SBFMQ mean score for the experimental class (M=3.44)
was higher than the mean score of the control class (M=2.89), an indication that the
experimental students had stronger beliefs about Further Mathematics when compared with
their counterparts in the control class after intervention. The standard deviation of the post-
treatment SBFMQ scores for the experimental class (S.D =.36) was lower than the standard
deviation of the control class (S.D=.48), an attestation that scores obtained by students in the
experimental class clustered around the mean while scores obtained by the control class were
spread away from the mean.
Table 4.9 Results of statistical analysis of post-treatment scores on SBFMQ Control class (n = 54) Experimental class
(n = 42)

110
Beliefs Statements Mean ( )
SD Rank Mean ( )
SD Rank
Theme 1: Cognitive beliefs about the teaching and learning of Further Mathematics 5: Right answers are much more important in Further Mathematics than the ways in which you get them
3.80 .63 2 3.45 .74 9.5
6: Further Mathematics knowledge is the result of the learner interpreting and organizing the information gained from experiences
2.85 1.17 13 3.48 .83 8
7: Being able to build on other students’ ideas make extensions of FM real
1.83 1.04 15 2.90 .98 15
8: Students are rational decision makers capable of determining for themselves what is right and wrong
3.17 1.11 8 3.76 .43 2.5
12: Students should be allowed to use any method known to them in solving FM problems
3.07 1.06 10.5 3.52 .83 7
13: Young students are capable of much higher levels of mathematical thought than has been suggested traditionally
3.07 1.08 10.5 3.45 .80 9.5
15: Being able to memorize facts is critical in Further Mathematics learning
2.96 1.24 12 3.26 1.04 13
16: Further Mathematics learning is enhanced by activities which build upon and respect students’ experiences
3.15 1.05 9 3.40 .77 11
18: Teachers should provide instructional activities which result in problematic situations for learners
2.22 1.16 14 3.29 .77 12
21: The role of the Further Mathematics teacher is to transmit mathematical knowledge and to verify that learners have received this knowledge
3.48 .93 6 3.12 .97 14
22: Teachers should recognize that what seem like errors and confusions from an adult point of view are students’ expressions of their current understanding
3.56 .97 5 3.76 .58 2.5
23: Teachers should negotiate social norms with the students in order to develop a cooperative learning environment in which students can construct their knowledge
3.57 .92 4 3.74 .50 4
24: Further Mathematics concepts enable students to interpret and solve applied problems
3.59 .92 3 3.71 .51 5
25: Further Mathematics is a product of 3.89 .46 1 3.81 .46 1
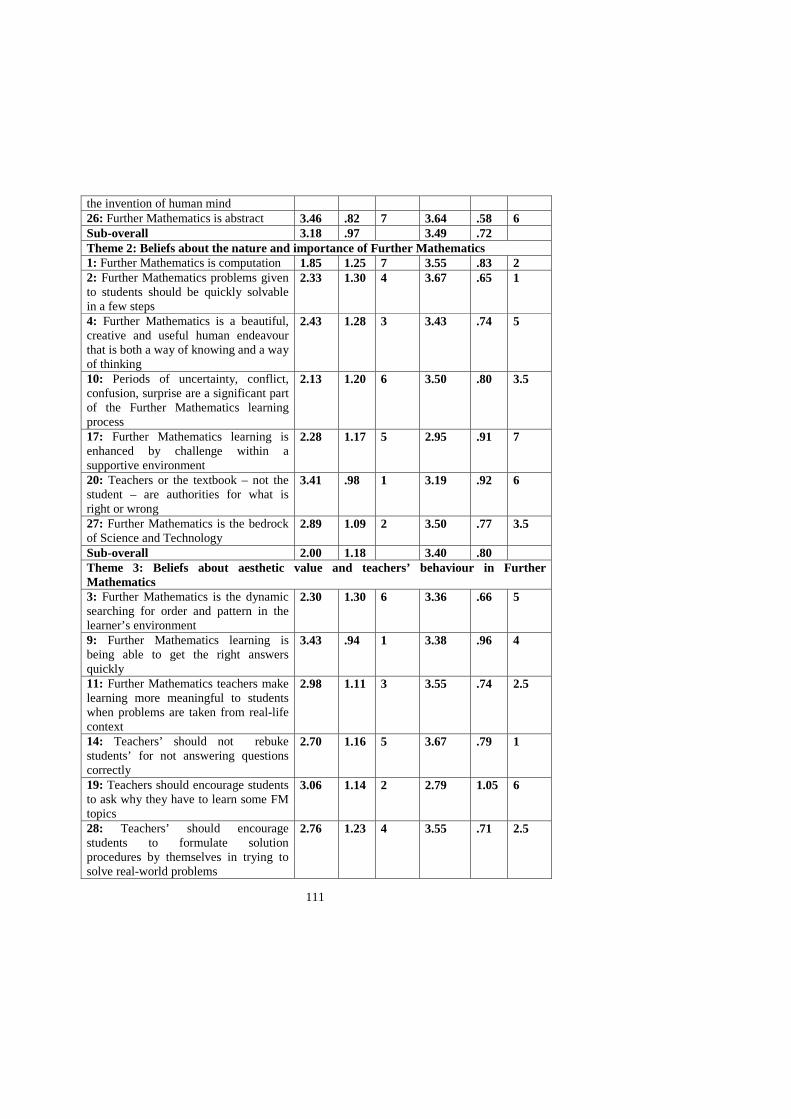
111
the invention of human mind 26: Further Mathematics is abstract 3.46 .82 7 3.64 .58 6 Sub-overall 3.18 .97 3.49 .72 Theme 2: Beliefs about the nature and importance of Further Mathematics 1: Further Mathematics is computation 1.85 1.25 7 3.55 .83 2 2: Further Mathematics problems given to students should be quickly solvable in a few steps
2.33 1.30 4 3.67 .65 1
4: Further Mathematics is a beautiful, creative and useful human endeavour that is both a way of knowing and a way of thinking
2.43 1.28 3 3.43 .74 5
10: Periods of uncertainty, conflict, confusion, surprise are a significant part of the Further Mathematics learning process
2.13 1.20 6 3.50 .80 3.5
17: Further Mathematics learning is enhanced by challenge within a supportive environment
2.28 1.17 5 2.95 .91 7
20: Teachers or the textbook – not the student – are authorities for what is right or wrong
3.41 .98 1 3.19 .92 6
27: Further Mathematics is the bedrock of Science and Technology
2.89 1.09 2 3.50 .77 3.5
Sub-overall 2.00 1.18 3.40 .80 Theme 3: Beliefs about aesthetic value and teachers’ behaviour in Further Mathematics 3: Further Mathematics is the dynamic searching for order and pattern in the learner’s environment
2.30 1.30 6 3.36 .66 5
9: Further Mathematics learning is being able to get the right answers quickly
3.43 .94 1 3.38 .96 4
11: Further Mathematics teachers make learning more meaningful to students when problems are taken from real-life context
2.98 1.11 3 3.55 .74 2.5
14: Teachers’ should not rebuke students’ for not answering questions correctly
2.70 1.16 5 3.67 .79 1
19: Teachers should encourage students to ask why they have to learn some FM topics
3.06 1.14 2 2.79 1.05 6
28: Teachers’ should encourage students to formulate solution procedures by themselves in trying to solve real-world problems
2.76 1.23 4 3.55 .71 2.5

112
Sub-overall 2.87 1.15 3.38 .82 Grand-overall 2.89 .48 3.44 .36
The mean gain (.88) in the experimental class was above the mean gain (.06) recorded in the
control class. Further analysis to determining whether or not there was a significant
difference between the post-treatment SBFMQ mean scores of students exposed to the PBL
and those exposed to the TM, led to the adoption of an independent t-test statistic in the
study. In corroborating the result of the t-test and making conclusion transparent, one-way
ANOVA was used. However, the impact of the intervention analysed using the statistical
tools of t-test and one-way ANOVA on achievements in and beliefs about Further
Mathematics follow.
4.4 Impact of the intervention on achievements in and beliefs about Further
Mathematics
As earlier indicated in chapters one and three, the study investigated the impact of one
independent variable (instructional strategy) manipulated at two levels (PBL & TM) on the
dependent variables of achievements in Further Mathematics (measured by a post-test
manipulated at two levels: TMT & RDT) and beliefs about Further Mathematics (measured
by a post-treatment questionnaire of SBFMQ). In this section, attempts were made to assess
the veracity of the statements occasioned by the analysis of the post-test scores on TMT and
RDT and post-treatment score on SBFMQ of the students in both the experimental and
control classes. The descriptive statistics of mean and standard deviation as contained in the
preceding section of 4.3 on the post-test and post-treatment questionnaire were utilised. The
three important statements that emerged had connection with the three vital research
questions set for the study. Thus, a one-to-one mapping between the three statements and the
three research questions exists.
Statement One: The marks obtained in the post-test TMT by students in the experimental
class were higher than the marks obtained by students in the control class. This claim could
be justified by the higher mean mark 43.79 (cf. Table 4.7) recorded by the students in the
experimental class after being taught using the PBL. This statement linked the research
question one and research hypothesis one stated below in the study.
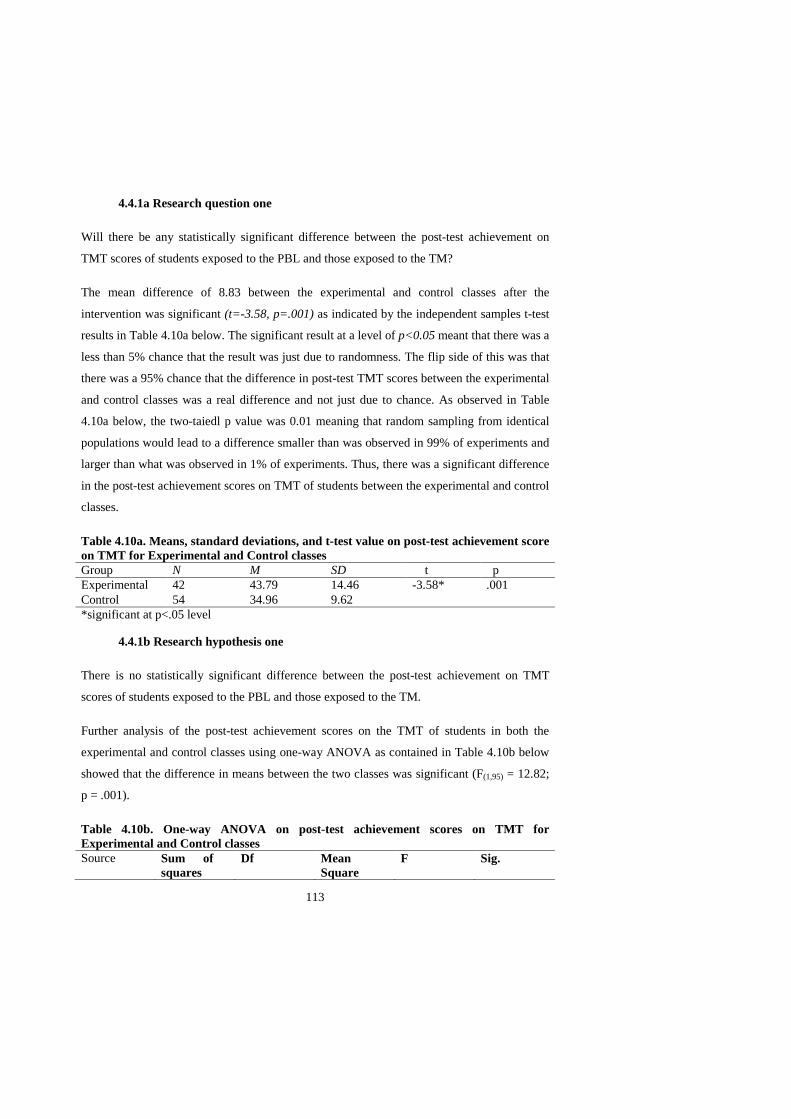
113
4.4.1a Research question one
Will there be any statistically significant difference between the post-test achievement on
TMT scores of students exposed to the PBL and those exposed to the TM?
The mean difference of 8.83 between the experimental and control classes after the
intervention was significant (t=-3.58, p=.001) as indicated by the independent samples t-test
results in Table 4.10a below. The significant result at a level of p<0.05 meant that there was a
less than 5% chance that the result was just due to randomness. The flip side of this was that
there was a 95% chance that the difference in post-test TMT scores between the experimental
and control classes was a real difference and not just due to chance. As observed in Table
4.10a below, the two-taiedl p value was 0.01 meaning that random sampling from identical
populations would lead to a difference smaller than was observed in 99% of experiments and
larger than what was observed in 1% of experiments. Thus, there was a significant difference
in the post-test achievement scores on TMT of students between the experimental and control
classes.
Table 4.10a. Means, standard deviations, and t-test value on post-test achievement score on TMT for Experimental and Control classes Group N M SD t p Experimental 42 43.79 14.46 -3.58* .001 Control 54 34.96 9.62 *significant at p<.05 level
4.4.1b Research hypothesis one
There is no statistically significant difference between the post-test achievement on TMT
scores of students exposed to the PBL and those exposed to the TM.
Further analysis of the post-test achievement scores on the TMT of students in both the
experimental and control classes using one-way ANOVA as contained in Table 4.10b below
showed that the difference in means between the two classes was significant (F(1,95) = 12.82;
p = .001).
Table 4.10b. One-way ANOVA on post-test achievement scores on TMT for Experimental and Control classes Source Sum of
squares Df Mean
Square F Sig.

114
Between groups
1838.992 1 1838.92 12.82 .001
Within groups
13482.997 94 143.436
Total 15321.990 95
Since the ANOVA generalises the t-test to more than two groups, it is apparent that the
relation F = t2 (cf.4.1) must hold when t = -3.58. However, the p value of 0.001 recorded on
the ANOVA table above tallied with the p value obtained in the t-test. Thus, research
hypothesis one was rejected. Hence, there was a statistically significant difference between
the post-test achievement scores on TMT of students exposed to the PBL and those exposed
to the TM.
Statement Two: The marks obtained in the post-test RDT by students in the experimental
class were better than the marks obtained by students in the control class. This claim could be
justified by the higher mean mark 2.43 (cf. Table 4.8) recorded by the students in the
experimental class after being taught using the PBL. This statement linked the research
question two and research hypothesis two stated below in the study.
4.4.2a. Research question two
Will there be any statistically significant difference between the post-test achievement scores
on RDT of students exposed to the PBL and those exposed to the TM?
The mean scores of 2.43 and 1.34 between the experimental and control classes after
treatment was significant (t=-5.92, p=0.000) as indicated by the independent samples t-test
results in Table 4.2. The significant result at a level of p<0.05 meant that there was a less
than 5% chance that the result was just due to randomness. The flip side of this was that there
was a 95% chance that the difference in post-test RDT scores between the experimental and
control classes was a real difference and not just due to chance. As observed in the table
below, the two-tailed p value was 0.000 meaning that random sampling from identical
populations would lead to a difference smaller than was observed in 100% of experiments
and larger than was observed in 0% of experiments. Thus, there was a significant difference

115
in the post-test achievement scores on RDT of students between the experimental and control
classes.
Table 4.11a. Means, standard deviations, and t-test value on post-test achievement score on RDT for Experimental and Control classes
Group N M SD t p Experimental 42 2.43 1.07 -5.92* .000 Control 54 1.34 0.72 *significant at p<.05 level
4.4.2b. Research hypothesis two
There is no statistically significant difference between the post-test achievement scores on
RDT of students exposed to the PBL and those exposed to the TM
Further analysis of post-test achievement scores on RDT of students in both the experimental
and control classes using one-way ANOVA as contained in Table 4.11b below showed that
difference in means between the two classes was significant (F(1,95) = 35.06; p = .000).
Table 4.11b. One-way ANOVA on post-test achievement scores on RDT for Experimental and Control classes Source Sum of
squares Df Mean
Square F Sig.
Between groups
27.862 1 27.862 35.062 .000
Within groups
74.698 94 .795
Total 102.560 95
Since the ANOVA generalises the t-test to more than two groups, it is apparent that the
relation F = t2 (cf.4.1) must hold when t = -5.92. However, the p value of 0.000 recorded on
the ANOVA table above tallied with the p value obtained in the t-test. Thus, research
hypothesis two was rejected. Hence, there was a statistically significant difference between
the post-test achievement scores on RDT of students exposed to the PBL and those exposed
to the TM.

116
Statement Three: The marks obtained in the post-treatment questionnaire of SBFMQ by
students in the experimental class were better than the scores obtained by the students in the
control class. This claim was justified by the higher mean score 3.44 (cf. Table 4.9) recorded
by the students in the experimental class after being taught using the PBL. This statement
linked the research question three and research hypothesis three stated below in this study.
4.4.3a. Research question three
Will there be any statistically significant difference between the post-treatment scores on
SBFMQ of students exposed to the PBL and those exposed to the TM?
The mean difference of 0.55 between the experimental and control classes after treatment was
significant (t=-6.22, p=.000) as indicated by the independent samples t-test results in Table
4.12a below. The significant result at a level of p<0.05 meant that there was a less than 5%
chance that the result was just due to randomness. The flip side of this was that there was a
95% chance that the difference in post-treatment score on SBFMQ between the experimental
and control classes was a real difference and not just due to chance. As observed in Table
4.12a below, the two-tailed p value was 0.000 meaning that random sampling from identical
populations would lead to a difference smaller than was observed in 100% of experiments
and larger than was observed in 0% of experiments. Thus, there was a significant difference
in the post-treatment scores on the SBFMQ of students between the experimental and control
classes.
Table 4.12a. Means, standard deviations, and t-test value on post-treatment score on SBFMQ for Experimental and Control classes N M SD t p Experimental 42 96.38 10.02 -6.22* .000 Control 54 80.89 13.50 *significant at p<.05 level
4.4.3b. Research hypothesis three
There is no statistically significant difference between the post-treatment scores on SBFMQ
of students exposed to the PBL and those exposed to the TM.
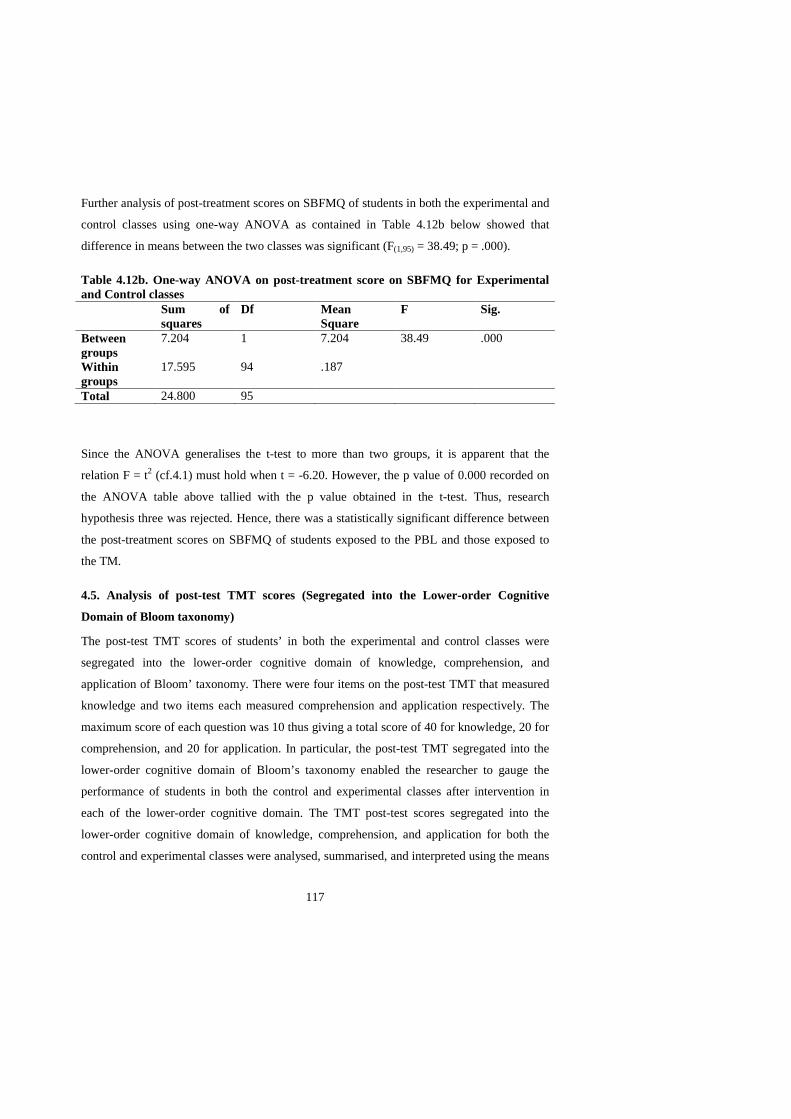
117
Further analysis of post-treatment scores on SBFMQ of students in both the experimental and
control classes using one-way ANOVA as contained in Table 4.12b below showed that
difference in means between the two classes was significant (F(1,95) = 38.49; p = .000).
Table 4.12b. One-way ANOVA on post-treatment score on SBFMQ for Experimental and Control classes Sum of
squares Df Mean
Square F Sig.
Between groups
7.204 1 7.204 38.49 .000
Within groups
17.595 94 .187
Total 24.800 95
Since the ANOVA generalises the t-test to more than two groups, it is apparent that the
relation F = t2 (cf.4.1) must hold when t = -6.20. However, the p value of 0.000 recorded on
the ANOVA table above tallied with the p value obtained in the t-test. Thus, research
hypothesis three was rejected. Hence, there was a statistically significant difference between
the post-treatment scores on SBFMQ of students exposed to the PBL and those exposed to
the TM.
4.5. Analysis of post-test TMT scores (Segregated into the Lower-order Cognitive
Domain of Bloom taxonomy)
The post-test TMT scores of students’ in both the experimental and control classes were
segregated into the lower-order cognitive domain of knowledge, comprehension, and
application of Bloom’ taxonomy. There were four items on the post-test TMT that measured
knowledge and two items each measured comprehension and application respectively. The
maximum score of each question was 10 thus giving a total score of 40 for knowledge, 20 for
comprehension, and 20 for application. In particular, the post-test TMT segregated into the
lower-order cognitive domain of Bloom’s taxonomy enabled the researcher to gauge the
performance of students in both the control and experimental classes after intervention in
each of the lower-order cognitive domain. The TMT post-test scores segregated into the
lower-order cognitive domain of knowledge, comprehension, and application for both the
control and experimental classes were analysed, summarised, and interpreted using the means

118
and standard deviations. In effect, attempts were made to discuss the analysis of each of the
three levels of lower-order cognitive domain one after the other.
4.5.1. TMT post-test scores in the knowledge domain of Bloom’s Taxonomy
Below are the results of the statistical analysis of the post-test TMT scores on the knowledge
domain in both the experimental and control classes as contained in Table 4.13. The post-test
TMT mean score for the experimental class in the knowledge domain (M=21.29) was higher
than the mean score of the control class (M=0.74), an indication that students in the
experimental class performed better on the post-test TMT items that bordered on knowledge.
Also, the standard deviation of the post-test TMT scores in the knowledge domain for the
experimental class (S.D =5.97) was higher than the standard deviation of the control class
(S.D=1.79). This seems to imply that even though the students’ performance improved after
being taught through the PBL as compared to their counterparts taught through the traditional
approach, their performance seemed to differ widely. In the post-experimental class 24
(57.1%) of the students obtained raw scores well above the mean mark of 21.29 in the
knowledge domain while the remaining 18 (42.9%) students obtained raw scores below the
mean mark in the knowledge domain. In the post-control class, only eight (14.8%) of the
students obtained raw scores well above the mean mark of 0.74 in the knowledge domain
while the remaining 46 (85.2%) students obtained raw scores well below the mean mark in
the knowledge domain. Hence, more than 50% of the students in the experimental class and
less than 20% of the students in the control class obtained raw scores well above their
respective mean marks.
Table 4.13 Results of statistical analysis on post-test scores on knowledge domain of TMT Experimental class Control class Total score 40 40 Mean (M) 21.29 0.74
Standard deviation (SD) 5.97 1.79 Number of students 42 54
Looking closely at the mean marks obtained by students in the post-test TMT knowledge
domain it seemed that the marks obtained by students in the experimental class were better
than the marks obtained by students in the control class.

119
4.5.2. TMT Post-test scores in the comprehension domain of Bloom’s Taxonomy
Below are the results of the statistical analysis of post-test scores on the TMT in the
comprehension domain in both the experimental and control classes as contained in Table
4.14. The post-test TMT mean score for the experimental class in the comprehension domain
(M=10.71) was slightly higher than the mean score of the control class (M=10.09). This
shows that the performance of students in both the experimental and control classes were
almost at par. Also, the standard deviation of the post-test TMT scores in the comprehension
domain for the experimental class (S.D =4.74) was lower (an indication that students’ marks
clustered around the mean mark) than the standard deviation of the control class (S.D=6.90)
(an attestation that students’ scores were dispersed away from the mean mark).
Table 4.14 Results of statistical analysis of post-test achievement scores on TMT in the comprehension domain Experimental class Control class Total score 20 20 Mean (M) 10.71 10.09
Standard deviation (SD) 5.97 6.90 Number of students 42 54
A close look at the mean marks obtained by the students in the post-test TMT comprehension
domain in both the experimental and control classes revealed that the marks obtained by
students in the control class were at par with the marks obtained by students in the
experimental class. In the post-experimental class 30 (71.4%) students obtained raw scores
well above the mean mark of 10.71 in the comprehension domain while the remaining 12
(28.2%) students obtained raw scores below the mean mark in the comprehension domain.
In the post-control class, 14 (25.9%) students obtained raw scores well above the mean mark
of 10.09 in the comprehension domain while the remaining 40 (74.1%) students obtained raw
scores well below the mean mark in the comprehension domain. Hence, more than 70% of
the students in the experimental class and less than 30% of the students in the control class
obtained raw scores well above their respective group mean marks.

120
4.5.3. TMT post-test scores in the application domain of Bloom’s Taxonomy
Below are the results of the statistical analysis of the post-test scores on the TMT in the
application domain of Bloom taxonomy in both the experimental and control classes as
contained in Table 4.15. The post-test TMT mean score for the experimental class in the
application domain (M=17.29) was higher than the mean score of the control class (M=7.13),
an indication that students in the experimental class did better on the application domain
items when compared with the students in the control class. Also, the standard deviation of
the post-test TMT scores in the application domain for the experimental class (S.D =4.07)
was lower than the standard deviation of the control class (S.D=4.51). This indicates that
students’ marks in the experimental class clustered around the mean mark as against the
marks obtained by the control students, which were dispersed from the mean mark.
Table 4.15 Results of statistical analysis of post-test scores on TMT in the application domain
Experimental class Control class
Total score 20 20 Mean (M) 17.29 7.13
Standard deviation (SD) 4.07 4.51 Number of students 42 54
As earlier indicated, the mean marks obtained by the students in the post-test TMT
application domain was required to correctly gauge the performance of a student in either the
experimental or control class in the application domain. However, it seemed that the marks
obtained by students in the experimental class were better than the marks obtained by
students in the control class. In the post-experimental class 24 (57.1%) of the students
obtained raw scores well above the mean mark of 17.29 in the application domain while the
remaining 18 (42.9%) students obtained raw scores below the mean mark in the application
domain. In the post-control class, 26 (48.1%) students obtained raw scores well above the
mean mark of 7.13 in the application domain while the remaining 28 (51.9%) of the students
obtained raw scores well below the mean mark in the application domain. Hence, more than
55% of the students in the experimental class and less than 50% of the students in the control
class obtained raw scores well above the respective mean marks.

121
4.6 Impact of the intervention on the lower-order cognitive domain of Bloom’s
Taxonomy in the TMT post-test
One of the aims of the present study and as already stated in chapter one was to investigate
the impact of one independent variable (instructional strategy) manipulated at two levels
(PBL & TM) on the dependent variable of achievement in Further Mathematics (measured by
post-test TMT) segregated into the three levels of Bloom’s lower-order cognitive domain
(knowledge, comprehension, and application). In this section, attempts were made to confirm
the veracity of the statements occasioned by the analysis of post-test TMT scores of students
segregated into knowledge, comprehension, and application domains in both the experimental
and control classes. The descriptive statistics of the mean and standard deviation as contained
in the preceding section of 4.5 on the post-test TMT segregated into the lower-order cognitive
domain were used. The three important statements that emerged and couched into a new
statement four had connection with the remaining one vital research question set for the
study.
Statement Four: The mark obtained in the post-test TMT segregated into knowledge,
comprehension, and application by students in the experimental class was better than the
mark obtained by students in the control class. This claim was justified by the higher mean
marks in the post-test TMT knowledge domain (cf. Table 4.13), post-test TMT
comprehension domain (cf. Table 4.14), and post-test TMT application domain (cf. Table
4.15) recorded by the students in the experimental class after being taught using the PBL.
This statement linked the research question four and research hypothesis four stated below in
this study.
4.6.1a Research question four
Will there be any statistically significant difference between the students’ achievement scores
in post-test TMT disaggregated into knowledge, comprehension and application levels of
cognition after being exposed to the PBL and the TM?
The mean difference of 20.55 in the knowledge domain between the experimental and control
classes after treatment was significant (t= -23.97, p=.000) as indicated by the independent
samples t-test results in Table 4.16a below. The significant result at a level of p<0.05 meant
that there was a less than 5% chance that the result was just due to randomness. The flip side
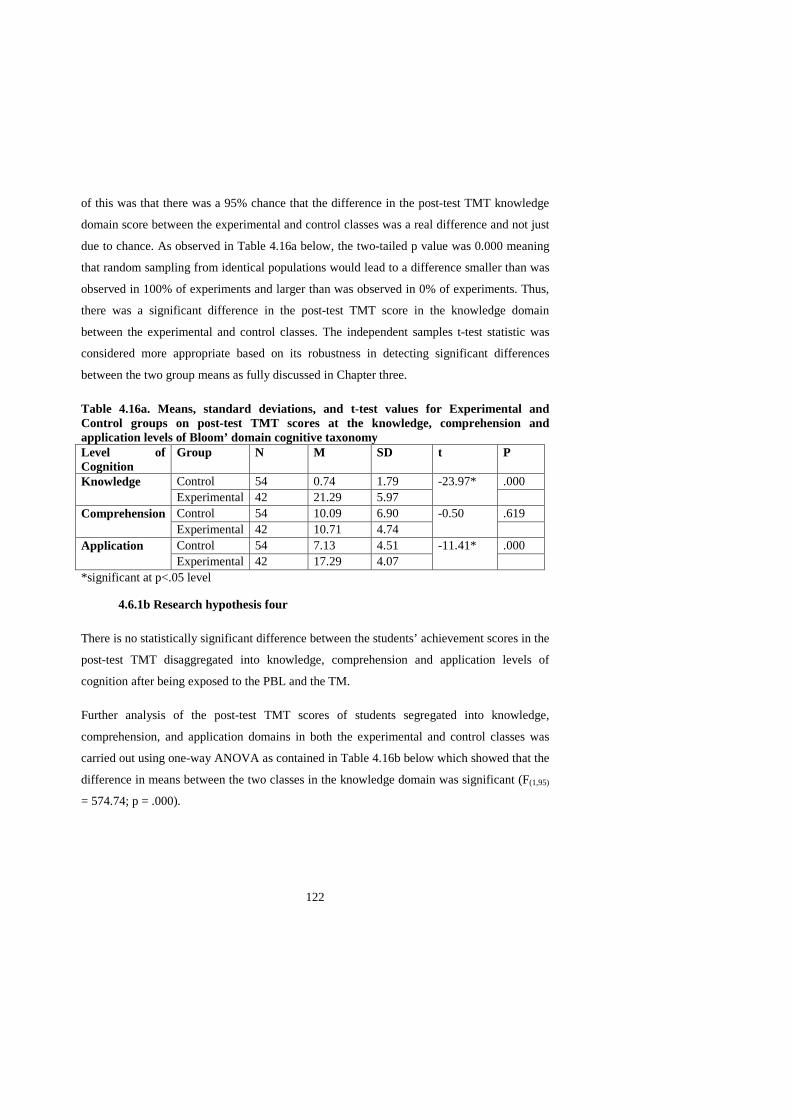
122
of this was that there was a 95% chance that the difference in the post-test TMT knowledge
domain score between the experimental and control classes was a real difference and not just
due to chance. As observed in Table 4.16a below, the two-tailed p value was 0.000 meaning
that random sampling from identical populations would lead to a difference smaller than was
observed in 100% of experiments and larger than was observed in 0% of experiments. Thus,
there was a significant difference in the post-test TMT score in the knowledge domain
between the experimental and control classes. The independent samples t-test statistic was
considered more appropriate based on its robustness in detecting significant differences
between the two group means as fully discussed in Chapter three.
Table 4.16a. Means, standard deviations, and t-test values for Experimental and Control groups on post-test TMT scores at the knowledge, comprehension and application levels of Bloom’ domain cognitive taxonomy Level of Cognition
Group N M SD t P
Knowledge Control 54 0.74 1.79 -23.97*
.000 Experimental 42 21.29 5.97
Comprehension Control 54 10.09 6.90 -0.50 .619 Experimental 42 10.71 4.74
Application Control 54 7.13 4.51 -11.41* .000 Experimental 42 17.29 4.07
*significant at p<.05 level
4.6.1b Research hypothesis four
There is no statistically significant difference between the students’ achievement scores in the
post-test TMT disaggregated into knowledge, comprehension and application levels of
cognition after being exposed to the PBL and the TM.
Further analysis of the post-test TMT scores of students segregated into knowledge,
comprehension, and application domains in both the experimental and control classes was
carried out using one-way ANOVA as contained in Table 4.16b below which showed that the
difference in means between the two classes in the knowledge domain was significant (F(1,95)
= 574.74; p = .000).

123
Table 4.16b. One-way ANOVA on post-test achievement scores on TMT of students in the Experimental and Control classes at the knowledge, comprehension and application levels of Bloom’s domain cognitive taxonomy Level of cognition
Sum of squares
Df Mean Square
F Sig.
Knowledge Between groups Within groups Total
9972.017 1630.942 11602.958
1 94 95
9972.017 17.350
574.74* .000
Comprehension Between groups Within groups Total
9.131 3445.108 3454.240
1 94 95
9.131 36.650
.250 .619
Application Between groups Within groups Total
2436.826 1760.664 4197.490
1 94 95
2436.826 18.730
130.10* .000
*significant at p<.05 level
Since the ANOVA generalises the t-test to more than two groups, it is apparent that the
relationship F = t2 (cf.4.1) must hold when t = -23.97. However, the p value of 0.000 recorded
on the ANOVA table above tallied with the p value obtained in the t-test. Hence, there was a
statistically significant difference between the post-test TMT achievement scores in the
knowledge domain of students exposed to the PBL and those exposed to the TM.
The mean score 10.71 and 10.09 in the comprehension domain between the experimental and
control classes after treatment was however not significant (t= -0.5, p=.619) as indicated by
the independent samples t-test results in Table 4.16a above. Further analysis of the post-test
TMT scores of students in the comprehension domain in both the experimental and control
classes was carried out using one-way ANOVA as contained in Table 4.16b above which
showed that differences in means between the two classes in the comprehension domain was
not significant (F(1,95) = .250; p = .619). Since the ANOVA generalises the t-test to more than
two groups, it is apparent that the relationship F = t2 (cf.4.1) must hold when t = -.50.
However, the p value of 0.619 recorded on the ANOVA table above tallied with the p value
obtained in the t-test. Hence, there was no statistically significant difference between the
post-test TMT achievement scores in the comprehension domain of students exposed to the
PBL and those exposed to the TM.
The mean difference of 10.16 in the application domain between the experimental and control
classes after treatment was significant (t= -11.41, p=.000) as indicated by the independent
samples t-test results in Table 4.16a above. The significant result at a level of p<0.05 meant
that there was a less than 5% chance that the result was just due to randomness. The flip side
of this was that there was a 95% chance that the difference in the post-test TMT application
124
domain score between the experimental and control classes was a real difference and not just
due to chance. As observed in Table 4.16b above, the two-tailed p value was 0.000 meaning
that random sampling from identical populations would lead to a difference smaller than was
observed in 100% of experiments and larger than was observed in 0% of experiments. Thus,
there was a significant difference in the post-test TMT application domain scores of students
between the experimental and control classes.
Further analysis of the post-test TMT scores of students in the application domain in both the
experimental and control classes was carried out using one-way ANOVA as contained in
Table 4.16b above which showed that the difference in means between the two classes in the
application domain was significant (F(1,95) = 130.10; p = .000). Since the ANOVA generalises
the t-test to more than two groups, it is apparent that the relationship F = t2 (cf.4.1) must hold
when t = -11.41. However, the p value of 0.000 recorded on the ANOVA table above tallied
with the p value obtained in the t-test. Hence, there was a statistically significant difference in
the post-test achievement scores on theTMT in the application domain between students
exposed to the PBL and those exposed to the TM.
4.7. Summary of the chapter
In this chapter, the data collected from the field were analysed using both the descriptive
(means and standard deviations) and inferential (independent samples t-tests and one-way
ANOVA) statistics. The results of the study were logically presented starting from the results
of students in the TMT and RDT before and after the intervention, pre- and post-treatment of
SBFMQ questionnaire to the impact of the treatment on students’ achievements in and beliefs
about Further Mathematics. In essence, the highlights of the results are stated below:
• There was a significant difference in the post-test achievement scores on the TMT
between students exposed to the PBL and those exposed to the TM.
• There was a significant difference in the post-test achievement scores on the RDT
between students exposed to the PBL and those exposed to the TM.
• There was a significant difference in the post-treatment scores on the SBFMQ
between students exposed to the PBL and those exposed to the TM.

125
• There was a significant difference in the post-test achievement scores on the TMT at
knowledge and application but not at comprehension levels of cognition of Bloom’
taxonomy between students exposed to the PBL and the TM.
126
CHAPTER FIVE
SUMMARY OF THE STUDY, DISCUSSION, CONCLUSION AND
RECOMMENDATIONS
5.1 Introduction
The summary of major findings of the study is given in this Chapter. Based on this,
suggestions and recommendations are made. The chapter concludes with suggestions for
future research in problem-based learning.
5.2 Summary of the study
This study was set out to investigate the influence of the PBL approach on students’ (i)
achievements in Further Mathematics, (ii) beliefs about Further Mathematics, and (iii)
achievement in Further Mathematics along the lower-order cognitive level of Bloom’s
taxonomy (cf. 1.5). In particular the study investigated the effectiveness of PBL in the
Further Mathematics classrooms in Nigeria within the blueprint of pre-test-post-test non-
equivalent control group quasi-experimental design. The target population consisted of all
Further Mathematics students in the Senior Secondary School year one in Ijebu division of
Ogun State, Nigeria. Using purposive and simple random sampling techniques, two schools
were selected from eight schools that were taking Further Mathematics. One school was
randomly assigned as the experimental while the other as the control school. Intact classes
were used and in all, 96 students participated in the study (42 in the experimental group
taught by the researcher with the PBL and 54 in the control group taught by the regular
further mathematics teacher using the Traditional Method (TM)).
Four research questions and four research hypotheses were raised, answered and tested in the
study. Four research instruments namely pre-test manipulated at two levels: Researcher-
Designed Test (RDT) (r = 0.87) and Teacher- Made Test (TMT) (r = 0.88); post-test
manipulated at two levels: RDT and TMT; pre-treatment survey of Students Beliefs about
Further Mathematics Questionnaire (SBFMQ) (r = 0.86); and post-treatment survey of
SBFMQ were developed for the study. The study lasted thirteen weeks (three weeks for pilot

127
study and ten weeks for the main study) and data collected were analysed using Mean,
Standard deviation, Independent Samples t-test statistic, and Analysis of Variance.
Results showed that there were statistically significant differences in the mean post-test
achievement scores on the TMT (t=-3.58, p<0.05), mean post-test achievement scores on
RDT (t=-5.92, p<0.05) and mean post-treatment scores on SBFMQ (t=-6.22, p<0.05)
between students exposed to the PBL and those exposed to the TM. Results also revealed
that there was statistically significant difference in the post-test achievement scores on the
TMT at knowledge (t= -23.97, p<0.05) and application (t= -11.41, p<0.05) but not at
comprehension (t= -0.50, p>0.05, ns) levels of Bloom’s taxonomy cognition domain between
students exposed to the PBL and the TM.
5.3 Discussion of results
Results pertaining to the four research questions were fully discussed and previous
results/findings used to corroborate the present study results.
5.3.1a Research question one
Will there be any statistically significant difference in the post-test achievement on the TMT
scores between students exposed to the PBL and those exposed to the TM?
5.3.1b Research hypothesis one
There is no statistically significant difference in the post-test achievement on TMT scores
between students exposed to the PBL and those exposed to the TM.
At the outset, consideration was given to the selection of two schools with comparable
characteristics in terms of achievement in FM, age, language, etc. so that the two groups that
emerged from these schools would enter the instruction/experiment on relatively comparable
strength. This was to ensure that if any observable significant difference was seen in the mean
post-test scores of the two groups on the TMT then such difference would not be attributed to
chance but the effect of the intervention. This set the stage for the discussion of results in
respect of the above research question one and research hypothesis one analysed in Chapter
four of the present study.

128
It was found that the mean post-test scores on the TMT of the students in the experimental
(PBL) group was statistically significantly different at p< 0.05 from that of the students in the
control (TM) group in favour of the PBL group. This finding showed that students who were
exposed to the PBL performed better in Further Mathematics thereby corroborating the views
of PBL proponents that the strategy is effective in enhancing students’ achievement and self-
regulated learning (Sungur & Tekkaya, 2006; Iroegbu, 1998; Wheijin, 2005). Sungur &
Tekkaya (2006) found that PBL students, among others, achieved better.
Similarly, Gordon, Rogers, Comfort, Gavula & McGee (2001) found that PBL students value
the student-centred nature of PBL, including information seeking, high levels of challenge,
group work, and personal relevance of the material. The finding of this study was also
consistent with the PBL research in showing that PBL had a positive impact on students’
acquisition of domain specific knowledge (Cognition & Technology Group at Vanderbilt,
1992; Gallagher & Stepien, 1996). When the students were exposed to the PBL classroom,
their achievement scores increased more than those students who learned the same content in
the traditional classroom. Williams, Pedersen & Liu (1998) found that both the computer-
supported and paper based PBL were equally effective in enhancing students’ achievement.
Six Thinking Hats Results confirmed that pre-tutorial preparation, when measured by
attendance and academic achievement, increased across all levels of the undergraduate
programme for the PBL groups that used scaffolding, when compared to the PBL groups
without scaffolding and lecture-based delivery groups. This study supports the inclusion of
scaffolding during the brainstorming stage of PBL. In effect, in this study, the students’
achievement in Further Mathematics differed significantly in favour of those treated with the
PBL.
5.3.2a Research question two
Will there be any statistically significant difference between the post-test achievement scores
on the RDT between students exposed to the PBL and those exposed to the TM?
5.3.2b Research hypothesis two
There is no statistically significant difference between the post-test achievement scores on the
RDT between students exposed to the PBL and those exposed to the TM.
129
From the results of this study, the experimental and control groups that participated in the
study displayed comparable characteristics in terms of achievement in the Further
Mathematics topics considered. In short, the two groups entered the instruction/experiment
on relatively comparable strength. This lends support to the view expressed above (cf. 5.2.1)
that the two groups were suitable for the study when comparing the effects of PBL with the
TM on the dependent variable of achievement in Further Mathematics. More so, this is an
attestation that if any observable significant difference is seen in the mean post-test scores of
the two groups on the RDT then such difference would not be attributed to chance but to the
effect of the intervention.
In consonance with the preceding discussion on theTMT, the discussion relating to the result
of analysis of data in Chapter four for answering research question two and testing research
hypothesis two stated in Chapter one of this study is given. It was revealed that a statistically
significant difference in the mean post-test scores on the RDT between the students in the
experimental group treated with the PBL and those that received instruction in the traditional
method existed. This higher mean in favour of the experimental class showed the efficacy of
the use of the PBL in promoting students’ achievement in Further Mathematics thereby
supporting previous research that indicated that the PBL is an effective strategy for
stimulating students’ learning outcomes (Williams, Pedersen & Liu, 1998; Sungur &
Tekkaya, 2006; Iroegbu, 1998; Wheijin, 2005; Gordon, Rogers, Comfort, Gavula, & McGee,
2001; Gallagher & Stepien, 1996). Although PBL may be beneficial for long-term retention
of knowledge, more didactic forms of teaching achieve higher examination results (Strobel &
van Barneveld, 2009),which is one possible reason why some academics refuse to spend time
redeveloping the curriculum, if the potential gain in terms of academic achievement are
minimal and, in some cases, reduced (Albanese & Mitchell, 1993).
In the present study, it was found that statistically significance difference existed in mean
post-test scores on the RDT between students exposed to the PBL and those exposed to the
traditional method. This finding suggests that the PBL class performed better in the Further
Mathematics topics treated during instruction than did their traditional counterparts. In the
PBL classroom, students’ were introduced to the problem before they had learned the
necessary content knowledge. They then worked collaboratively to define the issues and their
learning needs, locating relevant information, questioning and researching to build a deeper

130
understanding, evaluating possible solutions to the problem, choosing a “best fit” solution
and reflecting on both the process and the solutions (Delisle, 1997; Lambos, 2004; Stepien,
Senn, & Stepien, 2000; Torp & Sage, 2002). This was not the case in the traditional
classroom. Thus, throughout the investigation, the PBL class “engaged in ongoing reflective
activities such as journaling, self-evaluation, and group debriefings” (Ertmer & Simons,
2006). All these might have contributed to the better performance of the PBL class on the
post-test RDT.
5.3.3a Research question three
Will there be any statistically significant difference in the post-treatment scores on SBFMQ
between students exposed to the PBL and those exposed to the TM?
5.3.3b Research hypothesis three
There is no statistically significant difference in the post-treatment scores on the SBFMQ
between students exposed to the PBL and those exposed to the TM.
Contrary to the discussions above (cf. 5.2.1 & 5.2.2), this study revealed that the mean pre-
treatment scores on the SBFMQ of the students in the experimental group was statistically
significantly different from that of the students in the control group. This is an indication that
the two groups showed remarkable difference in their responses to the beliefs about Further
Mathematics questionnaire prior to the intervention. Thus, the two groups did not enter the
instruction/experiment on equal footing and any observable significant difference in the mean
post-treatment scores on the SBFMQ of the two groups could be attributed to chance.
Going by the results of the data analysis presented in Chapter four for research question three
and research hypothesis three there was a significant difference in the post-treatment scores
on beliefs about Further Mathematics between the students exposed to the PBL and those
taught with the TM. This finding revealed that students treated with the PBL recorded
stronger beliefs about Further Mathematics than their counterparts who were exposed to the
traditional instruction. Although, literature is scanty on the relation between PBL and
students’ beliefs, evidence suggests that PBL has no positive impact on students’ beliefs
(Sahin, 2009). Şahin (2009) found that PBL and traditional groups displayed similar degree
of ‘expert’ beliefs. He maintained that the results of his study showed that university

131
students’ expectations and beliefs about physics and physics learning have deteriorated
because of one semester of instruction whether in PBL or traditional context. Cotič & Zuljan
(2009) found no significant effect of PBL on students’ attitudes toward Mathematics.
The effectiveness of the PBL on the students’ beliefs about Further Mathematics recorded in
this study coincided with previous research findings on self-regulated learning. Sungur &
Tekkaya (2006) found that the PBL students had higher levels of intrinsic goal orientation,
task value, use of elaboration learning strategies, critical thinking, metacognitive self-
regulation, effort regulation, and peer learning compared with the control group students
treated with the traditional instruction. Similarly, Gordon, Rogers, Comfort, Gavula, &
McGee (2001) found that the PBL students value the student-centred nature of PBL,
including information seeking, high levels of challenge, group work, and personal relevance
of the material. Although these researchers did not consider beliefs as dependent variable but
beliefs and self-regulated learning fall under the same domain called affective and each has
been found to impact students’ achievement (Andreassen & Rees, 2005; Furinghetti &
Pehkonen, 2000). The noticeable impact of the PBL on students’ achievement in and beliefs
about Further Mathematics recorded in this study may be attributed to the features inherent in
the use of PBL. PBL offers students opportunity to analyse and discuss problems so that they
can realise gaps in their knowledge base, determine their strengths and weaknesses, control
their own learning, and develop self-regulatory skills (Glaser as cited in Karabulut, 2002).
The learning outcomes of students are strongly related to their beliefs and attitudes towards
Mathematics (Andreassen & Rees, 2005; Furinghetti & Pehkonen, 2000; Leder, Pehkonen &
Torner, 2002; Pehkonen, 2003; Schoenfeld, 1992, Thompson, 1992) and as suggested by
previous studies (Pekhonen, 2003; Mason, 2003; Kloosterman & Stage, 1992); the existence
of a system of beliefs affects students’ behaviour which impedes rather than facilitates
understanding when students solve mathematical problems.
According to Karabulut (2002), PBL creates an environment in which students actively
participate in the learning process, take responsibility for their own learning, and become
better learners in terms of time management skills and ability to identify learning issues and
to access resources. In this study, the PBL not only allowed the arrangement of students
into heterogeneous ability groups but also facilitated students’ adoption of problem solving

132
process of identifying the problem, making assumptions, formulating a model, using the
model and evaluating the model within the teachers’ scaffolding role. Scaffolds are forms of
support provided by the teacher (or another student) to help students’ bridge the gap between
their current abilities and the intended goals. In support of PBL and beliefs, Giovanni
&Sangcap (2010) carried out a study that aimed at analyzing possible significant differences
in Mathematics related beliefs, related to gender, year level and field of specialization. The
results of the study showed positive beliefs that Filipino students valued effort in increasing
ones mathematical ability and considered Mathematics as useful in their daily lives. This
finding incidentally constitutes the hallmarks of PBL. Observations in the PBL classroom in
this study revealed that students thought to be shy and passive during Further Mathematics
lessons suddenly became active participants following PBL instruction, thereby making the
perceived low able students rank shoulder to shoulder with the brilliant ones in the Further
Mathematics lesson. Thus, it may be concluded that students exposed to the PBL held
stronger beliefs about Further Mathematics than their counterparts that were treated with the
traditional instruction.
5.3.4a Research question four
Will there be any significant difference between the students’ achievement scores in TMT
post-test disaggregated into knowledge, comprehension and application levels of cognition
after being exposed to the PBL and the TM?
5.3.4b Research hypothesis four
There is no statistically significant difference between the students’ achievement scores in
TMT post-test disaggregated into knowledge, comprehension and application levels of
Bloom’s taxonomy cognition after being exposed to the PBL and the TM.
The results of this study pertaining to the above research question and research hypothesis
revealed that there were statistically significant differences between the experimental group
and the control group at the lower-order cognitive level of Bloom’s taxonomy with the
exception of comprehension level of cognition. In this study, the experimental group
performed better on the knowledge and application levels of cognition of Bloom’s taxonomy
133
on the TMT than the control group. This finding partially supported the finding of Awofala,
Fatade & Ola-Oluwa (2012) in which they found that learner-centred strategy (of cooperative
learning) enhanced students’ achievement at the comprehension and application levels of
cognition than the traditional method. Since the PBL is learner-centred and perhaps involves
some element of cooperation among students, the use of the PBL in this study might have
enabled students to recall information, facts and concepts in FM and used those concepts in a
new situation to promote meaningful learning thereby allowing students’ unprompted use of an
abstraction. Other studies have shown that PBL students work well in teams and small groups
(Gallagher, Rosenthal, & Stephien, 1992), gained other skills such as working in teams and
being more involved in the learning process (Gabric & Ludovice, 2011) and that a PBL
classroom provided students with high levels of interaction for peer learning, peer teaching and
group presentation (Finucane, Johnson & Prideaux, 1998; Jones, 1996; Smith, 1995). All these
attributes may have enhanced the better performance of the PBL group.
5.4. Implications of the findings
The poor achievement of the control group in this study was an attestation of the inherent
weakness of the traditional method of instruction as a means of enhancing learning in Further
Mathematics. The traditional method of teaching is typical of Nigerian Further Mathematics
classes and the poor performance of students may be because of over reliance on this method.
The effectiveness of the PBL in this study lied in the fact that it stimulated students’ level and
ways of thinking. The method allowed students to make decisions of their own. It helped
students to develop their ability to frame and ask questions. The PBL method made students to
be bold and convinced when a solution was appropriate or not. It agitated the minds of the
students via their experience to be able to defend their discoveries; hence, the method
stimulated their reasoning capability. The method encouraged discussion between and among
the students. It promoted interpersonal relationships among the students. Within the group,
students learned and gained various ideas. It encouraged teamwork among students. Criticism
is allowed which made students to understand better.
The implication of the findings of this study to educational practice is that PBL as part of the
current reform in (Further) Mathematics is likely to make students develop problem-solving
134
skills for performing higher-level operations in an atmosphere of active inquiry-based
constructivist instructional environments.
A major pre-occupation of (Further) Mathematics teachers in this 21st century has been shifting
from traditional teaching approaches that emphasized rote learning to student- centred, minds-
on, and activity-based approaches that promote meaningful learning. Adopting the PBL
approach in (Further) Mathematics classes requires that teachers have a good knowledge of
constructivist learning and the ways in which PBL can be used to promote the students’
thinking. This calls for new roles on the part of teachers thereby shifting from telling, dictating
and drilling which are considered less motivating and incompatible with constructivism to
learning and constructing meaning. Efforts should be made to integrate the philosophy of PBL
into the pre-service teachers’ curriculum at the teacher-preparation institutions in Nigeria.
5.5 Conclusion
In the course of the present study, it can be asserted that the PBL as a constructivist
instructional strategy is more amenable to the teaching of Further Mathematics. Effective
teaching and learning of Further Mathematics could only be achieved through the introduction
of various innovative strategies that are cognitively learner-centred, minds-on, hands-on, and
peer-mediated like the PBL in this study. As shown in this study the PBL approach made
students more creative, act purposefully, think rationally and relate effectively with their peers
in the Further Mathematics classroom. The adoption of the PBL prompted teachers to know
when and how to apply scaffolding during the course of classroom teaching. It also assisted
teachers through diagnostic testing to ascertain the students’ level of preparedness before the
introduction of PBL as an intervention strategy. The adoption of the PBL in the Further
Mathematics classroom could assist low achievers and enhance their interest in Further
Mathematics at the Senior Secondary School Certificate Examinations. The PBL could be
adopted as a viable strategy for strengthening the students’ cognition at the levels of
knowledge and application.
135
5.6 Recommendations
The following recommendations are hereby made:
(1) The results from this study show that mathematics teachers need in-service training on
modern instructional strategies including the PBL regularly to make them competent in
preparing the 21st century students to face global challenges in their chosen disciplines.
(2) Government should give greater emphasis to in-service education for teachers because no
matter the efficiency of pre-service training, the constant change in society and resultant
change in curriculum will necessitate continuous in-service training for Mathematics teachers.
(3) The study has in no small dimension revealed that problem-based learning approach could
improve the students’ cognition at the knowledge and application levels thereby improving
their achievement in Further Mathematics.
(4) It could also positively influence the students’ belief about Further Mathematics. There is
need for Mathematics teachers to be knowledgeable about problem-based learning approach
before it can be introduced into the classrooms at all levels of education especially at the
elementary and secondary levels.
(5) If the PBL approaches were to be adopted, significant changes would have to be effected in
the classroom structure in the area of sitting arrangements, location and placement of all
materials needed by the teacher. School time-table, curriculum, assessment orientations and a
host of others would also have to be re-structured to favour PBL.
(6) Textbook writers and Publishers would also have to incorporate this new technique in their
write-ups for the benefit of both the teachers and the students.
(7) The NERDC whose part of its mandates is to develop, review, and produce the school-
based subject curricula should consider it expedient to review the broad based and highly
loaded Further Mathematics curriculum for students’ active participation in class discussion
and consequently improving their achievement.
(8) Professional bodies such as the Science Teachers’ Association of Nigeria (STAN), the
Mathematics Association of Nigeria (MAN), and Nigeria Mathematical Society (NMS) would
136
have to start thinking about how PBL approach could be integrated into their yearly Panel
workshops and annual conferences as the case may be for thorough practical demonstration for
all participants.
5.7 Suggestions for further studies
In view of the limitations of this study, suggestions are made for further studies.
(1) It may be a worthwhile effort for future researchers to engage in a longitudinal study of
the effect of PBL on students’ learning outcomes in Further Mathematics classrooms.
(2) One of the limitations of the present study was that it did not consider the moderating
effect of variables such as gender, parental educational background, cognitive style, reading
ability, locus of control, etc. that could influence the findings of this study. Future studies
may consider these intervening variables with larger sample size.
(3) Efforts could also be made to consider the effects of PBL on students’ higher-order
cognitive skills as this study shows the effectiveness of the PBL in strengthening students’
cognitive achievement at the levels of knowledge and application.
(4) The feasibility of the PBL in a computer-mediated environment could also be
investigated. The present study could be said to have covered one of the six geographical
zones in the country. The study could therefore be replicated in other zones to further give
credence to the generalisability of the findings of this study.

137
REFERENCES
Abraham, R. R., Ramnarayan, K. G., Bincy, M. A., Indira, K.; Girija, R.; Suvarna, N.; Devi,
V.; Lakshminarayana, S. K.; Mamot, M. B.; Jamil, W. N. B. W., & Haripin, N. B.
A. (2012). Effects of problem-based learning along with other active learning
strategies on short-term learning outcomes of students in an Indian medical
school. International Journal of Health & Allied Sciences, 1(2), 98-103.
Achilles, C. M., & Hoover, S. P. (1996). Exploring problembased learning (PBL) in grades
6–12. Paper presented at the annual meeting of the Mid-South Educational Research
Association, Tuscaloosa, AL.
Adler, J., Ball, D., Krainer, K., Lin, F. L., & Novotna, J. (2005). Reflections on an emerging
field: Researching mathematics teacher education, Educational Studies in
Mathematics 60, 359-381.
Adler, J. (1997). A Participatory-Inquiry and the mediation of mathematical knowledge in a
multilingual classroom. Educational Studies in Mathematics, 33(1), 235-258.
Adler, J. & Davis, Z. (2006). Opening another black box: Researching mathematics for
teaching in mathematics teacher education. Journal for Research in Mathematics
Education, 37 (4), 270-296.
Akinoglu, O. & Tandogan, R. O. (2007). The Effects of Problem-Based Active Learning in
Science Education on Student’ Academic Achievement, Attitude and Concept
Learning: Eurasia Journal of Mathematics, Science & Technology Education, 3(1),
71-81.
Albanese, M., & Mitchell, S. (1993). Problem-based learning: A review of the literature on its
outcomes and implementation issues. Academic Medicine, 68 (1), 52-81.
Aldridge, S. & Bobis, J. (2001). Multiple learning contexts: A vehicle for changing pre-
service primary teachers’ mathematical beliefs, knowledge, and practices. In J. Bobis,
B., Perry & M. Mitchelmore, (Eds.) Numeracy and beyond (Proceedings of the

138
Twenty-Fourth Annual Conference of Mathematics Education Research Group of
Australasia, (43-49) Sydney: MERGA.
Amarto, S. A., & Watson, A. (2003). Improving student teachers’ understanding of
multiplication by two digit numbers In Pateman, N. A., Dougherty, B. J., & Zilliox
(Eds), Proceedings of the 27th Conference of the International Group for the
Psychology of Mathematics Education and the 25th Conference of PME NA Honolulu,
HI:PME.
Amit, M., & Fried, M. N. (2005). Authority and authority relations in mathematics education:
A view from an 8th grade classroom. Educational Studies in Mathematics, 58(2),
145–168.
Anderson, L. W. & Krathworhl, D. R. (2001). A taxonomy for learning, teaching and
assessing New York, NY: Longman.
Andreassen, S. & Rees, S. (2005). Mathematical models of oxygen and carbon dioxide
storage and transport: Interstitial fluid and tissue stores and whole-body transport.
Critical Reviews in Biomedical Engineering 33:265-298.
An, S., Kulm, G. & Wu, Z. (2004). The pedagogical content knowledge of middle school,
mathematics teachers in China and the U.S., Journal of Mathematics Teacher
Education, 7, 145-172.
Arigbabu, A.A. (1997). An Overview of the JSS and SSS Mathematics Curriculum The
Forum. A Journal of Ijebu Academic Forum 1(1), 1-7.
Ashlock, R. B., Johnson, M. L., Wilson, J. W., & Jones, W. L. (1979). Guiding Each Child’s
Learning of Mathematics: A Diagnostic Approach to Instruction. Charles, E. Merril
Publishing Company.
Awodeyi, A. F. (2003). Overhauling the Mathematics Programme of Science Education
Department for Effective Teacher Education. Abacus-The Journal of the
Mathematical Association of Nigeria, 28(1), 27-34.

139
Awofala, A. O, A. 2011 Effect of Concept Mapping Strategy on Students’ Achievement in
Junior Secondary School Mathematics International Journal of Mathematics Trends
and Technology 2(3), 11-16.
Awofala, A. O. A., Fatade, A. O., & Ola-Oluwa, S. A. (2012). Achievement in Cooperative
versus Individualistic Goal-Structured Junior Secondary School Mathematics
Classrooms in Nigeria International Journal of Mathematics Trends and Technology,
3(1), 7-12.
Azuka, B. F. (2003). The challenges of Mathematics in Nigeria’s Economic and
Technological Development- Implication for Tertiary Education Abacus The Journal
of the Mathematical Association of Nigeria 28(1), 19-26.
Ball, D. L. 1989. Research on teaching mathematics: Making subject matter knowledge part
of the equation In J. Brophey (Ed.) Advances in research on teaching: Teachers’
subject matter knowledge and classroom instruction Vol. 2, 1- 48 Greenwich, CT: JAI
Press.
Ball, D. L. (2000). Bridging Practices: Intertwining content and pedagogy in teaching and
learning to teach. Journal of Teacher Education, 51(3), 241-247.
Ball, D., & Bass, H. (2001). Interweaving content and pedagogy in teaching and learning to
teach: knowing and using mathematics In J. Boaler (Ed.). Multiple perspectives on
teaching and learning (pp. 83-104). Westport, CT: Ablex Publishing.
Ball, D. L., Bass, H., Sleep, L., & Thames, M. (2005). A theory of mathematical knowledge
for teaching Paper presented at The Fifteen ICMI Study: The Professional Education
and Development of Teachers of Mathematics, 15-21 May 2005, State University of
Sao Paolo at Rio Claro, Brazil Retrieved December 1, 2006 from
http://stwww.weizmann.ac.il/G-math/ICMI/log in.html.
Bartholomew, D. J., Steele, F., Galbraith, J. & Moustaki, I. (2008). Analysis of Multivariate
Social Science Data (2ed). New York: Chapman & Hall/Crc.
Beers, G. (2005). The effect of teaching method on objective test scores: PBL versus Lecture.
Journal of Nursing Education, 44(7), 305-309.

140
Bell, S. H. (2008). Quasi-Experimental Methods http://www.urban.org/toolkit/data-
methods/quasi-experimental.cfm?renderforprint=1 retrieved on 2008/09/15.
Bergma, M. M. (2008). Advances in Mixed methods research. London: Sage.
Beukes, F., Visagrie, A. & Kasanda, C. D. (2007). Mathematics Teacher Education: Trends
across Twelve African Countries. Proceedings of First Africa Regional Congress of
the International Commission on Mathematical Instruction (AFRICME) under the
theme 'Mathematics Teaching and Teacher Education in Changing Times' held at
University of Witwatersrand's School of Education in June 2005
Blaxter, I., Hughes, C. & Tight, M. (1996). How to Research Burkingham. Open University
Press.
Bloom, B. S., Engelhart, M. D., Furst, E. J., Hill, W. H., & Krathwohl, D. R. (1956).
Taxonomy of educational objectives: the classification of educational goals;
Handbook I: Cognitive Domain New York, Longmans, Green.
Blum, W., Niss, M., & Huntley, I. (1989). Modeling, Application & Applied Problem
Solving: Teaching Mathematics in a real context (pp 184-185), Ellis Horwood Ltd
Halsted Press: a division of John Wiley & Sons.
Boaler, J. (2008). Promoting 'Relational Equity' and High Mathematics Achievement through
an Innovative Mixed Ability Approach. British Educational Research Journal, 34 (2),
167-194.
Burch, V. C., Sikakana, C. N. T., Yeld, N., Seggie, J. L. & Schmidt, H. G. (2007).
Performance of academically ar-risk medical students in a problem-based learning
programme: A preliminary reort, Advances in Health Siences Education, 12, 345-358.
Boudi, D. & Felleti, G. (1991b). Introduction. In D. Boud & G. Felleti (Eds.), The challenge
of Problem-based learning (pp. 13-22), New York: St. Martin’s Press.
Brousseau, G. (1986). Basic theory and methods in the didactics of mathematics. In P.
Verstappen (Ed.), Report of the second conference on "Systematic Cooperation

141
between Theory and Practice in Mathematics Education" (pp. 109–161). Enschede:
SLO.
Brousseau, G. (1997). Theory of didactical situations in mathematics 1970-1990 by
Brousseau; edited and translated by N. Balacheff, M. Cooper, R. Sutherland & V.
Warfield. Dordrecht; London: KLUWER Academic Publishers.
Brown, T. (2001). Mathematics Education and Language. Dordrecht: Kluwer Academic
Publishers
Brown, C. A, & Borko, H. (1992). Becoming a mathematics teacher In D.A. Grouws (Ed.),
Handbook of research on mathematics teaching and learning (pp. 209-239). New
York: Macmillan.
Cattel, R., B. (1966). The Scree-test for the number of factors. Multivariate Behavioral
Research, 1, 245-276.
Chen, P., & Zimmerman, B. (2007). A cross-national comparison study of self-efficacy
beliefs of middle-school mathematics students. Journal of Experimental Education,
75(3), 221-244.
Chick, H. I. (2002) Pre-service primary teachers’ assessment of and performance on
multiplicative numeracy items In A. D. Cockburn, & E. Nardi, (Eds), Proceedings of
the 26th Annual Conference of the International Group for the Psychology of
Mathematics, 2, 233-240 Norwich, UK: PME.
Chin, C. & Chia, L. G. (2006). Problem-based learning: Using ill-structured Problems in
Biology Project work. Science Education, 90, 44-67.
Clark, C. M. & Peterson, P. L. (1986). Teachers’ Thought Processes. In: M.C. Wittrock (Ed),
Handbook of research on teaching, 3rd edition. New York: Macmillan.
Clarke, D. M. (1997). The changing role of the mathematics teacher. Journal for Research on
Mathematics Education, 28(3), 278-308.

142
Clarke, D.J., Breed, M., & Fraser, S. (2004). The Consequences of a Problem-Based
Mathematics Curriculum. The Mathematics Educator, 14(2), 7-16.
Clarke, D., & Xu, L. H. (2008). Distinguishing between mathematics classrooms in
Australia, China, Japan, Korea and the USA through the lens of the distribution of
responsibility for knowledge generation; Public oral interactivity and mathematical
orality. ZDM Mathematics Education, 40, 963-972.
Clements, D.H. & Sarama, J.( Eds) (2004). Hypothetical learning trajectories. Mathematical
Thinking and Learning 6(2),
Clements, D.H. & Sarama, J. 2010 Learning Trajectories in Early Mathematics-Sequences of
Acquisition and Teaching. Encylopedia on Early Childhood Development Published
online July 21, 2010.
Cobb, P. (1986). Contexts, goals, beliefs, and learning mathematics For the Learning of
Mathematics, 6(2), 2-9.
Cobb, P., Yackel, E. & Wood, T. (1992). A Constructivist Alternative to the Representational
View of Mind in Mathematics Education. Journal for Research in Mathematics
Education, 23(1), 2-23.
Cognition and Technology Group at Vanderbilt (1992). The Jasper series as an example of
anchored instruction: Theory, program description, and assessment data. Education
Psychologist, 27(3), 291-315.
Cotic, M., & Zuljan, M. (2009). Problem-based instruction in mathematics and its impact on
the cognitive results of the students and on affective-motivational aspects.
Educational Studies, 35(3), 297-310.
Creswell, J. W., & Plano Clark, V. L. (2011). Designing and Conducting mixed methods
research Thousand Oaks, CA: Sage.
Crocker, L., & Algina, J. (1986). Introduction to Classical and Modern Test Theory,
Harcourt Brace Jovanovich College Publishers: Philadelphia.
143
Dalton, J. (1985). Adventures in Thinking, Thomas Nelson, Melbourne, p.2.
Davis, B. & Simmt, E. (2006). Mathematics-for-teaching: An ongoing investigation of the
mathematics that teachers (need) to know. Educational Studies in Mathematics, 61(3),
293-319.
De Corte, E. & Op’t Eynde, P. (2003). When girls value mathematics as highly as boys: an
analysis of junior high students’ mathematics-related beliefs. Paper presented to the
symposium, the relationship between students’ epistemological beliefs, cognition and
learning, at the annual meeting of the American Educational Research Association,
April 21-25, Chicago. Department of Education (DoE) 2003 Policy handbook for
educators Pretoria: Government Printer.
De Vos, A. S. (2002). Research at Grass Root: For the social sciences and human service
professions Pretoria: Van Schaik.
Delisle, R. (1997) How to use problem-based learning in the classroom. Alexandria, VA:
Association for Supervision and Curriculum Development (ED 415 004).
Denzin, N .K. (1970). The research act: A theoretical introduction to sociological methods,
Chicago: Aldine.
Department of Education (DoE) (1996). National Education Policy Act No. 27 of 1996 Policy
handbook for educators, Pretoria: Universal Print Group.
Department of Education (DoE) (2002). Policy handbook for educators Pretoria: Government
Printer.
Department of Education (DoE) (2003). Policy handbook for educators, Pretoria:
Government Printer.
Department of Education (DoE) (2006). Policy handbook for educators, Pretoria:
Government Printer.
Dossey, J. A., McCrone, S., Giordano, F. R., & Weir, M. (2002). Mathematics Methods and
Modeling for Today’s Mathematics Classroom: A Contemporary approach to

144
teaching Grades 7–12. U.S.A. Brooks/Cole Thompson Learning Academic Resource
Centre p. 34
Ebel, R. L. (1979). Educational test and measurement, evaluations; design and construction,
interpretation. Eaglewood Cliffs, N.J: Prentice-Hall, Inc.
Ebel, R. L., & Frisbee, D. A. 1986. Essentials of educational measurement (4th ed.).
Englewood Cliffs, NJ: Prentice-Hall, Inc.
Educational Testing Service (2011). The Praxis Series: Middle School Mathematics (0069)
Test at a Glance.
Elby, A. (1999). Another reason that physics students learn by rote Physics Education
Research, Supplement of American Journal of Physics, 67(7), 52-57.
Ertmer, P. A., & Simons, K. D. (2006). Jumping the PBL implementation hurdle. Supporting
the efforts of k-12 teachers. Interdisciplinary Journal of Problem-based learning,
1(1), Article 5, Retrieved Nov.2, 2009 at http://docs.lib.purdue.edu/ijpbl/vol.1/iss1/5
Ernest, P. (1991). The philosophy of mathematics education. Bristol: The Falmer Press.
Fatade, A. O., Arigbabu, A. A. & Wessels, D. C. J. (2011). Teaching Conic Sections and their
Applications. Journal of Modern Mathematics and Statistics, 5(3), 60-65.
Fatade, A. O. (1998). Assessment of Secondary School Teachers’ Mastery of Difficult
concepts in Further Mathematics. An unpublished M.Ed. Dissertation, University of
Lagos, Lagos.
Federal Ministry of Education (FME) (1976). Modern Mathematics versus Traditional
Mathematics. National Conference organised by the Federal Government of Nigeria,
held at Benin, February, 1976.
Federal Ministry of Education (FME) (1985). National Curriculum for Further-Mathematics.
NERDC Press, Lagos.
Federal Republic of Nigeria (FRN) (2004). National Policy on Education 4th Edition Lagos,
NERDC Press.

145
Fennema, E., & Franke, M. L. (1992). Teacher’s knowledge and its impact In D. A. Grouws
(Ed.), Handbook of research on mathematics teaching and learning. 147-164, New
York: McMillan.
Fennema, E. H., & Sherman, J. A. (1978). Sex-related differences in mathematics
achievement and related factors: A further study. Journal for Research in
Mathematics Education, 9, 189-203
Finucane, P. M., Johnson, S. M., & Prideaux, D. J. (1998). Problem based learning: Its
rationale and efficacy, Medical Journal of Australia 168, 445-448.
Fisher, K. M. (1990) Semantic Networking: The New Kid on the Block. Journal of Research
in Science Teaching, 27, 1001-1018.
Franco, C., Sztajn, P., & Ortigao, M. I. R. (2007). Mathematics Teachers, Reform, and
Equity: Results from the Brazilian National Assessment. Journal for Research in
Mathematics Education, 38(4), 393-419
Fried, M. N., & Amit, M. (2003). Some reflections on mathematics classroom notebooks and
their relationship to the public and private nature of student practices. Educational
Studies in Mathematics, 53, 91–112.
Freudenthal, H. (1991). Revising mathematics education. China Lectures. Dordrecht: Kluwer.
Furinghetti, F., & Pehkonen, E. (2000). A comparative study of students’ beliefs concerning
their autonomy of doing mathematics. Nordisk Matematikkdidaktikk, 8(4), 7-26.
Gabric, K. & Ludovice, T. (2002). The Effect of Problem-Based Learning on Long-term
Content Retention. Illinois Mathematics and Science Academy, Smithsonian Research
and Diffusion Network, pp. 69-86.
Gagné, R. M. (1987). The Idea of Schema. AECT paper. ERIC clearinghouse. ED 285 536.
Gagné, R. M, Leslie J. Briggs, & Walter W. Wager. (1992). Principles of
Instructional Design. 4th ed. Fort Worth:Harcourt Brace Jovanovich College
Publishers.

146
Gallagher, S. A. & Stepien, W. J. (1996). Content acquisition in PBL: Depth versus breath in
American Studies. Journal Education of the Gifted, 19, 257-275.
Gallagher, S. A., Stepian, W. J., Sher, B. T., & Workman, D. 1995. Implementing problem-
based learning in science classrooms. School Science and Mathematics, 95, 136-146
Giovanni, P. &, A. Sangcap (2010). Mathematics-related Beliefs of Filipino College
Students: Factors Affecting Mathematics and Problem Solving Performance Journal:
Procedia-Social and Behavioral Sciences, Vol.8, 465-475.
Gómez, P., & Rico, L. (2002). Didactical analysis and planning of school tasks in pre-service
mathematics teacher training. In D. S. Mewborn, White, D. Y. White, H. G. Wiegel,
R. L. Bryant, K. Nooney (Eds.), Proceedings of the twenty-fourth annual meeting of
the North American Chapter of the International Group for the Psychology of 2–478
PME28 – 2004 Mathematics Education (Vol. 3) (pp. 1214-1217). Columbus, OH:
ERIC Clearinghouse for Science, Mathematics, and Environmental Education.
Gomez, R. L., Bootzin, R. R., & Nadel, L. (2006). Naps Promote Abstraction in Language-
Learning Infants. Psychological Science, 17(8), 670-67.
Gordon, P. R., Rogers, A. M., Comfort, M., Gavula, N., & McGee, B. P. (2001). A taste of
problem-based learning increases achievement of urban minority middle-school
students. Educational Horizons, 79, 171-175.
Gorsuch, R. L. (1983). Factor Analysis. Hillsdale, NJ: Lawrence Erlbaum.
Green, T. F. (1968). A Topology of the Teaching Concept” In C. J. B. Macmillan & T. W.
Nelson (Eds.), Concepts of Teaching: Philosophical Essays. p.56, Chicago: Rand
McNally.
Grouws, D. & Schultz, K. (1996). Mathematics teacher education In J. Sikula (Ed),
Handbook of Research on Teacher Education, 2nd edition p.443-464 USA:
Publication.
Grouws, D. Smith, M., & Sztajn, P. (2004). The preparation and teaching practices of United
States mathematics teachers: Grades 4 and 8. In P. Kloosterman & F. Lester, Jr.
(Eds.), Results and interpretations of the 1990 through 2000 mathematics assessments

147
of th National Assessment of Educational Progress (pp. 221-267). Reston, VA:
National Council of Teachers of Mathematics.
Gronlund, N, E., & Linn, R. L. (1990). Measurement and Evaluation in teaching. (6th ed.)
New York: MacMillan.
Haigh, W. E. (1986). Problem-solving Techniques with Microcomputers. Mathematics
Teacher, 79(8), 599-655
Hallam, S & Ireson, J. (2005). Secondary school teachers' pedagogic practices when teaching
mixed and structured ability classes. Research Papers in Education, 20(1), 3-24.
Handal, B. & Herrington, A. (2003). Mathematics Teachers’ Beliefs and Curriculum Reform.
Mathematics Educational Research Journal 15(1), 59-69
Hansson, A. (2010). Instructional responsibility in mathematics education: modelling
classroom teaching using Swedish data. Educational Studies in Mathematics, 75(2), 171–189.
Harbor-Peters, V. A. (1990). Aspects of Further-Mathematics that present Difficulties to
Graduating Senior Secondary Students. A paper presented at the 28th Annual
Conference of Mathematical Association of Nigeria held at ATBU, Bauchi, 3rd to 7th
Sept, 1990.
Harbor-Peters, V. A. (1991). Teaching and Learning of Further-Mathematics, Policies and
Strategies. A paper commissioned for presentation at the inauguration of the National
Planning and Implementation Committee of Mathematics Education at the National
Mathematical Centre, Abuja.
Harris, A. (1998). Effective teaching: A review of the Literature School Leadership &
Management, 18, 168-183.
Hestenes, D., Wells, M. & Swackhamer, G. (1995). A modeling method for high school
physics instruction. American Journal of Physics, 63(7), 606-619
Hiebert, J., Carpenter, T.P., Fennema, E., Fuson, K.,Human, P., Murray, H., Olivier, A., &
Wearne, D. (1996). Problem Solving as a basis for reform in curriculum and
instruction The Case of Mathematics. Educational Researcher, 25(4), 12 – 21.
148
Hiebert, J., Carpenter, T.P., Fennema, E., Fuson, K.,Human, P., Murray, H., Olivier, A., &
Wearne, D. (1997). Making mathematics problematic. A rejoinder to Prawat and
Smith. Educational Researcher, 26(2) 24 – 26.
Hiebert, J., & Stigler, J. W. (2004). A world of difference: Classrooms abroad provide
lessons in teaching math and science. Journal of Staff Development, 25 (4), 10-15.
Hill, T. & Lewicki, P. (2007). STATISTICS Methods and Applications StatSoft, Tulsa, Ok.
Hoffman, B., & Ritchie, D. (1997). Using multimedia to overcome the problems with
problem-based learning. Instructional Science, 25, 97–115.
House, J.D. (2006). Mathematics beliefs and achievement of elementary school students in
Japan and the United States: Results from the Third International Mathematics and
Science Study. Journal of Genetic Psychology, 167, 31-45.
Huang, H. E. (2004) Investigation of teachers’ mathematical conceptions and pedagogical
content knowledge in mathematics www.nku.edu/ retrieved on 2009/05/15.
Iroegbu, T. O. (1998). Problem-based learning, numerical ability and gender as determinants
of achievement in line graphing skills in Senior Secondary Physics. Unpublished Ph.D
Thesis, University of Ibadan, Nigeria.
Jonassen, D. H. (1994). Technology as cognitive tools: Learners as designers Retrieved May
20, 2005 from http://itechl.coe.uga.edu/itforum/paper1/paper1.html.
Jones, R. W. (2006). PBL: Description, advantages, disadvantages, scenarios and facilitation.
Anaesthesia and Intensive care, 34(4), 485-488.
Kadivar, P., Nejad, S. N., & Emamzade, Z. M. (2005). Effectiveness of Multi-Grade Classes:
Cooperative Learning as a key Element of Success. World Academy of Science,
Engineering and Technology 8,169-172.
Kaiser, H. F. (1960). The application of electronic computers to factor analysis. Educational
and Psychological Measurement, 20, 141-151.
149
Kaput, J. J. (1992). Technology and Mathematics education. In D. A. Grouws (Ed.)
Handbook of Rsearch on Mathematics Teaching and Learning. A project of the
National Council of Teachers of Mathematics. Macmillan, New York, 515-556.
Karabulut, U. S. (2002). Curricular elements of problem-based learning that cause
developments of self-directed learning behaviours among students and its
implications on elementary education. Unpublished doctoral dissertation, The
University of Tennessee, Knoxville.
Karakas, M. (2008) Graduating reflective Science Teachers through problem-based learning
instruction. Bulgarian Journal of Science and Education Policy (BJSEP) 2(1), 59-71.
Kenney, P. A., & E. A. Silver, (1997). Results from the Sixth Mathematics Assessment of the
National Assessment of Educational Progress Reston, VA: National Council of
Teachers of Mathematics.
Khuzwayo, B. (2005). A History of Mathematics education research in South Africa. R.
Vithal, J. Adler & C. Keitel, (Eds.) Researching Mathematics Education in South
Africa: Perspectives, practices and possibilities. Cape Town: HSRC Press
Kimberlin, C. L. & Winterstein, A. G. (2008). Validity and reliability of measurement
instrument used in research. American Journal of Health System Pharmarcy- 65,
2276-2284.
Kimchi, J., Polivka, B., & Stevenson, J. S. (1991). Triangulation: Operational definitions,
Nursing Research, 40(6), 364-366.
Kloosterman, P. & Stage, F. K. (1992) Measuring Beliefs About Mathematical Problem
Solving. School Science and Mathematics, 92(3), 109.
Kotsopoulos, D. & Lavigne, S.(2008). Examining Mathematics for Teaching Through an
analysis of Teachers’ Perceptions of Student Learning Paths. International Electronic
Journal of Mathematics Education, 3(1), 1-23.
150
Krulik, S., & Rudnick, J. A. (1999). Innovative tasks to improve critical and creative-thinking
skills In I.V. Stiff (Ed.), Developing mathematical reasoning in grades K – 12
National Council of Teachers of Mathematics, Reston, V.A:138 – 145.
Krynock, K.B. & Robb, L. (1996). Is problem-based learning a problem for your curriculum?
Illinois School Research and Development Journal, 33, 21-24.
Krynock, K. & Robb, L. (1999). Problem Solved: How to coach cognition. Educational
Leadership, November, 28-29.
Kyeong Ha, R. (2003). Problem-Based Learning in Mathematics ERIC Clearinghouse for
Science Mathematics and Environmental Education Columbus OH
http://www.ericdigests.org/2004-3/math.html retrieved on 6/11/2008.
Lambos, A. (2004). Problem-based learning in middle and high school classrooms: A
teacher’s guide to implementation. Thousand Oaks, CA: Corwin.
Lampert, M. (1990). When the problem is not the question and the solution is not the answer:
Mathematical knowing and teaching. Educational Researcher, 27(1), 29-63.
Leder, G. C., Pehkonen, E., & Törner, G. (Eds.). (2002) Beliefs: A hidden variable in
mathematics education? Dordrecht: Kluwer Academic Publishers.
Lester, F. K. (1980). Research on mathematical problem solving. In Shumway R. J. (ed.).
Research in Mathematics Education. National Council of Teachers of Mathematics,
Reston. Virgia.
Lobato, J., Clarke, D.J., & Ellis, A.B. (2005). Initiating and Eliciting in Teaching: A
Reformulation of Telling. Journal for Research in Mathematics Education 36(2), 101-
136.
Magee, J. B. (1971) Philosophical Analysis in Education (New York: Harper and Row), p.71
Mahendru, P. & Mahindru, D. V. (2011). Problem-based learning: Influence on
students’learning in an Electronic & Communication Engineering course. Global
151
Journal of Researches in Engineering, Electronic and Electronics Engineering, 11(8),
1-9.
Major, C. H. (2001). Assessing the Effectiveness of Problem-Based Learning in Higher
Education: Lessons from the Literature. Academic Exchange Quarterly, 5(1), 1-6.
Major, C. & Palmer, B. (2001). Assessing the effectiveness of PBL in higher education:
Lessons from the Literature. Academic Exchange Quarterly, 5(1), 4-9.
Marks, R. (1990). Pedagogical content knowledge: From a mathematical case to a modified
conception Journal of Teacher Education, 41(3)3-11.
Martins, R. C., Sexton, Franklin, T. J. & Gerlovich (2005). Teaching Science for All
Children: An Inquiry Approach. 4th Edition, Allyn & Bacon.
Mason, J. (2003). Seeing worthwhile things: A response to Alan Schoenfeld’s Review of
Researching Your Own Practice in JMTE 6.1. Journal of Mathematics Teacher
Education, 6, 281–292.
Matlock-Hetzel, S. (1997). Basic concepts in item and Test Analysis. Paper presented at the
annual meeting of the Southwest Educational Research Association, Austin.
McBroom, D. G., & McBroom, W. H. (2001). Teaching molecular genetics to secondary
students: An illustration and evaluation using problem-based learning. The Problem
Log, 6, 2-4.
Mcknight, C., Magid, A., Murphy, T. J., & Mcknight, M. (2000). Mathematics Education
Research : A Guide for Research Mathematics Providence, RI : American
Mathematical Society.
McLeod, D. B. (1992). Research on affect in mathematics education: A re-conceptualization.
In D.A Grouws Ed., Handbook of Research on Mathematics Teaching and Learning
(pp.575 -596), New York: Macmillan.
McMillan, J. H. (2004). Educational research (4th Ed) Boston: Pearson
152
Mertler, C. A., & Charles, C. M. (2005). Introduction to educational research (5th Ed)
Boston: Pearson
Middleton, J. A. & Geopfert, P. (1996). Inventive Strategies for teaching mathematics:
Implementing Standards for reform. American Psychological Association.
Washington. D. C.
Mikusa, M. G., & Lewellen, H 1999 Now Here Is That Authority on Mathematics Reform,
Dr. Constructivist! The Mathematics Teacher, 92(2), 158-163.
Ministry of Education & Training. (MOET) (2003). Lesotho’s Education Statistics Bulletin,
1999-2003. Maseru, Lesotho: Ministry of Education, Training and Planning Unit.
Mji, A. (2003). A three-year perspective on conceptions of and orientations to learning
mathematics of prospective teachers and first year university students. International
Journal of Mathematical Education in Science and Technology, 34(5), 687 – 698.
Mok, I. A. C., & Morris, P.(2001). The metamorphosis of the “virtuoso”: Pedagogic patterns
in Hong Kong primary mathematics classrooms. Teaching and Teacher Education,
17(4), 455–468.
Mok, I. A. C. (2003). A teacher-dominatin lesson in Shanghai: The teacher´s and the
learner´s perspectives. Paper presented at the The Conference of the Learner´s
Perspective Study.
Mok, I., Cai, J., & Fong Fung, A. (2008). Missing learning opportunities in classroom
instruction: Evidence from an analysis of a well-structured lesson on comparing
fractions. The Mathematics Educator, 11(1/2), 111–126.
Morris, E. (2001). Interview on Breakfast with Frost BBC 1 Television, 2 September.
Moschkovich, J. (2002). A situated and sociocultural perspective on bilingual mathematics
learners, Mathematical Thinking and Learning, 4(2/3), 189–212.
Moust, J. H. C., Van Berkel, P. H. J., & Schmidt, H. G. (2005). Signs of erosion: Reflections
on three decades of PBL at Maastricht University. Higher Education, 50(4), 665-683.

153
Mulder, J. C. (1989). Statistical Techniques in Education. Pretoria: Haum Educational
Publishers.
Namibia Human Resources Development Programme (NHRDP) (2002). Improving
Mathematics Education in Namibia. A full report by the British Council Mathematics
International Consultant and the Task Force. Windhoek, In J. Adler, (Eds) 2007
Mathematics Teacher Education: Trends across Twelve African Countries.
Proceedings of First Africa Regional Congress of the International Commission on
Mathematical Instruction (AFRICME) under the theme 'Mathematics Teaching and
Teacher Education in Changing Times held at University of Witwatersrand's School
of Education in June 2005.
National Council of Teachers of Mathematics (1991). Principles and standards for school
mathematics. Reston, VA: Author.
National Council of Teachers of Mathematics (1995). Principles and standards for school
mathematics. Reston, VA: Author.
National Council of Teachers of Mathematics (2000). Principles and standards for school
mathematics. Reston, VA: Author.
National Council of Teachers of Mathematics (2002). Principles and standards for school
mathematics. Reston, VA: Author.
National Council of Teachers of Mathematics (2005). Principles and standards for school
mathematics. Reston, VA: Author.
National Council of Teachers of Mathematics (2006). Principles and standards for school
mathematics. Reston, VA: Author.
National Research Council (1986). Mathematical Sciences: A unifying and dynamic resource.
Washington, D.C. National Academy Press.
National Research Council (1989). Everybody counts: A report to the nation on the future of
mathematics education. Washington, D.C: National Academy Press.
National Research Council (2004). Mathematical Sciences: A Patent System for the 21st
century.Washington, D.C.: National Academy Press.
Nigeria National Population Commission (2006): Population and Housing Census of the
Federal Republic of Nigeria: National and State Population and Housing. National
Population Commission, 1, 1-90
154
Nigerian Educational Research and Development Council (2008). Frequently Asked
Questions (FAQ) The New 9-year Basic Education Curriculum Structure, Abuja:
NERDC.
Ndlovu, M. (2008). Modeling with Sketchpad to Enrich Students’ Concept Image of the
Derivative in Introductory Calculus: Developing Domain Specific Understanding. An
Unpublished D.Ed Thesis, University of South Africa.
Notar, C. E., Zeulke, D. C., Wilson, J. D. & Yunker, B. D. (2004). The Table of
Specifications: Insuring Accountability in Teacher Made Tests Journal of
Instructional Psychology, 31
Nunnally, J.C., & Bernstein, I.H. (1994). Psychometric Theory, (3rdr edn), Mcgraw-Hill: New
York.
Nyaumwe, L. (2004). The Impact of Full Time Student Teaching on Pre-Service Teachers’
Conceptions of Mathematics Teaching and Learning. Mathematics Teacher Education
and Development 6, 23-36.
Obioma, G. (1992). Teachers’ Assessment of the difficulty levels of the further-mathematics
contents. ABACUS, The Journal of the Mathematical Association of Nigeria 22(1),
48-51.
Okpala, O. N., Onocha, C. O. & Oyedeji, O. A. (1993). Measurement and Evaluation in
Education. Ibadan: Stirling Horden Publishers (Nig.) Ltd.
Opdenakker, M. C, & Damme, J. V. (2006). Teacher characteristics and teaching styles as
effectiveness enhancing factors of classroom practice. Teaching and Teacher
Education, 22(1), 1-21.
Pajares, M. F. (1992). Teachers’ beliefs and educational research: Cleaning up a messy
construct Review of Educational Research, 62, 307-332.
Park, S. H. & Ertmer, P. A. 2007 Impact of Problem-based learning (PBL) on Teachers’
Beliefs regarding technology use Journal of Research on Technology in Education
40(2), 247-267.
155
Paul, R. & Elder, L. (2006). Critical Thinking Tools for taking charge of your learning and
your life. New Jersey: Prentice Hall Publishing.
Paulsen, C. A. & Dailey, D. (2002). A guide for Education personnel: Evaluating a program
or Intervention. Elementary & Middle Schools Technical Assistance Center,
American Institutes for Research, Washington, DC 20007.
Pedhazur, E. J. & Schemlkin, L. P. (1991). Measurement, design and analysis: An integrated
approach Hillsdale, N.J: Erlbaum.
Pehkonen, E. (2003) Læreres og elevers oppfatninger som en skjult faktor i matematikk
undervisningen. In B. Grevholm (Ed.), Matematikk for skolen (pp. 154-181). Bergen:
Fagbokforlaget.
Perry, B., Howard, P. & Conroy, J. (1996). K-6 teacher beliefs about the learning and
teaching of mathematics. In Clarkson, P. C. (Ed.) Technology in mathematics
education Proceedings of the 19th Annual Conference of the Mathematics Education
Research Group of Australasia, 453-460 Melbourne: MERGA.
Perry, B., Howard, P. & Tracey, D. (1999). Head mathematics teachers’ beliefs about the
learning and teaching of mathematics. Mathematics Education Research Journal, 11,
39-53.
Perry, B., Vistro-Yu, C., Howard, P., Wong, N. Y., & Fong, H. K, (2002). Beliefs of primary
teachers about mathematics and its teaching and learning: Views of Singapore,
Philippines, mainland China, Hong Kong Taiwan and Australia In Barton, B,. Irwin,
M, Pfannkuch, & Thomas, M (Eds) Mathematics education in the South Pacific
Proceedings of the Twenty-Fifth Annual Conference of the Mathematics Education
Rsearch Group of Australasia, 551-558, Sydney: MERGA.
Perry, B., Way, J., Southwell, B., White, A., & Pattison, J. (2005). Mathematical beliefs and
achievement of pre-service primary teachers. In P. Clarkson, A. Downton, D. Gronn,
M. Horne, A. McDonough, R. Pierce, & A. Roche (Eds.), Building connections:
Research, theory and practice (Proceedings of the 28th annual conference of the
156
Mathematics Education Research Group of Australasia, Vol. 2, pp. 625-632). Sydney:
MERGA.
Piaget, J. (1957). Construction of reality in the child. London: Routledge & Kegan Paul.
Piaget, J. (1972). The psychology of the child. New York: Basic Books.
Pike, G .R. (1999). The Constant Error of the halo in educational outcomes research Research
in Higher Education 40(1) 61-86.
Pohl, M. (2000). Learning to think, thinking to learn: Models and Strategies to develop a
classroom culture of thinking, Cheltenham, Via: Hawker Brownlow.
Polya, G. (1957). How to Solve It. 2nd edition, Princeton University Press.
Prawat, R. S. (1992). From Individual Differences to Learning Communities – Our Changing
Focus, Educational Leadership, April, p.9-13.
Prince, M. (2004). Does active learning work? A review of the research. Journal of
Engineering Education, 93(3), 223-231.
Ratsatsi, D. (2005). Traditional and alternative views of school system Mathematics
performance. Paper presented at the SACMEQ International Invitational Conference,
Paris, 28-30 September 2005
Republic of South Africa (2005). National Curriculum Statement Grades 10-12 (General)
Subject Assessment Guidelines.
Reys, B. J., Long, V. M. (2005). Teacher as Architect of Mathematical Tasks In A. R. Teppo,
(Ed.) Reflecting on Practice in Elementary School Mathematics Readings from
NCTM’s School Based Journals and other Publications, 81-84.
Robson, L. S., Shannon, H. S, Goldenhar, L. M. & Hale, A. R. (2001). Quasi-experimental
and experimental designs. More powerful evaluation designs, chapter 4 of Guide to
Evaluating the Effectiveness of Strategies for preventing Work Injuries: How to show
whether a safety intervention really works, Institute for Work and Health, Canada.

157
Rohr, A. R. (1975). Creative Process and Methods in Problem Solving ( Weingeim: Belz).
Rogers, S. & Renard, L. 1999 Relationship-Driven Teaching Educational Leadership, 57(3),
34.
Rosenshine, B., & Meister, C. (1992). The Use of Scaffolds for Teaching Higher-Level
Cognitive Strategies, Educational Researcher, April, 26-33.
Rossi, P. H., & Freeman, H. E. (1993). Evaluation: A systematic approach, Sage Publication
Newbury Park, Calif 5th edition.
Rutman, L. (1984). Evaluation Research Methods A Basic Guide, Second Edition Beverly,
Hills: SAGE Publications.
Sahin, M. (2009) Exploring University Students’ Expectations and beliefs about Physics and
Physics learning in a problem-based learning context. Eurasian Journal of
Mathematics, Science and Technology Education, 5(4), 321-333.
Sahu, A. R. (1983). On some educational and psychological aspects of problem solving.
International Journal of Mathematics Education, Science and Technology, 14(5), 555-
563.
Santrock, .J .W. (2005). Educational Psychology Classroom Update: Preparing for
PRAXISTM and Practice Ta ta McGraw-Hill Publishing Company Limited New
Delhi.
Savoie, J. M., & Hughes, A. S. (1994). Problem-based learning as classroom solution.
Educational Leadership, 52, 54-57.
Selcuk, G. S. 2010 The effects of Problem-based learning on pre-service teachers’
achievement, approaches and attitudes towards learning Physics International Journal
of the Physical Sciences 5(6), 711-723.
Schifter, D. & Fosnot, C.T. (1993). Reconstructing Mathematics Education, Stories of
Teachers Meeting the Challenge of Reform, Teachers College, Columbia University,
New York and London. pp1-9.

158
Schreiber, J. B. (2000). Institutional and student factors and their influence in advanced
mathematics achievement The Journal of Educational Research, 95(5), 274-287.
Schuck, S., & Grootenboer, P. (2004). Affective issues in mathematics education In Perry, B.,
Anthony, G., & Diezmann, C. (Eds.) Research in mathematics education in Austrasia
2000-2003 (53-74) Sydney MERGA.
Schoenfeld, A. H. (1983). Beyond the purely cognitive: Beliefs system, social cognitions and
metacognitions as driving forces in intellectual performance. Cognitive Science, 7,
329-363.
Schoenfeld, A. H. (1985). Mathematical Problem Solving. New York: Academic Press.
Schoenfeld, A. H. (1992). Learning to think mathematically: Problem solving, metacognition,
and sense making in mathematics. In D. A. Grouws (Ed.), Handbook of research on
mathematics teaching and learning (pp. 334-369). New York: Macmillan.
Science Teachers Association of Nigeria (STAN) (1992). Raising the Standard of
Performance in Public Examinations in Science, Technology and Mathematics.
STAN Position Paper No. 4
Scriven, M. (1991). Evaluation thesaurus 4th ed. Newbury Park, CA: Sage.
Shadish, W. R., Cook, T. D., & Campbell, D. T. (2002). Experimental and Quasi-
Experimental Designs for Generalised Causal Inference. New York: Houghton
Mifflin Company.
Shayer, M., & Adhami, M. (2007). Fostering cognitive development through the context of
mathematics: Results of the CAME project. Educational Studies in Mathematics,
64(3), 265–291.
Shuell, T. J. (1996). Teaching and Learning in a Classroom context In D.C. Berliner, &
Calfee (Eds) Handbook of educational Psychology. pp. 726-764, New York
Macmillan.
Shulman, L. S. (1986). Those Who Understand: Knowledge Growth in Teaching.
Educational Researcher, 15(2), 4 – 14.
159
Shulman, L. S. (1987). Knowledge and Teaching: Foundations of the New Reform. Harvard
Educational Review, 57(1), 1 – 21.
Silver, E. A., & Smith, M. S. (1996). Building discourse communities in mathematics
classrooms: A worthwhile but challenging journey In P. Elliott (Ed.), Communication
in mathematics, K-12 and beyond (pp. 20–28) Yearbook, Reston, VA: National
Council of Teachers of Mathematics.
Simkin, M. G., & Kuechler, W. L. (2005). Multiple-Choice Tests and Student Understanding:
What is the Connection? Decision Sciences Journal of Innovative Education 3(1),
Spring USA.
Simmons, M. (1993). The Effective Teaching of Mathematics. In E. Perrott (Ed). The
Effective teacher series. Longman Publishers, London & New York.
Simon, M. A., & Schifter, D. E. (1991). Towards a constructivist perspective: An
intervention study of mathematics teacher development. Educational Studies in
Mathematics, 22(5), 309 – 331.
Smits, P.B.A., Verbeek, J.H.A.M. & de Buisonje, C.D. 2002 PBL in continuing medical
education: A review of controlled evaluation studies British Medical Journal, 324,
153-156.
Smith, J. P. (1997). Problems with Problematizing Mathematics: A Reply to Hiebert et al.
Educational Researcher, 26(2), 22-24.
Smith, M. & Cook, K. 2012 Attendance and Achievement in PBL: The value of Scaffolding
Interdisciplinary Journal of PBL, 6(1), Article 8.
Speaking of Teaching. (2001) Problem-based learning. Stanford University Newsletter on
teaching 11(1), 1-8.
Stein, M.K., Grover, B.W., and Henningsen, M. (1996). Building Student capacity for
mathematical thinking and reasoning: An analysis of mathematical tasks used in
reform classrooms. American Educational Research Journal, 33, 455-488.

160
Smith, G.T., & McCarthy, D.M. (1995). Methodological considerations in the refinement of
clinical assessment instruments. Psychological Assessment, 7(3), 300-308.
Stepien, W.J., Senn, P.R., & Stepien, W.C. (2000). The internet and problem-based learning-
developing solutions through the web. Tucson AZ: Zephyr.
Stewart, J., Redlin, L. and Watson, S. (2006) Pre-calculus fifth Edition Mathematics for
Calculus International Student Edition.
Stiggins, R. (1994). Student-centred classroom assessment. Ontario: Macmillan College
Publishing Co.
Stigler, J. W. & Hiebert, J. 1997 Understanding and Improving Classroom Mathematics
Instruction An Overview of the TIMSS Video Study, A Journal of Phi Delta Kappan
14-21.
Strobel, J. & van Barneveld, A. (2009). When is PBL more effective? A meta-synthesis of
meta-analyses comparing PBL to conventional classrooms Interdisciplinary Journal
of Problem based Learning, 3(1), Article 4 Retrieved Nov 2 2009 at
http://docs.lib.purdue.edu/ijpbl/vol3/iss1/4 .
Sungur, S. & Tekkaya, C. (2006). Effects of Problem–Based Learning and Traditional
Instruction on Self–Regulated Learning. Journal of Educational Research, 99 (5) 307-
317.
Szetela, W. & Nicol, C. (1992). Evaluating Problem Solving in Mathematics. Educational
Leadership May, 42 – 45.
Tall, D. (1991). Reflective Abstraction in Advanced Mathematical Thinking. Advanced
Mathematical Thinking. 95-102 Dordrecht, The Netherlands: Kluwer Academic.
Taylor-Powell, E & Steele, S (1996). Collecting Evaluation data: An overview of sources and
methods. Program Development and Evaluation, University of Wisconsin-Extension.
Tuttuh-Adegun, M. R., Sivasubranmaniam, S., & Adegoke, R. (2002). Further Mathematics
Project 2 NPS Educational Publishers Limited, Ibadan: Nigeria.
161
Trendsin International Mathematics and Science Study (TIMSS) 1995. International
Mathematics Report. December, 1996.
Trends in International Mathematics & Science Study (TIMSS) (2007). International
Mathematics Report. December, 2008.
Thompson, A. G. (1992). Teachers’ beliefs and conceptions: A synthesis of the research. In
D.A. Grouws (Ed.), Handbook of research on mathematics teaching and learning,
127-146, New York: Macmillan.
The Guardian Nigeria Newspaper (2011). Analysis of 2010/2011 May/June West African
Senior School Certificate Examinations results.
Torp, L. & Sage, S. (2002). Problems as possibilities: Problem-based learning for K-16
Education (2nd ed.) Alexandria, VA: Association for Supervision and Curriculum
Development.
Turnuklu, E. B., & Yesildere, S. ()2007. The pedagogical content knowledge in mathematics:
Pre-service Primary Mathematics Teachers’ Perspectives in Turkey. IUMPST: The
Journal, (Content Knowledge), October, p.1-13.
Universal Basic Education Commission (2002). Second Primary Education Project (PEP II)
Teaching and Learning Studies, Abuja
Van der Walt, M., & Maree, K. (2007). Do mathematics learning facilitators implement
metacognitive strategies? South African Journal of Education 27(2), 223-241.
Van de Walle, J.A. (2007) Elementary and Middle School Mathematics – Teaching
Developmentally. Pearson Education Inc; Boston, p.1-70.
Van den Heuvel-Panhuizen, M. (2000). Mathematics education in the Netherlands: A guided
tour. Freudenthal Institute Cd-rom for ICME9. Utrecht: Utrecht University.
Vernon, D. T. A., & Blake, R. L. (1993). Does problem-based learning work? A meta-
analysis of evaluative research. Academic Medicine, 68(7), 550-563.
162
Von Glasersfeld, E. (1990). An exposition of constructivism: Why some like it radical, in
R.B. Davis, C. A., Maher and N. Noddings (Eds), Constructivism views on teaching
and learning Mathematics 19-29, National Council of Teachers of Mathematics:
Reston, V A.
Vygotsky, L. S. (1978). Mind in society. Cambridge, MA: Harvard University Press.
WAEC (2008-20012). The West African Examination Council: Regulations and Syllabuses
for WASSCE, 234-247 WAEC Press, Lagos..
W.A.E.C. (2007). Chief Examiners Report (2007) Senior School Certificate Examination.
Lagos.
Ward, G (2007). Constructing an effective mathematics environment for ESL students
METSMac-1, 34-52 Third Annual Conference for Middle East Teachers of Science,
Mathematics and Computing March 17- 19, 2007, Abu-Dhabi.
West Africa Examination Council (WAEC) (2011). Result Analysis, Test Development
Department, Lagos.
West, S. A. (1992). Problem-based learning – A viable addition for secondary school science.
School Science Review, 73, 47-55.
Wheijen, C. (2005). Impact of Constructivist Teaching on Student Believes About Teaching
and Learning in Introductory Physics. Canadian Journal of Science, Mathematics and
Technology Education, 5(1) 95 – 109.
Whitcomb, J.; Borko, H. & Liston, D.( 2008) Why Teach?, Journal of Teacher Education
59:1, 3-9
Wigley. A. 1992 Models for teaching mathematics. Mathematics Teaching 141: 4–7
Williams, D., Pedersen, S. & Liu, M. 1998 An evaluation of the use of PBL software by
Middle School students. Journal for Universal Computer Science (Special Issue),
4(4), 466-483.

163
Wimmer, R. D. & Dominic, J. (2000) Mass media Research: An introduction. 6th Edition
Wadsworth Publishing Company.
Wood, T., Cobb, P., & Yackel, E. (1990). The contextual nature of teaching: Mathematics
and reading instruction in one second grade classroom. The Elementary School
Journal, 90(5), 495-513
Wood, T. Cobb, P.; Yackel, E. (1995). Reflections on learning and teaching mathematics in
elementary school. In: Steffe, L.P.; Gale, J. (eds) Constructivism in education 401-
422 Hillsdale, NJ, Lawrence Erlbaum Associates.
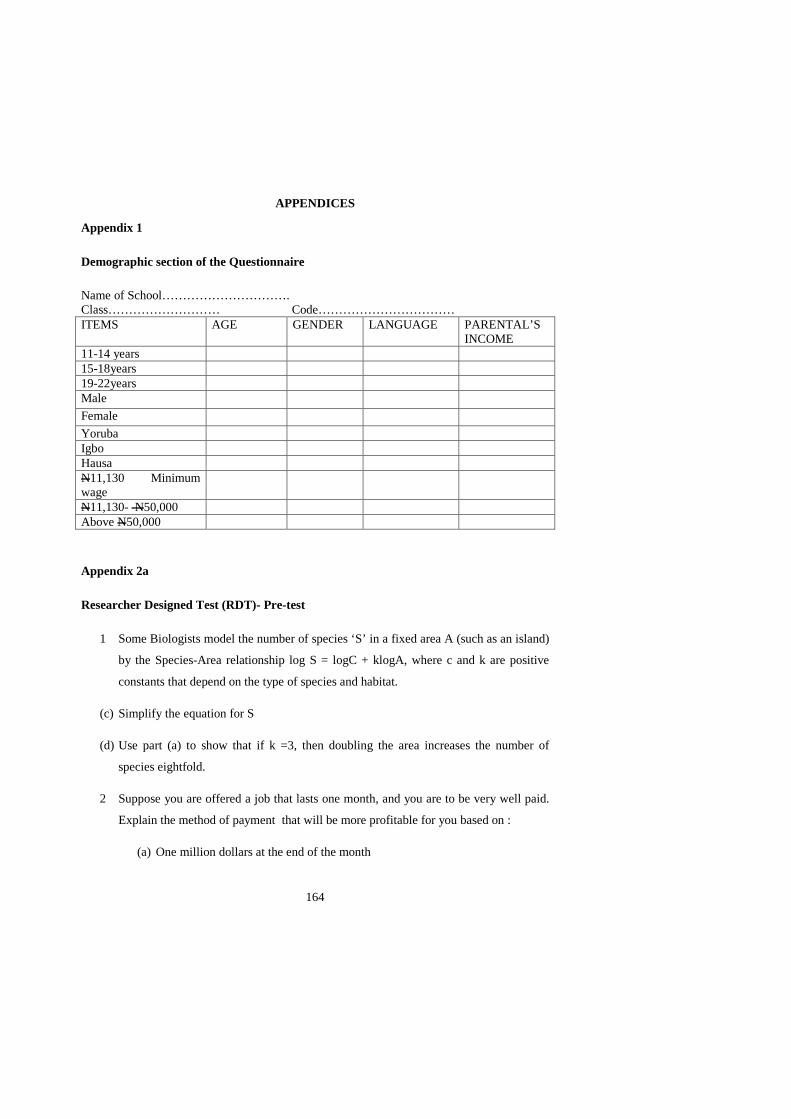
164
APPENDICES Appendix 1
Demographic section of the Questionnaire
Name of School…………………………. Class……………………… Code…………………………… ITEMS AGE GENDER LANGUAGE PARENTAL’S
INCOME 11-14 years 15-18years 19-22years Male Female Yoruba Igbo Hausa N11,130 Minimum wage
N11,130- N50,000 Above N50,000
Appendix 2a
Researcher Designed Test (RDT)- Pre-test
1 Some Biologists model the number of species ‘S’ in a fixed area A (such as an island)
by the Species-Area relationship log S = logC + klogA, where c and k are positive
constants that depend on the type of species and habitat.
(c) Simplify the equation for S
(d) Use part (a) to show that if k =3, then doubling the area increases the number of
species eightfold.
2 Suppose you are offered a job that lasts one month, and you are to be very well paid.
Explain the method of payment that will be more profitable for you based on :
(a) One million dollars at the end of the month

165
(b) Two cents on the first day of the month, 4 cents on the second day, 8 cents on
the third and, in general, 2n cents on the nth day.
3 A large pond is stocked with fish. The fish population P is modeled by the formula, P
= 3t + 10√t + 140, where t is the number of days since the fish were first introduced
into the pond. Evaluate the number of days it will take the fish population to reach
500.
4 Make up several pairs of polynomials, and then calculate the sum and product of each
pair. Based on your experiments and observations, answer the following questions:
(a) Evaluate why the degree of the product is related to the degrees of the original
polynomials?
(b) Justify why the degree of the sum is related to the degrees of the original
polynomials?
Appendix 2b
Researcher Designed Test (RDT) -Post-Test
1 Some Biologists model the number of species ‘S’ in a fixed area A (such as an island)
by the Species-Area relationship log S = logC + klogA, where c and k are positive
constants that depend on the type of species and habitat.
(a) Simplify the equation for S
(b) Use part (a) to show that if k =3, then doubling the area increases the number of
species eightfold.
2 A large pond is stocked with fish. The fish population P is modeled by the formula,
P = 3t + 10√t + 140, where t is the number of days since the fish were first introduced
into the pond. Evaluate the number of days it will take the fish population to reach
500.
3 Suppose you are offered a job that lasts one month, and you are to be very well paid.

166
Explain the method of payment that will be more profitable for you based on :
(a) One million dollars at the end of the month
(b) Two cents on the first day of the month, 4 cents on the second day, 8 cents on
the third and, in general, 2n cents on the nth day.
4 Make up several pairs of polynomials, and then calculate the sum and product of each
pair. Based on your experiments and observations, answer the following questions:
(a) Evaluate why the degree of the product is related to the degrees of the original
polynomials?
(b) Justify why the degree of the sum is related to the degrees of the original
polynomials?
Appendix 3a
Teacher Made Test (TMT)- Pre-Test
1. Evaluate 3.375-1⅓
2. Solve for x if (i) 125(3x-2) = 1, (ii) 52x+1 – 26(5x) + 5 = 0
3. Simplify ½log48 + log432 – log42
4. Express y in terms of x if ½log2(y+3) = 2x
5. If log102 = 0.3010, log103 = 0.4771, log105 = 0.6990, find (i) log 72 (ii) log 0.6
6. Express √32 + 6/√2 as a single surd
7. Calculate the number of terms in the A.P.:¼, ½,……,7½
8. Find (i) the common difference and (ii) the sum of the first 20 terms of the A.P.: log a,
log a2, log a3,……
9. If k+1, 2k-1, 3k+1 are three consecutive terms of a G.P., find the possible values of
the common ratio.
10. The third term and the seventh term of a G.P. are 18 and 35/9 respectively; find the
sum of the first 7 terms.

167
Appendix 3b
Teacher Made Test (TMT)- Post-Test
1. The third term and the seventh term of a G.P. are 18 and 35/9 respectively; find the
sum of the first 7 terms.
2. If k+1, 2k-1, 3k+1 are three consecutive terms of a G.P., find the possible values of
the common ratio.
3. Find (i) the common difference and (ii) the sum of the first 20 terms of the A.P.: log a,
log a2, log a3,……
4. If log102 = 0.3010, log103 = 0.4771, log105 = 0.6990, find (i) log 72 (ii) log 0.6
5. Express y in terms of x if ½log2(y+3) = 2x
6. Express √32 + 6/√2 as a single surd
7. Calculate the number of terms in the A.P.:¼, ½,……,7½
8. Solve for x if (i) 125(3x-2) = 1, (ii) 52x+1 – 26(5x) + 5 = 0
9. Simplify ½log48 + log432 – log42
10. Evaluate 3.375-1⅓
168
Appendix 4
Students’ Beliefs about Further Mathematics Questionnaire (SBFMQ) Item No
Beliefs Statements SD D A SA
1 Further Mathematics is computation 2 Further Mathematics problems given to students should be
quickly solvable in a few steps
3 Further Mathematics is the dynamic searching for order and pattern in the learner’s environment
4 Further Mathematics is a beautiful, creative and useful human endeavour that is both a way of knowing and a way of thinking
5 Right answers are much more important in Further Mathematics than the ways in which you get them
6 Further Mathematics knowledge is the result of the learner interpreting and organizing the information gained from experiences
7 Being able to build on other students’ ideas make extensions of FM real
8 Students are rational decision makers capable of determining for themselves what is right and wrong
9 Further Mathematics learning is being able to get the right answers quickly
10 Periods of uncertainty, conflict, confusion, surprise are a significant part of the Further Mathematics learning process
11 Further Mathematics teachers make learning more meaningful to students when problems are taken from real-life context
12 Students should be allowed to use any method known to them in solving FM problems
13 Young students are capable of much higher levels of mathematical thought than has been suggested traditionally
14 Teachers’ should not rebuke students’ for not answering questions correctly
15 Being able to memorize facts is critical in Further Mathematics learning
16 Further Mathematics learning is enhanced by activities which build upon and respect students’ experiences
17 Further Mathematics learning is enhanced by challenge within a supportive environment
18 Teachers should provide instructional activities which result in problematic situations for learners
19 Teachers should encourage students to ask why they have to learn some FM topics
20 Teachers or the textbook – not the student – are authorities for what is right or wrong

169
21 The role of the Further Mathematics teacher is to transmit mathematical knowledge and to verify that learners have received this knowledge
22 Teachers should recognize that what seem like errors and confusions from an adult point of view are students’ expressions of their current understanding
23 Teachers should negotiate social norms with the students in order to develop a cooperative learning environment in which students can construct their knowledge
24 Further Mathematics concepts enable students to interpret and solve applied problems
25 Further Mathematics is a product of the invention of human mind
26 Further Mathematics is abstract 27 Further Mathematics is the bedrock of Science and
Technology
28 Teachers’ should encourage students to formulate solution procedures by themselves in trying to solve real-world problems
Appendix 5
Item Difficulty and Discrimination Index of RDT
Appendix 6
Item Difficulty and Discrimination Index for TMT in the study
Item No. Item Difficulty Discrimination
Index
1 0.72 .64
2 0.86 .42
3 0.25 .46
4 0.34 .50
Item No. Item Difficulty Discrimination
Index

170
1 0.75 .67
2 0.88 .44
3 0.25 .46
4 0.34 .50
5 0.63 .48
6 0.75 .67
7 0.63 .48
8 0.38 .47
9 0.88 .44
10 0.63 .48

171
Appendix 7
Teaching specific topics in Senior Secondary year one further mathematics class
Topics such as Indices, Indicial equations, Logarithms, Algebraic equations Sequences and
Series are included in the Nigeria Further Mathematics National Curriculum for Senior
Secondary School One. The way these topics are taught by teachers in Nigeria using the
traditional method is demonstrated in this section. The researcher also explained how the
same topics could be taught using PBL approach.
Teaching of Indices and Logarithms using Traditional Method
Objectives: At the end of the lesson students will be able to (i) Use the laws of indices in
calculations and simplifications (ii) Use the relationship between Indices and Logarithms to
solve problems (iii) Change bases in logarithms
Content: Indices as a shorthand notation, Laws of indices, Meaning of a0, a-n, a1/n Elementary
theory of Indices, log(a – b), log(a/b) log an , log(a)1/n Elementary theory of logarithms, Base
10 logarithm tables and antilogarithm tables, Calculations involving multiplication, division,
powers and nth roots.
Previous Knowledge: Students have learnt how to express numbers in index and standard
forms.
Procedure:
Step 1: State the laws of Indices
Step 2: Give examples to show how each of the laws is applied
Step 3: Repeat steps 1&2 for Logarithms
Step 4: Explain the relationship between Indices and Logarithms by setting y = 10x
Step 5: Use the above steps to solve some problems for the students
Question 1: Evaluate 41/2 x 41/3

172
Solution: 41/2 x 41/3 = 41/2 + 1/3 = 45/6 (Application of 1st law)
Question 2: Evaluate 41/2 divided by 41/3
Solution: 41/2 / 41/3 = 41/2 – 1/3 = 41/6 (Application of 2nd law)
Question 3: Evaluate 641/3
Solution: 641/3 = ((4)3)1/3 = 4 (Application of 3rd law)
Question 4: Write as a single logarithm; 2log23 + 2
Solution: Re-write 2 as log24 then the question becomes 2log23 + log24
From 3rd law of logarithms 2log23 = log29
2log23 + log24 = log29 + log24
Applying 1st law of logarithms we have log2(9)(4) = log236
Question 5: Write as a single logarithm 2logm – 3logn
Solution: logm2 – logn2 = log(m2/n2) 2nd law of logarithm
Question 6: Evaluate log7(1/49)
Solution: log7(1/49) = log77-2 = -2 Applying 3rd law of logarithm
Question 7: If log34 = x and log49 = y, find the value of xy
Solution: Re-write log49 as 2log43
From log34 = x Let 3x = 4
Taking logarithm on both sides we have xlog3 = log4
X = (log4)/(log3). Similarly 2log43 = 2{log3/log4} hence x = 2/y
Finally xy = 2.
Evaluation Question:
173
Give ten minutes to the students to solve the problems below in the class:
Solve the following equation: 252+3x = 1254-x and Solve for x if 2logx = log16
Assignment: (i) If 1252x-3 = 25-2x-1, find x; (ii) Solve the simultaneous equations:
Log10x + log10y = 4 and log10x + 2log10y = 3
Teaching of Indices and Logarithms using PBL Approach
Objectives: At the end of the lesson students will be able to (i) Investigate the conditions
under which the laws of indices are applicable (ii) Use the relationship between Indices and
Logarithms to solve real-life problems (iii) Change bases in logarithms
Content: Definitions of Index and Indices, Indices as a shorthand notation, Laws of indices,
Meaning of a0, a-n, a1/n Elementary theory of Indices, log(a – b), log(a/b) log an , log(a)1/n
Elementary theory of logarithms, Base 10 logarithm tables and antilogarithm tables,
Calculations involving multiplication, division, powers and nth roots.
Previous Knowledge: Students have learnt how to express numbers in index and standard
forms.
Procedure:
Step 1: Arrangement of students into heterogeneous ability groups based on their
previous performance in Mathematics. The regular Further Mathematics teacher could help in
this area. The PBL teacher poses some problems for the students to solve e.g. Investigate the
correctness of the given equations:
(i) 22 x 33 = 66? (ii) (23)4 = 27; 64; 212; 163 (Pick the correct answers)
Step 2: Adoption of Problem-solving process
Stage I: Identify the problem – This requires (a) identifying the bases (b) identifying the
powers and (c) the arithmetic operation involved
Stage II: Make assumptions – This requires ability to manipulate the expression on the left
hand side to get expression on the right hand side

174
Stage III: Formulate a model – This requires ability to identify a valid approach among many
alternatives. In solving the problem, two options are feasible namely direct computation of
values on the left hand side and using the law of indices. The law of indices could not be used
because the numbers given at the left hand side are not of the same base. An ideal model
would be direct computation.
Stage IV: Use the model – 22 x 33 = (2 x 2) x (3 x 3 x 3) = 4 x 27 = 108
Stage V: Evaluate the model – Obviously 108 could not be expressed as 66 in anyway and as
such, the left hand side does not correspond to the value on the right hand side. Therefore, the
identity does not hold.
Step 3: The teacher gives class work to each group while encouraging them to follow the
heuristics of the model in their discussion.
Step 4: The teacher appoints any member of the group to present their findings to the entire
class while acting as facilitator in a scaffolding manner and other groups engage the presenter
in dialogue to arrive at a consensus.
Step 5: The teacher gives an overview of the whole lesson leaning on the model. Thereafter
the teacher gives assignment to the class.
Question: Which is larger log417 or log524? Explain your reasoning
Teaching of Algebraic Equations using Traditional Method
Objectives: At the end of the lesson students will be able to solve problems involving
quadratic equations by algebraic method
Content: Revision of factorisation, Solution of quadratic equations using (i) factorisation (ii)
completing the squares (iii) almighty formula
Previous Knowledge: Students have learnt that when the highest power of an unknown
expression is two, that expression is called quadratic. The general quadratic expression is of

175
the form ax2 + bx + c, where a, b and c are constants and a, the coefficient of x2 is not zero.
Also that the product of two linear expressions produces one quadratic expression
Activities: Revise factorisation and also the expansion of algebraic factors. Work problems
using the fact that if the product of 2 numbers is zero, one of the numbers must be zero.
Extend this to factors.
Procedure:
Step 1: Let the students expand (x + 2)2 and (x + 2)(x + 3) and ask them for the name of the
equation obtained.
Step 2: Let the students identify the coefficients of x2, x and the constants in Step 1.
Step 3: Ask the students to obtain the almighty formula from completing the squares method
Step 4: Use the above steps to solve some problems for the students
Questions: Find the roots of the following quadratic equations x2 + 6x + 9 = 0 and 5x2 + 8x +
3 = 0
Solutions: By factorisation, x2 + 6x + 9 = 0 becomes x2 + 3x + 3x + 9 = 0, i.e. x(x + 3) + 3(x
+ 3) = 0 The factors are x + 3 (twice). Hence x = -3. Similarly by factorisation 5x2 + 8x + 3 =
0 become 5x2 + 3x + 5x + 3 = 0, i.e. x(5x + 3) + 1(5x + 3) = 0, (x + 1)(5x + 3) = 0
Hence the roots are x = -1 or -3/5
Evaluation Question: (i) Factorise 24 – 10x + x2 and
(ii) Solve the quadratic equation 7x2 – 28x -35 = 0
Assignment: Solve the quadratic equation 27x2 + 3x = 0
Teaching of Algebraic Equations using PBL Approach
Objectives: At the end of the lesson students will be able to (i) identify linear equations (ii)
identify quadratic expressions (iii) describe the nature of curves using the discriminants (iv)
factorise and solve quadratic equations (v) form quadratic equations with given roots

176
Content: Revision of factorisation, Solution of quadratic equations using (i) factorisation (ii)
completing the squares (iii) almighty formula
Previous Knowledge: Students are used to linear expressions of the form ax + b, where a and
b are constants and x, the only variable, is raised to power one.
Procedure:
Step 1: Arrangement of students into heterogeneous ability groups based on their
previous performance in Mathematics. The regular Further Mathematics teacher could help in
this area. The PBL teacher poses some problems for the students to solve e.g.
Find the roots of the quadratic equation 5x2 + 8x + 3 = 0
Step 2: Adoption of Problem-solving process
Stage I: Identify the problem – This requires (a) identifying the coefficients of x2, x and
constant (b) considering the nature of the curve (discriminants)
Stage II: Make assumptions – This requires ability to guess through ‘trial and error’ values of
x that will satisfy the given equation i.e. values of x that will make left hand side of the
equation to become zero
Stage III: Formulate a model – This requires ability to identify a valid approach among many
alternatives. In solving the problem, three options are feasible namely factorisation,
completing the square and the general formula
Stage IV: Use the model → 5x2 + 8x + 3 = 0, a = 5; b = 8 and c = 3
The discriminant b2 – 4ac = 3 hence b2 > 4ac (the equation is solvable with 2 distinct real
roots). Factorising the left hand side of the equation gives 5x2 + 5x + 3x + 3 = 0, 5x(x + 1) +
3(x + 1) = 0, (5x + 3)(x + 1) = 0, Equating each of the two factors to 0 gives x = -1 or -3/5.
Some students might substitute the coefficients of a, b, c directly into the almighty formula to
obtain the values of x. Note that almighty formula is obtainable through completing the
square process

177
Stage V: Evaluate the model – substituting x = -1 or -3/5 into the given equation makes the
left and right-hand side of the equation to be equal. Any other values apart from these two
values will obviously not satisfy the equation. Hence, the whole process will be repeated.
Step 3: The teacher gives class work to each group while encouraging them to follow the
heuristics of the model in their discussion.
Step 4: The teacher appoints any member of the group to present their findings to the entire
class while acting as facilitator in a scaffolding manner and other groups engage the presenter
in dialogue to arrive at a consensus.
Step 5: The teacher gives an overview of the whole lesson leaning on the model. Thereafter
the teacher gives assignment to the class.
The under- listed procedure is suggested for a teacher introducing the concept of quadratic
equation to the students for the first time at a PBL senior school:
(i) The teacher may ask the students to distinguish between linear and quadratic form
of equation [The linear form, y = mx + c is expected to have been taught at the
Junior secondary level]
(ii) The teacher may ask the students to give geometrical interpretations to the two
forms of the equation (meaning of y = mx; y = mx + c; y = k and x = p
(iii) The teacher may ask the students in turns to identify the coefficients of x , x2 and
constant in a given quadratic equation of the form ax2 + bx + c
(iv) The teacher may ask the students to explain the term ‘discriminant’
(v) The teacher may ask the students to write down the mathematical expression for
discriminant in their notebooks (identify b2 - 4ac as discriminant usually written
as D = b2 – 4ac)
(vi) The teacher should let the students know that the discriminant could be used to
describe the nature of curves. Its applications in Physical Sciences should also be
stressed especially in diffusion and waves equations.

178
(vii) The teacher may introduce the concept of equality and inequality to the students
(two possibilities exists for inequality; greater than ‘>’ or less than <’
(viii) The teacher may give the interpretation of each of the nature of the curves to the
students as:
D > 0, existence of two different real roots
D < 0, existence of two complex roots
D = 0, existence of equal, repeated or coincident roots
(ix) The teacher could thereafter pose the problem below for students to solve in the
class using any method:
If the quadratic equation (x + 1)(x + 2) = k(3x + 7) has equal roots, find the
possible values of the constant. (SSCE, May/June 2009 Further Mathematics
Question 3)
Topics like Sequences and Series could also be taught to students using PBL approach. The
teacher poses open-ended questions that allow the students to reason critically without
necessarily relying on the set rules and formulas, as was the case in the traditional approach.
Examples of such questions are:
1. Suppose you are offered a job that lasts one month and you to be very well paid. Which of
the following methods of payment is more profitable for you?
(i) One million dollars at the end of the month
(ii) Two cents on the first day of the month, 4 cents on the second day, 8 cents on the
third and, in general, 2n cents on the nth day.
2. If k + 1, 2k – 1 and 3k + 1 are three consecutive terms of a Geometric Progression,
find the possible values of the common ratio?

179
Related Documents