Investigating Strategies to Enhance Microbial Production of and Tolerance Towards Aromatic Biochemicals by Michael Machas A Dissertation Presented in Partial Fulfillment of the Requirements for the Degree Doctor of Philosophy Approved July 2019 by the Graduate Supervisor Committee: David R. Nielsen, Chair Karmella Haynes Xuan Wang Brent Nannenga Arul Varman ARIZONA STATE UNIVERSITY August 2019

Welcome message from author
This document is posted to help you gain knowledge. Please leave a comment to let me know what you think about it! Share it to your friends and learn new things together.
Transcript

Investigating Strategies to Enhance Microbial Production of
and Tolerance Towards Aromatic Biochemicals
by
Michael Machas
A Dissertation Presented in Partial Fulfillment of the Requirements for the Degree
Doctor of Philosophy
Approved July 2019 by the Graduate Supervisor Committee:
David R. Nielsen, Chair
Karmella Haynes Xuan Wang
Brent Nannenga Arul Varman
ARIZONA STATE UNIVERSITY
August 2019

i
ABSTRACT
Aromatic compounds have traditionally been generated via petroleum feedstocks and have wide
ranging applications in a variety of fields such as cosmetics, food, plastics, and pharmaceuticals.
Substantial improvements have been made to sustainably produce many aromatic chemicals from
renewable sources utilizing microbes as bio-factories. By assembling and optimizing native and
non-native pathways to produce natural and non-natural bioproducts, the diversity of biochemical
aromatics which can be produced is constantly being improved upon. One such compound, 2-
Phenylethanol (2PE), is a key molecule used in the fragrance and food industries, as well as a
potential biofuel. Here, a novel, non-natural pathway was engineered in Escherichia coli and
subsequently evaluated. Following strain and bioprocess optimization, accumulation of inhibitory
acetate byproduct was reduced and 2PE titers approached 2 g/L – a ~2-fold increase over
previously implemented pathways in E. coli. Furthermore, a recently developed mechanism to
allow E. coli to consume xylose and glucose, two ubiquitous and industrially relevant microbial
feedstocks, simultaneously was implemented and systematically evaluated for its effects on L-
phenylalanine (Phe; a precursor to many microbially-derived aromatics such as 2PE) production.
Ultimately, by incorporating this mutation into a Phe overproducing strain of E. coli, improvements
in overall Phe titers, yields and sugar consumption in glucose-xylose mixed feeds could be
obtained. While upstream efforts to improve precursor availability are necessary to ultimately reach
economically-viable production, the effect of end-product toxicity on production metrics for many
aromatics is severe. By utilizing a transcriptional profiling technique (i.e., RNA sequencing), key
insights into the mechanisms behind styrene-induced toxicity in E. coli and the cellular response
systems that are activated to maintain cell viability were obtained. By investigating variances in
the transcriptional response between styrene-producing cells and cells where styrene was added
exogenously, better understanding on how mechanisms such as the phage shock, heat-shock and
membrane-altering responses react in different scenarios. Ultimately, these efforts to diversify the
collection of microbially-produced aromatics, improve intracellular precursor pools and further the
understanding of cellular response to toxic aromatic compounds, give insight into methods for
improved future metabolic engineering endeavors.

ii
AKNOWLEDGMENTS
I would firstly like thank my advisor, David Nielsen (and Maeve!), for being the greatest mentor in
the world. His support and guidance were unmatched, and I could not have asked for a better PhD
advisor. Without his patience (so much patience!), approachability and leadership, this would have
been a much less rewarding experience and I am extremely appreciative. Thank you to my
committee, Drs. Karmella Haynes, Xuan Wang, Brent Nannenga, Arul Varman, for taking time out
of their busy schedule to provide guidance and insight and be a big part of my academic journey.
A very special thank you to Mr. Fred Pena for his expertise and skillset – his knowledge regarding
engineering equipment and processes and willingness to always provide me with assistance has
been vital to my success here at ASU. I would like to thank all of the graduate students and lab
members at ASU who I have had the pleasure of working with during my time here and who have
always been willing to lend a helping hand, talk through problems and make the lab experience so
worthwhile: Andrew Flores, Zach Dookeran, Rodrigo Martinez, Cody Kamoku, Sydney Parrish,
Anirudh Vasudevan, Daniel Herschel, Yifei Xu, John Hagstrom, Lizbeth Nieves and Drs. Brian
Thompson, Kyle Staggs, Gavin Kurgan, Christopher Jones, Yuji Aso, Bohan Shan, Matt
Christensen, Karthik Pushpavanam, Stefan Tekel and many others. A big thank you to all the
undergraduate and high school students who I was able to work and made the lab a little more
exciting every day: Jordan Hines, Zeynap Ayla, Kaleigh Johnson, Christopher Gregson, Min Su
Park, Jimmy Xu, Chantal Navrital, Adit Sakthi, Gavin Steeber, Brian Wynne, Alyssa Shapiro and
Aidan Schneider.
I would like to thank all my roommates and friends that I have had during my graduate school career
– without them, I would have never made it: Dr. Zoran Bundalo, Dr. Jared Schoepf, Tim Duarte,
Amelia Bourke, Marwan Osman, Jamie Balesteri, Jay Rubenstein, Dr. Jeff Johannesmeyer, Kristen
Riske, Justin Jordan, Isaac Sitter, Greg Mirza, Ryan Jordan, Dr. Chad Campbell, Gabrielle Porti,
Erica Engelschall, Taylor Barker, Frankie Kennedy, Dr. Eric Stevens, Jordan Cunningham, Quan
Truong, Ben Pohle, Josh Topel, David Reinkensmeyer, Dr. Tarek Kaakani and Dr. Adam Odeh.

iii
I would especially like to acknowledge and thank Daryl and Christine Burton and the entire Burton
family for supporting me and my research adventure for the past two years through ARCS
Foundation (Phoenix Chapter). They have been so encouraging and excited about the research
that I have done, and I am grateful that I have been able to develop this relationship with such an
amazing and supportive family.
I have the greatest girlfriend of all time (Lindsay!) and I can’t believe she put up with me going to
lab pretty much every day, leaving her to take care of our crazy dog and spending more time with
my bacteria babies than her. I appreciate everything that she does for me and I’m so lucky that
she was willing to take this journey with me. Thanks to her parents, Linda and Brian, brother, Zach,
and whole extended family for treating me like a member of the family. Also, extra special shout-
out to Serena and Boomer! Thanks to my dog, Mia, for teaching me what patience really means
but always being there with a big tail wag when I have a bad day.
Without my parents, Jim and Stephanie, I would not be here, and I am forever grateful for everything
they have given me. They are the best parents that anyone could ever ask for and I am so lucky
to have them. Thanks to my sister, Melina, for growing up with me and constantly supporting me
and always being my friend even when I am particularly annoying. I am also extremely grateful to
my extended family – grandparents, aunts, uncles, cousins, godparents, and everyone in my Greek
family – for providing me with an amazing and loving support system.

iv
TABLE OF CONTENTS
Page
LIST OF TABLES .......................................................................................................................... viii
LIST OF FIGURES .......................................................................................................................... ix
CHAPTER
1. EMERGING TOOLS, ENABLING TECHNOLOGIES, AND FUTURE OPPORTUNITIES FOR
THE BIOPRODUCTION OF AROMATIC CHEMICALS .................................................................. 1
1.1 Introduction ...................................................................................................................... 2
1.2 Modular Engineering Strategies for Optimizing Pathway Flux and Function .................. 3
1.2.1 Engineering Modular Aromatic Biosynthesis Pathways ................................................. 4
1.3 Metabolic Control Strategies for Enhancing Aromatic Bioproduction .............................. 5
1.3.1 Application and Potential of asRNA and Synthetic sRNAs for Aromatic Bioproduction . 6
1.3.2 Application and Potential of CRISPRi for Aromatic Bioproduction ................................. 6
1.3.3 Application and Potential of Synthetic Gene Circuits for Aromatic Bioproduction ......... 7
1.4 Biosensor-Based Approaches for Improving Aromatic Chemical Production ................. 8
1.4.1 Development of Aromatic-Responsive Biosensors ........................................................ 9
1.4.2 Improving Aromatic Bioproduction Using in vivo Biosensors as Screening Tools ....... 10
1.5 Future Outlooks ............................................................................................................. 11
1.6 Conclusions ................................................................................................................... 13
2. EXPANDING UPON STYRENE BIOSYNTEHSIS TO ENGINEER A NOVEL ROUTE TO 2-
PHENYLETHANOL ....................................................................................................................... 14
2.1 Introduction .................................................................................................................... 15
2.2 Materials and Methods .................................................................................................. 19

v
CHAPTER Page
2.2.1 Microorganisms ............................................................................................................ 19
2.2.2 Plasmid Construction .................................................................................................... 20
2.2.3 Assaying SOI Activity in Whole Resting Cells .............................................................. 21
2.2.4 Assaying 2PE Toxicity .................................................................................................. 22
2.2.5 Production of 2PE from Glucose by Engineered E. coli ............................................... 22
2.2.6 Analytical Methods ....................................................................................................... 23
2.2.7 Thermodynamic Analysis ............................................................................................. 23
2.3 Results ........................................................................................................................... 23
2.3.1 Comparative Assessment of Alternative 2PE Pathways .............................................. 23
2.3.2 Engineering 2PE Pathways .......................................................................................... 24
2.3.3 Demonstrating and Comparing 2PE Production via Alternative Pathways .................. 26
2.3.4 Host Strain Engineering to Increase Precursor Availability .......................................... 28
2.3.5 Optimizing Culture Conditions to Further Improve 2PE Production ............................. 31
2.4 Discussion ..................................................................................................................... 37
3. BIOPROCESSING AND GENETIC ALTERATIONS TO IMPROVE PRODUCTION OF L-
PHENYLALANINE UTILIZING XYLOSE AND GLUCOSE FEEDSTOCKS .................................. 41
3.1 Introduction .................................................................................................................... 42
3.2 Materials and Methods .................................................................................................. 44
3.2.1 Microorganisms ............................................................................................................ 44
3.2.2 DNA Cassette Construction .......................................................................................... 44
3.2.3 Production of Phe by Engineered E. coli ...................................................................... 45
3.2.4 Analytical Methods ....................................................................................................... 46

vi
CHAPTER Page
3.3 Results and Discussion ................................................................................................. 47
3.3.1 Comparison Between Utilization of Glucose and Xylose for Production of L-
Phenylalanine ........................................................................................................................ 47
3.3.2 Utilization of Xylose and Glucose for Production of Phenylalanine in E. coli ............... 50
3.3.3 Effect of xylR Mutation on Aerobic Xylose Consumption Rates and Phenylalanine
Production .............................................................................................................................. 53
3.3.4 Genetic Modifications to Improve Phe Production in Xylose-Utilizing Cells ................. 54
3.4 Discussion ..................................................................................................................... 60
3.5 Conclusions ................................................................................................................... 63
4. TRANSCRIPTIONAL ANALYSIS OF ESCHERICHIA COLI RESPONSE TO STYRENE
EXPOSURE ................................................................................................................................... 64
4.1 Introduction .................................................................................................................... 65
4.2 Materials and Methods .................................................................................................. 67
4.2.1 Strains and Cultivation Conditions Used ...................................................................... 67
4.2.2 RNA-seq Data Collection and Analysis ........................................................................ 68
4.2.3 Gene Ontology and KEGG Pathway Analysis .............................................................. 69
4.3 Results ........................................................................................................................... 69
4.3.1 Characterizing the Overall Transcriptomic Response of E. coli to Styrene Exposure . 69
4.3.2 DNA Synthesis, Replication, and Repair ...................................................................... 75
4.3.3 Protein and Amino Acid Biosynthesis ........................................................................... 76
4.3.4 Cell Replication ............................................................................................................. 77
4.3.5 Central Metabolic Pathways ......................................................................................... 78
4.3.8 Cell Envelope Modification ........................................................................................... 82

vii
CHAPTER Page
4.3.9 Efflux Transporters ....................................................................................................... 84
4.3.10 Comparing E. coli’s Response to Styrene Addition versus Styrene Production ........ 87
4.4 Discussion ..................................................................................................................... 91
5. FUTURE WORK AND DISCUSSION ........................................................................................ 96
5.1 Furthering the Understanding of Aromatic Toxicity in E. coli and Improving Tolerance
towards Aromatics Using High-Throughout Methods ................................................................ 97
5.1.1 Transcriptomic Analysis of E. coli for Various Toxic Aromatics ................................... 97
5.1.2 Directed Evolution Strategies to Improve Tolerance of E. coli to Aromatics ................ 99
5.1.3 Directed Evolution of Small Protein AcrZ for Modified Substrate Specificity of E. coli
Efflux Pump AcrAB .............................................................................................................. 104
5.2 Engineering of a Solvent Tolerant Organism as a Host for Aromatic Bioproduction .. 107
5.2.1 Engineering of Pseudomonas putida DOT-T1E for the Production of Styrene .......... 109
5.2.2 Utilization of Alternative Substrates for Styrene Production in P. putida DOT-T1E ... 114
5.3 Conclusions ................................................................................................................. 118
REFERENCES ............................................................................................................................ 119

viii
LIST OF TABLES
Table Page
2.1 Strains, Plasmids, and Pathways Constructed and/or Used for 2PE Production. .................. 19
2.2 Acetate Accumulation in Wild-Type E. coli Expressing ARO10 with Pyruvate Feeding. ........ 31
2.3 2PE Production Metrics for the Ehrlich and Styrene-derived Pathways. ................................ 37
3.1 Primers for the Insertion of xylR (R121C, P363S) into Production Strains. ............................ 45
3.2 Summary of Phe Production Metrics for NST74 and Various Genetic Variations. ................. 59
4.1 Differentially Expressed Efflux Transporters upon Styrene Exposure. ................................... 86
4.2 Genes DE in Opposite Directions upon Styrene Addition or Production. ............................... 90
5.1 Genes to Investigate with EvolvR to Improve E. coli Tolerance Towards Styrene. .............. 103

ix
LIST OF FIGURES
Figure Page
1.1 Bioproduction of Aromatic Chemicals from Renewable Substrates. ......................................... 3
1.2 Biosensors Facilitate Optimization of Aromatic Bioproduction. ................................................. 9
2.1 2-Phenylethanol Bioproduction Routes in E. coli. ................................................................... 18
2.2 Resting Cell Assay of StyC activity in E. coli for Conversion of (S)-Styrene Oxide. ............... 26
2.3 Toxicity assay of 2PE on E. coli NST74. ................................................................................. 28
2.4 2PE Titers for the Ehrlich and Styrene-derived Pathways with Gene Deletions. .................... 30
2.5 Effect of Induction Timing on 2PE Production. ........................................................................ 32
2.6 Accumulation of Acetate in E. coli Cells Producing 2PE via the Ehrlich Pathway. ................. 33
2.7 Effect of Initial Glucose Concentration on Production of 2PE. ................................................ 34
2.8 Time Course of 2PE, Cell Biomass, and Acetate Production and Glucose Consumption for the
Ehrlich and Styrene-derived Pathways. ........................................................................................ 36
3.1 Metabolic Pathway of E. coli from Glucose and Xylose to Phenylalanine. ............................. 50
3.2 Time Course of NST74 Phe Production on 2% (w/v) Xylose or Glucose................................ 51
3.3 Time Course of NST74 Phe Production on Glucose-Xylose (67%-33%) Feed. ..................... 52
3.4 Time Course of NST74xylR* Phe Production on Glucose-Xylose (67%-33%) Feed. ............. 54
4.1 A) Three Conditions upon which RNA was Extracted and, B) Styrene Accumulation in
Production Strain and Styrene Addition in Styrene-Added Strain. ................................................ 70
4.2 Overall Statistics for RNA-seq Analysis Showing DE Genes and Common DE Genes between
Modes of Styrene Exposure. ......................................................................................................... 71
4.3 List of Relevant GO Terms for DE Genes after Exposure to Styrene. .................................... 73
4.4 List of Relevant KEGG Pathways for DE Genes after Exposure to Styrene. .......................... 74
5.1 Proposed Protocol for Utilization of EvolvR System to Identify Genetic Mutants which Improve
Tolerance to Biochemicals. ......................................................................................................... 101
5.2 Interaction of AcrZ with the AcrAB-TolC Efflux Pump in E. coli. ........................................... 106
5.3 Pathway Map of Phenylalanine Biosynthesis and Metabolism in P. putida DOT-T1E. ........ 111
5.4 Overview of Procedure to Engineer P. putida DOT-T1E to Overproduce Phenylalanine. .... 113

x
Figure Page
5.5 Sucrose Metabolism Gene Cluster cscRABY from P. protogens pf-5 and Potential Metabolism
of Sucrose with CscRABY in P. putida DOT-T1E. ...................................................................... 117

1
CHAPTER 1. EMERGING TOOLS, ENABLING TECHNOLOGIES, AND FUTURE
OPPORTUNITIES FOR THE BIOPRODUCTION OF AROMATIC CHEMICALS
Abstract
Aromatic compounds, which are traditionally derived from petroleum feedstocks, represent a
diverse class of molecules with a wide range of industrial and commercial applications. Significant
progress has been made to alternatively and sustainably produce many aromatics from renewable
substrates using microbial biocatalysts. While the construction of both natural and non-natural
pathways has expanded the number and diversity of aromatic bioproducts, pathway modularization
in both single- and multi-strain systems continues to support the enhancement of key production
metrics towards economically-viable levels. While product toxicity persists as a key challenge
limiting the production of many aromatics, various successful strategies have been demonstrated
towards improving tolerance, including via membrane and efflux pump engineering as well as by
exploiting alternative production hosts. Finally, as a further step towards sustainable and
economical aromatic bioproduction, non-model substrates including lignin-derived compounds
continue to emerge as viable feedstocks. This chapter highlights recent and notable achievements
related to such efforts while offering future outlooks towards engineering microbial cell factories for
aromatic production.
This chapter contains sections from the published work below:
Machas, M., Kurgan, G., Jha, A.K., Flores, A., Schneider, A., Coyle, S., Varman, A., Wang, X.,
Nielsen, D.R. Emerging Tools, Enabling Technologies, and Future Opportunities for the
Bioproduction of Aromatic Chemicals. J Chem Technol Biotechnol 2018, doi: 10.1002/jctb.5762.

2
1.1 Introduction
Aromatic chemicals represent a diverse and important class of conventional petrochemicals with a
wide range of commercial and industrial applications. It has been estimated that about 40% (by
mass) of bulk petrochemicals contain aromatic functionality (i.e., one or more substituted benzene
rings) 1, serving, for example, as monomers for synthesizing highly durable and thermostable
polymers and coatings, building blocks for active pharmaceutical ingredients, and even fuel
additives. In recent years, significant and growing interest has emerged in the development of
alternative, microbial production routes for aromatic chemicals from renewable, biomass-derived
substrates. Such efforts have been aided by advancements in metabolic engineering, protein
engineering, and systems and synthetic biology 2,3, which continue to guide both rational and
combinatorial approaches towards efficient biocatalyst development. As a result, the de novo
biosynthesis of a diversity of different aromatic chemicals is now a reality, with applications that,
like their petroleum-derived counterparts, include bulk chemicals and plastics, specialty chemicals,
flavors and fragrances, and pharmaceuticals and nutraceuticals (Figure 1.1).
Several notable reviews have reported on recent and important progress made towards the
microbial biosynthesis of aromatic chemicals 4-9, predominantly focusing on key developments in
both host and pathway engineering that have enabled the high-level biosynthesis of a growing list
of aromatic products. In particular, these reviews comprehensively summarize the diversity of
different aromatic biochemicals that have been produced to date, as well as comparing different
carbon sources, host strains/organisms, culture conditions and important metabolic engineering
strategies employed; illustrating key progress made with respect to engineering microbial
production of both naturally occurring (i.e., amino acids) and novel aromatic biochemicals.
Accordingly, with the goal of complementing rather than duplicating these existing works, the
objective of this chapter is more specifically to highlight the role of emerging tools and enabling
technologies as applied to this end, while also identifying potential avenues for future
advancements in this area. As will be discussed, this includes the use of modular engineering
strategies for improving biosynthetic function, tolerance engineering to increase strain robustness,

3
and alternative biomass feedstocks to improve economic viability and sustainability. Finally, while
the primary focus will be related to the bioproduction of molecules with aromatic functionality, select
products derived from aromatic biosynthesis (e.g., cis,cis-muconic acid) will also be highlighted as
illustrative examples, where appropriate.
Figure 1.1 Bioproduction of Aromatic Chemicals from Renewable Substrates.
Metabolic and pathway engineering strategies have enabled the de novo microbial production of an array of aromatic biochemicals with a range of possible end uses. In addition to glucose, other biomass-derived sugars, lignin, and lignin-derived monomers have been investigated as renewable substrates to this end.
1.2 Modular Engineering Strategies for Optimizing Pathway Flux and Function
Microbial production of aromatic chemicals has largely been enabled via pathway engineering,
generally consisting of either: a) the functional reconstruction of naturally-occurring but non-native
(often plant) pathways, or b) the bottom-up construction of novel pathways comprised of individual
enzymes derived from a diversity of heterologous sources. Recent examples include the
successful engineering of microbes capable of the de novo production of, in the first case,

4
flavonoids (usually consisting of two phenyl groups and a heterocyclic ring) 10,11, stilbenes (ethylene
moiety with two phenyl groups) 12,13, and coumarins (containing a 1,2-benzopyrone backbone) 14,15,
and, in the second case, numerous aromatic aldehydes, alcohols, and acids 16-21, styrenics 22-25,
and phenolics 26-33. In most cases, these heterologous pathways stem from natively produced
aromatic chemicals such as the aromatic amino acids (i.e., L-phenylalanine, L-tyrosine, and L-
tryptophan) or their precursors (e.g., chorismate; derived from the shikimate pathway). Irrespective
of the target, both approaches require the synchronous function of multiple enzymatic ‘steps’, each
with net activities precisely tuned so as to balance metabolite flux and avoid formation of
undesirable bottlenecks. For a multi-step pathway, achieving this outcome often requires the
construction and screening of a large number of unique pathway variants. As has been
demonstrated for the case of other, non-aromatic biochemicals 34-36, the identification of optimal
pathway configurations can often be facilitated through modularization of the biosynthesis scheme.
Two main approaches have been explored to this end, including the engineering of: i) modular
pathways, and ii) modular cells.
1.2.1 Engineering Modular Aromatic Biosynthesis Pathways
Modular pathway engineering involves compartmentalizing a multi-step pathway into discrete
modules in order to facilitate the combinatorial screening of relevant expression parameters for the
collective purpose of achieving optimal expression levels and maximal pathway flux. Juminaga et
al., for example, successfully implemented such an approach towards the efficient production of
tyrosine in Escherichia coli 37. Specifically, the entire tyrosine biosynthesis pathway – from
erythrose-4-phosphate (E4P) and phosphoenolpyruvate (PEP) to tyrosine – was decomposed into
two modules: i) the ‘shikimate module’ (comprised of aroG*, aroB, aroD, and ydiB, along with ppsA
and tktA), and ii) the ‘tyrosine module’ (comprised of aroK, aroA, aroC, tyrA*, and tyrB), split at the
intermediate shikimate (* indicates a gene encoding a feedback-resistant mutant). In the final
design, constructs were systematically optimized with respect to each of the plasmid copy number,
promoter strength, gene codon usage, and the relative placement of genes in each operon,
ultimately leading to the production of >2 g/L tyrosine at 80% of the theoretical yield.

5
Analogous strategies have also been adopted to enhance microbial production of naringenin which,
like other flavonoids, displays important human health benefits (e.g., anti-cancer, anti-oxidant), and
is naturally produced in plants from endogenous malonyl-CoA and phenylpropanoid precursors 38.
Wu et al., for example, constructed a naringenin biosynthesis pathway in E. coli comprised of three
modules expressing: 1) tyrosine ammonia lyase and 4-coumaroyl-CoA ligase, 2) chalcone
synthase and chalcone isomerase, and 3) malonate synthetase and malonate carrier protein 39. In
this case, by simultaneously varying both plasmid copy number and promoter strength across all
three modules, final naringenin titers were improved by almost 3-fold, reaching up to 100 mg/L.
These efforts built upon the important preceding works of Santos et al. who also demonstrated a
modular approach towards flux balancing of the naringenin pathway, in their case by varying the
enzyme sources and tuning expression levels 40. More recently, modular pathway engineering has
also been extended to aid production of aromatic bulk chemicals, including styrene 25, for example.
In addition to aiding the systematic and simultaneous optimization of multiple expression
parameters for a single pathway/product, modular pathway engineering strategies can also be used
to facilitate targeting of additional products of interest. In particular, from common intermediates,
different modules can be combined to create multiple pathways. Chorismate, for example, is a
versatile endogenous intermediate with the potential to be converted to various aromatic end
products. Following extensive host engineering to enhance endogenous chorismate production,
Noda and co-workers introduced seven unique downstream pathway modules to produce seven
unique chorismate-derived products, including salicylate, phenol, 3-hydroxybenzoate, and cis,cis-
muconic acid, among others 41. This approach was further exploited by Shen et al., in this case to
convert chorismate to either salicyl alcohol (precursor to the anti-inflammatory, salicin) or gentisyl
alcohol (an antioxidant and antibiotic); both through salicylate as a common intermediate 42.
1.3 Metabolic Control Strategies for Enhancing Aromatic Bioproduction
Various different metabolic control strategies have recently emerged as powerful tools for use in
scenarios where classical gene knockouts are incompatible. This includes not only enabling
individual growth essential genes to be targeted for tunable downregulation, but also, as such

6
methods are typically amenable to multiplexing, parallel targeting of multiple distinct processes with
minimal strain engineering required. To date, the most promising strategies involve the use of: i)
antisense RNAs (asRNAs), ii) synthetic small RNAs (sRNAs), iii) clustered regularly interspaced
short palindromic repeats interference (CRISPRi), and iv) conditional gene expression using
synthetic circuits.
1.3.1 Application and Potential of asRNA and Synthetic sRNAs for Aromatic Bioproduction
Both asRNA and synthetic sRNAs can be designed to target specific mRNA sequences, binding to
transcripts and, as a result, inhibiting translation. sRNA, however, offers potential benefits such as
improved silencing efficiency and longer half-lives due to association with and stabilization by an
RNA chaperone 43. Na et al., were among the first to report on the utility of synthetic sRNAs for
biochemical production, doing so to enhance tyrosine biosynthesis. Specifically, by constructing
sRNAs to simultaneously inhibit production of both TyrR and CsrA in E. coli, final tyrosine titers
reaching 2 g/L were realized 44. The same system was later utilized as a platform for phenol
bioproduction, with final titers of 1.69 g/L reported for fed-batch cultures following introduction of
tyrosine-phenol lyase (TPL) 45. On the other hand, naringenin production in E. coli, for example,
has been enhanced via the use of asRNA. Specifically, using anti-fabB/fabF asRNAs targeting
various positions in the 5’-UTR to tune the level of down-regulation and balance malonyl-CoA flux
between fatty acid biosynthesis and flavonoid production, final naringenin titers were increased by
431% 46. Later, Yang et al. also utilized asRNAs to target not only fabB and fabF but also fabD and
fabH as a strategy to similarly enhance malonyl-CoA availability and improve naringenin
production, as well as that of 4-hydroxycoumarin and resveratrol (note: both fabB and fabD are
growth essential) 47.
1.3.2 Application and Potential of CRISPRi for Aromatic Bioproduction
Similar to asRNA- and synthetic sRNA-based approaches, CRISPRi enables targeting of desired
genes for tunable down-regulation, in this case via the design and introduction of custom single
guide RNAs (sgRNAs) which associate with a catalytically-inactive version of Streptococcus
pyogenes Cas9 (dCas9) to inhibit transcription 48,49. Notable examples employing CRISPRi to

7
enhance aromatic bioproduction are again seen with respect to flavonoids. In a series of studies
by Wu et al., for example, CRISPRi was employed to preserve malonyl-CoA availability in E. coli
by targeting both fabB and fabF, along with several other less intuitive targets (e.g., fumC, sucC,
adhE, eno) in a multiplexed manner. As a result, production of naringenin was improved 7.4-fold
50 and that of pinocembrin was improved 9.8-fold 51. Similar strategies have since also been used
to support pinosylvin production in E. coli 52 and naringenin production in S. cerevisiae 53.
Meanwhile, in addition to S. pyogenes dCas9, the use of alternative CRISPR systems have also
been employed. For instance, Cress et al. recently reported on the development of CRISPathBrick,
which instead utilizes Type II-A CRISPR arrays to rapidly assemble multiplexed modules for gene
repression 54. Validation of this alternative system was achieved by demonstrating improved
production of naringenin.
1.3.3 Application and Potential of Synthetic Gene Circuits for Aromatic Bioproduction
Shikimate is a valuable precursor for the synthesis of oseltamivir phosphate (i.e., Tamiflu®) and
other high-value pharmaceuticals 55. However, it is also a key intermediate of the shikimate
pathway and thus is a precursor to several growth essential compounds (e.g., aromatic amino
acids). As deletion of genes immediately downstream of shikimate cannot be accomplished without
generating multiple auxotrophies, these genes (i.e., encoding shikimate kinase) are ideal targets
for emerging metabolic control strategies 56. Gu et al., for example, developed a synthetic gene
circuit to function as a switch for controlling expression of aroK (encoding the main shikimate kinase
in E. coli) 57. In this case, the native aroK promoter was replaced with PLtetO1 and tetR expression
was controlled by PBAD, thus allowing arabinose addition to tunably down-regulate aroK expression
at desired times and levels. As a result, the culture could be controlled through initial growth and
subsequent production phases, enabling production of 13.15 g/L shikimate from glucose in fed-
batch culture.
One shortcoming experienced by at least the majority of the above examples is the need to add an
exogenous inducer molecule which in turn increases overall costs. This requirement has been
circumvented by others, for example, by instead incorporating quorum sensing (QS) to control

8
induction of the synthetic gene circuit. By modulating the efficacy of QS circuits, gene expression
profiles can be altered to respond in a tunable manner to increasing cell densities, making them
suitable for use in different applications. In a recent demonstration, Williams et al. engineered a
synthetic QS circuit in S. cerevisiae to improve the production of 4-hydroxybenzoate 58. Here, the
QS circuit was coupled to various RNA interference (RNAi) 59 modules to down-regulate key genes
responsible for consuming phosphoenolpyruvate (CDC19, PYK2) and chorismate (ARO7), thereby
enhancing chorismate availability and resulting in a 37-fold increase in 4-hydroxybenzoate titer.
1.4 Biosensor-Based Approaches for Improving Aromatic Chemical Production
Microbes have evolved various mechanisms for sensing and responding to extracellular and
intracellular chemical changes, including through the use of numerous small molecule-responsive
transcription factors and their cognate promoters 60. When linked to an appropriate readout (e.g.,
fluorescent reporter or antibiotic resistance gene), such a machinery can be used to construct in
vivo biosensors useful for detecting and responding to the intracellular presence of various products
61 (or intermediates 62,63) of interest, typically with high selectivity and sensitivity, as well as in a
dose-dependent manner 64 (Figure 1.2).

9
Figure 1.2 Biosensors Facilitate Optimization of Aromatic Bioproduction.
(A) An aromatic biosensor can be constructed by using an aromatic-responsive transcriptional regulator that, in the absence of an aromatic, binds to its cognate transcription factor operator (TFO), blocking RNA polymerase (RNApol) and thus expression of a suitable reporter (e.g., GFP). In the presence of a recognized aromatic, transcriptional repression is released and reporter expression is “turned on”. (B) Such biosensors can be used to facilitate library screening (e.g., RBS and/or enzyme) allowing, for example, flux bottlenecks to be overcome. In the example shown, the most effective combination of RBS and enzyme (e2) variants will produce the most product ‘D’ which, once detected by the biosensor, will yield the highest output signal.
1.4.1 Development of Aromatic-Responsive Biosensors
To date, a diversity of naturally-evolved transcriptional regulators have been identified to control
gene expression in response to the presence of various aromatic compounds of interest. These
regulators are largely derived from soil bacteria where they serve to control the expression of
aromatic degradation pathways 65-67 and tolerance mechanisms 68,69. A comprehensive review by
Diaz and Prieto summarizes the characterized function of a wide range of aromatic-responsive
regulators, including aromatic effectors that are also bioproduct targets of interest (e.g., phenol,
salicylate, benzoate, and styrene) 66. More recently, Xue et al. further probed the response of four
such previously identified regulators (NahR, XylS, HbpR, and DmpR) towards a panel of 20 unique
aromatic compounds, also including select bioproducts (e.g., phenol, catechol, and 2-
phenylacetate) 70, whereas others have since also been reported in the literature (e.g., QsuR for
chorismate 71 and MarR for salicylate 72). Taken together, these examples provide a glimpse of the
spectrum of aromatic chemicals that can currently be detected using just naturally-evolved,
transcriptional regulators. In addition to transcription factor-based biosensors, meanwhile,
10
regulatory RNA-based riboswitches have also been developed as small molecule-inducible gene
expression activators 73,74, and hold similar potential with respect to detecting and responding to
aromatic biochemicals. Although the diversity of aromatic effectors reported thus far is limited,
promising results with tryptophan 74, dopamine and 2,4-dinitrotoluene 75, for example, bode well for
the future potential of such devices.
1.4.2 Improving Aromatic Bioproduction Using in vivo Biosensors as Screening Tools
Once developed and optimized, in vivo biosensors can be used to facilitate the
engineering/evolution of strains with improved bioproduction phenotypes via the use of high-
throughput screening 76 (Figure 1.2). For example, by utilizing E. coli’s native TyrR (a
transcriptional repressor that controls expression of multiple genes in the shikimate pathway), to
sense elevated phenylalanine levels and drive yfp expression from its cognate tyrP promoter, a
screening platform was developed to improve phenylalanine biosynthesis 77. The same platform
was further employed to sequentially screen both a ribosome binding site (RBS) library (expressing
aroD, a known bottleneck in the shikimate pathway 78) and a whole cell random mutagenesis library
(generated by atmospheric and room-temperature plasma), together leading to the isolation of
strains capable of ~290% greater phenylalanine production (9.29 g/L vs. 3.21 g/L). Other
successful examples have also been reported outside of E. coli. For example, a shikimate
biosensor was recently developed in Corynebacterium glutamicum using the native transcriptional
regulator ShiR for shikimate and GFP as reporter and used to screen an RBS library for optimal
precursor supply. Using FACS to facilitate selection, a 2.4-fold improvement in final titer was
ultimately attained 79.
Finally, in addition to reporters offering externally detectable feedback (e.g., GFP), genes conferring
a fitness advantage can alternatively be expressed to enable cell screening under selective
conditions. Raman et al., employed such an approach utilizing a TtgR-TolC “sensor-selector” to
screen targeted genome-wide mutagenesis libraries (generated by multiplexed automated genome
engineering, MAGE 80) to improve naringenin production in E. coli by 36-fold 81. Chou and Keasling,
meanwhile, recently reported a novel strain evolution platform wherein TyrR regulated the

11
expression of a mutator protein encoded by mutD5 via a modified aroF promoter. This scheme
enabled higher mutD5 expression and thus higher mutation rates in strains producing low levels of
tyrosine, and the mutD5 expression reduced as tyrosine levels rose 82. This ‘feedback-regulated
evolution of phenotype’ (FREP) method enabled the isolation of an evolved strain capable of 5-fold
increased tyrosine titers.
1.5 Future Outlooks
Aromatic biochemicals remain as attractive bioproduction targets due to their broad utility in
chemical, pharmaceutical and food industries, as well as, in some cases, their high commercial
value and difficulties associated with their chemical synthesis 9. Accordingly, pathway engineering
efforts are expected to continue in this area, including with respect to both the reconstitution of
naturally-occurring routes and de novo construction of novel ones. In both cases, these efforts will
continue to be fueled by both the discovery and engineering of unique enzyme chemistries.
Recently, for example, Beller and co-workers applied a metagenomics and metaproteomics
approach towards the discovery of a novel phenylacetate decarboxylase (encoded by phdB) 83.
Isolated from anoxic lake sediments, PhdB (a glycyl radical enzyme) is responsible for the
biosynthesis of toluene, an aromatic bulk chemical and potential fuel additive, from phenylacetate.
Additional product diversity is also possible via the interfacing of enzymatic and non-enzymatic
processes. For example, Wallace and Balskus recently reported on the coupling of styrene
production by E. coli with an in situ cyclopropanation reaction (catalyzied by iron(III) phthalocyanine
in biocompatible micelles) to demonstrate production of non-natural phenyl cyclopropanes from
glucose 84.
Once pathways are developed, strains must then be optimized to achieve meaningful production
metrics. As efficient strain optimization demands more rapid design-build-test cycles, emerging
tools supporting more precise metabolic control will play an increasingly important role by
supporting facile implementation for rapid hypothesis testing and multiplexing for high-throughput
screening. Meanwhile, , new approaches relying upon, for example, genome-wide sgRNA
libraries85-88 for CRISPRi applications will surely continue to accelerate the strain optimization

12
process. Furthermore, new insights gained by studying naturally-occurring microbial and fungal
consortia will support the discovery of novel products of interest as well as new strategies for
engineering co-cultures using ‘modular’ cells 89. Such efforts will likely find future applications for
aromatic bioproduction, in particular for the biosynthesis of high-value natural products whose
synthesis relies upon complex and difficult to optimize pathways. As a result of these and other
collective efforts, the list of aromatic compounds that can be produced as renewable bioproducts
will undoubtedly continue to grow.
As aromatic toxicity remains a persistent challenge, the further development of strategies for
increasing strain robustness will be important to achieving competitive product titers and yields.
This will no doubt include, for example, the prospecting for as well as engineering of efficient
aromatic efflux pumps. Meanwhile, as known trade-offs exist with respect to the overexpression of
membrane transporters, for which an optimal balance between function and burden has been
reported 90, more sophisticated control strategies for transporter expression in response to aromatic
production levels might play a key role towards circumventing this caveat 91,92. Such prospective
applications, meanwhile, also further highlight the importance of developing aromatic biosensors
and their potential utility for allowing cells to autonomously respond to their changing production
environment. Further identification and engineering of alternative hosts with greater inherent
aromatic tolerance will also be important to addressing product toxicity. Several bacteria with
enhanced tolerance to other membrane disruptive compounds have already been identified, for
example, including species of Clostridium 93, Lactobacillus 94, Zymomonas 93,95, and Deinococcus
96. Although, to the best of our knowledge, these have not yet been investigated as potential hosts
for aromatic bioproduction, they and others might indeed prove useful to this end.
Finally, in addition to expanding biochemical diversity and improving production metrics, the
utilization of alternative feedstocks remains as an alluring prospect due to the potential for lower
costs and, in some cases, higher theoretical yields. Important to this outcome is the exploitation of
non-model organisms that can naturally depolymerize and metabolize lignin to directly produce
high value aromatic products. Key to this will be further understanding of the involved pathways

13
and their regulation, as well as the continued identification and elimination of associated pathway
bottlenecks 97,98. Thus, further discovery of non-conventional microbes and development of genetic
tools for their subsequent engineering will be critical to achieving this goal.
1.6 Conclusions
Through extensive metabolic engineering efforts, microbial bioproduction of a multitude of aromatic
products is currently possible and will only continue to grow. Progress to this end continues to be
enabled by the development of versatile synthetic and systems biology tools, as well as the
discovery of novel biomolecules, phenotypes, and strains. Though much work surely remains,
continued efforts in this area will undoubtedly lead to the commercialization of bio-based aromatic
products, in some cases supplanting their conventional, petroleum-derived predecessors.

14
CHAPTER 2. EXPANDING UPON STYRENE BIOSYNTEHSIS TO ENGINEER A NOVEL
ROUTE TO 2-PHENYLETHANOL
Abstract
2-Phenylethanol (2PE) is a key molecule used in the fragrance and food industries, as well as a
potential biofuel. In contrast to its extraction from plant biomass and/or more common chemical
synthesis, microbial 2PE production has been demonstrated via both native and heterologous
expression of the yeast Ehrlich pathway. Here, a novel alternative to this established pathway was
systematically engineered in Escherichia coli and evaluated as a more robust and efficient route.
This novel pathway was constructed via the modular extension of a previously-engineered styrene
biosynthesis pathway, proceeding from endogenous L-phenylalanine in five steps and involving
four heterologous enzymes. This ‘styrene-derived’ pathway boasts a ~10-fold greater
thermodynamic driving force than the Ehrlich pathway, and enables reduced accumulation of
acetate byproduct. When directly compared using a host strain engineered for L-phenylalanine
over-production, preservation of phosphoenolpyruvate, and reduced formation of byproduct 2-
phenylacetic acid, final 2PE titers via the styrene-derived and Ehrlich pathways reached 1817 and
1164 mg/L, respectively, at yields of 60.6 and 38.8 mg/g. Following optimization of induction timing
and initial glucose loading, 2PE titers by the styrene-derived pathway approached as high as 2 g/L
– a ~2-fold increase over prior reports for 2PE production by E. coli employing the Ehrlich pathway.
This chapter contains work published in:
Machas, M.S., McKenna, R., Nielsen, D.R. Expanding Upon Styrene Biosynthesis to Engineer a
Novel Route to 2-Phenylethanol Biotechnol J 2017 (12)10. doi: 10.1002/biot.201700310.

15
2.1 Introduction
With its ‘rose-like’ aroma, 2-phenylethanol (2PE) is an important molecule in the flavor and
fragrance industries 16,99. More specifically, 2PE is used in the production of various foods and
beverages and, most notably, remains the most used fragrance compound in the cosmetics and
perfume industries 100. Meanwhile, in addition to its traditional usage as a specialty chemical, 2PE
has also garnered recent interest as a potential biofuel molecule due to its low volatility, high energy
density and non-hygroscopic properties 101, or alternatively as a fuel additive helpful for preventing
knocking as a result of its high octane number and reduced gas-phase reactivity 102,103. Altogether,
annual global demand for 2PE exceeds 10,000 tons 99, with a market size expected to reach $700
million by 2019 104. Traditional 2PE production methods involve its extraction from the essential
oils of many flowering plant species – most notably, rose oil, which contains up to 60% 2PE 105.
Although extraction is still practiced to obtain the natural product, this process is expensive and
poorly scalable, and thus the bulk of 2PE production instead presently occurs via its chemical
synthesis from petrochemical feedstocks. Though cheaper, 2PE production in such a manner is
both non-renewable and unsustainable, and furthermore employs carcinogenic precursors (i.e.,
benzene 99) as feedstocks; undesirable from a ‘green chemistry’ perspective and a feature that
imposes usage restrictions, especially in flavor/fragrance applications 105.
In light of the above limitations, microbiological production of 2PE via a variety of synthesis routes
has recently been explored as a more sustainable alternative. A natural fermentation product of
several yeast strains (albeit typically at only trace levels), 2PE is in large part responsible for the
‘floral’ aromas present in many fermented foods and beverages 106,107. In yeast, 2PE is produced
via the Ehrlich pathway 108,109; a two-step pathway stemming from phenylpyruvate, an intermediate
of the shikimic acid (SA) pathway and direct precursor to L-phenylalanine (Phe). First,
phenylpyruvate decarboxylase (PPDC) serves to convert phenylpyruvate to 2-phenylacetaldehyde
which is subsequently reduced to 2PE by an alcohol dehydrogenase (Figure 2.1). In S. cerevisiae,
for example, Aro10p, a thiamine pyrophosphate-dependent enzyme, catalyzes the first step 110
whereas reduction of 2-phenylacetaldehyde to 2PE occurs by the aid of one or more native

16
dehydrogenases (including ADH1-5) 111. Achieving high levels of 2PE via their native Ehrlich
pathway, however, typically requires select yeast strains (e.g., S. cerevisiae 111,112, Kluyveromyces
marxianus 113) to be cultured under nitrogen limited conditions while supplementing the medium
with excess exogenous Phe 105,112 (note: Phe transaminase (e.g., ARO9 in S. cerevisiae 114)
converts Phe and 2-ketoglutarate to phenylpyruvate and L-glutamate, the latter being degraded to
provide nitrogen for growth). However, as Phe is a relatively expensive feedstock with limited
scalability, 2PE production directly from renewable biomass sugars could represent a more
promising approach.
To date, microbial 2PE production from glucose has focused predominantly on expanded
applications of the Ehrlich pathway, most commonly via its functional reconstruction in other,
heterologous microbes. For example, Atsumi et al. first reported the functional reconstruction of
the Ehrlich pathway in E. coli (comprised of kivd from Lactococcus lactis and ADH2 from S.
cerevisiae), demonstrating production of 57.3 mg/L 2PE from 36 g/L glucose (a yield of 1.59 mg/g)
using a wild-type background 101. Kang et al. later also reconstructed the Ehrlich pathway in E. coli
(in this case instead using kdc and ADH1 from Pichia pastoris and S. cerevisiae, respectively) and,
following deregulation of metabolite flux through the SA pathway, reported 2PE titers as high as
285 mg/L 115. Finally, expressing the Ehrlich pathway composed instead of ipdC from Azospirillum
brasilense and yahK from E. coli in a Phe over-producing host, Koma et al. engineered E. coli for
direct 2PE production from glucose at titers reaching 940.6 mg/L and a yield of 94.06 mg/g 16. To
the best of our knowledge, this output represents the highest 2PE production from glucose by
engineered E. coli reported to date.
For several years, our research has focused on the engineering of non-natural pathways for the
renewable production of various bulk and specialty aromatic chemicals 19,32,116, including a recent
series of studies demonstrating: i) engineering of a novel pathway for styrene biosynthesis from
glucose (Figure 2.1; from Phe, comprised of PAL2 from Arabidopsis thaliana and FDC1 from S.
cerevisiae) 117, and ii) subsequent extension of the styrene pathway to (S)-styrene oxide (i.e., by
additional co-expression of styAB from Pseudomonas putida S12, encoding styrene
17
monooxygenase (SMO)) 118. Common to numerous Pseudomonas sp., SMO serves as the first
step in one of the principle aerobic styrene degradation pathways 119. Following SMO, styrene
oxide isomerase (SOI; encoded by styC in P. putida S12, for example) is subsequently responsible
for converting (S)-styrene oxide to 2-phenylacetaldehyde before further catabolism then takes
place. Recognizing, however, that 2-phenylacetaldehyde also serves as precursor to 2PE (as in
the Ehrlich pathway), as further illustrated in Figure 2.1, it was postulated that a novel, ‘styrene-
derived’ pathway could also be engineered for de novo 2PE production from glucose. Accordingly,
this non-natural pathway, which couples styrene biosynthesis with its subsequent, partial aerobic
degradation, was systematically engineered and comparatively evaluated as an alternative to the
established Ehrlich pathway.
18
Figure 2.1 2-Phenylethanol Bioproduction Routes in E. coli.
Comparing 2PE biosynthesis via the established Ehrlich and proposed styrene-derived pathways. Endogenous pathway steps shown with black arrows whereas heterologous steps are shown in gray. In the case of aroG and pheA, ‘X’ indicates alleviation of allosteric inhibition caused by Phe due to the presence of feedback resistant mutants of these genes in E. coli NST74. In the case of feaB, ‘X’ indicates its chromosomal deletion. Inset: Comparing the change in Gibbs free energy due to reaction (ΔrG’°) with progress through each of the two pathways (Ehrlich pathway, blue squares; styrene-derived pathway, red circles) from phenylpyruvate to 2PE.
19
2.2 Materials and Methods
2.2.1 Microorganisms
All strains used in this study are listed in Table 2.1. E. coli NEB 10-beta was obtained from New
England Biolabs (NEB; Ipswich, MA) and was used for cloning and the propagation of all plasmids.
E. coli NST74 (ATCC 31884), a feedback resistant mutant of E. coli which overproduces Phe 120,
and P. putida S12 (ATCC 700801), which served as the genetic source of styABC, were both
purchased from the American Type Culture Collection (ATCC; Manassas, VA). S. cerevisiae W303,
which served as the genetic source of ARO10, was a kind gift from Prof. Kristala Prather (MIT). E.
coli strains JW1380-1, JW1843-2, JW1666-3, and JW2410-1 were obtained from the Coli Genetic
Stock Center (CGSC; New Haven, CT) and served as the genetic source for the feaB::FRT-kanR-
FRT, pykA::FRT-kanR-FRT, pykF::FRT-kanR-FRT, and crr::FRT-kanR-FRT deletion cassettes,
respectively, along with wild-type E. coli BW25113. Chromosomal in-frame gene deletions in E.
coli and subsequent kanR marker removal were accomplished via a method modified from that of
Datsenko and Wanner 121, as previously described 32.
Table 2.1 Strains, Plasmids, and Pathways Constructed and/or Used for 2PE Production.
Strains Description Source
E. coli NST74 aroH367, tyrR366, tna-2, lacY5, aroF394(fbr), malT384, pheA101(fbr),pheO352, aroG397(fbr)
ATCC 31884
E. coli BW25113 Δ(araD-araB)567, ΔlacZ4787::rrnB-3, λ-, rph-1, Δ(rhaD-rhaB)568, hsdR514
CGSC
E. coli NEB-10 beta
araD139 ∆(ara,leu)7697 fhuA lacX74 galK16 galE15 mcrA f80d(lacZ∆M15)recA1 relA1 endA1 nupG rpsL rph spoT1∆(mrr-hsdRMS-mcrBC)
NEB
S. cerevisiae W303
Source of ARO10, FDC1 Prather Lab, MIT
P. putida S12 Source of styABC ATCC 700801
E. coli NST74 ΔfeaB
ΔfeaB mutation in E. coli NST74 This study
E. coli NST74 ΔfeaB Δcrr
Δcrr mutation in E. coli NST74 ΔfeaB This study

20
E. coli NST74 ΔfeaB Δcrr ΔpykA
ΔpykA mutation in E. coli NST74 ΔfeaB Δcrr This study
E. coli NST74 ΔfeaB Δcrr ΔpykF
ΔpykF mutation in E. coli NST74 ΔfeaB Δcrr This study
E. coli NST74 ΔfeaB Δcrr ΔpykA ΔpykF
ΔpykF mutation in E. coli NST74 ΔfeaB Δcrr ΔpykA This study
Plasmids Features and/or Construction Source
pTrcColaK ColA ori, lacIq, Kanr, PTrc 118
pBbA5a p15A ori, lacI, Ampr, PlacUV5; derived from pY3 37
pCP20 FLP, ts-rep, [cI857](lambda)(ts), Ampr CGSC
pKD46 repA101(ts) and R101 ori, Ampr, araC, araBp CGSC
pTpal-fdc PAL2 from A. thaliana and FDC1 of S. cerevisiae inserted into the NcoI and XbaI and SbfI and HindIII sites of pTrc99A
118
pY-PAL2FDC1 PAL2-FDC1 operon from pTpal-fdc inserted into the BglII and XhoI sites of pY3
This study
pTrcColaK-styC styC from P. putida S12 inserted into the PstI and HindIII sites of pTrcColaK
This study
pTrcColaK-styABC
styABC from P. putida S12 inserted into the XbaI and HindIII sites of pTrcColaK
This study
pY-ARO10 ARO10 from S. cerevisiae inserted into the BglII and XhoI sites of pY3
This study
Pathway Composed of plasmids Source
Ehrlich pY-ARO10 This study
Styrene-derived pY-PAL2FDC1, pTrcColaK-styABC This study
2.2.2 Plasmid Construction
All plasmids constructed and used in this study are listed in Table 2.1. Plasmid pY3 (Addgene
plasmid #50606), originally derived from pBbA5a, was a gift from Prof. Jay Keasling (UC-Berkeley).
21
Custom DNA oligonucleotides were synthesized by Integrated DNA Technologies (Coralville, IA).
Genomic DNA (gDNA) was prepared from cell cultures using the ZR Fungal/Bacterial DNA
MiniPrep (Zymo Research, Irvine, CA) according to vendor protocols. All genes were PCR
amplified with Q5 High-Fidelity DNA Polymerase (NEB) using standard protocols. Amplified linear
DNA fragments were purified using the Zymo Research DNA Clean & Concentrator Kit (Zymo
Research) according to manufacturer protocols. Once purified, DNA fragments were then digested
with appropriate restriction endonuclease enzymes at 37°C for > 6 h (NEB). Digested fragments
were gel purified using the Zymoclean Gel DNA Recovery Kit (Zymo Research, Irvine, CA) and
ligated at room temperature for >1 h using T4 DNA ligase (NEB). Ligation reactions were
transformed into chemically-competent E. coli NEB 10-beta (NEB) and selected by plating on Luria-
Bertani (LB) solid agar containing appropriate antibiotics. Transformant pools were subsequently
screened by colony PCR and restriction digest mapping.
2.2.3 Assaying SOI Activity in Whole Resting Cells
SOI activity was assayed in whole resting cells engineered to express styC from P. putida S12.
More specifically, E. coli BW25113 was first transformed with either pTrcColaK-styC or pTrcColaK
(as control). Seed cultures were prepared by growing individual colonies from LB-agar plates in 3
mL of LB for ~12 h at 32°C. Seed cultures were used to inoculate 50 mL of LB broth supplemented
with 35 mg/L kanamycin in a 250 mL shake flask. Flasks were cultured at 32°C with shaking for
~8 h, at which time they were induced by addition of isopropyl β-D-1-thiogalactopyranoside (IPTG)
at a final concentration of 0.2 mM. Following induction, cultures were incubated at 32°C overnight,
after which cells were then harvested by centrifugation at 3,000 x g. The cell pellet was washed
twice with pH 7.4 phosphate buffered saline (PBS) solution, and resuspended in 50 mL pH 7.4 PBS
solution to a final cell density determined as an optical density at 600 nm (OD600) of ~4. For the
assay, a series of resting cell suspensions, each with a total volume of 50 mL in a 250 mL shake
flask, were prepared at final cell densities of OD600 ~0.01, 0.03, and 0.07 (i.e., by resuspending an
appropriate volume of the above stock suspension) in fresh pH 7.4 PBS solution supplemented
with (S)-styrene oxide at an initial concentration of 1300 mg/L. Over the course of 6.5 h, flasks

22
were incubated at 32°C with shaking at 200 RPM while samples (each 0.5 mL) were periodically
taken for HPLC analysis to determine concentrations of residual (S)-styrene oxide and produced
2-phenylacetaldehyde, as described below.
2.2.4 Assaying 2PE Toxicity
The effects of 2PE on E. coli growth rate and yield was determined by monitoring the impacts of its
exogenous addition at increasing final concentrations on growing cultures. Approximately 1 ml of
an E. coli NST74 seed culture was used to inoculate 50 ml of LB broth in a 250 mL shake flask.
When cultures reached OD600 ~0.6, 2PE was added to the flasks at an array of final concentrations
ranging from 0 to 2 g/L. Culturing then resumed for an additional 6 h with periodic monitoring of
OD600.
2.2.5 Production of 2PE from Glucose by Engineered E. coli
Seed cultures were grown in 3 mL LB broth supplemented with appropriate antibiotics at 32oC for
12 – 16 h. Next, 0.5 mL of seed culture was used to inoculate 50 mL (in 250 mL shake flasks) of
pH 6.8 MM1 – a phosphate-limited minimal media adapted from McKenna and Nielsen 117, with the
following recipe (in g/L): glucose (20), MgSO4·7H2O (0.5), (NH4)2SO4 (4.0), MOPS (24.7), KH2PO4
(0.3), and K2HPO4 (1.0), as well as 1 mL/L of a trace mineral solution containing (in g/L): Thiamine
HCl (0.101), MnCl2·4H2O (1.584), ZnSO4·7H2O (0.288), CoCl2·6H2O (0.714), CuSO4 (0.1596),
H3BO3 (2.48), (NH4)6Mo7O24·4H2O (0.370), and FeCl3 (0.050). Once inoculated, cultures were
grown at 32oC while shaking at 200 RPM until reaching an OD600 of 0.8 (~8 h), at which time they
were induced by addition of IPTG at a final concentration of 0.2 mM. Following induction, strains
were cultured for a total of 72 h (unless otherwise stated), during which time samples were
periodically withdrawn for cell growth and metabolite analysis. Meanwhile, intermittently throughout
each culture, pH was increased back to its initial value by adding a minimal volume (typically ~0.2-
0.4 mL) of 0.4 g/L K2HPO4 solution.
23
2.2.6 Analytical Methods
Cell growth was measured as OD600 using a UV/Vis spectrophotometer (Beckman Coulter DU800,
Brea, CA). Culture samples were centrifuged at 11,000 x g for 4 min to pellet cells, after which
0.25 mL of the resulting supernatant was then transferred to a glass HPLC vial containing an equal
volume of 1 N HCl before being sealed with a Teflon-lined cap. Analysis of all aromatic metabolites
was performed via high performance liquid chromatography (HPLC; Agilent 1100 series HPLC,
Santa Clara, CA) using a diode array (UV/Vis) detector. Separation was achieved on a reverse-
phase 5μm Hypersil Gold C18 column (4.6 mm x 100 mm; Thermo Fisher, USA) operated at 45oC
using mobile phase consisting of water with 0.1% formic acid (A) and methanol (B), flowing at a
constant rate of 0.75 mL/min according to the following gradient: 5% B at 0 min, 5% to 80% B from
0 to 10.67 min, 80% B from 10.67 to 13.33 min, 80% to 5% B from 13.33 to 18.67 min, and 5% B
from 18.67 to 20 min. The eluent was monitored using a diode array detector (DAD) set at 215 nm
for detection of Phe, trans-cinnamic acid, styrene and (S)-styrene oxide, and 258 nm for detection
of 2-phenylacetaldehyde, 2-phenylacetic acid, and 2PE. Glucose and acetate analysis, meanwhile,
was performed using the same HPLC system equipped with a refractive index detector (RID) and
an Aminex HPX-87H column (BioRad, Hercules, CA) operated at 35ºC. The column was eluted
using 5 mM H2SO4 as the mobile phase at a constant flow rate of 0.55 mL/min for 20 min. External
calibrations were prepared and used to quantify each species of interest.
2.2.7 Thermodynamic Analysis
To compare relative pathway energetics, net changes in Gibbs free energy due to reaction, ΔrG’°,
were determined for each reaction using the eQuilibrator online tool 122, at a reference state of
25oC, pH 7, and ionic strength of 0.1 M.
2.3 Results
2.3.1 Comparative Assessment of Alternative 2PE Pathways
As seen in Figure 2.1, both the proposed, styrene-derived and established, Ehrlich pathways stem
from precursors in the SA pathway, namely Phe and phenylpyruvate, respectively. As such, both

24
pathways share the same theoretical yield, estimated as 0.36 g/g on glucose (with functional PTS,
based on estimates derived from Varma et al. 123). Moreover, both pathways converge at 2-
phenylacetaldehyde before its reduction to 2PE, as has been reported to readily occur via one or
more native, NADPH-dependent alcohol dehydrogenases (ADHs; e.g., yqhD, yahK, yjgB) and/or
aldo-keto reductases (AKRs; e.g., dkgA, dkgB, yeaE) 17,124. However, between the last common
precursor (i.e., phenylpyruvate) and 2PE, the two pathways differ greatly and in several important
ways. For instance, unlike the Ehrlich pathway, which employs only one foreign enzyme, the
styrene-derived pathway is instead composed of four heterologous steps. However, despite its
length, the thermodynamic driving force associated with the styrene-derived pathway is nearly 10-
fold greater than that of the Ehrlich pathway. More specifically, when compared from
phenylpyruvate to 2PE, the net change in Gibbs free energy of reaction (ΔrG’°) for the Ehrlich
pathway is -50.9 kJ/mol compared to -474.4 kJ/mol for the styrene-derived pathway (Figure 2.1
inset); the bulk of the difference being due to the highly favorable conversion of styrene to (S)-
styrene oxide via styrene monooxygenase (NADH-dependent, encoded by styAB), which
contributes -419.4 kJ/mol (or 88%) to the total ΔrG’° of the pathway 122. As a consequence,
however, the styrene-derived pathway consumes twice as many reducing equivalents (1 NADH
and 1 NADPH per molecule of 2PE produced) than the Ehrlich pathway (only 1 NADPH).
Accordingly, whereas similarities certainly exist, both 2PE pathways appear to possess their own
unique and inherent merits and limitations, the likes of which were next experimentally investigated.
2.3.2 Engineering 2PE Pathways
Construction of the styrene-derived 2PE pathway began from a previously-engineered (S)-styrene
oxide pathway, comprised of PAL2 from A. thaliana, FDC1 from S. cerevisiae, and styAB from P.
putida S12 118. To convert (S)-styrene oxide to 2-phenylacetaldehyde, however, it was first
necessary to identify a suitable gene encoding SOI activity. Of particular interest was styC from P.
putida S12 125 which, together with styAB, functions as part of its native styrene degradation
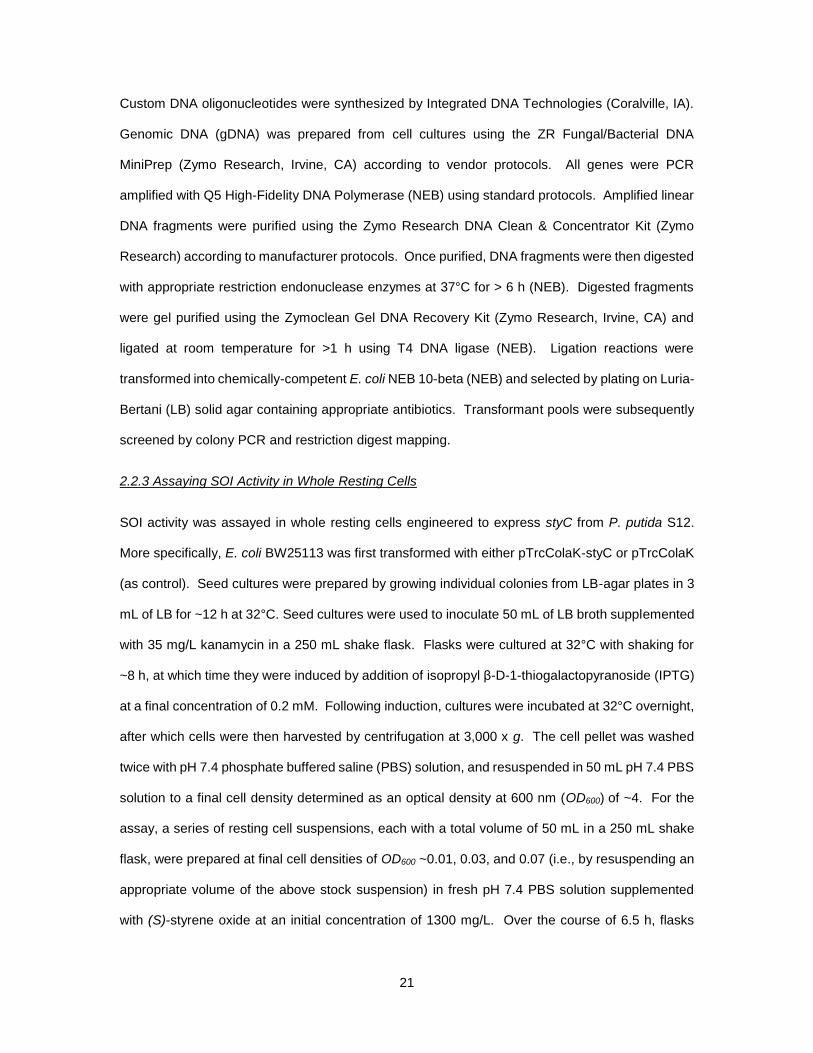
pathway 126,127. Following the cloning and subsequent expression of styC in E. coli BW25113
pTrcColaK-styC, a whole resting cell assay was performed wherein, as seen in Figure 2.2,

25
recombinant SOI activity was demonstrated via the conversion of exogenous (S)-styrene oxide to
2-phenylacetaldehyde (note: control experiments using E. coli BW25113 pTrcColaK showed no
conversion of (S)-styrene oxide; data not shown). Initially, the assay was performed at a high cell
density (i.e., OD600 ~4; representing that of a typical culture), however, under such conditions 100%
conversion was achieved in <10 min at stoichiometric yield (data not shown). To slow the net
reaction rate and allow for improved monitoring, the experiment was repeated at lower cell
densities; specifically, OD600 of 0.01, 0.03, and 0.07. In this case, increasing cell density expectedly
resulted in faster rates of (S)-styrene oxide consumption and 2-phenylacetaldehyde production,
with the former reaching as high as 5.6 g/L-h. For comparison, when previously assayed under
analogous conditions, styAB-expressing E. coli resting cells produced (S)-styrene oxide from
exogenous styrene at rates reaching only as high as ~0.1 g/L-h; albeit at much higher cell densities
(OD600 ~1). Consequently, it was expected that recombinant StyC activity would be sufficiently
high so as to avoid a potential flux bottleneck at this step.
Based on this result, styC was cloned for expression as part of the full, styrene-derived pathway,
in this case as part of the natural styABC operon (encoding both SMO and SOI) and expressed via
a Ptrc promoter in plasmid pTrcColaK-styABC. Plasmid pY-PAL2FDC1 was constructed by cloning
a previously assembled operon composed of PAL2 from A. thaliana and FDC1 from S. cerevisiae
from pTpal-fdc 118 behind the PlacUV5 promoter of pBbA5a 37. In the case of the Ehrlich pathway,
meanwhile, PPDC plays a key role as the first committed pathway step. Previously, Atsumi et al.
evaluated 5 different PPDC isozymes (namely those encoded by ARO10, PDC6 and THI3 from S.
cervisiae, kivd from L. lactis, and pdc from C. acetobutylicum) in E. coli, ultimately finding Aro10p
to support the greatest 2PE production from glucose 101. Accordingly, ARO10 was fused to a PlacUV5
promoter in pBbA5a, resulting in pY-ARO10.
26
Figure 2.2 Resting Cell Assay of StyC activity in E. coli for Conversion of (S)-Styrene Oxide.
Screening styrene oxide isomerase enzyme activity using E. coli BW25113 pColaK-styC whole resting cells. Conversion of (S)-styrene oxide (open shapes, dotted line) to 2-phenylacetaldehyde (solid shapes, solid line) by StyC using three different cell densities (OD600 ~ 0.01, 0.03, and 0.07 are blue squares, red circles, and black diamonds, respectively). Error bars reported at one standard deviation from triplicates experiments.
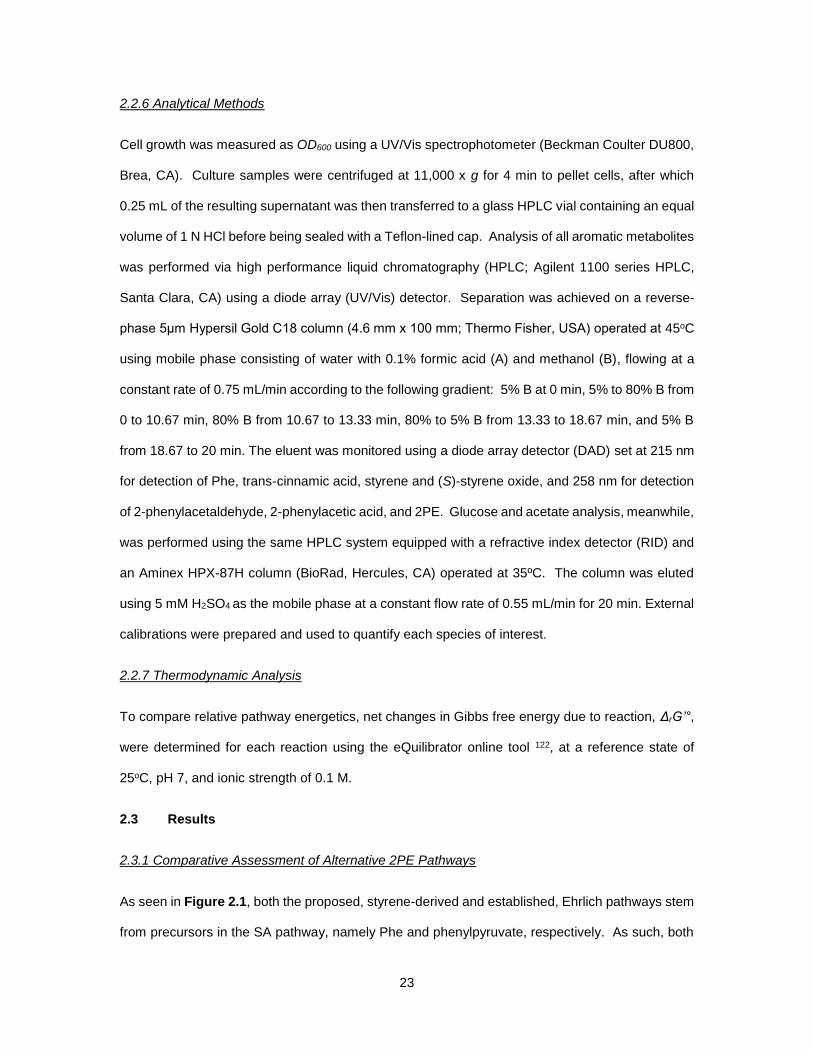
2.3.3 Demonstrating and Comparing 2PE Production via Alternative Pathways
The Ehrlich and styrene-derived pathways were both constructed as described in Table 2.1 and
first introduced and expressed in E. coli NST74 (a previously-engineered, Phe-overproducing strain
120), with the resulting strains producing 158 ± 12 and 182 ± 4 mg/L of 2PE, respectively. However,
in addition to 2PE, both strains also co-produced 2-phenylacetic acid as a major byproduct, whose
final titers reached 352 ± 12 and 503 ± 21 mg/L, respectively. In E. coli, 2-phenylacetaldehyde is
converted to 2-phenylacetic acid via a native, NAD+-dependent 2-phenylacetaldehyde
dehydrogenase, encoded by feaB (Figure 2.1) 128. In this case, the ~1.5-fold greater 2-
phenylacetic acid production accompanying the styrene-derived pathway was likely due to its

27
aforementioned increased redox requirement, which would be partially balanced via oxidation of 2-
phenylacetaldehyde to 2-phenylacetic acid (regenerating 1 NADH; Figure 2.1). To eliminate
undesirable accumulation of 2-phenylacetic acid, feaB was next deleted from NST74. When
introduced and expressed in NST74 ΔfeaB, 2-phenylacetic acid production was no longer detected
for either the Ehrlich or styrene-derived pathway and, after 72 h, 2PE titers now reached 552 ± 14
and 643 ± 29 mg/L, respectively; in both cases at similar glucose yields (35.1 ± 0.5 and 37.7 ± 1.2
mg/g, or 9.7 and 10.5% of the theoretical maximum).
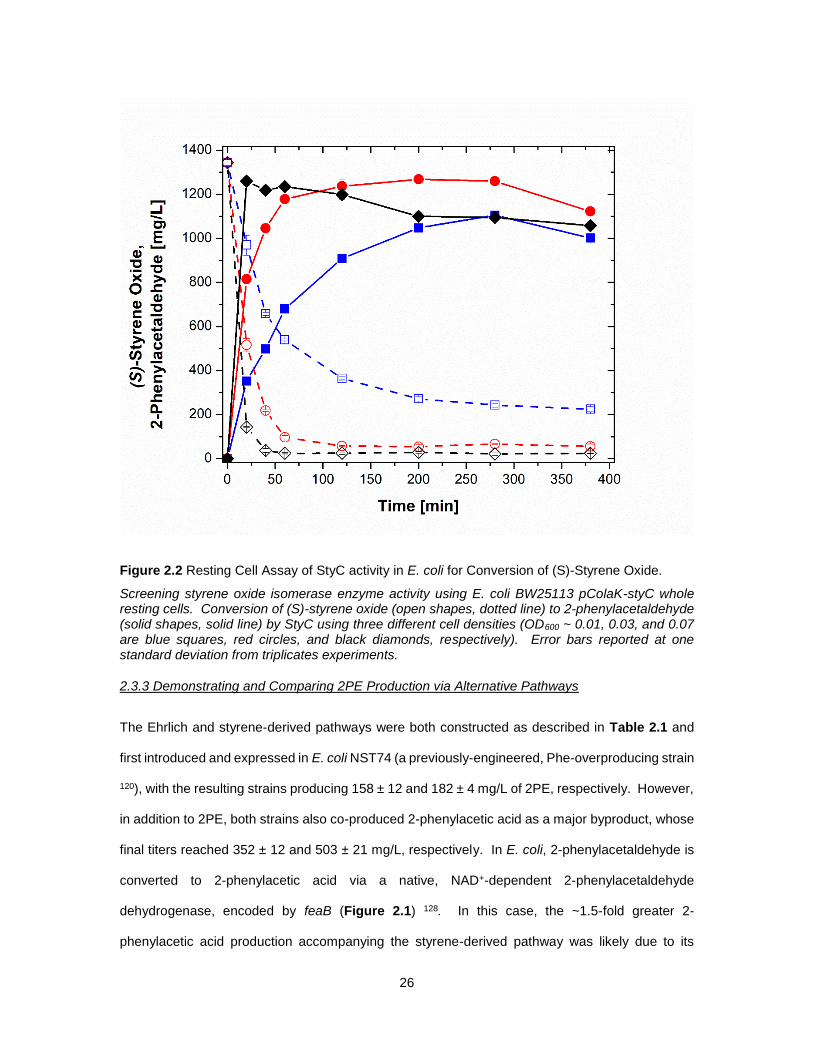
To assess if 2PE production in these initial strains was perhaps limited by end-product inhibition, a
growth challenge study was performed to characterize the response of E. coli growth to the addition
of exogenous 2PE at a range of increasing final concentrations (Figure 2.3). While growth rate
and yield were reduced in the presence of as little as 1 g/L 2PE, severe growth inhibition did not
occur until reaching about 2 g/L 2PE. This compares well with prior reports wherein 2PE was
reported to inhibit E. coli at levels of ~1 g/L 115, and suggests that, at least in these initial strains,
2PE production by either pathway was likely not yet limited by end-product inhibition.
28
Figure 2.3 Toxicity assay of 2PE on E. coli NST74.
Growth response of E. coli NST74 following exogenous 2PE addition at final concentrations of 0 g/L (control; squares), 1 g/L (circles), 1.25 g/L (upright triangles), 1.5 g/L (diamonds), 1.75 g/L (inverted triangles) and 2 g/L (right triangles). Error bars reported at one standard deviation from triplicate experiments.
2.3.4 Host Strain Engineering to Increase Precursor Availability
Robust 2PE production by either pathway depends on ample production of SA pathway precursors
(Figure 2.1), which in turn is known to benefit from increased availability of phosphoenolpyruvate
(PEP). Noda et al. previously reported deletion of both pykF and pykA (encoding pyruvate kinase
isozymes I and II, respectively, which convert PEP to pyruvate, producing ATP) as an effective
strategy for both promoting PEP availability while reducing acetate yield (by as much as 4.5-fold),
in their case also enhancing the production of various chorismate-derived aromatic products 129.
Meanwhile, it has been further demonstrated that PEP availability can be improved via the partial
inactivation of the glucose-specific phosphotransferase system (PTS; which facilitates glucose
uptake via its phosphorylation at the expense of PEP), as can be achieved by deleting crr (encoding
IIAGlc) 130. This mutation also further benefits the culture by reducing rates of glucose uptake which,

29
in turn, also decreases overflow metabolism and the associated production of unwanted (and
potentially inhibitory) acetate 130,131. Accordingly, NST74 ΔfeaB was further engineered to
systematically introduce ΔpykA, ΔpykF, and Δcrr mutations, upon which the resulting strains were
tested for their relative ability to support 2PE production via the two pathways. The resulting 2PE
titers are compared in Figure 2.4, along with the relative effects of the same mutations on Phe
production by each host strain (i.e., in the absence of either pathway) for comparison. As can be
seen, compared to the above results using NST74 ΔfeaB as host, deletion of crr had a significant
effect on 2PE production by both the Ehrlich and styrene-derived pathways, improving final titers
by 77% and 67%, respectively. Deletion of crr also resulted in expected reductions in acetate
accumulation, in each case by 45-60%. Meanwhile, the additional, combined deletion of pykA and
pykF led to even further improvements in 2PE production by both the Ehrlich and styrene-derived
pathways, reaching 1163 ± 3 and 1468 ± 47 mg/L (or 9.52 ± 0.02 and 12.02 ± 0.38 mM),
respectively, after 72 h (increases of 19% and 37% relative to using NST74 ΔfeaB Δcrr as host).
Interestingly, as is most prominent in the case of the styrene-derived pathway, individual deletion
of just pykA or pykF alone gave little or no improvement, suggesting that full inactivation of pyruvate
kinase activity was necessary to realize the beneficial effects of this strategy. That said, analogous
experiments in the absence of the pathway (i.e., for Phe production) suggest the ΔpykA mutation
to perhaps be most important (Figure 2.4); a surprising observation given that PykF has been
reported to provide the dominant pyruvate kinase activity during aerobic growth on glucose 132. For
comparison, in the absence of either pathway, NST74 ΔfeaB Δcrr ΔpykA ΔpykF produced a total
of 2076 ± 19 mg/L (12.57 ± 0.11 mM) Phe. Accordingly, and assuming constant flux through the
SA pathway in each case, this suggests that the styrene-derived pathway was more efficient than
the Ehrlich pathway (96 vs. 76%) at assimilating and ultimately converting their corresponding
endogenous precursor to 2PE.

30
Figure 2.4 2PE Titers for the Ehrlich and Styrene-derived Pathways with Gene Deletions.
Final titers of 2PE after 72 h of culturing for the Ehrlich (blue) and styrene-derived (red) pathways in E. coli NST74 strains harboring various deletions of genes feaB, crr, pykA and pykF (left and center, respectively). Right: Final Phe titers by the same host strain in the absence of either pathway (green). Final acetate concentrations are also shown (n.d. indicates not detected). Error bars reported at one standard deviation from triplicate experiments.
Interestingly, acetate production via the styrene-derived pathway was minimal regardless of which
host background was used and, in all cases, was 14- to 71-fold lower than when expressing the
Ehrlich pathway. Most strikingly, although in the absence of either pathway acetate accumulation
was undetected with NST74 ΔfeaB Δcrr ΔpykA ΔpykF, upon introduction of the Ehrlich pathway,
acetate levels rose back up to 5.23 ± 0.06 g/L (compared to just 0.29 ± 0.02 g/L with the styrene-
derived pathway). Given this substantial difference, it was hypothesized that acetate production
could perhaps be occurring as a result of Aro10p promiscuity. Decarboxylation of pyruvate, for
example, yields acetaldehyde which, in turn, could be oxidized to acetate via E. coli’s NADP+-
dependent aldehyde dehydrogenase (encoded by aldB) 133. To provide an initial assessment of
this proposed phenomena, control cultures were prepared of E. coli BW25113 pY-ARO10 grown
in the absence or presence of 6 g/L exogenously-supplied sodium pyruvate. After 48 h,
accumulated acetate levels were 3.8-fold higher following sodium pyruvate addition (5.41 vs. 1.41
g/L; Table 2.2). While more detailed characterizations are needed, these findings certainly support
the proposed, ARO10-associated mechanism of increased acetate accumulation.
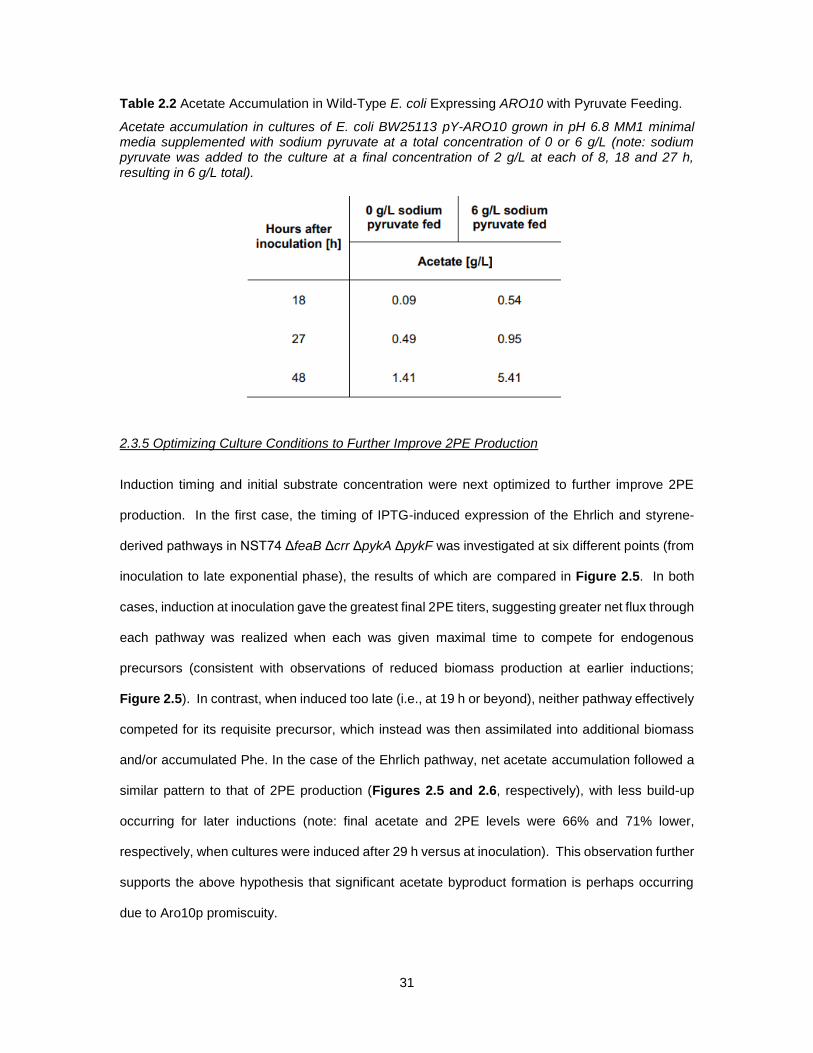
31
Table 2.2 Acetate Accumulation in Wild-Type E. coli Expressing ARO10 with Pyruvate Feeding.
Acetate accumulation in cultures of E. coli BW25113 pY-ARO10 grown in pH 6.8 MM1 minimal media supplemented with sodium pyruvate at a total concentration of 0 or 6 g/L (note: sodium pyruvate was added to the culture at a final concentration of 2 g/L at each of 8, 18 and 27 h, resulting in 6 g/L total).
2.3.5 Optimizing Culture Conditions to Further Improve 2PE Production
Induction timing and initial substrate concentration were next optimized to further improve 2PE
production. In the first case, the timing of IPTG-induced expression of the Ehrlich and styrene-
derived pathways in NST74 ΔfeaB Δcrr ΔpykA ΔpykF was investigated at six different points (from
inoculation to late exponential phase), the results of which are compared in Figure 2.5. In both
cases, induction at inoculation gave the greatest final 2PE titers, suggesting greater net flux through
each pathway was realized when each was given maximal time to compete for endogenous
precursors (consistent with observations of reduced biomass production at earlier inductions;
Figure 2.5). In contrast, when induced too late (i.e., at 19 h or beyond), neither pathway effectively
competed for its requisite precursor, which instead was then assimilated into additional biomass
and/or accumulated Phe. In the case of the Ehrlich pathway, net acetate accumulation followed a
similar pattern to that of 2PE production (Figures 2.5 and 2.6, respectively), with less build-up
occurring for later inductions (note: final acetate and 2PE levels were 66% and 71% lower,
respectively, when cultures were induced after 29 h versus at inoculation). This observation further
supports the above hypothesis that significant acetate byproduct formation is perhaps occurring
due to Aro10p promiscuity.

32
Figure 2.5 Effect of Induction Timing on 2PE Production.
Effect of induction timing on production of 2PE and Phe as well as growth after 72 h by both pathways when expressed in E. coli NST74 ΔfeaB Δcrr ΔpykA ΔpykF. Upper panels: final OD600 (solid, dark blue/red) and OD600 at time of induction for the Ehrlich (striped, light blue) and styrene-derived (striped, light red) pathways. Lower panels: Final concentrations of 2PE (solid, maroon) and Phe (striped, gold). Error bars reported at one standard deviation from duplicate experiments.
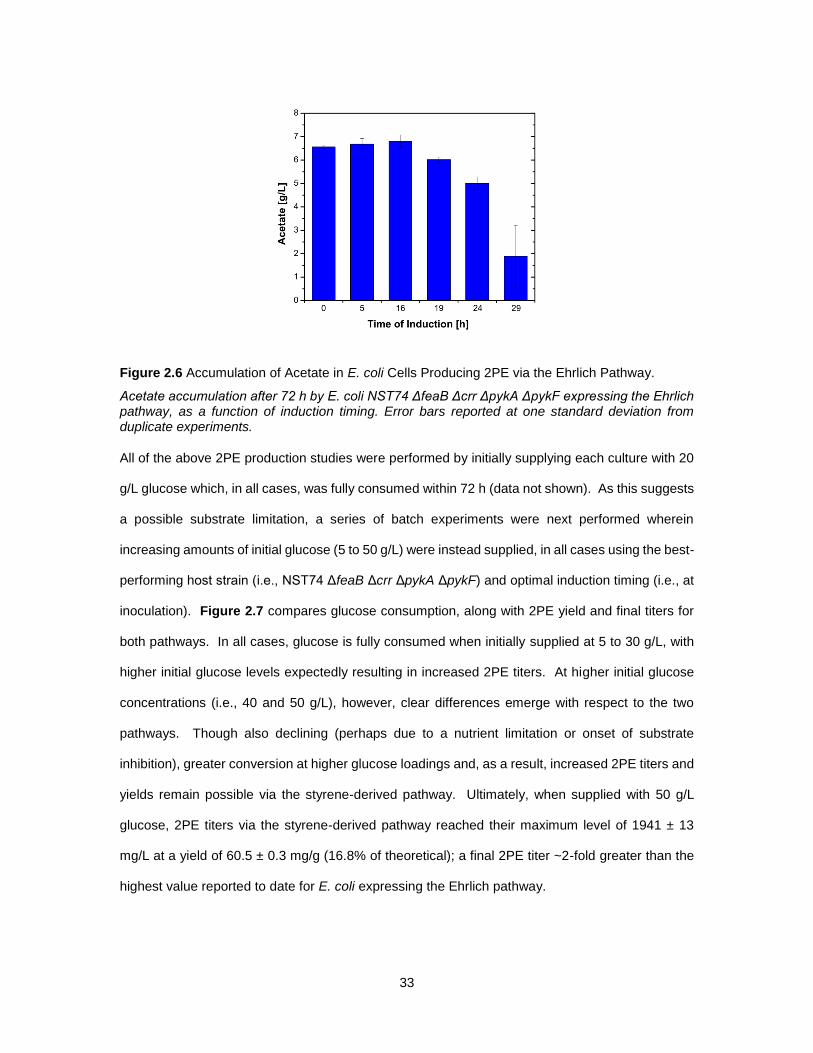
33
Figure 2.6 Accumulation of Acetate in E. coli Cells Producing 2PE via the Ehrlich Pathway.
Acetate accumulation after 72 h by E. coli NST74 ΔfeaB Δcrr ΔpykA ΔpykF expressing the Ehrlich pathway, as a function of induction timing. Error bars reported at one standard deviation from duplicate experiments.
All of the above 2PE production studies were performed by initially supplying each culture with 20
g/L glucose which, in all cases, was fully consumed within 72 h (data not shown). As this suggests
a possible substrate limitation, a series of batch experiments were next performed wherein
increasing amounts of initial glucose (5 to 50 g/L) were instead supplied, in all cases using the best-
performing host strain (i.e., NST74 ΔfeaB Δcrr ΔpykA ΔpykF) and optimal induction timing (i.e., at
inoculation). Figure 2.7 compares glucose consumption, along with 2PE yield and final titers for
both pathways. In all cases, glucose is fully consumed when initially supplied at 5 to 30 g/L, with
higher initial glucose levels expectedly resulting in increased 2PE titers. At higher initial glucose
concentrations (i.e., 40 and 50 g/L), however, clear differences emerge with respect to the two
pathways. Though also declining (perhaps due to a nutrient limitation or onset of substrate
inhibition), greater conversion at higher glucose loadings and, as a result, increased 2PE titers and
yields remain possible via the styrene-derived pathway. Ultimately, when supplied with 50 g/L
glucose, 2PE titers via the styrene-derived pathway reached their maximum level of 1941 ± 13
mg/L at a yield of 60.5 ± 0.3 mg/g (16.8% of theoretical); a final 2PE titer ~2-fold greater than the
highest value reported to date for E. coli expressing the Ehrlich pathway.

34
Figure 2.7 Effect of Initial Glucose Concentration on Production of 2PE.
Various initial concentrations of glucose (ranging from 5 to 50 g/L) for 2PE production of E. coli NST74 ΔfeaB Δcrr ΔpykA ΔpykF induced at inoculation. Glucose consumed as a percentage of glucose fed (striped, gold) and mass yield of 2PE from glucose (solid, maroon) after 96 h of culturing for the Ehrlich and styrene-derived pathways (left and center, respectively). Right: 2PE titers for the Ehrlich (solid, blue) and styrene-derived (striped, red) pathways at the 96 h mark are shown for various concentrations of initial glucose. Error bars reported at one standard deviation from triplicate experiments.
A series of batch cultures were lastly performed to investigate the dynamics of 2PE production via
both pathways, in each case utilizing NST74 ΔfeaB Δcrr ΔpykA ΔpykF as host while supplying 30
g/L glucose (to ensure full utilization) and performing induction at inoculation. Figure 2.8 compares
glucose consumption, 2PE and acetate production, and biomass accumulation in each case.
Initially, rates of sugar consumption as well as 2PE and biomass production were slower for the
styrene-derived pathway. Notably, for instance, while expressing the Ehrlich pathway, average
volumetric rates of glucose consumption and 2PE production during the first 24 h were 401 ± 9 and
28.1 ± 2.3 mg/L-h, respectively, compared to just 230 ± 30 and 15.6 ± 0.6 mg/L-h for the styrene-
derived pathway. However, by ~36 h, 2PE production by the Ehrlich pathway (which occurred
coincidently with cell growth) levels off, whereas production continues for an additional ~30 h via
the styrene-derived pathway (during which time cell growth had already entered the stationary
phase). Ultimately, after 87 h, final 2PE titers reached 1817 ± 15 and 1164 ± 85 mg/L for the
styrene-derived and Ehrlich pathways, respectively, at yields of 60.6 ± 0.5 and 38.8 ± 2.8 mg/g. It
should also be noted that by 36 h, acetate accumulation in cultures expressing the Ehrlich pathway
approached 2 g/L while still remaining below 0.5 g/L for the styrene-derived pathway, suggesting
that the ability of the styrene-derived pathway to maintain longer periods of productivity and greater
35
net 2PE production may be due in part to its ability to minimize inhibitory byproduct accumulation.
Notably, and in contrast to the results of Figure 2.4, by 87 h, acetate levels still accumulated to
appreciable levels (3.32 g/L, or a net increase of ~3 g/L) for strains expressing the styrene-derived
pathway. However, it was further noted that a similar net increase in acetate production (2.2 g/L)
was also realized for strains expressing the Ehrlich pathway when supplied with 30 vs. 20 g/L
glucose (Table 2.3). These behaviors suggest that, in spite of the introduced Δcrr ΔpykA ΔpykF
mutations, increased acetate production might still be occurring due to overflow metabolism 134.

36
Figure 2.8 Time Course of 2PE, Cell Biomass, and Acetate Production and Glucose Consumption for the Ehrlich and Styrene-derived Pathways.
Time course analysis of 2PE production and relevant culture metrics over 87 h for the Ehrlich (blue squares) and styrene-derived (red circles) pathways in E. coli NST74 ΔfeaB Δcrr ΔpykA ΔpykF supplied with 30 g/L glucose and induced at inoculation. First: glucose consumption. Second: 2PE production. Third: Acetate production. Fourth: Cell growth as represented by OD600. Error bars reported at one standard deviation from triplicate experiments.

37
Table 2.3 2PE Production Metrics for the Ehrlich and Styrene-derived Pathways.
Relevant culture performance and 2PE production metrics for both the Ehrlich and styrene-derived pathways at 72 h when supplied with an initial glucose concentration of either 20 or 30 g/L. Both pathways were expressed in E. coli NST74 ΔfeaB Δcrr ΔpykA ΔpykF. These data have been compiled for comparison from the results of Figure 2.4 (for 20 g/L glucose) and Figure 2.8 (for 30 g/L glucose).
2.4 Discussion
Through the continued, modular extension of a previously-engineered styrene biosynthesis
pathway, a novel route to 2PE has been engineered as a robust and efficient alternative to the
established, Ehrlich pathway. Ultimately, for example, when compared under otherwise analogous
conditions (Figure 2.8), 2PE titers and yields were about 56% greater via the styrene-derived
versus Ehrlich pathway, with final titers capable of approaching ~2 g/L with additional glucose
supplementation. As characterized via both in silico analyses and experimental studies, relative to
the Ehrlich pathway, the styrene-derived 2PE pathway was found to possess its own unique and
notable advantages, as well as certain caveats. For example, as has been previously
characterized with respect to (S)-styrene oxide production (also produced via styrene, as in Figure
2.1) 118, the highly favorable SMO reaction (which is largely responsible for the ~10-fold greater
thermodynamic driving force of the styrene-derived pathway), serves to effectively ‘pull’ more
precursor (i.e., Phe) into the pathway. This phenomenon is further supported in the case of 2PE
production, noting that conversion of endogenous precursors via the styrene-derived pathway was
38
96% versus just 76% by the Ehrlich pathway. Additionally, and in contrast to the Ehrlich pathway,
which branches off from native metabolism (i.e., at phenylpyruvate), the styrene-derived pathway
instead extends from a terminal pathway metabolite (i.e., Phe; Figure 2.1). In this way, the styrene-
derived pathway also importantly avoids introducing a competitive ‘branch point’. In the Ehrlich
pathway, as PPDC (e.g., Aro10p, Km = 100 µM 135) must directly compete against native Phe
aminotransferase (i.e., TyrB, Km = 12 µM 136) for available phenylpyruvate, kinetic limitations can in
turn reduce the flux of metabolites that enter the pathway at its first committed step. While deletion
of tyrB can eliminate such competition, preserving phenylpyruvate for the Ehrlich pathway, such a
mutation significantly impairs both Phe and Tyr biosynthesis, thereby necessitating their
supplementation or the use of rich media which increases costs and reduces scalability. Meanwhile,
however, construction of the styrene-derived pathway requires the simultaneous expression of four
heterologous genes. Though perhaps not apparent under the conditions examined here, this could
ultimately lead to reduced host fitness and decreased production metrics as a result of increased
metabolic burden.
One of the most significant differences between employing the two 2PE pathways concerns not the
product, but rather a byproduct, namely acetate. As evidenced by the results of Figure 2.4, even
when using a host background virtually deficient in acetate accumulation (i.e., NST74 ΔfeaB Δcrr
ΔpykA ΔpykF), significant acetate production reemerged upon introduction of the Ehrlich pathway,
reaching final concentrations as high as 5.23 ± 0.06 g/L (in experiments with 20 g/L glucose).
Previous studies have found that acetate concentrations above 1 g/L can deter biomass and protein
production, reduce protein stability, and lower pH, causing cell lysis 137. Accordingly, and
regardless of the specific mechanism, the ability to significantly reduce acetate byproduct
accumulation when employing the styrene-derived pathway is postulated as a significant reason
for the ability of this pathway to support superior 2PE production metrics. Though still warranting
further investigation, acetate byproduct accumulation when expressing the Ehrlich pathway is
thought to be a result of Aro10p promiscuity. Although prior reports suggest that, at least with
respect to its native expression in S. cerevisiae, Aro10p displays minimal activity on pyruvate (with
in vitro assays reporting kcat/Km = 200 and 0.035 mM-1·s-1 for phenylpyruvate and pyruvate,
39
respectively 135), here, experimental evidence might suggest otherwise, at least with respect to its
recombinant, in vivo function in E. coli.
With final 2PE titers via the styrene-derived pathway ultimately approaching ~2 g/L (at high glucose
loading), and in contrast to preliminary cultures, said output now approaches the toxicity limit of
2PE. As the mode of aromatic toxicity against bacteria has most commonly been reported to be
associated with their accumulation within and disruption of the cytoplasmic membrane 138, a similar
phenomenon was also anticipated here. In fact, with a toxicity threshold determined as ~2 g/L, the
present observations of 2PE toxicity agree well with previously-reported model used to predict the
toxicity of various aromatic bioproducts (e.g., styrene, (S)-styrene oxide, and various phenolics)
based on estimates of the membrane-water partitioning coefficient (KM/W) 118. Accordingly, future
improvements in 2PE production will likely necessitate strategies designed to increase inherent
tolerance to 2PE or to circumvent its toxic effects (e.g., via its in situ removal). It was recently
reported that tolerance to and thus production of styrene, for example, could be improved via
rigidification of E. coli’s cytoplamsmic membrane, in this case by increasing the proportion of trans
unsaturated fatty acids (as achieved by expressing heterologous cis-trans isomerase, encoded by
cti from P. aeruginosa) 139. Meanwhile, various strategies for in situ 2PE removal have also been
investigated, including, for example, via its extraction in a biphasic ionic liquid system which gave
3- to 5-fold increases in 2PE production by S. cerevisiae 140. Other approaches, meanwhile,
including pervaporation 141 and solid-phase extraction (i.e., using hydrophobic resins) 142 have
shown as high as 10-fold improvements in 2PE production.
Finally, whereas the styrene-derived pathway for 2PE production represents a novel alternative to
the Ehrlich pathway, two additional routes to 2PE have also recently been reported. In one case,
for example, phenylacetaldehyde synthase (PAAS) from Rosa hybrid was expressed in E. coli to
convert Phe to 2-phenylacetaldehyde, which was then subsequently reduced to 2PE. Although
this route could, in theory, be expressed in a Phe over-producing host to enable 2PE production
directly from glucose, applications to date have been limited just to 2PE production via
biotransformation of exogenous Phe (with up to 0.39 g/L 2PE produced in this manner) 143. That

40
said, however, while this pathway has the advantage of only requiring one heterologous step, PAAS
is a pyridoxal 5’-phosphate (PLP) dependent enzyme and its expression in E. coli would thus
necessitate external cofactor addition or introduction of a PLP production pathway. A second
alternative 2PE production pathway was also recently discovered in tomato. In this case, Phe
decarboxylase first converts Phe to phenylethylamine which is then further converted to 2-
phenylacetaldehyde via an ammonia-lyase 100. To our knowledge, this pathway has not yet been
expressed in microbes for the purposes of 2PE production, but could provide yet another alternative
route for 2PE biosynthesis.

41
CHAPTER 3. BIOPROCESSING AND GENETIC ALTERATIONS TO IMPROVE PRODUCTION
OF L-PHENYLALANINE UTILIZING XYLOSE AND GLUCOSE FEEDSTOCKS
Abstract
A significant and persistent challenge faced by most microbial biocatalysts reamins the ability to
convert multiple feedstocks (e.g., different sugars) into a single product in a resourceful manner.
Glucose and xylose, for example, are produced from lignocellulosic biomass and represent the
most abundant carbon sources in nature. Unfortunately, however, the metabolism of many
microbes (including E. coli), is subject to carbon catabolite repression (CCR) - a natural regulatory
mechanism that precludes their ability to utilize more than one sugar at a time. Recently, it was
discovered that (R121C, P363S) mutations in XylR (xylose regulator) released glucose-induced
CCR of xylose utilization under anaerobic conditions, allowing strains expressing the mutated xylR
to efficiently and simultaneously co-utilize glucose and xylose. Here, the efficacy of this strategy
was investigated for the first time under aerobic conditions in E. coli, and as a proof-of-concept,
used to demonstrate enhanced production of phenylalanine from glucose-xylose mixtures.
Additionally, the versatility of aromatic amino acids such as phenylalanine to be enzymatically
transformed into industrially relevant and value-added compounds makes the demonstration of
glucose and xylose co-utilization of great applicability to potentially improve production metrics of
many aromatic compounds. Ultimately, by implementing XylR* into NST74, a L-phenylalanine
overproducing strain, along with other mutations known to affect sugar assimilation
rates/mechanisms (i.e., Δcrr) and enhanced intracellular pools of a key precursor (i.e., ΔpykAF,
which promotes phosphoenolpyruvate, PEP), 3509 ± 465 mg/L L-phenylalanine was produced from
a 2% (w/v) sugar mixture containing 67% glucose and 33% xylose. Overall, the approach shows
promise to improve the production of other aromatic chemicals from biomass-derived sugars
mixtures.

42
3.1 Introduction
Lignocellulose derived from plant biomass represents a potentially vital renewable resource to
serve as substrates for microbially-catalyzed conversion to valuable chemicals and fuels 144. While
the predominant sugar utilized for the demonstration of bioproduction in E. coli is glucose, there is
a need and desire to consume other sugars as well. As many challenges remain in terms of
breaking down and converting lignocelluose into usable substrates for E. coli 145, extensive effort
has been put into engineering microbes to efficiently utilize these substrates for the production of
value-added chemicals. Glucose (via cellulose) makes up the plurality of biomass in lignocellulose
(30-40% by weight) but other sugars are present as well, including xylose (the predominant portion
of hemicellulose) 146. Therefore, upon improvement of lignocellulose-degrading technology one
goal for improving bioproduction is the utilization of all basal components of plant biomass, most
predominantly glucose and xylose.
However, in E. coli, a major impediment exists to the co-utilization of both glucose and xylose –
namely, carbon catabolite repression (CCR). CCR is a phenomenon that exists in bacteria that
causes cells to consume sugars in a sequential basis with the sugar that leads to the fastest growth
rates usually being consumed first and the many regulatory mechanisms controlling CCR has been
reviewed 147. As E. coli growth on xylose is usually slow and inefficient relative to glucose 148, E.
coli cultures fed with a feedstock containing both sugars will not consume xylose until all glucose
is depleted 149. Although CCR is important for evolutionary and survival purposes, it can often limit
production metrics in bioproduction scenarios. Several strategies have been utilized to overcome
this phenomenon. One early example demonstrates the utilization of microbial co-cultures to
consume both glucose and xylose concurrently. Here, two E. coli strains were engineered – one
with mutation of genes necessary to consume glucose (i.e., glk, ptsG, manZ) and one with a
mutation in xylA, which is necessary to consume xylose 150. When cultured together, one strain
was able to consume glucose while the other simultaneously consumed xylose, leading to improved
sugar consumption rates. Another example of overcoming CCR via co-cultures is in the production
of cis,cis-muconic acid (MA). Here, one strain of E. coli was able to only consume xylose for the

43
purpose of producing the MA intermediate DHS, while a second strain utilized only glucose and
could import and convert DHS into MA 151. This allowed for elimination of CCR in MA production
with improvements in titers up to 4.7 g/L with yields as high as 0.35 g/g-total sugar.
While the utilization of co-cultures is useful to overcome CCR, it necessitates the need to multiple
strains and careful balancing of the two in culture. Therefore, effort has been put into genetic
engineering methods to overcome CCR between xylose and glucose. Previously, the production
of the shikimic acid pathway-derived compound 4-hydroxymandelic acid (via 4-
hydroxyphenylpyruvic acid and the expression of shmaS from Amycolatopsis orientalis) utilizing a
co-sugar mixture of glucose and xylose has been demonstrated in E. coli 152. The deletion of ptsG
led to a reduction of CCR between the two sugars and further mutations in pykAF, pheA, aspC,
tyrB and tyrR allowed for titers reaching 15.8 g/L of 4-hydroxymandelic acid in a fed-batch setting.
The deletion of ptsG also allows for improvements in PEP availability and ultimately flux through
the aromatic amino acid synthesis pathway via inactivation of the PTS system (converts PEP to
pyruvate for the import and phosphorylation of glucose) 153. Ultimately, after examining various
ratios of glucose-xylose mixtures, researchers determined that the maximum titers were achieved
at a 50-50% (by mass) ratio of glucose and xylose.
One such mutation to reduce the effects of CCR is in the gene xylR in E. coli, which was identified
by Sievert et al. via adaptive laboratory evolution 154. XylR (the production of xylR) is a xylose-
specific activator which induces expression of xylose-utilizing genes in E. coli upon the presence
of xylose 155. Sievert et al. found that introducing mutations into native xylR (R121C and P363S)
(henceforth referred to as xylR*) led to activation of xylose-utilizing genes (i.e., xylA and xylB,
which encode for a xylose isomerase and xylose dehydrogenase, respectively, and xylFGH which
encode for a xylose ABC transporter) even in the presence of glucose and allowed for
improvements in xylose consumption rates. When implemented in a D-lactate producer, 94% of
sugars in a 50-50% (by mass) mixture of glucose and xylose mixture were utilized when cultured
anaerobically and D-lactate titers increased by 50% 154. While xylR* implementation in E. coli
allowing for improved rates of utilization of xylose has previously been demonstrated in anaerobic

44
fermentations for lactate and ethanol production 154,156, to the best of my knowledge, this mutation
has not been utilized for aerobic culturing purposes.
3.2 Materials and Methods
3.2.1 Microorganisms
E. coli NST74 (ATCC 31884), a feedback resistant mutant of E. coli which overproduces Phe 120
was purchased from the American Type Culture Collection (ATCC; Manassas, VA). E. coli strains
JW2410-1, JW1843-2, and JW1666-3 were obtained from the Coli Genetic Stock Center (CGSC;
New Haven, CT) and served as the genetic source for the crr::FRT-kanR-FRT, pykA::FRT-kanR-
FRT and pykF::FRT-kanR-FRT deletion cassettes. E coli W-variant LN6 154, which served as the
template for the cloning of mutations (R121C, P363S) into wild-type xylR, was a generous gift from
the Xuan Wang lab. Chromosomal in-frame gene deletions in E. coli and subsequent kanR marker
removal were accomplished utilizing the plasmid pSIJ8 via a method adapted from Jensen et al.
157 with 5% (w/v) L-arabinose for induction of λ red recombinase and 50 mM rhamnose for induction
of the FLP recombinase. E. coli W3110 variant T-SACK 158, which served as a template for tetA-
sacB, was a generous gift from the Donald Court lab.
3.2.2 DNA Cassette Construction
Custom DNA oligonucleotides were synthesized by Integrated DNA Technologies (Coralville, IA).
Genomic DNA (gDNA) was prepared from cell cultures using the ZR Fungal/Bacterial DNA
MiniPrep (Zymo Research, Irvine, CA) according to vendor protocols. All genes were PCR
amplified with Q5 High-Fidelity DNA Polymerase (NEB) using standard protocols. Amplified linear
DNA fragments were purified using the Zymo Research DNA Clean & Concentrator Kit (Zymo
Research) according to manufacturer protocols.
Table 3.1 shows the primers utilized for incorporation of mutations into xylR. Utilizing methods
adapted from Datsenko and Wanner 121, as previously described 32, tetA-sacB was integrated into
the xylR locus. Colonies were selected from on LB-agar plates containing 10 ng/uL tetracycline.
Positive clones were checked for insertion of tetA-sacB into the xylR locus via colony PCR.

45
Subsequently, correct clones were then subjected to a secondary integration of xylR (R121C,
P363S) from LN6 and screened for insensitivity to 10% (w/v) sucrose in liquid LB media followed
by plating on LB-agar plates containing 6% (w/v) sucrose 158,159. Colonies were subsequently
verified via colony PCR.
Table 3.1 Primers for the Insertion of xylR (R121C, P363S) into Production Strains.
Primer Name Sequence (5' -> 3') Purpose
F - xylR
(R121C,
P363S) from
LN6
gtgggaagcgttgccgg
Cloning of xylR (R121C,
P363S) from LN6 R - xylR
(R121C,
P363S) from
LN6
cctgatgtgacgccgacaattctc
F - tetA-sacB
into xylR
tttgagtttttgcatgattcagcaggaaaagaacctcctaatttttgttg
acactctatc Cloning of tetA-sacB from
T-SACK R - tetA-sacB
into xylR
gttacctgatgtgacgccgacaattctcatcatcgatcaaaggga
aaactgtccatatgc
F - xylR (780
bp homology) ctgtatcccccaccagcgcc
Cloning of homology
arms for tetA-sacB from
T-SACK and xylR
(R121C, P363S) from
LN6 and colony PCR
R - xylR (790
bp homology) ggaaaaaggcgtttctccggaccg
F - xylR
helper cgatgatgagaattgtcggcg
Helper primers for cloning
of homology arms for
tetA-sacB from T-SACK
and xylR (R121C, P363S)
from LN6
R - xylR
helper ggttcttttcctgctgaatcatgc
3.2.3 Production of Phe by Engineered E. coli
Seed cultures were grown in 3 mL LB broth at 32oC for 12 – 16 h. Next, 0.25 mL of seed culture
was used to inoculate 25 mL (in 125 mL shake flasks) of pH 6.8 MM1 – a phosphate-limited minimal
media adapted from McKenna and Nielsen 117, with the following recipe (in g/L): MgSO4·7H2O (0.5),
46
(NH4)2SO4 (4.0), MOPS (24.7), KH2PO4 (0.3), and K2HPO4 (1.0), as well as 1 mL/L of a trace
mineral solution containing (in g/L): MnCl2·4H2O (1.584), ZnSO4·7H2O (0.288), CoCl2·6H2O
(0.714), CuSO4 (0.1596), H3BO3 (2.48), (NH4)6Mo7O24·4H2O (0.370), and FeCl3 (0.050). The type
of carbon source (i.e., glucose or xylose) and concentration used for each experiment is noted in
the text.
Once inoculated, cultures were grown at 32oC while shaking at 200 RPM. Following inoculation,
strains were cultured until the time stated in the text, during which time, samples were periodically
withdrawn for cell growth and metabolite analysis. Meanwhile, intermittently throughout each
culture, pH was increased back to its initial value by adding a minimal volume (typically ~0.1-0.3
mL) of 0.4 g/L K2HPO4 solution.
3.2.4 Analytical Methods
Cell growth was measured as OD600 using a UV/Vis spectrophotometer (Beckman Coulter DU800,
Brea, CA). Culture samples were centrifuged at 11,000 x g for 4 min to pellet cells, after which
0.25 mL of the resulting supernatant was then transferred to a glass HPLC vial containing an equal
volume of 1 N HCl before being sealed with a Teflon-lined cap. Analysis of Phe was performed via
high performance liquid chromatography (HPLC; Agilent 1100 series HPLC, Santa Clara, CA) using
a diode array (UV/Vis) detector. Separation and analysis of phenylalanine was achieved on a
reverse-phase 5μm BDS Hypersil C18 column (3 mm x 250 mm; Thermo Electron, USA) operated
at 45oC using a mobile phase consisting of 85% 5 mM H2SO4 and 15% acetonitrile, flowing at a
constant rate of 0.5 mL/min for 6.5 min. The eluent was monitored using a diode array detector
(DAD) set at 215 nm for detection of phenylalanine. Glucose, xylose and acetate analysis,
meanwhile, was performed using the same HPLC system equipped with a refractive index detector
(RID) and an Aminex HPX-87H column (BioRad, Hercules, CA) operated at 35ºC. The column
was eluted using 5 mM H2SO4 as the mobile phase at a constant flow rate of 0.55 mL/min for 20
min. External calibrations were prepared and used to quantify each species of interest. Data
reported here is a result of triplicate experiments, unless otherwise noted, along with one standard
deviation.

47
3.3 Results and Discussion
3.3.1 Comparison Between Utilization of Glucose and Xylose for Production of L-Phenylalanine
The production of L-phenylalanine (Phe) in E. coli necessitates the production of two intracellular
metabolites that funnel into the shikimic acid pathway – erythrose-4-phosphate (E4P) and
phosphoenolpyruvate (PEP) – which are converted to 3-deoxy-D-arabino-heptulosonate-7-
phosphate (DAHP), the precursor to all three aromatic amino acids (AAAs), via three enzymes in
E. coli – AroG, AroF and AroH. Figure 3.1 shows pertinent reactions, substrates, co-factors and
products in E. coli to convert glucose and/or xylose to Phe (one of the AAAs). Therefore, to
maximize production of aromatic amino acids – and the production of their derivatives – a careful
balance between the pools of PEP and E4P must be maintained. While ideally, the production
rates of both metabolites will be maximized, without a consistent, simultaneous supply of both PEP
and E4P, final production of aromatic amino acids will suffer. Additionally, as a second PEP
molecule is consumed during the production of the aromatic amino acids (i.e., shikimate-3-
phosphate + PEP → 5-enolpyruvoyl-shikimate 3-phosphate + phosphate via AroA), the flux towards
PEP and the buildup of a pool of this molecule is critical to enchancing production of AAAs.
While E4P is predominately utilized for production of aromatic amino acids and as a part of the
pentose phosphate pathway, PEP plays a significant role in both glycolysis and glucose transport
into the cell. While a large portion of PEP pools are predominantly produced during glycolysis,
PEP also serves as the direct precursor to pyruvate (reaction catalyzed by pyruvate kinase – PykA
and PykF in E. coli) where pyruvate is subsequently converted into acetyl-CoA and funneled into
the TCA cycle. Additionally, PEP is converted to pyruvate via a different enzyme to facilitate
glucose uptake in the phosphotransferase system (PTS) of E. coli which serves as another sink for
PEP pools. Conversely, E4P is mainly produced in the pentose phosphate pathway. Additionally,
E4P can serve as a substrate in the reversible transketolase reaction (encoded by tktAB in E. coli)
which converts E4P and xylulose-5-phosphate (X5P) into fructose-6-phosphate (F6P) and
glyceraldehyde-3-phosphate (G3P). In 13C-flux analysis studies of wild-type cells, when grown on
glucose, the flux through the pentose phosphate pathway, and ultimately, E4P, was quite low 160.

48
For glucose, the ratio of flux from S7P to E4P compared to the flux from 3-phosphoglycerate to
PEP was ~1:23.7 while this ratio when grown on xylose was ~1:3.5 160. Therefore, even though
the number of PEP molecules to produce one Phe is twice the number of E4P needed, the severe
difference in flux towards PEP when grown on glucose may ultimately limit Phe production. The
production of aromatic amino acids (such as Phe) representatives a potentially useful application
and test case due to the need for two intracellular precursors (one E4P and two PEP molecules) to
produce one molecule of the aromatic amino acid.
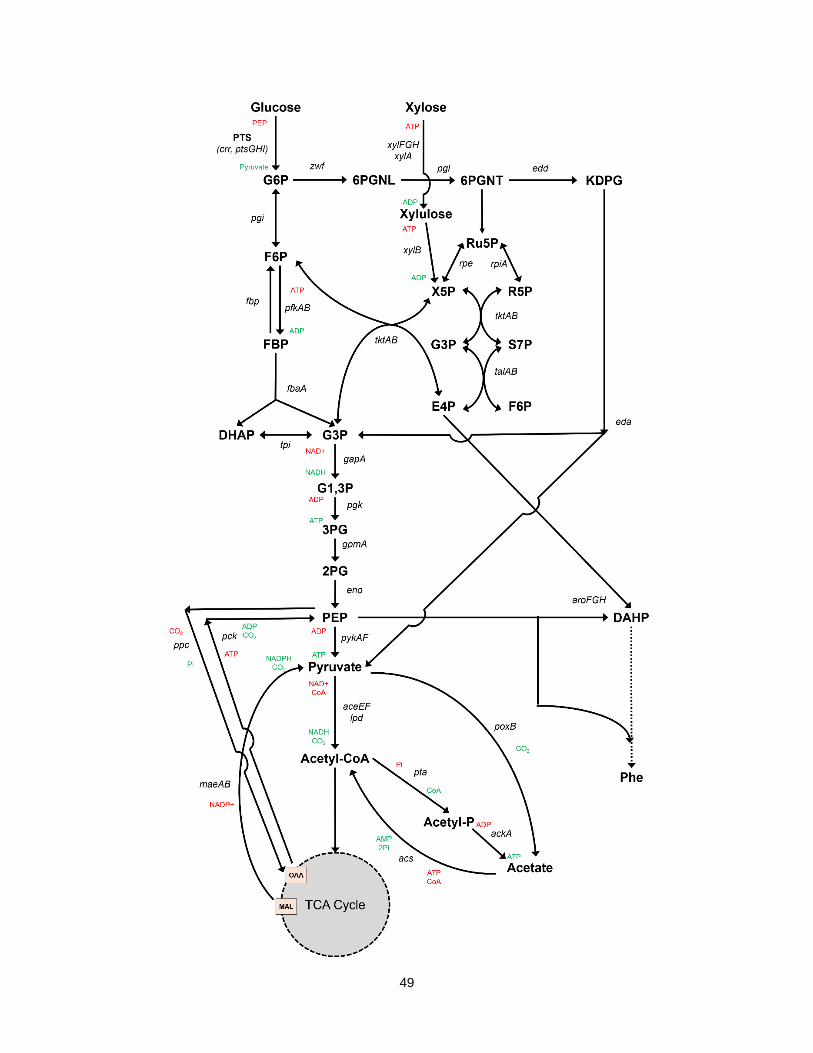
49

50
Figure 3.1 Metabolic Pathway of E. coli from Glucose and Xylose to Phenylalanine.
Metabolic pathway of glucose and xylose metabolism to phenylalanine (Phe). Single enzymatic steps are shown as solid lines, pathways with multiple steps are shown as dashed lines. Lines which have arrows are either end illustrate reversible reactions. The genes which encode each step are shown next to the enzymatic line in italics. Co-factors for each reaction are shown in green (if produced) and red (if consumed). G6P = glucose-6-phosphate, F6P = fructose-6-phospate, FBP = fructose-1,6-biphosphate, DHAP = dihydroxy-acetone-phosphate, G3P = glyceraldehyde-3-phosphate, 6PGNL = 6-phosphogluconolactone, 6PGNT = 6-phosphogluconate, KDPG = 2-keto-3-deoxy-6-phosphogluconate, Ru5P = ribulose-5-phosphate, X5P = xylulose-5-phosphate, R5P = ribose-5-phosphate, S7P = seudoheptulose-7-phosphate, E4P = erythrose-4-phosphate, G1,3P = glyceraldehyde-1,3-phosphate, 3PG = 3-phosphoglycerate, 2PG = 2-phosphoglycerate, PEP = phosphoenolpyruvate, DAHP = 3-deoxy-D-arabino-heptulosonate-7-phosphate, Acetyl-P = acetyl-phosphate, OAA = oxaloacetate, MAL = malate. Note: G3P and F6P appear twice on this pathway map for clarity purposes.
3.3.2 Utilization of Xylose and Glucose for Production of Phenylalanine in E. coli
To analyze the production capacity of either xylose or glucose for the bioconversion to
phenylalanine, NST74, a Phe overproducing strain, was utilized and the time course of pertinent
performance metrics are shown in Figure 3.2. Either 2% (w/v) of glucose or xylose was fed to cells
and with glucose as the sole substrate, NST74 produced 567 ± 25 mg/L Phe at a mass yield of
28.4 ± 2.8 mg-Phe/g-glucose after 96 h of culturing (cells were grown to 120 h but Phe titers were
maximized after 96 h). Utilizing xylose as the sole substrate, NST74 produced 1315 ± 65 mg/L
Phe at a mass yield of 63.1 ± 3.1 mg-Phe/g-xylose after 138.5 h of culturing. Other than the large
differences in titer and yield, there were other variations observed when NST74 was grown on the
two substrates such as those observed in terms of sugar consumption and Phe production rates.
Overall, NST74 consumed 100% of the original glucose at an overall rate of 0.181 g glucose/L-h
(after 120 h). When only xylose was fed, 100% of the original xylose was also consumed at a
surprisingly quicker rate of 0.217 g xylose/L-h (after 95 h). In terms of overall rates, the production
of Phe ran concurrently to the rate of sugar consumption. Cells produced Phe at a much slower
degree as production from glucose occurred at an overall rate of 5.9 ± 0.3 mg Phe/L-h (after 96 h)
while overall Phe production rates from xylose were 9.5 ± 0.5 mg Phe/L-h (over 138.5 h). While
strains utilizing only glucose reached near maximum production levels at around 50 h after
inoculation (i.e., ~92% of final titers of Phe was produced in the first 50 h of culturing), cells growing
only on xylose took much longer to reach final production concentrations as only ~77% of total Phe
production was accomplished in the first 50 h of culturing. Even so, the concentrations of Phe at

51
this time point (50 h) were 523 ± 27 and 1010 ± 45 mg/L Phe from glucose and xylose, respectively,
indicating the high production capabilities of Phe overproducing strains from xylose. It is likely that
the abundance of E4P plays a key role in the high production on xylose, as the availability of E4P
is much higher on this substrate.
Figure 3.2 Time Course of NST74 Phe Production on 2% (w/v) Xylose or Glucose.
Time course of NST74 production of Phe on xylose or glucose as measured by (Top) OD600 (dashed line) and acetate (g/L; solid line) and (Bottom) sugar consumption (g/L; solid line) and Phe production (mg/L; dashed line). Data of strains grown on xylose are shown in green while data from glucose is shown in maroon. Error bars reported as one standard deviation from triplicate experiments.

52
While growth on 100% glucose or xylose is possible at the lab scale, as biomass sugars typically
consist of sugar mixtures, this approach is likely less viable at the large scale. For typical sources
of lignocellulosic biomass, the ratio between glucose and xylose is approximately 2:1
(glucose:xylose). Accordingly, this same ratio was next employed in model glucose-xylose
mixtures and evaluated with respect to Phe production by NST74 (Figure 3.3). Here, 13.4 and 6.6
g/L of glucose and xylose, respectively, were initially fed to NST74 for an overall sugar
concentration of 2% (w/v). After 141.5 h of culturing, 559 ± 105 mg/L Phe was produced at a mass
yield of 37.8 ± 7.1 mg-Phe/g-total sugar. In this case, no xylose was consumed during the culture,
even after 100% of glucose was utilized indicating the significant impact of CCR on cell growth.
This ultimately limited Phe production, as the strain was unable to take advantage of the benefits
of xylose for aromatic amino acid production.
Figure 3.3 Time Course of NST74 Phe Production on Glucose-Xylose (67%-33%) Feed.
Time course of NST74 production of Phe on mixed sugar feed (67% glucose, 33% xylose; total sugar concentration = 20 g/L) as measured by OD600 (solid black line, triangle), acetate (g/L; solid gold line, diamond), glucose remaining (g/L; solid maroon line, circle), xylose remaining (g/L; solid green line, square) and Phe production (mg/L; dashed blue line, square). Error bars reported as one standard deviation from triplicate experiments.
53
3.3.3 Effect of xylR Mutation on Aerobic Xylose Consumption Rates and Phenylalanine Production
It was previously demonstrated under anaerobic conditions that the introduction of XylR* effectively
eliminated glucose CCR, allowing for efficient and simultaneous consumption of both glucose and
xylose 154,156. To examine the effects of XylR* on aerobic growth and production of Phe, xylR
(R121C, P363S) was integrated into NST74 at its native locus, resulting in NST74xylR*. When a
sugar mixture of glucose (67%) and xylose (33%) was fed to these cells, xylose utilization was
improved upon and Phe production increased as seen in Figure 3.4. When compared to NST74
(Figure 3.3), both strains consumed 100% of the supplied glucose fed, no xylose was consumed
by NST74 whereas NST74xylR* utilized 100% of supplied xylose, occurring in parallel with glucose
consumption. Consequently, it is clear that introduction of XylR* not only alleviates glucose CCR
during anaerobic fermentations, but under aerobic conditions as well. Ultimately, the co-utilization
of both sugars led to improved titers and yields for NST74xylR* when compared to NST74, as
NST74xylR* produced over 3-fold more Phe (1755 ± 91 versus 559 ± 105 mg/L) at a significantly
higher yield (83.1 ± 4.3 versus 37.8 ± 7.1 mg Phe/g sugar). This is due to the efficient co-utilization
of xylose in NST74xylR* (100% xylose utilized by 71.5 h) compared to NST74 which consumed no
xylose even after 141.5 h of culturing.

54
Figure 3.4 Time Course of NST74xylR* Phe Production on Glucose-Xylose (67%-33%) Feed.
Time course of NST74xylR* production of Phe on mixed sugar feed (67% glucose, 33% xylose; total sugar concentration = 20 g/L) as measured by OD600 (solid black line, triangle), acetate (g/L; solid gold line, diamond), glucose remaining (g/L; solid maroon line, circle), xylose remaining (g/L; solid green line, square) and Phe production (mg/L; dashed blue line, square). Error bars reported as one standard deviation from triplicate experiments.
3.3.4 Genetic Modifications to Improve Phe Production in Xylose-Utilizing Cells
Although NST74xylR* consumed more sugar by mass than NST74, it produced 53% less acetate
even after 141.5 h. Along with differences in the metabolic pathways for conversion of glucose and
xylose into central metabolism, the increased rate of glucose consumption compared to xylose may
play a role in increased acetate accumulation 134. Therefore, one reason that NST74xylR* may
display reduced production of acetate compared to NST74, is a decrease in glucose assimilation
rates. When compared Figure 3.3 and Figure 3.4, it can be seen that the rate at which glucose is
consumed from the culture media is slower in NST74xylR* compared to NST74. In fact, over the
first 53 h of culturing, when xylose is still present, glucose is consumed at a rate of 0.140 ± 0.007
g glucose/L-h in NST74xylR* compared to 0.216 ± 0.002 g glucose/L-h for NST74. This difference
in glucose consumption rates is only observed in the presence of xylose as NST74 and NST74xylR*
grown in media containing only 2% (w/v) glucose showed similar consumption rates (data not

55
shown). In contrast, however, NST74xylR* accumulated ~61.4% more biomass when compared
to NST74, an interesting phenomenon that may simply be due to an increase in total sugar
consumed.
As the increased production of Phe depends on improving the availability of intracellular
metabolites PEP and E4P, further genetic mutations were investigated for their effect on NST74
and NST74xylR* and the abilities of these strains to consume pure xylose and glucose-xylose
feedstocks. Previously, pykF and pykA, which encode for pyruvate kinase enzymes, have been
utilized to improve the production of a variety of compounds derived from the shikimic acid pathway
and its derivatives as well as reduce acetate accumulation via reduced pyruvate production 18,129,152.
As two PEP molecules are needed to produce one Phe molecule (compared to only one E4P
molecule), it is thought that improvements in PEP pools, rather than E4P, may be more effective at
boosting titers of Phe, especially in feedstocks containing xylose due to its more significant flux
through E4P 161.
Additionally, as the observed acetate accumulation arises as glucose is introduced into the feed, a
genetic modification to reduce overflow metabolism from glucose catabolism was implemented.
The crr gene encodes for IIAGlc, an important member of the glucose:PTS 130, and can work to
reduce acetate accumulation rates as discussed in Chapter 2 130,131. Previously, in a glucose-only
feed, the introduction of this mutation reduced glucose uptake rates and acetate production in the
media significantly decreased. This deletion may also have the effect of improving PEP availability
with feedstocks containing glucose as the removal of crr seems to “slow down” glucose assimilation
into the cell, allowing PEP pools to build up for further enzymatic conversion to the SA pathway. In
an effort to investigate the effects of minimizing acetate production via upstream modifications and
improve the availability of PEP, crr, pykA and pykF were deleted from NST74xylR* ΔpykAF to
produce NST74xylR* Δcrr ΔpykAF. When comparing NST74xylR* to NST74xylR* Δcrr ΔpykAF,
as seen in Table 3.2, it can be observed that 100% of sugar fed is consumed in both strains,
however, NST74xylR* Δcrr ΔpykAF produceds almost 2 times the amount of Phe as NST74xylR*,
indicating that these mutations are helpful in a mixed sugar feed scenario, not only with a pure

56
glucose feed. Additionally, a comparison between NST74 Δcrr ΔpykAF and NST74xylR* Δcrr
ΔpykAF in terms of sugar consumption, acetate and biomass accumulation, and Phe production
was investigating as shown in Figure 3.5.
Figure 3.5 Time Course of NST74 Δcrr ΔpykAF and NST74xylR* Δcrr ΔpykAF Phe Production on Glucose-Xylose (67%-33%) Feed.
Time course of NST74 Δcrr ΔpykAF and NST74xylR* Δcrr ΔpykAF production of Phe on mixed sugar feed (67% glucose, 33% xylose; total sugar concentration = 20 g/L) as measured by (Top) OD600 (dashed line) and acetate (g/L; solid line) and (Bottom) glucose consumption (g/L; double dashed line, half-moon), xylose consumption (g/L, solid line, square) and Phe production (mg/L; dashed line). Data of from NST74 Δcrr ΔpykAF is shown in black, data from NST74xylR* Δcrr ΔpykAF is shown in red. Error bars reported as one standard deviation from triplicate experiments.
Here, the most obvious differences are observed in terms of glucose consumption and initial growth
rate. For NST74 Δcrr ΔpykAF, 100% of glucose fed is consumed by 41 h into culturing while
NST74xylR* Δcrr ΔpykAF has only consumed ~2 g/L glucose after 65.5 h of culturing.
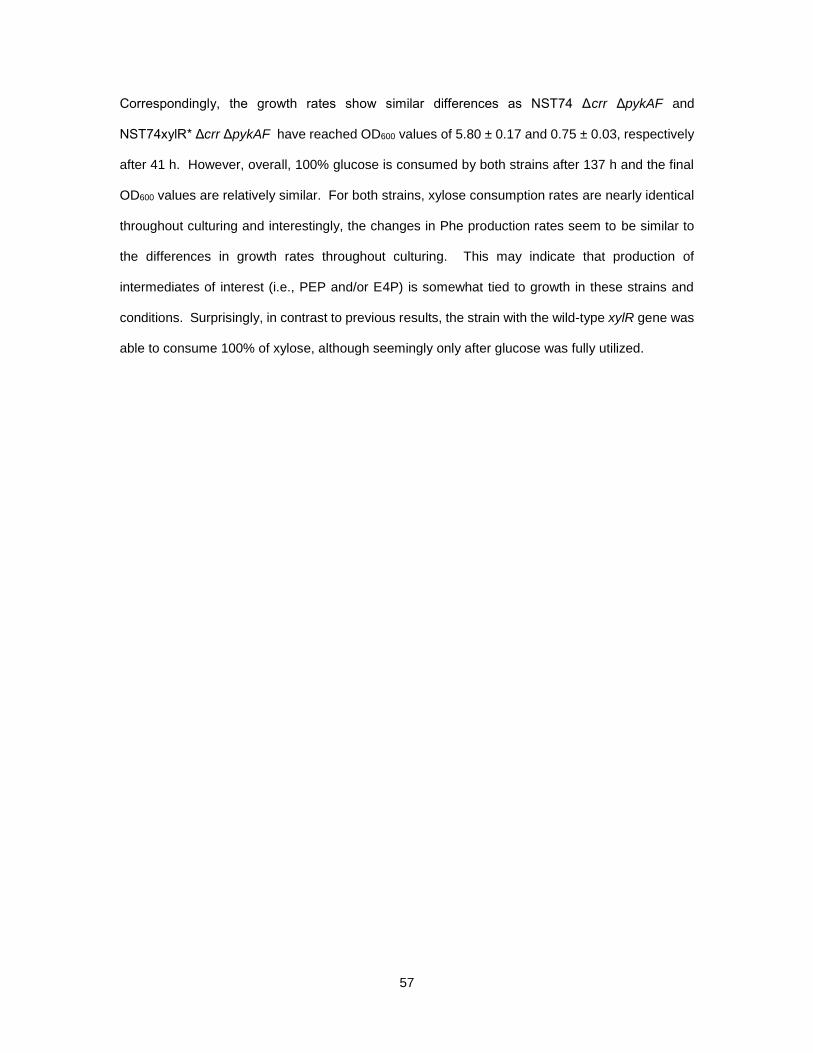
57
Correspondingly, the growth rates show similar differences as NST74 Δcrr ΔpykAF and
NST74xylR* Δcrr ΔpykAF have reached OD600 values of 5.80 ± 0.17 and 0.75 ± 0.03, respectively
after 41 h. However, overall, 100% glucose is consumed by both strains after 137 h and the final
OD600 values are relatively similar. For both strains, xylose consumption rates are nearly identical
throughout culturing and interestingly, the changes in Phe production rates seem to be similar to
the differences in growth rates throughout culturing. This may indicate that production of
intermediates of interest (i.e., PEP and/or E4P) is somewhat tied to growth in these strains and
conditions. Surprisingly, in contrast to previous results, the strain with the wild-type xylR gene was
able to consume 100% of xylose, although seemingly only after glucose was fully utilized.
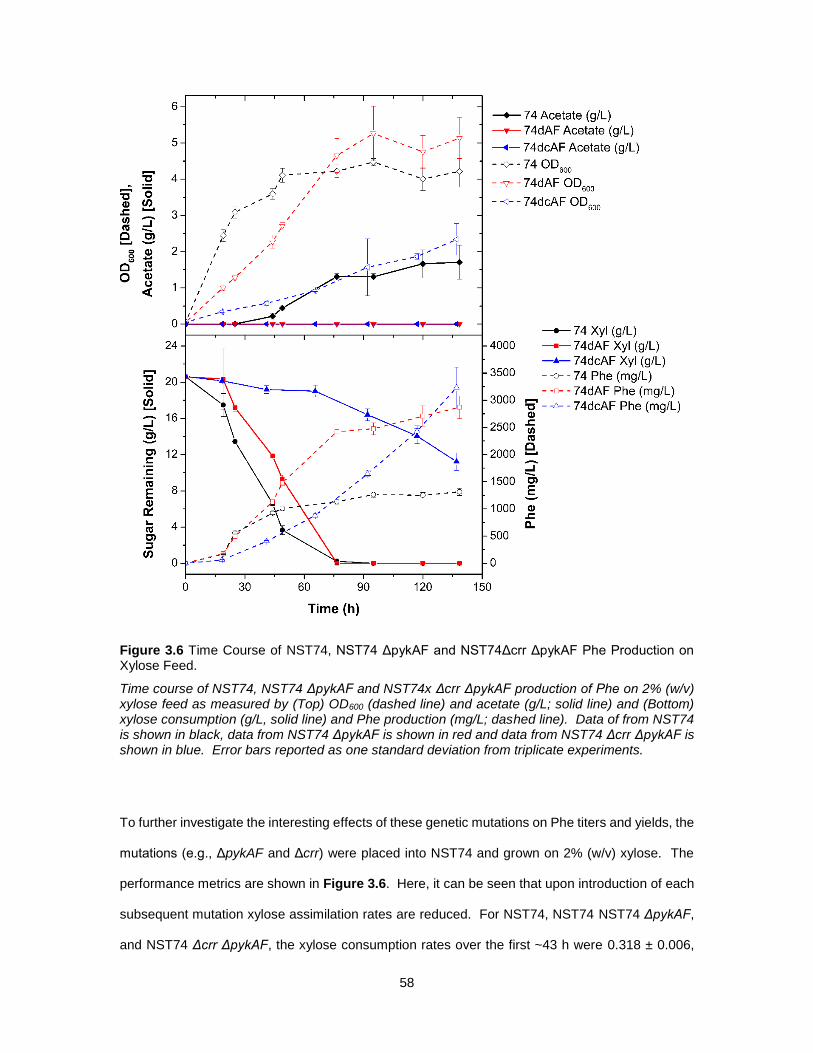
58
Figure 3.6 Time Course of NST74, NST74 ΔpykAF and NST74Δcrr ΔpykAF Phe Production on Xylose Feed.
Time course of NST74, NST74 ΔpykAF and NST74x Δcrr ΔpykAF production of Phe on 2% (w/v) xylose feed as measured by (Top) OD600 (dashed line) and acetate (g/L; solid line) and (Bottom) xylose consumption (g/L, solid line) and Phe production (mg/L; dashed line). Data of from NST74 is shown in black, data from NST74 ΔpykAF is shown in red and data from NST74 Δcrr ΔpykAF is shown in blue. Error bars reported as one standard deviation from triplicate experiments.
To further investigate the interesting effects of these genetic mutations on Phe titers and yields, the
mutations (e.g., ΔpykAF and Δcrr) were placed into NST74 and grown on 2% (w/v) xylose. The
performance metrics are shown in Figure 3.6. Here, it can be seen that upon introduction of each
subsequent mutation xylose assimilation rates are reduced. For NST74, NST74 NST74 ΔpykAF,
and NST74 Δcrr ΔpykAF, the xylose consumption rates over the first ~43 h were 0.318 ± 0.006,

59
0.199 ± 0.008, 0.035 ± 0.011 g xylose/L-h, respectively. However, the overall Phe production (in
terms of titers and yields) showed corresponding increases upon addition of these mutations.
Clearly a key aspect to enhance Phe production (i.e., yield) from xylose (and glucose), may be the
ability to slow down sugar utilization rates and cell growth. A summary of all experiments and
relevant production metrics is shown in Table 3.2.
Table 3.2 Summary of Phe Production Metrics for NST74 and Various Genetic Variations.
Summary of data showing the strain, percentage of sugar used, Phe titers, culture time, Mass yield, growth as measured by OD600 and acetate accumulation at the end of culturing. All data is with 2% (w/v) total sugar and error bars represent one standard deviation from triplicate experiments. “n.d.” = “not detected”.
Strain Time (h)
Phe Titer (mg/L)
Phe Mass Yield (mg-
Phe/g-total
sugar)
% Total Glucose
Used
% Total Xylose Used
Final OD600
Final Acetate
(g/L)
100% Glucose
NST74 120 567 ± 29 (at 96 h)
28.4 ± 2.8 (at 96
h) 100% N/A
4.37 ± 0.28
5.88 ± 0.13
100% Xylose
NST74 138.5 1315 ±
65 63.1 ±
3.1 N/A 100%
4.22 ± 0.43
1.71 ± 0.47
NST74 ΔpykAF
138.5 2870 ±
209 137.7 ±
10.0 N/A 100%
5.14 ± 0.57
n.d.
NST74 Δcrr ΔpykAF
137 3234 ±
377 348.4 ±
70.7 N/A
45.6 ± 4.6%
2.34 ± 0.43
n.d.
67% Glucose/33% Xylose
NST74 141.5 559 ± 105
37.8 ± 7.1
100% 0% 3.66 ± 0.32
3.30 ± 0.26
NST74xylR* 141.5 1755 ±
91 83.1 ±
4.3 100% 100%
5.96 ± 0.19
1.56 ± 1.37
NST74 Δcrr ΔpykAF
137 2875 ±
286 127.8 ±
12.7 100% 100%
6.95 ± 0.88
n.d.
NST74xylR* Δcrr ΔpykAF
137 3509 ±
465 156.0 ±
20.7 100% 100%
8.25 ± 1.27
n.d.
Strain Time (h)
Phe Titer (mg/L)
Phe Mass Yield (mg-
Phe/g-total
sugar)
% Total Glucose
Used
% Total Xylose Used
Final OD600
Final Acetate
(g/L)
60
3.4 Discussion
One factor that may be severely limiting overall Phe production is the co-accumulation of byproduct
acetate; a problem often exacerbated by higher rates of and overall consumption of sugars
(especially glucose). For instance, NST74 grown on glucose produced 5.88 ± 0.13 g/L acetate
after 120 h with levels reaching over 1 g/L (the level where reduction in cell growth and protein
stability commonly occurs 137) within 25 h of culturing (as seen in Figure 3.2). In contrast, for cells
grown on xylose, overall accumulation of acetate only reached a maximum of 1.71 ± 0.47 g/L
(occurring at the end of culturing). This may help play a role in the fact that NST74 continues to
produce Phe into stationary phase when grown on xylose while cells grown on glucose stop
producing significant levels of Phe at an earlier time point. As acetate accumulation is known to
inhibit E. coli growth 137, additional strain engineering to reduce acetate production was expected
to improve Phe production. Acetate production at levels of 0.5 g/L have been shown to reduce E.
coli growth rates while concentrations above 2 g/L are severely inhibitory 162,163. High levels of
acetate production in these scenarios here may play an even more significant role here compared
to glucose-based production as it has previously been observed that inhibition caused by acetic
acid in E. coli production runs has a more pronounced effect on hindering xylose utilization than
with glucose 164.
Additionally, one important by-product of the pyruvate kinase reaction is ATP. In wild-type,
signficant carbon flux flows through this reaction 161 as it is one of the main pathways by which cells
funnel carbon into the TCA cycle. While, in wild-type, significant levels of ATP is generated in this
reaction, the removal of these enzymes may reduce intracellular ATP levels. As ATP is needed to
import xylose into E. coli through XylFGH 155 (although, alternatively, XylE, a xylose:H+ symporter,
can also uptake xylose into the cell), the decrease in available intracellular pools of ATP may
potentially limit the rate of xylose uptake and utilization and flux through the pentose phosphate
pathway. In fact, through in silico models of shikimic acid (SA) production in E. coli from various
carbon sources, researchers estimated that the the ATP demand for SA from xylose when utilizing
XylFGH for import was 2.27 mol ATP/mol SA compared to that from glucose (utilzing the native

61
PTS system) which was 1.97 mol ATP/mol SA 165. To further test this theory, the ΔpykAF mutation
was placed in NST74 and grown on 100% xylose. Here, over the first 49 h, NST74 consumed
xylose at a rate of 0.346 ± 0.010 g xylose/L-h. Comparatively, NST74 ΔpykAF only utilized xylose
at a rate of 0.231 ± 0.009 g xylose/L-h (Figure 3.6).
In addition to the possible explanation of limited ATP availability to explain reduced titers, the
production of pyruvate may also play a role. Pyruvate kinase is the main mechanism by which
pyruvate is produced in growing, wild-type E. coli cells. Upon removal of this enzymatic reaction,
other avenues through which pyruvate (and subsequently acetyl-CoA) can be be produced become
vital. When cells are grown on glucose, pyruvate can be generated via the
glucose:phosphotransferase system (PTS) which simultaneously phosphorylates and imports
glucose by converting PEP into pyruvate. However, when grown on xylose, this reaction does not
occur. In this scenario, pyruvate can be generated by two mechanisms (as seen in Figure 3.1): 1)
conversion of PEP into oxaloacetate via phosphoenolpyruvate carboxylase (encoded by ppc; an
essential gene in E. coli grown in minimal media on glucose) followed by a multi-step process in
the TCA cycle to produce malate which can subsequently be converted in pyruvate via malate
dehydrogenase (encoded by maeA and maeB), and 2) the catabolism of xylose via the pentose
phosphate pathway 166, followed by gluconeogenic steps to produce glucose-6-phosphate (G6P)
from fructose-6-phosphate via G6P isomerase (encoded by pgi), and subsequent conversion into
glyceraldehyde-3-phosphate (G3P) and pyruvate in the Entner-Doudoroff pathway 167 (reactions:
G6P → 6-phosphogluconolactone (6PGNL) via G6P dehydrogenase (encoded by zwf); 6PGNL →
phosphogluconate (6PGNT) via 6-phosphoglucocnolactonase (encoded by pgl); 6PGNT → 2-keto-
3-deoxy-6-phosphogluconate (KDPG) via phosphogluconate dehydratase (encoded by edd);
KDPG → G3P + pyruvate via KDPG aldolase (encoded by eda). As these two mechanisms are
complex, involving multiple enzymatic steps, it may be likely that pyruvate (and acetyl-CoA)
limitations upon growth on a glucose-xylose mixed feed ultimately play a role in affecting Phe
production.

62
The removal of crr led to increases in Phe yields and titers and as well as the elimination of acetate
accumulation. Interestingly, crr (i.e., its gene product IIAGlc) plays a pivotal role not only in the
mechanism of glucose uptake via the PTS system but also affects xylose catabolism and is the
central component of regulating carbon catabolite repression. The phosphorylation state of IIAGlc
regulates the levels of cAMP as IIAGlc-P binds to and subsequently activates adenylate cyclase in
the cell, which can then convert ATP into cAMP 147,168. High levels of cAMP will bind to CRP which
can later activate genes of other, non-glucose sugars (e.g., xylose). In the presence of glucose,
the phosphate group from IIAGlc-P is donated to the PTS system to allow for glucose to be imported
into the cell and converted into glucose-6-phosphate. In this case, levels of IIAGlc-P are low which
no longer activates adenylate cyclase and subsequently, leaves xylose-utilizing genes inactive.
However, when no glucose is present, IIAGlc-P dominates, and the above cascade is induced
leading to activation of xylose-utilizing genes (i.e., xylAB, xylFGH) 211. Furthermore, CRP-cAMP
coactivates these genes with XylR 155, indicating that, at least in a wild-type strain, both systems
are necessary to fully induce the xylose-utilizing operons. However, upon deletion of crr, IIAGlc is
no longer present and activation of adenylate cyclase cannot occur in the manner previously
described. So, while glucose uptake and utilization rates are reduced, the removal of crr may also
negate the improvements seen in xylose utilization rates when the xylR* mutation is introduced.
Surprisingly, in NST74 Δcrr ΔpykAF with a mixed sugar feed, cells consumed 100% of both xylose
and glucose fed, whereas in NST74 and NST74 ΔpykAF, cells utilized 100% of glucose but no
consumption of xylose was detected. As the above discussion indicates that the presence of IIAGlc
plays a significant role in activating xylose-utilizing genes, it is unexpected that the removal of crr
allows for the consumption of xylose in these feeds compared to its parent strains. This may
indicate further mechanisms at play affecting xylose consumption post-glucose assimilation, such
as the presence of significant acetate levels in the media.
Furthermore, as NST74 is a mutated strain maintain various single-nucleotide polymorphisms
(SNPs), insertions and deletions, there may be differences in terms of regulatory mechanisms
concerning glucose and xylose interactions compared to a wild-type strain. For example, in NST74,
a mutation replacing two codons in the gene encoding for adenylate cyclase (i.e., cyaA) is present

63
(data not shown). Two codons starting 831 nucleotides into the gene (CCA and CGT encoding for
proline and arginine, respectively) are replaced with GTC (encodes for valine). This change may
play some effect on the activity and functionality of adenylate cyclase in NST74. Also, NST74
contains a codon change in the gene crp (K29T), which may affect the activity of this gene product
on inducing xylose-utilizing genes. Nonetheless, introduction of the xylR* mutation into NST74
allows for the co-utilization of both glucose and xylose as previously observed in other wild-type
and production strains 154, indicating the complexity of the regulatory mechanisms which govern
sugar utilization and carbon catabolite metabolism in E. coli.
3.5 Conclusions
While the co-consumption of industrially relevant carbon sources is critical to future efforts to
enhance titers and yields of Phe-derived compounds, it seems that a delicate balance must be
maintained. Sugar consumption at too rapid of a pace is inefficient for Phe production and
ultimately leads to accumulation of inhibitory acetate levels. From the above results, a slower
consumption of sugar (especially xylose), seems to be more beneficial for Phe titers and yields.
However, as an ideal, economically viable production scenario would consist of rapid production
and purification of Phe (or its derivatives), a strain that very slowly consumes sugars and produces
the desired product may not be idyllic. Therefore, future efforts to improve Phe production metrics
may focus on engineering strains to consume sugars at increased rates while maintaining high
intracellular pools of E4P and PEP for Phe production-use only. By perhaps investigating methods
to tie Phe production directly to growth, such as allowing sugar catabolism only upon conversion of
E4P and PEP into DAHP, Phe titers and yields may be maximized.
64
CHAPTER 4. TRANSCRIPTIONAL ANALYSIS OF ESCHERICHIA COLI RESPONSE TO
STYRENE EXPOSURE
Abstract
Transcriptomic profiling is an important tool that can help to reveal key insights regarding how cells
react and respond to different environmental stimuli, including the presence of inhibitory biofuels
and biochemicals. Here, the transcriptional response of E. coli to the aromatic biochemical styrene
was determined by performing RNA sequencing (RNA-seq) analysis. Furthermore, the potential
influence of the source of exposure was comparatively evaluated by applying RNA-seq analysis to
both styrene-producing and styrene-exposed cells. In both cases a systems-level assessment of
transcriptional response was performed, with special attention given to response and potential role
of different general tolerance mechanisms, as well as to the identification of possible gene markers
displaying unique patterns of differential expression in one exposure mode versus the other. Genes
involved in the phage shock protein response (e.g., pspABCDE/G), general stress regulators (e.g.,
marA, rpoH), and several membrane-altering genes (notably, bhsA, ompR, ldtC) showed up-
regulation in response to styrene exposure. Overall, the expression profiles of external addition
and internal production of styrene were similar with some differences observed in the magnitude of
differential expression for some important genes (e.g., up-regulated genes such as pspABCDE/G,
recA, marA, micF) and expression of some genes involved in amino acid biosynthesis.

65
4.1 Introduction
Through metabolic engineering and synthetic biology strategies, significant effort has been put into
producing value-added chemicals or bioenergy alternatives from renewable sources. Through the
engineering of industrially relevant strains to enhance the production of native metabolic
precursors, remove pathways that produce harmful or unnecessary byproducts and alter native flux
regulation processes, the bioproduction of both natural and non-natural compounds in microbes
has been improved upon 169. One significant group of potentially vital bioproducts are aromatics,
which contain one or more substituted benzene rings. Aromatics have many industrially relevant
purposes such as precursors to pharmaceuticals, plastic monomers and biofuel alternatives so
recent research has focused on improving the diversity of aromatics that can be produced in
microbes as well as developing methods which can improve production metrics of these chemicals
as has been recently reviewed 5,6,170.
One limitation in the quest for improved microbial production of aromatics is end-product toxicity
21,117,171,172. Often, aromatics are highly lipophilic and have many solvent-like properties that lend
themselves to poor biocompatibility by causing changes in membrane integrity and inhibiting
function of membrane proteins 173-176. While the goal of tolerance engineering is ultimately to
enhance production of the target biochemical, many times, chemical tolerance does not necessarily
lead to production improvements. In some cases, the resulting fitness improvements enabled by
tolerance engineering strategies do not lead to increases in titers and yields 177,178. Clearly, such
phenotypes are often very complex and multi-genic in nature, as well as difficult to fully and
independently resolve.
One such complication pertains to understanding if, how, when and to what degree various
tolerance-related mechanisms are turned on when exposed to various stresses. As the first steps
in cellular adaptation to environmental changes involve sensing the change and performing
alterations on the transcriptional level, transcriptomic data (obtained by microarray analysis or RNA
sequencing) provides the most comprehensive datasets needed to elucidate and understand what
role native tolerance strategies might play in solvent tolerance. Examination of gene families which

66
are up- or down-regulated can be utilized to illuminate mechanisms of toxicity and subsequently,
help develop synthetic engineering strategies to improve tolerance and cell fitness.
Transcriptomics-based strategies have been utilized to investigate the transcriptional effect of
exposure to compounds such as isobutanol 179, acetate 180, 1,4-butanediol 181, ethanol 182 and free
fatty acids 183 among others 184-186.
Several studies have investigated the transcriptional response of microbes when stressed with
aromatic chemical toxicity such as in E. coli, with most research focusing on antibiotics (e.g.,
triclosan, sulfamethoxazole, tetracycline) 187. However, the transcriptional effects of more
industrially-relevant aromatic compounds have also been examined in E. coli such as toluene 188,
p-hydroxybenzoic acid 189 and cinnamaldehyde 185,190 (along with the 2-phenylethanol stress
response in S. cerevisiae 191). In response to 0.02% (v/v) toluene exposure, for example,
researchers found 641 differentially expressed genes, with many of them involved in Fe/S assembly
and oxidative and universal stress responses (flagella biogenesis and assembly related genes were
also significantly down-regulated) 188. When exposed to salicylate, an industrially relevant aromatic
acid, E. coli activated global stress response systems such those mediated by the marRAB operon
184.
To gain a more complete understanding of transcriptomic response to aromatic exposure, RNA-
seq analysis has been performed on E. coli under styrene-induced stress and two distinct exposure
modes: extracellular addition versus intracellular production. The differences between
exogenously added solvent versus internally produced solvent may be significant as, for many
industrial processes, the internal production condition is much more relevant. Fundamental modes
of toxicity may be different within the cell versus outside the cell and tolerance engineering
strategies that succeed in one scenario may not help in others. Toxicity of styrene in E. coli, for
example, has previously been investigated in terms of these different conditions when exposed to
the chemical. Using membrane leakage as an analogue for membrane integrity, researchers found
that less than 10% of cells exposed to styrene addition demonstrated membrane leakage while
more than 50% of styrene-producing cells showed damaged membranes (although researchers

67
found no membrane fluidity changes caused by styrene production) 192. In said study, however, no
comparisons of transcriptional responses between the two different styrene-exposure modes were
performed.
In particular, specific emphasis has been given to: i) comparing and contrasting the effect of
different styrene exposure modes (i.e., P vs. A) on the cellular response, ii) elucidating which known
tolerance mechanisms E. coli attempts to employ for inherent styrene resistance and which remain
unchanged or inactivated, and iii) understanding the overall physiological response of E. coli
following exposure to inhibitory concentrations of styrene. Overall, the objective of this work is to
obtain an improved understanding as to how E. coli naturally responds to styrene toxicity, gives
input on how cells respond differently when producing a toxin versus when they are externally
exposed to it, identifies native machinery that might serve to construct aromatic-inducible
transcriptional elements, and provides clues on possible future directions for improvements to
engineer E. coli for aromatic tolerance.
4.2 Materials and Methods
4.2.1 Strains and Cultivation Conditions Used
E. coli NST74 (a phenylalanine-overproducing strain) 120 carrying pTrcColaK-PAL2 and pTrc99A-
FDC1 (expressing PAL2 from Arabidopsis thaliana and FDC1 from Saccharomyces cerevisiae,
respectively, to collectively convert endogenous phenylalanine to styrene) was used as the styrene
producing strain. E. coli NST74 cells carrying the empty vectors pTrcColaK and pTrc99A were
utilized as a non-producing strain for exogenous styrene addition and unexposed control
conditions. Seed cultures were grown in 3 mL LB broth supplemented with appropriate 100 g/mL
ampicillin and 30 g/mL kanamycin at 32oC while shaking at 200 rpm for 12 – 16 h. Seed cultures
were used to inoculate 50 mL of pH 6.8 MM1 minimal media supplemented with 1.5% glucose in
100 mL Teflon-capped corning bottles (to prevent styrene loss via evaporation) at a starting OD600
of ~0.01. MM1, a phosphate-limited minimal media adapted from McKenna and Nielsen 117, was
prepared according to the following recipe (in g/L): MgSO4·7H2O (0.5), (NH4)2SO4 (4.0), MOPS
(24.7), KH2PO4 (0.3), and K2HPO4 (1.0), as well as 1 mL/L of a trace mineral solution containing
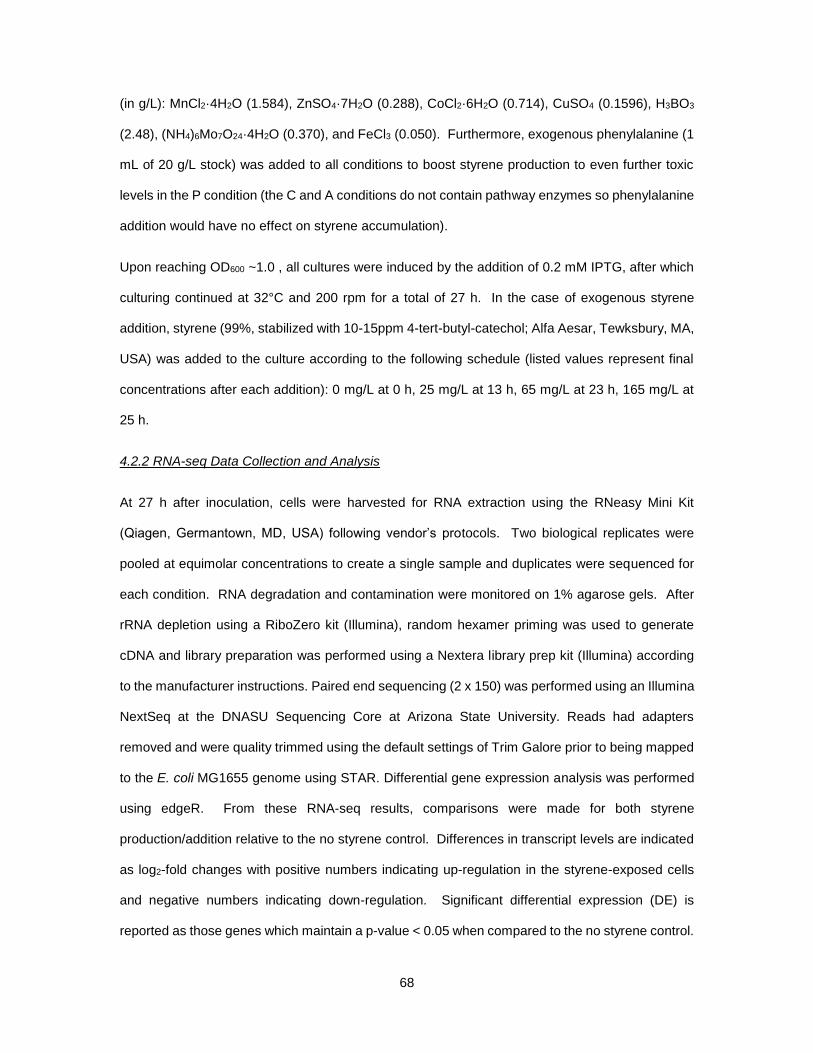
68
(in g/L): MnCl2·4H2O (1.584), ZnSO4·7H2O (0.288), CoCl2·6H2O (0.714), CuSO4 (0.1596), H3BO3
(2.48), (NH4)6Mo7O24·4H2O (0.370), and FeCl3 (0.050). Furthermore, exogenous phenylalanine (1
mL of 20 g/L stock) was added to all conditions to boost styrene production to even further toxic
levels in the P condition (the C and A conditions do not contain pathway enzymes so phenylalanine
addition would have no effect on styrene accumulation).
Upon reaching OD600 ~1.0 , all cultures were induced by the addition of 0.2 mM IPTG, after which
culturing continued at 32°C and 200 rpm for a total of 27 h. In the case of exogenous styrene
addition, styrene (99%, stabilized with 10-15ppm 4-tert-butyl-catechol; Alfa Aesar, Tewksbury, MA,
USA) was added to the culture according to the following schedule (listed values represent final
concentrations after each addition): 0 mg/L at 0 h, 25 mg/L at 13 h, 65 mg/L at 23 h, 165 mg/L at
25 h.
4.2.2 RNA-seq Data Collection and Analysis
At 27 h after inoculation, cells were harvested for RNA extraction using the RNeasy Mini Kit
(Qiagen, Germantown, MD, USA) following vendor’s protocols. Two biological replicates were
pooled at equimolar concentrations to create a single sample and duplicates were sequenced for
each condition. RNA degradation and contamination were monitored on 1% agarose gels. After
rRNA depletion using a RiboZero kit (Illumina), random hexamer priming was used to generate
cDNA and library preparation was performed using a Nextera library prep kit (Illumina) according
to the manufacturer instructions. Paired end sequencing (2 x 150) was performed using an Illumina
NextSeq at the DNASU Sequencing Core at Arizona State University. Reads had adapters
removed and were quality trimmed using the default settings of Trim Galore prior to being mapped
to the E. coli MG1655 genome using STAR. Differential gene expression analysis was performed
using edgeR. From these RNA-seq results, comparisons were made for both styrene
production/addition relative to the no styrene control. Differences in transcript levels are indicated
as log2-fold changes with positive numbers indicating up-regulation in the styrene-exposed cells
and negative numbers indicating down-regulation. Significant differential expression (DE) is
reported as those genes which maintain a p-value < 0.05 when compared to the no styrene control.

69
4.2.3 Gene Ontology and KEGG Pathway Analysis
For gene ontology (GO) term analysis, GeneSCF 193 was utilized, employing all three databases
for GO analysis (i.e., biological process, molecular function, cellular components) and the E. coli
organism database. For KEGG pathway analysis and identification of enriched pathways, KOBAS
3.0 (KEGG Orthology Based Annotation System) was utilized 194,195. Only differentially expressed
genes below the p-value of 0.05 cut-off were included in the GO term and KEGG pathway analyses.
Significantly over-represented GO terms or KEGG pathways are reported if, when compared to all
the genes in the E. coli K-12 genome, the p-value was < 0.05.
4.3 Results
4.3.1 Characterizing the Overall Transcriptomic Response of E. coli to Styrene Exposure
To elucidate the effect of styrene exposure on E. coli cells, as depicted in Figure 4.1A, a total of
three conditions representing different styrene exposure modes were investigated in this study:
styrene production (P), styrene addition (A), and a no styrene (production or addition) control (C).
During A, the schedule of styrene addition was designed to mimic the profile of its accumulation
during a typical production culture (Figure 4.1B). In each case, cells were harvested after 27 h,
after which their total RNA was extracted and sequenced. There were 30.59 and 37.15 M reads
generated for C runs (83.3% and 82.3% of reads mapped to genome, respectively), 28.41 and
42.91 M reads generated for A runs (81.7% and 82.6% of reads mapped to genome, respectively)
and 35.49 and 37.23 reads generated for P runs (83.9% and 83.3% of reads mapped to genome,
respectively). Changes (all relative to C) in global transcriptomic patterns arising in each case were
then identified via bioinformatic analysis of the obtained RNA-seq data.

70
Figure 4.1 A) Three Conditions upon which RNA was Extracted and, B) Styrene Accumulation in Production Strain and Styrene Addition in Styrene-Added Strain.
A) Three conditions were used here: No styrene present (C), styrene added exogenously (A) and styrene produced internally (P). B) Approximate time-course of extracellular styrene concentration in the three conditions.
In total, 1,674 and 980 differentially expressed (DE) genes were identified for A and P (both relative
to C), respectively (Figure 4.2A). Among these, approximately 50% of DE genes were up-
regulated for A, compared to 56% in the case of P. Among up-regulated genes, the average
magnitudes of differential expression were much higher for P than for A (~1.52 log2-fold change vs.
~1.11 log2-fold change) whereas, for down-regulated genes, the average magnitudes of differential
expression were closer though still slightly higher for P compared to A (~-1.26 log2-fold change vs.
~-1.18 log2-fold change). The observed difference in magnitude, especially among up-regulated
genes, could suggest that, at least amongst this subset of DE genes, sensitivity to styrene exposure
is elevated when styrene originates from inside the cell, perhaps resulting due to its higher apparent
intracellular concentration and/or limitations associated with its extracellular export. Meanwhile, a
total of 652 genes were DE under both styrene exposure modes, compared to 1022 and 328 genes
were only DE for P and A, respectively (Figure 4.2B).
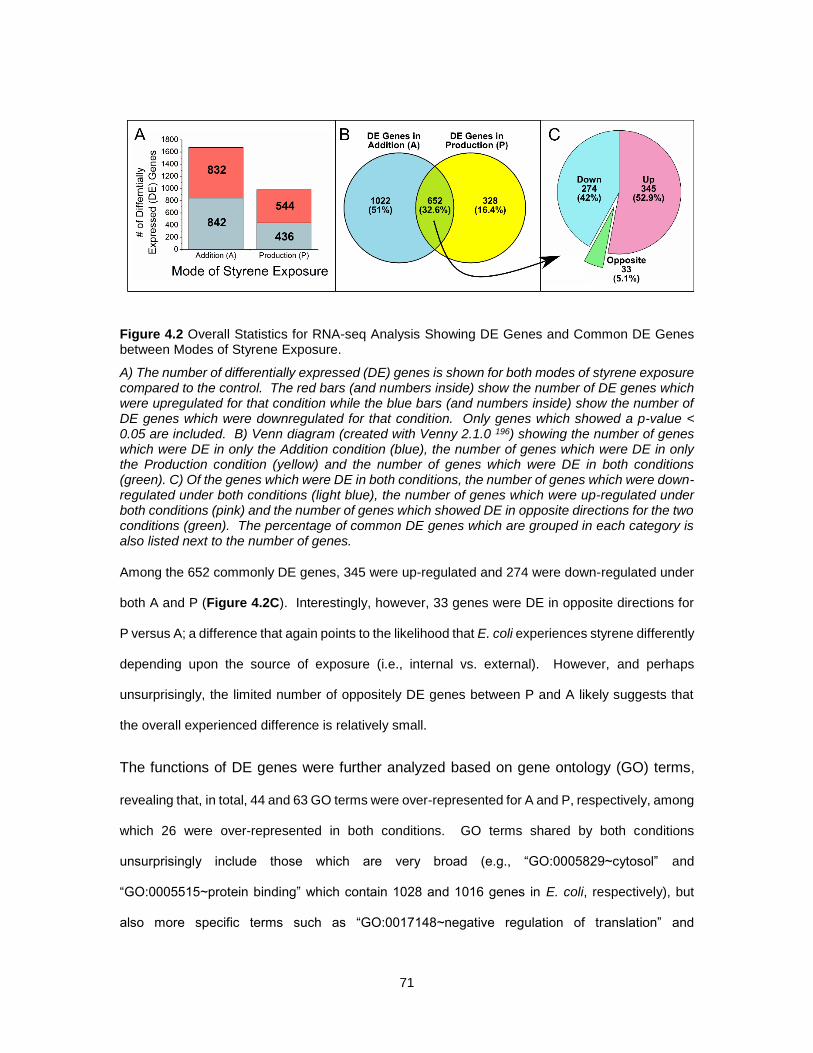
71
Figure 4.2 Overall Statistics for RNA-seq Analysis Showing DE Genes and Common DE Genes between Modes of Styrene Exposure.
A) The number of differentially expressed (DE) genes is shown for both modes of styrene exposure compared to the control. The red bars (and numbers inside) show the number of DE genes which were upregulated for that condition while the blue bars (and numbers inside) show the number of DE genes which were downregulated for that condition. Only genes which showed a p-value < 0.05 are included. B) Venn diagram (created with Venny 2.1.0 196) showing the number of genes which were DE in only the Addition condition (blue), the number of genes which were DE in only the Production condition (yellow) and the number of genes which were DE in both conditions (green). C) Of the genes which were DE in both conditions, the number of genes which were down-regulated under both conditions (light blue), the number of genes which were up-regulated under both conditions (pink) and the number of genes which showed DE in opposite directions for the two conditions (green). The percentage of common DE genes which are grouped in each category is also listed next to the number of genes.
Among the 652 commonly DE genes, 345 were up-regulated and 274 were down-regulated under
both A and P (Figure 4.2C). Interestingly, however, 33 genes were DE in opposite directions for
P versus A; a difference that again points to the likelihood that E. coli experiences styrene differently
depending upon the source of exposure (i.e., internal vs. external). However, and perhaps
unsurprisingly, the limited number of oppositely DE genes between P and A likely suggests that
the overall experienced difference is relatively small.
The functions of DE genes were further analyzed based on gene ontology (GO) terms,
revealing that, in total, 44 and 63 GO terms were over-represented for A and P, respectively, among
which 26 were over-represented in both conditions. GO terms shared by both conditions
unsurprisingly include those which are very broad (e.g., “GO:0005829~cytosol” and
“GO:0005515~protein binding” which contain 1028 and 1016 genes in E. coli, respectively), but
also more specific terms such as “GO:0017148~negative regulation of translation” and

72
“GO:0005525~GTP binding”, which contain only 12 and 16 genes in E. coli, respectively. Figure
4.3 shows some of the GO terms of particular interest for this study along with the percentage of
genes in each term that were significantly repressed or induced upon styrene addition or
production. Some noteworthy terms are those related to cell division, response to DNA damage
via the SOS response and cellular response to various stresses (e.g., heat, radiation).
Additional KEGG pathway analysis, meanwhile, revealed that 8 and 17 KEGG pathways were over-
represented for A and P, respectively. Of these, 5 KEGG pathways were over-represented in both
conditions, including ‘ribosome’ (eco03010), ‘metabolic pathways’ (eco01100), ‘homologous
recombination’ (eco03440), ‘biosynthesis of secondary metabolites’ (eco01110), and ‘pyrimidine
metabolism’ (eco00240). Similarly to the GO terms, a multitude of relevant KEGG pathways and
the percentage of genes that are induced or repressed for both styrene conditions are illustrated in
Figure 4.4. KEGG pathways of significant interest include those related to the biosynthesis of
amino acids, genes involved in central metabolism and those related to the production of
membrane components (e.g., fatty acids, peptidoglycan). Further analysis and discussion
regarding many of the GO terms and KEGG pathways, as well as the genes involved in each, is
included in the following sections.
To gain a more detailed understanding of how E. coli responds to and is affected by styrene, a
subset of the most statistically significant as well as generally interesting outcomes from the
RNAseq results were selected for more detailed analysis and discussion in the following sections,
as organized according to major cellular functions, systems, or roles. Overall, most behaviors were,
at least qualitatively, conserved between A and P. Therefore, to facilitate the discussion the focus
is first on the outcomes of just A, after which a comparison of notable differences between A and
P is presented.
73
Figure 4.3 List of Relevant GO Terms for DE Genes after Exposure to Styrene.
A selection of Gene Ontology (GO) Terms. The total number of genes in each GO term in the E. coli genome is listed in parenthesis next to the GO term. The x-axis indicates the percentage of total genes in the GO term which were significantly repressed (left, blue) or induced (right, red) for each styrene exposure condition compared to the control. The addition condition is shown as light red or blue (with stripes) while the production condition is dark red or blue. The superscript ‘A’ or ‘P’ indicates that the GO term was significantly over-represented (p-value < 0.05) for the addition or production conditions, respectively, compared to the E. coli genome. GO term analysis was accomplished via GeneSCF 193.

74
Figure 4.4 List of Relevant KEGG Pathways for DE Genes after Exposure to Styrene.
A selection of KEGG pathways. The total number of genes in each KEGG pathway in the E. coli genome is listed in parenthesis next to the KEGG pathway. The x-axis indicates the percentage of total genes in the KEGG pathway which were significantly repressed (left, blue) or induced (right, red) for each styrene exposure condition compared to the control. The addition condition is shown as light red or blue (with stripes) while the production condition is dark red or blue. The superscript ‘A’ or ‘P’ indicates that the GO term was significantly over-represented (p-value < 0.05) for the addition or production conditions, respectively, compared to the E. coli genome. GO term analysis was accomplished via KOBAS 3.0 194,195.
75
4.3.2 DNA Synthesis, Replication, and Repair
One emergent pattern gleaned from overall dataset is that styrene exposure appears to trigger the
shutdown of cell growth in a ‘bottom up’ manner, beginning with the synthesis and replication of
DNA. Specifically, numerous DE genes were found to be associated with the “DNA replication”
(GO:0006260) GO term, including those encoding for DNA polymerase (dnaX, DNA polymerase III
subunit) and the replication initiator protein (dnaA), along with members of the primosome (priA
and priB, primosomal replication factor and protein, respectively; which work to restart stalled DNA
replication), all of which were significantly repressed. Meanwhile, pathways used to supply
precursors to DNA synthesis were also repressed. For example, purR encodes a transcriptional
repressor involved in regulating purine and pyrimidine nucleotide biosynthesis. While expression
of purR was found to be mostly unchanged in the presence styrene, of the 31 known PurR-
repressed genes, 23 were DE for A, all of which were downregulated. In concordance with the
above data, the GO term “purine nucleotide biosynthetic process” (GO:0006164) showed 4 of the
6 total genes were down-regulated for the A condition. Since purine and pyrimidine biosynthesis
is quite energy intensive, downregulation of these pathways may represent an attempt by the cell
to conserve and possibly redistribute energy resources to other processes of more critical
importance to aiding in survival.
Beyond simply inhibiting DNA replication, styrene exposure also appears to elicit DNA damage
(e.g., double-strand breaks), in a manner similar to exposure to UV radiation or DNA-arresting
chemicals 197,198. In response to such damage, the SOS response is commonly activated as a
mechanism to repair the damage through homologous recombination and DNA replication 198,199.
Analysis of genes associated with the “SOS response” (GO:0009432) GO term revealed that 10 of
22 were DE for A, 9 of which were upregulated. The gene recA (log2fold change = 0.46) encodes
a recombinase that plays a major role of the SOS response 197. Meanwhile, SOS-induced DNA
polymerases (such as Pol IV and Pol V, encoded by dinB and umuDC, respectively), which enable
replication through various damage and lesions that DNA polymerase III cannot 200, were also DE
with dinB and umuD showing log2-fold changes of 0.82 and 0.80 for A, respectively. However,

76
since SOS-induced DNA polymerases are considered to be of lower fidelity 200, this suggest the
cells might use this response as a mechanism to incorporate mutations that might improve the
chance of survival.
4.3.3 Protein and Amino Acid Biosynthesis
Styrene exposure also caused the differential expression of several genes associated with
ribosomal activity, suggesting that, like DNA synthesis, protein biosynthesis was also decreased.
For example, in the case of A, 69% of all genes involved in the “ribosome” KEGG pathway
(eco03010) were DE, 100% of which were repressed. Similarly, many genes associated with the
biosynthesis of precursor amino acids were also DE, however, the resulting trends were not as
clear or widespread. Specifically, analysis of the “biosynthesis of amino acids” KEGG pathway
(eco01230) showed that 22% and 19% of the 118 total genes in this pathway were upregulated
and downregulated, respectively, in response to styrene exposure. For example, of the 17 genes
involved with converting α-ketoglutarate into the amino acids, L-glutamate, L-proline, L-arginine, L-
glutamine, 12 were downregulated while none were upregulated. Genes such as glnA (encoding
glutamine synthetase) and argI (encoding ornithine carbamoyltransferase) showed a log2-fold
change of -4.77 and -3.27, respectively. Additionally, expression of all three subunits of the
glutamine ABC transporter (encoded by glnQHP) were highly downregulated (log2-fold change = -
3.58, -4.58 and -3.47, respectively). Shutdown of pathways competing for α-ketoglutarate might
represent a strategy used by the cells to increase energy generation by enhancing flux through the
TCA. Conversely, 7 genes involved in the biosynthesis of aromatic amino acids (i.e., L-
phenylalanine, L-tyrosine, L-tryptophan) were upregulated while only two were downregulated. In
fact, regarding the KEGG pathway for “phenylalanine, tyrosine and tryptophan biosynthesis”
(eco00400), 33% of genes were upregulated for A, while only 10% were downregulated. This
could, at least in part, be an experimental artifact, derived from the fact that the host strain (NST74)
is a L-phenylalanine over-producing strain that carries a tyrR deletion, along with several additional
point mutations in key shikimate pathway genes.

77
4.3.4 Cell Replication
In addition to its aforementioned role in facilitating DNA repair, the SOS response also influences
cell division, notably via the inhibitor protein encoded by sulA (which disrupts cell division and can
lead to loss of cell viability 201), whose expression was also increased (log2-fold change = 0.86)
following styrene addition. Meanwhile, other genes associated with the GO term “cell division site”
(GO:0032153), of which there are 32 in total, were also mostly repressed. Specifically, 15 genes
were downregulated upon exposure to styrene, whereas 2 (ftsL and zapC) were upregulated. To
date, over 3 dozen proteins have been identified to make up the so-called ‘divisome’ in E. coli 202.
Several vital components of the divisome belong to the dcw cluster: an operon consisting of 16
genes that each play key roles in controlling cell division, synthesizing cell wall components or the
production/transport of peptidoglycan (PG) precursors (e.g., lipid II) 203. Eight genes in this cluster
were significantly downregulated following styrene exposure, including (log2 fold change shown in
parentheses): lpxC (-0.44), mraY (-0.54), murE (-0.56), ftsW (-0.95), ddlB (-0.95), ftsQ (-0.97),
murG (-1.10) and murC (-1.11). Among these, ftsW, ftsQ, and ftsL all belong to the dozen total
genes that are essential for cell division 202. Other genes involved in synchronizing cell envelope
division, controlling elongation machinery, and mediating cell wall synthesis also showed significant
downregulation (log2-fold change in parentheses), including mreB (-1.22; encoding a dynamic
cytoskeletal protein that controls PG biosynthesis 204), as well as those genes making up the Tol
system (tolA (-1.50), tolQ (-1.11), tolR (-1.23), tolB (-1.04) and pal (-1.05)) which controls initiation
of outer membrane (OM) constriction 204. Previously, it has been shown that damage to any part
of the Tol system leads to decreased OM integrity and periplasmic leakage, thus leading to
increased sensitivity to drugs and other stresses 204. As the initiation of cell division processes and
constriction of the OM are often the most vulnerable moments for E. coli cells when exposed to
various stresses 205, cells may be attempting to reduce expression of cell envelope organization
genes upon styrene exposure to reduce times when cells are most susceptible to stress-induced
damage. Furthermore, by downregulating genes involved in cell division and protein production,
cells may be able to focus resources on stress responses and energy generation perhaps in an
effort to move from a growth to survival mode.
78
4.3.5 Central Metabolic Pathways
The main KEGG pathways associated with central metabolism were also analyzed, revealing a
wide distribution of genes were DE following styrene, including 21% upregulated and 19%
downregulated for “glycolysis/gluconeogenesis” (eco00010; 42 genes total), 20% upregulated and
33% downregulated for “pentose phosphate pathway” (eco00030; 30 genes total), and 22%
upregulated and 11% downregulated for “citrate cycle (TCA cycle)” KEGG pathway (eco00020; 27
genes total). One particularly interesting behavior revealed by this analysis pertains to the
production (from pyruvate) and subsequent consumption (to citrate and into the TCA cycle) of
acetyl-CoA by the pyruvate dehydrogenase complex (PDH; encoded by aceEF-lpd) and citrate
synthase (encoded by gltA). Expression of PDH is negatively regulated by the dual regulator PdhR,
whose own expression was also significantly upregulated (log2-fold change = 2.12) in the case of
A. Previously, activation of PdhR has been reported for E. coli in response to a variety of acid
stresses 206. Binding of PdhR to its cognate operator is influenced by the availability of pyruvate.
More specifically, when present, pyruvate binds to and releases the transcriptional repression
caused by PdhR. In the case of A, each of aceE, lpd and gltA were upregulated (log2-fold change
= 1.06, 0.89 and 1.30, respectively). In addition to PDH, meanwhile, PdhR has been also shown
to negatively regulate ndh – a key gene involved in respiration – although its expression was
upregulated in A (log2-fold change = 0.82) perhaps in an effort to support flux through the TCA
cycle. Overall, these collective behaviors suggest that the cells are attempting to increase energy
generation by shuttling more carbon to pyruvate and, in turn, into the TCA cycle. Consistent with
the above indicators of α-ketoglutarate preservation, these changes further support of a model
suggesting that styrene exposure causes a shift towards increased energy generation by increasing
carbon flux into and through the TCA cycle. Interestingly, this behavior differs from what has been
previously reported for the case of octanoic acid stress in E. coli, for which flux analysis revealed a
diversion of pyruvate flux from the TCA cycle and towards acetate via the more thermodynamically
favorable pyruvate oxidase (PoxB) 207.

79
4.3.6 Global Stress Response
Unsurprisingly, several known and common stress response systems were also found to be
activated in response to styrene addition. This included significant upregulation of several DE
genes from GO terms including “response to radiation” (GO:0009314; 61% of 49 total genes),
“response to UV” (GO:0009411; 67% of 15 total genes), “response to heat” (GO:0009498; 44% of
54 total genes), “response to osmotic stress” (GO:0006970; 78% of 18 total genes), and “response
to drug” (GO:0042493; 58% of 24 total genes). The gene marA, for example, which is part of the
marRAB locus and encodes a dual transcriptional regulator responsible for modulating expression
of several genes involved in resistance to multiple antibiotics and other inhibitory
compounds/conditions 208, was found to be up-regulated upon styrene addition (log2-fold change =
1.08). This is consistent with previous transcriptomic analyses focused on characterizing the
response of E. coli to a variety of inhibitory conditions, where marA expression was almost always
upregulated (93% of the time), including in the case of exposure to phenolic compounds 187,209.
MarA has been shown to directly and indirectly activate expression of as many as 47 different
genes while repressing expression of at least 15 additional genes, including OM proteins like the
porin-encoding ompF 210. Surprisingly, however, several genes whose expression is known to be
regulated by MarA, and which typically play key roles in E. coli’s tolerance mechanisms, were not
upregulated in the case of A. This includes acrAB and tolC (encoding for the multi-drug efflux
transporter AcrAB-TolC), as well as and soxS (encoding for a stress-responsive transcriptional
regulator). In fact, expression of acrB was actually repressed (log2-fold change = -0.84) following
styrene addition. This seemingly conflicting behavior may be due to the fact that the MarA regulon
is governed by a “cascade”-like regulation where, for example, certain genes (e.g., micF, sodA and
marRAB; all upregulated in A) are activated at low MarA levels whereas others (e.g., tolC) are
induced only at higher concentrations 211,212.
The global stress response of E. coli is partially governed by the universal stress protein
superfamily comprised of six proteins encoded by uspACDEFG, all of which are separately
transcribed 213. Increased transcription of these genes has been shown to be induced to a wide
80
variety of stresses, however, such as exposure to heat, ethanol and several antibiotics 213.
Meanwhile, whereas UspA and UspD have been implicated in protecting against superoxide stress,
overall, the physiological roles of these genes are not well known. Here, styrene addition resulted
in upregulation of each of uspC, uspD, uspE and uspG, however, uspA and uspF showed no DE.
E. coli’s heat shock response also appears to be activated in response to styrene exposure. For
instance, transcript levels for the heat shock responsive sigma factor, σ32 (encoded by rpoH), also
showed significant upregulation (log2-fold change = 1.48). Expression of rpoH and its regulon have
also been reported to respond to similar stresses, including ethanol 214 and n-butanol 215 addition.
Two of the most upregulated genes in the dataset were ibpA and ibpB, both of which are part of
the σ32 regulon and encode small heat shock chaperones 216 (log2-fold change = 2.27 and 3.94,
respectively). Deletion of these genes is known to increase sensitivity to heat shock 217 while their
overexpression correspondingly improves resistance 218. Upregulation of the heat-responsive gene
yibA (log2 fold change = 1.83) was also observed. While not well characterized, strains lacking
YibA showed increased sensitivity to nalidixic acid, tetracycline, mitomycin 219, and UV- and X-
radiation 220 while overexpression of yibA increased tolerance of E. coli to n-butanol by ~13% 221.
4.3.7 Membrane Stress Response
Aromatic chemicals, including styrene, have commonly be reported to cause membrane damage
and stress 138,176,192. Thus, unsurprisingly, several stress responses known to be associated with
membrane-related damage were also found to be activated. For example, in E. coli, five main
envelope stress response systems have been identified, including the Psp, Cpx, Bae, Rcs and σE
signaling pathways, which collectively work to restore the cell envelope upon damage, as well as
maintain cell envelope stability and integrity 222. The conditions under which these pathways are
activated have previously been studied via induction of representative promoters 223. In this case,
styrene addition was found to upregulate expression of both the Psp and σE signaling pathways.
Conserved in multiple different bacteria, the Psp (phage shock protein) system has been shown to
respond to multiple stresses, including exposure to ethanol, methanol and other hydrophobic
solvents (e.g., n-hexane, cyclohexane) 224,225. In the present study, those genes comprising the

81
pspABCDE and pspG operons (which, along with pspF, collectively make up the Psp system) were
among the most highly upregulated overall (log2 fold change = 5.18 to 5.99). Although the Psp
system is responsive to a variety of stresses, unlike other cell envelope-based stress responses,
its effect is self-contained (i.e., not global) 46. Although several induction signals and mechanisms
have been proposed for the Psp system, including dissipation of the proton motive force, changes
in redox state of the quinone pool, and stored curvature elastic stress on the membrane, no one
signal has been proven to be correct 47. E. coli mutants lacking the psp operon, meanwhile, have
been reported to display reduced biofilm formation, a common survival mechanism employed in
response to solvent and other stresses 226. Perhaps more interestingly, psp null mutants have also
been found to display difficulties in maintaining proton motive force when exposed to different
stresses, suggesting that this system plays a role in helping to maintain inner membrane stability
and rigidity under stress 224,225.
The sigma factor σE (encoded by rpoE), meanwhile, has been shown to be responsive to outer
membrane stresses and membrane protein misfolding and controls expression of several genes
related to membrane stress 227. Upon styrene exposure, rpoE expression was slightly up-regulated
(log2 fold change = 0.63). It has been shown that expression of rpoE is up-regulated upon
misfolding of OM proteins, as well as in response to various forms of membrane stress 228,229. The
induction of rpoE can further up-regulate rpoH (the heat-shock sigma factor), which can further act
to respond to misfolded membrane proteins 230. Activation of rpoE expression plays a role in
amplifying the rate of formation of double stranded DNA breaks and triggering induction of
mutagenesis systems, which might facilitate E. coli’s ability to adapt and evolve in high-stress
environments 231. Ultimately, the activation of the σE sigma factor can improve the stability of the
outer membrane by inducing the expression of genes that can re-fold membrane proteins, reduce
the expression of new outer membrane proteins, and rapidly modify the cell envelope upon sensing
stress 232.

82
4.3.8 Cell Envelope Modification
Since aromatic chemicals and other solvents are known to cause stress and damage to the cell
envelope, adjustments made to its structure and composition have thus accordingly been found to
significantly influence tolerance 233-238. Numerous genes associated with several GO terms related
to the cellular envelope were highly DE, including from “membrane” (GO:0016020; 47% of 181 total
genes), “gram-negative-bacterium-type cell outer membrane assembly” (GO:0043165; 73% of 11
total genes), and “outer membrane-bounded periplasmic space” (GO:0030288; 34% of 154 total
genes). Additionally, KEGG pathways which showing significant overrepresentation includes
“lipopolysaccharide biosynthesis” (eco00540; 65% of 31 total genes) and “protein export”
(eco03060; 74% of 19 total genes). One important component of the cell envelope stress response
concerns the use of mechanisms to maintain proper cross-linking of the peptidoglycan (PG) layer.
This can include intermolecular cross-linking via DacC, cross-linking of the PG to the OM lipoprotein
(Lpp) via LdtC, or removal of intermolecular cross-linking via AmiA. Significant upregulated
expression of both lpp and ldtC (log2-fold change = 0.70 and 3.84, respectively) resulted following
styrene exposure, suggesting that cells are attempting to increase production of Lpp while also
decreasing the amount of free Lpp by anchoring it to PG 239. This same mechanism has been
reported to maintain or increase stability of the cell wall in response to penicillin-exposure and/or
induction of the Cpx system 239-241. Lpp plays an important role in the properties of the OM. Deleting
lpp, for example, causes an increase in OM permeability 242, and has been shown to facilitate the
uptake of the very hydrophobic organophosphorus compound coumaphos (logKow = 4.13 versus
2.95 for styrene) 242. If the opposite is also true, E. coli’s response to styrene appears to perhaps
include the use of strategies aimed at reducing membrane permeability and further stabilizing the
OM to protect the cell from styrene-induced damage.
Overall, it has often been found that the composition and structure of the OM is a strong determinant
of tolerance, especially in the case of hydrophobic solvents 178,234,243,244. One of most important
regulators of OM composition is the two-component signal transduction system composed of ompR
and envZ 245 (log2 fold change for A of 0.80 and 0.51, respectively), both of whose expression was
83
upregulated in the case of A. One function of this system has been shown to be its ability to provide
variable control over the expression of two small RNAs (sRNAs) omrA and omrB 246, as well as the
OM porins ompF and ompC, which it does in response to changes including those in osmolarity,
pH or temperature 247. Activation of omrA and omrB has previously been reported following
exposure to several other bioproducts, including butanol, furfural, geraniol and succinic acid 248.
OmpF, meanwhile, belongs to the General Bacterial Porin (GBP) family and facilitates the diffusion
of various small (600 Da or less; note: styrene is ~104 Da) molecules (e.g., ions, antibiotics, small
proteins) through the OM 249,250. In addition to its function as a porin, meanwhile, OmpF has also
been reported to impose a significant impact on membrane composition, hydrophobicity and,
ultimately, solvent tolerance 251. For example, ompF expression was repressed in a series of
isolated mutants with enhanced tolerance to a variety of hydrophobic solvents (e.g., cyclohexane,
xylene) 252. In a follow-up study, however, ompF-null mutants showed no improvement in solvent
tolerance 251, suggesting that its relative abundance is a key factor. However, others have utilized
the deletion of ompF with an overexpression of fadL, an OM ligand gated channel, to increase
integrity of the membrane and consequently improve production of fatty acids by ~53% 253. Here,
expression of ompF was significantly downregulated following styrene exposure (log2-fold change
= -1.89). Furthermore, translation of ompF has been shown to be inhibited by an increase in
expression of the sRNA micF, which concurrently was found to be upregulated in the case of A
(log2-fold change = 2.02).
Another of the most highly upregulated genes, meanwhile, was bhsA (log2-fold change = 5.03),
which encodes an OM protein. Induction of bhsA expression has often been associated with biofilm
formation, and has been observed in response to various stresses (e.g., hydrogen peroxide 186,
cadmium 254 and salicylate 184). Null mutants of bhsA, meanwhile, have been found to suffer from
increased sensitivity to acid, hydrogen peroxide and heat treatment, while displaying upregulation
of a significant number of membrane proteins and downregulation several genes encoding cell
surface proteins, ultimately leading to significant increases in both cell hydrophobicity and
aggregation 255. In contrast, overexpression of bhsA has been shown to reduce cell surface
hydrophobicity, which lead to improved tolerance to and production of octanoic acid 256. Separately,
84
while investigating several E. coli mutants tolerant to different organic solvents (e.g., n-hexane, p-
xylene, cyclohexane), it was similarly reported that the cell surfaces of the more tolerant mutants
were less hydrophobic then the parent strain (K-12) 252. While several mechanisms remain to be
elucidated, these collective observations at least suggest that E. coli is attempting to increase
styrene tolerance via a multi-level strategy designed strengthen the membrane by modifying its
structure and composition while also limiting styrene diffusion into the cell.
4.3.9 Efflux Transporters
One mechanism commonly utilized by various microbes to overcome the toxicity associated with
small molecules involves the use of multi-drug resistant (MDR) efflux transporters to export species
across the cell membrane and into the extracellular medium 257. One of the most well-studied
families of MDR transporters, in particular with respect to solvent-like hydrocarbons, are the RND
(Resistance-Nodulation-Division) efflux pumps. In particular, it was previously reported that strains
lacking acrB exhibited inhibited growth profiles when exposed to various concentrations of styrene
relative to the wild-type control 258. In another studies, E. coli strains which showing improved
tolerance to added toluene showed 2.8- and 5.2-fold increases in transcript levels of acrA and acrB,
respectively 259. Interestingly, however in the case of A, of all known RND efflux transporters in E.
coli, only 1 component was DE upon styrene addition (acrB) and transcript levels were, in fact,
reduced relative to the control (log2-fold change = -0.84). Since efflux transporters activation
typically involves by a transcription factor via a toxin dosage response 260,261, it is possible that
intracellular styrene levels did not surpass the characteristic minima necessary for upregulation of
RND transporters under the conditions examined.
Furthermore, the long-term exposure to styrene in this case may play a role in the lack of expression
of RND efflux pumps as Molina-Santiago et al. demonstrated that in a toluene-sensitive strain (P.
putida KT2440), transcriptional changes in efflux pump expression after short-term (one hour)
exposure to toluene, were of a much higher magnitude compared to the long-term (several hours)
exposure 262. Furthermore, many efflux pumps which showed no DE upon short-term exposure,
were subsequently DE after long-term exposure while many of the upregulated pumps in the short-

85
term demonstrated no DE after long-term exposure 262. Therefore, the expression profile seen here
under styrene exposure may be quite different from that seen directly after a sudden styrene shock
as cells may utilize different mechanisms to survive a short-term exposure to styrene compared to
a long-term exposure. An argument could be made that the utility of RND efflux transporters as a
tolerance strategy is only feasible in the short-term due to consumption of energy (i.e., ATP) for
molecule export.
One accessory protein related to active efflux that was upregulated upon styrene addition (log2-fold
change = 1.43) is the 49 amino acid-long small protein AcrZ, which was found to associate with
AcrB in the AcrAB-TolC complex 263. Researchers have shown that removal of the acrZ gene could
negatively impact the minimum inhibitory concentrations (MIC) of chloramphenicol, for example,
where while deletion of acrB may have lowered the MIC from 8 to 1 µg/mL, deletion of acrZ alone
reduced the MIC from 8 to 4 µg/mL 263. Not all AcrB-dependent compounds saw enhanced toxicity
upon deletion of acrZ, however, including erythromycin and fusidic acid. Nevertheless, it is likely
that AcrZ plays a noteworthy role in the AcrAB-TolC-dependent efflux of some compounds, and it
has been suggested that AcrZ perhaps aids in determining substrate specificity and may serve as
an interesting target for future engineering efforts.
The transcriptional responses of other MDR transporters were analyzed and most MDR pumps
were not responsive to either external exposure of styrene. The expression of genes such as emrE,
fsr, ynfM, emrY, ydiM, and ydeA, which encode for transporters, was increased upon styrene
external exposure. Table 4.1 shows a list of DE genes encoding for a variety of MDR efflux pumps
and other transporters of interest in E. coli when cells were exposed to styrene via both modes. Of
transporter-encoding genes which were upregulated under both modes of styrene exposure, ydeA
and mdtG, which encode for a known L-arabinose exporter and a MDR efflux pump, respectively,
are of particular interest. These results may indicate that the ydeA and mdtG promoters in E. coli
have a natural positive response to styrene exposure.
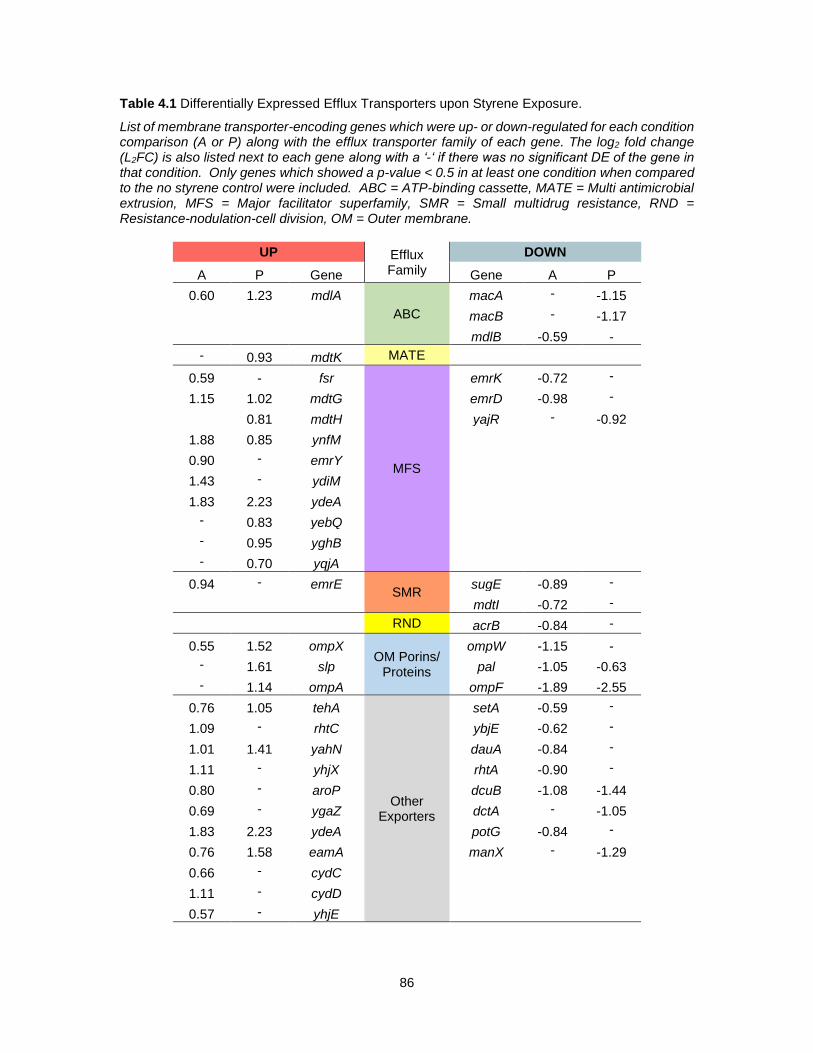
86
Table 4.1 Differentially Expressed Efflux Transporters upon Styrene Exposure.
List of membrane transporter-encoding genes which were up- or down-regulated for each condition comparison (A or P) along with the efflux transporter family of each gene. The log2 fold change (L2FC) is also listed next to each gene along with a ‘-‘ if there was no significant DE of the gene in that condition. Only genes which showed a p-value < 0.5 in at least one condition when compared to the no styrene control were included. ABC = ATP-binding cassette, MATE = Multi antimicrobial extrusion, MFS = Major facilitator superfamily, SMR = Small multidrug resistance, RND = Resistance-nodulation-cell division, OM = Outer membrane.
UP Efflux Family
DOWN
A P Gene Gene A P
0.60 1.23 mdlA
ABC
macA - -1.15
macB - -1.17
mdlB -0.59 -
- 0.93 mdtK MATE
0.59 - fsr
MFS
emrK -0.72 -
1.15 1.02 mdtG emrD -0.98 -
0.81 mdtH yajR - -0.92
1.88 0.85 ynfM
0.90 - emrY
1.43 - ydiM
1.83 2.23 ydeA
- 0.83 yebQ
- 0.95 yghB
- 0.70 yqjA
0.94 - emrE SMR
sugE -0.89 -
mdtI -0.72 -
RND acrB -0.84 -
0.55 1.52 ompX OM Porins/
Proteins
ompW -1.15 -
- 1.61 slp pal -1.05 -0.63
- 1.14 ompA ompF -1.89 -2.55
0.76 1.05 tehA
Other Exporters
setA -0.59 -
1.09 - rhtC ybjE -0.62 -
1.01 1.41 yahN dauA -0.84 -
1.11 - yhjX rhtA -0.90 -
0.80 - aroP dcuB -1.08 -1.44
0.69 - ygaZ dctA - -1.05
1.83 2.23 ydeA potG -0.84 -
0.76 1.58 eamA manX - -1.29
0.66 - cydC
1.11 - cydD
0.57 - yhjE

87
4.3.10 Comparing E. coli’s Response to Styrene Addition versus Styrene Production
One motivation in this study was to identify similarities and differences in the transcriptional
response when cells were exposed to styrene via exogenous addition versus when cells internally
produced styrene. Overall, the responses identified were largely the same with slight differences.
Responses such as up-regulation of phage shock response, DNA damage response and cell
envelope-altering genes as well as down-regulation of ribosomal and nucleotide biosynthesis
genes were consistent between the two modes of exposure.
Although, the DE profile of genes in the two modes of exposure contain many similarities in terms
of responses, a difference emerged in terms of the magnitude of DE between certain gene sets in
the production and addition mechanisms of exposure. As discussed in section 4.3.1, the magnitude
of DE for up-regulated genes was significantly higher in P compared to A. Among genes which
were up-regulated under both modes of exposure, the average log2-fold changes for P and A were
1.58 and 1.38, respectively. When analyzing specific genes, these differences can become even
larger. Among the highly up-regulated genes involved in the phage shock response (i.e.,
pspABCDE, pspG), the average log2-fold changes for P and A were 7.33 and 5.45, respectively.
This was also prevalent in terms of cellular response to DNA damage mechanisms such as the
SOS response. Genes such as recA and sulA showed increased responsiveness in styrene
producing cells (recA: P log2-fold change = 0.90, A log2-fold change = 0.46; sulA: P log2-fold change
= 1.90, A log2-fold change = 0.86). Other genes of interest saw similar DE magnitude differences
such as marA (P log2-fold change = 2.52, A log2-fold change = 1.08), lpp (P log2-fold change =
1.77, A log2-fold change = 0.70), and micF (P log2-fold change = 2.75, A log2-fold change = 2.02).
Additionally, up-regulation of genes associated with the heat shock response seem to be more
prevalent upon styrene addition as log2-fold changes were 111% and 108% higher for ibpA and
ibpB, respectively, than in production strains. Additionally, while rpoH was up-regulated (log2-fold
change = 1.48) in the addition mode of exposure, it showed no DE in cells producing styrene.
A further difference between the two conditions is seen among amino acid biosynthesis. Overall,
in the KEGG pathway “biosynthesis of amino acids” (eco01230; 118 genes total), the A condition
88
showed 22% of genes up-regulated and 19% of genes down-regulated. Conversely, in the P
condition, only 9% of genes were up-regulated while 33% of genes in this KEGG pathway were
down-regulated. While the expression of genes involved in the biosynthesis of some amino acids
shows a similar profile (e.g., arginine biosynthesis, phenylalanine, tyrosine and tryptophan
biosynthesis), there are larger differences among others. For example, in the KEGG pathway for
“valine, leucine and isoleucine biosynthesis” (eco00290; 16 genes total), seven genes (44%) were
DE for the A condition, with all of them being induced upon styrene addition. However, in the P
condition, only one gene was induced in this KEGG pathway while 5 (31%) were repressed.
Exposure to certain aromatic compounds (e.g., p-coumaric acid) has previously been shown to
result in DNA binding and damage 198. In section 4.3.2, data showing the impact of styrene
exposure to E. coli cells on DNA damage and repair mechanisms was illustrated. However, one
key difference (namely, expression of dps) in this regard was identified between styrene-producing
cells and cells where styrene was exogenously added. Dps is an important DNA-binding protein
that works to protect DNA from a variety of stresses (most critically, oxidative stress) via prevention
of DNA breakage, iron sequestration and ferroxidase activity 264. Its encoding gene (dps) has been
reported as one the most commonly DE genes, appearing in over 70 separate transcriptomic
studies investigating the effects of exposure to compounds such as isobutanol, salicylate, and a
variety of acids 187,209. Interestingly, in the present study, dps showed no DE for A although it was
up-regulated for P (log2-fold change = 1.95). Thus, the inhibition caused by styrene exposure is
not likely due to any significant effect that it has on DNA damage.
As seen in Figure 4.2C, there were 33 genes which showed significant DE in opposite directions
for the two modes of styrene exposure. These genes, as well as the log2 fold change in each
condition is listed in Table 4.2. One gene of note is mepS which encodes for a DD-endopeptidase
which functions to help expand the peptidoglycan layer by abolishing current cross-links to allow
for incorporation of further peptidoglycan 265,266. This is a vital process during growth and a
reduction of MepS levels in the cell can inhibit synthesis of peptidoglycan (allow it is suggested that
MepM/H are redundant of MepS in E. coli) 265,266. Here, expression of mepS was significantly

89
repressed upon styrene addition while induced upon styrene production (log2-fold change of -1.94
and 1.45, respectively). The expression of mtgA, which encodes for a peptidoglycan
glycosyltransferase 267, shows a similar profile (log2-fold change of -0.93 and 1.44 for A and P,
respectively). The enzyme MtgA works to polymerize lipid II molecules for further synthesis of
peptidoglycan 268. This interesting expression of these two genes may indicate that, in production
strains, cells are actually attempting to produce and incorporate more peptidoglycan even though
cell division mechanisms are seemingly shutting down.
One interesting difference between the two modes of styrene exposure involves the various cold
shock proteins found in E. coli. Overall, components of the CspA family of cold shock proteins
were found to be down-regulated in cells exposed to exogenous styrene while up-regulated in cells
producing styrene (Table 4.2). For example, cold shock proteins encoded by cspB and cspG were
up-regulated in P (log2-fold changes of 1.44 and 1.53, respectively) while showing down-regulation
in A (log2-fold changes of -1.37 and -2.84, respectively). Further differences were seen among
genes in this family such as with the cases of cspA (log2-fold change = -4.17 for A, no DE for P)
and cspE (no DE for A, log2-fold change = 1.72 for P).
Interestingly, expression of ompT (which encodes for an OM protease) was slightly down-regulated
in the presence of styrene in the case of A, but up-regulated in the case of P (Table 4.2). Others
have demonstrated that expression of ompT is often repressed upon up-regulation of omrA/B 246.
However, as OmpT has also been shown to be highly abundant in strains overexpressing
recombinant proteins 269,270, this discrepant behavior may be an artifact of expressing the styrene
pathway in P, and be unrelated to differences in the toxic action of styrene.

90
Table 4.2 Genes DE in Opposite Directions upon Styrene Addition or Production.
List of genes that were DE under both modes of styrene exposure but show DE in opposite directions (compared to the control). The log2-fold change of expression between the styrene addition (A) or styrene production (P) compared to the no styrene control strain from our RNA-seq results is listed.
log2-fold change
Gene A P
ilvM 0.85 -3.79
ilvE 0.66 -2.76
ilvX 0.80 -2.33
metQ 0.74 -1.40
mepS -1.94 1.45
cspG -2.84 1.53
ompT -0.63 1.33
patA -1.03 1.20
yeiH 0.82 -1.17
aceB 0.66 -1.18
rstA -1.81 1.16
uxuA 0.56 -1.08
yeaQ -0.73 0.97
ybgS -0.69 1.17
csrC 0.76 -2.34
csrB 1.11 -2.24
elaB -1.49 0.86
gadB -1.05 1.17
hdeA -1.04 1.31
gatY 0.80 -0.79
dacC -0.58 0.87
yoaC -0.74 0.82
yjdN -0.52 0.91
yodD -1.03 0.81
mgrB -0.88 1.51
ybgA -0.82 0.89
ycgB -0.73 0.73
otsB -1.29 0.84
mnmE 0.92 -0.75
cspB -1.37 1.44
mtgA -0.93 1.44
tusD 0.59 -0.75
thrU -1.48 1.06

91
4.4 Discussion
While the present study represents the first to report on the transcriptome-wide response of E. coli
to styrene, others have explored the impacts of other hydrophobic solvents on E. coli as well as
different aromatic chemicals on other microorganisms. In terms of aromatic chemicals, Jin et al.
recently performed a transcriptomic analysis of Saccharomyces cereviasiae following 2-
phenylethanol exposure 191, whereas Molina-Santiago et al. previously compared the
transcriptional response of two P. putida strains (KT2440 and DOT-T1E) to toluene exposure 262
and Yung et al. investigated the effect of sub-lethal levels of toluene on the transcriptome of E. coli
188.
As a result of styrene exposure, the collective responses demonstrate that E. coli alters expression
of numerous membrane-related functions, the likes of which likely represent a concerted effort by
the cell to repair and alter the membrane composition in order to minimize direct harmful
interactions with or other indirect effects of styrene. This type of survival strategy is common across
bacteria. For instance, in the case of toluene exposure to P. putida KT2440 and DOT-T1E (toluene
tolerant), whereas the more tolerant DOT-T1E strain mostly altered the expression of “intracellular
parts”, the more sensitive KT2440 strain differentially expressed a greater number of genes
involved with a variety of different membrane functions, especially those encompassing energy
generation and iron uptake 262. As with styrene and E. coli, this response postulated to constitute
an overall effort by the cell to alter membrane permeability and protect the cell from the membrane-
damaging effects of toluene. Meanwhile, to provide the energy and material resources needed to
repair, stabilize, and alter the membrane, cells must also divert and reallocate such resources from
elsewhere in the cell. In the case of KT2440, it was seen that energy-intensive processes such as
flagellar assembly were highly down-regulated (unlike in DOT-T1E), allowing more resources to be
focused on stress management 262. A similar picture emerged for styrene and E. coli, as cells seem
to have worked to shut down processes which require significant energy such as cell division and
nucleotide and protein biosynthesis to focus efforts on global stress responses and membrane

92
altering strategies. Overall, these findings underscore the importance of developing engineering
strategies aimed at increasing the robustness and reducing the permeability of the cell membrane.
Accordingly, many tolerance engineering strategies have been investigated to improve the fitness
of cells when exposed to solvent-like chemicals. For example, tolerance engineering has led to
successful improvements in product yields such as with ethanol production in S. cerevisiae 271,272,
as well as both limonene 257 and isopentenol 273 in E. coli. Furthermore, by incorporating
heterologous parts from solvent-tolerant sources, tolerance of E. coli towards industrially relevant
chemicals can be obtained. Tan et al. improved the growth rate of E. coli in the presence of a
variety of compounds (e.g., styrene, toluene, succinate, butanol, hexanoic acid) and stresses (e.g.,
heat shock, osmotic pressure) by expressing the heterologous cis-trans isomerase (cti) from
Pseudomonas aeruginosa 234. This enzyme introduces the non-native process of producing trans
unsaturated fatty acids into E. coli and incorporating this into the membrane to alter membrane
properties. This group further demonstrated the utility of membrane engineering by overexpressing
the native phosphatidylserine synthase (encoded by pssA in E. coli) which increased the
abundance of the phosphoethanolamine head group in the membrane 237. This change led to
differences in membrane integrity and fluidity along with surface potential and hydrophobicity.
Ultimately, this strain showed improved growth rates in the presence of styrene, toluene, vanilic
acid, ferulic acid, 4-hydroxybenzoate and several others. These examples demonstrate the
importance of identifying and developing mechanisms that can alter important membrane
properties to protect cells against cell envelope-damaging compounds.
The importance of multi-drug resistant efflux transporters to maintain or improve tolerance to a
variety of compounds has been shown for several organisms, including E. coli
69,90,92,189,257,260,261,274,275. Furthermore, the intracellular accumulation of toxic compounds can have
a significant impact on the expression of different efflux transporters by their associated hosts. For
example, pumps such as AcrAB-TolC (from E. coli), TtgABC and SrpABC (from P. putida) have all
been shown to become induced upon solvent exposure to minimize intracellular concentrations 276.
In the case of styrene exposure, it is difficult to isolate any single efflux transporter or system that

93
shows high up-regulation in the presence of styrene (at least in the long-term). Interestingly, only
one member of the RND families of efflux pumps in E. coli showed any differential expression upon
styrene exposure (i.e., acrB: log2 fold change of -0.84 in A). Previously, the AcrAB-TolC efflux
transporter was implicated as an important part of E. coli growth in the presence of styrene and
removal of this transporter inhibited both growth and production of styrene in NST74 258.
Interestingly, a recent evolution of E. coli K-12 to improve tolerance to the aromatic acid benzoate
showed that cells with higher tolerance actually lost of MDR efflux pumps (e.g., emrA/Y, mdtEF)
and important regulators of MDR pump expression (e.g., marRAB) 277. This may help indicate that
specific efflux transporters are needed for improved chemical tolerance and the energy-intensive
expression and subsequent placement of transporters which have limited or no activity on said
chemical is ultimately counter-productive. This makes the isolation and engineering of specific
efflux pumps with high activity for individual compounds of interest (such as styrene) vital to reduce
toxicity through efflux transporter-mediated methods. Several examples have previously been
demonstrated through the expression of heterologous RND-family efflux transporters in E. coli to
improve the tolerance of cells to n-butanol 236, limonene, geraniol and others 257.
Even considering these successful examples, it may be that significant improvements in tolerance
for many biochemicals (i.e., enough to allow for economically viable production levels), may not be
obtained simply through expression of one, highly active and specific efflux transporter. In the
toluene and styrene tolerant P. putida strain DOT-T1E, three main RND efflux transporters
(TtgABC, TtgDEF, TtgGHI) are up-regulated upon exposure to toluene or styrene and play a role
in the strain’s significant tolerance to organic solvents 278,279. Researchers found that removal of
even one of these efflux systems led to at least a two order-of-magnitude reduction in cell survival
278. Additionally, other efflux transporters in this strain have been found to play a role in DOT-T1E
tolerance towards toluene 280 along with differences in fatty acid biosynthesis 281 further implicating
a complex mechanism in overcoming solvent toxicity. Therefore, engineering efforts which focus
on multiple strategies and genes may be the most effective method for future tolerance
improvements endeavors, as has been suggested elsewhere 233.

94
As it will likely be important to sense and respond to membrane stress caused by styrene to improve
tolerance in this case, the engineering of global regulators which can affect change in the
membrane composition and properties may be useful. For example, researchers saw a 3.19-fold
increase in cell viability in the presence of toxic levels of the aromatic phloroglucinol when
overexpressing the chaperone-encoding groESL (production of phloroglucinol was also improved
by 39.5% utilizing this strategy) 282. The sigma factor encoded by rpoE, which responds to cell
envelope stress, has previously been mutated to provide a more robust and rapid response,
allowing the cell to repair defects and alter the cellular envelope composition 283. Incorporating this
mutation may be useful in improving tolerance towards membrane-damaging compounds such as
styrene.
A key aspect of this study is the transcriptional analysis of long-term exposure of E. coli cells to
styrene. This allows for better understanding of how cells are attempting to survive styrene-induced
toxicity after long periods of contact. However, there is a dearth of data and knowledge regarding
the temporal effects of styrene exposure. As the styrene exposure time in this study is hours, rather
than minutes, only certain conclusions can be made regarding the transcriptional response of E.
coli to styrene. It may be that responses to styrene exposure in the short-term and long-term are
similar, perhaps only changing in magnitude of response. However, it may be more likely that an
entirely different expression profile is observed between the two cases. In the aforementioned
study regarding exposure of P. putida KT2440 and DOT-T1E to toluene, the transcriptional
response between both short-term and long-term was analyzed for both strains 262. In this case,
the number of DE genes and the magnitude of fold change in KT2440 was higher in the short-term
compared to the long-term.
Although the current dataset does not enable delineation of a clear timeline of events, several
styrene-induced behaviors support a response model that includes cell envelope damage,
inhibition of cell wall biosynthesis, and disruption of normal cell division. I theorize that the cells
are attempting to shuttle resources and energy from a “growth” mode before styrene addition to a
“survival” mode once they have been stressed. For the most part, cells reduce the expression of

95
genes involved in DNA and protein biosynthesis to allow the cell to focus on mechanisms necessary
to stop cell death induced by styrene. Stress response systems such the phage shock response,
stress-responsive sigma factors and the MarA-mediated response are all turned on to respond to
the damage caused by styrene. Furthermore, by up-regulating bhsA, ompR, ldtC and the sRNAs
omrA/B and micF, it is proposed that the cell is attempting to significantly alter the membrane
composition, rigidity and fluidity in order to survive in the presence of styrene. By focusing on these
areas, future engineering strategies to improve the tolerance of E. coli to aromatics such as styrene,
and perhaps even other hydrophobic compounds, may prove to be successful.

96
CHAPTER 5. FUTURE WORK AND DISCUSSION
Abstract
Biochemical production metrics are often limited by end-product and/or intermediate-induced
toxicity to the cell. At this time, for many chemicals (e.g., styrene, 2-phenylethanol, phenol), current
improvements in production levels are entirely or partially impeded by low tolerance to these
compounds by bacteria, especially E. coli. In an effort to discover mechanisms to improve the
tolerance of E. coli to toxic aromatics, this chapter discusses potential future work to utilize a high-
throughput method to isolate mutant strains which harbor increased tolerance towards compounds
of interest. Additionally, proposed works will involve the engineering of a highly tolerant strain of
P. putida (i.e., DOT-T1E), to over-produce the aromatic amino acid, L-phenylalanine, and express
heterologous enzymes for the production of styrene. Further engineering efforts will focus on
constructing an efficient sucrose-utilizing strain of this styrene producer to allow for improved yields
and titers.

97
5.1 Furthering the Understanding of Aromatic Toxicity in E. coli and Improving
Tolerance towards Aromatics Using High-Throughout Methods
There is interest in further understanding and improving the ability of E. coli to produce toxic
aromatics and one of the first steps is comprehending how cells respond to this toxicity. While the
RNA-seq results and analysis generated for Chapter 4 of this dissertation is a useful guide to
understand the impact of styrene-induced toxicity in E. coli, it is insufficient evidence for the
complete understanding of aromatic-based tolerance mechanisms in E. coli. This research gives
a starting point for constructing a model for aromatic toxicity but certainly does not tell the whole
story. More research is needed to determine which of the mechanisms induced by styrene toxicity
(e.g., phage shock response, membrane alterations) are conserved over other aromatics and which
are not. It is likely that there will be some overlap here but that there will be many responses that
are activated upon styrene exposure but lie dormant when exposed to other aromatics and vice
versa.
Towards the aim of broadening the understanding of aromatic tolerance in E. coli, several studies
are here proposed.
5.1.1 Transcriptomic Analysis of E. coli for Various Toxic Aromatics
To better understand the broad transcriptional response of E. coli to a broad number of aromatic
species, additional and complementary methods are needed. To this end, a previously developed
GFP-based promoter library represents a useful tool. This library could be utilized to investigate
the transcriptional response of specific E. coli genes identified from the styrene RNA-seq data
obtained and analyzed in Chapter 4 from the above enrichment screens to each of various aromatic
species of industrial interest (e.g., styrene oxide, 2PE, phenol, naringenin) along with controls (e.g.,
antibiotics, butanol, ethanol). Although, the results in Chapter 4 indicate that some native genes
are up-regulated upon exposure to styrene, it is not known if, naturally, these responses are
aromatic-specific or respond to other stresses.

98
One method that is often used to understand promoter dynamics, is the fusion of that promoter to
a reporter (e.g., GFP, mCherry) and tracking the expression of that reporter under various
conditions. Therefore, by fusing the promoters for each gene of interest to a reporter such as GFP
and exposing the cells to various aromatics at different concentrations, the response of that
promoter can easily be observed utilizing a fluorescent plate reader. Fortunately, a library of
fluorescent transcriptional reporters was constructed with over 2,000 different promoters fused to
GFP on a low copy plasmid 284. A model study was done here to demonstrate utility of the library,
illustrating differences in promoter activity in a glucose-lactose diauxic shift. This library allows for
a more high-throughput manner of analyzing transcriptional response and can be utilized to
understand promoter dynamics under aromatic toxicity conditions.
This data will provide us with information regarding the evolutionary progression of various stress
response genes and how E. coli activates them. Genes that are “turned on” under a variety of
aromatic exposure, will help to illustrate how these stress response mechanisms have evolved to
help alleviate toxicity brought on by these chemicals. Alternatively, genes that show no up-
regulation under these conditions may indicate that transcriptional elements that control these
genes are not responsive to these aromatics but are affected by some styrene-induced stress.
Styrene-responsive transcriptional elements from P. putida S12 have previously been identified 69
along with the regulator DmpR from Pseudomonas CF600 which is responsive to phenol 285.
Unfortunately, not all promoters in E. coli are part of this GFP library so, therefore, plasmids
harboring missing promoters from this library (e.g., PpspA) can be constructed (in a manner
analogous to others in the library). Screening can be completed utilizing high-throughput
microplate assays, where increases to induction ratio (as determined by RFUs vs. no aromatics
controls and promoterless plasmids) can be used to indicate and quantify expression levels.
Furthermore, as the knowledge gained via RNA-seq regarding styrene exposure to E.coli, as
discussed in Chapter 4, only concerns styrene exposure at one concentration and is limited to a
single point in time, utilization of this library will allow for the elucidation of promoter dynamics
throughout the course of culturing and with different concentrations. Furthermore, these

99
experiments could help determine if the up- or down-regulated genes/operons found in the Chapter
4 are consistent amongst other aromatics, different time points in culturing and varying
concentrations of toxin.
5.1.2 Directed Evolution Strategies to Improve Tolerance of E. coli to Aromatics
While the utilization of such methods as adaptive laboratory evolution allows for the broad
perturbation of an entire genome, it can often be a slow, labor-intensive process that necessitates
the investment of many research hours 286-289. However, as the amount of knowledge about the
functionality of proteins in E. coli and the ways in which compounds impart toxicity onto cells is
amplified, other high-throughput methods can be utilized to elucidate mechanisms by which cells
can gain tolerance. One such process involves directed evolution where a single, target single (or
multiple genes) are altered either randomly, or at specific sites, to generate an altered phenotype
290.
One method for directed evolution is in vitro replication. Here, an error-prone polymerase is utilized
to perform a polymerase chain reaction (PCR) over a specific length of DNA (often, a single gene)
291,292. Due to the low fidelity of the polymerase, mutations are inserted into the sequence. The
degenerate DNA is then introduced into the strain with the desired outcome of a changes in
phenotype due to a mutation. One drawback of this method is that it can be limited by
transformation efficiency as the mutated DNA must be put back into the desired strain, often via a
selection step. Therefore, the speed of experimentation and library size of mutations is often
restricted by the transformation and selection step which can hinder the ability to obtain phenotypic
changes.
In an effort to eliminate the limiting step in error-prone PCR methods, an in vivo strategy for directed
evolution has recently been demonstrated. The method, EvolvR, generates mutations in vivo
utilizing a nicking-variant of Cas9 (nCas9) fused to a DNA polymerase with lowered fidelity to first
introduce nicks into a DNA sequence followed by nick repair via the error-prone DNA polymerase
(PolI3M) 293,294. This system allows for the user to target a specific region of their choice while
diversifying the nucleotide composition over a range of DNA. In the initial study, Halperin et al.
100
demonstrated the utility of this system to reintroduce the resistance capabilities of the
spectinomycin resistance gene after it had been inactivated with a specific mutation. By plating
cells that had been subjected to EvolvR on spectinomycin plates and comparing the number of
strains which harbored spectinomycin resistance to the original number of cells, a mutation rate
could be determined. Here, they determined that the mutation rate of wild-type E. coli cells was
10-10 mutations per nucleotide per generations, whereas the mutation rates of cells utilizing EvolvR
were calculated from 24,500-fold to 7,770,000-fold higher (depending on if mutations were
incorporated into nCas9 or PolI3M) at the target DNA location. In fact, the researchers suggest
that 1 μL of cells expressing the EvolvR variant, enCas9-PolI3M-TBD, for 16 hours will contain all
substitution possibilities in a 60-nucleotide window with over ten-fold coverage. While the tunable
window over which mutations can be generated is not long (max of 350 bp from PAM start site),
the high number of mutations that can be introduced in this range and the ease by which the window
can be moved simply with a change in gRNA sequence, makes this a potentially valuable tool to
directly evolve bacteria cells.
To introduce mutations to improve tolerance towards a variety of aromatics, specific genes in
interest in E. coli will be targeted for mutagenesis utilizing high-throughput methods – chief among
them, the EvolvR technique. As the EvolvR technology is relatively new in the biotechnological
landscape, this will represent a novel use and may have implications for its utility in future tolerance
engineering endeavors. By combining the high-throughput aspects of EvolvR with the growth-
based selection process utilized to identify strains with improved tolerance, novel mutations will be
identified which can help improve understanding of bacterial aromatic toxicity and mechanisms
through which microbes survive. Plasmid parts of the EvolvR system are available on Addgene
(pEvolvR-enCas90PolI5M – ID113078 and pEvolvR-enCas90PolI5M-TBD – ID113077) and will be
purchased. The targeting gRNA part of this plasmid will be constructed for each separate gene
target utilizing CPEC (Circular Polymerase Extension Cloning) 295. A basic outline for the proposed
protocol is illustrated in Figure 5.1. This will involve transformation of EvolvR plasmid with
designed gRNA(s) expressed targeting region(s)/gene(s) of interest. The EvolvR system will be
induced to generate a library of genetic variants. These variants will then be subjected to serial

101
transfers of increasing chemical (e.g., styrene) concentrations to kill any cells which have neutral
or deleterious effects and eventually isolate those mutants which provide beneficial traits to the
cells when exposed to the toxic compound (e.g., styrene). Variants can then be sequenced and
tested further in terms of improving cell viability and growth as well as various structural protein
changes that may be of interest to investigate.
Figure 5.1 Proposed Protocol for Utilization of EvolvR System to Identify Genetic Mutants which Improve Tolerance to Biochemicals.
Procedure to utilize EvolvR to identify useful mutations that improve the tolerance of strains towards toxic chemicals of interest. This involves transforming the desired strain with the pEvolvR plasmid containing a gRNA targeting a gene of interest. Then, EvolvR will be induced and mutated strains will be exposed to the toxic compound, followed by growth and serial transfers in increasing concentrations of the toxin. Mutated strain growth will be compared to a control (e.g., strain harboring pEvolvR plasmid with a nonsense gRNA) followed by isolation and sequencing of useful mutants.
In Chapter 4, several genes were identified via RNA-seq which may serve an important role in the
survival of E. coli to styrene. While not comprehensive or necessarily applicable to all aromatics,
a survey of these genes will serve as a starting point for genes to target for mutagenesis. As these
genes were identified in a screen against styrene, and styrene represents an important chemical
upon which production in E. coli has reached near toxicity limits, it will serve as the initial compound

102
for screening this method. However, as this tool can be utilized for the entire genome in E. coli,
this procedure could be optimized for other compounds such as antibiotics (to better understand
mechanisms behind antibacterial resistances) and industrially relevant biochemicals (in efforts to
improve tolerance and production).
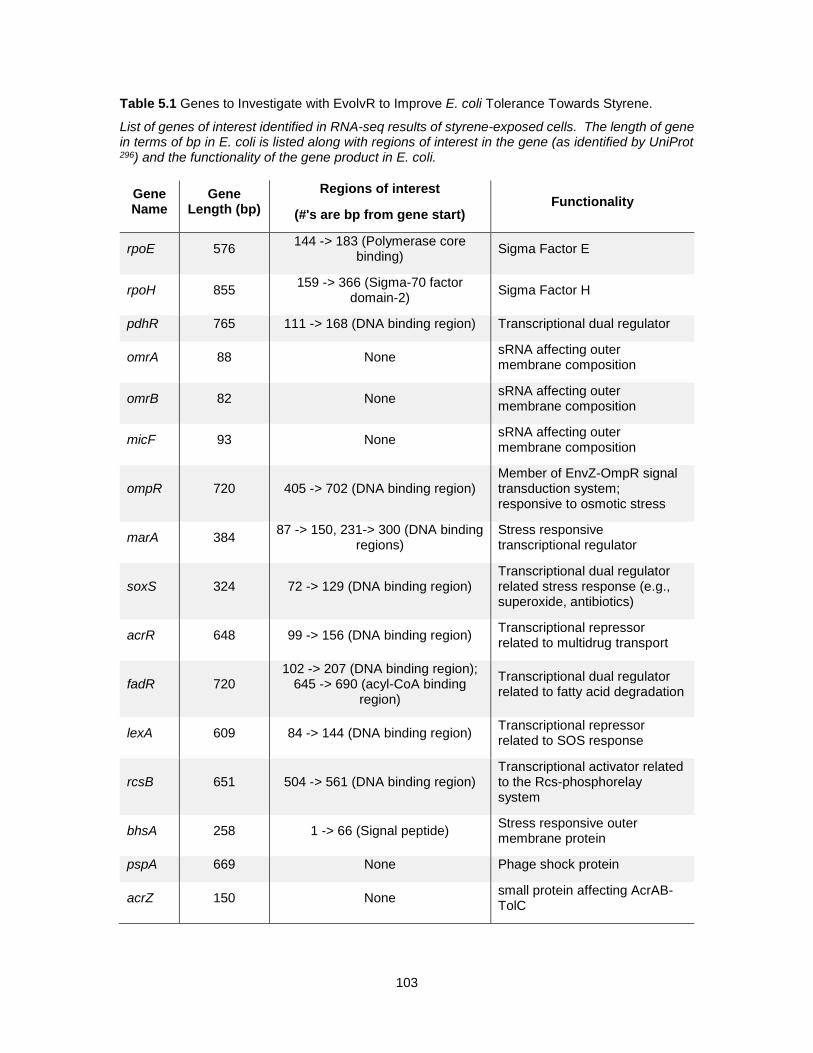
103
Table 5.1 Genes to Investigate with EvolvR to Improve E. coli Tolerance Towards Styrene.
List of genes of interest identified in RNA-seq results of styrene-exposed cells. The length of gene in terms of bp in E. coli is listed along with regions of interest in the gene (as identified by UniProt 296) and the functionality of the gene product in E. coli.
Gene Name
Gene Length (bp)
Regions of interest
(#'s are bp from gene start) Functionality
rpoE 576 144 -> 183 (Polymerase core
binding) Sigma Factor E
rpoH 855 159 -> 366 (Sigma-70 factor
domain-2) Sigma Factor H
pdhR 765 111 -> 168 (DNA binding region) Transcriptional dual regulator
omrA 88 None sRNA affecting outer membrane composition
omrB 82 None sRNA affecting outer membrane composition
micF 93 None sRNA affecting outer membrane composition
ompR 720 405 -> 702 (DNA binding region) Member of EnvZ-OmpR signal transduction system; responsive to osmotic stress
marA 384 87 -> 150, 231-> 300 (DNA binding
regions) Stress responsive transcriptional regulator
soxS 324 72 -> 129 (DNA binding region) Transcriptional dual regulator related stress response (e.g., superoxide, antibiotics)
acrR 648 99 -> 156 (DNA binding region) Transcriptional repressor related to multidrug transport
fadR 720 102 -> 207 (DNA binding region);
645 -> 690 (acyl-CoA binding region)
Transcriptional dual regulator related to fatty acid degradation
lexA 609 84 -> 144 (DNA binding region) Transcriptional repressor related to SOS response
rcsB 651 504 -> 561 (DNA binding region) Transcriptional activator related to the Rcs-phosphorelay system
bhsA 258 1 -> 66 (Signal peptide) Stress responsive outer membrane protein
pspA 669 None Phage shock protein
acrZ 150 None small protein affecting AcrAB-TolC
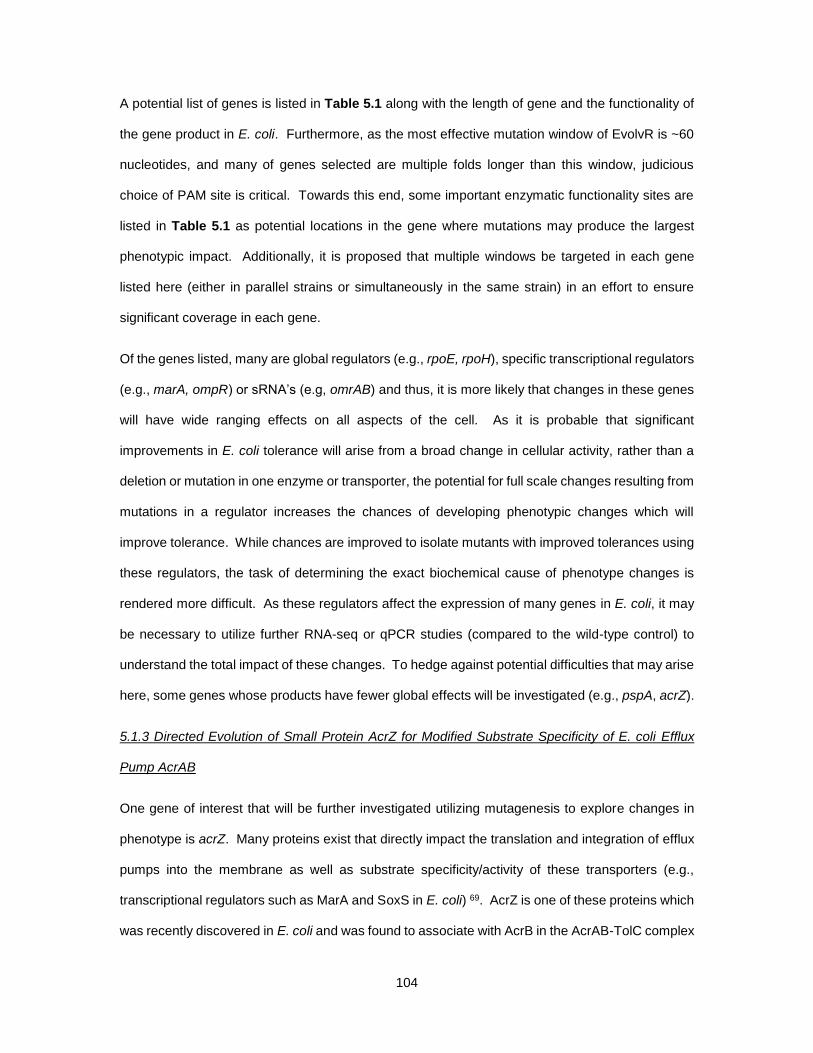
104
A potential list of genes is listed in Table 5.1 along with the length of gene and the functionality of
the gene product in E. coli. Furthermore, as the most effective mutation window of EvolvR is ~60
nucleotides, and many of genes selected are multiple folds longer than this window, judicious
choice of PAM site is critical. Towards this end, some important enzymatic functionality sites are
listed in Table 5.1 as potential locations in the gene where mutations may produce the largest
phenotypic impact. Additionally, it is proposed that multiple windows be targeted in each gene
listed here (either in parallel strains or simultaneously in the same strain) in an effort to ensure
significant coverage in each gene.
Of the genes listed, many are global regulators (e.g., rpoE, rpoH), specific transcriptional regulators
(e.g., marA, ompR) or sRNA’s (e.g, omrAB) and thus, it is more likely that changes in these genes
will have wide ranging effects on all aspects of the cell. As it is probable that significant
improvements in E. coli tolerance will arise from a broad change in cellular activity, rather than a
deletion or mutation in one enzyme or transporter, the potential for full scale changes resulting from
mutations in a regulator increases the chances of developing phenotypic changes which will
improve tolerance. While chances are improved to isolate mutants with improved tolerances using
these regulators, the task of determining the exact biochemical cause of phenotype changes is
rendered more difficult. As these regulators affect the expression of many genes in E. coli, it may
be necessary to utilize further RNA-seq or qPCR studies (compared to the wild-type control) to
understand the total impact of these changes. To hedge against potential difficulties that may arise
here, some genes whose products have fewer global effects will be investigated (e.g., pspA, acrZ).
5.1.3 Directed Evolution of Small Protein AcrZ for Modified Substrate Specificity of E. coli Efflux
Pump AcrAB
One gene of interest that will be further investigated utilizing mutagenesis to explore changes in
phenotype is acrZ. Many proteins exist that directly impact the translation and integration of efflux
pumps into the membrane as well as substrate specificity/activity of these transporters (e.g.,
transcriptional regulators such as MarA and SoxS in E. coli) 69. AcrZ is one of these proteins which
was recently discovered in E. coli and was found to associate with AcrB in the AcrAB-TolC complex

105
as seen in Figure 5.2 263. This 49 amino acid-long small protein (E. coli contains ~60 known small
proteins 297) is highly conserved among enterobacteria such as Shigella and Klebsiella sp and
maintains a helical transmembrane domain. Additionally, transcription of acrZ is regulated by the
same proteins as acrAB and tolC, namely, MarA, Rob and SoxS 263.
Furthermore, researchers showed that removal of the acrZ gene could negatively impact the
minimum inhibitory concentrations (MIC) of several compounds. Concerning chloramphenicol, for
example, while deletion of acrB may have lowered the MIC from 8 to 1 µg/mL, deletion of just acrZ
alone reduced the MIC from 8 to 4 µg/mL 263. Not all AcrB-dependent compounds saw enhanced
toxicity upon deletion of acrZ, however, including erythromycin and fusidic acid. Nevertheless, it is
apparent that AcrZ plays a noteworthy role in the AcrAB-TolC-dependent efflux of some
compounds, and it has been suggested that AcrZ perhaps aids in determining substrate specificity.
Researchers proposed two methods of action for AcrZ-mediated efflux activity – firstly, the binding
of AcrZ confers conformational changes in AcrB, causing alterations in substrate specificity or
secondly, AcrZ cooperates with other AcrB-interacting proteins to deliver chemicals to AcrAB-TolC
for further efflux. Additionally, I believe that AcrZ may have an important role in mediating tolerance
of certain aromatics such as styrene. In transcriptome-level experiments presented in the next
chapter, expression of acrZ was up-regulated when exposed to styrene (log2-fold changes ranging
from +1.43 to +1.78 depending on the mode of exposure).
With the goal of further investigating the role of AcrZ in bacterial tolerance, I propose to use EvolvR
to examine if AcrZ-derived mutants with improved specificity towards aromatic substrates can be
isolated. As AcrZ is such a small protein (49 amino acids long), the number of iterations needed
to cover a large part of the fitness landscape is relatively small. Firstly, acrZ strains will be tested
against wild-type strains to assess tolerance to a variety of aromatic chemicals such as styrene, 2-
phenylethanol and phenol. Plasmid-based expression of acrZ will then be tested with chemicals
that show enhanced sensitivity in the ΔacrZ strain, to test if native tolerance levels can be restored
via plasmid-based complementation. Here, induction levels will be titrated to 1) analyze the effect
of variations in AcrZ expression levels and 2) determine the optimal induction level that allows for
106
similar tolerance for most compounds. Finally, EvolvR will be utilized to generate a genomic
“library” of acrZ mutants which will subsequently be used to screen for tolerance improvements.
Figure 5.2 Interaction of AcrZ with the AcrAB-TolC Efflux Pump in E. coli.
As the desired phenotype is directly tied to improved growth under otherwise inhibitory conditions,
enrichment screens with serial dilutions will be utilized. Controls will include: 1) ΔacrZ mutant strain
and 2) wild-type E. coli. Ideally, cells harboring the acrZ “library” will display improved growth at
inhibitory concentrations relative to both of these controls. Following enrichments, mutants will be
isolated and sequenced to determine which acrZ mutations confer improved tolerance. As not
much is known regarding AcrZ and its role in substrate specificity, these enrichments can be
applied to toxins beyond the aromatic class such as antibiotics and compounds that have been
linked to AcrAB-TolC mediated efflux (e.g., 1-hexene 258 and octane 298). If AcrZ is indeed directly
tied to substrate specificity of AcrAB-TolC, this screen may help to identify mutants which can shift
the activity of the efflux pump from one chemical class to another. Additionally, another protein,
YajC (part of the SecDF-YajC complex), was found to interact with AcrB, although, the extent of its
107
effect on bacterial tolerance was not examined thoroughly (strains harboring ΔyajC mutants
showed decreased tolerance to β-lactam antibiotics) 299. Depending on time constraints and the
success seen by evolving AcrZ, further directed evolution of YajC may be investigated.
5.2 Engineering of a Solvent Tolerant Organism as a Host for Aromatic Bioproduction
With end-product toxicity representing a significant bottleneck in production of many industrially
relevant chemicals, the previous sections of this chapter have focused on the engineering of E. coli
for improved fitness when exposed to these compounds. Due to its ease of genetic manipulation
and the demonstration of high levels of bioproduction in E. coli strains, it is sensible to explore
avenues to enhance tolerance in these strains. On the other hand, there are bacterial species that
have naturally evolved to grow in toxic environments and thrive in the presence of many solvents.
Rather than engineering tolerance in product-making strains, pathways can be constructed in
strains that already have high tolerance. As microbial tolerance is almost always not strictly limited
to one mechanism (e.g., efflux pumps, membrane stabilization), but rather a multitude of factors,
utilizing an already tolerant host for bioproduction is often the better path forward 300.
Perhaps the most well-known species of aromatic-tolerant microorganisms is the soil bacterium,
Pseudomonas putida. Many strains of this species that thrive when exposed to a variety of solvents
have been isolated, such as a strain of P. putida, IH-2000, which can grow in up to 50% (v/v)
toluene (most bacteria cannot grow in higher than 0.3% (v/v) toluene) 301. For many of these
strains, efflux pumps play a crucial role, especially those in the RND family. The three RND
complexes of note are TtgABC, TtgDEF and TtgGHI and are found in various combinations in
different strains of P. putida. The solvent tolerant strain DOT-T1E278 has all three while F1 has two
(TtgABC and TtgDEF) and KT2440 only has one (TtgABC) of the three 301. There seems to be
significant variation in the transcriptional response of these strains when exposed to toluene, for
example. With DOT-T1E, ~54% of the up-regulated genes under toluene exposure are not part of
the core P. putida genome indicating that accessory proteins and their response under stressful
conditions play a major role in solvent tolerance 301. Additionally, many of these strains can utilize
these solvents as a carbon source such as P. putida S12 which maintains the styABCDE operon,

108
allowing for styrene to be catabolized, providing the cells with carbon as well as reducing
concentrations of the toxic solvent 125,302.
The utilization of P. putida as a chassis for production of industrially relevant biochemicals has
recently garnered significant interest. While the use of E. coli and S. cerevisiae is much more
prevalent in biochemical production processes due to the fast growth and breadth of knowledge
regarding each species, the exploitation of P. putida has some advantages. As a bacterium
isolated from soil, many P. putida strains have faced stresses and toxins from their naturally
surrounding environment that make these members of these species tolerant to a variety of toxic
compounds. Additionally, while not nearly at the levels of those for E. coli, a wide array of genetic
tools has been developed for use in P. putida 303. These include inducer-based expression systems
such as NahR/Psal (induced by salicylate) 304, MtlR/PmtlE (induced by mannitol) 305 and more
common systems such as LacI/Plac 306 and PT7 307 (induced by IPTG). Further genetic tools, such
as the utilization of plasmids for gene overexpression 308 and the ability to “knockout” genes utilizing
I-SceI 309,310 have been demonstrated as well as a method to incorporate heterologous expression
cassettes onto the chromosome of P. putida via yTREX 311. Furthermore, the incorporation of
CRISPR/Cas9-based tools into the P. putida toolbox has led to other metabolic engineering
strategies being possible including targeted chromosomal mutagenesis 312, targeted down-
regulation 313,314 and plasmid curing 315. The review by Martínez-García and Lorenzo outlines some
of the recent advances in this field 316.
The continuous development and demonstration of genetic tools for P. putida engineering purposes
has led to the established production of a variety of biochemicals. As many strains of P. putida are
tolerant to aromatics and maintain aromatic-degrading mechanisms, a vast number of aromatic
production studies have been demonstrated. One of the earliest uses of P. putida to produce
aromatics was by Wierckx et al., engineering P. putida S12 for the production of phenol from
glucose 26. Here, a heterologous tyrosine phenol lyase from Pantoea agglomerans was expressed
via plasmid to convert tyrosine into phenol. Then, flux towards tyrosine was improved via
overexpression of aroF-1 and random mutagenesis by introducing anti-metabolites for
109
phenylalanine and tyrosine. In batch culture, up to 1.5 mM phenol was produced while fed-batch
runs led to accumulation of up to 5 mM phenol (~320 mg/L phenol; at this concentration, end-
product toxicity limited further production). Additionally, researchers produced 1.73 g/L 4-
hydroxybenzoic acid via the endogenous metabolite chorismate from glucose in P. putida KT2440
317. To improve flux towards chorismate (and ultimately, 4-hydroxybenzoic acid), the feedback
resistant mutant of 3-deoxy-D-arabino-heptulosonate-7-phosphate synthase from E. coli
(aroGD146N) was overexpressed and the E4P supply was improved via deletion of hexR, a negative
repressor of glucose metabolism. In P. putida S12, Verhoef et al. demonstrated the production of
p-hydroxystyrene from glucose by expressing pal and pdc from Rhodosporidium toruloides and
Lactobacillus plantarum, respectively 318. These are just a few of the examples of bioproduction in
Pseudomonads with many more referenced and discussed in section 1.3.3 of this dissertation.
5.2.1 Engineering of Pseudomonas putida DOT-T1E for the Production of Styrene
As DOT-T1E is a highly tolerant strain when exposed to aromatics such as toluene and styrene 319
and has no known styrene degradation mechanism, it is an attractive option to produce styrene.
Some work has already been done to engineer DOT-T1E for the production of phenylalanine
through toxic analog mutation, deletion of off-stream pathways and overexpression of feedback-
resistant mutant enzymes in the phenylalanine production pathway 308. Here, ~870 mg/L
phenylalanine was produced from 1.5% (v/v) glucose in minimal media and the introduction of
heterologous enzymes allowed for the production of 180 and 200 mg/L 2-phenylethanol and trans-
cinnamic acid, respectively. Additionally, researchers demonstrated the enhanced tolerance of
DOT-T1E to other aromatics of interest with 2-, 2-, 4- and 2- times higher MICs compared to E. coli
(DH5α) for phenylalanine, 2-PE, phenylacetaldehyde and trans-cinnamic acid. While the titers
obtained are not high compared to similar production in other organisms, these production levels
are not near reaching completely inhibitory levels for P. putida or E. coli.
Towards the end of further demonstrating the potential of P. putida for efficient bioproduction, DOT-
T1E will be engineered to first, overproduce the native aromatic precursor, L-phenylalanine, and
second, introduce heterologous pathway enzymes to produce styrene, serving as a model for other

110
toxic aromatics. As styrene has a much lower toxicity limit (~300 mg/L) in E. coli and toxicity is
likely the main bottleneck for improved production in this organism, transferring the styrene
production pathway to DOT-T1E has high potential benefits. Additionally, previous researchers in
the David Nielsen lab attempted to engineering P. putida S12 to overproduce styrene, however,
deletion of the gene encoding the first step in styrene degradation, styA, removed any tolerance
advantages it maintained over E. coli production strains (data not shown). This may indicate that
the improved tolerance of P. putida S12 to styrene is mostly (or fully) due to the styrene degradation
machinery in this strain. As DOT-T1E has no known styrene degradation-encoding genes, it is
likely that tolerance is due solely to structural differences in DOT-T1E compared to other strains
and is a superior potential host for styrene production. Figure 5.3 shows the metabolism of
aromatic amino acids (with specific details regarding phenylamine) as well as inherent
phenylalanine catabolism processes present in DOT-T1E.
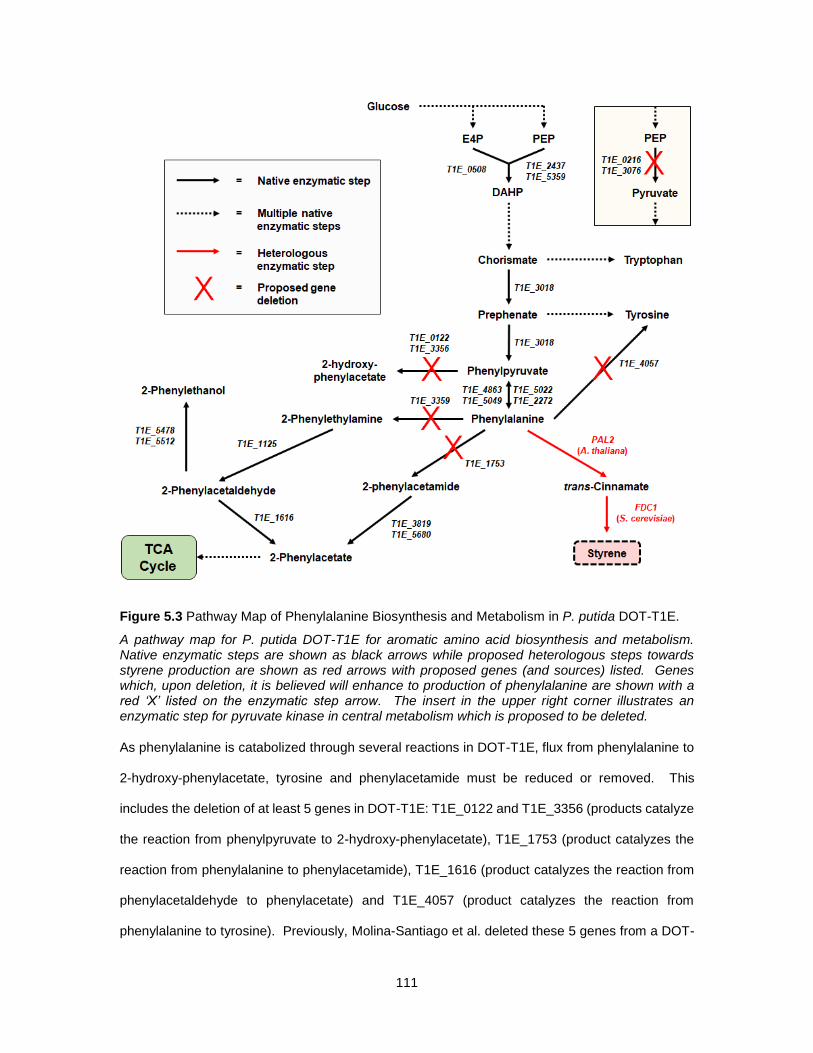
111
Figure 5.3 Pathway Map of Phenylalanine Biosynthesis and Metabolism in P. putida DOT-T1E.
A pathway map for P. putida DOT-T1E for aromatic amino acid biosynthesis and metabolism. Native enzymatic steps are shown as black arrows while proposed heterologous steps towards styrene production are shown as red arrows with proposed genes (and sources) listed. Genes which, upon deletion, it is believed will enhance to production of phenylalanine are shown with a red ‘X’ listed on the enzymatic step arrow. The insert in the upper right corner illustrates an enzymatic step for pyruvate kinase in central metabolism which is proposed to be deleted.
As phenylalanine is catabolized through several reactions in DOT-T1E, flux from phenylalanine to
2-hydroxy-phenylacetate, tyrosine and phenylacetamide must be reduced or removed. This
includes the deletion of at least 5 genes in DOT-T1E: T1E_0122 and T1E_3356 (products catalyze
the reaction from phenylpyruvate to 2-hydroxy-phenylacetate), T1E_1753 (product catalyzes the
reaction from phenylalanine to phenylacetamide), T1E_1616 (product catalyzes the reaction from
phenylacetaldehyde to phenylacetate) and T1E_4057 (product catalyzes the reaction from
phenylalanine to tyrosine). Previously, Molina-Santiago et al. deleted these 5 genes from a DOT-
112
T1E mutant to improve production of phenylalanine by ~45% 308. Figure 5.3 shows the enzymatic
deletions that will be investigated in DOT-T1E to enhance flux towards phenylalanine (and
ultimately, styrene) along with the genes that produce enzymes associated with those reactions.
Other enzymes which consume phenylalanine will also be investigated and, if found, subsequently
deleted. One reaction pathway of note is that from phenylalanine to phenylethylamine which can
further be converted into phenylacetate. This will encompass one method to improve production
of phenylalanine. Previous studies have made significant usage of toxic anti-metabolites (e.g., p-
fluoro-DL-phenylalanine) along with chemical-induced mutagenesis to produce mutants which
exhibit higher than normal levels of aromatic amino acids 26,308. Additionally, through
overexpression of genes encoding for limiting pathway enzymes (as well as feedback resistant
mutants of such enzymes) such as aroG 317, further improvements in flux towards aromatic amino
acid biosynthesis have been made. The incorporation of these methods into a phenylalanine
overproducing strain of DOT-T1E will be investigated. Figure 5.4 illustrates some of the methods
that will be utilized to produce this strain.

113
Figure 5.4 Overview of Procedure to Engineer P. putida DOT-T1E to Overproduce Phenylalanine.
The proposed procedure to develop a phenylalanine overproducer from DOT-T1E. Three strategies will be used which are shown in the grey boxes.
While previous studies have demonstrated the enhanced tolerance of DOT-T1E towards styrene
319, further toxicity assays will be done to confirm previous results and investigate the effect of
styrene on DOT-T1E in production-like conditions. Additionally, a comparison between wild-type
DOT-T1E and the mutants engineered for enhanced phenylalanine production will be completed to
investigate changes in tolerance towards styrene and other aromatics of interest (e.g., 2-
phenylethanol, phenol). Further studies will be done to investigate the capacity of DOT-T1E (and
its mutants) to catabolize important compounds in the biosynthesis of styrene (i.e., phenylalanine,
trans-cinnamate, styrene). If degradation of any of the above compounds is observed, further

114
studies into possible enzymatic reactions which consume these compounds will be done and
identified genes will be deleted.
Subsequently, PAL2 from A. thaliana or FDC1 from S. cerevisiae will be overexpressed in the final
phenylalanine production strain to investigate the efficiency of conversion of phenylalanine to trans-
cinnamate (for PAL2) and trans-cinnamate to styrene (for FDC1). Here, cells will be grown up
expressing the heterologous enzyme and then resuspended in PBS buffer. Precursor
(phenylalanine or trans-cinnamate) will be fed to cells and conversion will be tracked over time.
This will allow for the confirmation of proper enzymatic expression in the cells. Additionally, utilizing
random mutagenesis or codon-optimization strategies for P. putida, variants of each enzyme can
easily be interrogated to achieve improved conversion. Once discovery of the most effective
enzyme variant for each heterologous pathway is confirmed, both genes will be introduced in the
production strain via several methods – overexpression via both heterologous (e.g., T7, lacI/Plac)
and native (e.g., XylS/Pm, NahR/Psal) expression systems using both plasmid-based expression
and chromosomal integration strategies.
5.2.2 Utilization of Alternative Substrates for Styrene Production in P. putida DOT-T1E
The usage and development of tools for catabolizing alternative feedstocks is a significant field of
study in the quest to make bioprocesses cost-effective and economical. Significant work has gone
into demonstrating this for E. coli and S. cerevisiae, where cells have been engineered to introduce
and/or improve utilization a variety of feedstocks such as starch 320, cellulose 321, lactose 322,
sucrose 160,323, xylose 154, glycerol 324, and fructose 325.
While the utilization of glucose for biochemical production in P. putida has dominated, there is
significant interest in incorporating alternative feedstocks. In fact, there are many studies which
have illustrated the potential of utilizing other substrates as carbon sources. One such example is
that of glycerol which has been used as a feedstock for P. putida fermentations due to its low cost
and fewer carbons which need to be oxidized compared to glucose 326. Kenny et al., for example,
utilized glycerol to produce up to 6.3 g/L polyhydroxyalkanoate (PHA) in a fed-batch scenario in the
P. putida strain GO16 327. PHA has been one of the most widely produced compounds from
115
glycerol in P. putida strains due to the fact that many Pseudomonads already produce PHA
naturally and the structure of the monomer can be tuned depending on the carbon feedstock
selection and availability 328,329. Meanwhile, the demonstration of glycerol-conversion to aromatics
of interest in P. putida strains has also been accomplished. Utilizing fed-batch principles, up to 1.8
g/L p-hydroxybenzoate was produced at a molar carbon yield of 8.5% from glycerol in P. putida
S12 330 while phenol has also been produced (0.4 g/L) in a Pseudomonas taiwanensis strain from
glycerol 30.
One carbon source of high interest to the viability of future microbial bioproduction endeavors is
sucrose (a disaccharide composed of one fructose residue and one glucose residue). As one of
the major byproducts of the sugar industry, sucrose is inexpensive and there are vast, unused
amounts available for biochemical conversion processes 331,332. Furthermore, it can easily be fed
to microbes as either the raw juice from sugarcane or as refined molasses (via sugar production)
160,333. While P. putida is unable to naturally metabolize sucrose, previous studies have shown the
high potential of using sucrose for bioproduction as theoretical yields for the production of
rhamnolipids were higher for sucrose compared to glucose 334. Therefore, Löwe et al. worked to
engineer P. putida to metabolize sucrose by incorporating sucrose-utilizing enzymes from E. coli
W 331. The genes cscA and cscB (encoding for a sucrose hydrolase and permease, respectively)
from E. coli W were expressed in P. putida KT2440 to allow for metabolization of sucrose into
central metabolism. However, the growth rate of this engineered strain on sucrose was significantly
lower than on a mixture of glucose and fructose (0.27 and 0.45 h-1, respectively). Therefore, to
improve sucrose utilization rates, Löwe et al. demonstrated another method to introduce sucrose
into the metabolism of P. putida 335. Here, researchers identified a sucrose-utilizing gene cluster
from Pseudomonas protegens Pf-5 which was composed of four genes named cscR (AKA
PFL_3236; encoding for a repressor of genes encoding for sucrose-utilizing proteins), cscA (AKA
PFL_3237; encoding for a sucrose hydrolase), cscB (AKA PFL_3238; encoding for a sucrose/H+
symporter) and cscY (AKA PFL_3239; encoding for a sucrose-specific porin) 335. The gene cluster
from P. protogens Pf-5 as well as the functionality of the gene products in P. putida metabolism are
shown in Figure 5.5. Compared to the E. coli-derived sucrose utilization system, the cscRABY

116
system allowed for much higher growth rates on sucrose. Furthermore, the importance of the porin
for sucrose metabolism was here demonstrated (when cscY was absent, growth rates decreased
significantly) as researchers hypothesized that the outer membrane of P. putida was not permeable
to sucrose. Unlike E. coli, which has broad-spectrum porins (e.g., OmpC, OmpF), porins in P.
putida are more specific and less permeable which may account for the high level of solvent
tolerance present in Pseudomonads 336.
Utilizing similar methods to those implemented by Löwe et al. in the aforementioned study 335,
sucrose metabolism will be incorporated in the phenylalanine overproducing variant of P. putida
DOT-T1E constructed in section 5.3.1 above. This will involve cloning the sucrose metabolism
gene cluster from P. protogens Pf-5 into a plasmid suitable for P. putida (e.g., pSEVA221) for initial
examination of whether or not this system will function in the engineered DOT-T1E strain.
Following initial testing, the gene cluster will be transferred to a plasmid which can easily be
manipulated to incorporate this cluster onto the genome. This can be done via conjugation
methods with DNA transfer from E. coli 335 or utilizing a recent method to incorporate heterologous
expression cassettes onto the chromosome of P. putida with yTREX, as previously mentioned 311.
Once onto the genome, the effect of the presence of the gene cluster will be compared to
expression from the plasmid to evaluate differences in growth rate and sugar consumption.
Additionally, comparisons between the two scenarios will be evaluated for phenylalanine
production titers and yields. Furthermore, these metrics will be utilized to compare the engineered
phenylalanine-overproducing DOT-T1E strain for production on sucrose versus other carbon
sources, especially glucose.
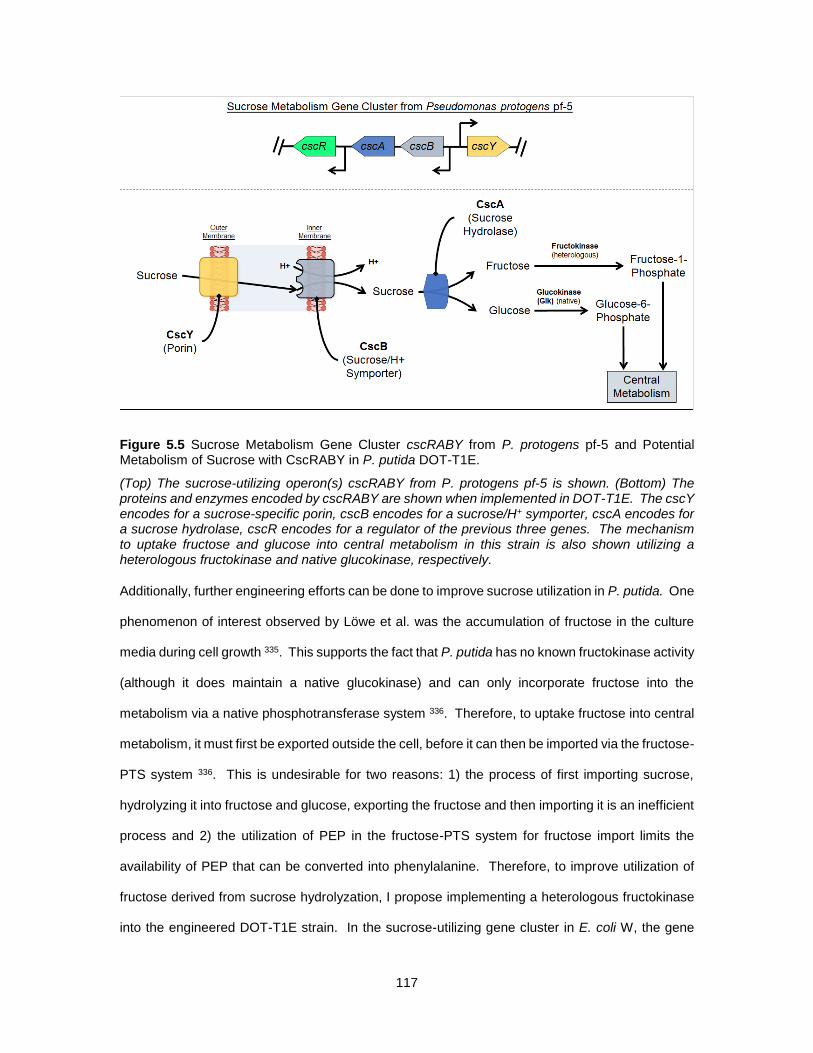
117
Figure 5.5 Sucrose Metabolism Gene Cluster cscRABY from P. protogens pf-5 and Potential Metabolism of Sucrose with CscRABY in P. putida DOT-T1E.
(Top) The sucrose-utilizing operon(s) cscRABY from P. protogens pf-5 is shown. (Bottom) The proteins and enzymes encoded by cscRABY are shown when implemented in DOT-T1E. The cscY encodes for a sucrose-specific porin, cscB encodes for a sucrose/H+ symporter, cscA encodes for a sucrose hydrolase, cscR encodes for a regulator of the previous three genes. The mechanism to uptake fructose and glucose into central metabolism in this strain is also shown utilizing a heterologous fructokinase and native glucokinase, respectively.
Additionally, further engineering efforts can be done to improve sucrose utilization in P. putida. One
phenomenon of interest observed by Löwe et al. was the accumulation of fructose in the culture
media during cell growth 335. This supports the fact that P. putida has no known fructokinase activity
(although it does maintain a native glucokinase) and can only incorporate fructose into the
metabolism via a native phosphotransferase system 336. Therefore, to uptake fructose into central
metabolism, it must first be exported outside the cell, before it can then be imported via the fructose-
PTS system 336. This is undesirable for two reasons: 1) the process of first importing sucrose,
hydrolyzing it into fructose and glucose, exporting the fructose and then importing it is an inefficient
process and 2) the utilization of PEP in the fructose-PTS system for fructose import limits the
availability of PEP that can be converted into phenylalanine. Therefore, to improve utilization of
fructose derived from sucrose hydrolyzation, I propose implementing a heterologous fructokinase
into the engineered DOT-T1E strain. In the sucrose-utilizing gene cluster in E. coli W, the gene
118
cscK encodes for a fructokinase which could be expressed in P. putida DOT-T1E alongside the
cscRABY gene cluster to efficiently import fructose into the central metabolism. Figure 5.5
illustrates the full metabolism of sucrose into central metabolism in DOT-T1E upon expression of
cscRABY along with a functional fructokinase (e.g., cscK). The expression of these genes in a
phenylalanine overproducing variant of DOT-T1E will allow for efficient utilization of the inexpensive
feedstock sucrose to produce phenylalanine and demonstrate the utility of sucrose as a valuable
potential carbon source for future efforts to produce value-added aromatics in P. putida.
Alternatively, cscRABY and fructokinase gene can be placed into the native DOT-T1E strain before
phenylalanine engineering strategies are utilized. By incorporating sucrose importing genes both
before and after the engineering of phenylalanine over-production, the most efficient utilizer of
sucrose and producer of phenylalanine can be isolated.
5.3 Conclusions
The above proposed works demonstrate the potential to utilize synthetic biology and metabolic
engineering principles and strategies to overcome end-product-induced toxicity. By utilizing high
throughput methods to engineer and isolate mutants of strains (e.g., E. coli NST74) which already
maintain the capacity to highly produce industrially relevant compounds (or intermediates for those
compounds), inherent stress response mechanisms in these strains can be improved upon to allow
for enhanced tolerance and production metrics. Alternatively, strains which already possess the
capacity to be highly tolerant to these compounds (e.g., P. putida DOT-T1E) can be engineered to
over-produce important biochemicals such as styrene. By utilizing both methods in parallel, there
is a greater chance for success. Through tolerance engineering strategies, greater knowledge can
be gained about native mechanisms to overcome toxicity and what systems may have the most
impact on tolerance towards toxic compounds. By using metabolic engineering strategies, highly
tolerant microbes can not only be engineered to produce deadly biochemicals in large quantities,
but greater insight on best practices to engineer lightly used strains such as DOT-T1E and further
understanding strategies to broadly allow these types of strains to become versatile chassis for
biochemical production can be gained.

119
REFERENCES
1 van Haveren J, Scott EL, Sanders J. Bulk chemicals from biomass. Biofuel Bioprod Bior. 2(1):41-57 (2008).
2 King, J., Edgar, S., Qiao, K. & Stephanopoulos, G. Accessing Nature’s diversity through metabolic engineering and synthetic biology. F1000Research, doi:10.12688/f11000research.17311.12681, doi:doi:10.12688/f1000research.7311.1. (2016).
3 Smanski, M. J. et al. Synthetic biology to access and expand nature's chemical diversity. Nat Rev Microbiol 14, 135-149, doi:10.1038/nrmicro.2015.24 (2016).
4 Wang, J., Shen, X. L., Rey, J., Yuan, Q. P. & Yan, Y. J. Recent advances in microbial production of aromatic natural products and their derivatives. Appl Microbiol Biot 102, 47-61, doi:10.1007/s00253-017-8599-4 (2018).
5 Thompson, B., Machas, M. & Nielsen, D. R. Creating pathways towards aromatic building blocks and fine chemicals. Current opinion in biotechnology 36, 1-7, doi:10.1016/j.copbio.2015.07.004 (2015).
6 Noda, S. & Kondo, A. Recent Advances in Microbial Production of Aromatic Chemicals and Derivatives. Trends Biotechnol 35, 785-796, doi:10.1016/j.tibtech.2017.05.006 (2017).
7 Gosset, G. Production of aromatic compounds in bacteria. Current opinion in biotechnology 20, 651-658, doi:10.1016/j.copbio.2009.09.012 (2009).
8 Rodriguez, A. et al. Engineering Escherichia coli to overproduce aromatic amino acids and derived compounds. Microbial cell factories 13, 126, doi:10.1186/s12934-014-0126-z (2014).
9 Averesch, N. J. & Kromer, J. O. Metabolic Engineering of the Shikimate Pathway for Production of Aromatics and Derived Compounds—Present and Future Strain Construction Strategies. Front. Bioeng. Biotechnol. 26, https://doi.org/10.3389/fbioe.2018.00032, doi:https://doi.org/10.3389/fbioe.2018.00032 (2018).
10 Wang, Y. C., Chen, S. & Yu, O. Metabolic engineering of flavonoids in plants and microorganisms. Appl Microbiol Biot 91, 949-956 (2011).
11 Trantas, E. A., Koffas, M. A. G., Xu, P. & Ververidis, F. When plants produce not enough or at all: metabolic engineering of flavonoids in microbial hosts. Front Plant Sci 6, doi:UNSP 710.3389/fpls.2015.00007 (2015).
12 Katsuyama, Y., Funa, N., Miyahisa, I. & Horinouchi, S. Synthesis of unnatural flavonoids and stilbenes by exploiting the plant biosynthetic pathway in Escherichia coli. Chem Biol 14, 613-621, doi:10.1016/j.chembiol.2007.05.004 (2007).
13 Lim, C. G., Fowler, Z. L., Hueller, T., Schaffer, S. & Koffas, M. A. High-yield resveratrol production in engineered Escherichia coli. Appl Environ Microbiol 77, 3451-3460, doi:10.1128/AEM.02186-10 (2011).
14 Yang, S. M., Shim, G. Y., Kim, B. G. & Ahn, J. H. Biological synthesis of coumarins in Escherichia coli. Microbial cell factories 14, 65, doi:10.1186/s12934-015-0248-y (2015).

120
15 Lin, Y., Sun, X., Yuan, Q. & Yan, Y. Combinatorial biosynthesis of plant-specific coumarins in bacteria. Metab Eng 18, 69-77, doi:10.1016/j.ymben.2013.04.004 (2013).
16 Koma, D., Yamanaka, H., Moriyoshi, K., Ohmoto, T. & Sakai, K. Production of aromatic compounds by metabolically engineered Escherichia coli with an expanded shikimate pathway. Appl Environ Microbiol 78, 6203-6216, doi:10.1128/aem.01148-12 (2012).
17 Kunjapur, A. M., Tarasova, Y. & Prather, K. L. Synthesis and accumulation of aromatic aldehydes in an engineered strain of Escherichia coli. J Am Chem Soc 136, 11644-11654, doi:10.1021/ja506664a (2014).
18 Machas, M., McKenna, R. & Nielsen, D. R. Expanding Upon Styrene Biosynthesis to Engineer a Novel Route to 2-Phenylethanol. Biotechnol J doi: 10.1002/biot.201700310 (2016).
19 Pugh, S., McKenna, R., Halloum, I. & Nielsen, D. R. Engineering Escherichia coli for renewable benzyl alcohol production. Metabolic Engineering Communications 2, 39-45, doi:http://dx.doi.org/10.1016/j.meteno.2015.06.002 (2015).
20 Gottardi, M. et al. De novo biosynthesis of trans-cinnamic acid derivatives in Saccharomyces cerevisiae. Appl Microbiol Biotechnol 101, 4883-4893, doi:10.1007/s00253-017-8220-x (2017).
21 Vargas-Tah, A. et al. Production of cinnamic and p-hydroxycinnamic acid from sugar mixtures with engineered Escherichia coli. Microb Cell Fact 14, 6, doi:10.1186/s12934-014-0185-1 (2015).
22 Qi, W. W. et al. Functional expression of prokaryotic and eukaryotic genes in Escherichia coli for conversion of glucose to p-hydroxystyrene. Metab Eng 9, 268-276 (2007).
23 McKenna, R. & Nielsen, D. R. Styrene biosynthesis from glucose by engineered E. coli. Metab Eng 13, 544-554 (2011).
24 Kang, S. Y. et al. Artificial de novo biosynthesis of hydroxystyrene derivatives in a tyrosine overproducing Escherichia coli strain. Microbial cell factories 14, 78, doi:10.1186/s12934-015-0268-7 (2015).
25 Liu, C. et al. A systematic optimization of styrene biosynthesis in Escherichia coli BL21(DE3). Biotechnol Biofuels 11, 14, doi:10.1186/s13068-018-1017-z (2018).
26 Wierckx, N. J., Ballerstedt, H., de Bont, J. A. & Wery, J. Engineering of solvent-tolerant Pseudomonas putida S12 for bioproduction of phenol from glucose. Applied and environmental microbiology 71, 8221-8227 (2005).
27 Miao, L., Li, Q., Diao, A., Zhang, X. & Ma, Y. Construction of a novel phenol synthetic pathway in Escherichia coli through 4-hydroxybenzoate decarboxylation. Appl Microbiol Biotechnol, doi:10.1007/s00253-015-6497-1 (2015).
28 Ren, Y. X., Yang, S., Yuan, Q. P. & Sun, X. X. Microbial production of phenol via salicylate decarboxylation. Rsc Adv 5, 92685-92689 (2015).
29 Thompson, B., Machas, M. & Nielsen, D. R. Engineering and comparison of non-natural pathways for microbial phenol production. Biotechnol Bioeng 113, 1745-1754, doi:10.1002/bit.25942 (2016).

121
30 Wynands, B. et al. Metabolic engineering of Pseudomonas taiwanensis VLB120 with minimal genomic modifications for high-yield phenol production. Metab Eng 47, 121-133, doi:10.1016/j.ymben.2018.03.011 (2018).
31 Weber, C. et al. Biosynthesis of cis,cis-muconic acid and its aromatic precursors, catechol and protocatechuic acid, from renewable feedstocks by Saccharomyces cerevisiae. Appl Environ Microbiol 78, 8421-8430, doi:10.1128/AEM.01983-12 (2012).
32 Pugh, S., McKenna, R., Osman, M., Thompson, B. & Nielsen, D. R. Rational engineering of a novel pathway for producing the aromatic compounds p-hydroxybenzoate, protocatechuate, and catechol in Escherichia coli. Process Biochemistry 49, 1843-1850, doi:http://dx.doi.org/10.1016/j.procbio.2014.08.011 (2014).
33 Wang, J. et al. Exploring the Promiscuity of Phenol Hydroxylase from Pseudomonas stutzeri OX1 for the Biosynthesis of Phenolic Compounds. ACS Synth Biol, doi:10.1021/acssynbio.8b00067 (2018).
34 Xu, P. et al. Modular optimization of multi-gene pathways for fatty acids production in E. coli. Nature communications 4, 1409, doi:10.1038/ncomms2425 (2013).
35 Jiang, W., Qiao, J. B., Bentley, G. J., Liu, D. & Zhang, F. Modular pathway engineering for the microbial production of branched-chain fatty alcohols. Biotechnol Biofuels 10, 244, doi:10.1186/s13068-017-0936-4 (2017).
36 Ajikumar, P. K. et al. Isoprenoid pathway optimization for Taxol precursor overproduction in Escherichia coli. Science 330, 70-74, doi:10.1126/science.1191652 (2010).
37 Juminaga, D. et al. Modular Engineering of L-Tyrosine Production in Escherichia coli. Appl Environ Microb 78, 89-98 (2012).
38 Trantas, E. A., Koffas, M. A., Xu, P. & Ververidis, F. When plants produce not enough or at all: metabolic engineering of flavonoids in microbial hosts. Front Plant Sci 6, 7, doi:10.3389/fpls.2015.00007 (2015).
39 Wu, J., Zhou, T., Du, G., Zhou, J. & Chen, J. Modular optimization of heterologous pathways for de novo synthesis of (2S)-naringenin in Escherichia coli. PLoS One 9, e101492, doi:10.1371/journal.pone.0101492 (2014).
40 Santos, C. N., Koffas, M. & Stephanopoulos, G. Optimization of a heterologous pathway for the production of flavonoids from glucose. Metab Eng 13, 392-400, doi:10.1016/j.ymben.2011.02.002 (2011).
41 Noda, S., Shirai, T., Oyama, S. & Kondo, A. Metabolic design of a platform Escherichia coli strain producing various chorismate derivatives. Metabolic Engineering 33, 119-129, doi:http://dx.doi.org/10.1016/j.ymben.2015.11.007 (2016).
42 Shen, X. et al. Establishment of novel biosynthetic pathways for the production of salicyl alcohol and gentisyl alcohol in engineered Escherichia coli. ACS Synth Biol, doi:10.1021/acssynbio.8b00051 (2018).
43 Sharma, V., Yamamura, A. & Yokobayashi, Y. Engineering artificial small RNAs for conditional gene silencing in Escherichia coli. ACS Synth Biol 1, 6-13, doi:10.1021/sb200001q (2012).

122
44 Na, D. et al. Metabolic engineering of Escherichia coli using synthetic small regulatory RNAs. Nat Biotechnol 31, 170-174, doi:10.1038/nbt.2461 (2013).
45 Kim, B., Park, H., Na, D. & Lee, S. Y. Metabolic engineering of Escherichia coli for the production of phenol from glucose. Biotechnol J 9, 621-629, doi:10.1002/biot.201300263 (2014).
46 Wu, J., Yu, O., Du, G., Zhou, J. & Chen, J. Fine-Tuning of the Fatty Acid Pathway by Synthetic Antisense RNA for Enhanced (2S)-Naringenin Production from l-Tyrosine in Escherichia coli. Appl Environ Microbiol 80, 7283-7292, doi:10.1128/AEM.02411-14 (2014).
47 Yang, Y., Lin, Y., Li, L., Linhardt, R. J. & Yan, Y. Regulating malonyl-CoA metabolism via synthetic antisense RNAs for enhanced biosynthesis of natural products. Metab Eng 29, 217-226, doi:10.1016/j.ymben.2015.03.018 (2015).
48 Qi, L. et al. Repurposing CRISPR as an RNA-Guided Platform for Sequence-Specific Control of Gene Expression. Cell 152, 1173-1183 (2013).
49 Larson, M. H. et al. CRISPR interference (CRISPRi) for sequence-specific control of gene expression. Nat Protoc 8, 2180-2196, doi:10.1038/nprot.2013.132 (2013).
50 Wu, J., Du, G., Chen, J. & Zhou, J. Enhancing flavonoid production by systematically tuning the central metabolic pathways based on a CRISPR interference system in Escherichia coli. Sci Rep 5, 13477, doi:10.1038/srep13477 (2015).
51 Wu, J., Zhang, X., Zhou, J. & Dong, M. Efficient biosynthesis of (2S)-pinocembrin from d-glucose by integrating engineering central metabolic pathways with a pH-shift control strategy. Bioresour Technol 218, 999-1007, doi:10.1016/j.biortech.2016.07.066 (2016).
52 Liang, J. L. et al. A novel process for obtaining pinosylvin using combinatorial bioengineering in Escherichia coli. World J Microbiol Biotechnol 32, 102, doi:10.1007/s11274-016-2062-z (2016).
53 Vanegas, K. G., Lehka, B. J. & Mortensen, U. H. SWITCH: a dynamic CRISPR tool for genome engineering and metabolic pathway control for cell factory construction in Saccharomyces cerevisiae. Microbial cell factories 16, 25, doi:10.1186/s12934-017-0632-x (2017).
54 Cress, B. F. et al. CRISPathBrick: Modular Combinatorial Assembly of Type II-A CRISPR Arrays for dCas9-Mediated Multiplex Transcriptional Repression in E. coli. ACS Synth Biol 4, 987-1000, doi:10.1021/acssynbio.5b00012 (2015).
55 Ghosh, S., Chisti, Y. & Banerjee, U. C. Production of shikimic acid. Biotechnology advances 30, 1425-1431, doi:10.1016/j.biotechadv.2012.03.001 (2012).
56 Gu, P., Fan, X., Liang, Q., Qi, Q. & Li, Q. Novel technologies combined with traditional metabolic engineering strategies facilitate the construction of shikimate-producing Escherichia coli. Microbial cell factories 16, 167, doi:10.1186/s12934-017-0773-y (2017).
57 Gu, P., Su, T., Wang, Q., Liang, Q. & Qi, Q. Tunable switch mediated shikimate biosynthesis in an engineered non-auxotrophic Escherichia coli. Sci Rep 6, 29745, doi:10.1038/srep29745 (2016).
123
58 Williams, T. C. et al. Quorum-sensing linked RNA interference for dynamic metabolic pathway control in Saccharomyces cerevisiae. Metab Eng 29, 124-134, doi:10.1016/j.ymben.2015.03.008 (2015).
59 Drinnenberg, I. A. et al. RNAi in budding yeast. Science 326, 544-550, doi:10.1126/science.1176945 (2009).
60 Stanton, B. C. et al. Genomic mining of prokaryotic repressors for orthogonal logic gates. Nat Chem Biol 10, 99-105, doi:10.1038/nchembio.1411 (2014).
61 van Sint Fiet, S., van Beilen, J. B. & Witholt, B. Selection of biocatalysts for chemical synthesis. Proc Natl Acad Sci U S A 103, 1693-1698, doi:10.1073/pnas.0504733102 (2006).
62 Liu, D., Xiao, Y., Evans, B. S. & Zhang, F. Negative feedback regulation of fatty acid production based on a malonyl-CoA sensor-actuator. ACS Synth Biol 4, 132-140, doi:10.1021/sb400158w (2015).
63 Li, H., Chen, W., Jin, R., Jin, J. M. & Tang, S. Y. Biosensor-aided high-throughput screening of hyper-producing cells for malonyl-CoA-derived products. Microbial cell factories 16, 187, doi:10.1186/s12934-017-0794-6 (2017).
64 Binder, S. et al. A high-throughput approach to identify genomic variants of bacterial metabolite producers at the single-cell level. Genome Biol 13, doi:ARTN R4010.1186/gb-2012-13-5-r40 (2012).
65 Tropel, D. & van der Meer, J. R. Bacterial transcriptional regulators for degradation pathways of aromatic compounds. Microbiology and molecular biology reviews : MMBR 68, 474-500, table of contents, doi:10.1128/MMBR.68.3.474-500.2004 (2004).
66 Diaz, E. & Prieto, M. A. Bacterial promoters triggering biodegradation of aromatic pollutants. Current opinion in biotechnology 11, 467-475 (2000).
67 Shingler, V., Bartilson, M. & Moore, T. Cloning and nucleotide sequence of the gene encoding the positive regulator (DmpR) of the phenol catabolic pathway encoded by pVI150 and identification of DmpR as a member of the NtrC family of transcriptional activators. J Bacteriol 175, 1596-1604 (1993).
68 Fillet, S. et al. Transcriptional control of the main aromatic hydrocarbon efflux pump in Pseudomonas. Environ Microbiol Rep 4, 158-167, doi:10.1111/j.1758-2229.2011.00255.x (2012).
69 Sun, X., Zahir, Z., Lynch, K. H. & Dennis, J. J. An antirepressor, SrpR, is involved in transcriptional regulation of the SrpABC solvent tolerance efflux pump of Pseudomonas putida S12. J Bacteriol 193, 2717-2725, doi:10.1128/JB.00149-11 (2011).
70 Xue, H. et al. Design, construction, and characterization of a set of biosensors for aromatic compounds. ACS Synth Biol 3, 1011-1014, doi:10.1021/sb500023f (2014).
71 Kubota, T. et al. Chorismate-dependent transcriptional regulation of quinate/shikimate utilization genes by LysR-type transcriptional regulator QsuR in Corynebacterium glutamicum: carbon flow control at metabolic branch point. Mol Microbiol 92, 356-368, doi:10.1111/mmi.12560 (2014).
124
72 Martin, R. G. & Rosner, J. L. Binding of purified multiple antibiotic-resistance repressor protein (MarR) to mar operator sequences. Proc Natl Acad Sci U S A 92, 5456-5460 (1995).
73 Salis, H., Tamsir, A. & Voigt, C. Engineering bacterial signals and sensors. Contrib Microbiol 16, 194-225, doi:10.1159/000219381 (2009).
74 Yang, J. et al. Synthetic RNA devices to expedite the evolution of metabolite-producing microbes. Nature communications 4, 1413, doi:10.1038/ncomms2404 (2013).
75 Borujeni, A. E., Mishler, D. M., Wang, J. Z., Huso, W. & Salis, H. M. Automated physics-based design of synthetic riboswitches from diverse RNA aptamers. Nucleic Acids Res 44, 1-13, doi:10.1093/nar/gkv1289 (2016).
76 Morgan, S. A., Nadler, D. C., Yokoo, R. & Savage, D. F. Biofuel metabolic engineering with biosensors. Curr Opin Chem Biol 35, 150-158, doi:10.1016/j.cbpa.2016.09.020 (2016).
77 Liu, Y. et al. Biosensor-Based Evolution and Elucidation of a Biosynthetic Pathway in Escherichia coli. ACS Synth Biol 6, 837-848, doi:10.1021/acssynbio.6b00328 (2017).
78 Singh, P. et al. Application of targeted proteomics to metabolically engineered Escherichia coli. Proteomics 12, 1289-1299, doi:10.1002/pmic.201100482 (2012).
79 Liu, C., Zhang, B., Liu, Y. M., Yang, K. Q. & Liu, S. J. New Intracellular Shikimic Acid Biosensor for Monitoring Shikimate Synthesis in Corynebacterium glutamicum. ACS Synth Biol 7, 591-601, doi:10.1021/acssynbio.7b00339 (2018).
80 Wang, H. H. et al. Programming cells by multiplex genome engineering and accelerated evolution. Nature 460, 894-898, doi:10.1038/nature08187 (2009).
81 Raman, S., Rogers, J. K., Taylor, N. D. & Church, G. M. Evolution-guided optimization of biosynthetic pathways. Proc Natl Acad Sci U S A 111, 17803-17808, doi:10.1073/pnas.1409523111 (2014).
82 Chou, H. H. & Keasling, J. D. Programming adaptive control to evolve increased metabolite production. Nature communications 4, 2595, doi:10.1038/ncomms3595 (2013).
83 Beller, H. R. et al. Discovery of enzymes for toluene synthesis from anoxic microbial communities. Nat Chem Biol, doi:10.1038/s41589-018-0017-4 (2018).
84 Wallace, S. & Balskus, E. P. Interfacing microbial styrene production with a biocompatible cyclopropanation reaction. Angew Chem Int Ed Engl 54, 7106-7109, doi:10.1002/anie.201502185 (2015).
85 Lane, A. B. et al. Enzymatically Generated CRISPR Libraries for Genome Labeling and Screening. Dev Cell 34, 373-378, doi:10.1016/j.devcel.2015.06.003 (2015).
86 Köferle, A. et al. CORALINA: a universal method for the generation of gRNA libraries for CRISPR-based screening. BMC Genomics 17, 917, doi:10.1186/s12864-016-3268-z (2016).
87 Kaya-Okur, H. S. & Belmont, A. S. CRISPR EATING on a Low Budget. Dev Cell 34, 253-254, doi:10.1016/j.devcel.2015.07.013 (2015).
88 Arakawa, H. A method to convert mRNA into a gRNA library for CRISPR/Cas9 editing of any organism. Sci Adv 2, e1600699, doi:10.1126/sciadv.1600699 (2016).

125
89 Marmann, A., Aly, A. H., Lin, W., Wang, B. & Proksch, P. Co-cultivation--a powerful emerging tool for enhancing the chemical diversity of microorganisms. Mar Drugs 12, 1043-1065, doi:10.3390/md12021043 (2014).
90 Turner, W. J. & Dunlop, M. J. Trade-Offs in Improving Biofuel Tolerance Using Combinations of Efflux Pumps. ACS Synth Biol 4, 1056-1063, doi:10.1021/sb500307w (2015).
91 Boyarskiy, S., Davis Lopez, S., Kong, N. & Tullman-Ercek, D. Transcriptional feedback regulation of efflux protein expression for increased tolerance to and production of n-butanol. Metab Eng 33, 130-137, doi:10.1016/j.ymben.2015.11.005 (2016).
92 Siu, Y., Fenno, J., Lindle, J. M. & Dunlop, M. J. Design and Selection of a Synthetic Feedback Loop for Optimizing Biofuel Tolerance. ACS Synth Biol 7, 16-23, doi:10.1021/acssynbio.7b00260 (2018).
93 Huffer, S., Clark, M. E., Ning, J. C., Blanch, H. W. & Clark, D. S. Role of alcohols in growth, lipid composition, and membrane fluidity of yeasts, bacteria, and archaea. Appl Environ Microbiol 77, 6400-6408, doi:10.1128/AEM.00694-11 (2011).
94 Knoshaug, E. P. & Zhang, M. Butanol tolerance in a selection of microorganisms. Applied biochemistry and biotechnology 153, 13-20, doi:10.1007/s12010-008-8460-4 (2009).
95 Swings, J. & De Ley, J. The biology of Zymomonas. Bacteriol Rev 41, 1-46 (1977).
96 Lange, C. C., Wackett, L. P., Minton, K. W. & Daly, M. J. Engineering a recombinant Deinococcus radiodurans for organopollutant degradation in radioactive mixed waste environments. Nat Biotechnol 16, 929-933, doi:10.1038/nbt1098-929 (1998).
97 Sonoki, T. et al. Enhancement of protocatechuate decarboxylase activity for the effective production of muconate from lignin-related aromatic compounds. J Biotechnol 192 Pt A, 71-77, doi:10.1016/j.jbiotec.2014.10.027 (2014).
98 Johnson, C. W. et al. Enhancing muconic acid production from glucose and lignin-derived aromatic compounds via increased protocatechuate decarboxylase activity. Metabolic Engineering Communications 3, 111-119, doi:https://doi.org/10.1016/j.meteno.2016.04.002 (2016).
99 Hua, D. & Xu, P. Recent advances in biotechnological production of 2-phenylethanol. Biotechnol Adv 29, 654-660, doi:10.1016/j.biotechadv.2011.05.001 (2011).
100 Tieman, D. et al. Tomato aromatic amino acid decarboxylases participate in synthesis of the flavor volatiles 2-phenylethanol and 2-phenylacetaldehyde. Proc Natl Acad Sci U S A 103, 8287-8292, doi:10.1073/pnas.0602469103 (2006).
101 Atsumi, S., Hanai, T. & Liao, J. C. Non-fermentative pathways for synthesis of branched-chain higher alcohols as biofuels. Nature 451, 86-89, doi:10.1038/nature06450 (2008).
102 Tian, M., Van Haaren, R., Reijnders, J. & Boot, M. Lignin Derivatives as Potential Octane Boosters. SAE Int. J. Fuels Lubr. 8, 415-422, doi:10.4271/2015-01-0963 (2015).
103 Shankar, V. S. B. et al. Antiknock quality and ignition kinetics of 2-phenylethanol, a novel lignocellulosic octane booster. Proceedings of the Combustion Institute 36, 3515-3522, doi:10.1016/j.proci.2016.05.041 (2017).

126
104 Suastegui, M. & Shao, Z. Yeast factories for the production of aromatic compounds: from building blocks to plant secondary metabolites. J Ind Microbiol Biotechnol 43, 1611-1624, doi:10.1007/s10295-016-1824-9 (2016).
105 Etschmann, M. M., Bluemke, W., Sell, D. & Schrader, J. Biotechnological production of 2-phenylethanol. Appl Microbiol Biotechnol 59, 1-8, doi:10.1007/s00253-002-0992-x (2002).
106 Lee, C.-W. & Richard, J. Catabolism of L-phenylalanine by some microorganisms of cheese origin. Journal of Dairy Research 51, 461-469, doi:10.1017/s0022029900023761 (1984).
107 Kieser, M. E., Pollard, A., Stevens, P. M. & Tucknott, O. G. Determination of 2-Phenylethanol in Cider. Nature 204, 887 (1964).
108 Hazelwood, L. A., Daran, J. M., van Maris, A. J., Pronk, J. T. & Dickinson, J. R. The Ehrlich pathway for fusel alcohol production: a century of research on Saccharomyces cerevisiae metabolism. Appl Environ Microbiol 74, 2259-2266, doi:10.1128/aem.02625-07 (2008).
109 Ehrlich, F. Concerning the conditions for fusel oil formation and concerning its connection with the protein formation of yeast. Berichte Der Deutschen Chemischen Gesellschaft 40, 1027-1047, doi:DOI 10.1002/cber.190704001156 (1907).
110 Vuralhan, Z. et al. Physiological characterization of the ARO10-dependent, broad-substrate-specificity 2-oxo acid decarboxylase activity of Saccharomyces cerevisiae. Appl Environ Microbiol 71, 3276-3284, doi:10.1128/aem.71.6.3276-3284.2005 (2005).
111 Dickinson, J. R., Salgado, L. E. & Hewlins, M. J. The catabolism of amino acids to long chain and complex alcohols in Saccharomyces cerevisiae. J Biol Chem 278, 8028-8034, doi:10.1074/jbc.M211914200 (2003).
112 Kim, B., Cho, B.-R. & Hahn, J.-S. Metabolic engineering of Saccharomyces cerevisiae for the production of 2-phenylethanol via Ehrlich pathway. Biotechnology and Bioengineering 111, 115-124, doi:10.1002/bit.24993 (2014).
113 Etschmann, M. M. W., Sell, D. & Schrader, J. Screening of yeasts for the production of the aroma compound 2-phenylethanol in a molasses-based medium. Biotechnology Letters 25, 531-536, doi:10.1023/a:1022890119847 (2003).
114 Iraqui, I., Vissers, S., Cartiaux, M. & Urrestarazu, A. Characterisation of Saccharomyces cerevisiae ARO8 and ARO9 genes encoding aromatic aminotransferases I and II reveals a new aminotransferase subfamily. Mol Gen Genet 257, 238-248 (1998).
115 Kang, Z., Zhang, C., Du, G. & Chen, J. Metabolic Engineering of Escherichia coli for Production of 2-phenylethanol from Renewable Glucose. Applied Biochemistry and Biotechnology 172, 2012-2021, doi:10.1007/s12010-013-0659-3 (2014).
116 Thompson, B., Machas, M. & Nielsen, D. R. Engineering and comparison of non-natural pathways for microbial phenol production. Biotechnology and Bioengineering 113, 1745-1754, doi:10.1002/bit.25942 (2016).
117 McKenna, R. & Nielsen, D. R. Styrene biosynthesis from glucose by engineered E. coli. Metabolic Engineering 13, 544-554, doi:http://dx.doi.org/10.1016/j.ymben.2011.06.005 (2011).

127
118 McKenna, R., Pugh, S., Thompson, B. & Nielsen, D. R. Microbial production of the aromatic building-blocks (S)-styrene oxide and (R)-1,2-phenylethanediol from renewable resources. Biotechnology Journal 8, 1465-1475, doi:10.1002/biot.201300035 (2013).
119 O'Leary, N. D., O'Connor, K. E. & Dobson, A. D. W. Biochemistry, genetics and physiology of microbial styrene degradation. FEMS Microbiology Reviews 26, 403-417, doi:10.1111/j.1574-6976.2002.tb00622.x (2002).
120 Tribe, D. E. (US Patent 4,681,852, 1987).
121 Datsenko, K. A. & Wanner, B. L. One-step inactivation of chromosomal genes in Escherichia coli K-12 using PCR products. Proc Natl Acad Sci U S A 97, 6640-6645 (2000).
122 Flamholz, A., Noor, E., Bar-Even, A. & Milo, R. eQuilibrator—the biochemical thermodynamics calculator. Nucleic Acids Research 40, D770-D775, doi:10.1093/nar/gkr874 (2012).
123 Varma, A., Boesch, B. W. & Palsson, B. O. Biochemical production capabilities of escherichia coli. Biotechnology and Bioengineering 42, 59-73, doi:10.1002/bit.260420109 (1993).
124 Rodriguez, G. M. & Atsumi, S. Toward aldehyde and alkane production by removing aldehyde reductase activity in Escherichia coli. Metabolic Engineering 25, 227-237, doi:10.1016/j.ymben.2014.07.012 (2014).
125 Panke, S., Witholt, B., Schmid, A. & Wubbolts, M. G. Towards a Biocatalyst for (S)-Styrene Oxide Production: Characterization of the Styrene Degradation Pathway of Pseudomonas sp. Strain VLB120. Appl Environ Microbiol 64, 2032-2043 (1998).
126 Warhurst, A. M. & Fewson, C. A. Microbial metabolism and biotransformations of styrene. Journal of Applied Bacteriology 77, 597-606, doi:10.1111/j.1365-2672.1994.tb02807.x (1994).
127 O'Connor, K., Buckley, C. M., Hartmans, S. & Dobson, A. D. Possible regulatory role for nonaromatic carbon sources in styrene degradation by Pseudomonas putida CA-3. Appl Environ Microbiol 61, 544-548 (1995).
128 Parrott, S., Jones, S. & Cooper, R. A. 2-Phenylethylamine catabolism by Escherichia coli K12. J Gen Microbiol 133, 347-351, doi:10.1099/00221287-133-2-347 (1987).
129 Noda, S., Shirai, T., Oyama, S. & Kondo, A. Metabolic design of a platform Escherichia coli strain producing various chorismate derivatives. Metab Eng 33, 119-129, doi:10.1016/j.ymben.2015.11.007 (2016).
130 Gosset, G. Improvement of Escherichia coli production strains by modification of the phosphoenolpyruvate:sugar phosphotransferase system. Microbial Cell Factories 4, 14, doi:10.1186/1475-2859-4-14 (2005).
131 Liu, S. P. et al. A systems level engineered E. coli capable of efficiently producing L-phenylalanine. Process Biochemistry 49, 751-757, doi:https://doi.org/10.1016/j.procbio.2014.01.001 (2014).
132 Cunningham, D. S. et al. Pyruvate kinase-deficient Escherichia coli exhibits increased plasmid copy number and cyclic AMP levels. J Bacteriol 191, 3041-3049, doi:10.1128/JB.01422-08 (2009).

128
133 Ho, K. K. & Weiner, H. Isolation and Characterization of an Aldehyde Dehydrogenase Encoded by the aldB Gene of Escherichia coli. Journal of Bacteriology 187, 1067-1073, doi:10.1128/jb.187.3.1067-1073.2005 (2005).
134 Veit, A., Polen, T. & Wendisch, V. F. Global gene expression analysis of glucose overflow metabolism in Escherichia coli and reduction of aerobic acetate formation. Appl Microbiol Biotechnol 74, 406-421, doi:10.1007/s00253-006-0680-3 (2007).
135 Kneen, M. M. et al. Characterization of a thiamin diphosphate-dependent phenylpyruvate decarboxylase from Saccharomyces cerevisiae. FEBS Journal 278, 1842-1853, doi:10.1111/j.1742-4658.2011.08103.x (2011).
136 Gelfand, D. H. & Steinberg, R. A. Escherichia coli mutants deficient in the aspartate and aromatic amino acid aminotransferases. Journal of Bacteriology 130, 429-440 (1977).
137 De Mey, M., De Maeseneire, S., Soetaert, W. & Vandamme, E. Minimizing acetate formation in E. coli fermentations. J Ind Microbiol Biotechnol 34, 689-700, doi:10.1007/s10295-007-0244-2 (2007).
138 Sikkema, J., de Bont, J. A. & Poolman, B. Interactions of cyclic hydrocarbons with biological membranes. J Biol Chem 269, 8022-8028 (1994).
139 Tan, Z., Yoon, J. M., Nielsen, D. R., Shanks, J. V. & Jarboe, L. R. Membrane engineering via trans unsaturated fatty acids production improves Escherichia coli robustness and production of biorenewables. Metabolic Engineering 35, 105-113, doi:http://dx.doi.org/10.1016/j.ymben.2016.02.004 (2016).
140 Sendovski, M., Nir, N. & Fishman, A. Bioproduction of 2-Phenylethanol in a Biphasic Ionic Liquid Aqueous System. Journal of Agricultural and Food Chemistry 58, 2260-2265, doi:10.1021/jf903879x (2010).
141 Etschmann, M. M. W., Sell, D. & Schrader, J. Production of 2-phenylethanol and 2-phenylethylacetate from L-phenylalanine by coupling whole-cell biocatalysis with organophilic pervaporation. Biotechnology and Bioengineering 92, 624-634, doi:10.1002/bit.20655 (2005).
142 Achmon, Y., Goldshtein, J., Margel, S. & Fishman, A. Hydrophobic microspheres for in situ removal of 2-phenylethanol from yeast fermentation. Journal of Microencapsulation 28, 628-638, doi:10.3109/02652048.2011.599443 (2011).
143 Achmon, Y., Ben-Barak Zelas, Z. & Fishman, A. Cloning Rosa hybrid phenylacetaldehyde synthase for the production of 2-phenylethanol in a whole cell Escherichia coli system. Appl Microbiol Biotechnol 98, 3603-3611, doi:10.1007/s00253-013-5269-z (2014).
144 Kumar, R., Singh, S. & Singh, O. V. Bioconversion of lignocellulosic biomass: biochemical and molecular perspectives. J Ind Microbiol Biotechnol 35, 377-391, doi:10.1007/s10295-008-0327-8 (2008).
145 Alvira, P., Tomás-Pejó, E., Ballesteros, M. & Negro, M. J. Pretreatment technologies for an efficient bioethanol production process based on enzymatic hydrolysis: A review. Bioresour Technol 101, 4851-4861, doi:10.1016/j.biortech.2009.11.093 (2010).
146 Saha, B. C. Hemicellulose bioconversion. J Ind Microbiol Biotechnol 30, 279-291, doi:10.1007/s10295-003-0049-x (2003).
129
147 Görke, B. & Stülke, J. Carbon catabolite repression in bacteria: many ways to make the most out of nutrients. Nat Rev Microbiol 6, 613-624, doi:10.1038/nrmicro1932 (2008).
148 Beall, D. S., Ohta, K. & Ingram, L. O. Parametric studies of ethanol production form xylose and other sugars by recombinant Escherichia coli. Biotechnol Bioeng 38, 296-303, doi:10.1002/bit.260380311 (1991).
149 Kim, J. H., Block, D. E. & Mills, D. A. Simultaneous consumption of pentose and hexose sugars: an optimal microbial phenotype for efficient fermentation of lignocellulosic biomass. Appl Microbiol Biotechnol 88, 1077-1085, doi:10.1007/s00253-010-2839-1 (2010).
150 Eiteman, M. A., Lee, S. A. & Altman, E. A co-fermentation strategy to consume sugar mixtures effectively. J Biol Eng 2, 3, doi:10.1186/1754-1611-2-3 (2008).
151 Zhang, H., Pereira, B., Li, Z. & Stephanopoulos, G. Engineering Escherichia coli coculture systems for the production of biochemical products. Proc Natl Acad Sci U S A 112, 8266-8271, doi:10.1073/pnas.1506781112 (2015).
152 Li, F. F., Zhao, Y., Li, B. Z., Qiao, J. J. & Zhao, G. R. Engineering Escherichia coli for production of 4-hydroxymandelic acid using glucose-xylose mixture. Microb Cell Fact 15, 90, doi:10.1186/s12934-016-0489-4 (2016).
153 Yao, Y. F., Wang, C. S., Qiao, J. & Zhao, G. R. Metabolic engineering of Escherichia coli for production of salvianic acid A via an artificial biosynthetic pathway. Metab Eng 19, 79-87, doi:10.1016/j.ymben.2013.06.001 (2013).
154 Sievert, C. et al. Experimental evolution reveals an effective avenue to release catabolite repression via mutations in XylR. Proc Natl Acad Sci U S A 114, 7349-7354, doi:10.1073/pnas.1700345114 (2017).
155 Song, S. & Park, C. Organization and regulation of the D-xylose operons in Escherichia coli K-12: XylR acts as a transcriptional activator. J Bacteriol 179, 7025-7032, doi:10.1128/jb.179.22.7025-7032.1997 (1997).
156 Flores, A. D., Ayla, E. Z., Nielsen, D. R. & Wang, X. Engineering a Synthetic, Catabolically Orthogonal Coculture System for Enhanced Conversion of Lignocellulose-Derived Sugars to Ethanol. ACS Synth Biol 8, 1089-1099, doi:10.1021/acssynbio.9b00007 (2019).
157 Jensen, S. I., Lennen, R. M., Herrgård, M. J. & Nielsen, A. T. Seven gene deletions in seven days: Fast generation of Escherichia coli strains tolerant to acetate and osmotic stress. Sci Rep 5, 17874, doi:10.1038/srep17874 (2015).
158 Li, X. T., Thomason, L. C., Sawitzke, J. A., Costantino, N. & Court, D. L. Positive and negative selection using the tetA-sacB cassette: recombineering and P1 transduction in Escherichia coli. Nucleic Acids Res 41, e204, doi:10.1093/nar/gkt1075 (2013).
159 Jantama, K. et al. Eliminating side products and increasing succinate yields in engineered strains of Escherichia coli C. Biotechnol Bioeng 101, 881-893, doi:10.1002/bit.22005 (2008).
160 Mohamed, E. T. et al. Generation of an E. coli platform strain for improved sucrose utilization using adaptive laboratory evolution. Microbial Cell Factories 18 (2019).

130
161 Gonzalez, J. E., Long, C. P. & Antoniewicz, M. R. Comprehensive analysis of glucose and xylose metabolism in Escherichia coli under aerobic and anaerobic conditions by. Metab Eng 39, 9-18, doi:10.1016/j.ymben.2016.11.003 (2017).
162 Shiloach, J. & Fass, R. Growing E. coli to high cell density--a historical perspective on method development. Biotechnol Adv 23, 345-357, doi:10.1016/j.biotechadv.2005.04.004 (2005).
163 Eiteman, M. A. & Altman, E. Overcoming acetate in Escherichia coli recombinant protein fermentations. Trends Biotechnol 24, 530-536, doi:10.1016/j.tibtech.2006.09.001 (2006).
164 Lawford, H. G. & Rousseau, J. D. Effects of pH and acetic acid on glucose and xylose metabolism by a genetically engineered ethanologenic Escherichia coli. Appl Biochem Biotechnol 39-40, 301-322 (1993).
165 Ahn, J. O. et al. Exploring the effects of carbon sources on the metabolic capacity for shikimic acid production in Escherichia coli using in silico metabolic predictions. J Microbiol Biotechnol 18, 1773-1784 (2008).
166 Sprenger, G. A. Genetics of pentose-phosphate pathway enzymes of Escherichia coli K-12. Arch Microbiol 164, 324-330 (1995).
167 Peekhaus, N. & Conway, T. What's for dinner?: Entner-Doudoroff metabolism in Escherichia coli. J Bacteriol 180, 3495-3502 (1998).
168 Bettenbrock, K. et al. Correlation between growth rates, EIIACrr phosphorylation, and intracellular cyclic AMP levels in Escherichia coli K-12. J Bacteriol 189, 6891-6900, doi:10.1128/JB.00819-07 (2007).
169 Matsumoto, T., Tanaka, T. & Kondo, A. Engineering metabolic pathways in Escherichia coli for constructing a “microbial chassis” for biochemical production. Bioresource Technology 245, 1362-1368 (2017).
170 Machas, M. et al. Emerging tools, enabling technologies, and future opportunities for the bioproduction of aromatic chemicals. Journal of Chemical Technology & Biotechnology 94 (2018).
171 Yoon, S. H. et al. Enhanced vanillin production from recombinant E. coli using NTG mutagenesis and adsorbent resin. Biotechnol Prog 23, 1143-1148, doi:10.1021/bp070153r (2007).
172 Li, W., Xie, D. & Frost, J. W. Benzene-free synthesis of catechol: interfacing microbial and chemical catalysis. J Am Chem Soc 127, 2874-2882, doi:10.1021/ja045148n (2005).
173 Scott, C. C. & Finnerty, W. R. Characterization of intracytoplasmic hydrocarbon inclusions from the hydrocarbon-oxidizing Acinetobacter species HO1-N. J Bacteriol 127, 481-489 (1976).
174 Sikkema, J., de Bont, J. A. & Poolman, B. Mechanisms of membrane toxicity of hydrocarbons. Microbiol Rev 59, 201-222 (1995).
175 Jarboe, L. R. et al. Metabolic engineering for production of biorenewable fuels and chemicals: contributions of synthetic biology. J Biomed Biotechnol 2010, 761042, doi:10.1155/2010/761042 (2010).

131
176 Antunes-Madeira, M. C. & Madeira, V. M. Membrane fluidity as affected by the insecticide lindane. Biochim Biophys Acta 982, 161-166 (1989).
177 Lennen, R. M., Politz, M. G., Kruziki, M. A. & Pfleger, B. F. Identification of transport proteins involved in free fatty acid efflux in Escherichia coli. J Bacteriol 195, 135-144, doi:10.1128/JB.01477-12 (2013).
178 Lennen, R. M. & Pfleger, B. F. Modulating membrane composition alters free fatty acid tolerance in Escherichia coli. PloS one 8, e54031, doi:10.1371/journal.pone.0054031 (2013).
179 Brynildsen, M. P. & Liao, J. C. An integrated network approach identifies the isobutanol response network of Escherichia coli. Mol Syst Biol 5, 277, doi:10.1038/msb.2009.34 (2009).
180 Arnold, C. N., McElhanon, J., Lee, A., Leonhart, R. & Siegele, D. A. Global analysis of Escherichia coli gene expression during the acetate-induced acid tolerance response. J Bacteriol 183, 2178-2186, doi:10.1128/JB.183.7.2178-2186.2001 (2001).
181 Rau, M. H., Calero, P., Lennen, R. M., Long, K. S. & Nielsen, A. T. Genome-wide Escherichia coli stress response and improved tolerance towards industrially relevant chemicals. Microb Cell Fact 15, 176, doi:10.1186/s12934-016-0577-5 (2016).
182 Horinouchi, T. et al. Transcriptome analysis of parallel-evolved Escherichia coli strains under ethanol stress. BMC Genomics 11, 579, doi:10.1186/1471-2164-11-579 (2010).
183 Lennen, R. M. et al. Membrane stresses induced by overproduction of free fatty acids in Escherichia coli. Appl Environ Microbiol 77, 8114-8128, doi:10.1128/AEM.05421-11 (2011).
184 Pomposiello, P. J., Bennik, M. H. & Demple, B. Genome-wide transcriptional profiling of the Escherichia coli responses to superoxide stress and sodium salicylate. J Bacteriol 183, 3890-3902, doi:10.1128/JB.183.13.3890-3902.2001 (2001).
185 Visvalingam, J., Hernandez-Doria, J. D. & Holley, R. A. Examination of the genome-wide transcriptional response of Escherichia coli O157:H7 to cinnamaldehyde exposure. Appl Environ Microbiol 79, 942-950, doi:10.1128/AEM.02767-12 (2013).
186 Zheng, M. et al. DNA microarray-mediated transcriptional profiling of the Escherichia coli response to hydrogen peroxide. J Bacteriol 183, 4562-4570, doi:10.1128/JB.183.15.4562-4570.2001 (2001).
187 Erickson, K. E., Winkler, J. D., Nguyen, D. T., Gill, R. T. & Chatterjee, A. The Tolerome: A Database of Transcriptome-Level Contributions to Diverse Escherichia coli Resistance and Tolerance Phenotypes. ACS Synth Biol 6, 2302-2315, doi:10.1021/acssynbio.7b00235 (2017).
188 Yung, P. Y. et al. Global transcriptomic responses of Escherichia coli K-12 to volatile organic compounds. Sci Rep 6, 19899, doi:10.1038/srep19899 (2016).
189 Van Dyk, T. K., Templeton, L. J., Cantera, K. A., Sharpe, P. L. & Sariaslani, F. S. Characterization of the Escherichia coli AaeAB efflux pump: a metabolic relief valve? J Bacteriol 186, 7196-7204, doi:10.1128/JB.186.21.7196-7204.2004 (2004).

132
190 Lin, S. et al. Microarray analysis of the transcriptome of the Escherichia coli (E. coli) regulated by cinnamaldehyde (CMA). 28, 500-515, doi:10.1080/09540105.2017.1300875 (2017).
191 Jin, D. et al. A Transcriptomic Analysis of Saccharomyces cerevisiae Under the Stress of 2-Phenylethanol. Curr Microbiol 75, 1068-1076, doi:10.1007/s00284-018-1488-y (2018).
192 Lian, J. et al. Production of biorenewable styrene: utilization of biomass-derived sugars and insights into toxicity. J Ind Microbiol Biotechnol 43, 595-604, doi:10.1007/s10295-016-1734-x (2016).
193 Subhash, S. & Kanduri, C. GeneSCF: a real-time based functional enrichment tool with support for multiple organisms. BMC Bioinformatics 17, 365, doi:10.1186/s12859-016-1250-z (2016).
194 Xie, C. et al. KOBAS 2.0: a web server for annotation and identification of enriched pathways and diseases. Nucleic Acids Res 39, W316-322, doi:10.1093/nar/gkr483 (2011).
195 Ai, C. & Kong, L. CGPS: A machine learning-based approach integrating multiple gene set analysis tools for better prioritization of biologically relevant pathways. J Genet Genomics 45, 489-504, doi:10.1016/j.jgg.2018.08.002 (2018).
196 Oliveros, J. C. (2007-2015). Venny. An interactive tool for comparing lists with Venn's diagrams. https://bioinfogp.cnb.csic.es/tools/venny/index.html.
197 Janion, C. Inducible SOS response system of DNA repair and mutagenesis in Escherichia coli. Int J Biol Sci 4, 338-344 (2008).
198 Lou, Z. et al. p-Coumaric acid kills bacteria through dual damage mechanisms. Food Control 25, 550-554 (2012).
199 Dörr, T., Lewis, K. & Vulić, M. SOS response induces persistence to fluoroquinolones in Escherichia coli. PLoS Genet 5, e1000760, doi:10.1371/journal.pgen.1000760 (2009).
200 Finkel, S. E. Long-term survival during stationary phase: evolution and the GASP phenotype. Nat Rev Microbiol 4, 113-120, doi:10.1038/nrmicro1340 (2006).
201 Fonville, N. C., Bates, D., Hastings, P. J., Hanawalt, P. C. & Rosenberg, S. M. Role of RecA and the SOS response in thymineless death in Escherichia coli. PLoS Genet 6, e1000865, doi:10.1371/journal.pgen.1000865 (2010).
202 Du, S. & Lutkenhaus, J. Assembly and activation of the Escherichia coli divisome. Mol Microbiol 105, 177-187, doi:10.1111/mmi.13696 (2017).
203 Vicente, M., Gomez, M. J. & Ayala, J. A. Regulation of transcription of cell division genes in the Escherichia coli dcw cluster. Cell Mol Life Sci 54, 317-324, doi:10.1007/s000180050158 (1998).
204 Gray, A. N. et al. Coordination of peptidoglycan synthesis and outer membrane constriction during Escherichia coli cell division. Elife 4, doi:10.7554/eLife.07118 (2015).
205 Egan, A. J. F. Bacterial outer membrane constriction. Mol Microbiol 107, 676-687, doi:10.1111/mmi.13908 (2018).

133
206 King, T., Lucchini, S., Hinton, J. C. & Gobius, K. Transcriptomic analysis of Escherichia coli O157:H7 and K-12 cultures exposed to inorganic and organic acids in stationary phase reveals acidulant- and strain-specific acid tolerance responses. Appl Environ Microbiol 76, 6514-6528, doi:10.1128/AEM.02392-09 (2010).
207 Moreau, P. L. Diversion of the metabolic flux from pyruvate dehydrogenase to pyruvate oxidase decreases oxidative stress during glucose metabolism in nongrowing Escherichia coli cells incubated under aerobic, phosphate starvation conditions. J Bacteriol 186, 7364-7368, doi:10.1128/JB.186.21.7364-7368.2004 (2004).
208 Randall, L. P. & Woodward, M. J. The multiple antibiotic resistance (mar) locus and its significance. Res Vet Sci 72, 87-93, doi:10.1053/rvsc.2001.0537 (2002).
209 Alekshun, M. N. & Levy, S. B. The mar regulon: multiple resistance to antibiotics and other toxic chemicals. Trends Microbiol 7, 410-413 (1999).
210 Barbosa, T. M. & Levy, S. B. Differential expression of over 60 chromosomal genes in Escherichia coli by constitutive expression of MarA. J Bacteriol 182, 3467-3474 (2000).
211 Garcia-Bernardo, J. & Dunlop, M. J. Tunable stochastic pulsing in the Escherichia coli multiple antibiotic resistance network from interlinked positive and negative feedback loops. PLoS Comput Biol 9, e1003229, doi:10.1371/journal.pcbi.1003229 (2013).
212 Martin, R. G., Bartlett, E. S., Rosner, J. L. & Wall, M. E. Activation of the Escherichia coli marA/soxS/rob regulon in response to transcriptional activator concentration. J Mol Biol 380, 278-284, doi:10.1016/j.jmb.2008.05.015 (2008).
213 Nachin, L., Nannmark, U. & Nyström, T. Differential roles of the universal stress proteins of Escherichia coli in oxidative stress resistance, adhesion, and motility. J Bacteriol 187, 6265-6272, doi:10.1128/JB.187.18.6265-6272.2005 (2005).
214 VanBogelen, R. A., Acton, M. A. & Neidhardt, F. C. Induction of the heat shock regulon does not produce thermotolerance in Escherichia coli. Genes Dev 1, 525-531 (1987).
215 Rutherford, B. J. et al. Functional genomic study of exogenous n-butanol stress in Escherichia coli. Appl Environ Microbiol 76, 1935-1945, doi:10.1128/AEM.02323-09 (2010).
216 Kitagawa, M., Miyakawa, M., Matsumura, Y. & Tsuchido, T. Escherichia coli small heat shock proteins, IbpA and IbpB, protect enzymes from inactivation by heat and oxidants. Eur J Biochem 269, 2907-2917 (2002).
217 Kuczyńska-Wiśnik, D. et al. The Escherichia coli small heat-shock proteins IbpA and IbpB prevent the aggregation of endogenous proteins denatured in vivo during extreme heat shock. Microbiology 148, 1757-1765, doi:10.1099/00221287-148-6-1757 (2002).
218 Kitagawa, M., Matsumura, Y. & Tsuchido, T. Small heat shock proteins, IbpA and IbpB, are involved in resistances to heat and superoxide stresses in Escherichia coli. FEMS Microbiol Lett 184, 165-171, doi:10.1111/j.1574-6968.2000.tb09009.x (2000).
219 Han, X. et al. Escherichia coli genes that reduce the lethal effects of stress. BMC Microbiol 10, 35, doi:10.1186/1471-2180-10-35 (2010).
134
220 Sargentini, N. J., Gularte, N. P. & Hudman, D. A. Screen for genes involved in radiation survival of Escherichia coli and construction of a reference database. Mutat Res 793-794, 1-14, doi:10.1016/j.mrfmmm.2016.10.001 (2016).
221 Reyes, L. H., Almario, M. P. & Kao, K. C. Genomic library screens for genes involved in n-butanol tolerance in Escherichia coli. PLoS One 6, e17678, doi:10.1371/journal.pone.0017678 (2011).
222 Rowley, G., Spector, M., Kormanec, J. & Roberts, M. Pushing the envelope: extracytoplasmic stress responses in bacterial pathogens. Nat Rev Microbiol 4, 383-394, doi:10.1038/nrmicro1394 (2006).
223 Bury-Moné, S. et al. Global analysis of extracytoplasmic stress signaling in Escherichia coli. PLoS Genet 5, e1000651, doi:10.1371/journal.pgen.1000651 (2009).
224 Flores-Kim, J. & Darwin, A. J. The Phage Shock Protein Response. Annu Rev Microbiol 70, 83-101, doi:10.1146/annurev-micro-102215-095359 (2016).
225 Manganelli, R. & Gennaro, M. L. Protecting from Envelope Stress: Variations on the Phage-Shock-Protein Theme. Trends Microbiol 25, 205-216, doi:10.1016/j.tim.2016.10.001 (2017).
226 Darwin, A. J. The phage-shock-protein response. Mol Microbiol 57, 621-628, doi:10.1111/j.1365-2958.2005.04694.x (2005).
227 Ades, S. E., Grigorova, I. L. & Gross, C. A. Regulation of the alternative sigma factor sigma(E) during initiation, adaptation, and shutoff of the extracytoplasmic heat shock response in Escherichia coli. J Bacteriol 185, 2512-2519 (2003).
228 Mecsas, J., Rouviere, P. E., Erickson, J. W., Donohue, T. J. & Gross, C. A. The activity of sigma E, an Escherichia coli heat-inducible sigma-factor, is modulated by expression of outer membrane proteins. Genes Dev 7, 2618-2628 (1993).
229 Bianchi, A. A. & Baneyx, F. Hyperosmotic shock induces the sigma32 and sigmaE stress regulons of Escherichia coli. Mol Microbiol 34, 1029-1038 (1999).
230 Wang, Q. P. & Kaguni, J. M. A novel sigma factor is involved in expression of the rpoH gene of Escherichia coli. J Bacteriol 171, 4248-4253, doi:10.1128/jb.171.8.4248-4253.1989 (1989).
231 Gibson, J. L. et al. The sigma(E) stress response is required for stress-induced mutation and amplification in Escherichia coli. Mol Microbiol 77, 415-430, doi:10.1111/j.1365-2958.2010.07213.x (2010).
232 Mitchell, A. M. & Silhavy, T. J. Envelope stress responses: balancing damage repair and toxicity. Nat Rev Microbiol 17, 417-428, doi:10.1038/s41579-019-0199-0 (2019).
233 Sandoval, N. R. & Papoutsakis, E. T. Engineering membrane and cell-wall programs for tolerance to toxic chemicals: Beyond solo genes. Curr Opin Microbiol 33, 56-66, doi:10.1016/j.mib.2016.06.005 (2016).
234 Tan, Z., Yoon, J. M., Nielsen, D. R., Shanks, J. V. & Jarboe, L. R. Membrane engineering via trans unsaturated fatty acids production improves Escherichia coli robustness and production of biorenewables. Metabolic engineering 35, 105-113, doi:10.1016/j.ymben.2016.02.004 (2016).

135
235 Junker, F. & Ramos, J. L. Involvement of the cis/trans isomerase Cti in solvent resistance of Pseudomonas putida DOT-T1E. J Bacteriol 181, 5693-5700 (1999).
236 Bui le, M. et al. Improved n-butanol tolerance in Escherichia coli by controlling membrane related functions. J Biotechnol 204, 33-44, doi:10.1016/j.jbiotec.2015.03.025 (2015).
237 Tan, Z. et al. Engineering Escherichia coli membrane phospholipid head distribution improves tolerance and production of biorenewables. Metab Eng 44, 1-12, doi:10.1016/j.ymben.2017.08.006 (2017).
238 Heipieper, H. J., Meinhardt, F. & Segura, A. The cis-trans isomerase of unsaturated fatty acids in Pseudomonas and Vibrio: biochemistry, molecular biology and physiological function of a unique stress adaptive mechanism. FEMS Microbiol Lett 229, 1-7 (2003).
239 Surmann, K., Ćudić, E., Hammer, E. & Hunke, S. Molecular and proteome analyses highlight the importance of the Cpx envelope stress system for acid stress and cell wall stability in Escherichia coli. Microbiologyopen 5, 582-596, doi:10.1002/mbo3.353 (2016).
240 Braun, V. & Wolff, H. Attachment of lipoprotein to murein (peptidoglycan) of Escherichia coli in the presence and absence of penicillin FL 1060. J Bacteriol 123, 888-897 (1975).
241 Braun, V. & Rehn, K. Chemical characterization, spatial distribution and function of a lipoprotein (murein-lipoprotein) of the E. coli cell wall. The specific effect of trypsin on the membrane structure. Eur J Biochem 10, 426-438 (1969).
242 Ni, Y., Reye, J. & Chen, R. R. lpp deletion as a permeabilization method. Biotechnol Bioeng 97, 1347-1356, doi:10.1002/bit.21375 (2007).
243 Sherkhanov, S., Korman, T. P. & Bowie, J. U. Improving the tolerance of Escherichia coli to medium-chain fatty acid production. Metab Eng 25, 1-7, doi:10.1016/j.ymben.2014.06.003 (2014).
244 Glebes, T. Y. et al. Genome-wide mapping of furfural tolerance genes in Escherichia coli. PloS one 9, e87540, doi:10.1371/journal.pone.0087540 (2014).
245 Wang, L. C., Morgan, L. K., Godakumbura, P., Kenney, L. J. & Anand, G. S. The inner membrane histidine kinase EnvZ senses osmolality via helix-coil transitions in the cytoplasm. EMBO J 31, 2648-2659, doi:10.1038/emboj.2012.99 (2012).
246 Guillier, M. & Gottesman, S. Remodelling of the Escherichia coli outer membrane by two small regulatory RNAs. Mol Microbiol 59, 231-247, doi:10.1111/j.1365-2958.2005.04929.x (2006).
247 Pratt, L. A., Hsing, W., Gibson, K. E. & Silhavy, T. J. From acids to osmZ: multiple factors influence synthesis of the OmpF and OmpC porins in Escherichia coli. Mol Microbiol 20, 911-917 (1996).
248 Rau, M. H., Bojanovič, K., Nielsen, A. T. & Long, K. S. Differential expression of small RNAs under chemical stress and fed-batch fermentation in E. coli. BMC Genomics 16, 1051, doi:10.1186/s12864-015-2231-8 (2015).
249 Nikaido, H. Outer membrane barrier as a mechanism of antimicrobial resistance. Antimicrob Agents Chemother 33, 1831-1836, doi:10.1128/aac.33.11.1831 (1989).

136
250 Pichler, H. & Emmerstorfer-Augustin, A. Modification of membrane lipid compositions in single-celled organisms - From basics to applications. Methods 147, 50-65, doi:10.1016/j.ymeth.2018.06.009 (2018).
251 Asako, H., Kobayashi, K. & Aono, R. Organic solvent tolerance of Escherichia coli is independent of OmpF levels in the membrane. Appl Environ Microbiol 65, 294-296 (1999).
252 Aono, R. & Kobayashi, H. Cell surface properties of organic solvent-tolerant mutants of Escherichia coli K-12. Appl Environ Microbiol 63, 3637-3642 (1997).
253 Tan, Z., Black, W., Yoon, J. M., Shanks, J. V. & Jarboe, L. R. Improving Escherichia coli membrane integrity and fatty acid production by expression tuning of FadL and OmpF. Microb Cell Fact 16, 38, doi:10.1186/s12934-017-0650-8 (2017).
254 Egler, M., Grosse, C., Grass, G. & Nies, D. H. Role of the extracytoplasmic function protein family sigma factor RpoE in metal resistance of Escherichia coli. J Bacteriol 187, 2297-2307, doi:10.1128/JB.187.7.2297-2307.2005 (2005).
255 Zhang, X. S., García-Contreras, R. & Wood, T. K. YcfR (BhsA) influences Escherichia coli biofilm formation through stress response and surface hydrophobicity. J Bacteriol 189, 3051-3062, doi:10.1128/JB.01832-06 (2007).
256 Chen, Y. et al. Lessons in Membrane Engineering for Octanoic Acid Production from Environmental Escherichia coli Isolates. Appl Environ Microbiol 84, doi:10.1128/AEM.01285-18 (2018).
257 Dunlop, M. J. et al. Engineering microbial biofuel tolerance and export using efflux pumps. Molecular systems biology 7, 487 (2011).
258 Mingardon, F. et al. Improving olefin tolerance and production in E. coli using native and evolved AcrB. Biotechnol Bioeng 112, 879-888, doi:10.1002/bit.25511 (2015).
259 Basak, S., Song, H. & Jiang, R. Error-prone PCR of global transcription factor cyclic AMP receptor protein for enhanced organic solvent (toluene) tolerance. Process Biochemistry 47, 2152-2158 (2012).
260 Anes, J., McCusker, M. P., Fanning, S. & Martins, M. The ins and outs of RND efflux pumps in Escherichia coli. Front Microbiol 6, 587, doi:10.3389/fmicb.2015.00587 (2015).
261 Amaral, L., Fanning, S. & Pagès, J. M. Efflux pumps of gram-negative bacteria: genetic responses to stress and the modulation of their activity by pH, inhibitors, and phenothiazines. Adv Enzymol Relat Areas Mol Biol 77, 61-108 (2011).
262 Molina-Santiago, C., Udaondo, Z., Gómez-Lozano, M., Molin, S. & Ramos, J. L. Global transcriptional response of solvent-sensitive and solvent-tolerant Pseudomonas putida strains exposed to toluene. Environ Microbiol 19, 645-658, doi:10.1111/1462-2920.13585 (2017).
263 Hobbs, E. C., Yin, X., Paul, B. J., Astarita, J. L. & Storz, G. Conserved small protein associates with the multidrug efflux pump AcrB and differentially affects antibiotic resistance. Proc Natl Acad Sci U S A 109, 16696-16701, doi:10.1073/pnas.1210093109 (2012).
137
264 Calhoun, L. N. & Kwon, Y. M. Structure, function and regulation of the DNA-binding protein Dps and its role in acid and oxidative stress resistance in Escherichia coli: a review. J Appl Microbiol 110, 375-386, doi:10.1111/j.1365-2672.2010.04890.x (2011).
265 Singh, S. K., Parveen, S., SaiSree, L. & Reddy, M. Regulated proteolysis of a cross-link-specific peptidoglycan hydrolase contributes to bacterial morphogenesis. Proc Natl Acad Sci U S A 112, 10956-10961, doi:10.1073/pnas.1507760112 (2015).
266 Singh, S. K., SaiSree, L., Amrutha, R. N. & Reddy, M. Three redundant murein endopeptidases catalyse an essential cleavage step in peptidoglycan synthesis of Escherichia coli K12. Mol Microbiol 86, 1036-1051, doi:10.1111/mmi.12058 (2012).
267 Spratt, B. G., Zhou, J., Taylor, M. & Merrick, M. J. Monofunctional biosynthetic peptidoglycan transglycosylases. Mol Microbiol 19, 639-640 (1996).
268 Derouaux, A. et al. The monofunctional glycosyltransferase of Escherichia coli localizes to the cell division site and interacts with penicillin-binding protein 3, FtsW, and FtsN. J Bacteriol 190, 1831-1834, doi:10.1128/JB.01377-07 (2008).
269 Gill, R. T., Valdes, J. J. & Bentley, W. E. A comparative study of global stress gene regulation in response to overexpression of recombinant proteins in Escherichia coli. Metab Eng 2, 178-189, doi:10.1006/mben.2000.0148 (2000).
270 Gill, R. T., DeLisa, M. P., Shiloach, M., Holoman, T. R. & Bentley, W. E. OmpT expression and activity increase in response to recombinant chloramphenicol acetyltransferase overexpression and heat shock in E. coli. J Mol Microbiol Biotechnol 2, 283-289 (2000).
271 Alper, H., Moxley, J., Nevoigt, E., Fink, G. R. & Stephanopoulos, G. Engineering yeast transcription machinery for improved ethanol tolerance and production. Science (New York, N.Y 314, 1565-1568, doi:10.1126/science.1131969 (2006).
272 Lam, F. H., Ghaderi, A., Fink, G. R. & Stephanopoulos, G. Biofuels. Engineering alcohol tolerance in yeast. Science 346, 71-75, doi:10.1126/science.1257859 (2014).
273 Foo, J. L. et al. Improving microbial biogasoline production in Escherichia coli using tolerance engineering. MBio 5, e01932, doi:10.1128/mBio.01932-14 (2014).
274 Foo, J. L. & Leong, S. S. Directed evolution of an E. coli inner membrane transporter for improved efflux of biofuel molecules. Biotechnol Biofuels 6, 81, doi:10.1186/1754-6834-6-81 (2013).
275 Jones, C. M., Hernandez Lozada, N. J. & Pfleger, B. F. Efflux systems in bacteria and their metabolic engineering applications. Appl Microbiol Biotechnol 99, 9381-9393, doi:10.1007/s00253-015-6963-9 (2015).
276 Mukhopadhyay, A. Tolerance engineering in bacteria for the production of advanced biofuels and chemicals. Trends Microbiol 23, 498-508, doi:10.1016/j.tim.2015.04.008 (2015).
277 Moore, J. P. et al. Inverted Regulation of Multidrug Efflux Pumps, Acid Resistance and Porins in Benzoate-Evolved. Appl Environ Microbiol, doi:10.1128/AEM.00966-19 (2019).
278 Rojas, A. et al. Three efflux pumps are required to provide efficient tolerance to toluene in Pseudomonas putida DOT-T1E. J Bacteriol 183, 3967-3973, doi:10.1128/JB.183.13.3967-3973.2001 (2001).
138
279 Ramos, J. L., Duque, E., Godoy, P. & Segura, A. Efflux pumps involved in toluene tolerance in Pseudomonas putida DOT-T1E. J Bacteriol 180, 3323-3329 (1998).
280 García, V. et al. Functional analysis of new transporters involved in stress tolerance in Pseudomonas putida DOT-T1E. Environ Microbiol Rep 2, 389-395, doi:10.1111/j.1758-2229.2009.00093.x (2010).
281 Segura, A. et al. Fatty acid biosynthesis is involved in solvent tolerance in Pseudomonas putida DOT-T1E. Environ Microbiol 6, 416-423 (2004).
282 Zhang, R., Cao, Y., Liu, W., Xian, M. & Liu, H. Improving phloroglucinol tolerance and production in Escherichia coli by GroESL overexpression. Microb Cell Fact 16, 227, doi:10.1186/s12934-017-0839-x (2017).
283 Konovalova, A., Schwalm, J. A. & Silhavy, T. J. A Suppressor Mutation That Creates a Faster and More Robust σE Envelope Stress Response. J Bacteriol 198, 2345-2351, doi:10.1128/JB.00340-16 (2016).
284 Zaslaver, A. et al. A comprehensive library of fluorescent transcriptional reporters for Escherichia coli. Nat Methods 3, 623-628, doi:10.1038/nmeth895 (2006).
285 Pavel, H., Forsman, M. & Shingler, V. An aromatic effector specificity mutant of the transcriptional regulator DmpR overcomes the growth constraints of Pseudomonas sp. strain CF600 on para-substituted methylphenols. J Bacteriol 176, 7550-7557 (1994).
286 Reyes, L. H., Almario, M. P., Winkler, J., Orozco, M. M. & Kao, K. C. Visualizing evolution in real time to determine the molecular mechanisms of n-butanol tolerance in Escherichia coli. Metab Eng 14, 579-590, doi:10.1016/j.ymben.2012.05.002 (2012).
287 LaCroix, R. A., Palsson, B. O. & Feist, A. M. A Model for Designing Adaptive Laboratory Evolution Experiments. Appl Environ Microbiol 83, doi:10.1128/AEM.03115-16 (2017).
288 Kildegaard, K. R. et al. Evolution reveals a glutathione-dependent mechanism of 3-hydroxypropionic acid tolerance. Metab Eng 26, 57-66, doi:10.1016/j.ymben.2014.09.004 (2014).
289 Dragosits, M. & Mattanovich, D. Adaptive laboratory evolution -- principles and applications for biotechnology. Microb Cell Fact 12, 64, doi:10.1186/1475-2859-12-64 (2013).
290 Rasila, T. S., Pajunen, M. I. & Savilahti, H. Critical evaluation of random mutagenesis by error-prone polymerase chain reaction protocols, Escherichia coli mutator strain, and hydroxylamine treatment. Anal Biochem 388, 71-80, doi:10.1016/j.ab.2009.02.008 (2009).
291 Emond, S. et al. A novel random mutagenesis approach using human mutagenic DNA polymerases to generate enzyme variant libraries. Protein Eng Des Sel 21, 267-274, doi:10.1093/protein/gzn004 (2008).
292 Zaccolo, M., Williams, D. M., Brown, D. M. & Gherardi, E. An approach to random mutagenesis of DNA using mixtures of triphosphate derivatives of nucleoside analogues. J Mol Biol 255, 589-603, doi:10.1006/jmbi.1996.0049 (1996).
293 Halperin, S. O. et al. CRISPR-guided DNA polymerases enable diversification of all nucleotides in a tunable window. Nature 560, 248-252, doi:10.1038/s41586-018-0384-8 (2018).

139
294 Sadanand, S. EvolvR-ing to targeted mutagenesis. Nat Biotechnol 36, 819, doi:10.1038/nbt.4247 (2018).
295 Quan, J. & Tian, J. Circular polymerase extension cloning of complex gene libraries and pathways. PLoS One 4, e6441, doi:10.1371/journal.pone.0006441 (2009).
296 Consortium, U. UniProt: a worldwide hub of protein knowledge. Nucleic Acids Res 47, D506-D515, doi:10.1093/nar/gky1049 (2019).
297 Hemm, M. R., Paul, B. J., Schneider, T. D., Storz, G. & Rudd, K. E. Small membrane proteins found by comparative genomics and ribosome binding site models. Mol Microbiol 70, 1487-1501, doi:10.1111/j.1365-2958.2008.06495.x (2008).
298 Tsukagoshi, N. & Aono, R. Entry into and release of solvents by Escherichia coli in an organic-aqueous two-liquid-phase system and substrate specificity of the AcrAB-TolC solvent-extruding pump. J Bacteriol 182, 4803-4810 (2000).
299 Törnroth-Horsefield, S. et al. Crystal structure of AcrB in complex with a single transmembrane subunit reveals another twist. Structure 15, 1663-1673, doi:10.1016/j.str.2007.09.023 (2007).
300 Poblete-Castro, I., Becker, J., Dohnt, K., dos Santos, V. M. & Wittmann, C. Industrial biotechnology of Pseudomonas putida and related species. Appl Microbiol Biotechnol 93, 2279-2290, doi:10.1007/s00253-012-3928-0 (2012).
301 Rojo, F. Traits allowing resistance to organic solvents in Pseudomonas. Environ Microbiol 19, 417-419, doi:10.1111/1462-2920.13631 (2017).
302 Weber, F. J., Ooijkaas, L. P., Schemen, R. M., Hartmans, S. & de Bont, J. A. Adaptation of Pseudomonas putida S12 to high concentrations of styrene and other organic solvents. Appl Environ Microbiol 59, 3502-3504 (1993).
303 Nikel, P. I. & de Lorenzo, V. Pseudomonas putida as a functional chassis for industrial biocatalysis: From native biochemistry to trans-metabolism. Metab Eng 50, 142-155, doi:10.1016/j.ymben.2018.05.005 (2018).
304 Cebolla, A., Guzmán, C. & de Lorenzo, V. Nondisruptive detection of activity of catabolic promoters of Pseudomonas putida with an antigenic surface reporter system. Appl Environ Microbiol 62, 214-220 (1996).
305 Hoffmann, J. & Altenbuchner, J. Functional Characterization of the Mannitol Promoter of Pseudomonas fluorescens DSM 50106 and Its Application for a Mannitol-Inducible Expression System for Pseudomonas putida KT2440. PLoS One 10, e0133248, doi:10.1371/journal.pone.0133248 (2015).
306 Graf, N. & Altenbuchner, J. Genetic engineering of Pseudomonas putida KT2440 for rapid and high-yield production of vanillin from ferulic acid. Appl Microbiol Biotechnol 98, 137-149, doi:10.1007/s00253-013-5303-1 (2014).
307 Herrero, M., de Lorenzo, V., Ensley, B. & Timmis, K. N. A T7 RNA polymerase-based system for the construction of Pseudomonas strains with phenotypes dependent on TOL-meta pathway effectors. Gene 134, 103-106 (1993).
308 Molina-Santiago, C. et al. Pseudomonas putida as a platform for the synthesis of aromatic compounds. Microbiology-Sgm 162, 1535-1543, doi:10.1099/mic.0.000333 (2016).

140
309 Martínez-García, E. & de Lorenzo, V. Engineering multiple genomic deletions in Gram-negative bacteria: analysis of the multi-resistant antibiotic profile of Pseudomonas putida KT2440. Environ Microbiol 13, 2702-2716, doi:10.1111/j.1462-2920.2011.02538.x (2011).
310 Martínez-García, E. & de Lorenzo, V. Transposon-based and plasmid-based genetic tools for editing genomes of gram-negative bacteria. Methods Mol Biol 813, 267-283, doi:10.1007/978-1-61779-412-4_16 (2012).
311 Domröse, A. et al. Rapid generation of recombinant. Synth Syst Biotechnol 2, 310-319, doi:10.1016/j.synbio.2017.11.001 (2017).
312 Aparicio, T., de Lorenzo, V. & Martínez-García, E. CRISPR/Cas9-Based Counterselection Boosts Recombineering Efficiency in Pseudomonas putida. Biotechnol J 13, e1700161, doi:10.1002/biot.201700161 (2018).
313 Tan, S. Z., Reisch, C. R. & Prather, K. L. J. A Robust CRISPR Interference Gene Repression System in Pseudomonas. J Bacteriol 200, doi:10.1128/JB.00575-17 (2018).
314 Kim, S. K. et al. CRISPR interference-mediated gene regulation in Pseudomonas putida KT2440. Microb Biotechnol, doi:10.1111/1751-7915.13382 (2019).
315 Lauritsen, I., Porse, A., Sommer, M. O. A. & Nørholm, M. H. H. A versatile one-step CRISPR-Cas9 based approach to plasmid-curing. Microb Cell Fact 16, 135, doi:10.1186/s12934-017-0748-z (2017).
316 Martínez-García, E. & de Lorenzo, V. Pseudomonas putida in the quest of programmable chemistry. Curr Opin Biotechnol 59, 111-121, doi:10.1016/j.copbio.2019.03.012 (2019).
317 Yu, S., Plan, M. R., Winter, G. & Krömer, J. O. Metabolic Engineering of. Front Bioeng Biotechnol 4, 90, doi:10.3389/fbioe.2016.00090 (2016).
318 Verhoef, S., Wierckx, N., Westerhof, R. G., de Winde, J. H. & Ruijssenaars, H. J. Bioproduction of p-hydroxystyrene from glucose by the solvent-tolerant bacterium Pseudomonas putida S12 in a two-phase water-decanol fermentation. Appl Environ Microbiol 75, 931-936 (2009).
319 Ramos, J. L., Duque, E., Huertas, M. J. & Haïdour, A. Isolation and expansion of the catabolic potential of a Pseudomonas putida strain able to grow in the presence of high concentrations of aromatic hydrocarbons. J Bacteriol 177, 3911-3916 (1995).
320 Vongpichayapaiboon, T., Pongsawasdi, P. & Krusong, K. Optimization of large-ring cyclodextrin production from starch by amylomaltase from Corynebacterium glutamicum and effect of organic solvent on product size. J Appl Microbiol 120, 912-920, doi:10.1111/jam.13087 (2016).
321 Liu, C. G. et al. Cellulosic ethanol production: Progress, challenges and strategies for solutions. Biotechnol Adv 37, 491-504, doi:10.1016/j.biotechadv.2019.03.002 (2019).
322 Guimarães, P. M., Teixeira, J. A. & Domingues, L. Fermentation of lactose to bio-ethanol by yeasts as part of integrated solutions for the valorisation of cheese whey. Biotechnol Adv 28, 375-384, doi:10.1016/j.biotechadv.2010.02.002 (2010).
323 Sabri, S., Nielsen, L. K. & Vickers, C. E. Molecular control of sucrose utilization in Escherichia coli W, an efficient sucrose-utilizing strain. Appl Environ Microbiol 79, 478-487, doi:10.1128/AEM.02544-12 (2013).
141
324 Swinnen, S., Ho, P. W., Klein, M. & Nevoigt, E. Genetic determinants for enhanced glycerol growth of Saccharomyces cerevisiae. Metab Eng 36, 68-79, doi:10.1016/j.ymben.2016.03.003 (2016).
325 Kornberg, H. L. Routes for fructose utilization by Escherichia coli. J Mol Microbiol Biotechnol 3, 355-359 (2001).
326 Poblete-Castro, I., Wittmann, C. & Nikel, P. I. Biochemistry, genetics and biotechnology of glycerol utilization in Pseudomonas species. Microb Biotechnol, doi:10.1111/1751-7915.13400 (2019).
327 Kenny, S. T. et al. Development of a bioprocess to convert PET derived terephthalic acid and biodiesel derived glycerol to medium chain length polyhydroxyalkanoate. Appl Microbiol Biotechnol 95, 623-633, doi:10.1007/s00253-012-4058-4 (2012).
328 Prieto, A. et al. A holistic view of polyhydroxyalkanoate metabolism in Pseudomonas putida. Environ Microbiol 18, 341-357, doi:10.1111/1462-2920.12760 (2016).
329 Chen, G. Q. & Jiang, X. R. Engineering microorganisms for improving polyhydroxyalkanoate biosynthesis. Curr Opin Biotechnol 53, 20-25, doi:10.1016/j.copbio.2017.10.008 (2018).
330 Verhoef, S., Ruijssenaars, H. J., de Bont, J. A. & Wery, J. Bioproduction of p-hydroxybenzoate from renewable feedstock by solvent-tolerant Pseudomonas putida S12. J Biotechnol 132, 49-56, doi:10.1016/j.jbiotec.2007.08.031 (2007).
331 Löwe, H., Schmauder, L., Hobmeier, K., Kremling, A. & Pflüger-Grau, K. Metabolic engineering to expand the substrate spectrum of Pseudomonas putida toward sucrose. Microbiologyopen 6, doi:10.1002/mbo3.473 (2017).
332 Bevan, M. W. & Franssen, M. C. Investing in green and white biotech. Nat Biotechnol 24, 765-767, doi:10.1038/nbt0706-765 (2006).
333 Fadel, M., Keera, A. A., Mouafi, F. E. & Kahil, T. High Level Ethanol from Sugar Cane Molasses by a New Thermotolerant Saccharomyces cerevisiae Strain in Industrial Scale. Biotechnol Res Int 2013, 253286, doi:10.1155/2013/253286 (2013).
334 Wittgens, A. et al. Growth independent rhamnolipid production from glucose using the non-pathogenic Pseudomonas putida KT2440. Microb Cell Fact 10, 80, doi:10.1186/1475-2859-10-80 (2011).
335 Löwe, H., Sinner, P., Kremling, A. & Pflüger-Grau, K. Engineering sucrose metabolism in Pseudomonas putida highlights the importance of porins. Microb Biotechnol, doi:10.1111/1751-7915.13283 (2018).
336 Nikaido, H. Molecular basis of bacterial outer membrane permeability revisited. Microbiol Mol Biol Rev 67, 593-656, doi:10.1128/mmbr.67.4.593-656.2003 (2003).
Related Documents


![· Web viewCaenorhabditis elegans [55]. Prior studies investigating chemotherapy-related microbiota alterations revealed a severe imbalance in microbial composition and function,](https://static.cupdf.com/doc/110x72/5e91c6b4d76b4c0b1e79781c/web-view-caenorhabditis-elegans-55-prior-studies-investigating-chemotherapy-related.jpg)


