Investigating Ride Sharing Opportunities through Mobility Data Analysis Nicola Bicocchi 1 , Marco Mamei 2 1 Dipartimento di Ingegneria “Enzo Ferrari”, 2 Dipartimento di Scienze e Metodi dell’Ingegneria University of Modena and Reggio Emilia, Italy Abstract Smart phones and social networking tools allow to collect large-scale data about mobility habits of people. These data can support advanced forms of sharing, coordination and cooperation possibly able to reduce the overall demand for mobility. Our goal is to develop a recommender system - to be integrated in smart phones, tablets, and in-vehicle platforms - capable of identifying opportunities for sharing cars and rides. We present a methodol- ogy, based on the extraction of suitable information from mobility traces, to identify rides along the same trajectories that are amenable for ride sharing. We provide experimental results showing the impact of this technology and we illustrate a Web-based platform implementing the key concepts presented. Keywords: Mobility Patterns, Ride Sharing, Pervasive Computing. 1. Introduction Travel has become an indispensable aspect of our lives. The current level of personal mobility was unheard of just 50 years ago, and it has shaped the way in which we build our communities, where and how we work and spend our leisure time. People travel more often and over longer distances than in the past - whether for commuting between home to work or school, shopping or going on holidays. But the freedom of personal mobility has brought it into a collision course with the boundary of finite resources. On a global scale, personal mobility is now responsible for 26% of carbon dioxide (CO2) emissions [1]. In Europe, mobility has the fastest growing energy demands of all sectors and, despite international agreements, is the only sector with consistently increasing emissions in most countries [1]. Preprint submitted to PMC - Social Car SI September 22, 2014

Welcome message from author
This document is posted to help you gain knowledge. Please leave a comment to let me know what you think about it! Share it to your friends and learn new things together.
Transcript

Investigating Ride Sharing Opportunities through
Mobility Data Analysis
Nicola Bicocchi1, Marco Mamei2
1Dipartimento di Ingegneria “Enzo Ferrari”, 2Dipartimento di Scienze e Metodidell’Ingegneria
University of Modena and Reggio Emilia, Italy
Abstract
Smart phones and social networking tools allow to collect large-scale dataabout mobility habits of people. These data can support advanced formsof sharing, coordination and cooperation possibly able to reduce the overalldemand for mobility. Our goal is to develop a recommender system - tobe integrated in smart phones, tablets, and in-vehicle platforms - capable ofidentifying opportunities for sharing cars and rides. We present a methodol-ogy, based on the extraction of suitable information from mobility traces, toidentify rides along the same trajectories that are amenable for ride sharing.We provide experimental results showing the impact of this technology andwe illustrate a Web-based platform implementing the key concepts presented.
Keywords: Mobility Patterns, Ride Sharing, Pervasive Computing.
1. Introduction
Travel has become an indispensable aspect of our lives. The current levelof personal mobility was unheard of just 50 years ago, and it has shaped theway in which we build our communities, where and how we work and spendour leisure time. People travel more often and over longer distances than inthe past - whether for commuting between home to work or school, shoppingor going on holidays. But the freedom of personal mobility has brought itinto a collision course with the boundary of finite resources. On a globalscale, personal mobility is now responsible for 26% of carbon dioxide (CO2)emissions [1]. In Europe, mobility has the fastest growing energy demandsof all sectors and, despite international agreements, is the only sector withconsistently increasing emissions in most countries [1].
Preprint submitted to PMC - Social Car SI September 22, 2014

In response to these problems, improvements are expected from vehicle-to-vehicle or vehicle-to-infrastructure coordination schemes. Moreover, au-tonomous cars currently being developed promise to further improve fuelefficiency by removing the human factor. Another, more radical solution,could be based on a radical shift to renewable energy sources and the devel-opment of fully electric vehicles.
In this work we investigate a social, more than a technical, solution tack-ling the issue by reshaping the demand for mobility by supporting car sharingand ride sharing practices. Such an approach looks promising in that it canprovide viable and high-impact solutions in a short time frame, and couldaddress several issues related to personal mobility at the same time [2]. Asreported in [1], mobility demand spans all aspects of our life and by no meansit reduces to home-work commute. Accordingly, effective systems to reshapemobility demand have to consider all aspects of our life, including free timeand leisure.
The increasing adoption of smart phones and social networking tools al-low to collect large-scale information about the mobility habits of people,and can support advanced forms of sharing, coordination and cooperationthat can drastically reduce the overall demand for mobility [3, 4, 5]. Specif-ically, our proposal is to develop a recommender system - to be integratedin smart phones, tablets, and in-vehicle platforms - capable of identifyingopportunities for sharing cars and rides. In particular, such a system would:
1. Collect mobility information2. Identify routine behaviours3. Identify sharing opportunities (e.g., two users who do not know each
other but live and work close by - familiar strangers [6])4. Recommend users about mobility alternatives
The key novelty of our proposal is that our system is fully autonomous.Users do not enter their availabilities and needs explicitly. Sharing opportu-nities are automatically identified by analysing people mobility patterns, andare recommended when suitable conditions arise. This kind of unobtrusiveand proactive approach could facilitate the application diffusion and improveits effectiveness [7].
The contribution of this paper is twofold: on the one hand, we presenta methodology to extract suitable information form mobility traces. On theother hand, we describe the implementation of a prototypical system offeringride sharing opportunities on the basis of the extracted information.
2

The rest of the paper is structured as follows: Section 2 discusses relatedwork in the area both in terms of data mining mechanisms for mobility data,and in terms of ride sharing applications. Section 3 introduces our approachfor automatically discovering and labelling routine behaviours and describessome experiments conducted with two complementary real-world datasets.Section 4 discusses our proposals for identifying possible shared rides on thebasis of the discovered routines, illustrates our implementation and discussesabout privacy issues associated with these systems. Section 5 concludes thepaper and illustrates further developments.
2. Related work
An increasing number of research proposals applies advanced data miningtechniques on mobility data with the goal of improving mobility services insmart city scenarios. In this section, we analyse related work in the areas ofboth mobility analysis and innovative mobility services.
2.1. Mobility Analysis
The availability of affordable localisation mechanisms and the recognitionof location as a primary source of context information has stimulated a wealthof work trying to extract high-level information from raw mobility traces.While a complete survey is outside the scope of this paper, we present someexemplary researches trying to emphasize the novel aspects of our work.
The CitySense project (www.citysense.com) uses GPS and WiFi data tocluster people whereabouts and discover hotspots of activity in the city area.In a similar work based on extremely large anonymized mobility data comingfrom Telecom operators authors were able to extract the spatio-temporaldynamics of the city, highlighting where people usually go during the day.The authors were able also to identify the most visited areas by touristsand the typical time of the visit (see for example [8], [9]). While these worksfocus mainly on hot-spot identification, our approach goes further and is ableto identify and label patterns and routine behaviours that will be useful toidentify ride-sharing opportunities.
The approach proposed in [10] uses Principal Component Analysis (PCA)to identify the main components structuring daily human behaviour. Themain components of the human activities, which are the top eigenvectorsof the PCA decomposition are termed eigenbehaviours. Similarly, the work
3

presented in [11] compares different data mining techniques to extract pat-terns from mobility data. In particular, they found that Principal Compo-nent Analysis (PCA) and Independent Component Analysis (ICA) are bestsuited to the task of identifying daily patterns. In comparison with thesetechniques, the topic model we propose has the advantage of capturing char-acteristic trends occurring over parts of the day (such as lunch time only),whereas eigenbehaviours tend to capture features over the entire day (seeSection 3.4 for more discussion with this regard).
In [12, 13] authors propose the use of probabilistic topic models to capturehuman routines from cell tower connections. Our work uses a more complexdataset, thus allowing to analyse the topic models method at a finer-grainscale with a higher number of places. As mentioned above, the geographiccoordinates provided by our GPS and CDR datasets allow to enrich thelocation vocabulary with a higher number of places (in contrast with the‘home’, ‘work’ and ‘elsewhere’ labels used in [12]). In addition, in our workwe also present algorithms to automatically label topics in order to makethem more understandable and usable.
The M-Atlas approach is a recent proposal to extract patterns from mo-bility data [14]. M-Atlas creates an origin-destination matrix counting thenumber of repeated trips in the dataset. High-values in this matrix representrecurrent patterns. The proposed topic model is more flexible in that it canidentify patterns even if no direct trajectories between places are present.
The evaluation of most of the researches in this area has been mainlyqualitative, largely because of lack of ground-truth. Novel methodologiesto quantitatively assess results are needed. In particular, the idea of usingmultiple data sources – observing user daily life from multiple perspectives –to cross validate results seems very promising. We presents some experimentsevaluating our proposal in Section 3.6 and in Section 4.1.
2.2. Mobility Services and Car Sharing Applications
The idea of reshaping mobility demand by supporting ride sharing and carpooling activities is not new [15]. For example, systems like - www.mitfahrzentrale.de provide advanced car pooling solutions since 1998. However, thevast majority of systems that are in place today supports ride sharing forplanned and long-distance (> 100km) travels. The novel opportunities of-fered by pervasive technologies (and exploited in our work) lies in bringingride sharing into routine drives within the city. Pervasive technologies and
4

mobile computing allow in fact to automate the process of identifying andnegotiating matching rides among users.
BlaBlaCar [16], a French startup, is a fully working web service enablingpeer-to-peer ride sharing among users. Users can buy and sell rides on aneBay-like platform. Ride fares are established by the car owner and eventu-ally negotiated in person. UberPop [17], is a peer-to-peer ride sharing serviceoffered by Uber. It extends the Uber taxi-like service by enabling users tocontact directly other users. Rides have a time-based fare. Flinc [18], isanother ride sharing service gaining popularity. It has been designed to dealboth with occasional trips and frequent routines. It embeds a social networkto keep users connected and enforce trust-based policies. It is also integratedwith widespread navigation platforms allowing users to offer and search ridesfrom the car deck. However, while these systems use recent Web technologies,they still do not automate the process of identifying sharing opportunities.Users have to explicitly enter their availability and needs. The system wepresent, instead, performs the latter step in an automatic way on the basis ofpast user’s routines. Accordingly, our mechanisms could be effectively inte-grated in systems like BlaBlaCar, UberPop or Flinc for providing users withan automatic way to participate.
The work presented in [19] describes a multi modal journey planner that,relying on a number of mobility data, computes the probability distributionsof end-to-end travel times, taking into account uncertain departure, traveland transfer times. While the goal of this system is rather different from theone we present, the basic mechanisms to extract information from underlyingmobility data are similar.
The research presented in [20] analyses mobile phone location data tomeasure the amount of overlapping in people daily mobility as a pre-conditionto enable ride sharing opportunities. They show that simple ride-sharingamong people having neighbouring home and work locations can reduce thenumber of cars in the city at the expense of a relatively short detour to pickup/drop of passengers. Our work is very similar in spirit with this research, inaddition the mobility analysis we propose can improve and generalise mobilityroutine identification. The proposed topic model, in fact, can identify alsoroutine behaviours other than home-work commute.
Another example of using social interactions to ease traffic problems isdescribed in [21]. Authors propose to use crowd-sourcing to collect, andkeep updated the information about parking slots in the city. Althoughthey focus on a different case study, we think that some of the algorithms
5

we propose to automatically extract places and routine behaviours couldeffectively complement crowd-source information collection.
The work presented in [15] use a probabilistic model to analyse the like-lihood that a person will be successful in finding a ride-match, given a poolsize of potential ride matches. In this work, the authors also observe thatthere are many obstacles, primarily in terms of communication and socialnorms, preventing ride sharing from actually happening. The work in [22]analyses this latter issue further, trying to identifying the social enablers forride sharing. In this direction is also sthe work on persuasive technologies[7, 23] that analyses social and psychological aspects related to behaviour-influencing technologies and crowd-source coordinated activities. Althoughour work does not deal with this issues yet, these aspects are very importantfor the practical applicability and success of ride sharing systems. In our fu-ture work we will investigate these aspects trying, for example, to leverage onthe social links among people as an information to foster sharing practices.For example, a user might be more inclined to share a ride with a friend-of-a-friend rather than with a complete stranger. In this line of inquiry is alsothe analysis of incentives and reputation mechanisms [23] supporting ridesharing activities.
3. Discovering and Labeling routine behaviours
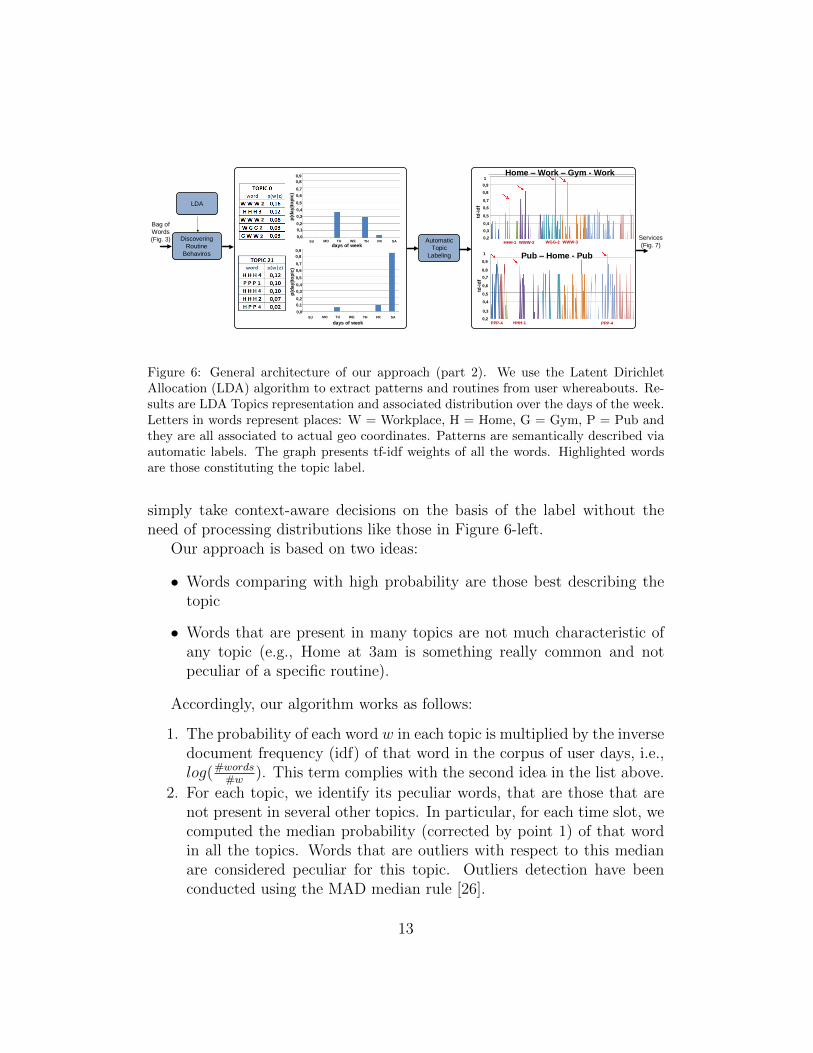
The architecture in Figure 3, 6, 7 summarises the proposed approach.We analysed mobility data using two different datasets described in Section3.1. Our approach works as follows: the most visited places by the userare automatically identified. Moreover, they are labeled either via reversegeo-coding, or by names provided by the user (see Figure 3). Then, weshow how a probabilistic data mining technique, namely Latent DirichletAllocation (LDA), can both successfully extract routine behaviours in anunsupervised manner and make mobility data more meaningful. Eventually,extracted routines are automatically labeled via semantic descriptions (seeFigure 6). The final result (see Figure 7) is the input of the ride sharingmodule described in Section 4.
3.1. Dataset
The research has been based on two complementary datasets.
1. We recorded the daily whereabouts of three persons over the period ofalmost one year. One subject is one of the authors of this paper, the
6

Source Timestamp Longitude Latitude CellID Radius (m)Google 2012/10/4:10.25 45.07 7.67 - -Google 2012/10/4:17.18 45.17 7.37 - -CDR 2012/10/4:27.18 45.15 7.17 11763 500CDR 2012/10/4:28.18 45.09 7.41 14832 500
Figure 1: GPS traces collected via Google Latitude (upper two lines). CDR data collectedfrom the Telecom operator (lower two lines).
other two subjects are not part of our research group. Subjects recordeddata by continuously running Google Latitude in background. Figure1 illustrates the schema of this dataset.
2. We obtained a large set of mobility data from an Italian telecom op-erator. In particular, we analysed anonymized CDR data (Call DetailRecords) for 1000 persons living in the same city spanning 1 month. Foreach user, CDR data logs the approximate location of the user when-ever (s)he uses the phone to send or receive calls or text messages, oraccess the network. The user’s location is given in terms of the cellnetwork antenna the user was connected with. The area covered by agiven antenna can be approximated by a circle with a given center andradius. Figure 1 illustrates the schema of this dataset.
Despite the structural similarity, these datasets are rather different. Theformer dataset is very fine grained with information on users’ GPS locationsevery few minutes. We have ground-truth information and we can ask theusers to validate results of data analysis. The latter dataset is much moreapproximate. For each user we have about 10 locations per day, we do nothave ground-truth information, nor we can interact with the users. On theother hand, we have a lot of users to experiment with. Figure 2 illustratessome key distributions for the telecom dataset. In particular, we present theusers’ distributions both in terms of the number of trips being conducted andthe number of kilometres. These distributions show that we are focusing ona rather large number of short movements. As discussed in the related worksection, while traditional ride sharing systems provide solutions for plannedlong distance trips, one innovation of our approach is to focus on shorterroutine movements, typically happening within a city.
7

a)
0
100
200
300
0 5 10 15 20trips
coun
t
b)
0
100
200
300
400
0 25 50 75 100km
coun
t
Figure 2: (a) Distribution of CDR users on the basis of the number of trips being recorded.(b) Distribution of CDR users on the basis of the number of Km being recorded.
3.2. Key Places Identification
The first step to process data is to identify the places most visited by theuser (see Figure 3-left). Mainstream approaches are based on segmenting andclustering location-traces to infer what are the places relevant to the user [24].More in detail, we created a grid of non-overlapping cells (500x500m size)over the area visited by the user. Cells in which on average the user spendsmore than an hour per week are marked as relevant (see Figure 4).
Once key places have been identified, it is important to name them. Ask-ing the users to label key places is a practical way to get concise and under-standable descriptions. This is basically the approach used by Foursquareand Google Now which tries to predict where people might travel to on thebasis of their past activities. In addition, it could be also possible to reverse-geocode a given location to discover what is in there, and use that informationfor labelling. This latter approach tends to produce noisier labels, but wouldbe completely unsupervised. We adopted the first mechanism for the firstdataset. On the contrary, we adopted the second mechanism for the CDRdata in that we could not contact the original subjects involved in the datacollection. We automatically name Home “H” the place most visited at nightand Work “W” the place most visited during the day. We named other placeswith the name of the grid cell overlaid to the area (see Figure 4).
An informal survey conducted with the Google Latitude users in our studyverified that the mechanism correctly labels their home and workplace. We
8

Place
IdentificationBag of Words
representation
Identifying
Routines
(Fig. 6)
Reverse
Geocode
User Input
GPS
Trace
Home
(H)
H H H H W W W ... W E E H H
HHH1 HWW2 HHH4
sliding window
bag of words
HHH1
DAY Nth
Figure 3: General architecture of our approach (part 1). We start from a log of GPStraces. We apply a place identification algorithm to discover the places most visited bythe user. Places are annotated either by user input or by reverse geo-coding. Places areorganized in a bag of words representation.
applied the same algorithm to the CDR dataset extracting few key placesfor the each user. In this case we did not have ground-truth information tovalidate the results. However, some evaluation with regard to this dataset ispresented in Section 3.6.
3.3. Bag of Words Representation
In the second step, following the approach proposed in [12, 10], we or-ganised the dataset into a sequence of days each consisting of 24 time-slotslasting 60 minutes each. For each time-slot, if the associated location recordsfall within 500 meters from a place identified in the previous step, then wemark the time-slot with that place. Otherwise, we mark the location asNULL. Following this process, each day is then represented by a string of 24symbols. To capture transitions between locations, in the final step of thepre-processing phase, we run a sliding window over each day. The slidingwindow takes 3 consecutive symbols and concatenates them with anotherlabel capturing the time of the day where these locations have been visited.In particular, we considered the following 4 time labels: 0-6am (1 - night),7am-1pm (2 - morning), 2pm-6pm (3 - afternoon), 7pm-11pm (4 - evening).These time segments were chosen to capture common events in daily life,such as lunch time (transition form time labels 1 and 2), dinner time (timelabel 4), or morning and afternoon work times. The result is a set of wordseach containing 3 location letters and a time label (see Figure 3-right). Eachword also keeps a reference to the actual geographic coordinates in order tolocalise the place.
9

Figure 4: Grid-based key place identification technique. GPS points are accumulated overa grid (500x500m size). Cells reaching a certain threshold, are marked as relevant. In theexample above, a day of a single commuter has been processed. Home and work placeshave been correctly identified. The other marked cells are those that accumulated GPSpoints but did not reach the threshold.
The resulting bag of words summarises the original dataset and is theinput data structure for the algorithm to extract routine behaviours (i.e.,topics) and add semantics.
3.4. Routine Identification
Discovering routine behaviours is an important step to add semantics tousers’ whereabouts. On the one hand, patterns and routines represent a stepfurther in describing information about the user. On the other hand, theyrepresent also information about how a place is “used” by a given user. Sothat the “Fox pub” can be a place where to go after work for some userswhile it is the workplace itself for the bar tender.
LDA is a probabilistic generative model [25] used to cluster documentsaccording to the topics (i.e., word patterns) they contain. LDA is an un-supervised learning mechanism that do not require a labeled (difficult to beacquired) training set. Moreover, LDA has two key advantages compared toother clustering mechanisms (such as k-means): (i) The LDA model resultsin probabilistic distributions of days given all topics whereas other clusteringalgorithms (e.g., k-means) assigns only one cluster per day. (ii) Meaning-ful word distributions as the representation of topics. Topics are based ondiscriminative location sequences characterising routines [12].
More in detail, LDA is based on the Bayesian network depicted in Figure5. A word w is the basic unit of data, representing user location at a given
10
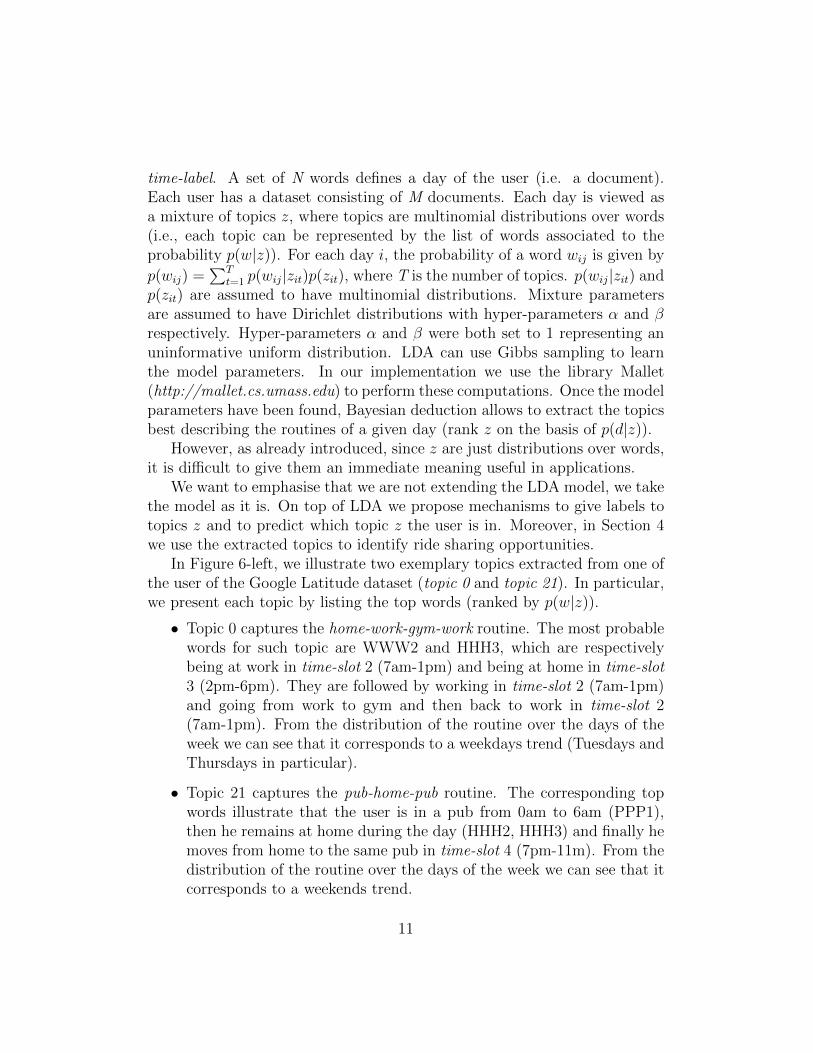
time-label. A set of N words defines a day of the user (i.e. a document).Each user has a dataset consisting of M documents. Each day is viewed asa mixture of topics z, where topics are multinomial distributions over words(i.e., each topic can be represented by the list of words associated to theprobability p(w|z)). For each day i, the probability of a word wij is given by
p(wij) =∑T
t=1 p(wij|zit)p(zit), where T is the number of topics. p(wij|zit) andp(zit) are assumed to have multinomial distributions. Mixture parametersare assumed to have Dirichlet distributions with hyper-parameters α and βrespectively. Hyper-parameters α and β were both set to 1 representing anuninformative uniform distribution. LDA can use Gibbs sampling to learnthe model parameters. In our implementation we use the library Mallet(http://mallet.cs.umass.edu) to perform these computations. Once the modelparameters have been found, Bayesian deduction allows to extract the topicsbest describing the routines of a given day (rank z on the basis of p(d|z)).
However, as already introduced, since z are just distributions over words,it is difficult to give them an immediate meaning useful in applications.
We want to emphasise that we are not extending the LDA model, we takethe model as it is. On top of LDA we propose mechanisms to give labels totopics z and to predict which topic z the user is in. Moreover, in Section 4we use the extracted topics to identify ride sharing opportunities.
In Figure 6-left, we illustrate two exemplary topics extracted from one ofthe user of the Google Latitude dataset (topic 0 and topic 21). In particular,we present each topic by listing the top words (ranked by p(w|z)).
• Topic 0 captures the home-work-gym-work routine. The most probablewords for such topic are WWW2 and HHH3, which are respectivelybeing at work in time-slot 2 (7am-1pm) and being at home in time-slot3 (2pm-6pm). They are followed by working in time-slot 2 (7am-1pm)and going from work to gym and then back to work in time-slot 2(7am-1pm). From the distribution of the routine over the days of theweek we can see that it corresponds to a weekdays trend (Tuesdays andThursdays in particular).
• Topic 21 captures the pub-home-pub routine. The corresponding topwords illustrate that the user is in a pub from 0am to 6am (PPP1),then he remains at home during the day (HHH2, HHH3) and finally hemoves from home to the same pub in time-slot 4 (7pm-11m). From thedistribution of the routine over the days of the week we can see that itcorresponds to a weekends trend.
11

N
T
M
w
φβ
α θ z
Figure 5: Plate notation representing the LDA model. α is the parameter of the uniformDirichlet prior on the per-document topic distributions. β is the parameter of the uniformDirichlet prior on the per-topic word distribution. θi is the topic distribution for document(day) i, ϕj is the topic distribution for word j. These variables are modelled with aDirichlet distribution. zij is the topic for the j-th word in document i, and wij is thespecific word. These variables are modelled as multinomial distributions. The wij are theonly observable variables, and the other variables are latent variables.
These results illustrate that the LDA model applied to GPS data suc-cessfully reveals different types of patterns.
The above results illustrate also one of the key advantages of LDA com-pared to other clustering mechanisms (e.g., k-means). While most otherclustering algorithms group together days that are similar for the whole 24hours (i.e., they associate a given day - feature vector with a single cluster),LDA can cluster days that are similar only in a given time interval (i.e., theyassociate a given day - feature vector with multiple topics). For example,LDA can cluster the days in which the user went to a given place in theafternoon, even if those days have very different signatures in the morning.Other clustering mechanisms are not able to identify that cluster since theyconsider whole days only [25, 12].
3.5. Routine Labeling
As from the previous examples, automatically understanding topics canbe difficult, in that they are raw probability distributions over words repre-senting places and time of visit [13]. A further step in the meaningful de-scription of user whereabouts would be to automatically attach to each topica concise and meaningful label describing the user routine (e.g., the user isin the “Gym at lunch break” routine). Applications and services could then
12
Discovering
Routine
Behaviros
LDA
Automatic
Topic
Labeling
td-i
df
WWW-2 WGG-2 WWW-3
td-i
df
PPP-4 PPP-4
0,3
0,4
0,5
0,6
0,7
0,8
0,9
1
0,3
0,4
0,5
0,6
0,7
0,8
0,9
1
0,2HHH-1
0,2HHH-1
SU FRTHWETUMO SA
0,1
0,0
0,2
0,3
0,4
0,5
0,6
0,7
0,8
0,9
SU FRTHWETUMO SA
0,0
0,2
0,3
0,4
0,5
0,6
0,7
0,8
0,9
0,1
days of week
days of week
p(d
ay|t
op
ic)
p(d
ay|t
op
ic)
Services
(Fig. 7)
Bag of
Words
(Fig. 3)
Home – Work – Gym - Work
Pub – Home - Pub
2
2
2
2
4
4
Figure 6: General architecture of our approach (part 2). We use the Latent DirichletAllocation (LDA) algorithm to extract patterns and routines from user whereabouts. Re-sults are LDA Topics representation and associated distribution over the days of the week.Letters in words represent places: W = Workplace, H = Home, G = Gym, P = Pub andthey are all associated to actual geo coordinates. Patterns are semantically described viaautomatic labels. The graph presents tf-idf weights of all the words. Highlighted wordsare those constituting the topic label.
simply take context-aware decisions on the basis of the label without theneed of processing distributions like those in Figure 6-left.
Our approach is based on two ideas:
• Words comparing with high probability are those best describing thetopic
• Words that are present in many topics are not much characteristic ofany topic (e.g., Home at 3am is something really common and notpeculiar of a specific routine).
Accordingly, our algorithm works as follows:
1. The probability of each word w in each topic is multiplied by the inversedocument frequency (idf) of that word in the corpus of user days, i.e.,log(#words
#w). This term complies with the second idea in the list above.
2. For each topic, we identify its peculiar words, that are those that arenot present in several other topics. In particular, for each time slot, wecomputed the median probability (corrected by point 1) of that wordin all the topics. Words that are outliers with respect to this medianare considered peculiar for this topic. Outliers detection have beenconducted using the MAD median rule [26].
13

Resulting
Routines
Labeled
Topics
(Fig 6)
Home – Work – Gym - Work Pub – Home - Pub
2
2
2
3
1
2
HPP
Figure 7: General architecture of our approach (part 3). Graphic representation of twodiscovered routines: spatial distribution of the routine displayed on a map. The largerthe circle, the higher is the probability associated to the given place. These results will beused to find users with similar routines to identify ride sharing opportunities – see nextSection.
3. We create the label for each topic by ordering the topic’s peculiar wordaccording to their time stamp. For each word we take the place inwhich the user spends most of the time (e,g., WHH = ‘Home’)
As an example, assuming that all the words of the topics reported inFigure 6 are peculiar (e.g., they are characteristic of that topics), topic 0would be described by the label “Home - Work - Gym - Work”. Topic 21would be described by the label “Pub - Home - Pub”.
To evaluate the appropriateness of the label to describe the topic, wecomputed the tf-idf weight (term frequency – inverse document frequency)of each word with respect to the identified topic. Tf–idf is a weight, oftenused in information retrieval and text mining, to evaluate how important aword is to a document in a collection or corpus. Figure 6-right shows the tf-idf weights of all the words. Words considered for the label are indeed thosehaving the highest weight. Time stamps having no words with a spike (i.e.,having all words with low tf–idf weights) are not considered for the label,since they are not peculiar for the given topic.
3.6. Validation and Discussion
Given the lack of accurate ground-truth information, and the fact thattopics cluster data in classes that are not defined a priori, it is difficult toprovide sound measures on the accuracy of the obtained results (this is ageneral limitation of the current state of the art). As a partial solution, wecollected Google Latitude dataset in order to evaluate the outcome of theproposed approach. Talking with the Google Latitude subjects in our study
14
topics number of topics
pe
rce
nta
ge
of
da
ys
(a)
0
5
45
40
35
30
25
20
15
10
50
3015129630 18 21 2724
(c)
(b)
2520151050 30
p(d
|z)
0
0,05
0,4
0,35
0,3
0,25
0,2
0,15
0,1
topics
2520151050 30
p(d
|z)
0
0,02
0,18
0,16
0,14
0,08
0,1
0,06
0,04
(b)
0,12
0,2
Figure 8: Topics’ distribution for the first user in our study: (a) p(d|z) plot for daysdescribed with low probability by many topics. (b) p(d|z) plot for days well described byfew topics. (c) histogram of number of dominating topics per day.
the topics being extracted are reasonable and describe parts of the actualusers’ routine behavior.
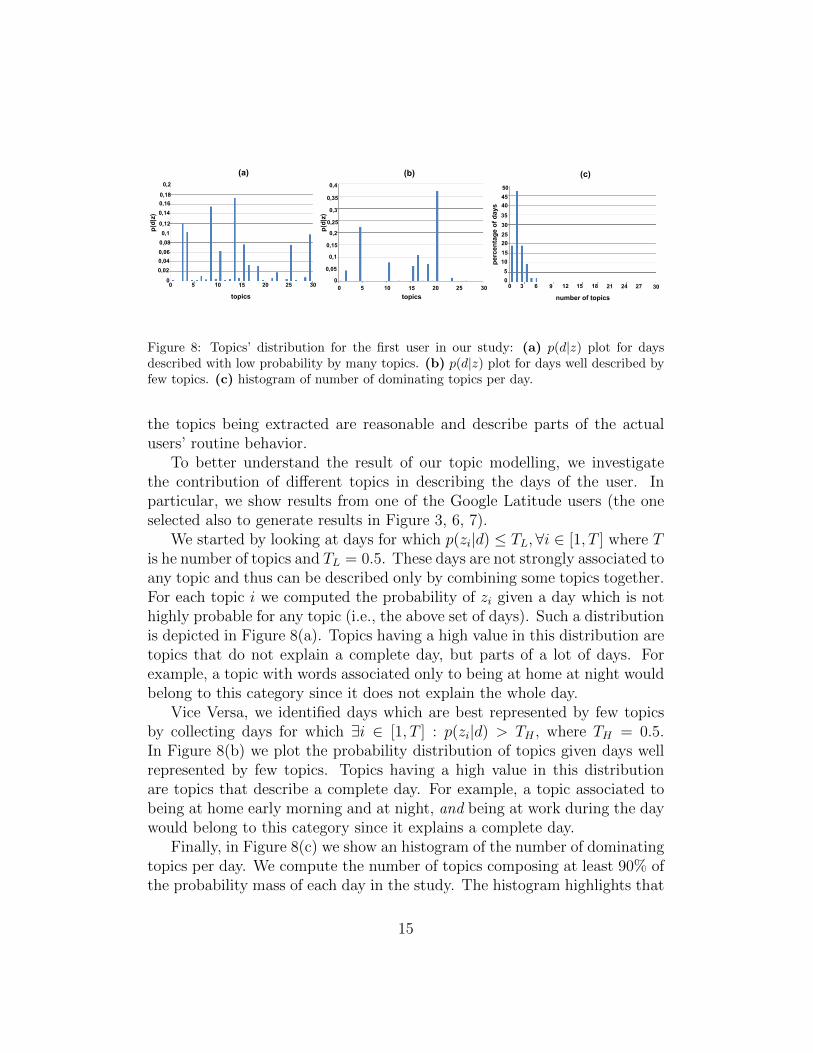
To better understand the result of our topic modelling, we investigatethe contribution of different topics in describing the days of the user. Inparticular, we show results from one of the Google Latitude users (the oneselected also to generate results in Figure 3, 6, 7).
We started by looking at days for which p(zi|d) ≤ TL, ∀i ∈ [1, T ] where Tis he number of topics and TL = 0.5. These days are not strongly associated toany topic and thus can be described only by combining some topics together.For each topic i we computed the probability of zi given a day which is nothighly probable for any topic (i.e., the above set of days). Such a distributionis depicted in Figure 8(a). Topics having a high value in this distribution aretopics that do not explain a complete day, but parts of a lot of days. Forexample, a topic with words associated only to being at home at night wouldbelong to this category since it does not explain the whole day.
Vice Versa, we identified days which are best represented by few topicsby collecting days for which ∃i ∈ [1, T ] : p(zi|d) > TH , where TH = 0.5.In Figure 8(b) we plot the probability distribution of topics given days wellrepresented by few topics. Topics having a high value in this distributionare topics that describe a complete day. For example, a topic associated tobeing at home early morning and at night, and being at work during the daywould belong to this category since it explains a complete day.
Finally, in Figure 8(c) we show an histogram of the number of dominatingtopics per day. We compute the number of topics composing at least 90% ofthe probability mass of each day in the study. The histogram highlights that
15

the subject under investigation follows a consistent routine and few topicsare enough to explain most of his days.
In general it is possible to see that topic modelling works best, like inthis case, when the number of relevant locations for the user is limited. Inthis situation, there is enough repetitiveness in the user routine to let theLDA algorithm effectively identify relevant topics. It is worth noticing thatmost related work [10, 12, 13] deal in fact with only 3 kind of places (Home,Work and Elsewhere). In our experiments we considered users having upto 10 different locations, that are suitable to identify most of their routinebehaviours.
In addition to these experiments on the Google Latitude dataset, we runalso some analysis on the larger telecom dataset. In these experiments wetried to measure the fraction of daily movements that are represented inthe top words of the most probable topic (see Figure 9(a)). Vice versa wetried to measure the fraction of the topics’ top words that are representedby the days associated with that topic. (see Figure 9(b)). The two graphsshow the distribution of such a fraction over all the users. It is possible tosee that even considering only the most probable topic’s top words we areable to represent a large fraction of the user routine movements. However,from Figure 9(b), it is possible to see that some movements described in atopic are not always present in the actual data. In the lack of ground-truthinformation, we speculate that some of that movements did actually takeplace and where simply just not recorded by the CDR data.
4. Ride Matching
Once routine movements have been identified, the next step is to discoversimilarities among them. In particular, given a user A and one of her routinesru we want to identify a set of n routines from other users “covering” ru.
More in detail, the proposed algorithm works as follows: each routine ruthat is typically followed by a user u on some days of the week can be factoredin a set of transitions described by the travel’s source s and destination dcoordinates, and the time t in which the transition happens.
The algorithm selects all the routines r performed by users other than uon days of the week that overlaps with the set days. Then, for each transitiontx ∈ ru, the algorithm scans all the transitions ty ∈ r looking for matches [27].In particular – calling tx.t the time frame in which the transition happens,
16

a)
0
50
100
150
200
250
0.0 0.4 0.8 1.2fract. of movements in top words of best topic
coun
t
b)
0
100
200
300
0.25 0.50 0.75 1.00fract. of top topic movements in best matching day
coun
t
Figure 9: Evaluation of topic modeling approach. a) fraction of daily movements that arerepresented in the top words of the most probable topic. b) fraction of the topics’ topwords that are represented by the days associated with that topic.
tx.s the transition starting coordinates and tx.d the transition destinationcoordinates – we define that two transitions tx and ty match if:
tx.t = ty.t ∧ dist(tx.s, ty.s) < δ ∧ dist(tx.d, ty.d) < δ
Where dist is the geographic distance between the points and δ is athreshold parameter. It is worth noticing that the current approach is rathersimple: two transitions match if they happen in the same time window, andif their starting and ending points are close to each other. More advancedmatching could rely on the fact that a user could pick up/leave anotheruser in between of a transition. Our current algorithm does not considerthis possibility since it would require a detailed road map of the area underanalysis to understand if the pick up/leave is actually compatible with userroute. We will address this extension in our future work.
4.1. Experimental Evaluation
To evaluate the impact of the proposed approach we conducted a set ofexperiments with the dataset from the telecom operator described in Section3.1. Specifically, we wanted to show the number of both movements and kmthat could be saved.
As described in Section 3.4, we applied the LDA algorithm and selectedthe first 1000 most active users. The mobility routines of each user are de-
17

HOME
WORK
PUB
GYM
HOME
HOME
WORK
User B
User C
User A
Figure 10: Ride matching approach. The routine of user A is “covered” by the routinesof users B and C. Successful ride sharing would allow user A to leave the car at home andgoing to work with user C and coming back home with user B.
scribed by a set of LDA topics. Each topic is essentially a list of movementsdescribed as a tuple like the following: (source time, source longitude, sourcelatitude, destination time, destination longitude, destination latitude, prob-ability). To make our investigation more meaningful, we removed all thetuples with the following features:
• distance between geographic source and destination < 100m (i.e., theuser spending time in the same place)
• probability < 0.1 (i.e., topics that are likely to be poorly informativeabout actual habits of the user)
• duplicated tuples (i.e., the same movement included in different topics)
By applying this filtering stage to the initial set of about 50000 move-ments, we obtained 7700 unique movements (characterised in Figure 2).Then, we spatially and temporally aggregated all movements. Specifically, weaggregated movements with the same time values and with spatial sourcesand destinations comprised within a search radius variable between 100mand 2000m. Furthermore, we considered the capacity boundary of cars andavoided to aggregate more than 4 movements together. What we achievedis depicted in Figure 11. The number of possibly saved trips halves with aradius of 1300m, while exceeds 60% with a radius of 2000m. Despite, theseresults are based on the assumption that all users participate to our sharing
18

a)
0
2000
4000
6000
8000
0 500 1000 1500 2000radius (m)
n. u
niqu
e pa
ths
b)
0
20
40
60
0 500 1000 1500 2000radius (m)
%. t
rips
save
d
Figure 11: The impact of our system in a real-word scenario. In particular, picture (a)represents the number unique (i.e., that cannot be further aggregated) paths needed tomeet mobility requirements of all 1000 users with different search radiuses. The higherthe radius, the more the users are likely to walk to reach each other. Picture (b), instead,shows the percentage of saved trips. The number of paths, strictly correlated with km andpollution saved, halves with a search radius of about 1300m.
system, they are encouraging especially in light of the fact that more complexand effective matching algorithms could be used.
4.2. Implementation
We developed a first prototype or our system as a Web application (http://lica.lab.unimo.it). The web application connects to a mobile app developedfor both Android and iOS recording GPS data for each user and allowing ridesearches. The application runs the workflow we have presented, extractingusers’ mobility routines and storing key places and movements in a database.
We still did not implement opportunistic (i.e., proactive) recommenda-tions, as we are still trying to engineering the user interface for such advices.In the current implementation, the user has to access a Web interface toquery for available ride sharing options. The system applies the describedride matching algorithm to select users with similar routine behaviours.
The system connects via email to the selected user indicating the “ridesharing” request. On acceptance, the system notifies both users about thecomplete transaction. Figure 12 illustrates a screenshot of the application.In the current system, we did not implement any compensation/paymentschema for a successful ride share.
19

Figure 12: Screenshots (iOS version) of the mobile app we have developed. It collects GPSdata at user-definable rates (left) and allows users to search for rides (center) or otherusers with similar routines (right). The web portion of the system can be experienced athttp://lica.lab.unimo.it.
4.3. Privacy Issues
Privacy issues are fundamental for the applicability of the idea presentedin this work. In fact, even if the practical advantages (both at the individualand social level) would be consistent, only few people would allow to sharedetailed mobility data because of privacy concerns. To mitigate these issueswe propose a layered approach. In general, adding layers increases both thecomplexity of the system and the level of anonymity.
The first layer regards the physical devices in which raw data are storedand LDA models computed. While, at the time of writing, computation isdone in a centralised fashion, it would be possible to let each user run theLDA algorithm locally (e.g., in a smart phone) and transmit to a centralprovider the resulting LDA model. Although the LDA model still containsprivacy sensitive information, it is less detailed (i.e., more privacy-compliant)that the raw traces. In fact, it does not contain every spatial movements butonly the recurrent ones.
Furthermore, as a second layer, it is worth considering that the matchingalgorithm among users’ traces naturally tolerates approximate locations. In
20

fact, a user A can share a ride with user B even though the source andthe destination of the trips do not perfectly overlap. This would allow todeliberately approximate users’ locations within LDA models thus enablingthe system for k-anonymity [28].
Finally, as a third layer, LDA models could be exchanged in a peer-to-peerfashion by making use of technologies such as distributed hash tables. Asfor other well-established networks such as FreeNet [29], both requests andreplies (i.e., matching LDA models), could be rooted through the overlay.Communication messages between nodes are ciphered and the actual sourceand destination IP addresses are obfuscated. Thus for an eventual attacker,it would be difficult to collect and reconstruct LDA models of specific users.
As a final general remark, the proposed topic-modelling approach andits inherent tolerance in identifying ride sharing opportunities already sup-port some basic privacy issues. In our future work we will try to actuallyimplement these aspects in our system.
5. Conclusion
A number of problems in our society, from urban management to en-vironmental issues, require highly collaborative approaches in which peopleare asked to gradually change their behaviours and habits. Pervasive andmobile computing technologies allow to support such collaborative activitiesby automatically monitoring people behaviours and suggesting possible im-provements. In this direction, the paper presents the idea of a recommendersystem capable of identifying opportunities for sharing cars and rides byanalysing mobility data. In particular, we presented a methodology to au-tomatically extract suitable information form mobility traces and identifysharing opportunities. Experimental results show the feasibility of the ap-proach and the potential to mitigate several traffic-related issues. In ourfuture work, other than better assessing the accuracy and generality of theapproach, we will conduct user studies to evaluate the contribution of theidentified whereabouts patterns in the development of behaviour-influencingapplications.
Acknowledgements: Work supported by the ASCENS (Autonomic ServiceComponents Ensembles) project (FP7-FET, Contract No. 257414)). Wewould like to thank Laura Ferrari who realized the LDA approach. We would
21

also like to thank our students: Dario Stabili, Andrea Borghi, Marco Frigeriand Francesco Bartolacelli who developed the Web site of the application.
[1] B. Tuner, One Planet Mobility: A Journey towards a sustainable future,2008.
[2] A. Riener, K. Zia, A. Ferscha, C. B. Ruiz, J. J. M. Rubio, Traffic flowharmonization in expressway merging, Personal and Ubiquitous Com-puting 17 (3) (2013) 519–532.
[3] M. Conti, S. K. Das, C. Bisdikian, M. Kumar, L. M. Ni, A. Passarella,G. Roussos, G. Trster, G. Tsudik, F. Zambonelli, Looking ahead inpervasive computing: Challenges and opportunities in the era of cyber-physical convergence, Pervasive and Mobile Computing Journal 8 (1)(2012) 2–21.
[4] F. Zambonelli, Toward sociotechnical urban superorganisms, IEEEComputer 45 (8) (2012) 76–78.
[5] N. Bicocchi, A. Cecaj, D. Fontana, M. Mamei, A. Sassi, F. Zambonelli,Collective awareness for human-ict collaboration in smart cities, in:IEEE International Conference on Enabling Technologies: Infrastruc-tures for Collaborative Enterprises, Hammet, Tunisia, 2013.
[6] S. Milgram, The individual in a social world: essays and experiments,McGraw-Hill, 1992.
[7] B. Fogg, Persuasive technology: using computers to change what wethink and do, ACM Ubiquity 5 (2002) .
[8] F. Calabrese, J. Reades, C. Ratti, Eigenplaces: analysing cities usingthe space-time structure of the mobile phone network, IEEE PervasiveComputing 9 (1) (2010) 78–84.
[9] F. Girardin, J. Blat, F. Calabrese, F. D. Fiore, C. Ratti, Digital foot-printing: Uncovering tourists with user-generated content, IEEE Perva-sive Computing 7 (4) (2008) 36–43.
[10] N. Eagle, A. Pentland, Eigenbehaviors: Identifying structure in routine,Behavioral Ecology and Sociobiology 63 (7) (2009) 1057–1066.
22

[11] S. Sigg, S. Haseloff, K. David, An alignment approach for context predic-tion tasks in ubicomp environments, IEEE Pervasive Computing 9 (4)(2010) 90–97.
[12] K. Farrahi, D. Gatica-Perez, Discovering routines from large-scale hu-man locations using probabilistic topic models, ACM Transactions onIntelligent Systems and Technology 2 (1) (2011) .
[13] Classification and prediction of whereabouts patterns from the realitymining dataset, Pervasive and Mobile Computing 9 (2013) 516527.
[14] R. Trasarti, S. Rinzivillo, F. Pinelli, M. Nanni, A. Monreale, C. Renso,D. Pedreschi, F. Giannotti, Exploring real mobility data with m-atlas,in: European conference on Machine learning and knowledge discoveryin databases, Barcelona, Spain, 2010.
[15] R. Hall, A. Qureshi, Dynamic ride-sharing: Theory and practice, Jour-nal of Transportation Engineering 123 (4) (1997) 308–315.
[16] Blablacar.URL http://www.blablacar.com/
[17] Uber.URL http://www.uber.com/
[18] Flinc.URL http://www.flinc.org/
[19] A. Baptista, E. Bouillet, F. Calabrese, O. Verscheure, Towards buildingan ncertainty-aware personal journay planner, in: International IEEEConference on Intelligent Transportation Systems, Washington (DC),USA, 2011.
[20] B. Ciciy, A. Markopoulou, E. Fras-Martnez, N. Laoutaris, Quantifyingthe potential of ride-sharing using call description records, in: ACM In-ternational Workshop on Mobile Computing Systems and Applications,Jekyll Island (GE) USA, 2013.
[21] X. Chen, E. Santos-Neto, M. Ripeanu, Crowdsourcing for on-streetsmart parking, in: ACM international symposium on Design and anal-ysis of intelligent vehicular networks and applications, Paphos, Cyprus,2012.
23

[22] M. Brereton, P. Roe, M. Foth, J. Bunker, L. Buys, Designing participa-tion in agile ridesharing with mobile social software, in: ACM OZCHIConference of the Australian Computer-Human Interaction, Melbourne,AU, 2009.
[23] I. Rahwan, S. Dsouza, A. Rutherford, V. Naroditskiy, J. McInerney,M. Venanzi, N. R. Jennings, M. Cebrian, Global manhunt pushes thelimits of social mobilization, IEEE Computer 46 (4) (2013) 68–75.
[24] N. Marmasse, C. Schmandt, Location-aware information delivery withcommotion, in: International Symposium on Handheld and UbiquitousComputing, Bristol, UK, 2000.
[25] D. Blei, A. Ng, M. Jordan, Latent dirichlet allocation, Journal of Ma-chine Learning Research 3 (1) (2003) 993–1022.
[26] R. Wilcox, Introduction to Robust Estimation and Hypothesis Testing,Elsevier Academic Press, Burlington (MA), 2005.
[27] A. Sassi, F. Zambonelli, Towards an agent coordination framework forsmart mobility services, in: ACM International Workshop on Agents inTraffic and Transportation, Paris, France, 2014.
[28] L. Sweeney, k-anonymity: A model for protecting privacy, InternationalJournal on Uncertainty,Fuzziness and Knowledge-based Systems 18 (10)(2002) 557–570.
[29] S. Androutsellis-Theotokis, D. Spinellis, A survey of peer-to-peer con-tent distribution technologies, ACM Computing Surveys 36 (4) (2004)335–371.
24
Related Documents


