Electronic copy available at: http://ssrn.com/abstract=2535224 Investigating liquidity in a frontier government bond market: the case of Bucharest Stock Exchange Prof.dr. Cornelia Pop, Department of Business, Faculty of Business, Babes-Bolyai University, Cluj-Napoca, Romania, [email protected] Assoc.Prof.dr. Maria-Andrada Georgescu, Department of Economics and Public Policies, National University of Political Studies and Public Administration, Bucharest, Romania Lecturer dr. Iustin Atanasiu Pop, Department of Business, Faculty of Business, Babes-Bolyai University, Cluj-Napoca, Romania (version August 10 th 2014) Abstract: Liquidity is an important feature for any domestic bond market, being associated with a well organized market. A liquid secondary government bond market must be of interest for any frontier economy policy-makers given the important benefits. The present paper is the first to investigate the liquidity of government bond secondary market in Romania, included in the subgroup of frontier securities market. The paper use multivariate empirical analysis using the data set available at Bucharest Stock Exchange for the period August 2008, when the secondary market for government bonds was launched, and December 2013. Since this is the first paper trying to measure the liquidity of BVB government bond market segment, a high number of proxies were first selected in order to capture all the liquidity dimensions. Also five factors were identified to influence the majority of these proxies. In the end, four factors of the initial five proved to have an increased explanatory power over the liquidity proxies. Further, the number of twelve liquidity proxies should be reduced and a PCA was conducted in order to extract a smaller number. The final result indicates a number of four liquidity proxies that captured in a satisfactory manner all the liquidity dimensions. The results suggests that the Romanian Ministry of Finance should pay a special attention to these four proxies and to the idemtfied factors influencing them in order to increase the government bond segment liquidity at Bucharest Stock Exchange. Key words: government bonds, liquidity, factors, liquidity proxy, Principal-Component Analysis JEL Classification: G100, G190 1. Introduction The ability of emerging economies to develop domestic debt markets was documented by recent studies of Jaramillo & Weber (2013), Comelli (2012), and Burger et al. (2012) and highlighted by Global Financial Stability Reports of 2005, 2006 and 2013. The subgroup of frontier economies, smaller and less developed, seems to follow the same trend in establishing local currency-denominated bond markets, nevertheless this phenomenon and related topics, like liquidity, remained of low interest for academic studies. Liquidity is an important feature for any domestic bond market, being associated with a well organized market. A liquid secondary government bond market must be of interest for any frontier economy policy-makers given the important benefits. The importance of liquidity and liquidity functions for government bond markets were documented and underlined by McCauley & Remolona (2000), Mohanty (2002), Anderson & Lavoie (2004), Luengnaruemitchai & Ong (2005), Burger & Warnok (2006), Burger & Warnok (2007), Peiris (2010), Daniel (2008), and Ebeke & Lu (2014). A brief synthesis of what the mentioned studies underscored is presented as follow.

Welcome message from author
This document is posted to help you gain knowledge. Please leave a comment to let me know what you think about it! Share it to your friends and learn new things together.
Transcript

Electronic copy available at: http://ssrn.com/abstract=2535224
Investigating liquidity in a frontier government bond market:
the case of Bucharest Stock Exchange
Prof.dr. Cornelia Pop, Department of Business, Faculty of Business, Babes-Bolyai University,
Cluj-Napoca, Romania, [email protected]
Assoc.Prof.dr. Maria-Andrada Georgescu, Department of Economics and Public Policies,
National University of Political Studies and Public Administration, Bucharest, Romania
Lecturer dr. Iustin Atanasiu Pop, Department of Business, Faculty of Business, Babes-Bolyai
University, Cluj-Napoca, Romania
(version August 10th
2014)
Abstract:
Liquidity is an important feature for any domestic bond market, being associated with a well organized market. A
liquid secondary government bond market must be of interest for any frontier economy policy-makers given the
important benefits. The present paper is the first to investigate the liquidity of government bond secondary market in
Romania, included in the subgroup of frontier securities market. The paper use multivariate empirical analysis using
the data set available at Bucharest Stock Exchange for the period August 2008, when the secondary market for
government bonds was launched, and December 2013. Since this is the first paper trying to measure the liquidity of
BVB government bond market segment, a high number of proxies were first selected in order to capture all the
liquidity dimensions. Also five factors were identified to influence the majority of these proxies. In the end, four
factors of the initial five proved to have an increased explanatory power over the liquidity proxies. Further, the
number of twelve liquidity proxies should be reduced and a PCA was conducted in order to extract a smaller
number. The final result indicates a number of four liquidity proxies that captured in a satisfactory manner all the
liquidity dimensions. The results suggests that the Romanian Ministry of Finance should pay a special attention to
these four proxies and to the idemtfied factors influencing them in order to increase the government bond segment
liquidity at Bucharest Stock Exchange.
Key words: government bonds, liquidity, factors, liquidity proxy, Principal-Component Analysis
JEL Classification: G100, G190
1. Introduction
The ability of emerging economies to develop domestic debt markets was documented by recent
studies of Jaramillo & Weber (2013), Comelli (2012), and Burger et al. (2012) and highlighted
by Global Financial Stability Reports of 2005, 2006 and 2013. The subgroup of frontier
economies, smaller and less developed, seems to follow the same trend in establishing local
currency-denominated bond markets, nevertheless this phenomenon and related topics, like
liquidity, remained of low interest for academic studies.
Liquidity is an important feature for any domestic bond market, being associated with a well
organized market. A liquid secondary government bond market must be of interest for any
frontier economy policy-makers given the important benefits. The importance of liquidity and
liquidity functions for government bond markets were documented and underlined by McCauley
& Remolona (2000), Mohanty (2002), Anderson & Lavoie (2004), Luengnaruemitchai & Ong
(2005), Burger & Warnok (2006), Burger & Warnok (2007), Peiris (2010), Daniel (2008), and
Ebeke & Lu (2014). A brief synthesis of what the mentioned studies underscored is presented as
follow.

Electronic copy available at: http://ssrn.com/abstract=2535224
First, a domestic government security market provides a basis for a robust and efficient financial
system as a whole. Burger & Warnok (2006) documented the correlation between the issuance of
domestic debt and the quality improvement of financial systems. A liquid market allows lower
financing cost for government deficits, and also plays an important role in the implementation
and transmission of monetary policies by absorbing a share of liquid savings.
Second, a local currency-denominated bond market reduces the reliance on overseas financing in
foreign currency, and helps reducing the financial fragility and vulnerabilities associated with
currency mismatches. Through a liquid domestic government bond market, a frontier economy is
able to borrow ‘abroad’ (Daniel 2008) in its own currency, and by attracting foreign investors
that could act as catalysts for further development mainly by diversifying the investor base, and
increasing the demand for local debt securities (Peiris 2010, Ebeke & Lu 2014). Moreover, such
and evolution can create room for countercyclical domestic policy response to adverse external
shocks (Miyajima et al. 2012).
Third, a local government bond market generates a yield curve that reflects market-determined
interest rates that reveal the opportunity costs of funds for a wider range of maturities, providing
the policy-makers with a source of information on financial market interest expectations.
Fourth, a liquid secondary market for government bonds can represent a credible benchmark,
facilitating the pricing of other riskier assets, the hedging of other types of assets, encouraging
the use of government bonds as collateral for other financial transactions, having an important
impact on other financial market segments developments.
Given the importance of liquidity for a domestic government bond market development in a
frontier economy, it is critical to measure the liquidity of such a market in order to allow further
studies regarding the liquidity determinants and liquidity premium.
Liquidity is an elusive, amorphous, complex, an abstract feature for any market, difficult to
capture by a single measure given its multifaceted nature associated with multiple dimensions
Amihud (2002), Mohanty (2002), Anderson & Lavoie (2004), Diaz et al. (2006), Schaeffer &
Schmalz (2009). As highlighted by Borio (2000), and Jankowitsch et al. (2002), many market
participants and academic researchers have a general sense of what liquidity means, being more
easily recognized than defined and measured.
The concept of liquidity and various aspects of this concept were discussed and investigated by a
large number of academic studies and papers. In recent years the following authors Jankowitsch
et al.(2002), Kay (2008), Goyenko et al.(2011), Schaeffer & Schmalz (2009), provided
comprehensive literature reviews and discussions regarding liquidity concept and it will be
pointless to repeat their ideas. However, a synthesis of liquidity dimensions and their potential
measures along with a series of stylized facts regarding liquidity was seldom or never done and
is of interest for the present paper.
While the academic literature investigating liquidity in developed and emerging government
bond markets is extensive, little attention was concentrated on frontier markets either due to
absence of such markets or the lack of data.
The present paper is the first to investigate the liquidity of government bond secondary market in
Romania, included in the subgroup of frontier securities market. The paper use multivariate
empirical analysis using the data set available at Bucharest Stock Exchange for the period
August 2008, when the secondary market for government bonds was launched, and December
2013. Through the investigations regarding the presence of stylized facts on government bond
liquidity, and by revealing the liquidity proxies that can be calculated for this market, along with
their determinants, the paper further reveals a low to moderate level of liquidity and points out

that the main problem lays with the government bond issuer, Romanian Ministry of Finance,
which after five years is still struggling to grasp the significant role government bonds play as
benchmarks for the domestic market, including the importance of liquidity for these securities’
secondary market. In addition to this contribution to the academic literature, the paper proposes a
synthesis of liquidity dimensions and their potential measures or proxies, identifies and present a
series of six stylized facts regarding government bond liquidity, and proposes that several of
former liquidity proxies (outstanding quantity, coupon and time to maturity) to be considered
rather liquidity determinants/ factors since they are given characteristics established by the
issuer.
Further, the paper is structured as follow: subparagraphs 1.1. and 1.2. are related to introduction
and present a synthesis of liquidity dimensions and their proposed proxies, as the academic
literature discuss and use them, and respectively a selection of stylized facts regarding
government bond liquidity. Part 2 presents briefly the data and methodology. Part 3 offers an up
to date survey of the government bond market segment at Bucharest Stock Exchange. Part 4
presents the findings and discussions and part 5 concludes.
1.1. Liquidity dimensions
As mentioned above, the difficulty in measuring liquidity arises from its complex and
multifaceted nature associated with its multiple dimensions. Table 1 below presents a synthesis
of these dimensions’ definitions and the measures or liquidity proxies that can be associated with
the respective dimensions.
Table 1: Liquidity dimensions and corresponding measures/ proxies
Liquidity dimension1)
Liquidity measures/ proxies2)
Tightness: refers to the cost efficiency of any
transactions; the lower the cost, the higher the
liquidity. Note: Anderson & Lavoie (2004) citing Gravelle 1999,
names this dimension width.
Traditionally measured by bid-ask spread.
Alternative measures: Roll measure, gamma,
zero return days (or LOT), Imputed Roundtrip
Trades, dispersion or unique round trip cost.
Depth: refers to transaction dimensions
(abundant number of orders and order volume)
that can be absorbed by the market without
causing sharp changes in price. Note: most of the sources above imply that depth
includes breadth. Breadth is mentioned only by Sarr &
Lybeck (2002) and Baker (1996) as cited by Gabrielsen
et al.(2011)
Traditionally associated mainly with volume
based liquidity measures like trading volume,
size of trade, volume per trade, order volume,
turnover ratio, liquidity ratio, index of Martin,
Amihud illiquidity measure1, latent liquidity,
volume-weighted difference measure, Hui-
Heubel liquidity ratio.
Resiliency or resilience: refers to the market
capacity to absorb random shocks by
correcting order imbalances and/ or dissipating
price fluctuations with the highest speed
possible.
There is no consensus regarding the proxies
capturing this liquidity dimension. However,
the following proxies might capture it: liquidity
ratio, index of Martin Marsh and Rock
liquidity ratio, Amihud illiquidity measure,
trading frequency, frequency of trade, volume-
weighted difference measure, Hui-Heubel
liquidity ratio, market efficiency coefficient or
1 Since Amihud illiquidity measure (Amihud 2002) is related to price impact coefficient or lambda proposed by
Kyle (1985), Kyle’s coefficient was not mentioned distinctly.

variance ratio, non-trading-day adjusted
Amihud (illiquidity) measure or illiq_zero.
Immediacy: refers to the time needed for an
order to be processed; it considers the time
elapsed between the moment one order was
placed until it was settled
This is the most elusive liquidity dimension
and almost impossible to be captured with the
proxies proposed until now by the academic
literature.
Nevertheless, one can consider that the
liquidity proxies that capture resiliency
indirectly capture immediacy also. The simple
reasoning is: a high speed in absorbing the
random shocks must be supported by a fast
order processing activity. Note 1): The definitions of above presented liquidity dimensions represent authors’ compilation based on the
following sources: CGFS (1999), Borio (2000), Upper 2000, Mohanty (2002), Sarr & Lybeck (2002), Anderson &
Lavoie (2004), Schaeffer & Schmalz (2009), Turner (2012)
Note 2): The measures were compiled based on the following sources: Roll (1984), CGFS (1999), Lesmond et
al.(1999), Amihud (2002), Fleming (2003), Anderson & Lavoie (2004), Christodoulopoulos & Grigoratou (2005),
Mahanti et al.(2007), Bao et al.(2009), Jankowitsch et al.(2008), Dick-Nielsen et al.(2012), Schaeffer & Schmalz
(2009), Zhang (2010), Bushman et al.(2010), Gabrielsen et al.(2011).
The following academic studies provide further literature review and in depth discussions
regarding the liquidity measures: Sarr & Lybeck (2002), Goyenko et al.(2009), Dick-Nielsen et
al.(2012), Schaeffer & Schmalz (2009), Bushman et al.(2010), Zhang (2010), Gabrielsen et
al.(2011). The ideas expressed within these papers were considered and embedded in the
investigations of the current paper.
Most of the papers cited above also consider that coupon, outstanding quantity or inventory and
the age of the bond, as proposed by Sarig & Warga (1989), can stand as proxies for government
bond liquidity. Thus, these three measures do not capture any of the liquidity dimensions
presented above. Moreover, these three proposed proxies are in fact (government) bond given
characteristics, established by the issuer and should be considered rather factors that influence
the liquidity measures presented in Table 1, as the stylizes facts below suggest. Within this
paper, coupon, outstanding quantity and bond age will be considered liquidity factors and not
liquidity proxies.
1.2. Selected stylized facts regarding government bond liquidity
The abundant academic literature concerning the topic of government bond liquidity allow the
selection of the following features that can be currently considered stylized facts due to the
existing documented works and there are commonly accepted as such by numerous academic
papers. The further presentation of selected stylized facts was based on the following sources:
Amihud & Mendelson (1991), Gravelle (1999), Mohanty (2002), Jankowitsch et al.(2002), Sarig
& Warga (1989), Longstaff et al.(2004), Das et al.(2005), Kamara (1994), Fleming (2003),
Christodoulopoulos & Grigoratou (2005).
First, the benchmark2 (Treasury) bonds are often considered more liquid than other bonds. The
benchmark bonds also tend to trade close to par. Hence, the benchmarks are preferred by active
2 A benchmark bond, according to Banks (2005, pp.33), is a a market leading bond, generally featuring significant
liquidity and narrow bid-ask spread. It used to be also bellwether. Because a benchmark is used as a standard against

traders. In the US Treasury market, the benchmark property is closely related to the on-the-run
property and a concentration of liquidity can be seen in on-the-run and near maturity
benchmarks. Also in connection with the benchmark property, it is underscored that benchmark
bonds tend to cover particular maturity buckets and that there a strategy of concentrating the
issuance on a few important maturities is taking shape and is followed by many countries. This
strategy is used in order to avoid the problem of market fragmentation arising from issuing a
large number of maturities with small issue size.
Second, the ‘on-the-run’3 long term government bonds are considered to enjoy higher liquidity
before they are absorbed into investors’ portfolios. The phenomenon of trading concentration on
the most recently issued government bonds is described by mainly by Warga (1992) and Amihud
et al.(2005) showing that the availability of the on-the-run T-bonds through various investment
houses and banks make them more attractive for traders and investors.
Third, bond liquidity tends to decrease with age and the older bonds may be less liquid than more
recent issue bonds. This fact is related with (and might be considered a corollary of) the on-the-
run property and the trading behavior toward the newly issued bonds as mentioned within the
second stylized fact. Moreover, as stressed by Sarig & Warga (1989), once a bond becomes
illiquid, it tends to stay illiquid until it matures.
Fourth, the notional amount outstanding for a bond is used as an indicator of the general
availability of the respective bond in the market. Hence, it is expected that the bond issue size to
affect its liquidity in a positive way. The corollary is that the T-bonds with larger issues are
(expected to be) more liquid than the bonds with smaller issuers, and are expected to register
larger turnovers.
Fifth, more liquid bonds are expected to have higher prices (lower yields) than less liquid bonds.
Sixth, academic literature reports that high coupon bonds tend to be more liquid than the bonds
with low coupons.
2. Data, research questions and methodology
The main data set used for the present paper is represented by the daily information provided by
Bucharest Stock Exchange through the respective daily trading reports, including a dedicate
section for government bond trading. This data set was used, when appropriate, as end of period
data and as daily averages. The main data set was completed, when necessary, by information
provided through their official websites by Romanian Ministry of Finance and Romanian
National Bank.
The following research questions were addressed: 1) Do the six selected stylized facts regarding
government bond liquidity hold for Bucharest Stock Exchange? 2) The calculation of a set of
liquidity proxies based on the main data set available. 3) Verifying the general hypothesis: do the
identified liquidity factors have a combined influence over each liquidity proxy that could be
calculated? 4) Selecting of the calculated liquidity proxies a smaller number that captures better
all the liquidity dimensions at Bucharest Stock Exchange.
which other bonds are measured, T-bonds or government bonds are almost always used as benchmark
(Investopedia). The government benchmark bonds might have the reopening feature, meaning that a secondary
offering of a new tranche of securities under an existing issue with a defined coupon and maturity might be made.
For the secondary market, mainly in US, a benchmark T-bond is the most recently auctioned Treasury issue for each
maturity (Investopedia). 3 The ‘on-the-run’ property refers to the most recently issued bond for a given maturity bucket and are considered
more liquid than off-the-run bonds Jankowitsch et al.(2002).

The multivariate analysis was used, along with multiple regressions in order to address the first
three research questions. The answer to the fourth research question was obtained by using the
Pricipal-Component Analysis.
3. Government bond market segment at Bucharest Stock Exchange: August 2008- December
2013
The domestic government bonds were introduced for trading at Bucharest Stock Exchange (BVB
hereafter4) August 4
th 2008. They were the last newcomers of the BVB bond sector which was
launched in November 2001 with the listing of municipal bonds. Further, in May 2003, the
domestic corporate bonds were introduced, followed by the international (corporate) bonds in
September 2006. However, the bond sector had a relative low profile within BVB, as Graph 1
and Graph 2 below show. Before the introduction of T-bonds, the bond sector represented around
6% of BVB turnover, more than half due to the bond public offerings, thus infrequent, of large
value compared with daily bond turnover. The listing of T-bonds increased the bond sector share
to about 10%, while the importance of the bond public offerings remained over 3%. It must be
mentioned that none of the BVB bond public offerings included T-bonds.
Graph 1: BVB main market structure as of
December 2007
Graph 2: BVB main market structure as of
December 2013
Source: authors’ calculations based on BVB data
Source: authors’ calculations based on BVB data
The evolution of bond sector at BVB and its structure presented in the Table 2 show a very thin
market between the end of 2001 and 2003 revealing the low interest the domestic municipal
bonds attracted. After the introduction of corporate bonds, the bulk of the trading activity
gravitated around them and moved toward the international bonds segment in 2007 and 2008.
Since 2009, the domestic government bonds are the main focus of bond trading, a situation
generated not only by the importance of T-bonds for domestic institutional investor portfolios,
but also by the complete absence of listed domestic corporate bond since the beginning of 2010
4 BVB abbreviation was chosen over BSE in order to keep the identity of the main Romanian security market. BVB
is the abbreviation of Romanian name: Bursa de Valori Bucuresti. The BSE abbreviation for Bucharest Stock
Exchange might generate confusions with Budapest Stock Exchange, Bulgarian Stock Exchange, Bratislava Stock
Exchange, and Belgrade Stock Exchange, all functioning in the same region of Central and Eastern Europe.
shares, 93.87%
bond-public offerings,
3.65%
bonds (municipals,
intl., corporate),
2.25%
other securities
(rights, futures),
0.23%
shares, 87.20%
T-bonds, 5.53%
bond-public offerings,
3.27%
bonds (municipals,
intl., corporate),
1.56%
other securities
(rights, futures, ETFs,
structured products),
2.44%

until the fourth quarter of 2012. The more intense trading activity of 2009 and 2010 was almost
entirely generated by the ‘flight to safety’ behavior as a response to global financial crisis
influence on shares. However, this interest toward domestic government bonds was abruptly
stopped by the sovereign bond crisis in Greece and the lack of investor confidence in the
sovereign bonds of several European Union countries. While Romanian economy was suffering,
the Romanian domestic government bonds never showed signs of distress. Thus, the general
mistrust in sovereign bonds mainly issued by emerging/ frontier economies left its imprint on
BVB bond market sector also.
Table 2: BVB bond sector trading and structure (without public offerings) Year No. of
trades
Volume Trading
value
(mil.EUR)
No.of
listed
issues
(end of
period)
New
listed
issues
% of
municipal
bonds
% of
corporate
bonds
% of
intl
bonds
% of T-
bonds
2001 5 45 0.00 2 2 100 - - -
2002 10 59,050 0.25 4 2 100 - - -
2003 37 29,870 0.36 10 9 95.66 4.34 - -
2004 274 118,136 13.15 25 17 10.02 89.98 - -
2005 334 197,107 29.67 19 6 2.38 97.62 - -
2006 319 603,208 53.88 18 5 3.80 49.38 46.82 -
2007 233 3,652,467 147.99 22 11 2.00 10.03 87.97 -
2008 547 862,927 53.47 50 34 15.92 22.30 52.09 9.69
2009 958 1,822,908 277.75 60 16 1.65 5.15 15.80 77.40
2010 540 591,511 552.87 55 7 0.99 0.00 0.59 98.42
2011 245 857,248 105.21 59 6 1.91 0.00 16.55 81.54
2012 368 220,238 264.87 63 8 0.04 0.00 0.91 99.05
2013 475 106,048 95.21 67 7 0.65 9.44 0.05 89.86 Source: Source: authors’ calculations based on BVB data
Note: the exchange rate used is the one reported by EUROSTAT, available at
http://epp.eurostat.ec.europa.eu/tgm/table.do?tab=table&init=1&language=en&pcode=tec00033&plugin=1
Table 3 presents only the government bond (T-bond) market segment evolution at BVB.
As mentioned above, the intense trading activity of 2009 and 2010 took place under the influence
of the global financial crisis on shares and the alternative offered by the newly listed T-bonds
represented a welcomed investment alternative. The year 2011 suffered from the influence of
successive outburst of Greece sovereign bond crisis and its effects were still present during 2012
when the market reached only half the level of 2010. The 2013 decrease indicates a lack of
interest toward T-bonds since the equity market recovered and offers better returns.
Table 3: BVB T-bond market segment Year No. of trades Volume Trading value
(mil.EUR)
No.of listed
issues
(end of period)
New listed
issues
2008 17 2,069 5.18 24 25
2009 346 85,689 241.98 26 2
2010 435 203,724 544.13 18 2
2011 181 35,889 85.78 21 4

2012 358 114,245 262.37 24 7
2013 337 35,575 86.56 26 4 Source: Source: authors’ calculations based on BVB data
Note: the exchange rate used is the one reported by EUROSTAT, available at
http://epp.eurostat.ec.europa.eu/tgm/table.do?tab=table&init=1&language=en&pcode=tec00033&plugin=1
It is interesting to observe that there seems to be a constant reluctance of Romanian Ministry of
Finance in listing the domestic government bond issues. With the exception of 2012, when 7 new
issues were listed, the newly introduced issues are scarce and they are just enough to keep the
number of total listed T-bonds around 25, as many as they were when this sector was launched.
In fact, this situation of newly listed T-bond issues at BVB only confirms the general non-
collaborative attitude of Romanian Ministry of Finance representatives who were asked since
1998 by BVB representatives to list the domestic government bonds. The reluctance manifested
by the Ministry of Finance combined with the Romanian National Bank lack of willingness to
lose a share of the secondary interbank government bond market it organize and supervise
(Pandele 2007).
The “change of heart” of 2008 might took place under the requirements/ recommendations of
European Union (EU), after Romania became an EU member, rather than of internal willingness.
Another factor that pressured the listing of T-bonds was the launch, at the beginning of 2008, of
the second pillar’s private pension funds which had limited investment options and the domestic
government bonds represent the main recommended placements. Under these two impulses, the
transparency regarding Romanian sovereign debt increased abruptly from non existent through a
dedicated link on Romanian Ministry of Finance website.
Further, several selected facts regarding the listed T-bonds will be presented.
As Table 4 shows, while the internal debt financed through government bonds grew between
2008 and 2013, the outstanding listed T-bonds at BVB decrease from 70% of the issued
government bonds at the end of 2008 to 17% at the end of 2013. Also, the listed T-bonds barely
overpass 4% of GDP in 2009 and were less than 3% in 2013. This only support the observation
above regarding the fact that only a small number of the issued government bonds are introduced
to the secondary market provided by BVB.
Table 4: BVB listed T-bonds within domestic internal debt and GDP (mil.EUR and %)
2008 2009 2010 2011 2012 2013
Internal debt of central
public administration
financed through
government bonds
( % of internal debt)
4,762.18
(63.06)
10,841.95
(75.30)
15,108.76
(77.74)
19,114.62
(82.56)
21,358.67
(87.04)
21,828.81
(87.90)
Outstanding listed
T-bonds
as % of internal debt
financed through
government bonds
68.58 44.58 32.07 23.87 18.33 17.28
Outstanding listed
T-bonds
as % of GDP
2.34 4.09 3.90 3.47 2.98 2.64

Source: authors’ calculations based on the data available at:
http://www.mfinante.ro/trezorengl.html?pagina=domenii
Note: the exchange rate used is the one reported by EUROSTAT, available at:
http://epp.eurostat.ec.europa.eu/tgm/table.do?tab=table&init=1&language=en&pcode=tec00033&plugin=1
No government bon public offer was launched through BVB system for the period under
scrutiny; the primary dealers system of the primary market was preferred instead.
Since August 2008 until December 2013, a number of 44 government bond issues were listed at
BVB, of which 19 reached the maturity; 7 of the matured bonds were never traded during the
listing period.
The situation of listed and traded T-bonds at BVB is presented in Graph 3 below and reflects that
between one third and half of the listed T-bonds were traded, with the exception of a slow first
year and the decrease of 2011, due to the sovereign crisis.
Graph 3: Listed and traded T-bonds at BVB between August 2008 and December 2013
Source: authors’ calculations based on the data available at BVB, http://www.bvb.ro/Companies/DGovBonds.aspx
The general profile of BVB listed government bonds includes the following features: they are
vanilla (bullet) bonds, with medium to long-term maturities, a nominal/ face value of 10,000
RON or about 2,376 EUR (average value for the period 2008 to December 2013). The coupon is
fix and paid annually.
The BVB listed government bonds are of two types: common (symbol starting with letter F) and
benchmark (symbol starting with letter B). The listed benchmark government bonds were issued
starting with 2007, according to the data offered by BVB. However, the Romanian Ministry of
Finance did not ‘capture’ the international meaning of benchmark bonds. The brief definition
that exists (available in Romanian only on BVB website) emphasizes the reopening feature of the
benchmark bonds. Until now, this feature was never used by Romanian authorities in order to
concentrate liquidity on a given maturity. The differences between the common bonds and
benchmark bonds can be observed in Annex 2 and the main difference is given by the issue
dimension: benchmark issues are larger, while common issues ranged between 1,000 and 20,000
0
5
10
15
20
25
30
Au
g-0
8
No
v-0
8
Feb
-09
May
-09
Au
g-0
9
No
v-0
9
Feb
-10
May
-10
Au
g-1
0
No
v-1
0
Feb
-11
May
-11
Au
g-1
1
No
v-1
1
Feb
-12
May
-12
Au
g-1
2
No
v-1
2
Feb
-13
May
-13
Au
g-1
3
No
v-1
3
listed issues traded issues
bonds. Another ‘difference’ is the fact that no new common bond issue was listed at BVB
starting with 2009. Therefore, the benchmark is rather a label than an active feature.
Nevertheless, the benchmark bonds are the most traded.
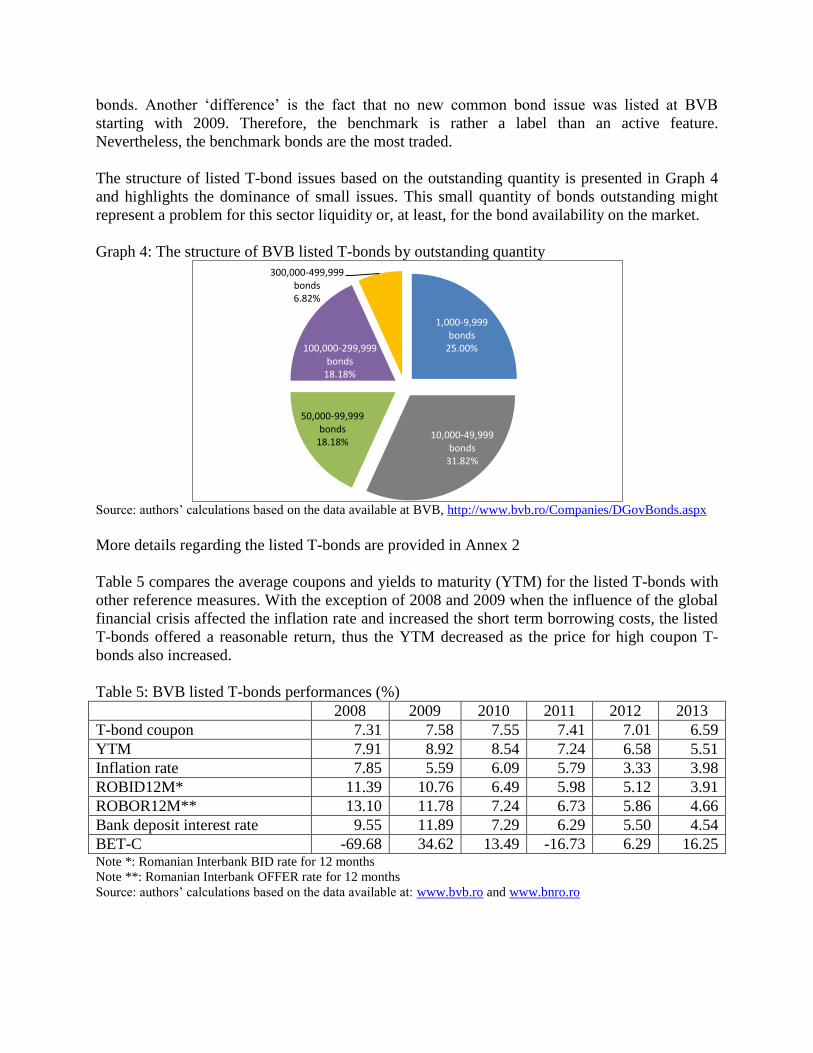
The structure of listed T-bond issues based on the outstanding quantity is presented in Graph 4
and highlights the dominance of small issues. This small quantity of bonds outstanding might
represent a problem for this sector liquidity or, at least, for the bond availability on the market.
Graph 4: The structure of BVB listed T-bonds by outstanding quantity
Source: authors’ calculations based on the data available at BVB, http://www.bvb.ro/Companies/DGovBonds.aspx
More details regarding the listed T-bonds are provided in Annex 2
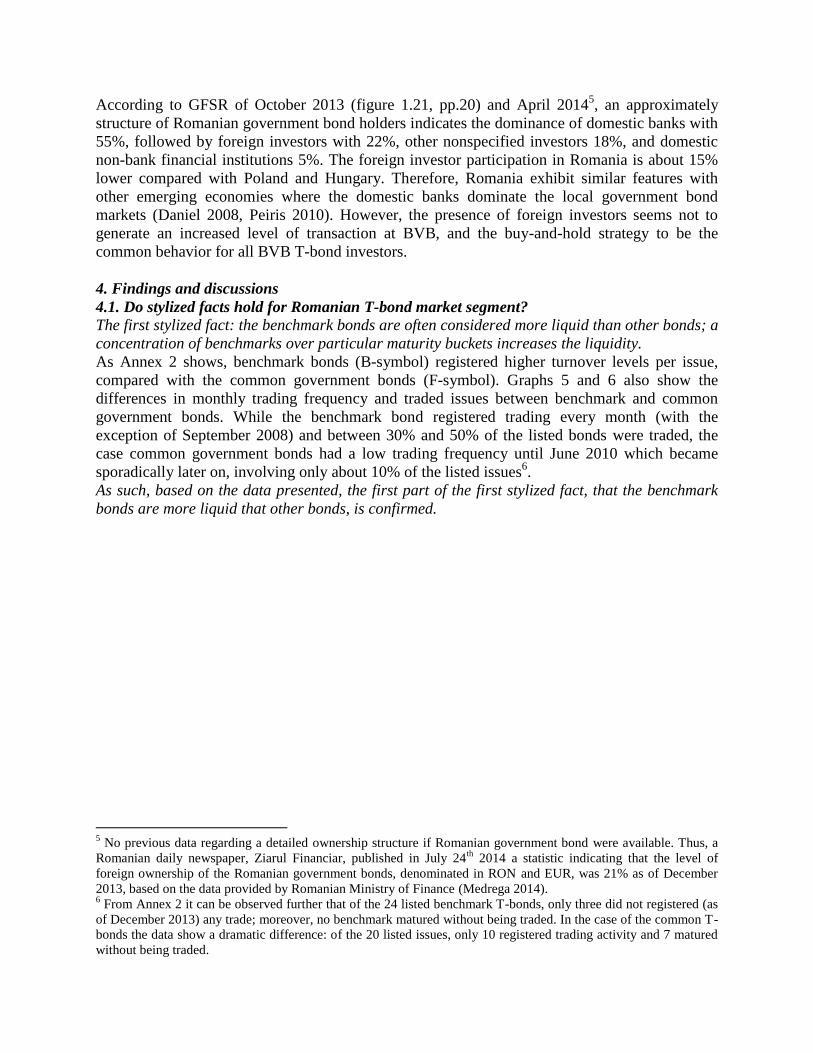
Table 5 compares the average coupons and yields to maturity (YTM) for the listed T-bonds with
other reference measures. With the exception of 2008 and 2009 when the influence of the global
financial crisis affected the inflation rate and increased the short term borrowing costs, the listed
T-bonds offered a reasonable return, thus the YTM decreased as the price for high coupon T-
bonds also increased.
Table 5: BVB listed T-bonds performances (%)
2008 2009 2010 2011 2012 2013
T-bond coupon 7.31 7.58 7.55 7.41 7.01 6.59
YTM 7.91 8.92 8.54 7.24 6.58 5.51
Inflation rate 7.85 5.59 6.09 5.79 3.33 3.98
ROBID12M* 11.39 10.76 6.49 5.98 5.12 3.91
ROBOR12M** 13.10 11.78 7.24 6.73 5.86 4.66
Bank deposit interest rate 9.55 11.89 7.29 6.29 5.50 4.54
BET-C -69.68 34.62 13.49 -16.73 6.29 16.25 Note *: Romanian Interbank BID rate for 12 months
Note **: Romanian Interbank OFFER rate for 12 months
Source: authors’ calculations based on the data available at: www.bvb.ro and www.bnro.ro
1,000-9,999 bonds
25.00%
10,000-49,999 bonds
31.82%
50,000-99,999 bonds
18.18%
100,000-299,999 bonds
18.18%
300,000-499,999 bonds 6.82%
According to GFSR of October 2013 (figure 1.21, pp.20) and April 20145, an approximately
structure of Romanian government bond holders indicates the dominance of domestic banks with
55%, followed by foreign investors with 22%, other nonspecified investors 18%, and domestic
non-bank financial institutions 5%. The foreign investor participation in Romania is about 15%
lower compared with Poland and Hungary. Therefore, Romania exhibit similar features with
other emerging economies where the domestic banks dominate the local government bond
markets (Daniel 2008, Peiris 2010). However, the presence of foreign investors seems not to
generate an increased level of transaction at BVB, and the buy-and-hold strategy to be the
common behavior for all BVB T-bond investors.
4. Findings and discussions
4.1. Do stylized facts hold for Romanian T-bond market segment?
The first stylized fact: the benchmark bonds are often considered more liquid than other bonds; a
concentration of benchmarks over particular maturity buckets increases the liquidity.
As Annex 2 shows, benchmark bonds (B-symbol) registered higher turnover levels per issue,
compared with the common government bonds (F-symbol). Graphs 5 and 6 also show the
differences in monthly trading frequency and traded issues between benchmark and common
government bonds. While the benchmark bond registered trading every month (with the
exception of September 2008) and between 30% and 50% of the listed bonds were traded, the
case common government bonds had a low trading frequency until June 2010 which became
sporadically later on, involving only about 10% of the listed issues6.
As such, based on the data presented, the first part of the first stylized fact, that the benchmark
bonds are more liquid that other bonds, is confirmed.
5 No previous data regarding a detailed ownership structure if Romanian government bond were available. Thus, a
Romanian daily newspaper, Ziarul Financiar, published in July 24th
2014 a statistic indicating that the level of
foreign ownership of the Romanian government bonds, denominated in RON and EUR, was 21% as of December
2013, based on the data provided by Romanian Ministry of Finance (Medrega 2014). 6 From Annex 2 it can be observed further that of the 24 listed benchmark T-bonds, only three did not registered (as
of December 2013) any trade; moreover, no benchmark matured without being traded. In the case of the common T-
bonds the data show a dramatic difference: of the 20 listed issues, only 10 registered trading activity and 7 matured
without being traded.

Graph 5: Benchmark listed and traded T-bonds at BVB
Source: authors’ calculations based on the data available at BVB, http://www.bvb.ro/Companies/DGovBonds.aspx
Graph 6: Common listed and traded T-bonds at BVB
Source: authors’ calculations based on the data available at BVB, http://www.bvb.ro/Companies/DGovBonds.aspx
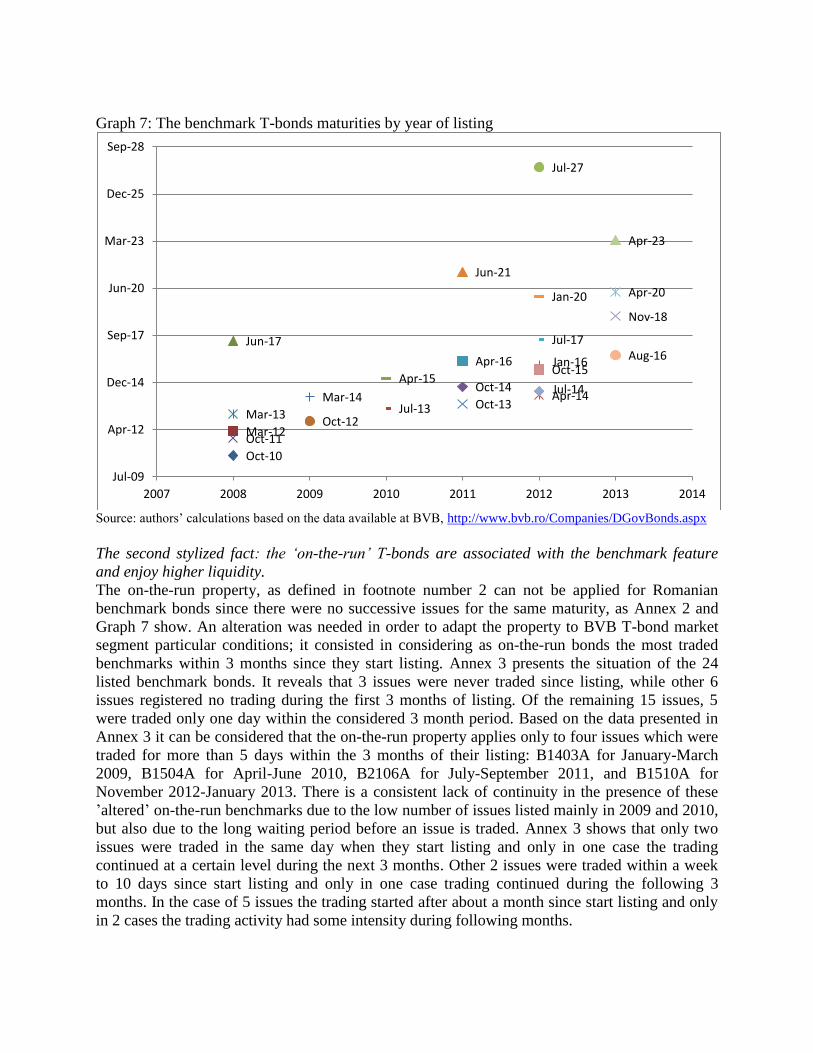
Further, Graph 7 shows the distribution of benchmark maturities by year of listing. There is no
tendency to concentrate on several maturities, which indicates that, at least for the last 5 years
since the launch of T-bond segment at BVB, there existed no strategy regarding the T-bonds’
maturities. As mentioned before, the reopening feature of benchmark issues was never used and
as the listed maturities multiplied, the trading spread thin among these maturities, as Annex 2
also shows.
Based on this finding, the second part of the first stylized fact, referring to the concentration of
benchmarks on several maturity buckets can not be confirmed for BVB T-bond market segment.
As such, the trading at BVB is fragmented covering most of the maturities of listed T-bonds.
0
2
4
6
8
10
12
14
16
18
20 A
ug-
08
Oct
-08
Dec
-08
Feb
-09
Ap
r-0
9
Jun
-09
Au
g-0
9
Oct
-09
Dec
-09
Feb
-10
Ap
r-1
0
Jun
-10
Au
g-1
0
Oct
-10
Dec
-10
Feb
-11
Ap
r-1
1
Jun
-11
Au
g-1
1
Oct
-11
Dec
-11
Feb
-12
Ap
r-1
2
Jun
-12
Au
g-1
2
Oct
-12
Dec
-12
Feb
-13
Ap
r-1
3
Jun
-13
Au
g-1
3
Oct
-13
Dec
-13
B listed issues B traded issues
0
5
10
15
20
25
Au
g-0
8
No
v-0
8
Feb
-09
May
-09
Au
g-0
9
No
v-0
9
Feb
-10
May
-10
Au
g-1
0
No
v-1
0
Feb
-11
May
-11
Au
g-1
1
No
v-1
1
Feb
-12
May
-12
Au
g-1
2
No
v-1
2
Feb
-13
May
-13
Au
g-1
3
No
v-1
3
F traded issues F listed issues
Graph 7: The benchmark T-bonds maturities by year of listing
Source: authors’ calculations based on the data available at BVB, http://www.bvb.ro/Companies/DGovBonds.aspx
The second stylized fact: the ‘on-the-run’ T-bonds are associated with the benchmark feature
and enjoy higher liquidity.
The on-the-run property, as defined in footnote number 2 can not be applied for Romanian
benchmark bonds since there were no successive issues for the same maturity, as Annex 2 and
Graph 7 show. An alteration was needed in order to adapt the property to BVB T-bond market
segment particular conditions; it consisted in considering as on-the-run bonds the most traded
benchmarks within 3 months since they start listing. Annex 3 presents the situation of the 24
listed benchmark bonds. It reveals that 3 issues were never traded since listing, while other 6
issues registered no trading during the first 3 months of listing. Of the remaining 15 issues, 5
were traded only one day within the considered 3 month period. Based on the data presented in
Annex 3 it can be considered that the on-the-run property applies only to four issues which were
traded for more than 5 days within the 3 months of their listing: B1403A for January-March
2009, B1504A for April-June 2010, B2106A for July-September 2011, and B1510A for
November 2012-January 2013. There is a consistent lack of continuity in the presence of these
’altered’ on-the-run benchmarks due to the low number of issues listed mainly in 2009 and 2010,
but also due to the long waiting period before an issue is traded. Annex 3 shows that only two
issues were traded in the same day when they start listing and only in one case the trading
continued at a certain level during the next 3 months. Other 2 issues were traded within a week
to 10 days since start listing and only in one case trading continued during the following 3
months. In the case of 5 issues the trading started after about a month since start listing and only
in 2 cases the trading activity had some intensity during following months.
Oct-10
Mar-12
Jun-17
Oct-11
Mar-13 Oct-12
Mar-14 Jul-13
Apr-15 Oct-14
Apr-16
Jun-21
Oct-13 Apr-14
Jul-27
Jan-16
Jul-17
Jan-20
Jul-14
Oct-15
Apr-23
Nov-18
Apr-20
Aug-16
Jul-09
Apr-12
Dec-14
Sep-17
Jun-20
Mar-23
Dec-25
Sep-28
2007 2008 2009 2010 2011 2012 2013 2014

Based on these facts and on the data presented in Annex 3 only 3 issues (B1504A, B2106A and
B1510A) exhibit some features of on-the-run bonds. These three were selected based on the
trading volume and turnover registered during the 3 month period after listing. In Annex 4 can be
seen that these issues considered on-the-run rank 6th
, 4th
and 11th
when the average daily turnover
and the average daily volume are considered.
Hence, it can be reckoned that in an altered form the on-the-run property can be found in a
sporadically manner among the Romanian benchmaks7. However, it has no practical value since
there is not followed by frequent trading of the newly listed benchmarks.
The findings presented above indicate that the on-the-run property (even in a modified form) can
not be automatically associated with benchmark bonds at BVB and the identified on-the-run T-
bonds do not exhibit higher liquidity compared with the other benchmarks. The second stylized
fact is not confirmed at BVB.
The third stylized fact: bond liquidity tends to decrease with age and the older bonds may be less
liquid than more recent issue bonds.
In relation with on-the-run property, comes the age of the bond. While the third stylized fact
states that the older bonds may be less liquid than those more recently issued, Graphs 8 and 9
shows something different for BVB government bond market segment.
Graph 8: Benchmark bonds B1403A, B1203A and B1210A position in T-bond segment turnover
Source: authors’ calculations based on the data available at BVB, http://www.bvb.ro/Companies/DGovBonds.aspx
7 While the on-the-run property does not apply to the common T-bonds, it is interesting to mention that none of the
10 ordinary government bonds that registered trading activity was traded during the first 3 months since start listing.
B1203A, 26.94
B1203A, 12.67
B1203A, 4.65
B1203A, 12.34
B1203A, 1.29
B1403A, 43.43
B1403A, 54.88
B1403A, 0.23
B1403A, 10.05 B1403A, 13.14
B1210A, 23.56
B1210A, 14.55 B1210A, 13.50
B1210A, 1.79 0.00
10.00
20.00
30.00
40.00
50.00
60.00
2008 2009 2010 2011 2012 2013
%
B1203A B1403A B1210A

Graph 9: Benchmark bonds B1010A, B1504A, B1604A and B2106A position in T-bond
segment turnover
Source: authors’ calculations based on the data available at BVB, http://www.bvb.ro/Companies/DGovBonds.aspx
The most traded maturities (considered as percentage of the total T-bond market turnover of the
respective year) are the medium term ones. Thus, between 2011 and 2013, a long term maturity
(B2106A) was also intensely traded. Only in the case of the matured bonds B1010A and B1210A
the trading activity decreased as they approached their respective maturities. This might have
happened because their maturities were shorter than 5 years when they start trading. The other 5
most traded bonds show oscillations of the trading activity. They seem to become illiquid during
one year, just to come back the next year among the traded T-bonds (mainly the case of
B1403A). Also, the following cases must be mentioned: B1706A issue seemed to be an illiquid
one, while no trading was registered for almost one year and a half after listing; since January
2010 is traded with some frequency. In other two cases a similar pattern appeared; the bonds
start trading after more than 6 month after start listing.
Taking into consideration these observations, the third stylized fact does not hold for BVB T-
bond market segment. The most newly issued bonds do not trade immediately, and older issues,
which might seem illiquid, can start trading after a (long) waiting period. The combined causes
of this situation are: the relative low number of listed benchmark bonds and their spread among a
relative wide range of maturities. In this situation, the investors might start trading a T-bond that
was illiquid in the absence of other alternatives, without paying too much attention to the
maturity.
The fourth stylized fact: the T-bonds with larger issues are more liquid and are expected to
register larger turnovers.
As showed in paragraph 3 and presented in Annex 2, the outstanding amount of benchmark
bonds is considerably higher than that of the common bonds. The BVB benchmarks exhibit an
average of 141,400 bonds per issue, compared with an average of about 8,000 bonds per issue
B1010A, 65.40
B1010A, 6.81 B1010A, 3.14 B1504A, 2.26
B1504A, 15.64
B1504A, 24.75
B1504A, 0.43
B1604A, 14.19
B1604A, 5.06
B1604A, 17.64
B2106A, 8.26
B2106A, 23.59
B2106A, 6.89
0.00
10.00
20.00
30.00
40.00
50.00
60.00
70.00
2008 2009 2010 2011 2012 2013
%
B1010A B1504A B1604A B2106A

for the common T-bonds. As highlighted previously and presented in Annex 2, the benchmark
bonds registered higher turnover compared with common bonds.
Based on these observations the fourth stylized fact is confirmed for T-bond market segment at
BVB. The T-bond issues with larger outstanding amount registered, in general, higher turnover.
The fifth stylized fact: more liquid bonds have higher prices.
Annex 2 shows that the average closing price of benchmark bonds is higher and almost at par
than the average closing price of common bonds. As shown above, the BVB benchmarks are
more liquid than the common bonds. However, when details are considered, the data from Annex
2 are not conclusive. Hence, the daily averages were taken into consideration and presented in
Annex 4 The new data show more consistently that higher (supra par) prices are related to more
liquid T-bonds. While in the majority cases of the top 20 T-bonds, the fifth stylized fact is
verified, exceptions occur often and they are related to the coupon of the respective T-bonds, the
period when were issued and traded. The most obvious situation is that of the several illiquid
common (F symbol) T-bonds which registered high prices. This exception might have been
generated by fact that common bond coupons are at the level of 2005 when they were issued and
currently exhibit 200 to 300 basis points above the level of newly issued benchmark bonds.
Based on the facts presented above, it can be stated that, in general, the fifth stylized fact is
confirmed at BVB; more liquid bonds tend to have higher prices.
The sixth stylized fact: high coupon bonds tend to be more liquid than low-coupon bonds.
The data in Annex 2 show that at the level of total turnover, all the benchmark bonds with a
coupon higher than 6.00% registered trading values over 100 mil.RON. Thus, the common
bonds, with coupons ranging from 6.50% to 8.00% were seldom traded or never traded at all.
This situation can be explained by their low outstanding quantities combined with the fact that
being so scarce, the investors rather preferred to keep them in their portfolio than to trade them
even at a supra par price. When coupon is under scrutiny, the period when the T-bond was issued
and became available for trading should be considered, due to the fact that Romania exhibited a
decrease in inflation rate and a general decrease of interest rates, including the interest rates for
T-bonds.
It can be considered that, in general, the sixth stylized fact is confirmed for BVB T-bonds; thus
the peculiarities of this frontier market should be taken into consideration.
4.2. The liquidity factors and liquidity proxies for BVB T-bond market segment
4.2.1. The liquidity factors
Based on the ideas presented in paragraphs 3 and 4.1., and considering the data available at BVB
for the government market segment, the following five liquidity factors were identified: a) the
coupon (C), b) the outstanding quantity (Q), c) the time to maturity when listing (TM), d) the
listing period, and e) the retail trading (R).
While several of these factors are usually regarded as liquidity proxies, within this paper it was
chosen to take into consideration their role as liquidity determinants since the coupon, the
outstanding quantity and the time to maturity are given characteristics decided by the T-bond
issuer. Time to maturity when listing was taken into consideration instead of the time to
maturity, since in the case of T-bonds first listed in August 2008 the gap between the initial
maturity and the remaining life of the bond is important, mainly for common bonds (F-symbol),
as Annex 2 reveals. Starting with 2009 listed T-bonds, the gap decreased. Thus, in some cases
one month or more elapsed before the respective T-bond issue was listed. Time to maturity when
listed is strongly correlated with time to maturity and is a characteristics upon which investors
have no influence. Moreover, this factor considers the T-bond life span available to interested
investors. The listing period was considered as factor based on the observation related to the
third stylized fact which revealed that previously never traded issues might become active when
the number of listed issues decreases due to expiration, or when their coupon is considered
interesting enough to generate a high price. Also, the listing period might be considered a
substitute for on/off the run characteristic of T-bonds, which could not be highlighted at BVB, as
mentioned in paragraph 4.1.. For the fifth factor, retail trading, a proxy was considered due to the
absence of detailed information regarding the general investors’ structure (namely the percentage
of individual investors) for listed T-bond issues from the official custodian. The proxy capturing
the retail trading is the percentage of days (out of total number of days when trade occurred)
when only 1 to 5 bonds were traded. This proxy was chosen based on data availability and on the
reasoning that an institutional investors is highly unlikely to trade such small quantities. To this
assumption, the high nominal (face) value of a T-bond, of 10,000 RON, was added. It is unlikely
that a Romanian individual investor will spend more than 50,000 RON for an individual security,
due to the low level of resources available for investments.
4.2.2. The liquidity proxies
The following twelve liquidity proxies were considered in order to capture the liquidity of
government bond market segment at BVB: 1) active days, 2) value/ turnover, 3) volume per
trade, 4) turnover ratio, 5) liquidity ratio, 6) Amihud measure, 7) Martin liquidity index, 8)
Marsh & Rock liquidity ratio, 9) Hui-Heubel liquidity ratio, 10) dispersion, 11) gamma, and 12)
Roll measure.
The main selection criteria for these proxies were the availability of data necessary for
calculations. The formulas, the meaning and detailed explanation for every of the chosen proxies
are presented in Annex 1. Value/ turnover, volume per trade, turnover ratio, liquidity ratio,
Amihud measure, Martin liquidity index, Marsh & Rock liquidity ratio, Hui-Heubel liquidity
ratio, dispersion are reported as daily averages for every BVB traded T-bond.
These proxies can be split in two categories: a) simple proxies which comprise: active days,
value/ turnover, and volume per trade; they are either directly observable from the official
reports (value/ turnover) or simply extracted from the available data; usually these simple
proxies capture just one dimension of liquidity; and b) complex proxies which include: turnover
ratio, liquidity ratio, Amihud measure, Martin liquidity index, Marsh & Rock liquidity ratio, Hui-
Heubel liquidity ratio, dispersion, gamma, and Roll measure; their calculation need more
information derived from a combination of available data; complex proxies may capture a
combination of two of the liquidity dimensions.
Table 6 presents a brief synthesis of these twelve proxies’ characteristics.
Some of the proxies selected provide similar information. Thus, they were kept in this first study
in order to assess which one captures better the liquidity dimensions for the particular T-bond
segment at BVB.

Table 6: Proposed liquidity proxies’ characteristics
Liquidity proxy Liquidity dimension
captured
Type of proxy8
Level needed for
showing liquidity
Active days Indirectly: resilience &
immediacy9
Frequency based measure High
Value/ turnover Depth Volume based measure High
Volume per trade Depth Volume based measure High
Turnover ratio Depth Volume based measure High
Liquidity ratio Depth Volume based measure High
Amihud measure Resiliency (price
impact) and depth
Volume based measure Low
Martin liquidity index Tightness and depth Volume based measure Low
Marsh & Rock
liquidity ratio
Tightness and
resilience
Price based measure Low
Hui-Heubel liquidity
ratio
Depth and resiliency Price and volume based
measure
Low
Dispersion Tightness Price based measure Low
Gamma Tightness Price based measure Low
Roll measure Tightness Price based measure Low
Note: To mention from which source/ paper I took this classification
4.3. Findings regarding the liquidity factors and liquidity proxies for BVB T-bond market
segment
4.3.1. The liquidity factors
The general hypothesis verified in this section is: the identified liquidity factors have a combined
influence over each liquidity proxy considered.
Annex 5 contains the descriptive statistics and the correlation matrices for the identified five
liquidity factors for the traded T-bonds.
The small number of observations provided data series far from normal distributions and with
high coefficients of variations. The closest to a normal distribution are the data series for
common bonds (F-symbol); since in all the common bond cases only 10 observations are
available, this situation is rather accidental. Moreover, the fifth factor – retail trading or R –
could not be calculated for common bonds since they registered only sporadic transactions, all
above 100 bonds per trade. The most important differences between benchmarks and common
bonds arise from a) the outstanding quantities, larger in the case of benchmarks; b) the coupon,
larger in the case of common bonds, since they were all issued in 2005 under the financing
conditions of that year; c) the time to maturity and listing period, longer for the common bonds,
and d) the retail trading, present only on the case of benchmarks. The data confirm the idea
expressed in paragraph 4.1. suggesting that the common bonds are rather treasured mainly in
institutional investors’ portfolios.
The correlations between coupon and outstanding quantities, moderate for all T-bonds and strong
for benchmark bonds, are generated by the way Romanian Ministry of Finance was issuing
8 Based on Schaeffer & Schmalz (2009), and Gabrielsen et al.(2011)
9 The frequency of trading measures, like the active days measure proposed here, can suggest the presence of
resilience and immediacy since the more frequent a T-bond is traded, the more likely the market can absorb random
shocks.
bonds: during 2008 and 2009 the increased financial needs triggered larger issues while the
borrowing costs increased under the global financial crisis influence; starting with 2010, the
borrowing costs decreased and, it seems, financial needs decreased also as the new issues’
dimensions indicate. These correlations might also be under the influence of the small number of
traded issues.
A moderate correlation can be also observed between the outstanding quantity and the listing
period for benchmark bonds. This correlation is generated by the same reason presented
previously: the largest listed and traded issues were introduced at BVB during 2008 and 2009.
The most interesting correlation for benchmark bonds is the moderate negative one between the
time to maturity and the retail trading, indicating that individual investors seem to prefer shorter
maturities when trading.
The moderate to strong correlations which occurred in the case of common bonds are under the
influence of Romanian Ministry of Finance decisions to issue T-bonds; thus, the small number of
observations also impairs the results accuracy.
Based on the reasons presented above, for all T-bonds and benchmark bonds all the five
identified factors were taken into consideration in order to test the general hypothesis. The
common bonds were eliminated form this test due to low correlation accuracy and by the fact
that four of the twelve proxies could not be calculated, as Annex 6 show.
Further, the multiple regression was chosen in order to asses the influence of the considered
liquidity factors over the liquidity proxies. The general model used is:
n
1i
iii0 εXbbY (1)
Where:
Y represents the dependent variable
X represent the independent variables
b0 represents the constant
bi represent the estimates for the independent variables
εi represents the residuals.
The results were considered valid for a p-value of < 0.05, at a standard confidence level of 95%.
Every one of the twelve liquidity proxies that could be calculated was considered the dependent
variable, while the liquidity factors were the independent variables. The multiple regression
results are presented in Annex 7
For all traded T-bonds, the combination of the five identified factors explains about 35% or more
of seven proxies’ variability at a confidence level of 95%; in other three cases the combination
explains between 12% and 19% of the respective proxy variability at a confidence level of 85%
or more. Only one liquidity proxy, the Martin index, remained unexplained. Of the five factors,
the outstanding quantity is significant for 8 proxies at a confidence level of 95% and for 2
proxies at a confidence level between 90% and 95%. Coupon appears to have significance
mainly for the price related proxies, while time to maturity is significant for only three proxies.
The factor least significant is the listing period.

The significance of the outstanding quantity indicates that it plays an important role in the
trading decision, hence its importance and influence over liquidity proxies.
For the traded benchmark bonds (B-symbols), the five factor combination explains about 32% or
more of nine proxies’ variability at a confidence level of 95%; in one case it explains 18.9% of
the proxy variability at a confidence level of 85%. In two cases (Gamma and Roll, both price
related proxies) the five factors have no explanatory power. Time to maturity seems to become
the most significant factor at 95% confidence level, while the significance of coupon is lower, at
90% confidence level. As in the case of all traded T-bonds, the listing period seems to be the
least significant factor.
These multiple regression results indirectly confirm also the 1st, 4
th, and 5
th stylized facts at BVB.
Based on the findings presented above, the general hypothesis formulated at the beginning of
this paragraph can be accepted; for the majority of the considered liquidity proxies, the
combination of identified liquidity factors explains a satisfactory level of variability at a
confidence level of 95%.
However, the investigation was continued by eliminating the least significant factor of the five:
the listing period. The combination of the remaining four factors has an increased explanatory
power for all the traded T-bonds and for the traded benchmark bonds. The importance of
outstanding quantity in the case of all T-bonds and of time to maturity for benchmark bonds
remained unchanged.
The modified form of the general hypothesis is: a combination of four of the five identified
factors explains at an improved level the variability for the majority of the liquidity proxies at a
confidence level of 95%.
4.3.2 The liquidity proxies
The descriptive statistics for the twelve liquidity proxies are available in Annex 6 and in a brief
synthesis in Table 7. In most cases the values are far from a normal distribution and the
coefficient of variation tends to be high, due to wide value intervals.
Table 7: Average from descriptive statistics
Proxy All traded T-bonds Traded B symbols Traded F symbols
Active days 4.5623 6.6271 0.2260
Value/ turnover 3.7516 4.6943 1.7720
Volume per trade 236 277 150
Turnover ratio 1.3642 0.8662 2.4099
Liquidity ratio 93.9917 138.0030 1.5688
Amihud measure 5.1489 5.6652 4.0646
Martin liquidity index 12.4198 7.6844 22.3642
Marsh & Rock
liquidity ratio
1.3186 0.5815 2.8666
Hui-Heubel liquidity
ratio
*0.9878 1.4582 n/a
Dispersion *0.0001 0.0001 n/a
Gamma *0.0544 0.0804 n/a
Roll measure *0.2549 0.3763 n/a

Note*: The Hui-Heubel liquidity ratio, dispersion, gamma and Roll measure were considered zero for the common
(F-symbol) bonds when the average of respective measures was calculated for all traded T-bonds.
Since no previous paper measured the BVB T-bond segment liquidity, there is no benchmark for
the results presented above and the evaluation of the meaning of high and low is relative. Thus,
in combination with what was already revealed regarding BVB T-bond segment, the general
picture provided by the liquidity proxies show a relative low level of liquidity.
One set of proxies confirm this low liquidity. The trading frequency, measured by the number of
active days, is low; similarly low is the trading intensity, measured by daily value/ turnover,
volume per trade and turnover ratio. The Amihud measure indicates that the absolute return
varies 5 % for every daily million traded, which can be considered a relative high variation
indicating a low resilience, hence a low liquidity.
Another set of proxies seems to indicate a rather moderate level of liquidity; this set includes the
liquidity ratio, Hui-Heubel liquidity ratio, dispersion, and gamma and Roll measure. Thus, the
intimacy of available data should be considered when the significance of these proxies is
regarded. Hui-Heubel liquidity ratio and dispersion are based on the dispersion between the
maximum and minimum price registered. At daily level, often, this dispersion is zero for BVB
traded T-bonds; this situation is generated by the low trading frequency and the low number of
investors in the T-bond market. Both ratios rather show the relative lack of investors’ interest
toward the T-bond segment rather than a moderate level of liquidity. Gamma and Roll measure
are based on the negative correlation of only 12 benchmark traded bonds; for all traded T-bonds
this number represent less than half, while for the benchmark bonds it is close to 60%. Thus,
when combined with other information available, the relative moderate liquidity that seems to be
depicted by these four proxies should be rather ignored. Only the liquidity ratio level remains,
for now, unexplained and needs further investigation. Thus, since the other volume based proxies
indicate a relative low level of liquidity, the information offered by the liquidity ratio should be
adapted to the general picture resulted by combining all the information available.
Also from Table 7 it can be observed that in most cases the calculated proxies indicate that the
benchmark (B-symbol) bonds are more liquid that the common (F-symbol) bonds. Thus, two
proxies: the turnover ratio and Amihud measure point that the common bonds are more liquid. In
the case of turnover ration this somewhat distorted information is generated by the fact that the
outstanding quantity of these bond is low (see Graph 4 and Annex 2) and, while seldom traded,
the traded quantity had the tendency to represent a higher percentage of the outstanding volume
than in the case of benchmark bonds. In the case of Amihud measure, the distortion in
information comes from the fact that, thus seldom traded, the common (F-symbol) bonds prices
varied less than the benchmark bond prices.
Based on the combined information available, the proxies indicate a low level of liquidity for
the BVB T-bond market segment. The liquidity is slightly higher for the benchmark bonds,
while for the common bonds the liquidity can be considered very low.
Annex 8 presents the proxies grouped by clusters. The T-bonds were grouped using the five
identified factors as reference in order to enhance their explanatory power. From Annex 8 (A and
B) it is obvious that the most liquid (benchmark) T-bonds are those with the larger outstanding
quantity, highest coupon, a listing of over 3 years, and which registered less than 20% retail
trading. The decrease in turnover ratio as the outstanding quantity increases only confirms the
low level of trading activity, hence the general low level of liquidity of BVB T-bond market
segment. The mix results for time to maturity cluster indicate that other reasons (factors) have a
stronger influence over the decision to trade. For the common bonds (F-symbol), the results even

by clusters do not reveal a clear pattern for liquidity; this situation arises from the very low
trading frequency for this T-bond group and reveals insolated decisions of institutional investors
to sell/ buy the respective common bonds.
4.3.3. Principal-Component Analysis
The twelve liquidity proxies calculated in for BVB T-bond sector are too many and in some
cases they describe the same liquidity dimension(s), as presented in Table 6. In other cases, they
exhibit moderate to strong significant correlations, as Annex 6 show. A Principal-Component
Analysis (PCA) was conducted in order to extract a smaller number a proxies that capture the
BVB T-bond sector liquidity, while retaining as much as possible of the variation in the original
set of proxies. Since the measures for the twelve proxies are different and of different scale, the
Principal Components (PCs) were extracted from the correlation matrix.
PCA was performed in three steps. First, PCA was conducted for all the twelve proxies and four
PCs resulted, as presented in Annexes 9 and 10. These four PCs capture 82.35% of the original
proxies’ variation. The result is to be expected since no proxy was eliminated.
Further, the loading of PC1 was considered and all the components with a weight lower than 0.3,
in absolute value, were eliminated. In the case of all T-bonds, the remaining six proxies
generated just one PC which captures 57.3% of the original variation. For benchmark bonds, the
remaining seven proxies generated two PCs resulted, capturing 77.56% of the original variation.
The results seem satisfactory. Thus, a closer look at the six proxies’ PC1 loading for all T-bonds
revealed that four proxies have a weight closer or higher than 0.4. Hence, two more proxies with
a loading less than 0.39 were eliminated and the remaining four proxies were combined in one
PC which captures 74.62% of the original variation. In the case of benchmark bonds, the
remaining seven proxies, within the two PCs, were considered too many. While the PC1 loading
rather suggest the elimination of liquidity ratio instead of Marsh & Rock10
, it was chosen to test
the explanatory power of the same four proxies that were extracted at all T-bond level. The
combination of these four proxies captures a satisfactory 72.67% of the original variation11
.
Based on these results, the following four proxies satisfactory capture the various liquidity
dimensions for all BVB traded T-bonds and benchmark bonds: i) active days – based on
frequency which indirect describes resiliency and immediacy, ii) liquidity ratio which is seizing
depth, iii) Hui-Heubel ratio capturing depth and resiliency, and iv) dispersion capturing
tightness. The four proxies indicate a moderate to low liquidity for T-bond market segment at
BVB, dominated by benchmark bonds.
All four proxies are significantly influenced by the 4 remaining factors identified to influence
liquidity, respectively: outstanding quantity, coupon, time to maturity and the retail trading. For
all T-bonds and for benchmark bonds only, the multiple regression models are significant and
explain between 21% and 57% of the respective proxies’ variance (Annex 7).
10
If the liquidity ratio was eliminated and the four remaining proxies were: active days, Marsh & Rock, Hui-Heubel
ratio and dispersion, their combination results in two PCs seize 93.83% of the initial variation. Thus, it was tested
further if a combination of other four proxies can generate only one PC and the result presented in Annex 10
emerged. 11
A closer look at the PC1 loading in Annex 10 step 2 indicates, in fact, the necessity of eliminating both liquidity
ratio and Marsh & Rock. In this case, the three remaining proxies generate one PC that seizes 81.17% of the
original variation. Thus, the depth is only marginally described by the combination of the three remaining proxies
(active days, Hui-Heubel ratio, and dispersion). Based on this fact it the combination of the four proxies presented in
text was chosen.
These combined results indicate that liquidity as measured by the four proxies can be improved
if the Romanian government authorities will pay more attention to the four factors highlighted
above.
5. Conclusions
Within the present paper several aspects of T-bond segment liquidity within a frontier security
market, Bucharest Stock Exchange (BVB), were under scrutiny. The general presentation of
BVB government bond segment permitted a first glance of a low liquidity. Further, the holding
of six stylized facts regarding liquidity was investigated. The results showed that while three
stylized facts could be confirmed, at general level, other two were rejected and one only partially
confirmed. An in-depth look at the causes revealed that the benchmark feature for the traded
bonds is superficially understood by the bonds’ issuer, the Romanian Ministry of Finance, and no
concentration on specific maturity buckets can be found. This situation had a direct influence
over on/off the run feature which can not be confirmed even in a modified form. Moreover, the
three confirmed stylized facts should be considered under the peculiarities of T-bond segment at
BVB.
Since this is the first paper trying to measure the liquidity of BVB government bond market
segment, a high number of proxies were first selected in order to capture all the liquidity
dimensions. Also five factors were identified to influence the majority of these proxies. In the
end, four factors of the initial five proved to have an increased explanatory power over the
liquidity proxies. Further, the number of twelve liquidity proxies should be reduced and a PCA
was conducted in order to extract a smaller number. The final result indicates a number of four
liquidity proxies that captured in a satisfactory manner all the liquidity dimensions. One is a
simple proxy, directly observable, the other three are complex proxies. The data regarding these
four proxies indicate a low to moderate liquidity for the BVB government bond market segment
currently dominated by the trading of the benchmark bonds. The four proxies are under the
combined influence of four factors in the following order of importance: outstanding quantity,
time to maturity, coupon and retail trading. This suggests that the Romanian Ministry of Finance
should pay a special attention to these factors in order to increase the government bond segment
liquidity at BVB.
This finding is confirmed by suggestions of McCauley & Remolona (2000) and Daniel (2008).
Also, a previous general survey of the Romanian government bond market by Pop & Georgescu
(2012) suggested also the need of an increased issue size for the traded government bonds and
their availability for retail investors. A timid step was made by Romanian Ministry of Finance
during 2014 when it announced its intention to launch, through public offer, several issues with a
nominal/ face value ten times smaller than the current one of 10,000 RON. However, by the end
of July 2014 no such issue was launched and it remains unclear how large such an issue will be.
Until the four factors affecting the Romanian government bond segment liquidity at BVB will
not be properly addressed by the Romanian Ministry of Finance, all the other measures to
increase this segment liquidity will remain academic.
While the findings of the present paper can stand for a base for future researches, the results must
be considered under the reserve represented by the limited number of data available which might
impair on results’ accuracy.

References
Amihud, Y., Mendelson, H. (1991), Liquidity asset prices and financial policy, Financial
Analysts Journal, vol.47, issue 6, pp.56-66
Amihud, Y., (2002), Illiquidity and stock returns: cross-section and time-series effects, Journal
of Financial Markets, vol.5, issue 1, pp.31-56
Amihud, Y., Mendelson, H., Pedersen, L.H., (2005), Liquidity and asset prices, Foundations and
Trends in Finance, vol.1, no.4, pp.269-364
Anderson, S., Lavoie, S., (2004), The evolution of liquidity in the market for government of
Canada bonds, Bank of Canada, Summer 2004, pp.19-31
Baker, H.K., (1996), Trading location and liquidity: an analysis of US dealers and agency
markets for common stocks, Financial Markets Institutions & Instruments, vol.5, no.4, pp.51. e-
book, as cited by Gabrielsen et al.(2011)
Banks, E., (2005), Financial lexicon, Palgrave Macmillan, United Kingdom
Bao, J., Pan, J., Wang, J., (2009), Liquidity of corporate bonds, available at:
www.haos.berkeley.edu/groups/finance/bond_liquidity.pdf
Borio, C., (2000), III Special feature: Market liquidity and stress: selected issues and policy
implications, BIS Quarterly Review, November 2000, pp.38-51
Burger, J.D., Warnok, F.E., (2006), Local currency bond markets, IMF Staff Papers, vol.53,
Special Issue, pp.133-146
Burger, J.D., Warnok, F.E., (2007), Foreign participation in local currency bond markets,
Review of Financial Economics, vol.15, issue 3, pp.291-304
Burger, J.D., Warnok, F.E., Cacdac Warnok, V., (2012), Emerging local currencies bond
markets, Financial Analysts Journal, vol.68, no.4, pp.73-93
Bushman, R.M., Le, A., Vasvari, F., (2010), Implied bond liquidity, January 2010, available at:
http://www3.nd.edu/~carecob/April2011Conference/VasvariPaper.pdf
Christodoulopoulos, T.N., Grigoratou, I. (2005), Measuring liquidity in the Greek government
securities market, Bank of Greece, working paper no.23, available at:
www.bankofgreece.gr/BogEkdoseis/Paper200523.pdf
Comelli, F., (2012), Emerging market sovereign bond spreads: Estimations and back-testing,
Emerging Markets Review, vol.13, issue 4, pp.598-625
Committee on the Global Financial System (CGFS), (1999), Market liquidity: research findings
and selected policy implications, Basel 1999, available at: www.bis.org/cgfs11overview.pdf

Daniel, L., (2008), Foreign investors’ participation in emerging market economies’ domestic
bond markets, Banque de France Bulletin Digest, no.173, May-June 2008, pp.1-17
Das, S.R., Ericsson, J., Kalimipalli, M., (2003), Liquidity and bond markets, Revistas de Temas
Financieros, vol. II, no.2, 2005, pp.91-104, available at: www.sbs.gob.pe
Diaz, A., Merrick Jr., J.J., Navarro, E., (2006), Spanish Treasury bond market liquidity and
volatility pre- and post-European Monetary Union, Journal of Banking and Finance, vol.30, issue
4, pp.1309-1332
Dick-Nielsen, J., Feldhuetter, P., Lando, D., (2012), Corporate bond liquidity before and after the
onset of the subprime crisis, Journal of Financial Economics, vol.103, issue 3, pp.471-492
Ebeke, C., Lu, Y., (2014), Emerging market local currency bond yields and foreign holdings in
the post-Lehman period – a fortune or misfortune?, IMF Working Paper WP/14/29
Fleming, M.J., (2003), Measuring Treasury market liquidity, FRBNY Economic Policy Review,
September 2003, pp.83-108
Gabrielsen, A., Marzo, M., Zagaglia, P., (2011), Measuring market liquidity: an introductory
survey, University of Bologna – Department of Economics, 13 December 2011, MPRA Paper
no.35829, available at: http://mpra.ub.uni-muenchen.de/35829/
Global Financial Stability Report, (2005), Market developments and issues, September 2005,
International Monetary Fund
Global Financial Stability Report, (2006), Market developments and issues, September 2006,
International Monetary Fund
Global Financial Stability Report, (2013), Transition challenges to stability, October 2013,
International Monetary Fund
Goyenko, R.Y., Holden, C.W., Trzcinka, C.A., (2009), Do liquidity measures measure liquidity?,
Journal of Financial Economics, vol.92, issue 2, pp.153-181
Goyenko, R., Subrahmanyam, A., Ukhov, A., (2011), The term structure of bond market
liquidity and its implications for expected bond returns, Journal of Financial and Quantitative
Analysis, vol.46, no.1, pp.111-139
Gravelle, T., (1999), Liquidity of the Government of Canada securities market: Stylized facts
and some microstructure comparisons to the United States Treasury market, Bank of Canada
Working Paper 99-11, July 1999, available at: www.bankofcanada.ca/wp-
content/uploads/2010/05/wp99-11.pdf
Jankowitsch, R., Moesenbacher, H., Pilcher, S., (2002), Measuring the liquidity impact on EMU
government bond prices, February 2002, available at: http://ssrn.com/abstract=302795
Jankowitsch, R., Nashikkar, A.J., Subrahmanyam, M.G., (2008), Price dispersion in OTC
markets: A new measure of liquidity, April 2008, paper presented at EFA 2008 Athens Meeting,
available at: http://ssrn.com/abstract=1100704
Jaramillo, L., Weber, A., (2013), Bond yields in emerging economies: It matters what sate you
are in, Emerging Markets Review, volume 17, pp.169-185
Kamara, A., (1994), Liquidity, taxes, and short-term treasury yields, The Journal of Financial
and Quantitative Analysis, vol.29, no.3, pp.403-417
Kay, B., (2008), Literature review: Financial market liquidity, Free e-book, available at:
https://www.yumpu.com/la/document/view/7464804/literature-review-financial-market-
liquidity, last accessed August 7th
2014
Kyle, A.S., (1985), Continuous auctions and inside trading, Econometrica, vol.53, no.6,
pp.1315-1336
Lesmond, D.A., Ogden, J.P., Trzcinka, C.A., (1999), A new estimate of transaction costs, The
Review of Financial Studies, vol.12, no.5, Winter 1999, pp.1113-1141
Longstaff, F., Mithal, S., Neis, E., (2004), Corporate yield spreads: default risk or liquidity? New
evidence from credit-default swap market, NBER Working Papers Series, working paper 10418,
available at: www.nber.org/papers/w10418
Luengnaruemitchai, P., Ong, L.L., (2005), An anatomy of corporate bond markets: Growing
pains and knowledge gains, IMF Working Paper WP 05/152
Mahanti, S., Nashikkar, A.J., Chaco, G., Mallik, G., (2008), Latent liquidity: a new measure of
liquidity with an application to corporate bonds, Journal of Financial Economics, vol.88, issue 2,
May 2008, pp.272-298
McCauley, R., Remolona, F., (2000), IV Special feature: Size and liquidity of government bond
markets, BIS Quarterly Review, November 2000, pp.52-60
Medrega, C., (2014), Strainii aveau in mai titluri de stat de 4.8 miliarde euro. Intra noi capitaluri
dupa decizia JP Morgan? Ziarul Financiar din 24.07.2014, available at:
http://www.zf.ro/banci-si-asigurari/strainii-aveau-in-mai-titluri-de-stat-de-4-8-miliarde-de-euro-
intra-noi-capitaluri-dupa-decizia-jp-morgan-12965932
Miyajima, K., Mohanty, M.S., Chan, T., (2012), Emerging market local currency bonds:
diversification and stability, BIS Working Paper no.391, November 2012

Mohanty, M.S., (2002), Improving liquidity in government bond markets: what can be done?,
BIS Papers No.11, June 2002, pp.49-80
Pandele, M., (2007), Brokerii vor tranzactiona titluri de stat, dupa ani de asteptare, Capital no.25,
21 iunie 2007, pp.28
Peiris, S.J., (2010), Foreign participation in emerging markets’ local currency bond markets, IMF
Working Paper WP/10/88
Pop, C., Georgescu, M.A., (2012), Municipal and bond market segments development at
Bucharest Stock Exchange, Transylvanian Review of Administrative Sciences, no.35, E/2012,
pp.197-218
Roll, R., (1984), A simple implicit measure of the effective bid-ask spread in an efficient market,
The Journal of Finance, vol.39, no.4, September 1984, pp.1127-1139
Sarig, O., Warga, A., (1989), Bond price data and bond market liquidity, The Journal of
Financial and Quantitative Analysis, vol.24, no.3, September 1989, pp.367-378
Sarr, A., Lybeck, T., (2002), Measuring liquidity in financial markets, IMF Working Paper
WP/02/232
Schaeffer, C., Schmalz, C., (2009), Market liquidity: An introduction for practitioners, Frankfurt
School Working Paper Series No.131, October 2009, available at: http://www.frankfurt-
school.de/clicnetclm/fileDownload.do?goid=000000167768AB4
Turner, P., (2012), Weathering financial crisis: domestic bond markets in EMEs, BIS Papers
no.63, January 2012, pp.15-34
Upper, C., (2000), How safe was the ‘safe heaven’? Financial market liquidity during the 1998
turbulences, Economic Research Group of the Deutsche Bundesbank, Discussion Paper 1/00,
February 2000, available at:
http://www.bundesbank.de/Redaktion/EN/Downloads/Publications/Discussion_Paper_1/2000/20
00_02_01_dkp_01.pdf?__blob=publicationFile
Warga, A., (1992), Bond returns, liquidity and missing data, The Journal of Financial and
Quantitative Analysis, vol.27, no.4, December 1992, pp.605-617
Zhang, H., (2010), Measuring liquidity in emerging markets, version December 2010, available
at: http://old.acem.sjtu.edu.cn/upload/publish/img/111221350580.pdf

Annex 1
The liquidity proxies’ formulas
Liqudity proxy and formula
(for T-bond i, daily level)
Symbols significance Based on
Active days
100Ld
TdAD
i
ii
Tdi = trading days or days when trading occurred
Ldi = number of listing days
Authors’ choice of measure for frequency of trade.
Since the trading frequency is low, it was chosen to
report the days when transactions occurred.
Daily turnover
DTi DTi = the value of daily trade Authors’ choice for daily volume of trade.
Volume per trade
i
ii
T
VVT
Vi = daily trading volume (quantity)
Ti = daily number of trades
Authors’ choice for trade size.
Turnover ratio
100Q
VTR
i
ii
Vi = daily trading volume (quantity)
Qi = outstanding quantity
Schaeffer & Schmalz (2009)
Gabrielsen et al.(2011)
Liquidity ratio
i
ii
r
DTLR
DTi = the value of daily trade
ri = absolute value of daily return*
Schaeffer & Schmalz (2009)
Gabrielsen et al.(2011)
Amihud measure or illiquidity ratio
)LR
1(
DT
rILRAmihud
ii
i
i
ri = absolute value of daily return
DTi = the value of daily trade
Amihud (2002)
Gabrielsen et al.(2011)
Liquidity ratio of Marsh and Rock
i
i
iT
rMR
ri = absolute value of daily return
Ti = daily number of trades
Gabrielsen et al.(2011)
Martin liquidity index
i
2
1)i(tit
iDT
PPMLI
DTi = the value of daily trade Gabrielsen et al.(2011)
Hui-Heubel liquidity ratio
i
min imin imax iHH
TR
PPPLR
Pi max = maxim price registered for the respective day
Pi min = minim price registered for the respective day
TRi = turnover ratio
Schaeffer & Schmalz (2009)
Gabrielsen et al.(2011)
Price dispersion (coefficient) Pi max = maxim price registered for the respective day Dick-Nielsen et al.(2012)
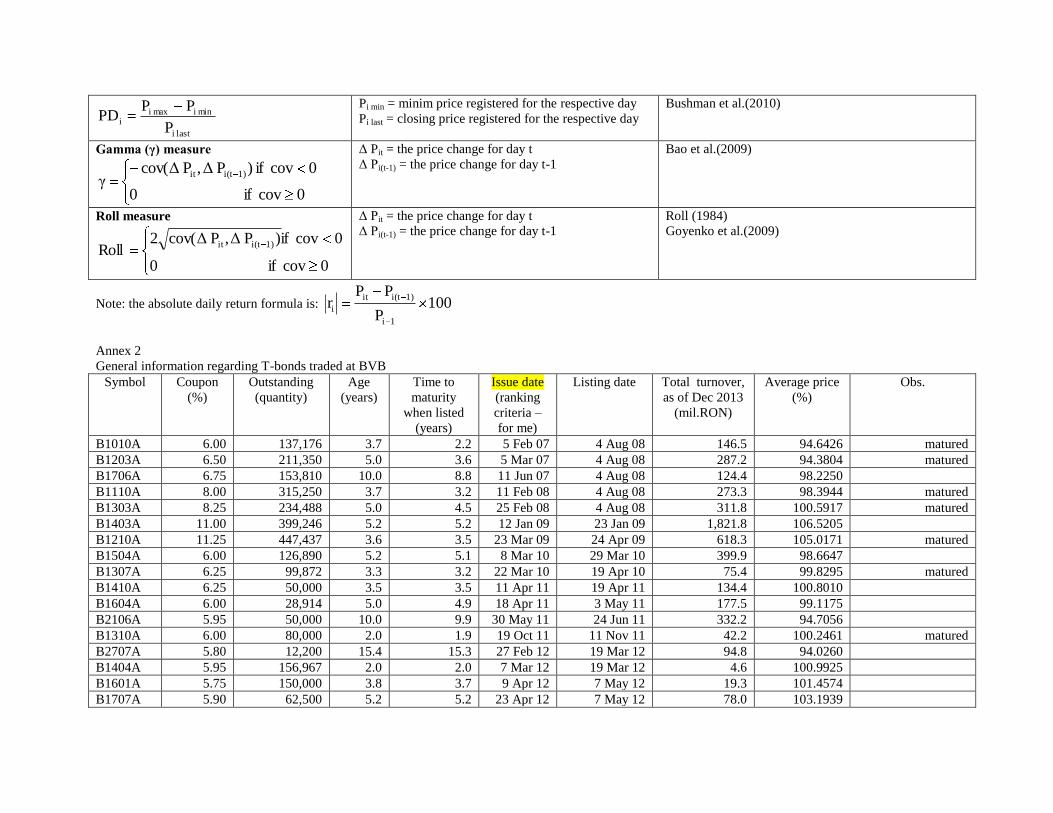
last i
min imax ii
P
PPPD
Pi min = minim price registered for the respective day
Pi last = closing price registered for the respective day Bushman et al.(2010)
Gamma (γ) measure
0cov if 0
0cov if )P Δ,P cov(Δγ
1)i(tit
Δ Pit = the price change for day t
Δ Pi(t-1) = the price change for day t-1 Bao et al.(2009)
Roll measure
0 cov if 0
0cov if)P Δ,P cov(Δ2Roll
1)i(tit
Δ Pit = the price change for day t
Δ Pi(t-1) = the price change for day t-1 Roll (1984)
Goyenko et al.(2009)
Note: the absolute daily return formula is: 100P
PPr
1i
1)i(tit
i
Annex 2
General information regarding T-bonds traded at BVB
Symbol Coupon
(%)
Outstanding
(quantity)
Age
(years)
Time to
maturity
when listed
(years)
Issue date
(ranking
criteria –
for me)
Listing date Total turnover,
as of Dec 2013
(mil.RON)
Average price
(%)
Obs.
B1010A 6.00 137,176 3.7 2.2 5 Feb 07 4 Aug 08 146.5 94.6426 matured
B1203A 6.50 211,350 5.0 3.6 5 Mar 07 4 Aug 08 287.2 94.3804 matured
B1706A 6.75 153,810 10.0 8.8 11 Jun 07 4 Aug 08 124.4 98.2250
B1110A 8.00 315,250 3.7 3.2 11 Feb 08 4 Aug 08 273.3 98.3944 matured
B1303A 8.25 234,488 5.0 4.5 25 Feb 08 4 Aug 08 311.8 100.5917 matured
B1403A 11.00 399,246 5.2 5.2 12 Jan 09 23 Jan 09 1,821.8 106.5205
B1210A 11.25 447,437 3.6 3.5 23 Mar 09 24 Apr 09 618.3 105.0171 matured
B1504A 6.00 126,890 5.2 5.1 8 Mar 10 29 Mar 10 399.9 98.6647
B1307A 6.25 99,872 3.3 3.2 22 Mar 10 19 Apr 10 75.4 99.8295 matured
B1410A 6.25 50,000 3.5 3.5 11 Apr 11 19 Apr 11 134.4 100.8010
B1604A 6.00 28,914 5.0 4.9 18 Apr 11 3 May 11 177.5 99.1175
B2106A 5.95 50,000 10.0 9.9 30 May 11 24 Jun 11 332.2 94.7056
B1310A 6.00 80,000 2.0 1.9 19 Oct 11 11 Nov 11 42.2 100.2461 matured
B2707A 5.80 12,200 15.4 15.3 27 Feb 12 19 Mar 12 94.8 94.0260
B1404A 5.95 156,967 2.0 2.0 7 Mar 12 19 Mar 12 4.6 100.9925
B1601A 5.75 150,000 3.8 3.7 9 Apr 12 7 May 12 19.3 101.4574
B1707A 5.90 62,500 5.2 5.2 23 Apr 12 7 May 12 78.0 103.1939

B2001A 5.85 41,718 7.6 7.5 28 May 12 27 Jun 12 0 n/a 0 trades
B1407A 5.85 28,620 2.1 2.0 9 Jul 12 25 Jul 12 45.3 101.2409
B1510A 5.80 25,000 3.0 3.0 15 Oct 12 29 Oct 12 51.6 100.4730
B2304A 5.85 110,662 10.0 10.0 28 Jan 13 8 Feb 13 40.7 104.5494
B2004A 5.75 80,000 7.1 6.9 20 Mar 13 17 May 13 0 n/a 0 trades
B1811A 5.60 90,000 5.6 5.5 8 Apr 13 9 May 13 23.8 103.4995
B1608A 4.75 54,186 3.2 3.0 10 Jun 13 7 Aug 13 0 n/a 0 trades
Average
Bs
6.70 141,447 5.4 5.1 212.6
(243.0)
(100.0271)
F1002A 7.90 4,000 5.0 1.5 7 Feb 05 4 Aug 08 0 n/a 0 trades; matured
F1003A 6.50 5,400 5.0 1.6 7 Mar 05 4 Aug 08 0 n/a 0 trades; matured
F1004A 7.25 12,871 5.0 1.7 11 Apr 05 4 Aug 08 0 n/a 0 trades; matured
F1204A 7.00 5,000 7.0 3.7 11 Apr 05 4 Aug 08 1.6 98.1187 matured
F1504A 6.75 3,281 10.0 6.7 11 Apr 05 4 Aug 08 0 n/a 0 trades
F1004B 7.25 14,895 5.0 1.7 18 Apr 05 4 Aug 08 0 n/a 0 trades; matured
F1704A 7.00 3,740 12.0 8.7 18 Apr 05 4 Aug 08 1.9 100.1629
F2004A 7.25 5,000 15.0 11.7 18 Apr 05 4 Aug 08 0 n/a 0 trades
F1005A 7.80 17,202 5.0 1.8 9 May 05 4 Aug 08 2.2 98.1482 matured
F1005B 7.80 8,650 5.0 1.8 16 May 05 4 Aug 08 0 n/a 0 trades; matured
F1206A 7.00 1,829 7.0 3.8 6 Jun 05 4 Aug 08 0 n/a 0 trades; matured
F1506A 7.50 4,009 10.0 6.8 6 Jun 05 4 Aug 08 3.3 103.2855
F1006A 7.80 10,000 5.0 1.8 13 Jun 05 4 Aug 08 1.5 94.4940 matured
F1706A 7.25 4,676 12.0 8.9 20 Jun 05 4 Aug 08 3.3 102.9461
F2006A 7.30 5,000 15.0 11.9 20 Jun 05 4 Aug 08 1.0 98.5771
F1007A 8.00 15,000 5.0 1.9 20 Jul 05 4 Aug 08 3.0 96.3847 matured
F1507A 7.85 10,000 10.0 6.9 20 Jul 05 4 Aug 08 12.7 104.4262
F1008A 7.48 10,000 5.0 2.0 10 Aug 05 4 Aug 08 1.0 93.2673 matured
F1508A 7.49 10,000 10.0 7.0 17 Aug 05 4 Aug 08 0 n/a 0 trades
F0809A 6.47 10,000 3.0 0.1 19 Sep 05 4 Aug 08 0 n/a 0 trades; matured
Average
Fs
7.50 8,463 7.8 5.4 1.6
(3.2)
(98.9811)
Source: authors’ calculations based on data provided at http://www.bvb.ro/Companies/DGovBonds.aspx
Note 1: The symbol of every T-bond listed at BVB can be red as follow: the letter B or F signifies if the bond is a benchmark or a common one. The next two figures indicate the
years when the bond will mature. The last two figures indicate the month when the bond will mature. The letter A means that it is the first issue for the respective maturity.
Note 2: All the T-bonds listed up to December 2013 at BVB have the nominal value of 10,000 RON
Note 3: The average figures in brakets are only for the figures different from zero or n/a

Annex 3
Information regarding the potential on/off the run property for Romanian T-bonds (as of Dec 31st 2013)
Symbol Listing date First trade date Trading activity during the first three months of listing
Days Trades Volume (quantity) Turnover (mil.RON)
B1010A 4 Aug 08 11 Aug 08 3 3 867 8.45
B1203A 4 Aug 08 31 Oct 08 1 1 90 0.76
B1706A 4 Aug 08 14 Jan 10 0 0 0 0.00
B1110A 4 Aug 08 4 Aug 08 1 1 99 1.00
B1303A 4 Aug 08 7 Apr 09 0 0 0 0.00
B1403A 23 Jan 09 27 Feb 09 7 8 1,021 10.09
B1210A 24 Apr 09 22 May 09 3 5 1,043 15.41
B1504A 29 Mar 10 29 Mar 10 8 12 4,738 45.92
B1307A 19 Apr 10 5 May 10 4 5 1,547 15.71
B1410A 19 Apr 11 21 Jul 11 0 0 0 0.00
B1604A 3 May 11 5 Jul 11 2 3 27 0.26
B2106A 24 Jun 11 25 Jul 11 11 16 2,405 21.83
B1310A 11 Nov 11 6 Jan 12 1 4 561 5.62
B2707A 19 Mar 12 10 Apr 12 3 6 439 4.31
B1404A 19 Mar 12 4 May 12 1 2 135 1.36
B1601A 7 May 12 2 Jul 12 3 7 1,505 15.19
B1707A 7 May 12 28 Dec 12 0 0 0 0.00
B2001A 27 Jun 12 Never traded since listed
B1407A 25 Jul 12 26 Oct 12 0 0 0 0.00
B1510A 29 Oct 12 7 Nov 12 6 11 4,016 40.01
B2304A 8 Feb 13 28 Jun 13 0 0 0 0.00
B1811A 9 May 13 18 Jun 13 1 1 387 3.99
B2004A 17 May 13 Never traded since listed
B1608A 7 Aug 13 Never traded since listed Source: authors’ calculations based on data provided at http://www.bvb.ro/Companies/DGovBonds.aspx
Annex 4
BVB traded T-bonds ranked based on average daily turnover (period ended December 31st 2013)
Symbol Average daily turnover
(mil.RON)
Average daily
volume
Average daily
trades
Listing days Trading days Coupon
(%)
Outstanding bonds Average price
(%)
B1403A 10.53 915 2 1,247 173 11.00 399,246 106.5205
B1707A 9.75 927 2 415 8 5.90 62,500 103.1939
B2707A 9.48 961 2 448 10 5.80 12,200 94.0260
B2106A 8.10 816 2 634 41 5.95 50,000 94.7056
B1811A 7.92 742 1 163 3 5.60 90,000 103.4995
B1504A 7.55 753 1 951 53 6.00 126,890 98.6647

F1507A 6.33 600 2 1,362 2 7.85 10,000 104.4262
B1210A 6.06 538 2 889 102 11.25 447,437 105.0171
B1110A 4.63 447 1 814 59 8.00 315,250 98.3944
B1303A 4.52 428 2 1,154 69 8.25 234,488 100.5917
B1510A 4.30 429 2 292 12 5.80 25,000 100.4730
B1706A 4.29 407 2 1,362 29 6.75 153,810 98.2250
B2304A 4.07 379 1 225 10 5.85 110,662 104.5494
B1010A 3.66 367 2 559 40 6.00 137,176 94.6426
B1203A 3.59 356 2 904 80 6.50 211,350 94.3804
B1604A 3.35 324 2 671 53 6.00 28,914 99.1175
B1410A 2.04 199 2 680 66 6.25 50,000 100.8010
F1506A 1.64 150 2 1,362 2 7.50 4,009 103.2855
F1706A 1.63 150 2 1,362 2 7.25 4,676 102.9461
B1407A 1.62 157 1 359 28 5.85 28,620 101.2409
F1204A 1.62 156 1 931 1 7.00 5,000 98.1187
F1006A 1.49 150 1 464 1 7.80 10,000 94.4940
F1007A 1.49 150 1 490 2 8.00 15,000 96.3847
B1601A 1.14 112 1 415 17 5.75 150,000 101.4574
F1005A 1.09 110 1 440 2 7.80 17,202 98.1482
F2006A 1.01 100 1 1,362 1 7.30 5,000 98.5771
B1307A 0.99 97 1 828 76 6.25 99,872 99.8295
F1704A 0.93 90 2 1,362 2 7.00 3,740 100.1629
B1310A 0.84 81 1 477 50 6.00 80,000 100.2461
F1008A 0.49 50 2 505 2 7.48 10,000 93.2673
B1404A 0.15 15 1 448 30 5.95 156,967 100.9925
Source: authors’ calculations based on data provided at http://www.bvb.ro/Companies/DGovBonds.aspx
Annex 5
A: Descriptive statistics for the factors determining liquidity for all T-bonds traded at BVB Coupon (%) - C Outstanding quantity - Q Time to maturity – years
TM
Listing period – years
LP
Retail (%1-5 bond days)
R
Average 6.9574 98,549 5.1845 3.0452 14.4029
Standard deviation 1.3917 117,226 3.4003 1.5756 16.8817
Minumum 5.6000 3,740 1.7500 0.7000 0.0000
Maximum 11.2500 447,437 15.3300 5.5000 56.6700
Skewness 4.0335 3.7706 2.8701 1.0266 2.3429
Kurtosis 4.0298 2.7267 1.4508 -1.3095 0.2453
Coefficient of variation (%) 20.0030 118.9530 65.5855 51.7416 117.2100
Count 31 31 31 31 31

B: Descriptive statistics for the factors determining liquidity for the benchmark (B symbol) T-bonds traded at BVB
Coupon (%) Outstanding quantity Time to maturity – years Listing period - years Retail (%1-5 bond days)
Average 6.7000 141,447 5.0638 2.6476 21.2614
Standard deviation 1.6223 120,883 3.3500 1.3288 16.5642
Minumum 5.6000 12,200 1.9200 0.7000 0.0000
Maximum 11.2500 447,437 15.3300 5.5000 56.6700
Skewness 4.1611 2.5223 3.3572 1.0977 1.1231
Kurtosis 3.8863 1.2107 3.1696 -0.3331 -0.1917
Coefficient of variation (%) 24.2129 85.4616 66.1560 50.1872 77.9073
Count 21 21 21 21 21
C: Descriptive statistics for the factors determining liquidity for the common (F symbol) T-bonds traded at BVB
Coupon (%) Outstanding quantity Time to maturity – years Listing period - years Retail (%1-5 bond days)
Average 7.4980 8,463 5.4380 3.8800 n/a
Standard deviation 0.3583 4,792 3.6736 1.7912 n/a
Minumum 7.0000 3,740 1.7500 1.8000 n/a
Maximum 8.0000 17,202 11.8800 5.5000 n/a
Skewness -0.1747 1.0213 0.5828 -0.3131 n/a
Kurtosis -0.8875 -0.3801 -0.7711 -1.4754 n/a
Coefficient of variation (%) 4.7785 56.6237 67.5546 46.1653 n/a
Count 10 10 10 10 10
D: Correlation coefficients and p-values for the factors determining liquidity
For all T-bonds traded at BVB For the benchmark (B symbol) T-bonds traded at
BVB
For the common (F symbol) T-bonds
traded at BVB
Co
up
on
(1)
Ou
tsta
nd
ing
qu
anti
ty
(2)
Tim
e to
mat
uri
ty
(3)
Lis
tin
g p
erio
d
(4)
Ret
ail
(5)
Co
up
on
(1)
Ou
tsta
nd
ing
qu
anti
ty
(2)
Tim
e to
mat
uri
ty
(3)
Lis
tin
g p
erio
d
(4)
Ret
ail
(5)
Co
up
on
(1)
Ou
tsta
nd
ing
qu
anti
ty
(2)
Tim
e to
mat
uri
ty
(3)
Lis
tin
g p
erio
d
(4)
(1) 1 0.5839
(0.0006)
-0.1222
(0.5124)
0.4560
(0.0099)
-0.2146
(0.2463)
1 0.9087
(0.0000)
-0.1212
(0.6007)
0.6117
(0.0032)
-0.0676
(0.7710)
1 0.8148
(0.0041)
-0.5236
(0.1204)
-0.5250
(0.1192)
(2) 1 -0.1943
(0.2949)
0.1264
(0.4980)
0.3093
(0.0905)
1 -0.2312
(0.3133)
0.5823
(0.0056)
-0.0198
(0.9322)
1 -0.7195
(0.0190)
-0.7774
(0.0081)
(3) 1 0.3603
(0.0465)
-0.3603
(0.0465)
1 0.0042
(0.9855)
-0.5150
(0.0181)
1 0.9186
(0.0002)
(4) 1 -0.1920
(0.3008)
1 0.0522
(0.8121)
1

(5) 1
Annex 6
A: Descriptive statistics for the liquidity proxies for all T-bonds traded at BVB
Act
ive
day
s (%
)
Val
ue
(mil
.RO
N)
Vo
lum
e p
er
trad
e
Tu
rnov
er r
atio
(TR
2)
Liq
uid
ity
rat
io
Am
ihu
d
mea
sure
Mar
tin
Mar
sh &
Ro
ck
Hu
i-H
eub
el r
atio
Dis
per
sio
n
Gam
ma
Ro
ll
Average 4.5623 3.7516 236 1.3642 93.9917 5.1489 12.4198 1.3186 0.9878 0.0001 0.0544 0.2549
Std deviation 4.0692 3.0549 200 1.8164 168.7310 4.9153 26.7016 1.5845 3.2238 0.0002 0.1069 0.3974
Minumum 0.0700 0.1500 10 0.0096 0.0586 0.5466 0.9451 0.1144 0.0000 0.0000 0.0000 0.0000
Maximum 13.8700 10.5300 832 7.8754 717.2290 19.6657 149.8050 6.8152 16.5418 0.0010 0.3644 1.2072
Skewness 1.0846 1.9379 3.4499 5.1104 5.8623 4.0462 11.0462 5.4589 9.5694 7.1894 5.1187 3.1441
Kurtosis 0.9773 -0.4877 2.4891 6.1785 7.3438 3.1662 28.7122 6.3744 21.7581 13.1972 4.7235 0.8486
C.of variation 89.1919 81.4305 84.9543 133.1470 179.5160 95.4619 214.9920 120.1580 326.3530 215.9050 196.3180 155.8950
Count 31 31 31 31 31 31 31 31 31 31 31 31
B: Descriptive statistics for the liquidity proxies for the benchmark (B symbol) T-bonds traded at BVB
Act
ive
day
s (%
)
Val
ue
(mil
.RO
N)
Vo
lum
e p
er
trad
e
Tu
rnov
er r
atio
(TR
2)
Liq
uid
ity
rat
io
Am
ihu
d
mea
sure
Mar
tin
Mar
sh &
Ro
ck
Hu
i-H
eub
el
rati
o
Dis
per
sio
n
Gam
ma
Ro
ll
Average 6.6271 4.6943 277 0.8662 138.0030 5.6652 7.6844 0.5815 1.4582 0.0001 0.0804 0.3763
Std deviation 3.3091 3.1444 212 1.6919 190.7750 4.8392 8.4315 0.3893 3.8560 0.0002 0.1223 0.4346
Minumum 1.8400 0.1500 10 0.0096 2.4546 0.5466 0.9451 0.1144 0.0000 0.0000 0.0000 0.0000
Maximum 13.8700 10.5300 832 7.8754 717.2290 19.6657 38.4323 1.3731 16.5418 0.0010 0.3644 1.2072
Skewness 0.5090 0.7869 2.4299 7.2837 3.8376 3.1479 2.1409 1.5950 6.3949 4.7754 3.1207 1.4962
Kurtosis -0.3395 -0.8322 1.6263 15.3614 3.4029 2.7470 8.3019 -0.1967 11.7267 7.0770 1.5112 -0.5634
C.of variation 49.9320 66.9827 76.7531 195.3250 138.2400 85.4196 109.7220 66.9545 264.4350 169.4110 152.1250 115.5080
Count 21 21 21 21 21 21 21 21 21 21 21 21
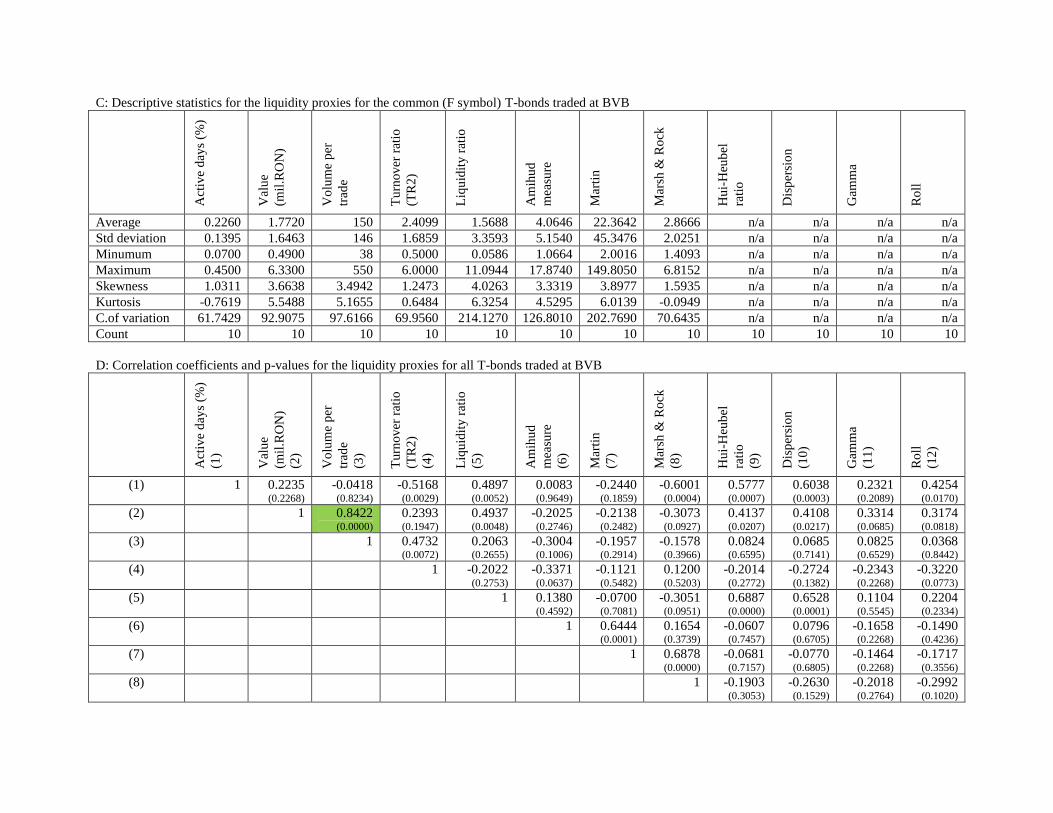
C: Descriptive statistics for the liquidity proxies for the common (F symbol) T-bonds traded at BVB
Act
ive
day
s (%
)
Val
ue
(mil
.RO
N)
Vo
lum
e p
er
trad
e
Tu
rnov
er r
atio
(TR
2)
Liq
uid
ity
rat
io
Am
ihu
d
mea
sure
Mar
tin
Mar
sh &
Ro
ck
Hu
i-H
eub
el
rati
o
Dis
per
sio
n
Gam
ma
Ro
ll
Average 0.2260 1.7720 150 2.4099 1.5688 4.0646 22.3642 2.8666 n/a n/a n/a n/a Std deviation 0.1395 1.6463 146 1.6859 3.3593 5.1540 45.3476 2.0251 n/a n/a n/a n/a Minumum 0.0700 0.4900 38 0.5000 0.0586 1.0664 2.0016 1.4093 n/a n/a n/a n/a Maximum 0.4500 6.3300 550 6.0000 11.0944 17.8740 149.8050 6.8152 n/a n/a n/a n/a Skewness 1.0311 3.6638 3.4942 1.2473 4.0263 3.3319 3.8977 1.5935 n/a n/a n/a n/a Kurtosis -0.7619 5.5488 5.1655 0.6484 6.3254 4.5295 6.0139 -0.0949 n/a n/a n/a n/a C.of variation 61.7429 92.9075 97.6166 69.9560 214.1270 126.8010 202.7690 70.6435 n/a n/a n/a n/a Count 10 10 10 10 10 10 10 10 10 10 10 10
D: Correlation coefficients and p-values for the liquidity proxies for all T-bonds traded at BVB
Act
ive
day
s (%
)
(1)
Val
ue
(mil
.RO
N)
(2)
Vo
lum
e p
er
trad
e
(3)
Tu
rnov
er r
atio
(TR
2)
(4)
Liq
uid
ity
rat
io
(5)
Am
ihu
d
mea
sure
(6)
Mar
tin
(7)
Mar
sh &
Ro
ck
(8)
Hu
i-H
eub
el
rati
o
(9)
Dis
per
sio
n
(10
)
Gam
ma
(11
)
Ro
ll
(12
)
(1) 1 0.2235 (0.2268)
-0.0418 (0.8234)
-0.5168 (0.0029)
0.4897 (0.0052)
0.0083 (0.9649)
-0.2440 (0.1859)
-0.6001 (0.0004)
0.5777 (0.0007)
0.6038 (0.0003)
0.2321 (0.2089)
0.4254 (0.0170)
(2) 1 0.8422 (0.0000)
0.2393 (0.1947)
0.4937 (0.0048)
-0.2025 (0.2746)
-0.2138 (0.2482)
-0.3073 (0.0927)
0.4137 (0.0207)
0.4108 (0.0217)
0.3314 (0.0685)
0.3174 (0.0818)
(3) 1 0.4732 (0.0072)
0.2063 (0.2655)
-0.3004 (0.1006)
-0.1957 (0.2914)
-0.1578 (0.3966)
0.0824 (0.6595)
0.0685 (0.7141)
0.0825 (0.6529)
0.0368 (0.8442)
(4) 1 -0.2022 (0.2753)
-0.3371 (0.0637)
-0.1121 (0.5482)
0.1200 (0.5203)
-0.2014 (0.2772)
-0.2724 (0.1382)
-0.2343 (0.2268)
-0.3220 (0.0773)
(5) 1 0.1380 (0.4592)
-0.0700 (0.7081)
-0.3051 (0.0951)
0.6887 (0.0000)
0.6528 (0.0001)
0.1104 (0.5545)
0.2204 (0.2334)
(6) 1 0.6444 (0.0001)
0.1654 (0.3739)
-0.0607 (0.7457)
0.0796 (0.6705)
-0.1658 (0.2268)
-0.1490 (0.4236)
(7) 1 0.6878 (0.0000)
-0.0681 (0.7157)
-0.0770 (0.6805)
-0.1464 (0.2268)
-0.1717 (0.3556)
(8) 1 -0.1903 (0.3053)
-0.2630 (0.1529)
-0.2018 (0.2764)
-0.2992 (0.1020)

(9) 1 0.9177 (0.0000)
0.1699 (0.3608)
0.2977 (0.1038)
(10) 1 0.1545 (0.4066)
0.2743 (0.1354)
(11) 1 0.9517 (0.0000)
(12) 1
E: Correlation coefficients and p-values for the liquidity proxies for the benchmark (B symbol) T-bonds traded at BVB
Act
ive
day
s (%
)
(1)
Val
ue
(mil
.RO
N)
(2)
Vo
lum
e p
er
trad
e
(3)
Tu
rnov
er r
atio
(TR
2)
(4)
Liq
uid
ity
rat
io
(5)
Am
ihu
d
mea
sure
(6)
Mar
tin
(7)
Mar
sh &
Ro
ck
(8)
Hu
i-H
eub
el
rati
o
(9)
Dis
per
sio
n
(10
)
Gam
ma
(11
)
Ro
ll
(12
)
(1) 1 -0.2058 (0.3709)
-0.4615 (0.0352)
-0.4127 (0.0630)
0.3304 (0.1435)
-0.2108 (0.3590)
-0.3324 (0.1410)
-0.7171 (0.0003)
0.6432 (0.0017)
0.5748 (0.0064)
-0.0564 (0.8081)
0.1502 (0.5158)
(2) 1 0.8098 (0.0000)
0.4680 (0.0324)
0.4072 (0.0670)
-0.3084 (0.1738)
-0.0597 (0.7972)
-0.4236 (0.0557)
0.3850 (0.0848)
0.3310 (0.1427)
0.2153 (0.3485)
0.1504 (0.5151)
(3) 1 0.6751 (0.0008)
0.1082 (0.6407)
-0.3724 (0.0964)
-0.0403 (0.8625)
0.6894 (0.0005)
0.0209 (0.9283)
-0.0357 (0.8779)
-0.0310 (0.8939)
-0.1276 (0.5816)
(4) 1 -0.0732 (0.7526)
-0.2087 (0.3640)
-0.0327 (0.8880)
0.3929 (0.0781)
-0.1543 (0.5042)
-0.1963 (0.3938)
-0.1266 (0.5844)
-0.2065 (0.3691)
(5) 1 0.1081 (0.6411)
0.1356 (0.5578)
-0.2126 (0.3549)
0.6723 (0.0008)
0.6047 (0.0037)
-0.0312 (0.8931)
0.0577 (0.8039)
(6) 1 0.7929 (0.0000)
-0.1250 (0.5893)
-0.1197 (0.6054)
0.0385 (0.8683)
-0.2945 (0.1951)
-0.3046 (0.1794)
(7) 1 0.2424 (0.2898)
-0.0476 (0.8377)
0.0323 (0.8896)
-0.2204 (0.3370)
-0.2353 (0.3045)
(8) 1 -0.2192 (0.3397)
-0.2126 (0.3549)
0.2301 (0.3157)
0.0511 (0.8259)
(9) 1 0.9180 (0.0000)
0.1021 (0.6597)
0.2305 (0.3148)
(10) 1 0.0435 (0.8516)
0.1517 (0.5117)
(11) 1 0.9483 (0.0000)
(12) 1
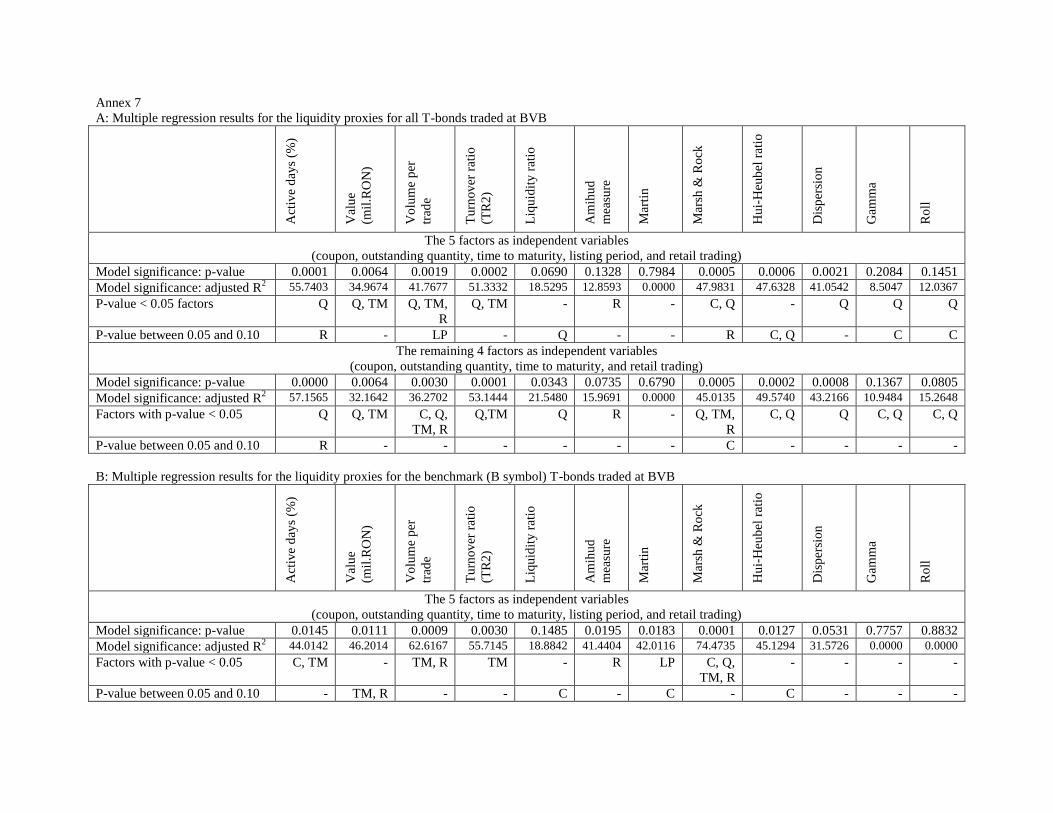
Annex 7
A: Multiple regression results for the liquidity proxies for all T-bonds traded at BVB
Act
ive
day
s (%
)
Val
ue
(mil
.RO
N)
Vo
lum
e p
er
trad
e
Tu
rnov
er r
atio
(TR
2)
Liq
uid
ity
rat
io
Am
ihu
d
mea
sure
Mar
tin
Mar
sh &
Ro
ck
Hu
i-H
eub
el r
atio
Dis
per
sio
n
Gam
ma
Ro
ll
The 5 factors as independent variables
(coupon, outstanding quantity, time to maturity, listing period, and retail trading)
Model significance: p-value 0.0001 0.0064 0.0019 0.0002 0.0690 0.1328 0.7984 0.0005 0.0006 0.0021 0.2084 0.1451
Model significance: adjusted R2 55.7403 34.9674 41.7677 51.3332 18.5295 12.8593 0.0000 47.9831 47.6328 41.0542 8.5047 12.0367
P-value < 0.05 factors Q Q, TM Q, TM,
R
Q, TM - R - C, Q - Q Q Q
P-value between 0.05 and 0.10 R - LP - Q - - R C, Q - C C
The remaining 4 factors as independent variables
(coupon, outstanding quantity, time to maturity, and retail trading)
Model significance: p-value 0.0000 0.0064 0.0030 0.0001 0.0343 0.0735 0.6790 0.0005 0.0002 0.0008 0.1367 0.0805
Model significance: adjusted R2 57.1565 32.1642 36.2702 53.1444 21.5480 15.9691 0.0000 45.0135 49.5740 43.2166 10.9484 15.2648
Factors with p-value < 0.05 Q Q, TM C, Q,
TM, R
Q,TM Q R - Q, TM,
R
C, Q Q C, Q C, Q
P-value between 0.05 and 0.10 R - - - - - - C - - - -
B: Multiple regression results for the liquidity proxies for the benchmark (B symbol) T-bonds traded at BVB
Act
ive
day
s (%
)
Val
ue
(mil
.RO
N)
Vo
lum
e p
er
trad
e
Tu
rnov
er r
atio
(TR
2)
Liq
uid
ity
rat
io
Am
ihu
d
mea
sure
Mar
tin
Mar
sh &
Ro
ck
Hu
i-H
eub
el r
atio
Dis
per
sio
n
Gam
ma
Ro
ll
The 5 factors as independent variables
(coupon, outstanding quantity, time to maturity, listing period, and retail trading)
Model significance: p-value 0.0145 0.0111 0.0009 0.0030 0.1485 0.0195 0.0183 0.0001 0.0127 0.0531 0.7757 0.8832
Model significance: adjusted R2 44.0142 46.2014 62.6167 55.7145 18.8842 41.4404 42.0116 74.4735 45.1294 31.5726 0.0000 0.0000
Factors with p-value < 0.05 C, TM - TM, R TM - R LP C, Q,
TM, R
- - - -
P-value between 0.05 and 0.10 - TM, R - - C - C - C - - -

The remaining 4 factors
(coupon, outstanding quantity, time to maturity, and retail trading)
Model significance: p-value 0.0059 0.0041 0.0003 0.0018 0.0828 0.0274 0.3484 0.0000 0.0048 0.0292 0.6728 0.7776
Model significance: adjusted R2 46.9741 49.5214 63.9591 54.5904 23.2175 34.4617 3.8722 75.1518 48.3817 33.8895 0.0000 0.0000
Factors with p-value < 0.05 C, TM R TM, R TM - R - C, Q,
TM, R
C - - -
P-value between 0.05 and 0.10 - TM Q C - TM, R - - - -
Annex 8
A: Results by clusters for all T-bonds traded at BVB
Act
ive
day
s (%
)
Val
ue
(mil
.RO
N)
Vo
lum
e p
er
trad
e
Tu
rnov
er r
atio
(TR
2)
Liq
uid
ity
rat
io
Am
ihu
d
mea
sure
Mar
tin
Mar
sh &
Ro
ck
Hu
i-H
eub
el r
atio
Dis
per
sio
n
Gam
ma
Ro
ll
All T-bonds 4.5623 3.7516 236 1.3642 93.9917 5.1489 12.4198 1.3186 0.9878 0.0001 0.0544 0.2549
Cluster 1: Outstanding quantity (in brackets the average values for coupon, time to maturity, listing period, and retail trading)
3,000 to 9,999 bonds (C:7.21; TM:7.98; LP:5.14; R:0)
0.1260 1.3660 100 2.8925 0.6844 2.4615 5.9777 1.6798 0 0 0 0
10,000 to 49,999 bonds (C:6.93; TM:4.42; LP:2.24; R:8.83)
2.6300 3.2933 260 2.3217 78.4992 5.9852 25.2146 2.5144 0.0236 0 0.0045 0.0447
50,000 to 99,999 bonds (C:5.99; TM:4.88; LP:2.13; R:20.94)
6.6017 4.9400 299 0.7561 33.4919 3.5765 2.8237 0.5456 0.2361 0.0001 0.0844 0.3774
100,000 to 299,999 bonds (C:6.38; TM:4.98; LP:2.99; R:24.57)
5.6163 3.6213 220 0.2380 111.0757 7.7838 12.0251 0.6899 0.8403 0.0002 0.1195 0.5115
300,000 to 450,000 bonds (C:10.08;TM:3.96;LP:3.90;R:14.92)
10.8633 7.0733 305 0.1638 371.4236 3.2378 5.0176 0.3639 7.4239 0.0004 0.0619 0.3813
Cluster 2: Coupon (in brackets the average values for outstanding quantity ( thou), time to maturity, listing period, and retail trading)
5% to 5.99% (Q:76;TM:6.29;LP:1.52;R:21.46)
4.4022 5.1700 343 1.6116 97.8994 5.8977 6.0105 0.7515 0.0269 0.0001 0.0853 0.3121
6% to 6.99% (Q:111;TM:4.16;LP:3.21;R:22.45)
7.6225 3.2888 201 0.3765 102.5941 6.3472 10.6960 0.4980 0.9490 0.0001 0.0919 0.4936
7% to 7.99% (Q:7;TM:5.82;LP:4.09;R:0)
0.2056 1.8033 150 2.5666 1.7079 4.1578 23.1526 2.6531 0 0 0 0
8% to 11.25% (Q:282;TM:3.68;LP:3.64;R:14.75)
7.7960 5.4460 254 0.3348 239.0517 3.7784 5.4276 0.3661 5.6970 0.0004 0.0464 0.2860
Cluster 3: Time to maturity (in brackets the average values forcoupon, outstanding quantity ( thou), listing period, and retail trading)
1.75 to 2.99 years (C:6.86;Q:57;LP:1.86;R:17.25)
4.2025 1.3538 110 0.5703 21.7057 5.9546 25.3666 2.5061 0.0261 0 0.0519 0.2489

3 to 4.99 years (C:7.11;Q:157;LP:3.01;R:21.90)
6.8660 3.224 177 0.7140 132.3295 5.8387 7.1769 0.5746 1.3659 0.0002 0.0275 0.2034
5 to 6.99 years (C:7.31;Q:115;LP:3.70;R:9.67)
3.9183 7.2867 419 2.1453 203.1914 3.6111 5.6840 0.9600 2.7876 0.0002 0.1055 0.4450
8.5 to 9.99 years (C:6.56;Q:65;LP:3.97;R:6.29)
2.6680 3.8040 244 1.5680 30.9187 5.7924 13.2843 1.3467 0.0058 0 0.0729 0.2414
10 to 16 years (C:6.55;Q:9;LP:3.65;R:0)
1.1500 5.2450 466 4.9377 21.5304 1.4820 4.8939 1.2950 0 0 0 0
Cluster 4: Listing period (in brackets the average values for coupon, outstanding quantity ( thou), time to maturity, and retail trading)
0.5 to 1.99 years (C:6.19;Q:68;TM:4.75;R:20.16)
4.0273 3.8045 266 1.3737 79.8564 5.2670 6.9813 1.2203 0.0251 0 0.0745 0.2970
2 to 2.99 years (C:6.61;Q:49;TM:4.09;R:10.65)
5.3417 3.1888 196 0.8196 39.1476 6.9638 31.1243 2.2794 0.2292 0.0001 0.0607 0.2567
3 to 4.99 years (C:7.61;Q:206;TM:3.83;R:16.96)
6.9157 4.1371 238 0.6319 136.9541 3.7997 6.0283 0.6388 1.7724 0.0002 0.0501 0.3304
5 to 5.5 years (C:7.81;Q:83;TM:8.17;R:6.01)
2.3814 3.7657 221 2.5481 120.2512 4.7569 11.3253 1.3295 2.3664 0.0001 0.0218 0.1117
Cluster 5: Retail (1 to 5 bond days (%) (in brackets the average values for coupon, outstanding quantity ( thou), time to maturity, and listing period)
0% (C:7.09;Q:23;TM:6.55;LP:3.25)
0.8285 3.0146 258 2.5493 8.6085 3.3627 18.0977 2.5047 0 0 0.0280 0.0929
1 to 1.99 % (C:5.92;Q:71;TM:5.03;LP:1.97)
5.9133 5.3533 327 1.2052 209.3819 3.6333 4.5867 0.6536 0.0128 0.0001 0.1079 0.3794
10 to 19.99% (C:8.55;Q:300;TM:4.11;LP:3.82)
9.4020 6.4720 315 0.2506 312.6361 4.1899 7.2525 0.4630 5.6552 0.0004 0.0828 0.4991
20 to 29.99% (C:6.63;Q:106;TM:5.41;LP:3.41)
5.5300 4.7900 220 0.6899 66.6427 8.3248 12.7994 0.5563 0.3753 0.0001 0.0809 0.3218
30 to 59.99% (C:5.96;Q:103;TM:2.58;LP:2.02)
7.6520 0.9480 60 0.1660 55.4585 8.4855 7.1449 0.2490 0.0864 0.0001 0.0362 0.2904
B: Results by clusters for the benchmark (B symbol) T-bonds traded at BVB
Act
ive
day
s (%
)
Val
ue
(mil
.RO
N)
Vo
lum
e p
er
trad
e
Tu
rnov
er r
atio
(TR
2)
Liq
uid
ity
rat
io
Am
ihu
d
mea
sure
Mar
tin
Mar
sh &
Ro
ck
Hu
i-H
eub
el r
atio
Dis
per
sio
n
Gam
ma
Ro
ll
All T-bonds 6.6271 4.6943 277 0.8662 138.0026 5.6652 7.6844 0.5815 1.4582 0.0001 0.0804 0.3763
Cluster 1: Outstanding quantity (in brackets the average values for coupon, time to maturity, listing period, and retail trading)
3,000 to 9,999 bonds - - - - - - - - - - - -
10,000 to 49,999 bonds (C:5.86; TM:6.33; LP:1.78; R:19.87)
5.5100 4.6875 335 2.8146 173.5567 6.3819 8.2943 0.5818 0.0530 0 0.0101 0.1005
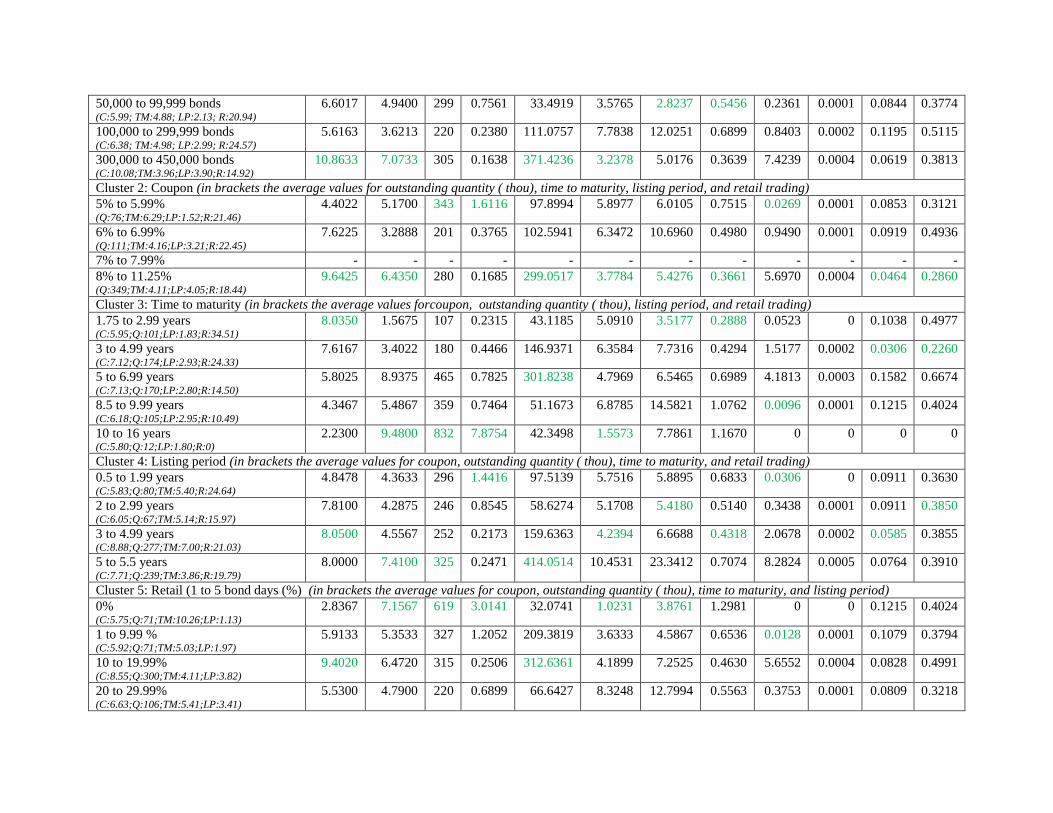
50,000 to 99,999 bonds (C:5.99; TM:4.88; LP:2.13; R:20.94)
6.6017 4.9400 299 0.7561 33.4919 3.5765 2.8237 0.5456 0.2361 0.0001 0.0844 0.3774
100,000 to 299,999 bonds (C:6.38; TM:4.98; LP:2.99; R:24.57)
5.6163 3.6213 220 0.2380 111.0757 7.7838 12.0251 0.6899 0.8403 0.0002 0.1195 0.5115
300,000 to 450,000 bonds (C:10.08;TM:3.96;LP:3.90;R:14.92)
10.8633 7.0733 305 0.1638 371.4236 3.2378 5.0176 0.3639 7.4239 0.0004 0.0619 0.3813
Cluster 2: Coupon (in brackets the average values for outstanding quantity ( thou), time to maturity, listing period, and retail trading)
5% to 5.99% (Q:76;TM:6.29;LP:1.52;R:21.46)
4.4022 5.1700 343 1.6116 97.8994 5.8977 6.0105 0.7515 0.0269 0.0001 0.0853 0.3121
6% to 6.99% (Q:111;TM:4.16;LP:3.21;R:22.45)
7.6225 3.2888 201 0.3765 102.5941 6.3472 10.6960 0.4980 0.9490 0.0001 0.0919 0.4936
7% to 7.99% - - - - - - - - - - - -
8% to 11.25% (Q:349;TM:4.11;LP:4.05;R:18.44)
9.6425 6.4350 280 0.1685 299.0517 3.7784 5.4276 0.3661 5.6970 0.0004 0.0464 0.2860
Cluster 3: Time to maturity (in brackets the average values forcoupon, outstanding quantity ( thou), listing period, and retail trading)
1.75 to 2.99 years (C:5.95;Q:101;LP:1.83;R:34.51)
8.0350 1.5675 107 0.2315 43.1185 5.0910 3.5177 0.2888 0.0523 0 0.1038 0.4977
3 to 4.99 years (C:7.12;Q:174;LP:2.93;R:24.33)
7.6167 3.4022 180 0.4466 146.9371 6.3584 7.7316 0.4294 1.5177 0.0002 0.0306 0.2260
5 to 6.99 years (C:7.13;Q:170;LP:2.80;R:14.50)
5.8025 8.9375 465 0.7825 301.8238 4.7969 6.5465 0.6989 4.1813 0.0003 0.1582 0.6674
8.5 to 9.99 years (C:6.18;Q:105;LP:2.95;R:10.49)
4.3467 5.4867 359 0.7464 51.1673 6.8785 14.5821 1.0762 0.0096 0.0001 0.1215 0.4024
10 to 16 years (C:5.80;Q:12;LP:1.80;R:0)
2.2300 9.4800 832 7.8754 42.3498 1.5573 7.7861 1.1670 0 0 0 0
Cluster 4: Listing period (in brackets the average values for coupon, outstanding quantity ( thou), time to maturity, and retail trading)
0.5 to 1.99 years (C:5.83;Q:80;TM:5.40;R:24.64)
4.8478 4.3633 296 1.4416 97.5139 5.7516 5.8895 0.6833 0.0306 0 0.0911 0.3630
2 to 2.99 years (C:6.05;Q:67;TM:5.14;R:15.97)
7.8100 4.2875 246 0.8545 58.6274 5.1708 5.4180 0.5140 0.3438 0.0001 0.0911 0.3850
3 to 4.99 years (C:8.88;Q:277;TM:7.00;R:21.03)
8.0500 4.5567 252 0.2173 159.6363 4.2394 6.6688 0.4318 2.0678 0.0002 0.0585 0.3855
5 to 5.5 years (C:7.71;Q:239;TM:3.86;R:19.79)
8.0000 7.4100 325 0.2471 414.0514 10.4531 23.3412 0.7074 8.2824 0.0005 0.0764 0.3910
Cluster 5: Retail (1 to 5 bond days (%) (in brackets the average values for coupon, outstanding quantity ( thou), time to maturity, and listing period)
0% (C:5.75;Q:71;TM:10.26;LP:1.13)
2.8367 7.1567 619 3.0141 32.0741 1.0231 3.8761 1.2981 0 0 0.1215 0.4024
1 to 9.99 % (C:5.92;Q:71;TM:5.03;LP:1.97)
5.9133 5.3533 327 1.2052 209.3819 3.6333 4.5867 0.6536 0.0128 0.0001 0.1079 0.3794
10 to 19.99% (C:8.55;Q:300;TM:4.11;LP:3.82)
9.4020 6.4720 315 0.2506 312.6361 4.1899 7.2525 0.4630 5.6552 0.0004 0.0828 0.4991
20 to 29.99% (C:6.63;Q:106;TM:5.41;LP:3.41)
5.5300 4.7900 220 0.6899 66.6427 8.3248 12.7994 0.5563 0.3753 0.0001 0.0809 0.3218

30 to 59.99% (C:5.96;Q:103;TM:2.58;LP:2.02)
7.6520 0.9480 60 0.1660 55.4585 8.4855 7.1449 0.2490 0.0864 0.0001 0.0362 0.2904
C: Results by clusters for the common (F symbol) T-bonds traded at BVB
Act
ive
day
s (%
)
Val
ue
(mil
.RO
N)
Vo
lum
e p
er
trad
e
Tu
rnov
er r
atio
(TR
2)
Liq
uid
ity
rat
io
Am
ihu
d
mea
sure
Mar
tin
Mar
sh &
Ro
ck
Hu
i-H
eub
el r
atio
Dis
per
sio
n
Gam
ma
Ro
ll
All T-bonds 0.2260 1.7720 150 2.4099 1.5688 4.0646 22.3642 2.8662 0 0 0 0
Cluster 1: Outstanding quantity (in brackets the average values for coupon, time to maturity, listing period, and retail trading)
3,000 to 9,999 bonds (C:7.21; TM:7.98; LP:5.14; R:0)
0.1260 1.3660 100 2.8925 0.6844 2.4615 5.9777 1.6728 0 0 0 0
10,000 to 49,999 bonds (C:7.79; TM:2.90; LP:2.62; R:0)
0.3260 2.1780 200 1.9273 2.4533 5.6678 38.7508 4.0605 0 0 0 0
50,000 to 99,999 bonds - - - - - - - - - - - -
100,000 to 299,999 bonds - - - - - - - - - - - -
300,000 to 450,000 bonds - - - - - - - - - - - -
Cluster 2: Coupon (in brackets the average values for outstanding quantity ( thou), time to maturity, listing period, and retail trading)
5% to 5.99% - - - - - - - - - - - -
6% to 6.99% - - - - - - - - - - - -
7% to 7.99% (Q:7;TM:5.82;LP:4.09;R:0)
0.2056 1.8033 150 2.5666 1.7079 4.1578 23.1526 2.6513 0 0 0 0
8% to 11.25% (Q:15;TM:1.96;LP:1.96;R:0)
0.4100 1.4900 150 1.0000 0.3176 3.2259 15.2688 4.8049 0 0 0 0
Cluster 3: Time to maturity (in brackets the average values forcoupon, outstanding quantity ( thou), listing period, and retail trading)
1.75 to 2.99 years (C:7.77;Q:13;LP:1.90;R:0)
0.3700 1.1400 112 0.9092 0.2930 6.8181 47.2155 4.7233 0 0 0 0
3 to 4.99 years (C:7.00;Q:5;LP:3.70;R:0)
0.1100 1.6200 156 3.1200 0.8608 1.1616 2.1854 1.8813 0 0 0 0
5 to 6.99 years (C:7.68;Q:7;LP:5.50;R:0)
0.1500 3.9850 325 4.8708 5.9267 1.2396 3.9590 1.4822 0 0 0 0
8.5 to 9.99 years (C:7.13;Q:4;LP:5.50;R:0)
0.1500 1.2800 73 2.8005 0.5457 4.1632 11.3377 1.7523 0 0 0 0
10 to 16 years (C:7.30;Q:5;LP:5.50;R:0)
0.0700 1.0100 100 2.0000 0.7109 1.4067 2.0016 1.4229 0 0 0 0
Cluster 4: Listing period (in brackets the average values for coupon, outstanding quantity ( thou), time to maturity, and retail trading)
0.5 to 1.99 years (C:7.80;Q:14;TM:1.79;R:0)
0.3350 1.2900 130 1.0683 0.3979 3.0863 11.8942 3.6366 0 0 0 0
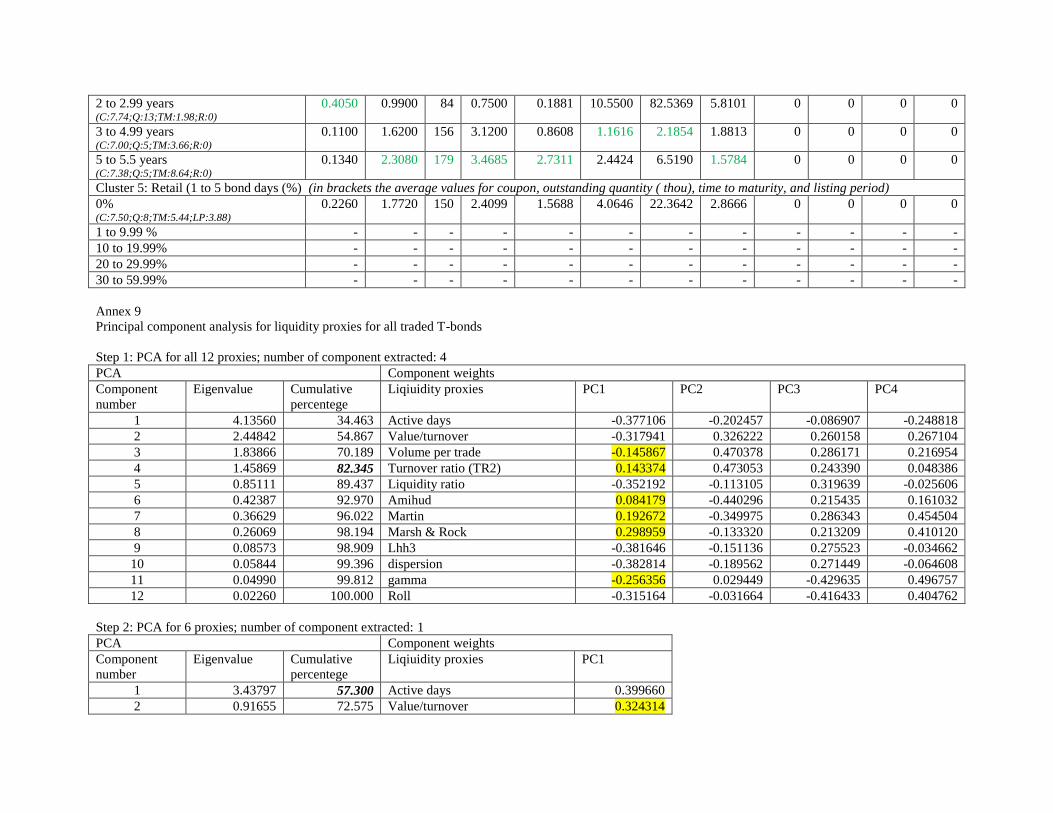
2 to 2.99 years (C:7.74;Q:13;TM:1.98;R:0)
0.4050 0.9900 84 0.7500 0.1881 10.5500 82.5369 5.8101 0 0 0 0
3 to 4.99 years (C:7.00;Q:5;TM:3.66;R:0)
0.1100 1.6200 156 3.1200 0.8608 1.1616 2.1854 1.8813 0 0 0 0
5 to 5.5 years (C:7.38;Q:5;TM:8.64;R:0)
0.1340 2.3080 179 3.4685 2.7311 2.4424 6.5190 1.5784 0 0 0 0
Cluster 5: Retail (1 to 5 bond days (%) (in brackets the average values for coupon, outstanding quantity ( thou), time to maturity, and listing period)
0% (C:7.50;Q:8;TM:5.44;LP:3.88)
0.2260 1.7720 150 2.4099 1.5688 4.0646 22.3642 2.8666 0 0 0 0
1 to 9.99 % - - - - - - - - - - - -
10 to 19.99% - - - - - - - - - - - -
20 to 29.99% - - - - - - - - - - - -
30 to 59.99% - - - - - - - - - - - -
Annex 9
Principal component analysis for liquidity proxies for all traded T-bonds
Step 1: PCA for all 12 proxies; number of component extracted: 4
PCA Component weights
Component
number
Eigenvalue Cumulative
percentege
Liqiuidity proxies PC1 PC2 PC3 PC4
1 4.13560 34.463 Active days -0.377106 -0.202457 -0.086907 -0.248818
2 2.44842 54.867 Value/turnover -0.317941 0.326222 0.260158 0.267104
3 1.83866 70.189 Volume per trade -0.145867 0.470378 0.286171 0.216954
4 1.45869 82.345 Turnover ratio (TR2) 0.143374 0.473053 0.243390 0.048386
5 0.85111 89.437 Liquidity ratio -0.352192 -0.113105 0.319639 -0.025606
6 0.42387 92.970 Amihud 0.084179 -0.440296 0.215435 0.161032
7 0.36629 96.022 Martin 0.192672 -0.349975 0.286343 0.454504
8 0.26069 98.194 Marsh & Rock 0.298959 -0.133320 0.213209 0.410120
9 0.08573 98.909 Lhh3 -0.381646 -0.151136 0.275523 -0.034662
10 0.05844 99.396 dispersion -0.382814 -0.189562 0.271449 -0.064608
11 0.04990 99.812 gamma -0.256356 0.029449 -0.429635 0.496757
12 0.02260 100.000 Roll -0.315164 -0.031664 -0.416433 0.404762
Step 2: PCA for 6 proxies; number of component extracted: 1
PCA Component weights
Component
number
Eigenvalue Cumulative
percentege
Liqiuidity proxies PC1
1 3.43797 57.300 Active days 0.399660
2 0.91655 72.575 Value/turnover 0.324314
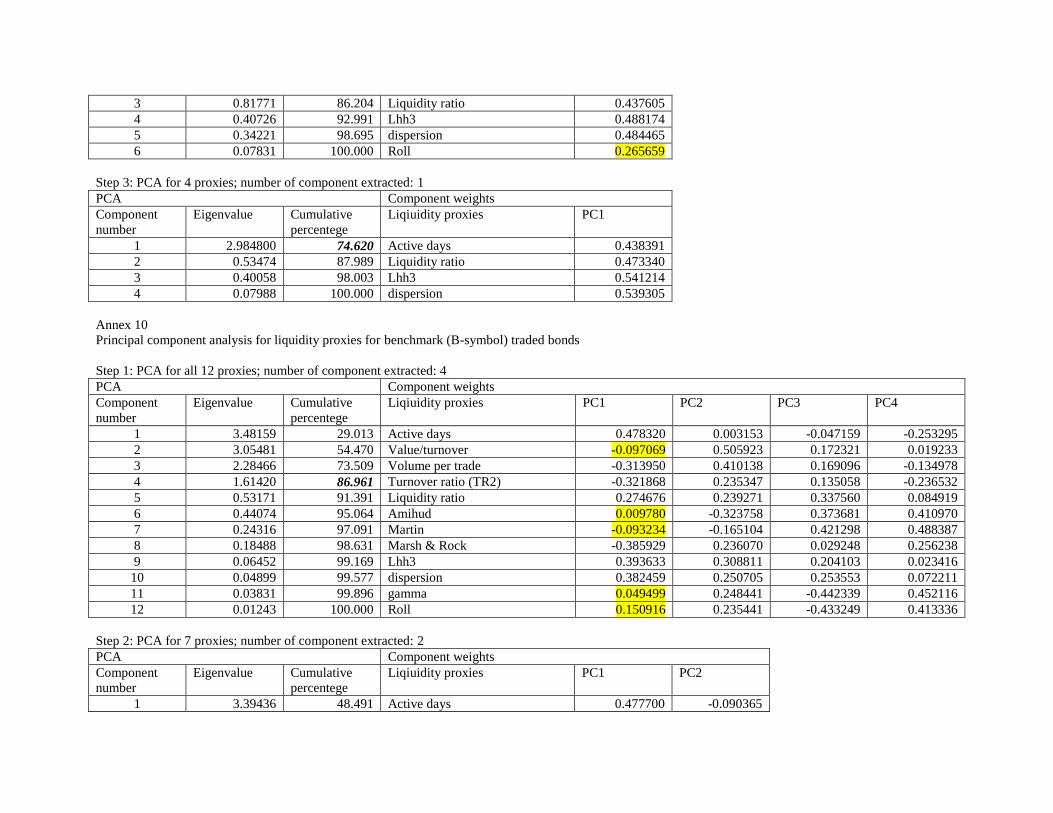
3 0.81771 86.204 Liquidity ratio 0.437605
4 0.40726 92.991 Lhh3 0.488174
5 0.34221 98.695 dispersion 0.484465
6 0.07831 100.000 Roll 0.265659
Step 3: PCA for 4 proxies; number of component extracted: 1
PCA Component weights
Component
number
Eigenvalue Cumulative
percentege
Liqiuidity proxies PC1
1 2.984800 74.620 Active days 0.438391
2 0.53474 87.989 Liquidity ratio 0.473340
3 0.40058 98.003 Lhh3 0.541214
4 0.07988 100.000 dispersion 0.539305
Annex 10
Principal component analysis for liquidity proxies for benchmark (B-symbol) traded bonds
Step 1: PCA for all 12 proxies; number of component extracted: 4
PCA Component weights
Component
number
Eigenvalue Cumulative
percentege
Liqiuidity proxies PC1 PC2 PC3 PC4
1 3.48159 29.013 Active days 0.478320 0.003153 -0.047159 -0.253295
2 3.05481 54.470 Value/turnover -0.097069 0.505923 0.172321 0.019233
3 2.28466 73.509 Volume per trade -0.313950 0.410138 0.169096 -0.134978
4 1.61420 86.961 Turnover ratio (TR2) -0.321868 0.235347 0.135058 -0.236532
5 0.53171 91.391 Liquidity ratio 0.274676 0.239271 0.337560 0.084919
6 0.44074 95.064 Amihud 0.009780 -0.323758 0.373681 0.410970
7 0.24316 97.091 Martin -0.093234 -0.165104 0.421298 0.488387
8 0.18488 98.631 Marsh & Rock -0.385929 0.236070 0.029248 0.256238
9 0.06452 99.169 Lhh3 0.393633 0.308811 0.204103 0.023416
10 0.04899 99.577 dispersion 0.382459 0.250705 0.253553 0.072211
11 0.03831 99.896 gamma 0.049499 0.248441 -0.442339 0.452116
12 0.01243 100.000 Roll 0.150916 0.235441 -0.433249 0.413336
Step 2: PCA for 7 proxies; number of component extracted: 2
PCA Component weights
Component
number
Eigenvalue Cumulative
percentege
Liqiuidity proxies PC1 PC2
1 3.39436 48.491 Active days 0.477700 -0.090365
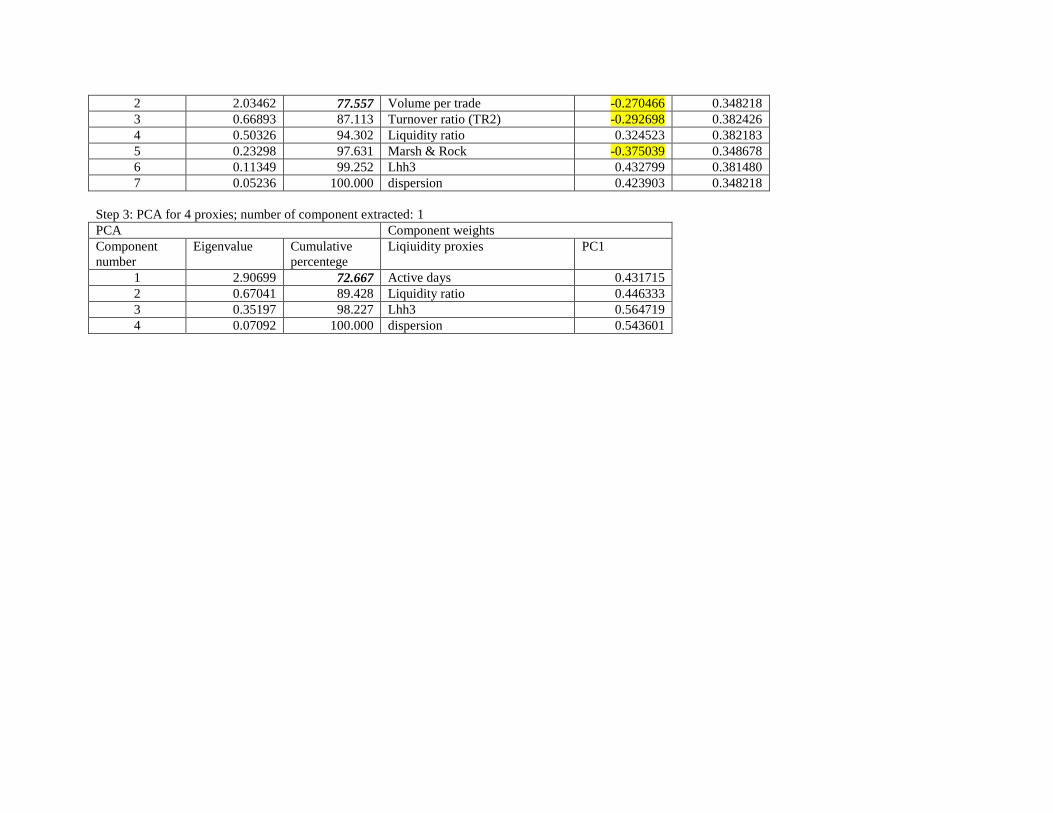
2 2.03462 77.557 Volume per trade -0.270466 0.348218
3 0.66893 87.113 Turnover ratio (TR2) -0.292698 0.382426
4 0.50326 94.302 Liquidity ratio 0.324523 0.382183
5 0.23298 97.631 Marsh & Rock -0.375039 0.348678
6 0.11349 99.252 Lhh3 0.432799 0.381480
7 0.05236 100.000 dispersion 0.423903 0.348218
Step 3: PCA for 4 proxies; number of component extracted: 1
PCA Component weights
Component
number
Eigenvalue Cumulative
percentege
Liqiuidity proxies PC1
1 2.90699 72.667 Active days 0.431715
2 0.67041 89.428 Liquidity ratio 0.446333
3 0.35197 98.227 Lhh3 0.564719
4 0.07092 100.000 dispersion 0.543601
Related Documents