Investigating intrinsic connectivity networks using simultaneous BOLD and CBF measurements S.D. Mayhew a, ⁎ ,1 , K.J. Mullinger a,b,1 , A.P. Bagshaw a , R. Bowtell b , S.T. Francis b a Birmingham University Imaging Centre (BUIC), School of Psychology, University of Birmingham, Birmingham, UK b Sir Peter Mansfield Magnetic Resonance Centre, School of Physics and Astronomy, University of Nottingham, Nottingham, UK abstract article info Article history: Accepted 14 May 2014 Available online 23 May 2014 When the sensory cortex is stimulated and directly receiving afferent input, modulations can also be observed in the activity of other brain regions comprising spatially distributed, yet intrinsically connected networks, suggest- ing that these networks support brain function during task performance. Such networks can exhibit subtle or un- predictable task responses which can pass undetected by conventional general linear modelling (GLM). Additionally, the metabolic demand of these networks in response to stimulation remains incompletely under- stood. Here, we recorded concurrent BOLD and CBF measurements during median nerve stimulation (MNS) and compared GLM analysis with independent component analysis (ICA) for identifying the spatial, temporal and metabolic properties of responses in the primary sensorimotor cortex (S1/M1), and in the default mode (DMN) and fronto-parietal (FPN) networks. Excellent spatial and temporal agreement was observed between the positive BOLD and CBF responses to MNS detected by GLM and ICA in contralateral S1/M1. Values of the change in cerebral metabolic rate of oxygen consumption (Δ%CMRO 2 ) and the Δ%CMRO 2 /Δ%CBF coupling ratio were highly comparable when using either GLM analysis or ICA to extract the contralateral S1/M1 responses, val- idating the use of ICA for estimating changes in CMRO 2 . ICA identified DMN and FPN network activity that was not detected by GLM analysis. Using ICA, spatially coincident increases/decreases in both BOLD and CBF signals to MNS were found in the FPN/DMN respectively. Calculation of CMRO 2 changes in these networks during MNS showed that the Δ%CMRO 2 /Δ%CBF ratio is comparable between the FPN and S1/M1 but is larger in the DMN than in the FPN, assuming an equal value of the parameter M in the DMN, FPN and S1/M1. This work sug- gests that metabolism-flow coupling may differ between these two fundamental brain networks, which could originate from differences between task-positive and task-negative fMRI responses, but might also be due to in- trinsic differences between the two networks. © 2014 The Authors. Published by Elsevier Inc. This is an open access article under the CC BY license (http://creativecommons.org/licenses/by/3.0/). Introduction A large body of literature has demonstrated that spontaneous, low frequency fluctuations in BOLD (blood oxygenation level dependent) functional magnetic resonance imaging (fMRI) signals are highly corre- lated between brain regions that share a common functional specializa- tion (Biswal et al., 1995; De Luca et al., 2006; Fox et al., 2005; Greicius et al., 2003; Lowe et al., 1998; Smith et al., 2009) (see (Cole, 2010; Van Dijk et al., 2009) for recent methodological reviews). The spatio- temporal coherence of BOLD signals is commonly called “functional connectivity” and is used to define intrinsic connectivity networks (ICNs) during both rest (Damoiseaux et al., 2006) and task-driven paradigms (Sadaghiani et al., 2010; Smith et al., 2009). The importance of brain network dynamics in supporting cognitive function is becoming increasingly apparent (Laird et al., 2011; Leech et al., 2011; Mennes et al., 2011; Menon and Uddin, 2010; Seeley et al., 2007; Spreng et al., 2010). BOLD fMRI provides a means to study how the cooperation of macroscale brain units gives rise to complex be- haviour. Furthermore, ICNs also provide a valuable opportunity to study how the functional architecture of the brain changes in disease pathol- ogy. In comparison with healthy controls, alterations in resting-state functional connectivity have been reported during normal ageing (Andrews-Hanna et al., 2007) and in a wide range of pathologies, including chronic pain (Baliki et al., 2008, 2011), depression (Veer et al., 2010), schizophrenia (Lynall et al., 2010), epilepsy (Bettus et al., 2009; Waites et al., 2006) and Alzheimer's disease (Agosta et al., 2012). The neuro-scientific information extracted in these studies has the potential to be clinically valuable in aiding diagnosis and monitoring the progression of neurological diseases. The default mode network (DMN) (Raichle et al., 2001) is the most widely studied ICN. The DMN is preferentially engaged during rest and NeuroImage 99 (2014) 111–121 ⁎ Corresponding author at: Birmingham University Imaging Centre (BUIC), School of Psychology, University of Birmingham, B15 2TT, UK. E-mail address: [email protected] (S.D. Mayhew). 1 These authors contributed equally to this work. http://dx.doi.org/10.1016/j.neuroimage.2014.05.042 1053-8119/© 2014 The Authors. Published by Elsevier Inc. This is an open access article under the CC BY license (http://creativecommons.org/licenses/by/3.0/). Contents lists available at ScienceDirect NeuroImage journal homepage: www.elsevier.com/locate/ynimg

Welcome message from author
This document is posted to help you gain knowledge. Please leave a comment to let me know what you think about it! Share it to your friends and learn new things together.
Transcript
NeuroImage 99 (2014) 111–121
Contents lists available at ScienceDirect
NeuroImage
j ourna l homepage: www.e lsev ie r .com/ locate /yn img
Investigating intrinsic connectivity networks using simultaneous BOLDand CBF measurements
S.D. Mayhew a,⁎,1, K.J. Mullinger a,b,1, A.P. Bagshaw a, R. Bowtell b, S.T. Francis b
a Birmingham University Imaging Centre (BUIC), School of Psychology, University of Birmingham, Birmingham, UKb Sir Peter Mansfield Magnetic Resonance Centre, School of Physics and Astronomy, University of Nottingham, Nottingham, UK
⁎ Corresponding author at: Birmingham University ImPsychology, University of Birmingham, B15 2TT, UK.
E-mail address: [email protected] (S.D. Mayhe1 These authors contributed equally to this work.
http://dx.doi.org/10.1016/j.neuroimage.2014.05.0421053-8119/© 2014 The Authors. Published by Elsevier Inc
a b s t r a c t
a r t i c l e i n f oArticle history:Accepted 14 May 2014Available online 23 May 2014
When the sensory cortex is stimulated and directly receiving afferent input, modulations can also be observed inthe activity of other brain regions comprising spatially distributed, yet intrinsically connected networks, suggest-ing that these networks support brain function during task performance. Such networks can exhibit subtle or un-predictable task responses which can pass undetected by conventional general linear modelling (GLM).Additionally, the metabolic demand of these networks in response to stimulation remains incompletely under-stood. Here, we recorded concurrent BOLD and CBF measurements during median nerve stimulation (MNS)and compared GLM analysis with independent component analysis (ICA) for identifying the spatial, temporaland metabolic properties of responses in the primary sensorimotor cortex (S1/M1), and in the default mode(DMN) and fronto-parietal (FPN) networks. Excellent spatial and temporal agreement was observed betweenthe positive BOLD and CBF responses to MNS detected by GLM and ICA in contralateral S1/M1. Values of thechange in cerebral metabolic rate of oxygen consumption (Δ%CMRO2) and the Δ%CMRO2/Δ%CBF coupling ratiowere highly comparablewhen using either GLM analysis or ICA to extract the contralateral S1/M1 responses, val-idating the use of ICA for estimating changes in CMRO2. ICA identified DMN and FPN network activity that wasnot detected by GLM analysis. Using ICA, spatially coincident increases/decreases in both BOLD and CBF signalsto MNS were found in the FPN/DMN respectively. Calculation of CMRO2 changes in these networks duringMNS showed that the Δ%CMRO2/Δ%CBF ratio is comparable between the FPN and S1/M1 but is larger in theDMN than in the FPN, assuming an equal value of the parameter M in the DMN, FPN and S1/M1. This work sug-gests that metabolism-flow coupling may differ between these two fundamental brain networks, which couldoriginate from differences between task-positive and task-negative fMRI responses, but might also be due to in-trinsic differences between the two networks.
© 2014 The Authors. Published by Elsevier Inc. This is an open access article under the CC BY license(http://creativecommons.org/licenses/by/3.0/).
Introduction
A large body of literature has demonstrated that spontaneous, lowfrequency fluctuations in BOLD (blood oxygenation level dependent)functional magnetic resonance imaging (fMRI) signals are highly corre-lated between brain regions that share a common functional specializa-tion (Biswal et al., 1995; De Luca et al., 2006; Fox et al., 2005; Greiciuset al., 2003; Lowe et al., 1998; Smith et al., 2009) (see (Cole, 2010;Van Dijk et al., 2009) for recent methodological reviews). The spatio-temporal coherence of BOLD signals is commonly called “functionalconnectivity” and is used to define intrinsic connectivity networks(ICNs) during both rest (Damoiseaux et al., 2006) and task-drivenparadigms (Sadaghiani et al., 2010; Smith et al., 2009).
aging Centre (BUIC), School of
w).
. This is an open access article under
The importance of brain network dynamics in supporting cognitivefunction is becoming increasingly apparent (Laird et al., 2011; Leechet al., 2011; Mennes et al., 2011; Menon and Uddin, 2010; Seeleyet al., 2007; Spreng et al., 2010). BOLD fMRI provides a means to studyhow the cooperation of macroscale brain units gives rise to complex be-haviour. Furthermore, ICNs also provide a valuable opportunity to studyhow the functional architecture of the brain changes in disease pathol-ogy. In comparison with healthy controls, alterations in resting-statefunctional connectivity have been reported during normal ageing(Andrews-Hanna et al., 2007) and in a wide range of pathologies,including chronic pain (Baliki et al., 2008, 2011), depression (Veeret al., 2010), schizophrenia (Lynall et al., 2010), epilepsy (Bettus et al.,2009; Waites et al., 2006) and Alzheimer's disease (Agosta et al.,2012). The neuro-scientific information extracted in these studies hasthe potential to be clinically valuable in aiding diagnosis andmonitoringthe progression of neurological diseases.
The default mode network (DMN) (Raichle et al., 2001) is the mostwidely studied ICN. The DMN is preferentially engaged during rest and
the CC BY license (http://creativecommons.org/licenses/by/3.0/).
112 S.D. Mayhew et al. / NeuroImage 99 (2014) 111–121
displays task-induced reductions in BOLD signal in response to the ma-jority of tasks (Hutchinson et al., 1999). These DMN deactivations arecommonly observed concurrently with increased BOLD signal in thetask-positive or fronto-parietal network (FPN) (Dosenbach et al.,2007; Fox et al., 2005; Spreng, 2012; Vincent et al., 2008). Although con-sistently identified during the resting-state (Damoiseaux et al., 2006)and widely implicated in task performance (Corbetta and Shulman,2002; Raichle and Snyder, 2007; Spreng and Schacter, 2012; Sprenget al., 2010), these ICNs are not robustly detected by conventional gen-eral linear model (GLM) analysis in all experimental paradigms. This ispossibly because the particular attentional demands and level of cogni-tive engagement (Pallesen et al., 2009) that characterises the putativefunction of the DMN and FPN can result in subtle responses that displaya high degree of trial-by-trial variability and/or non-canonical haemo-dynamic response shape. However, independent component analysis(ICA) allows coherent spatiotemporal patterns of brain activity to beresolved without a-priori assumptions concerning the timing or shapeof the haemodynamic response (McKeown et al., 1998). Obtaining abetter understanding of how the activity of the DMN and FPN supportsthe functional architecture of the brain requires more fundamentalcharacterization of the neurophysiological origins of ICN activity.
Evidence of a neuronal origin underlying ICN activity as defined byBOLD-sensitive fMRI is provided by patterns of coherent fluctuationsin neuronal activity during intra-cortical recordings in primates(Leopold and Logothetis, 2003; Scholvinck et al., 2010; Vincent et al.,2007) and also between regions of the DMN in human epilepsy (Jerbiet al., 2010; Miller et al., 2009). These findings have recently beencomplementedwith non-invasive studies of ICNs in humans usingmag-netoencephalography (MEG) (Brookes et al., 2011). Additionally, func-tional connectivity is localised to grey matter (De Luca et al., 2006)and often reflects the brain's structural connectivity (Greicius et al.,2009; van den Heuvel et al., 2009). Although MEG (Brookes et al.,2011) and positron-emission tomography (PET) (Raichle et al., 2001)have been used tomeasure ICN activity in humans, to-date themajorityof studies have used BOLD fMRI. Whilst an understanding of the neuro-nal origins and functional significance of ICN activity is being progres-sively established, the complex neurophysiological origin of the BOLDsignal means that changes in ICN BOLD activity should be carefullyinterpreted (Power et al., 2012; Van Dijk et al., 2012). Previouswork has improved the understanding of the effect of physiologicalvariability on BOLD signals (Birn, 2012; Wise et al., 2004). This issue isespecially important when comparing BOLD measurements of activitybetween healthy and ageing or diseased brains, where alterationsin neurovascular coupling are expected (D'Esposito et al., 2003;Kannurpatti et al., 2010). It is therefore imperative to obtain a more de-tailed understanding of the underlying neurophysiology and metabolicdemand of ICN activity as measured by BOLD fMRI.
A powerful, non-invasive approach for investigating the neuro-vascular coupling in ICNs is to concurrently record the BOLD signalwith arterial spin-labeling (ASL)MRI, whichmeasures the local cerebralblood flow (CBF) or perfusion (Detre et al., 1994). CBF measurementsprovide a method to probe brain physiology and, when combinedwith the BOLD signal, allow the estimation of the cerebral metabolicrate of oxygen consumption (CMRO2), a fundamental parameter ofthe energy supply supporting brain function. Coherent fluctuations inresting-state CBF measurements have already been reported betweenregions of the visual, motor, attention and default mode networkswith good spatial agreement with BOLD data (Chuang et al., 2008; DeLuca et al., 2006; Li et al., 2012; Liang et al., 2013; Viviani et al., 2011;Wu et al., 2009; Zou et al., 2009). Taken together, these studies indicatethat spontaneous fluctuations in the BOLD signal at rest likely originatefrom coupled changes in cerebral blood flow andmetabolismwhich re-flect changes in neuronal activity. However, although the relationshipbetween changes in BOLD, CBF and CMRO2 has been investigated inthe primary visual and sensorimotor cortical areas that are directly driv-en by afferent stimulus input (Ances et al., 2008; Chiarelli et al., 2007a;
Kastrup et al., 2002; Leontiev et al., 2007; Stefanovic et al., 2004), rela-tively few studies have investigated these relationships in ICNsbeyond these primary sensory regions (Liang et al., 2013; Lin et al.,2010). This is despite widespread evidence of the involvement of ICNsin supporting brain function and task performance (Laird et al., 2011;Meier et al., 2012; Mennes et al., 2011; Sadaghiani et al., 2010;Sala-Llonch et al., 2012).
In the present study, we used concurrent BOLD and CBF measure-ments to perform a detailed comparison of CMRO2 changes induced insensorimotor regions (S1/M1), DMN and FPN network activity duringmedian nerve stimulation (MNS), providing a more complete characteri-sation of the complex haemodynamic changes that accompany neural ac-tivity in these ICNs.We compare the ability of conventional GLM analysisand ICA to identify these ICNs in both the BOLD and CBF data. Further-more, we compare the spatial localisation and temporal correlation ofthe extracted responses to MNS between BOLD and CBF measurements,for each ICN. We validate the use of ICA timecourses to calculate thechange in CMRO2 induced byMNS, by comparisonwith S1/M1 responsescalculated using GLMmethods. Subsequently, we use ICA to compare thecoupling ratio between the percent signal change (Δ%) in CBF andCMRO2
in the DMN and FPN, and relate this to the Δ%CMRO2/Δ%CBF couplingratio in S1/M1 that is directly driven by afferent MNS input.
Materials and methods
Stimulation paradigm and data acquisition
Data were collected on 18 right-handed subjects (age 27 ± 3 years,8 female).Written, informed consentwas obtained from all participantsand this study was conducted with approval from the local ethics com-mittee. These data were acquired as part of an EEG-fMRI study, whichused different analysis methods to investigate the fMRI post-stimulusundershoot (Mullinger et al., 2013).
Stimulationwas applied to themedian nerve of the rightwrist usingsquare wave electrical pulses of 0.5 ms duration (Digitimer DS7A,Letchworth Garden City, UK). The stimulation current amplitude wasset just above the individual motor threshold (range 2.6–7 mA, mean4.6 ± 1 mA) so as to cause a small thumb distension. Individual blocksof stimulation consisted of 10 s of 2 HzMNS, followed by approximately20 s periods of passive rest. The onset of each period ofMNSwas jitteredby up to 500 ms to reduce the expectation of stimulus onset. A total of40 blocks were acquired in each subject.
A Philips Achieva 3 T MRI scanner (Philips Medical Systems, Best,Netherlands) with an 8-channel receive coil was used to acquire BOLDand ASL data. Cardiac and respiratory cycles were simultaneouslyrecorded using the scanner's vector cardiogram and respiratory belt.S1/M1 was localised during an initial experiment where BOLDdata (TE = 40 ms, 64 × 64 matrix, 3.25 × 3.25 mm2 resolution, flipangle = 85°, SENSE factor = 2, TR = 2 s, 20 slices of 5 mm thickness)were acquired during ten blocks of 2 Hz MNS. IViewBOLD (PhilipsGLM analysis software) was used to provide real time statistical mapsof the BOLD response to MNS in S1/M1. For the main simultaneousBOLD-ASL experiment, ten contiguous axial slices, providing approxi-mately half brain coverage,were centred on the localiser slice exhibitingpeak activation in contralateral S1/M1. A FAIR Double Acquisition Back-ground Suppression (DABS) sequence (Wesolowski et al., 2009) wasused for simultaneous acquisition of BOLD and ASL data (TE = 13 ms[ASL], 33 ms [BOLD], 2.65 × 2.65 × 5 mm3 voxels, 212 mm FOV, SENSEfactor = 2; TR = 2.6 s for each label or control acquisition, ASL labeldelay = 1400 ms, background suppression pulses at TBGS1/TBGS2 =340 ms/560 ms, scan duration ~ 21 min). To facilitate co-registrationand normalisation of functional data, a single EPI volume was acquiredwith the same geometry as the FAIR DABS imaging (TE = 40ms, flipangle = 85°, SENSE factor = 2, TR = 8 s), along with both local andwhole-head anatomical images, each at 1 mm isotropic spatialresolution.
113S.D. Mayhew et al. / NeuroImage 99 (2014) 111–121
Data pre-processing
The DABS dataset was separated into BOLD and ASL data for subse-quent analysis. Physiological noise associated with the cardiac and re-spiratory cycles were regressed out of the BOLD data usingRETROICOR (Glover et al., 2000), whereas the use of background sup-pression reduces physiological noise in the ASL data. All data werethen motion corrected using FLIRT (Jenkinson et al., 2002) (FSL, http://www.fmrib.ox.ac.uk/fsl/). Three subjects were excluded from furtheranalysis due to multiple, gross head movements (N3 mm). Data werethen interpolated (interp.m function in MATLAB) to an effective TR of2.6 s, taking account of the timing difference between the ASL andBOLD timecourses (1.2 s, TR-TI). Label-control image pairs of ASL datawere subtracted to create CBF images. The BOLD-weighted images ofeach label-control pair were averaged to produce mean BOLD-weighteddata. Further pre-processing was carried out in SPM8 (http://www.fil.ion.ucl.ac.uk/spm/). BOLD and CBF data were smoothed with a Gaussiankernel (5 mm FWHM) and then normalised to the MNI standard brainusing affine matrix transforms calculated from the BOLD data.
Functional data analyses were then performed to identify brain net-works where the BOLD and CBF signals were modulated by the MNS,first using a conventional univariate GLM to identify voxel-wise, linearcorrelations between the fMRI signal and the timings of the MNS;and secondly usingmultivariate ICA to identify coherent spatial patternsof signal fluctuations without a priori assumptions on the timing orshape of the haemodynamic response (HR).
Spatial localisation and response timecourse extraction: GLM
GLM analyses were performed using FEAT 5.98 (www.fmrib.ox.ac.uk/fsl/). At the first-level, individual subject's BOLD and CBF responsesto MNS were modelled using a constant-amplitude boxcar regressorof the stimulation timecourse convolved with the canonical double-gamma HRF. Second level, fixed-effects analyses were then performedto calculate group average activation maps for both positive and nega-tive contrasts. BOLD Z-statistic images were threshold using clustersdetermined by a Z N 2.3 and cluster-corrected significance thresholdof p b 0.05. Due to the intrinsically lower contrast-to-noise ratio(CNR) of ASL data, CBF Z-statistic imageswere less stringently thresholdat Z N 1.6, uncorrected. The group-level conjunction of significant posi-tive BOLD and CBF responses to MNS in S1/M1 was calculated and amask created. The group conjunction mask was then used to mask theindividual subject BOLD Z-statistic images and cubic (3 × 3 × 3 voxels)regions of interest (ROI) were centred on the peak voxel. To facilitatesubsequent comparison of BOLD and CBF responses, these ROIs wereused to extract the mean timecourses for both BOLD and CBF data, foreach subject. BOLD and CBF timecourses were epoched based on MNStimings to extract single block (0–30 s) responses. Responses werethen converted to percentage signal change relative to the mean ofthe final 6 s of the block (defined as baseline), and averaged acrossblocks. The peak BOLD signal change occurring in the first 20 s of theblock (the period of MNS-induced signal change) was then found. Themean BOLD response amplitude (Δ%BOLD) was calculated as the aver-age signal within a 2.6 s (1 TR period) window centred on this peak la-tency to take into account the interpolation. To allow for slightdifferences in time-to-peak of the BOLD and CBF signal, whilst ensuringthat the equivalent signal changewasmeasured, the peak signal changein themean CBF response within a timewindow of±TR from the time-to-peak of the BOLD response was identified. Finally, the mean CBF re-sponse amplitude (Δ%CBF) was calculated as the average signal withina 2.6 s window centred on the peak response latency.
Spatial localisation and response timecourse extraction: ICA
Separately, BOLD and CBF datasets were temporally concatenatedacross all subjects and MELODIC (Beckmann and Smith, 2004) used to
decompose the group data into 20 independent spatial maps and theirassociated time-courses. Dual-regression (Beckmann, 2009) was thenused to identify individual subject timecourses and spatial mapsfor each independent component (IC). Separately for BOLD and CBF, asingle component representing the stimulus response in contralateralS1/M1, as well as the DMN and FPN networks were found. The DMNand FPN were identified from the characteristic spatial pattern ofthese networks (DMN: precuneus/posterior cingulate (PCC), bilateralinferior parietal lobe (IPL) and medial prefrontal cortex (mPFC); FPN:bilateral intraparietal sulcus (IPS) and lateral prefrontal cortex (lPFC))(Damoiseaux et al., 2006; De Luca et al., 2006). The following analyseswere then performed for contralateral S1/M1, DMN and FPN. Firstly,to assess the spatial similarity of ICNs defined from BOLD and CBF mea-surements, ICmaps were threshold at a Z-statistic N 4 (BOLD) and Z N 2(CBF), and the conjunction between BOLD and CBF regions calculated atboth the group and individual level. Secondly, the correlation betweenthe BOLD and CBF time-series for each subject was calculated as a mea-sure of the temporal similarity between the two signals. As described forthe GLManalysis, for each subject both BOLD and CBF timecourses wereepoched to extract a single block (0–30 s) response. Responses werethen converted to percentage signal and averaged across blocks. Sepa-rately for each of the S1/M1, DMN and FPN ICA responses the maximalsignal change (whether positive or negative) occurring in the first 20 sof the average block-response, the time-period within which all signalchanges peaked on average, was calculated from the mean BOLD re-sponse timecourse (Δ%BOLD). The equivalent maximal signal changein the mean CBF response (Δ%CBF) within a time window of ±TRfrom the time-to-peak of the BOLD response was then found. Themean BOLD and CBF response amplitudes were then calculated as theaverage signal within a 2.6 s window centred on the latency of thesepeak responses.
A normalised measure of the single-trial amplitude variability ineach network was then obtained to allow comparison of the responsevariability across networks. This was done by calculating themaximum(S1/M1 and FPN) or minimum (DMN) single-trial amplitude of theBOLD response from each trial within a ±TR time window of themean peak BOLD response. For each subject, we calculated the ratio ofthe single-trial amplitude standard deviation to the peak signal changemeasured from themeanBOLD response timecourse, and averaged oversubjects. This metric expresses the proportional relationship betweenthe trial-by-trial variability and the magnitude of a subject's averageresponse.
CMRO2 estimation
The following methodology was applied to the S1/M1 timecoursesderived from the GLM analysis, and the S1/M1, DMN and FPNtimecourses derived from ICA. Themaximum signal change in the aver-age BOLD and CBF responses were input to the Davis model (Eq. (1))(Davis et al., 1998) to estimate the resultant change in CMRO2 relativeto baseline levels (CMRO2)0 for each subject:
CMRO2
CMRO2ð Þ0¼ 1−
ΔBOLDBOLD0
� �M
0@
1A
1β
CBFCBF0
� �1−α=β ð1Þ
where the subscript 0 denotes the parameter value for the baseline pe-riod; α (Grubb coefficient) was chosen to be 0.2, in line with recent MRliterature (Chen and Pike, 2010); and β, which reflects deoxy-haemoglobin concentration, was chosen to be 1.3 (Mark et al., 2011).M represents the maximum BOLD signal change, i.e. due to an increasein CBF, which causes complete oxygen saturation in venous vessels.M isdependent on field strength and TE (Chiarelli et al., 2007a) and is oftencalculated using a hypercapnic challenge (Gauthier et al., 2011). Sincea hypercapnic challenge was not performed in this study, a range ofM-values appropriate for grey matter was identified from the literature
114 S.D. Mayhew et al. / NeuroImage 99 (2014) 111–121
and normalised to the field strength (3 T) and TE (33 ms) used in thisstudy, resulting in M values ranging from 6% (Gauthier et al., 2011) to14.9% (Kastrup et al., 2002). The percentage change in CMRO2
(Δ%CMRO2) was calculated for each of these M values as well as forthe mean value of M (10.45%). The coupling ratio (n) of Δ%CMRO2/Δ%CBF was calculated for each of theseM values to ascertain the effectof variation in this parameter.
Results
In contralateral S1/M1, a significant increase in BOLD signal associat-ed with a spatially coincident increase in CBF was found in response toMNS in all subjects using both ICA and GLM analysis. However, only ICAidentified coherent spatial patterns of BOLD and CBF responses in theDMN and FPN, in addition to S1/M1. We first describe the spatio-temporal properties of BOLD and CBF responses in the S1/M1 network,and compare the Δ%CMRO2/Δ%CBF coupling calculated using the GLMand ICA methods of response localisation, before focusing upon theBOLD and CBF responses and Δ%CMRO2/Δ%CBF coupling in the DMNand FPN ICNs.
S1/M1: spatio-temporal correlation between BOLD and CBF response
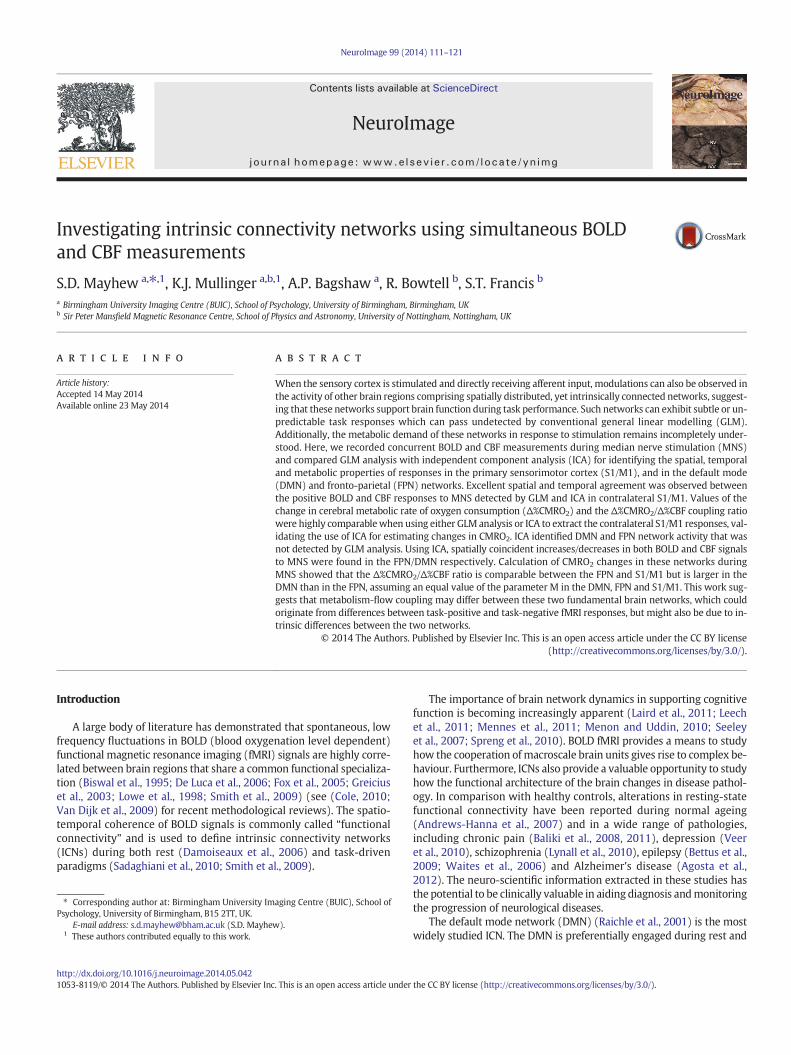
Conventional GLM analysis using a boxcar regressor of consistentamplitude stimulation identified significant positive BOLD and CBF re-sponses to MNS in the contralateral primary S1/M1 (Fig. 1A). Similarspatial patterns of both BOLD and CBF responses were identified in con-tralateral S1/M1 using ICA (Fig. 1B). A high degree of spatial similaritywas observed between the group-level regions of positive BOLD andCBF response in contralateral S1/M1 (Figs. 1A & B, green voxels) usingboth GLMand ICAmethods. A total of 1876 significant voxelswere com-mon between the BOLD-CBF conjunctions that were separately definedby GLM and ICA methods (Fig. 1C, purple). The location of the grouppeak voxels (MNI co-ordinates [x, y, z] mm) were: GLM BOLD = [−42,−24, 54], GLM CBF = [−42, −14, 48]; ICA BOLD = [−42, −22, 52];ICA CBF = [−42,−22, 50].
The temporal correlation between the entire BOLD and CBFtimecourses was significant (p b 0.05) in 14/15 subjects for both GLM(R range = 0.08–0.67, median = 0.42) and ICA (R range = 0.04–0.45,median = 0.36) methods (note that the non-significant subject wasdifferent between GLM and ICA analysis). The temporal profile of the
0 10 20 30-10
0
10
20
30
Time (s)
CB
F c
hang
e (%
)
0
0.2
0.4
0.6
BO
LD c
hang
e (%
)
0 10 20 30-10
0
10
20
30
Time (s)
CB
F c
hang
e (%
)
0
0.2
0.4
0.6
BO
LD c
hang
e (%
)
BOLD Z-stat 2.3
0
B
A
BOLD
CBF
BOLD
CBF
BOLD Z-stat
0
2.3
Fig. 1. Group Z-statistic maps and fMRI response timecourses of A) significant contralateralcomponent defined using temporal concatenation ICA, from BOLD (red) and CBF (blue) dataBOLD and CBF responses to MNS were observed in both GLM- and ICA-derived timecourses. Tof the mean over subjects. A high spatial overlap was observed between the BOLD–CBF conjun
primary phase of the response was comparable between GLM and ICAmethods, showing an increase in BOLD and CBF signals in all subjects,peaking 7–8 s post-stimulus onset (Figs. 1A & B). Group averagepeak response amplitudes were not significantly different betweenanalysis methods for either BOLD (GLM analysis 0.54 ± 0.16%, ICA0.47 ± 0.15%, p = 0.67), or CBF (GLM analysis 25 ± 10.1%, ICA 23 ±9.3%, p = 0.81).
S1/M1: CMRO2 estimation
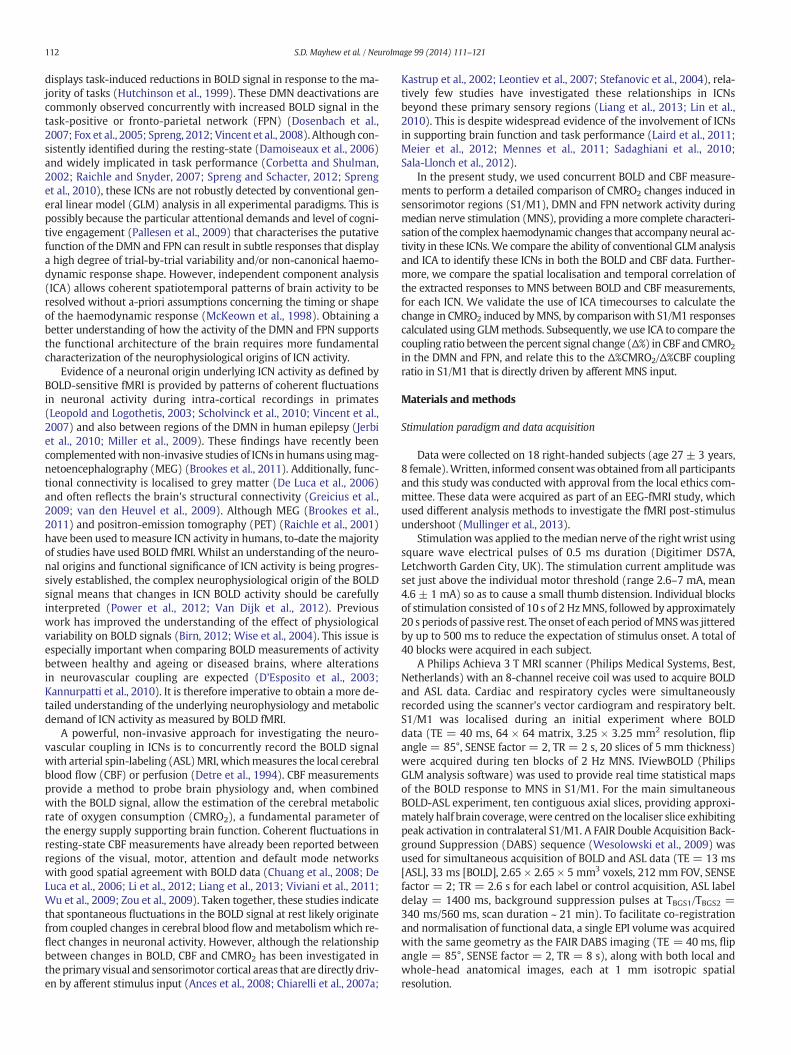
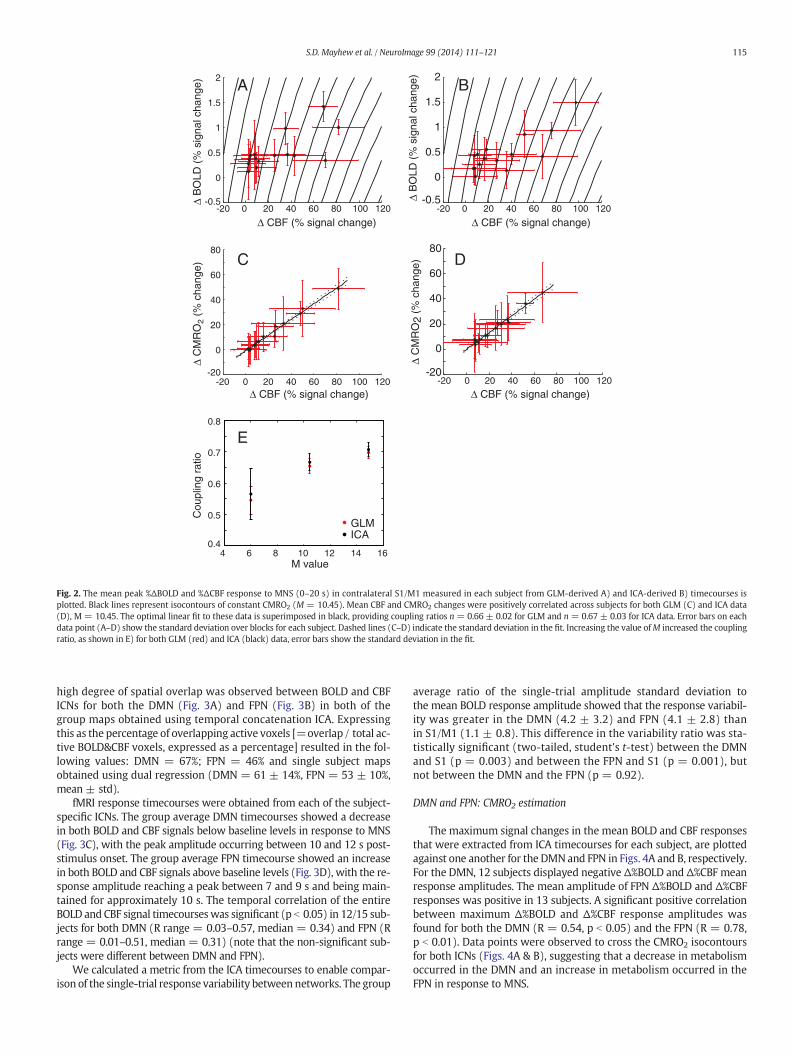
The maximum signal change in the mean BOLD and CBF responsetimecourses extracted from the GLM and ICA data are plotted foreach subject in Figs. 2A and B respectively. A significant positive correla-tion between maximum Δ%BOLD and Δ%CBF response amplitudeswas found using the GLM analysis (R = 0.89, p b 0.001) and ICA (R =0.82, p b 0.001). Data points were also observed to cross the CMRO2
isocontours (Figs. 2A & B) for both GLM and ICA data, indicating anincrease in metabolism due to MNS.
The linear fit between Δ%CBF and Δ%CMRO2 for GLM (n = 0.66 ±0.02) and ICA (n=0.67± 0.03) data are displayed in Figs. 2C and D re-spectively (M = 10.45). The effect of varying M upon the Δ%CMRO2/Δ%CBF coupling ratio (n) is shown in Fig. 2E. The values of n werefound to be highly comparable between the GLM and ICA methods.GLM and ICA values of nwerewithin error margins of each other acrossthe range of M values investigated.
These results demonstrate that ICA can localize and extract bothBOLD and CBF responses and allows the calculation of changes in oxy-gen metabolism to MNS which are equivalent to GLM methods. Wefurther used timecourses extracted from ICA to investigate the spatialand temporal similarity of BOLD and CBF responses in the DMN andFPN (not identified by the GLM) and compared the Δ%CMRO2/Δ%CBFcoupling ratios in these networks.
DMN and FPN: spatio-temporal correlations between BOLD and CBFresponses
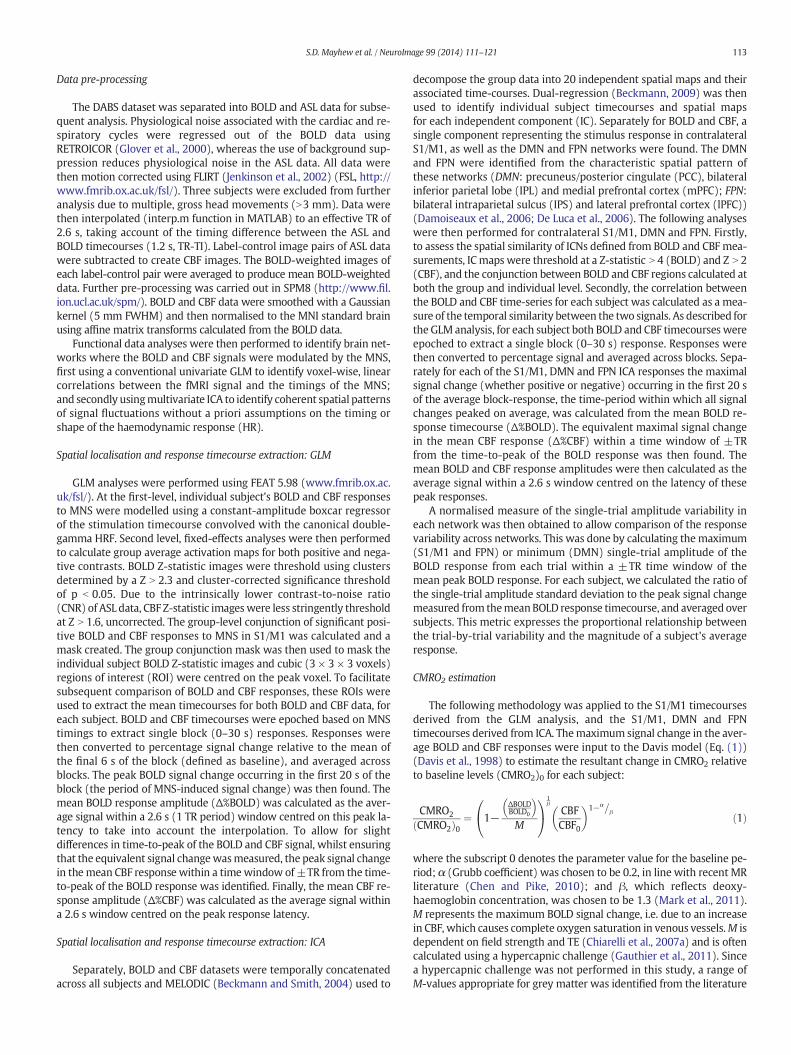
Conventional GLM analysis only identified small regions of positiveBOLD response toMNS in themost lateral regions of the IPS,with no sig-nificant BOLD or CBF correlations to MNS observed in DMN regions.However, coherent spatial patterns of BOLD and CBF signals in the DMNand FPN were clearly identified using ICA (Figs. 3A & B respectively). A
CBF Z-stat 12 1.6 8
Cy = -14mm
BOLD/CBF conjunction 1
GLM/ICA conjunction
z = 50mm
0 1 CBF Z-stat
BOLD/CBF conjunction 1
contra ipsi
contra ipsi
contra ipsi
12 1.6 8
S1/M1 responses to MNS defined using a fixed-effects GLM; B) the contralateral S1/M1. The conjunction of significant BOLD and CBF voxels is superimposed in green. Positivehe MNS period is indicated by the grey rectangle. Error bars represent the standard errorctions separately defined by GLM and ICA methods C).
-20 0 20 40 60 80 100 120-0.5
0
0.5
1
1.5
2
-20 0 20 40 60 80 100 120-0.5
0
0.5
1
1.5
2
-20 0 20 40 60 80 100 120-20
0
20
40
60
80
-20 0 20 40 60 80 100 120 -20
0
20
40
60
80
Δ CBF (% signal change)
Δ B
OLD
(%
sig
nal c
hang
e)
Δ CBF (% signal change)
Δ B
OLD
(%
sig
nal c
hang
e)
Δ C
MR
O2
(% c
hang
e)
Δ CBF (% signal change)
Δ C
MR
O2
(% c
hang
e)
Δ CBF (% signal change)
4 6 8 10 12 14 160.4
0.5
0.6
0.7
0.8
M value
Cou
plin
g ra
tio
A B
C D
E
GLMICA
Fig. 2. The mean peak %ΔBOLD and %ΔCBF response to MNS (0–20 s) in contralateral S1/M1 measured in each subject from GLM-derived A) and ICA-derived B) timecourses isplotted. Black lines represent isocontours of constant CMRO2 (M = 10.45). Mean CBF and CMRO2 changes were positively correlated across subjects for both GLM (C) and ICA data(D), M = 10.45. The optimal linear fit to these data is superimposed in black, providing coupling ratios n = 0.66 ± 0.02 for GLM and n = 0.67 ± 0.03 for ICA data. Error bars on eachdata point (A–D) show the standard deviation over blocks for each subject. Dashed lines (C–D) indicate the standard deviation in the fit. Increasing the value ofM increased the couplingratio, as shown in E) for both GLM (red) and ICA (black) data, error bars show the standard deviation in the fit.
115S.D. Mayhew et al. / NeuroImage 99 (2014) 111–121
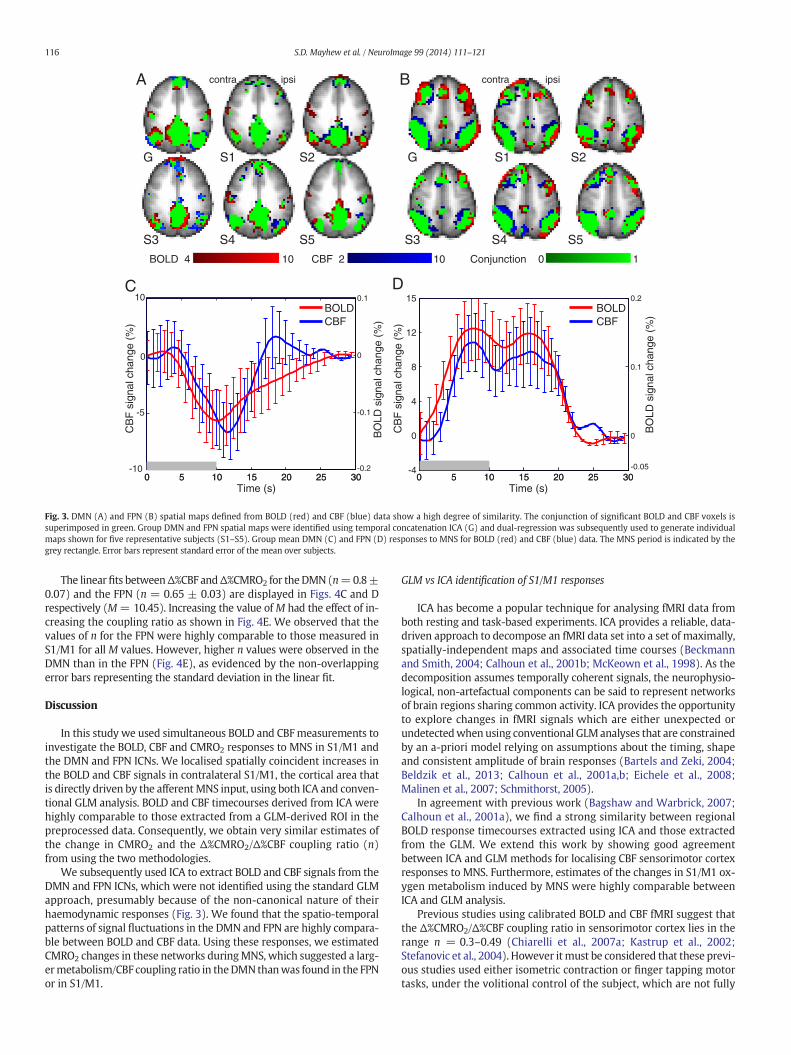
high degree of spatial overlap was observed between BOLD and CBFICNs for both the DMN (Fig. 3A) and FPN (Fig. 3B) in both of thegroup maps obtained using temporal concatenation ICA. Expressingthis as the percentage of overlapping active voxels [=overlap / total ac-tive BOLD&CBF voxels, expressed as a percentage] resulted in the fol-lowing values: DMN = 67%; FPN = 46% and single subject mapsobtained using dual regression (DMN = 61 ± 14%, FPN = 53 ± 10%,mean ± std).
fMRI response timecourses were obtained from each of the subject-specific ICNs. The group average DMN timecourses showed a decreasein both BOLD and CBF signals below baseline levels in response to MNS(Fig. 3C), with the peak amplitude occurring between 10 and 12 s post-stimulus onset. The group average FPN timecourse showed an increasein both BOLD and CBF signals above baseline levels (Fig. 3D), with the re-sponse amplitude reaching a peak between 7 and 9 s and being main-tained for approximately 10 s. The temporal correlation of the entireBOLD and CBF signal timecourseswas significant (p b 0.05) in 12/15 sub-jects for both DMN (R range = 0.03–0.57, median = 0.34) and FPN (Rrange = 0.01–0.51, median = 0.31) (note that the non-significant sub-jects were different between DMN and FPN).
We calculated a metric from the ICA timecourses to enable compar-ison of the single-trial response variability between networks. The group
average ratio of the single-trial amplitude standard deviation tothe mean BOLD response amplitude showed that the response variabil-ity was greater in the DMN (4.2 ± 3.2) and FPN (4.1 ± 2.8) thanin S1/M1 (1.1 ± 0.8). This difference in the variability ratio was sta-tistically significant (two-tailed, student's t-test) between the DMNand S1 (p = 0.003) and between the FPN and S1 (p = 0.001), butnot between the DMN and the FPN (p = 0.92).
DMN and FPN: CMRO2 estimation
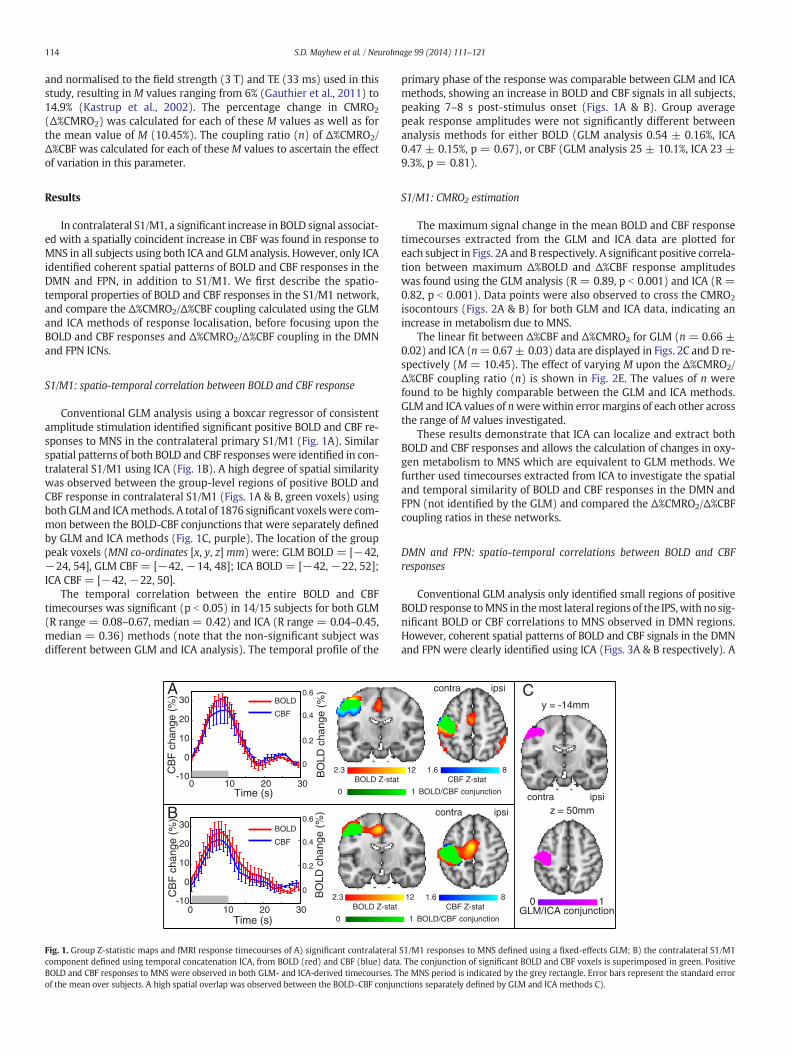
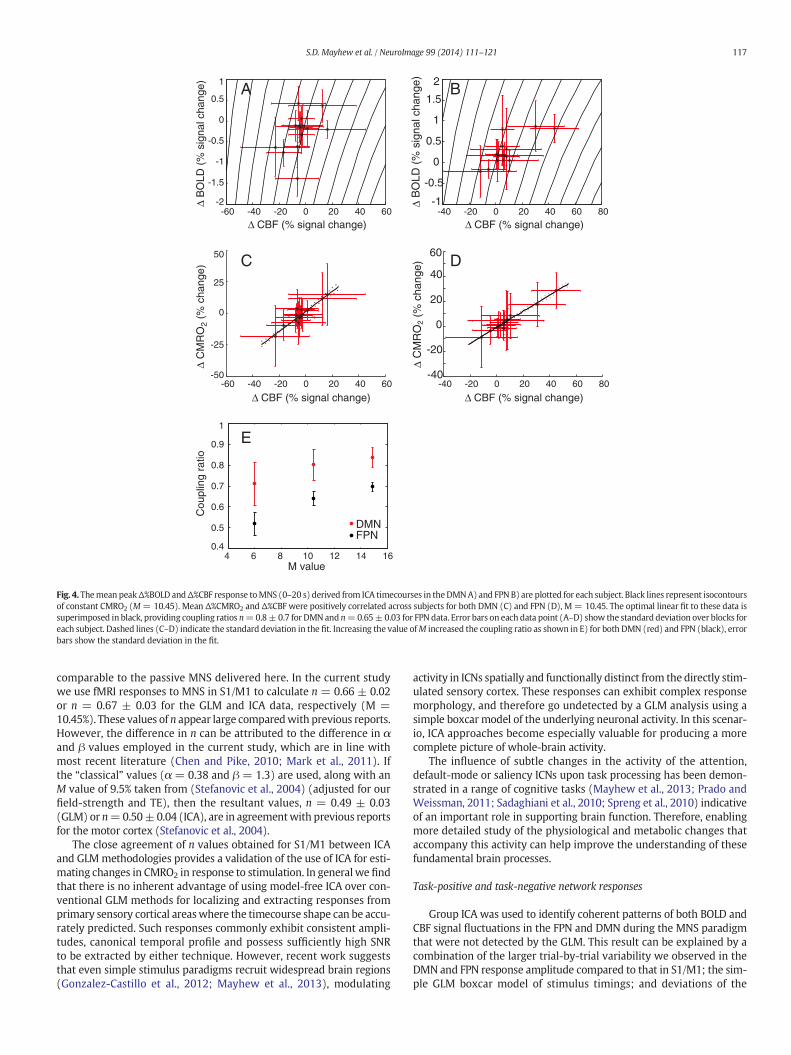
The maximum signal changes in the mean BOLD and CBF responsesthat were extracted from ICA timecourses for each subject, are plottedagainst one another for the DMNand FPN in Figs. 4A and B, respectively.For the DMN, 12 subjects displayed negative Δ%BOLD and Δ%CBF meanresponse amplitudes. The mean amplitude of FPN Δ%BOLD and Δ%CBFresponses was positive in 13 subjects. A significant positive correlationbetween maximum Δ%BOLD and Δ%CBF response amplitudes wasfound for both the DMN (R = 0.54, p b 0.05) and the FPN (R = 0.78,p b 0.01). Data points were observed to cross the CMRO2 isocontoursfor both ICNs (Figs. 4A & B), suggesting that a decrease in metabolismoccurred in the DMN and an increase in metabolism occurred in theFPN in response to MNS.
0 5 10 15 20 25 30-4
0
4
8
12
15
Time (s)0 5 10 15 20 25 30
-0.05
0
0.1
0.2
0 5 10 15 20 25 30-10
-5
0
10
Time (s)0 5 10 15 20 25 30
-0.2
-0.1
0
0.1
BOLD 4 10 CBF 2 10 Conjunction 0 1
G S1 S2
S3 S4 S5
A
G S1 S2
S3 S4 S5
B
CB
F s
igna
l cha
nge
(%)
BO
LD s
igna
l cha
nge
(%)
CB
F s
igna
l cha
nge
(%)
BO
LD s
igna
l cha
nge
(%)
BOLD CBF
BOLD CBF
C D
contra ipsi contra ipsi
Fig. 3. DMN (A) and FPN (B) spatial maps defined from BOLD (red) and CBF (blue) data show a high degree of similarity. The conjunction of significant BOLD and CBF voxels issuperimposed in green. Group DMN and FPN spatial maps were identified using temporal concatenation ICA (G) and dual-regression was subsequently used to generate individualmaps shown for five representative subjects (S1–S5). Group mean DMN (C) and FPN (D) responses to MNS for BOLD (red) and CBF (blue) data. The MNS period is indicated by thegrey rectangle. Error bars represent standard error of the mean over subjects.
116 S.D. Mayhew et al. / NeuroImage 99 (2014) 111–121
The linearfits betweenΔ%CBF andΔ%CMRO2 for the DMN (n=0.8±0.07) and the FPN (n = 0.65 ± 0.03) are displayed in Figs. 4C and Drespectively (M= 10.45). Increasing the value ofM had the effect of in-creasing the coupling ratio as shown in Fig. 4E. We observed that thevalues of n for the FPN were highly comparable to those measured inS1/M1 for all M values. However, higher n values were observed in theDMN than in the FPN (Fig. 4E), as evidenced by the non-overlappingerror bars representing the standard deviation in the linear fit.
Discussion
In this study we used simultaneous BOLD and CBFmeasurements toinvestigate the BOLD, CBF and CMRO2 responses to MNS in S1/M1 andthe DMN and FPN ICNs. We localised spatially coincident increases inthe BOLD and CBF signals in contralateral S1/M1, the cortical area thatis directly driven by the afferentMNS input, using both ICA and conven-tional GLM analysis. BOLD and CBF timecourses derived from ICA werehighly comparable to those extracted from a GLM-derived ROI in thepreprocessed data. Consequently, we obtain very similar estimates ofthe change in CMRO2 and the Δ%CMRO2/Δ%CBF coupling ratio (n)from using the two methodologies.
We subsequently used ICA to extract BOLD and CBF signals from theDMN and FPN ICNs, which were not identified using the standard GLMapproach, presumably because of the non-canonical nature of theirhaemodynamic responses (Fig. 3). We found that the spatio-temporalpatterns of signal fluctuations in the DMN and FPN are highly compara-ble between BOLD and CBF data. Using these responses, we estimatedCMRO2 changes in these networks duringMNS, which suggested a larg-ermetabolism/CBF coupling ratio in theDMN thanwas found in the FPNor in S1/M1.
GLM vs ICA identification of S1/M1 responses
ICA has become a popular technique for analysing fMRI data fromboth resting and task-based experiments. ICA provides a reliable, data-driven approach to decompose an fMRI data set into a set of maximally,spatially-independent maps and associated time courses (Beckmannand Smith, 2004; Calhoun et al., 2001b; McKeown et al., 1998). As thedecomposition assumes temporally coherent signals, the neurophysio-logical, non-artefactual components can be said to represent networksof brain regions sharing common activity. ICA provides the opportunityto explore changes in fMRI signals which are either unexpected orundetectedwhen using conventional GLManalyses that are constrainedby an a-priori model relying on assumptions about the timing, shapeand consistent amplitude of brain responses (Bartels and Zeki, 2004;Beldzik et al., 2013; Calhoun et al., 2001a,b; Eichele et al., 2008;Malinen et al., 2007; Schmithorst, 2005).
In agreement with previous work (Bagshaw and Warbrick, 2007;Calhoun et al., 2001a), we find a strong similarity between regionalBOLD response timecourses extracted using ICA and those extractedfrom the GLM. We extend this work by showing good agreementbetween ICA and GLM methods for localising CBF sensorimotor cortexresponses to MNS. Furthermore, estimates of the changes in S1/M1 ox-ygen metabolism induced by MNS were highly comparable betweenICA and GLM analysis.
Previous studies using calibrated BOLD and CBF fMRI suggest thatthe Δ%CMRO2/Δ%CBF coupling ratio in sensorimotor cortex lies in therange n = 0.3–0.49 (Chiarelli et al., 2007a; Kastrup et al., 2002;Stefanovic et al., 2004). However itmust be considered that these previ-ous studies used either isometric contraction or finger tapping motortasks, under the volitional control of the subject, which are not fully
Δ CBF (% signal change)
Δ B
OLD
(%
sig
nal c
hang
e)
Δ CBF (% signal change)
Δ B
OLD
(%
sig
nal c
hang
e)
Δ C
MR
O2
(% c
hang
e)
Δ CBF (% signal change)
Δ C
MR
O2
(% c
hang
e)
Δ CBF (% signal change)
Cou
plin
g ra
tio
E
-60 -40 -20 0 20 40 60-2
-1.5
-1
-0.5
0
0.5
1
-40 -20 0 20 40 60 80 -1
-0.5
0
0.5
1
1.5
2
-60 -40 -20 0 20 40 60-50
-25
0
25
50
-40 -20 0 20 40 60 80-40
-20
0
20
40
60
A B
C D
0.4
0.5
0.6
0.7
0.8
0.9
1
4 6 8 10 12 14 16M value
DMNFPN
Fig. 4. Themean peakΔ%BOLD andΔ%CBF response toMNS (0–20 s) derived from ICA timecourses in theDMNA) and FPN B) are plotted for each subject. Black lines represent isocontoursof constant CMRO2 (M= 10.45). Mean Δ%CMRO2 and Δ%CBF were positively correlated across subjects for both DMN (C) and FPN (D), M= 10.45. The optimal linear fit to these data issuperimposed in black, providing coupling ratios n=0.8±0.7 for DMN and n=0.65±0.03 for FPN data. Error bars on each data point (A–D) show the standard deviation over blocks foreach subject. Dashed lines (C–D) indicate the standard deviation in the fit. Increasing the value ofM increased the coupling ratio as shown in E) for both DMN (red) and FPN (black), errorbars show the standard deviation in the fit.
117S.D. Mayhew et al. / NeuroImage 99 (2014) 111–121
comparable to the passive MNS delivered here. In the current studywe use fMRI responses to MNS in S1/M1 to calculate n = 0.66 ± 0.02or n = 0.67 ± 0.03 for the GLM and ICA data, respectively (M =10.45%). These values of n appear large comparedwith previous reports.However, the difference in n can be attributed to the difference in αand β values employed in the current study, which are in line withmost recent literature (Chen and Pike, 2010; Mark et al., 2011). Ifthe “classical” values (α = 0.38 and β = 1.3) are used, along with anM value of 9.5% taken from (Stefanovic et al., 2004) (adjusted for ourfield-strength and TE), then the resultant values, n = 0.49 ± 0.03(GLM) or n=0.50±0.04 (ICA), are in agreementwith previous reportsfor the motor cortex (Stefanovic et al., 2004).
The close agreement of n values obtained for S1/M1 between ICAand GLMmethodologies provides a validation of the use of ICA for esti-mating changes in CMRO2 in response to stimulation. In general we findthat there is no inherent advantage of using model-free ICA over con-ventional GLM methods for localizing and extracting responses fromprimary sensory cortical areaswhere the timecourse shape can be accu-rately predicted. Such responses commonly exhibit consistent ampli-tudes, canonical temporal profile and possess sufficiently high SNRto be extracted by either technique. However, recent work suggeststhat even simple stimulus paradigms recruit widespread brain regions(Gonzalez-Castillo et al., 2012; Mayhew et al., 2013), modulating
activity in ICNs spatially and functionally distinct from the directly stim-ulated sensory cortex. These responses can exhibit complex responsemorphology, and therefore go undetected by a GLM analysis using asimple boxcar model of the underlying neuronal activity. In this scenar-io, ICA approaches become especially valuable for producing a morecomplete picture of whole-brain activity.
The influence of subtle changes in the activity of the attention,default-mode or saliency ICNs upon task processing has been demon-strated in a range of cognitive tasks (Mayhew et al., 2013; Prado andWeissman, 2011; Sadaghiani et al., 2010; Spreng et al., 2010) indicativeof an important role in supporting brain function. Therefore, enablingmore detailed study of the physiological and metabolic changes thataccompany this activity can help improve the understanding of thesefundamental brain processes.
Task-positive and task-negative network responses
Group ICA was used to identify coherent patterns of both BOLD andCBF signal fluctuations in the FPN and DMN during the MNS paradigmthat were not detected by the GLM. This result can be explained by acombination of the larger trial-by-trial variability we observed in theDMN and FPN response amplitude compared to that in S1/M1; the sim-ple GLM boxcar model of stimulus timings; and deviations of the
118 S.D. Mayhew et al. / NeuroImage 99 (2014) 111–121
response timecourse from the morphology of the canonical HR used inthe GLM analyses. The FPN fMRI responses display longer duration sig-nal increases (N20 s post stimulus cessation) whilst the time to peak(10–12 s) of the negative DMN responses are later than those typicallymodelled by the canonical HR. The deviations of the DMN and FPN fromcanonical responses illustrate the utility of ICA in identifying unpredict-able brain activity.
The amount of variability in the DMN and FPN responses is evidentfrom the error bars on the group mean timecourses (Fig. 3). Howeverit is clear that on average the FPN displays fMRI signal increases andthe DMN displays fMRI signal decreases in response to MNS, althoughthe average signal changes are smaller than those observed in S1/M1.These responses are consistent with the widely held description of theFPN and DMN as task-positive and task-negative networks respectively(Dosenbach et al., 2007; Gusnard et al., 2001; Hutchinson et al., 1999;Raichle et al., 2001), although it must be noted that this simplified con-ceptualisation does not hold in all experimental contexts (Spreng,2012).
CMRO2/CBF coupling in the DMN and FPN
This study advances understanding of themetabolism-flow couplingin two of the brain's fundamental networks, the DMN and FPN. Our re-sults strongly suggest that, for theMNS used here, theΔ%CMRO2/Δ%CBFcoupling ratio is larger in the DMN than in the FPN and S1/M1. Thesefindings are in contrast to a recent study which used an arithmetic cal-culation task to induce negative BOLD and CBF responses in DMN re-gions and reported that DMN n values were similar to those calculatedin the occipital cortex and inferior frontal gyrus (IFG) regions, whichresponded positively to the same task, for M values ranging between5.7 and 25% (Lin et al., 2010). Lin et al's upper estimate of n for thePCC node of the DMN was 0.62 ± 0.02 based on using M = 25%(Uludağ et al., 2004). This is very similar to their corresponding upperestimate of n=0.62±0.01 in the positively responding occipital cortexand IFG. However, the discrepancy between this study and the findingsdescribed here could arise from a number of experimental differences:1) Lin et al. used a 4 T scanner and the traditional value of α = 0.38(here we use 3 T and α = 0.2); 2) BOLD measures were obtainedfrom an ASL sequence with TE = 17 ms in Lin et al. (2010), comparedto our use of a DABS sequence optimised to measure concurrent BOLD(TE = 33 ms) and CBF (TE = 13 ms) signals; 3) the presence of higherphysiological noise in non-background suppressed ASL data; and 4) Linet al. also used a very different cognitively engaging task to inducestrong DMN deactivations, compared to our passive, sensory MNS task.
The difference in the n values that we observe in the FPN and DMNsuggests a difference in the Δ%CMRO2/Δ%CBF coupling that underliesthe responses in these brain regions. However, when interpreting dif-ferences in Δ%CMRO2/Δ%CBF coupling and comparing these results topreviouswork in sensory cortex, it is important to consider the sensitiv-ity of the Davis model to variations in the parameters α, β and M. Asfound with the Δ%CMRO2/Δ%CBF coupling in S1/M1, the calculatedvalues of n in the DMN and FPN are higher than previously reported.However, it is difficult to make comparisons between our DMN andFPN measures and previous studies as, to the authors' knowledge,only Lin et al. have calculated n outside of primary sensory cortex(Lin et al., 2010). The use of recently updated parameter values in thecurrent study can again partially account for this difference. Usingthe “classical” values of α = 0.38, β = 1.2 and M = 10.45% gave n =0.46 ± 0.04/0.65 ± 0.06 for the FPN/DMN, which is similar to/largerthan previous estimates in sensory cortex (Ances et al., 2008).
A difference between the coupling in the FPN and DMN wasobserved when using a range of α and β values (α = 0.15–0.45 andβ = 0.9–1.4), suggesting that the values of α and β employed in thisstudy are not the cause of the difference in nwhichwe observe betweenthe ICNs.We further tested the possibility that increased sensitivity toαand β in the task-negative DMN compared with the task-positive FPN
could result in an over-estimation of CMRO2 (Griffeth and Buxton,2011), and consequently n in the DMN. Equivalent n values forthe two ICNs were only obtained (n = 0.64) when using α = 0.2 andβ = 1.3 for the FPN and the combination of α = 0.3–0.42, β = 0.95–1.2 for the DMN. However no previous work supports the use of suchdivergent parameter values across brain regions.
The value ofM employed in the Davis model also affects calculationsof n (Chiarelli et al., 2007b). As hypercapnic calibration was not used tocalculate subject specific M-values in this study, it is not possible tocharacterise the coupling ratios in the FPN and DMN definitively. There-fore, in this study we investigated the effect on the coupling ratio ofusing a range of M values derived from the literature, scaled to ourfield strength and TE. Fig. 4E strongly suggests that if the same Mvalue can be used for both of these ICNs, then n is significantly largerfor the FPN compared to the DMN, regardless of the exact value of Memployed in theDavismodel.We also note that even if a physiologicallyunrealistic value M = 100% is used, n is still found to be higher in theDMN than in the FPN.
Since the PCC and the mPFC nodes of the DMN are deeper brainstructures with different composition and vasculature to that found inthe upper cortical IPS and lPFC regions of the FPN, it is possible thatthe maximum BOLD response, and hence M, could vary between thetwo ICNs. It is further possible that M could vary between the differentnodes of a single ICN that is comprised of widespread brain regions.However, the literature suggests the variability ofMwithin grey matteris small compared to that between subjects (Gauthier et al., 2011).Although the value ofM for the DMN and FPN has not been specificallycalculated in previous studies, parameters characterising cerebral phys-iology across the whole brain have been estimated in several recentcalibrated fMRI studies (Bulte et al., 2012; Gauthier and Hoge, 2012;Wise et al., 2013). These studies showed regional variability in M overthe cortex and the data is suggestive of a higher value ofM in the prima-ry DMN node of the PCC than other greymatter brain regions (GauthierandHoge, 2012;Wise et al., 2013). The oxygen extraction fraction (OEF)is thought to be consistent between brain regions (Wise et al., 2013),therefore the value ofM is closely influenced by the cerebral blood vol-ume (CBV). As the PCC is known to exhibit relatively high CBV (Ito et al.,2003), a larger value of M could be expected for the PCC. However,Fig. 4E clearly shows that increasing M has the effect of increasing thevalue of n. Using a larger M for the DMN compared to the FPN wouldconsequently cause a greater divergence of n across the two ICNs thanusing the same value of M.
To investigate the variability in coupling ratio between networksfurther, we analysed individual nodes of the DMN and FPN using themethods described above. For both BOLD and CBF group ICA data, theDMN component was manually divided into three ROIs (PCC, bilateralIPL and mPFC) and the FPN into bilateral IPS and bilateral lPFC ROIs.Dual regression was then used to extract BOLD and CBF responsetimecourses and Δ%CMRO2/Δ%CBF was calculated for each ROI. Wefound that n was largest in the PCC and IPL, however there was no sig-nificant difference in n between nodes in either network for the samevalue of M (Fig. S1 in Supplementary material).
In summary, we have not performed a hypercapnic/hyperoxiccalibration, which might enable a more definitive value of n withinthe two networks to be calculated. However, previous investigationsof the variation of M across the cortex indicate that the difference in nthat we observe between the FPN and DMN is consistent with a differ-ence in the CBF-metabolism coupling that underlies the responses inthese brain regions, and that the couplingwe report could be considereda lower limit given the effect of likely spatial variations in M.
The DMN has recently been shown to exhibit levels of resting-stateaerobic glycolysis (linear regression of glucose utilization onto oxygenconsumption) that are significantly higher than the brain average(Vaishnavi et al., 2010). Further work is required to elucidate whetherthis difference is also present during task-induced changes in DMN ac-tivity, but it may suggest that the DMN activity is supported by energy
119S.D. Mayhew et al. / NeuroImage 99 (2014) 111–121
supply mechanisms different to those of other cortical areas, which is inline with the findings presented here.
Origin of altered metabolism-blood flow coupling in the DMN
Previous studies have demonstrated that n is not an absolute, fixedquantity even within a cortical area and can vary with experimentalmanipulations such as caffeine administration (Griffeth et al., 2011),stimulus duration (Lin et al., 2009) and attention (Moradi et al., 2012).The effect of experimental context may be especially important to themodulation of activity in the FPN and DMN, as the extent to whichthese networks are recruited by a task will vary depending on the par-ticular experimental paradigm and its associated cognitive demands.For instance, the magnitude of DMN deactivation has been previouslylinked with the level of engagement in task performance (McKiernanet al., 2005; Pallesen et al., 2009; Singh and Fawcett, 2008) and FPN re-cruitment varies with attentional load (Adler et al., 2001; Lawrenceet al., 2003;Nebel et al., 2005). Furthermore, the occurrence of function-al interactions between the DMN and the FPN has been shown to pre-dict and support the performance of certain tasks (Fornito et al., 2012;Prado and Weissman, 2011). It remains to be established what conse-quences such co-operative signaling and related activity between thetwo ICNs have upon Δ%CMRO2/Δ%CBF coupling ratios.
A difference in n between grey matter in visual cortex and sub-cortical thalamic nuclei has previously been reported (Ances et al.,2008) despite similar reported M values in both regions. Therefore,our higher n value for the DMN could be explained by a larger propor-tion of the DMN comprising deep cortical grey matter compared withthe FPN. The coupling differences we observe between the two ICNssuggest a reduced responsiveness of CBF (compared with CMRO2) inthe DMN compared with the FPN, which may be due to differences invascular biomechanics or control by the sympathetic nervous system(Ances et al., 2008). Additionally, a recent study has shown that CBFin the PCC node of the DMN was larger than the other brain regions atrest (Pfefferbaum et al., 2011). Furthermore, although CBF levels inthis region decreased in response to a working-memory task, theyremained higher than in themajority of other cortical areas investigated(Pfefferbaum et al., 2011), suggesting that the perfusion characteristicsor neurovascular coupling of this region are perhaps not closely compa-rable to the rest of the brain.
Alternatively, an altered BOLDmechanismmay underlie CMRO2 var-iations in the task-negative DMN. The observation of similar couplingratios between S1/M1 and the FPN leads to the possibility that the originof the difference in n between the FPN and DMN is related to differencesin the underlying neurophysiological basis of the positive fMRI responseobserved in the FPN compared with the negative fMRI responsesobserved in the DMN. Recently we have shown, using these data, higherΔ%CMRO2/Δ%CBF coupling in task-negative, ipsilateral S1/M1 com-pared with the task-positive contralateral S1/M1 (Mullinger et al.,2014). Negative BOLD responses to stimulation have been widelyreported in sensory cortex as well as DMN areas and are thought to,at least partly, represent decreases in neural activity and metabo-lism (Kastrup et al., 2008; Schafer et al., 2012; Shmuel et al., 2006;Stefanovic et al., 2004). However, much still remains to be understoodabout the representation of inhibition in the BOLD signal, as recentwork has demonstrated that increased inhibitory neuronal activity canresult in a positive BOLD response (Enager et al., 2009; Pelled et al.,2009). Decreases in neuronal activity are known to arise throughmulti-plemechanisms involving different contributions of decreased excitato-ry input and increased activity of inhibitory neuronal populations(Attwell et al., 2010; Boorman et al., 2010; Buzsáki et al., 2007; Cauliet al., 2004; Lauritzen et al., 2012; Logothetis, 2008; Moraschi et al.,2012; Schubert et al., 2008). However, the recruitment of different clas-ses of neurons/neuronal–astrocyte interactions could result in differentmetabolic demands and different control of the vascular response(Lauritzen et al., 2012) between the negative BOLD regions of the
DMN compared with the positive BOLD regions of the FPN and S1/M1.This provides another plausible explanation for the difference incoupling ratios observed here and requires further investigation.
Conclusion
Our work demonstrates the importance of simultaneous BOLDand CBF measurements for relating coherent BOLD signal fluctuationsin ICNs to physiological variables, such as the Δ%CMRO2/Δ%CBF cou-pling. Our results suggest that the default mode network may exhibitmetabolism-flow coupling distinct frommany other brain regions. Fur-ther investigation of the source of the observed metabolic differencesbetween the DMN and FPN and S1/M1 cortical areas and extensioninto the study of other ICNs is important to improve understandingof the healthy brain's functional architecture and the significance ofchanges that occur in disease conditions.
Supplementary data to this article can be found online at http://dx.doi.org/10.1016/j.neuroimage.2014.05.042.
Acknowledgments
Wethank theMedical ResearchCouncil (MRC), Engineering andPhys-ical Science Research Council (EPSRC) and University of Nottingham forfunding this research. Grants: G0901321, EP/F023057/1, EP/J006823/1.KJM was supported by a University of NottinghamMansfield Fellowshipand AnneMcLaren Fellowship; SDMwas funded by an EPSRC Fellowship(EP/I022325/1) and a Birmingham Fellowship.
References
Adler, C.M., Sax, K.W., Holland, S.K., Schmithorst, V., Rosenberg, L., Strakowski, S.M., 2001.Changes in neuronal activation with increasing attention demand in healthy volun-teers: an fMRI study. Synapse 42, 266–272.
Agosta, F., Pievani, M., Geroldi, C., Copetti, M., Frisoni, G.B., Filippi, M., 2012. Resting statefMRI in Alzheimer's disease: beyond the default mode network. Neurobiol. Aging 33,1564–1578.
Ances, B.M., Leontiev, O., Perthen, J.E., Liang, C., Lansing, A.E., Buxton, R.B., 2008. Regionaldifferences in the coupling of cerebral blood flow and oxygen metabolism changes inresponse to activation: implications for BOLD-fMRI. Neuroimage 39, 1510–1521.
Andrews-Hanna, J.R., Snyder, A.Z., Vincent, J.L., Lustig, C., Head, D., Raichle, M.E., Buckner,R.L., 2007. Disruption of large-scale brain systems in advanced aging. Neuron 56,924–935.
Attwell, D., Buchan, A.M., Charpak, S., Lauritzen, M., Macvicar, B.A., Newman, E.A., 2010.Glial and neuronal control of brain blood flow. Nature 468, 232–243.
Bagshaw, A.P., Warbrick, T., 2007. Single trial variability of EEG and fMRI responses tovisual stimuli. Neuroimage 38, 280–292.
Baliki, M.N., Geha, P.Y., Apkarian, A.V., Chialvo, D.R., 2008. Beyond feeling: chronicpain hurts the brain, disrupting the default-mode network dynamics. J. Neurosci.28, 1398–1403.
Baliki, M.N., Baria, A.T., Apkarian, A.V., 2011. The cortical rhythms of chronic back pain.J. Neurosci. 31, 13981–13990.
Bartels, A., Zeki, S., 2004. The chronoarchitecture of the human brain—natural viewingconditions reveal a time-based anatomy of the brain. Neuroimage 22, 419–433.
Beckmann, C.F., 2009. Group comparison of resting-state fMRI data using multi-subjectICA and dual regression. Proc OHBM San Francisco.
Beckmann, C.F., Smith, S.M., 2004. Probabilistic independent component analysis for func-tional magnetic resonance imaging. IEEE Trans. Med. Imaging 23, 137–152.
Beldzik, E., Domagalik, A., Daselaar, S., Fafrowicz, M., Froncisz, W., Oginska, H., Marek, T.,2013. Contributive sources analysis: a measure of neural networks' contribution tobrain activations. Neuroimage 76, 304–312.
Bettus, G., Guedj, E., Joyeux, F., Confort-Gouny, S., Soulier, E., Laguitton, V., Cozzone, P.J.,Chauvel, P., Ranjeva, J.P., Bartolomei, F., Guye, M., 2009. Decreased basal fMRIfunctional connectivity in epileptogenic networks and contralateral compensatorymechanisms. Hum. Brain Mapp. 30, 1580–1591.
Birn, R.M., 2012. The role of physiological noise in resting-state functional connectivity.Neuroimage 62, 864–870.
Biswal, B., Yetkin, F.Z., Haughton, V.M., Hyde, J.S., 1995. Functional connectivity in themotor cortex of resting human brain using echo-planar MRI. Magn. Reson. Med. 34,537–541.
Boorman, L., Kennerley, A.J., Johnston, D., Jones, M., Zheng, Y., Redgrave, P., Berwick, J.,2010. Negative blood oxygen level dependence in the rat: a model for investigatingthe role of suppression in neurovascular coupling. J. Neurosci. 30, 4285–4294.
Brookes, M.J., Woolrich, M., Luckhoo, H., Price, D., Hale, J.R., Stephenson, M.C., Barnes, G.R.,Smith, S.M., Morris, P.G., 2011. Investigating the electrophysiological basis ofresting state networks using magnetoencephalography. Proc. Natl. Acad. Sci. 108,16783–16788.
120 S.D. Mayhew et al. / NeuroImage 99 (2014) 111–121
Bulte, D.P., Kelly, M., Germuska, M., Xie, J., Chappell, M.A., Okell, T.W., Bright, M.G., Jezzard,P., 2012. Quantitative measurement of cerebral physiology using respiratory-calibrated MRI. Neuroimage 60, 582–591.
Buzsáki, G., Kaila, K., Raichle, M., 2007. Inhibition and brain work. Neuron 56, 771–783.Calhoun, V.D., Adali, T., McGinty, V.B., Pekar, J.J., Watson, T.D., Pearlson, G.D., 2001a.
fMRI activation in a visual-perception task: network of areas detected usingthe general linear model and independent components analysis. Neuroimage14, 1080–1088.
Calhoun, V.D., Adali, T., Pearlson, G.D., Pekar, J.J., 2001b. A method for making group infer-ences from functional MRI data using independent component analysis. Hum. BrainMapp. 14, 140–151.
Cauli, B., Tong, X.K., Rancillac, A., Serluca, N., Lambolez, B., Rossier, J., Hamel, E., 2004. Cor-tical GABA interneurons in neurovascular coupling: relays for subcortical vasoactivepathways. J. Neurosci. 24, 8940–8949.
Chen, J.J., Pike, G.B., 2010. MRI measurement of the BOLD-specific flow–volume relation-ship during hypercapnia and hypocapnia in humans. Neuroimage 53, 383–391.
Chiarelli, P.A., Bulte, D.P., Gallichan, D., Piechnik, S.K., Wise, R., Jezzard, P., 2007a. Flow-metabolism coupling in human visual, motor, and supplementary motor areasassessed by magnetic resonance imaging. Magn. Reson. Med. 57, 538–547.
Chiarelli, P.A., Bulte, D.P., Piechnik, S.K., Jezzard, P., 2007b. Sources of systematicbias in hypercapnia-calibrated functional MRI estimation of oxygen metabolism.Neuroimage 34, 35–43.
Chuang, K.H., van Gelderen, P., Merkle, H., Bodurka, J., Ikonomidou, V.N., Koretsky, A.P.,Duyn, J.H., Talagala, S.L., 2008. Mapping resting-state functional connectivity usingperfusion MRI. Neuroimage 40, 1595–1605.
Cole, 2010. Advances and pitfalls in the analysis and interpretation of resting-state FMRIdata. Front. Syst. Neurosci. 4 (8), 1–15.
Corbetta, M., Shulman, G.L., 2002. Control of goal-directed and stimulus-driven attentionin the brain. Nat. Rev. Neurosci. 3, 201–215.
Damoiseaux, J.S., Rombouts, S.A., Barkhof, F., Scheltens, P., Stam, C.J., Smith, S.M.,Beckmann, C.F., 2006. Consistent resting-state networks across healthy subjects.Proc. Natl. Acad. Sci. U. S. A. 103, 13848–13853.
Davis, T.L., Kwong, K.K., Weisskoff, R.M., Rosen, B.R., 1998. Calibrated functional MRI:mapping the dynamics of oxidative metabolism. Proc. Natl. Acad. Sci. U. S. A. 95,1834–1839.
De Luca, M., Beckmann, C.F., De Stefano, N., Matthews, P.M., Smith, S.M., 2006. fMRI rest-ing state networks define distinct modes of long-distance interactions in the humanbrain. Neuroimage 29, 1359–1367.
D'Esposito, M., Deouell, L.Y., Gazzaley, A., 2003. Alterations in the BOLD fMRI signal withageing and disease: a challenge for neuroimaging. Nat. Rev. Neurosci. 4, 863–872.
Detre, J.A., Zhang, W., Roberts, D.A., Silva, A.C., Williams, D.S., Grandis, D.J., Koretsky, A.P.,Leigh, J.S., 1994. Tissue specific perfusion imaging using arterial spin labeling. NMRBiomed. 7, 75–82.
Dosenbach, N.U., Fair, D.A., Miezin, F.M., Cohen, A.L., Wenger, K.K., Dosenbach, R.A., Fox,M.D., Snyder, A.Z., Vincent, J.L., Raichle, M.E., Schlaggar, B.L., Petersen, S.E., 2007.Distinct brain networks for adaptive and stable task control in humans. Proc. Natl.Acad. Sci. U. S. A. 104, 11073–11078.
Eichele, T., Debener, S., Calhoun, V.D., Specht, K., Engel, A.K., Hugdahl, K., von Cramon, D.Y.,Ullsperger, M., 2008. Prediction of human errors by maladaptive changes in event-related brain networks. Proc. Natl. Acad. Sci. U. S. A. 105, 6173–6178.
Enager, P., Piilgaard, H., Offenhauser, N., Kocharyan, A., Fernandes, P., Hamel, E., Lauritzen,M., 2009. Pathway-specific variations in neurovascular and neurometabolic couplingin rat primary somatosensory cortex. J. Cereb. Blood Flow Metab. 29, 976–986.
Fornito, A., Harrison, B.J., Zalesky, A., Simons, J.S., 2012. Competitive and cooperative dy-namics of large-scale brain functional networks supporting recollection Proc NatlAcad Sci USA 109 (31), 12788-93.
Fox, M.D., Snyder, A.Z., Vincent, J.L., Corbetta, M., Van Essen, D.C., Raichle, M.E., 2005.The human brain is intrinsically organized into dynamic, anticorrelated functionalnetworks. Proc. Natl. Acad. Sci. U. S. A. 102, 9673–9678.
Gauthier, C.J., Hoge, R.D., 2012. Magnetic resonance imaging of resting OEF and CMRO(2)using a generalized calibration model for hypercapnia and hyperoxia. Neuroimage60, 1212–1225.
Gauthier, C.J., Madjar, C., Tancredi, F.B., Stefanovic, B., Hoge, R.D., 2011. Eliminationof visually evoked BOLD responses during carbogen inhalation: implications forcalibrated MRI. Neuroimage 54, 1001–1011.
Glover, G.H., Li, T.Q., Ress, D., 2000. Image-based method for retrospective correction ofphysiological motion effects in fMRI: RETROICOR. Magn. Reson. Med. 44, 162–167.
Gonzalez-Castillo, J., Saad, Z.S., Handwerker, D.A., Inati, S.J., Brenowitz, N., Bandettini, P.A.,2012. Whole-brain, time-locked activation with simple tasks revealed using massiveaveraging and model-free analysis. Proc. Natl. Acad. Sci. U. S. A. 109, 5487–5492.
Greicius, M.D., Krasnow, B., Reiss, A.L., Menon, V., 2003. Functional connectivity in theresting brain: a network analysis of the default mode hypothesis. Proc. Natl. Acad.Sci. U. S. A. 100, 253–258.
Greicius, M.D., Supekar, K., Menon, V., Dougherty, R.F., 2009. Resting-state functionalconnectivity reflects structural connectivity in the default mode network. Cereb.Cortex 19, 72–78.
Griffeth, V.E.M., Buxton, R.B., 2011. A theoretical framework for estimating cerebral oxy-gen metabolism changes using the calibrated-BOLD method: modeling the effectsof blood volume distribution, hematocrit, oxygen extraction fraction, and tissuesignal properties on the BOLD signal. Neuroimage 58, 198–212.
Griffeth, V.E.M., Perthen, J.E., Buxton, R.B., 2011. Prospects for quantitative fMRI:Investigating the effects of caffeine on baseline oxygen metabolism and the responseto a visual stimulus in humans. Neuroimage 57, 809–816.
Gusnard, D.A., Akbudak, E., Shulman, G.L., Raichle, M.E., 2001. Medial prefrontal cortexand self-referential mental activity: relation to a default mode of brain function.Proc. Natl. Acad. Sci. U. S. A. 98, 4259–4264.
Hutchinson, M., Schiffer, W., Joseffer, S., Liu, A., Schlosser, R., Dikshit, S., Goldberg, E.,Brodie, J.D., 1999. Task-specific deactivation patterns in functional magnetic reso-nance imaging. Magn. Reson. Imaging 17, 1427–1436.
Ito, H., Kanno, I., Takahashi, K., Ibaraki, M., Miura, S., 2003. Regional distribution of humancerebral vascular mean transit time measured by positron emission tomography.Neuroimage 19, 1163–1169.
Jenkinson, M., Bannister, P., Brady, M., Smith, S., 2002. Improved optimization for therobust and accurate linear registration and motion correction of brain images.Neuroimage 17, 825–841.
Jerbi, K., Vidal, J.R., Ossandon, T., Dalal, S.S., Jung, J., Hoffmann, D., Minotti, L., Bertrand, O.,Kahane, P., Lachaux, J.P., 2010. Exploring the electrophysiological correlates of thedefault-mode network with intracerebral EEG. Front. Syst. Neurosci. 4, 27.
Kannurpatti, S.S., Motes, M.A., Rypma, B., Biswal, B.B., 2010. Neural and vascularvariability and the fMRI-BOLD response in normal aging. Magn. Reson. Imaging28, 466–476.
Kastrup, A., Kruger, G., Neumann-Haefelin, T., Glover, G.H., Moseley, M.E., 2002. Changesof cerebral blood flow, oxygenation, and oxidative metabolism during gradedmotor activation. Neuroimage 15, 74–82.
Kastrup, A., Baudewig, J., Schnaudigel, S., Huonker, R., Becker, L., Sohns, J.M., Dechent, P.,Klingner, C., Witte, O.W., 2008. Behavioral correlates of negative BOLD signal changesin the primary somatosensory cortex. Neuroimage 41, 1364–1371.
Laird, A.R., Fox, P.M., Eickhoff, S.B., Turner, J.A., Ray, K.L., McKay, D.R., Glahn, D.C.,Beckmann, C.F., Smith, S.M., Fox, P.T., 2011. Behavioral interpretations of intrinsicconnectivity networks. J. Cogn. Neurosci. 23, 4022–4037.
Lauritzen, M., Mathiesen, C., Schaefer, K., Thomsen, K.J., 2012. Neuronal inhibition andexcitation and the dichotomic control of brain hemodynamic and oxygen responses.Neuroimage 62, 1040–1050.
Lawrence, N.S., Ross, T.J., Hoffmann, R., Garavan, H., Stein, E.A., 2003. Multiple neuronalnetworks mediate sustained attention. J. Cogn. Neurosci. 15, 1028–1038.
Leech, R., Kamourieh, S., Beckmann, C.F., Sharp, D.J., 2011. Fractionating the default modenetwork: distinct contributions of the ventral and dorsal posterior cingulate cortex tocognitive control. J. Neurosci. 31, 3217–3224.
Leontiev, O., Dubowitz, D.J., Buxton, R.B., 2007. CBF/CMRO2 coupling measured withcalibrated BOLD fMRI: sources of bias. Neuroimage 36, 1110–1122.
Leopold, D.A., Logothetis, N.K., 2003. Spatial patterns of spontaneous local field activity inthe monkey visual cortex. Rev. Neurosci. 14, 195–205.
Li, Z., Zhu, Y., Childress, A.R., Detre, J.A., Wang, Z., 2012. Relations between BOLD fMRI-derived resting brain activity and cerebral blood flow. PLoS One 7, e44556.
Liang, X., Zou, Q., He, Y., Yang, Y., 2013. Coupling of functional connectivity and regionalcerebral blood flow reveals a physiological basis for network hubs of the humanbrain. Proc. Natl. Acad. Sci. U. S. A. 110, 1929–1934.
Lin, A.L., Fox, P.T., Yang, Y., Lu, H., Tan, L.H., Gao, J.H., 2009. Time-dependent correlation ofcerebral blood flow with oxygen metabolism in activated human visual cortex asmeasured by fMRI. Neuroimage 44, 16–22.
Lin, P., Hasson, U., Jovicich, J., Robinson, S., 2010. A neuronal basis for task-negativeresponses in the human brain. Cereb. Cortex 21, 821–830.
Logothetis, N., 2008. What we can and what we cannot do with fMRI. Nature 453, 869.Lowe, M.J., Mock, B.J., Sorenson, J.A., 1998. Functional connectivity in single andmultislice
echoplanar imaging using resting-state fluctuations. Neuroimage 7, 119–132.Lynall, M.E., Bassett, D.S., Kerwin, R., McKenna, P.J., Kitzbichler, M., Muller, U., Bullmore, E.,
2010. Functional connectivity and brain networks in schizophrenia. J. Neurosci. 30,9477–9487.
Malinen, S., Hlushchuk, Y., Hari, R., 2007. Towards natural stimulation in fMRI—issues ofdata analysis. Neuroimage 35, 131–139.
Mark, C.I., Fisher, J.A., Pike, G.B., 2011. Improved fMRI calibration: precisely controlledhyperoxic versus hypercapnic stimuli. Neuroimage 54, 1102–1111.
Mayhew, S.D., Hylands-White, N., Porcaro, C., Derbyshire, S.W., Bagshaw, A.P., 2013.Intrinsic variability in the human response to pain is assembled from multiple,dynamic brain processes. Neuroimage 75C, 68–78.
McKeown,M.J., Makeig, S., Brown,G.G., Jung, T.P., Kindermann, S.S., Bell, A.J., Sejnowski, T.J.,1998. Analysis of fMRI data by blind separation into independent spatial components.Hum. Brain Mapp. 6, 160–188.
McKiernan, K.A., Kaufman, J.N., Kucera-Thompson, J., Binder, J.R., 2005. A parametric ma-nipulation of factors affecting task-induced deactivation in functional neuroimaging.Journal Cognitive Neuroscience 15 (3), 394–408.
Meier, T.B., Wildenberg, J.C., Liu, J., Chen, J., Calhoun, V.D., Biswal, B.B., Meyerand,M.E., Birn, R.M., Prabhakaran, V., 2012. Parallel ICA identifies sub-componentsof resting state networks that covary with behavioral indices. Front. Hum. Neurosci.6, 281.
Mennes, M., Zuo, X.-N., Kelly, C., Di Martino, A., Zang, Y.-F., Biswal, B., Castellanos, F.X.,Milham, M.P., 2011. Linking inter-individual differences in neural activation andbehavior to intrinsic brain dynamics. Neuroimage 54, 2950–2959.
Menon, V., Uddin, L.Q., 2010. Saliency, switching, attention and control: a network modelof insula function. Brain Struct. Funct. 214, 655–667.
Miller, K.J., Weaver, K.E., Ojemann, J.G., 2009. Direct electrophysiological measurement ofhuman default network areas. Proc. Natl. Acad. Sci. U. S. A. 106, 12174–12177.
Moradi, F., Buracas, G.T., Buxton, R.B., 2012. Attention strongly increases oxygenmetabolicresponse to stimulus in primary visual cortex. Neuroimage 59, 601–607.
Moraschi, M., DiNuzzo, M., Giove, F., 2012. On the origin of sustained negative BOLDresponse. J. Neurophysiol. 108, 2339–2342.
Mullinger, K.J., Mayhew, S.D., Bagshaw, A.P., Bowtell, R., Francis, S.T., 2013. Poststimulusundershoots in cerebral blood flow and BOLD fMRI responses are modulated by post-stimulus neuronal activity. Proc. Natl. Acad. Sci. U. S. A. 110, 13636–13641.
Mullinger, K.J., Mayhew, S.D., Bagshaw, A.P., Bowtell, R., Francis, S.T., 2014. Evidence thatthe negative BOLD response is neuronal in origin: a simultaneous EEG–BOLD–CBFstudy in humans. Neuroimage (94), 263–274.

121S.D. Mayhew et al. / NeuroImage 99 (2014) 111–121
Nebel, K., Wiese, H., Stude, P., de Greiff, A., Diener, H.C., Keidel, M., 2005. On the neuralbasis of focused and divided attention. Brain Res. Cogn. Brain Res. 25, 760–776.
Pallesen, K.J., Brattico, E., Bailey, C.J., Korvenoja, A., Gjedde, A., 2009. Cognitive andemotional modulation of brain default operation. J. Cogn. Neurosci. 21, 1065–1080.
Pelled, G., Bergstrom, D.A., Tierney, P.L., Conroy, R.S., Chuang, K.H., Yu, D., Leopold, D.A.,Walters, J.R., Koretsky, A.P., 2009. Ipsilateral cortical fMRI responses after peripheralnerve damage in rats reflect increased interneuron activity. Proc. Natl. Acad. Sci.U. S. A. 106, 14114–14119.
Pfefferbaum, A., Chanraud, S., Pitel, A.L., Muller-Oehring, E., Shankaranarayanan, A., Alsop,D.C., Rohlfing, T., Sullivan, E.V., 2011. Cerebral blood flow in posterior cortical nodesof the default mode network decreases with task engagement but remains higherthan in most brain regions. Cereb. Cortex 21, 233–244.
Power, J.D., Barnes, K.A., Snyder, A.Z., Schlaggar, B.L., Petersen, S.E., 2012. Spurious butsystematic correlations in functional connectivity MRI networks arise from subjectmotion. Neuroimage 59, 2142–2154.
Prado, J., Weissman, D.H., 2011. Heightened interactions between a key default-moderegion and a key task-positive region are linked to suboptimal current performancebut to enhanced future performance. Neuroimage 56, 2276–2282.
Raichle, M.E., Snyder, A.Z., 2007. A default mode of brain function: a brief history of anevolving idea. Neuroimage 37, 1083–1090 (discussion 1097–1089).
Raichle, M.E., MacLeod, A.M., Snyder, A.Z., Powers, W.J., Gusnard, D.A., Shulman, G.L.,2001. A default mode of brain function. Proc. Natl. Acad. Sci. U. S. A. 98, 676–682.
Sadaghiani, S., Scheeringa, R., Lehongre, K., Morillon, B., Giraud, A.L., Kleinschmidt, A.,2010. Intrinsic connectivity networks, alpha oscillations, and tonic alertness: a simul-taneous electroencephalography/functional magnetic resonance imaging study.J. Neurosci. 30, 10243–10250.
Sala-Llonch, R., Pena-Gomez, C., Arenaza-Urquijo, E.M., Vidal-Pineiro, D., Bargallo, N.,Junque, C., Bartres-Faz, D., 2012. Brain connectivity during resting state andsubsequent working memory task predicts behavioural performance. Cortex 48,1187–1196.
Schafer, K., Blankenburg, F., Kupers, R., Gruner, J.M., Law, I., Lauritzen, M., Larsson, H.B.,2012. Negative BOLD signal changes in ipsilateral primary somatosensory cortexare associated with perfusion decreases and behavioral evidence for functional inhi-bition. Neuroimage 59, 3119–3127.
Schmithorst, V.J., 2005. Separate cortical networks involved in music perception: prelim-inary functional MRI evidence for modularity of music processing. Neuroimage 25,444–451.
Scholvinck, M.L., Maier, A., Ye, F.Q., Duyn, J.H., Leopold, D.A., 2010. Neural basis of globalresting-state fMRI activity. Proc. Natl. Acad. Sci. U. S. A. 107, 10238–10243.
Schubert, R., Ritter, P., Wüstenberg, T., Preuschhof, C., Curio, G., Sommer, W., Villringer, A.,2008. Spatial attention related SEP amplitude modulations covary with BOLD signalin S1—a simultaneous EEG–fMRI study. Cereb. Cortex 18, 2686–2700.
Seeley, W.W., Menon, V., Schatzberg, A.F., Keller, J., Glover, G.H., Kenna, H., Reiss, A.L.,Greicius, M.D., 2007. Dissociable intrinsic connectivity networks for salience process-ing and executive control. J. Neurosci. 27, 2349–2356.
Shmuel, A., Augath, M., Oeltermann, A., Logothetis, N.K., 2006. Negative functional MRIresponse correlates with decreases in neuronal activity in monkey visual area V1.Nat. Neurosci. 9, 569–577.
Singh, K.D., Fawcett, I.P., 2008. Transient and linearly graded deactivation of the humandefault-mode network by a visual detection task. Neuroimage 41 (1), 100-12.
Smith, S.M., Fox, P.T., Miller, K.L., Glahn, D.C., Fox, P.M., Mackay, C.E., Filippini, N., Watkins,K.E., Toro, R., Laird, A.R., Beckmann, C.F., 2009. Correspondence of the brain's func-tional architecture during activation and rest. Proc. Natl. Acad. Sci. U. S. A. 106,13040–13045.
Spreng, R.N., 2012. The fallacy of a “task-negative” network. Front. Psychol. 3, 145.Spreng, R.N., Schacter, D.L., 2012. Default network modulation and large-scale network
interactivity in healthy young and old adults. Cereb. Cortex 22, 2610–2621.Spreng, R.N., Stevens, W.D., Chamberlain, J.P., Gilmore, A.W., Schacter, D.L., 2010.
Default network activity, coupled with the frontoparietal control network, supportsgoal-directed cognition. Neuroimage 53, 303–317.
Stefanovic, B., Warnking, J.M., Pike, G.B., 2004. Hemodynamic and metabolic responses toneuronal inhibition. Neuroimage 22, 771–778.
Uludağ, K., Dubowitz, D.J., Yoder, E.J., Restom, K., Liu, T.T., Buxton, R.B., 2004. Couplingof cerebral blood flow and oxygen consumption during physiological activation anddeactivation measured with fMRI. Neuroimage 23, 148–155.
Vaishnavi, S.N., Vlassenko, A.G., Rundle, M.M., Snyder, A.Z., Mintun, M.A., Raichle, M.E.,2010. Regional aerobic glycolysis in the human brain. Proc. Natl. Acad. Sci. U. S. A.107, 17757–17762.
van den Heuvel, M.P., Mandl, R.C., Kahn, R.S., Hulshoff Pol, H.E., 2009. Functionally linkedresting-state networks reflect the underlying structural connectivity architecture ofthe human brain. Hum. Brain Mapp. 30, 3127–3141.
Van Dijk, K.R.A., Hedden, T., Venkataraman, A., Evans, K.C., Lazar, S.W., Buckner, R.L., 2009.Intrinsic functional connectivity as a tool for human connectomics: theory, proper-ties, and optimization. J. Neurophysiol. 103, 297–321.
Van Dijk, K.R., Sabuncu, M.R., Buckner, R.L., 2012. The influence of head motion on intrin-sic functional connectivity MRI. Neuroimage 59, 431–438.
Veer, I.M., Beckmann, C.F., van Tol, M.J., Ferrarini, L., Milles, J., Veltman, D.J., Aleman, A.,van Buchem, M.A., van der Wee, N.J., Rombouts, S.A., 2010. Whole brain resting-state analysis reveals decreased functional connectivity in major depression. Front.Syst. Neurosci. 4.
Vincent, J.L., Patel, G.H., Fox, M.D., Snyder, A.Z., Baker, J.T., Van Essen, D.C., Zempel, J.M.,Snyder, L.H., Corbetta, M., Raichle, M.E., 2007. Intrinsic functional architecture in theanaesthetized monkey brain. Nature 447, 83–86.
Vincent, J.L., Kahn, I., Snyder, A.Z., Raichle, M.E., Buckner, R.L., 2008. Evidence for a fronto-parietal control system revealed by intrinsic functional connectivity. J. Neurophysiol.100, 3328–3342.
Viviani, R., Messina, I., Walter, M., 2011. Resting state functional connectivity in perfusionimaging: correlation maps with BOLD connectivity and resting state perfusion. PLoSOne 6, e27050.
Waites, A.B., Briellmann, R.S., Saling, M.M., Abbott, D.F., Jackson, G.D., 2006. Functionalconnectivity networks are disrupted in left temporal lobe epilepsy. Ann. Neurol. 59,335–343.
Wesolowski, R., Gowland, P.A., Francis, S.T., 2009. Double Acquisition BackgroundSuppressed (DABS) FAIR at 3 T and 7 T: advantages for simultaneous BOLD andCBF acquisition. Proceedings of ISMRM, p. 6132.
Wise, R.G., Ide, K., Poulin, M.J., Tracey, I., 2004. Resting fluctuations in arterial carbondioxide induce significant low frequency variations in BOLD signal. Neuroimage 21,1652–1664.
Wise, R.G., Harris, A.D., Stone, A.J., Murphy, K., 2013. Measurement of OEF and absoluteCMRO: MRI-based methods using interleaved and combined hypercapnia andhyperoxia. Neuroimage 83C, 135–147.
Wu, C.W., Gu, H., Lu, H., Stein, E.A., Chen, J.H., Yang, Y., 2009.Mapping functional connectivitybased on synchronized CMRO2 fluctuations during the resting state. Neuroimage 45,694–701.
Zou, Q., Wu, C.W., Stein, E.A., Zang, Y., Yang, Y., 2009. Static and dynamic characteristics ofcerebral blood flow during the resting state. Neuroimage 48, 515–524.
Related Documents