Investigating Consumer-Brand Relationships D I S S E R T A T I O N zur Erlangung des akademischen Grades doctor rerum politicarum (Doktor der Wirtschaftswissenschaft) eingereicht an der Wirtschaftswissenschaftlichen Fakultät der Humboldt-Universität zu Berlin von Diplom-Psychologe Matthias Maximilian Birk geboren am 14.07.1978 in München Präsident der Humboldt-Universität zu Berlin: Prof. Dr. Dr. h.c. Christoph Markschies Dekan der Wirtschaftswissenschaftlichen Fakultät: Prof. Oliver Günther, Ph.D. Gutachter: 1. Prof. Dr. Marcel Paulssen 2. Prof. Dr. Lutz Hildebrandt Tag des Kolloquiums: 21. 12. 2009

Welcome message from author
This document is posted to help you gain knowledge. Please leave a comment to let me know what you think about it! Share it to your friends and learn new things together.
Transcript
Investigating Consumer-Brand Relationships
D I S S E R T A T I O N
zur Erlangung des akademischen Grades
doctor rerum politicarum
(Doktor der Wirtschaftswissenschaft)
eingereicht an der
Wirtschaftswissenschaftlichen Fakultät
der Humboldt-Universität zu Berlin
von Diplom-Psychologe Matthias Maximilian Birk
geboren am 14.07.1978 in München
Präsident der Humboldt-Universität zu Berlin:
Prof. Dr. Dr. h.c. Christoph Markschies
Dekan der Wirtschaftswissenschaftlichen Fakultät:
Prof. Oliver Günther, Ph.D. Gutachter: 1. Prof. Dr. Marcel Paulssen 2. Prof. Dr. Lutz Hildebrandt Tag des Kolloquiums: 21. 12. 2009

ii
Acknowledgements
First of all, I would like to thank my advisor Prof. Dr. Marcel Paulssen for his supervision,
his support, guidance and motivation during the process of my dissertation as well as Prof.
Dr. Lutz Hildebrandt for his willingness to participate in my dissertation committee and
valuable suggestions, discussions and comments in his doctoral seminar.
Second, I would like to express my gratitude for the guidance and support of Prof. Gita Johar,
Ph.D. during my visiting scholarship at the Columbia Business School and over the further
course of my dissertation. In addition, I am thankful that Prof. Richard Bagozzi, Ph.D., Prof.
Dr. Björn Ivens, Prof. Jaideep Sengupta, Ph.D., and Prof. Dr. Sabine Einwiller gave me the
great pleasure and honor to work with and learn from them.
This dissertation has benefited greatly from the priceless advice of many: Prof. Dr. Christian
Schade provided valuable suggestions and recommendations in his doctoral seminar, as did
my visiting scholar colleagues at Columbia Business School, Prof. Dr. Martin Eisend and
Prof. Dr. Florian Stahl, as well as Rom Schrift and Liad Weiss. Several people have helped
me with data collection as well as the technical handling of the experiments; these were Eric
Hamerman, Nora Simon, Martin Wodnitzki, Jeff Parker, and Rom Schrift. Ronnie Sacco and
Shamik Chakraborty further provided research assistance for one of the articles in this
dissertation.
A NaFöG-Dissertation Scholarship by the Berlin Senate, a scholarship by the German
Academic Exchange Service (DAAD) and grants by the Columbia Business School enabled
this dissertation. Conference travels were generously supported by the Society for Economics
and Management at Humboldt University of Berlin. This support was the precondition for my
thesis and is greatly acknowledged.
Most of all, I am deeply in debt and grateful for the support of my family. I owe it all to
them. Thank you.

iii
Table of Contents
Acknowledgements………………………………………………………………………......ii Table of Contents.…………………………………………………………………………...iii List of Tables…………………………………………………………………………..........vii List of Figures…………………………………………………………………………........viii
1. Introduction.......................................................................................................................1
1.1. Brands as Relationship Partners ..............................................................................................................1
1.2. Entering Consumers’ Consideration Sets................................................................................................4 1.2.1. Consideration Sets................................................................................................................................5 1.2.2. Consideration Sets as Goal-Derived Categories...................................................................................7 1.2.3. The Relationship between Consideration Sets, Market Segments and Strategic Groups....................7 1.2.4. Contributions of Article 1 ....................................................................................................................9
1.3. Establishing Lasting Brand Relationships.............................................................................................10 1.3.1. Consumer Loyalty..............................................................................................................................11 1.3.2. Consumer Satisfaction .......................................................................................................................11 1.3.3. The Satisfaction-Loyalty Link ...........................................................................................................12 1.3.4. Contributions of Article 2 ..................................................................................................................13
1.4. Norms in Consumer-Brand Relationships.............................................................................................14 1.4.1. The Norm Concept.............................................................................................................................15 1.4.2. Relational Exchange Theory ..............................................................................................................17 1.4.3. Contributions of Article 3 ..................................................................................................................19
1.5. The Effect of Negative Information on Consumers’ Attitude Strength ..............................................20 1.5.1. Attitudes and Attitude Strength..........................................................................................................21 1.5.2. Dual Process Theories........................................................................................................................22 1.5.3. The Effect of Elaboration on Attitude Inconsistent Information on Attitude Strength ......................23 1.5.4. Contributions of Article 4 ..................................................................................................................24
1.6. How Companies Should React to Negative Brand Information .......................................................... 25 1.6.1. Brand Crises and their Effect on Brands ............................................................................................25 1.6.2. Truth of the Allegation.......................................................................................................................27 1.6.3. Severity of the Crisis..........................................................................................................................28 1.6.4. Consumers’ Commitment ..................................................................................................................29 1.6.5. Contributions of Article 5 ..................................................................................................................30
1.7. References.................................................................................................................................................31
2. Article 1: When Customers Think Differently: A Customer-Side Categorization Approach to Strategic Groups.......................................................................................57
2.1. Abstract ....................................................................................................................................................57
2.2. Introduction..............................................................................................................................................58
2.3. Goal-Derived Categorization ..................................................................................................................59 2.3.1. Brand Categorization and Market Structure.......................................................................................60
iv
2.4. Hypothesis Development .........................................................................................................................63
2.5. Method ......................................................................................................................................................66 2.5.1. Setting ................................................................................................................................................66 2.5.2. Data and Descriptives ........................................................................................................................67 2.5.3. Construct Operationalization..............................................................................................................67
2.6. Results.......................................................................................................................................................68 2.6.1. Latent Class Analysis with Brand Categorization..............................................................................69 2.6.2. Product Category Goals and Market Structure...................................................................................73
2.7. Discussion .................................................................................................................................................78
2.8. References.................................................................................................................................................82
2.9. Appendix...................................................................................................................................................89
3. Article 2: Satisfaction and Repurchase Behavior in a Business-to-Business Setting: Investigating the Moderating Effect of Manufacturer, Company and Demographic Characteristics ........................................................................................90
3.1. Abstract ....................................................................................................................................................90
3.2. Introduction..............................................................................................................................................91
3.3. Theoretical Background..........................................................................................................................92
3.4. Model Development .................................................................................................................................94 3.4.1. Satisfaction Threshold........................................................................................................................95 3.4.2. Response Bias ....................................................................................................................................98
3.5. Method .................................................................................................................................................... 102 3.5.1. Research Setting............................................................................................................................... 102 3.5.2. Data Collection ................................................................................................................................ 103 3.5.3. Sample Characteristics and Measures .............................................................................................. 104 3.5.4. Thresholds........................................................................................................................................ 108 3.5.5. Response Bias .................................................................................................................................. 113
3.6. Discussion ............................................................................................................................................... 116 3.6.1. Managerial Implications................................................................................................................... 117 3.6.2. Limitations and Future Research...................................................................................................... 118
3.7. References............................................................................................................................................... 121
4. Article 3: When Implicit Promises are Broken: The Role of Relational Norms in Consumers’ Reactions to Brand Transgressions .......................................................127
4.1. Abstract .................................................................................................................................................. 127
4.2. Introduction............................................................................................................................................ 127
4.3. Relational Exchange Theory................................................................................................................. 130
4.4. Discussion of the Applicability of RET to Consumer-Brand Relationships .................................... 131 4.4.1. What Norms Govern Consumer-Brand Relationships?....................................................................133 4.4.2. Norms’ Guiding Role in Consumers’ Reactions to Relationship Transgressions ............................137

v
4.5. Scale Development ................................................................................................................................. 142
4.6. Study Design........................................................................................................................................... 142
4.7. Results..................................................................................................................................................... 143 4.7.1. Measure Validation Procedure ......................................................................................................... 143 4.7.2. Test of Hypotheses........................................................................................................................... 145
4.8. Discussion ............................................................................................................................................... 151 4.8.1. Discussion of the Results ................................................................................................................. 151 4.8.2. Contributions of the Paper................................................................................................................ 151 4.8.3. Managerial Implications................................................................................................................... 153 4.8.4. Limitations and Directions for Future Research .............................................................................. 154
4.9. References............................................................................................................................................... 156
4.10. Appendix............................................................................................................................................... 168
5. Article 4: When Bad News Really Hurts – the Differential Effect of Message Elaboration in the Light of its Source .........................................................................171
5.1. Abstract .................................................................................................................................................. 171
5.2. Introduction............................................................................................................................................ 171
5.3. Theoretical Framework......................................................................................................................... 173 5.3.1. Source Credibility and Message Diagnosticity ................................................................................ 174 5.3.2. Differential Effects of Elaboration on Attitude Strength.................................................................. 176
5.4. Experiment 1: Weakening Effect of Elaboration on Attitude Strength............................................179 5.4.1. Design and Procedure of Study 1..................................................................................................... 180 5.4.2. Results of Study 1 ............................................................................................................................ 182 5.4.3. Discussion of Study 1....................................................................................................................... 183
5.5. Experiment 2: Strengthening Effect of Elaboration on Attitude Strength .......................................184 5.5.1. Design and Procedure of Study 2..................................................................................................... 184 5.5.2. Results of Study 2 ............................................................................................................................ 185 5.5.3. Discussion of Study 2....................................................................................................................... 187
5.6. General Discussion................................................................................................................................. 188
5.7. References............................................................................................................................................... 191
6. Article 5: Brand Recovery – Communication in the Face of Crisis .........................199
6.1. Abstract .................................................................................................................................................. 199
6.2. Introduction............................................................................................................................................ 199 6.2.1. Post-Crisis Communication.............................................................................................................. 200 6.2.2. Navigating the Crisis........................................................................................................................ 201 6.2.3. Customers’ Thoughts and Attribution.............................................................................................. 201 6.2.4. Is this True?...................................................................................................................................... 202 6.2.5. Who is Responsible? ........................................................................................................................ 202 6.2.6. Was it Intentional? ........................................................................................................................... 203 6.2.7. Will the Brand Do this Again?......................................................................................................... 204 6.2.8. What Does this Event Say about the Brand?.................................................................................... 204
vi
6.3. Communication Arsenal when the Transgression is Real .................................................................. 205 6.3.1. The ‘Come Clean’ Response............................................................................................................ 205 6.3.2. The ‘Polish the Halo’ Response ....................................................................................................... 206 6.3.3. The ‘Not Just Me’ Response ............................................................................................................ 207 6.3.4. The ‘Yes, But…’ Response.............................................................................................................. 207
6.4. Communication Arsenal when the Transgression is Not Real........................................................... 208 6.4.1. The ‘No, Not I’ Response ................................................................................................................ 208 6.4.2. The ‘Rebuttal’ Response .................................................................................................................. 209 6.4.3. The ‘Inoculation’ Response ............................................................................................................. 210 6.4.4. The ‘Attack the Accuser’ Response ................................................................................................. 211
6.5. Summary ................................................................................................................................................ 211
6.6. Exhibit 1: The Role of Customer Commitment................................................................................... 212
6.7. Brand Crises Examples ......................................................................................................................... 213 6.7.1. Example 1: Cremalita....................................................................................................................... 213 6.7.2. Example 2: Dell ............................................................................................................................... 216 6.7.3. Example 3: Jetblue Airways............................................................................................................. 218 6.7.4. Example 4: Pepsi.............................................................................................................................. 220 6.7.5. Example 5: Whole Foods ................................................................................................................. 223 6.7.6. Example 6: Mattel ............................................................................................................................ 225
vii
List of Tables
Table 2-1: Non-Bootstrapped Measures of Fit for the Latent Class Model ............................70 Table 2-2: Bootstrapped Measures of Fit for the Latent Class Model.....................................71 Table 2-3: Class Size and Class-Specific Probabilities for the Five-Class Model ..................71 Table 2-4: Results of Multiple Group Analysis.......................................................................74 Table 2-5: Estimated Coefficients and T-Values for the Product Category Goal Model........75 Table 2-6: Confirmatory Factor Analysis with Mean Structures.............................................76 Table 2-7: Factor Means for the Four Segments in the Product Category Goal Model ..........77 Table 2-8: Scale Validation for Benefits .................................................................................89 Table 2-9: Correlations (Below Diagonal), Chi-Square Difference Tests (Above Diagonal).89 Table 3-1: Sample Characteristics of the German CV-Market..............................................105 Table 3-2: Model Iterations German CV-Market ..................................................................107 Table 3-3: Satisfaction Thresholds ........................................................................................109 Table 3-4: Manufacturer-Specific Satisfaction Thresholds ...................................................111 Table 3-5: Response Bias Effects ..........................................................................................114 Table 3-6: Manufacturer-Specific Response Bias Effects .....................................................114 Table 3-7: Overview of Propositions and Findings ...............................................................116 Table 4-1: Correlations between Constructs..........................................................................145 Table 4-2: Effects of REL on Severity and Coping Strategies ..............................................147 Table 4-3: Effects of Severity on Coping Strategies .............................................................148 Table 4-4: Effects of Trust, Satisfaction and Recommendation Behavior on Coping Strategies
........................................................................................................................................150 Table 4-5: Constructs and Measures......................................................................................168 Table 5-1: Weakening Effect of Elaboration on Negative Brand Information......................182 Table 5-2: Weakening and Strengthening Effect of Elaboration on Negative Brand
Information ..........................................................................................................185
viii
List of Figures Figure 3-1: Differential Satisfaction Thresholds .....................................................................95 Figure 3-2: Differential Response Bias....................................................................................99 Figure 3-3: Differential Satisfaction Threshold of Length of Ownership .............................110 Figure 3-4: Differential Satisfaction Thresholds of Length of Ownership for Different
Manufacturers .....................................................................................................113 Figure 3-5: Differential Response Bias Effect of Age for Customers of Different
Manufacturers .....................................................................................................115 Figure 4-1: Proposed Model Structure...................................................................................140 Figure 4-2: Second-Order Factor Model for Relational Norms.............................................144 Figure 4-3: Tested Model Structure.......................................................................................146 Figure 4-4: Tested Model Structure with Trust, Satisfaction and Recommendation Behavior
........................................................................................................................................149 Figure 6-1: Comprehensive Crisis Communication Framework ...........................................213
1 Introduction
1
1. Introduction
1.1. Brands as Relationship Partners
Traditionally, a brand has been understood as “a name, term, sign, symbol or design, or a
combination of them which is intended to identify the goods and services of one seller or a
group of sellers and to differentiate them from those of competitors” (Kotler, 1997, p. 443).
With the advancement of brand research however, the ability of brands to serve as
relationship partners for consumers has become a focal point of research. Relationship
principles have virtually replaced short-term exchange notions in both marketing thought
(Webster, 1992) and practice (Peppers & Rogers, 1993) precipitating what has been
considered a paradigm shift in marketing research (Deighton, 1996): “A call for the
advancement of understanding consumer-firm relationships comes as customer satisfaction
and other traditional measures used for relationship evaluation such as trust, commitment,
and long term orientation do not seem to capture the fullness of the relationship notion”
(Walls, 2003, p. 7).
A key reason for the advancement of the relationship paradigm in consumer research is the
new, increasingly efficient ways that companies have of understanding and responding to
customers' needs and preferences, allowing them to build more meaningful connections with
consumers than ever before (Fournier, Dobscha, & Mick, 1998). In fact Deighton (1996) has
argued for a shift from broadcast marketing to interactive marketing. The term interactive
refers to two communication features: the ability to address an individual and the ability to
remember his response. That way the company can address the individual again, taking into
account his prior unique response, thus making an interactive communication between
company and customer possible. According to Deighton, mass marketing concepts and
practices are taking advantage of new ways to become more customized, more responsive to
the individual.
The idea that people form relationships with brands is not without controversy however.
Researchers have critically acknowledged that non-social judgments differ from social
judgments in several ways. For example Kardes (1986) found that the effect of an initial
judgment on subsequent judgments of a product differs from the extent of this effect on social
1 Introduction
2
judgments. In addition people often use the self as a frame of reference when judging other
people, but do not do so when judging nonsocial objects (Fiske & Taylor, 1991). Hence, is it
at all valid to conceptualize brands as relationship partners?
Relationships have traditionally been defined as sequences of interactions between parties
where the probable course of future interactions between them is significantly different from
that of strangers (Hinde, 1976). Based on that, Aggarwal (2004) argues that established
consumer interactions with brands could also be characterized as relationships because they
too can be seen as sequences of interactions that differ from mere singular transactions.
Concerning the question, when we can speak of a relationship, Macneil (1978) argues that
purely discrete transactions constitute a rare exception. He suggests a continuum ranging
from discrete transactions to relationships. According to him most transactions (including
purely commercial transactions) have a relational character. The idea of a relationship
continuum can also be found in Fournier’s (1998) work: she describes consumers’
relationships with brands as ranging from best friendships to forced marriages or flings.
Empirical support for the relationship metaphor can be found in studies showing that
consumers anthropomorphize brands as well as research showing that consumers bond with
brands in similar ways as they do with social relationship partners. On a very general level,
the human tendency to anthropomorphize inanimate objects has been identified as universal
to all societies (Brown, 1991). Theories of animism suggest a felt need of people to
anthropomorphize objects in order to facilitate interactions with the nonmaterial world
(Gilmore, 1919; McDougall, 1911; Nida & Smalley, 1959). In fact consumer research has
provided first evidence that consumers are able and willing to view brands as animate
objects: they consistently assign personality traits to brands (Aaker, 1997; Aaker, Fournier, &
Brasel, 2004) and engage in trait inferences similar to those used in personal interactions
(Johar, Sengupta, & Aaker, 2005) or think about brands as if they were human characters
(Levy, 1985; Plummer, 1985).
Recent research in marketing has adopted relationship specific concepts and successfully
applied them to the consumer-brand domain: Paulssen and Fournier (under review) applied
and extended attachment theory, which has produced a large body of evidence for explaining
individual differences in personal relationship behavior (see e.g., Ainsworth & Bowlby,
1991), to the marketing domain. They found that, similar to the interpersonal domain,
1 Introduction
3
consumers develop different attachment styles in relationships with their brands. Based on
their work they concluded that “although the existential reality of the commercial relationship
may never be proven, empirical results such as ours, which demonstrate that consumer-
brand/dealer engagements behave in an ‘as if’ fashion to personal relationships, provide
reasons to continue development of the relationship paradigm in consumer research”
(Paulssen & Fournier, under review). Furthermore, Aggarwal and colleagues (Aggarwal,
2004; Aggarwal & Law, 2005; Aggarwal & Zhang, 2006) have provided first indications that
norms may govern consumer-brand relationships and influence consumers’ acceptance of
certain marketing tactics, perceived as ‘brand behavior’.
However, by and large, research on consumer-brand relationships remains scarce: “The study
of relationships is increasingly important to marketing theory and practice, yet research on
consumer product and brand relationships has been limited” (Fournier & Brasel, 2002, p.
102). It is the aim of this dissertation to fill several important lacks in consumer-brand
relationship research, thereby advancing the field as a whole and providing further evidence
for the relationship metaphor in consumer research. This dissertation consists of five articles
concerned with different aspects of consumer-brand relationships. In the remainder of this
chapter the articles will be introduced and their relation to the broader topic of consumer-
brand relationships will be pointed out. Each of the following subsections will also go beyond
the articles and provide a wider introduction of the focal topics at hand. Article 1 looks at
what makes consumers consider a brand in the first place, the precondition for a brand to
establish a relationship with a consumer. Article 2 deals with sustaining consumer-
relationships and the role of satisfaction in retaining customers. Article 3 looks at whether
consumers stay with the brand in the case of a relationship problem, actively work to sustain
the relationship or silently let it deteriorate. It shows that relationship norms constitute an
important factor in how consumers react to such negative incidents in a relationship. Article 4
investigates the effect of negative brand information on consumers’ attitudes and article 5
develops communication strategies for companies to employ when negative brand incidents
occur.

1 Introduction
4
1.2. Entering Consumers’ Consideration Sets
“One of the most important roles played by brands … is their effect on consumer brand
choice and consideration” (Erdem & Swait, 2004, p. 191). Entering a consumer’s
consideration set is the condition sine qua non for establishing a relationship. However,
whether consumers consider a brand ultimately depends on their perceptions of the brand and
whether they think that the brand is able to satisfy their relevant purchase goals:
“What matters in the construction of brand relationships is not simply what
managers intend for them, or what brand images ‘‘contain’’ in the culture … but
what consumers do with brands to add meaning in their lives. The abstracted, goal-
derived, and experiential categories that consumers create for brands are not
necessarily the same as the categories imposed by the marketers in charge of brand
management” (Fournier, 1998, p. 367).
As an example, when VW decided to launch its luxury car VW Phaeton its goal was to
establish relationships with customers on whom the VW brand previously had missed out on:
the segment of luxury car customers, willing to pay premium prices and promising high
margins. From a resource based strategic management perspective the outlook was
optimistic: VW had control of the essential resources and adequate firm characteristics for
production, existing distribution channels and even experience with the production and sales
of luxury brands like Bentley, Lamborghini, and Bugatti. However despite millions of Euros
spent in marketing costs and a product equal or superior to competitors’ products VW failed
to sell more than a fifth of VW Phaeton cars from what management had expected (Rust,
Zeithaml, & Lemon, 2004). What VW managers may have overestimated is the ability of a
VW brand car to satisfy the product category goal of consumers in the luxury car segment
despite a strategic positioning to do so. As the results of article 1 show, most customers in the
luxury car segment did not consider the VW brand, in fact many even clearly rejected it.

1 Introduction
5
1.2.1. Consideration Sets
Consumers do not equally consider all brands before making a purchase decision (see
Roberts & Lattin, 1997). Some brands are rejected immediately because they are not relevant
for purchase, too expensive or of clearly insufficient quality and so forth. Other brands
receive intense scrutiny and are part of a set of brands a consumer actively considers before
making a purchase decision. Wright and Barbour (1977, p. 91) were the first to introduce the
term consideration set, defining it simply as “the brands a consumer will consider”.
Generally consideration sets are seen as being dynamic in the sense that they evolve over
time (Howard, 1977; Roberts & Lattin, 1991).
Narayana and Markin (1975) conceptualized the categorization process comprising of an
awareness and an unawareness set, the latter containing all the brands the consumer has never
heard of. The awareness set in turn, they argued, consists of a consideration set, containing
the brands a consumer has a positive evaluation of and that he actively considers, an inert set,
containing brands he carries neither a positive nor negative evaluation, and an inept set,
containing brands he clearly rejects. Brisoux and Laroche (1980) advanced the model by
differentiating between processed set and foggy set, the latter containing all those brands that
due to cognitive capacity limits are not completely processed. Similar to Narayana and
Markin, Brisoux and Laroche differentiate between consideration set, hold set and reject set.
In contrast to the inert set, the hold set however does not consist of brands with neutral
evaluation but brands that are neither acceptable nor unacceptable. Early work on
consideration sets has focused on consideration set size and correlates and provided
conclusive evidence for the existence of consideration sets (see Ostlund, 1974; Jarvis &
Wilcox, 1973; Maddox et al., 1978; Gronhaug, 1973; Belonax & Mittelstaedt, 1978; Prasad,
1975; Gronhaug & Troye, 1983; May & Homans, 1977; Belonax & Javalgi, 1989).
Different perspectives on consideration set formation have evolved in the literature.
Normative approaches (see Hauser & Wernerfelt, 1990; Roberts & Lattin, 1991) are based on
Stigler’s (1961) notion that the economic theory of utility-maximizing behavior can be used
to predict the amount of information a decision maker should acquire. While search costs
remain constant with each additional brand considered, the marginal expected utility from the
search decreases with the number of brands already examined. Hence, an optimal number of
1 Introduction
6
brands to consider exists: a consumer outweighs the cost of including additional brands into
his consideration set against the expected benefit of adding more brands (Roberts &
Nedungadi, 1995).
Information processing approaches argue that consideration set formation is a consequence of
humans’ constraint capacity to consider and evaluate all existing brands. Howard and Sheth
(1969) conceptualized consideration set formation as a learning process, in which a consumer
tries and evaluates different brands and over repeated exposure and purchase eventually
learns which brands to include. The consideration set is viewed as a heuristic to reduce
purchase effort.
Stimulus-based choice approaches focus on the limited capacity of short-term memory and its
influence on information processing (Bettman, 1979). The formation process is
conceptualized as a two-stage process, with an initial non-compensatory screening phase and
a mostly compensatory evaluation phase (Bettman, 1979; Lussier & Olshavsky, 1979;
Olshavsky, 1979). This two-step process could be observed in several studies (see Lussier &
Olshavsky, 1979; Olshavsky, 1979; Wright & Barbour, 1977; Payne, 1976). Memory-based
choice approaches have focused on the influence of retrieval processes on consideration-set
formation. The approach rests on the availability–accessibility paradigm (Tulving &
Pearlstone, 1966) distinguishing between general awareness (i.e., known brands) or
availability and (b) situation-specific awareness (i.e., retrieved brands) or accessibility.
Memory-based choice approaches are problematic however, because brands may be recalled
even though they will eventually be rejected (see Holden, 1993). Therefore, Paulssen and
Bagozzi (2005) provided a direct investigation of the antecedents of brand categorization.
Based on Carver and Scheier’s (1998) theory of self-regulation, they developed and
empirically tested a self-regulatory model of consideration-set formation that incorporates
consumers’ goal-oriented, purposive behavior (Bagozzi & Dholakia, 1999; Bagozzi &
Nataraajan, 2000). Similarly, Chakrawati, & Janiszewski (2003) could point out the role of
motives on the consideration set composition in novel purchase situations. Their work
represents a shift from the prevalent information-processing perspective and the
accessibility–availability paradigm to a motivational point of view on consideration set
formation and consumer behavior.
1 Introduction
7
1.2.2. Consideration Sets as Goal-Derived Categories
Following Ratneshwar, Pechmann, and Shocker‘s (1996) initial hypothesis, Paulssen and
Bagozzi (2005) could show that consideration sets can be conceptualized as goal-derived
categories. The term ‘goal-derived categories’ was originally coined by Barsalou (1991)
based on early research on categorization processes (see Mervis & Rosch, 1981), describing
often highly specialized sets of objects people create in everyday life, like ‘things to eat on a
diet’. Similar to classic taxonomic categories, goal-derived categories possess a continuum of
degrees of membership that range from typical members to typical non-members. This has
been referred to as ‘graded structure’ (Rosch, 1975; Barsalou, 1991).
Similar to graded structure where typical members of a category, unclear members of a
category and non-members can be distinguished, frameworks of brand-categorization with a
similar tri-partition into consideration, hold, and reject set have been developed (Laroche &
Toffoli, 1999; Brisoux & Laroche, 1980; Peter & Olson, 2005). For example, depending on
the goals of consumers, members of the product category ‘chair’ should be assigned different
degrees of membership in the resulting goal-derived categories. The degree of membership of
a particular chair in the different goal-derived categories will then be a function of its ability
to serve the associated goals. A consumer with the goal derived category ‘chairs that provide
back support’ will assign an orthopedic chair a high degree of membership whereas a
consumer with the goal derived category ‘chairs that look stylish’ will likely assign it a low
degree of membership. In a purchase situation a consumer with the goal derived category
‘chairs that provide back support’ would hence include the orthopedic chair in his
consideration set, whereas a consumer with a goal-derived category ‘chairs that look stylish’
would likely include it in his reject set. A third customer with the goal derived category
‘chairs that are durable’ may neither clearly consider nor clearly reject it and include the
orthopedic chair in his hold set (see Paulssen & Bagozzi, 2005).
1.2.3. The Relationship between Consideration Sets, Market Segments and Strategic Groups
To understand which brands comprise consumers’ consideration sets is of crucial importance
because these are the only ones that are seriously scrutinized in a purchase decision. A market
can be divided into a certain number of segments in which consumers consider a distinctive
1 Introduction
8
subset of brands (Cooper & Inoue, 1996). Each market segment can also be described by the
probabilities that brands are in the consideration, hold or reject set of its respective customers.
Competition between them exists to the extent that potential customers perceive them as
substitutes at a particular purchase occasion (Cooper & Inoue, 1996; Siddarth, Bucklin, &
Morrison, 1995)
The supply-side analogue to market segments are strategic groups (Grover & Srinivasan,
1987), commonly defined as firms that intensely compete in a particular segment and use
similar strategies (Bauer, 1991). The topic of strategic groups has been one of the most active
areas of strategic management research (see Peteraf & Shanley, 1997) and has generated
large amounts of publications on the topic over the last three decades (McNamara,
Deephouse, & Luce, 2003). It was Hunt (1972) who first introduced the concept of strategic
groups in his dissertation in order to describe intra-industry structure. Porter (1979) later
conceptualized strategic groups as persistent structural features of industries and Hatten and
Hatten (1987, p. 329) contended that strategic groups segment firms into “sets of companies
whose competitors, actions and results are relevant to each other”.
Most research on strategic groups has been conducted by analyzing archival strategy
variables (McGee & Thomas, 1986; Ketchen, Thomas, & Snow, 1993), mostly using cluster
analysis methods (Cool & Schendel, 1988; Fiegenbaum & Thomas, 1990). However these
approaches have been criticized for a lack of theory (Barney & Hoskisson, 1990; Peteraf &
Shanley, 1997), an over-reliance on secondary data (Thomas & Venkatraman, 1988), an
inability to explain how and why competitive structures in industries come to develop
(Hodgkinson, 1997) and a failure to predict future strategic behavior and performance
(Thomas & Venkatraman, 1988). Starting with Porac, Thomas, and Baden-Fuller (1989)
research on strategic groups in the nineties has investigated groupings of firms based on
managers’ cognitions (Reger & Huff, 1993). Porac et al. found that managers shared themes
about the boundaries of the competitive domain and often showed wide agreement about the
competitive process in that domain. Many studies have since been concerned with managers’
groupings of firms, investigating links to other grouping methods (Nath & Gruca, 1997),
performance measures (McNamara, Luce, & Thompson, 2002; Osborne, Stubbart, &
Ramaprasad, 2001; Zúñiga-Vicente et al., 2003) and reputation differences (Ferguson,
Deephouse, & Luce, 2000). Summarizing the contribution of cognitive research in the
1 Introduction
9
strategic group domain, Peteraf and Shanley (1997, p. 165) argued, “The most compelling
evidence for the existence of meaningful groups of firms within industries comes from
cognitive studies and from organizational ecology”. Surprisingly few studies however exist,
investigating customer-side approaches to strategic groups (exceptions are Day et al., 1987
and Pegels & Sekar, 1989).
Corollary to the existence of strategic groups is the concept of mobility barriers (McGee &
Thomas, 1986): “the concept of mobility barriers is inextricably bound to any discussion of
strategic groups” (Olusoga, Mokwa, & Nobel, 1995). Mobility barriers are structural forces
impeding firms from freely changing their competitive position (Hodgkinson, 1997).
Mobility barriers can be caused by market related strategies, industry supply characteristics
and firm characteristics (McGee & Thomas, 1986) as well as assets such as brand name, loyal
customer base or distribution channels (Mascarenhas & Aaker, 1989). From a customer side
perspective, a strategic group is at least partly sheltered from competition because other firms
cannot readily imitate the mix of product attributes preferred by customers of a particular
segment. Hence, customer preferences restrict strategic movements of companies. Therefore
customer preferences can be conceptualized as mobility barriers for firms.
Because brands that make up an individual’s consideration set are those brands he perceives
as substitutes (Roberts & Lattin, 1991), competition between goods or services exists to the
extent that potential customers jointly consider them in a particular purchase. The more
consumers jointly consider two brands, the higher the degree of substitutability and hence the
greater the intensity of competition between those two brands should be (Cooper & Inoue,
1996; Siddarth et al., 1995). Following this argument, several researchers have employed
consideration sets in order to structure a market (e.g., DeSarbo & Jedidi, 1995; Finn &
Louviere, 1990).
1.2.4. Contributions of Article 1
Following Cooper and Inoue (1996) article 1 proposes that market segments or strategic
groups can be seen as types of consumers with homogeneous patterns of brand
categorization. Using latent class analysis article 1 shows that consumer groups or brand
categorization types with intense rivalry between certain brands but lesser rivalry with other

1 Introduction
10
brands emerge. Further, results of article 1 show that the salience of the product category goal
‘self-presentation of social status’ differs across these types and that in turn the salience of
this product category goal determines the importance consumers attach to certain benefits like
‘sporty driving’ or ‘comfort’.
Structuring markets based on consumers’ brand categorization patterns allows the
characterization of market segments by the probability of brand consideration, rejection, or
neutrality. This approach results in a clear picture of preference barriers, which can be seen as
mobility barriers for firms. By categorizing brands into ‘consideration’, ‘uncertain’ and
‘reject’ set, these patterns also allow for an estimation of the strength of demand-side
mobility barriers. Firms that want to overcome these barriers will need to address prevalent
customer goals and corresponding benefits. Apparently VW’s Phaeton was not able to
sufficiently satisfy the goal of ‘self presentation of social status’. Article 1 shows that the
probability that consumers in the ‘luxury car segment’ would reject a VW-brand car was
0.83, creating an especially high mobility barrier for VW.
Article 1 contributes to research on consumer-brand relationships by providing support for
Fournier’s (1998) notion that the goal-derived categories that consumers create for brands are
not necessarily the same as the categories imposed by marketers in charge of brand
management. When trying to enter consumer relations marketing managers hence are well
advised to investigate customers’ perceptions of a brand’s ability to satisfy their relevant
consumption goals.
1.3. Establishing Lasting Brand Relationships
Undoubtedly, entering the consideration set of a consumer is a pre-condition for establishing
a relationship with a consumer, followed by the consumer’s actual choice of the brand over
the other competing brands in his consideration set. Until the eighties marketing researchers
have primarily focused on single transactions that consumers make (Homburg & Bruhn,
2005). As outlined above, during the nineties, marketing has undergone a paradigm shift
(Grönroos, 1994; McLoughlin & De Bourca, 1996; Brodie et al., 1997), redefining marketing
in relationship terms and stressing the need for effective management of consumer-brand
loyalties (Blattberg & Deighton, 1991; Reichheld & Sasser, 1990; Webster, 1992) making
1 Introduction
11
brand loyalty a key topic of interest for marketing scholars until today (see e.g., Homburg,
Hoyer, & Stock-Homburg, 2007).
1.3.1. Consumer Loyalty
In contrast to a consumer’s single choice of a brand over competing alternatives in his
consideration set, loyalty has been defined as “the biased behavioral response expressed over
time by some decision-making unit with respect to one or more alternative brands out of a set
of such brands” (Jacoby & Chestnut, 1978, p. 80). More extensive definitions of consumer
loyalty conceptualize it as a three-dimensional construct comprising, repurchase behavior,
willingness to cross-buy other products from the same company and willingness to
recommend (Anderson, 1998; Homburg & Bruhn, 2005; Szymanski & Henard, 2001).
Part of the interest in brand loyalty stems from the recognition that attracting new customers
is typically much more expensive than keeping existing customers: across a wide range of
businesses, the pattern is the same: the longer a company keeps a customer, the more money
it makes (Reichheld & Sasser, 1990, p. 106). The reason for this is usually, that attracting
new customers comes with costs attached (e.g., advertisements, promotions). Hence, research
on customer relationship management has essentially focused on activities that attempt to
retain existing customers (Homburg, Hoyer, & Stock-Homburg, 2007). A central research
issue in this context is the investigation of the relationship between loyalty and another key
marketing concept - customer satisfaction (e.g., Anderson et al., 1994; Bolton, 1998;
Kamakura et al., 2002; Mittal & Kamakura, 2001; Mittal, Ross, & Baldasare, 1998; Taylor &
Baker, 1994).
1.3.2. Consumer Satisfaction
Satisfaction can be seen as an attitude-like judgment following a purchase act or based on a
series of consumer product interactions (Czepiel & Rosenberg, 1977; Day & Landon, 1977;
Yi, 1990). Oliver (1997, p. 13) defines satisfaction as a “consumer’s fulfillment response. It
is a judgment that a product or service feature, or the product or service itself, provided (or is
providing) a pleasurable level of consumption-related fulfillment, including levels of under-
or overfulfillment.” The concept of under- or overfulfillment is mirrored in the most widely

1 Introduction
12
accepted model of customer satisfaction, the Confirmation-Disconfirmation (CD) –
Paradigm, that has prevailed as the key satisfaction paradigm (see Oliver, 1997; Bolton &
Drew, 1991; Cadotte, Woodruff, & Jenkins, 1987; LaBarbera & Mazursky, 1983; Richins &
Bloch, 1991; Spreng, MacKenzie, & Olshavsky, 1996). The CD-Paradigm can be seen as an
integrative framework, in which numerous other theories explaining customer satisfaction
like assimilation theory (see Clow, Kurtz, & Ozmet, 1998; Mittal, Kumar, & Tsiros, 1999),
contrast theory (see Oliver, 1997), assimilation-contrast theory (see Meyers-Levy & Tybout,
1997) attribution theory (see Folkes, 1984, 1988) or prospect theory (see Tversky &
Kahneman, 1981, 1991) can be integrated (see Homburg & Stock-Homburg, 2006).
According to the CD-Paradigm confirmation or disconfirmation of pre-consumption product
standards is the essential determinant of customer satisfaction (Everelles & Levitt, 1992;
Oliver, 1997). Confirmed standards should thereby lead to moderate satisfaction whereas
positively disconfirmed standards (exceeding the expectations) should lead to high
satisfaction. Dissatisfaction in turn should be the result of negatively disconfirmed standards
(underachieving expectations). Three main comparison standards have evolved in the
literature (Fournier & Mick, 1999): predictive expectations of attribute performance
(Boulding et al. 1993; Oliver, 1997; Tse & Wilton, 1988), experience-based norms derived
from personal experience or information received (Cadotte, Woodruff, & Jenkins, 1987), and
desires based on features and benefits that are perceived as ideal (Westbrook & Reilly, 1983).
1.3.3. The Satisfaction-Loyalty Link
Even though a strong relation between satisfaction and loyalty is a widely held assumption in
management, research on the proposed link between satisfaction and loyalty has repeatedly
found that the “intuitive” underlying assumption that satisfied customers stay loyal to the
brand does not always hold (Bendapudi & Berry, 1997; Ganesh, Arnold, & Reynolds, 2000;
Jones & Sasser, 1995; Keaveney, 1995), which led to an increased interest of researchers on
the link between satisfaction and loyalty in the nineties (e.g., Reichheld & Sasser, 1990;
Fornell, 1992; Fornell et al., 1996; Heskett et al., 1994; Giering, 2000). Researchers have
acknowledged that the link between satisfaction and loyalty may be more complex than
previously assumed (Oliva, Oliver, & MacMillan, 1992) and have found that several
demographic customer characteristics like education, sex, or age moderate the satisfaction-

1 Introduction
13
loyalty link (Mittal & Kamakura, 2001). For example, Mittal and Kamakura found that
women needed a lower level of satisfaction to repurchase than men. However, Seiders et al.
(2005) provided and extensive overview of different studies concerned with moderators of
the satisfaction-loyalty link and found only little congruence between the results of the
different studies. They concluded that, “although prior research points to several variables
that may moderate the satisfaction repurchase relationship, empirical results are equivocal
and difficult to reconcile” (Seiders et al., 2005, p. 26).
A further problem of satisfaction-loyalty research has been a lack of studies using behavioral
measures (Mittal & Kamakura, 2001) with the majority of them using intentional loyalty
measures (for a review see Seiders et al., 2005). This is surprising, as the question whether
satisfaction ultimately translates into consumers’ repurchasing behavior is of pivotal
importance to management. The use of intentional measures further suffers from problems
such as inflated common method variance (see Mazursky & Geva, 1989) as well as spurious
correlations (Arnold, Feldman, & Purbhoo, 1985; Zedeck, Kafry, & Jacobs, 1976).
Specifically Mittal and Kamakura (2001) as well as Seiders and colleagues (2005) found that
results from studies using intentional measures differed significantly from those using actual
behavior data.
1.3.4. Contributions of Article 2
Article 2 makes two central contributions to research on the satisfaction-loyalty link. First, it
addresses the problem of previous equivocal findings on the role of demographics as
moderators of the satisfaction-loyalty link: a key problem with existing studies investigating
the satisfaction-loyalty link has been, that they each focused on one single brand. The
possible moderating role of brand has so far been fully neglected, i.e., whether the
moderating role of demographics varies for different brands. Article 2 addresses this by
investigating moderating variables of the satisfaction-loyalty link for various brands. Second,
instead of intentional measures it investigates consumers’ actual repurchase behavior and
satisfaction with the replaced vehicle. One of the key results of article 2 is that the
moderating role of demographic variables differs for different brands.
1 Introduction
14
Findings from this article are of key theoretic and managerial importance. From a theoretic
standpoint they can explain the equivocal results of previous studies: the moderating role of
demographic characteristics cannot simply be extrapolated from one brand to another. In
other words, whereas women may need to be less satisfied in order to repurchase a Mercedes-
Benz than men, no such differences may exist for VW customers. From a managerial
perspective the advantages are two-fold: identifying those customers with a high intrinsic
retainability (those customers who will stay in the relationship even at low satisfaction levels)
is central for identifying those customers for whom relationship building does pay out
(Reinartz & Kumar, 2003). Those customers that are intrinsically volatile (leaving the
company even when highly satisfied) are short lived and investments in relationship building
with these may be a waste of resources. On the other hand customers of key competitors with
little intrinsic retainability should represent the customer group that should switch most easily
and should specifically be targeted by management.
1.4. Norms in Consumer-Brand Relationships
Although customer satisfaction has become a key focus of marketing strategy (Homburg,
Koschate, & Hoyer, 2005), marketing tactics or mistakes repeatedly lead to violations of
consumers’ expectations towards their brands and subsequently to a decline in satisfaction:
“Customer satisfaction rates in the United States are at an all-time low, while complaints,
boycotts, and other expressions of consumer discontent rise” (Fournier, Dobscha, & Mick,
1998, p. 43). Fournier and colleagues argue that this is due to brand behavior that many
customers do not find acceptable: “When we talk to people about their lives as consumers, we
do not hear praise for their so-called corporate partners. Instead, we hear about the confusing,
stressful, insensitive, and manipulative marketplace in which they feel trapped and
victimized” (Fournier, Dobscha, & Mick, 1998, p. 43).
Similarly McGraw and Tetlock (2005, p. 14) reason: “Consumers who have been gulled into
thinking of themselves as part of a corporate family or partnership may feel especially bitter
when they discover that the other party was treating them along purely as objects of monetary
calculation”. As Aaker, Fournier, and Brasel (2002) argue, relationship growth is a complex
process in which the occurrence of a transgression or letdown is inevitable. A transgression is
commonly defined as a behavior by a relationship partner that is perceived as inconsistent

1 Introduction
15
with a relational rule or expectation (see e.g., Baumeister, Stillwell, & Heatherton, 1995;
Boon & Holmes, 1999). However research on consumer-brand relationships has so far widely
neglected to specify what relational rules or norms actually govern consumers’ relationships
with brands (Aaker et al., 2004).
Research in consumer behavior has just recently turned to the topic of norms that may evolve
in consumer-brand relationships (see e.g., Aggarwal, 2004; Aggarwal & Law, 2005;
Aggarwal & Zhang, 2006). However this research suffers from key deficits, such as the lack
of a measurement of norms in real consumer-brand relationships (focusing on hypothetical
brand relationships in the laboratory), hence leaving Johar’s (2005, p. 26) key question “is
there a norm attached to brand behavior” unanswered. For the advancement of the consumer-
brand relationship metaphor, investigating whether relationship norms do govern consumer-
brand relationships hence is of pivotal importance.
1.4.1. The Norm Concept
On a general level Kahneman and Miller (1986) developed a model of norms, specifically
explaining activation processes that lead to the generation of norms. According to their
model, a stimulus recruits the ad hoc generation of alternatives, the so-called counterfactual
reasoning and in parallel recruits its own alternatives, its own frame of reference to which the
stimulus is compared to. The aggregated set of recruited representations constitutes the norm.
A stimulus event not only elicits a norm that it is compared to, it also influences the norm that
subsequent events are being compared to. The latter is done in two different ways: a) by
eliciting expectations for future events and b) by laying down a memory trace that is
activated when a subsequent event is an appropriate reminder (see Kahneman & Miller,
1986). According to Kahneman and Miller (1986) an event is considered abnormal if it has
highly available alternatives. These alternatives may be constructed as counterfactual
alternatives retrieved from memory. Norms can be evoked by probes, and one and the same
probe can elicit retrieval as well as construction: a probe can remind a person of similar
experiences in the past and lead to the generation of counterfactual alternatives. Probes are
either experiences of an object / event or references to a category. Accordingly Kahneman
and Miller distinguish between two kinds of norms, stimulus norms and category norms. In
category-centered comparisons, the object of judgment is compared to the norm for a
specified category. Explicit reference to a category however, permits a high degree of control

1 Introduction
16
over the selection of norm elements. In stimulus-centered comparisons, the elements of the
norm are recruited directly by the stimulus. Those elements are favored that resemble the
evoking stimulus.
The notion of category norms assumes that a single instance should be sufficient for setting
up a norm. This becomes apparent in findings that people are willing to radically generalize
from single observations of certain behavior to a norm for the behavior a) across other people
in the same situation and b) across situations for the same person (see e.g, Nisbett & Ross,
1980; Read, 1983). Generalizations are apparently made with high confidence, depending
largely on the consistency of the information as compared to quantity and quality of the
information (see e.g., Kahneman & Tversky, 1973) and lead to predictions of future behavior
as well as to inferences about traits.
On a more relationship specific level, Fiske (1991) developed a model specifying norms that
emerge in relationships. Fiske’s Relational Models Theory accounts for people’s implicit
representations of their relationships. He proposed four elementary and universal cognitive
models for the representation of social relationships. Those models are communal sharing,
based on the norm of equivalence, authority ranking, based on the norm of asymmetry,
equality matching based on the norm of reciprocity and market pricing based on the norm of
proportionality. In the marketing domain, McGraw and Tetlock (2005) have drawn on
Fiske’s (1991) Relational Models Theory to investigate the role different relational models in
market transactions. They could show in several scenario-based studies that the prevalent
relationship norm strongly influenced the perceived acceptability of a certain market
transaction between seller and buyer. In a slightly simplified model Clark and Mills (1993)
distinguish between communal and exchange relationships based on the norms of giving
benefits to the partner. Exchange relationships are based on the reciprocity norm, the idea of
giving something in return for getting something back. On the contrary in communal
relationships – that are commonly found between family members – benefits are given to the
relationship partner out of a concern for his well being, without expecting a comparable
benefit back in return. In fact receiving monetary benefits for providing help is seen as a
transgression in communal relationships. Aggarwal and colleagues (Aggarwal, 2004;
Aggarwal & Law, 2005; Aggarwal & Zhang, 2006) adopted Clark and Mill’s framework to
the consumer-brand domain. From a conceptual point of view it is questionable whether the
concept of communal relationships is at all adequate for consumer-brand relationships that at
1 Introduction
17
their core are based on exchange and in which monetary compensation is the ultimate reason
for companies to bond with consumers.
Hence, it is surprising that consumer research has so far widely neglected the extensive body
of research on norms in business-to-business relationships, which since more than 20 years
has successfully drawn on Relational Exchange Theory (RET) in explaining normative
regulations of business relationships. This is especially striking as RET a) focuses on
exchange relationships and b) has been conceptualized to apply to all forms of exchange
between individuals or organizations (Macneil, 1985). As such, RET seems to provide a more
adequate framework for research on norms in consumer-brand relationships than theories
from the interpersonal domain.
1.4.2. Relational Exchange Theory
Relational Exchange Theory was developed by Macneil (1974, 1978) in response to the
observations that written agreements are often intentionally left incomplete by parties in order
to leave room for adaptation to changes (Milgrom & Roberts, 1992). In contrast to the (neo-)
classic view, which assumes that all current and future transactions are regulated by written
agreements, RET underscores the role of norms in relationships (Ivens & Blois, 2004).
According to RET, agreements between parties usually contain explicit as well as implicit
agreements or norms (Hadfield, 1990). Norms according to that view can be seen as
expectations towards the other party’s behavior (Heide & John, 1990; Lipset, 1975), as
guidelines towards own behavior (Scanzoni, 1979), or as “general frame of reference, order,
and standards against which to guide and assess appropriate behavior in uncertain and
ambiguous situations” (Cannon, Achrol, & Gundlach, 2000, p. 184).
Norms have been shown to develop early in the relationship process (Dwyer, Schurr, & Oh,
1987) and limit the danger of opportunistic behavior on one side (Ouchi, 1980; Nohria &
Ghoschal, 1990): “Because they involve expectations rather than rigid requirements of
behavior, they create a cooperative as opposed to a confrontational environment for
negotiating adaptations, thus promoting continuity in exchange” (Cannon, Achrol, &
Gundlach, 2000, p. 184). The fact that norms are in general not discussed explicitly, and even
less specified in detail but rather developed on a relatively general level however, leaves

1 Introduction
18
room for an individual interpretation of a norm’s content by the parties involved in exchange
transactions.
According to Macneil (1985) RET as a theory applies to all forms of exchange between
individuals or organizations. He assumes that exchange is not purely an economic
phenomenon but characterizes all forms of social interaction. Transactions according to RET
can be classified on a continuum ranging from discrete to relational exchange. Purely discrete
transactions according to Macneil (1983) however constitute an exception, with most
transactions having relational character.
Macneil (1980, 1983) developed ten relational norms: role integrity, reciprocity,
implementation of planning, effectuation of consent, flexibility, solidarity, the linking norms,
creation and restraint of power, propriety of means and harmonization with the social matrix.
As these norms originally were not created for empirical purposes, they are partly
overlapping. Investigating the dimensional structure of Macneil’s norms using explanatory
factor analysis, Ivens (2006) found two emerging factors that he termed value-claiming and
value-creating norms. Due to these problems, most empirical work on Macneil’s norms
focuses on a subset of three to four norms (see e.g., Dant & Schul, 1992; Jap & Ganesan,
2000; Heide & Miner, 1992; Heide & John, 1992; Kaufman & Stern, 1988). Acknowledging
the high interdependence of these norms, researchers have also argued for one meta-norm and
have found empirical support for it (Heide & John, 1992).
The central role of norms in relationships according to Macneil (1978) exists because all
economic exchange is conflict laden, the reason being that interests of parties involved
usually diverge on several issues. RET posits that in addition to differences regarding the
sources of conflict, discrete and relational exchange also vary concerning conflict resolution
behavior. Parties in relations with a high degree of norm orientation should seek conflict
resolution mechanisms that do not threaten the continuity of the relationship (Achrol, 1997).
Such a behavior implies considering one’s own and the partner’s interests jointly. Under
relational exchange, conflict resolution should be achieved through communication with the
partner.
Concerning the effect of relational norms, Kaufman and Stern (1988) found that perceptions
of unfairness of the other party’s behavior were influenced by relational norms. Doney and
1 Introduction
19
Cannon (1997) found a positive relationship between relational norms and trust and Jap and
Ganesan (2000) report a positive relationship between norms and perceived commitment.
Concerning the impact on relationship relevant behavior, Dant and Schul (1992) studied the
impact of role integrity (one of Macneil’s norms) on four potential conflict resolution
strategies (problem solving, persuasion, bargaining, and politics) and Gundlach, Achrol, and
Mentzer (1995) could show that relational norms positively influence behaviors expressing
commitment. Also, the links between relational norms and relationship variables such as
relationship duration (Haugland, 1996), relationship performance (Noordewier, John, &
Nevin, 1990; Lusch & Brown, 1996; Bello & Gilliland 1997; Cannon, Achrol, & Gundlach,
2000), relationship quality (Gassenheimer, Calantone, & Scully, 1995; Johnson, 1999), or
acquisition and operating costs (Cannon & Homburg, 2001) have been examined.
A large body of research has further investigated antecedents to the emergence of relational
norms. Heide and John (1990) found that technological unpredictability decreased
expectations of continuity whereas Bello and Gilliland (1997) argue for a negative influence
of market volatility on flexibility. Actual commitments (Gundlach, Achrol, & Mentzer,
1995), the use of non-coercive influence strategies (Kim, 2000), specific human investments
(Bello & Gilliland, 1997), and manifest opportunism have proven to positively or negatively
influence the development and intensity of a number of relational norms. Key relationship
marketing variables, such as trust and satisfaction with past outcomes, equally have a positive
impact on the norm of long-term orientation (Ganesan, 1994).
1.4.3. Contributions of Article 3
Although recent research has turned to the investigation of norms in consumer-brand
relationships, several open questions have remained. Norm research in the consumer domain
has applied constructs from the interpersonal domain without discussing whether these are at
all applicable to brand relationships that in essence are based on exchange. This problem is
amplified by the fact that these norms have not been measured in actual consumer-brand
relationships (see Aggarwal 2004; Aggarwal & Law 2005; Aggarwal & Zhang 2006). Hence,
whether norms do at all evolve between consumers and their brands remains an open
question. In the light of the conceptual problems it is especially surprising that consumer
research has so far fully neglect the impressive body of research on norms in the business-to-

1 Introduction
20
business area. This research has mainly drawn on Relational Exchange Theory (RET), and
has shown in numerous empirical investigations that RET norms like solidarity, reciprocity
or flexibility do evolve in and govern business-to-business relationships.
In order to address these issues, article 3 adapted RET to consumer-brand relationships. A
scale was developed to measure RET norms in consumer-brand relationships and consumer
relationships with their banks were surveyed. Results showed that, RET norms did evolve in
consumer-brand relationships and that these norms differed from key relationship marketing
variables such as satisfaction and trust. Further, article 3 could show that, norms guided the
perception of severity of critical incidents in the relationships: the higher relationships scored
on RET norms, as the more severe relationship transgressions were perceived. Furthermore,
RET norms influenced consumers’ resolution strategies: consumers in relationships high in
RET norms were more likely to choose constructive resolution strategies like voicing the
problem. These results remained largely stable when taking into account key relationship
marketing variables like satisfaction and trust.
Summarizing, article 3 provides evidence for the notion that consumers do form relationships
with their brands that are governed by norms. These norms guide consumers’ perceptions of
transgressions and choice of resolution strategies and are different from key existing
relationship marketing variables.
1.5. The Effect of Negative Information on Consumers’ Attitude Strength
When consumers receive bad news about brands in the media, how does it affect their
attitudes and the strength of their attitudes? In the modern marketing sphere, with consumers’
access to all kinds of different media channels and media’s broad coverage of brand mishaps,
product failures and service deficiencies, consumers usually learn about negative brand
incidents via the media. The credibility of different media sources however varies widely
and, especially with sources like the Internet, source credibility is often hard to judge. Several
questions for researchers and practitioners hence emerge: does bad brand news influence
consumers’ attitudes even when they know that it is from a non-credible source? And what
happens when people learn about that source after they have already read the news? Will the
news still affect their attitudes or are consumers able to ‘correct’ for the lack of credibility?

1 Introduction
21
1.5.1. Attitudes and Attitude Strength
The attitudes that consumers carry towards their brands are of pivotal relevance for
marketers. A key reason for this interest in attitudes is the underlying assumption that
attitudes predict consumers’ behavior. However, as chapter 1.3. has already pointed out (and
article 2 will in more detail) with the example of satisfaction - an attitude-like judgment -
attitudes do not always translate nicely into behavior: article 2 shows only a moderate
relationship between satisfaction and repurchase behavior. In fact, the finding that the
predictive ability of attitudes may be limited is almost as old as attitude research itself (see
LaPiere, 1934) and some scholars have subsequently questioned whether a link between
attitudes and behavior exists at all (Corey, 1937; Ajzen & Fishbein, 1977). Similarly many
attitude change studies in laboratory settings have shown that attitudes could often be
changed quite easily (see Eagly & Chaiken, 1993; Petty & Cacioppo, 1981). On the other
hand researchers have found that some attitudes can be very stable and very difficult to
change. In fact Hovland (1959) as well as Hyman and Sheatsley (1947) found that most
attitudes appear to change only little over the course of a lifespan. In addition, some attitudes,
especially political attitudes, have been shown to be very powerful determinants of behavior
(Schuman & Johnson, 1976).
As a result, social scientists started to acknowledge that attitudes could vary considerably in
their strength (see e.g., Raden, 1985; Schuman & Presser, 1981). However attitude strength
has long remained a vaguely defined ‘metaphor’ (Raden, 1985). According to most current
definitions strong attitudes possess two main features: they are durable and they have impact.
Accordingly Krosnick and Petty (1995, p. 3) define attitude strength as “the extent to which
attitudes manifest the qualities of durability and impactfulness”. Instead of conceptualizing
attitude strength as a latent psychological construct with durability and strength as effect
indicators, durability and strength are commonly conceptualized as causal indicators of
attitude strength which is seen as a phantom variable (Krosnick & Petty, 1995). Hence,
strength is not presumed to be a latent construct but a heuristic label attached to attitudes “as
a way of efficiently noting that they possess certain characteristics” (Krosnick & Petty, 1995,
p. 3).
A key determinant of attitude strength is the amount of elaboration spent on attitude relevant
information. Attitudes that are based on more careful elaboration are stronger than those that

1 Introduction
22
are created by more peripheral processes (e.g., accepting information without careful scrutiny
because it comes from an expert; see e.g., Petty, Haugtvedt, & Smith, 1995). Two main
theories have been developed to account for these two different processes: the Elaboration
Likelihood Model (ELM; Petty, 1977; Petty & Cacioppo, 1981, 1986) and the Heuristic
Systematic Model (HSM; Chaiken, Liberman, & Eagly, 1989). Because both propose two
routes by which attitudes can be created or changed they are often summarized as Dual
Process Theories.
1.5.2. Dual Process Theories
The Elaboration Likelihood Model (ELM) has been developed by Petty and Cacioppo in the
late seventies and early eighties based on Petty’s doctoral dissertation (Petty, 1977; Petty &
Cacioppo, 1981, 1986) and has since then generated a large number of publications in various
disciplines (see Petty & Wegener, 1999 for a review). The ELM postulates two routes by
which attitudes can change, the central and the peripheral route. These two routes differ in the
degree of effortful processing. The central route involves extensive and effortful information
processing activity aimed at scrutinizing and uncovering the central merits of the information,
whereas attitude change by the peripheral route is based on low resource demanding change
processes, such as heuristics (Chaiken, 1987), classical conditioning (Staats & Staats, 1958)
or self-perception (Bem, 1972). When an attitude changes as a result of careful thinking (i.e.,
via the central route) the resulting attitude will be stronger than when it is changed by cursory
thought based on a simple cue (e.g., accepting an argument because the person formulating it
is perceived as an expert). Thoughtful (i.e., central) attitude changes have been shown to be
more persistent over time, resistant to counter-persuasive attempts and predictive of behavior
than attitudes changed by only little attitude relevant thought (for a review see Petty, 1994).
Similarly the Heuristic Systematic Model (HSM; Chaiken, Liberman, & Eagly, 1989)
assumes two different processing routes, systematic and heuristic processing. Systematic
processing refers to scrutinizing all informational input for its relevance to the judgment.
Heuristic processing on the other hand is based on the retrieval of certain learned rules from
memory (like “statements from experts can be trusted”) that allow the evaluation of a
message without careful processing (Chaiken et al., 1989). Like the ELM the HSM assumes
that people will only exert as much cognitive effort as necessary in order to reach a certain

1 Introduction
23
processing goal (Eagly & Chaiken, 1993). If achieving high accuracy is the goal, then careful
scrutiny on the message is most likely when accuracy cannot be achieved by the reliance on
certain cues (e.g., source credibility). Hence according to both theories, source credibility
(i.e., expertise and trustworthiness of the source) plays a significant role in determining how
much cognitive effort is spent on the message. It has been found repeatedly that the
knowledge of high source credibility reduces the scrutiny of the arguments and leads to more
shallow processing because the information is more readily accepted without elaborating on
the quality of the arguments (Priester & Petty, 1995, 2003).
More evidence for the role of source credibility in preventing careful elaboration comes from
research on the sleeper effect. The sleeper effect describes a delayed increase in persuasion,
an effect first reported by Hovland, Lumsdaine, and Sheffield (1949) that since then has
generated a large body of research. The central finding is, that a message from a non-credible
source has little immediate effect on attitudes however regains an effect over time (see
Kumkale & Albaraccin, 2004 for a review). This effect however only appears when the
message is elaborated carefully. Knowledge of the non-credible source before the message
has been found to prevent the sleeper effect because the knowledge of the source prevents
careful elaboration of the message (Kumkale & Albaraccin, 2004; Priester et al., 1999;
Pratkanis et al., 1988).
1.5.3. The Effect of Elaboration on Attitude Inconsistent Information on Attitude Strength
Consumers usually hold positive attitudes towards their brands. Hence, when they encounter
negative information, this is usually inconsistent with their prior attitude. A central question
for marketing and an issue of considerable controversy thus has been, whether elaboration on
negative inconsistent information leads to stronger or weaker overall attitudes. Traditionally
research has argued that exposure to inconsistent information leads to higher elaboration on
the complete information set and hence should lead to stronger attitudes (Maheswaran &
Chaiken, 1991; Srull & Wyer, 1989). Alternatively researchers have shown that
inconsistencies in the structure of attitudes can result in conflict of opposing attitude elements
(Bargh et al., 1992; Thompson, Zanna, & Griffin, 1995). Conflict in turn has been shown to
weaken the strength of attitudes (Conner et al., 1996). Hence a weakening effect of
elaboration should theoretically be possible. Sengupta and Johar (2002) were first to show

1 Introduction
24
such a weakening effect of elaboration on attitudes and show that the presence of a
reconciliation goal determines whether inconsistent information leads to stronger or weaker
attitudes. Usually consumers are motivated to reconciliate conflicting attitudes in order to
arrive at a consistent attitude (Maheswaran & Chaiken, 1991). In the presence of such a
reconciliation goal, greater elaboration has been shown to lead to overall stronger attitudes
(Jonas, Diehl, & Brömer, 1997). If however reconciliation is prevented, structural
inconsistencies prevail and no consistent attitude can evolve (Sengupta & Johar, 2002).
1.5.4. Contributions of Article 4
How does negative brand information impact on the strength of consumers brand attitudes?
Article 4 shows that the effect of negative information on attitude strength depends on two
factors: source credibility and the time consumers become aware of the source credibility.
Extending research in the line of Dual Process Theories, article 4 shows that knowledge of
source credibility cannot only prevent but also increase careful elaboration on the message,
when the source information is given after the message as opposed to before. This is because
source credibility conveys information about how relevant (i.e., diagnostic) the processed
message is for attitude formation. When consumers learn after reading the message that it
was either highly relevant for attitude formation (e.g., because it came from a very credible
source) or possibly biased them (e.g., because it came from a clearly non-credible source),
article 4 shows that further elaboration on the message is prompted.
Article 4 further shows that the effect of this elaboration on attitude strength differs
depending on whether it was prompted by a credible or non-credible source. Elaboration on
attitude-inconsistent information in the light of a credible source apparently leads to the
maintenance of structural inconsistencies and hence results in weaker attitudes. The reason,
article 4 argues, is that receiving the source information after the message alerts consumers of
the fact that the negative message they have read is valid and relevant for attitude formation.
Hence, further elaboration should be aimed at maintaining the structurally inconsistent
negative arguments. On the other hand, when consumers learn that the message came from a
non-credible source, this should alert them to the fact that they just processed invalid
information. The prompted elaboration hence should be aimed at refuting the inconsistent
negative information and subsequently lead to stronger attitudes. Summarizing, article 4

1 Introduction
25
shows that elaboration on negative brand information can do both, weaken as well as
strengthen consumers’ attitudes.
1.6. How Companies Should React to Negative Brand Information
1.6.1. Brand Crises and their Effect on Brands
Whereas article 4 deals with the question of how consumers react to negative brand
information consumers receive over the media, article 5 deals with the company side: how
should companies react when negative messages about their brands are spread in the media.
Article 4 points out that such negative information can potentially harm consumers’ attitudes.
Article 3 shows that some consumers may decide to let their relationship deteriorate when
confronted with incidents they find severe. How should companies hence react to counter
such detrimental effects? Apart from an effect on consumers’ attitude strength, researches
have also shown that such brand crises have negative effects on market share, sales of
recalled products, stock prices, purchase intentions, and sales of other company products
(Pruitt & Peterson, 1986; Siomkos & Kurzbard, 1994) as well as threatening a company’s
reputation (Berman, 1999; Davies et al., 2003; Mowen, 1980). The devastating effect of
negative brand news on their companies is partly due to the fact that negative information is
perceived to be more diagnostic and informative, and weighed more heavily in consumer
judgments than positive information, an effect referred to as negativity bias (Herr, Kardes, &
Kim, 1991). In addition, because negative news deviates from the norm – consumers are used
to positive (advertising) messages about brands - negative news is reported more frequently
and more vividly by consumers (Weinberger & Lepkowska-White, 2000) as well as
considered more credible than positive news spread by the company itself (Ahluwalia,
Burnkrant, & Unnava, 2000). As a result, customer preferences may shift towards competing
products during the recall period, and competitors often increase their advertising spending in
the wake of a competing brand’s crisis (Cleeren, DeKimpe, & Helsen, 2006).
Despite the increasing occurrence of brand crises and the risks for the companies involved,
research on brand crises still remains scarce (Klein & Dawar, 2004). In fact, previous
research has mostly relied on general strategies providing check-lists or ‘six-step plans’ with
general recommendations like ‘act quickly’ and ‘take responsibility’ (see Turpin, 2008) on
1 Introduction
26
how to deal with brand crises. In general, case studies have been used to derive conclusions
about which strategies work and which do not (e.g., Chisholm, 1998; Marconi, 1997; Pearson
& Mitroff, 1993; Weinberger, Romeo, & Piracha, 1991; Kurzbard, & Siomkos, 1992; Smith,
Thomas, & Quelch, 1996). “This literature, however, provides little direction for
understanding the problem from a theoretical perspective” (Ahluwalia, Burnkrant, & Unnava,
2000, p. 203) and few research exists developing strategies to combat marketing crises taking
into account the variables that influence consumers’ perceptions and their processing of brand
crisis information (Cleeren, Dekimpe, & Helsen, 2006; Ahluwalia, Burnkrant, & Unnava,
2000).
From a managerial vantage point an adequate communication response is of utmost
importance. In a study by DDB Needham involving 2,645 consumers it was found that a
company’s handling of a crisis ranked as the third most important influence on consumer
purchasing, after product quality and handling of complaints (Marketing News, 1995). The
importance of adequate crisis communication is further underlined by findings showing that
company communication after an emergency has strong implications for the image of a
company (Dawar & Pillutla, 2000). In addition, most crisis-management experts agree that it
is not a matter of if a company will be faced with a crisis, but when and how well prepared
executives are to weather the storm (Albrecht, 1996). The importance of an effective
communicating strategy is further reinforced by the growth of so called “instant information”
networks. Due to the Internet, dissatisfied employees, angry customers and other
disappointed stakeholders can spread information and false facts almost instantaneously
(Turpin, 2008). Hence, developing a proper communication strategy is a key challenge for
companies faced with a crisis situation (e.g., Hale, Dulek, & Hale, 2005; Coombs, 2000;
Cleeren, DeKimpe, & Helsen, 2006).
It was the aim of article 5 to develop an actionable framework for communication strategies
based on psychological and consumer research on persuasion processes, information
processing, attribution processes and attitude formation as well as marketing research on
consumer reactions to product harm crises and rumors. Three key variables were identified in
the literature, which should determine the choice of a successful communication strategy:
truth of the allegation, severity of the crisis and consumers’ commitment. The three will be
outlined in the following.
1 Introduction
27
1.6.2. Truth of the Allegation
Most research on brand crises has focused on one of two types of crises, product harm crises
or rumors. Whereas product-harm crises constitute real threats to the consumer, rumors
concern negative brand information based on false facts. Product harm crises are usually
defined as discrete, well-publicized occurrences wherein products are found to be defective
or dangerous (Dawar & Pillutla, 2000). These can result from product tampering incidents or
problems inherent in the product, the latter being far more common than the former (Laufer
& Coombs, 2006). Apart from the damage to a brand’s reputation by a product harm crisis,
these are usually followed by product recalls. During these out-of-stock situations customers
may switch to competing brands which may lead to lost customers in the long run, who once
changed to another brand do not return (e.g., because of a lock-in to a rival brand; Goldfarb,
2006). Getting lost customers back, may be a difficult task, especially in the case of a
product-harm crisis, because consumers perceive buying a brand that has just been affected as
highly risky (Pennings, Wansink, & Meulenberg, 2002). In addition, a product-harm crisis
may corrode trust in the product category as a whole, leading customers to decide to stop
buying from the affected product category overall because the crisis is perceived as an
industry-wide problem (De Alessi & Staaf, 1994; Jarrell & Peltzman, 1985).
Rumors have been defined as “unverified information of uncertain origin which is usually
spread by word of mouth” (Akande & Odewale, 1994, p. 27). Rumors become increasingly
common with the advances in communication technology and many well-known companies
(e.g., Procter & Gamble, McDonald’s) have been the target of negative rumors, sometimes
with serious consequences. As implied by the above definition, rumor is negative word of
mouth (WOM) based on false facts (Kamins, Folkes, & Perner, 1997). Negative WOM has
been shown to be an important determinant of consumers’ choice of products (Herr, Kardes,
& Kim, 1991; Reingen & Kernan, 1986). A central problem in defeating rumors is that
negative information is more likely to be attributed to the qualities of the product rather than
to the credibility of the transmitter, which gives the rumor more credibility (Mizerski, 1982).
In addition, rumors have been shown to affect consumers independent of whether they
believed them or not. Tybout, Calder, & Sternthal (1981) found that despite consumers’
assertions that they disbelieved a rumor saying that McDonald’s hamburgers contained
worms, purchase intention and evaluations of McDonald’s were adversely affected.

1 Introduction
28
One might reason, that when an allegation is not justified – as is the case with a rumor - the
company does not really have to do anything at all. However, not reacting to an unfounded
allegation may hurt the company in some cases: “Even if management perceives the crisis as
‘unfounded’ or ‘unfair’ because of below-the-belt attacks or because they underestimate the
problem at hand, years of efforts aimed at building a strong brand and reputation can be
ruined in the time it takes to say ‘no comment’” (Turpin, 2008, p. 1). In some cases however
refuting a negative rumor about a firm may be counterproductive, because it may serve to
reintroduce the rumor in the process of discounting it (Tybout, Calder, & Sternthal, 1981).
Ahluwalia, Burnkrandt, and Unnava (2000) however found that a focused approach to
refutation, depending on consumers’ commitment could be effective. Hence, whether and
how to best react to a rumor is further dependent on customer commitment. The central role
of customer commitment is outlined in chapter 1.6.4.
1.6.3. Severity of the Crisis
Several authors have stressed the central role of severity of brand crises. Crises can differ
widely in their severity. For example, certain types of product failure may only involve mild
inconveniences for the consumer. These may involve incidents, in which the product is not
working as well as suggested in advertisements. In contrast, product harm crises usually
involve more serious problems that can result in injuries, sickness and even deaths (Laufer &
Coombs, 2006). Examples are unknown side-effects of pharmaceutical products as in Bayer’s
anti-cholesterol drug Lipobay that in the late nineties in combination with other drugs had
caused 59 deadly cases of a rare muscle tissue disease or the case of Ford’s Pinto car that due
to engineering flaws led the cars’ engines to catch fire easily in accidents, resulting in 27
deaths in the seventies. Whereas these cases obviously are severe crises, ultimately severity
lies in the eyes of the beholders – namely the consumers.
The role of crisis severity has been shown to be of special relevance for defensive attributions
(Laufer & Coombs, 2006). The defensive attribution hypothesis predicts that when an
incident is high in severity, more blame will be attributed to a potentially responsible party
than when the severity of the incident is low (see Robbennolt, 2000 for a review). The reason
for this is that as the consequences of an incident become more severe, the notion that they
might be accidental and outside control becomes less bearable. Perceiving the incident as

1 Introduction
29
more predictable by blaming it on a person or institution makes the incident seem more
avoidable (e.g., by simply reducing one’s interaction with the person or institution who
caused the incident) than when acknowledging that it was an uncontrollable accident (Fiske
& Taylor, 1991). Laufer and colleagues (2005) found in a corporate setting that, as
perceptions of crisis severity increased, more blame was in fact assessed to the firm.
1.6.4. Consumers’ Commitment
The concept of commitment is deeply intertwined with the concept of loyalty (Morgan &
Hunt, 1994). In fact Bloemer and Kasper (1995, p. 314) argue that “true brand loyalty is
brand commitment, since, brand commitment is a necessary condition for true brand loyalty
to occur.” By true brand loyalty, Bloemer and Kasper refer to the fact that a customer may
repurchase without being committed to the brand (e.g., because it simply is the cheapest
product on the shelf). Commitment has traditionally been defined as the pledging or binding
of an individual to his brand choice (Kiesler, 1968) as an emotional or psychological
attachment to a brand within a product class (Lastovicka & Gardner, 1978).
For consumers’ reactions to negative information commitment is of special relevance.
Although committed consumers have been shown to be more aware of a crisis (Dawar &
Pillutla, 2000), they are also more likely to engage in biased processing (Ahluwalia,
Burnkrant, & Unnava, 2000). Ahluwalia, Burnkrant, and Unnava (2000) found that
commitment not only moderates the negativity effect, whereas lowly committed consumers
give more weight to negative than positive information, because they perceive it to be more
diagnostic, highly committed consumers do not only exhibit an absence of the negativity
effect but consider positive information about the brand as more diagnostic. Consumers who
are committed to a brand also counter-argue negative information about the brand, mitigating
the negative effects of the information by reducing the likelihood of attitude degradation.
Lowly commitment consumers however counter-argue to a lesser degree and even though
they may like the brand as much as the highly committed consumers, they exhibit greater
attitude change and increased attitude ambivalence upon exposure to negative information
about the brand. In addition, committed consumers have been found to show more sympathy
for the brand and to believe that the company deserves their help (Stockmeyer, 1996) and to
be less likely to switch brands during out-of-stock situations, which is partly due to their

1 Introduction
30
increased search costs because of their limited experience with other brands (Campo,
Gijsbrechts, & Nisol, 2000). Hence, instead of the commonly used "mass approaches" in
responding to negative publicity (see, e.g., Pearson & Mitroff 1993; Weinberger, Romeo, &
Piracha, 1991) companies should consider using a targeted approach, because different
response strategies are likely to be more effective for highly and lowly committed consumers.
However Ahluwalia, Burnkrant and Unnava (2000) acknowledge, that the effect of consumer
commitment may be moderated by severity of the crisis: when the crisis is high in severity
then consumer commitment should not play a role. This is because it may be difficult even
for the committed consumers to discount very severe negative information.
1.6.5. Contributions of Article 5
How should marketing managers react when negative brand information is spread in the
media? In order to answer this question, a literature review was conducted. To the best of the
author’s knowledge no comprehensive framework has been developed yet that incorporates
findings from different research streams on how people process negative information in order
to arrive at recommendations for how to counter the adverse effect of a brand crisis. Based on
persuasion literature, research on information processing, attribution processes and attitude
formation as well as marketing research on consumers’ reactions to negative brand
information article 5 provides a framework, suggesting what communication strategies
should be most effective. As a result of this extensive literature review the variables, truth of
the allegation, severity of the crisis and consumers’ commitment emerged as factors that
strongly affect consumers’ perceptions of the incident. They influence how much attention
consumers devote to the incident, whether they counter-argue the allegations, what they
attribute the crisis to and how strongly the incident affects their attitudes and attitude
strength. Hence companies are well advised to adapt their response strategies to these three
variables. Based on the identified three central variables, six fundamentally different crisis
situations are derived and the applicability of eight different strategies discussed.

1 Introduction
31
1.7. References
Aaker, J., Fournier, S., & Brasel, S. A. (2004). When Good Brands Do Bad. Journal of
Consumer Research, 31(1), 1-16.
Aaker, J. (1997). Dimensions of Brand Personality. Journal of Marketing Research,
34(August), 347-356.
Achrol, R. S. (1997). Changes in the Theory of Interorganizational Relations in Marketing:
Toward a Network Paradigm. Journal of the Academy of Marketing Science,
25(Winter), 56-71.
Ajzen, I., & Fishbein, M. (1977). Attitude-Behavior Relations: A Theoretical Analysis and
Review of Empirical Research. Psychological Bulletin, 84(5), 888-918.
Akande, A., & Odewale, F. (1994). One more Time: How to Stop Company Rumours.
Leadership & Organization Development Journal, 15(4), 27-30.
Aggarwal, P., (2004). The Effects of Brand Relationship Norms on Consumer Attitudes and
Behavior. Journal of Consumer Research, 31(June), 87-101.
Aggarwal, P., & Law, S. (2005). Role of Relationship Norms in Processing Brand
Information. Journal of Consumer Research, 32(December), 453-464
Aggarwal, P., & Zhang, M. (2006). The Moderating Effect of Relationship Norms. Journal
of Consumer Research, 33(December), 413-419.
Ahluwalia, R., Burnkrant, R. E., & Unnava, H. R. (2000). Consumer Response to Negative
Publicity: The Moderating Role of Commitment. Journal of Marketing Research,
37(May), 203-214.
Ainsworth, M. D., & Bowlby, J. (1991). An Ethological Approach to Personality
Development. American Psychologist, 46(April), 331-341.
1 Introduction
32
Albrecht, S. (1996). Crisis Management for Corporate Self-Defense. New York: Amacom.
Anderson, E. (1998). Customer Satisfaction and Word-of-Mouth. Journal of Service
Research, 1(1), 5-17.
Anderson, E. W., Fornell, C., & Lehmann, D. R. (1994). Customer Satisfaction, Market
Share, and Profitability: Findings From Sweden. Journal of Marketing, 58, 53–66.
Arnold, H. J., Feldman, D. C., & Purbhoo, M. (1985). The Role of Social Desirability
Response Bias in Turnover Research. Academy of Management Journal, 28(4),
955−966.
Bagozzi, R. P., & Dholakia, U. (1999). Goal-Setting and Goal-Striving in Consumer
Behavior. Journal of Marketing, 63, 19–32.
Bagozzi, R. P., & Nataraajan, R. (2000). The Year 2000: Looking Forward. Psychology &
Marketing, 17, 1–11.
Barney, J. B., & Hoskisson, R. E. (1990). Strategic Groups, Untested Assertions and
Research Proposals. Managerial and Decision Economics, 11(3), 187–198.
Barsalou, L. W. (1991). Deriving categories to achieve goals. In G. H. Bower (Ed.), The
Psychology of Learning and Motivation: Advances in Research and Theory (Vol.27,
pp. 1–64). New York: Academic Press.
Bauer, H. H. (1991). Unternehmensstrategie und Strategische Gruppen. In K.P. Kistner &R.
Schmidt (Eds.), Unternehmensdynamik. Wiesbaden.
Baumeister, R. F., Stillwell, A. M., & Heatherton, T. (1995). Personal Narratives About
Guilt: Role in Action Control and Interpersonal Relationships. Basic and Applied
Social Psychology, 17, 173-198.
1 Introduction
33
Bello, D. C., & Gilliland, D. I. (1997). The Effect of Output Controls, Process Controls, and
Flexibility on Export Channel Performance. Journal of Marketing, 61(January), 22-
38.
Belonax, J. A. & Javalgi, R. G. (1989). The Influence of Involvement and Product Class
Quality on Consumer Choice Sets. Journal of the Academy of Marketing Science
17(3), 209-216.
Belonax, J. A., & Mittelstaedt, R. A. (1978). Evoked Set Size as a Function of Number of
Choice Criterion and Information Variability. Advances in Consumer Research, 5, 48-
51.
Bem, D. J. (1972). Self-Perception Theory. In L. Berkowitz (Ed.), Advances in Experimental
Social Psychology (Vol. 6, pp. 1-62). New York: Academic Press.
Bendapudi, N., & Berry, L. L. (1997). Customers’ Motivations for Maintaining Relationships
with Service Providers. Journal of Retailing, 71(3), 223-247.
Berman, B. (1999). Planning for the Inevitable Product Recall. Business Horizons, 42(2), 69
– 78.
Bettman, J. R. (1979). An Information Processing Theory of Consumer Choice. Reading,
MA: Addison-Wesley.
Blattberg, R. C., & Deighton, J. (1991). Interactive Marketing: Exploiting the Age of
Addressability. Sloan Management Review (Fall), 5-14.
Bloemer, J. M. M., & Kasper, H. D. P. (1995). The Complex Relationship Between
Consumer Satisfaction and Brand Loyalty. Journal of Economic Psychology, 16, 311-
329.
Bolton, R. (1998). A Dynamic Model of the Duration of the Customer’s Relationship with a
Continuous Service Provider: The role of satisfaction. Marketing Science, 17, 45–65.

1 Introduction
34
Bolton, R., & Drew, J. (1991). A Longitudinal Analysis of the Impact of Service Changes on
Customer Attitudes. Journal of Marketing, 55(1), 1-9.
Boon, S. D., & Holmes, J. G. (1999) Interpersonal Risk and the Evaluation of Transgressions
in Close Relationships. Personal Relationships, 6, 151-168.
Boulding, W., Kalra, A., Staelin, R., & Zeithaml, V. (1993). A Dynamic Process Model of
Service Quality: From Expectations to Behavioral Intentions. Journal of Marketing
Research, 30(February), 7-27.
Brisoux, J. E., & Laroche, M. (1980). A Proposed Consumer Strategy of Simplification for
Categorizing Brands. In J. D. Sumney & R. D. Taylor (Eds.), Evolving Marketing
Thought for 1980. Proceedings of the Annual Meeting of the Southern Marketing
Association. Carbondale. IL: Southern Marketing Association.
Brodie, R., Coviello, N., Brookers, R.W., & Little, V. (1997). Towards a Paradigm Shift in
Marketing? An Examination of Current Marketing Practices. Journal of Marketing
Management, 13(5), 383-406.
Brown, D.E. (1991). Human Universals. New York: McGraw Hill.
Cadotte, E., Woodruff, R., & Jenkins, R. (1987). Expectation and Norms in Models of
Consumer Satisfaction. Journal of Marketing Research, 24(3), 305-314.
Campo, K., Gijsbrechts, E., & Nisol, P. (2000). Towards Understanding Consumer Response
to Stock-Outs. Journal of Retailing, 76(Summer), 219-242.
Cannon, J. P., Achrol, R. S., & Gundlach, G. T. (2000). Contracts, Norms, and Plural Form
Governance. Journal of the Academy of Marketing Science, 28(Spring), 180-194.
Cannon, J. P., & Homburg, C. (2001). Buyer-Supplier Relationships and Customer Firm
Costs. Journal of Marketing, 65 (January), 29-43.

1 Introduction
35
Carver, C. S., & Scheier, M. F. (1998). On the Self-Regulation of Behavior. Cambridge, UK:
Cambridge University Press.
Chaiken, S. (1987). The Heuristic Model of Persuasion. In M. P. Zanna, & J. M. Olson, & C.
P. Herman (Eds.), Social influence: The Ontario Symposium (Vol. 5, pp. 3-39).
Hillsdale, NJ: Erlbaum.
Chaiken, S., Liberman, A., & Eagly, A. H. (1989). Heuristic and Systematic Information
Processing Within and Beyond the Persuasion Context. In J. S. Uleman & J. A. Bargh
(Eds.), Unintended Thought (pp. 212–252). New York: Guilford Press.
Chakravarti, A., & Janiszewski, C. (2003). The Influence of Macro-Level Motives on
Consideration Set Composition in Novel Purchase Situations. Journal of Consumer
Research, 30, 244–258.
Chisholm, S. J. (1998). Coping With Minority Crises. Advertising Age, 69(April 6), 24.
Clark, M. S. & Mills, J. (1993). The Difference between Communal and Exchange
Relationships: What It Is and Is Not. Personality and Social Psychology Bulletin,
19(December), 684–91.
Cleeren, K., Dekimpe, M. G., & Helsen, K. (2006). Weathering Product Harm Crises.
FETEW Research Report MO_0611 K.U.Leuven.
Clow, K. E., Kurtz, D. L., & Ozmet, J. (1998). A Longitudinal Study of the Stability of
Consumer Expectations of Services. Journal of Business Research, 42(1), 63-73.
Conner, M., Sparks, P. Povey, R., James, R., & Shepherd, R. (1996). Attitude-Intention-
Behavior Links: Moderating Role of Attitudinal Ambivalence. Paper presented at the
11th General Meeting of the European Association of Experimental Social
Psychology, Gmünden, Austria.
Cool, K., & Schendel, D. (1988). Performance Differences Among Strategic Group
Members. Strategic Management Journal 9(3), 207-223.
1 Introduction
36
Coombs, W. T. (2000). Designing Post-Crisis Messages: Lessons for Crisis Response
Strategies. Review of Business, 21(Fall), 37-41.
Cooper, L. G., & Inoue, A. (1996). Building Market Structures from Consumer Preferences.
Journal of Marketing Research, 33(3), 293–306.
Corey, S. M. (1937). Professional Attitudes and Actual Behavior. Journal of Educational
Psychology, 28(1), 271-280.
Czepiel, J. A., & Rosenberg, L. J. (1977). Consumer satisfaction: concept and measurement.
Journal of the Academy of Marketing Science, 5(4), 403-411 11.
Dant, R. P., & Schul, P. L. (1992). Conflict Resolution Processes in Contractual Channels of
Distribution. Journal of Marketing, 56(January), 38-54.
Dawar, N., & Pillutla, M. M. (2000). Impact of Product Harm Crises on Brand Equity: The
Moderating Role of Consumer Expectations. Journal of Marketing Research, 37(2),
215 – 226.
Day, R., & Landon, E. L. (1977). Toward a Theory of Consumer Complaining Behavior. In:
A. G. Woodside, J. N. Sheth, & P. Bennett (Eds.), Consumer and Industrial Buying
(pp. 425 -437). North-Holland: Elsevier.
Day, D. L., DeSarbo, W. S., & Oliva, T. A. (1987). Strategy Maps: A Spatial Representation
of Intra-Industry Competitive Strategy. Management Science, 33(12): 1534-1551.
Davies, G., Chun, R., da Silva, R. V., & Roper, S. (2003). Corporate Reputation and
Competitiveness. Human Relations, 30(1), 95 – 107.
De Alessi, L., & Staaf, R. J. (1994). What Does Reputation Really Assure? The Relationship
of Trademarks to Expectations and Legal Remedies. Economic Inquiry, 32(July), 477-
485.

1 Introduction
37
Deighton, J. (1996). The Future of Interactive Marketing. Harvard Business Review,
(November-December), 151-152.
DeSarbo, W. S., & Jedidi, K. (1995). The Spatial Representation of Heterogeneous
Consideration Sets. Marketing Science, 14(3): 326-342.
Doney, P. M., & Cannon, J. P. (1997). An Examination of the Nature of Trust in Buyer-Seller
Relationships. Journal of Marketing, 61(April), 35-51.
Dwyer, F. R., Schurr, P.H., & Oh, S. (1987). Developing Buyer-Seller Relationships. Journal
of Marketing, 51(April), 11-27.
Eagly, A. H., & Chaiken, S. (1993). The Psychology of Attitudes. Fort Worth, TX: Hartcourt,
Brace, Jovanovich.
Erdem, T., & Swait, J. (2004). Brand Credibility, Brand Consideration, and Choice. Journal
of Consumer Research, 31(June), 191-198.
Everelles, S., & Levitt, C. (1992). A Comparison of Current Models of Consumer
Satisfaction/Dissatisfaction. Journal of Consumer Satisfaction, Dissatisfaction, and
Complaining Behavior, 5, 104-114.
Ferguson, T. D., Deephouse, D. L., & Ferguson, W. L. (2000). Do Strategic Groups Differ in
Reputation? Strategic Management Journal 21(12), 1195-1214.
Finn A., & Louviere J. (1990). Shopping-Center Patronage Models: Fashioning a
Consideration Set Segmentation Solution. Journal of Business Research 21(3), 259-
275.
Fiegenbaum, A., & Thomas, H. (1990). Strategic Groups and Performance - the United-
States Insurance Industry, 1970-84. Strategic Management Journal 11(3): 197-215
Fiske, A. P. (1991). Structures of Social Life: The Four Elementary Forms of Human
Relations. New York: Free Press

1 Introduction
38
Fiske, S. T., & Taylor, S. E. (1991). Social Cognition. New York: McGraw Hill.
Folkes, V. (1984). Consumer Reactions to Product Failure: An Attributional Approach.
Journal of Consumer Research, 10(4), 398-409.
Folkes, V. (1988). Recent Attribution Research in Consumer Behavior: A Review and New
Directions. Journal of Consumer Research, 14(4), 548-565.
Fong, G. T., & Markus, H. (1982). Self-Schemas and Judgments About Others. Social
Cognition, 1(3), 191– 204.
Fornell, C. (1992). A National Customer Satisfaction Barometer: The Swedish Experience.
Journal of Marketing, 56(1), 6-21.
Fornell, C., Johnson, M., Anderson, E., Cha, J., & Bryant, B. (1996). The American
Customer Satisfaction Index: Nature, Purpose and Findings. Journal of Marketing,
60(4), 7-18.
Fournier, S. & Brasel, S. A. (2002). Making Good of Doing Bad : Negotiating Transgressions
in Consumer Brand-Relationships. Advances in Consumer Research, 102-104.
Fournier, S., Dobscha, S., & Mick, D. (1998). Preventing the Premature Death of
Relationship Marketing. Harvard Business Review, 76(1), 42-51.
Fournier, S., & Mick, D. G. (1999). Rediscovering Satisfaction. Journal of Marketing, 63(4),
5-23.
Gassenheimer, J. B., Calantone, R. J., & Scully, J. I. (1995). Supplier Involvement and
Dealer Satisfaction: Implications for Enhancing Channel Relationships. Journal of
Business & Industrial Marketing, 10(Spring), 7-19.
Ganesan, S. (1994). Determinants of Long-Term Orientation in Buyer-Seller Relationships.
Journal of Marketing, 58(April), 1-19.
1 Introduction
39
Ganesh, J., Arnold, M. J., & Reynolds, K. E. (2000). Understanding the Customer Base of
Service Providers: An Examination of the Differences Between Switchers And
Stayers. Journal of Marketing, 64(July), 65−87.
Giering, A. (2000). Der Zusammenhang zwischen Kundenzufriedenheit und Kundenloyalität.
Eine Untersuchung moderierender Effekte. Wiesbaden: Gabler-Verlag.
Gilmore, G. W. (1919). Animism. Boston: Marshall Jones.
Goldfarb, A. (2006). The Medium-Term Effects of Unavailability. Quantitative Marketing
and Economics, 4(June), 143-171.
Gronhaug, K. (1973). Some Factors Influencing the Size of a Buyer’s Evoked Set. European
Journal of Marketing, 7, 232-241.
Gronhaug, K., & Troye, S. V. (1983). Exploring the Content of the Evoked Set in Car
Buying. European Research, 11, 98-104.
Grönroos, C. (1994). From Marketing Mix to Relationship Marketing: Towards a Paradigm
Shift in Marketing. Management Decision, 32(2), 4-20.
Grover, R., & Srinivasan, V. (1987). A Simultaneous Approach to Market Segmentation and
Market Structuring. Journal of Marketing Research, 24(2), 139–153.
Gundlach, G., Achrol, R. S. & Mentzer, J. T. (1995). The Structure of Commitment in
Exchange. Journal of Marketing, 59(January), 78-92.
Hadfield, G. K. (1990). Problematic Relations: Franchising and the Law of Incomplete
Contracts. Stanford Law Review, 42, 927-992.
Hale, J. E., Dulek, R. E., & Hale, D. P. (2005). Crisis Response Communication Challenges.
Journal of Business Communication, 42(April), 112-134.

1 Introduction
40
Hatten K. J., & Hatten M. L. (1987). Strategic Groups, Asymmetrical Mobility Barriers and
Contestability. Strategic Management Journal 8(4), 329–342.
Haugland, S. A. (1996). Factors Influencing the Duration of International Buyer-Seller
Relationships. Proceedings of the 1996 International Research Conference on
Relationship Marketing, Berlin, 221-224.
Hauser, J. R., & Wernerfelt, B. (1990). An Evaluation Cost Model of Consideration
Sets. Journal of Consumer Research, 16(4), 393- 407.
Heide J., & John, G. (1990). Alliances in Industrial Purchasing: The Determinants of Joint
Action in Buyer-Supplier Relationships. Journal of Marketing Research,
27(February), 24-36.
Heide J., & John, G. (1992). Do Norms Matter in Marketing Relationships?. Journal of
Marketing, 56(April), 32-44.
Herr, P. M., Kardes, F. R., & Kim, J. (1991). Effects of Word-of-Mouth and Product
Attribute Information on Persuasion. An Accessibility-Diagnosticity Perspective.
Journal of Consumer Research, 17 (4), 454-462
Heide, J. B., & Miner, A. S. (1992). The Shadow of the Future: Effects of Anticipated
Interaction and Frequency of Contact on Buyer–Seller Cooperation. Academy of
Management Journal, 35(2): 265–91
Heskett, J. L., Jones, T. O., Loveman, G. W., Sasser, W.E., & Schlesinger, L.A. (1994).
Putting the Service-Profit Chain to Work. Harvard Business Review, 72(2), 164-174.
Hinde, R. A. (1976). On Describing Relationships. Journal of Child Psychology and
Psychiatry and Allied Disciplines, 17(January), 1–19.
Hodgkinson G. P. (1997). The Cognitive Analysis of Competitive Structures: a Review and
Critique. Human Relations, 50(6), 625-654.

1 Introduction
41
Holden, S. J. (1993). Understanding Brand Awareness: Let Me Give You a C(l)ue. Advances
in Consumer Research, 20, 383-388.
Homburg, C., & Bruhn, M. (2005). Kundenbindungsmanagement – Eine Einführung in die
theoretischen und praktischen Problemstellungen. In M. Bruhn & C. Homburg (Eds.),
Handbuch Kundenbindungsmanagement, 6. Aufl. (pp. 3-37). Wiesbaden: Gabler-
Verlag.
Homburg, C., Hoyer, W., & Stock-Homburg, R. (2007). How to Get Customers Back?
Insights Into Customer Relationship Revival Activities. Journal of the Academy of
Marketing Science, 35(4), 461-474.
Homburg, C., Koschate, N., & Hoyer, W. D. (2005). Do Satisfied Customers Really Pay
More? A Study of the Relationship Between Customer Satisfaction and Willingness to
Pay. Journal of Marketing, 69(2), 84-96.
Homburg, C., & Stock-Homburg, R. (2006). Theoretische Perspektiven zur
Kundenzufriedenheit. In C. Homburg (Ed.), Kundenzufriedenheit, 6. Aufl. (17- 51).
Wiesbaden: Gabler-Verlag.
Howard, J. A. (1977). Consumer Behavior: Application of Theory. New York: McGraw-Hill.
Howard, J. A., & Sheth, J. N. (1969). The Theory of Buyer Behavior. New York:
John Wiley.
Hovland, C. I. (1959). Reconciliating Conflicting Results Derived from Experimental and
Survey Studies of Attitude Change. American Psychologist, 14, 8-17.
Hovland, C. I., Lumsdaine, A. A., & Sheffield, F. D. (1949). Experiments on Mass
Communication. Princeton, NJ: Princeton University Press.
Hunt, M. S. (1972). Competition in the Major Home Appliance Industry, 1960-1970.
Unpublished Doctoral Dissertation, Harvard University.
1 Introduction
42
Hyman, H. H., & Sheatsley, P. B. (1947). Some Reasons Why Information Campaigns Fail.
Public Opinion Quarterly, 11, 412-423.
Ivens, B. S., & Blois, K. J. (2004). Relational Exchange norms in marketing: a critical review
of Macneil’s contribution. Marketing Theory, 4(3), 239-263.
Ivens, B.S. (2006). Norm-Based Relational Behaviours: Is There an Underlying Dimensional
Structure? Journal of Business & Industrial Marketing, 21(2), 94 – 105
Jap, S. D. & Ganesan, S. (2000). Control Mechanisms and the Relationship Life Cycle:
Implications for Safeguarding Specific Investments and Developing Commitment.
Journal of Marketing Research, 37(May), 227-245.
Jarvis, L. P., & Wilcox, J. B. (1973). Evoked Set Size - Some Theoretical Foundations and
Empirical Evidence. In T. V. Greer (Ed.), Combined Proceedings, American
Marketing Association, 236-240.
Jacoby, J., & Chestnut, R. W. (1978). Brand Loyalty: Measurement and management. New
York : Wiley.
Jarrell, G. & Peltzman, S. (1985). The Impact of Product Recalls on the Wealth of Sellers.
Journal of Political Economy, 93(June), 512-536.
Johar, G. V. (2005). The Price of Friendship: When, Why, and How Relational Norms Guide
Social Exchange Behavior. Journal of Consumer Psychology, 15(1), 22-27.
Johar, G. V., Sengupta, J., & Aaker, J. (2005). Two Roads to Updating Brand Personality
Impressions: Trait versus Evaluative Inferencing. Journal of Marketing Research,
42(4), 458-469.
Johnson, J. L. (1999). Strategic Integration in Industrial Distribution Channels: Managing the
Interfirm Relationship as a Strategic Asset. Journal of the Academy of Marketing
Science, 27(Winter), 4-18.
1 Introduction
43
Jonas, K., Diehl, M. &, Brömer, P. (1997). Effects of Attitude Ambivalence on Information
Processing and Attitude-Intention Consistency. Journal of Experimental Social
Psychology, 33(March), 190–210.
Jones, T. O., & Sasser, W. E. (1995). Why Satisfied Customers Defect. Harvard Business
Review, 73(6), 88−99.
Kahneman, D., & Miller, D. T. (1986). Norm Theory: Comparing Reality to Its Alternatives.
Psychological Review, 93(2), 136-153.
Kahneman, D., & Tversky, A. (1973). On the Psychology of Prediction. Psychological
Review, 80(4), 237-251.
Kamakura, W. A., Mittal, V., de Rosa, F., & Mazzon, J. A. (2002). Assessing the Service
Profit Chain. Marketing Science, 21, 294– 317.
Kamins, M. A., Folkes, V. S. & Perner, L. (1997). Consumer Responses to Rumors: Good
News, Bad News. Journal of Consumer Psychology, 6(2), 165-187.
Kardes, F. R. (1986). Effects of Initial Product Judgments on Subsequent Memory-Based
Judgments. Journal of Consumer Research, 13, 1–11.
Kaufman, P. J., & Stern, L.W. (1988). Relational Exchange Norms, Perceptions of
Unfairness, and Retained Hostility in Commercial Litigation. Journal of Conflict
Resolution, 32(September), 534-552.
Keaveney, S. M. (1995). Customer Switching Behavior in Service Industries — An
Exploratory-Study. Journal of Marketing, 59(2), 71−82.
Ketchen D. J., Thomas, J. B., & Snow, C. C. (1993). Organizational Configurations and
Performance: A Comparison of Theoretical Approaches. Academy of Management
Review 36(6), 1278-1313.

1 Introduction
44
Kiesler, C. A. (1968). Commitment. In P.A. Abelson et al. (Eds.), Theories of Cognitive
Consistency: A Source Book (pp. 448-455). Chicago, IL: Rand McNally.
Kim, K. (2000). On Interfirm Power, Channel Climate, and Solidarity in Industrial
Distributor-Supplier Dyads. Journal of the Academy of Marketing Science,
28(Summer), 388-405.
Klein, J., & Dawar, N. (2004). Corporate Social Responsibility and Consumers’ Attributions
and Brand Evaluations in a Product-Harm Crisis. International Journal of Research in
Marketing, 21(September), 203-217.
Kotler, P. (1997). Marketing Management, 7th ed. Englewood Cliffs, NJ: Prentice-Hall.
Krosnick, J. A. & Petty, R. E. (1995). Attitude strength: An overview. In R. E. Petty & J. A.
Krosnick (Eds.), Attitude strength: Antecedents and consequences (pp. 1–24).
Mahwah, NJ: Erlbaum.
Kumkale, G. T., & Albaraccin, D. (2004). The Sleeper Effect in Persuasion: A Meta-Analytic
review. Psychological Bulletin, 130(1), 143-172.
Kurzbard, G., & Siomkos, G. J. (1992). Crafting a Damage Control Plan: Lessons from
Perrier. Journal of Business Strategy, 13(March/April), 39-43.
Lastovicka, J. L., & Gardner, D. M. (1978). Components of Involvement. In J. C. Maloney &
B. Silverman (Eds.), Attitude Research Plays for High Stokes (pp. 53-73). Chicago:
American Marketing Association.
Laufer, D., & Coombs, W. T. (2006). How Should a Company respond to a Product Harm
Crisis? The Role of Corporate Reputation and Consumer-Based Cues. Business
Horizons, 49, 379-385.
Laufer, D., Gillespie, K., McBride, B., & Gonzalez, S. (2005). The Role of Severity in
Consumer Attributions of Blame: Defensive Attributions in Product Harm Crises in
Mexico. Journal of International Consumer Marketing, 17(2/3), 33 – 50.
1 Introduction
45
LaBarbera, P., & Mazursky, D. (1983). A Longitudinal Assessment of Consumer
Satisfaction/Dissatisfaction: The Dynamic Aspect of the Cognitive Process. Journal
of Marketing Research, 20(4), 394-404.
LaPiere, R. (1934). Attitudes Versus Actions. Social Forces, 13, 230-237.
Laroche, M., & Toffoli, R. (1999). Strategic Brand Evaluations Among Fast-Food
Franchises. A Test of Two Frameworks. Journal of Business Research, 45(2), 221–
233.
Levy, S. J. (1985). Dreams, Fairy Tales, Animals, and Cars. Psychology & Marketing,
2(Summer), 67-81.
Lipset, S. M. (1975). Social Structure and Social Change. In P. M. Blau (Ed.), Approaches to
the Study of Social Structure. New York: The Free Press.
Lusch, R. F., & Brown, J. R. (1996). Interdependency, Contracting, and Relational Behavior
in Marketing Channels. Journal of Marketing, 60(October), 19-38.
Lussier, D.A., & Olshavsky, R.W. (1979). Task Complexity and Contingent Processing in
Brand Choice. Journal of Consumer Research, 6(2), 154–165.
Macneil, I. R. (1974). The Many Futures of Contracts. Southern California Law Review,
47(September), 691-816.
Macneil, I. R. (1978). Contracts: Adjustment of Long-Term Economic Relations Under
Classical, Neoclassical, and Relational Contract Law. Northwestern University Law
Review, 72, 854-905.
Macneil, I. R. (1983). Values in Contract: Internal and External. Northwestern University
Law Review, 78, 340-418
Macneil, I. R. (1985). Relational Contract: What We Do Know and What We Do Not Know.
Wisconsin Law Review, 3, 483-525.

1 Introduction
46
Maddox, R. N., Gronhaug, K., Homans, R. E., & May, F. E. (1978). Correlates of
Information Gathering and Evoked Set Size for new Automobile Purchases in Norway
and the U.S. Advances in Consumer Research, 5, 167-170.
Maheswaran, D. & Chaiken, S. (1991). Promoting Systematic Processing in Low-
Involvement Settings: Effect of Incongruent Information on Processing and Judgment.
Journal of Personality and Social Psychology, 61(July), 13–25.
Marconi, J. (1997). Crisis Marketing: When Bad Things Happen to Good Companies.
Chicago: American Marketing Association.
Marketing News (1995). Consumers Eager to Know Values that Guide Business Decisions
(11/06/05).
Mascarenhas B., & Aaker D. A. (1989). Mobility Barriers and Strategic Groups. Strategic
Management Journal ,10(5), 475–485.
May, F. E., & Homans, R. E. (1977). Evoked Set Size and the Level of Information
Processing in Product Comprehension and Choice Criteria. Advances in Consumer
Research, 4, 172-177.
McDougall, W. (1911). Body and Mind: A History and Defense of Animism. New York:
Macmillan.
McGee, J., & Thomas, H. (1986). Strategic Groups: Theory, Research and Taxonomy.
Strategic Management Journal, 7(2): 141-160.
McGraw, A. P., & Tetlock, P.E. (2005). Taboo Trade-Offs, Relational Framing, and the
Acceptability of Exchanges. Journal of Consumer Psychology, 15(1), 2-15.
McLoughlin, D., & De Bourca, S. (1996). When is a Relationship Really a Relationship?
(When Do Organizations and Consumers Engage in Long Term Interactive
Relationships?). In H. G. Gemünden, T. Ritter, & A. Walter (Eds.), Interaction,

1 Introduction
47
Relationships and Networks, Proceedings of the 12th International Conference on
Industrial Marketing and Purchasing, Vol. 2 (pp. 1013-1026). Karlsruhe.
McNamara, G. M., Deephouse, D. L., & Luce, R. A. (2003). Competitive Positioning Within
and Across a Strategic Groups Structure: the Performance of Core, Secondary, and
Solitary Firms. Strategic Management Journal 24(2), 161-181.
McNamara, G. M., Luce, R. A., & Tompson, G. H. (2002). Examining the Effect of
Complexity in Strategic Group Knowledge Structures on Firm Performance. Strategic
Management Journal 23(2), 153-170.
Mervis, C. B., & Rosch, E. (1981). Categorization of Natural Objects. Annual Review of
Psychology, 32, 89–115.
Meyers-Levy, J., & Tybout, A. (1997). Context Effects at Encoding and Judgment in
Consumption Settings: The Role of Cognitive Resources. Journal of Consumer
Research, 24(1), 1-15.
Milgrom, P. R., & Roberts, J. (1992). Economics, Organization and Management.
Englewood Cliffs : Prentice Hall.
Mittal, V., & Kamakura, W. A. (2001). Satisfaction, Repurchase Intent, and Repurchase
Behavior: Investigating the Moderating Effect of Customer Characteristics. Journal of
Marketing Research, 38(February), 131–142.
Mittal, V., Kumar, P. & Tsiros, M. (1999). Attribute-Level Performance, Satisfaction and
Behavioral Intentions over Time: A Consumption-System Approach. Journal of
Marketing, 63(2), 88-101.
Mittal, V., Ross, W. T. Jr., & Baldasare, P. M. (1998). The Asymmetric Impact of Negative
and Positive Attribute-Level Performance on Overall Satisfaction and Repurchase
Intentions. Journal of Marketing, 62(January), 33–47.

1 Introduction
48
Mizerski, R. W. (1982). An Attribution Explanation of the Disproportionate Influence of
Unfavorable Information. Journal of Consumer Research, 9(3), 301–310.
Morgan, R. M., & Hunt, S. D. (1994). A Commitment-Trust Theory of Relationship
Marketing. Journal of Marketing, 58(July), 20-38.
Mowen, J. C. (1980). Further Information on Consumer Perceptions of Product Recalls.
Advances in Consumer Research, 7(1), 519 – 523.
Narayana, C. L., & Markin, R. J. (1975). Consumer Behavior and Product Performance: An
Alternative Conceptualization. Journal of Marketing, 39(4), 1-6.
Nath D., & Gruca, T. S. (1997). Convergence Across Alternative Methods for Forming
Strategic Groups. Strategic Management Journal 18(9), 745-760.
Nida, E. A., & Smalley, W. (1959). Introducing Animism. New York: Friendship Press.
Nisbett, R. E., & Ross, L. (1980). Human Inference: Strategies and Shortcomings of Social
Judgment. Englewood Cliffs, NJ: Prentice-Hall.
Nohria, N., & Ghoshal, S. (1990). Differentiated Fit and Shared Values: Alternatives for
Managing Headquarters-Subsidiary Relations. Strategic Management Journal, 15(6),
491-502.
Noordewier, T. G., John, G., & Nevin, J. R. (1990). Performance Outcomes of Purchasing
Arrangements in Industrial Buyer-Vendor Relationships. Journal of Marketing,
54(October), 80-93.
Oliva, T. A., Oliver, R. L., & MacMillan, I. C. (1992). A Catastrophe Model for Developing
Service Satisfaction Strategies. Journal of Marketing, 56(3), 83−95.
Oliver, R. (1997). Satisfaction: A Behavioral Perspective on the Consumer. New York:
McGraw-Hill.
1 Introduction
49
Olshavsky, R. W. (1979). Task Complexity and Contingent Processing in Decision-Making:
A Replication and Extension. Organizational Behavior and Human Performance, 24,
300–316.
Olusoga, S. A., Mokwa, M. P., & Nobel, C. H. (1995). Strategic Groups, Mobility Barriers,
and Competitive Advantage: An Empirical Investigation. Journal of Business
Research 33(2): 153-164.
Osborne, J. D., Stubbart, C. I., & Ramaprasad ,A. (2001). Strategic Groups and Competitive
Enactment: A Study of Dynamic Relationships Between Mental Models and
Performance. Strategic Management Journal 22(5). 435-454
Ostlund, L. E. (1974). Evoked Set Size: Some Empirical Results. In T. V. Greer (Ed.),
Combined Proceedings, American Marketing Association, 226-230.
Ouchi, W. G. (1980). Markets, Bureaucracies, and Hierarchies. Administrative Science
Quarterly, 25(1), 129-141.
Paulssen, M., & Bagozzi, R. P. (2005). A Self-Regulatory Model of Consideration Set
Formation. Psychology & Marketing, 22(10), 785–812.
Paulssen, M. & Fournier, S. (under review). Attachment Security and the Strength of
Commercial Relationships: A Longitudinal Study. Manuscript submitted for
publication.
Payne, J. W. (1976). Task Complexity and Contingent Processing in Decision Making: An
Information Search and Protocol Analysis. Organizational Behavior and Human
Performance, 16, 366-387.
Pearson, C. M., & Mitroff, I. I. (1993). From Crisis Prone to Crisis Prepared: A Framework
for Crisis Management. Academy of Management Executive, 7(1), 48-59.
Pegels, C. C., & Sekar, C. (1989). Determining Strategic Groups Using Multidimensional
Scaling. Interfaces 19(3): 47-57.

1 Introduction
50
Pennings, J. M. E., Wansink, B., & Meulenberg, M. T. G. (2002). A Note on Modeling the
Consumer Reactions to a Crisis: The Case of the Mad Cow Disease. International
Journal of Research in Marketing, 19(March), 91-100.
Peppers, D., & Rogers, M. (1993). The One-to-One Future: Building Relationships One
Customer at a Time. New York: Currency/Doubleday.
Peter, J. P., & Olson, J. C. (2005). Consumer Behavior & Marketing Strategy. McGraw Hill:
Irwin.
Peteraf, M., & Shanley, M. (1997). Getting to Know You: a Theory of Strategic Group
Identity. Strategic Management Journal, 18(Summer Special Issue), 165–186.
Petty, R. E. (1977). A Cognitive Response Analysis of the Temporal Persistence of Attitude
Changes Induced by Persuasive Communications. Doctoral Dissertation, Ohio State
University.
Petty, R. E. (1994). Two Routes to Persuasion: State of the Art. In G. d'Ydewalle, P. Eelen, &
P. Bertelson (Eds.), International Perspectives on Psychological Science, Vol. 2 (pp.
229-247). Hillsdale, NJ: Erlbaum.
Petty, R. E., & Cacioppo, J. T. (1981). Attitudes and persuasion: Central and peripheral
routes to attitude change. New York: Springer.
Petty, R. E. & Cacioppo, J. T. (1986). Communication and Persuasion: Central and
Peripheral Routes to Attitude Change. New York: Springer.
Petty, R. E., Haugtvedt, C. P., & Smith, S. M. (1995). Elaboration as a Determinant of
Attitude Strength: Creating Attitudes that are Persistent, Resistant, and Predictive of
Behavior. In R. E. Petty & J. A. Krosnick (Eds.), Attitude strength: Antecedents and
Consequences (pp. 93–130). Mahwah, NJ: Erlbaum.
1 Introduction
51
Petty, R. E., & Wegener, D. T. (1999). The Elaboration Likelihood Model: Current Status
and Controversies. In S. Chaiken, & Y. Trope (Eds.), Dual Process Theories in Social
Psychology (pp. 41-72). New York: Guilford Press
Plummer, J. (1985). How Personality Makes a Difference. Journal of Advertising Research,
24(December/January), 27-31.
Porac, J. F., Thomas, H., & Baden-Fuller, C. (1989). Competitive Groups as Cognitive
Communities - The Case of Scottish Knitwear. Journal of Management Studies 26(4):
397-416.
Porter, M. E. (1979). The Structure Within Industries and Companies’ Performance. Review
of Economics & Statistics, 61, 214-227.
Prasad, K. V. (1975). Evoked Set size - Personality Correlates and Mediating Variables.
Journal of the Academy of Marketing Science, 3, 272-279.
Pratkanis, A. R., Greenwald, A. G., Leippe, M. R., & Baumgardner, M. H. (1998). In Search
of Reliable Persuasion Effects: III. The sleeper Effect is Dead. Long Live the Sleeper
Effect. Journal of Personality and Social Psychology, 54(2), 203-218.
Priester, J. M., & Petty, R. E. (1995). Source Attributions and Persuasion: Perceived Honesty
as a Determinant of Message Scrutiny. Personality and Social Psychology Bulletin,
21(6), 637-654.
Priester, J. R., & Petty, R. E. (2003). The Influence of Spokesperson Trustworthiness on
Message Elaboration, Attitude Strength, and Advertising Effectiveness. Journal of
Consumer Psychology, 13, 408-421.
Priester, J. R., Wegener, D., Petty, R, & Fabrigar, L. (1999). Examining the Psychological
Process Underlying the Sleeper Effect: The Elaboration Likelihood Model
Explanation. Media Psychology, 1, 27-48.
1 Introduction
52
Pruitt, S. W., & Peterson, R. D. (1986). Security Price Reactions Around Product Recall
Announcements. Journal of Financial Research, 9(2), 113 – 122.
Raden, D. (1985). Strength-Related Attitude Dimensions. Social Psychology Quarterly, 48,
312-330.
Ratneshwar, S., Pechmann, C., & Shocker, A. D. (1996). Goal-Derived Categories and the
Antecedents of Across-Category Consideration. Journal of Consumer Research,
23(3), 240–250.
Read, S. (1983). Once Is Enough: Causal Reasoning From a Single Instance. Journal of
Personality and Social Psychology, 45(2) , 323 – 334.
Reger, R. K., & Huff, A. S. (1993). Strategic Groups a Cognitive Perspective. Strategic
Management Journal 14(2): 103-123.
Reichheld, F., & Sasser, E. (1990). Zero Defections: Quality Comes to Services. Harvard
Business Review 68, 105-111.
Reinartz, W. J., & Kumar, V. (2003). The Impact of Customer Relationship Characteristics
on Profitable Lifetime Duration. Journal of Marketing, 67(1), 77−99
Reingen, P. H., & Kernan, J. B. (1986). Analysis of Referral Networks in Marketing.
Methods and Illustration. Journal of Marketing Research, 23(4), 370-378.
Richins, M. & Bloch, P. (1991). Post-Purchase Product Satisfaction: Incorporating the
Effects of Involvement and Time. Journal of Business Research, 23(2), 145-158.
Robbennolt, J. K. (2000). Outcome Severity and Judgments of Responsibility: A Meta-
Analytic Review. Journal of Applied Psychology, 30(12), 2575 – 2609.
Roberts, J. H., & Lattin, J. M. (1997). Consideration: Review of Research and Prospects for
Future Insights. Journal of Marketing Research, 34(3), 406-410.

1 Introduction
53
Roberts, J., & Nedungadi, P. (1995). Studying Consideration in the Consumer Decision
Process: Progress and Challenges. International Journal of Research in Marketing,
12, 3-7.
Rosch, E. (1975). Cognitive Representation of Semantic Categories. Journal of Experimental
Psychology: General, 104, 192–233.
Rust, R. T., Zeithaml, V. A., & Lemon, K. N. (2004). Customer-Centered Brand
Management. Harvard Business Review, 82(9), 110–118.
Scanzoni, J. (1979). Social Exchange and Behavioral Interdependence. In R. L. Burgess & T.
L. Huston (Eds.), Social Exchange in Developing Relationships (pp. 61-75). New
York : Academic Press.
Schuman, H., & Johnson, M. P. (1976). Attitudes and Behavior. Annual Review of Sociology,
2, 161-207.
Seiders, K., Voss, G. B., Grewal, D., & Godfrey, A. L. (2005). Do satisfied customers buy
more? Examining moderating influences in a retailing context. Journal of Marketing,
69(4), 26−43.
Sengupta, J., & Johar, G.V. (2002). Effects of Inconsistent Attribute Information on the
Predictive Value of Product Attributes: Toward a Resolution of Opposing
Perspectives. Journal of Consumer Research, 29(June), 39-56.
Siddarth, S., Bucklin, R. E., & Morrison, D. G. (1995). Making the Cut: Modeling and
Analyzing Choice Set Restrictions in Scannerpanel Data. Journal of Marketing
Research, 32(3), 255–266.
Siomkos, G. J., & Kurzbard, G. (1994). The Hidden Crisis in Product Harm Crisis
Management. European Journal of Marketing, 28(2), 30 – 41.

1 Introduction
54
Smith, N. C., Thomas, R. J., & Quelch, J. A. (1996). A Strategic Approach to Managing
Product Recalls. The Journal of Product Innovation Management,
74(September/October), 102-112.
Spreng, R., MacKenzie, S., & Olshavsky, R. (1996). A Reexamination of the Determinants of
Consumer Satisfaction. Journal of Marketing , 60(3), 15-32.
Srull, T. K., & Wyer Jr., R. S. (1989). Person Memory and Judgment. Psychological Review,
96(January), 58–83.
Staats, A. W., & Staats, C. K. (1958). Attitudes Established by Classical Conditioning.
Journal of Abnormal and Social Psychology, 57, 37-40.
Stigler, G. J. (1961). The Economics of Information. The Journal of Political Economy, 69,
213-225.
Stockmeyer, J. (1996). Brand in Crisis: Consumer Help for Deserving Victims. Advances in
Consumer Research, 23(1), 429-435.
Szymanski, D., & Henard, D. (2001). Customer Satisfaction: A Meta-Analysis of the
Empirical Evidence. Journal of the Academy of Marketing Science, 29(1), 16-35.
Taylor, S. A., & Baker, T. L. (1994). An Assessment of the Relationship Between Service
Quality and Customer Satisfaction in the Formation of Consumers’ Purchase
intentions. Journal of Retailing, 70, 163–178.
Thomas, H., & Venkatraman, N. (1988). Research on Strategic Groups – Progress and
Prognosis. Journal of Management Studies 25(6), 537-55.
Thompson, M. M., Zanna, M. P., & Griffin, D. W. (1995). Let's Not Be Indifferent About
(Attitudinal) Ambivalence. In R. E. Petty & J. A. Krosnick (Eds.), Attitude Strength:
Antecedents and Consequences (pp. 361–386). Mahwah, NJ: Erlbaum.

1 Introduction
55
Tse, D. K., & Wilton, P. C. (1988). Models of Consumer Satisfaction Formulation: An
Extension. Journal of Marketing Research, 24(August), 204-212.
Tulving, E., & Pearlstone, Z. (1966). Availability Versus Accessibility of Information in
Memory for Words. Journal of Verbal Learning and Verbal Behavior, 5, 381-391
Turpin, D. (2008). Communicating in a Crisis. European Business Forum.
http://www.ebfonline.eu/Article.aspx?ArticleID=74
Tversky, A. & Kahneman, D. (1981). The Framing of Decisions and the Psychology of
Choice. Science, 211(30), 358-453.
Tversky, A. & Kahneman, D. (1991). Loss Aversion in Riskless Choice: A Reference-
Dependent Model. The Quarterly Journal of Economics, 106(4), 1039-1061.
Tybout, A. M., Calder, B. J., & Sternthal, B. (1981). Using Information Processing Theories
to Design Marketing Strategies. Journal of Marketing Research, 18(February), 73-79.
Walls, S. (2003). Relationship Marketing: The Dyadic Bonding Experience between a
Consumer and a Company. Dissertation at the University of Tennessee, Knoxville.
Webster, F. E. (1992). The Changing Role of Marketing in the Corporation. Journal of
Marketing, 56, 1-17.
Weinberger, M. G., & Lepkowska-White, E. (2000). The Influence of Negative Information
on Purchase Behavior. Journal of Marketing Management, 16(June), 465-482.
Weinberger, M. G., Romeo, J. B., & Piracha, A. (1991). Negative Product Safety News:
Coverage, Responses, and Effects. Business Horizons (May/June), 23-31.
Westbrook, R. A., & Reilly, M. D. (1983). Value-Percept-Disparity: An Alternative to the
Disconfirmation of Expectations Theory of Consumer Satisfaction. Advances in
Consumer Research, 10, 256-261.
1 Introduction
56
Wright, P. L., & Barbour, F. (1977). Phased Decision Strategies: Sequels to Initial Screening.
In M. K. Starr, & M. Zeleny (Eds.), North Holland TIMS Studies in the Management
Science: Multiple Criteria Decision Making, 6 (pp. 91-109). Amsterdam: North
Holland Publishing Company.
Yi, Y. (1990). A Critical Review of Consumer Satisfaction. In V. A. Zeithaml (Ed.), Review
of Marketing. Chicago: American Marketing Association.
Zedeck, S., Kafry, D., & Jacobs, R. (1976). Format and Scoring Variations in Behavioural
Expectation Evaluations. Organizational Behavior and Human Performance,
17(October), 171−184.
Zúñiga-Vicente J. A, de la Fuente-Sabate, J. M., & Suarez-Gonzalez, I. (2003). Dynamic of
the Strategic Group Membership-Performance Linkage in Rapidly Changing
Environments. Journal of Business Research 57(12), 1378-1390.

2 When Customers Think Differently
57
2. Article 1: When Customers Think Differently: A Customer-Side Categorization Approach to Strategic Groups
Together with Marcel Paulssen and Richard P. Bagozzi
Published in Marketing Journal for Research and Management, 2(3), 91–104, (2007).
2.1. Abstract
This paper draws upon categorization theory and applies it to segmentation and strategic
group research. In contrast to existing approaches that have investigated the categorizations
of managers and industry experts, we investigate customers’ patterns of brand categorization.
Customer groups defined by their pattern of brand categorization can be conceptualized as
the demand-side counterpart of strategic groups. Characterizing customer segments or
strategic groups by their respective probabilities of brand categorization (brand consideration,
brand neutrality, brand rejection) helps to understand the competitive structure of a market
and preference barriers that exist for brands (i.e., it is very difficult for a firm to enter a
segment/strategic group where its brand is rejected). These preference barriers in effect
represent mobility barriers for firms and are crucial for understanding the dynamics of
competition in a given market. Conceiving brand categorization as a goal-derived
categorization process, we propose and show that product category goals and category-
specific benefits differ across brand categorization segments. Applying our approach in the
automotive industry helps to explain market phenomena that are difficult to account for with
solely a traditional resource based perspective on strategic groups.

2 When Customers Think Differently
58
2.2. Introduction
When Volkswagen launched its luxury-model Phaeton in 2003, it expected annual sales of
15,000 cars in Europe alone. Although most experts rated its technical features (e.g., fit and
finish, comfort, and power) at least equal to rival brands BMW and Mercedes-Benz, VW
failed to sell more than a fifth of what they had expected (Rust/Zeithaml/Lemon 2004). Thus
the question arises why VW was not able to successfully enter the market segment of luxury-
car customers, despite the company’s resources and the demonstrated technical quality of its
product.
There is ample evidence that consumers do not consider all brands in a given market before
making a purchase decision (for a review Roberts/Lattin 1997). Previous empirical work on
how consumers may narrow down attention to a subset of brands out of a larger set of brands
has developed the concept of the consideration set, the set of brands a consumer will consider
in a purchase situation (e.g Nedungadi 1990; Erdem/Swait 2004). The notion of a
consideration set implies a two-stage decision process, with a consideration stage followed by
an evaluation stage. Consumer choices have therefore been conceptualized and modeled as
the outcome of a two-stage process of consideration set formation and conditional brand
choice (e.g., Andrews/Srinivasan 1995; Roberts/Lattin 1991). Since brand consideration is a
precondition for brand evaluation and choice, understanding the consideration stage in the
choice process can be crucial from both a theoretical and a practical perspective.
Consideration set formation has among other things been shown to impact on brand
switching behavior (Sambandam/Lord 1995) as well as to change market share independent
of brand evaluation (Nedungadi 1990). Specifically in today’s highly competitive and
crowded markets, it is likely that many brands may not even get access to consumer
consideration sets (Desai/Hoyer 2000). In the car market of the introductory example aided
brand awareness of new car buyers for most relevant competitors is on a very high level.
Thus getting into the consideration sets of consumers is crucial for marketing success. It is
likely that the Volkswagen Phaeton did not even manage to enter the consideration sets of its
target customer segments. Therefore, the understanding of what determines consideration set
composition is an important research question and can as we will show in this paper be
employed to understand the structure of a market. Building on recent work (e.g.,
Paulssen/Bagozzi 2005; Chakravarti/Janiszewski 2003), who demonstrated that customers’
2 When Customers Think Differently
59
brand consideration can be conceptualized as a goal-derived categorization process, we now
turn to the concept of goal-derived categorization.
2.3. Goal-Derived Categorization
Based on early research on categorization processes (see Mervis/Rosch 1981), Barsalou
(1991) could show that in everyday life people often create and use highly specialized sets of
objects, such as ‘things to eat on a diet’ which he called ‘goal-derived categories’. Like
classic taxonomic categories, goal-derived categories possess a continuum of degrees of
membership ranging from typical members to typical non-members, which has been referred
to as ‘graded structure’ (Rosch 1975; Barsalou 1991). A category can therefore be
conceptualized as a fuzzy set with different degrees of membership and unclear category
boundaries (McCloskey/Glucksberg 1978). Early approaches for modeling consideration set
composition have used the crisp set model and investigated whether an alternative is
considered or not within the choice process (e.g., Roberts/Lattin 1991; Andrews/Srinivasan
1995). Newer approaches have built on the notion that the consideration stage of the choice
process can be conceptualized as a categorization process and investigated varying degrees of
membership (e.g., Viswanathan/Childers 1999, Wu/Rangaswamy 2003). Similar to graded
structure where typical members of a category, unclear members of a category (e.g., is a
duckbill a mammal?) and non-members can be distinguished, frameworks of brand-
categorization with a similar tri-partition into consideration, hold and reject set have been
developed (Laroche/Toffoli 1999; Brisoux/Laroche 1980; Peter/Olson 2005). In addition to
the brands a consumer considers in a choice situation (consideration set), brands that the
consumer clearly rejects (reject set) and brands that for various reasons are neither acceptable
nor unacceptable for choice (hold set) are distinguished. Already Roberts/Lattin (1991) had
proposed that approaches that allow for different degrees of membership would possess
higher process validity and more flexibility. A recent validation study of the Brisoux-Laroche
categorization framework provided support for meaningful differentiation of brands within
the different brand sets on the basis of their market share position. Specifically
Laroche/Toffoli (1999) concluded that simply classifying a brand as being in the
consideration set or not may hide considerable differences that still exist between brands.
Thus the Brisoux-Laroche categorization framework provides a more refined measure of the

2 When Customers Think Differently
60
resulting graded structure of the brand categorization stage of the choice process than a mere
consideration/non-consideration measure.
Concerning the determinants of graded structure for goal-derived categories, Barsalou (1991)
hypothesized that background goals determine ideals, which in turn determine graded
structure. Ideals can be defined as characteristics an exemplar should have in order to satisfy
a goal connected with a category (Barsalou 1985). For the goal-derived category ‘things to
eat on a diet’ an ideal value of the attribute, calories, would be zero. In a consumption
context, these ideals are basically the benefits desired given particular background goals of a
consumer or given a specific usage situation (Desai/Hoyer 2000; Chakravati/Janiszewski
2003). Consequently desired benefits determine graded structure in goal-derived
categorization in a consumption context, that is consideration set formation. Benefits are
defined as the personal value a consumer attaches to product or service attributes
(O’Connor/Sullivan 1995; Srinivasan/Park 1997; Ratneshwar et al. 1999). Thus for the goal
derived category ‘things to eat on a diet’ the benefit, low calories, would be particularly
important and determine the degree of membership for different food products in that
category. A consumer who only attaches a high importance to the benefit ‘low calories’ will
construct a different goal-derived category ‘things to eat on a diet’ than a consumer who
attaches high importance to both the benefits low calories and good taste. The relevance of
benefits themselves is determined by salient background goals associated with the goal-
derived category (e.g., the goal to lose body weight might influence the evaluation of
benefits). We will apply the concept of goal-derived categorization to the consumer context
in order to derive and understand competitive market structure and preference-based mobility
barriers for companies.
2.3.1. Brand Categorization and Market Structure
The brands that comprise an individual’s consideration set are the only one’s that are
seriously scrutinized in a purchase decision. Thus the market for each consumer is restricted
to his consideration set. In a given market consumers categorize brands differently
(Cooper/Inoue 1996). For example a consumer seeking prestige and status in a car might
consider a Porsche or a BMW whereas a Kia would be clearly rejected. In contrast a
consumer, considering cars just as a method of transportation, might consider brands such as
2 When Customers Think Differently
61
Kia or Logan but would reject Porsche or BMW. A market can thus be divided into a certain
number of segments in which consumers consider a distinctive subset of brands
(Cooper/Inoue 1996). Within segments brand categorization is homogenous and across
segments brand categorization is heterogeneous. Thus a market can be divided into K
segments Sk (k = 0, …, K) of size wk, where 1=∑K
k kw that can be conceptualized as latent
types of consumers with homogeneous patterns of brand categorization (De Sarbo/Jedidi
1995). A method to derive these latent consumer types or segments would be a latent class
analysis (see section 6.1). Latent class analysis assumes that customers belong to one or
several a posteriori defined segments. Based on his or her individual pattern of brand
categorization every customer can be assigned with a certain probability to each of the latent
types or market segments.
On an aggregate level each market segment can also be described by the probabilities that
brands are in the consideration, hold or reject set of its respective customers. Competition
between goods and services exist to the extent that potential customers perceive them as
substitutes at a particular purchase occasion (Cooper/Inoue 1996; Siddarth/Bucklin/Morrison
1995). Several researchers have employed consideration sets as measures of perceived
substitutability to understand the competitive structure of a market (e.g., DeSarbo/Jedidi
1995; Finn/Louviere 1990). As Ratneshwar et al. (1999, p. 193) emphasized, consideration
sets ‘… provide competitor information relevant to a comparative assessment of a firm’s
resources and competencies’. This means that brands/firms that are simultaneously
categorized into the consideration set by a particular customer segment possess a high degree
of competition in that group or segment. Market segments based on brand categorization
patterns can therefore yield insight into the competitive relations between companies and
their brands in a given market. Two brands that are considered by a high proportion of
customers in a segment would be intense competitors in that segment. Brands or companies
can be represented in strategic groups – with intense rivalry within groups and lessened
rivalry between groups (Porter 1979). Firms that intensely compete in a particular segment
can potentially be conceived as a strategic group (Bauer 1991). A strategic group is therefore
the supply-side analogue to the demand-side market segment. Grover/Srinivasan (1987)
demonstrated this interrelation by simultaneously inferring strategic groups and market
segments through a latent class analysis of a matrix of brand switching data. From this
perspective, a strategic group is therefore (at least temporarily) sheltered from competition

2 When Customers Think Differently
62
because other competitors cannot readily imitate the mix of product attributes preferred by
customers of a particular segment. That is, customer preferences restrict movements of
companies between strategic groups and can therefore be conceptualized as mobility barriers
for companies. Mobility barriers are structural forces impeding firms from freely changing
their competitive position (Hodgkinson 1997). Mobility barriers are a corollary to the
existence of strategic groups (McGee/Thomas 1986). They can also be conceptualized as a
generalization of the concept of entry barriers, consisting of various factors that prevent
members of one group from transferring or extending their membership to other groups
(Hodgkinson 1997). In order to enter and compete within a new strategic group or segment,
as in the Phaeton example, a company or brand has to move from a position of brand
neutrality (hold set) or even brand rejection (reject set) into the consideration sets of these
new target customers. This represents a mobility barrier that has to be overcome (see also
Mascarenhas/Aaker 1989). Mobility barriers that restrict movements of companies between
strategic groups are the counterpart to preference barriers that restrict the movement of the
individual consumer between segments (Bauer 1991, Hatten/Hatten 1987; Harrigan 1985)
Although the topic of strategic groups has been one of the most active areas of strategic
management research (Peteraf/Shanley 1997; McNamara/Deephouse/Luce 2003) there have
been surprisingly few customer-side approaches to strategic groups (two exceptions are the
studies by Day/DeSarbo/Oliva 1987, and Pegels/Sekar 1989, which are limited in scope).
This is even more surprising when one notes that a customer-side approach to strategic
groups seems a promising path for explaining market outcomes like the mentioned example
of the VW Phaeton. VW apparently was unable to pass the mobility barrier that separated it
from the luxury-car producer group/segment, despite its resources and the product’s
acknowledged technical features. We argue that customers’ brand categorizations determine
the competitive structure of a market and represent mobility barriers for companies
(Mascarenhas/Aaker 1989). In the case of the VW Phaeton, customers’ brand categorization,
in this case ‘rejection’, may have constituted a significant mobility barrier for entering the
luxury car segment. Thus an understanding of customers’ brand categorization processes can
provide further insights into the determinants of a market’s competitive structure and its
underlying mobility barriers. In the next section we develop hypotheses concerning the
determinants of brand categorization for the product category cars.
2 When Customers Think Differently
63
2.4. Hypothesis Development
Individuals use products and brands to cultivate and preserve their identities. Consumer
goods are capable of serving consumers in this way because of the symbolic meaning that is
embedded in them (Belk 1988; Leigh/Gabel 1992; Solomon 1983). Therefore, consumers do
not make consumption choices solely from a product’s utilities, per se, but also based on their
symbolic meanings (Belk 1988). The consumption of symbolic meaning, particularly through
the use of advertising as a cultural commodity, provides individuals with opportunities to
construct, maintain, and communicate identity and social meaning (Elliott 1997).
Communication by symbolic consumption has been thought to be an important part early on
in marketing research (Levy 1959). Consider the example of a Rolex watch: it undoubtedly
communicates the time of day, but apart from that, and supposedly more importantly for
typical Rolex customers, it communicates symbolic issues, such as status and self image. A
number of researchers have suggested that various aspects of products and possessions
contain symbolic meanings and can therefore be used to express a particular self-image
(Bearden/Etzel 1982; Belk 1981; Solomon 1983). In other words, individuals consume
products and brands for their symbolic properties as much as for their functional benefits
(Elliott 1997; Levy 1959). In social psychology self presentation has been defined as the
process through which people try to control the impressions other people form of them. Self-
presentation is a goal-directed conscious or unconscious attempt to influence the perceptions
of other people about a person (Leary 1995). That is if a consumers purchase a brand in a
given product category primarily for its symbolic meaning than they want to consciously
influence the perceptions other people have of them and self-presentation is a salient goal
associated with that particular product category.
In a consumption context desired benefits given particular background goals of a consumer
determine graded structure in brand categorization (Desai/Hoyer 2000;
Chakravati/Janiszewski 2003). Background goals can be as abstract as a terminal value or a
self-ideal. Building on Barsalou’s (1991) research we chose to investigate a middle level of
goal abstractedness that we label product category goal. The scope of a product category goal
typically does not extend much beyond a product category. In light of the above said we want
to investigate how the salience of the goal to use the products of a category for self-

2 When Customers Think Differently
64
presentational purposes determines the relevance of benefits and subsequently brand
categorization. In our empirical study in the product category cars we specifically want to
study the impact of the goal ‘status presentation’. Thus we propose that the salience of the
product category goal ‘status presentation’ determines the relevance of benefits for the
product category, cars. Four important benefits recently found for consumers considering the
purchase of cars are ‘economy’, ‘sporty driving’, ‘comfort’, and ‘safety’ (e.g.,
Paulssen/Bagozzi, 2005). If ‘status presentation’ is a salient goal for a customer when
considering the purchase of a car, then it would be prudent for the product and advertising to
communicate symbolic issues such as status or personality style. Two examples of classic
status symbols in many societies are sporty cars with powerful engines, as well as large,
comfortable roomy cars. Hence, we propose that to the extent that ‘status presentation’ is a
prevalent consumption goal, then the benefits ‘sporty driving’ and ‘comfort’ will be highly
relevant for consumers. Thus,
H1: The salience of the product category goal ‘status presentation’ has a positive
impact on the importance attached to the benefit ‘sporty driving’.
H2: The salience of the product category goal ‘status presentation’ has a positive
impact on the importance attached to the benefit ‘comfort’.
The salience of the goal ‘status presentation’ is however also likely to have a negative impact
on the relevance of certain benefits. Unlike an especially sporty car with a powerful engine or
a large roomy car, a particular car scoring high on economic benefits may not be as well
suited for status differentiation. Specifically, because such attributes as low fuel consumption
or low maintenance cost are not readily visible as a symbol for communicating to others, they
are not well suited to expressing a particular self-image. Furthermore an economic car, for
technical reasons, is usually small, and has an efficient, but low power consumption, and
rather weak engine. Hence, we would expect that for customers with a strong salience of the
goal ‘status presentation’ the benefit ‘economy’ will be perceived to be counter productive.
Therefore,
H3: The salience of the product category goal ‘status presentation’ has a negative
impact on the importance attached to the benefit ‘economy’.

2 When Customers Think Differently
65
What about the benefit ‘safety’? Until quite recently, more expensive and exclusive cars
provided higher levels of safety. But nowadays most cars, even very small ones, provide high
levels of safety, as confirmed in published safety test findings. Therefore, having a safe car
will not necessarily communicate symbolic meaning, such as status. We would thus assume
that the product category goal ‘status presentation’ will have no impact on the relevance a
consumer attaches to safety. Hence,
H4: The salience of the product category goal ‘status presentation’ will have no
impact on the importance attached to the benefit ‘safety’.
Several researchers have employed consideration sets to structure a market (e.g.,
DeSarbo/Jedidi 1995; Finn/Louviere 1990). Cooper/Inoue (1996) proposed that
consideration sets are homogenous within segments and heterogeneous across segments and
that these segments can be conceptualized as strategic groups. Their study employed latent
structure models with the assumption of conditional independence to determine the number
and composition of segments (see also DeSarbo/Jedidi 1995). Other researchers have found
that probabilistic independence of brand consideration exists for the whole market
(Hauser/Wernerfeldt 1989). The present paper follows the proposition of Cooper/Inoue
(1996) that market segments/strategic groups can be conceptualized as latent types of
consumers with homogeneous patterns of brand categorization. Note here that we use brand
categorization, where three brand sets are distinguished, rather than two (the considered and
not considered sets), for brand consideration. The probabilistic independence hypothesis
confirmed by Hauser/Wernerfeldt (1989) essentially states that a market is unstructured or
unpartitioned. All brands in the market compete with each other proportionally to their
market share, and the whole market is one class or segment. That is, the number of segments
equals 1 (c=1). The probabilistic independence hypothesis will be used as a null market
structure hypothesis against which the market structure hypothesis proposed below will be
tested. As a consequence,
H5: Brand consideration is conditionally independent given c classes/segments
with c ≥ 2.
2 When Customers Think Differently
66
To the extent that H5 is confirmed, a number of segments/strategic groups greater than one
will be derived. Based on research on goal-derived categorization, we propose that the
salience of the product category goal ‘status presentation’ determines the relevance of
benefits for the product category cars, which in turn determines the categorization of
particular car brands into ‘consideration’, ‘hold’, or ‘reject sets’. Given that different brand
categorization types exist, these latent types should differ with respect to the salience of the
product category goal and the importance of benefits. Different salience of the product
category goal and different relevance of benefits results in unique patterns of brand
categorization and are consequently the reason for the existence of distinct segments/strategic
groups, where these are defined as latent consumer types with homogenous patterns of brand
categorization. Thus,
H6: The relevance of benefits differs across latent brand categorization types.
H7: The salience of the product category goal ‘status presentation’ differs across
latent brand categorization types.
2.5. Method
2.5.1. Setting
The automotive industry was chosen as an appropriate study context in light of the high
product involvement with strong non-functional attributes and implications (Johnson et. al.
1997) as well as the high decision complexity that characterize automotive purchases relative
to many other goods (Kardes et. al. 1993). Due to these characteristics consideration set
formation constitutes a distinct stage of the decision process and is more deliberative than in
many other product categories (Sambandam/Lord 1995). Given the initial example of the
VW Phaeton and also the fact that the product category, car, is particularly well suited for
symbolic consumption purposes, we consider the automotive market as an appropriate setting
for testing our hypotheses. As explained above, focus on a particular setting is also relevant
for hypothesis specification. Given that we want to investigate brand categorization, we need
to select respondents with purchase experience in that category. Therefore, only respondents
were interviewed who possessed a new (i.e., not previously owned) car purchased within the
2 When Customers Think Differently
67
last four years. This selection was necessary to assure that respondents were familiar with the
product category and could meaningfully answer the brand categorization questions described
below.
2.5.2. Data and Descriptives
A total of 1247 respondents were personally interviewed. The survey was conducted by a
major German market research company. A quota sampling based on car ownership was
employed to select respondents who fulfilled the above mentioned recruitment criteria.
Quotas to recruit respondents (car owners who purchased a new car within the last four years)
were based on the percentage of brand registrations within the last four years prior to the
survey. The characteristics of the sample can be described as follows: people interviewed
were on average 41.8 years old (SD=12.6), living on average in a 2.6 person household
(SD=1.1) and having on average 0.7 children (SD=0.87) and 1.5 cars (SD=0.62).
2.5.3. Construct Operationalization
Brand Categorization: We applied the framework for brand categorization validated by
Laroche/Toffoli (1999). Respondents had to check brands from a list of 25 brands that they
knew (awareness set). They were asked: ‘Which of the brands you know would you consider
in a future purchase?’ (consideration set), and ‘Which model do you think of in particular?’
Respondents were then asked to indicate which of the known brands they would not consider
at all in a future purchase (reject set). To measure uncertainty, the so-called ‘foggy’ set, they
were asked: ‘Which brands are you not sure whether you should consider in a purchase,
because you do not know these brands well enough?’. In the last question of this section,
respondents were asked to check those brands that they knew well enough, but would neither
consider nor reject in a future purchase (hold set).
Benefits: Respondents were asked to rate the importance of 18 different benefits for the
purchase of a new car that were taken from a study in the automotive context by
Paulssen/Bagozzi (2005). The lead-in question was phrased as follows: ‘Suppose you would
buy a brand new car in the next couple of days. What importance would the following aspects
2 When Customers Think Differently
68
have for your personal decision for a new automobile? You can distribute between 1 and 5
points per aspect. The more important an aspect is for you personally, the more points you
should distribute’. The response format was a 5 point scale that ranged from totally
unimportant (1 point) to absolutely important (5 points). We tested the model with the four
benefit dimensions ‘safety’, ‘sporty driving’, ‘comfort’ and ‘economy’, proposed by
Paulssen/Bagozzi (2005) with a confirmatory factor analysis (CFA) for our sample. The fit of
the model was excellent with χ2(15) = 24.54 (p = 0.06), RMSEA = 0.024, and CFI = 1.00.
Thus the four-dimensional benefit model generalizes to our sample and will be employed in
our analyses. Furthermore the four benefit dimensions display discriminant and convergent
validity (see Table 2-8 in Appendix).
Product category goal: Respondents were asked two questions to measure the salience of the
goal ‘status presentation’ in the product category, cars. The questions were phrased in a four-
point Likert format with a scale ranging from ‘I totally agree” to “I totally disagree’. The two
statements to measure the salience of the product category goal ‘status presentation’ were
phrased as follows, ‘For me a car is a means to express my personality and my individuality’
(M = 2.61, SD = 0.97) and ‘The car I drive should express my position in society’ (M = 2.07,
SD = 0.97). All lambda (factor loading) values are significant and substantial in our models.
2.6. Results
In analyzing the data we conducted two major steps. First we tested hypothesis 5 and
conducted a latent class analysis with brand categorization data. Since we had sparse data
additional parametric bootstrap simulations were conducted to decide on the number of
classes. In a second step we performed multi-group analysis. As a precondition for
meaningful group comparisons we assessed tau-equivalence of constructs across strategic
groups. Then we tested the relations between product category goal and benefits as proposed
in hypothesis 1 to hypothesis 4 and whether these relations are invariant across strategic
groups. In a last step of multi-group analysis we tested whether the latent means of product
category goal and benefits differ across strategic groups as proposed in hypothesis 6 and
hypothesis 7.
2 When Customers Think Differently
69
2.6.1. Latent Class Analysis with Brand Categorization
First we test the proposition that segments/strategic groups can be conceptualized as groups
of customers with homogenous patterns of brand categorization by use of a latent class
analysis. Forman (1984) recommends as a minimum requirement for latent class analysis that
the number of cases should be greater than the number of cells. If we distinguish the five
categories or sets from the Brisoux/Laroche (1980) framework of brand categorization, then
the minimum requirement of a ratio of one between cells and cases would allow for only four
brands as indicators of the latent market structure variable. From a practical point of view, the
differences of brands in the unawareness set, foggy set, and hold set are not large. Brands in
these three sets are neither considered nor rejected in a purchase decision. The position
against those brands is neutral, although for different reasons, because they are unknown
(unawareness set), not known well enough (foggy set), or because they are neither acceptable
nor unacceptable for a purchase (hold set). In principle it would be desirable to use brand
categorization indicators with five levels. But in order to include a reasonable number of
brands as indicators of the latent market structure variable in the model, the required sample
size would be prohibitively large. Therefore in the present study, the number of levels is
reduced to three, and the unawareness set, hold set, and foggy set are treated as one single
level of brand categorization. A contingency table with 6 indicators each measured at three
levels would contain 729 cells. Thus the six brands with the highest share of brand
consideration were retained for the analysis. These brands were Audi, BMW, Ford,
Mercedes-Benz, Opel, and Volkswagen. The restriction to six brands as observed indicators
of the latent class variable will not deliver a complete picture of the market, per se. However,
the purpose of this analysis is to demonstrate the applicability of our approach to the analysis
of strategic groups. Cases with missing values were deleted. The remaining 836 cases satisfy
the above mentioned minimum requirement. Since 411, or 56% of the cells in the table were
empty we have sparse data. Table 2-1 shows the non-bootstrapped fit measures for an
exploratory latent class analysis with different class sizes.

2 When Customers Think Differently
70
Table 2-1: Non-Bootstrapped Measures of Fit for the Latent Class Model
Model Df G2 P RC P χ2 p AIC BIC
1 Class 716 1852 0.00 2338 0.00 3112 0.00 10880 10993
2 Class 703 1308 0.00 1457 0.00 1756 0.00 10338 10456
3 Class 690 929 0.00 960 0.00 1098 0.00 9985 10165
4 Class 679 813 0.00 857 0.00 1000 0.00 9894 10135
5 Class 670 713 0.09 729 0.039 841 0.00 9821 10124
6 Class 659 641 0.60 657 0.43 757 0.00 9774 10139
Test of Hypothesis 5: One hundred samples of random starting values were evaluated prior to
each model estimation to avoid local optima. Again the one-class model is essentially a test
of the hypothesis that brand categorization of the 6 regarded brands is probabilistically
independent. Considering the degree of sparseness in our data a test of this hypothesis with
chi-square based statistics is problematic (Langeheine/Pannekoek/van de Pol 1996).
However, the values of the chi-square based goodness of fit measures show that the
independence model does not fit the data at all. The five-class model is the first model where
the log-likelihood ratio (G2) is non-significant, and the Read-Cressie (RC) statistic is only
marginally significant. For the six-class-model, both statistics are highly non-significant. The
Pearson’s chi-square test is, for both the five- and the six-class models, also non-significant.
The BIC favors a five-class model, whereas the AIC favors a six-class model.
Parametric bootstrap simulations were conducted to get a bootstrapped α (see Table 2-2).
Following the recommendation of Langeheine/van de Pol/Pannekoek (1997), 1000 bootstrap
samples were evaluated. Bootstrap α’s for the three statistics already show an adequate fit for
the five-class model. Thus, considering parsimony and fit, the five-class model is favored,
and H5 can be accepted and the null market structure hypothesis can be rejected. The
percentage of subjects correctly allocated in the five-class model (85%), and the lambda
measure of association (0.79) confirms the five class solution, compared to the two, three and
four class solution where those values are lower. Predictability is more certain for the five
class solution.
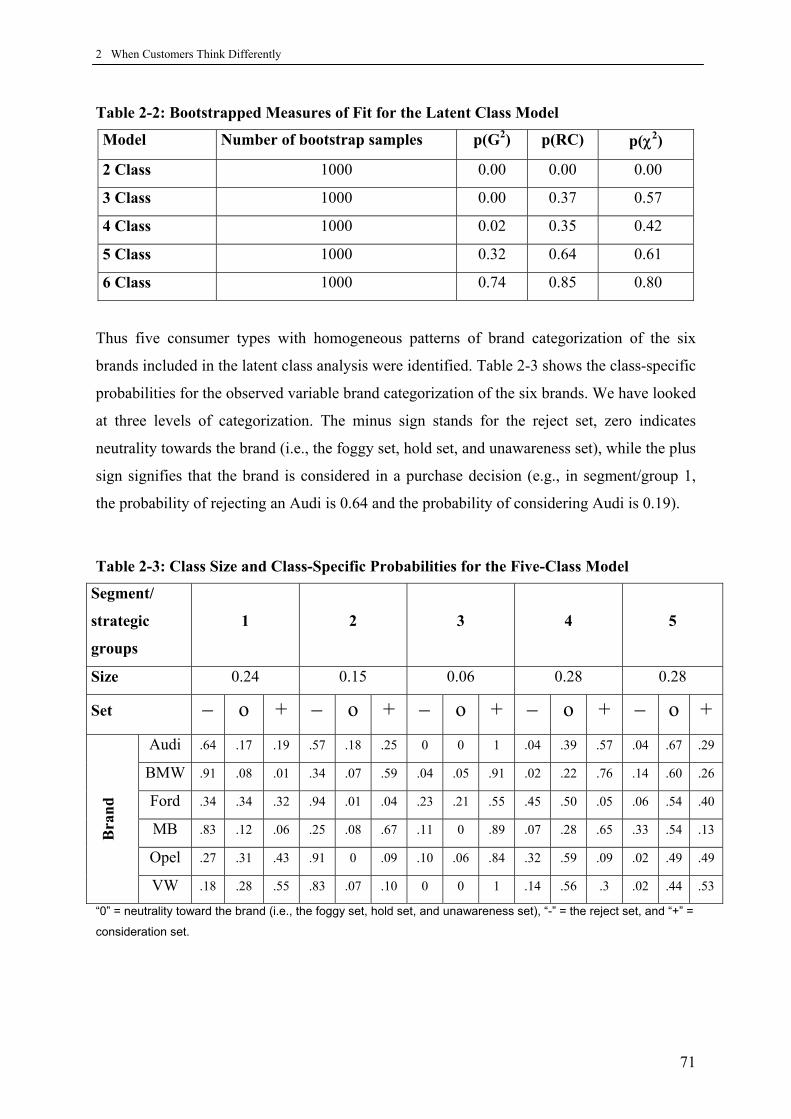
2 When Customers Think Differently
71
Table 2-2: Bootstrapped Measures of Fit for the Latent Class Model
Model Number of bootstrap samples p(G2) p(RC) p(χ2)
2 Class 1000 0.00 0.00 0.00
3 Class 1000 0.00 0.37 0.57
4 Class 1000 0.02 0.35 0.42
5 Class 1000 0.32 0.64 0.61
6 Class 1000 0.74 0.85 0.80
Thus five consumer types with homogeneous patterns of brand categorization of the six
brands included in the latent class analysis were identified. Table 2-3 shows the class-specific
probabilities for the observed variable brand categorization of the six brands. We have looked
at three levels of categorization. The minus sign stands for the reject set, zero indicates
neutrality towards the brand (i.e., the foggy set, hold set, and unawareness set), while the plus
sign signifies that the brand is considered in a purchase decision (e.g., in segment/group 1,
the probability of rejecting an Audi is 0.64 and the probability of considering Audi is 0.19).
Table 2-3: Class Size and Class-Specific Probabilities for the Five-Class Model
Segment/
strategic
groups
1 2 3 4 5
Size 0.24 0.15 0.06 0.28 0.28
Set − o + − o + − o + − o + − o +Audi .64 .17 .19 .57 .18 .25 0 0 1 .04 .39 .57 .04 .67 .29
BMW .91 .08 .01 .34 .07 .59 .04 .05 .91 .02 .22 .76 .14 .60 .26
Ford .34 .34 .32 .94 .01 .04 .23 .21 .55 .45 .50 .05 .06 .54 .40
MB .83 .12 .06 .25 .08 .67 .11 0 .89 .07 .28 .65 .33 .54 .13
Opel .27 .31 .43 .91 0 .09 .10 .06 .84 .32 .59 .09 .02 .49 .49
Bra
nd
VW .18 .28 .55 .83 .07 .10 0 0 1 .14 .56 .3 .02 .44 .53
“0” = neutrality toward the brand (i.e., the foggy set, hold set, and unawareness set), “-” = the reject set, and “+” =
consideration set.
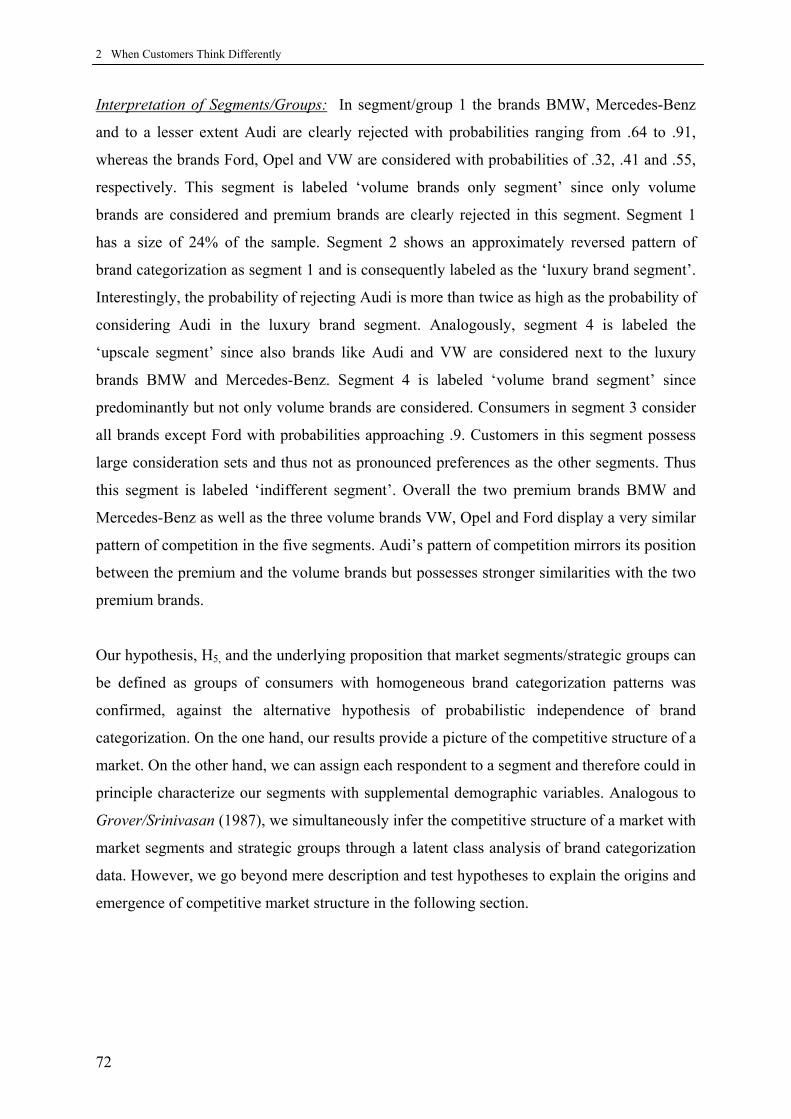
2 When Customers Think Differently
72
Interpretation of Segments/Groups: In segment/group 1 the brands BMW, Mercedes-Benz
and to a lesser extent Audi are clearly rejected with probabilities ranging from .64 to .91,
whereas the brands Ford, Opel and VW are considered with probabilities of .32, .41 and .55,
respectively. This segment is labeled ‘volume brands only segment’ since only volume
brands are considered and premium brands are clearly rejected in this segment. Segment 1
has a size of 24% of the sample. Segment 2 shows an approximately reversed pattern of
brand categorization as segment 1 and is consequently labeled as the ‘luxury brand segment’.
Interestingly, the probability of rejecting Audi is more than twice as high as the probability of
considering Audi in the luxury brand segment. Analogously, segment 4 is labeled the
‘upscale segment’ since also brands like Audi and VW are considered next to the luxury
brands BMW and Mercedes-Benz. Segment 4 is labeled ‘volume brand segment’ since
predominantly but not only volume brands are considered. Consumers in segment 3 consider
all brands except Ford with probabilities approaching .9. Customers in this segment possess
large consideration sets and thus not as pronounced preferences as the other segments. Thus
this segment is labeled ‘indifferent segment’. Overall the two premium brands BMW and
Mercedes-Benz as well as the three volume brands VW, Opel and Ford display a very similar
pattern of competition in the five segments. Audi’s pattern of competition mirrors its position
between the premium and the volume brands but possesses stronger similarities with the two
premium brands.
Our hypothesis, H5, and the underlying proposition that market segments/strategic groups can
be defined as groups of consumers with homogeneous brand categorization patterns was
confirmed, against the alternative hypothesis of probabilistic independence of brand
categorization. On the one hand, our results provide a picture of the competitive structure of a
market. On the other hand, we can assign each respondent to a segment and therefore could in
principle characterize our segments with supplemental demographic variables. Analogous to
Grover/Srinivasan (1987), we simultaneously infer the competitive structure of a market with
market segments and strategic groups through a latent class analysis of brand categorization
data. However, we go beyond mere description and test hypotheses to explain the origins and
emergence of competitive market structure in the following section.
2 When Customers Think Differently
73
2.6.2. Product Category Goals and Market Structure
Five market segments were identified through latent class analysis. Segment 3, which was
labeled the ‘indifferent segment’, has a size of only 6% of the sample, or after accounting for
missing values of only 45 respondents. Results from simulation studies indicate that with
samples smaller than 50, the probability of an improper solution steeply increases in
structural equation models (Boomsma 1982). Thus segment 3 is not included in the multiple
group analysis that follows when testing the remaining hypotheses.
Before further comparisons can be meaningfully tested we have to verify that our measures
are tau-equivalent across groups. First a model with a similar factor pattern is tested. The
model shows a very good fit with 2χ (104) = 140.99 (p = 0.01), RMSEA = 0.044, and CFI =
0.98 and the hypothesis of congeneric equivalence cannot be rejected. The next step in
multiple group analysis is the test of tau-equivalency. The chi-square difference test, 2dχ (3)
= 3.64; p > .05, shows that this hypothesis can be accepted both for the product category goal
status presentation and for the benefit dimensions ( 2dχ (12) = 14.15; p > .05.).

2 When Customers Think Differently
74
Table 2-4: Results of Multiple Group Analysis
Model
Goodness of Fit
Test of
Hypothesis
M1: Equal factor
Pattern
χ(104,N1=197,N2=119, N4=230, N5=207) =
140.99
p = 0.0092
---
M2: Λx invariant
Λy pattern
similar
χ(107,N1=197,N2=119, N4=230, N5=207) =
144.63
p = 0.0090
M2 - M1
2dχ (3) = 3.64
p > .05
M3: Λx invariant
Λy invariant
χ(119,N1=197,N2=119, N4=230, N5=207) =
158.78
p = 0.0087
M3 – M2
2dχ (12) = 14.15
p > .05
M4: Λx invariant
Λy invariant
Γ invariant
χ(131,N1=197,N2=119, N4=230, N5=207) =
176.63
p = 0.0049
M4 – M3
2dχ (12) = 17.85
p > .05
Test of Hypotheses H1-H4: In order to test the influence of category goals on benefits, the
equivalence of the gamma-matrix across groups is tested. The hypothesis underlying this test
is that the causal influence of the product category goal on the importance of benefits is
invariant across segments. The hypothesis can be accepted with 2dχ (12) = 17.85; p > .05.
Moreover, three hypotheses concerning relations between the product category goal and the
benefit dimensions (H1, H2, H3) can be confirmed (see Table 2-5). The gamma-coefficients
are all significant at p < .05. The explained variance of the benefit constructs is 3% for
‘comfort’, 35% for ‘economy’, and 28% for ‘sporty driving’. As hypothesized, the salience of
the product category goal, status presentation, increases the importance of the benefits, sporty
driving and comfort, but decreases the importance of the benefit economy. Contrary to H4, a
significant negative relationship between the product category goal and the benefit ‘safety’
exists. The more a consumer pursues the goal ‘status presentation’ for the product category
cars, the lower will be the importance of the benefit ‘safety’ in a purchase decision. It is
possible that consumers with a high salience of the goal ‘status presentation’ take ‘safety’ for
granted or perceive it as a hygiene factor (Herzberg 1966) and consequently put relatively
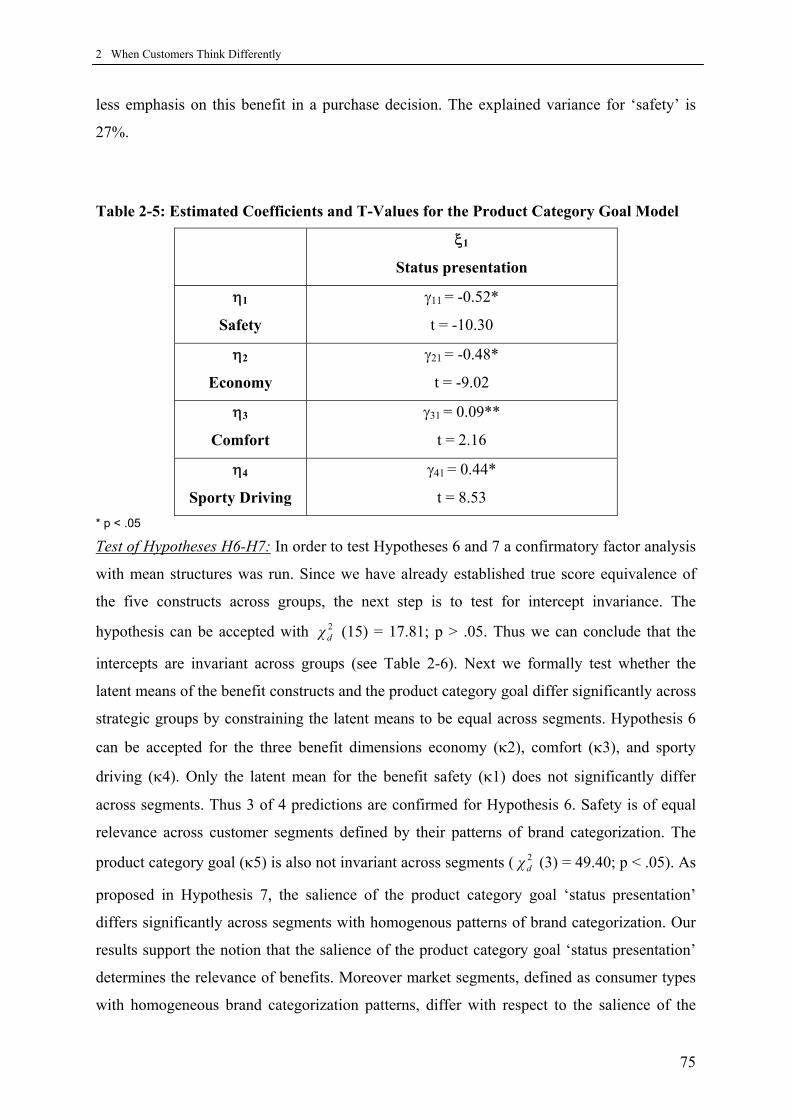
2 When Customers Think Differently
75
less emphasis on this benefit in a purchase decision. The explained variance for ‘safety’ is
27%.
Table 2-5: Estimated Coefficients and T-Values for the Product Category Goal Model
ξ1
Status presentation
η1
Safety
γ11 = -0.52*
t = -10.30
η2
Economy
γ21 = -0.48*
t = -9.02
η3
Comfort
γ31 = 0.09**
t = 2.16
η4
Sporty Driving
γ41 = 0.44*
t = 8.53 * p < .05
Test of Hypotheses H6-H7: In order to test Hypotheses 6 and 7 a confirmatory factor analysis
with mean structures was run. Since we have already established true score equivalence of
the five constructs across groups, the next step is to test for intercept invariance. The
hypothesis can be accepted with 2dχ (15) = 17.81; p > .05. Thus we can conclude that the
intercepts are invariant across groups (see Table 2-6). Next we formally test whether the
latent means of the benefit constructs and the product category goal differ significantly across
strategic groups by constraining the latent means to be equal across segments. Hypothesis 6
can be accepted for the three benefit dimensions economy (κ2), comfort (κ3), and sporty
driving (κ4). Only the latent mean for the benefit safety (κ1) does not significantly differ
across segments. Thus 3 of 4 predictions are confirmed for Hypothesis 6. Safety is of equal
relevance across customer segments defined by their patterns of brand categorization. The
product category goal (κ5) is also not invariant across segments ( 2dχ (3) = 49.40; p < .05). As
proposed in Hypothesis 7, the salience of the product category goal ‘status presentation’
differs significantly across segments with homogenous patterns of brand categorization. Our
results support the notion that the salience of the product category goal ‘status presentation’
determines the relevance of benefits. Moreover market segments, defined as consumer types
with homogeneous brand categorization patterns, differ with respect to the salience of the

2 When Customers Think Differently
76
product category goal as well as the relevance of category-specific benefits. The causal
interrelations between product category goal and benefits are invariant (i.e., generalizes)
across segments. The different salience of product category goals determine the salience of
benefits, and thereby brand categorization, in a consumption context. Different patterns of
brand categorization, in turn, determine the structure of the market.
Table 2-6: Confirmatory Factor Analysis with Mean Structures
Model
Goodness of Fit
Test of Hypothesis
M1: Λx invariant χ(119,N1=197,N2=119, N4=230, N5=207) =
158.78
p = 0.0087
---
M2: Λx invariant
νx invariant
χ(134,N1=197,N2=119, N4=230, N5=207) =
176.59
p = 0.0080
M2 - M1
2dχ (15) = 17.81
p > .05
M3: Λx invariant
νx invariant
….. κ1 invariant
χ(137,N1=197,N2=119, N4=230, N5=207) =
180.82
p = 0.0087
M3 – M2
2dχ (3) = 4.23
p > .05
M4: Λx invariant
νx invariant
….. κ2 invariant
χ(137,N1=197,N2=119, N4=230, N5=207) =
197.06
p = 0.0006
M4 – M2
2dχ (3) = 20.47
p < .05
M5: Λx invariant
νx invariant
….. κ3 invariant
χ(137,N1=197,N2=119, N4=230, N5=207) =
305.67
p = 0.00
M5– M2
2dχ (3) = 129.08
p < .05
M6: Λx invariant
νx invariant
….. κ4 invariant
χ(137,N1=197,N2=119, N4=230, N5=207) =
270.27
p = 0.00
M6– M2
2dχ (3) = 93.68
p < .05
M7: Λx invariant
νx invariant
….. κ5 invariant
χ(137,N1=197,N2=119, N4=230, N5=207) =
225.99
p = 0.00
M7– M2
2dχ (3) = 49.40
p < .05
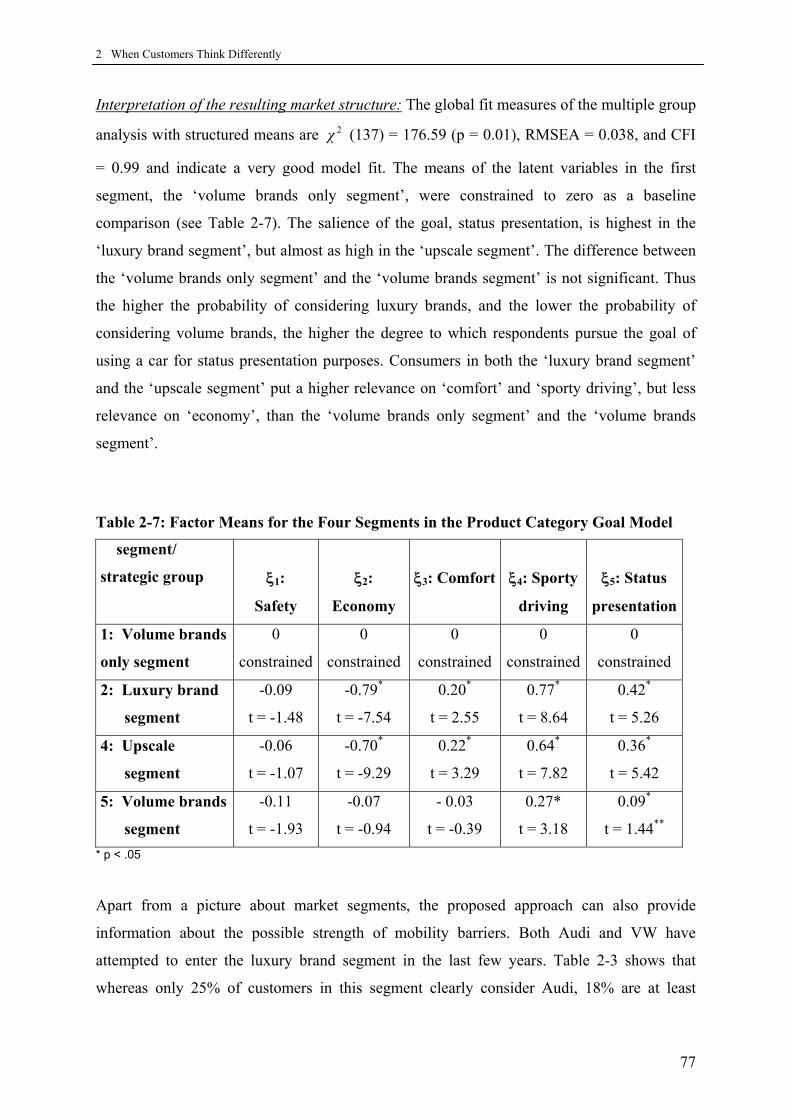
2 When Customers Think Differently
77
Interpretation of the resulting market structure: The global fit measures of the multiple group
analysis with structured means are 2χ (137) = 176.59 (p = 0.01), RMSEA = 0.038, and CFI
= 0.99 and indicate a very good model fit. The means of the latent variables in the first
segment, the ‘volume brands only segment’, were constrained to zero as a baseline
comparison (see Table 2-7). The salience of the goal, status presentation, is highest in the
‘luxury brand segment’, but almost as high in the ‘upscale segment’. The difference between
the ‘volume brands only segment’ and the ‘volume brands segment’ is not significant. Thus
the higher the probability of considering luxury brands, and the lower the probability of
considering volume brands, the higher the degree to which respondents pursue the goal of
using a car for status presentation purposes. Consumers in both the ‘luxury brand segment’
and the ‘upscale segment’ put a higher relevance on ‘comfort’ and ‘sporty driving’, but less
relevance on ‘economy’, than the ‘volume brands only segment’ and the ‘volume brands
segment’.
Table 2-7: Factor Means for the Four Segments in the Product Category Goal Model
segment/
strategic group
ξ1:
Safety
ξ2:
Economy
ξ3: Comfort
ξ4: Sporty
driving
ξ5: Status
presentation
1: Volume brands
only segment
0
constrained
0
constrained
0
constrained
0
constrained
0
constrained
2: Luxury brand
segment
-0.09
t = -1.48
-0.79*
t = -7.54
0.20*
t = 2.55
0.77*
t = 8.64
0.42*
t = 5.26
4: Upscale
segment
-0.06
t = -1.07
-0.70*
t = -9.29
0.22*
t = 3.29
0.64*
t = 7.82
0.36*
t = 5.42
5: Volume brands
segment
-0.11
t = -1.93
-0.07
t = -0.94
- 0.03
t = -0.39
0.27*
t = 3.18
0.09*
t = 1.44** * p < .05
Apart from a picture about market segments, the proposed approach can also provide
information about the possible strength of mobility barriers. Both Audi and VW have
attempted to enter the luxury brand segment in the last few years. Table 2-3 shows that
whereas only 25% of customers in this segment clearly consider Audi, 18% are at least
2 When Customers Think Differently
78
undecided (segment 2 in Table 2-3). By contrast, VW is only considered by 10% of the
customers in this segment, plus only 7% of customers in this segment are undecided. There is
a marked difference between whether brands that are not considered are rejected or are in a
neutral position. It is much more difficult for a brand to move from the ‘reject set’ into the
‘consideration set’ than it is to move from a neutral position into the ‘consideration set’. In
the former case the brand has to overcome strong preferences against considering its
products. Whereas 83% of the customers in the ‘luxury brand segment’ definitely reject VW,
only 57% reject Audi. It is apparent that VW has much harder prospects in competing in the
strategic group of luxury-car producers than Audi, because winning the ‘clear-reject’
customers of the associated luxury target segment will be connected with much higher
marketing efforts, and thus sunk costs, than winning the ‘undecided’ customers to buy one’s
product. The main difference between the luxury brand segment and the upmarket brand
segment 4 is the barrier to entry for competitors such as VW, Opel, and Ford in the form of
customers’ preference barriers. Structuring markets with customers’ brand categorization thus
makes it possible to structure a market into segments as well as to map the degree of entry
barriers for brands into these segments in the form of preference barriers. Furthermore
analyzing benefit importance and product category goal salience helps to understand the
determinants of those preference barriers. Customers in the ‘volume brands only segment’
and the ‘volume brands segment’ differ in the emphasis they put on the benefit ‘sporty
driving’ in purchase decisions. Thus the ‘volume brands segment’ is more vulnerable to
competition from premium brands than the ‘volume brands only segment’ (where the benefit
sporty driving is less important), as indicated by their respective pattern of brand
categorization. This result is plausible because up-market brands are better able to provide the
benefit of sporty driving (e.g., through making available a powerful engine and special
suspension system). In the ‘volume brand segment’, the probability of considering luxury
brands, such as BMW or Mercedes-Benz, is higher, and the probability of rejecting these
brands is clearly lower than in the ‘volume brand only segment’.
2.7. Discussion
An important stream of research on strategic groups has focused on managers’ mental models
of strategic groups within their industries (Peteraf/Shanley 1997;
Osborne/Stubbart/Ramaprasad 2001). The underlying idea of this stream of research is to
2 When Customers Think Differently
79
form groupings of firms based on managers’ cognitions (Reger/Huff 1993). From a
psychological point of view this stream of research investigates how managers categorize
companies into different groups. In this paper, we took a look at the other side of the coin and
investigated how customers categorize brands. By drawing on research on categorization
processes, we have offered a theoretical grounding for investigating a customer-side approach
to strategic groups and mobility barriers. Building on Cooper/Inoue (1996), we proposed that
market segments/strategic groups can be defined as types of consumers with homogeneous
patterns of brand categorization. Using latent class analysis we could show that brands are
not uniformly distributed throughout the competitive space. Instead we have groups or brand
categorization types with intense rivalry between certain brands but lessened rivalry with
other brands that are mainly considered and thus competing in other groups. Our approach
provides both a picture of the competitive structure of a market and market segmentation by
allowing one to assign each respondent to a brand categorization type. A look at the derived
segments/strategic groups (see Table 2-3) can help managers understand who they are
competing against and how this competition varies within segments/strategic groups.
Although some researchers have concluded that ‘the literature is replete with sources of
mobility barriers’ (Lee/Lee/Rho 2002, p. 731), this is the first study to investigate the strength
of mobility barriers derived from customers’ brand perceptions. Structuring markets based on
customers’ brand categorization patterns allows the characterization of market segments by
the probability of brand consideration, brand rejection, and brand neutrality. We have
demonstrated that such a characterization allows for the estimation of demand-side
preference barriers that act as mobility barriers for firms. The outcome was a clear picture of
preference barriers and hence – important for strategic group research - mobility barriers.
Apart from estimating the possible strength of a demand-side mobility barrier, our approach
can also serve to get a better picture of what kind of efforts have to be undertaken to
overcome the identified mobility barriers. We conceptualized brand categorization as a goal-
derived categorization process and showed that the salience of a product category goal ‘status
presentation’ determined different category-specific benefits. We further showed that,
according to the salience of the goal ‘status presentation’ different patterns of brand
categorization evolved. These different patterns of brand categorization determine the
competitive structure of a market. Based on this reasoning we could show that brand
categorization types differ with respect to the salience of the product category goal as well as
the relevance of category-specific benefits. Since goals and benefits determine
2 When Customers Think Differently
80
categorizations and hence mobility barriers, firms willing to overcome those mobility barriers
will need to address those prevalent customer goals and corresponding benefits. To enter the
segment/strategic group where ‘status presentation’ is a highly salient consumer goal, a firm
will need to put efforts into satisfying this goal with its products. Higher spending in
marketing and advertising may be needed. For the case of the VW Phateon, such an analysis
might have yielded the insight that only with a different brand name could this goal be
achieved. Toyota has shown the success of such a strategy with it’s Lexus: the image of
Lexus’ independent brand is not hurt by the identity with the corporate group of Toyota
because brand name and dealerships are kept separate. Based on our results, we would have
predicted that VW would have to overcome a strong mobility barrier before entering the
luxury brand segment or strategic group of luxury car producer. Strategic group research has
been criticized for its inability to explain how and why competitive structures in industries
come to develop (Hodgkinson 1997). In our approach, the strategic groups could be
differentiated by the salience of the goal, status presentation and corresponding benefits for
their respective customers.
Our research endeavour is not without limitations. Future research should investigate the
simultaneous impact of multiple goals on brand categorization (e.g.,
Ratneshwar/Pechmann/Shocker 1996). Other possible determinants such as income or dealer
proximity were not investigated (see e.g., Punj/Brookes 2001 for recent work on pre-decision
constraints in consideration set formation). The restriction to six brands as observed
indicators of the latent class variable will, as has been argued above, not deliver a complete
picture of the market, per se. A larger data set would have allowed to include more brands in
the model. However, the purpose of this analysis is to demonstrate the applicability of our
approach to the analysis of strategic groups. Another future extension would be to investigate
brand categorization on a model level. In order to apply a latent class model to a data set with
model level data instead of brand level data, an excessive sample size would be required.
Furthermore brand categorization can vary with time and context. Thus different competitive
structures might exist for different consumption contexts or situations. This could be a
promising extension of our approach for fast-moving consumer goods markets. The equation
of market segments and strategic groups may be criticized as an oversimplification. However,
we argue that our approach is consistent with widely shared claims for research on strategic
groups. Our approach is in concert with Hatten/Hatten’s (1987) definition of strategic groups
as companies whose actions are relevant for each other. A company’s sole adoption of similar

2 When Customers Think Differently
81
strategies does not yet mean that this has relevance for other companies in a strategic group,
as could be seen in the VW example.
From a managerial perspective the identification of mobility barriers is of utmost importance
for a company’s strategy definition for a number of reasons. Structuring a market based on
customers’ brand categorization can give insight into which segments/strategic groups can be
entered without too much effort in terms of advertising, developing a brand image, and
establishing distribution channels. It can also highlight the danger of sunk costs when
preference barriers are high and successful market entry may be at risk. Further, the approach
supports the assessment of the danger of potential competition through new competitors and
can be part of a strategic scanning system. In the short run, BMW and Mercedes-Benz should
not be too concerned if lets say Opel attempts to enter the luxury segment with a new model,
because the preference barrier is very high. More than 90% of the customers in this segment
reject Opel. This obvious mobility barrier is difficult to explain from a resource based
perspective focusing on firm skills and key strategic variables. However, the behavioral
perspective presented herein can provide an explanation for these preference-based mobility
barriers. Looking again at the example of VW’s Phaeton, the reason for customers’ rejection
will not be found in technical features but rather in customers’ brand perceptions: ‘And by all
accounts the objective attributes of the Phaeton…are competitive with those of other luxury
marques. Unfortunately, the company’s brand is defined not so much by its exacting
producers as by its customers. It has virtually no brand equity among luxury buyers.’
(Rust/Zeithaml/Lemon 2004). Or in the words of Axel Mess, head of Audi of America: ‘It
could be the best car, but I still would not buy it because it has the VW logo and because I
have to go to a VW dealership where the salesmen are used to selling Jettas and Golfs’
(Kisiel 2004). If VW’s managers thought they could overcome the mobility barrier separating
VW from the luxury-brand segment, then our results suggest that customers apparently
thought differently.

2 When Customers Think Differently
82
2.8. References
Andrews, R.L./Srinivasan, T.C. (1995): Studying consideration effects in empirical choice
models using scanner pannel data, in: Journal of Marketing Research, Vol. 32, pp. 30-
41.
Barsalou, L.W. (1985): Ideals, central tendency, and frequency of instantiation as
determinants of graded structure in categories, in: Journal of Experimental
Psychology: Learning, Memory, and Cognition, Vol. 11, No. 4, pp. 629-649.
Barsalou, L.W. (1991): Deriving categories to achieve goals, in: Bower, G.H. (ed.): The
Psychology of Learning and Motivation: Advances in research and theory, Academic
Press, Vol. 27, New York, pp. 1-64.
Bauer, H.H. (1991): Unternehmensstrategie und Strategische Gruppen, in: Kistner, K.P./
Schmidt, R. (eds.); Unternehmensdynamik, Wiesbaden 1991.
Bearden, W.O./Etzel, M.J. (1982): Reference group influence on product and brand purchase
decisions, in: Journal of Consumer Research, Vol. 9, September, pp. 183 – 194.
Belk, R. (1981): Determinants of consumption cue utilization in impression formation: An
association derivation and experimental verification, in: Advances in Consumer
Research, Vol. 8, pp. 170-175.
Belk, R. (1988): Possessions and the extended self, in: Journal of Consumer Research, Vol.
15, No. 2, pp. 139-168.
Boomsma, A. (1982): The robustness of LISREL against small sample sizes in analysis
models, in: Jöreskog, K.G./Wold, H. (eds): Systems under indirect observation:
causality structure prediction, North-Holland Publishing Company: Amsterdam, pp.
149-173.

2 When Customers Think Differently
83
Brisoux, J.E./Laroche, M. (1980): A proposed consumer strategy of simplification for
categorizing brands, in: Sumney, J.D./Taylor, R.D. (eds): Evolving marketing thought
for 1980, Proceedings of the Annual Meeting of the Southern Marketing Association,
Southern Marketing Association: Carbondale IL, pp. 112-114.
Chakrawati, A./Janiszewski, C. (2003). The influence of macro-Level motives on
consideration set composition in novel purchase situations, in: Journal of Consumer
Research, Vol. 30, pp. 244-258.
Cooper, L.G./Inoue, A. (1996): Building market structures from consumer preferences, in:
Journal of Marketing Research, Vol. 33, No. 3, pp. 293-306.
Day, D.L./DeSarbo, W.S./Oliva, T.A. (1987): Strategy maps: a spatial representation of intra-
industry competitive strategy, in: Management Science, Vol. 33, No. 12, pp. 1534-
1551.
De Sarbo, W.S./Jedidi, K. (1995): The spatial representation of heterogeneous consideration
sets, in: Marketing Science, Vol. 14, No. 3, pp. 326-342.
Desai, K.K./Hoyer, W.D. (2000): Descriptive characteristics of memory-based consideration
sets: Influence of usage occasion frequency and usage location familiarity, in: Journal
of Consumer Research, Vol. 27, pp. 309-323.
Elliott, R. (1997): Existential consumption and irrational desire, in: European Journal of
Marketing, Vol. 31, No. 4, pp. 285-296.
Erdem, T./Swait, J. (2004): Brand credibility, brand consideration, and choice, in: Journal of
Consumer Research, Vol. 31, No. 1, pp. 191-198.
Finn, A../Louviere, J. (1990): Shopping-center patronage models: fashioning a consideration
set segmentation solution, in: Journal of Business Research, Vol. 21, No. 3, pp. 259-
275.
2 When Customers Think Differently
84
Forman, A.K. (1984): Die Latent-Class-Analyse - Einführung in Theorie und Anwendung,
Beltz Verlag: Weinheim.
Grover, R./Srinivasan, V. (1987): A simultaneous approach to market segmentation and
market structuring, in: Journal of Marketing Research, Vol. 24, No. 2, pp. 139–153.
Hatten, K.J./Hatten, M.L. (1987): Strategic groups, asymmetrical mobility barriers and
contestability, in: Strategic Management Journal, Vol. 8, No. 4, pp. 329–342.
Hauser, J.R./Wernerfelt, B. (1989): The competitive implications of relevant-Set /response
analysis, in: Journal of Marketing Research, Vol. 26, No. 4, pp. 391-405.
Harrigan, K.R. (1985): An application of clustering for strategic group analysis, in: Strategic
Management Journal, Vol. 6, No. 1, pp. 55–73.
Herzberg, F. (1966): The Work and the Nature of Man, The World Publishing Company:
Cleveland OH.
Hodgkinson, G.P. (1997): The cognitive analysis of competitive structures: a review and
critique, in: Human Relations, Vol. 50, No. 6, pp. 625-654.
Hunt, M.S. (1972): Competition in the Major Home Appliance Industry, 1960-1970,
Unpublished doctoral dissertation, Harvard University.
Johnson, M. D./Herrmann, A./ Huber, F./Gustafsson, A. (1997). Customer Retention in the
Automotive Industry: Quality, Satisfaction and Loyalty. Wiesbaden, Germany: Gabler
Verlag.
Kardes, F.R./Kalayanarma, G./Chandrashekaran, M./Dornoff, R.J. (1993): Brand retriveal,
consideration set, somposition, consumer choice, and the pioneering advantage, in:
Journal of Consumer Research, Vol. 20, pp. 62-75.
Kisiel, R. (2004): Audi chief: VW brand too weak for Phaeton, in: Automotive News, Vol.
79, No. 8.

2 When Customers Think Differently
85
Langeheine, R./Pannekoek, J./van de Pol, F. (1996): Bootstrapping goodness-of-fit measures
in categorial data analysis, in: Sociological Methods & Research, Vol. 24, No. 4, pp.
492-516.
Langeheine, R./van de Pol, F./Pannekoek, J. (1997): Kontingenztabellen-Analyse bei kleinen
Stichproben: Probleme bei der Prüfung der Modellgültigkeit mittels Chi-Quadrat
Statistiken, in: Empirische Pädagogik, Vol. 11, pp. 63-77.
Laroche, M./Toffoli, R. (1999). Strategic brand evaluations among fast-food franchises. A test
of two Frameworks, in Journal of Business Research, Vol. 45, No. 2, pp. 221-233.
Leary, M. R. (1995): Self Presentation: Impression Management and Interpersonal
Behaviour. Madison, Wi: Brown & Benchmark.
Lee, J./Lee, K./Rho, S. (2002): An evolutionary perspective on strategic group emergence: a
genetic algorithm-based model, in: Strategic Management Journal, Vol. 23, No. 8, pp.
727-746.
Leigh, J.H./Gabel, T.G. (1992): Symbolic interactionism: its effects on consumer behaviour
and implications for marketing strategy, in: Journal of Consumer Marketing, Vol. 9,
winter, pp. 27–38.
Levy, S. (1959): Symbols for sale, in: Harvard Business Review, Vol. 37, July/August, pp.
117–124.
Mascarenhas, B./Aaker, D.A. (1989): Mobility barriers and strategic groups, in: Strategic
Management Journal, Vol. 10, No. 5, pp. 475–485.
McCloskey, M./Glucksberg, S. (1978): Natural categories: Well-defined or fuzzy sets?, in:
Memory & Cognition, Vol. 6, pp. 462-472.
McGee, J./Thomas, H. (1986): Strategic groups: theory, research and taxonomy, in: Strategic
Management Journal, Vol. 7, No. 2, pp. 141-160.

2 When Customers Think Differently
86
McNamara, G.M./Deephouse, D.L./Luce, R.A. (2003): Competitive positioning within and
across a strategic groups structure: the performance of core, secondary, and solitary
firms, in: Strategic Management Journal, Vol. 24, No. 2, pp. 161-181.
Mervis, C.B./Rosch, E. (1981): Categorization of natural objects, in: Annual Review of
Psychology, Vol. 32, pp. 89-115.
Nedungadi, P. (1990): Recall and consumer consideration sets: influencing choice without
altering brand evaluations, in: Journal of Consumer Research, Vol. 17, pp. 263-276.
Osborne, J.D./Stubbart, C.I./Ramaprasad, A. (2001): Strategic groups and competitive
enactment: a study of dynamic relationships between mental models and performance,
in: Strategic Management Journal, Vol. 22, No. 5, pp. 435-454.
O’Connor, P.J./Sullivan, G.L. (1995): Market segmentation: a comparison of
benefits/attributes desired and brand preference, in: Psychology & Marketing, Vol.
12, No. 7, pp. 613–635.
Paulssen, M./Bagozzi, R.P. (2005): A self-regulatory model of consideration set formation,
in: Psychology & Marketing, Vol. 22, No. 10, pp. 785-812.
Pegels, C.C./Sekar, C. (1989): Determining strategic groups using multidimensional scaling,
in: Interfaces, Vol. 19, No. 3, pp. 47-57.
Peter, J. P./Olson, J. C. (2005): Consumer Behavior & Marketing Strategy, McGraw Hill:
Irwin.
Peteraf, M./Shanley, M. (1997): Getting to know you: a theory of strategic group identity, in:
Strategic Management Journal, Vol. 18, Summer Special Issue, pp. 165–186.
Porter, M.E. (1979): The structure within industries and companies’ performance, in: Review
of Economics & Statistics, Vol. 61, pp. 214-227.

2 When Customers Think Differently
87
Punj, G./Brookes, R. (2001). Decision constraints and consideration-set formation in
consumer durables, in: Psychology & Marketing, Vol. 18, pp. 843-863.
Reger, R.K./Huff, A.S. (1993): Strategic groups a cognitive perspective, in: Strategic
Management Journal, Vol. 14, No. 2, pp. 103-123.
Ratneshwar, S./Shocker, A.D./Cotte, J./Srivastava, R.K. (1999): Product, person, and
purpose: putting the consumer back into theories of dynamic market behavior, in:
Journal of Strategic Marketing, Vol. 7, September, pp. 191-208.
Ratneshwar, S./Pechmann,C./Shocker, A.D. (1996): Goal-derived categories and the
antecedents of across-category consideration, Journal of Consumer Research, Vol. 23,
pp. 240-250.
Roberts, J.H./Lattin, J.M. (1997). Consideration: Review of research and prospects for future
insights, in: Journal of Marketing Research, Vol. 34, 406-410.
Rosch, E. (1975): Cognitive representation of semantic categories, in: Journal of
Experimental Psychology, Vol. 104, pp. 192-233.
Rust, R.T./Zeithaml, V.A./Lemon, K.N. (2004): Customer-centered brand management, in:
Harvard Business Review, Vol. 82, No. 9, pp. 110-118.
Sambandam, R./Lord, K. R. (1995): Switching behavior in automobile markets: A
consideration-sets model, in: Journal of the Academy of Marketing Science, Vol. 23
(1), 57-65.
Solomon, M.R. (1983): The role of products as social stimuli: A symbolic interaction
perspective, in: Journal of Consumer Research, Vol. 10, December, pp. 319-329.
Siddarth, S./Bucklin, R.E./Morrison, D.G. (1995). Making the cut: modeling and analyzing
choice set restrictions in scanner panel data, in: Journal of Marketing Research, Vol.
32, No. 3, pp. 255-266.

2 When Customers Think Differently
88
Srinivasan, V./Park, C.S. (1997): Surprising robustness of the self-explicated approach to
customer preference structure measurement, in: Journal of Marketing Research, Vol.
34, No. 2, pp. 286-291.
Thomas, H./Venkatraman, N. (1988): Research on strategic groups – progress and prognosis,
Journal of Management Studies, Vol. 25, No. 6, pp. 537-55.
Viswanathan, M./Childers, T.L. (1999): Understanding how product attributes influence
product categorization: development ad validation of fuzzy set-based measures of
gradedness in product categories, in: Journal of Marketing Research, Vol. 36, No. 1,
pp. 75-94.
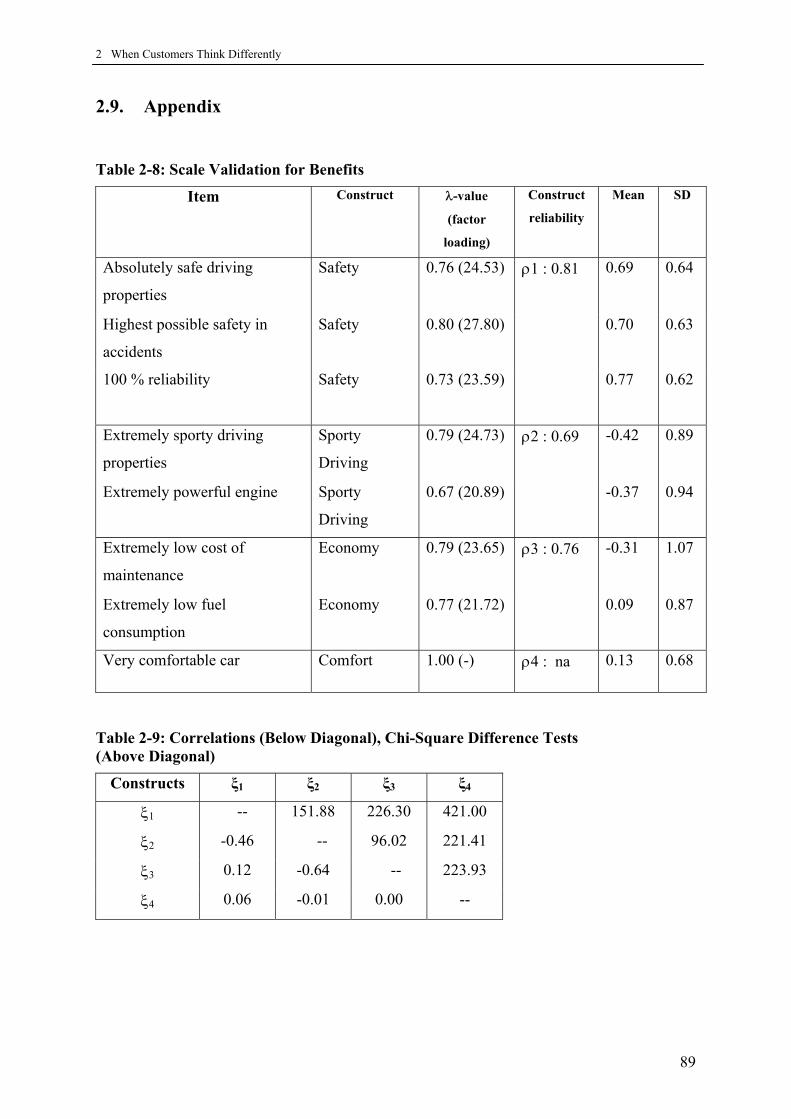
2 When Customers Think Differently
89
2.9. Appendix
Table 2-8: Scale Validation for Benefits
Item Construct λ-value
(factor
loading)
Construct
reliability
Mean SD
Absolutely safe driving
properties
Safety 0.76 (24.53) ρ1 : 0.81
0.69 0.64
Highest possible safety in
accidents
Safety 0.80 (27.80)
0.70 0.63
100 % reliability Safety 0.73 (23.59)
0.77 0.62
Extremely sporty driving
properties
Sporty
Driving
0.79 (24.73) ρ2 : 0.69
-0.42 0.89
Extremely powerful engine Sporty
Driving
0.67 (20.89)
-0.37 0.94
Extremely low cost of
maintenance
Economy 0.79 (23.65) ρ3 : 0.76
-0.31 1.07
Extremely low fuel
consumption
Economy 0.77 (21.72)
0.09 0.87
Very comfortable car Comfort 1.00 (-) ρ4 : na 0.13 0.68
Table 2-9: Correlations (Below Diagonal), Chi-Square Difference Tests (Above Diagonal)
Constructs ξ1 ξ2 ξ3 ξ4
ξ1 -- 151.88 226.30 421.00
ξ2 -0.46 -- 96.02 221.41
ξ3 0.12 -0.64 -- 223.93
ξ4 0.06 -0.01 0.00 --
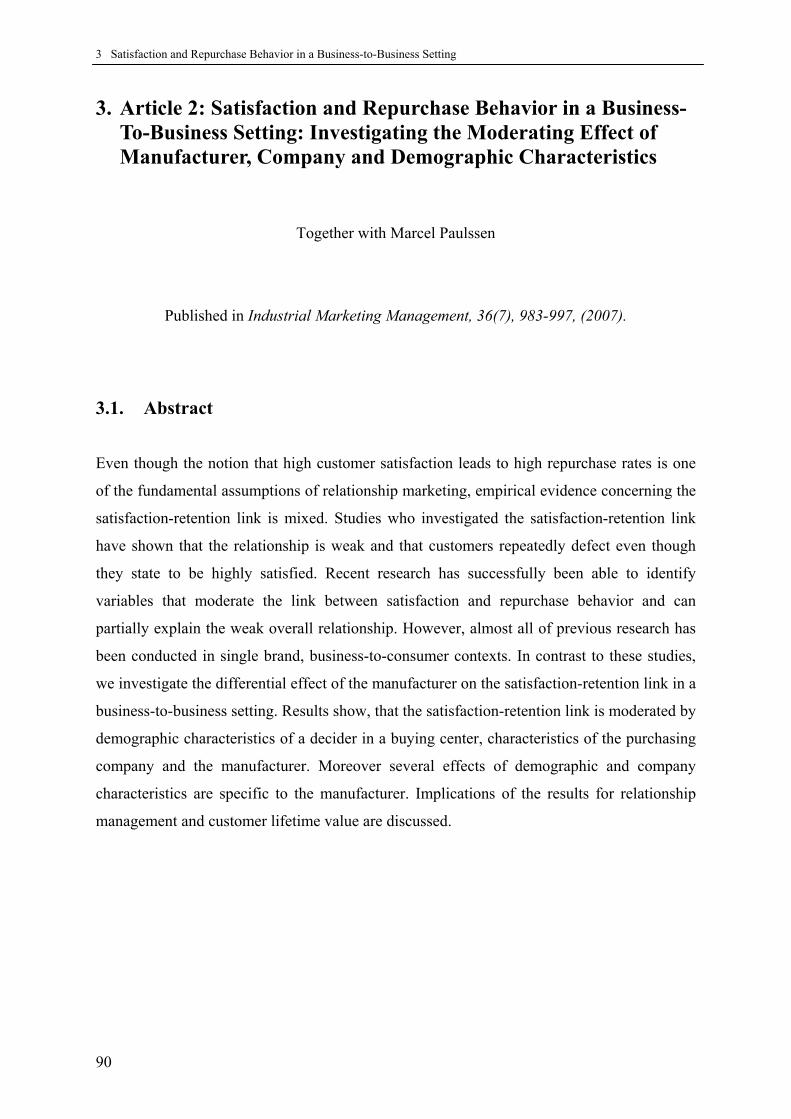
3 Satisfaction and Repurchase Behavior in a Business-to-Business Setting
90
3. Article 2: Satisfaction and Repurchase Behavior in a Business-To-Business Setting: Investigating the Moderating Effect of Manufacturer, Company and Demographic Characteristics
Together with Marcel Paulssen
Published in Industrial Marketing Management, 36(7), 983-997, (2007).
3.1. Abstract
Even though the notion that high customer satisfaction leads to high repurchase rates is one
of the fundamental assumptions of relationship marketing, empirical evidence concerning the
satisfaction-retention link is mixed. Studies who investigated the satisfaction-retention link
have shown that the relationship is weak and that customers repeatedly defect even though
they state to be highly satisfied. Recent research has successfully been able to identify
variables that moderate the link between satisfaction and repurchase behavior and can
partially explain the weak overall relationship. However, almost all of previous research has
been conducted in single brand, business-to-consumer contexts. In contrast to these studies,
we investigate the differential effect of the manufacturer on the satisfaction-retention link in a
business-to-business setting. Results show, that the satisfaction-retention link is moderated by
demographic characteristics of a decider in a buying center, characteristics of the purchasing
company and the manufacturer. Moreover several effects of demographic and company
characteristics are specific to the manufacturer. Implications of the results for relationship
management and customer lifetime value are discussed.
3 Satisfaction and Repurchase Behavior in a Business-to-Business Setting
91
3.2. Introduction
The question of how customer satisfaction translates into repurchase behavior lies at the heart
of relationship marketing. Previous studies, however, have found that satisfaction alone is a
weak predictor of repurchase behavior. The relationship is largely dependent on moderating
variables (see e.g., Mittal & Kamakura, 2001; Seiders et al., 2005). However, most studies
have investigated the satisfaction-retention link in business-to-consumer relationships
(Homburg, Giering, & Menon, 2003). Therefore, the investigated moderating variables have
been largely specific to business-to-consumer contexts. However, there can be no doubt that
understanding how satisfaction translates into retention is also of key relevance for business-
to-business marketing. Even though stark differences exist between business-to-business and
business-to-consumer marketing (e.g., Jackson & Cooper, 1988) previous research has
demonstrated that consumer concepts may be successfully transferred to the business-to-
business context (Cooper & Jackson, 1988; Durvasula et al., 1999). In line with the theme of
the 22nd Annual IMP Conference, “Opening the network”, we investigate the satisfaction-
retention link in a business-to-business context by building on research and models that have
been developed in a business-to-consumer context. By doing so, we not only show the
viability of building on consumer research models for business-to-business research but also
find that the conclusions from our research have relevance for the whole field of marketing:
previous research has found that findings on moderating effects of customer characteristics
from different studies were equivocal and hard to reconcile (Seiders et al., 2005). One reason
for this may be that all of these studies investigated moderating variables in a single company
setting. The potential moderating role of the brand or manufacturer has so far been neglected.
Unlike previous studies we conducted a multi-manufacturer study, investigating the
moderating role of manufacturer and whether the effects of other moderators on the
satisfaction-retention link are manufacturer-specific. Further, we provide one of the first
studies to investigate the satisfaction-retention link in a business-to-business setting. This
enables us to analyze the impact of company characteristics, in addition to the demographic
characteristics of the decider in a buying center, as potential moderators of the satisfaction-
retention link.

3 Satisfaction and Repurchase Behavior in a Business-to-Business Setting
92
3.3. Theoretical Background
Many executives seem to trust their intuitive sense that high customer satisfaction will
eventually translate into higher loyalty and with it ultimately into improved company
performance. Thus achieving high customer satisfaction has become a central focus of
corporate strategy for most firms (Homburg, Koschate, & Hoyer, 2005; Honomichl, 1993).
However, “despite the claim that satisfaction ratings are linked to repurchase behavior, few
attempts can be found that relate satisfaction ratings to actual repurchase behaviour” (Mittal
& Kamakura, 2001, p. 131). That the validity of this assumption is all but given, is nicely
illustrated by Reichheld (1996), who reports that while around 90% of industry customers
report to be satisfied or even very satisfied, only between 30% to 40% actually do repurchase.
Some researchers have consequently even gone as far as to question the usefulness of
satisfaction measures in general (e.g., Reichheld, 2003). Apparently, current knowledge fails
to fully explain the prevalence of satisfied customers who defect and dissatisfied customers
who do not (Bendapudi & Berry, 1997; Ganesh, Arnold, & Reynolds, 2000; Jones & Sasser,
1995; Keaveney, 1995). One reason for that is that the relationship between satisfaction and
retention is not a simple linear one, but moderated by several different variables. Oliva,
Oliver and MacMillan (1992, p. 84) stated that “the response function linking […]
satisfaction to customer response may not operate as is frequently assumed because the
complexity of the relationship may be underestimated”.
Several studies have since investigated the effect of moderating variables on the satisfaction-
retention link. However the great majority of empirical studies that examined direct and
moderated satisfaction-repurchase effects measured repurchase intentions instead of objective
repurchase behavior (Seiders et al., 2005). Several problems in interpretation arise through
the use of a satisfaction measure and an intentional measure of loyalty in the same survey:
common-method variance may inflate the relationship. Mazursky and Geva (1989) found that
satisfaction and intention ratings were highly correlated when measured at the same time but
had no correlation when measured at two different points in time. Additionally both ratings
may be influenced by the same response bias thereby leading to spurious correlations
(Arnold, Feldman, & Purbhoo, 1985; Zedeck, Kafry, & Jacobs, 1976). Studies of Mittal and
Kamakura (2001) as well as Seiders et al. (2005) show, that the results concerning
moderators of the satisfaction- intention link cannot simply be extrapolated to the

3 Satisfaction and Repurchase Behavior in a Business-to-Business Setting
93
satisfaction-retention link. Seiders et al. (2005) for example could show that for low
involvement there is virtually no relationship between satisfaction and actual repurchase
behavior but a very strong positive relationship between satisfaction and repurchase
intentions. Finally a central argument for investigating repurchase behavior is that both from
a scientific and a managerial standpoint it is real repurchase behavior that we aim to
understand. However especially in a business-to-business context, studies on the satisfaction-
loyalty link are scarce (Homburg, Giering, & Menon, 2003) and studies on the satisfaction-
retention link do not exist. One of the rare investigations has been provided by Homburg,
Giering and Menon (2003), who investigated the impact of relational norms on the
satisfaction-loyalty link but not on the satisfaction-retention link.
A further shortcoming of the current literature is that most studies have focused on
moderating variables in the business-to-consumer context (Homburg, Giering, & Menon
2003). But do demographic characteristics of the buyer, like age, that have been found to
moderate the satisfaction-retention link in a consumer setting also serve as moderators of the
satisfaction-retention link in a business-to-business setting? Further, do company
characteristics of the buying firm, like size of the company or branch of industry moderate
how satisfaction translates into repurchase as has been suggested by Homburg and Giering
(2001). Those are questions that should be of interest for business marketers but have largely
been neglected by prior research.
Overall the results of prior research concerning moderators of the satisfaction–retention link
are not clear-cut. Summarizing the state of knowledge in this area, Seiders et al. (2005, p. 26)
state that “Although prior research points to several variables that may moderate the
satisfaction repurchase relationship, empirical results are equivocal and difficult to
reconcile”. A major limitation of previous research on moderating effects of the satisfaction
retention link has been that it solely investigated customers of one company (e.g., Mittal &
Kamakura, 2001; Seiders et al., 2005; Homburg & Giering, 2001; etc.). However, it is
possible that the partially equivocal findings of previous research are due to the fact, that
results are manufacturer/brand-specific, meaning that the effects may change in size and
direction for customers of different manufacturers or brands in a given product category.
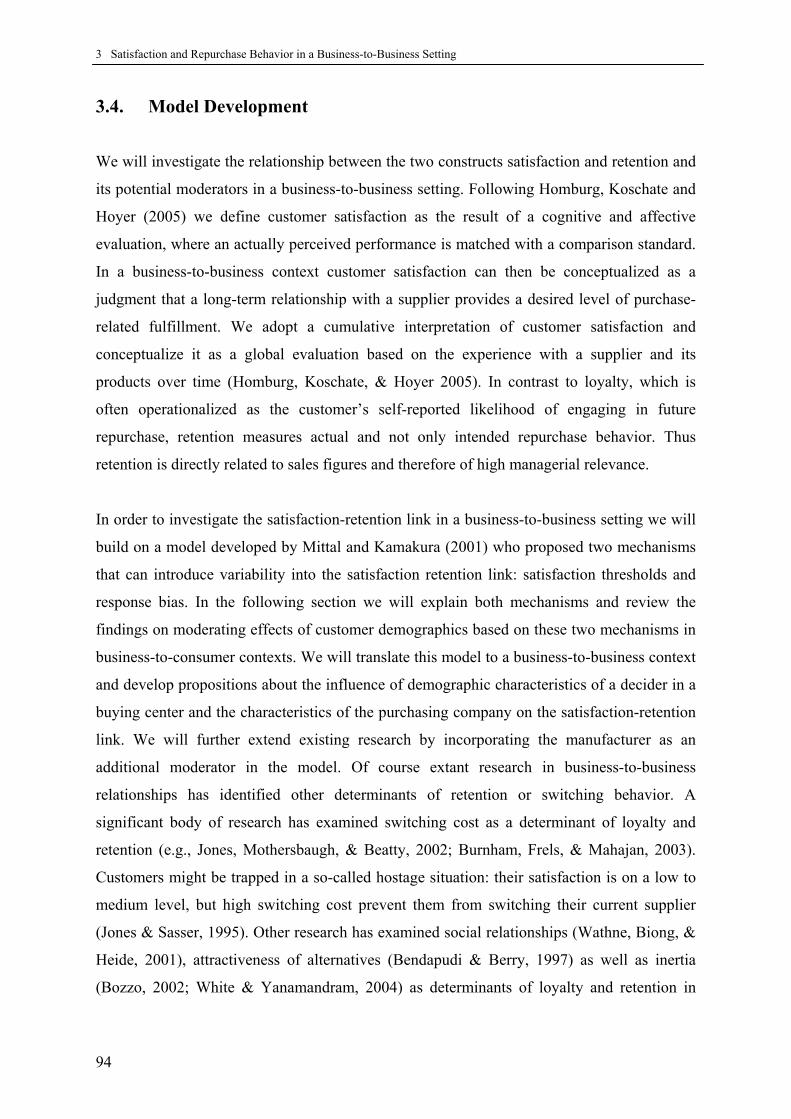
3 Satisfaction and Repurchase Behavior in a Business-to-Business Setting
94
3.4. Model Development
We will investigate the relationship between the two constructs satisfaction and retention and
its potential moderators in a business-to-business setting. Following Homburg, Koschate and
Hoyer (2005) we define customer satisfaction as the result of a cognitive and affective
evaluation, where an actually perceived performance is matched with a comparison standard.
In a business-to-business context customer satisfaction can then be conceptualized as a
judgment that a long-term relationship with a supplier provides a desired level of purchase-
related fulfillment. We adopt a cumulative interpretation of customer satisfaction and
conceptualize it as a global evaluation based on the experience with a supplier and its
products over time (Homburg, Koschate, & Hoyer 2005). In contrast to loyalty, which is
often operationalized as the customer’s self-reported likelihood of engaging in future
repurchase, retention measures actual and not only intended repurchase behavior. Thus
retention is directly related to sales figures and therefore of high managerial relevance.
In order to investigate the satisfaction-retention link in a business-to-business setting we will
build on a model developed by Mittal and Kamakura (2001) who proposed two mechanisms
that can introduce variability into the satisfaction retention link: satisfaction thresholds and
response bias. In the following section we will explain both mechanisms and review the
findings on moderating effects of customer demographics based on these two mechanisms in
business-to-consumer contexts. We will translate this model to a business-to-business context
and develop propositions about the influence of demographic characteristics of a decider in a
buying center and the characteristics of the purchasing company on the satisfaction-retention
link. We will further extend existing research by incorporating the manufacturer as an
additional moderator in the model. Of course extant research in business-to-business
relationships has identified other determinants of retention or switching behavior. A
significant body of research has examined switching cost as a determinant of loyalty and
retention (e.g., Jones, Mothersbaugh, & Beatty, 2002; Burnham, Frels, & Mahajan, 2003).
Customers might be trapped in a so-called hostage situation: their satisfaction is on a low to
medium level, but high switching cost prevent them from switching their current supplier
(Jones & Sasser, 1995). Other research has examined social relationships (Wathne, Biong, &
Heide, 2001), attractiveness of alternatives (Bendapudi & Berry, 1997) as well as inertia
(Bozzo, 2002; White & Yanamandram, 2004) as determinants of loyalty and retention in

3 Satisfaction and Repurchase Behavior in a Business-to-Business Setting
95
industrial business relationships. Similar to all the studies cited above we do not attempt to
develop a comprehensive model of customer retention, but rather want to answer the focused
research question of whether demographic characteristics of the decider in a buying center,
company characteristics and the manufacturer moderate the satisfaction-retention link. From
an application standpoint our variables have the advantage to be easy to measure and to likely
be available in customer databases. Thus segmenting and targeting of customers based on
study results will be much simpler than with the above-mentioned determinants of
satisfaction-retention link (inertia, switching cost, perception of alternatives etc.).
3.4.1. Satisfaction Threshold
Customers may vary systematically in their tolerance levels or thresholds toward repurchase
that are not fully captured in their satisfaction ratings. A satisfaction threshold can be
interpreted as a “reservation value” (Mittal & Kamakura, 2001, p. 134), i.e. the value that is
associated with the customer’s next best alternative other than repurchasing. This evaluation
will not only be based on the satisfaction with the previously purchased manufacturer but
also the expected satisfaction with potential alternative manufacturers. A customer with a
lower “reservation value” or low satisfaction threshold will be more likely to repurchase at
the same satisfaction level as a customer with a higher “reservation value” and better
alternatives (Mittal & Kamakura, 2001).
0
10
20
30
40
50
60
70
80
1 2 3 4 5
Satisfaction Rating
Rep
urch
ase
Prob
abili
ty
Customer group ACustomer group B
Figure 3-1: Differential Satisfaction Thresholds

3 Satisfaction and Repurchase Behavior in a Business-to-Business Setting
96
Graphically differences in satisfaction thresholds manifest itself in differences in elevation. In
Figure 3-1 customer group B has a lower satisfaction threshold than customer group A, i.e. at
the same level of satisfaction repurchase probability is higher for customer group B than for
customer group A. Mittal and Kamakura (2001) could show that the satisfaction thresholds or
reservation values differ for customers with different demographic characteristics. They
suggested for example, that older customers may be more likely to remain loyal to a
manufacturer due to their accumulated investments in and knowledge about the manufacturer,
whereas younger customers may in contrast be more willing to search for information and
thus switch manufacturers. Subsequently they could show that younger customers have a
higher satisfaction threshold than older customers. The open question here is whether the
demographic characteristics of a decider in a buying center moderate the satisfaction-
retention link in a business-to-business context. We would assume similar effects for the
business-to-business context and hence propose:
P1: Satisfaction thresholds vary with demographic characteristics of a decider in a
buying center
In the following, demographic characteristics of a decider in a buying center are meant, when
we speak of demographics. In contrast, demographic characteristics of the purchasing
company (e.g., number of employees, branch of industry etc.) are subsequently referred to as
company characteristics. Already Homburg and Giering (2001, p. 59) stated that,
“organizational characteristics of the buying firm as well as relational characteristics of the
buyer – supplier relationship might have a strong moderating influence on the relationship
between satisfaction with a supplier and loyalty”. Following their proposition we would
expect company characteristics such as company size to have an impact on the satisfaction
threshold in a business-to-business context. Existing research for example shows that larger
companies are likely to cooperate more intensively with their vendors and tend to work with
fewer vendors (Bowman & Narayandas, 2001). Thus, with increasing size, companies are
likely to have fewer alternatives to consider. All else being equal, the reservation value and
thus the satisfaction threshold for larger companies should be lower than for smaller
companies. We thus propose:
P2: Satisfaction thresholds vary with company characteristics
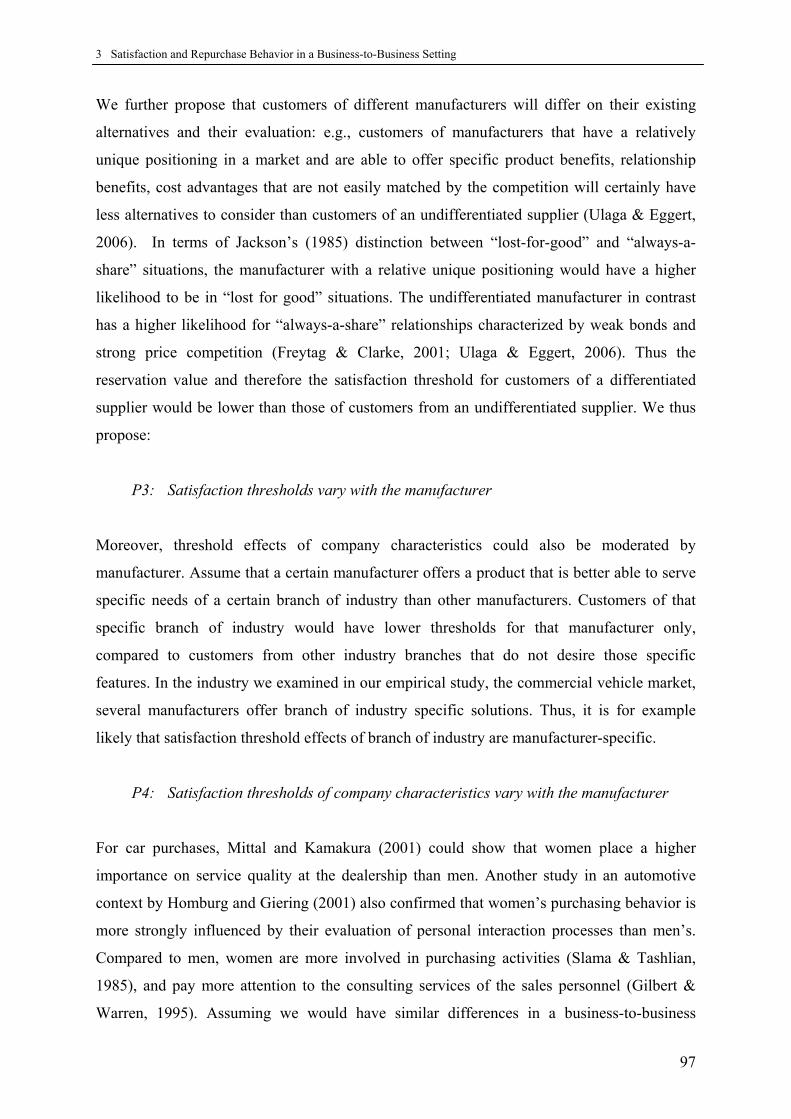
3 Satisfaction and Repurchase Behavior in a Business-to-Business Setting
97
We further propose that customers of different manufacturers will differ on their existing
alternatives and their evaluation: e.g., customers of manufacturers that have a relatively
unique positioning in a market and are able to offer specific product benefits, relationship
benefits, cost advantages that are not easily matched by the competition will certainly have
less alternatives to consider than customers of an undifferentiated supplier (Ulaga & Eggert,
2006). In terms of Jackson’s (1985) distinction between “lost-for-good” and “always-a-
share” situations, the manufacturer with a relative unique positioning would have a higher
likelihood to be in “lost for good” situations. The undifferentiated manufacturer in contrast
has a higher likelihood for “always-a-share” relationships characterized by weak bonds and
strong price competition (Freytag & Clarke, 2001; Ulaga & Eggert, 2006). Thus the
reservation value and therefore the satisfaction threshold for customers of a differentiated
supplier would be lower than those of customers from an undifferentiated supplier. We thus
propose:
P3: Satisfaction thresholds vary with the manufacturer
Moreover, threshold effects of company characteristics could also be moderated by
manufacturer. Assume that a certain manufacturer offers a product that is better able to serve
specific needs of a certain branch of industry than other manufacturers. Customers of that
specific branch of industry would have lower thresholds for that manufacturer only,
compared to customers from other industry branches that do not desire those specific
features. In the industry we examined in our empirical study, the commercial vehicle market,
several manufacturers offer branch of industry specific solutions. Thus, it is for example
likely that satisfaction threshold effects of branch of industry are manufacturer-specific.
P4: Satisfaction thresholds of company characteristics vary with the manufacturer
For car purchases, Mittal and Kamakura (2001) could show that women place a higher
importance on service quality at the dealership than men. Another study in an automotive
context by Homburg and Giering (2001) also confirmed that women’s purchasing behavior is
more strongly influenced by their evaluation of personal interaction processes than men’s.
Compared to men, women are more involved in purchasing activities (Slama & Tashlian,
1985), and pay more attention to the consulting services of the sales personnel (Gilbert &
Warren, 1995). Assuming we would have similar differences in a business-to-business

3 Satisfaction and Repurchase Behavior in a Business-to-Business Setting
98
context, female customers of a commercial vehicle manufacturer with a unique positioning
on service quality at its dealerships should have lower thresholds than male customers
specifically for this manufacturer. This means that if sex is investigated as a moderating
variable for a manufacturer that does not place a high emphasis on service quality, chances
are that the satisfaction thresholds for women would be substantially higher (assuming other
manufacturers offer higher service quality). We thus propose:
P5: Satisfaction thresholds of demographic characteristics of a decider in a buying
center vary with the manufacturer
Propositions four and five would explain why findings about moderating variables have been
partially equivocal: they may be manufacturer-specific. However none of the studies
investigating the satisfaction-retention link in a recent review by Seiders et al. (2005) has
investigated this potential moderating effect of manufacturer even though already Mittal and
Kamakura (2001) have called this one of the major limitations of their study and a promising
area for subsequent research.
3.4.2. Response Bias
Satisfaction ratings may not be solely influenced by the true satisfaction level but are error
prone measures of a true latent satisfaction. Ratings may be too easy or too harsh compared
to customers’ true satisfaction (Arndt & Crane, 1975; Dwyer, 1980; Kalwani & Silk, 1982).
This may be explained by differences in consumer socialization (see Zuckermann, 1981) and
role theory (see Hoffman & Hurst, 1990) that may predispose some consumers to engage in
“yes-saying” more than others.
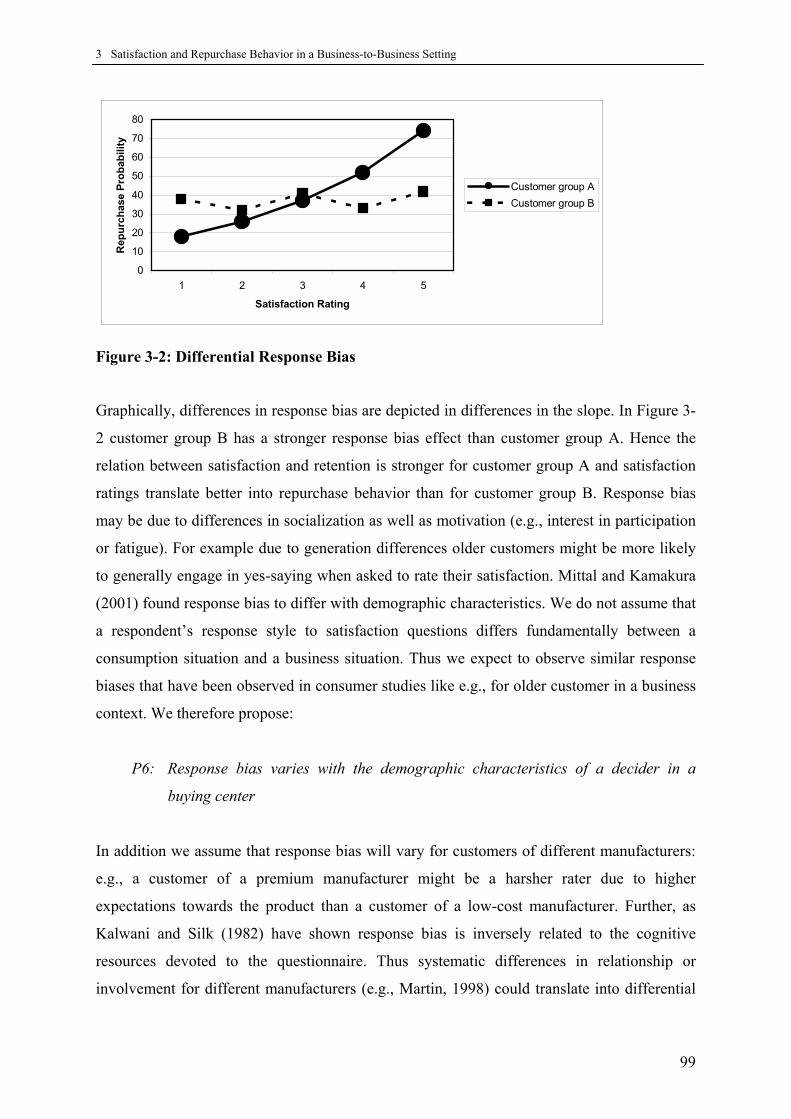
3 Satisfaction and Repurchase Behavior in a Business-to-Business Setting
99
0
10
20
30
40
50
60
70
80
1 2 3 4 5
Satisfaction Rating
Rep
urch
ase
Prob
abili
ty
Customer group ACustomer group B
Figure 3-2: Differential Response Bias
Graphically, differences in response bias are depicted in differences in the slope. In Figure 3-
2 customer group B has a stronger response bias effect than customer group A. Hence the
relation between satisfaction and retention is stronger for customer group A and satisfaction
ratings translate better into repurchase behavior than for customer group B. Response bias
may be due to differences in socialization as well as motivation (e.g., interest in participation
or fatigue). For example due to generation differences older customers might be more likely
to generally engage in yes-saying when asked to rate their satisfaction. Mittal and Kamakura
(2001) found response bias to differ with demographic characteristics. We do not assume that
a respondent’s response style to satisfaction questions differs fundamentally between a
consumption situation and a business situation. Thus we expect to observe similar response
biases that have been observed in consumer studies like e.g., for older customer in a business
context. We therefore propose:
P6: Response bias varies with the demographic characteristics of a decider in a
buying center
In addition we assume that response bias will vary for customers of different manufacturers:
e.g., a customer of a premium manufacturer might be a harsher rater due to higher
expectations towards the product than a customer of a low-cost manufacturer. Further, as
Kalwani and Silk (1982) have shown response bias is inversely related to the cognitive
resources devoted to the questionnaire. Thus systematic differences in relationship or
involvement for different manufacturers (e.g., Martin, 1998) could translate into differential
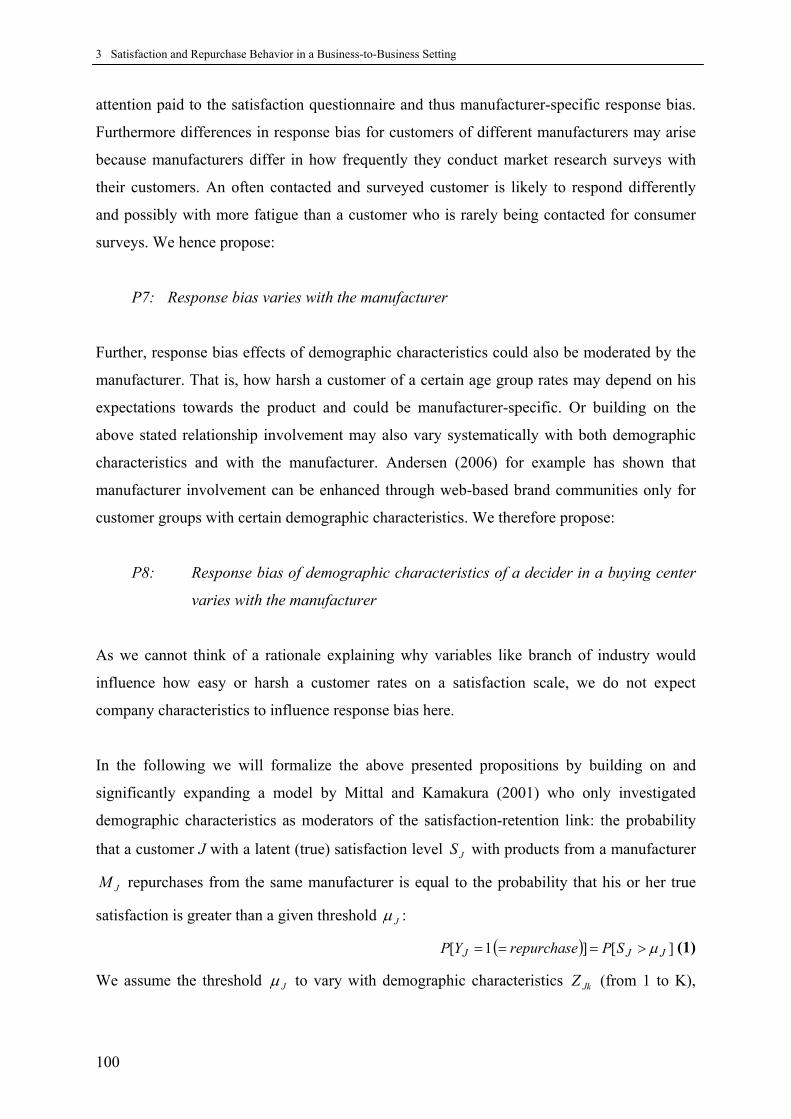
3 Satisfaction and Repurchase Behavior in a Business-to-Business Setting
100
attention paid to the satisfaction questionnaire and thus manufacturer-specific response bias.
Furthermore differences in response bias for customers of different manufacturers may arise
because manufacturers differ in how frequently they conduct market research surveys with
their customers. An often contacted and surveyed customer is likely to respond differently
and possibly with more fatigue than a customer who is rarely being contacted for consumer
surveys. We hence propose:
P7: Response bias varies with the manufacturer
Further, response bias effects of demographic characteristics could also be moderated by the
manufacturer. That is, how harsh a customer of a certain age group rates may depend on his
expectations towards the product and could be manufacturer-specific. Or building on the
above stated relationship involvement may also vary systematically with both demographic
characteristics and with the manufacturer. Andersen (2006) for example has shown that
manufacturer involvement can be enhanced through web-based brand communities only for
customer groups with certain demographic characteristics. We therefore propose:
P8: Response bias of demographic characteristics of a decider in a buying center
varies with the manufacturer
As we cannot think of a rationale explaining why variables like branch of industry would
influence how easy or harsh a customer rates on a satisfaction scale, we do not expect
company characteristics to influence response bias here.
In the following we will formalize the above presented propositions by building on and
significantly expanding a model by Mittal and Kamakura (2001) who only investigated
demographic characteristics as moderators of the satisfaction-retention link: the probability
that a customer J with a latent (true) satisfaction level JS with products from a manufacturer
JM repurchases from the same manufacturer is equal to the probability that his or her true
satisfaction is greater than a given threshold Jμ :
( ) ][]1[ JJJ SPrepurchaseYP μ>=== (1)
We assume the threshold Jμ to vary with demographic characteristics JkZ (from 1 to K),

3 Satisfaction and Repurchase Behavior in a Business-to-Business Setting
101
company characteristics JtC (from 1 to T), the manufacturer JM and the interactions of JkZ
and JtC with JM . The threshold is therefore regressed on the demographic and company
characteristics, the previously purchased manufacturer and their interactions:
(2)1 11 1
0 ∑ ∑∑ ∑= == =
++++++=K
kJJJt
T
tcmtJJkzmk
K
kJlmlJt
T
tctJkzkJ MCMZMCZ ηγγγγγγμ
where Jη is a Gumbel-distributed random error, 0γ describes the influence of factors
independent of differences in thresholds due to demographic, company characteristics and
manufacturer, zkγ the influence of demographic characteristics, ctγ the influence of
company characteristics, mγ the influence of manufacturer, zmkγ the influence of the
interaction of demographic characteristics and manufacturer and cmtγ the influence of the
interaction of company characteristics and the manufacturer. This threshold defines the true
satisfaction level necessary for the customer to be indifferent between switching or
repurchasing from the same manufacturer.
The observed satisfaction rating JO is an indicator of the true underlying satisfaction JS ,
therefore we regress the latent satisfaction on this indicator:
JJJJ OS εβ += (3)
where Jε is a Gumbel distributed random error and Jβ is the response bias, representing the
translation of true satisfaction into observed satisfaction ratings. As noted above, we assume
that the response bias depends on demographics, manufacturer and their interaction:
Jlml
K
kJJk
K
kzmkJkzkJ MMZZ δδδδβ +++= ∑ ∑
= =1 10
(4)
where 0δ describes the influence independent of demographic characteristics, the
manufacturer and their interaction, zkδ describes the response bias due to demographic
characteristics and mδ the response bias due to manufacturer. zmkδ describes the influence of
the interaction between response bias due to demographics and manufacturer. By combining
these, we arrive at the following formula where the difference between the independent and
identically Gumbel-distributed random errors Jη and Jε is logistically distributed:

3 Satisfaction and Repurchase Behavior in a Business-to-Business Setting
102
⎥⎦
⎤⎟⎠
⎞−−−−−
⎢⎢⎣
⎡⎜⎜⎝
⎛−⎟
⎠
⎞⎜⎝
⎛+++−==
∑∑∑∑
∑∑
====
==
JJt
T
tcmtJ
K
kJkzmkJlmlJt
T
tct
K
kJkzk
J
K
kJJkzmk
K
kJlmlJkzkJJJ
MCγMZγMγCγZγγ
OMZδMδZδδεηP]P[Y
11110
1101 p
(5)
3.5. Method
3.5.1. Research Setting We investigated repurchases of commercial vehicles in a non-contractual business-to-
business setting. Several manufacturers compete in this market. Customers rely on different
vendors and usually possess mixed fleets with vehicles from different manufacturers. They
change their allocation of purchase shares according to the record of the manufacturer’s
performance. Similar to other studies in the business-to-business domain, a key informant
procedure was used (e.g., Morgan & Hunt, 1994; Rindfleisch & Moorman, 2001). Prior to the
survey respondents were screened whether they were responsible for fleet management.
Respondents who were not responsible for fleet management were asked for the name and
telephone number of the fleet manager and were excluded from the interview. In addition,
each respondent was asked whether he or she was responsible for purchase decisions of new
vehicles and supplier selection. Respondents who did not participate in purchase decisions
and supplier selection were also excluded from the interview. In general, companies’
purchase decisions are multiperson processes, and different participants have different roles
(e.g., Sheth, 1973; Webster & Wind, 1972). However, this study investigates straight rebuy
or modified rebuy purchasing situations (companies already owned commercial vehicles).
These more routine types of buying situations are often carried out by small buying centers
(Anderson et al., 1987), and decisions are more likely to be made autonomously (Sheth,
1973). Considering the type of purchase and in line with extant literature (e.g., Morgan &
Hunt, 1994; Rindfleisch & Moorman, 2001; Bowman & Narayandas, 2004) the key
informant approach was deemed to be an acceptable choice.
3 Satisfaction and Repurchase Behavior in a Business-to-Business Setting
103
3.5.2. Data Collection
The data is part of a large multi-client study of new commercial vehicle buyers in a major
European market. All relevant commercial vehicle manufacturers in this market participated
in this survey and provided name and telephone number of customers that have just
purchased (a) new vehicle(s) to a commercial research company. The commercial research
company conducted telephone interviews with these new commercial vehicle buyers.
Respondents were randomly sampled from the customer database that consisted of the
addresses and telephone numbers of new vehicle customers provided by the sponsoring
manufacturers. Interviewers asked respondents to participate in a survey of new vehicle
owners’ perceptions and experiences of the purchase process. As stated above, prior to the
main survey respondents were screened to assure that they were responsible for fleet
management and that they participated in purchase decisions of new vehicles. Surveys
averaged 25 minutes in length. Overall 4997 respondents were interviewed. The response rate
was 27,76 %, which is acceptable, compared to other published studies in a business-to-
business setting (e.g., Morgan & Hunt, 1994; Homburg, Giering & Menon, 2003). The
sample distribution on branch of industry, number of employees and fleet size was compared
with aggregate data provided by the manufacturers association for the respective study year.
No notable discrepancies were found. Even though only respondents who stated that they
were responsible for fleet management and participated in the purchase decision were eligible
for the survey, an initial question block was administered to measure the degree of
participation in the purchase decision. Of the surveyed respondents 91.6% stated that they
were very involved in the purchase process, whereas only 8.4% stated that they were only
somewhat involved. Furthermore 88,2 % of the respondents stated that they participated in
trade talks at dealerships and 95.8 % of the respondents stated that they were involved in day-
to-day running of the vehicles. Furthermore respondents had to indicate the type of
purchase/buying decision. 70 (1.4%) of the respondents conducted a new buy and the
purchased vehicle was their first commercial vehicle. 1662 (33.25%) respondents conducted
a modified rebuy in that the new vehicle was used for fleet expansion and not replacing an
existing vehicle. Finally 3265 (65.33%) respondents replaced an existing vehicle with the
new vehicle. However 941 (18.83%) of those respondents replaced a vehicle from a different
category (e.g., a passenger car, an estate vehicle or a truck) with a commercial vehicle. For
replacement purchases where a vehicle from a different category was replaced with a
commercial vehicle other factors than the satisfaction with the replaced vehicle may have

3 Satisfaction and Repurchase Behavior in a Business-to-Business Setting
104
impacted the purchase decision (i.e. many of the replaced passenger cars, estate vehicles or
trucks come from brands or manufacturers that do not offer commercial vehicles). The
remaining 2324 (46.50%) respondents conducted straight rebuys, in which a commercial
vehicle was actually replaced by a commercial vehicle with the same specifications and were
retained for the analysis. Those who replaced a vehicle with one from the same manufacturer
were considered loyal, those who did replace the vehicle with one form another manufacturer
were not considered as loyal. After listwise deletion of cases with missing values on the
model variables 1493 cases remained for the analysis. In order to ensure that the data
adequately represented the actual market situation data was weighted by vehicle registration
data of the respective market and year. The high level of self-stated involvement in the
purchase process as well as the fact that we only analyzed straight repurchases further
supported the choice of the key informant approach.
3.5.3. Sample Characteristics and Measures
The survey contained various themes around the new vehicle purchase: exact specification of
the vehicle (i.e. number of seats), specification of the previous vehicle (i.e. make, model),
intended usage (i.e. which goods will be transported), payment condition (i.e. discounts,
source of credit), satisfaction with the purchase process, alternatives considered, reason for
purchase/rejection, company characteristics and demographics of the respondent. Satisfaction
with the replaced vehicle was measured on a Likert-scale ranging from 1 = “completely
dissatisfied” to 5 = “completely satisfied”. The question read as follows: “Please think about
your ownership experience with your previous vehicle. Overall how satisfied have you been
with your previous vehicle”. When the new vehicle was from the same manufacturer as the
replaced vehicle a customer was considered to be loyal. Table 3-1 gives an overview of the
sample distribution of the demographics variables as well as the company characteristics that
we used in the model. Additionally the average satisfaction ratings and average repurchase-
probabilities are shown for each level of the model variables. The following demographic and
company characteristics were surveyed:
Demographic characteristics: sex, age and consideration of other manufacturers (whether
other manufacturers than that of the replaced vehicle were considered prior to purchase).
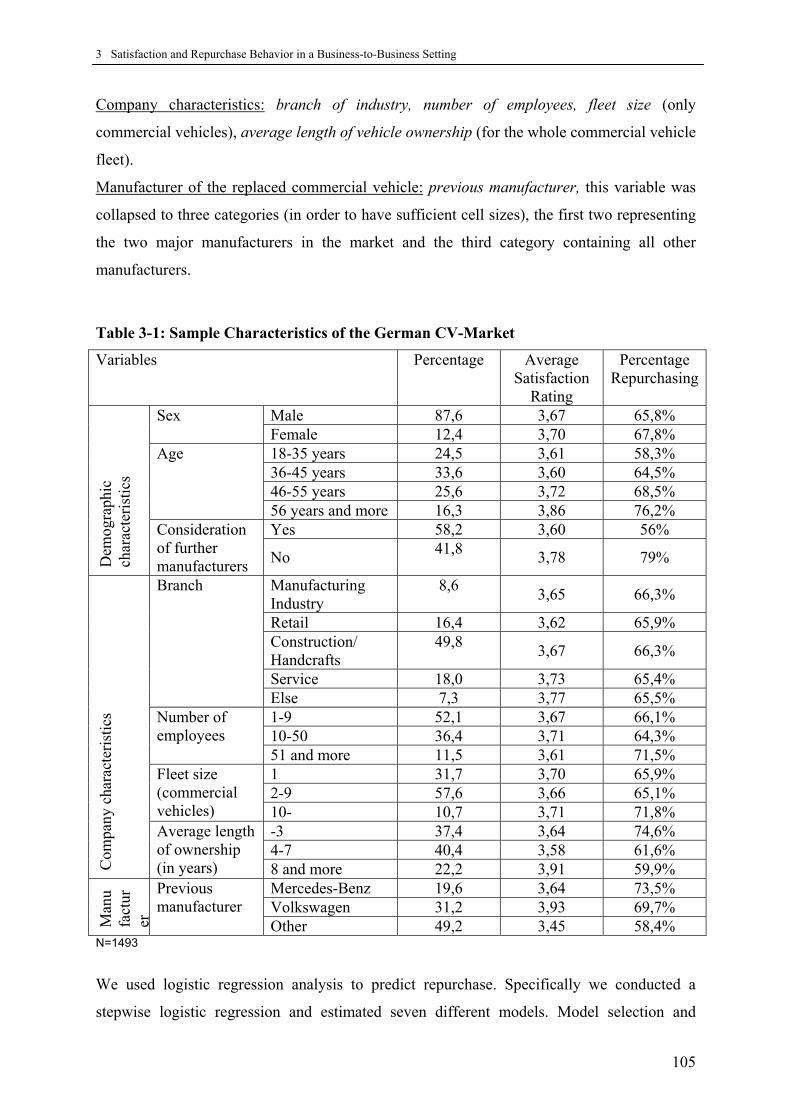
3 Satisfaction and Repurchase Behavior in a Business-to-Business Setting
105
Company characteristics: branch of industry, number of employees, fleet size (only
commercial vehicles), average length of vehicle ownership (for the whole commercial vehicle
fleet).
Manufacturer of the replaced commercial vehicle: previous manufacturer, this variable was
collapsed to three categories (in order to have sufficient cell sizes), the first two representing
the two major manufacturers in the market and the third category containing all other
manufacturers.
Table 3-1: Sample Characteristics of the German CV-Market
Variables Percentage Average Satisfaction
Rating
Percentage Repurchasing
Male 87,6 3,67 65,8% Sex Female 12,4 3,70 67,8% 18-35 years 24,5 3,61 58,3% 36-45 years 33,6 3,60 64,5% 46-55 years 25,6 3,72 68,5%
Age
56 years and more 16,3 3,86 76,2% Yes 58,2 3,60 56%
Dem
ogra
phic
ch
arac
teris
tics
Consideration of further manufacturers No 41,8 3,78 79%
Manufacturing Industry
8,6 3,65 66,3%
Retail 16,4 3,62 65,9% Construction/ Handcrafts
49,8 3,67 66,3%
Service 18,0 3,73 65,4%
Branch
Else 7,3 3,77 65,5% 1-9 52,1 3,67 66,1% 10-50 36,4 3,71 64,3%
Number of employees
51 and more 11,5 3,61 71,5% 1 31,7 3,70 65,9% 2-9 57,6 3,66 65,1%
Fleet size (commercial vehicles) 10- 10,7 3,71 71,8%
-3 37,4 3,64 74,6% 4-7 40,4 3,58 61,6%
Com
pany
cha
ract
eris
tics
Average length of ownership (in years) 8 and more 22,2 3,91 59,9%
Mercedes-Benz 19,6 3,64 73,5% Volkswagen 31,2 3,93 69,7%
Man
ufa
ctur
er
Previous manufacturer Other 49,2 3,45 58,4%
N=1493
We used logistic regression analysis to predict repurchase. Specifically we conducted a
stepwise logistic regression and estimated seven different models. Model selection and
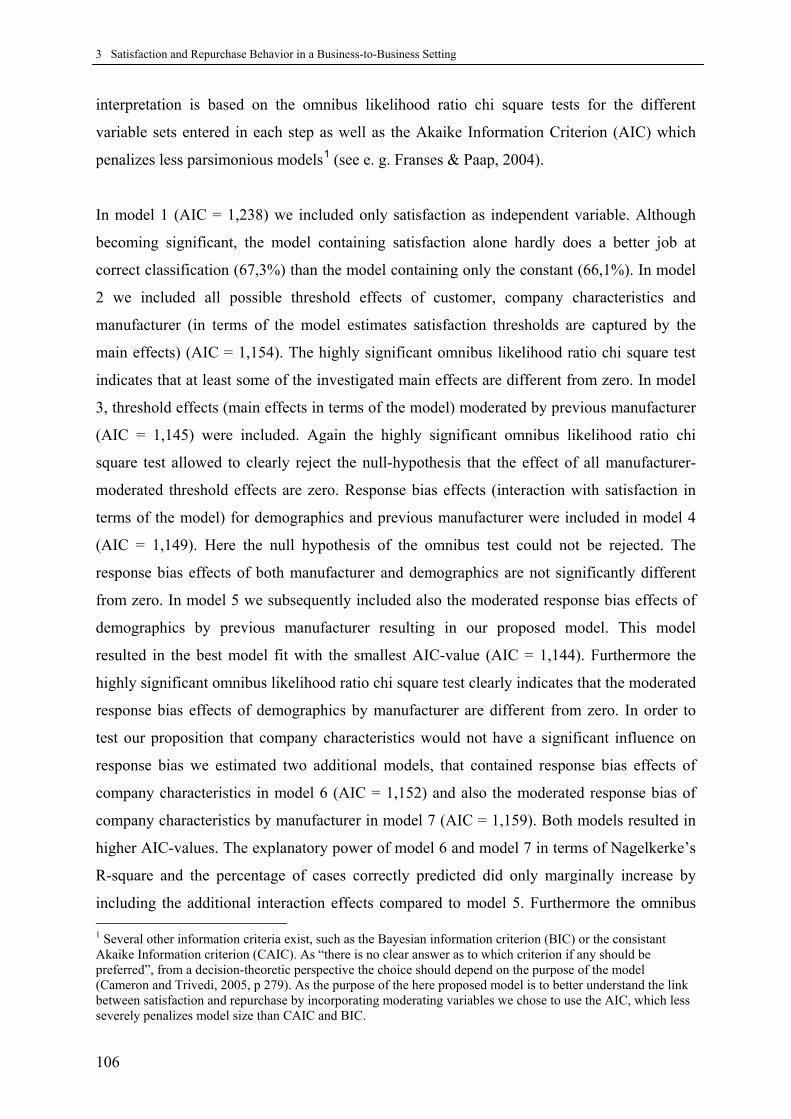
3 Satisfaction and Repurchase Behavior in a Business-to-Business Setting
106
interpretation is based on the omnibus likelihood ratio chi square tests for the different
variable sets entered in each step as well as the Akaike Information Criterion (AIC) which
penalizes less parsimonious models1 (see e. g. Franses & Paap, 2004).
In model 1 (AIC = 1,238) we included only satisfaction as independent variable. Although
becoming significant, the model containing satisfaction alone hardly does a better job at
correct classification (67,3%) than the model containing only the constant (66,1%). In model
2 we included all possible threshold effects of customer, company characteristics and
manufacturer (in terms of the model estimates satisfaction thresholds are captured by the
main effects) (AIC = 1,154). The highly significant omnibus likelihood ratio chi square test
indicates that at least some of the investigated main effects are different from zero. In model
3, threshold effects (main effects in terms of the model) moderated by previous manufacturer
(AIC = 1,145) were included. Again the highly significant omnibus likelihood ratio chi
square test allowed to clearly reject the null-hypothesis that the effect of all manufacturer-
moderated threshold effects are zero. Response bias effects (interaction with satisfaction in
terms of the model) for demographics and previous manufacturer were included in model 4
(AIC = 1,149). Here the null hypothesis of the omnibus test could not be rejected. The
response bias effects of both manufacturer and demographics are not significantly different
from zero. In model 5 we subsequently included also the moderated response bias effects of
demographics by previous manufacturer resulting in our proposed model. This model
resulted in the best model fit with the smallest AIC-value (AIC = 1,144). Furthermore the
highly significant omnibus likelihood ratio chi square test clearly indicates that the moderated
response bias effects of demographics by manufacturer are different from zero. In order to
test our proposition that company characteristics would not have a significant influence on
response bias we estimated two additional models, that contained response bias effects of
company characteristics in model 6 (AIC = 1,152) and also the moderated response bias of
company characteristics by manufacturer in model 7 (AIC = 1,159). Both models resulted in
higher AIC-values. The explanatory power of model 6 and model 7 in terms of Nagelkerke’s
R-square and the percentage of cases correctly predicted did only marginally increase by
including the additional interaction effects compared to model 5. Furthermore the omnibus 1 Several other information criteria exist, such as the Bayesian information criterion (BIC) or the consistant Akaike Information criterion (CAIC). As “there is no clear answer as to which criterion if any should be preferred”, from a decision-theoretic perspective the choice should depend on the purpose of the model (Cameron and Trivedi, 2005, p 279). As the purpose of the here proposed model is to better understand the link between satisfaction and repurchase by incorporating moderating variables we chose to use the AIC, which less severely penalizes model size than CAIC and BIC.

3 Satisfaction and Repurchase Behavior in a Business-to-Business Setting
107
likelihood ratio chi square test for both the interactions between satisfaction and company
characteristics in model 6 and the three-way interaction between satisfaction, company
characteristics and manufacturer of the previous vehicle in model 7 are not significant. Thus
for both model 6 and model 7 we cannot reject the null hypotheses that the estimated effects
are zero. These results confirm that our proposed model, model 5, possesses the best fit to the
data. This model was therefore retained and interpreted.
Table 3-2: Model Iterations German CV-Market
M Variables Chi-square
df Delta Sig. -2log-likelihood
Nagelkerke R Square
Percent correct pred.
AIC
Constant 66,1 1 SAT 67.11 1 1845,74 0,061 67,3 1,2382 SAT, DEM, COM,
MAN 225.24 18 158.13 0.00 1687,61 0,194 71,8 1,1543 SAT, DEM, COM,
MAN, DEM*MAN, COM*MAN 298.72 48 73.48 0.00 1614,13 0,251 72,8 1,145
4 SAT, DEM, COM, MAN, DEM*MAN,
COM*MAN, SAT*DEM, SAT*MAN 306.89 55 8.17 0.318 1605,96 0,257 72,7 1,149
5 SAT, DEM, COM, MAN, DEM*MAN,
COM*MAN, SAT*DEM, SAT*MAN,
SAT*DEM*MAN 334.57 65 27.69 0.002 1578,28 0,278 74,4 1,1446 SAT, DEM, COM,
MAN, DEM*MAN, COM*MAN, SAT*DEM, SAT*MAN,
SAT*DEM*MAN, SAT*COM 342.30 75 7.73 0.655 1570,55 0,284 74,5 1,152
7 SAT, DEM, COM, MAN, SAT*COM,
DEM*MAN, SAT*DEM, SAT*MAN,
SAT*DEM*MAN, COM*MAN,
SAT*COM*MAN 373.02 95 30.72 0.059 1539,83 0,306 75,0 1,159SAT=Satisfaction, DEM = Demographics , COM=Company Characteristics, MAN= Previous Manufacturer;
N=1493

3 Satisfaction and Repurchase Behavior in a Business-to-Business Setting
108
3.5.4. Thresholds
In terms of the model estimates, satisfaction thresholds are captured by the main effects of
company, demographic characteristics, and previous manufacturer (γ parameters in the
model). Positive coefficients indicate lower thresholds compared to the reference category. A
customer with a lower “reservation value” or lower satisfaction threshold will be more likely
to repurchase at the same satisfaction level as a customer with a higher “reservation value”
and better alternatives. An example might illustrate the interpretation of the threshold
parameters. Consider the positive and significant coefficient of 0.769 for the length of
ownership of up to three years versus the reference category of length of ownership of eight
years and longer. This positive coefficient and thus lower threshold would indicate that
customers who hold their vehicles three years and less would have higher repurchase
probabilities at the same level of satisfaction as the reference category (customers who hold
their vehicles more than eight years). This result is nicely illustrated in Figure 3-3. Further the
interactions of manufacturer with company and demographic characteristics can be
interpreted as thresholds moderated by previous manufacturer (manufacturer of the replaced
vehicle). That is, threshold effects of company or demographic characteristics depend on the
manufacturer of the replaced vehicle. Table 3-3 shows the γ coefficients of the logistic
regression. To enhance readability, the significant coefficients are highlighted.

3 Satisfaction and Repurchase Behavior in a Business-to-Business Setting
109
Table 3-3: Satisfaction Thresholds
Indices Variable CoefficientStandard Error p-Value
1zγ Satisfaction 0,378 0,326 0,247 Age 0,769
2zγ Age(1) = 18 to 35 years -0,778 1,088 0,475 3zγ Age(2) = 36 to 45 years -1,064 1,049 0,311 4zγ Age(3) = 46 to 55 years -1,032 1,139 0,365 5zγ Sex(1) = Male 0,468 0,925 0,613
6zγ Consid(1) = Consideration of other vehicles -1,706* 0,680 0,012
Branch 0,349 1cγ Branch(1) = Manufacturer -0,977 0,541 0,071 2cγ Branch(2) = Retail -0,375 0,459 0,415 3cγ Branch(3) = Construction -0,644 0,412 0,118 4cγ Branch(4) = Service -0,546 0,452 0,227
Number of employees 0,064
5cγ Number of employees(1) = 1 to 9 -0,713 0,469 0,129
6cγ Number of employees(2) = 10 to 50 -0,978* 0,456 0,032
Length of ownership (Lenown) 0,000 7cγ Lenown(1) = up to 3 years 0,769** 0,282 0,006 8cγ Lenown(2) = 4 to 7 years -0,100 0,268 0,711
Number of CVs 0,362 9cγ Number of CVs(1) = 1 -0,418 0,425 0,326 10cγ Number of CVs(2) = 2 to 9 -0,133 0,396 0,736
Manufacturer (Manu) 0,000 1mγ Manu(1) = Mercedes-Benz 4,590 2,551 0,072 2mγ Manu(2) = Volkswagen -7,167** 2,285 0,002
*=p<.05, **=p<.01
Of all demographic characteristics only consideration of other manufacturers had a
significant effect, providing general support for proposition P1. Customers considering not
only the replaced manufacturer prior to purchase show a higher satisfaction threshold
(indicated by the negative coefficient), hence a lower repurchase probability at an equivalent
level of satisfaction, than customers considering only the replaced manufacturer ( 6zγ = -
1,706, p<.05). Further, the company characteristics, number of employees and length of
ownership significantly affected the satisfaction threshold, providing support for proposition

3 Satisfaction and Repurchase Behavior in a Business-to-Business Setting
110
P2: companies with 10-50 employees have a significantly higher threshold than companies
with more than 50 employees ( 6cγ = -0,978, p<.05). This result is in line with Bowman and
Narayandas (2001) finding that larger companies tend to work with fewer vendors and thus
are likely to have lower thresholds compared to smaller companies. Companies that hold
their commercial vehicles for a short term (on average up to three years) evidenced a
significantly lower satisfaction threshold (thus higher repurchase probabilities with
equivalent levels of satisfaction) ( 7cγ = 0,769, p<.01), than companies holding their
commercial vehicles eight years and longer. Further, manufacturer significantly influenced
the satisfaction threshold. Customers whose previous vehicle was from Volkswagen,
evidenced a significantly higher threshold than customers of other manufacturers ( 2mγ = -
7,167, p<.01). Apparently Volkswagen has a less loyal customer base than other
manufacturers. Hence, these findings support proposition P3. In the market under study, the
commercial vehicle market, Volkswagen is a large volume producer. In the European Market
where we conducted our study its market share was above 30% at the time of the survey.
Large volume producer have traditionally less loyal customers than smaller producers with
often stronger brands such as Mercedes-Benz.
Fairly Satisfied Very Satsified Completely Satisfied
Satisfaction
0,50
0,60
0,70
0,80
Mea
n Pr
obab
ility
of r
epur
chas
e
Length of ownershipup to 3 years4 to 7 years8 and more years
Figure 3-3: Differential Satisfaction Threshold of Length of Ownership

3 Satisfaction and Repurchase Behavior in a Business-to-Business Setting
111
Figure 3 exemplarily gives a graphical depiction of one of the found effects, the differential
threshold effects of length of ownership. It becomes apparent that customers who on average
keep their vehicles for a shorter period of time have lower satisfaction thresholds: at the same
satisfaction level customers with shorter ownership cycles have a higher probability of
repurchase than customers with an on average longer ownership cycle. We depict only the
three highest levels of the satisfaction measure because the two lower satisfaction levels
combined contain only around 10% of the respondents.
Table 3-4: Manufacturer-Specific Satisfaction Thresholds
Indices Variable CoefficientStandard Error p-Value
Age * Manufacturer (Manu) 0,0631zmγ Age(1) by Manu(1) -5,130* 2,121 0,0162zmγ Age(1) by Manu(2) 1,571 1,826 0,3903zmγ Age(2) by Manu(1) -3,296 1,997 0,0994zmγ Age(2) by Manu(2) 1,963 1,601 0,2205zmγ Age(3) by Manu(1) -1,672 2,212 0,4506zmγ Age(3) by Manu(2) 2,913 1,865 0,118
Manu * Sex 0,1207zmγ Manu(1) by Sex(1) -1,940 1,715 0,2588zmγ Manu(2) by Sex(1) 2,272 1,723 0,187
Manu * Consideration of other vehicles (Consid) 0,129
9zmγ Manu(1) by Consid(1) 1,726 1,115 0,12210zmγ Manu(2) by Consid(1) 2,028 1,143 0,076
Branch * Manu 0,0001cmγ Branch(1) by Manu(1) 1,926* 0,872 0,0272cmγ Branch(1) by Manu(2) 1,412 0,732 0,0543cmγ Branch(2) by Manu(1) -0,045 0,778 0,9544cmγ Branch(2) by Manu(2) 1,574* 0,664 0,0185cmγ Branch(3) by Manu(1) 0,588 0,703 0,4036cmγ Branch(3) by Manu(2) 1,742** 0,576 0,0027cmγ Branch(4) by Manu(1) 1,128 0,792 0,1548cmγ Branch(4) by Manu(2) 0,636 0,630 0,313
Manu * Number of employees 0,842
9cmγ Manu(1) by Number of employees(1) 0,08410cmγ Manu(1) by Number of employees(2) -0,103 0,693 0,882
3 Satisfaction and Repurchase Behavior in a Business-to-Business Setting
112
11cmγ Manu(2) by Number of employees(1) 0,659 0,670 0,32512cmγ Manu(2) by Number of employees(2) 1,164 0,620 0,060
Manu * Length of ownership (Lenown) 0,05513cmγ Manu(1) by Lenown(1) -0,108 0,501 0,82914cmγ Manu(1) by Lenown(2) 0,768 0,412 0,06316cmγ Manu(2) by Lenown(1) 0,086 0,446 0,84817cmγ Manu(2) by Lenown(2) 1,032** 0,374 0,006
Manu * Number of CVs 0,17918cmγ Manu(1) by Number of CVs(1) 0,431 0,752 0,56719cmγ Manu(1) by Number of CVs(2) -0,491 0,670 0,46420cmγ Manu(2) by Number of CVs(1) 0,382 0,624 0,54021cmγ Manu(2) by Number of CVs(2) -0,189 0,571 0,741
Note: *=p<.05, **=p<.01
Whereas age does not show a significant threshold effect on its own, it significantly
influences the threshold when moderated by manufacturer, showing support for proposition
P5. Mercedes-Benz customers who are between 18 to 35 years old have a significantly higher
threshold ( 1zmγ = -5,130 p<.05) than older customers. This effect however cannot be found
for other manufacturers. This result stands in line with findings of Mittal and Kamakura
(2001) who found that older customers have lower satisfaction thresholds. The same result
can be found for branch of industry: no threshold effect can be found if the manufacturer
variable is neglected. However it becomes clear from Table 3-4 that thresholds differ
significantly for different branches of industries if the manufacturer is taken into account. The
threshold effect of length of ownership, it appears is also moderated by manufacturer:
whereas Figure 3-3 shows a strong threshold effect of length of ownership, the analysis on a
manufacturer level shows, that this effect only holds true for Volkswagen, not however for
Mercedes-Benz or other manufacturers, also confirming proposition P4.
Figures 4a-c graphically depict the differential impact of length of ownership for customers
of different manufacturers. The importance of taking the manufacturer into the analysis
becomes apparent: a general inspection of moderating effects has shown that customers with
a lower length of ownership have a lower satisfaction threshold and hence a higher intrinsic
retainability. An analysis on a manufacturer level however shows that this holds true only for
customers who have replaced a vehicle from Volkswagen, not so for customers of Mercedes-
Benz and other manufacturers. Summarizing, we could provide support for all our

3 Satisfaction and Repurchase Behavior in a Business-to-Business Setting
113
propositions concerning satisfaction threshold effects as captured in P1 to P5.
Figure 3-4: Differential Satisfaction Thresholds of Length of Ownership for Different Manufacturers
3.5.5. Response Bias
In terms of the model estimates the response bias is captured by the interactions between
satisfaction ratings and the demographics, respectively satisfaction ratings and manufacturer
(δ parameters) implying that even after accounting for the differences in average rating, the
translation of reported satisfaction into repurchase depends on demographic characteristics
and the previous manufacturer. Negative coefficients indicate higher response bias compared
to the reference category. Again higher response bias implies that satisfaction ratings
translate less well into repurchase behavior. Graphically this results in a flatter slope of the
satisfaction-repurchase probability line. Not a single demographic characteristic in our model
shows a significant response bias effect on its own, clearly rejecting proposition P6 and
standing in contrast with previous findings in the literature (e.g., Mittal & Kamakura, 2001).
Only manufacturer has a significant response bias effect, providing support for proposition P7
(see Table 3-5).
Fairly Satisfied Very Satsified Completely Satisfied
Satisfaction
0,2
0,3
0,4
0,5
0,6
0,7
0,8
0,9
Mea
n Pr
obab
ility
of r
epur
chas
e
Fairly Satisfied Very Satsified Completely Satisfied
Satisfaction
0,20
0,30
0,40
0,50
0,60
0,70
0,80
0,90
Volkswagen
Fairly Satisfied Very Satsified Completely Satisfied
Satisfaction
0,2
0,3
0,4
0,5
0,6
0,7
0,8
0,9Length of ownership
up to 3 years4 to 7 years8 and more years
Other brandsMercedes-Benz

3 Satisfaction and Repurchase Behavior in a Business-to-Business Setting
114
Table 3-5: Response Bias Effects
Indices Variable Coefficient Standard Error p-Value
Age * Satisfaction 0,6571zδ Age(1) by Satisfaction 0,045 0,287 0,8742zδ Age(2) by Satisfaction 0,266 0,279 0,3413zδ Age(3) by Satisfaction 0,257 0,307 0,4024zδ Satisfaction by Sex(1) -0,138 0,256 0,589
5zδ Consideration of other vehicles (1) by Satisfaction 0,230 0,192 0,230
Manu * Satisfaction 0,0001mδ Manu(1) by Satisfaction -1,416* 0,614 0,0212mδ Manu(2) by Satisfaction 1,469* 0,574 0,011
Note: For an explanation of the abbreviated categories see Table 3-3; *=p<.05, **=p<.01
The fact that no single demographic characteristic has an effect on response bias is particular
striking as all of them evidence significant effects on response bias when the manufacturer
was taken into account, providing clear support for proposition P8 and strongly highlighting
the necessity to investigate the effect of manufacturer on response bias effects (see Table 3-
6).
Table 3-6: Manufacturer-Specific Response Bias Effects
Indices Variable CoefficientStandard Error p-Value
Age * Satisfaction * Manu 0,0401zmδ Age(1) by Satisfaction by Manu(1) 1,358* 0,541 0,0122zmδ Age(1) by Satisfaction by Manu(2) -0,470 0,479 0,3273zmδ Age(2) by Satisfaction by Manu(1) 0,638 0,508 0,2094zmδ Age(2) by Satisfaction by Manu(2) -0,659 0,422 0,1185zmδ Age(3) by Satisfaction by Manu(1) 0,355 0,560 0,5266zmδ Age(3) by Satisfaction by Manu(2) -0,736 0,490 0,133
Satisfaction * Sex * Manu 0,0127zmδ Satisfaction by Sex(1) by Manu(1) 0,814 0,448 0,0698zmδ Satisfaction by Sex(1) by Manu(2) -0,789 0,472 0,094
Consid * Satisfaction * Manu 0,06210zmδ Consid(1) by Satisfaction by Manu(1) -0,487 0,307 0,11311zmδ Consid(1) by Satisfaction by Manu(2) -0,679* 0,305 0,026
Note: For an explanation of the abbreviated categories see Table 3-3; *=p<.05, **=p<.01

3 Satisfaction and Repurchase Behavior in a Business-to-Business Setting
115
For young customers (18 to 35 years) the response bias is lower, meaning that changes in
their satisfaction ratings strongly translate into repurchase for this age group only for
Mercedes-Benz ( 1zmδ =1,358; p<.05) whereas there is no significant difference in response
bias due to age for customers of other manufacturers.
Figure 3-5: Differential Response Bias Effect of Age for Customers of Different Manufacturers
It can be seen clearly from figure 3-5 that differences in satisfaction ratings translate better
into repurchase behavior for younger customers than for older customers. Apparently
response bias is stronger for older customers than for younger customers. However this is
only the case for customers of Mercedes-Benz (respondents who replaced a vehicle from
Mercedes-Benz). Younger customers of other manufacturers do not show a lower response
bias than older customers. Similarly differential effects of response bias for manufacturers
can be found for sex and consideration of other manufacturers. Customers of Volkswagen
who considered more than the replaced manufacturer prior to their purchase show a
significantly higher response bias (meaning their satisfaction ratings translate less well into
repurchase behavior) than customers who only consider the replaced manufacturer ( 11zmδ =-
0,679; p<.05). The translation of satisfaction ratings into repurchase behavior for customers
of Mercedes-Benz and other manufacturers however does not differ with the consideration of
other manufacturers. Summarizing our results support P7 and P8 while P6 has to be rejected
and further underscores the utility and also necessity to include manufacturer as an additional
moderating variable. Table 3-7 provides an overview of our findings.
Fairly Satisfied Very Satsified Completely Satisfied
Satisfaction
0,20
0,40
0,60
0,80
1,00
Mea
n Pr
obab
ility
of r
epur
chas
e
Mercedes-Benz
Fairly Satisfied Very Satsified Completely Satisfied
Satisfaction
0,20
0,40
0,60
0,80
1,00
Mea
n Pr
obab
ility
of r
epur
chas
e
Volkswagen
Fairly Satisfied Very Satsified Completely Satisfied
Satisfaction
0,2
0,4
0,6
0,8
1,0
Mea
n Pr
obab
ility
of r
epur
chas
e
Age18-3536-4546-55>55
Other brands
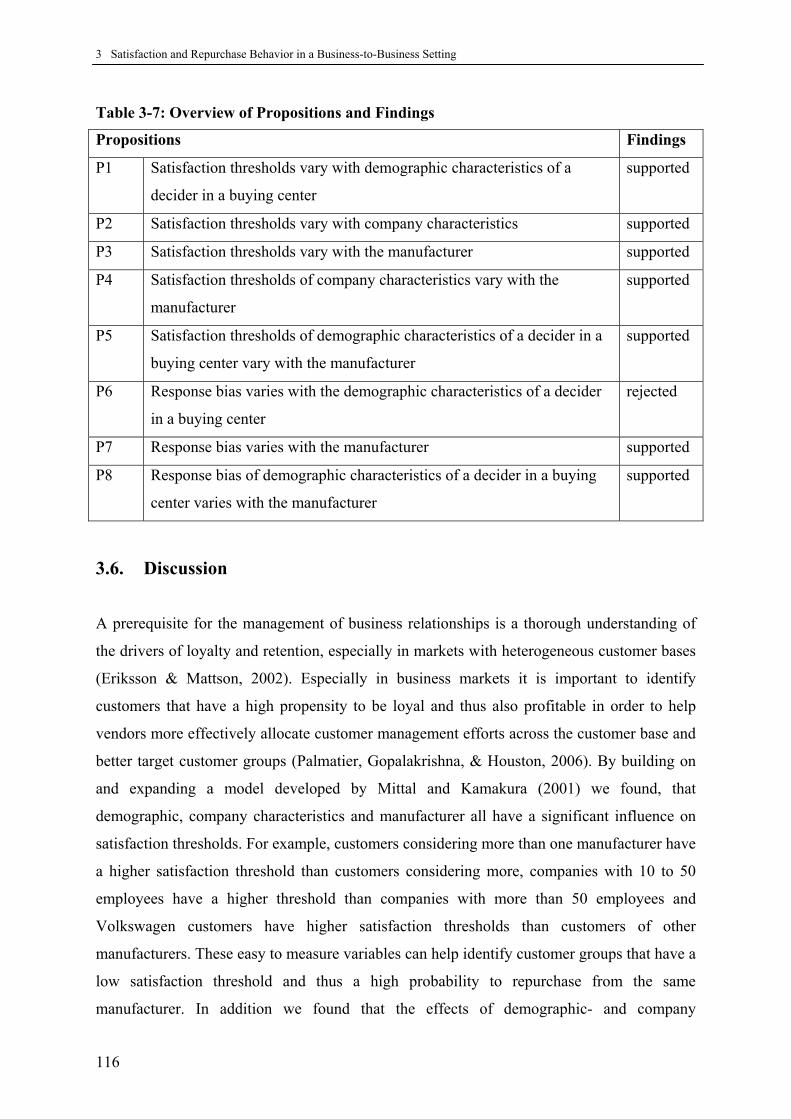
3 Satisfaction and Repurchase Behavior in a Business-to-Business Setting
116
Table 3-7: Overview of Propositions and Findings
Propositions Findings
P1 Satisfaction thresholds vary with demographic characteristics of a
decider in a buying center
supported
P2 Satisfaction thresholds vary with company characteristics supported
P3 Satisfaction thresholds vary with the manufacturer supported
P4 Satisfaction thresholds of company characteristics vary with the
manufacturer
supported
P5 Satisfaction thresholds of demographic characteristics of a decider in a
buying center vary with the manufacturer
supported
P6 Response bias varies with the demographic characteristics of a decider
in a buying center
rejected
P7 Response bias varies with the manufacturer supported
P8 Response bias of demographic characteristics of a decider in a buying
center varies with the manufacturer
supported
3.6. Discussion
A prerequisite for the management of business relationships is a thorough understanding of
the drivers of loyalty and retention, especially in markets with heterogeneous customer bases
(Eriksson & Mattson, 2002). Especially in business markets it is important to identify
customers that have a high propensity to be loyal and thus also profitable in order to help
vendors more effectively allocate customer management efforts across the customer base and
better target customer groups (Palmatier, Gopalakrishna, & Houston, 2006). By building on
and expanding a model developed by Mittal and Kamakura (2001) we found, that
demographic, company characteristics and manufacturer all have a significant influence on
satisfaction thresholds. For example, customers considering more than one manufacturer have
a higher satisfaction threshold than customers considering more, companies with 10 to 50
employees have a higher threshold than companies with more than 50 employees and
Volkswagen customers have higher satisfaction thresholds than customers of other
manufacturers. These easy to measure variables can help identify customer groups that have a
low satisfaction threshold and thus a high probability to repurchase from the same
manufacturer. In addition we found that the effects of demographic- and company
3 Satisfaction and Repurchase Behavior in a Business-to-Business Setting
117
characteristics on the satisfaction thresholds largely depends on the manufacturer.
Furthermore we could show that the manufacturer had a significant impact on response bias
and that the impact of demographic characteristics on response bias is manufacturer-specific.
For example, satisfaction ratings of young Mercedes-Benz customers translate much better
into actual repurchase than those of older Mercedes-Benz customers, a finding that is specific
to Mercedes-Benz and could not be found for customers of other manufacturers. Our results
imply that great care should be paid when generalizing findings on the moderating role of
demographic characteristics on the satisfaction retention link from one manufacturer to
another. Further we could show that satisfaction alone is a very weak predictor of repurchase
behavior, highlighting the importance of taking into account moderating variables in a
business-to-business setting.
3.6.1. Managerial Implications
Identifying manufacturer-specific satisfaction thresholds and response biases may be useful
to managers for various reasons: manufacturer-specific customer groups defined by certain
demographics or company characteristics with low satisfaction thresholds can be viewed as
inherently loyal customers. Several authors stress the importance of identifying customers
with high levels of intrinsic retainability on which companies can focus their relationship-
building efforts (Reichheld, 1996; Reinartz & Kumar, 2000). A key conclusion of Reinartz
and Kumar’s (2000) study is that a substantial group of intrinsically short-lived customers
exists and that it is necessary to identify this group as early as possible and stop investing in
them. Instead, relationship building should focus on customers with higher levels of intrinsic
retainability (Mittal & Kamakura, 2001; Reichheld, 1996). These customers can also be seen
as a shelter from competition by other manufacturers as they apparently see fewer
alternatives other than to repurchase from the manufacturer even when their satisfaction is
low. Thus our results can further be used for customer value models and value based
segmentation approaches for relationship marketing purposes. Customers belonging to a
group with low satisfaction threshold for a certain manufacturer will be more likely to
repurchase at the same satisfaction level and thus represent long-term customers for that
manufacturer. All relevant relationship marketing measures, that management deems
appropriate, can be offered to this group (Reinartz & Kumar, 2003). In contrast, customers
with high satisfaction thresholds are inherently short-lived and following Reinartz and

3 Satisfaction and Repurchase Behavior in a Business-to-Business Setting
118
Kumar’s (2003, p. 79) suggestion, companies should stop “chasing these customers”. Our
results show that the retention rates differ substantially for certain customer groups with
similar satisfaction scores. Since our grouping variables were easy to measure demographic
variables of a decider in a buying center and company characteristics that are often available
in customer data bases, our analyses can provide an actionable framework for management to
identify potential life-time customers and differentiate their relationship marketing efforts.
However, as our results show, managers cannot rely on general findings about moderating
characteristics but are well advised to tap into their own customer base. Apart from
identifying satisfaction thresholds of one’s own customer base, identifying customers with
high satisfaction thresholds of key competitors’ may also provide valuable insight. Those
customers should be the most volatile and the most easy to specifically target and conquer
when entering a new segment or placing a new product.
Research on the high defection rate of satisfied customers has left managers with an irritation
about how to interpret satisfaction surveys or if to conduct them at all: “They tend to be long
and complicated, yielding low response rates and ambiguous implications that are difficult
for operating managers to act on” (Reichheld, 2003, p. 47). Identifying customer specific
response biases’ may help managers to better interpret satisfaction survey results. Questions
like “for what customers do changes in satisfaction ratings translate into changes in
repurchase behavior?” are extremely relevant for managers. Managers may then want to
monitor satisfaction ratings of those customer groups with low response bias more closely
than satisfaction ratings of other customer groups with high response bias. Only for customer
groups with low response bias changes in satisfaction scores are managerially relevant: For
these, changes directly translate into changes in repurchase behavior.
3.6.2. Limitations and Future Research
Why do certain customer or company characteristics positively impact on satisfaction
thresholds and response bias whereas others possess a negative impact? And why does a
certain characteristic impact on the response bias for one manufacturer but not for another? It
seems hardly feasible to provide a solid theory for those differences and thus we refrained
from deriving specific hypotheses and hence also abstained from providing ex-post

3 Satisfaction and Repurchase Behavior in a Business-to-Business Setting
119
explanations of why certain characteristics impacted on the satisfaction-threshold in a certain
way and why others did not. The selection of our sampled and investigated characteristics as
well as our selection of categories may thus seem arbitrary from a theoretical viewpoint.
However we did not aim at providing and testing a theory of why certain characteristics
impact on the satisfaction-retention link in a certain way but at showing that moderating
effects are manufacturer-specific and that company characteristics have to be taken into
account as moderators in business-to-business contexts. Further, we focused largely on
demographic characteristics of the key decider in a buying center as well as demographic
company characteristics. The aim was to investigate, whether demographic variables serve as
moderators of the satisfaction-retention link in a business-to-business setting as was found for
business-to-consumer settings. The answer is yes. Both can serve as moderators in business-
to-business settings. However, business settings allow for further potential moderators that
have not been investigated in this study, like the ability to switch from one supplier to another
(see Jones & Sasser, 1995) or relational norms (see Heide & John, 1992). Future research
should aim at testing their moderating role on the satisfaction-retention link.
We investigated the commercial vehicle market in a major European market. The majority of
customers for commercial vehicles are handcraft companies (painters, plumbers, builders
etc.), as well as small retail and service companies. Larger retailers typically have their own
truck fleets or employ professional shipping companies. The market is therefore dominated
by small companies. In the country of our study over 887.000 handcraft enterprises exist.
More than 94% employ less than 20 employees. Thus our sample contains predominantly
small and medium-sized companies. Buying decisions in smaller companies are typically less
collective and are closer to buying behavior for consumer goods than buying decisions in
very large companies. On the one hand side this fact supports our key informant approach,
but on the other hand side it raises the question whether buying decisions for very large
companies do deviate from the obtained results. Since our sample reflected the population
under study the proportion of large companies was too small to allow separate analyses for
larger companies. This only would have been possible with a boost sample of only large
companies. Even though this limits the generalizability of our findings to business markets
with only few very large customers, our results and methodology can still aid managers to
understand the satisfaction-retention link, where it is most needed: for markets with a large
and heterogeneous customer base of predominantly small to medium sized companies
(Eriksson & Mattsson, 2002).

3 Satisfaction and Repurchase Behavior in a Business-to-Business Setting
120
One may criticize, that we did not use a longitudinal design as would be desirable in
investigations of the satisfaction-retention link in a business-to-consumer setting. However
constructing a longitudinal design where satisfaction and repurchase is measured at two
different points in time is difficult to impossible in a business-to-business setting for one
reason: contrary to the business-to-consumer context, in a business-to-business context a high
number of vehicles are purchased over time. Asked at one point in time to give a satisfaction
rating with a specific vehicle, it will be hard to impossible for a customer to specify at a
different point in time if that exact same vehicle was replaced with one of the same or another
manufacturer as many new vehicles may have been purchased in the elapsed time. In order to
assure a clear link between satisfaction and retention we thus decided to measure satisfaction
with a vehicle that has just been replaced with a new vehicle with similar specifications.
Nevertheless we are aware that this may have led to an inflated relation of the investigated
satisfaction retention link. Cognitive dissonance theory would predict that customers who
repurchased the same vehicle give higher and customers who switched to another
manufacturer give lower satisfaction ratings to their replaced vehicle (see Festinger, 1957).
This would in effect to lead to a stronger relationship between satisfaction and repurchase.
However the influence of satisfaction alone on repurchase was low anyhow, and rose only by
incorporating further variables.
3 Satisfaction and Repurchase Behavior in a Business-to-Business Setting
121
3.7. References
Anderson, E., Chu, W., & Weitz, B. (1987). Industrial Purchasing: an Empirical Exploration
of the Buyclass Framework. Journal of Marketing, 51(3), 71–86.
Andersen, P. H. (2006). Relationship Marketing and Manufacturer Involvement of
Professionals Through Web-Enhanced Manufacturer Communities: The Case of
Coloplast. Industrial Marketing Management, 34, 39-51.
Anderson, E., & Sullivan, M. W. (1993). The Antecedents and Consequences of Customer
Satisfaction for Firms. Marketing Science, 12(2), 125-143.
Arndt, J., & Crane, E. (1975). Response Bias, Yea-Saying, and Double Negative. Journal of
Marketing Research, 12(2), 218-220.
Arnold, H. J., Feldman, D. C., & Purbhoo, M. (1985). The Role of Social-Desirability
Response Bias in Turnover Research. Academy of Management Journal, 28(4), 955-
966.
Bendapudi, N., & Berry, L. L. (1997). Customers’ Motivations for Maintaining Relationships
with Service Providers. Journal of Retailing, 71(3), 223-247.
Bolton, R. N. (1998). A Dynamic Model of the Duration of the Customer’s Relationship with
a Continuous Service Provider: the Role of Satisfaction. Marketing Science, 17(1),
45-65.
Bowman, D., & Narayandas, D. (2001). Managing Customer-Initiated Contacts with
Manufacturers: The Impact on Share of Category Requirements and Word-of-Mouth
Behavior. Journal of Marketing Research, 38(August), 281-297.
Bowman, D., & Narayandas, D. (2004). Linking Customer Management Effort to Customer
Profitability in Business Markets. Journal of Marketing Research, 41(November),
433-447.
3 Satisfaction and Repurchase Behavior in a Business-to-Business Setting
122
Bozzo, C. (2002), Understanding Inertia in an Industrial Context. Journal of Customer
Behaviour, 1, 335-355.
Burnham, T. A., Frels, J. K., & Majahan, V. (2003). Consumer Switching Costs: a Typology,
Antecedents, and Consequences. Journal of the Academy of Marketing Science, 31(2),
109-126.
Cameron, C. A., & Trivedi, P. K. (2005). Microeconometrics. Methods and Applications.
Cambridge: Cambridge University Press.
Cooper, P. D., & Jackson, R. W. (1988). Applying a Service Marketing Orientation to the
Industrial Services Sector. Journal of Service Marketing, 2(2), 66-70.
Durvasula, S., Lysonski, S., & Mehta, S. (1999). Testing the SERVQUAL Scale in the B2B
Sector: the Case of Ocean Freight Shipping. Journal of Service Marketing, 13(2), 132-
151.
Dwyer, F. R. (1980). Response Errors in Survey-Research. California Management Review,
23(1), 39-45.
Eriksson, K., & Mattsson, J. (2002). Managers’ Perception of Relationship Management in
Heterogeneous Markets. Industrial Marketing Management, 31, 535-543.
Festinger, L. (1957). A Theory of Cognitive Dissonance. Stanford, CA: Stanford University
Press.
Franses, P. H., & Paap, R. (2004). Quantitative Models in Marketing Research. Cambridge:
Cambridge University Press.
Freytag, P.V., & Clarke, A. H. (2001). Business to Business Market Segmentation. Industrial
Marketing Management, 30, 473-486.
Gilbert, F. W., & Warren, W. E. (1995). Psychographic Constructs and Demographic
Segments. Psychology and Marketing, 12, 223-237.

3 Satisfaction and Repurchase Behavior in a Business-to-Business Setting
123
Heide, J. B., & John, G. (1992). Do Norms Matter in Marketing Relationships? Journal of
Marketing, 56(2), 32-44.
Hoffman, C., & Hurst, N. (1990). Gender Stereotypes: Perception or Rationalization. Journal
of Personality and Social Psychology, 58 (February), 197-298.
Homburg, C., & Giering, A. (2001). Personal Characteristics as Moderators of the
Relationship Between Customer Satisfaction and Loyalty – an Empirical Analysis.
Psychology & Marketing, 18(1), 43-66.
Homburg, C., Giering, A., & Menon, A. (2003). Relationship Characteristics as Moderators
of the Satisfaction-Loyalty Link: Findings in a Business-to-Business Context. Journal
of Business-to-Business Marketing, 10(3), 35-60.
Homburg, C., Koschate, N., & Hoyer, W. D. (2005). Do Satisfied Customers Really Pay
More? A Study of the Relationship Between Customer Satisfaction and Willingness to
Pay. Journal of Marketing, 69(2), 84-96.
Honomichl, J. (1993). Spending on Customer Satisfaction Continues to Rise. Marketing
News, April 12, 17-18.
Hosmer, D. W., & Lemeshow, S. (2005). Applied Logistic Regression. New York: John
Wiley and Sons.
Jackson, B. B. (1985). Build Customer Relationships that Last. Harvard Business Review,
November-December, 120-128.
Jackson, R. W., & Cooper, P. D. (1988). Unique Aspects of Marketing Industrial Services.
Industrial Marketing Management, 17, 111-118.
Jones, T. O., & Sasser, W. E. (1995). Why Satisfied Customers Defect. Harvard Business
Review, 73(6), 88-99.

3 Satisfaction and Repurchase Behavior in a Business-to-Business Setting
124
Jones, M. A., Mothersbaugh, D. L., & Beatty, S. E. (2000). Switching Barriers and
Repurchase Intentions in Services. Journal of Retailing, 76(2), 259-270.
Jones, M. A., Mothersbaugh, D. L., & Beatty, S. E. (2002). Why Customers Stay: Measuring
the Underlying Dimensions of Services Switching Costs and Managing Their
Differential Strategic Outcomes. Journal of Business Research, 55, 441-450.
Kalwani, M. U., & Silk, A. J. (1982). On the Reliability and Predictive Validity of Purchase
Intention Measures. Marketing Science, 1(3), 243-286.
Keaveney, S. M. (1995). Customer Switching Behavior in-Service Industries - an
Exploratory-Study. Journal of Marketing, 59(2): 71-82.
Martin, C. L. (1998). Engineering High-Meaning, High Involvement Manufacturers as a
Relationship Marketing Strategy. Journal of Product and Manufacturer Management,
7(1), 6-26.
Mazursky, D., & Geva, A. (1989). Temporal Decay in Satisfaction-Purchase Intention
Relationship. Psychology & Marketing, 6(3), 211-227.
Mittal, V., & Kamakura, W. A. (2001). Satisfaction, Repurchase Intent, and Repurchase
Behavior: Investigating the Moderating Effect of Customer Characteristics. Journal of
Marketing Research, 38(1), 131-142.
Mittal, V., Ross, W. T., & Baldasare, P. W. (1998). The Asymmetric Impact of Negative and
Positive Attribute-Level Performance on Overall Satisfaction and Repurchase
Intentions. Journal of Marketing, 62(1), 33-47.
Morgan, R. M., & Hunt, S. (1994). The Commitment–Trust Theory of Relationship
Marketing. Journal of Marketing, Vol. 58(3), 20–38.
Oliva, T. A., Oliver, R.L., & MacMillan. I. C. (1992). A Catastrophe Model for Developing
Service Satisfaction Strategies. Journal of Marketing, 56(3), 83-95.

3 Satisfaction and Repurchase Behavior in a Business-to-Business Setting
125
Oliver, R. L. (1999). Whence Consumer Loyalty? Journal of Marketing, 63, 33-44.
Reichheld, F. F. (1996). Learning From Customer Defections. Harvard Business Review,
74(2), 56-69.
Reichheld, F. F. (1993). Loyalty-Based Management. Harvard Business Review, 71(2), 64-
73.
Reichheld, F. F. (2003). The One Number You Need to Grow. Harvard Business Review,
81(12), 46-57.
Reichheld, F. F., & Teal, T. (1996). The Loyalty Effect: The Hidden Force Behind Growth,
Profits, and Lasting Value. Harvard Business School Press, Boston, MA.
Rindfleisch, A., & Moorman, C. (2001). The Acquisition and Utilization of Information in
New Product Alliances: a Strength-of-Ties Perspective. Journal of Marketing, 65(1),
1–18.
Rust, R. T., & Zahorik, A. J. (1993). Customer Satisfaction, Customer Retention, and Market
Share. Journal of Retailing, 69(2), 193-215.
Seiders, K., Voss, G. B., Grewal, D., &. Godfrey, A.L. (2005). Do Satisfied Customers Buy
More? Examining Moderating Influences in a Retailing Context. Journal of
Marketing, 69(4), 26-43.
Slama, M. E., & Tashlian, A. (1985). Select Socioeconomic Characteristics Associated with
Purchasing Involvement. Journal of Marketing, 49, 72-82.
Sheth, J. N. (1973). A Model of Industrial Buyer Behavior. Journal of Marketing, 37(4), 50–
56.
Stewart, K. (1998). The Customer Exit Process - A Review And Research Agenda. Journal
of Marketing Management, 14, 235-250.
3 Satisfaction and Repurchase Behavior in a Business-to-Business Setting
126
Ulaga, W., & Eggert, A. (2006). Value-Based Differentiation in Business-Relationships:
Gaining and Sustaining Key Supplier Status. Journal of Marketing, 70(1), 119-136.
Wathne, K. H., Biong, H., & Heide, J. B. (2001). Choice of Supplier in Embedded Markets:
Relationship and Marketing Program Effects. Journal of Marketing, 65(April), 54-66.
White, L., & Yanamandram, V. (2004), Why Customers Stay: Reasons of Inertia in Financial
Services. Managing Service Quality, 14(2/3), 183-194.
Zedeck, S., Kafry, D., & Jacobs, R. (1976). Format and Scoring Variations in Behavioural
Expectation Evaluations. Organizational Behavior and Human Performance, 17
(October), 171-84.
Zuckermann, D. M. (1981). Family Background, Sex-Role Attitudes, and Life Goals of
Technical College and University Students. Sex Roles, 7, 1109-1126

4 When Implicit Promises are Broken
127
4. Article 3: When Implicit Promises are Broken: The Role of Relational Norms in Consumers’ Reactions to Brand Transgressions
Together with Marcel Paulssen and Björn S. Ivens
To be submitted to Journal of the Academy of Marketing Science
4.1. Abstract
In recent years, consumers and their interactions with brands have been studied from a
relationship perspective. In particular, it has been posited that norms play a crucial role in
understanding how consumers respond to brand behavior. However, prior research has relied
upon broad and undifferentiated operationalizations of the norm concept. More generally,
empirical research on norms in real brand relationships in the field has been lacking. Little is
known about the type of norms that may operate and what impact they may have on
consumers’ reactions to brand behavior. In this paper, the authors draw upon Macneil’s
Relational Exchange Theory and expand it from the business-to-business to the consumer-
brand domain. They develop a conceptual framework modeling the impact of norms on
consumers’ reactions to brand transgressions and test it in an empirical study in the banking
sector. The results provide evidence that relational exchange norms do operate in consumer-
brand relationships and that they are conceptually distinct from concepts such as trust or
satisfaction.
4.2. Introduction
Practitioners and scholars largely agree that brands may constitute one of the most important
intangible assets under a company’s control (e.g., Srivastava, Tasadduq, and Fahey 1998;
Hunt 2000). Consequently, brand management counts as one of marketing’s core processes.
According to Ailawadi and Keller (2004, p. 338) the key question in defining brand potential

4 When Implicit Promises are Broken
128
thereby is, „what should the brand promise be? How should the brand be competitively
positioned?“ and according to Herbert Hainer, CEO of adidas Inc., the world’s second largest
sports goods manufacturer, “who reneges on this promise will loose” (Hainer 2006, p. 1). Put
differently, brand management is about making and keeping promises. But what precisely
happens when brand promises are broken? From a consumer-brand relationship perspective
such incidents are of pivotal importance because people primarily derive inferences about
their relationship partner from negative acts. As Ybarra and Stephan (1999, p. 719) explain
“negative behavior seems to provide the perceiver with a window into the dispositional
qualities of the person.” Given that building long-term relationships with customers is a core
objective in relationship marketing, understanding consumers’ reactions toward
transgressions is an important research topic. Surprisingly few studies, however, have
investigated this issue. Fournier and Brasel (2002, p. 102) comment, “work focusing on
mistakes that companies or brands inevitably make has been rare in relationship research”.
Actors in a relationship develop expectations about what type of behavior towards the other
party is appropriate (Macneil 1980). In marketing and in other disciplines such expectations
have been referred to as relational norms (e.g., Ivens and Blois 2004). Relational norms
represent informal rules, i.e. they are not written down in formal contracts. When a person
experiences that his relationship partner has behaved in a manner inconsistent with a
relational norm, this partner’s behavior is considered a transgression (e.g., Baumeister,
Stillwell, and Heatherton 1995; Boon and Holmes 1999).
In a longitudinal field experiment, Aaker, Fournier, and Brasel (2004) investigated the
moderating effect of brand personality (see Aaker 1997) on consumers’ perception of
marketing failures. They found that one and the same transgression led to different results in
relationship strength depending on the brand’s personality. They argue that essentially
consumers must have formed different kinds of expectations toward the different brands and
that those expectations must have been the cause for different reactions towards the same
service failure: “Findings corroborate the view that objective evidence, such as that revealed
by a transgression, may be interpreted differently depending on prior experiences and
relationships” (Aaker et al. 2004, p. 13). It thus appears in their study that the one brand’s
personality has elicited certain expectations towards the relationship that the other one hasn’t,
making the same incident a transgression in the one relationship but not in the other. In a
similar perspective, Aggarwal (2004) has dealt with the question whether one and the same
brand behavior leads to different consumer responses. Instead of focusing on brand
4 When Implicit Promises are Broken
129
personality however, Aggarwal directly influenced participants’ relationship norms, by
applying a social relationship framework (Clark and Mills 1993), differentiating between
essentially two types of relationships, communal and exchange relationships. He found that
consumers evaluated the brand’s action - charging a fee for a service - differently depending
on the kind of brand relationship norm that was activated. Although Aggarwal’s (2004)
results highlight the potential role of relationship norms in consumer-brand relationships
several conceptual problems arise from his study. At the centre lies the question, whether
Clark and Mills’ relationship framework is at all applicable to the brand context. As
consumer-brand relationships are at their very core based on exchange it is at least
questionable whether communal relationships (the central norm in a communal relationship is
to give without expecting to get something back in return) at all exist in the consumer-brand
domain. Even more importantly however, Aggarwal did not measure actual brand
relationships but confronted participants in an experiment with hypothetical descriptions of
relationships. Johar’s (2005, p. 26) key question, “Is there a norm attached to brand
behavior?” hence still remains unanswered.
In addition to answering whether norms do evolve in brand relationships and guide
consumers’ behavior, researchers have asked that future research should “ideally specify the
contract terms that govern each relationship type” (Aaker et al. 2004, p. 14). The purpose of
this paper is to provide more detailed insights into which role relational norms play in
consumer-brand relationships. More precisely we draw upon the extant literature in the field
of legal sociology as well as business-to-business relationships. In these fields, Macneil’s
(1978, 1980, 1981) Relational Exchange Theory (RET) builds the foundation for the study of
norms and their impact on relationship quality. The remainder of this paper is structured as
follows: in a first step we introduce Relational Exchange Theory and discuss its applicability
to the field of consumer-brand relationships. Secondly, we analyze the importance of norms
in understanding consumers’ reactions to relationship transgressions. We develop a
conceptual model and formulate hypotheses about the impact of relational norms on
consumers’ coping strategies. Next we present the design and the results of an empirical
study conducted in the banking sector. We conclude with a discussion of theoretical as well
as managerial implications and we present avenues for further research.

4 When Implicit Promises are Broken
130
4.3. Relational Exchange Theory
The general idea that economic exchange is influenced by norms is prominent in many
different research streams, including sociology (e.g., Granovetter 1985), organization theory
(e.g., Ouchi 1980), negotiation theory (e.g., Greenhalgh 1987), strategy (e.g., Gulati 1995),
contract law (e.g., Macneil 1981), economics (e.g., Gibbons 1999), industrial marketing (e.g.,
Noordewier, John, and Nevin 1990), channel relationships (e.g., Jap and Ganesan 2000), and
consumer behavior (e.g., Aggarwal 2004). Norms can be defined as unwritten or informal
codes of conduct that either prescribe or discourage behaviors for actors by defining them as
illegitimate in the context at hand (Coleman 1990; Gibbs 1981). The overwhelming part of
articles on relationship norms in marketing has drawn upon Ian Macneil’s Relational
Exchange Theory (see e.g., Macneil 1978, 1980, 1981; for reviews see Heide and John 1992;
as well as Ivens and Blois 2004). Macneil as well as other authors (e.g., Kaufmann and Stern
1988; Noordewier, John, and Nevin 1990; Heide 1994; Lusch and Brown 1996) have
identified several norms (e.g., solidarity, flexibility, or reciprocity) that structure and govern
exchange relationships. So far, empirical tests of these norms have only been conducted in
the field of business-to-business relationships. The literature on the role of norms in
consumer-brand relationships has been scarcer. And extant work in this field has not
operationalized norms by drawing upon Relational Exchange Theory. For example, Aggarwal
(2004) in an experimental study finds empirical evidence for the importance of norms in
consumer-brand relationships. However his focal point of investigation were hypothetical
brand relationships, the investigation of the type of norms guiding actual brand relationships
has so far been widely neglected. Hence, we propose to test the applicability of Macneil’s
Relational Exchange Theory in the context of consumer-brand relationships.
Exchange theory lies at the core of marketing (Dwyer, Schurr, and Oh 1987). RET allows
understanding the different facets of exchange by developing a framework of several
exchange norms. It assumes that exchange is not only an economic phenomenon but
characterizes all forms of interaction and posits that exchange acts (transactions) differ
according to their character (Macneil 1980). They can be classified on a continuum that
ranges from discrete to relational exchange. Purely discrete exchange, however, constitutes
an exception and consequently most transactions have relational character (Macneil 1983).
Agreements between two parties can contain explicit as well as implicit arrangements -

4 When Implicit Promises are Broken
131
relational norms (e.g., Hadfield 1990). The norm concept has been applied to the analysis of
interactions between individuals or groups in different disciplines (Thibaut and Kelley 1959;
Axelrod 1986; Bendor and Mookherjee 1990). Macneil (1980) considers exchange processes
(regardless whether discrete or relational) to be fundamental and omnipresent social
phenomena (Whitford 1985). He developed a comprehensive set of common norms for the
governance of exchange processes, which he interpreted as principles of right action with
binding character. In this perspective, their function is to guide and control behavior. In
addition to their ex ante role as expectations (Heide and John 1992; Lipset 1975) or
guidelines for appropriate behavior (Scanzoni 1979), norms have an ex post function as
reference points for the evaluation of the behavior actually shown in a given situation. They
permit the judging of the conformity of a party’s actions with the established standards.
4.4. Discussion of the Applicability of RET to Consumer-Brand Relationships
Some elementary differences exist between the nature of business-to-business and consumer-
brand relationships, which raises the question of the applicability of Macneil’s RET to the
consumer-brand domain. Whereas business-to-business relationships are often characterized
by a high degree of interpersonal interaction between relationship partners, consumer-brand
relationships usually involve little if any interpersonal interaction. So one central question is,
how relationship expectations can evolve in such relationships. Undoubtedly, brand
management creates at least unilateral expectations on the customer side. It does so by
making value propositions, by using the marketing mix, or through the behaviors of brand
representatives (managers, sales people, or celebrity endorsers). The customer receives
signals from which he derives the brand’s personality structure and, through inference (Johar,
Sengupta, and Aaker 2005), develops a set of expectations what behavior he may expect from
the brand (see Aaker et al., 2004).
However, for at least some brands a more interactive perspective on the exchange with its
customers seems to be justified, in which norms can be interpreted as joint expectations and,
hence, as governance mechanisms for the relationship. In fact Muniz and O’Guinn (2001)
argue that brands are social objects and that consumers are actively involved in their creation.
Brands interact with their customers in various ways. In fact, Fournier (1998, p. 345) argues
that, “everyday execution of marketing plans and tactics can be construed as behaviors

4 When Implicit Promises are Broken
132
performed by the brand acting in its relationship role.” On the one hand they actively
communicate their personality traits in a unidirectional and rather anonymous way through
mass media. However, in addition to this, many brands attempt relating to customers in a
more bidirectional, individualized and direct manner through relationship marketing tools
such as customer clubs, event marketing, direct mail and the like. In reaction to these
communication efforts, customers provide feedback in the form of purchases and
communication through letters, telephone calls, emails, Internet blog entries or brand
communities (see McAlexander, Schouten, and Koenig 2002). Muniz and O’Guinn (2001)
argue that brand communities represent a form of consumer agency. France and Muller
(1999) suggest that due to their collective nature new forms of computer-mediated
communication, consumers now have a greater voice than they have in more isolated
situations. As an example of interactive consumer-brand communication, in 2005 the internet
blog author Jeff Jarvis stirred up strong customer and media attention by describing his
difficulties in getting his Dell computer repaired and coining the term “Dell Hell” (Daily
Telegraph 2/20/07). This eventually led Dell to significantly increase its customer service
efforts and even create an own website called www.dellideastorm.com, a community site for
customers to share and discuss their ideas and concerns concerning service, products and
even future products with Dell. Via these channels, customers transmit valuable information
about their expectations and about brand behaviors they consider to be unacceptable. In fact
Moon (2000, p. 325) argues that, computer technology is making reciprocal exchange
between brands and customers increasingly tractable:
“Marketers have already discovered that one of the advantages of such technology
is its ability to engage in one-on-one interactions on a large scale. And as computer
programs become increasingly sophisticated, it is reasonable to assume that their
ability to carry on “intelligent” conversations—that is, conversations that can
address an individual in a personalized manner and respond to that individual in
some contingent fashion (Deighton 1996)—will only improve over time”.
In addition, researchers have formulated the notion that companies, too, have specific
expectations towards their customers’ behavior: “There's a balance between giving and
getting in a good relationship. But when companies ask their customers for friendship,
loyalty, and respect, too often they don't give those customers friendship, loyalty, and respect
in return” (Fournier, Dobscha, and Mick 1999, p. 44). From this vantage point, norms emerge

4 When Implicit Promises are Broken
133
through interactions taking place between the customer and the brand. In fact some scholars
have argued for a paradigm shift to interactive marketing, promoted by advances in
technology (Deighton 1996). Through a process of signaling and adjustment both parties may
eventually form joint expectations. This dynamic evolvement of norms in the relationship
development process was confirmed in a longitudinal study of consumers of an Internet
grocery service provider (Fournier, Avery, and Wojnicki 2005). In terms of relationship
phases (Dwyer, Schurr, and Oh 1987), norm formation was especially prevalent in the
relationship expansion phase, providing initial qualitative support for our reasoning.
Whereas RET norms are conceptualized to complete written agreements in business-to-
business relationships, few if any written agreements exist in most consumer-brand
relationships. However, even more so, norms should take over the governing role in the
absence of written agreements. According to Macneil (1980) norms should evolve in all
relationships. A relationship exists as soon as exchange exceeds the single discrete
transaction (Macneil 1983). This conceptualization of relationships seems far more applicable
to the consumer-brand domain than conceptualizations that lean on the interpersonal
relationship domain (see Fournier 1998). That means, consumers do not have to feel like their
relation to a brand resembles a relationship with a friend, spouse or colleague for the brand
relation to qualify as a relationship in RET terms. Although several boundary conditions for
the emergence of norms are likely to exist in the consumer-brand domain, previous research
(see Aaker et al. 2004; Aggarwal 2004; Aggarwal and Law 2005; Aggarwal and Zhang 2006)
clearly points to the possibility that norms can at least potentially emerge in real consumer-
brand relationships. However it is left to empirical research to test whether RET norms do
govern actual consumer-brand relationships. It is the aim of this paper to attempt such a first
empirical investigation.
4.4.1. What Norms Govern Consumer-Brand Relationships?
As in most empirical studies on RET we focus on three norms to span the domain of social
norms in exchange relationship (see e.g., Kaufman and Stern 1988; Heide and John 1992).
The three norms we identify as having particular relevance to the study of consumer-brand
relationships are the norms of reciprocity, flexibility and solidarity.

4 When Implicit Promises are Broken
134
Reciprocity:
Reciprocity is a norm of distributive justice. No exchange relationship continues unless both
partners are making some kind of profit (Homans 1961). Reciprocity is characterized by
mutually agreeable amounts of give and take (Gouldner 1960). Both sides expect that none of
the actors will try to benefit solely on the cost of the other. Whereas reciprocity is more
apparent in a discrete exchange than in a relational one because of the immediacy of a
discrete exchange, the vital point in relational exchange is a more open-ended perception of
reciprocity, i.e. both parties assume that in the long run mutual concessions will even out, so
that both benefit from the relationship (see Ivens and Blois 2004). A sense of reciprocity is a
condition sine qua non for the establishment of long-term relationships in any context. Such
an attitude prevents the parties from maximizing their individual relationship benefits at the
expense of the exchange partner. Houston and Gassenheimer (1987) argue that reciprocity is
said to transform the relationship between the exchange partners, establishing a bond between
the donor and recipient. According to Miller and Kean (1997), reciprocal behavior permeates
everyday living from the micro level of social exchange between family members to the
macro level of international trade agreements.
Reciprocity is an important variable in marketing relationships and has been advanced as a
key to creating successful commercial interaction by some scholars (e.g., Anderson 1994).
Similarly, Fournier (1998, p. 345) argues for the applicability of the reciprocity norm to
consumer-brand relationships:
“Undoubtedly, there exists a lack of parallelism in applying the reciprocity
criterion to an inanimate brand object. A brand may enjoy selected animistic
properties, but it is not a vital entity. In fact, the brand has no objective existence at
all: it is simply a collection of perceptions held in the mind of the consumer. The
brand cannot act or think or feel — except through the activities of the manager
that administers it. In accepting the behavioral significance of marketing actions,
one accepts the legitimacy of the brand as contributing relationship partner.”
According to Fournier (1998) consumers expect some degree of reciprocity from their brands
through actions taken on the brand’s behalf by the associated firm. In fact, in identifying 15
different types of consumer-brand relationships, reciprocity is one of the key differentiating
features Fournier draws on.
4 When Implicit Promises are Broken
135
For Cowles (1996, p. 3) reciprocity between customer and company is a precondition for
trust to emerge in relationships, “if firms ask for customer trust, they should also trust their
customers in return”. Miller and Kean (1997) found that reciprocity can be a more important
factor to the longevity of consumer-retailer relationships than economic motives or utility
alone. In personal as well as service relationships people expect significant levels of
reciprocity. For example, sharing personal information tends to be a mutual exchange
between hairstylist and customer in a strong service relationship (Price and Arnould 1999). In
an experimental investigation Moon (2000) has applied the reciprocity principle to
information exchange in consumer-brand relationships and could show that consumers are
willing to disclose even intimate personal information as long as it is preceded by some
disclosure from the company side, so that consumers feel a sense of reciprocity.
Flexibility:
Flexibility is a bilateral expectation of willingness to make adaptations as circumstances
change (Noordewier et al. 1990). It provides for relationship adaptation through the
modification of agreements in response to unforeseen events and changing circumstances
(Macneil 1980; Boyle et al. 1991; Noordewier, John, and Nevin 1990). The probability that at
least one party feels the need to adapt the original agreement to changed circumstances
increases with the length of the time horizon in a relationship (Ganesan 1994). Flexibility
hence describes an actor’s willingness and his expectation of the partner’s willingness to
adapt an existing implicit or explicit agreement to new environmental conditions
(Noordewier, John, and Nevin 1990). Since consumers, just as much as professional
purchasing managers, make agreements or conclude contracts under conditions of
uncertainty, the underlying causes of the need for flexibility are identical in all those
consumer-brand relationship in which a consumer enters some sort of explicit agreement or
contract (e.g., in the form of subscriptions to tickets or magazines, insurance contracts,
buying agents, service agreements, auction platforms and the like).
Solidarity:
The norm of solidarity can be defined as the willingness of relationship parties to strive for
joint benefits (Achrol and Gundlach 1999; Antia and Frazier 2001; Heide and John 1992;
Kaufmann 1987; Rokkan, Heide, and Wathne 2003). Solidarity is expressed through
behaviors that contribute directly to the relationship maintenance (Heide and John 1992;
Macneil 1980; Kaufmann and Stern 1988). In practice, a solidarity norm manifests in the
4 When Implicit Promises are Broken
136
form of a ‘we- feeling’ or shared identity between the exchange partners (Etzioni 1988;
Greenhalgh 1987; Macneil 1980; Takahashi 2000). Evidence for the fact that consumers can
in some cases develop such a ‘we-feeling’ with their brands can be found for example in
research on brand communities where members report to feel an important connection to the
brand (see Muniz and O’Guinn 2001). One way this ‘we-feeling’ can materialize is in
customers’ strong and public opposition to the brand’s competitors (for example Apple users
outlying the disadvantages of Windows-PCs on personal web-sites) or by celebrating the
brand’s history (see Muniz and O’Guinn, 2001).
The norm of solidarity becomes especially relevant in situations in which the relationship
partner is in predicament. It promotes a bilateral approach to problem-solving and supports
mutual adjustments within the exchange relationship (Macneil 1980; Poppo and Zenger
2002). As an example of solidarity in consumer-brand relationships, a customer in a
relationship high on the norm of solidarity who experiences temporary liquidity problems,
failing to keep up his payments (e.g., monthly installments) should expect the seller to
express his solidarity by not insisting on a prompt payment (see Achrol 1997).
Relationalism as a meta-norm:
Although reciprocity, flexibility and solidarity are conceptually distinguishable, RET norms
are usually conceptualized as highly interrelated dimensions of a higher-order construct
relationalism (REL; see e.g., Noordewier, John and Nevin 1990; Heide and John 1992). As
Macneil (1980) notes, one of the sources of reciprocity is solidarity, but at the same time
solidarity cannot survive long in the face of perceptions that one side is constantly getting too
good a deal, which is a perceived failure of reciprocity. Likewise, long-term reciprocity can
hardly be achieved without at least some degree of flexibility (Gundlach et al. 1995). Hence,
Noordewier, John, and Nevin (1990) argue that relationalism can be appropriately viewed as
an underlying syndrome or a higher order norm, which gives rise to other, more specific
norms. Heide and John (1992) found empirical support for such a higher second order norm:
although all three norms had good measurement qualities by themselves and could be seen as
single factors they strongly loaded on a higher order factor. Although these three dimensions
have distinct elements, they originate from a single order relational norm (Noordewier, John,
and Nevin 1990). Similar to Heide and John (1992) our measurement structure hence models
relational norms as a single second-order factor with three first order factors, representing the
three dimensions, reciprocity, flexibility, and solidarity.

4 When Implicit Promises are Broken
137
4.4.2. Norms’ Guiding Role in Consumers’ Reactions to Relationship Transgressions
A transgression is usually defined as a violation of the implicit or explicit rules guiding
relationship performance and evaluation (Metts 1994). It has been argued that how people
cope with negative incidents in relationships has greater impact on relationship strength than
positive relationship features (Rusbult et al. 1991). This is because of the high levels of
salience and the high diagnosticity of negative events (Fiske 1980). From a marketing
perspective, how consumers choose to react to such a transgression is of special relevance.
Do they actively engage in joint problem solving or do they simply exit the relationship
towards a competitor’s brand? Three responses to relationship problems in marketing have
received special scrutiny: loyalty, voice and neglect. Several authors have confirmed the
existence of these responses to relationship problems in marketing contexts (e.g., Andreasen
1985; Ping 1993, 1997; Singh 1990). Further, research has proposed that these constructs
should be antecedents of exiting (see Duck 1982; Ping and Dwyer 1991; Rosse and Miller
1984), something Ping (1999) could empirically show in a marketing context.
Loyalty:
Hirschman (1970) described loyal behavior as remaining silent with confidence that things
will eventually get better or simply refusing to exit. He argues that the decision to stay loyal
should be based on a) an evaluation of the chances of getting back on track with the firm
through the actions of others (e.g., the firm) and b) the judgment that it is worth to trade the
uncertainty of an alternative relationship against those chances. Loyal behavior is a passive
response strategy because no action is taken to improve conditions instead it is expected that
conditions will improve by actions of the partner or others. Several studies have since
conceptualized and operationalized loyal behavior as remaining silent, confident things will
get better in the future (e.g., Farrell 1983; Ping 1993; Paulssen and Bagozzi 2007).
Voice:
When loyal consumers believe solving relationship problems is desirable, but that the
situation won’t change through the actions of others, Hirschman (1970) argues they will try
to voice the problem and only exit after having voiced the issue fails to improve things.
Rusbult, Johnson, and Morrow (1986) operationalized voice as alerting the relationship
partner, working out relationship problems and improving objectionable relationship
conditions. In contrast to loyal behavior, voice is an active response to relationship problems
because the relationship partner attempts to take action in order to deal with problematic

4 When Implicit Promises are Broken
138
incidents and remedy the relationship (Hirschman 1970; Ping 1997, 1999; Fornell and
Wernerfelt 1987). Both, voice and loyal behavior are constructive responses that are
generally intended to maintain or revive the current relationship (Geyskens and Steenkamp
2000).
Neglect:
Rusbult Zembrodt, and Gunn (1982) identified relationship neglect as an additional response
to relationship problems in long-term relationships that occurs before exiting. Ping (1993) has
argued that a firm can react to relationship problems by emotionally exiting that relationship,
which is by neglecting it. Neglect involves not caring about the relationship, expending no
effort to maintain it, and a willingness to let the relationship deteriorate. According to Ping
(1993) neglect involves reduced contact and social exchanges with the offending partner firm.
Neglect can be seen as a passive response strategy because no action is taken to change the
problem at hand. In contrast to loyal response behavior and voice, neglect tends to be
destructive in regard to the future of the current relationship (Geyskens and Steenkamp
2000).
From a company perspective it is of pivotal importance that consumers engage in relationship
prolonging behavior such as loyal or voicing behavior in reaction to a relationship problem.
The reason being, that in general, the longer a customer stays with a company, the more a
customer is worth (Reichheld 1996), which has to do with the usually higher costs of
attracting new customers than retaining existing ones (Fornell 1992; Fornell and Wernerfeldt
1987). A customer choosing to neglect a relationship is likely to exit at a later stage.
Customers voicing a problem however not only provide the company with valuable feedback
but also are more likely to remain loyal to the brand over the long-run. Consumers differ in
their response tendencies toward service failure encounters depending on the nature of their
relationship with the organization (Smith, Bolton, and Wagner 1999).
It is the proposition of this paper, that the degree of relationalism in the form of the
prevalence of the three norms, reciprocity, flexibility and solidarity in consumer-brand
relationships is a key determinant of consumers’ choice of a conflict resolution strategy. In
relationships high in relationalism, parties view the exchange relationship as important in and
of itself (Kaufmann and Stern 1988) and hence should engage in more cooperative and
constructive resolution strategies. Further, as relational forms of governance imply continuity

4 When Implicit Promises are Broken
139
of exchanges and future cooperative intent (Macneil 1980, 1981) parties should engage in
problem solving behavior that promotes the relationship to continue. Through recurrent
cooperative interaction, parties intentionally create mutual reputations for commitment to the
preservation of the relationship leading to more cooperative forms of conflict resolutions
(Kaufman and Dant 1988). Similarly, Kaufman and Stern (1988, p. 535) argue that “when …
a serious conflict episode occurs, the norms under which the exchange relationship generally
operates will play an important role in determining the parties' reactions to each other's
behavior during and after the dispute”. And Dant and Schul (1992, p. 40) contend that
reactions to relationship problems are at least partially dependent on “relationship
characteristics or the elements defining the character of the exchange relationship itself”.
Hence we expect that a high degree of relationalism will lead to the use of more constructive
coping strategies, thereby enabling the relationship to continue, while it should discourage
destructive coping strategies that lead to the deterioration of the relationship. Hence we
propose:
H1: Relationalism increases the likelihood of constructive coping.
H2: Relationalism decreases the likelihood of destructive coping.
Transgression severity and service failures have received some attention by researchers (see
e.g., Maxham and Netemeyer 2002; Gilly and Gelb 1982; Hoffman, Kelley, and Rotalsky
1995; Richins 1983; Weun, Beatty, and Jones 2004). Aaker et al. (2004, p. 14) argue, that in
order to understand the severity of transgressions, research needs to specify the contract terms
that govern consumer-brand relationships, such as relational norms: “this would further serve
to sharpen the conceptualization of transgression events themselves, and provide a framework
for understanding transgression severity”. The underlying idea is, that whether a certain
incident is perceived as a severe transgression or not depends largely on whether it violates a
norm or relational rule (see e.g., Baumeister, Stillwell, and Heatherton 1995; Boon and
Holmes 1999). RET norms are conceptualized as rules “of right action binding upon the
members of a group and serving to guide, control, or regulate proper and acceptable
behavior” (Macneil 1980, p.38). Kaufman and Dant (1988, p. 535) have argued that, “norms
governing commercial exchange relationships affect perceptions of unfair treatment during
serious disputes”. Aggarwal (2004) found that depending on the activated relationship norm,
consumers found a certain marketing action more or less appropriate. Similarly McGraw and

4 When Implicit Promises are Broken
140
Tetlock (2005) could show in a scenario based study that certain incidents did not matter as
long as they were couched in a relationally acceptable way but had especially negative effects
when they violated relationship-expectations. Hence we argue that the extent of relationalism
in a consumer-brand relationship should influence the perceived severity of a transgression.
H3: Relationalism increases the perceived severity of a transgression.
Apart from the direct effect of relationalism on perceived severity of brand behavior and the
choice of coping strategy, we also hypothesize an effect of perceived severity on the choice
of a coping strategy. In general it is reasonable to assume that the more severe a consumer
perceives a transgression, the more likely he is to act on it and the less likely he is to “let it
pass”. High severity should hence lead to more active and less passive coping.
H4: Severity increases the likelihood of active coping.
H5: Severity decreases the likelihood of passive coping.
Figure 4-1 depicts our proposed model structure.
REL
SOL FLEX REC
Constructive Coping
Destructive Coping
Passive
Active
Passive
Voice
Loyalty
NeglectSeverity
+
+
+
-+
-
-
Figure 4-1: Proposed Model Structure Note: SOL – Solidarity, FLEX – Flexibility, REC – Reciprocity, REL - Relationalism

4 When Implicit Promises are Broken
141
Few research has investigated the link between RET and other key marketing constructs. An
exception is Ganesan’s (1994) work, showing that trust and satisfaction have a positive
impact on the norm of long-term orientation. Although in general, a positive relationship
between REL and key brand relationship constructs like trust, satisfaction and
recommendation behavior can be assumed we argue that REL is conceptually different from
them. Based on that we assume that they cannot explain differences in coping and trust above
REL and that the proposed effects of REL on severity and the effects of REL and severity on
coping strategies hold when trust, satisfaction and recommendation behavior are controlled
for.
H6: Trust, satisfaction and recommendation behavior cannot explain differences in
coping strategies above REL.
H7: Trust, satisfaction and recommendation behavior cannot explain differences in
perceived severity above REL.
H8: The effects of REL on coping strategies hold when trust, satisfaction and
recommendation behavior are controlled for.
H9: The effect of REL on perceived severity holds when trust, satisfaction and
recommendation behavior are controlled for.
H10: The effect of perceived severity on coping strategies holds when trust,
satisfaction and recommendation behavior are controlled for.
In understanding exchange relationships, trust is considered to be a construct of major
importance and has been shown to be an essential ingredient for successful relationship
marketing (Doney and Cannon 1997; Morgan and Hunt 1994; etc.). Customer satisfaction has
generated extensive amounts of research in marketing and can be defined as a consumer’s
“judgment that a product or service feature, or the product or service itself, provided (or is
providing) a pleasurable level of consumption-related fulfillment, including levels of under-
or over-fulfillment” (Oliver 1997, p.13). Because customer satisfaction has often been shown
to be a weak predictor of loyalty (see e.g., Seiders et al. 2005) some scholars have argued that
recommendation behavior is a more predictive measure than satisfaction (Reichheld 2003, p.
48).

4 When Implicit Promises are Broken
142
4.5. Scale Development
Based on Macneil’s theoretic work several scales have been developed to measure the extent
of a norm orientation in business-to-business relationships (see Kaufman and Dant 1992;
Ganesan 1994; Kaufman and Stern 1988; Mohr and Spekman 1994; Jap and Ganesan 2000;
Heide and John 1990; Dant and Schul 1992; Noordewier et al. 1990; Lusch and Brown 1996;
Kim 2000; Heide 1994; Gassenheimer, Calantone, and Scully 1995; Cannon and Homburg
2001; Cannon and Perreault 1999). The norm scales were based on established scales from
the literature and slightly adapted to fit the consumer-brand relationship context (see Table 4-
5 in the appendix). Specifically, the solidarity scales were based on scales by Heide and John
(1992) and Lusch and Brown (1996), flexibility scales were based on scales by Heide and
John (1992) as well as Kaufmann and Dant (1992) and reciprocity scales were based on
scales by Ganesan (1994).
4.6. Study Design
The banking sector was chosen as an ideal setting for our investigation due to its interactive
nature and high customer involvement. 343 bank customers participated in the study either
filling out a paper pencil questionnaire or an online questionnaire, 201 of which were
completed fully and further served as the basis for evaluation. The sample consisted of a
60.2% working population, 27.4% students and 12.4% others. Average duration of their
brand relationship was 5.8 years (SD = 5.4) with 37.1% of the participants having a personal
bank account representative. Participants were asked about their trust in their bank on three
five-point scales (α = .81), their recommendation behavior on three five-point scales (α =
.87) and satisfaction on three five-point scales (α = .85). Subsequently they were asked to
rate their relationship with their bank on three seven-point solidarity scales (α = .78), four
seven-point flexibility scales (α = .91) and four seven-point reciprocity scales (α = .87).
Following that, participants were given two scenarios and asked to imagine that this incident
would happen in the relationship with their bank. These scenarios were designed to violate
the three relationship norms but not constitute a transgression in relationships low on these
relationship norms.
4 When Implicit Promises are Broken
143
The two scenarios read the following:
Scenario 1: Imagine that five years ago you closed a building loan contract with your bank
that requires regular monthly deposits from you. Recently however, you decided to take a
sabbatical from work, which means that you will have to get along with a lower income for
that time. Hence you inquire at your bank whether you can suspend the monthly payments
until you return to your job. An account representative of your bank however informs you
that such an option is not provided for in the contract and that you would loose all benefits
when suspending your monthly deposits. The bank is not willing to make an exception despite
your unique situation.
Scenario 2: Imagine that you want to close a long-term oriented savings plan at your bank. In
a sales talk with an account representative of your bank, the representative tries to persuade
you of the benefits of a certain plan that has a 5 % issue surcharge. It becomes obvious to
you that he wants to talk you into making high initial deposits in order to increase his own
provisions.
Following each of the two scenarios, participants were asked how severe they would find the
incident, in case it would happen in the relationship with their bank, on three seven-point
scales (2002; scenario 1: α = .91; scenario 2: α = .90; see table 4-5 in the Appendix for a
description of the items and their origin) and about the likelihood that they would resolve the
situation using one of the following strategies on one five-point scale per coping strategy:
loyalty, meaning remaining silent with confidence that things will eventually get better, voice,
meaning actively trying to talk with their bank about the issue and trying to find a joint
solution, or neglect, doing nothing and slowly letting the relationship deteriorate.
4.7. Results
4.7.1. Measure Validation Procedure
For the multi-item measures each set of items was initially subjected to an examination of
item-to-total correlations to identify items that did not belong to the specific domain.
Subsequently item were subjected to a confirmatory factor analysis to verify the hypothesized
factor structure. The relational norm items were hypothesized to have a factor structure with
the three factors solidarity, flexibility and reciprocity comprising the higher-order norm

4 When Implicit Promises are Broken
144
relationalism (REL). This structure corresponds to a second-order confirmatory factor model
in which the observed items are hypothesized to originate from the three first-order factors
and the three first-order factors in turn originate from one second-order factor. The
hypothesized factor structure and MPLUS parameter estimates are shown in Figure 4-2. The
proposed model showed good fit (χ2 (41) = 68.28, p = .00, CFI = .98, RMSEA = .057).
REL
ξ1
SOLη1
RECη3
FLEXη2
S1
λR43=.71
λR33=.76
λR23=.84
λR13=.86
λF42 =.79
λF32 =.85
λF22 =.88
λF12=.89
λS31=.80
λS21=.85
λS11=.58
εS1
γ11=.76
εS2
εS3
εF1
εF2
εF3
εF4
εR1
εR2
εR3
εR4
S2
S3
F1
F2
F3
F4
R1
R2
R3
R4
ζ1
ζ2
ζ3
γ21=.77
γ31=.86
Figure 4-2: Second-Order Factor Model for Relational Norms Note: SOL – Solidarity, FLEX – Flexibility, REC – Reciprocity, REL - Relationalism
Evidence of discriminant validity (Fornell and Larcker 1981) between the three norm
constructs solidarity, flexibility, and reciprocity as well as trust, satisfaction, recommendation
behavior and severity was also obtained: the average variance extracted clearly exceeded the

4 When Implicit Promises are Broken
145
shared variance of the constructs (see Table 4-1).
Table 4-1: Correlations between Constructs
Construct 1 2 3 4 5 6 7 8
1. Solidarity .51
2. Flexibility .58 .73
3. Reciprocity .65 .66 .63
4. Trust .39 .23 .33 .60
5. Satisfaction .12 .07 .14 .59 .64
6. Recommendation .21 .15 .24 .39 .68 .72
7. Severity (s1) .18 .17 .13 -.05 -.12 -.05 .80
8. Severity (s2) .06 .15 .18 -.11 -.17 .04 .28 .75 NOTE: The average variance extracted for each construct is provided in the diagonal of the matrix. The notation
in brackets indicates the scenario: s1 for scenario 1 and s2 for scenario 2. The average variance extracted
exceeded the shared variance (squared correlations) with other constructs for all model constructs.
4.7.2. Test of Hypotheses
We tested the proposed model structure for both scenarios. The overall fit for the model was
good for both scenarios (scenario 1: χ2(109) = 156.60 (p=.001), RMSEA = .047, and CFI =
.98; scenario 2: χ2(109) = 165.17 (p=.000), RMSEA = .051, and CFI = .97).
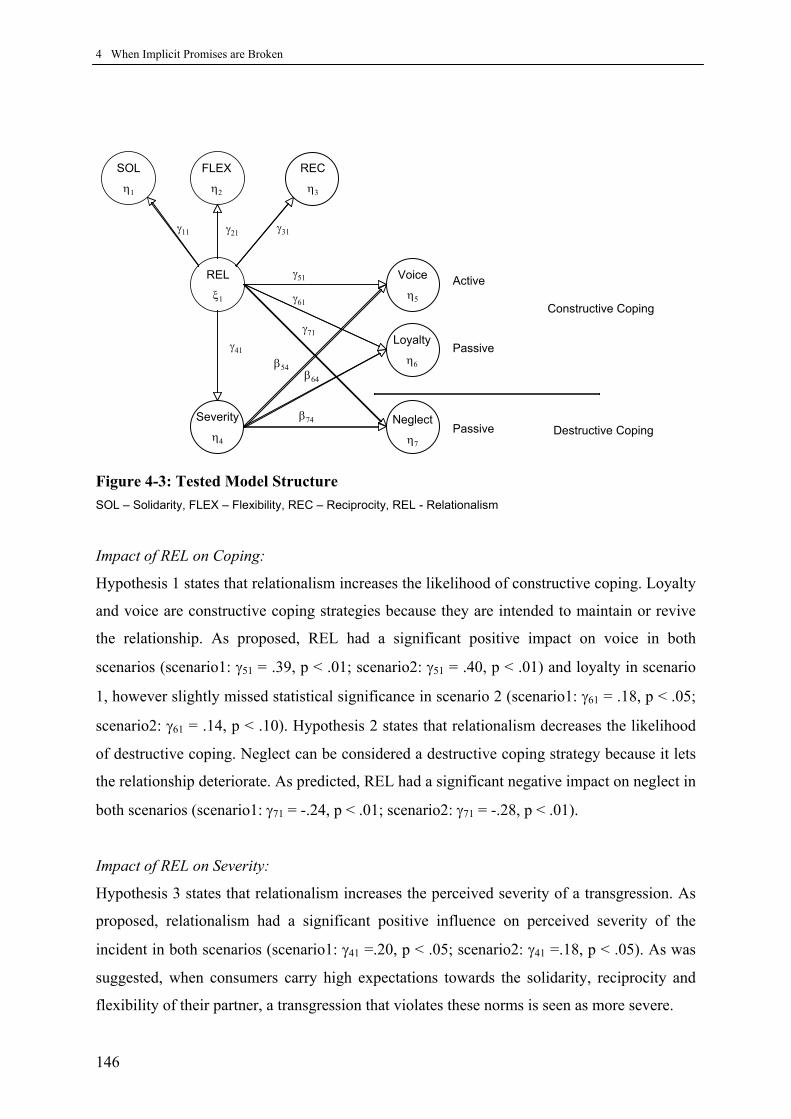
4 When Implicit Promises are Broken
146
REL
ξ1
SOL
η1
FLEX
η2
REC
η3
Constructive Coping
Destructive Coping
Passive
Active
Passive
Voice
η5
Loyalty
η6
Neglect
η7
Severity
η4
γ51
γ61
β54
γ71
γ41
γ11 γ21 γ31
β74
β64
Figure 4-3: Tested Model Structure
SOL – Solidarity, FLEX – Flexibility, REC – Reciprocity, REL - Relationalism
Impact of REL on Coping:
Hypothesis 1 states that relationalism increases the likelihood of constructive coping. Loyalty
and voice are constructive coping strategies because they are intended to maintain or revive
the relationship. As proposed, REL had a significant positive impact on voice in both
scenarios (scenario1: γ51 = .39, p < .01; scenario2: γ51 = .40, p < .01) and loyalty in scenario
1, however slightly missed statistical significance in scenario 2 (scenario1: γ61 = .18, p < .05;
scenario2: γ61 = .14, p < .10). Hypothesis 2 states that relationalism decreases the likelihood
of destructive coping. Neglect can be considered a destructive coping strategy because it lets
the relationship deteriorate. As predicted, REL had a significant negative impact on neglect in
both scenarios (scenario1: γ71 = -.24, p < .01; scenario2: γ71 = -.28, p < .01).
Impact of REL on Severity:
Hypothesis 3 states that relationalism increases the perceived severity of a transgression. As
proposed, relationalism had a significant positive influence on perceived severity of the
incident in both scenarios (scenario1: γ41 =.20, p < .05; scenario2: γ41 =.18, p < .05). As was
suggested, when consumers carry high expectations towards the solidarity, reciprocity and
flexibility of their partner, a transgression that violates these norms is seen as more severe.
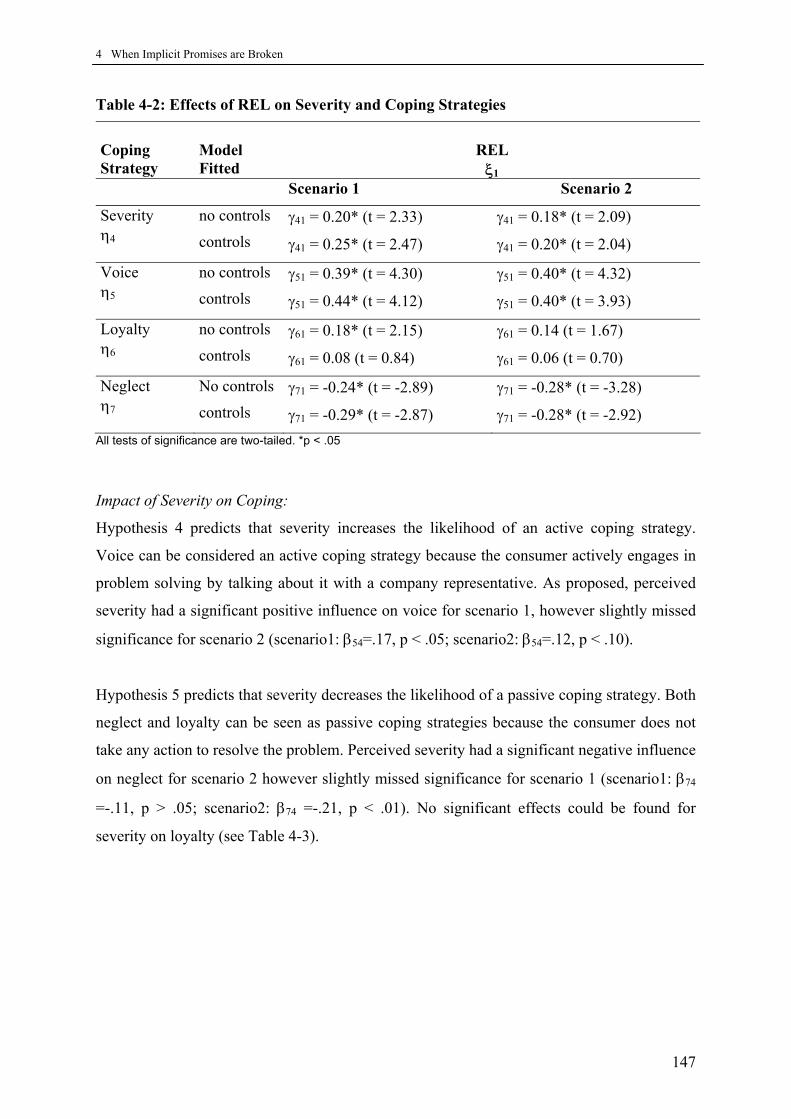
4 When Implicit Promises are Broken
147
Table 4-2: Effects of REL on Severity and Coping Strategies
Coping Strategy
Model Fitted
REL ξ1
Scenario 1 Scenario 2
Severity η4
no controls
controls γ41 = 0.20* (t = 2.33)
γ41 = 0.25* (t = 2.47) γ41 = 0.18* (t = 2.09)
γ41 = 0.20* (t = 2.04)
Voice η5
no controls
controls γ51 = 0.39* (t = 4.30)
γ51 = 0.44* (t = 4.12) γ51 = 0.40* (t = 4.32)
γ51 = 0.40* (t = 3.93)
Loyalty η6
no controls
controls γ61 = 0.18* (t = 2.15)
γ61 = 0.08 (t = 0.84) γ61 = 0.14 (t = 1.67)
γ61 = 0.06 (t = 0.70)
Neglect η7
No controls
controls γ71 = -0.24* (t = -2.89)
γ71 = -0.29* (t = -2.87) γ71 = -0.28* (t = -3.28)
γ71 = -0.28* (t = -2.92) All tests of significance are two-tailed. *p < .05
Impact of Severity on Coping:
Hypothesis 4 predicts that severity increases the likelihood of an active coping strategy.
Voice can be considered an active coping strategy because the consumer actively engages in
problem solving by talking about it with a company representative. As proposed, perceived
severity had a significant positive influence on voice for scenario 1, however slightly missed
significance for scenario 2 (scenario1: β54=.17, p < .05; scenario2: β54=.12, p < .10).
Hypothesis 5 predicts that severity decreases the likelihood of a passive coping strategy. Both
neglect and loyalty can be seen as passive coping strategies because the consumer does not
take any action to resolve the problem. Perceived severity had a significant negative influence
on neglect for scenario 2 however slightly missed significance for scenario 1 (scenario1: β74
=-.11, p > .05; scenario2: β74 =-.21, p < .01). No significant effects could be found for
severity on loyalty (see Table 4-3).
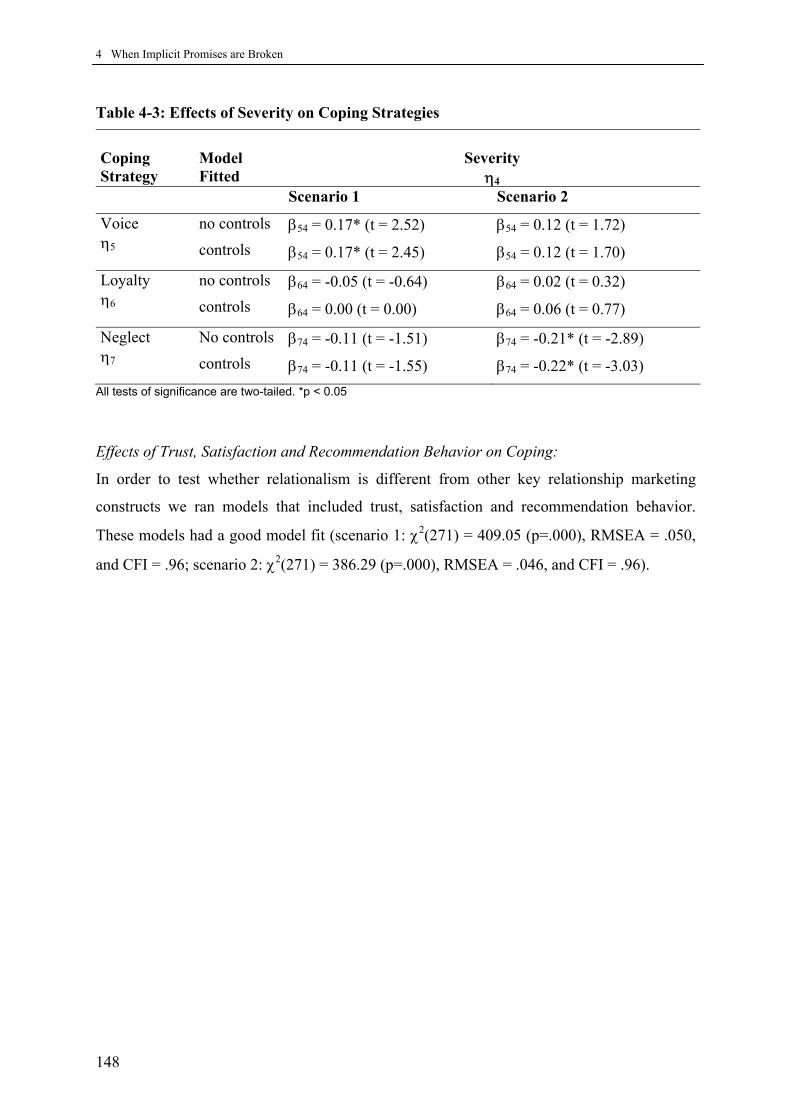
4 When Implicit Promises are Broken
148
Table 4-3: Effects of Severity on Coping Strategies Coping Strategy
Model Fitted
Severity
η4 Scenario 1 Scenario 2 Voice η5
no controls
controls β54 = 0.17* (t = 2.52)
β54 = 0.17* (t = 2.45) β54 = 0.12 (t = 1.72)
β54 = 0.12 (t = 1.70)
Loyalty η6
no controls
controls β64 = -0.05 (t = -0.64)
β64 = 0.00 (t = 0.00) β64 = 0.02 (t = 0.32)
β64 = 0.06 (t = 0.77)
Neglect η7
No controls
controls β74 = -0.11 (t = -1.51)
β74 = -0.11 (t = -1.55) β74 = -0.21* (t = -2.89)
β74 = -0.22* (t = -3.03) All tests of significance are two-tailed. *p < 0.05
Effects of Trust, Satisfaction and Recommendation Behavior on Coping:
In order to test whether relationalism is different from other key relationship marketing
constructs we ran models that included trust, satisfaction and recommendation behavior.
These models had a good model fit (scenario 1: χ2(271) = 409.05 (p=.000), RMSEA = .050,
and CFI = .96; scenario 2: χ2(271) = 386.29 (p=.000), RMSEA = .046, and CFI = .96).
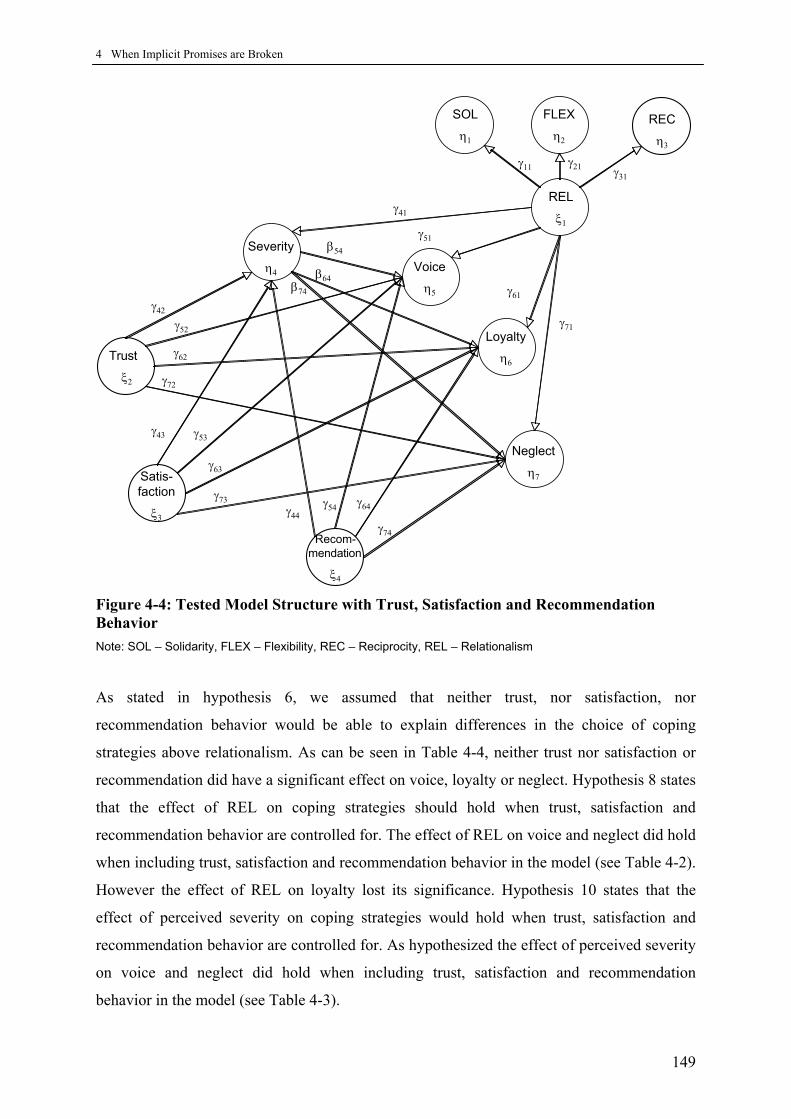
4 When Implicit Promises are Broken
149
Voice
η5
Loyalty
η6
Neglect
η7
Severit y
η4
β54
β64
Recom-mendation
ξ4
Trust
ξ2
Satis-faction
ξ3
γ42
γ52
γ62
γ72
γ43 γ53
γ73
γ63
γ44γ54 γ64
γ74
REL
ξ1
SOL
η1
FLEX
η2
REC
η3
γ11 γ21 γ31
γ51
γ61
γ71
γ41
β74
Figure 4-4: Tested Model Structure with Trust, Satisfaction and Recommendation Behavior Note: SOL – Solidarity, FLEX – Flexibility, REC – Reciprocity, REL – Relationalism
As stated in hypothesis 6, we assumed that neither trust, nor satisfaction, nor
recommendation behavior would be able to explain differences in the choice of coping
strategies above relationalism. As can be seen in Table 4-4, neither trust nor satisfaction or
recommendation did have a significant effect on voice, loyalty or neglect. Hypothesis 8 states
that the effect of REL on coping strategies should hold when trust, satisfaction and
recommendation behavior are controlled for. The effect of REL on voice and neglect did hold
when including trust, satisfaction and recommendation behavior in the model (see Table 4-2).
However the effect of REL on loyalty lost its significance. Hypothesis 10 states that the
effect of perceived severity on coping strategies would hold when trust, satisfaction and
recommendation behavior are controlled for. As hypothesized the effect of perceived severity
on voice and neglect did hold when including trust, satisfaction and recommendation
behavior in the model (see Table 4-3).
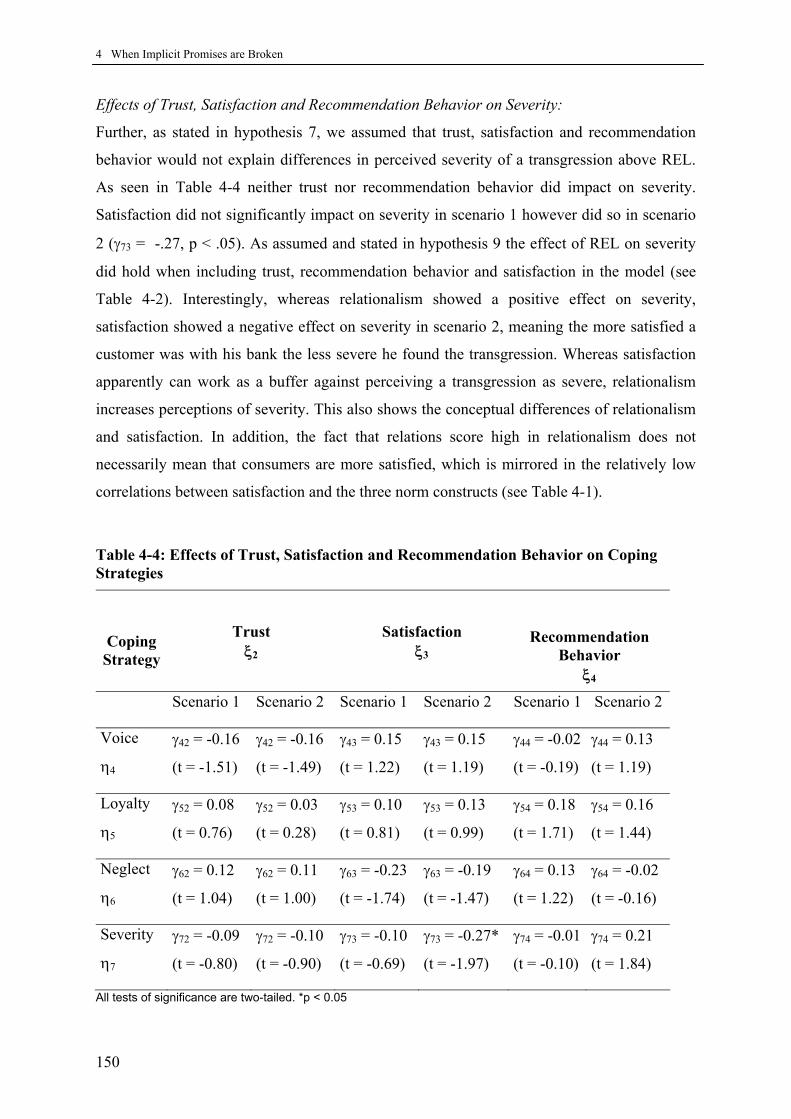
4 When Implicit Promises are Broken
150
Effects of Trust, Satisfaction and Recommendation Behavior on Severity:
Further, as stated in hypothesis 7, we assumed that trust, satisfaction and recommendation
behavior would not explain differences in perceived severity of a transgression above REL.
As seen in Table 4-4 neither trust nor recommendation behavior did impact on severity.
Satisfaction did not significantly impact on severity in scenario 1 however did so in scenario
2 (γ73 = -.27, p < .05). As assumed and stated in hypothesis 9 the effect of REL on severity
did hold when including trust, recommendation behavior and satisfaction in the model (see
Table 4-2). Interestingly, whereas relationalism showed a positive effect on severity,
satisfaction showed a negative effect on severity in scenario 2, meaning the more satisfied a
customer was with his bank the less severe he found the transgression. Whereas satisfaction
apparently can work as a buffer against perceiving a transgression as severe, relationalism
increases perceptions of severity. This also shows the conceptual differences of relationalism
and satisfaction. In addition, the fact that relations score high in relationalism does not
necessarily mean that consumers are more satisfied, which is mirrored in the relatively low
correlations between satisfaction and the three norm constructs (see Table 4-1).
Table 4-4: Effects of Trust, Satisfaction and Recommendation Behavior on Coping Strategies
Coping Strategy
Trust ξ2
Satisfaction ξ3
Recommendation Behavior
ξ4
Scenario 1 Scenario 2 Scenario 1 Scenario 2 Scenario 1 Scenario 2
Voice
η4 γ42 = -0.16
(t = -1.51)
γ42 = -0.16
(t = -1.49)
γ43 = 0.15
(t = 1.22)
γ43 = 0.15
(t = 1.19)
γ44 = -0.02
(t = -0.19)
γ44 = 0.13
(t = 1.19)
Loyalty
η5 γ52 = 0.08
(t = 0.76)
γ52 = 0.03
(t = 0.28)
γ53 = 0.10
(t = 0.81)
γ53 = 0.13
(t = 0.99)
γ54 = 0.18
(t = 1.71)
γ54 = 0.16
(t = 1.44)
Neglect
η6 γ62 = 0.12
(t = 1.04) γ62 = 0.11
(t = 1.00) γ63 = -0.23
(t = -1.74) γ63 = -0.19
(t = -1.47) γ64 = 0.13
(t = 1.22) γ64 = -0.02
(t = -0.16)
Severity
η7 γ72 = -0.09
(t = -0.80)
γ72 = -0.10
(t = -0.90)
γ73 = -0.10
(t = -0.69)
γ73 = -0.27*
(t = -1.97)
γ74 = -0.01
(t = -0.10)
γ74 = 0.21
(t = 1.84)
All tests of significance are two-tailed. *p < 0.05
4 When Implicit Promises are Broken
151
4.8. Discussion
4.8.1. Discussion of the Results
The scale developed for measuring relationalism showed very good scale properties. For the
second order model we observed good fit, indicating that, although solidarity, flexibility and
reciprocity are different constructs, they are rooted in the higher order construct
relationalism. The results of both tests for scenario 1 and 2 support our notion that consumers
in relationships characterized by high levels of relationalism have a higher likelihood of
reacting with a constructive than a destructive coping strategy. In fact it seems that
relationalism serves as a buffer against destructive coping.
On the other hand, a high norm orientation toward the relationship partner was also shown to
lead to stronger perceptions of severity when an incident violated these norms. The more
consumers perceived an incident as severe the more likely they were to choose an active
coping strategy and the less likely they were to choose a passive coping strategy. Whereas
with incidents perceived low in severity consumers may decide to “let it pass”, when
incidents violate the core of their relationship expectations, they are likely to take action.
Tests of discriminant validity showed that relationalism is not the same as trust, satisfaction
or recommendation behavior. Further model tests showed that when relationalism was
included as a predictor, neither trust, nor satisfaction, nor recommendation behavior could
predict the choice of response strategies. Whereas including them into the model did not alter
the effect of relationalism on voice and neglect, it did “steal” variance from relationalism in
predicting loyalty.
4.8.2. Contributions of the Paper
Although some research has turned to the topic of norms in consumer-brand relationships in
recent years, several open questions have remained: first of all, little attention has been
devoted to a conceptual discussion of what contract terms may govern consumer-brand
relationships (Aaker et al. 2004). Instead most prior research has drawn upon norm concepts
from the interpersonal domain without a thorough discussion of whether these norms do

4 When Implicit Promises are Broken
152
apply to the consumer-brand domain (compare Aggarwal 2004; Aggarwal and Law 2005;
Aggarwal and Zhang 2006). This article fills that gap by providing a critical discussion of the
nature of consumer-brand relationships and the applicability of the norm concept in general.
In our theoretical discussion, while acknowledging that certain limitations may exist we have
provided arguments for the transferability of Macneil’s (1980) RET framework. Prior
research has suffered from conceptual problems, applying communal relationship norms
(giving without expecting something in return) without providing evidence whether
communal relationships at all exist between consumers and their brands. In contrast we have
drawn on norms developed in the context of Relationship Exchange Theory (Macneil 1980),
thereby focusing on norms in commercial exchange relationships.
Second, a major problem of recent research has been the lack of research of actual consumer-
brand relationships, which prompted Johar (2005, p. 26) to proclaim that it is still unclear
whether there is in fact “a norm attached to brand behavior?” Prior research has mainly
focused on hypothetical consumer-brand relationships in scenario-based studies. Based on
Relationship Exchange Theory we have developed scales for the norms of reciprocity,
solidarity and flexibility that have been found in prior research to play an important
governing role in business-to-business relationships. An empirical investigation of actual
consumer-brand relationships provided evidence for the notion that norms can evolve in
consumer-brand relationships. Further, prior research has suggested that norms should guide
the differential evaluation of a transgression and reactions following such events (Aaker et al.
2004). Our empirical investigation has found support for both assumptions: transgressions
were perceived as more severe when relationships were high in relationalism. Second
reaction intentions were influenced by the extent of relationalism above some of the central
existing relationship marketing concepts. In a broader picture we thereby also strengthened
the notion that consumers do form relationships with brands (Fournier 1998).
Third, our results provided support for Macneil’s (1980) notion that most transactions are
guided by relational norms. To the best of our knowledge, this study is the first to
theoretically and empirically investigate the applicability of relational exchange norms as
developed by Macneil (1978, 1980, 1981) and subsequent contributions in the field of
marketing (e.g., Heide and John 1992; Jap and Ganesan 2000) to the consumer domain.
4 When Implicit Promises are Broken
153
4.8.3. Managerial Implications
From a managerial perspective the topic of norms is of special interest in order to understand
when certain marketing tactics or strategies may potentially violate established brand-specific
expectations and, in turn, make consumer behavior more predictable. According to RET,
norms “increase the probability of one type of action occurring within the choice set
available” (Ivens and Blois 2004, p. 241). In other words, depending on the specific
constellation of relationship norms formed over time consumers expect specific brand
behaviors and exclude others from their set of tolerable brand behaviors. Norms serve as
reference points and determine how acceptable consumers find actual brand behaviors. The
outcome of the comparison between observed and expected brand behavior has an impact on
the consumer’s reactions. Although there is variance in consumers’ reactions to the same
brand behavior, knowing that consumers feel that a specific relational norm has emerged in
their relationship with a brand makes certain reactions more likely; even if norms “do not
erase individual freedom of choice but contribute to the convergence of plans by increasing
the probability of one type of action within the choice set available” (Gloria-Palermo 1999, p.
145). Hence, norms influence the course of action consumers take in reaction to norm
relevant brand behavior. This observation can be relevant for companies in several situations.
A field where it is of paramount importance is complaint management.
When a person experiences that his relationship partner has behaved in a manner inconsistent
with a relational rule or norm, this partner’s behavior is considered a transgression (see e.g.,
Baumeister, Stillwell, and Heatherton 1995; Boon and Holmes 1999). Surprisingly few
studies have been concerned with the question of how consumers react to brand
transgressions: “Work focusing on mistakes that companies or brands inevitably make has
been rare in relationship research” (Fournier and Brasel 2002, p. 102). From a relationship
perspective, transgressions are of pivotal relevance because people derive inferences about
their relationship partner especially from negative acts: “Negative behavior seems to provide
the perceiver with a window into the dispositional qualities of the person” (Ybarra and
Stephan 1999, p. 719). Such inferences may be crucial for a consumer’s willingness to
continue a relationship and may thereby threaten a central goal of relationship marketing:
building long-term relationships. Understanding which norms are salient in consumer-brand
relationships and which behaviors and marketing actions constitute a norm violation is
therefore crucial for relationship management. It may allow structuring a company’s

4 When Implicit Promises are Broken
154
complaint management system. First of all, it can build the starting point for a segmentation
of consumers’ complaint behavior. By analyzing its customer base’s expectations in
interactions with the brand, a company may structure the customer portfolio into groups of
homogeneous complainers. Second, depending upon the complaint segment and customer
norms companies may also develop strategies how to cope with customers who feel that a
transgression has taken place. Finally, companies may use knowledge about norms governing
consumer-brand relationships in order to train their employees. This is particularly relevant
for brands in which customers interact with the brand through employees.
A company would thus be more than well advised to be aware of the relational norms that
govern their customer relationships. This knowledge should guide decisions in brand
management. In addition, it could also be used to potentially alter prevalent norms so that
harmful effects of certain necessary marketing actions can be buffered. The norm-like
expectations a customer develops toward a brand are mainly formed through perceptions of
signals the brand sends out. Hence, companies should analyze how precisely their
communication impacts norm formation. By identifying signals that lead to the formation of
norms the company can actively communicate in advance when it cannot conform to certain
expectations – before transgressions hurt their customer relationships.
4.8.4. Limitations and Directions for Future Research
As one of the first attempts to apply Macneil’s (1980) RET framework to the consumer
domain, this study provides first support for our general notion that certain RET norms can
evolve over time in consumer relationships and guide consumers’ behavior especially in
conflict situations. However several boundary conditions exist concerning the extent to which
our results are generalizable to other brand relationship domains. In general, consumer
relationships to their banks are characterized by a relatively high degree of interaction. In
addition there usually is a high degree of interpersonal contact. Although we specifically
asked participants about norms in the relationships with their banks and not their individual
account representatives, we cannot exclude that interaction with individuals representing the
brand may have played a role in forming expectations. It remains for future research to
investigate whether the norms of reciprocity, solidarity and flexibility evolve in consumer
relationships where no personal contact to brand representatives exists at all. Further

4 When Implicit Promises are Broken
155
consumer relationships to their banks usually are characterized by a relatively consistent
interaction (the average length of subjects’ relationship to their bank was 5.8 years in our
sample). In consumer-brand relationships - as compared to the business-to-business context -
discrete transactions may be more frequent with fewer real brand relationships evolving (see
Fournier, Dobscha, and Mick 1998). Hence future research should determine whether norms
operate in all types of consumer-brand relationships.
4 When Implicit Promises are Broken
156
4.9. References
Aaker, Jennifer. 1997. “Dimensions of Brand Personality.” Journal of Marketing Research
34 (August): 347-356.
Aaker, Jennifer, Susan Fournier, and S. Adam Brasel. 2004. “When Good Brands Do Bad.”
Journal of Consumer Research 31 (June): 1-16.
Achrol, Ravi S. 1997. “Changes in the Theory of Interorganizational Relations in Marketing:
Toward a Network Paradigm.” Journal of the Academy of Marketing Science 25
(Winter): 56-71.
Achrol, Ravi S. and Gregory T. Gundlach. 1999. “Legal and Social Safeguards Against
Opportunism in Exchange.” Journal of Retailing 75 (1): 107-124.
Aggarwal, Pankaj. 2004. “The Effects of Brand Relationship Norms on Consumer Attitudes
and Behavior.” Journal of Consumer Research 31 (June): 87-101.
Aggarwal, Pankaj and Sharmistha Law. 2005. "Role of Relationship Norms in Processing
Brand Information." Journal of Consumer Research 32 (December): 453-464.
Aggarwal, Pankaj and Meng Zhang. 2006. "The Moderating Effect of Relationship Norms."
Journal of Consumer Research 33 (December): 413 – 419.
Ailawadi, Kusum, L. and Kevin L. Keller. (2004). “Understanding Retail Branding:
Conceptual Insights and Research Priorities.” Journal of Retailing 80: 331-342.
Anderson, Eugene W. (1994). “Cross-Category Variation in Customer Satisfaction and
Retention.” Marketing Letters 5 (1): 19-30.
Andreasen, Alan R. (1985). “Consumer Responses to Dissatisfaction in Loose Monopolies.”
Journal of Consumer Research 12 (2): 135–141.
4 When Implicit Promises are Broken
157
Antia, Kersi D. and Gary L. Frazier. 2001. “The Severity of Contract Enforcement in
Interfirm Channel Relationships.” Journal of Marketing 65 (October): 67-81.
Axelrod, Robert. 1986. “An Evolutionary Approach to Norms.” American Political Science
Review 80 (December): 1095-1111.
Baumeister, Roy, F., Arlene M. Stillwell and Todd Heatherton. 1995. “Personal Narratives
About Guilt: Role in Action Control and Interpersonal Relationships.” Basic and
Applied Social Psychology 17: 173-198.
Bendor, Jonathan and Dilip Mookherjee. 1990. “Norms, Third-Party Sanctions, and
Cooperation.” Journal of Law, Economics and Organization 6 (Spring): 33-63.
Boon, Susan D. and John G. Holmes. 1999. “Interpersonal Risk and the Evaluation of
Transgressions in Close Relationships.” Personal Relationships 6: 151-168.
Boyle, Brett, F. Robert Dwyer, Robert A. Robicheaux, and James T. Simpson. 1991.
"Influence Strategies in Marketing Channels: Measures and Use in Different
Relationship Structures." Journal of Marketing Research 29 (November): 462-73.
Cannon, Joseph P. and Christian Homburg. 2001. “Buyer-Supplier Relationships and
Customer Firm Costs.” Journal of Marketing 65 (January): 29-43.
Cannon, Joseph, P. and William D. Perreault. 1999. “Buyer-Seller Relationships in Business
Markets.” Journal of Marketing Research 36 (4): 439-460.
Clark, Margaret S. and Judson Mills. 1993. “The Difference Between Communal and
Exchange Relationships: What It Is and Is Not.” Personality and Social Psychology
Bulletin 19: 684-691.
Coleman, James E. 1990. Foundations of Social Theory. Cambridge : Belknap Press of
Harvard.

4 When Implicit Promises are Broken
158
Cowles, Deborah L. 1996. “The Role of Trust in Customer Relationships: Asking the Right
Questions.” Management Decisions 35 (4): 273-282.
Daily Telegraph. 2/20/07. “Michael Dell is planning to change his firm’s course completely
to recover lost ground.”
Dant, Rajiv P. and Patrick L. Schul. 1992. “Conflict Resolution Processes in Contractual
Channels of Distribution.” Journal of Marketing 56 (January): 38-54.
Deighton, John. 1996. “The Future of Interactive Marketing.” Harvard Business Review
(November-December): 151-152.
Doney, Patricia M. and Joseph P. Cannon. 1997. “An Examination of the Nature of Trust in
Buyer-Seller Relationships.” Journal of Marketing 61: 35–51.
Duck, Stephen W. 1982. “A Topography of Relationship Disengagement and Dissolution.” In
Personal Relationships 4: Dissolving Personal Relationships. Ed. Stephen Duck.
Academic Press.
Dwyer, F. Robert, Paul H. Schurr, and Sejo Oh. 1987. “Developing Buyer-Seller
Relationships.” Journal of Marketing 51 (April): 11-27.
Etzioni, Amitai. 1988. The Moral Dimension: Toward a New Economics. New York: The
Free Press.
Farrell, Dan. 1983. “Exit, Voice, Loyalty, and Neglect as Responses to Job Dissatisfaction: A
Multidimensional Scaling Study.” Academy of Management Journal 26 (4): 596 –
607.
Fornell, Claes. 1992. “A National Customer Satisfaction Barometer: The Swedish
Experience.” Journal of Marketing Research 55 (January): 1-21.

4 When Implicit Promises are Broken
159
Fornell, Claes and David F. Larcker. 1981. “Evaluating Structural Equation Models with
Unobservable Variables and Measurement Error.” Journal of Marketing Research 18
(1): 39-50.
Fornell, Claes and Birger Wernerfeldt. 1987. “Defensive Marketing Strategy by Customer
Complaint Management: A theoretical Analysis.” Journal of Marketing Research 24:
337-346.
Fournier, Susan. 1998. “Consumers and Their Brands: Developing Relationship Theory in
Consumer Research.” Journal of Consumer Research 24: 343-373.
Fournier, Susan, Jill Avery, and Andrea C. Wojnicki. 2005. “Contracting for Relationships:
A Developmental View.” Advances in Consumer Research 32.
Fournier, Susan and S. Adam Brasel. 2002. “Making Good of Doing Bad : Negotiating
Transgressions in Consumer Product Relationships.” Advances in Consumer Research
29: 102-104.
Fournier, Susan, Susan Dobscha, and David G. Mick. 1998. “Preventing the Premature Death
of Relationship Marketing.” Harvard Business Review 76 (1): 42-51.
France, Mike and Joann Muller. 1999. “A Site for Soreheads.” Business Week 12 (April): 86–
90.
Fiske, Susan T. 1980. “Attention and Weight in Person Perception: The Impact of Negative
and Extreme Behavior.” Journal of Personality and Social Psychology 38 (6): 889–
906.
Ganesan, Shankar. 1994. Determinants of Long-Term Orientation in Buyer-Seller
Relationships. Journal of Marketing 58 (April): 1-19.
Gassenheimer, Jule B., Roger J. Calantone, and Joseph I. Scully. 1995. “Supplier
Involvement and Dealer Satisfaction: Implications for Enhancing Channel
Relationships.” Journal of Business & Industrial Marketing 10 (Spring): 7-19.

4 When Implicit Promises are Broken
160
Geyskens, Inge and Jan-Benedict E. M. Steenkamp. 2000. “Economic and Social
Satisfaction: Measurement and Relevance to Marketing Channel Relationships.”
Journal of Retailing 76 (1): 11–32.
Gibbons, Robert. 1999. “Taking Coase Seriously.” Administrative Science Quarterly 44
(March): 145–57.
Gibbs, Jack P. 1981. Norms, Deviance and Social Control: Conceptual Matters. New York:
Elsevier.
Gilly. Mary C. and Betsy D. Gelb. 1982. "Post-Purchase Consumer Processes and the
Complaining Consumer." Journal of Consumer Research 9 (December): 323-28.
Gloria-Palermo, S. 1999. The Evolution of Austrian Economics: From Menger to Lachmann.
Routledge: London.
Gouldner, Alvin W. 1960. “The Norm of Reciprocity: A Preliminary Statement.” American
Sociological Review 25 (2): 161–78.
Granovetter, Mark. 1985. “Economic Action and Social Structure: The Problem of
Embeddedness.” American Journal of Sociology 91 (November): 481–510.
Greenhalgh, Leonard. 1987. “Relationships in Negotiations.” Negotiation Journal 3 (July):
235–43.
Gremler, Dwayne, D., and Kevin, P. Gwinner (2000). “Customer-Employee Rapport in
Service Relationships.” Journal of Service Research 3 (1): 82-104.
Gulati, Ranjay. 1995. “Does Familiarity Breed Trust? The Implications of Repeated Ties for
Contractual Choices in Alliances.” Academy of Management Journal 38 (1): 85–112.
Gundlach, Gregory, Ravi S. Achrol, and John T. Mentzer. 1995. “The Structure of
Commitment in Exchange.” Journal of Marketing 59 (January): 78-92.

4 When Implicit Promises are Broken
161
Hadfield, Greg K. 1990. “Problematic Relations: Franchising and the Law of Incomplete
Contracts.” Stanford Law Review 42: 927-992.
Hainer, Herbert. 2006. “Der störrische Konsument - Marketing und Wertewandel. Materielle,
soziologische und fiskalische Ursachen, gesellschaftliche Trends und Lösungen.” Talk
given at the School of Business and Economics, Humboldt University of Berlin,
05/02/06.
Heide, Jan B. 1994. “Interorganizational Governance in Marketing Channels.” Journal of
Marketing 58 (January): 71-85.
Heide, Jan B. and George John. 1992. “Do Norms Matter in Marketing Relationships?”
Journal of Marketing 56 (April): 32-44.
Hirschman, Albert O. 1970. Exit, Voice, and Loyalty: Responses to Decline in Firms,
Organizations, and States. Cambridge, MA: Harvard University Press.
Homans, George C. 1961. Social Behavior: Its Elementary Forms. New York: Harcourt
Brace Jovanovich.
Hoffman, K. Douglas, Scott W. Kelley and Holly M. Rotalsky. 1995. “Tracking Service
Failures and Employee Recovery Efforts.” Journal of Services Marketing 9 (2): 49-
61.
Housten, Franklin S. and Jule B. Gassenheimer. 1987. “Marketing and Exchange.” Journal of
Marketing 51 (October): 3-18.
Hunt, Shelby D. 2000. A General Theory of Competition - Resources, Competences,
Productivity, Economic Growth. Thousand Oaks: Sage Publications.
Ivens, Bjoern S. and Blois Keith J. 2004. “Relational Exchange Norms in Marketing: A
Critical Review of Macneil's Contribution.” Marketing Theory 4 (3): 239-263.
4 When Implicit Promises are Broken
162
Jap, Sandy D. and Shankar Ganesan. 2000. “Control Mechanisms and the Relationship Life
Cycle: Implications for Safeguarding Specific Investments and Developing
Commitment.” Journal of Marketing Research 37 (May): 227-245.
Johar, Gita V. 2005. “The Price of Friendship: When, Why, and How Relational Norms
Guide Social Exchange Behavior.” Journal of Consumer Psychology 15 (1): 22-27.
Johar, Gita V., Jaideep Sengupta, and Jennifer Aaker. 2005. “Two Roads to Updating Brand
Personality Impressions: Trait versus Evaluative Inferencing.” Journal of Marketing
Research 42 (4): 458-469.
Kaufmann, Patrick J. 1987. “Commercial Exchange Relationships and the “Negotiator’s
Dilemma.” Negotiation Journal 3 (January): 73-80.
Kaufmann, Patrick J. and Rajiv P. Dant. 1992. “The Dimensions of Commercial Exchange.”
Marketing Letters: A Journal of Research in Marketing 3 (2): 171-185.
Kaufmann, Patrick J. and Louis W. Stern. 1988. “Relational Exchange Norms, Perceptions of
Unfairness, and Retained Hostility in Commercial Litigation.” Journal of Conflict
Resolution 32 (September): 534-552.
Kim, Keysuk. 2000. “On Interfirm Power, Channel Climate, and Solidarity in Industrial
Distributor-Supplier Dyads.” Journal of the Academy of Marketing Science 28
(Summer): 388-405.
Lipset, Seymour M. 1975. “Social Structure and Social Change.” In Approaches to the Study
of Social Structure. Ed. Peter M. Blau. New York : The Free Press.
Lusch. Robert F. and James R. Brown. 1996. "Interdependency, Contracting, and Relational
Behavior in Marketing Channels." Journal of Marketing 60 (October): 19-38.
McGraw, A. Peter and Phillip E. Tetlock. (2005). “Taboo Trade-Offs, Relational Framing,
and the Acceptability of Exchanges.” Journal of Consumer Psychology 15 (1): 2-15.

4 When Implicit Promises are Broken
163
Macneil, Ian R. 1978. “Contracts: Adjustment of Long-Term Economic Relations Under
Classical, Neoclassical, and Relational Contract Law.” Northwestern University Law
Review 72: 854-905.
Macneil, Ian R. 1980. The New Social Contract. New Haven: Yale University Press.
Macneil, Ian R. 1981. “Economic Analysis of Contractual Relations: Its Shortfalls and the
Need for a Rich Classificatory Apparatus.” Northwestern University Law Review 75:
1018-1063.
Macneil, Ian R. 1983. “Values in Contract: Internal and External.” Northwestern University
Law Review 78: 340-418.
Maxham, James G. Ill & Richard G. Netemeyer. 2002. "A Longitudinal Study of
Complaining Customers' Evaluations of Multiple Service Failures and Recovery
Efforts." Journal of Marketing 66 (October): 57-71.
McAlexander, James H., John W. Schouten, and Harold F. Koenig. 2002. “Building Brand
Community.” Journal of Marketing 66: 36-54.
Metts, Sandra. 1994. “Relational Transgressions.” In The Dark Side of Interpersonal
Communications. Eds. William R. Cupach and Brian Spitzberg. Hillsdale, NJ:
Lawrence Erlbaum.
Miller, Nany J. and Rita C. Kean. 1997. ”Reciprocal Exchange in Rural Communities:
Consumers’ Inducements to Inshop.” Psychology & Marketing 14 (7): 637-661.
Mohr, Jakki and Robert Spekman, R. 1994. “Characteristics of Partnership Success:
Partnership Attributes, Communication Behavior, and Conflict Resolution
Techniques.'' Strategic Management Journal 15: 135-52.
Moon, Youngme. 2000. “Intimate Exchanges: Using Computers to Elicit Self-Disclosure
From Consumers.” Journal of Consumer Research 26 (March): 323-339.

4 When Implicit Promises are Broken
164
Morgan, Robert M. and Shelby Hunt. 1994. “The Commitment-Trust Theory of Relationship
Marketing.” Journal of Marketing 58 (7): 20–38.
Muniz, Jr., Albert M. and Thomas C. O’Guinn. 2001. “Brand Community.” Journal of
Consumer Research 27 (March): 412-432.
Noordewier, Thomas G., George John, and John R. Nevin. 1990. “Performance Outcomes of
Purchasing Arrangements in Industrial Buyer–Vendor Relationships.” Journal of
Marketing 54 (October): 80–93.
Oliver, Richard, L. (1997). Satisfaction: A Behavioral Perspective on the Consumer.
Boston: McGraw-Hill, 1997.
Ouchi, William G. 1980. "Markets Bureaucracies, and Clans." Administrative Science
Quarterly 25 (September): 129-141.
Paulssen, Marcel. Forthcoming. “Attachment Styles in Business-to-Business Relationships.”
Psychology & Marketing.
Paulssen, Marcel and Richard P. Bagozzi. 2007. “Customer Coping to Relationship
Transgressions: An Attachment Theoretic Approach.” Proceedings of the Advertising
and Consumer Psychology Conference, Santa Monica, USA, New Frontiers in
Branding: Attitudes, Attachment, and Relationships.
Ping, Robert, A. Jr. 1993. “The Effects of Satisfaction and Structural Constraints on Retailer
Exiting, Voice, Loyalty, Opportunism, and Neglect.” Journal of Retailing 69 (3): 320
–352.
Ping, Robert, A. Jr. 1997. “Voice in Business-to-Business Relationships: Cost-of-Exit and
Demographic Antecedents.” Journal of Retailing 73: 261-281.
Ping, Robert A., Jr. 1999. “Unexplored Antecedents of Exiting in a Marketing Channel.”
Journal of Retailing 75 (2): 218 – 241.
4 When Implicit Promises are Broken
165
Ping, Robert A. and F. Robert Dwyer. (1991). “A Preliminary Model of Relationship
Termination in Marketing Channels.” In Advances in Distribution Channel Research.
Ed. G. L. Frazier. Greenwich CT: JAI Press.
Poppo, Laura and Todd R. Zenger. 2002. “Do Formal Contracts and Relational Governance
Function as Substitutes or Complements?” Strategic Management Journal 23(8): 707-
725.
Price, Linda L. and Eric J. Arnould. 1999. “Commercial Friendships: Service Provider-Client
Relationships in Context.” Journal of Marketing 63 (October): 38-56.
Reichheld, Frederic. 2003. “The One Number You Need to Grow.” Harvard Business
Review: 46-54.
Reichheld, Frederic. 1996. “Learning from Customer Defections.” Harvard Business Review
(March-April): 56 - 69.
Richins, Marsha L. 1983. “Negative Word-of-Mouth by Dissatisfied Consumers: A Pilot
Study.” Journal of Marketing 47: 68–78.
Roccan, Axel I., Jan B. Heide, and Kenneth H. Wathne. 2003. “Specific Investments in
Marketing Relationships: Expropriation and Bonding Effects.” Journal of Marketing
Research XL (May): 210-224.
Rosse, Joseph G. and Howard E. Miller. (1984). “Relationship Between Absenteeism and
Other Employee Behaviors.” In Absenteeism. Eds. Pauls S. Goodman and Robert S.
Atkin. San Francisco: Jossey-Bass.
Rusbult, Caryl E., Dennis J. Johnson, and Gregory D. Morrow. 1986. “Determinants and
Consequences of Exit, Voice, Loyalty, and Neglect: Responses to Dissatisfaction in
Adult Romantic Involvements.” Human Relations 39 (January): 45-63.
4 When Implicit Promises are Broken
166
Rusbult, Caryl E., Isabella M. Zembrodt, and Lawanna K. Gunn. 1982. “Exit, Voice, Loyalty,
and Neglect: Responses to Dissatisfaction in Romantic Involvement.” Journal of
Personality and Social Psychology 43 (6): 1230 –1242.
Rusbult, Caryl E., Julie Verette, Gregory Whitney, Linda Slovik, and Issac Lipkus. 1991.
“Accommodation Processes in Close Relationships: Theory and Preliminary Research
Evidence.” Journal of Personality and Social Psychology 60 (1): 53–78.
Scanzoni, John. 1979. “Social Exchange and Behavioral Interdependence.” In Social
Exchange in Developing Relationships. Eds. Robert L. Burgess and Ted L. Huston.
New York : Academic Press.
Seiders, Kathleen, Glenn B. Voss, Dhruv Grewal, and Andrea L. Godfrey. 2005. “Do
Satisfied Customers Buy More? Examining Moderating Influences in a Retailing
Context.” Journal of Marketing 69 (4): 26-43.
Singh, Jagdip. 1990. “A Topology of Consumer Dissatisfaction Response Styles.” Journal of
Retailing 66 (1): 57–99.
Smith, Amy K., Ruth N. Bolton, and Janet Wager. 1999. “A Model of Customer Satisfaction
With Service Encounters Involving failure and Recovery.” Journal of Marketing
Research 36 (3): 356-372.
Srivastava, Rajendra K., Tasadduq A. Shervani, and Liam Fahey. 1998. "Market-based
Assets and Shareholder Value: A Framework for Analysis." Journal of Marketing 62
(1): 2-19.
Stephen, Andrew T. and Leonard V. Coote. 2007. “Interfirm Behavior and Goal Alignment
in Relational Exchanges.” Journal of Business Research 60, 285-295.
Takahashi, Nobuyuki. 2000. “The Emergence of Generalized Exchange.” American Journal
of Sociology 105 (4): 1105–34.

4 When Implicit Promises are Broken
167
Thibaut, John W. and Harold H. Kelley. 1959. The Social Psychology of Groups. New York:
John Wiley and Sons.
Weun, Seungoog, Sharon E. Beatty and Michael A. Jones. 2004. “The Impact of Service
Failure Severity on Service Recovery Evaluations and Post-Recovery Relationships.”
Journal of Services Marketing 18 (2): 133-146.
Whitford, William C. 1985. “Ian Macneil’s Contribution to Contracts Scholarship.”
Wisconsin Law Review 3: 545-560.
Ybarra, Oscar and Walter G. Stephan. 1999. “Attributional Orientations and the Prediction of
Behavior: The Attribution-Prediction Bias.” Journal of Personality and Social
Psychology 76 (5): 718-727.
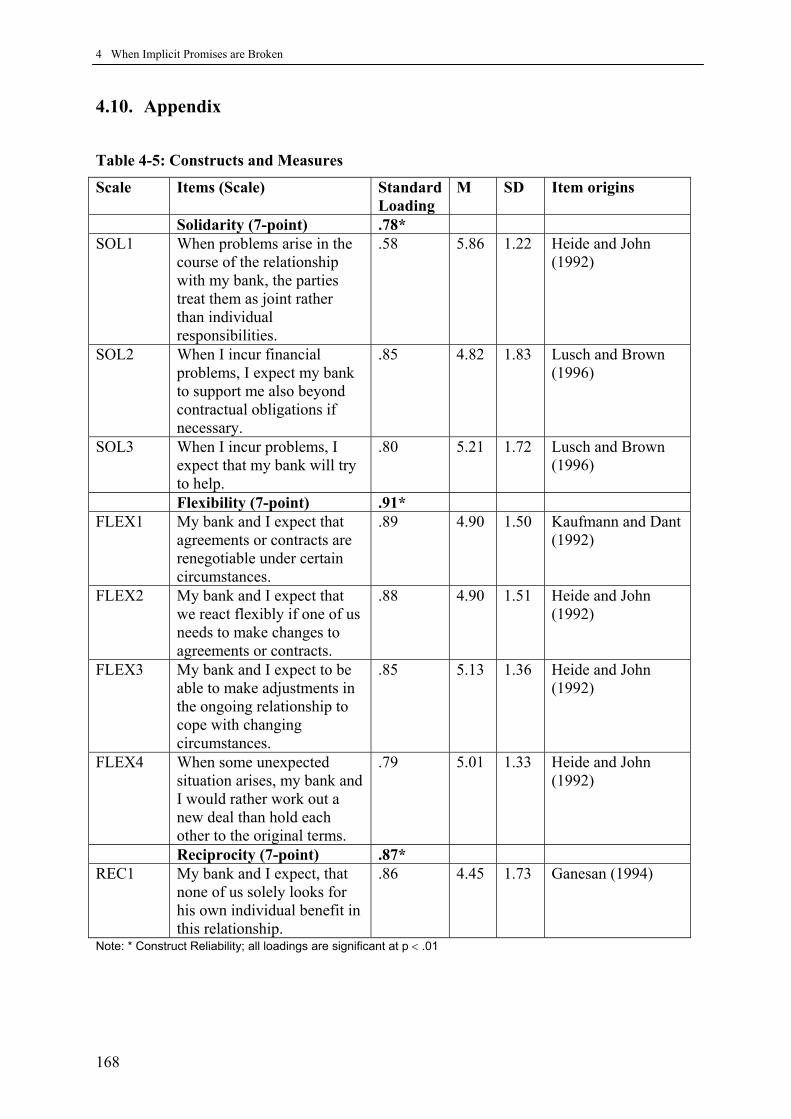
4 When Implicit Promises are Broken
168
4.10. Appendix
Table 4-5: Constructs and Measures
Scale Items (Scale) Standard Loading
M SD Item origins
Solidarity (7-point) .78* SOL1 When problems arise in the
course of the relationship with my bank, the parties treat them as joint rather than individual responsibilities.
.58 5.86 1.22 Heide and John (1992)
SOL2 When I incur financial problems, I expect my bank to support me also beyond contractual obligations if necessary.
.85 4.82 1.83 Lusch and Brown (1996)
SOL3 When I incur problems, I expect that my bank will try to help.
.80 5.21 1.72 Lusch and Brown (1996)
Flexibility (7-point) .91* FLEX1 My bank and I expect that
agreements or contracts are renegotiable under certain circumstances.
.89 4.90 1.50 Kaufmann and Dant (1992)
FLEX2 My bank and I expect that we react flexibly if one of us needs to make changes to agreements or contracts.
.88 4.90 1.51 Heide and John (1992)
FLEX3 My bank and I expect to be able to make adjustments in the ongoing relationship to cope with changing circumstances.
.85 5.13 1.36 Heide and John (1992)
FLEX4 When some unexpected situation arises, my bank and I would rather work out a new deal than hold each other to the original terms.
.79 5.01 1.33 Heide and John (1992)
Reciprocity (7-point) .87* REC1 My bank and I expect, that
none of us solely looks for his own individual benefit in this relationship.
.86 4.45 1.73 Ganesan (1994)
Note: * Construct Reliability; all loadings are significant at p < .01
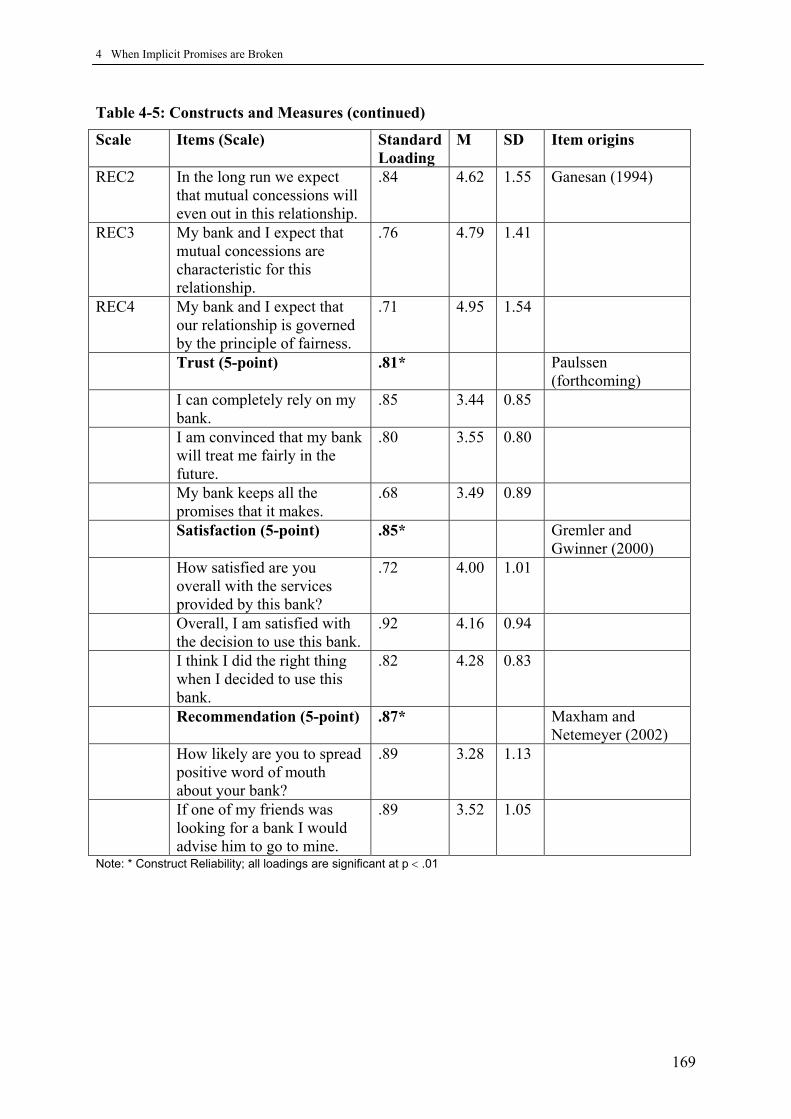
4 When Implicit Promises are Broken
169
Table 4-5: Constructs and Measures (continued)
Scale Items (Scale) Standard Loading
M SD Item origins
REC2 In the long run we expect that mutual concessions will even out in this relationship.
.84 4.62 1.55 Ganesan (1994)
REC3 My bank and I expect that mutual concessions are characteristic for this relationship.
.76 4.79 1.41
REC4 My bank and I expect that our relationship is governed by the principle of fairness.
.71 4.95 1.54
Trust (5-point) .81* Paulssen (forthcoming)
I can completely rely on my bank.
.85 3.44 0.85
I am convinced that my bank will treat me fairly in the future.
.80 3.55 0.80
My bank keeps all the promises that it makes.
.68 3.49 0.89
Satisfaction (5-point) .85* Gremler and Gwinner (2000)
How satisfied are you overall with the services provided by this bank?
.72 4.00 1.01
Overall, I am satisfied with the decision to use this bank.
.92 4.16 0.94
I think I did the right thing when I decided to use this bank.
.82 4.28 0.83
Recommendation (5-point) .87* Maxham and Netemeyer (2002)
How likely are you to spread positive word of mouth about your bank?
.89 3.28 1.13
If one of my friends was looking for a bank I would advise him to go to mine.
.89 3.52 1.05
Note: * Construct Reliability; all loadings are significant at p < .01
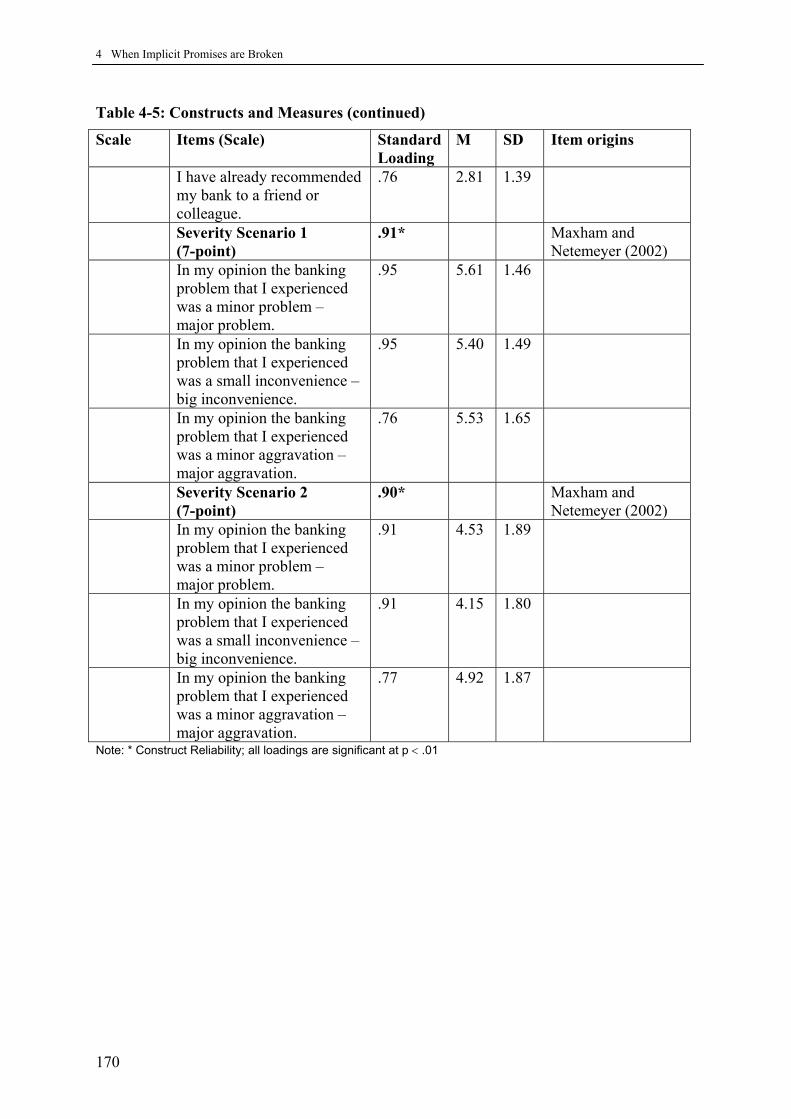
4 When Implicit Promises are Broken
170
Table 4-5: Constructs and Measures (continued)
Scale Items (Scale) Standard Loading
M SD Item origins
I have already recommended my bank to a friend or colleague.
.76 2.81 1.39
Severity Scenario 1 (7-point)
.91* Maxham and Netemeyer (2002)
In my opinion the banking problem that I experienced was a minor problem – major problem.
.95 5.61 1.46
In my opinion the banking problem that I experienced was a small inconvenience – big inconvenience.
.95 5.40 1.49
In my opinion the banking problem that I experienced was a minor aggravation – major aggravation.
.76 5.53 1.65
Severity Scenario 2 (7-point)
.90* Maxham and Netemeyer (2002)
In my opinion the banking problem that I experienced was a minor problem – major problem.
.91 4.53 1.89
In my opinion the banking problem that I experienced was a small inconvenience – big inconvenience.
.91 4.15 1.80
In my opinion the banking problem that I experienced was a minor aggravation – major aggravation.
.77 4.92 1.87
Note: * Construct Reliability; all loadings are significant at p < .01
5 When Bad News Really Hurts
171
5. Article 4: When Bad News Really Hurts – the Differential Effect of Message Elaboration in the Light of its Source
Together with Gita V. Johar and Jaideep Sengupta
To be submitted to Journal of Consumer Research
5.1. Abstract
When does bad news weaken consumers’ brand attitudes? Consumers are frequently
confronted with negative brand information (e.g., in the form of product reviews or consumer
reports) without a clear understanding of how credible the information actually is. In our
research, we investigate the effect of source credibility and time the source is known on the
impact of negative brand information on consumers’ attitude strength. In two studies we find
that message elaboration is heightened when participants receive information about the
source of the negative information after the message – but only when the source is clearly
credible or non-credible, not when it is ambiguous. The effect on attitude strength is twofold:
when credible source information follows the negative message, a weakening effect to the
attitude results from the heightened elaboration. When non-credible source information
however follows the message, the heightened elaboration results in a strengthening effect to
the attitude. We propose that the quality of elaboration essentially differs depending on
whether the negative message is elaborated on in the light of a credible or non-credible
source.
5.2. Introduction
Negative brand information is increasingly common for consumers. This is especially true
now with the Internet and the rise of Internet blogs allowing average consumers to spread the
word about their negative experience with brands. Jeff Jarvis caused a ruckus in 2005 when
5 When Bad News Really Hurts
172
he detailed his quest to fix a Dell PC, leading to an outburst in negative customer advocacy,
“the computer makers reputation could scarcely be lower…the internet is littered with
websites detailing customers’ frustrations of wading through ‘Dell Hell’“(Daily Telegraph,
2/20/07). Negative brand information on the web however is not an isolated phenomenon of
tech brands. ACNielsen (2005) found, that of the top 50 UK grocery brands, almost 40% of
the first ten Google-search results contained negative brand information ranging from
government official sites to individuals’ blogs, whose credibility often remained unclear or
become clear only after reading the information. In a recent prominent example the CEO of
Whole Foods, posted over a thousand blog entries containing critical reviews of competitor
Wild Oats under a pseudonym. The source of these reviews came to light well after
consumers had read the original postings (USAToday 7/12/07).
A key question concerns the impact of such negative information on attitudes and attitude
strength. Attitude strength concerns “the extent to which attitudes manifest the qualities of
durability and impactfulness” (Krosnick & Petty, 1995, p. 3). In this paper we propose that
negative information can have either a strengthening or a weakening effect on brand attitudes
depending on two critical factors: a) the credibility of the source providing the negative
information, and b) whether the recipient is made aware of the source credibility before or
after processing the negative information. Specifically we propose that the nature of
elaboration that is prompted by the source information differs depending on whether the
message is elaborated on in the light of a credible or non-credible source.
We will argue that when consumers are made aware of high source credibility after they have
read a negative product message, this will alert them to the relevance of the message and
prompt further elaboration of the message. Likewise they should be alerted when they learn
after having read the message that it came from a non-credible source, which should also
prompt further elaboration. We will further argue and show, that the effect of the heightened
elaboration on attitude strength should differ fundamentally depending on the source that
prompted it: when elaboration is prompted by a credible source, it should be aimed at
maintaining the negative information and hence weaken a prior positive attitude. When
elaboration is prompted by a non-credible source however, elaboration should be aimed at
overcoming the potential biasing effect of the message and the initial attitude should be
strengthened.
5 When Bad News Really Hurts
173
5.3. Theoretical Framework
An entire research stream has been concerned with the question of what makes persuasive
attempts – be it in the form of pro- or counter-attitudinal messages – effective. A key role in
the effectiveness of a persuasion attempt is the amount of careful elaboration on the message.
Attitudes that are the result of scrutiny on the message’s arguments are stronger than attitudes
that are based on less effortful thought on the message (see Petty & Cacioppo, 1986; Petty,
Haugtvedt, & Smith, 1995; Petty, Priester, & Wegener, 1994, for reviews). They not only
have been found to persist longer than attitudes based on less thoughtful processes (e.g.,
Chaiken, 1980; Elms, 1966; Haugtvedt & Petty, 1992; Verplanken, 1991), but also to be
more resistant to counter-attitudinal persuasion attempts (e.g., Haugtvedt & Petty, 1992;
Haugtvedt & Wegener, 1994) and – of specific relevance for marketers- more predictive of
behavior (e.g., Cacioppo, Petty, Kao, & Rodriquez, 1986; Kallgren & Wood, 1986; Leippe &
Elkin, 1987; Verplanken, 1991).
Elaboration on a persuasive message can differ systematically: current theories of attitudes
and persuasion such as the elaboration likelihood model (ELM; Petty & Cacioppo, 1981,
1986) and the heuristic-systematic model (HSM; Chaiken, Liberman, & Eagly, 1989) hold
that attitude change can be the result of two qualitatively different processes. According to
these models, attitude change can be the result of careful and effortful elaboration of a
message or less cognitively effortful inferences and associative processes. Because
individuals generally seek to hold accurate attitudes (Petty & Cacioppo, 1986), scrutiny of the
message will be higher when the source cannot be used as a cue from which to infer its
accuracy: receiving a cue that validates a message before the message itself may satisfy
recipients and prevent or reduce further scrutiny of the message arguments.
In two experiments Priester and Petty (1995) could show that participants who are low in
need for cognition (NFC; Cacioppo & Petty, 1982; i.e., people who do not enjoy careful
thinking and are especially miserly in their expenditure of cognitive resources) elaborated
less on a message when they knew before that it was from a trustworthy source, than when
they knew that it was from an untrustworthy source. Apparently the fact that participants
knew about the high trustworthiness was sufficient for them to accept the message and
prevented careful argument scrutiny. They further found that argument quality (i.e., whether

5 When Bad News Really Hurts
174
arguments of the message were strong or weak) did not have an effect on attitudes when the
message came from a trustworthy source; a further indication that participants did not
elaborate on the arguments from a trustworthy source. However, when the message was from
an untrustworthy source, participants did elaborate carefully on the message and hence
messages containing strong arguments influenced participants more than messages containing
weak arguments. Priester and Petty (2003) could replicate these findings and show that the
higher elaboration led to stronger – more accessible – attitudes.
According to the dual process models (ELM and HSM) source credibility can prevent careful
elaboration of a message when given before the message itself. In line with these models
research has mostly focused on the role of source credibility when presented before the
message. In this article we argue and show that source credibility can also affect elaboration
when presented after the message.
5.3.1. Source Credibility and Message Diagnosticity
Source credibility has been conceptualized as a message source’s perceived expertise and
trustworthiness (e.g., Kelman & Hovland, 1953). Source credibility hence can reveal
something about the diagnosticity of the message. Diagnosticity differentiates the message as
being relevant from other less relevant information, “the diagnosticity of an input is largely
driven by the ability of that input to discriminate the best alternative from the rest” (Alba,
Hutchinson, & Lynch, 1991, p. 29) and is conceptually related to Hampton’s (1987) concept
of importance, or Rosch’s (1974) cue validity. Especially in the marketing domain, where
consumers are often confronted with a plethora of brand information of often dubious
credibility (e.g., in advertisement claims), high source credibility should lend high
diagnosticity to the message, meaning that in contrast to other messages (of unknown
credibility) this message is relevant for attitude formation. Argument quality can also serve as
a source for diagnosticity of the message when source information is unavailable. However,
argument quality of typical brand messages (e.g., advertisements) is often low: “Even a
cursory review of advertising reveals that many of the stimuli within an add are devoid of any
information about the product itself” (Miniard, Sirdeshmukh, & Innis, 1992, p. 226).

5 When Bad News Really Hurts
175
As was outlined, being made aware of the high source credibility of a message before the
message can lead participants to simply accept the message as being relevant without
carefully elaborating on it (Priester & Petty, 1995, 2003). However, what happens when
participants are made aware of the source after they have read a message? Receiving relevant
source information after the message carries an element of surprise because it disconfirms
expectations. According to Grice’s (1975) maxim of manner, recipients expect information to
be presented in a manner that is as clear and as orderly as it can be, avoiding any ambiguity
or obscurity. Grice developed a theory of conversational implicature, according to which
conversations are guided by a set of four central tacit expectations people carry. These are
quantity, quality, relation and manner. When recipients are presented with a cue that contains
information about the message’s high credibility after presenting the message, this should
violate the maxim of manner. It should make participants engage in questions like: “Why am
I being told this now? Obviously, this has relevance to the message I just read.”
It has been found in several studies that violating expectations prompts careful elaboration.
Maheswaran and Chaiken (1991) found that when message quality differed from participants’
expectations, the message was processed more carefully. Likewise Baker and Petty (1994)
showed that participants expect the majority to agree with their position and the minority to
disagree. A violation of this expectation led to higher message scrutiny. Smith and Petty
(1995) found that people who expected a negatively framed message and received a
positively framed (or vice versa) engaged in more careful processing of that message. The
effect of disconfirmation of expectations on elaboration has also been shown in research on
causal attribution (e.g., Pyszczynski & Greenberg, 1981; Wong & Weiner, 1981) and on
impression formation (e.g., Fiske & Neuberg, 1990; Hastie, 1984; Srull & Wyer, 1989)
showing that perceivers engaged in increased effortful processing after their expectations
were disconfirmed (see Olson, Roese, & Zanna, 1996; Stangor & McMillan, 1992, for
reviews). Similarly, Miller and Kahn (2005) found that violating consumers’ conversational
expectations by giving them ambiguous color names led to higher elaboration.
Hence, opposed to previous studies, which found that presenting high source credibility
before the message could prevent message elaboration, we propose that presenting credible
source information after the message can actually increase elaboration. In contrast, unclear
source credibility information should not prompt further elaboration because it does not
reveal any further relevant information about the diagnosticity of the message.

5 When Bad News Really Hurts
176
Similar to learning that the source is very credible after the message is presented, learning
that the source is very non-credible after the message should also violate expectations and
result in heightened elaboration. Grice (1975) formulates this in his maxim of quality. The
maxim of quality states that recipients expect the information not to be false or stating
something for which adequate evidence is lacking. When consumers receive a brand message
and are told afterwards that it was from a non-credible source they should engage in thoughts
like, “Why am I being told this now? If the message was not credible, why was I given it in
the first place?” Elaboration prompted by non-credible source information should be aimed at
removing the potential bias from the invalid brand message. Hence, although elaboration
should be heightened in both cases, quality of elaboration should differ. This will be outlined
in the following.
5.3.2. Differential Effects of Elaboration on Attitude Strength
Consumers usually carry positive attitudes towards their brands. Hence when negative brand
information is encountered, the new information is inconsistent with consumers’ prior
attitude. Different predictions prevail in the literature concerning the effect of elaboration on
attitude inconsistent information. Traditionally it has been argued that greater elaboration
should lead to stronger attitudes (Petty et al., 1995). We propose that the effect of elaboration
on attitude strength should differ depending on the credibility of the source. Specifically we
argue that elaboration on attitude inconsistent information from a non-credible source has
refutational character – aimed at overcoming the persuasive attempt and refuting possible
structural inconsistencies of the attitude. This refutational elaboration should result in a
strengthening of the attitude. Conversely, elaboration on inconsistent information from a
credible source should have the opposite effect: increased elaboration should lead to the
maintenance of the structural inconsistencies, resulting in a weakening of the attitude.
Strengthening Effect of Elaboration:
Based on the premise that people are spontaneously motivated to arrive at an integrated
evaluation (Hastie, 1980; McGuire, 1981; Srull & Wyer, 1989) careful consideration of
positive and negative aspects in relation to each other may create an integrated judgment
(Maheswaran & Chaiken, 1991; Srull & Wyer, 1989). By drawing on the heuristic-systematic
model, Jonas, Diehl, and Brömer (1997) showed that inconsistent brand information
5 When Bad News Really Hurts
177
decreased participants’ confidence in their attitude prompting systematic processing of the
relevant information. This systematic processing in turn increased structural consistency
between attitudes and behavioral intentions.
Refutational Elaboration:
When encountering a persuasive attempt from a non-credible source, elaboration should be
aimed at removing the potential bias. Research on correction processes supports this view.
Past research has shown that when individuals become aware of a persuasion attempt, they
may attempt to correct for the influence by adjusting their attitude in the opposite direction of
the persuasion attempt (Wegener & Petty, 1995). Correction processes like these are based on
implicit theories people hold about their own cognitive processes (Jost, Krugklanski, &
Nelson, 1998). For example, when people believe that a contextual factor such as source
trustworthiness influences them unfavorably, correction instructions cause them to adjust
their judgments away from that influence, but when they believe that the context influences
them negatively, the instructions cause them to adjust their judgments toward the context
(Jost, Kruglanski, & Nelson, 1998).
Specifically research has revealed recipients’ active counter-arguing as a key mechanism
through which recipients resist persuasion (e.g., Brock, 1967; Killeya & Johnson, 1998;
Petty, Ostrom, & Brock, 1981). Tormala and Petty (2002) found that not only did counter-
arguing lead recipients to resist the persuasion attempts but it actually made them more
certain of their original attacked attitudes. They proposed a meta-cognitive framework,
arguing that people perceive their own resistance, reflect on it and in turn form attribution-
like inferences about their own attitudes. In a series of experiments participants were
presented with counter-attitudinal messages and instructed to counter-argue. When they
successfully counter-agued, their initial attitudes became more certain than they had been on
the outset. Specifically, when participants believed persuasive messages to contain strong
arguments, resisting strengthened the attitude, not so however when messages were perceived
as weak. Hence, only when participants believed that they had overcome a strong persuasive
attempt, they reasoned, that their initial attitude must have been very valid otherwise it would
not have resisted their attack. Such an attribution-like inference however is only justified
when a strong, not when a weak attack is overcome.
5 When Bad News Really Hurts
178
Based on these findings we argue that when elaboration is prompted by non-credible source
information elaboration on the message should be in the light of this new information. People
should engage in meta-cognitive thinking, wondering whether the message from a non-
credible source potentially did influence their attitude. Similar to when participants are being
made aware of a persuasive attempt, elaboration should resemble the counter-arguing in
Tormala and Petty’s (2002, 2004) work in that it is aimed at refuting the message’s impact on
the attitude. As a result this refutational elaboration should lead to a rejection of the
message’s inconsistent negative information and similar to Tormala and Petty’s findings
result in stronger attitudes, and in line with Wegener & Petty’s (1995) findings also in more
positive attitudes.
Weakening Effect of Elaboration:
In a different perspective, research on the structure-strength relationship has argued that an
attitude based on inconsistent elements should be weaker than an attitude based on mutually
consistent elements. The existence of separate conflicting dimensions increases the likelihood
that attitude and behavior are based on discrepant elements lowering the correspondence
between them (Lavine et al., 1998). Structural inconsistencies that exist and are not
reconciliated have been shown to lower attitude stability (Rosenberg, 1968) and the attitude-
behavior link (Norman, 1975). In addition response competition between conflicting
evaluations should reduce attitude accessibility (Bargh et al., 1992; Bassili, 1998). In recent
research Sengupta and Johar (2002) found that elaboration on inconsistent information
decreases attitude strength when conditions are unfavorable for reconciliation. Under most
conditions individuals should be motivated to arrive at an integrated evaluation by
reconciliating inconsistent information (Hastie, 1980; Maheswaran & Chaiken, 1991; Srull &
Wyer, 1989). However under certain circumstances (e.g., individuals’ motivation to minimize
regret) individuals may be motivated to maintain evaluative inconsistencies. Under these
conditions, Sengupta and Johar found that elaboration of inconsistent information actually led
to weaker as opposed to stronger attitudes.
Maintenance Elaboration:
It was proposed above that receiving high source credibility information after the message
should lend further diagnosticity to the message. This in turn should prompt additional
elaboration on the message. In the light of the newly acquired information that the message
was of importance for attitude formation it should be weighted more heavily. Receiving the
5 When Bad News Really Hurts
179
source info after the message was already scrutinized should also alert the recipient to the
question whether he took the message into account sufficiently. In contrast to when
elaboration is in the light of a non-credible source with a refutation aim, when elaboration is
prompted by a credible source it should be aimed at making sure the information was indeed
taken into account. Hence we propose that elaboration prompted by a highly credible source
should lead to the maintenance of structural inconsistencies and in line with theories on the
structure-strength relationship lead to weaker attitudes.
Summarizing, we assume that when the source of the inconsistent message is credible, and
people learn of this source after the message, this should prompt elaboration, which in turn
should weaken the attitude. We test this proposition in experiment 1. In contrast, when the
elaboration is prompted by a non-credible source we expect the elaboration to strengthen the
attitude. We will test that assumption in experiment 2.
5.4. Experiment 1: Weakening Effect of Elaboration on Attitude Strength
This experiment is concerned with the effect of credible vs. ambiguous source credibility and
the time consumers learn about the source on elaboration and the effect of the resulting
elaboration on attitude accessibility. Attitudes can be seen as associations between objects
and evaluations (Fazio, et al., 1982). The strength of the object-evaluation association can
vary. This associative strength is the major determinant of attitude accessibility, the
likelihood that the attitude will be activated from memory when the individual encounters the
attitude object. Central measure for attitude accessibility is the latency with which individuals
respond to an inquiry about their attitudes. The reasoning for this is, that the more accessible
an associated evaluation is from memory, the less cognitive work an individual would have to
do to respond to an attitudinal inquiry and the more automatic such a process would be
(Fazio, 1995). The link between associative strength and automatic activation has been
shown in several studies (e.g., Bargh et al., 1992; Sanbonmatsu, Osborne, & Fazio, 1986) and
has been shown to be of high reliability in meta-analytic studies (Fazio, 1993). Several
studies have validated response time latency as a valid predictor of other facets of attitude
strength: Houston and Fazio (1989) found that more accessible attitudes are more stable over
time than less accessible ones. Similarly Bassili and Fletcher (1991) found that more
accessible attitudes are more resistant to counter-arguments. Concerning the attitude behavior

5 When Bad News Really Hurts
180
link it has been found that enhancing the strength of the attitude accessibility led to an
increase in attitude-behavior consistency (Fazio et al., 1982), and that voters’ attitudes were
far more predictive of actual voting behavior when they were highly accessible. Similarly in a
consumer context, Fazio, Powell, and Williams (1989) found that the more accessible
subjects’ attitudes were towards consumer products, the more predictive they were of their
actual product selection. Comparing, response time latencies, an implicit measure of attitude
strength, with respondents’ self expressed confidence in their attitudes, an explicit measure of
attitude strength, Bassili (1993) found response time latencies to be a better predictor of
actual voting behavior than voters’ expressed attitudinal confidence.
Experiment 1 was designed for two purposes: first to investigate whether giving credible
source information but not ambiguous source information after the message would prompt
additional elaboration on the message. Second, to test whether the elaboration on the
additional negative information would weaken the overall attitude. As argued above, when
consumers receive negative brand information that is inconsistent with prior positive
information, this may lead to attitudinal conflict and result in ambivalence. Attitude
ambivalence involves a response competition between the positive and the negative
components of the attitude, which has been shown to lead to higher response times (Bargh et
al., 1992). Hence we assume that the extended elaboration on the negative information from a
credible source should lead to a response time competition and hence extended response time
latencies.
5.4.1. Design and Procedure of Study 1
Eighty students at Columbia University participated in the 2 x 2 experiment manipulating
source credibility (high vs. ambiguous) and time the source information was given (before vs.
after negative brand information). Participants were informed that the experimenters were
interested in evaluations of a new DVD-player, the VX-5000. All participants were initially
presented with attribute information allegedly from an independent consumer research
agency about the VX-5000 and two competitors’ brands, aimed at eliciting an initial positive
brand attitude towards the VX-5000. After reading the initial information, participants were
given additional information about the VX-5000 that reportedly came from a Google-search
on the brand. Both, the initial positive as well as the additional negative information

5 When Bad News Really Hurts
181
contained eight pieces of information. Whereas the initial information focused on picture
quality attributes, the additional information focused on the durability and workmanship of
the DVD-player. By focusing on different attributes we aimed to avoid that initial and
additional information would contradict each other. Participants were either presented with a
description of the website that contained the product evaluation or with the product
evaluation itself at first. Participants who first read the description of the website were given
the product evaluation after reading the information about the source and vice versa. The
product evaluation information was the same in all four conditions. Participants were either
told that the source was the official website of the Consumer Union, describing it in a way
aimed at eliciting highly credible evaluations of the site or that the source was a website
where consumers freely publish their own evaluations. This site was described in a way
aimed at eliciting ambiguous evaluations of source credibility: Participants were told that this
site had been criticized in the past for publishing reports of dubious credibility, and that it
was not always clear whether the published statements were consumers’ honest opinions.
This was followed by a reaction time procedure, aimed at measuring participants’ attitude
accessibility. We thereby followed a procedure and instructions recommended by Fazio
(1990). We specifically instructed participants to react as quickly and as accurately as
possible. We instructed them to press the “agree” button when they agreed or even mildly
agreed with the statement concerning the VX-5000 and to press the “disagree” button when
they disagreed or even mildly disagreed with the statement. Participants were first confronted
with a practice trial, and were then given two attitudinal statements concerning the VX-5000.
This was followed by three seven-point attitude scales (α= .96). Subsequently participants
were asked to list their thoughts concerning the negative information about the VX-5000 and
afterwards asked to rate the amount they elaborated on the additional negative information on
two seven-point scales (α= .84). As a manipulation check of the credibility manipulation
subjects were then asked on two seven-point scales how credible they found the source (α=
.90).
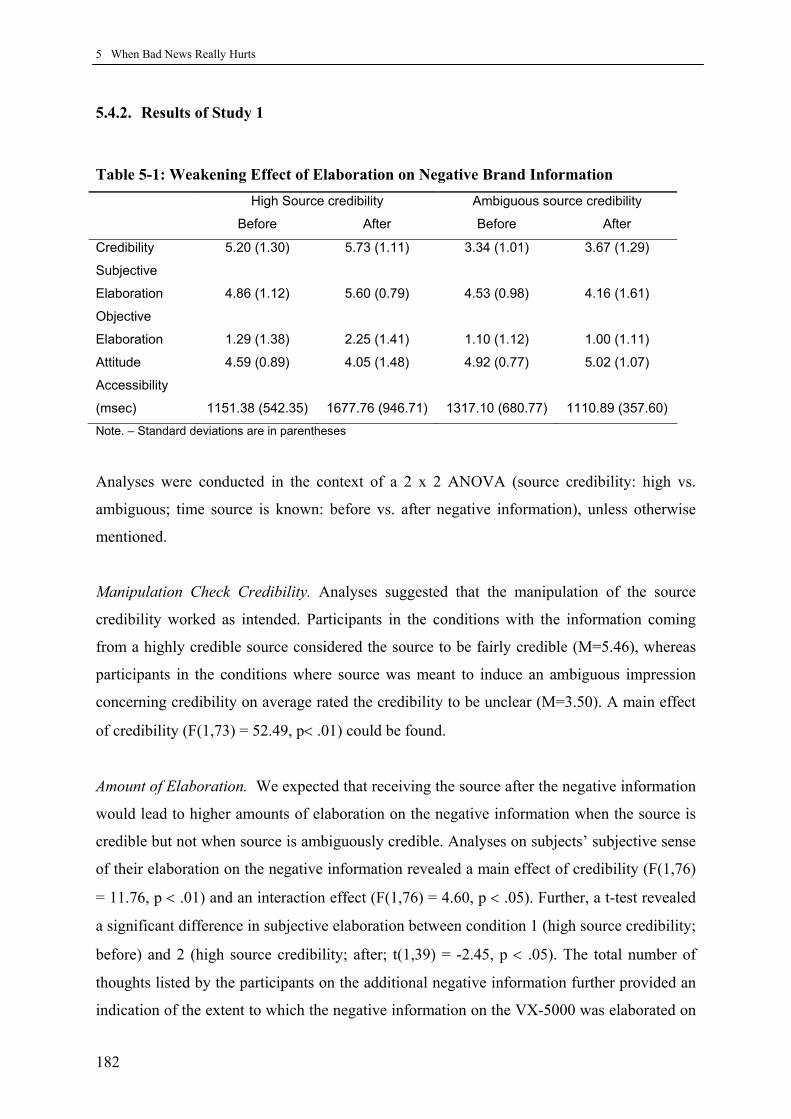
5 When Bad News Really Hurts
182
5.4.2. Results of Study 1
Table 5-1: Weakening Effect of Elaboration on Negative Brand Information High Source credibility Ambiguous source credibility
Before After Before After
Credibility 5.20 (1.30) 5.73 (1.11) 3.34 (1.01) 3.67 (1.29)
Subjective
Elaboration 4.86 (1.12) 5.60 (0.79) 4.53 (0.98) 4.16 (1.61)
Objective
Elaboration 1.29 (1.38) 2.25 (1.41) 1.10 (1.12) 1.00 (1.11)
Attitude 4.59 (0.89) 4.05 (1.48) 4.92 (0.77) 5.02 (1.07)
Accessibility
(msec) 1151.38 (542.35) 1677.76 (946.71) 1317.10 (680.77) 1110.89 (357.60)
Note. – Standard deviations are in parentheses
Analyses were conducted in the context of a 2 x 2 ANOVA (source credibility: high vs.
ambiguous; time source is known: before vs. after negative information), unless otherwise
mentioned.
Manipulation Check Credibility. Analyses suggested that the manipulation of the source
credibility worked as intended. Participants in the conditions with the information coming
from a highly credible source considered the source to be fairly credible (M=5.46), whereas
participants in the conditions where source was meant to induce an ambiguous impression
concerning credibility on average rated the credibility to be unclear (M=3.50). A main effect
of credibility (F(1,73) = 52.49, p< .01) could be found.
Amount of Elaboration. We expected that receiving the source after the negative information
would lead to higher amounts of elaboration on the negative information when the source is
credible but not when source is ambiguously credible. Analyses on subjects’ subjective sense
of their elaboration on the negative information revealed a main effect of credibility (F(1,76)
= 11.76, p < .01) and an interaction effect (F(1,76) = 4.60, p < .05). Further, a t-test revealed
a significant difference in subjective elaboration between condition 1 (high source credibility;
before) and 2 (high source credibility; after; t(1,39) = -2.45, p < .05). The total number of
thoughts listed by the participants on the additional negative information further provided an
indication of the extent to which the negative information on the VX-5000 was elaborated on

5 When Bad News Really Hurts
183
(see Sengupta & Johar, 2002). Analyses revealed a main effect of credibility (F(1,76) = 6.42,
p < .01) as well as an interaction effect (F(1,76) = 3.53, p < .10). Further, a t-test revealed a
significant difference between condition 1 and 2 (t(1,39) = -2.21, p < .05).
Attitude. No assumptions were made about the effect of increased elaboration on negative
information from a credible source on the attitude itself. ANOVA results only revealed a
main effect of credibility (F(1,76) = 7.10, p < .01).
Attitude Accessibility. We expected that the extended elaboration on the additional negative
information on the VX-5000 should lead to a response competition and hence extended
response time latencies. Response time latencies were analyzed in a manner recommended by
Fazio (1990). Data was screened for outliers; in addition, in order to deal with the problem of
individually different baseline response times we used the mean latencies from the practice
trials as covariates, as is commonly employed (see Smith & Lerner, 1986; Fazio, 1990).
Mean latencies across two attitude statements served as dependent variables in an ANCOVA.
Analysis revealed a significant interaction effect (F(1,74) = 5.56 , p < .05). Further contrasts
between condition 1 and 2 revealed significant differences (F(1,37) = 4.19, p < .05).
5.4.3. Discussion of Study 1
According to ELM and HSM, giving credible source information prior to the message can
potentially prevent careful argument scrutiny for participants low in NFC (Priester & Petty,
1995). Our results do not show such a difference in elaboration when source is presented
before the message: participants who received the credible source information before the
message did not elaborate less on the message than those receiving ambiguous source
information before the message. This may be due to the fact that we did not differentiate
between people who are high and low in NFC.
However in line with our prediction, we found that elaboration was elevated when credible
source information followed the message as compared to when it preceded it, not however
when ambiguous source information followed the message. Neither ELM nor HSM can
explain these differences. According to them, amount of elaboration should have been the
same independent of whether the source information after the message was credible or

5 When Bad News Really Hurts
184
ambiguous. Our results hence suggest that the credible source prompted further elaboration
on the message, but not the ambiguous source. Presenting credible source information after
the message seems to have served as a marker, to recall the just processed information and
make sure it was firmly understood.
Further, as hypothesized, the heightened elaboration on the inconsistent negative brand
information led to a weakening of the attitude as measured by response latencies. Participants
receiving the credible source information after the message showed the longest response
latencies. In line with past research on the effect of structural inconsistencies on attitude
strength, inconsistent brand information apparently led to higher attitudinal conflict. As
proposed elaborating on negative brand information in the light of a highly credible source
apparently maintained the structural inconsistencies in the attitude.
5.5. Experiment 2: Strengthening Effect of Elaboration on Attitude Strength
Experiment 2 was conducted for three purposes: first, to replicate the weakening effect of
increased elaboration on credible inconsistent information on attitudes; second, to investigate
whether elaboration similarly increases when consumers learn about a non-credible source
after receiving the message as opposed to before; third, to examine the effect of elaboration
on a message from a non-credible source on attitude strength. Different from elaboration that
is prompted by a credible source we argue that elaboration prompted by a non-credible source
should differ qualitatively, aimed at refuting structural inconsistencies and hence lead to
stronger attitudes and in line with Wegener and Petty’s (1995) research on bias correction to
more positive attitudes.
5.5.1. Design and Procedure of Study 2
Sixty-eight students at Columbia University participated in the 2 x 2 experiment
manipulating source credibility (high vs. low) and time of source information (before vs. after
negative information). The procedure was similar to that of study 1 with the difference that in
contrast to study 1, the low source credibility information was aimed at eliciting highly non-
credible evaluations. Specifically, participants in the low source credibility conditions were
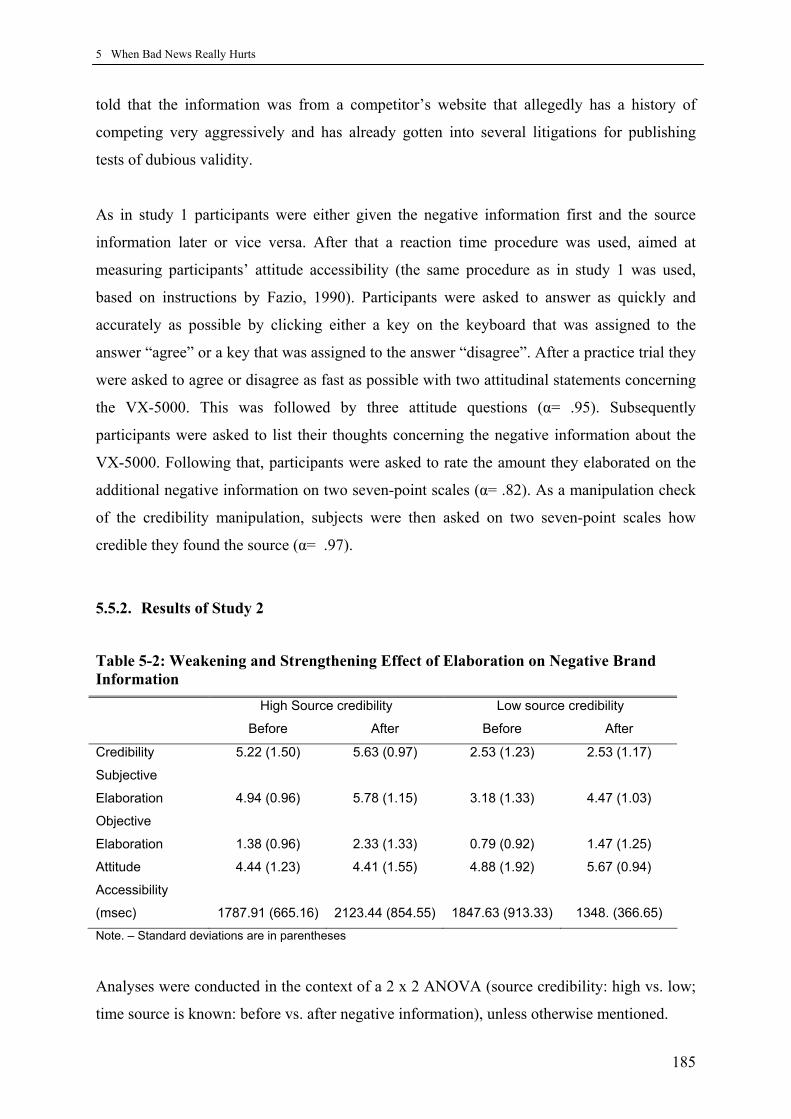
5 When Bad News Really Hurts
185
told that the information was from a competitor’s website that allegedly has a history of
competing very aggressively and has already gotten into several litigations for publishing
tests of dubious validity.
As in study 1 participants were either given the negative information first and the source
information later or vice versa. After that a reaction time procedure was used, aimed at
measuring participants’ attitude accessibility (the same procedure as in study 1 was used,
based on instructions by Fazio, 1990). Participants were asked to answer as quickly and
accurately as possible by clicking either a key on the keyboard that was assigned to the
answer “agree” or a key that was assigned to the answer “disagree”. After a practice trial they
were asked to agree or disagree as fast as possible with two attitudinal statements concerning
the VX-5000. This was followed by three attitude questions (α= .95). Subsequently
participants were asked to list their thoughts concerning the negative information about the
VX-5000. Following that, participants were asked to rate the amount they elaborated on the
additional negative information on two seven-point scales (α= .82). As a manipulation check
of the credibility manipulation, subjects were then asked on two seven-point scales how
credible they found the source (α= .97).
5.5.2. Results of Study 2
Table 5-2: Weakening and Strengthening Effect of Elaboration on Negative Brand Information
High Source credibility Low source credibility
Before After Before After
Credibility 5.22 (1.50) 5.63 (0.97) 2.53 (1.23) 2.53 (1.17)
Subjective
Elaboration 4.94 (0.96) 5.78 (1.15) 3.18 (1.33) 4.47 (1.03)
Objective
Elaboration 1.38 (0.96) 2.33 (1.33) 0.79 (0.92) 1.47 (1.25)
Attitude 4.44 (1.23) 4.41 (1.55) 4.88 (1.92) 5.67 (0.94)
Accessibility
(msec) 1787.91 (665.16) 2123.44 (854.55) 1847.63 (913.33) 1348. (366.65)
Note. – Standard deviations are in parentheses
Analyses were conducted in the context of a 2 x 2 ANOVA (source credibility: high vs. low;
time source is known: before vs. after negative information), unless otherwise mentioned.

5 When Bad News Really Hurts
186
Manipulation Check Credibility. Analyses suggested that the manipulation of the source
credibility worked as intended. Participants in the conditions with the information coming
from a highly credible source considered the source to be fairly credible (M = 5.42), whereas
participants in the conditions with the information coming from a low credible source
considered the source to be rather non-credible (M = 2.53). A main effect of credibility
(F(1,59) = 85.95, p < .01) could be found.
Amount of Elaboration. We expected that elaboration should be higher when either high or
low source credibility is given after the negative information than when it is given before the
information. Analyses on subjects’ subjective sense of elaboration on the negative
information revealed a main effect of credibility (F(1,64) = 30.55 , p < .01) and time of
information (F(1,64) = 14.66, p < .01), further, t-tests revealed significant differences
between condition 1(high source credibility; before) and 2 (high source credibility; after;
t(32) = -2.29, p<.05) as well as between condition 3 (low source credibility; before) and 4
(low source credibility; after; t(32)=-3.09, p<.01). As in study 1, the total number of thoughts
listed by the participants on the additional negative information further served as an indicator
of the extent to which the negative information on the VX-5000 was elaborated on (see
Sengupta & Johar, 2002). Analyses revealed a main effect of credibility (F(1,64) = 7.05, p <
.01) and time of information (F(1, 64) = 8.94 , p < .01). T-Tests between condition 1 and 2
showed significant differences (t(32) = -2.39, p<.05) as well as between condition 3 and 4
(t(32) = -1.83, p<.10).
Attitude. Analysis revealed a main effect of credibility (F(1,64) = 7.66, p < .01). Based on the
findings on bias correction (Wegener & Petty, 1995) we expected that participants who, after
having read the negative information about the VX-5000, learn about the non-credible source
of the information should re-adjust their attitude towards a more positive attitude. A t-Test
between condition 3 and condition 4 revealed that participants in condition 4 in fact did have
the highest attitudes (t(32) = -2.09, p<.05).
Attitude Accessibility. Analysis of reaction time latencies were conducted in the manner
described in experiment 1 with mean latencies from the practice trials serving as covariates
and mean latencies of two attitude measures serving as dependent variables in an ANCOVA.
Analysis revealed a main effect of credibility (F(1,62) = 2.87 , p < .01) and an interaction

5 When Bad News Really Hurts
187
effect (F(1,62) = 5.99 , p < .05). As in study 1 we expected that the extended elaboration on
credible negative information should lead to a weakening effect of the attitude and hence to
the highest latencies in condition 2. Contrasts between condition 1 and 2 slightly missed
significance. However, contrasts between condition 2 and condition 1, 3, 4 revealed that
participants in condition 2 did have the highest reaction times over all conditions (F(1,64) =
4.88, p< .05). We further expected that the extended elaboration on the information from a
non-credible source should lead to a strengthening effect and hence to the lowest latencies.
Contrasts between condition 3 and 4 were significant (F(1,30) = 4.17, p< .05). Likewise
contrasts between condition 4 and condition 1, 2, 3 revealed that participants in condition 4
had the lowest reaction times over all conditions (F(1,64) = 6.09, p< .05).
5.5.3. Discussion of Study 2
We were able to replicate our main findings from study 1 in study 2: presenting participants
with a credible source after the message increased elaboration. The increased elaboration in
turn apparently led to the maintenance of structural inconsistencies of the attitude, resulting in
weaker attitudes as found in the highest response latencies. In addition, as assumed, also
presenting non-credible source information after the message led to higher elaboration
compared to when it was presented before the message. Neither ELM nor HSM would have
predicted such a difference. Similar to receiving credible source information after the
message, receiving non-credible source information after the message prompted further
elaboration.
As predicted, the effect of elaboration that was prompted by the non-credible source
information differed from the effect of elaboration prompted by credible source information.
In line with Wegener and Petty’s (1995) findings, the extended elaboration resulted in more
positive attitudes. Apparently being made aware of the non-credible source after the message
alerted participants of the potential biasing effect of the message. As a result, they apparently
tried to correct for the false negative message, which resulted in a more positive attitude. In
addition to the effect on the attitude we could further show an effect on attitude strength.
Similar to Tormala and Petty’s (2002, 2004) finding that actively counter-arguing a message
strengthens the original attitude, being made aware of the potential biasing effect of a non-
credible message similarly strengthened the initial attitude.

5 When Bad News Really Hurts
188
Although elaboration is heightened when non-credible source information follows the
message, as opposed to when it precedes it, our results also show that elaboration is lower
when receiving non-credible source information as opposed to credible source information
before the message. This finding is not in line with prior findings in the tradition of the dual
process models which found that information from untrustworthy sources actually tends to be
elaborated on more than from trustworthy sources (e.g., Priester & Petty, 1995).
5.6. General Discussion
When consumers incur negative brand information, how does it affect their attitudes and the
strength of their attitudes? In the current study we investigated the effect of source position
relative to the message and the source credibility on elaboration and resulting attitude
strength. Two major findings emerged. The first concerns the role of the source in prompting
further message elaboration, meaning the source’s role in influencing the quantity of
elaboration. The second concerns the differential effect of elaboration on attitude strength.
Concerning the relative role of source position, current research holds that source information
can prevent elaboration when presented before the message because it leads recipients to
accept the message without elaborating carefully on the quality of the arguments. In this
article we proposed and showed that when consumers received credible or non-credible
source information after the message, the source information prompted further elaboration on
the message. Hence we extended current research on the role of cue position by showing that
a) a cue can affect elaboration also when given after the message as opposed to before, and b)
only when that cue is relevant (i.e. credible or non-credible source information) elaboration is
prompted. A non-diagnostic cue, such as source information that is ambiguous did not
prompt further elaboration.
Our findings imply a difference in quality of elaboration. Little research has dealt with the
quality of elaboration as opposed to the quantity of elaboration. Recent research on
persuasion has been concerned with the role of people’s meta-cognitions (Tormala & Petty,
2002, 2004) and has shown that people engage in meta-cognitive processes inferring
information about the validity of their own attitude from their own counter-arguing of
persuasive messages. In a similar vain, when recipients are made aware after the message of
the lack of its credibility, they are likely to wonder whether the information did not invalidly
5 When Bad News Really Hurts
189
impact their judgment. This is nicely illustrated in a comment one of our participants in
experiment 2 gave who had received non-credible source information after she had read the
negative message: „Well it’s hard not to think about it because I read it before I knew that the
credibility of the source was no good. So while I know that the negative information may not
be true it’s still sort of in the back of my head.“ Being made aware of the potential biasing
effect of the invalid brand information, elaboration is likely to be aimed at refuting the
persuasive attempt. Such elaboration should qualitatively differ from elaboration in the light
of a credible source that prompted it. Whereas in the case of a non-credible source recipients
should engage in meta-cognitive processes concerned with whether the invalid message
impacted their judgment too much, recipients who received the credible source should be
concerned whether the valid message did impact their judgment sufficiently. Hence
elaboration in the latter case should be aimed at maintaining the structural inconsistencies of
the attitude caused by the inconsistent information. This notion is in line with current meta-
cognitive conceptualizations of attitude formation (Petty, 2006; Petty et al., 2007).
Concerning the effect of elaboration on attitude strength, our results showed that extended
elaboration on attitude inconsistent information can do both: strengthen and weaken an
attitude. What effect the quantity of elaboration has on attitude strength should depend on the
quality of elaboration. We could thereby extend recent research (Sengupta & Johar, 2002)
that investigated the effect of inconsistent information on attitude strength by showing that
whether a strengthening or weakening effect results also depends on source credibility and
time participants learn about the source. In addition, recent research that has been concerned
with meta-cognitive processes in overcoming persuasive attempts has solely focused on a
strengthening effect of attitudes (Tormala & Petty, 2002, 2004). Our research extends this
work by suggesting that meta-cognitive processes may result in weakening effects likewise.
In addition to the theoretical contributions, our research provides interesting practical insights
for consumer researchers and practitioners. Despite the prevalence of negative information
about brands especially with the rise of consumer complaints on Internet blogs, the effect of
information inconsistencies on consumers’ brand attitudes has remained a research field with
relatively little attention devoted to (Sengupta & Johar, 2002). In the modern marketing
sphere, receiving information about brands of invalid source credibility or learning about the
credibility after having heard or read the message becomes increasingly common. Sources
like the Internet provide outraged consumers and cunning competitors alike with a quick tool

5 When Bad News Really Hurts
190
to publish their comments without revealing their identities. Hence, how worried should
marketers be about the increasing amount of negative messages about their brands? Our
results are two-fold: when allegations are from non-credible sources and consumers find out
about this, marketers do not need to worry too much, even when consumers learn of the
invalidity of the message after they have already processed the message. On the contrary, our
results suggest that such an attack on the brand may even strengthen consumers’ attitudes. On
the other side, our results suggest that mentioning the credible source after the message can
strengthen the persuasive impact of a counter-attitudinal message, leading to weaker
attitudes. Something companies may want to engage in when planning an attack on
competitors’ brands.
Our results may further provide interesting insights for companies’ communication strategies
in response to false allegations and rumors. When the sources of such allegations are
sufficiently non-credible, simply re-stating them and clearly pointing out the non-credible
source may provide an effective refutation strategy. Some boundary conditions however have
to be pointed out: the conditions under which our experiments were run were such that
participants were presented with prior positive brand information (to insure a positive prior
attitude) and had the ability to process the information (i.e., they were not distracted or
capacity restrained, something that may not necessarily be the case in a non-laboratory
setting).
Some limitations of this research should also be acknowledged. Both experiments focused on
one brand from a single product category. Future research should aim to replicate these
findings with brands from other product categories. In addition future research should aim at
investigating the behavioral relevance of our results. While previous research has found that
more accessible attitudes have more behavioral relevance, future research should replicate
our results showing an effect on actual behavior. More importantly future research should
specifically look at the process of how structural inconsistencies are refuted or maintained by
the different kinds of elaboration.

5 When Bad News Really Hurts
191
5.7. References
ACNielsen (2005). Search is brand. Retrieved September 28, 2008, from
http://www.marketsentinel.com.
Baker, S. M., & Petty, R. E. (1994). Majority and minority influence: source-position
imbalance as a determinant of message scrutiny. Journal of Personality and Social
Psychology, 67, 5- 19.
Alba, J. W., Hutchinson, J. W., & Lynch, J. G. Jr. (1991). Memory and decision making. In
T. S. Robertson & H. H. Kassarjian (Eds.), Handbook of Consumer Behavior (pp. 1-
49). Englewood Cliffs, NJ: Prentice-Hall.
Bargh, J.A., Chaiken, S., Govender, R., & Pratto, F. (1992). The generality of the automatic
attitude activation affect. Journal of Personality and Social Psychology, 62, 893-912.
Bassili, J. N. (1993). Response latency versus certainty as indices of the strength of voting
intentions in a CATI survey. Public Opinion Quarterly, 57, 54-61.
Bassili, J. N. (1998). Simultaneous accessibility: a prerequisite to heated intrapsychic
conflict. Paper presented at the annual meeting of the International Society of Political
Psychology, Montreal.
Bassili, J.N., & Fletcher, J. (1991). Response time measurement in service research. Public
Opinion Quarterly , 55, 331-346.
Bless, H., Strack, F., & Schwarz, N. (1993). The informative functions of research
procedures: bias and the logic of conversation. European Journal of Social
Psychology, 23(2), 149-165.
Brock, T. C. (1967). Communication discrepancy and intent to persuade as determinants of
counterargument production. Journal of Experimental Social Psychology, 3, 296-309.
5 When Bad News Really Hurts
192
Cacioppo, J. T., & Petty, R. E. (1982). The need for cognition. Journal of Personality and
Social Psychology, 42, 116–131.
Cacioppo, J. T., Petty, R. E., Kao, C. F., & Rodriquez, R. (1986). Central and peripheral
routes to persuasion: An individual difference perspective. Journal of Personality and
Social Psychology, 51, 1032–1043.
Chaiken, S. (1980). Heuristic versus systematic information processing and the use of source
versus message cues in persuasion. Journal of Personality and Social Psychology,
39(5), 752-766.
Chaiken, S., Liberman, A., & Eagly, A. H. (1989). Heuristic and systematic information
processing within and beyond the persuasion context. In J. S. Uleman & J. A. Bargh
(Eds.), Unintended thought (pp. 212–252). New York: Guilford Press.
Daily Telegraph (2/20/07). Michael Dell is planning to change his firm’s course completely
to recover lost ground.
Eagly, A. H., & Chaiken, S. (1993). The psychology of attitudes. Fort Worth, TX: Harcourt
Brace Jovanovich.
Elms, A. C. (1966). Influence of fantasy ability on attitude change through role-playing.
Journal of Personality and Social Psychology, 4, 36–43.
Fazio, R. H. (1990). A practical guide to the use of response latency in social psychological
research. In C. Hendrick, & M. S. Clark (Eds.), Review of Personality and Social
Psychology: Vol. 11. Research Methods in Personality and Social Psychology (pp.
74-97). Newbury Park, CA: Sage Publications.
Fazio, R. H. (1993). Variablity in the likelihood of automatic attitude activation: Data re-
analysis and commentary on Bargh, Chaike, Govender, and Pratto (1992). Journal of
Personality and Social Psychology, 64, 753-758.

5 When Bad News Really Hurts
193
Fazio, R. H. (1995). Attitudes as object-evaluation associations: determinants, consequences,
and correlates of attitude accessibility. In R. E. Petty & J. A. Krosnick (Eds.), Attitude
strength: Antecedents and consequences (pp. 247-282). Mahwah, NJ: Erlbaum.
Fazio, R. H., Chen, J., McDonel, E. C., & Sherman, S. J. (1982). Attitude accessibility,
attitude-behavior consistency, and the strength of the object-evaluation association.
Journal of Experimental Social Psychology, 18, 339-357.
Fazio, R. H., Powell, M. C., & Williams, C. J. (1989). The role of attitude accessibility in the
attitude-to-behavior process. Journal of Consumer Research, 16, 280-288.
Fiske, S. T., & Neuberg, S. L. (1990). A continuum of impression formation, from category-
based to individuating processes: Influences of information and motivation on
attention and interpretation. In M. P. Zanna (Ed.), Advances in experimental social
psychology (Vol. 23, pp. 1-74 ). San Diego: Academic Press.
Grice, H. P. (1975). Logic and conversation. In P. Cole & J. L. Morgan (Eds.), Syntax and
Semantics (p. 41-58). New York: Academic Press.
Hampton, J. A. (1987). Inheritance of attributes in natural concept conjunctions. Memory and
cognition, 15(1), 55-71.
Hastie, R. (1980). Memory for information which confirms or contradicts a general
impression. In R. Hastie et al. (Eds.), Person memory: The cognitive basis of social
perceptions, (pp. 155—157). Hillsdale, NJ: Erlbaum.
Hastie, R. (1984). Causes and effects of causal attribution. Journal of Personality and Social
Psychology, 37, 25- 38.
Haugtvedt, C. P., & Petty, R. E. (1992). Personality and persuasion: Need for cognition
moderates the persistence and resistance of attitude changes. Journal of Personality
and Social Psychology, 63, 308–319.
5 When Bad News Really Hurts
194
Haugtvedt, C. P., & Wegener, D. T. (1994). Message order effects in persuasion: An attitude
strength perspective. Journal of Consumer Research, 21, 205–218.
Houston, D. A., & Fazio, R. H. (1989). Biased processing as a function of attitude
accessibility: making objective judgments subjectively. Social Cognition, 7(1), 51-66.
Jonas, K., Diehl, M., & Brömer, P. (1997). Effects of attitude ambivalence on information
processing and attitude-intention consistency. Journal of Experimental Social
Psychology, 33(March), 190–210.
Jost, J., Kruglanski, A. W., & Nelson, T. O. (1998). Social metacognition: An expansionist
review. Personality and Social Psychology Review, 2(2), 137-55.
Kallgren, C. A., & Wood, W. (1986). Access to attitude relevant information in memory as a
determinant of attitude-behavior consistency. Journal of Experimental Social
Psychology, 22, 328–338.
Kelman, H. C., & Hovland, C. I. (1953). Reinstatement of the communicator in delayed
measurement of opinion change. Journal of Abnormal and Social Psychology, 48,
327–335.
Killeya, L. A., & Johnson, B. T. (1998). Experimental induction of biased systematic
processing: The directed-thought technique. Personality and Social Psychology
Bulletin, 24, 17–33.
Krosnick, J. A., & Petty, R. E. (1995). Attitude strength: An overview. In R. E. Petty & J. A.
Krosnick (Eds.), Attitude strength: Antecedents and consequences (pp. 1-24).
Mahwah, NJ: Erlbaum.
Lavine, H., Thomsen, C. J., Zanna, M. P., & Borgida, E. (1998). On the primacy of affect in
the determination of attitudes and behavior: The moderating role of affective-
cognitive ambivalence. Journal of Experimental Social Psychology, 34(July), 398–
421.
5 When Bad News Really Hurts
195
Leippe, M. R., & Elkin, R. A. (1987). When motives clash: Issue involvement and response
involvement as determinants of persuasion. Journal of Personality and Social
Psychology, 52, 269–278.
Maheswaran, D., & Chaiken, S. (1991). Promoting systematic processing in low-involvement
settings: effect of incongruent information on processing and judgment. Journal of
Personality and Social Psychology, 61(July), 13–25.
McGuire, W. J. (1981). The probabilogical model of cognitive structure and attitude change.
In R. E. Petty, T. M. Ostrom, & T. C. Brock (Eds.), Cognitive Responses in
Persuasion (pp. 291–307). Hillsdale, NJ: Erlbaum.
Miller, E. G., & Kahn, B. E. (2005). Shades of meaning: The effect of color and flavor names
on consumer choice. Journal of Consumer Research, 32, 86-92.
Miniard, P. W., Sirdeshmukh, D., & Innis, D. E. (1992). Peripheral persuasion and brand
choice. Journal of Consumer Research, 19(2), 226–39.
Norman, R. (1975). Affective-cognitive consistency, attitudes, conformity and behavior.
Journal of Personality and Social Psychology, 32(July), 83–91.
Olson, J. M., Roese, N. J., & Zanna, M. P. (1996). Expectancies. In E. T. Higgins & A. W.
Kruglanski (Eds.), Social psychology: Handbook of basic principles (pp. 211-238).
New York: Guilford Press.
Petty, R. E. (2006). A metacognitive model of attitudes. Journal of Consumer Research,
33(1), 22-24.
Petty, R. E., Briñol, P., Tormala, Z. L., & Wegener, D. T. (2007). The role of meta-cognition
in social judgment. In A. W. Kruglanski & E. T. Higgins (Eds.), Social psychology:
Handbook of basic principles (2nd ed., pp. 254-284). New York: Guilford Press.
Petty, R. E., & Cacioppo, J. T. (1981). Attitudes and persuasion: Classic and contemporary
approaches. Dubuque, IA: Brown.

5 When Bad News Really Hurts
196
Petty, R. E., & Cacioppo, J. T. (1986). Communication and persuasion: Central and
peripheral routes to attitude change. New York: Springer.
Petty, R. E., Haugtvedt, C. P., & Smith, S. M. (1995). Elaboration as a determinant of attitude
strength: Creating attitudes that are persistent, resistant, and predictive of behavior. In
R. E. Petty & J. A. Krosnick (Eds.), Attitude strength: Antecedents and consequences
(pp. 93–130). Mahwah, NJ: Erlbaum.
Petty, R. E., Ostrom, T. M., & Brock, T. C. (1981). Historical foundations of the cognitive
response approach to attitudes and persuasion. In R. Petty, T. Ostrom, & T. Brock
(Eds.), Cognitive responses in persuasion (pp. 5-29). Hillsdale, NJ: Erlbaum.
Petty, R. E., Priester, J. R., & Wegener, D. T. (1994). Cognitive processes in attitude change.
In R. Wyer & T. Srull (Eds.), Handbook of social cognition (2nd edition) (Vol. 2, pp.
69-142). Hillsdale, NJ: Erlbaum.
Priester, J. M., & Petty, R. E. (1995). Source attributions and persuasion: Perceived honesty
as a determinant of message scrutiny. Personality and Social Psychology Bulletin, 21,
637-654.
Priester, J. R., & Petty, R. E. (2003). The influence of spokesperson trustworthiness on
message elaboration, attitude strength, and advertising effectiveness. Journal of
Consumer Psychology, 13, 408-421.
Pyszczynski, T. A., & Greenberg, J. (1981 ). Role of disconfirmed expectancies in the
instigation of attributional processing. Journal of Personality and Social Psychology,
40, 31-38.
Rosch, E. (1974). Linguistic relativity. In A. Silverstein (Ed.), Human communication:
theoretical explorations. Hillsdale, NJ: Erlbaum.
Rosenberg, M. J. (1968). Hedonism, inauthenticity, and other goads toward expansion of a
consistency theory. In R. P. Abelson et al. (Eds.), Theories of Cognitive Consistency:
A Sourcebook (pp. 73-111). Chicago: Rand McNally.
5 When Bad News Really Hurts
197
Sanbonmatsu, D.M., Osborne, R.E., & Fazio, R.H. (1986). The measurement of automatic
attitude activation. Paper presented at the meeting of the Midwestern Psychological
Association, Chicago.
Schwarz, N. (1994). Judgments in a social context: Biases, shortcomings, and the logic of
conversation. In M. Zanna (Ed.), Advances in experimental social psychology
(Vol.26, pp.123-162). San Diego, CA: Academic Press.
Schwarz, N. (1996). Cognition and communication: Judgmental biases, research methods,
and the logic of conversation. Mahwah, NJ: Lawrence Erlbaum.
Sengupta, J., & Johar, G.V. (2002). Effects of inconsistent attribute information on the
predictive value of product attributes: Toward a resolution of opposing perspectives.
Journal of Consumer Research, 29(June), 39-56.
Smith, E. R., & Lerner, M. (1986). Development of automatism of social judgments. Journal
of Personality and Social Psychology, 50(2), 246-259.
Smith, S. M., & Petty, R. E. (1995). Personality moderators of mood congruency effects on
cognition: The role of self-esteem and negative mood regulation. Journal of
Personality and Social Psychology, 68, 1092-1107.
Srull, T. K., & Wyer, R. S. Jr. (1989). Person memory and judgment. Psychological Review,
96(January), 58–83.
Stangor, C., & McMillan, D. (1992). Memory for expectancy-congruent and expectancy-
incongruent social information: A meta-analytic review of the social psychological
and social developmental literatures. Psychological Bulletin, 111, 42-61.
Tormala, Z. L., & Petty, R. E (2002). What doesn’t kill me makes me stronger: The effects of
resisting persuasion on attitude certainty. Journal of Personality and Social
Psychology, 83(6), 1298-1313.
5 When Bad News Really Hurts
198
Tormala, Z. L., & Petty, R. E (2004). Resistance to persuasion and attitude certainty: The
moderating role of elaboration. Personality and Social Psychology Bulletin, 30, 1446-
1457.
USA Today.com (7/12/07). Whole foods’ CEO was busy guy online.
Verplanken, B. (1991). Persuasive communication of risk information: A test of cue versus
message processing effects in a field experiment. Journal of Personality and Social
Psychology,17, 188–193.
Wegener, D. T. & Petty, R. E. (1995). Flexible correction processes in social judgment: The
role of naïve theories in corrections for perceived bias. Journal of Personality and
Social Psychology, 68(1), 36-51.
Wong, P. T. P., & Weiner, B. (1981). When people ask “why” questions, and the heuristics of
attributional search. Journal of Personality and Social Psychology, 40, 650-663.

6 Brand Recovery
199
6. Article 5: Brand Recovery – Communication in the Face of Crisis
Together with Gita V. Johar and Sabine Einwiller2
Published in Columbia Case Works, ID 070504, Columbia Business School, New York
(2007).
6.1. Abstract
This research note uses scientific research on persuasion to develop recommendations on
what to say (and what not to say) when your brand is in crisis, that is, in those situations
where a brand faces significant criticism in the marketplace and media. We develop
communication strategies that help the brand recover from a crisis and restore consumer trust
and liking for the brand. Six examples illustrate the range of responses to crisis situations and
serve as cases to apply the proposed communication framework.
6.2. Introduction
“We’re Mad as Hell…”3
“Travelers Suffer ‘JetBlues’ on Valentine's Day”4
“Can one very bad week for JetBlue Airways wipe out years of industry-leading customer
satisfaction ratings?”5
2 Ronnie Sacco and Shamik Chakraborty provided research assistance fort this article 3 Newsweek Web Exclusive (2/16/07), We’re Mad as Hell. 4 Fox News (2/15/07), More Flights Canceled as Midwest, Northeast Recover From Valentine’s Day Storm. http://www.foxnews.com/story/0,2933,252122,00.html 5 New York Times (2/17/06), Long Delays Hurt Image of JetBlue.
6 Brand Recovery
200
What should JetBlue say when faced with these adverse comments from consumers and the
media? Should it apologize? Should it blame the bad weather for flight delays and absolve
itself of blame? And should it focus on different messages to different audiences? In this
research note, we draw on scientific research on persuasion to develop recommendations on
what to say when your brand is in crisis. We develop communication strategies that help the
brand recover from a crisis and restore consumer trust and liking for the brand. We define
crisis situations as those where a brand faces significant criticism in the marketplace and
media.
6.2.1. Post-Crisis Communication
When JetBlue was criticized for operational failure, it seemed that customers previously
ecstatic with JetBlue’s fares and service would lose faith in the brand. The brand failure and
accompanying negative publicity would make customers like the brand less, feel negatively
toward it and if these feelings were strong enough, would make them abandon the brand and
switch to other (possibly low-fare) airlines. Potential customers who have never flown
JetBlue may make a mental note to never book a flight on that airline. JetBlue management
had a choice—to be resigned to this fate or to use the powerful tool of communication to
recover from the crisis. The goal of the communication strategy should be to restore the
brand’s image to pre-crisis state. And here’s an amazing thing: recovering from a crisis in the
“right” way may sometimes even improve brand image!6 By the same token, using the
“wrong” communication strategy in a given situation (one that could be appropriate in a
different situation but does not fit the current situation) could damage the brand beyond
repair.
The goal of this note is to recommend the communication strategy that should be used in
different crisis situations to restore brand image with customers (other stakeholders such as
investors need to be considered as well; however, this note focuses on best practices in
response to customers). We illustrate our recommendations using cases of successful as well
as unsuccessful handling of the recovery from brand crises. At the end of this note, you
should know what to say as well as what not to say in different crisis situations.
6 Aaker, J., Fournier, S. & Brasel, S. A. (2004). When Good Brands Do Bad. Journal of Consumer Research, 31 (1), 1-16.

6 Brand Recovery
201
6.2.2. Navigating the Crisis
When the crisis hits, or better yet when you anticipate a crisis, ask yourself how severe the
crisis is from the viewpoint of the current and potential customer. Will customers classify the
event precipitating the crisis as serious? What will be the media slant on the crisis, and how
will this influence perceived crisis severity by the customer? Crisis severity lies in the eyes of
the beholder, in this case the customer. From the brand management’s standpoint, the
incident that sets off a crisis could seem minor. Yet, it could be magnified by circumstances
or by buzz. For example, in the case of Proctor & Gamble (P&G), distributors of a
competitor’s brand, Amway, started spreading a rumor that over the years developed into a
“public relations nightmare”: the story claimed that P&G donated large amounts of its
revenues to the church of Satan.7 As obscure as this rumor may sound, it has troubled P&G’s
management for decades and has led to several lawsuits. P&G says it has sustained major
losses, including hundreds of millions of dollars in sales and other damages.8
Based on the crisis severity analysis, put yourself in your customers’ shoes and try to predict
what they will think about the crisis. Will the crisis-precipitating event be believed by
customers (note that this is as important as whether the event is objectively true or a rumor)?
Who will customers blame? Will they consider the transgression to be intentional, and will
they believe that this type of thing is likely to happen again? Most important, what can you
say to customers to reduce their perception of your culpability or reduce their perception of
how indicative the crisis is of your brand’s true colors?
6.2.3. Customers’ Thoughts and Attribution
Events that precipitate crises are not the norm and are unexpected by consumers for the most
part. If there is no pattern of crisis-prone behavior, then consumers are likely to start thinking
about the event and why it happened.9 When the JetBlue disaster hit, consumers reading or
hearing about it likely asked themselves such questions as: Is this true? Who is responsible?
Was it intentional? Will the brand do this again? What does this event say about the
7 New York Times (3/27/01), Proctor & Gamble Suit Over Satan Rumor Resurrected. 8Ibid. 9 Johar, G. V. (1996). Intended and Unintended Effects of Corrective Advertising on Beliefs and Evaluations: An Exploratory Analysis. Journal of Consumer Psychology, 5 (3), 209–30.
6 Brand Recovery
202
brand/firm? Research in consumer psychology helps us understand what the answers to these
questions are likely to be under different types of crisis situations.
6.2.4. Is this True?
Did JetBlue customers really get no warning that the flights would be canceled? Did they
really sit in planes on the tarmac for 10 hours or more? Is it true that they did not get
compensated? Customers’ beliefs regarding the validity of the event provoking the crisis are
likely to be based on whether someone they know experienced it or where they saw or heard
about it (i.e., source credibility10), how often they are exposed to it11 and how plausible it is
that the brand would behave that way. Stories covered by CNN and the New York Times are
likely to be believed more than those covered by blogs. At the same time, hearing about the
event repeatedly, even if the repeated messages are from sources of dubious repute, will make
consumers believe that the event was real. Consumers who are ambivalent about the brand
are likely to believe even somewhat implausible rumors about the brand because, in an
attempt to solidify their brand attitudes, they will not check the veracity of the source.12
Finally, consumers are likely to think that negative events are true if there is a history of
transgressions by the brand.
6.2.5. Who is Responsible?
Consumers are likely to blame the brand for the transgression if they do not feel favorably
about the brand (e.g., the brand has an unfavorable reputation13) or are not committed to the
brand,14 do not trust the brand,15 if the crisis is severe16 or if there is no easy-to-expect
alternative to blame. For example, with flight delays, the weather is a convenient scapegoat. 10 Tybout, A. M. (1978). Relative Effectiveness of Three Behavioral Influence Strategies as Supplements to Persuasion in a Marketing Context. Journal of Marketing Research, 15 (May), 229-42. 11 Roggeveen, A. & Johar, G. V. (2002). Perceived Source Variability Versus Recognition: Testing Competing Explanations for the Truth Effect. Journal of Consumer Psychology, 12 (2), 81-91. 12 Zemborain, M. & Johar, G. V. (2007). Attitudinal Ambivalence and Openness to Persuasion: A Framework for Interpersonal Influence. Journal of Consumer Research, 33 (4), 506–14. 13 Laczniak, R. N., DeCarlo, T. E. & Ramaswami, S. N. (2001). Consumers’ Response to Negative Word-of-Mouth Communication: An Attribution Theoretic Perspective. Journal of Consumer Psychology, (11) 1, 57-73. 14 Johar, G. V. (1996). Intended and Unintended Effects of Corrective Advertising on Beliefs and Evaluations: An Exploratory Analysis. Journal of Consumer Psychology, 5 (3), 209–30. 15 Gorn, G. J., Jang, Y. & Johar, G. V. (2007). Babyfaces, Trait Inferences, and Company Evaluations in a PR Crisis. Columbia Business School Working Paper. 16 Robbennolt, J. K. (2000). Outcome Severity and Judgments of Responsibility: A Meta-analytic Review. Journal of Applied Psychology, 30 (12), 2575-609.
6 Brand Recovery
203
Brands that have a history of flight delays, however, are less likely to get away with this
excuse and are likely to be held responsible for the delay. Hence, one way to reduce being
blamed in case of a crisis is to build up a good reputation beforehand. For example, a
company that has a reputation of being very environmentally conscious will be held less
responsible in case of a crisis affecting the environment than one that is known to care little.17
In really severe and valid crises, there may be no one else who can be blamed.18 Consider, for
example, the case of GlaxoSmithKline’s diabetes drug Avandia. In a scientific study
including more than 28 thousand patients, it was found that usage of Avandia increases the
risk of heart attack by 43%.19 In response, the Food and Drug Administration issued a public
safety alert and advised an estimated two million patients worldwide to consult their doctors.
GlaxoSmithKline issued news releases that it “strongly disagrees” with the finding of the
study, however, its shares fell by nearly 8% in response.20
6.2.6. Was it Intentional?
Did JetBlue abandon its customers on purpose? Or was it unaware of what was happening?
Could it have averted the 10-hour wait on the tarmac? Was it misinformed by the airport
control tower? The answers to these questions will determine how hard the brand needs to
work to regain consumer trust. Part of the answers comes from media reports on the event
and the rest from consumers’ inferences based on their feelings toward the brand, past history
of the brand and plausibility of innocence on the part of the brand. Consider the extreme case
of Ford’s Pinto in the 1960s. In an attempt to build a car that could sell for under $2,000,
Ford’s management knowingly sacrificed customers’ safety for the sake of finance: after the
production line was already set, engineers found that the Pinto had a potentially lethal flaw—
in rear-end collisions the fuel system ruptured easily and could cause the car to catch fire.
Management calculated the costs of fixing the flaw versus managing lawsuits from deaths
and injuries and decided to go ahead with the launch of the faulty car. However, the costs of
17 Klein, J. & Dawar, N. (2004). Corporate Social Responsibility and Consumers’ Attributions and Brand Evaluations in a Product-Harm Crisis. International Journal of Research in Marketing, 21, 203-217. 18 Gorn, G. J., Jang, Y. & Johar, G. V. (2007). Babyfaces, Trait Inferences, and Company Evaluations in a PR Crisis. Columbia Business School Working Paper. 19 Reuters (6/4/07), Interview—Avandia-type crisis could hit other drugs—Hassan. 20 New York Times (5/22/07), Heart Attack Risk Seen in Drug for Diabetes.

6 Brand Recovery
204
lawsuits turned out to be much higher than the engineering solutions would have been, not to
mention the damage in reputation and customers’ trust.21
6.2.7. Will the Brand Do This Again?
Consumers could infer that JetBlue makes razor-thin margins, so this type of incident is
inevitable when circumstances are not ideal (e.g., there is bad weather). Or they could forgive
the brand and consider this event a one-time transgression. Consumers’ predispositions
toward the brand are likely to determine which of these inferences is made. Those who have
had prior positive experiences and like the brand are more likely to forgive it, as long as there
is a way to reason why it won’t happen again. If consumers believe there is a recurring
pattern of transgression, they are likely to leave the brand altogether. This is likely even if the
crisis is not very severe, as in the case of New-York based ice cream chain CremaLita. The
continuous misstatement of its product’s fat content led to severe short-term drops in sales
and the closing of more than half of its Manhattan stores during the year of the crisis.
Ironically, severe crises may be perceived as relatively rare, and consumers may be less likely
to believe that a negative event of this magnitude would happen again.
6.2.8. What Does this Event Say about the Brand?
Is JetBlue any different from other airlines? After deregulation, aren’t they all equally bad? If
other airlines are reported to have had problems similar to JetBlue’s (even if on a slightly less
severe scale), consumers may not make sweeping generalizations about the brand. However,
if it looks like other airlines weathered the storm, consumers may draw inferences about
JetBlue that even go beyond its operational abilities. For example, they may also disparage
JetBlue’s service and schedules.22 This type of “halo” effect—where an isolated negative
event with direct implications for one feature of the brand (operational efficiencies in this
case) also spills over to affect beliefs about other features—is especially likely with less loyal
and less-committed customers.23
21 Coombs, T. (2006). Code Red in the Boardroom. Crisis Management as Organizational DNA. Praeger: Westport. 22 Johar, G. V., Sengupta, J. & Aaker, J. (2005). Two Roads to Updating Brand Personality Inferences: Trait Versus Evaluative Inferencing. Journal of Marketing Research, 42 (November), 458-69. 23 Ahluwalia, R. (2000). Examination of Psychological Processes Underlying Resistance to Persuasion. Journal of Consumer Research, 27 (2), 217-32; Ahluwalia, R., Burnkrant, R. E. & Unnava, H. R. (2000). Consumer
6 Brand Recovery
205
6.3. Communication Arsenal when the Transgression is Real Your communication strategy should provide consumers with an answer to the questions
posed above. To be sure, the answer you provide depends on whether the information
provoking the crisis (the transgression) is objectively true or not. We provide normative
communication strategies that answer consumers’ questions in two situations—when the
transgression is objectively real versus not (e.g., a rumor). We start with the first situation.
6.3.1. The ‘Come Clean’ Response
If the brand is clearly at fault, and the crisis is severe, come clean at once. Apologize and
accept responsibility, do not try to minimize the situation but communicate all the bad news
at once. If it was unintentional (e.g., the Exxon Valdez oil spill), explain this by
communicating regulations and safety procedures that should have prevented the oil spill.
Help consumers make sense of the event. Discuss how you will prevent these types of events
from occurring again. If this information is made compelling, customers may have even
stronger attitudes toward the brand than they did before the crisis hit.24
In severe cases where the brand is at fault, corrective action may be necessary in addition to
an admission of guilt and an apology. Take JetBlue, for example. The company apologized in
mass media publications as well as directly to its customers. To show that it means what it
says, since the crisis JetBlue has canceled flights rather than take chances with the weather.
Consumers may be influenced by what you say. But even more, they are influenced by what
you do and whether you live up to your words. Corrective action can forestall the inference
that this type of event will be associated with the brand in the future and may even reduce
perceptions of responsibility and intentionality.
Another example of a severe crisis that called for an apology and corrective action is that of
the Tylenol tampering incident. Johnson and Johnson (J&J) simultaneously launched a Response to Negative Publicity: The Moderating Role of Commitment. Journal of Marketing Research, 37 (May), 203–14; Johar, G. V., Jaideep, S. & Aaker, J. (2005). Two Roads to Updating Brand Personality Inferences: Trait Versus Evaluative Inferencing. Journal of Marketing Research, 42 (November), 458-69. 24 Sengupta, J. & Johar, G. V. (2002). Effects of Inconsistent Attribute Information on the Predictive Value of Product Attributes: Toward a Resolution of Opposing Perspectives. Journal of Consumer Research, 29 (June), 39-56.

6 Brand Recovery
206
communication campaign issuing warnings to customers and withdrew the approximately 30
million bottles on store shelves. This quick information campaign coupled with corrective
action ensured that J&J did not suffer much fallout from the disaster. The media praised the
firm’s handling of the crisis, and Tylenol recovered its market share of 35% in less than a
year (from an 8% low at the time of the crisis). The Tylenol strategy worked with current
customers by illustrating the firm’s responsiveness and providing them with reasons to stay
with the company, and it worked with potential customers by assuring them of absence of
risk.25The apology and admission of guilt strategy should be accompanied by a “Polish the
halo” strategy to overcome the potential backlash to the brand.26
6.3.2. The ‘Polish the Halo’ Response
When an apology becomes necessary, the brand may also need to bolster its image so that
less-committed customers do not become even more negative toward the brand27 or transfer
their negative beliefs about certain features to other features of the brand (a so-called
“spillover” effect).28 Brands need to be vigilant and guard against spillover from features that
are central to the crisis to other features of the brand. One way to prevent spillover is to
buffer the brand by polishing the brand image. Less-committed customers interpret
information through a broader lens and use their liking for the brand to determine what the
information means in terms of brand features.29 Brand advertising and PR activities could
bolster brand image immediately in the aftermath of a crisis. An image-building campaign
emphasizing the positive aspects of the brand should accompany or follow the apology
without seeming to excuse the transgression in any way.
Consider the example of Pepsi India, who faced accusations in 2003 concerning the low
quality and possibly toxic nature of the water used for its products. A denial and attack the
accuser strategy proved to be ineffective and similar accusations were made by the media
25 Dawar, N. & Pillutla, M. (2000). The Impact of Product–harm Crises on Brand Equity: The Moderating Role of Consumer Expectations. Journal of Marketing Research, 37, 215–26. 26 Johar, G. V. (1995). Consumer Involvement and Deception from Implied Advertising Claims. Journal of Marketing Research, Volume 32, no. 3: 267–79. 27 Johar, G. V. (1996). Intended and Unintended Effects of Corrective Advertising on Beliefs and Evaluations: An Exploratory Analysis. Journal of Consumer Psychology, 5 (3), 209–30. 28 Einwiller, S. & Johar, G. V. (2007). Preventing Damage from Accusations—The Case of WalMart. European Marketing Conference, Reykjavik. 29 Johar, G. V., Sengupta, J. & Aaker, J. (2005). Two Roads to Updating Brand Personality Inferences: Trait Versus Evaluative Inferencing. Journal of Marketing Research, 42 (November), 458-69.

6 Brand Recovery
207
three years later. With great media attention and personal efforts by the company’s CEO,
Pepsi used a “Polish the halo” strategy in 2006, publicly announcing its efforts to help India
monitor and improve its quality of water and food supply. This strategy eventually led the
media to lavishly praise the company and its CEO.30 The “Polish the halo” strategy has the
advantage of working even without consumers’ extensively processing the message. This
makes it a viable choice in less severe cases in which customers invest less attention to the
specifics of the crisis. This strategy is of special importance for uncommitted customers who
are far less likely than committed customers to refute the message themselves.
6.3.3. The ‘Not Just Me’ Response
This response can help consumers understand the bigger picture. For example, it may be that
the transgression is not something unique to your brand, but could happen to any other brand
as well. If consumers understand this, then they are less likely to generalize from the crisis
instance to other aspects of the brand, including its future trajectory. Give consumers
information to consider when they ask themselves whether the crisis-provoking event was
unique to your brand. For example, could market conditions have provoked this crisis for any
competing brand as well? Provide cues that help consumers construct a narrative (a story with
a sequence of events) that absolves your brand of the sole responsibility for the event. This
message can help consumers put the transgression in perspective and lead the way to brand
forgiveness. The “Not just me” response should be especially effective with committed
customers. These customers are prone to counterargue themselves and just need to be
provided with ammunition in the form of information cues.
6.3.4. The ‘Yes, But…’ Response
This response involves explaining the reasons for the crisis and/or downplaying the damage
done. This justification response can only be used when the accusation is valid and the crisis
is not severe. Justification is especially needed for customers who are less committed to the
brand (see Exhibit 1 for a definition of commitment), because they will not generate these
excuses for themselves. They are likely to believe that the transgression was intentional and
the brand is to blame. Further, they may believe that this is the “true face” of the brand and
30 BusinessWeek (6/11/07), Pepsi: Repairing a Poisoned Reputation in India.
6 Brand Recovery
208
events such as these are likely to occur again. Providing reasons why the transgression
occurred could make these customers’ attributions of blame less severe and help keep them in
the brand franchise. Because uncommitted customers may not process this information in
detail, combine this strategy with a “Polish the halo” strategy.
6.4. Communication Arsenal when the Transgression is Not Real
6.4.1. The ‘No, Not I’ Response
If the accusation against the brand is not true, then denial could be a useful strategy if target
consumers are committed to the brand and do not perceive the crisis to be severe. Denial
should only be used if the accusations have gained traction, are clearly linked to your brand
and are widely reported in the media. Otherwise, denial could be seen as an admission of
guilt.31 In general denial has to be plausible, and the claim that the reported transgression did
not in reality occur or that the brand has nothing to do with it has to be viewed as plausible.
Trustworthiness of the brand’s denial message is key. Some ways to make the brand’s denial
ring true include providing a narrative (a story line) that absolves the brand completely and
using tactics that increase message credibility. However, the effectiveness of such a strategy
will be most effective for committed customers. Customers who are less committed to the
brand are unlikely to devote much attention to such a narrative and hence approaches like the
“Polish the halo” may be more effective with them. In some cases, companies have to go to
great lengths to develop the “No, not I” response. In 1996, rumors spread that fashion
designer Tommy Hilfiger had appeared on the Oprah Winfrey Show stating he wished people
of color would not wear his clothes. As Internet blogs called for boycotts, the company was
forced to react. The firm addressed these rumors on discussion boards and created a section
on its own website denying the claim. Hilfiger hired outside experts to try to trace the source
of this erroneous rumor. Oprah Winfrey herself denied the allegations on her show in 1999
and posted a statement on her website that Hilfiger had never appeared on her show.
However, the rumor proved so persistent that in May 2007 Hilfiger did appear on Oprah
Winfrey’s show in another attempt to make clear that the allegations were false.
31 Roehm, M. L. & Tybout, A. M. (2006). When Will a Brand Scandal Spill Over, and How Should Competitors Respond? Journal of Marketing Research, 43 (3), 366-73.
6 Brand Recovery
209
Consumers determine trustworthiness of the denial of wrongdoing based on cues such as
company, brand and spokesperson history. Consumers also make inferences about
trustworthiness based on surface cues such as the appearance of the spokesperson. For
example, a large body of research suggests that characteristics associated with a babyface
(round eyes, small chin) increase perceptions of honesty and message credibility suggesting
that brands can send out a babyface in times of crisis.32 Caution is important though, because
even a babyface will not be believed if the crisis is severe and the denial is considered
implausible.
6.4.2. The ‘Rebuttal’ Response
When the crisis is severe, a “No, not I” or a “Yes, but…”strategy could backfire, even if the
crisis was provoked by a rumor and is unjustified. When consumers believe that they
personally are at risk (e.g., from previously unannounced side effects of prescription drugs),
then brands need to come up with a point-by-point rebuttal of the accusation. Ignoring the
attack, even if it is not valid, could sink the brand. Witness the Swift Boat campaign against
John Kerry in the 2004 presidential election. A group called the “Swift Boat Veterans for
Truth” that was allegedly financed by people close to competitor George W. Bush accused
Kerry of lying about his action in the Vietnam War. The Kerry campaign did not immediately
respond, and many believe that this lack of response was the key event that lost the election
for Kerry.
The rebuttal response even works for crises that are not very severe, but are in danger of
being perceived as severe by less-committed customers as the crisis unfolds. Committed
consumers spontaneously question the validity of an attack and can generate their own
counterarguments. They are less likely to need help to counterargue when the crisis is not
severe.33 If the incident that caused the crisis is very severe, however, then those highly
committed to the brand or company have been shown to react just as negatively as those not
committed. The bottom line is that severe crises require fast response with complete
32 Gorn, G. J., Jang, Y. & Johar, G. V. (2007). Babyfaces, Trait Inferences, and Company Evaluations in a PR Crisis. Columbia Business School Working Paper. 33 Ahluwalia, R. (2000). Examination of Psychological Processes Underlying Resistance to Persuasion. Journal of Consumer Research, 27 (2), September, 217-32; Ahluwalia, R., Burnkrant, R. E. & Unnava, H. R. (2000). Consumer Response to Negative Publicity: The Moderating Role of Commitment. Journal of Marketing Research, 37 (May), 203–14.
6 Brand Recovery
210
information to help customers rebut the accusation if it is invalid.34 One tactic that could
work to help consumers integrate the counterarguments is to frame them in a way that is
similar to the framing of the attack.35 In this case, correction of false beliefs brought about by
the false accusation may be automatic and not require much effort. And effort is something
that consumers are unlikely to spend on a brand especially if they are not very committed to
it. Consumers who are not motivated and able to hold accurate brand beliefs may not
integrate the brand’s response to crisis.36 Framing the message to match the attack is a good
tactic for these consumers.
6.4.3. The ‘Inoculation’ Response37
This is the only strategy that requires anticipating a crisis and preparing consumers for it by
giving them counterarguments. This strategy is particularly effective if the crisis is severe and
likely to receive a lot of media coverage. If you believe that even committed consumers will
begin to question your brand when the news hits, then it is time to adopt an aggressive full-
frontal strategy. Anticipate the criticism and prepare consumers with counterarguments prior
to the attack. The inoculation message acts like a vaccine and prevents the “crisis virus” from
attacking the brand. Consumers are fortified by the message and ready to counterargue when
the crisis hits. Inoculation can be used with caution if the crisis-provoking event is true—in
this case, the role of the message is to make consumers believe that the crisis is not as severe
as it will be made out to be in the media. Counterarguments, whether used as rebuttal or as
inoculation, can point out that the attack is not valid, or not important, or not indicative of the
true nature of the brand.
34 Einwiller, S., Fedorikhin, A., Johnson, A., & Kamins, M. (2006). Enough Is Enough! When Identification No Longer Prevents Negative Corporate Associations. Journal of the Academy of Marketing Science, 34 (2), 185-94. 35 Johar, G. V. & Roggeveen, A. (forthcoming). Changing False Beliefs from Repeated Advertising: The Role of Claim-Refutation Alignment. Journal of Consumer Psychology. 36 Johar, G. V. & Simmons, C. The Use of Concurrent Disclosures to Correct Invalid Inferences. Journal of Consumer Research, 26 (4), 307-22. 37 Einwiller, S. & Johar, G.V. (2007). Preventing Damage From Accusations – The Case of WalMart. European Marketing Conference, Reykjavik.
6 Brand Recovery
211
6.4.4. The ‘Attack the Accuser’ Response38
This strategy should be used in small doses because it could backfire if it is viewed as being
unfair or defensive. However, it may be necessary to attack the accuser especially if the
accusation is severe. In less severe cases, attacking the accuser is unnecessary with highly
committed customers, but should be used with less-committed customers. The idea here is to
decrease the credibility of the claim by discrediting the accuser. If the unjustified attack
originated from a competitor and then took off, the brand could bring this to light and show
that vested interests are the origin of the attack.
6.5. Summary
As you can see, the goal of communication during a crisis is to diffuse the crisis by helping
consumers understand why it happened and why the brand should not be viewed more
negatively as a result of the crisis. Manage consumers’ attributions of blame as well as their
thoughts about the future of the brand by providing them with a clear and cohesive narrative
that answers their questions about the crisis in a compelling way. Figure 1 provides an
overview of the communication tools that are most useful in different circumstances. By
choosing wisely from the communication arsenal, you can avert backlash from consumers
and perhaps even strengthen your brand when a crisis hits.
38 Einwiller, S. & Johar, G.V. (2007). Preventing Damage From Accusations – The Case of WalMart. European Marketing Conference, Reykjavik.
6 Brand Recovery
212
6.6. Exhibit 1: The Role of Customer Commitment
High customer commitment is one of the best insurances against the possibly devastating
effects a crisis can have for an organization. Committed customers feel emotionally attached
to a certain brand.39 They wish to maintain their relationship with the brand or the company
and believe that that the relationship is worth working for.40 Usually commitment arises when
customers are highly involved with a certain product of the company.41 Building brand
commitment requires heavy investment of marketers’ resources42 but in the case of a
marketing crisis it certainly pays off: because of their attachment to the brand, committed
customers start questioning by themselves, whether reports about a crisis are true or not.43
Hence, with theses customers it may be enough to simply provide them with information
supporting that the accusation is not true. And even when an accusation is true, committed
customers tend to perceive the event as less important than uncommitted customers.44
Uncommitted customers instead will devote less attention to carefully examine whether the
information is true. Further they are more likely to think that the problem may also affect
other parts of the brand or the company.45 So for uncommitted customers it is necessary that
companies actually provide counterarguments, as they are unlikely to engage in counter-
arguing themselves.
39 Fournier, S. (1998). Consumers and Their Brands: Developing Relationship Theory in Consumer Research. Journal of ConsumerResearch, 24 (March), 343–73; Lastovicka, J.L. &.Gardner, D.M. (1978). Components of Involvement. In: Attitude Research Plays for High Stakes, eds. John L. Maloney and Bernard Silverman, Chicago: American Marketing Association, 53–73. 40 Morgan, R. & Hunt, D.S. (1994). The Commitment-Trust Theory of Relationship Marketing. Journal of Marketing, 58(3), 20-38. 41 Beatty, S.E., Kahle, L.R. & Homer, P. (1988). The Involvement-Commitment Model: Theory and Implications, Journal of Business Research, 16 (2), 149–67; Crosby, L. A. & Taylor, J.R. (1983). Psychological Commitment and Its Effects on Post-decision Evaluation and Preference Stability among Voters. Journal of Consumer Research, 9 (March), 413–31. 42 Ahluwalia, R. Unnava, H.R. & Burnkrant, R. (2001). The Moderating Role of Commitment on the Spillover Effect of Marketing Communications. Journal of Marketing Research, 38(4), 458-70. 43 Ahluwalia, R. (2000). Examination of Psychological Processes Underlying Resistance to Persuasion. Journal of Consumer Research, 27 (2), September, 217-32. 44 Ahluwalia, R. , Burnkrant, R. E. & Unnava, H. R. (2000). Consumer Response to Negative Publicity: The Moderating Role of Commitment. Journal of Marketing Research, 37 (May), 203–14. 45 Ahluwalia, R. Unnava, H.R. & Burnkrant, R. (2001). The Moderating Role of Commitment on the Spillover Effect of Marketing Communications. Journal of Marketing Research, 38(4), 458-70.

6 Brand Recovery
213
Yes
No
Reduce perceptions ofRecommended Communication
Responses
Are customers committed?
Yes
No
Are customers committed?
Is transgression
real?
Yes
No
Yes
No
Is crisis severe?
Yes
No
Is crisis severe?
Come Clean + Polish the Halo + Not Just Me + Inoculation
• Brand responsibility • Brand intentionality • Repeat occurrence
• Accusation as reflective of the brand
Yes, but… + Not Just Me
Yes, but… + Polish the Halo
• Brand responsibility • Brand intentionality • Repeat occurrence • Accusation as reflective of the brand
• Accusation truth • Brand responsibility • Accusation as reflective of the brand
• Accusation truth
Rebuttal + Attack the Accuser + Inoculation
No, Not I
• Accusation truth Attack the Accuser + Polish the Halo
Figure 6-1: Comprehensive Crisis Communication Framework
6.7. Brand Crises Examples
6.7.1. Example 1: Cremalita
Company
CremaLita, a family-owned low calorie ice cream chain, opened its first store in New York in
August 2001. Owner Jeffrey Britz stated in National Restaurant News that the chain targets
audiences in “busy metropolitan areas” and planned to “ramp up expansion through
franchising.”46 Within two years of its launch, the company included 10 Manhattan
46 National Restaurant News (8/4/03), CremaLita Grabs Scoop of Burgeoning Low-Fat Dessert Niche.

6 Brand Recovery
214
franchises and had made numerous deals with contract feeders and corporate cafeterias.47
When CremaLita was introduced to the Los Angeles market in late 2003, Variety announced,
“CremaLita ice cream has reached near-cult status in New York…and now Angelenos can
get their paws on the coveted cone, too.”48
Crisis: False Statement of Calories
On October 2, 2002, The New York Times featured CremaLita in its “Dining In, Dining Out”
column with headline reading: “Fewer Calories than Ice Cream, But More than You Think.”
After conducting lab tests that found substantially higher fat and calorie values than
Cremalita advertised, the Times accused CremaLita of deceptive advertising. In response to
the Times expose, the New York City Department of Consumer Affairs (DCA)
commissioned the U.S. Food and Drug Administration (FDA) to test samples of the frozen
dessert. On December 30, 2003 DCA announced the findings of these tests in a press release
widely quoted by New York area media: “New Yorkers think they’re getting a sweet deal,
but in reality they are being fed false claims and three times the calories…What you think is
60 calories is really closer to 300 calories.”49 The DCA hit CremaLita with 61 counts of
deceptive and misleading trade practices and the company faced $30,500 in fines.50 On May
4, 2004, ABC News included CremaLita in their story headlined, “Are Some Low-Cal Food
Claims Big Fat Lies?”51 On May 26, 2004, the DCA and CremaLita jointly announced they
had come to an agreement stating, “certain charges in the initial notice of violation were
based, in good faith, on erroneous FDA analyses of the product, and that CremaLita admits
no wrong doing.”52 The new findings suggested that “CremaLita is not low-calorie (by
Federal definition), but it’s not as fattening as the city Department of Consumer Affairs
charged.”53
Communication Strategy:
On the day the DCA announced its charges, chain owner Allison Britz maintained her stores
sold a “good-for-you product.” “I just think their tests are incorrect,” she told the New York
Sun. “We don’t think we’re wrong. I’ve tested this stuff…There is no reason for the labs to
47 Ibid. 48 Variety (11/3/03). 49 New York Sun (12/31/03), ‘Guilt Free’ Ice Cream Guilty?. 50 New York Sun (12/31/03), ‘Guilt Free’ Ice Cream Guilty? 51 http://www.abcnews.com (5/4/04), Are Some Lo-Cal Food Claims Big Fat Lies? 52 http://www.nyc.gov (5/26/04) New Yorkers Get the Real Skinny. 53 New York Daily News (5/27/04), CremaLita Lo-Cal Tiff Lands in the Middle.

6 Brand Recovery
215
give us bad tests.”54 Britz did admit to larger than advertised serving sizes, but she attributed
this to repeated customer demands. When asked to respond to accusations about deceptive
advertising by ABC News in early May 2004, Britz replied in an e-mail statement, “There
were serious errors in the FDA methodology leading to a substantial overstatement of
CremaLita’s calorie count, fat content and other nutritional information.”55 When CremaLita
reached a compromise with the city on May 26, Ms. Britz stated in her joint press release
with the DCA: “We are pleased to reach this agreement with the Department of Consumer
Affairs, and believe that the end result will be a win for all consumers…We also hope that
our new voluntary level of disclosure and independent testing will become the industry
standard…As an industry leader, our goal is to give our customers the highest quality fat-and
cholesterol-free ice cream, accompanied by the kind of information needed to make an
informed and satisfying choice.”56
Result:
According to Cremalita sales at stores dropped by 30% following DCA accusations,
contributing to the closings of 6 of the 10 Manhattan stores in 2004.57 Traces of the
Times/DCA allegations continue to haunt the brand. When CremaLita opened its first café in
Phoenix in early 2007, the first blogger to add a review on the City Guide wrote: “NY Times
did an expose on CremaLita revealing that the calorie content of their ‘small’ is 3x what they
advertised.”58 The DCA’s initial indictment of Cremalita kept many customers away from the
stores, according to Cremalita.59 Some customers - as revealed in personal blogs and local
media interviews - felt “betrayed” to hear how fattening a supposedly low-cal snack might
be.60 One consumer, Stephen Brandt, did attempt to bring a class action suit against the
company in 2004 claiming that “as a result of CremaLita’s alleged false advertising…he and
countless ‘other members of the class’ were put at risk of severe health problems,”61 but a
Manhattan judge dismissed the suit in May 2006.
54 New York Sun (12/31/03), “Guilt Free” Ice Cream Guilty? 55 http://www.abcnews.com (5/4/04), Are Some Low-Cal Food Claims Big Fat Lies? 56 http://www.nyc.gov (5/26/04), New Yorkers Get the Real Skinny. 57 New York Times (4/17/05), As Calories Add Up, the Costs Can, Too. 58 http://search.cityguide.aol.com/phoenix (1/19/07), CremaLita: Ratings and User Reviews. 59 New York Times (4/17/05), As Calories Add Up, the Cost Can, Too. 60 New York Sun (12/31/03), ‘Guilt Free’ Ice Cream Guity? 61 http://www.overlawyered.com (5/30/06).

6 Brand Recovery
216
6.7.2. Example 2: Dell
Company
In 2005 Dell was the world’s largest computer manufacturer (currently the number three in
the market) with an 18.2% market share62, generating $55,908 million in global revenues.
Dell was founded in 1984 and is based in Texas.63 Dell pioneered the direct-sales model for
computers by eliminating the middleman.64 According to the American Customer
Satisfaction index, Dell scored 79 in August 2004, comfortably above the industry average.65
Crisis: Customer Support Problems – “Dell Hell”
On June 21, 2005, Jeff Jarvis, creator of BuzzMachine, a popular weblog tracking new
developments in media, headlined his entry “Dell lies. Dell sucks”,66 coining the phrase “Dell
Hell.” Throughout the summer of 2005, Jarvis chronicled his efforts to get Dell to fix his
broken computer, a quest he claims included “an infuriating string of unanswered or
improperly handled e-mails and phone calls.”67 The complain was that Dell’s customer
service was poor, long wait times on the phone, unresolved technical problems and hard-to-
understand customer service representatives working in India.68 Soon mainstream media like
Business Week, Fast Company, ZDNet, PC World and the Houston Chronicle gave the claim
a wider audience. 69 In October 2005, Business Week headlined an article, “Hanging Up On
Dell?” referencing Jarvis’ blog and stating that “plenty of people are going public with
complaints” about Dell, giving birth to websites like www.ihatedell.net. An industry observer
noted “What began as a personal account by Jarvis of his problems with Dell on his
BuzzMachine blog has turned into a public perception nightmare.”70
Communication Strategy:
Initially Dell ignored the blogger uprising and the subsequent media coverage. In August
2005, Dell CEO Rollins refuted news of a recent slip in Dell’s American Customer
62http://www.netadvantage.standardpoor.com 63 Hoovers, Dell Inc., Information and Related Industry Information. 64 Ibid. 65 Austin American Statesmen (8/16/05), Study Finds Fewer Dell Customers Satisfied, Company Disputes Finding of Increased Complaints. 66 http://www.buzzmachine.com (6/21/05), Dell Lies. Dell Sucks. 67 http://directmag.com (10/1/05), Dell Takes One Hell of a Blogging. 68 Investor’s Business Daily (4/10/07), HP Advances, Dell Stumbles in Buyer Poll. 69 B to B/Crain Communications (9/12/05), How One Man’s Weblog Became Dell’s Nightmare. 70 B to B/ Crain Communications (9/12/05), How One Man’s Weblog Became Dell’s Nightmare.
6 Brand Recovery
217
Satisfaction Index rating stating that “findings from another organization and its own internal
check showed that service is still strong and improving.”71 In October 2005, John Hamlin,
senior VP of Dell’s U.S. consumer business, told Business Week that Dell was “hiring a few
thousand additional reps this year and striving to reduce call transfers.” For over a year, Dell
endured eroding market share and increasing slippage in customer satisfaction ratings, yet
took no direct action in response to the Dell Hell attacks. Then, in November 2006, CEO
Rollins announced the company would spend $150 million to fix customer service problems
that left U.S. buyers in what the company acknowledged was “Dell Hell.” On January 9,
2007, a Houston Chronicle “Tech Blog” reported that newly Dell re-appointed CEO Michael
Dell said he was “very aware of blog guru Jeff Jarvis’ crusade against his computer company
over poor customer service…and now concedes that the way it was handled at the time was a
mistake.”72 In February 2007, CEO Dell launched wwww.dellideastorm.com, a website “to
gauge which ideas are most important and most relevant to the public” with a page which
demonstrates how Dell is acting upon suggestions. 73
Result:
The customer responses to Jarvis’ blog were unprecedented; he appeared to unite millions of
consumers furious about Dell’s poor service.74 Mainstream media backed up the bloggers’
complaints with their own interviews of disgruntled Dell customers. Business Week, in a
story prompted by the Dell Hell fury, reported on the saga of several Dell consumers—
including one that spent nearly three hours on the phone talking to half a dozen reps to solve
a simple keyboard problem. “I certainly won’t buy another product from Dell,” she told
Business Week. “I will make sure that any other prospective Dell customer I meet knows
what kind of treatment they’ll get.”75 In August 2005, a study issued by the University of
Michigan found Dell’s American Customer Satisfaction Index dropped 6% to 74 points from
79 in August 2004.76 In November 2006 Dell’s stock had fallen nearly 4% over one year
ago, while Hewlett Packer quadrupled its profits in the same period.77 By July 2007, Dell
71 Austin American-Statesman (8/16/05), Study finds fewer Dell customers satisfied, Company disputes finding of increased complaints. 72 http://blogs.chron.com (1/9/07), Dell on Dell Hell: We were mostly to blame. 73 Wikipedia, “Dell IdeaStorm”. 74 The Guardian, (8/29/05) My Dell Hell. 75 Business Week (10/10/05), Hanging up on Dell? 76 Austin American-Statesman (8/16/05), Study finds fewer Dell customers satisfied. 77 The Guardian (11/17/06), Financial: Dell results delay deepen woes as HP quadruples profits.
6 Brand Recovery
218
slipped from its number one spot in worldwide PC sales to commanding the number three
spot with a 17.1% market share.78
While Dell’s perceived customer service problem was gaining momentum before Jarvis
blogged his views, industry experts agree that BuzzMachine propelled the issue to crisis
status. In August 2006, Ad Age observed that Dell’s “brand image has been damaged by
rampant online customer –service complaints—driven by BuzzMachine blogger Jeff Jarvis’
rants.”79 By February 2007, when Hewlett-Packer had overtaken Dell as the market leader,
the Daily Telegraph observed, “the computer makers reputation could scarcely be lower…the
internet is littered with websites detailing customers’ frustrations of wading through ‘Dell
Hell.”80
6.7.3. Example 3: Jetblue Airways
Company
JetBlue is a low-cost low-fare passenger airline, based in New York, that began operation in
2000. It offers approximately 500 daily flights from 50 destinations, and has a market
capitalization of around $2.4billion81. In a February 2007 survey by the Consumer Reports
National Research Center, just days before the Valentine’s Day crisis it was ranked as No. 1
in customer satisfaction with a score of 87 out of a possible 100.82
Crisis: Valentine’s Day delay with passengers stuck in planes, Feb. 14th, 2007
On Valentine’s Day in 2007 a series of storms in the eastern U.S. halted air traffic. Although
many other carriers had already cancelled dozen of flights in preparation of the storm, due to
its policy to ensure a flight is completed, JetBlue’s management opted to wait it out and
boarded the planes, which were subsequently waiting on the runway for the weather
conditions to improve. But instead of improving, freezing rain and sleet continued and planes
and equipment were slowly freezing to the tarmac. Customers were stuck in the airplanes and
78 http://www.netadvantage.standardpoor.com,, Dell Inc. 79 Ad Age (8/21/06), Dell Still No. 1, But Blogger, Battery Recall Dent Image. 80 Daily Telegraph (2/2/07), Michael Dell is Planning to Change his Firm’s Course Completely to Recover Lost Ground. 81 Bartholomew, D. & Duwall, M. (2007). What Really Happened at JetBlue. Baseline Magazine. http://www.baselinemag.com/article2/0,1540,2111617,00.asp 82 USAToday (2007). What Meltdown? JetBlue Named Top U.S. Airline. http://www.usatoday.com/travel/flights/2007-06-05-jetblue-survey_N.htm

6 Brand Recovery
219
not allowed to leave for up to eleven hours83 with little to eat, problematic air and bathroom
conditions84. After it became clear the planes would not be able to take off, due to the heavy
snow and ice storms, passengers had to be taken back to the terminal by bus. Customers were
claiming their experience to be “the worst” and “horrific”85.
In addition JetBlue was accused of having heavily underinvested in its information system.
JetBlue was unable to handle the resulting calls from passengers that were trying to reserve
other flights due to an outdated information system not prepared for dealing with such a
situation. As a result many passengers were unable to get through to the reservation system or
had to wait more than an hour on the line. Also, JetBlue did not have a computerized system
in place for recording and tracking lost bags, which meant that the returning bags from the
planes piled up and passengers had to wait for up to three days to reclaim their baggage86.
Communication Strategy:
In a first step JetBlue apologized by personally calling affected customers and providing
information by explaining passengers individually the reasons for the failures.87 The
company’s CEO further publicly apologized by saying he was “sorry and embarrassed” 88
acknowledging that the situation was totally “unacceptable”89. In an effort to come clean
JetBlue offered immediate refunds and travel vouchers for customers stuck on planes for
longer than three hours. In addition, the company’s CEO announced a new “customers’ bill
of rights” and created a “service guarantee”, that includes certain guaranteed vouchers
relative to the length of the delay. Also, JetBlue’s CEO vouched for new investments in
weather related operations, thereby bolstering the company’s reputation of customer-
friendliness90.
Result:
As a response to the JetBlue crisis, Consumer Reports conducted a small follow-up survey in
April and found that JetBlue's Valentine's Day problems had little effect on the airline's
83 Factiva (02/15/07). DJ Update: Airlines Scramble to Recover After US Winter Storm 84 Factiva (02/16/07). NYC Fliers Stranded on Planes for Hours. 85 Factiva (02/16/07). NYC Fliers Stranded on Planes for Hours. 86 Bartholomew, D. & Duwall, M. (2007). What Really Happened at JetBlue. Baseline Magazine. http://www.baselinemag.com/article2/0,1540,2111617,00.asp 87 Business Week (03/62/2007), Readers Report. JetBlue Customers stand by their Carrier. 88 Business Week (03/12/2007). Is JetBlue the Next People Express? 89 Factiva (02/16/07). NYC Fiers Stranded on Planes for Hours. 90 Business Week (03/05/2007). An Extraordinary Stumble at JetBlue.

6 Brand Recovery
220
overall levels of satisfaction, with the carrier remaining among the top-rated airlines in the
survey. 91 In a Business Week Readers Report passengers involved in the Valentine’s Day
crisis applauded the communication strategy employed by JetBlue in response to the crisis.
One passenger: “Many companies, when faced with such a consumer crisis, first deny the
problem, then promise to study the issue, then resolve it with some personnel changes. In
stark contrast, JetBlue moved swiftly to own up to its failures, honestly explain why they
happened […], and worked to both fix the problem and mend fences with customers who
were harmed.”92 However, the former CEO Neeleman had to step down in response to the
Valentine crisis93 a couple of months later and similar problems have been reported with
passengers delayed in planes for 25hours in June 2007.94
6.7.4. Example 4: Pepsi
Company
Pepsi was founded in 1965, and is one of the largest food and beverage companies in the
world. Headquartered in Purchase, New York, the company has operations in 200 countries.
Pepsi recorded revenues of $35 billion in 2006 with a net profit of $6 million.95 Pepsi Cola
International first entered the Indian market in 1988 through a joint venture with a
government-owned company. In 1994, Pepsi-Co bought out its Indian partner.96 From 1989-
2004, Pepsi-Co invested $700 million in the Indian growth market; annual sales for Pepsi
India in 2004 neared $1 billion.97
Crisis: Pesticides in Pepsi drinks
On August 5, 2003, the Center for Science and Environment (CSE) Director Sunita Narain
announced that her group had conducted a study that revealed “shocking quantities of
pesticides” in many Pepsi and Coca-Cola beverages produced in India.98 Narain, a well-
known activist, emphasized the “extremely toxic” nature of the pesticides that, with
prolonged exposure, cause “cancer, damage to the nervous and reproductive systems, birth
91 USAToday (2007). What meltdown? JetBlue Named Top U.S. Airline. http://www.usatoday.com/travel/flights/2007-06-05-jetblue-survey_N.htm 92 Business Week (03/62/2007), Readers Report. JetBlue Customers stand by their Carrier. 93 The Star (06/01/2007). Ex-JetBlue CEO Sells 2.5M Shares. 94 New York Post (06/29/2007). Get a Clue Blue! 25-hr. Ordeal of JFK-Bound Fliers. 95 http://www.datamonitor.com (6/24/07), Company Profiles: Pepsi-Co. 96 Ibid. 97 http://www.domain-b.com (10/26/04), Pepsi-Co India Sales to Hit $1-Billion Mark Soon. 98 http://www.tribuneindia.com (8/05/03), Pesticides Found in Coke, Pepsi.
6 Brand Recovery
221
defects and severe disruption of the immune system.”99Narain said that the study found the
pesticides in Pepsi-Co brands to be, on average, 36 times higher than the European Economic
Commission (EEC) standards; no such standards had yet been established by the Indian
government for beverages. Moreover, the CSE found vastly lower incidences of pesticides in
sodas sold and manufactured in the US, prompting Narain to accuse these “global players
who fake social responsibility” of producing products abroad “they wouldn’t dare sell at
home.”100 The Indian press was outraged at news of this report, the Times of India wrote of
the “deadly cocktail of pesticide residues”101 in major cold drink brands; the Tribune called
the report “a startling revelation.”102
Communication Strategy:
Hours after the CSE accusations became public, Pepsi denied all claims of tainted products;
Pepsi India Chief Executive Rajeev Bakshi suggested the CSE report was “baseless” and
“should be disregarded.”103 The company quickly placed ads in the largest circulation
newspapers seeking to counter the accusations—but these same papers ran editorials accusing
Pepsi of utilizing double standards.104 Bakshi publicly criticized the inflammatory campaign
being waged by the Indian media declaring, “this is a trial by media,” and considered
bringing the CSE to court for publishing what Pepsi considered to be bogus findings.105
Pepsi executives resolutely discredited the CSE findings, suggesting that the method used
was for testing water and that it would lead to the wrong conclusion for soft drinks.106 In an
article which focused on the dire health concerns presented in the CSE findings, Bakshi was
unflappable: “We expect a temporary setback for about a week or so and then we are sure the
consumers will have the same confidence in us they have always shown.”107
Result:
Initially, Indian consumers were enraged by the CSE findings. Protestors in Mumbai and
Kolkata defaced Pepsi and Coke ads and burned placards depicting soda bottles; several India
99 Ibid. 100 Business Week (6/11/07), Pepsi: Repairing a Poisoned Reputation in India. 101 The Times of India (6/5/03), Test Reveal Pesticides in Coke, Pepsi, Mirinda”. 102 http://www.tribuneindia.com (8/5/03), Pesticides Found in Coke, Pepsi. 103http:// www.abc.com (8/6/03), Coke, Pepsi in India Deny Pesticides in Soft Drinks. 104 The Financial Times (8/8/03), Coca Cola and Pepsi May Take Legal Action Over ‘Pesticide’ Claim. 105 Ibid. 106 Indian Business Insight (8/16/03), Pepsi India Chief Slams CSE Test Method. 107 Inter Press Service (8/6/03), Health: Indian Coke and Pepsi Laced with Pesticides, says NGO.

6 Brand Recovery
222
states temporarily restricted or banned soda sales.108 A popular Indian guru, Baba Ramdeu,
began telling his cable-television viewers that Pepsi and Coke should be used as “toilet
cleaners.”109 Moreover, the CSE continued a campaign of e-mail alerts and accusatory press
releases inviting comments from journalists and bloggers worldwide.
Several weeks after the CSE report was released, Pepsi officials reported daily sales figures
had dropped by 30%.110 According to Business Week, linking Pepsi with pesticides was
enough to scare off even sophisticated consumers. Advertising executive Manish Sinha, a
former cola loyalist, admits he would rather be safe than drink Pepsi. “I no longer trust the
cola companies,” he said.111 Fallout from the 2003 crisis also took the form of management
shakeouts: three executive VP’s, one unit head and an executive director of Pepsi India
resigned in December 2003 due to “low morale and discontent in the company after the
pesticide controversy.112 Nonetheless, despite short-term losses and lingering consumer
concerns, Pepsi appeared to be financially recovering from its pesticide crisis. By September
20, Bakshi reported that Pepsi’s sales were returning to the pre-controversy level.113 In
October 2003, Business Standard reported that “Indian operations have contributed
significantly to the third-quarter growth of Pepsi-Co International”- despite the sharp dip in
sales in the “days” following the CSE report.114 By April 2004, the Economic Times of India
headlined an article “Cola majors get fizz back” and reported Indian sales growth for Pepsi
for first quarter 2004 to be in the high teens.115 Some analysts believed the crisis had been
averted, if not resolved, just as “previous health scares blew over.”116
Over time, however, the crisis actually smoldered. The CSE, under Narain’s direction,
continued to pursue the pesticide problem, building a strong consumer following along the
way. On August 2, 2006, the CSE issued a second report that declared, “three years after CSE
released its findings…soft drinks remain unsafe and unhealthy.”117 Media analysts agreed
that this second crisis was more serious than the first. In the days that followed the 2006 CSE 108 Ibid. 109 Wall Street Journal (9/12/06), Economics: Path to India’s Market dotted with Potholes. 110 Dow Jones International News (8/21/03), India Government: Toxin Levels in Coke, Pepsi Less than Alleged. 111 Business Week (6/11/07), Pepsi: Repairing a Poisoned Reputation in India. 112 Indian Business Insight (12/27/03), It’s Official: Pepsi Loses Managers. 113 India Business Insight (9/30/03) 114 Business Standard (10/8/03), India Sales Prop Pepsico Profit. 115 Economic Times (4/24/04), Cola Majors Get Fizz Back. 116 Reuters Health E-Line (8/18/03), Coke, Pepsi in Hot Water Over India Health Scare. 117 The Indian Economic Times (8/4/06), Cola Giants Get Déjà Vu Feeling.
6 Brand Recovery
223
report, seven of India’s 28 states imposed partial or complete bans on Pepsi and other
company sodas. There were also reported scattered demonstrations with environmental
groups calling out: “Coke, Pepsi, Quit India.”118
6.7.5. Example 5: Whole Foods
Company
Whole Foods was founded in 1980 in Austin, Texas, pioneering the supermarket concept in
natural and organic foods retailing119 with 190 stores in the U.S., Canada and the U.K. and
$5.6 billion in revenues.120 Since 1996, the company has consistently ranked as one of the
“100 Best Companies to Work for in America” by Fortune.121 On February 21, 2007, Whole
Foods agreed to buy arch competitor Wild Oats Market for $565 million.122 Viewing the
merger as “anticompetitive,” the Federal Trade Commission (FTC) sought to block Whole
Foods’ offer and, in June 2007, initiated an investigation.123
Crisis: CEO’s anonymous Internet postings
While investigating the company’s motives for the proposed merger, the FTC stumbled upon
a disturbing skeleton in CEO John Mackey’s closet: since 1999, Mackey had been engaged in
pseudonymous postings on Yahoo’s Finance Message Board. According to USA Today,
“Rahodeb” (Mackey’s online identifier) was “unstintingly bullish on the prospects of Whole
Foods continuing growth, and frequently critical of a rival company, Wild Oats.”124 In light
of Whole Foods’ intended takeover of Wild Oats, the media pounced on the story, revealing
the often-incriminating details of Mackey’s postings. Industry observers voiced surprise and
disillusionment in both mainstream media and on specialized sites—debating the legality and
morality of Mackey’s actions. Describing the incident as an “…embarrassing message board
brouhaha,” the technology industry newsletter Techdirt commented, “It’s not clear that what
he did was necessarily illegal, but his posting seems unethical and highly foolish...If nothing
118 Associated Press Newswires (8/27/06), Coke, Pepsi Doing Little to Confront Pesticide Allegations in India. 119http://www.wholefoodsmarket.com. 120 Hoovers, Whole Foods Market, Inc., Financials. 121 http://www.wholefoodsmarket.com. 122 usatoday.com (7/12/07), Whole Foods’ CEO Was Busy Guy Online. 123 Ibid. 124 Ibid.
6 Brand Recovery
224
else, the company’s stockholders should wonder about what the boss is doing with his
time.”125
Once the details of Mackey’s postings were made public, it appeared some investors had lost
faith in Mackey and the future success of the brand. CTW Investment Group, a major Whole
Foods Market shareholders group, sent a letter to the chain’s board of directors asking that
Mackey step down as chairman. Lay bloggers and Whole Foods customers, on the other
hand, were neither unanimously angry with Mackey nor ready to turn away from the brand,
en masse, as a result of the incident. As one contributor to Techdirt’s site wrote: “Isn’t part of
the CEO’s job to promote public confidence for his company? As long as he’s just
cheerleading and not disclosing insider information, isn’t this what he is supposed to be
doing?”126 While not overly critical of Mackey, a woman writing on www.allbusiness.com
nonetheless expressed confusion over his actions: “Whole Foods are fantastic stores, and it’s
a great company. But what public company CEO makes this kind of rookie mistake?”127 And,
for some bloggers, Mackey’s only mistake was getting caught, as exemplified by this posting
on Wired, “Forget just the CEOs. How many various high level employees…are hitting the
financial blogs? Maybe the better question is—how many are not?”128
Communication Strategy:
One week after the FTC revealed “Rahodeb’s” Internet activities, CEO Mackey issued the
following succinct public apology statement directed at Whole Foods investors:
“I sincerely apologize to all Whole Foods Market stakeholders for my error in judgment in
anonymously participating on online financial message boards. I am very sorry and I ask our
stakeholders to please forgive me.”129 Mackey followed this formal apology by publishing an
explanation under the “FAQ” section on the company website, using a tone more appropriate
for Whole Foods customers than investors, writing:
“I posted on Yahoo under a pseudonym because I had fun doing it. Many people
post on bulletin boards using pseudonyms. I never intended any of those postings
to be identified with me…The views articulated by “rahodeb” sometimes
125 http://www.techdirt.com (7/12/07), Whole Foods CEO Caught in Embarrassing Message Board Brouhaha. 126 Ibid. 127 http://www.allbusiness.com (7/16/07), Whole Foods CEO Leads Interesting On-line Life. 128 http://blog.wired.com (7/18/07), Whole Foods CEO Apology Followed by Internal Investigation. 129 http://www.smartmoney.com (7/17/07), Whole Foods CEO Threatens Merger, Fuels Arbitrage.

6 Brand Recovery
225
represented what I actually believed and sometimes they didn’t. Sometimes I
simply played “devil’s advocate” for the sheer fun of arguing. Anyone who knows
me realizes that I frequently do this in person, too.”130
Result:
Ultimately, the Rahodeb incident had little long-term effect on consumers. Perhaps, as crisis
communications consultant Eric Dezenhall suggested soon after the story broke, the incident
represented “more of an embarrassment than an issue of profound ethical and legal
consequence.”131 On the day following the FTC disclosures, Whole Foods Market’s share
price dropped only slightly—about 1%—with double the average shares changing hands.132
A few weeks later, Whole Foods reported a less-than-anticipated dip in third- quarter profits
and a 13% increase in revenues, significantly bumping up share prices.133 One month after
Mackey’s postings were made public, on August 17, 2007, the Federal Court overrode the
FTC’s ruling, permitting Whole Foods to merge with Wild Oats. Commenting on the
decision, the New York Times wrote, “In the end, the online ramblings of Rahodeb didn’t
scuttle the plans of Whole Foods Market to buy Wild Oats.”134 A press release issued on
November 20, 2007, by Whole Foods Market reported fourth-quarter revenues, ending
September 30, to have increased 24.7% versus a year ago. Annual revenues, ending on the
same date, jumped from $5.6 billion to $6.6 billion. More than six months after the FTC
revealed Rahodeb’s identity, Mackey remained president and CEO of Whole Foods Market.
6.7.6. Example 6: Mattel
Company
Mattel, based in El Segundo, California, was founded in 1945 and has since grown to become
the largest toy manufacturer in the world with revenues of nearly $5.7 billion in 2006135 and
an annual toy output of nearly 800 million units.136 Its product line includes Barbie dolls,
Fisher Price toys and Hot Wheels and Matchbox cars.137 In 2006, Mattel owned and operated
130 http://www.forbes.com (7/12/07), Mackey’s Alter Ego. 131 usatoday.com (7/12/07), Whole Foods’ CEO Was Busy Guy On-line. 132 Austin American-Statesman (7/13/07), Whole Foods Trades Heavily, Dips Slightly. 133 Dow Jones Business News (8/1/07), Whole Foods Profits Slips, But Shares Soar. 134 http://www.newyorktimes.com (8/17/07), Judge Sides with Whole Foods on Deal for Wild Oats. 135 Hoovers, Mattel, Financials, 1/29/08. 136 BBC (9/21/07), China Detains Four for Involvement in Mattel Toy Recall. 137 Hoovers, Mattel, Overview, 1/29/08.

6 Brand Recovery
226
10 factories worldwide that produced half of its toys. The remaining 50% of Mattel’s
production was outsourced to third-party vendors in China.138
Crisis: Lead paint and loose magnets on toys
During the summer of 2007, Mattel endured three separate toy recalls, ultimately involving
the recall of nearly 20 million toys worldwide. Of these toys, 17.4 million were recalled
because of loose magnets and the possibility of near-fatal intestinal complications if ingested,
while 2.2 million were recalled because of impermissible levels of lead linked to serious
health problems in children, including brain damage.139 This prompted a U.S. Congressional
Committee to demand information from Mattel about the numerous recalls involving lead-
tainted children’s products made in China.
Communication Strategy:
Mattel was quick to empathize with consumer concerns, but backed away from taking direct
responsibility for the recalls, blaming Chinese manufacturers for ignoring Mattel’s quality
control mandates. On the day news of lead paint on Mattel toys broke, CEO Bob Eckert
commented to the New York Times: “This is a vendor plant with whom we’ve worked for 15
years; this isn’t somebody that just started making toys for us. They understand our
regulations, they understand our program, and something went wrong. That hurts.”140 On the
day following the second recall announcement, Mattel ran an ad campaign in the Wall Street
Journal, the New York Times, the Financial Times US and USA Today featuring a photograph
of children playing and a letter written by CEO Eckert: “Nothing is more important than the
safety of our children…Our long record of safety at Mattel is why we’re one of the most
trusted names with parents, and I am confident that the actions we are taking now will
maintain that trust.”141 Eckert added that Mattel had implemented a three-point checking
system “to ensure that only paint from certified suppliers is used.”142 Eckert also filmed a
video apology to parents that was distributed online pledging to “significantly increase the
frequency of its paint inspections.”143 Making appearances on numerous TV news programs,
including CNN and ABC News: Nightline, Eckert maintained Mattel’s commitment to
rigorous standards, once again inferring that Chinese factories had let Mattel down: “I’m
138 cnnmoney.com (8/14/07), Blame U.S. Companies for Bad Chinese Goods. 139 BBC (9/21/07), China Detains Four for Involvement in Mattel Toy Recall. 140 http://www.newyorktimes.com (8/2/07), Lead Paint Prompts Mattel to Recall 967,000 Toys. 141 Brand Republic (8/15/07), Mattel Launches Ad Campaign as Second Recall Is Revealed. 142 Ibid. 143 http://www.wallstreetjournal.com (8/15/07), Mattel Does Damage Control.

6 Brand Recovery
227
disappointed, I’m upset. But I can assure your viewers that…we’ll continue to enforce the
highest quality standards in the industry.”144
Ten days after the Senate hearings, in a dramatic and unexpected about-face, Mattel
Executive VP Thomas Debrowski traveled to Beijing to publicly apologize to the Chinese
government and to finally assume “full responsibility” for the past summer’s recalls, noting
Mattel’s duty to perform final quality checks on its imports. Debrowski also acknowledged,
“The vast majority of those products that were recalled were the result of a design flaw in
Mattel’s design [referring to the magnet issue]…lead-tainted toys accounted for only a small
percentage of the toys recalled…We understand and appreciate deeply the issues that this has
caused for the reputation of Chinese manufacturers.”145
Result:
Not surprisingly, U.S. consumers were losing faith in the Mattel brand and its reliance on
Chinese production facilities as a result of the recurring recalls. As one mother whose young
son had repeatedly “mouthed” a Mattel toy targeted by the recall expressed on ABC News:
Nightline, “You just expect more from an American company, an American toy company,
knowing that their products are going into the hands and the mouths of small children.”146
Another mother of a five-year-old girl was quoted in the Newark Star Ledger: “I’m very
worried. Today when I saw the newspaper, my daughter was playing with that Barbie doll.
You can lose a kid over a $14.99 doll. It’s very scary.”147
After the massive second recall, toy industry analyst Doug Hart predicted, “This could be the
time that consumer perception begins to change in relation to Mattel and Barbie.”148 Crisis
communications consultant Howard Rubenstein agreed: “Mattel has a spectacular reputation
that they risk now…it is a mighty blow.”149 Rubenstein further suggested Mattel needed to
take “dramatic steps” to contain the damage. One day after news of the first recall was
released, Mattel reported that this recall alone would reduce second-quarter 2007 operating
income by almost 50%.150 On the day the second recall was announced, Mattel stocks
144 cnn.com (8/14/08), Rigorous Standards After Massive Recall. 145 Washington Times (9/22/07), Mattel Apologizes to China. 146 ABC News: Nightline (8/14/07), Tainted Toys: Mattel Recalled More Chinese-made Toys. 147 Newark Star Ledger (8/16/07), Jersey Toy Stores Empty Their Shelves. 148 http://www.wallstreetjournal.com (8/15/07), Mattel Does Damage Control. 149 Reuters (8/14/07), Mattel Image Hit, Recall Suits a Risk. 150 Vancouver Sun (8/3/07), Mattel Toy Recall Forecast to Cut Q2 Income by Half.
6 Brand Recovery
228
plunged by as much as 6%.151 On October 15, in an article headlined “Mattel: Recalls Are
the Least of Its Problems,” CNN Money reported dramatically lower-than-projected third-
quarter profits and sales for Mattel, with U.S. sales of its flagship Barbie brand tumbling 19%
as a result of the recalls.152
151 Reuters (8/14/07), Mattel Recalls Millions More Chinese-made Toys. 152 cnnmoney.com (10/15/07), Mattel: Recalls Are the Least of Its Problems.
Related Documents