Investigating changes in the Investigating changes in the Atlantic Waters Atlantic Waters characteristics along the characteristics along the Egyptian Mediterranean Coast Egyptian Mediterranean Coast M. A. Said, M. A. Gerges, I. A. M. A. Said, M. A. Gerges, I. A. Maiyza, Maiyza, M.A. Hussien and A. A. Radwan M.A. Hussien and A. A. Radwan National Institute of Oceanography and National Institute of Oceanography and Fisheries, Alexandria, Egypt Fisheries, Alexandria, Egypt

Investigating changes in the Atlantic Waters characteristics along the Egyptian Mediterranean Coast M. A. Said, M. A. Gerges, I. A. Maiyza, M.A. Hussien.
Dec 29, 2015
Welcome message from author
This document is posted to help you gain knowledge. Please leave a comment to let me know what you think about it! Share it to your friends and learn new things together.
Transcript
Investigating changes in the Atlantic Investigating changes in the Atlantic Waters characteristics along the Waters characteristics along the Egyptian Mediterranean CoastEgyptian Mediterranean Coast
M. A. Said, M. A. Gerges, I. A. Maiyza,M. A. Said, M. A. Gerges, I. A. Maiyza,
M.A. Hussien and A. A. RadwanM.A. Hussien and A. A. RadwanNational Institute of Oceanography and Fisheries, National Institute of Oceanography and Fisheries,
Alexandria, EgyptAlexandria, Egypt

IntroductionIntroduction
The surface Atlantic Waters, flowing into the The surface Atlantic Waters, flowing into the Mediterranean are subject to evaporation Mediterranean are subject to evaporation and mixing with the underlying waters, and mixing with the underlying waters, causing a progressive increase of the salinity causing a progressive increase of the salinity from 36.25 in the Gibraltar area to 37.25 in from 36.25 in the Gibraltar area to 37.25 in the Strait of Sicily and to values higher than the Strait of Sicily and to values higher than 38.50 in the Levantine Sea. Its west to east 38.50 in the Levantine Sea. Its west to east path across the Mediterranean can be path across the Mediterranean can be tracked by a subsurface salinity minimum, tracked by a subsurface salinity minimum, representing the signature of their Atlantic representing the signature of their Atlantic origin. origin.
IntroductionIntroduction
Millot (2007), using an autonomous CTD Millot (2007), using an autonomous CTD set at 80 m depth on the Moroccan shelf to set at 80 m depth on the Moroccan shelf to monitor the inflowing AW during the monitor the inflowing AW during the period 2003-2007, found that the AW has period 2003-2007, found that the AW has encountered considerable salinification at encountered considerable salinification at the rate of about 0.05/yr, i.e. ~0.2 in the the rate of about 0.05/yr, i.e. ~0.2 in the 4-year period of observation, together with 4-year period of observation, together with consequent densification (~0.03 kgm-3/yr consequent densification (~0.03 kgm-3/yr in the same period, i.e. 0.12 kgm-3). The in the same period, i.e. 0.12 kgm-3). The much larger warming (~0.3°C/dec) of the much larger warming (~0.3°C/dec) of the AW was found off the coast of Spain AW was found off the coast of Spain (Pascual et al., 1995). (Pascual et al., 1995).

Aim of the present workAim of the present work
The present work aims to give better The present work aims to give better understanding of the long-term changes understanding of the long-term changes in the Atlantic waters passing along the in the Atlantic waters passing along the Egyptian Mediterranean coast, and to Egyptian Mediterranean coast, and to show the seasonal variability of the show the seasonal variability of the salinity of the inflowing AW due to the salinity of the inflowing AW due to the mixing processes and the interannual mixing processes and the interannual variability variability
Area of InvestigationArea of Investigation The investigated area which is the Egyptian The investigated area which is the Egyptian
Mediterranean coast lies between longitudes 25°30'E Mediterranean coast lies between longitudes 25°30'E and 34°E and extends northward to the 33°N latitude. and 34°E and extends northward to the 33°N latitude. Its surface area is about 154,840 kmIts surface area is about 154,840 km22, with an estimated , with an estimated water volume of about 225 kmwater volume of about 225 km33. The most striking . The most striking feature of this area is the presence of different water feature of this area is the presence of different water masses which converge and mix. These are:masses which converge and mix. These are:
i-i- the surface water mass of high salinity; the surface water mass of high salinity; ii-ii- the subsurface water mass of minimum salinity and the subsurface water mass of minimum salinity and
maximum oxygen, which is of Atlantic origin and maximum oxygen, which is of Atlantic origin and extends between 50-150 m; extends between 50-150 m;
iii-iii- the intermediate water mass of maximum of salinity the intermediate water mass of maximum of salinity that extends below 150 m to about 300-400 m depth, andthat extends below 150 m to about 300-400 m depth, and
iv-iv- the deep Eastern Mediterranean waters. the deep Eastern Mediterranean waters.

Area of investigationArea of investigation
2 5 2 5 . 5 2 6 2 6 . 5 2 7 2 7 . 5 2 8 2 8 . 5 2 9 2 9 . 5 3 0 3 0 . 5 3 1 3 1 . 5 3 2 3 2 . 5 3 3 3 3 . 5 3 4
L o n g i t u d e ( ° E )
3 1
3 2
3 3
Lat
itu
de
(°N
)
Sources of DataSources of DataThe hydrographic data used in the present study were The hydrographic data used in the present study were
taken from several expeditions carried out by Egypt taken from several expeditions carried out by Egypt and different countries from within and outside the and different countries from within and outside the Mediterranean region, for the last 50 years (1959-2008). Mediterranean region, for the last 50 years (1959-2008). The temperature and salinity were averaged and The temperature and salinity were averaged and mapped on a ½°×½° grid for winter and summer mapped on a ½°×½° grid for winter and summer seasons. The grid points with missing data were filled by seasons. The grid points with missing data were filled by interpolation of the surrounding values. Winter was interpolation of the surrounding values. Winter was represented by data collected during the period from represented by data collected during the period from January to March, while summer was represented by January to March, while summer was represented by data collected from July to September. To seek better data collected from July to September. To seek better quality of hydrographic data, a few observations have quality of hydrographic data, a few observations have been rejected because of their poor quality, perhaps due been rejected because of their poor quality, perhaps due to personal, instrumental, and/or location errors.to personal, instrumental, and/or location errors.
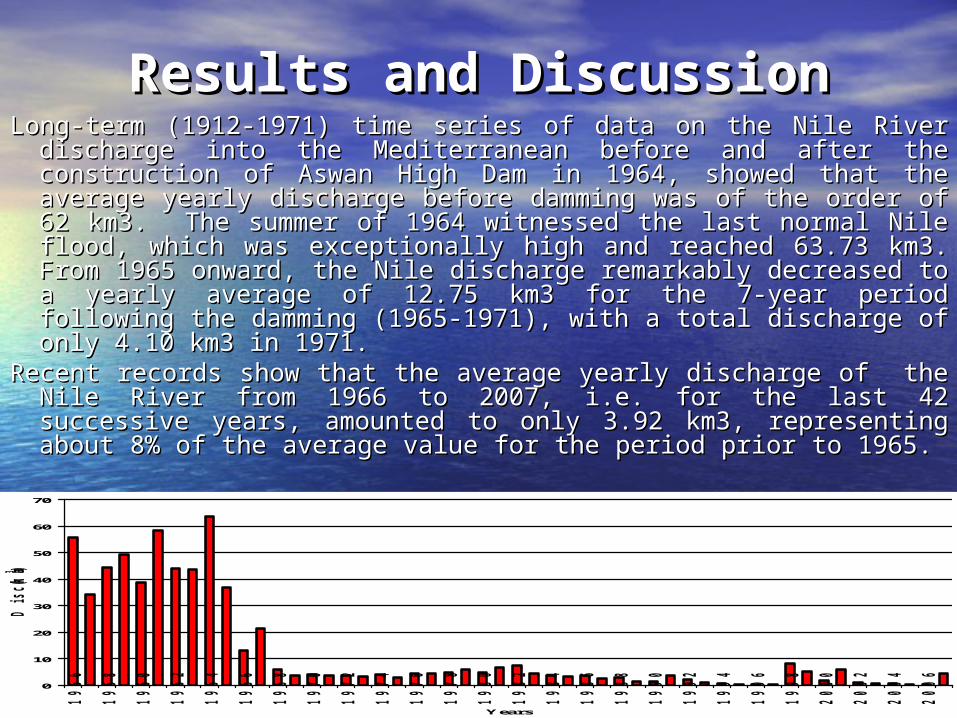
Results and DiscussionResults and DiscussionLong-term (1912-1971) time series of data on the Nile River discharge into Long-term (1912-1971) time series of data on the Nile River discharge into
the Mediterranean before and after the construction of Aswan High Dam the Mediterranean before and after the construction of Aswan High Dam in 1964, showed that the average yearly discharge before damming was in 1964, showed that the average yearly discharge before damming was of the order of 62 km3. The summer of 1964 witnessed the last normal of the order of 62 km3. The summer of 1964 witnessed the last normal Nile flood, which was exceptionally high and reached 63.73 km3. From Nile flood, which was exceptionally high and reached 63.73 km3. From 1965 onward, the Nile discharge remarkably decreased to a yearly 1965 onward, the Nile discharge remarkably decreased to a yearly average of 12.75 km3 for the 7-year period following the damming average of 12.75 km3 for the 7-year period following the damming (1965-1971), with a total discharge of only 4.10 km3 in 1971.(1965-1971), with a total discharge of only 4.10 km3 in 1971.
Recent records show that the average yearly discharge of the Nile River Recent records show that the average yearly discharge of the Nile River from 1966 to 2007, i.e. for the last 42 successive years, amounted to only from 1966 to 2007, i.e. for the last 42 successive years, amounted to only 3.92 km3, representing about 8% of the average value for the period 3.92 km3, representing about 8% of the average value for the period prior to 1965. prior to 1965.
0
10
20
30
40
50
60
70
1956
1958
1960
1962
1964
1966
1968
1970
1972
1974
1976
1978
1980
1982
1984
1986
1988
1990
1992
1994
1996
1998
2000
2002
2004
2006
Years
Disch
arge
(km3 )

Results and DiscussionResults and Discussion
The anomaly of the Nile water discharge The anomaly of the Nile water discharge through Rosetta Branch indicated that the through Rosetta Branch indicated that the yearly values during the last three decades yearly values during the last three decades are less than the average yearly discharge.are less than the average yearly discharge.
-5
0
5
10
15
20
19
66
19
68
19
70
19
72
19
74
19
76
19
78
19
80
19
82
19
84
19
86
19
88
19
90
19
92
19
94
19
96
19
98
20
00
20
02
20
04
20
06
year
Dis
ch
arge A
nom
aly
(k
m3 )
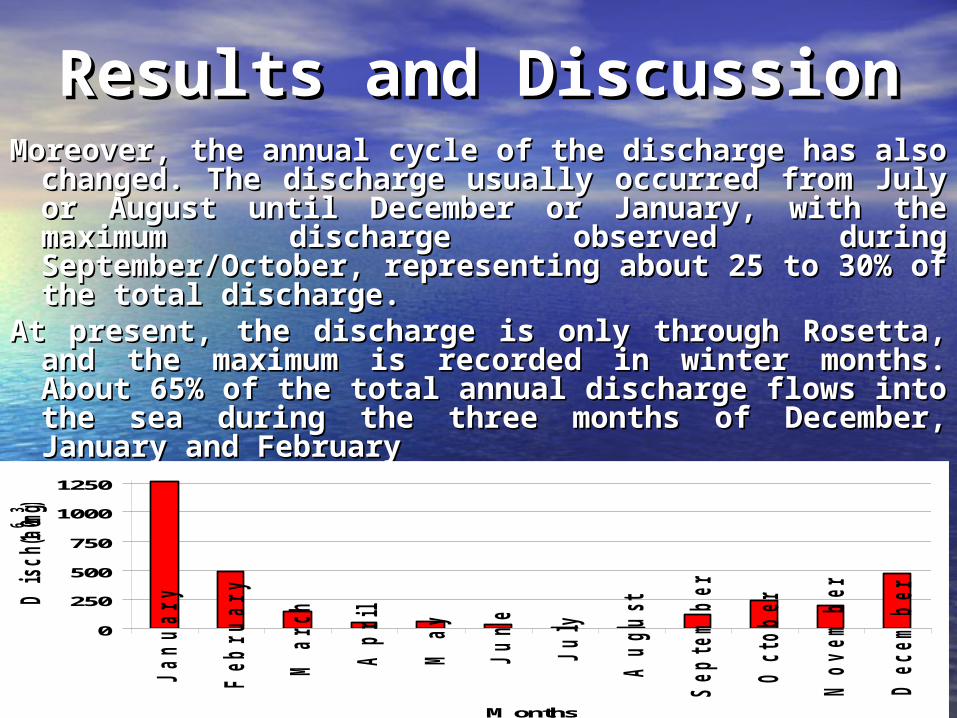
Results and DiscussionResults and DiscussionMoreover, the annual cycle of the discharge has also changed. Moreover, the annual cycle of the discharge has also changed.
The discharge usually occurred from July or August until The discharge usually occurred from July or August until December or January, with the maximum discharge December or January, with the maximum discharge observed during September/October, representing about 25 observed during September/October, representing about 25 to 30% of the total discharge.to 30% of the total discharge.
At present, the discharge is only through Rosetta, and the At present, the discharge is only through Rosetta, and the maximum is recorded in winter months. About 65% of the maximum is recorded in winter months. About 65% of the total annual discharge flows into the sea during the three total annual discharge flows into the sea during the three months of December, January and Februarymonths of December, January and February
0
250
500
750
1000
1250
Ja
nu
ary
Feb
ru
ary
Ma
rch
Ap
ril
Ma
y
Ju
ne
Ju
ly
Au
gu
st
Sep
tem
ber
Octo
ber
No
vem
ber
Decem
ber
Months
Dis
ch
arg
e
(106 m
3 )

Characteristics of the Characteristics of the Atlantic waters off the Atlantic waters off the Egyptian coastEgyptian coast
• In order to study the vertical space In order to study the vertical space variability of the hydrographic variability of the hydrographic parameters, the average winter and parameters, the average winter and summer values of each of the water summer values of each of the water temperature, salinity and density temperature, salinity and density t t were presented on a vertical section were presented on a vertical section taken parallel to the Egyptian Coast taken parallel to the Egyptian Coast along latitude 32°30`N and between along latitude 32°30`N and between 25°30` and 34°00`E longitudes 25°30` and 34°00`E longitudes
Winter SeasonWinter Season
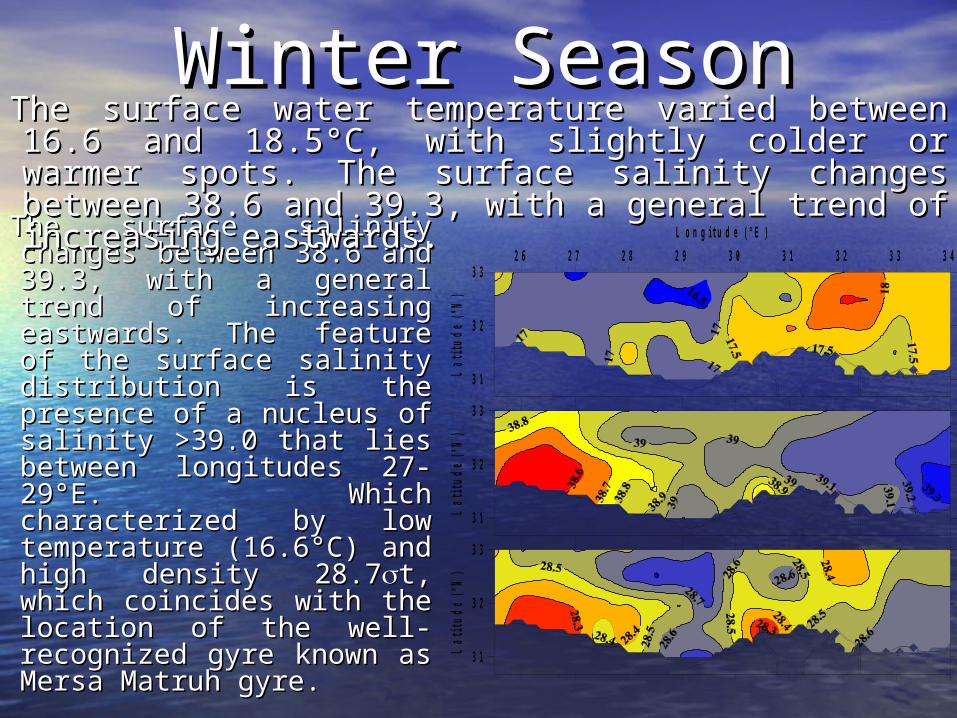
The surface salinity changes The surface salinity changes between 38.6 and 39.3, with a between 38.6 and 39.3, with a general trend of increasing general trend of increasing eastwards. The feature of the eastwards. The feature of the surface salinity distribution is surface salinity distribution is the presence of a nucleus of the presence of a nucleus of salinity >39.0 that lies salinity >39.0 that lies between longitudes 27-29°E. between longitudes 27-29°E. Which characterized by low Which characterized by low temperature (16.6°C) and high temperature (16.6°C) and high density 28.7density 28.7t, which t, which coincides with the location of coincides with the location of the well-recognized gyre the well-recognized gyre known as Mersa Matruh gyre.known as Mersa Matruh gyre.
2 6 2 7 2 8 2 9 3 0 3 1 3 2 3 3 3 4
L o n g i t u d e ( ° E )
3 1
3 2
3 3
Lat
itud
e (°
N)
3 1
3 2
3 3
Lat
itud
e (°
N)
3 1
3 2
3 3
Lat
itu
de (
°N)
The surface water temperature varied between 16.6 and 18.5°C, with The surface water temperature varied between 16.6 and 18.5°C, with slightly colder or warmer spots. The surface salinity changes between slightly colder or warmer spots. The surface salinity changes between 38.6 and 39.3, with a general trend of increasing eastwards. 38.6 and 39.3, with a general trend of increasing eastwards.

Winter SeasonWinter SeasonThe vertical distribution of the The vertical distribution of the
water temperature in the upper water temperature in the upper 200 m layer of this section shows 200 m layer of this section shows a great uniformity in temperature a great uniformity in temperature in the western part of the study in the western part of the study area which could be attributed to area which could be attributed to a severe cooling at the sea surface a severe cooling at the sea surface in winter. Salinity values increase in winter. Salinity values increase eastwards and show also great eastwards and show also great homogeneity, obviously due to homogeneity, obviously due to vertical mixing vertical mixing
Only one surface water mass could Only one surface water mass could be observed during winter in the be observed during winter in the upper 200 m layer. This surface upper 200 m layer. This surface water mass is characterized by water mass is characterized by temperature values ranging from temperature values ranging from 15° to 17°C, salinity maximum in 15° to 17°C, salinity maximum in the range of 38.90 - >39.10 and the range of 38.90 - >39.10 and corresponding density values of corresponding density values of 28.5-28.9 28.5-28.9 tt
L o n g itu d e (°E )
2 5 0
2 0 0
1 5 0
1 0 0
5 0
0
Dep
th (
m)
2 6 2 7 2 8 2 9 3 0 3 1 3 2 3 3 3 4
2 5 0
2 0 0
1 5 0
1 0 0
5 0
0
Dep
th (
m)
2 5 0
2 0 0
1 5 0
1 0 0
5 0
0
Dep
th (
m)
3 8 .6
3 8 .8
3 9
3 9 .1
1 4 .5
1 5 .5
1 6 .5
1 7 .5
1 8 .5
2 8 .3
2 8 .5
2 8 .7
2 8 .9
2 9 .1

Summer SeasonSummer SeasonThe surface water The surface water temperature varied temperature varied between 22 and 28°C, between 22 and 28°C, except in an area with except in an area with slightly cold water. slightly cold water. This is the area of the This is the area of the above- mentioned above- mentioned Mersa Matruh gyre Mersa Matruh gyre which lies between which lies between longitudes 27° and longitudes 27° and 29°E. The gyre area is 29°E. The gyre area is characterized by low characterized by low values of water values of water temperature (22-25°C), temperature (22-25°C), salinity (39.10-39.20) salinity (39.10-39.20) and high density (26.4-and high density (26.4-27 27 t). t).
2 6 2 7 2 8 2 9 3 0 3 1 3 2 3 3 3 4
L o n g i t u d e ( ° E )
3 1
3 2
3 3
Lat
itu
de
(°N
)
3 1
3 2
3 3
Lat
itu
de
(°N
)
3 1
3 2
3 3
Lat
itu
de
(°N
)
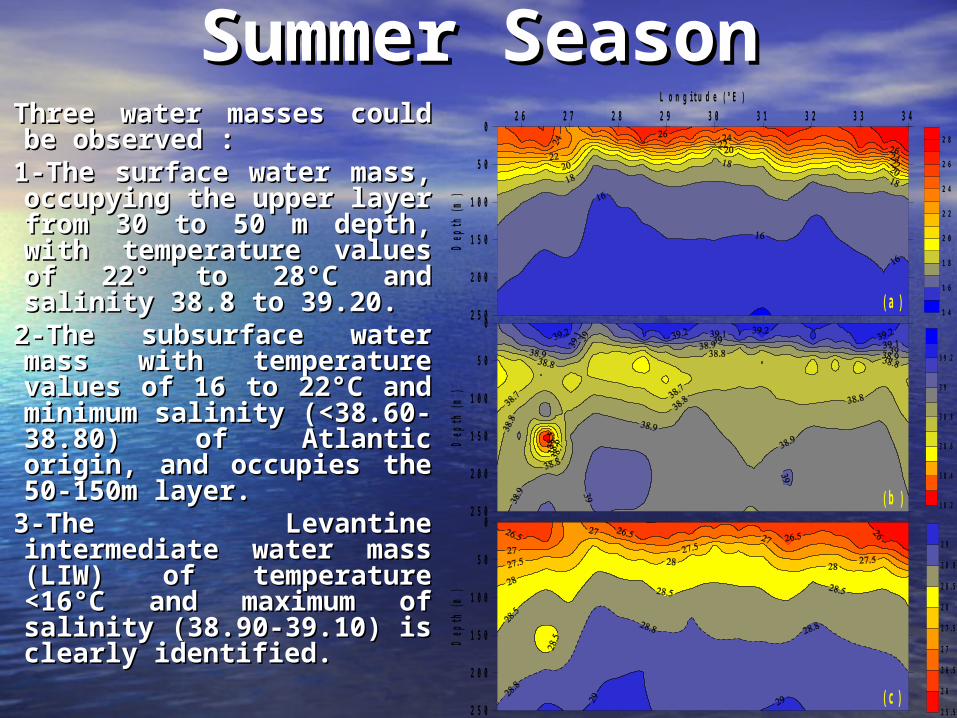
Summer SeasonSummer SeasonThree water masses could be Three water masses could be observed :observed :
1-The surface water mass, 1-The surface water mass, occupying the upper layer occupying the upper layer from 30 to 50 m depth, with from 30 to 50 m depth, with temperature values of 22° to temperature values of 22° to 28°C and salinity 38.8 to 28°C and salinity 38.8 to 39.20.39.20.
2-The subsurface water mass 2-The subsurface water mass with temperature values of with temperature values of 16 to 22°C and minimum 16 to 22°C and minimum salinity (<38.60-38.80) of salinity (<38.60-38.80) of Atlantic origin, and occupies Atlantic origin, and occupies the 50-150m layer.the 50-150m layer.
3-The Levantine intermediate 3-The Levantine intermediate water mass (LIW) of water mass (LIW) of temperature <16°C and temperature <16°C and maximum of salinity (38.90-maximum of salinity (38.90-39.10) is clearly identified. 39.10) is clearly identified.
2 5 0
2 0 0
1 5 0
1 0 0
5 0
0
Dep
th (
m)
(c )
2 5 0
2 0 0
1 5 0
1 0 0
5 0
0
Dep
th (
m)
(b )
L o n g itu d e (°E )
2 5 0
2 0 0
1 5 0
1 0 0
5 0
0
Dep
th (
m)
(a )
2 6 2 7 2 8 2 9 3 0 3 1 3 2 3 3 3 4
14
16
18
20
22
24
26
28
38 .2
38 .4
38 .6
38 .8
39
39 .2
25 .5
26
26 .5
27
27 .5
28
28 .5
28 .8
29
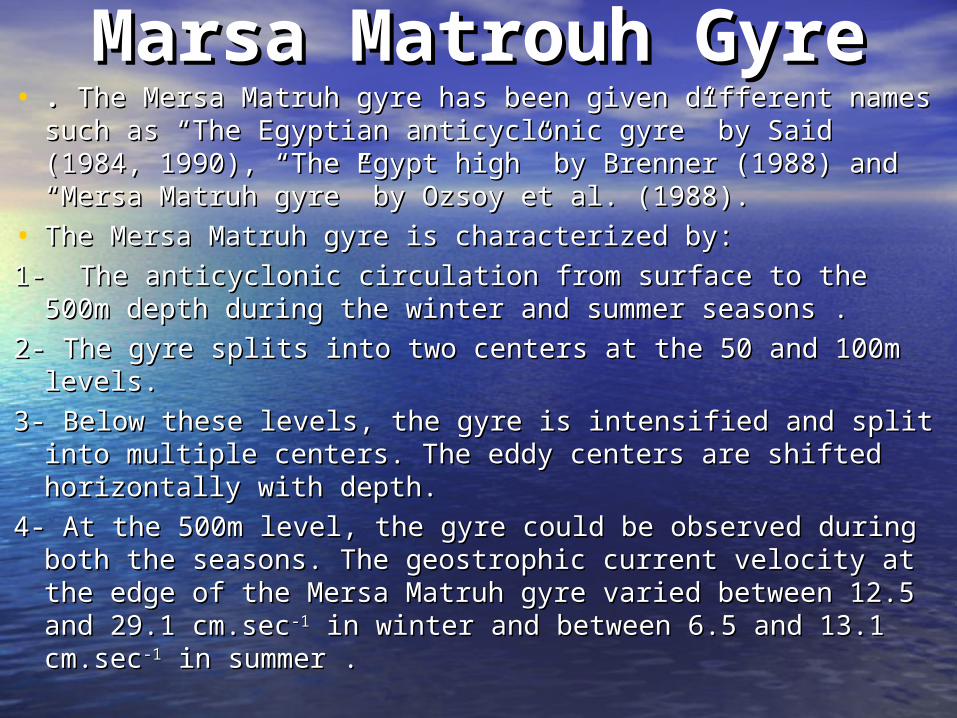
Marsa Matrouh GyreMarsa Matrouh Gyre• . . The Mersa Matruh gyre has been given different names The Mersa Matruh gyre has been given different names
such as “The Egyptian anticyclonic gyre” by Said (1984, such as “The Egyptian anticyclonic gyre” by Said (1984, 1990), “The Egypt high” by Brenner (1988) and “Mersa 1990), “The Egypt high” by Brenner (1988) and “Mersa Matruh gyre” by Ozsoy et al. (1988). Matruh gyre” by Ozsoy et al. (1988).
• The Mersa Matruh gyre is characterized by:The Mersa Matruh gyre is characterized by:
1- The anticyclonic circulation from surface to the 500m 1- The anticyclonic circulation from surface to the 500m depth during the winter and summer seasons . depth during the winter and summer seasons .
2- The gyre splits into two centers at the 50 and 100m levels.2- The gyre splits into two centers at the 50 and 100m levels.
3- Below these levels, the gyre is intensified and split into 3- Below these levels, the gyre is intensified and split into multiple centers. The eddy centers are shifted horizontally multiple centers. The eddy centers are shifted horizontally with depth.with depth.
4- At the 500m level, the gyre could be observed during both 4- At the 500m level, the gyre could be observed during both the seasons. The geostrophic current velocity at the edge the seasons. The geostrophic current velocity at the edge of the Mersa Matruh gyre varied between 12.5 and 29.1 of the Mersa Matruh gyre varied between 12.5 and 29.1 cm.seccm.sec-1-1 in winter and between 6.5 and 13.1 cm.sec in winter and between 6.5 and 13.1 cm.sec-1-1 in in summer .summer .
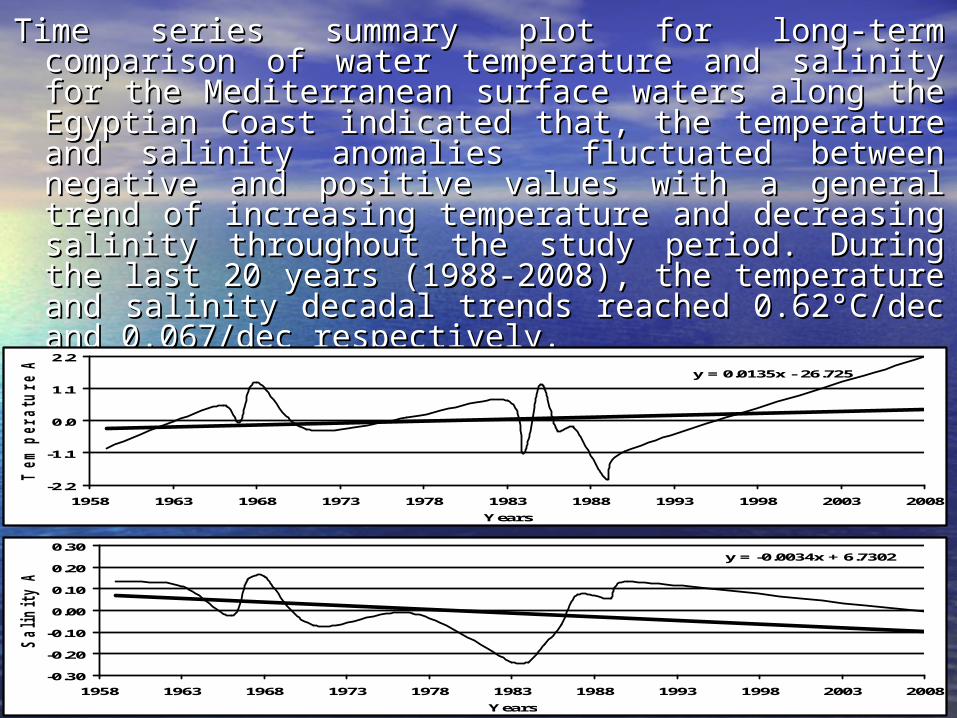
Time series summary plot for long-term comparison of water Time series summary plot for long-term comparison of water temperature and salinity for the Mediterranean surface temperature and salinity for the Mediterranean surface waters along the Egyptian Coast indicated that, the waters along the Egyptian Coast indicated that, the temperature and salinity anomalies fluctuated between temperature and salinity anomalies fluctuated between negative and positive values with a general trend of negative and positive values with a general trend of increasing temperature and decreasing salinity throughout increasing temperature and decreasing salinity throughout the study period. During the last 20 years (1988-2008), the the study period. During the last 20 years (1988-2008), the temperature and salinity decadal trends reached 0.62°C/dec temperature and salinity decadal trends reached 0.62°C/dec and 0.067/dec respectively. and 0.067/dec respectively.
y = 0.0135x - 26.725
-2.2
-1.1
0.0
1.1
2.2
1958 1963 1968 1973 1978 1983 1988 1993 1998 2003 2008
Years
Tem
pera
tu
re A
no
ma
ly (
°C
)
(a)
y = -0.0034x + 6.7302
-0.30
-0.20
-0.10
0.00
0.10
0.20
0.30
1958 1963 1968 1973 1978 1983 1988 1993 1998 2003 2008
Years
Sa
lin
ity
An
om
aly
(b)
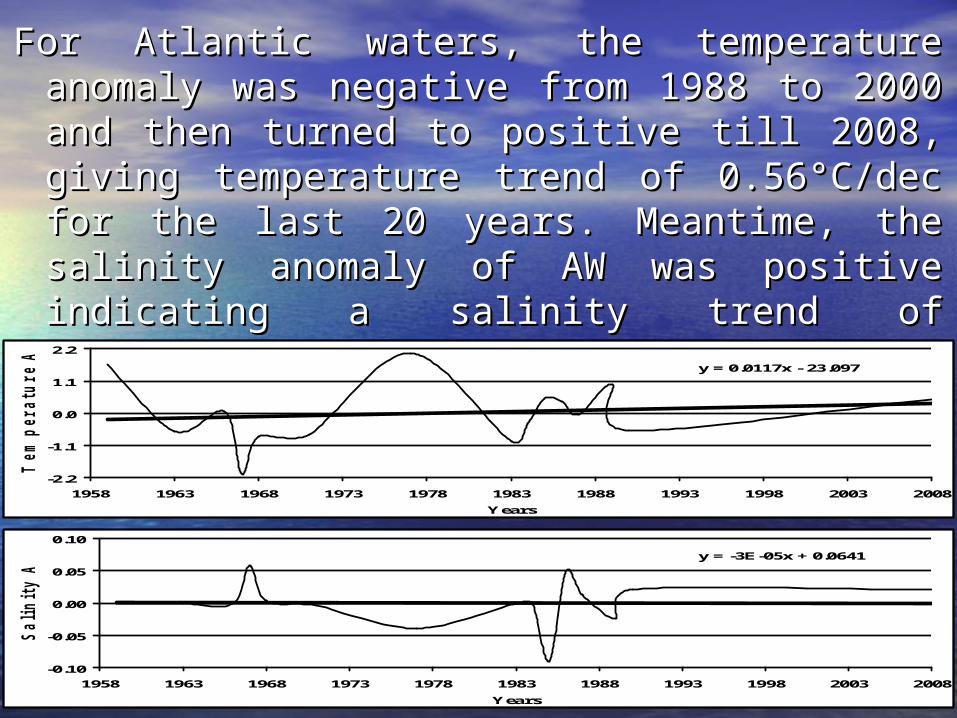
For Atlantic waters, the temperature anomaly was For Atlantic waters, the temperature anomaly was negative from 1988 to 2000 and then turned to negative from 1988 to 2000 and then turned to positive till 2008, giving temperature trend of positive till 2008, giving temperature trend of 0.56°C/dec for the last 20 years. Meantime, the 0.56°C/dec for the last 20 years. Meantime, the salinity anomaly of AW was positive indicating a salinity anomaly of AW was positive indicating a salinity trend of 0.035/dec.salinity trend of 0.035/dec.
y = 0.0117x - 23.097
-2.2
-1.1
0.0
1.1
2.2
1958 1963 1968 1973 1978 1983 1988 1993 1998 2003 2008
Years
Tem
pera
tu
re A
no
ma
ly (
°C
)
(a)
y = -3E-05x + 0.0641
-0.10
-0.05
0.00
0.05
0.10
1958 1963 1968 1973 1978 1983 1988 1993 1998 2003 2008
Years
Sa
lin
ity
An
om
aly
(b)

ConclusionsConclusions(1) As a result of the erection of Aswan High (1) As a result of the erection of Aswan High
Dam in 1965, the yearly fresh water Dam in 1965, the yearly fresh water discharge of the Nile River into the discharge of the Nile River into the southeastern Mediterranean remarkably southeastern Mediterranean remarkably decreased. The annual cycle of the discharge decreased. The annual cycle of the discharge has also changed. At present, the discharge is has also changed. At present, the discharge is only through Rosetta, and the maximum only through Rosetta, and the maximum discharge is recorded in winter months. Such discharge is recorded in winter months. Such a change in both the total amount and pattern a change in both the total amount and pattern of fresh water discharge had obviously of fresh water discharge had obviously affected the characteristics of the coastal affected the characteristics of the coastal waters off Nile Delta. waters off Nile Delta.

ConclusionsConclusions(2) Three water masses could now be observed (2) Three water masses could now be observed
in summer, namely, the surface water mass in in summer, namely, the surface water mass in the upper 30-50 m of temperature 22-28°C the upper 30-50 m of temperature 22-28°C and salinity 38.8-39.20, the subsurface water and salinity 38.8-39.20, the subsurface water mass of temperature 16-22°C and minimum mass of temperature 16-22°C and minimum salinity (<38.60-38.80), which is of Atlantic salinity (<38.60-38.80), which is of Atlantic origin and occupies the 50-150 m layer, and origin and occupies the 50-150 m layer, and the Levantine intermediate water mass (LIW) the Levantine intermediate water mass (LIW) of temperature <16°C and maximum of of temperature <16°C and maximum of salinity (38.90-39.10).salinity (38.90-39.10).

ConclusionsConclusions(3) Temperature and salinity anomalies of the (3) Temperature and salinity anomalies of the
surface water indicated increasing trends in surface water indicated increasing trends in the last 20 years that reached 0.62°C/dec and the last 20 years that reached 0.62°C/dec and 0.067/dec respectively. For the Atlantic 0.067/dec respectively. For the Atlantic waters, the rate of increase was 0.56°C/dec waters, the rate of increase was 0.56°C/dec for the temperature and 0.035/dec for the for the temperature and 0.035/dec for the salinity.salinity.

ConclusionsConclusions(4) The observed increase with time of (4) The observed increase with time of
temperature and salinity of the Atlantic Water temperature and salinity of the Atlantic Water in the Eastern Mediterranean off the Egyptian in the Eastern Mediterranean off the Egyptian coast is hereby confirmed to be attributed to coast is hereby confirmed to be attributed to two main factors: anthropogenic two main factors: anthropogenic modifications, especially the damming of the modifications, especially the damming of the Nile River, and to local climatic changes. The Nile River, and to local climatic changes. The amount and type of information available to-amount and type of information available to-date on the latter factor, calls for further work date on the latter factor, calls for further work to be carried out on this question.to be carried out on this question.

Thank youThank you
Related Documents