Investigating and Comparing Multimodal Biometric Techniques Christopher Andrade and Sebastian H. von Solms Academy for Information Technology University of Johannesburg Johannesburg, South Africa Abstract. Determining the identity of a person has become vital in today’s world. Emphasis on security has become increasingly more common in the last few decades, not only in Information Technology, but across all industries. One of the main principles of security is that a system only be accessed by a legitimate user. According to the ISO 7498/2 document [1] (an international standard which defines an information security system architecture) there are 5 pillars of information security. These are Identification/Authentication, Confidentiality, Authorization, Integrity and Non Repudiation. The very first line of security in a system is identifying and authenticating a user. This ensures that the user is who he/she claims to be, and allows only authorized individuals to access your system. Technologies have been developed that can automatically recognize a person by his unique physical features. This technology, referred to as ‘biometrics’, allows us to quickly, securely and conveniently identify an individual. Biometrics solutions have already been deployed worldwide, and it is rapidly becoming an acceptable method of identification in the eye of the public. As useful and advanced as unimodal (single biometric sample) biometric technologies are, they have their limits. Some of them aren’t completely accurate; others aren’t as secure and can be easily bypassed. Recently it has been reported to the congress of the U.S.A [2] that about 2 percent of the population in their country do not have a clear enough fingerprint for biometric use, and therefore cannot use their fingerprints for enrollment or verification. This same report recommends using a biometric system with dual (multimodal) biometric inputs, especially for large scale systems, such as airports. In this technical paper we will investigate and compare multimodal biometric techniques, in order to determine how much of an advantage lies in using this technology, over its unimodal equivalent. 1 Introduction The use of biometric technologies – the mathematical analysis of a unique characteristic such as fingerprints, iris and retina – has been adopted worldwide and on a large scale. It is used in many different sectors, including government, banking, airports and schools. However, successful use of biometric systems in these areas does not automatically imply an ideal security system. Please use the following format when citing this chapter: Andrade, C. and von Solms, S. H., 2008, in IFIP International Federation for Information Processing, Volume 261; Policies and Research in Identity Management; Eds. E. de Leeuw, Fischer-Hübner, S., Tseng, J., Borking, J.; (Boston: Springer), pp. 79–90.

Welcome message from author
This document is posted to help you gain knowledge. Please leave a comment to let me know what you think about it! Share it to your friends and learn new things together.
Transcript

Investigating and Comparing Multimodal Biometric Techniques
Christopher Andrade and Sebastian H. von Solms
Academy for Information Technology University of Johannesburg Johannesburg, South Africa
Abstract. Determining the identity of a person has become vital in today’s world. Emphasis on security has become increasingly more common in the last few decades, not only in Information Technology, but across all industries. One of the main principles of security is that a system only be accessed by a legitimate user. According to the ISO 7498/2 document [1] (an international standard which defines an information security system architecture) there are 5 pillars of information security. These are Identification/Authentication, Confidentiality, Authorization, Integrity and Non Repudiation. The very first line of security in a system is identifying and authenticating a user. This ensures that the user is who he/she claims to be, and allows only authorized individuals to access your system. Technologies have been developed that can automatically recognize a person by his unique physical features. This technology, referred to as ‘biometrics’, allows us to quickly, securely and conveniently identify an individual. Biometrics solutions have already been deployed worldwide, and it is rapidly becoming an acceptable method of identification in the eye of the public. As useful and advanced as unimodal (single biometric sample) biometric technologies are, they have their limits. Some of them aren’t completely accurate; others aren’t as secure and can be easily bypassed. Recently it has been reported to the congress of the U.S.A [2] that about 2 percent of the population in their country do not have a clear enough fingerprint for biometric use, and therefore cannot use their fingerprints for enrollment or verification. This same report recommends using a biometric system with dual (multimodal) biometric inputs, especially for large scale systems, such as airports. In this technical paper we will investigate and compare multimodal biometric techniques, in order to determine how much of an advantage lies in using this technology, over its unimodal equivalent.
1 Introduction
The use of biometric technologies – the mathematical analysis of a unique characteristic such as fingerprints, iris and retina – has been adopted worldwide and on a large scale. It is used in many different sectors, including government, banking, airports and schools. However, successful use of biometric systems in these areas does not automatically imply an ideal security system.
Please use the following format when citing this chapter:
Andrade, C. and von Solms, S. H., 2008, in IFIP International Federation for Information Processing, Volume 261; Policies and Research in Identity Management; Eds. E. de Leeuw, Fischer-Hübner, S., Tseng, J., Borking, J.; (Boston: Springer), pp. 79–90.

Christopher Andrade and Sebastian H. von Solms
Most biometric systems are unimodal (i.e. they use only 1 biometric sample to recognize a user). Even the best unimodal biometric systems (usually iris, fingerprint and retina scanners) are far from perfect. They have many inherent problems in their use. The major dilemma is that no single biometric technology is perfectly suited for all applications. Furthermore, these unimodal technologies suffer from noisy sensor data, lack of individuality, non-universality, spoof attacks and included error rates in their use [3].
It is logical then, to try and combine multiple biometric samples to ‘get the best of both worlds’ so to speak. Some of the problems inherent in unimodal biometric systems can therefore be overcome by using multiple sources of information. Such systems are known as multimodal biometric systems. Multimodal biometric systems use 2 or more biometric samples from the same person in order to identify him/her.
These systems are then expected to be more accurate and less problematic because they take more independent pieces of evidence into account, before making a decision.
The purpose of this technical report is to determine if multimodal biometrics provide any significant improvement in accuracy over its unimodal counterpart.
Secondly, we will provide an objective analysis of available multimodal biometric fusion and normalization methods, to highlight their strengths and weaknesses, and to further explore their performance, relative to each other.
2 Multimodal Biometrics
Multimodal biometrics are systems that merge inputs obtained from two or more biometric sources. By combining these inputs from different sources, one can drastically improve the overall accuracy of the biometric system [3].
Multimodal biometric systems provide greater population coverage, because it is able to identify a person by more than just one unique identifier. Because of its improved security, it also discourages intruders to attempt to bypass or spoof the system. Adding more biometric checks makes it much more difficult for someone to simultaneously spoof different biometric traits.
A multimodal biometric system based on 2 or more biometric inputs is expected to be more resilient to noise, address problems of non universality (uniqueness of a biometric trait), increase matching accuracy, and increase security by making it harder for people to get away with spoof attacks.
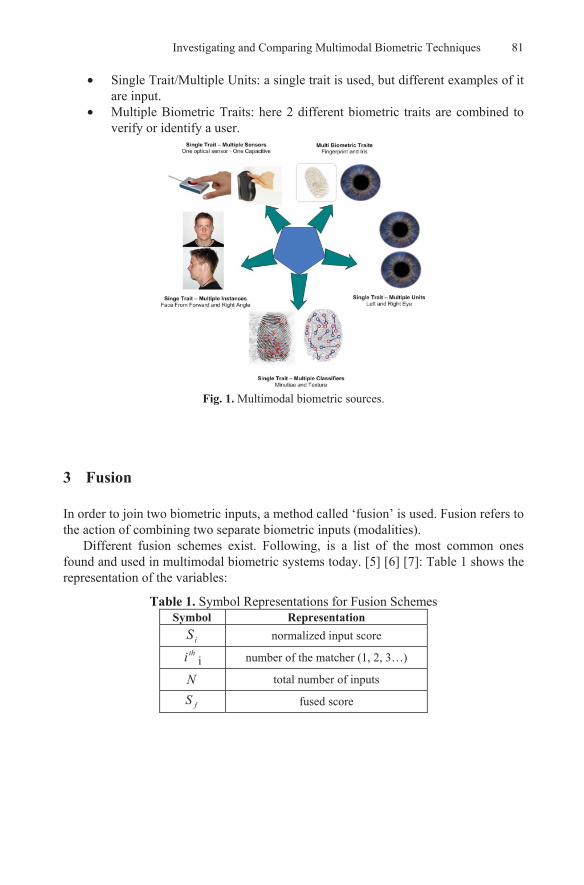
These different inputs can come from a variety of sources [4]:
2.1 Multimodal biometric sources
• Single Trait/Multiple Classifiers: a single trait is used, but different classifiers are input to the system.
• Single Trait/Multiple Instances: again, a single trait is used, but similar inputs that are slightly different to one another are used.
80
Investigating and Comparing Multimodal Biometric Techniques
• Single Trait/Multiple Units: a single trait is used, but different examples of it are input.
• Multiple Biometric Traits: here 2 different biometric traits are combined to verify or identify a user.
Fig. 1. Multimodal biometric sources.
3 Fusion
In order to join two biometric inputs, a method called ‘fusion’ is used. Fusion refers to the action of combining two separate biometric inputs (modalities).
Different fusion schemes exist. Following, is a list of the most common ones found and used in multimodal biometric systems today. [5] [6] [7]: Table 1 shows the representation of the variables:
Table 1. Symbol Representations for Fusion Schemes Symbol Representation
iS normalized input score thi i number of the matcher (1, 2, 3…)
N total number of inputs
fS fused score
81

Christopher Andrade and Sebastian H. von Solms
3.1 Simple-Sum:
∑=
=N
iif SS
1
3.2 Min-Score:
Nf SSSS .....,,min( 21= )
3.3 Max-Score:
Nf SSSS .....,,max( 21= )
3.4 Matcher Weighting:
In this method, weights are assigned to individual matchers according to their Equal Error Rates. The more accurate a matcher is, the higher weight it is assigned, giving it more of a bias when it comes to the final fused score. Table 2 explains the variables:
Table 2. Symbol representations for fusion schemes. Symbol Representation
imn normalized input score
m matcher mr equal error rate mw weight of input
m
M
mm
m
rrw
)1/1(1∑
==
Note:
∑ ==∀≤≤ M
mmm wmw
11,,10
The formula then becomes:
∑=
∀=M
m
mi
mf inwS
1,
3.5 Sum of Probabilities:
We use )|( genuinesp and )|( impostersp to evaluate:
)|()|()|()|(imposterspgenuinesp
genuinespSgenuineP+
=
In this method, the fused score is determined by the summation of the probability of true scores.
82

Investigating and Comparing Multimodal Biometric Techniques
∑=
=N
iif SgenuinePS
1)|(
4 Normalization
Fusion works well if biometric scores are homogenous (i.e. of the same nature). However, if scores are non homogenous, then they require normalization to convert them into a range that makes them more similar to each other.
Normalization is usually necessary or preferred before the two biometric inputs are combined at the fusion point. Normalization simply refers to scores being converted into a more common domain. For example: If one matching module provides scores that are in the range of [10, 10 000] and another in the range of [0, 1], this becomes a problem.
Table 3. Symbol representation for normalization methods. Symbol Representation
s Input Score 's Normalized Score
S Total number of Inputs
4.1 Min-Max:
)min()max()min('
SSSss
−−=
4.2 Z-Score:
)()('
SstdSmeanss −=
4.3 TanH:
]1))(
))((01.0[tanh(21' +−=
SstdSmeanss
83
Christopher Andrade and Sebastian H. von Solms
4.4 Double Sigmoid Normalization:
,))
2(2exp(1
1'
))1
(2exp(1
1'
otherwise
rts
s
tsif
rts
s
−−+=
<⋅⋅−−+
=
5 Practical Work
5.1 Scoresets
We have used the publicly available BSSR1 Scoreset, obtained from NIST (National Institute of Science and Technology) in the U.S.A. This is a set of generated similarity scores from two face recognition systems and one fingerprint system [8] In addition to using the BSSR1 scoreset, we have created our own database of biometric similarity scores. The score database consists of a small population (50 people) of face and finger scores.
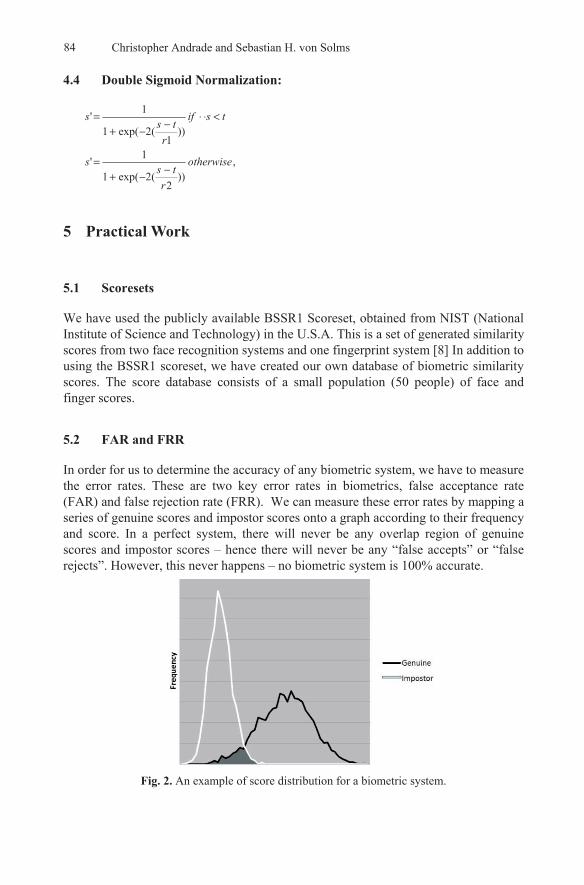
5.2 FAR and FRR
In order for us to determine the accuracy of any biometric system, we have to measure the error rates. These are two key error rates in biometrics, false acceptance rate (FAR) and false rejection rate (FRR). We can measure these error rates by mapping a series of genuine scores and impostor scores onto a graph according to their frequency and score. In a perfect system, there will never be any overlap region of genuine scores and impostor scores – hence there will never be any “false accepts” or “false rejects”. However, this never happens – no biometric system is 100% accurate.
84
Fig. 2. An example of score distribution for a biometric system.

Investigating and Comparing Multimodal Biometric Techniques
From Figure 2 we can see the two populations – one being genuine and one being impostor. The overlap region between these two populations is shaded in grey. It is apparent now that it is not easy to classify if a score is “genuine” or not when it falls into this overlap region. This is where the error rates - FRR and FAR tie into.
5.3 Genuine Acceptance Rate
Genuine Acceptance Rate (GAR) is an overall accuracy measurement of a biometric system. It is calculated by the formula: GAR = 1 – FRR [11]. GAR is important because it is the chief measurement of precision in this paper. Figure 3 below shows how GAR, FRR and FAR are linked:
Fig. 3. FAR, FRR and GAR illustrated
FAR and GAR are usually mapped against each-other on a graph known as a ROC (Receiver Operating Characteristic) curve [12]. ROC curve’s are used often in biometrics to compare the accuracy of a biometric matcher at a given confidence level (Example a FAR set to 1%).
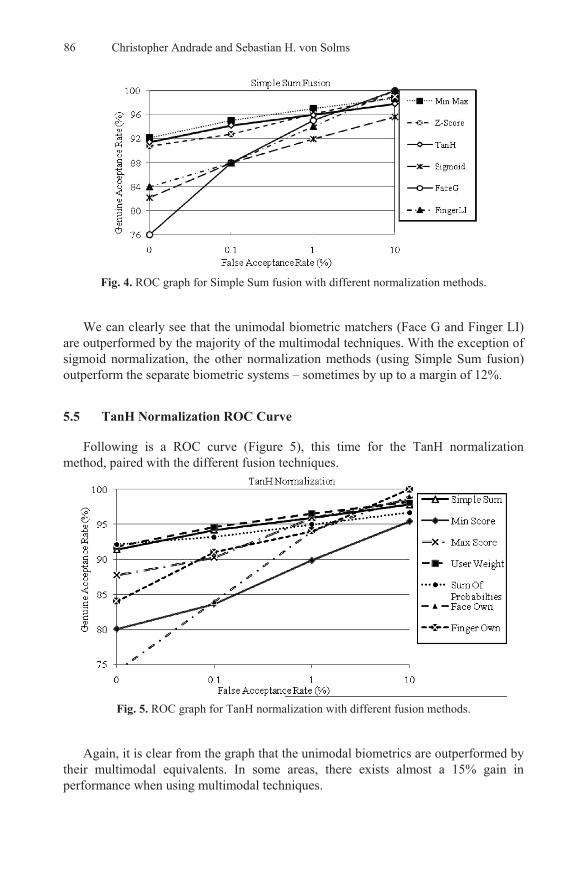
5.4 Simple Sum Fusion - ROC Curve
Following is a ROC curve. It shows the performance of the simple sum fusion technique, paired with various normalization techniques.
85
Christopher Andrade and Sebastian H. von Solms
Fig. 4. ROC graph for Simple Sum fusion with different normalization methods.
We can clearly see that the unimodal biometric matchers (Face G and Finger LI) are outperformed by the majority of the multimodal techniques. With the exception of sigmoid normalization, the other normalization methods (using Simple Sum fusion) outperform the separate biometric systems – sometimes by up to a margin of 12%.
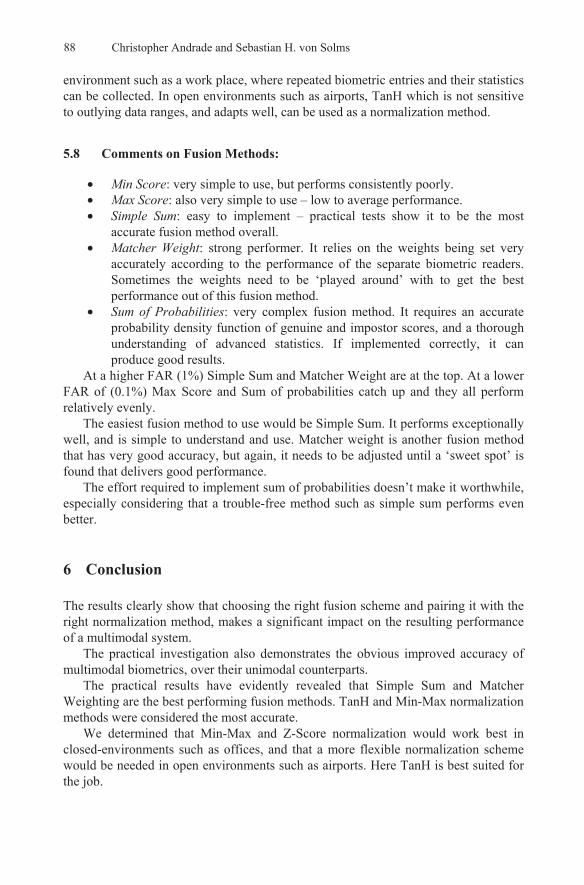
5.5 TanH Normalization ROC Curve
Following is a ROC curve (Figure 5), this time for the TanH normalization method, paired with the different fusion techniques.
Fig. 5. ROC graph for TanH normalization with different fusion methods.
Again, it is clear from the graph that the unimodal biometrics are outperformed by their multimodal equivalents. In some areas, there exists almost a 15% gain in performance when using multimodal techniques.
86

Investigating and Comparing Multimodal Biometric Techniques 5.6 Summary Performance Table
The table that follows is the combined average scores for all tested fusion and normalization methods. This table shows clear performance differences between these methods. The highlighted scores in bold show the highest performing fusion methods, paired with a normalization algorithm. The average performance of a fusion method is shown in the column on the right, while the average performance of a normalization method is shown in the column at the bottom.
Table 4 demonstrates all the methods at a False Acceptance Rate of 0, 1%: Interpretation: at FAR of 0, 1% the Simple Sum fusion method is the most
accurate, obtaining the highest GAR rate with 2 out of 4 normalization techniques. Simple Sum retains 1st place overall (Column on the right) for the best fusion method. TanH does the same (Column at the bottom) and is considered to be the most accurate. According to these results the Sigmoid normalization and Min Score fusion perform consistently in the lower range, and is considered the least accurate.
Table 4. GAR Performance at a FAR of 0. 1%. Normalization Algorithms
Fusion Algorithms Min Max Z-Score TanH Sigmoid Average Fusion
Simple Sum 95.02 92.78 94.20 87.93 92.48 Min Score 84.40 85.18 83.63 83.30 84.12 Max Score 84.48 88.26 90.28 88.09 87.7
Matcher Weight 95.00 89.74 94.58 87.99 91.82 Sum of Probabilities 94.17 86.97 93.17 85.26 89.89
Average Normalization
90.61 88.56 91.172 86.51
5.7 Comments on Normalization Methods:
• Min Max: easy to use normalization method. Performs consistently well across all FAR ranges
• Sigmoid: complex normalization method. It produces very poor results – often worse than a single biometric.
• Z-score: quite a simple method to use. Consistently near the top performer in the practical experiments. It does not do well if input score is outside the range of original training scores.
• TanH: best overall normalization technique in practical tests. It adapts well to scores that fall outside the range of original training scores.
At a higher FAR (1%), Min-Max and TanH seem to perform the best. At a lower FAR of (0,1%) Z-Score catches up, and performs just as well and Min-Max and TanH.
If information such as minimum and maximum (for Min Max) and mean and standard deviation (for Z-Score) can be determined from the scores before hand, then these two normalization algorithms will work just fine. This is ideal in a closed
87
Christopher Andrade and Sebastian H. von Solms
environment such as a work place, where repeated biometric entries and their statistics can be collected. In open environments such as airports, TanH which is not sensitive to outlying data ranges, and adapts well, can be used as a normalization method.
5.8 Comments on Fusion Methods:
• Min Score: very simple to use, but performs consistently poorly. • Max Score: also very simple to use – low to average performance. • Simple Sum: easy to implement – practical tests show it to be the most
accurate fusion method overall. • Matcher Weight: strong performer. It relies on the weights being set very
accurately according to the performance of the separate biometric readers. Sometimes the weights need to be ‘played around’ with to get the best performance out of this fusion method.
• Sum of Probabilities: very complex fusion method. It requires an accurate probability density function of genuine and impostor scores, and a thorough understanding of advanced statistics. If implemented correctly, it can produce good results.
At a higher FAR (1%) Simple Sum and Matcher Weight are at the top. At a lower FAR of (0.1%) Max Score and Sum of probabilities catch up and they all perform relatively evenly.
The easiest fusion method to use would be Simple Sum. It performs exceptionally well, and is simple to understand and use. Matcher weight is another fusion method that has very good accuracy, but again, it needs to be adjusted until a ‘sweet spot’ is found that delivers good performance.
The effort required to implement sum of probabilities doesn’t make it worthwhile, especially considering that a trouble-free method such as simple sum performs even better.
6 Conclusion
The results clearly show that choosing the right fusion scheme and pairing it with the right normalization method, makes a significant impact on the resulting performance of a multimodal system.
The practical investigation also demonstrates the obvious improved accuracy of multimodal biometrics, over their unimodal counterparts.
The practical results have evidently revealed that Simple Sum and Matcher Weighting are the best performing fusion methods. TanH and Min-Max normalization methods were considered the most accurate.
We determined that Min-Max and Z-Score normalization would work best in closed-environments such as offices, and that a more flexible normalization scheme would be needed in open environments such as airports. Here TanH is best suited for the job.
88
Investigating and Comparing Multimodal Biometric Techniques
We have learned that multimodal biometric systems may take a fair amount of time to setup initially, as training sets or data needed for the algorithms are gathered. This has proven to be a long process, especially in databases with large populations. However, once in place, multimodal biometric systems function just as speedily as their unimodal equivalent.
We have also shown in our own practical experimentation that by using a unimodal biometric source, many false users are let into a system (resulting from the unimodal error rates being higher than the multimodal ones). By using multimodal biometric systems, we can improve accuracy by cutting down on error rates. We also improve security as it is harder for an intruder to bypass multiple systems at once then it is to spoof a single one.
The biometric challenge has always been to create a system that is completely accurate and safe from intruders. Even the best unimodal biometric schemes by themselves have not accomplished this feat. With the introduction of multimodal biometrics as a technology, we are now moving towards that “perfect” recognition system, although we are not quite there yet.
While unimodal biometrics leaves an accuracy gap for multimodal biometric systems to fill, multimodal systems will always exist. The need then becomes to either further increase the accuracy of single biometric systems, or to ensure that multimodal systems become more mainstream.
References
1. ISO 7498-2 Information processing systems - Open Systems Interconnection Basic Reference Model -- Part 2: Security Architecture
2. NIST Report to the United States Congress - Summary of NIST Standards for Biometric Accuracy, Tamper Resistance, and Interoperability, November 13 2002.
3. Multibiometric Systems 34 January 2004/Vol. 47, No. 1 Communications of the ACM – By Anil K Kain and Arun Ross Pg 37-38. http://www.csee.wvu.edu/~ross/ pubs/RossMultibiometric_CACM04.pdf
4. Score normalization in multimodal biometric systems - Anil Jaina, Karthik Nandakumara, Arun Rossb, A. Jain et al. / Pattern Recognition 38 (2005) Pg 2270. http:// biometrics.cse.msu.edu/Publications/Multibiometrics/JainNandakumarRoss_ScoreNormalization_PR05.pdf
5. Large-Scale Evaluation of Multimodal Biometric Authentication Using State-of-the-Art Systems - IEEE TRANSACTIONS ON PATTERN ANALYSIS AND MACHINE INTELLIGENCE, VOL. 27, NO. 3, MARCH 2005 - Robert Snelick, Pages 2-3. http:// ieeexplore.ieee.org/iel5/34/30209/01388269.pdf
6. Multimodal Biometric Systems: A Survey - Arpit Gattani Utah State University – PDF Document – Pages 6. http://cc.usu.edu/~gattani/Biometrics-Gattani.doc
7. Score normalization in multimodal biometric systems - Anil Jaina, Karthik Nandakumara, Arun Rossb - Pattern Recognition 38 (2005) 2270 – 2285.
8. http://www.itl.nist.gov/iad/ 894.03/biometricscores/ 9. http://www.neurotechnologija.com/mm_sdk.html 10. http://www.acsysbiometrics.com/product_sdk.html
89

Christopher Andrade and Sebastian H. von Solms
11. Improving Personal Identification Accuracy Using Multisensor Fusion for Building Access Control Applications - Lisa Osadciw, Pramod Varshney, and Kalyan Veeramachaneni PG 1-2. http://ieeexplore.ieee.org/Xplore/login.jsp?url=/iel5/7951/2195 4/01020946.pdf
12. Validating a Biometric Authentication System: Sample Size Requirements – PDF document - Sarat C. Dass, Member, IEEE, Yongfang Zhu.. http://www.stt.msu.edu/ ~sdass/papers/DassZhuJain_SampleSize_PAMI06.pdf
90
Related Documents


