April 26 th 2017 invest in Invest in remarkable indonesia Invest in remarkable indonesia indonesia Invest in remarkable indonesia Invest in remarkable indonesia Invest in remarkable indonesia indonesia Invest in Invest in remarkable indonesia Invest in remarkable indonesia Invest in remarkable indonesia indonesia Invest in Invest in Invest in able indonesia Invest © 2017 by Indonesia Investment Coordinating Board. All rights reserved Indonesia Investment Coordinating Board DOMESTIC AND FOREIGN DIRECT INVESTMENT REALIZATION IN QUARTER I 2017

Welcome message from author
This document is posted to help you gain knowledge. Please leave a comment to let me know what you think about it! Share it to your friends and learn new things together.
Transcript

April 26th 2017
invest in
Invest in remarkable indonesia Invest in
remarkable indonesiaindonesia
Invest in remarkable indonesia
Invest in remarkable indonesia
Invest in remarkable indonesia
indonesia
Invest in
Invest in remarkable indonesia
Invest in remarkable indonesia
Invest in remarkable indonesia
indonesia
Invest in
Invest in
Invest in
able indonesia Invest
© 2017 by Indonesia Investment Coordinating Board. All rights reserved
Indonesia Investment Coordinating Board
DOMESTIC AND FOREIGN DIRECT INVESTMENT REALIZATION
IN QUARTER I 2017

The Investment Coordinating Board of the Republic of Indonesia
2
LIST OF CONTENTS
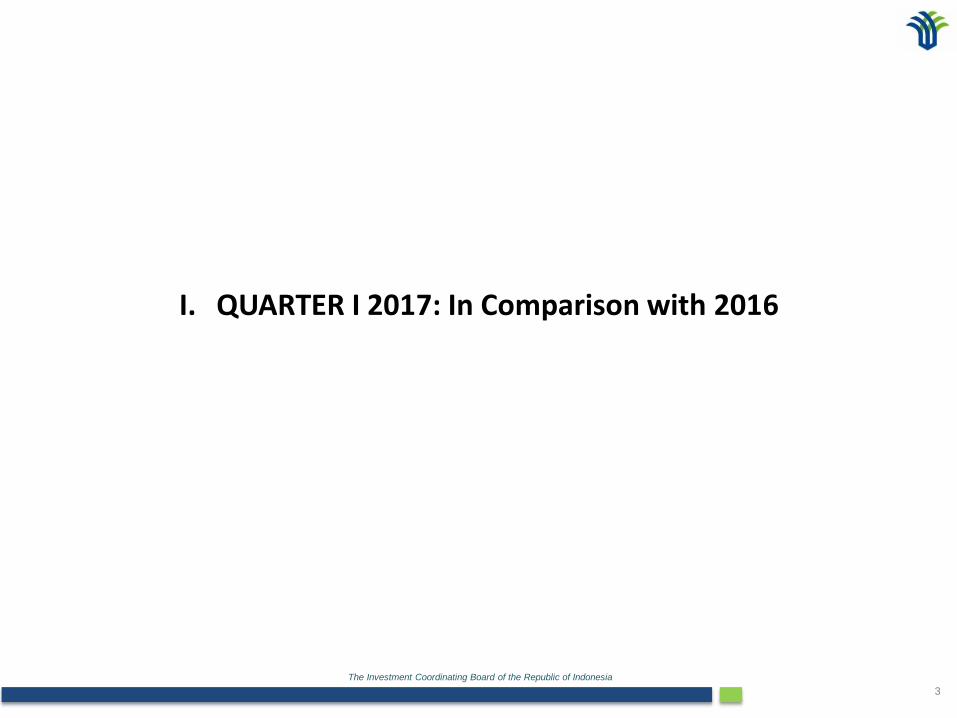
I. QUARTER I 2017: In Comparison with 2016
II. QUARTER I 2017: Sector, Location, Country of Origin, and Region
III. INDONESIAN LABOR ABSORPTION
IV. PROGRESS OF INVESTMENT REALIZATION 2012 – MARCH 2017
The Investment Coordinating Board of the Republic of Indonesia
3
I. QUARTER I 2017: In Comparison with 2016

The Investment Coordinating Board of the Republic of Indonesia
4
*) 2017 Investment Realization Target, BKPM’s Strategic Planning 2015 - 2019**) Achievement against 2017 target
Investment Realization in Quarter I 2017
The value of investment in Quarter I 2017, the investment realization during threemonths period of report (January – March 2017), is based on investment realizationreport from DDI and FDI companies.
Oil and Gas, Banking, Non-Bank Financial Institution, Insurance, Leasing, and HomeIndustry are excluded .
The investment value is in Rupiah Trillion (T) and the currency rate of US$ 1= Rp.13,300 based on National Budget 2017.
Investment realization in Quarter I 2017: Rp. 165.8 T, increases around 13.2% fromQuarter I 2016 (Rp. 146.5 T).
DDI: Domestic Direct InvestmentFDI: Foreign Direct Investment
Quarter I 2017 : In Comparison With 2016
Quarter I 2017
y-o-y q-o-q
DDI 36.5% 18.4%
FDI 0.9% -4.2%
TOTAL 13.2% 4.0%
Q I 2016 Q IV 2016 Q I 2017 Target 2017*) Achievement**)
TOTAL 146.5 159.4 165.8 678.8 24.4
DDI 50.4 58.1 68.8 249.8 22.6
FDI 96.1 101.3 97.0 429.0 27.5
0
100
200
300
400
500
600
700
Rp
Trill
ion

The Investment Coordinating Board of the Republic of Indonesia
5
Investment Realization in Quarter I 2017 Compared to The Same Period in 2016:
DDI and FDI; Java and Outside Java
Quarter I 2016 Quarter I 2017
Quarter I 2016 Quarter I 2017
1. Quarter I 2016 and Quarter I 2017 : FDI and DDI
2. Quarter I 2016 and Quarter I 2017 : Java and Outside Java
T= Trillion
JavaRp 80.7 T(55.1%)
OutsideJava
Rp 65.8 T(44.9%)
Quarter I 2017 : In Comparison With 2016
Realization y-o-y
DDI 36.5%
FDI 0,9%
TOTAL 13.2%
Realization y-o-y
Java 12.2%
Outside Java 14.4%
TOTAL 13.2%
DDIRp 68.8 T(41.5%)
FDIRp 97.0 T(58.5%)
Total: Rp 165.8 T
DDIRp 50.4 T(34.4%)
FDIRp 96.1 T(65.6%)
Total: Rp 146.5 T
JavaRp 90.5 T(54.6%)
Outside Java
Rp 75.3 T(45.4%)
Total: Rp 165.8 T

The Investment Coordinating Board of the Republic of Indonesia
6
II. Quarter I 2017 : Sector, Location, Country of Origin, and Region

The Investment Coordinating Board of the Republic of Indonesia
7
FDI
DDI DDI + FDI
T= TrilionB= Bilion
Quarter I 2017 : Sector, Location, Country of Origin and Region
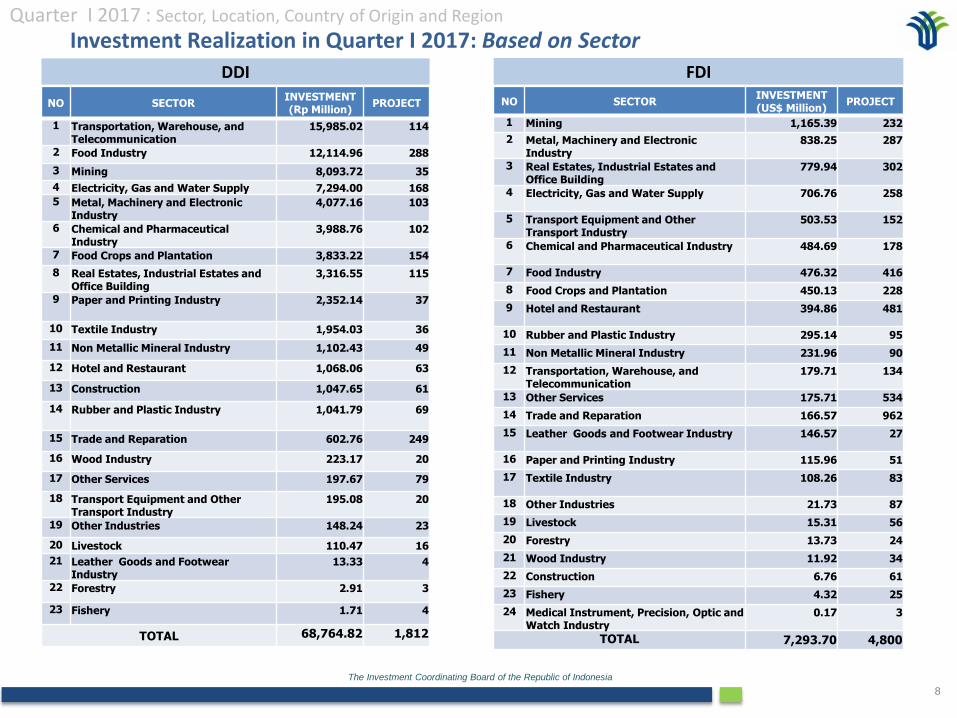
Investment Realization in Quarter I 2017: Based on Sector
MiningUS$ 1.2 B(16.0%)
Metal, Machinery and
Electronic Industry
US$ 0.8 B(11.5%)
Real Estates, Industrial
Estates and Office Building
US$ 0.8 B(10.7%)
Electricity, Gas and Water Supply
US$ 0.7 B(9.7%)
Transport Equipment and Other Transport Industry
US$ 0.5 B(6.9%)
OthersUS$ 3.3 B(45.2%)
Transportation, Warehouse, and
TelecommunicationRp 16.0 T(23.2%)
Food IndustryRp 12.1 T(17.6%)
MiningRp 8.1 T(11.8%)
Electricity, Gas and Water Supply
Rp 7.3 T(10.6%)
Metal, Machinery and
Electronic IndustryRp 4.1 T(5.9%)
OthersRp 21.2 T(30.8%)
MiningRp 23.6 T(14.2%)
Food IndustryRp 18.5 T(11.1%)
Transportation, Warehouse, and
TelecommunicationRp 18.4 T(11.1%)
Electricity, Gas and Water Supply
Rp 16.7 T(10.1%)
Metal, Machinery and Electronic
IndustryRp 15.2 T
(9.2%)
OthersRp 73.4 T(44.3%)
The Investment Coordinating Board of the Republic of Indonesia
8
NO SECTORINVESTMENT(US$ Million)
PROJECT
1 Mining 1,165.39 232
2 Metal, Machinery and Electronic Industry
838.25 287
3 Real Estates, Industrial Estates and Office Building
779.94 302
4 Electricity, Gas and Water Supply 706.76 258
5 Transport Equipment and Other Transport Industry
503.53 152
6 Chemical and Pharmaceutical Industry 484.69 178
7 Food Industry 476.32 416
8 Food Crops and Plantation 450.13 228
9 Hotel and Restaurant 394.86 481
10 Rubber and Plastic Industry 295.14 95
11 Non Metallic Mineral Industry 231.96 90
12 Transportation, Warehouse, and Telecommunication
179.71 134
13 Other Services 175.71 534
14 Trade and Reparation 166.57 962
15 Leather Goods and Footwear Industry 146.57 27
16 Paper and Printing Industry 115.96 51
17 Textile Industry 108.26 83
18 Other Industries 21.73 87
19 Livestock 15.31 56
20 Forestry 13.73 24
21 Wood Industry 11.92 34
22 Construction 6.76 61
23 Fishery 4.32 25
24 Medical Instrument, Precision, Optic and Watch Industry
0.17 3
TOTAL 7,293.70 4,800
FDIDDI
NO SECTORINVESTMENT(Rp Million)
PROJECT
1 Transportation, Warehouse, and Telecommunication
15,985.02 114
2 Food Industry 12,114.96 288
3 Mining 8,093.72 35
4 Electricity, Gas and Water Supply 7,294.00 168
5 Metal, Machinery and Electronic Industry
4,077.16 103
6 Chemical and Pharmaceutical Industry
3,988.76 102
7 Food Crops and Plantation 3,833.22 154
8 Real Estates, Industrial Estates and Office Building
3,316.55 115
9 Paper and Printing Industry 2,352.14 37
10 Textile Industry 1,954.03 36
11 Non Metallic Mineral Industry 1,102.43 49
12 Hotel and Restaurant 1,068.06 63
13 Construction 1,047.65 61
14 Rubber and Plastic Industry 1,041.79 69
15 Trade and Reparation 602.76 249
16 Wood Industry 223.17 20
17 Other Services 197.67 79
18 Transport Equipment and Other Transport Industry
195.08 20
19 Other Industries 148.24 23
20 Livestock 110.47 16
21 Leather Goods and Footwear Industry
13.33 4
22 Forestry 2.91 3
23 Fishery 1.71 4
TOTAL 68,764.82 1,812
Quarter I 2017 : Sector, Location, Country of Origin and Region
Investment Realization in Quarter I 2017: Based on Sector

The Investment Coordinating Board of the Republic of Indonesia
9
FDI
DDI DDI + FDI
T= TriliunB= Billion
Investment Realization Quarter I 2017 : Based on LocationQuarter I 2017 : Sector, Location, Country of Origin, and Region
West JavaUS$ 1.5 B(20.8%)
Special Territory of
JakartaUS$ 0.9 B(12.8%)
PapuaUS$ 0.6 B
(8.1%)
Central JavaUS$ 0.5 B
(7.1%)
BantenUS$ 0.5 B
(7.1%)
OthersUS$ 3.2 B(44.1%)
Special Territory of
JakartaRp 11.8 T(17.2%)
East JavaRp 9.4 T(13.7%)
West JavaRp 9.1 T(13.2%)
BantenRp 5.5 T(8.0%)
Central JavaRp 5.0 T(7.2%)
OthersRp 28.0 T(40.7%)
West JavaRp 29.32 T
(17.7%)
Special Territory of
JakartaRp 24.24 T
(14.6%)
East JavaRp 12.62 T
(7.6%)
BantenRp 12.34 T
(7.4%)
Central JavaRp 11.88 T
(7.2%)
OthersRp 75.38 T
(45.5%)

The Investment Coordinating Board of the Republic of Indonesia
10
NO LOCATIONINVESTMENT(US$ Million)
PROJECT
1 West Java 1,520.28 651
2 Special Territory of Jakarta 934.74 1,378
3 Papua 589.76 57
4 Central Java 518.92 168
5 Banten 515.20 368
6 East Kalimantan 300.16 105
7 Riau Islands 275.70 159
8 Southeast Sulawesi 272.20 38
9 Central Sulawesi 269.24 57
10 East Java 242.45 298
11 Central Kalimantan 208.88 87
12 South Sumatera 203.59 83
13 South Sulawesi 201.89 68
14 North Sumatera 195.31 152
15 West Kalimantan 190.62 147
16 North Sulawesi 151.49 54
17 Bali 135.24 301
18 Riau 114.16 71
19 Maluku 91.92 10
20 South Kalimantan 75.40 24
21 Bangka Belitung Islands 48.33 29
22 Lampung 34.97 34
23 North Maluku 32.23 15
24 West Nusa Tenggara 30.56 197
25 East Nusa Tenggara 28.95 54
26 Jambi 27.84 21
27 West Papua 24.45 25
28 North Kalimantan 24.37 27
29 Bengkulu 13.72 15
30 West Sulawesi 8.80 9
31 West Sumatera 5.53 35
32 Special Territory of Yogyakarta 3.76 26
33 Gorontalo 2.10 14
34 Aceh 0.95 23
TOTAL 7,293.70 4,800
FDIDDI
NO LOCATIONINVESTMENT(Rp Million)
PROJECT
1 Special Territory of Jakarta 11,807.58 132
2 East Java 9,390.60 293
3 West Java 9,102.21 180
4 Banten 5,488.51 111
5 Central Java 4,973.66 224
6 North Sumatera 4,311.50 64
7 East Kalimantan 3,197.22 53
8 Riau 3,001.68 74
9 South Sumatera 2,631.46 75
10 West Kalimantan 2,439.26 76
11 West Nusa Tenggara 2,199.98 21
12 South Kalimantan 1,850.55 28
13 Lampung 1,589.92 9
14 Southeast Sulawesi 1,406.20 25
15 Bangka Belitung Islands 1,258.67 15
16 West Sumatera 570.60 67
17 Aceh 503.40 43
18 Jambi 385.18 32
19 East Nusa Tenggara 362.82 24
20 Papua 353.05 17
21 North Maluku 344.07 2
22 Central Kalimantan 316.07 26
23 North Sulawesi 257.61 20
24 Central Sulawesi 257.21 27
25 South Sulawesi 251.63 60
26 West Sulawesi 104.86 3
27 Riau Islands 103.53 45
28 Gorontalo 82.39 6
29 Bali 79.03 17
30 Special Territory of Yogyakarta 72.30 24
31 North Kalimantan 62.06 10
32 Maluku 10.00 3
33 Bengkulu 0.00 6
TOTAL 68,764.82 1,812
Quarter I 2017 : Sector, Location, Country of Origin and Region
Investment Realization in Quarter I 2017: Based on Location

The Investment Coordinating Board of the Republic of Indonesia
11
Investment Realization Quarter I 2017 : Based on Country of Origin
B = Billion
Quarter I 2017 : Sector, Location, Country of Origin, and Region
SingaporeUS$ 2.1 B(28.2%)
JapanUS$ 1.4 B(19.2%)
ChinaUS$ 0.6 B
(8.2%)
United States of AmericaUS$ 0.6 B
(8.1%)
South KoreaUS$ 0.4 B
(5.8%)
OthersUS$ 2.2 B(30.5%)

The Investment Coordinating Board of the Republic of Indonesia
12
Quarter I 2017 : Sector, Location, Country of Origin and RegionInvestment Realization in Quarter I 2017 : Based on Country of Origin
NO COUNTRY OF ORIGININVESTMENT (US$ Million)
PROJECT
1 Singapore 2,054.35 1,314
2 Japan 1,402.60 414
3 China 599.57 480
4 United States of America 587.37 94
5 South Korea 423.07 402
6 Hongkong, China 402.05 272
7 Mauritius 256.31 49
8 Netherlands 245.99 140
9 Taiwan 224.32 70
10 Malaysia 215.49 332
11 British Virgin Islands 192.28 190
12 Australia 146.69 158
13 English 116.21 119
14 Seychelles 58.12 36
15 Switzerland 45.81 25
16 Thailand 40.57 63
17 Cayman Islands 36.87 20
18 Belgium 35.39 24
19 France 34.45 97
20 Luxembourg 25.89 20
21 Canada 15.24 30
22 Channel Islands 14.77 1
23 The Philippines 13.94 12
24 Brazil 13.18 7
25 Italy 11.34 58
26 Iran 11.31 9
27 India 8.83 90
28 Sweden 8.69 11
29 German 7.67 43
30 Pakistan 5.38 7
31 New Zealand 4.18 10
32 Panama 3.64 1
33 Russia 3.50 10
34 Sri Lanka 3.44 3
35 United Arab Emirates 3.08 11
36 Anguillas 3.07 1
NO COUNTRY OF ORIGININVESTMENT (US$ Million)
PROJECT
37 Spain 2.72 19
38 Guernsey 2.26 2
39 Ireland 1.28 4
40 Guinea 1.20 3
41 South Africa 1.14 3
42 Marshall Island 1.13 4
43 Malta 0.89 1
44 Yemen 0.83 10
45 West Samoa 0.83 13
46 Poland 0.73 4
47 Czech 0.60 1
48 Jordan 0.58 6
49 Bahrain 0.56 2
50 Austria 0.52 5
51 Myanmar 0.50 1
52 Saudi Arabia 0.39 9
53 Macao 0.35 1
54 Lithuania 0.33 1
55 Senegal 0.30 1
56 Syria 0.22 3
57 Norway 0.15 7
58 Kuwait 0.15 1
59 Ukraine 0.12 1
60 Egypt 0.12 3
61 Iraq 0.10 1
62 Bulgaria 0.10 4
63 Turkey 0.10 9
64 Brunei Darussalam 0.09 6
65 Cameroon 0.09 3
66 Colombia 0.08 2
67 Cook Islands 0.08 2
68 Lebanon 0.06 1
69 Latvia 0.06 2
70 Netherlands Antilles 0.06 2
71 Afghanistan 0.05 2
72 Hungary 0.05 2
NO COUNTRY OF ORIGININVESTMENT (US$ Million)
PROJECT
73 Vietnam 0.05 1
74 Denmark 0.04 4
75 Burkina Faso 0.04 1
76 Bangladesh 0.03 2
77 Argentina 0.02 2
78 Nigeria 0.01 4
79 Venezuela 0.01 2
80 Mexico 0.01 3
81 Slovakia 0.01 1
82 Skotlandia 0.00 1
83 Kenya 0.00 1
84 Chili 0.00 1
85 Aljazair 0.00 1
86 Siprus 0.00 3
87 Maladewa 0.00 1
88 Mali 0.00 1
89 Belize 0.00 1
90 Rumania 0.00 1
91 Niger 0.00 1
92 Bermuda 0.00 1
93 Slovenia 0.00 3
TOTAL 7,293.70 4,800

The Investment Coordinating Board of the Republic of Indonesia
13
DDI and FDI
Investment Realization Quarter I 2017 : Based on Region
T= Trillion
Quarter I 2017 : Sector, Location, Country of Origin and Region
FDI
DDI
Based on region, during January–March 2017, the highest investment realization for DDI and FDI is located in Java region. The next ranks of investment realization for DDI are Sumatera, Kalimantan, Bali and Nusa Tenggara, Sulawesi and Maluku and Papua regions. On the other hand, the next ranks for FDI realization are Sumatera, Sulawesi,Kalimantan, Maluku and Papua, and Bali and Nusa Tenggara
3,735.4
920.1 905.7 799.4 738.4
194.7
0
500
1,000
1,500
2,000
2,500
3,000
3,500
4,000
Java Sumatera Sulawesi Kalimantan Maluku andPapua
Bali andNusa
Tenggara
US$
.Mill
ion
40,834.9
14,355.9
7,865.2
2,641.8 2,359.9707.1
0
5,000
10,000
15,000
20,000
25,000
30,000
35,000
40,000
45,000
Java Sumatera Kalimantan Bali andNusa
Tenggara
Sulawesi Maluku andPapua
Rp
Bill
ion
JavaRp 90.5 T(54.6%)
SumateraRp 26.6 T(16.0%)
KalimantanRp 18.5 T(11.2%)
SulawesiRp 14.4 T
(8.7%)
Maluku and PapuaRp 10.5 T
(6.4%)
Bali and Nusa TenggaraRp 5.2 T(3.2%)

The Investment Coordinating Board of the Republic of Indonesia
14
III. Indonesian Labor Absorption

The Investment Coordinating Board of the Republic of Indonesia
15
Progress of Indonesian Labor Absorption 2012 – March 2017 : Per QuarterIndonesian Labor Absorption
people
TW I TW II TW III TW IV TW I TW II TW III TW IV TW I TW II TW III TW IV TW I TW II TW III TW IV TW I TW II TW III TW IV TW I
2012 2013 2014 2015 2016 2017
DDI 107,6 141,6 144,7 149,6 148,5 239,8 150,0 159,3 67,69 82,25 84,55 180,6 113,3 147,8 132,5 111,0 136,5 87,03 92,017 124,84 67,807
FDI 250,7 209,8 126,8 158,3 213,4 386,5 261,5 270,7 192,4 268,5 264,8 289,8 201,8 223,0 240,9 264,9 190,6 267,7 184,00 309,62 126,32
Total 358,3 351,5 271,6 307,9 361,9 626,3 411,5 430,1 260,1 350,8 349,3 470,5 315,2 370,9 373,5 375,9 327,1 354,7 276,0 434,4 194,1
0
130,000
260,000
390,000
520,000
650,000

The Investment Coordinating Board of the Republic of Indonesia
16
IV. Progress of Investment Realization : 2012 – March 2017

The Investment Coordinating Board of the Republic of Indonesia
17
Progress of Investment Realization 2012 – March 2017 : Per Quarter
Investment Realization Progress : 2012 – March 2017
Q I Q II Q III Q IV Q I Q II Q III Q IV Q I Q II Q III Q IV Q I Q II Q III Q IV Q I Q II Q III Q IV Q I
2012 2013 2014 2015 2016 2017
DDI 19.7 20.8 25.2 26.5 27.5 33.1 33.5 34.1 34.6 38.2 41.6 41.7 42.5 42.9 47.8 46.2 50.4 52.2 55.6 58.1 68.8
FDI 51.5 56.1 56.6 56.8 65.5 66.7 67.0 71.2 72.0 78.0 78.3 78.7 82.1 92.2 92.5 99.2 96.1 99.4 99.7 101.3 97.0
Total 71.2 76.9 81.8 83.3 93.0 99.8 100.5 105.3 106.6 116.2 119.9 120.4 124.6 135.1 140.3 145.4 146.5 151.6 155.3 159.4 165.8
0
20
40
60
80
100
120
140
160
Rp
Tri
llio
n

The Investment Coordinating Board of the Republic of Indonesia
18
Progress of FDI Investment Realization 2012 – March 2017 in USD: Per Quarter
Notes:- 2012, exchange rate US$ 1 = Rp 9,000- 2013 (Q I and Q II), exchange rate US$ 1 = Rp 9,300 (based on State Budget 2013)- 2013 (Q III and Q IV), exchange rate US$ 1 = Rp 9,600 (based on Revised State Budget 2013)- 2014 (Q I, Q II and Q III) exchange rate US$ 1 = Rp 10,500 (based on StateBudget 2014)- 2014 (Q IV) exchange rate US$ 1 = Rp 11,600 (based on Revised State Budget 2014)- 2015 (Q I, Q II, Q III and Q IV) exchange rate US$ 1 = Rp 12,500 (based on Revised StateBudget 2015)- 2016 (Q I and Q II) exchange rate US$ 1 = Rp 13,900 (based on State Budget 2016)- 2016 (Q III and Q IV) exchange rate US$ 1 = Rp 13,500 (based on State Budget 2016)- 2017 (Q I) exchange rate US$ 1 = Rp 13,300 (based on State Budget 2017)
Investment Realization Progress : 2012 – March 2017
Q I Q II Q III Q IV Q I Q II Q III Q IV Q I Q II Q III Q IV Q I Q II Q III Q IV Q I Q II Q III Q IV Q I
2012 2013 2014 2015 2016 2017
FDI 5.7 6.2 6.3 6.3 7.0 7.2 7.0 7.4 6.9 7.4 7.4 6.8 6.6 7.4 7.4 7.9 6.9 7.1 7.4 7.5 7.3
-
1.0
2.0
3.0
4.0
5.0
6.0
7.0
8.0
9.0
US$
Bill
ion
FDI

The Investment Coordinating Board of the Republic of Indonesia
19
I = Investment(Rp Trillion)
Progress of Investment Realization 2012 – March 2017 : New and Expansion Projects
Investment Realization : 2012 – March 2017
DDI2012 2013 2014 2015 2016 Jan - Mar 2017
Total
2012 – Mar 2017
I % I % I % I % I % I % I %
New 46.0 49.9 74.8 58.3 110.1 70.5 114.7 63.9 157.0 72.6 53.8 78.2 556.3 66.1
Expansion 46.2 50.1 53.4 41.7 46.0 29.5 64.8 36.1 59.3 27.4 15.0 21.8 284.7 33.9
Total 92.2 100.0 128.2 100.0 156.1 100.0 179.5 100.0 216.2 100.0 68.8 100.0 841.0 100.0
FDI2012 2013 2014 2015 2016 Jan - Mar 2017
Total
2011 – Mar 2017
I % I % I % I % I % I % I %
New 115.7 52.4 176.0 65.1 213.1 69.4 284.4 77.7 305.8 77.1 79.5 81.9 1,174.5 70.8
Expansion 105.3 47.6 94.4 34.9 93.9 30.6 81.5 22.3 90.9 22.9 17.5 18.1 483.5 29.2
Total 221.0 100.0 270.4 100.0 307.0 100.0 365.9 100.0 396.6 100.0 97.0 100.0 1,658.0 100.0
2012 2013 2014 2015 2016 Jan-Mar 2017Percentage
Based on Jan-Mar 2017
2012- Mar 2017Percentage
Based on 2012-Mar 2017
New 161.7 250.8 323.2 399.1 462.6 133.3 80.4 1,730.7 69.3
Expansion 151.5 147.8 139.9 146.3 150.2 32.5 19.6 768.2 30.7
Total 313.2 398.6 463.1 545.4 612.8 165.8 100.0 2,498.9 100.0
0
130
260
390
520
650
Rp
Tri
llio
n
The Investment Coordinating Board of the Republic of Indonesia
20
I = Investment (Rp Trillion)
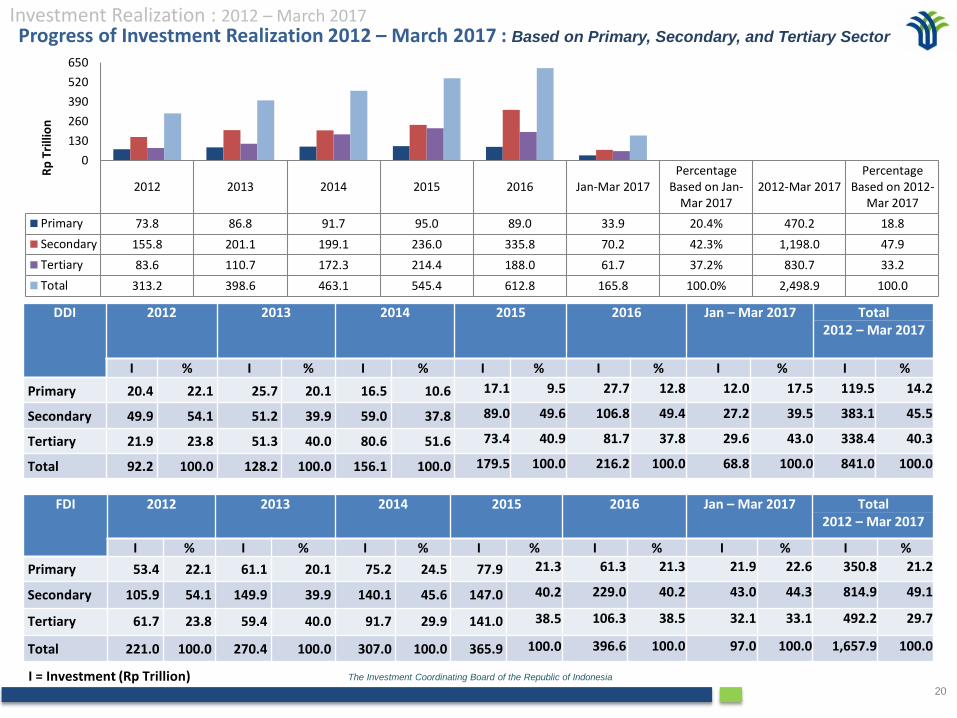
Progress of Investment Realization 2012 – March 2017 : Based on Primary, Secondary, and Tertiary Sector
Investment Realization : 2012 – March 2017
FDI 2012 2013 2014 2015 2016 Jan – Mar 2017 Total2012 – Mar 2017
I % I % I % I % I % I % I %
Primary 53.4 22.1 61.1 20.1 75.2 24.5 77.9 21.3 61.3 21.3 21.9 22.6 350.8 21.2
Secondary 105.9 54.1 149.9 39.9 140.1 45.6 147.0 40.2 229.0 40.2 43.0 44.3 814.9 49.1
Tertiary 61.7 23.8 59.4 40.0 91.7 29.9 141.0 38.5 106.3 38.5 32.1 33.1 492.2 29.7
Total 221.0 100.0 270.4 100.0 307.0 100.0 365.9 100.0 396.6 100.0 97.0 100.0 1,657.9 100.0
DDI 2012 2013 2014 2015 2016 Jan – Mar 2017 Total2012 – Mar 2017
I % I % I % I % I % I % I %
Primary 20.4 22.1 25.7 20.1 16.5 10.6 17.1 9.5 27.7 12.8 12.0 17.5 119.5 14.2
Secondary 49.9 54.1 51.2 39.9 59.0 37.8 89.0 49.6 106.8 49.4 27.2 39.5 383.1 45.5
Tertiary 21.9 23.8 51.3 40.0 80.6 51.6 73.4 40.9 81.7 37.8 29.6 43.0 338.4 40.3
Total 92.2 100.0 128.2 100.0 156.1 100.0 179.5 100.0 216.2 100.0 68.8 100.0 841.0 100.0
2012 2013 2014 2015 2016 Jan-Mar 2017Percentage
Based on Jan-Mar 2017
2012-Mar 2017Percentage
Based on 2012-Mar 2017
Primary 73.8 86.8 91.7 95.0 89.0 33.9 20.4% 470.2 18.8
Secondary 155.8 201.1 199.1 236.0 335.8 70.2 42.3% 1,198.0 47.9
Tertiary 83.6 110.7 172.3 214.4 188.0 61.7 37.2% 830.7 33.2
Total 313.2 398.6 463.1 545.4 612.8 165.8 100.0% 2,498.9 100.0
0
130
260
390
520
650R
p T
rilli
on
The Investment Coordinating Board of the Republic of Indonesia
21
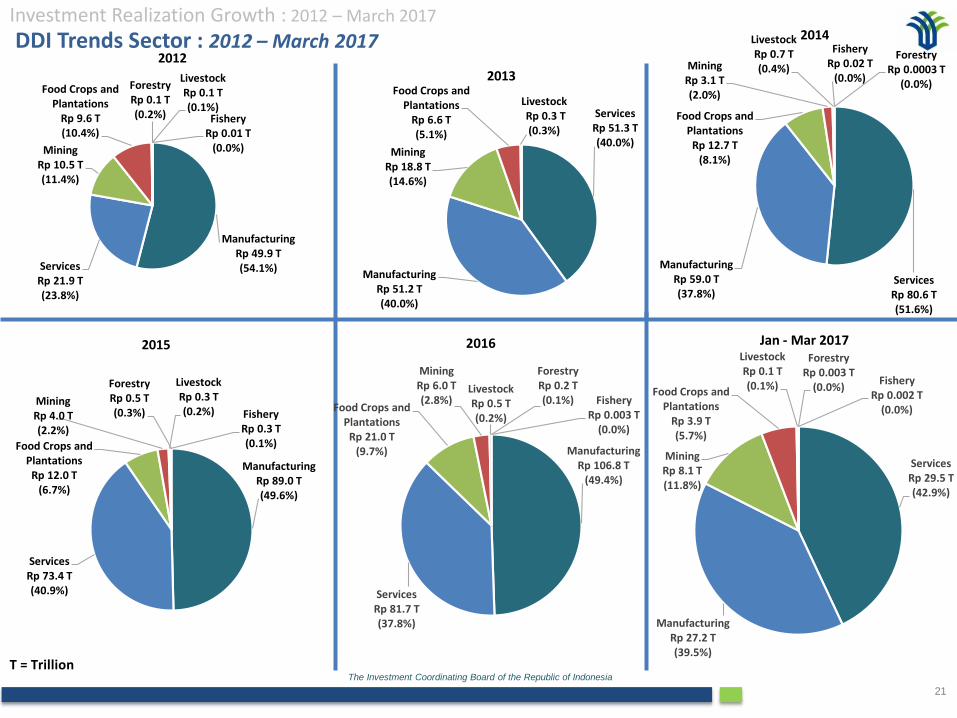
DDI Trends Sector : 2012 – March 2017
T = Trillion
Investment Realization Growth : 2012 – March 2017
Jan - Mar 20172016
ManufacturingRp 89.0 T(49.6%)
ServicesRp 73.4 T(40.9%)
Food Crops and PlantationsRp 12.0 T
(6.7%)
MiningRp 4.0 T(2.2%)
LivestockRp 0.3 T(0.2%) Fishery
Rp 0.3 T(0.1%)
ForestryRp 0.5 T(0.3%)
2015
ServicesRp 80.6 T(51.6%)
ManufacturingRp 59.0 T(37.8%)
Food Crops and PlantationsRp 12.7 T
(8.1%)
MiningRp 3.1 T(2.0%)
LivestockRp 0.7 T(0.4%)
FisheryRp 0.02 T
(0.0%)
ForestryRp 0.0003 T
(0.0%)
2014
ManufacturingRp 49.9 T(54.1%)Services
Rp 21.9 T(23.8%)
MiningRp 10.5 T(11.4%)
Food Crops and Plantations
Rp 9.6 T(10.4%)
ForestryRp 0.1 T(0.2%)
LivestockRp 0.1 T(0.1%)
FisheryRp 0.01 T
(0.0%)
2012
ServicesRp 51.3 T(40.0%)
ManufacturingRp 51.2 T(40.0%)
MiningRp 18.8 T(14.6%)
Food Crops and Plantations
Rp 6.6 T(5.1%)
LivestockRp 0.3 T (0.3%)
2013
ServicesRp 29.5 T(42.9%)
ManufacturingRp 27.2 T(39.5%)
MiningRp 8.1 T(11.8%)
Food Crops and Plantations
Rp 3.9 T(5.7%)
LivestockRp 0.1 T(0.1%)
ForestryRp 0.003 T
(0.0%)Fishery
Rp 0.002 T(0.0%)
ManufacturingRp 106.8 T
(49.4%)
ServicesRp 81.7 T(37.8%)
Food Crops and PlantationsRp 21.0 T
(9.7%)
MiningRp 6.0 T(2.8%)
LivestockRp 0.5 T(0.2%)
ForestryRp 0.2 T(0.1%) Fishery
Rp 0.003 T(0.0%)

The Investment Coordinating Board of the Republic of Indonesia
22
FDI Trends Sector : 2012 - March 2017
B = Billion
Investment Realization Growth : 2012 – March 2017
ManufacturingUS$ 11.8 B
(47.9%)Services
US$ 6.9 B(28.0%)
MiningUS$ 4.2 B(17.3%)
Food Crops and PlantationUS$ 1.6 B
(6.5%) FisheryUS$ 0.03 B
(0.1%)
ForestryUS$ 0.03 B
(0.1%)
LivestockUS$ 0.02 B
(0.1%)
2012
ManufacturingUS$ 15.8B
(55.4%)
ServicesUS$ 6.3 B(22.0%)
MiningUS$4.8 B(16.8%)
Food Crops and
PlantationsUS$ 1.6 B
(5.6%)
ForestryUS$ 0.03 B
(0.1%)
LivestockUS$ 0.01 B
(0.1%)Fishery
US$ 0.01 B(0.0%)
2013
ManufacturingUS$ 11.8 B
(40.2%)
ServicesUS$ 11.3 B
(38.5%)
MiningUS$4.0 B(13.7%)
Food Crops and PlantationUS$ 2.0 B
(7.0%)
LivestockUS$ 0.1 B
(0.3%)
FIsheryUS$ 0.0 B
(0.2%)
ForestryUS$ 0.0 B (0.1%)
2015
ManufacturingUS$ 13.0 B
(45.6%)
ServicesUS$ 8.5 B(29.9%)
MiningUS$4.7 B(16.4%)
Food Crops and PlantationUS$ 2.2 B
(7.7%)
ForestryUS$ 0.05 B
(0.2%)Fishery
US$ 0.04 B(0.1%)
LivestockUS$ 0.03 B
(0.1%)
2014
Jan - Mar 20172016
ManufacturingUS$ 3.2 B(44.3%)
ServicesUS$ 2.4 B(33.0%)
MiningUS$ 1.2 B(16.0%)
Food Crops and PlantationsUS$ 0.5 B
(6.2%)
LivestockUS$ 0.02 B
(0.2%)
ForestryUS$ 0.01 B
(0.2%)
FisheryUS$ 0.004 B
(0.1%)
ManufacturingUS$ 16.7 B
(57.6%)
ServicesUS$ 7.8 B(26.9%)
MiningUS$ 2.7 B
(9.5%)
Food Crops and PlantationsUS$ 1.6 B
(5.5%)
ForestryUS$ 0.08 B
(0.3%)
LivestockUS$ 0.05 B
(0.2%)
FisheryUS$ 0.04 B
(0.1%)

The Investment Coordinating Board of the Republic of Indonesia
23
T = Trillion
DDI and FDI Trends Sector : 2012 – March 2017 Investment Realization Growth : 2012 – March 2017
ManufacturingRp 155.8 T
(49.7%)
ServicesRp 83.6 T (26.7%)
MiningRp 48.8 T (15.6%)
Food Crops and
PlantationsRp 24.0 T
(7.7%)
ForestryRp 0.4 T (0.1%) Livestock
Rp 0.3 T (0.1%)
FisheryRp 0.2 T(0.1%)
2012
ManufacturingRp 201.1 T
(50.5%)
ServicesRp 110.7 T
(27.7%)
MiningRp 64.3 T(16.1%)
Food Cropsand Plantations
Rp 21.8 T(5.5%)
LivestockRp 0.6 T(0.2%)
FisheryRp 0.1 T(0.0%)
ForestryRp 0.1 T(0.0%)
2013
ManufacturingRp 199.1 T
(43.0%)
ServicesRp 172.3 T
(37.2%)
MiningRp 53.3 T(11.5%)
Food Crops and Plantations
Rp 36.4 T(7.9%)
LivestockRp 1.0 T(0.2%)
ForestryRp 0.6 T(0.1%)
FisheryRp 0.4 T(0.1%)
2014
ManufacturingRp 236.0 T
(43.3%)
ServicesRp 214.4 T
(39.3%)
MiningRp 54.2 T
(9.9%)
Food Cropsand Plantations
Rp 37.9 T(7.0%)
LivestockRp 1.3 T(0.2%)
ForestryRp 0.9 T(0.2%)
FisheryRp 0.7 T(0.1%)
2015 2016 Jan – Mar 2017
ManufacturingRp 70.2 T(42.4%)
ServicesRp 61.6 T(37.1%)
MiningRp 23.6 T(14.2%)
Foodcrops and Plantation
Rp 9.8 T(5.9%)
LivestockRp 0.3 T(0.2%)
ForestryRp 0.2 T(0.1%) Fishery
Rp 0.1 T(0.04%)
ManufacturingRp 335.8 T
(54.8%)
ServicesRp 188 T(30.7%)
MiningRp 43.6 T
(7.0%)
Food Crops and
PlantationsRp 42.8 T
(7.0%)
ForestryRp 1.3 T(0.2%)
LivestockRp 1.1 T(0.2%)
FisheryRp 0.6 T(0.1%)

The Investment Coordinating Board of the Republic of Indonesia
24
East JavaRp 34.8 T(27.2%)
East Kalimantan
Rp 15.8 T(12.3%)Central Java
Rp 12.6 T(9.8%)
West JavaRp 9.0 T(7.0%)
South Kalimantan
Rp 8.3 T(6.5%)
OthersRp 47.7 T(37.1%)
2013DDI Trends Location : 2012 – March 2017
T= Trillion
East JavaRp 21.5 T(23.3%)
West JavaRp 11.4 T(12.3%)
Special Territory of
JakartaRp 8.5 T(9.3%)East Kalimantan
Rp 5.9 T(6.4%)
Central JavaRp 5.8 T(6.3%)
OthersRp 39.1 T(42.4%)
2012 East JavaRp 38.1 T(24.4%)
West JavaRp 18.7 T(12.0%)
Special Territory of
JakartaRp 17.8 T(11.4%)
Central JavaRp 13.6 T
(8.7%)
East Kalimantan
Rp 12.9 T(8.2%)
OthersRp 55.0 T(35.3%)
2014
East JavaRp 35.5 T (19.8%)
West JavaRp 26.3 T (14.6%)
Special Territory of JakartaRp 15.5 T
(8.6%)
Central JavaRp 15.4 T
(8.6%)
South SumateraRp 10.9 T
(6.1%)
OthersRp 75.9 T (42.3%)
2015
Investment Realization Progress : 2012 – March 2017
Jan - Mar 20172016
Special Teritory of Jakarta
Rp 11.8 T(17.2%)
East JavaRp 9.4 T(13.7%)
West JavaRp 9.1 T(13.2%)Banten
Rp 5.5 T(8.0%)
Central JavaRp 5.0 T(7.2%)
OthersRp 28.0 T(40.7%)

The Investment Coordinating Board of the Republic of Indonesia
25
FDI Trends Location : 2012 – March 2017
B = Billion
West JavaUS$ 4.2 B(17.1%)
Special Territory of JakartaUS$ 4.1 B(16.7%)
BantenUS$ 2.7 B(11.1%)
East JavaUS$ 2.3 B
(9.4%)
East Kalimantan US$ 2.0 B
(8.2%)
OthersUS$ 9.2 B(37.5%)
2012 West JavaUS$ 7.1 B(24.9%)
BantenUS$ 3.7 B(13.0%)East Java
US$ 3.4 B (11.9%)
Special Territory of JakartaUS$ 2.6 B
(9.1%)
PapuaUS$ 2.4 B
(8.2%)
OthersUS$ 9.4 B(32.9%)
2013West JavaUS$ 6.6 B(23.0%)
Special Terriroty of JakartaUS$ 4.5 B(15.8%)
East Kalimantan US$ 2.1 B
(7.5%)
BantenUS$ 2.0 B
(7.1%)
East JavaUS$ 1.8 B
(6.3%)
OthersUS$ 11.5 B
(40.3%)
2014
West JavaUS$ 5.7 B (19.6%)
Special Territory of JakartaUS$ 3.6 B (12.4%)
East JavaUS$ 2.6 B
(8.9%)Banten
US$ 2.5 B (8.7%)
East Kalimantan US$ 2.4 B
(8.1%)
OthersUS$ 12.4 B
(42.3%)
2015
Investment Realization Growth : 2012 – March 2017
Jan - Mar 2017West JavaUS$ 1.5 B(20.8%)
Special Teritory of
JakartaUS$ 0.9 B(12.8%)
PapuaUS$ 0.6 B
(8.1%)
Central Java US$
0.5 B(7.1%)
BantenUS$ 0.5 B
(7.1%)
OthersUS$ 3.2 B(44.1%)
2016
The Investment Coordinating Board of the Republic of Indonesia
26
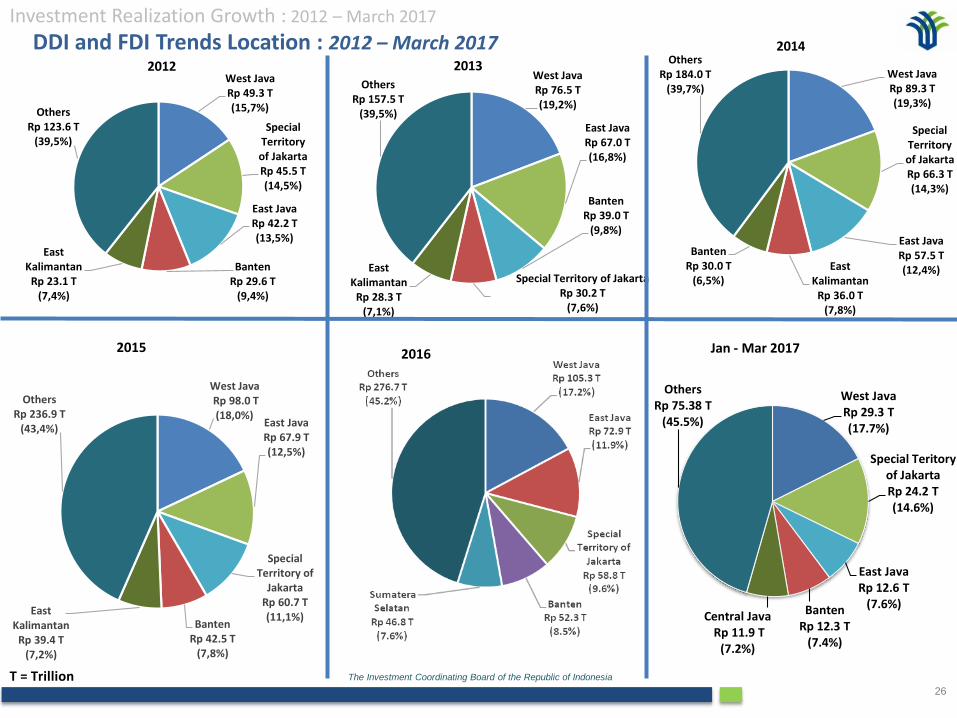
DDI and FDI Trends Location : 2012 – March 2017
West JavaRp 76.5 T(19,2%)
East JavaRp 67.0 T(16,8%)
BantenRp 39.0 T
(9,8%)
Special Territory of JakartaRp 30.2 T
(7,6%)
EastKalimantan
Rp 28.3 T(7,1%)
OthersRp 157.5 T
(39,5%)
2013
T = Trillion
West JavaRp 49.3 T(15,7%)
Special Territory of JakartaRp 45.5 T(14,5%)
East JavaRp 42.2 T(13,5%)
BantenRp 29.6 T
(9,4%)
EastKalimantan
Rp 23.1 T(7,4%)
OthersRp 123.6 T
(39,5%)
2012West JavaRp 89.3 T(19,3%)
Special Territory of JakartaRp 66.3 T(14,3%)
East JavaRp 57.5 T(12,4%)East
Kalimantan Rp 36.0 T
(7,8%)
BantenRp 30.0 T
(6,5%)
OthersRp 184.0 T
(39,7%)
2014
West JavaRp 98.0 T (18,0%)
East JavaRp 67.9 T (12,5%)
Special Territory of
JakartaRp 60.7 T (11,1%)
BantenRp 42.5 T
(7,8%)
EastKalimantan
Rp 39.4 T (7,2%)
OthersRp 236.9 T
(43,4%)
2015
Investment Realization Growth : 2012 – March 2017
Jan - Mar 20172016
West JavaRp 29.3 T(17.7%)
Special Teritory of JakartaRp 24.2 T(14.6%)
East JavaRp 12.6 T
(7.6%)BantenRp 12.3 T
(7.4%)
Central JavaRp 11.9 T
(7.2%)
OthersRp 75.38 T
(45.5%)

The Investment Coordinating Board of the Republic of Indonesia
27
FDI Trends by Country of Origin (Top 5) : 2012 – March 2017
SingaporeUS$4.9 B(19.8%)
JapanUS$ 2.5 B(10.0%)
South KoreaUS$ 1.9 B
(7.9%)
USAUS$ 1.2 B
(5.1%)
MauritiusUS$ 1.1 B
(4.3%)
OthersUS$ 13.0 B
(52.9%)
2012 JapanUS$ 4.7 B(16.5%)
SingaporeUS$ 4.7 B(16.3%)
USAUS$ 2.4 B
(8.5%)
South KoreaUS$ 2.2 B
(7.7%)
UKUS$ 1.1 B
(3.8%)
OthersUS$ 13.5 B
(47.2%)
2013SingaporeUS$ 5.8 B(20.4%)
JapanUS$ 2.7 B
(9.5%)
MalaysiaUS$ 1.8 B
(6.2%)
NetherlandsUS$ 1.7 B
(6.1%)UKUS$ 1.6 B
(5.6%)
OthersUS$ 14.9 B
(52.2%)
2014
B = Billion
Investment Realization : 2012 – March 2017
SingaporeUS$ 5.9 B (20.2%)
MalaysiaUS$ 3.0B(10.5%)
JapanUS$ 2.9 B
(9.8%)
NetherlandsUS$ 1.3 B
(4.5%)
South KoreaUS$ 1.2 B
(4.1%)
OthersUS$ 14.9 B
(50.9%)
2015
2016
SingaporeUS$ 2.1 B(28.2%)
JapanUS$ 1.4 B(19.2%)
ChinaUS$ 0.6 B
(8.2%)
USAUS$ 0.6 B
(8.1%)
South KoreaUS$ 0.4 B
(5.5%)
OthersUS$ 2.2 B(30.5%)
Jan - Mar 2017

The Investment Coordinating Board of the Republic of Indonesia
28
FDI Trends by Main Country of Origin: 2012 – March 2017
B = Billion
Investment Realization : 2012 – March 2017
SingaporeUS$ 4.9 B
(19.7%)
JapanUS$ 2.5 B
(10.0%)
UEUS$ 2.3 B
(9.2%)
South KoreaUS$ 1.9 B
(7.6%)
USA
US$ 1.2 B(4.8%)
Australia US$ 0.7 B
(2.8%)
TaiwanUS$ 0.6 B
(2.6%)
Malaysia US$ 0.5 B
(2.0%)
Hong KongUS$ 0.3 B
(1.2%)
ChinaUS$ 0.1 B
(0.4%)
Others US$ 9.9 B (39.7%)
2012 JapanUS$ 4.7 B
(16.2%)
SingaporeUS$ 4.7 B
(16.2%)
USAUS$ 2.4 B
(8.3%)
UEUS$ 2.4 B
(8.3%)
South KoreaUS$ 2.2 B
(7.6%)Malaysia US$ 0.7 B
(2.4%)
Hong KongUS$ 0.4 B
(1.4%)
Taiwan US$ 0.4 B
(1.4%)
ChinaUS$ 0.3 B
(1.0%)
Australia US$ 0.2 B
(0.7%)
OthersUS$ 10.6 B
(36.5%)
2013
SingaporeUS$ 5.8 B
(20.3%)
UEUS$ 3.8 B(13.3%)
JapanUS$ 2.7 B
(9.5%)
Malaysia US$ 1.8 B
(6.3%)
USA
US$ 1.3 B(4.5%)
South KoreaUS$ 1.1 B
(3.8%)
ChinaUS$ 0.8 B
(2.8%)
Hong Kong US$ 0.7 B
(2.4%)
Australia US$ 0.6 B
(2.1%)
TaiwanUS$ 0.1 B
(0.4%)
OthersUS$ 9.9 B
(34.6%)
2014
Jan - Mar 20172016SingaporeUS$ 5.9 B(20.1%)
MalaysiaUS$ 3.1 B(10.6%)
JapanUS$ 2.9 B
(9.9%)
UEUS$ 2.3 B
(7.8%)South Korea
US$ 1.2 B(4.1%)
USAUS$ 0.9 B
(3.1%)
HongkongUS$ 0.9 B
(3.1%)
ChinaUS$ 0.6 B
(2.0%)
AustraliaUS$ 0.2 B
(0.7%)
TaiwanUS$ 0.1 B
(0.3%)
OthersUS$ 11.2 B
(38.2%)
2015
SingaporeUS$ 2.1 B(28.2%)
JapanUS$ 1.4 B(19.2%)
ChinaUS$ 0.6 B
(8.2%)
USAUS$ 0.6 B
(8.0%)
UEUS$ 0.5 B
(6.8%)
South KoreaUS$ 0.4 B
(5.8%)
HongkongUS$ 0.4 B
(5.5%)
TaiwanUS$ 0.2 B
(3.1%)
MalaysiaUS$ 0.2 B
(3.0%)
AustraliaUS$ 0.2 B
(2.0%)
OthersUS$ 0.7 B(10.2%)
SingaporeUS$ 9.2 B(31.7%)
JapanUS$ 5.4 B(18.6%)
ChinaUS$ 2.7 B
(9.2%)
UEUS$ 2.6 B
(9.0%)
HongkongUS$ 2.2 B
(7.8%)
USAUS$ 1.2 B
(4.0%)
MalaysiaUS$ 1.1 B
(3.9%)
South KoreaUS$ 1.1 B
(3.7%)
AustraliaUS$ 0.2 B
(0.6%)
TaiwanUS$ 0.1 B
(0.5%)
OthersUS$ 3.2 B(11.0%)

Badan Koordinasi Penanaman Modal (BKPM)
Indonesia Investment Coordinating Board
Jln. Jend. Gatot Subroto No. 44
Jakarta 12190 - Indonesia
t .+62 21 5292 1334
f .+62 21 5264 211
www.bkpm.go.id
Thank You
Terima Kasih
Indonesia Investment Promotion Centre (IIPC)
Related Documents