Inverse emission estimates for Europe using tall tower observations and the COMET inverse model Alex Vermeulen 1 , Gerben Pieterse 1,2 1: ECN 2: IMAU

Inverse emission estimates for Europe using tall tower observations and the COMET inverse model Alex Vermeulen 1, Gerben Pieterse 1,2 1: ECN2: IMAU.
Dec 20, 2015
Welcome message from author
This document is posted to help you gain knowledge. Please leave a comment to let me know what you think about it! Share it to your friends and learn new things together.
Transcript
Inverse emission estimates for Europe using tall tower observations and the COMET inverse model
Alex Vermeulen1, Gerben Pieterse1,2
1: ECN 2: IMAU
28th Transcom meetingPurdue Univ.; April 24, 2007
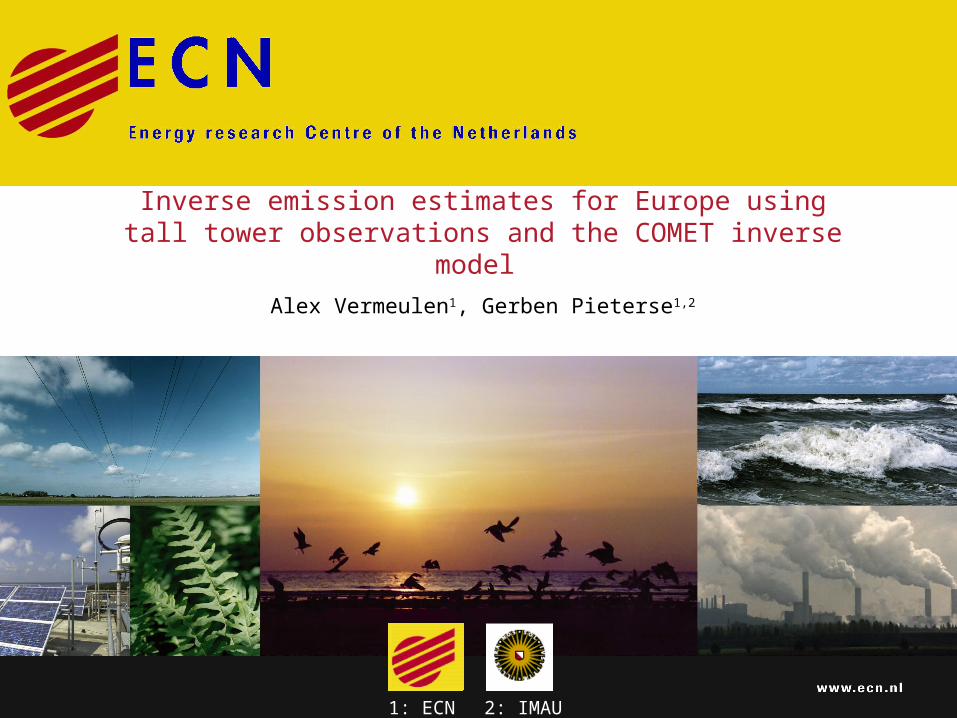
ECN and Cabauw observations
38th Transcom meetingPurdue Univ.; April 24, 2007
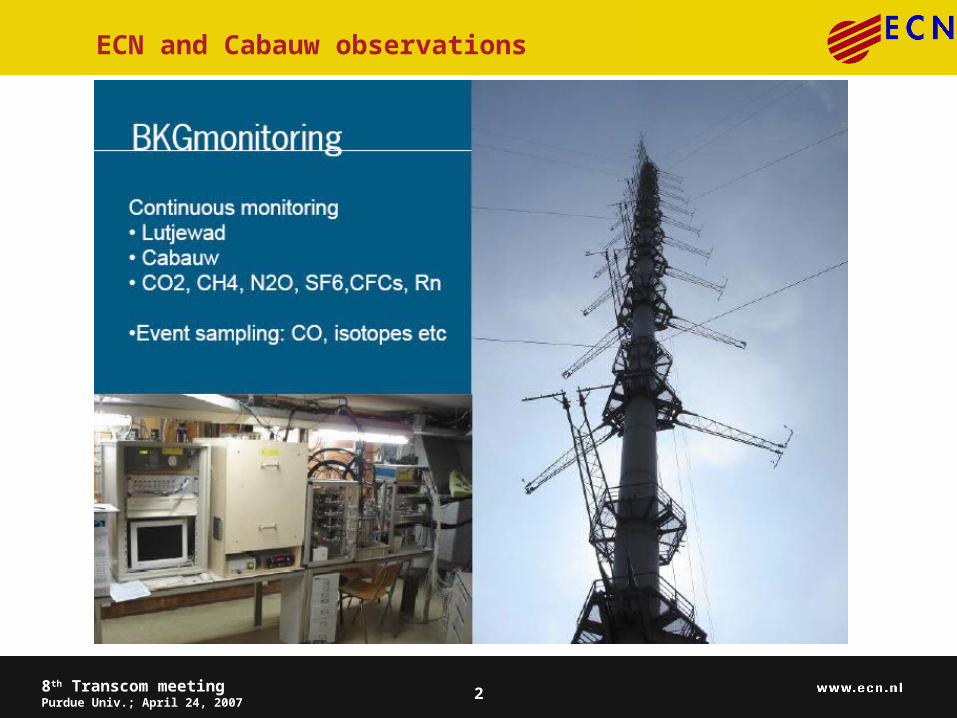
Cabauw – CBW – The Netherlands (ECN)
ÊÚ
TestUrbanUrban sprawlIndustrialRoad/Rail(Air)portsMineral extractionConstruction siteRecreationArableFruit treesPasturesCropsForestNatural grasslandMoors, heathlandDunes, sand, beachMarshesWaterSeaNo Data
ÊÚ Theme1.shp
30 0 30 60 Kilometers
S
N
EW
Gas Method Operational Precision
CO2 LICOR 7000 Nov-04 0.05 ppm
Flask sampler CIO Nov-04
222Rn ANSTO Nov-05 50 mBq.m-3
CH4 GC-FID
Nov-04
2 ppb
CO GC-FID 1 ppb
N2O GC-ECD 0.4 ppb
SF6 GC-ECD 0.2 ppt
Height: 200m AGL
Base: -2m ASL
Lon: 04°56’
Lat: 51°58’
Levels: 20m, 60m, 120m, 200m
LU: Grassland, crops
48th Transcom meetingPurdue Univ.; April 24, 2007
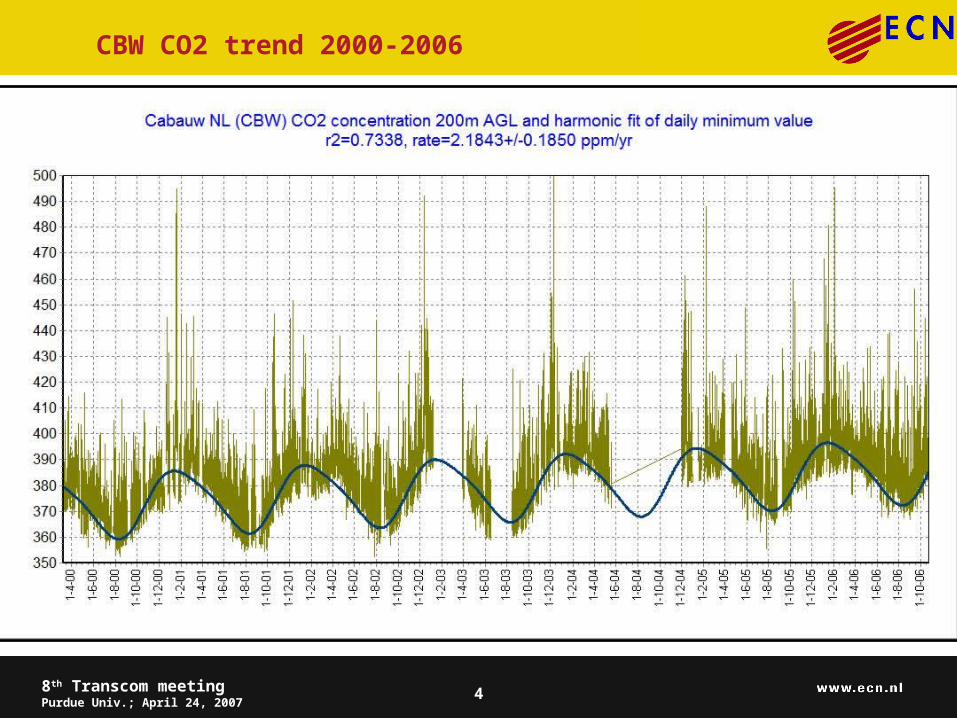
CBW CO2 trend 2000-2006
58th Transcom meetingPurdue Univ.; April 24, 2007
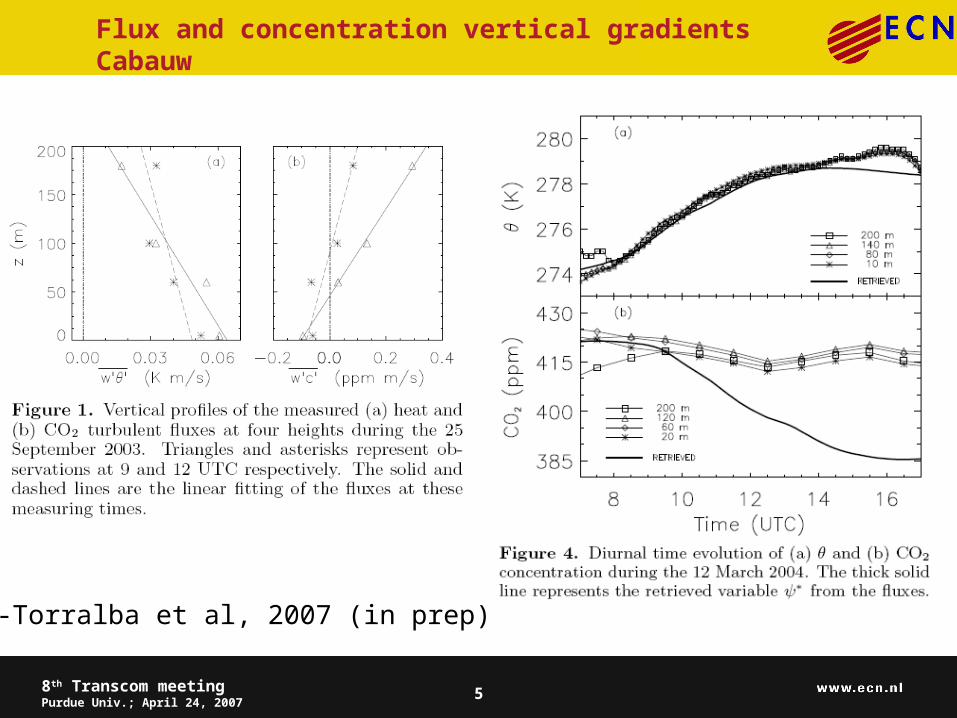
Flux and concentration vertical gradients Cabauw
Casso-Torralba et al, 2007 (in prep)
68th Transcom meetingPurdue Univ.; April 24, 2007
Measurements, Modelling, SRM’s and Inversion
Independent verification of bottom up estimates: UNFCCC, process models
It seems so easy: Subtract the influence of meteorology on the concentration, what remains is the influence of emissions
BUT: the atmosphere is a very efficient mixer, most of the signal is lost in 1-2 days of travel
SO: measure close to the sources at high temporal resolution, extend in the mixed layer to reduce the very local influence
Current global network not sufficient
Not many stations, but high frequency measurements and lots of noise in atmosphere and models
Mathematically: Ill posed problem, we need constraints
78th Transcom meetingPurdue Univ.; April 24, 2007
The COMET model
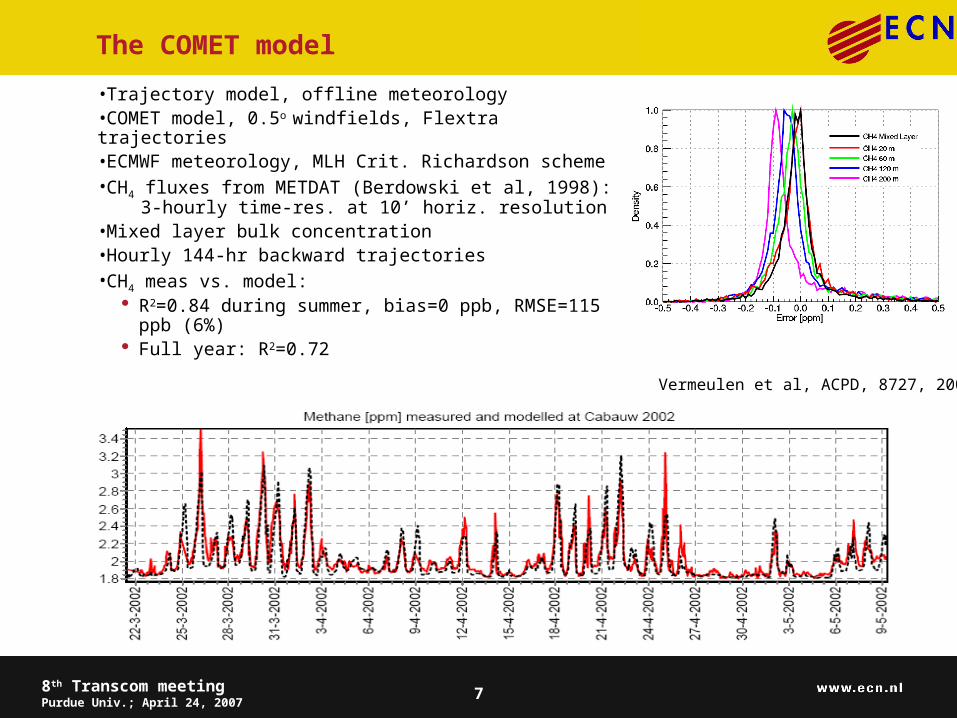
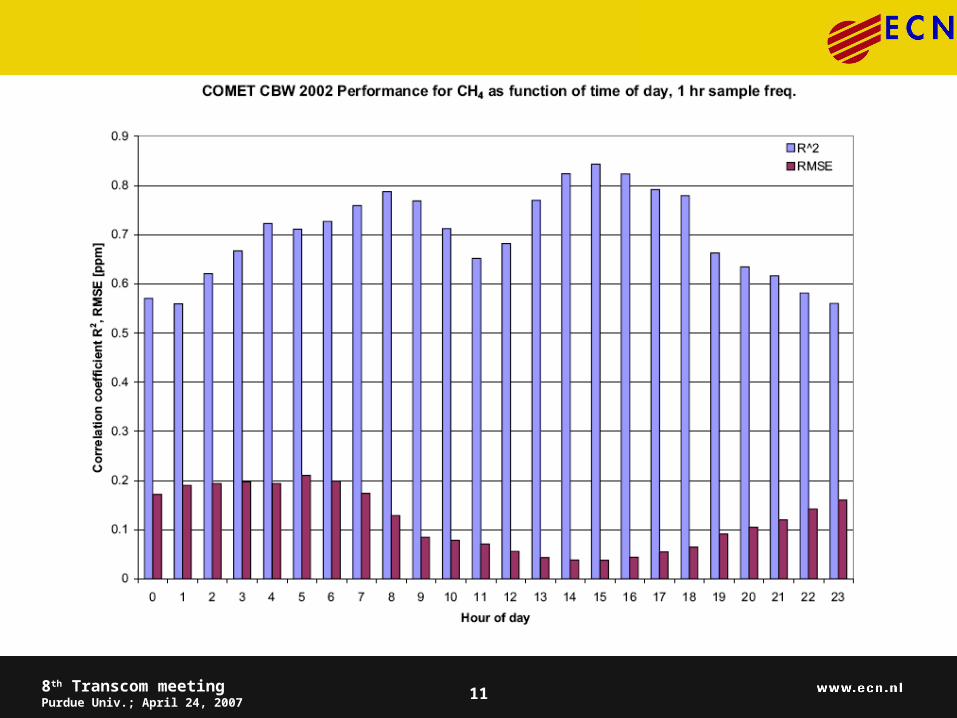
•Trajectory model, offline meteorology•COMET model, 0.5o windfields, Flextra trajectories •ECMWF meteorology, MLH Crit. Richardson scheme•CH4 fluxes from METDAT (Berdowski et al, 1998): 3-hourly time-res. at 10’ horiz. resolution•Mixed layer bulk concentration •Hourly 144-hr backward trajectories•CH4 meas vs. model:
R2=0.84 during summer, bias=0 ppb, RMSE=115 ppb (6%)
Full year: R2=0.72Vermeulen et al, ACPD, 8727, 2006
88th Transcom meetingPurdue Univ.; April 24, 2007
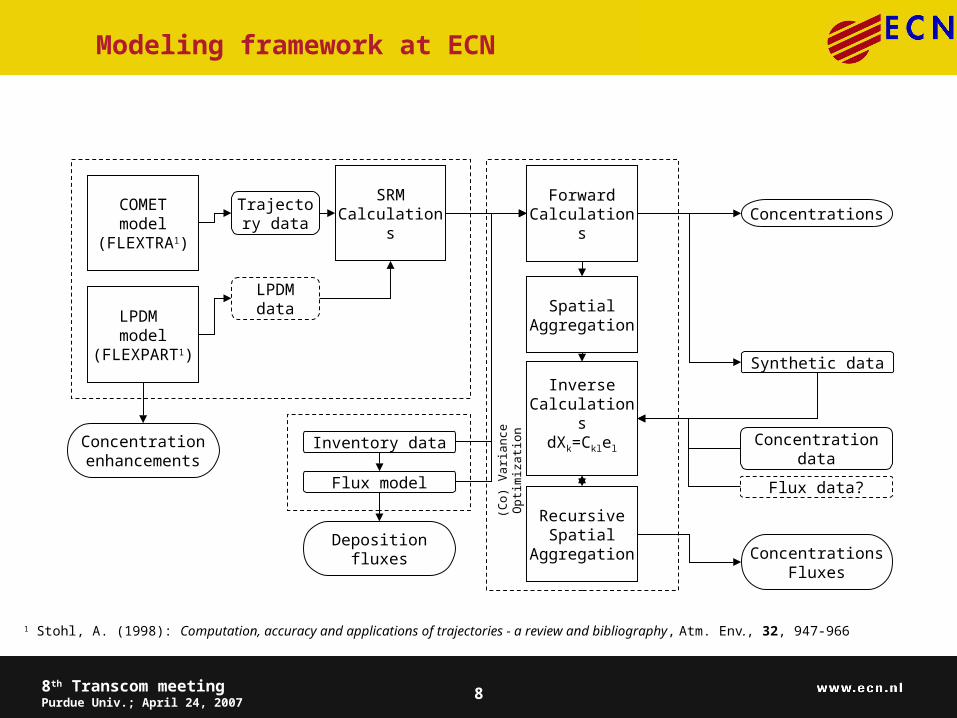
Modeling framework at ECN
ForwardCalculations
Spatial Aggregation
InverseCalculations
dXk=Cklel
Trajectory data
LPDM data
Inventory data
Flux model
Concentration data
Flux data?
Recursive Spatial
Aggregation
LPDM model
(FLEXPART1)
COMETmodel
(FLEXTRA1)
(C
o)
Var
ian
ce
Opt
imiz
atio
n
Concentrations
ConcentrationsFluxes
Synthetic data
1 Stohl, A. (1998): Computation, accuracy and applications of trajectories - a review and bibliography, Atm. Env., 32, 947-966
Deposition fluxes
Concentration enhancements
SRMCalculations
98th Transcom meetingPurdue Univ.; April 24, 2007
Diurnal variation get lost after 24 hours…
Model: COMET; Background CO2 levels from TM5 (Krol, pers comm).
HUN 48m 2003 CO2 modelled as function of travel time
360
370
380
390
400
410
420
430
440
450
460
1-5 3-5 5-5 7-5 9-5 11-5 13-5
Date time
Co
nc
en
tra
tio
n [
pp
m]
CO2
CO2 backgr.
CO2-24
CO2-48
108th Transcom meetingPurdue Univ.; April 24, 2007
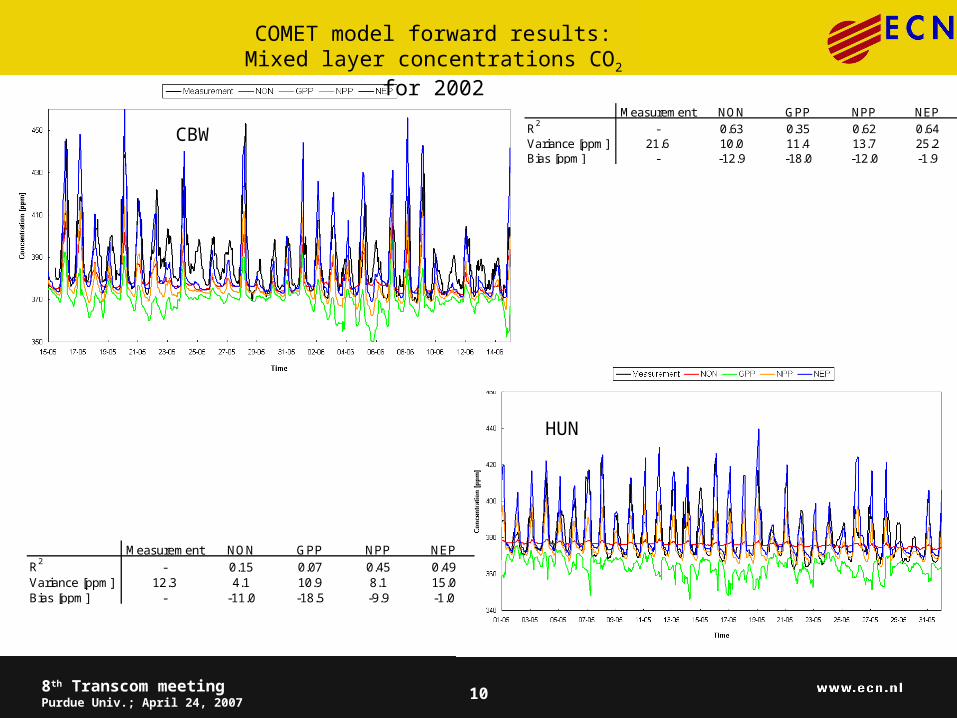
Measurement NON GPP NPP NEPR2 - 0.15 0.07 0.45 0.49Variance [ppm] 12.3 4.1 10.9 8.1 15.0Bias [ppm] - -11.0 -18.5 -9.9 -1.0
Measurement NON GPP NPP NEPR2 - 0.63 0.35 0.62 0.64Variance [ppm] 21.6 10.0 11.4 13.7 25.2Bias [ppm] - -12.9 -18.0 -12.0 -1.9
CBW
HUN
COMET model forward results: Mixed layer concentrations CO2 for 2002
118th Transcom meetingPurdue Univ.; April 24, 2007
128th Transcom meetingPurdue Univ.; April 24, 2007
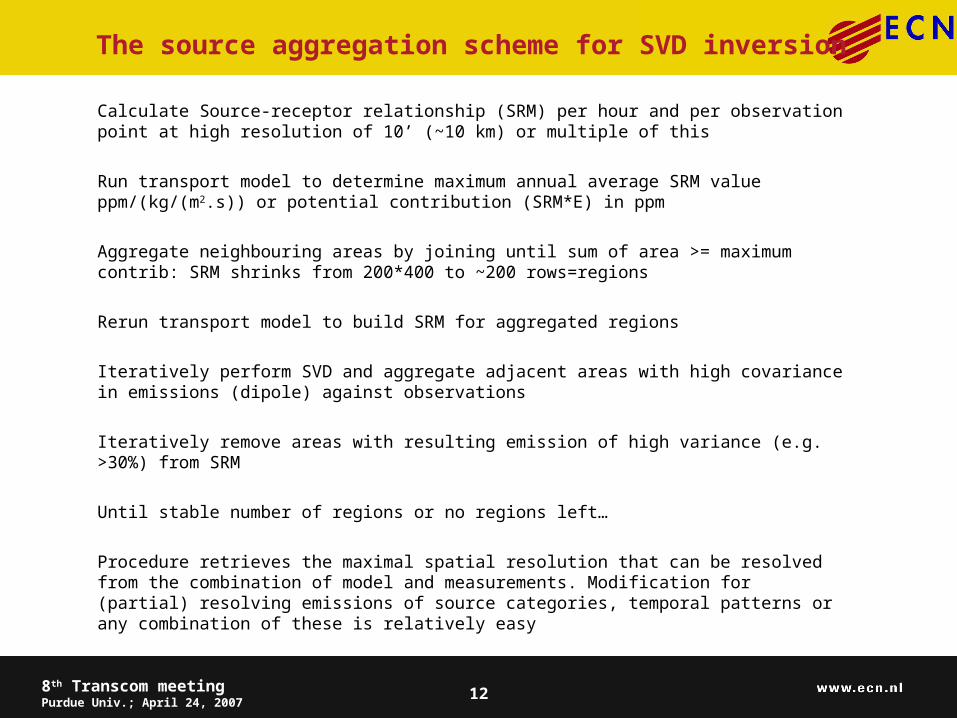
The source aggregation scheme for SVD inversion
Calculate Source-receptor relationship (SRM) per hour and per observation point at high resolution of 10’ (~10 km) or multiple of this
Run transport model to determine maximum annual average SRM value ppm/(kg/(m2.s)) or potential contribution (SRM*E) in ppm
Aggregate neighbouring areas by joining until sum of area >= maximum contrib: SRM shrinks from 200*400 to ~200 rows=regions
Rerun transport model to build SRM for aggregated regions
Iteratively perform SVD and aggregate adjacent areas with high covariance in emissions (dipole) against observations
Iteratively remove areas with resulting emission of high variance (e.g. >30%) from SRM
Until stable number of regions or no regions left…
Procedure retrieves the maximal spatial resolution that can be resolved from the combination of model and measurements. Modification for (partial) resolving emissions of source categories, temporal patterns or any combination of these is relatively easy
138th Transcom meetingPurdue Univ.; April 24, 2007
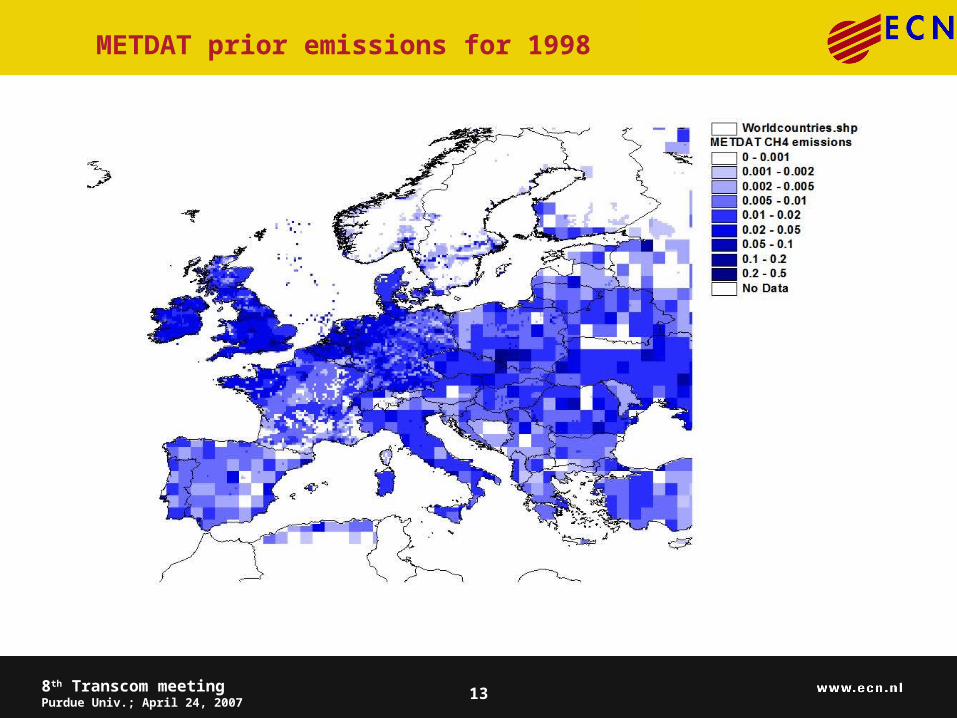
METDAT prior emissions for 1998
148th Transcom meetingPurdue Univ.; April 24, 2007
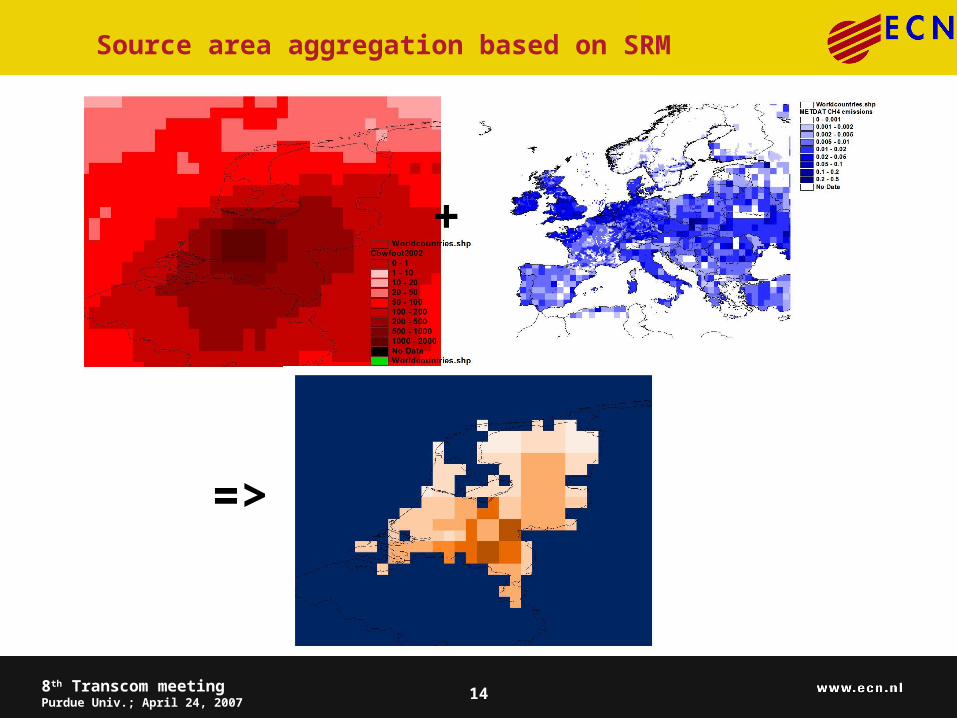
Source area aggregation based on SRM
+
=>
158th Transcom meetingPurdue Univ.; April 24, 2007
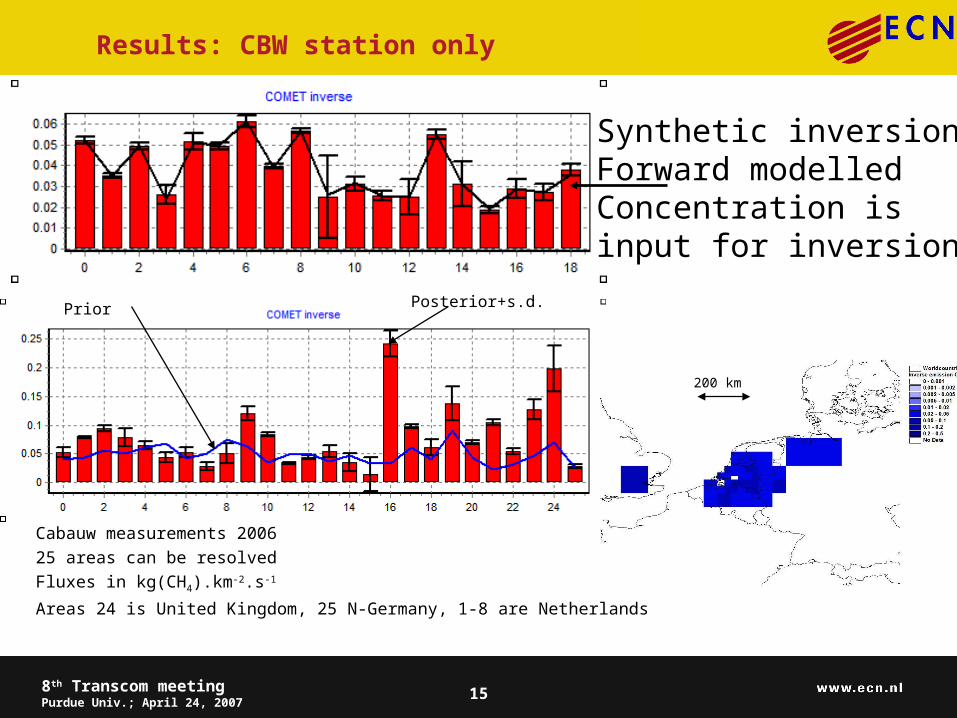
Results: CBW station only
Synthetic inversion:Forward modelledConcentration is input for inversion
200 km
Cabauw measurements 2006
25 areas can be resolved
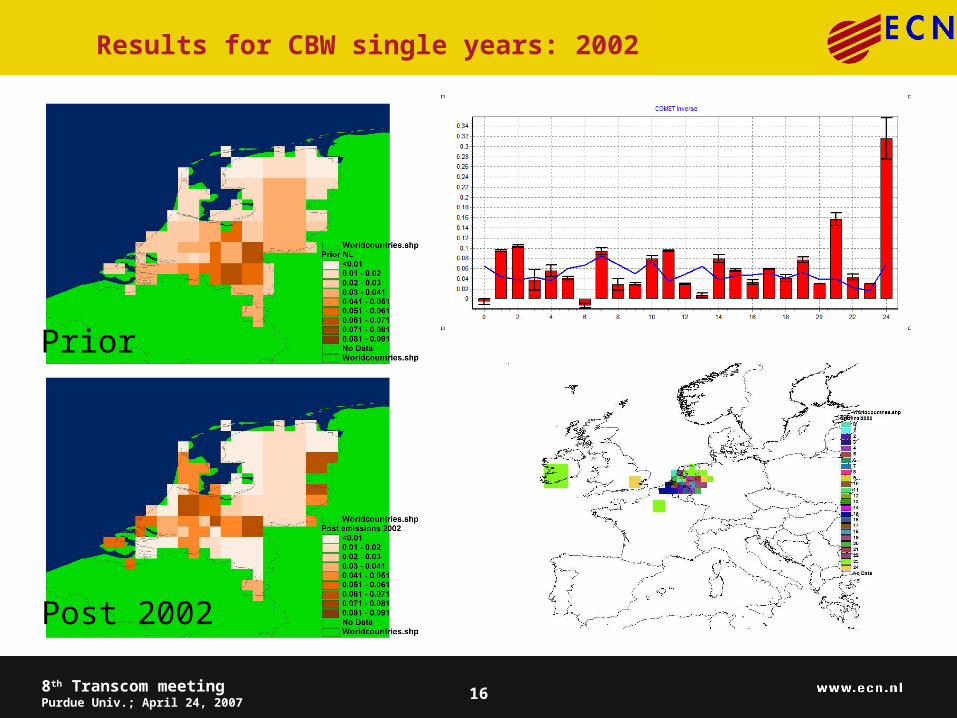
Fluxes in kg(CH4).km-2.s-1
Areas 24 is United Kingdom, 25 N-Germany, 1-8 are Netherlands
Prior Posterior+s.d.
168th Transcom meetingPurdue Univ.; April 24, 2007
Results for CBW single years: 2002
Prior
Post 2002
178th Transcom meetingPurdue Univ.; April 24, 2007
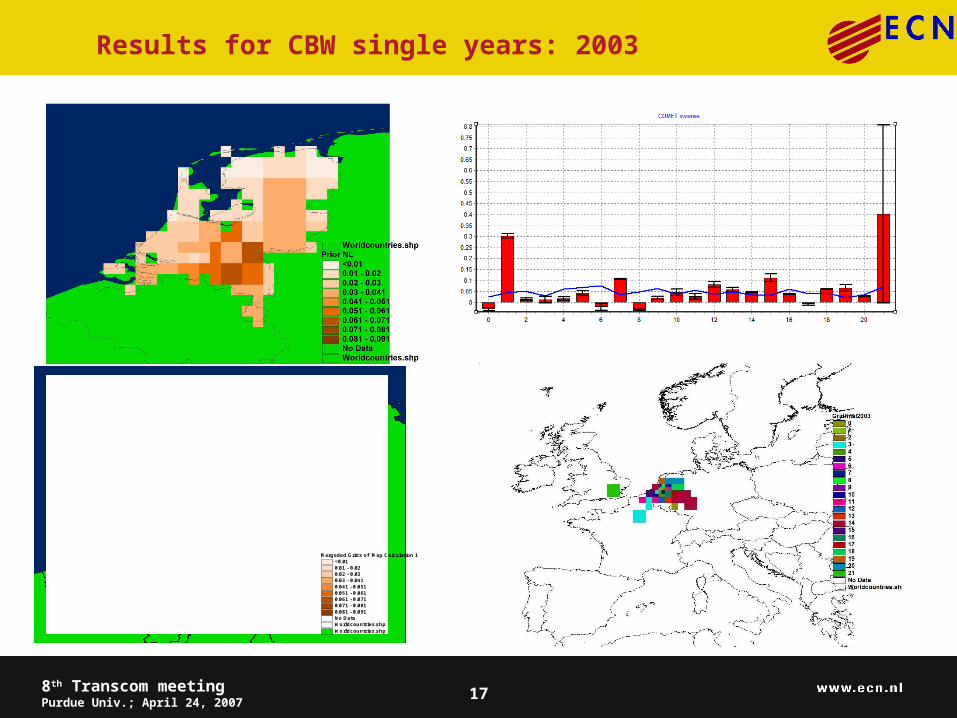
Results for CBW single years: 2003
Worldcountries.shpWorldcountries.shp
Mergeded Grids of Map Calculation 1<0.010.01 - 0.020.02 - 0.030.03 - 0.0410.041 - 0.0510.051 - 0.0610.061 - 0.0710.071 - 0.0810.081 - 0.091No Data
188th Transcom meetingPurdue Univ.; April 24, 2007
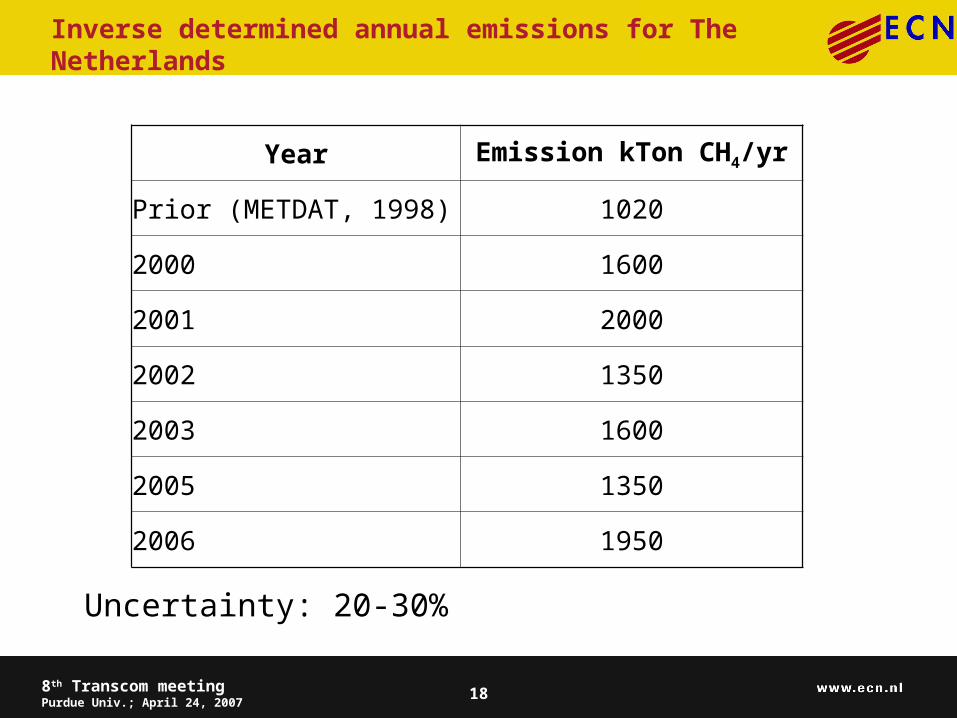
Inverse determined annual emissions for The Netherlands
Year Emission kTon CH4/yr
Prior (METDAT, 1998) 1020
2000 1600
2001 2000
2002 1350
2003 1600
2005 1350
2006 1950
Uncertainty: 20-30%
198th Transcom meetingPurdue Univ.; April 24, 2007
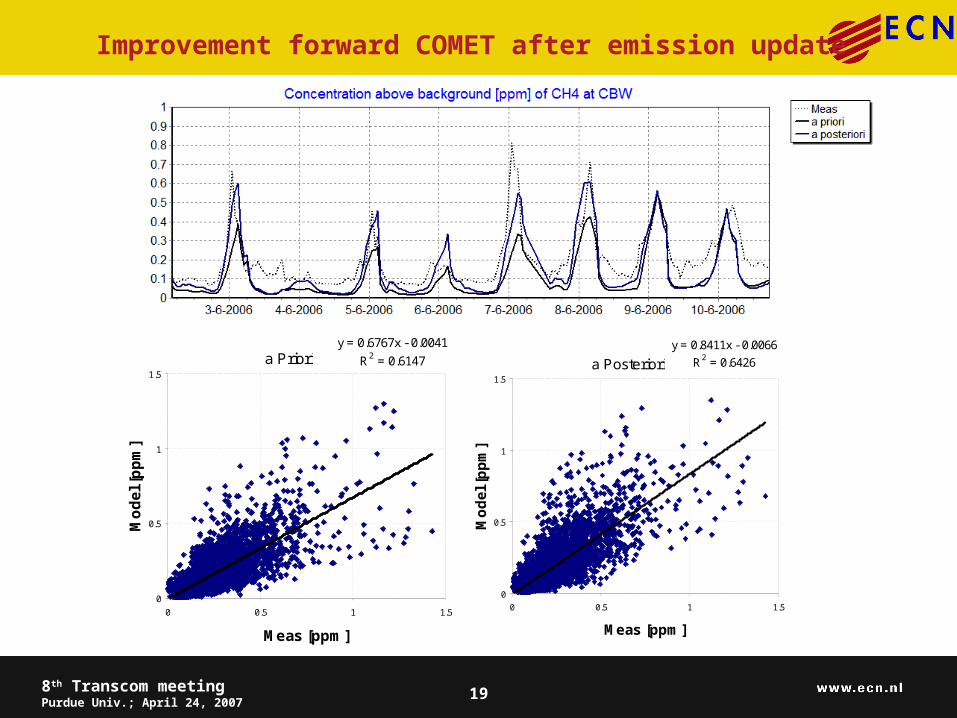
Improvement forward COMET after emission update
a Posterioriy = 0.8411x - 0.0066
R2 = 0.6426
0
0.5
1
1.5
0 0.5 1 1.5
Meas [ppm]
Mo
del
[p
pm
]
a Prioriy = 0.6767x - 0.0041
R2 = 0.6147
0
0.5
1
1.5
0 0.5 1 1.5
Meas [ppm]
Mo
del
[p
pm
]
208th Transcom meetingPurdue Univ.; April 24, 2007
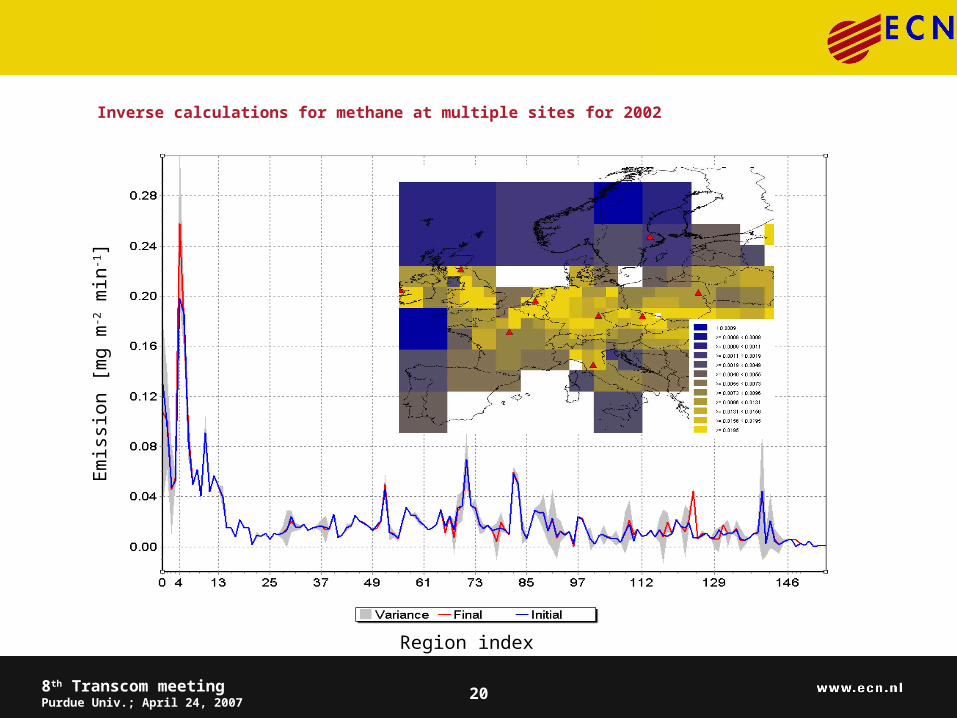
Inverse calculations for methane at multiple sites for 2002
Em
issi
on [
mg
m-2 m
in-1]
Region index
218th Transcom meetingPurdue Univ.; April 24, 2007
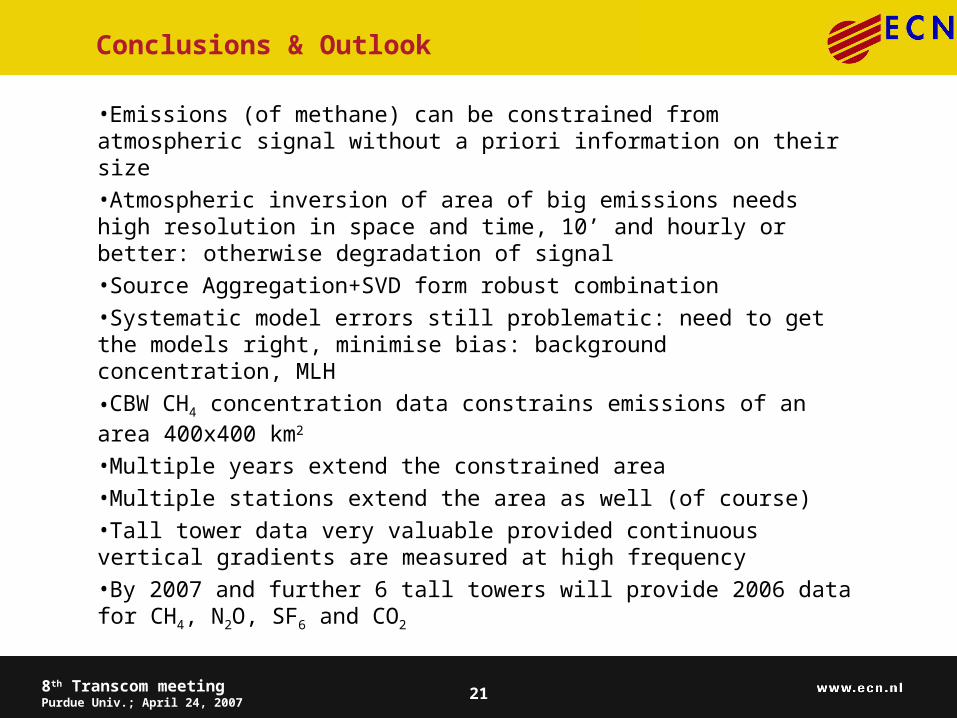
Conclusions & Outlook
•Emissions (of methane) can be constrained from atmospheric signal without a priori information on their size
•Atmospheric inversion of area of big emissions needs high resolution in space and time, 10’ and hourly or better: otherwise degradation of signal
•Source Aggregation+SVD form robust combination
•Systematic model errors still problematic: need to get the models right, minimise bias: background concentration, MLH
•CBW CH4 concentration data constrains emissions of an area 400x400 km2
•Multiple years extend the constrained area
•Multiple stations extend the area as well (of course)
•Tall tower data very valuable provided continuous vertical gradients are measured at high frequency
•By 2007 and further 6 tall towers will provide 2006 data for CH4, N2O, SF6 and CO2
228th Transcom meetingPurdue Univ.; April 24, 2007
Acknowledgements
Climate Changes spatial planning/Klimaat voor ruimte Research Program
EU FP5: CHIOTTO, contract EVK2-2002-0163
National funding agencies:
VROM
Senter/NOVEM
The Transcom continuous experiment: http://www.purdue.edu/transcom/protocol_v5.pdf
Maarten Krol (IMAU,WuR) for background CO2 data from TM5
Sander Houweling (IMAU) for background CH4 data from TM3
Pim van den Bulk
Piet en Mike Jongejan
Han Mols
Related Documents