Inverse correlation of brain and blood BDNF levels in a genetic rat model of depression Betina Elfving 1 , Pia Høgh Plougmann 1 , Heidi Kaastrup Mu ¨ ller 1 , Aleksander A. Mathe ´ 2 , Raben Rosenberg 1 and Gregers Wegener 1 1 Centre for Psychiatric Research, Aarhus University Hospital, Risskov, Denmark 2 Karolinska Institutet – Clinical Neuroscience, Psychiatry M56, Karolinska University Hospital Huddinge, Stockholm, Sweden Abstract There is accumulating evidence that brain-derived neurotrophic factor (BDNF) plays a critical role in the pathophysiology of depression. Decreased serum levels have been reported in major depression, and a correlation between BDNF reduction and the severity of the disease was found. Moreover, in post-mortem hippocampal tissue, increased levels of BDNF immunoreactivity have been reported in subjects treated with antidepressants compared to untreated subjects. These findings indicate parallel changes in brain and serum BDNF levels during depression. BDNF has been measured in selected brain areas in several animal models. In investigations between Flinders Sensitive Line (FSL) and Flinders Resistant Line (FRL) rats, a genetic rat model of depression, no differences were found in BDNF levels in the frontal cortex and hippocampus, areas believed to be core brain regions in depression. However, to our knowledge brain and serum BDNF levels have never been reported in parallel for any psychiatric disease model. Therefore, we examined the levels of BDNF in whole blood, serum, cerebrospinal fluid (CSF), hippocampus, and frontal cortex in male FSL and FRL rats. BDNF levels in serum and whole blood of FSL rats were significantly increased compared to FRL rats. In contrast, in the hippocampus the BDNF level was significantly decreased in FSL compared to FRL rats while no differences were found in the frontal cortex and CSF. The differential regulation of the BDNF levels in hippocampus, serum, and whole blood in FSL/FRL rats adds to the hypothesis that neurotrophic factors are related to the pathophysiology of depression. Received 7 July 2009 ; Reviewed 14 August 2009 ; Revised 21 August 2009 ; Accepted 24 August 2009 ; First published online 2 October 2009 Key words : BDNF, blood, correlation, frontal cortex, hippocampus. Introduction Brain-derived neurotrophic factor (BDNF) is an im- portant member of the neurotrophin family, abundant in the brain and the periphery. BDNF is a key media- tor of neuronal plasticity in the adult nervous system and is involved in the dynamic regulation of synaptic composition, neurotransmitter release and excitability (Huang & Reichardt, 2001 ; Schinder & Poo, 2000). Recent reports have suggested a pathophysiological role for BDNF in major depressive disorder, as de- creased serum and plasma levels have been reported (Aydemir et al. 2006 ; Karege et al. 2002 a ; Lee et al. 2007 ; Shimizu et al. 2003). Moreover, BDNF levels in serum were found to correlate with the severity of depression (Karege et al. 2005) and importantly, after antidepressant treatment serum BDNF levels of de- pressed patients have been reported to increase to the levels of healthy controls (Aydemir et al. 2005 ; Gonul et al. 2005 ; Shimizu et al. 2003). To date only a few studies investigating the ex- pression of BDNF in human brain tissue have been conducted. Increased levels of BDNF immuno- reactivity in post-mortem hippocampal tissue were reported in subjects treated with antidepressants at the time of death compared to those of antidepressant untreated subjects (Chen et al. 2001). Another study showed a tendency towards reduced BDNF mRNA expression in dorsolateral prefrontal cortex of de- pressed patients compared to controls (Molnar et al. 2003). Interestingly, BDNF has been reported to read- ily cross the blood–brain barrier (Pan et al. 1998) and there is evidence that peripheral blood BDNF levels Address for correspondence : B. Elfving, Ph.D., Centre for Psychiatric Research, Aarhus University Hospital, Risskov, Skovagervej 2, DK-8240 Risskov, Denmark. Tel. : +45 77893552 Fax : +4577893549 Email : [email protected] International Journal of Neuropsychopharmacology (2010), 13, 563–572. Copyright f CINP 2009 doi:10.1017/S1461145709990721 ARTICLE THEMATIC SECTION BDNF/Neurogenesis/ Cell Differentiation

Welcome message from author
This document is posted to help you gain knowledge. Please leave a comment to let me know what you think about it! Share it to your friends and learn new things together.
Transcript
Inverse correlation of brain and blood BDNFlevels in a genetic rat model of depression
Betina Elfving1, Pia Høgh Plougmann1, Heidi Kaastrup Muller1, Aleksander A. Mathe2,
Raben Rosenberg1 and Gregers Wegener1
1 Centre for Psychiatric Research, Aarhus University Hospital, Risskov, Denmark2 Karolinska Institutet – Clinical Neuroscience, Psychiatry M56, Karolinska University Hospital Huddinge, Stockholm, Sweden
Abstract
There is accumulating evidence that brain-derived neurotrophic factor (BDNF) plays a critical role in the
pathophysiology of depression. Decreased serum levels have been reported in major depression, and a
correlation between BDNF reduction and the severity of the disease was found. Moreover, in post-mortem
hippocampal tissue, increased levels of BDNF immunoreactivity have been reported in subjects treated
with antidepressants compared to untreated subjects. These findings indicate parallel changes in brain
and serum BDNF levels during depression. BDNF has been measured in selected brain areas in several
animal models. In investigations between Flinders Sensitive Line (FSL) and Flinders Resistant Line (FRL)
rats, a genetic rat model of depression, no differences were found in BDNF levels in the frontal cortex and
hippocampus, areas believed to be core brain regions in depression. However, to our knowledge brain and
serum BDNF levels have never been reported in parallel for any psychiatric disease model. Therefore, we
examined the levels of BDNF in whole blood, serum, cerebrospinal fluid (CSF), hippocampus, and frontal
cortex in male FSL and FRL rats. BDNF levels in serum and whole blood of FSL rats were significantly
increased compared to FRL rats. In contrast, in the hippocampus the BDNF level was significantly
decreased in FSL compared to FRL rats while no differences were found in the frontal cortex and CSF. The
differential regulation of the BDNF levels in hippocampus, serum, and whole blood in FSL/FRL rats adds
to the hypothesis that neurotrophic factors are related to the pathophysiology of depression.
Received 7 July 2009 ; Reviewed 14 August 2009 ; Revised 21 August 2009 ; Accepted 24 August 2009 ;
First published online 2 October 2009
Key words : BDNF, blood, correlation, frontal cortex, hippocampus.
Introduction
Brain-derived neurotrophic factor (BDNF) is an im-
portant member of the neurotrophin family, abundant
in the brain and the periphery. BDNF is a key media-
tor of neuronal plasticity in the adult nervous system
and is involved in the dynamic regulation of synaptic
composition, neurotransmitter release and excitability
(Huang & Reichardt, 2001 ; Schinder & Poo, 2000).
Recent reports have suggested a pathophysiological
role for BDNF in major depressive disorder, as de-
creased serum and plasma levels have been reported
(Aydemir et al. 2006 ; Karege et al. 2002a ; Lee et al.
2007 ; Shimizu et al. 2003). Moreover, BDNF levels in
serum were found to correlate with the severity of
depression (Karege et al. 2005) and importantly, after
antidepressant treatment serum BDNF levels of de-
pressed patients have been reported to increase to the
levels of healthy controls (Aydemir et al. 2005 ; Gonul
et al. 2005 ; Shimizu et al. 2003).
To date only a few studies investigating the ex-
pression of BDNF in human brain tissue have been
conducted. Increased levels of BDNF immuno-
reactivity in post-mortem hippocampal tissue were
reported in subjects treated with antidepressants at the
time of death compared to those of antidepressant
untreated subjects (Chen et al. 2001). Another study
showed a tendency towards reduced BDNF mRNA
expression in dorsolateral prefrontal cortex of de-
pressed patients compared to controls (Molnar et al.
2003). Interestingly, BDNF has been reported to read-
ily cross the blood–brain barrier (Pan et al. 1998) and
there is evidence that peripheral blood BDNF levels
Address for correspondence : B. Elfving, Ph.D., Centre for Psychiatric
Research, Aarhus University Hospital, Risskov, Skovagervej 2,
DK-8240 Risskov, Denmark.
Tel. : +45 77893552 Fax : +4577893549
Email : [email protected]
International Journal of Neuropsychopharmacology (2010), 13, 563–572. Copyright f CINP 2009doi:10.1017/S1461145709990721
ARTICLE
THEMATIC SECTIONBDNF/Neurogenesis/Cell Differentiation
correlate with BDNF concentrations in the central
nervous system (CNS), in that brain and serum BDNF
levels underwent similar changes during maturation
and ageing processes in rats (Karege et al. 2002b).
Based on these findings, parallel changes in brain and
serum BDNF levels during depression were hypo-
thesized.
BDNF levels have been measured in selected brain
areas in a genetic animal model of depression, the
Flinders Sensitive Line (FSL) and the Flinders
Resistant Line (FRL) rats (Angelucci et al. 2000, 2003;
Overstreet, 1993), and diverging results from two dif-
ferent studies have been reported (Angelucci et al.
2000, 2003).
In light of these findings further studies are war-
ranted and the present study investigated the possible
correlation of peripheral and central BDNF levels
using a genetic animal model of depression.
Materials and methods
Animals
Male Flinders Line rats (FSL and FRL, age 20 wk),
from the colony maintained at the University of
Aarhus, weighing 280–350 g were used. They were
housed in pairs (Cage 1291H Eurostandard Type III H,
425r266r185 mm; Techniplast, Italy) at 20¡2 xC on
a 12-h light/dark cycle (lights on 07:00 hours). Tap
water and chow pellets were available ad libitum. All
animal procedures were approved by the Danish
National Committee for Ethics in Animal Exper-
imentation (2007/561-1378). The behaviour of FSL and
FRL rats was tested with the forced swim test (FST).
FSL rats displayed increased immobility in the FST
compared to FRL rats. The increased immobility is a
depression related behaviour. The FST was performed
using a transparent cylinder (diameter 24 cm, height
60 cm, filled with 40 cm of water (25¡0.5 xC) (Porsolt
et al. 1977). On the first of two test days, the rats were
placed in the cylinder for 15 min. The following day,
the rats were gently placed in the cylinder for 5 min.
The behaviour was video-recorded, and the immo-
bility time (in seconds) was assessed using Noldus
Ethovision XT (The Netherlands).
Measurements of BDNF mRNA level with
quantitative real-time polymerase chain reaction
(real-time qPCR)
The rats were decapitated and the brains were quickly
removed, dissected, and frozen on dry ice powder.
Frontal cortex and hippocampus were weighed and
stored at x80 xC until required.
Tissue homogenization, RNA extraction, RNA
characterization, cDNA synthesis, and real-time qPCR
were carried out as previously described (Elfving et al.
2008). Briefly, frontal cortex and hippocampus were
homogenized in lysis buffer (Applied Biosystems,
USA) with mixer-mill (Retsch, Germany) 2r1 min
(30 Hz/s). Total RNA was isolated using the ABI
PrismTM 6100 Nucleic Acid Prepstation (Applied Bio-
systems, USA) following the manufacturer’s instruc-
tions. Aliquots of the RNA solution were taken for
both RNA quantification and qualification. The integ-
rity of RNA and the RNA concentration was deter-
mined with RNA StdSens microfluidic chips using the
ExperionAutomated Electrophoresis System (Bio-Rad,
USA). The RNA purity and the RNA concentration
were determined by spectrophotometer (UV1650PC
Shimadzu, Japan). Data on quality and purity of the
extracted RNA was evaluated with Student’s t test.
Afterwards RNA was reversely transcribed using ran-
dom primers and Superscript II Reverse Transcriptase
(Invitrogen, USA) following the manufacturer’s in-
structions and with a RNA concentration per reaction
of 27 ng/ml. The cDNA samples were diluted 1:30
with DEPC water before being used as a qPCR tem-
plate.
Real-time qPCR
The real-time qPCR reactions were carried out in 96-
well PCR plates using the Mx3000P (Stratagene, USA)
and SYBRGreen. Each SYBRGreen reaction (20 ml total
volume) contained 1x SYBR Green master mix (Bio-
Rad), 0.5 mM primer pairs, and 6 ml of diluted cDNA.
The gene expression of BDNF and eight different ref-
erence genes [18s subunit ribosomal RNA (18s rRNA),
b-actin (Actb), cyclophilin A (CycA), glyceraldehyde-3-
phosphate dehydrogenase (Gapd), hydroxy-methylbi-
lane synthase (Hmbs), hypoxanthine guanine phospho-
ribosyl transferase 1 (Hprt1), ribosomal protein L13A
(Rpl13A), tyrosine 3-monooxygenase/tryptophan 5-
monooxygenase activation protein, zeta (Ywhaz)] was
investigated. The reference genes were selected as de-
scribed by Bonefeld et al. (2008). The primers were
designed and tested as described by Elfving et al.
(2008).
The following forward and reverse primers were
used:
BDNF – forward: GAAAGTCCCGGTATCAAAAG,
reverse : CGCCAGCCAATTCTCTTTTTG (187 bp) ;
18s rRNA – forward:ACGGACCAGAGCGAAAGCAT,
reverse : TGTCAATCCTGTCCGTGTCC (310 bp) ;
ActB – forward: TGTCACCAACTGGGACGATA,
reverse : GGGGTGTTGAAGGTCTCAAA (165 bp) ;
564 B. Elfving et al.
CycA – forward: AGCACTGGGGAGAAAGATT,
reverse : AGCCACTCAGTCTTGGCAGT (248 bp) ;
Gapd – forward: TCACCACCATGGAGAAGGC,
reverse : GCTAAGCAGTTGGTGGTGCA (168 bp) ;
Hmbs – forward: TCCTGGCTTTACCATTGGAG,
reverse : TGAATTCCAGGTGAGGGAAC (176 bp) ;
Hprt 1 – forward: GCAGACTTTGCTTTCCTTGG,
reverse : CGAGAGGTCC TTTTCACCAG (81 bp) ;
Rpl13A – forward: ACAAGAAAAAGCGGATGGTG,
reverse : TTCCGGTAATGGATCTTTGC (167 bp) ;
Ywhaz – forward: TTGAGCAGAAGACGGAAGGT;
reverse : GAAGCATTGGGGATCAAGAA (136 bp).
The primers were obtained from DNA Technology
A/S (Denmark).
Data analysis
For data normalization, we first measured mRNA
levels for the reference genes. Stability comparison
of the expression of the reference genes was conducted
with Normfinder software (http://www.mdl.dk)
(Andersen et al. 2004). Ywhaz and Hmbs were deter-
mined to be the best combination in the hippocampus,
whereas Ywhaz and Actb were determined to be the
best combination in the frontal cortex. Therefore,
values for each individual were normalized with the
geometric mean of the reference genes Ywhaz and
Hmbs in the hippocampus and Ywhaz and Actb in the
frontal cortex.
Measurements of BDNF protein levels with
enzyme-linked immunosorbent assay (ELISA) kits
Collection of cerebrospinal fluid (CSF), brain tissue, and
blood
Since some studies in rodents show a circadian
rhythm of BDNF in certain brain regions (Allen et al.
2005 ; Schaaf et al. 2000) the rats were housed and sac-
rificed by cervical dislocation under similar standar-
dized time conditions. The rats were anaesthetized
between 10:30 and 11:30 hours with 2 ml pentobarbi-
tal/lidocainhydroxy-chlorid and CSF was taken from
the suboccipital cavity. CSF was placed on ice for
5 min while the rat was decapitated. Mixed arterio-
venous blood was collected from the neck wound.
Whole blood was collected in tubes with EDTA
(Terumo, VenosafeTM, VF-053STK) and blood for ser-
um samples was collected in anticoagulant-free tubes
with gel (Terumo, VenosafeTM, VF-054SAS). The brain
was quickly removed and frontal cortex and hippo-
campus were dissected on a cold tile. The tissue was
frozen on dry-ice powder and stored at x80 xC.
Preparation of CSF
CSF was centrifuged (800 g, 10 min, 4 xC) and the
supernatant collected and stored at x80 xC.
Number of platelets
In the blood BDNF is essentially stored in platelets
(Fujimura et al. 2002). Therefore the number of plate-
lets was determined with Sysmex 3000 (Sysmex,
Denmark) in FSL and FRL rats.
Preparation of serum and whole blood lysate
The blood collected in tubes with/without EDTA was
kept at room temperature for between 30 min and 1 h.
Blood for serum samples was centrifuged (1500 g,
10 min, 4 xC) and the supernatant was aliquoted and
stored at x80 xC.
Whole blood lysates were prepared by mixing 9
volumes of blood with 1 volume of 10% Triton-X100
in water, followed by incubation at 4 xC for 1 h and
centrifugation at 15000 g for 5 min (Fujimura et al.
2002). Whole blood lysates were aliquoted and stored
at x80 xC.
Preparation of brain tissue
Brain BDNF protein was extracted from left frontal
cortex and hippocampus. The brain tissue was homog-
enized (1 :10, w/v) with a polytron for 30 s in ice-cold
extraction buffer containing 100 mM Tris–HCl (pH 7.2),
400 mM NaCl, 4 mM EDTA, 0.05% sodium azide, 0.5%
gelatin, 0.2% Triton-X 100, 2% BSA, and CompleteTM
protease inhibitor mixture (Roche Diagnostics A/S,
Denmark). The homogenates were centrifuged
(11000 g, 20 min, 4 xC). The supernatant was collected
and stored at x80 xC.
Determination of BDNF concentration with ELISA
Quantification of endogenous BDNF was performed
with ELISA kits (Promega, Switzerland) within 2
months from collection. The same batch number was
used for the entire experiment. As an inter-plate con-
trol, in addition to the standard curves calculated for
each ELISA kit, two standards were always included
among the other samples. The standard curves and the
samples were run in duplicate. Serum and whole
blood lysates were diluted 1:20 in Block and Sample
buffer (Promega). CSF was not diluted. Hippocampus
and frontal cortex were diluted 1:12 and 1:2 in
extraction buffer, respectively. The standard curve for
determination of BDNF in brain tissue was prepared
Inverse correlation of brain and blood BDNF levels 565
in extraction buffer, whereas the standard curve for
determination of BDNF in CSF, serum, and whole
blood lysate was prepared in Block and Sample buffer.
The BDNF standard curves ranged from 7.8 to 300 pg/
ml. Briefly, 96-well immunoplates (NUNC, Denmark)
were coated with 100 ml/well of monoclonal anti-
BDNF mouse antibody and incubated overnight at
4 xC. Non-specific binding was blocked with Block
and Sample buffer. Then the samples and standards in
duplicate were added to the coated wells (100 ml each)
for 2 h at room temperature with shaking. After 2 h,
the antigen was incubated with polyclonal anti-human
BDNF antibody for 2 h at room temperature with
shaking and then incubated with an anti-IgY HRP for
1 h at room temperature. The addition of 3,3k,5,5k-tetramethylbenzidine started the colour reaction.
The reaction was stopped 10 min later with 1 M HCl
solution, and the absorbency was immediately
measured at 450 nm (EL 800 Universal Microplate
reader, Bio-Tek instruments Inc., USA). According to
the manufacturer the BDNF ELISA kit has<3% cross-
reactivity with other related neurotrophic factors, e.g.
NGF, NT-3 and NT-4 and the sensitivity is 15.6 pg/ml
BDNF.
BDNF in the adult brain is present in two forms: the
mature form (mBDNF) and the precursor form
(proBDNF) (Martinowich et al. 2007). The above-
mentioned protocol was used to measure the amount
of free mBDNF in our samples. Total free BDNF was
measured as described in the manufacturer’s protocol
with acid-treatment of the preparations. Samples were
processed with 1 M HCl acidification and subsequent
1 M NaOH neutralization.
Measurements of BDNF protein levels with
Western blot
To confirm the BDNF data obtained with the ELISA
kit, Western blotting was conducted with serum and
brain samples. Serum samples were diluted 1:4 in
PBS containing 1% Triton X-100 and 1x CompleteTM
protease inhibitor mixture (Roche Diagnostics A/S).
Samples were mixed with SDS sample buffer [125 mM
Tris–HCl (pH 6.8), 20% glycerol, 4% SDS, 0.02%
Bromphenol Blue, and 125 mM dithiothreitol] and in-
cubated at 50 xC for 30 min. Brain homogenates were
mixed with an additional two volumes of lysis buffer
[50 mM Tris–HCl (pH 7.4), 150 mM NaCl, 2 mM EDTA,
1% Triton X-100, 1x CompleteTM protease inhibitor
mixture] and incubated on ice for 30 min. The samples
were centrifuged at 15000 g for 10 min and the super-
natants were incubated with SDS sample buffer for
30 min at 50 xC. The serum samples (5 ml) and brain
homogenates (10 ml) were analysed by SDS–PAGE
using 10% precast NuPAGE gels (Invitrogen, USA)
with a MES buffer system. Proteins were transferred
onto nitrocellulose membranes using the iBlot dry
blotting system (Invitrogen) and membranes were
blocked with 5% dry milk in TBS-T [50 mM Tris–HCl
(pH 8.0), 150 mM NaCl, and 0.5% Tween-20] for 1 h at
room temperature. The membranes were probed
overnight at 4 xC with the primary antibodies : rabbit
polyclonal anti-BDNF (1 :500, sc-546 ; Santa Cruz) and
mouse monoclonal anti-b-actin (1 :2000, A 5316;
Sigma) followed by incubation with the appropriate
peroxidase-conjugated secondary antibody: goat
anti-rabbit antibody (1 :25.000, no. 1858415; Pierce)
and goat anti-mouse antibody (1 :2000, no. 1858413;
Pierce) for 1 h at room temperature. Immunoreactive
bands were visualized using ECL Advance Western
Blotting Detection Reagent (GE Healthcare, UK)
and the chemiluminescent signals were captured on a
Kodak Image Station 440 and relative intensities
were quantified by the Kodak 1D3.6 Image Analysis
Software.
Statistics
Student’s t test was used to compare the FSL and FRL
groups in the FST, at the mRNA, and protein level ;
p<0.05 was considered statistically significantly dif-
ferent. Correlation between measurements of BDNF in
blood and brain preparations was determined by cal-
culation of the Spearman coefficient, r. Correlations
were considered significant when p<0.05. To achieve
a sufficient number of animals for correlation the FSL
and FRL groups were combined.
Results
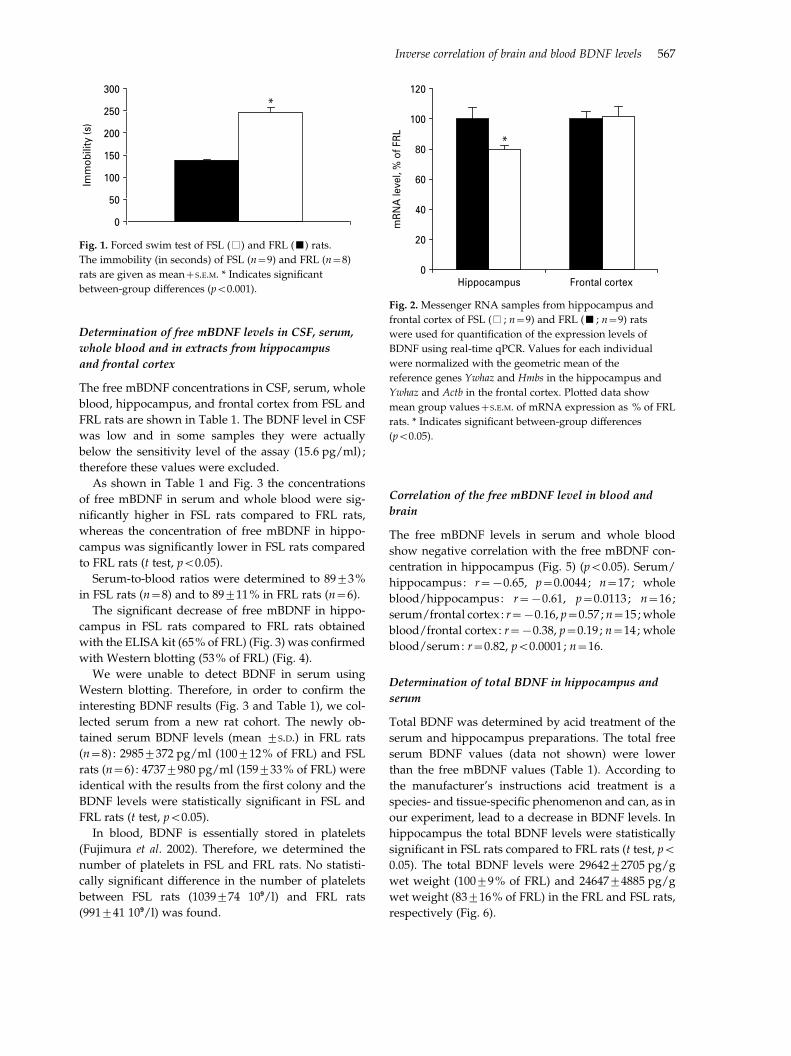
The FSL rats from our breeding colony displayed in-
creased immobility in the FST compared to FRL rats
(83% vs. 47%, p<0.001) (Fig. 1).
Determination of BDNF mRNA levels with qPCR
No differences between FSL and FRL rats were found
with respect to the 18s/28s rRNA ratio or RNA purity
in the frontal cortex or in the hippocampus (data not
shown).
The normalized mRNA levels of BDNF in hippo-
campus and frontal cortex are given in Fig. 2. The
hippocampal mRNA level was significantly lower
in FSL rats compared to FRL rats, whereas the
mRNA level in frontal cortex was similar in FSL and
FRL rats.
566 B. Elfving et al.
Determination of free mBDNF levels in CSF, serum,
whole blood and in extracts from hippocampus
and frontal cortex
The free mBDNF concentrations in CSF, serum, whole
blood, hippocampus, and frontal cortex from FSL and
FRL rats are shown in Table 1. The BDNF level in CSF
was low and in some samples they were actually
below the sensitivity level of the assay (15.6 pg/ml) ;
therefore these values were excluded.
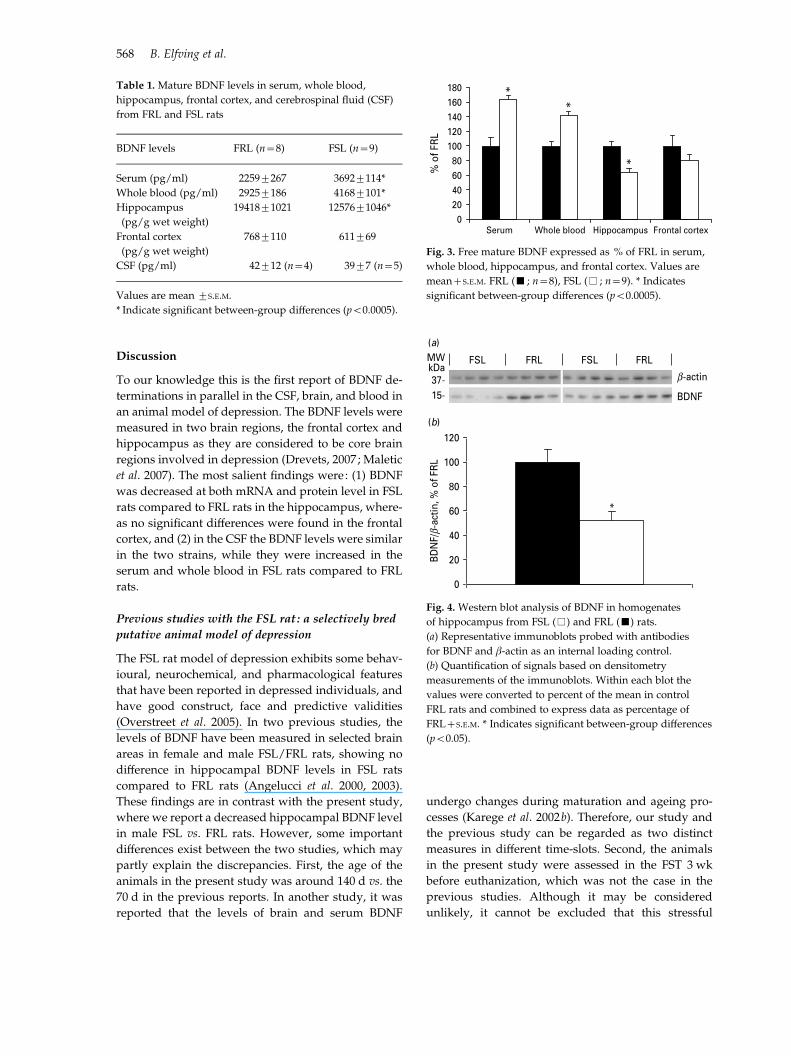
As shown in Table 1 and Fig. 3 the concentrations
of free mBDNF in serum and whole blood were sig-
nificantly higher in FSL rats compared to FRL rats,
whereas the concentration of free mBDNF in hippo-
campus was significantly lower in FSL rats compared
to FRL rats (t test, p<0.05).
Serum-to-blood ratios were determined to 89¡3%
in FSL rats (n=8) and to 89¡11% in FRL rats (n=6).
The significant decrease of free mBDNF in hippo-
campus in FSL rats compared to FRL rats obtained
with the ELISA kit (65% of FRL) (Fig. 3) was confirmed
with Western blotting (53% of FRL) (Fig. 4).
We were unable to detect BDNF in serum using
Western blotting. Therefore, in order to confirm the
interesting BDNF results (Fig. 3 and Table 1), we col-
lected serum from a new rat cohort. The newly ob-
tained serum BDNF levels (mean ¡S.D.) in FRL rats
(n=8) : 2985¡372 pg/ml (100¡12% of FRL) and FSL
rats (n=6) : 4737¡980 pg/ml (159¡33% of FRL) were
identical with the results from the first colony and the
BDNF levels were statistically significant in FSL and
FRL rats (t test, p<0.05).
In blood, BDNF is essentially stored in platelets
(Fujimura et al. 2002). Therefore, we determined the
number of platelets in FSL and FRL rats. No statisti-
cally significant difference in the number of platelets
between FSL rats (1039¡74 109/l) and FRL rats
(991¡41 109/l) was found.
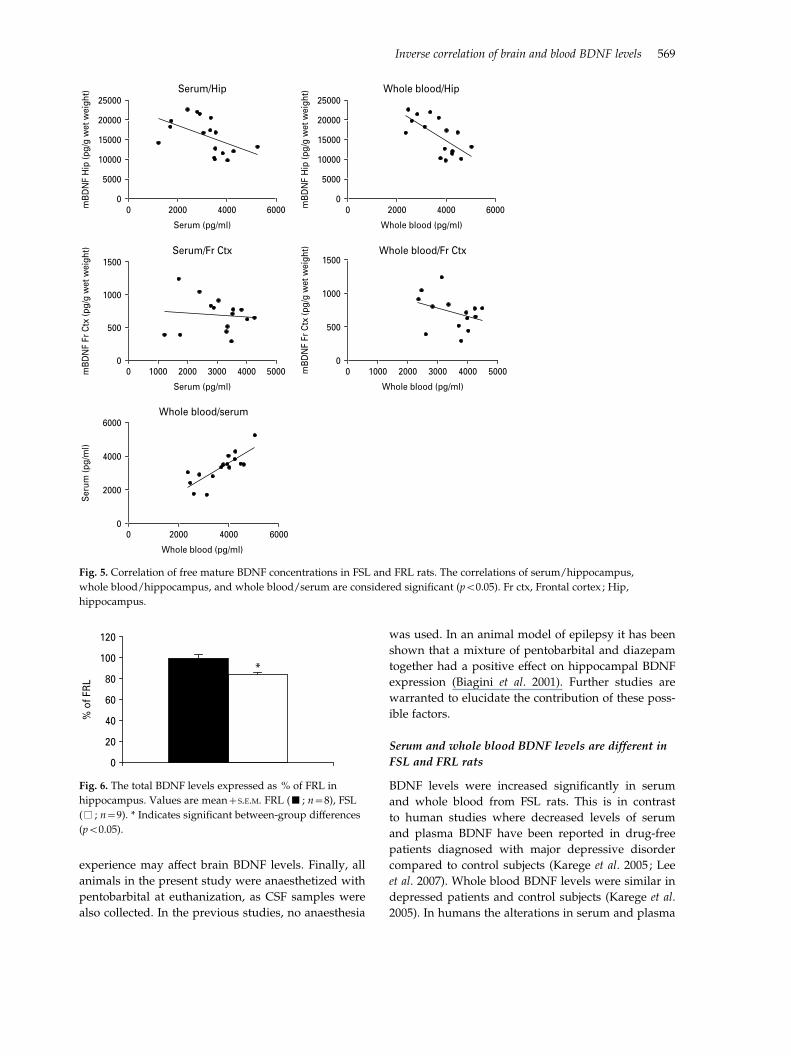
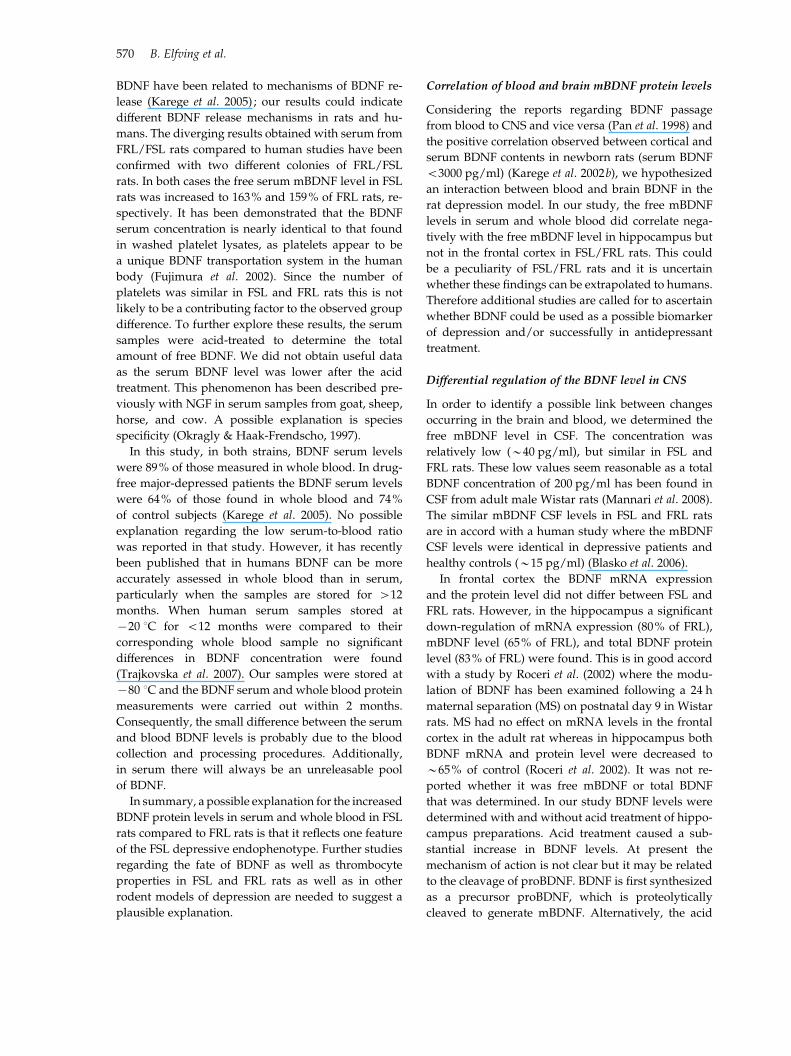
Correlation of the free mBDNF level in blood and
brain
The free mBDNF levels in serum and whole blood
show negative correlation with the free mBDNF con-
centration in hippocampus (Fig. 5) (p<0.05). Serum/
hippocampus: r=x0.65, p=0.0044; n=17 ; whole
blood/hippocampus : r=x0.61, p=0.0113; n=16;
serum/frontal cortex : r=x0.16, p=0.57 ; n=15; whole
blood/frontal cortex : r=x0.38, p=0.19 ; n=14; whole
blood/serum: r=0.82, p<0.0001 ; n=16.
Determination of total BDNF in hippocampus and
serum
Total BDNF was determined by acid treatment of the
serum and hippocampus preparations. The total free
serum BDNF values (data not shown) were lower
than the free mBDNF values (Table 1). According to
the manufacturer’s instructions acid treatment is a
species- and tissue-specific phenomenon and can, as in
our experiment, lead to a decrease in BDNF levels. In
hippocampus the total BDNF levels were statistically
significant in FSL rats compared to FRL rats (t test, p<0.05). The total BDNF levels were 29642¡2705 pg/g
wet weight (100¡9% of FRL) and 24647¡4885 pg/g
wet weight (83¡16% of FRL) in the FRL and FSL rats,
respectively (Fig. 6).
*300
250
200
150
100
50
0
Imm
obili
ty (s
)
Fig. 1. Forced swim test of FSL (%) and FRL (&) rats.
The immobility (in seconds) of FSL (n=9) and FRL (n=8)
rats are given as mean+S.E.M. * Indicates significant
between-group differences (p<0.001).
120
100
80
60
40
20
0
mR
NA
leve
l, %
of F
RL
Hippocampus Frontal cortex
*
Fig. 2. Messenger RNA samples from hippocampus and
frontal cortex of FSL (% ; n=9) and FRL (& ; n=9) rats
were used for quantification of the expression levels of
BDNF using real-time qPCR. Values for each individual
were normalized with the geometric mean of the
reference genes Ywhaz and Hmbs in the hippocampus and
Ywhaz and Actb in the frontal cortex. Plotted data show
mean group values+S.E.M. of mRNA expression as % of FRL
rats. * Indicates significant between-group differences
(p<0.05).
Inverse correlation of brain and blood BDNF levels 567
Discussion
To our knowledge this is the first report of BDNF de-
terminations in parallel in the CSF, brain, and blood in
an animal model of depression. The BDNF levels were
measured in two brain regions, the frontal cortex and
hippocampus as they are considered to be core brain
regions involved in depression (Drevets, 2007 ; Maletic
et al. 2007). The most salient findings were: (1) BDNF
was decreased at both mRNA and protein level in FSL
rats compared to FRL rats in the hippocampus, where-
as no significant differences were found in the frontal
cortex, and (2) in the CSF the BDNF levels were similar
in the two strains, while they were increased in the
serum and whole blood in FSL rats compared to FRL
rats.
Previous studies with the FSL rat : a selectively bred
putative animal model of depression
The FSL rat model of depression exhibits some behav-
ioural, neurochemical, and pharmacological features
that have been reported in depressed individuals, and
have good construct, face and predictive validities
(Overstreet et al. 2005). In two previous studies, the
levels of BDNF have been measured in selected brain
areas in female and male FSL/FRL rats, showing no
difference in hippocampal BDNF levels in FSL rats
compared to FRL rats (Angelucci et al. 2000, 2003).
These findings are in contrast with the present study,
where we report a decreased hippocampal BDNF level
in male FSL vs. FRL rats. However, some important
differences exist between the two studies, which may
partly explain the discrepancies. First, the age of the
animals in the present study was around 140 d vs. the
70 d in the previous reports. In another study, it was
reported that the levels of brain and serum BDNF
undergo changes during maturation and ageing pro-
cesses (Karege et al. 2002b). Therefore, our study and
the previous study can be regarded as two distinct
measures in different time-slots. Second, the animals
in the present study were assessed in the FST 3 wk
before euthanization, which was not the case in the
previous studies. Although it may be considered
unlikely, it cannot be excluded that this stressful
Table 1. Mature BDNF levels in serum, whole blood,
hippocampus, frontal cortex, and cerebrospinal fluid (CSF)
from FRL and FSL rats
BDNF levels FRL (n=8) FSL (n=9)
Serum (pg/ml) 2259¡267 3692¡114*
Whole blood (pg/ml) 2925¡186 4168¡101*
Hippocampus
(pg/g wet weight)
19418¡1021 12576¡1046*
Frontal cortex
(pg/g wet weight)
768¡110 611¡69
CSF (pg/ml) 42¡12 (n=4) 39¡7 (n=5)
Values are mean ¡S.E.M.
* Indicate significant between-group differences (p<0.0005).
120
180160140
100806040200
% o
f FR
L
Serum Whole blood
**
*
Hippocampus Frontal cortex
Fig. 3. Free mature BDNF expressed as % of FRL in serum,
whole blood, hippocampus, and frontal cortex. Values are
mean+S.E.M. FRL (& ; n=8), FSL (% ; n=9). * Indicates
significant between-group differences (p<0.0005).
*
120
100
80
60
40
20
0
BD
NF/
β-ac
tin, %
of F
RL
(a)
(b)
β-actin
BDNF
MWkDa37-15-
FSL FRL FSL FRL
Fig. 4. Western blot analysis of BDNF in homogenates
of hippocampus from FSL (%) and FRL (&) rats.
(a) Representative immunoblots probed with antibodies
for BDNF and b-actin as an internal loading control.
(b) Quantification of signals based on densitometry
measurements of the immunoblots. Within each blot the
values were converted to percent of the mean in control
FRL rats and combined to express data as percentage of
FRL+S.E.M. * Indicates significant between-group differences
(p<0.05).
568 B. Elfving et al.
experience may affect brain BDNF levels. Finally, all
animals in the present study were anaesthetized with
pentobarbital at euthanization, as CSF samples were
also collected. In the previous studies, no anaesthesia
was used. In an animal model of epilepsy it has been
shown that a mixture of pentobarbital and diazepam
together had a positive effect on hippocampal BDNF
expression (Biagini et al. 2001). Further studies are
warranted to elucidate the contribution of these poss-
ible factors.
Serum and whole blood BDNF levels are different in
FSL and FRL rats
BDNF levels were increased significantly in serum
and whole blood from FSL rats. This is in contrast
to human studies where decreased levels of serum
and plasma BDNF have been reported in drug-free
patients diagnosed with major depressive disorder
compared to control subjects (Karege et al. 2005 ; Lee
et al. 2007). Whole blood BDNF levels were similar in
depressed patients and control subjects (Karege et al.
2005). In humans the alterations in serum and plasma
5000
10000
15000
20000
25000
0
mB
DN
F H
ip (p
g/g
wet
wei
ght) Serum/Hip
0 2000 4000 6000
Serum (pg/ml)
5000
10000
15000
20000
25000
0
mB
DN
F H
ip (p
g/g
wet
wei
ght) Whole blood/Hip
0 2000 4000 6000
Whole blood (pg/ml)
500
1000
1500
0
mB
DN
F Fr
Ctx
(pg/
g w
et w
eigh
t) Serum/Fr Ctx
0 20001000 40003000 5000
Serum (pg/ml)
2000
4000
6000
0
Ser
um (p
g/m
l)
Whole blood/serum
0 2000 4000 6000
Whole blood (pg/ml)
500
1000
1500
0
mB
DN
F Fr
Ctx
(pg/
g w
et w
eigh
t) Whole blood/Fr Ctx
0 2000 30001000 4000 5000
Whole blood (pg/ml)
Fig. 5. Correlation of free mature BDNF concentrations in FSL and FRL rats. The correlations of serum/hippocampus,
whole blood/hippocampus, and whole blood/serum are considered significant (p<0.05). Fr ctx, Frontal cortex ; Hip,
hippocampus.
120
100
80
60
40
20
0
% o
f FR
L
*
Fig. 6. The total BDNF levels expressed as % of FRL in
hippocampus. Values are mean+S.E.M. FRL (& ; n=8), FSL
(% ; n=9). * Indicates significant between-group differences
(p<0.05).
Inverse correlation of brain and blood BDNF levels 569
BDNF have been related to mechanisms of BDNF re-
lease (Karege et al. 2005) ; our results could indicate
different BDNF release mechanisms in rats and hu-
mans. The diverging results obtained with serum from
FRL/FSL rats compared to human studies have been
confirmed with two different colonies of FRL/FSL
rats. In both cases the free serum mBDNF level in FSL
rats was increased to 163% and 159% of FRL rats, re-
spectively. It has been demonstrated that the BDNF
serum concentration is nearly identical to that found
in washed platelet lysates, as platelets appear to be
a unique BDNF transportation system in the human
body (Fujimura et al. 2002). Since the number of
platelets was similar in FSL and FRL rats this is not
likely to be a contributing factor to the observed group
difference. To further explore these results, the serum
samples were acid-treated to determine the total
amount of free BDNF. We did not obtain useful data
as the serum BDNF level was lower after the acid
treatment. This phenomenon has been described pre-
viously with NGF in serum samples from goat, sheep,
horse, and cow. A possible explanation is species
specificity (Okragly & Haak-Frendscho, 1997).
In this study, in both strains, BDNF serum levels
were 89% of those measured in whole blood. In drug-
free major-depressed patients the BDNF serum levels
were 64% of those found in whole blood and 74%
of control subjects (Karege et al. 2005). No possible
explanation regarding the low serum-to-blood ratio
was reported in that study. However, it has recently
been published that in humans BDNF can be more
accurately assessed in whole blood than in serum,
particularly when the samples are stored for >12
months. When human serum samples stored at
x20 xC for <12 months were compared to their
corresponding whole blood sample no significant
differences in BDNF concentration were found
(Trajkovska et al. 2007). Our samples were stored at
x80 xC and the BDNF serum and whole blood protein
measurements were carried out within 2 months.
Consequently, the small difference between the serum
and blood BDNF levels is probably due to the blood
collection and processing procedures. Additionally,
in serum there will always be an unreleasable pool
of BDNF.
In summary, a possible explanation for the increased
BDNF protein levels in serum and whole blood in FSL
rats compared to FRL rats is that it reflects one feature
of the FSL depressive endophenotype. Further studies
regarding the fate of BDNF as well as thrombocyte
properties in FSL and FRL rats as well as in other
rodent models of depression are needed to suggest a
plausible explanation.
Correlation of blood and brain mBDNF protein levels
Considering the reports regarding BDNF passage
from blood to CNS and vice versa (Pan et al. 1998) and
the positive correlation observed between cortical and
serum BDNF contents in newborn rats (serum BDNF
<3000 pg/ml) (Karege et al. 2002b), we hypothesized
an interaction between blood and brain BDNF in the
rat depression model. In our study, the free mBDNF
levels in serum and whole blood did correlate nega-
tively with the free mBDNF level in hippocampus but
not in the frontal cortex in FSL/FRL rats. This could
be a peculiarity of FSL/FRL rats and it is uncertain
whether these findings can be extrapolated to humans.
Therefore additional studies are called for to ascertain
whether BDNF could be used as a possible biomarker
of depression and/or successfully in antidepressant
treatment.
Differential regulation of the BDNF level in CNS
In order to identify a possible link between changes
occurring in the brain and blood, we determined the
free mBDNF level in CSF. The concentration was
relatively low (y40 pg/ml), but similar in FSL and
FRL rats. These low values seem reasonable as a total
BDNF concentration of 200 pg/ml has been found in
CSF from adult male Wistar rats (Mannari et al. 2008).
The similar mBDNF CSF levels in FSL and FRL rats
are in accord with a human study where the mBDNF
CSF levels were identical in depressive patients and
healthy controls (y15 pg/ml) (Blasko et al. 2006).
In frontal cortex the BDNF mRNA expression
and the protein level did not differ between FSL and
FRL rats. However, in the hippocampus a significant
down-regulation of mRNA expression (80% of FRL),
mBDNF level (65% of FRL), and total BDNF protein
level (83% of FRL) were found. This is in good accord
with a study by Roceri et al. (2002) where the modu-
lation of BDNF has been examined following a 24 h
maternal separation (MS) on postnatal day 9 in Wistar
rats. MS had no effect on mRNA levels in the frontal
cortex in the adult rat whereas in hippocampus both
BDNF mRNA and protein level were decreased to
y65% of control (Roceri et al. 2002). It was not re-
ported whether it was free mBDNF or total BDNF
that was determined. In our study BDNF levels were
determined with and without acid treatment of hippo-
campus preparations. Acid treatment caused a sub-
stantial increase in BDNF levels. At present the
mechanism of action is not clear but it may be related
to the cleavage of proBDNF. BDNF is first synthesized
as a precursor proBDNF, which is proteolytically
cleaved to generate mBDNF. Alternatively, the acid
570 B. Elfving et al.
treatment may dissociate BDNF from its receptor, the
tyrosine kinase receptor B (TrkB) (Martinowich et al.
2007 ; Okragly & Haak-Frendscho, 1997). Both expla-
nations seem plausible and more studies are war-
ranted to understand possible differences in proBDNF
vs. mBDNF in FSL/FRL rats. In conclusion, we have
found differential regulation of mBDNF levels in hip-
pocampus, serum, and whole blood in FSL and FRL
rat strains. In the hippocampus the BDNF mRNA
level, mBDNF level, and total BDNF protein level were
down-regulated in FSL rats compared to FRL rats. In
addition, correlations of the mBDNF levels in hippo-
campus/serum and hippocampus/whole blood were
found.
We believe that our study with parallel optimized
analyses of the BDNF levels in the CSF, brain, and
blood in FSL/FRL rats contributes significantly to the
understanding of BDNF regulation in the genetic rat
model of depression.
Acknowledgements
B. Elfving was supported by the Danish Research
Council, Ministry of Science, Technology and Inno-
vation. The study was supported by the Augustinus
Foundation and The Biomedical Laboratory Scientist
Education and Research Fund. We thank David H.
Overstreet for providing us with the initial FSL/FRL
breeding pairs.
Statement of Interest
None.
References
Allen GC, Qu X, Earnest DJ (2005). TrkB-deficient mice show
diminished phase shifts of the circadian activity rhythm in
response to light. Neuroscience Letters 378, 150–155.
Andersen CL, Jensen JL, Ørntoft TF (2004). Normalization
of real-time quantitative reverse transcription-PCR
data : a model-based variance estimation approach to
identify genes suited for normalization, applied to
bladder and colon cancer data sets. Cancer Research 64,
5245–5250.
Angelucci F, Aloe L, Jimenez-Vasquez P, Mathe AA (2003).
Lithium treatment alters brain concentrations of nerve
growth factor, brain-derived neurotrophic factor and glial
cell line-derived neurotrophic factor in a rat model of
depression. International Journal of Neuropsychopharmacology
6, 225–231.
Angelucci F, Aloe L, Vasquez PJ, Mathe AA (2000).
Mapping the differences in the brain concentration of
brain-derived neurotrophic factor (BDNF) and nerve
growth factor (NGF) in an animal model of depression.
Neuroreport 11, 1369–1373.
Aydemir C, Yalcin ES, Aksaray S, Kisa C, et al. (2006).
Brain-derived neurotrophic factor (BDNF) changes in the
serum of depressed women. Progress in
Neuropsychopharmacology and Biological Psychiatry 30,
1256–1260.
Aydemir O, Deveci A, Taneli F (2005). The effect of chronic
antidepressant treatment on serum brain-derived
neurotrophic factor levels in depressed patients : a
preliminary study. Progress in Neuropsychopharmacology and
Biological Psychiatry 29, 261–265.
Biagini G, Avoli M, Marcinkiewicz J, Marcinkiewicz M
(2001). Brain-derived neurotrophic factor superinduction
parallels anti-epileptic – neuroprotective treatment in the
pilocarpine epilepsy model. Journal of Neurochemistry 76,
1814–1822.
Blasko I, Lederer W, Oberbauer H, Walch T, et al.
(2006). Measurement of thirteen biological markers in
CSF of patients with Alzheimer’s disease and other
dementias. Dementia and Geriatric Cognitive Disorders 21,
9–15.
Bonefeld BE, Elfving B, Wegener G (2008). Reference genes
for normalization : a study of rat brain tissue. Synapse 62,
302–309.
Chen B, Dowlatshahi D, MacQueen GM, Wang JF, et al.
(2001). Increased hippocampal BDNF immunoreactivity
in subjects treated with antidepressant medication.
Biological Psychiatry 50, 260–265.
Drevets WC (2007). Orbitofrontal cortex function and
structure in depression. Annals of the New York Academy of
Sciences 1121, 499–527.
Elfving B, Bonefeld BE, Rosenberg R, Wegener G (2008).
Differential expression of synaptic vesicle proteins after
repeated electroconvulsive seizures in rat frontal cortex
and hippocampus. Synapse 62, 662–670.
Fujimura H, Altar CA, Chen R, Nakamura T, et al. (2002).
Brain-derived neurotrophic factor is stored in human
platelets and released by agonist stimulation. Thrombosis
and Haemostasis 87, 728–734.
Gonul AS, Akdeniz F, Taneli F, Donat O, et al. (2005).
Effect of treatment on serum brain-derived neurotrophic
factor levels in depressed patients. European Archives of
Psychiatry and Clinical Neuroscience 255, 381–386.
Huang EJ, Reichardt LF (2001). Neurotrophins : roles in
neuronal development and function. Annual Review of
Neuroscience 24, 677–736.
Karege F, Bondolfi G, Gervasoni N, SchwaldM, et al. (2005).
Low brain-derived neurotrophic factor (BDNF) levels in
serum of depressed patients probably results from lowered
platelet BDNF release unrelated to platelet reactivity.
Biological Psychiatry 57, 1068–1072.
Karege F, Perret G, Bondolfi G, Schwald M, et al. (2002a).
Decreased serum brain-derived neurotrophic factor levels
in major depressed patients. Psychiatry Research 109,
143–148.
Karege F, Schwald M, Cisse M (2002b). Postnatal
developmental profile of brain-derived neurotrophic
Inverse correlation of brain and blood BDNF levels 571
factor in rat brain and platelets. Neuroscience Letters 328,
261–264.
Lee BH, Kim H, Park SH, Kim YK (2007). Decreased plasma
BDNF level in depressive patients. Journal of Affective
Disorders 101, 239–244.
Maletic V, Robinson M, Oakes T, Iyengar S, et al. (2007).
Neurobiology of depression: an integrated view of key
findings. International Journal of Clinical Practice 61,
2030–2040.
Mannari C, Origlia N, Scatena A, Del DA, et al. (2008).
BDNF level in the rat prefrontal cortex increases following
chronic but not acute treatment with duloxetine, a dual
acting inhibitor of noradrenaline and serotonin re-uptake.
Cellular and Molecular Neurobiology 28, 457–468.
Martinowich K, Manji H, Lu B (2007). New insights into
BDNF function in depression and anxiety. Nature
Neuroscience 10, 1089–1093.
Molnar M, Potkin SG, Bunney WE, Jones EG (2003).
MRNA expression patterns and distribution of white
matter neurons in dorsolateral prefrontal cortex of
depressed patients differ from those in schizophrenia
patients. Biological Psychiatry 53, 39–47.
Okragly AJ, Haak-Frendscho M (1997). An acid-treatment
method for the enhanced detection of GDNF in biological
samples. Experimental Neurology 145, 592–596.
Overstreet DH (1993). The Flinders sensitive line rats : a
genetic animal model of depression. Neuroscience and
Biobehavioral Reviews 17, 51–68.
Overstreet DH, Friedman E, Mathe AA, Yadid G (2005). The
Flinders Sensitive Line rat : a selectively bred putative
animal model of depression. Neuroscience and Biobehavioral
Reviews 29, 739–759.
Pan W, Banks WA, Fasold MB, Bluth J, et al. (1998).
Transport of brain-derived neurotrophic factor across
the blood-brain barrier. Neuropharmacology 37, 1553–1561.
Porsolt RD, Le PM, Jalfre M (1977). Depression : a new
animal model sensitive to antidepressant treatments.
Nature 266, 730–732.
Roceri M, Hendriks W, Racagni G, Ellenbroek BA, et al.
(2002). Early maternal deprivation reduces the expression
of BDNF and NMDA receptor subunits in rat
hippocampus. Molecular Psychiatry 7, 609–616.
Schaaf MJ, Duurland R, de Kloet ER, Vreugdenhil E
(2000). Circadian variation in BDNF mRNA expression in
the rat hippocampus. Brain Research. Molecular Brain
Research 75, 342–344.
Schinder AF, Poo M (2000). The neurotrophin hypothesis
for synaptic plasticity. Trends in Neurosciences 23, 639–645.
Shimizu E, Hashimoto K, Okamura N, Koike K, et al.
(2003). Alterations of serum levels of brain-derived
neurotrophic factor (BDNF) in depressed patients with
or without antidepressants. Biological Psychiatry 54, 70–75.
Trajkovska V, Marcussen AB, Vinberg M, Hartvig P, et al.
(2007). Measurements of brain-derived neurotrophic
factor : methodological aspects and demographical data.
Brain Research Bulletin 73, 143–149.
572 B. Elfving et al.
Related Documents


