L03-05: Multi Period Inventory Systems SCM 2011 IIM Lucknow 1 Multi-Period Inventory Systems Inventory Management Inventory Management Inventory Management Inventory Management Sushil Kumar, PhD IIM Lucknow SK/SCM2011/L3-5/2 Introduction to a few Terms • Customer – anyone or anything that creates demand for items • Supplier – anyone or anything that replenishes or adds to stock • Stock – all the goods and materials that are stored by an organization until they are needed • Inventory – is a list of the items held in stock (often taken as being the stock itself) • Consumables – stocks of materials needed to support operations, but which do not form part of the final product, such as oil, paper, cleaners, etc. • Item – a single article that is kept in stock – it is one entry in the inventory • Stock Keeping Unit (SKU) – an alternative name for item SK/SCM2011/L3-5/3 Introduction to a few Terms • Spare parts – items held in stock as replacements to keep machinery, equipment, etc working properly • Item coding – an arrangement for giving every package of material moved an identifying tag, usually a bar code or magnetic strip • Unit – the standard size or quantity of a stock item • Unit cost – cost of buying (or acquiring) each unit of an item • Unitization – putting materials into standard packages (typically on pallets or in containers) to ease movement • Vendor-managed inventory – has suppliers managing both their own stocks and those held further down the supply chain • Stocktaking – periodic checks to find differences between recorded and actual stock levels SK/SCM2011/L3-5/4 Introduction to a few Terms • Safety stock – a reserve of materials that is not normally needed, but is held to cover unexpected circumstances • Service level – a measure of the proportion of customer demand met from stock (or some equivalent measure) (Fill Rate) • Purchasing – part of procurement responsible for actually buying materials (and often used to mean the same as procurement) • Procurement –the function responsible for acquiring all the materials needed by an organization • Procurement cycle – sequence of activities needed to acquire materials • Replenishment – putting materials into stock to replace units that have been used

Welcome message from author
This document is posted to help you gain knowledge. Please leave a comment to let me know what you think about it! Share it to your friends and learn new things together.
Transcript
L03-05: Multi Period Inventory Systems SCM 2011
IIM Lucknow 1
Multi-Period Inventory Systems
Inventory ManagementInventory ManagementInventory ManagementInventory Management
Sushil Kumar, PhDIIM Lucknow
SK/SCM2011/L3-5/2
Introduction to a few Terms
• Customer –anyone or anything that creates demand for items
• Supplier – anyone or anything that replenishes or adds to stock
• Stock – all the goods and materials that are stored by an organization until they are needed
• Inventory – is a list of the items held in stock (often taken as being the stock itself)
• Consumables – stocks of materials needed to support operations, but which do not form part of the final product, such as oil, paper, cleaners, etc.
• Item – a single article that is kept in stock – it is one entry in the inventory
• Stock Keeping Unit (SKU) – an alternative name for item
SK/SCM2011/L3-5/3
Introduction to a few Terms
• Spare parts – items held in stock as replacements to keep machinery, equipment, etc working properly
• Item coding – an arrangement for giving every package of material moved an identifying tag, usually a bar code or magnetic strip
• Unit – the standard size or quantity of a stock item
• Unit cost – cost of buying (or acquiring) each unit of an item
• Unitization – putting materials into standard packages (typically on pallets or in containers) to ease movement
• Vendor-managed inventory –has suppliers managing both their own stocks and those held further down the supply chain
• Stocktaking – periodic checks to find differences between recorded and actual stock levels
SK/SCM2011/L3-5/4
Introduction to a few Terms
• Safety stock – a reserve of materials that is not normally needed, but is held to cover unexpected circumstances
• Service level – a measure of the proportion of customer demand met from stock (or some equivalent measure) (Fill Rate)
• Purchasing –part of procurement responsible for actually buying materials (and often used to mean the same as procurement)
• Procurement –the function responsible for acquiring all the materials needed by an organization
• Procurement cycle –sequence of activities needed to acquire materials• Replenishment –putting materials into stock to replace units that have
been used
L03-05: Multi Period Inventory Systems SCM 2011
IIM Lucknow 2
SK/SCM2011/L3-5/5
Introduction to a few Terms
• Destock – reduce the amount of stock held• Cycle-counting – where stock is checked at regular intervals, with a
small proportion of items typically checked every week• Dependent demand methods – assume the demand for an item is
directly related to the demand for other items, with this relationship used to control stocks
• Lost sales –when customer demand cannot be met, and the customer withdraws their demand
• MRP – material requirements planning• MRP II – manufacturing resource planning• Lot sizing – combining several small orders into larger ones
SK/SCM2011/L3-5/6
Introduction to a few Terms
• Newsboy problem – a standard problem of finding the best order size for a single stock cycle, with uncertain demand
• Electronic data interchange (EDI) – a method of transferring data directly between remote computers
• Electronic fund transfer (EFT) – a method of automatically debiting a customer’s bank account and crediting the money to a supplier’s account
• Electronic point of sales (EPOS) – a system that records transactions at a cash register and transfers the information to stock control and other functions
• Order – a message from an organization to a supplier requesting a delivery of materials
http://www.inventoryops.com/dictionary.htm
SK/SCM2011/L3-5/7
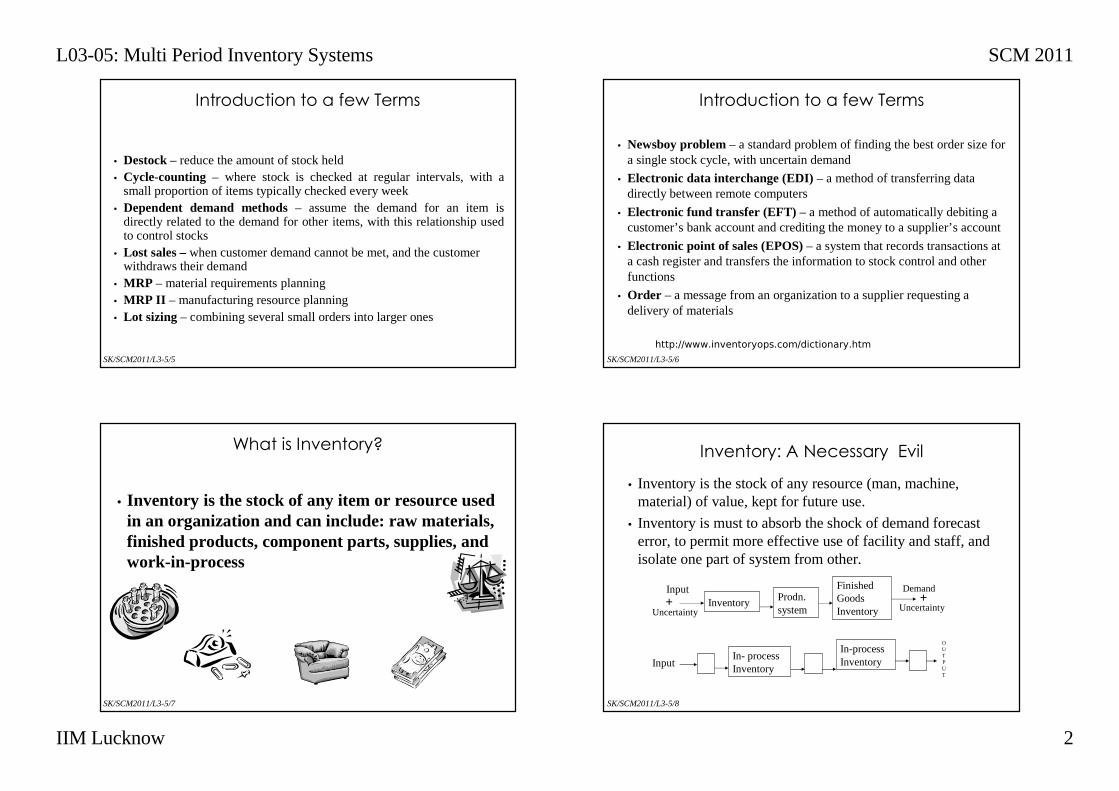
• Inventory is the stock of any item or resource used in an organization and can include: raw materials, finished products, component parts, supplies, and work-in-process
What is Inventory?
SK/SCM2011/L3-5/8
Inventory: A Necessary Evil
• Inventory is the stock of any resource (man, machine, material) of value, kept for future use.
• Inventory is must to absorb the shock of demand forecast error, to permit more effective use of facility and staff, and isolate one part of system from other.
+Inventory Prodn. system
Finished Goods Inventory
Demand
Uncertainty
Input
Uncertainty+
In- process Inventory
In-process InventoryInput
OUTPUT
L03-05: Multi Period Inventory Systems SCM 2011
IIM Lucknow 3
SK/SCM2011/L3-5/9
Examples of inventories:
• Manufacturing firms carry supplies of raw materials, purchased parts, finished items, spare parts, tools,....
• Department stores carry clothing, furniture, stationery, appliances,...
• Hospitals stock drugs, surgical supplies, life-monitoring equipment, sheets, pillow cases,...
• Supermarkets stock fresh and canned foods, packaged and frozen foods, household supplies,..
SK/SCM2011/L3-5/10
Purposes of Inventory
1. To maintain independence of operations
2. To meet variation in product demand
3. To allow flexibility in production scheduling
4. To provide a safeguard for variation in raw material deliverytime
5. To take advantage of economic purchase-order size
6. To help hedge against price increases
SK/SCM2011/L3-5/11
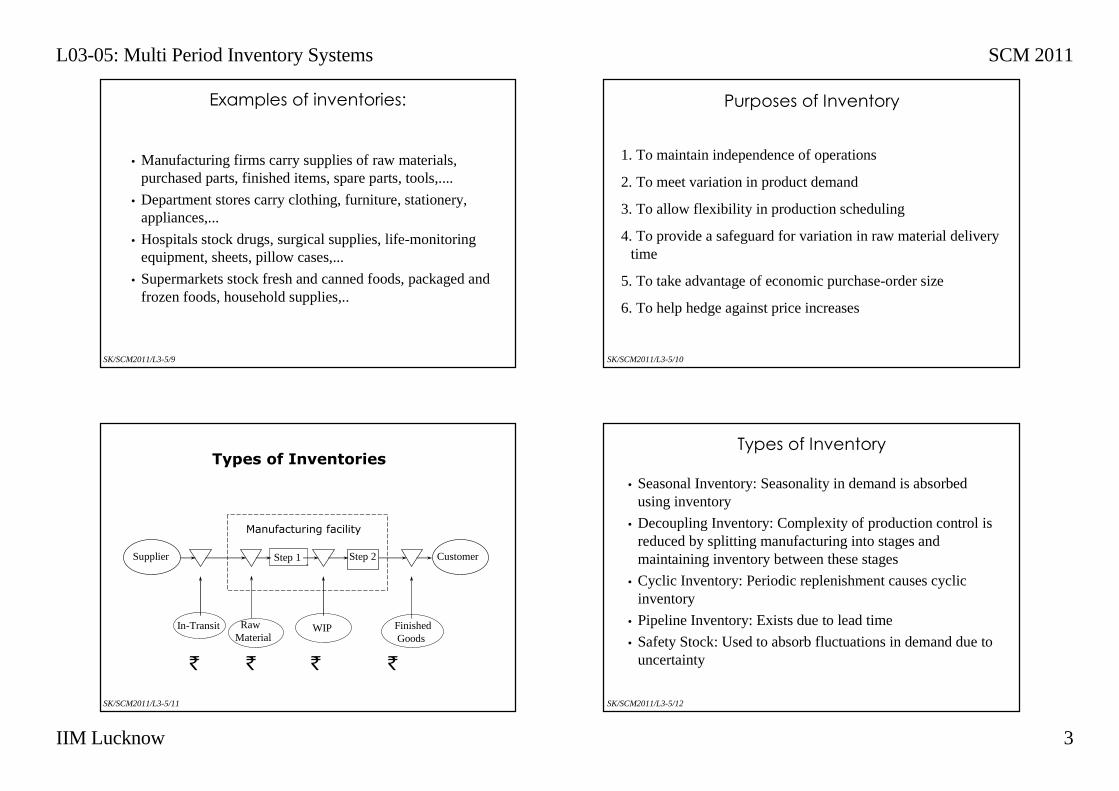
Types of Inventories
Supplier Customer
Manufacturing facility
Step 1 Step 2
In-Transit RawMaterial
WIP FinishedGoods
`
` ` ` `
SK/SCM2011/L3-5/12
Types of Inventory
• Seasonal Inventory: Seasonality in demand is absorbed using inventory
• Decoupling Inventory: Complexity of production control is reduced by splitting manufacturing into stages and maintaining inventory between these stages
• Cyclic Inventory: Periodic replenishment causes cyclic inventory
• Pipeline Inventory: Exists due to lead time
• Safety Stock: Used to absorb fluctuations in demand due to uncertainty
L03-05: Multi Period Inventory Systems SCM 2011
IIM Lucknow 4
SK/SCM2011/L3-5/13
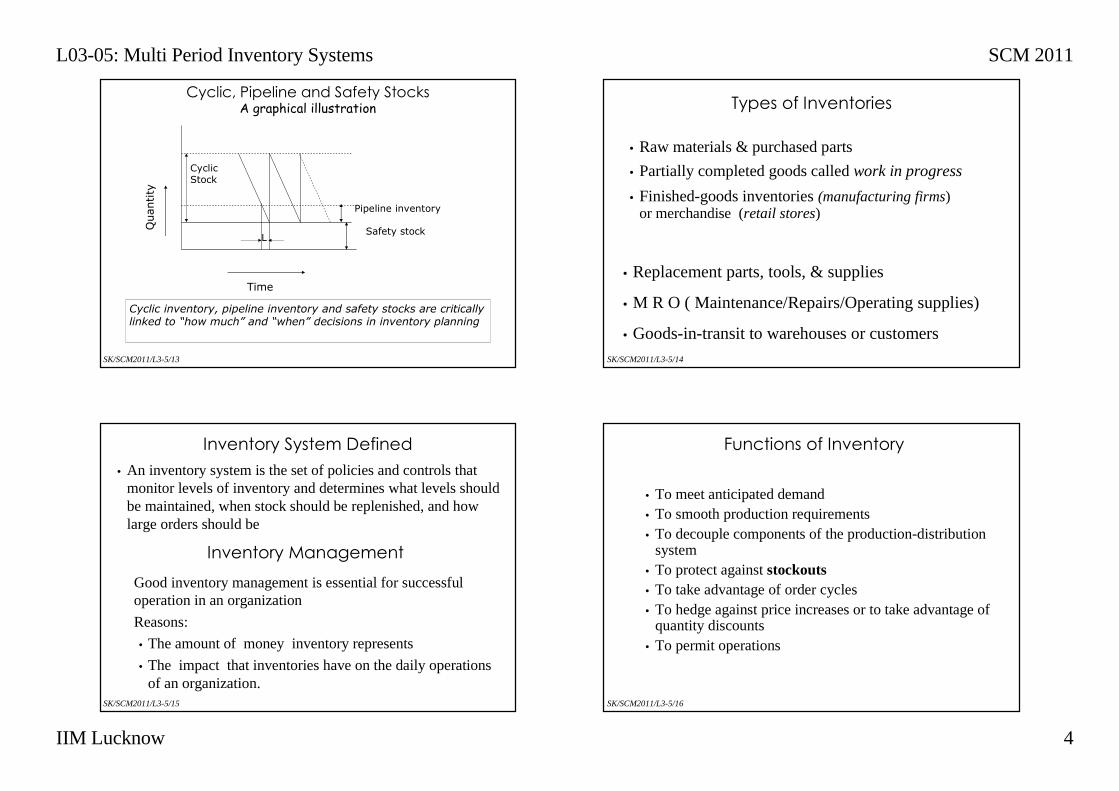
Quantity
Time
Safety stock
Cyclic Stock
Pipeline inventory
L
Cyclic, Pipeline and Safety StocksA graphical illustration
Cyclic inventory, pipeline inventory and safety stocks are critically linked to “how much” and “when” decisions in inventory planning
SK/SCM2011/L3-5/14
Types of Inventories
• Raw materials & purchased parts
• Partially completed goods called work in progress
• Finished-goods inventories(manufacturing firms) or merchandise (retail stores)
• Replacement parts, tools, & supplies
• M R O ( Maintenance/Repairs/Operating supplies)
• Goods-in-transit to warehouses or customers
SK/SCM2011/L3-5/15
• An inventory system is the set of policies and controls that monitor levels of inventory and determines what levels should be maintained, when stock should be replenished, and how large orders should be
Inventory System Defined
Inventory Management
Good inventory management is essential for successful operation in an organization
Reasons:
• The amount of money inventory represents
• The impact that inventories have on the daily operations of an organization.
SK/SCM2011/L3-5/16
Functions of Inventory
• To meet anticipated demand• To smooth production requirements• To decouple components of the production-distribution
system• To protect against stockouts• To take advantage of order cycles• To hedge against price increases or to take advantage of
quantity discounts• To permit operations
L03-05: Multi Period Inventory Systems SCM 2011
IIM Lucknow 5
SK/SCM2011/L3-5/17
Objectives of Inventory Control
• Inadequate control of inventories can result in both under- and overstocking of items...• Understocking results in missed deliveries, lost sales,
dissatisfied customers, and production delays.
• Overstocking ties up funds that might be more productive elsewhere.
SK/SCM2011/L3-5/18
This means, the manager tries to achieve a balance in stocking.
Two fundamental decisions are to be made:
• Timing of the order
• Sizeof the order.
Achieve satisfactory levels of customer service while keeping inventory costs
within reasonable bounds.
Inventory Management:
Overall Objective
SK/SCM2011/L3-5/19
Requirements for Effective Inventory Management
(Systems)
• A system to keep track of inventory
• A reliable forecast of demand
• Knowledge of lead times
• Reasonable estimates of• Holding costs
• Ordering costs
• Shortage costs
• A classification system
SK/SCM2011/L3-5/20
Inventory Costs
• Holding (or carrying) costs• Costs for storage, handling, insurance, etc
• Setup (or production change) costs• Costs for arranging specific equipment setups, etc
• Ordering costs• Costs of someone placing an order, etc
• Shortage costs• Costs of canceling an order, etc
L03-05: Multi Period Inventory Systems SCM 2011
IIM Lucknow 6
SK/SCM2011/L3-5/21
Costs in Inventory PlanningCarrying Cost
• Interest for short-term borrowals for working capital
• Cost of stores and warehousing
• Administrative costs related to maintaining and accounting for inventory
• Insurance costs, cost of obsolescence, pilferage, damages and wastage
• All these costs are directly related to the level of inventory
SK/SCM2011/L3-5/22
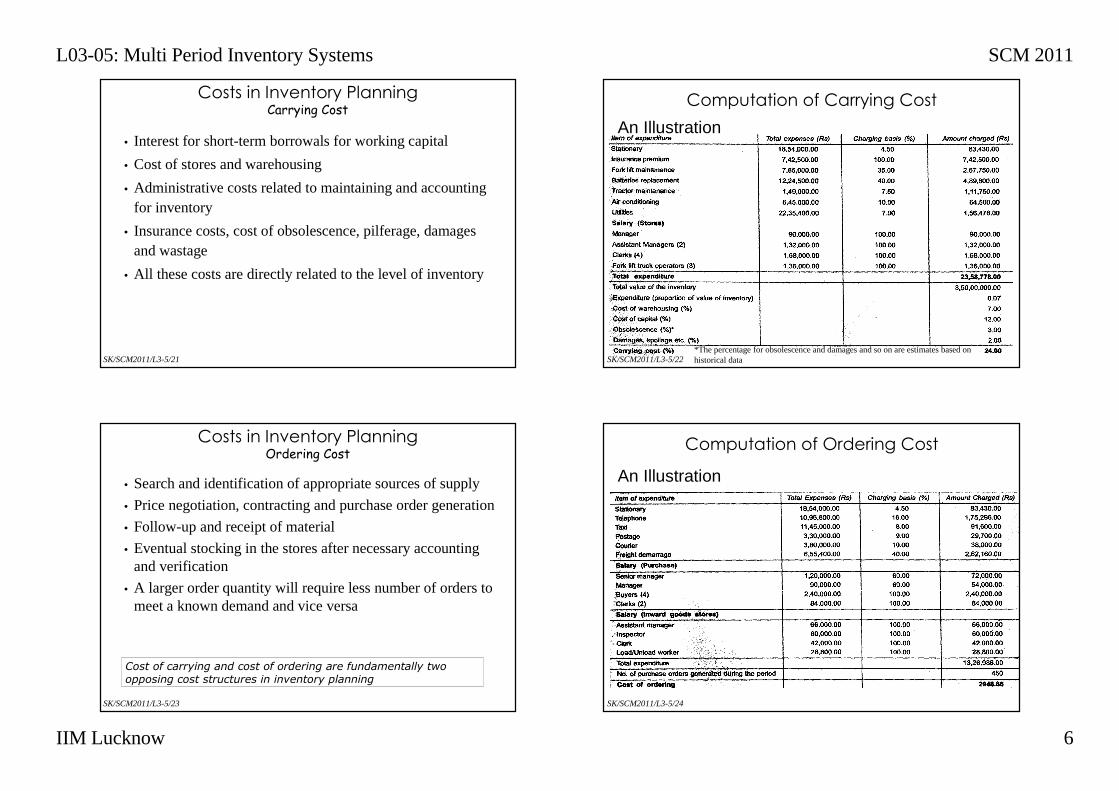
Computation of Carrying Cost
An Illustration
*The percentage for obsolescence and damages and so on are estimates based on historical data
SK/SCM2011/L3-5/23
Costs in Inventory PlanningOrdering Cost
• Search and identification of appropriate sources of supply
• Price negotiation, contracting and purchase order generation
• Follow-up and receipt of material
• Eventual stocking in the stores after necessary accounting and verification
• A larger order quantity will require less number of orders to meet a known demand and vice versa
Cost of carrying and cost of ordering are fundamentally two opposing cost structures in inventory planning
SK/SCM2011/L3-5/24
Computation of Ordering Cost
An Illustration
L03-05: Multi Period Inventory Systems SCM 2011
IIM Lucknow 7
SK/SCM2011/L3-5/25
Costs in Inventory PlanningShortage Cost
• Costs arising out of pushing the order back and rescheduling the production system to accommodate these changes
• Rush purchases, uneven utilisation of available resources and lower capacity utilisation
• Missed delivery schedules leading to customer dissatisfaction and loss of good will
• The effects of shortage are vastly intangible, it is indeed difficult to accurately estimate
SK/SCM2011/L3-5/26
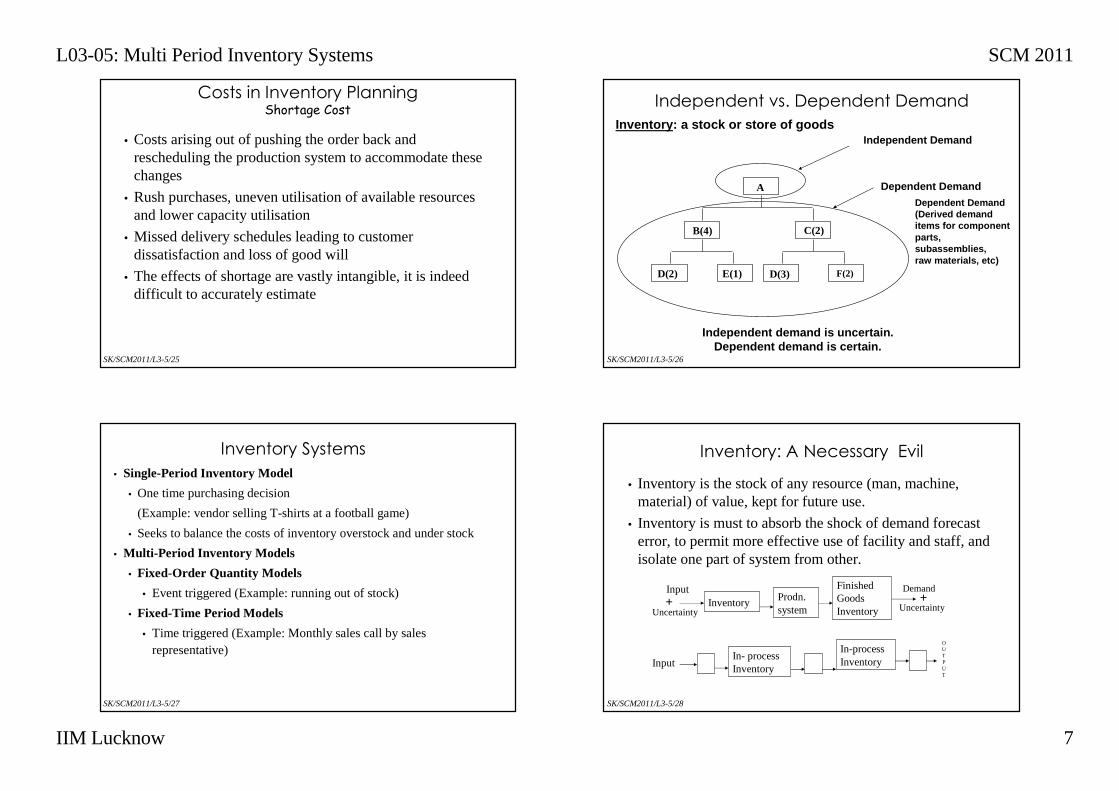
Independent Demand
A
B(4) C(2)
D(2) E(1) D(3) F(2)
Dependent Demand
Independent demand is uncertain. Dependent demand is certain.
Inventory: a stock or store of goods
Independent vs. Dependent Demand
Dependent Demand(Derived demand items for component parts, subassemblies, raw materials, etc)
SK/SCM2011/L3-5/27
Inventory Systems
• Single-Period Inventory Model
• One time purchasing decision
(Example: vendor selling T-shirts at a football game)
• Seeks to balance the costs of inventory overstock and under stock
• Multi-Period Inventory Models
• Fixed-Order Quantity Models
• Event triggered (Example: running out of stock)
• Fixed-Time Period Models
• Time triggered (Example: Monthly sales call by sales representative)
SK/SCM2011/L3-5/28
Inventory: A Necessary Evil
• Inventory is the stock of any resource (man, machine, material) of value, kept for future use.
• Inventory is must to absorb the shock of demand forecast error, to permit more effective use of facility and staff, and isolate one part of system from other.
+Inventory Prodn. system
Finished Goods Inventory
Demand
Uncertainty
Input
Uncertainty+
In- process Inventory
In-process InventoryInput
OUTPUT
L03-05: Multi Period Inventory Systems SCM 2011
IIM Lucknow 8
SK/SCM2011/L3-5/29
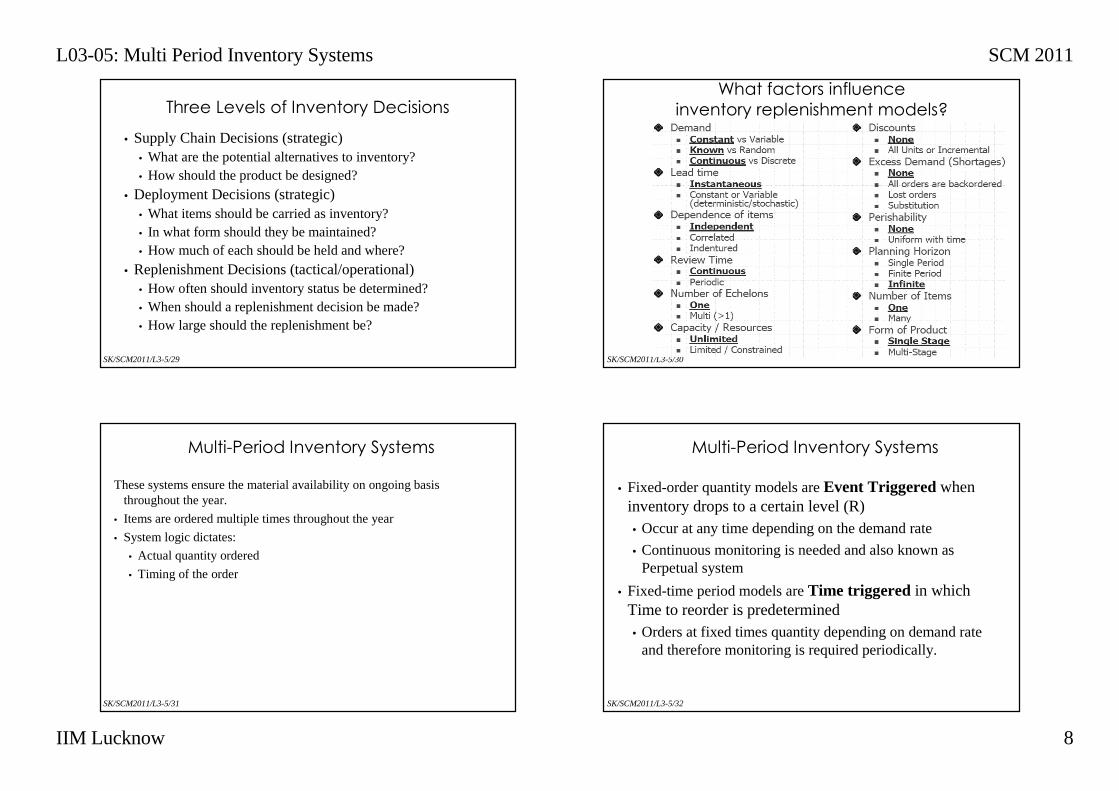
Three Levels of Inventory Decisions
• Supply Chain Decisions (strategic)• What are the potential alternatives to inventory?• How should the product be designed?
• Deployment Decisions (strategic)• What items should be carried as inventory?• In what form should they be maintained?• How much of each should be held and where?
• Replenishment Decisions (tactical/operational)• How often should inventory status be determined?• When should a replenishment decision be made?• How large should the replenishment be?
SK/SCM2011/L3-5/30
What factors influence
inventory replenishment models?
SK/SCM2011/L3-5/31
Multi-Period Inventory Systems
These systems ensure the material availability on ongoing basis throughout the year.
• Items are ordered multiple times throughout the year
• System logic dictates:
• Actual quantity ordered
• Timing of the order
SK/SCM2011/L3-5/32
Multi-Period Inventory Systems
• Fixed-order quantity models are Event Triggered when inventory drops to a certain level (R)• Occur at any time depending on the demand rate
• Continuous monitoring is needed and also known as Perpetual system
• Fixed-time period models are Time triggered in which Time to reorder is predetermined• Orders at fixed times quantity depending on demand rate
and therefore monitoring is required periodically.
L03-05: Multi Period Inventory Systems SCM 2011
IIM Lucknow 9
SK/SCM2011/L3-5/33
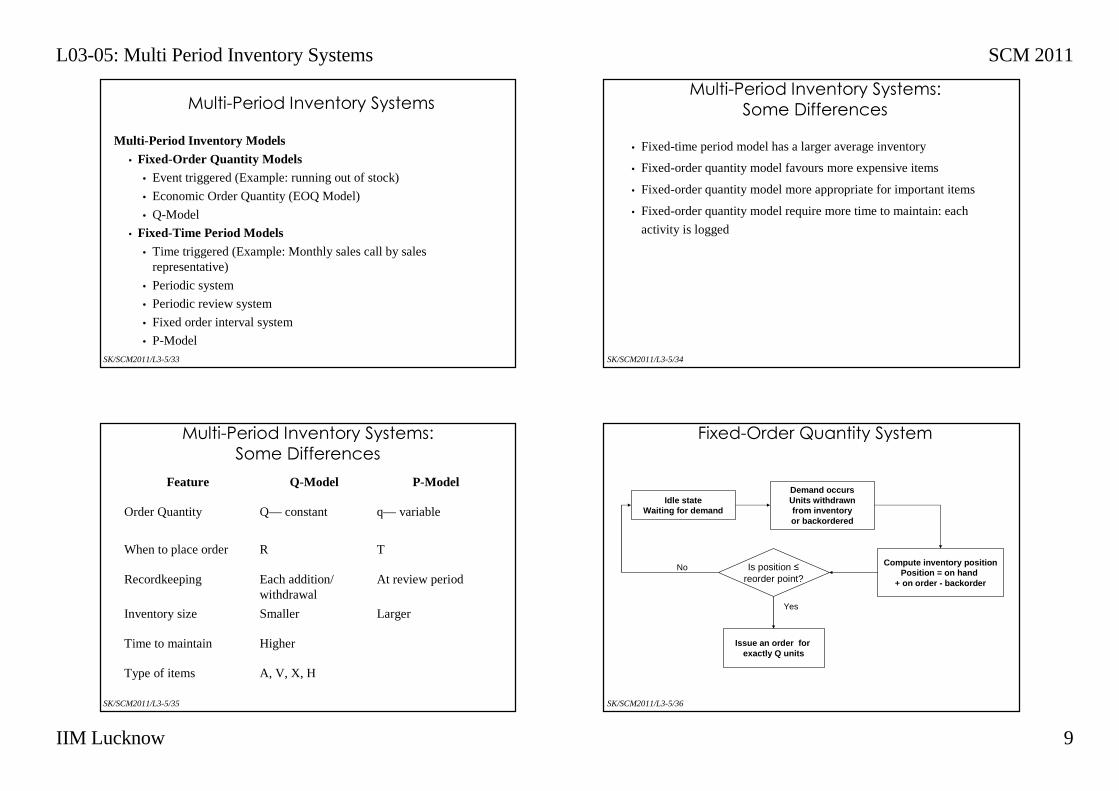
Multi-Period Inventory Systems
Multi-Period Inventory Models
• Fixed-Order Quantity Models• Event triggered (Example: running out of stock)
• Economic Order Quantity (EOQ Model)
• Q-Model
• Fixed-Time Period Models
• Time triggered (Example: Monthly sales call by sales representative)
• Periodic system
• Periodic review system
• Fixed order interval system
• P-ModelSK/SCM2011/L3-5/34
Multi-Period Inventory Systems:
Some Differences
• Fixed-time period model has a larger average inventory
• Fixed-order quantity model favours more expensive items
• Fixed-order quantity model more appropriate for important items
• Fixed-order quantity model require more time to maintain: each
activity is logged
SK/SCM2011/L3-5/35
Multi-Period Inventory Systems:
Some Differences
A, V, X, H Type of items
Higher Time to maintain
LargerSmallerInventory size
At review periodEach addition/ withdrawal
Recordkeeping
TRWhen to place order
q— variableQ— constantOrder Quantity
P-ModelQ-ModelFeature
SK/SCM2011/L3-5/36
Fixed-Order Quantity System
Idle stateWaiting for demand
Demand occursUnits withdrawnfrom inventory or backordered
Compute inventory positionPosition = on hand
+ on order - backorder
Issue an order for exactly Q units
Is position ≤reorder point?
Yes
No
L03-05: Multi Period Inventory Systems SCM 2011
IIM Lucknow 10
SK/SCM2011/L3-5/37
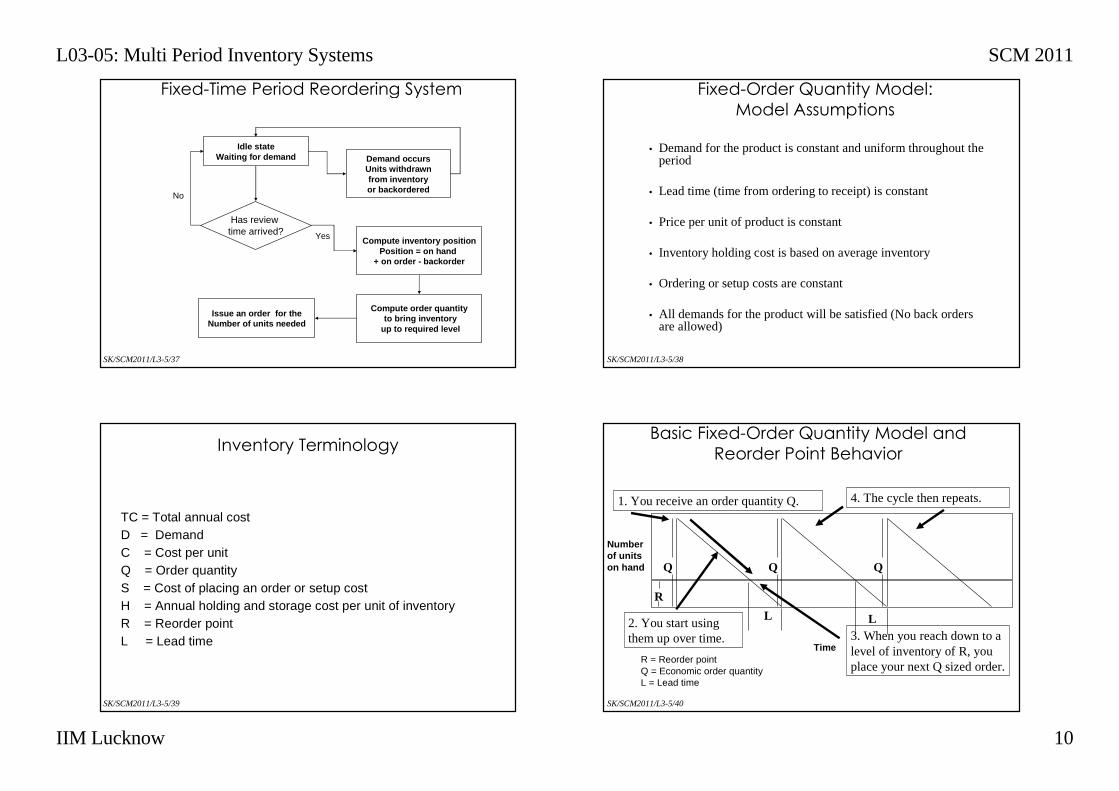
Fixed-Time Period Reordering System
Idle stateWaiting for demand Demand occurs
Units withdrawnfrom inventory or backordered
Compute inventory positionPosition = on hand
+ on order - backorder
Issue an order for theNumber of units needed
Has review time arrived? Yes
No
Compute order quantityto bring inventory
up to required level
SK/SCM2011/L3-5/38
Fixed-Order Quantity Model:
Model Assumptions
• Demand for the product is constant and uniform throughout the period
• Lead time (time from ordering to receipt) is constant
• Price per unit of product is constant
• Inventory holding cost is based on average inventory
• Ordering or setup costs are constant
• All demands for the product will be satisfied (No back orders are allowed)
SK/SCM2011/L3-5/39
Inventory Terminology
TC = Total annual costD = DemandC = Cost per unitQ = Order quantityS = Cost of placing an order or setup costH = Annual holding and storage cost per unit of inventoryR = Reorder pointL = Lead time
SK/SCM2011/L3-5/40
Basic Fixed-Order Quantity Model and
Reorder Point Behavior
R = Reorder pointQ = Economic order quantityL = Lead time
L L
Q QQ
R
Time
Numberof unitson hand
1. You receive an order quantity Q.
2. You start using them up over time. 3. When you reach down to a
level of inventory of R, you place your next Q sized order.
4. The cycle then repeats.
L03-05: Multi Period Inventory Systems SCM 2011
IIM Lucknow 11
SK/SCM2011/L3-5/41
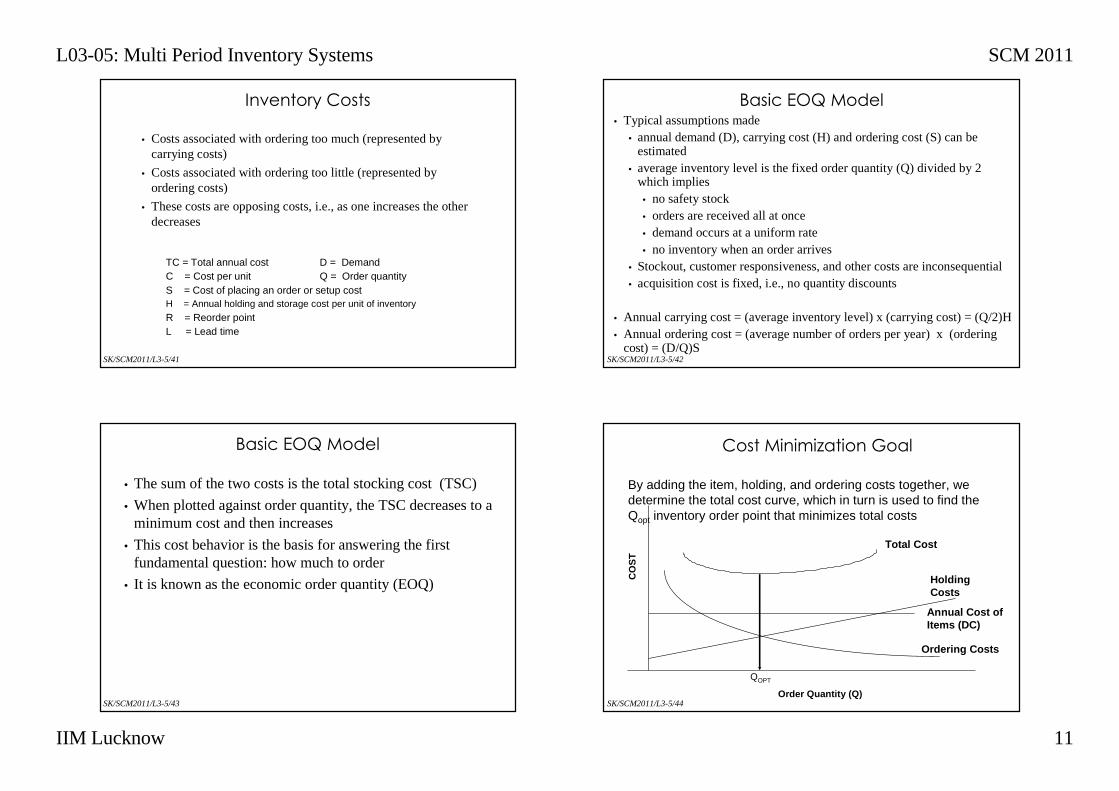
Inventory Costs
• Costs associated with ordering too much (represented by carrying costs)
• Costs associated with ordering too little (represented by ordering costs)
• These costs are opposing costs, i.e., as one increases the otherdecreases
TC = Total annual cost D = DemandC = Cost per unit Q = Order quantityS = Cost of placing an order or setup costH = Annual holding and storage cost per unit of inventory
R = Reorder pointL = Lead time
SK/SCM2011/L3-5/42
Basic EOQ Model• Typical assumptions made
• annual demand (D), carrying cost (H) and ordering cost (S) can be estimated
• average inventory level is the fixed order quantity (Q) divided by 2 which implies
• no safety stock• orders are received all at once• demand occurs at a uniform rate• no inventory when an order arrives
• Stockout, customer responsiveness, and other costs are inconsequential• acquisition cost is fixed, i.e., no quantity discounts
• Annual carrying cost = (average inventory level) x (carrying cost) = (Q/2)H• Annual ordering cost = (average number of orders per year) x (ordering
cost) = (D/Q)S
SK/SCM2011/L3-5/43
Basic EOQ Model
• The sum of the two costs is the total stocking cost (TSC)
• When plotted against order quantity, the TSC decreases to a minimum cost and then increases
• This cost behavior is the basis for answering the first fundamental question: how much to order
• It is known as the economic order quantity (EOQ)
SK/SCM2011/L3-5/44
Cost Minimization Goal
Ordering Costs
HoldingCosts
Order Quantity (Q)
Annual Cost ofItems (DC)
Total Cost
QOPT
By adding the item, holding, and ordering costs together, we determine the total cost curve, which in turn is used to find the Qopt inventory order point that minimizes total costs
CO
ST
L03-05: Multi Period Inventory Systems SCM 2011
IIM Lucknow 12
SK/SCM2011/L3-5/45
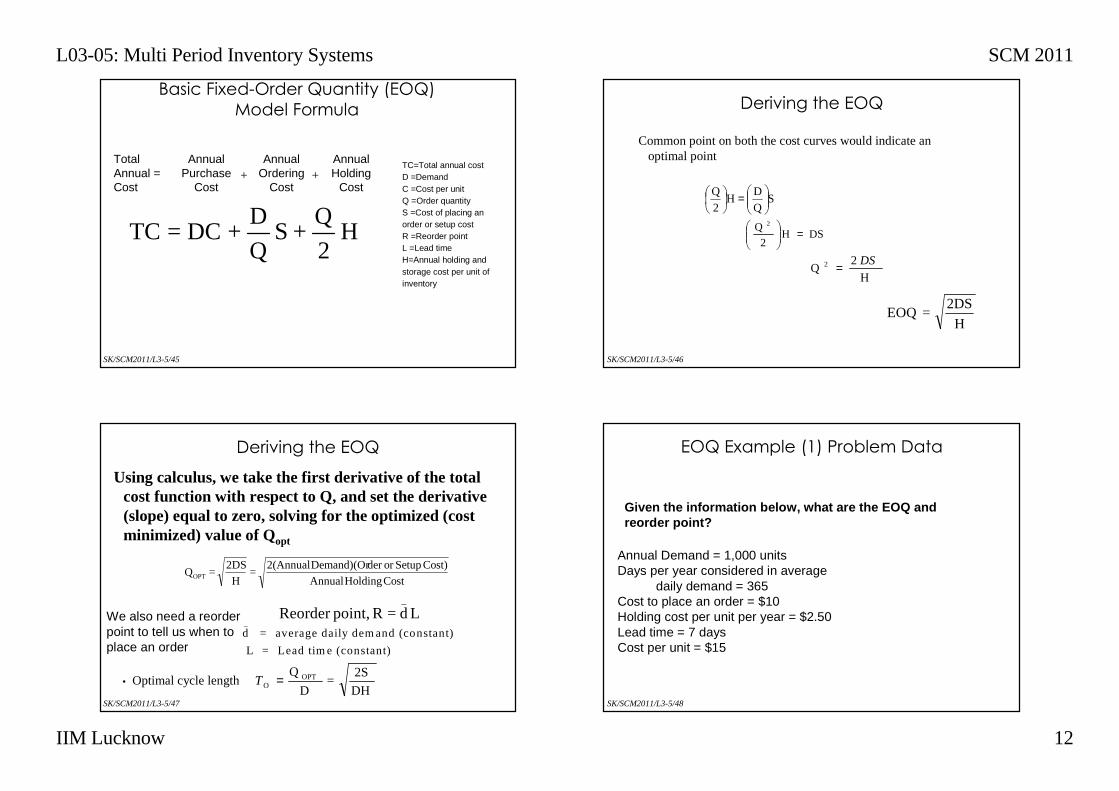
Basic Fixed-Order Quantity (EOQ)
Model Formula
H 2
Q + S
Q
D + DC = TC
Total Annual =Cost
AnnualPurchase
Cost
AnnualOrdering
Cost
AnnualHolding
Cost+ +
TC=Total annual costD =DemandC =Cost per unitQ =Order quantityS =Cost of placing an order or setup costR =Reorder pointL =Lead timeH=Annual holding and storage cost per unit of inventory
SK/SCM2011/L3-5/46
Deriving the EOQ
Common point on both the cost curves would indicate an optimal point
SQ
DH
2
Q
=
DSH2
Q 2
=
H
2Q 2 DS=
H
2DS=EOQ
SK/SCM2011/L3-5/47
Deriving the EOQ
Using calculus, we take the first derivative of the total cost function with respect to Q, and set the derivative (slope) equal to zero, solving for the optimized (cost minimized) value of Qopt
Cost Holding Annual
Cost) Setupor der Demand)(Or 2(Annual =
H
2DS = QOPT
d = average daily dem and (constant)
L = Lead tim e (constant)
_We also need a reorder point to tell us when to place an order
Ld=R point,Reorder _
DH
2S =
D
Q OPT
O =T• Optimal cycle length
SK/SCM2011/L3-5/48
EOQ Example (1) Problem Data
Annual Demand = 1,000 unitsDays per year considered in average
daily demand = 365Cost to place an order = $10Holding cost per unit per year = $2.50Lead time = 7 daysCost per unit = $15
Given the information below, what are the EOQ and reorder point?
L03-05: Multi Period Inventory Systems SCM 2011
IIM Lucknow 13
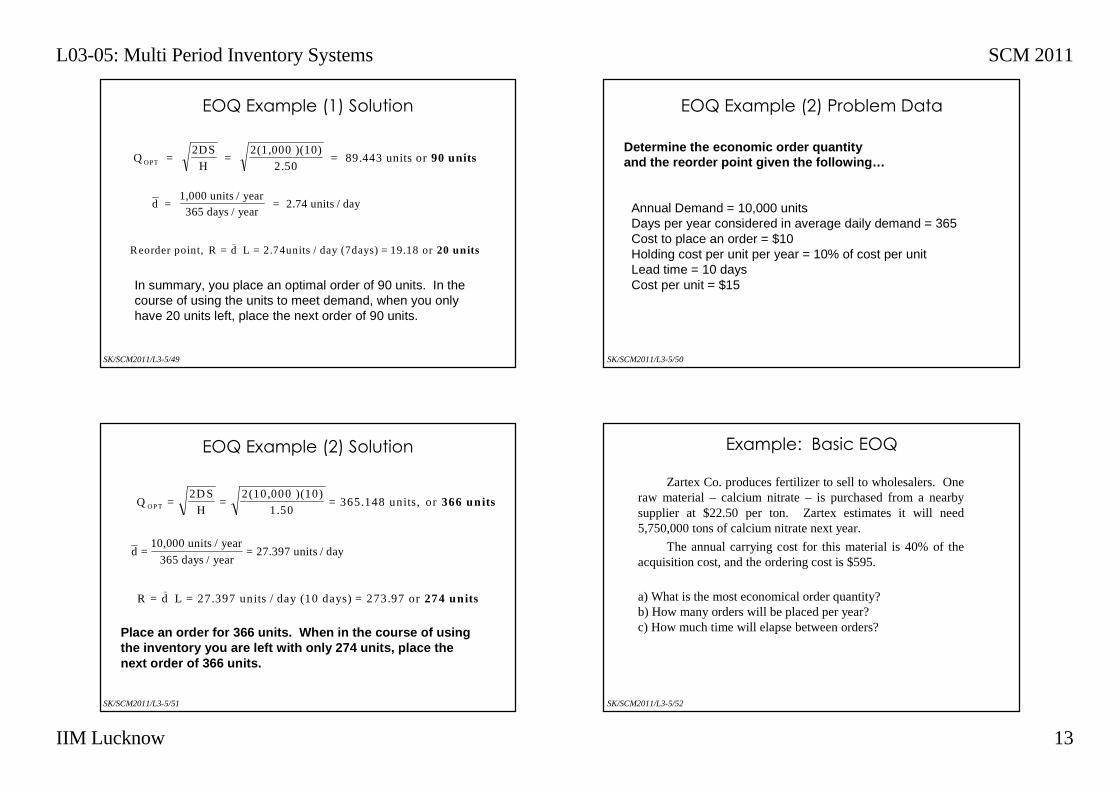
SK/SCM2011/L3-5/49
EOQ Example (1) Solution
Q = 2DS
H =
2(1,000 )(10)
2.50 = 89.443 units or OPT 90 units
d = 1,000 units / year365 days / year
= 2.74 units / day
Reorder point, R = d L = 2.74units / day (7days) = 19.18 or _
20 units
In summary, you place an optimal order of 90 units. In the course of using the units to meet demand, when you only have 20 units left, place the next order of 90 units.
SK/SCM2011/L3-5/50
EOQ Example (2) Problem Data
Annual Demand = 10,000 unitsDays per year considered in average daily demand = 365Cost to place an order = $10Holding cost per unit per year = 10% of cost per unitLead time = 10 daysCost per unit = $15
Determine the economic order quantity and the reorder point given the following…
SK/SCM2011/L3-5/51
EOQ Example (2) Solution
Q =2DS
H=
2(10,000 )(10)
1.50= 365.148 units, or O PT 366 units
d =10,000 units / year
365 days / year= 27.397 units / day
R = d L = 27.397 units / day (10 days) = 273.97 or _
274 units
Place an order for 366 units. When in the course o f using the inventory you are left with only 274 units, pla ce the next order of 366 units.
SK/SCM2011/L3-5/52
Example: Basic EOQ
Zartex Co. produces fertilizer to sell to wholesalers. One raw material – calcium nitrate – is purchased from a nearby supplier at $22.50 per ton. Zartex estimates it will need 5,750,000 tons of calcium nitrate next year.
The annual carrying cost for this material is 40% of the acquisition cost, and the ordering cost is $595.
a) What is the most economical order quantity?b) How many orders will be placed per year?c) How much time will elapse between orders?
L03-05: Multi Period Inventory Systems SCM 2011
IIM Lucknow 14
SK/SCM2011/L3-5/53
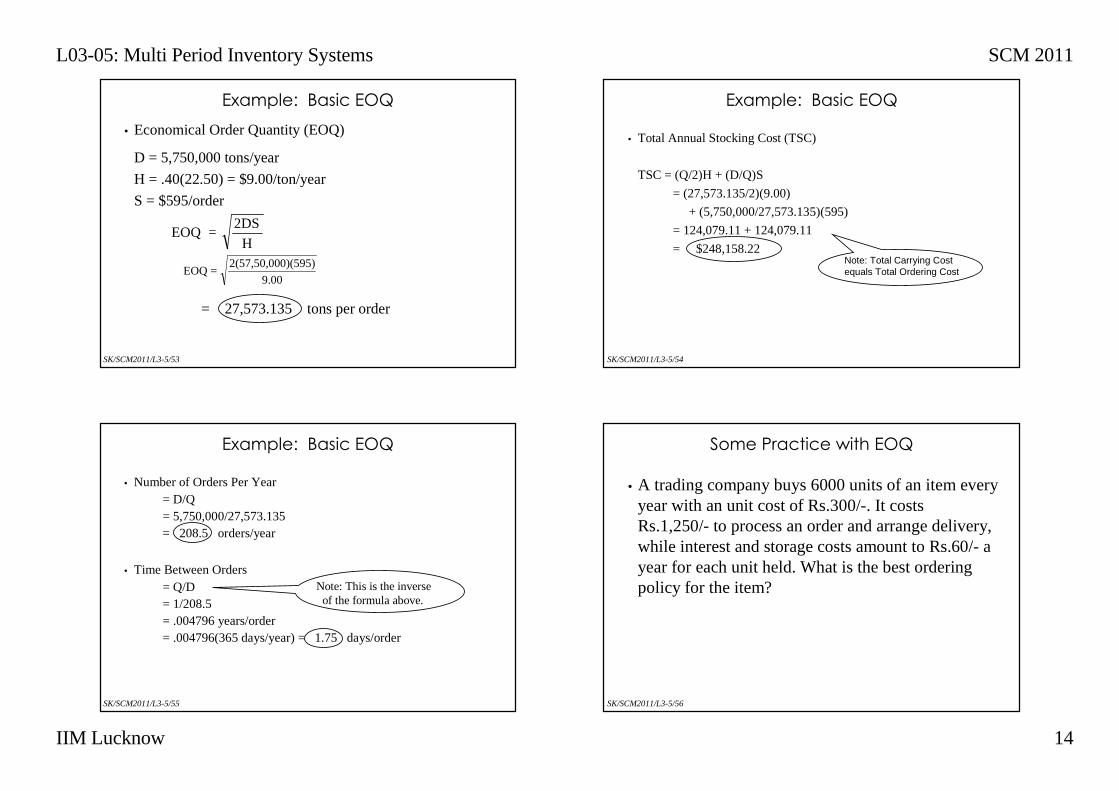
Example: Basic EOQ
• Economical Order Quantity (EOQ)
D = 5,750,000 tons/year
H = .40(22.50) = $9.00/ton/year
S = $595/order
= 27,573.135 tons per order
H
2DS=EOQ
9.00
0)(595)2(57,50,00=EOQ
SK/SCM2011/L3-5/54
Example: Basic EOQ
• Total Annual Stocking Cost (TSC)
TSC = (Q/2)H + (D/Q)S
= (27,573.135/2)(9.00)
+ (5,750,000/27,573.135)(595)
= 124,079.11 + 124,079.11
= $248,158.22Note: Total Carrying Costequals Total Ordering Cost
SK/SCM2011/L3-5/55
Example: Basic EOQ
• Number of Orders Per Year= D/Q = 5,750,000/27,573.135 = 208.5 orders/year
• Time Between Orders= Q/D= 1/208.5= .004796 years/order= .004796(365 days/year) = 1.75 days/order
Note: This is the inverseof the formula above.
SK/SCM2011/L3-5/56
Some Practice with EOQ
• A trading company buys 6000 units of an item every year with an unit cost of Rs.300/-. It costs Rs.1,250/- to process an order and arrange delivery, while interest and storage costs amount to Rs.60/- a year for each unit held. What is the best ordering policy for the item?
L03-05: Multi Period Inventory Systems SCM 2011
IIM Lucknow 15
SK/SCM2011/L3-5/57
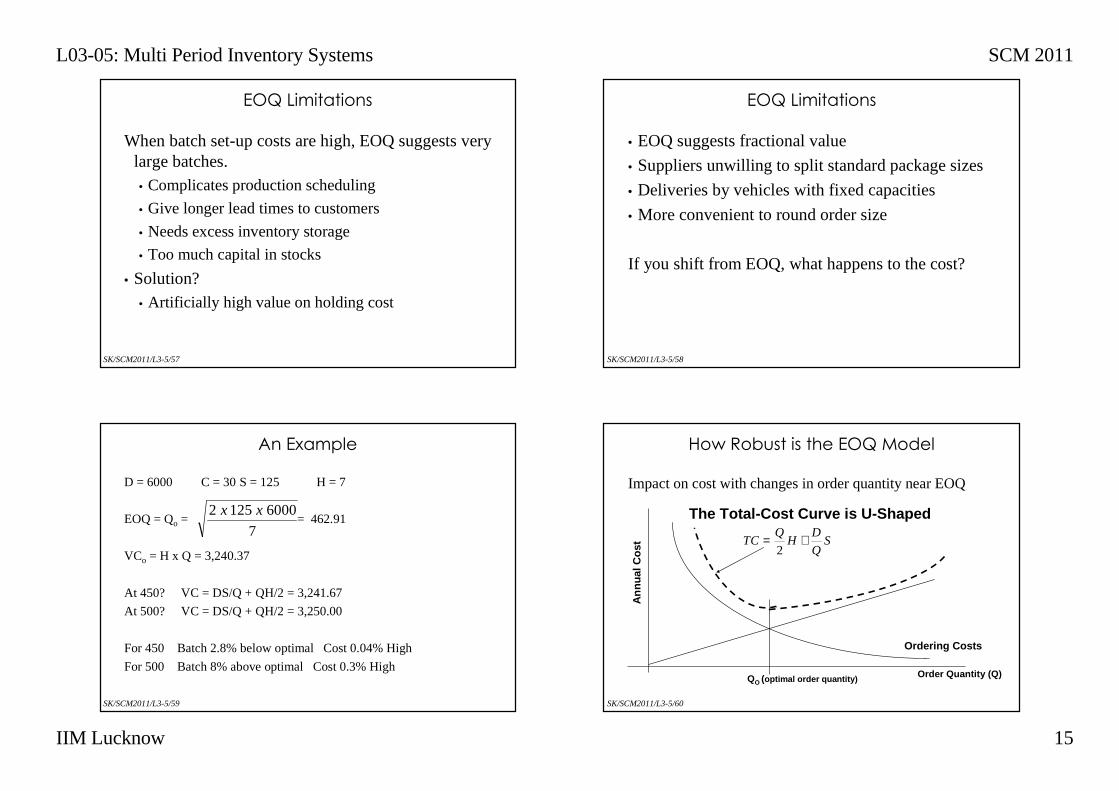
EOQ Limitations
When batch set-up costs are high, EOQ suggests very large batches.• Complicates production scheduling
• Give longer lead times to customers
• Needs excess inventory storage
• Too much capital in stocks
• Solution?• Artificially high value on holding cost
SK/SCM2011/L3-5/58
EOQ Limitations
• EOQ suggests fractional value
• Suppliers unwilling to split standard package sizes
• Deliveries by vehicles with fixed capacities
• More convenient to round order size
If you shift from EOQ, what happens to the cost?
SK/SCM2011/L3-5/59
An Example
D = 6000 C = 30 S = 125 H = 7
EOQ = Qo = = 462.91
VCo = H x Q = 3,240.37
At 450? VC = DS/Q + QH/2 = 3,241.67
At 500? VC = DS/Q + QH/2 = 3,250.00
For 450 Batch 2.8% below optimal Cost 0.04% High
For 500 Batch 8% above optimal Cost 0.3% High
7
60001252 xx
SK/SCM2011/L3-5/60
Impact on cost with changes in order quantity near EOQ
How Robust is the EOQ Model
Order Quantity (Q)
The Total-Cost Curve is U-Shaped
Ordering Costs
QO
Ann
ual C
ost
(optimal order quantity)
TCQ
HD
QS= +
2
L03-05: Multi Period Inventory Systems SCM 2011
IIM Lucknow 16
SK/SCM2011/L3-5/61
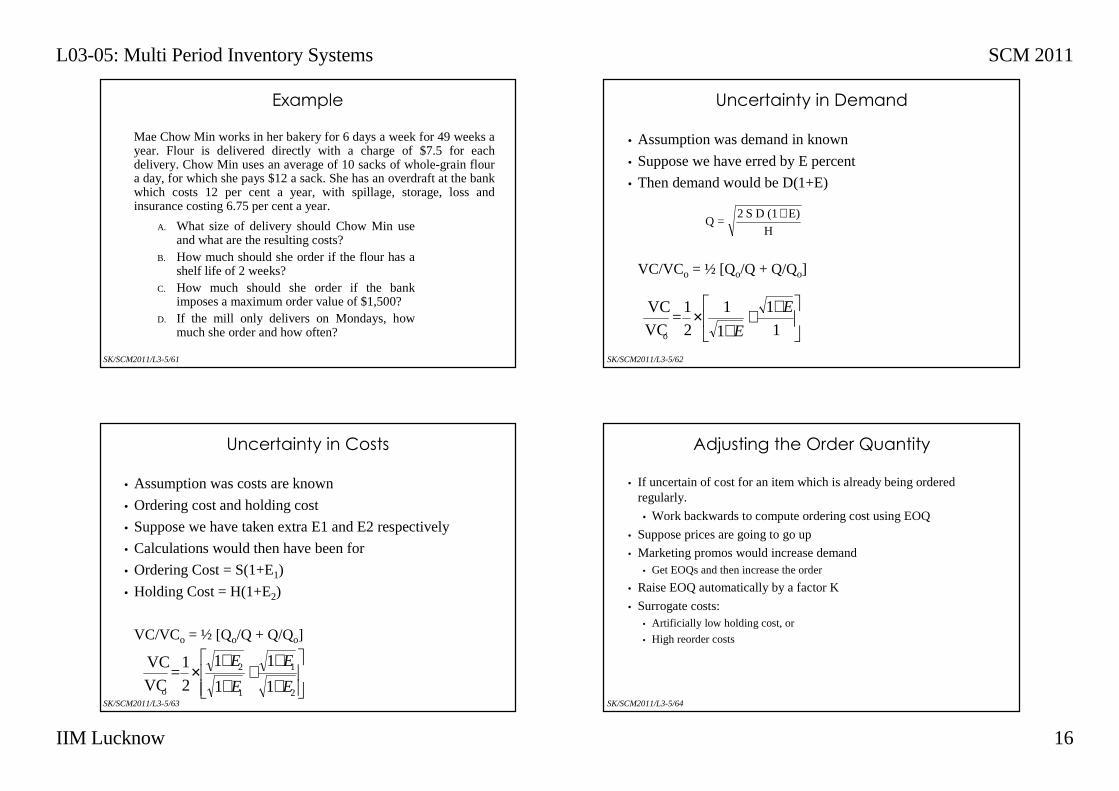
Example
Mae Chow Min works in her bakery for 6 days a week for 49 weeks a year. Flour is delivered directly with a charge of $7.5 for eachdelivery. Chow Min uses an average of 10 sacks of whole-grain flour a day, for which she pays $12 a sack. She has an overdraft at the bank which costs 12 per cent a year, with spillage, storage, loss andinsurance costing 6.75 per cent a year.
A. What size of delivery should Chow Min use and what are the resulting costs?
B. How much should she order if the flour has a shelf life of 2 weeks?
C. How much should she order if the bank imposes a maximum order value of $1,500?
D. If the mill only delivers on Mondays, how much she order and how often?
SK/SCM2011/L3-5/62
Uncertainty in Demand
• Assumption was demand in known
• Suppose we have erred by E percent
• Then demand would be D(1+E)
VC/VCo = ½ [Qo/Q + Q/Qo]
H
E)(1DS2=Q
+
+++
×1
1
1
1
2
1=
VC
VC
o
E
E
SK/SCM2011/L3-5/63
Uncertainty in Costs
• Assumption was costs are known
• Ordering cost and holding cost
• Suppose we have taken extra E1 and E2 respectively
• Calculations would then have been for
• Ordering Cost = S(1+E1)
• Holding Cost = H(1+E2)
VC/VCo = ½ [Qo/Q + Q/Qo]
++
+++
×2
1
1
2
o 1
1
1
1
2
1=
VC
VC
E
E
E
E
SK/SCM2011/L3-5/64
Adjusting the Order Quantity
• If uncertain of cost for an item which is already being ordered regularly.
• Work backwards to compute ordering cost using EOQ
• Suppose prices are going to go up
• Marketing promos would increase demand• Get EOQs and then increase the order
• Raise EOQ automatically by a factor K
• Surrogate costs:• Artificially low holding cost, or
• High reorder costs
L03-05: Multi Period Inventory Systems SCM 2011
IIM Lucknow 17
SK/SCM2011/L3-5/65
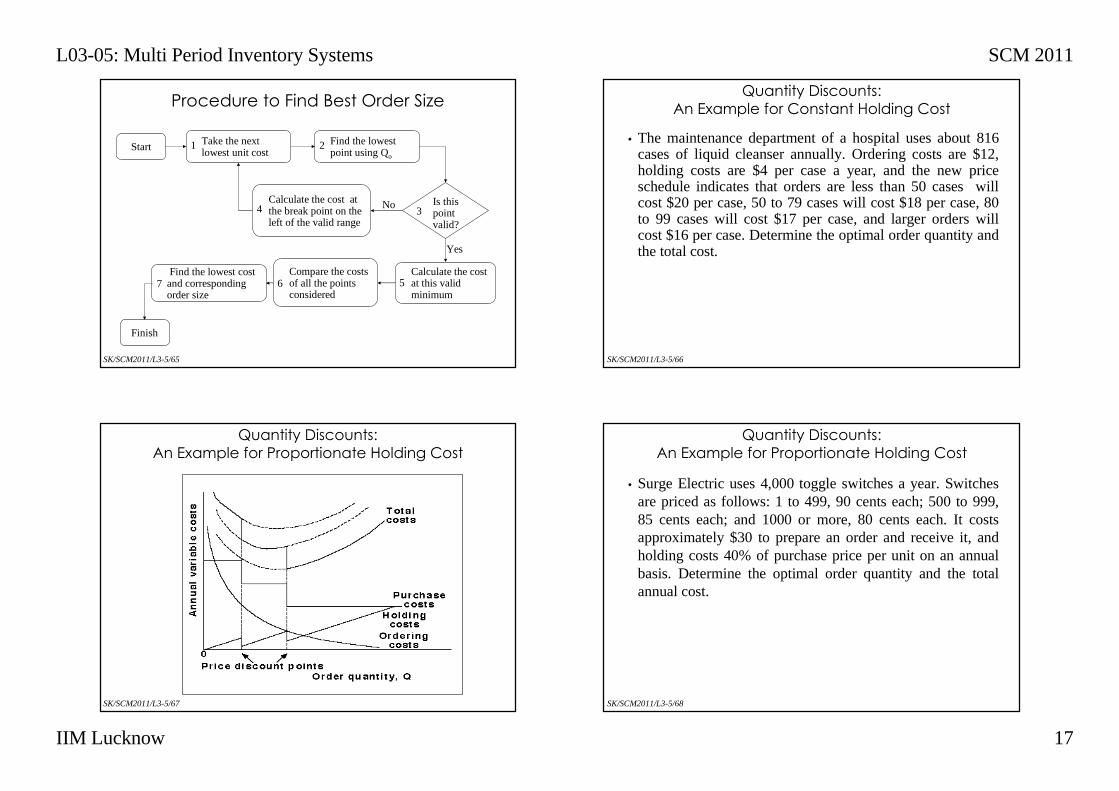
Procedure to Find Best Order Size
Start
Finish
Take the next lowest unit cost
1 Find the lowest point using Qo
2
Calculate the cost at this valid minimum
5Compare the costs of all the points considered
6Find the lowest cost and corresponding order size
7
Calculate the cost at the break point on the left of the valid range
4 3Is this point valid?
Yes
No
SK/SCM2011/L3-5/66
Quantity Discounts:
An Example for Constant Holding Cost
• The maintenance department of a hospital uses about 816 cases of liquid cleanser annually. Ordering costs are $12, holding costs are $4 per case a year, and the new price schedule indicates that orders are less than 50 cases will cost $20 per case, 50 to 79 cases will cost $18 per case, 80 to 99 cases will cost $17 per case, and larger orders will cost $16 per case. Determine the optimal order quantity and the total cost.
SK/SCM2011/L3-5/67
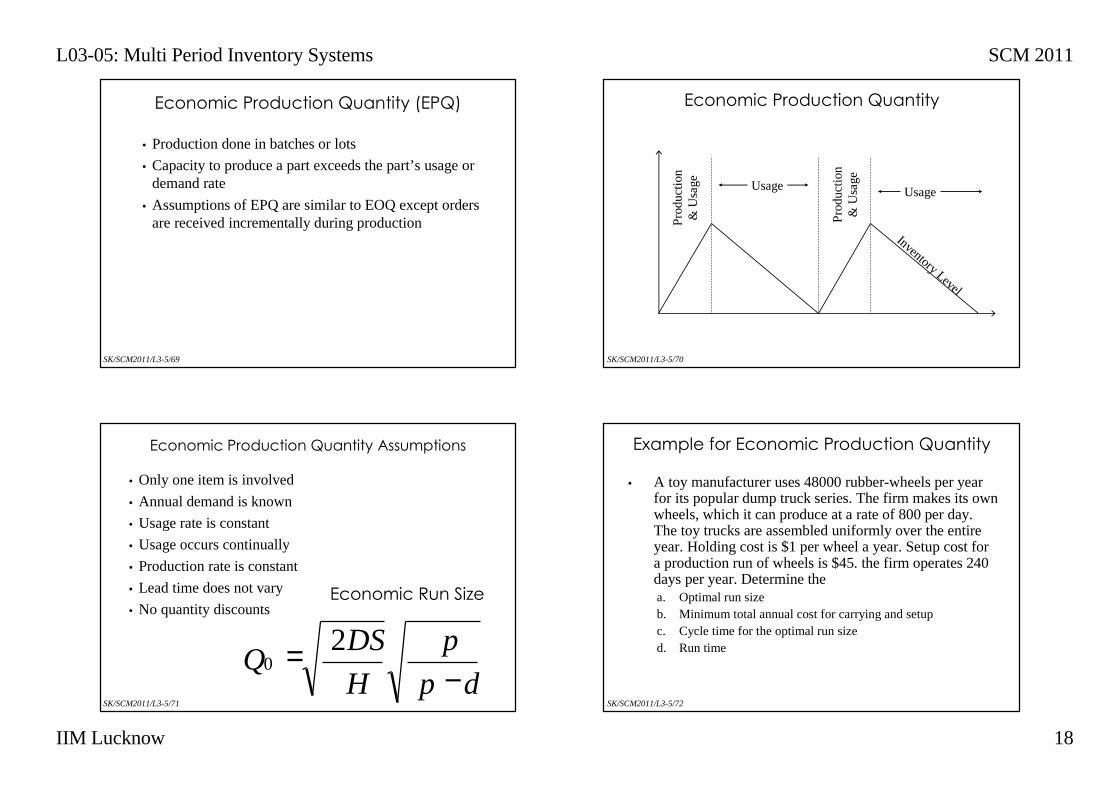
Quantity Discounts:
An Example for Proportionate Holding Cost
SK/SCM2011/L3-5/68
Quantity Discounts:
An Example for Proportionate Holding Cost
• Surge Electric uses 4,000 toggle switches a year. Switches are priced as follows: 1 to 499, 90 cents each; 500 to 999, 85 cents each; and 1000 or more, 80 cents each. It costs approximately $30 to prepare an order and receive it, and holding costs 40% of purchase price per unit on an annual basis. Determine the optimal order quantity and the total annual cost.
L03-05: Multi Period Inventory Systems SCM 2011
IIM Lucknow 18
SK/SCM2011/L3-5/69
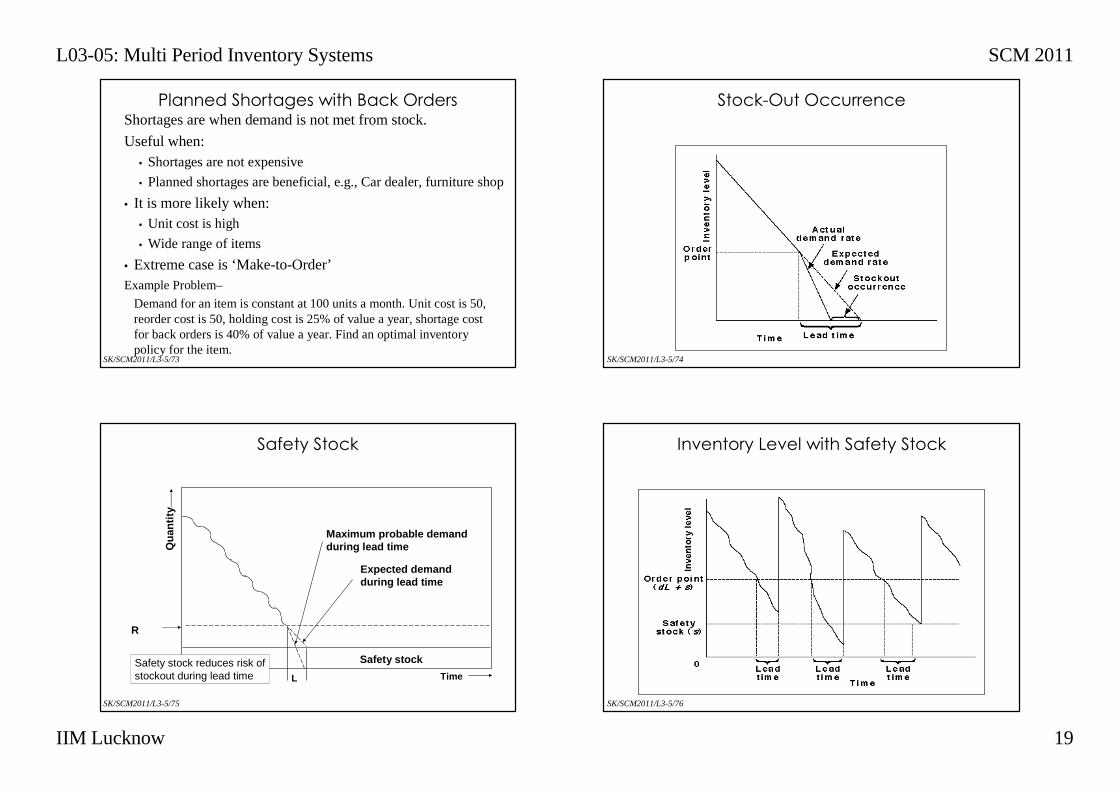
• Production done in batches or lots
• Capacity to produce a part exceeds the part’s usage or demand rate
• Assumptions of EPQ are similar to EOQ except orders are received incrementally during production
Economic Production Quantity (EPQ)
SK/SCM2011/L3-5/70
Economic Production Quantity
Inventory Level
Usage Usage
Pro
duct
ion
& U
sage
Pro
duct
ion
& U
sage
SK/SCM2011/L3-5/71
• Only one item is involved
• Annual demand is known
• Usage rate is constant
• Usage occurs continually
• Production rate is constant
• Lead time does not vary
• No quantity discounts
Economic Production Quantity Assumptions
Economic Run Size
dp
p
H
DSQ
−= 2
0
SK/SCM2011/L3-5/72
Example for Economic Production Quantity
• A toy manufacturer uses 48000 rubber-wheels per year for its popular dump truck series. The firm makes its own wheels, which it can produce at a rate of 800 per day. The toy trucks are assembled uniformly over the entire year. Holding cost is $1 per wheel a year. Setup cost for a production run of wheels is $45. the firm operates 240 days per year. Determine the a. Optimal run sizeb. Minimum total annual cost for carrying and setupc. Cycle time for the optimal run sized. Run time
L03-05: Multi Period Inventory Systems SCM 2011
IIM Lucknow 19
SK/SCM2011/L3-5/73
Planned Shortages with Back OrdersShortages are when demand is not met from stock.
Useful when: • Shortages are not expensive
• Planned shortages are beneficial, e.g., Car dealer, furniture shop
• It is more likely when:• Unit cost is high
• Wide range of items
• Extreme case is ‘Make-to-Order’Example Problem–
Demand for an item is constant at 100 units a month. Unit cost is 50, reorder cost is 50, holding cost is 25% of value a year, shortage cost for back orders is 40% of value a year. Find an optimal inventory policy for the item.
SK/SCM2011/L3-5/74
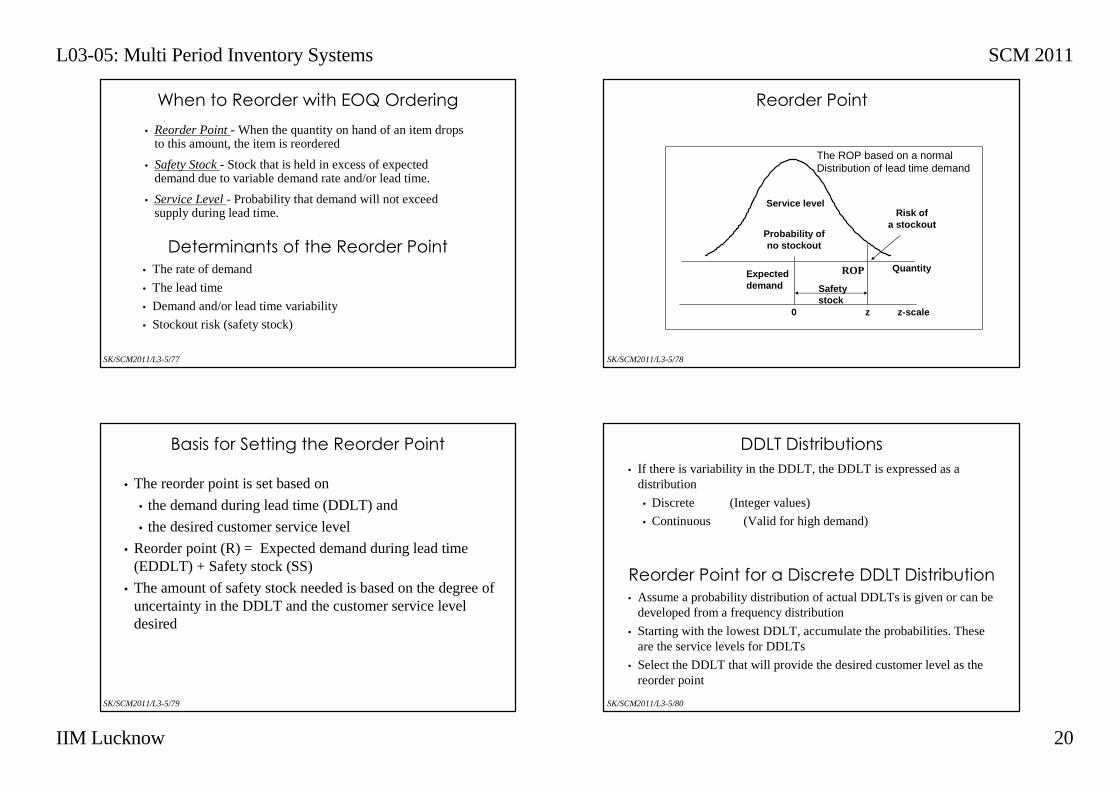
Stock-Out Occurrence
SK/SCM2011/L3-5/75
L Time
Expected demandduring lead time
Maximum probable demandduring lead time
R
Qua
ntity
Safety stockSafety stock reduces risk ofstockout during lead time
Safety Stock
SK/SCM2011/L3-5/76
Inventory Level with Safety Stock
L03-05: Multi Period Inventory Systems SCM 2011
IIM Lucknow 20
SK/SCM2011/L3-5/77
• Reorder Point - When the quantity on hand of an item drops to this amount, the item is reordered
• Safety Stock - Stock that is held in excess of expected demand due to variable demand rate and/or lead time.
• Service Level - Probability that demand will not exceed supply during lead time.
When to Reorder with EOQ Ordering
Determinants of the Reorder Point
• The rate of demand
• The lead time
• Demand and/or lead time variability
• Stockout risk (safety stock)
SK/SCM2011/L3-5/78
ROP
Risk ofa stockout
Service level
Probability ofno stockout
Expecteddemand Safety
stock0 z
Quantity
z-scale
The ROP based on a normalDistribution of lead time demand
Reorder Point
SK/SCM2011/L3-5/79
Basis for Setting the Reorder Point
• The reorder point is set based on
• the demand during lead time (DDLT) and
• the desired customer service level
• Reorder point (R) = Expected demand during lead time (EDDLT) + Safety stock (SS)
• The amount of safety stock needed is based on the degree of uncertainty in the DDLT and the customer service level desired
SK/SCM2011/L3-5/80
Reorder Point for a Discrete DDLT Distribution
• Assume a probability distribution of actual DDLTs is given or can be developed from a frequency distribution
• Starting with the lowest DDLT, accumulate the probabilities. These are the service levels for DDLTs
• Select the DDLT that will provide the desired customer level as the reorder point
DDLT Distributions
• If there is variability in the DDLT, the DDLT is expressed as a distribution
• Discrete (Integer values)
• Continuous (Valid for high demand)
L03-05: Multi Period Inventory Systems SCM 2011
IIM Lucknow 21
SK/SCM2011/L3-5/81
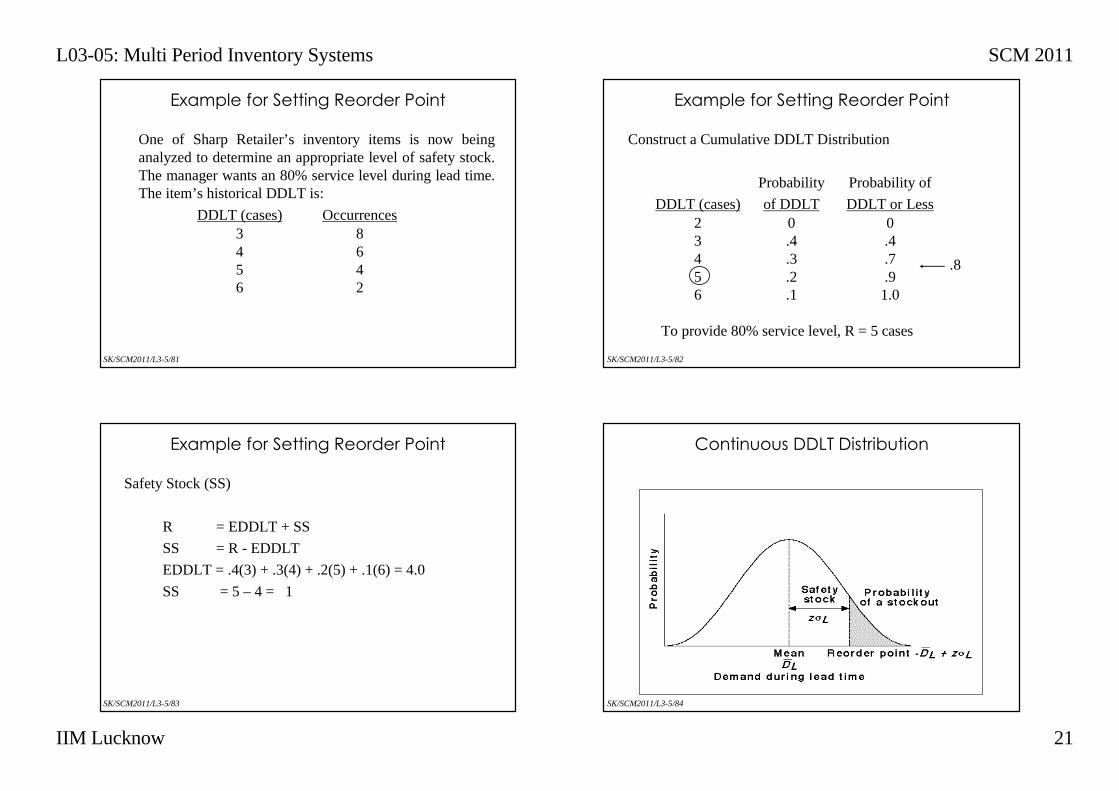
Example for Setting Reorder Point
One of Sharp Retailer’s inventory items is now being analyzed to determine an appropriate level of safety stock. The manager wants an 80% service level during lead time. The item’s historical DDLT is:
DDLT (cases) Occurrences3 84 65 46 2
SK/SCM2011/L3-5/82
Construct a Cumulative DDLT Distribution
Probability Probability of
DDLT (cases) of DDLT DDLT or Less2 0 03 .4 .44 .3 .75 .2 .96 .1 1.0
To provide 80% service level, R = 5 cases
.8
Example for Setting Reorder Point
SK/SCM2011/L3-5/83
Example for Setting Reorder Point
Safety Stock (SS)
R = EDDLT + SS
SS = R - EDDLT
EDDLT = .4(3) + .3(4) + .2(5) + .1(6) = 4.0
SS = 5 – 4 = 1
SK/SCM2011/L3-5/84
Continuous DDLT Distribution
L03-05: Multi Period Inventory Systems SCM 2011
IIM Lucknow 22
SK/SCM2011/L3-5/85
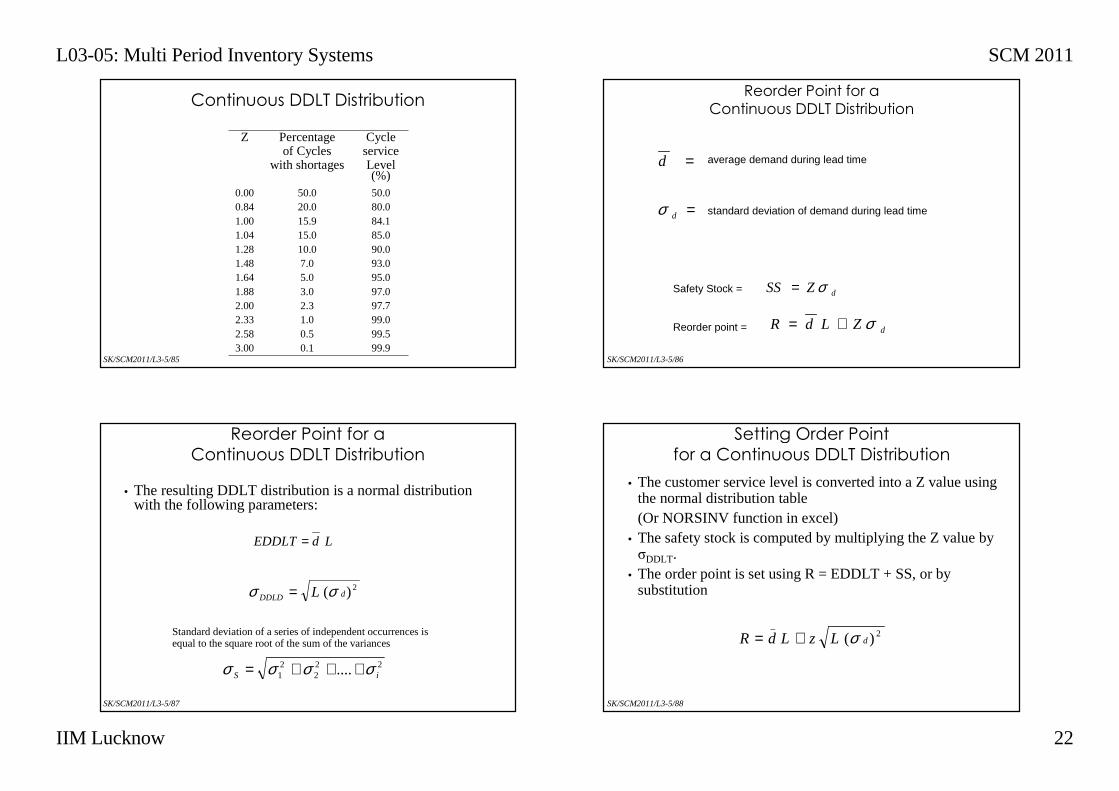
Continuous DDLT Distribution
50.080.084.185.090.093.095.097.097.799.099.599.9
50.020.015.915.010.07.05.03.02.31.00.50.1
0.000.841.001.041.281.481.641.882.002.332.583.00
Cycle service Level (%)
Percentageof Cycles
with shortages
Z
SK/SCM2011/L3-5/86
Reorder Point for a
Continuous DDLT Distribution
=
=
d
d
σ
average demand during lead time
standard deviation of demand during lead time
Safety Stock =
Reorder point =
dZSS σ=
dZLdR σ+=
SK/SCM2011/L3-5/87
Reorder Point for a
Continuous DDLT Distribution
• The resulting DDLT distribution is a normal distribution with the following parameters:
LdEDDLT =
2)( dDDLD L σσ =
Standard deviation of a series of independent occurrences is equal to the square root of the sum of the variances
222
21 .... iS σσσσ +++=
SK/SCM2011/L3-5/88
Setting Order Point
for a Continuous DDLT Distribution
• The customer service level is converted into a Z value using the normal distribution table (Or NORSINV function in excel)
• The safety stock is computed by multiplying the Z value by σDDLT.
• The order point is set using R = EDDLT + SS, or by substitution
2_
)( dLzLdR σ+=
L03-05: Multi Period Inventory Systems SCM 2011
IIM Lucknow 23
SK/SCM2011/L3-5/89
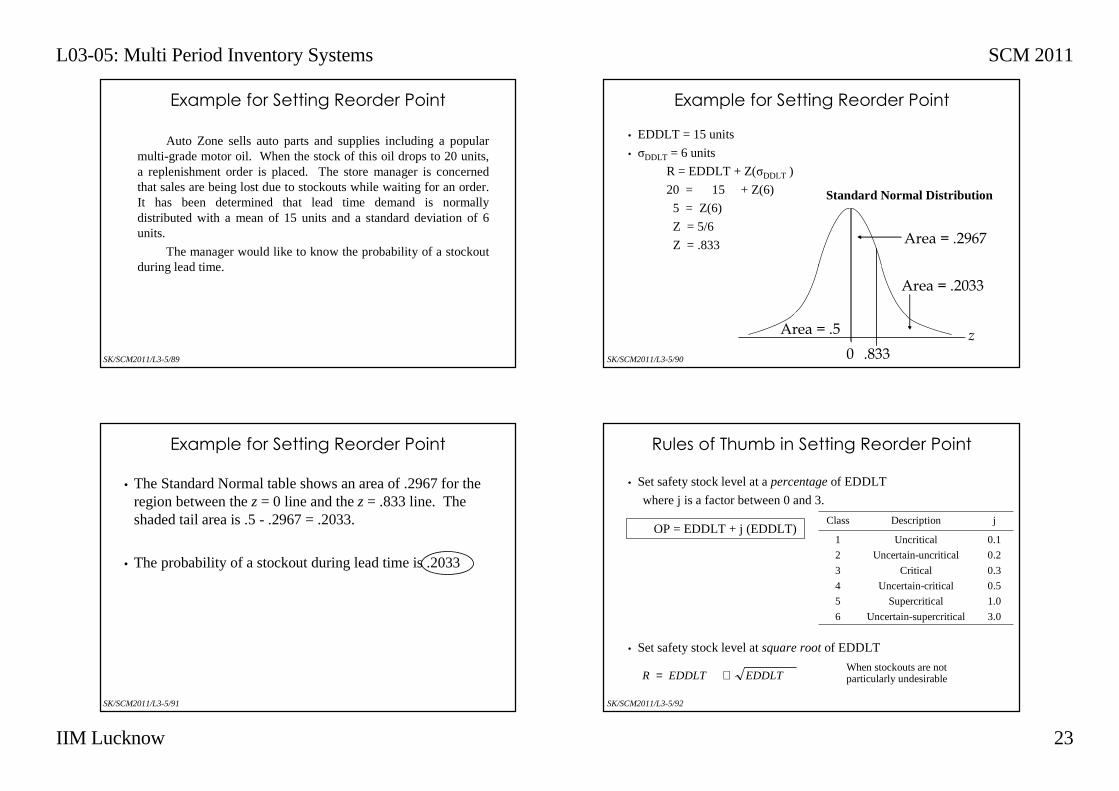
Auto Zone sells auto parts and supplies including a popular multi-grade motor oil. When the stock of this oil drops to 20 units, a replenishment order is placed. The store manager is concernedthat sales are being lost due to stockouts while waiting for an order. It has been determined that lead time demand is normally distributed with a mean of 15 units and a standard deviation of 6 units.
The manager would like to know the probability of a stockoutduring lead time.
Example for Setting Reorder Point
SK/SCM2011/L3-5/90
Example for Setting Reorder Point
• EDDLT = 15 units
• σDDLT = 6 units
R = EDDLT + Z(σDDLT )
20 = 15 + Z(6)
5 = Z(6)
Z = 5/6
Z = .833
0 .833
Area = .2967
Area = .5
Area = .2033
z
Standard Normal Distribution
SK/SCM2011/L3-5/91
Example for Setting Reorder Point
• The Standard Normal table shows an area of .2967 for the region between the z = 0 line and the z = .833 line. The shaded tail area is .5 - .2967 = .2033.
• The probability of a stockout during lead time is .2033
SK/SCM2011/L3-5/92
Rules of Thumb in Setting Reorder Point
• Set safety stock level at a percentage of EDDLT
where j is a factor between 0 and 3.
• Set safety stock level at square root of EDDLT
OP = EDDLT + j (EDDLT)
EDDLTEDDLTR +=
0.1
0.2
0.3
0.5
1.0
3.0
Uncritical
Uncertain-uncritical
Critical
Uncertain-critical
Supercritical
Uncertain-supercritical
1
2
3
4
5
6
jDescriptionClass
When stockouts are not particularly undesirable
L03-05: Multi Period Inventory Systems SCM 2011
IIM Lucknow 24
SK/SCM2011/L3-5/93
Also known as Fixed Order Interval Model
• Orders are placed at fixed time intervals
• Order quantity for next interval?
• Suppliers might encourage fixed intervals
• May require only periodic checks of inventory levels
• Risk of stockout
Fixed Time Period Models
SK/SCM2011/L3-5/94
• Tight control of inventory items• Items from same supplier may yield savings in:
• Ordering• Packing• Shipping costs
• May be practical when inventories cannot be closely monitored
Fixed Time Period Benefits
• Requires a larger safety stock
• Increases holding/carrying cost
• Costs of periodic reviews
Fixed Time Period Disadvantages
SK/SCM2011/L3-5/95
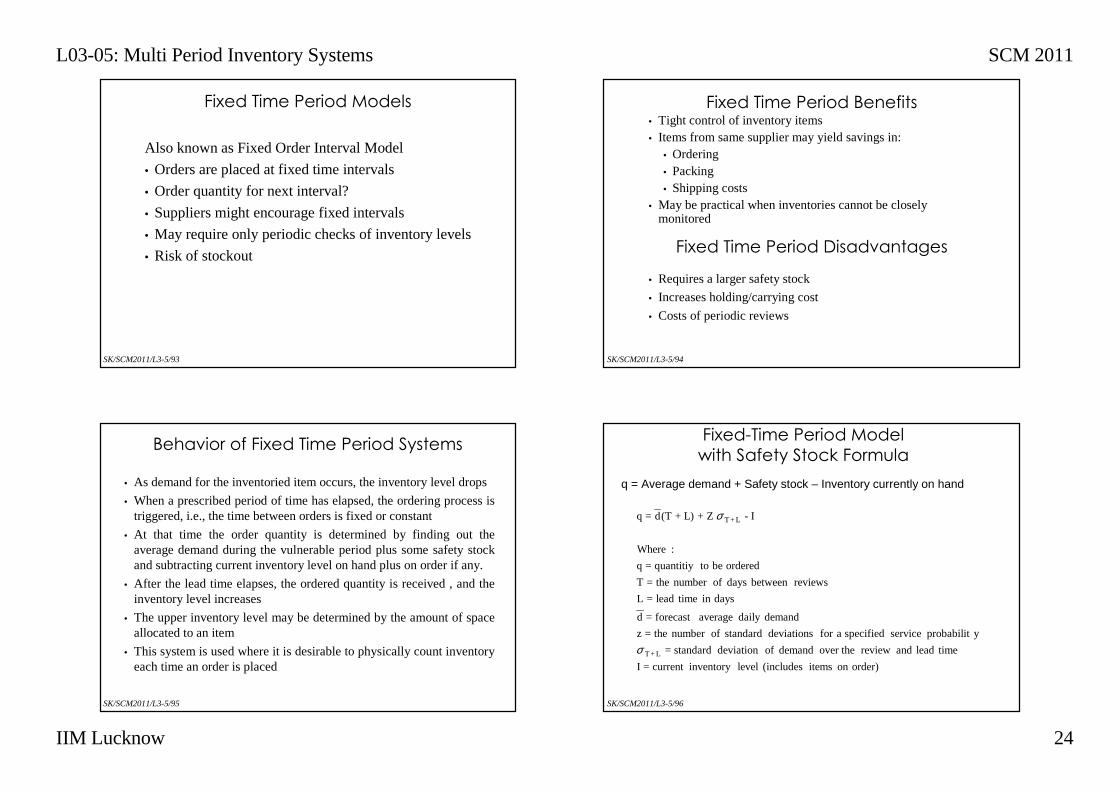
Behavior of Fixed Time Period Systems
• As demand for the inventoried item occurs, the inventory level drops
• When a prescribed period of time has elapsed, the ordering process is triggered, i.e., the time between orders is fixed or constant
• At that time the order quantity is determined by finding out theaverage demand during the vulnerable period plus some safety stock and subtracting current inventory level on hand plus on order if any.
• After the lead time elapses, the ordered quantity is received , and the inventory level increases
• The upper inventory level may be determined by the amount of space allocated to an item
• This system is used where it is desirable to physically count inventory each time an order is placed
SK/SCM2011/L3-5/96
Fixed-Time Period Model with Safety Stock Formula
order)on items (includes levelinventory current = I
timelead and review over the demand ofdeviation standard =
yprobabilit service specified afor deviations standard ofnumber the= z
demanddaily averageforecast = d
daysin timelead = L
reviewsbetween days ofnumber the= T
ordered be toquantitiy = q
:Where
I - Z+ L)+(Td = q
L+T
L+T
σ
σ
q = Average demand + Safety stock – Inventory currently on hand

L03-05: Multi Period Inventory Systems SCM 2011
IIM Lucknow 25
SK/SCM2011/L3-5/97
Determining Quantity in Fixed period Model
• Using an approach similar to that used to derive EOQ, the optimal value of the fixed time between orders is derived to be
2S/DH= EOPPeriodFixed =
SK/SCM2011/L3-5/98
Fixed-Time Period Model:
Determining the Value of σT+L
( )
2dL+T
d
L+T
1i
2dL+T
L)+(T =
constant, is andt independen isday each Since
= i
σσ
σ
σσ ∑=
The standard deviation of a sequence of random events equals the square root of the sum of the variances.
SK/SCM2011/L3-5/99
Example of the Fixed-Time Period Model
Average daily demand for a product is 20 units. The review period is 30 days, and lead time is 10 days. Management has set a policy of satisfying 96 percent of demand from items in stock. At the beginning of the review period there are 200 units in inventory. The daily demand standard deviation is 4 units.
Given the information below, how many units should be ordered?
SK/SCM2011/L3-5/100
Example of the Fixed-Time Period Model:
Solution (Part 1)
( )( )σ σT+ L d2 2 = (T + L) = 30 + 10 4 = 25.298
The value for “z” is found by using the Excel NORMSINV function.
For a probability 0.96, z = 1.75
L03-05: Multi Period Inventory Systems SCM 2011
IIM Lucknow 26
SK/SCM2011/L3-5/101
Example of the Fixed-Time Period Model:
Solution (Part 2)
or 644.272, = 200 - 44.272 800 = q
200- 298)(1.75)(25. + 10)+20(30 = q
I - Z+ L)+(Td = q L+T
units 645+
σ
So, to satisfy 96 percent of the demand, you should place an order of 645 units at this review period
SK/SCM2011/L3-5/102
Hybrid Inventory Models
• Optional replenishment model• Similar to the fixed order period model
• Unless inventory has dropped below a prescribed level when the order period has elapsed, no order is placed
• Protects against placing very small orders
• Attractive when review and ordering costs are large
SK/SCM2011/L3-5/103
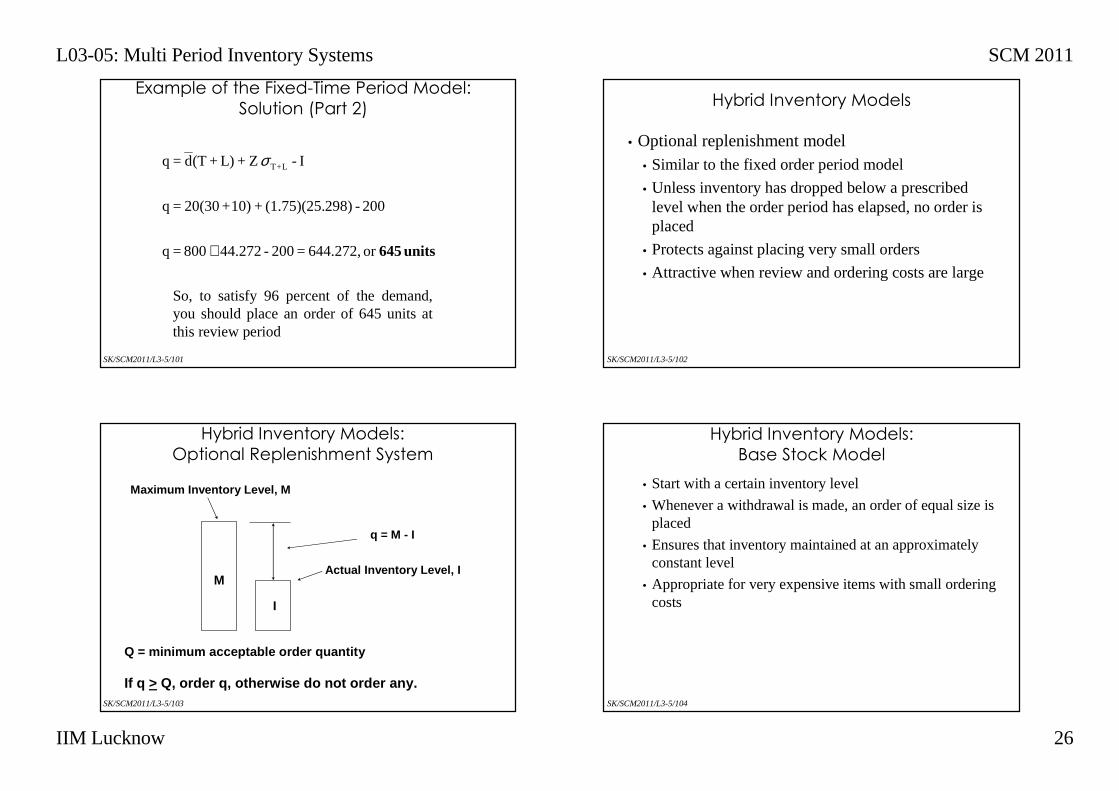
Hybrid Inventory Models:
Optional Replenishment System
Maximum Inventory Level, M
MActual Inventory Level, I
q = M - I
I
Q = minimum acceptable order quantity
If q > Q, order q, otherwise do not order any.SK/SCM2011/L3-5/104
Hybrid Inventory Models:
Base Stock Model
• Start with a certain inventory level
• Whenever a withdrawal is made, an order of equal size is placed
• Ensures that inventory maintained at an approximately constant level
• Appropriate for very expensive items with small ordering costs
L03-05: Multi Period Inventory Systems SCM 2011
IIM Lucknow 27
SK/SCM2011/L3-5/105
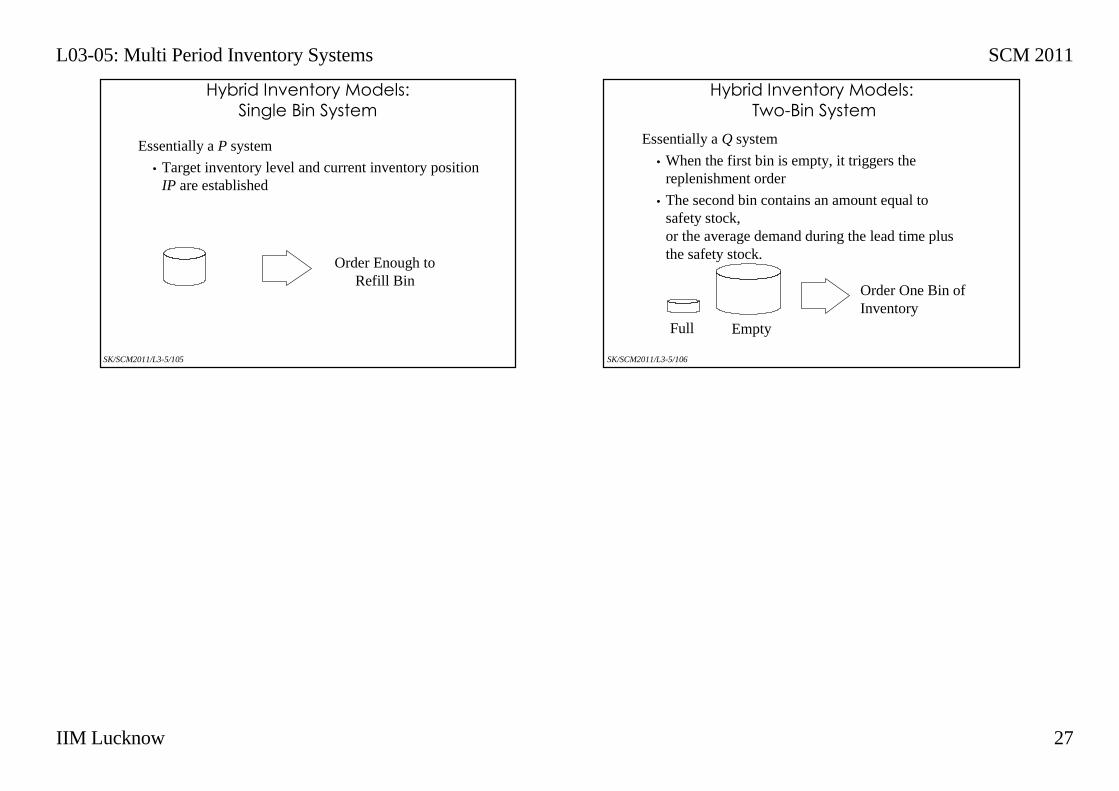
Hybrid Inventory Models:
Single Bin System
Order Enough toRefill Bin
Essentially a P system
• Target inventory level and current inventory position IP are established
SK/SCM2011/L3-5/106
Hybrid Inventory Models:
Two-Bin System
Full Empty
Order One Bin ofInventory
Essentially a Q system
• When the first bin is empty, it triggers the replenishment order
• The second bin contains an amount equal to safety stock, or the average demand during the lead time plus the safety stock.
Related Documents