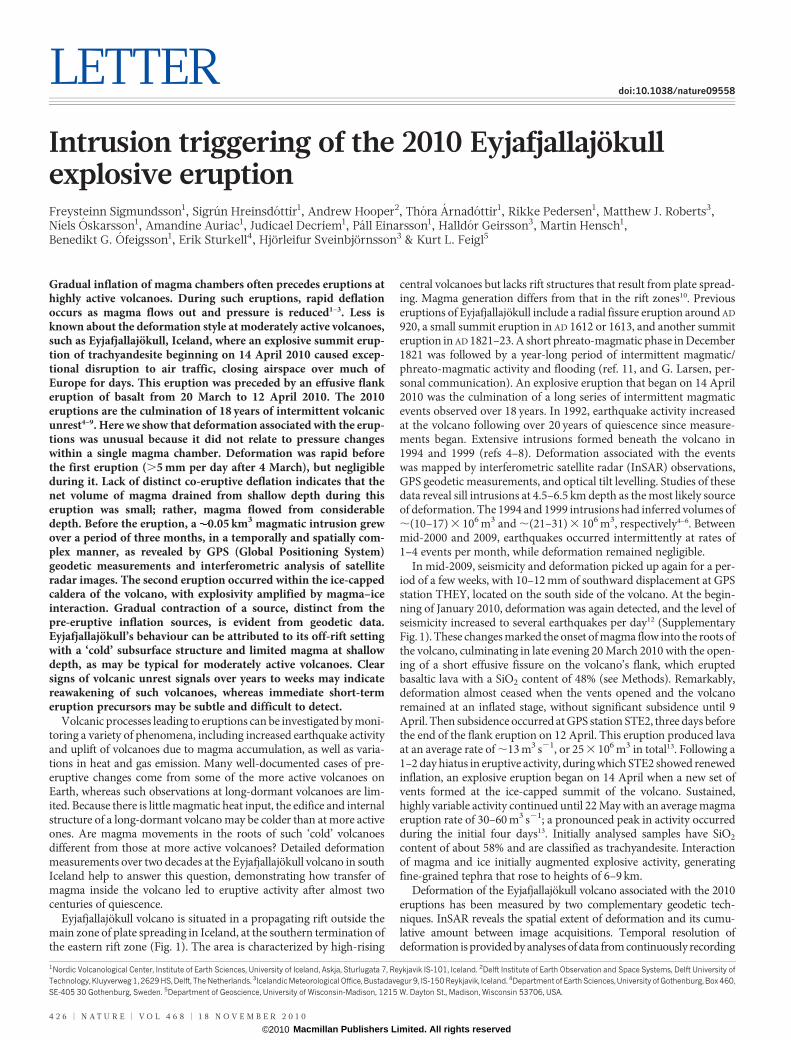
LETTER doi:10.1038/nature09558 Intrusion triggering of the 2010 Eyjafjallajo ¨kull explosive eruption Freysteinn Sigmundsson 1 , Sigru ´n Hreinsdo ´ttir 1 , Andrew Hooper 2 , Tho ´ra A ´ rnado ´ttir 1 , Rikke Pedersen 1 , Matthew J. Roberts 3 , Nı ´els O ´ skarsson 1 , Amandine Auriac 1 , Judicael Decriem 1 , Pa ´ll Einarsson 1 , Halldo ´r Geirsson 3 , Martin Hensch 1 , Benedikt G. O ´ feigsson 1 , Erik Sturkell 4 , Hjo ¨rleifur Sveinbjo ¨rnsson 3 & Kurt L. Feigl 5 Gradual inflation of magma chambers often precedes eruptions at highly active volcanoes. During such eruptions, rapid deflation occurs as magma flows out and pressure is reduced 1–3 . Less is known about the deformation style at moderately active volcanoes, such as Eyjafjallajo ¨kull, Iceland, where an explosive summit erup- tion of trachyandesite beginning on 14 April 2010 caused excep- tional disruption to air traffic, closing airspace over much of Europe for days. This eruption was preceded by an effusive flank eruption of basalt from 20 March to 12 April 2010. The 2010 eruptions are the culmination of 18 years of intermittent volcanic unrest 4–9 . Here we show that deformation associated with the erup- tions was unusual because it did not relate to pressure changes within a single magma chamber. Deformation was rapid before the first eruption (.5 mm per day after 4 March), but negligible during it. Lack of distinct co-eruptive deflation indicates that the net volume of magma drained from shallow depth during this eruption was small; rather, magma flowed from considerable depth. Before the eruption, a 0.05 km 3 magmatic intrusion grew over a period of three months, in a temporally and spatially com- plex manner, as revealed by GPS (Global Positioning System) geodetic measurements and interferometric analysis of satellite radar images. The second eruption occurred within the ice-capped caldera of the volcano, with explosivity amplified by magma–ice interaction. Gradual contraction of a source, distinct from the pre-eruptive inflation sources, is evident from geodetic data. Eyjafjallajo ¨kull’s behaviour can be attributed to its off-rift setting with a ‘cold’ subsurface structure and limited magma at shallow depth, as may be typical for moderately active volcanoes. Clear signs of volcanic unrest signals over years to weeks may indicate reawakening of such volcanoes, whereas immediate short-term eruption precursors may be subtle and difficult to detect. Volcanic processes leading to eruptions can be investigated by moni- toring a variety of phenomena, including increased earthquake activity and uplift of volcanoes due to magma accumulation, as well as varia- tions in heat and gas emission. Many well-documented cases of pre- eruptive changes come from some of the more active volcanoes on Earth, whereas such observations at long-dormant volcanoes are lim- ited. Because there is little magmatic heat input, the edifice and internal structure of a long-dormant volcano may be colder than at more active ones. Are magma movements in the roots of such ‘cold’ volcanoes different from those at more active volcanoes? Detailed deformation measurements over two decades at the Eyjafjallajo ¨kull volcano in south Iceland help to answer this question, demonstrating how transfer of magma inside the volcano led to eruptive activity after almost two centuries of quiescence. Eyjafjallajo ¨kull volcano is situated in a propagating rift outside the main zone of plate spreading in Iceland, at the southern termination of the eastern rift zone (Fig. 1). The area is characterized by high-rising central volcanoes but lacks rift structures that result from plate spread- ing. Magma generation differs from that in the rift zones 10 . Previous eruptions of Eyjafjallajo ¨kull include a radial fissure eruption around AD 920, a small summit eruption in AD 1612 or 1613, and another summit eruption in AD 1821–23. A short phreato-magmatic phase in December 1821 was followed by a year-long period of intermittent magmatic/ phreato-magmatic activity and flooding (ref. 11, and G. Larsen, per- sonal communication). An explosive eruption that began on 14 April 2010 was the culmination of a long series of intermittent magmatic events observed over 18 years. In 1992, earthquake activity increased at the volcano following over 20 years of quiescence since measure- ments began. Extensive intrusions formed beneath the volcano in 1994 and 1999 (refs 4–8). Deformation associated with the events was mapped by interferometric satellite radar (InSAR) observations, GPS geodetic measurements, and optical tilt levelling. Studies of these data reveal sill intrusions at 4.5–6.5 km depth as the most likely source of deformation. The 1994 and 1999 intrusions had inferred volumes of ,(10–17) 3 10 6 m 3 and ,(21–31) 3 10 6 m 3 , respectively 4–6 . Between mid-2000 and 2009, earthquakes occurred intermittently at rates of 1–4 events per month, while deformation remained negligible. In mid-2009, seismicity and deformation picked up again for a per- iod of a few weeks, with 10–12 mm of southward displacement at GPS station THEY, located on the south side of the volcano. At the begin- ning of January 2010, deformation was again detected, and the level of seismicity increased to several earthquakes per day 12 (Supplementary Fig. 1). These changes marked the onset of magma flow into the roots of the volcano, culminating in late evening 20 March 2010 with the open- ing of a short effusive fissure on the volcano’s flank, which erupted basaltic lava with a SiO 2 content of 48% (see Methods). Remarkably, deformation almost ceased when the vents opened and the volcano remained at an inflated stage, without significant subsidence until 9 April. Then subsidence occurred at GPS station STE2, three days before the end of the flank eruption on 12 April. This eruption produced lava at an average rate of ,13 m 3 s 21 , or 25 3 10 6 m 3 in total 13 . Following a 1–2 day hiatus in eruptive activity, during which STE2 showed renewed inflation, an explosive eruption began on 14 April when a new set of vents formed at the ice-capped summit of the volcano. Sustained, highly variable activity continued until 22 May with an average magma eruption rate of 30–60 m 3 s 21 ; a pronounced peak in activity occurred during the initial four days 13 . Initially analysed samples have SiO 2 content of about 58% and are classified as trachyandesite. Interaction of magma and ice initially augmented explosive activity, generating fine-grained tephra that rose to heights of 6–9 km. Deformation of the Eyjafjallajo ¨kull volcano associated with the 2010 eruptions has been measured by two complementary geodetic tech- niques. InSAR reveals the spatial extent of deformation and its cumu- lative amount between image acquisitions. Temporal resolution of deformation is provided by analyses of data from continuously recording 1 Nordic Volcanological Center, Institute of Earth Sciences, University of Iceland, Askja, Sturlugata 7, Reykjavik IS-101, Iceland. 2 Delft Institute of Earth Observation and Space Systems, Delft University of Technology, Kluyverweg 1, 2629 HS, Delft, The Netherlands. 3 Icelandic Meteorological Office, Bustadavegur 9, IS-150 Reykjavik, Iceland. 4 Department of Earth Sciences, University of Gothenburg, Box 460, SE-405 30 Gothenburg, Sweden. 5 Department of Geoscience, University of Wisconsin-Madison, 1215 W. Dayton St., Madison, Wisconsin 53706, USA. 426 | NATURE | VOL 468 | 18 NOVEMBER 2010 Macmillan Publishers Limited. All rights reserved ©2010

Welcome message from author
This document is posted to help you gain knowledge. Please leave a comment to let me know what you think about it! Share it to your friends and learn new things together.
Transcript
LETTERdoi:10.1038/nature09558
Intrusion triggering of the 2010 Eyjafjallajokullexplosive eruptionFreysteinn Sigmundsson1, Sigrun Hreinsdottir1, Andrew Hooper2, Thora Arnadottir1, Rikke Pedersen1, Matthew J. Roberts3,Nıels Oskarsson1, Amandine Auriac1, Judicael Decriem1, Pall Einarsson1, Halldor Geirsson3, Martin Hensch1,Benedikt G. Ofeigsson1, Erik Sturkell4, Hjorleifur Sveinbjornsson3 & Kurt L. Feigl5
Gradual inflation of magma chambers often precedes eruptions athighly active volcanoes. During such eruptions, rapid deflationoccurs as magma flows out and pressure is reduced1–3. Less isknown about the deformation style at moderately active volcanoes,such as Eyjafjallajokull, Iceland, where an explosive summit erup-tion of trachyandesite beginning on 14 April 2010 caused excep-tional disruption to air traffic, closing airspace over much ofEurope for days. This eruption was preceded by an effusive flankeruption of basalt from 20 March to 12 April 2010. The 2010eruptions are the culmination of 18 years of intermittent volcanicunrest4–9. Here we show that deformation associated with the erup-tions was unusual because it did not relate to pressure changeswithin a single magma chamber. Deformation was rapid beforethe first eruption (.5 mm per day after 4 March), but negligibleduring it. Lack of distinct co-eruptive deflation indicates that thenet volume of magma drained from shallow depth during thiseruption was small; rather, magma flowed from considerabledepth. Before the eruption, a 0.05 km3 magmatic intrusion grewover a period of three months, in a temporally and spatially com-plex manner, as revealed by GPS (Global Positioning System)geodetic measurements and interferometric analysis of satelliteradar images. The second eruption occurred within the ice-cappedcaldera of the volcano, with explosivity amplified by magma–iceinteraction. Gradual contraction of a source, distinct from thepre-eruptive inflation sources, is evident from geodetic data.Eyjafjallajokull’s behaviour can be attributed to its off-rift settingwith a ‘cold’ subsurface structure and limited magma at shallowdepth, as may be typical for moderately active volcanoes. Clearsigns of volcanic unrest signals over years to weeks may indicatereawakening of such volcanoes, whereas immediate short-termeruption precursors may be subtle and difficult to detect.
Volcanic processes leading to eruptions can be investigated by moni-toring a variety of phenomena, including increased earthquake activityand uplift of volcanoes due to magma accumulation, as well as varia-tions in heat and gas emission. Many well-documented cases of pre-eruptive changes come from some of the more active volcanoes onEarth, whereas such observations at long-dormant volcanoes are lim-ited. Because there is little magmatic heat input, the edifice and internalstructure of a long-dormant volcano may be colder than at more activeones. Are magma movements in the roots of such ‘cold’ volcanoesdifferent from those at more active volcanoes? Detailed deformationmeasurements over two decades at the Eyjafjallajokull volcano in southIceland help to answer this question, demonstrating how transfer ofmagma inside the volcano led to eruptive activity after almost twocenturies of quiescence.
Eyjafjallajokull volcano is situated in a propagating rift outside themain zone of plate spreading in Iceland, at the southern termination ofthe eastern rift zone (Fig. 1). The area is characterized by high-rising
central volcanoes but lacks rift structures that result from plate spread-ing. Magma generation differs from that in the rift zones10. Previouseruptions of Eyjafjallajokull include a radial fissure eruption around AD
920, a small summit eruption in AD 1612 or 1613, and another summiteruption in AD 1821–23. A short phreato-magmatic phase in December1821 was followed by a year-long period of intermittent magmatic/phreato-magmatic activity and flooding (ref. 11, and G. Larsen, per-sonal communication). An explosive eruption that began on 14 April2010 was the culmination of a long series of intermittent magmaticevents observed over 18 years. In 1992, earthquake activity increasedat the volcano following over 20 years of quiescence since measure-ments began. Extensive intrusions formed beneath the volcano in1994 and 1999 (refs 4–8). Deformation associated with the eventswas mapped by interferometric satellite radar (InSAR) observations,GPS geodetic measurements, and optical tilt levelling. Studies of thesedata reveal sill intrusions at 4.5–6.5 km depth as the most likely sourceof deformation. The 1994 and 1999 intrusions had inferred volumes of,(10–17) 3 106 m3 and ,(21–31) 3 106 m3, respectively4–6. Betweenmid-2000 and 2009, earthquakes occurred intermittently at rates of1–4 events per month, while deformation remained negligible.
In mid-2009, seismicity and deformation picked up again for a per-iod of a few weeks, with 10–12 mm of southward displacement at GPSstation THEY, located on the south side of the volcano. At the begin-ning of January 2010, deformation was again detected, and the level ofseismicity increased to several earthquakes per day12 (SupplementaryFig. 1). These changes marked the onset of magma flow into the roots ofthe volcano, culminating in late evening 20 March 2010 with the open-ing of a short effusive fissure on the volcano’s flank, which eruptedbasaltic lava with a SiO2 content of 48% (see Methods). Remarkably,deformation almost ceased when the vents opened and the volcanoremained at an inflated stage, without significant subsidence until 9April. Then subsidence occurred at GPS station STE2, three days beforethe end of the flank eruption on 12 April. This eruption produced lavaat an average rate of ,13 m3 s21, or 25 3 106 m3 in total13. Following a1–2 day hiatus in eruptive activity, during which STE2 showed renewedinflation, an explosive eruption began on 14 April when a new set ofvents formed at the ice-capped summit of the volcano. Sustained,highly variable activity continued until 22 May with an average magmaeruption rate of 30–60 m3 s21; a pronounced peak in activity occurredduring the initial four days13. Initially analysed samples have SiO2
content of about 58% and are classified as trachyandesite. Interactionof magma and ice initially augmented explosive activity, generatingfine-grained tephra that rose to heights of 6–9 km.
Deformation of the Eyjafjallajokull volcano associated with the 2010eruptions has been measured by two complementary geodetic tech-niques. InSAR reveals the spatial extent of deformation and its cumu-lative amount between image acquisitions. Temporal resolution ofdeformation is provided by analyses of data from continuously recording
1Nordic Volcanological Center, Institute of Earth Sciences, University of Iceland, Askja, Sturlugata 7, Reykjavik IS-101, Iceland. 2Delft Institute of Earth Observation and Space Systems, Delft University ofTechnology, Kluyverweg 1, 2629 HS, Delft, The Netherlands. 3Icelandic Meteorological Office, Bustadavegur 9, IS-150 Reykjavik, Iceland. 4Department of Earth Sciences, University of Gothenburg, Box 460,SE-405 30 Gothenburg, Sweden. 5Department of Geoscience, University of Wisconsin-Madison, 1215 W. Dayton St., Madison, Wisconsin 53706, USA.
4 2 6 | N A T U R E | V O L 4 6 8 | 1 8 N O V E M B E R 2 0 1 0
Macmillan Publishers Limited. All rights reserved©2010
GPS geodetic receivers around the volcano that give three-dimensionaldisplacements as a function of time. We asked the German Space Agency(DLR) to program the TerraSAR-X satellite14 to acquire images overEyjafjallajokull, beginning in July 2009. On 20 March 2010, images wereacquired in both ascending and descending satellite tracks, providinginterferograms spanning almost the entire pre-eruptive inflation intervaluntil a few hours before the first eruption. InSAR interferograms span-ning the flank eruption indicate no detectable deformation, whereasthose spanning the initial part of the second eruption show deflation(Fig. 2 and Supplementary Fig. 3). The GPS data reveal a complexpattern. Station THEY began to move southward in January, indicating
inflation. Station SKOG began to move southeastwards a few weeks later.A final phase of pre-eruptive deformation began on 4 March whenstation STE2 started moving westward. In combination, the geodeticdata reveal three stages of deformation: (1) a pre-eruptive stage of infla-tion due to a complicated time-evolving magma intrusion that producedvariable and high rates of deformation, in particular after 4 March; (2)from 20 March to 9 April, a co-eruptive stage characterized by a pause indeformation (negligible rates); and (3) a co-eruptive deformation stageassociated with the April–May summit eruption, indicating gradualdeflation of a source distinct from the pre-eruptive inflation source.
Modelling indicates a pre-eruptive intrusion of complicated geo-metry over an extended depth range. The combined GPS and InSARdata set for this period is poorly fitted by models involving a singlespherical or tabular intrusion (dyke or sill). Inversion has been con-ducted to find sources embedded within a homogeneous elastic half-space capable of recreating the observed deformation. Two differentapproaches were used, based on: (1) sources of simple geometries15,16
and (2) sources of irregular shape and variable opening, imposing ahydrostatic overpressure boundary condition (Methods Summary). AMarkov chain Monte Carlo method was used to estimate the probabilitydistribution of the model parameters17. Both methods give the maxi-mum likelihood range for the model parameters (95% confidence inter-vals). Observations from December to the end of February can beexplained by a single horizontal sill inflating at a depth of 4.0–5.9 kmunder the southeastern flank of the volcano, with a volume increase of(8–18) 3 106 m3. The March pre-eruptive deformation is explained by asecond sill at about the same depth under the northeastern flank of thevolcano, together with a southeast-tilted dyke reaching from 3.2–6.1 kmdepth to within a few hundred metres, or less, of the surface (Fig. 3). Thesills link to a seismically inferred ‘upflow zone’ of magma within thevolcano12,18,19, and the dyke model is consistent with its origin at thedepth of the sills. The modelling thus suggests one interconnectedintrusion in the pre-eruptive stage with magma flow at an average rateof 2–3 m3 s21 before March, followed by an average flow rate of30–40 m3 s21. The total inferred volume increase is (49–71) 3 106 m3.A deflating source associated with the 14 April summit eruption issimpler and better constrained than the pre-eruptive intrusion. The datacan be fitted by a horizontal deflating sill at a depth of 4.0–4.7 km, with avolume decrease of (13–15) 3 106 m3 until 22 April. This source isspatially offset from, and different to, the pre-eruptive complex.
Our observations have revealed the growth of an intrusive complexin the roots of Eyjafjallajokull volcano during the three months beforeeruption onset. After initial horizontal growth, it shows both hori-zontal and sub-vertical growth in the three weeks before the firsteruption. This behaviour can be attributed to subsurface variationsin crustal stress and strength originating from complicated volcanofoundations formed in a propagating rift. A low-density layer maycapture magma, allowing pressure to build before an intrusion canascend towards higher levels20. The intrusive complex was presumablyformed by basalt, as erupted on the volcano flank from 20 March to 12April; its growth halted at the onset of this eruption. Deformationassociated with the eruption onset was minor, as the dyke had alreadyapproached the surface. Furthermore, our inferred average inflow rateto the intrusion in March is about three times higher than the averageeruption rate during the flank eruption. Isolated eruptive vents open-ing on long-dormant volcanoes may represent magma leakingupwards from extensive pre-eruptive intrusions formed at depth.The deflation source activated during the summit eruption of tra-chyandesite is distinct from, and adjacent to, all documented sourcesof inflation in the volcano roots.
The basaltic magma that recharged the volcano appears to havetriggered the summit eruption, although the exact mode of triggeringis uncertain. Scenarios include stress triggering or propagation ofbasalt into more evolved magma. The trachyandesite includes crystalsthat could be remnants of a minor recent intrusion of basalt (seeMethods). The trachyandesite may have formed over many years
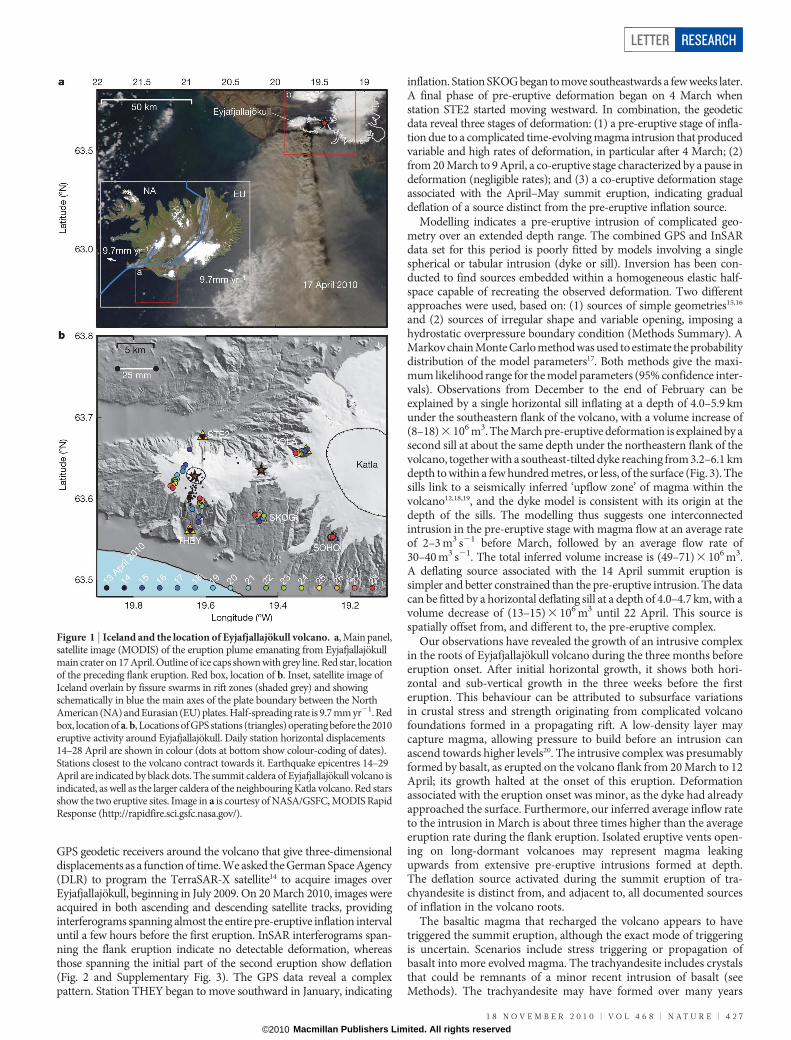
Figure 1 | Iceland and the location of Eyjafjallajokull volcano. a, Main panel,satellite image (MODIS) of the eruption plume emanating from Eyjafjallajokullmain crater on 17 April. Outline of ice caps shown with grey line. Red star, locationof the preceding flank eruption. Red box, location of b. Inset, satellite image ofIceland overlain by fissure swarms in rift zones (shaded grey) and showingschematically in blue the main axes of the plate boundary between the NorthAmerican (NA) and Eurasian (EU) plates. Half-spreading rate is 9.7 mm yr21. Redbox, location of a. b, Locations of GPS stations (triangles) operating before the 2010eruptive activity around Eyjafjallajokull. Daily station horizontal displacements14–28 April are shown in colour (dots at bottom show colour-coding of dates).Stations closest to the volcano contract towards it. Earthquake epicentres 14–29April are indicated by black dots. The summit caldera of Eyjafjallajokull volcano isindicated, as well as the larger caldera of the neighbouring Katla volcano. Red starsshow the two eruptive sites. Image in a is courtesy of NASA/GSFC, MODIS RapidResponse (http://rapidfire.sci.gsfc.nasa.gov/).
LETTER RESEARCH
1 8 N O V E M B E R 2 0 1 0 | V O L 4 6 8 | N A T U R E | 4 2 7
Macmillan Publishers Limited. All rights reserved©2010
before the triggering intrusion, by partial melting of hydrated crustaround the margins of multiple basaltic intrusions, within a domain atthe melting point of the trachyandesite. Alternatively, mixing of largerportion of basalt with more evolved magma may have occurred21. Thegeodetically inferred sill-shaped source of deflation during the erup-tion suggests, however, that magma was drained from a widespreaddomain under the summit area, eventually limiting the flow rate andcontributing to the long duration of the summit eruption. Consideringuncertainties in the modelling, we cannot clearly discriminate betweena model with a stack of vertically separated sills and a model consistingof all the intrusions occurring at the same depth. A layer of partial meltor magma within the volcano would contribute to capturing of basaltintrusions from depth, because of its low strength and density. Thegeodetic data show that the intrusion formed before the initial eruptiondid not deflate during the second one. This argues against all the
deformation sources relating to a single magma chamber. The shorteruptive pause following the closure of the flank eruption’s feeder chan-nel suggests critical pressure conditions in the system. Continued inflowfrom depth caused eventual pressure build-up in the intrusive complex,providing the trigger needed to initiate the explosive eruption.
Our observations have implications for interpretation of other casesof bimodal volcanism, such as the 1996 eruption of Karymsky volcanowhen andesite erupted from its main vent and basalt from its flank22,and for studies of eroded exposures of complicated volcano interiorsthat reveal interconnected network of sills and dykes23. Intrusions maylead to eruptions not only when they find their way to the surface, butalso when they hit magma residing in the roots of volcanoes. AtEyjafjallajokull our observations show how primitive melts in anintrusive complex active since 1992 triggered an explosive eruptionof trachyandesite.
0
0.5
1
1.5
2
2.5
20
10
Num
ber o
f earth
quakes x
10
3
Jan.Nov.Sep. Dec. Apr.Mar.Feb.
Month in 2010Month in 2009
STEI/STE2 at N101º
THEY at N185º
SKOG at N121ºE
−60
−40
−20
0
20
40
60
Sum
mit e
rup
tio
n
Fla
nk e
rup
tio
n
4 M
arc
h
0.0 15.5 mm
LOS displacement
19.8a
b
19.6 19.4 19.2
Longitude (ºW)
5 km
25 Sep. 2009 − 20 Mar. 2010
0.0 15.5 mm
LOS displacement
19.8 19.6 19.4 19.2
63.5
63.6
63.7
63.8
5 km
11–22 Apr. 2010
Dis
pla
cem
ent
(mm
) L
atitu
de (ºN
)
−80
80
63.5
63.6
63.7
63.8
Oct.
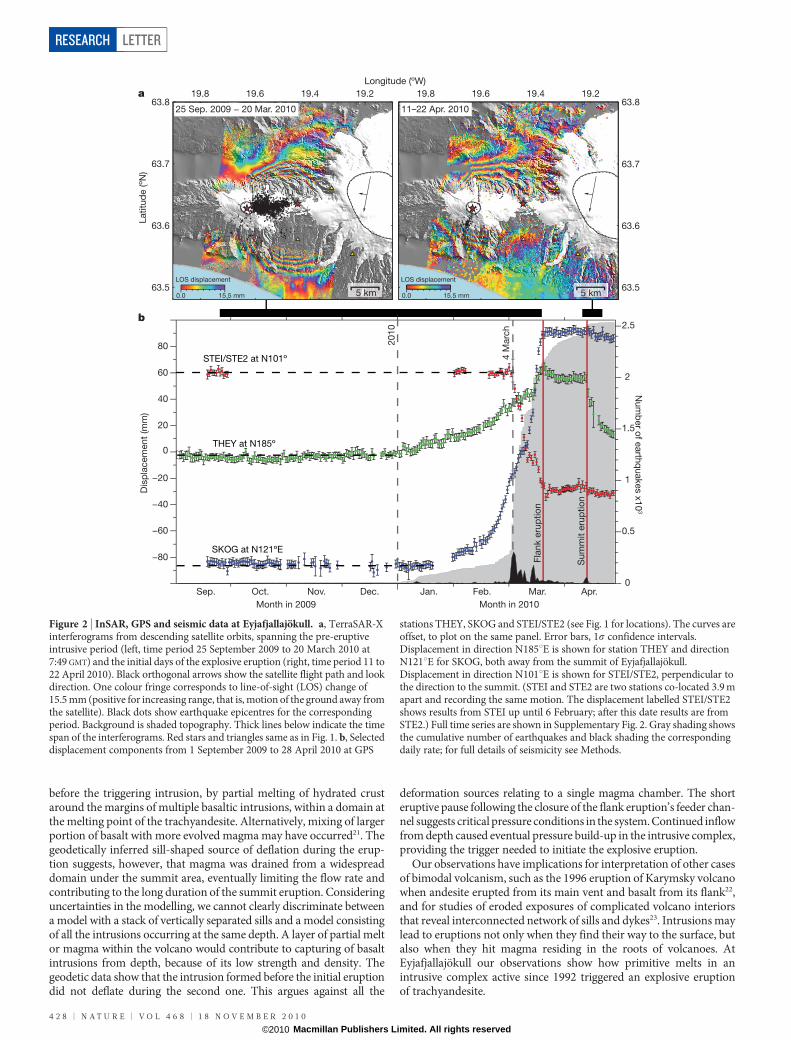
Figure 2 | InSAR, GPS and seismic data at Eyjafjallajokull. a, TerraSAR-Xinterferograms from descending satellite orbits, spanning the pre-eruptiveintrusive period (left, time period 25 September 2009 to 20 March 2010 at7:49 GMT) and the initial days of the explosive eruption (right, time period 11 to22 April 2010). Black orthogonal arrows show the satellite flight path and lookdirection. One colour fringe corresponds to line-of-sight (LOS) change of15.5 mm (positive for increasing range, that is, motion of the ground away fromthe satellite). Black dots show earthquake epicentres for the correspondingperiod. Background is shaded topography. Thick lines below indicate the timespan of the interferograms. Red stars and triangles same as in Fig. 1. b, Selecteddisplacement components from 1 September 2009 to 28 April 2010 at GPS
stations THEY, SKOG and STEI/STE2 (see Fig. 1 for locations). The curves areoffset, to plot on the same panel. Error bars, 1s confidence intervals.Displacement in direction N185uE is shown for station THEY and directionN121uE for SKOG, both away from the summit of Eyjafjallajokull.Displacement in direction N101uE is shown for STEI/STE2, perpendicular tothe direction to the summit. (STEI and STE2 are two stations co-located 3.9 mapart and recording the same motion. The displacement labelled STEI/STE2shows results from STEI up until 6 February; after this date results are fromSTE2.) Full time series are shown in Supplementary Fig. 2. Gray shading showsthe cumulative number of earthquakes and black shading the correspondingdaily rate; for full details of seismicity see Methods.
RESEARCH LETTER
4 2 8 | N A T U R E | V O L 4 6 8 | 1 8 N O V E M B E R 2 0 1 0
Macmillan Publishers Limited. All rights reserved©2010
METHODS SUMMARYGPS data were analysed using GAMIT/GLOBK24. InSAR images were formed withDoris software25 using scripts from StaMPS17. Earthquake hypocentres were locatedusing data acquired by the SIL system26. The chemical composition of eruptiveproducts was determined using inductively coupled plasma optical emission spec-trometry. In the joint inversion of the GPS and InSAR data sets, we solved for theopening of each element for a given hydrostatic overpressure, using a boundary
element model, assuming a density difference between the magma and surroundingrock of 250 kg m23 and a traction-free interface27. Our model extends that of ref. 28but our imposition of hydrostatic rather than uniform overpressure means that theoverpressure decreases with depth. An exponential covariance function with vari-ance of 1 cm2 for each interferometric pair was assumed. Our estimate of the modelparameters accounts for 87% of the variance in the data and the results are supportedby supplementary modelling of InSAR29 and GPS data alone30 that we carried out.
Opening (m)
0 –0.5 –1
19.9 19.8 19.7 19.6 19.5 19.4 19.3 19.2 19.1 19.9 19.8 19.7 19.6 19.5 19.4 19.3 19.2 19.1
19.9 19.8 19.7 19.6 19.5 19.4 19.3 19.2 19.1
19.9 19.919.8 19.7 19.6 19.5
Longitude (ºW) Longitude (ºW)
19.4 19.8 19.7 19.6 19.5 19.419.3 19.319.2 19.1
19.9 19.8 19.7 19.6 19.5 19.4 19.3 19.2 19.1
Opening (m)
0 1 2
ba
dc
fe
Dike
(m)
5 km5 km
5 km
5 km 5 km
5 km
Sill 2
Deflation
source
1999
1994Sill 1
63.5
63.6
63.7
63.8
63.5
63.6
63.7Latitu
de (ºN
)Latitu
de (ºN
)Latitu
de (ºN
)
63.8
63.5
63.6
63.7
63.8
63.5
63.6
63.7
63.8
63.5
63.6
63.7
63.8
2,000
0
–2,000
–4,000
–6,000
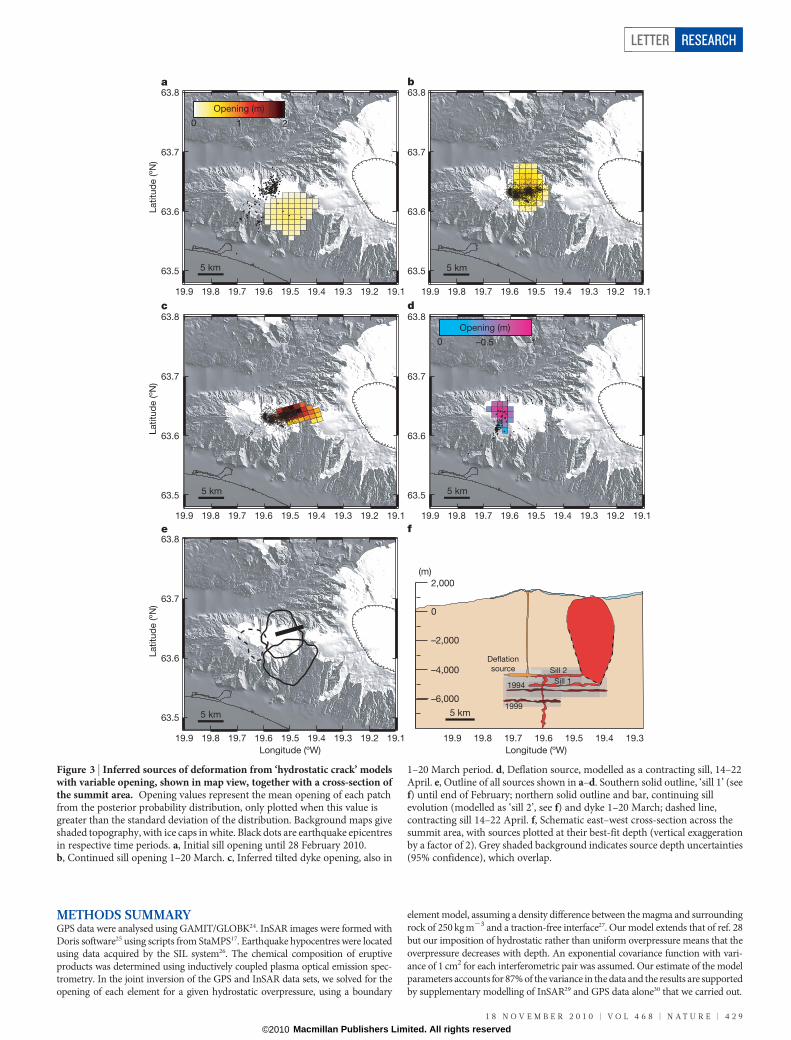
Figure 3 | Inferred sources of deformation from ‘hydrostatic crack’ modelswith variable opening, shown in map view, together with a cross-section ofthe summit area. Opening values represent the mean opening of each patchfrom the posterior probability distribution, only plotted when this value isgreater than the standard deviation of the distribution. Background maps giveshaded topography, with ice caps in white. Black dots are earthquake epicentresin respective time periods. a, Initial sill opening until 28 February 2010.b, Continued sill opening 1–20 March. c, Inferred tilted dyke opening, also in
1–20 March period. d, Deflation source, modelled as a contracting sill, 14–22April. e, Outline of all sources shown in a–d. Southern solid outline, ‘sill 1’ (seef) until end of February; northern solid outline and bar, continuing sillevolution (modelled as ‘sill 2’, see f) and dyke 1–20 March; dashed line,contracting sill 14–22 April. f, Schematic east–west cross-section across thesummit area, with sources plotted at their best-fit depth (vertical exaggerationby a factor of 2). Grey shaded background indicates source depth uncertainties(95% confidence), which overlap.
LETTER RESEARCH
1 8 N O V E M B E R 2 0 1 0 | V O L 4 6 8 | N A T U R E | 4 2 9
Macmillan Publishers Limited. All rights reserved©2010

Full Methods and any associated references are available in the online version ofthe paper at www.nature.com/nature.
Received 14 May; accepted 5 October 2010.
1. Dzurisin, D. Volcano Deformation (Springer, 2007).2. Amelung, F., Jonsson, S., Zebker, H. & Segall, P. Widespread uplift and trapdoor
faulting on Galapagos volcanoes observed with radar interferometry. Nature 407,993–996 (2000).
3. Sigmundsson, F. Iceland Geodynamics: Crustal Deformation and Divergent PlateTectonics (Springer, 2006).
4. Pedersen,R.&Sigmundsson,F. InSARbasedsillmodel linksspatially offsetareasofdeformation and seismicity for the 1994 unrest episode at Eyjafjallajokull volcano,Iceland. Geophys. Res. Lett. 31, L14610, doi:10.1029/2004GL020368 (2004).
5. Pedersen, R. & Sigmundsson, F. Temporal development of the 1999 intrusiveepisode in the Eyjafjallajokull volcano, Iceland, derived from InSAR images. Bull.Volcanol. 68, 377–393 (2006).
6. Hooper, A., Pedersen, R. & Sigmundsson, F. in The VOLUME Project — Volcanoes:Understanding Subsurface Mass Movement (eds Bean, C. J. et al.) 13–24 (UniversityCollege Dublin, 2009).
7. Sturkell, E., Sigmundsson, F. & Einarsson, P. Recent unrest and magmamovements at Eyjafjallajokull and Katla Volcanoes, Iceland. J. Geophys. Res. 108,2369, doi:10.1029/2001JB000917 (2003).
8. Sturkell, E. et al. Katla andEyjafjallajokull Volcanoes.Dev.Quat. Sci. 13, 5–21 (2010).9. Hooper, A.Amulti-temporal InSARmethod incorporatingbothpersistent scatterer
and small baseline approaches. Geophys. Res. Lett. 35, L16302, doi:10.1029/2008GL034654 (2008).
10. Oskarsson, N., Sigvaldason, G. E. & Steinthorsson, S. A dynamic model of rift zonepetrogenesis and the regional petrology of Iceland. J. Petrol. 23, 28–74 (1985).
11. Larsen, G., Dugmore, A. J. & Newton, A. J. Geochemistry of historical-age silicictephras in Iceland. Holocene 9, 463–471 (1999).
12. Hjaltadottir, S. & Vogfjord, K. Seismic evidence of magma transport inEyjafjallajokull during 2009–2010. Eos 91(Fall meet. suppl) (abstract V21F-02).
13. Gudmundsson, M. T. et al. The Eyjafjallajokull eruption in April-May 2010; course ofevents,ashgenerationandashdispersal.Eos91(Fallmeet. suppl.) (abstractV53F-01).
14. Eineder, M. & Fritz, T. TerraSAR-X Ground Segment Basic Product SpecificationDocument TX-GS-DD-3302 (DLR, 2009).
15. Okada, Y. Internal deformation due to shear and tensile faults in a half-space. Bull.Seismol. Soc. Am. 82, 1018–1040 (1992).
16. Fialko, Y., Khazan, Y. & Simons, M. Deformation due to a pressurized horizontalcircular crack in an elastic half-space, with applications to volcano geodesy.Geophys. J. Int. 146, 181–190 (2001).
17. Hooper, A., Segall, P. & Zebker, H. Persistent scatterer interferometric syntheticaperture radar for crustal deformation analysis, with application to Volcan Alcedo,Galapagos. J. Geophys. Res. 112, B07407, doi:10.1029/2006JB004763 (2007).
18. Hjaltadottir, S., Vogfjorð, K. S. & Slunga R. Seismic Signs of Magma PathwaysThrough the Crust in the Eyjafjallajokull Volcano, South Iceland. (IcelandicMeteorological Office report VI 2009-13, 2009).
19. Vogfjord, K. S., Hjaltadottir, S., Kjartansson, E. & Roberts, M. J. in The VOLUMEProject — Volcanoes: Understanding Subsurface Mass Movement (eds Bean, C. J. etal.) 237–249 (University College Dublin, 2009).
20. Taisne, B. & Jaupart, C. Dike propagation through layered rocks. J. Geophys. Res.114, B09203, doi:10.1029/2008JB006228 (2009).
21. Sigmarsson O., Vlastelic, I. & Devidal, J. Trace-element variations reveal dynamicmagma mixing during the 2010 eruption of Eyjafjallajokull, Iceland. Eos 91(Fallmeet. suppl.) (abstract V21F-04).
22. Eichelberger, J. C., Izbekov, P. E. & Browne, B. L. Bulk chemical trends at arcvolcanoes are not liquid lines of descent. Lithos 87, 135–154 (2006).
23. Marsh, B. A magmatic mush column Rosetta Stone: The McMurdo Dry Valleys ofAntarctica. Eos 47, 497–508 (2004).
24. Hreinsdottir, S. & Bennett, R. A. Active aseismic creep on the Alto Tiberina low-angle normal fault, Italy. Geology 37, 683–686 (2009).
25. Kampes, B.,Hanssen,R. F. & Zbigniew, P. Radar interferometry with public domaintools. In Proceedings ‘Fringe 2003 Workshop’ (ESA SP-550, European SpaceAgency, 2004).
26. Jakobsdottir, S. S. Seismicity in Iceland: 1994–2007. Jokull 58, 75–100 (2008).27. Hooper, A. et al. Is magma generated due to retreating ice caps, likely to erupt?
Constraints on lower-crustal stress in Iceland from InSAR. In Proceedings ‘Fringe2009 Workshop’ (ESA SP-677, European Space Agency, 2010).
28. Yun, S., Segall, P. & Zebker, H. Constraints on magma chamber geometry at SierraNegra volcano, Galapagos Islands, based on InSAR observations. J. Volcanol.Geotherm. Res. 150, 232–243 (2006).
29. Feigl, K. L. & Thurber, C. H. A method for modelling radar interferograms withoutphase unwrapping: application to the M 5 Fawnskin, California earthquake of1992 December 4. Geophys. J. Int. 176, 491–504 (2009).
30. Arnadottir, T., Jiang, W., Feigl, K. L., Geirsson, H. & Sturkell, E. Kinematic models ofplate boundary deformation in southwest Iceland derived from GPS observations.J. Geophys. Res. 111, B07402, doi:10.1029/2005JB003907 (2006).
Supplementary Information is linked to the online version of the paper atwww.nature.com/nature.
Acknowledgements We acknowledge the efforts of Th. Jonsson, J. Holmjarn,S. Steinthorsson, H. Olafsson, Th. Ingvarsson and B. Brandsdottir in making fieldoperations run smoothly, as well as consultation and discussions with the staff of ourinstitutes.We thankP.Segall andC.Wicks for commentson themanuscript, andNASA/GSFC for useof theMODIS image. Financial support for this workwas received from theIcelandic Research Fund, the research fund at the University of Iceland, and the USNational Science Foundation (grant EAR 1042103). Funds were received for hazardmitigation from the Icelandic government. We thank the Geodesy Laboratory at theUniversity of Arizona for computing facilities and UNAVCO for technical support. GMTpublic domain software was used for some figures. TerraSAR-X data were provided bythe German Space Agency under project number GEO0609.
Author Contributions F.S. coordinated the writing of the paper and the research it isbased on; S.H. and F.S. supervised the installation of new semi-continuous GPSstations; A.H. formed the interferograms and modelled the joint geodetic dataset; S.H.analysed the GPS data and produced the GPS time series; T.A. modelled the GPSdisplacements; A.H., F.S., K.L.F. and R.P. planned the InSAR data acquisitions; S.H.,M.J.R., A.A., H.G., M.H., B.G.O., H.S., E.S., P.E. and F.S. did the GPS measurements; N.O.conducted the geochemical analysis; P.E. has been involved in monitoring the volcanosince 1971; M.J.R., S.H., R.P., P.E., N.O and F.S. were involved in daily monitoring of theeruptive activity; J.D. unwrapped the interferograms; K.L.F. formed additionalinterferograms and modelled them; A.H., R.P., S.H. and J.D. produced the figures; F.S.,A.H., S.H., T.A., R.P., N.O, P.E. and K.L.F. led the writing of the paper, with all authorscommenting on and discussing its results.
Author Information Reprints and permissions information is available atwww.nature.com/reprints. The authors declare no competing financial interests.Readers are welcome to comment on the online version of this article atwww.nature.com/nature. Correspondence and requests for materials should beaddressed to F.S. ([email protected]).
RESEARCH LETTER
4 3 0 | N A T U R E | V O L 4 6 8 | 1 8 N O V E M B E R 2 0 1 0
Macmillan Publishers Limited. All rights reserved©2010
METHODSSeismology. Earthquakes were located using the now national SIL (South IcelandLowland) seismic network in Iceland operated by the Icelandic MeteorologicalOffice (IMO). The network comprises 56 three-component digital seismic stationslocated throughout Iceland26,31,32. Eight SIL stations, sampling continuously at100 Hz, are located within 50 km of the summit of Eyjafjallajokull. Over 2,800earthquakes were used for analysis from the IMO catalogue, with each eventinteractively picked using the SIL velocity model18. Events were selected accordingto the following constraints: (1) waveform detections at three or more SIL stations;(2) sourced from within an area encompassing 63.2–63.8u N and 19.45–19.8u W;(3) occurring between 1 September 2009 and 30 April 2010; and (4) local magni-tudes (ML) $ 0.8, denoting the minimum magnitude of completeness for theregion. Mean, standard deviation, and maximum earthquake sizes were ML 1.2,0.3, and 3.6, respectively. The absolute locational accuracy of the selected earth-quakes was horizontally 60.6 km with a standard deviation of 0.01 km, and ver-tically 61.5 km with a standard deviation of 1.2 km. Focal depths ranged from lessthan 1 km to 23 km, with a mean concentration at a depth of 7.5 km (and standarddeviation of 2.7 km). Note that the catalogue of earthquakes is incomplete asseveral hundred earthquakes from the pre-eruption swarms await manual analysis.The SIL network is operated by the IMO; for further details, see: http://en.vedur.is/.Radar interferometry. We used radar data acquired by the TerraSAR-X satelliteoperated by the German Space Agency DLR14 from both ascending track 132 anddescending track 125. For track 132 the ground heading is 347.4u and the meanangle of incidence is 30.5u. For track 125 the ground heading is 190.8u and themean angle of incidence is 37.4u. Interferograms were formed with Doris soft-ware25 using scripts from StaMPS17. Precise orbits from DLR and the 25 m digitalelevation model from the National Land Survey of Iceland were used to correct forthe geometric component of the interferometric phase. The resulting phase valueswere unwrapped using a statistical cost flow algorithm33 and then resampled usinga quad-tree approach34.GPS. The GPS stations around Eyjafjallajokull volcano are equipped with Trimbledual frequency GPS receivers and Chokering and Zephyr geodetic antennas. Weanalysed data from these GPS stations using GAMIT software version 10.3 (refs 24and 35). In addition to data from continuous GPS stations in Iceland, we analyseddata from over 150 global reference stations of which 35 were used to determine theITRF05-Eurasia fixed reference frame36,37. We applied the ocean-loading modelFES2004 and used the IGS absolute antenna phase centre models for both satelliteand ground-based antennas. We used GLOBK software38 to estimate the daily posi-tions for the GPS stations. We estimated linear, annual and semi annual correctionterms using data from THEY spanning 2002.0 to 2009.0 (ref. 39) to detrend all timeseries. Annual and semi annual terms for THEY were used for SKOG and STE2.Modelling. Our preferred models are found by joint inversion of GPS and InSARdata; their details are listed in Supplementary Table 1. Two approaches were applied,the first using only simple geometries, with penny-shaped cracks16 representing sillsand a rectangular dislocation representing a dyke15. In our second modellingapproach, we divided potential sources into multiple rectangular elements andsolved for the opening of each element for a given hydrostatic overpressure, usinga boundary elements approach. We assumed a density difference between themagma and surrounding rock of 250 kg m23 and a traction-free interface27. Ourmodel extends that of ref. 28, but our imposition of hydrostatic rather than uniformoverpressure means that the overpressure decreases with depth. An elastic halfspacewas assumed in both approaches, with Poisson’s ratio of 0.27 and a shear modulus of30 GPa. We applied Markov chain Monte Carlo sampling17 to build the probabilitydistribution of the model parameters, assuming a uniform prior probability. Anexponential covariance function with variance of 1 cm2 and unknown decay con-stant was assumed for each interferogram, with the decay constants estimated duringthe inversion. Observations, predicted deformation from the maximum likelihoodmodel, and residuals between observations and predictions for the two modellingapproaches used are shown in Supplementary Figs 4 and 5. The ‘hydrostatic cracks’model accounts for 87% of the variance in the data.
Complementary initial modelling was carried out with GPS data separately. TheGPS time series were divided into several time intervals (1 Jan – 1 March, 1–20March, 20 March – 13 April, 13–16 April, and 16–24 April) and the displacementsmodelled for each, assuming planar constant opening mode dislocations embeddedin elastic half-space15. We assumed a Poisson’s ratio of 0.25 and a shear modulus of30 GPa. Nonlinear optimization was used to minimize the weighted residual sum ofsquares (WRSS) and the model fit judged by calculating a normalized x2
n (5WRSS/(N2m)) (ref. 30). We estimate 95% uncertainties in the model values using abootstrap approach. For the bootstrap calculation, we sample the original dataat random to generate a new data vector where data from one station may appearmore than once, and data from another station may not be included. The GPSdisplacements in January and February are well fitted by a sill located at ,6 kmdepth, with a volume increase of 18 3 106 m3 (x2
n 5 1.8). Bootstrap calculations
give a depth range for the sill of 4–8 km and a volume change of (13–30) 3 106 m3.These bounds agree with the preferred model, although they give a larger range;this is expected, since there are many more InSAR data than GPS vectors used inthe joint inversion, and the methods for estimating the model bounds are different.The GPS displacements leading up to the flank eruption are more difficult to fitwith simple planar dislocations. Continued expansion of the sill found for the firsttime interval (volume increase of 12 3 106 m3), accompanied by a dyke extendingto the surface, has the best fit of the models tested (x2
n 5 35). The total volumeincrease of the sill and dyke sources from 1 January to March 20 is about50 3 106 m3. Little deformation is observed during 20 March to 13 April, andmodels for that time interval have not been extensively tested. Following the onsetof the second eruption, the GPS data indicate a contracting source at the summit ofEyjafjallajokull, located at 3–4 km depth, with decreasing volume change(14.6 3 106 m3 during 13–16 April, and 8 3 106 m3 for 16–24 April). GPS displa-cements during the time interval spanned by the InSAR data (11–22 April) can befitted by a single contracting sill at ,3 km depth with a volume decrease of21 3 106 m3 (x2
n 5 4). Bootstrap calculations give a depth range of 1–5 km anda volume decrease of (5–44) 3 106 m3. Again, the range of model parameters ismuch larger than estimated for the preferred model, as explained above. TheInSAR data were also considered separately, with the general inversion of phasetechnique29. It works directly on the wrapped phase, as shown in Fig. 2 andSupplementary Fig. 2. This algorithm minimizes a cost function that quantifiesthe misfit between observed and modelled values in terms of wrapped phase.Applying the general inversion of phase technique to an interferogram spanningthe interval from 10 July 2009 through to 3 May 2010, we find an acceptable fitusing a single sill at 6 km depth that inflates by (30–40) 3 106 m3. Although thismodel neglects the time dependence of the deformation field and likely sourcecomplications, the inferred net volume change in the volcano roots is comparableto those found using the other modelling approaches.Geochemistry and petrology. The chemical composition of eruptive productsfrom the two eruptions were analysed with a Spectro ICP-OES (inductively coupledplasma optical emission spectrometry) spectrograph at the University of Iceland.Results reported in Supplementary Table 2 are the average of duplicate analysis, ontwo representative samples from the 2010 flank and summit eruptions, respectively.Rock powder was fluxed with lithium metaborate, and then dissolved in a mixture ofnitric, hydrochloric and oxalic acids. Reference samples USGS-BHVO and USGSQLO-1 were used. The samples from the flank eruption are olivine basalt, weaklyalkalic with minor normative nepheline. They are similar to those that make upmost of the Eyjafjoll mountain40,41 (the lower part of the Eyjafjallajokull volcano).On the basis of microscope work, the erupted olivine basalt has a very low degree ofcrystallinity, less than 2 wt% of olivine, plagioclase and clinopyroxene. Unzonedmicrophenocrysts of these minerals are also found dispersed in the otherwise almostaphyric groundmass. Together, these features indicate short crustal residence timebefore eruption. Olivine and plagioclase occur in glomerophyric aggregates, indi-cating shallow pre-eruptive equilibration at pressures about or below 4 kbar (above13 km depth) where olivine and plagioclase are the first minerals to form. At higherpressures, clinopyroxene would be the first phase to form, followed by olivine in theabsence of plagioclase. The summit eruption produced trachyandesitic magma ofmildly alkalic iron-rich composition (common in the summit area of the moun-tain40). This magma is also very aphyric, with less than 2 wt% crystallinity. Themineralogy reveals equilibrium with the observed euhedral feldspar, clinopyroxene,olivine and spinel microphenocrysts. The low crystallinity suggests that the pre-eruptive crustal residence time of the andesite-magma body was short. Large euhe-dral xenocrysts of olivine, plagioclase and to a lesser extent clinopyroxene of basalticorigin occur within the trachyandesite. These crystals may be remnants of minorrecent intrusion of olivine basalt. Xenolithic fragments of diorite, the plutonicequivalent of the andesite, are found in the rock.
31. Bodvarsson, R., Rognvaldsson, S., Th., Slunga, R. & Stefansson, R. The SIL dataacquisition and monitoring system. Seismol. Res. Lett. 67, 35–46 (1996).
32. Jakobsdottir, S. S., Guðmundsson, G. B. & Sefansson, R. Seismicity in Iceland1991-2000 monitored by the SIL seismic system. Jokull 51, 87–94 (2002).
33. Hooper, A. A statistical-cost approach to unwrapping the phaseof InSAR timeseries.InProceedings‘Fringe2009Workshop’(ESASP-677,EuropeanSpaceAgency,2010).
34. Jonsson, S., Zebker, H., Segall, P. & Amelung, F. Fault slip distribution of the Mw 7.2Hector Mine earthquake estimated from satellite radar and GPS measurements.Bull. Seismol. Soc. Am. 92, 1377–1389 (2002).
35. King, R. W. & Bock, Y. GAMIT Reference Manual, GPS Analysis at MIT, Release 10.3(Technical report, MIT, 2006).
36. Altamimi, Z., Collilieux, X., Legrand, J., Garayt, B. & Boucher, C. ITRF2005: A newrelease of the International Terrestrial Reference Frame based on time series ofstation positions and earth orientation parameters. J. Geophys. Res. 112, B09401,doi:10.1029/2007JB004949 (2007).
37. Hreinsdottir, S. et al. A complex earthquake sequence captured by the continuousGPS network in SW Iceland. Geophys. Res. Lett. 36, L12309, doi:10.1029/2009GL038391 (2009).
LETTER RESEARCH
Macmillan Publishers Limited. All rights reserved©2010

38. Herring, T. A., King, R.W. & McClusky, S. C. GLOBK Reference Manual, Global KalmanFilter VLBI and GPS Analysis Program, Release 10.3 (Technical report, MIT, 2006).
39. Herring, T. MATLAB Tools for viewing GPS velocities and time series. GPS Solut. 7,194–199 (2003).
40. Loughlin, S. C. The Evolution of the Eyjafjoll Volcanic System, Southern Iceland. Ph.D.thesis, Univ. Durham (1996).
41. Jakobsson, S. P. Petrology of Recent basalts of the Eastern Volcanic Zone, Iceland.Acta Naturalia Islandica 26, 1–103 (1979).
RESEARCH LETTER
Macmillan Publishers Limited. All rights reserved©2010
Related Documents