Introduzione Introduzione a a MatLab MatLab Prof. Sebastiano Battiato

Welcome message from author
This document is posted to help you gain knowledge. Please leave a comment to let me know what you think about it! Share it to your friends and learn new things together.
Transcript

IntroduzioneIntroduzione a a MatLabMatLab
Prof. Sebastiano Battiato
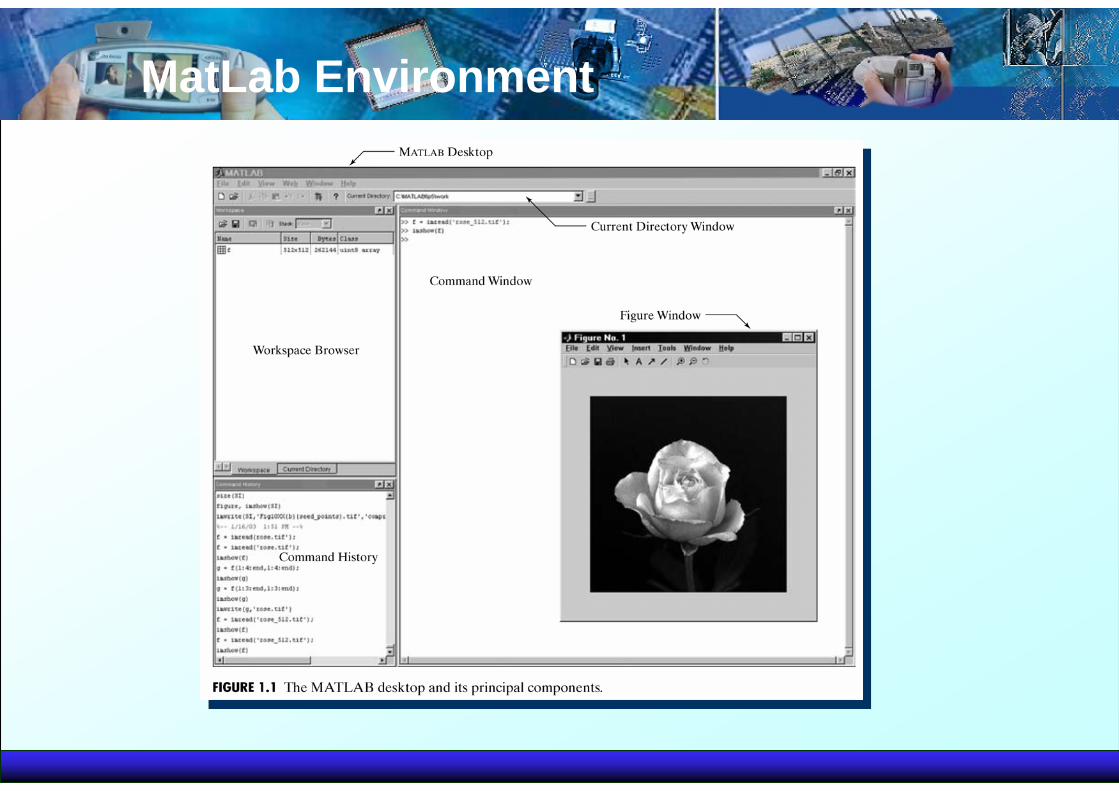
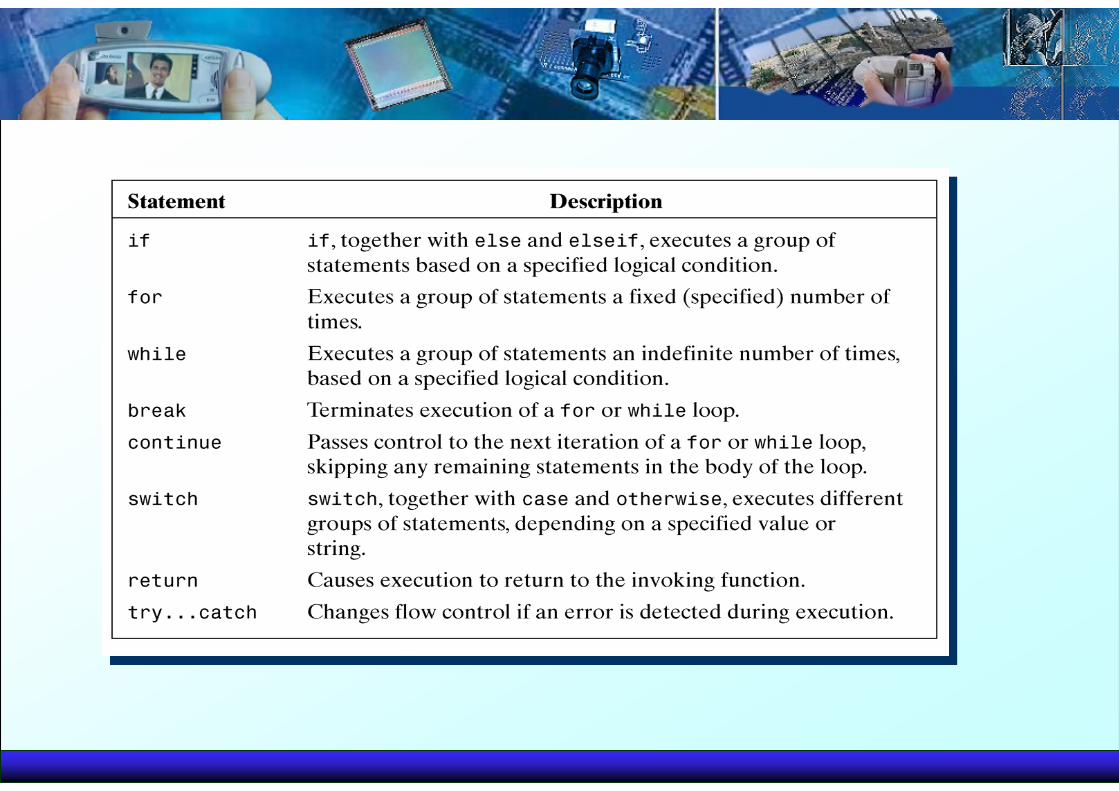
MatLab Environment
MATLAB
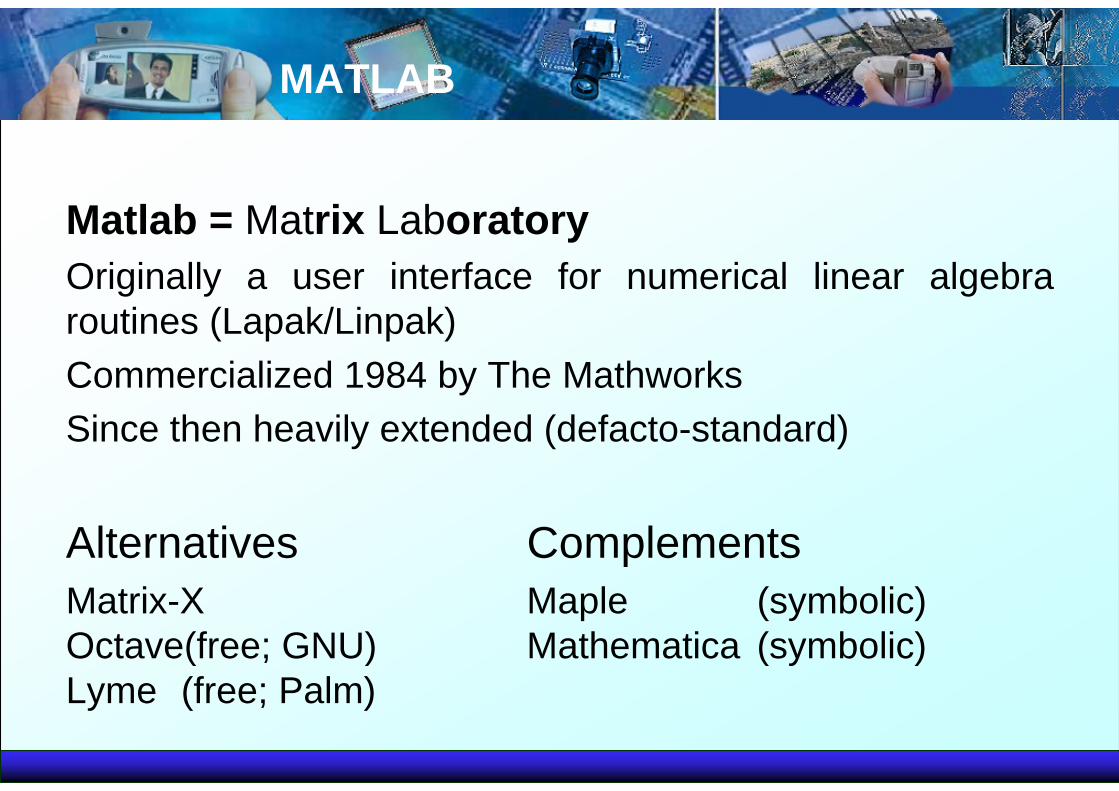
Matlab = Matrix LaboratoryOriginally a user interface for numerical linear algebra routines (Lapak/Linpak) Commercialized 1984 by The MathworksSince then heavily extended (defacto-standard)
Alternatives ComplementsMatrix-X Maple (symbolic)Octave(free; GNU) Mathematica (symbolic)Lyme (free; Palm)
MATLAB
The MATLAB environment is command oriented somewhat like UNIX. A prompt appears on the screen and a MATLAB statement can be entered. When the <ENTER> key is pressed, the statement is executed, and another prompt appears.
If a statement is terminated with a semicolon ( ; ), no results will be displayed. Otherwise results will appear before the next prompt.
The following slide is the text from a MATLAB screen.
MATLAB
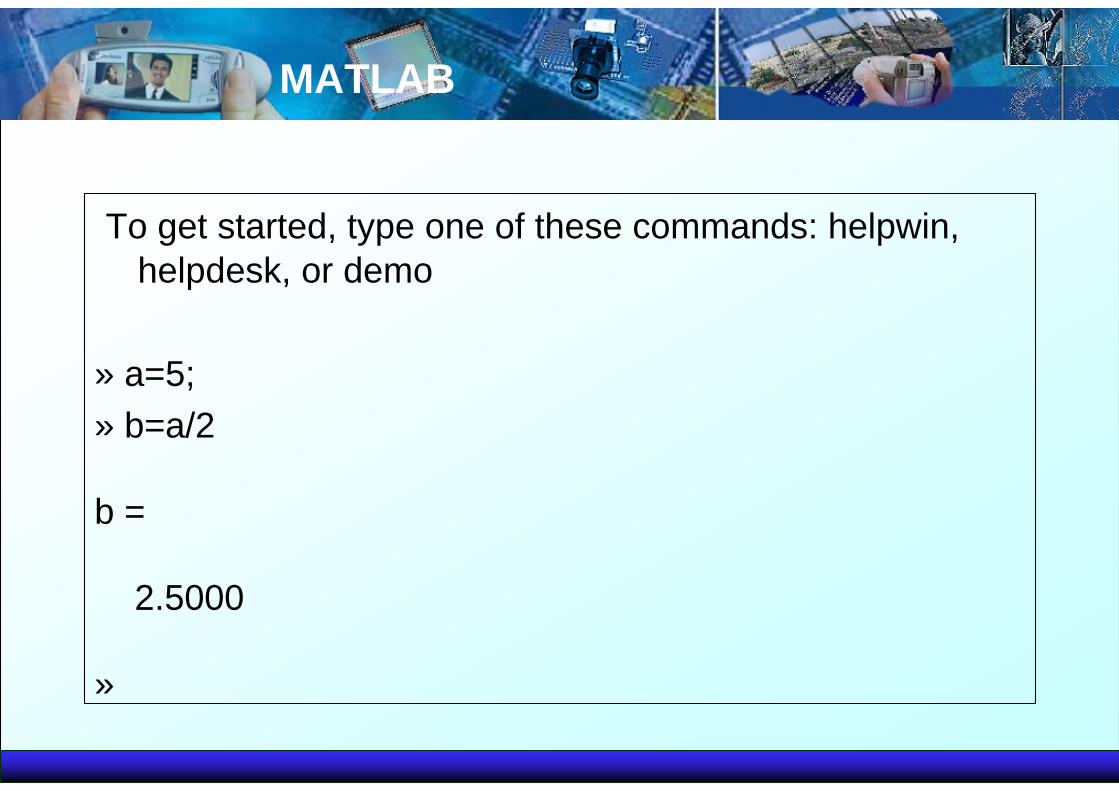
To get started, type one of these commands: helpwin, helpdesk, or demo
» a=5;» b=a/2
b =
2.5000
»
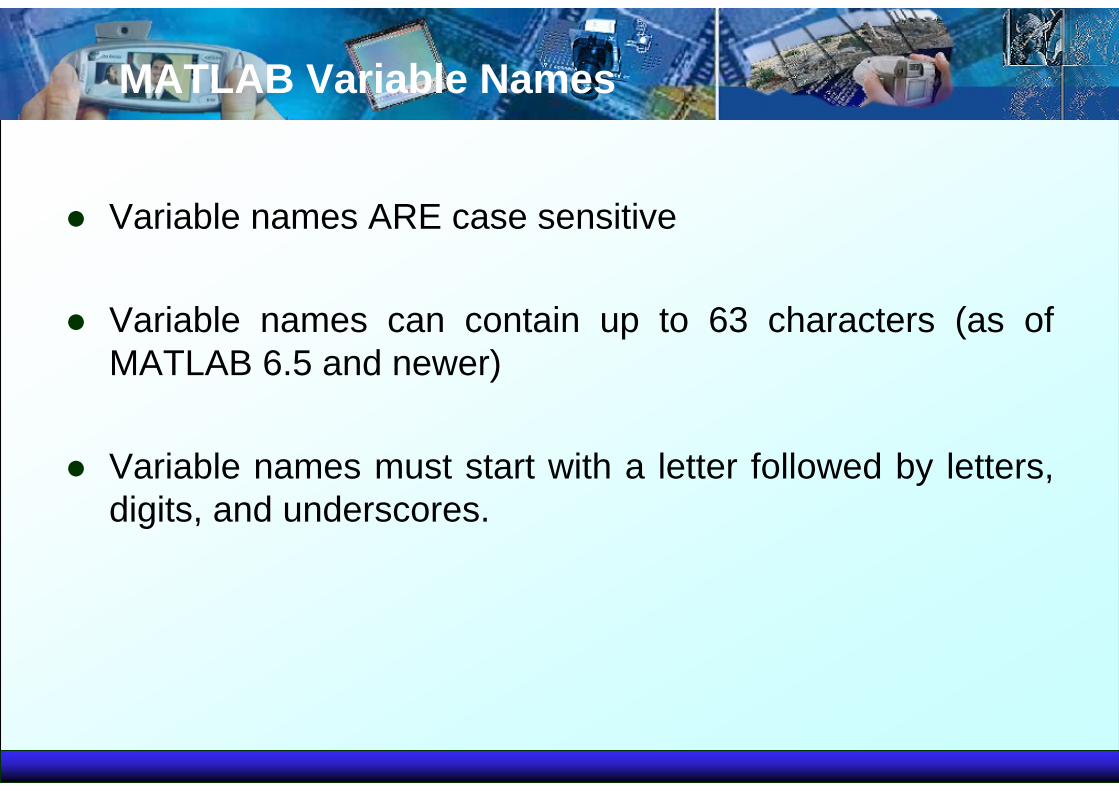
MATLAB Variable Names
Variable names ARE case sensitive
Variable names can contain up to 63 characters (as of MATLAB 6.5 and newer)
Variable names must start with a letter followed by letters, digits, and underscores.
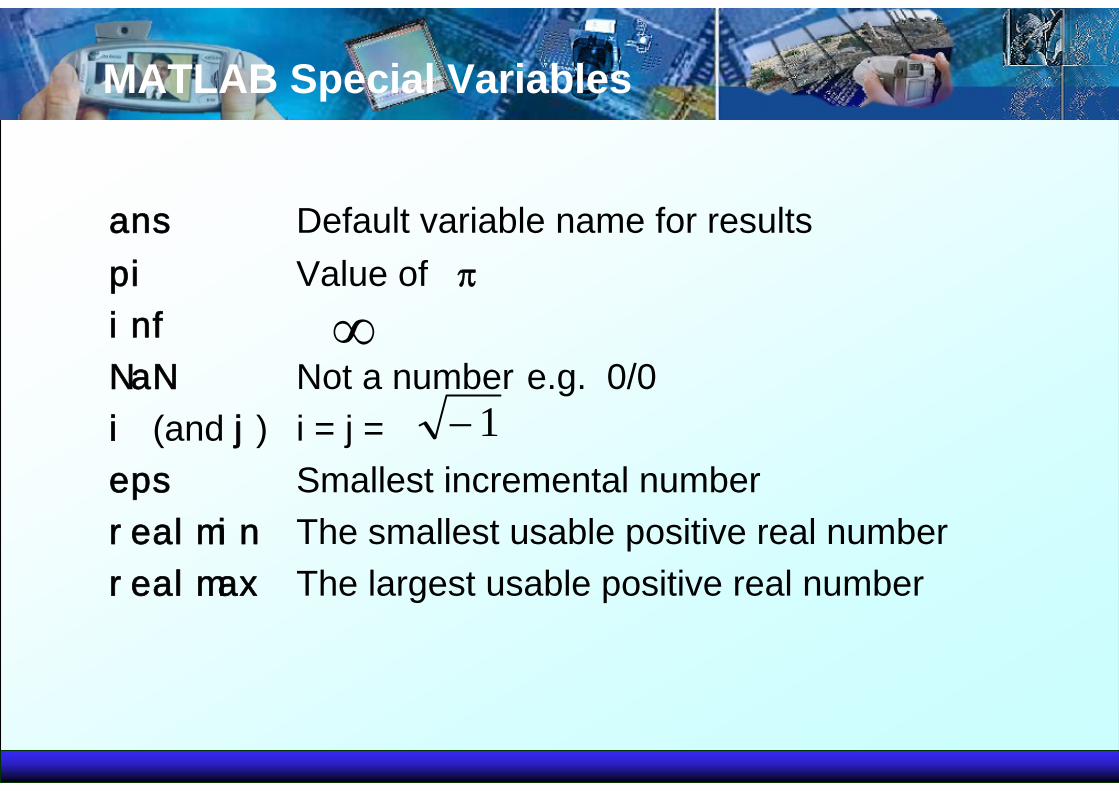
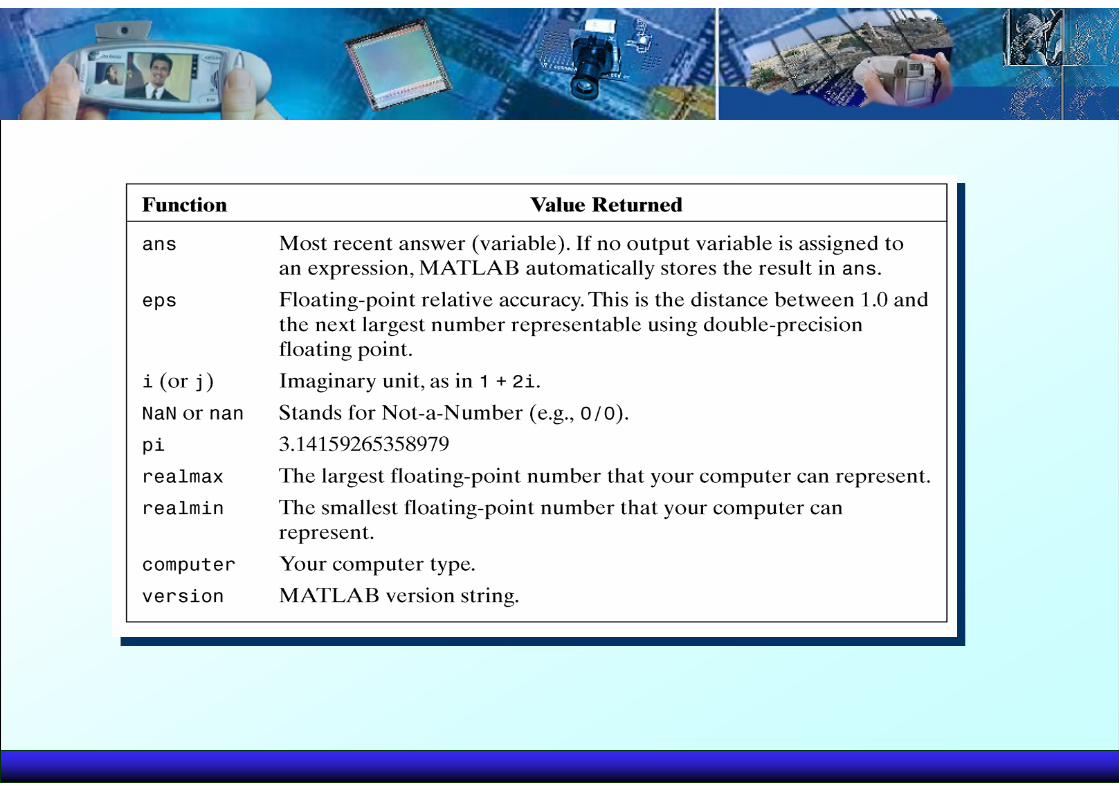
ans Default variable name for resultspi Value of πinf
NaN Not a number e.g. 0/0i (and j) i = j = eps Smallest incremental numberrealmin The smallest usable positive real numberrealmax The largest usable positive real number
MATLAB Special Variables
1−
∞
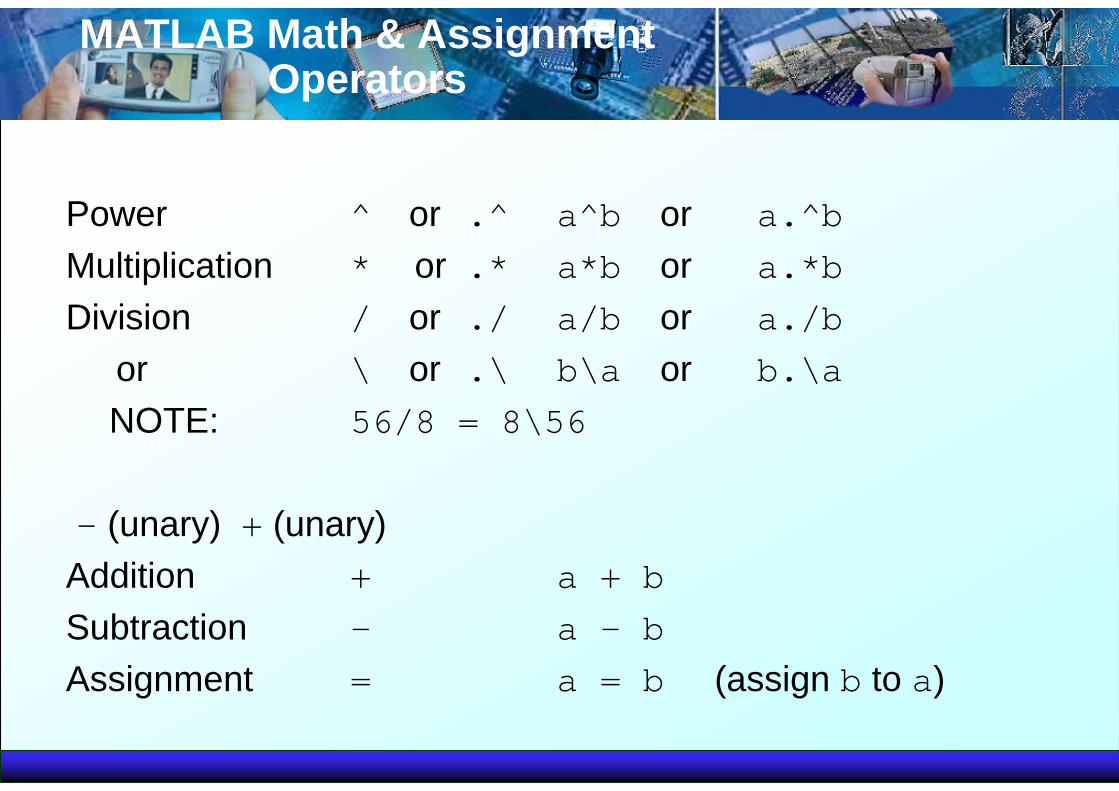
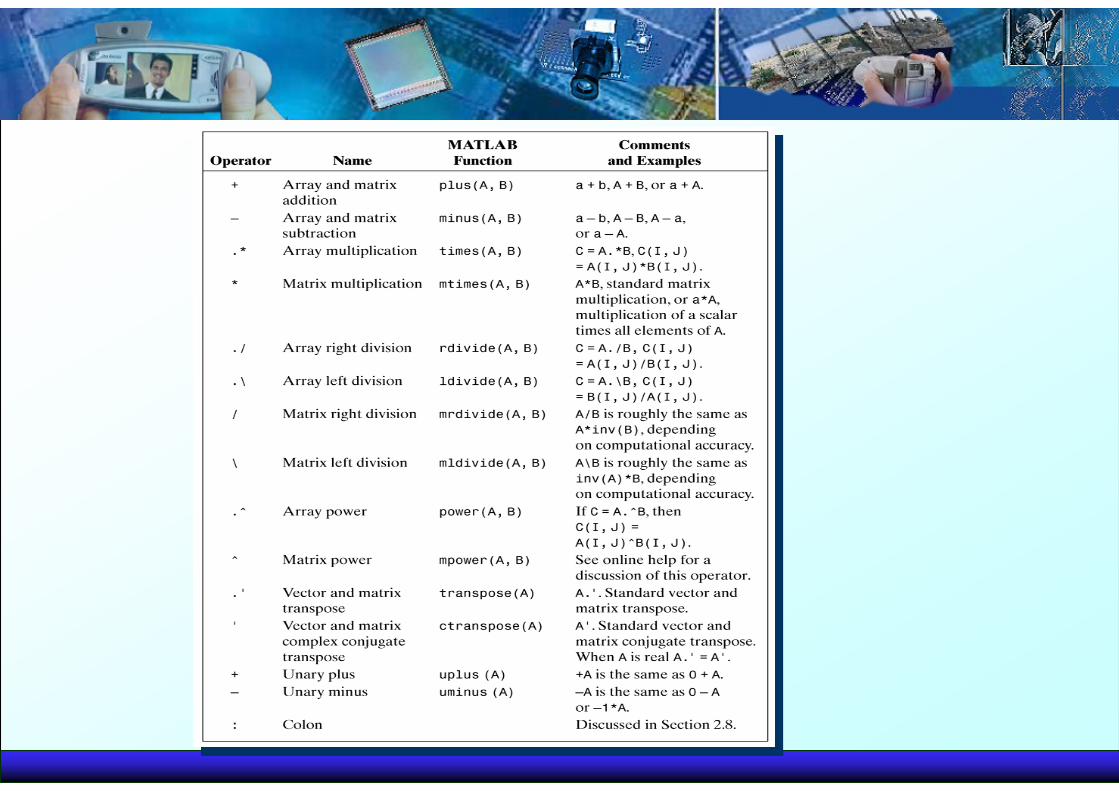
MATLAB Math & Assignment Operators
Power ^ or .^ a^b or a.^bMultiplication * or .* a*b or a.*bDivision / or ./ a/b or a./b
or \ or .\ b\a or b.\aNOTE: 56/8 = 8\56
- (unary) + (unary)Addition + a + bSubtraction - a - bAssignment = a = b (assign b to a)
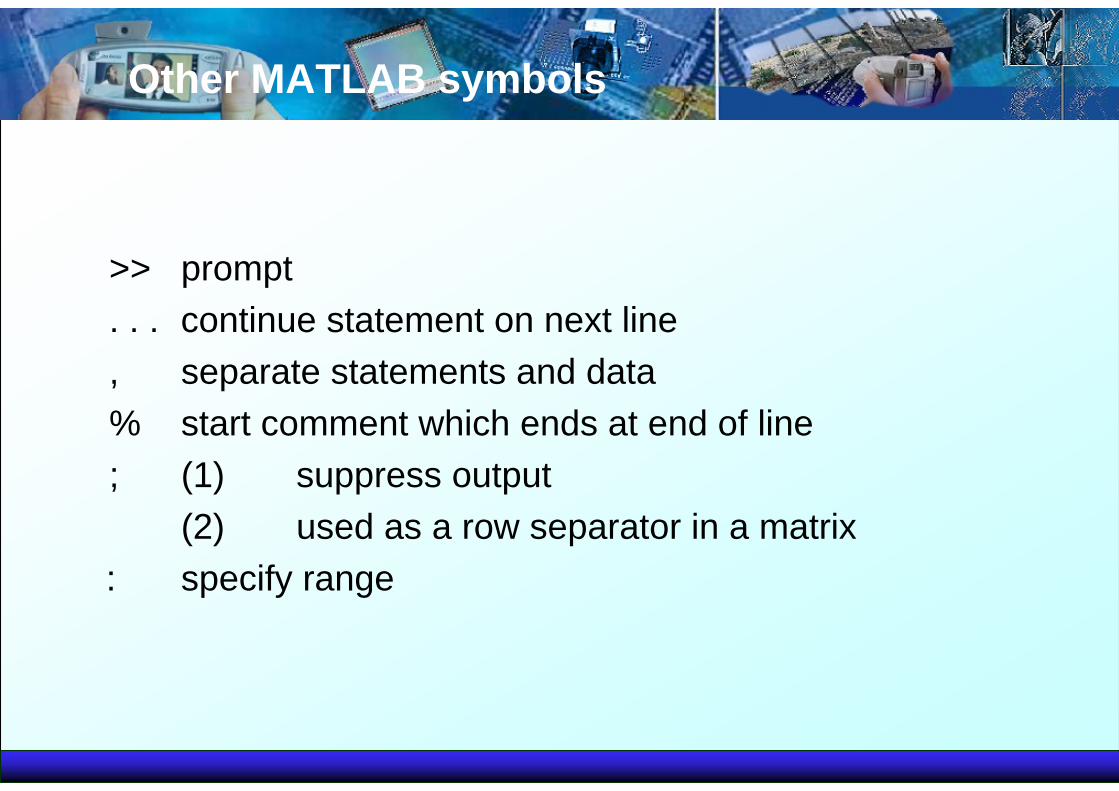
Other MATLAB symbols
>> prompt. . . continue statement on next line, separate statements and data% start comment which ends at end of line; (1) suppress output
(2) used as a row separator in a matrix: specify range
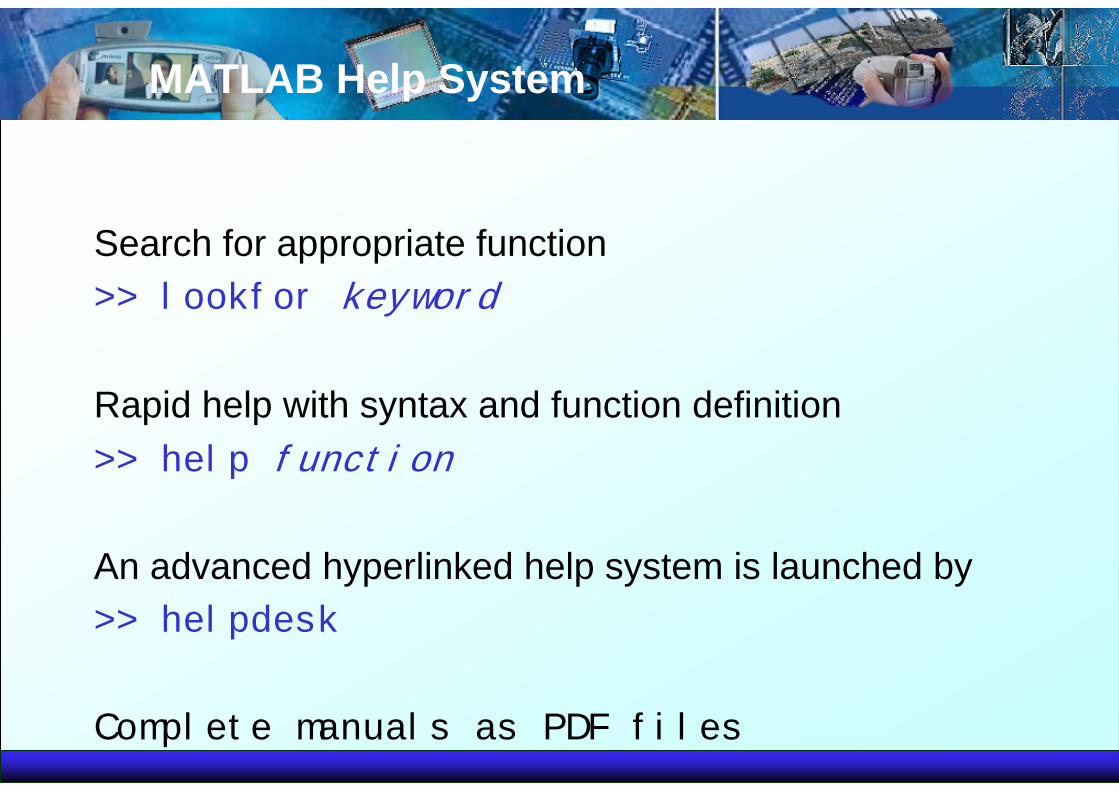
MATLAB Help System
Search for appropriate function>> lookfor keyword
Rapid help with syntax and function definition>> help function
An advanced hyperlinked help system is launched by>> helpdesk
Complete manuals as PDF files
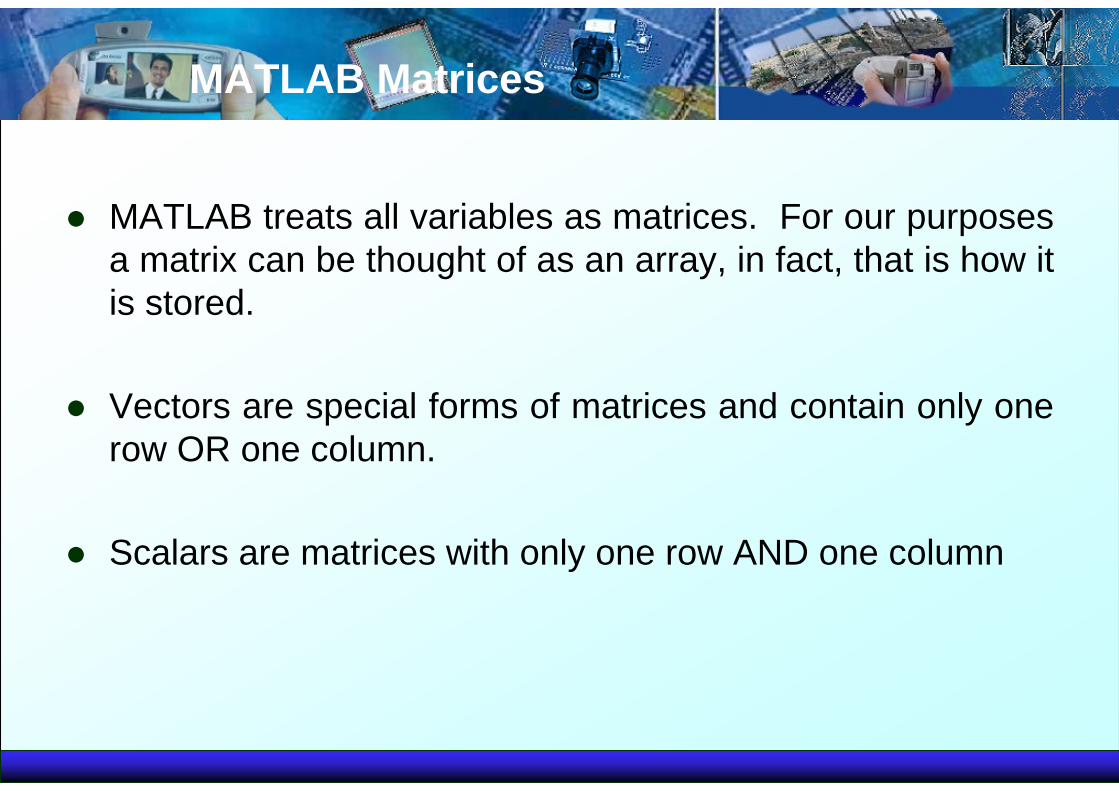
MATLAB Matrices
MATLAB treats all variables as matrices. For our purposes a matrix can be thought of as an array, in fact, that is how it is stored.
Vectors are special forms of matrices and contain only one row OR one column.
Scalars are matrices with only one row AND one column
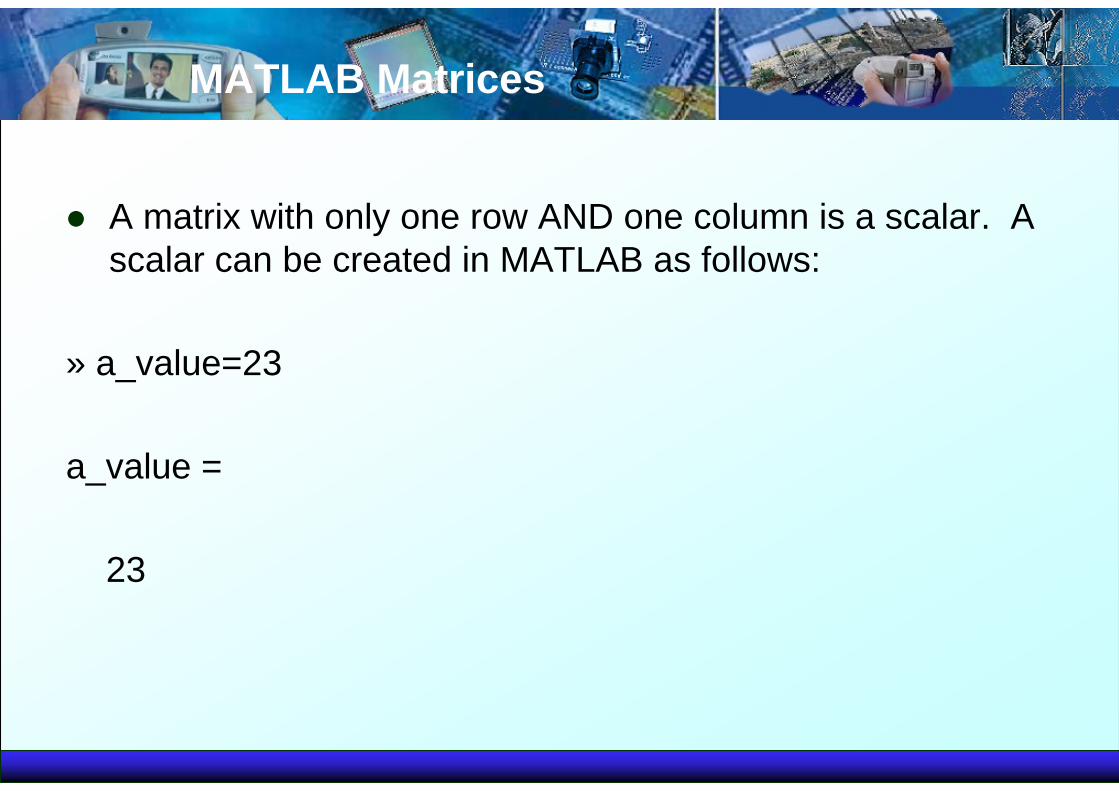
MATLAB Matrices
A matrix with only one row AND one column is a scalar. A scalar can be created in MATLAB as follows:
» a_value=23
a_value =
23
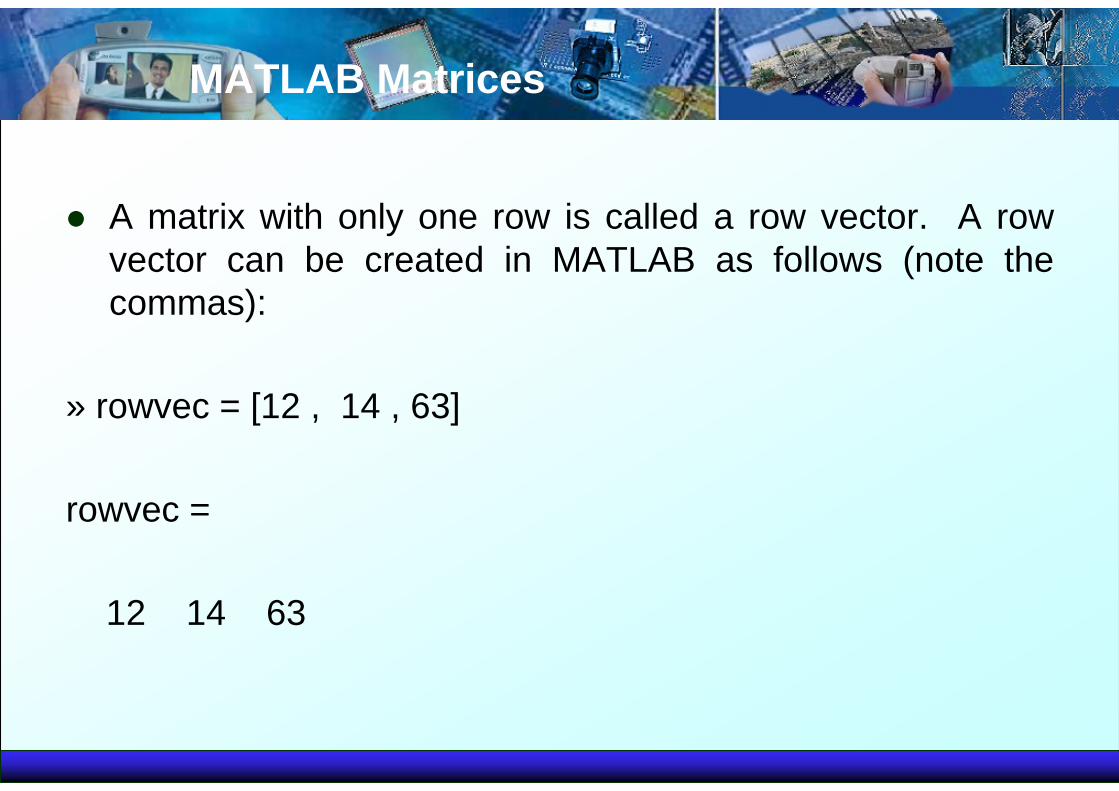
MATLAB Matrices
A matrix with only one row is called a row vector. A row vector can be created in MATLAB as follows (note the commas):
» rowvec = [12 , 14 , 63]
rowvec =
12 14 63
MATLAB Matrices
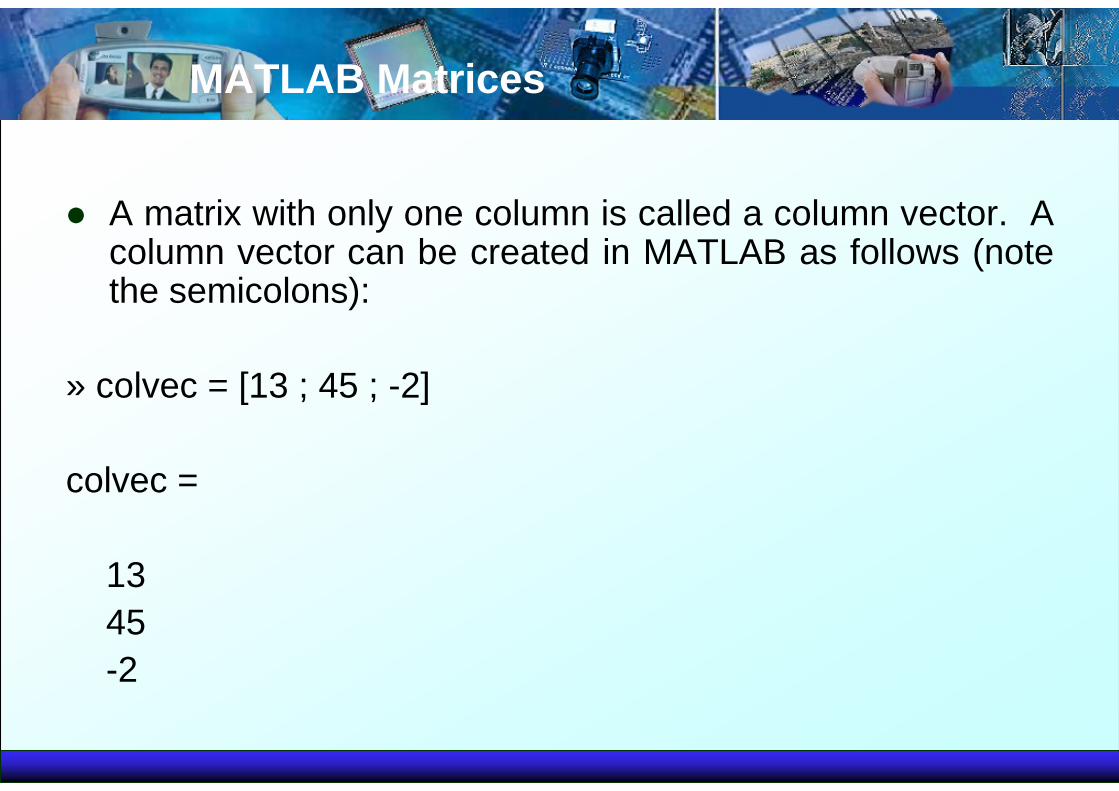
A matrix with only one column is called a column vector. A column vector can be created in MATLAB as follows (note the semicolons):
» colvec = [13 ; 45 ; -2]
colvec =
1345-2
MATLAB Matrices
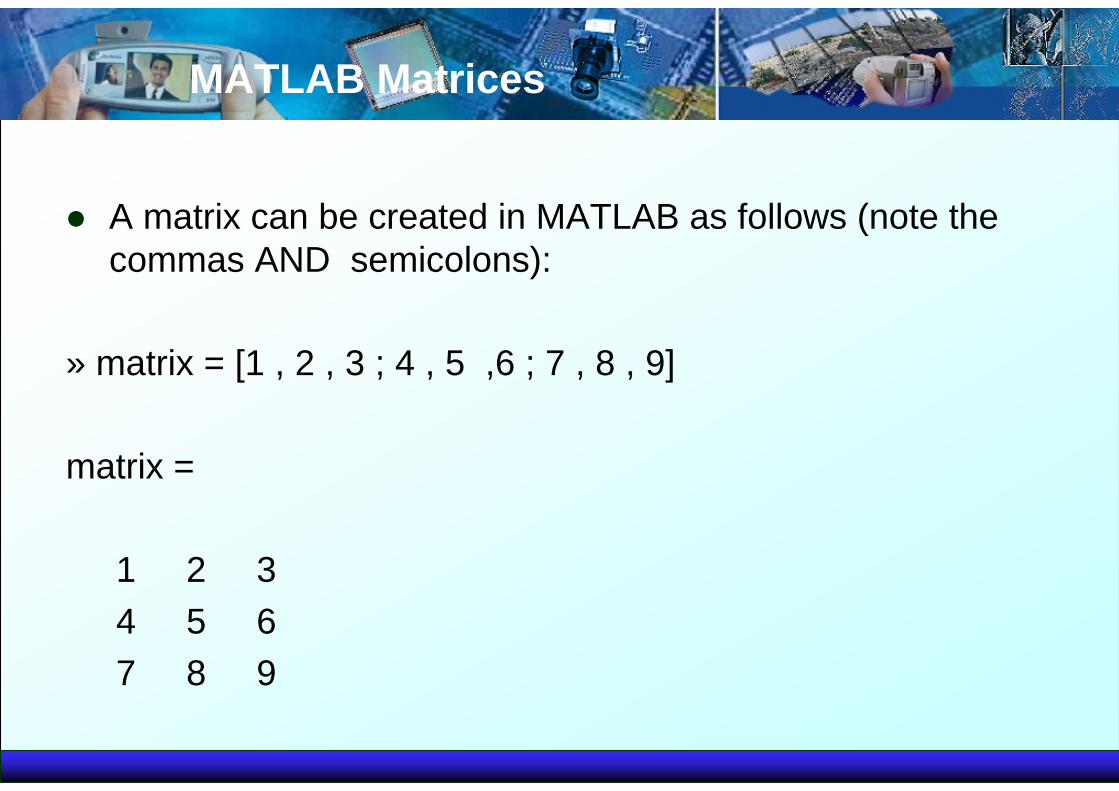
A matrix can be created in MATLAB as follows (note the commas AND semicolons):
» matrix = [1 , 2 , 3 ; 4 , 5 ,6 ; 7 , 8 , 9]
matrix =
1 2 34 5 67 8 9
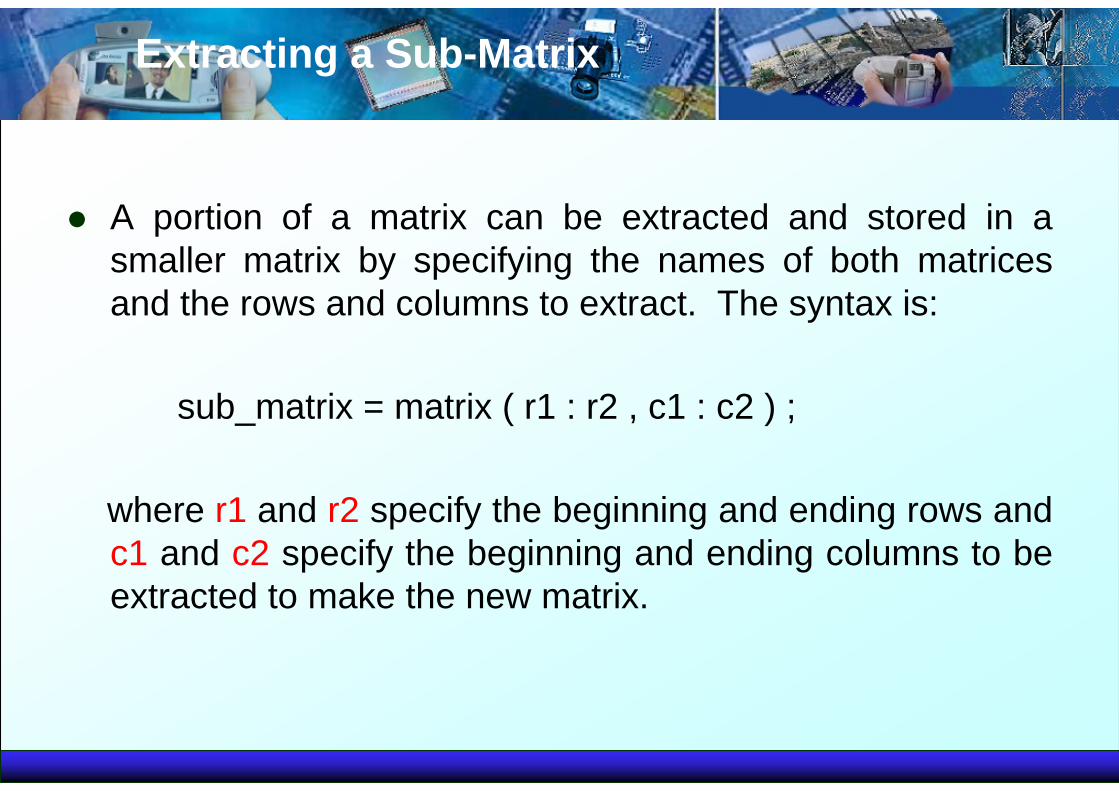
Extracting a Sub-Matrix
A portion of a matrix can be extracted and stored in a smaller matrix by specifying the names of both matrices and the rows and columns to extract. The syntax is:
sub_matrix = matrix ( r1 : r2 , c1 : c2 ) ;
where r1 and r2 specify the beginning and ending rows and c1 and c2 specify the beginning and ending columns to be extracted to make the new matrix.
MATLAB Matrices
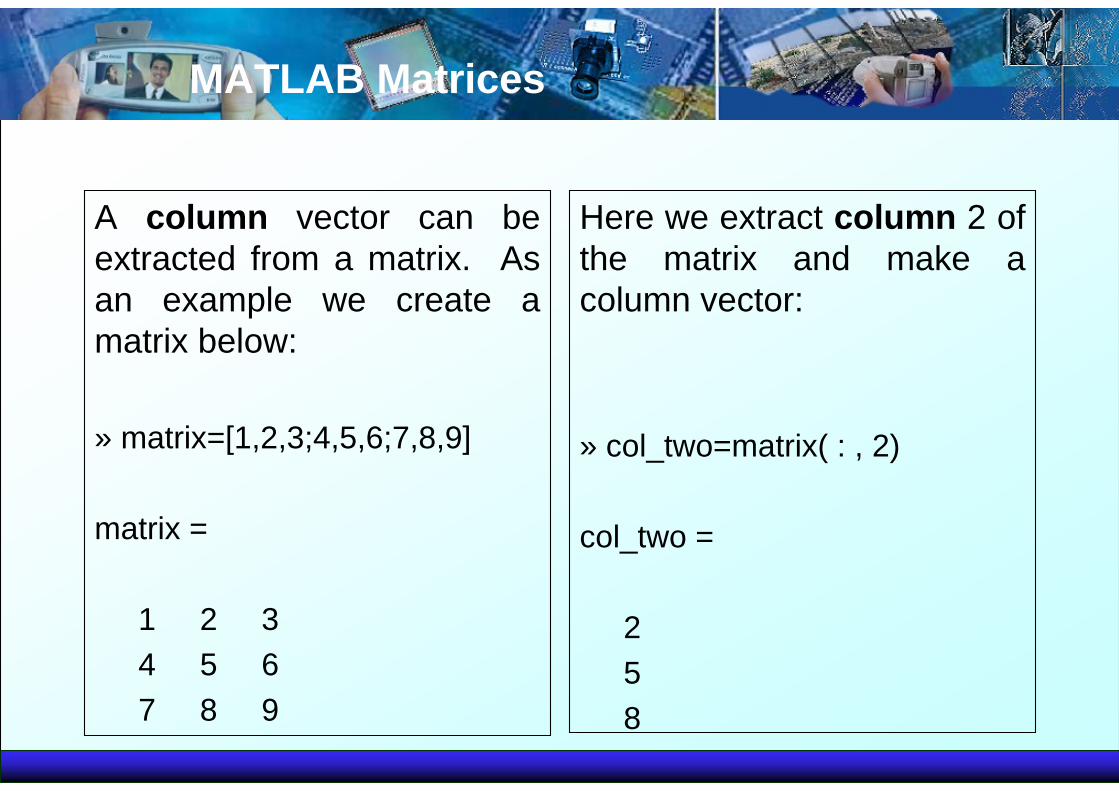
A column vector can be extracted from a matrix. As an example we create a matrix below:
» matrix=[1,2,3;4,5,6;7,8,9]
matrix =
1 2 34 5 67 8 9
Here we extract column 2 of the matrix and make a column vector:
» col_two=matrix( : , 2)
col_two =
258
MATLAB Matrices
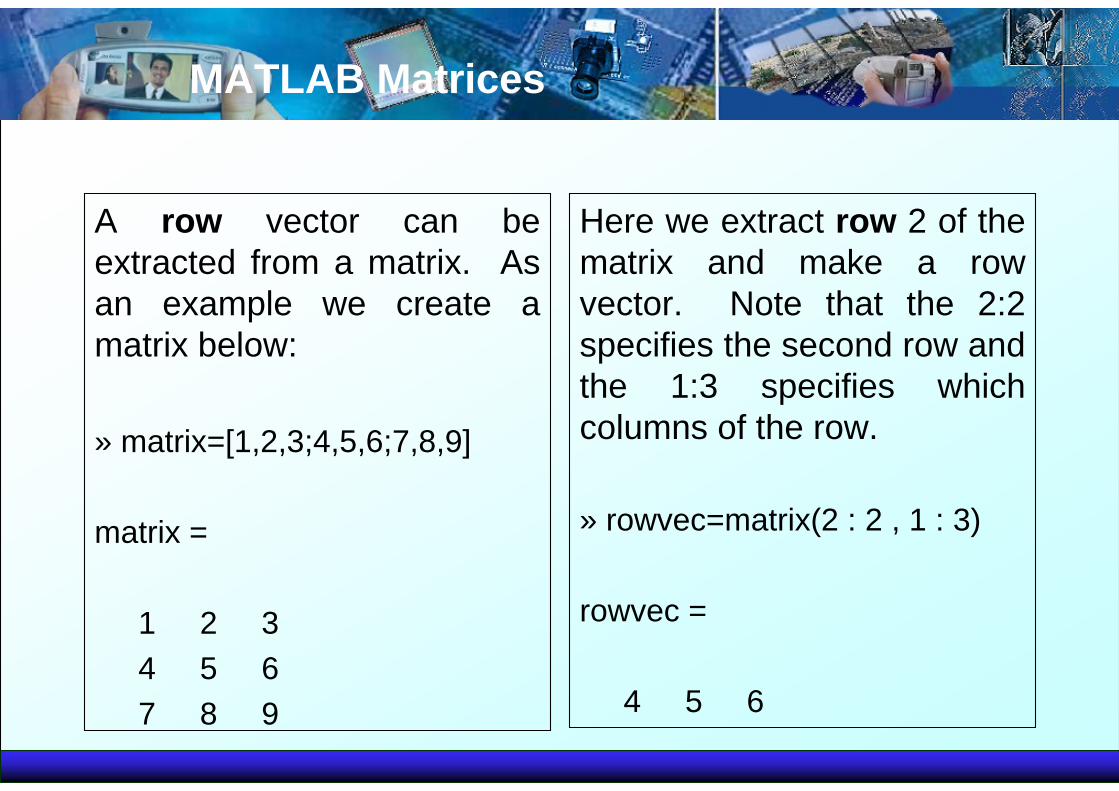
A row vector can be extracted from a matrix. As an example we create a matrix below:
» matrix=[1,2,3;4,5,6;7,8,9]
matrix =
1 2 34 5 67 8 9
Here we extract row 2 of the matrix and make a row vector. Note that the 2:2 specifies the second row and the 1:3 specifies which columns of the row.
» rowvec=matrix(2 : 2 , 1 : 3)
rowvec =
4 5 6
Reading Data from files
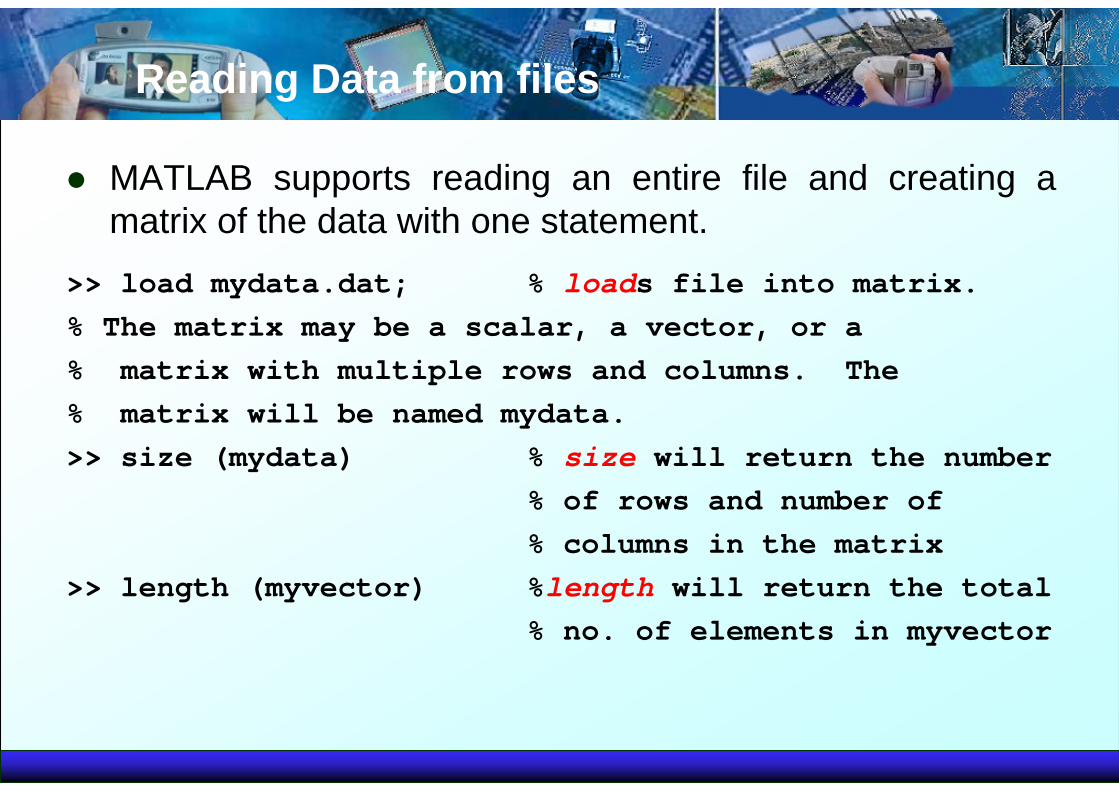
MATLAB supports reading an entire file and creating a matrix of the data with one statement.
>> load mydata.dat; % loads file into matrix.% The matrix may be a scalar, a vector, or a % matrix with multiple rows and columns. The% matrix will be named mydata.>> size (mydata) % size will return the number
% of rows and number of% columns in the matrix
>> length (myvector) %length will return the total% no. of elements in myvector
Plotting with MATLAB
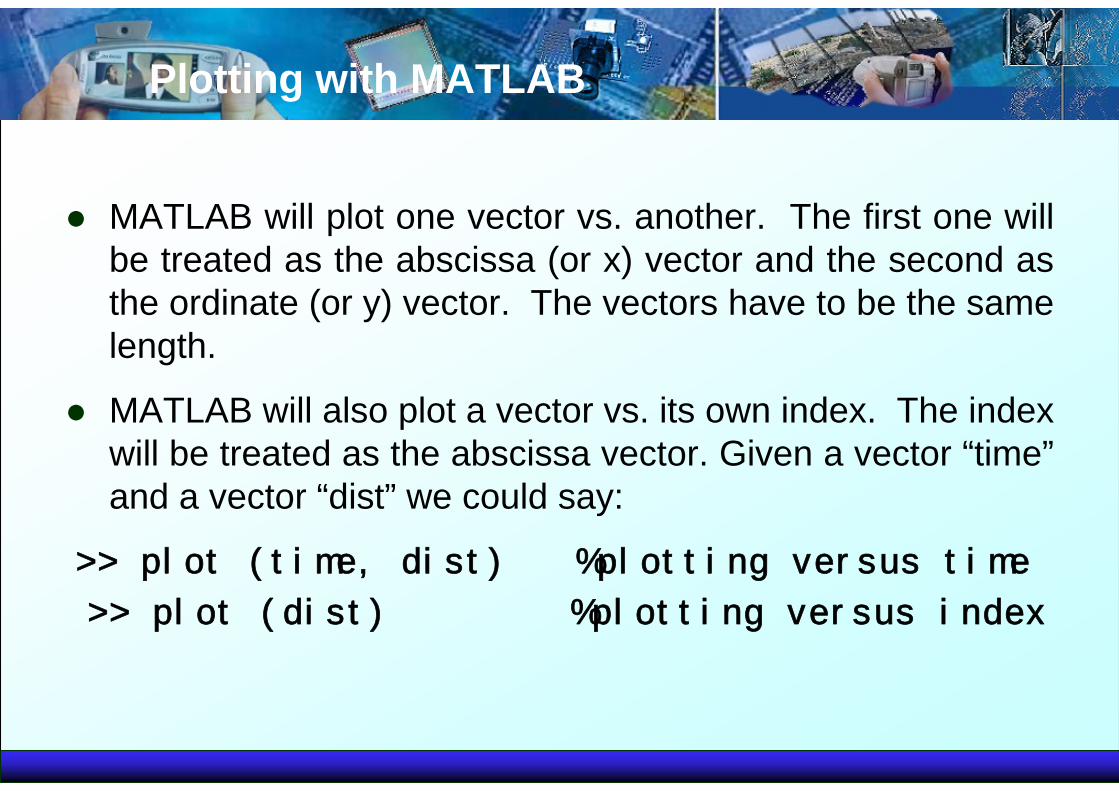
MATLAB will plot one vector vs. another. The first one will be treated as the abscissa (or x) vector and the second as the ordinate (or y) vector. The vectors have to be the same length.
MATLAB will also plot a vector vs. its own index. The index will be treated as the abscissa vector. Given a vector “time” and a vector “dist” we could say:
>> plot (time, dist) %plotting versus time
>> plot (dist) %plotting versus index
Plotting with MATLAB
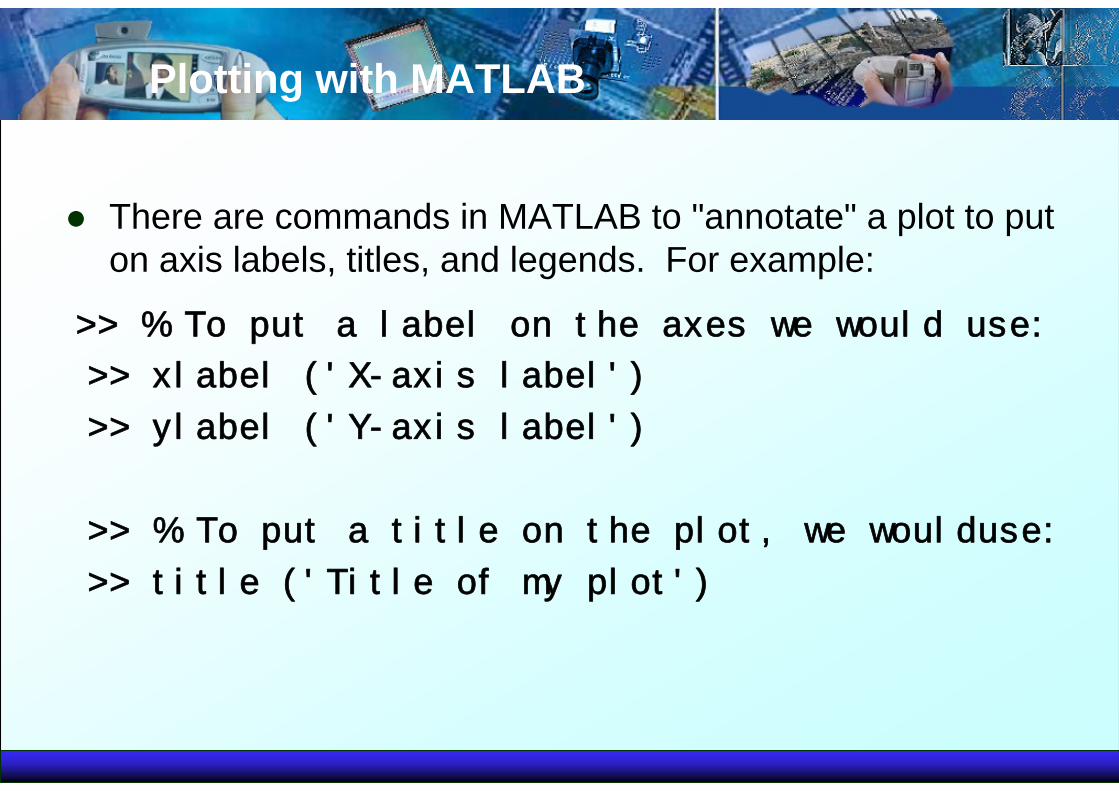
There are commands in MATLAB to "annotate" a plot to put on axis labels, titles, and legends. For example:
>> % To put a label on the axes we would use:
>> xlabel ('X-axis label')
>> ylabel ('Y-axis label')
>> % To put a title on the plot, we woulduse:
>> title ('Title of my plot')
Plotting with MATLAB
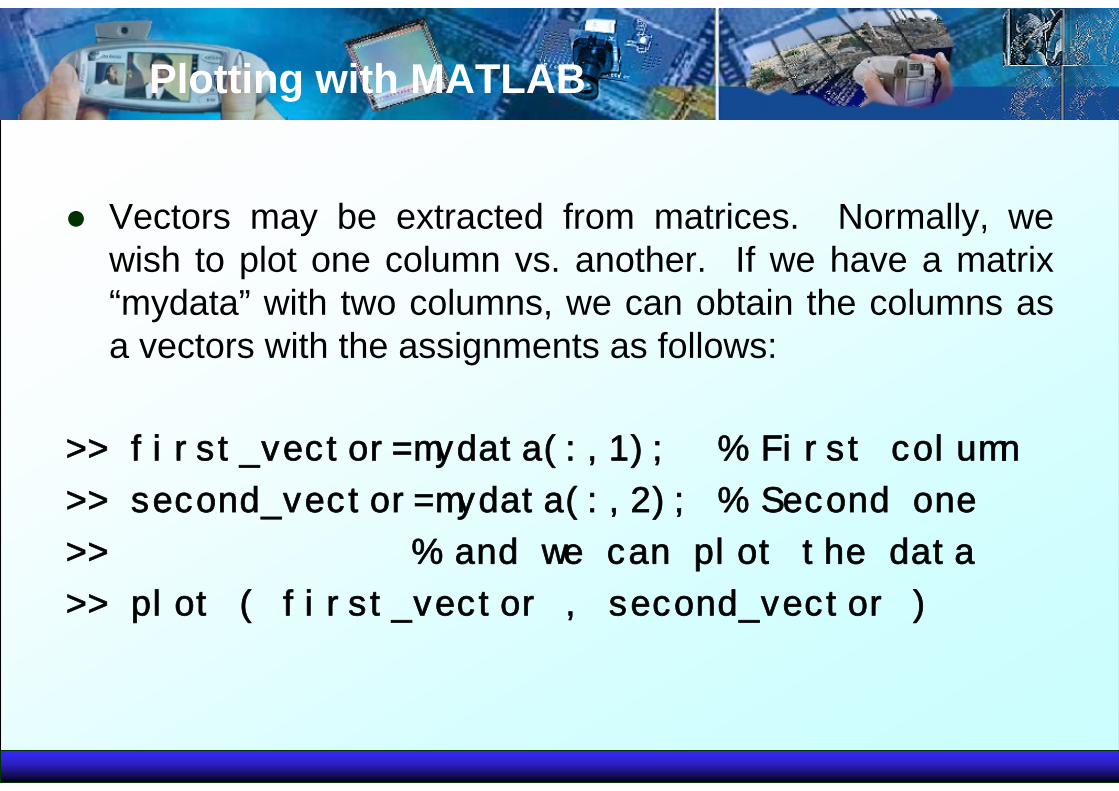
Vectors may be extracted from matrices. Normally, we wish to plot one column vs. another. If we have a matrix “mydata” with two columns, we can obtain the columns as a vectors with the assignments as follows:
>> first_vector=mydata(:,1); % First column
>> second_vector=mydata(:,2); % Second one
>> % and we can plot the data
>> plot ( first_vector , second_vector )
Some Useful MATLAB commands
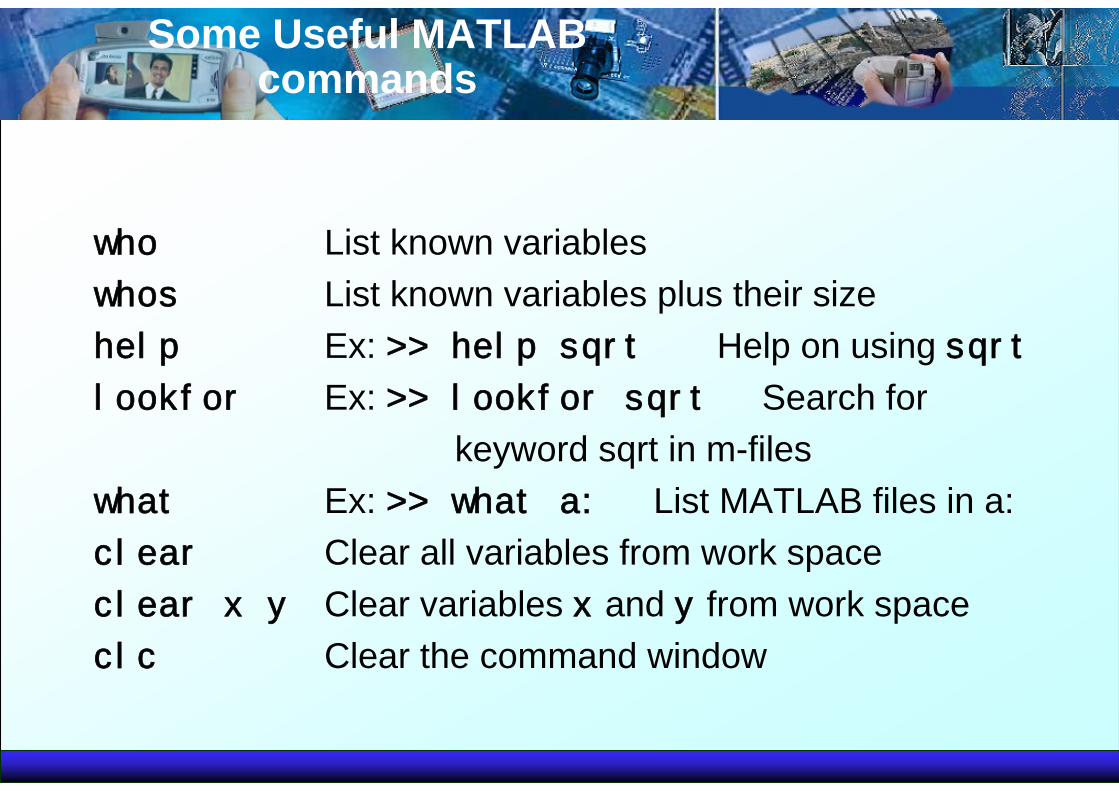
who List known variableswhos List known variables plus their sizehelp Ex: >> help sqrt Help on using sqrtlookfor Ex: >> lookfor sqrt Search for
keyword sqrt in m-fileswhat Ex: >> what a: List MATLAB files in a:clear Clear all variables from work spaceclear x y Clear variables x and y from work spaceclc Clear the command window
Some Useful MATLAB commands
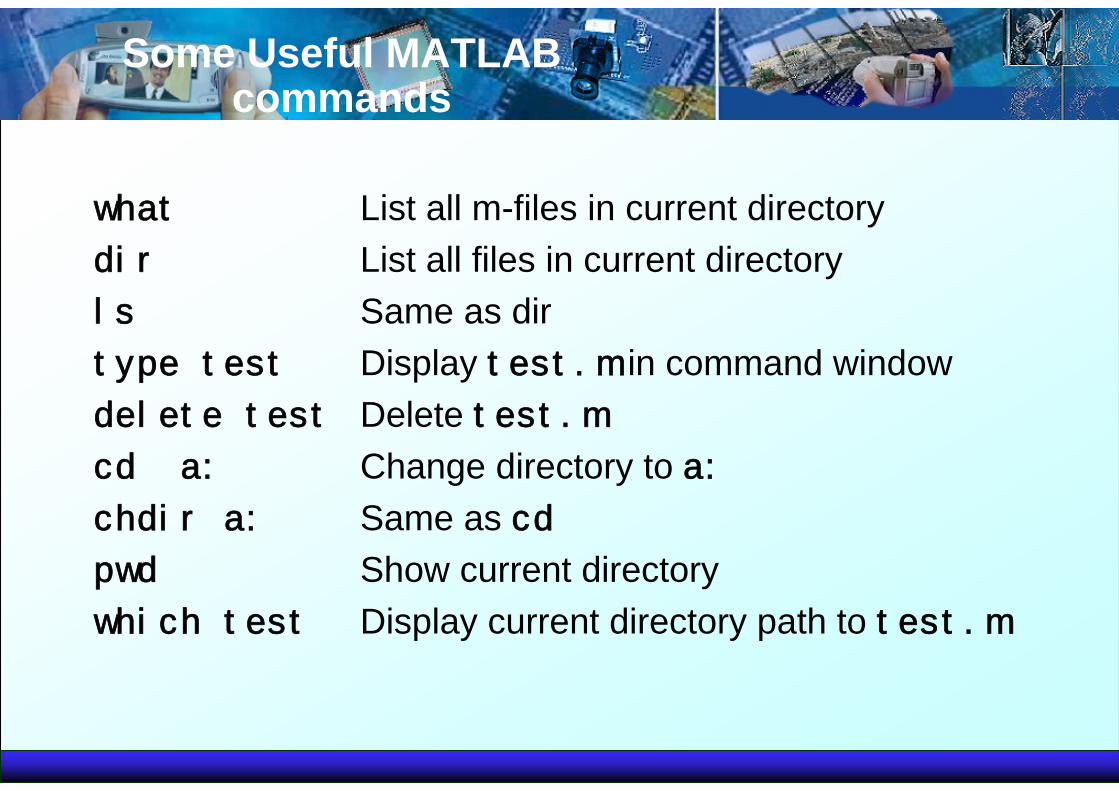
what List all m-files in current directorydir List all files in current directoryls Same as dirtype test Display test.m in command windowdelete test Delete test.mcd a: Change directory to a:chdir a: Same as cdpwd Show current directorywhich test Display current directory path to test.m
MATLAB Relational Operators
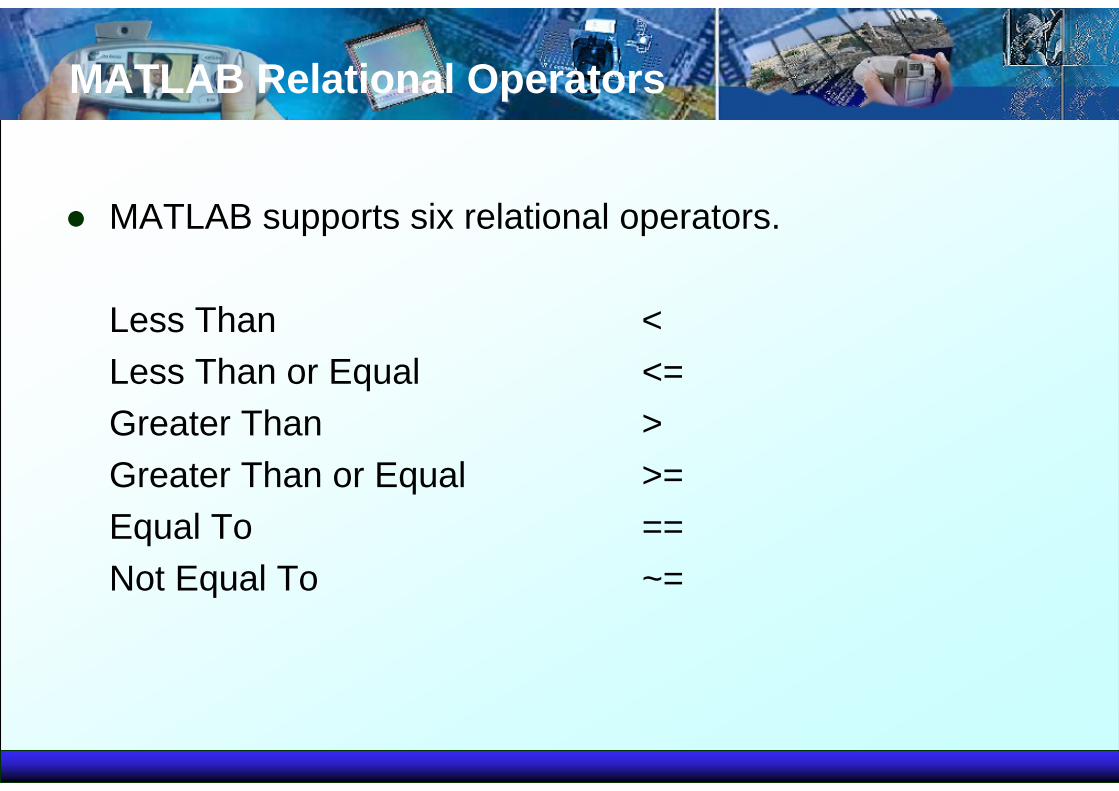
MATLAB supports six relational operators.
Less Than <Less Than or Equal <=Greater Than >Greater Than or Equal >=Equal To ==Not Equal To ~=
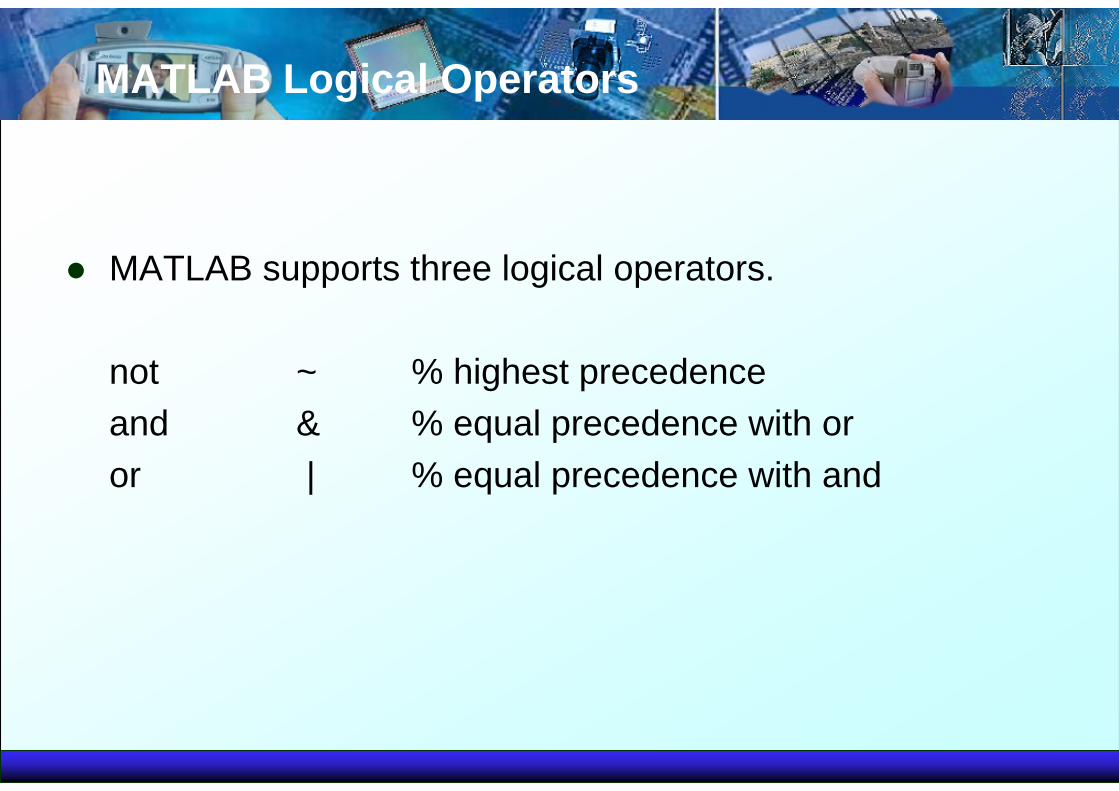
MATLAB Logical Operators
MATLAB supports three logical operators.
not ~ % highest precedenceand & % equal precedence with oror | % equal precedence with and
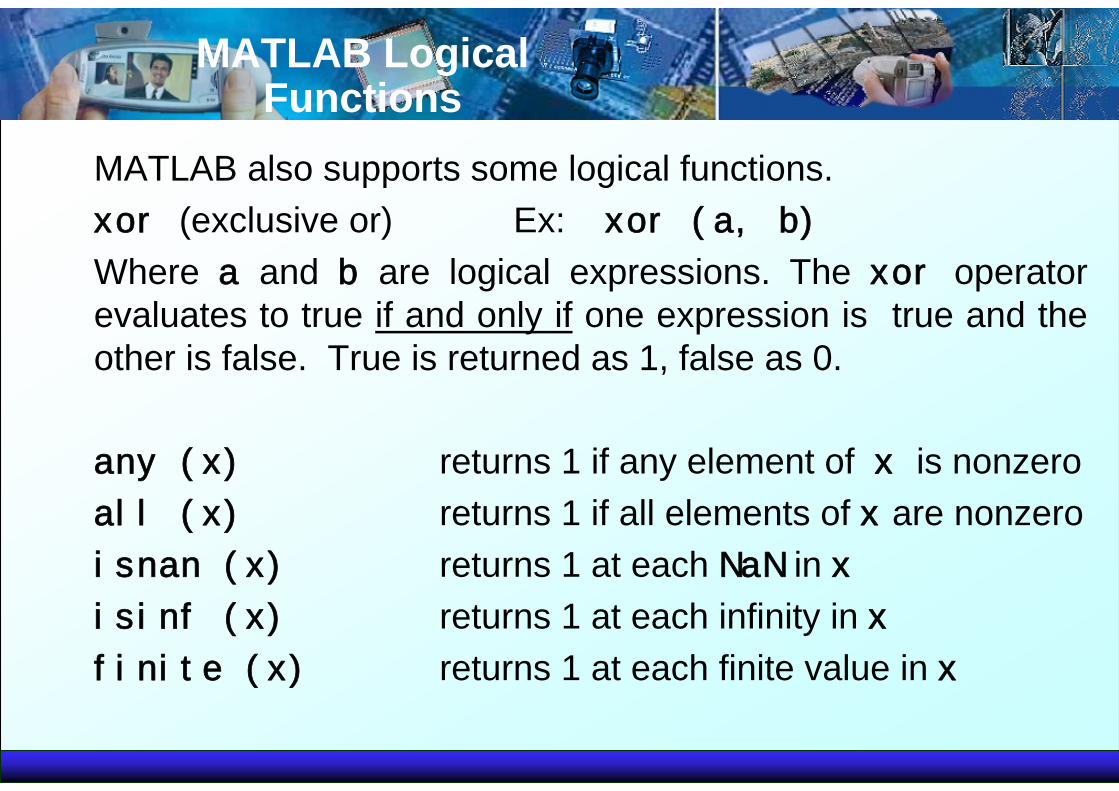
MATLAB Logical Functions
MATLAB also supports some logical functions.xor (exclusive or) Ex: xor (a, b)
Where a and b are logical expressions. The xor operator evaluates to true if and only if one expression is true and the other is false. True is returned as 1, false as 0.
any (x) returns 1 if any element of x is nonzeroall (x) returns 1 if all elements of x are nonzeroisnan (x) returns 1 at each NaN in xisinf (x) returns 1 at each infinity in xfinite (x) returns 1 at each finite value in x
Matlab Selection Structures
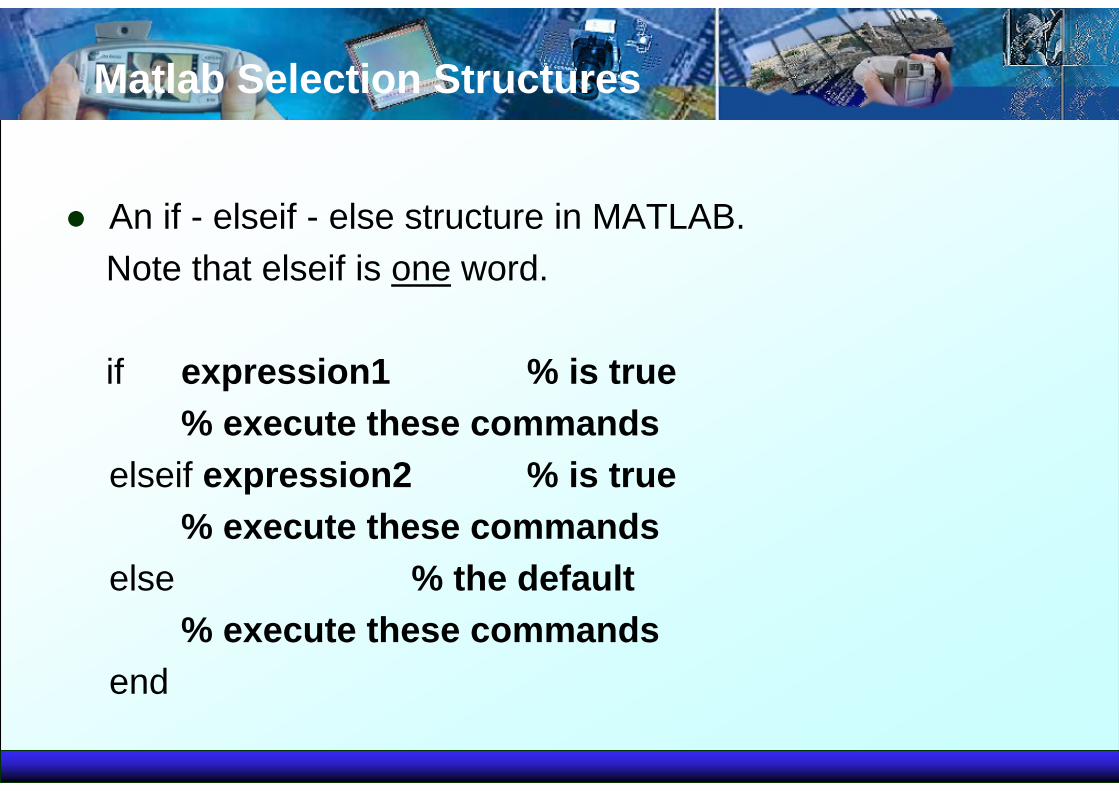
An if - elseif - else structure in MATLAB.Note that elseif is one word.
if expression1 % is true% execute these commands
elseif expression2 % is true% execute these commands
else % the default% execute these commands
end
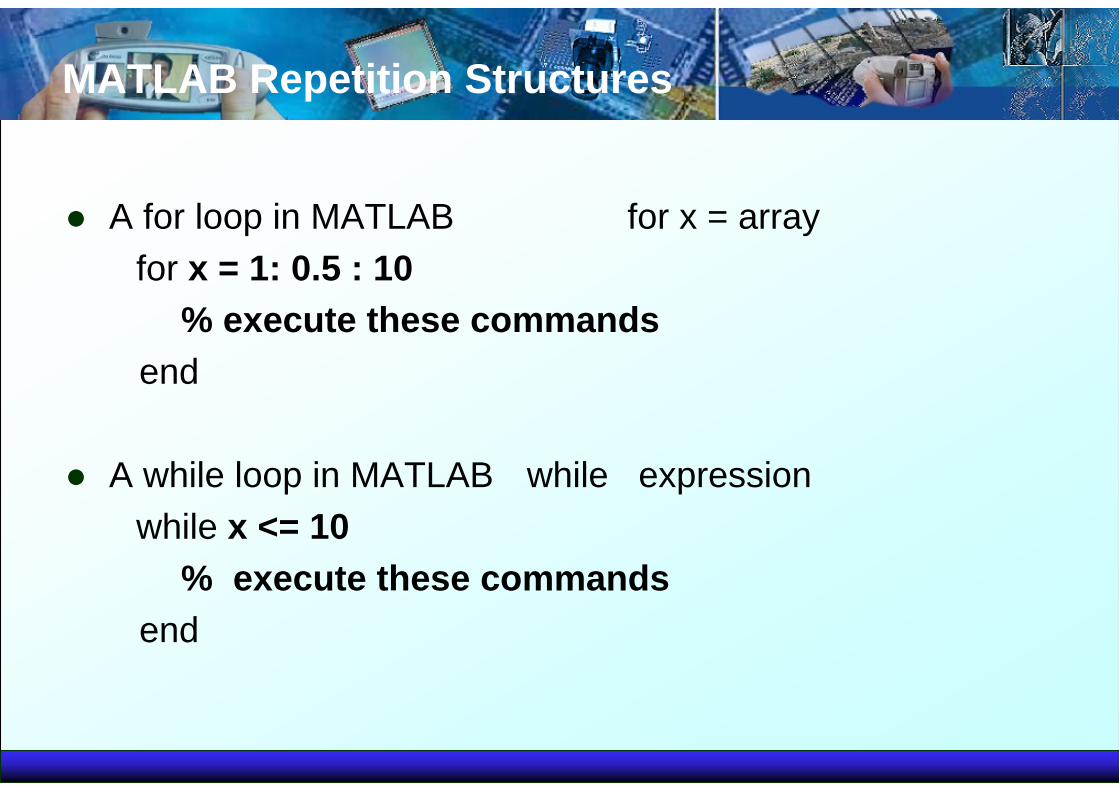
MATLAB Repetition Structures
A for loop in MATLAB for x = arrayfor x = 1: 0.5 : 10
% execute these commandsend
A while loop in MATLAB while expressionwhile x <= 10
% execute these commandsend

Scalar - Matrix Addition
» a=3;» b=[1, 2, 3;4, 5, 6]b =
1 2 34 5 6
» c= b+a % Add a to each element of bc =
4 5 67 8 9
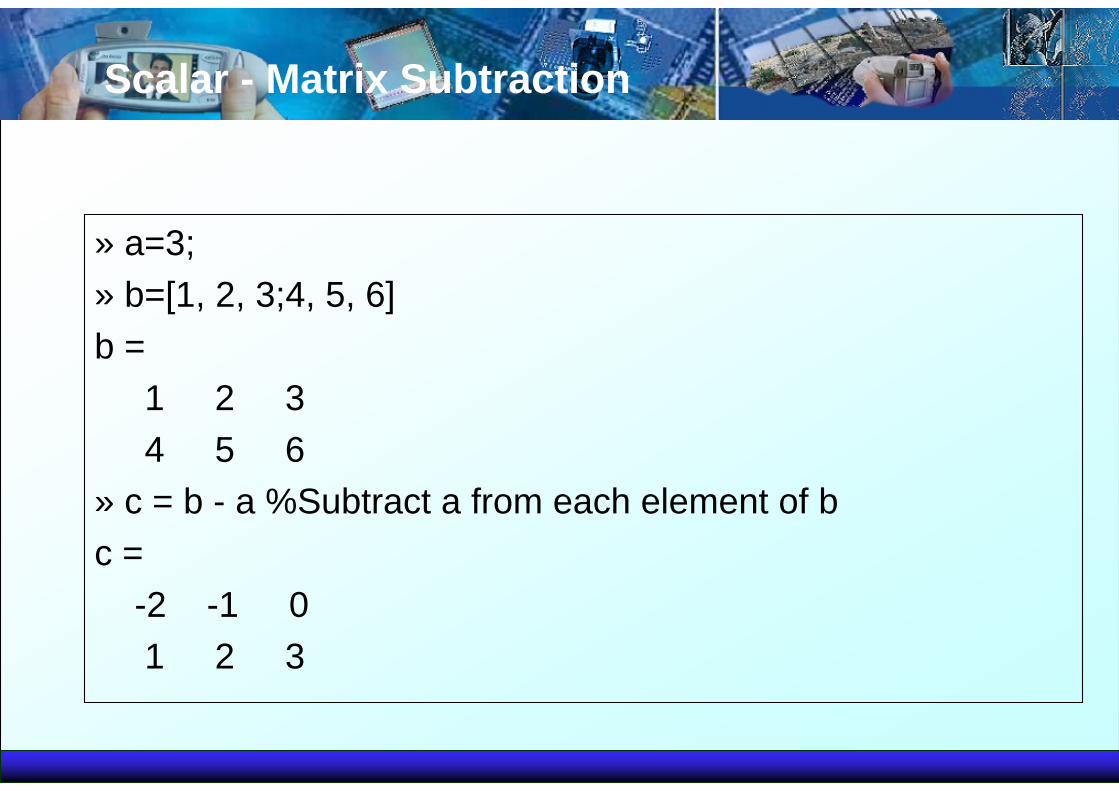
Scalar - Matrix Subtraction
» a=3;» b=[1, 2, 3;4, 5, 6]b =
1 2 34 5 6
» c = b - a %Subtract a from each element of bc =
-2 -1 01 2 3
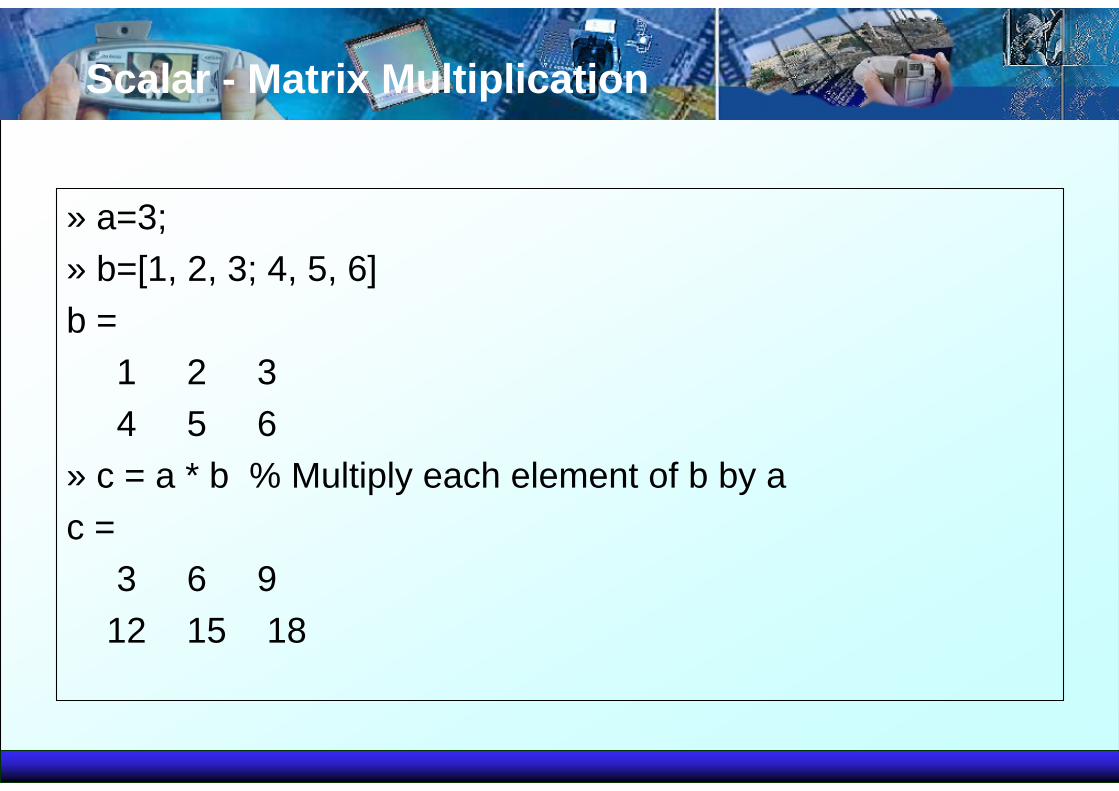
Scalar - Matrix Multiplication
» a=3;» b=[1, 2, 3; 4, 5, 6]b =
1 2 34 5 6
» c = a * b % Multiply each element of b by ac =
3 6 912 15 18
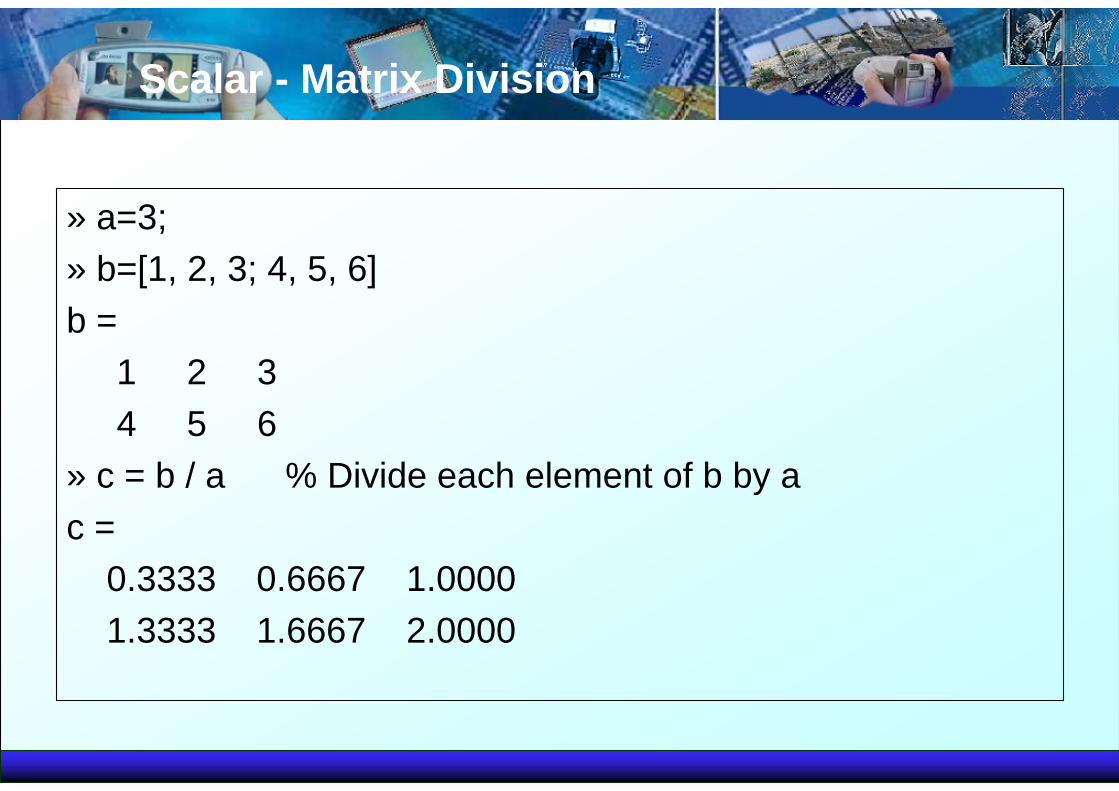
Scalar - Matrix Division
» a=3;» b=[1, 2, 3; 4, 5, 6]b =
1 2 34 5 6
» c = b / a % Divide each element of b by ac =
0.3333 0.6667 1.00001.3333 1.6667 2.0000
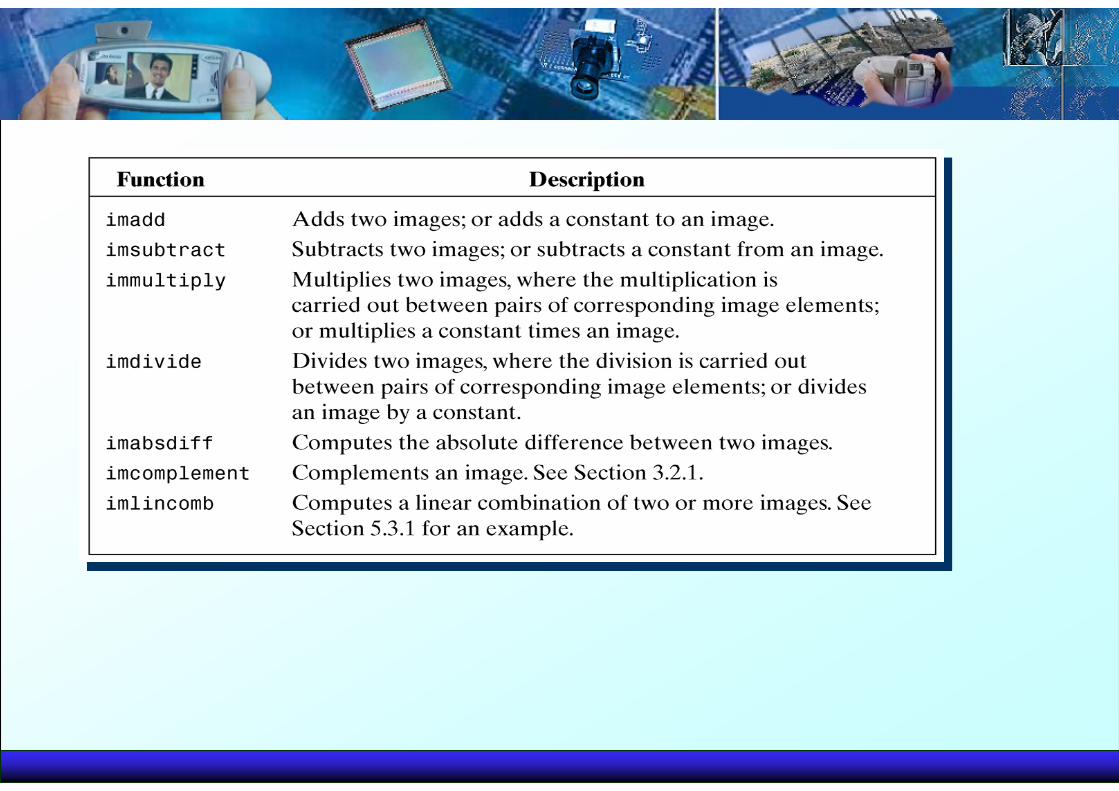
MATLAB Toolbox
MATLAB has a number of add-on software modules, called toolbox, that perform more specialized computations.
More than 60 toolboxes!More than 60 toolboxes!
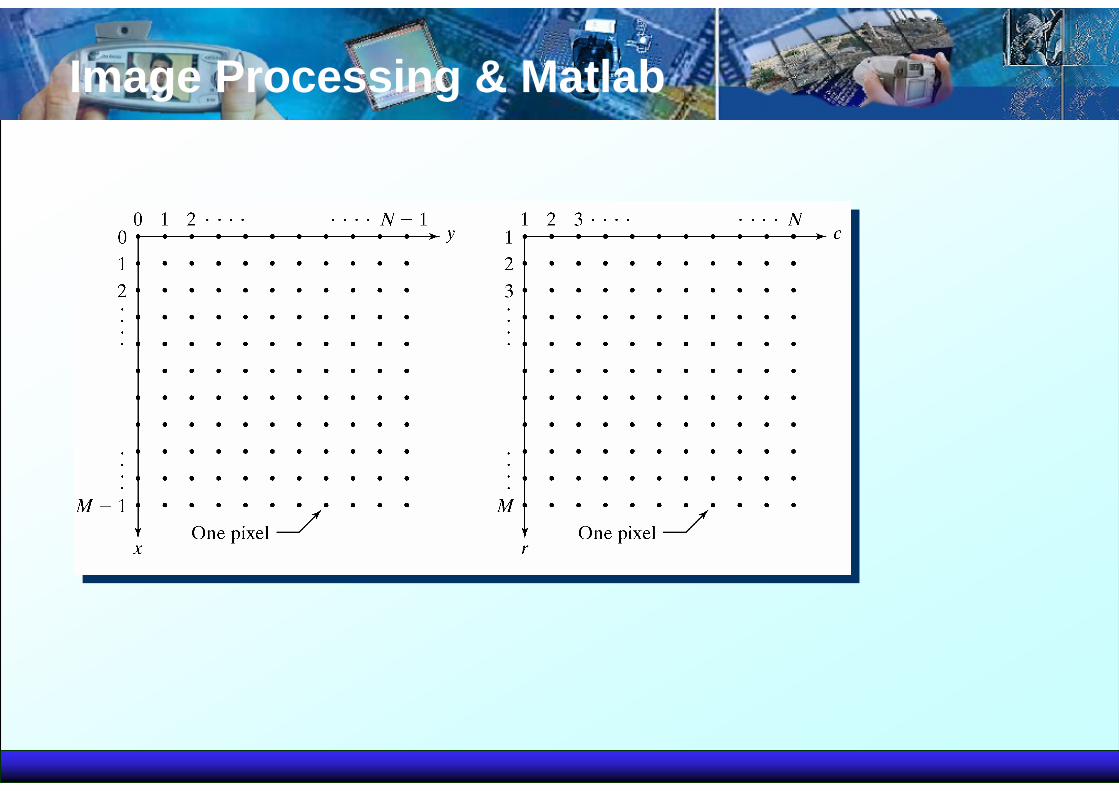
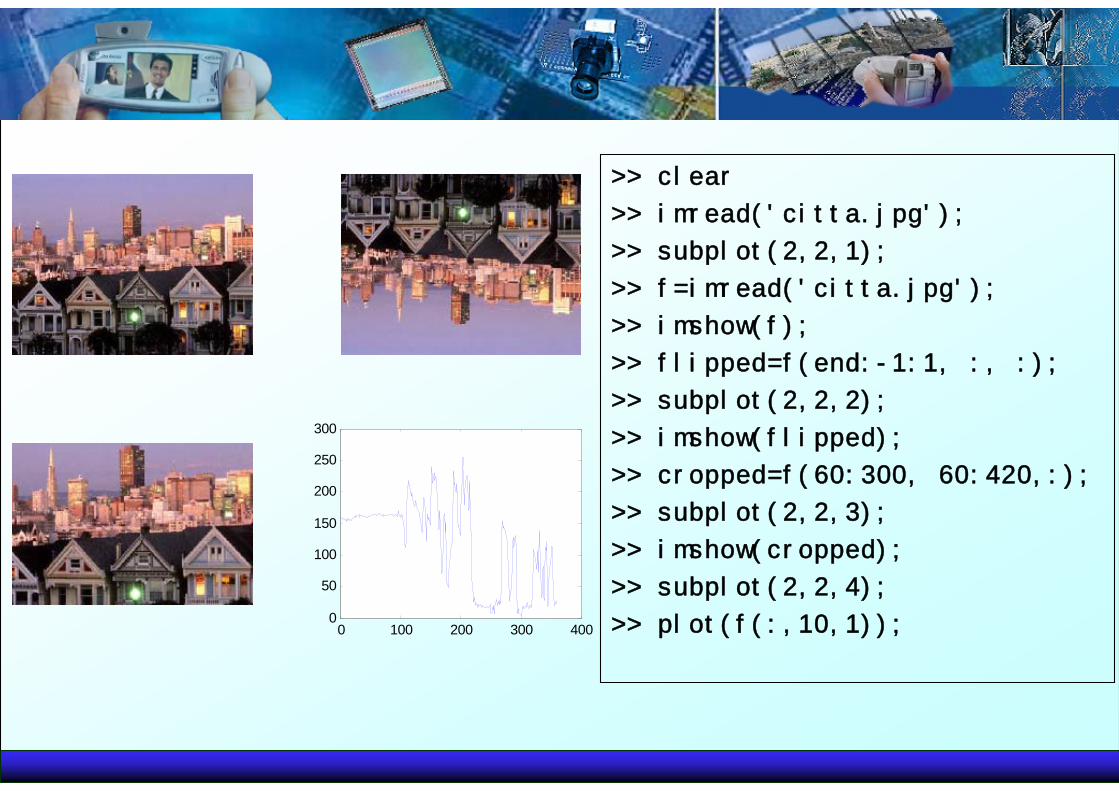
Image Processing & Matlab
0 100 200 300 4000
50
100
150
200
250
300
>> clear
>> imread('citta.jpg');
>> subplot(2,2,1);
>> f=imread('citta.jpg');
>> imshow(f);
>> flipped=f(end:-1:1, :, :);
>> subplot(2,2,2);
>> imshow(flipped);
>> cropped=f(60:300, 60:420,:);
>> subplot(2,2,3);
>> imshow(cropped);
>> subplot(2,2,4);
>> plot(f(:,10,1));
Tips and Tricks
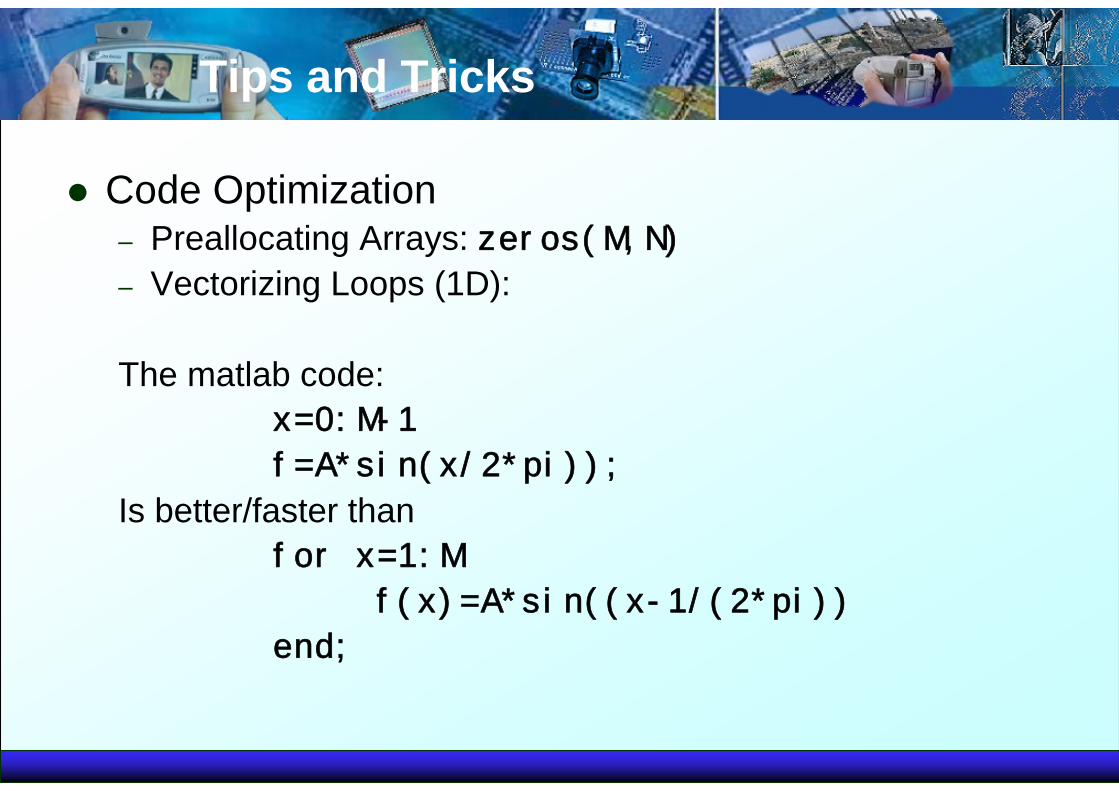
Code Optimization– Preallocating Arrays: zeros(M,N)– Vectorizing Loops (1D):
The matlab code:x=0:M-1
f=A*sin(x/2*pi));
Is better/faster thanfor x=1:M
f(x)=A*sin((x-1/(2*pi))
end;
Tips and Tricks
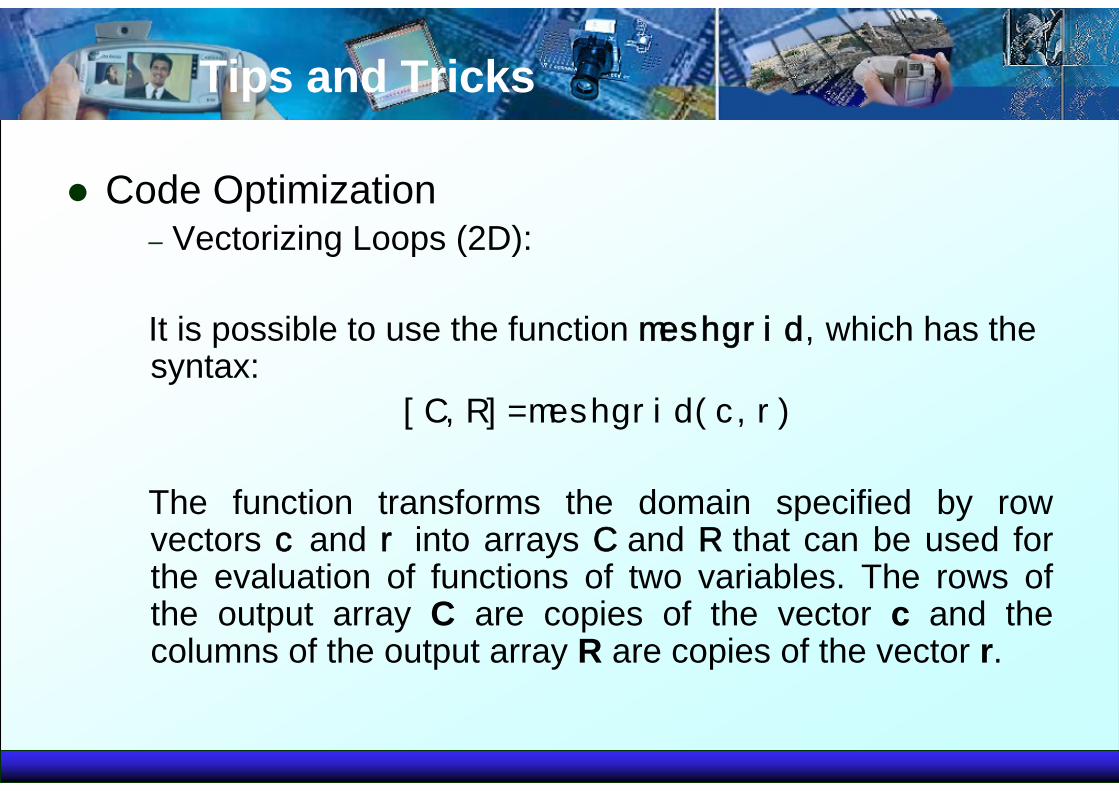
Code Optimization– Vectorizing Loops (2D):
It is possible to use the function meshgrid,which has the syntax:
[C,R]=meshgrid(c,r)
The function transforms the domain specified by rowvectors c and r into arrays C and R that can be used forthe evaluation of functions of two variables. The rows of the output array C are copies of the vector c and the columns of the output array R are copies of the vector r.
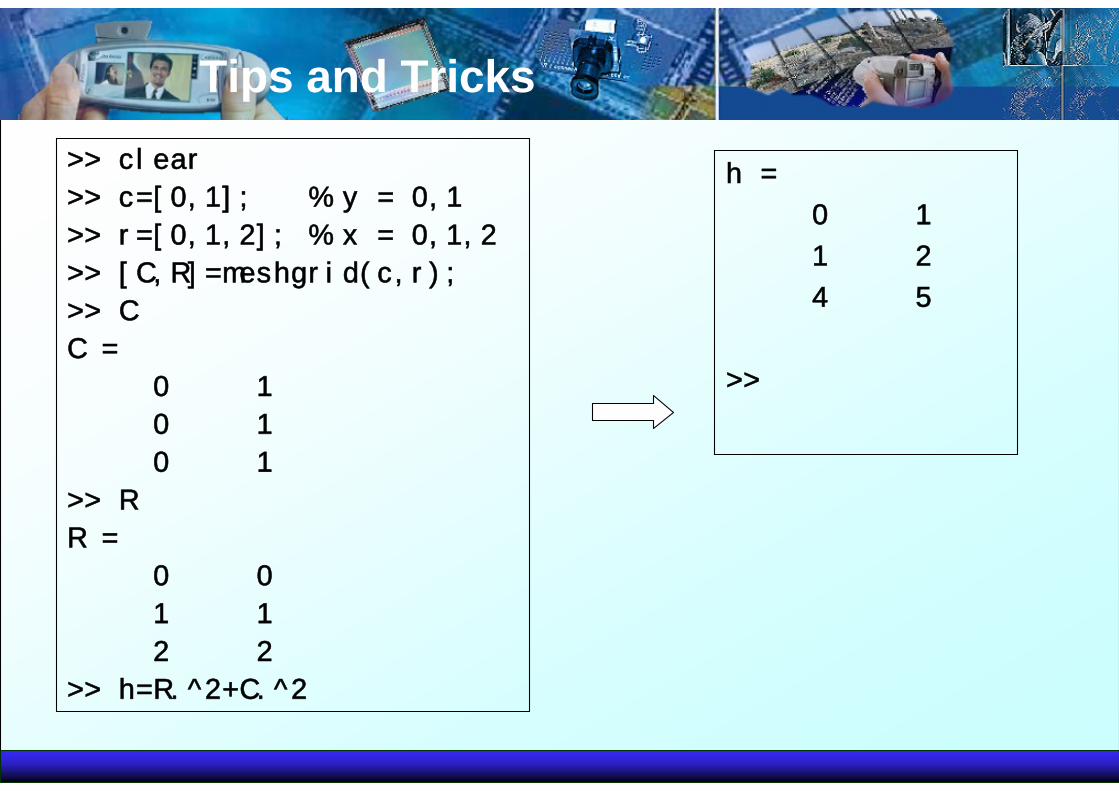
Tips and Tricks>> clear
>> c=[0,1]; % y = 0,1
>> r=[0,1,2]; % x = 0,1,2
>> [C,R]=meshgrid(c,r);
>> C
C =
0 1
0 1
0 1
>> R
R =
0 0
1 1
2 2
>> h=R.^2+C.^2
h =
0 1
1 2
4 5
>>
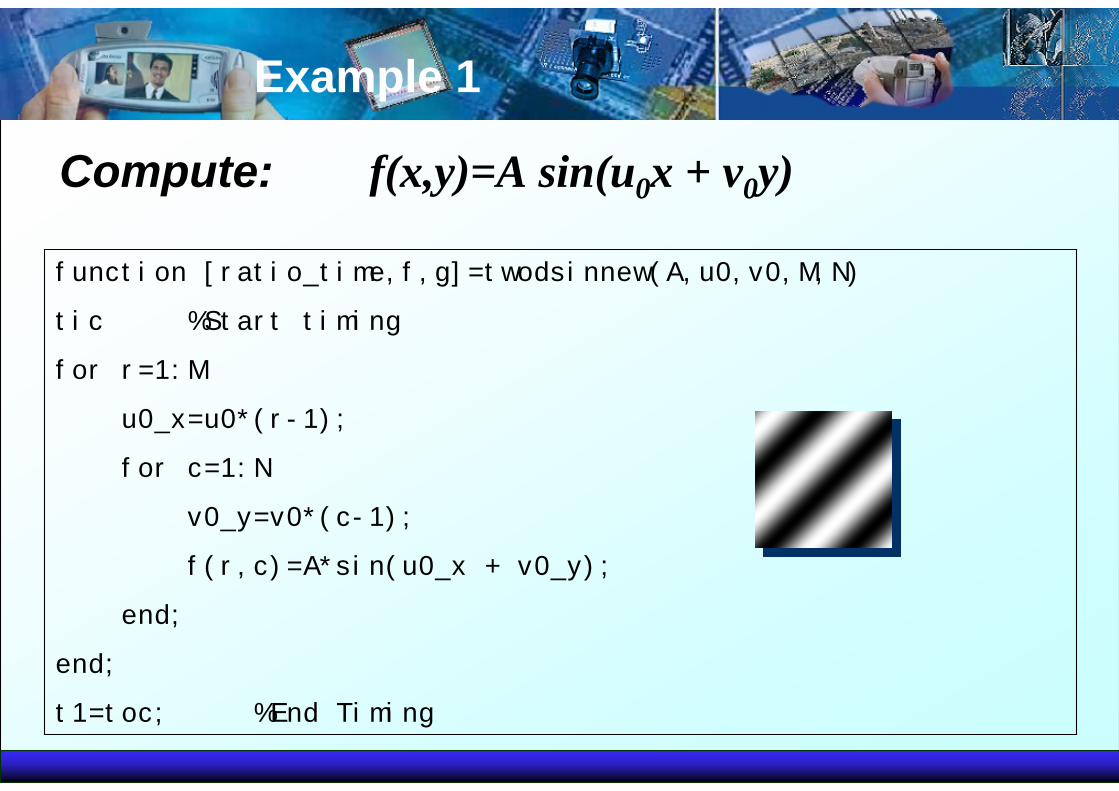
Example 1
function [ratio_time,f,g]=twodsinnew(A,u0,v0,M,N)
tic %Start timing
for r=1:M
u0_x=u0*(r-1);
for c=1:N
v0_y=v0*(c-1);
f(r,c)=A*sin(u0_x + v0_y);
end;
end;
t1=toc; %End Timing
Compute: f(x,y)=A sin(u0x + v0y)
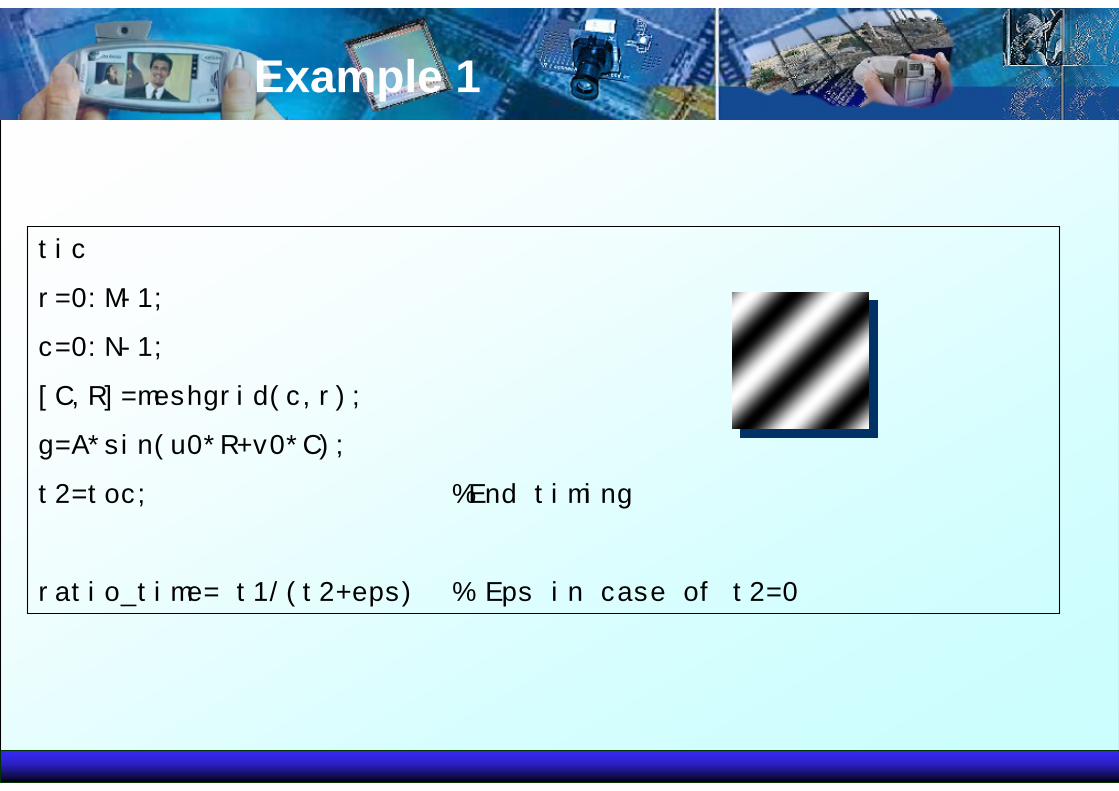
Example 1
tic
r=0:M-1;
c=0:N-1;
[C,R]=meshgrid(c,r);
g=A*sin(u0*R+v0*C);
t2=toc; %End timing
ratio_time= t1/(t2+eps) % Eps in case of t2=0
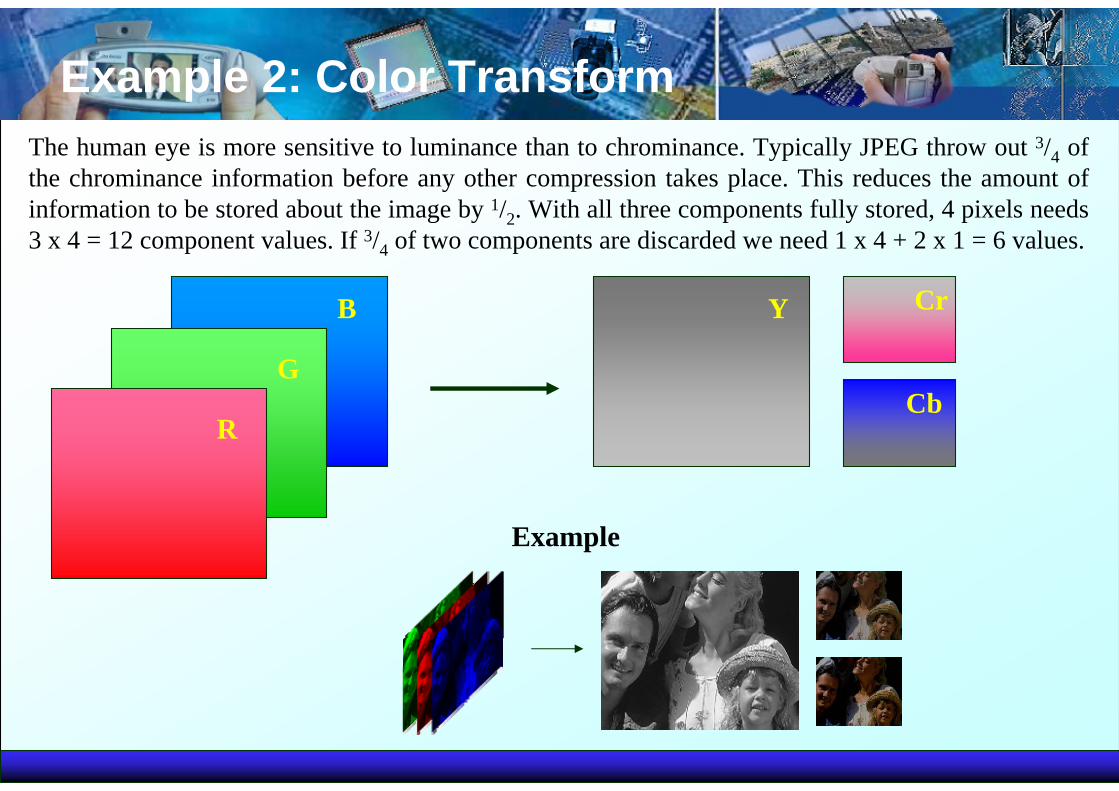
Example 2: Color Transform
R
B
G
Y
Cb
Cr
Example
The human eye is more sensitive to luminance than to chrominance. Typically JPEG throw out 3/4 of the chrominance information before any other compression takes place. This reduces the amount of information to be stored about the image by 1/2. With all three components fully stored, 4 pixels needs 3 x 4 = 12 component values. If 3/4 of two components are discarded we need 1 x 4 + 2 x 1 = 6 values.
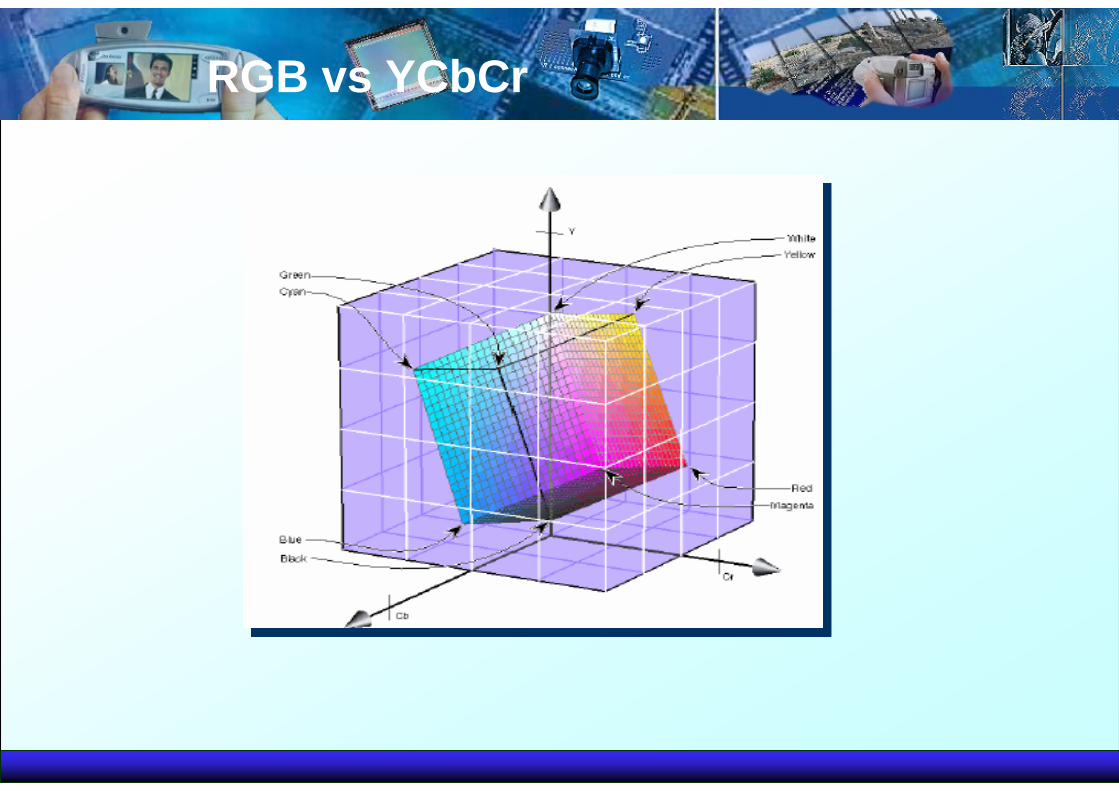
RGB vs YCbCr
Codice Matlab
Da inserire…
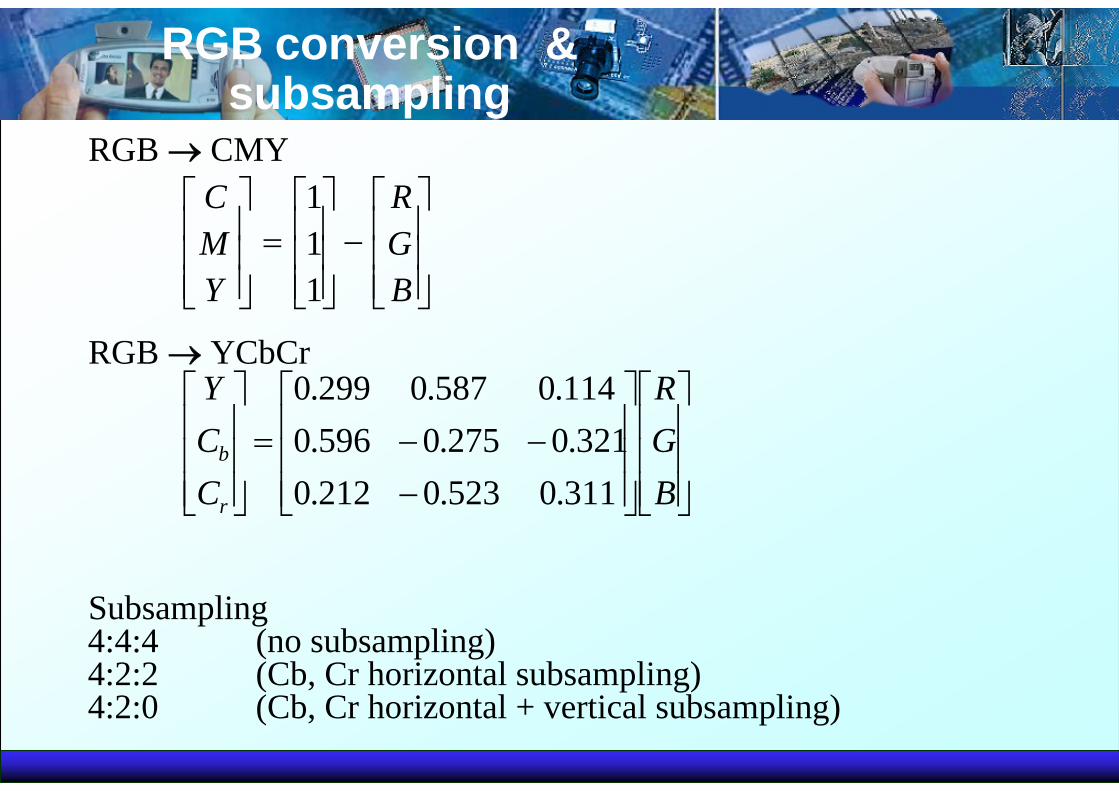
RGB conversion & subsampling
RGB → CMY
RGB → YCbCr
Subsampling4:4:4 (no subsampling)4:2:2 (Cb, Cr horizontal subsampling)4:2:0 (Cb, Cr horizontal + vertical subsampling)
⎥⎥⎥
⎦
⎤
⎢⎢⎢
⎣
⎡
⎥⎥⎥
⎦
⎤
⎢⎢⎢
⎣
⎡
−−−=
⎥⎥⎥
⎦
⎤
⎢⎢⎢
⎣
⎡
BGR
CCY
r
b
311.0523.0212.0321.0275.0596.0
114.0587.0299.0
⎥⎥⎥
⎦
⎤
⎢⎢⎢
⎣
⎡−
⎥⎥⎥
⎦
⎤
⎢⎢⎢
⎣
⎡=
⎥⎥⎥
⎦
⎤
⎢⎢⎢
⎣
⎡
BGR
YMC
111
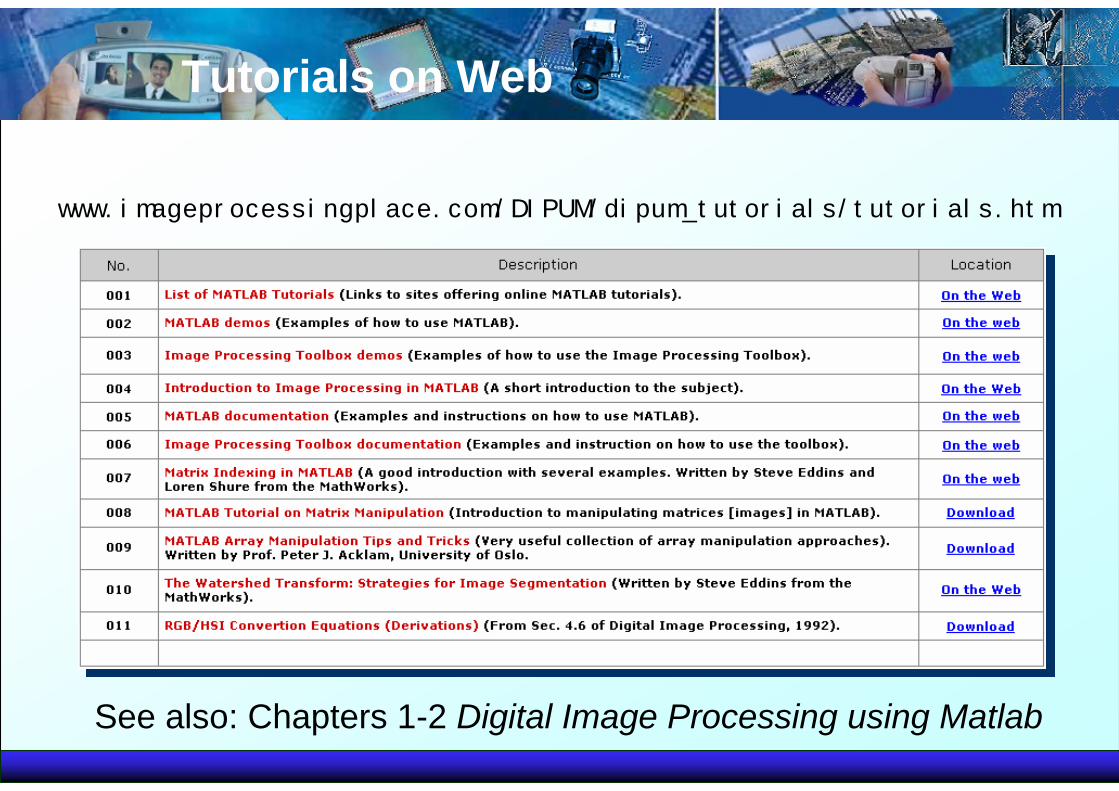
Tutorials on Web
www.imageprocessingplace.com/DIPUM/dipum_tutorials/tutorials.htm
See also: Chapters 1-2 Digital Image Processing using Matlab
Related Documents


